Role of crustal heterogeneity beneath Andaman–Nicobar Islands and its implications for coastal...
14
ORIGINAL PAPER Role of crustal heterogeneity beneath Andaman–Nicobar Islands and its implications for coastal hazard O. P. Mishra • D. Zhao • Chandan Ghosh • Z. Wang • O. P. Singh • Biman Ghosh • K. K. Mukherjee • D. K. Saha • G. K. Chakrabortty • S. G. Gaonkar Received: 15 January 2010 / Accepted: 24 November 2010 / Published online: 8 December 2010 Ó Springer Science+Business Media B.V. 2010 Abstract The Andaman–Nicobar (A–N) Islands region has attracted many geo-scientists because of its unique location and complex geotectonic settings. The recent occurrence of tsunamis due to the megathrust tsunamigenic north Sumatra earthquake (Mw 9.3) with a series of aftershocks in the A–N region caused severe damage to the coastal regions of India and Indonesia. Several pieces of evidence suggest that the occurrence of earthquakes in the A–N region is related to its complex geodynamical processes. In this study, it has been inferred that deep-seated structural heterogeneities related to dehydration of the subducting Indian plate beneath the Island could have induced the process of brittle failure through crustal weakening to contribute immensely to the coastal hazard in the region. The present study based on 3-D P-wave tomography of the entire rupture zone of the A–N region using the aftershocks of the 2004 Sumatra–Andaman earthquake (Mw 9.3) clearly demonstrates the role of crustal heterogeneity in seismogenesis and in causing the strong shakings and tsunamis. The nature and extent of the imaged crustal heterogeneity beneath A paper submitted to a special issue of Natural Hazard: ‘‘Tectonics of Bengal Fan and Arabian Sea with special emphasis on Coastal and Marine Geohazard’’. O. P. Mishra (&) Á O. P. Singh Á K. K. Mukherjee Á D. K. Saha Á G. K. Chakrabortty Á S. G. Gaonkar Geo-Seismology Division, CGD, Geological Survey of India (CHQ), Kolkata, India e-mail: [email protected]; [email protected]; [email protected] D. Zhao Department of Geophysics, Tohoku University, Sendai, Japan C. Ghosh National Institute of Disaster Management, New Delhi, India Z. Wang Chengdu Institute of Technology, Chengdu, China B. Ghosh Geodata and Database Division, Geological Survey of India, CHQ, Kolkata, India O. P. Mishra SAARC Disaster Management Centre, New Delhi, India 123 Nat Hazards (2011) 57:51–64 DOI 10.1007/s11069-010-9678-3
-
Upload
independent -
Category
Documents
-
view
4 -
download
0
Transcript of Role of crustal heterogeneity beneath Andaman–Nicobar Islands and its implications for coastal...
ORI GIN AL PA PER
Role of crustal heterogeneity beneath Andaman–NicobarIslands and its implications for coastal hazard
O. P. Mishra • D. Zhao • Chandan Ghosh • Z. Wang • O. P. Singh •
Biman Ghosh • K. K. Mukherjee • D. K. Saha • G. K. Chakrabortty •
S. G. Gaonkar
Received: 15 January 2010 / Accepted: 24 November 2010 / Published online: 8 December 2010� Springer Science+Business Media B.V. 2010
Abstract The Andaman–Nicobar (A–N) Islands region has attracted many geo-scientists
because of its unique location and complex geotectonic settings. The recent occurrence of
tsunamis due to the megathrust tsunamigenic north Sumatra earthquake (Mw 9.3) with a
series of aftershocks in the A–N region caused severe damage to the coastal regions of
India and Indonesia. Several pieces of evidence suggest that the occurrence of earthquakes
in the A–N region is related to its complex geodynamical processes. In this study, it has
been inferred that deep-seated structural heterogeneities related to dehydration of the
subducting Indian plate beneath the Island could have induced the process of brittle failure
through crustal weakening to contribute immensely to the coastal hazard in the region. The
present study based on 3-D P-wave tomography of the entire rupture zone of the A–N
region using the aftershocks of the 2004 Sumatra–Andaman earthquake (Mw 9.3) clearly
demonstrates the role of crustal heterogeneity in seismogenesis and in causing the strong
shakings and tsunamis. The nature and extent of the imaged crustal heterogeneity beneath
A paper submitted to a special issue of Natural Hazard: ‘‘Tectonics of Bengal Fan and Arabian Sea withspecial emphasis on Coastal and Marine Geohazard’’.
O. P. Mishra (&) � O. P. Singh � K. K. Mukherjee � D. K. Saha � G. K. Chakrabortty � S. G. GaonkarGeo-Seismology Division, CGD, Geological Survey of India (CHQ), Kolkata, Indiae-mail: [email protected]; [email protected];[email protected]
D. ZhaoDepartment of Geophysics, Tohoku University, Sendai, Japan
C. GhoshNational Institute of Disaster Management, New Delhi, India
Z. WangChengdu Institute of Technology, Chengdu, China
B. GhoshGeodata and Database Division, Geological Survey of India, CHQ, Kolkata, India
O. P. MishraSAARC Disaster Management Centre, New Delhi, India
123
Nat Hazards (2011) 57:51–64DOI 10.1007/s11069-010-9678-3
the A–N region may have facilitated the degree of damage and extent of coastal hazards in
the region. The 3-D velocity heterogeneities reflect asperities that manifest what type of
seismogenic layers exist beneath the region to dictate the size of earthquakes and thereby
they help to assess the extent of earthquake vulnerability in the coastal regions. The
inference of this study may be used as one of the potential inputs for assessment of seismic
vulnerability to the region, which may be considered for evolving earthquake hazard
mitigation model for the coastal areas of the Andaman–Nicobar Islands region.
Keywords Crustal heterogeneity � Tsunamis � Seismic imaging � Coastal hazard �Andaman–Nicobar Islands
1 Introduction
The damage survey reported that the Andaman–Nicobar (A–N) Islands is the worst
affected state of India because of strong shaking and tsunami caused by the 2004 Sumatra–
Andaman earthquake (Mw 9.3) (Mishra et al. 2005, 2007a, b). The mainshock also caused
a huge damage to both property and people of most coastal countries of Southeast Asia
(Bilham 2005). The mainshock was felt in the different parts of the world (e.g., Bangla-
desh, India, Indonesia, Malaysia, Maldives, Myanmar, Sri Lanka and Thailand) among
which Indonesia and India were worst affected countries during the tsunamis (Martin 2005;
Mishra et al. 2005, 2007a). In India, the earthquake was severely felt in the entire A–N
Islands and coastal belts of Tamil Nadu and Andhra Pradesh. The majority of damage in
these regions of India was caused by severe tsunamis, which witnessed a huge economic
loss of property and human lives at Carnicobar, Campbell, Camorta and Indira points in the
Andaman–Nicobar region. The earthquake shaking caused damages to buildings and
structures at Diglipur (north Andaman) and Myabandar (middle Andaman) despite their
distant locations of about 1,200 km from the north Sumatra mainshock epicenter. The
coastal people and islanders of Andaman–Nicobar were in shock and were afraid of further
imminent strong quakes and tsunamis in the region (Mishra et al. 2005). There was nothing
but chaos, panic, fear and despair among people in this region after this killer earthquake
(Mishra et al. 2007b), the second largest earthquake in the history of seismology after the
greatest 1960 Chilean earthquake (Mw 9.5) (Stein and Okal 2005; Mishra et al. 2007b).
The A–N region falls in the highest seismic hazard zone-V, which witnessed several past
damaging earthquakes that were akin to the Himalayan collision zone.
Tectonically, the A–N region (Fig. 1a) belongs to a very complex subduction system,
where the Burma–Andaman arc marks the eastern margin of the Indian plate along which
an oblique convergence is suggested by many authors (e.g., Fitch 1970; Curray 2005). The
Burma micro-plate (BMP), often referred to as an overriding sliver plate above the sub-
ducting Indian plate (IP) or subduction fault zone, forms the western segment of the main
Sunda plate (Curray 2005). The trench is a buried feature off Andaman–Nicobar fan
sediments. At the Andaman Sea, the western domain is composed of Andaman–Nicobar
Trench and accretionary subduction complex ridges (Curray 2005). The west Andaman
fault (WAF) with N–S-oriented dextral strike-slip is found to be a prominent fault all along
the A–N Islands that appears to be continuous from west off the northern Sumatra to where
it is lost beneath the terrigeneous fill of the Irrawaddy–Martaban shelf (Fig. 1a). Further
east, the line of the WAF is marked by the proximity of volcanic islands (Barren and
Narcondum).
52 Nat Hazards (2011) 57:51–64
123
Several studies, mainly based on old data recorded by the regional seismic networks,
were carried out to achieve the regional interpretation of the subduction processes in the
A–N region (Le Dain et al. 1984; Mukhopadhyay 1984; Dasgupta and Mukhopadhyay
1993). Moreover, Kayal et al. (2004) made a local aftershock investigation into the 13
September 2002 Diglipur earthquake (Mw 6.5), which, however, mainly confined to the
north Andaman, and they reported a transverse seismogenic structure to the north of the
Andaman Islands. Recently, Kennett and Cummins (2005) conducted a tomographic study
using regional data reported to the International Seismological Center (ISC) to investigate
the physical properties of the subducted slab along the Sumatra–Andaman arc, and they
found that changing morphology of the subduction zone is associated with changes in
physical properties, mainly with bulk modulus variations. However, this study lacks a
detailed insight into the geodynamical processes beneath the A–N region.
Prior to the 26th December 2004 tsunamis, the A–N Islands of India was a poorly
instrumented region without seismographic network except for a solitary permanent analog
seismograph station ascribed to the India Meteorological Department at the Port Blair,
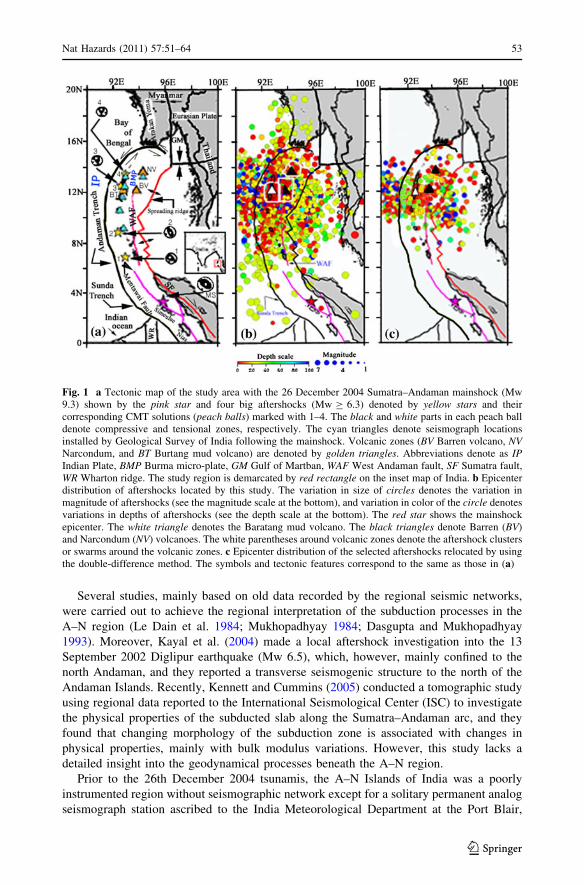
Fig. 1 a Tectonic map of the study area with the 26 December 2004 Sumatra–Andaman mainshock (Mw9.3) shown by the pink star and four big aftershocks (Mw C 6.3) denoted by yellow stars and theircorresponding CMT solutions (peach balls) marked with 1–4. The black and white parts in each peach balldenote compressive and tensional zones, respectively. The cyan triangles denote seismograph locationsinstalled by Geological Survey of India following the mainshock. Volcanic zones (BV Barren volcano, NVNarcondum, and BT Burtang mud volcano) are denoted by golden triangles. Abbreviations denote as IPIndian Plate, BMP Burma micro-plate, GM Gulf of Martban, WAF West Andaman fault, SF Sumatra fault,WR Wharton ridge. The study region is demarcated by red rectangle on the inset map of India. b Epicenterdistribution of aftershocks located by this study. The variation in size of circles denotes the variation inmagnitude of aftershocks (see the magnitude scale at the bottom), and variation in color of the circle denotesvariations in depths of aftershocks (see the depth scale at the bottom). The red star shows the mainshockepicenter. The white triangle denotes the Baratang mud volcano. The black triangles denote Barren (BV)and Narcondum (NV) volcanoes. The white parentheses around volcanic zones denote the aftershock clustersor swarms around the volcanic zones. c Epicenter distribution of the selected aftershocks relocated by usingthe double-difference method. The symbols and tectonic features correspond to the same as those in (a)
Nat Hazards (2011) 57:51–64 53
123
a capital city of Andaman–Nicobar Islands. There was no ocean bottom seismometer
(OBS) in the Andaman Sea to record the suboceanic earthquakes. During January 6–March
16, 2005, six temporary seismic stations were installed at Carnic, Hutbay, Port Blair,
Rangat, Diglipur, and Narcondum (Fig. 1a) by the Geological Survey of India in the
Andaman–Nicobar Islands following the great tsunamigenic earthquake (Mw 9.3), which
recorded a large amount of aftershock data. Analyzing this precious data set may provide a
better insight into the seismotectonics of the A–N Islands. Recently Mishra et al. (2007a)
analyzed about 18,000 aftershocks (M C 3.5) recorded by these six seismograph stations.
Based on erratic and unsteady decay in aftershocks, a north–south-trending aftershock
cluster in an area of about 800 9 300 km2, drastic variations in b-values, and varied
faulting patterns beneath the A–N region, they reported the existence of strong hetero-
geneities in the entire A–N region. Several pieces of evidence suggest that occurrence of
the small and large earthquakes in Andaman–Nicobar region is related to complex seis-
motectonic settings and geodynamical processes in the region. Seismogenesis is generally
dictated by structural heterogeneities that may be revealed by seismic tomography (Zhao
et al. 2002, 2004; Mishra and Zhao 2004; Lei and Zhao 2009; Wang et al. 2009a, b). It is
well documented that earthquake genesis is also influenced by magma and fluids (Zhao
et al. 2002). Deep-seated crustal heterogeneities related to dehydration of the subducting
Indian plate beneath the Island arc also facilitate the process of brittle failure through
crustal weakening and contributing immensely to the coastal hazard in the region (Mishra
and Zhao 2004; Zhao et al. 2004; Mishra et al. 2007a, b). The Andaman–Nicobar region
depicts all of tectonic intricacies which may facilitate the process of seismogenesis in the
region that have caused a huge loss of both flora and faunas due to strong shaking and
tsunamis in the coastal areas of most of South Asian countries, including several coastal
states of India (e.g., Andaman–Nicobar Islands; Tamil Nadu; Andhra Pradesh) during the
huge 2004 Sumatra earthquake (Mw 9.3).
There was no much work done earlier in the region to address the disaster scenario of
Andaman–Nicobar Islands despite the region belongs to seismically active and volcani-
cally prone regime of the geotectonic settings of India. No 3-D tomography study was
carried out earlier on local-scale to know how subsurface heterogeneities were related to
the scale of damage and geological disasters of the region. In the present study, we show
how the nature of seismogenesis may bear a close relationship with nature and extent of
our imaged structural heterogeneities in the region, which in turn may help to understand
how the degree of hazards in the coastal belts is dictated by the seismogenic strength of the
subsurface layers. Eruption of the Baratang mud volcanoes and the Barren lava volcano
during onset of aftershock cycle of the 2004 Sumatra–Andaman earthquake created severe
panic among the local people (Mishra et al. 2007b). Our detailed analyses may provide
significant information to understand the role of structural heterogeneities and their bearing
on stress pattern, which may have facilitated the continuous ejection of mud and slurry
materials during aftershock cycle from the mud crater at the Baratang, middle Andaman.
During earthquake chaos due to killer tsunamis in the year 2004–2005, people had doubt
on premature ejection of lavas from the erstwhile active Barren volcano in the region. We
address the issue by providing a plausible explanation derived from our assimilated 3-D Vp
tomograms of the crust and upper mantle under the region.
In the present study, 3-D seismic structure beneath the Andaman–Nicobar (A–N)
Islands of India has been assimilated, for the first time, on local-scale using arrival time
data from aftershocks recorded by a local temporary seismic network of Geological Survey
of India following the 26 December 2004 Sumatra mainshock (Mw 9.3). Our 3-D tomo-
graphic results may offer some potential information on the seismotectonics and its bearing
54 Nat Hazards (2011) 57:51–64
123
on structural heterogeneity that exist beneath the Andaman–Nicobar region to understand
what caused the crustal and subcrustal earthquakes and how these contributed to coastal
hazards.
2 Data and method
Based on uniform distribution of events along the rupture zone beneath the A–N region,
and smaller horizontal and vertical errors in locations, we selected 2091 aftershocks from
the catalog containing over 18,000 aftershocks (M C 3.5) (Mishra et al. 2007a) (Fig. 1b).
All of the 2091 events were recorded by at least 5 stations and have more than 5 P- and 4 S-
arrivals. In this study, we have used a total of 12,433 P- and 9,691 S-wave arrival time data
from 2091 selected aftershocks. The epicenter distribution of these aftershocks is shown in
Fig. 1b–c. The reading accuracy varies from 0.05 to 0.20 s for P-wave, whereas for
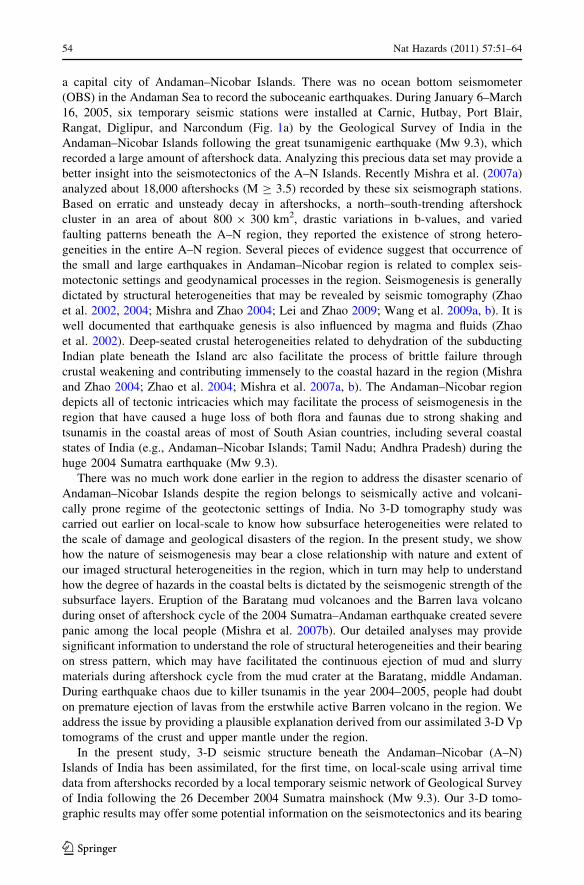
S-wave, the picking accuracy is larger and found to be 0.1–0.35 s. We also used 1,137
P-arrival times from 147 earthquakes recorded by 37 ISC stations as other group of our
dataset for enhancing the ray density in the vicinity of the A–N Islands (Fig. 2). Each of the
ISC earthquakes was recorded by at least 7 stations.
We have applied the tomographic method of Zhao et al. (1992) to the two groups of
arrival time data to determine the 3-D P-wave velocity structure beneath the region. Based
on the study of deep seismic soundings (DSS), gravity data, and the geological informa-
tion, we used a modified 1-D velocity model of Kieckhefer et al. (1981) and Kayal et al.
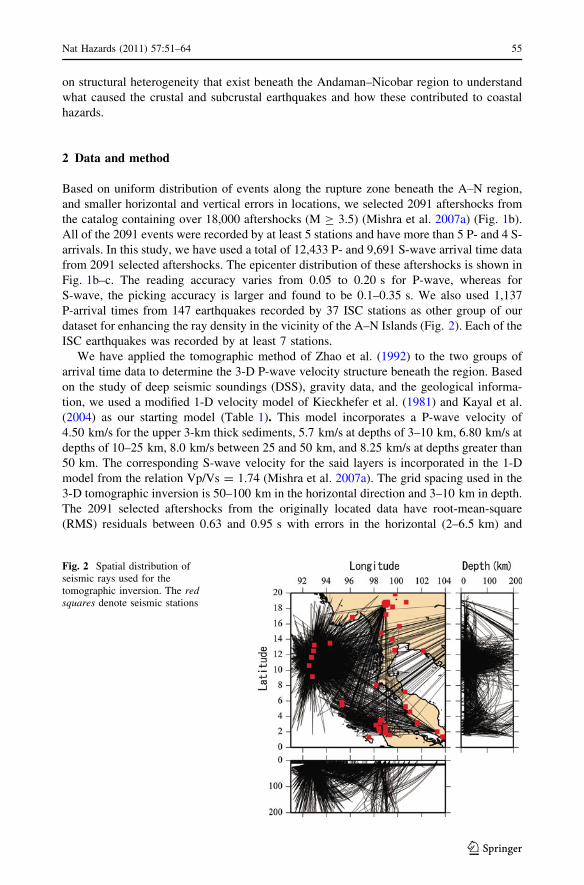
(2004) as our starting model (Table 1). This model incorporates a P-wave velocity of
4.50 km/s for the upper 3-km thick sediments, 5.7 km/s at depths of 3–10 km, 6.80 km/s at
depths of 10–25 km, 8.0 km/s between 25 and 50 km, and 8.25 km/s at depths greater than
50 km. The corresponding S-wave velocity for the said layers is incorporated in the 1-D
model from the relation Vp/Vs = 1.74 (Mishra et al. 2007a). The grid spacing used in the
3-D tomographic inversion is 50–100 km in the horizontal direction and 3–10 km in depth.
The 2091 selected aftershocks from the originally located data have root-mean-square
(RMS) residuals between 0.63 and 0.95 s with errors in the horizontal (2–6.5 km) and
Fig. 2 Spatial distribution ofseismic rays used for thetomographic inversion. The redsquares denote seismic stations
Nat Hazards (2011) 57:51–64 55
123
vertical (7.0–20.0 km) locations (Mishra et al. 2007a). These aftershocks were relocated by
using the double-difference location method (Wang and Zhao 2006a, b), which showed a
significant reduction in the horizontal and vertical location errors to 1.5–3.5 and
2.5–8.0 km, respectively (Fig. 1c). Both P- and S-arrival times from the 2091 aftershocks
were used in the event relocation, while the 147 events reported to the ISC stations were
not relocated and they were kept fixed in the tomographic inversion.
3 Results and discussion
This endeavor may help us to understand the nature and extent of crustal heterogeneities in
P-wave velocity structure at varying depths. In addition to that, it offers how crustal and
subcrustal heterogeneities are associated with the subducting Indian plate beneath Myan-
mar micro-plate and responsible for inducing moderate to large earthquakes. The 3-D
tomographic image is extended toward volcanic (Barren and Narcondum) zones to
understand geodynamical implications of the imaged heterogeneities in the vicinity of the
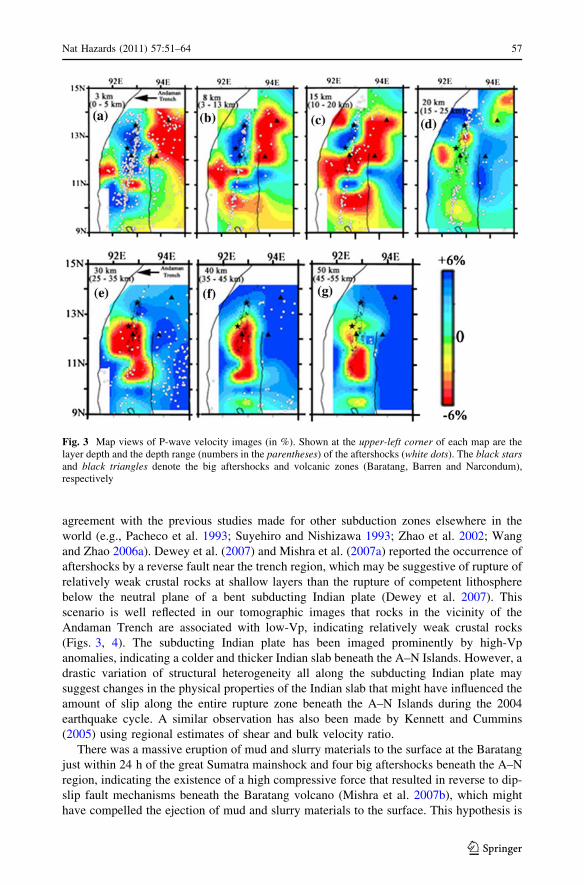
volcanic region. Figure 3 demonstrates Vp images at different depths ranging from 3 to
50 km with a distribution of aftershocks that occurred in the region. Cross-sectional images
for the same simulated Vp structure nearly perpendicular to the Andaman Trench axis are
shown in Fig. 4a–d. The results (Figs. 3, 4) depict a very heterogeneous and intriguing
seismic structure beneath the A–N Islands, showing a close correspondence to the local and
regional tectonics. We performed several synthetic tests for various simulated anomalous
zones that appeared in the obtained tomographic image to ascertain the degrees of recovery
and resolvability of our obtained images. The synthetic tests were carried out with syn-
thetic arrival time data that were made by incorporating a random noise of Gaussian
distribution to the original dataset, and then we inverted the synthetic data with the same
model parameterization using the same algorithm as that in the real dataset (Zhao et al.
1992). An example of the synthetic test is shown in Fig. 4 e–f, which shows that the input
anomalies at different locations (Fig. 4e) are well recovered in the output model (Fig. 4f)
for the given grid setup used in the 3-D inversion.
The imaging of high-Vp and low-Vp anomalies (Figs. 3, 4) at shallow layers may
correspond, respectively, to highly dense crystalline rocks and water-bearing sediments or
accreted materials, where the possibility of brittle failure becomes higher. Involvement of
fluids in seismogeneis is well documented for different plate boundary and intraplate
earthquakes elsewhere in the world (e.g., Zhao et al. 2002; Mishra et al. 2008; Lei et al.
2009a; Lei and Zhao 2009). The low-Vp near the Andaman Trench may represent the
deposited terrigeneous sediments or Bengal–Nicobar fan sediments. The low-Vp in the
upper crust (3–8 km) may manifest the presence of accreted sedimentary wedge materials
above the subducting Indian plate and the overriding Burma micro-plate, which is in good
Table 1 The starting 1-Dvelocity model used for the 3-Dtomographic inversion
Number oflayers
Depth oflayers (km)
Vp (km/sec)
1 0.0–3.0 4.50
2 3.0–10.0 5.70
3 10.0–25.0 6.80
4 25.0–50.0 8.00
5 [50.0 8.25
56 Nat Hazards (2011) 57:51–64
123
agreement with the previous studies made for other subduction zones elsewhere in the
world (e.g., Pacheco et al. 1993; Suyehiro and Nishizawa 1993; Zhao et al. 2002; Wang
and Zhao 2006a). Dewey et al. (2007) and Mishra et al. (2007a) reported the occurrence of
aftershocks by a reverse fault near the trench region, which may be suggestive of rupture of
relatively weak crustal rocks at shallow layers than the rupture of competent lithosphere
below the neutral plane of a bent subducting Indian plate (Dewey et al. 2007). This
scenario is well reflected in our tomographic images that rocks in the vicinity of the
Andaman Trench are associated with low-Vp, indicating relatively weak crustal rocks
(Figs. 3, 4). The subducting Indian plate has been imaged prominently by high-Vp
anomalies, indicating a colder and thicker Indian slab beneath the A–N Islands. However, a
drastic variation of structural heterogeneity all along the subducting Indian plate may
suggest changes in the physical properties of the Indian slab that might have influenced the
amount of slip along the entire rupture zone beneath the A–N Islands during the 2004
earthquake cycle. A similar observation has also been made by Kennett and Cummins
(2005) using regional estimates of shear and bulk velocity ratio.
There was a massive eruption of mud and slurry materials to the surface at the Baratang
just within 24 h of the great Sumatra mainshock and four big aftershocks beneath the A–N
region, indicating the existence of a high compressive force that resulted in reverse to dip-
slip fault mechanisms beneath the Baratang volcano (Mishra et al. 2007b), which might
have compelled the ejection of mud and slurry materials to the surface. This hypothesis is
Fig. 3 Map views of P-wave velocity images (in %). Shown at the upper-left corner of each map are thelayer depth and the depth range (numbers in the parentheses) of the aftershocks (white dots). The black starsand black triangles denote the big aftershocks and volcanic zones (Baratang, Barren and Narcondum),respectively
Nat Hazards (2011) 57:51–64 57
123
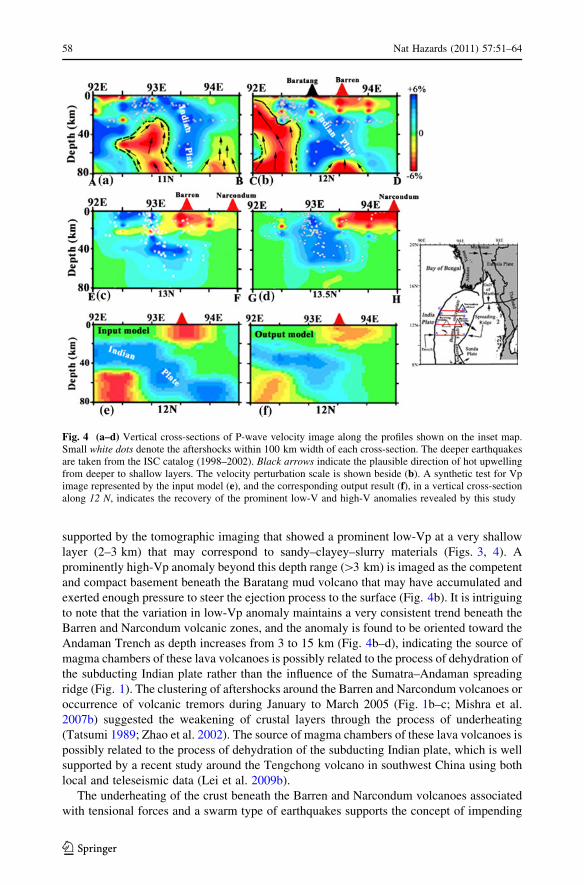
supported by the tomographic imaging that showed a prominent low-Vp at a very shallow
layer (2–3 km) that may correspond to sandy–clayey–slurry materials (Figs. 3, 4). A
prominently high-Vp anomaly beyond this depth range ([3 km) is imaged as the competent
and compact basement beneath the Baratang mud volcano that may have accumulated and
exerted enough pressure to steer the ejection process to the surface (Fig. 4b). It is intriguing
to note that the variation in low-Vp anomaly maintains a very consistent trend beneath the
Barren and Narcondum volcanic zones, and the anomaly is found to be oriented toward the
Andaman Trench as depth increases from 3 to 15 km (Fig. 4b–d), indicating the source of
magma chambers of these lava volcanoes is possibly related to the process of dehydration of
the subducting Indian plate rather than the influence of the Sumatra–Andaman spreading
ridge (Fig. 1). The clustering of aftershocks around the Barren and Narcondum volcanoes or
occurrence of volcanic tremors during January to March 2005 (Fig. 1b–c; Mishra et al.
2007b) suggested the weakening of crustal layers through the process of underheating
(Tatsumi 1989; Zhao et al. 2002). The source of magma chambers of these lava volcanoes is
possibly related to the process of dehydration of the subducting Indian plate, which is well
supported by a recent study around the Tengchong volcano in southwest China using both
local and teleseismic data (Lei et al. 2009b).
The underheating of the crust beneath the Barren and Narcondum volcanoes associated
with tensional forces and a swarm type of earthquakes supports the concept of impending
Fig. 4 (a–d) Vertical cross-sections of P-wave velocity image along the profiles shown on the inset map.Small white dots denote the aftershocks within 100 km width of each cross-section. The deeper earthquakesare taken from the ISC catalog (1998–2002). Black arrows indicate the plausible direction of hot upwellingfrom deeper to shallow layers. The velocity perturbation scale is shown beside (b). A synthetic test for Vpimage represented by the input model (e), and the corresponding output result (f), in a vertical cross-sectionalong 12 N, indicates the recovery of the prominent low-V and high-V anomalies revealed by this study
58 Nat Hazards (2011) 57:51–64
123
eruption (Linde and Sacks 1998), which finally erupted in June–July 2005 after a gap of
about 3–4 months from the 2004 Sumatra mainshock (Mw 9.3) as per our expectation
(Mishra et al. 2005, 2007a, b). Four big aftershocks (Mw [ 6.2) occurred beneath the
Islands that produced enough seismic energy to disturb the volcanic chambers through
shaking in the region (Linde and Sacks 1998). All these observations related to volcanic
activity are supported by our conspicuous imaging of low-Vp beneath Barren and Nar-
condum volcanic zones in the region (Figs. 3, 4b–d).
It is worth to point that the Andaman–Nicobar region of India suffered severely during
the megathrust Sumatra earthquake where public panic prevailed in every part of the
Andaman and Nicobar Islands following the mainshock on 26 December 2004. The present
result vindicates our earlier inference based on our continuous analyses of three-month
(January–March 2005) seismological data monitoring and recording of aftershocks fol-
lowing the mainshock to show how this endeavor reduced public panic and constituted an
important ingredient to a disaster management program for the Andaman–Nicobar region.
The 3-D seismic imaging of the A–N Islands region helped us to understand the nature and
extent of crustal heterogeneities in the region. Crustal and subcrustal heterogeneities
associated with the subducting Indian plate beneath Myanmar micro-plate are responsible
for inducing moderate to large earthquakes. The puzzle among Islanders due to continuous
shaking during the 2004 tsunamigenic aftershock cycle was very prevalent on two
important issues to know: whether the continuous shaking of the region led to eruption of
Barren volcano in the region? and whether any possibility of conversion of Baratang mud
volcano into lava volcano was there? We extended 3-D tomographic imaging toward
Baratang mud volcano and past erupted lava volcanic (Barren and Narcondum) zones to
see the geodynamical implications of the imaged heterogeneities in the vicinity of volcanic
regions. Our 3-D seismograms (Figs. 3, 4) provide a convincing explanation to both of the
issues. As explained before, the eruption of mud and slurry materials at Baratang may have
happened due to compressive forces exerting to the upper crustal layer from the deeper
layers (Mishra et al. 2007b), which is well reflected by low-Vp at shallow depths in our 3-
D seismic cross-section (Fig. 4). There is no evidence for any interconnectivity of Bara-
tang mud volcano with the Barren lava volcano beneath the A–N Island region.
Our detailed 3-D Vp image clearly explains how mud and lava volcanoes erupted after
megathrust Sumatra earthquake (Mishra et al. 2007b). The present results clearly explain
the puzzle related to mud and lava volcanoes following the 2004 Sumatra mainshock and a
series of its aftershocks; 3-D tomographic imaging provides a very convincing mechanism
to show how mud and lava volcanoes erupted after megathrust Sumatra earthquake (Mishra
et al. 2007b), which constitutes another ingredient to a disaster management program to
reduce future public panic during earthquake chaos once inhabitants of the region would be
timely educated by scientists on these facts. In addition, it provides insight into how crustal
and subcrustal heterogeneities are associated with the subducting Indian plate beneath the
Myanmar micro-plate and responsible for inducing moderate to large earthquakes.
Since almost all recorded aftershocks confined to depths of 30–45 km, and a very few
aftershocks located below this depth range, which may suggest the existence of complex
mechanical, geophysical, and geochemical processes occurring beneath the complicated
subduction system, which might have resisted the occurrence of the intermediate-depth or
deeper earthquakes beneath the A-R region, it is also possible that deep-sea faulting or
tearing of the Indian lithosphere during episodic large to moderate earthquakes beneath the
Andaman Sea (Curray 2005) might have infiltrated enough water into deeper layers to
facilitate the process of dehydration to cause excessive serpentinization of the fore-
arc mantle (Hyndman and Peacock 2003; Mishra et al. 2003; Mishra and Zhao 2004;
Nat Hazards (2011) 57:51–64 59
123
Zhao et al. 2009), which may corroborate to prominently imaged low-Vp at deeper layers
([45 km) (Figs. 3, 4), which in turn might have hindered the occurrence of the interme-
diate-depth or deeper earthquakes during the 2004 Sumatra–Andaman aftershock
sequence. There may be other possibilities for the low-Vp anomalies in the deeper layers
([60 km), such as upwelled hot magmatic materials or dry and ductile partial melts, where
none of aftershocks occurred in the forearc mantle (Figs. 3, 4). In addition, the vertical
propulsion of mantle materials from deeper layers in the forearc mantle might have exerted
enough stress on overlying crustal rocks to bring them into a brittle failure (Fig. 4),
indicating the influence of deep structure and regime on shallower crustal earthquakes
(Zhao et al. 2004). However, we need other pieces of supportive evidence from geophysics
(e.g., gravity, magnetic, and magnetotelluric), experimental petrology and mineral physics
to arrive at a better interpretation of our tomographic results. Thus, we can infer that deep-
seated crustal heterogeneities related to dehydration of the subducting Indian plate beneath
the Island facilitate the process of brittle failure through crustal weakening and contrib-
uting immensely to the coastal hazard in the region. Our 3-D tomographic images of the
region are resolvable for layers not beyond 80 km because we used only local earthquake
data. The 3-D seismic structure beyond 80 km depth along with estimate of the geometry
of the subducting Indian plate can be achieved in future by using data from teleseismic
events (e.g., Lei and Zhao 2005; Zhao et al. 2006; Gupta et al. 2009).
Thus, the extent of coastal hazard due to suboceanic earthquakes can be related to
nature and extent of crustal heterogeneities beneath the sea. The structural heterogeneities
in the crust and upper mantle under the Andaman–Nicobar region make the region vul-
nerable for frequent tremors and shaking, and they also facilitate the magmatic eruption
process for the Barren lava volcano due to continuous shaking through occurrence of large
aftershocks in the region, which in turn may facilitate coastal hazard. The subsurface layer
is associated with high-V anomalies that infer the compact and competent parts of layers,
which may apt to accumulate more strain energy for a longer duration, and once brittle
failures occur in the layer, they may cause strong shaking and tsunamis through release of
high amount of seismic energy during strong to great earthquakes, and such scenario can
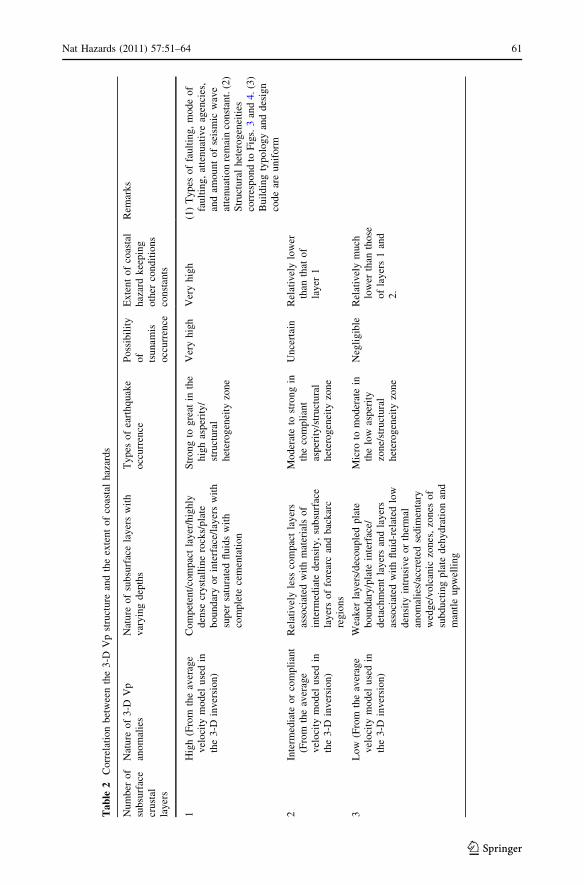
bring a huge loss of flora and faunas of the region (Table 2). We found that the occurrence
of earthquakes in the A–N Islands is associated with all sorts of anomalous layers having
low-Vp, intermediate-Vp, and high-Vp anomalies (Figs. 3, 4). We infer that the competent
and compact upper layers with very high-Vp anomalies beneath the A–N Islands may
result in moderate to strong earthquakes through weakening of strengths of rock materials
due to deep-seated extraneous agencies, exerting in form of mantle upwelling or magma
injection or injection of fluids to the upper crustal layers through the process of dehydration
of the subducting Indian plate. Thus, the extent of coastal hazards can be dictated by the
nature of structural heterogeneities and geological asperity of the seismogenic subsurface
layers. Table 2 shows the qualitative correlation between our tomographic image and the
extent of coastal hazards, keeping other conditions (e.g., mode and type of faulting, at-
tenuative agencies and amount of seismic wave attenuation) constant.
Nature of 3-D Vp structural heterogeneities may correspond to asperities that manifest
what type of seismogenic layers exists beneath the region to dictate the size of earthquake
occurrence and thereby the extent of earthquake vulnerability to coastal regions may be
estimated. Estimates of shear wave velocity and Poisson’s ratio structures in future may
provide a better constraint to our interpretation. Use of reanalyzed aftershocks of the 2004
great Sumatra earthquake in the A–N Islands using temporary local network and global
arrival time data by Engdahl et al. (2007) and precise relocations of the suboceanic
60 Nat Hazards (2011) 57:51–64
123
Ta
ble
2C
orr
elat
ion
bet
wee
nth
e3
-DV
pst
ruct
ure
and
the
exte
nt
of
coas
tal
haz
ard
s
Nu
mb
ero
fsu
bsu
rfac
ecr
ust
alla
yer
s
Nat
ure
of
3-D
Vp
ano
mal
ies
Nat
ure
of
sub
surf
ace
lay
ers
wit
hv
ary
ing
dep
ths
Ty
pes
of
eart
hq
uak
eo
ccu
rren
ceP
oss
ibil
ity
of
tsun
amis
occ
urr
ence
Ex
ten
to
fco
asta
lh
azar
dk
eep
ing
oth
erco
nd
itio
ns
con
stan
ts
Rem
ark
s
1H
igh
(Fro
mth
eav
erag
ev
eloci
tym
od
elu
sed
inth
e3
-Din
ver
sio
n)
Co
mp
eten
t/co
mp
act
lay
er/h
igh
lyd
ense
cryst
alli
ne
rock
s/p
late
boundar
yor
inte
rfac
e/la
yer
sw
ith
sup
ersa
tura
ted
flu
ids
wit
hco
mple
tece
men
tati
on
Str
on
gto
gre
atin
the
hig
has
per
ity
/st
ruct
ura
lh
eter
og
enei
tyzo
ne
Ver
yh
igh
Ver
yh
igh
(1)
Ty
pes
of
fault
ing
,m
od
eo
ffa
ult
ing,
atte
nuat
ive
agen
cies
,an
dam
ou
nt
of
seis
mic
wav
eat
tenuat
ion
rem
ain
const
ant.
(2)
Str
uct
ura
lh
eter
ogen
eiti
esco
rres
po
nd
toF
igs.
3an
d4.
(3)
Bu
ild
ing
typ
olo
gy
and
des
ign
cod
ear
eu
nif
orm
2In
term
edia
teor
com
pli
ant
(Fro
mth
eav
erag
ev
eloci
tym
od
elu
sed
inth
e3
-Din
ver
sio
n)
Rel
ativ
ely
less
com
pac
tla
yer
sas
soci
ated
wit
hm
ater
ials
of
inte
rmed
iate
den
sity
,su
bsu
rfac
ela
yer
so
ffo
rear
can
db
ack
arc
reg
ions
Mo
der
ate
tost
ron
gin
the
com
pli
ant
asp
erit
y/s
tru
ctu
ral
het
ero
gen
eity
zon
e
Unce
rtai
nR
elat
ivel
ylo
wer
than
that
of
lay
er1
3L
ow
(Fro
mth
eav
erag
ev
eloci
tym
od
elu
sed
inth
e3
-Din
ver
sio
n)
Wea
ker
lay
ers/
dec
ou
ple
dp
late
bo
und
ary
/pla
tein
terf
ace/
det
achm
ent
layer
san
dla
yer
sas
soci
ated
wit
hfl
uid
-rel
ated
low
den
sity
intr
usi
ve
or
ther
mal
anom
alie
s/ac
cret
edse
dim
enta
ryw
edg
e/v
olc
anic
zon
es,
zon
eso
fsu
bdu
ctin
gp
late
deh
ydra
tio
nan
dm
antl
eu
pw
elli
ng
Mic
roto
mod
erat
ein
the
low
asp
erit
yzo
ne/
stru
ctura
lh
eter
og
enei
tyzo
ne
Neg
lig
ible
Rel
ativ
ely
much
low
erth
anth
ose
of
lay
ers
1an
d2
.
Nat Hazards (2011) 57:51–64 61
123
aftershocks with well-detected sP-depth phase (Mishra et al. 2003; Zhao et al. 2002, 2009)
in future may improve the tomographic images of the Andaman–Nicobar forearc region.
4 Concluding remarks
Our investigation of the 3-D seismic structure beneath the Andaman–Nicobar (A–N)
Islands of India by inverting a large number of high-quality arrival time data from the 2091
selected aftershocks recorded by a local temporary seismic network revealed strong lateral
P-wave velocity variations (up to 6%) beneath the entire region of the A–N Islands,
indicating a close correspondence between the structural heterogeneities and failure of rock
materials. The subducting Indian plate and the volcanic zones (Barren and Narcondum) are
imaged as high-Vp and low-Vp anomalies, respectively. We infer that a prominent low-Vp
beneath the A–N Islands near the Andaman Trench may be associated with a deep-sea
faulting, or weak crustal rocks, or tearing of the Indian lithosphere during historical
damaging earthquakes. The low-Vp in the upper mantle beneath the subducting Indian
plate may correspond to hot upwelling materials from the deep mantle. A low-Vp anomaly
is revealed in the uppermost mantle above the Indian slab, which may reflect the dry and
ductile partial melts or excessively serpentinized forearc mantle that possibly resisted the
occurrence of intermediate-depth aftershocks ([45 km) beneath the A–N region. The
occurrence of shallow earthquakes in the A–N region may be related to the deep structure
and regime rather than the crustal heterogeneity alone. The extent of coastal hazard due to
suboceanic earthquakes can be related to the nature and extent of crustal heterogeneities
beneath the sea. Our present result vindicates the earlier inference based on our continuous
analyses of three-month (January–March 2005) seismological data monitoring and
recording of aftershocks following the 2004 mainshock (Mishra et al. 2007a, b) to show
how this endeavor reduced public panic and constituted an important ingredient to a
disaster management program for the Andaman–Nicobar region. The present results
clearly explain the puzzle related to mud and lava volcanoes following the 2004 Sumatra
mainshock and a series of its aftershocks; 3-D tomographic imaging provides a very
convincing mechanism to show how mud and lava volcanoes erupted after megathrust
Sumatra earthquake (Mishra et al. 2007b), which constitutes another ingredient to a
disaster management program to reduce future public panic during earthquake chaos once
inhabitants of the region would be timely educated with these facts by scientists.
However, in the same context, other pieces of supportive evidence from geophysics,
experimental petrology, and mineral physics coupled with shear wave velocity and Pois-
son’s ratio structures may provide a better constraint to our interpretation in future.
Incorporation of the reanalyzed aftershocks of the 2004 great Sumatra earthquake in the
Andaman–Nicobar Islands using the temporary local network and global arrival time data
and relocating the suboceanic aftershocks with well-detected sP-depth phase may improve
our tomographic results.
Acknowledgments OPM is grateful to Director General, Geological Survey of India, for his kindsupport and permission for carrying out this research. Infrastructural supports provided by localauthorities of Andaman–Nicobar administration, India, during our aftershock monitoring are gratefullyacknowledged. Critical reviews of two anonymous referees improved the original version of the MS. Wethank the Editor of the special issue for his continuous cooperation to process the revision and sub-mission of the MS.
62 Nat Hazards (2011) 57:51–64
123
References
Bilham R (2005) A flying start, then a slow slip. Science 308:1126–1127Curray JR (2005) Tectonics and history of the Andaman Sea region. J Asian Earth Sci 25:187–232Dasgupta S, Mukhopadhyay M (1993) Seismicity and plate deformation below Andaman arc, northeastern
Indian Ocean. Tectonophysics 225:529–542Dewey JW, Choy G, Presgrave B, Sipkin S, Tarr AC, Benz H, Earle P, Wald D (2007) Seismicity associated
with the Sumatra–Andaman Islands earthquake of December 26, 2004. Bull Seismol Soc Am97(1A):S34–S49
Engdahl ER, Villasenor A, DeShon HR, Thurber CH (2007) Teleseismic relocation and assessment ofseismicity (1918–2005) in the region of the 2004 Mw 9.0 Sumatra-Andaman and 2005 Mw 8.6 NiasIsland great earthquakes. Bull Seismol Soc Am 97(1A):S86–S105
Fitch TJ (1970) Earthquake mechanisms in the Himalayan, Burmese, and Andaman regions and continentaltectonics in central. Asia J Geophys Res 75:2699–2709
Gupta S, Zhao D, Rai S (2009) Seismic imaging of the upper mantle under the Erebus hotspot in Antarctica.Gondwana Res 16:109–118
Hyndman RD, Peacock SM (2003) Serpentinization of the forearc mantle. Earth Planet Sci Lett212:417–432
Kayal JR, Gaonkar SG, Chakrabortty GK, Singh OP (2004) Aftershocks and seismotectonic implications ofthe 13 September 2002 earthquake (Mw 6.5) in the Andaman Sea basin. Bull Seismol Soc Am94:326–333
Kennett BLN, Cummins PR (2005) The relationship of the seismic source and subduction zone structure forthe 2004 December 26 Sumatra–Andaman earthquake. Earth Planet Sci Lett 239:1–8
Kieckhefer RM, Moore GF, Emmel FJ (1981) Crustal structure of the Sunda forearc region west of centralSumatra from gravity data. J Geophys Res 86:7003–7012
Le Dain AY, Tapponier P, Molnar P (1984) Active faulting and tectonics of Burma and surrounding regions.J Geophysics Res 89:453–472
Lei J, Zhao D (2005) P-wave tomography and origin of the Changbai intraplate volcano in northeast Asia.Tectonophysics 397:281–295
Lei J, Zhao D (2009) Structural heterogeneity of the Longmenshan fault zone and the mechanism of the2008 Wenchuan earthquake (Ms 8.0). Geochem Geophys Geosyst 10:Q10010
Lei J, Zhao D, Steinburger B, Shen F, Wu B, Li Z (2009a) New seismic constraints on the upper mantlestructure of the Hainan plume. Phys Earth Planet Inter 173:33–50
Lei J, Zhao D, Su Y (2009b) Insight into the origin of the Tengchong intraplate volcano and seismotectonicsin southwest China from local and teleseismic data. J Geophys Res 114:B05302
Linde AT, Sacks IS (1998) Triggering of volcanic eruptions. Nature 371:408–410Martin SS (2005) Intensity distribution from the 2004 M 9.0 Sumatra–Andaman earthquakes. Seism Res
Lett 76:321–333Mishra OP, Zhao D (2004) Seismic evidence for dehydration embrittlement of the subducting Pacific slab.
Geophys Res Lett 31:L09610Mishra OP, Zhao D, Wang Z (2008) The genesis of the 2001 Bhuj, India, earthquake (Mw 7.6): a puzzle for
peninsular india. J Indian Miner (Special Issue) 61(3–4) & 62(1–4):149–170Mishra OP, Zhao D, Umino N, Hasegawa A (2003) Tomography of northeast Japan forearc and its
implications for interpolate seismic coupling. Geophys Res Lett 30. doi:10.1029/2003GL017736Mishra OP, Chakrabortty GK, Singh OP (2005) Aftershock investigation in Andaman–Nicobar Islands. Geol
Surv Ind Spcl Publ 89:115–163Mishra OP, Kayal JR, Chakrabortty GK, Singh OP, Ghosh D (2007a) Aftershock investigation in Andaman–
Nicobar Islands of India and its seismotectonic implications. Bull Seismol Soc Am 97(1A):S71–S85Mishra OP, Chakrabortty GK, Singh OP, Kayal JR, Ghosh D (2007b) Aftershock investigation in the
Andaman–Nicobar Islands: an antidote to public panic. Seismol Res Lett 78:591–600Mukhopadhyay M (1984) Seismotectonics of subduction and backarc rifting under the Andaman Sea.
Tectonophysics 108:229–239Pacheco JF, Sykes LR, Scholz CH (1993) Nature of seismic coupling along simple plate boundaries of the
subduction type. J Geophys Res 98:14,133–14159Stein S, Okal EA (2005) Speed of the Sumatra earthquake. Nature 434:581–582Suyehiro K, Nishizawa A (1993) Crustal structure and seismicity beneath the forearc off northeastern Japan.
J Geophys Res 99:22331–22347Tatsumi Y (1989) Migration of fluid phases and genesis of basalt magmas in subduction zones. J Geophys
Res 94:4697–4707
Nat Hazards (2011) 57:51–64 63
123
Wang Z, Zhao D (2006a) Seismic imaging of the entire arc of Tohoku and Hokkaido in Japan using P-wave,S-wave and sP depth-phase data. Phys Earth Planet Inter 152:144–162
Wang Z, Zhao D (2006b) Seismic images of the source area at the 2004 mid-Niigata prefecture earthquakein northeast Japan. Earth Planet Sci Lett 244:16–31
Wang Z, Zhao D, Huang R, Tang X, Mishra OP (2009a) Structural heterogeneity in Northeast Japan and itsimplications for the genesis of the 2004 and 2007 Niigata earthquakes. Bull Seism Soc Am99:3355–3373
Wang Z, Fukao Y, Zhao D, Kodaira S, Mishra OP, Yamada A (2009b) Structural heterogeneities in the crustand upper mantle beneath Taiwan. Tectonophysics 476:460–477
Zhao D, Hasegawa A, Horiuchi S (1992) Tomographic imaging of P and S wave velocity structure beneathnortheastern Japan. J Geophys Res 97:19909–19928
Zhao D, Mishra OP, Sanda R (2002) Influence of fluids and magma on earthquakes: seismological evidence.Phys Earth Planet Inter 132:249–267
Zhao D, Tani H, Mishra OP (2004) Crustal heterogeneity in the 2000 western Tottori earthquake region:effects of fluids from slab dehydration. Phys Earth Planet Inter 145:161–177
Zhao D, Lei J, Inoue T, Yamada A, Gao S (2006) Deep structure and origin of the Baikal rift zone. EarthPlanet Sci Lett 243:687–691
Zhao D, Wang Z, Umino N, Hasegawa A (2009) Mapping the mantle wedge and interplate thrust zone of thenortheast Japan arc. Tectonophysics 467:89–106
64 Nat Hazards (2011) 57:51–64
123


![SIPUNCULANS IN HUMP CORAL PORITES LUTEA, THE ANDAMAN SEA, THAILAND. [1994]](https://static.fdokumen.com/doc/165x107/6322f3f063847156ac06da7d/sipunculans-in-hump-coral-porites-lutea-the-andaman-sea-thailand-1994.jpg)