Role for stress fiber contraction in surface tension development and stretch-activated channel...
42
ROLE FOR STRESS FIBER CONTRACTION ON SURFACE TENSION DEVELOPMENT AND STRETCH-ACTIVATED CHANNEL (SAC) REGULATION IN C2C12 MYOBLASTS Francesca Sbrana 1 , Chiara Sassoli 2 , Elisabetta Meacci 3 , Daniele Nosi 2 , Roberta Squecco 4 , Ferdinando Paternostro 2 , Bruno Tiribilli 5 , Sandra Zecchi-Orlandini 2 , Fabio Francini 4 , Lucia Formigli 2 . 1 C.S.D.C. - Dept. of Physics, University of Florence, Florence, Italy 2 Dept. Anatomy, Histology, Forensic Medicine, University of Florence, Florence, Italy 3 Dept. Biochemical Sciences, University of Florence, Florence, Italy 4 Dept. Physiological Sciences, University of Florence, Florence, Italy 5 ISC-CNR, Institute for Complex Systems, Sesto Fiorentino, Italy The first two authors contributed equally to this work. Corresponding author: Prof. Lucia Formigli Dept. of Anatomy, Histology, Forensic Medicine University of Florence Viale Morgagni 85, 50134 Florence, Italy Phone number +39-0554271809 Fax number +39-0554379500 e-mail: [email protected] Running head: cytoskeleton mediated SAC activation. Articles in PresS. Am J Physiol Cell Physiol (May 14, 2008). doi:10.1152/ajpcell.00014.2008 Copyright © 2008 by the American Physiological Society.
Transcript of Role for stress fiber contraction in surface tension development and stretch-activated channel...

ROLE FOR STRESS FIBER CONTRACTION ON SURFACE TENSION DEVELOPMENT
AND STRETCH-ACTIVATED CHANNEL (SAC) REGULATION IN C2C12 MYOBLASTS
Francesca Sbrana1, Chiara Sassoli2, Elisabetta Meacci3, Daniele Nosi2, Roberta Squecco4,
Ferdinando Paternostro2, Bruno Tiribilli5, Sandra Zecchi-Orlandini2, Fabio Francini4, Lucia
Formigli2.
1C.S.D.C. - Dept. of Physics, University of Florence, Florence, Italy
2 Dept. Anatomy, Histology, Forensic Medicine, University of Florence, Florence, Italy
3Dept. Biochemical Sciences, University of Florence, Florence, Italy
4Dept. Physiological Sciences, University of Florence, Florence, Italy
5ISC-CNR, Institute for Complex Systems, Sesto Fiorentino, Italy
The first two authors contributed equally to this work.
Corresponding author:
Prof. Lucia Formigli
Dept. of Anatomy, Histology, Forensic Medicine
University of Florence
Viale Morgagni 85,
50134 Florence,
Italy
Phone number +39-0554271809
Fax number +39-0554379500
e-mail: [email protected]
Running head: cytoskeleton mediated SAC activation.
Articles in PresS. Am J Physiol Cell Physiol (May 14, 2008). doi:10.1152/ajpcell.00014.2008
Copyright © 2008 by the American Physiological Society.

Cytoskeleton mediated SAC activation
1
ABSTRACT
Membrane-cytoskeleton interaction regulates trans-membrane currents through stretch
activated channels (SACs); however the mechanisms involved have not been tested in living cells.
We combined atomic force microscopy, confocal immunofluorescence and patch clamp analysis to
show that stress fibers (SFs) in C2C12 myoblasts behave as cables which, tensed by myosin II
motor, activate SACs by modifying the topography, the viscoelastic (Young’s modulus and
hysteresis) and electrical passive (membrane capacitance, Cm) properties of the cell surface.
Stimulation with sphingosine 1-posphate (S1P) to elicit SF formation, the inhibition of Rho-
dependent SF formation by Y-27632 and of myosin II-driven SF contraction by blebbistatin,
showed that not SF polymerization alone but the generation of tensional forces by SF contraction
were involved in the stiffness response of the cell surface. Notably, this event was associated with a
significant reduction in the amplitude of the cytoskeletal-mediated corrugations in the cell surface
topography, suggesting a contribution of SF contraction to plasma membrane stretching. Moreover,
membrane capacitance, Cm used as an index of cell surface area, showed a linear inverse
relationship with cell stiffness, indicating participation of the actin cytoskeleton in plasma
membrane remodeling and the ability of SF formation to cause internalization of plasma membrane
patches to reduce Cm and increase membrane tension. SF contraction also increased hysteresis.
Together, these data provide the first experimental evidence for a crucial role of SF contraction in
SAC activation. The related changes in cell viscosity may prevent SAC from abnormal activation.
Keywords actin remodeling, atomic force microscopy (AFM), Young’s modulus, membrane
capacitance, hysteresis.

Cytoskeleton mediated SAC activation
2
INTRODUCTION
Stretch activated channels (SACs) are voltage-independent non selective ion channels localized on
the plasma membrane where they play an important role as mechanoreceptors (33). These channels,
in fact, are gated by tension developed within the lipid bilayer (25) and transduce the mechanical
stimulus into increased cation current and Ca2+ influx, thus converting electrical signals into
biochemical events involved in the coordination of numerous cellular processes, ranging from cell
volume regulation, membrane potential control, muscle cell contraction to regulation of gene
expression and cell differentiation (8, 9, 27). The analysis of mechanotransduction has been focused
on the identification of critical molecules and cellular components, such as integrins, focal
adhesions, cadherins, gap-junctions and cytoskeleton, which modulating cell-cell and cell-matrix
interactions contribute to the mechanosensitivity and promote SAC opening (18). However, there is
increasing evidence suggesting that actin cytoskeleton reorganization may also represent an
important mechanism of SAC regulation in the structural context of the single cell. This assumption
gains supports from recent studies suggesting a close structural interaction between cytoskeleton
and SACs. Indeed, single molecule force spectroscopy studies have shown that individual peptide
domains within proteins found in the actin cytoskeleton, unfold when SACs are mechanically
extended (19, 31) and recent evidence has demonstrated that members of the Transient Receptor
Potential (TRP) family of cation channels, likely molecular candidate for SACs (25, 34, 38), are
physically linked with ankyirin and dystrophin (30, 40). However, the functional impact of actin on
SAC activity is rather complicate and seems to depend mostly on the different status of the
microfilament system in specialized cells. In fact, actin cytoskeletal remodeling after the application
of mechanical stimuli or the loss of microfilaments by treatment with actin disrupter agents, such as
cytochalasins or latrunculin, could modulate the activity of SACs and increase stretch-induced
calcium transients (23, 44). On the other hand, actin cytoskeletal disassembly has been shown to
cause a decrease in single current and conductance of SACs in myeloid leukemia cells and

Cytoskeleton mediated SAC activation
3
ventricular myocytes (20, 37), suggesting that the organization of the cortical actin may be
determinant in positively modulating channel function in these cells. To further complicate this
scenario, we have demonstrated that actin polymerization and stress fiber (SF) formation in
response to stimulation with sphingosine 1-phosphate (S1P), a bioactive lipid, is also able to modify
the intrinsic conductive properties of SACs and increase the channel ion current (9, 10), thus
contributing to generate the idea that a well organized cytoskeleton might also exert tension forces
at the plasma membrane and provoke SAC opening.
On the basis of the aforementioned, in this study we combined atomic force microscopy
(AFM) and electrophysiological patch-clamp analysis to gain further insights into the relationship
between actin cytoskeletal features and mechanosensitivity (SAC activity) in living C2C12
myoblasts , with the potential to give information in a non-invasive way on the role of cytoskeleton
in the regulation of cell surface topography and plasma membrane stretching (15). To further stress
this point we examined the effects of SF formation and myosin II-driven SF contraction on cell
surface area and plasma membrane remodeling. The identification of the basic mechanisms
regulating SAC activation in myoblastic cells may have considerable implications in the
understanding of the role played by these channels in skeletal muscle biology and disease.

Cytoskeleton mediated SAC activation
4
MATERIALS AND METHODS
Cell cultures and treatments.
Murine C2C12 skeletal myoblasts obtained from American Type Culture Collection (Manassas,
VA, USA), were cultured in Dulbecco’s Modified Eagle Medium (DMEM) supplemented with
10% fetal calf serum (FCS), penicillin (100 U/ml), and streptomycin (100 µg/ml) (Sigma, Milan,
Italy) and maintained at 37°C in a humidified atmosphere of 5% CO2. For AFM investigation, cells
were grown on glass coverslip mounted on pierced culture 35 mm dishes, which were clamped to a
Petri dish holder on the stage of the microscope. To induce SF formation, cells were stimulated with
S1P for 30 min (1 μM, Calbiochem, San Diego, CA, USA). In parallel experiments, the cells were
treated for 30 min with the following reagents in the presence of S1P: Y-27632 (10
μΜ, Calbiochem) used to inhibit endogenous Rho kinase activation and SF formation, blebbistatin
(10 μM, Sigma) to inhibit myosin II ATPase activity.
Confocal immunofluorescence.
Cells grown on glass coverslips were fixed in 0.5% buffered paraformaldehyde (PFA) for 10 min at
room temperature, permeabilized with cold acetone for 3 min, washed in phosphate buffered saline
(PBS) and incubated with TRITC-labeled phalloidin (1:100; Sigma) to detect F-actin filaments. In
some experiments, the cells were also immunostained to reveal focal adhesions (FAs) or TRPC1, a
structural component of SACs. To this purpose, the cells were blocked with 0.5% bovine serum
albumine (BSA; Sigma) and 3% glycerol in PBS for 30 min, and incubated with either 1:100
dilution of rabbit polyclonal anti-FAK (Focal Adhesion Kinase, Santa Cruz, Milan, Italy) or 1:80
dilution of rabbit polyclonal anti-TRPC1 (Santa Cruz) antibodies, followed by Alexa488-
conjugated IgG (1:100; Molecular Probes, Eugene, OR, USA). Negative controls were carried out
by replacing the primary antibodies with non immune mouse serum; cross-reactivity of the
secondary antibodies was tested in control experiments in which primary antibodies were omitted.
Plasma membrane localization of TRPC1 was also determined. To this purpose, living cells were

Cytoskeleton mediated SAC activation
5
incubated with TRITC-conjugated wheat germ agglutinin (TRITC-WGA) (1:250, Molecular
Probes) for 10 min at room temperature to label the plasma membrane before being fixed and
immunostained for the expression of TRPC1. The coverslips containing the labeled cells, were then
mounted with an antifade mounting medium (Biomeda Gel mount, Electron Microscopy Sciences,
Foster City, CA, USA) and observed under a Bio-Rad MRC 1024 ES Confocal Laser Scanning
Microscope (CLSM) (Bio-Rad, Hercules, CA, USA) equipped with a Krypton/Argon (Kr/Ar) laser
source. The Argon (488 nm), and Krypton (568 nm) laser lines were used to excite the cells, and the
emitted fluorescence signals were collected with a Nikon Plan Apo 60X/1.4NA oil immersion
objective. Series of optical sections (512 X 512 pixels each; pixel size 200 nm X 200 nm or 150 nm
X 150 nm) were then taken through the depth of the cells at intervals of 0.4 µm. Images were then
z-projected onto a single max intensity projection image. Confocal images were deconvolved using
ImageJ 3D deconvolution software (NIH). Densitometric analysis of radial and longitudinal SFs
was performed measuring the average fluorescence intensity on regions of interest (ROI, 6 µm2
area) in single focal plane images of 3D confocal stacks, using ImageJ (NIH) software. At least 4
ROIs in 50 different cells were analyzed in each experiment (three preparations/experiment), and
the mean ± SE optical density (OD) was then calculated. In the co-localization experiments, a
confocal Leica TCS SP5 microscope (Leica Microsystems, Mannheim, Germany) equipped with a
HeNe/Ar laser source was used and the observations were performed using a Leica Plan Apo
63X/1.40NA oil immersion objective. To minimize crosstalk between fluorochromes, the
fluorescent signals were acquired sequentially at excitation wavelengths of 488 nm and 543 nm.
Series of optical sections (1024 X 1024 pixels each; pixel size 200 nm X 200 nm) were taken
through the depth of the cells at intervals of 0.4 μm. Quantitative assessment of co-localization
between TRPC1 and WGA fluorescence signals was performed by calculating the overlap
coefficient (ranging from 0, minimum co-localization degree, to 1, maximum co-localization
degree), using the Leica Application Suite Software. At least 50 different cells were analyzed in
each experiment (three preparations/experiment), and the mean ± SE overlap coefficient was then

Cytoskeleton mediated SAC activation
6
calculated. Statistical analysis of differences was performed using one-way ANOVA test. P<0.05
was considered significant. Calculation were performed using GraPhPad Prism software program
(GraPhPad , San Diego, CA, USA).
Atomic Force Microscopy (AFM) measurements and imaging.
Force-indentation measurements. A PicoSPM-scanning probe microscope (Molecular Imaging Inc.
Tempe, AZ) was used to evaluate the elastic and viscous properties of single living cells. To this
purpose, modified spherical AFM tips were used as micro-indenters in order to minimize the
damaging effects of tips and to perform quantitative measurements of the elasticity. These tips were
prepared by gluing a microglass sphere of 22 μm in diameter (Whitehouse-Scientific, Chester,
United Kingdom) at the end of a silicon triangular cantilever (MikroMasch, Estonia) with a
calibrated spring constant of 0.109 N/m. Load/unloading cycles were performed, where the AFM
spherical tip was approached to the cell, pushed to indent (maximal applied force 20nN), and then
retracted. The corresponding plots, so called force-distance curves, were collected. Deflection
signal was converted in nm; calibration was obtained for each experiment from a force distance
curve on a glass coverslip with cell culture medium. The time to record a force curve cycle was
about 0.6 s. Multiple force distance curves were systematically collected in six different areas of
each cell, in five different cells for each treatment. The measurements were accomplished by
avoiding epinuclear regions, to exclude the contribution of the nuclear stiffness, as well as near the
edge of the cells to avoid the possible contribution of the glass. In order to calculate elasticity
(Young’s modulus) and viscosity (normalized hysteresis), only the portion after contact of the
approaching curve was considered and converted into force-indentation (F-δ) curves. The Young’s
modulus (E) was estimated using the Hertz model extended by Sneddon (36) that describes the
indentation of a rigid tip onto a semi-infinite, isotropic homogeneous elastic surface. For hard
spherical tips with radius R, the force-indentation relation (42) was given by F(δ)=4R1/2Eδ3/2/3(1-
ν2), where F was the loading force, E the Young’s modulus, ν the Poisson ratio and δ the
indentation. The Poisson ratio was assumed to be 0.5, as previously reported for living cells (35)

Cytoskeleton mediated SAC activation
7
and the indentation was calculated as difference between the scanner position and the cantilever
deflection. The Young’s modulus was estimated in the first 400 nm on the approaching indentation
curve; this depth allowed us to analyze the mechanical properties of the plasma membrane and sub-
cortical cytoskeleton accordingly to previous reports (7, 21). Hysteresis was evaluated by estimating
the energy dissipated into the cell from the indentation of the AFM tip (45). The areas under the
curves for extension (Aext) and retraction (Aret) were calculated integrating over the indentation
depth and the difference between these areas (hysteresis) normalized respect to the input energy
Aext. The measurements were made at a velocity of about 1 μm/sec. Since it has been reported that
starting from a velocity of 0.25 μm/sec the viscous energy accounts for more than 70% of the
hysteresis, we assumed that the data obtained were indicative of cell viscosity (26). The data and
errors followed a Gaussian distribution. Young’s modulus and normalized hysteresis data were
expressed as mean ± S.E. Statistical analysis was performed by using ANOVA test (P<0.05).
AFM imaging. AFM imaging were performed on living cells, using the PicoSPM-scanning probe
microscope equipped with a Pulsed Force Mode (PFM) external unit (WITec, Wissenshaftliche
Instrumente und Technologie GmbH, Ulm, Germany). Simultaneous images of the topography
(heights), deflection and local stiffness of cells were acquired. The deflection images were related to
the gradient of the height and showed the fine details of the plasma membrane and sub-cortical
(cytoskeletal) structures. A sinusoidal z modulation was applied by PFM to the z-axis scanner, and
the system worked in a non-resonant intermediate-contact mode. The measurements were
performed at a frequency of 104 Hz, while the modulation amplitude was adjusted in such a way
that the AFM tip, briefly but periodically, touched the sample surface. The stiffness map was
recorded as the difference between a chosen trigger point and the maximum amplitude in the force
vs time curve, acquired point by point. Rectangular Ultrasharp silicon cantilevers (NT-MDT & Co.
Moscow, Russia) with a nominal spring constant of K=0.10 N/m were used. Images (256 X 256
pixels) were acquired using a 30 µm scanner at a scan rate of 0.2 line/s. The AFM was combined
with an inverted optical microscope (TE300 Eclipse, Nikon) to guide the movement of AFM probes

Cytoskeleton mediated SAC activation
8
directly above the designated cells. All experiments were performed in cell culture medium at room
temperature. In the stiffness maps, the values were represented by pseudo-color scales. The height
and stiffness profiles were evaluated along selected lines depicted in the images using WSxM
Nanotech software (16). The lines were selected in peripheral regions of the cells in order to avoid
epinuclear areas.
Electrophysiological analyses.
Whole cell path clamp. The electrophysiological properties of C2C12 cells were analyzed by single
microelectrode whole cell patch-clamp in voltage-clamp conditions, as previously described (9).
Briefly, the patch pipettes were filled with a solution containing: 150 mM CsBr, 5 mM MgCl2, 10
mM EGTA, 10 mM HEPES, which was filtered through 0.22 μm pores. pH was titrated to 7.4 with
NaOH and to 7.2 with TEA-OH for bath and pipette solution, respectively. To block K+ channels,
trans-membrane currents were recorded in K+-free bath solution (14) containing: 122.5 mM NaCl, 2
mM CaCl2, 20 mM TEA-OH and 10 mM HEPES.
The cell was held at – 60 mV and step pulses of 10 mV and 100 ms of duration, from –80 to 0 mV,
were applied every 10 s. Electrode capacitance was compensated before disrupting the patch.
Access resistance (Ra) was not compensated for monitoring membrane area. The area beneath the
capacitive transient and the time constant of the transient’s decay (τ) were used to calculate the cell
linear capacitance (Cm) and Ra from τ =RaCm. The measurement of membrane resistance (Rm) were
corrected for Ra and calculated from the steady-state membrane current (Im) using the relation: Rm
=(ΔV-ImRa)/Im, where ΔV is the command voltage step amplitude. Since the exponential rise of the
voltage step causes underestimation of Cm, particularly when leak conductance increases greatly,
Cm was corrected using the relation Cm=ΔQ(Rm+Ra)/RmΔV, where ΔQ is the sum of the time
integral of the current transient and Imτ elicited by each voltage step (10). Cm, as an index of the cell
surface area (assuming that membrane-specific capacitance is constant at 1 µF/cm2) was used to
compare the SAC currents in cells of different shape and surface area (Gm versus Cm relation). To
ensure that the registered trans-membrane currents occurred through putative SACs, parallel
Cytoskeleton mediated SAC activation
9
experiments were performed using Gadolinium Chloride (GdCl3; 50 μM; Sigma), a commonly used
SAC blocker, which was added to control and S1P-stimulated myoblasts 3 min prior to the
electrophysiological analysis. The SAC conductance was evaluated by subtracting from Gm the leak
conductance (Gm,leak) evaluated as the residual current in the presence of GdCl3. All experiments
were performed at room temperature (20-23°C). The relations between Gm and Cm, Gm and Young’s
modulus (E), Cm and Young’s modulus (E), Cm and normalized hysteresis, were evaluated by linear
and non-linear best fit. Data fitting used a nonlinear curve fitting procedure based on the Marquardt-
Levenberg algorithm (Sigmaplot 4 and Table Curve 3.10 by Jandel Scientific, CA, USA, and
Clampfit 6.02 by Axon Instruments, CA, USA). Linear or a sum of exponential functions consisting
of a different number of terms was fitted to the data. The best fit was chosen by means of a test
based on the value of the likelihood ratio statistic, LRS, with the same formalism previously
reported (12). The improvement of the fit was evaluated by χ2 statistics. The number of degrees of
freedom by using linear or one or two exponential terms was two or three or six. We used χ2
statistics with one degree of freedom (equal to the difference of number of parameters when one
exponential term or a linear term was used, and three degrees of freedom in the case of two and one
exponential terms used). The improvement of the fit was statistically significant (P<0.05) if the χ2
statistics exceeded 7.8. The data and errors followed a Gaussian distribution and were expressed as
mean ± SE. One-way ANOVA with repeated measures was utilized for multiple comparisons and α
value at P < 0.05 was considered significant.
SAC currents after mechanical stretching. To further demonstrate the presence of SACs we
stretched the cell membrane using two patch microelectrodes, according to the method described by
Zhang et al. (47). Briefly, one microelectrode was positioned, by a hydraulic micromanipulator, at
the centre of the cell and used for electrophysiological measurements. The other microelectrode,
sealed to 10-20 μm far, was moved by another hydraulic micromanipulator to apply a stretch to the
cell via longitudinal displacement. The stretching was applied in a region far from the nuclear zone.
Cytoskeleton mediated SAC activation
10
The extent of stretch was expressed as the percentage change in cell length (L) relative to the
original length: L = (Lstretch - Loriginal)/Loriginal × 100. The used stretch extent was 10%.
Ca2+ imaging after mechanical stimulation.
Ca2+ entry through SACs was estimated from the changes in total fluorescence that occurred when
SACs opened and Ca2+ bound to Fluo3-AM, used as a fluorescent Ca2+ indicator (Molecular
Probes). The channels were mechanically activated using the rectangular tip of an AFM (PicoSPM-
scanning probe microscope), as previously reported (10). For the observations, the AFM was
mounted on top of an inverted optical microscope (Nikon) equipped with a digital camera (Nikon
D100). The observations were performed during and soon after the mechanical stimulation. Images
were filtered with fast Fourier transform based band-pass filter to remove structures down to 80 µm
and up to 2 µm, corresponding to diffused light halos and digital camera noise respectively. The
intracellular Ca2+ levels were expressed as relative fluorescence [ΔF/Fb: ratio of fluorescence
difference, peak-basal (Fp-Fb), to basal (Fb) values], as previously reported (41).

Cytoskeleton mediated SAC activation
11
RESULTS
Effects of stress fibers (SFs) on C2C12 cell surface stiffening and topography.
Since previous reports and data from our laboratory have suggested the existence of a structural and
functional relationship between cytoskeleton and SAC activation (10, 19, 31), we first investigated
whether SF formation was capable of modifying the mechanical and topographic properties of the
cell surface and then correlated these features with the development of cell surface tension and SAC
activation. SACs are, in fact, trans-membrane channels that are activated by membrane stretch (18,
25). To this purpose, living C2C12 myoblasts were stimulated with S1P to obtain formation of SFs
and examined by confocal microscopy to visualize actin cytoskeleton and by AFM microscopy to
characterize the surface morphology and the mechanical properties (i.e. stiffness and viscosity) of
the cells.
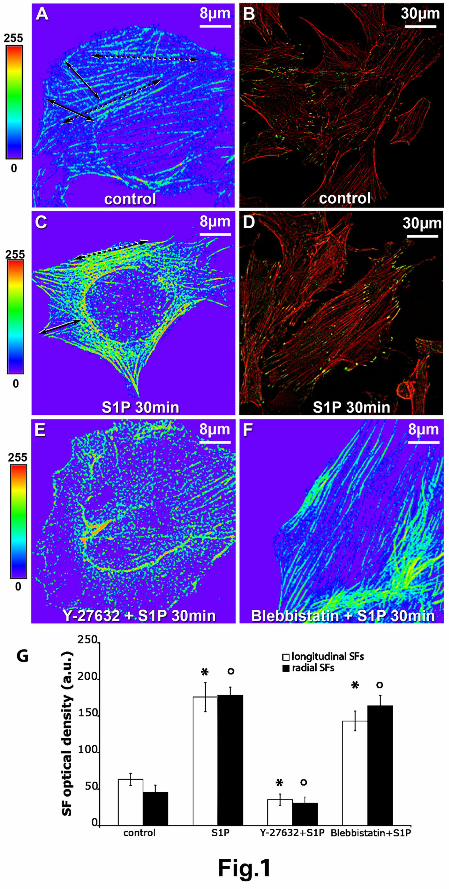
Confocal immunofluorescence of unstimulated control C2C12 cells showed the presence of two
types of actin distribution (Fig. 1A): radial actin bundles, connecting the perinuclear zone with the
cell surface (radial SFs) and cortical actin bundles (longitudinal SFs) running parallel underneath
the plasma membrane. Double staining of these cells with specific antibodies against Focal
Adhesion Kinase (FAK) (Fig. 1B), allowed us to show that these filaments terminated in focal
adhesion FAK-containing plaques which connected radial and longitudinal SFs to the plasma
membrane, further stressing the existence of a structural coupling between actin filaments and the
cell surface in myoblastic C2C12 cells. Stimulation with 1 μM S1P for 30 min greatly increased
radial and longitudinal SF and FA densities (Fig. 1, C, D and G).
The actin network has been reported to be the major molecular constituent in determining
cell stiffness (28). Therefore, cell stiffness in C2C12 cells undergoing cytoskeletal remodeling was
quantified by estimating the apparent elastic Young’s modulus from the statistical analysis of force-
indentation curves (Fig.2A, and B) obtained using modified AFM spherical tips as a micro-
indenters. Young’s modulus is indicative of the extension to which myoblasts deform after
Cytoskeleton mediated SAC activation
12
application of a stress and its increase indicates reduced passive deformation after application of a
load (5). Young’s modulus was estimated in the peripheral regions to exclude the nuclear zone and
was estimated taking into consideration the first 400 nm on the approaching indentation curve in
order to evaluate the sub-cortical and radial cytoskeleton (see methods and Fig. 2A). As expected,
this parameter increased significantly (P<0.001) after SF formation by S1P (Fig. 2B). Since SFs are
considered as temporary cytoskeletal structures composed by filamentous actin (F-actin) cross
linked by myosin IIs to form tensile bundles (4), we evaluated whether alterations of SF formation
and/or contraction could affect C2C12 cell microelasticity. To this end, the myoblasts were first
stimulated with S1P in the presence of 10 μM Y-27632, a specific inhibitor of Rho kinase, which
has been shown to regulate S1P-induced SF assembly in these cells (10, 11). In these experimental
conditions, C2C12 myoblasts underwent disorganization of SFs (Fig. 1E, and G) in coincidence
with a drastic decrease (P<0.01) of the Young’s modulus (Fig. 2B). To inhibit SF contraction, the
cells were then stimulated with S1P in the presence of 10 μM blebbistatin, a specific inhibitor of
myosin II ATPase activity (1). Short-term treatment (30 min) with blebbistatin also significantly
(P<0.01) reduced Young’s modulus (Fig. 2B) without perturbing much actin filament architecture
and SF formation, (Fig. 1F, and G). All these data indicated that not SF formation alone but the
generation of tensional forces within SFs contributed to the stiffening response of the myoblastic
cells.
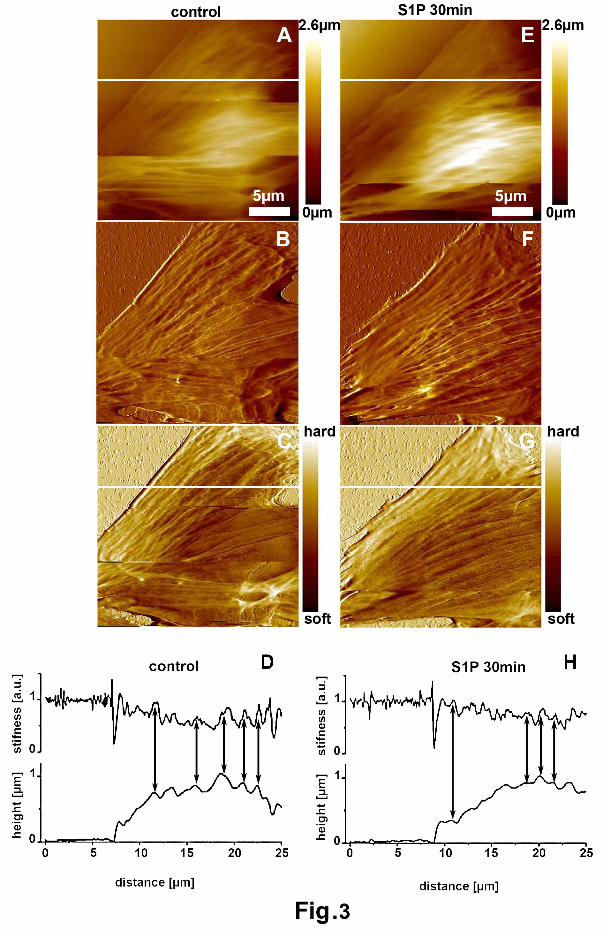
To correlate sub-cortical actin cytoskeleton with local variations of the topographic (heights)
and stiffness features of the cell surface, simultaneous topographic and stiffness images were
acquired by Pulsed Force Mode-AFM. As observed by comparing the pseudo-color scales of the
topographic and elastic maps (Fig. 3A, and C), the peripheral regions of the cells appeared lower
(darker areas, Fig. 3A) and stiffer (brighter areas, Fig. 3C) as compared with the nuclear zones.
Accordingly, the deflection AFM images revealed in the peripheral areas the presence of well-
defined filamentous structures overhanging the plasma membrane (Fig. 3B); the cytoskeletal
bundles ran along the entire cells leading to the formation of prominent cell surface corrugations. Of

Cytoskeleton mediated SAC activation
13
note, as shown in the line profiles (Fig. 3D) (evaluated along the white lines depicted in panel A and
C and selected in the peripheral regions of the cells to avoid the nucleus), the local higher stiffness
values corresponded to the higher topography values, presumably due to the presence of SFs
underneath the plasma membrane. Cell surface topography (Fig. 3, E and F) and stiffness (Fig. 3G)
of the same cell appeared greatly modified after 30 min of S1P stimulation. In particular, as shown
in the deflection image (Fig. 3F), the surface corrugations in the peripheral regions of the cells
appeared less pronounced and the sizes (depths) of depressions, in the topographic line profile (Fig.
2H), were reduced in S1P-stimulated cells compared to unstimulated cells (from 0.24 ± 0.03 of
controls to 0.17 ± 0.03 μm of S1P stimulated cells; mean ± SD, P<0.05), suggesting that formation
of robust SFs could contribute to mechanically stretch and flatten the plasma membrane.
As expected, the treatment with Y-27632 of S1P-stimulated myoblasts caused smoothening (Fig.4
A, B, and D) and softening (Fig.4 C, and D) of the cell surface in coincidence with the
disappearance of typical local variations. Of interest, stimulation of the cells in the presence of
blebbistatin abolished not only the normal development of cytoskeletal-mediated cell surface
stiffness (Fig.4 G, and H) but also the presence of the peripheral corrugations in the AFM deflection
images (Fig.4 E, F, and H). All these data, taken together suggested that the assembly of contractile
SF could generate tension in the plasma membrane of skeletal myoblasts.
Effects of stress fibers (SFs) on the viscous properties of C2C12 cells.
Since the true behavior of biological systems is viscoelastic, the effects of actin cytoskeletal
remodeling on hysteresis were also evaluated. This parameter is indicative of the viscous energy
dissipation into the cell during AFM indentation (5, 26, 46). Interestingly, either formation of SFs
by S1P (P<0.05), or SF disassembling by treatment with Y-27632 (P<0.05), or SF contractility
inhibition by blebbistatin (P<0.01), resulted in a small but significant increase in hysteresis relative
to control cells (Fig. 2C), suggesting a role for actin dynamics in the regulation not only of the
elastic but also of viscous properties of C2C12 myoblasts.
Effects of stress fibers (SFs) on membrane capacitance (Cm) of C2C12 myoblasts.

Cytoskeleton mediated SAC activation
14
To further correlate the stiffening response related to SF contraction with the possible
development of plasma membrane tension, membrane capacitance (Cm) from the capacitative
current transients defined in voltage-clamp experiments was measured and used as an index of the
electrically accessible membrane area. This in view of the previous reported findings showing that
tension in the cytoskeleton normally balances plasma membrane bleb formation and creates a
tension in the bilayer (6). Of note, stimulation with S1P caused a small (10.5 %) but significant (P <
0.05) decrease of Cm (Fig. 5A), whereas treatments with either Y-27632 or blebbistatin produced
opposite effects, increasing significantly Cm (approximately 26%, P < 0.05, and 34%, P < 0.01,
respectively) (Fig. 5A). Notably, an apparent negative linear correlation was found between Cm and
Young’s modulus (E) (E (kPa) = -0.22Cm + 5.8; where Cm is in pF; R2 = 0.93) (Fig. 5B). These data
indicated that SF contraction was associated with reduced plasma membrane area, stressing the role
for cytoskeletal contraction in the regulation of plasma membrane remodeling and stretching. Of
note, the plot of Cm and normalized hysteresis showed a U-shaped relation (Fig. 5C), suggesting
that any deformation (either increase or decrease) of the cell surface area was able to increase cell
viscosity.
Effects of stress fibers (SFs) on SAC activity of C2C12 cells.
On the basis of the above reported findings, we next examined whether cytoskeletal-mediated
effects (stiffness, surface topography and Cm) were associated with parallel modifications in SAC
current using patch clamp analyses. SACs are, in fact, trans-membrane channels that are activated
by tension in the bilayer (25). It was found that S1P had marked effects on SAC activity and gating
(Fig. 6); the addition of the sphingolipid to the culture medium resulted, in fact, in an evident
increase (P < 0.005) of the amplitude of trans-membrane ion current (Im) (Fig.6, A and B) and
conductance (Gm) (Fig.6, F and G) as compared to those of controls (unstimulated cells). The
treatments with either Y-27632 or blebbistatin resulted in a significant (P < 0.001) reduction of Im
and Gm in the stimulated cells, (Fig.6, C, D, F and G). As expected, the current passing through
these channels was efficiently inhibited in S1P stimulated cells by 50 μM GdCl3, a commonly used
Cytoskeleton mediated SAC activation
15
SAC inhibitor (Fig.6, E and F). Moreover, the addition of GdCl3 induced an 8% (P<0.05) increase
of Cm in S1P stimulated cells (Fig. 6F), implying a possible effect of calcium passing through SACs
in SF contraction and cell surface regulation. By contrast, the inhibitor did not cause any significant
changes of both Gm and Cm in S1P-stimulated cells in presence of either Y-27632 or blebbistatin. In
these latter experimental conditions, only the residual current, which represents the current leak,
could be evaluated, denoting that membrane tension was under-threshold for SAC activation. Of
interest, there was a negative exponential correlation between Gm and Cm [Gm (nS) = 6 exp(-(Cm-
18.5)/0.9))+0.57, where Cm is in pF] and a positive exponential correlation between and Gm and
Young’s modulus [Gm(nS)=0.0044 exp(E/0.28)+0.56, where E indicates the Young’s modulus in
kPa] (Fig.6, F and G), indicating that the increase of Young’s modulus (190%) and the little
decrease (10.5%) of cell surface due to S1P-induced SF contraction were both associated with
dramatic activation of SAC-mediated current (530%).
To stress the correlation between cytoskeletal contraction and SAC activation, we tested
whether SAC sensitivity to mechanical stimulation also changed in concomitance to actin
cytoskeletal remodeling. To this purpose unstimulated and S1P-stimulated C2C12 cells were
mechanically stretched using two microelectrodes (Fig.7, A and B), as previously reported (47).A
stretch of about the 10% determined an increase of 1.5 ± 0.3 and 3.7 ± 0.4 folds of Gm in control
(n=5) and S1P stimulated (n=6) cells respectively, compared to cell at resting length (Fig. 7, C-F),
indicating that S1P almost doubled SAC sensitivity to stretch. Additional experiments were
performed in cells loaded with the fluorescent Ca2+ indicator, Fluo3-AM, and then stretched using
the tip of an AFM probe. After mechanical stretching, the intracellular Ca2+ fluorescence increased
close to the tip and then spread to adjacent regions of the cell (Fig. 8), both in control and S1P-
stimulated cells. However, the general amplitude of the fluorescence changes was quite different
between the two cell preparations. In fact, consistent with electrophysiological measurements, the
relative fluorescence increase [ΔF/Fb] was about two fold higher in the S1P-stimulated cells

Cytoskeleton mediated SAC activation
16
compared to control ones. All these data taken together pointed to the role played by SF formation
elicited by S1P stimulation in the regulation of SAC sensitivity to stretch stimulation.
Effects of stress fibers (SFs) on SAC expression.
It has been recently reported that mechanisms involved in cytoskeletal remodeling may have a
critical role in controlling the plasma membrane insertion of ion channel proteins (2). On these
bases, we evaluated whether S1P-induced SF formation was associated with changes in the surface
expression of TRPC1, which has been recently identified as a component of SAC in several cell
types including C2C12 cells (25, 34, 38). By confocal microscopy, it was observed that TRPC1
protein was expressed in a vesicular manner in the cytoplasm and at the plasma membrane, as
assayed by co-localization with TRITC-WGA lectin (Fig. 9), in both control and S1P-stimulated
cells. Moreover, the plasma membrane insertion of this protein did not vary in S1P-treated cells
compared with control cells. In fact, the overlap coefficient between TRPC1 and the plasma
membrane specific signals (approximately of 0.60-0.65) was similar in the two cell preparations,
leading us to exclude the involvement of increased TRPC1 membrane association in cells
undergoing SF contraction and further suggesting that this latter event was the main contributor to
SAC activation in S1P-stimulated cells.

Cytoskeleton mediated SAC activation
17
DISCUSSION
There is substantial evidence that actin cytoskeletal remodeling is a crucial regulator of SAC
activity in numerous cell types (9, 19, 20, 23, 37, 44). However, the mechanisms involved in this
process are incompletely understood. In the current study, we provided the first experimental
evidence that SFs regulates gating behavior of SACs modulating plasma membrane stretching and
tension development. In particular, we have shown that formation of a well structured cytoskeleton
coupled with the plasma membrane via focal adhesions is associated with an increase in cell
stiffness in C2C12 myoblasts stimulated with S1P. These results agree with previous reports
obtained in other cell systems and in models of cell envelopes showing that the plasma membrane
microelasticity decreases with the increase of actin surface density (21, 28). Here, this phenomenon
was associated with modifications of cell surface topography suggestive of membrane deformations
and flattening and with reduction of cell surface area.
The use of specific pharmacological inhibitors of both SF formation and contraction allowed
us to clarify the mechanisms underlying the effects of SF on cell stiffness. In fact, SFs are
considered as temporary cytoskeletal structures composed by G-actin polymerized into filamentous
actin (F-actin) cross linked by myosin IIs to form tensile bundles. Myosin IIs are ATP-driven
molecular motors which form an essential part of the motile machinery of SFs generating the forces
to move actin filaments relative to each other (4). We have previously demonstrated that formation
of SFs by S1P in C2C12 cells is mediated by the activation of Rho/Rho kinase (ROK) pathway, on
the basis that the ectopic expression of RhoGDI (a physiological inhibitor of GDP dissociation from
Rho proteins) or with a selective ROK inhibitor, Y-27632, is accompanied by a drastic
disorganization of actin microfilaments (9-11). Several mechanisms have been envisioned to
explain the role of Rho pathway in the cytoskeletal response. One possible scheme is that ROK
inhibits the myosin phosphatase activity through the phosphorylation of the myosin binding subunit
of myosin phosphatase, and increases the phosphorylation levels of myosin light chain, resulting in

Cytoskeleton mediated SAC activation
18
the Ca2+-free contraction of the acto-myosin system and in the following bundling of F-actin into
SFs (11). Additional mechanisms involve the activation of other Rho-effectors, such as mDia and
ERM proteins, that contribute to the cytoskeletal response, favoring accumulation of polymerized
actin (10). Accordingly, we have demonstrated that stimulation with S1P of C2C12 cells in the
presence of the specific Rho kinase inhibitor, Y-27632, resulted in a profound disorganization of
SFs, thus emphasizing the importance of the Rho kinase activity for maintaining the integrity of SFs
in these cells. This cytoskeletal response was associated with a significant decrease in C2C12
cellular stiffness as compared to untreated control cells. The experiments performed in cells treated
with blebbistatin, a specific inhibitor of myosin II ATPase activity which reportedly prevents acto-
myosin dissociation and the transition of filament interaction into force-producing state (1), allowed
us to better clarify the mechanisms underlying the driving-force of the cytoskeletal-induced cell
stiffness and to dissect the roles of F-actin bundling from that of myosin II-driven SF contraction in
this event. In fact, blebbistatin was able to virtually abolish the normal development of cytoskeletal-
mediated cell stiffness, without substantially modifying SF formation in S1P-stimulated cells,
leading to the suggestion that not SF polymerization alone but the generation of tensional stresses
within SFs are responsible for the observed stiffening response to S1P.
Taking into consideration the tensegrity model of cell architecture proposed by Ingber (18), the
organization and contraction of the sub-membrane cytoskeleton may generate tensional pre-stress
against the plasma membrane. In line with this, we have shown that the surface corrugations in
AFM topography were less pronounced in S1P-stimulated cells compared to unstimulated cells,
suggesting that formation of robust SFs may contribute to mechanically stretch the plasma
membrane. More importantly, we have also shown that SF formation and contraction were able to
reduce the myoblastic cell surface area. Since regulation of cell surface area depends on plasma
membrane remodeling (13, 39), it is likely that SF contraction may reduce plasma membrane bleb
formation by inducing membrane internalization and vacuole formation and contribute to tension
development in the bilayer, as also suggested previously (6). On the basis of these considerations, it

Cytoskeleton mediated SAC activation
19
is also possible that the increase in cell surface area observed in cells with altered SF formation and
contraction (i.e. treated with Y-27632 and blebbistatin), may be due to the translocation and fusion
of sub-membrane vacuoles to the cell membrane as a consequence of the reduced plasma membrane
tension (6). The negative exponential correlation between Gm and Cm and the positive exponential
correlation between and Gm and Young’s modulus, may point out that the increase of Young’s
modulus (190%) and the slight decrease(10,5%)of cell surface area caused by cytoskeletal
contraction may act as an amplifier of the stress tension generated in the plasma membrane. The
amplified stress tension may in turn determine the remarkable increase of SAC activation (530%).
These assumptions were further strengthened by the results showing that SAC activity was strictly
depended on actin cytoskeletal remodeling; in fact, the amplitude of SAC-mediated current and
stretch-activated Ca2+ influx reached the highest values in coincidence with maximal SF formation
and contraction, whereas SAC opening was hampered and virtually abolished after cytoskeletal
disassembly and inhibition of acto-myosin interaction.
Previous observations have shown that actin remodeling may affect cell surface viscosity. In
particular, experiments performed in mouse dystrophic myotubes (39) and skeletal myoblasts (46)
have shown that the loss of dystrophin and the accompanying alterations of other cytoskeletal
components increase membrane hysteresis, probably due to an increase in surface viscosity
resulting from altered cytoskeletal organization and coupling to plasma membrane. In such a view,
the data reported here fit well with this idea, showing that both the treatments with Y-27632 and
blebbistatin result in a small but significant increase in the myoblastic hysteresis. Of note, we have
found that also formation of SFs increases hysteresis, underscoring the possible involvement of
cytoskeleton and its interaction with specific membrane receptors in the modulation of viscous
properties of cells. Taking into consideration the recent findings suggesting that membrane
viscosity may influence inherent channel sensitivity (39), it is tempting to speculate that increased
hysteresis following S1P-induced SF formation may be determinant in filtering the ions influx

Cytoskeleton mediated SAC activation
20
through SACs thus enabling the cells to resist passive deformation and preventing them from
excessive SAC activation.
In conclusion, these findings support our hypothesis that SFs are the major component
responsible for the modulation of plasma membrane tension generation and SAC activation in
skeletal myoblasts. However, formation of SFs alone does not provide the molecular basis for SAC
activation, and SAC inhibition induced by blebbistatin, a specific inhibitor of myosin ATPase,
indicates that the sustained contraction of SFs may represent the force-bearing event responsible for
cell surface stretching and SAC opening. We hypothesize that the increased viscosity observed in
S1P stimulated cells may produce a proportional increase in plasma membrane stability against
passive deformations, and prevent cells from abnormal SAC function.
Taking into consideration the emerging evidence of the roles played by SACs (9, 43) and
cytoskeletal remodeling in skeletal muscle differentiation (9, 29), this mechanism of SAC activation
may have profound implications in muscle development, regeneration and diseases, underlying the
need to understand the functions of the subplasmalemmal acto-myosin network and its ability to
transmit tensional forces to the cell membrane.

Cytoskeleton mediated SAC activation
21
GRANTS. This paper was supported by grants from the University of Florence (ex 60%) to L.F.,
S.Z.O., F.F; from Ente Cassa di Risparmio di Pistoia e Pescia to S.Z.O.
Cytoskeleton mediated SAC activation
22
REFERENCES
1. Allingham JS, Smith R, Rayment I. The structural basis of blebbistatin inhibition and
specificity for myosin II. Nat Struct Mol Biol. 12: 378-379, 2005.
2. Ambudkar IS. Ca2+ signaling microdomains: platforms for the assembly and regulation of
TRPC channels. Trends Pharmacol Sci 27: 25-32, 2006.
3. Bausch AR, Hellerer U, Essler M, Aepfelbacher M, Sackmann E. Rapid stiffening of
integrin receptor-actin linkages in endothelial cells stimulated with thrombin: a magnetic
bead microrheology study. Biophys J 80: 2649-2657, 2001.
4. Chrzanowska-Wodnicka M, Burridge K. Contractility Drives the Rho-stimulated
formation of stress fibers and focal adhesions. J Cell Biol 133: 1403–1415, 1996
5. Collinsworth AM, Zhang S, Kraus WE, Truskey GA. Apparent elastic modulus and
hysteresis of skeletal muscle cells throughout differentiation. Am J Physiol Cell Physiol
283: C1219-1227, 2002.
6. Dai J, Sheetz MP. Membrane tether formation from blebbing cells. Biophys 77: 3363-
3370, 1999.
7. Darling EM, Zauscher S, Guilak F. Viscoelastic properties of zonal articular
chondrocytes measured by atomic force microscopy. Osteoarthritis and Cartilage 14: 571-
579, 2006.
8. Dietrich A, Chubanov V, Kalwa H, Rost BR, Gudermann T. Cation channels of the
transient receptor potential superfamily: their role in physiological and pathophysiological
processes of smooth muscle cells. Pharmacol Ther 112: 744–760, 2006.
9. Formigli L, Meacci E, Sassoli C, Squecco R, Nosi D, Chellini F, Naro F, Francini F,
Zecchi-Orlandini S. Cytoskeleton/stretch-activated ion channels interaction regulates
myogenic differentiation of skeletal myoblasts. J Cell Physiol 211: 296-306, 2007.

Cytoskeleton mediated SAC activation
23
10. Formigli L, Meacci M, Sassoli C, Chellini F, Giannini R, Quercioli F, Tiribilli B,
Squecco R, Bruni P, Francini F, Zecchi-Orlandini S. Sphingosine 1-phosphate induces
cytoskeletal reorganization in C2C12 myoblasts: physiological relevance for stress fibers in
the modulation of ion current through stretch-activated channels. J Cell Sci 118: 1161-
1171, 2005.
11. Formigli L, Meacci E, Vassalli M, Nosi D, Quercioli F, Tiribilli B, Tani A, Squecco R,
Francini F, Bruni P, Zecchi-Orlandini S. Sphingosine 1-phosphate induces cell
contraction via calcium-independent/Rho-dependent pathways in undifferentiated skeletal
muscle cells. J Cell Physiol 198: 1–11, 2004.
12. Francini F, Bencini C, Squecco R, Piperio C. Separation of charge movement
components in mammalian skeletal muscle fibres. J Physiol 537: 45-56, 2001.
13. Herring TL, Cohan CS, Welnhofer EA, Mills LR, Morris CE. F-actin at newly
invaginated membrane in neurons: implications for surface area regulation. J Membr Biol
171: 151-169, 1999.
14. Heubach JF, Graf EM, Zahanich I, Christ T, Boxberger S, Wettwer E, Ravens U.
Electrophysiological properties of human mesenchymal stem cells. J Physiol 554: 659-672,
2004.
15. Hofmann UG, Rotsch C, Parak W, Radmacher M. Investigating the cytoskeleton of
chicken cardiocytes with the atomic force microscope. J Struct Biol 119: 84-91, 1997.
16. Horcas I, Fernández R, Gómez-Rodríguez JM, Colchero J, Gómez-Herrero J, Baro
AM. WSXM: software for scanning probe microscopy and a tool for nanotechnology. Rev
Sci Instrum 78: 013705, 2007.
17. Imbert N, Vandebrouck C, Duport G, Raymond G, Hassoni AA, Constantin B, Cullen
MJ, Cognard C. Calcium currents and transients in co-cultured contracting normal and
Duchenne muscular dystrophy human myotubes. J Physiol 534: 343-55, 2001.
18. Ingber DE. Cellular mechanotransduction: putting all the pieces together again. FASEB J
20: 811-827, 2006.
Cytoskeleton mediated SAC activation
24
19. Janmey PA. The cytoskeleton and cell signaling: component localization and mechanical
coupling. Physiol Rev 78:763– 781, 1998.
20. Kamkin A, Kiseleva I, Isenberg G. Ion selectivity of stretch-activated cation currents in
mouse ventricular myocytes. Pflugers Arch 446: 220-31, 2003.
21. Kasas S, Wang X, Hirling H, Marsault R, Huni B, Yersin A, Regazzi R, Grenningloh
G, Riederer B, Forrò L, Dietler G, Catsicas S. Superficial and deep changes of cellular
mechanical properties following cytoskeleton disassembly. Cell Motil Cytoskeleton 62:
124-132, 2005.
22. Kidoaki S, Matsuda T, Yoshikawa K. Relationship between apical membrane elasticity
and stress fiber organization in fibroblasts analyzed by fluorescence and atomic force
microscopy. Biomech Model Mechanobiol 5: 263-72, 2006.
23. Kim JH, Rhee PL, Kang TM. Actin cytoskeletons regulate the stretch-induced increase of
Ca2+ current in human gastric myocytes. Biochem. Biophys. Res. Commun. 352: 503-508,
2007.
24. Limozin L, Roth A, Sackmann E. Microviscoelastic moduli of biomimetic cell envelopes.
Phys Rev Lett 95: 178101, 2005.
25. Maroto R, Raso A, Wood TG, Kurosky A, Martinac B, Hamill OP. TRPC1 forms the
stretch-activated cation channel in vertebrate cells. Nat Cell Biol 7: 179–185, 2005.
26. Marthur AB, Collinsworth AM, Reichert WM, Kraus WE, Truskey GA. Endothelial,
cardiac muscle and skeletal muscle exhibit different viscous and elastic properties as
determined by atomic force microscopy. J Biomechanics 34: 1545-1553, 2001.
27. Martinac B. Mechanosensitive ion channels: molecules of mechanotrasduction. J Cell Sci
117: 2449-2460, 2004.
28. Martens JC, Radmacher M. Softening of the actin cytoskeleton by inhibition of myosin
II. Pflugers Arch 456: 95-100, 2008.

Cytoskeleton mediated SAC activation
25
29. Mebarek S, Komati H, Naro F, Zeiller C, Alvisi M, Lagarde M, Prigent AF, Némoz G.
Inhibition of de novo ceramide synthesis upregulates phospholipase D and enhances
myogenic differentiation. J Cell Sci 120: 407-416, 2007.
30. Minke B, and Cook B. TRP channel proteins and signal transduction. Physiol Rev 82:
429–472, 2002.
31. Oberhauser AF, Fernandez CB, Carrion-Vazquez M, Fernandez. JM. The mechanical
hierarchies of fibronectin observed with single-molecule AFM. J Mol Biol 319: 433–447,
2002.
32. Riethmüller C, Oberleithner H, Wilhelmi M, Franz J, Schlatter E, Klokkers J,
Edemir B. Translocation of aquaporin-containing vesicles to the plasma membrane is
facilitated by actomyosin relaxation. Biophys J 94: 671-678, 2008.
33. Sachs F, Morris CE. Mechanosensitive ion channels in non specialized cells. Rev Physiol
Biochem Pharmacol 132: 1-77, 1998.
34. Sassoli C, Martinesi M, Squecco R, Bini F , Zecchi-Orlandini S, Francini F, Formigli
L, Meacci E. Sphingosine 1-phosphate modulates Transient Receptor Potential Channel 1
(TRCP1) in skeletal muscle cells. Relevance for Connexin43-up-regulation and
myogenesis. VI International Meeting of the Sphingolipid Club, Bilbao, Abstract, PB14: 71,
2007.
35. Sato M, Theret DP, Wheeler LT, Ohshima N, Nerem RM. Application of the
micropipette technique to the measurement of cultured porcine aortic endothelial cell
viscoelastic properties. J Biomech Eng 112: 263-268, 1990.
36. Sneddon IN. The relation between load and penetration in the axisymmetric Boussineq
problem for a punch of arbitrary profile. Int J Eng Sci 3: 47-57, 1965.
37. Staruschenko A, Negulyaev YA, Morachevskaya EA. Actin cytoskeleton disassembly
affects conductive properties of stretch-activated cation channels in leukaemia cells.
Biochim Biophys Acta. 1669: 53– 60, 2005.

Cytoskeleton mediated SAC activation
26
38. Stiber JA, Zhang ZS, Burch J, Eu JP, Zhang S, Truskey GA, Seth M, Yamaguchi N,
Meissner G, Shah R, Worley PF, Williams RS, Rosenberg PB. Mice lacking homer 1
exhibit a skeletal myopathy characterized by abnormal transient receptor potential channel
activity. Mol Cell Biol 28: 2637-2647, 2008.
39. Suchyna TM, Sachs F. Mechanosensitive channel properties and membrane mechanics in
mouse dystrophic myotubes. J Physiol 581: 369-387, 2007.
40. Vandebrouck A, Sabourin J, Rivet J, Balghi H, Sebille S, Kitzis A, Raymond G,
Cognard C, Bourmeyster N , Constantin B. Regulation of capacitative calcium entries by
alpha1-syntrophin: association of TRPC1 with dystrophin complex and the PDZ domain of
alpha1-syntrophin. FASEB J 21: 608-617, 2007.
41. Viciencio JM, Ibarra C, Estrada M, Chiong M, Soto D, Parra V, Diaz-Araya G,
Jaimovich E, Lavandero S. Testosterone induces an intracellular calcium increase by a
nongenomic mechanism in cultured rat cardiac myocytes. Endocrinology 147: 1386-1395,
2006.
42. Vinckier A, Semenza G. Measuring elasticity of biological materials by atomic force
microscopy. FEBS 430: 12-16, 1998.
43. Wedhas N, Klamut HJ, Dogra C, Srivastava AK, Mohan S, Kumar A. Inhibition of
mechanosensitive cation channels inhibits myogenic differentiation by suppressing the
expression of myogenic regulatory factors and caspase-3 activity. FASEB J 19: 1986-1997,
2005.
44. Wu Z, Wong K, Glogauer M, Ellen RP, McCulloch CAG. Regulation of stretch
activated intracellular calcium transients by actin filaments. Biochem Biophys Res Commun
261: 419-425, 1999.
45. Yoshikawa Y, Yasuike T, Yagi A, Yamada T. Transverse elasticity of myofibrils of
rabbit skeletal muscle studied by atomic force microscopy. Biochem Biophys Res Comm
256: 13–19, 1999.

Cytoskeleton mediated SAC activation
27
46. Zhang JS, Kraus WE, Truskey GA. Stretch-induced nitric oxide modulates mechanical
properties of skeletal muscle cells. Am J Physiol Cell Physiol 287: C292-299, 2004.
47. Zhang YH, Youm JB, Sung HK, Lee SH, Ryu SY, Ho WK, Earm YE. Stretch-activated
and background non-selective cation channels in rat atrial myocytes. J Physiol 523: 607-
619, 2000.

Cytoskeleton mediated SAC activation
28
FIGURE LEGENDS
FIGURE 1. Confocal fluorescence analysis of cytoskeleton organization of skeletal myoblasts.
C2C12 cells were grown on glass coverslips, fixed with PFA 0.5% in PBS and stained with TRITC
labeled phalloidin to detect F-actin (red); in some experiments the cells were further incubated with
rabbit polyclonal anti-FAK antibody followed by Alexa488-conjugated IgG to reveal FA-adhesion
plaques (green). (A, B) Control, unstimulated C2C12 cells; (C, D) cells stimulated with 1μM S1P
for 30 min; cells treated with either (E) 10μM Y-27632 or (F) with 10μM blebbistatin in presence
of S1P. The fluorescence distribution and intensity of F-actin are shown in the reported pseudo-
color scale. In panels A and C two types of SFs, radial (underscored by continuous arrows) and
longitudinal (underscored by dotted arrows) aligned prevalently underneath the plasma membrane
are visible. (A-D) S1P elicits formation of dense SFs and FA plaques, whereas (E) Y-27632
prevents S1P-induced SF accumulation. Interestingly, (F) the treatment with blebbistatin does not
interfere with SF assembly. The images are representative of 5-6 independent experiments with
similar results. (G) Quantitative analysis of radial and longitudinal SF fluorescence in C2C12
myoblasts in the indicated experimental conditions. Mean ± SE from three separate experiments. *
and ° indicate parameters that are significantly different at P < 0.05 compared with those of control
cells.
FIGURE 2. Effects of cytoskeleton on the elastic (Young’s modulus) and viscous (hysteresis)
properties of living skeletal myoblasts.
C2C12 cells were cultured and treated as reported in Figure 1 and examined with a modified
spherical AFM tip to perform force-indentation curves and evaluate the viscoelastic properties of
the cell. (A) Representative AFM force-indentation curves performed in C2C12 cells stimulated
with S1P (continuous lines) and in C2C12 cells treated with blebbistatin and stimulated with S1P
(dashed lines). The indentation was calculated as difference between the scanner position and
cantilever deflection. (B) Apparent Young’s elastic modulus in the indicated treatments affecting

Cytoskeleton mediated SAC activation
29
actin cytoskeletal status. Young’s modulus was obtained from force-indentation curves using the
Hertz’s modified model and was estimated taking into consideration the first 400 nm on the
approaching indentation curve. (C) Normalized hysteresis in the indicated treatments affecting actin
cytoskeletal status. Hysteresis was calculated as the difference between the areas under the
extension curve and that of the retraction curve normalized by the input energy. In each
experimental condition, data are from 4-6 cells from three different experiments. Statistical analysis
was performed by using ANOVA test *P<0.05, **P<0.01 and *** P<0.001.
FIGURE 3. AFM imaging and analysis of living skeletal myoblasts.
C2C12 cells were grown on glass coverslips and examined prior (A-D) and after (E-H) stimulation
with 1μM S1P for 30 min. In particular, C2C12 cells were first imaged by Pulse Force Mode; then
the same cells were stimulated with S1P and imaged again after 30 min of stimulation.
Representative (A, E) topography, (B, F) deflection and (C, G) stiffness images acquired
simultaneously. (A, E) In the topography images, the higher zones are represented in brighter
colors. (B, F) In the deflection images, the local variations of heights appear more evident. (C, G) In
the stiffness maps, the brighter colors correspond to stiffer areas. (D, H) AFM height and stiffness
profiles evaluated along the horizontal white lines depicted in the images. The lines were selected in
peripheral regions of the cells where the measurements were not influenced by the nucleus.
Stiffness values are reported in arbitrary unit (a.u.) with a maximal value of 1 a.u. corresponding to
the glass. A close correlation (arrows) between the higher fluctuations of stiffness and the
corrugation peaks in the topography profile was observed. Of note, the topographic line profiles
show that the surface corrugations, due the presence of fibrous structures underneath, are less
pronounced and more densely packed in S1P-stimulated cells compared to those of unstimulated
ones, suggesting that SF assembly could mechanically stretch (flatten) the cell surface. Images are
representative of 4-5 independent experiments with similar results.
FIGURE 4. AFM imaging and analysis of living skeletal myoblasts with altered cytoskeletal
status.

Cytoskeleton mediated SAC activation
30
C2C12 cells cultured on glass coverslips were treated (A-D) with 10μM Y-27632 or (E-H) with
10μM blebbistatin, stimulated with 1μM S1P for 30 min and then examined with Pulse Force
Mode. Representative (A, E) topography, (B, F) deflection and (C, G) stiffness images acquired
simultaneously (D, H) AFM height and stiffness profiles evaluated along the white lines depicted in
the images. The lines were selected in peripheral regions of the cells where the measurements were
not influenced by the nucleus. Note that both disruption of SFs and inhibition of SF contraction
elicit a remarkable smoothening of the cell surface associated with substantial loss of the surface
rigidity. The images are representative of 4-5 independent experiments with similar results.
FIGURE 5 Effects of cytoskeleton on membrane capacitance (Cm) of living skeletal myoblasts.
C2C12 cells were cultured and treated as reported in Figure 1 and examined by patch clamp
analysis to measure membrane capacitance (Cm.) Cm was used as an index of cell surface area. (A)
Cm in the indicated experimental conditions. Statistical analysis was performed by using ANOVA
test; * P<0.05. (B) Relationship between Cm and Young’s modulus. The Young’s modulus shows a
linear inverse relation with Cm. (C) Relationship between Cm and normalized hysteresis.
Normalized hysteresis shows a U shaped relation with Cm. For each experimental condition,
electrophysiological (Cm) and AFM data (Young’s modulus and hysteresis) are from different cells
(15-19, for the electrophysiology and 4-6 for the AFM analyses) of parallel experiments.
FIGURE 6. SAC-current in living skeletal myoblasts with different cytoskeleton organization.
(A-E) Representative current traces recorded by whole cell patch clamp in single C2C12 cells (A)
in control condition, (B) after 1 μM S1P stimulation for 30 min, (C) treated with 10 μM Y-27632
and stimulated with S1P, (D) treated with 10 μM blebbistatin and stimulated with S1P, and (E)
stimulated with S1P and recorded in the presence of GdCl3. Voltage-clamp step pulses between –80
and 0 mV in 10 mV steps from a holding potential of –60 mV were applied to the cells for 100 ms.
(F) Relationship between plasma membrane conductance (Gm) and Cm. The best fit for Gm, versus
Cm was obtained by a single negative exponential function plus a constant. The plots refer to
myoblasts in the indicated (filled symbols) experimental conditions. Data recorded in the presence

Cytoskeleton mediated SAC activation
31
of GdCl3 (open symbols) are also reported. (G) Relationship between Gm and Young’s modulus. Gm
versus Young’s modulus plot was obtained by a single positive exponential function, plus a
constant. For each experimental condition, electrophysiological (Gm and Cm) and mechanical data
(Young’s modulus) are from different cells (15-19, for the electrophysiology and 4-6 for the AFM
analyses) of parallel experiments.
FIGURE 7. SAC-current after mechanical stretch of control and S1P stimulated skeletal
myoblasts. (A-B) Representative images obtained when (A) two patch pipettes were attached on
the cell at resting length and (B) after 10 % cell stretch induced by the movement of the lower
pipette in the longitudinal direction. (C-F) Time course of SAC-mediated currents (Im) in control
and S1P stimulated cells (C, E) before and (D, F) after the application of the cell stretch.
FIGURE 8. Visualization of Ca2+ entry in skeletal myoblasts after AFM mechanical
stimulation. (A-D) Control and (E-H) S1P-stimulated C2C12 cells were pre-loaded with Fluo3-
AM and mechanically stimulated with the rectangular tip of an AFM probe (grey lines).
Fluorescence images were acquired at a rate of 1 image/sec. The pseudo-coloring represents the
global Ca2+ increase as indicated by the color bar. (I) Histogram of relative fluorescence increase
(ΔF/Fb) in control and S1P-stimulated cells (mean ± SE, * P<0.05).
FIGURE 9. Effects of stress fiber formation on plasma membrane localization of TRPC1 in
skeletal myoblasts.
Cellular localization of TRPC1 in (A-D) control and (E-H) S1P-stimulated C2C12 myoblasts
immunostained with polyclonal anti-TRPC1 followed by Alexa488-conjugated IgG and
counterstained with TRITC-WGA lectin to visualize plasma membrane. The images refer to single
confocal optical section. (A, E) Plasma membrane staining is colored in red; (B, F) TRPC1 staining
is colored in green; (C, G) merged red and green images showing co-localization (yellow); (D, H)
scatterplots showing the distribution of sampled pixels plotted as a function of the red (y axis) and
green (x axis) emission intensity; colocalized pixels in the image are included in the yellow orange
region between the two white lines. (I) The histogram shows the overlap coefficient between

Cytoskeleton mediated SAC activation
32
TRPC1 and plasma membrane in control and S1P-stimulated cells. The images are representative of
5 independent experiments with similar results.