An exploratory study on skill shortages, labour migration, and ...
Upload
khangminh22Category
view
1download
0
Cambridge Journal of Regions, Economy and Society 2020, 13, 77–97doi:10.1093/cjres/rsz019Advance Access publication 29 November 2019
© The Author(s) 2019. Published by Oxford University Press on behalf of the Cambridge Political Economy Society. All rights reserved. For permissions, please email: [email protected]
Robots, skill demand and manufacturing in US regional labour markets
Nancey Green Leigh, Benjamin Kraft and Heonyeong Lee
College of Design, Georgia Institute of Technology, North Avenue, Atlanta, GA 30332, USA, [email protected], [email protected], [email protected]
Received on July 13, 2018; editorial decision on May 28, 2019; accepted on September 25, 2019
Advances in robotics and artificial intelligence (AI) technology have spurred a re-examin-ation of technology’s impacts on jobs and the economy. This article reviews several key contributions to the current jobs/AI debate, discusses their limitations and offers a modified approach, analysing two quantitative models in tandem. One uses robot stock data from the International Federation of Robotics as the primary indicator of robot use, whereas the other uses online job postings requiring robot-related skills. Together, the models suggest that since the Great Recession ended, robots have contributed positively to manufacturing employment in the USA at the metropolitan level.
Keywords: robotics, manufacturing, economic development, employment skills, technological change
Introduction
Researching how technological advances are changing the way we work is not a straight-forward task. A major barrier to conducting this research is the deficit of appropriate data with which to do so. The seriousness of this deficit grows as the previously catch-all terms of “computer” and “information technology” give way to robotics, machine learning and artificial intelligence (AI). In this article, we examine how data deficiencies influence as-sumptions behind contemporary estimates of impacts on employment, the most notable of which is that the relationship between robots and employment is invariant at the industry-region level. We also present alter-native constructs for measuring robot im-pact and apply them to a unique data set of
online job postings, augmented by standard socio-economic data sources. Our findings suggest that the impacts of robotics vary across metropolitan areas, so discussions of these impacts should not be assumed to be generalisable across space.
Work and technology in the 20th centuryWhile Braverman (1998) argued that craft skills were disappearing due to the adoption of 20th-century Fordist production methods, subsequent quantitative investigations suggest technology advances have been associated with increases in workers’ skill levels. For example, Autor, Levy and Katz (2003) found for the second half of the 20th century that increases in workers’ skills were directly attributable to computerisation.
Dow
nloaded from https://academ
ic.oup.com/cjres/article/13/1/77/5648036 by G
eorgia Institute of Technology user on 02 October 2020
78
Leigh et al.
Models of skill-biased technical change (SBTC) or upskilling, however, do a poor job accounting for growing wage polarisation and growth in “low-skill” service jobs (Acemoglu and Autor, 2011). To address this, subsequent research, incorporating changing consumer preferences and offshoring susceptibility, finds computerisation to be a key factor in the redis-tribution of middle-skill work towards the low- and high-skill ends of the labour market in the USA and Europe (Autor and Dorn, 2013; Goos et al., 2009).
While the econometric approach outlined above has been influential in policy debates about work and technology, it is one of many possible approaches to examining technology’s role in the changing nature of work. Sociology, management and organisational science re-search highlights the social context of techno-logical change by focussing on qualitative analyses, case studies and “microdynamics” (Adler, 1992, 7), often at the individual work-place level. These approaches include critiques of the abstract conceptualisation of technology and re-emphasis on the physical nature of various workplace technologies—their “ma-teriality”—and how they become incorporated into social systems (Leonardi, 2012; Orlikowski and Scott, 2008). This socially contingent per-spective of technology generates nuanced sets of findings that differ from workplace to work-place and complicate the generalised trends de-scribed by statistical analysis.
A socially contingent perspective on technology’s influence on work at meso and macro scales im-plies that machines are not the root “cause” of la-bour market problems. Instead, problems of skill bias, wage polarisation and technology-induced unemployment are fundamentally political ra-ther than technological problems (Grint and Woolgar, 2013). For example, what is interpreted as “upskilling” may actually be “up-credentialing”, driven by increased policy emphasis on degree-seeking (Keep and Mayhew, 2010) and increased employer selectiveness (Cappelli, 2012, 2014).
Even if machines are merely vehicles for politically induced labour market failures, the question of whether “this time is different” re-mains a pressing one. With the exception of Gordon (2012, 2014), who has been sceptical of the ability to innovate our way out of the long-term post-1973 period of economic stag-nation, economists have generally and until recently been optimistic about the capacity of technological progress to generate a net surplus of jobs: the virtuous cycle of rising wages and increased demand should spur labour reallo-cation to ever more useful functions. However, according to Brynjolfsson and McAfee (2014), we are now at an “inflection point”, whereby technological capabilities will outpace society’s ability to absorb the disruption that they cause, and radical changes in safety nets and educa-tion policy are in order.
With these issues in mind, this article inquires whether robots are exerting pressures on labour markets above and beyond that seen in pre-vious application of industrial automation. The answer we provide uses the case of industrial robots (those used in manufacturing operations), for two key reasons. First, even though the bulk of future disrupting technologies lie outside of manufacturing (for example, drones, autonomous vehicles, personal care robots), they will largely be based on the technology pioneered in industrial robotics. Second, industrial robots are already widely and systematically used in manufacturing, as opposed to service and consumer robots, which are in the early stages of adoption.
This article first summarises the sparse litera-ture on robotics impacts on employment, fol-lowed by the introduction of a new indicator of robotics presence in a regional economy, and employs it in an empirical model using a novel data source, real-time labour market information (RTLMI) that is derived from online job postings. We find that this new indi-cator performs better than others in explaining manufacturing job growth and that the effect of robots is a slightly positive one.
Dow
nloaded from https://academ
ic.oup.com/cjres/article/13/1/77/5648036 by G
eorgia Institute of Technology user on 02 October 2020
79
Robots, skill demand and manufacturing in USA
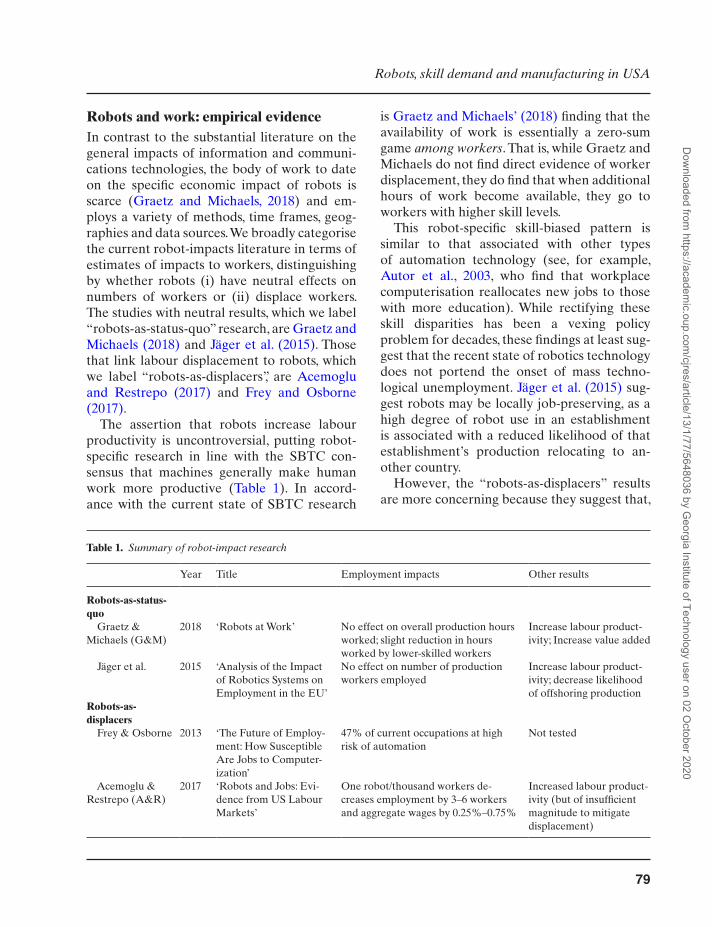
Robots and work: empirical evidenceIn contrast to the substantial literature on the general impacts of information and communi-cations technologies, the body of work to date on the specific economic impact of robots is scarce (Graetz and Michaels, 2018) and em-ploys a variety of methods, time frames, geog-raphies and data sources. We broadly categorise the current robot-impacts literature in terms of estimates of impacts to workers, distinguishing by whether robots (i) have neutral effects on numbers of workers or (ii) displace workers. The studies with neutral results, which we label “robots-as-status-quo” research, are Graetz and Michaels (2018) and Jäger et al. (2015). Those that link labour displacement to robots, which we label “robots-as-displacers”, are Acemoglu and Restrepo (2017) and Frey and Osborne (2017).
The assertion that robots increase labour productivity is uncontroversial, putting robot-specific research in line with the SBTC con-sensus that machines generally make human work more productive (Table 1). In accord-ance with the current state of SBTC research
is Graetz and Michaels’ (2018) finding that the availability of work is essentially a zero-sum game among workers. That is, while Graetz and Michaels do not find direct evidence of worker displacement, they do find that when additional hours of work become available, they go to workers with higher skill levels.
This robot-specific skill-biased pattern is similar to that associated with other types of automation technology (see, for example, Autor et al., 2003, who find that workplace computerisation reallocates new jobs to those with more education). While rectifying these skill disparities has been a vexing policy problem for decades, these findings at least sug-gest that the recent state of robotics technology does not portend the onset of mass techno-logical unemployment. Jäger et al. (2015) sug-gest robots may be locally job-preserving, as a high degree of robot use in an establishment is associated with a reduced likelihood of that establishment’s production relocating to an-other country.
However, the “robots-as-displacers” results are more concerning because they suggest that,
Table 1. Summary of robot-impact research
Year Title Employment impacts Other results
Robots-as-status-quo
Graetz & Michaels (G&M)
2018 ‘Robots at Work’ No effect on overall production hours worked; slight reduction in hours worked by lower-skilled workers
Increase labour product-ivity; Increase value added
Jäger et al. 2015 ‘Analysis of the Impact of Robotics Systems on Employment in the EU’
No effect on number of production workers employed
Increase labour product-ivity; decrease likelihood of offshoring production
Robots-as-displacers
Frey & Osborne 2013 ‘The Future of Employ-ment: How Susceptible Are Jobs to Computer-ization’
47% of current occupations at high risk of automation
Not tested
Acemoglu & Restrepo (A&R)
2017 ‘Robots and Jobs: Evi-dence from US Labour Markets’
One robot/thousand workers de-creases employment by 3–6 workers and aggregate wages by 0.25%–0.75%
Increased labour product-ivity (but of insufficient magnitude to mitigate displacement)
Dow
nloaded from https://academ
ic.oup.com/cjres/article/13/1/77/5648036 by G
eorgia Institute of Technology user on 02 October 2020
80
Leigh et al.
rather than setting in motion a reallocation of skills within the human workforce, robotics (and AI more generally) is instead shrinking the size of the labour market accessible to those who perform work that is more easily automatable.
As previously noted, the four studies re-viewed here are not perfectly comparable. Unlike the others, Frey and Osborne (2013) is a probabilistic forecast of threats to current occu-pations that can be expected in the near future based on mapping specific job tasks, as defined by the Standard Occupational Code (SOC), to experts’ assessments of technological capabil-ities and trajectories. It applies to AI in general rather than robots specifically. So, while the model predicts significant continued displace-ment to manufacturing jobs, it also includes lo-gistics and administrative jobs that lie outside the purview of traditional industrial robots. According to the model, most non-supervisory production occupations have at least a 50% chance of being “computerized”, while the bulk has at least a 75% chance.
Acemoglu and Restrepo (2017) build on Graetz and Michaels (2018) by deriving a sub-national estimation of robot use (or “ex-posure”) from International Federation of Robotics (IFR’s) industry and country tabu-lations. Because the IFR only provides robot sales and stock data for countries and indus-tries, Acemoglu and Restrepo map robot ex-posure by industry onto US Commuting Zones, based on the concentration of each industry within each commuting zone. Their findings suggest that robots exert substantial downward pressure on local employment and wages and that this pressure becomes intensified when inter-regional trade is taken into account.
Despite the divergent findings of the nascent robotics-impact literature, they are not neces-sarily contradictory. Differing results may be the result of the use of different methods, data sources, geographies and time periods in ques-tion. For example, robots may simultaneously
drive productivity growth with little job de-struction when aggregated across the EU and OECD member states—as Jäger et al. and Graetz and Michaels suggest—and displace workers and reduce salaries in the USA at the same time. While the geographic differential in robot uptake and impacts gets lost in the hyper-bole of the media debate on the topic, Leigh and Kraft (2017) show that regions within the USA have substantial differences in their ro-botics knowledge bases and that these differ-ences will likely affect the quantity and quality of local automation capabilities.
Robotics data in perspectiveThe unavailability of data on robotics pene-tration in industry remains a significant im-pediment that accounts for the discrepancy in (and shortage of) robot-impact research. There is no North American Industrial Classification System (NAICS) code to single out robotics manufacturers or consulting firms. Nor is there a SOC to identify employees who work directly with robots.1 Consequently, there is no way to isolate robot users or makers in these com-monly used, publicly available data sets.
One way to overcome the robotics data gap is to collect original data on robots. However, due in part to the time and expense involved in generating original data sets of this nature, these efforts have been scarce.
There are two examples to date of ori-ginal robotics data collection. The first ex-ample, a Fraunhofer Institute report to the European Commission (Jäger et al., 2015), uses one question from the 2009 European Manufacturing Survey (EMS) about robot utilisation to estimate several related impacts (summarised above). The question regarding robot utilisation on the EMS asks respond-ents to rate their use of robots on a three-point “low-medium-high” scale, so exact robot-to-job or robot-to-output associations are not possible.
Dow
nloaded from https://academ
ic.oup.com/cjres/article/13/1/77/5648036 by G
eorgia Institute of Technology user on 02 October 2020
81
Robots, skill demand and manufacturing in USA
The second example, Leigh and Kraft (2017), generated a robotics “census” by mining pro-prietary business databases for robotics firms in the USA. The resulting data set demonstrates the uneven geography of robotics suppliers and service providers (called integrators, discussed below). While the census demonstrates that robotics-related employment is geographic-ally correlated with the manufacturing sector, the actual use of robots cannot be determined from these data. Therefore, the census cannot be used to make definitive links to changes in employment, wages or productivity.
The other two studies (Graetz & Michaels [G&M] and Acemoglu & Restrepo [A&R]) use data from the IFR, which has been tracking robot sales since the early 1990s. The IFR sells a longitudinal data set of robot sales and robot stock (the latter is estimated by applying de-preciation rates to previous years’ sales) by country and industry for each year from 1993 to the present.
While the IFR data are the only of their type available, they present several problems. First, is that the concept of “robot stock” is an approximation based on annual robot sales. These stocks are inferred by depreciating accu-mulated robot sales to each country based on the assumption of a 12-year working life of a robot—a number which the IFR itself acknow-ledges is uncertain (2017). Robotics is a rapidly developing technology, so it is not unreason-able to assume that the rate of obsolescence is increasing.2
In fact, robot sales in North America (the bulk of which the USA is responsible for) experienced an abrupt discontinuity be-ginning in 2010, three years after the end of both Graetz and Michaels’ (2018) and Acemoglu and Restrepo’s (2017) time series (see Figure A1 in Supplementary Appendix). In North America, annual sales records were set every year from 2010 to 2018, while the price per unit has steadily declined (based on RIA data underlying Supplementary Figure A1, the price per robot unit in North
America fell from just over $83,000 in 1999 to $53,500 in 2018). However, the extent to which this period represents decisions to re-place old robots or to add new robots where none had previously existed is unknown. Do these sales increases coincide with increases in robotics technology, declining costs, deepening of pent-up capital after the Great Recession, or some combination thereof? This sharp break in robotics sales patterns presents researchers with a difficult choice: limiting analyses to pre- or post-Great Recession robot diffusion trends satisfies an important condition for internal validity, but the results may not be generalisable to sub-sequent periods.
Furthermore, reporting sources have changed over the course of the IFR’s data col-lection efforts, so annual robot stock figures are not fully comparable over time. Most signifi-cantly, no sales data were reported for North America until 2004 (International Federation of Robotics, 2017), so any estimates of US robots prior to that year must be derived from other nations’ diffusion patterns.
Alternative constructs of robot exposure and their limitationsStudies of the impacts of technology de-fined broadly have sidestepped data prob-lems by using expansive data sets in terms of both observations and time periods (for example, Autor, Katz and Kearney, 2008). These investigations are also afforded some leeway in conceptualising the primary vari-able, technology, because “computerization” applies in the same general sense to all in-dustries, from accounting and finance to manufacturing and agriculture. Furthermore, for at least the second half of the 20th cen-tury, computers have been so ubiquitously interwoven into daily life in both work and leisure that it makes little sense to try to the-orise one overarching mechanism for how they “affect” a person’s employment.
Dow
nloaded from https://academ
ic.oup.com/cjres/article/13/1/77/5648036 by G
eorgia Institute of Technology user on 02 October 2020
82
Leigh et al.
However, researchers interested in specific technological niches such as robots cannot re-sort to this rationale, and robot-specific impact studies must be more carefully operationalised. A&R’s term, “Robot Exposure”, is an intuitive and useful name for the concept at stake here, reflecting a concrete, epidemiological notion of exposure. However, as discussed above, avail-able robot data do not necessarily provide ready analogues to epidemiological vectors.
Two approaches to measuring robot exposure have so far been used: Graetz and Michaels’ “robot density” and A&R’s aforementioned “robot exposure”. Both derive worker–robot contact measures by creating a ratio of robots to human labour in each industry. Both use the IFR’s robot stock estimates as the “robot” input. G&M’s robot density uses “millions of hours worked” as the labour input, while robot exposure uses “thousands of workers”.
In addition to underlying problems with robot data, both of these constructs, when op-erationalised empirically, employ question-able assumptions that threaten their construct validity. The first of these assumptions is that robots are uniformly diffused and employed, and the second is that their uses and impacts outside of the manufacturing sector are com-parable to those within the sector.
Not all robots are “created” equalEven if we accept that robot stock data are, on average, reasonable estimates of the number of robots in use each year, the more problematic assumption is that the number of robots in use is in fact the key determinant of other employment-related outcomes. Robots have a wide variety of specifications and are used in a wide variety of applications. For example, some perform light-weight repetitive tasks at high speeds, while others may manipulate, weld or cut large pieces of material more methodically. The number of possible combinations of relationships between robots, other automation equipment, workers and output is essentially limitless. Condensing
the complexity of the human–robot relation-ship to one simplified parameter is an out-growth of the main problem of the task model upon which this research is based: generalisa-tions that divide work—whether performed by humans or machines—into a few tractable categories break down at all but the most ab-stract and aggregate levels of analysis.
Another problematic abstraction arising from the “robot stock” variable is that the pri-mary mechanism for industrial robot diffusion, robot integration, is overlooked. Industrial ro-botic systems are planned, engineered, installed and often sold by specialised engineering firms called robotics systems integrators. Integration is a substantial endeavour: Leigh and Kraft (2017) show that in the USA, integrators at specialised automation engineering firms account for two-thirds of overall robotics-related employment.
Estimates for integration costs, however, are difficult to attain for several likely reasons. For one, integrators may not want to disclose costs publicly because they must routinely bid against other firms for new jobs. For another, the process of integration is highly variable and complex, preventing the establishment of standard pricing. Differing production pro-cesses, automation goals and factory cap-abilities ensure that engineering challenges presented to integrators remain novel.
Robotic hardware is not the sole deter-minant of the costs and consequences of ro-botic processes. An encouraging aspect of A&R’s analysis is that their results stand up well to controls for capital expenditures—both those from IT specifically and the US Bureau of Labor Statistics’ (BLS) account of general capital stocks—and Leigh and Kraft’s (2017) measure of local robot-related employment, suggesting that the purchase of robots is inde-pendent, at the industry level, from other capital spending. However, it is far from clear how in-tegrator costs are reported. Some of these costs are for software and computing (for example, machine vision), while some are for hardware
Dow
nloaded from https://academ
ic.oup.com/cjres/article/13/1/77/5648036 by G
eorgia Institute of Technology user on 02 October 2020
83
Robots, skill demand and manufacturing in USA
(for example, physical robots and end-of-arm-tools). Some of these expenses are simply for the hourly costs of engineering services.
The high variability in robotic automation processes—and thus diffusion and depreci-ation—confounds attempts to apply gener-alised robotic diffusion patterns over time to geographically specific places. A&R’s model, which infers sub-national robot exposure pat-terns from national-level data weighted by commuting zone industrial mixes, is particu-larly vulnerable to this limitation. The “robot exposure” measure assumes that the nature and effects of robot use in a large auto plant in Michigan is essentially the same as it is in a large auto plant in South Carolina, and that small and medium-sized auto suppliers use robots in a fashion similar to their larger counterparts across the country. This is problematic not only because of the variability in the integration pro-cess itself, but also because prior research sug-gests that both plant size and geography are important and fundamental factors in adoption of technology. For example, intra-metropolitan differences in locations of metalworking firms are highly predictive of whether they chose to adopt programmable automation technology (Harrison et al., 1996), and smaller firms are consistently found to be less likely to adopt ad-vanced technology (Gomez and Vargas, 2009; Kelley and Helper, 1999). Additionally, national culture strongly shapes attitudes towards tech-nology and technicians within firms, thereby influencing the ultimate performance and prod-uctivity of the technology (Gertler, 1995).
Impacts of robots used outside of manufacturingAs it is applied in A&R, the “robot exposure” measure includes manufacturing subsectors at the three-digit NAICS level, and construction/extraction, utilities and education/research sec-tors at the two-digit level. However, outside of manufacturing, robots have minimal presence and are unlikely to have the same “effects” on
workers as they do in manufacturing, where they have been systematically used for sev-eral decades. For example, in 2007, the IFR re-ported that 50 robots were used in the USA in the construction and extraction industry,3 while workers in the industry, according to EUKLEMS, were about 7.8 million. Thus, we ar-rive at a robot exposure figure of 0.0064 robots per thousand workers.
The assumption that this tiny number of robots meaningfully affects labour market out-comes is untenable. The error compounds when the exposure factor is applied to all local US la-bour markets. Fifty robots obviously cannot be distributed across 709 commuting zones; most will have no construction robots—and thus no exposure. Because construction employment is a locally traded industry and relatively constant as a percentage of employment across labour markets—whereas manufacturing varies sig-nificantly—the “effect” of these 50 robots na-tionwide will be disproportionately large in most labour markets, and disproportionately small in the one or several that actually have these robots. The same problem applies to the utility sector.
Moreover, the “education and research” sector should be excluded from the exposure measure for a different reason altogether, which is that educational robots do not fall within the same theoretical framework. Little, if any, robot-related displacement would be ex-pected in the sector. Educators increasingly use robots as instructional tools as the demand for robotics skills in the workplace rises. While a limited number of robots may be used in bio-medical research labs in place of technicians, technology researchers conduct research on the robots themselves, suggesting that increased numbers of robots in research would be driven by more researchers and teams engaged in this area.
To date, the most impactful and ubiquitous types of non-manufacturing robots are those used in warehouses and distribution centres.
Dow
nloaded from https://academ
ic.oup.com/cjres/article/13/1/77/5648036 by G
eorgia Institute of Technology user on 02 October 2020
84
Leigh et al.
However, these robots were not commer-cially available by the end of previous studies’ time series. Furthermore, their pattern of dif-fusion today is highly skewed. E-commerce giant Amazon bought the first-mover firm in warehouse robots, Kiva, for its exclusive use. Consequently, Amazon’s estimated 100,000 warehouse robots (Wingfield, 2017) are still not included in IFR statistics, since Amazon does not sell its robotic systems on the open market. Other warehouse robot makers are starting to emerge in the market and should eventually be part of IFR statistics, though the results will continue to under-represent warehouse robots until Amazon robots are incorporated.
Data and methods
We use two approaches to address the prob-lems with IFR robot stock data outlined above. The first approach modifies A&R’s robot ex-posure variable, confining both the construc-tion of the variable and the estimated impacts to the manufacturing industry. We call this the Modified Robot Exposure (MRE) variable. The second approach uses an alternative data source, labour market data, to create an indi-cator for robot exposure.
While our approaches may be compared on conceptual grounds to those in the previous studies discussed above, they are not replica-tions because our labour market data (labelled RTLMI and explained below) begins in 2010 and cannot support the investigation of prior time periods. Therefore, this article should be viewed primarily as a comparison of two new measurement constructs of robotics’ impacts.
Modified Robot ExposureMRE limits the robot stock-derived exposure variable to the manufacturing industry, thereby eliminating the outsized influence of sectors that have minimal robot use but significant employment. Otherwise, it works similarly to the exposure measure created by A&R, with
national-level industry concentrations of robots being applied at the local level. However, we use US Census-defined core-based statistical areas (CBSAs) instead of commuting zones as labour market boundaries. CBSAs include metropolitan and micropolitan statistical areas, but exclude counties that are not part of an urban cluster of 10,000 people.4 While com-muting zones are more representative of actual labour markets and include more members of the US workforce, we use CBSAs for two reasons. The first is that non-metropolitan and non-micropolitan counties are subject to sub-stantial suppression of employment data at the level of manufacturing subsectors, meaning that missing data would undermine accurate estimates for small counties. The second is that our labour market data are also biased towards urban areas (see subsequent section on Data Limitations), excluding non-metropolitan areas maintains relative consistency in the universes across independent and dependent variables.
Robotics Skill Demand IndexUsing labour market data allows us to adjust, conceptually, the mechanism whereby jobs are impacted. With skill demand, the theorised im-pact no longer stems directly from the robot. Rather, it comes from the skills required by the presence of a robot. This slight shift in where the causal burden is applied adds a new di-mension to existing robot-impact research. We call the resulting measure the Robotics Skill Demand Index (RSDI).
The input for the RSDI comes from a novel source called RTLMI. RTLMI is labour market data that are extracted from internet job post-ings on a continual basis. Of the several RTLMI vendors, we chose Burning Glass Technologies (BGT) for our study. Using proprietary al-gorithms, BGT collects online job postings on a daily basis, cleans the raw data and for-mats it into a structured data set. Although it has primarily been used by human resources departments and workforce and economic
Dow
nloaded from https://academ
ic.oup.com/cjres/article/13/1/77/5648036 by G
eorgia Institute of Technology user on 02 October 2020
85
Robots, skill demand and manufacturing in USA
development agencies, it has emerged as a useful tool for academic researchers. Recent RTLMI-based work analysed labour market skill demands (Deming and Kahn, 2017; Mason et al., 2016; Wardrip et al., 2017), the adoption of labour-saving technologies (Hershbein and Kahn, 2016), and job recruiting and searching activities (Banfi and Villena-Roldán, 2016; Modestino et al., 2016).
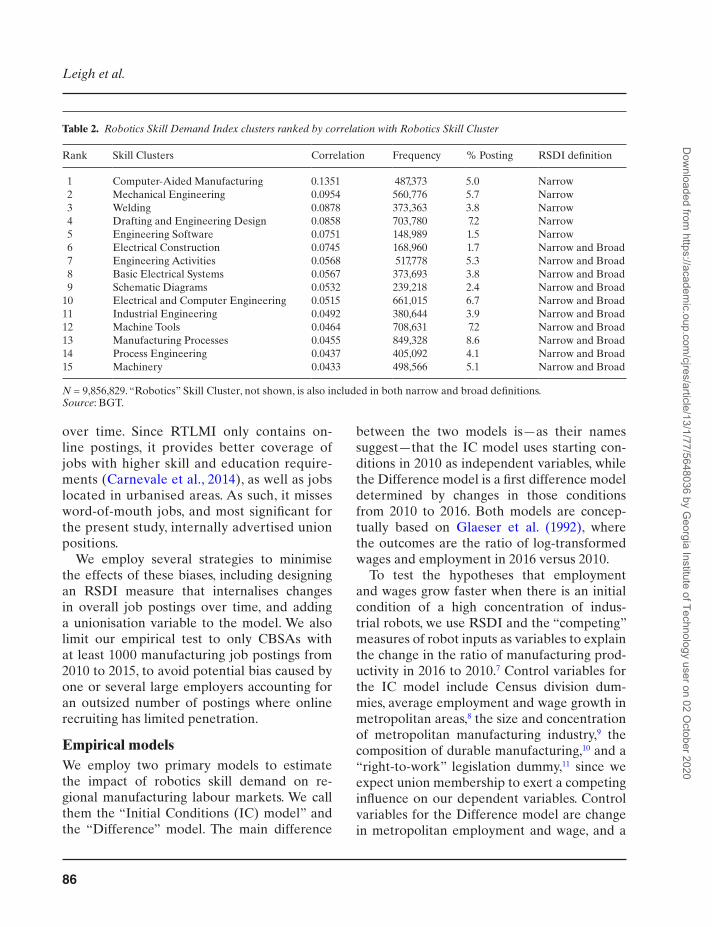
We utilise a variable created by BGT called “skill clusters” to derive our composite robot indicator. BGT defined these 559 skill clusters by subjecting the text of job ads to k-means cluster analysis and additional qualitative scru-tiny (B. Taska, Personal Communication). Each job ad is, in turn, associated with one or more skill clusters based on the text of the ad. Out of BGT’s 559 clusters, there is one specifically called “robotics”. Although the robotics skill cluster appears in 91,214 job ads in our data set, this frequency is insufficient for regression analysis. Thus, to achieve enough robot-related skill observations for the RSDI, we developed a composite measure of skill clusters related to and including robotics. Skill clusters were selected for the RSDI by calculating the mag-nitude of correlation between the robotics skill cluster and all other skill clusters in the data-base for job ads in the manufacturing industry. The RSDI comprised 15 skill clusters with the highest correlation coefficients (>0.04) (see Table 1).
The RSDI is further divided into “broad” and “narrow” definitions because the skills contained in the index are themselves general and not uniquely applicable to robots.5 The broad definition includes all 15 skill clusters and the robotics skill cluster (16 total clus-ters), while the narrow definition includes only the top five and the robotics skill cluster (six total clusters). Dividing the RSDI into these two versions enables us to gauge their relative performance in empirical tests, and thereby to assess whether the RSDI classification scheme is diluted by casting too wide of a net. In the
first model presented in the “Results” section, the broad definition is statistically significant, while the narrow is not (although its T-value is 1.4). This suggests that the construct sacrifices some fidelity capturing robotics work in ex-change for better statistical power. However, in the second model, only the narrow definition achieves statistical significance, indicating that some precision can be gained by zeroing in on robot-specific jobs. Either way, the RSDI con-struct unavoidably captures some jobs that are not directly related to robots.
The actual Robotics Skill Demand Index used in the regression analyses is calculated by dividing the number of job postings containing at least one skill cluster represented in Table 1 by the total number of manufacturing industry job postings within each CBSA in the US. Separate RSDIs are calculated for broad and narrow definitions.
The low correlations between the skill clus-ters (Table 2) are a methodological artefact. That is, since the k-means clustering process is used to establish unique groupings, high correl-ation coefficients are not expected. This is par-ticularly the case given the significant internal variation in the data set stemming from its 559 skill clusters and 9,856,829 total manufacturing job-posting observations.
Despite low statistical correlations, the skill clusters included in both the broad and narrow robot skill demand indices are qualitatively re-lated to industrial robot use and representative of advanced manufacturing in general.
Data limitationsAs we have emphasised, no existing data set is ideal for examining the impact of robotics. While RTLMI correlates over time with the US BLS Job Openings and Labor Turnover Survey (JOLTS),6 it contains inherent biases. RTLMI data are not derived from standard-ised or mandatory surveys, so they are subject to changes in posting strategies by employers
Dow
nloaded from https://academ
ic.oup.com/cjres/article/13/1/77/5648036 by G
eorgia Institute of Technology user on 02 October 2020
86
Leigh et al.
over time. Since RTLMI only contains on-line postings, it provides better coverage of jobs with higher skill and education require-ments (Carnevale et al., 2014), as well as jobs located in urbanised areas. As such, it misses word-of-mouth jobs, and most significant for the present study, internally advertised union positions.
We employ several strategies to minimise the effects of these biases, including designing an RSDI measure that internalises changes in overall job postings over time, and adding a unionisation variable to the model. We also limit our empirical test to only CBSAs with at least 1000 manufacturing job postings from 2010 to 2015, to avoid potential bias caused by one or several large employers accounting for an outsized number of postings where online recruiting has limited penetration.
Empirical modelsWe employ two primary models to estimate the impact of robotics skill demand on re-gional manufacturing labour markets. We call them the “Initial Conditions (IC) model” and the “Difference” model. The main difference
between the two models is—as their names suggest—that the IC model uses starting con-ditions in 2010 as independent variables, while the Difference model is a first difference model determined by changes in those conditions from 2010 to 2016. Both models are concep-tually based on Glaeser et al. (1992), where the outcomes are the ratio of log-transformed wages and employment in 2016 versus 2010.
To test the hypotheses that employment and wages grow faster when there is an initial condition of a high concentration of indus-trial robots, we use RSDI and the “competing” measures of robot inputs as variables to explain the change in the ratio of manufacturing prod-uctivity in 2016 to 2010.7 Control variables for the IC model include Census division dum-mies, average employment and wage growth in metropolitan areas,8 the size and concentration of metropolitan manufacturing industry,9 the composition of durable manufacturing,10 and a “right-to-work” legislation dummy,11 since we expect union membership to exert a competing influence on our dependent variables. Control variables for the Difference model are change in metropolitan employment and wage, and a
Table 2. Robotics Skill Demand Index clusters ranked by correlation with Robotics Skill Cluster
Rank Skill Clusters Correlation Frequency % Posting RSDI definition
1 Computer-Aided Manufacturing 0.1351 487,373 5.0 Narrow2 Mechanical Engineering 0.0954 560,776 5.7 Narrow3 Welding 0.0878 373,363 3.8 Narrow4 Drafting and Engineering Design 0.0858 703,780 7.2 Narrow5 Engineering Software 0.0751 148,989 1.5 Narrow6 Electrical Construction 0.0745 168,960 1.7 Narrow and Broad7 Engineering Activities 0.0568 517,778 5.3 Narrow and Broad8 Basic Electrical Systems 0.0567 373,693 3.8 Narrow and Broad9 Schematic Diagrams 0.0532 239,218 2.4 Narrow and Broad
10 Electrical and Computer Engineering 0.0515 661,015 6.7 Narrow and Broad11 Industrial Engineering 0.0492 380,644 3.9 Narrow and Broad12 Machine Tools 0.0464 708,631 7.2 Narrow and Broad13 Manufacturing Processes 0.0455 849,328 8.6 Narrow and Broad14 Process Engineering 0.0437 405,092 4.1 Narrow and Broad15 Machinery 0.0433 498,566 5.1 Narrow and Broad
N = 9,856,829. “Robotics” Skill Cluster, not shown, is also included in both narrow and broad definitions.Source: BGT.
Dow
nloaded from https://academ
ic.oup.com/cjres/article/13/1/77/5648036 by G
eorgia Institute of Technology user on 02 October 2020
87
Robots, skill demand and manufacturing in USA
dummy representing change in right-to-work status. The Leigh and Kraft’s (2017) local robot industry explanatory variable is not included in the Difference model because it was only ob-served for a single time period.
Further elaboration on these models including equations, assumptions and limita-tions is included in the “Empirical Models” section of Supplementary Appendix.
Geography of robotics skill demandThe geographic distribution of robotics de-mand defined by RSDI corresponds broadly with other indicators of robot penetration. Figures 1a and b show that robotics job demand is concentrated on the coasts and the Midwest region stretching south along the Interstate 75 corridor.
Higher numbers of robotics job demand are on the coasts, but the higher concentrations are in the interior. This greater intensity of robot skill demand in the Midwest and Southeast regions reflects the skill needs of the more manufacturing-centric labour markets in these areas.
Results
We display two main sets of results: em-ployment outcomes from both the IC and the “Difference” models. Only the models with employment outcomes are shown be-cause none of the robot indicators register as statistically significant predictors of wage outcomes.
While the initial sample of metro areas in-cludes 356 CBSAs based on the criterion of having at least 1000 job listings over the ana-lysis period of the labour market data, four additional outlying CBSAs were removed from the analysis because they were detected as un-usual and influential cases based on several cri-teria, including Leverage (observations with extreme predictor values) and Cook’s Distance (influence of a case on the predicted mean),
and Studentized residual values (difference be-tween predicted and observed).
These outliers are all small metro areas, with relatively undiversified economies and less rep-resentation in RTLMI. Factors such as a lack of industrial diversity, as well as plant openings or closings, will have outsized effects on input metrics for these communities. In general, our models were more accurate in predicting out-comes for large metros than for small metros.
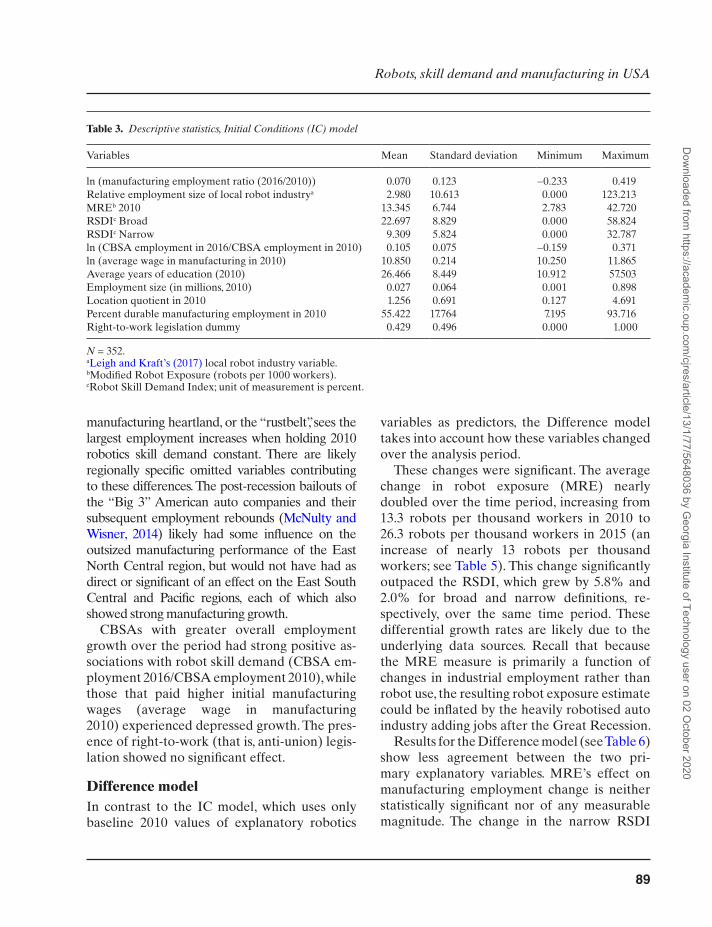
IC modelFor this sample of 352 CBSAs, the average MRE value is slightly over 13 robots per thou-sand workers (Table 3). The average metro-wide value for the broad Robotics Skill Demand Index (RSDI) is 22.7% of job postings, while the more restrictive narrow RSDI is 9.3% of postings. With an average location quotient of 1.26, and an average percentage of employment in durable manufacturing of 55.4% in 2010, this is a relatively manufacturing intensive group of CBSAs (by design, as previously explained).
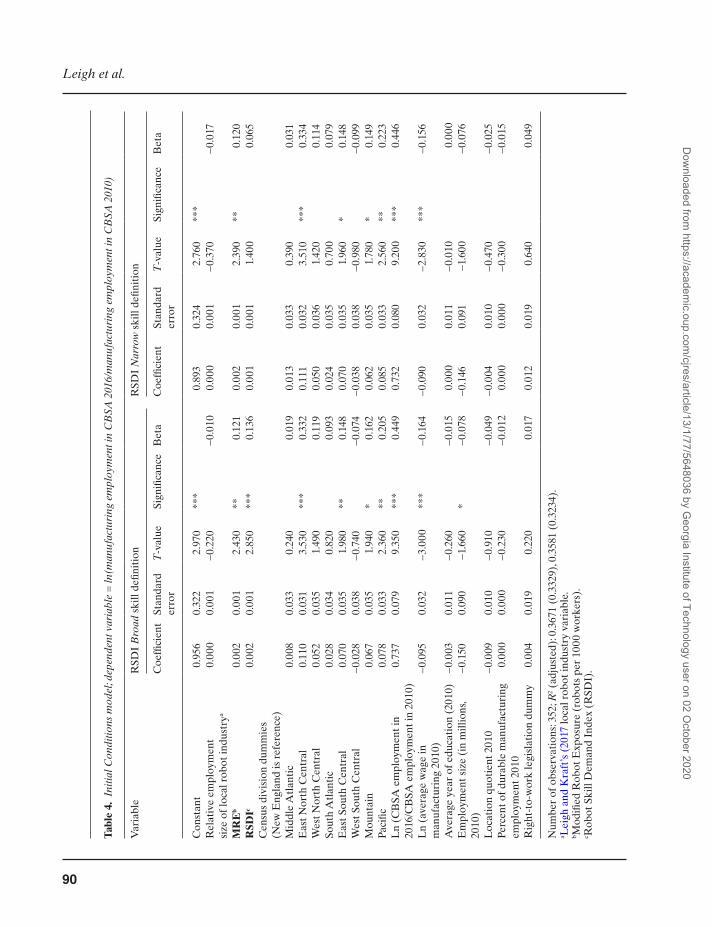
For the IC model, the MRE variable and the RSDI both have significant, positive effects on employment (see Table 4). While the narrow RSDI has a slightly stronger relationship to the manufacturing employment ratio than does MRE, the broad RSDI has no discernible re-lationship. Because the dependent variable is in natural log form, a unit change in either the narrow RSDI or MRE can be interpreted to predict a 0.2% increase in manufacturing em-ployment ratio. In other words, a CBSA with either a one percent above average RSDI, or one more robot per thousand workers than average in 2010, can expect approximately 0.2% more manufacturing employment growth than average by 2016 (with the understanding that growth is defined relative to size in 2010).
There is also a notable geographic difference in the regional manufacturing employment response to increased robotics skill demand in 2010. The East North Central census division, which is largely con-tiguous with what is thought of as the historical US
Dow
nloaded from https://academ
ic.oup.com/cjres/article/13/1/77/5648036 by G
eorgia Institute of Technology user on 02 October 2020

88
Leigh et al.
Figure 1. (a) Robotics skill demand (narrow definition) in CBSAs, 2015 (Magnitude). (b) Robotics skill demand (narrow definition) in CBSAs, 2015 (Concentration).Source: Authors’ calculations of BGT.
Dow
nloaded from https://academ
ic.oup.com/cjres/article/13/1/77/5648036 by G
eorgia Institute of Technology user on 02 October 2020
89
Robots, skill demand and manufacturing in USA
manufacturing heartland, or the “rustbelt”, sees the largest employment increases when holding 2010 robotics skill demand constant. There are likely regionally specific omitted variables contributing to these differences. The post-recession bailouts of the “Big 3” American auto companies and their subsequent employment rebounds (McNulty and Wisner, 2014) likely had some influence on the outsized manufacturing performance of the East North Central region, but would not have had as direct or significant of an effect on the East South Central and Pacific regions, each of which also showed strong manufacturing growth.
CBSAs with greater overall employment growth over the period had strong positive as-sociations with robot skill demand (CBSA em-ployment 2016/CBSA employment 2010), while those that paid higher initial manufacturing wages (average wage in manufacturing 2010) experienced depressed growth. The pres-ence of right-to-work (that is, anti-union) legis-lation showed no significant effect.
Difference modelIn contrast to the IC model, which uses only baseline 2010 values of explanatory robotics
variables as predictors, the Difference model takes into account how these variables changed over the analysis period.
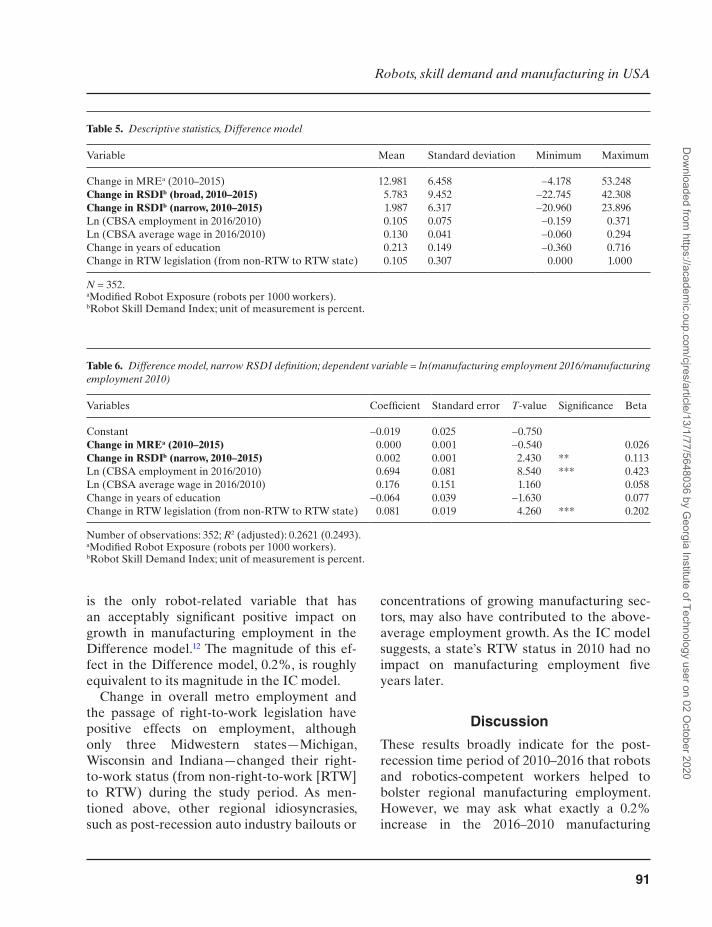
These changes were significant. The average change in robot exposure (MRE) nearly doubled over the time period, increasing from 13.3 robots per thousand workers in 2010 to 26.3 robots per thousand workers in 2015 (an increase of nearly 13 robots per thousand workers; see Table 5). This change significantly outpaced the RSDI, which grew by 5.8% and 2.0% for broad and narrow definitions, re-spectively, over the same time period. These differential growth rates are likely due to the underlying data sources. Recall that because the MRE measure is primarily a function of changes in industrial employment rather than robot use, the resulting robot exposure estimate could be inflated by the heavily robotised auto industry adding jobs after the Great Recession.
Results for the Difference model (see Table 6) show less agreement between the two pri-mary explanatory variables. MRE’s effect on manufacturing employment change is neither statistically significant nor of any measurable magnitude. The change in the narrow RSDI
Table 3. Descriptive statistics, Initial Conditions (IC) model
Variables Mean Standard deviation Minimum Maximum
ln (manufacturing employment ratio (2016/2010)) 0.070 0.123 −0.233 0.419Relative employment size of local robot industrya 2.980 10.613 0.000 123.213MREb 2010 13.345 6.744 2.783 42.720RSDIc Broad 22.697 8.829 0.000 58.824RSDIc Narrow 9.309 5.824 0.000 32.787ln (CBSA employment in 2016/CBSA employment in 2010) 0.105 0.075 −0.159 0.371ln (average wage in manufacturing in 2010) 10.850 0.214 10.250 11.865Average years of education (2010) 26.466 8.449 10.912 57.503Employment size (in millions, 2010) 0.027 0.064 0.001 0.898Location quotient in 2010 1.256 0.691 0.127 4.691Percent durable manufacturing employment in 2010 55.422 17.764 7.195 93.716Right-to-work legislation dummy 0.429 0.496 0.000 1.000
N = 352.aLeigh and Kraft’s (2017) local robot industry variable.bModified Robot Exposure (robots per 1000 workers).cRobot Skill Demand Index; unit of measurement is percent.
Dow
nloaded from https://academ
ic.oup.com/cjres/article/13/1/77/5648036 by G
eorgia Institute of Technology user on 02 October 2020
90
Leigh et al.
Tabl
e 4.
Ini
tial C
ondi
tions
mod
el; d
epen
dent
var
iabl
e =
ln(m
anuf
actu
ring
em
ploy
men
t in
CB
SA 2
016/
man
ufac
turi
ng e
mpl
oym
ent i
n C
BSA
201
0)
Var
iabl
eR
SDI
Bro
ad s
kill
defin
itio
nR
SDI
Nar
row
ski
ll de
finit
ion
Coe
ffici
ent
Stan
dard
er
ror
T-v
alue
Sign
ifica
nce
Bet
aC
oeffi
cien
tSt
anda
rd
erro
rT
-val
ueSi
gnifi
canc
eB
eta
Con
stan
t0.
956
0.32
22.
970
***
0.
893
0.32
42.
760
***
R
elat
ive
empl
oym
ent
size
of l
ocal
rob
ot in
dust
rya
0.00
00.
001
−0.
220
−
0.01
00.
000
0.00
1−
0.37
0
−0.
017
MR
Eb
0.00
20.
001
2.43
0**
0.12
10.
002
0.00
12.
390
**0.
120
RSD
Ic0.
002
0.00
12.
850
***
0.13
60.
001
0.00
11.
400
0.
065
Cen
sus
divi
sion
dum
mie
s
(New
Eng
land
is r
efer
ence
)
Mid
dle
Atl
anti
c0.
008
0.03
30.
240
0.
019
0.01
30.
033
0.39
0
0.03
1E
ast N
orth
Cen
tral
0.11
00.
031
3.53
0**
*0.
332
0.11
10.
032
3.51
0**
*0.
334
Wes
t Nor
th C
entr
al0.
052
0.03
51.
490
0.
119
0.05
00.
036
1.42
0
0.11
4So
uth
Atl
anti
c0.
028
0.03
40.
820
0.
093
0.02
40.
035
0.70
0
0.07
9E
ast S
outh
Cen
tral
0.07
00.
035
1.98
0**
0.14
80.
070
0.03
51.
960
*0.
148
Wes
t Sou
th C
entr
al−
0.02
80.
038
−0.
740
−
0.07
4−
0.03
80.
038
−0.
980
−
0.09
9M
ount
ain
0.06
70.
035
1.94
0*
0.16
20.
062
0.03
51.
780
*0.
149
Paci
fic0.
078
0.03
32.
360
**0.
205
0.08
50.
033
2.56
0**
0.22
3L
n (C
BSA
em
ploy
men
t in
20
16/C
BSA
em
ploy
men
t in
2010
)0.
737
0.07
99.
350
***
0.44
90.
732
0.08
09.
200
***
0.44
6
Ln
(ave
rage
wag
e in
m
anuf
actu
ring
201
0)−
0.09
50.
032
−3.
000
***
−0.
164
−0.
090
0.03
2−
2.83
0**
*−
0.15
6
Ave
rage
yea
r of
edu
cati
on (
2010
)−
0.00
30.
011
−0.
260
−
0.01
50.
000
0.01
1−
0.01
0
0.00
0E
mpl
oym
ent s
ize
(in
mill
ions
, 20
10)
−0.
150
0.09
0−
1.66
0*
−0.
078
−0.
146
0.09
1−
1.60
0
−0.
076
Loc
atio
n qu
otie
nt 2
010
−0.
009
0.01
0−
0.91
0
−0.
049
−0.
004
0.01
0−
0.47
0
−0.
025
Perc
ent o
f dur
able
man
ufac
turi
ng
empl
oym
ent 2
010
0.00
00.
000
−0.
230
−
0.01
20.
000
0.00
0−
0.30
0
−0.
015
Rig
ht-t
o-w
ork
legi
slat
ion
dum
my
0.00
40.
019
0.22
0
0.01
70.
012
0.01
90.
640
0.
049
Num
ber
of o
bser
vati
ons:
352;
R2 (
adju
sted
): 0.
3671
(0.
3329
), 0.
3581
(0.
3234
).a L
eigh
and
Kra
ft’s
(20
17 lo
cal r
obot
indu
stry
var
iabl
e.b M
odifi
ed R
obot
Exp
osur
e (r
obot
s pe
r 10
00 w
orke
rs).
c Rob
ot S
kill
Dem
and
Inde
x (R
SDI)
.
Dow
nloaded from https://academ
ic.oup.com/cjres/article/13/1/77/5648036 by G
eorgia Institute of Technology user on 02 October 2020
91
Robots, skill demand and manufacturing in USA
is the only robot-related variable that has an acceptably significant positive impact on growth in manufacturing employment in the Difference model.12 The magnitude of this ef-fect in the Difference model, 0.2%, is roughly equivalent to its magnitude in the IC model.
Change in overall metro employment and the passage of right-to-work legislation have positive effects on employment, although only three Midwestern states—Michigan, Wisconsin and Indiana—changed their right-to-work status (from non-right-to-work [RTW] to RTW) during the study period. As men-tioned above, other regional idiosyncrasies, such as post-recession auto industry bailouts or
concentrations of growing manufacturing sec-tors, may also have contributed to the above-average employment growth. As the IC model suggests, a state’s RTW status in 2010 had no impact on manufacturing employment five years later.
Discussion
These results broadly indicate for the post-recession time period of 2010–2016 that robots and robotics-competent workers helped to bolster regional manufacturing employment. However, we may ask what exactly a 0.2% increase in the 2016–2010 manufacturing
Table 5. Descriptive statistics, Difference model
Variable Mean Standard deviation Minimum Maximum
Change in MREa (2010–2015) 12.981 6.458 −4.178 53.248Change in RSDIb (broad, 2010–2015) 5.783 9.452 −22.745 42.308Change in RSDIb (narrow, 2010–2015) 1.987 6.317 −20.960 23.896Ln (CBSA employment in 2016/2010) 0.105 0.075 −0.159 0.371Ln (CBSA average wage in 2016/2010) 0.130 0.041 −0.060 0.294Change in years of education 0.213 0.149 −0.360 0.716Change in RTW legislation (from non-RTW to RTW state) 0.105 0.307 0.000 1.000
N = 352.aModified Robot Exposure (robots per 1000 workers).bRobot Skill Demand Index; unit of measurement is percent.
Table 6. Difference model, narrow RSDI definition; dependent variable = ln(manufacturing employment 2016/manufacturing employment 2010)
Variables Coefficient Standard error T-value Significance Beta
Constant −0.019 0.025 −0.750 Change in MREa (2010–2015) 0.000 0.001 −0.540 0.026Change in RSDIb (narrow, 2010–2015) 0.002 0.001 2.430 ** 0.113Ln (CBSA employment in 2016/2010) 0.694 0.081 8.540 *** 0.423Ln (CBSA average wage in 2016/2010) 0.176 0.151 1.160 0.058Change in years of education −0.064 0.039 −1.630 0.077Change in RTW legislation (from non-RTW to RTW state) 0.081 0.019 4.260 *** 0.202
Number of observations: 352; R2 (adjusted): 0.2621 (0.2493).aModified Robot Exposure (robots per 1000 workers).bRobot Skill Demand Index; unit of measurement is percent.
Dow
nloaded from https://academ
ic.oup.com/cjres/article/13/1/77/5648036 by G
eorgia Institute of Technology user on 02 October 2020
92
Leigh et al.
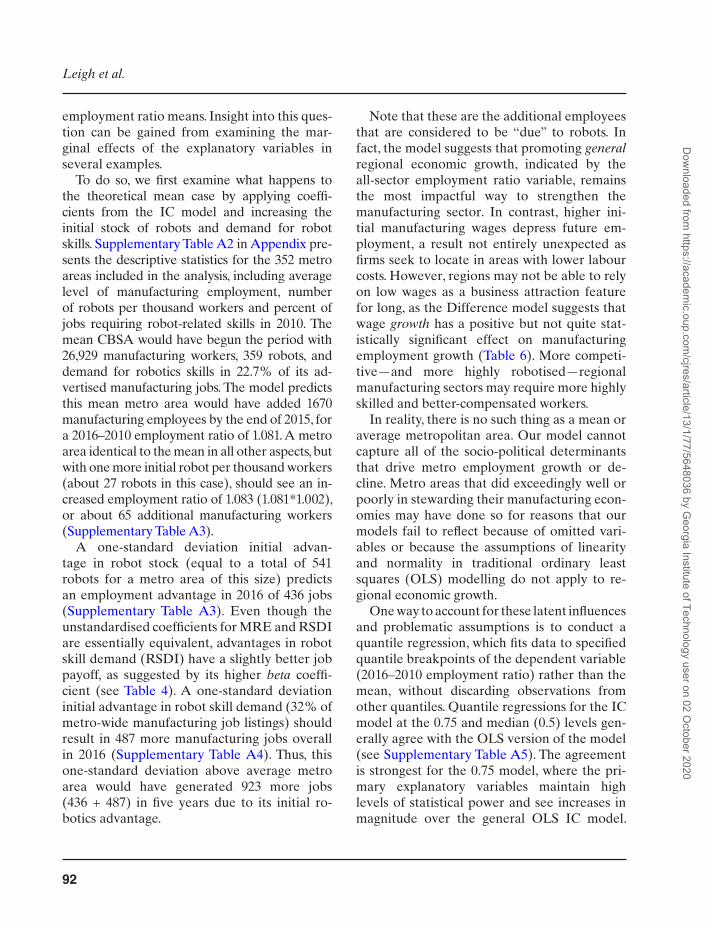
employment ratio means. Insight into this ques-tion can be gained from examining the mar-ginal effects of the explanatory variables in several examples.
To do so, we first examine what happens to the theoretical mean case by applying coeffi-cients from the IC model and increasing the initial stock of robots and demand for robot skills. Supplementary Table A2 in Appendix pre-sents the descriptive statistics for the 352 metro areas included in the analysis, including average level of manufacturing employment, number of robots per thousand workers and percent of jobs requiring robot-related skills in 2010. The mean CBSA would have begun the period with 26,929 manufacturing workers, 359 robots, and demand for robotics skills in 22.7% of its ad-vertised manufacturing jobs. The model predicts this mean metro area would have added 1670 manufacturing employees by the end of 2015, for a 2016–2010 employment ratio of 1.081. A metro area identical to the mean in all other aspects, but with one more initial robot per thousand workers (about 27 robots in this case), should see an in-creased employment ratio of 1.083 (1.081*1.002), or about 65 additional manufacturing workers (Supplementary Table A3).
A one-standard deviation initial advan-tage in robot stock (equal to a total of 541 robots for a metro area of this size) predicts an employment advantage in 2016 of 436 jobs (Supplementary Table A3). Even though the unstandardised coefficients for MRE and RSDI are essentially equivalent, advantages in robot skill demand (RSDI) have a slightly better job payoff, as suggested by its higher beta coeffi-cient (see Table 4). A one-standard deviation initial advantage in robot skill demand (32% of metro-wide manufacturing job listings) should result in 487 more manufacturing jobs overall in 2016 (Supplementary Table A4). Thus, this one-standard deviation above average metro area would have generated 923 more jobs (436 + 487) in five years due to its initial ro-botics advantage.
Note that these are the additional employees that are considered to be “due” to robots. In fact, the model suggests that promoting general regional economic growth, indicated by the all-sector employment ratio variable, remains the most impactful way to strengthen the manufacturing sector. In contrast, higher ini-tial manufacturing wages depress future em-ployment, a result not entirely unexpected as firms seek to locate in areas with lower labour costs. However, regions may not be able to rely on low wages as a business attraction feature for long, as the Difference model suggests that wage growth has a positive but not quite stat-istically significant effect on manufacturing employment growth (Table 6). More competi-tive—and more highly robotised—regional manufacturing sectors may require more highly skilled and better-compensated workers.
In reality, there is no such thing as a mean or average metropolitan area. Our model cannot capture all of the socio-political determinants that drive metro employment growth or de-cline. Metro areas that did exceedingly well or poorly in stewarding their manufacturing econ-omies may have done so for reasons that our models fail to reflect because of omitted vari-ables or because the assumptions of linearity and normality in traditional ordinary least squares (OLS) modelling do not apply to re-gional economic growth.
One way to account for these latent influences and problematic assumptions is to conduct a quantile regression, which fits data to specified quantile breakpoints of the dependent variable (2016–2010 employment ratio) rather than the mean, without discarding observations from other quantiles. Quantile regressions for the IC model at the 0.75 and median (0.5) levels gen-erally agree with the OLS version of the model (see Supplementary Table A5). The agreement is strongest for the 0.75 model, where the pri-mary explanatory variables maintain high levels of statistical power and see increases in magnitude over the general OLS IC model.
Dow
nloaded from https://academ
ic.oup.com/cjres/article/13/1/77/5648036 by G
eorgia Institute of Technology user on 02 October 2020
93
Robots, skill demand and manufacturing in USA
However, MRE does not appear to be an influ-ential factor for those in the bottom quarter of manufacturing growth. Instead, RSDI (broad) maintains strong or moderate statistical power (>10%) for all quantiles. This difference across categories and the low correlations between the two indicators (see Supplementary Table A6 in Appendix) suggests that they are indeed measuring different aspects of robotics use.
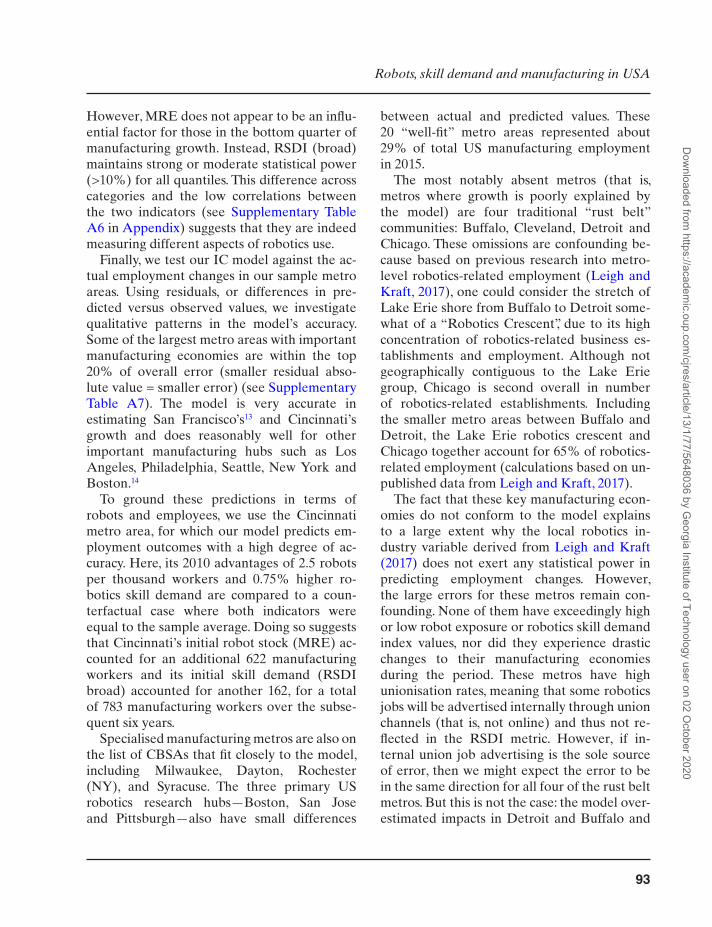
Finally, we test our IC model against the ac-tual employment changes in our sample metro areas. Using residuals, or differences in pre-dicted versus observed values, we investigate qualitative patterns in the model’s accuracy. Some of the largest metro areas with important manufacturing economies are within the top 20% of overall error (smaller residual abso-lute value = smaller error) (see Supplementary Table A7). The model is very accurate in estimating San Francisco’s13 and Cincinnati’s growth and does reasonably well for other important manufacturing hubs such as Los Angeles, Philadelphia, Seattle, New York and Boston.14
To ground these predictions in terms of robots and employees, we use the Cincinnati metro area, for which our model predicts em-ployment outcomes with a high degree of ac-curacy. Here, its 2010 advantages of 2.5 robots per thousand workers and 0.75% higher ro-botics skill demand are compared to a coun-terfactual case where both indicators were equal to the sample average. Doing so suggests that Cincinnati’s initial robot stock (MRE) ac-counted for an additional 622 manufacturing workers and its initial skill demand (RSDI broad) accounted for another 162, for a total of 783 manufacturing workers over the subse-quent six years.
Specialised manufacturing metros are also on the list of CBSAs that fit closely to the model, including Milwaukee, Dayton, Rochester (NY), and Syracuse. The three primary US robotics research hubs—Boston, San Jose and Pittsburgh—also have small differences
between actual and predicted values. These 20 “well-fit” metro areas represented about 29% of total US manufacturing employment in 2015.
The most notably absent metros (that is, metros where growth is poorly explained by the model) are four traditional “rust belt” communities: Buffalo, Cleveland, Detroit and Chicago. These omissions are confounding be-cause based on previous research into metro-level robotics-related employment (Leigh and Kraft, 2017), one could consider the stretch of Lake Erie shore from Buffalo to Detroit some-what of a “Robotics Crescent”, due to its high concentration of robotics-related business es-tablishments and employment. Although not geographically contiguous to the Lake Erie group, Chicago is second overall in number of robotics-related establishments. Including the smaller metro areas between Buffalo and Detroit, the Lake Erie robotics crescent and Chicago together account for 65% of robotics-related employment (calculations based on un-published data from Leigh and Kraft, 2017).
The fact that these key manufacturing econ-omies do not conform to the model explains to a large extent why the local robotics in-dustry variable derived from Leigh and Kraft (2017) does not exert any statistical power in predicting employment changes. However, the large errors for these metros remain con-founding. None of them have exceedingly high or low robot exposure or robotics skill demand index values, nor did they experience drastic changes to their manufacturing economies during the period. These metros have high unionisation rates, meaning that some robotics jobs will be advertised internally through union channels (that is, not online) and thus not re-flected in the RSDI metric. However, if in-ternal union job advertising is the sole source of error, then we might expect the error to be in the same direction for all four of the rust belt metros. But this is not the case: the model over-estimated impacts in Detroit and Buffalo and
Dow
nloaded from https://academ
ic.oup.com/cjres/article/13/1/77/5648036 by G
eorgia Institute of Technology user on 02 October 2020
94
Leigh et al.
underestimated Cleveland and Chicago. Like all statistical models, this one likely omits one or more key variables. The resulting discrepan-cies suggest that there is a need for geograph-ically informed qualitative research into the economic impact of robotics.
Even though the analyses presented in this article fall into the “robots-as-status-quo” side of the debate, they should not be viewed as contradictory to or irreconcilable with other analyses, such as Acemoglu and Restrepo (2017) and Frey and Osborne (2013). Notwithstanding the questionable assumptions in prior studies discussed here, it may be the case that robot adoption in the decade-and-a-half prior to the Great Recession did have a displacement ef-fect, while at the same time better equipping those individual manufacturers and industrial ecosystems that more aggressively robotised to thrive during the recovery. This interpretation is consistent with other research that finds that regionally embedded innovative capacity pre-vents “lock-in” and aids in resilience after nega-tive shocks (Christopherson et al., 2014).
However, our research also strongly suggests that technology adoption may be a necessary but far from sufficient criterion for resilience, and that changing firm routines, industrial policy, corporate structures and labour rela-tions are also important. A single-minded focus on technology upgrading is likely not helpful to firm or regional competitiveness. As has been apparent from previous rounds of “creative de-struction”, overall growth measured at any scale tends to leave behind vulnerable workers with significant social costs.
Conclusion
This article’s unequivocal support for robots as supporting employment growth places it into the “robots-as-status-quo” category because it supports the traditional theory that tech-nology leads to net job growth. Its other contri-bution has been to critique and improve upon
previously tested constructs for robot exposure. Three new constructs for measuring robot ex-posure were tested, and two of them—a robot stock variable modified from Acemoglu and Restrepo (2017) and a Robot Skill Demand Index derived for online job postings—are as-sociated with employment gains since 2010. Estimates of these gains can be quantified to the effect of an approximate 900 manufacturing employee gain over six years for a one-standard deviation above average level of robot use and demand for robotics-competent workers in manufacturing.
While these metrics are measuring different aspects of robot utilisation, they fall short of both a complete accounting of robots and a rigorously valid operationalisation of the con-cept of robot exposure. Until better robotics data exist, the economic impact of robots will have to be estimated via inference and triangu-lation, as well as more rigorously informed by how robots are used and diffused. Because of the limited diffusion of commercial robotics and other smart machines, geography must be closely considered before making generalisa-tions. Regional economies in the USA demon-strate significant variation in their response to technological change.
While econometric approaches have domin-ated the “robots and jobs” debate so far, it is important to remember the value of qualitative and ethnographic approaches. Although they do not yield satisfying universal ratios relating robots to jobs, such approaches are able to con-cretise the artefacts of workplace technology that large data sets render abstract. Qualitative and ethnographic methods can offer insights into how local and shop cultures, labour rela-tions, and gender and ethnicity shape robot dif-fusion and use. They can consider interactions between complex sets of variables that may lead to layoffs and wage stagnation, without needing to reductively operationalise them for statistical models. Importantly, qualitative in-quiry can elicit workers’ perspectives on robot
Dow
nloaded from https://academ
ic.oup.com/cjres/article/13/1/77/5648036 by G
eorgia Institute of Technology user on 02 October 2020

95
Robots, skill demand and manufacturing in USA
adoption, which is an essential input into the current debate if the benefits of robotics diffu-sion are to be shared broadly.
This article contributes to efforts to iden-tify the economic impacts of robots by (i) re-stricting analysis to the manufacturing sector, which is the only sector where robots are his-torically and systematically used; (ii) triangu-lating robot stocks and skill demand to derive a more holistic measure of robotics influence; and (iii) qualitatively disaggregating impacts according to geography. Data limitations con-fine the analysis to a unique six-year period during which the USA recovered from a his-toric recession. Thus, we cannot answer at this point in time whether the findings are unique to this period or are indicators of a long-term positive relationship between employment and robotics. Perhaps as robotics become both more user-friendly and “intelligent”, leading to easier integration and maintenance, another wave of displacement or upskilling will occur. This possibility underscores the imperative that advanced economies reduce labour pre-cariousness through truly effective policies and programs for retraining and reskilling workers when upskilling is not possible. In conclusion, we observe that there is a clear need for more research, data and theory to answer critical questions about the future of work and all of the ensuing implications of that future for local and regional economies and society.
Supplementary materialSupplementary data are available at Cambridge Journal of Regions, Economy and Society online.
Endnotes
1 The Occupational Information Network (O*NET) taxonomy is based on the SOC taxonomy and con-tains two expanded occupations that identify robot-related work: robotics engineers (17–2199.08) and robotics technicians (17–3024.01). However, neither
the US Census nor the Bureau of Labor Statistics (BLS) collects data at this level of disaggregation.2 We note that Graetz and Michaels (2018) find no meaningful impacts on their results from the appli-cation of different rates of depreciation to baseline 1993 levels of robot stocks.3 There are only 20 robots officially specified as being used in this industry, but if we distribute the remaining “unspecified” robots among the various industries at levels proportional to the distribution of “specified” robots, as A&R do, there should be roughly 30 more in this category.4 We use the terms “metro” and “metro area” inter-changeably with CBSA, even though CBSAs include “micro” areas (those with urban clusters of at be-tween 10,000 and 50,000 residents). Since for ana-lytical purposes we limit observations to those with a minimum level of job postings, we are effectively only considering metropolitan areas.5 For example, welding, a cluster highly associated with robotics, is often performed manually (that is, without the aid of a robot). But welding is also one of the most highly robotised industrial applications (International Federation of Robotics, 2017), and based on ongoing qualitative research by the au-thors, workers who operate welding robots generally must also be skilled welders.6 Although they are not exactly comparable, JOLTS is the public time series that most closely resembles BGT. From January 2010 to January 2017, the two time series correlate closely, with a coefficient of 0.89 (B. Taska, Personal Communication).7 From Bureau of Economic Analysis.8 From US Bureau of Labor Statistics Quarterly Census of Employment and Wages (QCEW).9 From QCEW.10 From QCEW.11 Right-to-work (RTW) laws present barriers to union organising as part of a “business-friendly” strategy. With the exception of Kentucky’s county-specific laws, they are passed on a statewide basis. Since some metropolitan areas straddle more than one state, the core city was used to designate whether the CBSA was RTW or not during any part of the time frame, al-though it is acknowledged that statewide RTW status may be a factor in intra-regional competition. RTW
Dow
nloaded from https://academ
ic.oup.com/cjres/article/13/1/77/5648036 by G
eorgia Institute of Technology user on 02 October 2020

96
Leigh et al.
status was derived from Peck (2016) and the National Conference of State Legislatures (2017) Right-to-Work Resource webpage.12 The broad RSDI, not shown, is significant at the 0.1 level, but has a nearly negligible coefficient of 0.0010072.13 We use central city names to designate metro areas. For example, “San Francisco” represents the entire San Francisco–Oakland–Hayward, CA statistical area.14 Boston did not make the “top 20%” list (Supplementary Table A6) but would be the next metro in line if the list were expanded.
Acknowledgements
This research was supported by National Science Foundation Award No. 1637737, NRI: Workers, Firms and Industries in Robotic Regions. We thank Professor Bill Drummond for his helpful comments and sugges-tions and Sian Llewellyn for her research assistance.
References
Acemoglu, D. and Autor, D. (2011) Skills, tasks, and technologies: implications for employment and earnings. In D. Card and O. Ashenfelter (eds.) Handbook of Labour Economics, vol. 4, pp. 1043–1171. New York: Elsevier.
Acemoglu, D. and Restrepo, P. (2017) Robots and Jobs: Evidence from US Labour Markets. Working Paper. Cambridge, MA: National Bureau of Economic Research.
Adler, P. S. (1992) Introduction. In P. S. Adler (ed.) Technology and the Future of Work. Oxford: Oxford University Press.
Autor, D. H. and Dorn, D. (2013) The growth of low-skill service jobs and the polarization of the US labour market, The American Economic Review, 103: 1553–1597.
Autor, D. H., Levy, F. and Murnane, R. J. (2003) The skill content of recent technological change: an empirical exploration. The Quarterly Journal of Economics, 118: 1279–1333.
Banfi, S. and Villena-Roldán, B. (2019) Do high-wage jobs attract more applicants? Directed search evi-dence from the online labor market. Journal of Labor Economics, 37: 715–746.
Braverman, H. (1998) Labour and Monopoly Capital: The Degradation of Work in the Twentieth Century. New York: NYU Press.
Brynjolfsson, E. and McAfee, A. (2014) The Second Machine Age: Work, Progress, and Prosperity in a Time of Brilliant Technologies. New York: W. W. Norton & Company.
Cappelli, P. (2012) Why Good People Can’t Get Jobs: The Skills Gap and What Companies Can Do About It. Philadelphia: Wharton Digital Press.
Cappelli, P. (2014) Skill Gaps, Skill Shortages and Skill Mismatches: Evidence for the US. Cambridge, MA: National Bureau of Economic Research.
Carnevale, A. P., Jayasundera, T. and Repnikov, D. (2014) Understanding Online Job Ads Data. Technical Report (April). Washington, DC: Georgetown University, Center on Education and the Workforce.
Christopherson, S., Martin, R., Sunley, P. and Tyler, P. (2014) Reindustrialising regions: rebuilding the manufacturing economy?, Cambridge Journal of Regions, Economy and Society, 7: 351–358.
David, H., Katz, L. F. and Kearney, M. S. (2006) The polarization of the US labor market. American economic review, 96: 189–194.
Deming, D. and Kahn, L. B. (2018) Skill require-ments across firms and labor markets: Evidence from job postings for professionals. Journal of Labor Economics, 36: S337–S369.
Frey, C. B. and Osborne, M. A. (2017) The future of employment: How susceptible are jobs to compu-terisation? Technological forecasting and social change, 114: 254–280.
Gertler, M. S. (1995) “Being there”: proximity, organ-ization, and culture in the development and adop-tion of advanced manufacturing technologies, Economic Geography, 71: 1–26.
Glaeser, E. L., Kallal, H. D., Scheinkman, J. A. and Shleifer, A. (1992) Growth in cities, Journal of Political Economy, 100: 1126–1152.
Gomez, J. and Vargas, P. (2009) The effect of finan-cial constraints, absorptive capacity and comple-mentarities on the adoption of multiple process technologies, Research Policy, 38: 106–119.
Goos, M., Manning, A. and Salomons, A. (2009) Job polarization in Europe, The American Economic Review, 99: 58–63.
Gordon, R. J. (2012) Is US Economic Growth Over? Faltering Innovation Confronts the Six Headwinds. NBER Working Paper Series. Cambridge, MA: National Bureau of Economic Research.
Gordon, R. J. (2014) The Demise of US Economic Growth: Restatement, Rebuttal, and Reflections. Cambridge, MA: National Bureau of Economic Research Working Paper Series.
Graetz, G. and Michaels, G. (2018) Robots at work, Review of Economics and Statistics, 100: 753–768.
Dow
nloaded from https://academ
ic.oup.com/cjres/article/13/1/77/5648036 by G
eorgia Institute of Technology user on 02 October 2020
97
Robots, skill demand and manufacturing in USA
Grint, K. and Woolgar, S. (2013) The Machine at Work: Technology, Work and Organization. Malden, MA: John Wiley & Sons.
Harrison, B., Kelley, M. R. and Gant, J. (1996) Innovative firm behavior and local milieu: ex-ploring the intersection of agglomeration, firm effects, and technological change, Economic Geography, 72: 233–258.
Hershbein, B. and Kahn, L. B. (2018) Do recessions accelerate routine-biased technological change? Evidence from vacancy postings, American Economic Review, 108: 1737–1772.
International Federation of Robotics. (2017) World Robotics: Industrial Robots 2017. Frankfurt, Germany: IFR Statistical Department.
Jäger, A., Moll, C., Som, O. and Zanker C. (2015) Analysis of the Impact of Robotic Systems on Employment in the European Union. Fraunhofer Institute for Systems and Innovation Research. Available at: http://publica.fraunhofer.de/dokumente/N-366982.html.
Keep, E. and Mayhew, K. (2010) Moving beyond skills as a social and economic panacea, Work, Employment & Society, 24: 565–577.
Kelley, M. R. and Helper, S. (1999) Firm size and capabilities, regional agglomeration, and the adop-tion of new technology, Economics of Innovation and New Technology, 8: 79–103.
Leigh, N. G. and Kraft, B. R. (2017) Emerging ro-botic regions in the United States: insights for re-gional economic evolution, Regional Studies, 52: 1–13. doi:10.1080/00343404.2016.1269158
Leonardi, P. M. (2012) Materiality, sociomateriality, and socio-technical systems: what do these terms mean? How are they different? Do we need them? In M. Paul, J. K. Leonardi and B. A. Nardi (eds.) Materiality and Organizing: Social Interaction in
a Technological World, pp. 25–48. Oxford: Oxford University Press.
Mason, J. L., Johnston, E., Berndt, S., Segal, K., Lei, M. ad Wiest, J. S. (2016) Labour and skills gap ana-lysis of the biomedical research workforce. The FASEB Journal, 30, 2673–2683.
McNulty, P. A. and Wisner, J. D. (2014) The impacts of the 2008 government bailouts on the US auto-mobile industry, The Journal of Human Resource and Adult Learning, 10: 20.
Modestino, A. S., Shoag, D. and Ballance, J. (2016) Downskilling: changes in employer skill require-ments over the business cycle, Labour Economics, 41: 333–347.
National Conference of State Legislatures. (2017) Right-to-Work Resources. Available at: http://www.ncsl.org/research/labour-and-employment/right-to-work-laws-and-bills.aspx.
Orlikowski, W. J. and Scott, S. V. (2008) Chapter 10: sociomateriality: challenging the separation of technology, work and organization, Academy of Management Annals, 2: 433–474. Available at: http://prx.library.gatech.edu/login?url=http://search.ebscohost.com/login.aspx?direct=true&db=bth&AN=39786577&site=ehost-live.
Peck, J. (2016) The right to work, and the right at work, Economic Geography, 92: 4–30.
Wardrip, K., Andreason, S. and De Zeeuw, M. (2017) Uneven Opportunity: Exploring Employers’ Educational Preferences for Middle-Skills Jobs. Philadelphia: Federal Reserve Bank of Philadelphia & Federal Reserve Bank of Atlanta.
Wingfield, N. (2017) As Amazon pushes forward with robots, workers find new roles. New York Times, September 10. Available at: https://www.nytimes.com/2017/09/10/technology/amazon-robots-workers.html.
Dow
nloaded from https://academ
ic.oup.com/cjres/article/13/1/77/5648036 by G
eorgia Institute of Technology user on 02 October 2020
Copyright © 2022 FDOKUMEN