Robeco Institutional Umbrella Fund
92
Robeco Institutional Umbrella Fund Semi-Annual Report and Unaudited Financial Statements For the six month financial period ended 30 June 2020
-
Upload
khangminh22 -
Category
Documents
-
view
1 -
download
0
Transcript of Robeco Institutional Umbrella Fund

Robeco Institutional Umbrella Fund
Semi-Annual Report and Unaudited Financial Statements For the six month financial period ended 30 June 2020

Robeco Institutional Umbrella Fund 2
Contents Report by the manager 4 General information 4 Key figures 5 General introduction 7 Investment policy 8 Investment result 13 Risk management 13 Remuneration policy 14 Sustainable investing 15 Semi-annual financial statements 18 Balance sheet 18 Profit and loss account 22 Cash flow statement 26 Notes 28 General 28 Accounting principles 28 Risk management 29 Notes to the balance sheet 43 Notes to the profit and loss account 51 Currency table 56 Equity portfolio 57 Other information 92 Provisions regarding appropriation of the result 92 Auditor 92

Robeco Institutional Umbrella Fund (open fund for joint account incorporated under Dutch law, subject to the definitions contained within the 1969 Dutch Corporation Tax Act, established in Rotterdam, the Netherlands)
Fund managers (continued) Arnoud Klep Machiel Zwanenburg Joop Huij Simon Lansdorp Wilma de Groot Tim Dröge Jan de Koning Yaowei Xu Han van der Boon Thijs van der Valk Guido Baltussen Daniel Haesen
Independent auditor KPMG Accountants N.V. Papendorpseweg 83 NL-3528 BJ Utrecht
Depositary Northern Trust Global Services SE Vinoly 7th Floor Claude Debussylaan 18A 1082 MD Amsterdam The Netherlands
Administrator Northern Trust International Fund Administration Services (Ireland) Limited George’s Court 54-62 Townsend Street Dublin 2 D02 R156 Ireland
Contact details Weena 850 PO Box 973 NL-3000 AZ Rotterdam Telephone +31 (0)10 - 224 12 24 Internet: www.robeco.com
Management board (and manager) Robeco Institutional Asset Management B.V. (‘RIAM’) Policymakers RIAM: Gilbert O.J.M. Van Hassel Karin van Baardwijk Lia Belilos-Wessels Peter J.J. Ferket (until 22 May 2020) Mark C.W. den Hollander Martin O. Nijkamp Hans-Christoph von Reiche Victor Verberk
Supervisory directors of RIAM: Jeroen J.M. Kremers (until 30 March 2020) Sonja Barendregt-Roojers Stanley H. Koyanagi (since 13 August 2020)Maarten F. Slendebroek (since 13 August 2020)Mark A.A.C. Talbot Radboud R.L. Vlaar
Custodian Northern Trust Global Services SE Vinoly 7th Floor Claude Debussylaan 18A 1082 MD Amsterdam The Netherlands
Fund managers Jan Sytze Mosselaar Arlette van Ditshuizen Maarten Polfliet Pim van Vliet
Robeco Institutional Umbrella Fund 3

Robeco Institutional Umbrella Fund 4
Report by the manager General information Legal aspects Robeco Institutional Umbrella Fund (the “fund”) is a fund for joint account incorporated under Dutch law, subject to the definitions contained within the 1969 Dutch Corporation Tax Act and is therefore fiscally transparent. This means that the sub-fund’s income is allocated directly to the participants. The sub-funds are open-end in nature. As from 1 January 2020, the fund is an Undertaking for Collective Investment in Transferable Securities (UCITS), as referred to in Section 1:1 of the Dutch Financial Supervision Act (hereinafter: the “Wft”) and the Council Directive for Investment Institutions dated 23 July 2014 (Directive 2014/91/EU, 'UCITS V'). UCITS have to comply with certain restrictions to their investment policy in order to protect investors. Robeco Institutional Asset Management B.V. (“RIAM”) is the fund manager. In this capacity, RIAM handles the asset management, administration and marketing and distribution of the fund. RIAM has a license from the AIFMD within the meaning of Section 2:65 of the Wft. In addition, RIAM is licensed as a manager of UCITS (2:69b Wft, the Dutch Financial Supervision Act), which includes managing individual assets and giving advice on financial instruments. RIAM is subject to supervision by the Dutch Authority for the Financial Markets (Stichting Autoriteit Financiële Markten, “AFM”). The assets of the fund are held in custody by Northern Trust Global Services SE, Amsterdam branch has been appointed custodian of the fund within the meaning of Section 4:56(1) of the Wft. The custodian is responsible for supervising the fund insofar as required under and in accordance with the applicable legislation. The manager and Northern Trust Global Services SE, Amsterdam branch have entered into a custody agreement. The fund is subject to statutory supervision by the AFM. The fund has been entered in the register as specified in Section 1:107 of the Wft.
Robeco When ‘Robeco’ is mentioned it means RIAM as well as the activities of other companies that fall within the scope of Robeco’s management.
Market Impact COVID-19 Robeco Institutional Asset Management B.V. considers the ongoing COVID-19 Pandemic as a significant event which may impact the Investment Funds under management. The impact of the pandemic on people, companies and the economy at large cannot be assessed in full depth at this stage. However, the impact may have a downward effect on the performance. Measures to mitigate the immediate operational risks are in place. Additional measures are dependent on our own assessments and the response of the authorities. Our operational measures for business continuity In response to the ongoing COVID-19 crisis, Robeco is constantly monitoring the latest developments and has taken all measures necessary to manage the situation and to ensure business continuity. Our operational measures and capabilities are such that Robeco remains fully functional in managing client portfolios and serving clients. Our systems and platforms are designed to enable our staff, most of whom are working from home, to operate as normal. Our approach is one of vigilance and flexibility, allowing us to implement new or revised measures smoothly and as necessary to ensure the health and safety of our staff while maintaining business continuity. Issuance and repurchase of participating units The issuance and repurchasing of participating units is possible exclusively through the fund in accordance with the terms set out in the Terms and Conditions of Management and Custody. For entry into the fund or for an increase in participation or for full or partial redemption of the participation, the manager will charge a fee on the deposit or cancellation value to cover the associated transaction costs. These fees will accrue to the fund. The fee thus determined can be requested from the manager. The maximum current surcharge is 0.15% and the maximum discount is 0.10%. Terms and Conditions for Management and Custody The Terms and Conditions of Management and Custody of the Robeco Institutional Umbrella Fund can be obtained from the fund's address.

Robeco Institutional Umbrella Fund 5
Key figures
Overview Robeco QI Institutional Global Developed Conservative Equities
30 June 2020 31 December 2019 31 December 2018 AveragePerformance in % based on:- Net asset value T1 EUR units1 (12.9%) 25.0% (4.4%) 1.5%- Net asset value T12 EUR units2 (16.3%) - - - - MSCI World Index (Net Return in EUR)1 (5.8%) 30.0% (3.3%) 6.5%- Net asset value T8 CAD units4 (8.4%) 16.6% (7.4%) 0.4%- MSCI World Index (Net Return in CAD)4 (1.0%) 21.2% (9.3%) 5.0%
Dividend in EUR T1 EUR units 13.52 - 0.51Dividend in EUR T2 EUR units - - 0.60Dividend in EUR T7 EUR units - - 0.54Dividend in EUR T8 CAD units 0.52 - - Total net assets8 512 920 905
Robeco QI Institutional Global Developed Momentum Equities
30 June 2020 31 December 2019 31 December 2018 AveragePerformance in % based on:- Net asset value T1 EUR units3 (9.8%) 26.8% (9.9%) 1.2%- Net asset value T12 EUR units2 (12.6%) - - - - MSCI World Index (Net Return in EUR)3 (5.8%) 30.0% (2.3%) 7.1%- Net asset value T8 CAD units4 (5.2%) 18.2% (15.5%) (2.5%)- MSCI World Index (Net Return in CAD)4 (1.0%) 21.2% (9.3%) (9.3%)
Dividend in EUR T1 EUR units 5.43 - 0.13Dividend in EUR T8 CAD units 0.52 - - Total net assets8 360 670 632
Robeco QI Institutional Global Developed Value Equities
30 June 2020 31 December 2019 31 December 2018 AveragePerformance in % based on:- Net asset value T1 EUR units3 (22.2%) 18.0% (6.3%) 1.0%- Net asset value T12 EUR units2 (21.8%) - - - - MSCI World Index (Net Return in EUR)3 (5.8%) 30.0% (2.3%) 7.1%- Net asset value T8 CAD units4 (18.3%) 10.0% (13.5%) (12.1%)- MSCI World Index (Net Return in CAD)4 (1.0%) 21.2% (9.3%) 4.8%
Dividend in EUR T1 EUR units 13.85 - 0.36Dividend in EUR T7 EUR units - - 0.33Dividend in EUR T8 CAD units 1.59 - - Total net assets8 349 659 673
Robeco QI Institutional Global Developed Quality Equities
30 June 2020 31 December 2019 31 December 2018 AveragePerformance in % based on:- Net asset value T1 EUR units3 (9.4%) 27.0% (0.4%) 5.3%- Net asset value T12 EUR units2 (10.3%) - - - - MSCI World Index (Net Return in EUR)3 (5.8%) 30.0% (2.3%) 7.1%- Net asset value T8 CAD units4 (4.8%) 18.4% (12.2%) 0.3%- MSCI World Index (Net Return in CAD)4 (1.0%) 21.2% (9.3%) 4.8%
Dividend in EUR T1 EUR units 3.87 - 0.20Dividend in EUR T8 CAD units 0.96 - - Total net assets8 202 187 124

Robeco Institutional Umbrella Fund 6
Key figures (continued)
Overview
Robeco QI Institutional Global Developed Enhanced Indexing Equities
30 June 2020 31 December 2019 31 December 2018 AveragePerformance in % based on:- Net asset value T1 EUR units1 (7.7%) 28.6% (4.9%) 4.7%- MSCI World Index (Net Return in EUR)1 (5.8%) 30.0% (3.3%) 6.5%
Dividend in EUR T1 EUR units 6.92 - 0.30Total net assets8 288 285 384
Robeco QI Institutional Global Developed Sustainable Conservative Equities
30 June 2020 31 December 2019 31 December 2018 AveragePerformance in % based on:- Net asset value T2 EUR units5 (12.8%) 27.3% (4.3%) 3.7%- MSCI World Index (Net Return in EUR) (5.8%) 30.0% (4.5%) 8.6%
Dividend in EUR T2 EUR units 3.25 - - Total net assets8 81 93 73
Robeco QI Institutional Global Developed Sustainable Multi-Factor Equities
30 June 2020 31 December 2019 31 December 2018 AveragePerformance in % based on:- Net asset value T1 EUR units6 (13.8%) 23.4% (4.6%) 0.9%- Net asset value T9 EUR units7 (13.9%) 10.3% - (3.7%)- MSCI World Index (Net Return in EUR) (5.8%) 30.0% (5.1%) 10.1%
Dividend in EUR T1 EUR units 2.34 - - Dividend in EUR T9 EUR units 1.44 - - Total net assets8 286 288 141
1 2020 concerns the period 1 January 2020 through 30 June 2020. 2018 concerns the period 2 November 2017 through 31 December 2018. Average concerns the period 2 November 2017 through 30 June 2020. 2 2020 concerns the period 29 January 2020 through 30 June 2020. 3 2020 concerns the period 1 January 2020 through 30 June 2020. 2018 concerns the period 16 November 2017 through 31 December 2018. Average concerns the period 2 November 2017 through 30 June 2020. 4 2020 concerns the period 1 January 2020 through 30 June 2020. 2018 concerns the period 5 September 2018 through 31 December 2018. Average concerns the period 5 September 2018 through 30 June 2020. 5 2020 concerns the period 1 January 2020 through 30 June 2020. 2018 concerns the period 24 October 2018 through 31 December 2018. Average concerns the period 24 October 2018 through 30 June 2020. 6 2020 concerns the period 1 January 2020 through 30 June 2020. 2018 concerns the period 12 December 2018 through 31 December 2018. Average concerns the period 12 December 2018 through 30 June 2020. 7 2020 concerns the period 1 January 2020 through 30 June 2020. 2019 concerns the period 18 February 2019 through 31 December 2019. Average concerns the period 18 February 2019 through 30 June 2020. 8 In EUR x million.

General introduction
Financial market environmentThe first half of the year 2020 will be reflected upon by economic historians in the future as a defining moment for the global economy. Initially, the first weeks of 2020 got off to a promising start. The long-anticipated signing of a “phase 1” trade agreement between China and the US took place on 15 January while global leading indicators surprised to the upside and confirmed expansion of economic activity. In the second half of January, however, these signals of reflation (increasing global growth towards trend level) were completely overshadowed by rising concerns over the outbreak of a coronavirus starting in Wuhan, which the WHO eventually named “COVID-19” and declared a pandemic later on.
With the IMF forecasting a contraction of the global economy by 4.9% in 2020, the global economy has been experiencing a deep recession. This is not a classic recession triggered by an unwind of excesses in the real economy built up during a long economic expansion. The policy-induced sudden stop of the global economy in response to an exogenous shock is what makes this crisis (and the aftermath) unique. COVID-19 has delivered a simultaneous negative supply and demand shock.
What also has been unprecedented, is the policy response to this crisis. Central banks and governments have pulled all stops to mitigate the economic downturn. The Federal Reserve Bank of the United States has provided massive liquidity by increasing its balance sheet by USD 3 trillion since the end of February. This is more than double the effort undertaken in the direct aftermath of the Great Financial crisis. The overall direct fiscal stimulus measures in response to COVID-19 amount to 7% of global GDP according to rating agency Fitch.
Local lockdowns seem to be the most effective mode to control the virus until there is an effective vaccine. From a policy perspective, this implies the pendulum will swing between local re-openings and partial lockdowns for longer. In response, more monetary and fiscal stimulus will likely be needed as bridge financing before a self-sustaining global economic recovery takes hold.
Outlook for the equity marketsFor financial markets, the first half of 2020 has been a rollercoaster. The S&P 500 index peaked on 19 February before sliding into a bear market at the fastest pace seen since 1929, but it also experienced the strongest bear market relief rally in equities since 1929. The MSCI World Index in local currency was still 5.3% down since the start of the year as of June 30th but also experienced a steep rebound in the second quarter, returning 18.5%.
Given the V-shaped recovery in developed equity market prices with the global economy only showing tentative signs of recovering towards a new post-COVID-19 normal, the divergence between risky asset prices and current economic fundamentals is notable. Nonetheless, central banks have given strong guidance to keep risk free rates low for an extended period of time, with low discount rates and a strong fiscal stimulus impulse supportive for the medium term equity outlook. The announcement of an effective vaccine late 2020 could also provide a boost for consumer sentiment. Risks remain however in the remainder of 2020 for equity markets as the global economic recovery will remain uneven and incomplete creating significant dispersion between equity sectors, regions and themes. A malignant mutation of the COVID-19 virus, the November 2020 US elections, an incomplete US-China trade deal and Brexit are additional risk factors that could create headwinds.
Robeco Institutional Umbrella Fund 7

Robeco Institutional Umbrella Fund 8
Investment policy
Introduction The sole objective of the sub-funds is to invest capital in financial instruments and other assets while applying the principle of risk diversification with the aim of enabling participants to participate in the investment returns. For all sub-funds, the investment policy is designed mainly to realise capital growth and/or direct income as described below.
Robeco QI Institutional Global Developed Conservative Equities
Robeco QI Institutional Global Developed Conservative Equities sub-fund investment policy The principal objective of Robeco QI Institutional Global Developed Conservative Equities (the “sub-fund”) is to achieve an optimal return per unit of risk (the price volatility) on the sub-fund assets, which are invested worldwide on behalf of the participants and for their account and risk.
Implementation of the investment policy The first half of 2020 was one for the history books. Not only did COVID-19 lead to an unprecedented series of lockdowns around the world, also the behavior of stock markets was quite unique. The first quarter was one of the worst quarters on record for the MSCI World since the index started in 1969, while the second quarter was one of the strongest quarters in history. Stock return dispersion was large in the first of 2020 as investors clearly identified the winners (mainly technology and health care stocks) and losers (mainly real estate, financial and energy companies) of the global pandemic, the associated lockdowns, and the drop in oil prices and interest rates.
Robeco Conservative Equities lagged the market index due to the exposure to lockdown-sensitive stocks such as retail REITs, retail chains, restaurant stocks and insurance companies. Moreover, the underweight in online stocks such as the large technology companies in the US, credit card companies and online shopping platforms had a negative impact on relative performance of the strategy.
The market index was supported by the good performance of the mega caps, thereby outperforming the average stock in the index. This effect had also a negative impact on the comparison between the Global Conservative Equities strategy versus the market index.
Moreover, as growth stocks such as technology and health care stocks outperformed the broader market while cheap financial stocks lagged the market, the value factor experienced a negative first half of the year. Also, high dividend stocks in US significantly lagged the market.
Robeco Conservative Equities is characterised by generally having lower absolute risk than its reference index, while having a high relative risk as the strategy deviates considerably from its reference index.
Robeco QI Institutional Global Developed Conservative Equities sub-fund currency policy The sub-fund invests in stocks issued in various currencies. The currency risk is not hedged as standard. For further quantitative information on the currency risk we refer to the information on currency risk provided on page 29.
Integration of ESG factors Sustainability factors based on RobecoSAM scores are integrated in the investment policy. These RobecoSAM scores take into account factors relating to environment, society and governance (ESG). The investment process is very disciplined and ensures that the sub-fund's overall sustainability score is higher than or equal to the overall sustainability score of the reference index. This means that a stock with a good score on factors relating to the environment, society and governance is more likely to be included in the portfolio. Companies with a poor score have less chance of being included in the portfolio.
In 2018, the ESG integration approach of having the portfolio scoring at least as good or better than the index on the total ESG score was extended to also apply to the individual dimensions of ESG – environmental, social and governance -, in addition to the overall ESG score.
Robeco QI Institutional Global Developed Momentum Equities
Robeco QI Institutional Global Developed Momentum Equities sub-fund investment policy The principal objective of Robeco QI Institutional Global Developed Momentum Equities (the “sub-fund”) is to achieve an optimal return per unit of risk (the price volatility) on the sub-fund assets, which are invested worldwide on behalf of the participants and for their account and risk.
Implementation of the investment policy The objective of the sub-fund is to exploit the momentum anomaly that is present in global stock markets. Momentum stocks are stocks that have recently performed well, for example in terms of return. In-depth research has shown that momentum stocks tend to outperform the market in the long term. The sub-fund offers diversified and efficient exposure to the momentum factor.
The sub-fund investable universe is made up of all stocks in developed economies with sufficient market value and daily trading volume. In principle, the investment universe comprises stocks that form part of the index. In order to also be able to select stocks with favorable momentum characteristics that are not part of this index, we have extended the universe to include stocks from the Broad Market Index, compiled by S&P. We use a minimum daily trading volume and a minimum market value to achieve a relatively stable and liquid investment universe.

Robeco Institutional Umbrella Fund 9
Investment policy (continued)
Robeco QI Institutional Global Developed Momentum Equities (continued)
Implementation of the investment policy (continued) By means of a bottom-up strategy, the sub-fund provides exposure to the momentum factor. At the same time, we aim to identify and avoid unrewarded factor risks. For example, we seek to reduce unrewarded time-varying risk exposures that are typical for a generic momentum strategy. In addition, we aim to prevent exposure to the momentum factor from creating negative exposure to another factor (like value and low-risk), as this can detract from the return. This can be reached by taking value, risk and quality characteristics into account in the selection of momentum stocks. This approach ensures that only attractive momentum stocks are identified. The portfolio construction process subsequently translates this information into an efficient and diversified factor portfolio. The portfolio construction process is highly disciplined and attempts to avoid unnecessary transaction costs by only buying stocks if their expected returns outweigh the associated costs. Cash flows are used efficiently to retain attractive momentum characteristics in the portfolio.
Robeco QI Institutional Global Developed Momentum Equities Fund sub-fund currency policy The sub-fund invests in stocks issued in various currencies. The currency risk is not hedged. For further quantitative information on the currency risk we refer to the information on currency risk provided on page 30.
Integration of ESG factors Sustainability factors based on RobecoSAM scores are integrated in the investment policy. These scores take into account environmental, social and governance (ESG) factors. The investment process is highly disciplined and ensures that the sub-fund's overall sustainability score is higher than or equal to the overall sustainability score of the benchmark. This means that a stock with a good ESG score is more likely to be included in the portfolio. Companies with a poor ESG score have less chance of being included in the portfolio.
Robeco QI Institutional Global Developed Value Equities
Robeco QI Institutional Global Developed Value Equities sub-fund investment policy The principal objective of Robeco QI Institutional Global Developed Value Equities (the “sub-fund”) is to achieve an optimal return per unit of risk (the price volatility) on the sub-fund assets, which are invested worldwide on behalf of the participants and for their account and risk.
Implementation of the investment policy The objective of the sub-fund is to exploit the value anomaly that is present in global stock markets. Value stocks are stocks that are cheap relative to the issuing company's fundamental values, such as book value. In-depth research has shown that value stocks tend to outperform the market in the long term. The sub-fund offers diversified and efficient exposure to the value factor.
The sub-fund’s investable universe is made up of all stocks in developed economies with sufficient market value and daily trading volume. In principle, the investment universe comprises stocks that form part of the index. In order to also be able to select stocks with favorable value characteristics that are not part of this index, we have extended the universe to include stocks from the Broad Market Index, compiled by S&P. We use a minimum daily trading volume and a minimum market value to achieve a relatively stable and liquid investment universe.
By means of a bottom-up strategy, the sub-fund provides exposure to the value factor. At the same time, we aim to identify and avoid unrewarded factor risks. For example, for the value factor we use a proprietary distress risk model to identify and avoid bankruptcy risk. In addition, we aim to prevent exposure to the value factor from creating negative exposure to another factor (like momentum and low-risk), as this can detract from the return. This can be reached by taking momentum, risk and quality characteristics into account in the selection of value stocks. This approach ensures that only attractive value stocks are identified. The portfolio construction process subsequently translates this information into an efficient and diversified factor portfolio. The portfolio construction process is highly disciplined and attempts to avoid unnecessary transaction costs by only buying stocks if their expected returns outweigh the associated costs. Cash flows are used efficiently to retain attractive value characteristics in the portfolio.
Robeco QI Institutional Global Developed Value Equities Fund sub-fund currency policy The sub-fund invests in stocks issued in various currencies. The currency risk is not hedged. For further quantitative information on the currency risk we refer to the information on currency risk provided on page 30.
Integration of ESG factors Sustainability factors based on RobecoSAM scores are integrated in the investment policy. These scores take into account environmental, social and governance (ESG) factors. The investment process is highly disciplined and ensures that the sub-fund's overall sustainability score is higher than or equal to the overall sustainability score of the benchmark. This means that a stock with a good ESG score is more likely to be included in the portfolio. Companies with a poor ESG score have less chance of being included in the portfolio.
Robeco QI Institutional Global Developed Quality Equities
Robeco QI Institutional Global Developed Quality Equities sub-fund investment policy The principal objective of Robeco QI Institutional Global Developed Quality Equities (the “sub-fund”) is to achieve an optimal return per unit of risk (the price volatility) on the sub-fund assets, which are invested worldwide on behalf of the participants and for their account and risk.

Robeco Institutional Umbrella Fund 10
Investment policy (continued)
Robeco QI Institutional Global Developed Quality Equities (continued)
Implementation of the investment policy The objective of the sub-fund is to exploit the quality anomaly that is present in global stock markets. Quality stocks are stocks of companies that have strong quality characteristics, such as high profitability. In-depth research has shown that quality stocks tend to outperform the market in the long term. The sub-fund offers diversified and efficient exposure to the quality factor.
The sub-fund’s investable universe is made up of all stocks in developed economies with sufficient market value and daily trading volume. In principle, the investment universe comprises stocks that form part of the index. In order to also be able to select stocks with favorable quality characteristics that are not part of this index, we have extended the universe to include stocks from the Broad Market Index, compiled by S&P. We use a minimum daily trading volume and a minimum market value to achieve a relatively stable and liquid investment universe.
By means of a bottom-up strategy, the sub-fund provides exposure to the quality factor. At the same time, we aim to identify and avoid unrewarded factor risks. For example, for the quality factor we only use indicators that have a strong link to the future earnings of a company. In addition, we aim to prevent exposure to the quality factor from creating negative exposure to another (like value and momentum), as this can detract from the return. This can be reached by taking value and momentum characteristics into account in the selection of quality stocks. This approach ensures that only attractive quality stocks are identified. The portfolio construction process subsequently translates this information into an efficient and diversified factor portfolio. The portfolio construction process is highly disciplined and attempts to avoid unnecessary transaction costs by only buying stocks if their expected returns outweigh the associated costs. Cash flows are used efficiently to retain attractive quality characteristics in the portfolio.
Robeco QI Institutional Global Developed Quality Equities Fund sub-fund currency policy The sub-fund invests in stocks issued in various currencies. The currency risk is not hedged. For further quantitative information on the currency risk we refer to the information on currency risk provided on page 31.
Integration of ESG factors Sustainability factors based on RobecoSAM scores are integrated in the investment policy. These RobecoSAM scores take into account factors relating to environment, society and governance (ESG). The investment process is very disciplined and ensures that the sub-fund's overall sustainability score is higher than or equal to the overall sustainability score of the index. This means that a stock with a good score on factors relating to the environment, society and governance is more likely to be included in the portfolio. Companies with a poor score have a smaller chance of being included in the portfolio.
Robeco QI Institutional Global Developed Enhanced Indexing Equities
Robeco QI Institutional Global Developed Enhanced Indexing Equities sub-fund investment policy The principal objective of Robeco QI Institutional Global Developed Enhanced Indexing Equities (the “sub-fund”) is to achieve an optimal return on the sub-fund assets compared to the sub-funds index with low risk. The sub-funds’ assets are invested worldwide on behalf of the participants and for their account and risk.
Implementation of the investment policy The investment objective of the sub-fund is to outperform its index, the MSCI World Index, with the aid of a quantitative stock selection model. Using a combination of factors (value, quality, momentum and analyst revisions), the model identifies broad groups of stocks that are likely to outperform in the long run. The sub-fund’s relative performance was negative. The value and quality factors delivered a negative contribution to relative performance and the momentum and analyst revisions factors a positive contribution to the sub-fund’s relative performance. The volatility of the sub-fund was in line with the volatility of the index, with a low level of active risk. Sustainability, based on RobecoSAM scores, is integrated into the investment policy of the sub-fund. The portfolio construction process is highly disciplined and ensures that the overall sustainability score of the portfolio is better than or equal to the overall sustainability score of the index.
Robeco QI Global Developed Enhanced Indexing Equities Fund sub-fund currency policy The sub-fund invests in stocks issued in various currencies. The currency risk is not hedged as standard. For further quantitative information on the currency risk we refer to the information on currency risk provided on page 31.
Integration of ESG factors ESG factors, for which the data originate from RobecoSAM in Switzerland, are integrated in both the stock selection model and the portfolio construction process. The portfolio construction algorithm ensures that the sub-fund's overall sustainability score after rebalancing is higher than or equal to the index's overall sustainability score. This means that a stock with a good score on factors relating to the environment, society and governance is more likely to be included in the portfolio. Companies with a poor score have less chance of being included in the portfolio.
In 2018, the ESG integration approach of having the portfolio scoring at least as good or better than the index on the total ESG score was extended to also apply to the individual dimensions of ESG – environmental, social and governance -, in addition to the overall ESG score.

Robeco Institutional Umbrella Fund 11
Investment policy (continued)
Robeco QI Institutional Global Developed Sustainable Conservative Equities
Robeco QI Institutional Global Developed Sustainable Conservative Equities sub-fund investment policy The principal objective of Robeco QI Institutional Global Developed Sustainable Conservative Equities (the “sub-fund”) is to achieve an optimal return per unit of risk (the price volatility) on the sub-fund assets, which are invested worldwide on behalf of the participants and for their account and risk.
Sustainability means the sub-fund will aim to achieve the investment objective, while at the same time taking into account ESG. In making sustainable investment decisions in accordance with this strategy, the sub-fund aims to have a better environmental footprint and a better sustainability profile compared to the index.
Implementation of the investment policy The first half of 2020 was one for the history books. Not only did COVID-19 lead to an unprecedented series of lockdowns around the world, also the behavior of stock markets was quite unique. The first quarter was one of the worst quarters on record for the MSCI World since the index started in 1969, while the second quarter was one of the strongest quarters in history. Stock return dispersion was large in the first of 2020 as investors clearly identified the winners (mainly technology and health care stocks) and losers (mainly real estate, financial and energy companies) of the global pandemic, the associated lockdowns, and the drop in oil prices and interest rates.
Robeco Conservative Equities lagged the market index due to the exposure to lockdown-sensitive stocks such as retail REITs, retail chains, restaurant stocks and insurance companies. Moreover, the underweight in online stocks such as the large technology companies in the US, credit card companies and online shopping platforms had a negative impact on relative performance of the strategy.
The market index was supported by the good performance of the mega caps, thereby outperforming the average stock in the index. This effect had also a negative impact on the comparison between the Global Conservative Equities strategy versus the market index.
Moreover, as growth stocks such as technology and health care stocks outperformed the broader market while cheap financial stocks lagged the market, the value factor experienced a negative first half of the year. Also high dividend stocks in US significantly lagged the market.
Robeco Conservative Equities is characterised by generally having lower absolute risk than its reference index, while having a high relative risk as the strategy deviates considerably from its reference index.
Robeco QI Global Developed Sustainable Conservative Equities Fund sub-fund currency policy The sub-fund invests in stocks issued in various currencies. The currency risk is not hedged. For further quantitative information on the currency risk we refer to the information on currency risk provided on page 32.
Integration of ESG factors Sustainability factors based on RobecoSAM scores are integrated in the investment policy. These RobecoSAM scores take into account factors relating to environment, society and governance (ESG). The investment process is very disciplined and ensures that the sub-fund's overall sustainability score is at least 20% higher than the overall sustainability score of the index. This means that a stock with a good score on factors relating to the environment, society and governance is more likely to be included in the portfolio. Companies with a poor score have a smaller chance of being included in the portfolio. In addition, the environmental footprint, as measured by greenhouse gas emissions, energy consumption, waste and water generation, of the portfolio is at least 20% lower than that of the index.
Robeco QI Institutional Global Developed Sustainable Multi-Factor Equities
Robeco QI Institutional Global Developed Sustainable Multi-Factor Equities sub-fund investment policy The principal objective of Robeco QI Institutional Global Developed Sustainable Multi-Factor Equities (the “sub-fund”) is to achieve an optimal return per unit of risk (the price volatility) on the sub-fund assets, which are invested worldwide on behalf of the participants and for their account and risk.
Implementation of the investment policy The objective of the sub-fund is to exploit the key anomalies known in global stock markets: value, momentum, low-risk and quality, while at the same time offering a significantly improved sustainability profile. Value stocks are stocks that are cheap relative to the issuing company's fundamental values, such as book value. Momentum stocks are stocks that have recently performed well, for example in terms of return. Low-risk stocks are characterised by, for example, lower volatility and market sensitivity. Lastly, quality stocks are stocks of companies that have strong quality characteristics, such as high profitability. For all these groups, in-depth research has shown that they outperform the market in the long term. The sub-fund offers diversified and efficient exposure to these factors, by investing a strategic weight of 25% in each of the four underlying factor strategies. Once a quarter, we assess whether the factor weights are still within the predetermined bandwidth that ensures proper diversification. If a factor weight does exceed the bandwidth the weight will be adjusted so that the factor diversification remains. In addition to this quarterly factor rebalancing process, cash flows are used to rebalance the sub-fund’s factor weights towards the strategic weights.

Robeco Institutional Umbrella Fund 12
Investment policy (continued)
Robeco QI Institutional Global Developed Sustainable Multi-Factor Equities (continued)
Implementation of the investment policy (continued) The sub-fund’s investable universe is made up of all stocks in developed economies with sufficient market value and daily trading volume. In principle, the investment universe comprises stocks that form part of the index. In order to also be able to select stocks with favorable quality characteristics that are not part of this index, we have extended the universe to include stocks from the Broad Market Index, compiled by S&P. We use a minimum daily trading volume and a minimum market value to achieve a relatively stable and liquid investment universe.
By means of a bottom-up strategy, the sub-fund provides exposure to the value, momentum, low-risk and quality factors. At the same time, we aim to identify and avoid unrewarded factor risks. For example, for the value factor, we use our distress risk model to identify and avoid bankruptcy risk. In addition, we aim to prevent exposure to one factor from creating negative exposure to another, as this can detract from the return. This can be reached by taking value, risk and quality characteristics into account in the selection of momentum stocks, for example. This approach ensures that for each factor, attractive stocks are identified efficiently. The portfolio construction process subsequently translates this into an optimal and diversified factor portfolio. The portfolio construction process is highly disciplined and attempts to avoid unnecessary transaction costs by only buying stocks if their expected returns outweigh the associated costs.
Robeco QI Institutional Global Developed Sustainable Multi-Factor Equities sub-fund currency policy The sub-fund invests in stocks issued in various currencies. The currency risk is not hedged as standard. For further quantitative information on the currency risk we refer to the information on currency risk provided on page 32.
Integration of ESG factors Sustainability factors based on RobecoSAM scores are integrated in the investment policy. These scores take into account environmental, social and governance (ESG) factors. The investment process is very disciplined and ensures that the sub-fund's overall sustainability score is at least 20% higher than the sustainability score of the index. This means that a stock with a good ESG score is more likely to be included in the portfolio. Companies with a poor ESG score have less chance of being included in the portfolio. In addition, the environmental footprint, as measured by greenhouse gas emissions, energy consumption, waste and water generation, of the portfolio is at least 20% lower than that of the index.

Investment result
Robeco QI Institutional Global Developed Conservative Equities
Return and risk Due to the long-term investment objective of the sub-fund (to deliver equity returns at 20% lower average risk than that of its reference index over a full performance cycle), investment results should be evaluated on a longer horizon.
Robeco Global Developed Conservative Equities is characterised by generally having lower absolute risk than its reference index, while having a high relative risk as the strategy deviates considerably from its reference index.
In the first half of 2020, Robeco Global Developed Conservative Equities showed a return of -12.56% against -5.82% for the MSCI World Index. Since inception of the sub-fund in October 2006, the fund showed an annualised return of 6.93%, while the reference index rose 5.78%. The risk level of the sub-fund has been lower than that of the reference index, as the volatility of the sub-fund has been 11.16% against 14.74% for the reference index.
Robeco QI Institutional Global Developed Momentum Equities sub-fund investment result
Return and risk The sub-fund underperformed the MSCI World Index in a falling market. The momentum exposure had the largest negative contribution to the relative performance of the sub-fund. Controlling for valuation also contributed negatively, while controlling for low-risk and quality had a neutral contribution. The risk profile of the sub-fund, as measured by the volatility, was higher than that of the index.
Robeco QI Institutional Global Developed Value Equities sub-fund investment result
Return and risk The sub-fund underperformed the MSCI World Index in a falling market. The value exposure had the largest negative contribution to the relative performance of the fund. Controlling for momentum and low-risk also contributed negatively, while quality had a positive contribution. The risk profile of the sub-fund, as measured by the volatility, was higher than that of the index.
Robeco QI Institutional Global Developed Quality Equities sub-fund investment result
Return and risk The sub-fund underperformed the MSCI World Index in a falling market. The quality factor had a positive contribution to the relative performance of the sub-fund. Controlling for value had a negative contribution, while the contribution of momentum was positive. The risk profile of the sub-fund, as measured by the volatility, was higher than that of the index.
Robeco QI Institutional Global Developed Enhanced Indexing Equities sub-fund investment result
Return and risk The sub-fund has an ex-ante tracking error limit of 2% annualised. The ex-ante tracking error was lower than the limit in 2020. The sub-fund aims for a beta of 1, which means that the fund has a comparable sensitivity to generally rising markets as the index. The objective of enhanced indexing is to achieve better returns than the index while maintaining a limited level of active share. Diversification is essential to keep active share levels low. This means that small overweight or underweight positions relative to the index weight have to be taken in a large number of stocks. The active share of the strategy has been 30% on average. The volatility of the sub-fund was in-line with the volatility of the index and with a low level of active share as measured by the tracking error.
Robeco QI Institutional Global Developed Sustainable Conservative Equities sub-fund investment result
Return and risk Robeco Conservative Equities is characterised by generally having lower absolute risk than its reference index, while having a high relative risk as the strategy deviates considerably from its reference index.
The investment objective of the strategy is having 20-30% lower risk than the reference index, while achieving equal or higher returns, over a full investment cycle of around seven years.
In the first half of 2020, Robeco QI Institutional Global Developed Sustainable Conservative Equities had a return of -12.46% against -5.82% for the MSCI World Index. Since inception of the sub-fund in October 2018, the sub-fund showed an annualised return of 4.48%, while the reference index returned 8.54%. The risk level of the sub-fund has been lower than that of the reference index, as the volatility of the sub-fund has been 18.21% against 19.50% for the reference index.
Robeco QI Institutional Global Developed Sustainable Multi-Factor Equities sub-fund investment result
Return and risk The sub-fund underperformed the MSCI World Index in a falling market. The value factor had the largest negative contribution to the relative performance of the sub-fund. The momentum, low-risk and quality factors also had a negative contribution. The risk profile of the sub-fund, as measured by the volatility, was higher than that of the index.
Risk management A description of the risk management can be found in the notes to the financial statements on pages 29 through 42.
Robeco Institutional Umbrella Fund 13

Remuneration policy The fund itself does not employ any personnel and is managed by RIAM. In the Netherlands, persons performing duties for the fund at management-board level and portfolio managers are employed by Robeco Nederland B.V. The remuneration for these persons comes out of the management fee. RIAM’s remuneration policy, that applies to all staff working under RIAM’s responsibility, meets the applicable requirements of the European frameworks of the AIFMD, MiFID, the UCITS Directive, the ESMA guidelines on sound remuneration policies under the UCITS Directive, as well as the Dutch Remuneration Policy (Financial Enterprises) Act (Wet beloningsbeleid financiële ondernemingen). The remuneration policy has the following objectives:
a.) To stimulate employees to act in our clients’ interests and avoid taking undesirable risks. b.) To promote a healthy corporate culture, with a strong focus on achieving sustainable results in accordance with the long-term
objectives of RIAM and its stakeholders. c.) To attract and retain good employees and to reward talent and performance fairly.
Responsibility for the remuneration policy The Supervisory Board of RIAM supervises the correct application of the remuneration policy and is responsible for the annual evaluation. Changes in the remuneration policy have to be approved by the Supervisory Board of RIAM. The Nomination & Remuneration Committee of the Supervisory Board of RIAM provides advice to the Supervisory Board of RIAM in the execution of these tasks, with the involvement of the HR Department and the relevant internal control officers. In the application and evaluation of the remuneration policy, RIAM regularly makes use of the services of various external advisers. The remuneration of fund managers consists of a fixed component and a variable component.
Fixed remuneration The fixed salary of each employee is based on his/her role and experience and is in accordance with the RIAM salary ranges, which have also been derived from benchmarks in the investment management sector. The fixed salary is deemed to be adequate remuneration for the employee to properly execute their responsibilities, regardless of whether the employee receives any variable remuneration.
Variable remuneration In accordance with the applicable laws and regulations, the available budget/pool for variable remuneration is approved in advance by the Supervisory Board of RIAM based on a proposal made by the Nomination & Remuneration Committee of the Supervisory Board of RIAM. The total budget/pool is based, in principle, on a percentage of RIAM's operating result. In order to ensure that the total variable remuneration accurately reflects the performance of RIAM and the funds that it manages, when determining the budget/pool, a correction is made for risks that may occur in the year concerned and furthermore for multiple-year risks that may affect the risk profile of RIAM.
The variable remuneration component for the fund managers depends on the multi-year performance of the fund. The system is linked to outperformance with regard to risk-adjusted pre-determined annual targets. The calculated outperformance over a one-year, three-year and five-year period is taken into account when determining the variable remuneration. Also important in this determination are behavior, the extent to which team- and individual qualitative and predetermined objectives have been achieved and the extent to which Robeco corporate values are observed. The fund manager’s contribution to the various organisational objectives is also taken into consideration. Poor performance, unethical or non-compliant behavior will reduce individual awards or can even result in no variable remuneration being awarded at all. For the senior fund manager, the Identified Staff regime also applies (see below).
Identified Staff RIAM has a specific and more stringent remuneration policy for employees who could have a material impact on the risk profile of the fund. These employees are designated to be 'Identified Staff'. As per 30 June 2020, in addition to the Management Board, RIAM has designated 98 employees as Identified Staff, including all senior portfolio managers, senior management and the heads of the control functions (HR, Compliance, Risk Management, Business Control, Internal Audit and Legal). Among other things the performance targets of these employees that are used to determine the award of variable pay are subject to additional risk analyses, both prior to the performance year and at the end when the results are evaluated. In addition, in all cases at least 70% of the payment of variable remuneration granted to these employees will be deferred for a period of four years, and 50% will be converted into instruments (‘Robeco Cash Appreciation Rights’) whose value will follow the company's future results.
Risk control RIAM has implemented additional risk management measures with regard to the variable remuneration. For instance, RIAM has the possibility with regard to all employees to reclaim the granted variable remuneration ('claw-back') when this has been based on incorrect assumptions, fraudulent acts, serious improper behavior, serious neglect of duties or behavior that has resulted in a considerable loss for RIAM. After the granting but before the actual payment of the deferred variable remuneration components to Identified Staff, an additional assessment is performed to check whether new information would result in decreasing the previously granted remuneration components (the so-called ‘malus arrangement’). The malus arrangement can be applied because of (i) misconduct or a serious error of judgement on the part of the employee (ii) a considerable deterioration of RIAM's financial results that was not foreseen at the time the remuneration was granted (iii) a serious violation of the risk management system, leading to changed circumstances compared with the granting of the variable remuneration or (iv) fraud committed by the employee concerned.
Annual assessment RIAM's remuneration policy and the application thereof was evaluated in 2019 under the responsibility of the Supervisory Board of RIAM, advised by the Nomination & Remuneration Committee of the Supervisory Board of RIAM. As a result no material changes were necessary to the remuneration policy.
Robeco Institutional Umbrella Fund 14

Robeco Institutional Umbrella Fund 15
Sustainable investing Sustainability Investing is one of the main pillars of Robeco's strategy and is firmly anchored in our investment convictions. We are convinced that including ESG1 factors leads to better investment decisions. We are also convinced that exercising our voting rights and engaging in a dialogue with companies have a positive effect on the investment result and society in general. During the first half of 2020, we made every effort to further stimulate Sustainability Investing at Robeco and beyond.
All Robeco’s investment activities comply with the Principles for Responsible Investing (PRI). In 2020, Robeco was awarded an A+ for most of the modules that were assessed as part of the Principles for Responsible Investment (PRI) 2020 report. This was the seventh year in a row that Robeco obtained the highest score for the majority of the modules assessed by PRI. Responsibility for implementing Sustainable investing lies with the Head of Investments, who also has a seat on Robeco's Executive Committee.
Focus on stewardshipFulfilling our responsibilities in the field of stewardship forms an integral part of Robeco's approach to Sustainable investing. A core aspect of Robeco's mission is fulfilling our fiduciary duties towards our clients and beneficiaries. Robeco manages investments for a variety of clients with different investment needs. We always strive in everything we do to serve our clients interests to the best of our ability.
In our view, the fact that more and more stewardship codes are being introduced around the globe is a positive development, and we are strong advocates of active ownership. For this reason we publish our own stewardship policy on our website. This policy describes how we deal with possible conflicts of interest, how we monitor the companies in which we invest, how we conduct activities in the field of engagement and voting, and how we report on our stewardship activities.
To mark our strong commitment to stewardship, we have become signatories to many different stewardship codes. In 2018 Eumedion, the Dutch governance platform for institutional investors, published a Dutch stewardship code. Robeco was a participant in the working group that wrote this code. In previous years we became signatories to the stewardship codes of the United Kingdom, Japan and Brazil. In addition, Robeco a.o. meets the Taiwanese Stewardship Principles for Institutional Investors, the US ISG stewardship principles, the Principles for Responsible Ownership in Hong Kong, Singapore Stewardship Principles and the Korean Stewardship Code.
Contributing to the Sustainable Development GoalsRobeco is a signatory in the Netherlands to the Sustainable Development Goals Investing Agenda. To help our customers contribute to the objectives, we worked on analysing the SDG2 contribution of companies and developing SDG investment solutions. Currently multiple solutions are available both in equity and fixed income and the amount of assets that are managed in line with this SDG methodology is increasing rapidly.
Furthermore, Robeco contributes to the SDGs by integrating ESG factors in its decision-making process for investments and encourages companies to act in support of these goals by means of a constructive dialogue. The SDGs are continually considered during the engagement and voting activities. These therefore present the opportunity to emphasise the effect that engagement can have on society. Robeco’s Active Ownership team would like new themes to always be directly linked to at least one of the goals. In 2019 we started engaging with companies for example on Palm Oil, directly linked to SDG 12 and 15, with a clear objective to improve the Roundtable on Sustainable Palm Oil (RSPO) certification and mitigate deforestation.
ESG integration by RobecoSustainability can bring about changes in markets, countries and companies in the long term. And since changes affect future performance, ESG factors can in our view add value to our investment process. We therefore look at these factors in the same way as we consider a company's financial position or market momentum. We have research available from leading sustainability experts, including our sister company RobecoSAM. The dedicated Sustainable Investing research team works together very closely with the investment teams to provide them with in-depth sustainability information.
The investment analysis focuses on the most material ESG factors and the connection with the financial performance of a company. We can then focus on the most relevant information in performing our investment-analysis and can reach enhanced investment decisions. Besides integrating ESG, Active Ownership and exclusions into all of our investment processes, in 2020 we continued developing new sustainable investment funds with specific sustainable goals and criteria. Furthermore we expanded our climate change strategy by integrating climate scenarios into our risk management process, developing portfolio tools to measure, monitor and manage carbon footprints and developed a decarbonised value factor that is implemented in all quantitative strategies.
Exclusion Robeco pursues an exclusion policy for companies that are involved in the production of or trade in controversial weapons such as cluster munition and anti-personnel mines, for tobacco companies and for companies that seriously and habitually violate either the United Nations Global Compact (UNGC) or OECD Guidelines for Multinational Enterprises. We apply strict criteria for this last category and if a dialogue fails the company can be excluded. Robeco publishes its exclusion policy and the list of exclusions on its website. In 2019 Robeco developed a palm oil policy. Robeco considers the production of palm oil a process with significant environmental and social risks, leading to breaches of the UN Global Compact when this product is not produced sustainably. Listed companies that have less than 20% of their plantations certified to sustainability standards are excluded from fund investments. Other palm oil producing companies are part of an engagement program where Robeco requires them to make progress towards full RSPO certification and addresses potential controversies and breaches of the UN Global compact.
1 ESG is the abbreviation of ‘Environmental, Social and Governance’, which refers to factors relating to the environment, society and corporate governance. 2 Sustainable Development Goals

Robeco Institutional Umbrella Fund 16
Sustainable investing (continued)
Active ownershipConstructive and effective activities under active ownership encourage companies to improve their management of risks and opportunities in the field of ESG. This in turn establishes a better competitive position and improved profitability and moreover has a positive impact on the community. Active ownership involves voting and engagement. Robeco exercises its voting rights for the shares in its investment funds all over the world. In addition, Robeco enters into an active dialogue with the companies in which it invests on questions concerning the environment, society and corporate governance. In 2020, our activities towards achieving active ownership were again awarded high scores under the Principles for Responsible Investment (PRI). Robeco has Active Ownership specialists in both Rotterdam and Hong Kong. In 2019 Robeco engaged with over 220 companies on different issues ranging from corporate governance to data privacy to climate change. The primary focus of this engagement is to address strategic ESG issues that might affect value creation in the long term. Hereafter, 2020 case studies are provided to illustrate Robeco’s approach towards fulfilling our stewardship responsibilities.
Robeco’s Active Ownership response to COVID-19 Robeco has been active with its engagement partners and in the media since the start of the COVID-19 pandemic with regard to the ESG-related impact of the crisis. Below, we highlight a few activities that have taken place since March.
1. Robeco signed the Investor Statement on Coronavirus ResponseAs long-term investors, Robeco urged the business community to take what steps they could and to consider the following steps inparticular: provide paid leave if necessary, prioritise health and safety of workers, maintain employment, maintain supplier/customerrelationships, and exhibit financial prudence. You can find the statement here: https://www.iccr.org/investor-statement-coronavirus-response.
2. Active Ownership participates in working groups PRI and ICCRTwo PRI working groups and one working group within the Interfaith Center for Corporate Responsibility (ICCR) will start:
• The first PRI working group will focus on short-term responses and ensuring responsible ESG approaches remain at the front ofinvestor activities.
• The second PRI working group will focus on a future economic recovery phase which will consider how the financial system shouldfunction to ensure sustainable outcomes.
• The ICCR group will focus mainly on US companies.
3. Robeco calls on pharmaceutical sector to maximise efforts in combatting COVID-19In collaboration with other international asset managers, pension funds and insurers, Robeco has supported several initiatives thatcall on pharmaceutical companies to uphold their social license to operate and maximise cooperation to minimise the spread of thevirus. First, Robeco engaged along with other global investors with Roche, producer of important diagnostics for test capacity to testpatients for COVID-19, to call upon the company to provide the formula for creating test reagents in the labs to support the globalcrisis response. In addition, Robeco joined two separate efforts with the ICCR and a group of Dutch institutional investors byreleasing an investor statement targeted at pharmaceuticals, asking them to adopt a collaborative approach to the design and deliveryof health technologies and govern with financial prudence and a commitment to uphold their social license to operate by ensuringaffordable access for all.
4. Impact on and call to the garment industry
The Platform Living Wages Financials published a public statement outlining investors' expectations on how the garment industryshould manage the COVID-19 crisis responsibly.
The International Labor Organisation (ILO) has published a Call to Action by garment industry employer and worker organisations,leading brands and retailers to work with governments and financial institutions to tackle the devastating economic disruption andthreat to livelihoods caused by the COVID-19 pandemic. Employers, workers, retailers and major brands involved in thecollaboration will form an international working group – convened by the ILO – to implement measures to limit the damage causedby the pandemic to enterprises and livelihoods. Several companies under engagement are participating in this call to action, andwe're also encouraging other brands to join the initiative in our public statement.
Robeco also published an article by Masja Zandbergen on ESG and the Coronavirus, “The most important ESG issue in the Coronavirus crisis is our response”, early on in the crisis that gained a good deal of traction. This article is part of our dedicated COVID-19 webpage on which we share the views and analysis of our investment teams and financial specialists.
Encouraging Shell to become a net zero emissions energy business by 2050 Robeco has once more been recognised for its critical role in persuading Royal Dutch Shell (Shell) to further strengthen its measures to reduce its carbon footprint. Together with the Church of England Pensions Board, Robeco led the investor engagement activities on behalf of Climate Action 100+, an initiative spearheaded by more than 450 investors with over USD $40 trillion in assets under management. This follows earlier engagement success with Shell in 2018.

Sustainable investing (continued)
Encouraging Shell to become a net zero emissions energy business by 2050 (continued) Shell has committed to take additional action on climate change. The company plans to become a net-zero emissions energy business by 2050 or sooner (covering scope one, two and three emissions). The steps include:
• An ambition to be net zero on all the emissions from the manufacture of all our products (scope one and two) by 2050 at the latest;• Accelerating Shell’s Net Carbon Footprint ambition to be in step with society’s aim to limit the average temperature rise to 1.5
degrees Celsius in line with the goals of the Paris Agreement on Climate Change. This means reducing the Net Carbon Footprint ofthe energy products Shell sells to its customers by around 65% by 2050 (increased from around 50%), and by around 30% by 2035(increased from around 20%);
• A pivot towards serving businesses and sectors that by 2050 are also net-zero emissions.
Voting In 1998, Robeco started voting for its investment funds and on behalf of its institutional clients. The votes are cast by specialised voting analysts in the Active Ownership team. We attend several shareholder meetings ourselves, but in most cases we cast our votes electronically. Our voting activities are published shortly after the shareholders’ meetings on our website, in line with best practice regarding voting transparency.
Our extensive voting policy is based on 20 years of experience and insight, and we anticipate the specific policy requests of our mandates if necessary. We vote at all meetings where this is possible. In practice, we only refrain from voting in the event of share blocking. In such cases, we assess the importance of the meeting and the influence of our positions on the voting.
Our voting policy and our analysis are based on the internationally accepted principles of the International Corporate Governance Network (ICGN) and on local directives. These principles constitute an extensive framework for assessing the corporate governance practices of companies. They also provide sufficient latitude for companies to be assessed on the basis of local standards, national legislation and codes of conduct for corporate governance. In our assessment we take into account company-specific circumstances.
Important decisions are taken in close consultation with the portfolio managers and the analysts in Robeco's investment teams and with our engagement specialists. The information we receive during shareholders’ meetings is taken into account in our engagement activities and in the investment process followed by the Robeco funds.
We voted at 581 shareholder meetings on behalf of Robeco Institutional Umbrella Fund. At 349 (60%) of the 581 meetings, we cast at least one vote against management's recommendation.
Engagement Since as early as 2005, we have encouraged management board members from the companies in which we invest to practice good corporate governance and to strive to achieve an environmentally and socially friendly policy. The aim of our engagement is to increase shareholder value in the long term and to achieve a positive impact on society. For Robeco, engagement and voting are important elements for achieving a successful integrated strategy for Sustainable investing that will lead to enhanced investment decisions and can improve the risk/return profile of our portfolios.
For our engagement activities we use a focused approach in which we enter into a constructive dialogue with a relevant selection of companies in which we invest. This dialogue deals with ESG factors such as quality of management, human rights and management of environmental risks. We differentiate between two types of engagement: the proactive Value Engagement approach and the Enhanced Engagement approach following a violation of the principles of the UN Global Compact and OECD Guidelines for Multinational Enterprises.
Our Value Engagement activities focus on a small number of sustainability themes with the greatest potential for value creation for the companies in which we invest. We select these themes on the basis of financial materiality by carrying out a baseline measurement and formulating engagement profiles for the companies we enter into a dialogue with. We select new engagement themes in close consultation with engagement specialists, portfolio managers and analysts, who work together closely throughout the dialogue. We give priority to companies in Robeco's portfolios with the greatest exposure to the selected engagement theme.
Our Enhanced Engagement program focuses on companies whose actions conflict seriously and systematically with the principles of the United Nations Global Compact (UNGC) in the field of human rights, labor, the environment and anti-corruption and OECD Guidelines for Multinational Enterprises. With this program we try to exert an influence on these companies to persuade them to act in accordance with the UNGC principles and OECD Guidelines. Our engagement normally lasts three years, during which time we hold regular meetings and conference calls with representatives from the company and monitor progress made on the engagement objectives.
If an Enhanced Engagement dialogue does not lead to the desired result, Robeco can exclude this company from Robeco's investment universe. The Enhanced Engagement process is a formal part of Robeco's exclusion policy.
For Robeco Institutional Umbrella Fund, we entered i nto a dialogue with 112 companies, involving 108 Value Engagement and 4 Enhanced Engagements.
Rotterdam, 31 August 2020 The Manager
Robeco Institutional Umbrella Fund 17

Robeco Institutional Umbrella Fund 18
Semi-annual financial statements Balance sheet
30 June 2020 31 December 2019 30 June 2020 31 December 2019Before profit appropriation, EUR x thousand EUR EUR EUR EURAssetsInvestmentsFinancial investmentsEquities 502,449 911,232 357,480 662,635 Derivatives 2 - - 81 38 Total investments 502,449 911,232 357,561 662,673
Accounts receivableDividends receivable 3 775 1,889 231 542 Receivables on securities transactions 1 3 - - Other receivables, prepayments and accrued income 4 2,608 1,901 1,191 996
3,384 3,793 1,422 1,538 Other assetsCash and cash equivalents 5 6,860 5,745 1,811 6,634
LiabilitiesAccounts payablePayable to affiliated parties 6 (275) (533) (196) (400)Other liabilities, accruals and deferred income 8 (196) (252) (118) (117)
(471) (785) (314) (517)
Accounts receivable and other assets less accounts payable 9,773 8,753 2,919 7,655
InvestmentsDerivatives 2 - - - (10)
Fund assets 9,10 512,222 919,985 360,480 670,318
Composition of fund assetsParticipants capital 9 476,460 767,619 347,552 590,335 General reserve 9 (51,870) (28,178) (15,007) (7,829)Undistributed earnings 9 87,632 180,544 27,935 87,812
512,222 919,985 360,480 670,318
Robeco QI Institutional Global Developed Conservative Equities
Robeco QI Institutional Global Developed Momentum Equities
The numbers of the items in the financial statements refer to the numbers in the notes.
Robeco Institutional Umbrella Fund 19
Semi-annual financial statements
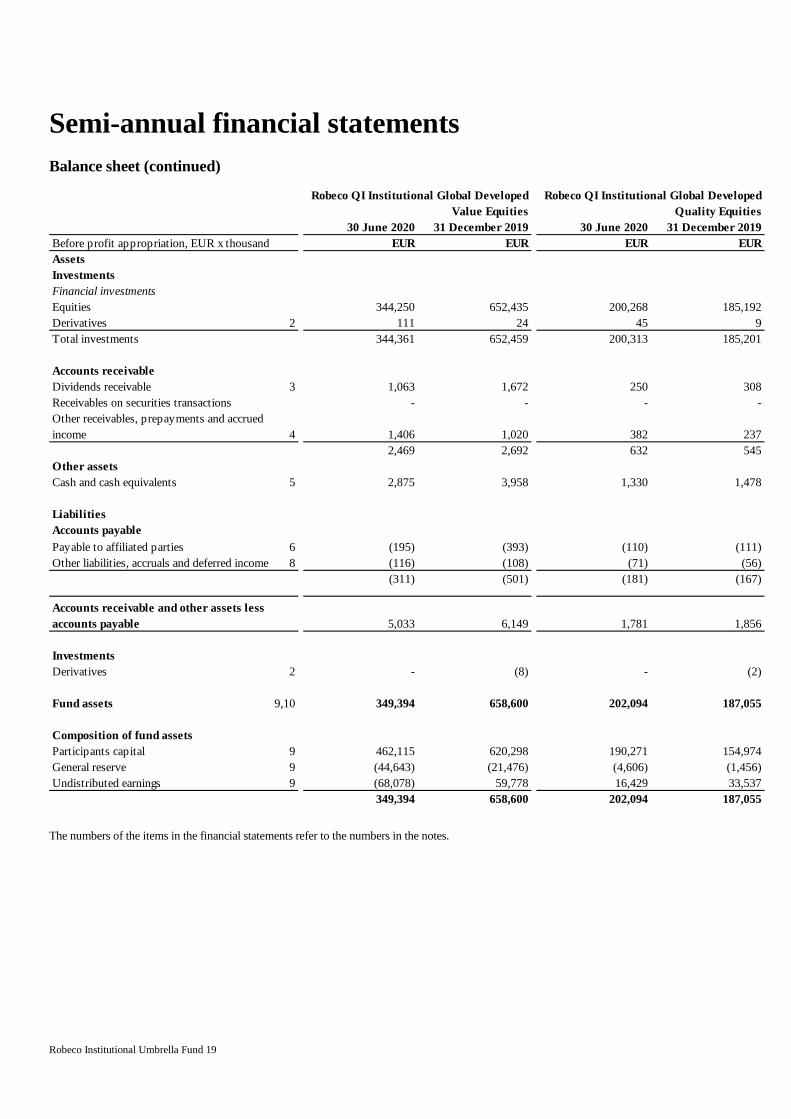
Balance sheet (continued)
30 June 2020 31 December 2019 30 June 2020 31 December 2019Before profit appropriation, EUR x thousand EUR EUR EUR EURAssetsInvestmentsFinancial investmentsEquities 344,250 652,435 200,268 185,192 Derivatives 2 111 24 45 9 Total investments 344,361 652,459 200,313 185,201
Accounts receivableDividends receivable 3 1,063 1,672 250 308 Receivables on securities transactions - - - - Other receivables, prepayments and accrued income 4 1,406 1,020 382 237
2,469 2,692 632 545 Other assetsCash and cash equivalents 5 2,875 3,958 1,330 1,478
LiabilitiesAccounts payablePayable to affiliated parties 6 (195) (393) (110) (111)Other liabilities, accruals and deferred income 8 (116) (108) (71) (56)
(311) (501) (181) (167)
Accounts receivable and other assets less accounts payable 5,033 6,149 1,781 1,856
InvestmentsDerivatives 2 - (8) - (2)
Fund assets 9,10 349,394 658,600 202,094 187,055
Composition of fund assetsParticipants capital 9 462,115 620,298 190,271 154,974 General reserve 9 (44,643) (21,476) (4,606) (1,456)Undistributed earnings 9 (68,078) 59,778 16,429 33,537
349,394 658,600 202,094 187,055
Robeco QI Institutional Global Developed Value Equities
Robeco QI Institutional Global Developed Quality Equities
The numbers of the items in the financial statements refer to the numbers in the notes.
Robeco Institutional Umbrella Fund 20
Semi-annual financial statements
Balance sheet (continued)
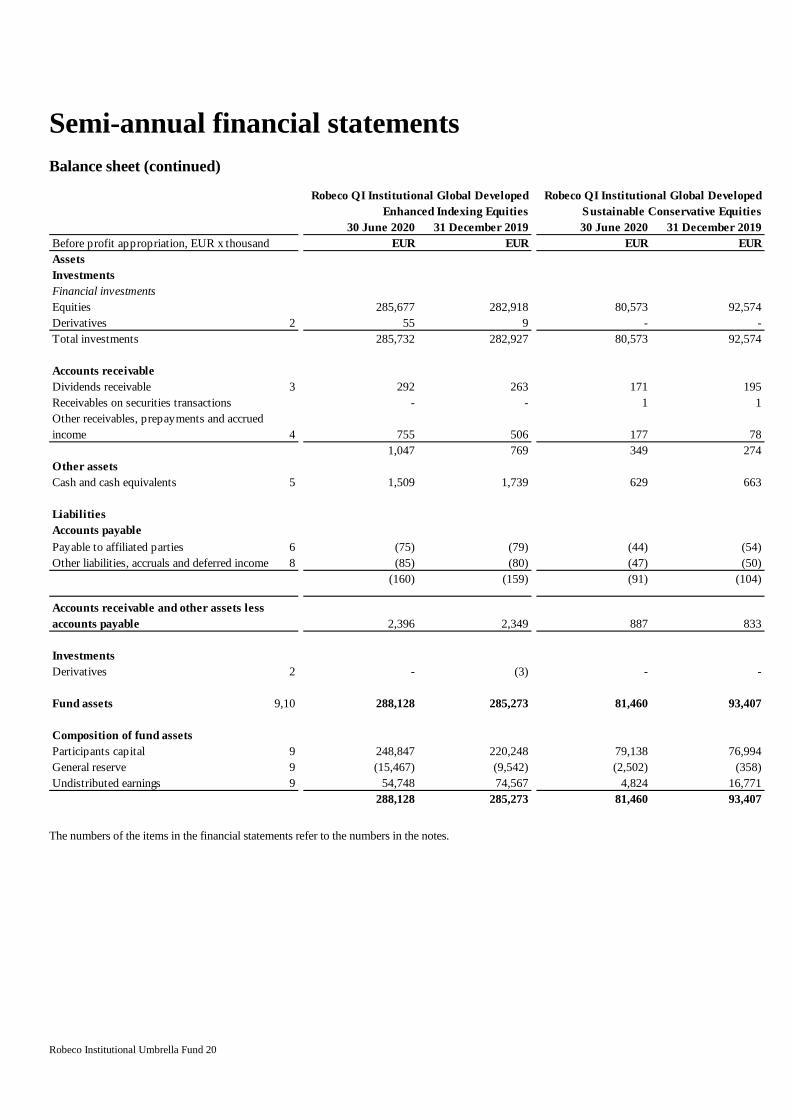
30 June 2020 31 December 2019 30 June 2020 31 December 2019Before profit appropriation, EUR x thousand EUR EUR EUR EURAssetsInvestmentsFinancial investmentsEquities 285,677 282,918 80,573 92,574 Derivatives 2 55 9 - - Total investments 285,732 282,927 80,573 92,574
Accounts receivableDividends receivable 3 292 263 171 195 Receivables on securities transactions - - 1 1 Other receivables, prepayments and accrued income 4 755 506 177 78
1,047 769 349 274 Other assetsCash and cash equivalents 5 1,509 1,739 629 663
LiabilitiesAccounts payablePayable to affiliated parties 6 (75) (79) (44) (54)Other liabilities, accruals and deferred income 8 (85) (80) (47) (50)
(160) (159) (91) (104)
Accounts receivable and other assets less accounts payable 2,396 2,349 887 833
InvestmentsDerivatives 2 - (3) - -
Fund assets 9,10 288,128 285,273 81,460 93,407
Composition of fund assetsParticipants capital 9 248,847 220,248 79,138 76,994 General reserve 9 (15,467) (9,542) (2,502) (358)Undistributed earnings 9 54,748 74,567 4,824 16,771
288,128 285,273 81,460 93,407
Robeco QI Institutional Global Developed Enhanced Indexing Equities
Robeco QI Institutional Global Developed Sustainable Conservative Equities
The numbers of the items in the financial statements refer to the numbers in the notes.

Robeco Institutional Umbrella Fund 21
Semi-annual financial statements
Balance sheet (continued)
30 June 2020 31 December 2019 30 June 2020 31 December 2019Before profit appropriation, EUR x thousand EUR EUR EUR EURAssetsInvestmentsFinancial investmentsEquities 285,078 285,942 2,055,775 3,072,928 Derivatives 2 - 2 292 82 Total investments 285,078 285,944 2,056,067 3,073,010
Accounts receivableDividends receivable 3 441 458 3,223 5,327 Receivables on securities transactions 2 2 4 6 Other receivables, prepayments and accrued income 4 179 113 6,698 4,851
622 573 9,925 10,184 Other assetsCash and cash equivalents 5 1,688 1,494 16,702 21,711
LiabilitiesAccounts payablePayable to affiliated parties 6 (156) (166) (1,051) (1,736)Other liabilities, accruals and deferred income 8 (1,003) (141) (1,636) (804)
(1,159) (307) (2,687) (2,540)
Accounts receivable and other assets less accounts payable 1,151 1,760 23,940 29,355
InvestmentsDerivatives 2 - - - (23)
Fund assets 9,10 286,229 287,704 2,080,007 3,102,342
Composition of fund assetsParticipants capital 9 298,756 250,519 2,103,139 2,680,987 General reserve 9 (5,577) (144) (139,672) (68,983)Undistributed earnings 9 (6,950) 37,329 116,540 490,338
286,229 287,704 2,080,007 3,102,342
Robeco QI Institutional Global Developed Sustainable Multi-Factor Equities Total
The numbers of the items in the financial statements refer to the numbers in the notes.

Robeco Institutional Umbrella Fund 22
Semi-annual financial statements Profit and loss account
period ended year ended period ended year ended30 June 2020 31 December 2019 30 June 2020 31 December 2019
EUR x thousand EUR EUR EUR EURIncomeDividends 11 10,842 30,656 4,355 11,883Interest 12 1 6 - 3Receipts on surcharges and discounts on issuance and repurchase of own units 662 472 607 164Changes in valueUnrealised profits on investments 14,323 192,120 31,788 181,511Realised profits on investments 68,033 46,755 72,688 64,433Unrealised (losses) on investments (136,969) (17,885) (113,837) (29,098)Realised (losses) on investments (47,500) (29,782) (53,629) (62,790)Net currency (loss)/profit (127) 198 (216) 51Total operating income (90,735) 222,540 (58,244) 166,157
ExpensesManagement costs 14 (2,100) (5,920) (1,519) (4,338)Other costs 16 (77) (250) (114) (268)Total operating expenses (2,177) (6,170) (1,633) (4,606)
Net result (92,912) 216,370 (59,877) 161,551
Robeco QI Institutional Global Developed Conservative Equities
Robeco QI Institutional Global Developed Momentum Equities
The numbers of the items in the financial statements refer to the numbers in the notes.

Robeco Institutional Umbrella Fund 23
Semi-annual financial statements
Profit and loss account (continued)
period ended year ended period ended year ended30 June 2020 31 December 2019 30 June 2020 31 December 2019
EUR x thousand EUR EUR EUR EURIncomeDividends 11 8,447 28,784 2,243 4,504Interest 12 1 3 - -Receipts on surcharges and discounts on issuance and repurchase of own units 515 169 45 57Changes in valueUnrealised profits on investments 39,994 130,015 13,662 39,272Realised profits on investments 36,675 31,468 5,190 5,628Unrealised (losses) on investments (131,760) (33,058) (30,558) (6,798)Realised (losses) on investments (80,407) (40,653) (7,039) (3,249)Net currency profit/(loss) 239 (79) (28) 29Total operating income (126,296) 116,649 (16,485) 39,443
ExpensesManagement costs 14 (1,451) (4,354) (584) (1,088)Other costs 16 (109) (230) (39) (70)Total operating expenses (1,560) (4,584) (623) (1,158)
Net result (127,856) 112,065 (17,108) 38,285
Robeco QI Institutional Global Developed Value Equities
Robeco QI Institutional Global Developed Quality Equities
The numbers of the items in the financial statements refer to the numbers in the notes.

Robeco Institutional Umbrella Fund 24
Semi-annual financial statements
Profit and loss account (continued)
period ended year ended period ended year ended30 June 2020 31 December 2019 30 June 2020 31 December 2019
EUR x thousand EUR EUR EUR EURIncomeDividends 11 3,415 8,684 1,366 2,728Interest 12 - 5 - -Receipts on surcharges and discounts on issuance and repurchase of own units 36 160 - -Changes in valueUnrealised profits on investments 19,879 74,400 3,364 18,434Realised profits on investments 8,178 36,070 1,034 2,120Unrealised (losses) on investments (40,102) (7,656) (14,334) (879)Realised (losses) on investments (10,713) (18,648) (3,079) (1,788)Net currency (loss)/profit (70) 28 (18) 20Total operating income (19,377) 93,043 (11,667) 20,635
ExpensesManagement costs 14 (406) (942) (261) (532)Other costs 16 (36) (79) (19) (52)Total operating expenses (442) (1,021) (280) (584)
Net result (19,819) 92,022 (11,947) 20,051
Robeco QI Institutional Global Developed Enhanced Indexing Equities
Robeco QI Institutional Global Developed Sustainable Conservative Equities
The numbers of the items in the financial statements refer to the numbers in the notes.

Robeco Institutional Umbrella Fund 25
Semi-annual financial statements
Profit and loss account (continued)
period ended year ended period ended year ended30 June 2020 31 December 2019 30 June 2020 31 December 2019
EUR x thousand EUR EUR EUR EURIncomeDividends 11 3,884 7,199 34,552 94,438Interest 12 - - 2 17Receipts on surcharges and discounts on issuance and repurchase of own units 76 157 1,941 1,179Changes in valueUnrealised profits on investments 15,988 46,041 138,998 681,793Realised profits on investments 6,072 5,390 197,870 191,864Unrealised (losses) on investments (54,445) (6,269) (522,005) (101,643)Realised (losses) on investments (14,923) (7,109) (217,290) (164,019)Net currency profit/(loss) 4 39 (216) 286Total operating income (43,344) 45,448 (366,148) 703,915
ExpensesManagement costs 14 (869) (1,529) (7,190) (18,703)Other costs 16 (66) (237) (460) (1,186)Total operating expenses (935) (1,766) (7,650) (19,889)
Net result (44,279) 43,682 (373,798) 684,026
Robeco QI Institutional Global Developed Sustainable Multi-Factor Equities Total
The numbers of the items in the financial statements refer to the numbers in the notes.

Robeco Institutional Umbrella Fund 26
Semi-annual financial statements Cash flow statement
period ended year ended period ended year ended30 June 2020 31 December 2019 30 June 2020 31 December 2019
Indirect method, EUR x thousand EUR EUR EUR EUR Cash flow from investment activities 313,615 202,209 244,778 124,829Cash flow from financing activities (314,189) (201,419) (250,568) (123,570)
Net cash flow (574) 790 (5,790) 1,259
Currency and cash revaluation 1,689 (199) 967 (168)Increase (+)/decrease (-) cash 1,115 591 (4,823) 1,091
Cash and cash equivalents at opening date 5,745 5,154 6,634 5,543
Cash and cash equivalents at closing date 6,860 5,745 1,811 6,634
Robeco QI Institutional Global Developed Conservative Equities
Robeco QI Institutional Global Developed Momentum Equities
period ended year ended period ended year ended30 June 2020 31 December 2019 30 June 2020 31 December 2019
Indirect method, EUR x thousand EUR EUR EUR EUR Cash flow from investment activities 180,284 122,362 (32,233) (24,941)Cash flow from financing activities (181,865) (125,962) 32,102 24,986
Net cash flow (1,581) (3,600) (131) 45
Currency and cash revaluation 498 (202) (17) (88)Decrease (-)/increase (+) cash (1,083) (3,802) (148) (43)
Cash and cash equivalents at opening date 3,958 7,760 1,478 1,521
Cash and cash equivalents at closing date 2,875 3,958 1,330 1,478
Robeco QI Institutional Global Developed Value Equities
Robeco QI Institutional Global Developed Quality Equities
The numbers of the items in the financial statements refer to the numbers in the notes.

Robeco Institutional Umbrella Fund 27
Semi-annual financial statements
Cash flow statement (continued)
period ended year ended period ended year ended30 June 2020 31 December 2019 30 June 2020 31 December 2019
Indirect method, EUR x thousand EUR EUR EUR EUR Cash flow from investment activities (22,883) 188,955 (24) 222Cash flow from financing activities 22,637 (190,639) - -
Net cash flow (246) (1,684) (24) 222
Currency and cash revaluation 16 600 (10) 8Decrease (-)/increase (+) cash (230) (1,084) (34) 230
Cash and cash equivalents at opening date 1,739 2,823 663 433
Cash and cash equivalents at closing date 1,509 1,739 629 663
Robeco QI Institutional Global Developed Sustainable Conservative Equities
Robeco QI Institutional Global Developed Enhanced Indexing Equities
period ended year ended period ended year ended30 June 2020 31 December 2019 30 June 2020 31 December 2019
Indirect method, EUR x thousand EUR EUR EUR EUR Cash flow from investment activities (42,530) (102,388) 641,007 511,248Cash flow from financing activities 42,728 102,600 (649,155) (514,004)
Net cash flow 198 212 (8,148) (2,756)
Currency and cash revaluation (4) (448) 3,139 (497)Increase (+)/decrease (-) cash 194 (236) (5,009) (3,253)
Cash and cash equivalents at opening date 1,494 1,730 21,711 24,964
Cash and cash equivalents at closing date 1,688 1,494 16,702 21,711
Robeco QI Institutional Global Developed Sustainable Multi-Factor Equities Total
The numbers of the items in the financial statements refer to the numbers in the notes.

Robeco Institutional Umbrella Fund 28
Notes
General The semi-annual financial statements have been drawn up in conformity with Part 9, Book 2 of the Dutch Civil Code. The fund’s financial period is from 1 January 2020 to 30 June 2020. The following participating units were in issue at the balance sheet date: Robeco QI Institutional Global Developed Conservative Equities • T1 EUR units • T8 CAD units • T12 EUR units
Robeco QI Institutional Global Developed Momentum Equities • T1 EUR units • T8 CAD units • T12 EUR units
Robeco QI Institutional Global Developed Value Equities • T1 EUR units • T8 CAD units • T12 EUR units
Robeco QI Institutional Global Developed Quality Equities • T1 EUR units • T8 CAD units • T12 EUR units
Robeco QI Institutional Global Developed Enhanced Indexing Equities • T1 EUR units
Robeco QI Institutional Global Developed Sustainable Conservative Equities • T2 EUR units
Robeco QI Institutional Global Developed Sustainable Multi-Factor Equities • T1 EUR units • T9 EUR units
Accounting principles General The financial statements are produced according to the going concern assumption. Unless stated otherwise, items shown in the semi-annual financial statements are included at nominal value and expressed in thousands of euros. Assets and liabilities are recognised or derecognised in the balance sheet on the transaction date. Financial investments The financial investments are classified as trading portfolio and are valued at fair value, unless stated otherwise. The fair value of stocks is determined on the basis of market prices and other market quotations at closing date. For forward exchange contracts, internal valuation models are used and the value is based on quoted currency rates and reference interest rates at closing date. Transaction costs incurred in the purchase and sale of investments are included in the purchase or sale price. Transaction costs incurred in the purchase and sale of investments will therefore be accounted for in the profit and loss account in the first period of valuation as part of the changes in value. Transaction costs on selling will be accounted for in the profit and loss account as part of the results realised. Changes to the valuation model for forward currency contracts may lead to a different valuation. Derivative instruments with a negative fair value are recognised under the derivatives item under investments on the liability side of the balance sheet.

Robeco Institutional Umbrella Fund 29
Risk management Risks relating to financial instruments Investment risk The value of investments may fluctuate. Past performance is no guarantee of future results. The value of a Participating Unit depends upon developments in the financial markets and may both rise and fall. Participants run the risk that their investments may end up being worth less than the amount they invested or even worth nothing. General investment risk can also be characterised as market risk. Market risk Market risk can be divided into three types: price risk, currency risk and concentration risk. Market risks are contained using limits on quantitative risk measures such as tracking error, volatility or value-at-risk. Indirectly, this also limits the underlying risk types (price risk, concentration risk and currency risk). Price risk The value of the Participating Units is sensitive to market fluctuations. In addition, investors should be aware of the possibility that the value of investments may vary as a result of changes in political, economic or market circumstances, as well as changes in an individual business situation. The entire portfolios are exposed to price risk. The degree of price risk that the sub-fund’s run depends among other things on the risk profile of the sub-fund's portfolio. More detailed information on the risk profile of the sub-fund's portfolio can be found in the section on return and risk on page 13. Currency risk All or part of the securities portfolio of the sub-fund may be invested in currencies, or financial instruments denominated in currencies other than the euro. As a result, fluctuations in exchange rates may have both a negative and a positive effect on the investment result of the sub-fund. Currency risks may be hedged with currency forward transactions and currency options. Currency risks can be limited by applying relative or absolute currency concentration limits. As at the balance sheet date, there were no positions in currency futures contracts. The table below shows the gross and net exposure to the different currencies on securities. Robeco QI Institutional Global Developed Conservative Equities
Currency-exposureIn EUR x thousand
CurrencyGross position
30 June 2020Net position
30 June 2020In %
30 June 2020In %
31 December 2019AUD 19,165 19,165 3.8% 6.2%CAD 35,590 35,590 7.1% 8.8%CHF 32,177 32,177 6.4% 5.6%DKK - - -% 0.2%EUR 34,926 34,926 6.9% 6.0%GBP 26,941 26,941 5.4% 5.4%HKD 7,906 7,906 1.6% 1.9%ILS 4,075 4,075 0.8% 0.4%JPY 30,417 30,417 6.1% 4.8%NOK 8,031 8,031 1.6% 0.9%NZD 3,227 3,227 0.6% 0.8%SEK 8,626 8,626 1.7% 2.5%SGD 4,434 4,434 0.9% 2.1%USD 286,934 286,934 57.1% 54.4%Total 502,449 502,449 100.0% 100.0%

Robeco Institutional Umbrella Fund 30
Currency risk (continued) Robeco QI Institutional Global Developed Momentum Equities
Currency-exposureIn EUR x thousand
CurrencyGross position
30 June 2020Net position
30 June 2020In %
30 June 2020In %
31 December 2019AUD 8,792 8,792 2.5% 4.5%CAD 16,826 16,826 4.7% 4.7%CHF 7,955 7,955 2.2% 2.9%DKK 4,345 4,345 1.2% 0.5%EUR 30,111 30,111 8.4% 9.7%GBP 4,274 4,274 1.2% 3.7%HKD 689 689 0.2% - %ILS - - -% 0.7%JPY 53,319 53,319 14.9% 11.5%NOK 4,710 4,710 1.3% 0.8%NZD 5,859 5,859 1.7% 0.9%SEK 6,137 6,137 1.7% 4.0%SGD 1,700 1,700 0.5% 0.3%USD 212,763 212,763 59.5% 55.8%Total 357,480 357,480 100.0% 100.0%
Robeco QI Institutional Global Developed Value Equities
Currency-exposureIn EUR x thousand
CurrencyGross position
30 June 2020Net position
30 June 2020In %
30 June 2020In %
31 December 2019AUD 3,471 3,471 1.0% 1.3%CAD 9,782 9,782 2.9% 3.0%DKK 5,374 5,374 1.6% 0.8%EUR 58,963 58,963 17.1% 17.2%GBP 24,255 24,255 7.0% 8.4%HKD 6,550 6,550 1.9% 1.8%ILS - - -% 0.6%JPY 38,853 38,853 11.3% 11.8%NOK 722 722 0.2% 0.5%SEK 593 593 0.2% 0.1%USD 195,687 195,687 56.8% 54.5%Total 344,250 344,250 100.0% 100.0%

Robeco Institutional Umbrella Fund 31
Currency risk (continued) Robeco QI Institutional Global Developed Quality Equities
Currency-exposureIn EUR x thousand
CurrencyGross position
30 June 2020Net position
30 June 2020In %
30 June 2020In %
31 December 2019AUD 7,673 7,673 3.8% 3.4%CAD 4,304 4,304 2.0% 2.8%CHF 3,526 3,526 1.8% 1.2%DKK 4,403 4,403 2.2% 3.1%EUR 17,350 17,350 8.7% 6.9%GBP 10,027 10,027 5.0% 6.1%HKD 364 364 0.2% 0.3%ILS 403 403 0.2% 0.2%JPY 22,348 22,348 11.2% 7.6%NOK - - -% 0.6%SEK 1,938 1,938 1.0% 1.5%SGD 111 111 0.1% 0.1%USD 127,821 127,821 63.8% 66.2%Total 200,268 200,268 100.0% 100.0%
Robeco QI Institutional Global Developed Enhanced Indexing Equities
Currency-exposureIn EUR x thousand
CurrencyGross position
30 June 2020Net position
30 June 2020In %
30 June 2020In %
31 December 2019AUD 5,274 5,274 1.8% 2.8%CAD 8,496 8,496 3.0% 3.4%CHF 9,463 9,463 3.3% 2.9%DKK 3,068 3,068 1.1% 0.7%EUR 28,957 28,957 10.1% 10.6%GBP 12,367 12,367 4.3% 5.5%HKD 2,340 2,340 0.8% 0.7%ILS 614 614 0.2% - %JPY 24,439 24,439 8.6% 8.7%NOK 114 114 0.1% 0.3%NZD 171 171 0.1% - %SEK 2,619 2,619 0.9% 0.9%SGD 987 987 0.3% 0.3%USD 186,768 186,768 65.4% 63.2%Total 285,677 285,677 100.0% 100.0%

Robeco Institutional Umbrella Fund 32
Currency risk (continued) Robeco QI Institutional Global Developed Sustainable Conservative Equities
Currency-exposureIn EUR x thousand
CurrencyGross position
30 June 2020Net position
30 June 2020In %
30 June 2020In %
31 December 2019AUD 4,059 4,059 5.0% 6.2%CAD 6,226 6,226 7.7% 8.1%CHF 5,885 5,885 7.3% 7.0%DKK 322 322 0.4% 0.1%EUR 5,051 5,051 6.3% 5.9%GBP 3,185 3,185 4.0% 5.7%HKD 921 921 1.1% 1.1%ILS 277 277 0.3% 0.7%JPY 4,002 4,002 5.0% 3.4%NOK 508 508 0.6% 0.6%NZD 739 739 0.9% 1.3%SEK 2,079 2,079 2.6% 3.4%SGD 1,015 1,015 1.3% 2.1%USD 46,304 46,304 57.5% 54.4%Total 80,573 80,573 100.0% 100.0%
Robeco QI Institutional Global Developed Sustainable Multi-Factor Equities
Currency-exposureIn EUR x thousand
CurrencyGross position
30 June 2020Net position
30 June 2020In %
30 June 2020In %
31 December 2019AUD 8,079 8,079 2.8% 4.2%CAD 11,877 11,877 4.2% 4.2%CHF 6,925 6,925 2.4% 2.3%DKK 2,283 2,283 0.8% 0.8%EUR 31,284 31,284 11.0% 13.2%GBP 12,048 12,048 4.2% 5.7%HKD 965 965 0.3% 0.3%ILS 457 457 0.2% 0.5%JPY 34,370 34,370 12.1% 8.9%NOK 984 984 0.3% 0.4%NZD 1,879 1,879 0.7% 0.5%SEK 2,844 2,844 1.0% 1.5%SGD 1,316 1,316 0.5% 0.6%USD 169,767 169,767 59.5% 56.9%Total 285,078 285,078 100.0% 100.0%

Robeco Institutional Umbrella Fund 33
Concentration risk Based on its investment policy, the sub-fund may invest in financial instruments from issuing institutions that – mainly – operate within the same sector or region, or in the same market. In the case of concentrated investment portfolios, events within the sectors, regions or markets in which they invest have a more pronounced effect on the sub-fund assets than in case of a less concentrated investment portfolio. Concentration risks can be limited by applying relative or absolute country or sector concentration limits. The following tables show the exposure to stock markets through stocks and stock-market index futures per country in amounts and as a percentage of the sub-fund's total equity capital. Robeco QI Institutional Global Developed Conservative Equities
Concentration risk by country In EUR x thousand
EquitiesEquity index-
futures Total exposure In % of net assets In % of net assets30 June 2020 30 June 2020 30 June 2020 30 June 2020 31 December 2019
AmericaCanada 35,590 - 35,590 7.1% 8.8% United States 286,919 - 286,919 57.1% 54.3%
AustraliaAustralia 19,165 - 19,165 3.8% 6.2% New Zealand 3,227 - 3,227 0.6% 0.8%
EuropeAustria 1,523 - 1,523 0.3% 0.2% Belgium 499 - 499 0.1% 0.3% Denmark - - - - 0.2% Finland 4,718 - 4,718 0.9% 0.6% Germany 9,374 - 9,374 1.9% 1.3% Italy 8,354 - 8,354 1.7% 2.4% Luxembourg 881 - 881 0.2% 0.1% Netherlands 5,996 - 5,996 1.2% 0.6% Norway 8,031 - 8,031 1.6% 0.9% Spain 3,581 - 3,581 0.7% 0.4% Sweden 8,626 - 8,626 1.7% 2.5% Switzerland 32,177 - 32,177 6.4% 5.7% United Kingdom 26,630 - 26,630 5.3% 5.4%
AsiaHong Kong 7,921 - 7,921 1.6% 2.0% Israel 4,386 - 4,386 0.9% 0.4% Japan 30,417 - 30,417 6.0% 4.8% Singapore 4,434 - 4,434 0.9% 2.1% Total 502,449 - 502,449 100.0% 100.0%

Robeco Institutional Umbrella Fund 34
Concentration risk (continued) Robeco QI Institutional Global Developed Momentum Equities
Concentration risk by country In EUR x thousand
EquitiesEquity index-
futures Total exposure In % of net assets In % of net assets30 June 2020 30 June 2020 30 June 2020 30 June 2020 31 December 2019
AmericaBermuda 666 - 666 0.2% 0.9% Canada 14,385 - 14,385 4.0% 4.3% Puerto Rico - - - - 1.2% United States 213,140 38 213,178 59.6% 53.9%
AustraliaAustralia 8,792 - 8,792 2.5% 4.5% New Zealand 5,859 - 5,859 1.6% 0.9%
EuropeAustria - - - - 0.2% Belgium 2,674 - 2,674 0.7% 0.5% Denmark 4,344 - 4,344 1.2% 0.5% Finland 1,655 - 1,655 0.5% 0.8% France 9,555 - 9,555 2.7% 3.3% Germany 4,453 43 4,496 1.3% 1.1% Ireland 1,670 - 1,670 0.5% - Italy 5,911 - 5,911 1.7% 2.2% Netherlands 4,433 - 4,433 1.2% 0.3% Norway 4,044 - 4,044 1.1% 0.6% Portugal - - - - 0.1% Spain - - - - 0.6% Sweden 6,137 - 6,137 1.7% 4.0% Switzerland 9,780 - 9,780 2.7% 2.9% United Kingdom 4,274 - 4,274 1.2% 4.7%
AsiaHong Kong 689 - 689 0.2% - Israel - - - - 0.7% Japan 53,319 - 53,319 14.9% 11.5% Singapore 1,700 - 1,700 0.5% 0.3% Total 357,480 81 357,561 100.0% 100.0%

Robeco Institutional Umbrella Fund 35
Concentration risk (continued) Robeco QI Institutional Global Developed Value Equities
Concentration risk by country In EUR x thousand
EquitiesEquity index-
futures Total exposure In % of net assets In % of net assets30 June 2020 30 June 2020 30 June 2020 30 June 2020 31 December 2019
AfricaSouth Africa 1,585 - 1,585 0.5% 1.0%
AmericaBermuda 1,083 - 1,083 0.3% 0.3% Canada 9,782 - 9,782 2.8% 3.0% United States 188,661 58 188,719 54.8% 52.7%
AustraliaAustralia 3,471 - 3,471 1.0% 1.2%
EuropeAustria 829 - 829 0.2% 0.2% Belgium 1,878 - 1,878 0.5% 0.2% Denmark 5,374 - 5,374 1.6% 0.8% Finland 2,764 - 2,764 0.8% 0.7% France 20,183 - 20,183 5.9% 6.3% Germany 4,263 53 4,316 1.2% 1.7% Ireland - - - - 0.8% Italy 3,252 - 3,252 0.9% 1.4% Jersey 628 - 628 0.2% 1.0% Netherlands 15,553 - 15,553 4.5% 3.3% Norway 722 - 722 0.2% 0.5% Spain 10,240 - 10,240 3.0% 3.0% Sweden 593 - 593 0.2% 0.1% United Kingdom 27,397 - 27,397 8.0% 7.3%
AsiaHong Kong 7,140 - 7,140 2.1% 2.1% Israel - - - - 0.6% Japan 38,852 - 38,852 11.3% 11.8% Total 344,250 111 344,361 100.0% 100.0%

Robeco Institutional Umbrella Fund 36
Concentration risk (continued)
Robeco QI Institutional Global Developed Quality Equities
Concentration risk by country In EUR x thousand
EquitiesEquity index-
futures Total exposure In % of net assets In % of net assets30 June 2020 30 June 2020 30 June 2020 30 June 2020 31 December 2019
AmericaBermuda - - - - 0.1% Canada 4,304 - 4,304 2.1% 2.8% United States 124,947 21 124,968 62.4% 64.4%
AustraliaAustralia 7,673 - 7,673 3.8% 3.5%
EuropeAustria 1,109 - 1,109 0.6% - Belgium 2,256 - 2,256 1.1% - Denmark 4,403 - 4,403 2.2% 3.1% Finland 1,215 - 1,215 0.6% - France 4,082 - 4,082 2.0% 1.8% Germany 2,611 24 2,635 1.3% 2.8% Gibraltar 604 - 604 0.3% 0.3% Ireland 753 - 753 0.4% - Jersey - - - - 0.6% Netherlands 6,211 - 6,211 3.1% 2.5% Norway - - - - 0.6% Spain - - - - 0.5% Sweden 1,938 - 1,938 1.0% 1.5% Switzerland 3,526 - 3,526 1.8% 1.2% United Kingdom 9,522 - 9,522 4.7% 5.2%
Asia -Israel 2,291 - 2,291 1.1% 1.1% Japan 22,348 - 22,348 11.2% 7.6% Macau 364 - 364 0.2% 0.3% Singapore 111 - 111 0.1% 0.1% Total 200,268 45 200,313 100.0% 100.0%

Robeco Institutional Umbrella Fund 37
Concentration risk (continued) Robeco QI Institutional Global Developed Enhanced Indexing Equities
Concentration risk by country In EUR x thousand
EquitiesEquity index-
futures Total exposure In % of net assets In % of net assets30 June 2020 30 June 2020 30 June 2020 30 June 2020 31 December 2019
AfricaSouth Africa 360 - 360 0.1% 0.2%
AmericaArgentina 268 - 268 0.1% 0.1% Canada 8,496 - 8,496 3.0% 3.4% United States 183,939 26 183,965 64.4% 62.5%
AustraliaAustralia 6,275 - 6,275 2.2% 3.2% New Zealand 171 - 171 0.1% -
EuropeBelgium 1,430 - 1,430 0.5% 0.4% Denmark 3,068 - 3,068 1.1% 0.8% Finland 613 - 613 0.2% 0.2% France 7,953 - 7,953 2.8% 3.6% Germany 7,827 29 7,856 2.7% 2.6% Ireland 1,267 - 1,267 0.4% 0.3% Italy 1,861 - 1,861 0.7% 1.0% Jersey - - - - 0.1% Luxembourg 386 - 386 0.1% - Netherlands 5,722 - 5,722 2.0% 1.9% Norway 114 - 114 - 0.3% Portugal 105 - 105 - - Spain 2,162 - 2,162 0.8% 0.8% Sweden 2,480 - 2,480 0.9% 0.8% Switzerland 10,110 - 10,110 3.5% 3.0% United Kingdom 12,234 - 12,234 4.3% 5.0%
AsiaChina 383 - 383 0.1% 0.1% Hong Kong 1,744 - 1,744 0.6% 0.6% Israel 1,125 - 1,125 0.4% 0.1% Japan 24,439 - 24,439 8.6% 8.6% Macao 158 - 158 0.1% 0.1% Singapore 987 - 987 0.3% 0.3% Total 285,677 55 285,732 100.0% 100.0%

Robeco Institutional Umbrella Fund 38
Concentration risk (continued) Robeco QI Institutional Global Developed Sustainable Conservative Equities
Concentration risk by country In EUR x thousand
EquitiesEquity index-
futures Total exposure In % of net assets In % of net assets30 June 2020 30 June 2020 30 June 2020 30 June 2020 31 December 2019
AmericaCanada 6,226 - 6,226 7.7% 8.1% United States 46,304 - 46,304 57.5% 54.4%
AustraliaAustralia 4,060 - 4,060 5.0% 6.2% New Zealand 738 - 738 0.9% 1.3%
EuropeAustria 137 - 137 0.2% 0.2% Belgium 77 - 77 0.1% 0.3% Denmark 321 - 321 0.4% 0.1% Finland 497 - 497 0.6% 0.5% France - - - - 0.2% Germany 1,818 - 1,818 2.3% 2.2% Italy 1,260 - 1,260 1.6% 1.6% Luxembourg 71 - 71 0.1% 0.1% Netherlands 490 - 490 0.6% 0.1% Norway 508 - 508 0.6% 0.6% Portugal 83 - 83 0.1% 0.1% Spain 619 - 619 0.8% 0.7% Sweden 2,079 - 2,079 2.6% 3.4% Switzerland 5,885 - 5,885 7.3% 6.9% United Kingdom 3,185 - 3,185 3.9% 5.7%
AsiaHong Kong 921 - 921 1.1% 1.1% Israel 277 - 277 0.3% 0.7% Japan 4,002 - 4,002 5.0% 3.4% Singapore 1,015 - 1,015 1.3% 2.1% Total 80,573 - 80,573 100.0% 100.0%
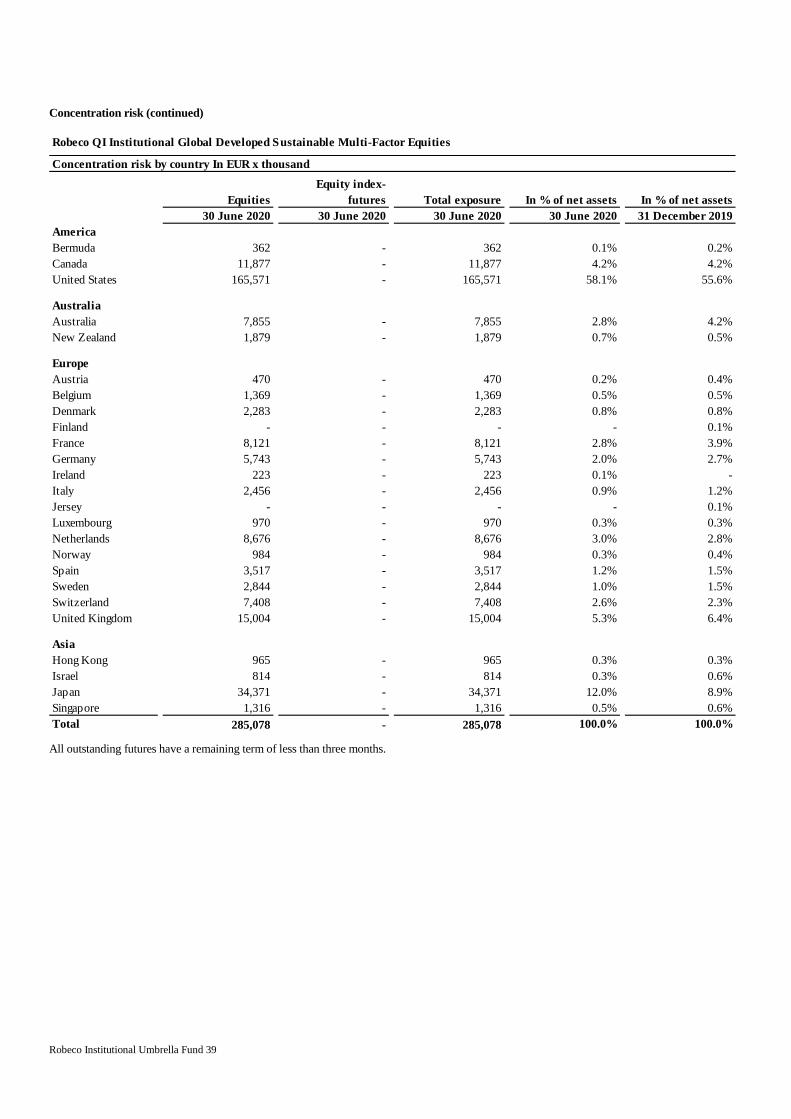
Robeco Institutional Umbrella Fund 39
Concentration risk (continued) Robeco QI Institutional Global Developed Sustainable Multi-Factor Equities
Concentration risk by country In EUR x thousand
EquitiesEquity index-
futures Total exposure In % of net assets In % of net assets30 June 2020 30 June 2020 30 June 2020 30 June 2020 31 December 2019
AmericaBermuda 362 - 362 0.1% 0.2% Canada 11,877 - 11,877 4.2% 4.2% United States 165,571 - 165,571 58.1% 55.6%
AustraliaAustralia 7,855 - 7,855 2.8% 4.2% New Zealand 1,879 - 1,879 0.7% 0.5%
EuropeAustria 470 - 470 0.2% 0.4% Belgium 1,369 - 1,369 0.5% 0.5% Denmark 2,283 - 2,283 0.8% 0.8% Finland - - - - 0.1% France 8,121 - 8,121 2.8% 3.9% Germany 5,743 - 5,743 2.0% 2.7% Ireland 223 - 223 0.1% - Italy 2,456 - 2,456 0.9% 1.2% Jersey - - - - 0.1% Luxembourg 970 - 970 0.3% 0.3% Netherlands 8,676 - 8,676 3.0% 2.8% Norway 984 - 984 0.3% 0.4% Spain 3,517 - 3,517 1.2% 1.5% Sweden 2,844 - 2,844 1.0% 1.5% Switzerland 7,408 - 7,408 2.6% 2.3% United Kingdom 15,004 - 15,004 5.3% 6.4%
AsiaHong Kong 965 - 965 0.3% 0.3% Israel 814 - 814 0.3% 0.6% Japan 34,371 - 34,371 12.0% 8.9% Singapore 1,316 - 1,316 0.5% 0.6% Total 285,078 - 285,078 100.0% 100.0%
All outstanding futures have a remaining term of less than three months.

Robeco Institutional Umbrella Fund 40
Concentration risk (continued) The sector concentrations are shown below. Robeco QI Institutional Global Developed Conservative Robeco QI Institutional Global Developed MomentumEquities Equities
Sector allocation Sector allocationIn % 30 June 2020 31 December 2019 In % 30 June 2020 31 December 2019Financials 23.6% 31.2% Financials 14.3% 25.5% Consumer staples 13.0% 15.2% Consumer staples 13.5% 16.2% Utilities 8.3% 11.8% Utilities 0.8% 0.7% Telecom services 15.1% 10.9% Telecom services 7.5% 6.8% Industrials 6.6% 7.3% Industrials 13.6% 12.5% Consumer discretionary 24.2% 16.7% Consumer discretionary 26.0% 20.7% Information technology 7.6% 4.7% Information technology 21.2% 14.3% Materials 1.0% 0.9% Materials 2.1% 1.4% Energy 0.6% 1.3% Energy 1.0% 1.9% Total 100.0% 100.0% Total 100.0% 100.0%
Robeco QI Institutional Global Developed Value Equities Robeco QI Institutional Global Developed Quality Equities
Sector allocation Sector allocationIn % 30 June 2020 31 December 2019 In % 30 June 2020 31 December 2019Financials 20.9% 19.6% Financials 13.7% 16.1% Consumer staples 19.3% 19.5% Consumer staples 16.0% 21.0% Utilities 1.4% 4.4% Utilities - 0.5% Telecom services 14.1% 14.0% Telecom services 11.0% 9.3% Industrials 4.6% 4.1% Industrials 9.6% 7.3% Consumer discretionary 12.5% 8.5% Consumer discretionary 22.4% 18.5% Information technology 10.3% 10.4% Information technology 23.1% 21.7% Materials 7.4% 10.7% Materials 2.9% 2.7% Energy 9.5% 8.6% Energy 1.3% 2.9% Other assets and liabilities - 0.2% Other assets and liabilities - - Total 100.0% 100.0% Total 100.0% 100.0%
Robeco QI Institutional Global Developed Sustainable Conservative Equities
Sector allocation Sector allocationIn % 30 June 2020 31 December 2019 In % 30 June 2020 31 December 2019Financials 15.3% 18.4% Financials 26.2% 33.8% Consumer staples 9.6% 11.2% Consumer staples 8.2% 14.8% Utilities 3.1% 2.9% Utilities 5.1% 4.8% Telecom services 13.3% 11.2% Telecom services 12.3% 12.2% Industrials 9.7% 10.3% Industrials 6.7% 7.5% Consumer discretionary 23.4% 22.4% Consumer discretionary 30.5% 19.0% Information technology 18.7% 14.3% Information technology 8.8% 6.0% Materials 3.7% 3.9% Materials 0.9% - Energy 3.1% 5.2% Energy 1.3% 1.9% Other assets and liabilities 0.1% 0.2% Other assets and liabilities - - Total 100.0% 100.0% Total 100.0% 100.0%
Robeco QI Institutional Global Developed Enhanced Indexing Equities

Robeco Institutional Umbrella Fund 41
Concentration risk (continued)
Sector allocationIn % 30 June 2020 31 December 2019Financials 18.8% 25.1% Consumer staples 14.5% 19.0% Utilities 2.2% 2.0% Telecom services 10.9% 10.3% Industrials 8.6% 7.8% Consumer discretionary 22.2% 17.0% Information technology 17.0% 13.0% Materials 2.8% 2.1% Energy 2.9% 3.6% Other assets and liabilities 0.1% 0.1% Total 100.0% 100.0%
Robeco QI Institutional Global Developed Sustainable Multi-Factor Equities
Counterparty risk Counterparty risk is an unintentional form of risk that is a consequence of the investment policy. It occurs when a counterparty of the fund fails to fulfill its financial obligations arising from financial transactions with the sub-fund. Counterparty risk is limited as much as possible by taking every possible care in the selection of counterparties. In selecting counterparties, the assessments of independent rating bureaus are taken into account, as are other relevant indicators. Wherever it is customary in the market, the fund will demand and obtain collateral in order to mitigate counterparty risk. The figure that best represents the maximum credit risk is given in the table below.
30 June 2020 31 December 2019 30 June 2020 31 December 2019In EUR x thousand In % of net assets In % of net assets
In EUR x thousand In % of net assets In % of net assets
Receivables 3,384 0.66% 0.41% Receivables 1,422 0.39% 0.23%Cash 6,860 1.34% 0.62% Cash 1,811 0.50% 0.99%Total 10,244 2.00% 1.03% Total 3,233 0.89% 1.22%
30 June 2020 31 December 2019 30 June 2020 31 December 2019In EUR x thousand In % of net assets In % of net assets
In EUR x thousand In % of net assets In % of net assets
Receivables 2,469 0.71% 0.41% Receivables 632 0.31% 0.29%Cash 2,875 0.82% 0.60% Cash 1,330 0.66% 0.79%Total 5,344 1.53% 1.01% Total 1,962 0.97% 1.08%
30 June 2020 31 December 2019 30 June 2020 31 December 2019In EUR x thousand In % of net assets In % of net assets
In EUR x thousand In % of net assets In % of net assets
Receivables 1,047 0.36% 0.27% Receivables 349 0.43% 0.29%Cash 1,509 0.52% 0.61% Cash 629 0.77% 0.71%Total 2,556 0.88% 0.88% Total 978 1.20% 1.00%
Robeco QI Institutional Global Developed Enhanced Indexing Equities
Robeco QI Institutional Global Developed Sustainable Conservative Equities
Robeco QI Institutional Global Developed Conservative Equities Robeco QI Institutional Global Developed Momentum Equities
Robeco QI Institutional Global Developed Value Equities Robeco QI Institutional Global Developed Quality Equities

Robeco Institutional Umbrella Fund 42
Counterparty risk (continued)
30 June 2020 31 December 2019In EUR x thousand In % of net assets In % of net assets
Receivables 622 0.22% 0.20%Cash 1,688 0.59% 0.52%Total 2,310 0.81% 0.72%
Robeco QI Institutional Global Developed Sustainable Multi-Factor Equities
No account is taken of collateral received in the calculation of the total credit risk. Counterparty risk is contained by applying limits on the exposure per counterparty as a percentage of the fund assets. The sub-fund's exposure to any single counterparty did not exceed 5% of the sub-fund's total assets. Liquidity risk Liquidity risk is an unintentional form of risk that is a consequence of the investment policy. Liquidity risk occurs when financial instruments cannot be sold in a timely fashion unless additional costs are incurred. Liquidity risk can be divided into two categories: exit risks and the liquidity risk of financial instruments. Exit risk Exit risks occur when the fund's value is negatively affected by the exit of one or more clients, with negative consequences for existing clients. The extent to which the value of the fund can be negatively affected depends on the liquidity of the financial instruments in the portfolio, and on the concentration of clients. To prevent any negative effects on the fund as a result of exiting, the fund makes a charge that serves to cover the costs of exiting. Liquidity risk of financial instruments The actual buying and selling prices of financial instruments in which the sub-fund invests partly depend upon the liquidity of the financial instruments in question. It is possible that a position taken on behalf of the sub-fund cannot be quickly liquidated at a reasonable price due to a lack of liquidity in the market in terms of supply and demand. The sub-fund minimises this risk by mainly investing in financial instruments that are tradable on a daily basis. Moreover, liquidity risks of financial instruments are contained using limits on the non-liquid portion of the securities portfolio. Manager Robeco Institutional Asset Management B.V. (“RIAM”) is the fund manager. In this capacity, RIAM handles the asset management, administration and marketing and distribution of the fund. RIAM has a license from the AIFMD within the meaning of Section 2:65 of the Wft. In addition, RIAM is licensed as a manager of UCITS (2:69b Wft, the Dutch Financial Supervision Act), which includes managing individual assets and giving advice on financial instruments. RIAM is subject to supervision by the Dutch Authority for the Financial Markets (Stichting Autoriteit Financiële Markten, “AFM”). RIAM has listed the fund with AFM. RIAM is a 100% subsidiary of ORIX Corporation Europe N.V. via Robeco Holding B.V. (until 1 January 2018 Robeco Groep N.V.) ORIX Corporation Europe N.V. is a part of ORIX Corporation. Depositary Northern Trust Global Services SE, Amsterdam branch has been appointed Depositary of the sub-fund within the meaning of Section 4:62m of the Wft. The Depositary is responsible for the safekeeping of all the assets (other than tangible moveable property) of the Fund and has a duty to take reasonable care to ensure that the Fund is managed in accordance with the Terms and Conditions and applicable legislation relating to the pricing of, and dealing in, Participating Units and relating to the income and the investment and borrowing powers of the sub-funds. The Manager and the Depositary have concluded a custody and depositary agreement (the Depositary Agreement). Liability of the Depositary The Depositary is liable to the Fund and/or the Participants for the loss of any financial instruments under the custody of the Depositary or of a third party to which custody has been delegated. The Depositary is not liable if it can demonstrate that the loss of financial instruments is a result of an external event that is beyond the Depositary’s reasonable control and whose consequences would have been unavoidable despite all reasonable efforts to the contrary. The Depositary is also liable to the Fund and/or the Participants for any other losses they suffer as a result of the Depositary’s negligent or intentional failure to perform its obligations pursuant to the UCITS Directive. Participants may make an indirect claim upon the liability of the Depositary through the Manager. If the Manager refuses to entertain such a request, the Participants are authorised to submit the claim for losses directly to the Depositary before the courts competent in Amsterdam, the Netherlands and such claim shall be governed, construed and interpreted in all respects in accordance with the laws of the Netherlands. Affiliated parties The fund and the manager may utilise the services of and carry out transactions with parties affiliated to the fund within the meaning of the Bgfo, including RIAM, Robeco Nederland B.V. and ORIX Corporation. The services or transactions that will or may be performed by or with Affiliated Entities or Affiliated Parties may include: treasury management, derivatives transactions, custody of financial instruments, lending of financial instruments, issuance and repurchase of shares, credit extension, the purchase and sale of financial instruments on regulated markets or through multilateral trading facilities. All these services and transactions are executed at market rates.

Robeco Institutional Umbrella Fund 43
Notes to the balance sheet 1 Equities Transaction costs Brokerage costs and exchange fees relating to investment transactions are discounted in the cost price or the sales value of the investment transactions. These costs and fees are charged to the result ensuing from changes in value. The quantifiable transaction costs are shown below.
EUR x thousand 30 June 2020 31 December 2019 30 June 2020 31 December 2019 30 June 2020 31 December 2019Transaction typeEquity 155 268 199 523 158 211
Robeco QI Institutional Global Developed Conservative Equities
Robeco QI Institutional Global Developed Momentum Equities
Robeco QI Institutional Global Developed Value Equities
EUR x thousand 30 June 2020 31 December 2019 30 June 2020 31 December 2019 30 June 2020 31 December 2019Transaction typeEquity 38 43 62 117 5 -
Robeco QI Institutional Global Developed Sustainable Conservative Equities
Robeco QI Institutional Global Developed Quality Equities
Robeco QI Institutional Global Developed Enhanced Indexing
Equities
EUR x thousand 30 June 2020 31 December 2019Transaction typeEquity 48 116
Robeco QI Institutional Global Developed Sustainable Multi-
Factor Equities
RIAM wants to be certain that the selection of counterparties for order execution (“brokers”) occurs using procedures and criteria that ensure the best results for the fund (best execution). No costs for research were charged to the fund during the financial period. 2 Derivatives The presentation of derivatives on the balance sheet is based on the liabilities. Robeco QI Institutional Global Developed Momentum Equities
EUR x thousand30 June 2020 30 June 2020 30 June 2020 31 December 2019
DerivativesFutures 81 - 81 28 Total 81 - 81 28
Presentation of derivatives in the balance sheetUnder Assets Under Liabilities Total
Robeco QI Institutional Global Developed Value Equities
EUR x thousand30 June 2020 30 June 2020 30 June 2020 31 December 2019
DerivativesFutures 111 - 111 16 Total 111 - 111 16
Under Assets Under Liabilities TotalPresentation of derivatives in the balance sheet
Robeco QI Institutional Global Developed Quality Equities
EUR x thousand30 June 2020 30 June 2020 30 June 2020 31 December 2019
DerivativesFutures 45 - 45 7 Total 45 - 45 7
Presentation of derivatives in the balance sheetUnder Assets Under Liabilities Total

Robeco Institutional Umbrella Fund 44
2 Derivatives (continued) Robeco QI Institutional Global Developed Enhanced Indexing Equities
EUR x thousand30 June 2020 30 June 2020 30 June 2020 31 December 2019
DerivativesFutures 55 - 55 6 Total 55 - 55 6
Presentation of derivatives in the balance sheetUnder Assets Under Liabilities Total
Robeco QI Institutional Global Developed Sustainable Multi-Factor Equities
EUR x thousand30 June 2020 30 June 2020 30 June 2020 31 December 2019
DerivativesFutures - - - 2 Total - - - 2
Presentation of derivatives in the balance sheetUnder Assets Under Liabilities Total
The results for futures are settled on a daily basis by means of the payment or receipt of the margin account (variation margin). Because of this interim realisation of result, the futures have a value of nil on the balance sheet. The total variation margin per position is the result obtained since the time of concluding the contract. The breakdown according to region for futures is given under the information on concentration risk under the information on risks relating to financial instruments. 3 Dividends receivable These are receivables arising from net dividends declared but not yet received. 4 Other receivables, prepayments and accrued income
EUR x thousand 30 June 2020 31 December 2019 30 June 2020 31 December 2019
Dividend tax to be reclaimed 2,608 1,901 893 670 Margin cash - - 298 326
Subtotal 2,608 1,901 1,191 996
Robeco QI Institutional Global Developed Conservative Equities
Robeco QI Institutional Global Developed Momentum Equities
EUR x thousand 30 June 2020 31 December 2019 30 June 2020 31 December 2019
Dividend tax to be reclaimed 949 757 215 148 Margin cash 457 263 167 89 Subtotal 1,406 1,020 382 237
Robeco QI Institutional Global Developed Value Equities
Robeco QI Institutional Global Developed Quality Equities
EUR x thousand 30 June 2020 31 December 2019 30 June 2020 31 December 2019
Dividend tax to be reclaimed 550 399 177 78 Margin cash 205 107 - - Subtotal 755 506 177 78
Robeco QI Institutional Global Developed Enhanced Indexing Equities
Robeco QI Institutional Global Developed Sustainable Conservative Equities
EUR x thousand 30 June 2020 31 December 2019
Dividend tax to be reclaimed 179 102 Margin cash - 11 Subtotal 179 113
Robeco QI Institutional Global Developed Sustainable Multi-Factor Equities

Robeco Institutional Umbrella Fund 45
5 Cash and cash equivalents
EUR x thousand 30 June 2020 31 December 2019 30 June 2020 31 December 2019Freely available cash 6,860 5,745 1,811 6,634 Total 6,860 5,745 1,811 6,634
Robeco QI Institutional Global Developed Conservative Equities
Robeco QI Institutional Global Developed Momentum Equities
EUR x thousand 30 June 2020 31 December 2019 30 June 2020 31 December 2019Freely available cash 2,875 3,958 1,330 1,478 Total 2,875 3,958 1,330 1,478
Robeco QI Institutional Global Developed Quality Equities
Robeco QI Institutional Global Developed Value Equities
EUR x thousand 30 June 2020 31 December 2019 30 June 2020 31 December 2019Freely available cash 1,509 1,739 629 663 Total 1,509 1,739 629 663
Robeco QI Institutional Global Developed Enhanced Indexing Equities
Robeco QI Institutional Global Developed Sustainable Conservative Equities
EUR x thousand 30 June 2020 31 December 2019Freely available cash 1,688 1,494 Total 1,688 1,494
Robeco QI Institutional Global Developed Sustainable Multi-Factor Equities
6 Payable to affiliated parties This concerns the following payables to RIAM:
EUR x thousand 30 June 2020 31 December 2019 30 June 2020 31 December 2019Payable management fees (275) (533) (196) (400)Total (275) (533) (196) (400)
Robeco QI Institutional Global Developed Conservative Equities
Robeco QI Institutional Global Developed Momentum Equities
EUR x thousand 30 June 2020 31 December 2019 30 June 2020 31 December 2019Payable management fees (195) (393) (110) (111)Total (195) (393) (110) (111)
Robeco QI Institutional Global Developed Value Equities
Robeco QI Institutional Global Developed Quality Equities
EUR x thousand 30 June 2020 31 December 2019 30 June 2020 31 December 2019Payable management fees (75) (79) (44) (54)Total (75) (79) (44) (54)
Robeco QI Institutional Global Developed Enhanced Indexing Equities
Robeco QI Institutional Global Developed Sustainable Conservative Equities
EUR x thousand 30 June 2020 31 December 2019Payable management fees (156) (166)Total (156) (166)
Robeco QI Institutional Global Developed Sustainable Multi-Factor Equities

Robeco Institutional Umbrella Fund 46
7 Payable to credit institutions This concerns temporary debit balances on bank accounts caused by investment transactions. 8 Other liabilities
EUR x thousand 30 June 2020 31 December 2019 30 June 2020 31 December 2019Accounting fee (4) (1) (4) (2)Administration fee (64) (29) (45) (21)Audit fees payable (25) (20) (25) (20)Custody fee (46) (69) (33) (50)Depositary fee (9) (16) (5) (12)Other payables (48) (117) (6) (12)Total (196) (252) (118) (117)
Robeco QI Institutional Global Developed Conservative Equities
Robeco QI Institutional Global Developed Momentum Equities
EUR x thousand 30 June 2020 31 December 2019 30 June 2020 31 December 2019Accounting fee (4) (1) (4) (1)Administration fee (43) (21) (18) (6)Audit fees payable (25) (20) (25) (20)Custody fee (28) (48) (12) (25)Depositary fee (6) (11) (1) (1)Other payables (10) (7) (11) (3)Total (116) (108) (71) (56)
Robeco QI Institutional Global Developed Value Equities
Robeco QI Institutional Global Developed Quality Equities
EUR x thousand 30 June 2020 31 December 2019 30 June 2020 31 December 2019Accounting fee (5) (1) (4) (2)Administration fee (26) (9) (1) (4)Audit fees payable (25) (20) (25) (20)Custody fee (20) (43) (8) (8)Depositary fee (2) (4) - (1)Other payables (7) (3) (9) (15)Total (85) (80) (47) (50)
Robeco QI Institutional Global Developed Enhanced Indexing Equities
Robeco QI Institutional Global Developed Sustainable Conservative Equities
EUR x thousand 30 June 2020 31 December 2019Accounting fee (4) (1)Administration fee (27) (9)Audit fees payable (25) (20)Custody fee (78) (85)Depositary fee (5) (4)Other payables (864) (22)Total (1,003) (141)
Robeco QI Institutional Global Developed Sustainable Multi-Factor Equities

Robeco Institutional Umbrella Fund 47
9 Fund assets
EUR x thousand 30 June 2020 31 December 2019 30 June 2020 31 December 2019Participant's capitalSituation on opening date 767,619 943,815 590,335 706,584 Received on units issued 146,721 45,838 43,551 19,568 Paid for units repurchased (437,880) (222,034) (286,334) (135,817)Situation on closing date 476,460 767,619 347,552 590,335
General reserveSituation on opening date (28,178) (2,955) (7,829) (508)Dividend payments (23,692) (25,223) (7,178) (7,321)Addition of result in previous financial year - - - - Situation on closing date (51,870) (28,178) (15,007) (7,829)
Undistributed earningsSituation on opening date 180,544 (35,826) 87,812 (73,739)Net result (92,912) 216,370 (59,877) 161,551 Distributed to holders of participating units - - - - Addition to the general reserve - - - - Situation on closing date 87,632 180,544 27,935 87,812
Situation on closing date 512,222 919,985 360,480 670,318
Robeco QI Institutional Global Developed Conservative Equities
Robeco QI Institutional Global Developed Momentum Equities
EUR x thousand 30 June 2020 31 December 2019 30 June 2020 31 December 2019Participant's capitalSituation on opening date 620,298 726,194 154,974 128,646 Received on units issued 79,026 42,747 36,303 37,859 Paid for units repurchased (237,209) (148,643) (1,006) (11,531)Situation on closing date 462,115 620,298 190,271 154,974
General reserveSituation on opening date (21,476) (1,410) (1,456) (114)Dividend payments (23,167) (20,066) (3,150) (1,342)Addition of result in previous financial year - - - - Situation on closing date (44,643) (21,476) (4,606) (1,456)
Undistributed earningsSituation on opening date 59,778 (52,287) 33,537 (4,748)Net result (127,856) 112,065 (17,108) 38,285 Distributed to holders of participating units - - - - Addition to the general reserve - - - - Situation on closing date (68,078) 59,778 16,429 33,537
Situation on closing date 349,394 658,600 202,094 187,055
Robeco QI Institutional Global Developed Value Equities
Robeco QI Institutional Global Developed Quality Equities

Robeco Institutional Umbrella Fund 48
9 Fund assets (continued)
EUR x thousand 30 June 2020 31 December 2019 30 June 2020 31 December 2019Participant's capitalSituation on opening date 220,248 402,479 76,994 76,636 Received on units issued 109,012 136,830 2,144 358 Paid for units repurchased (80,413) (319,061) - - Situation on closing date 248,847 220,248 79,138 76,994
General reserveSituation on opening date (9,542) (1,134) (358) - Dividend payments (5,925) (8,408) (2,144) (358)Addition of result in previous financial year - - - - Situation on closing date (15,467) (9,542) (2,502) (358)
Undistributed earningsSituation on opening date 74,567 (17,455) 16,771 (3,280)Net result (19,819) 92,022 (11,947) 20,051 Distributed to holders of participating units - - - - Addition to the general reserve - - - - Situation on closing date 54,748 74,567 4,824 16,771
Situation on closing date 288,128 285,273 81,460 93,407
Robeco QI Institutional Global Developed Sustainable Conservative Equities
Robeco QI Institutional Global Developed Enhanced Indexing Equities
EUR x thousand 30 June 2020 31 December 2019 30 June 2020 31 December 2019Participant's capitalSituation on opening date 250,519 147,775 2,680,987 3,132,129 Received on units issued 57,291 248,619 474,048 531,819 Paid for units repurchased (9,054) (145,875) (1,051,896) (982,961)Situation on closing date 298,756 250,519 2,103,139 2,680,987
General reserveSituation on opening date (144) - (68,983) (6,121)Dividend payments (5,433) (144) (70,689) (62,862)Addition of result in previous financial year - - - - Situation on closing date (5,577) (144) (139,672) (68,983)
Undistributed earningsSituation on opening date 37,329 (6,353) 490,338 (193,688)Net result (44,279) 43,682 (373,798) 684,026 Distributed to holders of participating units - - - - Addition to the general reserve - - - - Situation on closing date (6,950) 37,329 116,540 490,338
Situation on closing date 286,229 287,704 2,080,007 3,102,342
Robeco QI Institutional Global Developed Sustainable Multi-Factor Equities Total

Robeco Institutional Umbrella Fund 49
10 Fund assets, participating units outstanding and net assets value per participating units Robeco QI Institutional Global Developed Conservative Equities
30 June 2020 31 December 2019 30 June 2020 31 December 2019Fund assets in EUR x thousand 458,527 886,085 29,543 33,898 Number of participating units outstanding 3,029,599 4,844,866 459,191 450,965 Net asset value per unit in EUR x1 151.35 182.89 64.34 75.17
30 June 2020 31 December 2019Fund assets in EUR x thousand 24,152 - Number of participating units outstanding 288,437 - Net asset value per unit in EUR x1 83.73 -
T1 EUR T8 CAD
T12 EUR
Robeco QI Institutional Global Developed Momentum Equities
30 June 2020 31 December 2019 30 June 2020 31 December 2019Fund assets in EUR x thousand 304,301 638,878 31,797 31,440 Number of participating units outstanding 1,963,344 3,632,920 513,185 454,848 Net asset value per unit in EUR x1 154.99 175.86 61.96 69.12
30 June 2020 31 December 2019Fund assets in EUR x thousand 24,382 - Number of participating units outstanding 279,101 - Net asset value per unit in EUR x1 87.36 -
T12 EUR
T1 EUR T8 CAD
Robeco QI Institutional Global Developed Value Equities
30 June 2020 31 December 2019 30 June 2020 31 December 2019Fund assets in EUR x thousand 295,607 628,330 29,727 30,270 Number of participating units outstanding 2,615,606 3,998,436 591,106 457,871 Net asset value per unit in EUR x1 113.02 157.14 50.29 66.11
30 June 2020 31 December 2019Fund assets in EUR x thousand 24,060 - Number of participating units outstanding 307,462 - Net asset value per unit in EUR x1 78.25 -
T12 EUR
T1 EUR T8 CAD
Robeco QI Institutional Global Developed Quality Equities
30 June 2020 31 December 2019 30 June 2020 31 December 2019Fund assets in EUR x thousand 146,277 154,513 31,551 32,542 Number of participating units outstanding 1,110,241 1,042,532 487,280 450,021 Net asset value per unit in EUR x1 131.75 148.21 64.75 72.31
30 June 2020 31 December 2019Fund assets in EUR x thousand 24,266 - Number of participating units outstanding 270,541 - Net asset value per unit in EUR x1 89.69 -
T1 EUR T8 CAD
T12 EUR

Robeco Institutional Umbrella Fund 50
10 Fund assets, participating units outstanding and net assets value per participating units (continued) Robeco QI Institutional Global Developed Enhanced Indexing Equities
30 June 2020 31 December 2019Fund assets in EUR x thousand 288,128 285,273 Number of participating units outstanding 2,379,118 2,129,903 Net asset value per unit in EUR x1 121.11 133.94
T1 EUR
Robeco QI Institutional Global Developed Sustainable Conservative Equities
30 June 2020 31 December 2019Fund assets in EUR x thousand 81,460 93,407 Number of participating units outstanding 790,196 769,397 Net asset value per unit in EUR x1 103.09 121.40
T2 EUR
Robeco QI Institutional Global Developed Sustainable Multi-Factor Equities
30 June 2020 31 December 2019 30 June 2020 31 December 2019Fund assets in EUR x thousand 153,142 186,549 133,087 101,155 Number of participating units outstanding 1,548,628 1,586,623 1,422,240 917,285 Net asset value per unit in EUR x1 98.89 117.58 93.58 110.28
T1 EUR T9 EUR

Robeco Institutional Umbrella Fund 51
Notes to the profit and loss account
Income 11 Dividends This concerns net dividends received, dividend tax to be reclaimed and dividend-replacement payments received on positions lent. 12 Interest This is the balance of received and paid interest on bank balances. 13 Other income There is no other income for the financial period ended 30 June 2020. Costs 14 Management costs The management fee is charged by the manager. Management costs only relate to management fees. The fee is calculated daily on the basis of the sub-fund assets. Management costs based on the information memorandum
30 June 2020 31 December 2019Management costs in % in %Robeco QI Institutional Global Developed Conservative Equities 0.31% 0.62%Robeco QI Institutional Global Developed Momentum Equities 0.32% 0.64%Robeco QI Institutional Global Developed Value Equities 0.32% 0.64%Robeco QI Institutional Global Developed Quality Equities 0.32% 0.64%Robeco QI Institutional Global Developed Enhanced Indexing Equities 0.15% 0.29%Robeco QI Institutional Global Developed Sustainable Conservative Equities 0.31% 0.62%Robeco QI Institutional Global Developed Sustainable Multi-Factor Equities 0.31% 0.62%
The management fee is used to pay all the costs arising from the management and marketing of the fund, as well as costs of administration, external advisors, supervisors and costs relating to statutory reporting including annual and semi-annual reporting and the costs of holding participants’ meetings. The costs paid for the external auditor relate exclusively to audit-related costs and amount over the financial period to EUR 34,909 (31 December 2019: EUR 70,007). If the manager outsources operations to third parties, any costs associated with this will also be paid from the management fee. 15 Performance fee The sub-funds of the Robeco Institutional Umbrella Fund are not subject to a performance fee.
16 Other costs
In EUR x thousand 30 June 2020 31 December 2019 30 June 2020 31 December 2019Accounting fee (4) (1) (4) (1)Administration fee (66) (180) (46) (128)Audit fees (5) (10) (5) (10)Bank Interest Expense (54) (44) (50) (46)Custody fee 11 (15) 8 (21)Depositary fee (23) (60) (16) (43)Other fees 64 60 (1) (19)Total (77) (250) (114) (268)
Robeco QI Institutional Global Developed Conservative Equities
Robeco QI Institutional Global Developed Momentum Equities

Robeco Institutional Umbrella Fund 52
16 Other costs (continued)
In EUR x thousand 30 June 2020 31 December 2019 30 June 2020 31 December 2019Accounting fee (4) (1) (4) (1)Administration fee (44) (128) (18) (32)Audit fees (5) (10) (5) (10)Bank Interest Expense (44) (48) (6) (7)Custody fee 13 1 10 (7)Depositary fee (15) (43) (6) (11)Other fees (10) (1) (10) (2)Total (109) (230) (39) (70)
Robeco QI Institutional Global Developed Value Equities
Robeco QI Institutional Global Developed Quality Equities
In EUR x thousand 30 June 2020 31 December 2019 30 June 2020 31 December 2019Accounting fee (4) (1) (4) (9)Administration fee (27) (62) (9) (16)Audit fees (5) (10) (5) (10)Bank Interest Expense (1) (9) (2) (3)Custody fee 17 24 (3) (10)Depositary fee (9) (21) (3) (5)Other fees (7) - 7 1 Total (36) (79) (19) (52)
Robeco QI Institutional Global Developed Enhanced Indexing Equities
Robeco QI Institutional Global Developed Sustainable Conservative Equities
In EUR x thousand 30 June 2020 31 December 2019 30 June 2020 31 December 2019Accounting fee (4) (9) (28) (23)Administration fee (28) (47) (238) (593)Audit fees (5) (10) (35) (70)Bank Interest Expense (12) (17) (169) (174)Custody fee (5) (124) 51 (152)Depositary fee (9) (16) (81) (199)Other fees (3) (14) 40 25 Total (66) (237) (460) (1,186)
Robeco QI Institutional Global Developed Sustainable Multi-Factor Equities Total
17 Ongoing charges The percentage of ongoing charges is based on the average assets. The average assets are calculated on a daily basis. They comprise all costs deducted from the sub-fund assets in a financial period, excluding the costs of transactions in financial instruments and interest charges. Costs relating to entry and exit are not included in the ongoing charges either. Robeco QI Institutional Global Developed Conservative Equities
30 June 2020 31 December 2019 30 June 2020 31 December 2019Cost itemManagement fees 0.62% 0.62% - 0.34%Other costs 0.05% 0.03% - 0.05%Total 0.67% 0.65% - 0.39%
30 June 2020 31 December 2019 30 June 2020 31 December 2019Cost itemManagement fees 0.62% 0.62% 0.62% - Other costs 0.05% (0.02%) 0.06% - Total 0.67% 0.60% 0.68% -
T1 EUR T7 EUR
T8 CAD T12 EUR

Robeco Institutional Umbrella Fund 53
17 Ongoing charges (continued)
Robeco QI Institutional Global Developed Momentum Equities
30 June 2020 31 December 2019 30 June 2020 31 December 2019Cost itemManagement fees 0.64% 0.64% 0.64% 0.64%Other costs 0.05% 0.04% 0.06% 0.06%Total 0.69% 0.68% 0.70% 0.70%
30 June 2020 31 December 2019Cost itemManagement fees 0.64% - Other costs 0.06% - Total 0.70% -
Robeco QI Institutional Global Developed Value Equities
30 June 2020 31 December 2019 30 June 2020 31 December 2019Cost itemManagement fees 0.64% 0.64% - 0.35%Other costs 0.05% 0.03% - 0.04%Total 0.69% 0.67% - 0.39%
30 June 2020 31 December 2019 30 June 2020 31 December 2019Cost itemManagement fees 0.64% 0.64% 0.64% - Other costs 0.05% 0.05% 0.06% - Total 0.69% 0.69% 0.70% -
Robeco QI Institutional Global Developed Quality Equities
30 June 2020 31 December 2019 30 June 2020 31 December 2019Cost itemManagement fees 0.64% 0.64% - 0.64%Other costs 0.04% 0.04% - 0.05%Total 0.68% 0.68% - 0.69%
30 June 2020 31 December 2019 30 June 2020 31 December 2019Cost itemManagement fees 0.64% - 0.64% - Other costs 0.04% - 0.05% - Total 0.68% - 0.69% -
T12 EUR
T12 EUR
T8 CAD T12 EUR
T1 EUR T7 EUR
T8 CAD
T1 EUR T7 EUR
T1 EUR T8 CAD

Robeco Institutional Umbrella Fund 54
17 Ongoing charges (continued) Robeco QI Institutional Global Developed Enhanced Indexing Equities
30 June 2020 31 December 2019 30 June 2020 31 December 2019Cost itemManagement fees 0.30% 0.30% - 0.16%Other costs 0.04% (0.01%) - 0.06%Total 0.34% 0.29% - 0.22%
30 June 2020 31 December 2019Cost itemManagement fees - 0.10%Other costs - 0.14%Total - 0.24%
Robeco QI Institutional Global Developed Sustainable Conservative Equities
30 June 2020 31 December 2019Cost itemManagement fees 0.62% 0.62%Other costs 0.06% 0.07%Total 0.68% 0.69%
Robeco QI Institutional Global Developed Sustainable Multi-Factor Equities
30 June 2020 31 December 2019 30 June 2020 31 December 2019Cost itemManagement fees 0.62% 0.62% 0.62% 0.54%Other costs 0.04% 0.04% 0.05% 0.17%Total 0.66% 0.66% 0.67% 0.71%
T2 EUR
T1 EUR
T1 EUR T7 EUR
T11 EUR
T9 EUR
18 Turnover rate This ratio shows the rate at which the sub-fund's portfolio is turned over and is a measure of the incurred transaction costs resulting from the portfolio policy pursued and the ensuing investment transactions. The turnover ratio is determined by expressing the amount of the turnover as a percentage of the average sub-fund assets. The average assets are calculated on a daily basis. The amount of the turnover is determined by the sum of the purchases and sales of investments less the sum of issuance and repurchase of own participating units. Cash and money-market investments with an original life to maturity of less than one month are not taken into account in the calculation.
Average Amount of Turnover
As at 30 June 2020 fund assets the turnover rate %
Robeco QI Institutional Global Developed Conservative Equities 678,769 40,292 6%
Robeco QI Institutional Global Developed Momentum Equities 475,302 592,575 125%
Robeco QI Institutional Global Developed Value Equities 453,546 259,472 57%
Robeco QI Institutional Global Developed Quality Equities 183,211 65,476 36%
Robeco QI Institutional Global Developed Enhanced Indexing Equities 271,274 (14,429) (5)%
Robeco QI Institutional Global Developed Sustainable Conservative Equities 84,609 32,518 38%
Robeco QI Institutional Global Developed Sustainable Multi-Factor Equities 281,145 138,664 49%

Robeco Institutional Umbrella Fund 55
18 Turnover rate (continued) Average Amount of Turnover
As at 31 December 2019 fund assets the turnover rate %
Robeco QI Institutional Global Developed Conservative Equities 954,440 487,515 51%
Robeco QI Institutional Global Developed Momentum Equities 677,493 1,375,806 203%
Robeco QI Institutional Global Developed Value Equities 679,485 448,704 66%
Robeco QI Institutional Global Developed Quality Equities 169,811 77,929 46%
Robeco QI Institutional Global Developed Enhanced Indexing Equities 329,194 73,446 22%
Robeco QI Institutional Global Developed Sustainable Conservative Equities 85,825 51,566 60%
Robeco QI Institutional Global Developed Sustainable Multi-Factor Equities 246,845 (112,791) (46)%
19 Fiscal status The fund is transparent for tax purposes. A further description of the fiscal status is included in the general information of the management report on page 4. 20 Proposed profit appropriation In accordance with article 16 of the fund’s terms and conditions of management and custody, the unit classes may distribute dividend. The Manager determines what distribution shall be made from the net investment income and net capital gains attributable to the distributing Classes after the end of the financial period. It is intended that all Unit Classes will distribute whole or part of the net investment income on at least an annual basis. The Manager may decide to distribute on an interim base whole or part of the net investment income.

Robeco Institutional Umbrella Fund 56
Currency table Exchange ratesEUR 1 30 June 2020 31 December 2019AUD 1.63 1.60 CAD 1.53 1.46 CHF 1.06 1.09 DKK 7.45 7.47 GBP 0.91 0.85 HKD 8.70 8.75 ILS 3.89 3.88 JPY 121.17 121.99 NOK 10.84 9.86 NZD 1.74 1.66 SEK 10.46 10.51 SGD 1.57 1.51 USD 1.12 1.12

Robeco Institutional Umbrella Fund 57
Robeco QI Institutional Global Developed Conservative Equity Fund
Equity portfolio Equity portfolioAt 30 June 2020
M arket Value M arket Value M arket Value M arket Value Asia
Hong Kong New ZealandEUR HKD EUR NZD
HK Electric Investments & HK Electric 1,178,614 2,056,328 Fisher & Paykel Healthcare Corp Ltd 2,584,349 22,496,551 Investments Ltd 2,048,643 3,574,267 Spark New Zealand Ltd 4,618,114 40,200,309 HKT Trust & HKT Ltd
703,754 6,126,121 PCCW Ltd Europe EUR USD Austria
15,076 16,933 Hongkong Land Holdings Ltd EUR EUR 1,523,331 1,523,331 Oesterreichische Post AG
IsraelEUR ILS Belgium
4,074,791 15,839,405 Nice Ltd EUR EUR EUR GBP 498,959 498,959 Proximus SADP
310,658 282,385 Plus500 Ltd Finland
Japan EUR EUR EUR JPY 4,717,651 4,717,651 Elisa OYJ
1,709,947 207,195,999 Casio Computer Co Ltd400,888 48,576,000 Daiw abo Holdings Co Ltd Germany406,409 49,245,000 Glory Ltd EUR EUR
6,008,221 728,022,387 ITOCHU Corp 3,468,749 3,468,749 Deutsche Telekom AG 5,818,321 705,012,007 KDDI Corp Muenchener Rueckversicherungs -4,130,637 500,513,547 Mitsui & Co Ltd 5,084,552 5,084,552 Gesellschaft AG in Muenchen
684,850 82,984,000 Nippon Prologis Inc Reits 820,806 820,806 Telefonica Deutschland Holding AG5,070,868 614,442,349 NTT DOCOMO Inc1,817,324 220,206,999 Sankyo Co Ltd Italy3,550,386 430,203,998 Sekisui House Ltd EUR EUR
819,338 99,280,000 Sugi Holdings Co Ltd 268,856 268,856 Enav SpA2,787,231 2,787,231 Hera SpA
Singapore 4,466,022 4,466,022 Snam SpA EUR SGD 832,080 832,080 UnipolSai Assicurazioni SpA
206,982 324,310 Mapletree Industrial Trust Reits3,826,546 5,995,624 Singapore Exchange Ltd Luxembourg
400,242 627,120 StarHub Ltd EUR EUR 881,078 881,078 RTL Group SA
Australia Australia Netherlands
EUR AUD EUR EUR 553,516 902,951 AGL Energy Ltd 5,995,762 5,995,762 Koninklijke Ahold Delhaize NV
4,552,401 7,426,332 Aurizon Holdings Ltd 850,777 1,387,873 BWP Trust Reits Norway479,806 782,708 Coca-Cola Amatil Ltd EUR NOK 986,723 1,609,641 Cromw ell Property Group Reits 4,564,739 49,459,084 Gjensidige Forsikring ASA
3,030,920 4,944,339 Fortescue Metals Group Ltd 3,466,040 37,554,644 Orkla ASA4,610,459 7,521,042 JB Hi-Fi Ltd2,087,948 3,406,069 Rio Tinto Ltd Spain2,012,387 3,282,807 Telstra Corp Ltd EUR EUR
3,581,257 3,581,257 Endesa SA
Australia (continued)

Robeco Institutional Umbrella Fund 58
Robeco QI Institutional Global Developed Conservative Equity Fund(continued)
Equity portfolio Equity portfolioAt 30 June 2020
M arket Value M arket Value M arket Value M arket Value
Sweden Canada (continued)EUR SEK EUR CAD
1,468,411 15,365,452 Axfood AB RioCan Real Estate Investment3,762,868 39,374,651 Castellum AB 558,540 854,415 Trust Reits
505,501 5,289,564 Skandinaviska Enskilda Banken AB 1,689,162 2,583,961 Royal Bank of Canada 2,303,882 24,107,821 Skanska AB 2,049,898 3,135,790 Thomson Reuters Corp
585,132 6,122,819 Telia Co AB 492,687 753,679 Toronto-Dominion Bank
Switzerland United StatesEUR CHF EUR USD
2,025,234 2,155,335 Allreal Holding AG 3,541,870 3,978,051 Allison Transmission Holdings Inc 4,577,304 4,871,349 Banque Cantonale Vaudoise 5,056,710 5,679,443 Allstate Corp2,905,185 3,091,814 Mobimo Holding AG 4,396,868 4,938,342 Amdocs Ltd 1,723,095 1,833,787 Nestle SA 1,801,113 2,022,920 Ameren Corp3,171,301 3,375,025 PSP Sw iss Property AG 1,338,809 1,503,683 American Electric Pow er Co Inc2,566,042 2,730,885 Roche Holding AG 4,284,161 4,811,755 American Water Works Co Inc 4,595,572 4,890,792 Sw iss Prime Site AG 1,131,663 1,271,027 AMERISAFE Inc4,786,544 5,094,032 Sw iss Re AG 960,534 1,078,824 Amgen Inc4,924,328 5,240,667 Sw isscom AG 3,038,186 3,412,339 Apple Inc
902,513 960,490 Zurich Insurance Group AG Artisan Partners Asset Management792,136 889,687 Inc
United Kingdom 945,473 1,061,908 Assured Guaranty LtdEUR GBP 7,905,637 8,879,216 AT&T Inc
3,742,928 3,402,284 Admiral Group PLC 3,347,749 3,760,024 AutoZone Inc4,123,205 3,747,952 Berkeley Group Holdings PLC 5,013,984 5,631,456 Baxter International Inc4,359,575 3,962,810 Direct Line Insurance Group PLC 1,673,901 1,880,042 Benchmark Electronics Inc3,185,224 2,895,337 GlaxoSmithKline PLC 2,579,910 2,897,626 Best Buy Co Inc
877,419 797,565 IG Group Holdings PLC 3,415,035 3,835,597 Biogen Inc3,968,328 3,607,171 National Grid PLC 4,546,125 5,105,980 Booz Allen Hamilton Holding Corp 3,659,118 3,326,101 Persimmon PLC 496,555 557,706 Buckle Inc2,714,165 2,467,149 QinetiQ Group PLC 1,979,466 2,223,237 CACI International Inc
2,585,674 2,904,099 Campbell Soup Co3,054,372 3,430,518 Capitol Federal Financial Inc
Canada 905,977 1,017,548 Cardinal Health Inc EUR CAD 524,047 588,583 CBIZ Inc
3,266,365 4,996,657 BCE Inc 1,253,497 1,407,865 Church & Dw ight Co Inc2,690,074 4,115,086 Canadian Apartment Properties Reits 5,395,440 6,059,888 Cisco Systems Inc
137,117 209,752 Canadian Tire Corp Ltd 185,764 208,641 Citigroup Inc 3,141,797 4,806,101 CGI Group Inc 2,123,140 2,384,605 Citrix Systems Inc3,332,828 5,098,327 CI Financial Corp 3,440,700 3,864,422 Clorox Co 3,780,415 5,783,015 Cogeco 2,177,836 2,446,037 CNA Financial Corp
Granite Real Estate Investment 2,604,420 2,925,155 Coca-Cola Co3,623,153 5,542,445 Trust Reits 1,347,868 1,513,858 Cogent Communications Holdings Inc 1,834,386 2,806,115 Great-West Lifeco Inc 2,918,973 3,278,445 Cohen & Steers Inc 1,465,747 2,242,198 IGM Financial Inc 3,857,251 4,332,272 Consolidated Edison Inc4,635,656 7,091,302 Intact Financial Corp 3,330,683 3,740,857 Cummins Inc2,892,231 4,424,333 National Bank of Canada 3,126,705 3,511,758 DaVita Inc
Europe (continued) North America (continued)
North America

Robeco Institutional Umbrella Fund 59
Robeco QI Institutional Global Developed Conservative Equity Fund(continued)
Equity portfolio Equity portfolioAt 30 June 2020
M arket Value M arket Value M arket Value M arket Value
United States (continued) United States (continued)EUR USD EUR USD
3,455,013 3,880,498 Dollar General Corp 6,275,569 7,048,405 Target Corp3,019,908 3,391,810 Duke Energy Corp 1,261,084 1,416,386 Travelers Cos Inc
Easterly Government Properties Inc 3,101,517 3,483,469 United Therapeutics Corp 822,019 923,251 Reits 7,689,190 8,636,114 Verizon
1,878,141 2,109,434 eBay Inc 1,338,275 1,503,084 Virtu Financial Inc 4,771,401 5,358,999 Eli Lilly & Co 6,762,773 7,595,608 Walmart Inc4,410,769 4,953,955 Everest Re Group Ltd 1,388,301 1,559,270 Washington Federal Inc 2,286,772 2,568,388 Exelon Corp 1,348,990 1,515,118 WEC Energy Group Inc 4,751,861 5,337,052 Garmin Ltd 509,255 571,969 Weis Markets Inc3,062,438 3,439,577 General Mills Inc 4,689,180 5,266,654 Western Union Co 1,416,709 1,591,176 Genpact Ltd 3,091,271 3,471,963 White Mountains Insurance Group Ltd
604,237 678,649 Haw aiian Electric Industries Inc 1,222,706 1,373,282 Helen of Troy Ltd 502,448,950 2,524,616 2,835,523 Home Depot Inc1,700,699 1,910,140 Hormel Foods Corp7,184,341 8,069,093 Intel Corp2,590,495 2,909,514 Jack Henry & Associates Inc1,502,998 1,688,093 JM Smucker Co7,612,413 8,549,882 Johnson & Johnson7,711,303 8,660,950 JPMorgan Chase & Co 3,144,901 3,532,195 Kimberly-Clark Corp3,604,227 4,048,088 Kroger Co
828,656 930,705 Leidos Holdings Inc 5,413,611 6,080,297 Lockheed Martin Corp
610,474 685,654 ManTech International Corp6,725,111 7,553,308 McDonald's Corp7,721,984 8,672,946 Merck & Co Inc3,328,747 3,738,682 Microsoft Corp1,401,287 1,573,855 Morgan Stanley2,814,574 3,161,189 Murphy USA2,762,281 3,102,455 Old Republic International Corp 1,978,074 2,221,674 Omnicom Group Inc7,412,375 8,325,209 Oracle Corp 6,719,630 7,547,152 PepsiCo Inc6,720,423 7,548,043 Pfizer Inc
312,590 351,086 PNC Financial Services Group Inc9,275,391 10,417,655 Procter & Gamble Co 1,843,144 2,070,128 Public Service Enterprise Group Inc 4,700,990 5,279,917 Republic Services Inc1,256,662 1,411,420 Safety Insurance Group Inc 2,494,620 2,801,832 Silgan Holdings Inc
833,367 935,996 Southern Co2,360,564 2,651,267 Spire Inc
697,194 783,054 Sprouts Farmers Market Inc 4,625,127 5,194,711 Steris PLC
270,532 303,848 Sturm Ruger & Co Inc
Total - financial intruments that are offically listed on a regulated market
North America (continued) North America (continued)

Robeco Institutional Umbrella Fund 60
Robeco QI Institutional Global Developed Momentum Equities Fund
Equity portfolio Equity portfolioAt 30 June 2020
M arket Value M arket Value M arket Value M arket Value Asia Europe
Hong Kong BelgiumEUR HKD EUR EUR
689,029 5,997,941 PCCW Ltd 2,674,032 2,674,032 D'ieteren SA
Japan DenmarkEUR JPY EUR DKK
3,394,078 411,263,999 Advantest Corp 99,562 742,049 ALK-Abello A/S5,066,990 613,972,498 Chugai Pharmaceutical Co Ltd 2,395,985 17,857,686 Genmab A/S 1,005,136 121,793,400 CKD Corp 1,848,940 13,780,464 Ringkjoebing Landbobank A/S 3,124,509 378,599,998 Fujitsu Ltd 1,537,572 186,309,200 Hulic Co Ltd Finland
Japan Real Estate Investment Corp EUR EUR 3,135,328 379,910,998 Reits 1,654,494 1,654,494 Orion OYJ4,152,893 503,210,398 KDDI Corp4,953,634 600,236,997 NEC Corp France2,164,058 262,221,198 Nexon Co Ltd EUR EUR 1,844,253 223,470,000 Nissin Foods Holdings Co Ltd 1,788,851 1,788,851 Amundi SA 2,430,492 294,505,199 Nomura Holdings Inc 2,262,183 2,262,183 BioMerieux 3,234,480 391,925,298 Nomura Research Institute Ltd 2,955,915 2,955,915 Sanofi 3,080,459 373,262,398 Obayashi Corp 2,548,350 2,548,350 Sartorius Stedim Biotech 2,216,100 268,527,199 Ono Pharmaceutical Co Ltd
586,774 71,100,000 Rinnai Corp Germany1,687,086 204,425,999 Saw ai Pharmaceutical Co Ltd EUR EUR 2,894,677 350,750,998 Sega Sammy Holdings Inc 2,159,105 2,159,105 Telefonica Deutschland Holding AG2,457,171 297,737,998 Sundrug Co Ltd 2,293,479 2,293,479 Zalando SE 2,224,467 269,540,999 Toyo Suisan Kaisha Ltd 2,128,652 257,930,998 Yamato Holdings Co Ltd Ireland
EUR EUR Singapore 1,670,409 1,670,409 Flutter Entertainment PLC
EUR SGD 1,699,564 2,662,961 Singapore Exchange Ltd Italy
EUR EUR Australia 752,987 752,987 Anima Holding SpA Australia 2,071,382 2,071,382 DiaSorin SpA
EUR AUD 2,452,459 2,452,459 Leonardo SpA 5,012,566 8,176,999 Fortescue Metals Group Ltd 634,021 634,021 UnipolSai Assicurazioni SpA
545,602 890,041 IGO Ltd 770,177 1,256,390 JB Hi-Fi Ltd Netherlands
2,463,191 4,018,203 Wesfarmers Ltd EUR EUR 2,368,746 2,368,746 Koninklijke Ahold Delhaize NV
New Zealand EUR USD EUR NZD 2,064,225 2,318,433 NXP Semiconductors NV
2,940,333 5,129,999 Fisher & Paykel Healthcare Corp Ltd 2,919,090 5,092,937 Meridian Energy Ltd Norway
EUR NOK3,404,250 36,885,154 Gjensidige Forsikring ASA
639,675 6,930,902 Norw egian Finans Holding ASA

Robeco Institutional Umbrella Fund 61
Robeco QI Institutional Global Developed Momentum Equities Fund(continued)
Equity portfolio Equity portfolioAt 30 June 2020
M arket Value M arket Value M arket Value M arket Value
Sweden United States (continued)EUR SEK EUR USD
2,096,367 21,936,389 Nibe Industrier AB 2,724,931 3,060,506 BlackRock Inc 4,040,604 42,280,878 Skanska AB 2,609,444 2,930,797 Boise Cascade Co
770,633 865,536 Buckle IncSwitzerland 3,217,375 3,613,595 Cable One Inc
EUR CHF 2,359,621 2,650,208 Cardinal Health Inc 2,099,000 2,233,840 Julius Baer Group Ltd 3,421,821 3,843,219 Chipotle Mexican Grill Inc 5,856,205 6,232,407 Roche Holding AG 4,405,325 4,947,841 Ciena Corp
EUR EUR 1,119,537 1,257,408 Cirrus Logic Inc 1,824,970 1,824,970 STMicroelectronics NV 2,615,291 2,937,364 Clorox Co
3,490,171 3,919,986 Cloudera Inc United Kingdom 1,074,353 1,206,660 Commercial Metals Co
EUR GBP 2,249,919 2,526,997 Cummins Inc2,529,939 2,299,689 Persimmon PLC 2,442,795 2,743,625 DaVita Inc
323,973 294,488 QinetiQ Group PLC 4,123,483 4,631,289 DexCom Inc 737,729 670,588 Reckitt Benckiser Group PLC 2,896,394 3,253,085 DISH Netw ork Corp 682,619 620,494 TP ICAP PLC 4,040,951 4,538,594 DocuSign Inc
2,109,112 2,368,849 Domino's Pizza Inc3,805,830 4,274,518 Dover Corp
Bermuda 1,967,354 2,209,633 Dropbox Inc EUR NOK 2,609,634 2,931,011 eBay Inc
666,485 7,221,388 Frontline Ltd 1,707,731 1,918,038 eHealth Inc 3,309,912 3,717,528 Eli Lilly & Co
Canada 704,669 791,449 Equitable Holdings Inc EUR CAD 2,390,449 2,684,833 First Republic Bank
1,558,063 2,383,416 AltaGas Ltd 2,272,413 2,552,261 Fortinet Inc Com657,971 1,006,518 B2Gold Corp 1,338,294 1,503,105 Freeport-McMoRan Inc
1,518,380 2,322,711 CI Financial Corp 1,448,033 1,626,358 Group 1 Automotive Inc 3,295,363 5,041,016 Manulife Financial Corp 2,151,403 2,416,348 How met Aerospace Inc 2,111,755 3,230,415 Metro Inc 1,302,231 1,462,601 Itron Inc 1,821,003 2,785,642 Real Matters Inc 2,798,914 3,143,600 Jack Henry & Associates Inc3,422,210 5,235,056 Sun Life Financial Inc 2,669,660 2,998,429 Jefferies Financial Group Inc
2,620,918 2,943,685 KB HomeUnited States 3,131,210 3,516,819 Keysight Technologies Inc
EUR CAD 2,411,317 2,708,271 Kroger Co2,441,313 3,734,549 BRP Inc 2,274,423 2,554,519 Lennar Corp
EUR USD 851,058 955,865 Limelight Netw orks Inc2,447,668 2,749,098 Activision Blizzard Inc 1,637,596 1,839,266 LKQ Corp 3,475,526 3,903,537 Akamai Technologies Inc 2,167,539 2,434,471 MarketAxess Holdings Inc 3,125,306 3,510,187 Amedisys Inc 3,172,992 3,563,746 Martin Marietta Materials Inc 3,016,425 3,387,898 Apple Inc 2,303,138 2,586,769 Masco Corp 4,861,673 5,460,388 Applied Materials Inc 1,438,426 1,615,568 Masonite International Corp 1,985,567 2,230,089 Arrow Electronics Inc 3,425,366 3,847,199 MetLife Inc 1,992,996 2,238,433 Atkore International Group Inc 2,271,690 2,551,448 Moderna Inc 2,550,869 2,865,008 Bank of New York Mellon Corp 2,084,592 2,341,309 Murphy USA4,491,979 5,045,166 Best Buy Co Inc 4,017,835 4,512,632 Netflix Inc
Europe (continued) North America (continued)
North America

Robeco Institutional Umbrella Fund 62
Robeco QI Institutional Global Developed Momentum Equities Fund(continued)
Equity portfolio Futures portfolioAt 30 June 2020
M arket Value M arket Value M arket Value Unrealised Unrealised
United States (continued) Gain Gain EUR USD Europe
1,906,092 2,140,827 NortonLifeLock Inc Germany4,958,127 5,568,721 NVIDIA Corp EUR EUR5,588,060 6,276,229 Procter & Gamble Co 42,370 42,370 Eurx E-Stoxx 50 September 20203,620,726 4,066,619 PulteGroup Inc 3,976,383 4,466,075 Qorvo Inc North America1,108,680 1,245,214 Rambus Inc United States2,831,315 3,179,991 Regeneron Pharmaceuticals Inc EUR USD 3,240,315 3,639,360 ResMed Inc 38,241 42,951 S&P 500 Emini CME September 20205,168,302 5,804,778 S&P Global Inc 2,726,829 3,062,638 Seattle Genetics Inc 80,6111,312,235 1,473,836 SpartanNash Co 3,213,677 3,609,441 SPS Commerce Inc 1,313,363 1,475,104 SPX Corp 1,232,659 1,384,462 Stanley Black & Decker Inc3,763,830 4,227,346 State Street Corp 1,002,500 1,125,958 Synnex Corp 5,095,539 5,723,055 Synopsys Inc 4,585,882 5,150,634 Target Corp2,841,310 3,191,216 UFP Industries Inc 2,143,972 2,408,002 Virtu Financial Inc 2,401,046 2,696,735 West Pharmaceutical Services Inc2,512,401 2,821,803 Western Digital Corp 3,243,221 3,642,624 Western Union Co 2,018,991 2,267,629 Xerox Holdings Corp
989,741 1,111,628 Zumiez Inc
357,480,348 Total - financial intruments that are offically listed on a regulated market
Total - financial intruments that are offically listed on a regulated market
North America (continued) M arket Value

Robeco Institutional Umbrella Fund 63
Robeco QI Institutional Global Developed Value Equities Fund
Equity portfolio Equity portfolioAt 30 June 2020
M arket Value M arket Value M arket Value M arket Value Africa
South Africa BelgiumEUR GBP EUR EUR
1,584,480 1,440,277 Anglo American PLC 1,122,318 1,122,318 bpost SA755,926 755,926 Solvay SA
Asia Hong Kong Bermuda
EUR HKD EUR USD 1,597,511 13,906,203 CK Asset Holdings Ltd 1,083,460 1,216,888 Triton International Ltd2,847,004 24,782,945 PCCW Ltd2,105,706 18,330,004 Sino Land Co Ltd Denmark
EUR USD EUR DKK 589,932 662,582 Hutchison Port Holdings Trust 1,700,237 12,672,157 Danske Bank A/S
3,673,353 27,378,126 Pandora A/S Japan
EUR JPY Finland3,109,104 376,733,398 Bridgestone Corp EUR EUR 1,923,623 233,087,399 Canon Inc 2,764,206 2,764,206 UPM-Kymmene OYJ
831,697 100,777,599 Credit Saison Co Ltd 932,112 112,945,000 Fujif ilm Holdings Corp France825,483 100,024,649 Honda Motor Co Ltd EUR EUR 833,776 101,029,499 Japan Post Insurance Co Ltd 3,435,515 3,435,515 AXA SA
3,208,083 388,726,798 KDDI Corp 3,440,723 3,440,723 BNP Paribas SA1,909,027 231,318,749 Marubeni Corp Cie Generale des Etablissements 2,814,655 341,054,638 Mitsubishi Chemical Holdings Corp 1,073,637 1,073,637 Michelin SCA1,667,313 202,029,999 Mitsubishi Corp 2,524,456 2,524,456 Credit Agricole SA1,378,836 167,074,999 Mitsubishi Gas Chemical Co Inc 1,172,962 1,172,962 Orange SA
558,251 67,643,854 Mitsubishi Heavy Industries Ltd 1,915,894 1,915,894 Publicis Groupe SA 2,044,483 247,732,159 Mitsubishi UFJ Financial Group Inc 2,267,848 2,267,848 Societe Generale SA
461,884 55,966,950 Mitsui & Co Ltd 1,366,203 1,366,203 TOTAL SA1,463,058 177,280,199 Mizuho Financial Group Inc 2,985,852 2,985,852 Valeo SA 3,072,965 372,354,399 NTT DOCOMO Inc2,042,506 247,492,619 Resona Holdings Inc Germany
718,208 87,025,999 Sekisui House Ltd EUR EUR 1,772,170 214,735,699 Subaru Corp 1,494,324 1,494,324 Deutsche Lufthansa AG2,852,662 345,659,998 Sumitomo Corp 2,768,871 2,768,871 Telefonica Deutschland Holding AG2,387,145 289,252,799 Sumitomo Mitsui Financial Group Inc
787,049 95,367,599 Sumitomo Rubber Industries Ltd Italy601,881 72,930,547 Tokyu Construction Co Ltd EUR EUR 656,455 79,543,300 TS Tech Co Ltd 2,611,125 2,611,125 Eni SpA
640,683 640,683 Telecom Italia SpA Australia Australia Jersey
EUR AUD EUR GBP 3,470,939 5,662,143 Fortescue Metals Group Ltd 627,620 570,500 Genel Energy PLC
Europe NetherlandsAustria EUR EUR
EUR EUR 2,983,755 2,983,755 Aegon NV829,352 829,352 OMV AG 865,774 865,774 ING Groep NV
Europe (continued)

Robeco Institutional Umbrella Fund 64
Robeco QI Institutional Global Developed Value Equities Fund(continued)
Equity portfolio Equity portfolioAt 30 June 2020
M arket Value M arket Value M arket Value M arket Value
United StatesEUR EUR EUR USD
2,277,262 2,277,262 Koninklijke Ahold Delhaize NV 3,087,258 3,467,454 Ally Financial Inc3,136,704 3,136,704 Koninklijke KPN NV 2,066,296 2,320,760 Arrow Electronics Inc 3,359,385 3,359,385 NN Group NV 4,541,296 5,100,557 AT&T Inc2,930,123 2,930,123 Royal Dutch Shell PLC 894,145 1,004,259 Baker Hughes Co
3,488,803 3,918,449 Bed Bath & Beyond IncNorway 1,698,903 1,908,122 Benchmark Electronics Inc
EUR NOK 3,143,165 3,530,246 Best Buy Co Inc722,119 7,824,176 Equinor ASA 2,502,199 2,810,345 Biogen Inc
2,682,649 3,013,017 Brighthouse Financial Inc Spain 876,044 983,929 Brightsphere Investment Group Inc
EUR EUR 2,261,220 2,539,690 Buckle Inc871,822 871,822 Banco de Sabadell SA 3,351,052 3,763,734 Cardinal Health Inc
3,132,942 3,132,942 Endesa SA 2,882,985 3,238,025 CenturyLink Inc 2,634,954 2,634,954 Repsol SA 3,276,822 3,680,362 Cisco Systems Inc
146,638 146,638 Repsol SA Rights 2,711,982 3,045,962 CIT Group Inc 3,317,472 3,317,472 Telefonica SA 2,900,527 3,257,727 Citizens Financial Group Inc
136,776 136,776 Telefonica SA Rights 588,293 660,742 Colony Capital Inc Reits2,421,045 2,719,197 Comerica Inc
Sweden 2,919,719 3,279,283 ConocoPhillipsEUR SEK 1,942,406 2,181,613 CVR Energy Inc
593,024 6,205,399 Telia Co AB 665,519 747,477 DaVita Inc 737,800 828,660 Dell Technologies Inc
United Kingdom 1,388,065 1,559,005 Dillard's Inc EUR GBP 2,855,634 3,207,305 Discovery Inc
589,911 536,223 BT Group PLC 2,578,422 2,895,955 Domtar Corp2,118,866 1,926,028 J Sainsbury PLC 1,573,895 1,767,720 Dow Inc 4,062,843 3,693,083 Kingfisher PLC 2,732,479 3,068,983 DXC Technology Co 2,149,389 1,953,773 Marks & Spencer Group PLC 2,002,749 2,249,388 Equitable Holdings Inc 3,213,582 2,921,114 Persimmon PLC 1,038,153 1,166,001 Genesco Inc 1,182,416 1,074,805 Playtech PLC 3,967,943 4,456,595 Gilead Sciences Inc2,949,287 2,680,873 Royal Mail PLC 651,641 731,890 Halliburton Co 2,587,726 2,352,217 Taylor Wimpey PLC 1,362,116 1,529,861 Harley-Davidson Inc 3,189,157 2,898,912 Vodafone Group PLC 2,487,749 2,794,115 Hew lett Packard Enterprise Co
EUR USD 2,599,623 2,919,766 HollyFrontier Corp2,899,776 3,256,884 Janus Henderson Group PLC 3,549,131 3,986,206 HP Inc2,453,517 2,755,668 Liberty Global PLC 1,059,179 1,189,617 Humana Inc
1,994,840 2,240,505 Innoviva Inc 5,437,996 6,107,685 Intel Corp
Canada 4,552,195 5,112,798 International Business Machines CorpEUR CAD 3,384,756 3,801,588 International Paper Co
2,056,165 3,145,377 Air Canada 2,299,606 2,582,802 Interpublic Group of Cos Inc 687,104 1,051,083 Canadian Natural Resources Ltd 2,004,656 2,251,530 Invesco Ltd
2,184,481 3,341,666 Celestica Inc 1,484,823 1,667,679 Jazz Pharmaceuticals PLC 674,423 1,031,685 Corus Entertainment Inc 1,155,243 1,297,511 Juniper Netw orks Inc
3,321,697 5,081,299 Magna International Inc 4,080,296 4,582,784 Kraft Heinz Co 858,088 1,312,643 Transcontinental Inc 3,133,886 3,519,824 Kroger Co
Europe (continued) North America (continued) Netherlands(continued)
North America

Robeco Institutional Umbrella Fund 65
Robeco QI Institutional Global Developed Value Equities Fund(continued)
Equity portfolio Futures portfolioAt 30 June 2020
M arket Value M arket Value M arket Value M arket Value Unrealised Unrealised
United States (continued) Gain Gain EUR USD Europe
4,664,920 5,239,405 Lam Research Corp Germany2,914,124 3,272,998 Lear Corp 53,130 53,130 Eurx E-Stoxx 50 September 20202,516,061 2,825,913 Lincoln National Corp3,097,029 3,478,428 LyondellBasell Industries NV2,214,152 2,486,825 Manpow erGroup Inc United States3,020,287 3,392,235 Marathon Petroleum Corp 58,340 65,525 S&P 500 Emini CME September 20203,121,635 3,506,064 MEDNAX Inc 3,374,804 3,790,411 MetLife Inc 111,4702,663,814 2,991,863 Molson Coors Brew ing Co3,531,230 3,966,101 NetApp Inc3,194,267 3,587,641 New ell Brands Inc
651,493 731,724 Office Depot Inc 452,245 507,939 Patterson-UTI Energy Inc 444,779 499,553 Peabody Energy Corp
1,291,463 1,450,507 Pfizer Inc1,839,803 2,066,375 Plains GP Holdings LP3,153,364 3,541,700 Prudential Financial Inc1,176,938 1,321,878 Qurate Retail Inc 2,764,779 3,105,262 Schlumberger Ltd 2,973,692 3,339,903 Seagate Technology PLC2,015,718 2,263,954 SpartanNash Co 2,215,797 2,488,673 Steel Dynamics Inc 2,992,384 3,360,896 Synchrony Financial3,269,925 3,672,616 Target Corp
656,200 737,011 United Therapeutics Corp 2,861,326 3,213,699 Unum Group2,623,660 2,946,764 Valero Energy Corp1,903,817 2,138,272 Verizon1,642,734 1,845,037 Vistra Corp 3,675,236 4,127,842 Western Union Co 3,029,304 3,402,363 WestRock1,698,556 1,907,733 Xerox Holdings Corp
344,250,481 Total - financial intruments that are offically listed on a regulated market
Total - financial intruments that are offically listed on a regulated market
North America
North America (continued)

Robeco Institutional Umbrella Fund 66
Robeco QI Institutional Global Developed Quality Equities Fund
Equity portfolio Equity portfolioAt 30 June 2020
M arket Value M arket Value M arket Value M arket Value Asia
Israel Singapore EUR ILS EUR SGD
Bezeq The Israeli Telecommunication 110,581 173,264 Best World International Ltd 403,472 1,568,363 Corp Ltd
EUR GBP Australia 833,021 935,608 Check Point Softw are Technologies Ltd Australia
EUR USD EUR AUD 1,055,044 959,024 Plus500 Ltd 1,536,266 2,506,111 BHP Group Ltd
1,068,980 1,743,828 CIMIC Group LtdJapan 1,542,399 2,516,116 Fortescue Metals Group Ltd
EUR JPY Genw orth Mortgage Insurance167,207 20,260,600 Adastria Co Ltd 245,569 400,597 Australia Ltd232,712 28,198,000 AGC Inc/Japan 310,304 506,199 Qantas Airw ays Ltd
1,302,425 157,816,192 Astellas Pharma Inc 1,171,648 1,911,309 REA Group Ltd249,072 30,180,300 Bridgestone Corp 631,853 1,030,741 Sandfire Resources NL487,219 59,036,800 Brother Industries Ltd 956,500 1,560,339 Technology One Ltd
1,808,419 219,127,999 Capcom Co Ltd 209,207 341,280 Telstra Corp Ltd1,112,167 134,762,399 Daito Trust Construction Co Ltd 1,166,641 141,363,100 GungHo Online Entertainment Inc Europe
651,987 79,002,000 Hoya Corp Austria1,025,963 124,316,999 Jafco Co Ltd EUR EUR 1,127,720 136,646,999 JGC Holdings Corp 1,108,793 1,108,793 ANDRITZ AG
477,743 57,888,599 KDDI Corp897,417 108,741,000 Law son Inc Belgium282,691 34,254,000 Mixi Inc EUR EUR
1,430,031 173,278,399 Nomura Research Institute Ltd 1,073,757 1,073,757 Galapagos NV 1,522,212 184,447,999 NTT DoCoMo Inc 1,182,336 1,182,336 Telenet Group Holding NV
376,253 45,591,000 Oji Holdings Corp661,346 80,136,000 Oracle Corp Japan Denmark722,628 87,561,600 Sankyo Co Ltd EUR DKK 148,565 18,001,776 Seiko Epson Corp 514,333 3,833,413 Coloplast A/S
1,217,904 147,574,749 Sekisui House Ltd 1,901,405 14,171,493 Novo Nordisk A/S523,640 63,450,000 Shionogi & Co Ltd 1,211,302 9,028,040 Pandora A/S926,971 112,322,099 Sompo Holdings Inc 775,519 5,780,075 Vestas Wind Systems A/S212,734 25,777,250 Subaru Corp188,436 22,832,999 Sumitomo Rubber Industries Ltd Finland259,552 31,450,200 Suzuki Motor Corp EUR EUR 272,012 32,960,000 Toshiba TEC Corp 1,215,282 1,215,282 Orion OYJ
1,232,110 149,295,999 Trend Micro Inc495,391 60,027,100 TS Tech Co Ltd France
1,168,984 141,647,000 Welcia Holdings Co Ltd EUR EUR 853,215 853,215 Elior Group SA
Macau 1,030,994 1,030,994 Gaztransport Et Technigaz SA EUR HKD 768,106 768,106 Peugeot SA
364,114 3,169,585 Wynn Macau Ltd 241,413 241,413 Societe BIC SA
Asia (continued)

Robeco Institutional Umbrella Fund 67
Robeco QI Institutional Global Developed Quality Equities Fund(continued)
Equity portfolio Equity portfolioAt 30 June 2020
M arket Value M arket Value M arket Value M arket Value
France (continued) United Kingdom (continued)EUR EUR EUR GBP
1,187,906 1,187,906 Ubisoft Entertainment SA 676,922 615,315 Direct Line Insurance Group PLC688,685 626,007 InterContinental Hotels Group PLC
Germany 143,963 130,861 Kingfisher PLCEUR EUR 795,719 723,301 Man Group PLC
499,476 499,476 Allianz SE 919,189 835,534 Moneysupermarket.com Group PLC746,072 746,072 Borussia Dortmund GmbH & Co KGaA 855,645 777,772 Royal Mail PLC743,447 743,448 Covestro AG 1,278,015 1,161,703 Standard Life Aberdeen PLC622,152 622,152 ProSiebenSat.1 Media SE EUR USD
736,621 827,335 Liberty Global PLCGibraltar
EUR GBP604,410 549,403 888 Holdings PLC Canada
EUR CADIreland 928,364 1,420,146 CI Financial Corp
EUR EUR 687,590 1,051,827 Genw orth MI Canada Inc753,125 684,584 Greencore Group PLC 344,870 527,558 Gildan Activew ear Inc
208,176 318,452 IGM Financial IncNetherlands 1,084,006 1,658,237 Loblaw Cos Ltd
EUR EUR 1,050,648 1,607,208 Magna International Inc1,929,000 1,929,000 Adyen NV 1,067,416 1,067,416 Koninklijke Ahold Delhaize NV United States
911,781 911,781 Koninklijke KPN NV EUR USD997,743 997,743 Signify NV 1,824,261 2,048,918 AbbVie Inc
EUR USD 583,043 654,845 Aflac Inc1,304,634 1,465,300 NXP Semiconductors NV 936,006 1,051,275 Allstate Corp
487,721 547,784 Ally Financial IncSweden 613,081 688,582 American Express Co
EUR SEK 1,272,698 1,429,431 Ameriprise Financial Inc1,124,368 11,765,390 Hennes & Mauritz AB 1,798,639 2,020,141 Amgen Inc
814,068 8,518,408 Lundin Petroleum AB 4,542,664 5,102,093 Apple Inc398,142 447,173 Arch Resources Inc
Switzerland 1,184,463 1,330,330 Arista Netw orks Inc EUR CHF 1,083,481 1,216,912 Arrow Electronics Inc
1,213,559 1,291,518 Adecco Group AG 417,653 469,087 Assured Guaranty Ltd2,005,444 2,134,273 Roche Holding AG 1,643,014 1,845,351 Autodesk Inc
306,712 326,415 SGS SA 1,421,261 1,596,290 AutoZone Inc468,367 526,046 Bed Bath & Beyond Inc
United Kingdom 1,325,892 1,489,175 Best Buy Co IncEUR EUR 1,447,150 1,625,366 Biogen Inc
1,171,314 1,171,314 Dialog Semiconductor PLC 1,478,708 1,660,811 Booking Holdings IncEUR GBP 731,004 821,027 Brightsphere Investment Group Inc
469,576 426,840 3i Group PLC 1,691,165 1,899,432 Cadence Design Systems Inc944,808 858,821 Berkeley Group Holdings PLC 919,732 1,032,997 Cardinal Health Inc 841,848 765,231 Burberry Group PLC 1,157,016 1,299,502 Cerner Corp
Europe (continued) Europe (continued)
North America

Robeco Institutional Umbrella Fund 68
Robeco QI Institutional Global Developed Quality Equities Fund(continued)
Equity portfolio Equity portfolioAt 30 June 2020
M arket Value M arket Value M arket Value M arket Value
United States (continued) United States (continued)EUR USD EUR USD
281,072 315,687 CH Robinson Worldw ide Inc 249,089 279,764 Landstar System Inc1,240,440 1,393,201 Cirrus Logic Inc 234,415 263,283 Lear Corp1,998,193 2,244,270 Cisco Systems Inc 1,014,813 1,139,787 Lennox International Inc 1,289,887 1,448,736 Citigroup Inc 195,259 219,305 Lincoln National Corp1,562,000 1,754,360 Citrix Systems Inc 332,184 373,092 LyondellBasell Industries NV1,141,934 1,282,563 Colgate-Palmolive Co 1,453,405 1,632,392 Manhattan Associates Inc 1,309,033 1,470,240 Comerica Inc 235,176 264,138 Manpow erGroup Inc1,312,157 1,473,749 Cummins Inc 1,209,707 1,358,682 Masco Corp
674,292 757,331 CyberArk Softw are Ltd 671,478 754,170 Maxim Integrated Products Inc1,064,759 1,195,884 DaVita Inc 1,965,749 2,207,831 Medifast Inc
826,913 928,747 Deluxe Corp 1,858,082 2,086,905 Merck & Co Inc336,399 377,826 Devon Energy Corp 788,115 885,172 MetLife Inc774,351 869,713 Discover Financial Services 755,954 849,050 Mettler-Toledo International Inc
1,128,237 1,267,179 Domino's Pizza Inc 1,459,933 1,639,724 MSCI Inc1,184,013 1,329,824 Dover Corp 585,838 657,984 MSG Netw orks Inc
569,148 639,239 Dow Inc 1,176,102 1,320,939 NetApp Inc1,573,663 1,767,460 eBay Inc 971,463 1,091,099 New ell Brands Inc 1,620,531 1,820,099 Eli Lilly & Co 1,449,776 1,628,316 NIKE Inc
957,433 1,075,340 Equitable Holdings Inc 1,173,804 1,318,358 NortonLifeLock IncExpeditors International of Washington 1,868,515 2,098,623 NVIDIA Corp
374,124 420,197 Inc 1,447,432 1,625,683 PetMed Express Inc 912,274 1,024,620 F5 Netw orks Inc 2,233,007 2,508,001 Qualcomm Inc
1,635,165 1,836,535 Fortinet Inc 635,611 713,886 Ralph Lauren Corp650,375 730,469 Franklin Resources Inc 721,149 809,959 Regions Financial Corp523,506 587,975 Gilead Sciences Inc 862,148 968,321 Robert Half International Inc300,079 337,034 Graco Inc 1,095,201 1,230,075 Rockw ell Automation Inc465,080 522,355 GrafTech International Ltd 1,112,505 1,249,510 Seagate Technology PLC585,022 657,067 HD Supply Holdings Inc 1,266,590 1,422,570 Skyw orks Solutions Inc573,969 644,653 Herbalife Nutrition Ltd 127,157 142,817 Steel Dynamics Inc862,902 969,169 Hershey Co 1,412,743 1,586,722 Synchrony Financial772,102 867,186 Hew lett Packard Enterprise Co 636,366 714,734 Sysco Corp
2,501,866 2,809,971 Home Depot Inc 624,125 700,986 T Row e Price Group Inc1,077,117 1,209,764 HP Inc 1,087,084 1,220,958 Take-Tw o Interactive Softw are Inc1,521,448 1,708,814 Humana Inc 1,237,047 1,389,389 Target Corp1,100,288 1,235,788 IDEXX Laboratories Inc 255,808 287,310 Teradata Corp1,478,009 1,660,026 Illinois Tool Works Inc 1,790,456 2,010,951 Texas Instruments Inc1,682,460 1,889,655 Incyte Corp 395,720 444,453 Travelers Cos Inc
469,244 527,032 Insperity Inc 794,336 892,158 TripAdvisor Inc1,530,067 1,718,494 Intuit Inc 1,539,124 1,728,668 Ubiquiti Inc 1,168,485 1,312,384 Jazz Pharmaceuticals PLC 394,798 443,418 Unum Group
601,832 675,947 Juniper Netw orks Inc 1,064,495 1,195,587 USANA Health Sciences Inc284,101 319,088 Kforce Inc 292,071 328,039 Valero Energy Corp885,994 995,104 Kimberly-Clark Corp 1,105,463 1,241,600 VeriSign Inc
1,355,356 1,522,268 Kroger Co 837,220 940,324 Voya Financial Inc2,096,017 2,354,142 Lam Research Corp 924,400 1,038,239 Waddell & Reed Financial Inc
North America (continued) North America (continued)

Robeco Institutional Umbrella Fund 69
Robeco QI Institutional Global Developed Quality Equities Fund(continued)
Equity portfolio Futures portfolioAt 30 June 2020
M arket Value M arket Value M arket Value M arket ValueUnrealised Unrealised
United States (continued) Gain Gain EUR USD Europe
1,665,285 1,870,365 Walmart Inc Germany859,155 964,960 Waters Corp EUR EUR
1,164,860 1,308,313 Western Union Co 24,530 24,530 Eurx E-Stoxx 50 September 2020817,882 918,604 WW Grainger Inc917,863 1,030,898 Xerox Holdings Corp 465,866 523,238 Xilinx Inc United States555,437 623,839 Yelp Inc EUR USD
1,283,357 1,441,402 Yum! Brands Inc 20,591 23,127 S&P 500 Emini CME September 2020
200,267,953 45,121 Total - financial intruments that are offically listed on a regulated market
Total - financial intruments that are offically listed on a regulated market
North America (continued)
North America

Robeco Institutional Umbrella Fund 70
Robeco QI Institutional Global Developed Enhanced Indexing Fund
Equity portfolio Equity portfolioAt 30 June 2020
M arket Value M arket Value M arket Value M arket Value Africa
South AfricaEUR GBP EUR JPY
359,652 326,920 Anglo American PLC 125,967 15,263,600 Bridgestone Corp 133,879 16,222,258 Canon Inc
Asia 414,092 50,175,999 Capcom Co Ltd China 441,848 53,539,200 Chubu Electric Pow er Co Inc
EUR EUR 228,371 27,672,000 Chugai Pharmaceutical Co Ltd 286,860 286,860 Prosus NV 419,749 50,861,400 Dai Nippon Printing Co Ltd
EUR HKD 80,471 9,750,800 Dai-ichi Life Holdings Inc 96,279 838,100 BOC Hong Kong Holdings Ltd 290,697 35,224,000 Daiichi Sankyo Co Ltd
271,818 32,936,500 Daikin Industries Ltd Hong Kong 40,888 4,954,441 Daito Trust Construction Co Ltd
EUR HKD 151,046 18,302,400 Daiw a House Industry Co Ltd 111,296 968,820 AIA Group Ltd 114,520 13,876,500 Denso Corp 96,488 839,916 CK Asset Holdings Ltd 162,215 19,655,760 Eisai Co Ltd
100,403 874,000 CLP Holdings Ltd 91,740 11,116,200 JXTG Holdings Inc HK Electric Investments & HK 98,514 11,937,000 Fuji Media Holdings Inc
71,580 623,100 Electric Investements Ltd 197,836 23,972,000 FUJIFILM Holdings Corp 344,977 3,003,001 Hong Kong Exchanges & Clearing Ltd 145,810 17,667,949 Fujitsu Ltd 281,450 2,450,000 Kerry Properties Ltd 247,142 29,946,400 Hitachi Ltd 112,006 975,000 Sino Land Co Ltd 263,791 31,963,800 Honda Motor Co Ltd 125,039 1,088,450 Sun Hung Kai Properties Ltd 228,619 27,702,000 Hoya Corp 379,868 3,306,721 WH Group Ltd 55,038 6,669,000 Inpex Corp
EUR USD 235,654 28,554,450 ITOCHU Corp 61,409 68,971 Hongkong Land Holdings Ltd 80,207 9,718,800 Japan Exchange Group Inc 59,461 66,784 Jardine Matheson Holdings Ltd 70,867 8,587,028 Japan Post Holdings Co Ltd
80,462 9,749,664 Japan Post Insurance Co Ltd Israel Japan Real Estate Investment Corp
EUR ILS 45,638 5,530,000 Reits Bezeq The Israeli Telecommunication 49,158 5,956,501 Kansai Electric Pow er Co Inc
531,032 2,064,212 Corp Ltd 432,371 52,390,800 KDDI Corp 82,621 321,162 Nice Ltd 336,212 40,739,100 Kinden Corp
EUR USD 215,761 26,143,999 Kobe Bussan Co Ltd 82,164 92,282 Check Point Softw are Technologies Ltd 582,737 70,610,800 K's Holdings Corp
304,878 342,424 Taro Pharmaceutical Industries Ltd 128,653 15,589,000 M3 Inc 124,381 139,699 Teva Pharmaceutical Industries Ltd 110,680 13,411,200 Maeda Road Construction Co Ltd
57,532 6,971,250 Marubeni Corp Japan 192,881 23,371,650 Mitsubishi Electric Corp
EUR JPY 48,270 5,848,899 Mitsubishi Heavy Industries Ltd 75,761 9,180,039 Advantest Corp 304,098 36,847,839 Mitsubishi UFJ Financial Group Inc 86,828 10,521,000 Aeon Co Ltd 198,702 24,076,950 Mitsui & Co Ltd
294,301 35,660,758 Ajinomoto Co Inc 187,219 22,685,520 Mizuho Financial Group Inc 81,023 9,817,600 Asahi Group Holdings Ltd 83,084 10,067,375 MS&AD Insurance Group Holdings Inc
370,138 44,850,000 ASKUL Corp 601,604 72,896,999 NEC Corp 255,436 30,951,400 Astellas Pharma Inc 78,437 9,504,300 Nexon Co Ltd 130,952 15,867,600 Bandai Namco Holdings Inc 411,006 49,802,000 Nihon Unisys Ltd 391,150 47,396,000 Benesse Holdings Inc
Asia (continued) Japan (continued)
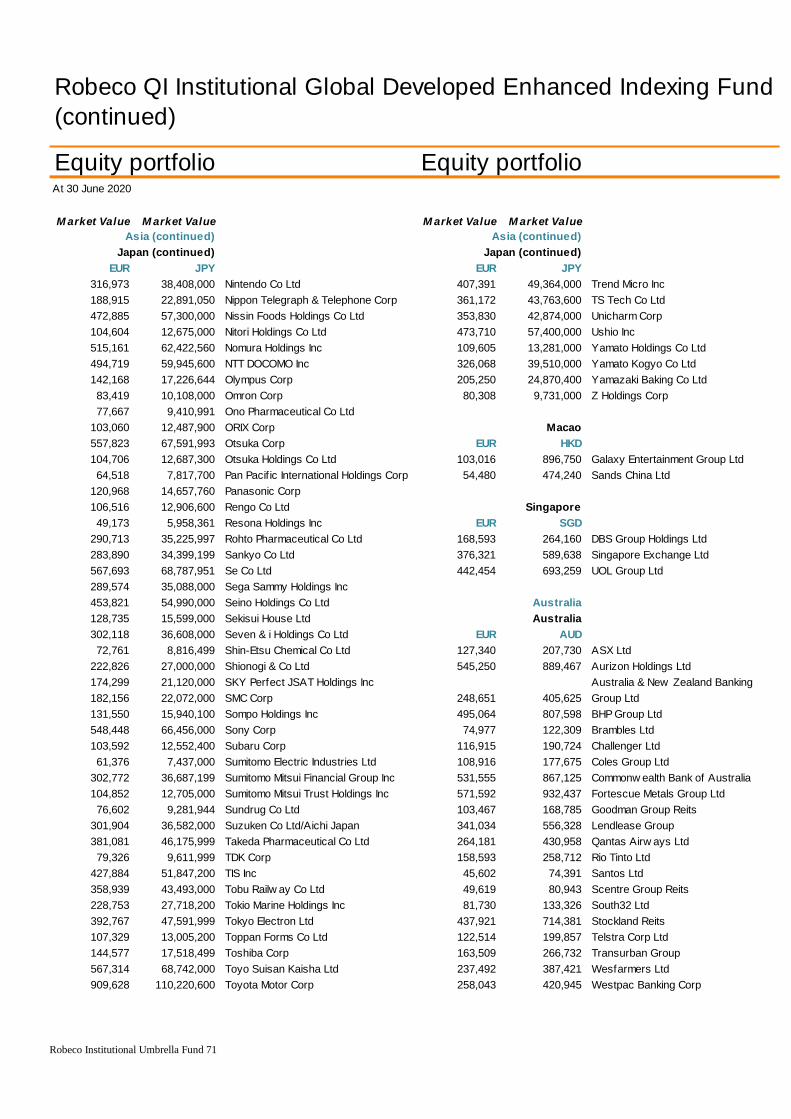
Robeco Institutional Umbrella Fund 71
Robeco QI Institutional Global Developed Enhanced Indexing Fund(continued)
Equity portfolio Equity portfolioAt 30 June 2020
M arket Value M arket Value M arket Value M arket Value
EUR JPY EUR JPY316,973 38,408,000 Nintendo Co Ltd 407,391 49,364,000 Trend Micro Inc188,915 22,891,050 Nippon Telegraph & Telephone Corp 361,172 43,763,600 TS Tech Co Ltd 472,885 57,300,000 Nissin Foods Holdings Co Ltd 353,830 42,874,000 Unicharm Corp 104,604 12,675,000 Nitori Holdings Co Ltd 473,710 57,400,000 Ushio Inc 515,161 62,422,560 Nomura Holdings Inc 109,605 13,281,000 Yamato Holdings Co Ltd 494,719 59,945,600 NTT DOCOMO Inc 326,068 39,510,000 Yamato Kogyo Co Ltd 142,168 17,226,644 Olympus Corp 205,250 24,870,400 Yamazaki Baking Co Ltd 83,419 10,108,000 Omron Corp 80,308 9,731,000 Z Holdings Corp77,667 9,410,991 Ono Pharmaceutical Co Ltd
103,060 12,487,900 ORIX Corp 557,823 67,591,993 Otsuka Corp EUR HKD104,706 12,687,300 Otsuka Holdings Co Ltd 103,016 896,750 Galaxy Entertainment Group Ltd 64,518 7,817,700 Pan Pacif ic International Holdings Corp 54,480 474,240 Sands China Ltd
120,968 14,657,760 Panasonic Corp 106,516 12,906,600 Rengo Co Ltd 49,173 5,958,361 Resona Holdings Inc EUR SGD
290,713 35,225,997 Rohto Pharmaceutical Co Ltd 168,593 264,160 DBS Group Holdings Ltd 283,890 34,399,199 Sankyo Co Ltd 376,321 589,638 Singapore Exchange Ltd 567,693 68,787,951 Se Co Ltd 442,454 693,259 UOL Group Ltd 289,574 35,088,000 Sega Sammy Holdings Inc 453,821 54,990,000 Seino Holdings Co Ltd Australia128,735 15,599,000 Sekisui House Ltd 302,118 36,608,000 Seven & i Holdings Co Ltd EUR AUD72,761 8,816,499 Shin-Etsu Chemical Co Ltd 127,340 207,730 ASX Ltd
222,826 27,000,000 Shionogi & Co Ltd 545,250 889,467 Aurizon Holdings Ltd 174,299 21,120,000 SKY Perfect JSAT Holdings Inc Australia & New Zealand Banking 182,156 22,072,000 SMC Corp 248,651 405,625 Group Ltd131,550 15,940,100 Sompo Holdings Inc 495,064 807,598 BHP Group Ltd 548,448 66,456,000 Sony Corp 74,977 122,309 Brambles Ltd 103,592 12,552,400 Subaru Corp 116,915 190,724 Challenger Ltd 61,376 7,437,000 Sumitomo Electric Industries Ltd 108,916 177,675 Coles Group Ltd
302,772 36,687,199 Sumitomo Mitsui Financial Group Inc 531,555 867,125 Commonw ealth Bank of Australia104,852 12,705,000 Sumitomo Mitsui Trust Holdings Inc 571,592 932,437 Fortescue Metals Group Ltd 76,602 9,281,944 Sundrug Co Ltd 103,467 168,785 Goodman Group Reits
301,904 36,582,000 Suzuken Co Ltd/Aichi Japan 341,034 556,328 Lendlease Group 381,081 46,175,999 Takeda Pharmaceutical Co Ltd 264,181 430,958 Qantas Airw ays Ltd 79,326 9,611,999 TDK Corp 158,593 258,712 Rio Tinto Ltd
427,884 51,847,200 TIS Inc 45,602 74,391 Santos Ltd 358,939 43,493,000 Tobu Railw ay Co Ltd 49,619 80,943 Scentre Group Reits 228,753 27,718,200 Tokio Marine Holdings Inc 81,730 133,326 South32 Ltd 392,767 47,591,999 Tokyo Electron Ltd 437,921 714,381 Stockland Reits 107,329 13,005,200 Toppan Forms Co Ltd 122,514 199,857 Telstra Corp Ltd144,577 17,518,499 Toshiba Corp 163,509 266,732 Transurban Group 567,314 68,742,000 Toyo Suisan Kaisha Ltd 237,492 387,421 Wesfarmers Ltd 909,628 110,220,600 Toyota Motor Corp 258,043 420,945 Westpac Banking Corp
Asia (continued) Asia (continued) Japan (continued) Japan (continued)
Macao
Singapore
Australia

Robeco Institutional Umbrella Fund 72
Robeco QI Institutional Global Developed Enhanced Indexing Fund(continued)
Equity portfolio Equity portfolioAt 30 June 2020
M arket Value M arket Value M arket Value M arket Value
EUR AUD EUR EUR95,848 156,356 Woodside Petroleum Ltd 64,682 64,682 Alstom SA
EUR GBP 621,014 621,014 Atos SE 273,151 248,292 BHP Group PLC 275,327 275,327 AXA SA821,930 747,126 GAM Multistock - Sw iss Equity 765,230 765,230 BNP Paribas SA
55,711 55,711 Bouygues SANew Zealand 123,971 123,971 Capgemini SE
EUR NZD 311,331 311,331 Carrefour SA89,556 156,248 Fisher & Paykel Healthcare Corp Ltd 12,732 12,732 Casino Guichard Perrachon SA81,470 142,141 Meridian Energy Ltd 242,362 242,362 Cie de Saint-Gobain
Cie Generale des EtablissementsEurope 112,193 112,193 Michelin SCA
Belgium 68,697 68,697 Credit Agricole SAEUR EUR 269,817 269,817 Danone SA
173,486 173,486 Anheuser-Busch InBev 118,036 118,036 Edenred65,885 65,885 Anheuser-Busch InBev SA/NV 429,466 429,466 Eiffage SA
452,504 452,504 Galapagos NV 153,769 153,769 Engie SA90,734 90,734 KBC Group NV 31,502 31,502 Faurecia SE62,353 62,353 Solvay SA 214,958 214,958 Hermes International
585,196 585,196 UCB SA 128,140 128,140 Legrand SA511,974 511,974 L'Oreal SA
Denmark 526,004 526,004 LVMH Moet Hennessy Louis Vuitton SEEUR DKK 146,699 146,699 Orange SA
260,256 1,939,729 AP Moller - Maersk A/S 60,121 60,121 Peugeot SA473,398 3,528,316 Carlsberg A/S 75,626 75,626 Publicis Groupe SA116,135 865,576 Coloplast A/S 723,568 723,568 Sanofi56,677 422,420 Danske Bank A/S 496,378 496,378 Schneider Electric SE
133,739 996,780 Genmab A/S 91,834 91,834 Societe Generale SA1,147,192 8,550,216 Novo Nordisk A/S 572,547 572,547 TOTAL SA
83,974 625,872 Novozymes A/S 64,907 64,907 Unibail-Rodamco-Westfield Reits542,492 4,043,288 Pandora A/S 44,150 44,150 Valeo SA254,277 1,895,173 Vestas Wind Systems A/S 128,068 128,068 Veolia Environnement SA
80,934 80,934 Worldline SAFindland
EUR EUR64,806 64,806 Elisa OYJ EUR EUR
159,478 159,478 Kone Oyj 547,825 547,825 Allianz SE 155,334 155,334 Nokia Oyj 433,556 433,556 Bayer AG 94,830 94,830 UPM-Kymmene Oyj 131,993 131,993 Bayerische Motoren Werke AG
EUR SEK 72,779 72,779 Continental AG 138,828 1,452,699 Nordea Bank Abp 234,943 234,943 Daimler AG
88,413 88,413 Delivery Hero SEFrance 127,358 127,358 Deutsche Bank AG
EUR EUR 211,298 211,298 Deutsche Boerse AG 431,039 431,039 Air Liquide SA 291,713 291,713 Deutsche Post AG
373,281 373,281 Deutsche Telekom AG
Australia (continued) France (continued) Australia (continued) Europe (continued)
Germany

Robeco Institutional Umbrella Fund 73
Robeco QI Institutional Global Developed Enhanced Indexing Fund(continued)
Equity portfolio Equity portfolioAt 30 June 2020
M arket Value M arket Value M arket Value M arket Value
Netherlands (continued)EUR EUR EUR EUR
517,992 517,992 Deutsche Wohnen SE 129,179 129,179 Akzo Nobel NV156,725 156,725 E.ON SE 1,066,021 1,066,021 ASML Holding NV116,815 116,815 Fresenius Medical Care AG & Co KGaA 64,254 64,254 Heineken Holding NV168,141 168,141 Fresenius SE & Co KGaA 532,569 532,569 ING Groep NV62,894 62,894 Hannover Rueck SE 75,692 75,692 Just Eat Takeaw ay.com NV 94,747 94,747 HeidelbergCement AG 361,741 361,741 Koninklijke Ahold Delhaize NV95,728 95,728 Henkel AG & Co KGaA 162,254 162,254 Koninklijke DSM NV
102,025 102,025 Henkel AG & Co KGaA 94,726 94,726 Koninklijke KPN NV171,760 171,760 Infineon Technologies AG 745,865 745,865 Koninklijke Philips NV163,421 163,421 Merck KGaA 66,827 66,827 NN Group NV
Muenchener Rueckversicherungs- 385,611 385,611 Signify NV712,018 712,018 Gesellschaft AG in Muenchen 612,610 612,610 Wolters Kluw er NV50,853 50,853 Porsche Automobil Holding SE EUR GBP
137,973 137,973 RWE AG 453,612 412,328 Royal Dutch Shell PLC-A859,673 859,673 SAP SE 358,478 325,853 Royal Dutch Shell PLC-B560,466 560,466 Siemens AG EUR USD303,216 303,216 Suedzucker AG 319,330 358,656 NXP Semiconductors NV 89,942 89,942 Symrise AG
485,693 485,693 Telefonica Deutschland Holding AG176,367 176,367 Volksw agen AG EUR NOK215,482 215,482 Vonovia SE 114,436 1,239,918 Equinor ASA72,323 72,323 Zalando SE
EUR EUREUR EUR 105,332 105,332 EDP - Energias de Portugal SA
620,827 620,828 CRH PLC646,191 646,191 Flutter Entertainment PLC
EUR EUR140,346 140,346 Amadeus IT Group SA
EUR EUR 602,915 602,916 Banco Bilbao Vizcaya Argentaria SA104,877 104,877 Assicurazioni Generali SpA 48,012 48,012 CaixaBank SA775,862 775,862 Enel SpA 506,268 506,268 EDP Renovaveis SA 151,046 151,046 Eni SpA 84,396 84,396 Ferrovial SA194,052 194,052 Intesa Sanpaolo SpA 452,181 452,181 Iberdrola SA246,272 246,272 Leonardo SpA 182,243 182,243 Industria de Diseno Textil SA121,365 121,365 Snam SpA 140,049 140,049 Telefonica SA67,867 67,867 Terna Rete Elettrica Nazionale SpA 5,774 5,774 Telefonica SA Rights
200,025 200,025 UniCredit SpA
EUR SEKEUR EUR 230,297 2,409,823 Atlas Copco AB-A
385,988 385,988 ArcelorMittal SA 112,561 1,177,843 Atlas Copco AB-B37,221 389,481 Epiroc AB
124,106 1,298,645 Essity ABEUR EUR 96,749 1,012,384 Hexagon AB
292,798 292,798 Aegon NV 163,759 1,713,575 Investor AB
Netherlands
Europe (continued) Europe (continued) Germany (continued)
Norway
PortugalIreland
Spain
Italy
Sweden Luxembourg

Robeco Institutional Umbrella Fund 74
Robeco QI Institutional Global Developed Enhanced Indexing Fund(continued)
Equity portfolio Equity portfolioAt 30 June 2020
M arket Value M arket Value M arket Value M arket Value
EUR SEK EUR GBP252,825 2,645,564 Lundin Petroleum AB 304,344 304,344 RELX PLC 132,555 1,387,056 Sandvik AB 931,229 846,477 Astrazeneca170,130 1,780,243 Skandinaviska Enskilda Banken AB 188,264 171,130 Barclays PLC342,256 3,581,362 Skanska AB 92,490 84,072 Barlow orld Ltd 299,885 3,137,999 SKF AB 338,268 307,482 Barratt Developments92,015 962,847 Svenska Handelsbanken AB 267,273 242,949 BP 72,754 761,295 Sw edbank AB 75,201 68,357 BT Group PLC
193,876 2,028,724 Telefonaktiebolaget LM Ericsson 147,213 133,815 Corp Industrial Carabobo SACA158,797 1,661,656 Volvo AB 417,883 379,852 Direct Line Insurance Group PLC
277,088 251,871 Dixons Carphone PLC635,327 577,506 GlaxoSmithKline PLC
EUR CHF 287,346 261,194 GVC Holdings PLC 261,794 278,612 ABB Ltd 189,862 172,583 Hikma Pharmaceuticals PLC96,670 102,880 Adecco Group AG 369,400 335,781 How den Joinery Group
157,476 167,592 Alcon Inc 420,843 382,542 Inchcape PLC Chocoladefabriken Lindt & Spruengli 111,107 100,995 L&G. Group
109,938 117,000 AG 67,650 61,493 Land Securities Group PLC Reits165,092 175,698 Credit Suisse Group AG 171,673 156,049 Lloyds Banking Group150,605 160,280 Geberit AG 203,665 185,129 London Stock Exchange Group PLC66,354 70,617 Julius Baer Group Ltd 33,982 30,889 M&G PLC
536,583 571,053 LafargeHolcim Ltd 265,715 241,532 National Grid PLC 80,214 85,367 Logitech International SA 510,728 464,247 Northw est Equity Corp/WI
266,024 283,113 Lonza Group AG 394,106 358,238 Persimmon PLC2,142,846 2,280,502 Nestle SA 267,121 242,810 Prudential1,273,426 1,355,231 Novartis AG 966,987 878,981 Reckitt Benckiser Group PLC1,953,919 2,079,439 Roche Holding AG 373,175 339,212 Royal Mail PLC
71,034 75,597 Schindler Holding AG 105,057 95,496 Sage Group PLC132,944 141,484 Sonova Holding AG 77,095 70,078 Segro PLC Reits150,724 160,407 Sw iss Life Holding AG 107,285 97,521 SSE PLC471,978 502,298 Sw iss Prime Site AG 77,045 70,033 Standard Life Aberdeen PLC121,373 129,170 Sw iss Re AG 168,564 153,223 Taylor Wimpey85,738 91,246 Sw isscom AG 188,088 170,970 Tesco
835,150 888,800 UBS Group AG 377,964 343,565 Unilever PLC 333,496 354,920 Zurich Insurance Group AG 269,252 244,747 Vodafone Group PLC
EUR EUR 106,474 96,783 WPP PLC142,102 142,102 STMicroelectronics NV EUR HKD
EUR GBP 463,393 4,033,801 CK Hutchison Holdings Ltd149,057 135,491 Glencore PLC EUR USD355,318 322,981 Mediclinic International PLC 277,286 311,434 Aon PLC
352,671 396,102 Coca-Cola European Partners PLC359,464 403,732 Liberty Global PLC-A
EUR EUR 195,039 219,058 Liberty Global PLC-C100,361 100,361 Fiat Chrysler Automobiles NV 700,644 786,928 Linde PLC
Europe (continued) Europe (continued) Sweden (continued) United Kingdom (continued)
Switzerland
United Kingdom
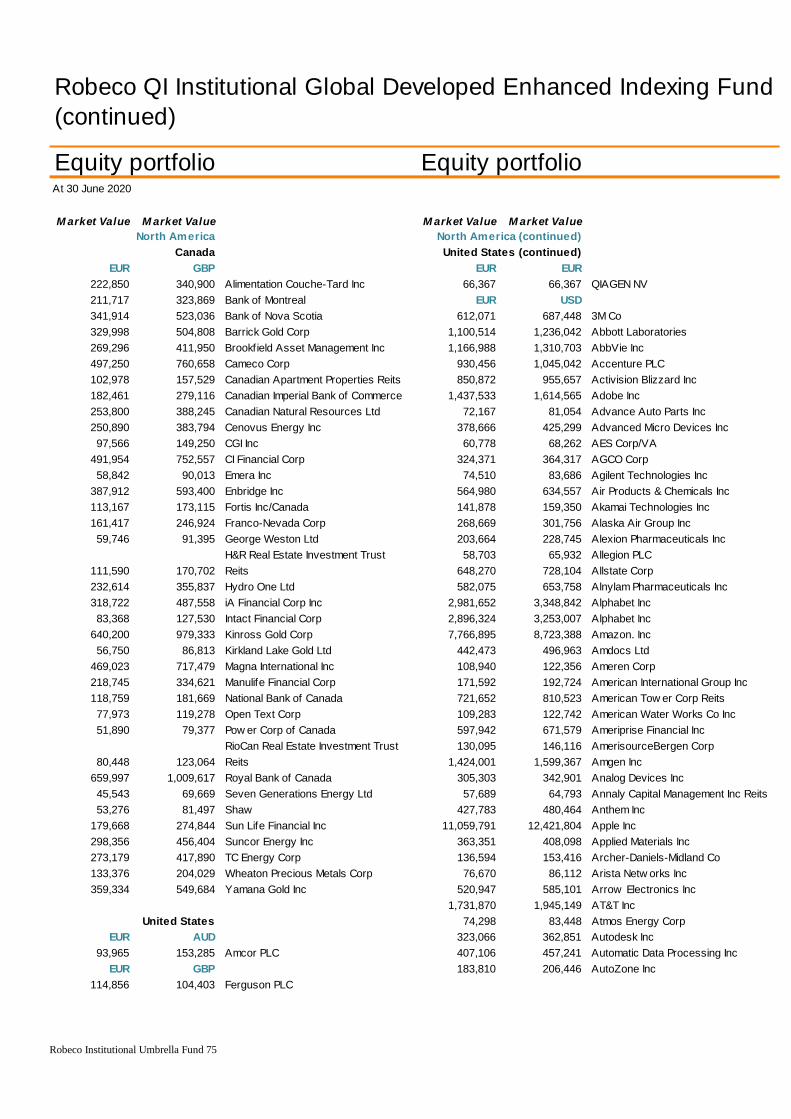
Robeco Institutional Umbrella Fund 75
Robeco QI Institutional Global Developed Enhanced Indexing Fund(continued)
Equity portfolio Equity portfolioAt 30 June 2020
M arket Value M arket Value M arket Value M arket Value
CanadaEUR GBP EUR EUR
222,850 340,900 Alimentation Couche-Tard Inc 66,367 66,367 QIAGEN NV 211,717 323,869 Bank of Montreal EUR USD341,914 523,036 Bank of Nova Scotia 612,071 687,448 3M Co 329,998 504,808 Barrick Gold Corp 1,100,514 1,236,042 Abbott Laboratories 269,296 411,950 Brookfield Asset Management Inc 1,166,988 1,310,703 AbbVie Inc497,250 760,658 Cameco Corp 930,456 1,045,042 Accenture PLC102,978 157,529 Canadian Apartment Properties Reits 850,872 955,657 Activision Blizzard Inc182,461 279,116 Canadian Imperial Bank of Commerce 1,437,533 1,614,565 Adobe Inc 253,800 388,245 Canadian Natural Resources Ltd 72,167 81,054 Advance Auto Parts Inc250,890 383,794 Cenovus Energy Inc 378,666 425,299 Advanced Micro Devices Inc97,566 149,250 CGI Inc 60,778 68,262 AES Corp/VA
491,954 752,557 CI Financial Corp 324,371 364,317 AGCO Corp58,842 90,013 Emera Inc 74,510 83,686 Agilent Technologies Inc
387,912 593,400 Enbridge Inc 564,980 634,557 Air Products & Chemicals Inc113,167 173,115 Fortis Inc/Canada 141,878 159,350 Akamai Technologies Inc161,417 246,924 Franco-Nevada Corp 268,669 301,756 Alaska Air Group Inc 59,746 91,395 George Weston Ltd 203,664 228,745 Alexion Pharmaceuticals Inc
H&R Real Estate Investment Trust 58,703 65,932 Allegion PLC 111,590 170,702 Reits 648,270 728,104 Allstate Corp232,614 355,837 Hydro One Ltd 582,075 653,758 Alnylam Pharmaceuticals Inc318,722 487,558 iA Financial Corp Inc 2,981,652 3,348,842 Alphabet Inc 83,368 127,530 Intact Financial Corp 2,896,324 3,253,007 Alphabet Inc
640,200 979,333 Kinross Gold Corp 7,766,895 8,723,388 Amazon. Inc56,750 86,813 Kirkland Lake Gold Ltd 442,473 496,963 Amdocs Ltd
469,023 717,479 Magna International Inc 108,940 122,356 Ameren Corp218,745 334,621 Manulife Financial Corp 171,592 192,724 American International Group Inc 118,759 181,669 National Bank of Canada 721,652 810,523 American Tow er Corp Reits77,973 119,278 Open Text Corp 109,283 122,742 American Water Works Co Inc 51,890 79,377 Pow er Corp of Canada 597,942 671,579 Ameriprise Financial Inc
RioCan Real Estate Investment Trust 130,095 146,116 AmerisourceBergen Corp80,448 123,064 Reits 1,424,001 1,599,367 Amgen Inc
659,997 1,009,617 Royal Bank of Canada 305,303 342,901 Analog Devices Inc 45,543 69,669 Seven Generations Energy Ltd 57,689 64,793 Annaly Capital Management Inc Reits53,276 81,497 Shaw 427,783 480,464 Anthem Inc
179,668 274,844 Sun Life Financial Inc 11,059,791 12,421,804 Apple Inc 298,356 456,404 Suncor Energy Inc 363,351 408,098 Applied Materials Inc273,179 417,890 TC Energy Corp 136,594 153,416 Archer-Daniels-Midland Co 133,376 204,029 Wheaton Precious Metals Corp 76,670 86,112 Arista Netw orks Inc 359,334 549,684 Yamana Gold Inc 520,947 585,101 Arrow Electronics Inc
1,731,870 1,945,149 AT&T IncUnited States 74,298 83,448 Atmos Energy Corp
EUR AUD 323,066 362,851 Autodesk Inc 93,965 153,285 Amcor PLC 407,106 457,241 Automatic Data Processing Inc
EUR GBP 183,810 206,446 AutoZone Inc114,856 104,403 Ferguson PLC
North America North America (continued) United States (continued)

Robeco Institutional Umbrella Fund 76
Robeco QI Institutional Global Developed Enhanced Indexing Fund(continued)
Equity portfolio Equity portfolioAt 30 June 2020
M arket Value M arket Value M arket Value M arket Value
EUR USD EUR USD135,619 152,320 AvalonBay munities Inc Reits 1,349,929 1,516,173 Cisco Systems Inc116,614 130,975 Avery Dennison Corp 1,166,180 1,309,795 Citigroup Inc49,891 56,035 Baker Hughes Co 392,527 440,867 Citizens Financial Group Inc
1,379,240 1,549,094 Bank of America Corp 645,686 725,202 Citrix Systems Inc 725,167 814,471 Bank of New York Mellon Corp 687,710 772,402 Clorox Co 265,318 297,992 Baxter International Inc 1,148,636 1,290,090 Coca-Cola Co268,749 301,846 Bed Bath & Beyond Inc 195,884 220,007 Cognizant Technology Solutions Corp
1,000,508 1,123,720 Berkshire Hathaw ay Inc 595,055 668,336 Conagra Brands Inc655,331 736,035 Best Buy Co Inc 70,660 79,362 Concho Resources Inc 773,957 869,270 Biogen Inc 614,390 690,052 ConocoPhillips150,778 169,346 BioMarin Pharmaceutical Inc 163,182 183,278 Consolidated Edison Inc68,740 77,205 Bio-Rad Laboratories Inc 200,005 224,636 Constellation Brands Inc
564,848 634,409 BlackRock Inc 156,330 175,582 Corteva Inc61,690 69,287 Boeing Co 914,908 1,027,579 Costco Wholesale Corp
453,678 509,549 Booking Holdings Inc 474,716 533,177 Crow n Castle International Corp Reits 71,615 80,435 Booz Allen Hamilton Holding Corp 57,409 64,479 Crow n Holdings Inc50,381 56,586 BorgWarner Inc 364,922 409,862 CSX Corp
113,382 127,345 Boston Properties Inc Reits 620,753 697,198 Cummins Inc299,539 336,427 Brighthouse Financial Inc 533,516 599,219 CVS Health Corp940,413 1,056,224 Bristol-Myers Squibb Co 505,287 567,513 DaVita Inc 15,905 17,864 Bristol-Myers Squibb Co Rights 289,073 324,672 Deere & Co
431,073 484,160 Brixmor Property Group Inc Reits 635,076 713,286 Dell Technologies Inc 436,400 490,142 Broad Inc 116,118 130,418 DENTSPLY SIRONA Inc169,937 190,864 Cadence Design Systems Inc 260,422 292,493 Devon Energy Corp55,391 62,212 Camden Property Trust Reits 253,025 284,185 Dex Inc
496,764 557,940 Campbell Soup Co 55,835 62,711 Discovery Inc241,076 270,764 Capital One Financial Corp 338,457 380,138 Discovery Inc 545,064 612,189 Cardinal Health Inc 547,785 615,244 DISH Netw ork Corp 71,599 80,416 CarMax Inc 767,558 862,083 DocuSign Inc
112,292 126,121 Carrier Global Corp 773,303 868,535 Dollar General Corp1,114,235 1,251,453 cast Corp 148,285 166,546 Dollar Tree Inc
460,655 517,385 Caterpillar Inc 455,935 512,083 Dominion Energy Inc 446,221 501,173 CBRE Group Inc 539,777 606,251 Domino's Pizza Inc113,268 127,217 CDW Corp/DE 527,097 592,009 Dover Corp102,318 114,919 Celanese Corp 190,381 213,827 Dow Inc212,069 238,185 Centene Corp 297,850 334,530 DR Horton Inc73,174 82,185 CenterPoint Energy Inc 352,237 395,615 Duke Energy Corp61,672 69,267 CenturyLink Inc 59,648 66,993 Duke Realty Corp Reits
177,608 199,480 Cerner Corp 252,700 283,820 DuPont de Nemours Inc53,466 60,051 CF Industries Holdings Inc 75,581 84,889 E*TRADE Financial Corp
509,518 572,265 Charter munications Inc 74,901 84,125 Eastman Chemical Co 1,144,820 1,285,804 Chevron Corp 404,395 454,196 Eaton Corp PLC
175,214 196,791 Chipotle Mexican Grill Inc 837,594 940,743 eBay Inc 451,269 506,843 Cigna Corp 296,216 332,695 Edw ards Lifesciences Corp97,945 110,007 Cintas Corp 64,647 72,608 Elanco Animal Health Inc
United States (continued) United States (continued) North America (continued) North America (continued)

Robeco Institutional Umbrella Fund 77
Robeco QI Institutional Global Developed Enhanced Indexing Fund(continued)
Equity portfolio Equity portfolioAt 30 June 2020
M arket Value M arket Value M arket Value M arket Value
EUR USD EUR USD777,380 873,115 Electronic Arts Inc 81,464 91,496 Halliburton Co 928,524 1,042,871 Eli Lilly & Co 112,305 126,136 Hartford Financial Services Group Inc707,644 794,790 Emerson Electric Co 165,403 185,773 HCA Healthcare Inc111,672 125,424 Entergy Corp 72,211 81,104 Henry Schein Inc34,025 38,215 Envista Holdings Corp 130,988 147,119 Hershey Co
186,059 208,972 EOG Resources Inc 336,242 377,650 Hew lett Packard Enterprise Co140,944 158,301 Equifax Inc 152,374 171,139 Hilton Worldw ide Holdings Inc407,692 457,900 Equinix Inc Reits 169,556 190,437 Hologic Inc535,359 601,289 Equitable Holdings Inc 1,655,643 1,859,536 Home Depot Inc86,225 96,844 Equity LifeStyle Properties Inc Reits 688,481 773,267 Honeyw ell International Inc
137,735 154,697 Equity Residential Reits 319,103 358,401 Host Hotels & Resorts Inc Reits102,633 115,273 Essex Property Trust Inc Reits 54,134 60,801 How met Aerospace Inc 66,276 74,438 Everest Re Group Ltd 312,472 350,953 HP Inc
216,224 242,852 Evergy Inc 851,348 956,191 Humana Inc183,570 206,177 Eversource Energy 57,670 64,772 Huntington Bancshares Inc/OH557,686 626,365 Exelon Corp 425,369 477,754 Huntington Ingalls Industries Inc70,479 79,158 Expedia Group Inc 176,927 198,716 IHS Markit Ltd
Expeditors International of 355,413 399,183 Illinois Tool Works Inc82,529 92,693 Washington Inc 152,926 171,759 Incyte Corp
615,604 691,416 Exxon Mobil Corp 46,393 52,106 Ingersoll Rand Inc3,724,017 4,182,629 Facebook Inc 1,775,749 1,994,433 Intel Corp
167,637 188,282 Fastenal Co 347,022 389,758 Intercontinental Exchange Inc39,774 44,672 Fidelity National Financial Inc 680,222 763,991 International Business Machines Corp
Fidelity National Information Services 115,793 130,053 International Flavors & Fragrances Inc 516,351 579,939 Inc 84,831 95,278 International Paper Co121,861 136,869 Fifth Third Bancorp 430,381 483,382 Intuit Inc121,641 136,621 First Republic Bank 518,269 582,094 Invitation Homes Inc Reits128,789 144,649 FirstEnergy Corp 552,344 620,365 Jack Henry & Associates Inc348,447 391,359 Fiserv Inc 76,785 86,242 Jacobs Engineering Group Inc145,552 163,476 FMC Corp 453,679 509,550 Jazz Pharmaceuticals PLC161,561 181,458 Ford Motor Co 82,338 92,478 JM Smucker Co 619,282 695,547 Fortinet Inc 2,522,237 2,832,851 Johnson & Johnson567,552 637,446 Fortune Brands Home & Security Inc 540,422 606,975 Johnson Controls International plc96,687 108,594 Fox Corp 2,231,512 2,506,323 JPMorgan Chase & Co15,533 17,446 Fox CorpClass B 336,463 377,899 Juniper Netw orks Inc
114,551 128,658 Freeport-McMoRan Inc 95,437 107,190 Kansas City Southern94,970 106,665 Garmin Ltd 103,812 116,596 Kellogg Co
833,124 935,724 General Electric Co 99,346 111,581 KeyCorp233,284 262,013 General Mills Inc 129,301 145,224 Keysight Technologies Inc 203,206 228,231 General Motors Co 397,816 446,807 Kimberly-Clark Corp79,825 89,656 Genuine Parts Co 38,412 43,142 Kimco Realty Corp Reits
1,090,648 1,224,961 Gilead Sciences Inc 192,722 216,456 KLA Corp 361,697 406,240 Global Payments Inc Knight-Sw ift Transportation Holdings85,464 95,989 GoDaddy Inc 560,949 630,030 Inc
563,045 632,384 Goldman Sachs Group Inc 580,332 651,800 Kraft Heinz Co
North America (continued) North America (continued) United States (continued) United States (continued)

Robeco Institutional Umbrella Fund 78
Robeco QI Institutional Global Developed Enhanced Indexing Fund(continued)
Equity portfolio Equity portfolioAt 30 June 2020
M arket Value M arket Value M arket Value M arket Value
EUR USD EUR USD577,453 648,566 Kroger Co 145,351 163,251 Motorola Solutions Inc237,476 266,721 L3Harris Technologies Inc 219,347 246,359 MSCI Inc136,065 152,821 Laboratory Corp of America Holdings 51,956 58,354 Mylan NV876,652 984,612 Lam Research Corp 67,277 75,562 NetApp Inc 58,002 65,145 Lamb Weston Holdings Inc 599,211 673,004 Netflix Inc
128,087 143,861 Las Vegas Sands Corp 103,553 116,305 New ell Brands Inc92,407 103,787 Lear Corp 316,904 355,931 New mont Mining Corp
460,031 516,684 Leidos Holdings Inc 488,402 548,549 New s Corp 141,164 158,548 Lennar Corp 800,816 899,437 NextEra Energy Inc 106,947 120,117 Liberty Broadband Corp 396,086 444,864 Nielsen Holdings PLC24,311 27,305 Liberty Media Corp-Liberty SiriusXM-A 833,445 936,083 NIKE Inc 2,300 2,583 Liberty Media Corp-Liberty SiriusXM-C 70,435 79,109 Nordson Corp
56,897 63,904 Lincoln National Corp 306,073 343,766 Norfolk Southern Corp1,028,982 1,155,702 Lockheed Martin Corp 108,998 122,422 Northern Trust Corp
65,945 74,066 Loew s Corp 553,453 621,611 NortonLifeLock Inc700,292 786,534 Low e's Cos Inc 552,287 620,301 Nuance Communications Inc 110,123 123,685 LyondellBasell Industries NV 80,007 89,860 Nucor Corp86,646 97,316 M&T Bank Corp 2,035,951 2,286,678 NVIDIA Corp
472,922 531,162 Manpow erGroup Inc 89,945 101,021 NVR Inc149,267 167,649 Marathon Petroleum Corp 103,806 116,589 Occidental Petroleum Corp129,339 145,267 MarketAxess Holdings Inc 110,528 124,140 Old Dominion Freight Line Inc 80,925 90,891 Martin Marietta Materials Inc 417,637 469,069 Omni Group Inc
158,982 178,561 Marvell Technology Group Ltd 1,297,712 1,457,525 Oracle Corp166,122 186,580 Masco Corp 143,675 161,369 Otis Worldw ide Corp 79,167 88,916 Masimo Corp 176,670 198,427 PACCAR Inc
1,100,499 1,236,026 Mastercard Inc 71,441 80,239 Packaging Corp of America172,476 193,717 Match Group Inc 154,797 173,860 Palo Alto Netw orks Inc 136,422 153,222 Maxim Integrated Products Inc 160,727 180,521 Parker-Hannif in Corp 287,919 323,376 McDonald's Corp 119,983 134,759 Paychex Inc596,933 670,445 McKesson Corp 506,022 568,338 PayPal Holdings Inc 366,978 412,171 MDU Resources Group Inc 1,121,881 1,260,041 PepsiCo Inc838,580 941,851 Medtronic PLC 74,322 83,475 PerkinElmer Inc
1,341,562 1,506,775 Merck & Co Inc 1,235,330 1,387,461 Pfizer Inc512,545 575,665 MetLife Inc 255,937 287,456 Phillips 66 52,637 59,119 MGM Resorts International 60,621 68,086 Pinnacle West Capital Corp
158,178 177,658 Microchip Technology Inc 135,353 152,021 Pioneer Natural Resources Co454,719 510,718 Micron Technology Inc 314,557 353,295 PNC Financial Services Group Inc
10,063,793 11,303,149 Microsoft Corp 158,361 177,863 PPG Industries Inc Mid-America Apartment munities Inc 116,207 130,518 PPL Corp
105,976 119,027 Reits 2,034,441 2,284,983 Procter & Gamble Co 74,162 83,295 Molina Healthcare Inc 434,595 488,116 Prologis Inc Reits44,359 49,822 Molson Coors Beverage Co 154,751 173,809 Prudential Financial Inc
462,612 519,583 Mondelez International Inc 155,251 174,371 Public Service Enterprise Group Inc 179,048 201,097 Monster Beverage 66,973 75,221 Public Storage Reits391,853 440,110 Morgan Stanley 581,251 652,832 PulteGroup Inc
North America (continued) North America (continued) United States (continued) United States (continued)

Robeco Institutional Umbrella Fund 79
Robeco QI Institutional Global Developed Enhanced Indexing Fund(continued)
Equity portfolio Equity portfolioAt 30 June 2020
M arket Value M arket Value
EUR USD EUR USD569,798 639,969 Qorvo Inc 287,557 322,969 T-Mobile US Inc 901,177 1,012,157 QUALM Inc 464 521 T-Mobile US Inc Rights151,487 170,142 Quest Diagnostics Inc 104,550 117,425 Tractor Supply Co 329,901 370,528 Qurate Retail Inc 166,449 186,947 Trane Technologies PLC68,637 77,090 Raymond James Financial Inc 77,293 86,812 Trimble Inc
1,077,740 1,210,464 Raytheon Technologies Corp 359,101 403,325 Truist Financial Corp131,910 148,155 Realty Income Corp Reits 83,079 93,311 Tyler Technologies Inc 428,667 481,458 Regeneron Pharmaceuticals Inc 81,495 91,531 Uber Technologies Inc93,483 104,995 Regions Financial Corp 110,942 124,605 Union Pacif ic Corp
116,739 131,116 Republic Services Inc 101,912 114,463 United Rentals Inc174,025 195,456 ResMed Inc 1,906,546 2,141,337 UnitedHealth Group Inc555,605 624,028 Robert Half International Inc 428,136 480,861 Unum Group155,699 174,873 Rockw ell Automation Inc 354,349 397,987 US Bancorp71,174 79,939 RPM International Inc 149,937 168,402 Valero Energy Corp
508,382 570,989 S&P Global Inc 90,869 102,059 Varian Medical Systems Inc270,700 304,037 salesforce. Inc 139,219 156,363 VeriSign Inc 228,914 257,105 SBA Communications Corp Reits 1,553,693 1,745,030 Verizon154,272 173,271 Schlumberger Ltd 994,625 1,117,113 Vertex Pharmaceuticals Inc 141,159 158,543 Seagate Technology PLC 57,785 64,901 VF Corp 139,034 156,156 Seattle Genetics Inc 78,775 88,476 ViaCBS Inc203,429 228,481 Sempra Energy 57,955 65,093 VICI Properties Inc Reits 129,010 144,897 Simon Property Group Inc Reits 1,543,778 1,733,894 Visa Inc 68,863 77,343 Sirius XM Holdings Inc 520,412 584,500 Vistra Energy Corp
137,178 154,071 Skyw orks Solutions Inc 205,883 231,237 Walgreens Boots Alliance Inc373,427 419,415 Southern Co 1,101,338 1,236,968 Walmart Inc290,770 326,578 Spectrum Brands Holdings Inc 669,765 752,246 Walt Disney Co79,353 89,125 SS&C Technologies Holdings Inc 282,515 317,306 Waste Management Inc
171,006 192,066 Stanley Black & Decker Inc 175,121 196,687 WEC Energy Group Inc 645,826 725,359 State Street Corp 831,809 934,246 Wells Fargo & Co 198,448 222,887 Steel Dynamics Inc 129,104 145,003 Welltow er Inc Reits104,511 117,382 STERIS PLC 102,951 115,630 West Pharmaceutical Services Inc 382,472 429,573 Stryker Corp 103,973 116,777 Western Digital Corp368,600 413,993 Synchrony Financial 57,979 65,119 Western Union Co216,155 242,775 Synopsys Inc 453,962 509,867 Westrock137,228 154,128 T Row e Price Group Inc 310,098 348,287 Weyerhaeuser Co Reits99,040 111,237 Take-Tw o Interactive Softw are Inc 78,769 88,469 Whirlpool Corp
873,674 981,267 Target Corp 187,160 210,209 Williams Cos Inc172,880 194,171 TE Connectivity Ltd 79,507 89,298 WP Carey Inc Reits 69,491 78,048 Teledyne Technologies Inc 98,179 110,270 WW Grainger Inc 88,336 99,215 Teradyne Inc 61,363 68,920 Yum! Brands Inc
995,062 1,117,603 Tesla Inc 111,208 124,904 Zebra Technologies Corp 808,746 908,343 Texas Instruments Inc 368,978 414,418 Zimmer Biomet Holdings Inc48,875 54,894 Textron Inc 185,784 208,663 Zoom Video Communications Inc
910,729 1,022,886 Thermo Fisher Scientif ic Inc
M arket Value M arket Value North America (continued) North America (continued)
United States (continued) United States (continued)

Robeco Institutional Umbrella Fund 80
Robeco QI Institutional Global Developed Enhanced Indexing Fund(continued)
Equity portfolio Futures portfolioAt 30 June 2020
M arket Value M arket Value Unrealised Unrealised
Gain Gain EUR USD Europe
267,693 300,659 MercadoLibre Inc GermanyEUR EUR
285,677,466 28,990 28,990 Eurx E-Stoxx 50 September 2020
United StatesEUR USD
26,475 26,475 S&P 500 Emini CME September 2020
55,465 Total - financial intruments that are offically listed on a regulated market
North America
M arket Value M arket Value South America
Argentina
Total - financial intruments that are offically listed on a regulated market

Robeco Institutional Umbrella Fund 81
Robeco QI Institutional Global Developed Sustainable Conservative Equities
Equity portfolio Equity portfolioAt 30 June 2020
M arket Value M arket Value M arket Value M arket Value Asia
Hong Kong New ZealandEUR HKD EUR NZD
444,225 3,866,941 HKT Trust & HKT Ltd 232,800 406,166 Meridian Energy Ltd476,676 4,149,426 Link Reits 505,641 882,192 Spark New Zealand Ltd
IsraelEUR ILS Austria
276,895 1,076,339 Nice Ltd EUR EUR 137,384 137,384 Oesterreichische Post AG
JapanEUR JPY Belgium
519,782 62,982,500 Astellas Pharma Inc EUR EUR 299,737 36,319,444 Chugai Pharmaceutical Co Ltd 76,547 76,547 Groupe Bruxelles Lambert SA 712,611 86,347,799 KDDI Corp222,898 27,008,799 Komeri Co Ltd Denmark297,395 36,035,700 Mitsui & Co Ltd EUR DKK 112,800 13,668,099 Mori Trust Sogo Inc Reits 195,769 1,459,102 Novo Nordisk A/S590,108 71,504,000 Nippon Prologis Inc Reits 125,661 936,576 Tryg A/S Com137,015 16,602,300 Nippon Telegraph & Telephone Corp 543,509 65,857,551 Nomura Research Institute Ltd Finland566,073 68,591,654 NTT DoCoMo Inc EUR EUR
496,518 496,518 Elisa OYJSingapore
EUR SGD Germany310,227 486,080 CapitaLand Mall Trust Reits EUR EUR 77,664 121,688 Mapletree Industrial Trust Reits 711,772 711,772 Allianz SE
543,988 852,348 Singapore Exchange Ltd 280,652 280,652 Deutsche Telekom AG 83,324 130,556 Singapore Press Holdings Ltd 209,084 209,084 Hannover Rueck SE
Muenchener Rueckversicherungs- Australia 616,450 616,450 Gesellschaft AG in Muenchen Australia
EUR AUD Italy676,686 1,103,878 ASX Ltd EUR EUR 222,005 362,156 Aurizon Holdings Ltd 527,946 527,946 Snam SpA
Australia & New Zealand Banking 732,459 732,459 Terna Rete Elettrica Nazionale SpA 108,597 177,155 Group Ltd91,779 149,719 BWP Trust Reits Luxembourg
343,504 560,358 Commonw ealth Bank of Australia EUR EUR 96,641 157,651 CSR Ltd 71,279 71,279 RTL Group SA
490,477 800,115 Dexus Reits698,927 1,140,160 Fortescue Metals Group Ltd Netherlands138,905 226,596 JB Hi-Fi Ltd EUR EUR 236,180 385,280 National Australia Bank Ltd 489,688 489,688 Koninklijke Ahold Delhaize NV141,583 230,964 Sonic Healthcare Ltd 225,685 368,160 Telstra Corp Ltd 588,509 960,034 Wesfarmers Ltd
Australia (continued)
Europe
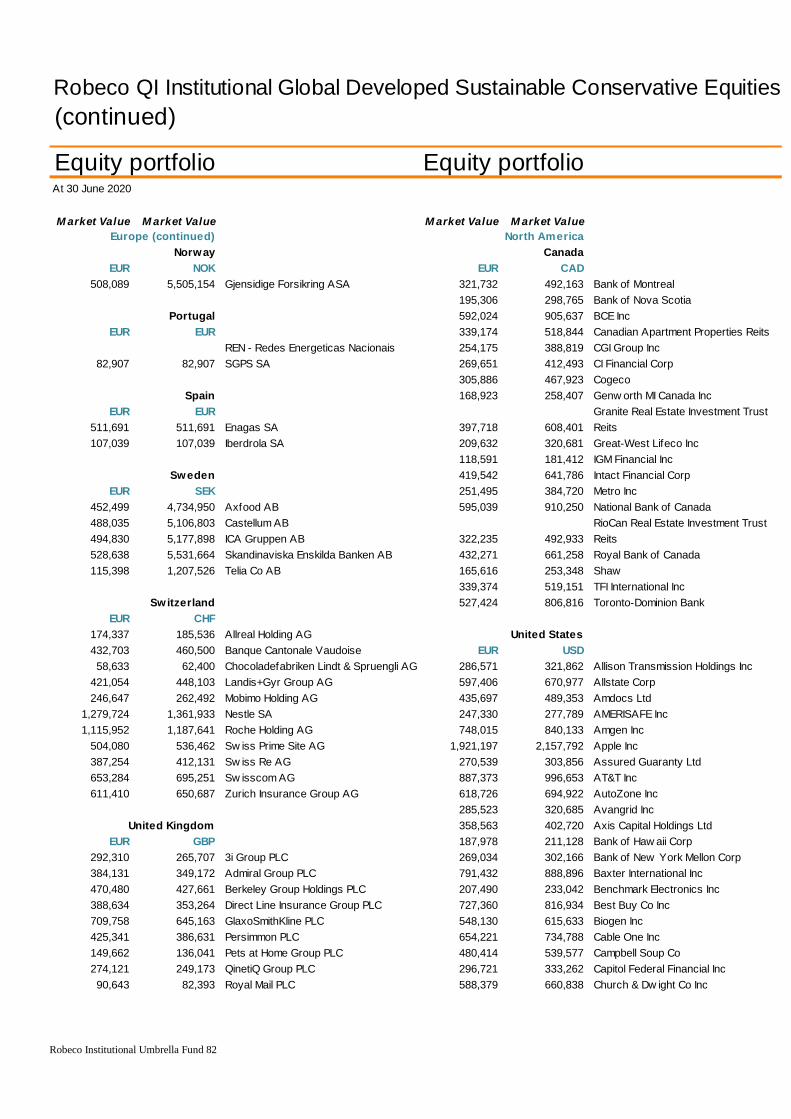
Robeco Institutional Umbrella Fund 82
Robeco QI Institutional Global Developed Sustainable Conservative Equities(continued)
Equity portfolio Equity portfolioAt 30 June 2020
M arket Value M arket Value M arket Value M arket Value
Norway CanadaEUR NOK EUR CAD
508,089 5,505,154 Gjensidige Forsikring ASA 321,732 492,163 Bank of Montreal 195,306 298,765 Bank of Nova Scotia
Portugal 592,024 905,637 BCE Inc EUR EUR 339,174 518,844 Canadian Apartment Properties Reits
REN - Redes Energeticas Nacionais 254,175 388,819 CGI Group Inc82,907 82,907 SGPS SA 269,651 412,493 CI Financial Corp
305,886 467,923 Cogeco Spain 168,923 258,407 Genw orth MI Canada Inc
EUR EUR Granite Real Estate Investment Trust511,691 511,691 Enagas SA 397,718 608,401 Reits107,039 107,039 Iberdrola SA 209,632 320,681 Great-West Lifeco Inc
118,591 181,412 IGM Financial Inc Sweden 419,542 641,786 Intact Financial Corp
EUR SEK 251,495 384,720 Metro Inc452,499 4,734,950 Axfood AB 595,039 910,250 National Bank of Canada 488,035 5,106,803 Castellum AB RioCan Real Estate Investment Trust494,830 5,177,898 ICA Gruppen AB 322,235 492,933 Reits528,638 5,531,664 Skandinaviska Enskilda Banken AB 432,271 661,258 Royal Bank of Canada 115,398 1,207,526 Telia Co AB 165,616 253,348 Shaw
339,374 519,151 TFI International Inc Switzerland 527,424 806,816 Toronto-Dominion Bank
EUR CHF174,337 185,536 Allreal Holding AG United States432,703 460,500 Banque Cantonale Vaudoise EUR USD58,633 62,400 Chocoladefabriken Lindt & Spruengli AG 286,571 321,862 Allison Transmission Holdings Inc
421,054 448,103 Landis+Gyr Group AG 597,406 670,977 Allstate Corp246,647 262,492 Mobimo Holding AG 435,697 489,353 Amdocs Ltd
1,279,724 1,361,933 Nestle SA 247,330 277,789 AMERISAFE Inc1,115,952 1,187,641 Roche Holding AG 748,015 840,133 Amgen Inc
504,080 536,462 Sw iss Prime Site AG 1,921,197 2,157,792 Apple Inc387,254 412,131 Sw iss Re AG 270,539 303,856 Assured Guaranty Ltd653,284 695,251 Sw isscom AG 887,373 996,653 AT&T Inc611,410 650,687 Zurich Insurance Group AG 618,726 694,922 AutoZone Inc
285,523 320,685 Avangrid Inc United Kingdom 358,563 402,720 Axis Capital Holdings Ltd
EUR GBP 187,978 211,128 Bank of Haw aii Corp 292,310 265,707 3i Group PLC 269,034 302,166 Bank of New York Mellon Corp 384,131 349,172 Admiral Group PLC 791,432 888,896 Baxter International Inc470,480 427,661 Berkeley Group Holdings PLC 207,490 233,042 Benchmark Electronics Inc388,634 353,264 Direct Line Insurance Group PLC 727,360 816,934 Best Buy Co Inc709,758 645,163 GlaxoSmithKline PLC 548,130 615,633 Biogen Inc425,341 386,631 Persimmon PLC 654,221 734,788 Cable One Inc 149,662 136,041 Pets at Home Group PLC 480,414 539,577 Campbell Soup Co274,121 249,173 QinetiQ Group PLC 296,721 333,262 Capitol Federal Financial Inc90,643 82,393 Royal Mail PLC 588,379 660,838 Church & Dw ight Co Inc
Europe (continued) North America

Robeco Institutional Umbrella Fund 83
Robeco QI Institutional Global Developed Sustainable Conservative Equities(continued)
Equity portfolio Equity portfolioAt 30 June 2020
M arket Value M arket Value M arket Value M arket Value
United States (continued) United States (continued)EUR USD EUR USD
467,999 525,633 Cisco Systems Inc 1,139,543 1,279,877 Procter & Gamble Co 604,292 678,710 Citigroup Inc 654,106 734,660 Regeneron Pharmaceuticals Inc 602,357 676,537 Clorox Co 584,062 655,989 Republic Services Inc508,799 571,457 Coca-Cola Co 109,656 123,160 Safety Insurance Group Inc 614,750 690,456 Consolidated Edison Inc 532,956 598,590 Seagate Technology PLC553,340 621,484 Cummins Inc 494,951 555,905 Sempra Energy 530,724 596,083 DaVita Inc 245,604 275,851 Spire Inc
Easterly Government Properties Inc 368,533 413,918 Sprouts Farmers Market Inc 218,695 245,627 Reits 602,339 676,517 Steris PLC732,927 823,187 Eaton Corp PLC 654,028 734,571 Target Corp524,570 589,171 eBay Inc 560,002 628,966 TJX Cos Inc773,282 868,512 Eli Lilly & Co 137,428 154,352 Tootsie Roll Industries Inc 211,864 237,955 Everest Re Group Ltd 548,623 616,186 Trane Technologies PLC270,313 303,602 Eversource Energy 317,937 357,091 Travelers Cos Inc 469,796 527,651 Flow ers Foods Inc 506,344 568,700 United Therapeutics Corp 412,345 463,126 FTI Consulting Inc 1,207,216 1,355,885 UnitedHealth Group Inc885,196 994,207 Garmin Ltd 968,401 1,087,660 Verizon638,319 716,928 General Mills Inc 389,713 437,707 Washington Federal Inc 114,106 128,159 Graham Holdings Co 867,818 974,690 Waste Management Inc325,179 365,225 H&R Block Inc 262,303 294,605 Weis Markets Inc364,100 408,938 Hartford Financial Services Group Inc 495,230 556,218 Western Union Co 601,850 675,968 Hershey Co 109,104 122,540 White Mountains Insurance Group Ltd 499,615 561,142 Home Depot Inc 208,218 233,861 Xerox Holdings Corp 142,986 160,595 Hormel Foods Corp152,974 171,813 Ingersoll Rand Inc 80,573,103183,461 206,055 Intel Corp435,713 489,371 JM Smucker Co395,210 443,880 Jack Henry & Associates Inc671,753 754,480 Johnson & Johnson449,301 504,632 JPMorgan Chase & Co 569,352 639,467 Kimberly-Clark Corp540,262 606,795 Kroger Co122,413 137,488 Life Storage Inc Reits969,365 1,088,742 McDonald's Corp698,231 784,218 Medtronic PLC
1,018,582 1,144,020 Merck & Co Inc1,854,357 2,082,721 Microsoft Corp
362,069 406,657 Motorola Solutions Inc575,405 646,267 Murphy USA273,147 306,785 New York Community Bancorp Inc 278,046 312,288 Old Republic International Corp 393,427 441,878 Omni Group Inc 798,429 896,756 Oracle Corp 732,580 822,797 Pfizer Inc390,261 438,321 Piedmont Office Realty Trust Inc Reits
Total - financial intruments that are offically listed on a regulated market
North America (continued) North America (continued)

Robeco Institutional Umbrella Fund 84
Robeco QI Institutional Global Developed Sustainable Multi-FactorEquities Fund
Equity portfolio Equity portfolioAt 30 June 2020
M arket Value M arket Value M arket Value M arket Value Asia
Hong Kong Japan (continued)EUR HKD EUR JPY
416,868 3,628,801 HKT Trust & HKT Ltd 1,160,541 140,624,000 NEC Corp 111,431 970,000 Kerry Properties Ltd NEC Netw orks & System Integration 248,294 2,161,380 PCCW Ltd 302,105 36,606,400 Corp188,289 1,639,040 Wharf Holdings Ltd 326,793 39,597,800 Nikon Corp
898,697 108,896,050 Nippon Prologis Inc Reits Israel 796,024 96,455,000 Nissin Foods Holdings Co Ltd
EUR ILS 974,187 118,043,280 Nomura Holdings Inc 220,616 857,573 Bank Leumi Le-Israel BM 1,690,916 204,890,050 Nomura Research Institute Ltd
Bezeq The Israeli Telecommunication 1,612,593 195,399,571 NTT DoCoMo Inc 236,087 917,710 Corp Ltd 560,108 67,868,849 Olympus Corp
EUR USD 286,009 34,656,000 Omron Corp 357,351 401,358 Check Point Softw are Technologies Ltd 463,414 56,152,299 Ono Pharmaceutical Co Ltd
432,024 52,348,800 Osaka Gas Co Ltd Japan 360,944 43,736,000 Otsuka Corp
EUR JPY 281,987 34,168,619 Resona Holdings Inc 585,883 70,992,052 Advantest Corp 838,994 101,661,800 Ricoh Co Ltd 140,756 17,055,599 Aoyama Trading Co Ltd 417,204 50,553,000 Seiko Epson Corp 546,513 66,221,549 Astellas Pharma Inc 1,455,049 176,309,750 Sekisui House Ltd 472,242 57,222,000 Benesse Holdings Inc 978,980 118,623,999 Seven & i Holdings Co Ltd 541,087 65,564,100 Bridgestone Corp 385,874 46,756,800 Sharp Corp270,855 32,819,782 Brother Industries Ltd 138,086 16,732,024 Sojitz Corp976,892 118,371,020 Casio Computer Co Ltd 367,117 44,484,000 Sompo Holdings Inc 599,475 72,639,009 Chugai Pharmaceutical Co Ltd 186,442 22,591,350 Sumitomo Corp 244,514 29,628,000 Dai Nippon Printing Co Ltd 389,695 47,219,700 Sumitomo Forestry Co Ltd 220,043 26,662,800 DMG Mori Co Ltd 392,853 47,602,399 Sumitomo Mitsui Financial Group Inc 874,552 105,970,400 Eisai Co Ltd 72,745 8,814,587 Sumitomo Rubber Industries Ltd356,555 43,204,200 JXTG Holdings Inc 427,206 51,765,000 Sundrug Co Ltd707,644 85,745,999 FUJIFILM Holdings Corp 386,882 46,878,900 T&D Holdings Inc 770,712 93,388,000 Fujitsu Ltd 363,534 44,049,800 Teijin Ltd 272,417 33,009,051 Hitachi Ltd 545,510 66,099,999 Tokyo Electron Ltd 413,879 50,150,099 Honda Motor Co Ltd 226,903 27,494,100 Toppan Printing Co Ltd381,679 46,248,400 Hulic Co Ltd 211,090 25,578,000 Tosoh Corp300,507 36,412,740 Inpex Corp 632,051 76,586,277 TS Tech Co Ltd
1,203,177 145,790,208 ITOCHU Corp 193,918 23,497,200 Wacom Co Ltd 362,987 43,983,500 Jafco Co Ltd 392,957 47,615,000 Yamada Denki Co Ltd 327,435 39,675,600 Kajima Corp 405,384 49,120,800 Yamaha Motor Co Ltd635,211 76,969,177 KDDI Corp432,149 52,364,000 Komeri Co Ltd Singapore767,939 93,051,999 Law son Inc EUR SGD 82,332 9,976,200 Lintec Corp 74,646 116,960 Best World International Ltd
576,692 69,878,400 LIXIL Group Corp 317,800 497,945 Mapletree Industrial Trust Reits362,091 43,875,000 Marubeni Corp 923,502 1,446,989 Singapore Exchange Ltd192,993 23,385,200 Mazda Motor Corp302,384 36,640,160 Mitsubishi Chemical Holdings Corp 352,444 42,706,000 Mitsubishi Gas Chemical Co Inc541,825 65,653,500 Mixi Inc
Asia (continued)

Robeco Institutional Umbrella Fund 85
Robeco QI Institutional Global Developed Sustainable Multi-FactorEquities Fund (continued)
Equity portfolio Equity portfolioAt 30 June 2020
M arket Value M arket Value M arket Value M arket Value
Australia FranceEUR AUD EUR EUR
519,503 847,465 Aurizon Holdings Ltd 160,191 160,191 Air France-KLM63,555 103,677 AusNet Services 266,747 266,747 AXA SA
336,242 548,512 BHP Group Ltd 955,485 955,485 BNP Paribas SA306,109 499,356 CIMIC Group Ltd 214,399 214,399 Carrefour SA233,466 380,852 Dexus Reits 187,022 187,022 Elior Group SA
2,596,487 4,235,649 Fortescue Metals Group Ltd 102,338 102,338 Eutelsat84,086 137,169 Goodman Group Reits 361,092 361,092 Gaztransport Et Technigaz SA
251,615 410,459 Harvey Norman Holdings Ltd 164,246 164,246 Nexity SA 969,936 1,582,256 JB Hi-Fi Ltd 564,807 564,807 Peugeot SA69,485 113,352 Magellan Financial Group Ltd 270,929 270,929 Publicis Groupe SA
235,487 384,150 Qantas Airw ays Ltd 68,457 68,457 Neopost SA333,940 544,756 Sandfire Resources NL 365,886 365,886 Rexel SA362,836 591,894 Sonic Healthcare Ltd 1,411,692 1,411,692 Sanofi478,075 779,883 Telstra Corp Ltd 567,450 567,450 Sartorius Stedim Biotech
1,014,522 1,654,989 Wesfarmers Ltd 192,236 192,236 Societe BIC SA402,664 402,664 Societe Generale SA
New Zealand 406,439 406,439 Sopra Steria Group EUR NZD 192,808 192,808 Suez
793,537 1,384,485 Fisher & Paykel Healthcare Corp Ltd 155,979 155,979 TOTAL SA559,799 976,681 Meridian Energy Ltd 419,921 419,921 Ubisoft Entertainment SA525,408 916,679 Spark New Zealand Ltd 689,774 689,774 Valeo SA
GermanyAustria EUR EUR
EUR EUR 791,747 791,747 Allianz SE 216,075 216,075 Oesterreichische Post AG 197,788 197,788 Borussia Dortmund GmbH & Co KGaA 253,950 253,950 Raiffeisen Bank International AG 218,603 218,603 Covestro AG
562,855 562,855 Deutsche Post AG Belgium 863,253 863,253 Deutsche Telekom AG
EUR EUR 362,062 362,062 LANXESS AG 489,911 489,911 Ageas 330,320 330,320 METRO AG 318,396 318,396 bpost SA Muenchener Rueckversicherungs -220,174 220,174 D'ieteren SA 1,083,878 1,083,878 Gesellschaft AG in Muenchen 340,752 340,752 Telenet Group Holding NV 521,473 521,473 ProSiebenSat.1 Media SE
330,211 330,211 Telefonica Deutschland Holding AG Bermuda 480,455 480,455 Zalando SE
EUR USD362,239 406,849 Triton International Ltd Ireland
EUR AUDDenmark 223,477 364,557 James Hardie Industries PLC
EUR DKK279,498 2,083,144 Danske Bank A/S Italy
1,147,538 8,552,792 Novo Nordisk A/S EUR EUR277,047 2,064,878 Pandora A/S 123,147 123,147 Eni SpA408,459 3,044,314 Ringkjoebing Landbobank A/S 197,981 197,981 Saipem SpA 170,874 1,273,552 Topdanmark A/S 527,036 527,036 Snam SpA
Australia Europe (continued)
Europe

Robeco Institutional Umbrella Fund 86
Robeco QI Institutional Global Developed Sustainable Multi-FactorEquities Fund (continued)
Equity portfolio Equity portfolioAt 30 June 2020
M arket Value M arket Value M arket Value M arket Value
Italy (continued) SwedenEUR EUR EUR SEK
401,968 401,968 Telecom Italia SpA 422,389 4,419,884 Axfood AB 1,019,650 1,019,650 Terna Rete Elettrica Nazionale SpA 192,993 2,019,479 Essity AB
185,786 185,786 UniCredit SpA 545,073 5,703,640 ICA Gruppen AB318,870 3,336,659 Lundin Petroleum AB
Luxembourg 455,975 4,771,323 Nibe Industrier AB EUR EUR 433,022 4,531,145 Skandinaviska Enskilda Banken AB
439,513 439,513 APERAM SA 318,115 3,328,755 Skanska AB530,043 530,043 RTL Group SA 157,751 1,650,706 Sw edbank AB
Netherlands SwitzerlandEUR EUR EUR CHF
143,974 143,974 ABN AMRO Group NV 299,066 318,278 ALSO Holding AG 236,979 236,979 Aegon NV 197,887 210,600 Chocoladefabriken Lindt & Spruengli AG438,784 438,784 ASM International NV 438,808 466,997 Julius Baer Group Ltd 505,106 505,106 ING Groep NV 1,095,092 1,165,441 Nestle SA
1,972,847 1,972,847 Koninklijke Ahold Delhaize NV 377,466 401,715 Novartis AG666,535 666,535 Koninklijke KPN NV 2,737,893 2,913,776 Roche Holding AG
1,175,369 1,175,369 NN Group NV 391,547 416,700 SGS SA560,491 560,491 PostNL NV 597,368 635,743 Sw isscom AG577,489 577,489 Royal Dutch Shell PLC 789,777 840,512 Zurich Insurance Group AG
1,023,699 1,023,699 Signify NV EUR EUR93,907 93,907 TomTom NV 483,371 483,371 STMicroelectronics NV
760,896 760,896 Wolters Kluw er NVEUR USD United Kingdom
520,371 584,455 NXP Semiconductors NV EUR GBP232,883 211,688 3i Group PLC
Norway 427,079 388,210 Aviva PLCEUR NOK 1,139,015 1,035,353 Barratt Developments PLC
36,936 400,205 Entra ASA 920,845 837,039 Berkeley Group Holdings PLC 172,480 1,868,825 Equinor ASA 149,411 135,813 BP PLC774,531 8,392,067 Gjensidige Forsikring ASA 301,884 274,410 Burberry Group PLC
103,035 93,658 Centrica PLCSpain 576,615 524,137 Direct Line Insurance Group PLC
EUR EUR 572,737 520,612 Dunelm Group PLC 192,692 192,692 Banco Bilbao Vizcaya Argentaria SA 702,178 638,273 GlaxoSmithKline PLC131,682 131,682 Banco de Sabadell SA 370,786 337,040 Greggs PLC 465,593 465,593 Banco Santander SA 164,970 149,956 InterContinental Hotels Group PLC 372,821 372,821 CaixaBank SA 472,295 429,312 J Sainsbury PLC861,322 861,322 Enagas SA 145,531 132,286 Jupiter Fund Management PLC 483,764 483,764 Ferrovial SA 449,996 409,042 Kingfisher PLC 307,330 307,330 Iberdrola SA 229,383 208,507 Man Group PLC249,775 249,775 Repsol SA 216,160 196,487 Marks & Spencer Group PLC13,900 13,900 Repsol SA Rights 60,271 54,785 Moneysupermarket.com Group PLC
420,453 420,453 Telefonica SA 228,523 207,725 Pearson PLC17,335 17,335 Telefonica SA Rights 487,584 443,209 Persimmon PLC
Europe (continued) Europe (continued)
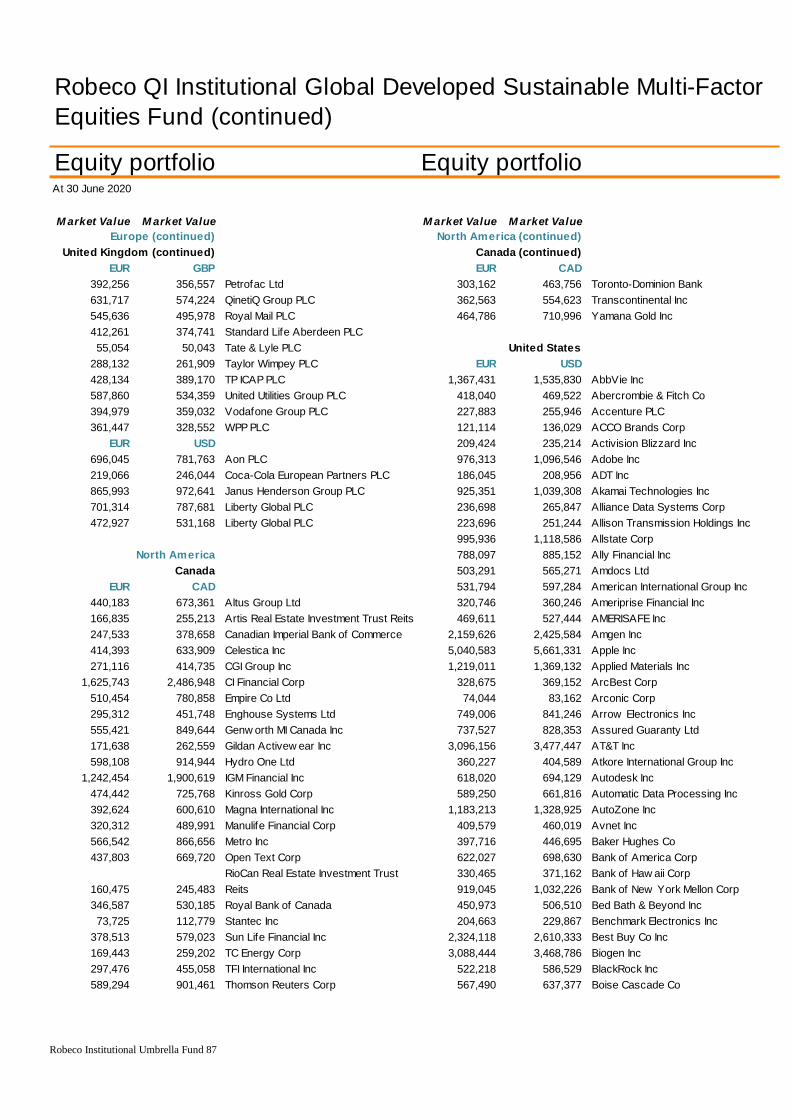
Robeco Institutional Umbrella Fund 87
Robeco QI Institutional Global Developed Sustainable Multi-FactorEquities Fund (continued)
Equity portfolio Equity portfolioAt 30 June 2020
M arket Value M arket Value M arket Value M arket Value
EUR GBP EUR CAD392,256 356,557 Petrofac Ltd 303,162 463,756 Toronto-Dominion Bank 631,717 574,224 QinetiQ Group PLC 362,563 554,623 Transcontinental Inc 545,636 495,978 Royal Mail PLC 464,786 710,996 Yamana Gold Inc 412,261 374,741 Standard Life Aberdeen PLC55,054 50,043 Tate & Lyle PLC United States
288,132 261,909 Taylor Wimpey PLC EUR USD428,134 389,170 TP ICAP PLC 1,367,431 1,535,830 AbbVie Inc587,860 534,359 United Utilities Group PLC 418,040 469,522 Abercrombie & Fitch Co394,979 359,032 Vodafone Group PLC 227,883 255,946 Accenture PLC361,447 328,552 WPP PLC 121,114 136,029 ACCO Brands Corp
EUR USD 209,424 235,214 Activision Blizzard Inc 696,045 781,763 Aon PLC 976,313 1,096,546 Adobe Inc 219,066 246,044 Coca-Cola European Partners PLC 186,045 208,956 ADT Inc 865,993 972,641 Janus Henderson Group PLC 925,351 1,039,308 Akamai Technologies Inc701,314 787,681 Liberty Global PLC 236,698 265,847 Alliance Data Systems Corp 472,927 531,168 Liberty Global PLC 223,696 251,244 Allison Transmission Holdings Inc
995,936 1,118,586 Allstate Corp788,097 885,152 Ally Financial Inc
Canada 503,291 565,271 Amdocs Ltd EUR CAD 531,794 597,284 American International Group Inc
440,183 673,361 Altus Group Ltd 320,746 360,246 Ameriprise Financial Inc166,835 255,213 Artis Real Estate Investment Trust Reits 469,611 527,444 AMERISAFE Inc247,533 378,658 Canadian Imperial Bank of Commerce 2,159,626 2,425,584 Amgen Inc414,393 633,909 Celestica Inc 5,040,583 5,661,331 Apple Inc271,116 414,735 CGI Group Inc 1,219,011 1,369,132 Applied Materials Inc
1,625,743 2,486,948 CI Financial Corp 328,675 369,152 ArcBest Corp510,454 780,858 Empire Co Ltd 74,044 83,162 Arconic Corp 295,312 451,748 Enghouse Systems Ltd 749,006 841,246 Arrow Electronics Inc 555,421 849,644 Genw orth MI Canada Inc 737,527 828,353 Assured Guaranty Ltd171,638 262,559 Gildan Activew ear Inc 3,096,156 3,477,447 AT&T Inc598,108 914,944 Hydro One Ltd 360,227 404,589 Atkore International Group Inc
1,242,454 1,900,619 IGM Financial Inc 618,020 694,129 Autodesk Inc 474,442 725,768 Kinross Gold Corp 589,250 661,816 Automatic Data Processing Inc392,624 600,610 Magna International Inc 1,183,213 1,328,925 AutoZone Inc320,312 489,991 Manulife Financial Corp 409,579 460,019 Avnet Inc 566,542 866,656 Metro Inc 397,716 446,695 Baker Hughes Co437,803 669,720 Open Text Corp 622,027 698,630 Bank of America Corp
RioCan Real Estate Investment Trust 330,465 371,162 Bank of Haw aii Corp 160,475 245,483 Reits 919,045 1,032,226 Bank of New York Mellon Corp 346,587 530,185 Royal Bank of Canada 450,973 506,510 Bed Bath & Beyond Inc73,725 112,779 Stantec Inc 204,663 229,867 Benchmark Electronics Inc
378,513 579,023 Sun Life Financial Inc 2,324,118 2,610,333 Best Buy Co Inc169,443 259,202 TC Energy Corp 3,088,444 3,468,786 Biogen Inc297,476 455,058 TFI International Inc 522,218 586,529 BlackRock Inc 589,294 901,461 Thomson Reuters Corp 567,490 637,377 Boise Cascade Co
Europe (continued) North America (continued) United Kingdom (continued) Canada (continued)
North America

Robeco Institutional Umbrella Fund 88
Robeco QI Institutional Global Developed Sustainable Multi-FactorEquities Fund (continued)
Equity portfolio Equity portfolioAt 30 June 2020
M arket Value M arket Value M arket Value M arket Value
EUR USD EUR USD425,323 477,702 Booking Holdings Inc 492,071 552,670 Dollar General Corp 402,681 452,271 Booz Allen Hamilton Holding Corp 708,585 795,848 Dover Corp273,153 306,792 BorgWarner Inc 521,571 585,803 Dow Inc 277,321 311,473 Brighthouse Financial Inc 290,158 325,891 DXC Technology Co336,752 378,223 Brightsphere Investment Group Inc Easterly Government Properties Inc 511,047 573,982 Brow n & Brow n Inc 326,622 366,845 Reits158,650 178,188 Buckle Inc 312,643 351,145 Eaton Corp PLC508,432 571,045 CACI International Inc 1,388,875 1,559,915 eBay Inc275,453 309,375 Cadence Design Systems Inc 507,457 569,950 Edw ards Lifesciences Corp658,537 739,636 Campbell Soup Co 984,658 1,105,919 Electronic Arts Inc785,998 882,794 Cardinal Health Inc 1,873,712 2,104,459 Eli Lilly & Co834,852 937,665 CenturyLink Inc 91,100 102,319 EMCOR Group Inc 478,687 537,638 Cerner Corp 131,497 147,691 EQT Corp 338,653 380,358 CH Robinson Worldw ide Inc 596,004 669,402 Equitable Holdings Inc 142,129 159,632 Chevron Corp 371,330 417,059 Etsy Inc 687,737 772,432 Chipotle Mexican Grill Inc 478,805 537,770 Everest Re Group Ltd 521,516 585,740 Ciena Corp 419,223 470,851 Exponent Inc431,687 484,849 Cirrus Logic Inc 287,033 322,381 Fifth Third Bancorp
3,206,269 3,601,121 Cisco Systems Inc 417,864 469,324 First Republic Bank109,782 123,302 CIT Group Inc 292,313 328,311 Flow ers Foods Inc
1,918,519 2,154,785 Citigroup Inc 302,595 339,860 Ford Motor Co756,043 849,150 Citizens Financial Group Inc 1,161,567 1,304,614 Fortinet Inc963,328 1,081,962 Citrix Systems Inc 255,527 286,995 Franklin Resources Inc717,789 806,185 Clorox Co 321,472 361,061 FTI Consulting Inc 925,067 1,038,989 Coca-Cola Co 395,764 444,502 Garmin Ltd 326,274 366,454 Cogent Communications Holdings Inc 255,130 286,549 General Mills Inc505,903 568,205 Colgate-Palmolive Co 179,563 201,676 Genesco Inc108,627 122,004 Colony Capital Inc Reits 186,320 209,265 Genw orth Financial Inc 666,576 748,665 Comerica Inc 1,176,895 1,321,830 Gilead Sciences Inc718,772 807,288 ConocoPhillips 183,204 205,766 Globe Life Inc 250,344 281,174 Consolidated Edison Inc 180,676 202,926 Goodyear Tire & Rubber Co432,212 485,439 Costco Wholesale Corp 444,464 499,200 H&R Block Inc 502,069 563,898 Crocs Inc 455,522 511,620 Halliburton Co
1,604,485 1,802,077 Cummins Inc 458,786 515,286 Harley-Davidson Inc164,780 185,073 CVR Energy Inc 704,791 791,586 Hartford Financial Services Group Inc603,973 678,352 CVS Health Corp 210,402 236,313 HD Supply Holdings Inc275,939 309,921 CyberArk Softw are Ltd 237,424 266,663 Helmerich & Payne Inc
1,981,054 2,225,021 DaVita Inc 285,182 320,303 Herbalife Nutrition Ltd516,064 579,617 Dell Technologies Inc 399,541 448,744 Hershey Co468,893 526,637 Deluxe Corp 704,183 790,903 Hew lett Packard Enterprise Co768,822 863,502 DexCom Inc 525,478 590,190 HollyFrontier Corp674362 757410 Dick's Sporting Goods Inc 930,310 1,044,877 Home Depot Inc85,259 95,758 Dillard's Inc 207,065 232,565 Hormel Foods Corp
290,733 326,537 Discover Financial Services 639,007 717,701 Houlihan Lokey Inc 421,906 473,864 Discovery Inc 337,025 378,530 How met Aerospace Inc
North America (continued) North America (continued) United States (continued) United States (continued)

Robeco Institutional Umbrella Fund 89
Robeco QI Institutional Global Developed Sustainable Multi-FactorEquities Fund (continued)
Equity portfolio Equity portfolioAt 30 June 2020
M arket Value M arket Value M arket Value M arket Value
EUR USD EUR USD1,379,145 1,548,987 HP Inc 546,602 613,916 McDonald's Corp
626,255 703,378 Humana Inc 126,695 142,297 Medical Properties Trust Inc Reits400,372 449,678 IDEXX Laboratories Inc 691,863 777,066 Medtronic PLC545,341 612,500 Illinois Tool Works Inc 1,491,726 1,675,432 Merck & Co Inc62,967 70,722 Ingersoll Rand Inc 323,142 362,937 Mercury Systems Inc
531,567 597,029 Innoviva Inc 1,806,734 2,029,234 MetLife Inc1,746,611 1,961,706 Intel Corp 476,954 535,691 Mettler-Toledo International Inc
498,069 559,407 International Business Machines Corp 473,761 532,104 MGIC Investment Corp 166,590 187,106 International Paper Co 550,452 618,240 Micron Technology Inc434,214 487,687 Interpublic Group of Cos Inc 2,828,465 3,176,791 Microsoft Corp517,142 580,829 Intuit Inc 216,444 243,099 Moderna Inc 336,338 377,757 Itron Inc 198,468 222,909 Momenta Pharmaceuticals Inc361,100 405,570 JM Smucker Co 89,864 100,931 Mondelez International Inc 585,934 658,092 Jack Henry & Associates Inc 307,667 345,556 MSC Industrial Direct Co Inc 293,644 329,806 Jazz Pharmaceuticals PLC 391,155 439,326 Murphy USA
1,041,750 1,170,042 Johnson & Johnson 642,390 721,500 NetApp Inc345,397 387,933 Johnson Controls International plc 711,842 799,505 Netflix Inc 171,429 192,541 JPMorgan Chase & Co 385,565 433,048 New ell Brands Inc656,745 737,623 Juniper Netw orks Inc 703,883 790,567 Nielsen Holdings PLC217,145 243,887 Kforce Inc 622,355 698,998 NIKE Inc298,112 334,825 Kilroy Realty Corp Reits 965,802 1,084,741 NortonLifeLock Inc
1,014,111 1,138,999 Kimberly-Clark Corp 2,117,808 2,378,616 NVIDIA Corp 610,374 685,542 KLA Corp 794,049 891,836 Omnicom Group Inc648,476 728,336 Kraft Heinz Co 314,651 353,401 OneMain Holdings Inc
1,002,405 1,125,851 Kroger Co 927,556 1,041,784 Oracle Corp 1,764,825 1,982,163 Lam Research Corp 452,572 508,306 PACCAR Inc
64,996 73,000 Lancaster Colony Corp 300,917 337,975 Patterson-UTI Energy Inc 396,082 444,860 Landstar System Inc 621,088 697,575 Perdoceo Education Corp 403,602 453,305 Lear Corp 399,445 448,636 PetMed Express Inc 602,237 676,403 Lennar Corp 669,110 751,511 Pfizer Inc253,703 284,947 Lennox International Inc 327,124 367,409 Phillips 66 395,971 444,735 Lexington Realty Trust Reits 329,227 369,772 Piedmont Office Realty Trust Inc Reits389,133 437,055 Life Storage Inc Reits 158,586 178,116 Plains GP Holdings LP391,763 440,008 Lincoln National Corp 348,248 391,135 Preferred Bank
1,289,183 1,447,946 Low e's Cos Inc 227,966 256,041 PriceSmart Inc 316,268 355,217 LyondellBasell Industries NV 228,828 257,008 Principal Financial Group Inc437,305 491,159 Manhattan Associates Inc 1,061,401 1,192,113 Procter & Gamble Co 739,989 831,119 Manpow erGroup Inc 507,305 569,780 Prologis Inc Reits252,946 284,097 ManTech International Corp 419,465 471,122 Prudential Financial Inc550,341 618,116 Marathon Petroleum Corp 1,329,023 1,492,692 PulteGroup Inc483,459 542,997 MarketAxess Holdings Inc 653,546 734,030 Qorvo Inc 272,739 306,327 Marsh & McLennan Cos Inc 906,700 1,018,360 Qualcomm Inc525,235 589,917 Masco Corp 441,878 496,296 Quest Diagnostics Inc533,723 599,450 Masonite International Corp 348,670 391,609 Qurate Retail Inc 132,601 148,931 MAXIMUS Inc 224,569 252,225 Ralph Lauren Corp
North America (continued) North America (continued) United States (continued) United States (continued)

Robeco Institutional Umbrella Fund 90
Robeco QI Institutional Global Developed Sustainable Multi-FactorEquities Fund (continued)
Equity portfolio Equity portfolioAt 30 June 2020
M arket Value M arket Value M arket Value M arket Value
EUR USD EUR USD1,094,990 1,229,838 Regeneron Pharmaceuticals Inc 109,687 123,195 Weis Markets Inc
534,382 600,191 Regions Financial Corp 504,440 566,562 West Pharmaceutical Services Inc309,820 347,974 Republic Services Inc 845,263 949,357 Western Digital Corp282,162 316,910 RLJ Lodging Trust Reits 1,224,225 1,374,988 Western Union Co103,197 115,906 RMR Group Inc 268,016 301,022 White Mountains Insurance Group Ltd 304,614 342,127 Robert Half International Inc 394,116 442,651 WW Grainger Inc486,440 546,345 Rockw ell Automation Inc 609,504 684,564 Xerox Holdings Corp 606,362 681,035 S&P Global Inc 279,759 314,211 Xperi Holding Corp 354,685 398,364 Schlumberger Ltd 663,843 745,596 Yelp Inc
1,375,945 1,545,392 Seagate Technology PLC 469,236 527,022 Yum! Brands Inc 471,567 529,641 Seattle Genetics Inc 364,808 409,734 Zions Bancorp NA 693,370 778,759 Sempra Energy 600,693 674,669 Zynga Inc 285,876 321,082 Silgan Holdings Inc 396,279 445,081 Skyw orks Solutions Inc 285,078,421 504,600 566,741 Sprouts Farmers Market Inc 344,068 386,440 SPX Corp 479,140 538,146 Stanley Black & Decker Inc
1,086,826 1,220,668 State Street Corp 637,859 716,411 Steris PLC761,074 854,800 Synchrony Financial347,432 390,218 Sysco Corp 487,746 547,812 Take-Tw o Interactive Softw are Inc209,437 235,229 Tapestry Inc
1,049,114 1,178,312 Target Corp424,973 477,308 Teledyne Technologies Inc632,617 710,524 Texas Instruments Inc722,648 811,642 Thermo Fisher Scientif ic Inc305,083 342,654 Tractor Supply Co 484,769 544,469 Trane Technologies PLC114,339 128,420 Travelers Cos Inc 548,231 615,746 TRI Pointe Group Inc 329,051 369,574 TripAdvisor Inc255,003 286,407 United Therapeutics Corp 347,457 390,247 Unum Group248,756 279,390 US Bancorp132,457 148,769 USANA Health Sciences Inc299,769 336,686 Valero Energy Corp
1,064,755 1,195,880 Verizon364,594 409,494 Voya Financial Inc 326,799 367,044 Waddell & Reed Financial Inc931,130 1,045,799 Walmart Inc289,274 324,898 Washington Federal Inc 54,562 61,281 Washington Prime Group Inc Reits
443,480 498,095 Waste Management Inc226,956 254,905 Waters Corp
Total - financial intruments that are offically listed on a regulated market
North America (continued) North America (continued) United States (continued) United States (continued)

Robeco Institutional Umbrella Fund 91
Rotterdam, 31 August 2020
The Manager Robeco Institutional Asset Management B.V. (‘RIAM’) Policymakers RIAM: Gilbert O.J.M. Van Hassel Karin van Baardwijk Lia Belilos-Wessels Mark C.W. den Hollander Martin O. Nijkamp Hans-Christoph von Reiche Victor Verberk

Robeco Institutional Umbrella Fund 92
Other information Directors’ interests The total personal interests in the investments of the fund held by the policymakers of the management (also the manager) of the fund on 1 January 2020 and 30 June 2020 are shown in the table below. Directors' interestAs at 1 January 2020 Description QuantityABN Amro Bank Shares 1,453 Barclays Shares 5,000 Bayer Shares 500 BNP Paribas Shares 400 ING Groep NV Shares 230,888 JP Morgan Chase Shares 4,092 KBC Group Shares 180 Koninklijke Ahold Delhaize Shares 2,210 NN Group NV Shares 17,070 Royal Dutch Shell Shares 9,749 Unibail Rodamco Westfield Shares 205 Unilever Shares 2 Volkswagen Shares 100
As at 30 June 2020 Description QuantityABN Amro Bank Shares 2,653 Barclays Shares 5,000 Bayer Shares 500 BNP Paribas Shares 400 Heineken Shares 550 ING Groep NV Shares 230,888 JP Morgan Chase Shares 4,092 KBC Group Shares 180 Koninklijke Ahold Delhaize Shares 2,210 NN Group NV Shares 18,679 Royal Dutch Shell Shares 10,075 Unibail Rodamco Westfield Shares 605 Unilever Shares 1,002 Volkswagen Shares 100 Auditor No external audit has been conducted.