Barings International Umbrella Fund
93
Barings International Umbrella Fund (an umbrella fund constituted as an open-ended unit trust established pursuant to the Unit Trusts Act, 1990) Interim Report & Unaudited Financial Statements For the financial period ended 31 October 2021
-
Upload
khangminh22 -
Category
Documents
-
view
1 -
download
0
Transcript of Barings International Umbrella Fund

Barings International Umbrella Fund(an umbrella fund constituted as an open-ended unit trustestablished pursuant to the Unit Trusts Act, 1990)
Interim Report & Unaudited Financial Statements For the financial period ended 31 October 2021

Barings International Umbrella FundInterim Report and Unaudited Financial Statements
ContentsFor the financial period ended 31 October 2021
Directors and Other Information 1
Introduction 3
Investment Objective and Policy 4
Investment Managers’ Report 6
Statement of Financial Position 15
Statement of Comprehensive Income 19
Statement of Changes in Net Assets Attributable to Holders of Redeemable Participating Units 23
Notes to the financial statements 27
Schedule of InvestmentsBarings ASEAN Frontiers Fund 48
Barings Asia Growth Fund 52
Barings Australia Fund 55
Barings Europa Fund 57
Barings Hong Kong China Fund 59
Barings Global Bond Fund 63
General information 67
Appendix 1 – Information for investors in Switzerland 68
Appendix 2 – Information for investors in Germany 71
Appendix 3 – Additional information Hong Kong Code 72
Appendix 4 – Significant Changes in Portfolio Composition 85

1
Barings International Umbrella FundDirectors and Other Information
Directors of the ManagerAlan Behen (Irish)David Conway† (Irish) Barbara Healy† (Irish) Paul Smyth (Irish)Julian Swayne (British) † Non-executive Directors independent of the Investment Manager.
ManagerBaring International Fund Managers (Ireland) Limited70 Sir John Rogerson’s QuayDublin 2D02 R296 Ireland
Investment Managers Baring Asset Management Limited 20 Old BaileyLondon EC4M 7BF United Kingdom
Baring Asset Management (Asia) Limited* 35th Floor, Gloucester Tower 15 Queen’s Road Central Hong Kong
Barings LLC*300 S. Tryon StreetSuite 2500 CharlotteNorth Carolina 28202United States
Baring Japan Limited*7F Kyobashi Edogrand 2-2-1,Kyobashi Chuo-ku Tokyo 104-0031 Japan * Baring Asset Management (Asia) Limited, Barings LLC and Barings Japan Limited are the delegated Sub-Investment Managers of the relevant funds as detailed in the Investment Manager’s reports of the relevant funds.
Depositary Northern Trust Fiduciary Services (Ireland) LimitedGeorges Court54-62 Townsend StreetDublin 2D02 R156 Ireland
Administrator and Registrar Northern Trust International Fund Administration Services (Ireland) Limited Georges Court54-62 Townsend StreetDublin 2D02 R156Ireland
Company SecretaryMatsack Trust Limited 70 Sir John Rogerson’s Quay Dublin 2 D02 R296Ireland
Independent Auditors PricewaterhouseCoopers One Spencer Dock North Wall Quay Dublin 1 D01 X9R7Ireland

2
Barings International Umbrella FundDirectors and Other Information (continued)
Legal Advisers and Sponsoring BrokerAs to Irish Law Matheson70 Sir John Rogerson’s Quay Dublin 2 D02 R296 Ireland
As to Hong Kong Law Deacons Alexandra House 16-20 Chater RoadCentral Hong Kong
Paying agents UniCredit Bank Austria AG Schottengasse 6-8 1010 Vienna Austria
BNP Paribas Securities Services 9 rue du Débarcadère 93500 Pantin Cedex France
Deutsche Bank AG Global Transaction Banking Issuer Services - Global Securities Services Post IPO Services Taunusanlage 12 60325 Frankfurt am Main Germany
Paying agents (continued)Baring Asset Management GmbH Ulmenstraße 5460325 Frankfurt am MainGermany
Northern Trust Global Services LimitedLuxembourg Branch 6, rue Lou Hemmer L-1748 SenningerbergGrand Duchy of Luxembourg
S.E. Banken Skandinaviska Enskilda Banken AB (publ)Transaction Banking KB BV, SE-106 40 Stockholm Sweden
BNP Paribas Securities Services, Paris,Succursale de Zurich Selnaustrasse 16 CH-8002 Zurich Switzerland

3
Barings International Umbrella FundIntroduction
Barings International Umbrella Fund (the “Unit Trust”) is a unit trust managed by Baring International Fund Managers (Ireland) Limited (the “Manager”). The Unit Trust was established pursuant to the Unit Trusts Act, 1990, and a Trust Deed dated 11 February 1992 (as supplemented or amended from time to time) (the “Trust Deed”) made between the Manager and Northern Trust Fiduciary Services (Ireland) Limited (the “Depositary”) and authorised by the Central Bank of Ireland (the “CBI”), pursuant to the European Communities (Undertakings for Collective Investment in Transferable Securities) Regulations 2011 (as amended) (the “UCITS Regulations”). The Unit Trust is also listed on the Euronext Dublin Global Exchange Market.
As the Unit Trust is registered for sale in Hong Kong, the Unit Trust has also been authorised by the Hong Kong Securities and Futures Commission (“SFC”) pursuant to the provisions of the Hong Kong Code on Unit Trusts and Mutual Funds, supplemented or consolidated from time to time. Further details of the Funds are contained in the supplement to the Prospectus. The assets of the Funds are invested in accordance with the investment objective and policy.
The Unit Trust is organised in the form of an umbrella fund. The Trust Deed provides that the Unit Trust may offer separate series of units, each representing an interest in a Unit Trust Fund (a “Fund”) comprised of a distinct portfolio of investments. A separate Fund is maintained for each series of units and is invested in accordance with the investment objective applicable to such Fund to date. Each Fund may create more than one class of units in relation to a Fund (a “class”) and these separate classes of units may be denominated in different currencies. A unit represents a beneficial interest in a Fund (a “unit”).
The Unit Trust has six active Funds as at 31 October 2021 which have been approved by the CBI:
Fund Fund launch dateBarings ASEAN Frontiers Fund 01/08/2008Barings Asia Growth Fund 03/02/1987Barings Australia Fund 04/12/1981Barings Europa Fund 24/01/1987Barings Hong Kong China Fund 03/12/1982Barings Global Bond Fund 07/07/1978
Each of the Funds had several classes of units on offer at the financial period-end, which are outlined in note 10 to these financial statements. Further details of the Funds are contained in the individual supplements to the full Prospectus.
The financial statements include all the trades received up until 12:00p.m. (Irish time) on 29 October 2021, the valuation point for the Unit Trust.

4
Barings International Umbrella FundInvestment Objective and Policy
Barings ASEAN Frontiers Fund The investment objective of the Barings ASEAN Frontiers Fund (the “Fund”) is to achieve long-term capital growth in the value of assets by investing in companies in Asia which the Manager believes will benefit from the economic growth and development of the region.
The Fund will seek to achieve its investment objective by investing at least 70% of its total assets at any one time in equities and equity-related securities of companies incorporated in, or exercising the predominant part of their economic activity in, countries which are members of the Association of South-East Asian Nations (“ASEAN”), or quoted or traded on the stock exchanges in those countries. The members of ASEAN include Singapore, Thailand, the Philippines, Malaysia, Indonesia and Vietnam.
The Fund will invest at least 50% of the Fund’s total assets in equities of companies that exhibit positive or improving environmental, social and governance ("ESG") characteristics.
Barings Asia Growth Fund The investment objective of Barings Asia Growth Fund (the “Fund”) is to achieve long-term capital growth in the value of assets by investing in Asia and the Pacific region excluding Japan. The Fund will seek to achieve its investment objective by investing at least 70% of its total assets in equities and equity-related securities of companies incorporated in, or exercising the predominant part of their economic activity in, the Asia Pacific region excluding Japan, or quoted or traded on the stock exchanges in those countries, including developed and emerging markets.
The Fund will invest at least 50% of the Fund’s total assets in equities of companies that exhibit positive or improving environmental, social and governance ("ESG") characteristics.
Barings Australia Fund The investment objective of the Barings Australia Fund (the “Fund”) is to achieve long-term capital growth in the value of assets by investing in Australia. The Fund will seek to achieve its investment objective by investing at least 70% of its total assets at any one time in equities and equity-related securities of companies incorporated in, or exercising the predominant part of their economic activity, in Australia, or quoted or traded on the stock exchanges in Australia.
The Fund will invest at least 50% of the Fund’s total assets in equities of companies that exhibit positive or improving environmental, social and governance ("ESG") characteristics.
Barings Europa FundThe investment objective of the Barings Europa Fund (the “Fund”) is to achieve long-term capital growth in the value of assets by investing in companies in Europe (including the United Kingdom). The Fund will seek to achieve its investment objective by investing at least 70% of its total assets at any one time in equities and equity-related securities of companies incorporated in, or exercising the predominant part of their economic activity in, any European country (including the United Kingdom), or quoted or traded on the stock exchanges in such countries.
The Fund will invest at least 50% of the Fund’s total assets in equities of companies that exhibit positive or improving environmental, social and governance ("ESG") characteristics.
Barings Hong Kong China FundThe investment objective of Barings Hong Kong China Fund (the “Fund”) is to achieve long-term capital growth in the value of assets by investing in Hong Kong, China and Taiwan.
The Fund will seek to achieve its investment objective by investing at least 70% of its total assets at any one time either directly in equities or through equity-related securities (including depositary receipts) of companies (i) incorporated, or (ii) exercising the predominant part of their economic activity, or (iii) quoted or traded on the stock exchanges in markets in Hong Kong or China.
The Fund will invest at least 50% of the Fund’s total assets in equities of companies that exhibit positive or improving environmental, social and governance ("ESG") characteristics.

5
Barings International Umbrella FundInvestment Objective and Policy (continued)
Barings Global Bond FundThe investment objective of the Barings Global Bond Fund (the “Fund”) is to achieve an attractive level of income together with long-term growth in the value of assets by investing in a diversified portfolio of fixed-interest securities.
The Fund will seek to achieve its investment objective by investing at least 70% of its total assets at any one time in an internationally diversified portfolio of both corporate and government fixed-interest securities. The portfolio may also, from time to time, include securities with floating interest rates.
Please refer to the Prospectus for the full investment objective and policy for all the Funds.
How the Funds are managedThe Manager of Barings ASEAN Frontiers Fund, Barings Asia Growth Fund, Barings Australia Fund and Barings Hong Kong China Fund has appointed Baring Asset Management Limited as the Investment Manager of the Funds. In turn, Baring Asset Management Limited has appointed Baring Asset Management (Asia) Limited as Sub-Investment Manager to the Funds.
At Barings, our equity investment teams share the philosophy of quality Growth at a Reasonable Price (“GARP”). We believe that earnings growth is the principal driver of equity market performance over the medium to long term, and favour high quality companies for their ability to outperform the market on a risk-adjusted basis. In particular, we believe that structured fundamental research and a disciplined investment process combining quality growth and upside disciplines can allow us to identify attractively priced, long-term growth companies which will outperform the market. Our approach emphasises quality criteria when looking at companies and a three- to five-year time horizon when forecasting company earnings. In determining upside, we use consistent and transparent methods to place emphasis on discounted earnings models.
The Manager of Barings Europa Fund has appointed Baring Asset Management Limited as the Investment Manager of the Fund.
The Fund is invested in European equity markets (including the United Kingdom), using a “bottom-up” investment approach. This means that we focus more on the individual merits of a specific company, rather than taking a stance on a sector of the market or macroeconomic trends such as interest rate rises. Within this, Barings manages the Fund using a GARP approach. This means that when researching candidates for the portfolio, we place just as much emphasis on the likely growth in corporate earnings at a company as we do on the unit price valuation before deciding whether to invest or not. We believe this approach combines the best features of both “growth” and “value” investment styles, to the benefit of investors. We invest in companies which we believe offer potential for delivering better than expected earnings growth. We do this by carefully researching a company’s corporate strategy and revenue sources. An important part of the investment process involves regular meetings with the management of companies in which we are considering investment. We then work to put a price on the units of the company in the light of our assessment of its earnings prospects and compare this to its peers in the sector and globally. When we are satisfied that a company meets our criteria for investing, we purchase an appropriate number of units.
The Manager of Barings Global Bond Fund has appointed Baring Asset Management Limited as the Investment Manager of the Fund. Barings LLC and Barings Japan Limited were appointed as Sub-Investment Managers of the Fund.
Baring Asset Management Limited seeks investment returns by investing in bond markets where we believe yields are likely to fall and avoiding those we think are expensive. The overall duration, or interest rate sensitivity, of the Fund will fluctuate as our expectations for economic developments change, relative to the market. We will also look to add value through foreign exchange management, identifying those markets where currencies are attractive, for example due to sound economic fundamentals or rising interest rates.
Please refer to the Prospectus for the full risk profile of each of the Funds. Investors should read the Prospectus and carefully consider the potential risk factors as well as reward factors before investing.

Barings International Umbrella FundInvestment Managers’ Report
For the financial period ended 31 October 2021
6
Barings ASEAN Frontiers Fund
Performance Barings ASEAN Frontiers Fund (the “Fund”) registered a gross return of 8.59% on the Class A USD Inc unit class. The Fund over performed against the performance comparator that delivered a return of 1.69%* during the reporting period, and generated a net return of 7.66% on the Class A USD Inc unit class.
ASEAN markets suffered in the first half of the review period, dragged by a confluence of negative headwinds, predominantly a new wave of COVID-19 with record high of new infection cases. The situation was further exacerbated by the low vaccination rates. This ultimately led to governments re-imposing lockdowns, which impacted the economic recovery trajectory across the region. On the macro front, the mounting worries over inflation and a strengthening of US dollar on the back of potentially sooner US tapering also weighed on ASEAN equity performance. Fortunately, COVID-19 situation came under control in the second half of the review period as number of new infection cases peaked out, with some of the countries announcing reopening in stages and introducing endemic policies. This has revitalized a strong turnaround of the broad ASEAN markets and lifted investor sentiment on positive recovery expectations. Concurrently, the heightened regulatory scrutiny and increased concern over a spill-over from the property debt crisis in China has also shifted investors' interest away from the country to ASEAN.
Over the review period, stock selection served as a key driver to relative outperformance, especially from sectors such as Information Technology and Communication Services. Our largest holding on an absolute and relative basis, SEA Ltd., which is ASEAN’s leading game developer and e-commerce marketplace, continued as a key contributor to the Fund over the 6-month period. The company delivered strong quarterly performance in both gaming and e-commerce businesses, coupled with its new e-commerce business expansion in the Latin American markets that serve as another strong growth catalyst. Flat Glass, a Chinese solar glass manufacturer that also has factory exposure in Vietnam, also added value to the Fund, driven by the company’s strong results over the first half of 2021 alongside continuing capacity expansion, which underpins the company’s leading position in the solar glass manufacturing industry in the longer run. On the other hand, Singapore’s advanced material supplier Nanofilm Technologies detracted from relative performance on the back of muted earnings results over the second quarter, caused by a combination of new project delays and a shift in product mix due to chip shortage. Thailand-based entertainment and media services provider R.S. was another key drag to the Fund over the past 6 months, as the extension of lockdown amid re-elevated COVID-19 situation in the country weighed on near-term domestic consumption outlook and the share price.
Market outlook ASEAN countries have survived yet another wave of COVID-19. However, this time, governments were more experienced in handling the pandemic and acted swiftly to contain the outbreaks. On top of reinstating mobility restrictions and social distancing measures, they also accelerated vaccination programs. Looking ahead, while headwinds from COVID-19 may continue in the near-term, countries such as Malaysia and Singapore have started to transit from pandemic control to sustainable endemic measures. Efforts such as gradually easing of the virus curbs and restoring connectivity with the rest of the world will largely rebuild business confidence and further promote economic recovery. This will ultimately lead to the corporations resuming their earnings growth. Meanwhile, the relentless rally in commodities prices – both soft and hard – is also expected to benefit some of the ASEAN countries like Indonesia, which is a major commodities exporter. Further, relative valuations for ASEAN are now looking compelling after prolonged underperformance, and the region is under-owned by foreign investors.

7
Barings International Umbrella FundInvestment Managers’ Report (continued)
For the financial period ended 31 October 2021
Our ASEAN equity strategy remains positioned in companies exposed to the secular growth themes such as technological ubiquity (the digitalization and connectivity of everything), evolving lifestyle and societal values (sustainability, rising middle class, healthy living) and de-globalization (supply chain diversification/bifurcation and reshoring). For the ASEAN region, the coming quarters are also expected to prove extremely exciting with market structure reflecting the rising digitalization of the economy. While stylistic rotations have caused some volatility in recent performance, our Growth-at-a-Reasonable-Price (GARP) bottom-up investment approach has positioned our portfolio favorably beyond the near-term gyrations, as at the stock selection level we do not overpay for the company’s growth, while at the portfolio construction level, we ensure that our portfolios are not overly exposed to unintended styles or risks.
* The Fund return uses the midday prices, whereas the return of the comparator is calculated using global close prices.
Baring Asset Management (Asia) Limited and Barings LLC,appointed as Sub-Investment Managers byBaring Asset Management LimitedNovember 2021 Baring Asset Management Limited (the “Investment Manager”) gives its portfolio managers full authority to manage their funds as they see fit, within the established guidelines set down. This includes the views that managers may take of the markets and sectors they invest in, which may differ from the views of other Barings portfolio managers.
Barings ASEAN Frontiers Fund (continued)
Market outlook (continued)

8
Barings International Umbrella FundInvestment Managers’ Report (continued)
For the financial period ended 31 October 2021
Barings Asia Growth Fund
PerformanceBarings Asia Growth Fund (the “Fund”) registered a gross return of -2.20% on the Class A USD Inc unit class, and over performed against the performance comparator that delivered a return of -7.09%* during the reporting period. The Fund generated a net return of -3.04% on the Class A USD Inc unit class.
Asian equity markets trended lower over the review period on the back of multiple headwinds, ranging from tightening regulatory policies especially for internet and several New Economy sectors in China and South Korea, debt default crisis of Chinese property giant Evergrande that led to worries over spill-over risks outside China, to challenging COVID-19 re-outbreaks in the ASEAN region. Meanwhile, style rotations from growth to value extended as post-pandemic reopening of economies carried on globally, with value cyclicals such as Financials and Energy being relative outperformers, while Communication Services and Consumer Discretionary came as laggards on the back of heightened regulatory pressure and weaker-than-expected consumption recovery.
At a stock level, Singapore-based gaming developer and e-commerce marketplace Sea Ltd. ended the review period as a notable contributor to the Fund. The company delivered strong performance in both gaming and e-commerce businesses over the second quarter, coupled with its ongoing retail e-commerce business expansion in the Latin American markets that serve as another strong growth catalyst. Chinese sportswear manufacturer Li Ning also added value to the Fund’s performance. A strong beat in the company’s quarterly retail sales that even came higher than before the pandemic, along with improving fundamentals particularly on retail channel efficiency and inventory management, stimulated share price appreciation. On the other hand, China-based video streaming platform Kuaishou Technology was a key detractor to the Fund over the past 6 months, as elevated regulatory risks to the internet sector in China led to muted earnings growth outlook of the company. The newly-listed Chinese clinical testing services provider, Kindstar Globalgene Technology, also detracted from relative performance over the review period. Share price came under pressure on the back of the revenue miss over the first half of 2021, as patient traffic recovery came slower than expected.
Market outlookLooking forward, we expect Asian equity markets to remain volatile in the near-term, but increasingly subject to the idiosyncrasies of each market. Supply chain dislocations, monetary policies, and geopolitics could also introduce volatility in the markets. On the bright side, regions with lagging vaccination rates have gradually improved, and COVID-19 outbreaks have been largely contained in Asia. In addition, the newly announced anti-viral COVID-19 treatment drugs have improved the prospects of effective medication. Some countries in the region are planning to reopen their borders to foreign visitors in the fourth quarter of 2021, starting with Singapore, Malaysia and Thailand, helping to restart the economic engine. We are constructive on Asian equities and expect the returns to be driven by substantial corporate earnings recovery in the coming quarters, particularly with markets having a heavier domestic composition. External balances for South Asian economies are much healthier than before and therefore less subjected to currency movements. ASEAN’s delay in containing COVID-19 means deferring its growth acceleration in 2022. ASEAN equities are also supported by the relentless rallies in commodities – both soft and hard – something that a number of ASEAN countries are endowed with. As for China, the equity markets have suffered in the near-term due to various regulatory crackdown and policy tightening. However, market valuations have significantly moderated and supportive policies are expected, which provide buying opportunities for long-term investors.

9
Barings International Umbrella FundInvestment Managers’ Report (continued)
For the financial period ended 31 October 2021
Our Asian equities strategy remains positioned in stocks exposed to the secular growth themes such as technological ubiquity (digitalization and connectivity of everything), evolving lifestyle and societal values (sustainability, millennial/Gen Z consumption trends, healthy living) and de-globalization (supply chain diversification/bifurcation and reshoring). Recent corrections in some of the sectors have made valuations more attractive, and we would look for opportunities to add on weakness. While the stylistic rotations have caused some volatility in recent performance, our Growth-at-a-Reasonable-Price (GARP) bottom-up investment approach has positioned our portfolio favourably beyond the near-term gyrations, as at the stock selection level we do not overpay for the company’s growth, while at the portfolio construction level, we ensure that our portfolios are not overly exposed to unintended styles or risks.
* The Fund return uses the midday prices, whereas the return of the comparator is calculated using global close prices.
Baring Asset Management (Asia) Limitedand Barings LLC,appointed as Sub-Investment Managers byBaring Asset Management LimitedNovember 2021 Baring Asset Management Limited (the “Investment Manager”) gives its portfolio managers full authority to manage their funds as they see fit, within the established guidelines set down. This includes the views that managers may take of the markets and sectors they invest in, which may differ from the views of other Barings portfolio managers.
Barings Asia Growth Fund (continued)

10
Barings International Umbrella FundInvestment Managers’ Report (continued)
For the financial period ended 31 October 2021
Barings Australia Fund
PerformanceThe Barings Australia Fund (the “Fund”) generated a gross return of 4.37% on the Class A USD Inc unit class and outperformed against the performance comparator, which returned 2.63%* during the reporting period. The Fund generated a net return of 3.48% on the Class A USD Inc unit class.
At a stock-specific level, the largest positive contributor to relative performance over the year was Macquarie Group, a high quality, diversified bank with a strong competitive position across asset management, commodities trading and other financial services. It delivered significant earnings upgrades though it remains attractive in our view as it is well-positioned to take further share and benefit from growth in infrastructure spend and a structural global pivot towards renewable energy.
Aristocrat Leisure was also a large positive contributor. Aristocrat has developed a highly profitable presence in mobile gaming over the last few years that complements a market leadership position in slot machine leasing. Execution has been good across both divisions and the easing of COVID-19 restrictions in the US has been a tailwind. A strong innovation engine continues to drive market share gains and the long-term growth opportunity is significant (and potential to expand into further adjacencies).
Westpac Banking Corporation was among the largest negative contributors to relative performance as its share price saw a significant recovery over the period from a COVID-19 driven low and the Fund's lack of exposure worked against us. Ansell, a healthcare and industrial protective glove manufacturer, was also a negative contributor. Earnings growth slowed as it lapped a COVID-19 driven spike in demand and it faced supply chain disruption in Malaysia and Vietnam. Ansell remains a leader in glove innovation and looking beyond COVID-19 distortion, we expect long-term, structural demand growth from Emerging Markets.
Market outlookWe continue to follow our Growth-at-a-Reasonable-Price investment style. We aim to own attractively valued companies with strong business franchises that should deliver better-than-market earnings growth over a long-term investment horizon. Stock selection remains driven by fundamental, bottom-up analysis and incorporates proprietary ESG analysis and active engagement with management teams.
We are positive on the outlook of the Australian market with management commentary pointing to a rebound in activity as the latest COVID-19 restrictions ease. With over 80% of the population now double vaccinated, Australia is on track to have one of the highest vaccination rates in the world.
We also remain positive on the outlook of the companies held in the Fund over the long-term investment horizon. In addition to owning some high quality, large-cap companies that are included in the performance comparator, we also note some very attractive investment opportunities among smaller Australian companies, not large enough to be included in benchmark, but still with very strong quality and growth attributes that present a lot of long-term share price upside.
Computershare is a relatively recent addition to the Fund. It has a strong international market position in shareholder registry services (high recurring revenue) and the potential to replicate this success as it expands into the Corporate Trust registry. Earnings should also benefit from a rising interest rate environment though growth is not dependent on this. The Fund also recently increased its position in Bapcor, a high quality, market-leading Autoparts distributor. We believe Bapcor should drive strong and cyclically defensive earnings growth over the next 5 years as it continues to win domestic market share while there is even longer-term upside from expansion into other Asian markets that are under-served.
* The Fund return uses the midday prices, whereas the return of the comparator is calculated using global close prices. Baring Asset Management (Asia) Limitedand Barings LLC,appointed as Sub-Investment Managers byBaring Asset Management LimitedNovember 2021

11
Barings International Umbrella FundInvestment Managers’ Report (continued)
For the financial period ended 31 October 2021
Barings Europa Fund
PerformanceThe Barings Europa Fund (the “Fund”) generated a gross return of 8.90% on the Class A USD Inc unit class and outperformed against the performance comparator, which returned 5.71%* during the reporting period. The Fund generated a net return of 7.97% on the Class A USD Inc unit class.
European equity markets moved higher over the period in response to strong corporate earnings momentum; as the accelerated rollout of vaccination programs allowed for the further withdrawal of lockdown measures across many developed economies. Markets did experience a period of weakness during September due to concerns that central banks may start to tighten monetary policy quicker than was being anticipated, and on the rising cases of the delta COVID-19 variant, but rebounded strongly during October on generally less hawkish stances by these same central banks, as well as on an overall well received corporate results season covering the third quarter of 2021.
European IT services major group CapGemini ended the period as one of the top contributors to relative performance, after the company upgraded its 2021 earnings guidance and raised 2022 outlook targets. The accelerated growth reflects the strengthening of the positive trends of previous few quarters in all sectors and regions. Meanwhile, health care company Roche performed well, due to good pipeline newsflow in general, strong underlying performance of its diagnostic business and an increasing focus on commercial possibilities of the company’s Alzheimer’s drug. Finally, the impact that rapidly rising energy prices will have on earnings and cash flow generation benefited our holding in Royal Dnfideutch Shell.
In contrast, our investment in Associated British Foods underperformed over the period. AB Foods’ Primark clothing retail business has suffered as a result of slower store traffic with the rise of COVID-19. We believe the long-term growth outlook remains intact however, as the company continues to successfully expand the store estate in the US and Europe. Meanwhile, industrial company Siemens Gamesa pulled back over the period along with many other renewable energy related stocks. Some of this weakness has been related to near-term margin pressures from higher steel costs input costs but, in our view, the long-term growth and profitability outlook continues to look attractive and we have maintained our investment.
Market outlookWe remain confident in the outlook for European equity markets, even taking into account the strong recovery from the March-2020 lows. Central Bank policies remain accommodative, and even if, looking ahead, they will not be as loose as in the past, they should still be commensurate with the improving outlook. In addition, with end market demand remaining robust, companies should in time begin to deliver on the strong backlog of orders many have reported once supply chain constraints are resolved. As evert though, progress is unlikely to be smooth. Raw materials, including energy, pricing pressures could remain in place for a significant amount of time for instance. Therefore it is important to invest in companies that are relatively unaffected to these price moves, or have strong pricing power when they are, or actually benefit from the rising cost of various commodities. There is also the energy transition to consider – again something that will not be smooth, but something that, through huge investment programmes that should benefit the stronger companies in those specific value chains. Finally, there is now potential ongoing threats from COVID-19 to consider, for example with regard to those sectors of the economy more exposed to “re-opening” such as travel & leisure and hospitality. In the context of this complex and dynamic investment environment therefore, we shall continue to follow our quality Growth at a Reasonable Price investment approach. Our aim remains to identify attractively valued investment opportunities in companies whose strategic positioning and competitive strengths can drive sustained improvements in their profitability and returns.
* The Fund return uses the midday prices, whereas the return of the comparator is calculated using global close prices.
Baring Asset Management LimitedNovember 2021 Baring Asset Management Limited (the “Investment Manager”) gives its portfolio managers full authority to manage their funds as they see fit, within the established guidelines set down. This includes the views that managers may take of the markets and sectors they invest in, which may differ from the views of other Barings portfolio managers.

12
Barings International Umbrella FundInvestment Managers’ Report (continued)
For the financial period ended 31 October 2021
Barings Hong Kong China Fund
PerformanceBarings Hong Kong China Fund (the “Fund”) registered a gross return of -11.08% on the Class A USD Inc unit class and over performed against the performance comparator with a return of -13.13%* during the reporting period. The Fund generated a net return of -11.83% on the Class A USD Inc unit class.
It was a bumpy ride for Chinese equities over the past 6 months. As the government aims at shaping the Chinese economy for long-term sustainable growth, a series of regulatory changes were announced particularly on the New Economy sectors such as internet, education, cloud and e-commerce, which dragged market sentiment and led to sell-offs in those said sectors. Moreover, recent economic activity data also indicated further weakness, reflecting a confluence of negative factors including COVID-19 outbreaks and local lockdowns, a slowdown in the property market partly impacted by property giant Evergrande’s debt default turmoil, as well as drags on production from power rationing in multiple provinces of China. On the bright side, value cyclicals such as Industrials, Materials and Energy were relative outperformers over the review period, underpinned by the reopening of global economies and commodities prices surge due to supply-demand imbalance.
Stock selection and sector allocation both contributed positively to relative performance over the review period, particularly from Industrials, Information Technology and Financials. At a stock level, EV (Electric Vehicle) battery manufacturer Contemporary Amperex Technology ended as a notable contributor to the Fund, driven by strong demand momentum from global EV manufacturers, coupled with the release of Chinese government’s detailed roadmap for carbon neutrality by 2060 with emphasis on green transition, which also lifted investor interests in the EV supply chain. Sportswear manufacturer Li Ning also added value to the Fund’s performance. A strong beat in the company’s quarterly retail sales that even came higher than before the pandemic, along with improving fundamentals particularly on retail channel efficiency and inventory management, stimulated share price appreciation. On the other hand, video streaming platform Kuaishou Technology detracted from relative performance over the past 6 months, as elevated regulatory risks to the internet sector in China led to muted earnings growth outlook of the company in the near-term. Aluminum Corporation of China was another key detractor to the Fund, largely due to the company’s production interruptions in light of power rationing as well as more cautious earnings outlook in the last quarter of the year on the back of cost inflation pressure.
Market outlookWe expect market volatilities to continue in the near-term on worries of weakening economic outlook amid COVID-19 waves, indirect impact of consumer sentiment following the regulatory crackdown on certain sectors such as property, as well as lingering concerns over cost inflation and supply chain bottlenecks. On the bright side, looking ahead we expect a more policy-friendly environment from the Chinese government. Supportive monetary policy and additional fiscal spending are expected to be rolled out to stabilize the overall economy, while the frequency and severity of further regulations should also be moderated. Meanwhile, we believe the recent regulatory policies, aimed at shaping the Chinese economy for long-term sustainable growth, could lead to new waves of structural opportunities. We are closely analyzing key areas illustrated in the 14th five-year-plan, such as the continuation of economic transformation towards sustainable growth, self-sufficiency in the supply chain, scientific and technological innovations, and green ecology awareness. These should bolster the outlook on sectors and themes such as new infrastructure, domestic consumption, health care, technology localization and sustainability in the medium to longer term.

13
Barings International Umbrella FundInvestment Managers’ Report (continued)
For the financial period ended 31 October 2021
In terms of positioning, we are consistently executing our bottom-up investment process and closely monitoring the situation to assess if there is any fundamental impact of the policy changes on the overall economy and individual companies. We have taken advantage of the recent market volatility to build positions in high quality companies that have returned to reasonable valuations, and currently favor the investment themes with structural growth opportunities as illustrated in the 14th five-year-plan and are relatively neutral to current regulatory direction, such as hardware technology like AR/VR and semiconductors, which will continue to benefit from the upcoming 5G era and Chinese domestic innovation. Sportswear is another area we like over the medium to longer run, which is expected to benefit from the National Fitness Program recently announced by the Chinese government alongside increasing awareness of healthcare and physical well-being. We are also positive on the long-term growth outlook of sustainability thematic, such as electronic vehicles and green energy, which is also a significant part of China’s roadmap to carbon neutrality.
* The Fund return uses the midday prices, whereas the return of the comparator is calculated using global close prices.
Baring Asset Management (Asia) Limitedand Barings LLC,appointed as Sub-Investment Managers byBaring Asset Management LimitedNovember 2021 Baring Asset Management Limited (the “Investment Manager”) gives its portfolio managers full authority to manage their funds as they see fit, within the established guidelines set down. This includes the views that managers may take of the markets and sectors they invest in, which may differ from the views of other Barings portfolio managers.
Barings Hong Kong China Fund (continued)
Market outlook (continued)

14
Barings International Umbrella FundInvestment Managers’ Report (continued)
For the financial period ended 31 October 2021
Barings Global Bond Fund
PerformanceThe Barings Global Bond Fund (the “Fund”) generated a gross return of -2.68% on the Class A USD Inc unit class and underperformed its index comparator with a return of -1.82%* during the reporting period. The Fund generated a net return of -3.26% on the Class A USD Inc unit class.
The yield curve strategy was a positive contributor to performance, while the duration strategy and spread strategy were negative contributors to performance. The yield curve strategy’s positive contribution came from our positioning in Mexican long tenors as the tenors outperformed other tenors. In terms of the duration strategy, our exposure to Mexican rates was a negative contributor as rates rose on the back of higher inflation. In addition, our exposure to New Zealand rates was a negative contributor as the rate rose on the back of rate hike by New Zealand central bank (“RBNZ”). RBNZ decided to do rate hike due to higher inflation and economic recovery after COVID-19 shock. In terms of our spread strategy, Australian provincial bonds were negative contributors due to the spread widening.
Market outlookGlobal economic recovery has continued on the back of COVID-19 vaccinations and economic re-opening. In particular, we have seen a short-term economic recovery year-over-year due to base effect. But we can also see some signs of slowdowns like China.
With the global PMI’s peaking, monetary and fiscal policy are both on a tightening course, which are headwinds for a strong recovery. History shows that the slowdown makes the safe assets shine in the investor portfolio. As markets regain normal functioning, money injection from the central banks may be gradually tapered. Despite the central bank’s highlighting the decoupling of tapering and rate hikes, markets tend to react to the tapering as serial steps to the rate hikes. In this case, it presents a bond buying opportunity. The lingering concern on the Delta variant continues to be the biggest wild card for the economic recovery and inflation expectations. Whether the inflation is transitory or permanent may shake the markets and the inflation-linked bond may prove the effective hedge for the yield hunters.
In terms of current positioning, we have bond positions in Australia, Mexico, Euro, New Zealand, and Sweden. Within Euro denominated fixed income positions, we continue to favour European peripherals. We have continued a long duration stance against the benchmark. In terms of currency positioning, we expect appreciation in the Polish Zloty, Mexican Peso and Australian dollar, while expecting depreciation pressures in the Euro and New Zealand dollar.
* The Fund return uses the midday prices, whereas the return of the comparator is calculated using global close prices.
Barings LLC and Barings Japan Limitedappointed as Sub-Investment Managers byBaring Asset Management LimitedNovember 2021 Baring Asset Management Limited (the “Investment Manager”) gives its portfolio managers full authority to manage their funds as they see fit, within the established guidelines set down. This includes the views that managers may take of the markets and sectors they invest in, which may differ from the views of other Barings portfolio managers.

The accompanying notes form an integral part of these financial statements.
15
Barings International Umbrella FundStatement of Financial Position
As at 31 October 2021
Barings ASEAN Frontiers Fund
31 October 2021
Barings Asia Growth Fund
31 October 2021
Barings Australia Fund
31 October 2021Assets Notes US$ US$ US$Financial assets at fair value through profit or loss 2 572,948,669 227,036,558 71,378,469Cash and cash equivalents 3 21,044,688 62,879 1,407,458Securities sold receivable 103,837 2,126,596 380,626Receivable for units sold 381,169 73,885 47,188Dividends receivable 123,604 95,772 –Other assets – 19 –Total assets 594,601,967 229,395,709 73,213,741
LiabilitiesFinancial liabilities at fair value through profit or loss 2 (12,521) – –Management fee payable 6 (468,544) (210,129) (60,479)Administration, depositary & operating fees payable 6 (166,021) (76,668) (21,400)Securities purchased payable – (1,161,982) –Accrued capital gains tax – (1,422,221) –Payable for units redeemed (1,808,268) (1,076,087) (63,302)Total liabilities (excluding net assets attributable to holders of redeemable participating units) (2,455,354) (3,947,087) (145,181)
Net assets attributable to holders of redeemable participating units 592,146,613 225,448,622 73,068,560

The accompanying notes form an integral part of these financial statements.
16
Barings International Umbrella FundStatement of Financial Position (continued)
As at 31 October 2021
Barings Europa Fund
31 October 2021
Barings Hong Kong China Fund
31 October 2021
Barings Global Bond Fund
31 October 2021Assets Notes US$ US$ US$Financial assets at fair value through profit or loss 2 30,865,261 2,094,983,751 70,822,238Cash and cash equivalents 3 299,039 16,955,187 1,424,521Securities sold receivable 730 – –Receivable for units sold 2,104 1,385,807 8,668Interest receivable – – 490,160Other assets – 419 –Total assets 31,167,134 2,113,325,164 72,745,587
LiabilitiesFinancial liabilities at fair value through profit or loss 2 – (1) (492,420)Management fee payable 6 (29,792) (2,023,989) (42,289)Administration, depositary & operating fees payable 6 (11,223) (729,684) (25,275)Securities purchased payable – (6,205,989) –Payable for units redeemed (64,103) (2,528,019) (12,433)Total liabilities (excluding net assets attributable to holders of redeemable participating units) (105,118) (11,487,682) (572,417)
Net assets attributable to holders of redeemable participating units 31,062,016 2,101,837,482 72,173,170

The accompanying notes form an integral part of these financial statements.
17
Barings International Umbrella FundStatement of Financial Position (continued)
As at 30 April 2021
Barings ASEAN Frontiers Fund
30 April 2021
Barings Asia Growth Fund 30 April 2021
Barings Australia Fund
30 April 2021Assets Notes US$ US$ US$Financial assets at fair value through profit or loss 2 454,592,329 240,381,019 75,256,911Cash and cash equivalents 3 6,755,879 1,628,533 636,573Securities sold receivable 2 9,819 1,357,795 1,435,719Receivable for units sold 2 1,101,810 655,012 56,811Dividends receivable 2 913,761 206,015 –Other assets 525 1,172 –Total assets 463,374,123 244,229,546 77,386,014
LiabilitiesFinancial liabilities at fair value through profit or loss 2 (567) – –Management fee payable 6 (402,978) (231,165) (67,449)Administration, depositary & operating fees payable 6 (143,176) (82,866) (23,891)Securities purchased payable 2 (1,013,372) (1,919,097) –Accrued capital gains tax – (1,013,002) –Payable for units redeemed 2 (1,301,802) (235,024) (1,671,754)Other liabilities – (4,047) –Total liabilities (excluding net assets attributable to holders of redeemable participating units) (2,861,895) (3,485,201) (1,763,094)
Net assets attributable to holders of redeemable participating units 460,512,228 240,744,345 75,622,920

The accompanying notes form an integral part of these financial statements.
18
Barings International Umbrella FundStatement of Financial Position (continued)
As at 30 April 2021
Barings Europa Fund
30 April 2021
Barings Hong Kong China Fund
30 April 2021
Barings Global Bond Fund
30 April 2021Assets Notes US$ US$ US$Financial assets at fair value through profit or loss 2 31,378,965 2,419,299,817 77,006,533Cash and cash equivalents 3 146,522 15,503,976 1,133,956Securities sold receivable 2 – 11,729,870 –Receivable for units sold 2 2,387 6,672,397 24,325Interest receivable 2 – – 472,574Dividends receivable 2 66,670 1,432,201 –Other assets 13 3,620 –Total assets 31,594,557 2,454,641,881 78,637,388
LiabilitiesFinancial liabilities at fair value through profit or loss 2 – (10) (417,624)Management fee payable 6 (32,470) (2,462,143) (48,443)Administration, depositary & operating fees payable 6 (12,049) (888,610) (28,949)Securities purchased payable 2 – (10,933,345) –Payable for units redeemed 2 (29,334) (3,371,486) (53,622)Total liabilities (excluding net assets attributable to holders of redeemable participating units) (73,853) (17,655,594) (548,638)
Net assets attributable to holders of redeemable participating units 31,520,704 2,436,986,287 78,088,750

The accompanying notes form an integral part of these financial statements.
19
Barings International Umbrella FundStatement of Comprehensive Income
For the financial period ended 31 October 2021
Barings ASEAN Frontiers Fund
31 October 2021
Barings Asia Growth Fund
31 October 2021
Barings Australia Fund
31 October 2021Notes US$ US$ US$
IncomeBank interest income 1,828 691 482Dividend income 6,623,242 2,746,914 1,913,919Net fair value gain/(loss) on financial assets and financial liabilities at fair value through profit or loss 2 38,272,004 (6,904,701) 1,753,862Total income/(expense) 44,897,074 (4,157,096) 3,668,263
ExpensesManagement fees 6 (2,687,294) (1,345,946) (391,224)Administration, depositary & operating fees 6 (949,761) (481,468) (138,287)General expenses 6 (3,250) (3,250) (3,251)Total operating expenses (3,640,305) (1,830,664) (532,762)
Net profit/(loss) before finance costs and taxation 41,256,769 (5,987,760) 3,135,501
Finance costsDistributions (1,665,820) – (439,064)Bank interest expense (4,855) (3,044) (771)Total finance costs (1,670,675) (3,044) (439,835)
Increase/(decrease) in net assets attributable to holders of redeemable participating units before taxation 39,586,094 (5,990,804) 2,695,666
TaxationWithholding tax on dividends and other investment income (434,252) (243,354) (501,550)Capital gains tax – (729,615) –Total taxation (434,252) (972,969) (501,550)
Increase/(decrease) in net assets attributable to holders of redeemable participating units 39,151,842 (6,963,773) 2,194,116

The accompanying notes form an integral part of these financial statements.
20
Barings International Umbrella FundStatement of Comprehensive Income (continued)
For the financial period ended 31 October 2021
Barings Europa Fund
31 October 2021
Barings Hong Kong China Fund
31 October 2021
Barings Global Bond Fund
31 October 2021Notes US$ US$ US$
IncomeBank interest income 3,592 2,664 919Interest income – – 329,679Dividend income 416,758 26,561,919 –Net fair value gain/(loss) on financial assets and financial liabilities at fair value through profit or loss 2 2,284,262 (291,272,640) (2,271,698)Total income/(expense) 2,704,612 (264,708,057) (1,941,100)
ExpensesManagement fees 6 (194,293) (13,889,326) (275,915)Administration, depositary & operating fees 6 (69,945) (4,994,436) (164,906)General expenses 6 (5,445) (10,406) (3,250)Total operating expenses (269,683) (18,894,168) (444,071)
Net profit/(loss) before finance costs and taxation 2,434,929 (283,602,225) (2,385,171)
Finance costsDistributions (175,214) – (174,783)Bank interest expense (3,409) (12,296) (1,794)Total finance costs (178,623) (12,296) (176,577)
Increase/(decrease) in net assets attributable to holders of redeemable participating units before taxation 2,256,306 (283,614,521) (2,561,748)
TaxationWithholding tax on dividends and other investment income (26,495) (1,292,906) 5,493Total taxation (26,495) (1,292,906) 5,493
Increase/(decrease) in net assets attributable to holders of redeemable participating units 2,229,811 (284,907,427) (2,556,255)
Gains and losses solely from continuing operations. There were no gains or losses other than those dealt with in the Statement of Comprehensive Income.

The accompanying notes form an integral part of these financial statements.
21
Barings International Umbrella FundStatement of Comprehensive Income (continued)
For the financial period ended 31 October 2020
Barings ASEAN Frontiers Fund
31 October 2020
Barings Asia Growth Fund
31 October 2020
Barings Australia Fund
31 October 2020Notes US$ US$ US$
IncomeBank interest income 236 92 120Dividend income 4,495,319 958,795 977,533Net fair value gain on financial assets and financial liabilities at fair value through profit or loss 2 66,798,837 37,002,623 10,550,827Total income 71,294,392 37,961,510 11,528,480
ExpensesManagement fees 6 (1,763,241) (714,900) (331,199)Administration, depositary & operating fees 6 (628,154) (256,621) (117,927)General expenses 6 (1,265) (426) –Total operating expenses (2,392,660) (971,947) (449,126)
Net profit before finance costs and taxation 68,901,732 36,989,563 11,079,354
Finance costsDistributions (2,532,687) (245,230) (911,089)Bank interest expense (3,266) (1,058) (286)Total finance costs (2,535,953) (246,288) (911,375)
Increase in net assets attributable to holders of redeemable participating units before taxation 66,365,779 36,743,275 10,167,979
TaxationWithholding tax on dividends and other investment income (320,797) (98,315) (242,695)Capital gains tax – (322,796) –Total taxation (320,797) (421,111) (242,695)
Increase in net assets attributable to holders of redeemable participating units 66,044,982 36,322,164 9,925,284

The accompanying notes form an integral part of these financial statements.
22
Barings International Umbrella FundStatement of Comprehensive Income (continued)
For the financial period ended 31 October 2020
Barings Europa Fund
31 October 2020
Barings Hong Kong China Fund
31 October 2020
Barings Global Bond Fund
31 October 2020Notes US$ US$ US$
IncomeBank interest income 28 510 226Interest income – – 961,059Dividend income 347,678 18,306,373 –Net fair value gain on financial assets and financial liabilities at fair value through profit or loss 2 857,456 505,036,265 5,287,310Total income 1,205,162 523,343,148 6,248,595
ExpensesManagement fees 6 (177,722) (10,920,958) (354,951)Administration, depositary & operating fees 6 (63,980) (3,930,400) (212,348)General expenses 6 (2,024) (11,876) (358)Total operating expenses (243,726) (14,863,234) (567,657)
Net profit before finance costs and taxation 961,436 508,479,914 5,680,938
Finance costsDistributions (267,975) (2,128,901) (504,088)Bank interest expense (126) (7,930) (1,101)Total finance costs (268,101) (2,136,831) (505,189)
Increase in net assets attributable to holders of redeemable participating units before taxation 693,335 506,343,083 5,175,749
TaxationWithholding tax on dividends and other investment income 8,972 (1,064,079) –Total taxation 8,972 (1,064,079) –
Increase in net assets attributable to holders of redeemable participating units 702,307 505,279,004 5,175,749
Gains and losses solely from continuing operations. There were no gains or losses other than those dealt with in the Statement of Comprehensive Income.

The accompanying notes form an integral part of these financial statements.
23
Barings International Umbrella FundStatement of Changes in Net Assets Attributable to Holders of Redeemable Participating Units
For the financial period ended 31 October 2021
Barings ASEAN Frontiers Fund
31 October 2021
Barings Asia Growth Fund
31 October 2021
Barings Australia Fund
31 October 2021Notes US$ US$ US$
Net assets attributable to holders of redeemable participating units at the beginning of the financial period 460,512,228 240,744,345 75,622,920Increase/(decrease) in net assets attributable to holders of redeemable participating units 39,151,842 (6,963,773) 2,194,116Issue of redeemable participating units during the financial period 4 173,818,373 37,917,582 4,986,406Redemption of redeemable participating units during the financial period 4 (81,280,407) (46,249,555) (9,710,631)Income equalisation (55,423) 23 (24,251)Net assets attributable to holders of redeemable participating units at the end of the financial period 592,146,613 225,448,622 73,068,560

The accompanying notes form an integral part of these financial statements.
24
Barings International Umbrella FundStatement of Changes in Net Assets Attributable to Holders of Redeemable Participating Units (continued)
For the financial period ended 31 October 2021
Barings Europa Fund
31 October 2021
Barings Hong Kong China Fund
31 October 2021
Barings Global Bond Fund
31 October 2021Notes US$ US$ US$
Net assets attributable to holders of redeemable participating units at the beginning of the financial period 31,520,704 2,436,986,287 78,088,750Increase/(decrease) in net assets attributable to holders of redeemable participating units 2,229,811 (284,907,427) (2,556,255)Issue of redeemable participating units during the financial period 4 1,003,464 186,646,693 7,643,702Redemption of redeemable participating units during the financial period 4 (3,679,142) (236,888,759) (11,002,439)Income equalisation (12,821) 688 (588)Net assets attributable to holders of redeemable participating units at the end of the financial period 31,062,016 2,101,837,482 72,173,170

The accompanying notes form an integral part of these financial statements.
25
Barings International Umbrella FundStatement of Changes in Net Assets Attributable to Holders of Redeemable Participating Units (continued)
For the financial period ended 31 October 2020
Barings ASEAN Frontiers Fund
31 October 2020
Barings Asia Growth Fund
31 October 2020
Barings Australia Fund
31 October 2020Notes US$ US$ US$
Net assets attributable to holders of redeemable participating units at the beginning of the financial period 284,185,412 93,523,454 49,892,887Increase in net assets attributable to holders of redeemable participating units 66,044,982 36,322,164 9,925,284Issue of redeemable participating units during the financial period 4 55,336,070 45,589,998 13,925,616Redemption of redeemable participating units during the financial period 4 (83,602,087) (30,391,706) (13,525,850)Income equalisation (28,469) 12,524 5,375Net assets attributable to holders of redeemable participating units at the end of the financial period 321,935,908 145,056,434 60,223,312

The accompanying notes form an integral part of these financial statements.
26
Barings International Umbrella FundStatement of Changes in Net Assets Attributable to Holders of Redeemable Participating Units (continued)
For the financial period ended 31 October 2020
Barings Europa Fund
31 October 2020
Barings Hong Kong China Fund
31 October 2020
Barings Global Bond Fund
31 October 2020Notes US$ US$ US$
Net assets attributable to holders of redeemable participating units at the beginning of the financial period 26,389,514 1,488,667,746 72,377,921Increase in net assets attributable to holders of redeemable participating units 702,307 505,279,004 5,175,749Issue of redeemable participating units during the financial period 4 904,471 169,792,780 95,327,467Redemption of redeemable participating units during the financial period 4 (2,500,588) (249,747,211) (12,999,912)Income equalisation (8,033) (302,412) 304,644Net assets attributable to holders of redeemable participating units at the end of the financial period 25,487,671 1,913,689,907 160,185,869

27
Barings International Umbrella FundNotes to the financial statements
For the financial period ended 31 October 2021
1. Basis of measurement
The financial statements presented are unaudited condensed interim financial statements for the financial period ended 31 October 2021 that have been prepared in accordance with Financial Reporting Standard 104 ("FRS 104") "Interim Financial Reporting".
The condensed interim financial statements should be read in conjunction with the annual financial statements for the year ended 30 April 2021, which have been prepared in accordance with accounting standards generally accepted in Ireland, including FRS 102 "The Financial Reporting Standard applicable in the UK and Republic of Ireland" and Irish statute, comprising the Unit Trust Ac, 1990 and the provisions of the Hong Kong Code on Unit Trusts and Mutual Funds.
The accounting policies applied in these condensed interim financial statements are consistent with those used in the Barings International Umbrella Fund’s (the “Unit Trust’s”) most recent annual financial statements for the financial year ended 30 April 2021.
The condensed interim financial statements have been prepared under the historical cost convention as modified by the revaluation of financial assets and financial liabilities held at fair value through profit or loss. These financial statements were prepared on the going concern basis.
The Unit Trust meets all the conditions set out in FRS 102, Section 7, and consequently has availed of the exemption available to certain funds not to prepare a statement of cash flows.
The comparative figures included for the Statement of Financial Position relate to the previous financial year ended 30 April 2021, while the comparative figures included for the Statement of Comprehensive Income and Statement of Changes in Net Assets Attributable to Holders of Redeemable Participating Units relate to the six month period ended 31 October 2020.
2. Significant accounting policies
Fair value measurementBy fully adopting FRS 102, in accounting for its financial instruments, a reporting entity is required to apply either (a) the full requirements of FRS 102 relating to Basic Financial Instruments and Other Financial Instruments, b) the recognition and measurement provisions of IAS 39 Financial Instruments: Recognition and Measurement and only the disclosure requirements of FRS 102 relating to Basic Financial Instruments and Other Financial Instruments, or c) the recognition and measurement provisions of IFRS 9 Financial Instruments and only the disclosure requirements of FRS 102 relating to Basic Financial Instruments and Other Financial Instruments. The Unit Trust has chosen to implement (b) the recognition and measurement provisions of IAS 39 Financial Instruments: Recognition and Measurement and only the disclosure requirements of FRS 102 relating to Basic Financial Instruments and Other Financial Instruments.
The use of the IAS 39 recognition and measurement provisions is in line with the pricing policy, which outlines that the fair value of financial assets and financial liabilities be valued at the last traded prices. The financial statements include all the trades received up until 12:00p.m. (Irish time) on 29 October 2021, the valuation point for the Unit Trust.
3. Cash and cash equivalents, margin cash and bank overdrafts
Cash and cash equivalents, margin cash and bank overdrafts are valued at their fair value with interest accrued, where applicable. Barings ASEAN Frontiers Fund held cash deposits of US$21,044,688 (30 April 2021: US$6,755,879), Barings Asia Growth Fund held cash deposits of US$62,879 (30 April 2021: US$1,628,533), Barings Australia Fund held cash deposits of US$1,407,458 (30 April 2021: US$636,573), Barings Europa Fund held cash deposits of US$299,039 (30 April 2021: US$146,522), Barings Hong Kong China Fund held cash deposits of US$16,955,187 (30 April 2021: US$15,503,976) and Barings Global Bond Fund held cash deposits of US$1,424,521 (30 April 2021: US$1,133,956) maintained with The Northern Trust Company (“TNTC”), London branch, uninvested cash balances are being swept daily into the Northern Trust Global Funds.
Any margin cash is held by the broker as this is restricted cash. As at 31 October 2021 and 30 April 2021 the margin cash held was US$Nil.
28
Barings International Umbrella FundNotes to the financial statements (continued)
For the financial period ended 31 October 2021
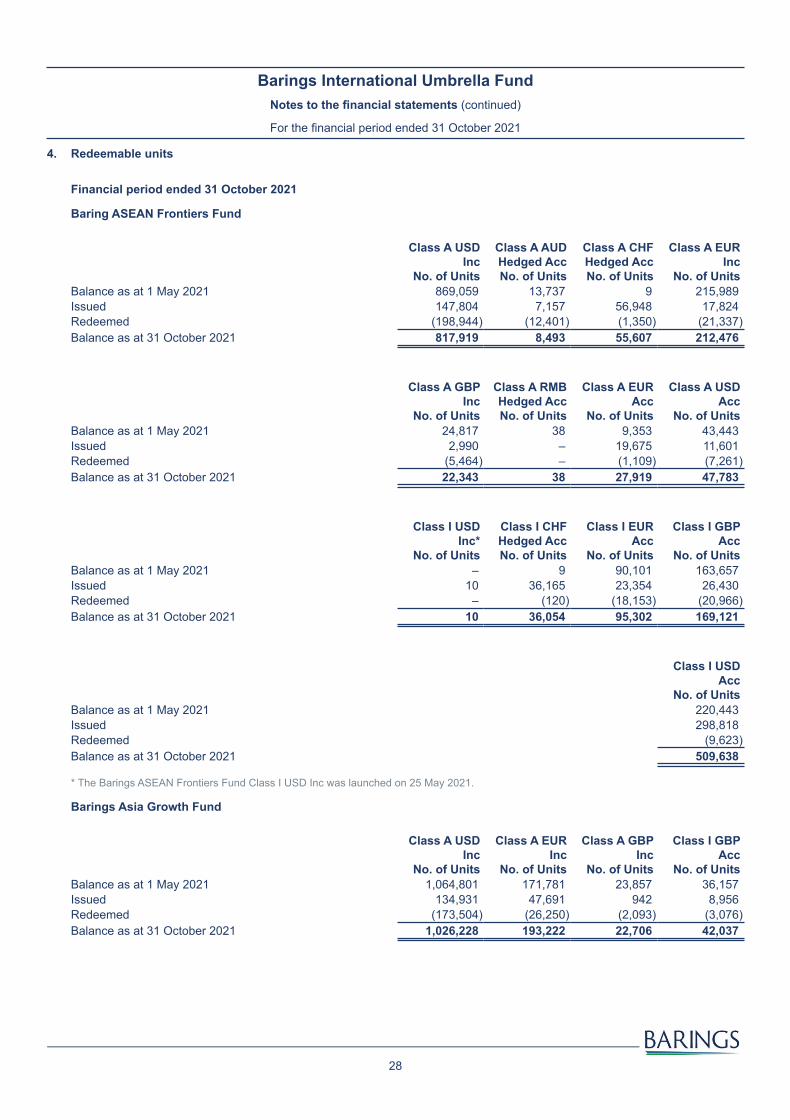
4. Redeemable units
Financial period ended 31 October 2021
Baring ASEAN Frontiers Fund1.1 1.15 1.2 1.25
Class A USD Inc
No. of Units
Class A AUD Hedged Acc No. of Units
Class A CHF Hedged Acc No. of Units
Class A EUR Inc
No. of UnitsBalance as at 1 May 2021 869,059 13,737 9 215,989Issued 147,804 7,157 56,948 17,824Redeemed (198,944) (12,401) (1,350) (21,337)Balance as at 31 October 2021 817,919 8,493 55,607 212,476
1.3 1.35 1.4 1.45Class A GBP
Inc No. of Units
Class A RMB Hedged Acc No. of Units
Class A EUR Acc
No. of Units
Class A USD Acc
No. of UnitsBalance as at 1 May 2021 24,817 38 9,353 43,443Issued 2,990 – 19,675 11,601Redeemed (5,464) – (1,109) (7,261)Balance as at 31 October 2021 22,343 38 27,919 47,783
1.46 1.5 1.55 1.6Class I USD
Inc* No. of Units
Class I CHF Hedged Acc No. of Units
Class I EUR Acc
No. of Units
Class I GBP Acc
No. of UnitsBalance as at 1 May 2021 – 9 90,101 163,657Issued 10 36,165 23,354 26,430Redeemed – (120) (18,153) (20,966)Balance as at 31 October 2021 10 36,054 95,302 169,121
1.65Class I USD
Acc No. of Units
Balance as at 1 May 2021 220,443Issued 298,818Redeemed (9,623)Balance as at 31 October 2021 509,638
* The Barings ASEAN Frontiers Fund Class I USD Inc was launched on 25 May 2021.
Barings Asia Growth Fund1.1 1.2 1.3 1.4
Class A USD Inc
No. of Units
Class A EUR Inc
No. of Units
Class A GBP Inc
No. of Units
Class I GBP Acc
No. of UnitsBalance as at 1 May 2021 1,064,801 171,781 23,857 36,157Issued 134,931 47,691 942 8,956Redeemed (173,504) (26,250) (2,093) (3,076)Balance as at 31 October 2021 1,026,228 193,222 22,706 42,037

29
Barings International Umbrella FundNotes to the financial statements (continued)
For the financial period ended 31 October 2021
1.5 1.6Class I USD
Acc No. of Units
Class I EUR Acc
No. of UnitsBalance as at 1 May 2021 146,524 43,477Issued 40,102 4,027Redeemed (47,235) (34,961)Balance as at 31 October 2021 139,391 12,543
Barings Australia Fund1.1 1.2 1.3 1.4
Class A USD Inc
No. of Units
Class A AUD Inc
No. of Units
Class A EUR Inc
No. of Units
Class A GBP Inc
No. of UnitsBalance as at 1 May 2021 314,381 6,963 27,704 1,757Issued 20,853 2,702 2,466 920Redeemed (59,644) (1,160) (2,192) (856)Balance as at 31 October 2021 275,590 8,505 27,978 1,821
1.5 1.6Class I GBP
Acc No. of Units
Class I USD Acc
No. of UnitsBalance as at 1 May 2021 31,005 109,625Issued 6,160 –Redeemed (2,631) –Balance as at 31 October 2021 34,534 109,625
Barings Europa Fund1.1 1.2 1.3 1.4
Class A USD Inc
No. of Units
Class A EUR Inc
No. of Units
Class C EUR Inc
No. of Units
Class C USD Inc
No. of UnitsBalance as at 1 May 2021 371,720 123,618 4,459 2,708Issued 11,162 4,373 – –Redeemed (44,070) (12,284) (396) (94)Balance as at 31 October 2021 338,812 115,707 4,063 2,614
Barings Hong Kong China Fund1.1 1.2 1.3 1.4
Class A USD Inc
No. of Units
Class A EUR Inc
No. of Units
Class A GBP Inc
No. of Units
Class A HKD Inc
No. of UnitsBalance as at 1 May 2021 944,585 180,456 4,116 5,185Issued 71,441 11,988 1,750 3,680Redeemed (92,756) (16,619) (428) (1,610)Balance as at 31 October 2021 923,270 175,825 5,438 7,255
4. Redeemable units (continued)
Financial period ended 31 October 2021 (continued)
Barings Asia Growth Fund (continued)

30
Barings International Umbrella FundNotes to the financial statements (continued)
For the financial period ended 31 October 2021
1.5 1.6 1.7 1.8Class A RMB Hedged Acc No. of Units
Class A USD Acc
No. of Units
Class C EUR Inc
No. of Units
Class C USD Inc
No. of UnitsBalance as at 1 May 2021 10 65,975 218 581Issued – 5,199 67 –Redeemed – (13,848) – (64)Balance as at 31 October 2021 10 57,326 285 517
1.9 2.1Class I GBP
Acc No. of Units
Class I USD Acc
No. of UnitsBalance as at 1 May 2021 6,233 20,672Issued 3,339 3,343Redeemed (1,581) (830)Balance as at 31 October 2021 7,991 23,185
Barings Global Bond Fund1.1 1.11 1.2 1.22
Class A RMB Hedged Inc* No. of Units
Class A USD Inc
No. of Units
Class A EUR Inc
No. of Units
Class A RMB Hedged
Acc** No. of Units
Balance as at 1 May 2021 – 2,463,762 230,204 –Issued 64 234,437 30,380 65Redeemed – (334,225) (42,956) –Balance as at 31 October 2021 64 2,363,974 217,628 65
1.3 1.4 1.5Class A GBP
Inc No. of Units
Class I GBP Inc
No. of Units
Class I USD Acc
No. of UnitsBalance as at 1 May 2021 10,125 24,776 68,872Issued 1,544 4,766 7,056Redeemed (609) (4,057) (14,897)Balance as at 31 October 2021 11,060 25,485 61,031
* The Barings Global Bond Fund Class A RMB Hedged Inc was launched on 4 June 2021.** The Barings Global Bond Fund Class A RMB Hedged Acc was launched on 14 July 2021.
Financial year ended 30 April 2021
Barings ASEAN Frontiers Fund1.1 1.15 1.2 1.25
Class A USD Inc
No. of Units
Class A AUD Hedged Acc No. of Units
Class A CHF Hedged Acc* No. of Units
Class A EUR Inc
No. of UnitsBalance as at 1 May 2020 937,204 9,851 – 189,857Issued 356,957 17,003 9 58,915Redeemed (425,102) (13,117) – (32,783)Balance as at 30 April 2021 869,059 13,737 9 215,989
4. Redeemable units (continued)
Financial period ended 31 October 2021 (continued)
Barings Hong Kong China Fund (continued)

31
Barings International Umbrella FundNotes to the financial statements (continued)
For the financial period ended 31 October 2021
1.3 1.35 1.4 1.45Class A GBP
Inc No. of Units
Class A EUR Acc
No. of Units
Class A RMB Hedged Acc No. of Units
Class A USD Acc
No. of UnitsBalance as at 1 May 2020 32,185 10 38 32,999Issued 9,865 9,398 – 61,407Redeemed (17,233) (55) – (50,963)Balance as at 30 April 2021 24,817 9,353 38 43,443
1.5 1.55 1.6 1.65Class I CHF
Hedged Acc** No. of Units
Class I EUR Acc
No. of Units
Class I GBP Acc
No. of Units
Class I USD Acc
No. of UnitsBalance as at 1 May 2020 – 65,806 280,361 56,446Issued 9 29,632 74,027 224,857Redeemed – (5,337) (190,731) (60,860)Balance as at 30 April 2021 9 90,101 163,657 220,443
* The Barings ASEAN Frontiers Fund Class A CHF Hedged Acc was launched on 8 April 2021.** The Barings ASEAN Frontiers Fund Class I CHF Hedged Acc was launched on 8 April 2021.
Barings Asia Growth Fund1.1 1.2 1.3 1.4
Class A USD Inc
No. of Units
Class A EUR Inc
No. of Units
Class A GBP Inc
No. of Units
Class I GBP Acc
No. of UnitsBalance as at 1 May 2020 865,051 66,199 18,831 22,195Issued 767,134 196,704 14,877 25,798Redeemed (567,384) (91,122) (9,851) (11,836)Balance as at 30 April 2021 1,064,801 171,781 23,857 36,157
1.5 1.6Class I USD
Acc No. of Units
Class I EUR Acc
No. of UnitsBalance as at 1 May 2020 29,471 3,651Issued 122,085 89,175Redeemed (5,032) (49,349)Balance as at 30 April 2021 146,524 43,477
Barings Australia Fund1.1 1.2 1.3 1.4
Class A USD Inc
No. of Units
Class A AUD Inc
No. of Units
Class A EUR Inc
No. of Units
Class A GBP Inc
No. of UnitsBalance as at 1 May 2020 338,122 18,477 28,656 2,752Issued 142,480 6,017 71,097 1,132Redeemed (166,221) (17,531) (72,049) (2,127)Balance as at 30 April 2021 314,381 6,963 27,704 1,757
4. Redeemable units (continued)
Financial year ended 30 April 2021 (continued)
Barings ASEAN Frontiers Fund (continued)

32
Barings International Umbrella FundNotes to the financial statements (continued)
For the financial period ended 31 October 2021
1.5 1.6Class I GBP
Acc No. of Units
Class I USD Acc
No. of UnitsBalance as at 1 May 2020 5,435 109,625Issued 28,309 –Redeemed (2,739) –Balance as at 30 April 2021 31,005 109,625
Barings Europa Fund1.1 1.2 1.3 1.4
Class A USD Inc
No. of Units
Class A EUR Inc
No. of Units
Class C EUR Inc
No. of Units
Class C USD Inc
No. of UnitsBalance as at 1 May 2020 438,930 134,099 4,460 3,563Issued 26,147 7,112 – –Redeemed (93,357) (17,593) (1) (855)Balance as at 30 April 2021 371,720 123,618 4,459 2,708
Barings Hong Kong China Fund1.1 1.2 1.3 1.4
Class A USD Inc
No. of Units
Class A EUR Inc
No. of Units
Class A GBP Inc
No. of Units
Class A HKD Inc
No. of UnitsBalance as at 1 May 2020 967,298 165,002 799 1,411Issued 229,205 62,589 4,630 10,025Redeemed (251,918) (47,135) (1,313) (6,251)Balance as at 30 April 2021 944,585 180,456 4,116 5,185
1.5 1.6 1.7 1.8Class A RMB Hedged Acc No. of Units
Class A USD Acc
No. of Units
Class C EUR Inc
No. of Units
Class C USD Inc
No. of UnitsBalance as at 1 May 2020 10 52,759 104 609Issued – 26,435 144 6Redeemed – (13,219) (30) (34)Balance as at 30 April 2021 10 65,975 218 581
1.9 2.1Class I GBP
Acc No. of Units
Class I USD Acc
No. of UnitsBalance as at 1 May 2020 2,200 4,207Issued 7,143 21,628Redeemed (3,110) (5,163)Balance as at 30 April 2021 6,233 20,672
4. Redeemable units (continued)
Financial year ended 30 April 2021 (continued)
Barings Australia Fund (continued)

33
Barings International Umbrella FundNotes to the financial statements (continued)
For the financial period ended 31 October 2021
Barings Global Bond FundI
1.1 1.2 1.3 1.4Class A USD
Inc No. of Units
Class A EUR Inc
No. of Units
Class A GBP Inc
No. of Units
Class I GBP Inc
No. of UnitsBalance as at 1 May 2020 2,376,449 247,431 5,211 6,681Issued 4,156,028 62,894 8,547 33,899Redeemed (4,068,715) (80,121) (3,633) (15,804)Balance as at 30 April 2021 2,463,762 230,204 10,125 24,776
1.5Class I USD
Acc No. of Units
Balance as at 1 May 2020 67,880Issued 26,373Redeemed (25,381)Balance as at 30 April 2021 68,872
4. Redeemable units (continued)
Financial year ended 30 April 2021 (continued)

34
Barings International Umbrella FundNotes to the financial statements (continued)
For the financial period ended 31 October 2021
5. Distributions
The following distributions were declared by the below Funds during the financial period ended 31 October 2021 and 31 October 2020:
Distribution frequency
Distributed amount paid*
Income equalisation**
US$ US$Barings ASEAN Frontiers Fund - Class A Annually (1,665,820) (55,423)
US$ US$Barings Asia Growth Fund - Class A Annually – 23
US$ US$Barings Australia Fund - Class A Annually (439,064) (24,251)
US$ US$Barings Europa Fund - Class A Annually (175,214) (12,821)
US$ US$Barings Hong Kong China Fund - Class A Annually – 688
US$ US$Barings Global Bond Fund - Class A USD Inc Semi
Annually(156,230) (448)
€ €Barings Global Bond Fund - Class A EUR Inc Semi
Annually(14,735) (73)
£ £Barings Global Bond Fund - Class A GBP Inc Semi
Annually(656) –
Barings Global Bond Fund - Class I GBP Inc Semi Annually
(3,162) (39)
US$ US$Total distributions for the Barings Global Bond Fund (174,783) (588)
*Includes distributions with an ex-date of 4 May 2021 which were paid during the current financial period. These distributions with an ex-date of 4 May 2021 reflect the undistributed income on the Fund as at 30 April 2021.** Income equalisation relates to the dealing activity of distributing classes for the period from 1 May 2021 to 31 October 2021. The income equalisation of the distributing classes is disclosed separately in the statement of changes in net assets attributable to holders of redeemable participating shares for the financial period ended 31 October 2021.

35
Barings International Umbrella FundNotes to the financial statements (continued)
For the financial period ended 31 October 2021
Comparative 31 October 2020Distribution
frequencyDistributed
amount paid*Income
equalisation**
US$ US$Barings ASEAN Frontiers Fund - Class A Annually (2,532,687) (28,469)
US$ US$Barings Asia Growth Fund - Class A Annually (245,230) 12,524
US$ US$Barings Australia Fund - Class A Annually (911,089) 5,375
US$ US$Barings Europa Fund - Class A Annually (267,975) (8,033)
US$ US$Barings Hong Kong China Fund - Class A Annually (2,128,901) (302,412)
US$ US$Barings Global Bond Fund - Class A USD Inc Semi
Annually(501,416) 303,316
£ £Barings Global Bond Fund - Class I GBP Inc Semi
Annually(1,340) 1,033
US$ US$Total distribution for the Barings Global Bond Fund (504,086) 304,644
*Includes distributions with an ex-date of 1 May 2020 which were paid during the current financial period. These distributions with an ex-date of 1 May 2020 reflect the undistributed income on the Fund as at 30 April 2020.** Income equalisation relates to the dealing activity of distributing classes for the period from 1 May 2020 to 31 October 2020. The income equalisation of the distributing classes is disclosed separately in the statement of changes in net assets attributable to holders of redeemable participating shares for the financial period ended 31 October 2020.
5. Distributions (continued)

36
Barings International Umbrella FundNotes to the financial statements (continued)
For the financial period ended 31 October 2021
6. Significant agreements and fees
Management feesBarings International Fund Managers (Ireland) Limited (the “Manager”) is entitled under the Trust Deed to charge a management fee in respect of the Funds at the following percentage rate per annum of the Net Asset Value of the Funds:
Fund/Class Management feeBarings ASEAN Frontiers Fund - Class A USD Inc 1.25%Barings ASEAN Frontiers Fund - Class A AUD Hedged Acc 1.25%Barings ASEAN Frontiers Fund - Class A CHF Hedged Acc 1.25%Barings ASEAN Frontiers Fund - Class A EUR Inc 1.25%Barings ASEAN Frontiers Fund - Class A GBP Inc 1.25%Barings ASEAN Frontiers Fund - Class A RMB Hedged Acc 1.25%Barings ASEAN Frontiers Fund - Class A EUR Acc 1.25%Barings ASEAN Frontiers Fund - Class A USD Acc 1.25%Barings ASEAN Frontiers Fund - Class I USD Inc* 0.75%Barings ASEAN Frontiers Fund - Class I CHF Hedged Acc 0.75%Barings ASEAN Frontiers Fund - Class I EUR Acc 0.75%Barings ASEAN Frontiers Fund - Class I GBP Acc 0.75%Barings ASEAN Frontiers Fund - Class I USD Acc 0.75%Barings Asia Growth Fund - Class A USD Inc 1.25%Barings Asia Growth Fund - Class A EUR Inc 1.25%Barings Asia Growth Fund - Class A GBP Inc 1.25%Barings Asia Growth Fund - Class I EUR Acc 0.75%Barings Asia Growth Fund - Class I USD Acc 0.75%Barings Asia Growth Fund - Class I GBP Acc 0.75%Barings Australia Fund - Class A USD Inc 1.25%Barings Australia Fund - Class A AUD Inc 1.25%Barings Australia Fund - Class A EUR Inc 1.25%Barings Australia Fund - Class A GBP Inc 1.25%Barings Australia Fund - Class I GBP Acc 0.75%Barings Australia Fund - Class I USD Acc 0.75%Barings Europa Fund - Class A USD Inc 1.25%Barings Europa Fund - Class A EUR Inc 1.25%Barings Europa Fund - Class C EUR Inc 1.25%Barings Europa Fund - Class C USD Inc 1.25%Barings Hong Kong China Fund - Class A USD Inc 1.25%Barings Hong Kong China Fund - Class A EUR Inc 1.25%Barings Hong Kong China Fund - Class A GBP Inc 1.25%Barings Hong Kong China Fund - Class A HKD Inc 1.25%Barings Hong Kong China Fund - Class A RMB Hedged Acc 1.25%Barings Hong Kong China Fund - Class A USD Acc 1.25%Barings Hong Kong China Fund - Class C EUR Inc 1.25%Barings Hong Kong China Fund - Class C USD Inc 1.25%Barings Hong Kong China Fund - Class I GBP Acc 0.75%Barings Hong Kong China Fund - Class I USD Acc 0.75%Barings Global Bond Fund - Class A RMB Hedged Inc** 0.75%Barings Global Bond Fund - Class A USD Inc 0.75%Barings Global Bond Fund - Class A EUR Inc 0.75%Barings Global Bond Fund - Class A GBP Inc 0.75%Barings Global Bond Fund - Class A RMB Hedged Acc*** 0.75%Barings Global Bond Fund - Class I GBP Inc 0.50%Barings Global Bond Fund - Class I USD Acc 0.50%
* The Barings ASEAN Frontiers Fund Class I USD Inc was launched on 25 May 2021.** The Barings Global Bond Fund Class A RMB Hedged Inc was launched on 4 June 2021.*** The Barings Global Bond Fund Class A RMB Hedged Acc was launched on 14 July 2021.

37
Barings International Umbrella FundNotes to the financial statements (continued)
For the financial period ended 31 October 2021
The Unit Trust is managed by the Manager, which has delegated investment responsibilities to Baring Asset Management Limited (the “Investment Manager”). The Investment Manager is an investment management company incorporated in London on 6 April 1994. The Investment Manager is part of the Barings LLC Group and is a wholly owned subsidiary of Massachusetts Mutual Life Insurance Company (“MassMutual”). The Investment Manager has appointed Baring Asset Management (Asia) Limited, Barings LLC and Barings Japan Limited (together, the “Sub-Investment Managers”) as the Sub-Investment Managers to the relevant Funds. The Sub-Investment Managers are also part of the Barings LLC Group. Management fees charged during the financial period-end are disclosed on each Fund’s Statement of Comprehensive Income and the outstanding amounts payable for management fees as at the end of the financial period are disclosed on each Fund’s Statement of Financial Position.
The Manager will discharge the fees and expenses of the Investment Manager out of its own fee. The management fee is payable monthly in arrears and is calculated and accrued by reference to the Net Asset Value of each Funds as at each business day (“valuation day”).
Where the Net Asset Value of any Fund includes interests in any Investment Fund managed by a subsidiary of the parent company (a “Barings Fund”), the fee payable to the Manager relating to the holding will be reduced by the percentage rate (if any) charged to the Barings Fund for comparable management services.
Administration, Depositary and Operating fees The Manager is entitled to receive an Administration, Depositary and Operating fee. The fee payable is a percentage of the Net Asset Value of each class and is accrued daily and paid monthly in arrears. The Manager pays the aggregate fees and expenses of the Administrator and Depositary, in addition to certain other fees and ongoing expenses.
For Barings ASEAN Frontiers Fund, the Manager is entitled to receive a fee of 0.45% per annum for all A unit classes (A Hedged classes 0.4625%) and 0.25% per annum for all I unit classes (I Hedged classes 0.2625%).
For Barings Asia Growth Fund, the Manager is entitled to receive a fee of 0.45% per annum for all A unit classes (A Hedged classes 0.4625%) and 0.25% per annum for all I unit classes (I Hedged classes 0.2625%).
For Barings Australia Fund and Barings Global Bond Fund, the Manager is entitled to receive a fee of 0.45% per annum for all A unit classes (A Hedged classes 0.4625%) and 0.25% per annum for all I unit classes.
For Barings Europa Fund and Barings Hong Kong China Fund, the Manager is entitled to receive a fee of 0.45% per annum for all A and C unit classes (A Hedged classes 0.4625%) and 0.25% per annum for all I unit classes.
Please refer to the Prospectus for full details of the fees payable.
Investment fundsThe Funds currently invest in Northern Trust Global Funds managed by Northern Trust Global Funds a related party to the Administrator and Depositary. These holdings are detailed in the schedule of investments.
Trailer fees and reimbursementsTrailer fees (commissions for the marketing of the Funds) are paid to distribution, commission and sales agents out of the management fees. Reimbursements to institutional investors, who, from a commercial perspective, are holding the Funds’ redeemable participating units for third parties, are also paid out of the management fees.
6. Significant agreements and fees (continued)
Management fees (continued)

38
Barings International Umbrella FundNotes to the financial statements (continued)
For the financial period ended 31 October 2021
Transaction costsThe transaction costs incurred by the Funds for the periods ended 31 October 2021 and 31 October 2020 were as follows:
Fund
31 October 2021
31 October 2020
Barings ASEAN Frontiers Fund US$348,307 US$372,038Barings Asia Growth Fund US$187,635 US$135,747Barings Australia Fund US$6,959 US$5,835Barings Europa Fund US$5,754 US$13,710Barings Hong Kong China Fund US$2,854,522 US$1,934,433Barings Global Bond Fund – –
7. Related party transactions
Julian Swayne is employed by Barings Investment Services Limited. Alan Behen and Paul Smyth are employees of the Manager. David Conway and Barbara Healy are non-executive Directors, independent of the Investment Manager. The Manager will discharge the fees and expenses of the Investment Manager out of its own fee. The Investment Manager is part of the Barings LLC group and is a wholly owned subsidiary of Massachusetts Mutual Life Insurance Company (“MassMutual”). Baring Asset Management (Asia) Limited, Barings LLC and Barings Japan Limited (together, the “Sub-Investment Managers”) are also part of the Barings LLC Group. The Investment Manager will discharge the fees and expenses of the Sub-Investment Managers out of its own fee. Parties are considered to be related if one party has the ability to control the other party or exercise significant influence over the other party in making financial or operation decisions.
Significant unitholdingsThe following table details significant concentrations in unitholdings of each Fund, or instances where the units are beneficially held by other investment funds managed by the Manager or one of its affiliates. As at 31 October 2021 and 30 April 2021, the following had significant unitholdings in the Unit Trust:
Fund name
Number of unitholders with
beneficial interest greater than 20%
of the units in issue
Total % of units held by unitholders with
beneficial interest greater than 20% of
the units in issue
Total % of units held by investment funds managed
by Barings International Fund Managers (Ireland)
LimitedBarings ASEAN Frontiers Fund Nil (30 April 2021: Nil) Nil (30 April 2021: Nil) 2.65% (30 April 2021: 0.81%)Barings Asia Growth Fund Nil (30 April 2021: Nil) Nil (30 April 2021: Nil) 17.90% (30 April 2021: 6.29%)
Barings Australia Fund 1 (30 April 2021:1)23.92% (30 April 2021:
22.29%) Nil (30 April 2021: Nil)Barings Europa Fund Nil (30 April 2021: Nil) Nil (30 April 2021: Nil) Nil (30 April 2021: Nil)Barings Hong Kong China Fund 1 (30 April 2021: 1)
20.56% (30 April 2021: 20.28%) 1.17% (30 April 2021: 0.12%)
Barings Global Bond Fund 1 (30 April 2021: 1)24.51% (30 April 2021:
24.50%) 0.01% (30 April 2021: Nil)
6. Significant agreements and fees (continued)

39
Barings International Umbrella FundNotes to the financial statements (continued)
For the financial period ended 31 October 2021
8. Fair value hierarchy
FRS 102 requires the Funds to classify fair value measurements using a fair value hierarchy that reflects the significance of the inputs used in making the measurements. The fair value hierarchy has the following levels:
• Level 1: Quoted prices (unadjusted) in active markets for identical assets or liabilities.• Level 2: Inputs other than quoted prices included within level 1 that are observable for the asset or liability, either directly (that
is, as prices) or indirectly (that is, derived from prices).• Level 3: Inputs for the asset or liability that are not based on observable market data (that is, unobservable inputs).
The level in the fair value hierarchy within which the fair value measurement is categorised in its entirety is determined on the basis of the lowest input that is significant to the fair value measurement in its entirety. For this purpose, the significance of an input is assessed against the fair value measurement in its entirety. If a fair value measurement uses observable inputs that require significant adjustment based on unobservable inputs, that measurement is a level 3 measurement. Assessing the significance of a particular input to the fair value measurement in its entirety requires judgement, taking into consideration factors specific to the asset or liability.
The determination of what constitutes ‘observable’ requires significant judgement by the Manager. The Manager considers observable data to be market data that is readily available, regularly distributed or updated, reliable and verifiable, not proprietary, and provided by independent sources that are actively involved in the relevant market.
The following tables analyses, within the fair value hierarchy, the fund’s financial assets and financial liabilities measured at fair value.
As at 31 October 2021Barings ASEAN Frontiers Fund Level 1 Level 2 Level 3 TotalFinancial assets US$ US$ US$ US$Equities 525,091,530 46,544,158 – 571,635,688Warrants 1,022,432 37,306 – 1,059,738Open forward foreign currency exchange contracts – 253,243 – 253,243
526,113,962 46,834,707 – 572,948,669
Financial liabilitiesOpen forward foreign currency exchange contracts – (12,521) – (12,521)
– (12,521) – (12,521)Total 526,113,962 46,822,186 – 572,396,148
Barings Asia Growth Fund Level 1 Level 2 Level 3 TotalFinancial assets US$ US$ US$ US$Equities 224,594,663 – 2,441,895 227,036,558Total 224,594,663 – 2,441,895 227,036,558
Barings Australia Fund Level 1 Level 2 Level 3 TotalFinancial assets US$ US$ US$ US$Equities 71,378,469 – – 71,378,469Total 71,378,469 – – 71,378,469
Barings Europa Fund Level 1 Level 2 Level 3 TotalFinancial assets US$ US$ US$ US$Equities 30,865,261 – – 30,865,261Total 30,865,261 – – 30,865,261

40
Barings International Umbrella FundNotes to the financial statements (continued)
For the financial period ended 31 October 2021
Barings Hong Kong China Fund Level 1 Level 2 Level 3 TotalFinancial assets US$ US$ US$ US$Equities 2,094,983,544 – – 2,094,983,544Open forward foreign currency exchange contracts – 207 – 207
2,094,983,544 207 – 2,094,983,751
Financial liabilitiesOpen forward foreign currency exchange contracts – (1) – (1)
– (1) – (1)Total 2,094,983,544 206 – 2,094,983,750
Barings Global Bond Fund Level 1 Level 2 Level 3 TotalFinancial assets US$ US$ US$ US$Fixed interest – 70,703,839 – 70,703,839Open forward foreign currency exchange contracts – 118,399 – 118,399
– 70,822,238 – 70,822,238
Financial liabilitiesOpen Futures contracts – (71,289) – (71,289)Open forward foreign currency exchange contracts – (421,131) – (421,131)
– (492,420) – (492,420)Total – 70,329,818 – 70,329,818
As at 31 October 2021, Barings Asia Growth Fund holds position in SK IE Technology which is an IPO and is priced at the lower end of the range until a firm Offer price is published in line with the Investment Manager's internal pricing policy and so is held at level 3.
31 October 2021Level 3
US$Opening Balance 1 May 2021 439,502Purchases 1,990,304Movement in unrealised gain 12,089Closing Balance 31 October 2021 2,441,895
As at 30 April 2021Barings ASEAN Frontiers Fund Level 1 Level 2 Level 3 TotalFinancial assets US$ US$ US$ US$Equities 417,023,656 37,148,212 – 454,171,868Warrants 293,775 72,058 – 365,833Open forward foreign currency exchange contracts – 54,628 – 54,628
417,317,431 37,274,898 – 454,592,329
Financial liabilitiesOpen forward foreign currency exchange contracts – (567) – (567)
– (567) – (567)Total 417,317,431 37,274,331 – 454,591,762
Barings Asia Growth Fund Level 1 Level 2 Level 3 TotalFinancial assets US$ US$ US$ US$Equities 239,941,517 – 439,502 240,381,019Total 239,941,517 – 439,502 240,381,019
8. Fair value hierarchy (continued)
As at 31 October 2021 (continued)

41
Barings International Umbrella FundNotes to the financial statements (continued)
For the financial period ended 31 October 2021
Barings Australia Fund Level 1 Level 2 Level 3 TotalFinancial assets US$ US$ US$ US$Equities 75,256,911 – – 75,256,911Total 75,256,911 – – 75,256,911
Barings Europa Fund Level 1 Level 2 Level 3 TotalFinancial assets US$ US$ US$ US$Equities 31,378,965 – – 31,378,965Total 31,378,965 – – 31,378,965
Barings Hong Kong China Fund Level 1 Level 2 Level 3 TotalFinancial assets US$ US$ US$ US$Equities 2,419,299,493 – – 2,419,299,493Open forward foreign currency exchange contracts – 324 – 324
2,419,299,493 324 – 2,419,299,817
Financial liabilitiesOpen forward foreign currency exchange contracts – (10) – (10)
– (10) – (10)Total 2,419,299,493 314 – 2,419,299,807
Barings Global Bond Fund Level 1 Level 2 Level 3 TotalFinancial assets US$ US$ US$ US$Fixed interest – 76,786,075 – 76,786,075Open forward foreign currency exchange contracts – 220,458 – 220,458
– 77,006,533 – 77,006,533
Financial liabilitiesOpen Futures contracts (4,885) – – (4,885)Open forward foreign currency exchange contracts – (412,739) – (412,739)
(4,885) (412,739) – (417,624)Total (4,885) 76,593,794 – 76,588,909
As at 30 April 2021, Barings Asia Growth Fund holds position in SK IE Technology which is an IPO and is priced at the lower end of the range until a firm Offer price is published in line with the Investment Manager's internal pricing policy and so is held at level 3.
30 April 2021Level 3
US$Opening Balance 1 May 2020 –Transfer to Level 3 443,558Movement in unrealised loss (4,056)Closing Balance 30 April 2021 439,502
There have been no transfers during the financial period ending 31 October 2021 or financial year ended 30 April 2021 from level 1 to level 2 or from level 2 to level 1. The financial assets classified as level 3 at 31 October 2021 for the Barings Asia Growth Fund were US$2,441,895 (30 April 2021: US$439,502). Financial assets of US$1,990,304 (30 April 2021: US$439,502) which are classified as level 3 were purchased during the financial period ended 31 October 2021.
Transfers between levels, when applicable, occur at the end of the financial period.
8. Fair value hierarchy (continued)
As at 30 April 2021 (continued)

42
Barings International Umbrella FundNotes to the financial statements (continued)
For the financial period ended 31 October 2021
Cash includes deposits held with banks and other short-term investments in an active market and they are categorised as Level 1. All receivables and payables are categorised as Level 2.
9. Efficient portfolio management
The Funds may use Financial Derivative Instruments (“FDIs”) for efficient portfolio management. The efficient portfolio management purposes for which the Unit Trust intends to employ FDIs are reduction of risk, reduction of cost and the generation of additional capital or income for the relevant Fund with an appropriate level of risk, taking into account the risk profile of the Fund and the general provisions of the UCITS Regulations. The Unit Trust may use various types of derivatives for these purposes, including, without limitation, forwards, futures, options, swaps (including but not limited to total return swaps, credit default swaps, and IRSs) and contracts for differences for these purposes.
Risk Monitoring of Global Exposure
The method used to determine the global exposure for Barings Global Bond Fund is Value at Risk (“VaR”). VaR is calculated daily using Risk Metrics (one of the leading suppliers of risk management software).
Barings ASEAN Frontiers Fund, Barings Asia Growth Fund, Barings Australia Fund, Barings Europa Fund and Barings Hong Kong China Fund used the commitment approach to calculate their global exposure as described in detail in the risk management process of the Investment Manager.
The Commitment Approach has been calculated, in the case of FFCT’s, by converting the FFCT position into an equivalent position based on the market value of the underlying asset. As the Financial Derivative Instruments (“FDI”) are used for hedging purposes, the exposure of the FDI has been calculated and then netted against the instrument being hedged. The Global Exposure calculation is performed on a daily basis.
In no circumstances will the global exposure of a Fund exceed 100% of its Net Asset Value.
For relative VaR: the Fund’s VaR is shown as a percentage of the VaR of the performance comparator or reference portfolio to ensure that the relative figure is within an internal limit. This limit is set lower than a multiple of two (or 200%) of the performance comparison or reference portfolio VaR.
For absolute VaR: the Fund’s VaR is shown as a percentage of the Funds’ Net Asset Value and is monitored against an internal limit. This limit is set lower than 20%.
Fund NameFund Relative VaR over the period Performance comparator
or reference portfolio
31 October
202131 October
2020Lowest Highest Mean
Barings Global Bond Fund 104.65% 126.74% 98.32% 115.79% 103.62% FTSE WGBI
Fund Name Fund Absolute VaR over the period 31 October 2021 31 October 2020 Lowest Highest MeanBarings Global Bond Fund 3.42% 9.78% 2.69% 3.44% 3.22%FTSE WGBI 3.27% 7.72% 2.74% 3.32% 3.11%
Some limitations of VaR analysis are:
• the methodology is based on historical data and cannot take account of the fact that future market price movements, correlations between markets and levels of market liquidity in conditions of market stress may bear no relation to historical patterns; and
• the VaR is a point-in-time calculation, and does not necessarily reflect the risk position of the Funds at any time other than the date and time at which it is calculated.
8. Fair value hierarchy (continued)

43
Barings International Umbrella FundNotes to the financial statements (continued)
For the financial period ended 31 October 2021
10. NAV per redeemable participating units
31 October 2021 30 April 2021 30 April 2020Net assets attributable to holders of redeemable participating unitsBarings ASEAN Frontiers Fund US$592,146,613 US$460,512,228 US$284,185,412
NAV per redeemable unitsBarings ASEAN Frontiers Fund - Class A USD Inc US$288.29 US$269.30 US$172.83Barings ASEAN Frontiers Fund - Class A AUD Hedged Acc AU$319.77 AU$297.73 AU$190.43Barings ASEAN Frontiers Fund - Class A CHF Hedged Acc* ₣109.51 ₣102.14 –Barings ASEAN Frontiers Fund - Class A EUR Inc €247.43 €222.93 €158.92Barings ASEAN Frontiers Fund - Class A GBP Inc £209.31 £193.71 £138.26Barings ASEAN Frontiers Fund - Class A RMB Hedged Acc ¥2,202.52 ¥2,021.12 ¥1,258.37Barings ASEAN Frontiers Fund - Class A EUR Acc €129.63 €116.12 €81.67Barings ASEAN Frontiers Fund - Class A USD Acc US$307.03 US$285.18 US$180.64Barings ASEAN Frontiers Fund - Class I USD Inc** US$110.23 – –Barings ASEAN Frontiers Fund - Class I CHF Hedged Acc*** ₣109.93 ₣102.18 –Barings ASEAN Frontiers Fund - Class I EUR Acc €278.05 €248.23 €173.44Barings ASEAN Frontiers Fund - Class I GBP Acc £236.46 £216.86 £151.71Barings ASEAN Frontiers Fund - Class I USD Acc US$334.85 US$309.93 US$194.94
* The Barings ASEAN Frontiers Fund Class A CHF Hedged Acc was launched on 8 April 2021.** The Barings ASEAN Frontiers Fund Class I USD Inc was launched on 25 May 2021*** The Barings ASEAN Frontiers Fund Class I CHF Hedged Acc was launched on 8 April 2021.
31 October 2021 30 April 2021 30 April 2020Net assets attributable to holders of redeemable participating unitsBarings Asia Growth Fund US$225,448,622 US$240,744,345 US$93,523,454
NAV per redeemable unitsBarings Asia Growth Fund - Class A USD Inc US$156.01 US$160.90 US$92.86Barings Asia Growth Fund - Class A EUR Inc €133.87 €133.16 €85.36Barings Asia Growth Fund - Class A GBP Inc £113.17 £115.65 £74.22Barings Asia Growth Fund - Class I GBP Acc £118.45 £120.62 £76.65Barings Asia Growth Fund - Class I USD Acc US$163.24 US$167.78 US$95.87Barings Asia Growth Fund - Class I EUR Acc €140.09 €138.88 €88.16
Net assets attributable to holders of redeemable participating unitsBarings Australia Fund US$73,068,560 US$75,622,920 US$49,892,887
NAV per redeemable unitsBarings Australia Fund - Class A USD Inc US$148.15 US$144.43 US$95.08Barings Australia Fund - Class A AUD Inc AU$196.51 AU$186.14 AU$145.26Barings Australia Fund - Class A EUR Inc €127.09 €119.50 €87.39Barings Australia Fund - Class A GBP Inc £107.48 £103.81 £76.01Barings Australia Fund - Class I GBP Acc £133.71 £127.59 £90.33Barings Australia Fund - Class I USD Acc US$184.28 US$177.47 US$113.00

44
Barings International Umbrella FundNotes to the financial statements (continued)
For the financial period ended 31 October 2021
31 October 2021 30 April 2021 30 April 2020Net assets attributable to holders of redeemable participating unitsBarings Europa Fund US$31,062,016 US$31,520,704 US$26,389,514
NAV per redeemable unitsBarings Europa Fund - Class A USD Inc US$67.38 US$62.75 US$45.44Barings Europa Fund - Class A EUR Inc €57.82 €51.94 €41.77Barings Europa Fund - Class C EUR Inc €56.11 €50.37 €40.49Barings Europa Fund - Class C USD Inc US$65.54 US$61.00 US$44.13
Net assets attributable to holders of redeemable participating unitsBarings Hong Kong China Fund US$2,101,837,482 US$2,436,986,287 US$1,488,667,746
NAV per redeemable unitsBarings Hong Kong China Fund - Class A USD Inc US$1,743.81 US$1,977.89 US$1,244.25Barings Hong Kong China Fund - Class A EUR Inc €1,496.53 €1,637.15 €1,144.03Barings Hong Kong China Fund - Class A GBP Inc £1,264.92 £1,421.50 £994.28Barings Hong Kong China Fund - Class A HKD Inc HK$13,560.59 HK$15,357.26 HK$9,644.02Barings Hong Kong China Fund - Class A RMB Hedged Acc ¥12,738.22 ¥14,292.41 ¥8,838.50Barings Hong Kong China Fund - Class A USD Acc US$1,802.19 US$2,044.12 US$1,283.90Barings Hong Kong China Fund - Class C EUR Inc €1,374.18 €1,510.79 €1,064.64Barings Hong Kong China Fund - Class C USD Inc US$1,590.98 US$1,813.60 US$1,150.54Barings Hong Kong China Fund - Class I GBP Acc £1,361.15 £1,524.31 £1,057.27Barings Hong Kong China Fund - Class I USD Acc US$1,875.17 US$2,119.45 US$1,321.92
Net assets attributable to holders of redeemable participating unitsBarings Global Bond Fund* US$72,173,170 US$78,088,750 US$72,377,921
NAV per redeemable unitsBarings Global Bond Fund* - Class A RMB Hedged Inc** ¥97.71 – –Barings Global Bond Fund* - Class A USD Inc US$26.88 US$27.85 US$26.72Barings Global Bond Fund* - Class A EUR Inc €23.07 €23.05 €24.57Barings Global Bond Fund* - Class A RMB Hedged Acc*** ¥97.97 – –Barings Global Bond Fund* - Class A GBP Inc £19.53 £20.05 £21.39Barings Global Bond Fund* - Class I GBP Inc £19.58 £20.10 £21.45Barings Global Bond Fund* - Class I USD Acc US$29.47 US$30.39 US$28.70
* Barings International Bond Fund changed its name to Barings Global Bond Fund effective 16 August 2019.** The Barings Global Bond Fund Class A RMB Hedged Inc was launched on 4 June 2021.*** The Barings Global Bond Fund Class A RMB Hedged Acc was launched on 14 July 2021.
10. NAV per redeemable participating units (continued)

45
Barings International Umbrella FundNotes to the financial statements (continued)
For the financial period ended 31 October 2021
11. Exchange rates
The exchange rates used in the financial statements to convert to US dollars are as follows:
As at 31 October 2021
As at 30 April 2021
Australian dollar 1.3263 1.2889Canadian dollar 1.2337 1.2288Chinese renminbi 6.3931 6.4652Chinese yuan 6.3993 6.4715Czech Republic koruna 22.0295 21.4121Euro 0.8581 0.8277Hong Kong dollar 7.7765 7.7649Hungarian forint 309.5469 297.8812Indian rupee 74.8813 74.0725Indonesian rupiah 14,167.5000 14,445.0000Israeli shekel 3.1538 3.2428Japanese yen 113.7450 108.8650Malaysian ringgit 4.1410 4.0964Mexican peso 20.4715 20.0985New Zealand dollar 1.3938 1.3843Norwegian krone 8.3539 8.2346Philippines peso 50.4100 48.1500Polish zloty 3.9610 3.7808Pound sterling 0.7255 0.7188Singapore dollar 1.3459 1.3281South African rand 15.2513 14.4188South Korean won 1,168.5500 1,112.3500Swedish krona 8.5230 8.4188Swiss franc 0.9110 0.9095Taiwan dollar 27.8085 27.9330Thai baht 33.1825 31.1375Vietnamese new dong 22,751.5000 23,055.0000
12. Soft commission arrangements
The Investment Manager will pay for research from their own books, as commission paid on trades will be “execution only”, which is the agreed cost for that broker to settle the trade (31 October 2020: same).
13. Contingent liabilities
There are no contingent liabilities at financial period-end 31 October 2021 and financial year-end 30 April 2021.
14. Transactions with connected persons
The UCITS Regulations require that any transaction carried out with the Manager by a Promoter, Manager, Depositary, Investment Manager and/or associate of these (“connected persons”) must be carried out as if negotiated at arm’s length. Transactions must be in the best interests of the unitholders.
The Board of Directors of the Manager are satisfied that there are arrangements (evidenced by written procedures) in place to ensure that the obligations set out in Regulation 43(1) of the Central Bank UCITS Regulations are applied to all transactions with connected persons, and are satisfied that transactions with connected persons entered into during the period complied with the obligations set out in Regulation 43(1) of the Central Bank UCITS Regulations.

46
Barings International Umbrella FundNotes to the financial statements (continued)
For the financial period ended 31 October 2021
15. Taxation
Under current Irish law and practice, the Unit Trust qualifies as an investment undertaking as defined in Section 739B of the Taxes Consolidation Act, 1997, as amended (the “TCA”). On that basis, it is not chargeable to Irish tax on its income or gains.
However, Irish tax may arise if a "chargeable event" occurs. A chargeable event includes any distribution payments to unitholders or any encashment, redemption, cancellation, transfer or deemed disposal of shares for Irish tax purposes arising as a result of holding shares in the Unit Trust for a period of eight years or more, or the appropriation or cancellation of shares of a unitholder by the Unit Trust for the purposes of meeting the amount of tax payable on a gain arising on a transfer.
No Irish tax will arise on the Unit Trust in respect of chargeable events due to:
(a) a unitholder who is neither Irish resident nor ordinarily resident in Ireland for tax purposes at the time of the chargeable event, provided that a relevant declaration is in place (in accordance with Schedule 2b of the TCA) and the Unit Trust is not in possession of any information which would reasonably suggest that the information contained therein is no longer materially correct; or
(b) a unitholder who is an exempt Irish investor (as defined in Section 739D TCA).
Dividends, interest and capital gains (if any) received on investments made by the Unit Trust may be subject to withholding taxes imposed by the country from which the investment income/gains are received and such taxes may not be recoverable by the Unit Trust or its unitholders.
The Finance Act 2010 provides that the Revenue Commissioners may grant approval for Unit Trust Investment Undertakings marketed outside of Ireland to make payments to non-resident investors without deduction of Irish tax where no relevant declaration is in place, subject to meeting “equivalent measures”. A Unit Trust Investment Undertakings wishing to receive approval must apply in writing to the Revenue Commissioners, confirming compliance with the relevant conditions.
16. Bank facilities
There is a bank overdraft facility in place with The Northern Trust Company (“TNTC”). An “uncommitted” multi-currency loan facility has been made available by TNTC to the Funds. During the financial period ended 31 October 2021, Barings Australia Fund had drawn down on this facility (30 April 2021: Barings Australia Fund).
17. Material changes to the Prospectus
An updated Prospectus of the Unit Trust was issued on 9 December 2021. The following are the material changes made:
• Baring Global Bond Fund conversion from Article 6 to Article 8 under the Sustainable Finance Disclosure Regulation (“SFDR”), where it will seek to promote environmental, social and governance (“ESG”) characteristics investment policy. The Prospectus includes clarifications to the investment policy and strategy of the Fund.
• Incorporation of Global Technology Equity Fund into the Prospectus.• Updated disclosures to comply with Level 1 of EU Taxonomy Regulation.• For Barings Asia Growth Fund included Class I Euro Hedged Inc unit class.• Included that Class J does not charge preliminary charges.• Clarification on Investor Money Regulation (“IMR”) Collection Account.• Updated sub-custodian list.There are other immaterial changes to the Prospectus that are not listed above.

47
Barings International Umbrella FundNotes to the financial statements (continued)
For the financial period ended 31 October 2021
18. Significant events
COVID-19The spread of COVID-19 around the world in 2020 caused significant volatility in international markets. There is still significant uncertainty around the breadth and duration of business disruptions related to further COVID-19 variants, as well as its impact on international economies and, as such, the Unit Trust continues to actively monitor the extent of the impact to its operations, financial accounting and reporting.
BrexitThe United Kingdom (the “UK”) held a referendum on 23 June 2016 on whether to leave or remain in the European Union (the “EU”). The outcome of the referendum was in favour of leaving the EU. The UK officially withdrew from the EU on 31 January 2020, but continued to follow all of the EU rules and its trading relationship during a transitional period that ended on 31 December 2020. On 01 January 2021, the Trade and Cooperation Agreement between the UK and the EU came into force, and the UK left the EU single market and the EU customs union.
There remain a number of uncertainties in connection with the future of the UK and its relationship with the EU, including any agreements it reaches in relation to its future relationship with the EU and Barings continues to plan for a number of possible scenarios. Barings is committed to ensuring continuity of service for its investors and protecting its business against potential regulatory or other market access barriers related to Brexit.
In this regard, Baring International Fund Managers (Ireland) Limited (“BIFMI”), will continue as the Manager of the Unit Trust and the Funds will continue to be registered for distribution into relevant jurisdictions in the EU and elsewhere. Portfolio management in respect of European investments will continue to be delegated to Baring Asset Management Limited, a UK entity and portfolio management of US investments will continue to be conducted by Barings LLC, a US entity. The custodians and administrators of the Funds are also EU entities. In addition, BIFMI has enhanced its presence in Dublin and recruited locally at all levels to staff its new office, reflecting the increased significance of BIFMI’s role within the Barings business. Whilst the medium to long-term consequences of the decision to leave the EU remain uncertain in any scenario, there could be short-term volatility which could have a negative impact on general economic conditions, business and consumer confidence in both the UK and EU, which may in turn have negative political, economic and market impacts more widely. The longer-term consequences may be affected by the terms of any future arrangements the UK has with the EU. Among other things, the UK’s decision to leave the EU could lead to changes in the law and tax treatment of funds, instability in the equity, debt and foreign exchange markets, including volatility in the value of sterling or the euro.
There have been no other significant events to the financial period-end which, in the opinion of the Directors of the Manager, that may have had an impact on the financial statements for the financial period ended 31 October 2021.
19. Subsequent events
Barings Global Technology Equity Fund was launched on 16 November 2021.
Barings Global Balanced Fund launched on 5 November 2021 and on launch date, Barings Asia Balanced Fund, a Sub-Fund of Barings Global Opportunities Umbrella Fund merged with the new Fund.
The Prospectus of the Unit Trust was updated on 9 December 2021. The material changes to the Prospectus are outlined in note 17.
There have been no other events subsequent to the financial period-end which, in the opinion of the Directors of the Manager, may have had a material impact on these financial statements for the financial period ended 31 October 2021.
20. Approval of financial statements
The financial statements were approved by the Board of Directors of the Manager on 13 December 2021.

48
Barings International Umbrella Fund Barings ASEAN Frontiers Fund
Schedule of InvestmentsAs at 31 October 2021
Financial assets at fair value through profit or loss
Nominal SecurityFair value
US$% of
Net Assets
Equities: 96.54% (30 April 2021: 98.62%)
China: 4.11% (30 April 2021: 1.79%)2,038,000 Flat Glass 11,007,008 1.861,624,000 SITC International 5,502,784 0.937,396,700 Yangzijiang Shipbuilding 7,803,934 1.32
24,313,726 4.11
Indonesia: 21.26% (30 April 2021: 17.21%)51,773,700 Astra International 22,017,755 3.7262,086,000 Bank Central Asia 32,757,568 5.5360,807,468 Bank Rakyat Indonesia 18,241,167 3.0826,330,800 Bank Rakyat Indonesia Agroniaga 3,921,510 0.6627,339,200 Bank Tabungan Pensiunan Nasional Syariah 7,352,204 1.24
102,354,000 Bukalapak.com 5,021,072 0.853,921,400 Indocement Tunggal Prakarsa 3,273,023 0.555,449,600 Indofood CBP Sukses Makmur 3,384,964 0.57
45,160,800 Merdeka Copper Gold 10,072,923 1.70142,557,500 Surya Citra Media 4,226,162 0.71
24,186,100 Telekomunikasi Indonesia Persero 6,487,184 1.1026,778,200 Vale Indonesia 9,167,056 1.55
125,922,588 21.26
Malaysia: 8.94% (30 April 2021: 10.33%)9,956,000 CTOS Digital Berhad 4,640,203 0.78
11,317,650 Frontken Corp 10,413,003 1.76952,600 Hartalega 1,348,040 0.23
6,826,350 Pentamaster 8,819,361 1.4912,222,700 Press Metal Aluminium 16,411,063 2.77
2,378,200 ViTrox 11,302,337 1.9152,934,007 8.94
Philippines: 7.62% (30 April 2021: 4.18%)15,231,700 AC Energy 3,704,436 0.6212,252,800 AllHome 2,503,548 0.42
185,945 Globe Telecom 11,051,205 1.874,074,430 International Container Terminal Services 14,548,649 2.468,317,950 Metropolitan Bank & Trust 7,870,784 1.33
17,000,000 Monde Nissin 5,429,478 0.9245,108,100 7.62
Singapore: 29.46% (30 April 2021: 31.65%)1,052,100 AEM 3,275,354 0.552,363,500 Aztech Global 1,826,317 0.311,714,400 Credit Bureau Asia 1,566,767 0.261,415,400 DBS 33,158,156 5.605,728,400 Frencken 9,704,103 1.642,114,000 iFast 13,586,522 2.293,653,016 Mapletree Logistics Trust Reits 5,482,645 0.932,702,400 NanoFilm Technologies International 7,589,771 1.28
154,462 Sea ADR 54,483,381 9.20351,899 TDCX ADR 9,719,450 1.64
6,566,250 UMS 6,439,892 1.091,223,500 United Overseas Bank 24,317,278 4.11

49
Barings International Umbrella Fund Barings ASEAN Frontiers Fund
Schedule of Investments (continued)As at 31 October 2021
Financial assets at fair value through profit or loss (continued)
Nominal SecurityFair value
US$ % of
Net Assets
Equities: 96.54% (30 April 2021: 98.62%) (continued)
Singapore: 29.46% (30 April 2021: 31.65%) (continued) 236,100 Venture 3,299,681 0.56
174,449,317 29.46
Thailand: 22.75% (30 April 2021: 30.46%)2,293,200 Airports of Thailand 4,457,512 0.75
12,560,800 Asian Sea 5,980,883 1.0124,509,900 Bangkok Dusit Medical Services 17,358,025 2.93
1,058,900 Carabao Group 3,957,013 0.676,550,500 CP ALL 12,634,129 2.13
39,762 Fabrinet 3,839,021 0.659,019,900 Gulf Energy Development 11,756,519 1.993,457,300 Hana Microelectronics 8,335,237 1.41
17,553,300 Home Product Center 7,723,293 1.306,050,900 Ichitan 1,987,638 0.347,112,100 JMT Network Services PCL 10,448,727 1.764,239,900 KCE Electronics 11,116,441 1.887,809,900 Minor International 7,708,106 1.303,808,900 Osotspa 3,759,255 0.645,350,700 PTT Global Chemical 10,118,479 1.718,361,900 RS 4,409,953 0.751,768,300 Sri Trang Agro-Industry 1,731,929 0.292,281,305 Srisawad PCL 4,400,016 0.741,770,000 Thai Oil 2,973,781 0.50
134,695,957 22.75
Vietnam: 2.40% (30 April 2021: 3.00%)589,440 Saigon Beer Alcohol Beverage 4,158,193 0.70
1,818,400 Vietnam Dairy Products 7,249,143 1.231,466,900 Vietnam Engine & Agricultural Machinery 2,804,657 0.47
14,211,993 2.40
Total Equities (Cost: US$433,862,793) 571,635,688 96.54
Warrants: 0.18% (30 April 2021: 0.08%)
Malaysia: 0.09% (30 April 2021: 0.00%)3,772,550 Frontken Corp 537,504 0.09
Thailand: 0.09% (30 April 2021: 0.08%)795,427 JMT Network Services PCL 0.00% 234,918 0.04193,196 Minor International 29,111 0.01175,084 Minor International PCL 21,317 0.00
1,672,380 RS 199,582 0.03110,528 Srisawad PCL 0.00% 37,306 0.01
522,234 0.09
Total Warrants (Cost: US$Nil) 1,059,738 0.18

50
Barings International Umbrella Fund Barings ASEAN Frontiers Fund
Schedule of Investments (continued)As at 31 October 2021
Financial assets at fair value through profit or loss (continued)
Open forward foreign currency exchange contracts: 0.04% (30 April 2021: 0.01%)
Currency bought
Currency sold Counterparty
Maturity date
Unrealised gain US$
% of Net Assets
CHF 5,987,516 USD 6,471,780 State Street 15/11/2021 103,237 0.02AUD 3,139,426 USD 2,290,381 State Street 15/11/2021 76,698 0.01CHF 3,811,445 USD 4,119,711 State Street 15/11/2021 65,717 0.01AUD 280,171 USD 209,324 State Street 15/11/2021 1,920 0.00AUD 146,171 USD 108,421 State Street 15/11/2021 1,789 0.00CHF 185,877 USD 202,448 State Street 15/11/2021 1,667 0.00CHF 122,133 USD 133,022 State Street 15/11/2021 1,095 0.00CHF 82,725 USD 90,074 State Street 15/11/2021 768 0.00CNH 81,555 USD 12,607 State Street 15/11/2021 137 0.00AUD 5,512 USD 4,068 State Street 15/11/2021 87 0.00AUD 1,800 USD 1,313 State Street 15/11/2021 44 0.00AUD 1,602 USD 1,179 State Street 15/11/2021 29 0.00AUD 668 USD 488 State Street 15/11/2021 16 0.00AUD 3,526 USD 2,647 State Street 15/11/2021 12 0.00AUD 1,510 USD 1,131 State Street 15/11/2021 8 0.00AUD 430 USD 318 State Street 15/11/2021 6 0.00AUD 1,200 USD 900 State Street 15/11/2021 5 0.00AUD 914 USD 685 State Street 15/11/2021 5 0.00AUD 2,115 USD 1,592 State Street 15/11/2021 3 0.00CNH 275 USD 42 State Street 15/11/2021 0 0.00CNH 2,587 USD 404 State Street 15/11/2021 0 0.00
Total unrealised gain on open forward foreign currency exchange contracts 253,243 0.04
Total financial assets at fair value through profit or loss 572,948,669 96.76
Financial liabilities at fair value through profit or loss
Open forward foreign currency exchange contracts: 0.00% (30 April 2021: 0.00%)
Currency bought
Currency sold Counterparty
Maturity date
Unrealised loss US$
% of Net Assets
USD 503,498 AUD 681,226 State Street 15/11/2021 (10,136) 0.00USD 24,468 AUD 33,540 State Street 15/11/2021 (820) 0.00USD 40,213 CHF 37,204 State Street 15/11/2021 (642) 0.00USD 118,452 AUD 157,728 State Street 15/11/2021 (473) 0.00USD 25,586 CHF 23,672 State Street 15/11/2021 (408) 0.00USD 2,588 AUD 3,489 State Street 15/11/2021 (42) 0.00
Total unrealised loss on open forward foreign currency exchange contracts (12,521) 0.00
Total financial liabilities at fair value through profit or loss (12,521) 0.00
Total investments at fair value through profit or loss 572,936,148 96.76Cash and cash equivalents 21,044,688 3.55Other net liabilities (1,834,223) (0.31)Net assets attributable to holders of redeemable participating units 592,146,613 100.00

51
Barings International Umbrella Fund Barings ASEAN Frontiers Fund
Schedule of Investments (continued)As at 31 October 2021
Analysis of Total Assets % of total assets*Transferable securities admitted to an official stock exchange listing or traded on a recognised market 96.32OTC financial derivative instruments 0.04Other assets 3.64
Total 100.00
* Calculation based on the total assets of the Fund (excluding liabilities). This summary is a UCITS requirement.

52
Barings International Umbrella Fund Barings Asia Growth Fund
Schedule of InvestmentsAs at 31 October 2021
Financial assets at fair value through profit or loss
Nominal SecurityFair value
US$% of
Net Assets
Equities: 100.70% (30 April 2021: 99.85%)
China: 34.90% (30 April 2021: 39.51%)275,048 Alibaba 5,765,167 2.56515,121 Centre Testing International 2,226,274 0.99116,623 China International Travel Service 4,897,250 2.17393,600 Fuyao Glass Industry 2,272,570 1.01149,200 Hangzhou Tigermed Consulting 2,910,518 1.29
4,092,000 Huaneng Power International 2,120,589 0.941,596,000 Kindstar Globalgene Technology 985,122 0.44
17,120 Kweichow Moutai 4,890,036 2.17677,500 Li Ning 7,536,006 3.34174,900 Meituan Dianping 6,063,530 2.69688,473 NARI Technology 4,192,372 1.86737,548 Sany Heavy Industry 2,648,809 1.17436,220 Shenzhen Inovance Technology 4,450,835 1.97845,000 SITC International 2,863,210 1.27220,100 Tencent 13,613,849 6.04
39,800 Will Semiconductor 1,655,973 0.73211,500 Wuxi Biologics Cayman 3,220,163 1.43
1,348,000 Xinyi Solar 2,822,020 1.252,548,000 Zijin Mining 3,551,768 1.58
78,686,061 34.90
Hong Kong: 6.49% (30 April 2021: 7.17%)534,800 AIA 6,041,559 2.68
87,300 Hong Kong Exchanges & Clearing 5,285,262 2.35178,500 Orient Overseas 3,298,457 1.46
14,625,278 6.49
India: 14.03% (30 April 2021: 10.50%)16,782 Divi's Laboratories 1,154,225 0.5138,212 Dixon Technologies 2,548,215 1.1351,485 Gland Pharma 2,544,092 1.13
134,903 HDFC Bank 2,851,598 1.26125,223 Infosys 2,788,958 1.24
96,028 PI Industries 3,847,147 1.71180,049 Reliance Industries 6,098,313 2.71
92,362 Reliance Industries 2,346,570 1.04153,498 SBI Life Insurance 2,348,247 1.04104,267 Tata Steel 1,832,370 0.81
30,927 Titan 984,439 0.441,302,161 Zomato 2,287,612 1.01
31,631,786 14.03
Indonesia: 0.81% (30 April 2021: 0.00%)4,311,600 Astra International 1,833,590 0.81
Malaysia: 0.04% (30 April 2021: 0.97%)198,500 CTOS Digital Berhad 92,515 0.04
Singapore: 6.86% (30 April 2021: 4.86%)864,500 NanoFilm Technologies International 2,427,974 1.08

53
Barings International Umbrella Fund Barings Asia Growth FundSchedule of Investments (continued)
As at 31 October 2021
Financial assets at fair value through profit or loss (continued)
Nominal SecurityFair value
US$ % of
Net Assets
Equities: 100.70% (30 April 2021: 99.85%) (continued)
Singapore: 6.86% (30 April 2021: 4.86%) (continued) 31,196 Sea ADR 11,003,765 4.8873,454 TDCX ADR 2,028,800 0.90
15,460,539 6.86
South Korea: 19.96% (30 April 2021: 19.82%)36,313 Kakao 3,899,946 1.7327,921 KakaoBank 1,507,693 0.6735,886 Kia 2,613,408 1.16
6,398 Krafton 2,570,588 1.145,490 LG Chem 3,927,637 1.74
18,949 LG Electronics 1,954,007 0.8716,312 NAVER 5,681,386 2.52
6,575 POSCO 1,665,483 0.74186,213 Samsung Electronics 11,122,902 4.93
8,677 SK Bioscience 1,707,852 0.7647,862 SK Hynix 4,218,721 1.8717,138 SK IE Technology 2,441,895 1.0823,018 Studio Dragon 1,695,991 0.75
45,007,509 19.96
Taiwan: 16.57% (30 April 2021: 14.12%)484,203 Chailease 4,631,605 2.06
54,000 eMemory Technology 4,466,260 1.98199,000 Giant Manufacturing 2,307,838 1.02
1,019,000 Hon Hai Precision Industry 3,920,852 1.7479,000 MediaTek 2,593,703 1.15
916,000 Taiwan Semiconductor Manufacturing 19,434,346 8.6237,354,604 16.57
Thailand: 0.80% (30 April 2021: 2.67%)3,787,100 Asian Sea 1,803,245 0.80
Vietnam: 0.24% (30 April 2021: 0.23%)76,750 Saigon Beer Alcohol Beverage 541,431 0.24
Total Equities (Cost: US$162,904,802) 227,036,558 100.70
Total financial assets at fair value through profit or loss 227,036,558 100.70
Total investments at fair value through profit or loss 227,036,558 100.70Cash and cash equivalents 62,879 0.03Other net liabilities (1,650,815) (0.73)Net assets attributable to holders of redeemable participating units 225,448,622 100.00

54
Barings International Umbrella Fund Barings Asia Growth FundSchedule of Investments (continued)
As at 31 October 2021
Analysis of Total Assets % of total assets*Transferable securities admitted to an official stock exchange listing or traded on a recognised market 98.97Other assets 1.03
Total 100.00
* Calculation based on the total assets of the Fund (excluding liabilities). This summary is a UCITS requirement.

55
Barings International Umbrella Fund Barings Australia Fund
Schedule of InvestmentsAs at 31 October 2021
Financial assets at fair value through profit or loss
Nominal SecurityFair value
US$% of
Net Assets
Equities: 97.69% (30 April 2021: 99.52%)
Communication Services: 3.96% (30 April 2021: 2.96%)113,820 Carsales.com 2,116,188 2.90567,836 oOh!media 777,037 1.06
2,893,225 3.96
Consumer Discretionary: 7.84% (30 April 2021: 7.38%)78,193 Aristocrat Leisure 2,751,954 3.77
346,104 Bapcor 2,074,514 2.848,829 Domino's Pizza Enterprises 901,706 1.23
5,728,174 7.84
Consumer Staples: 8.93% (30 April 2021: 9.87%)217,293 Coles 2,808,013 3.84150,249 Endeavour 770,306 1.06
46,426 Wesfarmers 2,003,915 2.7432,795 Woolworths 941,558 1.29
6,523,792 8.93
Energy: 2.34% (30 April 2021: 3.19%)97,575 Woodside Petroleum 1,711,161 2.34
Financials: 32.16% (30 April 2021: 32.02%)165,393 Australia & New Zealand Banking Group 3,509,003 4.80
50,962 Commonwealth Bank of Australia 4,022,099 5.5135,063 Credit 828,761 1.13
465,097 Insurance Australia 1,683,167 2.3034,770 Macquarie 5,186,082 7.10
251,846 National Australia Bank 5,451,434 7.4610,255 REA 1,238,164 1.70
460,667 Stockland 1,580,306 2.1623,499,016 32.16
Health Care: 11.40% (30 April 2021: 14.33%)29,659 Ansell 704,608 0.9711,739 Cochlear 1,951,030 2.6715,584 CSL 3,530,624 4.8337,081 ResMed 1,039,170 1.4236,557 Sonic Healthcare 1,103,313 1.51
8,328,745 11.40
Industrials: 3.68% (30 April 2021: 3.25%)136,798 ALS 1,362,464 1.87655,126 Cleanaway Waste Management 1,323,739 1.81
2,686,203 3.68
Information Technology: 2.63% (30 April 2021: 0.00%)135,730 Computershare 1,919,779 2.63
Materials: 19.50% (30 April 2021: 21.27%)184,715 Amcor 2,226,861 3.05194,317 BHP Billiton 5,359,164 7.33
52,586 James Hardie Industries 2,047,779 2.80

56
Barings International Umbrella Fund Barings Australia Fund
Schedule of Investments (continued)As at 31 October 2021
Financial assets at fair value through profit or loss (continued)
Nominal SecurityFair value
US$ % of
Net Assets
Equities: 97.69% (30 April 2021: 99.52%) (continued)
Materials: 19.50% (30 April 2021: 21.27%) (continued) 75,459 Newcrest Mining 1,416,050 1.9479,503 OZ Minerals 1,506,324 2.0624,920 Rio Tinto 1,696,408 2.32
14,252,586 19.50
Real Estate: 5.25% (30 April 2021: 5.25%)232,310 Goodman 3,835,788 5.25
Total Equities (Cost: US$51,634,885) 71,378,469 97.69
Total financial assets at fair value through profit or loss 71,378,469 97.69
Total investments at fair value through profit or loss 71,378,469 97.69Cash and cash equivalents 1,407,458 1.93Other net assets 282,633 0.38Net assets attributable to holders of redeemable participating units 73,068,560 100.00
Analysis of Total Assets % of total assets*Transferable securities admitted to an official stock exchange listing or traded on a recognised market 97.49Other assets 2.51
Total 100.00
* Calculation based on the total assets of the Fund (excluding liabilities). This summary is a UCITS requirement.
.

57
Barings International Umbrella Fund Barings Europa Fund
Schedule of InvestmentsAs at 31 October 2021
Financial assets at fair value through profit or loss
Nominal SecurityFair value
US$% of
Net Assets
Equities: 99.37% (30 April 2021: 99.55%)
Communication Services: 4.58% (30 April 2021: 4.65%)63,471 Auto Trader 530,705 1.7124,786 Telenet 892,488 2.87
1,423,193 4.58
Consumer Discretionary: 2.88% (30 April 2021: 1.80%)35,050 Husqvarna 502,539 1.62
4,476 Prosus 392,808 1.26895,347 2.88
Consumer Staples: 12.19% (30 April 2021: 11.71%)23,682 Associated British Foods 584,804 1.8818,029 Nestle 2,359,534 7.6015,761 Unilever 841,734 2.71
3,786,072 12.19
Energy: 6.24% (30 April 2021: 7.32%)48,787 Royal Dutch Shell 1,142,006 3.6815,669 Total 796,370 2.56
1,938,376 6.24
Financials: 13.57% (30 April 2021: 15.10%)48,995 AXA 1,413,644 4.5510,158 Julius Baer 740,203 2.3826,029 KBC Ancora 1,366,742 4.4033,971 Prudential 695,595 2.24
4,216,184 13.57
Health Care: 13.57% (30 April 2021: 13.99%)12,151 AstraZeneca 1,524,153 4.91
174,497 ConvaTec Group PLC 500,055 1.615,651 Roche 2,190,426 7.05
4,214,634 13.57
Industrials: 7.46% (30 April 2021: 10.82%)20,606 Assa Abloy 606,119 1.9534,498 CNH Industrial 596,174 1.92
4,832 Schneider Electric 823,212 2.6510,702 Siemens Gamesa 290,326 0.94
2,315,831 7.46
Information Technology: 22.35% (30 April 2021: 19.47%)387 Adyen 1,153,584 3.72
1,414 ASM International 637,344 2.051,722 ASML 1,380,573 4.457,087 Capgemini 1,650,457 5.31
11,064 Halma 448,368 1.4416,178 Infineon Technologies 747,585 2.41
6,009 Temenos 922,838 2.976,940,749 22.35
Materials: 14.47% (30 April 2021: 12.71%)16,547 Anglo American 635,327 2.05

58
Barings International Umbrella Fund Barings Europa Fund
Schedule of Investments (continued)As at 31 October 2021
Financial assets at fair value through profit or loss (continued)
Nominal SecurityFair value
US$ % of
Net Assets
Equities: 99.37% (30 April 2021: 99.55%) (continued)
Materials: 14.47% (30 April 2021: 12.71%) (continued) 23,452 CRH 1,118,560 3.60
3,414 Koninklijke DSM 749,319 2.412,631 Linde 831,167 2.68
85,705 Norsk Hydro 650,853 2.099,674 Smurfit Kappa Group 510,672 1.64
4,495,898 14.47
Utilities: 2.06% (30 April 2021: 1.98%)7,998 RWE 313,061 1.01
56,881 Snam 325,916 1.05638,977 2.06
Total Equities (Cost: US$21,440,258) 30,865,261 99.37
Total financial assets at fair value through profit or loss 30,865,261 99.37
Total investments at fair value through profit or loss 30,865,261 99.37Cash and cash equivalents 299,039 0.96Other net liabilities (102,284) (0.33)Net assets attributable to holders of redeemable participating units 31,062,016 100.00
Analysis of Total Assets % of total assets*Transferable securities admitted to an official stock exchange listing or traded on a recognised market 99.03Other assets 0.97
Total 100.00
* Calculation based on the total assets of the Fund (excluding liabilities). This summary is a UCITS requirement.

59
Barings International Umbrella Fund Barings Hong Kong China Fund
Schedule of InvestmentsAs at 31 October 2021
Financial assets at fair value through profit or loss
Nominal SecurityFair value
US$% of
Net Assets
Equities: 99.67% (30 April 2021: 99.27%)
Basic Materials: 0.00% (30 April 2021: 0.98%)
Communication Services: 9.31% (30 April 2021: 9.47%)3,165,600 Tencent 195,801,916 9.31
Communications: 1.55% (30 April 2021: 5.32%)1,219,000 Kuaishou Technology 16,224,072 0.771,888,411 Zhihu ADR 16,429,176 0.78
32,653,248 1.55
Consumer Discretionary: 27.69% (30 April 2021: 26.86%)1,125,651 AiHuiShou International ADR 9,556,777 0.46
529,865 Alibaba ADR 89,965,778 4.281,100,000 ANTA Sports Products 17,200,540 0.821,010,500 BYD Company 38,541,027 1.83
799,920 China International Travel Service 33,590,359 1.604,059,600 Fuyao Glass Industry 23,439,342 1.124,150,000 JS Global Lifestyle 7,695,364 0.37
947,000 Li Auto 15,977,162 0.765,113,000 Li Ning 56,873,208 2.714,324,900 Meituan Dianping 149,938,024 7.13
403,188 Pinduoduo ADR 37,274,731 1.772,554,700 Shenzhou International 55,124,884 2.62
500,009 XPeng ADR 23,120,416 1.10403,100 Yum China 23,637,060 1.12
581,934,672 27.69
Consumer Staples: 3.80% (30 April 2021: 3.57%)2,521,436 China Resources Beer 20,913,344 0.99
14,675,000 China Youran Dairy 8,529,673 0.41176,999 Kweichow Moutai 50,556,746 2.40
79,999,763 3.80
Consumer, Cyclical: 0.31% (30 April 2021: 1.29%)713,500 Zhongsheng 6,454,668 0.31
Consumer, Non-cyclical: 0.66% (30 April 2021: 0.93%)1,065,680 Joinn Laboratories China 13,799,778 0.66
Energy: 1.00% (30 April 2021: 0.00%)42,650,000 China Petroleum & Chemical 20,950,685 1.00
Financials: 12.21% (30 April 2021: 11.69%)4,235,000 AIA 47,842,185 2.281,446,600 BOC Aviation 12,696,001 0.605,385,200 China International Capital 13,406,735 0.648,841,500 China Merchants Bank 74,527,143 3.552,047,584 China Resources Mixc Lifestyle Services 10,782,301 0.51
459,900 Hong Kong Exchanges & Clearing 27,842,978 1.327,594,751 Ping An Bank 23,165,232 1.10

60
Barings International Umbrella Fund Barings Hong Kong China Fund
Schedule of Investments (continued)As at 31 October 2021
Financial assets at fair value through profit or loss (continued)
Nominal SecurityFair value
US$ % of
Net Assets
Equities: 99.67% (30 April 2021: 99.27%) (continued)
Financials: 12.21% (30 April 2021: 11.69%) (continued) 63,726,000 Postal Savings Bank of China 46,381,940 2.21
256,644,515 12.21
Health Care: 4.94% (30 April 2021: 6.16%)546,000 Acotec Scientific 984,366 0.05541,900 Hangzhou Tigermed Consulting 10,571,109 0.50
2,396,000 Innovent Biologics 21,505,922 1.027,664,500 Kindstar Globalgene Technology 4,730,868 0.221,614,095 Remegen 20,112,622 0.963,022,500 Wuxi Biologics Cayman 46,018,646 2.19
103,923,533 4.94
Industrial: 10.62% (30 April 2021: 9.65%)3,267,064 Centre Testing International 14,119,751 0.67
455,208 Contemporary Amperex Technology 45,514,392 2.175,039,000 Hainan Meilan International Airport 20,443,702 0.97
18,565,000 Impro Precision Industries 5,729,570 0.273,601,888 NARI Technology 21,933,256 1.041,164,500 Orient Overseas 21,518,504 1.023,144,730 Shenzhen Inovance Technology 32,086,271 1.537,728,000 SITC International 26,185,662 1.251,730,000 Techtronic Industries 35,616,665 1.70
223,147,773 10.62
Information Technology: 14.29% (30 April 2021: 11.01%)410,738 GDS Holdings Ltd ADR 25,264,494 1.20958,000 Globalwafers 26,181,923 1.25
4,115,222 GoerTek 28,026,586 1.334,528,801 Lens Technology 15,067,432 0.721,760,389 LONGi Green Energy Technology 26,899,689 1.284,090,986 Luxshare Precision Industry 24,725,986 1.18
572,000 MediaTek 18,779,726 0.891,777,300 Sunny Optical Technology 48,040,694 2.282,655,000 Taiwan Semiconductor Manufacturing 56,329,899 2.68
369,603 Will Semiconductor 15,378,204 0.73913,079 Wingtech Technology 15,676,206 0.75
300,370,839 14.29
Materials: 5.05% (30 April 2021: 1.85%)24,848,000 Aluminum Corporation of China 14,857,995 0.71
5,618,000 Anhui Conch Cement 27,958,156 1.3320,486,000 China Resources Cement 17,281,317 0.82
8,518,885 ENN Ecological 24,531,553 1.1715,382,000 Zijin Mining 21,441,636 1.02
106,070,657 5.05
Real Estate: 2.21% (30 April 2021: 4.31%)6,639,000 Financial Street Property 3,466,128 0.178,840,000 Longfor Properties 42,969,459 2.04
46,435,587 2.21

61
Barings International Umbrella Fund Barings Hong Kong China Fund
Schedule of Investments (continued)As at 31 October 2021
Financial assets at fair value through profit or loss (continued)
Nominal SecurityFair value
US$ % of
Net Assets
Equities: 99.67% (30 April 2021: 99.27%) (continued)
Technology: 1.68% (30 April 2021: 2.33%)11,352,000 United Micro Electronics 23,676,789 1.123,654,000 Yidu Tech 11,746,930 0.56
35,423,719 1.68
Telecommunication Services: 0.51% (30 April 2021: 1.44%)139,776 Bilibili ADR 10,685,875 0.51
Utilities: 3.84% (30 April 2021: 2.41%)9,378,000 China Resources Power 24,239,414 1.151,080,400 ENN Energy 18,714,059 0.89
12,962,485 Huaneng Power International 15,632,597 0.7524,138,000 Kunlun Energy 22,100,246 1.05
80,686,316 3.84
Total Equities (Cost: US$1,552,352,809) 2,094,983,544 99.67
Open forward foreign currency exchange contracts: 0.00% (30 April 2021: 0.00%)
Currency bought
Currency sold Counterparty
Maturity date
Unrealised gain US$
% of Net Assets
CNH 118,682 USD 18,346 State Street 15/11/2021 199 0.00CNH 4,111 USD 635 State Street 15/11/2021 7 0.00CNH 444 USD 69 State Street 15/11/2021 1 0.00
Total unrealised gain on open forward foreign currency exchange contracts 207 0.00
Total financial assets at fair value through profit or loss 2,094,983,751 99.67
Financial liabilities at fair value through profit or loss
Open forward foreign currency exchange contracts: 0.00% (30 April 2021: 0.00%)
Currency bought
Currency sold Counterparty
Maturity date
Unrealised loss US$
% of Net Assets
CNH 4,589 USD 719 State Street 15/11/2021 (1) 0.00Total unrealised loss on open forward foreign currency exchange contracts (1) 0.00
Total financial liabilities at fair value through profit or loss (1) 0.00
Fair value US$
% of Net Assets
Total investments at fair value through profit or loss 2,094,983,750 99.67Cash and cash equivalents 16,955,187 0.81Other net liabilities (10,101,455) (0.48)Net assets attributable to holders of redeemable participating units 2,101,837,482 100.00

62
Barings International Umbrella Fund Barings Hong Kong China Fund
Schedule of Investments (continued)As at 31 October 2021
Analysis of Total Assets % of total assets*Transferable securities admitted to an official stock exchange listing or traded on a recognised market 99.13Other assets 0.87
Total 100.00
* Calculation based on the total assets of the Fund (excluding liabilities). This summary is a UCITS requirement.

63
Barings International Umbrella Fund Barings Global Bond Fund
Schedule of InvestmentsAs at 31 October 2021
Financial assets at fair value through profit or loss
Nominal SecurityFair value
US$% of
Net Assets
Fixed interest: 97.97% (30 April 2021: 98.33%)
Australian dollar: 7.74% (30 April 2021: 9.23%)1,200,000 Australia (Commonwealth of) 1.75% 21/11/2032 869,333 1.20
100,000 Australia (Commonwealth of) 3.75% 21/04/2037 88,199 0.12700,000 New South Wales Treasury 1.00% 08/02/2024 526,037 0.73
4,000,000 New South Wales Treasury 3.00% 20/03/2028 3,201,302 4.44200,000 New South Wales Treasury FRN 20/11/2025 232,826 0.32700,000 Queensland Treasury 5.75% 22/07/2024 590,851 0.82100,000 Western Australian Treasury 3.00% 21/10/2026 79,873 0.11
5,588,421 7.74
Canadian dollar: 1.83% (30 April 2021: 1.69%)1,000,000 Canada (Govt of) 6.25% 01/06/2032 1,108,203 1.54
200,000 Province of British Columbia Canada 4.70% 18/06/2037 208,556 0.291,316,759 1.83
Czech koruna: 0.71% (30 April 2021: 2.41%)13,000,000 Czech (Republic of) 0.95% 15/05/2030 511,254 0.71
Euro: 36.58% (30 April 2021: 34.60%)1,140,000 France (Republic of) 1.50% 25/05/2031 1,491,901 2.07
890,000 France (Republic of) 3.25% 25/05/2045 1,619,606 2.241,430,000 Hellenic Republic Government Bond 3.38% 15/02/2025 1,838,814 2.55
600,000 Hellenic Republic Government Bond 3.50% 30/01/2023 731,361 1.01880,000 Ireland (Republic of) 1.10% 15/05/2029 1,099,469 1.52700,000 Ireland (Republic of) 1.70% 15/05/2037 958,868 1.33
1,480,000 Italy (Republic of) 0.60% 15/06/2023 1,749,996 2.423,850,000 Italy (Republic of) 1.50% 01/06/2025 4,695,162 6.511,480,000 Italy (Republic of) 2.20% 01/06/2027 1,881,235 2.61
660,000 Italy (Republic of) 2.70% 01/03/2047 907,923 1.26670,000 Italy (Republic of) 5.00% 01/09/2040 1,207,639 1.67
1,080,000 Italy (Republic of) 5.25% 01/11/2029 1,686,286 2.34520,000 Italy Buoni Poliennali Del Tesoro FRN 15/05/2030 687,300 0.95
1,620,000 Spain (Kingdom of) 1.45% 30/04/2029 2,050,651 2.841,870,000 Spain (Kingdom of) 1.95% 30/04/2026 2,379,951 3.30
890,000 Spain (Kingdom of) 2.90% 31/10/2046 1,417,231 1.9626,403,393 36.58
Israeli new shekel: 0.85% (30 April 2021: 0.77%)1,500,000 Israel (Govt of) 3.75% 31/03/2047 610,216 0.85
Japanese yen: 11.17% (30 April 2021: 10.42%)192,500,000 Japan (Govt of) 0.30% 20/12/2039 1,657,727 2.30
51,800,000 Japan (Govt of) 1.20% 20/03/2035 513,201 0.71233,300,000 Japan (Govt of) 1.80% 20/09/2043 2,597,425 3.60372,000,000 Japan Government Twenty Year Bond 0.50% 20/03/2041 3,293,364 4.56
8,061,717 11.17
Mexican pesos: 2.53% (30 April 2021: 3.73%)38,200,000 Mexican Bonos 7.75% 13/11/2042 1,826,796 2.53
New Zealand dollar: 2.53% (30 April 2021: 3.81%)500,000 New Zealand (Govt of) 1.75% 15/05/2041 297,439 0.41200,000 New Zealand (Govt of) 2.00% 15/05/2032 135,270 0.19

64
Barings International Umbrella Fund Barings Global Bond FundSchedule of Investments (continued)
As at 31 October 2021
Financial assets at fair value through profit or loss (continued)
Nominal SecurityFair value
US$ % of
Net Assets
Fixed interest: 97.97% (30 April 2021: 98.33%) (continued)
New Zealand dollar: 2.53% (30 April 2021: 3.81%) (continued) 1,960,000 New Zealand (Govt of) 2.75% 15/04/2037 1,395,093 1.93
1,827,802 2.53
Polish zloty: 1.13% (30 April 2021: 5.68%)3,570,000 Republic of Poland Government Bond 1.75% 25/04/2032 814,992 1.13
Pound sterling: 3.98% (30 April 2021: 3.53%)2,070,000 UK (Govt of) 1.25% 22/10/2041 2,871,794 3.98
Singapore dollar: 1.09% (30 April 2021: 1.01%)980,000 Singapore (Govt of) 2.88% 01/07/2029 783,476 1.09
Swedish krona: 2.54% (30 April 2021: 0.75%)10,150,000 Kommuninvest I Sverige 1.00% 12/11/2026 1,209,381 1.68
5,200,000 Nordea Hypotek 1.00% 18/09/2024 622,370 0.861,831,751 2.54
US dollar: 25.29% (30 April 2021: 20.70%)1,100,000 Indonesia Government International Bond 5.88% 15/01/2024 1,218,596 1.69
800,000 Kreditanstalt Für Wiederaufbau 2.13% 17/01/2023 817,543 1.13500,000 Peruvian Government International Bond 2.78% 23/01/2031 499,800 0.69
1,450,000 Portugal (Republic of) 5.13% 15/10/2024 1,623,319 2.253,900,000 US Treasury Bond 1.88% 15/02/2051 3,818,344 5.294,200,000 US Treasury Note 1.13% 28/02/2027 4,176,457 5.79
800,000 US Treasury Note/Bond 1.50% 15/08/2026 812,594 1.132,900,000 US Treasury Note/Bond 1.75% 15/05/2022 2,926,474 4.05
800,000 US Treasury Note/Bond 4.75% 15/02/2041 1,171,250 1.622,000,000 US Treasury STRIP 0.00% 15/02/2048 1,191,091 1.65
18,255,468 25.29
Total Fixed interest (Cost: US$71,466,225) 70,703,839 97.97
Open forward foreign currency exchange contracts: 0.16% (30 April 2021: 0.28%)
Currency bought
Currency sold Counterparty
Maturity date
Unrealised gain US$
% of Net Assets
USD 1,833,326 MXN 36,990,000 Northern Trust 17/12/2021 38,987 0.05MXN 20,000,000 USD 951,027 State Street 17/12/2021 19,148 0.03NOK 2,400,000 USD 268,454 State Street 22/11/2021 18,801 0.03USD 549,636 CZK 11,835,000 Northern Trust 17/12/2021 13,315 0.02AUD 600,000 USD 443,070 State Street 22/11/2021 9,332 0.01NOK 1,850,000 USD 216,429 Northern Trust 22/11/2021 4,997 0.01CAD 165,000 USD 130,227 Standard Chartered 17/12/2021 3,528 0.01AUD 200,000 USD 147,370 Standard Chartered 19/01/2022 3,462 0.00USD 223,000 PLN 870,000 Northern Trust 22/11/2021 3,460 0.00USD 191,296 PLN 747,000 State Street 22/11/2021 2,794 0.00GBP 595,000 USD 819,746 Northern Trust 17/12/2021 554 0.00CNH 6,402 USD 990 State Street 15/11/2021 11 0.00CNH 6,314 USD 976 State Street 15/11/2021 10 0.00CNH 21 USD 3 State Street 15/11/2021 0 0.00

65
Barings International Umbrella Fund Barings Global Bond FundSchedule of Investments (continued)
As at 31 October 2021
Financial assets at fair value through profit or loss (continued)
Open forward foreign currency exchange contracts: 0.16% (30 April 2021: 0.28%) (continued)
Currency bought
Currency sold Counterparty
Maturity date
Unrealised gain US$
% of Net Assets
CNH 21 USD 3 State Street 15/11/2021 0 0.00Total unrealised gain on open forward foreign currency exchange contracts 118,399 0.16
Total financial assets at fair value through profit or loss 70,822,238 98.13
Financial liabilities at fair value through profit or loss
Open Futures contracts: (0.10%) (30 April 2021: 0.00%)*
Nominal Amount
US$ DescriptionUnrealised
loss US$% of
Net Assets25 US 2 YR Note CBT Futures Dec 2021 (24,218) (0.03)25 US 5 YR Note CBT Futures Dec 2021 (47,071) (0.07)
Unrealised loss on Open Futures contracts (71,289) (0.10)
Open forward foreign currency exchange contracts: (0.58%) (30 April 2021: (0.53%))
Currency bought
Currency sold Counterparty
Maturity date
Unrealised loss US$
% of Net Assets
USD 4,413,414 AUD 6,049,000 State Street 19/01/2022 (148,488) (0.20)USD 2,427,653 NZD 3,508,000 Standard Chartered 19/01/2022 (85,675) (0.12)JPY 437,282,000 USD 3,929,132 State Street 19/01/2022 (80,500) (0.11)USD 3,410,067 EUR 2,943,800 State Street 19/01/2022 (27,626) (0.04)PLN 2,000,000 USD 526,261 State Street 22/11/2021 (21,571) (0.03)USD 963,268 SEK 8,391,000 State Street 22/11/2021 (21,403) (0.03)USD 601,921 SEK 5,230,000 State Street 22/11/2021 (11,812) (0.02)USD 331,217 ILS 1,067,000 State Street 22/11/2021 (7,134) (0.01)USD 578,432 EUR 500,000 Standard Chartered 19/01/2022 (5,455) (0.01)USD 500,594 SGD 680,000 State Street 22/11/2021 (4,600) (0.01)USD 141,917 CAD 180,000 State Street 17/12/2021 (3,998) 0.00USD 59,398 SEK 520,000 State Street 22/11/2021 (1,623) 0.00USD 34,693 NZD 50,000 Standard Chartered 19/01/2022 (1,130) 0.00USD 14,742 SGD 20,000 State Street 22/11/2021 (116) 0.00USD 14 CNH 93 State Street 15/11/2021 0 0.00USD 14 CNH 92 State Street 15/11/2021 0 0.00
Total unrealised loss on open forward foreign currency exchange contracts (421,131) (0.58)
Total financial liabilities at fair value through profit or loss (492,420) (0.68)
Fair value US$
% of Net Assets
Total investments at fair value through profit or loss 70,329,818 97.45Cash and cash equivalents 1,424,521 1.97Other net assets 418,831 0.58Net assets attributable to holders of redeemable participating units 72,173,170 100.00

66
Barings International Umbrella Fund Barings Global Bond FundSchedule of Investments (continued)
As at 31 October 2021
Analysis of Total Assets % of total assets**Transferable securities admitted to an official stock exchange listing or traded on a recognised market 97.19OTC financial derivative instruments 0.16Other assets 2.65
Total 100.00
* The counterparty for Open Future contracts is UBS.** Calculation based on the total assets of the Fund (excluding liabilities). This summary is a UCITS requirement.

67
Barings International Umbrella FundGeneral information
For the financial period ended 31 October 2021
Market timingRepeatedly purchasing and selling units in the Funds in response to short-term market fluctuations – known as ‘market timing’ – can disrupt Baring Asset Management Limited’s (the “Investment Manager”) investment strategy and increase the Funds’ expenses to the prejudice of all unitholders. The Funds are not intended for market timing or excessive trading. To deter these activities, the Directors of Baring International Fund Managers (Ireland) limited (the “Manager”) may refuse to accept an application for units from persons that they reasonably believe are engaged in market timing or are otherwise excessive or potentially disruptive to the Funds.
The Directors of the Manager reserve the right to redeem units from a unitholder on the basis of the circumstances of the unitholder concerned, or if it has reasonable grounds to believe that the unitholder is engaging in any activity which might result in the Funds or their unitholders as a whole suffering any legal, regulatory, reputational or other material disadvantage which the Funds or their unitholders as a whole might not otherwise have suffered.
UK reporting fund statusUK taxable investors in UK reporting funds are subject to tax on their units of the UK reporting funds’ income attributable to their holdings in the Fund, whether or not distributed, while typically any gains on disposal of their holdings are subject to capital gains tax.
Details of the unit classes which currently have UK reporting fund status are available at the Her Majesty's Revenue and Customs (“HMRC”) Collective Investment Schemes Centre website:
http://www.hmrc.gov.uk/cisc/offshore-funds.htm.
As stated above UK tax payers should note that, for each unit class with reporting fund status, their share of any amounts of income, if any, that has not been distributed will be subject to tax.
Further details will be made available on the Barings website: www.barings.com.

68
Barings International Umbrella FundAppendix 1 – Information for investors in Switzerland
For the financial period ended 31 October 2021
Baring International Fund Managers (Ireland) Limited (the “Manager”) has appointed BNP Paribas Securities Services, Paris, Succursale de Zurich, Selnaustrasse 16, CH-8002, Zurich, Switzerland, as representative and paying agent for Switzerland. Units are distributed in Switzerland by BNP Paribas Securities Services, Paris at the above address. Investors can obtain, free of charge, the Prospectus, the Key Investor Information Document(s) (“KIID(s)”), the last annual and interim reports, the Trusts Act 1990, as well as a list of the purchases and sales made on behalf of the Funds, in French, from the representative at the above address. Official publications for the Funds are found on the internet at www.fundinfo.com. Unit prices (Net Asset Value with the words "plus commissions") are published daily on the internet at www.fundinfo.com.
All the information appearing in these reports and accounts is solely with respect to those Funds of Barings International Umbrella Fund (the “Unit Trust”) which are licensed for public offer and marketing in or from Switzerland, namely: Barings ASEAN Frontiers Fund, Barings Asia Growth Fund, Barings Australia Fund, Barings Europa Fund, Barings Hong Kong China Fund and Barings Global Bond Fund.
Representative and paying agent for Switzerland
BNP Paribas Securities Services, Paris,Succursale de Zurich Selnaustrasse 16 CH-8002 Zurich Switzerland

69
Barings International Umbrella FundAppendix 1 – Information for investors in Switzerland (continued)
For the financial period ended 31 October 2021
Total Expense Ratio
Pursuant to a guideline from the SFAMA dated 16 May 2008, the Funds are required to publish a total expense ratio (“TER”) for the financial period ended 31 October 2021.
The TERs for each Fund for the financial period ended 31 October 2021 and financial year ended 30 April 2021 are as follows:
Name of Fund 31 October 2021 TER in %
30 April 2021 TER in %
Barings ASEAN Frontiers Fund - Class A 1.70 1.70Barings ASEAN Frontiers Fund - Class I 1.00 1.00Barings ASEAN Frontiers Fund - Class I USD Inc* 0.87 -Barings ASEAN Frontiers Fund - Class A AUD Hedged Acc 1.71 1.71Barings ASEAN Frontiers Fund - Class A CHF Hedged Acc** 1.71 0.09Barings ASEAN Frontiers Fund - Class I CHF Hedged Acc*** 1.01 0.06Barings ASEAN Frontiers Fund - Class A RMB Hedged Acc 1.71 1.71Barings ASEAN Frontiers Fund - Class A EUR Acc 1.70 1.70Barings Asia Growth Fund - Class A 1.70 1.70Barings Asia Growth Fund - Class I GBP Acc 1.00 1.00Barings Asia Growth Fund - Class I USD Acc 1.00 1.00Barings Asia Growth Fund - Class I EUR Acc 1.00 1.00Barings Australia Fund - Class A 1.70 1.70Barings Australia Fund - Class I 1.00 1.00Barings Europa Fund - Class A 1.70 1.70Barings Europa Fund - Class C 2.70 2.70Barings Hong Kong China Fund - Class A 1.70 1.70Barings Hong Kong China Fund - Class C 2.70 2.70Barings Hong Kong China Fund - Class A RMB Hedged Acc 1.71 1.71Barings Hong Kong China Fund - Class A USD Acc 1.70 1.70Barings Hong Kong China Fund - Class I 1.00 1.00Barings Global Bond Fund - Class A 1.20 1.20Barings Global Bond Fund - Class I 0.75 0.75Barings Global Bond Fund - Class A RMB Hedged Inc**** 0.91 -Barings Global Bond Fund - Class A RMB Hedged Acc***** 0.67 -
* The Barings ASEAN Frontiers Fund Class I USD Inc was launched on 25 May 2021.** The Barings ASEAN Frontiers Fund Class A CHF Hedged Acc was launched on 8 April 2021.*** The Barings ASEAN Frontiers Fund Class I CHF Hedged Acc was launched on 8 April 2021.**** The Barings Global Bond Fund Class A RMB Hedged Inc was launched on 4 June 2021.***** The Barings Global Bond Fund Class A RMB Hedged Acc was launched on 14 July 2021.
This information was established by the Manager, Baring International Fund Managers (Ireland) Limited, based on the data contained in the Statement of Comprehensive Income for the above reference period (Fund management fees, administration fees, depositary fees, taxes and duties, and all other commissions and expenses appearing as per the breakdown of the Statement of Comprehensive Income and not already included in any of the foregoing categories). The TER is calculated using the average daily Net Asset Value for the period.

70
Barings International Umbrella FundAppendix 1 – Information for investors in Switzerland (continued)
For the financial period ended 31 October 2021
Trailer fees and reimbursementsTrailer fees (Bestandespflegekommissionen) may only be paid to the sales agents/partners indicated below:
• authorised sales agents (distributors) within the meaning of Article 19, Para 1, Collective Investment Funds Act (“CISA”);• sales agents (distributors) exempted from the authorisation requirement within the meaning of Article 19, Para 4, CISA and Article
8 Collective Investment Schemes Ordinance (“CISO”);• sales partners who place Fund units exclusively with institutional investors with professional treasury facilities; and/or• sales partners who place Fund units with their clients exclusively on the basis of a written commission-based asset management
mandate.Reimbursements (Rückvergütungen) may only be paid to the institutional investors detailed below who from a commercial perspective are holding the Fund units for third parties:
• life insurance companies (in respect of Fund units held for the account of insured persons or to cover obligations towards insured persons);
• pension funds and other retirement provision institutions (in respect of Fund units held for the account of beneficiaries);• investment foundations (in respect of Fund units held for the account of in-house funds);• Swiss fund management companies (in respect of Fund units held for the account of the funds managed);• foreign fund management companies and providers (in respect of Fund units held for the account of managed funds and investing
unitholders); and/or• investment companies (in respect of the investment of the company assets).

71
Barings International Umbrella FundAppendix 2 – Information for investors in Germany
For the financial period ended 31 October 2021
The Prospectus, the Key Investor Information Document(s) (“KIID(s)”), a list of portfolio changes, the Unit Trust Act 1990, as well as the annual and the interim reports are available free of charge in hard copy at the offices of the German Paying and Information Agent and the Further German Information Agent.
German Paying and Information Agent
Deutsche Bank AG Global Transaction Banking Issuer Services – Global Securities Services Post IPO Services Taunusanlage 12 60325 Frankfurt am Main Germany
Further German Paying and Information Agent
Baring Asset Management GmbH Ulmenstraße 5460325 Frankfurt am MainGermany
Special risks resulting from tax publication requirements in Germany Foreign investment companies (such as Baring International Fund Managers (Ireland) Limited (the “Manager”)) must provide documentation to the German fiscal authorities upon request, e.g. in order to verify the accuracy of the published tax information. The basis upon which such figures are calculated is open to interpretation and it cannot be guaranteed that the German fiscal authorities will accept the Manager’s calculation methodology in every material respect. In addition, if it transpires that these publications are incorrect, any subsequent correction will, as a general rule, not have retrospective effect and will, as a general rule, only take effect during the current period. Consequently, the correction may positively or negatively affect the investors who receive a distribution or an attribution of deemed income distributions in the current period.

72
Barings International Umbrella Fund Barings ASEAN Frontiers Fund
Appendix 3 – Additional information Hong Kong CodeFor the financial period ended 31 October 2021
Barings ASEAN Frontiers Fund is registered for sale in Hong Kong.
Highest issue and lowest redemption pricesHighest issue prices during the period/year*
31 October 2021 30 April 2021 30 April 2020 30 April 2019 30 April 2018Class A USD Inc 290.60 275.67 226.11 223.84 242.33Class I USD Inc** 111.08 N/A N/A N/A N/AClass A AUD Hedged Acc 322.36 304.91 254.71 254.54 274.70Class A CHF Hedged Acc*** 110.43 102.86 N/A N/A N/AClass A EUR Inc 249.82 226.62 204.94 192.21 195.22Class A GBP Inc 211.33 198.10 181.67 166.03 173.18Class A EUR Acc 130.88 118.04 105.32 N/A N/AClass A RMB Hedged Acc 2,218.02 2,058.63 1,651.77 1,613.41 1,730.41Class A USD Acc 309.49 291.92 236.33 232.08 249.99Class I CHF Hedged Acc**** 110.83 102.89 N/A N/A N/AClass I EUR Acc 280.69 251.98 223.23 206.66 207.15Class I GBP Acc 238.71 221.46 199.75 179.46 184.75Class I USD Acc 337.47 316.81 254.56 247.01 265.59
Highest issue prices during the period/year* (continued)
30 April 2017 30 April 2016 30 April 2015 30 April 2014 30 April 2013Class A USD Inc 189.31 190.22 199.83 221.42 213.79Class I USD Inc** N/A N/A N/A N/A N/AClass A AUD Hedged Acc 213.84 211.54 217.74 N/A N/AClass A CHF Hedged Acc*** N/A N/A N/A N/A N/AClass A EUR Inc 174.06 170.76 183.26 172.14 163.52Class A GBP Inc 150.68 124.74 132.64 146.39 138.87Class A EUR Acc N/A N/A N/A N/A N/AClass A RMB Hedged Acc 1,319.11 1,265.12 1,294.76 1,409.29 1,353.47Class A USD Acc 195.15 195.18 204.24 224.08 215.14Class I CHF Hedged Acc**** N/A N/A N/A N/A N/AClass I EUR Acc 183.57 178.15 189.78 177.00 167.15Class I GBP Acc 159.39 130.77 138.18 150.58 142.03Class I USD Acc 205.63 203.76 212.07 205.76 N/A
Lowest redemption prices during the period/year*
31 October 2021 30 April 2021 30 April 2020 30 April 2019 30 April 2018Class A USD Inc 254.35 165.90 133.46 184.89 187.74Class I USD Inc** 100.06 N/A N/A N/A N/AClass A AUD Hedged Acc 282.67 185.15 147.73 209.65 212.88Class A CHF Hedged Acc*** 96.99 98.18 N/A N/A N/AClass A EUR Inc 209.79 151.10 124.68 162.94 163.28Class A GBP Inc 180.88 132.27 115.78 144.31 144.25Class A EUR Acc 109.90 78.67 64.07 N/A N/AClass A RMB Hedged Acc 1,921.18 1,223.33 973.94 1,342.20 1,321.94Class A USD Acc 270.88 175.67 139.49 191.70 193.69Class I CHF Hedged Acc**** 97.05 98.19 N/A N/A N/AClass I EUR Acc 235.01 167.08 135.96 174.58 172.66Class I GBP Acc 203.69 147.06 127.01 155.40 153.09Class I USD Acc 294.46 189.59 150.43 204.74 204.82

73
Barings International Umbrella Fund Barings ASEAN Frontiers Fund
Appendix 3 – Additional information Hong Kong Code (continued)For the financial period ended 31 October 2021
Lowest redemption prices during the period/year* (continued)
30 April 2017 30 April 2016 30 April 2015 30 April 2014 30 April 2013Class A USD Inc 163.95 147.79 179.86 163.85 154.23Class I USD Inc** N/A N/A N/A N/A N/AClass A AUD Hedged Acc 185.07 165.79 196.58 N/A N/AClass A CHF Hedged Acc*** N/A N/A N/A N/A N/AClass A EUR Inc 146.39 129.80 132.22 122.57 123.90Class A GBP Inc 112.33 94.92 108.53 101.17 100.08Class A EUR Acc N/A N/A N/A N/A N/AClass A RMB Hedged Acc 1,120.31 986.52 1,166.61 1,048.02 975.48Class A USD Acc 169.00 152.11 183.80 165.81 155.19Class I CHF Hedged Acc**** N/A N/A N/A N/A N/AClass I EUR Acc 153.69 135.60 137.95 126.27 126.09Class I GBP Acc 118.58 99.72 113.61 104.50 101.91Class I USD Acc 177.76 159.22 191.08 170.85 N/A
* The above highest issue prices and lowest redemption prices during the period/year are quoted in their respective share classes’ denomination currency.** The Barings ASEAN Frontiers Fund Class I USD Inc was launched on 25 May 2021.*** The Barings ASEAN Frontiers Fund Class A CHF Hedged Acc was launched on 8 April 2021.**** The Barings ASEAN Frontiers Fund Class I CHF Hedged Acc was launched on 8 April 2021.
Statement of movements in portfolio holdings31 October 2021
% of NAV30 April 2021
% of NAV30 April 2020
% of NAV30 April 2019
% of NAVChina 4.11 1.79 0.63 1.30Indonesia 21.26 17.21 22.91 25.37Malaysia 8.94 10.33 9.67 7.22Philippines 7.62 4.18 6.95 11.42Singapore 29.46 31.65 25.50 25.11Thailand 22.75 30.46 25.13 22.49Vietnam 2.40 3.00 5.75 5.75Warrants 0.18 0.08 0.01 0.01Investment Funds – – 3.74 1.02Open forward foreign currency exchange contracts 0.04 0.01 0.03 –Total investments 96.76 98.71 100.32 99.69Cash/(bank overdraft) 3.55 1.47 (0.18) 0.12Other net (liabilities)/assets (0.31) (0.18) (0.14) 0.19Total net assets 100.00 100.00 100.00 100.00 * Movements in portfolio holdings have been analysed above based on a % of Net Asset Value invested in each geographic location. The movement in each country’s position between period/year has to be inferred.
Highest issue and lowest redemption prices (continued)

74
Barings International Umbrella Fund Barings ASEAN Frontiers Fund
Appendix 3 – Additional information Hong Kong Code (continued)For the financial period ended 31 October 2021
Portfolio information
Top Ten Holdings % of Net Assets
Sea ADR 9.20
DBS 5.60
Bank Central Asia 5.53
United Overseas Bank 4.11
Astra International 3.72
Bank Rakyat Indonesia 3.08
Bangkok Dusit Medical Services 2.93
Press Metal Aluminium 2.77
International Container Terminal Services 2.46
iFast 2.29

75
Barings International Umbrella Fund Barings Asia Growth Fund
Appendix 3 – Additional information Hong Kong CodeFor the financial period ended 31 October 2021
Barings Asia Growth Fund is registered for sale in Hong Kong.
Highest Issue and lowest redemption pricesHighest issue prices during the period/year*
31 October 2021 30 April 2021 30 April 2020 30 April 2019 30 April 2018Class A USD Inc 165.03 179.62 104.65 105.51 113.20Class A EUR Inc 138.83 179.61 94.16 89.20 92.49Class A GBP Inc 119.16 179.61 80.40 78.42 81.24Class I GBP Acc 124.60 187.07 82.87 79.78 82.45Class I USD Acc 172.28 187.04 107.83 107.33 114.90Class I EUR Acc 144.95 187.08 97.05 90.80 93.94
Highest issue prices during the period/year* (continued)
30 April 2017 30 April 2016 30 April 2015 30 April 2014 30 April 2013Class A USD Inc 79.03 78.07 77.35 65.11 64.40Class A EUR Inc 72.51 71.67 72.45 50.62 49.30Class A GBP Inc 61.89 50.74 52.24 42.97 43.09Class I GBP Acc 62.54 50.80 52.27 N/A N/AClass I USD Acc 79.88 78.14 N/A N/A N/AClass I EUR Acc 73.33 60.73 N/A N/A N/A
Lowest redemption prices during the period/year*
31 October 2021 30 April 2021 30 April 2020 30 April 2019 30 April 2018Class A USD Inc 148.08 88.88 74.27 78.82 79.03Class A EUR Inc 124.48 88.88 69.24 69.45 71.98Class A GBP Inc 107.14 88.88 64.41 61.57 61.10Class I GBP Acc 111.78 92.06 66.47 62.77 61.76Class I USD Acc 154.88 92.04 76.63 80.37 79.89Class I EUR Acc 129.86 92.06 71.45 70.87 72.81
Lowest redemption prices during the period/year* (continued)
30 April 2017 30 April 2016 30 April 2015 30 April 2014 30 April 2013Class A USD Inc 62.59 59.46 61.96 54.98 52.74Class A EUR Inc 55.81 51.74 44.48 41.88 41.98Class A GBP Inc 42.80 37.82 36.56 35.59 33.83Class I GBP Acc 43.06 37.91 46.53 N/A N/AClass I USD Acc 62.97 59.59 N/A N/A N/AClass I EUR Acc 56.17 53.92 N/A N/A N/A
*The above highest issue prices and lowest redemption prices during the period/year are quoted in their respective share classes’ denomination currency.

76
Barings International Umbrella Fund Barings Asia Growth Fund
Appendix 3 – Additional information Hong Kong Code (continued)For the financial period ended 31 October 2021
Statement of movements in portfolio holdings31 October 2021
% of NAV30 April 2021
% of NAV30 April 2020
% of NAV30 April 2019
% of NAVChina 34.90 39.51 40.76 38.52Hong Kong 6.49 7.17 7.88 9.25India 14.03 10.50 9.80 12.56Indonesia 0.81 – 2.30 3.03Malaysia 0.04 0.97 1.55 0.38Philippines – – 1.43 0.99Singapore 6.86 4.86 2.27 2.45South Korea 19.96 19.82 12.69 12.53Taiwan 16.57 14.12 12.43 12.59Thailand 0.80 2.67 3.41 2.84Vietnam 0.24 0.23 0.57 1.25Investment Funds – – – 2.46Total investments 100.70 99.85 95.09 98.85Cash 0.03 0.68 3.81 1.33Other net (liabilities)/assets (0.73) (0.53) 1.10 (0.18)Total net assets 100.00 100.00 100.00 100.00 * Movements in portfolio holdings have been analysed above based on a % of Net Asset Value invested in each geographic location. The movement in each country’s position between period/year has to be inferred. Portfolio information
Top Ten Holdings % of Net Assets
Taiwan Semiconductor Manufacturing 8.62
Tencent 6.04
Samsung Electronics 4.93
Sea ADR 4.88
Li Ning 3.34
Reliance Industries 2.71
Meituan Dianping 2.69
AIA 2.68
Alibaba 2.56
NAVER 2.52

77
Barings International Umbrella Fund Barings Australia Fund
Appendix 3 – Additional information Hong Kong CodeFor the financial period ended 31 October 2021
Barings Australia Fund is registered for sale in Hong Kong.
Highest Issue and lowest redemption pricesHighest issue prices during the period/year*
31 October 2021 30 April 2021 30 April 2020 30 April 2019 30 April 2018Class A USD Inc 150.38 146.24 126.76 123.36 124.61Class A AUD Inc 200.93 187.77 185.65 169.04 165.07Class A EUR Inc 129.33 120.90 114.84 107.65 103.01Class A GBP Inc 109.29 105.10 99.84 96.35 90.80Class I GBP Acc 135.96 129.14 118.05 110.77 101.84Class I USD Acc 187.04 179.69 150.36 141.85 139.76
Highest issue prices during the period/year* (continued)
30 April 2017 30 April 2016 30 April 2015 30 April 2014 30 April 2013Class A USD Inc 114.11 116.78 131.38 132.90 136.13Class A AUD Inc 150.18 148.24 153.98 140.45 131.58Class A EUR Inc 106.46 104.32 111.48 100.72 104.12Class A GBP Inc 91.42 76.50 80.93 85.37 90.02Class I GBP Acc 100.29 82.35 85.15 87.13 N/AClass I USD Acc 124.89 118.38 N/A N/A N/A
Lowest redemption prices during the period/year*
31 October 2021 30 April 2021 30 April 2020 30 April 2019 30 April 2018Class A USD Inc 137.32 87.89 71.74 101.97 104.77Class A AUD Inc 182.84 136.31 125.28 143.93 138.77Class A EUR Inc 116.03 80.02 66.99 89.36 86.60Class A GBP Inc 100.05 70.02 62.22 80.58 76.34Class I GBP Acc 124.08 85.45 73.90 92.87 85.26Class I USD Acc 170.73 107.25 85.21 117.52 117.01
Lowest redemption prices during the period/year* (continued)
30 April 2017 30 April 2016 30 April 2015 30 April 2014 30 April 2013Class A USD Inc 99.96 88.97 107.84 108.12 100.20Class A AUD Inc 132.51 125.96 128.93 117.26 102.18Class A EUR Inc 90.49 78.45 86.54 82.48 80.17Class A GBP Inc 70.17 59.76 68.54 69.46 64.33Class I GBP Acc 76.65 64.12 72.03 71.08 N/AClass I USD Acc 109.45 95.70 N/A N/A N/A *The above highest issue prices and lowest redemption prices during the period/year are quoted in their respective share classes’ denomination currency.

78
Barings International Umbrella Fund Barings Australia Fund
Appendix 3 – Additional information Hong Kong Code (continued)For the financial period ended 31 October 2021
Statement of movements in portfolio holdings31 October 2021
% of NAV30 April 2021
% of NAV30 April 2020
% of NAV30 April 2019
% of NAVCommunication Services 3.96 2.96 0.72 –Consumer Discretionary 7.84 7.38 3.62 4.83Consumer Staples 8.93 9.87 13.41 8.61Energy 2.34 3.19 3.99 8.89Financials 32.16 32.02 29.92 32.58Health Care 11.40 14.33 16.22 13.55Industrials 3.68 3.25 6.52 2.50Information Technology 2.63 – – 3.14Materials 19.50 21.27 18.28 20.60Real Estate 5.25 5.25 4.69 4.55Investment Funds – – 1.39 0.18Total investments 97.69 99.52 98.76 99.43Bank overdraft/(cash) 1.93 (1.26) 2.54 0.71Other net assets/(liabilities) 0.38 1.74 (1.30) (0.14)Total net assets 100.00 100.00 100.00 100.00 * Movements in portfolio holdings have been analysed above based on a % of Net Asset Value invested in each industry sector. The movement in each sector’s position between period/year has to be inferred. Portfolio information
Top Ten Holdings % of Net Assets
National Australia Bank 7.46
BHP Billiton 7.34
Macquarie 7.10
Commonwealth Bank of Australia 5.51
Goodman 5.25
CSL 4.83
Australia & New Zealand Banking Group 4.80
Coles 3.84
Aristocrat Leisure 3.77
Amcor 3.05

79
Barings International Umbrella Fund Barings Europa Fund
Appendix 3 – Additional information Hong Kong CodeFor the financial period ended 31 October 2021
Barings Europa Fund is registered for sale in Hong Kong.
Highest Issue and lowest redemption pricesHighest issue prices during the period/year*
31 October 2021 30 April 2021 30 April 2020 30 April 2019 30 April 2018Class A USD Inc 68.03 63.68 57.84 62.19 66.02Class A EUR Inc 57.82 63.68 52.71 52.65 54.58Class C EUR Inc 56.11 61.76 51.19 51.52 53.32Class C USD Inc 66.26 61.90 56.34 61.00 64.64Class I EUR Acc N/A N/A N/A N/A 50.14
Highest issue prices during the period/year* (continued)
30 April 2017 30 April 2016 30 April 2015 30 April 2014 30 April 2013Class A USD Inc 52.67 54.51 55.64 55.73 45.53Class A EUR Inc 48.15 49.08 49.19 40.40 34.03Class C EUR Inc 46.74 48.10 47.85 39.41 33.34Class C USD Inc 51.24 53.63 54.67 54.45 44.74Class I EUR Acc 48.76 42.18 N/A N/A N/A
Lowest redemption prices during the period/year*
31 October 2021 30 April 2021 30 April 2020 30 April 2019 30 April 2018Class A USD Inc 61.32 41.95 33.33 44.98 52.10Class A EUR Inc 50.80 41.95 31.00 39.52 43.07Class C EUR Inc 49.53 41.07 30.08 38.45 42.18Class C USD Inc 59.92 41.16 32.41 43.84 51.13Class I EUR Acc N/A N/A N/A N/A 48.71
Lowest redemption prices during the period/year* (continued)
30 April 2017 30 April 2016 30 April 2015 30 April 2014 30 April 2013Class A USD Inc 41.77 42.10 44.73 41.87 33.06Class A EUR Inc 37.93 37.13 35.10 31.94 26.82Class C EUR Inc 37.13 36.19 34.32 31.37 26.48Class C USD Inc 40.98 41.12 43.81 41.20 32.70Class I EUR Acc 38.28 37.13 N/A N/A N/A
*The above highest issue prices and lowest redemption prices during the period/year are quoted in their respective share classes’ denomination currency.

80
Barings International Umbrella Fund Barings Europa Fund
Appendix 3 – Additional information Hong Kong Code (continued)For the financial period ended 31 October 2021
Statement of movements in portfolio holdings31 October 2021
% of NAV30 April 2021
% of NAV30 April 2020
% of NAV30 April 2019
% of NAVCommunication Services 4.58 4.65 3.10 –Consumer Discretionary 2.88 1.80 9.72 10.77Consumer Staples 12.19 11.71 7.82 4.65Energy 6.24 7.32 10.72 10.11Financials 13.57 15.10 20.69 25.90Health Care 13.57 13.99 15.66 8.71Industrials 7.46 10.82 7.22 13.81Information Technology 22.35 19.47 14.22 17.31Materials 14.47 12.71 8.78 8.66Utilities 2.06 1.98 – –Investment Funds – – 2.07 0.27Total investments 99.37 99.55 100.00 100.19Cash/(bank overdraft) 0.96 0.46 0.05 (0.01)Other net liabilities (0.33) (0.01) (0.05) (0.18)Total net assets 100.00 100.00 100.00 100.00
* Movements in portfolio holdings have been analysed above based on a % of Net Asset Value invested in each Industry sector. The movement in each sectors position between period/year has to be inferred. Portfolio information
Top Ten Holdings % of Net Assets
Nestle 7.60
Roche 7.05
Capgemini 5.31
AstraZeneca 4.91
AXA 4.55
ASML 4.45
KBC Ancora 4.40
Adyen 3.72
Royal Dutch Shell 3.68
CRH 3.60

81
Barings International Umbrella Fund Barings Hong Kong China Fund
Appendix 3 – Additional information Hong Kong CodeFor the financial period ended 31 October 2021
Barings Hong Kong Fund is registered for sale in Hong Kong.
Highest Issue and lowest redemption pricesHighest issue prices during the period/year*
31 October 2021 30 April 2021 30 April 2020 30 April 2019 30 April 2018Class A USD Inc 2,036.86 2,419.60 1,336.81 1,328.56 1,368.57Class A EUR Inc 1,713.68 2,006.08 1,211.16 1,123.27 1,111.17Class A GBP Inc 1,470.74 1,745.27 1,024.98 987.26 975.60Class A HKD Inc 15,817.89 18,756.46 10,385.16 10,423.83 10,699.31Class A RMB Hedged Acc 14,767.84 17,420.18 9,518.35 9,409.77 9,629.11Class A USD Acc 2,105.05 2,500.61 1,379.40 1,366.36 1,406.45Class C EUR Inc 1,578.81 1,854.92 1,129.39 1,061.90 1,051.73Class C USD Inc 1,864.55 2,223.01 1,239.66 1,247.91 1,287.05Class I GBP Acc 1,578.98 1,868.96 1,087.70 1,032.42 2,031.77Class I USD Acc 2,185.20 2,589.15 1,417.39 1,388.22 1,425.34
Highest issue prices during the period/year* (continued)
30 April 2017 30 April 2016 30 April 2015 30 April 2014 30 April 2013Class A USD Inc 985.11 1,164.65 1,158.44 908.67 865.76Class A EUR Inc 914.93 1,067.64 1,090.90 671.37 657.81Class A GBP Inc 783.45 755.55 786.68 557.06 560.48Class A HKD Inc 7,664.58 9,029.26 8,978.65 7,044.26 6,712.29Class A RMB Hedged Acc 6,814.08 7,543.18 1,123.98 5,311.09 N/AClass A USD Acc 1,010.31 1,186.21 1,174.37 914.09 865.87Class C EUR Inc 866.86 1,023.92 1,042.60 645.51 634.55Class C USD Inc 926.99 1,109.55 1,099.34 867.81 829.15Class I GBP Acc 810.73 769.38 796.71 509.71 N/AClass I USD Acc 1,018.81 937.79 N/A N/A N/A
Lowest redemption prices during the period/year*
31 October 2021 30 April 2021 30 April 2020 30 April 2019 30 April 2018Class A USD Inc 1,628.43 1,185.84 1,003.01 952.92 965.73Class A EUR Inc 1,411.44 1,094.35 928.30 839.71 881.20Class A GBP Inc 1,199.59 952.20 823.31 747.73 746.37Class A HKD Inc 12,680.16 9,193.17 7,786.44 7,476.62 7,516.38Class A RMB Hedged Acc 11,877.29 8,435.64 7,142.60 6,787.11 6,697.37Class A USD Acc 1,682.94 1,225.53 1,034.97 980.04 992.46Class C EUR Inc 1,296.86 1,019.85 869.27 790.68 836.05Class C USD Inc 1,486.65 1,098.08 928.53 891.51 910.37Class I GBP Acc 1,290.28 1,014.17 869.88 784.10 1,295.69Class I USD Acc 1,750.33 1,261.94 1,064.77 998.49 1,000.92
Lowest redemption prices during the period/year* (continued)
30 April 2017 30 April 2016 30 April 2015 30 April 2014 30 April 2013Class A USD Inc 771.16 711.44 781.84 705.93 695.05Class A EUR Inc 681.73 627.45 563.57 537.71 553.96Class A GBP Inc 526.68 489.77 462.74 457.00 437.12Class A HKD Inc 5,988.92 5,542.80 6,060.67 5,475.19 5,391.38Class A RMB Hedged Acc 5,212.91 4,733.71 566.61 4,971.59 N/AClass A USD Acc 790.87 724.62 792.51 710.14 695.14Class C EUR Inc 651.83 597.34 543.66 519.26 536.15Class C USD Inc 732.50 672.92 749.13 677.15 668.20Class I GBP Acc 542.73 500.54 466.48 476.25 N/AClass I USD Acc 793.96 726.47 N/A N/A N/A
*The above highest issue prices and lowest redemption prices during the period/year are quoted in their respective share classes’ denomination currency.
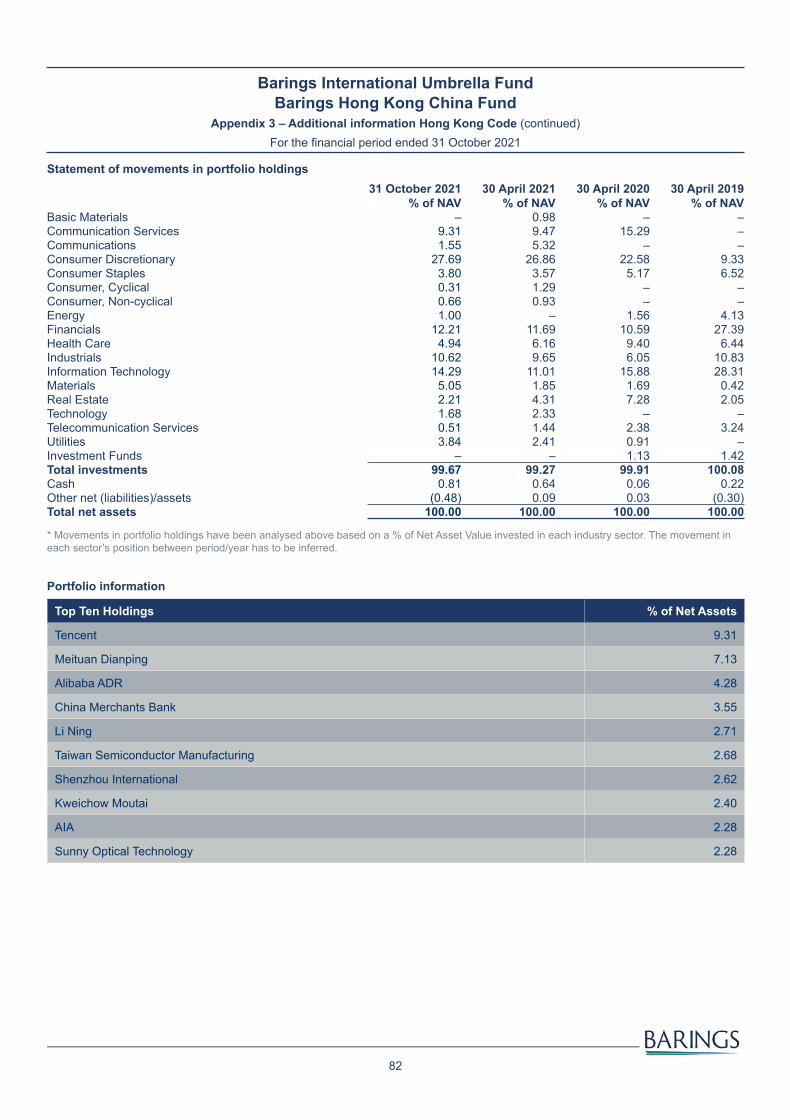
82
Barings International Umbrella Fund Barings Hong Kong China Fund
Appendix 3 – Additional information Hong Kong Code (continued)For the financial period ended 31 October 2021
Statement of movements in portfolio holdings31 October 2021
% of NAV30 April 2021
% of NAV30 April 2020
% of NAV30 April 2019
% of NAVBasic Materials – 0.98 – –Communication Services 9.31 9.47 15.29 –Communications 1.55 5.32 – –Consumer Discretionary 27.69 26.86 22.58 9.33Consumer Staples 3.80 3.57 5.17 6.52Consumer, Cyclical 0.31 1.29 – –Consumer, Non-cyclical 0.66 0.93 – –Energy 1.00 – 1.56 4.13Financials 12.21 11.69 10.59 27.39Health Care 4.94 6.16 9.40 6.44Industrials 10.62 9.65 6.05 10.83Information Technology 14.29 11.01 15.88 28.31Materials 5.05 1.85 1.69 0.42Real Estate 2.21 4.31 7.28 2.05Technology 1.68 2.33 – –Telecommunication Services 0.51 1.44 2.38 3.24Utilities 3.84 2.41 0.91 –Investment Funds – – 1.13 1.42Total investments 99.67 99.27 99.91 100.08Cash 0.81 0.64 0.06 0.22Other net (liabilities)/assets (0.48) 0.09 0.03 (0.30)Total net assets 100.00 100.00 100.00 100.00
* Movements in portfolio holdings have been analysed above based on a % of Net Asset Value invested in each industry sector. The movement in each sector’s position between period/year has to be inferred. Portfolio information
Top Ten Holdings % of Net Assets
Tencent 9.31
Meituan Dianping 7.13
Alibaba ADR 4.28
China Merchants Bank 3.55
Li Ning 2.71
Taiwan Semiconductor Manufacturing 2.68
Shenzhou International 2.62
Kweichow Moutai 2.40
AIA 2.28
Sunny Optical Technology 2.28

83
Barings International Umbrella Fund Barings Global Bond Fund
Appendix 3 – Additional information Hong Kong CodeFor the financial period ended 31 October 2021
Barings Global Bond Fund is registered for sale in Hong Kong.
Highest Issue and lowest redemption pricesHighest issue prices during the period/year*
31 October 2021 30 April 2021 30 April 2020 30 April 2019 30 April 2018Class A USD Inc 28.10 29.55 28.73 25.47 26.03Class A EUR Inc 23.79 24.59 25.14 22.69 22.42Class A GBP Inc 20.49 22.44 22.66 19.91 19.94Class A RMB Hedged Inc** 101.39 N/A N/A N/A N/AClass A RMB Hedged Acc*** 101.66 N/A N/A N/A N/AClass I GBP Inc 20.52 22.50 22.71 19.94 19.98Class I USD Acc 30.76 32.19 30.84 26.96 27.26
Highest issue prices during the period/year* (continued)
30 April 2017 30 April 2016 30 April 2015 30 April 2014 30 April 2013Class A USD Inc 26.80 26.07 27.70 28.02 28.77Class A EUR Inc 24.07 23.17 23.90 21.35 23.11Class A GBP Inc 21.16 18.48 17.25 18.07 18.47Class A RMB Hedged Inc** N/A N/A N/A N/A N/AClass A RMB Hedged Acc*** N/A N/A N/A N/A N/AClass I GBP Inc 21.21 18.53 23.96 18.10 18.46Class I USD Acc 27.81 26.94 27.97 27.67 N/A
Lowest redemption prices during the period/year*
31 October 2021 30 April 2021 30 April 2020 30 April 2019 30 April 2018Class A USD Inc 26.85 26.32 25.00 24.01 24.28Class A EUR Inc 22.71 23.02 22.36 20.96 20.62Class A GBP Inc 19.47 19.93 19.24 18.42 18.11Class A RMB Hedged Inc** 97.44 N/A N/A N/A N/AClass A RMB Hedged Acc*** 97.69 N/A N/A N/A N/AClass I GBP Inc 19.53 19.97 19.26 18.44 18.16Class I USD Acc 29.43 28.48 26.59 25.37 25.30
Lowest redemption prices during the period/year* (continued)
30 April 2017 30 April 2016 30 April 2015 30 April 2014 30 April 2013Class A USD Inc 23.66 24.27 24.92 26.11 27.31Class A EUR Inc 22.39 21.64 19.73 19.31 20.54Class A GBP Inc 17.43 15.51 16.08 16.06 17.14Class A RMB Hedged Inc** N/A N/A N/A N/A N/AClass A RMB Hedged Acc*** N/A N/A N/A N/A N/AClass I GBP Inc 17.46 15.53 19.76 16.09 17.35Class I USD Acc 24.62 24.86 25.39 26.80 N/A
* The above highest issue prices and lowest redemption prices during the period/year are quoted in their respective share classes’ denomination currency. ** The Barings Global Bond Fund Class A RMB Hedged Inc was launched on 4 June 2021.*** The Barings Global Bond Fund Class A RMB Hedged Acc was launched on 14 July 2021.

84
Barings International Umbrella Fund Barings Global Bond Fund
Appendix 3 – Additional information Hong Kong Code (continued)For the financial period ended 31 October 2021
Statement of movements in portfolio holdings31 October 2021
% of NAV30 April 2021
% of NAV30 April 2020
% of NAV30 April 2019
% of NAVAustralian dollar 7.74 9.23 1.32 4.05Canadian dollar 1.83 1.69 9.12 1.66Czech koruna 0.71 2.41 – –Euro 36.58 34.60 20.53 27.97Hungarian forint – – 1.76 1.91Israeli new shekel 0.85 0.77 0.95 –Japanese yen 11.17 10.42 2.88 5.64Mexican pesos 2.53 3.73 3.60 2.68New Zealand dollar 2.53 3.81 4.19 3.79Polish zloty 1.13 5.68 5.09 3.70Pound sterling 3.98 3.53 5.13 6.65Singapore dollar 1.09 1.01 – –South African rand – – – 0.38Swedish krona 2.54 0.75 – –Swiss franc – – 0.82 1.14US dollar 25.29 20.70 39.23 39.24Future contracts (0.10) – 0.11 –Open forward foreign currency exchange contracts (0.42) (0.25) 1.52 (0.09)Total investments 97.45 98.08 96.25 98.72Cash 1.97 1.45 3.05 0.50Other net assets 0.58 0.47 0.70 0.78Total net assets 100.00 100.00 100.00 100.00
* Movements in portfolio holdings have been analysed above based on a % of Net Asset Value invested in each geographic location. The movement in each country’s position between period/year has to be inferred. Portfolio information
Top Ten Holdings % of Net Assets
Italy (Republic of) 1.50% 01/06/2025 6.51
US Treasury Note 1.13% 28/02/2027 5.79
US Treasury Bond 1.88% 15/02/2051 5.29
Japan Government Twenty Year Bond 0.50% 20/03/2041 4.56
New South Wales Treasury 3.00% 20/03/2028 4.44
US Treasury Note/Bond 1.75% 15/05/2022 4.05
UK (Govt of) 1.25% 22/10/2041 3.98
Japan (Govt of) 1.80% 20/09/2043 3.60
Spain (Kingdom of) 1.95% 30/04/2026 3.30
Spain (Kingdom of) 1.45% 30/04/2029 2.84

Barings International Umbrella Fund Barings ASEAN Frontiers Fund
Appendix 4 – Significant Changes in Portfolio CompositionFor the financial period ended 31 October 2021
85
Cost Proceeds Purchases US$'000 Sales US$'000 Bank Rakyat Indonesia 10,589 PTT Global Chemical 7,677Gulf Energy Development 10,572 United Paper 6,675Globe Telecom 10,333 Sea 5,645Frencken 8,339 Sri Trang Agro-Industry 4,450Yangzijiang Shipbuilding 8,308 Hartalega 3,977Home Product Center 7,440 Asian Sea 3,296TDCX 6,334 Viettel Post Joint Stock 2,825Bukalapak.com 6,053 Indocement Tunggal Prakarsa 2,812SITC International 5,989 Mapletree Logistics Trust Reits 2,709UMS 5,869 Flat Glass 2,613Astra International 5,437 Credit Bureau Asia 2,543Monde Nissin 4,844 NanoFilm Technologies International 2,095Bank Rakyat Indonesia Agroniaga 4,236 Thai Oil 2,088Vietnam Dairy Products 3,872 DBS 2,032Press Metal Aluminium 3,818 Ichitan 1,791Bangkok Dusit Medical Services 3,785 AEM 1,575CTOS Digital Berhad 3,562 Bank Negara Indonesia Persero 1,493Bank Central Asia 3,530 Vietnam Engine & Agricultural Machinery 1,430Indofood CBP Sukses Makmur 3,328 Srisawad PCL 1,189iFast 3,161 KCE Electronics 729CP ALL 2,332Airports of Thailand 2,229Minor International 2,211AC Energy 2,062Vale Indonesia 1,649International Container Terminal Services 1,460
Listed above are aggregate purchases of securities exceeding one percent of the total value of purchases for the financial period ended 31 October 2021 and aggregate sales of securities greater than one percent of the total value of sales for the financial period ended 31 October 2021.
At a minimum, the largest 20 purchases and sales are disclosed, if applicable.

Barings International Umbrella Fund Barings Asia Growth Fund
Appendix 4 – Significant Changes in Portfolio Composition (continued)For the financial period ended 31 October 2021
86
Cost Proceeds Purchases US$'000 Sales US$'000Alibaba 4,513 Alibaba 6,381Wuxi Biologics Cayman 3,651 China Construction Bank 5,392Meituan Dianping 3,207 Sands China 3,638Krafton 2,807 Pegavison 3,086eMemory Technology 2,567 PTT Global Chemical 2,682Gland Pharma 2,359 Tata Steel 2,395BOC Hong Kong 2,353 IndiaMart InterMesh 2,165Zomato 2,337 Baidu 2,029Huaneng Power International 2,316 BOC Hong Kong 1,905Fuyao Glass Industry 2,229 Anhui Conch Cement 1,884SK IE Technology 1,986 NAVER 1,857Kindstar Globalgene Technology 1,924 Pentamaster 1,831Will Semiconductor 1,846 Kia 1,771Anhui Conch Cement 1,838 Meituan Dianping 1,749Astra International 1,805 21Vianet 1,746Hon Hai Precision Industry 1,688 Dixon Technologies 1,654TDCX 1,322 Li Ning 1,516Kweichow Moutai 1,246 Kuaishou Technology 1,467MediaTek 1,241 Li Auto 1,438Orient Overseas 1,231 Yidu Tech 1,177Divi's Laboratories 1,161 MediaTek 1,120KakaoBank 1,125 Asian Sea 1,073Kakao 1,101 Hangzhou Tigermed Consulting 1,057Infosys 1,095 Chailease 1,017NAVER 1,078 Orient Overseas 1,010Taiwan Semiconductor Manufacturing 888 JD Health International 990Tencent 869 Studio Dragon 925SK Bioscience 848 POSCO 916SBI Life Insurance 799 PI Industries 910Studio Dragon 700 Yihai International 882Hong Kong Exchanges & Clearing 688 Samsung Electronics 652AIA 684
Listed above are aggregate purchases of securities exceeding one percent of the total value of purchases for the financial period ended 31 October 2021 and aggregate sales of securities greater than one percent of the total value of sales for the financial period ended 31 October 2021. At a minimum, the largest 20 purchases and sales are disclosed, if applicable.

Barings International Umbrella Fund Barings Australia Fund
Appendix 4 – Significant Changes in Portfolio Composition (continued)For the financial period ended 31 October 2021
87
Cost Proceeds Purchases US$'000 Sales US$'000 Computershare 1,695 Woolworths 1,939BHP Billiton 731 Australia & New Zealand Banking Group 1,204Amcor 566 CSL 1,190Carsales.com 489 Ansell 983Bapcor 480 BHP Billiton 785Cleanaway Waste Management 467 Woodside Petroleum 604Coles 397 Goodman 589Cochlear 391 Sonic Healthcare 550Credit 311 Credit 539OZ Minerals 295 Domino's Pizza Enterprises 437Endeavour 275 Macquarie 398Australia & New Zealand Banking Group 249 ResMed 396Macquarie 248 Rio Tinto 387Insurance Australia 213 Aristocrat Leisure 364ALS 196 ALS 332Aristocrat Leisure 114 Cleanaway Waste Management 308
Marley Spoon 307Commonwealth Bank of Australia 278Insurance Australia 272oOh!media 181National Australia Bank 163
Listed above are aggregate purchases of securities exceeding one percent of the total value of purchases for the financial period ended 31 October 2021 and aggregate sales of securities greater than one percent of the total value of sales for the financial period ended 31 October 2021.
At a minimum, the largest 20 purchases and sales are disclosed, if applicable.

Barings International Umbrella Fund Barings Europa Fund
Appendix 4 – Significant Changes in Portfolio Composition (continued)For the financial period ended 31 October 2021
88
Cost
Proceeds
Purchases US$'000 Sales US$'000 Norsk Hydro 707 Allianz 878ASM International 564 ASML 789CNH Industrial 560 Prysmian 753Husqvarna 479 Galp Energia 648Associated British Foods 321 Koninklijke Philips 623Koninklijke DSM 191 Schindler 517AXA 154 Boliden 516Temenos 117 Siemens Gamesa 217Telenet 62 Capgemini 217Anglo American 62 Assa Abloy 192Halma 31 Nestle 162Auto Trader 31 Norsk Hydro 147
Adyen 94Prosus 64Julius Baer 63Royal Dutch Shell 63Koninklijke DSM 63Schneider Electric 62Jackson Financial 22Thungela Resources 3
Listed above are aggregate purchases of securities exceeding one percent of the total value of purchases for the financial period ended 31 October 2021 and aggregate sales of securities greater than one percent of the total value of sales for the financial period ended 31 October 2021. At a minimum, the largest 20 purchases and sales are disclosed, if applicable.

Barings International Umbrella Fund Barings Hong Kong China Fund
Appendix 4 – Significant Changes in Portfolio Composition (continued)For the financial period ended 31 October 2021
89
Cost Proceeds Purchases US$'000 Sales US$'000 Meituan Dianping 64,563 Baidu 48,147Shenzhen Inovance Technology 41,398 Unimicron Technology 35,803Tencent 33,292 Ping An Insurance Group of China 35,387Anhui Conch Cement 32,472 Alibaba ADR 29,852Unimicron Technology 31,840 Sany Heavy Industry 27,675Contemporary Amperex Technology 29,847 Zhongsheng 27,644Hong Kong Exchanges & Clearing 28,410 JD Health International 27,310GoerTek 25,882 Sunac Services 27,048Jiumaojiu International 24,064 Hon Hai Precision Industry 25,451Fuyao Glass Industry 23,704 JS Global Lifestyle 24,385ANTA Sports Products 23,577 Novatek Microelectronics 23,984Zhongsheng 23,405 Sunac China 22,769China Resources Cement 23,142 Alibaba 22,448Lenovo 22,721 JD.com 21,636Aluminum Corporation of China 21,511 Daqo New Energy 20,284Wuxi Biologics Cayman 21,420 Jiangsu Hengrui Medicine 19,820China Petroleum & Chemical 21,171 Jiumaojiu International 18,923Cansino Biologics 20,257 Hansoh Pharmaceutical 18,828China Resources Power 17,518 Lenovo 18,818Will Semiconductor 16,906 Geely Automobile 18,469AiHuiShou International ADR 15,759 Hualan Biological Engineering 16,035Orient Overseas 15,570 Bilibili ADR 14,728Wingtech Technology 14,604 iClick Interactive Asia Group 14,076Li Auto 14,513 Man Wah 12,886China Youran Dairy 13,333 Postal Savings Bank of China 12,104Globalwafers 12,521 Zhejiang Sanhua Intelligent Controls 11,982Pinduoduo ADR 12,483 Orient Overseas 11,904Longfor Properties 11,890 ENN Energy 11,897Shenzhou International 11,864 Cansino Biologics 11,870JD Health International 11,608 Kuaishou Technology 10,923ENN Ecological 10,763 Shenzhen Inovance Technology 10,663Huaneng Power International 10,604 China Resources Beer 10,519Kindstar Globalgene Technology 9,384 Kunlun Energy 10,454Kuaishou Technology 8,052 ZTO Express Cayman 10,239
ZTO Express Cayman ADR 10,073Zijin Mining 9,925Tuya 9,103Glodon 8,232
Listed above are aggregate purchases of securities exceeding one percent of the total value of purchases for the financial period ended 31 October 2021 and aggregate sales of securities greater than one percent of the total value of sales for the financial period ended 31 October 2021. At a minimum, the largest 20 purchases and sales are disclosed, if applicable.

Barings International Umbrella Fund Barings Global Bond Fund
Appendix 4 – Significant Changes in Portfolio Composition (continued)For the financial period ended 31 October 2021
90
Cost
Proceeds
Purchases US$'000 Sales US$'000 US Treasury Note/Bond 1.75% 15/05/2022 4,969 Poland (Republic of) 2.75% 25/04/2028 4,452US Treasury Bond 1.88% 15/02/2051 3,713 US Treasury Note 0.25% 30/06/2025 2,421Japan Government Twenty Year Bond 0.50% 20/03/2041 3,393 US Treasury Note/Bond 1.75% 15/05/2022 2,021Spain (Kingdom of) 1.45% 30/04/2029 1,633 New South Wales Treasury 3.00% 20/03/2028 1,913New Zealand (Govt of) 2.75% 15/04/2037 1,458 New Zealand (Govt of) 2.75% 15/04/2025 1,668US Treasury Note/Bond 4.75% 15/02/2041 1,190 Japan (Govt of) 0.30% 20/06/2046 1,625US Treasury Note 2.75% 15/02/2028 1,100 Czech (Republic of) 0.95% 15/05/2030 1,322Queensland Treasury 5.75% 22/07/2024 1,085 Japan (Govt of) 1.20% 20/03/2035 1,305New South Wales Treasury 1.00% 08/02/2024 948 US Treasury Note 0.63% 15/08/2030 1,301Australia (Commonwealth of) 1.75% 21/11/2032 922 US Treasury Note 2.75% 15/02/2028 1,100Republic of Poland Government Bond 1.75% 25/04/2032 922 US Treasury Bond 2.00% 15/02/2025 1,008US Treasury Note/Bond 1.50% 15/08/2026 828 Poland (Republic of) 3.25% 06/04/2026 939Kommuninvest I Sverige 1.00% 12/11/2026 636 Mexican Bonos 7.75% 29/05/2031 935Nordea Hypotek 1.00% 18/09/2024 629 Italy (Republic of) 2.70% 01/03/2047 848Peruvian Government International Bond 2.78% 23/01/2031 500 New Zealand (Govt of) 4.50% 15/04/2027 832Canada (Govt of) 6.25% 01/06/2032 282 Petroleos Mexicanos 6.88% 04/08/2026 830Province of British Columbia Canada 4.70% 18/06/2037 205 Petrobras Global Finance 8.75% 23/05/2026 735Italy (Republic of) 5.25% 01/11/2029 205 Treasury Corporation of Victoria 1.50%
20/11/2030692
Italy (Republic of) 1.50% 01/06/2025 183 Queensland Treasury 5.75% 22/07/2024 593Italy (Republic of) 5.00% 01/09/2040 181 Romania (Republic of) 4.63% 03/04/2049 571
New South Wales Treasury 1.00% 08/02/2024 522Canada (Govt of) 5.70% 18/06/2029 462Hellenic Republic Government Bond 3.50% 30/01/2023
444
Japan (Govt of) 0.40% 20/03/2056 324
Listed above are aggregate purchases of securities exceeding one percent of the total value of purchases for the financial period ended 31 October 2021 and aggregate sales of securities greater than one percent of the total value of sales for the financial period ended 31 October 2021. At a minimum, the largest 20 purchases and sales are disclosed, if applicable.

Registered address: Baring International Fund Managers (Ireland) Limited 70 Sir John Rogerson’s QuayDublin 2D02 R296Ireland
Contact:Tel: + 353 1 542 2930 Fax: + 353 1 670 1185 www.barings.com
Important information: This document is approved and issued by Baring International Fund Managers (Ireland) Limited.
Disclosure: Baring International Fund Managers (Ireland) Limited Authorised and regulated by the Central Bank of Ireland 70 Sir John Rogerson’s Quay, Dublin 2, D02 R296, Ireland