RM-Resilient Rural Society, Polity and Entrepreneurship
443
RM-Resilient Rural Society, Polity and Entrepreneurship MHRD Government of India Ministry of Human Resource Development First Edition RM-Resilient Rural Society, Polity and Entrepreneurship
-
Upload
khangminh22 -
Category
Documents
-
view
0 -
download
0
Transcript of RM-Resilient Rural Society, Polity and Entrepreneurship

RM-Resilient Rural Society, Polity and Entrepreneurship
MHRD Government of IndiaMinistry of Human Resource Development
First Edition
RM
-Re
sil
ien
t R
ura
l S
oc
iety
, P
oli
ty a
nd
En
tre
pre
ne
urs
hip

Editorial Board
Dr W G Prasanna Kumar
Dr K N Rekha
Ms V Anasuya
First Edition: 2019
ISBN: 978-93-89431-00-1
Price: ₹ 750/-
All Rights Reserved
No part of this book may be reproduced in any form or by any means without the prior
permission of the publisher.
Disclaimer
The editor or publishers do not assume responsibility for the statements/opinions expressed
by the authors in this book.
© Mahatma Gandhi National Council of Rural Education (MGNCRE) Department
of Higher Education
Ministry of Human Resource Development, Government of India
5-10-174, Shakkar Bhavan, Ground Floor, Fateh Maidan Road, Hyderabad - 500 004
Telangana State. Tel: 040-23422112, 23212120, Fax: 040-23212114
E-mail : [email protected] Website : www.mgncre.org
Published by: Mahatma Gandhi National Council of Rural Education (MGNCRE), Hyderabad
Printed by: Saras Enterprises, Hyderabad
Cover Design and Layout: Mr. G Sivaram

Contents
About the Book Block 1 Indian Rural Society and Administration Chapters
1. Rural Society 3 2. Panchayati Raj 24 3. Fundamentals of Rural Demography and Economics 46 4. Indian Agriculture 68 5. Land Tenure Systems and Land Reforms in India 87
Block 2Natural Resource Management, Watershed Management, and Sustainable Livelihoods Chapters
1. Introduction to Natural Resource Bases 116 2. Watershed Management 143 3. Food Resources Management 166 4. Land Resources Management 186 5. An introduction to Livelihood 204
Block 3 Community Resilience and Disaster Risk Management Chapters
1. Introduction 227 2. Disaster Management Cycle, Risk Reduction and Managing Risks 247 3. Disaster Risk ReductionTools and Capacity Building 268 4. Disaster Managementin India 291 5. International Framework 314
Block 4Social Entrepreneurship Chapters
1. Understanding Entrepreneurial Framework 331 2. Building a Sustainable Business Model 349 3. Civil Society and NGO-A Glimpse 367 4. Managing Civil Society and NGO 387 5. Corporate Social Responsibility 413

About the Book To understand India’s culture it is important to understand the rural society. Modernisation and Westernisation of the Indian society can be linked to its colonial history. When the East India Company arrived to trade in India around 1757 and began to take over administration, India was still ruled by the kings and princes and was in medieval ages. At this point of history, the west had started industrialising and their governments had also started to become democratic. With industrialisation, urbanisation also came about in the west.
After independence from colonial rule in the 1940s, India had 86% rural population and the government took charge of setting up industries because the economy was not modernised and could not have competed with its western markets. In this process, as many critics of the post-colonial industrial policy have pointed out, the growth of the agriculture sector was left behind. Green Revolution came to India in early 1960s and made the country self-sufficient in terms of food production. Later, the White Revolution, also called the Operation Flood was launched in 1970s and improved dairy production. Rural societies in India are now moving towards modernisation with innovation in agricultural practices. But at the same time, these societies uphold the traditional cultural values. Disasters are often seen as “large-scale, stressful and traumatic events” (Dominici et al., 2005). They result in extensive damage to public, property, network and transport, and also to natural resources. The outcomes are tragic leaving many deaths and injuries and severe disruption to the common lives. These effects disrupt socio-economical, cultural, and even political settings, of the society thereby obstructing the growth and progress of the society for a considerable period by destroying years of development in minutes. For instance, the Indian Ocean tsunami which occurred in 2004, collapsed 20 years of development of Maldives, a beautiful island which is located southwest to India and Sri Lanka.
Some key concepts like hazard, disaster, vulnerability, resilience, and risks are first discussed and defined. This is followed by the classification of disasters. Various kinds of disasters namely, geological disasters, hydro-meteorological disasters, biological disasters and man-made disasters are explained briefly. The Chapter ends with an explanation on global disaster trends and emerging risks of disasters with a note on climate change and urban disasters. Topics explained in the introductory chapter would help in understanding the topics discussed in further chapters.
Societies the world over face complex challenges today. The proliferation of capitalism has led to significant disparities in wealth. It has also led to indiscriminate use and often abuse of natural resources, which is causing pollution and leading to global warming. Leaders of all hues have called for corporations to be more socially responsible. The call is being answered through entrepreneurship that is aimed at being sustainable in an economic sense while not trying to maximize profits, by civil society organizations and non-governmental organizations that call for more equality, and by corporations themselves becoming more responsible through corporate social responsibility activities. Our approach has been to bring a mix of theory and practice in the book. The book refers to wide range of literature to build the concepts. In order to encourage thinking and application, hands-on activities have been included. Each Chapter first provides an overview

and then delves deeper into the concepts. Wherever appropriate and possible, explanations have been provided in tabular and pictographic manner. This book represents the collective efforts of so many remarkable individuals. I would like to thank the contributors to this volume for their collective wisdom, experience and insight. We would like to thank our Subject authors: Dr Ravi Dhanuka, Co-Founder and Director, I-Saksham Education and Learning Foundation, New Delhi; Dr Priyadarashini Vasamsetti, PhD Scholar, HCU, Hyderabad; Prof Prakash Satyavageeswaran, Assistant Professor, IIM Udaipur; and Prof DVR Seshadri, Clinical Professor of Business in Marketing, ISB, Hyderabad. I would like to thank our MGNCRE Team Members for extending support in completion of this book.
Dr W G Prasanna Kumar Chairman, MGNCRE


Contents
Chapter 1 Rural Society
1.1 Introduction to Rural Society
1.2Rural Demography
1.3 Rural Social Structure
1.4 Rural Economic Structure
1.5 Rural Power Structure
Chapter 2 Panchayati Raj
2.1 Evolution of Panchayati Raj in India
2.2 Role of Panchayati Raj
2.3 Structures and Tiers of Panchayati Raj
2.4 Rural Administration
2.5 Relationship with Bureaucracy
Chapter 3 Fundamentals of Rural Demography and Economics
3.1 Fundamentals of Demography
3.2 Demographic Transition in Rural India
3.3 Rural Economy
3.4 Rural Poverty
3.5 Challenges and Opportunities
Chapter 4 Indian Agriculture
4.1 Role and Importance of Agriculture
4.2 Key Features of Indian Agriculture
4.3 Phases in Agriculture Development in India
4.4 Modernization and Technology in Agriculture
4.5 Issues and Concerns
Chapter 5 Land Tenure Systems and Land Reforms in India
5.1 Origin and Development of Land Tenure Systems in India
5.2 Land Tenure Systems and Agrarian Structure-Part 1
5.3 Land Tenure Systems, and Agrarian Structure-Part 2
5.4 Land Reforms in Independent India
5.5 Implementation of Land reforms Experiences and Prospects

3 MGNCRE | Indian Rural Society and Rural Administration
Chapter 1 Rural Society
Introduction To understand India’s culture it is important to understand the rural society. Modernisation and
Westernisation of the Indian society can be linked to its colonial history. When the East India
Company arrived to trade in India around 1757 and began to take over administration, India was still
ruled by the kings and princes and was in medieval ages. At this point of history, the west had
started industrialising and their governments had also started to become democratic. With
industrialisation, urbanisation also came about in the west.
After independence from colonial rule in the 1940s, India had 86% rural population and the
government took charge of setting up industries because the economy was not modernised and
could not have competed with its western markets. In this process, as many critics of the post-
colonial industrial policy have pointed out, the growth of the agriculture sector was left behind.
Green Revolution came to India in early 1960s and made the country self-sufficient in terms of food
production. Later, the White Revolution, also called the Operation Flood was launched in 1970s and
improved dairy production. Rural societies in India are now moving towards modernisation with
innovation in agricultural practices. But at the same time, these societies uphold the traditional
cultural values.
Objectives
• To understand the complexities of studying the rural societies modernisation
• To map cultural and geographical differences across villages in India
• To study community organisations in India’s villages
• Understand local governance in villages
Panchayati Raj
1.1 Introduction to Rural Society
1.2 Rural Demography
1.3 Rural Social Structure
1.4 Rural Economic Structure
1.5 Rural Power Structure
1.1 Introduction to Rural Society
Studying Rural Societies Indian Context
Rural India is a major focus of many sociological studies. Economist, Sociologists, Political Scientists,
Anthropologists and most recently, Development Studies scholars and public policy professionals
have centred their interest in understanding villages of India. The academic literature in this field

4 MGNCRE | Indian Rural Society and Rural Administration
studies historical influences, regional variations, cultural aspects, governance and political
participation, tribal lifestyles, agricultural practices, demographic shifts, to list a few heads.
India Lives in Villages
Mahatma Gandhi had said these words before India got independence from the British colonial rule
that, “the real India lives in its villages”. Seventy years after freedom from the colonial rule, this
statement still holds true. Numerically speaking too, a majority of India’s population lives in villages
and is engaged in occupations related to farming, agriculture and allied sectors. According to the
most recent census of 2011, 68.8 per cent (83.3 crore or 833 million) of India’s population lives in
rural areas- this is a considerable majority. The proportion of rural population in 2001 declined from
72.2 per cent to 68.8 in 2011. This statistic also shows that the level of urbanization increased from
27.8 per cent in 2001 census to 31.2 per cent in 2011.
Figure 1.1 Population Pie Census 2011
Further, various estimates from census of India and other surveys held by the Indian government
show a trend of rural to urban migration across the country. Mostly, this migration is attributed to
search of economic opportunities or higher education.
Rural economy in post-liberalisation India is changing. A study by NITI Aayog has found that,
“Contrary to the common perception about predominance of agriculture in rural economy, about
two third of rural income is now generated in non-agricultural activities. Similarly, it looks amazing to
find that more than half of the value added in manufacturing sector in India is contributed by rural
areas. However, the impressive growth of non-agricultural sector in rural India has not brought
significant employment gains or reduction in disparity in worker productivity. This underlines the
need for a new approach to direct the transition of rural economy.” (Chand, Srivastava and Singh,
2017)
Traditionalism and Modernity
Rural societies are termed as traditional societies across academic writings. Traditionalism, however,
can have specific meanings in different cultures. For most of us who live in India, a village is a symbol
of conventional social norms. Community and caste ties also play an important role in the social
0%0%
Rural69%
Urban31%
Population Pie Census of India 2011

5 MGNCRE | Indian Rural Society and Rural Administration
make-up of village life. While in terms of geography villages of India can be in deserts in Rajasthan,
tribal forests in Odisha or Chhattisgarh, hilly in Jammu and Kashmir, Himanchal, Uttarakhand or the
seven sisters of north-eastern India, or they may lie in the interiors of the vast Deccan Plateau; in
terms of culture Indian villages have traditional lifestyles.
Scholars such as SH Rudolph and LI Rudolph (1967) have brought out this dichotomy in the village
societies of India. From colonial times, roads and railway networks began to connect villages and
helped modernity reach into India’s rural life. In post-liberalisation India too, the penetration of Fast-
Moving Consumer Goods (FMCG) and electronics and mobile penetration has reached villages to
introduce modern narratives to the parochial lives. Modernity in Indian villages can also be
understood in terms of familiarisation with democratic practices such as voting and use of Electronic
Voter Machines (EVMs).
Despite the communication channels that expose India’s villages to urban or industrial settings,
social structures in village communities remain traditional. These can be understood by modest and
indigenous dressing norms, peasant occupations, rigid caste affiliations in kinship ties, tribal sub-
cultures and the general day to day community lives of the folks depending on traditions from the
region they belong to.
Socio-Economic Backwardness in Rural India
Public infrastructure is the biggest visible difference between a village and a city for any observer.
Indian villages, along with representing peasant lifestyles also have different set of physical and
social infrastructure from those of cities. Indian cities have roads, highways, flyovers, public
transport facilities like local trains, metros, bus networks; villages are often off the highways and do
not have public transport systems as reachable or road networks as dense as cities. Rural households
in India may not necessarily be connected to metalled or pakka roads. Village case studies from
India, for example Palanpur The Economy of an Indian Village by C Bliss and N Stern (1982), will
begin with an ethnographic description of the location a reachability of the village.
The Indian government in the past decade has launched nation-wide electrification policies for
village households. Access to electricity for Indian villages is a big policy challenge for rapidly
developing Indian economy- both generation of electricity for all households and provision of
connectivity to each household. Not having access to electricity has major implication for rural
societies. It pushes them towards backwardness. Day to day tasks at household-level become
difficult to perform and are more time consuming. Also, without electricity, farming activities, most
importantly irrigation, have to depend on mechanical or manual labour.
The government keeps a record of healthcare services in the villages. A glance at the government
data can help understand the development in the health sector in the villages of India As on 31st
March, 2018, there were 158417 Sub Centers (SCs), 25743 Primary Health Centers (PHCs) and 5624
Community Health Centers (CHCs) functioning in the country, according to Ministry of Health and
To Do Activity Find out the top ten districts of India with highest rural population from the latest census records.

6 MGNCRE | Indian Rural Society and Rural Administration
Family Welfare estimates. Further, data from this 2018 report show that the number of Sub Centers
increased from 146026 in 2005 to 158417 in 2018. There has been a significant increase in the
number of Sub Centers in the States of Rajasthan (3893), Madhya Pradesh (2318), Gujarat (1878),
Chhattisgarh (1382), Karnataka (1300), Jammu & Kashmir (1088), Odisha (761), Tripura (481), Kerala
(286) and Uttarakhand (271).
Figure 1.2 Rural Healthcare System in India
Source Ministry of Health and Family Welfare, Government of India
Community-level healthcare centres are modelled to provide family health, mother and childcare
services and to create family planning awareness in villages. Duflo and Banerjee (2011) in their
extensive studies across Indian villages have noted many instances where governance from
grassroots level can be improved. For example, the researchers conducted field studies at villages in
Udaipur District in Rajasthan and showed the day to day challenges faced by nurses and health
workers in performing their duties in the villages.
With a stress on education policies from the government after the incorporation of the Right to
Education (RTE) as a fundamental right in 2002, schools in villages are now have become accessible
and the government has achieved full enrolment of children at elementary level of schooling. Under
the RTE, children up to 14 years of age must receive free and compulsory education and Right of
Children to Free and Compulsory Education Act was implemented as a law in 2009 to uphold this
provision.
Data records from the Unified District Information System for Education (U-DISE) show rural-urban
details of coverage of schools in the chart below.

7 MGNCRE | Indian Rural Society and Rural Administration
Table 1.1 Coverage of U-DISE
Coverage of U-DISE
Year Districts CD Blocks Clusters Villages Schools
2014-15 680 7257 82077 594473 1516892
2015-16 680 7317 82342 594736 1522346
2016-17 701 7448 82641 594182 1535610
Year Total# Rural Urban
Total Number of Institutions
2014-15 1516892 1287355 229494
2015-16 1522346 1289544 232783
2016-17 1535610 1297083 238520
Recognised Institutions
2014-15 1488218 1264751 223434
2015-16 1493734 1267386 226329
2016-17 1503551 1272555 230990
Unrecognised Institutions***
2014-15 28674 22604 6060
2015-16 28612 22158 6454
2016-17 32059 24528 7530
Total Teachers
2014-15 8561921 6303292 2258384
2015-16 8691922 6361626 2330220
2016-17 8905811 6505128 2400654
Teachers in Recognised Institutions
2014-15 8384113 6173089 2210779
2015-16 8504235 6228658 2275501
2016-17 8703641 6361918 2341694
Teachers in Unrecognised Institutions***
2014-15 177808 130203 47605
2015-16 187687 132968 54719
2016-17 202170 143210 58960
Total Enrolment**
2014-15 259469730 188359852 71108365
2015-16 260596960 187868102 72726493
2016-17 251309665 180248040 71061117
Enrolment in Recognised Institutions
2014-15 255693478 185725728 69966237
2015-16 256964281 185400546 71561370
2016-17 247875713 177883263 69991942
Enrolment in Unrecognised Institutions***
2014-15 3776252 2634124 1142128
2015-16 3632679 2467556 1165123
2016-17 3433952 2364777 1069175
# Total may not match with the sum of the schools/enrolment/teacher in rural and urban areas because of no response with respect to the location of the school. ** Actual enrolment reported in U-DISE 2016-17. It excludes the project enrolment of grade XI and XII (Andhra Pradesh -942752 and Karnataka 855988) *** Unrecognised institutions includes Unrecognised Madarsa & schools which are not recognised.
Source U-DISE, Flash Statistics on Education 2016-17
(http//udise.in/Downloads/Publications/Documents/Flash_Statistics_on_School_Education-2016-
17.pdf)
The Government of India also conducts All India Survey of Higher Education (AISHE). Data records
from AISHE 2018 report show distribution of universities and colleges in rural and urban India.

8 MGNCRE | Indian Rural Society and Rural Administration
Figure 1.3 Rural-Urban Distribution of Universities and Colleges
Source AISHE 2018, Ministry of Human Resource Development
Many NGOs work in the field of education at rural level and also help the government in assessing
the implementation of policies. One such NGO, with a nation-wide reach is Pratham. This
organisation also has members who help the central government in education policy-making. They
also conduct surveys across the country to produce their report titled Annual Status of Education
Report (ASER). The government has succeeded in sending all children to school, but these civil
society organisations help in assessing the quality of public services.
Given that a rural area is defined by a predominance of agricultural activity does not imply that
industries do not exist in villages. We shall see in following units how urbanisation trends are taking
over and how rural economy is diversifying into other sectors.
1.2 Rural Demography
The census surveys are conducted every decade in India and urban and rural areas are defined as
follows
An urban unit or a town is defined as “any place with a municipality, corporation, cantonment board
or notified town area committee, etc.”. These are also called ‘Statutory Towns’. All other places
which satisfy the following criteria are known as ‘Census Towns’ as per the definitions used by the
census surveys-
• A minimum population of 5,000
• At least 75 per cent of the male main workers engaged in non-agricultural pursuits
• A density of population of at least 400 per sq. km.
Table 1.2 Number of Urban Units in India (Source Census 2011)
Number of Urban Units in India
Census 2001 Census 2011 Increase
Total Towns 5,161 7,935 2,774
Statutory Towns 3,799 4,041 242
Census Towns 1,362 3,894 2,532
0
20
40
60
80
100
120
Universities Colleges
Urban
Rural

9 MGNCRE | Indian Rural Society and Rural Administration
Rural Areas are all areas which are not categorized as urban area under the definitions above,
according to Census definitions.
Table 1.3 Number of Rural Units (or Villages) in India (Source Census 2011)
Number of Rural Units (or Villages) in India
Census 2001 Census 2011 Increase
Total Villages 6,38,588 6,40,867 2,279
As noted above too, according to the 2011 Census data, 68.8 per cent of India’s population is rural.
Further, 72.4 per cent of workforce in India also lives in villages. Though, the 2011 census has shown
a decline of 5.9 per cent points in rural population growth and an increase of 0.3 per cent points in
urban population growth from the 2001 census.
Table 1.4 Growth Rate of Population (in per cent) (Source Census 2011)
Growth Rate of Population (in per cent)
1991-2001 2001-2011 Difference
India 21.5 17.6 -3.9
Rural 18.1 12.2 -5.9
Urban 31.5 31.8 +0.3
This data implies a trend of urbanization in India. Urbanization trend, to put in simple words, can
take place in two ways- one, when rural population migrate to cities and two, when villages
transform to urban areas and are reclassified. Studies estimate that more than half of the increase in
population in urban India during this period can be attributed to the migration from rural to urban
areas and re-classification of rural settlements into urban rather than natural increase (Pradhan
2013). However, demographic projections by the United Nations (2012) estimates do show that
India will continue to be predominantly rural till the year 2050. Urban population is estimated to
overtake the rural population after this marking year.
There has been regional or state-wise variation in rural population from 2001 census to 2011 in
India. During the 2001-11 decade the growth of population living in villages as estimated at 12.2 per
cent. Growth of rural population has been estimated to be steadily declining in India since 1991.
States of Meghalaya at 27 per cent and Bihar at 24 per cent witnessed largest growth of rural
population among Indian States in 2001-11. On the other hand, four States recorded a decline in
rural population in the decade of 2001-11. These are Kerala by 26 per cent, Goa by 19 per cent,
Nagaland by 15 per cent and Sikkim by 5 per cent.
To Do Activity What other countries of the world have similar rural-urban demographic profiles as compared to India? Where do countries with such profiles stand in terms of economic growth?

10 MGNCRE | Indian Rural Society and Rural Administration
Rural Poverty
Compared to urban India, there is more poverty in rural India. Estimation of poverty from
government of India shows a decline in both poverty ratio and the number of people living under the
poverty level in rural India between 1993 and 2011. But urban India had more decline in people
living below poverty line.
Table 1.5 Percentage and Number of Poor Estimated from Expert Group (Tendulkar) Methodology
Source Planning Commission Archive, 2014, Government of India
In order to further understand poverty in rural India, it is important to highlight more data points
about rural population. Compared to urban India, rural literacy rate is lower by 16 percentage
points. There is a big gap between male and female literacy in villages. According to 2011 census of
India data, only 58 per cent women in Indian villages are literate. The comparisons are illustrated in
data table below.
Literacy Rates
Table 1.6 Literacy Rates (in per cent)
Literacy Rates (in per cent)
Persons Male Female
Total Rural Urban Total Rural Urban Total Rural Urban
73 68 84 81 77 89 65 58 79
(Source Census 2011; Figures are rounded off)
Villages of India are also socially more backward that cities. The proportion of the Scheduled Caste
(SC) population in villages in 19 per cent, compared to 13 per cent in cities. Also, mostly tribal
populations live in villages. The proportion of STs in villages in 11 per cent compared to 3 per cent in
cities. The Indian social structure has been historically affected by the presence of the caste system.
In most cases, people belonging to lower castes have faced social exclusion and untouchability in
extreme cases. The government policy has taken many steps to improve the status of those
considered backward because of their caste.
Percentage and Number of Poor Estimated from Expert Group (Tendulkar) Methodology
Year Poverty Ratio (per cent) Number of Poor (million)
Rural Urban Total Rural Urban Total
1993-94 50.1 31.8 45.3 328.6 74.5 403.7
2004-05 41.8 25.7 37.2 326.3 80.8 407.1
2009-10 33.8 20.9 29.8 278.2 76.5 354.7
2011-12 25.7 13.7 21.9 216.7 53.1 269.8

11 MGNCRE | Indian Rural Society and Rural Administration
Table 1.7 Proportion of Scheduled Castes and Scheduled Tribes Population (in per cent)
(Source Census 2011; Figures are rounded off)
Scheduled Castes Scheduled Tribes
Total Persons Total Persons
Total Rural Urban Total Rural Urban
17 19 13 9 11 3
Another important aspect of rural demography is the working population. In the census surveys,
main workers are defined as those who work for more than six months in a year. Marginal workers
are those people with less than six months or less than three months of work in a year. In the data
table below, marginal workers category is combined to show both workers with less than six months
and less than three months of work. In comparison to cities, lesser proportion of people is engaged
in main work in the villages. Also, the proportion of people with marginal work is higher in the
villages. This indicates that there are more work opportunities in cities. Also, comparably, more
people live in villages in India, so, the number of people in villages with no jobs is higher than cities
according to the demographic data shown in the census 2011.
Table 1.8 Proportion of Worker Population to Total Population in Cities and Villages
Main Workers (in per cent) Marginal Workers (in per cent)
Persons Males Females Persons Males Females
Total 29.9 43.8 15.2 6.1 3.7 13.6
Rural 29.5 41.6 16.7 8.1 4.9 16.4
Urban 31.0 48.7 11.9 2.1 1.5 4.6
(Source Calculated from census of India 2011)
1.3 Rural Social Structures
Village Community Life
Caste-system and religious affiliation plays an important role in village community lives. A variation
in castes across regions of India can be studied in detail using the Government of India’s state-wise
lists of categories of castes in India. This trend shows regional diversity in the existence of various
castes. The following figure shows the social structure of the caste system in India.
To Do Activity Find out the top five and bottom five states of India with highest population of SCs and STs. How do you think this affects the social structures in villages of these states?

12 MGNCRE | Indian Rural Society and Rural Administration
Figure 1.4 Social Structure of Castes in India
As noted in 1.2, villages have a bigger proportion of populations from the Scheduled Castes and
Scheduled Tribes. Caste plays in important role in the structuring of the traditional societies in India’s
villages and any discussion about rural social structures cannot be complete without an
understanding or the role caste may play in the communities. In mostly all parts of India, castes and
sub-castes are referred to as jati. This is an Indo-Aryan word which means a category or social class
of people related through wither same physical characteristics or social- moral values. Further, the
word can also be used in the sense of genetic affiliation, species, or race. Caste is a systematic basis
upon which the jatis are organized in the society. In India, there is not a set pattern though, in
different regions of the country caste hierarchy may be different based on cultural or historical
factors. They may be different in different villages too.
Indian anthropologists have written about caste system from many perspectives. For example,
Dipankar Gupta in his book Interrogating Caste (2000) has written about uniformity in caste
hierarchies across India. MN Srinivas is the most celebrated Indian anthropologist who wrote about
caste and social stratification in India. Social stratification is way of social organisation based on
discriminating social groups and dividing people into hierarchical groups based upon
their occupation, income, wealth and social status. This stratification may also emerge
from power, social or political, derived by a particular group of people. Simply put, stratification is a
relative social status of people within a social group, village, or community. Srinivas conducted his
study in the village of Rampur in Mysore district in Karnataka in from 1950s to 1970s.
Another important contribution towards understanding caste-related violence in India is Smita
Narula’s book Broken People Caste Violence against India’s “Untouchables”. Published in 1999, this
book focuses on Dalits in India.
Even during the British period, religious riots were an administrative challenge- both in villages and

13 MGNCRE | Indian Rural Society and Rural Administration
cities. In 21st century India as well, religious tensions are a part of community life but the causes and
intensity of such tensions vary from region to region. India is a land of diversity of communities and
there are also villages where different communities live in harmony. Many instances of coexistence
of religious communities are reported from time to time in the media reports. Across villages in
India, there are mosques, temples, churches and gurudwaras that do community work for each
other.
Tribes of India
Proportionally, 11% of rural population in villages of India is tribal population. Anthropologists
studying tribes of India have classified them into various heads. First category is geographical
classification. Indian subcontinent can be divided into Northern and North-Eastern Zone, the Central
or Middle Zone and the Southern Zone and tribes can be associated with the specific regions.
Example of such a classification can be found in D.N. Majumdar and T.N. Madan’s Introduction to
Social Anthropology published in 1957.
Language is the next category for classifying Indian tribes. There are chiefly four language groups
that can be associated with the tribes of India. These are Indo-Aryan, Tibeto-Burman, Austro-Asiatic
and Dravidian. Writers such as L.P Vidyarthi and Binary Kumar Rai (1977) have put forward linguistic
classifications in their book titled The Tribal Culture of India.
Another form of classification of Indian tribes can be on the basis of race. Sir Herbert Risley, a
nineteenth century English ethnographer, made the first scientific attempt to ethnically classify
Indians according to their racial characteristics. He identified seven racial types in India namely, Turk
Iranian, Indo-Aryan, Scytho-Dravidian, Aryo-Dravidian, Mongolo-Dravidian, Mongoloid and the
Dravidian.
Figure 1.5 Classification of Indian Racial Types
Indian tribes can also be studied on the basis of the mode of livelihood or the subsistence pattern.
Tribal activities can be described as follows- hunters and food gatherers, pastoralists, horticulturists,
hill cultivation, simple artisan, folk artist, labourers engaged on farms or in factories where such
occupations are available.
To Do Activity Find instances of communal harmony using media reports. How do you think communal peace can contribute to well-being in a community in Indian contexts?

14 MGNCRE | Indian Rural Society and Rural Administration
Position of Women and Patriarchal Social Values
An important aspect about rural society and its structure is the position of women in the villages.
Census 2011 has shown that sex ratio has improved since 2001 from 933 women per 1000 men to
940 women per 1000 men across India. But rural India saw an increase of only one per cent point
from 946 in 2001 to 947 in 2011. In urban areas the increase was considerably higher at 26 points
from 900 in 2001 to 926 in 2011.
The family structures in villages are conservative and patriarchal. We can also observe from data on
rural literacy also discussed in 1.2 that female literacy is also low in rural areas at merely 58% in 2011
census. Though, rural women form a bigger part of the workforce that their urban counterparts,
they are actually engaged in informal sectors. The practice of child marriages in traditional cultures
also affects women and their socio-economic development. Early marriage is also one of the causes
of poor health maternal health. The government has taken many steps to stop child marriages. The
legal age for marriage in India is 18 years for girls and 21 years for boys, in India as per the 1978
amendment in the marital laws. Along with this, the government runs many awareness programmes
and promotes delay of marriages and focus on girl’s and women’s health through village health
workers as well.
Out-Migration from Villages
Because of lesser opportunities, the rate of out-migration from villages of rural to urban migration is
high in India. “Although rural to urban migration has been the dominant component of urbanization
in the western countries, India has experienced rapid urban population growth as a result of higher
contribution of urban natural increase. In the decade preceding the Census 2011, net rural to urban
classification in India contributed about one-third to urban population growth compared one-fourth
by net rural to urban migration” (Bhagat, 2012). In another paper Prof Bhagat (2017) has shown how
migration helps foster development as migrants from villages to urban areas learn more skills and
are pulled out of poverty. Policies in India are often aimed at reducing rural to urban migration and
tend to not include migration as an important factor in economic development.
Traditionalism in village culture has affected stratification of the society. Such stratification causes
socio-economic backwardness. Due to a strict caste system which is also based on functional roles of
the communities, people are not able to pull themselves out of the family trades. This is especially
true for the lower and backward castes.
Also, traditional occupations in modernising economies may not necessarily turn out to be very
profitable. For example, handloom industries in many villages of India are suffering in modern times
due to lack of economically beneficial policies for the artisans.
To Do Activity Create a map of important tribes of India. List their main occupations.

15 MGNCRE | Indian Rural Society and Rural Administration
1.4 Rural Economic Structure
Rural economy is defined by agricultural activity. If a majority of the population in a particular are is
engaged in farming and allied sectors and are governed by rural local governments, it is categorised
as rural. Since agriculture is considered to be the main occupation of the village folks, this unit will
focus on agrarian economy and its institutions in India.
Latest government assessment of changing rural economy has been highlighted in a paper by top
policy practitioners from the NITI Aayog in a discussion paper titled “Changing Structure of Rural
Economy of India Implications for Employment and Growth”. The data table below has been taken
from this paper to show how the share of the rural economy has been declining in India’s Net
Domestic Product (NDP) and also the people’s participation in rural workforce is decreasing.
(Note The data on rural and urban net domestic product (NDP) is available for the years 1970-71,
1980-81, 1993-94, 1999-00, 2004-05 and 2011-12 at current prices from Central Statistical Office.
The information on different aspects of employment in the country was extracted from the unit-
level data of quinquennial employment and unemployment surveys conducted by National Sample
Survey Office (NSS-EUS). The first quinquennial NSS-EUS was carried out during 1972-73 to assess
the volume and structure of employment and unemployment in the country. Thereafter these
surveys were repeated in the years 1983, 1993-94, 1999-00, 2004-05, 2009-10, and 2011-12.)
Table 1.9 Share of rural areas in total Net Domestic Product and Workforce (in per cent)
This paper notes an interesting aspect about the rural economy. The rural economy is no longer only
limited to agricultural activities, as is perceived. To quote from the paper “The most striking change
in rural share was observed in the case of manufacturing sector. Between 1970-71 and 2011-12, the
share of rural areas in output of manufacturing sector doubled and exceeded the manufacturing
production in urban areas. Rural areas contributed 51.3 per cent of manufactured output in year
2011-12. However, this sharp increase in the rural share in output did not fetch any increase in rural
share in employment in manufacturing sector. On the contrary, rural share in total manufacturing
employment in the country declined by 4.1 percentage points during the forty years ending with
2011-12” (Chand, Srivastava and Singh, 2017).
Growth on non-farm sectors in villages is an interesting trend, but the government of India’s Socio-
Economic Caste Census (SECC) survey released in 2015 showed some statistics about rural economy.
The data from the report showed that 75% of household in villages of India earn a monthly income
Year Economy Workforce
1970-71 62.4 84.1
1980-81 58.9 80.8
1993-94 54.3 77.8
1999-00 48.1 76.1
2004-05 48.1 74.6
2011-12 46.9 70.9
To Do Activity Plan a case study at a village in your state and chalk out the structure of the economy.

16 MGNCRE | Indian Rural Society and Rural Administration
of less than Rs 5,000. And it further showed that manual labor was the main source of income for
51% of households in rural areas. The table below shows occupational activities of people in India’s
villages according to SECC 2015 data.
Figure 1.6 Rural Occupations (SECC Data)
Informal Economy and Money-Lending NABARD, Agricultural Credit and Loan Wavers
One of the key features of the rural debt economy has been the informal or non-institutional money
lending practices. The All-India Debt and Investment Survey 2012, was released by the Ministry of
Statistics and Program me Implementation (MoSPI) in 2013. It was found that almost 48 per cent
farmers across villages of India had taken loans from informal institutions such as local agricultural
moneylenders or land-owning elites. Providing institutional credit to farmers has been an important
policy challenge for India.
Credit is important for the development of the villages. This has been a cause of concern for the
policy-makers in India from the early stages when planned economic development was started in
1950s. In the late 1970s, The Reserve Bank of India (RBI) on the insistence of the Government of
India, formed a Committee to Review the Arrangements for Institutional Credit for Agriculture and
Rural Development (CRAFICARD) to look into the aspect of rural credit. The Committee was formed
under the Chairmanship of Shri B. Sivaraman, who was also a former member of the Planning
Commission of India.
The interim report of this Committee was submitted in November 1979. This report suggested the
need for a new organisational device for providing specialized attention, and direction to rural credit
related issues to aid in economic development of villages. This is what led to the formation of the
National Bank for Agriculture and Rural Development (NABARD). It was approved by the Parliament
through an act in 1981.
NABARD formally came into existence on 12 July 1982 and the agricultural credit functions that the
RBI handled up to now were transferred to this organisation. The Agricultural Refinance and
Development Corporation (ARDC) and Agricultural Credit Department (ACD) and Rural Planning and
Credit Cell (RPCC) under the RBI were replaced by NABARD upon its formation. In the early 1980s,
NABARD was set up with an initial capital of Rs.100 crore (Rs 1000 million). As on 31 March 2018 it
paid up capital is at Rs.10,580crore (Rs 105,800 million).
0102030405060
SECC Data Rural Occupational Activity (in per cent)

17 MGNCRE | Indian Rural Society and Rural Administration
Rural India’s financial empowerment is the main goal of NABARD. Since its formation, the body has
endeavoured to build a financially inclusive rural Indian economy. NABARD has specific goal-oriented
departments to meet its policy requirements- these can be categorized broadly into three heads
“Financial, Developmental and Supervision” according to NABARD’s policy documents. Through
these departments the body tries to reach out to almost every aspect of India’s rural economy. It
provides expertise and credit support for providing refinance support to build infrastructure in
villages; for preparing credit plans at district level to guide and motivate the banking industry at local
levels in achieving their development targets. NABARD also supervises Cooperative Banks and
Regional Rural Banks (RRBs) in them developing sound banking strategies and practices for the
specific rural needs. It also helps in designing new development schemes for rural India and consults
for the implementation of the Government of India’s development schemes. Training of handicraft
artisans and providing them a marketing platform for selling their produce is also one of the
functions of NABARD.
Figure 1.7 NABARD and Micro-finance
Image Source NABARD
Over the years NABARD has achieved many goals in rural credit and micro-financing services. This
has helped improve many of rural lives across the India. Most important achievement has been the
Self-Help Group- Bank Linkage Project launched by in 1992, which grew into the world’s largest
micro finance project. NABARD also takes pride in Kisan Credit Card, designed by the body which is
one of the major sources of relief for the farmers. The bank has about financed one fifth of India’s
total rural infrastructure, according to its estimates in 2018. They are also pioneering in the field of
watershed development as a tool for sustainable climate proofing.

18 MGNCRE | Indian Rural Society and Rural Administration
Models of Rural Economic Development Self-help Groups and Rural Cooperatives
The Self-Help Group (SHG) model of development for rural India has been popularised by NABARD,
as we note above. SHGs function at community level to foster rural development through skill
training, government’s assistance, micro-finance and cooperation of the community members who
are a part of the SHG. Below is a model of how an SHG is organised.
Figure 1.8 Self-help Group Model
Member of an SHG help and support each other. They are also collectively responsible towards loan
repayments even of individual members. The local government committees at village level also help
in formation of SHGs and monitor progress and resolve disputes. Skill training is carried out for
members to set up local small-scale industries or handicrafts units. At times, the government
subsidises training or credit for SHGs under various schemes. NABARD also provides knowhow other
than micro-credit for the SHGs.
In the 1970s, India witnessed a revolution in the dairy sector. This was referred to as the White
Revolution or Operation Flood, as is also mentioned in the introduction to this Chapter.
This revolution provided one of the most successful models of a rural cooperative from India. A
discussion on models of rural development is incomplete without the mention of the Amul model as
shown in the diagram below.
Self Help Group Model
Self Help Group selected from a
village
Gram Sabha (Village Council)
approved selection
Skill training Government
subsidy
Bank credit

19 MGNCRE | Indian Rural Society and Rural Administration
Figure 1.9 Rural Cooperatives Model
This model is also based on community mobilisation at village levels. This was started in Anand in
Kaira district of Gujarat. This model is heavily based on strong institutional involvement of all
stakeholders who form the cooperative. A big hazard for farmers is to supply their produce to the
consumers. This model takes care of the supply networks and at the same time involves farmers as
professional partners. The cooperatives also provide advisory and veterinary services to the milk
farmers. This ensures efficiency in their operations.
The rural economic structure is a network of mixed stories of success and failure for the people.
Farming as an occupation, though declining, is still the biggest sector that employs people in the
villages. The government of India also runs the world’s largest rural guarantee scheme- the
Mahatma Gandhi National Rural Employment Guarantee Scheme (MGNREGS) in villages. This
scheme guarantees 100 days of work- mostly physical labouring jobs that don’t require any skill- to
all seekers in their own village and has fixed a minimum equal wage for all workers. This scheme has
also helped reduce extreme poverty for many families.
Consumer
State Cooperative Milk Marketing Federation
District Milk Cooperative Union
Village Dairy Cooperative
Milk Producer
Supply Chain Amul Milk Cooperative
To Do Activity Plan a visit to a village industrial unit and observe its economic model from the grassroots.

20 MGNCRE | Indian Rural Society and Rural Administration
1.5 Rural Power Structure
An understanding of the power structure in villages is important for both political-sociological
reasons as well as for policy practitioners. India’s demographic structure and economic profile has
been rural for centuries. During the Mughal period and then the British colonial rule, networks of
rural local aristocracy and patronage were created. This was mostly done to ease the revenue
collection for the governments that were on the top of the administrative system.
Zamindari System Historical Influences on Rural Power Networks
Zamindari and Ryotwari were created by the British administration as a system of land tenure in pre-
independence times. These classes were generally powerful upper caste people who were
responsible for collecting land revenue and taxes from the farmers and village folks.
The pyramid diagram below shows the flow of power in the system.
Figure 1.10 Zamindari System
The Zamindars received commissions from the government for their services. Zamindari was also
hereditary and the family controlled power positions over the farmers. In 1793, Lord Cornwallis had
established the Permanent Settlement Act under which Zamindars were made land owners. It was
introduced in four provinces under the British rule- Bengal, Bihar, Orissa and Varanasi.
Similarly, in 1820, Ryotwari system was started in the provinces of Madras, Bombay, parts of Assam
and Coorgh under British India. Under this system, farmers were land owners or Ryots. They paid the
revenues directly to the British government.
Another system of land revenue under the British government was created in 1833. This was the
Mahalwari system. It was introduced in the Central Province, North-West Frontier Province, Agra,
Punjab and the Gangetic Valley provinces under the British rule. This system comprised features of
both the Zamindari system and the Ryotwari system. The Mahals were administrative divisions of
land and could be comprised of one or two villages. The farmers were land-owners. A committee
system was established to collect taxes from the Mahals.
After independence from the British rule, the constitution of India was enforced in 1950. The
constitution enshrined right to property as a fundamental right. The newly formed states took the
British Government
Zamindars
Farmers, Villagers

21 MGNCRE | Indian Rural Society and Rural Administration
initiative to abolish Zamindari systems under their jurisdiction. But the provisions of this
fundamental right were in conflict with these systems. The constitution of India had to be amended
under the first amendment act, 1951 and the second amendment act 1955 to finally abolish
Zamindari and the dated British land tenure systems.
The fundamental rights had also abolished titles under the British government. However, the legal
power of this elite class has been abolished by the constitution of India, but in some parts they still
influence aristocratic control over local politics. Also, land-ownership was not totally lost for this
class. Owning land in villages implies power and control over resources.
Land-owning Farmers and Agricultural Labourers
Let us now try and look at the data of agriculture labourers, according to Census 2011. Very often,
agricultural labourers are added with cultivators to calculate the number of farmers. This is not the
case with the Census, which defines agriculture labour ‘A person who works on another person’s
land for wages in money or kind or share is regarded as an agricultural laborer. She or he has no risk
in the cultivation, but merely works on another person’s land for wages. An agricultural labourer has
no right of lease or contract on land on which she/he works.” (Salve, 201)
Table 1.10 Agricultural Labourers and Cultivators
Year
Agricultural
labourers
(in million)
Percentage of
Agricultural
labourers
Year Cultivators
(in million)
Percentage of
cultivators
1951 27.3 19.5 1951 69.9 49.9
1961 31.5 16.7 1961 99.6 52.8
1981 55.5 22.7 1981 92.5 37.8
1991 74.6 23.8 1991 110.7 35.2
2001 107.5 26.7 2001 127.6 31.7
2011 144.3 30 2011 118.6 24.6
(Source Census of India)
The number of people engaged as agricultural labourers in villages of India has been on an increase
since 1951 as shown in the data table above from the Census surveys. The proportion of agricultural
labourers has also increased from 19% in 1951 to 30% in 2011.
This means that the proportion of land-owning farmers has decreased over the past decades.
Between 2001 and 2011, the number of land owning farmers has also reduced from 127.6 million to
118.6 million- a fall of 9 million. Whereas, the number of people engaged as farm labourers has
increased by 38 million. Reduction on land-owning farmers and increase of agricultural labourers’
hints at a changing power structure in the rural economy.
Local Leadership and Influence of Social Stratification on Distribution of Resources
Local patronage networks in villages influence implementation of government policies and
distribution of resources for infrastructure development at village level. Some studies done by
political-economists may be noteworthy here.

22 MGNCRE | Indian Rural Society and Rural Administration
Francine Frankelin her book India’s Political Economy 1974-2004, published in 2005, has observed
historically that around the time the Third Plan (1961- 66) from the Planning Commission of India
was implemented, the politics of accommodation at local levels had taken over at the cost of socio-
economic goals. Local elites in the villages such as the land-owning elites, had taken over the control
of local politics and the expectation that the village cooperatives will ensure participation of the
poor people could not be realised. The resources that were provided to the villages under the
Community Development Programme were also taken over by the local elites, she notes in her
studies.
In another instance, Rob Jenkins (1999) in his book Democratic Politics and Economic Reform in
India has tracked the employment guarantee schemes that were implemented in villages. He says
that mass politics always need a socialist mask and schemes that offer job grantee for poor focus on
building assets such as road, canals are used by middle-class and land-owning farmers in villages
rather than the poorer or backward communities. Also, local elites, bureaucrats and politicians have
a bigger say in selection and the power in the sanctioning of such projects. The infrastructure needs
of the poor people get side-lined. The beneficiaries of the job guarantee are only the poorest in the
villages as these jobs demand a lot of physical labour and pay minimum wages. But the benefits of
the development do not go to them. Further, he also comments on corruption in the job guarantee
schemes but still, he says that it may not be the most economically efficient distribution but it
succeeds in engaging the poor and satisfying the local needs.
Summary
This Chapter has focused on introducing rural socio-economic structures to the readers. It touches
upon the main aspects if rural lives and highlights macro statistics from government records. Some
notable academic works have also been cited in the text that the readers can study in detail. The
Chapter focuses on sociological aspects of rural lives in depths. It uses historical references to
establish problems and at the same time highlights successful policy initiatives in the field of rural
development.
Model Questions
1. What are the rural to urban migration trends in India from government statics and highlight
the reasons for such migration?
2. How can better education and healthcare facilities benefit the rural societies?
3. What are the main indicators for socio-economic backwardness of rural populations of
India?
4. Do you think local power politics can affect development of villages? Give arguments for or
against the issue.
5. How would you classify rural India in terms of geography?
6. Give suggestions for creating more work opportunities in rural economies across India.

23 MGNCRE | Indian Rural Society and Rural Administration
References
1. Banerjee, AV and Duflo, E (2011). Poor Economics Rethinking Poverty and the Ways to End
It, New Delhi Random House India.
2. Banerjee, A., &Iyer, L. (2005). History, Institutions, And Economic Performance The Legacy
Of Colonial Land Tenure Systems In India. American economic review, 95(4), 1190-1213.
3. Bhagat, R. B. (2012) ‘Migrants (Denied) Right to the City’, In National Workshop on Internal
Migration and Human Development Workshop Compendium, Vol. 2, Workshop Papers,
UNESCO and UNICEF, New Delhi, pp. 86–99.
4. Bhagat, R. B. (2017, September). Migration and Urban Transition in India Implications for
Development. In United Nations Expert Group Meeting on Sustainable Cities. Human
Mobilities and International Migration. Department of Economic and Social Affairs UN
Secretariat. New York.
5. Bliss, C J and Stern, N H (1982). Palanpur The Economy of an Indian Village, OUP Catalogue.
6. Chand, R, Srivastava, SK, and Singh, J (2017). Changing Structure of Rural Economy of India
Implications for Employment and Growth, NITI Aayog.
https//niti.gov.in/writereaddata/files/document_publication/Rural_Economy_DP_final.pdf
7. Desai, AR (1994). Rural Sociology in India, Mumbai Popular Prakashan.
8. Frankel, F. R. (2006). India's Political Economy The Gradual Revolution (1947-2004). New
Delhi Oxford University Press.
9. Gupta, D (2000). Interrogating Caste, New Delhi Penguin.
10. Jenkins, R. (1999). Democratic Politics and Economic Reform in India (Vol. 5), Cambridge
Cambridge University Press.
11. Majumdar, D N, and Madan, T N (1957). An Introduction to Social Anthropology, New Delhi
Asia Publishing House.
12. Narula, S (1999). Broken People Caste Violence against India’s “Untouchables”, New York
Human Rights Watch.
13. Pradhan, K C (2013). “Unacknowledged Urbanization New Census Towns of India,” Economic
& Political Weekly, Vol 48, No 36, pp 43-51.
14. Rai, B K and Vidyarthi, L P (1977). The Tribal Culture of India. New Delhi Concept Publishing
Company.
15. Rudolph, LI and Rudolph SH (1967). The Modernity of Tradition, New Delhi Orient Longman.
16. Salve, P (2014). How Many Farmers Does India Really Have?,IndiaSpend. Accessed from
http//archive.indiaspend.com/special-reports/how-many-farmers-does-india-really-have-
46359
17. Singh, K (2009). Rural Development Principles, Policies and Management, New Delhi SAGE
Publications India.
18. Srinivas, M N (1959) ‘The Dominant Caste in Rampura’ , in American Anthropologist, n.s., 61
(1) 1–16.

24 MGNCRE | Indian Rural Society and Rural Administration
Chapter 2 Panchayati Raj
Introduction Rural self-governments or what are known as panchayats in India were set-up in villages of India
after Independence. Mahatma Gandhi was an exponent of decentralization of political and financial
powers that are vested in governments. He advocated the idea of assigning the highest powers to
the administration at local levels.
Local self-governments are important because they are the closest to the people. Governments at
village or city level also serve as training grounds for future politicians of the country. Also, local self-
governments are participatory form of democracy. Due to geographical and cultural factors, every
region faces challenges and development needs that may be specific to them. Local governments
serve to sort the regional issues of development at the regional level.
In this Chapter, we will study the historical evolution of the Panchayats in India, the importance of
panchayats in villages, the structures and composition of panchayats with a focus on constitutional
provisions.
Objectives
• To highlight the historical development of the panchayat institutions in India through
governance reports and reforms since independence
• To reflect on the panchayat structures and bodies through the constitutional provisions
• To understand the importance of panchayats for rural development and democracy
Structure
Panchayati Raj
2.1 Evolution of Panchayati Raj in India
2.2 Role of Panchayati Raj
2.3 Structures and Tiers of Panchayati Raj
2.4 Rural Administration
2.5 Relationship with Bureaucracy

25 MGNCRE | Indian Rural Society and Rural Administration
2.1 Evolution of Panchayati Raj in India
Gandhian Ideas on Panchayats before India’s Independence
Gandhi referred to Panchayati Raj as village Swaraj. He wanted each village to be like a small
republic, self-sufficient in its vital wants. He advocated that local bodies must enjoy the maximum
freedom of deciding the affairs of the locality.
In Young India (28.05.1931), Gandhi had described the panchayat system of local self-governments
as, “Panchayat has an ancient flavor; it is a good word. It literally means an assembly of five elected
by villagers. It represents the system, by which the innumerable village republics of India were
governed.”
After independence from British rule in 1947 and the enforcement of the constitution of India in
1950, the Panchayat Raj system of local government was first established by the state of Rajasthan
in Naguar district on 2 Oct 1959. Later in the following decade, other state governments also
adopted this system of local self-government in the villages. Laws were passed by each of the states
to establish panchayats within their jurisdiction.
Panchayati Raj system in India in its present form is a product of many governance
recommendations. These can be best understood through the reports of the following committees-
BalwantRai Mehta Committee
The BalwantRai Mehta Committee, headed by MP Balwantrai Mehta, was a committee appointed by
the Government of India in January 1957 to examine the work of the Community Development
Programme (1952) and the National Extension Service (1953), to suggest measures to improve their
work. The committee's recommendation of the committee by NDC in January 1958, and this set the
stage for the launching of Panchayati Raj Institutions throughout the country. The committee
recommended the establishment of the scheme of ‘democratic decentralization’, which finally came
to be known as Panchayati Raj. Democratic decentralisation means allocating more powers to the
governments that are closer to the people than the central government; in this case the local self-
governments at villages.
Main Recommendations on Panchayati Raj Institutions (1957)
1. The Government should divest itself completely of certain duties and responsibilities and
devolve them to body which will have the entire charge of all development work within its
jurisdiction, reserving to itself only the functions of guidance, supervision and higher
planning.
2. At the Chapter level, an elected self-governing institution should be set up with its
jurisdiction co-extensive with a development Chapter.
3. The panchayat samiti should be constituted by indirect elections from the village
panchayats.
4. The functions of the panchayatsamiti should cover the development of agriculture in all its
aspects, improvement of cattle, promotion of local industries, public health, welfare work,
administration of primary schools and collection and maintenance of statistics. It should also
act as an agent of the State Government in executing special schemes of development
entrusted to it. Other functions should be transferred to the panchayatsamitis only when
they have started functioning as efficient democratic institutions. '

26 MGNCRE | Indian Rural Society and Rural Administration
5. The State Government should give to these samitis adequate grants-in-aid conditionally or
unconditionally or on a matching basis, with due regard to economically backward areas.
6. All Central and State funds spent in a Chapter area should invariably be assigned to the
panchayatsamiti to be spent by it directly or indirectly excepting when the samiti
recommends direct assistance to an institution.
7. A certain amount of control should inevitably be retained by the Government,e.g., the
power of superseding a panchayatsamiti in public interest.
8. The constitution of the panchayat should be purely on an elective basis with the provision
for the co-option of two women members and one member each from the Scheduled Castes
and Scheduled Tribes. No other special groups need be given special representation.
9. Main resources of income of the panchayat will be property or house tax, tax on markets
and vehicles, octroi or terminal tax, conservancy tax, water and lighting rate, income from
cattle ponds, grants from the panchayatsamitis and fees charged from the registration of
animals sold.
10. The budget of the village panchayat will be subject to scrutiny and approval of the
panchayatsamiti, chief officer of which will exercise the same power in regard to the village
panchayat as the collective will in regard to the panchayatsamiti. No village panchayat
should however, be superseded except by the State Government who will do so only on the
recommendation of the ZilaPrishad,
11. The compulsory duties of the village panchayats should include among others provision of
water supply, sanitation, lighting, maintenance of roads, land management, collection and
maintenance of records and other statistics and the welfare of backward classes. It will also
act as an agent of the panchayatsamiti in executing any scheme entrusted to it.
12. The judicial panchayat may have much larger jurisdiction than even a Gram Sevak's circle,
and out of the panel suggested by village panchayats the sub-divisional or district magistrate
may select persons to form judicial panchayats.
13. To ensure necessary coordination between the panchayatsamitis, a ZilaParishad should be
constituted consisting of the presidents of these samitis, M.L.As and M.Ps representing the
area and the district level officers. The collector will be its chairman and one of the officers
will act as Secretary.
Ashok Mehta Committee
In late 1970s, the government of India appointed a high-powered committee, chaired by Sri Asoka
Mehta on the working of panchayati raj throughout India. The report of this committee was
important and eagerly awaited by everybody interested in panchayati raj movement, especially in
the context of the prevailing national consensus on decentralization at that time.
Main Recommendations of the Ashok Mehta Committee on Panchayati Raj Institutions (1978)
1. In the Panchayati Raj structure, there should be a two-tier set up, a district level, zilaparishad
and a Mandalpanchayat covering a population of 15,000 to 20,000.
2. With the two-tier structure, the Committee also suggested ultimate abolition of the Chapter
as a unit of developmental administration. 3. All the development functions relating to a
district which are now performed by the State Governments should be placed under the
zilaparishad.
3. The term of Panchayati Raj institutions should be 4 years. Direct elections to these bodies

27 MGNCRE | Indian Rural Society and Rural Administration
should be held simultaneously.
4. Political parties could participate in the Panchayati Raj elections.
5. Elections to Panchayati Raj bodies should be conducted by the Chief Electoral Officers of the
States in consultation with the Election Commission.
6. Nyayapanchayats should be kept separate from the developmental panchayats. A qualified
judge should preside over them and elected panches should act as members of benches of
Nyayapanchayats.
7. Panchayati Raj bodies should normally not be superseded, but if supersession become
necessary, election should be held within six months.
8. Representation of the scheduled castes and scheduled tribes in all Panchayati Raj bodies
should be on the basis of their population.
9. There should be complete transfer of the land revenue collections to panchayati Raj
institutions over a period of five year.
10. A permanent annual grant of not less than Rs.2.50 per capita should be made to the
mandalpanchayats.
11. The committee agreed to the need for some provision in the Constitution in order to provide
the Panchayati Raj institutions the requisite status as well as assurance of continuous
functioning, and wanted that this aspect should be considered.
G.V.K. Rao Committee
The main purpose of this committee was to examine rural development and implementation of
poverty alleviation programmes. This committee was set-up by the Ministry of Agriculture. This
committee also highlighted the need for the coordination of rural banks and administration to foster
rural development.
Main Recommendations of G.V.K. Rao Committee on Panchayati Raj Institutions (1985)
1. Panchayati Raj Institutions have to be activated and given all the support needed so that
they can become effective organizations for handling people's problems. Elections to these
bodies should be held regularly.
2. The Committee recommended a 3-tier structure for Panchayati Raj Institutions.
3. The district should be the basic unit for policy planning and programme implementation. The
ZilaParishad should, therefore, become the principal body for management of all
development programmes which can be handled at that level.
4. The President of the ZilaParishad can be directly elected for a term co-terminus with the
Zilaparishad or for one year each on the Mayoral Pattern. The work of the ZilaParishad
should be done by a number of Sub-Committees elected on the basis of the proportional
representation so that participatory democracy could be developed and encouraged.
5. Panchayati Raj Institutions at the district level and below should be assigned important role
in respect of planning, implementation and monitoring of rural development programmes.
6. The Committee recommends the introduction of the concept of district budget. It is
desirable that it is brought into being as quickly as possible.
7. The concept of properly prepared district plan is reitered. The preparation of a proper plan is
a pre-requisite for having a process of development which will ensure that the poor are
properly taken care of. All the development departments should clearly indicate the
activities which they would undertake for assisting the poor.

28 MGNCRE | Indian Rural Society and Rural Administration
8. The district plan should include all the resources available both in the plan and non-plan as
well as institutional resources.
9. The Committee is of the view that development administration at the district level has to be
treated as a major activity involving significant responsibilities and therefore, recommends
that a post of District Development Commissioner (DDC) be created to look after and
coordinate all the development activities in the district.
10. The DDC may be made the Chief Executive of the ZilaParishad in those states where the
Panchayati Raj institutions hold the responsibility for planning and implementation of
various development programmes.
11. In those states where ZilaParishadare not in position, the DDC could function as Chairman
and Chief Executive of the District Development Council.
12. The office of the DDC should be of a higher status than that of the District Collector in order
to establish the primary of the Development administration over maintenance
administration.
13. The Committee recommends that the Chapter Development Office should be the sheet-
anchor of the entire rural development process. For this purpose the status of this office
should be upgraded. The Chief Executive Officer of the Chapter/tehsil may be designated as
Assistant Development Commissioner (ADC). The ADC should be an officer of the status of
Sub-Divisional Officer.
14. The ADC should be a dynamic young person, preferably below the age of 35 and in any case
not above 40. His background, training, managerial capability and motivation should be
appropriate for the task as the leader of a team which will be in-charge of all development
functions in the Chapter.
15. On the basis of certain criteria of population, area and terrain, average size of the Chapter
may be one lakh population in the plains and 50,000 population in the hilly and difficult
terrain and tribal areas.
The LM Singhvi Committee
This committee was constituted in 1986 to study the problems faced by panchayat institutions. This
committee was the most important reform in the evolution of the panchayati raj system because it
recommended that local self-government should be constitutionally recognised. It highlighted the
need to protect and preserve these institutions by the adding a new chapter in the Constitution. It
also emphasized on the non-involvement of political parties in village elections.
Main Recommendations of Dr.L.M.Singhvi Committee for the Concept paper on Panchayati Raj
Institutions (1986)
1. Village may be reorganized and many of them may in the process be grouped and unlarged
in order to make for more viable village panchayats.
2. The Panchayati Raj Institutions have to be viewed as institutions of self-government which
would naturally facilitate the participation of the people in the process of planning and
development flowing from and as part of the concept of self-government. Development
planning should be democratic planning.
3. The operational dynamics of Panchayati Raj should be directed to achieve community and
social mobilization, transcending the barriers of caste, religion, sex and disparities of wealth
and surmounting social disabilities and disadvantages.

29 MGNCRE | Indian Rural Society and Rural Administration
4. Local self-government should be constitutionally recognised, protected and preserved by the
inclusion of a new chapter in the Constitution.
5. A Panchayati Raj - Judicial Tribunal to be constituted in each State to adjudicate
controversies in relation to elections, suspensions, supersessions, dissolutions, and other
matters relating to the working of panchayati Raj institutions and its elected personnel.
6. Ways and means should be found to ensure the, availability of adequate financial resources
of Panchayati Raj Institutions to function effectively.
Thungon Committee
This initiative was taken under the leadership of Rajiv Gandhi in 1988. A committee headed by P.K.
Thungon recommended that Panchayati Raj bodies should be constitutionally recognized and the
Constitution should have a provision to ensure timely and regular election to these bodies and their
term should be five years. The 73rd and 74th amendments to constitutionally set-up local
governments were brought in after these recommendations.
Main Recommendations of Thungon Committee on Panchayati Raj Institutions (1988)
1. Panchayati Raj bodies should be constitutionally recognized.
2. A three-tier structure for Panchayati Raj with Village Panchayat at the bottom, district
panchayat at the top and mandal Chapter panchayat in the middle, has been recommended
where it does not already exist.
3. The Sub-Committee is in favour of a model with the ZilaParishad as the only planning and
development agency in the district.
4. ' The Sub-Committee also suggests the setting up of a Planning and Coordination Committee
at the State level under the Chairmanship of the Planning Minister. Presidents of the
ZilaParishad would be members of the Committee.
5. The judicial functions of the village panchayat are required to be revived so that simple
disputes can be sorted out at the village level itself.
6. The Committee has recommended that MPs and MLAs should be suitably associated with
ZilaParishad.
7. The elected member of the ZilaParishad, in addition to members like MPs, MLAs, could as a
general rule be 5 to 15 in areas with the population of less than 15 lakhs and 15 to 60 in
areas with a population of over 15 lakhs.
8. As regards the procedure for the approval of the District Plan, it has been suggested that the
District Planning and Coordination Committee at the ZilaParishad should be well equipped
and should be able to draw upon the latest technology including computer linking the
district with the Divisional Headquarters and the State Capital with a two-way querying
system.
9. The suitable constitutional provision be made to ensure timely and regular elections. The
elections could be conducted by the Chief Electoral Officers of the State.
10. In case a local body does not function in accordance with lax-; or grossly abuses its powers, it
could be suspended or dissolved by the Static Government.’ After any dissolution, the State
Government will have to bring a Resolution in the State Legislature before the end of the
session or within six weeks of the commencement of the session whichever is earlier for
approval by the House. In any case, a body should not be superseded for a period of more
than six months.

30 MGNCRE | Indian Rural Society and Rural Administration
11. The term of Panchayati Raj bodies should be for a period of 5 years. However, the State
Government may choose the term depending upon their requirements but this terra may
not be less than 3 years.
12. It is recommended that a separate Panchayati Raj Judicial Tribunal should be appointed by
the State Government to adjudicate controversies in matters which hamper the functioning
of these institutions.
13. It is recommended that the system of reservation for all the three-tier of Panchayati Raj
bodies should be as per population. In case of areas with the tribal population of more than
30%, the Chairman of the body should be a member from the Scheduled Tribes. Vice-
Chairmanship of all the Panchayati Raj bodies should be reserved for a SC or ST member.
14. It is recommended that as a rule not less than two women should be members of Panchayati
Raj bodies at each level. In case of bodies of small size with membership upto five there
would be only one place reserved for a, woman member.
15. Collector/DC should be the pivotal point for both regulatory as well as development
administration. Collector should be the Chief Executive Officer of the - ZilaParishad. The
State Government should appoint officers of the rank of Additional Collectors to assist the
Collector in development and regulatory administration respectively.
16. The Sub-Committee feels that a detailed list of subjects to be dealt with at the district level
should be prepared and included in the corresponding schedule of the Constitution.
17. It is recommended that State Government should set up Finance Commissions to lay down
the criteria and guidelines whereby resources would be allocated to the districts. 18. Funds
should be allocated to the concerned departments like PWD, Irrigation, Public Health, Rural
Water Supply, etc. through the ZilaParishad.
18. The Sub-Committee envisage a District Budget where various schemes and projects required
in a district are to be taken into account along with contingencies which have not figured in
the district budget.
19. A Constitutional provision could be made whereby regular and timely elections to local
bodies could be ensured and the various powers and functions of these bodies delineated.
20. The Sub-Committee recommends that the Government of India could also consider
formulating a model Panchayat Act. The States could be requested to consider this model
Act for adoption.
21. The Sub-Committee felt that the Government of India could also promote Panchayati Raj
institutions by giving certain incentives to State Government,e.g. by way of increasing
grants-in-aid with reference to financial and other powers devolved upon these institutions
by the respective State Government.
22. The Central Government could organize training programmes for both officials and non-
officials of local bodies so that they could be fully familiar with the potentialities of these
bodies for development administration.
(NOTE This unit is based entirely on content from
http//shodhganga.inflibnet.ac.in/bitstream/10603/72213/17/17_appendix%20c.pdf
Source Lok Sabha Unstarred question No.2809 of 1 December, 1988, cited in Parliamentary
Research and Information Service, Seminar on Panchayati Raj, Lok Sabha Secretariat, New
Delhi, August 4-5, 1989 pp 25-34.)
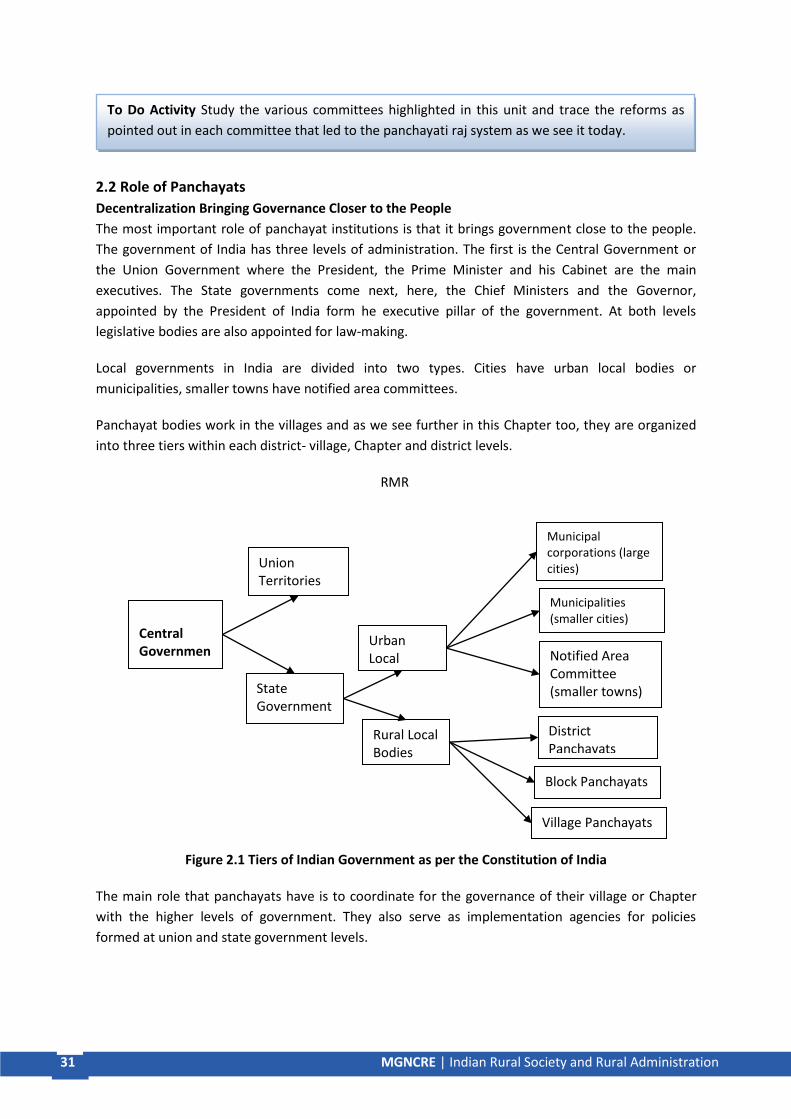
31 MGNCRE | Indian Rural Society and Rural Administration
2.2 Role of Panchayats
Decentralization Bringing Governance Closer to the People
The most important role of panchayat institutions is that it brings government close to the people.
The government of India has three levels of administration. The first is the Central Government or
the Union Government where the President, the Prime Minister and his Cabinet are the main
executives. The State governments come next, here, the Chief Ministers and the Governor,
appointed by the President of India form he executive pillar of the government. At both levels
legislative bodies are also appointed for law-making.
Local governments in India are divided into two types. Cities have urban local bodies or
municipalities, smaller towns have notified area committees.
Panchayat bodies work in the villages and as we see further in this Chapter too, they are organized
into three tiers within each district- village, Chapter and district levels.
RMR
Figure 2.1 Tiers of Indian Government as per the Constitution of India
The main role that panchayats have is to coordinate for the governance of their village or Chapter
with the higher levels of government. They also serve as implementation agencies for policies
formed at union and state government levels.
Central Government
State Government
Union Territories
Urban Local Bodies
Municipal corporations (large cities)
Municipalities (smaller cities)
Notified Area Committee (smaller towns)
District Panchayats
Rural Local Bodies
Village Panchayats
Block Panchayats
To Do Activity Study the various committees highlighted in this unit and trace the reforms as
pointed out in each committee that led to the panchayati raj system as we see it today.

32 MGNCRE | Indian Rural Society and Rural Administration
Community Development
The Community Development Programme was launched after independence and was operational
from 1952 to 1957, roughly for five years. The efforts of Albert Mayer in Etawah Pilot Projects may
be regarded as the preliminary work which laid the foundation of Community Development in India;
and following the recommendations of the Grow Moor Food Inquiry Committee, the Community
Development Programme was launched in the country on October 2, 1952.
Defining ‘Community’
A group of people living in a geographical area and have similar occupations and cultural affiliations
forms a community. It is a farm of social organization existing between the family and formal
institutions such as governments. A community, while in itself consisting of several parts, is also a
part of a larger social system. It is a dynamic social unit which is subject to change of internal or
external origin. Some of the important characteristics of the community are-
1. Communities are close-knit
2. Their customs are interrelated
3. These communities are complexes of sub-group relationship and
4. There is a discernible leadership within the community.
Defining ‘Development’
The term development connotes growth or maturation. It implies gradual and sequential phases of
change. Development can imply social, economic progress or improvement of physical infrastructure
in a given area.
Concepts of Community Development and Community Development Programmes
By understanding the above terms, we can say that community development programmes means a
programme for gradual change in a group of people living in a geographical area and have interest in
each other for the purpose of making a living or improvement in their physical quality of life.
1. Community development is a movement designed to promote better living for the whole
community with the active participation and on the initiative of the community.
2. Community development is a balanced programme for stimulating the local potential for
growth in every direction. Its promise is of reciprocal advance in both wealth and wealth
and welfare, not on the basis of outside charity but by building on the latent vitality of the
beneficiaries themselves with the minimum of outside aid.
3. Community development is technically aided and locally organized self-help.
4. The term community development has come into international usage to denote the process
by which the efforts of the people themselves are united with those the governmental
authorities to improve the economic social and cultural conditions of the communities, to
integrate these communities into the life of the nation and enable them to contribute fully
to national progress.
5. Community development is the term used to describe the technique which many
governments have adopted to reach their village people and to make more effective use of
local initiative and energy for increased production and better living standards.
6. Community development is a process of social action in which the people of a community
organize themselves for planning and action, define their needs and problems.

33 MGNCRE | Indian Rural Society and Rural Administration
Community development has now set the pattern for the development of the rural people and the
rural areas. The objectives of development and the new approach it makes to the solution of the
problem of rural reconstruction, the comprehensive nature of the programme that it is promoting.
The approach to the programme is two-fold, educational and organizational. The rural people are to
be educated in the art of better living, for bringing about a change in their attitude, for breaking
away from primitive methods of production, unhygienic says of living based on tradition and for the
adopting of progressive ways based on science and technology.
Area Planning
India, since independence, followed planning for economic growth. A Planning Commission (NITI
Aayog, since 2015) was set-up for this purpose. State governments also have planning offices. But it
is important to note here that these two levels of planning bodies were never given constitutional
status. Only district-level planning committees have been granted constitutional status. This implies
that their actions are more accountable. These committees work towards planning needs of the
region. Member of panchayats also serve in District Planning Committees.
The box below shows constitutional provisions for District Planning Committees-
Present PM Sri NarendraModi has started the Gram Panchayat Development Plan. Under this
scheme, Gram Panchayats have been mandated for the preparation of Gram Panchayat
Development Plan (GPDP) for economic development and social justice utilizing the resources
available to them. The GPDP planning process has to be comprehensive and based on participatory
Committee for District Planning
Article 243ZD. 1. There shall be constituted in every State at the district level a District Planning
Committee to consolidate the plans prepared by the Panchayats and the Municipalities in the district and to prepare a draft development plan for the district as a whole.
2. The Legislature of a State may, by law, make provision with respect to— (a) the composition of the District Planning Committees; (b) the manner in which the seats in such Committees shall be filled Provided that not less than four-fifths of the total number of members of such Committee shall be elected by, and from amongst, the elected members of the Panchayat at the district level and of the Municipalities in the district in proportion to the ratio between the population of the rural areas and of the urban areas in the district; (c) the functions relating to district planning which may be assigned to such Committees; (d) the manner in which the Chairpersons of such Committees shall be chosen.
3. Every District Planning Committee shall, in preparing the draft development plan,— (a) have regard to— (i) matters of common interest between the Panchayats and the Municipalities including spatial planning, sharing of water and other physical and natural resources, the integrated development of infrastructure and environmental conservation; (ii) the extent and type of available resources whether financial or otherwise; (b) consult such institutions and organisations as the Governor may, by order, specify.
4. The Chairperson of every District Planning Committee shall forward the development plan, as recommended by such Committee, to the Government of the State

34 MGNCRE | Indian Rural Society and Rural Administration
process which involves the full convergence with Schemes of all related Central Ministries / Line
Departments related to 29 subjects enlisted in the Eleventh Schedule of the Constitution.
Panchayats have a significant role to play in the effective and efficient implementation of flagship
schemes on subjects of National Importance for transformation of rural India. The People's Plan
Campaign will commence from 2nd October to 31st December, 2018 for preparing GPDP for 2019-20.
The campaign initiated under "SabkiYojanaSabkaVikas" will be an intensive and structured exercise
for planning at Gram Sabha through convergence between Panchayati Raj Institutions (PRIs) and
concerned Line Departments of the State.
Role of Panchayats in Agriculture Planning After the 73rd and 74th constitutional amendments, the Panchayti Raj Institution (PRI) is the major driver in the development of rural areas. It acts as a tool for implementation of all developmental schemes that are designed by the government of India or the state governments for specific regions. It is the main planning and executive agency for all kinds of development projects at the village or the gram panchayat level.
To prepare a good quality plan, quality of participation needs to be expanded and conscious efforts have to be made to ensure that every section of society participates in the Gram Sabha with active contributions on discussions towards identifying and prioritizing development issues and suggesting optimum solutions. India is not only has about xx% population living in villages, but a majority of the country’s population is also engaged in agriculture and allied sectors.
For this reason, panchayats have an important role in development of the agricultural sector. They need to coordinate with specialists in the field of agriculture policy so that the panchayat can make better participatory micro-plans as it is the most important source of livelihood for the village folks. Involvement of panchayats is important in preparing village level agriculture plans aligned with district vision and district agriculture plans.
Judicial Roles of Panchayats
Delivering justice is an implied primary function of the panchayats as per the constitution’s
provisions too. But there is still not enough legal clarity about judicial role of this body of local
governments in Indian villages. The union law ministry has from time to time emphasized the need
regarding the establishment of gram nyalayas.
At present, there is one nyayapanchayat for every three or four villages. Each village panchayat
elects a member to the nyayapanchayat. A sarpanch heads the nyayapanchayat. It has a jurisdiction
over minor civil and criminal cases.
Nyayapanchayat is a system of dispute resolution at village level in India. It can be endowed with
functions based on broad principles of natural justice and can tend to remain procedurally as simple
as possible.
To Do Activity Using an understanding of the village society and economy from previous study describe what you think are the main roles of panchayats in your area.

35 MGNCRE | Indian Rural Society and Rural Administration
2.3 Structures and Composition of Panchayati Raj
India’s political system saw a major shift in the early years of the decade of 1990s. First, the
economy was liberalized. A financial crisis had hit the Indian Government and the World Bank bailed
out the government with a loan. But there was a condition to the loan, they economy had to be
reformed and LPG- Liberalization, Privatization and Globalization reforms- had to brought in.
Parallel to these reforms, the central government’s control over federal policies had to be reduced.
After the recommendations of the LM Singhvi committee and Thungon Committee in 1980s, as we
see in unit 2.1 as well, the panchayati raj system was reformed too. The constitution of India was
amended and the 73rd amendment act, 1992, gave constitutional status to the Panchayati Raj
institutions all across India.
The provisions for setting up panchayats and their structures and institutions are mentioned in the
Part IX of the Constitution of India, Articles 243 to 243-O. The panchayats are organized into three
tiers as depicted in the diagram below-
Panchayats in India Definitions and Concepts as per the Constitution
Article 243. In this Part, unless the context otherwise requires, (a) “district” means a district in a State; (b) “Gram Sabha” means a body consisting of persons registered in the electoral rolls
relating to a village comprised within the area of Panchayat at the village level; (c) “intermediate level” means a level between the village and district levels specified by
the Governor of a State by public notification to be the intermediate level for the purposes of this Part;
(d) “Panchayat” means an institution (by whatever name called) of self-government constituted under article 243B, for the rural areas;
(e) “Panchayat area” means the territorial area of a Panchayat; (f) “population” means the population as ascertained at the last preceding census of which
the relevant figures have been published; (g) “village” means a village specified by the Governor by public notification to be a village
for the purposes of this Part and includes a group of villages so specified.

36 MGNCRE | Indian Rural Society and Rural Administration
Figure 2.2 Structure of Panchayati Raj
Structure of Panchayats as directed by the Constitution of India-
After the 73rd Amendment of the constitution in 1992, the panchayats in India got institutional status
from the highest law in the country. India, like all other democratic countries is also governed by a
constitution that highlights in detail how the governments in the country will be run.
It is essential to understand the constitutional provisions regarding the Panchayats to understand
their structure and functions. With a constitutional status, Panchayats are guided by the
At the village level, Gram Panchayats are set-up. This council is elected by all the people in the village
who are 18 years old and older. The size of the council depends on the population of the village-
ranging from 5 to 30 members. This council nominates a gram pradhan or council president, and
an up-pradhan, or vice-president. Members serve term for five-years and work towards the many
development goals of the village as we will see in the Unit 2.4 on rural administration. Additionally,
the pradhan and up-pradhan also work as members of the panchayatsamiti.
The panchayatsamiti functions at the Chapter level of rural administration. It may also be called the
'Chapter samiti’. The Chapter is made up of about 10 villages in a geographic area. This council
comprises the elected representatives – the gram pradhan and up-pradhan from the gram
panchayats of the villages. Other members include the representatives of different industries in the
area, and the Chapter Development Officer (BDO), appointed by the state government to aid the
Gram Sabha (Village Level)
Panchayat Samiti (Block Level)
Zilla Parishad (District-Level Council)
Structure of the Panchayats
Structure of Panchayats defined in the Constitution Article 243A. A Gram Sabha may exercise such powers and perform such functions at the village level as the Legislature of a State may, by law, provide. 243B. (1) There shall be constituted in every State, Panchayats at the village, intermediate and district levels in accordance with the provisions of this Part. (2) Notwithstanding anything in clause (1), Panchayats at the intermediate level may not be constituted in a State having a population not exceeding twenty lakhs.

37 MGNCRE | Indian Rural Society and Rural Administration
council in working with the state. Chapter samitis also serve for five years and elect their council
chairman and vice-chairman from their ranks to run meetings. The Chapter samitis also send
representatives to the higher tier than themselves- the zilla panchayat.
The zillaparishad is the highest tier of the panchayat system is and it represents a distinct district
within the state. Members of the zilla parishad are derived from the leaders of the panchayatsamitis
within the district. This council, like the lower bodies also elects a chairman and vice-chairman from
among the members who serve for a period of four to five years depending on the rules and
regulations set in that district. They work directly with the state government and help each Chapter
and the villages within the Chapters to provide for the administrative requirements of their people in
implementing the regional development programs.
Composition of Panchayats as described in the Constitution Article 243C. (1) Subject to the provisions of this Part, the Legislature of a State may, by law, make provisions with respect to the composition of Panchayats Provided that the ratio between the population of the territorial area of a Panchayat at any level and the number of seats in such Panchayat to be filled by election shall, so far as practicable, be the same throughout the State. (2) All the seats in a Panchayat shall be filled by persons chosen by direct election from territorial constituencies in the Panchayat area and, for this purpose, each Panchayat area shall be divided into territorial constituencies in such manner that the ratio between the population of each constituency and the number of seats allotted to it shall, so far as practicable, be the same throughout the Panchayat area. (3) The Legislature of a State may, by law, provide for the representation— (a) of the Chairpersons of the Panchayats at the village level, in the Panchayats at the intermediate level or, in the case of a State not having Panchayats at the intermediate level, in the Panchayats at the district level; (b) of the Chairpersons of the Panchayats at the intermediate level, in the Panchayats at the district level; (c) of the members of the House of the People and the members of the Legislative Assembly of the State representing constituencies which comprise wholly or partly a Panchayat area at a level other than the village level, in such Panchayat; (d) of the members of the Council of States and the members of the Legislative Council of the State, where they are registered as electors within— (i) a Panchayat area at the intermediate level, in Panchayat at the intermediate level; (ii) a Panchayat area at the district level, in Panchayat at the district level. (4) The Chairperson of a Panchayat and other members of a Panchayat whether or not chosen by direct election from territorial constituencies in the Panchayat area shall have the right to vote in the meetings of the Panchayats. (5) The Chairperson of— (a) apanchayat at the village level shall be elected in such manner as the Legislature of a State may, by law, provide; and (b) aPanchayat at the intermediate level or district level shall be elected by, and from amongst, the elected members thereof.
To Do Activity Visit your local panchayat body and draw a flowchart of the organisation and composition.

38 MGNCRE | Indian Rural Society and Rural Administration
2.4 Rural Administration
Ministry of Rural Development at the Union Government
The Government of India at present (in 2019) has a Ministry of Rural Development. This ministry has
two departments- Department of Rural Development and Department of Land Resources. The
ministry is responsible for designing and ensuring implementation various schemes for rural
development and coordinating with the panchayats.
Rural development implies both the economic betterment of people as well as greater social
transformation. In order to provide the rural people with better prospects for economic
development, increased participation of people in the rural development programmes,
decentralization of planning, better enforcement of land reforms and greater access to credit are
envisaged.
On 31st March 1952, an organization known as Community Projects Administration was set up under
the Planning Commission to administer the programmes relating to community development. The
community development programme inaugurated on October 2, 1952, was an important landmark
in the 97 history of the rural development. This programme underwent many changes and was
handled by different Ministries.
In October 1974, the Department of Rural Development came into existence as a part of Ministry of
Food and Agriculture. On 18th August 1979, the Department of Rural Development was elevated to
the status of a new Ministry of Rural Reconstruction. That Ministry was renamed as Ministry of Rural
Development on 23rd January 1982. In January 1985, the Ministry of Rural Development was again
converted into a Department under the Ministry of Agriculture and Rural Development which was
later rechristened as Ministry of Agriculture in September 1985. On July 5, 1991 the Department was
upgraded as Ministry of Rural Development.
Reservation in Panchayats
There is a provision of reservation of seats for SCs and STs at every level of Panchayat in proportion
to the population of the communities in the region.
One-third of the total seats are to be reserved for women in each panchayat.
This was a bold step that the reforms made towards the empowerment of women and backward
communities at village level. The constitutional provisions for reservation can be studied from the
box below-
39 MGNCRE | Indian Rural Society and Rural Administration
Financial Administration
Panchayats in India do not have direct fund-generation capacity. But the state government may
make laws to empower the panchayats financially.
Panchayats, can be empowered to impose taxes to levy, collect and appropriate suitable local taxes.
They may also be assigned the power of making grants-in-aid to the panchayats from the
consolidated fund of the state. But at every step, the State government has to make sure that the
panchayats discharge their functions smoothly with adequate finance at their disposal.
Reservation of Seats in Panchayats Article 243D. (1) Seats shall be reserved for— (a) the Scheduled Castes; and (b) the Scheduled Tribes, in every Panchayat and the number of seats so reserved shall bear, as nearly as may be, the same proportion to the total number of seats to be filled by direct election in that Panchayat as the population of the Scheduled Castes in that Panchayat area or of the Scheduled Tribes in that Panchayat area bears to the total population of that area and such seats may be allotted by rotation to different constituencies in a Panchayat. (2) Not less than one-third of the total number of seats reserved under clause (1) shall be reserved for women belonging to the Scheduled Castes or, as the case may be, the Scheduled Tribes. (3) Not less than one-third (including the number of seats reserved for women belonging to the Scheduled Castes and the Scheduled Tribes) of the total number of seats to be filled by direct election in every Panchayat shall be reserved for women and such seats may be allotted by rotation to different constituencies in a Panchayat. (4) The offices of the Chairpersons in the Panchayats at the village or any other level shall be reserved for the Scheduled Castes, the Scheduled Tribes and women in such manner as the Legislature of a State may, by law, provide Provided that the number of offices of Chairpersons reserved for the Scheduled Castes and the Scheduled Tribes in the Panchayats at each level in any State shall bear, as nearly as may be, the same proportion to the total number of such offices in the Panchayats at each level as the population of the Scheduled Castes in the State or of the Scheduled Tribes in the State bears to the total population of the State Provided further that not less than one-third of the total number of offices of Chairpersons in the Panchayats at each level shall be reserved for women Provided also that the number of offices reserved under this clause shall be allotted by rotation to different Panchayats at each level. (5) The reservation of seats under clauses (1) and (2) and the reservation of offices of Chairpersons (other than the reservation for women) under clause (4) shall cease to have effect on the expiration of the period specified in article 334. (6) Nothing in this Part shall prevent the Legislature of a State from making any provision for reservation of seats in any Panchayat or offices of Chairpersons in the Panchayats at any level in favour of backward class of citizens.

40 MGNCRE | Indian Rural Society and Rural Administration
Audit of Accounts The state legislatures (VidhanSabhas in states) have been given the power to
make provisions in respect of the maintenance of accounts by the Panchayats and they are also
responsible for auditing of their accounts. State Finance Commission This body is constituted at the
State level. Its main function is to review the financial position of Panchayats once in every five
years. It also recommends to the state the pattern of distribution of funds between the state
government and the Panchayat bodies.
State Election Commission Elections to the Panchayats are conducted regularly under the overall
supervision of the State Election Commission. The Election Commissions are headed by a State
Election Commissioner, who shall be appointed by the Governor in each state.
Powers to impose taxes by and Funds of the Panchayats Article 243H. The Legislature of a State may, by law,— (a) authorize a Panchayat to levy, collect and appropriate such taxes, duties, tolls and fees in accordance with such procedure and subject to such limits; (b) assign to a Panchayat such taxes, duties, tolls and fees levied and collected by the State Government for such purposes and subject to such conditions and limits; (c) provide for making such grants-in-aid to the Panchayats from the Consolidated Fund of the State; and (d) provide for constitution of such Funds for crediting all moneys received, respectively, by or on behalf of the Panchayats and also for the withdrawal of such moneys therefrom, as may be specified in the law.
State Finance Commission and Audit of Panchayat Accounts Article 243-I. (1) The Governor of a State shall, as soon as may be within one year from the commencement of the Constitution (Seventy-third Amendment) Act, 1992, and thereafter at the expiration of every fifth year, constitute a Finance Commission to review the financial position of the Panchayats and to make recommendations to the Governor as to— (a) the principles which should govern— (i) the distribution between the State and the Panchayats of the net proceeds of the taxes, duties, tolls and fees leviable by the State, which may be divided between them under this Part and the allocation between the Panchayats at all levels of their respective shares of such proceeds; (ii) the determination of the taxes, duties, tolls and fees which may be assigned to, or appropriated by, the Panchayats; (iii) the grants-in-aid to the Panchayats from the Consolidated Fund of the State; (b) the measures needed to improve the financial position of the Panchayats; (c) any other matter referred to the Finance Commission by the Governor in the interests of sound finance of the Panchayats. (2) The Legislature of a State may, by law, provide for the composition of the Commission, the qualifications which shall be requisite for appointment as members thereof and the manner in which they shall be selected. (3) The Commission shall determine their procedure and shall have such powers in the performance of their functions as the Legislature of the State may, by law, confer on them. (4) The Governor shall cause every recommendation made by the Commission under this article together with an explanatory memorandum as to the action taken thereon to be laid before the Legislature of the State. Article 243J. The Legislature of a State may, by law, make provisions with respect to the maintenance of accounts by the Panchayats and the auditing of such accounts.

41 MGNCRE | Indian Rural Society and Rural Administration
Powers and Functions of Panchayats
The Eleventh Schedule, added by the Constitution (Seventy-third Amendment) Act, 1992 highlights
the outlines the subjects relating to the powers, authority and responsibilities of the panchayats.
These powers are granted under article 243 G of the constitution of India.
The twenty-nine matters of jurisdiction for panchayats under the Eleventh Schedule are listed in the
box below-
Panchayat Elections, Duration of Term and Disqualification of Membership Article 243K. (1) The superintendence, direction and control of the preparation of electoral rolls for, and the conduct of, all elections to the Panchayats shall be vested in a State Election Commission consisting of a State Election Commissioner to be appointed by the Governor. (2) Subject to the provisions of any law made by the Legislature of a State, the conditions of service and tenure of office of the State Election Commissioner shall be such as the Governor may by rule determine Provided that the State Election Commissioner shall not be removed from his office except in like manner and on the like grounds as a Judge of a High Court and the conditions of service of the State Election Commissioner shall not be varied to his disadvantage after his appointment. (3) The Governor of a State shall, when so requested by the State Election Commission, make available to the State Election Commission such staff as may be necessary for the discharge of the functions conferred on the State Election Commission by clause (1). (4) Subject to the provisions of this Constitution, the Legislature of a State may, by law, make provision with respect to all matters relating to, or in connection with, elections to the Panchayats. Article 243E. (1) Every Panchayat, unless sooner dissolved under any law for the time being in force, shall continue for five years from the date appointed for its first meeting and no longer. (2) No amendment of any law for the time being in force shall have the effect of causing dissolution of a Panchayat at any level, which is functioning immediately before such amendment, till the expiration of its duration specified in clause (1). (3) An election to constitute a Panchayat shall be completed— (a) before the expiry of its duration specified in clause (1); (b) before the expiration of a period of six months from the date of its dissolution Provided that where the remainder of the period for which the dissolved Panchayat would have continued is less than six months, it shall not be necessary to hold any election under this clause for constituting the Panchayat for such period. (4) A Panchayat constituted upon the dissolution of a Panchayat before the expiration of its duration shall continue only for the remainder of the period for which the dissolved Panchayat would have continued under clause (1) had it not been so dissolved. Article 243F. (1) A person shall be disqualified for being chosen as, and for being, a member of a Panchayat— (a) if he is so disqualified by or under any law for the time being in force for the purposes of elections to the Legislature of the State concerned Provided that no person shall be disqualified on the ground that he is less than twenty-five years of age, if he has attained the age of twenty-one years; (b) if he is so disqualified by or under any law made by the Legislature of the State. (2) If any question arises as to whether a member of a Panchayat has become subject to any of the disqualifications mentioned in clause (1), the question shall be referred for the decision of such authority and in such manner as the Legislature of a State may, by law, provide.

42 MGNCRE | Indian Rural Society and Rural Administration
Eleventh Schedule (Article 243G)
1. Agriculture, including agricultural extension. 2. Land improvement, implementation of land reforms, land consolidation and soil conservation. 3. Minor irrigation, water management and watershed development. 4. Animal husbandry, dairying and poultry. 5. Fisheries. 6. Social forestry and farm forestry. 7. Minor forest produce. 8. Small scale industries, including food processing industries. 9. Khadi, village and cottage industries. 10. Rural housing. 11. Drinking water. 12. Fuel and fodder. 13. Roads, culverts, bridges, ferries, waterways and other means of communication. 14. Rural electrification, including distribution of electricity. 15. Non-conventional energy sources. 16. Poverty alleviation programme. 17. Education, including primary and secondary schools. 18. Technical training and vocational education. 19. Adult and non-formal education. 20. Libraries. 21. Cultural activities. 22. Markets and fairs. 23. Health and sanitation, including hospitals, primary health centres and dispensaries. 24. Family welfare. 25. Women and child development. 26. Social welfare, including welfare of the handicapped and mentally retarded. 27. Welfare of the weaker sections, and in particular, of the Scheduled Castes and the Scheduled Tribes. 28. Public distribution system. 29. Maintenance of community assets
To Do Activity Make a list of the schemes launched by the Ministry of Rural Development, Government of India and chalk out the role of district administration in implementing each scheme.
Powers, Authority and Responsibilities of Panchayats Article 243G. Subject to the provisions of this Constitution, the Legislature of a State may, by law, endow the Panchayats with such powers and authority as may be necessary to enable them to function as institutions of self-government and such law may contain provisions for the devolution of powers and responsibilities upon Panchayats at the appropriate level, subject to such conditions as may be specified therein, with respect to— (a) the preparation of plans for economic development and social justice; (b) the implementation of schemes for economic development and social justice as may be entrusted to them including those in relation to the matters listed in the Eleventh Schedule.

43 MGNCRE | Indian Rural Society and Rural Administration
2.5 Relationship with Bureaucracy
District was an important unit of administration during the British rule, mainly for revenue
collection. Even after independence, the district and the bloc are important for administration.
District Bureaucracy
The rural administration is managed bureaucrats or government officials that can be categorized
under four heads-
1-Police The police in village help in maintaining law and order.
2-Patwari (Land Measurer) The Patwari holds a record of land measures and solves disputes
regarding boundaries.
3-Tehsildar or Talukdar These people supervise the work of Patwaris mentioned above. They also
look at the general law and order of their areas and solve disputes that arise. These officers are also
in charge of handing our community certificates to villagers, like a Schedule Tribe certificate.
4-District Collector or District Magistrate These officers are the head of a district in each state. They
supervise the overall functioning of the district. A majority of them get the position by clearing the
tough Union Public Service Commission exam for Indian Administrative Services.
District Rural Development Agency
Every district if India with rural population has a District Rural Development Agency or DRDA. The
DRDA is the principal organ at the district level to manage and oversee the implementation of
different anti-poverty schemes of the Ministry of Rural Development. It is a supporting and
facilitating organization which plays a very effective role as a catalyst in development process.
The DRDA may be differently organized in each district according to the needs of the region. The
DRDA is one agency in rural administration where panchayat officials and bureaucrats work
together, along with other policy implementation bodies and technical staff.
The DRDA in India has been set up by the Ministry of Rural Development. This agency was created
originally to implement the Integrated Rural Development Programme (IRDP) in 1980s. Later the
DRDAs were entrusted with number of programmes of both state and central governments. Since
April 1999a separate DRDA Administration has been introduced to take care of the administrative
costs. This has been done to strengthen the DRDAs and make them more professional in managing
the anti-poverty programmes and be an effective link between the ministry at the top levels and the
districts at grassroots.
Decentralisation of Rural development and poverty alleviation programmes is essential, keeping in
view the large geographical areas, the administrative requirements and the need to involve
grassroots-level officials and the community in the implementation of the programmes. At the
District level, the programmes are implemented through the DRDAs The governing body of DRDA
can include Members of Parliament (MPs), Members of Legislative Assemblies (MLAs), District level
officials of Development Departments, Bankers, NGO's and representatives of weaker sections of the
society. The District Collector used to be (but not always at present) the Chairman of the Governing
Board. The Governing body at the district level provides guidance and directions to DRDA. The body
in DRDA responsible for actual implementation is headed by an Additional District Collector.
Many Schemes of the Central and State Governments are introduced from time to time towards
rural development. Several schemes are available providing support to different components of
Rural Development such as poverty alleviation or agriculture development or rural roads. Schemes

44 MGNCRE | Indian Rural Society and Rural Administration
are also periodically modified on the basis of experience over the years. The task of DRDA has been
to identify the region-specific the needs of the village population and reach the appropriate schemes
where they are needed. In implementing the schemes, the role of the DRDA has been Technical,
Managerial and Financial. Thus DRDA is not only a body to disburse the funds for the schemes but
also provide appropriate Managerial and Technical support.
Since each DRDA is organized according to local needs of development, the way the relationships
between bureaucracy and panchayats will shape up depends from region to region.
Coordination Problems Faced by Panchayats
Some factors that lead to problems in functioning and coordination at panchayati raj can be
identified as follows-
1. domination of panchayati raj institutions by elite groups from villages with vested interests
2. operational significance to those institutions with non-elected members, mainly gram sabha
has become a mere okaying body in most states and non-elected members such as
bureaucrats have bigger powers
3. heavy dependence on the state government for finances
4. domination of political class over bureaucracy
But any study on the structure and evolution of the panchayati raj system in India and its success is
incomplete without a deeper and more thorough understanding of the forms of economic
domination by certain classes in the Indian rural society. The four factors listed above are the biggest
challenges before panchayats in India.
Summary
This Chapter focused on rural self-governments in India. Decentralization has been an important
narrative in administrative reforms in India since independence. Strong local governments
contribute towards more participatory democracy and governance among community. At the same
time it helps in socio-economic development of the region.
This Chapter shows the legal aspects of the structure, composition and functions of the panchayats
in India by citing them from the constitution. Constitutional status to panchayat bodies means that
they were legally empowered. But at the same time we see in this Chapter how limited control over
finances and elitism in local society and bureaucracy makes panchayat bodies less powerful.
Model Questions
1. 1-What have been the five biggest reforms in the panchayati raj in India since
independence?
2. 2-Describe the election and structure of panchayats.
3. 3-List five most important functions of panchayats as defined in the constitution of India.
4. 4-What are the problems panchayats face
To Do Activity Make an organisational chart of the DRDA from your district.

45 MGNCRE | Indian Rural Society and Rural Administration
References
1. Gandhi, M.K. (1931), ‘Panchayats in Pre-Independence Days’, Young India.
https//www.mkgandhi.org/panchayat_raj/preindependence_panchayats.htm
2. Jain, S .C . (1967), Aspects of Community Development and Panchayati Raj in India. Allied
Publishers Pvt.Ltd.Calcutta.
3. Roupp, P. (e d .) (1953) , Approaches to Community Development, A Symposium
introductory to problems and methods of village welfare in underdeveloped areas;, w .Van
floeve L t d ., The Hague, Bandung.
4. My Agriculture Information Bank, ‘Community Development Programme’, Accessed from
http//www.agriinfo.in/default.aspx?page=topic&superid=7&topicid=1451

46 MGNCRE | Indian Rural Society and Rural Administration
Chapter 3
Fundamentals of Rural Demography and
Economics
Introduction This Chapter will introduce a basic understanding of the field of Demography to the readers.
Understanding of demography is important because it is a science that helps understand people,
their age groups, gender composition, economic engagements and living standards. Different
countries of the world collect socio-economic data in various ways.
In India, there are two main agencies that conduct surveys on population- the Office of the Registrar
General and Census Commissioner that holds Census on India survey every decade and the National
Sample Survey Organization that conduct household level surveys to measure the socio-economic
indicators of the country.
The Sample Registration Survey or SRS also keeps a record of health indicators, especially women
and child healthcare through infant and maternal mortality data. Other than this, the government of
India conducts the National Family and Health Surveys from time to time at household levels.
The Reserve Bank of India and the Planning Commission (now NITI Aayog) are also been important
sources of data and research on economic indicators for India.
This Chapter will focus on understanding demographic terminology and its implications for the socio-
economic policy in the context of rural India.
Objectives
• Studying basic concepts of demography to study populations
• Analyzing demographic transition of rural India
• Understanding the linkages between demographic and economic indicators
• Exploring policy implications for rural India due to demographic transition
Structure
Fundamentals of Rural Demography and Economics
3.1 Fundamentals of Demography
3.2 Demographic transition in Rural India
3.3 Rural Poverty
3.4 Rural Economy
3.5 Challenges and Opportunities

47 MGNCRE | Indian Rural Society and Rural Administration
3.1 Fundamentals of Demography
In order to understand policy needs it is first important to understand the people. A study of
Demography helps in systematically understanding the population of a particular region. This helps
in policy-making for the region.
Introduction to Demography
The field of demography can be broadly divided into five topics
• The size of the population;
• Its distribution across geographic areas;
• Its composition (e.g., age, sex, race, and other characteristics);
• Changes in population size, distribution, and composition over time and
• The determinants and consequences of population growth
Etymologically, ‘demos’ is the Greek root which means ‘people’ and ‘graphy’ in English literally
means ‘a written representation of’. Demography, thus, is the study of people. It involves statistical
study of populations. It helps us understand transitions within populations over time. It can involve
birth and death rates, life expectancy, diseases and health, gender composition, racial and ethnic
compositions, distribution of age groups.
The term demography was coined by a seventeenth century English haberdasher and statistician.
With his friend William Petty, he developed census methods after witnessing a rise in death due to
plague in seventeenth century England.
In-depth study of demography can also help understand socio-economic transitions. Socio-economic
transitions that Indian Census surveys have included in the study are data on religious minorities,
backward castes and tribal populations, occupation, income and education levels, household data.
An understanding of demography is helpful for policy-making. Let us see how various broad divisions
of demography can help us understand rural lives in India.
Population Size
The size of a population matters because it gives us an understanding of how many people live in a
particular area. When we know how many people live in a particular area over time, we can
calculate population density, population growth (or decline), death rates and birth rates.
All these aspects help in designing policy for a particular region. Policies could be related to
installation of public infrastructure such as schools, hospitals, roads or bridges or making policies for
health and economic needs of the people of a particular region. Understanding trends in rates of
population growth and death rates help in designing of health policies.
Geographical Distribution of Population
Geographical distribution of population can relate to political division- for example, distribution of
population among states of India. It can be related to rural or urban distribution or it can be in
relation to physical geography of a region.

48 MGNCRE | Indian Rural Society and Rural Administration
Composition of Population
Composition of the population hints at gender composition, age composition, compositions of
various minority communities- in the case of India, minority communities refers to religious
communities. Census of India also collects data on socially backward communities such as the
Scheduled Castes and Scheduled Tribes.
Composition of population indicated socio-economic needs of the region. If a region has high
concentration of backward population, policies need to focus on welfare of the society. If a region
shows poor sex ratio for women, the policy focus has to be on gender-focused schemes. Lesser
people in the working-age group (15 to 59 years in India) implies more dependency on the working
population of younger or older people.
Transition of Population
Transition of population can be understood in terms of decrease or increase in growth or birth or
death rates, transition from rural to urban population or socio-economic transition in terms of
occupation and income.
The "Demographic Transition" is a model that describes population change over time. It is based on
an interpretation from 1929 by an American demographer named Warren Thompson, who observed
changes, or ‘transitions’, in birth and death rates in industrialized societies over the past two
hundred years or so. This led to the expansion if the field as it helped policymakers predict or
estimate changes in population by observing trends to plan for the future.
Understanding Population Growth
The population of a country or area grows or declines through the interaction of three demographic
factors fertility, mortality, and migration. To project future population, demographers make
assumptions about how the current rates of births, deaths, and immigration and emigration will
change in the future. Based on these assumptions, age- and sex-specific population increases or
decreases over a future period are calculated and added to census results or an estimate of the
population at the beginning of the period.
Policymakers and economic planners have to rely on population projections to assess future demand
for resources such as food, water, and energy, as well as services such as health and education.
Projections alert policymakers and planners to major trends that may affect social and economic
development and help them craft appropriate policies and programs.
To Do Activity Study the Census records of India from 1951 and highlight the changes in census methodologies to study transition of rural societies.

49 MGNCRE | Indian Rural Society and Rural Administration
Demography Glossary of Terms
Birth Rate The Crude Birth Rate represents births in a given year for every 1000 persons.
Death Rate The Crude Death Rate represents deaths in a given year per 1000 people.
Natural Change and Rate of Natural Change in Population Natural change in population is the
difference between births and deaths. It does not include the effects of migration. Including the
effects of migration (both in and out) would give us Total Change. The difference between natural
and total change can be important in countries that are experiencing significant migration and one
should be careful when reading data to be sure which they represent.
Fertility The total fertility rate is the average number of children that would be born to a woman
during her lifetime if she were to pass through her childbearing years conforming the age-specific
fertility rates of the year in which she turned fifteen. Fertility across the world is correlated with a
number of factors. These include age of marriage; female literacy; childhood mortality.
Replacement fertility The level of fertility at which a cohort of women on the average are having
only enough children to replace themselves and their partner in the population. By definition,
"replacement" is considered only to have occurred when the offspring reach 15 yrs. In The United
States and other industrialized countries, a TFR of 2.1 is considered to be replacement level (more
than 2.0 to allow for childhood mortality).
Doubling time Doubling time is the number of years it will take to double the present population
given its present rate of growth. This time is approximated by dividing "70" by the per cent rate of
increase.
Survivorship curve Survivorship curves keep track of the fate of any given birth cohort. They show
the per cent still living at a given age. Nowadays in the developed world few children die before
reproduction.
Population pyramid A bar chart that shows the age and sex distribution of members of a population.
The age divisions are referred to as "cohorts" and may be in 5 or 10 year increments, depending on
the level of detail desired. By convention, females are always plotted to the right, males to the left.
The units across the base may be either absolute numbers or per cent of the population.
Population momentum Population momentum refers to the tendency for population growth to
continue beyond the time that replacement-level fertility has been achieved because of a highly
relatively high concentration of people in the childbearing years.
Age Structure The proportion of the total population in each age group.
Dependency Ratio A dependency ratio is the ratio of people in a dependent age group (those under
age 15 or ages 65 and older) to those in the economically productive age group (ages 15 to 64) of a
population. For instance, a child dependency ratio of 0.45 means there are 45 children for every 100
working-age adults.
Infant Mortality Rate The number of deaths of infants under age 1 per 1,000 live births in a given
year.
Life Expectancy The average number of additional years a person could expect to live if current
mortality trends were to continue for the rest of that person’s life. Most commonly cited as life
expectancy at birth.
Median Age The age that divides a population into two numerically equal groups; that is, half the
people are younger than this age and half are older.
Migration The movement of people across a specified boundary for the purpose of establishing a
new or semi-permanent residence. Divided into international migration (migration between
countries) and internal migration (migration within a country).
50 MGNCRE | Indian Rural Society and Rural Administration
“Population Explosion” (or “Population Bomb”) Expressions used to describe the 20th century
worldwide trend of rapid population growth, resulting from a world birth rate much higher than the
world death rate.
Population Projection Computation of future changes in population numbers, given certain
assumptions about future trends in the rates of fertility, mortality, and migration. Demographers
often issue low, medium, and high projections of the same population, based on different
assumptions of how these rates will change in the future.
Sex Ratio The number of females per 1000 males in a population (As used in Indian Census).
Zero Population Growth A population in equilibrium, with a growth rate of zero, achieved when
births plus immigration equal deaths plus emigration.
(Sources Population Reference Bureau, Washington DC, USA; University of Wisconsin Colleges,
Madison, USA)
3.2 Demographic Transition in Rural India
Urbanization Trends in India
About sixty-nine per cent of India’s population lived in villages according to 2011 census estimates.
About a hundred years ago in 1911, almost ninety per cent of the population was rural.
The transition of India’s population has been a gradual shift. Rural population, according to census
methodologies of estimation implies those populations who are engaged in agricultural activities
and live in areas governed by panchayats.
Recall from Chapter 1, an urban unit or a town is defined as “any place with a municipality,
corporation, cantonment board or notified town area committee, etc”. These are also called
‘Statutory Towns’. All other places which satisfy the following criteria are known as ‘Census Towns’
as per the definitions used by the census surveys-
• A minimum population of 5,000
• At least 75 per cent of the male main workers engaged in non-agricultural pursuits
• A density of population of at least 400 per sq. km.
Rural Areas are all areas which are not categorized as urban area under the definitions above,
according to Census definitions.
Table below shows proportion of rural and urban population of India Since 1901.

51 MGNCRE | Indian Rural Society and Rural Administration
Table 3.1 Population of India Rural-Urban
Census Year Proportion of Rural Population Proportion of Urban Population
1901 89.2 10.8
1911 89.7 10.3
1921 88.8 11.2
1931 88.0 12.0
1941 86.1 13.9
1951 82.7 17.3
1961 82.0 18.0
1971 80.1 19.9
1981 76.7 23.3
1991 74.3 25.7
2001 72.2 27.8
2011 68.8 31.2
Source Census of India
Transition of Rural to Urban Areas and Migration from Rural Areas
Recall from Chapter 1, according to the 2011 Census data, 68.8 per cent of India’s population is rural.
Further, 72.4 per cent of workforce in India also lives in villages. Though, the 2011 census has shown
a decline of 5.9 per cent points in rural population growth and an increase of 0.3 per cent points in
urban population growth from the 2001 census.
Table 3.2 Indian Population Growth Rate
Growth Rate of Population (in per cent)
1991-2001 2001-2011 Difference
India 21.5 17.6 -3.9
Rural 18.1 12.2 -5.9
Urban 31.5 31.8 +0.3
Source Census of India
This implies a trend of urbanization. Urbanization trend, to put in simple words, can take place in
two ways- one, when rural population migrate to cities and two, when villages transform to urban
areas and are reclassified. Studies estimate that more than half of the increase in population in
urban India during this period can be attributed to the migration from rural to urban areas and re-
classification of rural settlements into urban rather than natural increase (Pradhan 2013).
However, demographic projections by the United Nations (2012) estimates do show that India will
continue to be predominantly rural till the year 2050. Urban population is estimated to overtake the
rural population after this marking year.
There has been regional or state-wise variation in rural population from 2001 census to 2011 in
India. During the 2001-11 decade the growth of population living in villages was estimated at 12.2
per cent. Growth of rural population has been estimated to be steadily declining in India since 1991.

52 MGNCRE | Indian Rural Society and Rural Administration
Socio-Economic Characteristics of Rural Population
Rural India had been lagging behind from urban India in terms of socio-economic development. But
due to focused policies of the government there has been some improvement in the development
indicators in recent times. For example, in the past decade (2001-2011), there was a 14% rise in
literacy rates in rural India.
Literacy Rates in Post Independent India
Table 3.3 Literacy Rates in India (1951-2011)
Year Rural Urban Combined
Female Male Total Female Male Total Female Male Total
1951 4.87 19.02 12.1 22.33 45.6 34.59 8.86 27.15 18.32
1961 10.1 34.3 22.5 40.5 66 54.4 15.35 40.4 28.31
1971 15.5 48.6 27.9 48.8 69.8 60.2 21.97 45.96 34.45
1981 21.7 49.6 36 56.3 76.7 67.2 29.76 56.38 43.57
1991 30.17 56.96 36 64.05 81.09 67.2 39.29 64.13 52.21
2001 46.7 71.4 59.4 73.2 86.7 80.3 53.67 75.26 64.83
2011 58.75 78.57 67.8 79.92 89.67 84.1 65.46 82.14 74.04
% Increase in 2011 over 2001
26% 10% 14% 9% 3% 5% 22% 9%
14%
Source Census of India, Office of Registrar General, India. For 1951, the population male , female and persons refers to effective literacy rates and the break-up of Rural, Urban and male- female components are crude literacy rates. Notes 1. Literacy rates for 1951, 1961 and 1971 relate to population aged 5 years and above whereas literacy rates for 1981, 1991, 2001 and 2011 relate to the population aged 7 years and above. 2. The 1981 literacy rates exclude Assam where the 1981 Census could not be conducted. 3. The 1991 literacy rates exclude Jammu & Kashmir where the 1991 Census could not be conducted due to disturbed conditions. 4. The 2001 and 2011 literacy rates exclude Mao Maram, Paomata and Purul Sub-divisions of Senapat district of Manipur.
Data Source Ministry of Statistics and Program Implementation
Though, literacy indicators for rural India are improving, the social backwardness in rural areas is still
higher that urban areas. Recall from Chapter 1, 1.2, the proportion of the Scheduled Caste (SC)
population in villages in 19 per cent, compared to 13 per cent in cities. Also, mostly tribal
populations live in villages. The proportion of STs in villages in 11 per cent compared to 3 per cent in
cities. The Indian social structure has been historically affected by the presence of the caste system.
In most cases, people belonging to lower castes have faced social exclusion and untouchability in
extreme cases. The government policy has taken many steps to improve the status of those
considered backward because of their caste.

53 MGNCRE | Indian Rural Society and Rural Administration
Table 3.4 Proportion of Scheduled Castes and Scheduled Tribes Population (in per cent)
Scheduled Castes Scheduled Tribes
Total Persons Total Persons
Total Rural Urban Total Rural Urban
17 19 13 9 11 3
Source Census 2011; Figures are rounded off
Health Indicators
National Family Health Survey (NFHS) gathers household data on day-to-day health practices, using
sample survey techniques. So far, there have been four NFHS rounds since 1992 and the fifth one is
being carried out.
These surveys are important indicators of rural health and hygiene practices and help understand
policy impact and future recommendations.
National Family Health Survey-4 Key Statistics
Table 3.5 Health Indicators in India (2015-16)
1 Piped water into dwelling/yard/plot, public tap/standpipe, tube well or borehole, protected dug
well, protected spring, rainwater, community RO plant. 2 Flush to piped sewer system, flush to
septic tank, flush to pit latrine, ventilated improved pit (VIP)/biogas latrine, pit latrine with slab, twin
pit/composting toilet, which is not shared with any other household. 3 Electricity, LPG/natural gas,
biogas.
Source National Family and Health Survey (NFHS-4)
The chart from NFHS-4 above also shows transition from NFHS-3, conducted a decade prior to this
last survey. In 2015-16, rural households showed poor toilet and cooking gas facilities and this
helped the government to speed up sanitation policies under Swachh Bharat Mission and the
distribution of gas connection to every household.
Rural to Urban Transition Trends in India
Recall from Chapter 1, because of lesser opportunities, the rate of out-migration from villages of
rural to urban migration is high in India. “Although rural to urban migration has been the dominant
component of urbanization in the western countries, India has experienced rapid urban population

54 MGNCRE | Indian Rural Society and Rural Administration
growth as a result of higher contribution of urban natural increase. In the decade preceding the
Census 2011, net rural to urban classification in India contributed about one-third to urban
population growth compared one-fourth by net rural to urban migration” (Bhagat, 2012). In another
paper Prof Bhagat (2017) has shown how migration helps foster development as migrants from
villages to urban areas learn more skills and are pulled out of poverty.
Policies in India are often aimed at reducing rural to urban migration and tend to not include
migration as an important factor in economic development. For reducing migration, rural areas are
developed in a way to convert to urban areas.
3.3 Rural Poverty
At the time of independence, India suffered an economic drain due to the colonial policies of
utilizing the country’s resources for industrial production in Britain. As a result, India’s population
was mostly left with traditional occupations.
At the time of independence, India followed a path of planned economic development and the
government took charge of industrializing the economy and ensuring that the fruits of economic
development reach the poorest people. The Planning Commission (now NITI Aayog) was set up in
1950 to undertake this task. Over the years, this institution, with the help of economists, came
devised various methods to measure poverty to make policies for eradication. Let us see how
poverty is measured in India and where does rural India stand in poverty statistics.
Poverty Estimation in India and Difference in Rural-Urban Measurements
Poverty estimates became popular with the YK Alagh’s task force. To paraphrase the methodology,
the average calorie requirements from food intake were estimated- separately for rural and urban
demographics. Weighted averages of the age-gender-activity specific calorie intake were
recommended by the 1968 Nutrition Expert Group, using the 1971 population Census as reference.
The estimated calorie norm was set at 2400 kcal per capita per day for population in villages and
2100 kcal per capita per day in urban areas. To work out the monetary equivalent of these norms,
28th Round (1973-74) NSS data relating to household consumption both in quantitative and value
terms were used.
Based on the observed consumer behaviour in 1973-74 it was estimated that, on an average,
consumer expenditure (food and non-food) of Rs.49.09 per capita per month was associated with a
calorie intake of 2400 per capita per day in rural areas and Rs.56.64 per capita per month with a
calorie intake of 2100 per day in urban areas. This Monthly Per Capita Expenditure (MPCE) was
termed as poverty line. The poverty lines for later years were estimated by updating the poverty
lines of the year 1973-74 for price changes.
The methodology to measure poverty, as devised by Y K Alagh, in 1979 was further improvised by
the Expert Group headed by DT Lakdawala in 1993. Later an Expert Group led by Suresh Tendulkar in
To Do Activity From the latest census records, pull out the districts of India with the highest ratio of rural population.

55 MGNCRE | Indian Rural Society and Rural Administration
2009 devised methodologies to measure the number of poor in India. These improvisations led to
more reliance on the National Sample Survey Organisation’s (NSSO) methodologies on consumption
expenditure by households. This was considered to be a much better method to adjust for inter-
state and inter-region parities in price changes over time and the use of the better recall period
introduced in the NSSO’s survey
The C Rangarajan report (2014) was released two months before the Planning Commission was
closed down and later transformed into NITI Aayog. The report states that,
“The Planning Commission methodology for estimating poverty at national and state level was
regarded by some as inappropriate in giving a representative picture of the incidence of poverty in
the country. The main points of the criticism were (a) the adjustment procedure; (b) the choice of
deflators to represent price changes in the poverty line; (c) application of the same poverty line in all
the states, which imply the absence of price differentials across the states; (d) use of a fixed
consumption basket over time; and (e) the uniform consumption basket for all the states.”
Tables below show poverty estimates by Lakdawala and Tendulkar Methodologies. It was the
Tendulkar methodology that made the poverty line even across rural and urban areas and the states
of India and the only adjustment required is the cost of living to account for differences in prices. In
terms of monetary value, it expresses the monetary value of the normative expenditures necessary
for satisfying basic needs (Himanshu 2010)
. Table 3.6 Expert Group Lakdawala Method Poverty Ratio and Number of Poor
N.B. URP = URP consumption = Uniform Recall Period consumption in which the consumer
expenditure data for all the items are collected from 30-day recall period.
(Source Planning Commission Archive, 2014, Government of India)
Poverty Ratio and Number of Poor Expert Group (Lakdawala) Method
Year
Poverty Ratio (%) Number of Poor (million)
Rural Urban Total Rural Urban Total
1973-74 56.4 49.0 54.9 261.3 60.0 321.3
1977-78 53.1 45.2 51.3 264.3 64.6 328.9
1983 45.7 40.8 44.5 252.0 70.9 322.9
1987-88 39.1 38.2 38.9 231.9 75.2 307.1
1993-94 37.3 32.4 36.0 244.0 76.3 320.3
2004-05
(URP)
28.3 25.7 27.5 220.9 80.8 301.7

56 MGNCRE | Indian Rural Society and Rural Administration
Table 3.7 Tendulkar Methodology Percentage and Number of Poor
Source Planning Commission Archive, 2014, Government of India
Table 3.8 Decline in Poverty Ratio Estimated from Expert Group (Tendulkar) Methodology
Source Planning Commission Archive, 2014, Government of India
Planning Commission’s varied methodologies and resultant estimates of number of poor in the
county as we see from the data tables have been widely debated in the academic as well as policy
circles. But apart from the methodological debates in estimation, the poor have been an important
political narrative.
Challenges for the Indian government towards addressing inequality are a bit different than those in
the west, or from the Asian giants. India’s share in the global GDP is 3.15 per cent comparatively, US
is 24 per cent, China 15 per cent. India’s population is 17 per cent of the world. Indian corporations
are not as huge (in terms of capital) as that in the US, EU or in other Asian countries- and these
governments are not able to regulate corporate predation. Moreover, a majority of India’s
population still lives in villages and is engaged in agricultural activities. Though, that is slowly
changing, industrial opportunities for the rural populations are still lesser in India.
Socio-Economic and Caste Census and Rural Poverty
The census of 2011 and the subsequent socio-economic and caste census (SECC) conducted
household surveys to analyse poverty through household assets and income. About three-quarter of
Percentage and Number of Poor Estimated from Expert Group (Tendulkar) Methodology
Year Poverty Ratio (%) Number of Poor (million)
Rural Urban Total Rural Urban Total
1993-94 50.1 31.8 45.3 328.6 74.5 403.7
2004-05 41.8 25.7 37.2 326.3 80.8 407.1
2009-10 33.8 20.9 29.8 278.2 76.5 354.7
11-12 25.7 13.7 21.9 216.7 53.1 269.8
Decline in Poverty Ratio Estimated from Expert Group (Tendulkar) Methodology
(%age points per year)
Period
Rural Urban Total
1993-94 to 2004-05 0.75 0.55 0.74
2004-05 to 2011-12 2.32 1.69 2.18
1993-94 to 2011-12 1.36 1.01 1.30

57 MGNCRE | Indian Rural Society and Rural Administration
rural households in India were found to have a monthly income of less than Rs 5,000 and about half
of the households were dependant on manual labouring jobs to earn their livelihood. More than 70
million rural households were found to be facing exclusion, either from assets or socio-economic
benefits, according to data released by the Socio-Economic Caste Census (SECC) survey in 2015. As
many as 833 million people in India, or 69% of the population lived in rural areas according to censes
2011 estimates. Socio-economic exclusion also implies exclusion from state protection. This data-set
was released by the government of India at a time when global credit rating agencies, such as
Moody’s (in 2015), were indicating how slow growing rural economy was taking India’s economic
growth indicators down.
Another aspect of inequalities in India was highlighted by the state-wise indexing developed by the
Raghuram Rajan Committee, whose report was released in 2013.
The multi-dimensional human development index defined proposed by the Raghuram Rajan
Committee was calculated in terms of “(i) monthly per capita consumption expenditure, (ii)
education, (iii) health, (iv) household amenities, (v) poverty rate, (vi) female literacy, (vii) per cent of
scheduled castes-scheduled tribe population, (viii) urbanisation rate, (viii) financial inclusion, and (x)
connectivity”. This index replaces the earlier Gadgil-Mukherjee formula for allocation of welfare
funds for the states of India which was criticised as discretionary and at times arbitrary by many
quarters. “ … the Raghuram Rajan Committee effectively negates the "right to development", which
requires a Rawlsian framework of "differential treatment" (or "special status") to realise both
vertical and horizontal equity in a genuinely federal system” (Kumar 2013).
Aspirational Districts
NITI Aayog indexed the districts of India on the basis of poverty, education, health and public
infrastructure. A list of most backward districts was prepared to include regions from all the states of
India. Officers from the central government have been appointed to look after each district and help
stakeholders interact for smoother implementation of schemes.
To quote NITI Aayog’s policy declaration, “Launched by the Prime Minister in January 2018, the
‘Transformation of Aspirational Districts’ programme aims to quickly and effectively transform these
districts. The broad contours of the programme are Convergence (of Central & State Schemes),
Collaboration (of Central, State level ‘Prabhari’ Officers & District Collectors), and Competition
among districts driven by a mass Movement. With States as the main drivers, this program will focus
on the strength of each district, identify low-hanging fruits for immediate improvement, measure
progress, and rank districts.
The Government is committed to raising the living standards of its citizens and ensuring inclusive
growth for all – “SabkaSaathSabkaVikas”. To enable optimum utilization of their potential, this
program focusses closely on improving people’s ability to participate fully in the burgeoning
economy. Health & Nutrition, Education, Agriculture & Water Resources, Financial Inclusion & Skill
Development, and Basic Infrastructure are this programme’s core areas of focus. After several
rounds of consultations with various stakeholders, 49 key performance indicators have been chosen
to measure progress of the districts. Districts are prodded and encouraged to first catch-up with the

58 MGNCRE | Indian Rural Society and Rural Administration
best district within their state, and subsequently aspire to become one of the best in the country, by
competing with, and learning from others in the spirit of competitive & cooperative federalism.
NITI Aayog in partnership with the Government of Andhra Pradesh has created a dashboard for
monitoring the real-time progress of the districts. District Information Officers underwent training
on how to enter data to the dashboard and generate MIS (Management Information System)
reports. Districts will be ranked based on progress made (‘delta ranking’) on a real-time basis. The
dashboard will be open to the public to monitor the progress of the aspirational districts.”
3.4 Rural Economy
Contribution to GDP
To understand the contribution of the rural economy to India’s GDP, let us understand some
definitions first-
GDP or Gross Domestic Product can be defined as the total value of everything produced in the
country. It doesn't matter if it's produced by are citizens or foreigners. If they are located within the
country's boundaries, their production is included in GDP.
GDP is a method of estimation of country’s production.
The government of India, in 2015 decided to use another method- GVA or Gross Value Added.
Simply, GVA can be understood as-
GDP at Market Prices = Sum of GVA at basic prices + product taxes – product subsidies.
In this context, when GVA from all sectors are added together and necessary adjustment for taxes
and subsidies are made, we will get the GDP for the economy.
In 2018, the government moved to the GDP method again. But to understand the economic
production data from the period 2015 to 2018 from the government sources, we have to use GVA
methodology.
As shown in the table below, agriculture and allied sectors had a 15.4% share in the country’s GVA.
To Do Activity Create a map of NITI Aayog’s Aspirational Districts. What are the advantages of collecting real-time development data from villages for policy-making?

59 MGNCRE | Indian Rural Society and Rural Administration
Table 3.9 Gross Value Added (GVA) Major Sectors of India, 2015-16
Major Sectors of India Gross Value Added (GVA) 2015-16(Provisional Estimates)
Industry ( In ₹ Crore,at
constant prices)
Share in GVA
(in per cent)
1. Agriculture, forestry and fishing 16,04,044 15.4
2. Mining and quarrying 3,18,377 3.1
3. Manufacturing 18,21,926 17.5
4. Electricity, gas, water supply & other utility
services
2,31,228 2.2
5. Construction 8,87,957 8.5
6. Trade, repair, hotels and restaurants 19,98,292 19.2
8. Financial services 22,48,845 21.6
10. Public administration and defence 13,16,552 12.6
12. TOTAL GVA at basic prices 1,04,27,191
Source Central Statistics Office
Shifting Occupations and Sectors
Recall from Chapter 1, we had identified shifting occupations in rural India citing NITI Aayog study.
To cite from the same paper, “Contrary to the common perception about predominance of
agriculture in rural economy, about two third of rural income is now generated in non-agricultural
activities. Similarly, it looks amazing to find that more than half of the value added in manufacturing
sector in India is contributed by rural areas. However, the impressive growth of non-agricultural
sector in rural India has not brought significant employment gains or reduction in disparity in worker
productivity. This underlines the need for a new approach to direct the transition of rural economy.”
(Chand, Srivastava and Singh, 2017).
This study has shown that the rural economy is not only dependent on agriculture sector anymore. It
has shown the only one-fourth of industrial production came from rural factories in 1971 and this
was estimated to have doubled by the year 2012. But what was surprising in this study was the fact
that in the period 1971 to 2012, the share of industrial production from rural India doubled but
employment of village population in industries did not increase at the same rate.
This leaves rural population still engaged in agricultural occupation and many pushed into marginal
or part-time jobs. The biggest anti-poverty programme by the government of India- Mahatma
Gandhi National Rural Employment Guarantee Scheme (MGNREGS) also addresses the issue of
underemployment for rural population by providing them work for at least 100 days in a year and
fixing a minimum wage.
According to newspaper reports and government’s policy initiatives in 2018, the agriculture sector
during the budgeting exercise by the central government were not found to be in very good shape.

60 MGNCRE | Indian Rural Society and Rural Administration
The agriculture sector, it was found that, employed more than 50 per cent of the total workforce of
India and in proportion it contributed around 17-18 per cent to the country’s total GDP. Recall from
Chapter 1, the number of people engaged as agricultural labourers in villages of India has been on an
increase since 1951 as shown in the data table above from the Census surveys. The proportion of
agricultural labourers has also increased from 19% in 1951 to 30% in 2011.
It was found that the sale of tractors had increased, indicating that the farmers were moving
towards mechanization though, the sale of tractors is not the only measure of farm mechanization.
The economic reports from the government said that the Indian tractor industries had emerged as
the largest in the world. About one-third of total global tractor production, it was reported in 2018
economic survey, was from India. It was estimated that percentage of agricultural workers of the
total work force would drop to 25.7 per cent by 2050 from 58.2 per cent in 2001. Hence, the
government officials noted that there was a need to increase mechanization for farms if the
population is moving from agriculture as an occupation. Because of being labour-intensive, the crop
production costs are also too high and they need to be reduced as well to ensure more availability of
cheaper food for India’s poor.
Financing and Self-help Groups
Another important factor about rural economy is related to credit and financing in the rural sector.
Recall from Chapter 1, where we had discussed the structure and institutions of rural economy in
India. In this Chapter we discuss credit and loaning in the rural economy.
In the first Chapter we had also discussed NABARD. Over the years, after its genesis in 1982,
NABARD has achieved many goals in rural credit and micro-financing services. This has helped
improve many of rural lives across the India. Most important achievement has been the Self Help
Group- Bank Linkage Project launched by in 1992, which grew into the world’s largest micro finance
project. NABARD also takes pride in Kisan Credit Card, designed by the body which is one of the
major sources of relief for the farmers. The bank has about financed one fifth of India’s total rural
infrastructure, according to its estimates in 2018. They are also pioneering in the field of watershed
development as a tool for sustainable climate proofing.
Major sources of rural credit in India according are-
• Co-Operatives and Credit Societies- These are the most popular and least expensive in terms
of interest rates. These were introduced to curb the local, informal money lenders.
• Land Development Banks- formerly known as land mortgage banks, Land Development
banks mainly provide long-term loans to farmers against the mortgage of their lands at low
rates of interest over a period of 15 to 20 years. These banks cater to costly land
improvement needs of farmers such as digging or deepening of wells.
• Commercial Banks- Before bank nationalisation in 1969, where top 14 commercial banks
were nationalized, these banks only focussed on urban customers. Agriculture and rural
industries were neglected by them since agriculture was a risky venture, private commercial
banks turned away from rural areas. But after nationalization and efforts by NABARD later,
commercial banks also invested in the rural sector. It was one of the objectives of

61 MGNCRE | Indian Rural Society and Rural Administration
nationalisation of commercial banks to ensure a smooth flow of credit to agriculture and
small-scale industries—the two top priority sectors of Indian economy.
• Regional Rural Banks- The Government set up a network of regional rural banks In 1975, to
look into the special needs of small and marginal farmers, landless workers, rural artisans
and the rural poor in general. The unique feature of these banks is that they cater exclusively
to the weaker sections of the rural community through branches spread over India.
• The Government- The Government also provides short-term and long-term loans to farmers
in times of emergency such as floods or famine. Such loans are offered at a concessional rate
of interest and the mode of repayment is also very convenient. It can be repaid in several
instalments at the time of payment of land tax. However, such loans have not assumed
significance over the years.
Other than credit facilities, the government of India also from time to time gives loan wavers to
farmers. This is done mostly to overcome the climatic risks. Though criticized as populist measures,
loan wavers to farmers can be of great help in drought or flood years. Other than agricultural credit,
the two flourishing sectors in rural India are the small and medium enterprises and cooperatives.
Recall from Chapter 1, we studied structures of theSelf Help Group (SHG) model of development for
rural India has been popularised by NABARD. SHGs function at community level to foster rural
development through skill training, government’s assistance, micro-finance and cooperation of the
community members who are a part of the SHG. Below is a model of how an SHG is organised.
Figure 3.1 Self-help Group Model
Member of an SHG help and support each other both financially and for training to set up businesses
Self Help Group Model
Self Help Group selected from a
village
Gram Sabha (Village Council)
approved selection
Skill training Government
subsidy
Bank credit

62 MGNCRE | Indian Rural Society and Rural Administration
where needed. They are also collectively responsible towards loan repayments even of individual
members. The local government committees at village level also help in formation of SHGs and
monitor progress and resolve disputes. Skill training is carried out for members to set up local small-
scale industries or handicrafts units. At times, the government subsidises training or credit for SHGs
under various schemes. NABARD also provides knowhow other than micro-credit for the SHGs.
Risk Management and Insurance in Rural Credit
The financial product which is missing in rural credit is risk management. According to Mahajan
(2017), “For crop-insurance, the Prime Minister’s FasalBeemaYojana seems to incorporate all the
lessons that were learned from the Indian as well as international experience in crop insurance.
Some new technologies such as automated weather stations and global positioning systems have
been incorporated into it. It has been simplified at the front end while at the back end, a complex
claim determination process has been specified. There is also public private partnership in the sense
that the insurance provided by a private insurance company which gets this right through a reverse
bidding process for different regions. This is a state of the art design. We still have to see how the
PMFBY runs for three to five years.”
3.5 Challenges and Opportunities
India’s Changing Rural Demography
Over the past decades, India’s villages have witnessed a shift towards urbanization. Migration and
transition of villages into towns are responsible for this transition.
As we see in Prof Bhagat’s (2012,2017) papers, migration to urban areas implies economic
development. In his studies, it was found the labourers who migrate from villages to cities in India
often pick up two or more skills to keep themselves economically engaged. In NITI Aayog Studies
(Chand, Srivastav, and Singh, 2017) we saw a transition is sectors in rural India. Manufacturing sector
has risen in India’s villages over the past forty years and it has not employed as many people from
the villages.
One of the reasons for this can be that the cohorts in rural India that are in the working age
population of 15 to 59 years are still completely illiterate and unskilled. “India’s working-age
population, as per the 2011 census data, comprised of 197 million illiterates. Out these, 160 million
were in rural areas” (Tewari, 2017).Furhter, more than two decades after the liberalisation reforms
that took place in 1992, one- fourth of India’s rural population lived below the statistical poverty
according to the 2013 estimates by the Tendulkar methodology. In 1993-94, shortly after the
liberalisation reforms, the proportion this of population below the poverty line was 50 per cent in
rural India and 45 per cent overall. Over 328 million people in rural India were estimated to be living
below the poverty line (BPL) in the 1990s. They were dependent on the government’s welfare
To Do Activity Study a self-help group in a nearby village and build a structural model.
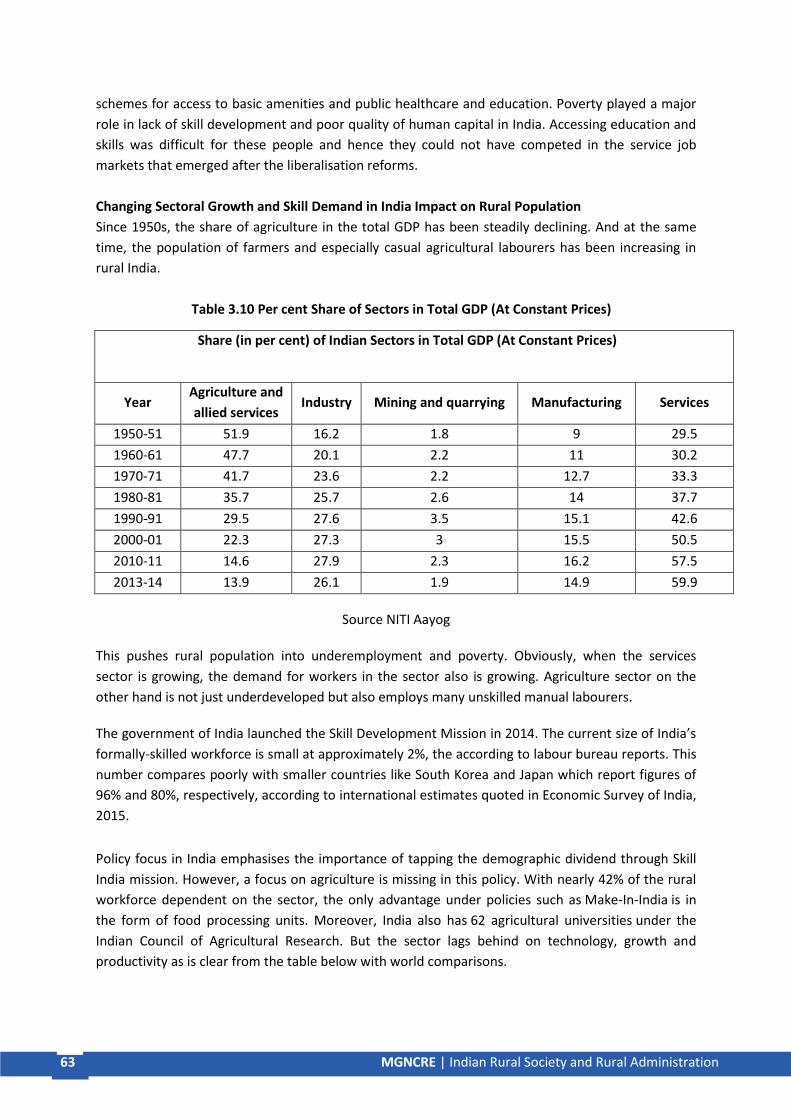
63 MGNCRE | Indian Rural Society and Rural Administration
schemes for access to basic amenities and public healthcare and education. Poverty played a major
role in lack of skill development and poor quality of human capital in India. Accessing education and
skills was difficult for these people and hence they could not have competed in the service job
markets that emerged after the liberalisation reforms.
Changing Sectoral Growth and Skill Demand in India Impact on Rural Population
Since 1950s, the share of agriculture in the total GDP has been steadily declining. And at the same
time, the population of farmers and especially casual agricultural labourers has been increasing in
rural India.
Table 3.10 Per cent Share of Sectors in Total GDP (At Constant Prices)
Share (in per cent) of Indian Sectors in Total GDP (At Constant Prices)
Year Agriculture and
allied services Industry Mining and quarrying Manufacturing Services
1950-51 51.9 16.2 1.8 9 29.5
1960-61 47.7 20.1 2.2 11 30.2
1970-71 41.7 23.6 2.2 12.7 33.3
1980-81 35.7 25.7 2.6 14 37.7
1990-91 29.5 27.6 3.5 15.1 42.6
2000-01 22.3 27.3 3 15.5 50.5
2010-11 14.6 27.9 2.3 16.2 57.5
2013-14 13.9 26.1 1.9 14.9 59.9
Source NITI Aayog
This pushes rural population into underemployment and poverty. Obviously, when the services
sector is growing, the demand for workers in the sector also is growing. Agriculture sector on the
other hand is not just underdeveloped but also employs many unskilled manual labourers.
The government of India launched the Skill Development Mission in 2014. The current size of India’s
formally-skilled workforce is small at approximately 2%, the according to labour bureau reports. This
number compares poorly with smaller countries like South Korea and Japan which report figures of
96% and 80%, respectively, according to international estimates quoted in Economic Survey of India,
2015.
Policy focus in India emphasises the importance of tapping the demographic dividend through Skill
India mission. However, a focus on agriculture is missing in this policy. With nearly 42% of the rural
workforce dependent on the sector, the only advantage under policies such as Make-In-India is in
the form of food processing units. Moreover, India also has 62 agricultural universities under the
Indian Council of Agricultural Research. But the sector lags behind on technology, growth and
productivity as is clear from the table below with world comparisons.

64 MGNCRE | Indian Rural Society and Rural Administration
Table 3.11 India and the World Cereal Productivity and Agriculture’s Share in GDP
India and the World Cereal Productivity and Agriculture’s Share in GDP
Country
Industry as
% of GDP
(2013)
Agriculture as
% of GDP, 2013
Cereals Total Yield, 2010
('000 hectograms/hectare)
Cereals Total
Production, 2010 ('000
tonnes)
China 43.9 10 55 497943
USA 21 1.3 70 401670
UK 20.2 0.7 70 20946
Brazil 25 5.7 40 75161
Japan 25.6 1.2 48 9234
Argentina 28.5 7 50 47146
India 30.7 18 27 267838
France 19.8 1.7 70 68285
South Africa 29.9 2.3 41 14699
Source FAO, World Bank
Promoting Good Practices in Rural India Environmental Concerns
A recent paper from the United Nations Development Programme (UNDP) highlighted the
environmental concerns related to rural development (Chopra et al, 2012). This policy report also
identified rural development schemes of the government of India where specific interventions can
lead to green development of India’s villages.
The paper highlights the following schemes that have had the potential to make a significant
contribution to sustaining natural resources and ecosystem services. To quote from the paper-
• A vast majority of the works under MGNREGS are linked to water, soil and land. The list of
‘permissible’ works provide environmental services such as conservation of water, groundwater
recharge, reduced soil erosion, increased soil fertility, conservation of biodiversity, reclamation of
degraded crop and grazing lands, enhanced leaf manure, fuel wood and non-wood forest products
supply among others.
• The Integrated Watershed Development Programme (IWDP) aimed to restore ecological balance in
a watershed by harnessing, conserving and developing degraded natural resources such as soil,
water and vegetative cover and thereby help provide sustainable livelihoods to the local people. The
scheme’s potential for green outcomes is also enhanced if it supports the adoption of “green
agronomy” practices and promotion of use patterns that sustain natural resources including
groundwater and soil fertility
• Under National Rural Livelihoods Mission or NRLM the guidelines for non-timber forest produce-
based livelihoods under the MahilaKisanSashaktikaranPariyojana (MKSP) identified regeneration and
sustainable harvesting of NTFP species as key objectives; similarly, promotion of organic and low-
chemical agriculture and increased soil health and fertility to sustain agriculture-based livelihoods is
an objective under the sustainable agriculture component of MKSP; increased availability of green

65 MGNCRE | Indian Rural Society and Rural Administration
inputs and advisory services to farmers and livestock herders and use of renewables-based energy
services for processing activities have immense potential for green outcomes
• Under Indira AawasYojana (now PradhanMantriAwasYojna), green results include efficient use of
resources, including water, energy and construction material. Further, IAY can encourage greater use
of renewable and locally available construction material, and reduced use of water and energy.
• Nirmal Bharat Abhiyan (now Swachh Bharat Abhiyan) – formerly the Total Sanitation Campaign
(TSC) - has recently expanded its scope from eradication of open defecation to comprehensive
sanitation in rural areas. Ten percent of the project funds is earmarked for solid and liquid wastes
management. NBA can ensure safe disposal of solid and liquid waste, and prevent untreated
wastewater from re-entering the water system. These results can substantially improve the quality
of water.
• The National Rural Drinking Water Program guidelines give high priority to water supply source
sustainability and water quality. Further, the potential for green outcomes is enhanced by an
emphasis on safe disposal of sludge after treatment of contaminated water, and the use of
renewable energy for water pumping.
India’s villages are developing and transitioning towards towns. In this scenario, good practices can
be adopted towards a more sustainable and ecology friendly growth.
Summary
In this Chapter we studied the fundamentals of demography and technical terminology from the
field. We also focused on the importance of demography in policy-making. Demographic transitions
in rural India are both due to urbanization and migration from villages to cities.
Rural poverty and is eradiation is a big challenge before the government of India right now. While
villages are contributing more towards industrial sector now, employment opportunities for people
from villages in the sectors are limited. Over the past decade, majority of rural population has been
pushed into casual farm laboring jobs and has been reliant on schemes such as MGNREGS for
economic welfare.
This Chapter focuses on the challenges and opportunities in the rural sector created by the shifts in
demographics and the economy and points out good practices that can be applied in policy towards
sustainable growth of India’s villages.
Model Questions
1. List five main uses of the study of demography for policymakers in the context of Indian
Census
To Do Activity In your local area, identify the changes in rural demography and economy in the past decade. Plan and conduct a small survey to find out changes in people’s change of occupation in the area.

66 MGNCRE | Indian Rural Society and Rural Administration
2. What are the main indicators of rural poverty in India across government statistics?
3. Does a shift in rural economy from agriculture to manufacturing imply a low availability of
foodgrains for India?
4. What are the main steps the government can take to improve agricultural credit?
5. How can demographic transitions affect the environmental policies?
Suggested Readings
1. Behari, B. (1976). Rural industrialization in India. New Delhi Vikas Publishing House.
2. Chambers, R. (2014). Rural development Putting the last first. Routledge.
3. Dyson, T. (Ed.). (1989). India's historical demography studies in famine, disease and society.
London Curzon Press.
4. Ford, T. R., &DeJong, G. F. (1970).Social Demography.
5. Glass, D. V., &Eversley, D. E. C. (Eds.). (1965). Population in history essays in historical
demography (p. 101). London E. Arnold.
6. Maheshwari, S. (1985). Rural development in India a public policy approach. Sage
Publications.
7. Malthus, T. R. (2018). An Essay on the Principle of Population The 1803 Edition. Yale
University Press.
References
1. Bhagat, R. B. (2012) ‘Migrants (Denied) Right to the City’, In National Workshop on Internal
Migration and Human Development Workshop Compendium, Vol. 2, Workshop Papers,
UNESCO and UNICEF, New Delhi, pp. 86–99.
2. Bhagat, R. B. (2017, September). Migration and Urban Transition in India Implications for
Development. In United Nations Expert Group Meeting onSustainableCivities.Human
Mobilities and International Migration.Department of Ecomomic and Social Affairs UN
Secretariat. New York.
3. Chand, R, Srivastava, SK, and Singh, J (2017).Changing Structure of Rural Economy of India
Implications for Employment and Growth, NITI Aayog.
https//niti.gov.in/writereaddata/files/document_publication/Rural_Economy_DP_final.pdf
4. Government of India. 1993. ‘Report of The Expert Group on Estimation of Proportion and
Number of Poor’, Planning Commission of India. New Delhi.
(http//planningcommission.nic.in/reports/publications/pub93_nopoors.pdf)
5. Government of India. 2014. ‘Report of the Expert Group to Review the Methodology for
Measurement of Poverty’, Planning Commission of India. New Delhi.
(http//planningcommission.nic.in/reports/genrep/pov_rep0707.pdf)
6. Himanshu (2010), ‘Demystifying Poverty Which Estimate and Why’, Mint.
(https//www.livemint.com/Opinion/UhxQYjZ7tqxw6bMQfISCSK/Demystifying-poverty-
which-estimate-and-why.html)
7. Kumar, Ashwani. 2013. ‘Has Bihar been betrayed?, Business Standard.
(http//www.business-standard.com/article/opinion/ashwani-kumar-has-bihar-been-
betrayed-113100200953_1.html)
8. Mahajan, V (2017), Valedictory Lecture, National Seminar on Changing Perspective of Rural
Finance and Financial Inclusion of Rural Poor, 28-29 April, 2017
http//www.nird.org.in/nird_docs/nae/nae170617.pdf

67 MGNCRE | Indian Rural Society and Rural Administration
9. Pradhan, K C (2013). “Unacknowledged Urbanization New Census Towns of India,” Economic
& Political Weekly, Vol 48, No 36, pp 43-51.
10. Tewari, S (2018), ‘Planning for Welfare in Post-Liberalisation India The Challenges of Building
Human Capital’, Journal of Public Affairs and Change, Volume I/Issue No. 2, Summer 2018.
11. UNDP India (2012), Greening Rural Development in India.New Delhi.
http//www.in.undp.org/content/dam/india/docs/EnE/greening-rural-development-in-
india.pdf

68 MGNCRE | Indian Rural Society and Rural Administration
Chapter 4 Indian Agriculture
Introduction The nature of Indian economy has remained agrarian since independence. Agriculture has been the
major source of livelihood for people in the country. Although the agricultural sector’s contribution
to GDP has come down from 51.81 per cent in 1950-51 to 14.39 per cent in 2018-19, the sector still
employs more than 50 per cent of total workforce in the country. After independence, the
agricultural output has recorded a steady growth and has also contributed in the growth of other
sectors.
Indian agriculture has done remarkably well in terms of output growth despite frequent weather and
price shocks. The production of food grains increased by more than five times and the production of
milk by more than seven times. During this period, the population increased by a little more than
three times. India has thus been able to produce food faster than its growth in population. The
Green Revolution in wheat and rice in the late 1960s and early 1970s, the White Revolution in milk in
the 1970s, and the Blue Revolution in fisheries have all contributed to that success, making Indian
agriculture a net exporter. Expansion of agricultural land area, institution reform and
implementation of major irrigation project played an important role in shaping the Indian
agricultural during the pre and early green revolution periods. India is a leading producer of pulses,
spices, plantation crops, jute, milk, livestock, poultry and fisheries. It also produces and exports rice,
wheat, sugarcane, groundnut, vegetables, fruits and cotton. India’s agricultural exports are booming
at a time when many other leading producers are facing stagnation or decline in their exports.
Meanwhile, public agencies have accumulated massive stocks of grain and the private sector’s share
of investments in agriculture has increased.
Although agriculture accounted for only 14.39 per cent of GDP at constant (2011-12) prices in 2018-
19, its role in Indian economy is much more significant due to its share in total employment. As per
the Economic Survey 2017-18, about 50 per cent of total workforce in the country is engaged in the
agriculture sector.
Objectives
• To highlight the importance of agriculture in India
• To characterize the key features of this sector
• To provide a profile of different phases of agricultural development
• To analyze the role of modernization and technology in agriculture
• To address the issues and concerns in the sector
Structure
Indian Agriculture
4.1 Role and Importance of Agriculture
4.2 Key features of Indian Agriculture
4.3 Phases in Agriculture Development in India
4.4 Modernization and technology in Agriculture
4.5 Issues and Concerns

69 MGNCRE | Indian Rural Society and Rural Administration
4.1 Role and Importance of Agriculture
1. Contribution to National Income
From the very beginning, agriculture has been contributing a major portion to our national income.
Though the share of agriculture has been declining gradually with the growth of other sectors, it still
remain very high compared to the developed countries of the world. Figure below shows the
percentage share of agriculture in the total GDP of the country. In 1950-51, agriculture and allied
activities contributed 51.88 per cent (at 2004-05 prices) of the total GDP. It declined to 47.65 per
cent in 1960-6, in , 41.66 per cent in 1970-71, 35.69 per cent in 1980-81, 29.53 per cent in 1990-91,
22.26 per cent in 2000-01 to 14.37 per cent in 2011-12; whereas in UK and USA agriculture
contributes only about 3 per cent of their national income.
Figure 4.1 Percentage share of agriculture in India’s GDP over years
2. Source of Livelihood
In India over half the total workforce is engaged directly on agriculture and allied activities and
depends on the earnings from this sector for their livelihood. As per the World Bank, share of
agricultural employment as percentage of total employment in India is 42.74 per cent. Whereas less
than 2 per cent of the total workforce in U.K. and U.S.A. is engaged in this sector. Even developing
countries like China and Brazil has the share of agricultural employment less than 18 per cent of the
total employment. The employment pattern of India is very much common to under-developed
countries of the world like Pakistan, Bhutan and countries from African Union.
3. Source of Food Supply and Role in the Public Distribution System (PDS)
Domestic agricultural production is the major source of food supply for such a huge population of
our country. It has been estimated that about 60 per cent of household consumption is met by
agricultural products. The agriculture sector is also closely linked to the Public Distribution System

70 MGNCRE | Indian Rural Society and Rural Administration
(PDS) operated by the government for the dual purpose of procuring food grain from farmers
(thereby protecting them against potential losses from price fluctuations in the markets of
agricultural products) and ensuring availability of food grain at state level at affordable prices. In
particular, the government manages the Public Distribution System for the following reasons
a) To protect the low income groups by guaranteeing the supply of certain minimum quantities of
food grains at affordable price;
b) Ensuring equitable distribution; and
c) Controlling the price rise of Essential Commodities in the open market.
Through this system, the government has attempted to ensure that both the farmers engaged in the
agriculture sector as well consumers of agricultural products are protected against adverse price
movements, and food availability is maintained across the country even in drought years. The
surplus production in the agricultural sector is important to maintaining a buffer stock within the
Public Distribution System.
4. Role of Agriculture in Industrial Development
Agriculture in India has been the major source of supply of raw materials to various important
industries of our country. Cotton, silk and jute textiles, sugar, vanaspati, edible oil, plantation
industries (viz. tea, coffee, rubber) and agro-based cottage industries regularly procure the raw
materials directly from agriculture. About 50 per cent of income generated in the manufacturing
sector comes from all these agro-based industries in India. Moreover, agriculture can provide a
market for industrial products as an increase in the level of agricultural income may lead to
expansion of market for industrial products. Thus agriculture has both demand side and supply side
linkages with the industrial sector.
5. Commercial Importance
At the dawn of independence, the export basket of the country was mostly consisting of jute, tea
and cotton textiles, which jointly contributed more than 50 per cent of the total exports earning of
the country. In 1950-51, these three commodities contributed about 60 per cent of the total export
earnings of the country. With the diversification and development of India’s industrial sector, the
percentage contribution of agriculture to India’s total exports has gradually declined. However,
agriculture continues to play a very important role in both the domestic and the international trade
of the country. Agricultural products like tea, coffee, sugar, tobacco, spices, cashew-nuts etc. are the
important items of our exports. Further, agriculture is helping the country in earning precious
foreign exchange to meet the required import bill of the country.
6. Source of Government Revenue
Agriculture is one of the major sources of revenue to both the Central and the State Governments of
the country. The Government gets a substantial income as land revenue. Some other sectors like
railway, roadways are also deriving a good part of their business and income from the transportation
of agricultural goods.

71 MGNCRE | Indian Rural Society and Rural Administration
7. Role of Agriculture in Economic Planning
The prospect of economic planning in India depends a lot on agricultural sector. A good crop always
provides impetus towards a planned economic development of the country by creating a better
business climate for the transport system, manufacturing industries, internal trade etc. A good crop
also brings a good amount of finance to the Government for meeting its planned expenditure.
Similarly, a bad crop lead to a total depression in business of the country, which ultimately lead to a
failure of economic planning. Thus the agricultural sector is playing a very important role in a
country like India and the prosperity of the Indian economy still largely depends on agricultural
sector. Thus from the foregoing analysis it is observed that agricultural development is the basic
precondition of sectoral diversification and development of the economy.
An increasing marketable surplus of agricultural output is very essential in India for
(i) Increasing supply of food and raw materials at non-inflationary prices;
(ii) Widening the domestic market for industrial products through higher purchasing capacities in the
rural sector;
(iii) Facilitating inter-sectoral transfers of capital needed for industrial development along-with
infrastructural development;
(iv) Increasing foreign exchange earnings through increasing volume of agricultural exports.
4.2 Key Features of Indian Agriculture
Gross cropped area 195 million hectare
Net sown area 141 million hectare
Agricultural irrigated land (percentage of total
agricultural land)
About 40 percent (as per World Bank data)
Animal husbandry output About 30 percent of the country’s agricultural
output
Agricultural growth 4.1% in 2017, after increasing from 1.2% in 2015-
16 (Economic Survey)
Figure 4.2 Some facts about Indian agriculture
Following are some of the broad features of the Indian agriculture
1. A significant proportion of the farmers in India practice subsistence farming, wherein the
prime aim is to meet the food and other requirements of its vast population. Farmers select
the crops with main objective of meeting their domestic needs rather than generating
surplus for national and international markets. It is only recently that agriculture has become
To Do Activity Find out the type of farming practised in your local area. Is this subsistence type or commercial type? Also, figure out types of crop which are grown.

72 MGNCRE | Indian Rural Society and Rural Administration
commercialised and market oriented, a role gaining popularity amongst the farmers with
large land holdings. The following table lists the difference between subsistence farming and
commercial farming.
Subsistence Farming Commercial Farming
This type of farming is practiced to meet the
needs of the farmer’s family.
Crops are grown and animals are reared for
the purpose of selling in markets.
Traditionally, low levels of technology and
household labour have been used to
produce on small landholdings, generating
small output.
The area cultivated and the amount of capital
used is large. Most of the work is done by
machines. Chemical fertilizers, pesticides,
insecticides and high yielding variety of seeds
are also used to get large output.
Subsistence farming may be primitive or
intensive in nature.
Commercial farming includes commercial
grain farming, mixed farming and plantation
agriculture.
Figure 4.3 Difference between subsistence farming and commercial farming
2. Indian agriculture is facing the population pressure of the country. About 70 per cent of the
country's population derives its livelihood from agriculture and allied occupations. Since
India's population is growing at a faster rate of 1.13 per cent per annum, the per capita
availability of agricultural land has declined over the years. This puts enormous pressure on
agriculture.
3. Indian agriculture has the predominance of the cultivation of food grains which occupy 76%
of the total cropped area and account for 80% of the total agricultural production of the
country. These cereals include rice, wheat, millet, gram, maize and pulses which are grown
to meet the food requirements of India's vast population (1027 million in 2001).
4. The agriculture shows diversity of crops. Sometimes four-five crops are grown simultane-
ously in the same field. This is done to ensure some agricultural production during
unfavorable weather conditions. This mixed cropping reduces the agricultural output and
per hectare yield.
5. India has the highest percentage (53%) of its geographical area under cultivation in compari-
son to many countries (USA 16.3%, China 11.8%, Japan 14.9%, Canada 4.3%, etc.) of the
world. The climatic conditions especially temperature helps in providing a long growing
season throughout the year. Due to pressure of population and consequent expansion in
agricultural lands vast tracts of forests have been removed from the plains. In India, there is
very little scope for increasing cropped area and in certain pockets even negative trend is
being witnessed.

73 MGNCRE | Indian Rural Society and Rural Administration
6. In India intensive farming is carried on in limited areas. Elsewhere, it is practiced on
traditional lines (primitive subsistence farming). That is why per hectare yield of different
crops is much lower than other countries of the world and India's total agricultural
production is not very satisfactory and rewarding. Although with the application of chemical
fertilisers and crop safety measures there has been marked increase in per hectare yield of
different crops, it is still much lower compared to international standard. The following table
shows the difference between intensive subsistence farming and primitive subsistence
farming.
Primitive subsistence farming Intensive subsistence farming
This type of farming is practiced on small
pieces of land with the help of primitive
tools like hoe, dao and digging sticks.
This type of farming is practiced with the help
of modern tools and modern inputs.
Land productivity under this type of
agriculture remains low
Land productivity is high due to use of
modern tools and inputs.
Farmers depend heavily on monsoons and
natural fertility of soil for yield.
Irrigation facilities like tube-wells and canal
irrigation are used by farmers.
Figure 4.4 Difference between primitive subsistence farming and intensive subsistence farming
7. Indian agriculture utilises a number of draught animals like bullocks, horses, camels etc. in
agricultural work. It is also labor based enterprise where all agricultural operations like till-
ing, sowing, weeding, sprinkling of insecticides/ pesticides, harvesting, threshing etc. are
carried out by human hands. Although the use of agricultural machinery is replacing animal
and human power, the pace of progress is very slow and confined to rich sections of the
cultivators.
8. Indian agriculture is mostly dependent on rainfall whose variability in time and place has
adverse effect on agricultural output. It is really a matter of concern that despite six decades
of constant endeavor only 41.2% of the total cropped area has been brought under
irrigation. Rest is dependent on rain water. That is why when rain fails agricultural
production is badly affected, scarcity prevails and prices reach sky high. If the entire
agricultural area is brought under irrigation agricultural production may be easily doubled.
The following table depicts the percentage of irrigated area in some states in the country.
Note that except for a few states, less than half of agricultural land in the country is under
irrigation.
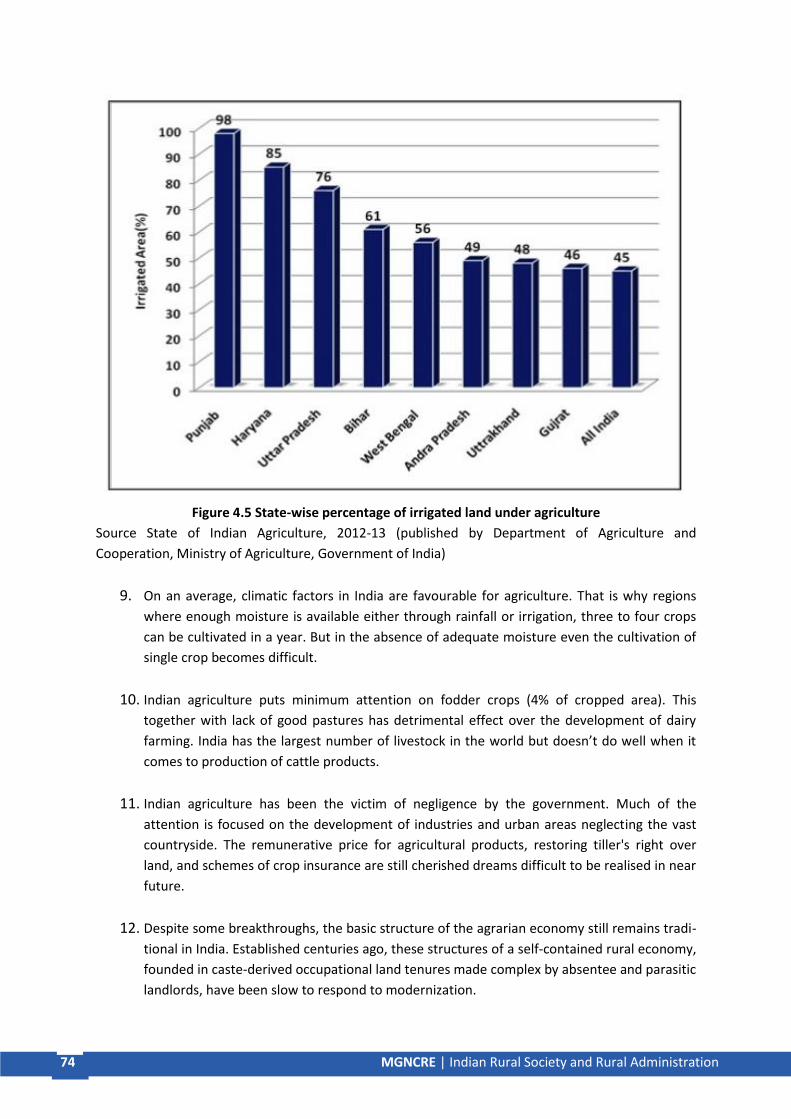
74 MGNCRE | Indian Rural Society and Rural Administration
Figure 4.5 State-wise percentage of irrigated land under agriculture
Source State of Indian Agriculture, 2012-13 (published by Department of Agriculture and
Cooperation, Ministry of Agriculture, Government of India)
9. On an average, climatic factors in India are favourable for agriculture. That is why regions
where enough moisture is available either through rainfall or irrigation, three to four crops
can be cultivated in a year. But in the absence of adequate moisture even the cultivation of
single crop becomes difficult.
10. Indian agriculture puts minimum attention on fodder crops (4% of cropped area). This
together with lack of good pastures has detrimental effect over the development of dairy
farming. India has the largest number of livestock in the world but doesn’t do well when it
comes to production of cattle products.
11. Indian agriculture has been the victim of negligence by the government. Much of the
attention is focused on the development of industries and urban areas neglecting the vast
countryside. The remunerative price for agricultural products, restoring tiller's right over
land, and schemes of crop insurance are still cherished dreams difficult to be realised in near
future.
12. Despite some breakthroughs, the basic structure of the agrarian economy still remains tradi-
tional in India. Established centuries ago, these structures of a self-contained rural economy,
founded in caste-derived occupational land tenures made complex by absentee and parasitic
landlords, have been slow to respond to modernization.

75 MGNCRE | Indian Rural Society and Rural Administration
13. Indian agriculture suffers from numerous problems, i.e., small land holdings, unscientific
method of farming, less irrigational facilities, less use of chemical, bio and natural fertilisers,
greater vulnerability to pests and diseases, less remunerative prices for agricultural
products, poverty amongst and lack of infrastructural facilities etc.
14. Indian agriculture also lacks a definite cultural land use policy at national and/or regional
level and it is upto the farmer to grow crop of her/his choice. This sometimes leads to excess
production and sometimes it leads to scarcity. Lack of marking and storage facility and the
activity of brokers and middlemen deprive farmers to fetch remunerative prices for
agricultural products.
15. In India agriculture is not considered to an honorable profession. This leads to dissepiments
and lack of enthusiasm amongst farmers. People prefer a petty government job to
agricultural work. Rich farmers invest their agricultural profits in agricultural sectors which
are more remunerate. There is mass exodus of people from rural to areas in search of
lucrative jobs. There is constant flow of human and material resources from villages to the
cities. This has led to growth of small urban centers and slums.
Thus many features of Indian agriculture are unfavourable for those depending on agriculture for
their income and livelihood. Small and fragmented land holdings, lack of intensive farming, lack of a
land use policy, etc. are challenges that have to be resolved with technological development and
social and policy reform. This is one of the important concerns for the government today.
4.3 Phases in Agricultural Development in India
For better understanding of the performance of Indian agriculture, the post-independence period
can be divided into five phases.
1. Phase I – Pre-green revolution period (1950-51 to 1967-68)
This was a technologically stagnant phase in which a larger farm production was possible mainly
through increased application of all three traditional inputs viz. land, labour and capital. The rate of
increase of output was normally lower than the rate of increase in inputs - revealing diminishing
productivity of inputs, even at a low yield. Even though some elements of dynamic agriculture like
application of fertiliser, improved seeds, and land reform were introduced, the increase in
productivity was smaller. Further, given their resources and knowledge, the traditional farmers could
not be more efficient as both these factors strongly limited their participation actively in contributing
to higher production.
This period was characterized by a sharp decline in growth in agriculture, with the fall in decadal
growth rates from 2.78 per cent to 1.06 per cent between the period 1950-51 and 1967-68. Majority
of the country’s policy makers used to think that the country cannot gain more growth rate in
agriculture sector. Indian government was trying to push industrial growth during this period and
hence lower allocation of resource towards agriculture during second and third plan. This turned out
to be the major reasons for reporting lower growth rate in the mid-1960s, as compared to 1950s.

76 MGNCRE | Indian Rural Society and Rural Administration
2. Phase II – Early green revolution period (1968-69 to 1985-86)
The Indian agriculture entered the next phase after 1960s. The green revolution was kick-started
from the year 1966 and the effects of adoption of superior technology and institutional reforms
were found to have manifested from 1968-69 onwards. This is the beginning of the process of
transformation from traditional agriculture to modern agriculture. In this phase, agriculture still
represented a large portion of the total economy. But as population and incomes of people
increased, it lead to increase in the demand for agricultural products while the size of the average
holding came down. There was also a scarcity of capital both in industry and agriculture. The farm
sector still used more labour than capital, since labour, owned or hired, would be still, relatively
cheaper than mechanisation.
The distinguishing feature of this phase is the application of science and technology, evolved by
research institutions, in a progressively large measure. This increased the productivity of farms when
small capital additions were made in the form of improved seeds, fertilizers and pesticides. The
profitable innovations were accepted by the farmers despite imperfections in land tenure, marketing
and input supply system. The stagnancy that had marked the agricultural sector during the early-
1960s, had largely been overcome around the end of the decade. In the wake of the new agricultural
strategy of growth (called the Borlaug seed-fertiliser-technology) that had been adopted, agricultural
production especially food grains, began to increase sharply.
Growth trend of Indian agriculture had been slow for many years. At the later stage of this phase,
some change in the growth of agriculture GDP was observed. But, the benefit of green revolution
was witnessed in the north Indian States, like Punjab, Haryana. Increase in agricultural production
can be attributed either
(i) To increase in area under cultivation (i.e. horizontal expansion), or
(ii) To an improvement in yield per hectare (i.e. vertical expansion), or
(iii) To both an increase in area under cultivation and an improvement in yield per hectare.
During this phase of transformation, significant contribution to improved agricultural output was
achieved by way of improvement in agricultural productivity with little change in area under
cultivation. Index number of area under cultivation changed marginally from 96.3 in 1970-71 to
105.2 in 1990-91. On the hand, the index number of agricultural production increased from 85.9 in
1970-71 to 148.4 in 1990-91 (Base 1981-82 = 100). This phase of agriculture transformation came to
be known as the period of Green Revolution. The green revolution was, however, confined to a few
crops- wheat and rice, and to few regions.

77 MGNCRE | Indian Rural Society and Rural Administration
Impact of the green revolution on food grain production in India
Figure 4.6 Trends of foodgrain production in India
Source James Killoran et al., The Key to Understanding Global History, Jarett Publishing Co.
(adapted)
Figure 4.7 Production of rice and wheat in India
Source Library of Congress, Federal Research Division (adapted)
3. Phase III– Period of wider dissemination (1986-87 to 1996-97)
As previous phase advanced, more and more innovations giving small returns singly, but large
returns jointly was adopted leading to higher productivity. In order to expedite progress, there was
an extensive utilisation of available abundant factors. At the same time, relatively scarce
infrastructural facilities like research, extension, marketing, etc. was being utilised optimally with
efforts directed towards expanding the infrastructural resources.

78 MGNCRE | Indian Rural Society and Rural Administration
Indian agriculture entered the third phase of technologically dynamic agriculture with high capital
intensity towards the end of the decade of 1980s. This was precisely the period when the non-
agricultural sectors also began their march towards modernisation. Non-agricultural sectors were
facilitated in their move towards aggressive modernisation by the new policies of liberalisation,
privatisation and globalisation. This phase of agricultural transformation is thus characterised by the
substitution of labour by capital by way of large-scale farm machinery, and considerable competition
between the sectors for capital.
The major aim of all the government programs was to transfer the benefit of green revolution from
northern States to other parts of the country. This period can be classified as the phase of wider
dissemination of technology for the benefit of the entire country. It was also witnessed that the
decadal growth of agriculture reached around 3 per cent by the decade ending with 1985-86.
4. Phase IV– Post-reform period (1997-98 to 2005-06)
This phase was less productive phase in Indian agriculture. Majority of the Indian policy makers
started giving higher importance to services sector. Therefore, tertiary sector found increasing trend
and played dominant role in determining the overall growth of Indian economy during this period.
This shift towards service sector has been attributed mainly to high marginal propensity to consume
and technological advancements in areas such as software development, trade, communications and
banking & insurance especially during the most recent period. The deceleration of growth started
from 1997-98 onwards and a clear indication of slumping of the agricultural sector was visible till the
year 2005-06. Expenditure on agriculture had experienced a major decline during this period. The
declining government expenditure and rising share of revenue expenditure were the major reason
for the lower agricultural growth rate during this period.
5. Phase V– Period of recovery (2006-07 to present)
A significant recovery of Indian agriculture was observed in the last few years that have pushed the
decadal growth rate above 3 per cent. After decades of underinvestment in the agriculture,
especially by the public sector, the declining trends in agricultural spending have recently begun to
reverse, particularly after 2006-07. Total Agricultural Production has increased significantly each
year post 2010. The promotion of Public Private Partnership (PPP) projects to support agriculture
could be another reason for reporting higher growth rate during this period.
Phases of agricultural development Conclusion
From the facts and figures depicted above, it is found that green revolution period has been the
golden period for Indian agriculture that witnessed tremendous growth in agricultural output as well
as input. The period of wide dissemination of technology can be considered as most successful
period in the history of Indian agriculture in which green revolution technologies have shifted from
north to south and other remaining part of India. Therefore, we consider shift in policy making as a
major driver of Indian agriculture sector mainly during green revolution and wide dissemination
period. The post-reforms period witnessed a visible deceleration of growth in most of the major
crops and this can be attributed to a significant diversion of resources away from agriculture to non-
agriculture sectors. From the above discussion, it is further clear that government expenditure had a
crucial role in influencing agriculture growth in the country. But private investment had a negative

79 MGNCRE | Indian Rural Society and Rural Administration
impact on growth during post-reform period. Moreover, the use of primary inputs in the sector
slowed down, and due to this, the yield of most of the crops went down. During this period, there
was a shift in cropping pattern from food-grain to horticulture crops. Similarly, the export of
horticulture crops was quite higher during this period. Therefore, we can argue that the rise in
horticulture sector has become one of the important factors responsible for higher agriculture
growth in the country. It is also found that the subsidy has played a crucial role for improving
agricultural growth, especially during the post-reform period when public expenditure was low.
There was a trade-off between subsidies and public investment in Indian agriculture. The public
investment rate in Indian agriculture started recovering after 2005-06 year. It is revealed that the
retardation of growth continued till 2005-06, and thereafter, a sharp recovery
The following table summarizes the five phases of development in Indian agriculture
Phase Features Approximate
duration
Pre- green revolution Sharp decline in growth of agriculture 1950 - 1960s
Early green revolution Modernisation of agriculture with adoption of
superior technology and institutional reforms
1960s- 1985
Wider dissemination Transfer of benefit of green revolution from northern
States to other parts of the country, with wider
dissemination of technology for the benefit of the
entire country.
1986 - 1997
Post reform period Decline in government focus and expenditure on
agriculture sector, with a shift towards focus on the
tertiary services sector. This period was marked with
deceleration of growth in agriculture.
1998 - 2006
Recovery Increase in total agricultural production and growth
rate in agriculture.
2007
onwards

80 MGNCRE | Indian Rural Society and Rural Administration
4.4 Modernization and Technology in Agriculture
Image Source kullabs.com
The importance of modernization and adoption of improved production technologies in the
agricultural sector has been well understood for a long time. As already discussed, the policy
initiatives that led to the Green Revolution were motivated by the need for improved agricultural
productivity, and it was understood that this increase in productivity could only be achieved by
technological advancements at both the biochemical and the mechanical level. While biochemical
innovations involved the use of hybrid seeds, improved fertilisers, herbicides and pesticides,
mechanical innovations involved irrigation to be powered by diesel and electric pump systems,
mechanisation in other agricultural activities and improvements in the transport system.
Immediately after the green revolution, food grain production saw a substantial growth and there
was a decline in the import of foodgrain. The production of rice and wheat crops enjoyed a
particularly significant growth. However, after the initial growth post Green Revolution,
technological advancement and modernization in India’s agricultural sector began stagnating again.
This was caused mainly by the farmers’ struggles with issues of inadequate farm equipment, lack of
access to fairly priced credit and distribution challenges due to intermediaries. In today’s scenario,
modernization is required in four main areas production, finance, infrastructure/storage and
distribution.
1. Production
Technological advancement in the form of better equipment, seed quality, pest-control and
disease mitigation technology can directly increase agricultural productivity. Here it is
important to remember that large machinery used in developed countries have very little
applicability in most of our small farms. The key is to build mechanised processes suitable for
small farms, that reduces dependency on manual effort and results in better productivity.
Further, technology can also be used to carefully analyse changing demand, pricing and

81 MGNCRE | Indian Rural Society and Rural Administration
fluctuations in weather conditions so as to allow farmers to make better choices about
which crops to produce in any season.
2. Infrastructure/Storage
Infrastructure constitutes several types of agricultural implements including machinery, cold
storage facilities, suitable supply of power, proper road network and effective transportation
systems. All of these are essential for agricultural produce to be stored and transported
effectively. Currently India has a gap of 3.28 million metric tons of cold-storage amenities for
fruits and vegetables. The accessibility of cold storage units and their apt use can maximize
profits of the farmers and contribute to growth of the agriculture sector. In this regard, there
is a need for investment in developing infrastructure and storage facilities, along with raising
awareness about facilities that do exist.
3. Distribution
There are many ways in which technology can potentially improve the distribution of
agricultural output in the country. E-markets (online platforms connecting buyers and
farmers) can drastically reduce the number of ‘middlemen’ or intermediaries in the
agricultural supply chain, allowing farmers to make better incomes and profits. Already
farmers in the country have begun to rely on technological solutions like online
communication and information channels to access and share information about inputs,
production technology and markets. For instance, a Facebook group for organic farmers in
India with a member strength of 22,000 has become an engaging platform for farmers to
seek help or advice from other farmers. Whatsapp groups are now used extensively by
farmers to exchange knowledge and collaborate with peers. From ordering seeds online to
seeking inputs on social media, there is rapid adoption of information technology by Indian
farmers. Thus there is every reason to believe that innovative methods of improving
distribution - with well designed awareness campaigns - will eventually be adopted by Indian
farmers.
4. Finance
Modernization of finance for the agricultural sector involves providing farmers with easily
accessible farm credit and crop insurance. Technology can be particularly useful in ensuring
that financial services reach even the remotest villages of the country and all farmers
engaged in the agricultural sector can be easily included in the banking system. Here, the
most important role of technology would be to make banking easy to access for farmers all
over the country.
Finally, all modernization and technological advancement in agriculture needs to be supported by
resolving the infrastructural issues of electric power supply and internet connectivity, which is
becoming essential to access services like online banking, e-markets, etc.
4.5 Issues and Concerns in Indian Agriculture
Despite continuous improvements since independence, the agricultural sector in India still faces a lot
of challenges. Some of the main issues are

82 MGNCRE | Indian Rural Society and Rural Administration
1. The issue of land
About 60 per cent of the total land area in India is classified as agricultural land. But there has been
gross underutilisation of the available agricultural land. There are many reasons for it. Some farmers
leave their land fallow for some seasons. Even though small farmers tend to utilise their land more
fully but there have been evidences of greater under-utilisation of agricultural holdings by socially
disadvantaged groups. Other than poor land quality, lack of proper irrigation facilities, problem of
credit etc., a major challenge faced by the agricultural sector is the fragmentation of land holdings
and massive inequality in distribution of land between small and large farmers.
Figure 4.8 Distribution of land holding in India
Source Agricultural Census of 2010-11
Category Operated Area
Marginal Holdings Below 1 Hectare
Small Holdings 1 to 2 Hectares
Semi-medium Holdings 2 to 4 Hectares
Medium Holdings 4 to 10 Hectares
Large Holdings 10 Hectares and above
Figure 4.9 Categories of land holdings in India
There have been inequalities in the access of land which has seriously affected the production base
of farmers with small and marginal land holdings. Data show that benefits of land redistribution has
trickled down only up to the middle level of peasantry as land base of marginal landowners has not
improved over time. According to the Agricultural Census of 2010-11, the average size of land
holding has been continuously decreasing on account of increasing number of land holdings From an
average of 1.41 hectares in 1995-96, it went down to 1.15 hectares in 2010-11, a decrease of 18%.
While the number of Medium & Large holdings account for less than 5%, they make up for close to
1/3rd of the total area under operation. Though the number of Marginal & Small holdings account

83 MGNCRE | Indian Rural Society and Rural Administration
for 85% of the total number of holdings, they together account for only 45% of the total area under
operation. This has proved to be a major handicap in improving the livelihood of the vast number of
tiny farmers.
Land available for agricultural purposes is declining as rapid urbanisation has led to conversion of
land to non- agricultural purposes. Degradation of agricultural land has already become a serious
concern in several parts of rural India. Land degradation is a localised problem and depends not only
on the agro-climatic and socio-economic conditions of the region but also on the farmer’s access to
productive assets. Most of this degradation has been caused by human action. But the perception
that degradation is caused by human actions attributable largely to the poverty of the farmers may
only be partially true. Strategies of poor farmers for a sustained livelihood flow are not profit
maximising strategies which are adopted by the rich farmers. Since the sustenance of land-poor
depends on the sustained productivity of their meagre land resource, they cannot perhaps afford to
allow the quality of their land to deteriorate. On the contrary, the land rich usually go for short-term
gains from the produce of the land and can afford to absorb and overlook some degree of
deterioration in quality
2. Irrigation System
The growth of irrigation potential since independence has been substantial, yet the utilisation has
remained a concern. Moreover, over the years, the structure of irrigation system has increasingly
shifted towards ground water irrigation. This is partly because of the farmers’ control over the
system and more because of the lack of access to the surface water irrigation. Another factor could
be the price-subsidisation of electricity for operating the tube wells or the diesel prices for gensets
and pump sets.
Resulting decline in the water table has serious consequences on the small and marginal farmers
whose access to groundwater is becoming increasingly costly. Reduced investment in canal
irrigation, higher recurring costs of existing medium and major irrigation projects have further given
a set back to the use of surface water. The system requires a review for the sustained growth of
agriculture which is critically dependent on water-resources.
3. Availability and Access to Credit
Some of the major issues concerning the availability and access to credit has continued to persist
despite remarkable changes in the institutional support for the supply of credit to agriculture. These
issues need to be examined and some of the policies governing the credit support system need to be
critically reviewed.
About 60 per cent of the credit requirement of the farmers are met by institutional sources and the
remaining 40 per cent by informal sources. The total amount of credit is highly inadequate for the
growth of agriculture. Small and marginal farmers, including tenants who account for nearly 80 per
cent of holdings and one-third of area operated, depend far more heavily on informal sources. The
role of the moneylender has not been eliminated and given the fact that the relative share of
commercial bank credit is on the decline, the role of the moneylender is likely to increase.
4. Other inputs

84 MGNCRE | Indian Rural Society and Rural Administration
The availability and use of inputs like fertilisers, seeds and pesticides have grown over the years. In
the process, a number of issues like the balanced use of fertiliser, fertiliser price & subsidy and
management of the subsidy have arisen. The gap between the production and requirement of
improved quality certified seeds and the indiscriminate use of pesticides persist. It is desirable to
improve the rates of production and productivity but there is an equally important need to
disseminate knowledge among farmers. An organisational set-up which operates at the village level
or closer to Chapter of villages with the Surveillance of Panchayats would perhaps be more effective.
5. Prices, Costs and Profitability
The economic issues of income generation in agriculture depends on the prices received by the farm
sector, prices paid (costs) and the profitability. Analysis of the prices and costs show that the MSP is
more likely to have introduced distortion in the agricultural sector of the country particularly in
respect of wheat and rice crops. It has also been inimical to the efficient allocation of resources
within the agricultural sector. The system of minimum support prices has been able to keep the
incomes of the farmers with large marketable surplus high but has been responsible for a fiscal
strain and increasing funds being Chaptered in food storage more than required for reasonable food
security and reasonable level of price stability.
6. Investment in Agriculture
Long-term development of the agricultural sector demands a fair share of investment flowing to
agriculture in particular and the rural sector in general. Availability of fixed capital, strong and
vibrant agricultural infrastructures are vital requirements of the agricultural sector. The relative
share of agricultural sector in the total Gross Capital Formation in the economy has declined both in
the public as well as private sector. The major concern is that even though the relative share of
agriculture in the GDP has been steadily declining, the relative decline in the investment in the
sector has been far steeper. In an economy where opportunities for employment outside the
agriculture sector are not growing at all or are growing at rates far below the rate of growth of
labour force, the consequences of the decline in investment in agriculture can be serious. Moreover,
with growing pressures for ‘globalisation’ i.e. opening up of the economy, the need for diversified
agricultural sector is obvious. Diversification calls for more and not less investment. Policy-makers
need to review their investment allocation policy soon enough; otherwise backlogs of investment
will create further complications.
7. WTO Agreements on Agriculture
Studies have shown that WTO-AOA has not benefited India in terms of agricultural exports. India
could have joined in terms of increased agricultural exports if the domestic support and export
subsidies were substantially reduced in the developed countries and market access enhanced
through reducing quota tariffs. After the removal of quantitative restrictions, the main problem for
India is from the heavily subsidised agricultural exports of the developed industrial countries. There
is a considerable amount of evidence that export prices of some of the agricultural products are far
below their costs of production. This can persist only through veiled or open subsidisation of
exports. The WTO can, therefore, hardly make a massive change in the flow of trade on a free-
market basis. This is only a wish which can hardly be fulfilled in a world where trade is going on
among unequal’s. Industrialised countries like USA, EU etc. can go to any extent to protect their
economic gains and institutions. In the unipolar world, they seem to have the muscle strength also
85 MGNCRE | Indian Rural Society and Rural Administration
for achieving their goals.
The list of issues and concerns mentioned above is by no means exhaustive; there are several other
issues and concerns governing agriculture. It is not even an ordered set of issues; they are not
presented here in the order of their importance. It is interesting to note that while corporate
management is becoming increasingly systematised and is scaling new and newer heights, the issues
governing the management of agriculture have continued to persist. Political tug of war over the
solutions raises din and dust which shrouds these issues and their solution.
Summary
This Chapter identifies the importance of agriculture in the Indian economy and society. Agriculture
has a significant share in the country’s GDP and engages more than half of the population for the
purpose of employment and livelihood. Agriculture is also important to India’s industrial
development, foreign exchange earnings through exports and government revenue. Through several
phases of development, India’s agriculture has increased its growth and productivity by adopting
modern inputs and techniques of production. However, many farmers engaged in the agricultural
sector continue to be plagued by problems arising out of dependency on weather conditions (lack of
irrigation), small and fragmented land holdings, and lack of financial credit etc. A strong policy effort
is required to bring the agricultural sector out of these troubles.
Model Questions
1. Give three reasons why agriculture is important to India’s economy.
2. What are the main ways in which the agricultural sector supports growth in the industrial
sector?
3. What is the difference between subsistence farming and commercial farming?
4. Identify five phases of development in Indian agriculture.
5. Identify four areas in which modernization and technological advancement can benefit the
agricultural sector of India.
References
1. Chand Ramesh (2003), “Government Intervention in Foodgrain Markets in the Changing
Context”, Policy Paper 19, National Centre for Agricultural Economics and Policy Research,
New Delhi.
2. Government of India (2015), Summary of Agriculture Census 2010-11 [web log post]
Retrieved February 19, 2019 from http//pib.nic.in/newsite/erelease.aspx?relid=132799
3. Government of India (2013), State of Indian Agriculture 2012-13. Directorate of Economics
and Statistics, Department of Agriculture and Cooperation, Ministry of Agriculture, New
Delhi.
4. Government of India (2008), Agricultural Statistics at a Glance.Directorate of Economics and
Statistics, Ministry of Agriculture, New Delhi.
5. Government of India (2017), Economic Survey 2016-17. Department of Economic Affairs,
Ministry of Finance, New Delhi
6. Government of India (2018), Economic Survey 2017-18. Department of Economic Affairs,
Ministry of Finance, New Delhi
7. Pradhan, R. P. (2007), “Indian Agriculture in the Globalization Era The Performance and

86 MGNCRE | Indian Rural Society and Rural Administration
Determinants”,Journal of Global Economy, 3(1) 3-12.
8. Rao, C.H. Hanumantha (2000), “Declining Demand for Foodgrains in Rural India Causes and
Implications”, Economic and Political Weekly, 22 (January) 201-206.
9. Subramanian, Arvind. “Incentivising Pulses Production Through Minimum Support Price and
Related Policies”, Ministry of Finance, Government of India.
10. Virmani, Arvind. "India's Economic Growth History Fluctuations, Trends, Break Points and
Phases." Indian Economic Review 41.1 (2006) 81.
11. World Bank Open Data (2019), Agricultural productivity (% of land area). Accessed from
https//data.worldbank.org/indicator/ag.lnd.agri.zs

87 MGNCRE | Indian Rural Society and Rural Administration
Chapter 5 Land Tenure Systems and Land
Reforms in India
Introduction Land tenure is the relationship, whether legally or customarily defined, among people, as individuals
or groups, with respect to land. Land tenure is an institution, i.e., rules invented by societies to
regulate behaviour. Rules of tenure define how property rights to land are to be allocated within
societies. They define how access is granted to rights to use, control, and transfer land, as well as
associated responsibilities and restraints.
Land tenure is an important part of social, political and economic structures. It is multi-dimensional,
bringing into play social, technical, economic, institutional, legal and political aspects that are often
ignored but must be taken into account. Land tenure relationships may be well-defined and
enforceable in a formal court of law or through customary structures in a community.
Land is precious for any country and used by people for productivity and as a source of food, for
place to live, for wood, for place to work. In India, before colonial rule the land used to be in the
hands of the community as a whole. However, during the British Raj, this was changed which made it
necessary to introduce reforms in land sector.
Land Reforms usually refer to redistribution of land from rich to poor. Land reforms include
• Regulation of Ownership
• Operation, Leasing, Sale
• Inheritance of Land
In an agrarian economy like India with massive inequalities of wealth and income, great scarcity and
an unequal distribution of land, coupled with a large mass of people living below the poverty line,
there are strong economic and political arguments for land reforms.
Due to all these compelling reasons, Land reforms had received top priority by the governments at
the time of independence. The Constitution of India left the adoption and implementation of the
land reforms to the state governments. This has led to a lot of variations in the implementation of
land reforms across states.
Objectives
• the major land tenure systems
• the concept of agrarian structure and land tenure
• the important features of agrarian structure before colonial rule
• the nature of land tenure systems and agrarian structure during colonial rule and
Independent India
• the concept of land reforms, its objectives and implementation

88 MGNCRE | Indian Rural Society and Rural Administration
Structure
5.1 Origin and Development of Land Tenure Systems in India
Scholarly opinions are divided with regard to the question of land ownership in ancient India. Some
holds the view that land ownership in India primarily belong to the state while others believe that
the private ownership was the tenurial mode in ancient India. Ancient texts refer to private
ownership of land, though at the same time some texts are found which affirm the existence of state
owned land. Private ownerships were not absolute, natural or universal in early India.
During the Vedic Age, land was considered to be the property of the community as well as the
individual. Vedic rules prescribe vigilance in the proper upkeep and maintenance of land. Whether
the land was owned by the community or the ruler or the individual, the main concern was the
judicious distribution of the land among the people.
During the post-Vedic period, the king generally had no right over the land except the right to a
share of the produce. The cultivators were regarded as the actual owners of the land.
Sher ShahSuri started a proper land revenue system, which was later completed by Akbar. The
Zamindars established their suzerainty during the Mughal period.
Under the British, the land tenure system was overruled for the benefit of the ruler. The zamindars
were given the right of proprietorship over their property. The result was that the zamindars became
the landlords and the cultivators were reduced to the position of mere tenants. They believed that
the traditional control over the land belonged to the jenmies. They followed this idea for getting the
support of the jenmies for their colonial rule and to create a favourable social background for their
imperial expansion.
There were three main types of land tenures in India
1. Landlord tenure or Zamindari System
2. Independent single tenure or Ryotwari System
3. Joint village or village community or Mahalwari System
Land Tenure Systems and Land Reforms
5.1 Origin and Development of Land Tenure Systems in India
5.2 Land Tenure Systems, and Agrarian Structure-Part 1
5.3 Land Tenure Systems, and Agrarian Structure-Part 2
5.4 Land Reforms in Independent India
5.5 Implementation of Land reforms Experiences, and Prospects

89 MGNCRE | Indian Rural Society and Rural Administration
Figure 5.1 Land Tenure Systems in British India
Under the Zamindari System, the land was held by a person who was solely responsible for the
payment of land revenue. Actual cultivation was done by the tenants while the land remained under
the control of absentee landlords. The landlord simply was the provider of land and the tenants
provided all the management and labour. This system was greatly responsible for exploitation of
peasants, their oppression and poverty and above all low productivity. It was uneconomic and
inefficient in respect of land use. The major defect of the Zamindari system was that, it led to breed
inefficiencies and inequalities. The landlord was responsible for the payment of land revenue to the
state and the actual tiller was not in direct contact with the state.
Figure 5.2 Types of Zamindari Settlements
Zamindari Settlements in India
Permanent Zamindari Settlement The permanent settlement fixed the land revenue on a permanent basis. This system prevailed in Bengal, Orissa, Bihar, North Madras, Assam (some areas) and Banaras.
Temporary Zamindari Settlement This system had the revenue assessed for a period ranging between 20 and 40 years. The revenue was revised after the end of the term. This system prevailed in United Province, Rajasthan, Punjab and MP.
Land Tenure Systems in British India
Timeline
Permanent settlement, Bengal (1793)
Ryotwari settlement, Madras &Mahalwari in
North west Province (1822)
Sepoy Mutiny (1857)
Ryotwari settlement,
Bombay (1835)
Talukdari in Awadh (1858)

90 MGNCRE | Indian Rural Society and Rural Administration
The British Government pleaded that the Zamindars represented the most enlightened section of
the rural population. But the Zamindari system as it worked in India suffered from a number of
defects.
(a) Hindrance to Agricultural Development The Zamindari system worked as a formidable obstacle in
bringing about economic transformation in rural India. The Zamindars evinced no interest in the
improvement of either land or cultivation. Collection of revenue was their sole interest.
(b) Problem of “Absentee-landlordism” The Zamindari system supposedly introduced to promote
progressive agriculture, degenerated into absentee landlordism. Absentee landlordism signifies
conferment of a right of the sharing of the produce of the land on a few without participating
personally in the productive process. The very creation of the section of absentee landlords resulted
in the decay of the agriculture.
RuddarDatt and K. P. M. Sundharam have succinctly observed, “Historically, the landlords as a class
are known for their extravagance on women, wine and vices. The landlords of India were no
exception. Thus the money extracted from the cultivators by these parasites did not result in capital
formation but increased conspicuous consumption.”
(c) Exploitation The Zamindari system itself was based on exploitation as it conferred unlimited
rights on the Zamindars to extract as much rent as they wished. Approximately, one-fourth of the
produce was taken away by the intermediaries in the form of rent.
(d) Psychological insecurity Under the Zamindari system the actual tiller of the land was not the
owner of the land. Hence he was always in fear of his ejection from the land.
Under the Ryotwari System, there was the direct relationship between the state and the tenant
(ryot), but when it fully developed, ryots began to sublet their lands. It was prevalent in most of
southern India, being the standard system of the Madras Presidency (a British-controlled area now
constituting much of present-day Tamil Nadu and portions of neighboring states). The system was
devised by Capt. Alexander Read and Thomas (later Sir Thomas) Munro at the end of the 18th
century and introduced by the latter when he was governor (1820–27) of Madras (now Chennai).
The principle was the direct collection of the land revenue from each individual cultivator by
government agents. For this purpose, all holdings were measured and assessed according to crop
potential and actual cultivation. The advantages of this system were the elimination of middlemen,
who often oppressed villagers, and an assessment of the tax on land actually cultivated and not
merely occupied. Offsetting these advantages was the cost of detailed measurement and of
individual collection. This system also gave much power to subordinate revenue officials, whose
activities were inadequately supervised.
The name of the system comes from the word ryot, an Anglicization by the British in India of the
Arabic word raʿīyah, meaning a peasant or cultivator. The Arabic word passed into Persian (raʿeyyat)
and was carried by the Mughals, who used it throughout India in their revenue administration. The
British borrowed the word from them and continued to use it for revenue purposes in the Anglicized

91 MGNCRE | Indian Rural Society and Rural Administration
form. The word has passed into various Indian languages, but in northern India the Hindi term kisan
is generally used.
The major advantage of this system was that there was no sub-infeudation and the cultivator had
direct relation with the government. The peasant was free to look after his land properly and
introduce, if necessary, all possible improvement on it and the magic of property ownership could
turn “sand into gold”. This system created an atmosphere of frequent sub-letting of land. The
defective method of assessment of land revenue under this system led to the decline of the
collective basis of village life which led to the decay of village community.
Advantages Disadvantages
• The system was successful in
abolishing intermediaries.
• The proprietor of the land evinced
keen interest in improving the land
and other associated facilities.
• The ryotwari system through sub-
letting encouraged the practice of
absentee landlords.
• Through the provision of mortgaging,
the system has given rise to a new
zamindar class with all its exploitative
practices.
• The method of assessment of land
revenue, undertaken periodically by
settlement officers, was arbitrary. As a
result the ryot with small holdings
suffered heavily in periods of irregular
monsoons, droughts.
The Regulation IX of 1833, which was passed during the period of Lord William Bentick, was the basis
of Mahalwari System. This had elements of both the Zamindari and the Ryotwari systems. This
system divided the land into Mahals. Sometimes, a Mahal was constituted by one or more villages.
Tax was assessed on the Mahal and revenue was collected from the village. The individual cultivators
were generally responsible for a certain share of the revenue but in the last resort, all the villages
were responsible jointly and severally. Here also, ownership rights were with the peasants. Revenue
was collected by the village headman or village leaders (lambardar). It introduced the concept of
average rents for different soil classes. The state share of the revenue was 66% of the rental value.
The settlement was agreed upon for 30 years. This system largely prevailed in Punjab, Agra and
Awadh. The Mahalwari System was an important innovation in the land revenue system under the
British rule. It was the recognition of a subtler form of property right than that of the absolute
ownership concept. This system was called the Modified Zamindari system because the village
headman became virtually a Zamindar.

92 MGNCRE | Indian Rural Society and Rural Administration
Tenure
system Presidency Features
Permanent
settlement
1. Bengal
2. Bihar
• Cornwallis + John Shore. In Bengal + Bihar. 1793
• Company ‘outsourced’ the revenue collection work to
Zamindars
• Very exploitative. Led to many revolts. Hence British
didn’t implement it in
• other parts of India.
• In Awadh/Oudh, Lord Delhousie wanted to implement
Mahalwari but then
• 1857’s munity broke out. Later Lord Canning
introduced Talukdari system
• similar to Permanent settlement.
Ryotwari
1. Madras,
2. Bombay
3. Assam
• Thomas Munro and Read in Madras. (1820)
• Wingate and Goldsmid in Bombay (1835). In 1820 it was
tried in Poona but
• failed. Later Wingate and Goldsmid start Bombay Survey
System in 1835 for
• individual settlement system.
• Company directly collected revenue from farmers.
• Madras was initially under Permanent settlement type
system but Thomas
• Munro convinced the directors of East India company to
convert this area
• underRyotwari / direct settlement system.
Mahalwari
1. Gangetic valley
2. north-west
provinces,
3. parts of central
India
4. Punjab
• Company ‘outsourced’ revenue collection work to Village
community itself
• -Technically village headman (Lambardar) was made
responsible for tax collection
• North West Provinces initially had Permanent settlement
but transformed to
• Mahalwari system by Holt Mackenzie.(1822)
As a result of the above factors, India has been facing agrarian crisis under the colonial rule in one
form or other. There was the increasing landlessness of the peasants accompanied by frequency of
famines and shortage in the production and supply of food materials. Absentee landlordism was
considered as the greatest barrier in the development of the agrarian structure in the country.
Important changes have been brought in terms of tenancy and land ownership in the country after
independence.

93 MGNCRE | Indian Rural Society and Rural Administration
5.2 Land Tenure Systems and Agrarian Structure Part I
The concept of agrarian system is based on relationship between the people, the groups of people
and land as systemic unity. Daniel Thornier in his book "The Agrarian prospects in India" has used the
term "Agrarian Structure" as the sum total of ways in which each group functions in relation to other
groups.
The system of land tenure governs the traditional or legal rights of individual or groups on land and
its consequences on the social relationships of rural population. Land tenure systems in India handed
down as a colonial legacy was rooted in exploitation of the large majority of rural population and a
big section of those who did not having access to land.
After independence it was considered necessary to introduce several measures to change land
tenure systems with a view to provide opportunities for the development of every section of
agrarian rural society. These measures of change in land tenure systems have introduced the
elements of transformation in agrarian structure prevalent during colonial rule.
Consequences of the British land revenue systems
• Land became a commodity.
• Earlier there was no private ownership of land. Even kings and cultivators did not consider
land as his ‘private property’.
• Due to the very high taxes, farmers resorted to growing cash crops instead of food crops.
This led to food insecurity and even famines.
• Taxes on agricultural produce were moderate during pre-British times. The British made it
very high.
• Insistence on cash payment of revenue led to more indebtedness among farmers.
Moneylenders became landowners in due course.
• Bonded labour arose because loans were given to farmers/labourers who could not pay it
back.
• When India achieved freedom from colonial rule, 7% of the villagers
(Zamindars/landowners) owned 75% of the agricultural land.
Agrarian Structure in Pre-British India
Indian rural society was self-sufficient village community based on agriculture. Agriculture and allied
activities were carried on with the primitive tools and handicrafts. Village as a self-sufficient basic
economic unit had existed for centuries in India. Village in India was like 'little republic' having nearly
everything they required within themselves and almost independent of any 'foreign' relations.
The village population was mainly composed of farmers. The farmer's family enjoyed a traditional
hereditary right to possess and cultivate its holdings from generation to generation. During the
period of Hindu rulers, the land belonged to the village community and was never regarded as the
property of the King. The king or his intermediaries claimed only a part of the produce of the land.
To do activity Find out the type of relationship existing between Zamindars and agricultural labourers in your region. Is this exploitative? Also suggest some solutions to improve their conditions.

94 MGNCRE | Indian Rural Society and Rural Administration
• Economic Features In Indian villages, the structure of agricultural production remained
untouched tor centuries. The entire agricultural produce was almost consumed locally by the
agriculturists and non-agriculturist village population, except the share of produce which the
village had to surrender to the ruler of that period. The village population besides the
farmer's families included industrial workers, such as a smith, a carpenter, a potter, a
weaver, a cobbler, a washer man, an oilman, a barber and others.
• Social Features So far as the Indian agrarian structure was concerned, conquests not
affected it. The pre-British Indian society was characterized by subordination of the
individual to the caste, the family and the village panchayats. Rigidity caste system exist with
the inexorable force of natural law, determined the occupation of its members of the village
community. Since castes were based on heredity, occupation also became hereditary.
The agrarian structure in India during pre-colonial period can be summarized at its best in terms of
O'Malley-
"The chief social institutions, as they existed in their integrity, were not individualist but collectivist.
The unit was not individual but the family whch regulated the relations of its members. The
interrelations of different families were governed by the village community and the caste, the
former of which was a collection of families organized for the purposes of communal self-
government, while the latter was an aggregation of families united by rules as to marriage, diet,
occupation and intercourse with the rest of community but not localized like the village community.
All three, the family, the caste and the village community maintained ideological control over the
individual who was bound to conform to their standards, the affairs of the caste and family,
however; were matters with which the state had no direct concern. The relations of their members
were governed not by secular but by Hindu laws and customary regulations."
Agrarian Structure during British Rule
The political and economic policies adopted by the British government after 'the conquest of India
introduced the elements of transformation in Indian economy and society. Before British conquest
of India land belonged to the village community and was never treated as the property of the kings -
benevolent or despotic, Hindu, Muslims or Buddhist. Nor it was treated as individual cultivator's
property. In short in pre-British India the private ownership of land did not exist in any form. Land
belonged to the village community.
British conquest introduced the concept of privateproperty in land by superseding the traditional
right of village community over the village land. In a sense of British conquest brought about an
agrarian revolution. The introduction of private ownership in land divided village community mainly
into peasant ownership and large scale landlord ownership. As a result of this material
transformation the agrarian society in India witnessed profound social, economic, political, cultural
and psychological change. Under the new land system, the village was no longer owner or supervisor
of agriculture. It had little to do withthe disputes related to land which had become the subject of
courts established by the British. This greatly undermined the prestige of the panchayats which lost
power. The new land revenue system created individual holders of land and introduced the system
of individual land assessment and revenue payment.

95 MGNCRE | Indian Rural Society and Rural Administration
A new method of fixing the land revenue and its payment was introduced and the new land system
and revenue system played an important role in snapping the traditional tie between the peasant
and the village community. Consequently, the self-sufficient nature of village community received a
serious setback. The coexistence of village agriculture and industry which the basic pillar of the self-
sufficient village economy, was disrupted. The Centralized state took over the functions of the village
community.
The village slowly but steadily became transformed from self-governing community to an -
administrative unit of centralized state the economic aspect largely a part of the national economy.
The collective village life based on common economic interests and the resultant cooperative
relations could not be sustained under the new arrangement. Ultimately it gave way to a new village
where existence was based on competition and struggle among independent individuals.
Impact of British Rule in Eastern and Western Parts of India
Eastern India The East India Company took over the Diwani (financial rights) of Bengal, Bihar and
parts of Orissa in the year 1765. The Company required large amount of money to finance trade and
commerce, and to maintain the army for strengthening and expansion of the rule. To realize the
objective of higher land revenue, the zamindari was auctioned to the highest bidder. This reckless
process was followed by frequent famines, loss of human life and large areas of land were rendered
as waste. The impact on agrarian society can be assessed from the fact that between 1765 to 1793
the revenue demand nearly doubled.
The Permanent Settlement of 1793 in Bengal and Bihar, besides declaring the zamindars,
proprietors of the soil, fixed their dues to the state on a permanent basis. It was argued that it would
ensure not only the security of revenue, but also lead to the prosperity of the Company's commerce.
A thriving commerce was the vital need of the British and Indian agriculture provided vdety of goods
for export. This period was of special significance because it was the time of the commencement of
the Industrial Revolution in Britain.
Moreover, behind these measures another objective was the creation of a new class, loyal to
company as 'zamindars' which will help in the stabilization of British rule in India. However, their
expectations were only partially fulfilled, in so far as the zamindars, new as well as old, failed to turn
into agrarian capitalists, and preferred to remain feudal landlords. Capital was invested not in
agricultural development but for purchasing of land. Moreover, in due course of time, a long chain of
intermediaries cropped up between the state and the tiller.
However, with increase in prices, the value of money was eroded. As a consequence, state and
peasants both were in no-win situation. The state lost because its revenues in terms of money were
permanently fixed, while the value of money had drastically fallen. The peasant lost because rents
were not regulated and the increased value of agricultural produce went to the zamindars and the
intermediaries.
It was realized that the freezing of the land revenue demand, which constituted by far the most
important source of the government income at that time, would not be advisable. Both in Orissa and
Assam settlements were kept temporary and the revenue demand was increased from time to time.
In Orissa, between 1805 and 1897, the government increased the land revenue to around 93 per

96 MGNCRE | Indian Rural Society and Rural Administration
cent. In Assam, the peasants surrendered to the State a larger proportion of their total agricultural
output. Since the British had their district professional army and an elaborate administrative
bureaucracy, the labour services of the paiks became redundant. The paiks were given a cash
tribute, which was quite high as compared to the nominal tax on paik's land during Ahom rule. Their
revenue-free estates were gradually confiscated.
Western India The system of revenue collection adopted in Western part of India was basically the
ryotwari system, but other systems of land revenue were also in practice. In this system, the
settlement was normally for a fixed period of 30 years, which meant that the revenue demand could
be enhanced after that period. Under the ryotwari& settlement, the ryot cultivator was directly
under the state, was recognized as proprietor and had right to sublet, mortgage or transfer his plot
of land by gift or sale. He could not be ejected so long as he paid the fixed revenue. With the
introduction of the new land revenue system in Western India; the 'miras' and 'upari' tenures were
merged and the occupant of the land had the same right irrespective of their earlier status. The
hereditary village and higher officials were prohibited from collection of customary perquisites from
the people. In addition to this, exclusion of these hereditary officials from revenue administration
also tended to lower their independence. The new system (ryotwari) adopted cash system of
revenue.
Changes in Agrarian Society
During 1860, there was a sharp rise in prices of agricultural commodities, specially of cotton. The
first to benefit from the boom were the traders and moneylenders, but cultivators also got some
benefit. Farmers, who were relatively well off concentrated on cash crops, because of the increase in
prices. The farmers who were comparatively less well-off tended to cultivate food grains where price
situation led Tenure Systems and was relatively stable. Thus, the incidence of land revenue on the
rich farmers Agrarian Structure-I declined faster than for the less well to do farmers.
Increasing indebtedness of the cultivators culminated in the Deccan riots in 1875 against
moneylenders. In addition to heavy land revenue demand, the new legal system had also given the
village moneylender more freedom. But in the new legal system the British courts were much more
rigid in enforcing the land transfer and the cultivators were often ignorant of the new laws. In the
beginning the business moneylenders were mainly interested in control of crops and trade. By the
mid nineteenth century the moneylenders controlled nearly all the internal trade of both grain and
cotton in the Deccan. Their interest was also to preserve this control through advancing loans to the
peasants who were required to sell their corps to them at a much lower price than prevailing market
prices.
The cultivation of cash crops such as sugarcane, tobacco, groundnut and cotton expanded during the
late 19' and early 20th centuries, leading to the emergence of rich peasantry. The small section of
the cultivators who had a surplus produce for market, made large profits, and invested them back
into agriculture. These rich farmers, who had been able to seize the new market opportunities, often
replaced the traditional moneylenders as sources of credit in the village. Very often these
commercialized agriculturists purchased the land of small cultivators, who were in heavy debt.
Data collected for the Royal Commission on Agriculture showed that in 1924-25, 86 per cent of the
total cultivated area was held by large owners each having more than 25 acres, and they formed just

97 MGNCRE | Indian Rural Society and Rural Administration
12 per cent of the total landowners. It seems that well-to-do owner cultivators started withdrawing
from cultivation and leased out their land during the first half of the twentieth century. In Gujarat
land owned by non-cultivating holders increased from 24 per cent to 30 per cent of the agricultural
area between 1916-17 and 1942-43, while their number rose from P 65,000 to 1,01,000. Most of
these tenants were tenants-at-will. The majority of tenants in Maharashtra paid in kind; the general
rate was half the crop, with the landlord paying the land revenue. This system was particularly
advantageous to the landlords when prices were rising.
5.3 Land Tenure Systems and Agrarian Structure Part II
The outcome of the land settlements instituted by the British can be summarized as
• It created a class of parasitic landlords, moneylenders, land speculators and Waders. They
dealt mainly with agricultural produce and started playing an important role in the
governance of countryside. This class was not interested in any productive investment or
agricultural development.
• It promoted commercialization of agriculture especially in the areas producing for export.
• It turned land into a private property. It made it possible that land could be alienated from
the cultivators, throughout the country. The parasitic elements who were controlled the
countryside had dominant hold on surplus produce generated by the cultivators.
Impact of British Rule in Northern and Central India
In Northern India various kinds of land tenure systems were inter mixed as both Zamindari and
Mahalwari systems were introduced in this region. Initially, Bengal type permanent settlement was
favoured, but after 1811, considerations of enhancement of revenue led to the abandonment of
fixed revenue system, and even in the case of zamindari areas only a small proportion of land was
under permanent settlement, the rest were settled temporarily.
In Punjab and parts of United Provinces, Mahalwari system was introduced where the unit of
assessment was the village. In this system payment of revenue became the joint responsibility of the
village proprietary body. Each individual cultivator contributed his share in the revenue. Initially the
burden of revenue was very heavy. The British laid claim to about 85 per cent of the rental. In
principle it was reduced to two thirds after 1833 and to one-half after 1855, but in actual practice
this principle was not adhered to.
From the very- beginning British government wanted to extract maximum revenue from the central
parts of India and for this region heavy assessment was imposed by the British. High assessment land
and an impossible revenue, impoverished the people. The mistake was realized at a later date and
To Do Activity Find out what is the major source of irrigation in your local area. Is it tank irrigation or tubewell or canal irrigation or the agriculture is rain fed?
Glossary Agrarian Structure It takes into account every conducive factor that is responsible for the sustained growth in the agricultural sector. Agrarian Structure involves the social, economic and technical elements that affect production in the agricultural sector.

98 MGNCRE | Indian Rural Society and Rural Administration
was condemned in the strongest terms. It was only in 1834 that a long settlement for twenty years
was concluded in these territories, which was allowed to continue till the early 1860s.
Under the new settlement of 1864, that was introduced in the Central Provinces, malaguzars or
revenue-payers were recognized as the proprietors of the soil with a right to sell or mortgage their
property. Tenancy rights were conferred on the Agrarian Structure cultivators. In principle it was
decided that the land revenue would be limited to one-half of the rental of estates, but the principle
was not adhered at the time of assessment. They estimated what the rental should be from their
own calculations, and based the land revenue demand on the estimated rentals. Thus, the rental
considered as the basis of assessment was higher than the actual rents received by the land owners.
As a result, land revenue demand was higher than 50 per cent of actual rental.
Impact of Land Revenue System
• Land revenue was to be paid in cash, not in kind.
• Secondly, the amount of revenue was kept fixed for a period of twenty or thirty years, under
the permanent settlement. Consequently, the revenue of the state did not increase.
On the other hand, the payment of revenue in cash generated a pressure on the cultivators. They
were forced to produce cash crops like indigo, sugarcane and wheat, and had to borrow money for
payment of tax or took advance from the village moneylenders of the local grain dealer-cum-
moneylender.
The transfer of ownership of land was massive and fast. These mutations were effecting a rapid and
complete revolution in the position of the ancient proprietors of the soil. Behind this alienation and
mortgage of land, there emerged a serious and much larger problem of indebtedness. It was
estimated that 10 percent of agricultural land had already passed into the hands of, what district
officers termed, as 'the wily mahajan' and 'sleek, impassive bania'. Yet official opinion remained
opposed to any tampering with free trade in land because of the fear that legislative inference might
seriously upset the provision of rural credit and jeopardize the security of the land revenue.
Similarly, by the time of the 1864 Settlement in the districts of Central Provinces, almost the whole
of the profits was taken away by the moneylenders. While mortgage was growing rapidly, decrees
were being carried out through 'the civil courts in the 1870s. Continuous transfer of land from
cultivators to moneylenders prompted legislation in the shape of Bundelkhand Alienation Act of
1903. But despite the Alienation Act the professional moneylenders in Bundelkhand remained a
permanent part of the rural scene and kept their hold over the peasants. Moneylenders-cum-traders
were more interested in receiving rent or in controlling the disposal of cash crops grown by the
peasants than directly engaging in agricultural. Thus the introduction of legal private property right
in land tended to enhanced the claim of intermediaries above the actual cultivator and left the
peasant based small scale traditional cultivation intact. The expectation of the British of the
emergence of capitalist agriculture, which would benefit from the economies of scale, did not
materialise.
Agrarian Structure after Independence
The agrarian structure which was marked, on the one hand, by the concentration of land ownership

99 MGNCRE | Indian Rural Society and Rural Administration
in the hands of parasitic class who played no positive role in the production and, on the other, had
divorced the landownership from the vast mass of peasantry who were the actual cultivators.
Therefore, a radical measure in the form of land reforms was required to bring fundamental changes
in rural social structure and economy.
In India, land reforms were initiated as an attempt to alter the pattern of distribution of land holding
through radical measures by the state. The measures of land reforms policy have been prominently
laid down in the Five Year Plan documents.
The main objective of the reforms policy may be summed up as
• To remove mutational and other impediments to increase agricultural production
• To eliminate all elements of exploitation and ensure social-injustice within agrarian system.
The land reforms have been considered as the number one priority area in the whole range of
agricultural development activities and have been on the national agenda of rural construction has
been constantly recognized in the successive Five Year Plans. Government of India has been
continuing play its advisory role in the field as the subject is in the state list of the constitution and is
in exclusive legislative and administrative jurisdiction of the States.
The Land Reforms Division of the Ministry of Rural Development has been playing a crucial role for
evolving a national consensus at various stages for taking up major steps towards effective land
reforms which included the abolition of Zamindari and of all the intermediaries since the beginning
of fifties. The Centre and State government have, as a result, adopted important strategies for rural
development by effecting major reorganization of socio-economic structure through land reforms.
The land reforms programme strives to fulfil all the principles of National Land Reforms
policy which consists of the following measures
• Abolition of intermediaries and bringing the tenants in direct contact with the government
• Tenancy reforms with a view to provide security of tenure to actual cultivators of land
against eviction and regulation of rents
• Redistribution of land by imposing ceiling on agricultural holding
• Consolidation of holdings
• Prevention of alienation/restoration of alienated tribal land
• Updating and computerization of land records
Though the Centre and State governments have initiated several meaningful measures related to
land reforms, there is still a wide gap between the proclaimed objectives and the actual outcome.
After the 73rd Constitutional Amendment Act 1992, Panchayati Raj institutions have become very
important. The nature of the land problem varies from state to state and even from region to region,
and in introducing the Land Reforms a flexible approach has been adopted to suit and respond to
the differing local requirements. The ideological and political factors and the way the ownership and
the use of land is interlocked with the power structures have been matters of great importance and
significance.
The first phase of post-independence land reforms in 1950s and 1960s yielded mixed results. It could
be termed successful in the sense that the intermediaries were abolished, which provided the basis
for improvement in agricultural productivity. Nevertheless, the unequal agrarian structure remained
in place. In 1953-54 nearly 8 percent of ownership holding accounted for 54 percent of the total

100 MGNCRE | Indian Rural Society and Rural Administration
land. However, at the all India level there was tendency towards unequal power structure in terms
of land ownership. Although the average size of holding declined from 2.39 hectares in 1993-54 to
2.21 hectares in 1971 in several states, the average size of large farms increased.
• Pattern of Ownership Holdings It may be noticed that nearly 310 million acres of land were
estimated to be owned by rural households in 1953-54. This was nearly 38.4 per cent of the
total geographical area and 61 per cent of the topographically usable land. A certain
proportion of land in the rural areas, no doubt, was owned by urban households.
The owned area of 310 million acres was held by 66 million households. The average size of
ownership holdings in the rural areas was around 4.72 acres. But when we look at the size of
distribution of holdings, the situation is far worse. Nearly 22 per cent of the households in the rural
areas did not hold any land. These households constituted the cultivating small tenants.
The average size of holding was the lowest in South India (about 3.42 acres), while it was the highest
in Central India (about 8.29 acres). It may be pointed out that, the efficiency of cultivation which
depends on appropriate combination of different factors of production.
• Pattern of Operational Holdings "Operational" or "cultivation" holdings refers to the
operational holdings that is more appropriate to the efficiency of agricultural operation.
Theoretically, even with a very adverse distribution of ownership, through a process of
leasing in and leasing out, it is possible to have a pattern of operational holdings, less
inconsistent with the dictates of efficient technology, or with the requirements of the laws
of returns, or of returns to scale.
Although a small decline in concentration of land took place after the land reform legislation, land
distribution remained highly skewed. In 1953-54, the bottom 60 per cent of holdings operated 15.5
per cent of area while in 1960-61 the bottom 62 per cent of holdings operated 19 per cent of area.
Consequences of Land Tenure Systems on Agrarian Society
The major changes introduced by the British rule were the new land revenue systems, high rates of
revenue, new administrative and judicial system, which not only damaged the management of the
villages, but introduced major changes in the Indian socio-economic and legal systems also.
• The functions of gram panchayat in the fields of land management and judicial function
were taken away. As a consequence, the old social, economic and political institutions
prevalent in the Indian village were destroyed.
• Due to the destruction of small village industries and crafts, land acquired much importance.
• Both the ownership of land and farmers became mobile bringing in the absentee landlords
and moneylenders on the villages.
• The land revenue was very high in both the zamindari and the Ryotwari systems and when
zamindars or ryotwars were not in a position to pay revenue in time, the British took away
the lands from them and sold it to businessmen.
• Majority of the farmers stopped farming and land became sterile/unproductive. The number
of sharecroppers and landless farmers increased significantly.
• The British land tenure system of Zamindari, Ryotwari and Mahalwari destroyed the self-
sufficiency of the Indian villages and brought fundamental changes in the rural social and
economic life which were often damaging to the old customs.

101 MGNCRE | Indian Rural Society and Rural Administration
• The land revenue was increased from 66 percent to 100 percent after American civil war.
The farmers had no right to appeal in the court of law.
• The creation of a class of zamindar provided social support for the colonial government and
made it easier to impose control over the rural population.
• The expansion of British rule and the requirement of more and more money led to the
increase in land revenue. It made agricultural production costly ultimately resulting into
agricultural backwardness. High level of revenue, costly agricultural production put farmers
into high debt.
5.4 Land Reforms in Independent India
Land Reforms refer to an institutional measure directed towards altering the existing pattern of
ownership, tenancy and management of land. It entails “a redistribution of the rights of ownership
and/or use of land away from large landowners and in favour of cultivators with very limited or no
landholdings.”
Thus, in a broad sense, land reform refers to an improvement in agro-economic institutions. It
includes measures and policies relating to redistribution of land, regulation of rent, improving the
conditions of tenancy, cooperative organisation, agricultural education, and so on.
Aspects of Land Reforms in India
British Land Tenure Systems
Permanent Settlement, Ryotwari System, Mahalwari System
Steps taken by Indian Government
Land Acquisition Acts, Compensation for land holdings, Modernization of National Land Records
Movements related to land reforms
Bhoodan Movement, Jan Satyagrah, Gramdan Movement, Forest Rights Movements
Land reforms after independence
Abolition of Zamindari System and other titles
Figure 5.3Different Aspects of Land Reforms
Need and Scope of Land Reforms
Productivity in Agriculture is mainly dependent on 2 set of factors-
1) Technological It includes use of agricultural inputs and methods such as improved seeds,
fertilizers, improved ploughs, tractors, harvesters etc. which help to raise productivity.
2) Institutional It includes redistribution of land ownership in favour of cultivating classes so as
to provide them a sense of participation in rural life, improving size of farms, providing
security of tenure.
To Do Activity Find out the changes which are brought to agriculture sector in terms of technology in your surrounding area. Find out the number of families which have access to latest technology.

102 MGNCRE | Indian Rural Society and Rural Administration
Consequently, 2 schools of thought emerged. Socialists believe that existence of feudal relations was
the real cause of backwardness and poverty. Other school believes that agricultural productivity is
purely a technological phenomenon.
Land ReformsPurpose
Figure 5.4 Purpose of Land Reforms
Land Reforms Objectives
Figure 5.5 Objectives of Land Reforms
Land ReformsObjectives
To provide financial impetus to farmers to improve investment in land and promote development of agricultural sector
To ensure equitable distribution of resources across the farming community
To create proprietorship of and for the farmers
To ensure a just and equitable distribution of incomes to promote consumer markets
Land ReformsSocio-economic Purpose
To remove obstacles in the way of agricultural production and bring efficiency in the administrative system
To eliminate inequalities in resource or socio-economic distribution among the farmers
To prevent exploitation of agricultural labourers
To provide economic security to the farmers

103 MGNCRE | Indian Rural Society and Rural Administration
Land Reforms Measures
Figure 5.6 Measures taken during Land Reforms
(i) Abolition of intermediaries Abolition of zamindari and similar intermediary tenures during 1950-
55 essentially involved removal of intermediary levels or layers of various amorphous and parasitic
groups in land between the State and the actual cultivators. However, such abolition of
intermediaries involved compensation to the owners of land.
As a result of this measure, about 2.5 crore farmers were brought into direct relationship with the
State. This facilitated distribution of 61 lakh hectares of land to landless farmers. Large areas of
privately-owned forests and wasteland now vested in the State.
Despite abolition of intermediary rights, poor peasantry continued to be exploited in various ways. It
led to large-scale ejectment of poor tenants from land. While landlordism has been abolished,
absentee landlordism now continues to flourish. The legislation conferred ownership rights not upon
the actual cultivator, but on the statutory tenant, who himself was an intermediary with a chain of
sub-tenants under him.
All this happened because
• The law permitted the intermediaries to retain their home farms,
• No limit was put on the area of land they could retain,
• The term ‘personal cultivation’ was ill-defined, and
• No protection was given to sharecroppers and other tenants-at-will.
Thus, the abolition of intermediary rights on land has not been an unmixed blessing.
Land Reforms Measures Undertaken
Abolishment of intermediaries
Tenancy reforms
Land ceilings and land consolidation
Development of agricultural cooperatives
104 MGNCRE | Indian Rural Society and Rural Administration
(ii) Tenancy Reforms
Tenancy legislations have taken three forms
• Regulation of rent
• Providing security of tenure
• Conferring rights of ownership for tenants
Rent payable to the landowners should not exceed one-fifth to one-fourth of the gross produce of
land. In the light of this guideline, all the states have enacted laws for fixation of rent. However,
large inter-state variations exist in the fixation of land rent rates. Further, one notices inter-state
differences in land rents.
Even the tenancy reforms have failed to regulate rent. Owing to the weak position of tenants,
demand for fair and just rent from landowners occasionally lead to ejectment from land. Tenancy
Legislations have made it clear that in no case the tenants can be evicted except only in the situation
where landlords themselves want to resume cultivation. Even in the event of resumption of
cultivation by the owners, tenancy legislations have made it obligatory to leave a minimum area for
the tenant.
Every important aspect of land reform is the conferment of ownership rights to tenants in respect of
non-resumable land. As a result of this measure, by 2000, only around 124.2 lakh tenants operating
no more than 4 p.c. of the cultivated area have been benefited from this ownership rights or their
rights have been protected on 63.2 lakh hectares of land.
Overall impact of tenancy reforms has been rather limited. Firstly, tenancy laws have been violated.
For instance, in Bihar, the maximum limit of rent was kept at 25 p.c. of the gross produce. But
tenants are required to pay even more than 50 p.c. as their social standing is abominably low.
Secondly, as regards the security of tenant- cultivator, escape clauses have been misused against the
interest of tenants.
Tenancy laws that have been framed in different states contained a provision for the resumption of
land by the landowners for ‘personal cultivation’ with the object of protecting the interests of
landowners, rather than tenants.
Due to a loose definition of the term personal cultivation, landowners continued to resume land for
self-cultivation. The law also permitted the voluntary surrender of tenancies. Informal or concealed
and oral tenancies are still prevalent.
Thus, the right of resumption of land for self-cultivation has rendered all tenancies insecure. Finally,
there is no legal provision for conferring ownership rights in the tenancy laws of some states. In
reality, legislation for conferment of ownership rights could not yield good results because many
tenants are incapable of buying land from the landowners and many of them are unwilling to do so.
(iii) Ceiling on Landholdings The Second Plan (1956-1961) recommended the imposition of ceilings
on agricultural holdings. It was envisaged that land above a certain limit would be acquired by the
State and redistributed among the landless workers and small farmers so as to meet their hunger for
land and, thus, to enable them to create economic holdings.

105 MGNCRE | Indian Rural Society and Rural Administration
Land ceiling laws were passed in two phases. In the first phase—which lasted up to the end of
1972— ‘landholder’ was treated as the unit of the cultivation. This ceiling unit was changed to
‘family’ after 1972. The ceiling limits have also been lowered in the second phase with differences
varying as between irrigated land with two crops, irrigated land with one crop, and dry land.
Up to end September 2001, the total amount of land declared surplus was 73.67 lakh acres, 64.95
lakh acres of land have been taken over by the states. A total of 53.79 lakh acres of land have been
distributed among 54.84 lakh tenants. This amounts to saying that about 12 lakh acres of land could
not be distributed because of variety of reasons, of which litigation is considered to be the most
inhibiting factor.
Why Land Ceiling? Argument against Land Ceiling
Arguments Against Land Ceiling
Reduced Economic Efficiency Larger farms have an edge over small holdings because cost of production per hectare is reduced due to increased resources Larger inputs can ensure better access to technology to improve production
Lesser Employment Opportunities Farm labourers will lose their jobs if land is redistributed into smaller parts Small farmers may not be able to afford more labourers as small holdings will mean smaller incomes
Figure 5.7 Arguments against Land Ceiling
The operations of the ceiling law made virtually no impact on the agrarian structure. The
enforcement of the ceiling law was preceded by a public debate spread over several years. This
enabled landowner to manipulate land records leading to fictitious (benami) and fraudulent
partitions of lands among their relations, friends, fictitious trusts, etc.
As a result, only the small landowners were caught in the net and most of the big landowners or
jotters circumvented it and, even if the land was taken from them, it was not redistributed among
the landless peasants. Lack of political will is considered to be the greatest stumbling Chapter for its
speedy implementation.
(iv) Consolidation of Landholdings Fragmented and subdivided landholdings as well as small-sized
holdings have made Indian agriculture un-remunerative. So consolidation of these lands is necessary
to boost efficiency and economy in India’s agriculture. It has been completed in the states of Punjab,
Haryana and Uttar Pradesh.
Till December 2001, nearly, 163.3 lakh acres of land or 1 /3rd of the total cultivated area have been
consolidated. Thus, the success story in this regard is rather disappointing. One of the reasons for
the tardy progress of this aspect of land reforms is that small farmers have a strong fear that
consolidation favours large farmers. That is why the threat of eviction of tenants from land out of
consolidation is the greatest.
Why the Program Failed?

106 MGNCRE | Indian Rural Society and Rural Administration
• Because the farmers are reluctant to exchange their lands for the new one.
• The farmers also complained about nepotism and corruption in the process of consolidation.
(v) Cooperative Farming Cooperative farming is advocated to solve the problem of sub-divisions of
land holdings. The idea was to make farming profitable for small and marginal farmers having small
pieces of land.
Under Cooperative Farming, setup farmers having very small holdings come together and join hands
to pool their lands for the purpose of cultivation. Pooling of farms helps in increasing production,
and the farmers can have more produce to sell in the markets after taking out their subsistence
need. Cooperative farming also helps in mechanisation of agriculture as the owner of the multiple
small farms can pool their money to buy a mechanical tractor or other equipment’s which they could
not afford otherwise.
Arguments in favour of cooperative farming –
• An effective method of making small uneconomic holdings profitable
• Cost reduction in inputs such as seeds, fertilizers, electricity
• Mechanization of farming
• More scope for technological innovation
• Efficiency in resource utilization
• Increase in labour wages
• Access to markets easy for farmers
5.5 Implementation of Land Reforms Experiences and Prospects
Most of the planks of land reform measures are ambivalent and there are large gaps between policy
and legislation and between legislation and implementation. And “land reform measures were
conceived boldly but were implemented badly.”
Land reforms have been half-heartedly attempted at various times and this has proved to be a case
of the remedy being worse than the disease. Commenting on the process of land reforms, Prof. M.L.
Dantwala observes; "By and large land reforms in India enacted so far and those contemplated in the
near future, are in the right direction; and yet due to lack of implementation the actual results are
far from satisfactory".
Joshi observes "There is no doubt that during the past twenty-five years land reforms in India have
not assumed the form of gigantic revolutionary upheaval as in China, or that of a dramatic change
brought about from above as in Japan. But from this to jump to the conclusion that the land reforms
programme has been a hoax or a total fiasco is to substitute assertion for a detailed empirical
examination. India has also witnessed important changes in the agrarian structure, which have gone
To Do Activity Find out which type of land reform was implemented in your area. Also, figure out how successful it was in improving conditions of the poor.
To Do Activity Find out the average size of land holding in your area.

107 MGNCRE | Indian Rural Society and Rural Administration
unnoticed because of the absence of a down-to-earth approach in assessing these changes.
The Government of India is aware that agricultural development in India could be achieved only with
the reform of India's rural institutional structure. It was said that the extent of the utilisation of
agricultural resources would be determined by the institutional framework under which the various
inputs were put to use. M. Dandekar observed "Among the actions intended to release the force
which may initiate or accelerate the process of economic growth, agrarian reform usually receives
high priority". The First Five-Year Plan stated "This (land reform) is a fundamental issue of national
importance. The former Prime Minister, Indira Gandhi, emphasised "Land Reforms is the most
crucial test which our political system must pass in order to survive." Land reforms therefore became
one of the vital aspects of the agricultural development policy especially after the concept of the
Five-Year Plan came to stay.
The Second Five-Year Plan emphasised the objectives of the land reforms thus
• To remove the impediments in the way of agricultural production as may arise from the
character of agrarian structure and to evolve an agrarian economy conducive of high levels
of efficiency and productivity;
• To establish an egalitarian society and to eliminate social inequality;
Again, in the Third Plan, the Planning Commission summed up the objectives of land reforms thus
"The first is to remove such impediments to increase in agricultural production as may arise from the
agrarian structure inherited from the past. This should help to create conditions for evolving as
speedily as possible an agricultural economy with a high level of efficiency. The second objective,
which is closely related to the first, is to eliminate all elements of exploitation and social injustice
within the agrarian system to provide security for the tiller of the soil and assure equality of status
and opportunity to all the sections of the rural population". Thus the land reforms in India aimed at
the redistribution of ownership holdings and reorganising operational holdings from the view point
of optimum utilisation of land. It has also aimed at providing security of tenure, fixation of rents and
conferment of ownership.
After Independence, attempts had been made to alter the pattern of distribution of land holdings on
the basis of four types of experiments, namely;
• Land reforms "from above" through legislation on the lines broadly indicated by the Central
Government, enacted by the State legislators, and finally implemented by the agencies of
the State Government.
• Land reforms "from above" as in the case of Telengana and the naxalite movement also to
some extent in the case of the "Land Grab" movement.
• Land reforms through legislative enactments "from above" combined with peasant
mobilisation "from below" as in the case of controlled land seizure in West Bengal and
protection of poor peasants in Kerala.
• Land reforms "from below" through permission of landlords and peaceful processions by
peasants as in the case of Bhoodan and Gramdan.
The Zamindars acted as the intermediaries. Until Independence, a large part of agricultural land was
held by the intermediaries under the zamindari, mahalwari and ryotwari systems. Consequently, the
tenants were burdened with high rents, unproductive cultivation and other forms of exploitation.
108 MGNCRE | Indian Rural Society and Rural Administration
By 1972, laws had been passed in all the States to abolish intermediaries. All of them had two
principles in common
1) abolition of intermediaries between the state and the cultivator and
2) the payment of compensation to the owners.
But there was no clear mention about just and equitable compensation. Therefore, the Zamindari
Abolition Act was challenged in the High Courts and the Supreme Court. But the Government
accomplished the task of abolishing intermediary tenures bringing nearly 20 million cultivators into
direct contact with the state. Nearly 57.7 lakh hectares were distributed to landless agriculturists
after the successful completion of the Zamindari Abolition Act. The abolition also had a favourable
economic impact on the country. By conferring the ownership of land to the tiller, the Government
provided an incentive to improve cultivation. This paved the way for increase in efficiency and yield.
This was an important step towards the establishment of socialism and the Government revenue
increased. It also ushered in cooperative farming.
The efficacy of the legislation was, however, considerably reduced for the following reasons;
• The act did not benefit sub-tenants and share croppers, as they did not have occupancy
rights on the land they cultivated.
• Intermediaries were abolished, but the rent receiving class continued to exist.
• Many landlords managed to retain considerable land areas under the various provisions of
the laws. Benami holdings became the order of the day in many States.
• The problems of transferring ownership rights from the actual cultivators of the land, the
tenants, the sub-tenants, share croppers, therefore, remained far from resolved.
Result, land reforms remain incomplete and unfinished.
After independence, the payment of rent by the tenants of all classes and the rate of rent were
regulated by legislation. The first Five-Year Plan laid down that rent should not exceed one-fifth to
one-fourth of the total produce. The law along these lines has been enacted in all the States. The
maximum rate of rent should not exceed that suggested by the Planning Commission in all parts of
the States. Maximum rents differed from one State to another - Rajasthan, Maharashtra and Gujarat
fixed one-sixth of the produce as maximum rent. In Kerala, it ranges between one-fourth and one-
third and in the Punjab one-third. In Tamil Nadu, the rent varies from one-third to 40 per cent of the
produce. In Andhra Pradesh it is one-fourth for irrigated land. The rent could be paid in cash instead
of kind.
With a view to ensuring security of tenure, various State Governments have passed laws which have
three essential aims
1) Ejectment does not take place except with the provisions of law
2) the land may be taken over by the owners for personal cultivation only
3) in the event of resumption, the tenant is assured of the prescribed minimum areas.
The measures adopted in different States fall in four categories;

109 MGNCRE | Indian Rural Society and Rural Administration
• First, all the tenants cultivating a portion of land have been given full security of tenure
without the land owners having any right to resume land for personal cultivation. This is in
operation in Uttar Pradesh and Delhi.
• Secondly, land owners are permitted to resume a limited area for personal cultivation, but
they should provide a minimum area to the tenants. This is in vogue in Assam, Maharashtra,
Gujarat, Punjab and Rajasthan.
• Thirdly, the landowner can resume only a limited extent of land and the tenant is not be
entitled to any part of it. This is operating in West Bengal, Jammu and Kashmir. In Tamil
Nadu, Karnataka, Kerala, Andhra Pradesh and Orissa, measures in the form of an order for
staying ejectments have been adopted to give temporary protection to the tenants.
• Fourthly, legislative measures have also indicated the circumstances under which only
ejectments are permitted. These grounds are (a) non-payment of rent (b) performance of an
act which is destructive or permanently injurious to land (c) subletting the land (d) using the
land for purpose other than agriculture and (d) reclamation of land for personal cultivation
by the landlords.
The ultimate aim of land reforms in India is to confer the rights of ownership to tenants to the larger
possible extent. Towards this end, the Government has taken three measures
(1) declaring tenants as owners and requiring them to pay compensation to owners in suitable
instalments
(2) acquisition of the right of ownership by the State on payment of compensation and transfer of
ownership to tenants and
(3) the states' acquisition of the landlords' rights brings the tenants into direct relationship with the
States.
One of the controversial measures of land reforms in India is the ceiling on land holding. By 1961-62,
ceiling legislation had been passed in all the States. The levels vary from State to State, and are
different for food and cash crops. In Uttar Pradesh and West Bengal, for example, the ceiling on
existing holding is 40 acres and 25 acres and on future acquisitions 121/1 acres and 25 acres
respectively. In Punjab, it ranges from 27 acres to 100 acres, in Rajasthan 22 acres to 236 acres and
in Madhya Pradesh 25 acres to 75 acres. The unit of application of ceiling also differs from State to
State. In Andhra Pradesh, Assam, Bihar, Punjab, Haryana, Uttar Pradesh, West Bengal, Madhya
Pradesh and Maharashtra, it is on the basis of a 'land holder', whereas in the other States it is one
the basis of a 'family'.
In order to bring about uniformity, a new policy was evolved in 1971. The main features were
• Lowering of ceiling to 28 acres of wet land and 54 acres of unirrigated land
• A change over to family rather than the individual as the unit for determining land holdings
lowered ceiling for a family of five.
• Fewer exemptions from ceilings
• Retrospective application of the law for declaring benami transactions null and void; and
• No scope to move the court on ground of infringement of fundamental rights

110 MGNCRE | Indian Rural Society and Rural Administration
Besides, national guidelines were issued in 1972, which specified the land ceiling limit as;
• The best land 10 acres
• For second class land 18-27 acres; and
• For the rest, 27-54 acres with a slightly higher limit in the hill and desert areas
According to the figures available till the beginning of the Seventh Plan, the area declared surplus is
72 lakh acres; the area taken over by the Government is 56 lakh acres; and the area actually
distributed is only 44 lakh acres. Thus, 28 lakh acres of land declared surplus have not been
distributed so far. Of this, 16 lakh reserved for specific public purposes. The process involved in the
distribution of surplus land was complicated and time consuming thanks to the intervention of the
court.
Several States have passed the Consolidation of Holdings Act. Statistics reveal that 518 lakhs of
hectares had been consolidated in the country at the beginning of the Seventh Five Year Plan, which
constitute about 33% of the cultivatable land. The food and the agricultural organisation (FAO), after
studying the position in Punjab and Uttar Pradesh regarding the operation of the consolidation of
holding act, remarked;" A significant reduction in the cost of cultivation, increased cropping intensity
and a more remunerative cropping pattern were developed in these two States."
Assessed from the point of view of two broad objectives namely, social justice and economic
efficiency, land reforms, one might say, has been partially successful. Since the adoption of land
reforms, the pattern of ownership in the country is changed but one wonders whether it will ensure
social justice in the country. Indian agriculture is in a stage of transition, from a predominantly semi-
feudal oriented agriculture characterised by large-scale leasing and subsistence farming to
commercialised agriculture or marker-oriented farming. Another noteworthy feature is the
emergence of modern farmers who are substantial landholders and cultivate their land through
hired labourers using new techniques.
One of the major negative features of agrarian transition in India is the continued concentration of
land in the hands of the upper strata of the rural society. This has not undergone any change in the
past five decades, despite the reforms. In fact, leasing in by the affluent farmer is common place.
An outstanding development of Indian Agriculture was the rapid growth of landless agricultural
labourers. They constitute about 10 per cent of the agricultural population and make up about 25
per cent of the labour force.
On the question of increasing productivity, it is difficult to assess the exact contribution of land
reforms because productivity has been more related to the technical revolution ushered in the
Indian agricultural sector. There are many factors responsible for the tardy progress but important
among them are the lack of adequate direction and determination, lack of political will, absence of
pressure from below, inadequate policy instrument, legal hurdles, absence of correct-up-dated land
records and the lack of financial support.
In order to achieve success, the Asian Development Bank has recommended a strategy on these
lines; political commitment at the top, administrative preparedness including the improvement of

111 MGNCRE | Indian Rural Society and Rural Administration
the technical design of enactments, the provision of financial resources and the streamlining of the
organisational machinery of implementation, creation of necessary supporting service for the
beneficiaries and finally the organisation of beneficiaries themselves.
Economic Arguments in favour of land reforms-
• Equity and Equality In a region of scarcity of resources, land reforms ensure a just
distribution
• Smaller farms are more manageable and tend to be more productive
• Owner-cultivated land is more productive than land under tenancy
Reasons for Failure of Land Reforms
Lack of Political Will
Lobbying by rich farmers with large land holdings
Benami properties and fraud transactions
Loopholes in administration and poor redressal system
Fallow and uncultivable land
Figure 5.8 Reasons for Failure of Land Reforms
To sum up, land reform programmes implemented since 1948 have not led to any radical
distribution of land or removal of some of the obstacles to raising agricultural productivity.
Nevertheless, it should not be written off as a non- event’. It brought great changes. It did away with
the numerous layers of parasitic intermediaries in almost all the states.
All the measures, however, have left untouched the bottom layer of the agrarian structure consisting
of agricultural labourers, sharecroppers, except in the states of West Bengal and Kerala where left-
wing political parties changed the destiny of the poor peasantry vis-a-vis the jotedars, are poor
customers.
Summary
This Chapter gives an overview of how land tenure system evolved from Vedic times to British era
and also explains different types of land tenure system existing during that time. Attempts have
been made to analyse socio-economic features of agrarian society prior to the colonial rule. We
noted that before the advent of British Rule Indian villages were self-sufficient and concept of
private properly was absent. British rule which introduced the concept of private property in land
and commercialization of agriculture. In the process of evolution of land relations, a non-agriculturist
community emerged which strengthened its grip on rural land and agricultural produce. Attempts
have been made to acquaint you of various problems that emerged in the agrarian structure due to
changes in land relations. In the last section, we have discussed the land reforms which were
introduced to create an egalitarian society and to improve condition of poor peasants. A brief
section is devoted to understand success rate of land reforms in their implementation and
To Do Activity Find out the reasons for either success or failure of land reforms in your local area.

112 MGNCRE | Indian Rural Society and Rural Administration
achievement of objectives which concludes that land reforms had a negative effect on poverty, while
the effect on productivity is mixed; major reason being lack of political will.
Model Questions
1. What were the three kinds of land settlement during British rule in India? Briefly discuss
their features and implications.
2. Discuss agrarian structure prevalent during pre-British period, colonial period and after
India’s independence. Explain how land relations changed during this course of time.
3. What are the major land reforms introduced in India? Discuss its objectives.
4. Give an appraisal of implementation of land reforms in India.
References
1. Banerjee, A.V. (1999) “Prospects and Strategies for Land Reforms”, In B. Pleskovic and J.
Stiglitz (eds), Annual World Bank Conference on Development Economics 1999. Washington,
DC World Bank, pp. 253-284.
2. Banerjee, A.V., P. J. Gertler, and M. Ghatak (2002) “Empowerment and Efficienncy Tenancy
Reform in West Bengal”, Journal of Political Economy. Vol. 110, No. 2, pp. 239-280
3. Bardhan, ,P. and D. Mookherjee (2005) “Political Economy of Land Reforms in West Bengal
1978-98”, Working Paper, University of California, Berkeley and Boston University.
4. Besley, T. and R. Burgess (2000) “Land Reform, Poverty Reduction, and Growth Evidence
from India”, Quarterly Journal of Economics, Vol. 115, No. 2, pp. 389-430.
5. Conning, J. and J. A. Robinson (2005) “Property Rights and the Political Organization of
Agriculture”, Forthcoming, Journal of Development Economics.
6. Desai, A.R. (1948), Social Background of Indian Nationalism, Popular Publication, ' Bombay.
7. Frykenberg, R.E. ed. (1977), Land Tenure and Peasant in South Asia, Manohar, New Delhi.
8. Frykenberg, R.E. ed., (1979), Land Control and Social Structure in Indian History, Manohar,
New Delhi.
9. Grover, B.L. (1985), Indian History, Manohar Publication. Delhi.
10. Romesh, Dutta (1990), The Economic History of India, Vol-1 and Vol-2, Low Prise
Publications, Delhi.
11. Rosenzweig, M. and H. Binswanger (1993) “Wealth, Weather Risk, and the Composition and
Profitability of Agriculture”, Economic Journal, Vol. 103, pp. 56-78.
12. Roy, Satya (1990), Bharat Me Upniv,?shvad, Manohar Publishing House, Delhi.
13. Sharma R.S. (1971), Land Revenue in India Historical Studies, MotomahalBanarsidas, Delhi.
14. Shaban, R. A. (1987) “Testing Between Alternative Models of Sharecropping”, Journal of
Political Economy, Vol. 95, pp. 893-920.
15. Singh, R.P. (I 987), Sociology of Development in India, Discovery Publishing House, Delhi.


Contents
Chapter 1 Introduction to Natural Resource Bases
1.1 Understanding the Concept of Natural Resources and its Classification
1.2Natural Resources Management
1.3 Management of Natural Resources in India
1.4 Forest Resources
1.5 Energy Resources
Chapter 2 Watershed Management
2.1 Water Resources, Classification and Characteristics, Overutilization and Pollution
2.2 Watershed - Concept, Meaning, Types, Characteristics and Factors
2.3 Watershed Management – Benefits, Objectives, Components
2.4 Watershed Management Indian and Global Perspective
2.5 Various Issues in Watershed Management
Chapter 3 Food Resources Management
3.1 Food Resources –Introduction, Types and Current Scenario
3.2 World Food Problems
3.3 Effects of Modern Agriculture
3.4 Food Security
3.5 Fisheries Management
3.6 Issues and Challenges in Fisheries
Chapter 4 Land Resources Management
4.1 Land as a Resource, Classification, Associated Problems and Methods of Conservation
4.2 Land Resources in India – Usage pattern, Classification and Problems
4.3 Land Capability and its Classification
4.4 Land Use Planning
4.5 Land resources Management and Major Issues
Chapter 5 An Introduction to Livelihood
5.1 Livelihood, Need for Livelihood Promotion and Sustainable Livelihood
5.2 Understanding Livelihoods in Rural India
5.3 Livelihood Interventions in India
5.4 Various Types of Livelihood Interventions
5.5 Designing a Livelihood Intervention
Natural Resources Management – An Introduction
Nature has bestowed us with many gifts. They are commonly called as natural resources. The natural
resources have made this planet liveable and have supported the evolution and sustenance of living
organisms. Natural resources are of utmost importance to all living beings particularly to humans. In
this Chapter, we will be discussing about natural resources such as land, water, energy, minerals,
forests and wildlife. Natural resources can be classified as physical resources or biotic resources and,
in other terms, as renewable or non-renewable resources.
India is a vast country and is blessed with many natural resources. We will discuss some general
features about India. The availability and distribution of these resources will be described in detail so
that you can appreciate the resource wealth of our country. We are fortunate in having all the vital
natural resources such as land, water, minerals and a large variety of living organisms. A brief
discussion of various natural resources would form part of this subject. The consumption of natural
resources is increasing because of many factors such as increasing population, increasing pace of
development including industrialization, urbanization, mining and related activities etc. However, the
amount of natural resources is limited, and they are depleting at a very fast rate. Thus, there is an
urgent need for their conservation.

RD-1 NRM, Watershed Management and Sustainable Livelihoods MGNCRE cxvi
RD-1 NRM, Watershed Management and Sustainable Livelihoods
116 MGNCRE
116 MGNCRE | Natural Resource Management and Sustainable Development
Chapter 1 Introduction to Natural Resource
Bases Introduction This Chapter focuses on natural resources, its nature, different types of natural resources and their
classification with examples. Natural resources are classified into four water resources, solar energy
resources, land resources, rock and mineral resources, and atmospheric resources. This Chapter
deliberates on the four types of resources with a special focus on Forest and Energy resources.
Objectives
• To define the term ‘resource’ and distinguish between different types of resources
• To explain the distribution of various natural resources and highlight their importance
• To understand various elements and strategies of natural resources management
• To give an in depth understanding of Forest Resources and Energy Resources
Structure
This chapter is divided into five main sections. The first section deals with natural resources and its
classification. The second section explains the concept of natural resource management followed by
the third section which is NRM in India. The fourth section explains about Forest resources and finally
the fifth section explains about Energy resources.
1.1 Understanding the Concept of Natural Resources and Its Classification
Nature
The dictionary of Environment and Ecology (5th edition) defines Nature as “all living organisms and
the environments in which they live”, and Resources in ecological point of view as “anything in the
environment which can be used.” The word natural resources evolve from these two definitions. In
order to comprehend the nature of resources, the natural resources in the environment must have to
be unfolded.
1.1 Understanding the Concept of Natural Resources and Its Classification
1.2 Natural Resource Management
1.3 Management of Natural Resources in India
1.4 Forest Resources
1.5 Energy Resources

RD-1 NRM, Watershed Management and Sustainable Livelihoods MGNCRE cxvii
RD-1 NRM, Watershed Management and Sustainable Livelihoods
117 MGNCRE
117 MGNCRE | Natural Resource Management and Sustainable Development
Concept of Resource
A resource is anything which is available from the environment in order to meet our needs and wants.
Some resources can be directly used by us and examples of such resources are freshwater, air, plants
and animals.
Natural resources are the raw materials available in the environment that organisms use for their
existence. They may be either biotic (forests and wildlife) or abiotic (water, soil, air and minerals) in
nature. The food you eat, the cloths you wear, and the roof over your head all of these are necessary
for your survival and they come from natural resources. Natural resources are, of course, the physical
bases for human life. The fertile farmland, for example, is a natural resource that supports food
production. However, a fast flowing river is an example of a potential resource for producing
hydroelectricity. In the case of fertile farmland and fast flowing river, useful products such as food and
electricity can be derived, but the value of the wilderness area or mountain cannot be expressed in
similar material terms. This is not to say that they have no value, but their value is of a kind different
from that of the farmland and the river. The wilderness and mountains too are important natural
resources. They are of enormous aesthetic value.
Natural resources can be defined as the resources obtained from nature which provides goods and
services for human beings. It includes opportunities for recreation, appreciation of scenic beauty, and
the disposal of wastes. Broadly speaking, natural resources can be categorized into three. The first
category of resources consists of raw materials and energy resources used by humans and these are
used as inputs into the economic system. Examples minerals, ores, coal and oil. The second category
is the natural environment which provides the essential life support system for humans. It includes
oxygen to breathe, water to drink as well as material goods such as food. Third category is another
group of resources that comprises parts of the environment which provide services rather than
material goods. They provide the sump into which the waste products of the economic system and
human life are disposed. In addition to purification of air, other natural processes such as nitrogen
fixation, soil formation and its fertility are very important for the survival of human beings.
Classification of Natural Resources
Natural resources are categorized into various types based on the nature of their origin, stages of
development, renewability and availability of resources. Examples of different categories of natural
resources are interwoven. Different categories of natural resources and their examples are given
below.
By Origin
1. Biotic Resources
These are living resources which are capable of reproduction, or that can be replaced and thus
increase. Example forest, agriculture, fish and wildlife.
2. Abiotic Resources (or Physical Resources)
These are non-living resources that do not replace themselves or their replacement happens
at a slow rate so that its replenishment does not occur in human lifetimes. Example petrol,
land and minerals.

RD-1 NRM, Watershed Management and Sustainable Livelihoods MGNCRE cxviii
RD-1 NRM, Watershed Management and Sustainable Livelihoods
118 MGNCRE
118 MGNCRE | Natural Resource Management and Sustainable Development
By Stages of Development
a) Potential Resources Potential resources are those resources that exist in different regions
around the globe and may be used in future. For example, petroleum is formed naturally in
sedimentary rocks. It exists in many parts of the world, it is mined or drilled out and put into
use and remains a potential resource.
b) Actual Resources Actual resources also known as developed resources are those resources of
which the stock and reserves have been surveyed, their quantity and quality determined and
are being used in present times. For example, the development of an actual resource such as
wood processing depends upon the technology available and the cost involved. That part of
the actual resource which can be developed profitably with available technology is called a
reserve.
By Availability
In terms of availability, resources could be classified as inexhaustible and exhaustible resources.
Figure 1.1 Classification of Resources
By Renewability
Based on renewability, natural resources can be categorised as renewable and non-renewable
resources.
1) Renewable Resources

RD-1 NRM, Watershed Management and Sustainable Livelihoods MGNCRE cxix
RD-1 NRM, Watershed Management and Sustainable Livelihoods
119 MGNCRE
119 MGNCRE | Natural Resource Management and Sustainable Development
Renewable resources are otherwise termed as inexhaustible resources. They can replenish
themselves by various means like recycling, reproduction and replacement. Examples of
renewable resources are sunlight, animals and plants, soil, water, etc.
2) Non-renewable Resources
Non-renewable resources are the resources that cannot be replenished once used or
perished. Examples of non-renewable resources are minerals, fossil fuels, etc.
Resources can also be classified as flow resources and stock resources. Those resources which are
permanently available (at least on the human time scale) and in a continuous supply are known as
flow resources. Examples solar energy, water. On the other hand, the stock resources are those whose
quantities are fixed, and they keep decreasing with human use. Examples fossil fuel deposits, mineral
deposits etc. Flow resources are not affected by human use while stock resources can be modified
very easily in the course of their human use.
There is another category of natural resources which is aesthetic or amenity resources. Examples
solitude, the scenic beauty and peaceful surroundings. As population surges and people look forward
to getting away from the crowd, aesthetic resources become more relevant.
Some examples of natural resources are given below.
• Atmosphere which include air, wind
• Animals which comprises of wildlife, game reserves
• Land that comprises of coal, fossil fuels, rock and mineral resources
• Plants of the forest
• Range and pasture
• Soils for agriculture and food
• Water resources that include sea, oceans, lakes, groundwater, rivers and fishery
• Solar power from the sun
Problems Associated with Natural Resources
1. The Unequal Consumption of Natural Resources
One of the major issues faced by the world today in terms of natural resources is that the
technologically advanced or the developed world usually known as ‘the West’ consumes a major
part of the natural resources. India and China of ‘the East’ which comes under the ‘developing
’nations also overuse many resources due to their overpopulation. However, the per capita (per
individual) consumption of resources of the developed countries is up to 50 times greater than in
most developing countries. Moreover, advanced countries produce over 75% of global industrial
waste and greenhouse gases.
2. Planning Land Use
Land is a major resource, needed not only for food production and animal husbandry, but also for
industry and for growing human settlements. These forms of intensive land use are frequently
extended at the cost of ‘wild lands’, our remaining forests, grasslands, wetlands and deserts. This
demands for a pragmatic policy that analyses the land allocation for different uses.
3. The Need for Sustainable Lifestyles
Human standard of living and the health of the ecosystem are indicators of sustainable use of
resources in any country or region. Ironically, both are not in concurrence with each other.

RD-1 NRM, Watershed Management and Sustainable Livelihoods MGNCRE cxx
RD-1 NRM, Watershed Management and Sustainable Livelihoods
120 MGNCRE
120 MGNCRE | Natural Resource Management and Sustainable Development
Increasing the level of one, usually leads to degradation of other. Development policies should be
formulated to strike a balance between the two.
Factors Influencing Resource Availability, Distribution and Uses
Not all areas of the world have the same natural resources. Some regions may enjoy fertile soils or
plenty of vegetation while others have abundant precious stones. This uneven distribution has led to
trade. One area can buy a resource scarce to them that is abundant somewhere else. Sometimes, the
location of resources is a matter of conflict, as one group tries to take ownership of a given resource
already under the control of someone else. The distribution of fertile soils is a determinant for
agriculture. Worldwide, the best soils are in the southern part of Russia, in the South American
pampas, and in the American prairies in the US. These regions are home to intensive agricultural
activities. Regions of Southeast Asia, southern China, South America, and Sub Saharan Africa also have
productive soils.
Enormous reserves of oil are located in the Middle East, especially in Saudi Arabia, Iraq, and Iran.
Venezuela, in South America, also holds huge amounts of oil. In the Chaptered States, most oil and
gas are located in Texas and along the Gulf Coast. Russia has the largest reserves of natural gas and is
also the largest producer. Iran and Qatar have plenty of gas, but the Chaptered States is the second
producer of gas (although it has only one fifth of Russia's reserves). Countries rich in precious metals
include Australia and South Africa, which has abundant diamonds. China, Russia, Chaptered States,
Canada, and Peru are the largest gold producers. Fresh water is becoming more and more valuable.
The Amazon Basin, especially Brazil and Colombia, are home to the largest amounts of fresh water,
followed by North America. On the other side of the world, Russia and China both have large reserves
as well. There are plenty of other natural resources and they are distributed irregularly, causing some
nations to be large producers and others to be dependent on imports.
Interrelationships among Different Types of Natural Resources
Natural resources are naturally occurring substances. It is considered as valuable in their natural form.
Generally, they are classified as renewable and non-renewable resources. Renewable natural
resources (RNRs) are generally living resources (i.e. fauna and flora) but also includes soil, water, wind,
tides, and solar radiation. Non-renewable resources can be extracted from nature but are not
replaced, such as minerals and petroleum. RNRs are available in the form of forestry, inland and
marine fisheries, wildlife, and grazing, land and water resources. Major debates encircle the levels and
nature of governance for natural resources. Their major focus is on three institutional arenas namely
the state, the civil society and markets. These debates are focused on the effectiveness and
appropriateness of each arena for delivering economic objectives, from natural resource conservation
to equitable economic development and poverty reduction.
To Do Activity
Take a simple object in daily use and track its components back to each of its spheres. E.g., this
textbook
1. paper from wood – biosphere
2. Water for pulping – hydrosphere
3. Bleach to whiten paper – a mineral from lithosphere

RD-1 NRM, Watershed Management and Sustainable Livelihoods MGNCRE cxxi
RD-1 NRM, Watershed Management and Sustainable Livelihoods
121 MGNCRE
121 MGNCRE | Natural Resource Management and Sustainable Development
1.2 Natural Resources Management
Natural Resources Management is essential not only for the existence of the present generation but
also for the sustenance of the future. It is a scientific approach for the utilization and conservation of
land, water bodies, soil systems, plants and animals to enable people to fulfil the requirement so that
along with the present generation the future generations would also be benefited. Therefore, the
management of natural resources is combination of scientific and technical understanding of the
same.
Ecological, Social and Economic Dimensions of Resource Management
Natural resources occur freely in nature and hence its conservation and management are at the
discretion of the people. People’s values, behaviour and decisions play a major role in the
management of natural resources and so it can be considered as social processes. Human individuals
relate to nature through social relations established with others, which in turn shapes their
perceptions, values, knowledge, power, Opportunity Unities and decisions. The success or failure of
conservation and management of resources depends largely on people's behaviour and decisions
towards nature. Successful management of resources can be judged by the degree to which it
contributes to the wellbeing of people and their environment. In this context, the social, cultural,
economic, and political factors in the conservation and management of natural resources are to be
taken into consideration. Various factors that contribute to this cause include peoples’ values,
attitudes, beliefs, behaviours, both individually and collectively, the ways people value and use natural
resources and the social, economic, and political organization of resource use. Therefore, it is
important to consider people’s perceptions, attitudes, expectations, and behaviour and the social and
economic impacts of conservation and management of natural resources. Considering all these
factors, some of the relevant questions to be considered in this regard include
• What is the nature and extent of the activity in and near the conserved area?
• Do the locals or indigenous people support or oppose the conserved area? Why or why not?
• What social and economic effects might be expected from establishing protected or
conserved area? How are these effects distributed? Are there alternative sites or designs that
might lessen the negative effects or increase the positive effects on resource users?
• How might the nature and extent of activity change with the conservation goal? Is there a
concentration of much activity at the area reserved?
• How would these changes affect resource conditions and outcomes in ecological, social, and
economic terms within and outside the conserved area?
The understanding of all aspects of conservation of natural resources is essential in minimizing the
negative effects of conservation. On the other hand, the provision of right information on
conservation maximizes their positive effects on resources conservation. Failure to consider them can
lead to the failure of resources conservation to achieve their ecological, social, and economic goals.
In order to achieve the goals of conservation, there should be open dialogue and negotiation among
different stakeholders within global, regional, national and local contexts. This will lead to more
equitable sharing of the costs and benefits of conservation. Policy issues at the national and global
level, such as international trade agreements, global conventions and treaties, shape decisions
affecting the use of natural resources and ecosystems, and therefore affect social stability and human
security. There is a need for environmental laws, regulations, policies and practices that contribute to

RD-1 NRM, Watershed Management and Sustainable Livelihoods MGNCRE cxxii
RD-1 NRM, Watershed Management and Sustainable Livelihoods
122 MGNCRE
122 MGNCRE | Natural Resource Management and Sustainable Development
more equitable sharing of the cost and benefits of conservation, and more even distribution of
entitlements of natural resources. Capacity building at the local and national level is essential to
support democratic participation of local people within policy development, in order to reach more
equitable power sharing between poor and rich countries.
The concept of social equity in conservation is important as it aims at fair distribution of the benefits
and costs of conservation among different social groups and individuals. It acknowledges that social
groups and individuals have differential needs, interests, rights and responsibilities over resources,
and that the impacts of conservation are experienced differently by these groups. Unless special
provisions are made to balance differences in tenure, power, knowledge and decisions, conservation
and sustainable use initiatives are going to perpetuate and sharpen social and economic
differentiation. By doing so, they would fail to build a solid social base for sustainability and
socioenvironmental security. Broad participation of stakeholders without gender, class, age, ethnicity,
religion, culture or racial discrimination is required within natural resources management, in order to
ensure their integrity and human development. Social equity is not only the keystone of long term
social stability and security, which are essential aspects of human welfare and sustainable
development, but it is also a fundamental condition for sustainable use of natural resources.
According to The International Union of Conservation of nature (IUCN), effective programs that
promote sustainable and equitable conservation and natural resources management must fully
embrace socioeconomic and cultural equity concerns in its policies, programs and projects at the local,
national, regional and global level. IUCN's mission has identified six major areas where issues of social
equity in resources conservation need to be explicitly addressed. These are
• Social Diversity and Equity
• Gender and Equity
• Tenure and Participatory Management
• Indigenous and Traditional Peoples
• Security and Equity
• Poverty
To achieve conservation of natural resources, it is important that fair access and control to natural
resources must be available to local people, without discrimination based on gender, class, ethnicity,
age or other social variables. Empowerment of comm Charteris and local users and recognition of their
rights and responsibilities help in achieving this goal. Means to sustainable livelihoods and human
development must be ensured. Fair and safe tenure systems for land and natural resources increases
social stability and local resources users' incentives and abilities to participate in resource
management decisions in effective ways. Very often indigenous and traditional peoples have been
unfairly affected by conservation policies and practices. It is because conservation policies and
practices often fail to understand the rights and roles of indigenous peoples in the management, use
and conservation of biodiversity. In line with numerous international agreements (e.g., Agenda 21;
ILO convention no. 169; Article 8(j) of the CBD; and the draft UN Declaration on the Rights of
Indigenous Peoples) several IUCN WCC resolutions emphasize indigenous people’s rights to lands and
territories, and natural resources on which they have traditionally subsisted. These resolutions stress
the need to enhance participation of indigenous peoples in all conservation initiatives and policy
developments that affect them. Moreover, it is recognised that indigenous peoples possess a unique
body of knowledge related to the conservation and use of natural resources. These include

RD-1 NRM, Watershed Management and Sustainable Livelihoods MGNCRE cxxiii
RD-1 NRM, Watershed Management and Sustainable Livelihoods
123 MGNCRE
123 MGNCRE | Natural Resource Management and Sustainable Development
• Respect indigenous people's knowledge and innovations, and their social, cultural, religious
and spiritual values and practices.
• Recognize the social, economic and cultural rights of indigenous peoples such as their right to
lands and territories and natural resources, respecting their social and cultural identity, their
customs, traditions and institutions.
• Ensure full and just participation of indigenous peoples in all conservation activities supported
and implemented by IUCN.
• Support indigenous peoples' right to make their own decisions affecting their lands, territories
and resources, by assuring their rights to manage natural resources, such as wildlife, on which
their livelihoods and ways of life depend, provided they make sustainable use of natural
resources.
• Strengthen the rights and full and equal participation of traditional institutions and strengthen
the capacity of indigenous people to ensure that they benefit from any utilization of their
knowledge.
Social equity is regarded as the cornerstone of long term environmental and human security. It is also
a prerequisite of sustainable conservation of nature and management of natural resources. The
surging demand for natural resources due to inequitable consumption and distribution of resources
and global economic development patterns leads to unsustainable environmental practices. These
global mechanisms exacerbate the demographic pressure on natural resources exerted by
communities and individuals whose livelihoods rely more directly on natural resources. The same
patterns of behaviour that increase high standards of wasteful consumption in the developed
countries leads to an increase in resource scarcity, conflicts and poverty in developing countries.
Often, we see the poorest people and commChapelriesat the receiving end who are affected by this
disproportionate appropriation and consumption of resources and by environmental degradation.
Globalization has great impact on local and national economies and societies, and it has affected
people's lives and use of natural resources. Various factors that directly affect natural resources and
indirectly on the long term security of humans on global scale include expansion of markets,
communication, western consumption patterns, homogenization and modernization of culture and
lifestyles, increasing pressure on natural resources, and sharpened differences between rich and the
poor. Interdependencies among stakeholders have increased which makes environmental and social
issues a common urgent agenda for all people around the world since it leaves no conserved place on
the earth. In order to ensure conservation of resources it is essential to raise awareness, increase
networking and to build institutional capacity to hasten this process. The aim is to secure healthy
ecosystems in terms of natural resources conservation and to build strong democratic and fair civil
society throughout the world.
Various factors including political and social causes adversely affect the conservation of resources.
Political and social disruptions like war, crime and corruption divert resources from areas of greatest
human need, damage the capacity of societies to plan for resources conservation and management,
and generally threaten human wellbeing and the environment. Depletion of natural resources
including fresh water increases the likelihood of “resource wars”. This aspect of resources
conservation is referred to as environmental security. This leads to a clear need for global
environmental agreements to manage resources such as aquifers and rivers which span political
boundaries, and to protect global systems including oceans and the atmosphere.

RD-1 NRM, Watershed Management and Sustainable Livelihoods MGNCRE cxxiv
RD-1 NRM, Watershed Management and Sustainable Livelihoods
124 MGNCRE
124 MGNCRE | Natural Resource Management and Sustainable Development
One of the important aspects in environmental resource management is sustainability. It involves
managing economic, social, and ecological systems both within and outside an organizational entity
so that it can sustain itself and the system it exists in. In context, sustainability implies that rather than
competing for endless growth on a finite planet, development improves quality of life without
necessarily consuming more resources. Management of environmental resources in a sustainable
manner requires organizational changes that instils sustainability values. These values should be
presented outwardly from all levels and reinforces them to surrounding stakeholders. This results in
a symbiotic relationship between the sustaining organization, community, and environment. Many
drivers compel environmental resource management to take sustainability issues into account.
Economical
The economy functions within and is dependent upon goods and services provided by natural
ecosystems. Both classical economics and neoclassical economic theories recognizes the role of
environment. Since the policy makers emphasise solely on economic growth, economic policies from
1950 to 1980 had neglected environment issues and was given a low priority. With the prevalence of
environmental problems, many economists embraced the notion that, "If environmental sustainability
must coexist for economic sustainability, then the overall system must permit identification of an
equilibrium between the environment and the economy." As such, economic policy makers began to
incorporate the functions of the natural environment—or natural capital — particularly as a sink for
wastes and for the provision of raw materials and amenities.
Economists now continue to debate as to how to account for natural capital, specifically whether
knowledge and technology can act as an alternative for technology or whether the environment is a
closed system that cannot be replenished and is finite. Today's economic paradigms do not protect
the natural environment, yet they intensify human dependency on biodiversity and ecosystem
services.
Ecological
Many environmental resource managers lament that there exists a significant uncertainty about the
behaviour and response of ecological systems and there is an urgency for near term action.
Ecologically this leads to severe environmental degradation and climate change which might
eventually threaten the stability of the very ecological systems which acts as the foundation of
humanity.
Social
Environmental degradation is highly aggravated by a variety of social factors which includes an
increasing gap between rich and poor. The global North South divide further deepens the situation by
denying masses access to basic human needs, rights, and education. Our earth’s unstable condition is
due to by many anthropogenic sources. In order to demonstrate effective outcomes and to arrest this
global scenario of environmental degradation, the modern organisation has the potential to apply
environmental resource management with sustainability principles that can act as a powerful
contributing factor.
Approaches to Natural Resource Management
Natural resource management is generally considered as the management of natural resources which
includes land, water, soil, plants and animals. It focuses on how management affects the quality of life
for both the present and future generations. Natural resource management looks at ways of

RD-1 NRM, Watershed Management and Sustainable Livelihoods MGNCRE cxxv
RD-1 NRM, Watershed Management and Sustainable Livelihoods
125 MGNCRE
125 MGNCRE | Natural Resource Management and Sustainable Development
interaction between people and natural landscapes and tries to manage it to the optimum levels. It
brings together land use planning, water management, biodiversity conservation, and the future
sustainability of industries like agriculture, mining, tourism, fisheries and forestry. Natural resource
management recognises that people and their livelihoods depend on the health and productivity of
our landscapes. It believes that in order to maintain the health and productivity of our landscapes
people play a critical role as stewards of our land.
Natural resource management specifically focuses on scientific and technical understanding of
resources and ecology and the life supporting capacity of those resources. Environmental
management functions like natural resource management. There are various approaches for natural
resources management and some of them are discussed below.
Community Based Natural Resource Management
The Community Based Natural Resource Management (CBNRM) approach integrates the objectives of
conservation with the generation of economic benefits for rural. The three key assumptions behind
this approach are (a) local communities are better placed to conserve natural resources (b) people will
conserve a resource only if the benefits accrued exceed the costs of conservation and (c) people will
conserve a resource if it is directly linked to their quality of life. If conservation enhances the quality
of life of locals, their commitment and efforts to ensure the future wellbeing of the resources are also
enhanced. Regional and community based natural resource management is also based on the principle
of subsidiarity.
Adaptive Management
Adaptive management is the primary methodological approach adopted by catchment management
authorities (CMAs) for regional natural resource management in Australia. This approach recognises
that adaption occurs through a process of ‘plan do review act’. It also emphasises on seven key
components for quality natural resource management practice. These are Determination of scale,
Collection and use of knowledge, Information management, Monitoring and evaluation, Risk
management, Community engagement, and Opportunities for collaboration.
Integrated Natural Resource Management
Integrated natural resource management (INRM) is a process of managing natural resources in a
systematic way. It includes varied aspects of natural resource use (biophysical, socio-political, and
economic) that meet production goals of producers and other direct users (e.g., food security,
profitability, risk aversion) as well as goals of the wider community (e.g., poverty alleviation, welfare
of future generations, environmental conservation). It focuses on sustainability and tries to
incorporate all possible stakeholders from the planning level itself, thus reducing possible future
conflicts. The conceptual basis of INRM has evolved in recent years through the convergence of
research in diverse areas such as sustainable land use, participatory planning, integrated watershed
management, and adaptive management. INRM is being used extensively and has been successful in
regional and community based natural management.
To Do Activity
Utilisation of resources
The use of a resource begins with its collection, its processing into a useable product, and transport
through a delivery system, to the consumer who uses it. It also involves disposal of the waste products
produced at each step. Each step in resource use can affect the environment for better or worse. The

RD-1 NRM, Watershed Management and Sustainable Livelihoods MGNCRE cxxvi
RD-1 NRM, Watershed Management and Sustainable Livelihoods
126 MGNCRE
126 MGNCRE | Natural Resource Management and Sustainable Development
control of these steps is known as environmental management. Think of a resource you use and track
it through these steps.
E.g. The cotton in the clothes you wear. At each step note
• What other resources are needed at this step to move the resource you chose to the next?
• What waste products are generated at that step?
• How are they likely to be disposed of?
• What pollutants are generated in the process?
1.3 Management of Natural Resources in India
The success of any biodiversity programme depends on the integration of indigenous communities
into it. Indigenous communities are considered as the holders and carriers of traditional ecological
knowledge and wisdom regarding the use and management of natural resources. In order to ensure
the sustainability and cost effectiveness of biodiversity programmes, it is essential to incorporate the
active participation of these communities. In other words, it is important that the prior consultation,
participation, and consent procedures (communication with each other) of these communities are
vital for implementing any such programmes. This is mainly because the approach of indigenous
communities towards assessing the value of natural resources (both in terms of conservation and
utilization) is unique as compared to the current conservation economists.
Natural resources such as land, water bodies, biodiversity and genetic resources, biomass resources,
forests, livestock and fisheries―are the basic sources of human survival and prosperity. However, it is
observed that they have been steadily degrading since 5000 B.C and the unprecedented pace of their
erosion is the root cause for the present environmental uncertainties. Most of the problems faced by
our planet namely land degradation, vegetation loss, pollution and the like are due to the
overexploitation of natural resources in the context of an ever growing population. To address such
issues, traditional knowledge can act as the main basis since it is a proven treasure for natural resource
management. One of the major concerns in this endeavour is to rehabilitate the degraded and
vulnerable lands.
Figure 1.2 Ground Level Organizational Chart for Sustainable Development of Natural Resources
Consequences of Exploitation of Natural Resources
The consequences of exploitation of natural resources are varied. Some examples are given below
Burning of fossil fuels creates air pollution. Excess amount of carbon dioxide in the atmosphere leads
RD-1 NRM, Watershed Management and Sustainable Livelihoods MGNCRE cxxvii
RD-1 NRM, Watershed Management and Sustainable Livelihoods
127 MGNCRE
127 MGNCRE | Natural Resource Management and Sustainable Development
to global warming. Some polluting gases like oxides of nitrogen and sulphur lead to acid rain, which is
harmful for living beings. Acid rain adversely affects monuments and buildings. Excess exploitation of
groundwater leads to a drastic fall in water table which results in acute shortage of drinking water in
many areas. Overuse of fertilisers and insecticides leads to soil pollution and soil erosion. Many
pollutants are directly flown into water bodies. This has resulted in water pollution in many rivers,
lakes and even in oceans.
Sustainable Development
Development is vital for making all round economic development. But development often comes at a
price and is often linked to environmental damage. Sustainable development ensures safety of our
environment by following certain practices. This is essential for maintaining our planet in a good
condition so that future generations can also enjoy the bounty of nature.
Three Rs (Reduce, Recycle and Reuse)
Reduce We should reduce the consumption of natural resources wherever possible. For example, we
can reduce the consumption of electricity by switching off lights and other appliances when they are
not in use. While leaving the home, one should always check for fans and lights and switch them off.
This can not only help in saving electricity but also in saving the fuels which are utilised in electricity
production. We should immediately repair a leaking tap so that precious water can be saved.
Recycle There are many items which can be recycled again and again. Recycling is another way of
reducing the demand for natural resources. For example, by recycling paper, we reduce the demand
for wood and thus help in saving the forest.
Reuse Many items can be reused many times. For example, old newspapers can be used for packing
many items.
National Policy on Conservation of Resources
There is a growing consciousness of environment conservation today and for a developing country like
India efficient use of resources is of utmost importance. Our R & D (Research and Development) efforts
must be enhanced to explore new resources, devise technologies to minimize waste and conserve
non-renewable resources. Government of India has formulated several policies and programmes for
the conservation of our biotic & abiotic resources.
1. A Ministry of Forests and Environment was created at the Union level in 1980 to give high
priority to issues relating to forest and environment in the country. Currently, all state
governments have created independent Ministry of Forest and Environment.
2. National Forest Policy of 1950 was revised in 1988 aiming at protection, conservation and
development of forests in the country. Under this policy Social Forestry Scheme was launched
to increase green coverage, produce and supply of fuel wood etc.
3. National Land Use and Conservation Boards were established in 1983and restructured in 1985
for land resource conservation and preparation of perspective plan for optimum utilization of
land resources.
4. National Water Policy was adopted in 1987 which accord the highest priority to drinking
water, followed by irrigational hydel power generation, navigational, industrial and other uses
of water.

RD-1 NRM, Watershed Management and Sustainable Livelihoods MGNCRE cxxviii
RD-1 NRM, Watershed Management and Sustainable Livelihoods
128 MGNCRE
128 MGNCRE | Natural Resource Management and Sustainable Development
5. A National Mineral Policy framed in 1990 has allowed both domestic and foreign enterprises
to invest in mineral extraction and export. It also allowed the authorities to permit investment
in mineral extraction directly under the Union Ministry of Mines.
6. In the new agriculture policy of govt of India, encouragement is given to the use of eco-friendly
and sustainable agricultural technology, i.e. biotechnology.
The Need Integrated Natural Resource Management Policy
There is an imminent danger awaiting our planet in terms of natural resources. To overcome this
threat, the best way forward is to consider natural resources as one integral piece of asset on our
earth. All our natural resources including land, water, air, forest and minerals should be governed by
uniform use policy. In fact, government should focus on a new set of policies with the primary goal of
natural resource management with conservation and resource enhancement and preservation and
pollution abatement. An integrated natural resource management policy can be a directive principle
underlying the policy for states to administer with various departments and the Centre to monitor and
evaluate the programmes. Umbrella legislation like the well drafted EPA (Environmental Protection
Act) 1986, can go a long way in making a thematic conservation strategy for resource utilization and
regeneration possible. Any policy should keep people as its prime focus.
Any programmes aimed at management of resources and conservation of world’s natural resources
can occur with the effective participation of people. In order to achieve this goal, people should be
given incentives which encourages them to reforms their behaviour and rethinks their decisions
towards the environment. This will help in preventing the largescale destruction of the nations and
the world’s natural resources. The failure to view natural resources and the environment as one whole
entity can have far reaching adverse consequences. Ecology entails an interrelated existence of living
beings and natural resources with environmental justice as the touching stone of resource
conservation. Considering that resource conservation is a necessary condition for ensuring
environmental justice, reorienting the legal regime towards this goal becomes significant in terms of
policy and effects.
The interlinkage between water (jal), soil (jameen) and forest (jungle) requires a long term plan for
developing forests, stopping the expansion of deserts, conserving soil fertility and nurturing
groundwater through rainwater harvesting, especially for meeting the challenges of droughts. The
present disintegrated approaches and standards adopted by different statutory bodies comes with
loopholes so that different entities accuse each other of violations and escape their accountability.
Integrated approaches and definitive standards are the need of the hour so that everyone is held
responsible for the violation of policies. Unless conservation and preservation become the main aim
of policymaking, environment in general and resources in particular face a possible threat of
extinction.
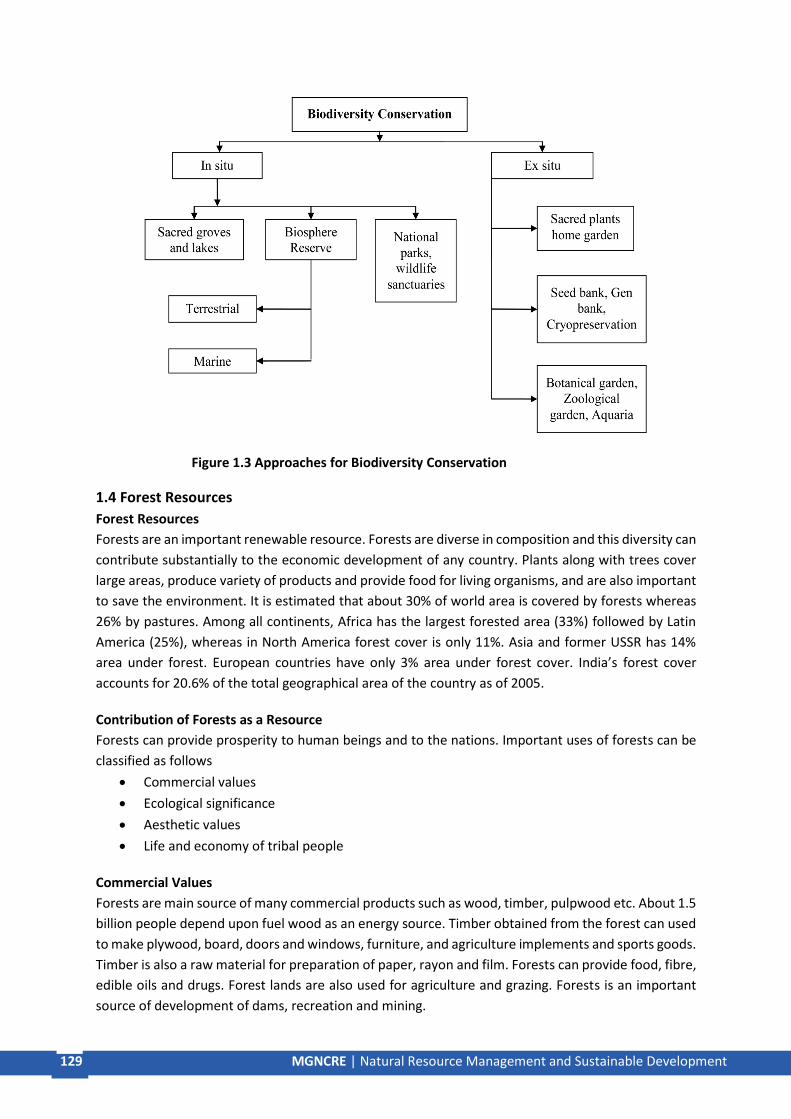
RD-1 NRM, Watershed Management and Sustainable Livelihoods MGNCRE cxxix
RD-1 NRM, Watershed Management and Sustainable Livelihoods
129 MGNCRE
129 MGNCRE | Natural Resource Management and Sustainable Development
Figure 1.3 Approaches for Biodiversity Conservation
1.4 Forest Resources
Forest Resources
Forests are an important renewable resource. Forests are diverse in composition and this diversity can
contribute substantially to the economic development of any country. Plants along with trees cover
large areas, produce variety of products and provide food for living organisms, and are also important
to save the environment. It is estimated that about 30% of world area is covered by forests whereas
26% by pastures. Among all continents, Africa has the largest forested area (33%) followed by Latin
America (25%), whereas in North America forest cover is only 11%. Asia and former USSR has 14%
area under forest. European countries have only 3% area under forest cover. India’s forest cover
accounts for 20.6% of the total geographical area of the country as of 2005.
Contribution of Forests as a Resource
Forests can provide prosperity to human beings and to the nations. Important uses of forests can be
classified as follows
• Commercial values
• Ecological significance
• Aesthetic values
• Life and economy of tribal people
Commercial Values
Forests are main source of many commercial products such as wood, timber, pulpwood etc. About 1.5
billion people depend upon fuel wood as an energy source. Timber obtained from the forest can used
to make plywood, board, doors and windows, furniture, and agriculture implements and sports goods.
Timber is also a raw material for preparation of paper, rayon and film. Forests can provide food, fibre,
edible oils and drugs. Forest lands are also used for agriculture and grazing. Forests is an important
source of development of dams, recreation and mining.

RD-1 NRM, Watershed Management and Sustainable Livelihoods MGNCRE cxxx
RD-1 NRM, Watershed Management and Sustainable Livelihoods
130 MGNCRE
130 MGNCRE | Natural Resource Management and Sustainable Development
Life and Economy of Tribal People
Forests provide food, medicine and other products needed for tribal people and play a vital role in the
life and economy of tribal living in the forest.
Ecological Uses
Forests are habitat to all wild animals, plants and support millions of species. They help in reducing
global warming caused by greenhouse gases and produces oxygen during photosynthesis. Forests can
act as pollution purifiers by absorbing toxic gases. Forests not only help in soil conservation but also
help to regulate the hydrological cycle.
Aesthetic Values
All over the world people appreciate the beauty and tranquillity of the forests because forests have a
great aesthetic value. Forests provide opportunity for recreation and ecosystem research.
Functions of Forest
Watershed Protection
• Reduce the rate of surface runoff of water.
• Prevent flash floods and soil erosion.
• Produces prolonged gradual runoff of water and thus prevent effects of drought.
Atmospheric Regulation
• Absorption of solar heat during evapotranspiration.
• Maintaining carbon dioxide levels for plant growth.
• Maintaining the local climatic conditions.
Erosion Control
Holding soil (by preventing rain from directly washing soil away).
Land Bank
Maintenance of soil nutrients and structure.
Local Use Consumption of forest produce by local people who collect it for subsistence (Consumptive
use)
• Food gathering plants, fishing, hunting from the forest. (In the past when wildlife was plentiful,
people could hunt and kill animals for food. Now that population of most wildlife species have
diminished, continued hunting would lead to extinction.)
• Fodder for cattle.
• Fuel wood and charcoal for cooking, heating.
• Poles building homes especially in rural and wilderness areas.
• Timber – household articles and construction.
• Fibre weaving of baskets, ropes, nets, strings, etc.
• Sericulture – for silk.
• Apiculture bees for honey, forest bees also pollinate crops.
• Medicinal plants traditionally used medicines, investigating them as potential source for new
modern drugs.

RD-1 NRM, Watershed Management and Sustainable Livelihoods MGNCRE cxxxi
RD-1 NRM, Watershed Management and Sustainable Livelihoods
131 MGNCRE
131 MGNCRE | Natural Resource Management and Sustainable Development
Market Use (Productive use)
• Most of the above products used for consumptive purposes are also sold as a source of income
for supporting the livelihoods of forest dwelling people.
• Minor forest produce (non-wool products) Fuel wood, fruit, gum, fibre, etc. which are
collected and sold in local markets as a source of income for forest dwellers.
• Major timber extraction construction, industrial uses, paper pulp, etc. Timber extraction is
done in India by the Forest Department, but illegal logging continues in many forests of India
and the world.
Use and Over Exploitation
India has about 12 percent of its land under forests according to the latest reports. The research and
survey suggest that India should ideally have 33 percent of its land under forests. Thus, there is a
greater need to protect existing forests and to increase our forest cover.
People who live in the forests or near it have firsthand knowledge of the value of forest resources.
They depend on forests for their livelihoods. On the other hand, we all depend on forests for many
things and derive great benefits from the forests which we are rarely aware of. We depend on forests
for one of the most essential need in our life which is water. The availability of water depends on the
existence of forests on the watersheds around river valleys. We use wood from forests to construct
our homes, furniture etc. The papers we use also use wood from forests. Much of the medicines we
use are based on forest produce. Forests provide us with plenty of oxygen and remove the carbon
dioxide we exhale. Forests once extended over large tracts of our country and people have used it for
thousands of years. With the advancement of agriculture, the tribal people began controlling the
forests and it became scanty. Tribal lifestyle was solely dependent on forest resources; they hunted
animals for food and gathered plants. Later when Britishers ruled India, deforestation was a major
concern as large amounts of timber was extracted for building their ships. This led the British to
develop scientific forestry in India. It was during this period that Reserved and Protected Forests were
created and they alienated tribal people and curtailed their access to the resources. This led to a loss
of stake in the conservation of the forests which ultimately led to a gradual degradation and
fragmentation of forests across the length and breadth of the country. Later after independence, once
the Britishers left our country, the local people began exploiting forests which further led to
overutilization and degradation of forests.
Deforestation
History reveals that whenever civilizations have cautiously used forest resources and taken care of
forests, they have prospered and wherever they destroyed forests people were gradually
impoverished. Around the world logging and mining are one of the major causes of loss of forests.
Dams built for hydroelectric power or irrigation have submerged forests and have displaced tribal
people whose lives are closely knit to the forests. This has become a serious cause of concern in India.
One of India’s serious environmental problems is forest degradation due to timber extraction. We
depend on forests for fuel wood. Our rural folk still depends largely on wood to cook their meals and
heat their homes. We have not been able to plant enough trees to support the need for timber and
fuel wood. The National Forest Policy of 1988 now gives an added importance to Joint Forest
Management (JFM). A resolution passed in 1990 provided a formal structure for community
participation through the formation of Village Forest Committees. Based on these experiences, new

RD-1 NRM, Watershed Management and Sustainable Livelihoods MGNCRE cxxxii
RD-1 NRM, Watershed Management and Sustainable Livelihoods
132 MGNCRE
132 MGNCRE | Natural Resource Management and Sustainable Development
JFM guidelines were issued in 2000. This stipulates that at least 25 per cent of the income from the
area must go to the community. From the initiation of the program, until 2002, there were 63,618 JFM
Committees managing over 140,953 sq. km of forest under JFM in 27 States in India.
The States have tried a variety of approaches to JFM. The share for village forest committees ranges
from 25 per cent in Kerala to 100 per cent in Andhra Pradesh, 50 per cent in Gujarat, Maharashtra,
Orissa and Tripura. In many States 25 per cent of the revenue is used for village development. In many
States non timber forest products (NTFPs) are available for people free of cost.
Some States have stopped grazing completely; some have rotational grazing schemes which have
helped in forest regeneration.
Causes of Deforestation
Reports reveal that there is an increase in forest area in some developed nations. However, in
developing countries, especially in tropical region, there is a decline in forest area. Some of the main
causes of deforestation are
a. Shifting cultivation or jhum cultivation
This practise is prevalent in tribal areas where forest lands are cleared to grow subsistence
crops. It is estimated that shifting cultivation is the principle cause of deforestation in tropics
in Africa, Asia and tropical America and is estimated to be 70%, 50%, and 35% respectively.
Shifting cultivation is a practice of slash and burn forest land for cultivation and it clears more
than 5 lakh hectares of land annually. In India, shifting cultivation is prevalent in northeast and
to a limited extent in M.P, Bihar and Andhra Pradesh and is one of the significant contributors
to deforestation.
b. Commercial logging
It is an important deforestation agent. It may not be the primary cause, but it acts as secondary
cause. It is because new logging lots permits shifting cultivation and fuel wood gatherers
access to new logged areas.
c. Need for fuel wood
India’s ever increasing population has led to increased demand for fuel wood, which is also
acting as an important deforestation agent, particularly in dry forest.
d. Expansion for agribusiness
With the addition of cash crops such as oil palm, rubber, fruits and ornamental plants, there
is a demand for land for agribusiness products which results in deforestation.
e. Development projects and growing need for food
The growing demand for electricity, irrigation, construction, mining, etc. has led to destruction
of forests. Increased population requires more food which demands more agricultural crops
which needs more land thus leading to deforestation.
f. Raw materials for industrial use
Forests provides raw materials for industry and it has exerted tremendous pressure on forests.
Increasing demand for plywood for packing has exerted pressure on cutting of some species
of trees such as fir to be used as packing material for apple in J&K and tea in northeaster
states.

RD-1 NRM, Watershed Management and Sustainable Livelihoods MGNCRE cxxxiii
RD-1 NRM, Watershed Management and Sustainable Livelihoods
133 MGNCRE
133 MGNCRE | Natural Resource Management and Sustainable Development
Major Effects of Deforestation
Deforestation adversely and directly affects and damages the environment and living beings. Major
causes of deforestation are
• Soil erosion and loss of soil fertility
• Decrease of rainfall due to its effect on hydrological cycle
• Expansion of deserts
• Climate change and depletion of water table
• Loss of biodiversity, flora and fauna
• Environmental changes and disturbances in forest ecosystems
Timber Extraction, Mining, Dams and their Effects on Forest and Tribal People
Timber extraction, mining and dams are inevitable for the survival of a developing country. If timber
is overharvested the forests lose its ecological functions. Forests are areas where there are rich
mineral resources. Forests also cover the steep embankments of river valleys, which are ideally suited
to develop hydel and irrigation projects. Thus, there is a constant conflict of interests between the
conservation interests of environmental scientists and the Mining and Irrigation Departments. What
needs to be understood is that longterm ecological gains cannot be sacrificed for short term economic
gains that lead to deforestation. The execution of various development projects in forests can also
lead to the displacement of thousands of tribal people.
Timber Extraction
There has been unlimited exploitation of timber for commercial use. Due to increased industrial
demand, timber extraction has significant effect on forests and tribal people.
Logging
Poor logging results in degraded forests and may lead to soil erosion especially on slopes. As the
permits for logging increases, it leads to new roads to these logging areas which allow shifting
cultivators and fuel wood gatherers to gain access to the logging area. It may result in
• Loss of long-term forest productivity
• Elimination of a variety of species of plants and animals
• Exploitation of tribal people
Mining
Mining is one of the major causes of deforestation in India. It adversely affects both the forests and
the tribal people. Major effects of mining on forests and tribal people are
• Mining from shallow deposits is done by surface mining while that from deep deposits is done
by subsurface mining. It leads to degradation of lands and loss of topsoil. It is estimated that
about eighty thousand hectares of land is under stress of mining activities in India.
• Mining leads to drying up of perennial sources of water like springs and streams in
mountainous areas.
• Mining and other associated activities remove vegetation along with underlying soil mantle,
which results in destruction of topography and landscape in the area.
Large scale deforestation has been reported in Mussorie and Dehradun valley due to indiscriminate
mining. It is estimated that the forested area has declined at an average rate of 33% and the resultant
increase in non forest area has resulted in relatively unstable zones leading to landslides.
RD-1 NRM, Watershed Management and Sustainable Livelihoods MGNCRE cxxxiv
RD-1 NRM, Watershed Management and Sustainable Livelihoods
134 MGNCRE
134 MGNCRE | Natural Resource Management and Sustainable Development
Indiscriminate mining in forests of Goa since 1961 has destroyed more than 50000 hectares of forest
land. Coal mining in Jharia, Raniganj and Singrauli areas has caused extensive deforestation in
Jharkhand.
Mining of magnetite and soapstone have destroyed 14 hectares of forest in hilly slopes of Khirakot,
Kosi valley and Almora. Mining of radioactive minerals in Kerala, Tamilnadu and Karnataka are posing
similar threats of deforestation. The rich forests of Western Ghats are also facing the same threat due
to mining projects for excavation of copper, chromite, bauxite and magnetite.
Effects of Dams on Forests and Tribal People
Pandit Jawaharlal Nehru referred dam and valley projects as “Temples of modern India”. Though these
big dams and river valley projects have multipurpose uses they are also the causes for the destruction
of forests. They are responsible for degradation of catchment areas, loss of flora and fauna, increase
of water borne diseases, disturbance in forest ecosystems, rehabilitation and resettlement of tribal
peoples. India has more than 1550 large dams, the maximum being in the state of Maharashtra (more
than 600), followed by Gujarat (more than 250) and Madhya Pradesh (130). The highest one is Tehri
dam, on river Bhagirathi in Uttaranchal and the largest in terms of capacity is Bhakra dam on river
Satluj in Himachal Pradesh. Big dams have been in sharp focus of various environmental groups all
over the world, which is mainly because of several ecological problems including deforestation and
socioeconomic problems related to tribal or native people associated with them. The Silent valley
hydroelectric project was one of the first such projects situated in the tropical rain forest area of
Western Ghats which attracted much concern of the people.
The crusade against the ecological damage and deforestation caused due to Tehri dam was led by Shri.
Sunder Lal Bahaguna, the leader of Chipko Movement. The cause of Sardar Sarovar Dam related issues
have been taken up by the environmental activitist Medha Patkar, joined by Arundhati Roy and Baba
Amte. For building big dams, large scale destruction of forests takes place which breaks the natural
ecological balance of the region. Floods, droughts and landslides become more prevalent in such
areas. Forests are the repositories of invaluable gifts of nature in the form of biodiversity and by
destroying them (particularly, the tropical rain forests), we are going to lose these species even before
knowing them. These species could be having marvellous economic or medicinal value and
deforestation results in loss of this storehouse of species which have evolved over millions of years in
a single stroke.
Case Study
Joint Forest Management
The need to include local communities in Forest Management has become a growing concern. Local
people will only support greening an area if they can see some economic benefit from conservation.
An informal arrangement between local communities and the Forest Department began in 1972, in
Midnapore District of West Bengal. JFM has now evolved into a formal agreement which identifies
and respects the local community’s rights and benefits that they need from forest resources. Under
JFM schemes, Forest Protection Committees from local community members are formed. They
participate in restoring green cover and protect the area from being over exploited.

RD-1 NRM, Watershed Management and Sustainable Livelihoods MGNCRE cxxxv
RD-1 NRM, Watershed Management and Sustainable Livelihoods
135 MGNCRE
135 MGNCRE | Natural Resource Management and Sustainable Development
Forest Products
A forest product is any material obtained from forests for direct consumption or commercial use, such
as lumber, paper, or forage for livestock. Wood, the dominant product of forests, is used for many
purposes, such as wood fuel (e.g. in form of firewood or charcoal) or the finished structural materials
used for the construction of buildings, or as a raw material, in the form of wood pulp, that is used in
the production of paper. All other non-wood products derived from forest resources, comprising a
broad variety of other forest products, are collectively described as non timber forest products (NTFP).
Non timber forest products are viewed to have fewer negative effects on forest ecosystem when
providing income sources for local community.
Non-wood products obtained from forests include food – such as berries, mushrooms, edible plants,
game and bush meat – fodder, and medicinal plants. These products perform a vital role in meeting
the subsistence needs of a large part of the world’s population living in or near forests and providing
them with income generating opportunities. Non wood forest products are collected for local
household use or trade, though some find export markets. Overall, about half of the world’s forests
are designated for production of forest products (as either primary or secondary function). At the
global level, 34% of total forest area has production of forest products as its main purpose.
Developing and Developed World Strategies for Forestry
In Africa, there appears to be a limited progress towards sustainable forest management during the
last 15 years. There are some indications that the net loss of forest area has slowed down, and that
the area of forests designated for conservation of biological diversity increased slightly. However,
there is a continued rapid loss of forest area in this region which is the highest among all the regions
which is a cause of great concern. In Asia, forest area was almost the same in 2005 as in 1990, mainly
due to large scale efforts to replant forests (afforestation), particularly in China. Though forest health
deteriorated, the area affected by forest fires, pests, and diseases is still a relatively small proportion
of the total forest area. The rapid decrease in area of primary forests is a cause for concern, while the
increase in area designated for conservation of biological diversity and for protective functions is
commendable. In Europe, the status of forest resources has essentially been stable, with the severe
storms of 1999 being the main reason for the negative trend in the health and vitality of forests. The
focus of forest management in Europe has moved from productive functions towards conservation of
biological diversity, protection, and multiple uses.
In North and Central America, progress towards sustainable forest management was generally
positive. However, the area adversely affected by insects, diseases, and other disturbances has
increased. There were considerable variations among the sub-regions. In Oceania, due to non-
availability of information and insufficiency of data, it is difficult to assess progress towards sustainable
forest management for that region. In South America, progress towards sustainable forest
management was mixed. The net loss of forest area and the rate of loss of primary forests are
increasing and it is a cause for concern. However, an increasing area of forest has been designated for
conservation of biological diversity and for social services. This area has shown a decrease in removals
of fuel wood which may reflect a reduced demand for this product. On the other hand, there was an
increase in removals of industrial round wood. The area of productive forest plantations increased
and may meet a larger proportion of the demand for wood in the future.

RD-1 NRM, Watershed Management and Sustainable Livelihoods MGNCRE cxxxvi
RD-1 NRM, Watershed Management and Sustainable Livelihoods
136 MGNCRE
136 MGNCRE | Natural Resource Management and Sustainable Development
The 2005 Global Forest Resource Assessment coordinated by the Food and Agriculture Organization
(FAO) of the Chaptered Nations is the most comprehensive assessment of forests to date, in terms of
content and the number of contributors. Information was collected from 229 countries and territories
for three points in time 1990, 2000 and 2005. A series of variables, related to the extent, condition,
uses, and values of forests and other wooded land, were analysed. It tells us that forests cover 30% of
the land area of planet Earth and range from boreal and temperate forests to arid woodlands and
tropical moist forests; from undisturbed primary forests to forests managed and used for a variety of
purposes. The assessment also tells us that deforestation continues at an alarmingly high rate, but
that the net loss of forest area is slowing down thanks to forest planting, landscape restoration, and
natural expansion of forests on abandoned land. Forests are increasingly being conserved and
managed for multiple uses and values and play a crucial role in climate change mitigation as well as in
the conservation of biodiversity and of soil and water resources. If managed sustainably, forests also
contribute significantly to local and national economies and to the wellbeing of current and future
generations. Overall, progress towards sustainable forest management has been mixed. Using the
thematic elements of sustainable management as an assessment framework has helped broaden the
perspective and the result is a much richer review of key trends in forest resources, their functions
and benefits.
1.5 Energy Resources
Energy Resources
Energy is defined by physicists as the capacity to do work. Energy is found on our planet in a variety
of forms, some of which are immediately useful to do work, while others require a process of
transformation.
The sun is the primary energy source in our lives. We use it directly for its warmth and through various
natural processes that provide us with food, water, fuel and shelter. The sun’s rays power the growth
of plants, which form our food material, give off oxygen which we breathe in and take up carbon
dioxide that we breathe out. Energy from the sun evaporates water from oceans, rivers and lakes, to
form clouds that turn into rain. Today’s fossil fuels were once the forests that grew in prehistoric times
due to the energy of the sun.
Chemical energy contained in chemical compounds is released when they are broken down by animals
in the presence of oxygen. In India, manual labour is still extensively used to get work done in
agricultural systems, and domestic animals used to pull carts and ploughs. Electrical energy is used in
several ways, powers transport, artificial lighting, agriculture and industry.
Electrical energy comes from hydel power based on the water cycle that is powered by the sun’s
energy that supports evaporation, or from thermal power stations powered by fossil fuels. Nuclear
energy is held in the nucleus of an atom and is now harnessed to develop electrical energy. We use
energy for household use, agriculture, production of industrial goods and for running transport.
Modern agriculture uses chemical fertilizers, which require large amounts of energy during their
manufacture. Industry uses energy to power manufacturing Chapters and the urban complexes that
To Do Activity
What are the various forest products that we use in our daily life? List out.
Examine the trees in your locality and explain how they are useful to you and in what ways.

RD-1 NRM, Watershed Management and Sustainable Livelihoods MGNCRE cxxxvii
RD-1 NRM, Watershed Management and Sustainable Livelihoods
137 MGNCRE
137 MGNCRE | Natural Resource Management and Sustainable Development
support it. Energy demanding roads and railway lines are built to transport products from place to
place and to reach raw materials in mines and forests.
No energy related technology is completely ‘risk free’ and unlimited demands on energy increase this
risk factor many folds. All energy use creates heat and contributes to atmospheric temperature. Many
forms of energy release carbon dioxide and lead to global warming. Nuclear energy plants have caused
enormous losses to the environment due to the leakage of nuclear material. The inability to effectively
manage and safely dispose of nuclear waste is a serious global concern.
At present almost 2 billion people worldwide have no access to electricity at all. While more people
will require electrical energy, those who do have access to it continue to increase their individual
requirements. In addition, a large proportion of energy from electricity is wasted during transmission
as well as at the user level. It is broadly accepted that long term trends in energy use should be towards
a cleaner global energy system that is less carbon intensive and less reliant on finite non-renewable
energy sources. It is estimated that the currently used methods of using renewable energy and non-
renewable fossil fuel sources together will be insufficient to meet foreseeable global demands for
power generation beyond the next 50 to 100 years.
Thus, when we use energy wastefully, we are contributing to a major environmental disaster for our
earth. We all need to become responsible energy users. An electrical light that is burning unnecessarily
contributes to environmental degradation.
Growing Energy Needs
Energy has always been closely linked to man’s economic growth and development. Present strategies
for development that have focused on rapid economic growth have used energy utilization as an index
of economic development. This index, however, does not consider the long term ill effects on society
of excessive energy utilisation. In 1998, the World Resources Institute found that the average
American uses 24 times the energy used by an Indian.
Between 1950 and 1990, the world’s energy needs increased fourfold. The world’s demand for
electricity has doubled over the last 22 years! The world’s total primary energy consumption in 2000
was 9096 million tons of oil. A global average per capita consumption works out to be 1.5 tons of oil.
Electricity is at present the fastest growing form of end use energy worldwide. By 2005 the Asia Pacific
region was expected to surpass North America in energy consumption and by 2020 is expected to
consume 40% more energy than North America.
For almost 200 years, coal was the primary energy source fuelling the industrial revolution in the 19th
century. At the close of the 20th century, oil accounted for 39% of the world’s commercial energy
consumption, followed by coal (24%) and natural gas (24%), while nuclear (7%) and hydro/renewables
(6%) accounted for the rest.
Among the commercial energy sources used in India, coal is a predominant source accounting for 55%
of energy consumption estimated in 2001, followed by oil (31%), natural gas (8%), hydro (5%) and
nuclear (1%).
In India, biomass (mainly wood and dung) accounts for almost 40% of primary energy supply. While
coal continues to remain the dominant fuel for electricity generation, nuclear power has been

RD-1 NRM, Watershed Management and Sustainable Livelihoods MGNCRE cxxxviii
RD-1 NRM, Watershed Management and Sustainable Livelihoods
138 MGNCRE
138 MGNCRE | Natural Resource Management and Sustainable Development
increasingly used since the 1970s and 1980s and the use of natural gas has increased rapidly in the
80s and 90s.
Renewable and Non-Renewable Energy Sources
Energy is generally classified into three renewable energy, non-renewable energy and nuclear energy.
Though nuclear energy uses small quantities of raw material (uranium) to produce energy, all three
types of energy are considered as limitless. On the other hand, this classification is inaccurate because
several of the renewable sources of energy can be depleted more quickly than they can be renewed
if unsustainable use of energy is continued.
Non-renewable Energy
Non-renewable energy resources produce energy by ignition of raw materials. The fuel is placed in a
well contained area and set on fire. The heat generated turns water to steam, which moves through
pipes, to turn the blades of a turbine. This converts magnetism into electricity, which we use in various
appliances.
Non-renewable Energy Sources
Sources of non-renewable energy consist of the mineral based hydrocarbon fuels, coal, oil and natural
gas, that were formed from ancient prehistoric forests. These are called ‘fossil fuels’ because they are
formed after plant life is fossilized. At the present rate of extraction, there is no need to worry, we
have enough coal for a long time to come. Oil and gas resources however are likely to be used up
within the next 50 years. When these fuels are burnt, they produce waste products suchas carbon
dioxide, oxides of sulphur, nitrogen, and carbon monoxide. These gases are released into the air and
are a major cause of air pollution. This had led to health issues including lung problems among large
number of people around the globe. They were also a threat to monuments like Taj Mahal and
endangered many forests and lakes due to acid rain. Many of these gases also act as greenhouse gases
letting sunlight in and trapping the heat inside. This ultimately leads to global warming, a raise in global
temperature, increased drought in some areas, floods in other regions, the melting of icecaps, and a
rise in sea levels, which is slowly submerging coastal belts all over the world. Warming the seas also
leads to the death of sensitive organisms such as coral.
Non-renewable energy resources can further be divided into two categories, viz. Recyclable and
Nonrecyclable resources
Recyclable Resources
Recyclable resources are non-renewable resources which can be recycled after use. These are mainly
the nonenergy mineral resources which occur in the earth’s crust (e.g. ores of aluminium, copper,
mercury etc.), deposits of fertilizer nutrients (e.g. phosphate rock and potassium) and minerals used
in their natural state (asbestos, clay, mica etc.)
Nonrecyclable Resources
These are non-renewable resources, which cannot be recycled in any way. Examples of these are fossil
fuels and nuclear energy sources (e.g. uranium) which provide 90 per cent of our energy requirements.

RD-1 NRM, Watershed Management and Sustainable Livelihoods MGNCRE cxxxix
RD-1 NRM, Watershed Management and Sustainable Livelihoods
139 MGNCRE
139 MGNCRE | Natural Resource Management and Sustainable Development
Figure 1.4 Sources of Energy
Energy Conservation
Conventional energy sources impact nature and human society in varied ways. India needs to rapidly
shift into a policy to reduce energy needs and use cleaner energy production technologies. We should
also shift to the use of alternate energy and renewable energy sources. An equitable and sustainable
use of this energy would bring about environmentally friendly and sustainable lifestyles. India must
also minimize its dependency on imported oil. At present we are underutilizing our natural gas
resources. India has a scope of developing thousands of mini dams to generate electricity. A large
amount of electricity is wasted in India during transmission. India needs to enhance fuel wood
plantations and proper implementation of Joint Forestry Management (JFM) has a great promise for
the future.
In India energy is wasted because of the use of inefficient cooking stoves. Efficient cooking stoves or
‘chulas’ help the movement of air through it so that the wood is burnt more efficiently. They also have
a chimney to prevent air pollution and thus reduce respiratory problems. While over 2 lakhs improved
chulas have been introduced throughout the country, the number in active use is unknown as most
rural people find it unusable due to several reasons. TERI in 1995 estimated that in India 95% of rural
people and 60% of urban poor still depend on firewood, cattle dung and crop residue for cooking and
other domestic purposes. Biomass can be converted into biogas or liquid fuels i.e. ethanol and
methanol. Biogas digesters convert animal waste or agricultural residues into gas. This is 60% methane
and 40% CO2 generated by fermentation. The commonly used Agri waste is dung of domestic animals
and rice husk, coconut shells, straw or weeds. The material left after the production of gas is used as
a fertilizer. Small hydro-generation Chapters are environment friendly. They do not displace people,
destroy forests or wildlife habitats or kill aquatic and terrestrial biodiversity. They can be placed in
several hill streams, on canals or rivers. The generation of energy depends on flowing water due to
gravity. However, this fails if the flow is seasonal. It is easy to waste energy but cheaper to save it than
generate it. We can conserve energy by preventing or reducing waste of energy and by using resources
more efficiently. People waste energy because government subsidises it. If the real cost was levied,
people would not be able to afford to waste it carelessly.
Industry and transport are the main growing users of energy in India. There are many industries which
are known for wasting most energy and they are also known for generating maximum pollution. These

RD-1 NRM, Watershed Management and Sustainable Livelihoods MGNCRE cxl
RD-1 NRM, Watershed Management and Sustainable Livelihoods
140 MGNCRE
140 MGNCRE | Natural Resource Management and Sustainable Development
include chemical industries, especially petrochemical industries, iron and steel, textiles, paper, etc.
Unplanned and inefficient public transport systems, especially in cities, waste large amount of energy.
Using bicycles is an excellent method to reduce the use of energy. In agriculture, irrigation pumps to
lift water are the most energy intensive. They either use electricity or run on fossil fuels.
Case Studies
• Indian industries use more energy than the required amount.
• Steel and energy to produce one tonne of steel, India spends 9.5 million kilocalories of energy
while in Italy it is 4.3 million kilocalories and for Japan it is only 4.1 million kilocalories of
energy.
• Cement industry Over 2 million kilocalories of energy are used to produce one tonne of
cement in India while in Germany it is 0.82 million kilocalories and in USA it is 0.92 million
kilocalories of energy.
• Vehicles Lighter materials should be used for the manufacture of cars to conserve energy.
Instead of steel, aluminium, fibre glass or plastics should be used for its production. These
lighter materials reduce the weight of cars by 15 % and thus increase the fuel economy by 6
to 8%.
• Refrigerators Use of advanced technologies reduced the annual energy consumption of a
typical Danish 200 litre refrigerator (with no freezer) from 350 kWh (kilo Watt hour) to 90
kWh.
• Lighting an 18Watt modern, compact fluorescent lamp can replace a standard 75Watt
incandescent lamp.
Use of Alternate Energy Sources
There is an urgent need to develop renewable energy sources which are available and could be utilized
or the energy sources which could be created and utilized. In India, the main renewable energy sources
are solar, wind, hydel, waste and biomass. Biomass are resources which are agriculture related like
wood, bagasse, cow dung, seeds, etc.
Hydel Energy
India has a total hydro energy potential of about 1.5 lakh MW, of which only about 20% is installed.
Small hydroelectric plant potential is about 15000 MW and most of it are in the northern and eastern
hilly regions.
Wind Energy
The wind power potential of India is about 45,000 MW out of which capacity of 8748 MW has been
installed in India till 2008. India is one of the leading countries in generating the power through wind
energy. Gujarat, AP, Karnataka, MP and Rajasthan are states having more than 5000 MW potential
each. These potentials could be improved if the technology of putting turbines in sea is embraced.
There are wind farms on sea generating as high as 160 MW of power.
Geothermal Energy
Geothermal energy is thermal energy generated and stored in the Earth. Thermal energy is the energy
that determines the temperature of matter. 20% of earth's geothermal energy originates from the
original formation of the planet and 80% from radioactive decay of minerals. Geothermal power is
cost effective, reliable, sustainable, and environmentally friendly, but has historically been limited to

RD-1 NRM, Watershed Management and Sustainable Livelihoods MGNCRE cxli
RD-1 NRM, Watershed Management and Sustainable Livelihoods
141 MGNCRE
141 MGNCRE | Natural Resource Management and Sustainable Development
areas near tectonic plate boundaries. Recent technological advances have dramatically expanded the
range and size of viable resources, especially for applications such as home heating, opening a
potential for widespread exploitation. Geothermal wells release greenhouse gases trapped deep
within the earth, but these emissions are much lower per energy Chapter than those of fossil fuels. As
a result, geothermal power has the potential to help mitigate global warming if widely deployed in
place of fossil fuels.
Ocean Thermal Energy Conversion (OTEC)
Ocean Thermal Energy Conversion (OTEC) uses the difference between cooler deep and warmer
shallow or surface ocean waters to run a heat engine and produce useful work, usually in the form of
electricity. A heat engine gives greater efficiency and power when run with a large temperature
difference. In the oceans the temperature difference between surface and deep water is greatest in
the tropics, although still a modest 20 to 25°C. OTEC therefore offers the greatest possibilities in the
tropics. OTEC has the potential to offer global amounts of energy that are 10 to 100 times greater than
other ocean energy options such as wave power.
Biomass Energy
Biomass is the oldest means of energy used by humans along with solar energy. As soon as the fire
was discovered, it was used widely among humans mainly for heat and light. Fire was generated using
wood or leaves, which is basically a biomass. The biomass could be used to generate steam or power
or used as a fuel. Power is generated using rice husk in Andhra Pradesh, while several bagasse based
plants are there. India has a potential of 3500 MW from bagasse plants. Other fast growing plants
could be planned over a huge area, so that it provides biomass for generating power. Organic wastes
such as dead plants and animal material, animal dung, and kitchen waste can be converted by the
anaerobic digestion or fermentation into a gaseous fuel called biogas. Biogas is a mixture of 65%
methane (CH4) and of 35% CO2 and may have small amounts of hydrogen sulphide (H2S), moisture and
siloxanes. It is a renewable energy resulting from biomass. Biogas can be used as a fuel in any country
for any heating purpose, such as cooking. It can also be used in anaerobic digesters where it is typically
used in a gas engine to convert the energy in the gas into electricity and heat. Biogas can be
compressed, much like natural gas, and used to power motor vehicles.
Biofuels
India has more than 50 million hectares of wasteland, which could be utilized for cultivating fuel
plants. Jatropha is one of the options which can be planted on arid lands and be used for production
of biofuels.
Solar Energy
India being a tropical country has the potential to use solar energy on commercial bases. According to estimates, 35 MW of power could be generated from one square kilometre. Solar energy has high potential and future for the development of our country. Initial cost is the biggest limitation which has led to the low realization of its potential. For solar energy to become one of the premium options as the source of energy, it will require lots of research, cheap technology and low capital.
RD-1 NRM, Watershed Management and Sustainable Livelihoods MGNCRE cxlii
RD-1 NRM, Watershed Management and Sustainable Livelihoods
142 MGNCRE
142 MGNCRE | Natural Resource Management and Sustainable Development
Textbooks
1. Francois Ramade(1984). Ecology of Natural Resources, John Wiley & Sons Ltd.
2. Odum, E.P. (1971). Fundamentals of Ecology< W.B. Saunders Co. USA.
References
1. Agarwal, K.C. (2001). Environmental Biology, Nidhi Publication Ltd. Bikaner.
2. Cunningham, W.P. Cooper, T.H.,Gorhani, E & Hepworth, M.T. (2001). Environmental
Encyclopedia, Jaico Publishing House.
3. Heywood, V.H. & Watson, R.T. (1995). Global Biodiversity Assessment, Cambridge Univ. Press.
4. Mann, K.H. (2000). Coastal Ecology & Management, Ecology of Coastal Waters with
Implications for Management (2nd Edition).Chap. 25, pp.1878 & Chap. 16, pp.280303.
5. Miller T.G. Jr. Environmental Science, Wadsworth Publishing Co. (TB).
6. Townsend C., Harper J, and Michael Begon. Essentials of Ecology, Blackwell Science.
7. Vitousek, P.M. (1994). Global Change and Natural Resource Management, Beyond global
warming Ecology and global change. Ecology 75, 18611876.
To Do Activity
What you may throw out in your garbage today could be used as fuel for someone else. Municipal
solid waste has the potential to be a large energy source. Garbage is an inexpensive energy
resource. Unlike most other energy resources, someone will collect garbage, deliver it to the
power plant, and even pay to get rid of it. This helps cover the cost of turning garbage into energy.
Garbage is also a unique resource because we all contribute to it.
Keep a record of all the garbage that you and your family produce in a day. What proportion of
it is in the form of biomass? Weigh this. How long would it take you to gather enough waste
biomass to make a tankful (0.85 cu.m.) of biogas? (Remember one ton of biomass produces 85
cu.m. of biogas).

RD-1 NRM, Watershed Management and Sustainable Livelihoods MGNCRE cxliii
RD-1 NRM, Watershed Management and Sustainable Livelihoods
143 MGNCRE
143 MGNCRE | Natural Resource Management and Sustainable Development
Chapter 2 Watershed Management
Introduction This Chapter focuses on Watershed management. It explains the concept of Watershed, types and
characteristics of Watershed and Watershed planning and management. This Chapter also exposes
water resources, types of water resources and uses of water resources.
Objectives
• To explain about water resources, their types, and uses of water resources
• To explain the concept of Watershed, types and characteristics of Watershed
• To understand the concept of Watershed planning and management
Structure
2.1 Water Resources
Water covers 71% of the earth's surface. Of this, 97.5% is the salty water of the oceans and only 2.5%
is freshwater, most of which is locked up. The remaining freshwater is found in glaciers, lakes, rivers,
wetlands, the soil, aquifers and atmosphere. Ocean circulation patterns have a strong influence on
climate and weather and, in turn, the food supply of both humans and other organisms. From 1961 to
2001 water demand doubled, agricultural use increased by 75%, industrial use by more than 200%,
and domestic use by more than 400%. In the 1990s it was estimated that humans were using 40– 50%
of the globally available freshwater in the approximate proportion of 70% for agriculture, 22% for
industry and 8% for domestic purposes with total use progressively increasing. Life is impossible
without water. It is used for manifold purposes like household purposes, irrigation, transport, for
producing tidal energy etc. Water is used in many industries like textiles, iron and steel, paper etc.
Tides occur due to the rise and fall of sea water which can be harnessed to produce electricity.
The water cycle, through evaporation and precipitation, maintains hydrological systems which form
rivers and lakes and support a variety of aquatic ecosystems. Wetlands are intermediate forms
between terrestrial and aquatic ecosystems and contain species of plants and animals that are highly
moisture dependent. All aquatic ecosystems are used by many people for their daily needs such as
2.1 Water Resources
2.2 Watershed
2.3 Watershed Management-Benefits, Objectives and Components
2.4 Watershed Management Indian and Global Perspectives
2.5 Various Issues in Watershed Management

RD-1 NRM, Watershed Management and Sustainable Livelihoods MGNCRE cxliv
RD-1 NRM, Watershed Management and Sustainable Livelihoods
144 MGNCRE
144 MGNCRE | Natural Resource Management and Sustainable Development
drinking, washing, cooking, watering animals, and irrigating fields. The world depends on a limited
quantity of fresh water. Water covers 70% of the earth’s surface but only 3% of this is fresh water. Of
this, 2% is in polar ice caps and only 1% is usable water in rivers, lakes and subsoil aquifers. Only a
fraction of this can be actually used. At a global level 70% of water is used for agriculture, about 25%
for industry and only 5% for domestic use. However, this varies in different countries and
industrialized countries use a greater percentage of water for industry. India uses 90% of water for
agriculture, 7% for industry and 3% for domestic use.
One of the greatest challenges facing the world in this century is the need to rethink the strategies of
overall management of water resources. The world population has crossed the 6 billion mark. Based
on the proportion of young people in developing countries, this will continue to increase significantly
during the next few decades. This places enormous demands on the world’s limited freshwater supply.
The total annual freshwater withdrawals today are estimated at 3800 cubic kilometres, twice as much
as just 50 years ago (World Commission on Dams, 2000). Studies indicate that a person needs a
minimum of 20 to 40 litres of water per day for drinking and sanitation. More than one billion people
worldwide have no access to clean water, and in many areas’ supplies are unreliable. Local conflicts
are already spreading to states. E.g. Karnataka and Tamil Nadu over the waters of Krishna.
India is expected to face critical levels of water stress by 2025. At the global level 31 countries are
already short of water and by 2025 there will be 48 countries facing serious water shortages. The UN
has estimated that by the year 2050, 4 billion people will be seriously affected by water shortages.
This will lead to multiple conflicts between countries over the sharing of water. Around 20 major cities
in India face acute water shortages. There are 100 countries that share the waters of 13 large rivers
and lakes. The upstream countries could starve the downstream nation’s leading to political unstable
areas across the world. Examples are Ethiopia, which is upstream on the Nile and Egypt, which is
downstream and highly dependent on the Nile. International accords that will look at a fair distribution
of water in such areas will become critical to world peace. India and Bangladesh already have a
negotiated agreement on the water use of the Ganges.
Figure 2.1 Hydrological Cycle

RD-1 NRM, Watershed Management and Sustainable Livelihoods MGNCRE cxlv
RD-1 NRM, Watershed Management and Sustainable Livelihoods
145 MGNCRE
145 MGNCRE | Natural Resource Management and Sustainable Development
Classification and Characteristics of Water Resources
Water sources can be classified into protected or unprotected water sources. Protected sources are
covered by stonework, concrete or other materials that prevent the entry of physical, chemical and
biological contaminants. Typical characteristics of a protected water source are given below.
Characteristics of a Protected Water Source
The water source is fully enclosed or capped and no surface water can run directly into it. People do
not step into the water while collecting it. Latrines, solid waste pits, animal excreta and other sources
of pollution are located as far away as possible from the water source and on ground lower in elevation
than the water source. There is no stagnant water within 5 metres of the water source. The water
collection buckets or hand pumps at the source are kept clean.
Unprotected sources are those with no barrier or other structure to protect the water from
contamination. All surface water sources such as lakes, rivers and streams or poorly constructed wells
are examples of unprotected sources. Water from unprotected sources cannot be considered safe to
drink unless it has been treated. The terms ‘improved’ and ‘unimproved’ are also used to describe
water sources and are broadly equivalent to ‘protected’ and ‘unprotected’. WHO /UNICEF categorises
water sources as shown in Figure 2.2. This shows the drinking water ladder, which describes the steps
in improvement of quality of water supply depending on the type of source. Surface water is at the
bottom of the ladder and piped water into the household is at the top.
Figure 2.2 Drinking Water Ladder
Overutilization and Pollution of Surface and Groundwater
With the growth of human population there is an ever increasing need for larger amounts of water to
fulfil a variety of human needs. It is becoming increasingly difficult to meet these requirements today.

RD-1 NRM, Watershed Management and Sustainable Livelihoods MGNCRE cxlvi
RD-1 NRM, Watershed Management and Sustainable Livelihoods
146 MGNCRE
146 MGNCRE | Natural Resource Management and Sustainable Development
Overutilization of water occurs at various levels. People tend to consume more water than they really
need. Many people waste water during bathing and washing of clothes. Agriculturists use more water
than necessary to grow crops. Use of newer methods like drip irrigation systems can reduce the use
of water without reducing yields.
Agriculture also contributes to the pollution of surface water and underground water stores by the
excessive use of chemical fertilizers and pesticides. Use of biomass, nontoxic pesticides such as neem
products and use of integrated pest management systems reduces the agricultural pollution of surface
and ground water.
Industries tend to maximise short term economic gains by releasing liquid wastes into streams, rivers
and the sea. In the longer term, as awareness of ‘green products’ made by Eco sensitive industries
increases, people may even boycott the polluter’s products. The industries that add to the pollution
of environment by avoiding effluent treatment plants may eventually be caught, punished and even
closed. Public awareness may increasingly put pressures on industry to produce only eco-friendly
products which are already gaining in popularity. Public awareness about the serious health hazards
caused by pesticides may put pressures on farmers to reduce the use of chemicals that are harmful to
health.
Global Climate Change
Increasing air pollution at a global level has resulted in climate change. In some regions global warming
and the El Nino winds have created unprecedented storms and in other places they lead to long
droughts. Everywhere the ‘greenhouse effect’ due to atmospheric pollution is leading to increasingly
erratic and unpredictable climatic effects. This has seriously affected regional hydrological conditions.
Floods
Floods have been a serious environmental hazard for centuries. However, the havoc raised by rivers
overflowing their banks has become progressively more damaging, as people have deforested
catchments and intensified use of river flood plains that once acted as safety valves. Wetlands in flood
plains are nature’s flood control systems into which overfilled rivers could spill and act like a temporary
sponge holding the water and preventing fast flowing water from damaging surrounding land.
Deforestation in the Himalayas causes floods that kill people, damage crops and destroy homes in the
Ganges and its tributaries and the Brahmaputra. Rivers change their course during floods and tons of
valuable soil is lost to the sea. As the forests are degraded, rainwater no longer percolates slowly into
the subsoil but runs off down the mountainside bearing large amounts of topsoil. This Chapters rivers
temporarily but gives way as the pressure mounts allowing enormous quantities of water to wash
suddenly down into the plains below. There, rivers swell, burst their banks and flood waters spread to
engulf peoples’ farms and homes.
Drought
In most arid regions of the world the rains are unpredictable. This leads to a time of serious scarcity
of water to drink, use in farms, or provide for urban and industrial use. Drought prone areas thus
regularly face irregular periods of famine. Agriculturists face serious loss of income during this period
and they live in constant fear of droughts. India has ‘Drought Prone Areas Development Programs’
which are used in such areas to buffer the effects of droughts. Under these schemes, people are given
wages in bad years to build roads, minor irrigation works and plantation programs. Drought has been

RD-1 NRM, Watershed Management and Sustainable Livelihoods MGNCRE cxlvii
RD-1 NRM, Watershed Management and Sustainable Livelihoods
147 MGNCRE
147 MGNCRE | Natural Resource Management and Sustainable Development
a major problem in our country especially in arid regions. It is an unpredictable climatic condition and
occurs due to the failure of one or more monsoons. It varies in frequency in different parts of our
country. While it is not feasible to prevent the failure of the monsoon, good environmental
management can reduce its ill effects. The scarcity of water during drought years affects homes,
agriculture and industry. It also leads to food shortages and malnutrition which especially affects
children.
Several preventive measures can be taken to minimise the serious impacts of droughts so that its
effect on local people is minimised.
One of the major failures our country faces is that when we have adequate monsoons, we fail to use
water judiciously and conserve it. This results in scarcity of drinking water when rains are poor.
Deforestation is one of the factors that worsen the effect of drought. Once hill slopes are denuded of
forest cover the rainwater rushes down the rivers and is lost. Forest cover permits water to be held in
the area permitting it to seep into the ground. This recharges the underground stores of water in
natural aquifers. This can be used in drought years if the stores have been filled during a good
monsoon. If water from the underground stores is overused, the water table drops, and vegetation
suffers. Thus, soil and water management and afforestation are long term measures that reduce the
impact of droughts.
Water for Agriculture and Power Generation
India’s increasing demand for water for intensive irrigated agriculture, for generating electricity, and
for consumption in urban and industrial centres, has been met by creating large dams. Irrigated areas
increased from 40 million hectares in 1900 to 100 million hectares in 1950 and to 271 million hectares
by 1998. Dams support 30 to 40% of this area.
Although dams ensure continuous supply of water for domestic use annually, provide extra water for
agriculture, industry, hydropower generation, they have several serious environmental problems.
They alter river flows, change nature’s flood control mechanisms such as wetlands and flood plains,
and destroy the lives of local people and the habitats of wild plant and animal species. Irrigation to
support cash crops like sugarcane produces an unequal distribution of water. Large landholders on
the banks of canals get the lion’s share of water, while poor, small farmers get less and are seriously
affected.
Sustainable Water Management
‘Save water’ campaigns are essential to make people aware of the dangers of water scarcity. Several
measures need to be taken for better management of the world’s water resources. These include
measures such as
• Building several small reservoirs instead of few mega projects.
• Develop small catchment dams and protect wetlands.
• Soil management, micro catchment development and afforestation permits recharging of
underground aquifers thus reducing the need for large dams.
• Treating and recycling municipal wastewater for agricultural use.
• Preventing leakages from dams and canals.
• Preventing loss in municipal pipes.
• Effective rainwater harvesting in urban environments.
• Water conservation measures in agriculture such as using drip irrigation.

RD-1 NRM, Watershed Management and Sustainable Livelihoods MGNCRE cxlviii
RD-1 NRM, Watershed Management and Sustainable Livelihoods
148 MGNCRE
148 MGNCRE | Natural Resource Management and Sustainable Development
• Pricing water at its real value makes people use it more responsibly and efficiently and reduces
water wasting.
• In deforested areas where land has been degraded, soil management by bunding along the
hill slopes and making ‘nala’ plugs can help retain moisture and make it possible to revegetate
degraded areas.
Case Study
Water Pollution Nepal
The Narayani River of Nepal has been polluted by factories located on its bank. This has endangered
fish, dolphins, crocodiles and other flora and fauna of the region.
1.2 Watershed
Our country can boast of nearly two third area of land as agriculture field. This area is mainly rainfed
agriculture and due to erratic rainfall and low levels of inputs it faces very low productivity. Though
water resources are limited, we should focus on increasing the productivity in rainfed areas by
adopting watershed management approach based on the active participation of the people at all
stages of the project. This will sustain agriculture and inclusive socioeconomic development. It also
deals with the reclamation of degraded soils by employing biological and engineering measures. The
integrated watershed management comprises of agriculture and inclusive socioeconomic
development. Panchayati Raj Institutions play a vital role by adopting watershed management
approach based on the active participation of the people at all the stages of the project. Participatory
watershed management approach based on community organization will lead to resource
conservation, productivity enhancement and livelihoods opportunities for all round socioeconomic
development.
The watershed projects need continuous monitoring and evaluation to assess the impact of various
activities on socioeconomic development of the region. Monitoring and assessment are also helpful
to improve the performance of existing watershed activities and better planning and design of new
activities. Watershed management activities are undertaken to preserve existing sustainable land use
practices and restore the existing conditions to a desirable level. Preventive strategies refer to the
measures to prevent a particular problem in a watershed. Remote sensing and information technology
go a long way in effective planning, implementation and evaluation of the watershed programmes.
Concept
Our country is facing acute poverty due to unsustainable agricultural practices. Though 65% of the
cultivated area in the country is rainfed, agricultural development is highly unsatisfactory. Low
productivity in rainfed agriculture is due to unpredictable rainfall and low level of inputs. In order to
increase food production with available limited water resources, it is essential that the rainfed farming
should be developed as a sustainable productive system by adopting watershed management
approach. Watershed management not only deals with reclamation of degraded soils by employing
biological and engineering measures but also enhances crop productivity by a package of water
To Do Activity
Observe a nearby pond in different seasons and document the seasonal changes in it. One can
also observe changes in a river or the seasonal changes in a forest or grassland.

RD-1 NRM, Watershed Management and Sustainable Livelihoods MGNCRE cxlix
RD-1 NRM, Watershed Management and Sustainable Livelihoods
149 MGNCRE
149 MGNCRE | Natural Resource Management and Sustainable Development
conservation and improved cropping practices. The integrated watershed management comprises of
agriculture and allied activities and this might result in long term agriculture sustainability and
wellbeing of the people. Strong linkages among central, state, district, village and project level
agencies including Panchayati Raj Institutions are crucial for effective management of watershed
development projects. The bottom up instead of top down approach ensures active participation of
the watershed community in different phases of the project which is essential to achieve desired
objectives. Remote sensing and GIS facilitate development planning process for conserving land and
water resources.
Meaning
The term watershed consists of two words water and shed. Water occurs in nature in three forms
namely solid, liquid and vapour. In watershed, water is considered mainly in liquid form. The word
"shed" refers to the roof of a shed which collects rainwater and drains out. Shed thus can be defined
as an area well marked by a boundary which receives rainwater and drains out towards a common
drainage point or outlet.
Watersheds are areas of land defined by the flow patterns of rainwater or melting snow and ice when
it is determined by topography of a region rather than political boundaries. In more general terms a
watershed is a geographic area where all the water, sediments, and dissolved materials drain to a
common outlet like a stream, river system, reservoir, lake, underground aquifer, estuary, wetland,
sea, ocean or other body of water. It can also be an area that "catches" water and routes it to a
common basin, channel, or network of channels. In the technical sense, a watershed refers to a divide
that separates one drainage area from another drainage area. Watersheds drain into other
watersheds in a hierarchical pattern, with smaller sub watersheds combining into larger watersheds.
However, the term is often used to mean a drainage basin or catchment area itself. Other terms that
are used to describe a watershed are catchment, catchment basin, drainage area, river basin, and
water basin.
Watersheds are similar but not identical to hydrologic units, which are drainage areas delineated so
as to nest into a multilevel hierarchical drainage system. Hydrologic units are designed to allow
multiple inlets, outlets, or sinks. In a strict sense, all watersheds are hydrologic units but not all
hydrologic units are watersheds. The watershed acts as a funnel by collecting all the water within the
area covered by the basin and channelling it to a single point. Each watershed or drainage basin is
separated topographically from adjacent basins by a geographical barrier such as a ridge, hill or
mountain in hilly country, but in flat country especially where the ground is marshy, the divide may
be invisible with just a more or less national line on the ground on either side of which falling raindrops
will start a journey to different rivers, and even to different sides of a region or continent.
Watershed or drainage divides are important geographically and in determining political boundaries.
Roads such as ridge ways and rail tracks often follow divides to minimise gradients, and to avoid
marshes and rivers. In another way, watershed can be a hindrance to river navigation. In preindustrial
times water divides were crossed at portages. Later, canals were built to connect the adjoining
watersheds.
Definition of Watershed
Watershed is a topographically delineated area drained by a stream system i.e. the total land area
above some point on a stream or river that drains down slope to the lowest point. The watershed is a

RD-1 NRM, Watershed Management and Sustainable Livelihoods MGNCRE cl
RD-1 NRM, Watershed Management and Sustainable Livelihoods
150 MGNCRE
150 MGNCRE | Natural Resource Management and Sustainable Development
hydrologic Chapter often used as physical Chapter, biological Chapter and a socioeconomic and
political Chapter for planning and management of natural resources. Watershed may also be defined
as a natural Chapter of land which collects water and drains through a common point called an outlet
by a system of drains. Therefore, watershed is the area encompassing the catchments, command and
delta area of a stream. The topmost portion of the watershed is known as "ridge" and a line joining
the ridge portion along the boundary of the watershed is called as "ridgeline". A watershed is thus a
logical Chapter for planning optimal development of its soil, water and biomass resources.
Types of Watershed
Watersheds are classified into five based on the size, drainage, shape and land use pattern.
• Macro watershed (> 50,000 Hectares)
• Sub watershed (10,000 to 50,000 Hectares)
• Milli watershed (1000 to10000 Hectares)
• Micro watershed (100 to 1000 Hectares)
• Mini watershed (1100 Hectares)
Watershed or Drainage divides can be categorised into three types
a. Continental Divide or Ocean Basins
Continental divide is a divide in which the waters on each side flow to different oceans. The
following is a list of some of the major ones
1. In North America, surface water drains to the Atlantic via the Saint Lawrence River and
Great Lakes basins, the Eastern Seaboard of the Chaptered States, the Canadian
Maritimes, and most of Newfoundland and Labrador. Nearly all of South America, east of
the Andes also drains to the Atlantic, as does most of Western and Central Europe, and
the greatest portion of western Sub Saharan Africa. The three major Mediterranean seas
of the world also flow to the Atlantic.
(i) The American Mediterranean Sea (the Caribbean Sea and Gulf of Mexico)
basin includes most of the American interior between the Appalachian and
Rocky Mountain ranges, a small part of the Canadian provinces of Alberta and
Saskatchewan, eastern Central America, the islands of the Caribbean and the
Gulf, and a small part of northern South America.
(ii) The European Mediterranean Sea basin includes much of northern Africa,
east central Africa (through the Nile), southern, central, and eastern Europe,
Turkey, and the coastal areas of Israel, Lebanon, and Syria.
(iii) The Arctic Ocean basin drains most of Western and Northern Canada east of
the Continental Divide, the north shore of Alaska and parts of North Dakota,
South Dakota, Minnesota, and Montana in the Chaptered States, the north
shore of the Scandinavian Peninsula in Europe, and much of central and
northern Russia.
2. About 13% of the land in the world drains to the Pacific Ocean. Its basin includes much of
China, southeaster Russia, Japan, Korea, most of Indonesia and Malaysia, the Philippines,
all of the Pacific Islands, the northeast coast of Australia, and the western parts of Canada,
the Chaptered States (including most of Alaska), Central America, and South America.

RD-1 NRM, Watershed Management and Sustainable Livelihoods MGNCRE cli
RD-1 NRM, Watershed Management and Sustainable Livelihoods
151 MGNCRE
151 MGNCRE | Natural Resource Management and Sustainable Development
3. The Indian Ocean's drainage basin also comprises about 13% of Earth's land. It drains the
eastern coast of Africa, the coasts of the Red Sea and the Persian Gulf, the Indian
subcontinent, Burma, and most of Australia.
4. The Southern Ocean drains to Antarctica. Antarctica comprises approximately eight
percent of the Earth's land.
b. Major and Minor Drainage Divide
In the major drainage divide, the waters on each side of the divide never meet again but do
flows into the same ocean. On the other hand, in the Minor drainage divide, the waters part
but eventually join again at a river confluence. The three largest river basins (by area), from
largest to smallest, are the Amazon basin, the Congo basin, and the Mississippi basin while
the three rivers that drain the most water, from most to least, are the Amazon, Congo, and
Ganges Rivers.
c. Endorheic Drainage Basins
The Endorheic drainage basins are inland basins that do not drain to an ocean but drains to
endorheic lakes or seas or sinks. The largest of these consists of much of the interior of Asia
and drains into the Caspian Sea and the Aral Sea. Other endorheic regions include the Great
Basin in the Chaptered States, much of the Sahara Desert, the watershed of the Okavango
River (Kalahari Basin), highlands near the African Great Lakes, the interiors of Australia and
the Arabian Peninsula, and parts in Mexico and the Andes.
Characteristics of Watershed
Every watershed has distinct characteristics and one watershed is different from the other. Size,
shape, drainage area and length are the main characteristics to be considered for watershed
management.
Size The size of a watershed may vary from a few square meters to thousands of square kilometres
depending on the time and money available for development of a watershed. Larger watersheds
could be selected in the plain valley areas or where grassland and forest development are the major
objectives. In the hilly areas or where intensive agriculture development is involved, the size of the
watershed would be small.
Shape Watersheds have a variety of shapes such as pear, elongated, triangular, circular etc. based on
morphologic parameters like geology and structure. It determines the length width ratio which affects
the runoff characteristics like runoff time. In a circular watershed, runoff from various parts of the
watershed reaches the outlet at the same time. However, an elliptical watershed has the outlet at one
end of the major axis and though it has the same area as the circular watershed. It would cause the
runoff to be spread out over time, thus producing a smaller flood peak than that of the circular
watershed.
Length of watershed is important in hydrologic computations and is defined as the distance measured
along the main channel from the watershed outlet to the basin divide. The length is usually used in
computing a time parameter, which is a measure of the travel time of water through a watershed.
Slope is an important factor which corresponds to distance along the principal flow path.

RD-1 NRM, Watershed Management and Sustainable Livelihoods MGNCRE clii
RD-1 NRM, Watershed Management and Sustainable Livelihoods
152 MGNCRE
152 MGNCRE | Natural Resource Management and Sustainable Development
Drainage Area The drainage area (A) is probably the single most important watershed characteristic
for hydrologic design as it reflects the volume of water that can be generated from rainfall.
Drainage Density Drainage density is an important characteristic of the watershed that influences
runoff. It is defined as the ratio of total length of all streams and catchment area. High drainage density
drains result in faster runoff and increase the peak of hydrograph.
Watershed Factors
The important watershed factors that determine likelihood of flood are topography, shape, size, soil
type and land use (paved or roofed areas).In other words; topography and shape determine the time
taken for rainwater to reach the river whereas size, soil type and development determine the amount
of water that reaches the river.
Topography
Topography determines the speed with which the runoff will reach a river. Rain that falls in steep
mountainous areas will reach the river faster than flat or gently sloping areas.
Shape
Shape contributes to the speed with which the runoff reaches a river. A long thin watershed will take
longer to drain than a circular watershed.
Size
Size will help determine the amount of water reaching the river. The larger the watershed, the greater
the potential for flooding.
Soil Type
Soil type will help determine the amount of water that reaches the river and certain soil types
contribute to flooding. Soil types such as sandy soils are very free draining and rainfall on sandy soil is
likely to be absorbed by the ground. On the other hand, soils containing clay can be almost
impermeable and therefore rainfall on clay soils will run off and contribute to flood volumes. After
prolonged rainfall even free draining soils can become saturated and any further rainfall will reach the
river rather than being absorbed by the ground.
Land Use
Land use can contribute to the volume of water reaching the river like clay soils. For example, rainfall
on roofs, pavements and roads will be collected by rivers with almost no absorption into the
groundwater.
2.3 Watershed Management – Benefits, Objectives and Components
Watershed management is the process of guiding and organizing use of land and other resources in
the watershed to provide desired goods and services without adversely affecting soil, water and other
natural resources.
Watershed management in the broader sense includes maintaining the equilibrium between elements
of natural ecosystem or vegetation, land or water on the one hand and human activities on the other
hand. The watershed management programmes aim at improving soil health, soil tilth and drainage
and achieving efficient use of harvested and stored rainwater for supplemental irrigation and
consequently enhanced productivity and higher economic returns. From community development

RD-1 NRM, Watershed Management and Sustainable Livelihoods MGNCRE cliii
RD-1 NRM, Watershed Management and Sustainable Livelihoods
153 MGNCRE
153 MGNCRE | Natural Resource Management and Sustainable Development
point of view, watershed management programmes aim at controlling flooding, water logging and soil
erosion in order to increase agricultural productivity and a more dependable, cleaner water supply for
domestic and industrial use. These programmes also help in minimizing risk of floods in rural and urban
areas down streams, reducing sedimentation and conserving natural resources efficiently and
effectively. Watershed management programmes strive to improve the lot of the entire farming
communities rather than focusing on individual farmers only.
Benefits of Watershed Management
Watershed management is expected to ensure the following benefits
• controls floods, erosion and sedimentation
• enhances productivity per Chapter area, per Chapter time and per Chapter of water
• increases cropping intensity
• leads to proper utilization of waste lands through alternate land use systems
• ensures ecological balance
• maximizes income through integrated farming system
• stabilizes income even under unfavourable weather conditions.
Objectives of Watershed Management
The main objective of watershed management is to overcome the problems of land and water use
based on interdependence of all the resources. The ultimate aim of watershed is enhancing the
standard of living of common man in the basin by optimising his earning capacity, by providing basic
facilities such as drinking water, electricity, water for irrigation, freedom from fear of floods and
droughts etc. Watershed management aims at optimum utilization of the entire resources namely soil,
water, crop including plantation, livestock, fishery and human population for sustained prosperity of
the watersheds. The overall objectives of watershed development programme are outlined below
• Recognition of watersheds as a proper Chapter for utilization and development of land. The
land should be treated according to its peculiar need and by methods that will control soil
erosion, conserve water, encourage wildlife, improve farm income and prevent flood damage
to agricultural lands.
• Retardation and prevention of floods through small multipurpose reservoirs and other water
impounding structures at the streams and in problem areas.
• Provision for an abundant water supply for domestic, industrial and agricultural needs.
• Minimizing organic, inorganic and soil pollution.
• Expansion of recreational facilities including picnic and camping sites with more lakes and
streams suitable for boating, fishing or swimming.
• Utilization of local natural resources for improving agriculture and utilization of allied
occupation or industries (small and cottage industries) to improve socioeconomic conditions
of the local residents and minimizing risks during aberrant weather conditions.
• Improving infrastructural facilities to improve storage, transportation and marketing of the
agricultural produce.
• Setting up small scale agro industries.
• Improving the socioeconomic status of farmers.
• Employment generation.
• Encouraging people participation.

RD-1 NRM, Watershed Management and Sustainable Livelihoods MGNCRE cliv
RD-1 NRM, Watershed Management and Sustainable Livelihoods
154 MGNCRE
154 MGNCRE | Natural Resource Management and Sustainable Development
Active participation of farmers is essential for the proper implementation of the programme. The
above objectives can be achieved only by planning and implementing the programme in a systematic
way. Constitution of cooperative watershed management societies also help in achieving the
objectives.
Components of Watershed Management
Two major components of watershed management are Engineering and Biological Practices.
Engineering and Biological Practices
Engineering and biological practices for soil and water conservation include measures for land, water
and biomass management in uncultivable lands. These practices are cost intensive and must be carried
out with government support.
Land Management
Land and water both are the most important natural resources for agriculture sustainability. The upper
layer of soil plays a crucial role in providing nutrition to the plants and therefore needs to be protected
and conserved. Depending on the soil characteristics, topography, climate and rainfall pattern,
appropriate measures need to be taken in order to control soil erosion and thus maintain soil
productivity. The biological or agronomic measures have proved to be effective for controlling both
wind and water erosion by employing agronomic practices which include conservation tillage, contour
cultivation, strip cropping and vegetative barriers. Mechanical measures include a wide variety of
conservation practices and structures such as contour bunds, graded bunds, earthen bunds, contour
terrace, contour trenches, bench terracing, channel walls, stream bank stabilization, check dams, gully
plugging etc. depending on land characteristics.
Water Management
Water is the most important natural resource required for regular activities of all the sectors viz.,
agriculture, industry and domestic. Only 4% share of world’s fresh water is available in India for
supporting 16% of world population. Mismanagement of restricted water resource results in recurring
floods and droughts. Irrigation is the biggest user of fresh water, but its share is likely to be reduced
considerably due to competing demand from other users like industry and public health due to ever
growing population. On the other hand, overexploitation of groundwater has led to its rapid depletion
and deterioration in water quality. It is, therefore, imperative that this natural resource is managed in
the most optimum way in order to meet its growing demand. More than 60% of agriculture is rainfed.
The rainfall distribution in the country is highly erratic and variable in time and space. Over 80% rainfall
is received during monsoon months of July, August and September. It is therefore of utmost
importance to manage the existing surface and groundwater resources for their longterm
sustainability.
The rainwater harvesting has an important role to play in augmenting these declining resources. It is
a technique of harvesting, collection and storage of rainwater aiming at conserving, storing and
utilizing every drop of rainwater harvested for various users and recharging groundwater reservoirs.
The harvested rainwater has immense potential for not only enhancing water availability in both rural
and urban areas but recharging surface and ground water reservoirs. Rainwater harvesting based on
local traditional knowledge has been an ancient practice successfully used for augmenting water
resources. Biomass Management The forest management and conservation, social forestry, Eco

RD-1 NRM, Watershed Management and Sustainable Livelihoods MGNCRE clv
RD-1 NRM, Watershed Management and Sustainable Livelihoods
155 MGNCRE
155 MGNCRE | Natural Resource Management and Sustainable Development
preservation and enhancing animal productivity are some of the main aspects for ensuring biomass
management.
2.4 Watershed Management Indian and Global Perspectives
India has the second highest population in the world which is over 1.3 billion [i.e., 17.1% of the world
population], a seventh highest land area of 3.29 million km2 among all the nations [i.e., 2.4% of the
world area] and an annual river flow of 1869 km3 out of an annual rainfall of about 4000 km3 [i.e., 4%
of the world water]. The rainfall distribution is highly uneven spatially with the highest annual rainfall
of 11,690 mm in the northeaster state of Meghalaya and the least annual rainfall of 150 mm in the
western part of the north western state of Rajasthan. The number of rainy days [i.e., number of days
with a minimum recorded daily rainfall of 2.5 mm] varies from 5 to 150. The rainfall distribution is also
very uneven temporally with about 75% of the annual rainfall occurring only in the four monsoon
months of June to September. The average annual rainfall is 1160 mm which is slightly higher than the
global average of 1110 mm. In the year 2010, the annual per capita water availability was estimated
at 1588 m3, which is considered as water stressed [i.e., between 1,000 and 1,700 m3] as per the
international norms. The per capita water availability was 5200 m3 during the year 1951. The annual
potential evapotranspiration (PET) varies from 1,500 to 3,500 mm.
Although India has a well-developed precipitation pattern in the form of monsoons and an equally
well developed drainage network consisting of 14 large river basins, 44 medium river basins and
hundreds of small river basins, there is a huge stress on water and land resources due to continuous
overexploitation. This has led to many adverse hydrometeorological impacts like large scale soil
erosion, excessive lowering of water table, extensive river/ ground water pollution due to
municipal/industrial wastewaters, widespread loss of forests/ grass lands/ crop lands/ wetlands/
water bodies, silting of existing water bodies, frequent occurrence of floods/ droughts, alarming
reduction in Himalayan glaciers etc. All these phenomena have generally made the Indian perspective
in watershed management very vulnerable to climatic and anthropogenic factors. Thus, achieving
sustainable water resources development and integrated watershed management are two major
challenges in the Indian context.
Despite this alarming scenario, there are hundreds of best management practices (BMPs) –adopted
both in the government sector and the nongovernment sector over the entire length and breadth of
India, which are commendable in water and land resources management. These BMPs employ
technologies which are either traditional or modern or a combination of both. Some of these BMPs
which were effectively implemented in different parts of India, are as follows
1. An effective implementation of the ban on tree cutting policy by the local government
authorities in the north-eastern state of Sikkim resulted in an increase in the forest cover from
44% in 1995’96 to 47.59% in 2009 [Hindustan Times, 2010].
2. During 2000 to 2006, voluntary work by hundreds of people led by a spiritual saint near
Jalandhar in the north Indian state of Punjab, resulted in the near total cleaning and
To Do Activity
Visit a nearby hill station and observe the agricultural practices being adopted there. Examine
the measures used for controlling soil erosion.

RD-1 NRM, Watershed Management and Sustainable Livelihoods MGNCRE clvi
RD-1 NRM, Watershed Management and Sustainable Livelihoods
156 MGNCRE
156 MGNCRE | Natural Resource Management and Sustainable Development
rejuvenation of 35 km of Kali Bein River, which was heavily polluted by industrial effluents and
garbage [The Times of India, 2007].
3. Over a 20year period starting from 1974, a severely drought prone village of Ralegan Siddhi in
the western Indian state of Maharashtra with an annual rainfall of about 200 mm, had been
transformed into a village with ample drinking water, food and fodder. This was possible due
to the adoption of ridge to valley approach in watershed management through social forestry,
grassland development, continuous contour trenching, loose boulder structures, brushwood
dams, nulla bunds, percolation tanks, underground dams, gabion bunds, check dams, farm
ponds, staggered trenches for arresting soil erosion and ban on free grazing [Hazare, 1994].
Global perspective on watershed management is having many similarities and some differences with
the Indian perspective. Moreover, there are even bigger spatial and temporal variations in water/
pollutant distribution. It is also very much affected by soil erosion, excessive lowering of water table,
extensive river/ ground water pollution due to municipal/industrial wastewaters, widespread loss of
forests/ grass lands/ crop lands/ wetlands/ water bodies, silting of existing water bodies, frequent
occurrence of floods/ droughts, alarming reduction in glaciers etc. These phenomena have resulted in
major constraints due to water scarcity and land scarcity. However, in majority of the developed world
and in many parts of the developing world, sufficient watershed management activities have been
initiated in the government and nongovernmental sectors.
The impact of these watershed management programs is varied ranging from failures with undesirable
environmental and socioeconomic consequences to significant benefits. To make the watershed
management programs sustainable, land and water resources need to be managed together with an
interdisciplinary approach. There is also a strong need to develop regional training and networking
programs at all levels, especially when government agencies are not fulfilling their role in watershed
management. The emergence of citizen based watershed organizations in the Chaptered States and
many other countries is a very positive development.
Watershed Development Programs in India
Watershed activities regarding hydrological monitoring were initiated in 42 small watersheds located
in 8 centres of Central Soil and Water Conservation Research and Training Institute (CSWCRTI) in 1956.
Subsequently watershed based Operational Research Projects (ORPs) were taken up in different parts
of the country in 1974, in order to reduce soil loss, increase water availability to enhance cropping
intensity, agricultural productivity and generate employment. The central and state governments have
undertaken various development programmes based on watershed approach as outlined below. The
Ministry of Rural Development, Government of India is a front runner in these efforts and has
implemented special area development programmes for water harvesting.
1. Soil Conservation in Catchment of River Valley Project
The programme was initiated during the Third Five Year Plan to treat catchment area for
reducing silt production rate and subsequent siltation of reservoirs, checking soil erosion and
consequently improving agricultural productivity.
2. Integrated Agricultural Development in Drought Prone Areas
The Drought Prone Area Programme (DPAP) of Government of India aimed at promoting
integrated agricultural development in dry farming regions based on ecologically balanced
approach instead of providing temporary relief.

RD-1 NRM, Watershed Management and Sustainable Livelihoods MGNCRE clvii
RD-1 NRM, Watershed Management and Sustainable Livelihoods
157 MGNCRE
157 MGNCRE | Natural Resource Management and Sustainable Development
3. Desert Development Programme (DDP)
The programme was initiated in 197778 to control desertification of the desert area by
integrating and linking other related state/central programmes and conserve and harness
land, water and other natural resources including rainfall for restoration of long term
ecological balance.
4. Himalayan Watershed Management Project in Uttar Pradesh
Himalayan watershed management project funded by the World Bank was taken up in 1983
in two watersheds namely Nayar in Garhwal and Panarin Kumaon regions in Uttarakhand
covering an area of 2.47 lakh hectares.
5. Operational Research Projects on Integrated Watershed Management
These projects were taken up in 47 watersheds spread over 16 states in 1983 covering an area
of 35739 hectares with the financial assistance of Ministry of Agriculture and Rural
Development, Government of India and under the technical guidance of Indian Council of
Agricultural Research (ICAR).
6. National Watershed Development Programme of Rainfed Agriculture (NWDPRA)
The programme initiated in 198687 in the unirrigated arable lands in 25 states mostly had
rainfall ranging between 500 and 1125 mm and more. The programme was restructured in
the Eighth Five Year Plan in order to achieve sustainable production of biomass as well as
restoration of ecological balance in the vast rainfed areas of the country.
Integrated Watershed Management
Watershed management mainly involves adoption of soil and water conservation practices such as
proper land use, preventing land against all forms of deterioration, maintaining soil fertility,
conserving water for farm use and increasing productivity, proper water management for drainage
and flood protection. All the natural resources in a watershed should be used as efficiently as possible
with minimum watershed degradation. In watersheds besides development of new water resources,
emphasis is laid on efficient utilization of existing water resources based on indigenous technologies.
The watershed management is rational utilization and conservation of land, water and biodiversity of
natural resources without further deterioration of environment. It is an integrated participatory
approach for sustainable development of natural resources. People's participation at all stages
starting from planning up to its implementation is an important element in its proper execution.
Watershed is a single window approach where all problems of watershed area are addressed, and
solutions sought. Watershed management is an ongoing process. It is, therefore, essential that original
watershed plans should be revised in case of new challenges.
Watershed management is an integral approach for sustainable use of natural resources, viz, land,
water, vegetation, livestock, fisheries and human resources. In watersheds, integrated farming
systems approach is followed. In addition to low external input of sustainable agriculture, it also
includes agroforestry, horticulture, silvipasture, aquaculture, animal husbandry, apiculture,
sericulture, lac culture etc. This ensures full utilization of resources for employment generation and
overall development of the watershed area. In agroforestry system, different species of trees
grownunder different situations such as floods, drought and landslide, mine area, saline and alkaline
conditions are identified.
2.5 Various Issues in Watershed Management
Various problems and constraints in watershed management are given below.

RD-1 NRM, Watershed Management and Sustainable Livelihoods MGNCRE clviii
RD-1 NRM, Watershed Management and Sustainable Livelihoods
158 MGNCRE
158 MGNCRE | Natural Resource Management and Sustainable Development
a. Land degradation in rainfed areas due to soil erosion from runoff is one of the major problems
in watershed management. It was estimated that soil erosion in the 1990s was almost double
that of soil erosion in the 1980s in our country. Rainfall uncertainty and poor economic
conditions also act as major constraints and thus prevents the farmers in rainfed areas from
making investments. This leads to improper watershed management.
b. Equitable benefit sharing of watershed management within the farming communities as well
as within the different locations of watershed is a huge problem. Generally, women, marginal
farmers and landless laborers gain very little or nothing at all from the watershed
management activities. Several case studies in water scarce states of Gujarat and Madhya
Pradesh in India have showed that overdevelopment of water harvesting structures in the
upstream portion of watersheds had significantly reduced the inflows into the downstream
reservoirs. On the other hand, it is also noticed that building of large reservoirs resulted in the
submergence and hardship in the upstream parts and benefits for people in the downstream
parts of the same watershed or a neighbouring watershed generally having an urban or an
industrial area.
c. Acute shortage of water in general and drinking water especially in summer has been
observed in many watersheds with inadequate watershed management which may result in
severe/ recurrent droughts. It may often result in limited and temporary food productivity
gains.
d. Many a times, common lands do not get treated adequately and re-vegetation does not take
place as expected in spite of watershed management programs. As a result of this, domestic/
ecosystem water requirements, and livestock water/ fodder needs are either inadequately
addressed or are made to suffer due to increased water withdrawals by other uses or due to
overgrazing.
e. Problems exist or new problems crop up due to improper understanding of the interaction
between biophysical and socioeconomic processes in watershed management.
f. Conflict among various government ministries such as those related to agriculture [with
emphasis on food production], rural development [with emphasis on employment generation
& poverty alleviation], forests [with emphasis on maintaining biodiversity & wildlife], as well
as conflict between government bureaucracy and elected representatives in their zeal to
control funds, is a major problem in watershed management programs which requires to be
resolved on a priority basis.
g. It is hard to conduct meaningful impact assessment studies on watershed management
programs for lack of baseline data for monitoring and comparison of the current conditions.
The whole exercise of watershed management is undertaken without properly estimating the
water supply scenarios under drought/ normal/ surplus years as well as without proper
demand management especially during drought years.
h. Large areas inhabited with tribal population lack facilities to harvest water and to stabilize
their food/ crop/ fodder production due to reduced forest yields, deterioration in land quality,
lack of tribal agriculture policy and population pressure. This leads to a sustained misery,
socio-political unrest and insurgency among the tribal population.
Surface Runoff Rainfall Runoff Relationship
One of the important questions in hydrology is the amount of stream flow to a river in response to a
given amount of rainfall. In order to understand this, we should know where the water goes when it

RD-1 NRM, Watershed Management and Sustainable Livelihoods MGNCRE clix
RD-1 NRM, Watershed Management and Sustainable Livelihoods
159 MGNCRE
159 MGNCRE | Natural Resource Management and Sustainable Development
rains, how long water remains in a watershed, and what pathway does water take to the stream
channel. These are the questions addressed in the study of rainfall – runoff processes, or more
generally surface water input – runoff processes. The term, "surface water input" is used in preference
to rainfall or precipitation to be inclusive of snowmelt as a driver for runoff.
To know the amount of runoff generated from surface water inputs requires partitioning water inputs
at the earth surface into two components namely components that infiltrate and components that
flow overland and directly enter streams. We should understand different pathways followed by
infiltrated water. One of the pathways is that infiltrated water can follow subsurface pathways that
take it to the stream relatively quickly which is called interflow or subsurface storm flow. Infiltrated
water can also percolate to deep groundwater, which may sustain the steady flow in streams over
much longer time scales that is called base flow. Infiltrated water can also remain in the soil to later
evaporate or be transpired back to the atmosphere. The paths taken by water determine many of the
characteristics of a landscape, the occurrence and size of floods, the uses to which land may be put
and the strategies required for wise land management. Comprehending and modelling the rainfall –
runoff process is therefore essential in many flood and water resources problems. Figure 2.3 illustrates
schematically many of the processes involved in the generation of runoff.
The rainfall – runoff question is vital for the interface linking meteorology and hydrology. Quantifying
and forecasting precipitation are in the sphere of meteorology and is part of the mission of the
National Weather Service. Meteorological forcing is also a driver of snowmelt surface water inputs.
River forecasting involves the use of meteorological variables as driving inputs to the surface
hydrology system to obtain stream flow. The temporal and spatial scales associated with surface water
inputs, given as output from meteorological processes have profound effects on the hydrological
processes that partition water inputs at the earth surface. High intensity short duration rainfall is much
more likely to exceed the capacity of the soil to infiltrate water and result in overland flow than a
longer less intense rainfall. In arid climates with deep water tables, spatially concentrated rainfall on
a small area may generate local runoff that then infiltrates downriver, whereas a more humid area
with shallow water tables is less likely to be subject to stream infiltration losses and even gentle rainfall
when widespread and accumulated over large areas may lead to large stream flows. Runoff includes
surface runoff (overland flow) and subsurface runoff or subsurface storm flow (interflow).

RD-1 NRM, Watershed Management and Sustainable Livelihoods MGNCRE clx
RD-1 NRM, Watershed Management and Sustainable Livelihoods
160 MGNCRE
160 MGNCRE | Natural Resource Management and Sustainable Development
Figure 2.3 Physical Processes Involved in Runoff Generation
(Sourcehttps//www.google.com/search?q=Physical+Processes+Involved+in+Runoff+Generation&source=lnms&tbm=isch&
sa=X&ved=0ahUKEwi6kM6G6IbjAhVFMY8KHbuLDQ8Q_AUIESgC&biw=1366&bih=651#imgrc=dleWIauxDjdE8M
Erosion Control
Erosion control is the process of preventing or controlling wind or water erosion in agriculture, land
development, coastal areas, riverbanks and construction. Effective erosion controls handle surface
runoff and are important techniques in preventing water pollution, soil loss, wildlife habitat loss and
human property loss.
Erosion controls are used effectively in natural areas, agricultural settings or urban environments. In
urban areas erosion controls are often part of storm water runoff management programs which is a
requirement of local governments. The controls often involve the creation of a physical barrier, such
as vegetation or rock, to absorb some of the energy of the wind or water that is causing the erosion.
They also involve building and maintaining storm drains. On construction sites they are often
implemented in conjunction with sediment controls such as sediment basins and silt fences.
Bank erosion is a natural process and without it, rivers would not meander and change course.
However, land management patterns that change the hydrograph and/or vegetation cover can act as
an agent to increase or decrease channel migration rates. In many places, whether or not the banks
are unstable due to human activities, people try to keep a river in a single place. This can be done for
environmental reclamation or to prevent a river from changing course into land that is being used by
people. One way that this is done is by placing riprap or gabions along the bank.
Factors Affecting Water Erosion
Water erosion occurs due to dispersive and transporting power of water. In water erosion, initially the
soil particles are detached from the soil surface by the force of raindrop and then transported with
surface runoff. There is a direct relationship between the soil loss and surface runoff volume. The
water erosion process is influenced primarily by climate, topography, soils and vegetative cover. The
following factors influence the water erosion.

RD-1 NRM, Watershed Management and Sustainable Livelihoods MGNCRE clxi
RD-1 NRM, Watershed Management and Sustainable Livelihoods
161 MGNCRE
161 MGNCRE | Natural Resource Management and Sustainable Development
Climatic Factors Climate includes rainfall, temperature and wind. The principal aspects of rainfall that
influence the volume of runoff, erosion and sediment (potential) from a given area are intensity and
duration of rainfall. As the volume and intensity of rainfall increase, the ability of water to detach and
transport soil particles increases. When storms are frequent, intense, and of long duration, the
potential for erosion of bare soils is high. Temperature has a major influence on soil erosion. Frozen
soils are relatively erosion resistant. However, bare soils with high moisture content are subject to
uplift or “spew” by freezing action and are usually easily eroded upon thawing. Wind contributes to
the drying of soil and increases the need for irrigation for new plantings and for applying wind erosion
control practices.
Soil Characteristics Soil characteristics include texture, structure, organic matter content and
permeability. These characteristics greatly decide the erodibility of soil. Soils containing high
percentages of sand and silt are the most susceptible to detachment because they lack inherent
cohesive characteristics. However, the high infiltration rates of sands either prevent or delay runoff
except where overland flow is concentrated. Clearly, well graded and well drained sands are usually
the least erodible soils in the context of sheet and rill erosion. Clay and organic matter act as a binder
to soil particles, thus reducing erodibility. As the clay and organic matter content of soils increase, the
erodibility decreases. However, while clay has a tendency to resist erosion, they are easily transported
by water once detached. Soils high in organic matter resist raindrop impact, and the organic matter
also increases the binding characteristics of the soil. Sandy and silty soils on slopes are highly
susceptible to gully erosion where flow concentrates because they lack inherent cohesiveness. Small
clay particles, referred to as colloids, resist the action of gravity and remain in suspension for long
periods of time. Colloids are potentially a major contributor to turbidity where they exist.
Vegetation Cover Vegetation cover is an extremely vital factor in reducing erosion at a place. It
absorbs energy of raindrops, binds soil particles, slows down the velocity of runoff water, increases
the ability of a soil to absorb water, removes subsurface water between rainfall events through the
process of evapotranspiration and reduces offsite fugitive dust. In order to reduce soil erosion, we
should limit the disturbances on vegetation cover and prevent the exposure of soils to erosive
elements. Vegetations obstruct raindrops from directly falling on the land surface as well as in the
flowing path of surface runoff. A good vegetative cover can nullify the effect of rainfall and protect
the land from soil erosion.
Topographic Effect The main topographic factors which influence soil erosion are land slope, length
of slope and shape of slope. The land slope or slope inclination is the main factor that affects the
erosion. As the slope increases, the runoff coefficient, kinetic energy and carrying capacity of surface
runoff also increases thereby decreasing the soil stability. Critical slope length is the slope length at
which the soil erosion begins. It is related to the critical land inclination. Lower the critical inclination
larger will be the critical slope length. The slope shapes have greater influence on erosion potential.
The base of a slope is more susceptible to erosion than the top, because runoff has more momentum
and is more concentrated as it approaches the base of slope. The slopes may be roughly convex or
concave. On convex slope the above phenomenon is magnified, whereas on concave slope it is
reduced. It is because in convex slope, the steepness increases towards bottom, while it is flattened
towards bottom in case of concave slope.

RD-1 NRM, Watershed Management and Sustainable Livelihoods MGNCRE clxii
RD-1 NRM, Watershed Management and Sustainable Livelihoods
162 MGNCRE
162 MGNCRE | Natural Resource Management and Sustainable Development
Mechanical Measures for Water Erosion Control
Mechanical practices are engineering measures that control the erosion from slopping land surfaces
and thus land surface modification is done for retention and safe disposal of runoff water. The basic
approach in this design is as follows (i) to increase the time of stay of runoff water in order to increase
the infiltration time for water, (ii) to decrease the effect of land slope on runoff velocity by intercepting
the slope at several points so that the velocity is less than the critical velocity, and (iii) to protect the
soil from erosion caused by the runoff water. Generally, the mechanical measures adopted for soil
and water conservation are bunding and terracing. Bonding is a mechanical method for control of soil
erosion. When agronomical measures fail to control erosion, other mechanical measures are adopted.
Watershed Restoration and Prioritization
In a watershed management programme, especially with large watersheds, it may not be feasible to
treat the entire area of the watershed with land treatment measures. Identification and selection of
few areas or sub watersheds having relatively more degradation problems are required for
development planning and implementation of conservation activities according to the level of need
and status of degradation. These few selected areas or sub watersheds within a large watershed are
called priority watersheds. In this process, collection of sufficient biophysical and socioeconomic
information is required for integrated watershed management planning. After effectively prioritizing
watersheds or sub watersheds, a sub watershed management plan for each priority sub watershed is
prepared in order to minimize natural and human induced hazards and to conserve valuable resources
(soil, water, biodiversity and socio-cultural aspects). And finally, various integrated watershed
management activities in the selected priority watershed (sub watershed) is implemented.
Factors Influencing Prioritizing Watersheds
We face enormous soil and water degradation issues. Due to lack of both finances and expertise, a
scientific approach to land resource management requires suitable methodology for clear
identification of critical areas for treatment. Prioritization of areas into very high, high, medium, low
and very low vulnerability helps in addressing the conservation and management efforts to secure
maximum benefit.
Watershed prioritization is a prerequisite to operationalize any major scheme as it allows the planners
and policy makers to adopt a selective approach considering the vastness of the catchment area,
severity of the problems, constraints of funds and manpower demands of the local and political
system. Though the prioritization of watersheds varies with the objectives of different schemes, the
basic framework of watershed remains unchanged.
Benefits of Prioritization
1. This approach is simple to adapt and useful for managers, as it combines the best available
information from scientific investigations with the knowledge and intentions of local
stakeholders.
2. While comparing among watersheds or varying condition within the same cluster type or
across cluster types, this approach generates a relevant list of prioritized watersheds.
3. It assists the users in developing a profile of watersheds of interest, by graphically locating a
watershed and obtaining relevant information about its vulnerability.
4. The contemplative process used to locate multiple watersheds is helpful in deciding upon a
course of action with regard to prioritizing watershed protection and restoration.
RD-1 NRM, Watershed Management and Sustainable Livelihoods MGNCRE clxiii
RD-1 NRM, Watershed Management and Sustainable Livelihoods
163 MGNCRE
163 MGNCRE | Natural Resource Management and Sustainable Development
Water Conservation
Water conservation is a procedure that includes all the policies, strategies and activities to sustainably
manage the natural resource of fresh water, to protect the hydrosphere, and to meet the current and
future human demand. The consumption of water depends on population, household size, and growth
and affluence. Climate change is one of the factors that have increased pressures on natural water
resources especially in manufacturing and irrigation sector.
The goals of water conservation efforts include
• Ensuring availability of water for future generations where the withdrawal of freshwater from
an ecosystem does not exceed its natural replacement rate.
• Energy conservation water pumping, delivery and wastewater treatment facilities consume
large amount of energy. In some regions of the world over 15% of total electricity
consumption is devoted to water management.
• Habitat conservation where minimizing human water use helps to preserve freshwater
habitats for local wildlife and migrating waterfowl, but also water quality.
Water conservation can be profitable through the following activities
1. Water loss and waste of water resources should be minimised.
2. Any damage to water quality must be avoided.
3. Water management practices that reduce the use of water or enhance the beneficial use of
water should be encouraged.
Strategies for Water Conservation
Rainwater harvesting is one of the important strategies for water conservation. Digging ponds, lakes,
canals, expanding the water reservoir, and installing rainwater catching ducts and filtration systems
on homes are different methods of harvesting rainwater. Many countries still collect rainwater in clean
containers, boil it and use it as potable water. Harvested and filtered rainwater can be used for varied
purposes like in toilets, home gardening, irrigation of lawns and in small scale agriculture.
Protecting groundwater resources is another major strategy in water conservation. When
precipitation occurs, some infiltrates the soil and goes underground. Water in this saturation zone is
called groundwater. Contamination of groundwater prevents the use of groundwater as a source of
fresh drinking water and the natural regeneration of contaminated groundwater can takes years to
replenish. Examples of potential sources of groundwater contamination are storage tanks, septic
systems, uncontrolled hazardous waste, landfills, atmospheric contaminants, chemicals, and road
salts. Contamination of groundwater decreases the replenishment of available freshwater, so
prevention of contamination of groundwater is important for water conservation.
Another strategy for water conservation is practicing sustainable methods of utilizing groundwater
resources. Groundwater flows due to gravity and eventually discharges into streams. Surplus use of
groundwater leads to a decrease in groundwater levels and if continued it can exhaust the resource.
Ground and surface waters are connected, and therefore overuse of groundwater can decline the
water supply of lakes, rivers, and streams. In coastal regions, excessive pumping of groundwater can
increase saltwater intrusion which results in the contamination of groundwater water supply.
Sustainable use of groundwater is essential in water conservation. A fundamental component to water
conservation strategy is communication and education outreach of different water programs.

RD-1 NRM, Watershed Management and Sustainable Livelihoods MGNCRE clxiv
RD-1 NRM, Watershed Management and Sustainable Livelihoods
164 MGNCRE
164 MGNCRE | Natural Resource Management and Sustainable Development
Developing communication to educate land managers, policy makers, farmers, and the general public
about the necessity of conservation of groundwater is another important strategy for water
conservation.
Ecosystem Services of Watershed
Ecosystem services are nature’s gift that humans freely gain from the natural environment and from
properly functioning ecosystems. Such ecosystems comprising ecosystems, forest ecosystems,
grassland ecosystems and aquatic ecosystems. Collectively, these benefits are known as 'ecosystem
services', and are often integral to the provisioning of clean drinking water, the decomposition of
wastes, and the natural pollination of crops and other plants.
Though scientists and environmentalists had been discussing the concept of ecosystem services
implicitly for decades, it was popularized through the Millennium Ecosystem Assessment (MA) in the
early 2000s. The ecosystem services are grouped into four broad categories provisioning, regulating,
supporting and cultural. Provisioning includes the production of food and water; regulating involves
the control of climate and disease; supporting meant nutrient cycles and oxygen production; and
cultural contains spiritual and recreational benefits. To help inform decision makers, many ecosystem
services are being assigned economic values. As per the 2006 Millennium Ecosystem Assessment
(MA), ecosystem services are "the benefits people obtain from ecosystems". The MA also delineated
the four categories of ecosystem services.
References
1. All India Soil and Land Use Survey (AISLUS). (1990). Watershed Atlas of India, All India Soil and
Land Use Survey, Ministry of Agriculture, Government of India, New Delhi, India
2. Bali, Y. P. (1980). Selection of implementation area/ catchment, watershed delineation,
classification and priority determination. National Seminar on Watershed Management
Rainfed and Himalayan Development. New Delhi, India.
3. Brooks, K. N. and Eckman, K. (2000). Global perspective of watershed management,
Chaptered States Department of Agriculture (USDA). Forest Service Proceedings of the Rocky
Mountain Research Station (RMRS) P13, USA.
4. Central Water Commission (CWC). (2011). Water Resources at a Glance. New Delhi, India.
[www.cwc.nic.in]
5. Folliott, P. F. [Ed.]. (2002). Land Stewardship through Watershed Management Perspectives
for the 21st Century, Springer, Germany.
6. Hindustan Times, Daily Newspaper, Kolkata. (2010). Aug. 31, West Bengal, India.
7. Jalvigyan Sameeksha (Hydrology Review), 21() 5166, Indian National Committee on Hydrology
(INCOH), National Institute of Hydrology, Roorkee, Uttarakhand, India.
8. Sharda, V. N. and Ojasvi, P. R. (2006). Moderation of floods and mitigation of droughts through
integrated watershed management.
To Do Activity
How much water is needed by one person per day? Several international agencies and experts
have proposed that 50 litres per person per day covers basic human water requirements for
drinking, sanitation, bathing and food preparation. Estimate your average daily consumption of
water.

RD-1 NRM, Watershed Management and Sustainable Livelihoods MGNCRE clxv
RD-1 NRM, Watershed Management and Sustainable Livelihoods
165 MGNCRE
165 MGNCRE | Natural Resource Management and Sustainable Development
Chapter 3 Food Resources Management
Introduction It is said that we are what we eat. Our existence and our aspirations as a society depend on the
availability of, and access to, food. At the same time, our food depends directly on the condition of
our natural resources. The food we grow, harvest, trade, transport, store, sell and consume is
therefore one of the essential connecting threads between people, their culture and wellbeing, and
the health of our planet. This Chapter focuses on food resources and their management.
Objectives
• To explain about food resources –introduction, types and current scenario
• To explain the concept of world food problems and effects of modern agriculture
• To understand the concept of fisheries and their management
Structure
3.1 Food Resources
India depends entirely on agriculture, animal husbandry and fishing for our supply of food. India is
self-sufficient in food production, thanks to the modern patterns of agriculture. But it is unfortunate
that these agricultural patterns are unsustainable and pollute our environment with excessive use of
fertilizers and pesticides.
The FAO defines sustainable agriculture as that “which conserves land, water and plant and animal
genetic resources, does not degrade the environment and is economically viable and socially
acceptable.” Most of our large farms grow single crops (monoculture). If this crop is hit by a pest, the
entire crop can be devastated, leaving the farmer with no income during the year.
On the other hand, if the farmer uses traditional varieties and grows several different crops, the
chance of complete failure is lowered considerably. Many studies have shown that one can use
alternatives to inorganic fertilizers and pesticides. This is known as Integrated Crop Management.
3.1 Food Resources
3.2 World Food Problems
3.3 Effects of Modern Agriculture
3.4 Food Security
3.5 Fisheries Management

RD-1 NRM, Watershed Management and Sustainable Livelihoods MGNCRE clxvi
RD-1 NRM, Watershed Management and Sustainable Livelihoods
166 MGNCRE
166 MGNCRE | Natural Resource Management and Sustainable Development
Food is essential for growth and development of living organisms. These essential materials are called
nutrients and these nutrients are available from a variety of animals and plants. There are thousands
of edible plants and animals over the world, out of which only about three dozen types constitute
major food of humans.
Types of Food Sources
A large population of people obtain food from cultivated plants and domesticated animals. Though
oceans and freshwaters also provide food for humans, majority of human population depend on food
obtained from traditional land based agriculture of crops and livestock.
Food Crops
It is estimated that out of about 2,50,000 species of plants, only about 3,000 have been tried as
agricultural crops. Under different agroclimatic condition, 300 are grown for food and only 100 are
used on a large scale. Some species of crops provide food, whereas others provide commercial
products like oils, fibres, etc. Raw crops are sometimes converted into valuable edible products by
using different value addition techniques. Ata global level, only 20 species of crops are used for food.
These crops in the order of importance are wheat, rice, corn, potatoes, barley, sweet potatoes,
cassavas, soybeans, oats, sorghum, millet, sugarcane, sugar beets, rye, peanuts, field beans, chickpeas,
pigeon peas, bananas and coconuts. Many of these crops are used directly and some others are used
by converting them into different forms and thus increasing its calorific value.
Livestock
Another important food source is domesticated animals. The major domesticated animals used as
food source by human beings are ‘ruminants’ (e.g. cattle, sheep, goats, camel, reindeer, llama, etc.).
Ruminants convert indigestible woody tissue of plants (cellulose) which are earth’s most abundant
organic compound into digestible food products for human consumption. Milk, which is provided by
milking animals, is considered as a complete food. Other domestic animals which are sources of meat
are sheep, goat, poultry and ducks.
Aquaculture
Fish and seafood contribute 17 million metric tonnes of high quality protein to provide balanced diet
to the world. Though aquaculture contributes only for a small amount of food worldwide, its
significance is increasing day by day.
Food System and Natural Resources – Current Scenario
The present food systems we follow are considered unsustainable from a natural resources
perspective. The way these food systems currently functions responsible for land degradation,
depletion of fish stocks, nutrient losses, impacts on terrestrial and aquatic biodiversity, impacts on air,
soil and water quality, and greenhouse gas emissions contributing to climate change. Various other
factors like population growth, expansion of cities, dietary shifts to unhealthy and unsustainable
consumption also will enhance the pressures on natural resources.
There are significant possibilities to separate food system activities from environmental degradation,
especially by increasing efficiencies and improving the management of the natural resource base.
Different methods for sustaining the environment are increasing efficiencies of livestock feed,
nutrients, genetics and water. Efficiency of livestock feed need to be increased as farmed animals
consume around 35% of the total crop production. Nutrient efficiency also requires enhancement as

RD-1 NRM, Watershed Management and Sustainable Livelihoods MGNCRE clxvii
RD-1 NRM, Watershed Management and Sustainable Livelihoods
167 MGNCRE
167 MGNCRE | Natural Resource Management and Sustainable Development
the global average nutrient efficiency for nitrogen and phosphorus is only around 20%. New farming
technologies (e.g. drip irrigation, ‘low till and precision agriculture’) and improved varieties of crops
(e.g. crops which are more resilient to water and heat stresses) have the potential to increase the
efficiency at multiple levels (e.g. lower nitrogen losses, lower water use, and higher productivity). This
will lead to increased production of food with fewer resources. New farm and decision-making related
innovations (e.g. use of mobile technology to provide price and weather related information to
farmers, remote sensing monitoring) can help reduce on farm food losses and improve transparency
in food markets thus reducing price volatility. More energy and water efficient food processing (e.g.
dry extraction of plant sourced protein) is also possible. A reduction in food loss and waste across food
systems, and a levelling off of meat and dairy consumption in developed countries could reduce the
global cereal demand by 15%. The reduction of meat and dairy consumption by 50% in these countries
could lead to up to 40% lower nutrient losses and greenhouse gas emissions.
Figure 3.1 Relation between Resource use and Environmental Impacts Related to Food System
Activities
3.2 World Food Problems
In many developing countries where there is rapid expansion of population, the production of food is
insufficient compared to the growing demand. Food production in 64 of the 105 developing countries
is lagging behind their population growth levels. This is due to their inability to produce more food
and their financial constraints to import it. India is one of the countries that have been able to produce

RD-1 NRM, Watershed Management and Sustainable Livelihoods MGNCRE clxviii
RD-1 NRM, Watershed Management and Sustainable Livelihoods
168 MGNCRE
168 MGNCRE | Natural Resource Management and Sustainable Development
enough food according to the population demand by cultivating a large portion of its arable land
through irrigation. The Green Revolution of the 60’s was one of the reasons for reduced starvation in
the country. However, the technologies we have used in Green Revolution to achieve this target are
now being questioned.
• Our fertile soils are being exploited faster than they can recuperate.
• Forests, grasslands and wetlands have been converted to agricultural use, which has led to
serious ecological problems.
• Our fish resources, both marine and inland, show evidence of exhaustion.
• There are great disparities in the availability of nutritious food across the country. Some
communities such as tribal people are still malnourished due to lack of nutritious food
especially among women and children.
These issues led to the question of meeting the increasing demands of food even with a slowing of
population growth. Today the world is experiencing a changing trend in dietary habits. People have
shifted to non vegetarian food as living standards are improving. As people change from eating grain
to meat, the world’s demand for feed for livestock based on agriculture increases as well. This uses
more land per Chapter of food produced and the result is that the world’s poor do not get enough
food to eat.
Women play an extremely vital role in food production as well as cooking and feeding children. But,
in most rural communities they have the least exposure to technical training and to issues related to
nutritional aspects. Women and girls often receive less food than men. These disparities need
immediate attention. In India, cultivable productive land is limited. Small farm sizes do not support a
family on farm produce alone. With each generation, farms are being subdivided further. Poor
environmental agricultural practices such as jhum cultivation, shifting cultivation, or ‘rabi’ (woodash)
cultivation degrade forests. Globally 5 to 7 million hectares of farmland is degraded each year. Land
degradation occurs due to loss of nutrients and overuse of chemicals for agricultural production.
Water scarcity is another important aspect of poor agricultural outputs. Salinization and water logging
have affected a large amount of agricultural land worldwide. Loss of genetic diversity in crop plants is
another issue that is leading to a fall in agricultural produce. Rice, wheat and corn are the staple foods
of two thirds of the world’s people. As wild relatives of crop plants in the world’s grasslands, wetlands
and other natural habitats are being lost, the ability to enhance traits that are resistant to diseases,
salinity, etc. is lost. Genetic engineering remains an untried and risky alternative to traditional cross
breeding.
As per the estimates of Food and Agriculture Organization (FAO), about 840 million people around the
world remain hungry and out of this 800 million are living in the developing world. In the last decade,
there is a decreasing trend at the rate of 2.5 million per year, but world’s population is increasing
simultaneously. With the present trend, the target of cutting half the number of world’s chronically
hungry and undernourished people by 2015 could not be met. Due to sparse purchasing power of the
poor to buy food, they are unable to maintain the minimum calorific requirement of human body per
day. Since large numbers of people in India are poor there exists an equitable distribution of income.
Food insufficiency can be divided into two categories undernourishment and malnourishment. Both
insufficiencies are global problems.

RD-1 NRM, Watershed Management and Sustainable Livelihoods MGNCRE clxix
RD-1 NRM, Watershed Management and Sustainable Livelihoods
169 MGNCRE
169 MGNCRE | Natural Resource Management and Sustainable Development
Under Nourishment
According to the estimates of FAO, globally the average minimum daily calorie intake is about 2,500
calories per day. People who receive less than 90% of their minimum dietary intake on a long term
basis are considered undernourished. Those who receive less than 80% of their minimum daily calorie
intake requirements are considered ‘seriously’ undernourished. Children who are seriously
undernourished are at the receiving end and they are likely to suffer from multiple problems like
stunted growth, mental retardation, and other social and developmental disorders. Therefore,
undernourishment means lack of enough calories in available food, resulting in little or no ability to
move or work.
Malnourishment
Malnourishment occurs due to deficiency in nutrients in body. Though a person may have excess food,
but still his/her diet suffers due to nutritional imbalance or inability to absorb the nutrients or may
have a problem to utilize essential nutrients. If we compare the diet of people from developed
countries with developing countries, people in developed countries have processed food which may
be deficient in fibre, vitamins and other components whereas the diet of developing countries lack
specific nutrients because of consumption of less meat, fruits and vegetables due to poor purchasing
power. Malnourishment can be defined as lack of specific components of food such as proteins,
vitamins, or essential chemical elements. The major problems of malnutrition are
Marasmus a progressive emaciation caused by lack of protein and calories.
Kwashiorkor lack of sufficient protein in the diet which leads to failure of neural development and
therefore learning disabilities.
Anaemia it is caused by lack of iron in the diet or due to an inability to absorb iron from food.
Pellagra it occurs due to the deficiency of vitamins in the diet.
Every year, lack of food and problems associated with it kill as many people as were killed by the
atomic bomb dropped in Hiroshima during World War II. This shows that there is a drastic need to
increase food production, equitably distribute it and to control population growth. Although India is
the third largest producer of staple crops, it is estimated that about 300 million Indians are still
undernourished. India has only half as much land as USA, but it has nearly three times the population
of USA to feed. Our food problems are directly related to population.
Balanced Diet
Supply of adequate amount of different nutrients can help to improve malnutrition and its ill effects.
Cereals like wheat and rice can supply only carbohydrates which are rich in energy supply but are only
a fraction of nutritional requirement. Cereal diet must be supplemented with other foods that can
supply fat, protein and minor quantities of minerals and vitamins. A balanced diet will help to improve
growth and health.
Changes Caused by Agriculture and Overgrazing
For centuries, agriculture is providing inputs to large number of industries involved in production,
processing and distribution of food. Accordingly, agriculture has a significant effect on environment.
The effects of agriculture on environment can be classified at local, regional, and global levels.
Generally, agriculture makes impact on the usage of land as follows

RD-1 NRM, Watershed Management and Sustainable Livelihoods MGNCRE clxx
RD-1 NRM, Watershed Management and Sustainable Livelihoods
170 MGNCRE
170 MGNCRE | Natural Resource Management and Sustainable Development
• Deforestation
• Soil Erosion
• Depletion of nutrients
• Impact related to high yielding varieties (HYV)
• Fertilizers related problems including micronutrient imbalance, nitrite pollution and
eutrophication.
• Pesticide related problems including creating resistance in pests and producing new pests,
death of nontarget organisms, biological magnification.
• Some other problems like water logging, salinity problems and the like.
The carrying capacity of land for cattle depends upon microclimate and soil fertility. If carrying capacity
is exceeded, then land is overgrazed. Because of overgrazing, the agricultural land gets affected as
follows
• Reduction in growth and diversity of plant species
• Reduced plant cover leads to increased soil erosion
• Cattle trampling leads to land degradation
3.3 Effects of Modern Agriculture
For sustainable production modern techniques are used to enhance productivity of different cropping
systems under different agroeconomics. Adoption of modern agricultural practises has both positive
and negative effects on environment. Effects of modern agriculture are briefly discussed under
different heads as under.
Soil Erosion
Raindrops falling on bare soil result in one of the oldest and still most serious problem of agriculture,
which is soil erosion. The history of soil erosion is one of devastation and it had greatly impacted
civilization. Eroded fields show that we are a failure as stewards of land.
Irrigation
Adequate rainfall is essential for farming in arid and semiarid regions and it is never guaranteed for
the dry land farmer. This makes irrigation indispensable for reliable production. Irrigation ensures
enough water when needed and allows farmers to expand their acreage of suitable cropland. In fact,
we rely heavily on crops from irrigated lands, and it is estimated that one third of the world's harvest
come from 17% of cropland that is under irrigation. Unfortunately, current irrigation practices severely
damage the cropland and the aquatic systems from which the water is withdrawn.
Agriculture and the Loss of Genetic Diversity
As modern agriculture converts an ever increasing portion of the earth's land surface to monoculture,
the genetic and ecological diversity of the planet erodes. The factors that contribute to genetic erosion
To Do Activity
Identify the main sources of food and the staple food consumed by the people in your area. Also
make a note on the production, distribution and supply of food resources in your area.

RD-1 NRM, Watershed Management and Sustainable Livelihoods MGNCRE clxxi
RD-1 NRM, Watershed Management and Sustainable Livelihoods
171 MGNCRE
171 MGNCRE | Natural Resource Management and Sustainable Development
include conversion of diverse natural ecosystems to new agricultural lands and the narrowing of the
genetic diversity of crops.
Fertilizer Pesticide Problems
For photosynthesis plants require water, sunshine and CO2. Apart from this, plants also need micro
and macro nutrients for growth. These nutrients are supplied in the form of fertilizers. There is lot of
potential to increase food productivity by increasing fertilizer use. On the one hand, application of
artificial chemical fertilizers increases the productivity at a faster rate as compared to organic
fertilizers, on the other hand, application of fertilizers can be a serious problem of pollution and can
create a number of problems. Excessive level of nitrates in ground water has created problems in
developed countries. These are
• Accumulated phosphorous because of the use of phosphoric fertilizers are posing serious
threat as residues in domestic water supply and for ecology of river and other water bodies.
Increased level of phosphates in different waters results in eutrophication.
• Effect of chemical fertilizer is long term, therefore leads to net loss of soil organic matter.
To control insects, pests, diseases and weeds which are responsible for reduction in productivity,
different chemicals are used as insecticides, pesticides and herbicides. Successful control of insects,
pests and weeds increases productivity and reduces losses and provide security for harvest and
storage. Applications of these synthetic chemicals have great economic values and at the same time
cause a number of serious problems such as
• Affects human health which includes acute poisoning and illness caused by higher doses and
accidental exposes
• As long term effect, cause cancer, birth defects, Parkinson’s disease and other regenerative
diseases.
• Long term application of pesticides can affect soil fertility.
• Danger of killing beneficial predators.
• Pesticides resistance and pest resurgence
Water Logging
High water table or surface flooding can cause water logging problems. Water logging may lead to
poor crop productivity due to anaerobic condition created in the soil. In India, deltas of Ganga,
Andaman and Nicobar Islands and some areas of Kerala are prone to frequent water logging.
Salinity
Due to adoption of intensive agriculture practices and increased concentration of soluble salts leads
to salinity. Due to poor drainage, dissolved salts accumulate on soil surface and affects soil fertility.
Excess concentration of these salts may form a crust on the surface which may be injurious to the
plants. The water absorption process is affected, and uptake of nutrient is disturbed. According to an
estimate, in India, 7 million hectares of land is saline, and that area is showing increasing trends due
to adoption of intensive agriculture practices.
Case Studies
1. A study on birth defects in water birds in Kester son wildlife refuge in California indicated that these
defects were due to high concentration of selenium.

RD-1 NRM, Watershed Management and Sustainable Livelihoods MGNCRE clxxii
RD-1 NRM, Watershed Management and Sustainable Livelihoods
172 MGNCRE
172 MGNCRE | Natural Resource Management and Sustainable Development
2. Recent reports from cotton growing belt of Punjab which covers Abohar, Fazalka and part of
Bathinda indicates that overuse of pesticides for control of insects in cotton to enhance productivity
has not only affected soil health, but also caused cancer in human beings.
3. Diclofenac is a drug for veterinary use to treat the livestock which have strong residual nature and
leads to high persistence throughout the food chain. Due to biomagnification it becomes more
dangerous to the vultures as they are consumers of diclofenac treated cattle. Diclofenac is responsible
for bringing three South Asian species of Gyps vultures to the brink of extinction. It has been banned
in India since 2006.
3.4 Food Security
It is estimated that 18 million people worldwide and mainly children, die each year due to starvation
or malnutrition, and many others suffer a variety of dietary deficiencies. The earth’s supply of food is
restricted. If the world’s carrying capacity to produce food cannot meet the demands of a growing
population, this might result in anarchy and conflict. Thus, food security and population control are
directly connected. Food security is also linked to the availability of water for farming. Equitable
distribution of food only can only result in food security. Generally, people waste a large amount of
food carelessly. This eventually places great stress on our environmental resources. One of the major
concerns in this sector is the support needed for small farmers so that they remain farmers rather
than shifting to urban centres as unskilled industrial workers. International trade policies regarding an
improved flow of food across national borders from those who have surplus to those who have a
deficit in the developing world is another issue that is a grave concern for planners who deal with
International trade concerns. ‘Dumping’ of under priced foodstuffs produced in the developed world,
onto markets in undeveloped countries undermines prices and forces farmers there to adopt
unsustainable practices to compete in this field.
Approaches to Sustainable Food Security in Developing Countries
Intensification of Agricultural Production
The main ideal behind intensification of agricultural production is that better conditions extended for
producers of food will jointly improve their livelihoods and reduce incentives for land clearing. For
example, African farmers have traditionally followed shifting cultivation in response to population
growth and declining soil fertility. This path of agricultural expansion is best suited to land abundant
countries.
Ensuring enhanced food security through reserves of grains and foodstuffs is an approach taken
mainly by governments. In this case the government buys grain from farmers in the postharvest
season and stores it as a reserve to sell where and when food shortages occur. In practice, government
storage programs are problematic due to inadequate infrastructure (i.e. lack of processing, storage
and transport facilities). Government storage schemes also tend to discourage private sector provision
of storage by undermining profitability of private efforts.
To Do Activity
Observe how food is being wasted in your area or community, whether it is a marriage function
or any other event. Also suggest some food conservation methods.

RD-1 NRM, Watershed Management and Sustainable Livelihoods MGNCRE clxxiii
RD-1 NRM, Watershed Management and Sustainable Livelihoods
173 MGNCRE
173 MGNCRE | Natural Resource Management and Sustainable Development
Food Aid
Food aid is one of the main international safety nets for many low income countries. Food aid has
been used for development purposes. The important role of food aid is to function as an instrument
to offset food shortages in developing countries, especially where fluctuations in domestic food
production threaten food security. In such settings internal mechanisms like providing grain stocks are
expensive and cash reserves (to buy food imports) are often inadequate to bridge the food gap
(Shapouri and Rosen, 2001). Food aid is expected to continue to play a crucial role in alleviating
transitory shortages and emergencies for low income countries. However, this is a short term solution
to solving the problems of food shortages and can be counterproductive by undermining incentives
for local agricultural producers.
Food Import
Governments in developing countries use food imports by importing food from developed countries
or other external sources during food shortages in their countries. However, this has been a failure
due to inadequate cash reserves with them to import food. In order to achieve this, developing
countries should promote exports to raise cash. This can be done through promoting both agricultural
and non-agricultural exports.
Livelihood Approach
The livelihood approach puts emphasis on the development of livelihood strategies those supporting
and boosting resources by developing or increasing incomes and assets through livelihood
diversification (WFP 1998). This approach originates from the premise that in developing countries
farmers mainly depend on agricultural production for food and income to meet other household
requirements. The livelihood approach recognizes that households pursue a range of livelihood
strategies through diversification of income sources or assets (natural, financial, social, human and
physical capital). This approach also recognizes that household needs consist of more than food, vital
non-food needs such as shelter, clothing and health compete with food needs in terms of household’s
resource allocation (Frankenberger, 1996).
The livelihood approach is said to be effective because it incorporates the present situation, the short
term and the long-term perspective. The objective is not only to preserve current patterns of
consumption, but also to avoid destruction or sacrificing future standards of living. The approach puts
emphasis on the livelihood systems maintained by a range of on farm and off farm activities. Together
these provide a variety of procurement strategies for food and cash (WFP, 1998). It provides a policy
framework for policymaking process that explicitly recognizes that increased agricultural productivity
is not the only solution. The answer lies in supporting the diversification of income sources and assets,
as well as promoting investments and activities that help households to face shocks to their livelihoods
and reduce risks.
Alternate Food Sources
Food can be innovatively produced if we break out of the current agricultural patterns. This includes
working on new avenues to produce food, such as using forests for their multiple nonwood forest
products, which can be used for food if harvested sustainably. This includes fruits, mushrooms, sap,
gum, etc. This takes time, as people must develop a taste for these new foods.

RD-1 NRM, Watershed Management and Sustainable Livelihoods MGNCRE clxxiv
RD-1 NRM, Watershed Management and Sustainable Livelihoods
174 MGNCRE
174 MGNCRE | Natural Resource Management and Sustainable Development
Case Study
Israel began using drip irrigation system as it is short of water. With this technique, farmers have been
able to improve the efficiency of irrigation by 95%. Over a 20year period, Israel’s food production
doubled without an increase in the use of water for agriculture.
In India, some traditional communities in urban and semi urban towns used to grow their own
vegetables in backyards on wastewater from their own homes. Calcutta releases its wastewater into
surrounding lagoons in which fish are reared and the water is used for growing vegetables.
3.5 Fisheries Management
Fish is an important protein food in many parts of the world, and this includes both marine and
freshwater fish. Around the globe, the supply of food from fisheries has increased phenomenally
between 1950 and 1990, and fish catch has shown a decline due to overfishing in several parts of the
world. FAO reports in 1995 reveals that 44% of the world’s fisheries are fully or heavily exploited, 16%
are overexploited, 6% are depleted, and only 3% are gradually recovering. Canada had to virtually
close down cod fishing in the 1990s due to depletion of fish reserves. Modern fishing technologies
using mechanized trawlers and small meshed nets results in overexploitation, which is not sustainable.
It is obvious that fish have to breed successfully and need time to grow if the yield has to be used
sustainably. The worst hits are the small traditional fishermen who cannot compete with organized
trawlers.
There is a large scope for the development of fisheries in our country because of large continental
shelf of 20 lakh square kms, availability of sufficient fish in big lakes and rivers, oceanic currents and
skilled fishermen. Marine fishing is done in seas and oceans and Inland fishing is carried out in lakes,
rivers and reservoirs. More than 1800 distinct species of fish are known to exist in India. Four forms
of fisheries exist in India, viz., marine fisheries, freshwater or inland fisheries, estuarine fisheries and
the pearl fisheries.
It is estimated that marine fisheries accounts for about 63 per cent of the annual fish production.
Major fishes are sardines, mackerel, prawns, clupeoids and silver bellies. About two fifths or 37 per
cent of the country’s total fish production comes from inland fisheries. Major fishes are catla, rohita,
kalabasil, mringal and carp etc. More than ninetenths or 97 percent of the country’s total production
of marine fish and more than three fourths or 77 per cent of inland water fish is raised in Kerala,
Maharashtra, Tamil Nadu, West Bengal, Andhra Pradesh, Karnataka and Gujarat. Notably, all are
coastal states.
Fish and Other Marine Resources
Fish is a cheap source of animal protein for our food. Fish production comprises the finned true fish
as well as shellfish such as prawns and molluscs. There are mainly two methods of obtaining fish, viz.,
capture fishing and culture fishery. Fish obtained from natural resources is called capture fishing. Fish
obtained by fish farming is called culture fishery. The water source for fishing can be either seawater
or fresh water, such as in rivers and ponds. Fishing can thus be done both by capture and culture of
fish in marine and freshwater ecosystems.
Marine Fisheries
India’s marine fishery resources include 7500 km of coastline and the deep seas beyond it. Popular
marine fish varieties include pomfret, mackerel, tuna, sardines and Bombay duck. Marine fish are

RD-1 NRM, Watershed Management and Sustainable Livelihoods MGNCRE clxxv
RD-1 NRM, Watershed Management and Sustainable Livelihoods
175 MGNCRE
175 MGNCRE | Natural Resource Management and Sustainable Development
caught using many kinds of fishing nets from fishing boats. Yields are increased by locating large
schools of fish in the open sea using satellites and echosounders.
Some marine fish of high economic value are also farmed in seawater. This includes finned fishes like
mullets, bhetki, pearl spots, shellfish such as prawns, mussels and oysters as well as seaweed. Oysters
are also cultivated for obtaining pearls. As the depletion of marine fish occurs, the demand for more
fish can only be met by such culture fisheries, a practice called mari culture.
Inland Fisheries
Fresh water resources of fisheries include canals, ponds, reservoirs and rivers. Brackish water
resources, where seawater and fresh water mix together, such as estuaries and lagoons are also
important fish reservoirs. Mostly capture fishing done in inland water bodies produces low yield. Most
fish production from these resources is through aquaculture. Fish culture is also done in combination
with a rice crop, and fish are grown in the water in the paddy field. More intensive fish farming can be
done in composite fish culture systems. Both local and imported fish species are used in such systems.
In a composite fish culture system, a combination of five or six fish species of fish is used in a single
fishpond. These species are selected in such a way that they have different types of food habits and
they do not compete for food among them. As a result, the food available in all parts of the pond is
used. As Catlas are surface feeders, Rohus feed in the middle zone of the pond, Mrigals and Common
Carps are bottom feeders, and Grass Carps feed on the weeds, these species can use all the food in
the pond without competing with each other. This increases the fish yield from the pond.
One of the problems with composite fish culture is that many of these fishes breed only during
monsoon. Even if fish seed is collected from the wild, it can be mixed with that of other species as
well. So, a major problem in fish farming is the lack of availability of good quality seed. To overcome
this problem, fish in ponds is bred using hormonal stimulation. This has ensured the supply of pure
fish seed in desired quantities.
Fisheries in India
Fisheries in India are a very important economic activity and a flourishing sector with varied resources
and potentials. But fisheries together with agriculture had been recognized as an important sector
only after independence. India had achieved a 11fold increase in production in fisheries sector in just
six decades, i.e. from 0.75 million tonnes in 195051 to 9.6 million tonnes during 2012–13. This means
that India had reached a second position in global fish production after China with an average annual
growth rate of over 4.5 percent over the years. Besides meeting the domestic needs, the dependence
of over 14.5 million people on fisheries activities for their livelihood and foreign exchange earnings to
the tune of US$ 3.51 billion (2012–13) from fish and fisheries products justifies the importance of the
sector on the country's economy and in livelihood security. India is also an important country that
produces fish through aquaculture in the world. India is home to more than 10 percent of the global
fish diversity. Presently, the country ranks second in the world in total fish production with an annual
fish production of about 9.06 million metric tonnes.
Freshwater aquaculture contributes to over 95 percent of the total aquaculture production. The
freshwater aquaculture includes the culture of carp fishes, catfishes (air breathing and nonair
breathing), freshwater prawns, pangasius, and tilapia. In addition, in brackish water sector, the
aquaculture includes culture of shrimp varieties namely, the native giant tiger prawn (Penaeus

RD-1 NRM, Watershed Management and Sustainable Livelihoods MGNCRE clxxvi
RD-1 NRM, Watershed Management and Sustainable Livelihoods
176 MGNCRE
176 MGNCRE | Natural Resource Management and Sustainable Development
monodon) and exotic whiteleg shrimp (Penaeusvannamei). Thus, the production of carp in freshwater
and shrimps in brackishwater form the bulk of major areas of aquaculture activity. The three Indian
major carps, namely catla (Catlacatla), rohu (Labourite) and mrigal (Cirrhinusmrigala) contribute the
bulk of production to the extent of 70 to 75 percent of the total fresh water fish production, followed
by silver carp, grass carp, common carp, catfishes forming a second important group contributing to
the rest of 25 to 30 percent.
The technologies of induced carp breeding and polyculture in static ponds and tanks virtually
revolutionized the freshwater aquaculture sector and turned the sector into a fast-growing
commercial sector. The developmental support provided by the Indian Government through a
network of Fish Farmers' Development Agencies and Brackish water Fish Farmers' Development
Agencies and the research and development programmes of the Indian Council of Agricultural
Research (ICAR) have been instrumental for this revolutionary development. Various state
governments, a host of organizations and agencies like the Marine Products Export Development
Authority, financial institutions, etc. have also contributed to this effect.
Culture for maricultural species has been initiated in our country. It is presently carried out to a limited
extent for seaweeds and mussels as a commercial activity and it is extended to some fish species like
seabass and cobia on an experimental basis to standardize the technology. This has led to
sustainability of fisheries and the present concern is regarding species diversification because the
country possesses several other endemic potential and cultivable medium and minor carp species
having regional demand. Efforts are being made to standardize the technology of mass scale seed
production of these species and their inclusion as a component of conventional carp polyculture,
based on their regional importance. In addition, there is contribution from cold water fisheries.
Though of high value, it is a low volume category with a projected volume of 1 percent. Important
fishes of cold waters are mahaseer and schizophrenicswhich belongs to the indigenous species and
trout’s among the exotic varieties.
India's aquaculture production is classified into freshwater and brackish water production. There are
429 Fish Farmers Development Agencies (FFDA) and 39 Brackish water Fish Farmers Development
Agencies (BFDAs) for promoting freshwater and coastal aquaculture. Some of the important species
cultured in India includes the Indian major carps and shrimp. Besides these, ornamental fish culture
and seaweed farming, are slowly gaining importance in the aquaculture scenario in the last few years
as alternative livelihood supporting sectors as small-scale activities.
Aquaculture in India has evolved as a possible commercial farming practice. It emerged from the level
of traditional backyard activity over last three decades with considerable diversification in terms of
species and systems. Aquaculture is growing in India at an annual growth rate of 67 percent. The carp
based freshwater aquaculture comprising the Indian major carps, such as, catla, rohu and mrigal, has
been contributing over 90 percent of the aquaculture production and satisfies the domestic need.
Though the shrimp based coastal aquaculture is comparatively less, it contributes to about 5 percent
of the export earnings. Induced breeding of carps and catfishes, hatcheries for mass scale spawning,
seed rearing and carp polyculture are some of the epoch making technologies guided by the
freshwater aquaculture development. In recent years, aquaculture sector has shown extensive
diversification with the adoption of other species such as catfishes and freshwater prawns, due to
their higher market demand and economic values.

RD-1 NRM, Watershed Management and Sustainable Livelihoods MGNCRE clxxvii
RD-1 NRM, Watershed Management and Sustainable Livelihoods
177 MGNCRE
177 MGNCRE | Natural Resource Management and Sustainable Development
Growth of India’s Fisheries Sector
The growth of India’s fisheries sector can be divided into three phases.
In the first phase (19501966), landings were mainly by non mechanized traditional crafts and gears,
such as hook and line, gillnets, seines, bag nets, and traps, from catamarans, canoes and plank built
boats.
During the second phase (19671986), these vessels were modified to hold outboard engines of 59 HP
(i.e., motorization), to travel farther and increase fishing effort.
In the third phase (1987 to 2010), significant endeavours were made to increase mechanization
further and develop the industrial fishing sector. Vessels were equipped to engage in multiday
voyages, and a large expansion of fishing grounds was observed.
Though mechanized fishing has increased, India's fisheries remain small-scale and difficult to
categorize. The boundaries between subsistence (i.e., small-scale non-commercial) and artisanal (i.e.,
small-scale commercial) sectors in fishing are blurred. There are approximately 1.45 million fishers in
India and the bulk of marine fish landed (about 70%) is being targeted by mechanized fishing vessels,
which can be defined as industrial.
Figure 3.2 Growth of India’s Fisheries Sector
The Institutional Framework for Fisheries in India
The Ministry of Agriculture of the Government of India has a Department of Animal Husbandry,
Dairying, and Fisheries with a Division of Fisheries as the nodal agency. This agency is responsible for
planning, monitoring and the funding of several centrally sponsored developmental schemes related
to fisheries and aquaculture in all the Indian States. Most of the states has a separate Ministry for
Fisheries or else it remains within the Ministry of Animal Husbandry. All states have well organized
fisheries departments, with fisheries executive officers at district level and fisheries extension officers
at Chapter level, who are involved in the overall development of the sector. However, the
administrative structure at state levels varies from state to state. Centrally sponsored schemes like
the 422 FFDAs cover almost all districts in the Country and the 39 BFDAs in the maritime districts have
also contributed to aquaculture development.

RD-1 NRM, Watershed Management and Sustainable Livelihoods MGNCRE clxxviii
RD-1 NRM, Watershed Management and Sustainable Livelihoods
178 MGNCRE
178 MGNCRE | Natural Resource Management and Sustainable Development
The Indian Council of Agricultural Research located within the Department of Agricultural Research
and Education, which is within the Ministry of Agriculture, has a Division of Fisheries, which undertakes
the R&D on aquaculture and fisheries through several research institutes. There are about 400 Krishi
Vigyan Kendras (Farm Science Centres) in the country, operated through State Agricultural
Universities, ICAR Research Institutes and NGOs, most of which also undertake aquaculture
development within their scope of activities. The MPEDA functioning under the Ministry of Commerce,
besides its role in the export of aquatic products also contributes towards the promotion of coastal
aquaculture. Many other organizations and agencies also support or conduct R&D in fisheries and
include the departments of Science and Technology, departments of Biotechnology, University Grants
Commission, NGOs and private industry.
Blue Revolution
The Honourable Prime Minister has called for “a revolution” in the fisheries sector and has named it
as “Blue Revolution”. The Blue Revolution, with its multidimensional activities, focuses mainly on
increasing fisheries production and productivity from aquaculture and fisheries resources, both inland
and marine.
Objectives
• To increase the overall fish production in a responsible and sustainable manner for economic
prosperity
• To modernize the fisheries with special focus on new technologies
• To ensure food and nutritional security
• To generate employment and export earnings
• To ensure inclusive development and empower fishers and aquaculture farmers
The Ministry of Agriculture and Farmers Welfare, Department of Animal Husbandry, Dairying &
Fisheries has accordingly restructured the scheme by merging all the ongoing schemes under an
umbrella of Blue Revolution. The restructured scheme under Blue Revolution provides focused
development and management of fisheries, covering inland fisheries, aquaculture, marine fisheries
including deep sea fishing, maricultural and all activities undertaken by the National Fisheries
Development Board (NFDB). The restructured Centrally Sponsored Scheme on Blue Revolution
initiated Integrated Development and Management of Fisheries formulated at a total Central outlay
of 3000 crores for five years with the following components
a. National Fisheries Development Board (NFDB) and its activities
b. Development of Inland Fisheries and Aquaculture
c. Development of Marine Fisheries, Infrastructure and Postharvest Operations
d. Strengthening of Database & Geographical Information System of the Fisheries Sector
e. Institutional Arrangement for Fisheries Sector
f. Monitoring, Control and Surveillance (MCS) and other need-based Interventions
g. National Scheme of Welfare of Fishers
3.6 Issues and Challenges in Fisheries
The central ethical issues in fisheries relate widely to human and ecosystem wellbeing. This section
provides a short overview of some of the most important ethical issues poverty, the right to food,
overfishing and ecosystem degradation. These sector specific issues comprise subsidiary issues.
Example, the equity of fish distribution, the real or perceived dangers of genetic modification

RD-1 NRM, Watershed Management and Sustainable Livelihoods MGNCRE clxxix
RD-1 NRM, Watershed Management and Sustainable Livelihoods
179 MGNCRE
179 MGNCRE | Natural Resource Management and Sustainable Development
(FAO/WHO, 2003); and the catching and discarding of unwanted species, including emblematic
species.
Problems in this sector are compounded by contextual changes related to climate change and
globalization. Globalization is a complex, multidimensional and pervasive process characterized by the
increasing integration of economies around the world through trade and financial flows. It raises a
number of ethical issues relating to(i) the risk of losing cultural identity and diversity in fishing
communities (ii) the risk of further degradation of biodiversity and fishery resources (iii) the difficulty
of trying to satisfy a broader range of stakeholders explicitly and (iv) the negative consequences on
efforts to reduce poverty, increase food security and guarantee justice and social peace.
Poverty
Fisheries constitute a major source of livelihood for millions of people. Nearly 35 million fishers are
directly engaged in fishing and fish farming as a fulltime (i.e. where fishers receive 90 percent or more
of their livelihood from fishing) or part-time occupation (FAO, 2002). Fishers are particularly
concentrated in developing countries, where about 95 percent of the world's fishers live, and in Asia
as a whole, where approximately 85 percent reside. Fisheries policies that weaken the economic
foundations of fishers' communities will be more consequential in remote and rural areas of
developing countries, because here people rely mostly on fisheries as their sole livelihood option and
alternative sources of livelihood are rare.
In many highly populated Asian countries, artisanal fishing families are among the most socially,
economically and politically disadvantaged segments of the population and maintain a status
comparable to that of landless labourers or marginal farmers. Deprivation is so severe that the basic
needs of life are hardly met at the minimum level necessary for survival. Malnutrition is common,
infant mortality is high, and chronic sickness and disease result in very low life expectancies.
Conditions are similar in several areas of Africa and Latin America. However, small scale fishing families
are generally better off on these continents, even if the average income levels in small scale fisheries
are often below the official poverty lines.
According to FAO estimates, the number of poor small-scale fishers and related employees in marine
and inland capture fisheries is 5.8 million, representing 20 percent of the world's 29 million fishers.
Small-scale fisheries often find themselves in growing competition with industrial fisheries for space,
resources, inputs (labour and finances) and markets, with a strong impact on incomes distribution.
The suppliers of fishing inputs may become better off, as may the consumers of fish. Small-scale
fishers, on the other hand, may become increasingly uncompetitive and may eventually find their
sources of livelihood severely compromised. In South and Southeast Asia, the fishing industry has been
increasingly overtaken by large companies. As a result, fisheries employment opportunities have been
shifted to urban areas, and opportunities in rural areas have declined, e.g. for the women who
traditionally play important roles in processing, marketing and distributing the catch. This has resulted
in a feeling of "hopelessness and despair or feelings of anger" among fishers, particularly small-scale
fishers (Chong, 1994).
A renewed focus on the right to food has been one of the constructive responses to the state of
poverty in the world. As a response to persistent and widespread hunger, the 1996 Rome Declaration
on World Food Security and the World Food Summit Plan of Action reaffirmed the right of everyone
to adequate food and the fundamental right to be free from hunger, as stated in the Universal

RD-1 NRM, Watershed Management and Sustainable Livelihoods MGNCRE clxxx
RD-1 NRM, Watershed Management and Sustainable Livelihoods
180 MGNCRE
180 MGNCRE | Natural Resource Management and Sustainable Development
Declaration of Human Rights and the International Covenant on Economic, Social and Cultural Rights
of the Chaptered Nations General Assembly and in other relevant international and regional
instruments. They urged that particular attention be paid to the implementation and full and
progressive realization of these rights as a means of achieving food security for all. In 2002, FAO
established an Intergovernmental Working Group for the elaboration of a set of guidelines on the right
to food. In 2004, the FAO Council adopted the Voluntary Guidelines to Support the Progressive
Realization of the Right to Adequate Food in the Context of National Food Security.
Fish is a major source of both livelihood and nutrition for millions of the world's poorest people. In
2001, more than 48 percent of the world population (close to 3 billion people) obtained 1525 percent
of their proteins from fisheries, and more than 400 million people received more than 50 percent of
their proteins from fisheries (FAO, 2004). The latter include the poorest people in coastal rural areas
and small island developing states for whom a decrease in fish catch often means an immediate loss
in sources of food and calorie intake.
In many parts of the world, traditional ways of ensuring the right to adequate food have been affected
and often undermined by the weakening of social and cultural ties, caused by the breakup of
traditional family Chapters; accelerated urbanization; and the globalization of markets, information
and culture. Technological developments, as well as changes in trade and markets, have radically
altered, and internationalized many aspects of local fisheries. These changes have certainly resulted
in economic benefits for a large number of people and, in some instances, in a more efficient use of
the resource. But they have also brought about a shift from highly dispersed, largely rural, labour-
intensive small-scale fishing operations to centralized, urban or peri urban, capital intensive industrial
fisheries. This shift has also affected sectors such as fish processing, distribution and marketing and
amplified negative consequences to employment, income and food security of the rural poor.
During the past two decades, technology and trade have not only altered many traditional forms of
production, processing and distribution, but also created conflicts over resource access and use. The
significant increase in the volume of international fish trade is a rising concern for poor people and
the aquatic environment. The local level benefits in productivity and efficiency cannot solve the
problem of the poor, instead they require significant improvements to governance, as well as trade
and market policies. The changing state of fisheries resources, the economic climate and
environmental conditions have resulted in fluctuations in fish supply and demand, but fisheries and
aquaculture continue to be a significant source of food, employment and revenue for many countries
and communities.
Overexploitation or Overfishing
Overexploitation or overfishing is the removal of marine living resources to levels that cannot sustain
viable populations. Ultimately, overexploitation can lead to depletion of resources and may lead to
extinction of endangered species. A greater variety of species at a higher trophic level is exploited in
the sea compared to land. Humans exploit over 400 species as food resources from the marine
environment, whereas only ten species are harvested for commercial use on land. Exploitation of
marine biodiversity is also far less managed than on land and amounts to the hunter gatherers stage
that humans abandoned on land over 10,000 years ago, yet exploitation technology is becoming so
advanced that many marine species are threatened to extinction. Insufficient consideration has been

RD-1 NRM, Watershed Management and Sustainable Livelihoods MGNCRE clxxxi
RD-1 NRM, Watershed Management and Sustainable Livelihoods
181 MGNCRE
181 MGNCRE | Natural Resource Management and Sustainable Development
given to the unexpected and unpredictable long-term effects that such primitive food gathering
practices engender.
The overexploitation of marine living resources was due to the exponential growth in human
population which had led to increasing demand for food. Today fishing fleets are two to three times
larger than what our oceans can support. They exploit fish and many other marine species. The use of
modern techniques that support harvesting, transport and storage has accelerated this trend.
According to the Chaptered Nations Food and Agriculture Organization (FAO) over 25% of all the
world's fish stocks are either overexploited or depleted and 52% are fully exploited. Thus, almost 80%
of the world's fisheries are fully exploited, overexploited or depleted, or in a state of collapse. Recent
studies show that 29% of fish and seafood species have collapsed (i.e., their catch has declined by
90%) and are projected to collapse within by 2048, if proper measures are not taken. Worldwide about
90% of the stocks of large predatory fish stocks have already collapsed.
Overexploitation affects both the open ocean or pelagic ecosystems and the coastal and intertidal
areas. For example, intertidal limpets in Hawaii (Cellanaspp.), the Azores, Madeira and Canaries
(Patella spp.) have shown decline, and particularly with Azores, there was a dramatic population
crashes due to food gathering.
Overexploitation Effects
Fishing activities in an unsustainable destructive manner can lead to overexploitation of marine living
resources. This overexploitation of marine resources has huge impacts on marine systems and
especially it affects target species. Fishing effect can be categorised into direct effects and indirect
effects. Direct effects are related to target species and by catch species.
Direct Effects
When fishing of target species is relatively high, the average size of individual fish is affected because
larger individual fish tend to be harvested more and it leads to overfishing. Due to exploitation of adult
fish, the number and size of the adult population (spawning biomass) is reduced to a point that it does
not possess the reproductive capacity to replenish itself, leading to recruitment overfishing. Direct
effects of fishing also include physical disturbance by fishing gear than can cause scraping, scouring
and resuspension of the substratum. The effects vary according to the gears used and the habitats
fished. Trawling for demersal species is having a major effect on the habitat for species other than
target species. It has been estimated that all the seabed of the North Sea is trawled over at least twice
per year and the gear is getting heavier over time. Trawls have destroyed long-lived species of molluscs
and echinoderms in the North Sea. It has far reaching consequences as these species play important
roles in biogeochemical cycling.
Indirect Effects
Fishing also results in indirect effects such as effect of "ghost fishing", trophic cascading effects and
food web competition. Trophic cascading effects has been observed when top-level predators are
removed resulting in indirect effects throughout the ecosystem. On many temperate reefs shifts from
macroalgae dominated habitats to habitats grazed by sea urchins, termed ‘urchin barrens’ are linked
to the overharvesting of top predators. The best example of this is the interaction between sea otters,
sea urchins and kelp. The importance of the sea otterurchinkelp trophic cascade was demonstrated
after sea otters were wiped out by harvesting for their fur, allowing their prey, sea urchins, to

RD-1 NRM, Watershed Management and Sustainable Livelihoods MGNCRE clxxxii
RD-1 NRM, Watershed Management and Sustainable Livelihoods
182 MGNCRE
182 MGNCRE | Natural Resource Management and Sustainable Development
overgraze kelps and dominate many benthic ecosystems. After the repopulation of areas by otters,
kelp and its associated communities became much more abundant.
Ghost Fishing is a phenomenon that occurs when fishing nets are left or lost in the ocean by fishermen.
Often these nets are invisible in the dim light, it may be left entangled on a rocky reef or it might drift
in the open sea. They can act as a trap to fish, dolphins, sea turtles, sharks, dugongs, crocodiles,
seabirds, crabs, and other creatures, including the occasional human diver. If trapped in these nets, it
may restrict movement of fish and other species and can cause starvation, laceration and infection
and suffocation.
Overfishing and Ecosystem Degradation
The decline in fish stocks due to overfishing is potentially dangerous and often a threat to life in the
ocean. Biodiversity is threatened by unsustainable fisheries and increasing pollution. Entire
ecosystems may be degraded, and even destroyed, by human intervention. Depletion of fish stocks
leads to a host of problems like decrease in food supply from the sea, economic loss, hardship to
fishers and disruption of traditional ways of life. Overfishing thus threatens the ecosystem, the
sustainable use of fishing grounds and the livelihood of fishing communities.
FAO indicates that about 50 percent of global marine fisheries resources are fully exploited, 25 percent
are overexploited, and about 25 percent could, as it seems, support higher rates of exploitation (FAO,
2005a). According to the National Marine Fisheries Service, 76 stocks were determined to be
overfished in waters of the Chaptered States of America (NMFS, 2004). On a global level, in addition
to what is harvested, during the past decade, over 7 million tonnes of fish about 8 percent of the global
catch have been killed and discarded yearly by fishers using insufficiently selective gear (FAO, 2005b).
Unsustainable Harvesting
Unsustainable fish harvesting are ways of catching wild fish that are not sustainable in the long term.
This occurs due to various factors it could threaten the fish stock itself by overfishing, or they threaten
the environment the fish need to thrive. In developing countries, dynamite fishing, electro fishing, or
fishing with poisons are examples of methods that threaten the environment.
Unsustainable fishing methods in the Western countries include bottom trawling. According to leading
marine environmentalists this results in 'great harm' to marine wealth. Illegal and unreported fishing
contributes to the reduction in fish stocks and hurts the ability to help in recovery of the fish
population. It is believed that 10 23 billion such incidences happen annually. Developing countries are
more likely to be at risk for illegal activities. Although officials have tried to control the blast fishing, it
is still practised in impoverished pockets in the world. The effects of the blast fishing are horrifying.
The water is littered with dead fish or struggling fish.
In Africa, poor Tanzanian fishermen use explosives to kill hundreds of fish in a matter of minutes. It is
believed that the fishermen are tossing explosives into the water around 10 times per day. Though a
dangerous practice, fishermen continue this practice due to the profit they receive.
Conservation of Fisheries
Marine conservation, also known as ocean conservation, is concerned with the study of marine plants
and animal resources and ecosystem functions. It is the protection and preservation of ecosystems in
oceans and seas through planned management in order to prevent the exploitation of these

RD-1 NRM, Watershed Management and Sustainable Livelihoods MGNCRE clxxxiii
RD-1 NRM, Watershed Management and Sustainable Livelihoods
183 MGNCRE
183 MGNCRE | Natural Resource Management and Sustainable Development
resources. Due to the manifold negative effects of marine exploitation namely species loss, habitat
degradation and changes in ecosystem, marine conservation is gaining popularity. It mainly focuses
on limiting human caused damage to marine ecosystems, restoring damaged marine ecosystems, and
preserving vulnerable species and ecosystems of the marine life. Marine conservation is a relatively
new discipline which has developed as a response to biological issues such as extinction and marine
habitats change.
A conventional idea of a sustainable fisheries one in which fish is harvested at a sustainable rate and
the fish population does not decline over time because of fishing practices. Sustainability in fisheries
includes the theoretical disciplines and practical strategies. Theoretical discipline involves the
population dynamics of fisheries. Various practical strategies for sustainable fisheries encompasses
practices such as avoiding overfishing through techniques such as individual fishing quotas, curtailing
destructive and illegal fishing practices by lobbying for appropriate law and policy, setting up
protected areas, restoring collapsed fisheries, incorporating all externalities involved in harvesting
marine ecosystems into fishery economics, educating stakeholders and the wider public, and
developing independent certification programs. Some primary concerns around sustainability are that
heavy fishing pressures, such as overexploitation and growth or recruitment overfishing, will result in
the loss of significant potential yield and the stock structure will erode to the point where it loses
diversity and resilience to environmental fluctuations; that ecosystems and their economic
infrastructures will cycle between collapse and recovery; with each cycle less productive than its
predecessor; and that changes will occur in the trophic balance (fishing down marine food webs).
According to fisheries scientists and marine conservationists, sustainable management of fisheries can
be achieved by considering that the long-term goals of fisheries management and environmental
conservation are equally important. Global wild fisheries are believed to have peaked and begun a
decline, which led our valuable habitats, such as estuaries and coral reefs, in critical condition. Current
aquaculture or farming of piscivorous fish, such as salmon, does not solve the problem because
farmed piscivores are fed products from wild fish, such as forage fish. Salmon farming also has major
negative impacts on wild salmon. Fish that occupy the higher trophic levels are less efficient sources
of food energy. Fishery ecosystems are an important subset of the wider marine environment.
Conservation Tools
Conservation tools and techniques for preserving marine biodiversity conservation combines
theoretical disciplines such as population and community marine biology, with practical conservation
strategies, such as setting up marine reserves or marine protected areas (MPAs). Other techniques for
conservation of fisheries comprise developing sustainable fisheries, which involves establishing fishing
quotas and restoring the populations of endangered species through artificial means. Another focus
of conservation effort is to halt human activities that are detrimental to the marine environment
through policies or legislations, at an international, European and/or regional level. Education of the
general public about conservation issues is crucial for the conservation of the marine environment.
There are many marine conservation organisations throughout the world that focus on funding
conservation efforts, educating the public and stakeholders, and lobbying for conservation law and
policy.

RD-1 NRM, Watershed Management and Sustainable Livelihoods MGNCRE clxxxiv
RD-1 NRM, Watershed Management and Sustainable Livelihoods
184 MGNCRE
184 MGNCRE | Natural Resource Management and Sustainable Development
Marine Reserves and Marine Protected Areas
Less than 1% of the earth’s oceans are protected compared to 12% of the land surface. Highly
protected marine reserves are areas of the sea where human disturbances are minimised, thus
allowing to maintain the natural biodiversity and helps to recover it to a more natural state. In Europe
there are very few marine reserves, they are small and are found in the Mediterranean. While, there
are many Marine Protected Areas (MPAs) in Europe, these areas only have some extra regulations or
planning procedures, but they do not fully protect marine biodiversity. Inside marine reserves all
extractive and potentially disturbing human activities are prohibited. Marine reserves are extremely
important to science and education, essential for conservation, useful in resource management and
necessary for reversing the effects of overexploitation. The benefits of marine reserves in New Zealand
where twenty marine reserves have been created over the last 25 years is notable. For example, inside
marine reserves the abundance of species of ecological and commercial importance, such as the
snapper Pagurus auratus and the spiny lobster Jasusedwardsiihave increased almost 9 and 4 times
compared to the adjacent unprotected areas. Furthermore, the mean body size of these animals is
significantly large inside reserves than in outside. This shows an urgent need for a representative,
replicated, networked and sustainable system of highly protected Marine Reserves.
References
1. Alkemade R., Van Oorschot M., Miles L., Nellemann C., Bakkenes M., Ten Brink B. (2009).
GLOBIO3 A framework to investigate options for reducing global terrestrial biodiversity loss.
Ecosystems, 12 374390. DOI 10.1007/ s1002100992295.
2. Beveridge M.C.M., Phillips M., Dugan P., Brummet R., Center W. (2010).Barriers to
aquaculture development as a pathway to poverty alleviation and food security. Advancing
the Aquaculture Agenda Workshop Proceedings, Organization for Economic Cooperation and
Development, Paris. pp. 345359.
3. CFS (2012b) Voluntary guidelines on the responsible governance of tenure of land, fisheries
and forests in the context of national food security, India, Committee on World Food Security.
4. Cordell D., Drangert J.O., White S. (2009). The story of phosphorus Global food security and
food for thought.
5. Global Environmental Change, 19 292305. doi 10.1016/j.gloenvcha.2008.10.009. FAO
(2012a).The State of World Fisheries and Aquaculture 2012, India, Food and Agriculture
Organization of India.
6. Vivekanandan, E., Srinath, M. and Somy Kuriakose (2005). Fishing the marine food web along
the Indian coast, Fisheries Research 72 241252
To Do Activity
Make a complete report of the various species of fish and other marine food species available in
India.

RD-1 NRM, Watershed Management and Sustainable Livelihoods MGNCRE clxxxv
RD-1 NRM, Watershed Management and Sustainable Livelihoods
185 MGNCRE
185 MGNCRE | Natural Resource Management and Sustainable Development
Chapter 4 Land Resources Management
Introduction You must have observed that the land around you is put to different uses. Some land is occupied by
rivers, some may have trees, and roads and buildings have been built on some parts. Different types
of lands are suited for different uses. Land is used as a resource for production as well as residence
and recreation by human beings. Thus, the building of your institution, the roads on which you travel,
parks in which you play, fields in which crops are grown and the pastures where animals graze
represent different uses to which land is put. This Chapter defines, explains and considers the
dimensions of land resources management.
Objectives
• To explain about land as a resource, classification, associated problems and methods of
conservation.
• To explain about land resources in India
• To understand land capability and its classification
• To give an in depth understanding of land resource management and its major issues
Structure
4.1 Land as a Resource
Land area constitutes about 1/5thof the earth’s surface. Efficient management of land resources is
crucial to meet the challenging demand of food, fibre and fuel for human population as well as fodder
for animals and industrial raw material for agro based industries. Soil, water, vegetation and climate
are the basic natural resources for agricultural growth and development.
People live in different landforms such as hills, valleys, plains, river basins and wetlands. These
landforms are resource generating areas and the people living in these areas depend on them for their
livelihood. Many traditional farming societies had different ways of preserving areas from which they
used resources. E.g. In the ‘sacred groves’ of the Western Ghats, simple rituals were conducted as
4.1 Land Resources
42 Land Resources in India- Usage Pattern, Classification and Problems
4.3 Land Capability and its Classification
4.4 Land Use Planning
4.5 Land Resource Management and Major Issues

RD-1 NRM, Watershed Management and Sustainable Livelihoods MGNCRE clxxxvi
RD-1 NRM, Watershed Management and Sustainable Livelihoods
186 MGNCRE
186 MGNCRE | Natural Resource Management and Sustainable Development
requests to the spirit of the Grove for permission to cut a tree or extract a resource. The outcome of
a chance fall on one side or the other of a stone balanced on a rock gave or withheld permission.
The request could not be repeated for a specified period. If land is utilized carefully it can be
considered a renewable resource. The roots of trees and grasses bind the soil. If forests are depleted,
or grasslands overgrazed, the land becomes unproductive and wasteland is formed. Intensive
irrigation leads to water logging and salination, on which crops cannot grow. Due to the dumping of
highly toxic industrial and nuclear wastes, land is converted into a non renewable resource.
Land on earth is as finite as any other natural resources. While mankind has learnt to adapt his lifestyle
to various ecosystems world over, he cannot live comfortably on polar ice caps, or under the sea, or
in space in the foreseeable future.
Man needs land for building homes, cultivating food, maintaining pastures for domestic animals,
developing industries to provide goods, and supporting the industry by creating towns and cities.
Equally importantly, man needs to protect wilderness area in forests, grasslands, wetlands,
mountains, coasts, etc. to protect our vitally valuable biodiversity.
Thus, a careful planning is essential for rational use of land. One can develop most of these different
types of land uses almost anywhere, but Protected Areas (National Parks and Wildlife Sanctuaries) can
only be situated where some of the natural ecosystems are still undisturbed. These Protected Areas
are important aspects of good land use planning.
Land Resource Classification
Land is one of the most important natural resources. Land supports our life system. Thus, careful
planning of use of land resource is necessary. India comprises of many types of land. These are
mountains, plateaus, plains and islands.
Figure 4.1 Land Resources in India
(Sourcehttps//www.google.co.in/search?q=land+resources+in+india&source=lnms&tbm=isch&sa=X
&ved=0ahUKEwjH48uzlZHjAhXMdCsKHYtDBsQQ_AUIECgB&biw=1366&bih=651#imgrc=lk3fAhIqFn1
MGM)
Mountains About 30% of land area in India is in the form of mountains. Mountains support the
perennial flow of rivers, which carry fertile soils, facilitate irrigation and provide drinking water.

RD-1 NRM, Watershed Management and Sustainable Livelihoods MGNCRE clxxxvii
RD-1 NRM, Watershed Management and Sustainable Livelihoods
187 MGNCRE
187 MGNCRE | Natural Resource Management and Sustainable Development
Plains About 43% of land area in India is in the form of plains. Plains provide facilities for agriculture,
building of industries and houses, etc.
Plateaus About 27% of land in India is in the form of plateaus which provides many types of minerals,
fossil fuels and forest.
Land not available for cultivation There are two types of land which are not used for agriculture
purpose. These are
• Barren and waste land
• Lands used for buildings, roads, factories, etc. i.e. for non-agricultural purpose.
Other uncultivated land (excluding fallow land)
• Permanent pastures and grazing land
• Land under miscellaneous tree crops groves (not included in net sown area)
• Cultivable waste land (left uncultivated for more than 5 agricultural years)
• Fallow lands
• Current fallow land (left without cultivation for one or less than one agricultural year)
• Other than current fallow land (left uncultivated for the past 1 to 5 agricultural years)
• Net sown area (area which is sown at least once in a year)
• Gross cropped area (area sown more than once in an agricultural year plus net sown area)
Problems Associated with Land resources
Land Degradation
Due to increasing population, the demands for arable land for producing food, fibre and fuel wood is
also increasing. Hence there is more and more pressure on the limited land resources, and it is getting
degraded due to overexploitation.

RD-1 NRM, Watershed Management and Sustainable Livelihoods MGNCRE clxxxviii
RD-1 NRM, Watershed Management and Sustainable Livelihoods
188 MGNCRE
188 MGNCRE | Natural Resource Management and Sustainable Development
Nearly 56% of total geographical area of the country is suffering due to land resource degradation.
Out of 17 million hectares ofcanal irrigated area, 3.4 million hectares is suffering from water logging
and salinity. Soil erosion, water logging, salinization and contamination of the soil with industrial
wastes like flyash, press mud or heavy metals cause degradation of land.
Farmland is under threat due to intense utilisation of land. Every year, between 5 to 7 million hectares
of land worldwide is added to the existing degraded farmland. When soil is used more intensively by
farming, it is eroded more rapidly by wind and rain. Overirrigating farmland leads to salinization, as
evaporation of water brings the salts to the surface of the soil on which crops cannot grow. Over
irrigation also creates water logging of the topsoil so that crop roots are affected, and the crop
deteriorates. The extensive use of chemical fertilizers poisons the soil so that eventually the land
becomes unproductive. As urban centres grow and industrial expansion occurs, the agricultural land
and forests shrink. This is a serious loss and has long term ill effects on human civilisation.
Soil Erosion Soil erosion is defined as the loss or removal of superficial layer of soil due to wind, water and human
factors. In other words, it can be defined as the movement of soil components, especially surface litter
and topsoil from one place to another. It has been estimated that more than 5000 million tonnes
topsoil is being eroded annually and 30% of total eroded mass is getting loosed to the sea. Itultimately
results in the loss of fertility. Soil erosion is basically of two types, viz. geologic erosion and accelerated
erosion. Various factors which affect soil erosions include soil type, vegetation cover, slope of ground,
soil mismanagement and intensity and amount of rainfall. Wind is also responsible for the land erosion
through saltation, suspension and surface creep.
In order to prevent soil erosion and conserve the soil the following conservation practices are
followed. It includes Conservational till farming, Contour farming and Terracing Strip cropping and
alley cropping, Wind breaks or shelterbelts.
The characteristics of natural ecosystems such as forests and grasslands depend on the type of soil.
Soils of various types support a wide variety of crops. The misuse of an ecosystem results in loss of
valuable soil through erosion by the monsoon rains and, to a smaller extent, by wind. The roots of the
trees in the forest hold the soil. Deforestation thus leads to rapid soil erosion. Soil is washed into
streams and is transported into rivers and finally lost to the sea. The process is more evident in areas
where deforestation has led to erosion on steep hill slopes as in the Himalayas and in the Western
Ghats. These areas are called ‘ecologically sensitive areas’ or ESAs. To prevent the loss of millions of
tons of valuable soil every year, it is essential to preserve what remains of our natural forest cover. It
is equally important to reforest denuded areas.

RD-1 NRM, Watershed Management and Sustainable Livelihoods MGNCRE clxxxix
RD-1 NRM, Watershed Management and Sustainable Livelihoods
189 MGNCRE
189 MGNCRE | Natural Resource Management and Sustainable Development
The linkage between the existence of forests and the presence of soil is greater than the forest’s
physical soil binding function alone. The soil is enriched by the leaflitter of the forest. This detritus is
broken down by soil microorganisms, fungi, worms and insects, which help to recycle nutrients in the
system. Further losses of our soil wealth will impoverish our country and reduces its capacity to grow
enough food in future.
Salinization
It refers to accumulation of soluble salts in the soil. Concentration of soluble salts increases due to
poor drainage facilities. In dry land areas, salt concentration increases where poor drainage is
accompanied by high temperature. High concentration of salts affects the process of water absorption
hence affects the productivity.
Water Logging

RD-1 NRM, Watershed Management and Sustainable Livelihoods MGNCRE cxc
RD-1 NRM, Watershed Management and Sustainable Livelihoods
190 MGNCRE
190 MGNCRE | Natural Resource Management and Sustainable Development
Excessive utilization of irrigation may disturb the water balance which can lead to waterlogging due
to rise of water table. Anaerobic condition due to poor availability of oxygen in waterlogged soils may
affect respiration process in plants which will ultimately affect the productivity of waterlogged soil.
Desertification
Desertification is a process whereby the productive potential of arid or semiarid lands falls by ten
percent or more. Desertification is characterized by devegetation and depletion of groundwater,
salinization and severe soil erosion.
Causes of desertification
• Deforestation
• Overgrazing
• Mining and quarrying
Shifting Cultivation
Shifting cultivation is a practice of slash and burn agriculture adopted by tribal communities and is a
main cause for soil degradation particularly tropical and subtropical regions. Shifting cultivation which
is also popularly known as ‘Jhum Cultivation’ has led to destruction of forest in hilly areas. It is
responsible for soil erosion and other problems related to land degradation in mountainous areas.

RD-1 NRM, Watershed Management and Sustainable Livelihoods MGNCRE cxci
RD-1 NRM, Watershed Management and Sustainable Livelihoods
191 MGNCRE
191 MGNCRE | Natural Resource Management and Sustainable Development
Man Induced Landslides
Human race has exploited land resources for their own comfort by constructing roads, railway tracks,
canals for irrigation, hydroelectric projects, large dams and reservoirs and mining in hilly areas.
Moreover, productive lands under crop production are decreasing because of development activities.
These factors are affecting the stability of hill slopes and damage the protective vegetation cover.
These activities are also responsible to upset the balance of nature and making such areas prone to
landslides.
Case Study
Selenium – Punjab
In 198182, farmers from Hoshiarpur and Nawanshahr districts approached scientists of the Punjab
Agricultural University (PAU), Ludhiana, as wheat crops had turned white. Soil analysis indicated that
selenium (Se) levels in the area were above toxic limits. Selenium is a naturally occurring trace
element, essential for animal and human health, but the gap between requirement and excess is
narrow. Soils containing 0.5 micrograms (ug) of Se per kg or more are injurious to health. In some
areas of Punjab, Se levels ranges from 0.31 ug/kg to 4.55ug/kg. Rice cultivation requires the presence
of standing water. Being highly soluble, Se dissolves and comes to the surface. The water then
evaporates leaving the Se behind.

RD-1 NRM, Watershed Management and Sustainable Livelihoods MGNCRE cxcii
RD-1 NRM, Watershed Management and Sustainable Livelihoods
192 MGNCRE
192 MGNCRE | Natural Resource Management and Sustainable Development
Figure 4.2 – Land Degradation in India
(Sourcehttps//www.google.co.in/search?biw=1366&bih=651&tbm=isch&sa=1&ei=vqsYXcTjBsahyAPt
i7Mw&q=land+degradation+in+India&oq=land+degradation+in+India&gs_l=img.12..0j0i5i30j0i8i30j0
i24l5.979988.986399..988545...0.0..0.156.3568.0j28......0....1..gwswizimg.......0i7i30j0i67j0i7i5i30j0i8
i7i30.WT_flLY7jZo#imgrc=6BhZgQLJnnEsIM)
Methods for Conserving Our Land Resources
According to Natural Resources Management Division, Department of Agriculture and Cooperation,
Ministry of Agriculture, Government of India, we can conserve our land resources by adopting the
following measures
RD-1 NRM, Watershed Management and Sustainable Livelihoods MGNCRE cxciii
RD-1 NRM, Watershed Management and Sustainable Livelihoods
193 MGNCRE
193 MGNCRE | Natural Resource Management and Sustainable Development
1. By educating, informing and sensitizing all landholders about various aspects of this precious
resources and their sustainable use.
2. Contour ploughing is another measure to conserve our land. By this method, the fields are
ploughed, harrowed and sown along the natural contour of the hills.
3. By terracing method, A series of wide steps are made along the slope following the contours.
This method is very common in rice growing regions.
4. Under the afforestation and reforestation programmes, planting of trees, bushes and grass
help to check the soil erosion.
5. Strict actions are taken to check reckless felling of trees and overgrazing.
6. Shelter belts (rows of trees) are planted on the margins of desert areas to check the fury of
wind.
7. Construction of dams and gully trap inculcate the water harvesting.
4.2 Land Resources in India – Usage pattern, Classification and Problems
1.3 million square miles of India’s area is a peninsula jutting into the Indian Ocean between the Arabian
Sea on the west and the Bay of Bengal on the east. In a country like ours, though plenty of land terrain
is available, both food production and the realty market are exerting pressure on the land. Land is a
non-renewable energy reserve and it is related to a variety of other elements such as availability of
water, agrarian structure of the rural and urban economy, etc. Increasing population demands rapid
urban development and increased land use. This leads to increased economic growth in selected
landscapes especially in India and other developing countries.
Effective land management is possible by continuous monitoring of land use changes to understand
land use over different temporal spatial time scales. Today, with rapid urbanization and
industrialization, there is increasing pressure on land, water and environment, particularly in the big
metropolitan cities. Land resource is further linked to urban sprawl. In order to utilize available land
resources in India effectively, the country is streamlining efforts in the areas of land resource
management. As result, we see a rise in the number of land resource companies, groups and other
service providers across the nation.
To Do Activity
Write a detailed note on various forms of land (mountains, plateaus, plains) – their advantages
and disadvantages.

RD-1 NRM, Watershed Management and Sustainable Livelihoods MGNCRE cxciv
RD-1 NRM, Watershed Management and Sustainable Livelihoods
194 MGNCRE
194 MGNCRE | Natural Resource Management and Sustainable Development
(Sourcehttps//www.google.co.in/search?biw=1366&bih=651&tbm=isch&sa=1&ei=nK8YXdaCGMeP9
QPcmpmgCw&q=land+resources+in+India&oq=land+resources+in+India&gs_l=img.12..0j0i24l6.9942
72.998931..1001190...0.0..0.206.2747.0j19j1......0....1..gwswizimg.......0i7i30j0i7i5i30j0i8i7i30.glAFL
mFdHoA#imgrc=GOrCO7MeTocmSM)
Land Use Pattern in India
Pattern of land use in India depends on both physical and human factors. Climate, topography, type
of soil, etc. are considered as physical factors while population, technology, skill, population density,
tradition, capability, etc. are considered as human factors. India has a total 3.28 million square
kilometre land, but only 93% of land of total geographical area is available for use. This is because land
used data has not been collected for the north eastern states except Assam and the land occupied by
Pakistan and China has not been surveyed because of many unavoidable reasons. The land under
permanent pasture is decreasing which creates the problem for grazing. The total net sown area (NSA)
is not more than 54% including land other than fallow land. Land other than fallow land is either of
poor quality or too costly to cultivate, these lands are cultivated only once or twice in two or three
consecutive years. The pattern of net sown area varies widely from state to state. Where net sown
area is 80% in state like Punjab, it is only 10% in the state of Arunachal Pradesh, Mizoram, Manipur
and Andaman and Nicobar Islands. Such difference is creating lot of discrimination.
According to National Forest Policy (1952), the forests should be 33% of total geographical area, which
is essential to maintain ecological balance. But the forest area in India is far less than desired
measures. This is because of illegal deforestation and development such as construction of roads and
building, etc. On the other hand, a large population which is dwelling at the fringe of forests depends

RD-1 NRM, Watershed Management and Sustainable Livelihoods MGNCRE cxcv
RD-1 NRM, Watershed Management and Sustainable Livelihoods
195 MGNCRE
195 MGNCRE | Natural Resource Management and Sustainable Development
upon the forest and its produce, resulting in the reduction of forest area. Continuous use of land over
a long period without proper conservation and management degrade them. This has resulted in
repercussions in society and creates serious environmental problems.
Land Use Classification
The land use categories according to the Land Revenue Records are as follows
(i) Forests It is important to note that area under actual forest cover is different from area classified
as forest. The latter is the area which the Government has identified and demarcated for forest
growth. The land revenue records are consistent with the latter definition. Thus, there may be an
increase in this category without any increase in the actual forest cover.
(ii) Land put to Non agricultural Uses Land under settlements (rural and urban), infrastructure (roads,
canals, etc.), industries, shops, etc. are included in this category. An expansion in the secondary and
tertiary activities would lead to an increase in this category of land use.
(iii) Barren and Wastelands The land which may be classified as wasteland such as barren hilly terrains,
desert lands, ravines, etc. normally cannot be brought under cultivation with the available technology.
(iv) Area under Permanent Pastures and Grazing Lands Most of this type of land is owned by the
village ‘Panchayat’ or the Government. Only a small proportion of this land is privately owned. The
land owned by the village panchayat comes under ‘Common Property Resources’.
(v) Area under Miscellaneous Tree Crops and Groves (Net sown Area is not included) The land under
orchards and fruit trees are included in this category. Much of this land is privately owned.
(vi) Cultivable Wasteland Any land which is left fallow (uncultivated) for more than five years is
included in this category. It can be brought under cultivation after improving it through reclamation
practices.
(vii) Current Fallow This is the land which is left without cultivation for one or less than one agricultural
year. Following is a cultural practice adopted for giving the land rest. The land recoups the lost fertility
through natural processes.
(viii) Fallow other than Current Fallow This is also a cultivable land which is left uncultivated for more
than a year but less than five years. If the land is left uncultivated for more than five years, it would
be categorised as cultivable wasteland.
(ix) Net Area Sown The physical extent of land on which crops are sown and harvested is known as
net sown area.

RD-1 NRM, Watershed Management and Sustainable Livelihoods MGNCRE cxcvi
RD-1 NRM, Watershed Management and Sustainable Livelihoods
196 MGNCRE
196 MGNCRE | Natural Resource Management and Sustainable Development
Figure 4.3 Land Use Classifications in India
Land Resource Problems in India
Our past generation left land for us without exploiting them too much and it is expected that we
conserve it. We fulfil most of our needs from the land. It includes food, clothing, shelter, drinking
water, etc. But the past few decades saw intense degradation of the quality of land by humans. Many
human activities aggravated the natural forces responsible for degrading the land resources.
Presently, about 130 million hectares of land is reported under degraded land in India, in which about
28% of land belongs to forests and about 28% is water eroded area. The other reasons for degradation
of land are over deposition of salinity and alkalinity. Overgrazing, mining, deforestation, division of
lands in small area because of family feuds, etc. are some of the major causes of degradation of land.
Mining in the states of Jharkhand, Chhattisgarh, Odisha and Madhya Pradesh led to abandoned lands
without proper treatment after the completion of mining works. This has resulted in the form of deep
scars and traces. Along with mining, deforestation also led to land degradation in these states. In the
states of Uttar Pradesh, Punjab, Haryana, over irrigation causes water shortage resulting in increase
in salinity and alkalinity due to water logging. In Bihar, Assam and Arunachal Pradesh, land degradation
occurs due to flood.
States, in which minerals are processed such as grinding of limestone, manufacturing of cement, etc.
produce huge quantity of dust. These dusts prevent the percolation of water to the ground due to
deposition on the ground and it leads to land degradation. The degradation of land causes many
problems such as flood, decrease in yield, etc. which leads to decrease in GDP which ultimately leads
to economic problems in our country.

RD-1 NRM, Watershed Management and Sustainable Livelihoods MGNCRE cxcvii
RD-1 NRM, Watershed Management and Sustainable Livelihoods
197 MGNCRE
197 MGNCRE | Natural Resource Management and Sustainable Development
Dry Land
Land resources in India include vast barren lands. They are mostly found in states like Rajasthan. Parts
of Leh and Jammu also has barren lands as snowfall prevents any major cultivation here. Real estate
lands are growing at an incredible rate in India. Due to increasing mobility of people because of
transferable jobs, the demand for more houses and apartments has grown in India. Havelis in
Rajasthan is becoming more expensive with passing years. There is a strong competition among
people in acquiring the best of farmlands, as they can be nestled in the best place replete with nature’s
gift.
4.3 Land Capability and its Classification
Land capability plays a vital role in deciding the land use. In this lesson, we shall discuss on land
capability and its classification.
Definition of Land Capability
Land capability may be defined as the ability of the land surface to support natural plant growth/
wildlife habitat or artificial crop growth/ human habitat. Thus, it indicates the type of land use [viz.,
human habitation, agriculture, pastures, forests, wildlife habitat, etc.] that is suitable over a particular
type of land. Different lands have different capabilities depending on the land characteristics like
slope, soil type, soil depth and erosion conditions. If certain land characteristics are not conducive for
agriculture, it is desirable to utilize or ensure the continuity of that land area for other land uses as
mentioned earlier. The ultimate goal of allocation of various land capabilities over a vast land area
with varied characteristics is to achieve complete soil conservation. Complete soil conservation implies
perfect soil health and zero soil erosion on a sustained basis. It also facilitates total water conservation
and total vegetation conservation. Thereby it results in integrated watershed management on a long
term basis.
In the next section, we shall discuss the classification of land capability based on the land
characteristics. This land capability classification should ensure appropriate land use for every land
area for peaceful coexistence of different flora and fauna including human habitation and also a
sustained productivity through human activities.
Classification of Land Capability
The Soil Conservation Service (SCS) of the Chaptered States Department of Agriculture (USDA) has
done a pioneering work on land capability classification [Kingfield and Montgomery, 1961]. According
to that, the land capability is classified broadly into two groups based on the cultivability of the land.
The first group consists of all the lands which are suitable for cultivation and is referred to as ‘Group
1 Lands’. The remaining group consists of all the lands which are unsuitable for cultivation which is
referred to as ‘Group 2 Lands’. Each of these two groups are further classified into four classes. Thus
‘Group 1 Lands’ comprise ‘Land Classes I to IV’ which are cultivable and ‘Group 2 Lands’ comprise ‘Land
Classes V to VIII’ which are non culturable.
The following paragraphs describe each of the two groups and eight land classes in terms of their land
characteristics and land use.
To Do Activity
Mark the distribution of wastelands on the Indian map and write a note about them.

RD-1 NRM, Watershed Management and Sustainable Livelihoods MGNCRE cxcviii
RD-1 NRM, Watershed Management and Sustainable Livelihoods
198 MGNCRE
198 MGNCRE | Natural Resource Management and Sustainable Development
Group 1 Lands Generally Suitable for Cultivation
Class I Lands These lands are nearly level with slopes generally within 1%. The soils are deep, fertile,
easily workable and are not subjected to damaging overflows. There are hardly any restrictions or
limitations for their use. These lands are very good lands which can be safely cultivated by using any
farming method to grow any crop, even intensively also. However, proper crop rotation and green
manure use should be followed to maintain soil fertility [Mal, 1994].
Class II Lands These lands generally have gentle slope in the range of 1 to 3%. They can be easily
cultivated with some conservation practices like contour farming, strip cropping, bund construction
or terracing. Therefore, one or more of the following limitations exist which slightly reduce the crop
choice [Murthy and Jha, 2011].
1. Moderate susceptibility to erosion by wind or water
2. Less than ideal soil depth
3. Somewhat unfavourable soil structure and workability
4. Slight to moderate salinity
5. Occasionally damaging overflows
6. Wetness existing permanently which can be corrected by drainage
7. Slight climatic limitations on land use and management
Class III Lands These lands generally have slopes in the range of 3 to 5% and therefore have severe
limitations which further reduce the crop choice or require special conservation practices [like contour
farming, strip cropping, cover cropping, bund construction or terracing] or both. Lands in this class
have more restrictions than those in Class II Lands due to land characteristics. All the limitations of
Class II Lands are applicable here to a greater extent. Hay or pasture crops that completely cover the
soil should be preferred. On wetlands of this Class which usually have heavy and slowly permeable
soils, a drainage system along with a suitable cropping plan to improve the soil structure is required.
Class IV Lands These lands have good soils [i. e., having shallow soil depth and low fertility] and
generally have somewhat steep slopes in the range of 5 to 8%. Therefore, they have either very severe
limitations that largely restrict the crop choice or require very careful management or both. Lands
may be suitable only for two to three common crops which build and maintain soil like the fully
covering pastures, with occasional grain crops which can be grown usually once in five years. These
lands may have one or more of the following permanent features [Murthy and Jha, 2011].
1. Heavy susceptibility for erosion due to wind, water with severe effects of past erosion
2. Low moisture holding capacity
3. Frequent overflows accompanied by severe crop damage
4. Water logging, excessive wetness and severe salinity
5. Moderately adverse climate.
Land Capability Subclasses Lands in Classes II, III and IV are further categorised into subclasses based
on the following limitations
1. Risk of erosion or past erosion damage is designated by the symbol ‘e’
2. Wetness damage or overflow is designated by the symbol ‘w’
3. Soil root zone limitations are denoted by ‘s’
4. Climatic limitations are designated by ‘c’

RD-1 NRM, Watershed Management and Sustainable Livelihoods MGNCRE cxcix
RD-1 NRM, Watershed Management and Sustainable Livelihoods
199 MGNCRE
199 MGNCRE | Natural Resource Management and Sustainable Development
Group 2 Lands Generally Not Suitable for Cultivation
Class V Lands These lands generally have slopes in the range of 8 to 12%. They usually have no to little
erosion hazard but have other limitations which restrict their use mainly to pastures, forests, wildlife
food and cover. Controlled grazing may be permitted. Some of the examples of Class V Lands are
1. Bottom lands which is subject to frequent overflows that prevent the normal production of
cultivated crops
2. Stony or rocky lands
3. Few ponded areas where soils are suitable for grasses or trees.
Class VI Lands The lands in this Class have shallow soils and generally have quite steep slopes ranging
to 18%. They have severe limitations which restrict their use to pastures with very limited grazing,
woodlands, wildlife food and cover. Some of the limitations of these lands which can’t be corrected
are
1. Severe erosion
2. Stony texture with shallow rocks
3. Excessive wetness or overflow
4. Low moisture capacity
5. Severe climate.
Class VII Lands The lands in this Class are generally eroded, rough, having shallow soil depth and
steeper slopes ranging to 25%. The soils may be swampy or drought prone, with all the limitations of
Class VI Lands even to a higher degree. If there is good rainfall, they may be used for forestry with full
green cover, gully control structures and severely restricted grazing.
Class VIII Lands These lands are rough with probably the worst soil types and possibly the steepest
slopes in excess of 25%. They can only be used with very sound gully control measures for forests –if
conducive for tree growth, and for wildlife habitat. However, tree felling, and grazing should be strictly
avoided. Certain lands in Group 2 can be made cultivable with major earthmoving or other effective
and costly reclamation operations. In India, both the Class VII Lands and Class VIII Lands are combined
as Class VII Lands.
4.4 Land Use Planning
Every country requires development in all forms and various methods like economic planning, spatial
planning or/and any other suitable planning are adopted for this purpose. Land use planning in India
came with the emergence of the need for the planned development of towns and cities. Before
independence, the population and the resource availability had a good ratio andthe need for planning
was not much required. But with the passage of time, there was unprecedented growth in population
which had deteriorated the conditions of urban areas. This led to greater need for planned
development. Before independence, due to the development of towns and cities various types of
cities emerged. The type of the city was predominantly governed by their locations which played an
important role in their function. For example, port cities were located on coastal areas and trade
through sea route took place in these cities. Development and more importantly “planned
development” are possible by efficient use of available resources like land, air, water, soil, forests and
To Do Activity
What are the laws regulating land governance in India? Write a brief note about them.

RD-1 NRM, Watershed Management and Sustainable Livelihoods MGNCRE cc
RD-1 NRM, Watershed Management and Sustainable Livelihoods
200 MGNCRE
200 MGNCRE | Natural Resource Management and Sustainable Development
other natural resources. For achieving efficiency and increasing output land use planning in India
gained importance.
Figure 4.4 Land Use Planning
The Emergence of Town Planning or City Planning
The evolution of planning started in the form of Improvement trusts which were assigned the
responsibility of checking health issues. There were several improvement trusts which existed, and
their administrative boundaries defined the area under their jurisdiction. After some time along with
the improvement trusts, municipalities were also established. The concept of assigning activities to a
particular parcel of land took its basic form in working with these improvement trusts and
municipalities. They prepared both theoretical or sector plans and spatial plans for various uses.
Property tax or similar tax was collected based on maps which had boundaries shown along with the
plot number; this was considered as the primary form of spatial planning.
Evolution of Development Authorities
As the cities grew in size and population, they faced more complex functioning. This increased
complexity required a unique/ designated body to look after its development. In small cities and towns
where development authorities are absent, many of the work is still under municipalities. On the other
hand, the process of urban development was given to development authorities in the case of large
cities. These development authorities used various ways to govern and plan for development and
monitoring. The method for administering growth included preparation of development plan (master
plan/zonal plan/sector plan/sub zonal plan/ layout plan/ local area plan etc.) and Town Planning
Schemes (T.P. Scheme). All plans depended on the state government as land is a state subject under
the Indian constitution.
Current Land Use Planning in India
Town or urban planning in India is relatively new. The importance of planning is increasingly becoming
popular as people are exploring ways for a better quality of life. Planning in India is done in various
ways which included Economic Plans in the form of Five-Year Plans by Planning Commission which
was renamed as NITI Aayog in 2015 which gives a sectoral allocation of money which will be spent in
different sectors. Urban planning in India is done through various types of development plans. One
such plan is a master plan which is made for urban areas which govern the growth of the urban areas.

RD-1 NRM, Watershed Management and Sustainable Livelihoods MGNCRE cci
RD-1 NRM, Watershed Management and Sustainable Livelihoods
201 MGNCRE
201 MGNCRE | Natural Resource Management and Sustainable Development
Other popular plans include Town Planning Scheme or TP Scheme which is widely adopted in Gujarat.
The most important feature of all development plans dealing with spatial planning is land use planning.
Land use planning in India is followed for all development purposes. One of the most essential parts
of any spatial plan includes a land use plan which assigns a plan of its spatial nature. The planning done
is called land use planning as it involves assigning the particular activity to a given parcel of land.
Importance of Land Use Planning in India
India is a developing country and a large population is still engaged in agricultural activity. However,
there is a remarkable increase in GDP. Rapid urbanization in India pushes people to migrate to cities
for various reasons like better job opportunities, health and educational facilities, better quality of life
and to enjoy urban amenities. This largely unplanned urbanization has forced India to use its land
resources more carefully. Strain over the land is increasing due to rapid increase in population in urban
areas. Farming in urban areas is becoming impossible as it is land intensive and because of this, they
rely on the surrounding regions to meet its requirement. Varied activities that occur in cities need
proper management.
Land use planning in India manages various activities taking place in different areas. The activities are
managed based on a master plan which governs the development of urban areas. Only those activities
which conform to the given master plan are allowed in those areas. This helps in avoiding conflict in
activities and thus reduces the negative impacts of different activities. For example, industries are not
allowed near the residential area to reduce the negative health impact. This management is also done
using zoning which involves segregating different activities in different places.
Colour Coding for Land Use Planning
Land use planning in India is done by employing colour codes in the development plans. Different
colours are assigned in the master plan or TP scheme which indicates a particular land use. Different
colours indicate different categories like residential, recreational, commercial, transportation,
industrial, public and semi-public on the map. Throughout India uniform colours are used for land use
with the exception for the commercial and public &semi-public spaces. The colour coding differs in
some states which include the use of red colour to indicate commercial areas and blue colour for
public &semi-public land use while the vice versa is followed in most other parts. So, it is advisable to
refer to the document/act which applies to the area if there is any confusion about the colour coding
before working. Residential areas are shown with yellow colour in almost all areas in India and green
colour is used for recreational areas.
4.5 Land Resource Management and Major Issues
Land resource management is the process of managing the use and development (in both urban and
rural settings) of land resources. Land resources are used for a variety of purposes which may include
organic agriculture, reforestation, water resource management and ecotourism projects. Land
management can have positive or negative effects on the terrestrial ecosystems. Land which is over
or misused can degrade and reduce productivity and disrupt natural equilibriums.
Land resources in India enclose approximately 1.3 million square miles and is a cape, protruding into
the Indian Ocean, in between the Bay of Bengal on the east and Arabian Sea on the west. Indian land
resources are segmented into varied relief features, 43% of land area is plain region; Indian mountain
region constitutes 30% of the area, whereas plateaus account for 27 % of the total surface area on the

RD-1 NRM, Watershed Management and Sustainable Livelihoods MGNCRE ccii
RD-1 NRM, Watershed Management and Sustainable Livelihoods
202 MGNCRE
202 MGNCRE | Natural Resource Management and Sustainable Development
nation. Despite sufficient accessibility of landed topography, population pressure in the country is
excessive and that makes space for both food production and the real estate market. Land resources
in India are at shortage in the present days. Land resources in India are considered as non renewable
energy reserve. Further, they are associated with a host of several other elements such as agrarian
base of rural as well as urban economy, accessibility of water, and other factors. India has seen rapid
urban expansion and rising land usages. It is due to the increasing population growth and economic
development in some selected landscapes. The monitoring of land use changes is essential to
understand land use over different sequential or spatial time scales for successful land management.
Today, with increasing urbanisation as well as industrialisation, an increased pressure has been
witnessed on land, water and other environment resources, mainly in big metropolitan cities. In order
to utilise available land resources in India effectively, the country is reorganising efforts in the areas
of land resource management. Thus, there has been a growth in land resource companies as well as
in other service providers across the country. India occupies a land area of around 3,287,263 sq. km.
There are different types of land in India, of which 54.7 % of it is civilised land. The different types of
land resources in India include agricultural land, farmland, barren land, real estate land, commercial
land and residential land. Majority of the population of India are engaged in agricultural and allied
activities and thus agricultural land accounts for about 56.78 % of the total land area of the country.
In India, the total cultivable area is 1,269,219 sq. km. Moreover, land is also used in India for grazing
and as permanent pastures.
The trend of love for nature and no availability of space in city apartments is increasing and farm land
is fast becoming the best option for land resources in India. Thus, land resources in India are crucial
factors dealt by the Indian government and managed effectively according to the requirements. In
order to make appropriate utilisation of obtainable land resources, the nation is making efforts to
manage land resources effectively. Thus, there has been an increase in the number of land resource
companies and service providers.
Sustainable Land Management
Sustainable land management means managing land without damaging ecological processes or
reducing biological diversity. It requires the maintenance of the following key components of the
environment biodiversity the variety of species, populations, habitats and ecosystems; ecological
integrity the general health and resilience of natural life-support systems, including their ability to
assimilate wastes and withstand stresses such as climate change and ozone depletion; and natural
capital the stock of productive soil, fresh water, forests, clean air, ocean, and other renewable
resources that underpin the survival, health and prosperity of human communities.
Land is often managed for varied benefits, such as agricultural production, biodiversity conservation,
water quality, soil health and supporting human life. To ensure long-term sustainability, land
managers need to consider economic, social and environmental factors. Sustainable land
management (SLM) in agriculture is a very complex and challenging concept. It encompasses
biophysical, socioeconomic and environmental concerns that must be viewed in integrated manner.
An international Framework for Evaluating Sustainable Land Management (FESLM) was recently
developed to provide a base for addressing these issues comprehensively. SLM combines
technologies, policies and activities aimed at integrating socioeconomic principles with environmental
concerns so as to simultaneously satisfy the five pillars of SLM

RD-1 NRM, Watershed Management and Sustainable Livelihoods MGNCRE cciii
RD-1 NRM, Watershed Management and Sustainable Livelihoods
203 MGNCRE
203 MGNCRE | Natural Resource Management and Sustainable Development
• Maintain or enhance production services (productivity)
• Reduce the level of production risk (security)
• Protect the potential of natural resources and prevent degradation of soil and water
quality (protection)
• Be economically viable (viability)
• Be socially acceptable (acceptability)
“Land resources management is the implementation of land use planning, as agreed between and
with the direct participation of stakeholders. It is achieved through political decisions; legal,
administrative and institutional execution; demarcation on the ground; inspection and control of
adherence to the decisions; solving of land tenure issues; settling of water rights; issuing of
concessions for plant and animal extraction (timber, fuel wood, charcoal and peat, non-wood
products, hunting); promotion of the role of women and other disadvantaged groups in agriculture
and rural development in the area, and the safeguarding of traditional rights of early indigenous
peoples.” (UNCED, 1993).
References
1. Mal, B. C. (1995). Soil and Water Conservation Engineering. Kalyani Publishers, Ludhiana,
India.
2. Murthy, V. V. N. and Jha, M. K. (2011). Land and Water Management Engineering. Kalyani
Publishers, Ludhiana, India.
3. Klingbiel, A. A. And Montgomery, P. H. (1961). Land Capability Classification Agriculture
Handbook No. 210. Soil Conservation Service, US Department of Agriculture, Washington, DC,
USA.
4. http//www.udel.edu/FREC/spatlab/oldpix/nrcssoilde/Descriptions/landca Jul. 08, 2013.
5. http//soils.usda.gov/technical/handbook/contents/part622.html; Jul. 08, 2013.
To Do Activity
Identify various approaches to ecology-based land management strategies or land conservation
strategies and briefly explain about each of them.

RD-1 NRM, Watershed Management and Sustainable Livelihoods MGNCRE cciv
RD-1 NRM, Watershed Management and Sustainable Livelihoods
204 MGNCRE
204 MGNCRE | Natural Resource Management and Sustainable Development
Chapter 5 An Introduction to Livelihood
Introduction In the present-day context of a changing economic scenario, there exists an increasing population
pressure on resources and hence, the livelihoods of the people, especially the poor, has emerged as
an important challenge for us. Over the years, many institutions, government and nongovernment
have made several attempts to address this issue. Some of these efforts have been in terms of actions
or interventions, while others have tried to change the context within which the livelihoods are
embedded.
This Chapter, therefore, defines, explains and considers the dimensions of Livelihood management.
Objectives
• To explain about Livelihood, Need of Livelihood Promotion and Sustainable Livelihood
• To understand Livelihoods in Rural India
• To understand Livelihood Interventions and approaches
• To give an in depth understanding of designing a Livelihood Intervention
Structure
5.1 Livelihood
Livelihood is defined as a set of economic activities, involving self employment and/or wage
employment by using one’s endowments (human and material) to generate adequate resources
(cash and noncash) for meeting the requirements of self and the household, usually carried out
repeatedly and as such become a way of life. Ideally, a livelihood should keep a person meaningfully
occupied in a sustainable manner with dignity. Livelihoods are therefore more than generating
income and much more than employment. Less than 10 percent of rural workers in India are
employed on a regular basis. Poor rural households engage in more than one activity for their
livelihoods.
5.1 Livelihood
5.2 Understanding Livelihoods in Rural India
5.3 Livelihood Interventions in India
5.4 Various Types of Livelihood Interventions
5.5 Designing a Livelihood Intervention

RD-1 NRM, Watershed Management and Sustainable Livelihoods MGNCRE ccv
RD-1 NRM, Watershed Management and Sustainable Livelihoods
205 MGNCRE
205 MGNCRE | Natural Resource Management and Sustainable Development
Livelihood refers to people, their capabilities, their assets, their income and the activities needed to
sustain a means of living, including ways of obtaining food. Therefore, understanding livelihood is
crucial to comprehending nutrition in emergencies. It is through livelihoods that people obtain food
and income security. Food and income security ensure that nutritional needs can be met. While
nutritional status is a key outcome of how we analyse and respond to support livelihoods, adequate
nutritional status is a key contributor to successful livelihoods.
Different phenomena, including globalisation, climate change, urbanization and conflict, can impact
on the success or failure of livelihood strategies. These phenomena have the potential to weaken
livelihoods making households more vulnerable to food and income insecurity.
Need for Livelihood Promotion
According to estimates of the Planning Commission for the Tenth Five Year Plan, more than 10 million
people in India will be seeking work every year. Thus, to ensure full employment within a decade,
more than 10 million new livelihoods will have to be generated every year. Given the magnitude of
the problem, and the dearth of resources for livelihood promotion, the task of promoting livelihoods
for the poor becomes even more compelling. It calls for organizations to use their resources optimally
to achieve maximum scale.
The primary reason to promote livelihoods is the belief in the essential right of all human beings to
equal opportunity. Poor people do not have life choices, nor do they have opportunities. Ensuring that
a poor household with a stable livelihood will substantially increase its income, and over a period of
time, asset ownership, self-esteem and social participation.
The second reason for livelihood promotion is to promote economic growth. The ‘bottom of the
pyramid’ comprising nearly 4 billion out of the 6 billion people in the world do not have the purchasing
power to buy even the bare necessities of life – food, clothing and shelter. But as they get consistent
incomes through livelihood promotion, they become customers of many goods and services, which
then promote growth. The third reason for promoting livelihoods is to ensure social and political
stability. When people are hungry, they take to violence and crime.
Thus, we see that there are idealistic, utilitarian and self-interest based arguments for livelihood
promotion.
Sustainable Livelihood
A livelihoods framework can be used to analyse situations where some form of intervention may be
necessary. The approach involves considering where people are, what they have, and what are their
needs and interests. A common livelihoods framework that is used to determine the appropriate
livelihoods programming is the ‘sustainable livelihoods framework’.
The main elements of a sustainable livelihoods’ framework are
• Vulnerability Context the structural and underlying causes of people’s vulnerability to food
and livelihood insecurity can include poverty, chronic food insecurity, a high prevalence of HIV
and AIDS and a lack of basic services.
• Policies, Institutions and Processes constitutes the governance environment, including
government and nongovernmental organizations (NGOs), and the private sector, as well as
processes such as laws, policies, culture or customary practices, markets and institutions.

RD-1 NRM, Watershed Management and Sustainable Livelihoods MGNCRE ccvi
RD-1 NRM, Watershed Management and Sustainable Livelihoods
206 MGNCRE
206 MGNCRE | Natural Resource Management and Sustainable Development
• Livelihoods Assets what people have, including social (status in society, extended family) and
human (labour) assets, as well as financial (cash, credit, savings, investments) and physical
assets (livestock, houses).
• Livelihoods Strategies what people do (agriculture, wage labour) and the practical means or
activities through which people access food and income.
• Livelihoods Outcomes the goals that people are pursuing, the ‘living’ that results from their
activities.
Figure 5.1 Sustainable livelihoods framework
5.2 Understanding Livelihoods in Rural India
Rural areas are those areas that do not have modern facilities and the population is much lower than
in cities. Livelihoods mean the type of jobs and lifestyles people undertake to earn a living.
Types of Rural Livelihoods
1] Agriculture Labourers
Agriculture labourers are daily wage earners who work as labourers in the fields. They comprise two
thirds of the total rural population in India. These labourers do not own land of their own and are
To Do Activity
Visit a village or assume a village and write all the possible livelihoods of the families there.
Classify them into farm, on farm, off farm and nonfarm.

RD-1 NRM, Watershed Management and Sustainable Livelihoods MGNCRE ccvii
RD-1 NRM, Watershed Management and Sustainable Livelihoods
207 MGNCRE
207 MGNCRE | Natural Resource Management and Sustainable Development
forced to work in the lands of rich farmers. Some labourers own a small piece of land which is does
not support the family. These workers are exploited by rich farmers, as they don’t have any alternative
ways to earn money and they come in plenty as ‘cheap labour’ for the fields.
2] Farmers
Farmers area group that consists of villagers who carry out farming activities in their own lands. They
sow seeds, weed and harvest crops and reap the product themselves. However, eighty percent of
these farmers also have very small land holdings and need to depend on other sources of income like
having a poultry or dairy business. To earn enough money to barely survive, these farmers borrow
money from money lenders for seeds, fertilisers, etc., and are at great risk of being in debt. This leads
to farmer suicides in our country.
3] Farmers with other Sources of Income
The farmers who do not earn enough from their land or by working on other rich farmers’ lands need
other sources of income. They work in mills near the farms or sell milk of the cows that they own.
Selling other byproducts like sap, collecting wood, leaves of certain plants, fruits, etc., helps them to
sustain and survive. Some farmers also seasonally go to the cities or towns to work as wage earners
as there is more opportunity to earn money in cities.
4] Rich Farmers and Landowners
The rich farmers are in a very small percentage in rural areas. They own most of the land and hire
agricultural labourers to work for them. They are also the exploitative village money lenders and
generally own the nearby mills and small factories.
5] Other Service Providers
In villages, apart from labourers, farmers and landlords, there are also people who provide basic
services. Barbers, nurses, village teachers, etc., are small professionals who are found in villages. Some
of them are self-employed and some are employed under government schools or hospitals.
The Importance of Rural Livelihoods
Between one quarter and one fifth of the world’s population derive their livelihood from small-scale
agriculture. Most of these people are members of peasant farm households or are dependent upon
the activities of peasant farm households. The large number of rural people and their involvement in
agriculture and other activities makes the understanding of rural people, peasants, and their
livelihoods important for many reasons.
In global terms, poverty is predominantly a rural phenomenon (as noted earlier although there are
large and increasing numbers of urban poor people, a greater proportion of poor people in the world
live in rural areas and poverty tends to be more severe in rural areas). Many of the rural poor depend
directly or indirectly upon peasant livelihoods. Peasant agriculture is significant in both national
economies and the world economy in terms of
– its contribution to production of livestock and of food, beverage and industrial crops
– its effect on the environment and scarce natural resources (peasant agriculture is an
important form of land use often found in marginal areas where land is vulnerable to
degradation and subject to competing uses and other natural resources, such as water, may
be scarce)

RD-1 NRM, Watershed Management and Sustainable Livelihoods MGNCRE ccviii
RD-1 NRM, Watershed Management and Sustainable Livelihoods
208 MGNCRE
208 MGNCRE | Natural Resource Management and Sustainable Development
Poor rural people’s livelihoods are significant in national economies and the world economy in terms
of
– the potential market for increased demand for consumer goods and services if rural people
become more wealthy
– their potential contribution to, or drain on, resources either as a dynamic and growing part of
national economies generating employment, tax revenues, and so on, or as a stagnant sector
demanding welfare support for a poor and large part of the population
Understanding these livelihoods is therefore important for our understanding ofrural poverty, the
resulting human suffering, and the pressures it then places on urban areas (through rural–urban
migration, national, regional, and global economies, and the environment) and to address these
issues.
The average Indian feels compassion for these rural folks and find ways to improve their quality of life
and to extend their control over their environments, resources, and destinies. However, if we are to
assist them (as policymakers, researchers or community development workers), we must understand
both their environments and their behaviour within those environments. This is necessary for
communication and partnership. It is also needed for analysis of what they are doing and why, for
identification of strategies for improvement, and for prediction of their responses to change.
Structural Characteristics of Rural Livelihoods
The livelihoods and characteristics of poor rural people and peasants are similar. These people engage
in part time farming activities with a mode of agricultural production distinct from that of other farms
(such as commercial, smallholder family or cooperative farms) with multiple economic activities which
are predominantly in small scale (often household) activities and enterprises in the informal economy.
These activities depend on family labour and use meagre capital. The distinctive features of poor rural
people’s activities require separate analysis as it is distinct from commercial agricultural or non-
agricultural enterprises in the formal sector.
– Partial integration into imperfect and incomplete markets
– Part societies with part cultures
– Transition
– Subordination
– Small scale agriculture using family labour
– Multiactivity livelihoods
– Dual economic nature
– Heterogeneity
Diversity
Diversification is a process (if planned) of growing new crop varieties, value crops, small enterprises,
casual labour etc where economic status of household could improve. Diversification implies
increased output from manufacturing (value addition) and services sectors and visible declining share
from primary activities (e.g. traditional cultivation). Diverse livelihoods imply a person relying on
different, multiple activities within a year. They could be
• Land based and nonland based activities

RD-1 NRM, Watershed Management and Sustainable Livelihoods MGNCRE ccix
RD-1 NRM, Watershed Management and Sustainable Livelihoods
209 MGNCRE
209 MGNCRE | Natural Resource Management and Sustainable Development
• Self-employment or labour
• Rural employment or outmigration (temporary)
Diversification and Specialization
As local economy keeps changing, individuals may become specialized in new sectors. For example, a
darjicould open a cloth store, a traditional carpenter opening a furniture store etc. In some cases, such
changes could occur without changes in the local economy. This is out of individuals’ needs,
aspirations and conditions that exist at local level. Various paan shops on roadside in villages are
examples of this type of diversification. Lack of capital and skills restricts some families to retain or
modify the traditional livelihoods.
If the new economic activities provide higher returns than a traditional activity, it is called ‘pull’ or
‘positive’ diversification. As a result, the household accumulates assets, live better. If new options
provide lower returns than usual, they are termed as coping strategies in response to shock. This is
called ‘push’ or negative diversification. As a result, the household get pushed in impoverishment
cycle.
Differences in Access, Opportunities and Market Returns
Those at the bottom of the wealth, caste and class system have little other than their own labour, and
they are generally unskilled and asset less. Thus, poor people are being trapped by their lack of assets
in low return activities which continue to prevent them from accessing the assets to escape poverty.
Even when the poor participate in activities and markets, they face unfavourable conditions. Economic
poverty and political disadvantage gandingan and gets poor share in policy entitlements.
Causes of Livelihood Change and Exclusion
In Andhra Pradesh and Madhya Pradesh both poor and well-off farmers practice sharecropping,
agriculture labour and borrowing. But the better-off households can access high return productive
land, well paid labour opportunities and much more likely to get formal sector credit at modest rates
of interest. In contrast, the poor access only low return land, gets low paid jobs, and invariably relies
for credit on moneylenders or large farmers charging higher interest rates. As poor have no savings to
fall back on, they are often forced to enter markets at the least favourable times (selling crops
immediately after harvest when prices are low). They also pay more for services such as credit and get
lower returns (in sharecropping). Powerful patron can be helpful in times of shock but also set
exploitative terms in several markets credit, land and labour. The policy challenge was to establish
forms of representation or awareness that increase the political negotiating ability for the
marginalised.
5.3 Livelihood Interventions in India
Livelihood interventions are conscious efforts by an agency or an organization to promote and support
livelihood opportunities for many people (other than those directly or indirectly employed by them).
Government of India has been one of the largest agencies involved in such livelihood promotion
To Do Activity
Visit a rural place, understand the realities of livelihoods. For this, you can either choose your
livelihoods or livelihoods of any of your family member or your friend’s livelihoods.

RD-1 NRM, Watershed Management and Sustainable Livelihoods MGNCRE ccx
RD-1 NRM, Watershed Management and Sustainable Livelihoods
210 MGNCRE
210 MGNCRE | Natural Resource Management and Sustainable Development
efforts. However, the cooperative sector, the corporate sector and many NGOs has also contributed
to promoting livelihoods.
Examples
• Government program for development of irrigation. India has added over 40 million hectares
of irrigation since independence, largest in human history. This has generated or stabilized the
livelihoods of millions of people.
• In agriculture, the predominant livelihood interventions covered irrigation through large dams
and canal systems till the 1960s, followed by the introduction of the high yielding varieties
package during the Green Revolution, impacting the livelihoods of over 40 million farmers and
a similar number of landless laborers.
• Government programs such as the National Rural Employment Program (NREP), refashioned
as the Sampoorna Gram Samriddhi Yojana (SGSY), to guarantee wage employment to the poor
in the lean season through public works such as road building. Part of the wages are paid in
kind as food grains, which is a carryover from the erstwhile “food for work” program.
• Government programs such as the erstwhile Integrated Rural Development Program (IRDP),
refashioned as the Swarna Jayanti Grameen Swarozgar Yojana (SGSY), to promote self-
employment among the poor through acquisition of an income generating asset with the help
of a bank loan and a government subsidy.
• Special government programs, run in specific states, to promote both wage employment, such
as the Employment Guarantee Scheme (EGS) of Maharahstra and to promote self-
employment through highly subsidised asset acquisition, such as the World Bank sponsored
District Poverty Initiatives Program (DPIP) in AP, MP and Rajasthan.
• Programs run by sectoral institutions such as the National Dairy Development Board, the
Central Silk Board, the Coir Board, the National Horticultural Board, and the Development
Commissioners for Handloom and Handicrafts.
• Programs run by nongovernmental agencies, for promoting livelihoods in different regions
and sectors, such as by SEWA, BAIF, MYRADA, AKRSP, PRADAN, RGVN and BASIX.
• The Self-employed Women’s Association (SEWA) works with over 750,000 self-employed
women of low income households.
• Bhartiya Agroindustry Foundation’s (BAIF) program supporting one million livelihoods,
comprising cattle crossbreeding, pasture development, horticulture, etc.
• Venkateshwara Hatcheries intervention to develop the poultry sector, culminating in the
National Egg Coordination Council, which serves over 200,000 poultry producers.
• Various microfinance interventions by banks and NGOs have influenced the livelihoods of
more than twelve million people.
Efforts of agribusiness companies or cooperatives to sell inputs such as the Indian Framers’ Fertiliser
Cooperative (IFFCO) selling though the network of primary agricultural cooperative societies; and Tata
Chemicals’ KisanKendras to sell fertilizers and offer extension services have also influenced the
livelihoods of large numbers, though they cannot be strictly called a livelihood intervention. Other
companies work to strengthen their supply chain such as the ITC Agri Business Division, which runs
the echoupal network for procurement of commodities such as soybean, prawns and coffee;
Hindustan Lever’s erstwhile milk procurement and processing business at Etah; and that of Nestle at

RD-1 NRM, Watershed Management and Sustainable Livelihoods MGNCRE ccxi
RD-1 NRM, Watershed Management and Sustainable Livelihoods
211 MGNCRE
211 MGNCRE | Natural Resource Management and Sustainable Development
Verka in Punjab; and the Rallis India projects for contract farming of wheat and rice, and by Pepsi for
tomatoes also have had impact on the livelihoods of the rural people.
Evolution of Livelihood Intervention in India
The livelihood promotion evolved with contributions from people like Rabindranath Tagore, conceiver
of the Sriniketan Experiment, Spencer Hatch, of YMCA, Martandam, Fr. Brayane of the Gurgaon
Project and Albert Meyer of the Etah project.
Mahatma Gandhi, one of the early livelihood thinkers of 20th century, had a holistic vision of
livelihoods, with a deep concern for both, the poor and for sustainability. Gandhiji suggested
developing local economies by promoting interdependent activities, as a member of a mutually
supportive community, eventually leading to “gram swaraj”.
During this period, the emphasis was on building human capital and imparting knowledge. It was
believed that people were deprived of good remuneration because they lacked the skills.To address
this gap, efforts were made to impart knowledge.
Even in the years after independence, government policies and strategies were based on similar
principles. Many educational institutes and research organizations were started during the first five
year plan. The Community Development Program of the Government of India was also designed on
these lines. The Second Five Year Plan attempted to institutionalize this through the concept of
Panchayat Raj, to ensure that local decentralized institutions were built for development.
However, the limitation of this approach became evident by late 1940’s when they realized that just
the skills were not enough, a variety of services to enhance livelihoods were also necessary. Therefore,
an alternative strategy was evolved, which tried to integrate various services like building market
linkages, technology transfer and building physical and social infrastructure, all in onefold, built
around a sector, such as wheat, paddy, milk or soybean.
Integrated Sectoral Strategies
The first two decades after independence rightly focused on development and stabilization of
agriculture through irrigation. The large number of irrigation development projects set up by various
state governments – such as the Western Yamuna Canal system in western Uttar Pradesh; the Bhakra
Nangal dam and canal system in Punjab; the Indira Gandhi Canal and the Chambal dams in Rajasthan;
the Nagarjuna Sagar and Sriram Sagar in Andhra Pradesh and the Tungabhadra and Krishna dams in
Karnataka, stabilized and enhanced incomes and generated wage employment for the landless
farmers.
Some examples of livelihood intervention based on integrated sectoral strategies, covering the entire
value chainendeavours like, KVIC, NDDB and the Green Revolution started emerging during the ‘50s–
60s.
Khadi and Village Industries Commission is the largest livelihood promotion efforts based on Gandhian
thinking. Setup in the 1950s, KVIC is an example of integrated sectoral livelihood intervention. It can
also be called the first government intervention in the non agriculture sector. The KVIC selected nearly
20 activities, from gur(jaggery) making to khadi (hand spun, hand woven cloth), and promoted a
network of training centres, production Chapters, common processing facilities and marketing outlets.

RD-1 NRM, Watershed Management and Sustainable Livelihoods MGNCRE ccxii
RD-1 NRM, Watershed Management and Sustainable Livelihoods
212 MGNCRE
212 MGNCRE | Natural Resource Management and Sustainable Development
In order to benefit the rural producers, they need training as well as working capital and access to
market.
Similarly, the Green Revolution was another example of integrated sectoral livelihood promotion.
Though Green Revolution started with introduction of high yielding variety seeds, infrastructure
support was provided in the form of irrigation facilities, roads, warehouses, market yards etc. This was
supplemented with development of agricultural credit delivery system, support to fertilizer and other
Agri input companies, and investments in agricultural universities for research and training. The Green
Revolution was essentially confined to wheat and later paddy, and much later soybean.
National Dairy Development Board (NDDB) set up in 1969 to replicate the Anand model of cooperative
milk marketing in the entire country. It created systems of milk procurement, processing and
marketing across the country under Operation Flood programs. Further, NDDB made infrastructure
investments in chilling centres, feeder balancing dairy plants, cattle feed plants, veterinary medicine
and vaccine plants, among others. It also invested in research and development projects related to
dairy science and processing of milk products.
Strategies for the Vulnerable Segments of the Population
Though these interventions could influence the livelihoods of millions of people, the poor, the
landless, the marginal farmers, women, tribals and people living in remote areas were left out of these
interventions because they lack resources for investments. By the 70s, despite the existence of this
kind of livelihood development approach, the gap between the rich and the poor was increasing. Deep
dissatisfaction with the prevailing inequities resulted in the rise of Leftist, especially the Naxalite
Movement in the country.
While the Naxalites chose the path of armed struggle, others who were dissatisfied with the state of
affairs joined the voluntary sector. The leading figure in the voluntary development movement in India
was JP (Jaya Prakash Narayan). Many voluntary agencies later became larger and professional
Nongovernmental Organizations (NGOs) and became an integral part of development scenario.
The efforts of these NGOswere focused on those who were left out of the benefits of mainstream
development. Some took this even further to work with the poorest or what was called the
‘sarvaharavarga’. However, this idea got politicized into the slogan of “garibihatao” and
bureaucratized through the launch of the nationwide program for poverty alleviation – the IRDP.
Minimalist Credit
Though various integrated approaches tried to support the livelihood of the poor, it failed to deliver
the expected results. The poor required perpetual ongoing subsidies and still did not generate
sustainable livelihoods. This led to a new thinking that the poor need access to capital not skills as they
know how to manage their livelihoods. In 1974, Ela Bhatt had started the SEWA Bank in India as a
cooperative bank of self-employed poor women. Prof. Mohammad Younus began the experiment of
the Grameen Bank in Bangladesh in 1976. In Latin America, large number of NGOs began microcredit
programs through solidarity groups.
In contrast to the IRDP type of loans, these efforts quickly multiplied and was highly successful with a
high repayment rate of over 95 percent. The 1990s saw millions of households being covered by
RD-1 NRM, Watershed Management and Sustainable Livelihoods MGNCRE ccxiii
RD-1 NRM, Watershed Management and Sustainable Livelihoods
213 MGNCRE
213 MGNCRE | Natural Resource Management and Sustainable Development
microcredit programs, all over the world. In Bangladesh alone, the Grameen bank, BRAC, ASA and
Prusik reached out to over 2 to 3 million borrowers each.
The debate between minimalist credit and integrated sectoral promotion approaches began to
converge in the 1990s. Several integrated programs dropped many of their offerings and became more
focused on credit. On the other hand, many minimalist credit programs, started providing a lot of
other inputs. An example of the synthesis is The Self-Employed Women’s Association, SEWA,
Ahmedabad. While the SEWA Bank was providing only savings and credit, it was embedded in a larger
system. SEWA itself was a trade union, which provided the organizational base, the credit reference
checks and the extension network of the Bank. The Mahila SEWA Trust provided a range of training
and support services to members and staff. Another arm provided healthcare and health insurance
services. Over 80 occupational cooperatives provided inputs, production facilities and market linkages.
Contingency Approach to Livelihood Promotion
In 1989, Vijay Mahajan and Thomas Dichter proposed an alternate livelihood promotion strategy
through a paper ‘A Contingency Approach to Enterprise Promotion’. They argued that promoting
enterprises was complex and a better approach was to identify the bottleneck and work on that. In
many cases, credit could be the only constraint. In such cases, minimalist credit was right and does
work well. In other cases, credit is needed but is not the main constraint, what is needed could be
skills, inputs or markets. Their argument was, though a large variety of services are required, all of
them are not required at the same time and in every case. Thus, the offering should be contingent
upon what is needed in the situation. They also asserted that only a specialised type of organisation
could do it. And as it is difficult to build competencies to address all these factors inhouse,
collaboration become necessary.
5.4 Various Types of Livelihood Interventions
Livelihood interventions exist in many forms and go far beyond running an income generation
program. Some of the approaches of livelihood interventions in India are
Spatial Approach Promoting livelihoods in a specified geographical area such as a region, subregion,
command area or a watershed.
Supporting locally interdependent economic activities, based on a leading intervention. It was
followed by various state governments in the irrigation command areas – the Indira Gandhi Canal in
Rajasthan, or the horticulture based DHRUVA project of BAIF in Valsad, South Gujarat.
Supporting livelihoods in a degraded watershed or degraded forest area, such as MYRADA’s PIDOW
project in Gulbarga, RalegaonSidhi in Maharashtra and the numerous joint forest management
projects supported by AKRSP in Gujarat are examples of spatial approach.
Intervention in a cluster of enterprises, such as Ludhiana for hosiery, BadohiMirzapur for carpets,
Kancheepuram in Tamilnadu and Sualkuchi in Assam for silk sarees, and so on.
Segmental Approach Promoting livelihoods for a vulnerable segment of the population, such as
landless households, tribals, women and the disabled.
Supporting livelihoods of the poor through microcredit, for example by SEWA, SHARE, CASHPOR and
BASIX

RD-1 NRM, Watershed Management and Sustainable Livelihoods MGNCRE ccxiv
RD-1 NRM, Watershed Management and Sustainable Livelihoods
214 MGNCRE
214 MGNCRE | Natural Resource Management and Sustainable Development
Investing in human development nutrition, health, education, and institutional development (for
example CARE’s Women’s Income and Self Help project, Jharkhand).
Asserting the rights and entitlements approach of the poor – whether to minimum wages, land tenure
or access to public services (for example the National Association of Street Vendors of India asserted
the rights of livelihood of street vendors).
Sectoral Approach Promoting livelihoods along a sectorof the economy such as agriculture, or a
subsector such as cotton.
Subsector Interventions, such as dairy, fishery, and sericulture, usually covering the value chain from
primary production to the ultimate consumer, e.g. NDDB in dairy.
Intervention along a Vector (something which cuts across all sectors) such as water, power or market
linkages. E.g. MART, which has worked on rural haats– local markets.
Spatial Interventions
Many livelihood interventions have a spatial geographical boundary. It may be a single village, a
watershed, a river basin, a Chapter, taluka or a district or a region. The main difference between other
approaches and a spatial (or area development) approach is that it tries to tackle all the sectors and
segments of the population in that area.
Area Development with a Leading Intervention (e.g. Irrigation)
This approach has been followed by governments in various ways – initially to develop the “command
area”, that is area irrigated by a canal system of a major dam. Most of these projects began in the
1950s and 60s. The leading intervention here was flow irrigation, and it was supplemented with on
farm development such as land levelling and bunding, building drainage channels, training of farmers
in irrigated agriculture through extension services, ensuring the availability of tractors, supply of new
water responsive varieties of seeds, setting up outlets for fertilizers and pesticides, and finally
marketing, in the form of rural roads, warehouses and market yards. This then led to the development
of the local economy in an interdependent manner. Over a period, nonfarm activities, based on agro
processing improved, and those which supplied goods and services to increasingly prosperous farm
households also prospered. While irrigation changed the livelihoods of millions of farmers for the
better, it also led to a rise of inequalities, particularly for those who did not have any land.
Watershed Development Approach
A watershed is a catchment area feeding into a single identifiable drainage system, such as a stream
or a river. Fostering appropriate local institutions for managing natural resources in the watershed
area, to increase the quality and productivity of those resources, constitutes a watershed
development program.
Out of a total geographical area of 329 million hectares, approximately 170 million hectares of land in
India is classified as degraded. Half of this land falls in undulating semiarid regions, where rainfed
farming is practised. Much of this degradation is due to inappropriate use of land and inadequate
protection. The introduction of appropriate physical barriers to soil and water flows, together with
revegetation and institutional arrangements for their conservation, can improve the productivity of
land. Typically, a watershed program includes the following interventions

RD-1 NRM, Watershed Management and Sustainable Livelihoods MGNCRE ccxv
RD-1 NRM, Watershed Management and Sustainable Livelihoods
215 MGNCRE
215 MGNCRE | Natural Resource Management and Sustainable Development
• Soil and Land Management
• Water Management
• Crop Management
• Afforestation
• Pasture/fodder Development
• Livestock Management
• Rural Energy Management
• Other Farm and Nonfarm Activities
• Community Mobilization
While these components are often understood in general/standardized terms, there is scope for
technology development and adaptation.
The Government of India started recognising the value of using a watershed as a Chapter of
intervention in the early 1980s. Over the last two decades it has set aside substantial budgetary
provisions for micro watershed rehabilitation and development.
Through a range of schemes and programs the government is investing over US$500 million every
year into the rehabilitation of micro watersheds. A set of Guidelines for Watershed Development (GoI
1994) was formulated by the Ministry of Agriculture and Development. They envisage a ‘bottom up
planning’ approach, where working with Non-Government Organisations (NGOs) and community
participation is the central principle.
Holistic Approaches to Livelihood Promotion
The endeavour called livelihood promotion is very complex. Though many development organizations
have attempted to extend a wide variety of services, there are few, which have attempted to address
it in its full range. One of the very good examples of providing them could be the Self-Employed
Women’s Association (SEWA), which has over 750,000 members. The range and scope of SEWA
activities were discussed early in this chapter.
Here is the range that SEWA spans Microfinance services (MFS) Savings and credit through the SEWA
Bank, district level self-help group federations linked to the SEWA Bank and insurance services through
Vimo SEWA.
Livelihood Promotion Services (LPS) the SEWA staff takes up livelihood identification in the retail
outlets and the market facilitation centre, which then informs various occupational cooperatives
about market opportunities. The producers are also provided a number of training programs in both
technical and commercial aspects of their occupation, linked with input suppliers and equipment
makers. SEWA also runs a chain of retail outlets for marketing the products of its members, and a
market facilitation centre to link them with overseas customers.
Institutional Development Services (IDS) SEWA itself is a registered trade union and places a lot of
emphasis on member organization and member education. It has also adopted the cooperative form
for organizing those of its members who need to come together for their work on a day-to-day basis.
SEWA also undertakes policy research and advocacy work. It has collaborated for decades with
researchers in the field of gender issues, informal sector and microfinance, and through them
influenced thinking and policy. Ela Bhatt has been a member of the National Commission on Labour

RD-1 NRM, Watershed Management and Sustainable Livelihoods MGNCRE ccxvi
RD-1 NRM, Watershed Management and Sustainable Livelihoods
216 MGNCRE
216 MGNCRE | Natural Resource Management and Sustainable Development
as well as member of the Planning Commission of India as also a Rajya Sabha MP and had actively tried
to draw attention to the cause of self-employed poor women.
There is no better example of holistic livelihood promotion in India than SEWA. There are other
examples, such as the NDDB, CDF, SIFFS, BAIF, MYRADA and PRADAN, all of whom have used different
combinations of this strategy. It is possible to conceptualise this work in the form of a “Livelihood
Triad”, as shown in the following diagram.
Figure 5.2 Livelihood Triad
The rationale behind this is as follows Microcredit in particular, and microfinance (including savings
and insurance) in general, is helpful for the more enterprising poor people in economically dynamic
areas. However, for poorer people in backward regions, various other livelihood promotion services
(input supply, training, technical assistance, market linkages) needs to be provided. Likewise, it is not
possible to work with poor households individually as they need to be organized into groups, informal
associations and sometimes cooperatives or producer companies, all of which requires institutional
development services.

RD-1 NRM, Watershed Management and Sustainable Livelihoods MGNCRE ccxvii
RD-1 NRM, Watershed Management and Sustainable Livelihoods
217 MGNCRE
217 MGNCRE | Natural Resource Management and Sustainable Development
Micro Finance Services (MFS)
Livelihood Promotion Services (LPS)
Institutional Development Services (IDS)
• Savings (Only in three districts where we have a banking license)
• Identification of livelihood opportunities
• Formations of groups, federations, cooperatives, mutual benefits, etc. of producers
• Credit for consumption as well productive needs
• Productivity enhancement • Capacity building of the
above
• Insurance for lives and livelihoods
• Market linkages – Input supply, output sales
• Accounting and management information systems
• Commodity futures, to reduce price risk
• Local value addition • Performance management
systems
• Financial orchestration (arranging funding from multiple sources for the same sub-sector)
• Risk mitigation (non-insurance)
• Policy analysis and sector work
Figure 5.3 Services offered under Livelihood Triad
5.5 Designing a Livelihood Intervention
While making a livelihood intervention, we are continuously engaged in making choices. These choices
include decisions on the objectives we wish to achieve, the communities, groups or individuals we
seek to help, the sector we work in, the scale of impact we desire, how we organize the livelihood
activity, and so on. This module proposes a framework that helps us think analytically and
systematically about the choices and help design a livelihood strategy.
The framework is not a planning or evaluation tool its utility lies in the fact that it helps us to be more
conscious and thoughtful about the choices we are making. Real learning from the framework will
emerge after it is applied to cases or to our own organization’s experience.
Choices in one element of the design may depend on choices made in another part. This means that
when we are designing an intervention we may need to go back and forth to different design elements,
as one choice influences another.
Elements of Design of Livelihood Intervention
There are three elements in the design of a livelihood intervention. These are (i) the objective of the
intervention (ii) the nature of the intervention and the design of the livelihood activity.
Livelihood intervention could be done with an objective to hold migration, as was in the case of
PRADAN Lift Irrigation, or for assuring a regular market, as in NDDB, or for ensuring that people got
what they were entitled to by law, as in SEWA. In other words, there could be different objectives of
a livelihood intervention. As most livelihood interventions evolve around some economic activities,
there is also an element of design of the livelihood activity. Interventions of different nature, such as
introduction of a technology, or treatment of a watershed, or making credit available could have
significant impact of the livelihoods of people.

RD-1 NRM, Watershed Management and Sustainable Livelihoods MGNCRE ccxviii
RD-1 NRM, Watershed Management and Sustainable Livelihoods
218 MGNCRE
218 MGNCRE | Natural Resource Management and Sustainable Development
Further, the Nature of Intervention proposed, and the Design of the Livelihood Activity depends on
the chosen objective. However, choices of these elements of design are made within a context the
External Context and an Internal Context. This relation can be depicted schematically as follows
Figure 5.4 A Framework for Analysing Livelihood Intervention Choices
a. The Internal Context
There are two elements of the internal context that we need to keep in mind while designing a
livelihood intervention. These are
• People, whose livelihoods are to be promoted
• Organization, which is going to promote/ support livelihoods.
Let us look at these two elements in greater details.
Internal Context the People
Livelihood promotion/ support efforts are always around a set of people. Therefore, it is essential to
get to know the people and their livelihood patterns before we design any intervention.
Though there may be inadequacies in their livelihood options, they are not bereft of any livelihood
activities. Therefore, whatever new activities are proposed will have to be incremental to their present
livelihoods. It is, therefore, important to know their livelihood portfolio and their livelihood strategy.

RD-1 NRM, Watershed Management and Sustainable Livelihoods MGNCRE ccxix
RD-1 NRM, Watershed Management and Sustainable Livelihoods
219 MGNCRE
219 MGNCRE | Natural Resource Management and Sustainable Development
As have been mentioned earlier, poor households are involved in a set of activities to maintain their
livelihoods. This constitutes their diversified livelihood portfolio.
Therefore, it is important to understand
• What is the livelihood pattern of the people?
• What is the existing mix of activities in which different members of a household are engaged
in?
However, the livelihood portfolio of a household depends on their livelihood capacity. Livelihood
capacity of a household is determined not only by the number of people in the family, but also on the
skills and knowledge set of the people, their attitudes towards new activities, their asset base, and
their opportunities, as well as cultural and social conditions of the area. Therefore, it is important to
know
• What are various sets of skills and knowledge that the people have?
• Shortfalls in a household’s income and buffers from which these are met.
• Opportunities that are accessible to them as a family in the area, including barriers posed by
the social and cultural conditions.
• Finance, including credit available throughout the year, to make investments as well as to
even out cashflows at different seasons
But even to use these capacities, different households use different livelihood strategies. Some work
in other people’s land, while some others chose to migrate. If there is some additional income some
chose to expand the existing activity, while some others chose to diversify. (BASIX, 2002) Different
people use different strategies for coping with the risks and shocks. Thus, it may also be useful to
understand
• The preferences of the families in choice of different livelihood strategies
• The risks and shocks they face
• Their ability and coping mechanism to meet these risks and shocks
• Entrepreneurial ability of the people both in terms of their ability to take risks and their
attitudes towards taking new initiatives.
Internal Context the Intervening Agency
The other important element of the internal context is provided by the organization making the
intervention. Let us now look at what are the various aspects of our organization we need to pay some
attention to.
Mission While intending to get involved in livelihood promotion, we need to understand what the
mission of our organization is. How does the intervention fit with our mission? How core is livelihood
promotion to the mission of our organization? Is it one of the many things our organization does?
What competences do we have for such an intervention? Where will the funding come from?
Competencies We need to remember that livelihood promotion is a difficult task and it is better to
understand what we are getting into, before jumping in. It is important to be aware of our core
competency, as it is likely to have serious implications on what intervention we would take up.
For example, AKRSP(I) addressed the problem of migration in parts of Gujarat through a watershed
intervention, as the core competency of AKRSP(I) was in making techno managerial interventions,

RD-1 NRM, Watershed Management and Sustainable Livelihoods MGNCRE ccxx
RD-1 NRM, Watershed Management and Sustainable Livelihoods
220 MGNCRE
220 MGNCRE | Natural Resource Management and Sustainable Development
which is necessary for effective management of watersheds. SEWA chose to organize the beedi rollers
of Gujarat to assert their rights as their core strength was in their trade union activities, which is
necessary for asserting the rights.
Often livelihood interventions necessitate getting involved in commercial business activities by
default. Therefore, it is important to access our strength in that area too.
Source of Capital Livelihood interventions need substantial capital investment that may come from
different sources. The source could be a donor, or a government programme, or investment made
directly in the activity. The more we engage in livelihood promotion, the more funding we need.
Grants may be great to get us started, but the total fund available is likely to be limited. A large volume
of capital can be mobilized from capital markets if, and only if, adequate returns on investments can
be generated.
Different funding sources may also influence the objectives and the implementation strategy.
Whether we receive funding from donors or from government, the missions of those agencies are
likely to play a major role in design of the intervention.
Legal Form of Organization Livelihood activities are commercial in nature. While promoting livelihood
activities, we need to remember that all organizational forms are not permitted to undertake all types
of commercial activities. Certain part of the intervention may be charitable in nature, like giving
training, skill building or building people’s organizations; but these often are only a part of the
intervention.
Some commercial activities can be taken up in small scale without really violating the law (like any
NGO can take up microfinance activities in a small way, many NGOs do marketing of handicrafts and
handloom items). But once the activity scales up and volumes are large, legal complications related to
taxation, capital mobilization, licenses might arise. Therefore, it is advisable to look at one’s own
organization form, as this would also help us in taking decisions on our strategy for scaling up.
b. The External Context
There are four elements of the external environment namely, the Factor Conditions, the Demand
Conditions, the Industry Conditions and the Institutional Condition, which influence the livelihood
choices.
Factor Conditions
Livelihood activities utilize various accessible resources. These resources that go into production of
goods and services constitute the Factor Condition. For example, land, water, agroclimatic conditions,
availability of skilled people, the prevailing political economy, conditions of roads, availability of
electricity. General development indicators of the place define what activities can support large
number of livelihoods in that area. These are the Factor Conditions we need to understand.
Presence of different Factor Conditions lead to adoption of different livelihood intervention strategies.
For example, the organization PRADAN, made intervention in promoting Lift Irrigation in the Ranchi
Lohardaga area, while worked on Leather Subsector in Barabanki Uttar Pradesh, because of different
favourable factor conditions (many of the resources) in these two locations.

RD-1 NRM, Watershed Management and Sustainable Livelihoods MGNCRE ccxxi
RD-1 NRM, Watershed Management and Sustainable Livelihoods
221 MGNCRE
221 MGNCRE | Natural Resource Management and Sustainable Development
Demand Conditions
Whatever be the chosen livelihood activity, there is some output of goods / services. These goods /
services are bought by some people that constitute the demand for them. Try to find who is
demanding them? Is the demand local? Is it increasing, decreasing or stagnant?
Such things determine the Demand Conditions, which in turn determines the number of livelihoods
that can be supported, the kind of income that can be generated from the activity.
Demand Conditions play a significant role in determining livelihood intervention strategy. For
example, MEADOW could be promoted by MYRADA because there was a scope of promoting ancillary
Chapters in that area. Similarly, with the introduction of lift irrigation by PRADAN, people started
growing vegetables for which there was a growing demand.
Industry Conditions
The third element of this external context is the nature and status of the industry, of which, the
livelihoods activity is a part. Here we use the word ‘industry’ in a broader sense, to include all
economic activities. For example, production of paddy is a part of cereal food industry
Thus, it is important to assess what is the status of the industry, in which we are going to promote
livelihoods. Is it growing and vibrant? Is it stagnant and dying? Are there other related and supporting
industries that extend services?
These related and support industries often play a critical role in the chosen livelihood activity. Their
presence or absence creates conditions for making one livelihood intervention more effective than
the other.
Institutional Conditions
All livelihood activities, for that matter, all economic activities are bound by some institutional context.
Apart from state policies, tax laws that govern the activity there are local norms, social arrangements
that also infringe upon the livelihood choices. Presence of various institutions such as promotional,
research and training institutions, producer associations, also has significant influence on the choice
of livelihoods.
These together define the Institutional Condition of the livelihood choice. Therefore, Institutional
Conditions form the fourth element of the external context, which influence the choices in a livelihood
intervention.
Therefore, livelihood interventions are made in a context, which has an internal and external facet.
Making Livelihood Intervention Design Choices
Having taken a close look at the context within which the livelihoods intervention is going to be made,
the three elements of the design of intervention are
a. Framing Our Objectives
Our objectives may be any of the following
• Enhancing income
• Creating assets or wealth
• Increasing food security

RD-1 NRM, Watershed Management and Sustainable Livelihoods MGNCRE ccxxii
RD-1 NRM, Watershed Management and Sustainable Livelihoods
222 MGNCRE
222 MGNCRE | Natural Resource Management and Sustainable Development
• Reducing risk
• Reducing variances in income
• Reducing rural to urban migration
• Organizing producers to have greater control over their livelihoods
• Enhancing the money that circulates within the local economy
The primary objective of most livelihood interventions in India today, is enhancing incomes and food
security. Asset creation is usually seen as a means to enhance incomes. While organizing producers,
again to achieve better returns, is also common, however, strategies to reduce risk are less common,
and very few interventions explicitly focus on enhancing the money that circulates within the local
economy. Reducing migration is often an outcome of other livelihood strategies but is very rarely a
stated objective. However, in the recent years, with the opening up of the insurance sector, many new
initiatives in this direction have been started. ICICI Lombard, ICICI Prudential, AVIVA, among others,
has developed different products to reduce the risk of various livelihoods supporting activities.
b. Nature of the Intervention
The nature of livelihood intervention can vary along three dimensions
• The Sector in which we Intervene What livelihood activity we want to intervene in? Do we
want to improve on an existing livelihood activity or promote a new one?
• The Point of Intervention Which part of the value addition chain will we focus on? Will we
provide one missing input, such as technology development or credit, integrate the delivery
of inputs, or intervene at multiple points providing several services?
• The Instrument of Intervention What is the tool of intervention? Do we want to train the
people to make the necessary changes?
Phases in a Livelihood Intervention
We find that most livelihood interventions go through three distinct phases.
• The pilot phase when we are still testing out a new idea to see if it works on a small scale.
• The development phase the pilot phase has proved successful and we are now developing a
model, with the expectation of scaling it up or replicating it.
• The scaling up or replication phase we now have a model which works and we go to scale by
expanding or replicating the business.
c. Design of the Livelihood Activity
Finally, the livelihood activity can be structured on different aspects in different ways. How are we
going to organize the producers? Will they be self-employed or wage earners? Who will own the
activity or network of activities? Who will manage it? And where will it source its funds? Though these
are some of the choices that we have, the type of employment an activity provides, its ownership,
management and size are closely interlinked issues. It is important to note that describing the business
activity is very different from choosing the subsector or industry in which we intend to work (which
we covered above under the type of intervention).
Management of the Livelihood Activity
Management of the livelihood activity need not always rest with the owners. Even in large
corporations, owners engage a group of professionals to manage the enterprise. AMUL, though

RD-1 NRM, Watershed Management and Sustainable Livelihoods MGNCRE ccxxiii
RD-1 NRM, Watershed Management and Sustainable Livelihoods
223 MGNCRE
223 MGNCRE | Natural Resource Management and Sustainable Development
owned by farmers of Khaira District, is professionally managed. There are various such choices
available.
• Producer managed Livelihood Activities
• Livelihood Activities Managed by Hired Professionals
Size of the Livelihood Activity
The size of a livelihood activity should ideally be determined by viability considerations. Economic
viability may suggest the need for a larger activity to achieve economies of scale. But the limited ability
of the producers to manage the activity may weigh in favour of a smaller activity. Collective ownership
may be an option for managing a larger activity. Example, a farmers’ cooperative establishing a paddy
processing unit.
PRADAN in its intervention has worked hard to divide the production processes for poultry and
mushrooms. Those processes that require more capital investment are to be managed as a large
enterprise by a collective group or by a more entrepreneurial member of the community. Other
processes those are viable, as microenterprises should be managed by individual households.
Funding of the Livelihood Activity
• Grant based Funding
• Loan based Funding
• Equity
Selecting Livelihood Activities Suitable for the Poor in the Area
Organizations that work directly to promote the livelihoods of the poor have primarily adopted three
approaches
a. Opportunities based approach
b. Ensuring access to entitlements approach
c. Approaches for the highly disadvantaged groups
a. Opportunities Based Approach
The opportunities based approach seeks to primarily improve the economic returns of the target
group by helping them leverage existing forms of capital (natural, social, human, etc.) and enhancing
them through productivity enhancement and market linkages. This approach therefore necessitates a
certain pre-existing degree of awareness within the target group, and availability and access of
resources. Natural resource regeneration approach and value chain-based interventions fall under this
category.
b. Ensuring Access to Entitlements Approach
The ensuring access to entitlements approach on the other hand seeks to primarily improve the social
and political situation by creating awareness, ownership and access to and control of
a. Social, economic and political entitlements
b. Different resources of land, water, forest, human and livestock
This is because net economic gains made by a family pursuing economic activities in a ‘low
entitlements environment’ are insufficient and unsustainable and the livelihood activity itself is highly
prone to risk of being lost. These rights and entitlements are experienced at an individual level, and

RD-1 NRM, Watershed Management and Sustainable Livelihoods MGNCRE ccxxiv
RD-1 NRM, Watershed Management and Sustainable Livelihoods
224 MGNCRE
224 MGNCRE | Natural Resource Management and Sustainable Development
at household and community levels. For example, within a household, women and men may or may
not enjoy the same kind of rights, while within a community different caste groups may have different
access rights to the same resource such as a water source or forest resources.
c. Approaches for the Highly Disadvantaged Groups
As the name suggests, the Approaches for the Highly Disadvantaged groups are methodologies
specialized and customized to the needs of the target group the disadvantaged, poorest of the poor,
women, those affected by natural disasters and people with disabilities.
References
1. BASIX (2002), ‘A Study of Microdiversification Pattern of Livelihoods in Andhra Pradesh’, Paper
done jointly with Overseas Development Institute, London.
2. Carney, D, Drinkwater, M, Rusinow, T, Neefjes, K, Wanmali, S & Singh, N. (1999). Livelihoods
approaches compared A brief comparison of the livelihoods approaches of the UK Department
for International Development (DFID), CARE, Oxfam and the Chaptered Nations Development
Programme (UNDP), November 1999.
3. Caroline Ashley and Diana Carney, ‘Sustainable Livelihoods Lessons from early experiences’,
DFID.
4. David G. Blanchflower and Andrew J. Oswald (2013), ‘Does High HomeOwnership Impair the
Labour Market?’, Working Paper, no. 19079, Cambridge, MA National Bureau of Economic
Research.
5. Ellis F (1993). Peasant Economics Farm Household and Agrarian Development, 2nd edn.
Cambridge University Press, Cambridge, pp. 3–15.
6. Government of India (2013), Report on Policy and Interventions to Spur Growth of
RentalHousing in India, New Delhi MoHUPA
7. K. Sundaram's, Employment and Poverty in 1990s' (Economic and Political Weekly), August
1117, 2001.
To Do Activity
Reflect on the factors that have affected the livelihood choices in your own life.

Contents
Chapter1 Introduction
1.1 Concepts and definitions of important terminology
1.2Classification of disasters – (Geological and Hydrometeorological disasters)
1.3Classification of disasters – (Biological, Technological and Manmade disasters)
1.4Global disaster trends – emerging risks of disasters
1.5Climate change and urban disasters
Chapter2 Disaster Management Cycle, Risk Reduction and Managing Risks
2.1 Disaster Management Cycle
2.2 Principles of Risk Management and Vulnerability Mapping and Analysis
2.3 Developmental projects (dams, power plants etc.)
2.4 Risk management
2.5 Post Disaster Management Activities
Chapter3 Disaster Risk Reduction Tools and Capacity Building
3.1 Disaster Risk Reduction
3.2 Prime Activities of Disaster Management
3.3 Application of Information Technology in Disaster Risk Reduction
3.4 Disaster Risk Transfer and Financing
3.5 Role of various stake holders during disasters
Chapter 4Disaster Management in India 4.1 Disaster Management in India
4.2 Disaster Management Act 2005 and National Guidelines and Plans on Disaster Management
4.3 Role of Government, Non-Government and Inter Governmental Agencies in National Disaster Management
4.4 National Disaster Management Authority (NDMA) and NIDM (National Institute of Disaster Management)
4.5 State Disaster Management Authorities and National Disaster Response Force
Chapter 5 International Framework
5.1 International Agencies
5.2 International Strategy for Disaster Reduction
5.3 International Frameworks
5.4 S&T Institutions for Disaster Management in India
5.5 India’s commitment at International Forum COP21

227 MGNCRE | Community Resilience and Disaster Management
Chapter 1 Introduction
Introduction Before discussing the various dimensions of Disaster Risk Management, it is essential to understand
some basic concepts and terminology related to Disaster Risk Management. This Chapter introduces
the reader to all the key concepts and terminology related to the subject and provides their
definitions.
Objectives
The objectives of this Chapter are
• To introduce the reader to all the key concepts and terminology related to Disaster Risk
Management
• To define all the key terms and concepts
• To provide a classification of disasters
• To brief up on global disaster trends and emerging risks
• To brief up on climate change and urban disasters
Structure
1.1 Concepts and definitions of Important Terminology
Hazard
Hazard can be understood as an unwanted happening or situation, which is capable of causing harm
or damage (Toft & Reynolds, 2005).Hazard is anything that can cause disturbance or damage to public,
public property, public services and environment in general.
The simplest definition of Hazard is “A hazard is a threat posed to people by the natural environment”
(Oliver, 2001). The United Nations defines hazard as “A potentially damaging physical event,
phenomenon or human activity that may cause the loss of life or injury, property damage, social and
economic disruption or environmental degradation” (UNISDR, 2004).
1.1 Concepts and Definitions of Important Terminology
1.2 Geological and Hydro Metero logical Disasters
1.3 Biological, Technological and Man Made Disasters
1.4 Global Disaster Trends-Emerging Risk of Disasters
1.5 Climate Change and Urban Disasters

228 MGNCRE | Community Resilience and Disaster Management
Disaster
Disaster can be understood as a severe disruption to the normal functioning of a society caused by
the interaction of hazards with exposure, vulnerability and risk thereby causing losses to public,
properties, economy and environmental elements.
Disaster is classically considered as an event. According to the International Federation of the Red
Cross Societies, “Disaster is a sudden, calamitous event that seriously disrupts the functioning of a
community or society and causes human, material, and economic or environmental losses that exceed
the community’s or society’s ability to cope using its own resources.”
However modern researchers consider disaster as the effect or outcome of the hazard rather than an
event. According to Dombrowski (1995), “Disasters do not cause effects. The effects are what we call
a disaster” (Dombrowski, 1995).
Disasters are often seen as “largescale, stressful and traumatic events” (Dominiciet al., 2005). They
result in extensive damage to public, property, network and transport, and also to natural resources.
The outcomes are tragic leaving many deaths and injuries and severe disruption to the common lives.
These effects disrupt socioeconomical, cultural, and even political settings, of the society thereby
obstructing the growth and progress of the society for a considerable period by destroying years of
development in minutes. For instance, the Indian Ocean tsunami which occurred in 2004, collapsed
20 years of development of Maldives, a beautiful island which is located southwest to India and Sri
Lanka.
According to Quadrantally (2000), disastrous events can be classified by two elements namely
capacity and demand. It is represented in table 1.1
Table 1.1 Classification of Disastrous Events by Means of Capacity and Demand.
Crisis Capacity is more than demand – with capacity to spare
Emergency Capacity reaches or slightly more than demand
Disaster Demand is more than capacity
Catastrophe Overwhelming Demand that may wipe out capacity.
Difference between Hazard and Disaster
Hazards are the starting points for disasters. Hazards may turn into disasters becoming sequential
events. A hazard refers to the probability of the happening of a negative event while disaster refers to
the negative effects of that event when the effect becomes severe enough to disturb public life.
Vulnerability
The word Vulnerability comes from the Latin word “vulnerability,” meaning “wounds or harm”.
Vulnerability is the scope of being harmed or wounded. In the context of Disaster Management,
Vulnerability refers to a set of factors such as economical, societal, physical or geographical factors
that decrease the capacity to prepare for and manage the effects of hazards.
Vulnerability is defined as “the conditions determined by physical, social, economic and
environmental factors or processes which increase the susceptibility of an individual, a community,
assets or systems to the impacts of hazards.” According toBlaikie et al., (1994), vulnerability is defined

229 MGNCRE | Community Resilience and Disaster Management
as “the characteristics of a person or group in terms of their capacity to anticipate, cope with, resist,
and recover from the impact of a natural hazard.”
Vulnerability is an important element of Disaster Management in the sense that Vulnerability
determines the extent of suffering by the effected society. In other words, Vulnerability is the answer
to the question why some societies or economies suffer more than others because of a disaster.
Vulnerability is the extent to which a system can face a disaster effectively and the ability of the system
to digest and recover from the ill effects of the disaster.
There is a famous quote from a disaster expert from Columbia University which says, “Earthquakes
don’t kill people. Bad buildings kill them”. Therefore, it is important to develop measures and
infrastructures to reduce vulnerability in order to face disaster effectively. This is where the concept
of Resilience comes in to picture, which is being discussed in the next section.
Resilience
Resilience is antonymous to Vulnerability in many ways. While vulnerability increases the exposure to
the outcomes of hazard, resilience on the other hand, increases the resistance towards hazard. In
other words, increased resilience would lead to reduced vulnerability.
Resilience comes from the Latin word “resilin”, meaning “to jump back”. Resilience is considered as
“the capacity of physical and human systems to respond to and recover from extreme events”. It is
described as “a buffer, or a shock absorber, promoting sustainable livelihoods by allowing individuals
and/or systems an opportunity to cope during an extreme event and not depleting all resources or
options for recovery in the following period”.
Resilience is defined as “the ability of a system, community or society exposed to hazards to resist,
absorb, accommodate, adapt to, transform and recover from the effects of a hazard in a timely and
efficient manner, including through the preservation and restorationof its essential basic structures
and functions through risk management.”
C.S. (Buzz) Holing, an ecologist by profession has put forward the concept of resilience in the year
1973. But it gained importance after the Hurricane Katrina in 2005, aiding the concept of disaster
resistance. And during the recent past, resilience has turned out to be an essential element of natural
hazard management and disaster reduction.
Risk
Risk generally refers to the probability of negative consequences which may occur due to particular
situations. Disaster Risk refers to the extent of threat presented by a hazard. Disaster Risk is
determined by individual, societal and cultural factors (Pidgeon et al., 1992). Disaster Risk refers to
the probability of negative consequences which may occur when hazards work together with
vulnerable places, public, property, and surroundings.
Disaster risk can be defined as “the potential loss of life, injury, or destroyed or damaged assets which
could occur to a system, society or a community in a specific period of time, determined
probabilistically as a function of hazard, exposure, vulnerability and capacity.” The most popular
definition of risk is “the likelihood of an event occurring multiplied by the consequences of that event”
It is represented as
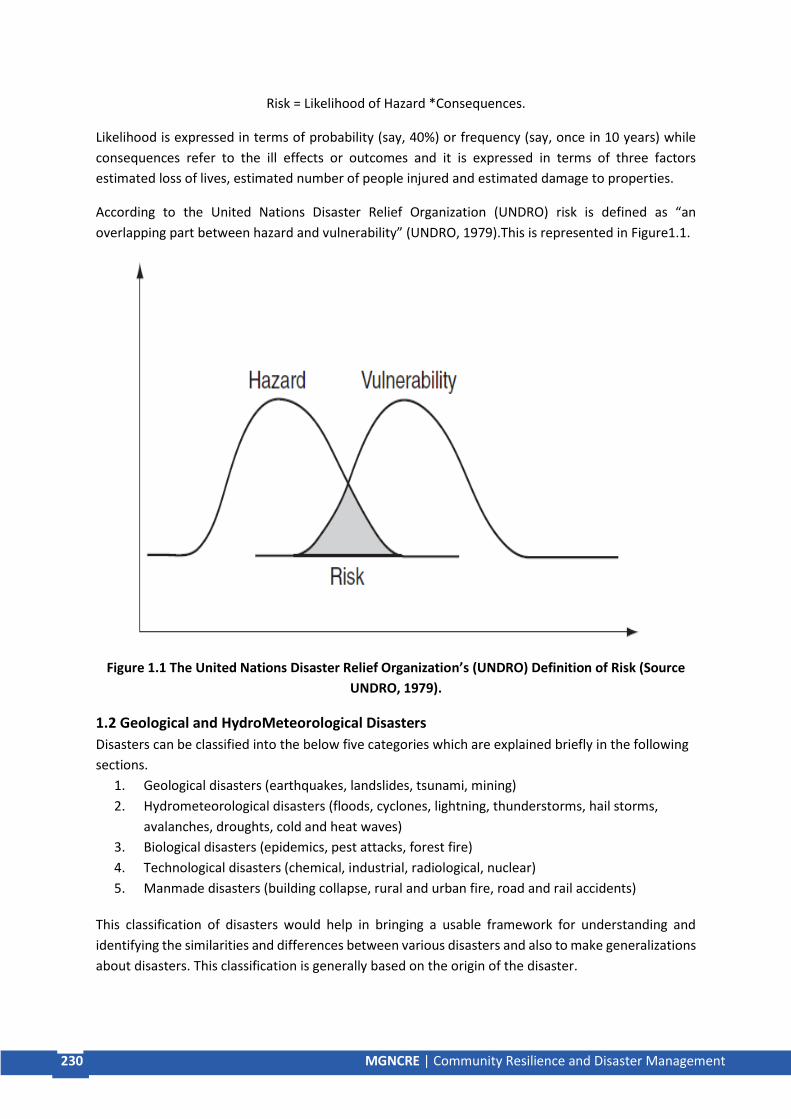
230 MGNCRE | Community Resilience and Disaster Management
Risk = Likelihood of Hazard *Consequences.
Likelihood is expressed in terms of probability (say, 40%) or frequency (say, once in 10 years) while
consequences refer to the ill effects or outcomes and it is expressed in terms of three factors
estimated loss of lives, estimated number of people injured and estimated damage to properties.
According to the United Nations Disaster Relief Organization (UNDRO) risk is defined as “an
overlapping part between hazard and vulnerability” (UNDRO, 1979).This is represented in Figure1.1.
Figure 1.1 The United Nations Disaster Relief Organization’s (UNDRO) Definition of Risk (Source
UNDRO, 1979).
1.2 Geological and HydroMeteorological Disasters
Disasters can be classified into the below five categories which are explained briefly in the following
sections.
1. Geological disasters (earthquakes, landslides, tsunami, mining)
2. Hydrometeorological disasters (floods, cyclones, lightning, thunderstorms, hail storms,
avalanches, droughts, cold and heat waves)
3. Biological disasters (epidemics, pest attacks, forest fire)
4. Technological disasters (chemical, industrial, radiological, nuclear)
5. Manmade disasters (building collapse, rural and urban fire, road and rail accidents)
This classification of disasters would help in bringing a usable framework for understanding and
identifying the similarities and differences between various disasters and also to make generalizations
about disasters. This classification is generally based on the origin of the disaster.

231 MGNCRE | Community Resilience and Disaster Management
Geological Disasters
Geological Disasters occur because of disturbances in the natural geological functions mostly due to
shifts in tectonic plates and seismic activities. Earthquakes, Landslides, Tsunami, and Mining fall under
the category of geological disasters. Each of them is discussed briefly here under.
Earthquakes
An earthquake is the sudden trembling or shaking of the ground caused by a sudden dislocation of
rock in the Earth's crust. The effect of earthquake is most shocking because it affects huge areas,
occurs abruptly and is unpredictable. It results in heavy loss of life and property and disrupts public
services such as water supply, sewage, network, electricity, transportation etc. They not only destroy
villages, towns and cities but the aftermath leads to destabilize the economy and social structure of
the nation.
The intensity of earthquakes is measured by using a seismograph. India has witnessed some severe
earthquakes. For instance, the Kashmir earthquake occurred in 2005 with a magnitude of 7.6 causing
1, 30,000 deaths in a matter of minutes.
Landslides
Landslides are defined as down slope movement of rock, debris and/or earth under the influence of
gravity. The main factors behind landslides are drainage, bedrock, plant life, climate, earthquakes etc.
People should avoid building houses near steep slopes to prevent themselves from falling victims to
landslides.

232 MGNCRE | Community Resilience and Disaster Management
Tsunami
Tsunamis and earthquakes occur subsequent to centuries of energy build up inside the earth.A
tsunami (in Japanese „tsu‟ means harbor and „nami‟ means wave) is a series of water waves caused
by the displacement of a large volume of a body of water, usually an ocean. Earthquakes, landslides,
volcanic eruptions, cosmic collisions and meteors that occur under the ocean are the major reasons
for the occurrence of tsunami.
Tsunamis can have wave lengths of hundreds of kilometres and can travel at about 800 km per hour,
but with less amplitude of about 1 km. But, when it travels towards the coast its wavelength decreases,
but amplitude grows rapidly, and it takes very less time to reach its full height. The 2004 Indian Ocean

233 MGNCRE | Community Resilience and Disaster Management
earthquake followed by tsunami exposed India’s vulnerability towards Tsunami. It is one of the
deadliest disasters killing more than 2.2 lakhs of people in 13 countries.
Mining
Mining disasters occur during the process of mining minerals. Many people die every year because of
these mining disasters especially underground coal mining. In India recently in December2018, a
mining disaster occurred in Meghalaya killing 13 people. Unregulated mining should be strictly
controlled and scientifically safe methods of mining should be established.
Hydro Meteorological Disasters
Hydro metrological disasters refer to natural disasters of atmospheric or oceanographic nature such
as floods, cyclones, droughts etc. Floods, cyclones, lightning, thunderstorms, hail storms, avalanches,
droughts, cold and heat waves fall under the category of Hydrometeorological disasters. Each of them
is discussed briefly here under.
Floods
Floods are the most common and expensive natural disasters. A flood is an excess of water (or mud)
on land that's normally dry and is a situation where in the inundation is caused by high flow, or
overflow of water in an established watercourse, such as a river, stream, or drainage ditch; or ponding
of water at or near the point where the rain fell. Floods can occur without warning when a huge
amount of rain falls in a short period.

234 MGNCRE | Community Resilience and Disaster Management
India is one of the most flood prone countries in the world. The principal reasons for flood lie in the
very nature of natural ecological systems in this country, namely, the monsoon, the highly silted river
systems and the steep and highly erodible mountains, particularly those of the Himalayan ranges.
Cyclones
Cyclone is a tropical weather hazard in which wind force is more than gale force (min 62 kmph). A
cyclone is a storm system characterised by a large low pressure centre and numerous thunderstorms
that produce strong winds and flooding rain.

235 MGNCRE | Community Resilience and Disaster Management
Lightning
Lightning is electrical discharges causing very bright flashes of light in the sky and often when striking
the ground, causing severe damage to persons or objects. Lightning is the natural disaster causing the
most number of deaths in India every year. Around 1,755 people die annually due to lightning strikes
in India. Lightning accounts to 39% of deaths caused by natural disasters in the country.
Thunderstorms and Hail Storms
A thunder storm produces thunder and lightning while a hailstorm produces chunks of ice that fall
from the sky as rain. A thunderstorm, also known as an electrical storm or a lightning storm, is a storm
characterized by the presence of lightning and its acoustic effect on the Earth's atmosphere, known
as thunder. Thunderstorms are caused by cumulonimbus clouds. They are usually accompanied by
strong winds, heavy rain, and sometimes snow, sleet, hail, or, in contrast, no precipitation at all.

236 MGNCRE | Community Resilience and Disaster Management
Hail is a form of solid precipitation. It is distinct from ice pellets, though the two are often confused.
It consists of balls or irregular lumps of ice, each of which is called a hailstone. Ice pellets fall generally
in cold weather while hail growth is greatly inhibited during cold surface temperatures.
Avalanches
Avalanches occur when snow cover on a slope tends to slide down the slope because of gravity.
Avalanches are seldom observed closely as they usually occur in a short period of one or two minutes.
Main causes of avalanches include weather conditions and weight of snow cover.
The Himalayas are well notorious for the incidence of snow avalanches predominantly Western
Himalayas i.e. the snowy regions of Jammu and Kashmir, Himachal Pradesh and Western Uttar
Pradesh.
Droughts
Droughts occur due to deficiency in rainfall i.e. if the rainfall is less than the annual average rainfall.
This can extend to a season or year or even more. Droughts cause reduction in agricultural produce,
greater fire hazard, shortage of water levels, increased stock and wildlife death rates, and damage to
wildlife and fish habitat.
Cold and Heat Waves
A heat wave is typically defined as a period of extremely hot weather conditions accompanied by high
levels of humidity. Heat waves are dangerously hot for the population and may affect human health
severely. However, threshold conditions for a heat wave vary across India and around the world.
According to the World Meteorological Organization when the daily maximum temperature of more
than five consecutive days exceeds the average maximum temperature by 5 °C (9 °F) it results in a
heat wave.

237 MGNCRE | Community Resilience and Disaster Management
Cold waves occur due to a rapid fall in temperature within a day disturbing agricultural, industrial,
commercial, and social activity. The northern India, particularly the hilly areas and the neighbouring
plains are affected by cold wave conditions and sometimes states like Maharashtra and Karnataka also
report cold waves.
1.3 Biological, Technological and Man-Made Disasters
Biological Disasters
Biological hazards refer to hazards that originate from biological reasons (e.g., epidemics) also called
biohazards. Sources of biological hazards include bacteria, viruses, medical wastes, insects, plants,
birds, animals, and humans. These sources can cause a variety of health effects ranging from skin
irritation, allergies, and infections (e.g., AIDS and tuberculosis) to deaths. Epidemics, pest attacks and
forest fire fall under the category of Biological disasters. Each of them is discussed briefly here under.
Epidemics
Epidemics can be defined as a widespread occurrence of an infectious disease in a community at a
particular time. An epidemic is the rapid spread of infectious disease to a large number of people in a
given population within a short period of time.
The prominent epidemics in India are Malaria, Cholera and Tuberculosis. They erupt when conditions
are favourable for their spread. In 2015 India has witnessed the outbreak of swine flu (H1N1 virus).
According to WHO “India has the third largest HIV epidemic in the world. In 2017, HIV prevalence
among adults (aged 1549) is estimated as 0.2%”

238 MGNCRE | Community Resilience and Disaster Management
Pest Attacks
According to the Indian Council of Agricultural Research, “the pest attacks in India is in a monotonic
increasing mode during the recent years, starting from recent Pink bollworm attack in Telangana,
Whitefly attack on Punjab, Brown plant hoppers in Orissa to wheat blast diseases in West Bengal and
about 3035% of the crop yield in India gets lost because of pests”. Climate Change, unavailability of
pesticides a, lack of awareness and support to farmers, overuse and misuse of pesticides are the major
reasons for the outburst of pest attacks.

239 MGNCRE | Community Resilience and Disaster Management
Forest Fire
Forests fires have existed since olden times. They spoil not only the wildlife and forest wealth but also
the surrounding communities. There is a rapid raise in the outburst of forest fires owing to the growth
of human and cattle population. According to the State of Forests Report 2015, “the Himalayan regions
and the dry deciduous forests of India, particularly in Andhra Pradesh, Assam, Chhattisgarh,
Jharkhand, Karnataka, Madhya Pradesh, Maharashtra and Odisha are ecologically sensitive areas” and
are the most affected by forest fires.
Technological Disasters
Technological hazards are hazards that originate from the interaction of society, technology and
natural systems (e.g., explosions, releases of toxic materials, and oil spills)and they have evolved since
the beginning of the industrial revolution. Chemical, industrial and radiological and nuclear disasters
fall under the category of Technological disasters. Each of them is discussed briefly here under.

240 MGNCRE | Community Resilience and Disaster Management
Chemical Disasters
A chemical disaster is defined as the unintentional release of one or more hazardous substances which
could harm human health or the environment. Chemical hazards are systems where chemical
accidents could occur under certain circumstances. Such events include fires, explosions, leakages or
release of toxic or hazardous materials that can cause people illness, injury, or disability. The major
causes for chemical disasters are the unwarranted use and misuse of chemical substances in
industries.
Industrial Disasters
Industrial hazards are hazard agents produced by the extraction, creation, distribution, storage, use,
and dispersal of chemicals, such as chlorine, benzene, insecticides, and fuel. The accidental release of
toxic gas from a pesticides plant in Bhopal, India in 1984 is often cited as one of the worst industrial
disasters in the world. It killed almost 3000 people and about 3 lakhs of people were exposed to the
deadly gas and suffered long term permanent disabilities.

241 MGNCRE | Community Resilience and Disaster Management
Nuclear Disasters
A nuclear disaster is caused by either a meltdown at a nuclear reactor plan or by an accident involving
nuclear weapons and nuclear materials, or the explosion of a nuclear bomb. The atomic bombing of
Hiroshima and Nagasaki and the Chernobyl nuclear disaster are the biggest nuclear disasters in the
world.
The Chernobyl Nuclear Disaster
Radiological Disasters
According to the National Disaster Management Association (NDMA) “A radiological accident is an
event that involves the release of potentially dangerous radioactive materials into the environment.
This release is usually in the form of a cloud or ‘plume’ and could affect the health and safety of
anybody in its path. Radiological accidents can occur anywhere that radioactive materials are used,
stored or transported. Nuclear power plants, transport of radiological materials and disposal of
radioactive waste all pose threats.” Certain types of radioactive materials are dangerous and harmful
to living beings. Radiation disasters contaminate the environment
Man Made Disasters
Man made disasters are caused by ignorance or negligence of human beings. Building collapses, rural
and urban fires, road and rail accidents fall under the category of Manmade disasters.

242 MGNCRE | Community Resilience and Disaster Management
Building Collapses
Building collapses and constructional collapses like flyover collapses, bridge collapses are common in
India. Buildings which are under construction and sometimes resident buildings also collapse because
of structural failures and unpermitted building of buildings and extra floors with low quality
construction materials. In April 2013, a building collapsed on a tribal land in Thane, Maharashtra killing
74people.
Rural and Urban Fires
Fire is defined as the rapid burning of combustible material with the evolution of heat and usually
accompanied by flame. But uncontrolled fire is one of the major causes of death and property damage.
Unpermitted preparation of crackers and usage of house wood for cooking during summers have

243 MGNCRE | Community Resilience and Disaster Management
caused fires in many rural areas while the lack of minimum fire safety precautions in hotels, hospitals
and large buildings can cause fire accidents in urban areas. Burning of dust near katcha houses also
causes fire. The incidence of fire accidents is more during summer season.
Road and Rail Accidents
Road accidents are the most frequent cause of deaths and injuries in India. The major reasons behind
road accidents are heavy and unregulated traffic, not following traffic rules and over speeding etc.
Although, travelling on train is highly safe, there is an incidence of rail accidents sometimes. According
to the National Crime Records Bureau (NCRB) report, “in the 6year period between 200910 and
201415, there were a total of 803 accidents in Indian Railways killing 620 people and injuring 1855
people, excessive traffic and underinvestment in rail infrastructure being the main underlying factors”.
1.4 Global Disaster Trends – Emerging Risks of Disasters
The modern world is experiencing more disasters and newer forms of disasters because of various
reasons like urbanisation, industrialisation, climate changes, deforestation, high densities of
population, human population displacement etc. Newer forms of disasters are attacking the world in
the form of technological disasters and biological disasters. This growth in disasters is an indicator of
unsustainable development.
The major global trends and emerging risks of disasters are given below.
1. The number of disasters is raising globally Since the 1970s the number of disasters has almost
tripled.
The world today has become vulnerable to newer and more disasters because of biological
and industrial threats. New viruses, epidemics and pest attacks are causing more biological
disasters. Global warming and rising sea levels have posed newer threats of hydro
244 MGNCRE | Community Resilience and Disaster Management
metrological disasters. Industrialisation has paved ways for newer forms of nuclear and
industrial disasters.
2. More people are being affected by disasters but disaster deaths are decreasing globally.
More people are being affected by disasters because of higher densities of populations,
growing number of cities and human settlement patterns. However, the death toll has
decreased because of improved early warning systems, effective risk reduction, international
cooperation and increased preparedness.
3. Disasters are causing more financial losses.
Urbanisation has created concentrated wealth, more buildings and infrastructures and more
costly technologies. But a single disaster is enough to collapse all this development in a matter
of minutes creating huge economic losses.
The Great HanshinAwaji earthquake in 1995 at Kobe, Japan is considered as the worst
economic loss during the last decade.
4. Poor people and poor countries are affected more.
This is because of the economic vulnerability to face the after effects of disasters. Settling in
disaster prone areas, unsafe housing, poverty and disease increase the vulnerability of the
poor to disasters.
The Bangladesh cyclone in 1991 which killed 139,000 is considered one the deadliest disasters
in the century. This is an example of how a developing country like Bangladesh suffered heavy
loss due to a disaster.
1.5 Climate Change and Urban Disasters
Global warming refers to the increase in the average temperature of the Earth’s atmosphere and
oceans since the mid twentieth century and its projected continuation. Global warming is strongly
related to an increase in the concentration of greenhouse gases. This greenhouse effect is causing
global warming which in turn is driving climate change. Rapid industrialisation, burning of fossil fuels,
traffic pollution and increased usage of Air conditioners and refrigerators are all reasons behind
greenhouse effect and climate change. The following are the results of global warming and
subsequent climate change.
1. Changes in Rainfall
Global warming would bring changes in rainfall leading to more extreme wet and dry seasons
and more severe storms.
2. Melting of Glacial and Ice Cap
Increased temperatures are melting Arctic ice and glaciers more rapidly than before. This can
cause floods downstream of the glacier and would displace people and animals living in the
surroundings.
3. Raising Ocean Temperatures
To Do Activity
Have you ever experienced any hazard in your community such as cyclone, storm, heat wave
or any release of hazardous wastes spoiling the environment or any other hazard? Did you
help anyone in such situations? What role did you play as a responsible citizen? Elucidate.

245 MGNCRE | Community Resilience and Disaster Management
Increased temperatures are also raising ocean temperatures. The average change in ocean
temperature over the past 40 years was 0.3◦C in the top 300m and 0.06◦C in the top 3.5 km
(Hyndman and Hyndman, 2011). This can cause intense storms, hurricanes and cyclones.
4. Effects on Ecosystems and Human Race
Global warming would change ecosystems all over the world. Certain plants and organisms
cannot survive in their current locations creating new species. It also can make some species
extinct from the planet. For instance, polar bear and arctic fox have already turned out to be
endangered species caused by melting of polar icecaps. Agricultural activities would be
severely affected by global warming.
References
1. Alexander, D. 2000, Confronting Catastrophe New Perspectives on Natural Disasters. New
York Oxford University Press.
2. Coppola, D.P. 2007, Introduction to International Disaster Management. Amsterdam Elsevier.
3. Curtis, A. 2010, Chronic disease as an evacuation impediment using a geographic information
system and 911 call data after Katrina to determine neighbourhood scale health vulnerability.
Risk, Hazards & Crisis in Public Policy 1 (3) 63–89.
4. Degg, M. 1992, Natural disasters recent trends and future prospects. Geography 77 (3) 198–
209.
5. Dombrowsky, W 1995, ‘Again and again is a disaster what we call “disaster”? Some conceptual
notes on conceptualizing the object of disaster sociology’, International Journal of Mass
Emergencies and Disasters, vol. 13, no.3.
6. Government of India, Ministry of Home Affairs, Disaster Management in India
7. GuhaSapir, D. et al. 2004, Thirty Years of Natural Disasters 1947–2003 The Numbers Centre
for Research on the Epidemiology of Disasters. LouvainlaNeuve, Belgium
8. IFRC (International Federation of Red Cross) and RCS (Red Crescent Societies) 2007, World
Disaster Report 2007 Focus on Discrimination. Geneva IFRC and RCS.
9. Kapur, A. 2010, Vulnerable India A Geographical Study of Disasters. New Delhi Sage
10. National Disaster Management Authority, Govt. of India (2012) Hand Book for Training and
Capacity Building of Civil Defence and Sister Organisations.
11. National Institute of Disaster Management, Ministry of Home Affairs, Govt. of India, Do’s &
Don’ts for Common Disasters.
12. Pidgeon, N, Hood, C, Jones, D, Turner, B & Gibson, R, 1992, ‘Risk perception’ in Risk analysis,
perception and management, pp. 89134, The Royal Society, London.
13. Quarantelli, E.L. 2006, Emergencies, Disasters, and Catastrophes are Different Phenomena.
http//www.udel.edu/DRC/preliminary/pp304.pdf.
14. Smith, K. 1996, Natural disasters definitions, databases and dilemmas, Geography Review.
To Do Activity
What kind of a community do you live in (urban or rural)? What kind of hazards is your
community vulnerable to? Explain the social, geographical, climatic and technological
vulnerabilities of your community. Also illustrate the kind of measures and support activities
undertaken by the government and public to prevent the community from hazards.

246 MGNCRE | Community Resilience and Disaster Management
15. Toft, B & Reynolds, S. 2005, Learning from Disasters; a Management Approach, 2nd edn,
MacMillan, Basingstoke.
16. UNDP (United Nations Development Programme) 2004, Reducing Disaster Risk A Challenge
for Development. New York UNDP Bureau for Crisis Prevention and Recovery.
17. Wisner, B. et al. 2004, At Risk Natural Hazards, People’s Vulnerability and Disaster. London
Routledge.

247 MGNCRE | Community Resilience and Disaster Management
Chapter 2 Disaster Management Cycle, Risk
Reduction and Managing Risks
Introduction This chapter is devoted to the various phases of disaster management cycle. This chapter will provide
an overview of risk reduction and Risk management. It is to be noted that the four disaster
management phases may or may not, occur in isolation or in the precise order. In many instances’
phases overlap, and the severity and the type of disaster greatly influences the length of each phase.
The resources that can be brought to bear to cope with impacts of the disaster also effect the length
of the phase. This chapter deals the topic from this perspective.
Objectives
• To discuss the phases of disaster management cycle
• To explain the measures for/ risk reduction
• To understand the components of risk management
Structure
2.1 Disaster Management Cycle
According to Mileti et al. (1999), “the contemporary hazards adjustment prototype and accompanying
model of human choice group hazard adjustments into four temporal phases or stages of emergency
management mitigation, preparedness, response, and recovery. Collectively these four stages are
known as the disaster cycle or disaster management cycle. The cycle illustrates the continuous process
through which disaster management agencies – with help from governments, businesses, and other
entities –strategizes to minimize losses from hazards, assure speedy assistance to disaster victims, and
adopt measures to recover from the impacts of disasters swiftly. For greater preparedness, better
warnings, as well as reduction in individual and community vulnerability to hazards and disasters it is
essential to adopt appropriate actions and measures at all stages in the cycle. The four stages of the
disaster management cycle are not exclusively marked from each other, but these are useful
2.1 Disaster Management Cycle
2.2 Principles of Risk Management and Vulnerability Mapping and Analysis
2.3 Developmental Projects
2.4 Risk Management
2.5 Post Disaster Management Activities

248 MGNCRE | Community Resilience and Disaster Management
categories to strategies activities, research, and policy for comprehensive hazard/disaster
management” (Mileti, 1999; Prater and Lindell, 2000; Tierney et al., 2001).
Figure 2.1 shows the four phases of disaster management cycle. “The phases of mitigation and
preparedness takes place before an extreme natural event occurs, whereas response and recovery
take place after the event occurs. There are multiple adaptions of the diagram illustrating the ongoing
nature of activities undertaken in each phase, every activity seeks to lessen probable fatalities and
injuries, property losses, give prompt assistance to the victims and achieve rapid and effective disaster
management.
Figure 2.1The Disaster Management Cycle (Source Alexander (2000), p. 3.).
Phase 1 Mitigation
Mitigation refers tothe polices and actions that aim to reduce and/or eliminate individual and/or
community vulnerability to injury and/or harm from future disasters. Mitigation agencies strive to
tackle the hazard such that it reduces itimpact on individuals and communities. Thus, natural hazards
have the potential to turn into disasters in the lack of mitigation measures. For this reason, the Federal
Emergency Management Authority (FEMA) in the United States considers mitigation as the
“cornerstone of disaster management” and it has defined mitigation as “any cost effective action
taken to eliminate or reduce the long term risk of life and property from natural and technological
hazards”. The phrase ‘cost effective’ essentially means that a mitigation measure should be productive
to its cost over the long term. There is a spike in disaster mitigation programs from both public and
private agencies since the 1970s. Literature also highlights the importance of allocation of budgets for
mitigation more than for relief by the government.

249 MGNCRE | Community Resilience and Disaster Management
As noted, “Mitigation measures and actions generally are in place before a disaster occurs and they
include a range of options and/or adjustments an individual or community may take to reduce long
term risk to life and property from a disaster event” (Maskrey 1989; NCDEM, 1998). Nevertheless, the
measures of mitigation are flexible enough to be implemented at any time – before a disaster, during
a disaster, or after a disaster, as well as during recovery or reconstruction phase. The destruction
induced by future disasters depends upon the type and magnitude of an extreme event and the types
of mitigation measures introduced. These measures tend to be expensive, time consuming, largescale,
high technology solutions, and managed and financed by large centralized agencies.”
Mitigation Goals
The goals of mitigation are
• Risk likelihood reduction
• Risk consequences reduction
• Risk avoidance
• Risk transfer, sharing, or spreading
Mitigation Measures
The following are the essential measures towards mitigation
• Land use planning and regulation
• Building codes and standards
• Insurance
• Engineering
• Warning
Phase 2 Preparation
Preparedness or Preparation is the level of alertness and readiness of an individual, a household, or a
community against a looming disaster. Amongst various activities, preparedness includes formulating,
testing and exercising disaster plans, providing hazard warnings, communicating with the public and
others regarding disaster vulnerability and what to do to reduce it, evacuating people from harm’s
way, conducting emergency response drills, and providing disaster training for emergency responders
and the general public.
According to Tierney et al., (2001), an important measure of hazard preparedness is the acquisition of
equipment to support emergency action. Such a measures ensure that the resources required for
carrying out an effective response in shortest possible time are already in place prior to the onset of
a disaster. Hence, they can be obtained promptly when needed. Preparedness reduces the adverse
consequences of such extreme events. It facilitates an effective response and also heightens the ability
of social units to effectively counter a disaster. Hazard preparedness is divided into two categories
physical preparedness and social preparedness. The former centres on adopting steps to ensure that
facilities and infrastructures can withstand disaster impacts so that the buildings and their contents
do not become a serious threat to life and cause any injuries. Social preparedness includes actions
(e.g., understanding what state and federal programs are available at the time of disaster, planning
for situations involving hazard warning and evacuation, establishing emergency recordkeeping
systems, and developing disaster plans) to ensure that community organizations are able to
adequately respond to the needs of victims in the event of a disaster”(Tierney et al., 2001).

250 MGNCRE | Community Resilience and Disaster Management
They also point out that “both physical and social preparedness are seen as part of a fivephase
preparedness cycle that consists of (i) raising awareness, (ii) conducting hazards and vulnerability
assessments, (iii) improving knowledge about hazard and how to cope with them, (iv) planning, and
(v) practice” (Tierneyet al., 2001).
Measures of Preparedness
As indicated above, preparedness means a range of activities and/or actions that are undertaken and
carried out (at different levels) immediately and/or any time before a disaster. Preparedness aims to
saves lives and minimize property damage. A number of preparedness activities are discussed below.
This discussion is followed by an analysis of preparedness activities at four distinct levels households,
organizations, communities, and state and national preparedness consecutively.
1. Warnings
Hazard warnings include a range of activities such as effective monitoring and accurate
forecasting of a forthcoming event, developing warning messages, and disseminating the
messages to those at risk.
2. Evacuation
Evacuation is “the primary protective action utilized in disasters such as floods, tsunamis, large
wildfires, hurricanes/cyclones, and volcanic eruptions. It refers to the movement of people
away from a potential or actual hazard impact area for the primary purpose of ensuring safety.
Evacuation can take place before, during, or after a disaster occurs.”
3. Exercises
“The most effective way to prepare for a disaster is to conduct practice exercises on a regular
basis. The primary goal of such exercises is to improve operational readiness for people who
participate in disaster response and recovery efforts. Exercises enhance a community’s overall
emergency management capabilities and provide useful tools for local programs to train
emergency personnel and evaluate their operational readiness.”
Phase 3 Response
Response refers to all types measures and steps adopted immediately before, during, and after the
occurrence of a disastrous event to prevent the loss of lives, minimize any damage to property, and
improve the effectiveness of recovery at shortest possible time. It is commonly more narrowly defined
to mean only the instantaneous actions (e.g., search and rescue operations for survivors, emergency
medical care for the injured including mental health counselling, the proper identification and
disposition of dead bodies, provision of temporary shelter, water, sanitation and food, repair utilities
and key infrastructure, security for victims, protection of property, closure of roads and bridges, and
attending to secondary hazards such as fire (in the case of earthquake) taken immediately after a
disaster at various levels, such as individual, household, community, national, and international
(Mitchell and Cutter, 1997).
According to Mileti, (1999), removal of debris from disaster affected areas and the restoration of roads
and infrastructure destroyed by disaster are also part of the emergency response. Disaster response
represents the early part of the relief phase of the disaster recovery cycle.
According to Fothergill and Peek, (2004), the emergency response may continue for hours or days,
perhaps up to one week depending on the magnitude and type of the event. Scare or poor response
creates a human induced tragedy that aggravates the plight of the victims of a natural disaster. Such

251 MGNCRE | Community Resilience and Disaster Management
response also mirrors the failure of government agencies and public administrators to provide
adequate emergency support to disaster victims of a major event (Fothergill and Peek, 2004).
Figure 2.2 The Disaster Recovery Cycle (Source Fiercest al. (1995), p. 363.)
Response Measures and Activities
i. Search and Rescue Operations
Search and rescue (SAR) operations contains multiple activities to be undertaken immediately
post a disaster to identify and rescue victims who are injured and/or caught under collapsed
buildings, debris, or by moving water and rescue them from danger or confinement. There are
three distinct but interrelated procedures under SAR procedures that consist of locating
victims; rescuing them from whatever condition has trapped them; and providing basic first
aid. The last action is essential to stabilize victims so that they may be transported to regular
emergency medical facilities for further treatment. Providing food and water to trapped
victims is also the responsibility of SAR personnel.
ii. Emergency Medical Care
Natural disasters are at the helm for the deaths and injuries of thousands every year
throughout the world. Generally, the causality is relatively greater in terms of injuries than
the loss of life from direct impacts associated with an extreme event. For example, Hurricane
Katrina killed some 2000 people, but injured 5698 – almost three times the number of
fatalities.
iii. Identification and Disposal of Dead Bodies

252 MGNCRE | Community Resilience and Disaster Management
After the occurrence of a major natural disasters, emergency managers, public health
personnel, and members of the general populace fear that corpses may cause epidemics.
iv. Debris Removal
Most natural disasters produce large amounts of debris and its disposal poses as a challenge
for public officials. The removal of debris is the clearance, removal, and/or disposal of items
damaged or destroyed by extreme events. It is necessary to (i) allow the safe passage of
emergency response vehicles in the aftermath of a disaster, (ii) eliminate public health and
safety hazards, and (iii) ensure the economic recovery of the affected community to benefit
the community at large. Delay in the removal of debris removal adversely impacts response
and recovery operations. Thus, crew must be deployed immediately for debris removal.
v. Repairing Utilities and Key Infrastructure
Power, water, sewer, communication networks, and other infrastructure, such as
transportation arteries, ports, airports, and rail lines, are often damaged or destroyed by
major disasters.
Post Disaster Sheltering and Housing
Most families are forced seek alternative temporary housing, post a disaster event until a permanent
housing solution can be found (Johnson, 2007). Unlike survivors of hurricanes/cyclones or
earthquakes, flood survivors may need alternative housing if their homes are submerged under flood
water. The magnitude and type of disaster generally results into number of people requiring post
disaster shelter depends on. In general, earthquakes, hurricanes/cyclones, and floods render more
people homeless than do tornadoes or droughts.
Phase 4 Recovery
According to Quadrantally, (1998), the primary objective of the recovery phase is the reversal of the
damaging effects of the disaster. The recovery phase of the disaster management cycle begins during
or after the response phase. In disaster literature, the term recovery’ has been used interchangeably
with rebuilding, reconstruction, restoration, rehabilitation, and post disaster redevelopment.
Historically, the term recovery broadly implies putting a disaster-stricken community back together to
its predisaster state. Hence, recovery meant to bring a disaster stricken community back to the state
of ‘normalcy’ that is the pre disaster stage. (Quarantelli, 1998).
According to Phillips, (2009),the recovery process consists of a range of stages, steps, and sequences
that disaster survivors, organizations, and communities undergo at varying rates. Thepostdisaster
phase is also often used to measure the current safety standards and propose future disaster
preparedness techniques. Disaster recovery is a process of interaction and decisionmaking among a
variety of groups and institutions, including households, businesses, and the community at large.
(Phillips, 2009).
The Disaster Recovery Cycle
The disaster recovery cycle consists off our overlapping phases or cycles development, relief,
rehabilitation, and reconstruction (Figure 2.2). The first and second cycles (i.e., development and
relief) activate instantaneously following a disaster, however differ in the length of their duration.
While development encompasses the entire recovery period, relief largely lasts up to six months or a
year, with a peak in the middle. In addition to providing disaster relief, this phase also imparts

253 MGNCRE | Community Resilience and Disaster Management
information about entitlements and other opportunities associated with their assets and livelihoods
to disaster victims. Thethird cycle (i.e., rehabilitation) may last anywhere between 12 and about 20
months, and the last cycle from one to four years. (Middleton and O’Keefe, 1998).
Recovery Resources
According to Coppola (2007), to recover from the impact of disasters an adequate funding is required
at all levels. The onus or the cost of reconstruction is divided between various sectors of the
community. The local government is responsible for rebuilding public facilities and infrastructure,
whereas the private sector, including industries, individuals, and households, will be responsible for
rebuilding houses and businesses. The private sector along with help from governments at various
levels, helps to restore overall economic vitality. The success in recovering from impact of a disaster
however depends on how quickly and successfully the affected community and disaster survivors are
able to secure assistance from external resources (Coppola, 2007).
2.2 Principles of Risk Management and Vulnerability Mapping and Analysis
Principles of Risk Management
The International Organization for Standardization (ISO) identifies the following principles of risk
management
Risk management should
• Create value – resources expended to mitigate risk should be less than the consequence of
inaction
• Be an integral part of organizational processes
• Be part of decision-making process
• Explicitly address uncertainty and assumptions
• Be a systematic and structured process
• Be based on the best available information
• Be tailorable
• Take human factors into account
• Be transparent and inclusive
• Be dynamic, iterative and responsive to change
• Be capable of continual improvement and enhancement
• Be continually or periodically reassessed
Principles of Disaster Response
According to Erik Auf Der Heide
• “Because of the limited resources available, disaster preparedness proposals need to take cost
effectiveness into consideration.
To Do Activity
Choose one of the world’s deadliest disasters and identify the various stages of disaster
management cycle that were implemented to face the outcomes of the disaster.

254 MGNCRE | Community Resilience and Disaster Management
• Planning should be for disasters of moderate size (about 120 casualties); disasters of this size
will present the typical inter-organizational coordination problems also applicable to larger
events.
• Interest in disaster preparedness is proportional to the recency and magnitude of the last
disaster.
• The best time to submit disaster preparedness programs for funding is, right after a disaster
(even if it has occurred elsewhere).
• Disaster planning is an illusion unless it is based on valid assumptions about human behavior,
incorporates an interorganizational perspective, is tied to
• Because of the limited resources available, disaster preparedness proposals need to take cost
effectiveness into consideration.
• Planning should be for disasters of moderate size (about 120 casualties); disasters of this size
will present the typical inter-organizational coordination problems also applicable to larger
events.
• Interest in disaster preparedness is proportional to the recency and magnitude of the last
disaster.
• The best time to submit disaster preparedness programs for funding is, right after a disaster
(even if it has occurred elsewhere).
• Disaster planning is an illusion unless it is based on valid assumptions about human behavior,
incorporates an interorganizational perspective, is tied to resources, and is known and
accepted by the participants.
• Base disaster plans on what people are "likely" to do, rather than what they "should" do
• For disaster planning to be effective, it must be inter-organizational.
• The process of planning is more important than the written document that results.
• Good disaster management is not merely an extension of good everyday emergency
procedures. It is more than just the mobilization of additional personnel, facilities, and
supplies. Disasters often pose unique problems rarely faced in daily emergencies.
• In contrast to most routine emergencies, disasters introduce the need for multi-organizational
and multidisciplinary coordination.
• In disasters, what are thought to be "communications problems" are often coordination
problems in disguise.
• Those who work together well on a daily basis tend to work together well in disasters.
• Disasters create the need for coordination among fire departments, law enforcement
agencies, hospitals, ambulances, military units, utility crews, and other organizations. This
requires interagency communication networks utilizing compatible radio frequencies.
• Procedures for ongoing needs assessment are a prerequisite to efficient resource
management in disasters.
• A basic concept of triage is to do the greatest good for the greatest number of casualties.
• Triage implies making the most efficient use of available resources.
• Good casualty distribution is particularly difficult to achieve in "diffuse" disasters, such as
earthquakes and tornadoes that cover large geographic areas.
• Effective triage requires coordination among medical and nonmedical organizations at the
disaster site and between the site and local hospitals
• Panic is not a common problem in disasters; getting people to evacuate is

255 MGNCRE | Community Resilience and Disaster Management
• Inquires about loved ones thought to be in the impact zone are not likely to be discouraged,
but can be reduced or channeled in less disruptive ways, if the needed information is provided
at a location away from the disaster area.
• Many of the questions that will be asked by reporters are predictable, and procedures can be
established in advance for collecting the desired information.
• Newsworthy information will rapidly spread among news organizations and from one type of
media to another.
• The media will often withhold newsworthy disaster stories it feels would be detrimental to
the public.
• Local officials will have to deal with different news media in times of disaster than those with
which they interface on a routine basis.
• Adequate disaster preparedness requires planning with the rather than for the media.
• The propensity for the media to share information and to assume ‘command post’ perspective
facilitates the establishment of a central source of disaster information.”
Hazard and Vulnerability Mapping and Analysis
The purpose of a hazard map is to analyse the underlying phenomenon of a hazard and to make it
known to residents. A disastrous phenomenon cannot be stopped by a hazard map. But the effective
use of hazard maps can minimize the magnitude of disasters. The objective of a hazard maps is to
create awareness and provide residents with the information on the range of possible damages and
disaster prevention activities. Hazard maps delineate zones that are identified in terms of the
probability of occurrence of potentially damaging phenomena within a certain span of time within a
specified location or an area (Varnes,1984).
Types of Hazard Maps
There are two types of hazard maps
1. Resident Educating Maps
Resident educating maps are meant to educate the residents within an area about the forecast
of danger. The information on areas of potential danger or places of safety and the basic
knowledge on disaster prevention are given to residents. Therefore, it is important to note
that such must be imparted in an understandable form.
2. Administrative Information Maps
Administrative information maps are the elementary materials that administrative agencies
utalise to provide disaster prevention services. These hazard maps can be used to set up a
warning system and the evacuation system, as well as evidence for land use regulations. They
may also be used in preventive works.
Steps in Creating Hazard Maps
1. Forecasting a range of disaster to define the subject phenomenon and its scale and forecast
the range of disaster using the digital simulation technology
2. Collecting the disaster related information to be inserted in the hazard map and representing
the information in the hazard map.
3. Publishing the maps by distributing directly to people or through Internet or by any other
means. Then, the disaster prevention activity will start using the hazard map.

256 MGNCRE | Community Resilience and Disaster Management
Guiding Principles for Creating Hazard Maps
While creating a hazard map, the topographic map of the subject area is necessary. The topographic
models and photographic maps may be acquired from a satellite. It is necessary that the data for which
any potential phenomenon can be forecast is made based on sound scientific methods. The objective
of a hazard map is to inform residents of a potential disaster and therefore the map should be
designed with the representations and contents that are comprehendible to nonprofessional people.
The digital analysis introduced before should be supported by complete data so there is a considerable
cost in carrying out the calculations. Irrespective of how high the data accuracy is, the digital
computation is a forecast. This is something that cannot be represented by computations. it is crucial
to recognize the limitation of these hazard maps. When the phenomenon and its scale are different
from the forecast ones, the range of disaster will also be different. Such cases will occur as there is no
case in which a disaster occurs as shown in a hazard map.
Digital analysis, disaster history and disaster geomorphological land classification map provide the
necessary information for disaster prevention. Therefore, it is essential to use them in forecasting a
disaster pattern.
Contents of a Hazard Map
• A base map is required. A topographic map or a photographic map (orthophotos) can be used
as a base map. The topographic map is supplementary to understand the information for a
hazard map than orthophotos. A photographic map contains information in large amounts to
interpret it.
• The most essential information that should be provided to residents must be disaster
prevention information. Mainly, the forecast area of disaster should be included and the past
disaster records may be included as needed. Or, the map can be divided into both types the
second information to be disseminated to residents is evacuation related information. The
location of refuges and evacuation routes to be used in case of a disaster are shown in the
map. Residents can see their evacuation route and places of refuge from the hazard map. In
addition, the system and instructions to accurately warn of an impending disaster and
appropriate evacuation procedures to residents are also described in the map, such as for
example, a forecasting siren or a warning siren.
• The behaviour of disaster phenomena and the basic knowledge on natural phenomena are
also described.
Hazard Maps and GIS
"Hazard maps are truly good with Global Information System or GIS. To begin with, GIS is exceptionally
valuable in orchestrating high volumes of information important to create a hazard map. At that point,
it tends to be utilized for examination of spots of refuge. Three dimensional portrayals and Digital
cartography is additionally accessible with GIS."
Utility of Hazard Maps
"A hazard map is noteworthy just when it is openly discharged to occupants. They can be utilized by
inhabitants in evacuation and when their lives are in peril. Organizations should attempt endeavours
to disseminate disaster prevention information to occupants by methods of hazard maps. It is
important to outfit inhabitants with school instruction and disaster prevention training once every

257 MGNCRE | Community Resilience and Disaster Management
year or more and repeatedly disperse the calamity prevention data through different techniques. It is
smarter to plan events which will build the inhabitant's interest and participation
"Hazard maps are not straightforwardly identified with preventive works, however utilizing hazard
maps, it is conceivable to appraise the expense of harms because of a disaster. Further, hazard maps
can be utilized for the financial assessment of a preventive work and for Benefit Cost (B/C)
examination. Accordingly, the priority order of preventive works can be resolved.”
Vulnerability Analysis
As indicated by Blaikie et al. (1994), " Vulnerabilityexamination is created from a scope of financial
ways to deal with dangers and what we could call 'the calamity of daily existence'. Vulnerability
examination attests that for there to be a disaster there must be a characteristic danger, yet in
addition a vulnerable populace. Vulnerability examination is perplexing and reliant on enormous
informational collections, and on subjective examination that requires contribution of the general
population concerned in the evaluation of their vulnerability" (Blaikie et al, 1994; Cannon 1994).
Figure 2.3 Disaster Map of India
A vulnerability assessment “the way toward distinguishing, evaluating, and organizing (or positioning)
the vulnerabilities in a framework. Instances of frameworks for which vulnerability evaluations are
performed incorporate, however are not restricted to, data innovation frameworks, vitality supply
frameworks, water supply frameworks, transportation frameworks, and correspondence frameworks.
Such assessments might be led in the interest of a scope of various associations, from independent

258 MGNCRE | Community Resilience and Disaster Management
companies up to huge territorial foundations. Vulnerability from the point of view of calamity the
executives means evaluating the dangers from the perspective of disaster management means
assessing the threats from potential hazards to the population and to infrastructure. It might be led in
the political, social, financial or ecological fields".
“Vulnerability assessment has many things in common with risk assessment. Assessments are typically
performed according to the following steps
1. Cataloguing assets and capabilities (resources) in a system.
2. Assigning quantifiable value (or at least rank order) and importance to those resources
3. Identifying the vulnerabilities or potential threats to each resource
4. Mitigating or eliminating the most serious vulnerabilities for the most valuable resources”.
Procedure for Conducting Vulnerability Analysis
The purpose of Vulnerability analysis is “to evaluate hazards, their risk of actual occurrence, and the
impact on life, property and business if the hazard occurred”. Following are the steps in involved in
Vulnerability analysis
1. Determining the probability and impact of hazard
Probability and impact are ranked as follows
Low – If the occurrence is rare
Moderate – If the occurrence is unusual
High – If the potential for occurrence is high or already experienced.
Then risk is calculated as follows
Risk = Probability X Severity of impact on life, property and business
2. Address mitigation, preparedness, response, and recovery for these hazards.
3. For high risk/high impact hazards, develop individual incident action plans.
Vulnerability Factors
Both natural and manmade factors are responsible for vulnerability. Some of the factors are discussed
below
Population Displacement
Populace displacements both a reason and a result of catastrophe. There is proof of positive
connection between poverty and economic inequality and rural to urban migrations, in that more the
degree of poverty and income inequality, more is the degree of rural to urban migration. The
phenomenon is most seen in poor underdeveloped nations where the poor relocate from rural to
urban territories in look of livelihoods."
As per Dhar (2002), "In the most recent decade, issues identified with disaster and development led
population removal and resettlement and rehabilitation have created extensive discourse Population
displacement, immediate and backhanded, results from natural and human procedures for example
natural disasters, urbanization and industrialisation, natural resource development, agricultural
change and infrastructure extension. There is additionally a worry that particularly vulnerable social
gatherings, including women, ethnic minorities, and landless individuals have for the most part
suffered more, than others from displacements” (Dhar, 2002).

259 MGNCRE | Community Resilience and Disaster Management
Urbanisation
As indicated by Jain and Ghosh (2005), "Rural to urban migration has prompted unmanageable
urbanization and urban blockage that has constrained human and physical capital extension in high-
risk zones. Therefore, the damage inflicting capability of disasters has gone up. Urbanisation has
gotten its wake, development of informal settlements, dangerous living conditions, disease, class
strife and social capital exhaustion as certain sections have been socially and financially marginalised.
Globalization has likewise contributed from numerous points of view to expanding the vulnerability
of the urban poor by making 'uncertain' employment however, the conspicuous effect is by all
accounts the improvement of life and better opportunities for all." (Jain, Ghosh, 2005).
They additionally discover that "Around 25 percent of the total population lives in zones of high risk
from natural disasters. Also, regulatory and political issues are caused because of the influx of exiles,
which disturbs the political and social grid of the district, similar to the influx of Bangladeshi refugees
in India, following the 1971 war. Epidemics and congestion are other managerial issues caused
because of mass flood of displaced people."
Gender
"Vulnerability because of Gender is a consequence of gradual addition of unfair social practices after
some time, which has caused debilitation of ladies in social economic and political arenas. Gender
inequality in social, economic and political circles has brought about tremendous contrasts among
men and women in crisis circumstances, concerning matters, for example, household decisions about
utilization of relief resources, voluntary relief and recovery work, access to evacuation sanctuary and
relief goods, and employment in disaster planning, relief and recovery programs among other areas
of concern in disaster relief. Disaster mitigation as additionally response strategy, especially
concerning control over relief assets need to consider this part in decision making it progressively fair
and in general, more effective."
Economic Factors
It is demonstrated that "there is a Positive correlation between poverty, disasters and environmental
degradation. Relative vulnerability of individuals is similarly a lot higher in underdeveloped nations
than in the developed world. According to United Nations gauges, albeit least developed nations show
less physical presentation to dangers (11%) they represent far more prominent number of losses,
(53%). On the opposite side, the most developed nations represent more (15%) physical exposure to
risks and record for altogether less (1.8%) victims. The derivation drawn is that the extent of calamity
endured is straightforwardly connected to the degree of development, which clarifies generally the
reality of the Third World representing altogether a greater number of misfortunes than the
developed nations.
"While all countries might be up against with common risks, natural hazard, the poorer developing
countries, specifically, are lopsidedly vulnerable against dangers. Disasters can carry poor
communities to much more poverty, as family units might be constrained into increased debt to
remake homes and address essential issues. Impacts of disasters on poorer developing nations are
long lasting and cause extreme interruption in the GDP. The impacts are more serious than in
developed nations, regularly draining rare budgetary assets and redirecting significant assets towards
post fiasco relief" (United Nations, 2004).

260 MGNCRE | Community Resilience and Disaster Management
Geographical Factors
As effectively noted in the prior chapters, "global warming threatens to disturb agribusiness in
developing nations. But most greenhouse gas emissions have occurred in the developed world. Global
warming has especially expanded the vulnerability of coastal areas, particularly small island
development states (SIDS) in that sea level rise will compromise the delicate ecosystem of these
districts, raising the frequency and degree of natural dangers like tsunamis, cyclones, floods and storm
surges. Coastal zones, wetlands and coral reefs are probably going to be hurt which go about as natural
buffers against risks like violent winds and cyclones. The greatness of disasters is additionally prone to
be more prominent as a result of the expanded pace of infrastructure development that has occurred
in these regions over the last few years, attributable to population pressure and growing
attractiveness of these regions from the point of view of tourism” (UNDP, 2002).
Livestock Vulnerability
As indicated by Herrmann, et al., "Livestock on occasion is the poor man's only resource. In contrast
to different types of property, livestock loss misfortune is fundamental and irreplaceable. The
unexpected issue here is quick arrangement of alternate occupation, which is the most troublesome
piece of rehabilitation. Deficiency of food affects livestock before it begins to influence individuals.
Malnutrition and infection decrease their productive capacity, which results in diminished pay for the
farmer. Diseases among livestock likewise spread during disasters. These still remain the less thought
about parts of disaster management. Insurance protection is the best choice however needs to be
duly considered in India. Vulnerability factors would be examined in detail in resulting units"
(Herrmann et al, 2010)
2.3 Developmental Projects (Dams, Power Plants etc.)
Developmental planning infers planned budget allocations for economic and social uplift by professing
welfare state ideology. In spite of the fact that the term ‘welfare state’ has not been decisively
characterized and is buried in political controversy especially in the context of liberalisation and
globalisation following accession of the free market economy principle, and the public choice theory
that advocates the free market system, mixed economy countries like India persist with
developmental planning for the uplift of the marginalised sections of society through state sponsored
welfare programmes. This has created a dilemma of sorts, which needs to be resolved in the interest
of sustained momentum of development. The chief agency for development planning in India is the
Planning Commission.
To Do Activity
1. On the basis of a general assessment of the vulnerability of area in which you reside,
list the essentials needed for its management.
2. Approach any one government departmental agency, a private organisation, a
person residing in your area, talk to them and observe their reactions and elicit their
views towards disaster management. Write a brief report on it.

261 MGNCRE | Community Resilience and Disaster Management
Every developmental planning needs some basic infrastructure. The infrastructure may be physical,
social or environmental. These infrastructures are used in some way for the developmental process.
In many cases, ordinarily, faulty management or unorganised implementation mechanism, the
developmental processes, rather than being good for the general population, makes vulnerable
conditions. For instance, dam construction for mitigating floods, may turn into the reason for extreme
flooding in the dam area. Uncontrolled utilization of synthetic manures for expanding production may
destroy the yields. Similarly, the construction of roads, railroads, and so forth for the comfort of
individuals, may prompt avalanches or different risky conditions for the general population. Along
these lines, planning for development itself creates unfavourable and vulnerable conditions. At
miniaturized scale and large scale levels, numerous such models can be found in developing as well as
developed nations. In addition, the variables causing natural hazards, some human exercises
additionally cause annihilation of the slope and ground surface, starting a chain of uncontrolled
erosion in the mountain landscape. Unearthing’s for mining, streets, channels and structures have
added extraordinarily to the mass developments, and strengthening of erosion in hilly territory
2.4 Risk Management
Disaster Risk Management is the utilization of disaster risk reduction policies and strategies, to prevent
new disaster risks, reduce existing disaster risks, and manage residual risks, contributing to the
strengthening of resilience and reduction of losses. Disaster risk management actions can be sorted
into; prospective disaster risk management, corrective disaster risk management and compensatory
disaster risk management (also referred to as residual risk management).
Emergencies and Post Disaster Assistance
The overall aims of emergency and post disaster assistance are
• “To ensure the survival of the maximum possible number of victims, keeping them in the best
possible health in the circumstances;
• To re-establish self sufficiency and essential services, as quickly as possible for all population
groups, with special attention to those whose needs are maximum, the most vulnerable and
underprivileged;
• To repair or replace damaged infrastructure and regenerate viable economic activities. To do
this, in a manner, that contributes to long term development goals and reduces vulnerability
to any future recurrence of potentially damaging hazards.
• In situations of civil or international conflicts, the aim is to protect and assist the civilian
population, in close collaboration with the International Committee of Red Cross (ICRC) and
in compliance with International Conventions. In case involving population displacements
(due to any type of disasters), the aim is to find durable solutions as quickly as possible, while
To Do Activity
Identify the developmental projects taken up by the government in your area and list out the
points highlighting the importance of these projects to your community. Also try to analyse
how they help or hinder disaster management in your area.

262 MGNCRE | Community Resilience and Disaster Management
ensuring protection and assistance as necessary in the mean time. There are important
differences, however, between sudden and slow onset disasters. Differences also emerge
when comparing the specific geographical situation and the disaster’s socio/political context.
The Following are Typical Activities for Survival
Warning refers to arrangements to rapidly disseminate information concerning imminent disaster
threat to government officials, institutions and the population at large in the areas at immediate risks.
Evacuation/ Migration Evacuation involves the relocation of a population from zones at risk of an
imminent disaster to a safer location. For evacuation to work there must be a timely and accurate
warning system, clear identification of escape routes, an established policy that requires everyone to
evacuate when an order is given, and a public education programme to make the community aware
of the plan. The movement of people from the zone where they are at risk to a safer site is not in fact,
evacuation but crisis induced migration.
Search and Rescue Search and rescue, often known by the acronym SAR, is the process of identifying
the location of disaster victims that may be trapped or isolated and bringing them to safety and
medical attention.
Post Disaster Assessment The primary objective of assessment is to provide a clear, concise picture
of the post disaster situation, identify relief needs and develop strategies for recovery. The post
disaster assessment must distinguish between predicate chronic conditions, which are worsened in
critical times, and post disaster trauma among victims. Ready resources are the key factor in post
disaster assistance. As a long term measure, Primary Health Care centres should be reformed and
readied for emergency situations.”
Emergency Operation Centre
“An emergency operations centre (EOC) is a central command and control facility (EOC) is a
headquarters and control office in charge of doing the standards of carrying out the principles of
emergency preparedness and emergency management, or disaster management functions at a
strategic level during an emergency, and ensuring the continuity of operation of a company, political
subdivision or other organization. An EOC is responsible for strategic direction and operational
decisions and does not normally directly control field assets, instead leaving tactical decisions to lower
commands. The common functions of EOCs are to collect, gather and analyze data; make decisions
that protect life and property, maintain continuity of the organization, within the scope of applicable
laws; and disseminate those decisions to all concerned agencies and individuals.
EOC may be permanent or temporary facilities provided to support the government during disaster
events. The functions carried out in the EOC include the
• Collection, collation and dissemination of information to the government and the public
• Provision of advice to the Disaster Chairs of Local Committee, and
• Coordination of Government resources in support of disaster affected communities
The EOC in its extended form will continue to function as long as the requirement for emergency relief
tasks proceeds till the long term plans for rehabilitation are finalised. For overseeing long haul
restoration programs, the responsibilities will be that of the respective line departments. This will
empower the EOC to take care of other disaster circumstances, if need be.

263 MGNCRE | Community Resilience and Disaster Management
The principle branches in the EOC during a disaster situation will be operations, services, resources,
infrastructure, health, logistics, communications and information management. Each branch will have
distinct tasks to perform with a branch official of the position of Deputy Secretary or Additional
Secretary. The limit of the different branches to organize among themselves and with the field units
will ultimately decide the quality of response.
The facilities and amenities to be given in the EOC incorporate well structured control room and
workstations for the branch and nodal officials furnished with VSAT, wireless communication, hotlines,
and intercoms. The EOC as an information bank will keep all area and state level activity plans and
maps. Arrangement of a vehicle with wireless communication will be made for the EOC during typical
occasions."
Incident Command System
"The Incident Command System (ICS) is an institutionalized way to deal with the command, control,
and coordination of emergency response giving a typical progression inside which responders from
various organizations can be effective. ICS was at first created to address issues of between
interagency response wildfires in California and Arizona however is currently a segment of the
National Incident Management System (NIMS) in the US, where it has advanced into All Hazards
situations. Likewise, ICS has acted as a pattern for similar approaches internationally.ICS is
interdisciplinary and authoritatively adaptable to meet the following disaster management challenges
• Meets the needs of a jurisdiction to cope with disasters of any kind or complexity (i.e. it
expands or contracts as needed).
• Allows personnel from a wide variety of agencies to meld rapidly into a common management
structure with common terminology.
• Provide logistical and administrative support to operational staff.
• Be cost effective by avoiding duplication of efforts, and continuing overhead.
• Provide a unified, centrally authorized emergency organization.”
Emergency Relief “Emergency relief is the provision on a humanitarian basis of material aid and
emergency medical care necessary to save and preserve human lives. It also enables families to meet
their basic needs for medical and health care, shelter, clothing, water, and food. Government has to
tackle the problem of too much relief too soon, from indigenous and international donors, probability
of theft and other forms of criminality, black market in relief items etc. Inventory management should
be a crucial component of disaster preparedness. The delivery of emergency relief will require
logistical facilities and capacity of well organised supply service is crucial for handling the procurement
or receipt, storage, and dispatch of relief supplies for distribution to disaster victims.
Communication and Information Management All the above activities are dependent on
communication. There are two aspects to communications in disasters. One is the technical aspect, or
the equipment that is essential for information flow, such as radios, telephones and their supporting
systems of repeaters, satellites and transmission lines. The other is information management, content
and protocol of knowledge communication, which communicates what information to whom, what
priority is to be given to it, and how it is to be disseminated and interpreted. Coordination of effort is
dependent on communication.

264 MGNCRE | Community Resilience and Disaster Management
Survivor Response and Coping In the rush to plan and execute a relief operation it is easy to overlook
the real needs and resources of the survivors. The assessment must take into account existing social
coping mechanisms that might even obviate the need to bring in outside assistance. On the other
hand, the ambit if social service may be widened as special needs of the vulnerable sections; the sick
and the homeless etc. would have to be handled.
Security
Security is always a priority issue after a sudden onset of natural disaster(s). There are incidents of
looting which have to be immediately controlled. Communal feelings are also incited during periods
of such stress, which turn to serious law and order problems if not controlled immediately.
Emergency Operations Management None of the above activities can be implemented without some
degree of emergency operations management. Policies and procedures for management
requirements need to be established well in advance of the disaster. The chief actor in emergency
operation and management are the army and the police and paramilitary organisations. The concept
of incident command is pertinent here. It was started in America after a series of wild fires in California
in 1970s. Incident command is based on integration of efforts in the field between all organisations, a
‘modular organisation’, which expands, and contracts as newer agencies join it; agency autonomy,
modern operations as per modern management principles like management by objectives (MBO), end
orientation; discovering new sources of resource, joint planning, resource management, timely
intelligence and thoroughly planned operations (Irwin, 2002).”
2.5 Post Disaster Management Activities
Rehabilitation and Reconstruction
“Rehabilitation and reconstruction complete the disaster response activities. The disaster occurred
because the society was vulnerable against the effect of the hazard concerned. Rehabilitation and
reconstruction must therefore not be seen as a process of simply restoring what existed previously.
Assistance to rehabilitation and reconstruction must therefore be planned on the basis of a thorough
assessment and appraisal of the technical and social issues involved. While arranging of such
assistance cannot be unduly rushed, it must be accomplished as expeditiously as possible. There are
two reasons for this
a. Certain rehabilitation and reconstruction measures if organised rapidly enough, can shorten
the period for which emergency relief assistance is needed and eliminate the need to invest
resources in temporary measures.
b. The window of opportunity may be short for the risk reduction measures in reconstruction (of
housing for instance) or new development initiatives (especially social aspects). The majority
of people affected are the poor. For the poor, disasters represent lost of property, jobs, and
economic opportunity. In real terms, that can mean enormous total economic setback.
Therefore, reconstruction assistance should be designed to
• Relieve economic constraints and reduce the cost of reconstruction
• Reject capital into the community
• Create employment opportunities
• Support and strengthen existing economic enterprises
Timely and imaginative planning is therefore required to dovetail rehabilitation and reconstruction
with short term relief measures, and to make the most effective use of external financial resources,

265 MGNCRE | Community Resilience and Disaster Management
materials, and technical assistance in achieving development gains while satisfying humanitarian
needs.”
Post disaster Damage and Needs Assessment
“Assessments in terms of the extent and monetary value of damages can be carried out with the help
of local government offices (e.g., municipal engineering office, municipal agricultural office, etc.), field
surveys and interviews.
a. Effects on Basic Services electricity, water supply (potable water and irrigation water),
sanitation
b. Infrastructure buildings, hospital/clinics, homes, road systems
c. Livelihood crops, sources of food/products
d. Landscape soil stability, extent of coastline and land erosion
e. Ecological Communities vegetation, terrestrial and aquatic life, forest cover
In order to come up with a proper and acceptable program for recovery and rehabilitation, it is also
important to understand the felt needs of affected communities. Consulting affected populations
through interviews prior to any recovery program ensures public acceptance and support of any
planned endeavour. A need assessment helps prioritize particular areas that need the most immediate
action for rehabilitation.”
a. Infrastructure and Services
b. Community Livelihood
c. Priorities for Habitat Restoration
Early Recovery – Reconstruction and Redevelopment
“The measures adopted in post disaster situations are critical to support human lives and sustain the
delivery of ecosystem goods and services such as food, fuel and protection from natural events. These
measures help to rehabilitate human communities and natural ecosystems. A key concept here is
climate resilient recovery (CRR)where communities are not only provided with assistance to recover
from climatic change events but are also equipped to deal with future disasters better. Reconstruction
is a much longer term activity that will involve permanent rebuilding, improved infrastructure, and
recovery with enhanced preparation for the next climate change related event. It should aim to build
a better standard than what existed before (‘build back better’ principle) and be guided by the
ecosystem approach to recovery and rehabilitation
1. Climate Resilient Livelihood
2. Climate Resilient Infrastructure
3. Ecological Restoration

266 MGNCRE | Community Resilience and Disaster Management
Ecological restoration encompasses intentional human interventions that are aimed to assist the
recovery of ecosystems and habitats after disturbance or damage. Recovery is reckoned to have been
achieved when the system contains sufficient living (e.g., microbial, animal and plant life) and
nonliving (e.g., soil, water, air) components that will allow development without further intervention
or subsidy (SER 2004). Restoration can promote the preservation of the biodiversity of the ecosystem,
conservation of endemic and indigenous species, and the sustainable management of the ecosystem.”
References
1. An Interim Report of the Sub Committee on Disaster Reduction, July 2003,”Reducing Disaster
Vulnerability through Science and Technology,” National Science and Technology Council,
Committee on the Environment and Natural Resources, at http//www.sdr.gov/
SDR_Report_ReducingDisasterVulnerability2003.pdf.
2. “Disaster Vulnerability Reduction Measures” at http//www.waikato.ac.nz/igci/downloads/
hazardsD.pdf.
3. “Development, Planning and Administration”, 2003, Course material for Commonwealth
Executive Masters in Public Administration, Commonwealth of Learning, Vancouver.
4. “Disaster Risk Reduction, Governance and Development”, 2004, UN/ISDR, Africa Educational
Series, Volume 2, Issue 4.
5. “Disaster Vulnerability Types” at http//www.ciarn.ca/app/filerepository/
337D68566F604DB0A8A3F5BDCAB58795.pdf.
6. Kulshreshtha, S.M, 2001, “Floods, Embankments and Dams,” Pardeep Sahni, Alka Dhameja,
Uma Medury (Eds), Disaster Mitigation Experiences and Reflections, PrenticeHall of India,
New Delhi.
7. Sinha, Anil, 2002, “Disaster Management Lessons Drawn and Strategies for the Future”, Paper
Presented in the Training Programme on Disaster Management at the Department of Public
Administration, University of Lucknow.
To Do Activity
1. In your local area, attempt to find out who is the government official responsible for
disaster preparedness, and about the key functionaries in different departments
entrusted with the task of disaster management in your area and about their roles.
2. Enquire whether there is an Emergency Operations Centre (Control Room) in the
vicinity of your area? If yes, what are its contact telephone numbers? Who is the
officer responsible of EOC? Has any disaster preparedness plan been prepared for
your area? If yes, make efforts to study it. In your opinion what improvements could
be made in the disaster preparedness plan?

267 MGNCRE | Community Resilience and Disaster Management
Chapter 3 Disaster Risk Reduction Tools and
Capacity Building
Introduction This chapter is devoted to understanding the process of Disaster risk reduction and its various tools.
More specifically, this chapter will provide a framework for risk reduction and capacity building. It
focuses on prevention and mitigation of disasters. It also deals with risk financing and risk transfer
tools. This chapter also discusses how ecosystems and systems approaches are used to manage
disaster reduction.
Objectives
• To discuss the process of disaster risk reduction
• To explain the tools for risk financing and risk transfer
• To understand eco systems management for risk reduction
Structure
3.1 Disaster Risk Reduction
Burton, Kates and White (1978) suggest that “Man can purposely adjust to the risk of environmental
extremes by changing habitation or resource use, community action, restorative activity or
redistribution of loss. Other adjustments are incidental but contribute to reducing loss. Disaster
reduction strategies include the assessment of the vulnerability of facilities crucial to the social and
economic infrastructure, the use of effective early warning systems, and the application of many
different types of scientific, technical, educational and other skilled abilities.”
Risk Reduction Framework
Many researchers opine that disasters disrupt development altogether and increase poverty and
vulnerability of people, particularly in low income countries. Therefore, there is a need for protective
strategies on a sustained basis to preserve the civilisation, which has been built assiduously over ages.
3.1 Disaster Risk Reduction
3.2 Prime Activities of Disaster Management
3.3 Application of Information Technology in Disaster Risk Reduction
3.4 Disaster Risk Transfer and Financing
3.5 Role of Various Stake Holders During Disasters

268 MGNCRE | Community Resilience and Disaster Management
The risk of disasters is fundamentally linked to environmental problems and unresolved issues
essential for sustainable development. Accordingly, there are two major objectives of disaster
reduction policies (1) to enable societies to be resilient to natural hazards and (2) to ensure that
development efforts do not increase vulnerability to those hazards.
ISDR’s publication, ‘Living with Risk A Global Review of Disaster Reduction Initiatives’ published in
2002 unfolds the disaster risk reduction framework as composed of the following fields of action.
• Risk awareness and assessment including hazard analysis and vulnerability and capacity
analysis.
• Knowledge development including education, training, research and information.
• Public commitment and institutional frameworks, including organisational, policy, legislation
and community action.
• Application of measures including environmental management, landuse and urban planning,
protection of critical facilities, application of science and technology, partnership and
networking, and, financial instruments.
• Early warning systems including forecasting, dissemination of warnings, preparedness
measures and reaction capacities.
Figure 3.1 Framework for Disaster Risk Reduction

269 MGNCRE | Community Resilience and Disaster Management
(Sourcehttps//www.google.co.in/search?biw=1366&bih=651&tbm=isch&sa=1&ei=IaMlXYLjL_LYz7sP
IulyAw&q=framework+for+disaster+reduction+reduction+&oq=framework+for+disaster+reduc)
Disaster Planning for Risk Reduction
Disaster planning implies securing administrative arrangements, involving unity of command, span of
control, line and staff coordination, delegation, etc. Precisely, it involves principles of organisation
theory to provide the administrative arrangements to prevent small scale, frequently occurring
disasters, which keep disrupting growth and set back development by several years. Planning is
followed by risk identification in order to secure a facility/area from likely risks.A disaster plan is the
result of a wide range of preliminary activities (Lindblom, 1999). Disaster planning is implemented
both at the micro (at an institutional level, involving instituting fire protection systems, electrical
systems, plumbing, and protection against environmental hazards etc.) and the macro levels. The
objectives of disaster planning as given by Anil Sinha (2002) are given below.
• Forecasting and forewarning of disaster threat and providing the institutional and
organisational setup and logistics, personnel, inventory, finances, etc., to achieve desired level
of preparedness.
• Mobilisation of resources from internal and external sources.
• Taking organisational and administrative steps, including disaster action plans, regular and
periodic updating of plans and projects securing institutional wherewithal to implement it,
providing for a horizontal and vertical coordination through a network of official and
nonofficial agencies involved viz. government departments, civil defence military and
paramilitary organisations running through the central, state and field levels.
• Placing on ground, well equipped modern forecasting and warning system and reliable and
fast communication system.
• Generating capabilities for prompt and rapid rescue, relief and rehabilitation work.
• Proper planning for medical assistance and health cover.
• Providing for other miscellaneous needs like stocking and distribution of food, medicines,
shelter, clothing, evacuation, transportation and longterm resettlement and rehabilitation of
affected communities.
• Securing water management practices and provision of clean water is often problem and a
necessity post disaster.
• Government initiatives implying long term measures identified by the central government,
instituting intensive training programmes, building data based on documentation of disasters
and lessons to be learnt there from, and, dissemination of information.
• Integration of disaster management with overall development planning.
• Improving public awareness.
• Investment in R&D, use of modern technology, particularly information and remote sensing
technologies.
Interventions Needed
• Develop district wise and institution wise integrated disaster action plans for all types of
disasters both natural and manmade. It involves preparedness, mitigation, risk mapping, relief
and rehabilitation for disasters like landslides, accidents, earthquakes etc.

270 MGNCRE | Community Resilience and Disaster Management
• Evolve a model state plan to ensure uniformity of approaches, actions and systems
throughout and their periodic updating.
• Provide training for local industries and businesses to ensure better implementation of plans
and procure cooperation of the private corporate sector and the voluntary sector.
3.2 Prime Activities of Disaster Management
Prevention of Disasters
Globally, studies involving handling of disasters show that the aftereffects of a disaster are more
harmful than the disaster itself. Hence the awareness towards taking preventive measures to minimise
the impact of disasters have increased.
Following are the various measures taken for disaster prevention which may be adopted by any
country/state.
• Integrating disaster prevention with national development plans. Disaster prevention must be
a part of development plans and projects of any state. Multiple methods followed in this
regard include construction of embankments for reducing the occurrence of floods,
promoting earthquake resistant structures, watershed management, rainwater harvesting,
alternative cropping patterns etc., to manage drought and the like.
• Formulating a disaster management policy for the country, providing for a legal framework
for the management of all types of disasters in a comprehensive manner. This facilitates
proper implementation of preventive measures at all levels by the concerned organisations.
• Making the community aware and educated on various types and levels of disasters. Develop
their capacities to manage disasters and build community leadership to make them self reliant
and resilient to cope with disasters.
• Involving educational and training institutions, corporate sectors, NGOs and the public to
generate awareness among all concerned stakeholders.
• Strengthening of existing infrastructure such as buildings, communication system, water
supply, sanitation facilities etc. for better prevention of disasters.
The High-Powered Committee (2001) has put forward the following proactive measures to bring in
the culture of prevention of disasters
• Proactive measures for disaster preparedness and mitigation should be administrative,
financial, legislative and techno legal.
• Capacity building in disaster management must be at policy, institutional and individual levels.
• Raising and recruitment of professionals to build up expertise for mitigation and management
of disasters.
• Enforcement of protection and prevention measures.
To Do Activity
Elicit various elements of disaster risk reduction framework. Explain the role of each element in the whole process.

271 MGNCRE | Community Resilience and Disaster Management
• Generating a proper understanding of risk among different stakeholders, training and
confidence building among professionals and masons with appropriate development planning
strategies.
• Rehabilitation is to be viewed as a long term phased activity. Midterm rehabilitation vision is
focused on reconstruction of infrastructure and livelihoods, while long term programmes are
geared towards addressing the issues of prevention, mitigation and preparedness.
Mitigation of Disasters
Mitigation refers to actions taken in advance to minimise or eliminate the risks arising out of disasters.
Mitigation involves taking short term as well as long term measures to reduce the extent of damage
to the community, location and property. It is concerned with prevention of occurrence of disasters,
reduction of risks, consequences associated with them, and dispersal of risks. The preparedness,
response and recovery phases of disaster management are concerned with occurrence of specific
events, while mitigation activities relate to events that may occur in the future.
Mitigation aims at
• Predicate preparedness and prevention measures that help the community recover from
disaster impact.
• Reduction of hazards faced by the community.
• Creation of awareness of risks at the community level.
• Encourage participation of community to lessen the risks.
• Protection and conservation of natural resources.
• Risk and vulnerability assessment to gauge the risks that the community faces and working
out methods of reducing the risks.
Early Warning Systems
Early warning systems used in disaster management should be people centred. To be effective in its
functioning, the following four elements should be integrated in it.
1. Knowledge of risk faced by the disaster.
2. Technical monitoring and warning services.
3. Dissemination of meaningful warnings to those at risk.
4. Public awareness and preparedness to act.
Failure in any of these four elements can mean failure of the entire early warning system. Early
warning systems are recognized by the Hyogo Framework for Action (HFA). It is as an important
element of disaster risk reduction and help protect development gains from increased occurrence and
impacts of disasters. The increased occurrence and rise in impact of disasters are due to the increased
size and vulnerability of exposed populations. The increased occurrence of disasters may also be due
to the increased frequency and severity of some hydrometeorological hazards which arises due to
climate change. Early warning systems have always proved to be a critical element in saving lives,
property and agricultural assets. Early warning information must be as accurate, timely and as credible
as possible so that people can trust it and act on it. People need to know exactly where to go for safety
and which route to take.

272 MGNCRE | Community Resilience and Disaster Management
Figure 3.2 Disaster Response Activities
(Source Cartes, Nick, (1991), Disaster Management A Disaster Management Handbook (Cartes, Nick,
1991)).
Scientific forecasts about impending hazards of disasters are usually broadcast on the radio and TV
and published in the newspapers. However, disseminating warnings through media needs utmost
care. Warnings should be clear with proper interpretations to avoid any misunderstandings thereby
creating panic among the common public. Media should take utmost care to provide accurate
information to the public. Local governments also play a vital role by providing a vital link between
national level warning and communities at risk. While radio and TV may transmit warnings to the most
remote parts of the country, it is local governments that must team up with the local Red Cross and
Red Crescent branch and NGOs to ensure that the warnings are understood by the population at risk,
shelters are ready in case of emergency and evacuation is provided if needed. For the sake of
efficiency, early warning systems need to be people centred. The objective of a people centred early
warning system is to empower individuals and communities threatened by hazards to act in adequate
time and manner to reduce the possibility of personal injury, loss of life, damage to property and the
environment, including the loss of livelihoods. The following are the services provided by early warning
systems.
Monitoring and Warning Service Warning services lie at the core of the disaster management system.
They must have a sound scientific basis for predicting and forecasting and must operate 24 hours a
day. Continuous monitoring of hazard parameters and precursors is necessary to generate accurate
and timely warnings. The coordinated efforts from different hazards warnings should be undertaken
to benefit from shared institutional, procedural and communication networks.

273 MGNCRE | Community Resilience and Disaster Management
Dissemination and Communication is important that warnings reach those at risk. All communication
must be clear, and care should be taken to provide useful information which would help people to
take proper responses. Regional, national and community level communication channels and tools
must be pre-identified and a single authoritative voice established. The use of multiple communication
channels is important to ensure that the message reaches everyone, and it also acts as guard against
any possible failure of a channel. The use of multiple channels helps reinforce the warning message.
Response Capacity In order to be effective, communities must respect the warning service and know
how to react to warnings. This is possible by providing systematic education to the people and by
organizing preparedness programmes led by disaster management authorities. It is essential that
disaster management plans are in place and are well practiced and tested. The community at risk
should be well informed on options for safe behaviour. The community must also be aware of varied
means to avoid damage and loss of property.
Disaster Preparedness
Disaster preparedness is an efficient way to decrease the effect of small as well as large scale disasters.
It acts as an effective link between emergency response and rehabilitation. Disasters expose the
vulnerability of individuals and communities. They face threat to their lives and their property,
infrastructure etc. This spells out the importance of developing disaster preparedness mechanisms
and processes to neutralise and reduce the vulnerability of people and minimise loss of lives and
property.
The United Nations Disaster Relief Office (LINDRO) defines Disaster Preparedness as "a series of
measures designed to organise and facilitate timely and effective rescue, relief and rehabilitation
operations in cases of disaster. Measures of preparedness include among others, setting up disaster
relief machinery, formulation of emergency relief plans, training of specific groups (and vulnerable
communities) to undertake rescue and relief, stock piling supplies and earmarking funds for relief
operations.”
Disaster Preparedness comprises different sets of activities before, during and after the disaster. Few
of those activities are outlined here.
Preparedness Activities before the Onset of Disaster
• Formulation of disaster preparedness plans at national, state, local and community levels.
• Generation and disseminating information through mass media about the potential hazards,
their frequency of occurrence and associated risks.
• Installation of appropriate forecasting and warning systems.
• Strengthening of physical infrastructure.
• Evacuation of people to safer areas.
Preparedness Activities during the Eventuality
• Provision of food, shelter, medical and first aid services.
• Security arrangements to prevent occurrence of untoward incidents.
Post disaster Preparedness Activities
• Rescue operations for affected.
• Proper relief distribution including food, clothes and medicines.

274 MGNCRE | Community Resilience and Disaster Management
• Restoration of communication system.
• Damage assessment and immediate financial assistance.
Awareness during Disasters
Community awareness forms the basic crux of present day disaster management. The prime objective
is to raise the awareness levels and knowledge base of the community to make them alert, self-reliant
and cope with the consequences. People have coping strategies that they derive from the past
experience. The communities possess the capacity and strength arising out of previous experiences in
facing emergencies. This needs to be harnessed. The awareness is required to enable the community
to understand the impact of disaster, efforts required to reduce its impact and save their lives and
property.
The Awareness should make the Community Conversant about
• Operationalising of preparedness or response or emergency plan prevalent at the local or
community level.
• Adhering to special instructions about warning and evacuation given during disaster.
• Getting conversant with evacuation procedures, routes for evacuation and necessary things
to be taken.
• Providing help to vulnerable sections such as women, children, old, physically challenged etc.
• Mobilising other community members in tackling the crisis.
• Distributing relief
Community awareness in case of cyclone prone areas can include providing information about
construction of wind resistant houses, avoidance of loose material such as metal or aluminium sheets,
which can be blown away, use of battery-operated communication system etc. Similarly, with regard
to flood mitigation, it can include use of water resistant material for flood resistant houses,
construction of dykes and embankments, afforestation in catchments areas etc. Mass awareness
programmes for drought management can include dry land farming, farm forestry, pasture land
management, soil and water conservation techniques.
3.3 Application of Information Technology in Disaster Risk Reduction
Information technology (IT) has “revolutionised communication, bringing within the ambit of
connectivity, remote and far flung areas and the illiterate marginalised masses, realised true
democracy and enhanced awareness of rights among people and duties among official agencies and
the lay public. Knowledge is power; hence ‘empowerment’ is the chief contribution/result of the
information communication revolution partaking in the developing world currently.” Specific
applications and benefits of IT are discussed by N. Vinod Chandra Menon (2003).
A) Decision Support and Public Awareness
The World Wide Web and the Internet have opened up possibilities of department specific web
sites, which provide information in specialised branches of disaster management. Some of these
web sites are accessible to people which disseminate valuable information for interest articulation
and academic deliberation in the area. There are specialised web sites on natural hazards such as
earthquakes and cyclones that provide comprehensive information regarding specific natural
hazards. Such web sites also form ‘knowledge bases’ in that a web site on earthquakes would

275 MGNCRE | Community Resilience and Disaster Management
present all information on the hazard and ways to deal with it. These form important decision
support tools (DCS) that facilitate knowledge transfer during critical times.
B) Information Sharing
The Information Communication Revolution has made possible the setting up of local area and
wide area networks known as INTRANETS and EXTRANETS that link up institutions over distant
regions and facilitate information sharing on a global basis. The integration of information
technology (IT) with telecommunication interfaces has made possible facilities like video
teleconferencing which provide for direct interface between aid givers and official agencies at the
emergency site, rendering relief and rescue process highly efficient, besides providing for
‘knowledge networking’ across institutions, especially research institutions during peace times.
Another significant development has been the Geographical Information System (GIS), by which
detailed spatial analysis of ‘at risk’ area is accomplished through satellite imagery. Comprehensive
information is collected about the area which is displayed graphically, on a map, highlighting critical
facilities and communities at risk, available communication infrastructure etc. which guides
immediate disaster response in the short run, and over the long run, facilitates risk mapping, risk
assessment, dissemination of information, public awareness etc. which aid long term policy
planning for disaster mitigation. The GIS has greatly facilitated response effort as strategies can be
devised on the basis of scientific simulation studies and scenario analysis using information made
available through remote sensing. The Indian Meteorological Department (IMD) has commissioned
a satellitebased communication system called Cyclone Warning Dissemination System for
dissemination of cyclone warning in coastal areas.
C) Policy Planning
Information Technology has greatly aided planning for disaster response and preparedness.
Information technology has made policy for disaster risk reduction more fact based and less
judgemental / ‘a priori’. Generally, policy making for traffic, transport, forest conservation, urban
congestion etc. is facilitated by spatial imagery through remote sensing.
Geoinformatics in Disaster Management (RS, GIS, GPS)
The problem with traditional manual maps is that they are tedious and time consuming to prepare,
difficult to update and inconvenient to maintain. Therefore, nowadays remote sensing is emerging as
a popular means of map preparation, and Geographical Information Systems (GIS) can be used for
storage, analysis and retrieval. Under remote sensing techniques, maps can be prepared using satellite
data or aerial photographs, and are then digitized and stored on computers using GIS software. Once
this is done, they can be retrieved and viewed on the computer any time.
“Mapping can be done regarding road and rail links, urban and rural pockets, socio economic profiling,
e.g. scheduled castes and scheduled tribes in a region, pockets of intense poverty, degree of
vulnerability as per different indices, total resultant vulnerability, categorization on a vulnerability
index etc. These maps can be superimposed on each other depending on the context within which
specific information is required. This can serve as an important policy tool as techniques get more
sophisticated and speedier and effective policy formation as well as implementation is required.”
(Arora, 2003).

276 MGNCRE | Community Resilience and Disaster Management
Remote Sensing
Remote sensing (RS) is the science of extracting information about the earth’s surface from images
acquired at a distance. It differs from aerial photography which deals with only the visible spectrum
while RS covers the infrared and microwave regions also. Data from satellites is downloaded in digital
form at Earth receiving stations, where they are converted into photographic form. Objectives are
differentiated on the basis of differing brightness or colour. Data image processing is a highly technical
process involving large scale analysis of data received from image sensors.
The Geographic Information System (GIS)
Disaster management is a multidisciplinary function involving information from various sources. Data
obtained from remote sensing has to be studied in conjunction with data from ancillary sources like
socio economic data, topography, soil type etc. that is analysed to deduce relevant information. The
global positioning system (GPS) has increased the scope of GIS. The GPS is a satellite basedradio
navigation system that provides real time data to GIS. For example, in earthquakes studies, the GPS
may be used to measure the deformations caused by an earthquake. This information along with
seismological and other data may be analysed in GIS to locate the source of an earthquake.
Disaster Communication Systems (Early Warning and Its Dissemination)
Warnings on disaster must reach people at risk. Warnings must be clear, and it should contain useful
information to enable proper responses from people. Regional, national and community level
communication channels and tools must be preidentified and one authoritative voice established. The
use of multiple communication channels is necessary to ensure that communication reaches to
everyone in case of failure of any one channel. It also aids in reinforcing the warning message.
Response Capability
Communities must also respond properly to the warning service provided by authorities and know
how to react to warnings. To achieve this, communities require systematic education and
preparedness programs led by disaster management authorities. It is essential that disaster
management plans are in place and are well practiced and tested. The community should be well
informed on various options for safe behaviour and different means to avoid damage and loss of
property.
Multi hazard Early Warning Systems
This system addresses several hazards of similar or different type in contexts and its impacts where
hazardous events may occur alone, simultaneously, cascading or cumulatively over time, and
considering the potential interrelated effects. A multi hazard early warning system with the ability to
warn of one or more hazards increases the efficiency and consistency of warnings through coordinated
and compatible mechanisms and capacities, involving multiple disciplines for updated and accurate
hazards identification and monitoring for multiple hazards.
Land Use Planning and Development
Land use planning (LUP) is currently considered to be one of the best practices at the core of natural
Disaster Risk Management (DRM) that can improve the security and resilience of the people affected.
With a LUP policy, a community can consider disaster risks and their spatial distribution, steer more
sustainable land development and use, and reduce the vulnerability of poor people who are often
settled on degraded sites with significant risks and constraints.

277 MGNCRE | Community Resilience and Disaster Management
LUP is both a volunteered collective approach and a local authoritative decision making process that
integrates natural risks and sensitive social concerns into institutional, communal, customary and legal
arrangements. The goal is to establish and enforce prohibitions over disaster prone areas and legal
restrictions or alternatives over exercise of land rights. Post disaster rehabilitation programmes and
reconstruction projects should also improve land tenure security by enforcing strict development rules
and building standards, in accordance with the assessed level of risks at particular sites.
Disaster Safe Designs and Constructions
Disaster resistant construction is one of the core issues at the disaster mitigation and prevention policy
levels. Few disaster safe designs are given below.
For earthquake resistant construction, avoiding hillside slopes and areas having sensitive and clayey
soil would be better. It is preferable to have several Chapters on terraces rather than one large Chapter
with footings at different clusters. The building as a whole should be kept almost symmetrical. Simple
rectangular shapes behave better in an earthquake than shapes with multiple projections. Separation
of a large building into several Chapters is required for symmetry and rectangularity of each Chapter.
Restricting the width of openings, using bond beams and taking recourse to steel or wooden dowels
as well as RCC band at plinth, lintel and roof levels are good disaster resistant techniques for buildings.
In case of cyclones, it would be better to erect structures in areas which provide a protective shield
from high winds with natural firm level foundation. Flat roof arrangement should be avoided.
Projecting elements like antennas and chimneys, eave projections, sunshades etc should also be
avoided. The construction should have adequate diagonal bracing, reinforced machinery, thicker plate
glass, and anchoring of purloins to gable ends. As far as flood resistant housing is concerned,
prohibited zones should be totally avoided. Layout of the buildings/ houses should be such that they
do not Chapter free flow of water. Construction should be done on raised mounds. Waterproofing
treatment, adequate bracing, afforestation in catchment areas are required for flood prone areas.
Structural and NonStructural Mitigation of Disasters
Mitigation measures are classified as Structural and NonStructural.Structural mitigation measures
include building and planning regulations for proper landuse management, guidelines for new
constructions based on earthquake mitigation measures and various technical measures of
strengthening buildings. Some other examples of structural mitigation measures include construction
of dykes to provide protection against river or sea floods (Charlotte Benson). It is important to
differentiate between engineered structures and non-engineered structures for better analysis of
structural mitigation.
In case of floods, structural interventions include the construction of dykes to provide protection
against river or sea floods. In Vietnam such structures have been built and maintained for some 2000
To Do Activity
Visit any meteorological laboratory or any government office involved in GIS or remote
sensing, any engineering institution or scientific laboratory or geography department of the
university or private consultancy firm in the field of CIS / remote sensing or newspaper office
and attempt to find out about GIs maps. Observe the map and note your observations.
278 MGNCRE | Community Resilience and Disaster Management
years. Bamboo houses are built in traditional communities to brace against cyclones. In case of
earthquakes, classification is attempted between engineered structures and non-engineered
structures.
3.4 Disaster Risk Transfer and Financing
Risk financing and risk transfer instruments are meant for reducing financial vulnerability by
addressing actual or impending financing gaps. These instruments may reduce the economic costs of
disasters by enabling the re-profiling or the transfer of risks, improving government financial planning,
and by providing incentives for risk reduction.
These instruments generally involve the operation of insurance, banking and capital markets. One
must understand it well to evaluate their cost effectiveness in bridging identified financing gaps.
Risk Financing
Risk financing comprises the retention of risks in case of a disaster. It is achieved by adopting a clear
financing strategy to ensure that adequate funds are available to meet the financial needs in such a
situation. Such financing can be established both internally and externally. Internally it is established
through the accumulation of funds set aside for future use and externally through prearranged credit
facilities. The banking sector, capital markets and international lending institutions function as
different sources of risk financing.
Risk Transfer
Risk transfer involves the shifting of risks to others by paying a premium. When a disaster occurs, they
provide compensation ensuring that any financing gap that might emerge is partially or fully bridged.
Risk transfer may be obtained through different means like insurance policies or capital market
instruments such as catastrophe bonds. The main sources of risk transfer are insurance and
reinsurance sectors and in some cases capital markets act as an alternative source. The payouts of risk
transfer instruments may be quantified on the basis of actual losses sustained by the protection buyer
(indemnity based), or the amount of such payment may be agreed upon by the parties irrespective of
actual losses and triggered by a physical parameter measuring the intensity of the hazard at given
locations (parametric) or by an index comprising multiple measurements of such parameters for each
event (parametric index).
Where risk financing and risk transfer markets are domestically well developed or can be accessed on
a cross border basis, those facing disaster risk need to evaluate whether, given their degree of financial
vulnerability, to retain risks and fund them solely on an ex post basis within existing financial capacities
or whether to manage risks ex ante through risk financing, risk transfer or additional risk reduction
measures based on their costs and benefits.
If disaster risks are relatively minor in comparison with risk bearing capacity, managing these risks
solely on an expost basis may be a viable approach, allowing funds to be more productively invested
elsewhere, supporting capital accumulation and thus augmenting financial capacity. However, if
disaster risks are material, ex ante financial tools can provide valuable protection, helping to bridge
financing gaps; alternatively, investment in risk reduction may yield benefits in terms of a reduced risk
exposure. These measures require, however, an exante commitment of resources, with attendant
opportunity costs given alternative uses of capital. Building up a dedicated pool of savings or reserves,

279 MGNCRE | Community Resilience and Disaster Management
a source of risk financing obtained through internally generated funds which are set aside in a disaster
fund and are drawn down in the event of a disaster, may prove valuable for those with relatively low
disaster risk exposures, for instance for more frequent but lesser impact hazards.
As disaster risk increases relative to risk bearing capacity, accessing external sources of risk financing
such as contingent credit facilities, where loans are provided in the event of a disaster event, may be
more efficient, as it may be more difficult to build up the necessary amount of internal funds to meet
the increased expected costs of disasters and such funds might be more productively invested
elsewhere.
Insurance may provide beneficial protection for those facing larger disaster risks relative to risk
bearing capacity. Insurance permits risks to be transferred to undertakings, namely insurers and
reinsurers, whose business is to pool and diversify risks. For households and other economic agents
with limited expertise and resources and facing material disaster exposures, the purchase of insurance
can – in those countries where insurance markets are well developed – provide simple and cost
effective financial protection. The same may apply to larger economic agents such as large
corporations and governments. Alternatively, simplified risk transfer tools such as micro insurance
and parametric insurance products may be deployed in countries where insurance markets are not
well developed or broad based.
As the severity of the risks further increases and size of the risk bearer increases, enabling direct access
to capital markets, additional risk transfer tools may become accessible, such as catastrophe linked
securities, which involve risk transfer through capital markets. In a limited number of cases, countries
have used catastrophe linked securities to cover higher layers of risk in the context of structured
disaster risk financing (e.g., a disaster fund) or risk transfer (e.g., an insurance scheme) mechanisms.
Opportunity costs linked to ex ante financial tools may rise with the size of the risk bearer given that
investment opportunities and investment management capacities may increase.
Investment in risk reduction will yield both economic and social benefits, such as avoidance of loss of
life and injury, as well as help to reduce overall country risk. Risk reduction measures can directly
substitute for, or complement, financial tools. If disaster risks are large, then initial investments in risk
reduction are likely to yield substantial benefits; however, there are likely to be diminishing returns as
such investment increases. At the level of an individual household or small business, the scope for risk
reduction may be limited compared to what might be achieved by a large corporation or government.
Disasters lead to a number of direct and indirect financial impacts on governments, businesses and
individuals. Post disaster financial needs are often defined by three phases (a) immediate relief and
rescue response, (b) early recovery and (c) the reconstruction phase.
Funding needs will differ in each phase. Relief and rescue require immediate access to funds for urgent
rescue, food, medicine, clean water and shelter for those injured, affected and displaced. Early
recovery requires funding, within weeks, to restore livelihoods, help communities return to some level
of normality and restart their economic activities. Reconstruction requires more substantial funds to
be mobilized for repairing and rebuilding damaged assets such as homes and critical infrastructure.
Funds are therefore required on different timescales. Delays in receiving funding can hamper each
phase, negatively impacting the population and the economy.

280 MGNCRE | Community Resilience and Disaster Management
The development of a successful risk financing and risk transfer programme requires the collaboration
of multiple stakeholders and information providers. Risk assessments and development of sovereign
risk financing and risk transfer programmes should engage a variety of stakeholders from the
government (relevant ministries), national technical agencies and data providers, academia and
centres of excellence, (re)insurance industry, international and regional development banks,
nongovernmental organizations and the risk modelling community.
Risk Financing in India
The policy arrangements for meeting relief expenditure related to natural disasters are primarily
based on the recommendations of successive Finance Commissions. The two main windows presently
open for meeting such expenditures are the Calamity Relief Fund (CRF) and National Calamity
Contingency Fund (NCCF). The Calamity Relief Fund is used for meeting the expenditure for providing
immediate relief to the victims of cyclone, drought, earthquake, fire, flood and hailstorm. Expenditure
on restoration of damaged capital works should generally be met from the normal budgetary heads,
except when it is to be incurred as part of providing immediate relief, such as restoration of drinking
water sources or provision of shelters etc., or restoration of communication links for facilitating relief
operations. The amount of annual contribution to the CRF of each State for each of the financial years
200001 to 200405 is as indicated by the Finance Commission. Of the total contribution indicated, the
Government of India contributes 75 percent of the total yearly allocation in the form of a non plan
grant, and the balance amount is contributed by the State Government concerned. A total of
Rs.11,007.59 crores was provided for the Calamity Relief Fund from 200005.
Pursuant to the recommendations of the Eleventh Finance Commission, apart from the CRF, a National
Calamity Contingency Fund (NCCF) Scheme came into force with effect from the financial year 200001
and would be operative till the end of the financial year 200405. NCCF is intended to cover natural
calamities like cyclone, drought, earthquake, fire, flood and hailstorm, which are considered to be of
severe nature requiring expenditure by the State Government in excess of the balances available in
its own Calamity Relief Fund. The assistance from NCCF is available only for immediate relief and
rehabilitation. Any reconstruction of assets or restoration of damaged capital should be financed
through reallocation of Plan funds. The initial corpus of the National Fund is Rs.500 crores, provided
by the Government of India. This fund is required to be recouped by levy of special surcharge for a
limited period on central taxes. Assistance provided by the Centre to the States from the National
Fund is to be financed by levy of a special surcharge on the central taxes for a limited period. A list of
items and norms of expenditure for assistance chargeable to CRF / NCCF in the wake of natural
calamities is prescribed in detail from time to time. There are a number of important ongoing schemes
that specifically help reduce disaster vulnerability. Some of these are Integrated Wasteland
Development Programme (IWDP), Drought Prone Area Programme (DPAP), Desert Development
Programme (DDP), Flood Control Programmes, National Afforestation & Eco-development
Programme (NA&ED), Accelerated Rural Water Supply Programme (ARWSP), Crop Insurance, Sampurn
Grameen Roger Yojana (SGRY), Food for Work etc.
The High Power Committee (HPC) constituted by GOI on Disaster Management which submitted its
report in October 2001 recommended that at least 10 percent of plan funds at the national, state and
district levels be earmarked and apportioned for schemes which specifically address areas such as
prevention, reduction, preparedness and mitigation of disasters. The Eleventh Finance Commission

281 MGNCRE | Community Resilience and Disaster Management
too paid detailed attention to the issue of disaster management and, in its chapter on calamity relief,
came out with a number of recommendations, of which the following have a direct bearing on the
Plan
a. Expenditure on restoration of infrastructure and other capital assets, except those that are
intrinsically connected with relief operations and connectivity with the affected area and
population, should be met from the plan funds on priority basis.
b. Medium and long term measures are devised by the concerned Ministries of the Government
of India, the State Governments and the Planning Commission to reduce, and if possible,
eliminate, the occurrences of these calamities by undertaking developmental works.
c. The Planning Commission, in consultation with the State Governments and concerned
Ministries, should be able to identify works of a capital nature to prevent the recurrence of
specific calamities. These works may be funded under the Plan.
In order to move towards safer development, development projects should be sensitive towards
disaster mitigation. With the kind of economic losses and developmental setbacks that the country
has been suffering year after year, it makes good economic sense to spend a little extra today in a
planned way on steps and components that can help in prevention and mitigation of disasters, than
be forced to spend more later on restoration and rehabilitation. The design of development projects
and the process of development should take the aspect of disaster reduction and mitigation within its
ambit; otherwise, the development ceases to be sustainable and eventually causes more hardship and
loss to the nation.
3.5 Role of Various Stake Holders during Disasters
Role of Print and Electronic Media during Disasters
Local media often plays a critical role in providing information during disasters; however, they receive
very little help from outside. In rural areas, most people give preference to the radio. The media’s role
in disaster risk reduction derives from the need to inform, educate and empower communities with
relevant knowledge for influencing public actions and policies towards disaster preparedness and
mitigation. Reduction of risks at all stages involves proper exchange of information. Today media plays
a vital role in spreading information to a larger audience. In Central Asia, and especially in Kazakhstan,
media have played an increasing role to convey disaster risk reduction messages. Stronger
cooperation between media and the disaster risk reduction community in Central Asia would clearly
benefit the population and should be encouraged.
Media can play different roles at each stages of disaster risk reduction process. In predisaster phase,
the primary role of the media is to emphasize the importance of disaster risk reduction and disaster
To Do Activity
As a team manager, identify the skills and qualities required amongst team members to
discharge activities in any disaster phase and make a brief report. Break this team into planning,
operations, information management, and financial administration sections. Identify skills
required for each of these functions.
Approach any agency involved in disaster management activity and examine the problems that
are encountered in a team work.

282 MGNCRE | Community Resilience and Disaster Management
preparedness. It should encourage decision makers and atrisk communities to undertake appropriate
actions to avoid future disasters. Media can do this by highlighting potential sources of risk or
vulnerabilities, analysing risk patterns and educating communities about measures they can
undertake at family, community and organizational levels to mitigate hazards and reduce their
vulnerability.
Media can use different Ways to Reach the Public. Some of these ways may Include
• Skilfully Produced Radio or TV Programmes Such programmes can go beyond simple
exchange of information by using entertaining soap operas to promote greater awareness of
risk such as earthquakes or infectious diseases. In Tajikistan, a “Radio Theatre for Children”
has been used, and in Afghanistan, the evaluation of a long running radio soap entitled “New
Homes and New Life” proved that listeners change their attitudes and behaviour after hearing
the drama (Source World Disaster Report, IFRC 2005).
• Organize Dialogues with Local Experts Dialogue among experts on the causes of disasters,
risk and vulnerabilities and on the identification of appropriate solutions would play an
important role in focusing communication among stakeholders on disaster problems and also
in raising public awareness. Therefore, media should consider holding forums among
representatives of scientific organizations’. The Meteorological Department and other
government departments, local NGOs, national societies of the Red Cross and Red Crescent
and UNDP.
• Public Auditing Media can conduct surveys and opinion polls to rate the relevance, quality
and quantity of the relief and rehabilitation assistance.
• Research Articles and Programmes Media professionals can conduct research on specific
issues such as risk generation factors in communities and publish them in newspapers or on
radio/TV broadcasts.
• Interviews Media can interview disaster management officials, e.g. the Director of the
National Disaster Management Office, the President of the National Society of the Red Cross
and Red Crescent Society, etc.
• Field Visits Media professionals can cover the plight of the vulnerable or disaster affected
people to advocate for disaster risk reduction or the provision of appropriate relief and
rehabilitation.
• Warning and Preparedness Message Dissemination When the hazard season is approaching,
media can publish and broadcast warnings and preparedness messages to inform the general
public about the risk and possible disasters they may face and actions they may take to avoid
or minimize the loss of life and property.
Community Based Disaster Risk Reduction
The goal of any disaster management initiative is to build a disaster resistant/resilient community
equipped with safer living and sustainable livelihoods to serve its own development purposes. The
community is also the first responder in any disaster situation, thereby emphasising the need for
community level initiatives in managing disasters. To encourage such initiatives, the following are the
measures required
a. Creating awareness through disaster education and training and information dissemination
are necessary steps for empowering the community to cope with disasters.

283 MGNCRE | Community Resilience and Disaster Management
b. Community based approach followed by most NGOs and Community Based Organisations
(CBOs) should be incorporated in the disaster management system as an effective vehicle of
community participation.
c. Efforts are needed to identify the most vulnerable groups like women and children, aged and
infirm and physically challenged people who need special care and attention and provide
special assistance in terms of evacuation, relief, aid and medical attention to them.
Health Issues and Hospital Preparedness and Response
Disaster management involves the joined effort from different community resources—from police
and fire to medical providers, structural and environmental engineers, and transportation and housing
experts. The hospital has a crucial role to play during disasters. It is the epic centre of medical care
delivered to those who are injured. Preparing a hospital during disaster is more complicated.
“Because of the unpredictability of demand for emergency services, hospitals face fluctuations in
utilization on an hourly, daily, and weekly basis. With many hospitals already operating at or near full
capacity, temporary surges can exacerbate chronic ED crowding, boarding, and ambulance diversion.
While these surges in demand can severely stretch the resources of a hospital’s staff and diminish the
quality and safety of patient care, hospitals generally maintain their normal standard of care through
these surges. In a disaster situation, however, hospitals may need to shift to a sufficiency of care mode,
in which the focus is on saving as many lives as possible rather than ensuring that each patient receives
the usual standard of care” (AHRQ, 2005). In the most extreme cases—for example, a full blown
influenza pandemic such as that experienced worldwide in 1918—this could mean assigning the most
severely ill or injured patients to expectant care, a strategy that withholds treatment for those who
have very little chance of survival to focus resources on saving the largest possible number of lives.
Capacity Building
Capacity building is the process through which individuals, organizations and societies obtain,
strengthen and maintain the capabilities to set and achieve their own development objectives over
time. The concept of capacity building for managing and reducing disaster risk is highlighted
extensively in the Hyogo Framework for Action 20052015. The framework calls for accelerated efforts
to build community and national level capacities to manage and reduce risk, and link these efforts to
all five priority areas of action. For example
1. Ensuring that disaster risk reduction is a national and local priority with a strong institutional
basis for implementation. It requires building institutional capacity through the development
of policy, legislative and institutional frameworks.
2. Identifying, assessing and monitoring disaster risks and enhancing early warning. It requires
developing scientific, technological and technical capacities to observe, analyse and forecast
disasters, and institutional capacities to integrate early warning systems into local and
national level processes and systems.
3. Using knowledge, innovation and education to build a culture of safety and resilience at all
levels and it requires supporting and building technical capacity to assess impact and
vulnerability, improve monitoring and evaluation, and promote communitybased education.
4. Reducing underlying risk factors requires integrating DRR planning and capacity building into
multiple sectors including the health sector (so that health care remains functional during

284 MGNCRE | Community Resilience and Disaster Management
disasters), and housing and construction sectors (to ensure that structures are resistant to
disasters through new building codes, standards and practices)
5. Strengthening disaster preparedness for effective response at all levels requires equipping
institutions, individuals and communities in disaster prone areas with the necessary
knowledge, skills and capacities to manage and reduce disaster risk.
A recent literature review on capacity building for DRM highlights a number of key enablers of and
barriers to effective capacity building (CB) interventions
• CB programmes must be locally ‘owned’ and are most effective when they are led by national
actors, with a limited role for external actors
• CB should relate to the local context, be rooted in a strong understanding of the country’s
formal and informal institutional environment ,and should build on resident capacities
• CB is not just a technical exercise the wider political and governance environment critically
affects CB success
• CB requires a multi stakeholder, multidimensional approach involving different levels of
government, different actors and different sectors
• High staff turnover impedes sustainability of CB
• Donor practices can create perverse incentives for CB, particularly through the imposition of
short timescales for projects and pressure to spend money quickly
• Long time horizons are ideal for DRM CB interventions, although there is typically a key
window of opportunity and momentum immediately after a disaster
• Careful design is required to ensure effectiveness, including the use of needs assessments,
defined objectives, theories of change, a comprehensive plan, and an exit strategy
• Be aware of barriers to participation in CB activities to ensure that vulnerable communities
are able to participate in programme design
• CB interventions should be based on equality where all the actors are on a shared learning
journey. For this reason many national governments prefer South approaches and triangular
cooperation.
Systems Approach in Disaster Management
The starting point of an integral risk management concept is the relation between hazard,
vulnerability, risk and risk management. The approach of the World Institute for Disaster Risk
Management (DRM) includes the systems approach (e.g. Wilhelm, 1999).

285 MGNCRE | Community Resilience and Disaster Management
Figure 3.4 Systems Approach for Disaster Risk Management
Source The World Institute for Disaster Risk Management (DRM) (Wilhelm, 1999).
The model links together the elements risk analysis, vulnerability, and risk assessment. It requires the
development of tools for an overall risk mitigation. The development of methods and measures to
support prevention and intervention activities such as monitoring, registration, forecasting, early
warning, and decision supporting tools for frontline decisions becomes particularly important.
Efficient risk management requires a careful evaluation of the vulnerability of the objects and of the
systems at risk. Cost benefit analyses of prevention measures can only be performed on the basis of a
quantitative evaluation of possible damage to structures and entire systems
Firstly, the fundamental relationship between natural and manmade risks and the process of
globalisation is estimated in terms of three elements
a. Interdependence between disaster and economic development
b. Interdependence between disaster and sustainability
c. Interdependence between disaster and resource allocation (especially capital and technology.
Secondly, the principles of welfare theory are needed to understand the precautionary measures.
Finally, institutional arrangements should be taken care of for the implementation of long term
strategies of risk prevention.
Disasters, Climate Change and Ecosystems
The impacts of climate change on society are occurring earlier and more frequently than predicted
(IPCC 2012). “Climate change impacts such as floods, drought, heat waves and increased intensity and
frequency of storms have been the major cause of long term increases in economic losses (IPCC 2012).

286 MGNCRE | Community Resilience and Disaster Management
Projected population increases and urbanization are increasing vulnerability and disaster risk by
placing additional development pressures in zones that are most sensitive to climate change impacts,
including coastal systems and low lying areas (Field et al. 2014).
Ecosystems and biodiversity provide services essential for helping people adapt to the impacts of
climate change and disaster risks. In recent years, “ecosystem based adaption” (EbA) and “ecosystem
based disaster risk reduction” (EcoDRR) have gained increasing attention in risk management. These
approaches emphasize the importance of ecosystems in effective climate change adaptation (CCA)
and disaster risk reduction (DRR) measures, and build on other practices such as conservation and
ecosystem restoration that seek to increase the resilience of ecosystems. EbA and EcoDRR have gained
traction because they provide multiple benefits for people, ecosystems and biodiversity, enable
planning for CCA and DRR on longer time scales, are costeffective compared to traditional engineered
infrastructure, and emphasize community participation and the use of traditional and local knowledge
systems. Due to their participatory nature and crosssectoral approaches to adaptation and disaster
risk reduction, EbA and EcoDRR can achieve multiple policy objectives, including local, regional and
national strategies for climate change, disaster risk reduction, and sustainable development, among
others.
Major international agreements such as the Paris Agreement and the Sustainable Development Goals
have called for enhancing the resilience of ecosystems and societies to the impacts of climate change
and disaster risk. Increasingly, countries are integrating ecosystem based approaches into national
plans and strategies to reduce the risk of climate impacts and hazards – examples have been
synthesized in CBD Technical Series No. 85 (Lo 2016). However, there remains a gap between policy
development and implementation. The objective of these guidelines is to support and enable the
design and implementation of EbA and EcoDRR strategies as part of an overall climate change
adaptation or DRR strategy, on multiple scales short, medium and longterm, and local, subnational
and national.
Figure 3.5Adaptation and Disaster Risk Reduction Options Within an Overall Adaptation Strategy
(GIZ 2015)

287 MGNCRE | Community Resilience and Disaster Management
Ecosystems Based Management for Disaster Risk Reduction and Resilience
The new approach in disaster management known as ‘ecosystem approach to disaster risk reduction
(Ecodrr)’ has displayed tremendous benefits. This approach is community based and it emphasises on
livelihood, health and food security within the framework of vulnerability reduction. The planning
framework at district level suggests an integrated district plan and opens avenue for a much awaited
‘environmental action plan’ mandate at state, district and local levels. This shall help facilitate the DRR
infusion with sustainable development agenda in much acceptable sense – in the governance as well
as in community actions. It aims at reducing externality in dependence, improving selfreliance and
local strengths for disaster mitigation and preparedness.
India has initiated the ‘Environment Based Disaster Management Module’ in 2009 at National Institute
of Disaster Management in addition to ‘climatechange and disaster management’ module launched
in 2007. Globally the disaster management initiative was formalized as an agenda during UNPEDRR
(Partnership for Environment and Disaster Risk Reduction) meeting at UN Campus in Bonn in 2010.
The 2004 Indian Ocean tsunami triggered global interest in promoting ecosystem management
approaches for reducing disaster risk, placing increased international attention on the role of coastal
ecosystems as natural shields against coastal hazards and resulting in major initiatives such as the
Mangroves for the Future (MFF) Programme. In 2005, the Hyogo Framework for Action (HFA)4, the
first global agreement on disaster reduction, recognized the importance of sustainable ecosystems
and environmental management in reducing disaster risk. Both the 2009 and 2011 Global Assessment
Report on Disaster Reduction identified ecosystems decline as a major driver of risk and called for
greater protection and enhancement of ecosystem services. Ecosystem management for disaster risk
reduction has been prioritized in both the 2009 and 2011 ISDR Global Platform for Disaster Risk
Reduction.
To Do Activity
Identify the following symbols. Improve your awareness on disaster management and try to bring awareness in your community

288 MGNCRE | Community Resilience and Disaster Management
References
1. “A Climate Risk Management Approach to Disaster Reduction and Adaptation to Climate
Change” UNDP Expert Group Meeting, Integrating Disaster Reduction with Adaptation to
Climate Change, Havana, June 1121 2002.
2. Basic Terms of Disaster Risk Reduction read online at http//www.unisdr.org
3. Mohan, Niraj, Arvind Narain, Deepu and Clifton Rozario(2005). “Relief and Rehabilitation
Ensuing, Inclusion”, Economic and Political Weekly, April 9 Issue.
4. “Reducing Disaster Vulnerability Through Science and Technology”, National Science and
Technology Council, Committee on the Environment and Natural Resources, An Interim
Report of the Subcommittee on Disaster Reduction, July 2003. Retrieved from http//sdr.gov/
SDR_Report_ReducingDisaster Vulnerability2003.pdf
5. Sahni, Pardeep and Alka Dhameja (2003). “Disaster Risk Reduction through Capacity Building
of the Community and Panchayati Raj Institutions”, Pardeep Sahni and Madhavi Ariyabandu
(Eds), Disaster Risk Reduction in South Asia, PrenticeHall of India, New Delhi.
6. Smith, K.(2001).Environmental Hazards, Assessing Risk and reducing Disaster, Third Edition,
Routledge, London.
7. UNDP, 2004, Reducing Disaster Risk A Challenge for Development, UNDP, Geneva.
8. UNISDR, 2004, “Living with Risk A Global Review of Disaster Reduction Initiatives”,
International Strategy for Disaster Reduction, United Nations InterAgency Secretariat,
Geneva.

289 MGNCRE | Community Resilience and Disaster Management
Chapter 4 Disaster Management in India
Introduction This chapter is dedicated to the concept of disaster management in India. More precisely, this chapter
will provide an overview of disaster management in India and its framework. This chapter deals with
the disaster management act 2005 and also explains the national guidelines and plans on disaster
management. The role of government, nongovernment and intergovernmental agencies and other
institutional arrangement during disasters is clearly discussed.
Objectives
• To discuss the concept of disaster management in India.
• To explain the disaster management act 2005 and the national guidelines and plans on
disaster management.
• To understand the role of government, nongovernment and intergovernmental agencies and
other institutional arrangement during disasters.
Structure
4.1 Disaster Management in India
Disaster Management discusses how a maximum number of lives and property can be protected
during a natural disaster. “Disaster management plans are usually multilayered with an aim to address
issues such as cyclones, hurricanes, floods, fires, mass failure of utilities and also spread of an
epidemic. India, because of its unique geoclimatic conditions is vulnerable to the natural disasters.
Floods, droughts, cyclones, earthquakes and landslides occur recurrently. In India about 59% of the
land is susceptible to earthquakes of various moderations; 69 % of the land mass is at risk of drought;
8% of the land area is susceptible to cyclones and over 40 million hectares is at risk of floods. Over a
decade from 19902000 almost 30 million people got affected by disasters and an average of about
4344 people had lost their lives every year. There has been a huge loss coming to public, private and
community assets.
4.1Disaster Management in India
4.2 Disaster Management Act 2005 and National Guidelines and Plans on Disaster Management
4.3 Role of Government, Non Government and Inter Governmental Agencies in National Disaster Management
4.4 National Disaster Management Authority and National Institute of Disaster Management
4.5 State Disaster Management Authorities and National Disaster Response Force

290 MGNCRE | Community Resilience and Disaster Management
The United Nations General Assembly, in 1989, declared the time period between 19902000 as
International Decade for Natural Disaster Reduction with an aim to reduce the loss of lives and assets
and control socioeconomic damage by taking combined international action in developing countries.
At the global level also there has been a substantial concern over natural disasters. Even after making
significant progress in the science, technology and infrastructure, the number of loss of lives and
property have not reduced. In fact, the number of people who lost their lives and the cost of physical
and socioeconomic damage has increased.
With the occurrence of Bhuj earthquake in January, 2001 in Gujarat and the super cyclone in October,
1999 in Odissa, the need for a multidimensional effort was emphasized. This effort involved working
on diverse scientific and engineering processes and also financial and social processes. The need for a
multisectoral and multidisciplinary approach arised and risk reduction got incorporated in the
developmental plans and strategies.
Conventional Response to Disasters
In ancient India, natural calamities like droughts were managed effectively by using conventional
water conservation methods, these methods are working and still in use in most parts of Rajasthan
and certain other parts of the country. Local communities have come forward and devised local safety
mechanisms and farming methods which are drought oriented, in several parts of our country. The
Seventh Schedule of the Indian constitution, which lists all the subjects concerned to Central and State
government has not mentioned the subject of disaster management in any of its three lists. After India
got independence, it was mentioned in the five year plans about how to lessen the effect of disasters
like droughts and floods; schemes such as the Drought Prone Area Program (DPAP), Desert
Development Program (DDP), National Watershed Development Project for Rain fed Areas (NWDPRA)
and Integrated Water Development Project (IWDP) are examples of this conventional paradigm
(Planning Commission, 2002).
Recent Changes
In India, in the late 1990s and the starting of this century, the management of disaster has seen a
diminishing ratio in its efficiency of handling disasters. The Gujarat Earthquake and Orissa Super
Cyclone taught the nation a hard lesson. The state, voluntary segment and the communities at large
helped in commencing the planning process concerning to disaster preparedness and mitigation of
disasters. A High Powered Committee on Disaster Management in 1999 was setup as a welcome step,
which submitted its report in 2001. The committee made an important recommendation of allocating
10% of funds of national, state and district levels be allocated for schemes referring to prevention,
reduction, preparedness and mitigation of disasters. Also, a special chapter with the title ‘Disaster
Management The development perspective’ was mentioned for the first time in the planning history
of India, in the tenth five year plan document (Planning Commission, 2002).
Institutions such as Ministry of Home Affairs (Disaster Management Division), National Institute for
Disaster Management (New Delhi), Gujarat State Disaster Management Authority (GSDMA), Orissa
State Disaster Management Authority (OSDMA), Disaster Mitigation Institute (Ahmedabad) were
some of the institutions which were setup with the objective of completely focussing on disaster
management. State governments also have put effort to mainstream disaster mitigation initiatives in
the rural development schemes. The Ministry of Rural Development and the Ministry of Home Affairs
have come together and put a combined effort in changing the guidelines of schemes such as Indira

291 MGNCRE | Community Resilience and Disaster Management
AwasYojna (IAY) and Sampoorn Grameen RojgarYojna (SGRY) so that the houses which are
constructed under IAY scheme and school buildings or community buildings which are constructed
under SGRY scheme are earthquake/cyclone/flood resistant.”
In the past 2 years, there has been a significant paradigm shift in the approach of the Government of
India towards disaster management. The new approach proceeds with the belief that development
cannot be sustained unless disaster mitigation methods are built into the development process.
Another important aspect of the approach is that disaster mitigation has to be multidisciplinary and it
has to cover all the sectors of development. The new policy also emanates on the belief that
investments which are done in mitigation are much more cost effective than the expenditure on relief
and rehabilitation process.
Disaster management occupies an important place in this country's policy framework as it is the poor
and the underprivileged who are worst affected on account of calamities/disasters. The steps being
taken by the Government emanate from the approach outlined above. The approach has been
translated into a National Disaster Framework (roadmap) covering institutional mechanisms, disaster
prevention strategy, early warning system, disaster mitigation, preparedness and response and
human resource development. The National Disaster Framework identifies and lists all the expected
inputs, the areas of intervention and the agencies which are to be involved at the National, State and
district levels. This roadmap is shared with all the State Governments and Union Territory
Administrations. The ministries and departments of Government of India, and the State
Governments/Union Territory Administrations have been advised to design and develop their own
roadmaps by taking the national roadmap as a guideline. There is now a common action strategy
which has been taken by all the participating organisations/stakeholders.
PM Narendra Modi released the first Disaster Management Plan of India on 1 June 2016 that seeks to
provide a framework and direction to government agencies for prevention, mitigation and
management of disasters. This is the first national plan since enactment of the Disaster Management
Act of 2005. The Disaster Management Act, 2005 (23 December 2005), was passed by the Rajya Sabha
on 28 November, and by the Lok Sabha, on 12 December 2005. It received Disaster Management Plan
Act the assent of The President of India on 9 January 2006. National Disaster Management Authority
(NDMA) is an agency of the Ministry of Home Affairs whose primary purpose is to coordinate response
to natural or manmade disasters and for capacity building in disaster resiliency and crisis response.
NDMA was established through the Disaster Management Act enacted by the Government of India in
December 2005. The Prime Minister is the ex-officio chairperson of NDMA. The Authority agency is
responsible for framing policies, laying down guidelines and best practices and coordinating with the
State Disaster Management Authorities (SDMAs).”
The National Disaster Management System
India has been traditionally vulnerable to natural disasters because of its unique geo-climatic
conditions. “The history of disasters has demonstrated the multi-hazard scenario in the country. The
main hazards that are experienced in the parts of country include earthquakes, cyclones, floods,
tsunamis, landslides, forest fires, drought, etc. Such natural events have often turned into disasters
causing significant disruption of socioeconomic life of communities leading to loss of life and property.

292 MGNCRE | Community Resilience and Disaster Management
After the Independence to India, the Union Home Ministry has taken the responsibility of looking at
the management of natural disasters. Initially the disaster management task was implemented by the
Ministry of Agriculture after setting up of the National Disaster Management Division [NDM]. In
February 2002, The Ministry of Home Affairs was assigned the roles and responsibility of Disaster
Management at the National Level. The major change in the strategy is a paradigm shift from the
culture of Response to the culture of Preparedness/Mitigation.
In the national and state levels various roles and responsibilities have been assigned. India has
administrative machinery for management of disasters at all the levels of national, state, district as
well as sub-district level. The Ministry of Home Affairs, Government of India handles disaster
management, it is the nodal Ministry for all matters related to disaster management. The Department
of Agriculture and Cooperation is the nodal ministry in managing the drought. Chemical disasters are
looked after by The Ministry of Environment and Forests. The Central Relief Commissioner in the
Ministry of Home Affairs is the nodal officer in carrying out all the relief operations for natural
disasters. Each of the Ministries has been assigned a specific group in the management of a disaster.
[Table4.1]
The New Vision Adopted for Disaster Management Comprises of the Following Concerns
• Preparedness rather than Crisis Management.
• Coordinated participatory approach rather than only state responsibility.
• Technology up gradation and deployment.
• Information as a tool for disaster management.
• Recognition of linkages between natural disasters and development.
• Connecting specific programs in the management of natural disasters.
• Highlighting on forecasting and warning using advanced technology.
• Preparedness and Mitigation through specific Plan Programs.
• Disaster management as a continuous and integrated part of development process.”
Table 4.1 Ministries at National Level and the Task Allocations
(Source Disaster Management The Development Perspective, An extract of the chapter in the tenth five year
plan document [20022007], Government of India, Ministry of Home Affairs, National Disaster Management
Division).
Type of Disaster Nodal Ministry
Natural Disaster Ministry of Home Affairs
Drought Relief Ministry of Agriculture
Air Accidents Ministry of Civil Aviation
Railway Accidents Ministry of Railways
Chemical Disasters Ministry of Environment
Biological Disasters Ministry of Health
Nuclear Disasters Department of Atomic Energy

293 MGNCRE | Community Resilience and Disaster Management
The framework of disaster management under the new vision with the culture from relief to
prevention is expected to undertake following arrangements
• “Encourage disaster mitigation and prevention.
• Establish Institutional mechanisms to ensure coordinated efforts between various
governments for disaster management.
• Disaster Management to be listed in List – III – [Concurrent List] of Seventh Schedule of the
constitution.
• Each of the states to draft the State Disaster Management Act.
• States to enunciate policy on disaster management.
• Governments at various levels to ensure the formulation and implementation of disaster
management codes.
• Early warning systems to be developed at all levels, with the establishment of emergency
operations centers.
• Institutionalize knowledge and lessons learnt in the process of working on the national
roadmap.
Strengths and Weaknesses of the National Disaster Management System
Strengths
1. From Relief to Prevention
One of the major strong points of the current national disaster management system is the
paradigm shift from relief management system to the development of prevention system. The
system ensures that the relief departments at state and national level be termed as disaster
management units/ departments. With the new terminology the tasks of these departments
at various government levels has been allocated to disaster preparedness, the development
of databases to support functionaries in case of disaster/emergency situation. Thus , there
has been a significant change in the development of prevention methods rather than relief
methods.
2. Sustainable Development
The past events of disasters such as earthquake of 1993 at Latur, cyclone of 1999 at Orrissa,
earthquake of January 2001 at Bhuj, etc have demonstrated that after every such a disaster,
a large part of the country’s as well as state economy is lost in the relief and response actions.
With this view, the national disaster management system promotes every state to ensure
annual allocation for disaster preparedness. Sustainability has been referred to as the key
word in the development of disaster management process. The Ministry of Home Affairs,
Government of India along with international organizations such as UNDP, USAID, AUSAID,
Government of Japan, European Union, etc has introduced various programs at national and
state levels on management of a disaster in order to ensure the capacity building at all levels,
and making the community to participate in the multi-hazard preparedness in all the states.
3. Mass Awareness Amongst Communities
The national disaster management system encourages the state governments to undertake
large scale preparedness measures such as awareness generation among people. Most of the
state governments have started mass awareness generation programs on disaster
management in different ways with the help of voluntary organizations such as Nehru Yuva
Kendra Sanghatan, National service scheme, etc. For example, In the state of Orissa ,under

294 MGNCRE | Community Resilience and Disaster Management
the Govt. of India UNDP India, Disaster Risk Management Program, about 81,847 sensitization
meetings were held to generate awareness among people about flood and cyclone
management.
Weaknesses
• Lack of Coordination Amongst Stakeholders
The earthquake of January 26, 2001 at Gujarat affected both life and economy significantly.
The disaster demonstrated that there is a need of a long term vision, with appropriate
involvement of different stakeholders. Though various agencies provided a large scale support
through tangible goods, financial support, human support, etc., the relief and immediate
response activities demonstrated the lack of coordination amongst these agencies and
stakeholders because of insufficient set operating procedures in case of such a mass disaster.
• Noncompliance of Norms on Safe Construction Practices
The earthquake which occurred in January,2001 in Gujarat state put into picture the wide
spread damages of both the types of engineered and nonengineered buildings in the affected
region. It was analyzed that these damages were attributed to the inherent construction
problems of the buildings. The nodal provisions and norms were defined in the rules and
regulations under the national vision of the disaster management. However, the disaster
demonstrated the compliance of these norms was not implemented at all. It is important to
note that the structures which were properly engineered and nonengineered in the epicentre
region escaped with only minor damage to them. This clearly demonstrates the importance
of a good construction practice for seismic safety of the constructions.
• There is a lack in updating the information on the available resources and plans.
Although Disaster management plans do exist at district and further levels in most of the
states, the plans have not been updated with the latest information and statistics. Though
most of the districts and states in India have a database of the available resources and plans
of disaster management have not been updated after an experience of any disaster. In India,
in the present disaster management system, there are a good number of arrangements and
schemes to address the natural disasters. There may be a few weaknesses in the system the
main strength lies in the paradigm shift from relief to prevention. Following recommendations
suggest steps to ensure that the process is implemented appropriately as pictured in the vision
of national disaster management policy.
• Develop Guidelines for Better Coordination Between Stakeholders
The past disasters which occurred in India have shown that there are a number of stakeholders
who might actually provide support during disasters or emergencies. It is important to develop
guidelines and take measures to receive a combined support from the agencies. The
guidelines may be framed accordingly depending on the type of
organization/agency/stakeholder and the type of support it can provide in peacetime as well
as during natural calamities. Based on the standard guidelines that are issued national to state
governments, an appropriate cooperation among different stakeholders may be undertaken.
• Training for technical skills during rescue operations at various levels
The key factors in a successful post disaster management are efficient technical skills during a
rescue operation, coordination during relief operation and people’s participation during
rehabilitation program. The expert team after the Gujarat earthquake has reviewed that the

295 MGNCRE | Community Resilience and Disaster Management
initiative which was people owned was the best option for successful disaster mitigation.
However, it was identified that there has been a lack in the number of people with adequate
skill set of rescue operations. The state governments may take the initiative of making
voluntary organizations, agencies, and institutes who has a good knowledge of how a rescue
operation is performed, to involve in the post disaster management program.
• Integration of Disaster Management into Development/Regional Plans
Sustainability is one of the main concerns of the National Disaster Management system. The
subject of disaster management has to be included in the planning system at all the levels of
district, city and region by using the guidelines from state development departments. The
national governments may tell the state governments to include the disaster management
initiatives in the regional and development plans of town planning departments.
• Strengthen the First Responder
The national system for disaster management has taken the initiative to develop skilled
personal and separate teams at state and community levels and make provisions for
specialized equipment, to develop an efficient communication network and emergency
control rooms.
4.2 Disaster Management Act 2005 and National Guidelines and Plans on Disaster
Management
Disaster Management Act 2005
“The Disaster Management Act, 2005 (DM Act 2005) lays down institutional and coordination
mechanism for effective Disaster Management (DM) at the national, state, district and local levels. As
mandated by this Act, the Government of India created a multitiered institutional system consisting
of the National Disaster Management Authority (NDMA) headed by the Prime Minister, the State
Disaster Management Authorities (SDMAs) headed by the respective Chief Ministers and the District
Disaster Management Authorities (DDMAs) headed by the District Collectors and co-chaired by
Chairpersons of the local bodies. These bodies have been set up to facilitate a paradigm shift from the
hitherto relief centric approach to a more proactive, holistic and integrated approach of strengthening
disaster preparedness, mitigation, and emergency response.”
“The Disaster Management Act, 2005, (23 December 2005) No. 53 of 2005, was passed by the Rajya
Sabha, the upper house of the Parliament of India on 28 November, and by the Lok Sabha, the lower
house of the Parliament, on 12 December 2005. It received the assent of The President of India on 9
January 2006. The Disaster Management Act, 2005 has 11 chapters and 79 sections. The Act extends
to the whole of India. The Act provides for the effective management of disasters and for matters
connected there with or incidental thereto.
To Do Activity
On the basis of newspaper clippings, magazines, journals, governmental reports,
nongovernmental surveys etc. & to trace and note down the history of disasters in your
hometown or the place where you stay, in order to find out the timeline of disasters that have
occurred so far.

296 MGNCRE | Community Resilience and Disaster Management
The Act has a National Disaster Management Authority (NDMA), with the Prime Minister of India as
its chairperson. Along with the Vice Chairperson there are not more than nine members in the NDMA.
The tenure of the members of the NDMA is five years. The NDMA which was established on 30 May
2005 by an executive order was constituted under Section3(1) of the Disaster Management Act, on 27
September 2006. The NDMA is responsible authority for setting the policies, plans and guidelines for
disaster management and to ensure timely and effective response when a disaster occurs. Under
section 6 of the Act the guidelines which are defined by the authority are to be followed by the State
Authorities in preparing the State Plans.
The Act under Section 8 instructs the Central Government to constitute a National Executive
Committee (NEC) to assist the NDMA. The NEC has Secretary level officers of the Government of India
in the Ministries, National Executive Committee of home, agriculture, atomic energy, defence,
drinking water supply, environment and forests, finance (expenditure), health, power, rural
development, science and technology, space, telecommunication, urban development, and water
resources. The Home secretary serves as the Chairperson, ex officio. The Chief of the Integrated
Defence Staff is an ex officio member of the NEC. The NEC under section 8 of the Act prepares the
National Disaster Management Plan for the whole country and ensures that it is reviewed and updated
annually".
“Under Section 14 of the Act, all the State Governments are mandated to establish a State Disaster
Management Authority (SDMA). The SDMA consists of the Chief Minister of the State, as the
Chairperson, and the Chairperson appoints not more than eight members in the SDMA. State
Executive Committee is responsible (Section 22) for preparing the plan for state disaster management
and also implementing the National Plan. Under Section 28 the SDMA is mandated to ensure that all
the departments of the SDMA to prepare state disaster management plans as prescribed by the
National and State Authorities. Collector is the Chairperson of District Disaster Management Authority
(DDMA) or District Magistrate or Deputy Commissioner of the district. The elected representative of
the area is member of the DDMA as an ex officio cochair person, (Section 25).

297 MGNCRE | Community Resilience and Disaster Management
The Section 44–45 of the Act provides a National Disaster Response Force "for the purpose of giving a
specialist response to a major disastrous situation or a natural disaster" under a Director General who
is appointed by the Central Government. In Kashmir floods which occurred in September 2014, NDRF
played an important role in rescue operations of the armed forces and tourists, for which government
of India awarded NDRF. Other Provisions are Section 42 of the Act is responsible for establishing a
National Institute of Disaster Management. Section 4650 directs funds for Disaster Mitigation at
various levels. The Act provides for civil and criminal liabilities for those who violate the provision of
the Act.”
National Guidelines and Plans on Disaster Management
“The National Disaster Management Plan (NDMP) provides the guidelines in designing the framework
and directs all the government agencies in all the phases of disaster management cycle. The NDMP is
a dynamic document which is periodically updated with the best global practices and knowledge base
in disaster management. It is prepared in accordance with the provisions of the Disaster Management
Act, 2005, the guidelines given in the National Policy on Disaster Management, 2009 (NPDM), and the
established national practices.
The NDMP identifies where there is a need to minimize without completely eliminating if there is any
ambiguity in the responsibility framework. It defines who is responsible for what in the different stages
of disaster management. The NDMP is envisaged as active and ready at all times in response to an
emergency situation in any part of the country. It is designed in a flexible and scalable manner so that
it can be implemented as needed in all the phases of managing a disaster. The different phases are a)
mitigation phase(prevention and risk reduction), b) preparedness phase, c) response phase and d)
recovery phase (immediate restoration to build back better).
The NDMP steadily follows the approaches which are promoted globally by the United Nations, in
particularly the Sendai Framework which was developed for Disaster Risk Reduction 20152030. It is a
nonbinding agreement, which the signatory nations will attempt to comply with on a voluntary basis.
By following the Sendai Framework recommendations and by adopting best practices which are
accepted globally, India is making all efforts to improve the disaster management cycle in India and to
contribute to the realization of the global targets.
The four priorities for action under the Sendai Framework are
1. Understanding the risk from a disaster
2. Firming up of the disaster risk governance to manage the risk
3. Spending in disaster risk reduction processes for resilience
4. Improving disaster preparedness so that there will be effective response and to have “Build
Back Better” in recovery, rehabilitation and reconstruction phases.
The NDMP includes the basic approach which is articulated in the Sendai Framework and help the
country to meet its goals that are set in the framework. The aim of the Sendai Framework is to achieve
substantial reduction of disaster risk and losses in lives, livelihoods, and health and in the economic,
physical, social, cultural, and environmental assets of persons, businesses, communities, and countries
by 2030. The goals and priorities which are set out in the Sendai Framework for DRR, are aligned
largely in the NDMP. The four crosscutting Sendai priorities are present explicitly or implicitly in every
aspect of this plan and certain chapters have specific priorities as per the dominant theme. The plan

298 MGNCRE | Community Resilience and Disaster Management
also incorporates measures that will be implemented over the short, medium, and long term more or
less according to the time horizon of the Sendai Framework ending in 2030. The measures which are
mentioned here are indicative ones and not exhaustive ones. The plan will incorporate changes based
on the national experiences and global practices during the periodic reviews and updates. The four
priorities which are enunciated in the Sendai Framework are included in the approach used in the
national plan for each hazard under the five Thematic Areas for Action
1. Understanding of the risk
2. Coordination between Inter-Agencies
3. Spending money in developing DRR – Structural Measures
4. Spending money in DRR – Non-Structural Measures
5. Developing capacity
The NDMP has put forward a set of major themes for each thematic area of action to responsibly
conduct activities as per the broad planning framework.”
Institutional Arrangements
Since Independence, the institutional and policy mechanisms have been well established in order to
efficiently conduct the response, relief and rehabilitation programs and these programs have proved
to be very strong and efficient in performing the response, relief and rehabilitation operations.
In the national government, the Ministry of Home Affairs is the nodal ministry for all matters related
to the disaster management. The Central Relief Commissioner (CRC) of the Ministry of Home Affairs
is the nodal officer to coordinate the relief operations of natural calamities. India Meteorological
Department (IMD) or the Central Water Commission of Ministry of Water Resources sends
information to the CRC, related to forecasting/warning of a natural calamity, on a continuous basis.
The Ministries/Departments/Organizations which are concerned with the primary and secondary
functions of the disaster management include India Meteorological Department, Central Water
Commission, Ministry of Home Affairs, Ministry of Defence, Ministry of Finance, Ministry of Rural
Development, Ministry of Urban Development, Department of Communications, Ministry of Health,
Ministry of Water Resources, Ministry of Petroleum, Department of Agriculture & Cooperation.
Ministry of Power, Department of Civil Supplies, Ministry of Railways, Ministry of Information and
Broadcasting, Planning Commission, Cabinet Secretariat, Department of Surface Transport, Ministry
of Social Justice, Department of Women and Child Development, Ministry of Environment and Forest,
Department of Food. Each Ministry/Department/Organization nominate their nodal officer to the
Crisis Management Group chaired by Central Relief Commissioner. The nodal officer who is appointed,
is responsible for preparing sectoral Action Plan/Emergency Support Function Plan of the disaster
management.
National Crisis Management Committee (NCMC) Cabinet Secretary, who is the highest executive
officer, heads the NCMC. The members of the NCMC are the Secretaries of all the concerned Ministries
/Departments as well as organizations. The NCMC guides the Crisis Management Group as required.
The Secretary, Ministry of Home Affairs is responsible to ensure that all developments are brought to
the notice of the NCMC promptly. The NCMC has the authority to give directions to any
Ministry/Department/Organization in taking the specific action as needed by the crisis situation.

299 MGNCRE | Community Resilience and Disaster Management
Crisis Management Group The Central Relief Commissioner in the Ministry of Home Affairs is the
Chairman of the CMG. It consists of senior officers (called nodal officers) from various concerned
Ministries. The CMG’s reviews the contingency plans of every year which are formulated by various
Ministries/Departments/Organizations in their respective sectors, it takes measures required in
dealing a natural calamity, it coordinates the activities of the Central Ministries and the State
Governments in the activities of disaster preparedness and relief and also to get information from the
nodal officers on measures relating to above. The CMG, whenever a natural disaster occurs, meets
frequently to review the rescue and relief operations and extend all the support to the affected States
to overcome the disaster situation effectively. The Resident Commissioner of the affected State is also
associated with such meetings.
Control Room (Emergency Operation Room) An Emergency Operations Centre (Control Room) exists
in the nodal Ministry of Home Affairs, which functions round the clock, to assist the Central Relief
Commissioner in the discharge of his duties. The activities of the Control Room include collection and
transmission of information concerning natural calamity and relief, keeping close contact with
governments of the affected States, interaction with other Central
Ministries/Departments/Organizations in connection with relief, maintaining records containing all
relevant information relating to action points and contact points in Central Ministries etc., keeping up-
to-date details of all concerned officers at the Central and State levels.
Contingency Action Plan A National Contingency Action Plan (CAP) for dealing with contingencies
arising in the wake of natural disasters has been formulated by the Government of India and it had
been periodically updated. It facilitates the launching of relief operations without delay. The CAP
identifies the initiatives required to be taken by various Central Ministries/Departments in the wake
of natural calamities, sets down the procedure and determines the focal points in the administrative
machinery.
State Relief Manuals Each State Government has relief manuals/codes which identify that role of each
officer in the State for managing the natural disasters. These are reviewed and updated periodically
based on the experience of managing the disasters and the need of the State.
Funding Mechanisms The policy and the funding mechanism for provision of relief assistance to those
affected by natural calamities is clearly laid down. These are reviewed by the Finance Commission
appointed by the Government of India every five years. The Finance Commission makes
recommendation regarding the division of tax and nontax revenues between the Central and the State
Governments and also regarding policy for provision of relief assistance and their share of expenditure
thereon.
As per the recommendations of the Eleventh Finance Commission a Calamity Relief Fund (CRF)has
been set up in each State. The Finance Commission fixes the size of this Calamity Relief Fund, after
considering and evaluating the costs spend on relief and rehabilitation programs over the past 10
years. The Government of India spends approximately 75% of the corpus amount of the Calamity
Relief Fund in each State. State Government contributes 25%. CRF grants the relief assistance to those
affected who are affected by natural calamities. All the rules for relief assistance are laid down by a
national committee with the representatives of States as its members. Different State Governments
have their own State specific norms as recommended by the State level committee under the direction

300 MGNCRE | Community Resilience and Disaster Management
of the Chief Secretary. The State Government seeks assistance from the National Calamity
Contingency Fund (NCCF)a fund which is created at the Central Government level, when a calamity
occurs of huge proportion that the which are available in the CRF are not sufficient for conducting the
relief operations.
A team from the Central Government assesses the requirements, whenever such requests are
received and these assessed requirements are cleared by a High Level Committee to which Deputy
Prime Minister is the Chairperson. In brief, the arrangements made for response and relief activities
by these institutions are well established and have proved to be strong and effective.
4.3 Role of Government, Non Government and Inter Governmental Agencies in National
Disaster Management
Role of the Union Government
“In spite of the fact that the State Government concerned has the essential duty regarding emergency
the board, the Union Government assumes a key steady job as far as physical and money related
assets and giving reciprocal measures, for example, early cautioning and coordination of endeavours
of every association service, divisions and associations. At the pinnacle level, a Cabinet Committee on
Natural Calamities surveys the emergency circumstance.
An abnormal state board of trustees of clergymen under the chairmanship of Minister of Agriculture
manages the issue of monetary help to be given to the State Governments from the National Disaster
Response Fund, if the assets accessible with the State Governments under State Disaster Response
Fund are not satisfactory. Matters identifying with atomic, natural and concoction crises are cared for
by the Cabinet Committee on Security.
National Crisis Management Committee
The Cabinet Secretary, as the most elevated official, heads the National Crisis Management
Committee (NCMC). Secretaries of services and divisions concerned and heads of different
associations are individuals from NCMC, which surveys and screens emergency circumstances all the
time and offers bearings to the Crisis Management Group, as considered important. The NCMC can
offer headings to any service, division or association for explicit activity required for gathering the
emergency circumstance. As debacle the executives is a multidisciplinary procedure, every single
Central Ministry and Departments have a key job in the field of calamity the board. In perspective on
the profoundly specialized and explicit nature of certain fiasco occasions, for example, flying fiascos,
rail mishaps, substance catastrophes and organic debacles and so on.; the services managing that
specific subject have the nodal duty regarding taking care of that specific kind of calamity.
Nodal Ministries/Department for Disaster Management at the National Level
1. Droughts – Ministry of agriculture.
2. Epidemics and Biological Disasters – Ministry of Health.
To Do Activity
Prepare a list of contacts (names, addresses and role) of as many disaster management
agencies a s you can in your neighbourhood / village / city.

301 MGNCRE | Community Resilience and Disaster Management
3. Chemical or Industrial Chemical Disasters – Ministry of Environment & Forest.
4. Nuclear Accidents – Department of Atomic Energy.
5. Railway Accidents – Ministry of Railways.
6. Air Accidents – Ministry of Civil Aviation.
7. Natural Disasters except Drought & Epidemics and Civil Strife – Ministry of Home Affairs.
The Secretaries of the Nodal Ministries and Departments of GOI, i.e. the Ministry of Home Affairs
(MHA), Agriculture, Civil Aviation, Environment and Forests, Health, Atomic Energy, Space, Earth
Sciences, Water Resources, Mines, Railways etc. are all members of the NEC and function as nodal
agencies for specific disasters based on their core competencies or as assigned to them. The
coordination between various nodal ministries/departments is done by National Executive Committee
(NEC), which is headed by Home Secretary.
Role of State Government
In India, the essential obligation to attempt salvage, help and recovery measures in case of
catastrophic events rests with the state government. Since the earliest reference point, the whole
structure of emergency organization in the state governments had been arranged towards post
calamity help and restoration.
A large portion of the states have Relief Commissioners who are accountable for the help and recovery
measures. A large portion of the states have exchanged over to a Disaster Management Department
with the required linkages with the different advancement and administrative divisions worried about
counteractive action, moderation and readiness.
Each state has a Crisis Management Committee under the chairpersonship of the Chief Secretary,
comprising of secretaries accountable for concerned offices, which audits emergency circumstances
on an everyday premise at the season of emergency, facilitates the exercises all things considered and
gives choice emotionally supportive network to the area organization. At the priests' level, a Cabinet
Committee on Natural Calamities under the chairpersonship of the Chief Minister checks out
circumstances and is in charge of exceedingly significant arrangement choices.
Role of District Administration
The District Magistrate/Collector has the duty regarding in general administration of catastrophes in
the locale. He has the expert to activate the reaction hardware and has been given monetary forces
to draw cash under the arrangements of the General Financial Rules/Treasury Codes. All branches of
the State Government, including the police, fire administrations, open works, water system and so
forth., work in an organized way under the authority of the Collector during a fiasco, with the
exception of in metropolitan regions where the civil body assumes a noteworthy job. The District
Collector likewise appreciates the specialist to demand for help from the Armed Forces if conditions
so request. NGOs have additionally been compelling in giving alleviation, salvage and restoration as of
late.
Role of Local Self Governments
Nearby self governments, both rustic and urban, have developed as significant levels of
administration, after the 73rd and 74th Amendments to the Constitution. For the general population,
they are likewise the closest units of organization and are among the people on call for any emergency

302 MGNCRE | Community Resilience and Disaster Management
other than being intently sew with the networks. These units would thus be able to assume a
significant job in emergency the executives under the general initiative of the District Administration."
Nongovernment and Intergovernmental Agencies
“NGO exercises structure a significant piece of global advancement and help work. There are various
NGOs like the Red Cross Society, which have explicit territories of field activities, and a broad system
to broaden material, budgetary, just as specialized help. There are beneficent trusts for undertaking
the dissemination work following the catastrophe. These associations consistently approached to
assume a significant job to help the administration in formative exercises in various pieces of the
nation. The High Powered Committee (HPC) 2001 has suggested an across the nation system of NGOs
for facilitated activity incorporating all parts of fiasco the board.
The Disaster Management Act 2005 stresses the requirement for persistent and incorporated
procedure of arranging, sorting out, organizing and executing strategies and plans on DM in a
comprehensive, network based, and participatory, comprehensive and practical way. The Act
endows/orders the State Executive Committees at various levels with the duty to exhort, help and
arrange the exercises of NGOs occupied with catastrophe the board.
The job of the philanthropic organizations and NGOs is to enhance the endeavours of the
administration along these lines helping networks to adapt and recuperate from the catastrophe. The
NGOs inside their very own abilities and orders play out these jobs (as indicated in various segments
of these Guidelines) in accordance with the fundamental standards of the Humanitarian Charter, The
Red Cross and Red Crescent NGO Code of Conduct, and the laws and guidelines, as relevant.
Some inter governmental agencies like the Housing Boards, working in the field of rehabilitation and
reconstruction of the disaster affected areas. Some of these agencies are
State Housing Corporation Its role is related to disaster resistant housing construction.
Building Materials and Technology Promotion Council (BMTPC) Its role pertains to propagating
lowcost building materials and alternative construction techniques for disaster resistant construction.
Central Building Research Institute It works in the area of research on the habitat aspects for
disasterprone areas.
Housing and Urban Development Corporation (HUDCO) It works in financing and executing
postdisaster rehabilitation work along with conceiving methods for disaster preparedness and disaster
resistant housing.
Structural Engineering Research Institute It works in the areas of postdisaster surveys, damage
analysis, vulnerability and risk analysis of buildings and structures against natural disasters.”

303 MGNCRE | Community Resilience and Disaster Management
4.4 National Disaster Management Authority (NDMA) and National Institute of Disaster
Management (NIDM)
“The Government of India (GOI), in acknowledgment of the significance of Disaster Management as a
national need, has set up a High Powered Committee (HPC) in August 1999 and furthermore a country
council after the Gujarat tremor, for making proposals on the arrangement of Disaster Management
plans and recommendation compelling moderation components. The Tenth FiveYear Plan Document
likewise had, just because, a point by point part on Disaster Management. Likewise, the Twelfth
Finance Commission was additionally commanded to audit the monetary game plans for Disaster
Management. On 23 December 2005, the Government of India authorized the Disaster Management
Act, which imagined the production of the National Disaster Management Authority (NDMA), headed
by the Prime Minister, and State Disaster Management Authorities (SDMAs) headed by particular
Chief Ministers, to initiate and execute an allencompassing and coordinated way to deal with Disaster
Management in India.
NDMA Vision
"To build a safer and disaster resilient India by a holistic, proactive, technology driven and sustainable
development strategy that involves all stakeholders and fosters a culture of prevention, preparedness
and mitigation."
Organisation Structure
The National Disaster Management Authority has been established under the Disaster Management
Act 2005, with the Prime Minister of India as its Chairman; a Vice Chairman with the status of Cabinet
Minister, and eight individuals with the status of Ministers of State. With wellcharacterized useful
spaces for every one of its individuals and worry to complete the ordered capacities, NDMA has
advanced into a lean and expert association which is IT empowered and information based. Aptitudes
and skill of the pros are widely used to address fiasco related issues. A practical and operational
To Do Activity
1) Contact any NGO working in the area of disaster management in your local area and enquire
about its activities.
2) Find out in your area about community based disaster preparedness programme. Write a note
about it and suggest ways of involving, the community in a more effective way in disaster
preparedness.

304 MGNCRE | Community Resilience and Disaster Management
framework has been manufactured, which is suitable for debacle the executives including
vulnerabilities combined with wanted strategies.
Thoughtfully the association depends on a 'calamity divisions cu secretariat' framework. Every
individual from the Authority heads fiasco explicit divisions for explicit debacle and useful spaces.
Every part has likewise been given the obligation of indicated states and UTs for close connection and
coordination. The NDMA Secretariat, headed by a Secretary, is in charge of giving secretarial help and
progression. The Secretariat manages alleviation, readiness, plans, recreation, network mindfulness
and money related and regulatory viewpoints. NDMA likewise has the National Disaster Management
Operations Centre which will be outfitted with a best in class flexible and repetitive correspondence
frameworks, NDMA additionally does the errands of limit advancement, preparing and information
the executives.
Functions and Responsibilities
NDMA, as the apex body, is mandated to lay down the policies, plans and guidelines for Disaster
Management to ensure timely and effective response to disasters. Towards this, it has the following.
Responsibilities
• Lay down strategies on calamity the executives.
• Approve the National Plan.
• Approve plans arranged by the Ministries or Departments of the Government of India as per
the National Plan.
• Lay down rules to be trailed by the State Authorities in illustration up the State Plan.
• Lay down rules to be trailed by the various Ministries or Departments of the Government of
India to coordinate the measures for aversion of debacle or the alleviation of its belongings in
their advancement plans and activities.
• Coordinate the authorization and execution of the strategy and plans for catastrophe the
executives.
• Recommend arrangement of assets with the end goal of relief.
• Provide such help to different nations influenced by serious catastrophes as might be dictated
by the Central Government.
• Take such different measures for the aversion of fiasco, or the relief, or readiness and limit
working for managing Threatening debacle circumstances or catastrophes as it might think
about important.
• Lay down wide strategies and rules for the working of the National Institute of Disaster
Management.
NDMA Policy
The National Policy system has been set up after due thought and keeping in view the National Vision
to construct a safe and calamity strong India by building up an all encompassing, proactive, multi
catastrophe and innovation driven technique for DM. This will be accomplished through a culture of
anticipation, alleviation and readiness to produce a brief and effective reaction during debacles. The
whole procedure will the focal point of the audience the network and will be given energy and
sustenance through the aggregate endeavours of all administration offices and Non-Governmental

305 MGNCRE | Community Resilience and Disaster Management
Organizations'. So as to make an interpretation of this vision into arrangement and plans, the NDMA
has embraced a mission mode approach including various activities with the assistance of different
establishments working at the national, state and nearby levels. Focal services, States and different
partners have been engaged with the participatory and consultative procedure of developing
strategies and rules. This Policy structure is additionally in congruity with the International Strategy
for Disaster Reduction, the Rio Declaration, the Millennium Development Goals and the Hyogo
Framework 20052015. The themes that underpin this policy are
• Community based disaster management, including last mile integration of the policy, plans
and execution.
• Capacity development in all related areas.
• Consolidation of past initiatives and best practices.
• Cooperation with agencies at the national, regional and international levels.
• Compliance and coordination to generate a multisectoral synergy.”
NIDM (National Institute of Disaster Management)
“Under Section 42 of the Disaster Management Act, 2005, NIDM was established to be the head
organization for limit building, preparing and advancement for calamity the executives in India. The
establishment has faith in a "Culture of Prevention" standpoint towards catastrophe hazard decrease.
Through a key, multiparter and multidisciplinary methodology, the foundation creates preparing
modules, arranges preparing programs, embraces research and documentation and advances courses,
addresses and meetings on calamity the executives and hazard decrease.
According to the arrangements of the ChapterVII of the DM Act, Government of India established the
National Institute of Disaster Management (NIDM) under an Act of Parliament with the objective of
being the head foundation for limit advancement for calamity the board in India and the area. The
vision of NIDM is to make a Disaster Resilient India by structure the limit at all levels for calamity
counteractive action and readiness. NIDM has been doled out nodal obligations regarding human
asset improvement, limit building, preparing, research, documentation, and arrangement backing in
the field of debacle the executives. The NIDM has manufactured key associations with different
services and branches of the focal, state, and neighbourhood governments, scholarly, research and
specialized associations in India and abroad and other bihorizontal and multiparallel worldwide
offices. It gives specialized help to the state governments through the Disaster Management Centers
(DMCs) in the Administrative Training Institutes (ATIs) of the States and Union Territories. Directly it
is supporting upwards of 30 such focuses. Six of them are being created as Centers of Excellence in
the specific territories of hazard the executives – flood, quake, violent wind, dry spell, avalanches, and
mechanical debacles."
4.5 State Disaster Management Authorities and National Disaster Response Force
State Disaster Management Authorities
“In the administrative set up of India, the fundamental duty regarding undertaking salvage, help and
recovery measures in case of a catastrophe is that of the State Government concerned. At the State
level, reaction, alleviation and recovery are taken care of by Departments of Relief and Rehabilitation.
The State Crisis Management Committee set up under the Chairmanship of Chief Secretary who is the
most noteworthy official functionary in the State. All the concerned Departments and associations of
the State and Central Government Departments situated in the State are spoken to in this Committee.
306 MGNCRE | Community Resilience and Disaster Management
This Committee audits the move made for reaction and alleviation and gives rules/bearings as vital. A
control room is set up under the Relief Commissioner. The control room is in steady touch with the
atmosphere observing/determining organizations and screens the move being made by different
offices in playing out their duties.
According to the DM Act of 2005, each state in India will have its own institutional structure for fiasco
the executives. In addition to other things, the DM Act, commands that each State Government will
make vital strides for the arrangement of state DM plans, mix of measures for avoidance of calamities
or alleviation into state improvement plans, distribution of assets, and build up EWS. Contingent upon
explicit circumstances and requirements, the State Government will likewise help the Central
Government and focal organizations in different parts of DM. Each state will set up its very own State
Disaster Management Plan.
The DM Act orders the setting of a State Disaster Management Authority with the Chief Minister as
the ex officio Chairperson. Comparative framework will work in every Union Territory with Lieutenant
Governor as the Chairperson. At the region level, District Disaster Management Authority (DDMA),
the District Collector or District Magistrate or the Deputy Commissioner, as appropriate, will be in
charge of by and large coordination of the fiasco the executives endeavors and arranging. Nitty gritty
DMP will be created, subject to occasional audit and correction, at the degrees of state, locale, towns
and Chapters (taluka)."Figure4.1 provides schematic view of the typical statelevel institutional
framework.
State Disaster Management Authority (SDMA)
“According to arrangements in ChapterIII of the DM Act, each State Government will set up a State
Disaster Management Authority (SDMA) or its proportionate under an alternate name with the Chief
Minister as the Chairperson. In the event of different UTs, the Lieutenant Governor or the
Administrator will be the Chairperson of that Authority. For the UT of Delhi, the Lieutenant Governor
and the Chief Minister will be the Chairperson and ViceChairperson individually of the State Authority.
On account of an UT having Legislative Assembly, with the exception of the UT of Delhi, the Chief
Minister will be the Chairperson of the Authority set up under this area. The SDMA will set down
approaches and plans for DM in the State. It will, entomb alia affirm the State Plan as per the rules set
somewhere near the NDMA, organize the usage of the State Plan, suggest arrangement of assets for
moderation and readiness measures and survey the formative plans of the various Departments of
the State to guarantee the incorporation of counteractive action, readiness and relief measures. The
State Government will comprise a State Executive Committee (SEC) to help the SDMA in the exhibition
of its capacities. The SEC will be going by the Chief Secretary to the State Government. The SEC will
arrange and screen the usage of the National Policy, the National Plan, and the State Plan. The SEC
will likewise give data to the NDMA identifying with various parts of DM.”

307 MGNCRE | Community Resilience and Disaster Management
Figure 4.4 State Level Disaster Management
National Disaster Response Force
The National Disaster Response Force (NDRF) is a particular power comprised "with the end goal of
expert reaction to an undermining calamity circumstance or fiasco under the Disaster Management
Act, 2005. The Apex Body for Disaster Management in India is the National Disaster Management
Authority (NDMA). The Chairman of the NDMA is the Prime Minister.
It is shaped in 2006 under the ward of Disaster Management Act, 2005. Its home office is in New Delhi.
National Disaster Response Force (NDRF) is under the National Disaster Management Authority. The
NDRF has been comprised according to the ChapterVIII of the DM Act 2005 as an expert reaction
power that can be conveyed in an undermining debacle circumstance or calamity. According to the
DM Act, the general superintendence, bearing and control of the NDRF will be vested and practiced
by the NDMA. The order and supervision of the NDRF will vest with the Director General designated
by the Government of India. The NDRF will position its contingents at various areas as required for
powerful reaction. NDRF units will keep up close contact with the assigned State Governments and
will be accessible to them in case of any genuine compromising calamity circumstance. The NDRF is
prepared and prepared to react to circumstances emerging out of catastrophic events and CBRN
crises. The NDRF units will likewise bestow fundamental preparing to every one of the partners
recognized by the State Governments in their individual areas. Further, a National Academy will be set
up to give preparing to mentors in a fiasco the executives and to meet related National and
International responsibilities. Involvement in serious catastrophes has plainly demonstrated the
requirement for pre-situating of some reaction powers to enlarge the assets at the State level at
urgent areas incorporating some in high height districts."

308 MGNCRE | Community Resilience and Disaster Management
Figure 4.5 NDRF Forces Serving during Gujarat Earthquake
Composition
"National Disaster Response Force (NDRF) is a power of 12 units, composed on paramilitary lines, and
kept an eye on by people on nomination from the paramilitary powers of India three Border Security
Force, three Central Reserve Police Force, two Central Industrial Security Force, two IndoTibetan
Border Police and two Sashastra Seema Bal. The all out quality of every legion is roughly 1149. Every
legion is equipped for giving 18 independent authority search and salvage groups of 45 staff each
including specialists, professionals, circuit repairmen, hound squads and therapeutic/paramedics.
NDRF notwithstanding having the option to react to cataclysmic events has four brigades equipped
for reacting to radiological, atomic, natural and concoction debacles.
Deployment
These NDRF legions are situated at twelve distinct areas in the nation dependent on the powerlessness
profile to chop down the reaction time for their sending. During the readiness time frame/in a
compromising fiasco circumstance, proactive sending of these powers will be done by the NDMA in
interview with state specialists.
Functional Parameters
The point of the National Disaster Management Authority is to assemble a more secure and fiasco
resilient India by building up an allen compassing, proactive, multi-calamity and innovation driven
system for debacle the executives. This must be accomplished through a culture of counteractive
action, relief and readiness to produce a brief and proficient reaction at the season of debacles. These
national visions bury alia, goes for teaching a culture of readiness among all partners. NDRF has
demonstrated its significance in accomplishing this vision by exceedingly gifted salvage and help tasks,
ordinary and escalated preparing and repreparing, acquaintance practices inside the territory of
obligation of separate NDRF Bns, doing taunt penetrates and joint activities with the different
partners.

309 MGNCRE | Community Resilience and Disaster Management
Disaster Response
NDRF has demonstrated its adequacy with its excellent presentation during different calamities
including the suffocating cases, building breakdown, avalanches, annihilating floods and Cyclones.
NDRF has spared 1,33,192 human lives and recovered 276 dead assortments of calamity unfortunate
casualties in 73 reaction tasks in the nation.”
Challenges for the Future
“There is a developing need to take a gander at debacles from an improvement point of view.
Catastrophes can have wrecking impact on networks and can essentially interfere with improvement
endeavors as it were. In any case, at that point, it could likewise offer a chance to put resources into
advancement endeavors in a post debacle situation. Fiascos are open doors for networks to rehash
themselves. Calamity counteractive action, moderation, readiness and help are four components,
which add to and gain from the usage of practical improvement arrangements. These components,
alongside ecological insurance and economical advancement, are intently between related. The
Yokohama Strategy, radiating from the worldwide decade for cataclysmic event decrease in May 1994,
underlines that calamity counteractive action, relief and readiness are superior to debacle reaction in
accomplishing the objectives and goals of weakness decrease.
The Government of India has received relief and anticipation as basic parts of its advancement
technique. The Tenth Five Year Plan accentuates the way that improvement can't be supportable
without relief being incorporated with the advancement procedure. In a nutshell, Disaster
Management is being regulated into improvement arranging. Be that as it may, there are different
hidden issues in the entire procedure. Actually, various issues originate from social imbalances. Over
the long haul, the onus is upon the nearby networks to deal with catastrophes with the assistance of
the state and other such associations. The people group elements are very unpredictable in a nation
like India. There is a need to address explicit nearby needs of helpless networks through neighborhood
conventions and societies. Reclamation of regular property assets with the cooperation of the
neighbourhood level bodies is a genuine test. The verifiable focal point of debacle the executives has
been on alleviation and recovery after the occasion yet now the emphasis is on making arrangements
for catastrophe readiness and relief. Given the high recurrence with which one or other piece of the
nation endures because of fiascos, relieving the effect of debacles must be a vital part of our
advancement arranging.
One of the glaring lacunae during the time spent Disaster Management in India has been the ignoring
of unnatural calamities. The ongoing endeavours centre absolutely around cataclysmic events, though
the current worldwide circumstance additionally requests activities in dealing with the effect of
unnatural debacles. Advancements at the universal level, especially the common wars and common
struggle in Eastern Europe and Southern America coming full circle on 9/11 have brought the issue of
unnatural fiascos at the cutting edge of catastrophe the board. The worldwide network has perceived
the genuine outcomes of Nuclear, Biological and Chemical (NBC) fighting. The remaining part is a
genuine test for India to address sooner rather than later.
The need of great importance is to chalk out a multipronged methodology for all out catastrophe the
executives involving counteractive action, readiness, reaction and recuperation from one viewpoint
and start improvement endeavours pointed towards hazard decrease and moderation on the other.
The nations in the Asia Pacific district ought to set up a local co-appointment component for space

310 MGNCRE | Community Resilience and Disaster Management
innovation based catastrophe alleviation and fortify co-task, Luan recommended, adding that they
additionally need to set up an all climate and unequalled exhaustive space based debacle relief
framework and offer the data. A professional dynamic position to decrease the toll of calamities in the
nation requires a progressively far reaching approach that includes both pre-catastrophe hazard
decrease and post debacle recuperation. It is confined by new approaches and institutional courses of
action that help successful activity. Such a methodology ought to include the accompanying
arrangement of exercises
• Risk examination to recognize the sorts of dangers looked by individuals and advancement
speculations just as their extent.
• Prevention and alleviation to address the basic wellsprings of helplessness.
• Risk move to spread money related dangers after some time and among various onscreen
characters.
• Emergency readiness and reaction to improve a nation's status to adapt rapidly and adequately
with a crisis.
• Post-catastrophe restoration and recreation to help successful recuperation and to shield
against future debacles."
References
1. Planning Commission (2002); "Tenth Five Year Plan (20022007) Vol.1"; Planning Commission,
Government of India; New Delhi.
2. Gupta A; "Information Technology and Natural Disaster Management in India";
www.gisdevelopment.net 3. www.ndmindia.nic.in
3. International Federation of Red Cross and Red Crescent Societies (2001); "World Disaster
Report Focus on reducing risk"; IFRCRCS; Geneva
4. Aparna Meduri (2006). "The Disaster Management Act, 2005" . The ICFAI Journal of
Environmental Law. The ICFAI University Press. pp. 9–11.
5. Ministry of Home (27 September 2006). "Notification for establishing NDMA," (PDF). The
Gazette of India.
6. Ministry of Home (27 September 2006). "Notification for constituting National Executive
Committee (NEC)" (PDF). The Gazette of India. Ministry of Home. p. Section 3, sub section (ii).
7. BMTPC (2016) Vulnerability Atlas of India.
http//www.bmtpc.org/topics.aspx?mid=56&Mid1=180
To Do Activity
Identify a major disaster in India like the Indian Ocean Tsunami in 2004 or Gujarat earthquake,
2001 or Kashmir floods, 2014 or any other major disaster and highlight how India has faced the
disaster with its existing mechanisms and policy framework for disaster management.

311 MGNCRE | Community Resilience and Disaster Management
Chapter 5 International Framework
Introduction This chapter is dedicated to the concept of International disaster management. More specifically, this
chapter will provide an overview of disaster management and its framework in internationally. This
chapter deals with the International disaster agencies and also explains the International Strategy for
Disaster Reduction on disaster management. The Hyogo Framework (20052015); Sendai Framework
and India’s commitment at International Fora COP21 is clearly discussed.
Objectives
• To discuss the concept of International disaster management.
• To explain the International disaster agencies and the International Strategy for Disaster
Reduction on disaster management.
• To understand the Hyogo Framework (20052015); Sendai Framework and India’s
commitment at International Fora COP21.
Structure
5.1 International Agencies
The United Nations Office for Disaster Risk Reduction (UNISDR)
UNISDR was created in December 1999. The successor to the secretariat of the International Decade
for Natural Disaster Reduction, it was established to ensure the implementation of the International
Strategy for Disaster Reduction. UNISDR was formed in 1999 with its Headquarters in Geneva,
Switzerland. The Parent organization of UNISDR is United Nations Secretariat. UNISDR is part of the
United Nations Secretariat and its functions span the social, economic, environmental as well as
humanitarian fields. UNISDR supports the implementation, follow up and review of the Sendai
Framework for Disaster Risk Reduction adopted by the Third UN World Conference on Disaster Risk
Reduction on 18 March 2015 in Sendai, Japan. The Sendai Framework is a 15year voluntary,
nonbinding agreement that maps out a broad, people centred approach to disaster risk reduction,
succeeding the 20052015 Hyogo Framework for Action. UNISDR’s vision is anchored on the four
priorities for action set out in the Sendai Framework understanding disaster risk, strengthening
5.1 International Agencies
5.2 International Strategy for Disaster Reduction
5.3 International Frameworks
5.4 S and T Institutions for Disaster Management in India
5.5 India’s Commitment at International Forum COP21

312 MGNCRE | Community Resilience and Disaster Management
disaster risk governance to manage disaster risk, investing in disaster risk reduction for resilience, and
enhancing disaster preparedness for effective response and to “Build Back Better” in recovery,
rehabilitation and reconstruction.
UNISDR is led by a United Nations Special Representative of the Secretary General for Disaster Risk
Reduction (SRSG) and has over 100 staff located in its headquarters in Geneva, Switzerland, 5 regional
offices (Africa Nairobi, the Americas Panama City, Arab States Cairo, Asia Pacific Bangkok and Europe
Brussels) and other field presences in Addis Ababa, Almaty, Bonn, Incheon, Kobe, New York UN
Headquarters, Rio de Janeiro and Suva. UNISDR coordinates international efforts in Disaster Risk
Reduction (DRR) and guide, monitor as well as report regularly on the progress of the implementation
of the Sendai Framework for Disaster Risk Reduction, following the Hyogo Framework for Action. It
convenes the biennial Global Platform on Disaster Risk Reduction with leaders and decision makers to
advance risk reduction policies and supports the establishment of regional, national and thematic
platforms. UNISDR informs and connects people by providing practical services and tools such as the
risk reduction website Prevention Web, terminology, publications on good practices, country profiles
and the Global Assessment Report on Disaster Risk Reduction which is an authoritative biennial
analysis of global disaster risks and trends.
1994 First World Conference on Disaster Reduction and the Yokohama Strategy for a Safer World
The Yokohama Strategy for a Safer World Guidelines for Natural Disaster Prevention, Preparedness
and Mitigation and its Plan of Action was adopted at the World Conference on Natural Disaster
Reduction, building on the midterm review of the International Decade for Natural Disaster Reduction.
2007 First Session of the Global Platform on Disaster Reduction
The UN General Assembly established a biennial Global Platform on disaster risk reduction to support
the implementation of the Hyogo Framework for Action, allowing government representatives, NGOs,
scientists, practitioners, private sector, IFIs and UN organizations to share experiences, identify
remaining gaps, formulate strategic guidance and advice for the implementation of the HFA. Six
Regional Platforms and over 80 National Platforms have also been established as multi stakeholder
forums.5 Regional Platforms also assess progress but focus on the details of the regional plans of
implementation and National Platforms act as the national coordinating body for disaster risk
reduction.
2011 Programme of Action for the Least Developed Countries for the Decade 2011-2020
The Istanbul Programme of Action (IPoA) charts out the international community’s vision and strategy
for the sustainable development of LDCs for the next decade with a strong focus on developing their
productive capacities. The Programme recognized that the scale and impact of natural disasters has
increased over recent decades, threatening hard won development gains of LDCs. It encourages LCDs
to take action in implementing and integrating disaster risk reduction in their national and long term
planning and policies.
2012 United Nations Conference on Sustainable Development Rio+20
The outcome Document The Future We Want – of the United Nations Conference on Sustainable
Development – Rio 20+ held in Rio de Janeiro, Brazil on 20–22 June 2012 contains a section (Chapter
VA) on disaster risk reduction that sets a firm foundation for discussions on a post2015 framework to
continue guiding nations after the Hyogo Framework expires in 2015.

313 MGNCRE | Community Resilience and Disaster Management
Global Assessment Report
The Global Assessment Report on Disaster Risk Reduction (GAR) is the United Nation’s biennial global
review and analysis of the natural hazards that are affecting humanity. The GAR monitors risk patterns
and trends and progress in disaster risk reduction while providing strategic policy guidance to
countries and the international community. The Report is produced in collaboration and consultation
with a wide range of stakeholders, including various UN agencies, governments, academic and
research institutions, donors and technical organizations and specialists. The Global Assessment
Report 2015 is titled ‘Making Development Sustainable The Future of Disaster Risk Management’ and
reviews the disaster risk governance under the HFA and assess to what extent the expected outcome
of the HFA has been achieved. The report can be accessed here Global Assessment Report 2015.
International Space Charter
The International Charter "Space and Major Disasters" is a nonbinding charter which provides for the
charitable and humanitarian retasked acquisition of and transmission of space satellite data to relief
organizations in the event of major disasters. Initiated by the European Space Agency and the French
space agency CNES after the UNISPACE III conference held in Vienna, Austria in July 1999, it officially
came into operation on November 1, 2000 after the Canadian Space Agency signed onto the charter
on October 20, 2000. Their space assets were then, respectively, ERS and ENVISAT, SPOT and
Formosat, and RADARSAT.
The assorted satellite assets of various corporate, national, and international space agencies and
entities provide for humanitarian coverage which is wide albeit contingent. First activated for floods
in northeast France in December 2001, the Charter has since brought space assets into play for
numerous floods, earthquakes, oil spills, forest fires, tsunamis, major snowfalls, volcanic eruptions,
hurricanes and landslides, and furthermore (and unusually) for the search for Malaysia Airlines Flight
370 and for the 2014 West Africa Ebola outbreak. As of August 2018, it had had 579 activations, from
125 countries, and had 17 members, which contributed 34 satellites. It won the prestigious Pecora
award in 2017. Furthermore, specific agreements with other entities, including corporations, allow
the Charter access to additional products of high and very high resolution from satellites such as the
Formosat series, Geo Eye, IKONOS, Quick Bird, and Worldview. In 2014 the charter was activated 41
times for disasters in 30 countries. The charter was activated for the 2004 Indian Ocean earthquake
and tsunami by the Indian Space Research Organisation (ISRO).
Other International Agencies
There are different international agencies like the United Nations (UN) that are participating in. the
assistance work related to reduction of natural disasters. The predisaster and post disaster recovery
process, usually consist of a series of distinct but interrelated programmes e.g., for financial grants,
building materials, technical equipment, rehabilitation, food for work, and also assistance in the future
development.
The important international agencies are United Nations Development Programme (UNDP), United
Nations Economic and Social cooperation (UNESCO), United Nations Children’s fund (UNICEF), World
Health Organisation (WHO), United Nations Office for the Coordination of Humanitarian Affairs
(UNOCHA), United Nations World Food Programme (WFP), Food Agricultural Organisation (FAO),
International Labour Organisation (ILO), United Nations Fund for Population (UNFPA), International

314 MGNCRE | Community Resilience and Disaster Management
Organisation for Migration (IOM), Asian Development Bank (ADB) and International Bank for
Reconstruction and Development.
International Federation of the Red Cross (WRC) and Red Crescent Societies It is the ' world's largest
humanitarian organisation. Its main mission, broadly speaking, is to improve the situation of the
world's most vulnerable people.
Department for International Development (DFID) It aims at funding and providing support to
disaster relief programmes.
USAID In majority of the cases, United States Aid Programme does not directly involve itself in disaster
relief. It is more concerned with monitoring and reporting on disaster preparedness and response
activities. There may, however, be a provision through partner NGOs for short term food aid to
disaster victims.
World Bank the Disaster Management Facility of the World Bank has been established to streamline
disaster prevention and mitigation initiatives connected with all the activities pertaining to disaster
management. It has been doing a lot of work in the area of disaster mitigation.
UNDP Although the agreement does not allow UNDP to participate in relief operations unless specially
requested, it does receive all information on the nature and extent of disaster damage and loss of life.
Its broad aim is to design responsive structures as well as implement prevention and mitigation
strategies.
UNICEF It contributes by donating funds to the Prime Minister's National Relief Fund. It regularly
meets with the government of the affected country in order to facilitate a more coordinated disaster
response mechanism.
UNOCHA This office of the United Nations is mandated by the UN General Assembly to coordinate
humanitarian assistance of the UN family as well as that of international humanitarian actions. A
Regional Office of the UNOCHA for Asia and the Pacific operates from Bangkok, Thailand.
5.2 International Strategy for Disaster Reduction
Continuing the context provided above, given the increasing concern about the impact of disasters,
the UN General Assembly declared 19901999 as the International Decade for Natural Disaster
Reduction (IDNDR). Under the theme ‘Building a Culture of Prevention’, work was done to advance a
wider commitment to activities that could reduce the consequences of natural disasters. The
Yokohama Strategy and Plan of Action for a Safer World (Yokohama strategy), conceived at the World
Conference on Natural Disaster Reduction in Yokohama in 1994, stressed that every country had the
To Do Activity
Collect the news coverage on the Global Ebola epidemic in 2014 or any other world’s deadliest
disaster from that year's magazines, journals and news clippings. Make a list of the factors that
have made the reconstruction and rehabilitation process a means of development in the
affected areas. Visualise the ways these factors could be further improved and pen them down.

315 MGNCRE | Community Resilience and Disaster Management
sovereign and primary responsibility to protect its people, infrastructure and national, social or
economic assets from the impact of natural disasters.
International Strategy for Disaster Reduction (ISDR)
The International Strategy for Disaster Reduction (ISDR) was adopted during the 1999 IDNDR
Programme Forum, held in July 1999 in Geneva, and ratified by the United Nations’ Economic and
Social Council (ECOSOC) and General Assembly during the second meeting of its Commission on
Sustainable Development. More than 20 speakers at the CSD spoke in favour of the Strategy and the
proposed institutional arrangements in November 1999, and a resolution to that effect was adopted.
The following is a summary of the International Strategy as agreed to during the July 1999 IDNDR
Programme forum. While hazards are inevitable, and the elimination of all risk is impossible, there
are many technical measures, traditional practices, and public experience that can reduce the extent
or severity of economic and social disasters. Hazards and emergency requirements are a part of living
with nature, but human behaviour can be changed. In the words of the Secretary General, “We must,
above all, shift from a culture of reaction to a culture of prevention. Prevention is not only more
humane than cure; it is also much cheaper… Above all, let us not forget that disaster prevention is a
moral imperative, no less than reducing the risks of war”.
Vision
“To enable all communities to become resilient to the effects of natural, technological and
environmental hazards, reducing the compound risks they pose to social and economic vulnerabilities
within modern societies and to proceed from protection against hazards to the management of risk
through the integration of risk prevention into sustainable development.”
Goals
1. Increase public awareness of the risks that natural, technological and environmental hazards
pose to modern societies.
2. Obtain commitment by public authorities to reduce risks to people, their livelihoods, social
and economic infrastructure, and environmental resources.
3. Engage public participation at all levels of implementation to create disaster resistant
communities through increased partnership and expanded risk reduction networks at all
levels.
4. Reduce the economic and social losses of disasters as measured, for example, by Gross
Domestic Product.
Objectives
1. Stimulate research and application, provide knowledge, convey experience, build capabilities
and allocate necessary resources for reducing or preventing severe and recurrent impacts of
hazards, for those people most vulnerable.
2. Increase opportunities for organizations and multidisciplinary relationships to foster more
scientific and technical contributions to the public decision making process in matters of
hazard, risk and disaster prevention.
3. Develop a more proactive interface between management of natural resources and risk
reduction practices.
4. Form a global community dedicated to making risk and disaster prevention a public value.

316 MGNCRE | Community Resilience and Disaster Management
5. Link risk prevention and economic competitiveness issues to enhance opportunities for
greater economic partnerships.
6. Complete comprehensives risk assessments and integrate them within development plans.
7. Develop and apply risk reduction strategies and mitigation measures with supporting
arrangements and resources for disaster prevention at all levels of activity.
8. Identify and engage designated authorities, professionals drawn from the widest possible
range of expertise, and community leaders to develop increased partnership activities.
9. Establish risk monitoring capabilities, and early warning systems as integrated processes, with
particular attention being given to emerging hazards with global implications such as those
related to climate variation and change, at all levels of responsibility.
10. Develop sustained programs of public information and institutionalized educational
components pertaining to hazards and their effects, risk management practices and disaster
prevention activities, for all ages.
11. Establish internationally and professionally agreed standards / methodologies for the analysis
and expression of the socioeconomic impacts of disasters on societies.
12. Seek innovative funding mechanisms dedicated to sustained risk and disaster prevention
activities.
Implementation
• Conduct a national audit or assessment process of existing functions necessary for a
comprehensive and integrated national strategy of hazard, risk and disaster prevention,
projected over 510- and 20-year time periods.
• Conduct dynamic risk analysis with specific consideration of demographics, urban growth, and
the interaction or compound relationships between natural, technological and environmental
factors.
• Build, or where existing, strengthen regional/sub regional, national and international
approaches, and collaborative organizational arrangements that can increase hazard, risk and
disaster prevention capabilities and activities.
• Establish coordination mechanisms for greater coherence and improved effectiveness of
combined hazard, risk and disaster prevention strategies at all levels of responsibility.
• Promote and encourage knowhow transfer through partnership and among countries with
particular attention given in the transfer of experience amongst those countries most exposed
to risks.
• Establish national, regional/sub regional, and global information exchanges, facilities, or
websites dedicated to hazard, risk and disaster prevention, linked by agreed communication
standards and protocols to facilitate interchange.
• Link efforts of hazard, risk and disaster prevention more closely with the Agenda 21
implementation process for enhanced synergy with environmental and sustainable
development issues.
• Focus multiyear risk reduction strategies on urban concentration and megacity environments.
Institute comprehensive application of land use planning and programmes in hazard prone
environments.
• Develop and apply standard forms of statistical recording of risk factors, disaster occurrences
and their consequences to enable more consistent comparisons.

317 MGNCRE | Community Resilience and Disaster Management
• Undertake periodic reviews of accomplishments in hazard, risk and disaster reduction efforts
at all levels of engagement and responsibility.
• Study the feasibility of specific alternative funding and resource allocation modalities that can
ensure continued commitment to sustained risk and disaster prevention strategies.
Inter Agency Secretariat of the ISDR
The Inter Agency Secretariat of the ISDR (UN/ISDR) is the focal point within the UN system for
coordination of strategies and programs for disaster reduction and ensuring compatibility between
disaster reduction activities and activities in the socioeconomic and humanitarian fields. “The
Secretariat also serves as an international clearinghouse for the identification, management and
dissemination of information pertaining to the current state of knowledge and the range of activities
underway that could contribute to the progress of disaster risk reduction efforts around the world.
The Secretariat also develops advocacy campaigns to promote wider understanding about natural
hazards and disaster risk to motivate a worldwide commitment to disaster reduction. A particularly
important role is to encourage both policy and advocacy studies through national committees,
networks or platforms dedicated to disaster reduction, closely aligning regional initiatives.
The Secretariat plays a facilitating role, bringing agencies, organisations and different disciplines
together on a common platform to deliberate on the scope of disaster risk reduction. Furthering the
end, the Secretariat supports the Inter Agency Task Force on Disaster Reduction in developing
universal policies/innovative strategies on disaster reduction.
The Task Force, supported by the ISDR Secretariat, formulated in 2001 a framework for action for the
implementation of ISDR with four main objectives
1. To increase public awareness to understand risk, vulnerability and disaster reduction.
2. To promote the commitment of public authorities to disaster reduction.
3. To stimulate multidisciplinary and intersect oral partnerships, including the expansion of risk
reduction networks.
4. To improve scientific knowledge about the causes of natural disasters, as well as the effects
that natural hazards and related technological and environmental disasters have on societies.
In Pursuing these Objectives, the Framework for Action Proposed, Outlines the Following Areas of
Common Concern
• Recognition and incorporation of special vulnerability of the poor and socially marginalised
groups in disaster reduction strategies.
• Environmental, social and economic vulnerability assessment with special reference to health
and food security.
• Ecosystems management, with particular attention given to the implementation of Agenda
21.
• Landuse management and planning, including appropriate land use in rural, mountain and
coastal areas, as well as unplanned urban areas in megacities and secondary cities.
• National, regional and international legislation with respect to disaster reduction.

318 MGNCRE | Community Resilience and Disaster Management
Regional Cooperation
A particular issue area in regional cooperation is sharing and management of common environmental
units, for example over an expanse of the ocean. More regional cooperation is needed to institute risk
reduction regarding shared resources. As explained by Pardeep Sahni and Madhavi Malalgoda
Ariyabandu (2003), there is need for networking of knowledge and expertise at the regional level to
develop credible data base for development of policy science and risk identification for disaster
mitigation policy on a regional scale.
The Pro Vention Consortium was launched in February 2000. As per the account given by Pardeep
Sahni and Madhavi Malalgida Ariyabandu (2003), it comprises 43 governments, international
organisations, academic institutions, banks, private sector organisations and civil society
organisations. Some of the notable members are the Munich Re, University of Kyoto, Japan, University
of Pennysylvania, Renaissance Reinsurers, Asian Development Bank, United Nations Development
Programme (UNDP), International Federation of Red Cross and Red Crescent Societies among many
more international institutes of repute.
Disasters have close linkages with Development. At times, it is development that causes disasters and
there are occasions when after disasters, new development takes place. The Disaster Risk Index
developed by UNDP has made an attempt to bringforth the relationship between development and
disaster risk based on scientific, methodical and systematic analysis of data. Eight Millennium
Development Goals (MDG)
1. Eradicating Extreme Poverty and Hunger.
2. Achieving Universal Primary Education.
3. Promoting Gender Equality and Empowering Women.
4. Reducing Child Morality.
5. Improving Maternal Health.
6. Combating HIV/AIDS, Malaria and other Diseases.
7. Ensuring Environmental Sustainability.
8. Developing a Global Partnership for Development”.
These goals have been set up by the General Assembly of the United Nations to be achieved by the
year 2015.
5.3 International Frameworks
Hyogo Framework (20052015)
The Hyogo Framework for Action 20052015 Building the Resilience of Nations and Communities to
Disasters (HFA) is the first plan to explain, describe and detail the work that is required from all
different sectors and actors to reduce disaster losses. “The HFA is a 10year plan to make the world
safer from natural hazards. It was endorsed by the UN General Assembly following the 2005 World
To Do Activity
Try to interview any government official working in the field of disaster management in your
area and find out about the government's disaster management plan for your locality/colony/
town/city. Ascertain your own role as well as your neighbours' role within the broad plan and
prepare an outline of a disaster management strategy based on this information.
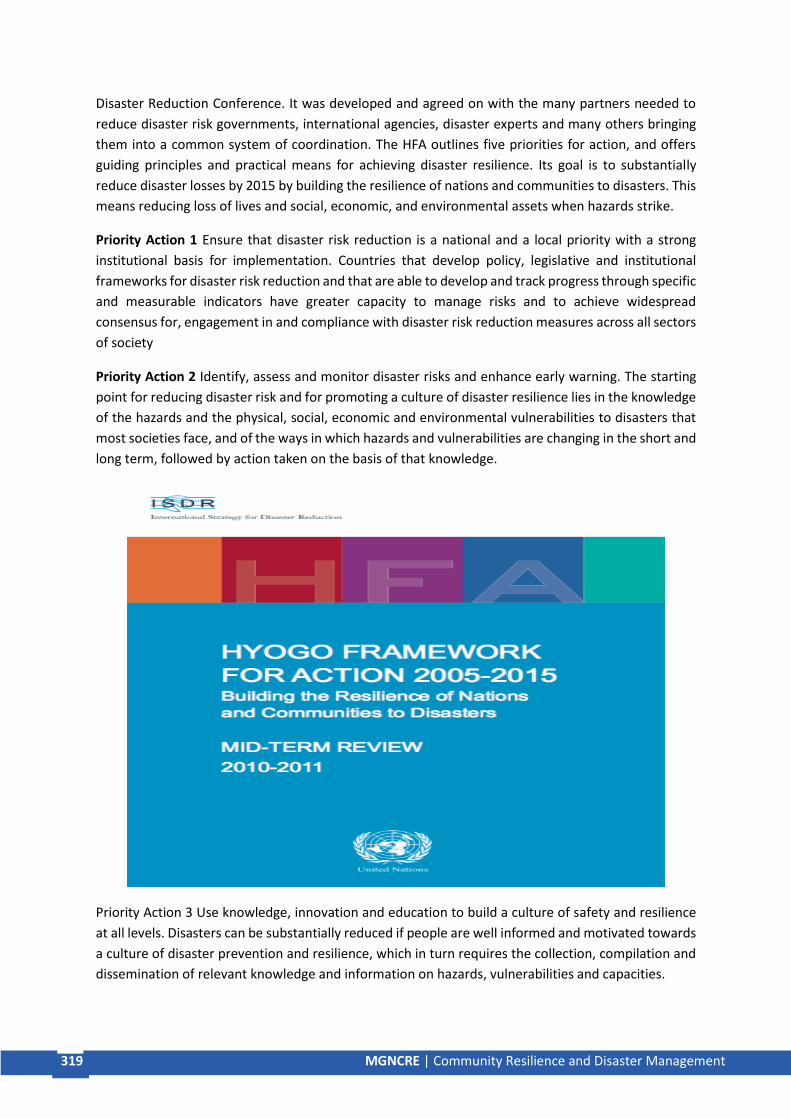
319 MGNCRE | Community Resilience and Disaster Management
Disaster Reduction Conference. It was developed and agreed on with the many partners needed to
reduce disaster risk governments, international agencies, disaster experts and many others bringing
them into a common system of coordination. The HFA outlines five priorities for action, and offers
guiding principles and practical means for achieving disaster resilience. Its goal is to substantially
reduce disaster losses by 2015 by building the resilience of nations and communities to disasters. This
means reducing loss of lives and social, economic, and environmental assets when hazards strike.
Priority Action 1 Ensure that disaster risk reduction is a national and a local priority with a strong
institutional basis for implementation. Countries that develop policy, legislative and institutional
frameworks for disaster risk reduction and that are able to develop and track progress through specific
and measurable indicators have greater capacity to manage risks and to achieve widespread
consensus for, engagement in and compliance with disaster risk reduction measures across all sectors
of society
Priority Action 2 Identify, assess and monitor disaster risks and enhance early warning. The starting
point for reducing disaster risk and for promoting a culture of disaster resilience lies in the knowledge
of the hazards and the physical, social, economic and environmental vulnerabilities to disasters that
most societies face, and of the ways in which hazards and vulnerabilities are changing in the short and
long term, followed by action taken on the basis of that knowledge.
Priority Action 3 Use knowledge, innovation and education to build a culture of safety and resilience
at all levels. Disasters can be substantially reduced if people are well informed and motivated towards
a culture of disaster prevention and resilience, which in turn requires the collection, compilation and
dissemination of relevant knowledge and information on hazards, vulnerabilities and capacities.

320 MGNCRE | Community Resilience and Disaster Management
Priority Action 4 Reduce the hidden hazard factors. Debacle dangers identified with evolving social,
financial, natural conditions and land use, and the effect of risks related with geographical occasions,
climate, water, atmosphere changeability and environmental change, are tended to in division
improvement arranging and projects just as in post catastrophe circumstances.
Priority Action 5 Strengthen calamity readiness for viable reaction at all levels. On occasion of fiasco,
effects and misfortunes can be significantly diminished if specialists, people and networks in peril
inclined regions are decidedly ready and prepared to act and are outfitted with the learning and
capacities with regards to viable catastrophe the board.
Sendai Framework (2015 2030)
The Sendai Framework was received by UN Member States on 18 March 2015 at the Third UN World
Conference on Disaster Risk Reduction in Sendai City, Miyagi Prefecture, Japan. "The Sendai
Framework for Disaster Risk Reduction 20152030 (Sendai Framework) is the primary real
understanding of the post2015 improvement motivation, with seven targets and four needs for
activity. It was supported by the UN General Assembly following the 2015 Third UN World Conference
on Disaster Risk Reduction (WCDRR). The Sendai Framework is a 15year deliberate, nonofficial
understanding which perceives that the State has the essential job to lessen calamity hazard however
that obligation ought to be imparted to different partners including neighbourhood government, the
private division and different partners. It goes for the accompanying result The generous decrease of
fiasco hazard and misfortunes in lives, employments and wellbeing and in the monetary, physical,
social, social and ecological resources of people, organizations, networks and nations. The Sendai
Framework is the successor instrument to the Hyogo Framework for Action (HFA) 20052015 Building
the Resilience of Nations and Communities to Disasters. It is the result of partner discussions started
in March 2012 and intergovernmental arrangements held from July 2014 to March 2015, which were
bolstered by the UNISDR upon the solicitation of the UN General Assembly. UNISDR has been
entrusted to help the usage, development and survey of the Sendai Framework."

321 MGNCRE | Community Resilience and Disaster Management
Figure 5.3 Sendai Framework
The Seven Global Targets
a. "Generously diminish worldwide fiasco mortality by 2030, meaning to lower normal per
100,000 worldwide death rates in the decade 20202030 contrasted with the period 20052015.
b. Substantially lessen the quantity of influenced individuals all around by 2030, planning to
lower normal worldwide figure per 100,000 in the decade 2020 2030 contrasted with the
period 20052015.
c. Reduce direct debacle financial misfortune in connection to worldwide total national output
(GDP) by 2030.
d. Substantially diminish catastrophe harm to basic foundation and interruption of fundamental
administrations, among them wellbeing and instructive offices, including through building up
their flexibility by 2030.
e. Substantially increment the quantity of nations with national and neighbourhood fiasco
hazard decrease methodologies by 2020.
f. Substantially upgrade worldwide collaboration to creating nations through satisfactory and
feasible help to supplement their national activities for execution of this Framework by 2030.
g. Substantially increment the accessibility of and access to multi danger early cautioning
frameworks and calamity hazard data and evaluations to the general population by 2030.

322 MGNCRE | Community Resilience and Disaster Management
The Four Priorities for Action (Source Sendai Framework for Disaster Risk Reduction
https//en.wikipedia.org/wiki/Sendai_Framework_for_Disaster_Risk_Reduction)
Priority 1 Understanding disaster risk Disaster risk management should be based on an understanding
of disaster risk in all its dimensions of vulnerability, capacity, exposure of persons and assets, hazard
characteristics and the environment. Such knowledge can be used for risk assessment, prevention,
mitigation, preparedness and response.
Priority 2 Strengthening disaster risk governance to manage disaster risk Disaster risk governance at
the national, regional and global levels is very important for prevention, mitigation, preparedness,
response, recovery, and rehabilitation. It fosters collaboration and partnership.
Priority 3 Investing in disaster risk reduction for resilience Public and private investment in disaster
risk prevention and reduction through structural and non-structural measures are essential to
enhance the economic, social, health and cultural resilience of persons, communities, countries and
their assets, as well as the environment.
Priority 4 Enhancing disaster preparedness for effective response and to “Build Back Better” in
recovery, rehabilitation and reconstruction. The growth of disaster risk means there is a need to
strengthen disaster preparedness for response, take action in anticipation of events, and ensure
capacities are in place for effective response and recovery at all levels. The recovery, rehabilitation
and reconstruction phase are a critical opportunity to build back better, including through integrating
disaster risk reduction into development measures.
Execution guides for the Sendai Framework. The Sendai Framework for Disaster Risk Reduction
outlines the worldwide course throughout the following 15 years. During the conferences and
exchanges that prompted its finish, solid calls were made to create useful direction to help usage,
guarantee commitment and responsibility for by all partners, and fortify responsibility in a fiasco
chance decrease. Passage 48 (c) of the Sendai Framework calls upon the United Nations Office for
Disaster Risk Reduction (UNISDR), specifically, to help the execution, development and audit of this
structure through creating proof based and handy direction for usage in close joint effort with States,
and through preparation of specialists; fortifying a culture of anticipation in important partners". So
as to help the procedure, various focused on Sendai Framework usage aides will be created.
5.4 S and T Institutions for Disaster Management in India
Specialized Organizations, for example, the Indian Meteorological Department (tornado/seismic
tremor), Central Water Commission (floods), Building Material and Technology Promotion Council
(development laws), Bureau of Indian (standards), Defence Research and Development Organization
(atomic/natural), Directorate General Civil Defence give explicit specialized help to coordination of
calamity reaction and the board capacities.
To Do Activity
Do a physical and social profile of a disaster prone region or country and list the hazards it is
exposed to. Find out the vulnerabilities and recommend what should be done to address the
concerns. What can be done to protect the environment? Make an Action Plan.

323 MGNCRE | Community Resilience and Disaster Management
Catastrophe the board depends intensely upon the contributions from different science and
innovation organizations. To be sure, real enhancements in a debacle the board endeavors might be
ascribed to advancements in science and innovation. As emergency the board is multidisciplinary in
nature, the significant research is done in a few part savvy innovative work associations. The
Administrative Reforms Committee has prescribed that The National Disaster Management Authority,
helped by NIDM, may encourage a typical stage between the science and innovation associations and
the clients of important advances. Such components might be made operational both at the Union
and State levels. Institutional advancement for catastrophe the board in the nation has plainly
endured by virtue of scarcity of expertly qualified faculty. While government workers and other senior
staff in associations like the police, military and civil bodies have given an influential position and their
administration will keep on being required, it is time that extraordinary consideration is paid to the
long felt need to professionalize fiasco the board in the nation.
The accepted procedures in calamity the executives are the methodologies and techniques idealized
by a few created nations and India can exploit from introduction to these practices. It is, in this way,
alluring the likelihood of reciprocal concurrences with outside governments for trade of encounters
and gaining from their documentation and research endeavours be completely investigated.
Millennium Development Goals
“In September 2000, leaders of 189 countries gathered at the United Nations headquarters and signed
the historic Millennium Declaration, in which they committed to achieving a set of eight measurable
goals that range from halving extreme poverty and hunger to promoting gender equality and reducing
child mortality, by the target date of 2015.
The Millennium Development Goals (MDGs)
Goal 1 Eradicate extreme poverty and hunger
Goal 2 Achieve universal primary education
Goal 3 Promote gender equality and empower women
Goal 4 Reduce child mortality
Goal 5 Improve maternal health
Goal 6 Combating HIV/AIDs, malaria, and other diseases
Goal 7 Ensure environmental sustainability
Goal 8 Develop a global partnership for development
The MDGs were progressive in giving a typical language to achieve worldwide understanding. The 8
objectives were reasonable and simple to convey, with an unmistakable estimation/checking system.
Generous advancement has been made in regards to the MDGs. The world has officially understood
the first MDG of splitting the outrageous destitution rate by 2015. Be that as it may, the
accomplishments have been uneven. The MDGs are set to lapse in 2015 and the talk of a post2015
motivation proceeds. The emphasis is currently on structure a supportable existence where ecological
maintainability, social consideration, and monetary improvement are similarly esteemed.
The MDG Fund contributed legitimately and in a roundabout way to the accomplishment of the MDGs.
It received a comprehensive and far reaching way to deal with the MDGs. The methodology was
guided continuously Declaration and its accentuation on improvement as a right, with focused
consideration coordinated towards customarily minimized gatherings, for example, ethnic minorities,
indigenous gatherings, and ladies.

324 MGNCRE | Community Resilience and Disaster Management
The Global Consultation of Sustainable Development Goals
The Rio+20 gathering (the United Nations Conference on Sustainable Development) in Rio de Janeiro,
June 2012, aroused a procedure to build up another arrangement of Sustainable Development Goals
(SDGs) which will carry on the force created by the MDGs and fit into a worldwide advancement
system past 2015.
In light of a legitimate concern for making another, individuals focused, advancement motivation, a
worldwide interview was led on the web and disconnected. Common society associations, natives,
researchers, scholastics, and the private division from around the globe were all effectively occupied
with the procedure. Exercises included topical and national counsels, and the My World review driven
by the United Nations Development Group. Particular boards were additionally held and given ground
to encourage intergovernmental talks. The UN Secretary General introduced a combination of the
aftereffects of these meeting forms. In July 2014, the UN General Assembly Open Working Group
(OWG) proposed an archive containing 17 objectives to be advanced for the General Assembly's
endorsement in September 2015. This report set the ground for the new SDGs and the worldwide
improvement motivation spreading over from 20152030.
Sustainable Development Goals (SDGs) as proposed by the OWG
Goal 1 End poverty in all its forms everywhere
Goal 2 End hunger, achieve food security and improved nutrition, and promote sustainable agriculture
Goal 3 Ensure healthy lives and promote wellbeing for all at all ages
Goal 4 Ensure inclusive and equitable quality education and promote lifelong learning opportunities
for all
Goal 5 Achieve gender equality and empower all women and girls
Goal 6 Ensure availability and sustainable management of water and sanitation for all
Goal 7 Ensure access to affordable, reliable, sustainable, and modern energy for all
Goal 8 Promote sustained, inclusive and sustainable economic growth, full and productive
employment, and decent work for all
Goal 9 Build resilient infrastructure, promote inclusive and sustainable industrialization, and foster
innovation
Goal 10 Reduce inequality within and among countries
Goal 11 Make cities and human settlements inclusive, safe, resilient and sustainable
Goal 12 Ensure sustainable consumption and production patterns
Goal 13 Take urgent action to combat climate change and its impacts
Goal 14 Conserve and sustainably use the oceans, seas, and marine resources for sustainable
development
Goal 15 Protect, restore and promote sustainable use of terrestrial ecosystems, sustainably manage
forests, combat desertification, halt and reverse land degradation, and halt biodiversity loss
Goal 16 Promote peaceful and inclusive societies for sustainable development, provide access to
justice for all, and build effective, accountable and inclusive institutions at all levels
Goal 17 Strengthen the means of implementation and revitalize the global partnership for sustainable
development.”
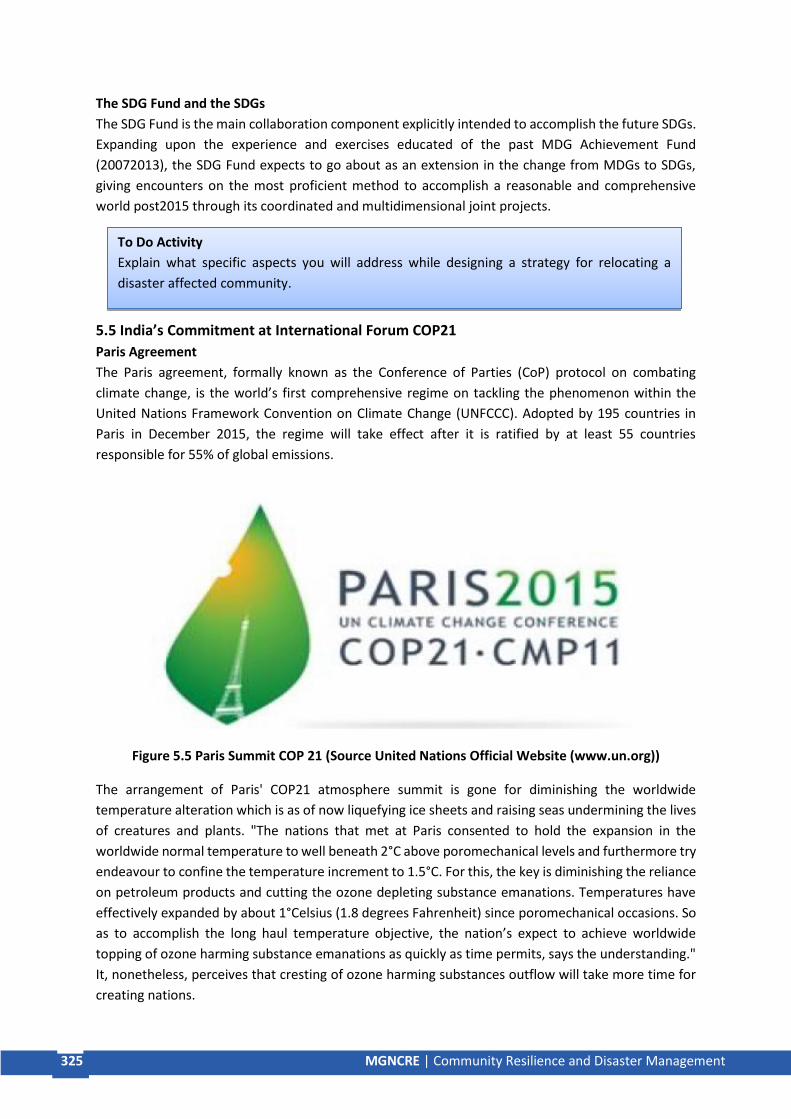
325 MGNCRE | Community Resilience and Disaster Management
The SDG Fund and the SDGs
The SDG Fund is the main collaboration component explicitly intended to accomplish the future SDGs.
Expanding upon the experience and exercises educated of the past MDG Achievement Fund
(20072013), the SDG Fund expects to go about as an extension in the change from MDGs to SDGs,
giving encounters on the most proficient method to accomplish a reasonable and comprehensive
world post2015 through its coordinated and multidimensional joint projects.
5.5 India’s Commitment at International Forum COP21
Paris Agreement
The Paris agreement, formally known as the Conference of Parties (CoP) protocol on combating
climate change, is the world’s first comprehensive regime on tackling the phenomenon within the
United Nations Framework Convention on Climate Change (UNFCCC). Adopted by 195 countries in
Paris in December 2015, the regime will take effect after it is ratified by at least 55 countries
responsible for 55% of global emissions.
Figure 5.5 Paris Summit COP 21 (Source United Nations Official Website (www.un.org))
The arrangement of Paris' COP21 atmosphere summit is gone for diminishing the worldwide
temperature alteration which is as of now liquefying ice sheets and raising seas undermining the lives
of creatures and plants. "The nations that met at Paris consented to hold the expansion in the
worldwide normal temperature to well beneath 2°C above poromechanical levels and furthermore try
endeavour to confine the temperature increment to 1.5°C. For this, the key is diminishing the reliance
on petroleum products and cutting the ozone depleting substance emanations. Temperatures have
effectively expanded by about 1°Celsius (1.8 degrees Fahrenheit) since poromechanical occasions. So
as to accomplish the long haul temperature objective, the nation’s expect to achieve worldwide
topping of ozone harming substance emanations as quickly as time permits, says the understanding."
It, nonetheless, perceives that cresting of ozone harming substances outflow will take more time for
creating nations.
To Do Activity
Explain what specific aspects you will address while designing a strategy for relocating a
disaster affected community.

326 MGNCRE | Community Resilience and Disaster Management
According to the understanding, created nations should "keep leading and spearheading" by
attempting economywide supreme outflow to decrease targets, while creating nations should keep
upgrading their relief endeavours. They are additionally urged to move after some time towards
economywide outflow decrease or restriction focuses in the light of various national conditions.
Nations will set national focuses for decreasing ozone depleting substance discharges like clockwork.
In excess of 180 nations have just submitted focuses for the primary cycle starting in 2020.
Major Deliverables
According to reports by the Intergovernmental Panel on Climate Change (IPCC), “global warming
beyond 2 degrees Celsius will lead to a rise in the number of extreme climate events. A major goal of
the Paris agreement, therefore, is to keep global temperature increase well below 2 degrees Celsius
and to pursue efforts to limit it to 1.5 degrees Celsius. The pact and its progress will be reviewed every
five years. In addition, the developed countries have pledged $100 billion a year in climate finance for
developing countries by 2020 with a commitment to further raise it in the future.” While there is no
penalty for countries that miss their targets, the agreement has transparency rules to help encourage
countries do achieve their obligations.
India’s Importance
The significance of New Delhi’s support to the climate pact lies in the fact that India accounts for over
4% of global emissions and is crucial for crossing the threshold mark of 55%. The world’s top two
polluters—the US and China —that together account for 40% of global carbon emissions, have already
ratified the document. Once the 55% barrier is crossed, the climate regime will become legally binding
on all signatories after a period of 30 days.
India’s Obligations
The three key moral commitments India has made at Paris are as follows
1. The country had committed to reducing its emissions intensity by 3335 per cent by 2030, compared
with 2005 levels. Since it seems to have achieved about 1215 per cent efficiency improvements in the
last decade, India is on target to easily achieve its target and could even exceed it.
India has tried to balance its carbon emissions with its economic growth objectives by not setting an
outright pollution reduction goal. But, being a part of the global climate change regime, India will have
significant obligations to meet under the treaty. The country will have to reduce its carbon footprint
by 3335% from its 2005 levels. This has to be achieved by 2030.
2. A key result area for India will come in the form of the reduction of emission intensity targets, which
basically is the volume of emissions per unit of gross domestic product (GDP). “The country will have

327 MGNCRE | Community Resilience and Disaster Management
to diversify its power generation sources and shift them significantly towards renewable energy
sources to reduce volumes of emissions per unit of GDP. In numbers, by 2025, India will need a 175
giga watt power production capacity from non-fossil fuel sources.
The private sector accounts for more than half of the electricity consumption in India. Commercial
buildings account for only 9 per cent of the total power consumption in the country. However, the
commercial sector is growing fast, and efficiency improvements here can make a big difference to the
country’s future power consumption and hence total emissions. Since most of the big projects in the
country are yet to come, energy experts see it also an opportunity to move to cutting edge technology
quickly.
So far, the energy efficiency movement in the private sector has had little to do with government
regulations. According to the non-profit Carbon Disclosure Project, more and more Indian companies
are now reporting their energy productivity data voluntarily.” Data in the last three years show that
the reporting companies are making improvements in energy efficiency.
The country is planning to boost its energy production from renewable sources to 40 percent of total
by 2030. In order to achieve this target, the government has set fivefold increase in renewable energy
capacity in the next five years to 175 gigawatts. Of the 175 gigawatts of renewable energy that India
plans to create, 100 gigawatts are just solar energy. Compare this with the world’s current solar
capacity of about 200 gigawatts. India’s current capacity is just 5 gigawatts, according to the consulting
from Bridge to India, but rapidly growing. India has to create 60 gigawatts of wind power while the
current capacity is about 25 gigawatts. Paradoxically, despite the current problems in wind power in
India, experts say that wind power targets are far easier to achieve than solar targets. India’s electricity
consumption starts rising when the sun begins to go down, and so a high proportion of solar energy
will affect grid stability. Wind, on the other hand, does not go down completely at any point. In many
places, it blows harder at night and early mornings, when solar power is either absent or present in
negligible amounts. So, wind power is considered a perfect balance to large solar plants. India’s wind
power potential has been revised of late from 48 gigawatts to above 1000 gigawatts, as the
assessments of potential have now been done at a higher altitude.
3. India’s third commitment is to increase the forest cover of the country and absorb 2.5 to 3 giga
tonnes of carbon from the atmosphere. “The treaty requires India to increase its forest cover by five
million hectares along with an improvement in the quality of green cover of an equal measure. It is
expected that increased forest coverage will help India absorb massive carbon emissions from the
atmosphere.
This means creating another five million hectares of forest, and improving the quality of another five
million hectares of forest. Forestry experts see some problems here as well. India’s definition of forests
is ambiguous, and includes even tree cover in urban areas. While that may be enough for removing
carbon from the atmosphere, it may not serve the country’s social goals as much. Even if India fulfils
all its INDC commitments (Intended Nationally Determined Contributions for reducing greenhouse gas
emissions), the country’s emissions are set to rise significantly.”
According to the consortium Climate Action Tracker, India’s emissions will increase 90 per cent by
2030, if current policies are any indication. This is due to the high absolute growth in thermal power,

328 MGNCRE | Community Resilience and Disaster Management
as the current base of thermal power is very large. A doubling of emissions will put Indian emissions
at about 9 per cent of the global total by 2030, compared to about 6 per cent now. India’s per capita
emissions will still be low, but its population is expected to grow for another six decades.
References
1. "15 Years of International Cooperation on Disaster Response". International Charter
Newsletter. International Charter Space and Major Disasters. p. 5.
2. "Global Ebola outbreak deaths exceed 4,000 WHO". BBC News. 10 October 2014.
3. Hyogo Framework for Action, UNISDR.
4. International Charter on Space and Major Disasters // International Symposium on Remote
Sensing Applications to Natural Hazards, Washington, D.C. 12 September 2007, Barbara J.
Ryan (Associate Director for Geography, U. S. Geological Survey).
5. Programme of Action for the Least Developed Countries for the Decade 2011 2020
A/CONF.219/3, Istanbul, 2011.
6. Report of the first World Conference on Natural Disaster Reduction A/CONF.172/9,
Yokohama, 27 September 1994.
7. Report of the second World Conference on Disaster Reduction A/CONF.206/6, Kobe, Japan,
March 2005.
8. Report of the World Summit on Sustainable Development A/CONF.199/20, Annex, IV
Paragraph 37, Johannesburg, September 2002.
9. Sendai Framework for Disaster Risk Reduction 20152030, UNISDR.
10. Special Representative of the Secretary General for Disaster Risk Reduction, UNISDR.


Contents
Chapter 1 Understanding Entrepreneurial Framework
1.1 Social Entrepreneurship – An Introduction
1.2 Forms of Social Entrepreneurship
1.3 Theory of Change
1.4 Creating Social Change
1.5 Sustainable Development
Chapter2 Building a Sustainable Business Model
2.1 The Business Model
2.2 Financial Management
2.3 Marketing and Human Resource Management
2.4 Performance Management
2.5 The future – Challenges Ahead
Chapter3 Civil Society and NGO – A Glimpse
3.1 Introduction to Civil Society
3.2 Types of Civil Society Organizations
3.3 Setting up the Organization
3.4 Strategizing Operations
3.5 Organizational Governance and Administration
Chapter 4 Managing Civil Society and NGO
4.1 Human Resource Management
4.2 Financial Management
4.3 Fund Management Procedures
4.4 Project Management in NGOs
4.5 Project Life Cycle
Chapter 5 Corporate Social Responsibility
5.1 Introduction to Corporate Social Responsibility (CSR)
5.2 Principles of CSR
5.3 CSR as a Strategy
5.4 CSR in India
5.5 Future of CSR

331 MGNCRE | Social Entrepreneurship
Chapter 1
Understanding Entrepreneurial Framework
Introduction With the growing need of sustainability in business development, the emergence of business tools to
find solutions to the problems at distinct levels has emerged. This has resulted in the development
of initiatives to improve the community and hence benefit the society at large. Social
entrepreneurship deals with the recognition of social problems and attaining a social change by
using entrepreneurial principles, processes, and operation. This unit introduces the concept of social
entrepreneurship and further delineates the characteristics of social entrepreneurs and concludes
with the global scenario of social entrepreneurship.
Objectives
• To understand the concept of social entrepreneurship.
• To identify the various forms of social entrepreneurship.
• To understand the theory of change, transformative nature of social entrepreneurship
• To Identify the social business opportunities
• To gain insights into the Millennium Ecosystem Assessment
Structure
1.1 Social Entrepreneurship
The concept of social enterprise is increasingly used to identify a ‘different way’ of doing business,
which occurs when enterprises are created specifically to pursue social goals. Social
entrepreneurship is defined as “innovative, social value-creating activity that can occur within or
across the nonprofit, government, or business sectors”. It can be observed here that on a broader
front, all enterprises, whether commercial or social, aim at generating social value. In this context, a
social enterprise primarily aims at creating social value, as opposed to magnifying shareholder
wealth.
1.1 Social Entrepreneurship – An Introduction
1.2 Forms of Social Entrepreneurship
1.3 Theory of Change
1.4 Creating Social Change
1.5 Sustainable Development

332 MGNCRE | Social Entrepreneurship
The European Commission gives the term ‘social enterprise’ the following meaning ‘an operator in
the social economy whose main objective is to have a social impact rather than make a profit for
their owners or shareholders. It operates by providing goods and services for the market in an
entrepreneurial and innovative fashion and uses its profits primarily to achieve social objectives. It is
managed in an open and responsible manner and, in particular, involves employees, consumers and
stakeholders affected by its commercial activities’ (Social Business Initiative, October 2011).
Following are some of the features of social entrepreneurship
• Having a social purpose
• Engaging in trading activities to achieve social purpose (at least in part)
• Not distributing profits to individuals
• Holding assets and wealth in trust for community benefit
• Democratically involving members of its constituency in governance of organization
• Independent organization with accountability to defined constituency & wider community
The Socio-Economic Context of Social Entrepreneurship
The socio-economic context of social entrepreneurship can be explained with the help of the
following quotation.
“Today the public interest is not only served by the government, but also by new private actors, for
example social entrepreneurs.” - Professor Jacques Deformed (Moneystore.be, February 2013).
If we go through the concept of social entrepreneurship, it can be observed that social
entrepreneurship overlaps with the traditional nomenclature of the socio-economic organizations.
Social entrepreneurship is defined as dealing “with the recognition of social problems and attaining a
social change by using entrepreneurial principles, processes, and operation”. It is all about making a
research to completely define a particular social problem and then organizing, creating, and
managing a social venture to attain the desired change. The change may or may not include a
thorough elimination of a social problem. It may be a lifetime process focusing on the improvement
of the existing circumstances.
While a general and common business entrepreneurship means taking a lead to open up a new
business or diversifying the existing business, social entrepreneurship mainly focuses on creating
social capital without measuring the performance in profit or return in monetary terms. Along with
social problems, social entrepreneurship also focuses on environmental problems. Child Rights
foundations, plants for treatment of waste products, and women empowerment foundations are
few examples of social ventures. Social entrepreneurs can be those individuals who are associated
with non-profit and non-government organizations that raise funds through community events and
activities. The key distinguishing factor between social enterprises and conventional enterprises is
the underlying objective, which in case of social enterprise is the social purpose. An indicator of this
social purpose is that the majority of any profits are reinvested or otherwise used to achieve the
social mission of the enterprise.

333 MGNCRE | Social Entrepreneurship
Social Entrepreneur vs. Social Entrepreneurship
Figure 1.1 Social Entrepreneur vs. Social Entrepreneurship
History of Social Entrepreneurship
The terms Social Entrepreneur and Social Entrepreneurship emerged into common parlance in the
early 1980s, when Bill Drayton identified this process as a form of entrepreneurship that tried to find
solutions to varied problems of humankind, especially the poor and the marginalized, in an
entrepreneurial manner (Drayton, 2002). The following figure illustrates India’s stand on social
entrepreneurship.
•Anyone who starts a social enterprise (SEFORIS, 2015)
•Anyone who uses earned incoem to deliver a social mission (Boschee and McClurg, 2003)
•ANyone who engages successfully in social innovation (Dees, 2003; Defourney and Nyssens, 2014)
Social Entrepreneur
•A process that starts with the recognition of an opportunity to deliver a social benefit (Martin and Thompson, 2010); may be stating a business (Choi and Majumbar, 2014)
•It is a practice that extends to firms and communities and applies same entrepreneurship theories, albeit it has social as well as finnacial impacts (Alvin C. Jones, 2010)
Social Entrepreneurship

334 MGNCRE | Social Entrepreneurship
Figure 1.2 History of Social Entrepreneurship
Characteristics of Social Entrepreneur
The key characteristics of social entrepreneurs (Dees, 2017) are as follows.
Figure 1.3 Characteristics of Social Entrepreneurs
Social Entrepreneurship Vs. Charity
Although, social entrepreneurship and charity share similar objectives of benefitting the society at
large by creating long-term solutions to complex problems, charities are limited in their scope of
work as they primarily focus on the ‘vulnerable groups’ in societies. On the contrary, social
entrepreneurs tend to deal with much wider issues that pertain to the quality of life vis-à-vis
environment protection, employment, access to clean water and healthy food, immigration,
education, energy, corruption, and democracy, among others.
1997 India's first social venture Capital firm Grassroots Innovations.
2001 India sawits first impact invetsment in 2001 when Acumen Fund invested in Aravind Eqye Hospital.
2007 India's first Social Enterprise related Academic course- Tata Institute of Social Sciences, Mumbai
2009 Sankalp Summit in 2009, Sankalp Forum hosted the first social enterprise focussed gathering in Mumbai.
2013 Companies Act, 2013, the Act mandates the corporates spend 2% of their net profiles on CSR.
Focus on social problems
Charitable consciousness-
business strategy Integration
Strategic thinkers
Mission driven Focussed ResourcefulResults
oriented
Challenge seekers
Perseverance Innovative Change agent Opinion leader Accountability Visionary

335 MGNCRE | Social Entrepreneurship
Figure 1.4 Social Entrepreneurship vs. Charity
The present section introduces to the concept of social entrepreneurship and also highlights the
emergence of the concept. The unit also talks about the key characteristics of social entrepreneurs,
which determine the success of the social enterprise. We then discuss the differences between
social entrepreneurship and charity.
1.2 Forms of Social Entrepreneurship
This section throws light on the different forms of social entrepreneurship. As discussed in unit I,
social entrepreneurship is different from traditional entrepreneurship and aims at solving complex
social issues. This unit explains the forms of social entrepreneurship with special reference to the
profit and non-profit social entrepreneurship.
The different forms of social entrepreneurship can be categorized broadly into two heads, namely,
for profit and not for profit entrepreneurships. The following figure highlights the distinction
between the two forms based on the concept of social entrepreneurship and its underlying nature of
integrating the commercial and social outcomes.
A social enterprise is an organizationthat applies commercial strategies tomaximize improvements in humanand environmental well-being—thismay include maximizing social impactalongside profits for externalshareholders.
A charitable organization is a type ofnon-profit organization, which centerson philanthropic goals as well as socialwell-being, which gathers no profit.
To Do Activity
Think of any one social enterprise and one business enterprise. Compare and contrast the
working business models for both and them and write down the pros and cons of each
entrepreneurship model.

336 MGNCRE | Social Entrepreneurship
Figure 1.5 Forms of Social Entrepreneurship
(Source Gandhi and Raina, 2018)
A detailed description of these two broad categories is given below
Figure 1.6 The Entrepreneurship Spectrum Illustrating the Boundaries of Social Entrepreneurship
(Source Safina, 2012)
For Profit Social Entrepreneurship
A for profit social entrepreneurship undertakes social and commercial entrepreneurial activities with
the objective of achieving sustainability. In this case, the nature of organization in which a social
entrepreneur operates is an integration of the social and the commercial. Also, such an organization
is financially independent and has the potential to benefit its stakeholders, viz. the founders as well
as the investors by providing the personal monetary gain.
Not for profit Social Entrepreneurship
In contrast to the for-profit entrepreneurship, a not for profit social entrepreneurship strives to
achieve self-sufficiency by undertaking hybrid commercial and social entrepreneurial activities. Thus,
in this case, the organization in which a social entrepreneur operates is both social and commercial.

337 MGNCRE | Social Entrepreneurship
It may be noted that here, the profits and revenues that are generated out of the activities are
utilized towards improving the delivery of social value in a more effective manner.
Factors determining the selection of forms of Social Entrepreneurship
The choice of the form of social entrepreneurship is based on a number of factors. The key criteria
that need to be taken care of while making a choice pertain to the distinction in these two forms
based on the following parameters.
Figure 1.7 Parameters for Selecting the form of Social Entrepreneurship
The Factors are Primarily Categorized into Two Domains
• Environmental factors
o Internal environmental factors
o External environmental factors
• Personal factors
The following figure describes the components of these factors in detail.
Figure 1.8 Factors Determining the Selection of forms of Social Entrepreneurship
(Source Faruk, Hasan and Islam, 2016)
Ownership
Transparency
Profits
Market
Capital
Control

338 MGNCRE | Social Entrepreneurship
The present section describes the two broad domains of social entrepreneurship – for profit and not
for profit social entrepreneurship. A for profit social entrepreneurship undertakes social and
commercial entrepreneurial activities with the objective of achieving sustainability. In contrast to the
for-profit entrepreneurship, a not for profit social entrepreneurship strives to achieve self-sufficiency
by undertaking hybrid commercial and social entrepreneurial activities. We also discussed the key
factors that influence the choice of form of social entrepreneurship by analyzing the environmental
as well as the personal factors.
1.3 Theory of Change
This section examines the nature of social entrepreneurship and highlights the underlying theory of
change that lays the theoretical foundation for understanding the role of social entrepreneurship as
a transformative change.
Social Entrepreneurship as a Transformative Change
Table 1.1 Social Entrepreneurship vs. Business Entrepreneurship
Basis of Distinction Social Entrepreneurship Business Entrepreneurship
Emphasis on
Individual vs. Team
The focus is more on gauging the
feasibility of the project on the basis of
individuals.
In this case, the decisions for the
viability of the project are on the basis
of team leadership.
Perceptions of Value The value is reflected in the social
benefit that is derived by the
community at large and is attributable
to the transformation witnessed in a
vulnerable community.
The value is reflected in the profits of
the enterprise, which are distributed
among the shareholders and other
stakeholders.
Measure of
Profitability
The profitability of social enterprise is
measured by the contribution made to
support the social causes. Hence, social
entrepreneurship can be regarded as a
not for profit entrepreneurship.
The profitability of business
entrepreneurship is measured through
the benefits obtained by the
stakeholders out of the profits earned
by the organization.
Approach to wealth
creation
The wealth is created by a social
entrepreneur in order to transform
community and hence, effect a social
change.
The wealth created by a business
entrepreneurship is primarily drive by
the innovation integrated with the
commercial strategies so as to provide
direct benefit to the consumers.
To Do Activity
Identify up to 5 social entrepreneurs in your area. Classify them based on their objective
(For profit or not for profit etc.). Discuss with them how they made the selection of the
form of social enterprise. Write a one-page report on your observations.

339 MGNCRE | Social Entrepreneurship
Target population
Who are you seeking to benefit or influence?
Results
What benefits are you seeking to achieve?
Time period
When will you achieve the results?
Strategies
How will you and others implement the strategies?
Context
Where & under what circumstances will you do your work?
Assumptions
Why do you believe your theory will bear out?
Social entrepreneurship deals with the application of commercial strategies to solve complex social
problems. This asserts that social entrepreneurship defines the challenges and applies theory of
change to determine the different ways in which the social entrepreneurs can address these
complex problems and solve them by using a specific set of interventions.
These are illustrated below:
Figure 1.9 Social Business Model vs. Traditional Business Model
(Source https//www.ericsson.com/en/trends-and-insights/networked-society-insights/social-
business)
Theory of Change
Theory of change is described as a strategy that delineates the different ways in which a social
enterprise will effect social change. The strategy is characterized as
• Specific
• Measurable
• Contextualized
The theory of change primarily addresses the following questions
Figure 1.10 Theory of Change – Foundation

340 MGNCRE | Social Entrepreneurship
The following figure explains in detail the key components of change. It highlights the plans of the
organization in terms of its inputs and activities and also the expected results in terms of outputs,
outcomes and impact.
Figure 1.11 Theory of Change – Plan and Expected Outcomes
(Source https//rankandfilemag.com/issue-10/theory-of-change-guide-for-social-impact-modeling/)
Activity
Based on the theory of change foundation and plans and outcomes, create your own change plan in
the following activity chart
(Source https//diytoolkit.org/tools/theory-of-change/)
In this section, we discussed about the role of social entrepreneurship as a transformative change
agent. The basic objective of social entrepreneurship is to solve complex social problems by
implementing the specific set of interventions. We then described the foundational questions that
the theory of change addresses along with its plans and expected outcomes.

341 MGNCRE | Social Entrepreneurship
1.4 Creating Social Change
This section introduces you to the process of creating social change. The process of creating this
change is contingent upon certain factors such as the social value, legal structure, and community
mapping, among others. This unit will provide detailed information on the key issues and concerns
for creating a social change.
Social Business Opportunities
From the definition of social entrepreneurship, it can be asserted that social entrepreneurship aims
at supporting a social cause. Hence, the opportunities for social entrepreneurs can be attributed to
the need for creating social value so as to benefit the community at large. The most common path
followed to achieve this objective is to identify the vulnerable segment of the society and find out
their areas of needs. A social entrepreneur then tries to formulate the strategies to solve these
problems and contribute towards the upliftment and development of that vulnerable community.
Thus, we can say that the key motivation for driving social entrepreneurship is the creation of social
value as opposed to the creation of wealth. It integrates the profit as well as non-profit ventures so
as to generate positive returns for the society at large. In short, the prime focus of social
entrepreneurship is to resolve environmental, social, and cultural issues and not maximizing the
financial gains.
Legal Structure
A legal structure may be defined as the legal business structure that a social organization may take.
A legal structure determines the operations of the organization by defining the elements vis-à-vis
amount of tax liability, eligibility for the grant in aid or the investments etc. For social
entrepreneurship, there are different types of legal structures that can be employed while setting up
an enterprise. However, due to diverse rules and complexities involved for each structure, it is very
important to decide the legal structure judiciously. Some of the examples of legal structures in India
include the following
• Unincorporated association
• Sole Trader
• Trust
• Partnership
• Company Ltd by Shares (CLS)
• Charitable Incorporated Organization (CIO)
• Company Ltd by Guarantee (CLG)
• Community Interest Company, limited by guarantee (CIC – CLG)
• Community Interest Company, limited by shares (CIC – CLS)
• Limited Liability Partnership
• Community Benefit Society (CBS)
• Co-operative Society (previously IPS)
To Do Activity
Think of up to 3 social entrepreneurial ideas. For any one of them, assess what all are the
potential contributions to the community and the society if the idea is implemented
successfully.

342 MGNCRE | Social Entrepreneurship
Community Asset Mapping
The term “community asset mapping” may be defined as a tool that provides a framework to target
the local audience and to further engage them in the activities of a social enterprise. In simple
words, it looks at the community through a transformed lens. The prime objective behind
community asset mapping is to involve the community and take it ahead as a part of the social
venture and hence strive towards the overall sustainable growth and development of community at
large. The process of community asset mapping involves the following steps
Figure 1.12 Steps Involved in Community Asset Mapping
A sample community asset map is given below
Figure 1.13 Sample Community Asset Map
(Source https//myemail.constantcontact.com/The-Vitality-of--ABDC-and-the-Movers---Shakers-in-
Research-Action-for-a--Healthy---Wealthy-Continental-African-
Population.html?soid=1105463482084&aid=Sn8r3-QFKeA)
Collecting an inventory of all the good things
about your community
•Step 1
Ranking the most valued
aspects of your community
•Step 2
Identifying what community assets are
valuable for your social enterprise.
•Step 3
Determining the ways of
preserving the community
assets
•Step 4

343 MGNCRE | Social Entrepreneurship
Social Value Proposition
A social value proposition (SVP) defines the "cause" or driving "force" behind a social enterprise. It
plays a significant role for the company by stating the social cause for the setting up the
organization. It may be noted here that as the social enterprise grows, the focus shifts from the
initial social value proposition to the internal organizational growth. Hence, it can be argued that
social value proposition plays a central role in defining the operations of the company. The following
figure illustrates this concept in more detail
Figure 1.14 Social Value Proposition
(Source Social Entrepreneurship Framework (Skillen et al., 2007, Entrepreneurship in the Social
Sector)
This unit throws light on the social change that the social entrepreneurship aims to achieve. It first
emphasizes on the process of social change and also the factors that influence this process. The
process of creating this change is contingent upon certain factors such as the social value, legal
structure, community mapping etc. All these factors are discussed in detail in the unit.
1.5 Sustainable Development
This section lays emphasis on the sustainable development in context of social entrepreneurship. It
describes the concept of sustainability and its importance for the community. Social
entrepreneurship aims at adopting innovative measures to effect social changes, taking into
consideration the social and ecological spheres.
To Do Activity
Search on the internet or in other sources and identify the various incentives that are offered
by the Government of India for promoting social entrepreneurship in India. Analyze the
change brought in by these initiative in terms of growth of entrepreneurial set ups in the
country.

344 MGNCRE | Social Entrepreneurship
Concept of Sustainable Development and its Importance
In business parlance, the concept of sustainable development can be defined as follows “For the
business enterprise, sustainable development means adopting business strategies and activities that
meet the needs of the enterprise and its stakeholders today while protecting, sustaining and
enhancing the human and natural resources that will be needed in the future.” (International
Institute for Sustainable Development, 1992, p. 11). The purpose of sustainable development
revolves around balancing our social, economic, and environmental needs, thereby allowing
prosperity for both ‘now’ and ‘future’ generations. The following figure depicts the concept of
sustainability.
Figure 1.15 Sustainable Development and Social Entrepreneurship
(Source Warden, 2016)
Factors Affecting the Sustainable Development
The factors that determine the extent of sustainability are categorized into three spheres. From a
wider perspective, it is evidently in the interest of the business to operate within a healthy
environment and economy. It is a widely accepted notion that the growing and sustainable
economies in the developing countries together will provide the greatest prospects for expanding
markets. These factors are also described in the figure below.

345 MGNCRE | Social Entrepreneurship
Figure 1.16 Factors Affecting Sustainable Development for Social Entrepreneurship
(Source Chris, 2018)
The Millennium Ecosystem Assessment
Millennium Ecosystem Assessment, 2005 is defined as “An assessment of the consequences of
ecosystem change for human well-being and the scientific basis for action needed to enhance the
conservation and sustainable use of those systems and their contribution to human well-being
(called for by the United Nations Secretary-General in 2000)”. The Millennium Assessment emphases
on
• How humans have transformed the ecosystems?
• How these changes in the ecosystem services have further influenced human well-being?
• How ecosystem changes may affect people in future decades?
• What types of responses can be adopted at local, national, or global scales to improve
ecosystem management and thereby contribute to human well-being and poverty
alleviation?
The details about the assessment can be found at https//youtu.be/aIGeYfQGZeg
To Do Activity
Observe the present business scenario and prepare a millennium ecosystem assessment
framework. From this framework, identify one major change that you would like to introduce
through social entrepreneurship venture.

346 MGNCRE | Social Entrepreneurship
Figure 1.17 Millennium Ecosystem Assessment
(Source Wang et al., 2015)
This Section lays emphasis on the sustainable development in context of social entrepreneurship.
Social entrepreneurship aims at adopting innovative measures to effect social changes, keeping into
consideration the social and ecological spheres. The purpose of sustainable development revolves
around balancing our social, economic and environmental needs, thereby allowing prosperity for
both ‘now’ and ‘future’ generations. The following figure depicts the concept of sustainability. From
a wider perspective, it is evidently in the interest of the business to operate within a healthy
environment and economy.
Model Questions
1. How is social entrepreneurship different from charity?
2. What are the different forms of social entrepreneurship?
3. How does social entrepreneurship effect social change?
4. Explain in detail the concept of community asset mapping.
5. What is social value proposition? Why is it important for a social entrepreneurship?
6. What is sustainable development? What are the elements of sustainable development?
7. Explain Millennium Ecosystem Assessment in detail.
Suggested Readings
1. “5 Bad Reasons to Start a For-Profit Social Enterprise” – Rich Leimsider, Harvard Business
Review, 2014.
2. 5 Things Great Social Entrepreneurs Do Differently – Tori Utley, Forbes (2018).
3. Deep Optimism the Unique Outlook of Social Entrepreneurs – Devin Thorpe, Forbes (2018).

347 MGNCRE | Social Entrepreneurship
4. Getting Beyond Better How Social Entrepreneurship Works – Roger Martin and Sally, HBRP,
2015
5. How Social Entrepreneurs Change the World – Steve Denning, Forbes, 2015
6. How Social Entrepreneurs Make Change Happen - Roger L. Martin and Sally R. Osberg,
Forbes, 2015
7. How to Create a Business that does Good with a Social Enterprise – Dr. Pragya Aggarwal,
Forbes, 2018.
8. International Institute for Sustainable Development (1992). “Business Strategy for
Sustainable Development, Leadership and Accountability for the ’90s”
9. International Institute for Sustainable Development, Winnipeg (2003). “MA conceptual
Framework in Ecosystems and Human Well-being A Framework for Assessment,” Island
Press.
10. Opportunities for Social Entrepreneurs In India – Samiksha Jain, Entrepreneur India, 2016
(can be retrieved from https//www.entrepreneur.com/article/273849).
11. Social Entrepreneurship and the Bottom of the Line – Jason Harbert
12. The For-profit Social Enterprise is the Impact Model of the Future – Pragya Narula and
Forbes Technology Council, 2017.
13. The Rise of The Social Enterprise A New Paradigm for Business – Josh Berlin, Forbes (2018).
14. The Rise of the Social Entrepreneur – Charles Leadbeater.
15. The state of social enterprise in India - British Council, 2016 (can be retrieved
fromhttps//www.britishcouncil.org/sites/default/files/bc-report-ch4-india-digital_0.pdf).
16. What Makes Social Entrepreneurs Different – Bright B. Simons, Harvard Business Review,
2013
References
1. Abu-Saifan, S. (2012). “Social entrepreneurship definition and boundaries. Technology
innovation management review,” 2(2), 22-27.
2. Brosche, J., & McClurg, J. (2003). “Toward a better understanding of social entrepreneurship
Some important distinctions,” Retrieved October, 9, 2008.
3. Choi, N., & Majumdar, S. (2014). “Social entrepreneurship as an essentially contested
concept Opening a new avenue for systematic future research,” Journal of business
venturing, 29(3), 363-376.
4. Community Asset Mapping and Financial Sustainability (retrieved
fromhttps//ebrary.net/8650/business_finance/community_asset_mapping_financial_sustai
nability, accessed on 18/2/2019 at 12.41 pm)
5. Dees, J. G. (2003). “Social entrepreneurship is about innovation and impact, not
income,” Social edge.
6. Dees, J. G. (2017). “1 The Meaning of Social Entrepreneurship. In Case Studies in Social
Entrepreneurship and Sustainability,” 34-42. Routledge.
7. Differences Between Social Entrepreneurs & Business Entrepreneurs – Daria Kelly Uhlig,
June, 2018 (retrieved from https//smallbusiness.chron.com/differences-between-social-
entrepreneurs-business-entrepreneurs-36624.html, accessed on 18/2/2019 at 11.07 am)
8. Drayton, W. (2002). “The citizen sector Becoming as entrepreneurial and competitive as
business,” California management review, 44(3), 120-132.
9. Economies of Scale in Sustainability – Sara Warden, 2016 (retrieved from
http//www.renewableenergymexico.com/economies-of-scale-in-sustainability/, accessed on
18/2/2019 at 2.55pm)

348 MGNCRE | Social Entrepreneurship
10. European Research Institute on Cooperative and Social Enterprises (2013). Social economy
and social entrepreneurship, Social Europe guide, European Union, Luxembourg
Publications.
11. Faruk, M., Hassan, N., & Islam, D. (2016). “Factors Influencing the Development of Social
Entrepreneurship in Bangladesh.”
12. Gandhi, T., & Raina, R. (2018). “Social entrepreneurship the need, relevance, facets and
constraints. Journal of Global Entrepreneurship Research,” 8(1), 9.
13. Hassan R, Scholes R, Ash N (eds) (2005).“Millennium Ecosystem Assessment Ecosystems and
Human Wellbeing, “Current State and Trends, 1, Island Press, Washington
14. How to Identify a Social Entrepreneurship Opportunity (retrieved
fromhttps//www.toppr.com/guides/business-management-and-entrepreneurship/social-
entrepreneurship/how-to-identify-a-social-entrepreneurship-opportunity/ , accessed on
18/2/2019 on 12.02 pm)
15. https//diytoolkit.org/tools/theory-of-change/
16. https//rankandfilemag.com/issue-10/theory-of-change-guide-for-social-impact-modeling/
17. https//www.ericsson.com/en/trends-and-insights/networked-society-insights/social-
business
18. International Institute for Sustainable Development (1992). “Business Strategy for
Sustainable Development, Leadership and Accountability for the ’90s”, International
Institute for Sustainable Development, Winnipeg
19. Jones, C. (2010). “Entrepreneurship education revisiting our role and its purpose,” Journal of
Small Business and Enterprise Development, 17(4), 500-513.
20. Martin, F., & Thompson, M. (2010). “Social Enterprise Developing Sustainable Businesses,”
Palgrave Macmillan.
21. Nyssens, M., &Defourny, J. (2014). “The EMES approach of social enterprise in a comparative
perspective,” In Social Enterprise and the Third Sector, 58-81. Routledge.
22. Selecting a legal structure for your social enterprise, School for Social Entrepreneurs
(retrieved from https//www.the-sse.org/resources/starting/selecting-a-legal-structure-for-
your-social-enterprise/, accessed on 18/2/2019 at 12.13 pm)
23. The Environmental, Economic, and Social Components of Sustainability – Wanamaker, 2018
(retrieved from https//soapboxie.com/social-issues/The-Environmental-Economic-and-
Social-Components-of-Sustainability, accessed on 18/2/2019 at 3.24 pm)
24. Theory of Change. (retrieved from https//www.futurelearn.com/courses/social-enterprise-
idea-action/0/steps/18830, accessed on 18/2/2019 at 11.36 am)
25. Wei-Skillen, J., Austin, J. E., Leonard, H., & Stevenson, H. (2007). “Entrepreneurship in the
social sector,” 13, Sage.
26. Why Social Enterprise Matters An Examination Into the Role of Social Enterprise to Solve
Social Problems – Akola, Change Creator, 2017 (retrieved
fromhttps//changecreator.com/blog/2017/10/10/why-social-enterprise-matters-an-
examination-into-the-role-of-social-enterprise-to-solve-social-problems/, accessed on
18/2/2019 at 12.08 pm)
27. Yang, W., Dietz, T., Kramer, D. B., Ouyang, Z., & Liu, J. (2015). “An integrated approach to
understanding the linkages between ecosystem services and human well‐being,” Ecosystem
Health and Sustainability, 1(5), 1-12.

349 MGNCRE | Social Entrepreneurship
Chapter 2 Building A Sustainable Business
Model
Introduction A deeper understanding about sustainability is a must for every business. We can say that a
sustainable company is one which has its objectives, purpose and actions equally aligned in financial,
economic and social concerns. Achieving sustainability for a business is a tough task and not an easy
one. It includes many complexities and issues that are to be taken care of.
Role of business model in social venture
Objectives • To understand role of business model in a social venture and social impact theory
• To gain insight in to the source of funding for social entrepreneurs
• To gain insight on the various social marketing strategies
• To learn to apply various tools for measuring impact
• To describe the challenges for social entrepreneurs
Structure
2.1 The Business Model
We can define a business model as a structure, design or framework that a business has to follow in
order to ensure value to its customers and clients. Social enterprises apply the solutions of the
business problems to the social problems and try to find out solutions for the same. Their major
objective is to achieve sustainability by enabling the nonprofit organizations to be able to support
themselves financially rather than being dependent on donations and government grants.
2.1 The Business Model
2.2 Financial Management
2.3 Marketing and Human Resource Management
2.4 Performance Management
2.5 The future – Challenges Ahead

350 MGNCRE | Social Entrepreneurship
Figure 2.1 Social Venture and Sustainability
(Source The Four Lenses Strategic Framework, Virtue Ventures LLC, 2010; A.T. Kearney Analysis)
Equitable Distribution of Value
The utmost important factor for any business model is the value proposition. It is really very
important that the products and services yield tangible and profitable results for the target
customers of the company. It’s the concept of value proposition that will distinguish a company from
its competitors. For any company possible areas for innovation and adaption are certainly
production and marketing. It will include all the set of activities related to providing and marketing of
a good or service to the consumer. At the production side it will consist of activities related to
creation of value and from the marketing perspective the activities will lead to capturing of value.
The Business Model Canvas
Business Model Canvas is defined as strategic management and lean startup template for developing
new or documenting existing business models. It is a visual chart with elements describing a firm's or
product's value proposition, infrastructure, customers, and finances. It assists firms in aligning their
activities by illustrating potential trade-offs.

351 MGNCRE | Social Entrepreneurship
r
Figure 2.2 The Business Model Canvas
(Source https//www.eship.ox.ac.uk/business-model-canvas-explained)
A business model canvas will systematically reflect on the business model of the company. This
enable to focus on our business model segment wise. Various points included can be seen in the
above figure.
Social Business Model Framework
A business model can be called a structure design or a framework that is followed by a business to
bring value to its customers and clients. Based upon the above definition we can conclude that a
social business model can be called a structure, design or a framework that a social business follows
so that it can bring a positive change along with maintaining healthy financial returns.
Figure 2.3 Social Business Model
(Source https//www.pngkey.com/detail/u2r5a9e6a9w7w7a9_professor-yunus-believes-such-
projects-might-work-especially/)

352 MGNCRE | Social Entrepreneurship
Social Impact Theory
Social impact theory states that amount of influence experienced by a person in a group setting
depends upon the following factors
• Strength of the group
• Number of people in the group that exert social influence
• Immediacy of the group
This theory is different from the others as it focuses on strength and immediacy. A detailed analysis
is presented below
Figure 2.4 Social Impact Theory
A deeper understanding about sustainability is a must for every business. Social enterprises apply
the solutions of the business problems to the social problems and try to find out solutions for the
same. The utmost important factor for any business model is the value proposition. It is really very
important that the products and services yield tangible and profitable results for the target
customers of the company. A business model canvas will systematically reflect on the business
model of the company. This enables to focus on our business model segment wise.
2.2 Financial Management
Financial Management is defined as “planning, organizing, directing and controlling the financial
activities such as procurement and utilization of funds of the enterprise.” In other words, it is the
application of general management principles to the financial resources of the enterprise. Since the
underlying objective of setting up a social enterprise is to effect social change and provide solutions
to the complex social problems, the element of financial management becomes more crucial in case
•Strength of the source/ target
•Ex expertise, powerStrength
•Immediacy of source to target
•Ex physical distance, psychological distanceImmediacy
•Number of sources relative to targets
•Ex OverpowerNumber of sources
To Do Activity
Take any social enterprise of your choice that is accessible to you. Prepare a social business
model for that enterprise.

353 MGNCRE | Social Entrepreneurship
of social entrepreneurship. This unit will highlight the various elements of financial management in a
social enterprise.
Finance Networking
“A financial network is a concept describing any collection of financial entities (such as traders, firms,
banks and financial exchanges) and the links between them, ideally through direct transactions or
the ability to mediate a transaction.” (Nagourney and Key, 2001)
Figure 2.5 Financial Management in Social Entrepreneurship
(Source Christina Moehrle, Social Finance Academy, June 22, 2018)
Sources of Funds
Because of the fact that the structure of social enterprises is distinct from a traditional business or
charity enterprise, the sources of funds for these social entrepreneurs are also different. Broadly,
their sources of funds may include investments, grants or a combination of both.
Figure 2.6. Sources of Funding for Social Entrepreneurship
(Source https//indiamicrofinance.com/main-sources-funding-social-enterprise-india-social-business-
survey.html)

354 MGNCRE | Social Entrepreneurship
How to Raise Capital as a Social Entrepreneur?
1. Detailed information (https//www.youtube.com/watch?v=CWwVJsKMlEI) on raising funds
for social entrepreneurship
Figure 2.7. How to Raise Funds for Social Entrepreneurship?
(Source https//www.pwc.nl/nl/assets/documents/pwc-social-enterprises.pdf)
Achieving Financial Stability
It has been observed that the traditional businesses achieve financial sustainability by either of the
following.
• Growing their revenue.
• Improving their gross margins.
• Improving their operating margins.
• Increasing their free cash flow.
• Efficiently managing capital expenditures.
• Efficiently managing working capital.
• Building their asset base.
In contrast to the traditional business enterprises, social enterprises also aim at achieving the
financial sustainability, except that they value social impact over profit. Also they use the profits for
creating a social impact. This hybrid structure becomes the foundation for achieving the financial
sustainability in social entrepreneurship. Here, in this case, the “income generating activities”,
popularly termed as IGAs, contribute towards achievement of this objective of financial

355 MGNCRE | Social Entrepreneurship
sustainability. These IGAs reduce the dependence on the government agencies or other grant giving
foundations (Shaughnessy, 2012).
Building a Financial Sustainable Model
Figure 2.8 Building a Financial Sustainable Business Model
(Source http//www.4lenses.org/setypology/print)
Financial management is the application of general management principles to the financial resources
of the enterprise. Since the underlying objective of setting up a social enterprise is to effect social
change and provide solutions to the complex social problems, the element of financial management
becomes more crucial in case of social entrepreneurship. A financial network is a concept describing
any collection of financial entities (such as traders, firms, banks and financial exchanges) and the
links between them, ideally through direct transactions or the ability to mediate a transaction.
Because of the fact that the structure of social enterprises is distinct from a traditional business or
charity enterprise, the sources of funds for these social entrepreneurs are also different. Broadly,
their sources of funds may include investments, grants or a combination of both. In contrast to the
traditional business enterprises, social enterprises also aim at achieving the financial sustainability,
except that they value social impact over profit. Also they use the profits for creating a social impact.
This hybrid structure becomes the foundation for achieving the financial sustainability in social
entrepreneurship.
2.3 Marketing and Human Resource Management
This section will throw light upon the basics of Social Marketing its Principles and various marketing
strategies. The unit also describes the concept of Human Resource Management.
To Do Activity
Talk to any social entrepreneur accessible to you. Understand how they assessed their
capital requirements at the time of starting their venture. Understand the various
challenges that they face while raising capital for their venture. What was different
alternatives and how did they make a decision? Write this into a half-page report.

356 MGNCRE | Social Entrepreneurship
Social Marketing
Social Marketing can be seen as an approach which is used to develop activities aimed at changing or
maintaining people’s behavior for the benefit of individual as well as the society. Social marketing is
a combination of commercial marketing and social science. Social marketing is helpful in influencing
behavior in a cost effective and sustainable manner. Click here (https//youtu.be/nf3FW1XhA6s) for
details.
Components of Social Marketing Example of Social Marketing
Figure 2.9. Concept of Social Marketing
(Source https//richtopia.com/strategic-marketing/what-is-social-marketing-how-does-it-work)
Principles of Social Marketing
Social marketing uses commercial marketing principles and techniques to improve the welfare of
people including the physical, social and economic environment in which they reside. Its actually a
very planned and long-term approach to change human behavior. The following figure explains the 8
Benchmark criteria delineating how social marketing works.
Figure 2.10 Principles of Social Marketing

357 MGNCRE | Social Entrepreneurship
Social Marketing Strategies
This strategy is actually a summary of everything we plan to do and what the company hopes to
achieve. It provides a guideline for the company. The strategy must be developed in a proper and
specific way so that it is effective and helpful in the company’s profitability.
Figure 2.11. Social Marketing Strategies
(Sourcehttps//www.slideshare.net/barenblat/viral-marketing-advertising-strategies-for-social-
networks/14-Social_Marketing_Strategy_WHY_WHO)
Human Resource Management
Human resource management, HRM, is the function of a business organization that aims to look
after the hiring, management and firing of staff. HRM focuses on the function of people within the
business, ensuring best work practices are in place at all times. It aims to ensure smooth running of
the business and smooth functioning of the staff within the organization.

358 MGNCRE | Social Entrepreneurship
Figure 2.12. Human Resource Management Concept
(Source https//www.managementstudyhq.com/hrm-models.html)
Figure 2.13 Scope of Human Resource Management
(Source http//www.yourarticlelibrary.com/hrm/human-resource-management-meaning-objectives-
scope-and-functions/35229)
There are a whole lot of functions that HRM includes. They are

359 MGNCRE | Social Entrepreneurship
Figure 2.14 Functions of Human Resource Management
(Source http//www.yourarticlelibrary.com/hrm/human-resource-management-meaning-objectives-
scope-and-functions/35229)
Social Marketing can be seen as an approach which is used to develop activities aimed at changing or
maintaining people’s behavior for the benefit of individual as well as the society. Social marketing
uses commercial marketing principles and techniques to improve the welfare of people including the
physical, social and economic environment in which they reside. It is actually a very planned and
long-term approach to change human behavior. The strategy must be developed in a proper and
specific way so that it is effective and helpful in the company’s profitability. HRM focuses on the
function of people within the business, ensuring best work practices are in place at all times. It aims
to ensure smooth running of the business and smooth functioning of the staff within the
organization.
2.4 Performance Management
Performance management has gained a significant relevance in the present scenario. Since the social
enterprises are primarily aimed at striving towards a social cause, the performance management
becomes more crucial. From the perspective of a social entrepreneur, measuring the performance of
a social enterprise is important because it helps in decision making and ensuring accountability
towards various stakeholders. Due to a varied magnitude of impact of the social entrepreneurship,
there are different ways that have emerged to measure this impact. This unit will focus on these
methods that allow a social entrepreneur to measure the performance of the social enterprise.
To Do Activity
Identify up to 3 social entrepreneurial firms. Analyses their marketing strategies. Compare and
contrast the pros and cons of each strategy. Write this into a half-page report.

360 MGNCRE | Social Entrepreneurship
Defining Performance Criteria
The performance criteria are classified under four heads
• Depth of Impact. This criterion defines the effectiveness of the organization at addressing
the fundamental causes of the social problem.
• Blended Value. This deals with the effectiveness of the organization at creating economic
wealth and social value.
• Efficiency. This criterion relates to the effectiveness of the organization at systematically
striving to generate a higher output with a lower input.
• Adaptability. This highlights the need for effectively adapting to the dynamic nature of
environmental conditions.
Figure 2.15 Determining the Performance Criteria
(Source http//www.4lenses.org/part2/performance_criteria)
Tools for Measuring Impact
The various tools that can be used to measure the impact of social enterprise are as follows.

361 MGNCRE | Social Entrepreneurship
Figure 2.16 Tools for Measuring Impact of a Social Entrepreneurship
The following figure illustrates the linkages between the different performance criteria and the
underlying synergies in the organization.
Figure 2.17 linkages between the Different Performance criteria and the underlying Synergies
(Source http//www.4lenses.org/part2/performance_criteria)
Social Accounting and Audit
•systematic analysis of the effects of an organisation on its communities of interest or stakeholders, with stakeholder input as part of the data that are analyzed for the accounting statement
•Three steps involved Planning, accounting, and reporting and audit
Logic models
•provides a framework that enables organizations to embed evaluation and performance assessment into the program design and life cycle process of the program.
Social Return on Invetsment (SROI)
•measuring and communicating a broad concept of value that incorporates social, environmental and economic impacts.
•Two types Evaluative SROIs and Forecast SROIs

362 MGNCRE | Social Entrepreneurship
Successful Initiatives -Aravind Eye Care
Figure 2.18 Successful Initiatives -Aravind Eye Care
(Source Rangan and Thulasiraj, 2007)
SEWA
Figure 2.19 Successful Initiatives - SEWA
(Source https//www.slideshare.net/yadavnavs/sewa-by-ppm-group)

363 MGNCRE | Social Entrepreneurship
GOONJ
Figure 2.20 Successful Initiatives - GOONJ
(Source https//ssir.org/articles/entry/circular_social_innovation_in_india)
From the perspective of a social entrepreneur, measuring the performance of a social enterprise is
important because it helps in decision making and ensuring accountability towards various
stakeholders. Due to a varied magnitude of impact of the social entrepreneurship, there are
different ways that have emerged to measure this impact. The unit discusses the various tools for
measuring this impact vis-à-vis social accounting and audit, logic models, social return on
investment, followed by real business cases.
2.5 The Future Challenges Ahead
Social entrepreneurs are increasing in response to the devastating social and environmental
challenges that are being faced by the society. Though social entrepreneurs have a dominant
influence on our society today, they are slowly redefining everything about an enterprise. But the
fundamental question is, “are social entrepreneurs the future of enterprise?” This unit addresses
this question and discusses the challenges for the social entrepreneurs and the path ahead for
attaining the goals.
Challenges for Social Entrepreneurs
India is one of the world's most populous nations, and despite India's influence on the global
economy and innovation sector, India's public and private sectors continue working on challenges to
bringing the nation's almost 180 million residents currently under the poverty line to a healthy and
To Do Activity
Take any 3 social entrepreneurship ventures. Prepare a comparative statement for these 5
firms measuring their impact as a tool of performance measurement.

364 MGNCRE | Social Entrepreneurship
safe way of life. The on-the-ground realities of running a social venture remain daunting. The key
challenges that the social entrepreneurs are facing are described below.
Figure 2.21. Challenges for Social Entrepreneurs
Figure 2.22. Social Challenges for Social Entrepreneurs
(Source
https//www.albany.edu/faculty/miesing/teaching/socent/9%20The%20Future%20of%20Social%20E
ntrepreneurship.pdf)
Paths to Social Entrepreneurship
Social entrepreneurs, often referred as the, “Agents of Change” are committed to formulate
innovative solutions for the most pressing problems in the world. These problems can be broadly
classified into the areas related to education, health-care, environment and livelihood opportunities.
Ashoka, 2012 explains the five predictions for the future of social entrepreneurship. These
predictions primarily focus on.
1. The structure of the sector does not promote innovation
2. The sector does not have consistent
access to capital3. Complex agendas
4. Non-transparent reporting
5. The media loves new non-profits
6. Social sector leaders struggle
with burnout
7. Communicating Value Objectively
8. Remaining True to the Mission

365 MGNCRE | Social Entrepreneurship
Figure 2.23 Five Predictions for Future Social Entrepreneurship
(Source Ashoka, 2012)
With its diverse and complex socio-cultural environment, high economic inequality between urban
and rural areas, and low human development index, India definitely demands skillful navigation of its
unique challenges. But in challenges lie opportunities focused government policies, quickly rising
investor interest, and a raw entrepreneurial energy waiting to be unleashed has positioned India to
take these challenges head-on.
Model Questions
1. What do you mean by business model? What role does it play in a social venture?
2. Discuss in detail the social impact theory.
3. What is financial management? How is the financial management different for a business
enterprise and a social enterprise?
4. Throw light on the social marketing strategies with reference to the Indian context.
5. Explain in detail the various tools that can be employed for measuring impact of social
entrepreneurship.
6. Critically evaluate the current scenario for social entrepreneurs.
To Do Activity
Search on the internet or in other sources and identify one successful social
entrepreneur. Write done a one-page report that captures the success story and also
discuss what you would have done differently if you were in his or her place.

366 MGNCRE | Social Entrepreneurship
Suggested Readings
1. 10 social entrepreneurs in India who are changing the country for the better (can be
retrieved from https//in.thehackerstreet.com/social-entrepreneurs-2/).
2. 4 Reasons Your Team May Be Overwhelmed by Social Marketing – John Rampton, Forbes,
2018.
3. Business Model Canvas A Simple Tool for Designing Innovative Business Models – Ted
Greenwald, Forbes, 2012
4. Five keys to success for social entrepreneurs (can be retrieved from
https//www.youtube.com/watch?v=Pl8c5ooHfWs).
5. Five Predictions for The Future of Social Entrepreneurship – Ashoka, Forbes, 2012.
6. How Social Entrepreneurs Begin To Measure Impact – Devin Thorpe, Forbes, 2017.
7. How to Build an Effective Social Marketing Strategy – Greg Sartell, Forbes, 2013.
8. Innovating Business Models in Real Time – Debora Mills Scofield, Forbes, 2011
9. Reinventing Human Resources What HR Leaders Need to Know about Workplace AI – Kelly
Siegel, Forbes, 2018.
10. Social Entrepreneurship How To Make Money And Help Others At The Same Time (can be
retrieved at https//www.youtube.com/watch?v=tl1f-dZWXFE).
11. The Future is Bright for Indian Social Enterprise - Here's Why (can be retrieved from
https//www.startupgrind.com/blog/3-reasons-why-sun-will-shine-on-social-entrepreneurs-
in-india/).
12. The Future of Social Enterprise – V. Chaturanga, Herman B. Leonard and Susan McDonald,
Harvard Business School, 2008.
13. The Importance of Building Brands with Purpose – David Shad pour, Forbes, 2018.
14. The power of social entrepreneurship (https//youtu.be/VZQvhsa6LN0).
15. What Do HR Professionals Really Do? Eight Experts Dispel Common Myths – Forbes Human
Resources Council, Forbes, 2018.
References
1. A Note on Financial Sustainability for Social Enterprises – Professor Dennis Shaughnessy,
February 2012.
2. Christina Moehrle (2018). “The top 3 finance issues of social entrepreneurs,” Social Finance
Academy.
3. Five Predictions for The Future of Social Entrepreneurship – Ashoka, Forbes, 2012 (retrieved
from https//www.forbes.com/sites/ashoka/2012/11/19/five-predictions-for-the-future-of-
social-entrepreneurship/#41832030508d).
4. How to raise capital as a social entrepreneur? (retrieved from
https//www.pwc.nl/nl/assets/documents/pwc-social-enterprises.pdf, accessed on
18/2/2019 at 7.17 pm).
5. http//www.4lenses.org/setypology/print.
6. https//richtopia.com/strategic-marketing/what-is-social-marketing-how-does-it-work.
7. https//ssir.org/articles/entry/circular_social_innovation_in_india.
8. https//www.albany.edu/faculty/miesing/teaching/socent/9%20The%20Future%20of%20Soc
ial%20Entrepreneurship.pdf.
9. https//www.managementstudyhq.com/hrm-models.html.

367 MGNCRE | Social Entrepreneurship
10. https//www.pngkey.com/detail/u2r5a9e6a9w7w7a9_professor-yunus-believes-such-
projects-might-work-especially/, Accessed on 18/2/2019 at 5.10 pm
11. https//www.slideshare.net/barenblat/viral-marketing-advertising-strategies-for-social-
networks/14-Social_Marketing_Strategy_WHY_WHO).
12. https//www.slideshare.net/yadavnavs/sewa-by-ppm-group.
13. Impact of social entrepreneurs from emerging economies (retrieved from
http//indiacsr.in/impact-of-social-entrepreneurship-in-emerging-economies/).
14. Main Sources of Funding for a Social Enterprise – India Social Business Survey (retrieved
from https//indiamicrofinance.com/main-sources-funding-social-enterprise-india-social-
business-survey.html, accessed on 18/2/2019 at 7.09 pm).
15. Nagourney, A., &Key, K. (2001). “Financial networks with intermediation. Quantitative
Finance,” 1(4), 441-451.
16. Rangan, V. K., &Thulasiraj, R. D. (2007). “Making sight affordable (innovations case narrative
theAravind eye care system),” Innovations Technology, Governance, Globalization, 2(4), 35-
49.

368 MGNCRE | Social Entrepreneurship
Chapter 3 Civil Society and NGO – A Glimpse
Introduction Non-governmental organizations are essentially nonprofit organizations in which people with similar
interests come together to work at the ground level. They are generally driven by humanitarian
motives and aim to bring change in society. They monitor policies and provide advice using their
expertise in the domain. They often pressurize government for better performance and serve as
warning mechanism in many cases (ngo.org, n.d.)
Objectives • To gain a basic idea about the purpose and significance of not-for-profit NGOs in the current
world.
• To gain a basic idea about the major types of CSOs functioning in society today.
• To internalize how to go about the process of setting up an NGO, given the prevailing norms
in society.
• To discuss and familiarize with the processes involved in planning to set up operations white
initiating an NGO.
• To acquaint with the processes involved in conception of governance protocols and office
administration in an NGO.
Structure
Due to the following reasons they are believed be the only carrier for fruition of MDGs
3.1 Introduction to Civil Society
3.2 Types of Civil Society Organizations
3.3 Setting up the Organization
3.4 Strategizing Operations
3.5 Organizational Governance and Administration

369 MGNCRE | Social Entrepreneurship
Advantages of Civil Societies
3.1 Introduction to Civil Society
Civil society organizations have been increasingly incorporating tasks formerly carried out by state
administrative bodies. Cross border campaigns for different violations like labor, human rights and
environment have increased along with formulation of development policies.(The University of
Melbourne, 2019). The purpose of these revolutions has not been clear as to if they lead to
decentralized and active government or show the advent of capitalism in the public domain. (The
University of Melbourne, 2019).
Global Responsibility Paired with Advocacy
In a globalized ecosystem, where “economies, political systems, information technologies and
development opportunities interact, and where threats, conflicts and world proportions challenge,
Global Responsibility Global Solidarity promotes civic humanism as a world alternative, based on the
dignity of the human person and their responsible and free projection into the communities where
political, economic and social life takes place.” (Global Responsibility, 2012).
“Advocacy works primarily to change the behavior of public leaders or decision-makers.
Communication generally targets individuals and small groups. Social mobilization aims to secure
community-based support.” (NCBI, 2008) Digital Governance as well as lay public models that utilize
e-advocacy and mobilization mainly through social media and other mass media has been on the rise
for the past decade. These have been proving to be much effective in reaching a large population
within a short time and thereby creating a significantly stronger impact.
Dedicated funding and transparent utilization
Minimal red-tapism as compared to State bodies
Comprised of people driven by common interest
Focus on specific areas of action
Ease of collaboration
Emphasis on advocacy
Less prone to corruption

370 MGNCRE | Social Entrepreneurship
Figure 3.2 - E-Advocacy Model
Source The Digital Governance Initiative – E-Advocacy Model
Two milestones in the timeline of NGOs can be said to be the declarations of Millennium
Development Goals (2000), and Sustainable Development Goals (2015) by the United Nations
Organization. This eventually gave rise to the “NGO revolution” as some scholars call it, which
essentially was a boom in the number as well as impact of not-for-profit NGOs operating across the
world. The very fact that these private entities are not constrained by the immense administrative
intricacies and formalities associated with State bodies by itself serves to prove the potential of such
organizations in helping to build a better working world.
Millennium Development Goals (MDGs)
The United Nations Millennium Development Goals were eight goals that all 191 UN member states
had agreed to try to achieve by the year 2015. The Millennium declaration signed by the United
Nations in 2000 commits that leaders from across the world will come together to fight the evils of
illiteracy, diseases, poverty, hunger, environmental damage and bias against women. Eight MDGs
stated below are a result of the millennium declaration.
Figure 3.3 - Millennium Development Goals
Source Outline of the Millennium Development Goals notable challenges

371 MGNCRE | Social Entrepreneurship
The MDGs are affected by each other and are dependent on each other. All the MDGs make an
impact on health and similarly health also makes an impact on all of them. For example, better
health enables faster learning in children and increased productivity and earning capacities of adults.
Gender equality is important for achievement of good health among females. Good health helps in
reducing poverty and overcome the problem of hunger. Reduction in environmental degradation
also leads to better health. (World Health Organization, 2019).
Here is a video on the accomplishments of
MDGs<https//www.youtube.com/watch?v=A5giOGjj5X8>.
Sustainable Development Goals
The Sustainable Development Goals are a collection of 17 global goals set by the United Nations
General Assembly in 2015. (United Nations Organization, 2015).
Actions must be taken to end poverty and establish peace and prosperity. The call for the action is
the sustainable development goal (SDG) or global goal.
Figure 3.4 - Sustainable Development Goals
Source SUSTAINABLE DEVELOPMENT GOALS | UNDP
“These Goals build on the successes of the Millennium Development Goals, while including new
areas such as climate change, economic inequality, innovation, sustainable consumption, peace and
justice, among other priorities. The goals are interconnected – often the key to success on one will
involve tackling issues more commonly associated with another.” (UNDP, 2019).

372 MGNCRE | Social Entrepreneurship
Here is a video commenting on India and the UNs SDGs.
<https//www.youtube.com/watch?v=Bh6SrEQSPOI>.
In this Unit we looked at the concept of the NGOs and considered the role of NGOs in development.
From the development perspective, we also looked at the Millennium Development Goals and the
Sustainable Development Goals from the United Nations.
3.2 Types of Civil Society Organizations
“Civil society organizations (CSOs) can provide both immediate relief and longer-term
transformative change – by defending collective interests and increasing accountability; providing
solidarity mechanisms and promoting participation; influencing decision making; directly engaging in
service delivery; and challenging prejudice. In this way, excluded groups can be effective drivers of
their own change by forming or participating in organizations that represent group interests. CSOs
also play an important role in conducting research to raise the profile of excluded groups.” (Khan,
Combaz, & McAslan Fraser, 2019).
Social Movement
Social movements are essentially meant to hold up the citizens’ active roles and to make the state to
account for its obligations to the society. When voluntary parties of citizens organise themselves in
the best interest of some public cause, it is a social movement; and when they take form of an
organization for the same, it is a social movement NGO.
Grassroots Association
A grassroots civil society association refers to a group of self-organized individuals coming together
to pursue interest common to them in volunteer-based model. The organization is a non –profit one.
(Civil Society Dialogue, 2017).
Fig 3.5 Grassroots Civil Society
It is established through a local initiative by local people
It has no branches
It has annual average income less than
a threshold set by th elocal governing bodies
To Do Activity
What are civil societies? Based on your study of the course explain the various types of
civil societies and their working in the present context. Study the working of UNICEF and
the role of civil societies with respect to it.

373 MGNCRE | Social Entrepreneurship
Social Enterprise
The social enterprise work on the ideology of operating a business that contributes positively
towards social or environmental causes and believes in investing the profits into causes which helps
in promoting the original ideology. (UK Civil Society Almanac, 2014) It applies commercial strategies
in order to maximize financial, social and environmental benefit, thereby maximizing social impact
along with business returns for external shareholders.
Development NGO
An aid intermediary, which is both non-profit and non-governmental in nature, which provides
proper flow of funds from the donor to the recipients in the developing or underdeveloped
countries. (Aldashev & Navarra, 2015).
In this Unit we have seen the various types of civil society organizations. From the definitions, we
find that each of these forms of organizations serves a different purpose.
3.3 Setting up the Organization
This Section will discuss the process followed for setting up an organization. This will also highlight
the importance of different authorities and their respective roles in facilitating the setting up an
organization.
Constituting Board of Governors
The board in an NGO may be called by different names like ‘Board of Directors; 'Advisory Group',
'Steering Committee' etc.
Functions
• The primary function is to come up with strategies and plans that is in line with the original
purpose and vision of the NGO.
• Set up plans and guidelines for various activities like operations, management etc. along
with budget allocation.
• It also helps in appointment of members and setting up criteria of membership for review
panels and also for support groups.
• It also works extensively on monitoring and evaluation of performance by defining a
framework for the same so that they can be carried out independently.
• It takes the views and ideas of NGO to a bigger stage by actively giving chance to represent
in larger scale outside the NGO.
• It also helps in active mobilization of the resources and coordination with agencies outside
the NGO ecosystem.
To Do Activity
You are working with a company who wishes to set up an NGO for ensuring education for girls.
What are the essential points of consideration that should be taken care of? If you are to lead
the project draft a proposal including all relevant details.

374 MGNCRE | Social Entrepreneurship
The board members are generally well-respected people in the society and can influence the key
decision makers to listen to the voices of the affected people. Moreover, they are the first contact
for anyone outside the NGOs. Many a times they could be the first checkpoint for hearing the voices
of the affected people.
Selection and Terms of Engagement
The following criteria are generally kept in mind while selecting the board members
• It is very important that the board members can add value to NGOs present set up in
understanding and solving issues related to NGO.
• They should have previous experience as board members in similar kind of workspace.
• They should very well understand the domain in which the NGO operates and have a clarity
on the opportunities and experience it represents.
• Apart from having an experience in the similar role, as already mentioned, they should have
ground level experience of community work.
• Communication and networking are two other criteria that should be looked upon during
the selection of an individual.
• They should be gender neutral and have good communication and networking skills
• A good team player with good political skills along good contacts with consulting and
support groups is always welcome into the system.
• They should be able to promote the vision of the NGO outside the NGO effectively.
Composition of Board
12-15 members including a treasurer, a president and various different task or job specific positions
required in the area where NGO operates. Rotation of positions take place along with renewal of
term in lieu of good performance.
Length of Terms
It varies from one organization to other. It is usually between a time periods of one to three years
Cessation of Appointment
There could be various reasons for cessation of appointment. Some of them are listed below
• Resignation by the board member is one of the most common reason
• He/she is not able to devote the time committed at the beginning of the tenure
• He/she is not able to undertake the responsibilities agreed upon
• He/she now has no active relation with the organization that helped in nomination or
selection of the member at first place
• He/she is not a team player and is not able to work with one or many other members of the
board
• He/she has developed a conflict of interest
Mandate and Working Methods
The board members have a very high attendance and generally do not miss any meetings. They can
use various digital communication tools for connecting with the other stakeholders in case are they
are not able to attend meetings due to their hectic schedule or travels. Board members motivate
that representatives from different communities come together to shape the overall policies and

375 MGNCRE | Social Entrepreneurship
direction of the NGO by discussing about implantation, monitoring and evaluation of different
programs and policies of the NGO.
They make sure that the resources are allocated appropriately and more attention is paid to the
issues which are important to the NGO and the community. They also take inputs from local
communities and share it with broader and global communities across the globe.
Setting up By-Laws
These are internal documents which signify rules and regulations that govern the conduct of affairs
in an organization. These documents should be clear and precise so that it is well understood by the
members of the organization and other stakeholders involved. It is very often used for the
registration process with different local and national authorities.
The bye-laws consists of the following
• Name and objectives
• Frequency of the meetings
• Voting rights
• Criteria of membership
• Book of accounts maintenance
• Rules and regulations keeping in mind the different amendments
Framing General Approach to Issues to be Addressed
The MIT guide to NGOs provides the following approach to problem solving (Source
http//web.mit.edu/is/NGOManagement.pdf)
“When an NGO approaches solving a problem, they can pursue the following structure
Gather information on the issue
• What is causing the problem?
• Who are the persons/organizations/department/ entity responsible?
• What are the consequences going to be? Assess magnitude, quality and prevalence.
• What are the alternatives/possible solutions?
• How much would they cost? Is it better to invest the money in other projects?
• Talk to people in the community for a holistic perspective.
• Talk to people who are in-charge and hear their side of the issue.
• You may be able to work towards solving problems together (co-operation, co-ordination).
• Request older, influential or respected people in the community to address public
gatherings.
• Use the mass media to generate interest, communicate the facts and discuss options.
• Write polite, succinct articles for magazines and newspapers identifying the issues.
• Include people from diverse backgrounds, so that your organization is not portrayed to be
linked with any particular political party or religious sect, etc.
• For fundraising purposes, let people know why funds are needed and how they will be used.
Transparent and detailed accounts are imperative to build trust.
• Link up with other NGOs to maximize the effect of the effort.” (Mostashari, June 2005).

376 MGNCRE | Social Entrepreneurship
In this section, we have understood how NGOs are established, how they are governed, and how
they function. We also looked into the contents of the by-laws.
3.5 Strategizing Operations
This section will introduce you to the process of formulating strategies for an organization. It
describes the key procedures as well as strategical insights for developing plans for the organization.
Operations Planning
A strategically crafted plan of operations is a vital tool to channel the work of any organization in an
efficient manner. It helps maintain a focused and long-term emphasis on the organization’s mission
and vision, that would in turn supplement the decision-making process regarding allocation of
resources. Let’s take a look at how to get started with developing a strategic plan, on the basis of a
shared vision of the future.
Fig 3.6 Operations Planning
Source (Progressio, 2016)
Prepare to plan
Clarify mandate and scope of work
Analyse the external environment
Analyse the internal environment
Identify the strategic issues
Define the strategic aims
Define strategies to address each strategic aim
Identify the resources required to
achieve the strategic aims
Draw up an internal capacity building plan
Cost the plan
To Do Activity
Take any two NGO’s of your choice. Study their strategies and working. Analyses and compare
their strategies and justify the analysis with examples and points.

377 MGNCRE | Social Entrepreneurship
Organizational Vision
The organizational vision serves as a tool in motivating individuals to achieve organizational goals
and hence a lot of care must be taken while defining it. The vision is specific to a particular
organization and should be re-examined from time to time during strategic planning process. The
results of the re-examination will serve as a feeder material for strategic planning.
Strategic Planning
Strategic planning is a set of systematic procedures to assist in making key decisions and concurring
on actionable particulars that would in turn mould an organization in terms of its mission (how), and
vision (why). The pros of formulating a strategic plan together as a team are many, such as Picturize
and project clearly about the purpose and direction of the organization’s work; craft it out into a
document against which members of the organization can monitor progress, learn and improvise to
maximize impact. Bolster team spirit by kindling a sense of belongingness in forging a clear mission
ahead, together as a team. Formulate action plans in collaboration with partners, beneficiaries and
other associated entities. Carefully plan resource utilization so as to ensure maximum exploitation of
available resources.
Structure of a Strategic Plan
Fig 3.7 Strategic Plan
Executive summary
Vision statement
Mandate and scope of work
Summary analysis of external and internal environment
Main strategic issues
Strategic aims with accompanying strategies
Human resource needs assessment
Budget projection

378 MGNCRE | Social Entrepreneurship
Capacity-Building
Capacity building is a series of processes that enables an organization to boost its effectiveness and
thereby impact in the society. This is meant help it achieve its objectives in a sustainable manner.
Fig 3.8 Capacity Building
Source (Progressio, 2016)
Development Definition and Approach
While NGOs differ from each other in multiple ways, their definition of ‘development’ often takes
the top position when it comes to the most pertinent factors of difference. This more or less unique
perspective they hold would reflect in all arenas of their operation, including stakeholders such as
beneficiaries, partner entities, and funding agencies. (Progressio, 2016).
Environmental Dynamics
Source (Mustaghis-ur-Rahman, 2007).
Political Environment
The political environment in which an organization operates influences it in various ways. For
instance, if the political or other ideology followed by the incumbent governing body isn’t aligned
well with that of the organization, this could mean trouble with operations in that particular state.
The scope of their work could be limited to a minute portion, or even denied the regulatory
framework clearance to operate altogether. Hence, it is imperative that an NGO be conscious of the
politico-legal environment of the target country while formulating their proposal documents as well
as the mission-vision statements.

379 MGNCRE | Social Entrepreneurship
Socio-Cultural Environment
The values, norms, lifestyle, historical perspectives, traditions, social ideologies, beliefs, etc. of a
society are reflected in their socio-cultural environment. It’s imperative that an NGO should
constantly be in contact with and sensitive to this environment and respect the socio-cultural
sentiments and other more tangible elements of their society in order to gain acceptance to work in
the social community.
Economic Environment
The economic environment of a society directly influences the operations of an NGO. This is
particularly visible in closed economies such as the Russian Federation and the People’s Republic of
China where the social ideology mandates that the provision of basic necessities as well as social
progress to be the sole responsibility of the State. In such (politico-)economic environments, the
rooting of a social cause NGO will be next to impossible as it doesn’t suit the society’s established
social ideologies. It would be helpful to the NGO to frame its vision and mission in alliance with the
larger economic environment prevailing in the country, to which the target community(ies)
subscribe.
Technological Environment
The technological environment prevalent in a society targeted by an NGO should be a prominent
concern while framing its vision, mission, and strategies. It has to be in congruence with the level of
technology common and familiar to the target community(ies), failing which there are high chances
the people might reject the advances of the NGO. Although this has a high chance of occurrence, the
inverse could also happen, depending on the specific historical social perspectives and social
ideologies held by the people.
Collaboration with Other NGOs
An NGO always have to remain in dynamic touch with the environment as well as all the players in it.
Collaborations with other NGOs along with other entities bolsters its reach and enables it to focus on
its area of expertise.
Stakeholders
NGOs are generally heavily dependent on its stakeholders owing to the simple fact that their entire
work is for, with, and most times by the stake holders themselves. This brings in the question who
these stakeholders are. They are the beneficiaries and benefactors of the NGO, regulatory and
administrative bodies, and the members of the NGO (thereby the NGO itself).
The beneficiaries of an NGO are also its active contributing partners, wherein they play a crucial role
in how the NGO’s work is shaped. It is standard practice among most NGOs to have representation
of beneficiaries from their projects on the board as honorary members, thereby including them in
the decision-making process. This aspect of positive ownership with the NGO could result in these
community representatives inducing a constructive influence over the project activities. This in turn
could result in two obvious benefits.

380 MGNCRE | Social Entrepreneurship
since the community representatives who are part of the board belong to the grassroot operations
level, a feedback system would be initiated from the project base to the NGO executive level – this
would prove to be extremely handy, probably even pivotal to the operational success of the NGO
due to community-participation in governance, transparency at all levels of operations in the
organization can be ensured.
Success in terms of an NGO would mean that the funds allocated for a project they undertake has
been efficiently utilized to serve the purpose mutually defined between the donor and itself. Donors
are concerned with financial transparency for obvious reasons, and expect the recipient NGO to
maintain a good working relationship with them and also follow principles of fairness mutually
agreed upon in the associative tie-up.
The work of an NGO is that of a supplementary nature to that of the State. Since social-economic
development is in principle the portfolio of the State administration, it has the authority to audit the
work being carried out by an NGO. That being said, the NGOs are generally a store house of rare
grassroot level information that is valuable to the State in its day to day functioning. Hence, it is
expected from NGOs to provide the State and its bodies with informed advice and information as
and when required.
Sustainability is probably the single most significant trait of an NGO that enables it to attain its goals
and remain operational.(Mustaghis-ur-Rahman, 2007).
In this section, we looked at how capacity building milestones could be achieved while setting up an
NGO.
3.5 Organizational Governance and Administration
“It is only through a system of strong organizational governance that beneficiaries can be assured
that an organization established on their behalf is indeed serving their best interests.”
Source (Progressio, 2016).
Leadership
The quality of the leadership is required at all levels of positions. The roles and responsibilities of the
different level of members and trustees is included in the governing document. Moreover, the job
descriptions of all the roles will include the leadership qualities expected in the role.
To Do Activity
Governing and administration of NGO is a very typical and difficult task. Explain why the
governance of NGO’s become so difficult even though so much support and grant is available.
What can be done to channelize the efforts in positive direction.

381 MGNCRE | Social Entrepreneurship
Fig 3.9 Roles of Governing Body
The governing body will include the executive directors, trustees and some non-voting members
representing interests of different stakeholders. The executive director doesn’t enjoy the pleasure of
a voting right since he or she is not a trustee. He is also accountable to the governing body since he
is appointed by the governing body itself.
Planning
Administration
Finance
Community relations

382 MGNCRE | Social Entrepreneurship
Fig 3.10 Organizational Structure
Source (Progressio, 2016)
Governing Document
A governing document basically outlines the basic purpose of the organization. It can be in the form
of a Memorandum of Association, a formal or legal document, a trust deed or a document carrying
legal bindings for the organization.
Ideally a governing document must be developed at the time of starting u the organization as it will
mention all the principles and rules on which the organization will run.

383 MGNCRE | Social Entrepreneurship
Developing Governing Document
Fig 3.11 Developing Governing Document
Organizational Policy Development
The governing body is responsible for the monitoring the development and implementation of the
organizational policies and rules. It provides guidelines via meetings that are held or through
committees and sub committees. It can be a time-consuming process if not taken care of properly.
Documentation should be kept minimum so as to save time and avoid complexity.
Office Administration
Organizational Structure Chart
An organizational structure chart is a diagram that represents an organization, identifying its
employees and departments and their relationships to each other.
Identify the main headings
Form an outline of the document, consider stakeholders to consult about its provisions
Consult stakeholders to draw points to draft the document
Draft document - take legal adviser's help
Circulate draft document, take suggestions from stakeholders
Incorporate reasonable suggestions, esure local compliance
Approval by governing body
Distribute final document to all trustees

384 MGNCRE | Social Entrepreneurship
Fig 3.12 Pros of organizational Structure Chart
Communications
People outside the organization communicate with the office in three main ways
• Visit
• Telephone
• Letter or email
• Text message/ social media messaging
The basic principle of working of a NGO focuses on the fact that it must it must be easily accessible
for the clients. People should be able to reach the organization and seek assistance and gather
information.
A proper appointment system for the meetings should be established in order to ensure smooth
functioning of regular work of the organization. A proper communication system should be
established within the organization.
Record Keeping
The primary step towards developing an efficient administrative system is to formulate an effective
filing system for the organization. It facilitates smooth functioning of the organization when all the
documents are systematically arranged and are kept in one common place. Moreover, it also helps
in reporting the information to the concerned stakeholders in case of exigency by providing a quick
access to the information. Since much of the information pertaining to the human resource
management is confidential in nature, it is usually a good practice to have a confidential file for each
member of staff which that person can have access to with the authorization of his or her manager,
which may be Executive Director for most staff or any other person in authority. These files should
be kept separately in a locked filing cabinet and rules concerning access to them must be clear and
transparent.
Administrative Audit
Similar to the financial audit, there is another important tool for keeping a check on the
administrative activities, known as administrative audit. The key different between financial audit
Clarifies line of authority and work sharing
Sense of belongiongness to employees
Serves as a map for outsiders about the work of the NGO
Illustrates the overall structure and strength
Compliments delegation of responsibilites
Supports accomplishment of objectives

385 MGNCRE | Social Entrepreneurship
and administrative audit is that in the former case, the financial systems are audited, whereas in the
latter case, the administrative systems are checked. The administrative audit takes care of the
functioning of the entire administration activities and examines if they are in order. This can be done
in two heads
Internal (done by someone from within an organization).
External (done by external agencies)
Fig 3.13 Internal Audit Checklist
Source (Progressio, 2016)
In this section, we glanced at how the administrative tasks such as record keeping, communication
etc. intertwine with the overall governing of the organization. We also gained an idea of how
significant the governing document is to an NGO.
Model Questions
1. What are the defining characteristics of an NGO?
2. How are the MDGs leading to development? What are the updates on the same?
3. How are the SDGs leading to sustainable development? What are the updates on the same?
4. What are the differences between an NGO and Social Enterprise?
5. What are the differences between an NGO and a Development NGO?
6. How should people be selected onto the board of an NGO?
7. What is usually covered by the by-laws of an NGO?
8. What functions does the vision statement serve in an NGO?
9. How does framing a strategic plan help in the successful capacity building of an NGO?

386 MGNCRE | Social Entrepreneurship
Suggested Readings
1. Attack, I. (1999). Four criteria of development NGO legitimacy. World development, 27(5),
855-864.
2. Azim Premji University Practice Initiative – Setting up an NGO -
http//practiceconnect.azimpremjiuniversity.edu.in/tag/setting-up-ngo/
3. Bhose, J. S. (2003). NGOs and rural development Theory and practice. Concept Publishing
Company.
4. Eade, D. (2000). Debating Development NGO's and the future. Oxfam GB.
5. Governing NGOs A Challenge in Four Acts -
https//ssir.org/articles/entry/governing_ngos_a_challenge_in_four_acts
6. Here is a case study of Haitian NGOs in capacity building
https//www.youtube.com/watch?v=e-SWCHJ2QKk
7. Lewis, D., & Kanji, N. (2009). Non-governmental organizations and development. Routledge.
8. Maier, F., & Meyer, M. (2011). Managerialism and beyond Discourses of civil society
organization and their governance implications. Voluntas International Journal of Voluntary
and Nonprofit Organizations, 22(4), 731.
9. Najam, A. (1996). NGO accountability A conceptual framework. Development Policy
Review, 14(4), 339-354.
10. Nelson, J. (2007). The operation of non-governmental organizations (NGOs) in a world of
corporate and other codes of conduct. Corporate Social Responsibility Initiative.
References
1. Aldashev, G., & Navarra, C. (2015). Development NGOs Basic Facts.
http//perso.fundp.ac.be/~galdashe/dnbf.pdf.
2. Civil Society Dialogue. (2017). New Grant Scheme from the Ministry for EU Affairs for
Participatory – Active – Strong Local Organization. Retrieved from Civil Society Dialogue
http//civilsocietydialogue.org/new-grant-scheme-ministry-eu-affairs-participatory-active-
strong-local-organization/
3. Global Responsibility. (2012). Global Responsibility. Retrieved Feb 18, 2019, from Global
Responsibility http//globalresponsibility.org/.
4. Khan, S., Combaz, E., & McAslan Fraser, E. (2019). The role of civil society and social
movements. Retrieved from GSDRC https//gsdrc.org/topic-guides/social-exclusion/lessons-
and-tools/the-role-of-civil-society-and-social-movements/
5. Mostashari, A. (June 2005). An Introduction to Non-Governmental Organizations (NGO)
Management . Cambridge Iranian Studies Group at MIT.
1. Mustaghis-ur-Rahman. (2007). NGO Management and Operation A South Asian Perspective.
Journal of Health Management, 9(2) 223-236.
6. NCBI. (2008). Advocacy, communication and social mobilization. Retrieved Feb 18, 2019,
from NCBI Bookshelf Implementing the WHO Stop TB Strategy A Handbook for National
Tuberculosis Control Programmes https//www.ncbi.nlm.nih.gov/books/NBK310747/.
7. ngo.org. (n.d.). DEFINITION OF NGOs. Retrieved Feb 18, 2019, from ngo.org
http//www.ngo.org/ngoinfo/define.html.
8. Progressio. (2016). Progressio Capacity Building Manual. Retrieved from Progressio
http//www.progressio.org.uk/content/capacity-building-manual

387 MGNCRE | Social Entrepreneurship
9. Progressio. (2016). Progressio Capacity Building Manual. Retrieved from Progressio
http//www.progressio.org.uk/content/capacity-building-manual.
10. Srinivas, H. (2016, Jun). An NGO for NGOs - Networking and Support Centers for NGOs.
Retrieved from GDRC http//www.gdrc.org/ngo/ngo-for-ngos.html
11. Sriskandarajah, D. (2017, Dec 15). How NGOs and social movements can learn to work
together better. Retrieved from Civil Society Futures https//civilsocietyfutures.org/ngos-
social-movements-can-learn-work-together-better/
12. The University of Melbourne. (2019, Jan 16). Civil Society, NGOs and the State (DEVT90039).
Retrieved Feb 18, 2019, from The University of Melbourne – Handbook
https//handbook.unimelb.edu.au/2019/subjects/devt90039.
13. UK Civil Society Almanac. (2014). What is the relationship between social enterprise and civil
society? Retrieved from NCVO https//data.ncvo.org.uk/a/almanac14/what-is-the-
relationship-between-social-enterprise-and-civil-society-2/
14. UNDP. (2019). SUSTAINABLE DEVELOPMENT GOALS | UNDP. Retrieved Feb 18, 2019, from
UNDP https//www.undp.org/content/undp/en/home/sustainable-development-goals.html.
15. United Nations Organization. (2015, Oct 21). United Nations Official Document. Retrieved
Feb 18, 2019, from United Nations
Organization.http//www.un.org/ga/search/view_doc.asp?symbol=A/RES/70/1&Lang=E.
16. World Health Organization. (2019). Millennium Development Goals (MDGs). Retrieved Feb
18, 2019, from WHO
https//www.who.int/topics/millennium_development_goals/about/en/.

388 MGNCRE | Social Entrepreneurship
Chapter 4 Managing Civil Society and NGO
Introduction It can be inferred from the foregoing discussion that the human resources play a pivotal role in the
functioning of an organization. Managing he human resources effectively and efficiently requires a
great deal of planning and implementation. Thus, there is a need for formulating a policy that lays
down the guidelines for managing people effectively. This policy essentially states the rules and
regulations and the guidelines that are required to be followed in the normal course of business.
Objectives • To internalize the significance as well as steps involved in managing the workforce in an
NGO.
• To grasp the need for financial management and accounting carried out in the proper
manner.
• To get accustomed with the methods of managing the financial resources, drawing from the
methods of recording and consolidating of financial transactions in controlling and managing
financial resources.
• To internalize the various phases of a project in its life cycle and the key points to remember
for each of them.
Structure
4.1 Human Resource Management
Now, that we know that the human resource management policy plays a vital role, another
important question that needs to be answered is how many policies should we ideally have to
ensure smooth functioning of the organization? To answer this question, it must be kept in mind
that the consistency has to be maintained in the structure of activities and hence, ideally there
should be one policy that deals with the management of human resources in an organization. The
nine elements of human resource management are illustrated in the diagram below.
4.1 Human Resource Management
4.2 Financial Management
4.3 Fund Management Procedures
4.4 Project Management in NGOs
4.5 Project Life Cycle

389 MGNCRE | Social Entrepreneurship
Figure 4.1 Scope of Human Resource Management
Source (Progressio, 2016)
Equal Opportunities and Diversity
The first principle of human resource management deals with the equality in providing the
opportunities. This reinforces that the human resource management policy should aim at providing
equal opportunities to all the employees. By equal opportunities we mean that there should be
equality in all the matters of an organization, whether they are related to employment or the
working conditions. This implies that the work environment and the organizational culture should be
a reflection of the discrimination free culture. This should not be confused with having diversity in an
organization. The existence of diversity in workforce and the organizational culture does not
necessarily mean that there is discrimination. To be effective, an organization must try to embrace
these diversities and strive towards celebrating these differences by seeking a set of values and
cultural ethos that do not have room for tolerating the discrimination and hence focus on active
commitment towards promoting these diversities.
Selection and Recruitment
Staffing is one of the most important processes in any organization as the quality of the employees
will determine the success of the organization. The experience, education and skills of the
employees definitely work towards betterment of enterprise. So, every organization must follow a
proper recruitment and selection procedure so as to ensure that there is right man at the right place.
This would enhance efficiency in the operations of the organization.

390 MGNCRE | Social Entrepreneurship
Figure 4.2 Recruitment and Selection Process
Terms and Conditions of Service
Figure 4.3 Terms and Conditions in Service
Analyse organisational needs
Job description
Advertise vacancies
Decide the selection panel
Selection criteria and shortlisting
Interview process
Final selection
Feedback to candidates
Employment offer and Letter of Appointment
Contract of employment and T&C of service
Induction and probation
Hours of work
Salary structure and remuneration
Subsistence and travel expenses
Leave structure (annual, sick, compassionate, etc.)
Maternity and paternity provisions
Secondary employment
Notice period and relievement

391 MGNCRE | Social Entrepreneurship
Performance Management
The success of an organization is based on the way the employees are managed. The employee
management focuses on employee satisfaction which in turn leads to job satisfaction, further
resulting in employee commitment and betterment of the organization. This laid emphasis on the
role of performance management system in an organization. A performance management system
incorporates the various elements of measuring performance and also defines the criteria for
measuring the performance.
Figure 4.4 Principles of Performance Management
Source (Progressio, 2016)
Staff Development
It is the most effective factor that helps in employee retention. It also leads to employee satisfaction
and increases their morale. Staff development actually increases an employee’s knowledge, skill and
potential. Staff development activities will ultimately lead to enhancing effectiveness and work
efficiency of the employee and ensures that the staff performs better.
Staff development can be both in form of formal training and other informal programmers.
Grievance Mechanism
Many times, certain organizational issues cannot be solved through simple communication. It
requires a formal procedure to solve the issue. Every organization must necessarily have a policy
through which problems related to staff can be solved effectively. Grievance policy today forms a

392 MGNCRE | Social Entrepreneurship
most important part of a corporate structure as it will the organization to solve the complex
problems in a simpler form. It will also create a positive feeling among the employees.
The below factors have to be kept in mind while framing a grievance policy
Figure 4.5 Grievance Mechanism
Health and Safety at Work
Reasons to have a health and safety policy for the organization
• Ensure safe and healthy working conditions.
• Sharing health and safety related information with all.
• To express organizational effort regarding the health and safety issues.
• To work as per the rules and guidelines set.
(Progressio, 2016)
We learnt about the elements involved in planning for, recruiting, and managing the workforce of an
NGO. We also glanced at various steps involved in selecting the right staff members.
4.2 Financial Management
Funds or grants are the lifeblood of organizations. In the case of not for profit organizations, these
funds are usually received as donations or grants. While managing money is important in any
context, managing and applying the money of others as per the agreement has an element of
trusteeship also, and has to be done with utmost care and seriousness. The principles and reasons
for fund management, accounting and tracking remain common across all types of organizations,
though the techniques used can vary a little from one type of organization to another.
To whom do employees air a grievance
When should an employee raise a concern? (e.g. Harassment and bullying at work)
Policies on ‘whistle blowing’?
To Do Activity
Take up any NGO and analyses its working, operation and management. Is it different from
the working of a non- NGO? If yes, what are the key points upon which working of NGO and
non-NGO be differentiated.

393 MGNCRE | Social Entrepreneurship
Fund Management
Fund refers to monetary resources available for achieving certain objectives. Any project that is
undertaken is dependent on resources in kind or cash to achieve its’ objectives. A few typical sources
of funds may be.
Figure 4.6- Sources of Funds
Management of funds refers to applying the monetary resources in an efficient and effective
manner in order to achieve the objectives of the project. Note that we have used the terms efficient
and effective. Efficient refers to using the optimal or correct amount of funds for each activity (for
example, purchasing items of the quality needed – neither lesser nor higher). Effective refers to
ensuring the successful completion of each activity while expending only the required and budgeted
amount (ensuring that no money is wasted without results).
While the accountant, finance manager, cashier or other finance related personnel have special
responsibilities when it comes to fund management, it is extremely important to note that every
member of the team shares some fundamental responsibilities when it comes to money –
Spend the funds as cautiously/ more cautiously than you would spend your own money since it has
been given to your project with trust.
Ensure it is spent for the purpose specified and not for anything else. In case expenditures have to
be undertaken for unapproved purposes, please ensure that approvals are taken in advance.
Ensure that the activity or item for which money was spent contributes to the specified goal. This
also connects with the earlier point about specified purposes. Overall, all spending should contribute
towards the achievement of the project objectives.
• Ensure that there are no losses and leakages. All amounts spent by every individual must to
reported correctly and in a timely manner.
• Ensure that all guidelines for spending of funds are followed and common sense is always
applied.
• Ensure that bills and other documents are properly procured and maintained for all
expenses.
Internal sources – e.gsale of products sourced from beneficiaries
General donations – fund received without any particular purpose attached to it
Specific grants – amounts received for a particular project or objective from a donor who specifies how the amounts can be utilized

394 MGNCRE | Social Entrepreneurship
As can now be appreciated, all the points mentioned above relate to every member of the project
team since money is handled directly or indirectly by everyone.
Basic Principles
Spending based on approvals is an important control system. This serves many purposes. It ensures
that the proposed expenditure is brought to the notice of the person authorized to expend. This
results in the responsible authority being able to track the expenditure against the progress stage of
the project and also against the budget. It also helps in discussing and ensuring due procedures are
followed at the time of spending, which may otherwise be inadvertently omitted if proper approvals
are not taken from the correct authority.
The implementation of the above point requires that financial responsibilities are clearly designed,
delegated and communicated to all in writing. This ensures that all team members know who is
responsible for what approvals, for custody of stock or assets, for cash management, for record
keeping etc. Based on the same, certain persons in the project will be provided with authorization
spending cash or signing cheques. Also, certain persons will have the authority to sign on behalf of
the project. This should also be clearly communicated to all persons in the project, in writing. This
ensures that only authorized persons represent the company in contracts and in official
communications with the external world.
All incomes and expenditures must be recorded correctly and promptly. Given the nature of book
keeping, delays in noting down details and creating vouchers may lead to confusions or even loss of
appropriate supporting documents as time elapses. A simple example that most of us can relate to is
the loss of supporting documents in travel claims as we delay the time to make the travel claims –
invariably, some bill or receipt is misplaced or forgotten.
Vouchers are the most basic mechanism for recording and entering data into the accounting system.
They can be simply thought of as template documents that ensure that all basic information about a
transaction are captured systematically. The types of vouchers used are

395 MGNCRE | Social Entrepreneurship
Figure 4.7 Principles of Fund Management
The utility of the voucher comes from the fact that it is pre-printed (or pre-designed in the case of
computer-generated vouchers) to ensure the noting down of key details. This helps in making sure
that information that is pertinent to the transaction is neither omitted nor forgotten. The vouchers
are also serially pre-numbered. This also is an important system to track that no vouchers are
misplaced or forgotten. The details required in vouchers are –
• Project Name, voucher number (pre-printed)
• Date, Account (to be debited and/ or credited), Narration, Amount
• Supporting documents
• Authorizations and signatures
• Revenue stamp for payments > Rs.500
As can be seen from the above list, the details collected are comprehensive and the narration
column allows for detailed remarks to be noted and maintained. Also, a key requirement of a
voucher is the availability of supporting documents. These are basically billing, receipts, invoices or
documents of similar nature that provide external (to the project) evidence of the nature and value
of the transaction.
Books of Record
Vouchers form the records of primary entry. While individual vouchers provide detailed information
about particular transactions, we need grouped and summarized information in order to get the
larger picture. This is accomplished at the next level by entering the vouchers into the cash & bank
book and into the ledger.
Cash payment – for recording transactions that involves spending cash from project
Bank payment – for recording transactions that involves expenditures through bank (e.g. cheques, letter based transfers, online transfers, etc.) from project
Cash receipt – for recording transactions that involves receipt of cash by the project (e.g. grants)
Bank receipt – for recording transactions that involves receipt of amounts into the bank. (e.g. grants, donations)
Journal voucher – for recording all other transactions that do not involve cash or bank transactions (e.g. accounting adjustments)

396 MGNCRE | Social Entrepreneurship
Cash & Bank Book
The cash & bank book is a single book that is used to consolidate all the transaction related to cash
and bank transaction from the cash or bank balance perspective. This book, in the physical form, has
two pages dedicated to each day with receipts being recorded on one page and the payments on the
other. There are columns provided for voucher number, particulars, account being debited or
credited (the other half of the double entry), and the amount. The amount will be noted under cash
column or bank column(s) depending on whether it is cash or bank transaction. Also, important to
note is that every day, the balance from the previous day is brought forward for the cash and the
bank(s) columns and at the end of the day, after all the transactions are noted and recorded from
the cash and bank vouchers, the closing balance is recorded. It is also common practice that the
cashier cross verifies the physical cash balance and notes the denominations on the same page after
closing the balance as a record and for reassurance that the physical cash balance tallies with the
cash balance as per the books (which it should!).
Ledger
As can now be seen, the entries in the cash book take care of consolidating the impact on cash and
bank balances on a daily basis. However, every transaction also affects other items. For example,
when you spend cash in order to buy stationery, you are not only reducing your cash balance, you
are also getting stationery. The fact that stationery has been procured needs to be recorded for
multiple reasons – in order to compare the expenditure against budgets, in order to understand
total expenditures on stationery, in order to know the status of stationery purchase etc. Thus, just as
we consolidated all cash transactions through entries into cash book, we consolidate the
corresponding aspects of the transactions into separate accounts in the ledger (example Stationery
account, Rent account, Donations account etc.). Each account will have a debit and credit column
under which the amount will be noted and columns for entering the date, voucher number etc.
All cash and bank vouchers will affect the ledger through one entry (into the corresponding affected
account). This is the case except for cash withdrawals from bank and cash deposits into bank where
both the entries will get reflected in the cash and bank book itself on the same date. For journal
vouchers, both aspects of the transaction will be entered in the ledger itself, into the two affected
accounts.
Asset Register
Often projects have provisions to purchase assets. Otherwise, assets are acquired by the
organization from own funds or from other donations. Since assets, by definition, are meant to
provide benefits for a longer duration, it is important to record their details and keep an updated list
in order to be able to track and trace. This helps in ensuring that assets are not lost, misplaced or
stolen or even if any of these events occur, the team can find out which particular item is missing
from comparing the remaining physical items against the records.
The asset register is the book the records details of different assets. These details include date of
purchase, amount paid, invoice details, identification details of the asset (including any serial
number, registration number etc.), the physical location of the asset, the asset tag number provided
by the project, date and mode of disposal and any other remarks. The asset tag number provided by
the project should be noted on the asset through a sticker/ etching, etc. Any movement of the asset

397 MGNCRE | Social Entrepreneurship
should be updated in the register. This register should be maintained in physical format with entries
in permanent ink. Periodic physical verification is recommended (at least once in a year) in order to
verify that all the assets as per the register are available with the project/ available with people to
whom they have been assigned by a person authorized by the project (example – laptop assigned to
a project member).
Stock Register
The stock register keeps track of items that are consumable in nature – stationery, communication
materials, and other materials that would be used in the running of the project or distributed to
beneficiaries. One or more pages would be allocated to noting the stock movement of a particular
item with columns for date, quantity received, issued and balance as well as columns for person
issued to and signatures of the issuing authority and the person receiving. The stock register has to
be maintained in an updated manner and should be handled only by an authorized person. Physical
balance of stocks needs to be cross verified against the balances as per stock register on a period
basis (at least once every year).
Bank Reconciliation
The balance as per the accounts book needs to be verified against the balance as per the bank
passbook or bank statement. However, unlike cash book and cash balance, the bank balances as per
bank column in the cash book and the bank statement may not necessarily tally. This can happen
due to the following.
• Cheques may have been issued but not presented at the bank by the receiver. Thus, as per
our bank column, the amount has already been reduced, but in the bank, this amount still
reflects in the account.
• Cheques or amounts may be directly deposited to the bank account by donor or other
parties without intimation to us. Thus, the balance as per bank statement will reflect a
higher amount than the balance in our cash and bank book.
• Cheques that are received physically by the project but not deposited into the bank will
result in the bank column of the cash and bank book reflecting a higher balance than the
bank statement.
• Even in cases where the cheques have been deposited, till they are cleared by the bank, the
balance in the cash & bank book will reflect a higher amount than the bank statement
Bank charges that are debited directly by the bank into the account. When this is not intimated by
the bank to the project, we can see how this will lead to a balance that is smaller in the bank
statement than in the cash & bank book.
Any one or more of the above reasons can result in the balance as per the cash & bank book not
matching with the balance as per bank statement. Thus, at a given point in time, these balances may
not match for reasons that are perfectly acceptable. In such a situation, the recourse we have is to
check and understand the reasons for the two balances not matching. If this difference can be
explained by way of transactions of the nature listed above, then the balances can be considered to
have matched.

398 MGNCRE | Social Entrepreneurship
The process of matching the two balances is called bank reconciliation and the statement that
systematically identifies and records the two balances and the transactions that form the legitimate
difference between the two balances is called the bank reconciliation statement. This statement is
prepared periodically (weekly, fortnightly, monthly or quarterly depending on the volume of bank
transactions – if the transactions are more, then the statement has to be prepared more frequently).
Figure 4.8 Sample Bank Reconciliation Statement
We picked up information on the elements involved in accounting for and managing the financial
components involved in running an NGO operation.
4.3 Fund Management Procedures
Budget is one of the most fundamental documents in resource management. This unit lays down the
procedures adopted by the civil societies for managing their funds. It also highlights the importance
of budget and the process of formulating the budget.
To Do Activity
“Finance is the life and blood of business.” But an NGO generally does not have a profit motive
then how are the finance issues handled in a typical NGO. Study about the financing options
available and its actual use for NGO.

399 MGNCRE | Social Entrepreneurship
Budget Management & Analysis
Budget is one of the most fundamental documents in resource management. The budget is the
planned estimate of resources required (or available) in order to produce a given outcome of an
expected quality and quantity. At the outset of the project, a budget is created and agreed to with
the donor. The budget is usually made line item wise and contains information about quantity as
well as amount. For example, the budget can refer to an allocation of Rs.10,000 for printing of 5,000
leaflets. This implies that the cost expected is Rs.2 per unit. However, in other portions of the budget
there can be specifications on the quality expected (size of the leaflet, quality of paper, single or
multi-color, etc.).
Budget Management
The agreed budget forms the basis of financial management in a project. The activities are planned
in accordance with the budget available. Expenditures are made as per availability of budget and the
person approving expenses has to keep an eye on the amounts already spent and balance available
before providing approvals for expenditures. A budget is usually a realistic estimate of the amounts
necessary for achieving the planned activities, objectives and goal of the project and keeping track of
actual expenditures till date before approving further expenses helps the manager in not losing
track.
Budget Variance Analysis
While the budget acts as a basic estimate of the proposed expenditure, it can also serve an
important purpose after expenditures are made. This stems from the analysis of actual expenditure
against the budget. This analysis is also called variance analysis since it analyses the variation of the
actual expenditure against the budget. Variance analysis can be done in different levels and each of
them will provide a different insight –
• Difference in total expenditure versus budget
• Difference in line item wise expenditure versus budget
• Difference in quantity/ level of activity (actual versus budget)
• Difference in timing of expenditure versus budget
The differences need to be analyzed and the impact on the project needs to be understood by the
manager. If there are adverse impacts, then the manager needs to initiate steps to ensure that
variances do not arise in the future, by keeping better track of the expenditures. In case the variance
is unavoidable, then the budget maybe considered as not realistic based on ground situation.
Discussions need to be conducted with the donor to explore the issue and to revise the budget in
keeping with the ground realities.
Procurement Process
In projects that have many consumables or materials that need to be provided to the beneficiaries,
procurement becomes an important function of the finance team. Since items need to be purchased
in large quantities, it is important the required quality materials be procured at the least possible
price. It is also important the procurement does not happen only on the basis of known contacts
since this can lead rise to real or perceived benefits to the person making the procurement.
In order to do and to be seen doing fair procurements, the project should have a procurement policy
in place that specifies the manner of procurement for contracts of different values. Usually, low

400 MGNCRE | Social Entrepreneurship
value procurements are done at pre-contracted rates from empanelled vendors (example stationery
items at pre-agreed rates from a empanelled stationery outlet). The empanelment process may be
done once in a year by calling qualified vendors to submit quotes for the items expected to be
regularly procured during the year. For items of medium value, the process can require multiple
independent quotations from qualified vendors and the lowest quoting vendor maybe awarded the
contract. For high value items, usually sealed tenders are invited through advertisement in
newspaper and contracts are awarded based on quality and pricing.
It is important that the project has these processes in a written manner and circulated to all
concerned. All procurements should be done based on these processes. The process must also
contain safe-guards to ensure quality post awarding of contracts to vendors, in the form of bank
guarantees and/ or retention money.
The donor may also prescribe processes and formats for standardized procurements. In such cases,
the project must ensure adherence to these. In case the donor’s requirements are silent on any
issue, then the project must fall back to its own internal processes.
Advances Management
Advances are provided by the project for travel, for minor purchases, against procurements etc. As a
matter of propriety, these advances need to be followed up and closed within a reasonable amount
of time in order to ensure that there is no misuse of funds. In the first instance, any request for
advance must be submitted by the project personnel in the appropriate format. The submitted
format is to be then checked and forwarded to the appropriate authority for signature. Based on the
signature, advance is released, usually as a cheque or bank transfer in favor of the recipient of the
advance. Only in exceptional circumstances should advance be given as cash, at that too with clear
remarks on the exceptional need for release of cash and with the signature of the approving
authority.
The person taking the advance should utilize it only for the purpose for which the advance has been
released (travel advance should be used only for travel purposes and should not be used for
purchase of any materials or assets). Within the required number of days, or within a reasonable
period of time (example, a week after the travel is completed), the advance should be settled along
with all the required documents (usually, the tour report, the bills and the balance amount). In case
the advance is not settled on time, it is the responsibility of the finance personnel to follow up and if
necessary, take up the issue to the notice of the project authorities. An advance is provided for
facilitating an express activity and should not allowed to be misused for any other purposes. It is also
important for the project management team to verify this on a random basis and compulsorily verify
any balances before doing the full and final settlement of any team member who leaves the project.
Tax
Non- profit organizations are exempt from paying tax as long as they do not indulge in any
commercial or business activity and apply the grants, donations and income from any property to a
charitable purpose. However, the NGO/ Trust still needs to register and get a TDS registration
number and deduct and pay taxes on all payments to vendors as per the stipulations of income tax
act and rules. Amounts should be deducted before making the payment and the should be deposited
within the due date. Also, at the end of the financial year, form 16 (for salary TDS) and form 16A (for

401 MGNCRE | Social Entrepreneurship
non- salary TDS) needs to be issued to all the employees/ vendors from whom tax has been
deducted.
Service tax is also applicable to NGOs unless specifically exempt. Registration needs to be taken for
service tax is total services provided exceeds Rs.9 lakhs per annum. Service tax needs to be added to
the service amount by the NGO for services provided. This amount is recovered from the customer
benefiting from the service (not the beneficiary, but the donor or company on who pays to the NGO
for performing a service). The service tax amount, along with the returns has to be submitted within
the due date.
FCRA Registration
Foreign contributions regulation act (FCRA) is the act that oversees all foreign contributions made to
charitable activities in India. Any NGO receiving funds of foreign origin needs to register itself with
the Ministry of Home Affairs. The NGO shall also open a FCRA designated bank account for receiving
all funds from foreign sources. It should be noted that every NGO shall have only one FRCA bank
account for receiving all foreign funds. Opening of multiple FCRA bank accounts is prohibited.
Funds received by the NGO in the FCRA account shall be used specifically for the purposes for which
they have been received. Application for other purposes in not permitted. The NGO shall also
provide an annual return to the ministry of home affairs in the prescribed format.
Further detailed information on the act and answers to frequently asked question on FCRA can be
procured from http//mha.nic.in/fcra.htm
Contracts & Other Documents
During the course of the project, many important documents are received and issued by the project.
These documents have legal and financial implications and the project must take care to have these
documents and copies secured in an organized and safe manner. A general list of documents &
contracts (indicative, not exhaustive) is –
Rental agreements (office building, clinic, etc.)
• Ownership documents for any property owned by the project – building, vehicles etc.
• Ownership/ invoices and warranty documents for assets purchased by the project
• Employment contracts for employees
• Consultancy contracts for consultants
• Guidelines, manuals, other documents issued by the project
• Originals of any artwork (leaflets, advertisements, etc.) commissioned by the project
• Reports and basic documents of any studies commissioned by the project
While the original documents must ideally by kept in a safe or in other locked cupboard, copies of
the same must be available in another physical location. In a similar manner, copies of all-important
financial documents (audited financial records, tax registrations audit reports, financial statements,
digital back up of accounts) must be also kept in a separate physical location. This is for safety and
continuation in case of any physical damages to the project location.

402 MGNCRE | Social Entrepreneurship
We internalized various aspects of financial juggling involved in an NGO operation such as budgeting,
advancing, tax compliance, etc.
4.4 Project Management in NGOs
Project management has increased in relevance in the past few decades with the increasing
understanding of its utility in the successful completion of time and resource bound ventures. The
application of project management principles to public health projects in the last two to three
decades, especially in the western world has brought about better outcomes.
Need for Project Management
Projects essentially are time bound ventures designed to achieve a certain predetermined objective.
They can be defined as collaborative enterprise carefully planned to achieve a particular aim.
Need for PM in an NGO can be explored here <https//www.youtube.com/watch?v=AtmbhQGfMos>
Figure 4.9 Need for Project Management (Golden Pyramid)
Source (Carroll A. , 1991)
Project Management can be understood as the act of people and resources coming together for a
pre-determined period of time to achieve a particular aim in an efficient and effective manner.
Efficient and effective are often used interchangeably. However, they do not mean the same thing.
Efficient refers to achieving maximum productivity with minimum wasted effort or expense, whereas
effective refers to the ability to produce a desired or intended result. As we can see, efficiency may
give maximum output while spending the least resources, but may not achieve the desired result. On
the other hand, effectiveness may achieve the desired result but may not do so at the least cost. In
management and in project management, we try to be efficient as well as effective.
To Do Activity
Study about the two NGO’s Child Rights and You, and Help Age India. Study there working and
based on your study develop a strategy regarding management of funds by an NGO. Take care
of rules of the govt. as well.
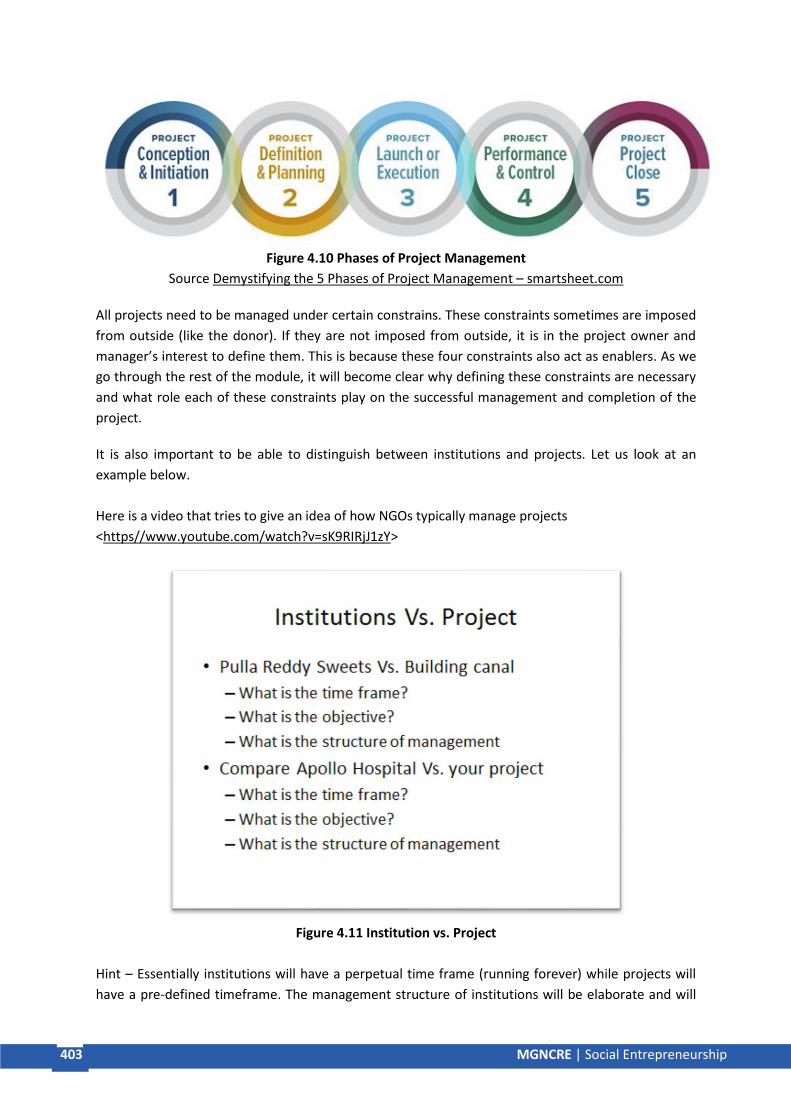
403 MGNCRE | Social Entrepreneurship
Figure 4.10 Phases of Project Management
Source Demystifying the 5 Phases of Project Management – smartsheet.com
All projects need to be managed under certain constrains. These constraints sometimes are imposed
from outside (like the donor). If they are not imposed from outside, it is in the project owner and
manager’s interest to define them. This is because these four constraints also act as enablers. As we
go through the rest of the module, it will become clear why defining these constraints are necessary
and what role each of these constraints play on the successful management and completion of the
project.
It is also important to be able to distinguish between institutions and projects. Let us look at an
example below.
Here is a video that tries to give an idea of how NGOs typically manage projects
<https//www.youtube.com/watch?v=sK9RIRjJ1zY>
Figure 4.11 Institution vs. Project
Hint – Essentially institutions will have a perpetual time frame (running forever) while projects will
have a pre-defined timeframe. The management structure of institutions will be elaborate and will

404 MGNCRE | Social Entrepreneurship
be oriented towards the long-term survival and success of the firm (example – there will a team
which looks at business expansions). However, the project management team structure will be short
term and will be defined exactly as per the requirements of the project.
Scope Management
Scope Management is perhaps one of the most important components from the lifetime perspective
of the project. Scope defines what is expected of the project and what is not. This helps in clarifying
the goal to the project team as well as to the various stakeholders. Since the focus is clearly on what
will be done by the project, the objectives and the activities of the project are also better defined.
This in turn helps in schedule management.
Usually, the scope of the project, in terms of the goals and objectives is provided by the donor or is
agreed with the donor. In projects where this is not the case, or where the project is created using
own funds, it is an important exercise for the project owner and the manager. Not defining the
scope of the project clearly can lead to situations where the project resources are not focused and
get spent in various directions due to lack of clarity and changing priorities.
Schedule Management
Schedule management is the process of creating a timeline of activities and tasks through the
project period, the completion of which will help achieve the project objectives and goal. A simple
manner of understanding this is to look at a car drive from Hyderabad to Mumbai. The journey is of
several hundred kilometers. Before starting on the journey, you will make a plan and note down
various towns and landmarks on the way so that you know you are on the correct path. You will also
note down where you will stop for food, for a rest and where you will sleep. In a similar manner, a
project can be scheduled for its’ duration.
The first step is to break the objectives created in the earlier process of scope management into
activities and tasks. These are then plotted against the calendar in such a manner that dependencies
are taken care of. Dependencies refer to situations where one activity depends on the completion of
another. For example, you can do one to one communication using a leaflet only after the leaflets
are printed and ready. So, the one to one communication activity using the leaflet is dependent on
the activity of designing and printing the leaflet.
Alongside the activity and tasks that are now noted on the calendar, the person responsible for each
task is also noted. The resources required and the outputs expected for each activity are also noted.
During the implementation of the project the activities undertaken are monitored against the
schedule and deviations are noted and analyzed. Consistent deviations may require the
management team to discuss with stake holders in order to correct the issue or to revise the
schedule in case of genuine issues in keeping to the planned schedule.
Budget Management
It is important that the budget for the project be clearly defined before the commencement. Usually
this is not a problem since the donor provides a specified budget amount along with expenditure
heads and sub-heads with the allocation under each of these heads and sub-heads. In case of

405 MGNCRE | Social Entrepreneurship
projects that are run with donations or own funds, the project owner and manager have to do this
exercise and define the budget and allocations.
A useful video on project cost management can be found here
<https//www.youtube.com/watch?v=oXhgwn-girI>
Another video on project budgeting here <https//www.youtube.com/watch?v=hePqA01jS1I>
At the time of creation of the budget, it is also important for the project management team to
clearly plan the level of activity against the budget amounts. This is crucial since the project can
remain within the budget during implementation, but may not function at the activity level that was
planned. For example, if the amount allocated for field travel for an employee for a month is
Rs.5,000, it is important to also define that the employee is expected to spend 10 days in the field in
the month. Later, during implementation, the monitoring will include not only checking that the
actual amount spent is under Rs.5,000, but also that the employee has spent 10 days in fieldwork.
Keeping the spend at Rs.4,800 while having worked in the field for 5 days should actually be noted as
overspending or inefficiency.
In terms of monitoring, the project management team should also ensure that due authorizations
are available for every expenditure. Monitoring would also include periodic checks, internal and
external audits and reporting to stakeholders on the levels of activity accomplished and the under/
over spend against the budget.
Quality Management
Defining the quality standards of the project is an often-ignored enabler. The importance of this
enabler lies in the fact that this has a direct impact on the beneficiaries of the project. Quality should
be defined in measurable terms for all important activities. For example, a bank measures the
quality of customer service at the call center by multiple means. It checks the amount of time a
person has to hold the call before being attended to, the time it takes to provide a solution to the
caller, whether the issue was resolved at the end of the call and the actual satisfaction rating
provided by the caller after the call.
From a project perspective, quality standards can be defined in terms of the quality of any goods or
services provided to beneficiaries. For example, where a project is providing free notebooks and
pens to school children, the quality of the notebook, the number of pages it should contain, the
number of notebooks given to each student, the time duration in which it would be given to the
student should be defined.
As with the other enablers, the quality of the outputs should be routinely or periodically monitored
against the standard and any deviations should be looked into. Quality management needs to be
taken very seriously because the beneficiaries usually are not in a position to raise a voice or
complain since they feel indebted for any help received. For example, a student is unlikely to
complain against the project if she receives five 80 pages notebooks instead of five 100 pages
notebook. However, the project management team should be aware that the student has a right to
get the correct notebooks.

406 MGNCRE | Social Entrepreneurship
Contract Management
Contract and supplies management is also known as procurement management. Common sense
suggests that we should plan for the procurement of all items based on their perishability and on the
time of need. If the items are non- perishable, like leaflets, and they are needed every month for one
year, then the entire procurement for the year should be done in one lot so as to get the best rates.
Based on the scheduling done earlier, the project management team already knows the inputs that
are required. This is then organized in a schedule and purchase planning is done. Based on the bulk
and the value of the purchase, the appropriate procedures should be followed for getting the items.
Details of the procurement process and rules are provided in the finance management training
module.
Team Management
The soul of any venture is its’ people. This is a fact that is increasingly acknowledged by all
organizations, large and small. The project must first create an organogram (a chart depicting the
different roles in the project and how they are connected to each other). The roles provided here
will be the same as the roles that were marked out for activities in the scheduling portion earlier.
Once the roles are marked out, the qualifications, experience and other requirements for each role
are identified and defined. The training that needs to be provided to each role holder is also
identified. The training can be a single one at the time of joining or multiple rounds of trainings, with
an induction training at the time of joining and one or several more rounds of training subsequently.
The appraisal process must also be decided and announced upfront. How often will the appraisal
happen, what points will the employee be appraised against, what will be the outcome of different
appraisal ratings etc., must be clearly communicated. This is also a period when formal feedback on
ways of working and areas of improvement can be provided to the employee.
It can be seen that all of the above processes help provide better clarity to the management team in
terms of identifying the right person for each role and also clarity to the employees in terms of what
is expected of them and what actions will get rewarded. Such clarity helps in maintaining high
morale in the team and encourages high levels of performance and promoted high level performers.
Here is a video discussing managing remote teams – very relevant to NGOs
<https//www.youtube.com/watch?v=rb3LhwPr7P4>
Stakeholder Management
Stakeholders are all the persons who have an interest in the project. This can include the
beneficiaries, the local government bodies, the donors, other projects or organizations that are
involved in similar work etc. Thus, we can see that while the donor may be paying the money for the
project, there are several groups who are interested in the project.
The project should identify the different stakeholder groups at the beginning of the project. This
exercise is useful in ensuring that all major decisions are taken keeping in mind these different
stakeholders. Once can see easily that such a decision-making process will help in avoiding conflicts
later in the project.

407 MGNCRE | Social Entrepreneurship
Once the stakeholders are identified, their interests and concerns should be listed. This again feeds
into the information that is provided to them on a periodic basis helping in creating a smooth
relationship. The communication strategy towards each stakeholder is built around this.
Self-test question - Who are the stakeholders for the current training program me?
Information Management
Data that is organized in a meaningful manner becomes information. Information is a crucial input
into all decision-making activities. For example, it would be difficult to take a decision on whether to
give an increment to an employee if the information about his or her past performance is not
available.
As a first step, various types of information that is required for implementing various activities and
for monitoring them should be identified and noted. Then the sources for this information need to
be identified. Who will provide this information, in what frequency and in what formats? Who will
make use of this information and for what?
It is very important that all the project team members understand why a piece of information is
being collected and how it will be used. This helps in two ways; one, it gives an idea about the
importance of the information to the person who is asked to collect it. Two, it also helps weed out
the collection of unnecessary bits of information that no one uses.
This video deals with using information systems in the NGO management space
<https//www.youtube.com/watch?v=sNNZ0iZ64OU>
As a last step in this process, the user of the information should necessarily provide feedback on the
results from the analysis of the information collected to all the people involved in its’ collection. This
is necessary to ensure proper use of the information and also for the people collecting the
information to benefit from its’ analysis.
Risk Management
As they say, ‘man proposes and God disposes. Things do not go always as planned. However, an
intelligent planner will always spend some time and energy anticipating the risks associated with the
project. A risk is any event that threatens the success of the project. For a risk to be considered, it
should either have a reasonably high chance of occurring and/ or it should be a low probability event
but with a high level of impact.
Here is a video discussing risk management in projects
<https//www.youtube.com/watch?v=D3S6kpBlDbk>
Once a risk is identified, the project management team has two alternatives. Either they can create a
plan to mitigate and reduce the risk, or they can create a back-up plan for achieving the success of
the project using alternatives that are not affected by the occurrence of the risk event. For high
impact events that can seriously affect the viability and success of the project, the project
management team should plan for risk mitigation as well as back-up options or what is popularly
called Plan B.

408 MGNCRE | Social Entrepreneurship
We learnt how the various elements involved in a project can be brought together under the
paradigm of project management, designed specifically for NGOs.
Describe the significance of project management in planning, execution and follow-up of a project
Compare the on-site and off-site components of a project through a PM lens. Attempt to connect
these with each other.
4.5 Project Life Cycle
This section discusses describes the project life cycle and also highlights the importance of every
phase in the project.
Initiation
This phase consists of all the activities before the project is actually started. This includes creating
the proposal, bidding, negotiation ending with signing the contract. This phase needs to be done
with due seriousness since not only does it result in the award of the project, but it is also the phase
where the terms of the project are agreed to. The project manager or owner should only agree to
those terms that they are confident of adhering to.
Planning
Once the project has been awarded, the task of planning starts. All the components we have seen
earlier in terms of enablers and facilitators are now defined and planned. The scope is defined, the
schedule made, the budget set, quality agreed. The procurement procedures are put in place, the
team planning is done, stakeholders are identified, information needs are assessed and the risk
mitigation plan put in place.
Setting goals that are specific, measurable, attainable, realistic and timely is key in this phase.
Figure 4.12 Phases of Project Management
Source Demystifying the 5 Phases of Project Management – smartsheet.com
To Do Activity
Assume that you are working with a NGO and have been given a project related to rural health
and hygiene. How will you go about it? Design the entire project management proposal keeping
in view the govt. rules and regulations applicable for NGO. Also take care of finance
requirements.

409 MGNCRE | Social Entrepreneurship
As the old saying goes, if you have 10 hours to cut a tree, spend 9 hours sharpening your axe.
Similarly, a time spent on planning is well spent. It will ensure that the project is well thought out. It
reduces the chances of problems, conflicts and issues in the future and increases the chances of
success.
Implementation
The action starts with the implementation of the project. This is where all the planning comes
together. The phase starts with staffing and training. Staff members are recruited as per the role
description and trainings are imparted. Once the staff are trained, field activities are initiated as per
the schedule alongside initiation of the procurement for materials.
While the implementation happens, monitoring should also be done to ensure that the activities are
undertaken within the budget allotted, while producing the outputs according to the quality agreed.
Reports and communications as per the plan should go out to the various stakeholders.
Monitoring
Monitoring is at the heart of project management. This is the critical tool used by the project
manager to ensure that once implementation starts, things are going according to plan and that the
project objectives and the goal would be achieved. Based on the information management system
put in place, reports are used to monitor the
• progress of the project against schedule
• quality of output against the agreed standards
• under or over spend against budget for the actual level of activity
Any deviations are analyzed to understand the reasons behind them. Deviations could be due to
external circumstances, due to improper implementation of attitudinal issues of staff. Corrective
measures need to be promptly taken by the project management team. These can range from
feedback and counselling to the staff, re-training, or considering a change in the schedule or budget
based on discussions with stakeholders.
• Monitoring may also take the form of external verifications. For example, external auditors
can audit the books of accounts, project officers from donor agency can visit and review the
progress.
• Monitoring also provides the necessary inputs, along with the information management
systems for communications with various stakeholders.
Adapting
While intelligent planning can go a long way in helping the project achieve its’ objectives and goal,
no amount of planning can consider all possible future circumstances. There can be issues or
constraints that were not anticipated at the planning stage. These will get revealed as variations
from the plan become apparent during monitoring. Where such constraints are revealed, the project
management team should discuss with the stakeholders and alter the plan in order to reflect the
realities with the objective of achieving the goal of the project.
Feedback Loop
Feedback loops basically take information about variances after the monitoring stage and use it as
inputs into planning. In the earlier subsection of adapting, we have looked at a scenario where there
are project planning or design issues. Certain constraints or environmental circumstances may not
have been considered or may have undergone substantial changes (like the introduction of a new
law affecting the space we are working in). Such cases have to be dealt with in the manner described
under adaptation as a revision to the plan in consultation with the various stakeholder groups.

410 MGNCRE | Social Entrepreneurship
Feedback loop can also reveal flaws in implementation. These are cases where the project planning
is fine, but the implementation is not achieving the desired results. Information from monitoring
needs to be considered and analyzed further. In many cases, the employee who is responsible for
the related activities may need to be re-trained and this will help resolve the issue. Sometimes, it
may be so that the employee is not suitable for the particular role. In such cases, he or she needs to
be transferred into other opportunities that are more suitable for him or her and recruitment should
take place without delay to fill the gap. In cases of attitudinal issues, it becomes clear that the
employee is not interested in producing the agreed outputs despite being provided training and
retraining and counselling. In these cases, the extreme step of letting the employee go is taken in the
interests of the project.
Closure
At the end of the project period, the project draws to a close. If it has been managed well and things
have gone as per plan or revised plans or even Plan B, the goal of the project should have been
achieved and the project can be wound up. In case the goal has not been achieved yet at the end of
the pre-determined period of the project, but the progress has been substantial, the project
management team can discuss with the donor and stakeholders for an extension of the project
period. This may be granted with cost or on a no-cost basis. Where cost is provided, the donor
supports by giving additional time and additional funding. Where the extension is on a no-cost basis,
the donor agrees to provide additional time to complete the project while utilizing the remainder
portion of the earlier budget.
Proper and formal closure is an important exercise and should cover the following –
• Achievements and learning from the project should be documented and shared
• Financial closure reports should be made and authenticated by the auditors
• Documentation of best practices should be done and disseminated
• All records and financial documents, hard and soft copies should be moved to safe storage.
Most donors require that the records be maintained for 5 to 8 years
• Any assets procured by the project from the project budget should be disposed of in a
manner agreed to with the donor
Impact Assessment
Integration of project and its impact assessment is one of the most important ways in which an NGO
manages its operation. NGO’s often have pressures from the funding agencies to explain their
working and operation. Many NGO’s use RCT’s for this purpose. Many NGO’s suffer at this end due
to lack of expertise and funds. Generally overall assessment of an NGO is not in practice but
assessment of one or the other project is frequently carried out by an expert.
We learnt about the elements involved in the various phases in a project’s life cycle. We also looked
at how impact assessment mechanisms are usually built into the project framework itself.
To Do Activity
Assume that you are working with a NGO and have been given a project related to rural health
and hygiene. How will you go about it? Design the entire project management proposal
keeping in view the govt. rules and regulations applicable for NGO. Also take care of finance
requirements.

411 MGNCRE | Social Entrepreneurship
Model Questions
1. Describe the significance of a grievance protocol in an NGO
2. Evaluate the statement “selecting the right candidate is even more valued in an NGO as
compared to for-profit organizations”.
3. How you think book keeping and bank reconciliation helps with financial resource
management in an NGO? How is this related with its fund management?
4. Describe the major elements of fund management as per an NGO stand point of operations
5. How would you relate the budgeting process in an NGO to its projects in the field?
6. Describe the significance of planning for the project life-cycle in a project management lens.
7. Elaborate how a project can be run through initiation to closure and follow up.
Suggested Readings
1. A brief introduction to PM can be found here
<https//www.youtube.com/watch?v=BOU1YP5NZVA> and here
<https//www.youtube.com/watch?v=49-LbHZSF3U>
2. A video on creating high performing project teams can be found here
<https//www.youtube.com/watch?v=4QjwoNVI1uU>
3. Burke, R. (2013). Project management planning and control techniques. New Jersey, USA.
4. Cleland, D. I., & King, W. R. (Eds.). (1988). Project management handbook (Vol. 997). New
York Van Nostrand Reinhold.Siegelaub, J. M. (2007). Six (yes six!) constraints an enhanced
model for project control. In PMI® Global Congress.
5. fundsForNGOs.org - Financial Management for NGOs -
https//www3.fundsforngos.org/category/financial-management/
6. Here is a video discussing the fundamentals of finance for non-profit organizations
<https//www.youtube.com/watch?v=p9hxNDEUet0>
7. Here is a video discussing vouchers <https//www.youtube.com/watch?v=RnIqDX8vh1Q>
8. Ismail, D., Majid, T. A., Roosli, R., & Ab Samaha, N. (2014). Project management success for
post-disaster reconstruction projects international NGOs perspectives. Procedia Economics
and Finance, 18, 120-127.
9. Kerzner, H., & Kerzner, H. R. (2017). Project management a systems approach to planning,
scheduling, and controlling. John Wiley & Sons.
10. NGO Management School of Switzerland - Project Cycle Management Compact -
http//ngomanager.org/project-cycle-management-compact-5-days/
11. Worth, M. J. (2018). Nonprofit management Principles and practice. Sage Publications.
References
1. Carroll, A. (1991, Jul-Aug). The Pyramid of Corporate Social Responsibility Toward the Moral.
Business Horizons, 39–48.
2. CIMA Global Academic Research Program me. (2017). Impact assessment in a non-
government organization. Chartered Institute of Management Accountants.
3. Keulder, Theunis; & Benz, Erika (2011). A Practical Guide to the Financial Management of
NGOs. Namibia Institute for Democracy.
4. Keulder, Theunis; & Benz, Erika (2011). A Practical Guide to the Financial Management of
NGOs. Namibia Institute for Democracy.
412 MGNCRE | Social Entrepreneurship
5. Lewis, T. (2015). Financial management essentials A handbook for NGOs. Mango
(Management Accounting for Non-governmental Organizations).
6. Lewis, T. (2015). Financial management essentials A handbook for NGOs. Mango
(Management Accounting for Non-governmental Organizations).
7. Masters, C., Tyler, P., & Copley, N. (2018). NGO Matters Practical Financial Management for
Nonprofits. Juta & Co.
8. Masters, C., Tyler, P., & Copley, N. (2018). NGO Matters Practical Financial Management for
Nonprofits. Juta & Co.
9. Mbugua, R., Njaramba, A., Young, D., & Mtshali, P. (2008). NGO financial management
pocket guide. Bristol-Myers Squibb Foundation
10. Mbugua, R., Njaramba, A., Young, D., & Mtshali, P. (2008). NGO financial management
pocket guide. Bristol-Myers Squibb Foundation
11. Meredith, J. R., & Mantel Jr, S. J. (2011). Project management a managerial approach. John
Wiley & Sons.
12. Progressio. (2016). Progressio Capacity Building Manual. Retrieved from Progressio
http//www.progressio.org.uk/content/capacity-building-manual

413 MGNCRE | Social Entrepreneurship
Chapter 5 Corporate Social Responsibility Introduction This section introduces to the concept of corporate social responsibility (CSR). Since an organization
operates in an environment that takes up the resources from the society, it understands its role in
paying back to the society.
Objectives
• To gain a basic understanding the concept of Corporate Social Responsibility, its underlying
philosophies, and significance.
• To gain insights on principles, theories, and various models of CSR
• To understand why CSR is significant as a strategy to your organization in the current times
• To review and understand the historical backgrounds and evolution of CSR philosophy in the
Indian context.
• To gain an insight into the different approaches adopted towards CSR and also the road
ahead for the companies indulging into CSR.
Structure
5.1 Corporate Social Responsibility
The term ‘corporate’ is generally used to refer to large profit-making organizations that operate and
exist as a part of the society and have a sense of responsibility towards the society. Since an
organization operates in an environment that takes up the resources from the society, it
understands its role in paying back to the society. This entire notion is what we formally address as
“corporate social responsibility”. (NPTEL & Malik, 2017).
“CSR is about how companies manage the business processes to produce an overall positive impact
on society.” (Baker, 2004)
The World Business Council for Sustainable Development in its publication Making Good Business
Sense used the following definition.
5.1 Introduction to Corporate Social Responsibility (CSR)
5.2 Principles of CSR
5.3 CSR as a Strategy
5.4 CSR in India
5.5 Future of CSR

414 MGNCRE | Social Entrepreneurship
“Corporate Social Responsibility is the continuing commitment by business to behave ethically and
contribute to economic development while improving the quality of life of the workforce and their
families as well as of the local community and society at large”. (Holme & Watts, 2001)
There are three components of corporate a social responsibility(NPTEL & Malik, 2017). These are
listed below
• corporate profit making,
• social connection with the environment in which the organization functions.
• responsibility to sustain the environment.
Figure 5.1 Elements of CSR
CSR Pyramid
CSR pyramid was developed by Carroll. Also known as Carroll’s CSR pyramid, it illustrates the
different types of obligations that society expects of businesses, through its different layers. In other
words, it is a framework describing the need and the ways in which the organizations strive to keep
their operations sustainable in all the aspects, vis-a-vis, socially, environmentally and economically. A
CSR pyramid is given below.
CSR
sustainability
social connection
profit making

415 MGNCRE | Social Entrepreneurship
Figure 5.2 CSR Pyramid
Source (Carroll A. , 1991)
The CSR model describes the profits as the base of the pyramid, which further extends towards
fulfilment of other obligations as to legal procedures, social norms etc. The hierarchy of the pyramid
states that only after the basic needs are fulfilled, the organizations will proceed towards fulfilling
their philanthropic interests. A brief description of these components of CSR pyramid is given below
• Economic Deals with the profits of the business
• Legal Deals with the Laws and regulations
• Ethical Deals with the ethics and moral practices followed by the business and also the
integrity of its stakeholders
• Philanthropic Deals with the moral responsibility of the business towards the society at large
in which it operates.
5.2 History and Evolution of CSR
“The historical evolution of the concept CSR can be divided into six phases from early 1950s to 2000s
• 1950-1960s—Period of Introduction of CSR in the academic arena and corporate
philanthropy as CSR.
• 1970s—Period of rapid growth in the concept of CSR.
• 1980s—Period of Stakeholder Theory and Business Ethics.
• 1990s—Period of CSR Practicing by Corporate.
• 2000 onwards—Period of empirical works to investigate the determinants and
consequences of CSR on corporate strategy” (Bhaduri & Selarka, 2016).
Frederick opinions out three core ideas of trusteeship and corporate philanthropy
• Corporate managers as public trustees.
• Balance of competing claims to corporate resources.
• The acceptance of philanthropy as a manifestation of business support of good causes.

416 MGNCRE | Social Entrepreneurship
following figure delineates the development of different CSR concepts over a period of time.
Figure 5.3 Development of CSR Concepts
Source (Jhawar & Gupta, 2017)
We learnt about the multi-level significance of CSR to businesses as well as the local community and
environment. We also glanced through the historical evolution of CSR.
To Do Activity
Study the CSR programs taken up by any two companies of your choice. Eg. TATA, ITC. Do you
think the activities taken up by them have a noble cause and based on your study of these
companies draft a set of activities you can take up as a part of the company in which you are
placed?

417 MGNCRE | Social Entrepreneurship
5.2 Principles of CSR
This unit introduces to the key principles of CSR. It also discusses the various theories that lay down
the guiding principles for implementing the CSR. Towards the end of the unit, we also describe the
different models of CSR that have evolved over a period of time.
Principles of CSR
CSR has become a vital component for almost every business today. It has been made mandatory by
the Government to contribute towards the CSR activities and hence, slowly the concept has gained
momentum. The CSR activities are also therefore governed by certain rules and regulations, which
we term as principles of CSR. The key principles of CSR are described below
• Developing structures, practices and procedures so as to ensure ethical conduct of activities.
• Maintaining transparency in the corporate communications so as to ensure the informed
decision making by the concerned stakeholders.
• Refrain from engaging in corrupt practices
• Following the mandatory disclosure norms so as to discharge the financial responsibility as
well
• Following the adequate reporting practices
• Ensuring that there is no violation of conduct on the part of the company for any third-party
transaction
Philanthrocapitalism
The term philanthrocapitalism is used to refer to the way of conducting a business in which there is
integration of venture philanthropy wherein specific social programs are pursued in order to yield
return on investment in the long term as well as the passive form involving social investors who tend
to seek benefit from the socially responsible programs.
Figure 5.4 - Scope of CSR
Theories of CSR
The following section describes the various theories of CSR. Let’s take them one by one
Corporate Social Responsibility (CSR)
‘Corporate social responsibility’ has two meanings. First, it’s a general name for any theory of the
corporation that emphasizes both the responsibility to make money and the responsibility to
interact ethically with the surrounding community. Second, corporate social responsibility is also a

418 MGNCRE | Social Entrepreneurship
specific conception of that responsibility to profit while playing a role in broader questions of
community welfare.
As a specific theory of the way corporations interact with the surrounding community and larger
world, corporate social responsibility (CSR) is composed of four obligations
• Economic responsibility.
• Legal responsibility
• Ethical responsibility
• Philanthropic responsibility
Taken in order from top to bottom, these four obligations are decreasingly pressing within the
theory of corporate social responsibility. As a hierarchy, the logic behind this ranking works easily.
For example, a law firm on the verge of going broke probably doesn’t need to feel the responsibility
to open up for school visits, at least not if the tours interfere with the accumulation of billable hours
and revenue. Obviously, if the firm does go broke and out of business, there won’t be any school
visits in any case, so faced with financial hardship, lawyers are clearly obligated to fulfil their
economic obligations before philanthropic ones.
More difficult questions arise when the economic responsibility conflicts with the legal one. But, at
the time of the decision, there may have been less certainty about exactly what the risks and
benefits were. Even among individuals promoting a strong sense of corporate responsibility for the
surrounding community, there may have been no clear answer to the question about the proper
course of action. Regardless, corporate social responsibility means every business holds four kinds of
obligations and should respond to them in order first the economic, then the legal, next the ethical,
and finally the philanthropic.
Triple Bottom Line Approach
Also known as TBL or 3BL, this approach proposes a three-level framework that includes social,
environment and financial components. This framework proposes to use these three areas to
evaluate the performance and hence create business value by adopting this broader perspective.
This theory clear cut indicates the sustainability to represent the intersection of ethics and
economics, thereby featuring the long-term maintenance of balance. As elaborated by theorists
including John Elkington, here’s how the balance is defined and achieved economically, socially, and
environmentally
• Economic sustainability (long-term financial solidity over more volatile, short-term profits,
no matter how high).
• Social sustainability (balance in people’s lives and the way we live)
• Environmental sustainability (Optimum utilization of scarce resources)
Together, these three notions of sustainability—economic, social, and environmental—help the
businesses strive toward Sustainability.

419 MGNCRE | Social Entrepreneurship
Legitimacy Theory
Legitimacy Theory highpoints the degree to which corporate disclosures, both social and
environmental are affected by the boundaries that are established by the society so as to be valued
and avoid being penalized by the community in which the company operates. (IGI Global, 2019)
The different ways that are adopted by the companies to legitimate their activities are described
below
• Reporting - Educating the relevant stakeholders about their actual performance.
• Public impression management - Changing the perceptions of the relevant stakeholders
about the fundamental problem without altering the organization’s behavior.
• CSR Activities and advertising - Distracting the attention away from the subject of concern
and seek to divert the attention to a favorable issue.
• Brand management- Seek to change external expectations about the organization’s
performance.
Stakeholder Theory
This theory is a blend of organizational management and business ethics. This theory addresses the
values and morals that are required while managing an organization. It integrates both market-
based view as well as the resource-based view and further takes it to a socio-political level. The
following figure illustrates the theory with its relevant areas.
Figure 5.5 - Relation between Stakeholder Theory and CSR
Source (Freeman & Dmytriyev, 2017)
Models of CSR
Traditional Conflict Model
This model lays emphasis on the conflicting role of CSR with the traditional profit-making objective
of the company.

420 MGNCRE | Social Entrepreneurship
Added Value Model
It proposes social and environmental commitments as a means to increase profit. This model focuses
on issues such as value of CSR in finding socially conscious employees, attracting socially conscious
consumers and managing the risks of negative press.
Multiple Goals Model
This model lays stress on the importance of social values in corporate decisions that are untethered
to economic values. This states that the corporations have goals that are beyond shareholder value,
and include the activities for enhancing the welfare of the community without respect to financial
advantage. Here is an article that speaks of how CSR can be deployed through social
entrepreneurship initiatives.
We went through the guiding principles, philosophies, theories as well as some major models of CSR,
and also explored the relatively new-fangled concept of philanthrocapitalism.
5.3 CSR as a Strategy
This section describes the strategic role of CRS. Understanding the role, a company plays in the
localities and communities that it serves is vital to determine the impacts its operations have on the
environment. Among its stakeholders, the communities and localities in which they function is also a
party whose goodwill and well-being the company should strive to ensure.
Strategic Corporate Philanthropy
Business entities need to play a strategic and constitutive role in attempts to address the most
pressing issues faced by our local, national and global communities. Society has increasingly been
mandating that for-profit organizations also engage in contributions to social purposes. It is
important for an organization to demonstrate to the larger society how it makes a beneficial
contribution to society.
Understanding the role, a company plays in the localities and communities that it serves is vital to
determine the impacts its operations have on the environment. Among its stakeholders, the
communities and localities in which they function is also a party whose goodwill and well-being the
company should strive to ensure. This in turn helps in identifying management strategies so as to
minimize the harm caused directly due to the company’s operations. For example, creating a diverse
workforce sourced out of the local population, providing retirement planning training early in their
career to prepare the staff and workforce for retirement, etc. are all ways of giving back to the
society which enables the company to operate and meet its objectives.
To Do Activity
Based on your study and understanding of the principles of CSR analyses the CSR activity taken
up by Starbucks and HZL. Do you find the initiative taken up by the companies justified with
reference to the objectives of CSR?

421 MGNCRE | Social Entrepreneurship
“Society is demanding that companies, both public and private, serve a social purpose. To prosper
over time, every company must not only deliver financial performance, but also show how it makes a
positive contribution to society. Companies must benefit all of their stakeholders, including
shareholders, employees, customers, and the communities in which they operate.” (DeBoskey,
2018)
– Larry Fink (Chairman and CEO, BlackRock).
According to 2017 Cone Communications CSR Study in the USA, “78% of consumers want companies
to address important social justice issues. 87% will purchase a product because a company
advocated for an issue they cared about” and, conversely, “76% will refuse to purchase a company’s
products or services upon learning it supported an issue contrary to their beliefs” (Cone
Communications, 2017). The 2016 Cone Communications Millennial Employee Engagement Study in
the USA found that “83% (consumers) would be more loyal to a company that helps them contribute
to social and environmental issues” and “88% say their job is more fulfilling when they are provided
opportunities to make a positive impact on social and environmental issue” (Cone Communications,
2016).
Even presenting employees with opportunities to engage in in social, environmental and other
sustainable causes are beginning to be seen as effective strategies to expand and diversify employee
skills to meet unique requirements of work in an ever-changing globalized world. For example,
employees who serve as members in non-profit boards, especially as their company’s
representatives enhance value at the workplace by helping promote diversity as well as inclusion
goals of their employer. This experience has also been found to bring about positive changes in the
communities where they live and work.
Figure 5.6 - Impacts of Sustainability Initiative Experience to Employees
Not-for-profit sustainability
initiative experience
Positive outlook
Enablers in community
More inclusive mindset
Sharing mentality
Creativity & innovation

422 MGNCRE | Social Entrepreneurship
Figure 5.7 - Impact of CSR on Consumer Decisions
Source (Cone Communications, 2017)
Strategic Corporate Philanthropy has increasingly been gaining momentum as a critical component
of attracting customers, irrespective of the size of the company, the beneficiaries, or the
involvement. Businesses increasingly recognize that their reputation as a responsible corporate
citizen actually boosts their prospects in recruiting, engaging and retaining employees. It also helps
forge healthier relationships with vendors and regulators, fulfil investors’ motives and deepen ties
with clients.
In today’s ruthlessly competitive and rapidly fluctuating business environmental conditions,
corporate philanthropy, without doubt is a critical component of business. It must be “strategic and
part of a company’s DNA – and so much more than random acts of kindness”. (DeBoskey, 2018).
Figure 5.8 - Scope of CSR

423 MGNCRE | Social Entrepreneurship
Corporate Citizenship
Corporate citizenship refers to the state when a company exhibits commitment to ethical and moral
values by balancing stakeholders' needs while still upholding protection of the environment. The
difference between CSR and corporate citizenship remains that there is a sharper focus on employee
rights, environment, and education with the latter. To illustrate with an example, Microsoft recently
won ‘Corporate Citizenship Company of the Year’ award for their efforts with ‘Making Cents
International’, an organization that helps with education and coaching of global youth.
Corporate Social Performance
“Corporate social performance (CSP) refers to the principles, practices, and outcomes of businesses’
relationships with people, organizations, institutions, communities, societies, and the earth, in terms
of the deliberate actions of businesses toward these stakeholders as well as the unintended
externalities of business activity”. It is defined as “a business organization's configuration of
principles of social responsibility, processes of social responsiveness, and policies, programs, and
observable outcomes as they relate to the firm's societal relationships”(Wood, 1991).
Corporate social performance refers to the stakeholders' temporal assessment of the CSR and
corporate citizenship in comparison with competition. Stakeholders are allowed to evaluate and
analyze a company through three variables.
The first component of corporate social performance model is social responsibility, which is
comprised of economic, legal, ethical, and philanthropic aspects. Organizations are expected to
examine whether they have been victorious in each specific component starting at the bottom of the
pyramid economic (since the primary motive of a business is profit).
The second component is the mode of social responsiveness which refers to how receptive a
company is to social concerns. A company can choose to be upbeat, accommodative, defensive, or
reactive. A socially receptive company will also be proactive. An example for this could be
Microsoft’s initiative called Youth Spark, which helps young minorities gain experience in technology
such as coding.
Social issues of stakeholders is the last element of corporate social performance analysis. This
element serves as a pointer to check whether their operations substantially affects adversely the
smooth social and cultural life of any stakeholder associated with the company either directly or
indirectly.” (Wood, 1991).
Corporate Social Irresponsibility
According to Friedman (1970), businesses ought not take social accountability, individuals should.
The people working with an establishment have an obligation towards the holders. The article
argues to make as large of a return of investment as possible, while still adhering to basic ethical
rules and statutory laws. If a person working in a company feels the need to act in a certain socially
accountable manner, this needs to be carried out on a personal level, and not based on the identity
of the company, since this can be seen as thieving from the proprietors. (Friedman, 1970).

424 MGNCRE | Social Entrepreneurship
Corporate social irresponsibility (CSI or CSIR) is a concept that has just begun to grow as a theme of
concern on the international scene. CSIR can be described as “a decision to accept a choice that is
less moral than its alternative” (Murphy & Schlegelmilch, 2013). Murphy and Schlegelmilch (2013)
further expand that while companies that have CSI arrangements might not be flouting the law, but
are, however, not taking complete accountability as a company. Wagner at al. call CSIR as negative
CSR, which is being conveyed to patrons by mass media (Wagner, Bicen, & Hall, 2008). Lin-Hi and
Müller (2013) described two kinds of irresponsibility; Intentional CSI denotes corporate acts like
bribery and tax evasion, and unintentional CSI denotes detrimental events, such as a cyclone,
triggered by external elements. (Lin-Hi & Müller, 2013).
We learnt how CSR can effectively be used as a corporate strategy to gain a competitive edge in the
market. We also glimpsed at the relatively recent idea of CSIR and how that too has been argued to
be a valid strategy for business enterprises.
5.4 CSR in India
This section discusses in detail the CSR scenario in India. CSR has been in informal practice since
ancient times in the form of charity to the disadvantaged and other people in need. Indian scriptures
in many instances mention the pivotal aspects of sharing part of one’s resources with the deprived
segments of society. We Indians can feel proud to possess a deep-rooted cultural trait of caring for
each other through sharing.
A Brief History
India boasts the world’s richest tradition of Corporate Social Responsibility and perhaps the longest
continuous cultural observance of the idea behind the concept. The term CSR may be relatively new
to India, but the concept of for-profit ventures giving back to the society and environment dates
back to Mauryan history, where philosophers like Kausalya underscored the relevance of ethical
practices and values while going about with business activities. CSR has been in informal practice
since ancient times in the form of charity to the disadvantaged and other people in need. Indian
scriptures in many instances mention the pivotal aspects of sharing part of one’s resources with the
deprived segments of society. We Indians can feel proud to possess a deep-rooted cultural trait of
caring for each other through sharing.
Philanthropy in India for the most part has always been associated with religious institutions. In the
socio-cultural setting of a hierarchical caste-based system of segregation dating from the Vedic ages,
religio-cultural traditions of Dan and Sava, and later the Zakat following the entry of Islam,
functioned in India for centuries serving to shape the affiliation between the privileged and the
ritually and otherwise cast out. Religion have also played a sizeable role in endorsing the concept of
CSR. Islam has a mandate called Zakat, which stipulates that a share of one’s income must be shared
with the less privileged as donations. Traders belonging to the Hindu cultural faith believed in giving
To Do Activity
Assuming that you are the head of the CSR division of an IT company design a CSR strategy for
your company keeping in view the primary objective of the company in compatibility with the
CSR objectives.

425 MGNCRE | Social Entrepreneurship
alms, contributed to get temples built and night shelters set-up for the disadvantaged sections of
society. Hindus followed the notion of Dharmada where the producer or seller levied a certain
amount from the buyer, which was meant to be utilized for charity. In similar terms, the Sikhs follow
Daashaant.
Some of the first industrialists of the 19th Century such as Jamshed Tata initiated the culture of
corporate donations via trusts, and endowed institutions managed by members of (often their own
or a relative’s) business families. A new leg of corporate philanthropy emerged after the First World
War when Mahatma Gandhi proposed a model of trusteeship for business in which businessmen
should comprehend their position as trustees of society’s wealth.
In the period immediately following Independence, the role of the Indian State extended
significantly and the corporate sector occupied a backseat in development efforts. In the course of
time, failures of the State to put an end to poverty and to support economic advancement led to
discontentment. The liberalization of the Indian economy in 1991 steered in a new globalized
economic playground characterized by rapid rise in overall wealth as well as in social inequality. The
widening gap between the most affluent Indians and those at the nethermost kindled innovation in
efforts by the corporate class to begin addressing social issues. In the context of a dwindling State,
an extensively globalized economy, and wide segregations in economic and social worlds, the
landscape of Indian CSR is captivating to say the very least.
Figure 5.9 – History of CSR in India
Source (Deo, 2015)

426 MGNCRE | Social Entrepreneurship
It is evident from the above figure that the history of CSR in India is temporally relatable to the
historical development of India. CSR has advanced in phases such as community engagement,
socially accountable production and consumption, and socially accountable workforce-relations.
Hence, the documented history of Corporate Social responsibility in India can be broadly grouped
into four distinct phases.
The first chapter of modern CSR in India was fueled by the noble deeds of philanthropists and
layman’s charity. Influenced by family-centered values, traditions, indigenous culture and religion, it
adapted in due time to the evolved needs of society after industrialization. The period up to roughly
around 1850 saw the wealthy tycoons sharing their prosperity with the wider society by either
building temples or other physical structures that provided shelter to people from all walks of life,
especially the lower strata. They were known to release the provisions deposited in their granaries
for the destitute and hungry during times of famine and shortage. With the onset of British colonial
rule in 1850, their strategy towards CSR underwent a major shift.
In the pre-independence era, the forerunners of industrialization also buttressed the concept of CSR.
The 1900s saw industrialist families like Tatas, Birla’s, Godrej, Bajaj’s and Singhania’s endorse this
notion by setting up altruistic foundations that served the society by imparting modern education
and healthcare, and also set-up trusts for community development. On a different note, it is also to
be marked that these efforts for social assistance were also motivated by political ambitions.
The second phase involves the beginning stages of the Indian freedom struggle when the business
tycoons were called to display their true commitment to the nation. Mahatma Gandhi urged the
influential industrialists to share part of their wealth towards the benefit of underprivileged sections
of the society. The concept of trusteeship contributed by him aided with the country’s socio-
economic growth. He influenced the large-scale entrepreneurs and business houses to set-up trusts
for research, educational and training institutes. These trusts also helped bring about social reforms
like rural development, women empowerment and spread of education.
In the third phase from 1960-1980, CSR practice was widely influenced by the emergence of Public
sector undertakings that also helped ensure a more even distribution of wealth. The administrative
policies of industrial licensing, high taxes and restrictions on the private sector played their parts in
giving rise to incorporate malpractices. This in turn led to enactment of legislation concerning
corporate governance, labor and environmental matters. However, the PSUs in general were not
very successful. Hence, there was a natural swing of expectations from the public to the private
sector and their active involvement in the nation’s socio-economic growth. In 1965, the
academicians, politicians and businessmen of the country converged on a national workshop on CSR,
where great emphasis was laid on social responsibility and transparency.
In the fourth phase from 1980 onwards, Indian companies infused CSR into a sustainable business
strategy that centered around the notion of ‘giving back to the society’. With globalization and
economic liberalization in the 1990s, and partial easing of controls and licensing structures, there
was a spike in the country’s economic growth. This in turn led to the boosted momentum in
industrial growth, enabling the companies to spend more towards social accountability. Thus, what
began as charity is now widely understood and acknowledged as responsibility.

427 MGNCRE | Social Entrepreneurship
In current India, the Companies Act amended in December 2012 requires the corporate to spend 2%
of their average net profits of the last three financial years towards CSR. Subject to qualifying
conditions, this Act emphasizes on carrying ahead the agenda of Corporate Social Responsibility.
(SoulAce, 2017)
Case Study
The corporate takeover in Kizhakkambalam
“An Indian garment manufacturing company called Kitex has taken over the administration of a
small village called Kizhakkambalam by winning the local body elections held in November 2015.
Mainstream political leaders and environmental activists feel that this can lead to a dangerous
precedent because corporate body can have a hidden agenda in taking over the administration of
political bodies. Former Indian MP Sebastian Paul says that "the company was at loggerheads with
the former panchayat on issues like environmental pollution so we don’t know what their vested
interest is in taking over the panchayat. They also employ a big segment of the population there and
also give out dole to locals. This model can be replicated...it is setting a dangerous precedent.”
Environmentalists like C. R. Neelakantan point out that the Kitex group has become active in social
service only after they were involved in court cases connected with water and land pollution.” (IPFS,
2019)
Legislation for CSR – India
CSR in its current state in India is a result of the 2013, Companies Act. India is in fact one of the few
countries to have a dedicated legal Act pertaining to CSR. The Companies Act, 2013, which is a
successor to The Companies Act, 1956, made CSR a compulsory provision. As per the notification
dated 27.2.2014, CSR has been demarcated in a rather broad style in Schedule VII of Companies Act,
2013. The definition is exhaustive as it includes “those specific CSR activities listed in Schedule VII
and other social programmers not listed in schedule VII, whose inclusion as a CSR activity is left to
the company’s discretion.” under Section 135 of Schedule VII of the new Act, CSR contribution is
mandatory for profit-making companies of all kinds, provided they satisfy any one or more of the
below fiscal criteria
Net worth of the business should be ≥ INR 500 crores
Annual turnover of the company should be ≥ INR 1000 crores
Annual net profits of the company should be ≥ INR 5 crores.
Those companies meeting any of these are required to form a committee to implement its CSR
mandate, with a minimum of three directors, one of whom is required to be an independent
member.
The responsibilities/ powers of the committee will be
Formulation of a detailed action-plan to implement its legally mandated CSR activities that conform
to Schedule VII of the Companies Act, 2013
Allocation and audit of funds for different CSR directions
Executive supervision of planned CSR activities
Release of annual report on all undertaken CSR activities during each financial year
Approve the form and format of CSR policies that are to be posted in public on the company’s official
website

428 MGNCRE | Social Entrepreneurship
The board of directors is legally bound to accept and execute any CSR suggestion put forward by the
committee.
Assess on a regular basis the net profits made by the company and warrant that at least two percent
of it is disbursed on CSR activities.
Warrant that local issues and regional concerns are given preference for inclusion into CSR activities
The specific details of funds utilized for CSR causes are to be included in the profit-loss report of the
company which is released annually.
The CSR rules came into effect on 1st April 2014 and blankets subsidiary companies, holdings, and
other foreign business entities that are involved in business activities in India. (Kumar, 2018). We
learnt about the evolution of the Western-originated concept of CSR in India. We also learnt about
ideas of present-day CSR as it was incorporated historically into the cultural fabric of India.
5.5 Future of CSR
This section talks about the future scope and opportunities for CSR in India.
A few fields where CSR actually has a lot of space to operate have been identified and discussed in
this section.
Socially Stigmatized Industries
Socially stigmatized industries are those industries that hold a status of promoting offerings that are
ideally harmful to a) people; b) planet (including other life forms) and c) certain socio-cultural aspect
of human existence.
A Recent Case for Socially Stigmatized Firms is given Below
Indian Tobacco Company (ITC) Choupal ITC has come up with this e-choupal as a more effective
supply chain that aims at delivering value to it is customers across the globe on a sustainable basis.
The e-choupal initiative is through the agribusiness initiative and is one of the successful initiatives
that we can talk about.
Megaproject Social Responsibility (MSR)
Mega projects may be defined as the large projects that are spread over long duration may be years
or even decades. These include the projects such as construction of dams or roads and construction
of flyovers and revamping the national highway or constructing a new national highway or
renovating an existing road into a national highway.
The key concern in these projects is the clash between the policies and practices of stakeholders
through the whole project lifecycle.
To Do Activity
Having understood the meaning of corporate sustainability design a series of activities that
can be taken up at the institute level to ensure environmental protection at the institute level.
Along with the set of activities also explain its implementation successfully.

429 MGNCRE | Social Entrepreneurship
Figure 5.10 Scope of MSR
Figure 5.11 Societal Governance Process of MSR
Territorial Social Responsibility
Territorial social responsibility is a form of governance that represents an integration of CSR and
sustainability-oriented strategies and are promoted by networks of local actors, which include,
public and private, for and nonprofit (such as institutions, universities, chambers of commerce, trade
Complexity of tasks
Huge size of projects – could be distributed in geography
Long lifecycle of projects and hence dynamic
Large number of stakeholders
Dynamic, ongoing, sizeable and usually irreversible impacts on social change
Multi-centric – Shared ownership and accountability
Social participation
Social learning
Social interaction
Social integration

430 MGNCRE | Social Entrepreneurship
union associations, businesses, foundations, banks, nonprofit organizations, professional order etc. )
and all those who are oriented toward sustainable development.
Sustainopreneurship (Sustainable Entrepreneurship)
The concept of Sustainopreneurship has emerged from the earlier concept’s social entrepreneurship
and ecopreneurship, via sustainability entrepreneurship. The concept refers to the use of creative
business that organize with the objective of solving problems pertaining to sustainability so as to
create social and environmental sustainability.
Dimensions of Sustainopreneurship
find and/or create innovations to solve sustainability-related problems
get solutions to the market through creative organizing
adds sustainability value with respect for life support systems
Forestry and Nature
Figure 5.12 Scope of CSR in Forestry
Cyber CSR (cyber security)
Figure 5.13 Cyber CSR
(Source https//www.kisspng.com/png-computer-security-managed-security-service-informa-
1587782/)
Environmental
• Promote sustainable forestry
• Promote use of renewable resources
• Strategies to reduce energy consumption
• Green strategies for waste-collection & management
Social
• Promote local public participation in environment and land management policies
• Invest in local communities
• Promote responsible consumption
• Engage with local communities

431 MGNCRE | Social Entrepreneurship
Heritage and Tourism
Figure 5.14 Scope of CSR in Heritage and Tourism Industry
This Section describes the challenges ahead for CSR initiatives in the present-day business
environment. The unit talks about the various sectors in which CSR has a long way to go. Particularly,
we discussed, Socially Stigmatized Industries, Megaproject Social Responsibility (MSR), Territorial
Social Responsibility, Sustainopreneurship (sustainable entrepreneurship), Forestry and Nature,
Cyber CSR (cyber security) and Heritage and Tourism.
Model Questions
1. How would you describe the significance of CSR in relation to both the business and the local
community as well as environment involved?
2. Briefly describe the evolutionary history of CSR in India. In your opinion, when did the idea
of need for CSR emerge in India?
3. What according to you will be the next biggest arena for CSR to step into? Justify.
4. How do you think CSR can be deployed in the cyberworld?
5. What is CSIR? Compare the philosophy behind CSIR with that of CSR.
Preserving heritage
Environmentally responsible tourism
Culturally sensitive tourism
Community-based tourism
Green strategies in upkeep of heritage monuments
Green tourist amenities
To Do Activity
Do you think CSR has a positive future in today’s rapidly changing world? Do the CSR efforts of
the company are really beneficial for the society or mere completion of obligation at the part
of the company. Support your answer with examples.
432 MGNCRE | Social Entrepreneurship
Suggested Readings
1. White, A. (2005). Fade, integrate or transform? The future of CSR. Business for Social
Responsibility, 75-88.
2. Al-Khateeb, H. M., Epiphanius, G., Alhaboby, Z. A., Barnes, J., & Short, E. (2017).
Cyberstalking Investigating formal intervention and the role of Corporate Social
Responsibility. Telematics and Informatics, 34(4), 339-349.
3.
4. Matten, D., & Moon, J. (2005). A conceptual framework for understanding CSR. Corporate
social responsibility across Europe, 335-356.
5. Hawkins, D. (2006). Corporate social responsibility balancing tomorrow's sustainability and
today's profitability. Springer.
6. McGoey, L. (2015). No such thing as a free gift The Gates Foundation and the price of
philanthropy. Verso Books.
7. Dawkins, J., & Lewis, S. (2003). CSR in stakeholde expectations and their implication for
company strategy. Journal of Business Ethics, 44(2-3), 185-193.
8. Why we need to rethink capitalism
<http//www.ted.com/talks/paul_tudor_jones_ii_why_we_need_to_rethink_capitalism/t
ranscript?language=end>.
9. Tench, R., Sun, W., & Jones, B. (Eds.). (2012). Corporate social irresponsibility A challenging
concept. Emerald Group Publishing Limited.
10. Origin of Corporate Social Responsibility - https//blog.ipleaders.in/corporate-social-
responsibility-2/
11. Bhaduri, S. N., &Selarka, E. (2016). Corporate governance and corporate social responsibility
of Indian companies. Springer Singapore.
12.
13. Arenas, D., Lozano, J. M., &Albareda, L. (2009). The role of NGOs in CSR Mutual perceptions
among stakeholders. Journal of business ethics, 88(1), 175-197.

433 MGNCRE | Social Entrepreneurship
References
1. Cone Communications. (2016). 2016 Cone Communications Millennial Employee
Engagement Study. Retrieved Feb 20, 2019, from Cone Communications
http//www.conecomm.com/research-blog/2016-millennial-employee-engagement-
study
2. Cone Communications. (2017). 2017 Cone Communications CSR Study. Retrieved Feb 20,
2019, from Cone Communications http//www.conecomm.com/research-blog/2017-csr-
study
3. DeBoskey, B. (2018, Feb 16). The Value of Strategic Corporate Philanthropy. Retrieved
Feb 20, 2019, from WealthManagement.com
https//www.wealthmanagement.com/philanthropy/value-strategic-corporate-
philanthropy
4. Friedman, M. (1970). A Friedman doctrine The social responsibility of business is to
increase its profits. The New York Times Magazine, pp. 13, no. (1970) 32-33.
5. Lin-Hi, N., & Müller, K. (2013). The CSR bottom line preventing corporate social
irresponsibility. Journal of Business Research, 66, p. 1928-1936.
6. Murphy, P. E., & Schlegelmilch, B. B. (2013). Corporate social responsibility and. Journal
of Business Research, 66, p. 1807-1813.
7. Wagner, T., Bicen, P., & Hall, Z. R. (2008). The dark side of retailing towards a scale of
corporate social irresponsibility. International Journal of Retail and Distribution, 36 (2),
p. 124-142.
8. Wood, D. J. (1991). Corporate social performancew revisited. The Academy of
Management Review, 16(4), 691-718.
9. IGI Global. (2019). What is Legitimacy Theory. Retrieved from IGI Global https//www.igi-
global.com/dictionary/legitimacy-theory/55617.
10. NPTEL, & Malik, A. (2017, Jun 08). NPTEL Corporate Social Responsibility. Retrieved Feb
18, 2019, from NPTEL https//nptel.ac.in/courses/110105081/.
11. Petryni, M. (2019, Jan 25). The Three Models of Corporate Social Responsibility.
Retrieved from disfluent https//bizfluent.com/info-8142792-three-models-corporate-
social-responsibility.html.
12. Philanthrocapitalism. (2013). FAQ. Retrieved Feb 18, 2019, from Philanthrocapitalism
http//philanthrocapitalism.net/about/FAQ/.
13. Sampath, G. (2015, Dec 05). The art of profitable giving. TheHindu.com. Retrieved Feb
18, 2019, from https//www.thehindu.com/opinion/op-ed/on-the-public-disdain-for-
philanthropy-and-how-it-has-changed/article10128736.ece.
14. The Economist. (2006, Feb 25). The birth of philanthrocapitalism. The Economist, pp. 1-
2. Retrieved Feb 19, 2019.
15. The Economist. (2006, Feb 25). The Business of Giving. Retrieved Feb 18, 2019.
16. Freeman, R. E., & Dmytriyev, S. (2017). Corporate social responsibility and stakeholder
theory Learning from each other. Symphonia - Emerging Issues in Management, (1), 7-
15.
17. Baker, M. (2004, Feb 06). Definitions of corporate social responsibility - What is CSR?
Retrieved Feb 19, 2019, from Mellen Baker http//mallenbaker.net/article/clear-
reflection/definitions-of-corporate-social-responsibility-what-is-csr
18. Bhaduri, S. N., & Selarka, E. (2016). Corporate Social Responsibility Around the World —
An Overview of Theoretical Framework, and Evolution. In S. N. Bhaduri, & E. Selarka,
Corporate Governance and Corporate Social Responsibility of Indian Companies (pp. 11-
32). Singapore Springer.

434 MGNCRE | Social Entrepreneurship
19. Carroll, A. (1991, Jul-Aug). The Pyramid of Corporate Social Responsibility Toward the
Moral. Business Horizons, 39–48.
20. Home, R., & Watts, P. (2001). Making Good Business Sense. Journal of Corporate
Citizenship, 17-20.
21. Jhawar, N., & Gupta, S. (2017). Understanding CSR- Its History and the Recent
Developments. IOSR Journal of Business and Management, May 105-109.
22. NPTEL, & Malik, A. (2017, Jun 08). NPTEL Corporate Social Responsibility. Retrieved Feb
18, 2019, from NPTEL https//nptel.ac.in/courses/110105081/
23. Deo, N. (2015, Jul 30). A brief history of Indian CSR. Retrieved from GatewayHouse
https//www.gatewayhouse.in/a-brief-history-of-indian-csr/
24. IPFS. (2019). Evolution of corporate social responsibility in India. Retrieved from IPFS
https//ipfs.io/ipfs/QmXoypizjW3WknFiJnKLwHCnL72vedxjQkDDP1mXWo6uco/wiki/Evol
ution_of_corporate_social_responsibility_in_India.html
25. Kumar, S. (2018, Jun 28). Corporate Social Responsibility under Companies Act.
Retrieved from iPleaders https//blog.ipleaders.in/csr-laws-india/
26. SoulAce. (2017, Jun 28). Evolution Of CSR In India. Retrieved from SoulAce
http//www.soulace.in/blog/evolution-of-csr-in-india/
27. Al-Khateeb, H. M., Epiphanius, G., Alhaboby, Z. A., Barnes, J., & Short, E. (2017).
Cyberstalking Investigating formal intervention and the role of Corporate Social
Responsibility. Telematics and Informatics, 34(4), 339-349.
Baldor, M. D. (2013). Territorial Social Responsibility and Territorial Small and Medium-Sized
Enterprises. In Encyclopedia of Corporate Social Responsibility (pp. 2516-2522). Springer.

Editors’ Profile Dr W G Prasanna Kumar Dr.W. G. Prasanna Kumar, PhD in Education with basic degree in Social Work and Master’s Degrees in Sociology, Public Administration and Political Science has professional education in Environmental Economics, Public Relations, Communication and Training and Development. Presently Chairman, Mahatma Gandhi National Council of Rural Education (MGNCRE) under the Ministry of Human Resource Development, in Government of India strives to promote resilient rural India through Higher Education interventions. The national initiative of reviving Mahatma Gandhi’s ideas of NaiTalim, spearheaded by Dr. W G Prasanna Kumar, has met unprecedented success at both national and state levels. The primary objective of this initiative is to promote Gandhiji’s ideas on Experiential Learning, NaiTalim, Work Education and Community Engagement, and mainstreaming them in School Education and Teacher Education Curriculum & Pedagogy. As Professor and Head Centre for Climate Education and Disaster Management in Dr MCR HRD Institute, conducted several capacity building and action research programmes in climate education, disaster management and crowd management. He has handled many regional, national and international environmental education programmes and events including UN CoP11 to Convention on Biological Diversity and Media Information Management on Environmental Issues.
He was Director in National Green Corps in the State Government for over 11 years and Senior Social Scientist in State Pollution Control Board for 6 years. Conducted various curriculum and non- curriculum related training programmes in environmental education. He was a Resource Person for AP Judicial Academy, AP Police Academy, AP Forest Academy, EPTRI, Commissonerate of Higher Education and Intermediate Education, State Council for Educational Research and Training and National Council for Educational Research and Training New Delhi, CCRT, BharathiyaVidyapeet University Pune, CPR Environmental Education Centre Chennai and Centre for Environment Education Ahmedabad. Dr W G Prasanna Kumar was trained in Community Consultation for Developmental Projects in EPA Victoria Australia in 1997 trained as State Chief Information Officer by IIM Ahmedabad and MCRHRDI Government of Andhra Pradesh in 2004 and trained in Environmental Education and Waste Management Technique by JICA, Japan in 2011.
He was awarded Best State Nodal Officer of National Green Corps Award from Centre for Science and Environment, New Delhi, 2008, Jal Mithra Award from Earthwatch Institute of India and Water Aid New Delhi, 2014 and Certificate of Commendation for the services in UN Conference of Parties to Convention for Biodiversity conducted at Hyderabad from 1-20 October 2012 by the Government of Andhra Pradesh 2012.
Dr K N Rekha Dr K N Rekha, is a PhD Graduate from IIT Madras. She has 13 years of experience in training and education Industry. She works at Mahatma Gandhi National Council of Rural Education (MGNCRE), Hdyerabad as Senior Faculty. She is involved in curriculum development on Rural Management and Waste Management. Prior to this, she worked as a Researcher at Indian School of Business (ISB), Hyderabad, and has a short stint at Centre for Organization Development (COD), Hyderabad. She has Co-authored a book on “Introduction to Mentoring”, book chapters, Peer reviewed research papers, book reviews, casestudy, and caselets in the area of HR/OB. She also presented papers in various national and international conferences. Her research areas include Mentoring, Leadership, Change Management, Coaching, 360 Degree Feedback appraisal, etc. She was also invited as a guest speaker at prominent institutions like IIT Hyderabad.

Authors’ Profile
Ravi Dhanuka Ravi Dhanuka is a co-founder of I-Saksham Education And Learning Foundation. i-Saksham builds community edu-leaders to enrich the education experiences of underserved children for their lifelong success in the world ahead.Ravi has served as Prime Minister’s Rural Development Fellow (PMRDF) for 3 and half years in Munger, Bihar to assist district administration in the implementation of flagship rural development schemes in extremism affected villages.Prior to joining PMRDF, Ravi worked with BASIX for two years in areas of microfinance, and rural livelihoods.Ravi has done Post Graduate Diploma in Rural Management from Institute of Rural Management, Anand (IRMA). He has Bachelors in Economics (H) from Hans Raj College, Delhi University.At i-Saksham, Ravi is primarily looking after field operations and implementing the i-Saksham model in far-flung areas. He brings with himself a huge passion to contribute to improve the capabilities of marginalized sections of the society. He considers education and values as his biggest assets Dr Priyadarshini Vasamsetti Dr Priyadarshini Vasamsetti, is a Senior Doctoral Research Fellow at the School of Management Studies, University of Hyderabad. She is a Master of Business Administration from Acharya Nagarjuna University and a Master of English from IGNOU. She started her career as a Faculty in Management. Prof Prakash Satyavageeswaran Prof. Prakash Satyavageeswaran’s research focuses on sustainable solutions supporting social enterprises and consumers in emerging markets, especially in the bottom of the pyramid. His research projects, co-authored with various researchers, have been supported by several competitive grants totaling over US$ 50,000. He has worked in the past with Spandana, a Microfinance institution, to promote micro insurance and micro credit in rural India. He has also worked with HLFPPT, a national level public health NGO, working on social marketing to promote healthy behaviors among vulnerable populations. His proposal with co-investigators to the Government of India under SPARC to study rural and women entrepreneurship and empowerment has been recently approved.
Prof D VR Seshadri Since 2000 until joining ISB as Clinical Full Professor of Business in the Marketing Area in July 2016, Prof. D.V.R. Seshadri taught in various IIMs (particularly at Bangalore, Ahmedabad and more recently at Udaipur since 2012). For 15 years prior to 2000, he worked in a variety of companies (public sector, family business and entrepreneurial start-ups, the last ten of them as CEO spanning a variety of industries (petroleum refining &petro-chemicals, bulk drugs, active pharmaceutical ingredients, precision manufacturing and software). His areas of interest among others include: Strategy, B2B Marketing, Innovation; Entrepreneurship & Intrapreneurship and Leadership. He is actively involved with several NGOs such as Aravind Eye Care Systems, Madurai and DHAN Foundation, Madurai in addition to engaging with several top corporates such as companies of the Tata Group and L&T. He has been engaged in teaching / consulting capacity with over 100 large corporates, both India-based and foreign MNCs. He has taught a variety of courses / programs in MBA, executive MBA, long duration programs in public policy, short duration executive education programs, etc. He has co-authored several books: ‘Innovation Management,’ with ShlomoMaital, Sage India in 2007; ‘Global Risk / Global Opportunity,’ with ShlomoMaital, Sage India, in June 2010; the Indian adaptation of ‘Business Market Management (B2B): Understanding, Creating and Delivering Value,’ with James Anderson, James Narus and Das Narayandas, Pearson Publishing, in June 2010; and ‘Smartonomics

for the Global Manager: Simple, Powerful Macroeconomic Tools For Success in an Uncertain World’ with ShlomoMaital, Sage India, 2016. He has developed over hundred case studies and authored several application-oriented journal articles in his areas of interest. His most recent book that he co-authored, is titled: ‘Nurturing Global Leaders of Tomorrow: An Inclusive Learning Model (SKMSVM) Shows the Way’ was launched recently in Chennai. He works closely with several companies, providing them training / consulting services in his areas of expertise.

#5-10-174, Shakkar Bhavan, Fateh Maidan Lane, Band Colony, Basheer Bagh, Hyderabad-500004
[email protected] - 2321 2120
Department of Higher EducationMinistry of Human Resource Development, Government of India
Mahatma Gandhi National Council of Rural Education(MGNCRE)
₹750