RLJ Lodging Trust 2012 Annual Report - AnnualReports.com
153
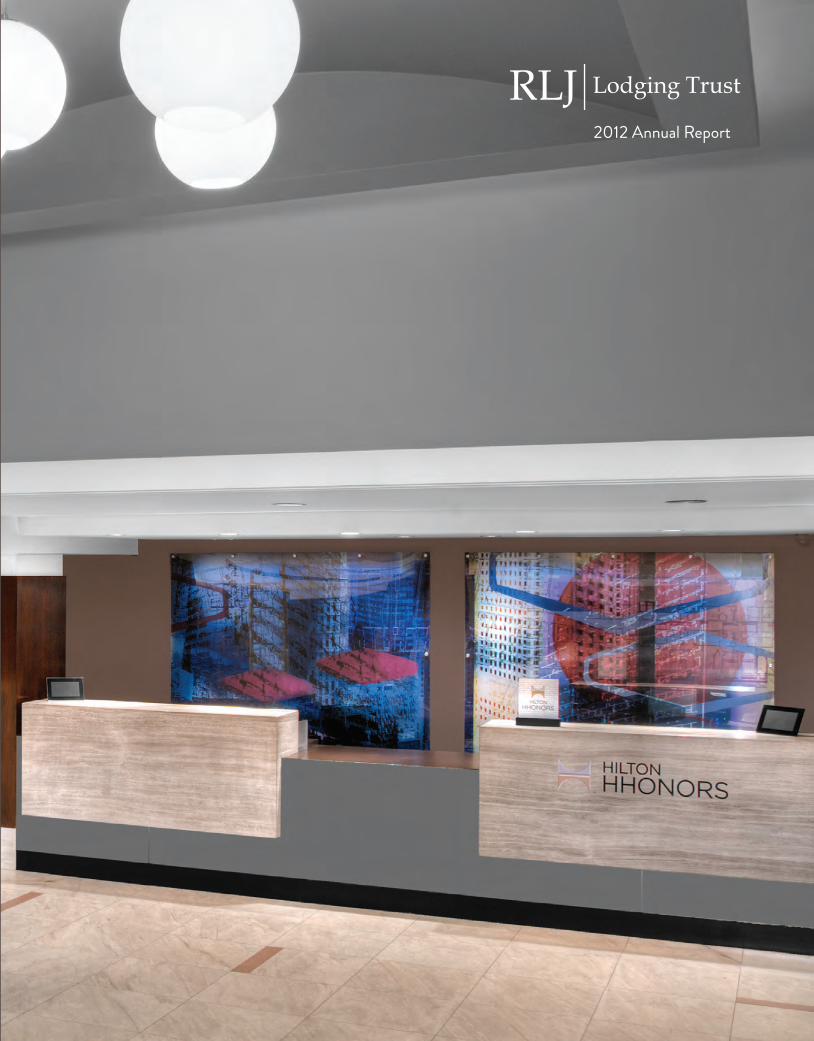
2012 Annual Report
-
Upload
khangminh22 -
Category
Documents
-
view
0 -
download
0
Transcript of RLJ Lodging Trust 2012 Annual Report - AnnualReports.com
2012 Annual Report
Green: C=88 M=45 Y=90 K=56 1Gray: C=0 M=0 Y=0 K=70
Green: C=88 M=45 Y=90 K=56 1Gray: C=0 M=0 Y=0 K=70
3 Bethesda Metro Centersuite 1000Bethesda, Md 20814(301) 280-7777rljlodgingtrust.CoM
rlj lo
dg
ing
tru
st | 2012 a
nn
ua
l re
Po
rt

Urban Markets
ValUable brands
ProdUct diVersificationBrands (Number of Hotels) Lodging Segments (% of Rooms)
RL J Lodging TRusT oveRview
CoRpoRaTe addRessRLJ Lodging Trust3 Bethesda Metro CenterSuite 1000Bethesda, MD 20814(301) 280-7777(301) 280-7750 (fax)Visit our website at: www.rljlodgingtrust.com
independenT audiToRsPricewaterhouseCoopers LLPMcLean, Virginia
LegaL CounseLHogan Lovells US LLPWashington, DC
TRansfeR agenTWells Fargo Bank, N.A.Shareowner Services161 North Concord ExchangeSouth St. Paul, MN 55075 (800) 468-9716 or for outside the U.S. (651) 450-4064.
exeCuTive offiCeRsRobeRT L. JohnsonExecutive Chairman of the Board
Thomas J. baLTimoRe, JR.President, Chief Executive Officer and Trustee
Ross h. bieRkanChief Investment Officer and Executive Vice President
LesLie d. haLeChief Financial Officer, Treasurer and Executive Vice President
independenT boaRd of TRusTeessenaToR evan bayhFormer U.S. Senator and Governor State of IndianaPartnerMcGuireWoods, LLC
naThanieL a. davisManaging Director RANDD Advisory Group
RobeRT m. La foRgiaPrincipal Apertor Hospitality, LLC
gLenda g. mCneaLExecutive Vice President and General Manager Global Client Group in Global Merchant ServicesAmerican Express Company
Joseph RyanRLJ Lead Independent DirectorChairman and Chief Executive Officer Ryan Investments, LLC and Joseph Ryan and Associates
seC foRm 10-k and oTheR infoRmaTionRequests for additional copies of the Company’s 2012 Annual Report on Form 10-K, charters of the board committees, code of ethics and corporate governance guidelines are made available on our website or in print by sending requests to:
RL J Lodging TRusTInvestor Relations Department3 Bethesda Metro CenterSuite 1000Bethesda, MD 20814
annuaL meeTing of shaRehoLdeRsThe 2013 Annual Meeting of Shareholders will be held on Thursday, May 2, 2013 at 11:00 a.m. local time, at the Residence Inn Bethesda Downtown, 7335 Wisconsin Avenue, Bethesda, Maryland 20814.
sToCk LisTingRLJ Lodging Trust is traded on the New York Stock Exchange under the symbol “RLJ”. The number of shareholders of record as of February 20, 2013 was 94.
dividendsThe Company declared cash dividends of $0.70 on its commonstock in 2012.
CoRpoRaTe infoRmaTion
Note: Information displayed as of December 31, 2012

RLJ Lodging TRusT 2012 1
TO OUR FELLOW SHAREHOLDERSin 2012, we continued to execute our proven investment strategy and successfully accomplished our key objectives. We acquired hotels in dynamic high-growth markets, enhanced our portfolio, and maintained a strong balance sheet. our value-add strategies resulted in outsized returns for the year and positioned us to deliver future growth in 2013 and beyond.
RESULTS DRIVENIn our second year as a public company, we take great pride in having achieved the key guiding principles that we set forth at the time of our IPO. We committed to drive operating performance, allocate capital prudently, and maintain a con-servative, low-leverage balance sheet. Through a focused and thoughtful approach, we delivered industry-leading revenue per available room (“RevPAR”) growth and hotel operating margins. our RevPAR growth of 7.4% over the prior year serves as positive reinforcement of the various portfolio enhancing strategies we initiated to increase the value of our portfolio. As we move forward, realizing the value of our investments and growing our RevPAR will continue to serve as key focal points.
in addition to driving operational efficiencies at our hotels, we continuously look to increase our portfolio’s value through strategic investments. in 2011, we embarked on an extensive two-year renovation program designed to reposition our assets as market leaders. in 2012, not only did we complete our two-year plan, we also began to see the results of these efforts in the form of outsized growth, especially at our hotels which underwent brand conversions.
in this highly competitive landscape, we remained committed to our investment strategy and acquired several high-quality hotels in growing markets that added positive momentum to the portfolio. After adding one hotel for $42 million in 2011, we acquired four additional hotels in 2012 and also agreed to acquire one hotel currently under construction. in total, we invested more than $360 million in new hotels over the first 18 months as a public company, in line with the guidance we provided at the time of our iPo.
our ability to generate strong cash flows from our opera-tions enabled us to increase our dividend more than 16% over the prior year’s annualized rate. The strength of our balance sheet provides us with the flexibility and liquidity to pursue our growth objectives, as well as return meaningful dividend yields to our investors. We will continue to be thoughtful in the execution of our investment strategy and maintain a conservative balance sheet.
COVER: The DoubleTree by Hilton Hotel Metropolitan, New York City underwent a multi-million dollar renovation. AbOVE: The Hilton Garden Inn Raleigh-Durham/Research Triangle Park was the recipient of Hilton’s 2011 best Conver-sion award for the Hilton Garden Inn brand.

2 RLJ LODging TRUST 2012
OPPORTUNISTIC ACQUISITIONS
RL J HOSPITALIT Y TRUST 2012

LEFT: The Courtyard Charleston Historic District was acquired following the completion of an extensive renovation, expansion, and brand conver-sion. AbOVE: The Embassy Suites boston/Waltham was acquired in November 2012 and marked RLJ’s entry into the boston market.
OPPORTUniSTiC ACQUiSiTiOnSWe selectively acquired high-quality assets and created shareholder value through our sharp-shooter approach. Through our long-standing relationships, solid reputation, and strong balance sheet, we accessed and executed several unique off-market transactions. We seized compelling opportunities and enhanced our portfolio by acquiring institutional-grade assets that generate attractive growth opportunities and also positively augment our portfolio. These assets expanded our geographic footprint into key gateway markets such as Boston, Miami, and the san Francisco Bay Area and increased our exposure to the top 10 RevPAR lodging markets.
We purchased the Courtyard new York Manhattan/upper East side, which was in bankruptcy, at a significant discount to replacement cost and at a considerable discount to other recently traded Manhattan hotels. Along with this acquisition, we also closed on two other assets, the Residence inn Bethesda downtown and the Hilton garden inn san Francisco oakland Bay Bridge.
The Residence inn Bethesda downtown benefits from its prime location in one of greater Washington, d.C.’s dense commercial markets that is currently experiencing an increase in corporate activity. The acquisition of the Hilton garden inn san Francisco oakland Bay Bridge marked RLJ’s entry into the san Francisco Bay Area, where we expect to benefit from strong market growth, including several upcoming large city-wide events.
We also acquired the Embassy suites Boston Waltham and agreed to acquire upon completion the Hilton Cabana Miami Beach, both of which represent our entry into two dynamic markets. The Embassy suites Boston Waltham’s recent brand conversion provides us with notable upside potential from its rebranding and we expect that the ocean-front Hilton Cabana Miami Beach will capitalize on Hilton’s limited presence in Miami Beach once construction is complete in late 2013.
our acquisitions continue to positively impact the composition of our portfolio. RevPAR for our 2012 acquisitions was more than 48% higher than the portfolio average, demonstrating their accretive value to our portfolio. Furthermore, these acquisitions increased our hotel EBiTdA in dynamic markets, with more than 16% of our hotel EBiTdA coming from new York City, the top lodging RevPAR market, and more than 7% coming from the greater Washington, d.C. metro, the seventh-highest RevPAR lodging market in the country.

4 RLJ LODging TRUST 2012
AWARD WINNING CONVERSIONS
RL J HOSPITALIT Y TRUST 2012

LEFT & AbOVE: The Hotel Indigo New Orleans Garden District opened in late December 2012 following an extensive renova-tion, which included rebranding the hotel. The hotel’s custom design is reflective of its local neighborhood character and RLJ’s in-house capabilities.
AWARD Winning COnVERSiOnSOur recently completed brand conversions and brand upgrades are generating high returns on our investment and have enhanced the overall quality of our portfolio. our extensive experience managing complex renovations allows us to target value-add acquisitions that lead to outsized results. in 2011, we initiated an extensive two-year renovation program largely focused on upgrading and/or repositioning 24 hotels we acquired in 2010 and 2011, including the rebranding of seven hotels.
Two of the seven brand conversions were completed in early 2011, four of the assets were completed at the beginning of 2012 and the final and most complex conversion, the Hotel indigo new orleans garden district, was completed this past december. The four assets finished earlier in the year posted outsized performance of more than 38% RevPAR growth. We expect that these four hotels, along with our final december conversion, will continue to deliver superior risk-adjusted returns into 2013.
Furthermore, several of these hotels received distinguished awards from their respective brands in 2012:
n The Fairfield inn & suites dC/downtown received the “design Excellence — Best Custom Project” award from Marriott international;
n The Hilton garden inn Pittsburgh university Place and the Hilton garden inn Raleigh/durham Research Triangle Park each received the “Best Conversion” award from Hilton Worldwide for the Hilton garden inn brand;
n The Embassy suites West Palm Beach-Central received the “Best Conversion” award from Hilton Worldwide for the Embassy suites Hotels brand.
These awards highlight the quality of our upgrades and are a clear testament to the expertise of our in-house design and construction team.
including these seven assets, we renovated 93 of our hotels for approximately $210 million over the past two years. our value-add strategies will continue to contribute to the long-term growth of the company. not only did our brand-converted hotels post outsized growth, our portfolio RevPAR grew 7.4%, above the industry average of 6.8%, despite these significant renovations. our investments have transformed these assets, increased their competitiveness, and enhanced the overall value of our portfolio.

6 RLJ LODging TRUST 2012
FORTRESS bALANCE SHEET
RL J HOSPITALIT Y TRUST 2012

TOP LEFT: The Hilton Garden Inn Los Angeles/Hollywood
bOTTOM LEFT: The Residence Inn Austin Downtown/ Convention Center
AbOVE: The SpringHill Suites Austin South
THOMAS J. bALTIMORE, JR.president and chief executive officer
RObERT L. JOHNSONexecutive chairman
FORTRESS BALAnCE SHEETWe increased our financial flexibility and took our first significant step toward our goal of becoming investment grade. our strong operational performance and our proactive approach to manage our debt profile created a great source of liquidity and flexibility. in particular, we completed several financing transactions that increased our liquidity and strengthened our balance sheet.
given our financial discipline and strong track record, we received considerable interest from our existing lenders and from several new lenders to participate in our capital market activity. As a result, we completed a $700 million unsecured facility that can be expanded to $1.2 billion. The facility, which was upsized due to excess demand, consists of a five-year and a seven-year unsecured term loan and an unsecured credit facility that replaced our prior credit facility.
This transaction allowed us to refinance near-term maturities and further stagger our remaining debt. We also capitalized on historically low interest rates and reduced our cost of debt, which we expect will generate substantial interest expense sav-ings in 2013. Furthermore, we were also able to unencumber several of our larger assets, thereby increasing the amount of income generated from our unencumbered hotels — a significant step toward our goal of investment grade.
With one of the strongest balance sheets in our industry, we have established a strong foundation for continued growth.
LOOKING AHEADWe are an entrepreneurial company whose top priority is to create long-term shareholder value. We have demonstrated that we are committed to driving growth and delivering excel-lent results. our cumulative total return to shareholders from our iPo through year-end 2012 was more than 16%. Through our opportunistic acquisitions, value-add capital improvements, and refinancings, we generated significant momentum and positioned ourselves for continued growth in 2013 and beyond.
As we move into 2013, we maintain a positive outlook. We are encouraged by strong lodging fundamentals, positive move-ment in the economy, and embedded growth in our portfolio. We have established a strong foundation rooted in a high-quality, diverse portfolio and a team of experienced profes-sionals. As we pursue future growth, we have clear direction, which includes recycling capital from slower growth assets into higher growth properties in key markets. With positive lodging fundamentals and a strong tailwind, we expect to see another year of strong results.

TOP: The Marriott Denver South at Park Meadows under-went a comprehensive renova-tion which was completed in May 2012. bOTTOM: The DoubleTree Hotel Columbia also underwent an extensive renovation of its guestrooms and public spaces that was completed in April 2012.

UNITED STATESSECURITIES AND EXCHANGE COMMISSION
Washington, D.C. 20549
FORM 10-K� ANNUAL REPORT PURSUANT TO SECTION 13 OR 15(d) OF THE
SECURITIES EXCHANGE ACT OF 1934For the fiscal year ended December 31, 2012
OR
� TRANSITION REPORT PURSUANT TO SECTION 13 OR 15(d) OF THESECURITIES EXCHANGE ACT OF 1934
For the transition period from to
Commission File Number 001-35169
RLJ LODGING TRUST(Exact Name of Registrant as Specified in Its Charter)
Maryland 27-4706509(State or Other Jurisdiction of Incorporation or Organization) (I.R.S. Employer Identification No.)
3 Bethesda Metro Center, Suite 1000Bethesda, Maryland 20814
(Address of Principal Executive Offices) (Zip Code)
(301) 280-7777(Registrant’s Telephone Number, Including Area Code)
Securities registered pursuant to Section 12(b) of the Act:Title of Each Class Name of Each Exchange on Which Registered
Common Shares, $0.01 par value New York Stock Exchange
Securities registered pursuant to Section 12(g) of the Act: None
Indicate by check mark if the registrant is a well-known seasoned issuer, as defined in Rule 405 of the SecuritiesAct. Yes � No �
Indicate by check mark if the registrant is not required to file reports pursuant to Section 13 or 15(d) of theAct. Yes � No �
Indicate by check mark whether the registrant (1) has filed all reports required to be filed by Section 13 or 15(d) of theSecurities Exchange Act of 1934 during the preceding 12 months (or for such shorter period that the registrant was required to filesuch reports), and (2) has been subject to such filing requirements for the past 90 days. � Yes � No
Indicate by check mark whether the registrant has submitted electronically and posted on its corporate Web site, if any, everyInteractive Data File required to be submitted and posted pursuant to Rule 405 of Regulation S-T (§232.405 of this chapter) duringthe preceding 12 months (or for such shorter period that the registrant was required to submit and post such files). � Yes � No
Indicate by check mark if disclosure of delinquent filers pursuant to Item 405 of Regulation S-K (§ 229.405 of this chapter) isnot contained herein, and will not be contained, to the best of registrant’s knowledge, in definitive proxy or information statementsincorporated by reference in Part III of this Form 10-K or any amendment to this Form 10-K. �
Indicate by check mark whether the registrant is a large accelerated filer, an accelerated filer, a non-accelerated filer, or asmaller reporting company. See the definitions of ‘‘large accelerated filer,’’ ‘‘accelerated filer’’ and ‘‘smaller reporting company’’ inRule 12b-2 of the Exchange Act.
Large accelerated filer � Accelerated filer � Non-accelerated filer � Smaller reporting company �(do not check if a
smaller reporting company)
Indicate by check mark whether the registrant is a shell company (as defined in Rule 12b-2 of the ExchangeAct). � Yes � No
The aggregate market value of the 102,481,816 common shares of beneficial interest held by non-affiliates of the Registrantwas approximately $1,857,995,324 based on the closing price of $18.13 as reported on the New York Stock Exchange for suchcommon shares of beneficial interest on June 29, 2012.
As of February 20, 2013, 106,540,971 common shares of beneficial interest of the Registrant, $0.01 par value per share, wereoutstanding.
Documents Incorporated by Reference
Portions of the Definitive Proxy Statement for our 2013 Annual Meeting of Shareholders are incorporated by reference intoPart III of this report. We expect to file our proxy statement within 120 days after December 31, 2012.

RLJ Lodging Trust
Index
Form 10-KReport
Item No. Page
PART IItem 1. Business . . . . . . . . . . . . . . . . . . . . . . . . . . . . . . . . . . . . . . . . . . . . . . . . . . . . . 3Item 1A. Risk Factors . . . . . . . . . . . . . . . . . . . . . . . . . . . . . . . . . . . . . . . . . . . . . . . . . . 10Item 1B. Unresolved Staff Comments . . . . . . . . . . . . . . . . . . . . . . . . . . . . . . . . . . . . . . 40Item 2. Properties . . . . . . . . . . . . . . . . . . . . . . . . . . . . . . . . . . . . . . . . . . . . . . . . . . . . 41Item 3. Legal Proceedings . . . . . . . . . . . . . . . . . . . . . . . . . . . . . . . . . . . . . . . . . . . . . . 52Item 4. Mine Safety Disclosures . . . . . . . . . . . . . . . . . . . . . . . . . . . . . . . . . . . . . . . . . 52
PART IIItem 5. Market for Registrant’s Common Equity, Related Shareholder Matters and
Issuer Purchases of Equity Securities . . . . . . . . . . . . . . . . . . . . . . . . . . . . . . . . 53Item 6. Selected Financial Data . . . . . . . . . . . . . . . . . . . . . . . . . . . . . . . . . . . . . . . . . . 57Item 7. Management’s Discussion and Analysis of Financial Condition and Results of
Operations . . . . . . . . . . . . . . . . . . . . . . . . . . . . . . . . . . . . . . . . . . . . . . . . . 59Item 7A. Quantitative and Qualitative Disclosures About Market Risk . . . . . . . . . . . . . . . 83Item 8. Financial Statements and Supplementary Data . . . . . . . . . . . . . . . . . . . . . . . . . 84Item 9. Changes in and Disagreements With Accountants on Accounting and Financial
Disclosure . . . . . . . . . . . . . . . . . . . . . . . . . . . . . . . . . . . . . . . . . . . . . . . . . . 84Item 9A. Controls and Procedures . . . . . . . . . . . . . . . . . . . . . . . . . . . . . . . . . . . . . . . . . 84Item 9B. Other Information . . . . . . . . . . . . . . . . . . . . . . . . . . . . . . . . . . . . . . . . . . . . . 85
PART IIIItem 10. Directors, Executive Officers of the Registrant and Corporate Governance . . . . . 85Item 11. Executive Compensation . . . . . . . . . . . . . . . . . . . . . . . . . . . . . . . . . . . . . . . . . 85Item 12. Security Ownership of Certain Beneficial Owners and Management and
Related Shareholder Matters . . . . . . . . . . . . . . . . . . . . . . . . . . . . . . . . . . . . . . 85Item 13. Certain Relationships, Related Transactions and Director Independence . . . . . . . 85Item 14. Principal Accounting Fees and Services . . . . . . . . . . . . . . . . . . . . . . . . . . . . . . 85
PART IVItem 15. Exhibits and Financial Statement Schedules . . . . . . . . . . . . . . . . . . . . . . . . . . . 85
1
SPECIAL NOTE ABOUT FORWARD-LOOKING STATEMENTS
Certain statements in this Annual Report on Form 10-K, other than purely historical information,including estimates, projections, statements relating to our business plans, objectives and expectedoperating results, and the assumptions upon which those statements are based, are ‘‘forward-lookingstatements’’ within the meaning of the Private Securities Litigation Reform Act of 1995, Section 27A ofthe Securities Act of 1933, as amended and Section 21E of the Securities Exchange Act of 1934, asamended. These forward-looking statements generally are identified by the use of the words ‘‘believe,’’‘‘project,’’ ‘‘expect,’’ ‘‘anticipate,’’ ‘‘estimate,’’ ‘‘plan,’’ ‘‘may,’’ ‘‘will,’’ ‘‘will continue,’’ ‘‘intend,’’ ‘‘should,’’‘‘may’’ or similar expressions. Although we believe that the expectations reflected in such forward-looking statements are based upon reasonable assumptions, beliefs and expectations, such forward-looking statements are not predictions of future events or guarantees of future performance and ouractual results could differ materially from those set forth in the forward-looking statements. Somefactors that might cause such a difference include the following: the current global economicuncertainty, increased direct competition, changes in government regulations or accounting rules,changes in local, national and global real estate conditions, declines in the lodging industry, seasonalityof the lodging industry, risks related to natural disasters, such as earthquakes and hurricanes, hostilities,including future terrorist attacks or fear of hostilities that affect travel, our ability to obtain lines ofcredit or permanent financing on satisfactory terms, changes in interest rates, access to capital throughofferings of our common and preferred shares of beneficial interest, or debt, our ability to identifysuitable acquisitions, our ability to close on identified acquisitions and integrate those businesses andinaccuracies of our accounting estimates. A discussion of these and other risks and uncertainties thatcould cause actual results and events to differ materially from such forward-looking statements isincluded in ‘‘Risk Factors’’ and ‘‘Management’s Discussion and Analysis of Financial Condition andResults of Operations’’ of this Annual Report on Form 10-K. Given these uncertainties, undue relianceshould not be placed on such statements. Except as required by law, we undertake no obligation toupdate or revise publicly any forward-looking statements, whether as a result of new information, futureevents or otherwise. Except where the context suggests otherwise, we define certain terms in thisAnnual Report on Form 10-K as follows:
• ‘‘our company,’’ ‘‘we,’’ ‘‘us’’ and ‘‘our’’ refer to RLJ Lodging Trust, a Maryland real estateinvestment trust, together with its consolidated subsidiaries, including RLJ Lodging Trust, L.P., aDelaware limited partnership, which we refer to as ‘‘our operating partnership’’;
• ‘‘our predecessor’’ collectively refers to RLJ Development, LLC, or RLJ Development, and twolodging-focused private equity funds that were sponsored and managed by RLJ Development,RLJ Lodging Fund II, L.P. (and its parallel fund), or collectively, Fund II, and RLJ Real EstateFund III, L.P. (and its parallel fund), or collectively, Fund III, all of which were entities underthe common control of Robert L. Johnson, our Executive Chairman;
• ‘‘our hotels’’ refers to the 145 hotels owned by us as of December 31, 2012;
• ‘‘our formation transactions’’ refers to a series of transactions in which, among other things,(1) our company was formed, (2) our operating partnership was formed, (3) each of Fund II andFund III were merged with and into our company, with investors in each of Fund II and FundIII receiving common shares as consideration, and (4) RLJ Development contributedsubstantially all of its assets and liabilities to our operating partnership in exchange for units oflimited partnership interest in our operating partnership, or OP units;
• a ‘‘compact full-service hotel’’ typically refers to any hotel with (1) less than 300 guestrooms andless than 12,000 square feet of meeting space or (2) more than 300 guestrooms where, unliketraditional full-service hotels, the operations focus primarily on the rental of guestrooms suchthat a significant majority of its total revenue is generated from room rentals rather than othersources, such as food and beverage;
2

• a ‘‘focused-service hotel’’ typically refers to any hotel where the operations focus primarily onthe rental of guestrooms and that offers services and amenities to a lesser extent than a typicalfull-service or compact full-service hotel. For example, a focused-service hotel may have arestaurant, but, unlike a restaurant in a typical full-service or compact full-service hotel, it maynot offer three meals per day and may not offer room service. In addition, a focused-servicehotel differs from a compact full-service hotel in that it typically has less than 2,000 square feetof meeting space, if any at all; and
• ‘‘TRSs’’ refers to our taxable REIT subsidiaries that are wholly-owned, directly or indirectly, byour operating partnership and any disregarded subsidiaries of our TRSs.
• ‘‘RevPAR penetration index’’ of our hotels is the measure of each hotel’s revenue per availableroom, or RevPAR, in relation to the average RevPAR of that hotel’s competitive set. Eachhotel’s competitive set consists of a small group of hotels in the relevant market that we and thethird-party hotel management company that manages the hotel believe are comparable forpurposes of benchmarking the performance of such hotel.
Item 1. Business
Our Company
We are a self-advised and self-administered Maryland real estate investment trust, or REIT, thatacquires primarily premium-branded, focused-service and compact full-service hotels. We are one of thelargest U.S. publicly-traded lodging REITs in terms of both number of hotels and number of rooms.Our hotels are concentrated in urban and dense suburban markets that we believe exhibit multipledemand generators and high barriers to entry. We believe focused-service and compact full-servicehotels with these characteristics generate high levels of RevPAR, strong operating margins andattractive returns.
As of December 31, 2012, we, through wholly-owned subsidiaries, owned 100% of the interests in144 hotels and a 95% interest in one hotel. Our 145 hotels are made up of 21,617 suites/rooms and arelocated in 21 states and the District of Columbia.
We elected to be taxed as a REIT, for U.S. federal income tax purposes, when we filed our U.S.federal tax return for the taxable year ended December 31, 2011. Substantially all of our assets are heldby, and all of our operations are conducted through, our operating partnership. We are the sole generalpartner of our operating partnership. As of December 31, 2012, we owned, through a combination ofdirect and indirect interests, 99.2% of the OP units in our operating partnership.
Our Investment and Growth Strategies
Our objective is to generate strong returns for our shareholders by continuing to acquire primarilypremium-branded, focused-service hotels and compact full-service hotels at prices where we believe wecan generate attractive returns on investment and long-term value appreciation through proactive assetmanagement. We intend to pursue acquisitions of these hotels in urban and dense suburban markets,and we also intend to selectively dispose of properties when we believe returns have been maximized inorder to redeploy capital into more accretive acquisitions and other opportunities. We intend to pursuethis objective through the following investment and growth strategies:
Investment Strategies
• Targeted ownership of premium-branded, focused-service and compact full-service hotels. We believethat premium-branded, focused-service hotels have the potential to generate attractive returnsrelative to other types of hotels due to their ability to achieve RevPAR levels at or close to thosegenerated by traditional full-service hotels, while achieving higher profit margins due to their
3

more efficient operating model and less volatile cash flows. We also may acquire compactfull-service hotels which have operating characteristics that resemble those of focused-servicehotels.
• Use of premium hotel brands. We believe in affiliating our hotels with premium brands owned byleading international franchisors such as Marriott, Hilton and Hyatt. Within the focused-servicecategory, we target hotels affiliated with premium brands such as Courtyard by Marriott,Residence Inn by Marriott, Hilton Garden Inn, Homewood Suites by Hilton and Hyatt Place.We believe that utilizing premium brands provides significant advantages because of their guestloyalty programs, worldwide reservation systems, effective product segmentation, globaldistribution and strong customer awareness.
• Focus on urban and dense suburban markets. We focus on owning and acquiring hotels in bothurban and dense suburban markets that we believe have multiple demand generators and highbarriers to entry. As a result, we believe that these hotels generate higher returns on investment.
Growth Strategies
• Maximize returns from our hotels. We believe that our hotels have the potential to generatesignificant improvements in RevPAR and earnings before interest, taxes, depreciation andamortization, or EBITDA, as a result of our proactive asset management and the ongoingeconomic recovery in the United States. We actively monitor and advise our third-party hotelmanagement companies on most aspects of our hotels’ operations, including propertypositioning, physical design, capital planning and investment, guest experience and overallstrategic direction. We regularly review opportunities to invest in our hotels in an effort toenhance the quality and attractiveness of our hotels, increase their long-term value and generateattractive returns on investment.
• Pursue a disciplined hotel acquisition strategy. We seek to acquire additional hotels at pricesbelow replacement cost where we believe we can generate attractive returns on investment. Weintend to target acquisition opportunities where we can enhance value by pursuing proactiveinvestment strategies such as renovation, repositioning or rebranding.
• Pursue a disciplined capital recycling program. We intend to continue to pursue a disciplinedcapital allocation strategy designed to maximize the value of our investments by selectivelyselling hotels that are no longer consistent with our investment strategy or whose returns appearto have been maximized. To the extent that we sell hotels, we intend to redeploy the capital intoacquisition and investment opportunities that we believe will achieve higher returns.
Our Hotels
Overview
As of December 31, 2012, we owned a high-quality portfolio of 145 hotels located in 21 states andthe District of Columbia comprised of over 21,600 rooms. Including certain pro forma operatinginformation, for the year ended December 31, 2012, the average occupancy rate for our hotels was72.9%, and the average daily rate, or ADR, and RevPAR of our hotels were $134.05 and $97.71,respectively. No single hotel accounted for more than 7.4% of our total revenue for the year endedDecember 31, 2012.
We believe that the quality of our portfolio is evidenced by the RevPAR penetration index of 111.2for our hotels for the year ended December 31, 2012 and portfolio-wide guest satisfaction scores thatare consistently higher than the average industry scores for their respective brands.
4

The following table sets forth certain pro forma operating information for our hotels as of and forthe years ended December 31, 2012, 2011 and 2010 (excluding hotels that were not open at the end ofthe applicable period):
For the year ended December 31,
2012 2011 2010
Statistical Data(1)(2):Number of hotels . . . . . . . . . . . . . . . . . . . . . . . . . . 144 144 144Number of rooms . . . . . . . . . . . . . . . . . . . . . . . . . . 21,480 21,480 21,480Occupancy(3) . . . . . . . . . . . . . . . . . . . . . . . . . . . . . 72.9% 71.6% 69.8%ADR(3) . . . . . . . . . . . . . . . . . . . . . . . . . . . . . . . . . $134.05 $126.55 $120.46RevPAR(3) . . . . . . . . . . . . . . . . . . . . . . . . . . . . . . . $ 97.71 $ 90.56 $ 84.09
(1) The table includes unaudited pro forma financial information that excludes discontinuedoperations and is not necessarily indicative of what actual results of operations of thehotels would have been had we owned them for the entirety of all periods presented.
(2) The 132-room Hotel Indigo New Orleans Garden District was closed for substantially allof the periods presented and, therefore, is not reflected in the table.
(3) For a more detailed explanation of the terms occupancy, ADR and RevPAR and adiscussion of how we use these metrics to evaluate the operating performance of ourbusiness, see ‘‘Management’s Discussion and Analysis of Financial Condition and Resultsof Operations—Key Indicators of Our Operating Performance.’’
Brand Affiliations
Our hotels operate under strong, premium brands, with approximately 96% of our hotels operatingunder existing relationships with Marriott, Hilton or Hyatt. The following table sets forth the brandaffiliations of our hotels as of December 31, 2012:
Number of Percentage of Number of Percentage ofBrand Affiliations hotels total rooms total
MarriottCourtyard by Marriott . . . . . . . . 34 23.4% 4,625 21.4%Fairfield Inn & Suites by Marriott 14 9.7% 1,433 6.6%Marriott . . . . . . . . . . . . . . . . . . 6 4.1% 1,834 8.5%Renaissance . . . . . . . . . . . . . . . . 3 2.1% 782 3.6%Residence Inn by Marriott . . . . . 34 23.4% 3,794 17.6%SpringHill Suites by Marriott . . . 11 7.6% 1,354 6.2%
Subtotal . . . . . . . . . . . . . . . . . 102 70.3% 13,822 63.9%Hilton
Doubletree . . . . . . . . . . . . . . . . 2 1.4% 916 4.2%Embassy Suites . . . . . . . . . . . . . 6 4.1% 1,419 6.6%Hampton Inn/Hampton Inn &
Suites . . . . . . . . . . . . . . . . . . . 9 6.2% 1,115 5.2%Hilton . . . . . . . . . . . . . . . . . . . . 2 1.4% 462 2.1%Hilton Garden Inn . . . . . . . . . . . 10 6.9% 1,993 9.2%Homewood Suites . . . . . . . . . . . 2 1.4% 301 1.4%
Subtotal . . . . . . . . . . . . . . . . . 31 21.4% 6,206 28.7%Hyatt
Hyatt House . . . . . . . . . . . . . . . 6 4.1% 828 3.8%Subtotal . . . . . . . . . . . . . . . . . 6 4.1% 828 3.8%
Other Brand Affiliation . . . . . . . . . 6 4.2% 761 3.6%
Total . . . . . . . . . . . . . . . . . . 145 100.0% 21,617 100.0%
5

Asset Management
We have a dedicated team of asset management professionals that proactively work with our third-party hotel management companies to maximize profitability at each of our hotels. Our assetmanagement team monitors the performance of our hotels on a daily basis and holds frequentownership meetings with personnel at the hotels. Our asset management team works closely with ourthird-party hotel management companies on key aspects of each hotel’s operation, including, amongothers, revenue management, market positioning, cost structure, capital and operational budgeting aswell as the identification of return on investment initiatives and overall business strategy. In addition,we retain approval rights on key staffing positions at many of our hotels, such as the hotel’s generalmanager and director of sales. We believe that our strong asset management process helps to ensurethat each hotel is being operated to our and our franchisors’ standards, that our hotels are beingadequately maintained in order to preserve the value of the asset and the safety of the hotel tocustomers, and that our hotel management companies are maximizing revenue and enhancing operatingmargins.
Competition
The U.S. lodging industry is highly competitive. Our hotels compete with other hotels for guests ineach of their markets on the basis of several factors, including, among others, location, quality ofaccommodations, convenience, brand affiliation, room rates, service levels and amenities, and level ofcustomer service. Competition is often specific to the individual markets in which our hotels are locatedand includes competition from existing and new hotels operated under premium brands in the focused-service and full-service segments. We believe that hotels, such as our hotels, that are affiliated withleading national brands, such as the Marriott, Hilton or Hyatt brands, will enjoy the competitiveadvantages associated with operating under such brands. Increased competition could harm ouroccupancy and revenues and may require us to provide additional amenities or make capitalimprovements that we otherwise would not have to make, which may materially and adversely affectour operating results and liquidity.
We face competition for the acquisition of hotels from institutional pension funds, private equityfunds, REITs, hotel companies and others who are engaged in the acquisition of hotels. Some of thesecompetitors may have substantially greater financial and operational resources and access to capitalthan we have and may have greater knowledge of the markets in which we seek to invest. Thiscompetition may reduce the number of suitable investment opportunities offered to us and decreasethe attractiveness of the terms on which we may acquire our targeted hotel investments, including thecost thereof.
Seasonality
The lodging industry is seasonal in nature, which can be expected to cause quarterly fluctuations inour revenues. Our quarterly earnings may be adversely affected by factors outside our control, includingweather conditions and poor economic factors in certain markets in which we operate. For example,our hotels in the Chicago, Illinois metropolitan area experience lower revenues and profits during thewinter months of December through March while our hotels in Florida generally have higher revenuesin the months of January through April. This seasonality can be expected to cause periodic fluctuationsin a hotel’s room revenues, occupancy levels, room rates, operating expenses and cash flows.
Our Financing Strategy
We expect to continue to maintain a prudent capital structure by limiting our net debt-to-EBITDAto a ratio of 5.0x or below. We define net debt as total indebtedness minus cash and cash equivalents.Over time, we intend to finance our long-term growth with equity issuances and debt financing having
6

staggered maturities. We will seek to primarily utilize unsecured debt (with the ultimate goal ofachieving an investment grade credit rating) and a greater percentage of fixed rate and hedged floatingrate debt relative to unhedged floating rate debt. Our debt currently is comprised of both unsecureddebt and mortgage debt secured by our hotels. We have a mix of fixed and floating rate debt; however,the majority of our debt either bears interest at fixed rates or effectively bears interest at fixed ratesdue to interest rate hedges on the debt.
Our Indebtedness
As of December 31, 2012, we had approximately $997.7 million of outstanding mortgage debt and$400.0 million in outstanding unsecured term loans. In addition, on November 20, 2012, we, throughour operating partnership, entered into a four-year, $300.0 million unsecured revolving credit facility, orour unsecured revolving credit facility, to fund future acquisitions, as well as for hotel redevelopments,capital expenditures and general corporate purposes. As of December 31, 2012, $16.0 million wasdrawn on our unsecured revolving credit facility. For more information regarding our indebtedness, see‘‘Management’s Discussion and Analysis of Financial Condition and Results of Operations—Liquidityand Capital Resources—Our Outstanding Mortgage Indebtedness.’’
Organizational Structure
We were formed as a Maryland real estate investment trust in January 2011. We conduct ourbusiness through a traditional umbrella partnership real estate investment trust, or UPREIT, in whichour hotels are indirectly owned by our operating partnership, RLJ Lodging Trust, L.P., through limitedpartnerships, limited liability companies or other subsidiaries. We are the sole general partner of ouroperating partnership and as of December 31, 2012, we owned 99.2% of the OP units in our operatingpartnership. In the future, we may issue OP units from time to time in connection with acquisitions ofhotels or for financing, compensation or other reasons.
In order for the income from our hotel operations to constitute ‘‘rents from real property’’ forpurposes of the gross income tests required for REIT qualification, we cannot directly or indirectlyoperate any of our hotels. Accordingly, we lease each of our hotels, and intend to lease any hotels weacquire in the future, to subsidiaries of our TRSs, or TRS lessees, which are wholly-owned by us, andour TRS lessees have engaged, or will engage, third-party hotel management companies to manage ourhotels, and any hotels we acquire in the future, on market terms. Our TRS lessees pay rent to us thatwe intend to treat as ‘‘rents from real property,’’ provided that the third-party hotel managementcompanies engaged by our TRS lessees to manage our hotels are deemed to be ‘‘eligible independentcontractors’’ and certain other requirements are met. Our TRSs are subject to U.S. federal, state andlocal income taxes applicable to corporations.
7

21FEB201322120420
The following chart generally depicts our corporate structure as of December 31, 2012:
Operating Partnership
Principals of RLJ Development
0.8%(1)
100% 100%
99.2%
RLJ Lodging Trust
TRS EntitiesHotel Special
PurposeEntities
Lessee SPEs
100%
Leases
(1) Reflects OP units issued to RLJ Development, an entity in which each of Messrs. Johnson,Baltimore and Bierkan hold an equity interest, as consideration for substantially all of RLJDevelopment’s assets and liabilities, which were contributed to us in connection with our formationtransactions.
Regulation
General
Our hotels are subject to various U.S. federal, state and local laws, ordinances and regulations,including regulations relating to common areas and fire and safety requirements. We believe that eachof our hotels has the necessary permits and approvals to operate its business.
Americans with Disabilities Act
Our hotels must comply with applicable provisions of the Americans with Disabilities Act of 1990,or ADA, to the extent that such hotels are ‘‘public accommodations’’ as defined by the ADA. TheADA may require removal of structural barriers to access by persons with disabilities in certain publicareas of our hotels where such removal is readily achievable. We believe that our hotels are insubstantial compliance with the ADA and that we will not be required to make substantial capitalexpenditures to address the requirements of the ADA. However, non-compliance with the ADA could
8

result in imposition of fines or an award of damages to private litigants. The obligation to make readilyachievable accommodations is an ongoing one, and we will continue to assess our hotels and to makealterations as appropriate in this respect.
Environmental Matters
Under various laws relating to the protection of the environment, a current or previous owner oroperator (including tenants) of real estate may be subject to liability related to contamination resultingfrom the presence or discharge of hazardous or toxic substances at that property and may be requiredto investigate and clean up such contamination at that property or emanating from that property. Thesecosts could be substantial and liability under these laws may attach without regard to whether theowner or operator knew of, or was responsible for, the presence of the contaminants, and the liabilitymay be joint and several. The presence of contamination or the failure to remediate contamination atour hotels may expose us to third-party liability for cleanup costs, property damage or bodily injury,natural resource damages and costs or expenses related to liens or property use restrictions andmaterially and adversely affect our ability to sell, lease or develop the real estate or to incur debt usingthe real estate as collateral. Furthermore, persons who sent waste to a waste disposal facility, such as alandfill or an incinerator, may be liable for costs associated with cleanup of that facility.
Our hotels are subject to various federal, state, and local environmental, health and safety lawsand regulations that address a wide variety of issues, including, but not limited to, storage tanks, airemissions from emergency generators, storm water and wastewater discharges, lead-based paint, moldand mildew and waste management. Our hotels incur costs to comply with these laws and regulationsand could be subject to fines and penalties for non-compliance. The costs of complying withenvironmental, health and safety laws could increase as new laws are enacted and existing laws aremodified.
Some of our hotels contain asbestos-containing building materials. We believe that the asbestos isappropriately contained, in accordance with current environmental regulations and that we have noneed for any immediate remediation or current plans to remove the asbestos. Environmental lawsrequire that owners or operators of buildings with asbestos-containing building materials properlymanage and maintain these materials, adequately inform or train those who may come into contactwith asbestos and undertake special precautions, including removal or other abatement, in the eventthat asbestos is disturbed during building renovation or demolition. These laws may impose fines andpenalties on building owners or operators for failure to comply with these requirements. In addition,third parties may seek recovery from owners or operators for personal injury associated with exposureto asbestos-containing building materials.
Some of our hotels may contain or develop harmful mold or suffer from other adverse conditions,which could lead to liability for adverse health effects and costs of remediation. The presence ofsignificant mold or other airborne contaminants at any of our hotels could require us to undertake acostly remediation program to contain or remove the mold or other airborne contaminants from theaffected hotel or increase indoor ventilation. In addition, the presence of significant mold or otherairborne contaminants could expose us to liability from guests or employees at our hotels and others ifproperty damage or health concerns arise.
Insurance
We carry comprehensive general liability, fire, extended coverage, business interruption, rental losscoverage and umbrella liability coverage on all of our hotels and earthquake, wind, flood and hurricanecoverage on hotels in areas where we believe such coverage is warranted, in each case with limits ofliability that we deem adequate. Similarly, we are insured against the risk of direct physical damage inamounts we believe to be adequate to reimburse us, on a replacement basis, for costs incurred to repair
9

or rebuild each hotel, including loss of rental income during the reconstruction period. We haveselected policy specifications and insured limits which we believe to be appropriate given the relativerisk of loss, the cost of the coverage and industry practice. We do not carry insurance for generallyuninsured losses, including, but not limited to losses caused by riots, war or acts of God. In the opinionof our management, our hotels are adequately insured.
Employees
As of December 31, 2012 we had 53 employees.
Corporate Information
Our principal executive offices are located at 3 Bethesda Metro Center, Suite 1000, Bethesda,Maryland 20814. Our telephone number is (301) 280-7777. Our website is located atwww.rljlodgingtrust.com. The information that is found on or accessible through our website is notincorporated into, and does not form a part of, this Annual Report on Form 10-K or any other reportor document that we file with or furnish to the SEC. We have included our website address in thisAnnual Report on Form 10-K as an inactive textual reference and do not intend it to be an active linkto our website.
We make available on our website, free of charge, our Annual Report on Form 10-K, QuarterlyReports on Form 10-Q, Current Reports on Form 8-K and amendments to those reports filed orfurnished pursuant to Section 13(a) or 15(d) of the Exchange Act as soon as reasonably practicableafter we electronically file such material with, or furnish it to, the SEC. We also make our Code ofBusiness Conduct and Ethics for our trustees, officers and employees available on our website on theCorporate Governance page under the Investor Relations section of our website.
This Annual Report on Form 10-K and other reports filed with the SEC can be read or copied atthe SEC’s Public Reference Room at 100 F Street, NE, Washington, D.C. 20549. Information on theoperation of the Public Reference Room can be obtained by calling the SEC at 1-800-SEC-0330. TheSEC maintains a website that contains reports, proxy and information statements, and otherinformation regarding issuers that file electronically with the SEC; the website address is www.sec.gov.
Item 1A. Risk Factors
Set forth below are the risks that we believe are material to our shareholders. You should carefullyconsider the following risks in evaluating our Company and our business. The occurrence of any of thefollowing risks could materially adversely impact our financial condition, results of operations, cash flow, themarket price of our common shares and our ability to, among other things, satisfy our debt serviceobligations and to make distributions to our shareholders, which in turn could cause our shareholders tolose all or a part of their investment. Some statements in this report including statements in the followingrisk factors constitute forward-looking statements. Please refer to the section entitled ‘‘Special Note AboutForward-Looking Statements’’ at the beginning of our Annual Report on Form 10-K.
Risks Related to Our Business and Properties
We will continue to be significantly influenced by the economies and other conditions in the specific marketsin which we operate, particularly in the metropolitan areas where we have high concentrations of hotels.
Our hotels located in the New York, New York, Chicago, Illinois, Austin, Texas, Denver-Boulder,Colorado, Louisville, Kentucky, and the Baltimore, Maryland-Washington, D.C. metropolitan areasaccounted for approximately 15.8%, 12.1%, 10.5%, 8.8%, 6.5%, and 5.8%, respectively, of our totalrevenue for the fiscal year ended December 31, 2012. As a result, we are particularly susceptible toadverse market conditions in these areas, including industry downturns, relocation of businesses and
10

any oversupply of hotel rooms or a reduction in lodging demand. Adverse economic developments inthe markets in which we have a concentration of hotels, or in any of the other markets in which weoperate, or any increase in hotel supply or decrease in lodging demand resulting from the local,regional or national business climate, could materially and adversely affect us.
We are dependent on the performance of the third-party hotel management companies that manage theoperations of each of our hotels and could be materially and adversely affected if such third-party managersdo not manage our hotels in our best interests.
Because federal income tax laws restrict REITs and their subsidiaries from operating or managinghotels, we do not operate or manage our hotels. Instead, we lease all of our hotels to subsidiaries ofour TRSs, and our TRS lessees retain third-party managers to operate our hotels pursuant tomanagement agreements. We have entered into individual hotel management agreements for ourhotels, 104 of which are with White Lodging Services, or WLS. We could be materially and adverselyaffected if any of our third-party managers fail to provide quality services and amenities, fail tomaintain a quality brand name or otherwise fail to manage our hotels in our best interest. In addition,from time to time, disputes may arise between us and our third-party managers regarding theirperformance or compliance with the terms of the hotel management agreements, which in turn couldadversely affect our results of operations. We generally will attempt to resolve any such disputesthrough discussions and negotiations; however, if we are unable to reach satisfactory results throughdiscussions and negotiations, we may choose to terminate our management agreement, litigate thedispute or submit the matter to third-party dispute resolution, the outcome of which may beunfavorable to us.
Under the terms of the hotel management agreements, our ability to participate in operatingdecisions regarding our hotels is limited to certain matters, including approval of the annual operatingbudget, and we do not have the authority to require any hotel to be operated in a particular manner(for instance, setting room rates). While our TRS lessees closely monitor the performance of our third-party managers, our general recourse under the hotel management agreements is limited to terminationupon sixty days’ notice if we believe our third-party managers are not performing adequately. Forexample, we have a right to terminate a management agreement with WLS, our largest provider ofmanagement services, if WLS fails to achieve certain hotel performance criteria measured over any twoconsecutive fiscal years, as outlined in each WLS management agreement. However, even if WLS failsto perform under the terms of a management agreement, it has the option (exercisable a maximum ofthree times per hotel) to avoid a performance termination by paying a performance deficit fee asspecified in the management agreement.
In the event that we terminate any of our management agreements, we can provide no assurancesthat we could find a replacement manager or that our franchisors will consent to a replacementmanager in a timely manner, or at all, or that any replacement manager will be successful in operatingour hotels. Furthermore, if WLS, as our largest provider of management services, is financially unableor unwilling to perform its obligations pursuant to our management agreements, our ability to find areplacement manager or managers for our WLS-managed hotels could be challenging and timeconsuming, depending on the number of WLS-managed hotels affected, and could cause us to incursignificant costs to obtain new management agreements for the affected hotels. Accordingly, if we losea significant number of our WLS management agreements, we could be materially and adverselyaffected. In addition, many of our existing franchise agreements provide the franchisor with a right offirst offer in the event of certain sales or transfers of a hotel and provide that the franchisor has theright to approve any change in the hotel management company engaged to manage the hotel. If any ofthe foregoing were to occur, it could have a material adverse effect on us.
11

Restrictive covenants in certain of our hotel management and franchise agreements contain provisions limitingor restricting the sale or financing of our hotels, which could have a material adverse effect on us.
Hotel management and franchise agreements typically contain restrictive covenants that limit orrestrict our ability to sell or refinance a hotel without the consent of the hotel management company orfranchisor. Many of our franchise agreements provide the franchisor with a right of first offer in theevent of certain sales or transfers of a hotel and provide that the franchisor has the right to approveany change in the hotel management company engaged to manage the hotel. Generally, we may notagree to sell, lease or otherwise transfer particular hotels unless the transferee is not a competitor ofthe hotel management company or franchisor and the transferee assumes the related hotel managementand franchise agreements. For example, substantially all of our management agreements with WLSprovide that any sale of a hotel to a purchaser who does not meet all of the requirements under theapplicable franchise agreement associated with such hotel must be first approved by WLS. If the hotelmanagement company or franchisor does not consent to the sale or financing of our hotels, we may beprohibited from taking actions that would otherwise be in our and our shareholders’ best interests.
Substantially all of our hotels operate under either Marriott or Hilton brands; therefore, we are subject torisks associated with concentrating our portfolio in just two brand families.
133 of the 145 hotels that we owned as of December 31, 2012 utilize brands owned by Marriott orHilton. As a result, our success is dependent in part on the continued success of Marriott and Hiltonand their respective brands. We believe that building brand value is critical to increase demand andbuild customer loyalty. Consequently, if market recognition or the positive perception of Marriottand/or Hilton is reduced or compromised, the goodwill associated with the Marriott- and Hilton-branded hotels in our portfolio may be adversely affected. Furthermore, if our relationship withMarriott or Hilton were to deteriorate or terminate as a result of disputes regarding the managementof our hotels or for other reasons, Marriott and/or Hilton could, under certain circumstances, terminateour current franchise licenses with them or decline to provide franchise licenses for hotels that we mayacquire in the future. If any of the foregoing were to occur, it could have a material adverse effect onus.
Our long-term growth depends in part on successfully identifying and consummating acquisitions of additionalhotels and the failure to make such acquisitions could materially impede our growth.
We can provide no assurances that we will be successful in identifying attractive hotels or that,once identified, we will be successful in consummating an acquisition. We face significant competitionfor attractive investment opportunities from other well-capitalized investors, some of which have greaterfinancial resources and a greater access to debt and equity capital to acquire hotels than we do. Thiscompetition increases as investments in real estate become increasingly attractive relative to otherforms of investment. As a result of such competition, we may be unable to acquire certain hotels thatwe deem attractive or the purchase price may be significantly elevated or other terms may besubstantially more onerous. In addition, we expect to finance future acquisitions through a combinationof borrowings under our unsecured revolving credit facility, the use of retained cash flows, andofferings of equity and debt securities, which may not be available on advantageous terms, or at all.Any delay or failure on our part to identify, negotiate, finance on favorable terms, consummate andintegrate such acquisitions could materially impede our growth.
The departure of any of our key personnel who have significant experience and relationships in the lodgingindustry, including Robert L. Johnson, Thomas J. Baltimore, Jr. and Ross H. Bierkan, could materially andadversely affect us.
We depend on the experience and relationships of our senior management team, especiallyRobert L. Johnson, Executive Chairman of our board of trustees, Thomas J. Baltimore, Jr., our
12

President and Chief Executive Officer and a member of our board of trustees, and Ross H. Bierkan,our Chief Investment Officer, to manage our day-to-day operations and strategic business direction.Messrs. Johnson, Baltimore and Bierkan have 19, 24 and 27 years of experience in the lodging industry,respectively, during which time they have established an extensive network of lodging industry contactsand relationships, including relationships with global and national hotel brands, hotel owners,financiers, operators, commercial real estate brokers, developers and management companies. We canprovide no assurances that any of our key personnel will continue their employment with us, eventhough all of the members of our senior management team have entered employment agreements withus. The loss of services of Messrs. Johnson, Baltimore or Bierkan, or of the services of other membersof our senior management team, or any difficulty attracting and retaining other talented andexperienced personnel, could adversely affect our ability to source potential investment opportunities,our relationship with global and national hotel brands and other industry participants and the executionof our business strategy. Further, such a loss could be negatively perceived in the capital markets, whichcould reduce the market value of our common shares.
Our business strategy depends on achieving revenue and net income growth from anticipated increases indemand for hotel rooms; accordingly, any delay or a weaker than anticipated economic recovery couldmaterially and adversely affect us and our growth prospects.
Our hotels experienced declining operating performance across various U.S. markets during themost recent economic recession. Our business strategy depends on achieving revenue and net incomegrowth from anticipated improvement in demand for hotel rooms as part of the continued economicrecovery. As a result, any delay or a weaker than anticipated continued economic recovery couldmaterially and adversely affect us and our growth prospects. Furthermore, even if the economycontinues to recover, we cannot provide any assurances that demand for hotel rooms will increase fromcurrent levels. If demand does not increase in the near future, or if demand weakens, our future resultsof operations and our growth prospects could be materially and adversely affected.
The ongoing need for capital expenditures at our hotels could have a material adverse effect on us.
Our hotels have an ongoing need for renovations and other capital improvements, includingreplacements, from time to time, of furniture, fixtures and equipment. The franchisors of our hotelsalso require periodic capital improvements as a condition of maintaining the franchise licenses. Inaddition, our lenders will likely require that we set aside annual amounts for capital improvements toour hotels. The costs of these capital improvements could materially and adversely affect us.
Any difficulties in obtaining capital necessary to make required periodic capital expenditures and renovationof our hotels could materially and adversely affect our financial condition and results of operations.
Our hotels require periodic capital expenditures and renovation to remain competitive. In addition,acquisitions or redevelopment of additional hotels will require significant capital expenditures. We maynot be able to fund capital improvements on our hotels or acquisitions of new hotels solely from cashprovided from our operating activities because we must distribute annually at least 90% of our REITtaxable income, determined without regard to the deduction for dividends paid and excluding netcapital gain, to maintain our qualification as a REIT, and we are subject to tax on any retained incomeand gain. As a result, our ability to fund capital expenditures, acquisitions or hotel redevelopmentthrough retained earnings is very limited. Consequently, we expect to rely upon the availability of debtor equity capital to fund capital improvements and acquisitions. If we are unable to obtain the capitalnecessary to make required periodic capital expenditures and renovate our hotels on favorable terms,or at all, our financial condition, liquidity and results of operations could be materially and adverselyaffected.
13

Adverse global market and economic conditions and dislocations in the markets could cause us to recognizeimpairment charges, which could materially and adversely affect our business, financial condition and resultsof operations.
We continually monitor events and changes in circumstances, including those resulting from therecent economic downturn that could indicate that the carrying value of the real estate and relatedintangible assets in which we have an ownership interest may not be recoverable. When circumstancesindicate that the carrying value of real estate and related intangible assets may not be recoverable, weassess the recoverability of these assets by determining whether the carrying value will be recoveredthrough the undiscounted future operating cash flows expected from the use of the asset and itseventual disposition. In the event that such expected undiscounted future cash flows do not exceed thecarrying value, we adjust the real estate and related intangible assets to the fair value and recognize animpairment loss. Because our predecessor acquired many of our hotels in the last five years, whenprices for hotels in many markets were at or near their peaks, we may be particularly susceptible tofuture non-cash impairment charges as compared to companies that have carrying values well belowcurrent market values, which could materially and adversely affect our business, financial condition andresults of operations. During the fiscal year ended December 31, 2012, we recognized an impairmentcharge on the Fairfield Inn Memphis of $0.9 million.
Projections of expected future cash flows require management to make assumptions to estimatefuture occupancy, hotel operating expenses, and the number of years the hotel is held for investment,among other factors. The subjectivity of assumptions used in the future cash flow analysis, includingdiscount rates, could result in an incorrect assessment of the hotel’s fair value and, therefore, couldresult in the misstatement of the carrying value of our real estate and related intangible assets on ourbalance sheet and our results of operations. Ongoing adverse market and economic conditions andmarket volatility will likely continue to make it difficult to value the hotels owned by us, as well as thevalue of our intangible assets. As a result of adverse market and economic conditions, there may besignificant uncertainty in the valuation, or in the stability of, the cash flows, discount rates and otherfactors related to such assets that could result in a substantial decrease in their value.
Competition from other hotels in the markets in which we operate could adversely affect occupancy levelsand/or ADRs, which could have a material adverse effect on us.
We face significant competition from owners and operators of other hotels. These competitors mayhave an operating model that enables them to offer rooms at lower rates than we can, which couldresult in those competitors increasing their occupancy at our expense and adversely affecting ourADRs. Given the importance of occupancy and ADR at focused-service and compact full-servicehotels, this competition could adversely affect our ability to attract prospective guests, which couldmaterially and adversely affect our results of operations.
The RevPAR penetration index may not accurately reflect our hotels’ respective market shares.
We use the RevPAR penetration index, which measures a hotel’s RevPAR in relation to theaverage RevPAR of that hotel’s competitive set, as an indicator of a hotel’s market share in relation toits competitive set. However, as a particular hotel’s competitive set is selected by us and the hotelmanagement company that manages such hotel, no assurance can be given that a competitive setconsisting of different hotels would not lead to a more accurate measure of such hotel’s market share.As such, the RevPAR penetration index may not accurately reflect our hotels’ respective market shares.
14

At December 31, 2012, we had approximately $1.4 billion of debt outstanding, which may materially andadversely affect our operating performance and put us at a competitive disadvantage.
Required repayments of debt and related interest may materially and adversely affect ouroperating performance. At December 31, 2012, we had approximately $1.4 billion of outstanding debt,approximately $643.0 million of which bears interest at variable rates. Increases in interest rates on ourexisting or future variable rate debt would increase our interest expense, which could adversely affectour cash flows and our ability to pay distributions to shareholders.
Because we anticipate that our internally generated cash will be adequate to repay only a portionof our debt at maturity, we expect that we will be required to repay debt through debt refinancingsand/or offerings of our securities. The amount of our outstanding debt may adversely affect our abilityto refinance our debt.
If we are unable to refinance our debt on acceptable terms, or at all, we may be forced to disposeof one or more of our hotels on disadvantageous terms, which may result in losses to us and mayadversely affect cash available for distributions to our shareholders. In addition, if then-prevailinginterest rates or other factors at the time of refinancing result in higher interest rates upon refinancing,our interest expense would increase, which would adversely affect our future operating results andliquidity.
Our substantial outstanding debt may harm our business, financial condition, liquidity, EBITDA,Funds from Operations, or FFO, and results of operations, including:
• requiring us to use a substantial portion of our cash flows to pay principal and interest, whichwould reduce the cash available for distributions to our shareholders;
• placing us at a competitive disadvantage compared to our competitors that have less debt;
• making us vulnerable to the ongoing economic recovery, particularly if the recovery were to slowor stall and reduce our flexibility to respond to difficult economic conditions; and
• limiting our ability to borrow more money for operations, capital or to finance futureacquisitions.
The use of debt to finance future acquisitions could restrict operations, inhibit our ability to grow our businessand revenues, and negatively affect our business and financial results.
We may incur additional debt in connection with future hotel acquisitions. We may, in someinstances, borrow under our unsecured revolving credit facility or borrow new funds to acquire hotels.In addition, we may incur mortgage debt by obtaining loans secured by a portfolio of some or all of thehotels that we own or acquire. If necessary or advisable, we also may borrow funds to makedistributions to our shareholders in order to maintain our qualification as a REIT for U.S. federalincome tax purposes. To the extent that we incur debt in the future and do not have sufficient funds torepay such debt at maturity, it may be necessary to refinance the debt through debt or equityfinancings, which may not be available on acceptable terms or at all and which could be dilutive to ourshareholders. If we are unable to refinance our debt on acceptable terms or at all, we may be forced todispose of hotels at inopportune times or on disadvantageous terms, which could result in losses. To theextent we cannot meet our future debt service obligations, we will risk losing to foreclosure some or allof our hotels that may be pledged to secure our obligations.
For tax purposes, a foreclosure of any of our hotels would be treated as a sale of the hotel for apurchase price equal to the outstanding balance of the debt secured by the mortgage. If theoutstanding balance of the debt secured by the mortgage exceeds our tax basis in the hotel, we wouldrecognize taxable income on foreclosure, but we would not receive any cash proceeds, which couldhinder our ability to meet the REIT distribution requirements imposed by the Internal Revenue Code
15

of 1986, as amended, or the Code. In addition, we may give full or partial guarantees to lenders ofmortgage debt on behalf of the entities that own our hotels. When we give a guarantee on behalf of anentity that owns one of our hotels, we will be responsible to the lender for satisfaction of the debt if itis not paid by such entity. If any of our hotels are foreclosed on due to a default, our ability to paycash distributions to our shareholders will be limited.
Our organizational documents have no limitation on the amount of indebtedness we may incur. As a result,we may become highly leveraged in the future, which could materially and adversely affect us.
Our business strategy contemplates the use of both non-recourse secured and unsecured debt tofinance long-term growth. In addition, our organizational documents contain no limitations on theamount of debt that we may incur, and our board of trustees may change our financing policy at anytime without shareholder notice or approval. As a result, we may be able to incur substantial additionaldebt, including secured debt, in the future. Incurring debt could subject us to many risks, including therisks that:
• our cash flows from operations may be insufficient to make required payments of principal andinterest;
• our debt may increase our vulnerability to adverse economic and industry conditions;
• we may be required to dedicate a substantial portion of our cash flows from operations topayments on our debt, thereby reducing cash available for distribution to our shareholders, fundsavailable for operations and capital expenditures, future business opportunities or otherpurposes;
• the terms of any refinancing may not be in the same amount or on terms as favorable as theterms of the existing debt being refinanced; and
• the use of leverage could adversely affect our ability to raise capital from other sources or tomake distributions to our shareholders and could adversely affect the market price of ourcommon shares.
If we violate covenants in future agreements relating to indebtedness that we may incur, we couldbe required to repay all or a portion of our indebtedness before maturity at a time when we might beunable to arrange financing for such repayment on attractive terms, if at all. In addition, futureindebtedness agreements may require that we meet certain covenant tests in order to makedistributions to our shareholders.
Disruptions in the financial markets could adversely affect our ability to obtain sufficient third-party financingfor our capital needs, including expansion, acquisition and other activities, on favorable terms or at all, whichcould materially and adversely affect us.
In recent years, the U.S. stock and credit markets have experienced significant price volatility,dislocations and liquidity disruptions, which have caused market prices of many stocks to fluctuatesubstantially and the spreads on prospective debt financings to widen considerably. These circumstanceshave materially impacted liquidity in the financial markets, making terms for certain financings lessattractive, and in some cases have resulted in the unavailability of financing, even for companies whichotherwise are qualified to obtain financing. In addition, several banks and other institutions thathistorically have been reliable sources of financing have gone out of business, which has reducedsignificantly the number of lending institutions and the availability of credit. Continued volatility anduncertainty in the stock and credit markets may negatively impact our ability to access additionalfinancing for our capital needs, including expansion, acquisition activities and other purposes, onfavorable terms or at all, which may negatively affect our business. Additionally, due to this uncertainty,we may in the future be unable to refinance or extend our debt, or the terms of any refinancing may
16

not be as favorable as the terms of our existing debt. If we are not successful in refinancing our debtwhen it becomes due, we may be forced to dispose of hotels on disadvantageous terms, which mightadversely affect our ability to service other debt and to meet our other obligations. A prolongeddownturn in the financial markets may cause us to seek alternative sources of potentially less attractivefinancing and may require us to further adjust our business plan accordingly. These events also maymake it more difficult or costly for us to raise capital through the issuance of new equity capital or theincurrence of additional secured or unsecured debt, which could materially and adversely affect us.
Hedging against interest rate exposure may adversely affect us.
Subject to maintaining our qualification as a REIT, we may manage our exposure to interest ratevolatility by using interest rate hedging arrangements, such as cap agreements and swap agreements.These agreements involve the risks that these arrangements may fail to protect or adversely affect usbecause, among other things:
• interest rate hedging can be expensive, particularly during periods of rising and volatile interestrates;
• available interest rate hedges may not correspond directly with the interest rate risk for whichprotection is sought;
• the duration of the hedge may not match the duration of the related liability;
• the credit quality of the hedging counterparty owing money on the hedge may be downgraded tosuch an extent that it impairs our ability to sell or assign our side of the hedging transaction;and
• the hedging counterparty owing money in the hedging transaction may default on its obligationto pay.
As a result of any of the foregoing, our hedging transactions, which are intended to limit losses,could have a material adverse effect on us.
Our failure to comply with all covenants in our existing or future debt agreements could materially andadversely affect us.
The mortgages on our hotels, and hotels that we may acquire in the future likely will, containcustomary covenants such as those that limit our ability, without the prior consent of the lender, tofurther mortgage the applicable hotel or to discontinue insurance coverage. In addition, our continuedability to borrow under our unsecured revolving credit facility is subject to compliance with ourfinancial and other covenants, including covenants relating to debt service coverage ratios and leverageratios, and our ability to meet these covenants will be adversely affected if U.S. lodging fundamentalsdo not continue to improve to the extent that we expect. In addition, any credit facility or securedloans that we enter into in the future likely will contain customary financial covenants, restrictions,requirements and other limitations with which we must comply. Our failure to comply with covenants inour existing or future indebtedness, as well as our inability to make required payments, could cause adefault under the applicable debt agreement, which could result in the acceleration of the debt andrequire us to repay such debt with capital obtained from other sources, which may not be available tous or may be available only on unattractive terms. Furthermore, if we default on secured debt, lenderscan take possession of the hotel or hotels securing such debt. In addition, debt agreements may containspecific cross-default provisions with respect to specified other indebtedness, giving the lenders the rightto declare a default on its debt and to enforce remedies, including acceleration of the maturity of suchdebt upon the occurrence of a default under such other indebtedness. If we default on several of ourdebt agreements or any significant debt agreement, we could be materially and adversely affected.
17

Covenants applicable to future debt could restrict our ability to make distributions to our shareholders and, asa result, we may be unable to make distributions necessary to maintain our qualification as a REIT, whichcould materially and adversely affect us and the market price of our common shares.
We intend to continue to operate in a manner so as to maintain our qualification as a REIT forU.S. federal income tax purposes. In order to qualify as a REIT, we generally are required to distributeat least 90% of our REIT taxable income, determined without regard to the dividends paid deductionand excluding net capital gain, each year to our shareholders. To the extent that we satisfy thisdistribution requirement, but distribute less than 100% of our REIT taxable income, we will be subjectto U.S. federal corporate income tax on our undistributed taxable income. In addition, we will besubject to a 4% nondeductible excise tax if the actual amount that we distribute to our shareholders ina calendar year is less than a minimum amount specified under the Code. In order to meet the REITrequirements, we may be required to issue common shares of beneficial interest in lieu of cashdistributions. If, as a result of covenants applicable to our future debt, we are restricted from makingdistributions to our shareholders, we may be unable to make distributions necessary for us to avoidU.S. federal corporate income and excise taxes and maintain our qualification as a REIT, which couldmaterially and adversely affect us and the market price of our shares.
We may change the distribution policy for our common shares of beneficial interest in the future.
Our management and Board of Trustees will continue to evaluate our distribution policy on aquarterly basis as they monitor the capital markets, the impact of the economy on our operations andother factors. Future distributions will be declared and paid at the discretion of our board of trusteesand will depend upon a number of factors, including our actual and projected financial condition,liquidity, EBITDA, FFO and results of operations, the revenue we actually receive from our properties,our operating expenses, our debt service requirements, our capital expenditures, prohibitions and otherlimitations under our financing arrangements, our REIT taxable income, the annual REIT distributionrequirements, applicable law and such other factors as our board of trustees deems relevant. Anychange in our distribution policy could have a material adverse effect on the market price of ourcommon shares.
Costs associated with, or failure to maintain, franchisor operating standards may materially and adverselyaffect us.
Under the terms of our franchise license agreements, we are required to meet specified operatingstandards and other terms and conditions. We expect that our franchisors will periodically inspect ourhotels to ensure that we and the hotel management companies follow brand standards. Failure by us, orany hotel management company that we engage, to maintain these standards or other terms andconditions could result in a franchise license being canceled or the franchisor requiring us to undertakea costly property improvement program. If a franchise license is terminated due to our failure to makerequired improvements or to otherwise comply with its terms, we also may be liable to the franchisorfor a termination payment, which will vary by franchisor and by hotel. Furthermore, under certaincircumstances, a franchisor may require us to make capital expenditures, even if we do not believe thecapital improvements are necessary or desirable or will result in an acceptable return on ourinvestment. If the funds required to maintain franchisor operating standards are significant, or if afranchise license is terminated, we could be materially and adversely affected.
If we were to lose a franchise license at one or more of our hotels, the value of the affected hotels coulddecline significantly and we could incur significant costs to obtain new franchise licenses, which could have amaterial adverse effect on us.
If we were to lose a franchise license, we would be required to re-brand the affected hotel(s). As aresult, the underlying value of a particular hotel could decline significantly from the loss of associated
18

name recognition, marketing support, participation in guest loyalty programs and the centralized systemprovided by the franchisor, which could require us to recognize an impairment on the hotel.Furthermore, the loss of a franchise license at a particular hotel could harm our relationship with thefranchisor, which could impede our ability to operate other hotels under the same brand, limit ourability to obtain new franchise licenses from the franchisor in the future on favorable terms, or at all,and cause us to incur significant costs to obtain a new franchise license for the particular hotel.Accordingly, if we lose one or more franchise licenses, we could be materially and adversely affected.
Applicable REIT laws may restrict certain business activities.
As a REIT, we are subject to various restrictions on our income, assets and activities. Businessactivities that could be impacted by applicable REIT laws include, but are not limited to, activities suchas developing alternative uses of real estate, including the development and/or sale of timeshare orcondominium units. Due to these restrictions, we anticipate that we will continue to conduct certainbusiness activities, including those mentioned above, in one or more of our TRSs. Our TRSs aretaxable as regular C corporations and are subject to federal, state, local, and, if applicable, foreigntaxation on their taxable income. In addition, neither we, nor our TRSs can directly manage or operatehotels, making us entirely dependent on unrelated third-party operators/managers.
Federal income tax provisions applicable to REITs may restrict our business decisions regarding the potentialsale of a hotel.
The federal income tax provisions applicable to REITs provide that any gain realized by a REITon the sale of property held as inventory or other property held primarily for sale to customers in theordinary course of business is treated as income from a ‘‘prohibited transaction’’ that is subject to a100% excise tax. Under existing law, whether property, including hotels, is held as inventory orprimarily for sale to customers in the ordinary course of business is a question of fact that dependsupon all of the facts and circumstances with respect to the particular transaction. We intend to holdour hotels for investment with a view to long-term appreciation, to engage in the business of acquiringand owning hotels and to make occasional sales of hotels consistent with our investment objectives.There can be no assurance, however, that the Internal Revenue Service, or the IRS, might not contendthat one or more of these sales are subject to the 100% excise tax. Moreover, the potential applicationof this penalty tax could deter us from selling one or more hotels even though it otherwise would be inthe best interests of us and our shareholders for us to do so. There is a statutory safe harbor availablefor a limited number of sales in a single taxable year of properties that have been owned by a REITfor at least two years, but that safe harbor likely would not apply to all sales transactions that we mightotherwise consider. As a result, we may not be able to vary our portfolio promptly in response toeconomic or other conditions or on favorable terms, which may adversely affect us.
Joint venture investments that we make could be adversely affected by our lack of sole decision-makingauthority, our reliance on joint venture partners’ financial condition and liquidity and disputes between usand our joint venture partners.
We own the Doubletree Metropolitan Hotel New York City through a joint venture with anaffiliate of the hotel’s property manager. In addition, we may enter into joint ventures in the future toacquire, develop, improve or partially dispose of hotels, thereby reducing the amount of capitalrequired by us to make investments and diversifying our capital sources for growth. Such joint ventureinvestments involve risks not otherwise present in a wholly-owned hotel or a redevelopment project,including the following:
• we may not have exclusive control over the development, financing, leasing, management andother aspects of the hotel or joint venture, which may prevent us from taking actions that are inour best interest but opposed by our partners;
19

• joint venture agreements often restrict the transfer of a partner’s interest or may otherwiserestrict our ability to sell the interest when we desire or on advantageous terms;
• joint venture agreements may contain buy-sell provisions pursuant to which one partner mayinitiate procedures requiring the other partner to choose between buying the other partner’sinterest or selling its interest to that partner;
• we may not be in a position to exercise sole decision-making authority regarding the hotel orjoint venture, which could create the potential risk of creating impasses on decisions, such asacquisitions or sales;
• a partner may, at any time, have economic or business interests or goals that are, or that maybecome, inconsistent with our business interests or goals;
• a partner may be in a position to take action contrary to our instructions, requests, policies orobjectives, including our current policy with respect to maintaining our qualification as a REIT;
• a partner may fail to fund its share of required capital contributions or may become bankrupt,which would mean that we and any other remaining partners generally would remain liable forthe joint venture’s liabilities;
• relationships with joint-venture partners are contractual in nature and may be terminated ordissolved under the terms of the applicable joint venture agreements and, in such event, we maynot continue to own or operate the interests or assets underlying such relationship or may needto purchase such interests or assets at a premium to the market price to continue ownership;
• disputes between us and a partner may result in litigation or arbitration that would increase ourexpenses and prevent our officers and trustees from focusing their time and efforts on ourbusiness and could result in subjecting the hotels owned by the joint venture to additional risk;or
• we may, in certain circumstances, be liable for the actions of a partner, and the activities of apartner could adversely affect our ability to qualify as a REIT, even though we do not controlthe joint venture.
Any of the above might subject a hotel to liabilities in excess of those contemplated and adverselyaffect the value of our current and future joint venture investments.
Risks Related to the Lodging Industry
Our ability to make distributions to our shareholders may be adversely affected by various operating riskscommon to the lodging industry, including competition, over-building and dependence on business travel andtourism.
The hotels that we own have different economic characteristics than many other real estate assets.A typical office property, for example, has long-term leases with third-party tenants, which provides arelatively stable long-term stream of revenue. Hotels, on the other hand, generate revenue from gueststhat typically stay at the hotel for only a few nights, which causes the room rate and occupancy levels ateach of our hotels to change every day, and results in earnings that can be highly volatile.
In addition, our hotels are subject to various operating risks common to the lodging industry, manyof which are beyond our control, including, among others, the following:
• competition from other hotels in the markets in which we operate;
• over-building of hotels in the markets in which we operate, which results in increased supply andwill adversely affect occupancy and revenues at our hotels;
20

• dependence on business and commercial travelers and tourism;
• labor strikes, disruptions or lockouts that may impact operating performance;
• increases in energy costs and other expenses affecting travel, which may affect travel patternsand reduce the number of business and commercial travelers and tourists;
• requirements for periodic capital reinvestment to repair and upgrade hotels;
• increases in operating costs due to inflation and other factors that may not be offset byincreased room rates;
• changes in interest rates;
• changes in the availability, cost and terms of financing;
• changes in governmental laws and regulations, fiscal policies and zoning ordinances and therelated costs of compliance with laws and regulations, fiscal policies and ordinances;
• adverse effects of international, national, regional and local economic and market conditions;
• unforeseen events beyond our control, such as terrorist attacks, travel-related health concerns,including pandemics and epidemics such as the H1N1 influenza, the avian bird influenza andSARS, imposition of taxes or surcharges by regulatory authorities, travel-related accidents andunusual weather patterns, including natural disasters such as hurricanes, tsunamis orearthquakes;
• adverse effects of worsening conditions in the lodging industry; and
• risks generally associated with the ownership of hotels and real estate, as we discuss in detailbelow.
The occurrence of any of the foregoing could materially and adversely affect us.
The seasonality of the lodging industry could have a material adverse effect on us.
The lodging industry is seasonal in nature, which can be expected to cause quarterly fluctuations inour revenues. Our quarterly earnings may be adversely affected by factors outside our control, includingweather conditions and poor economic factors in certain markets in which we operate. For example,our hotels in the Chicago, Illinois metropolitan area experience lower revenues and profits during thewinter months of December through March while our hotels in Florida generally have higher revenuesin the months of January through April. This seasonality can be expected to cause periodic fluctuationsin room revenues, occupancy levels, room rates and operating expenses in particular hotels. We canprovide no assurances that our cash flows will be sufficient to offset any shortfalls that occur as a resultof these fluctuations. As a result, we may have to enter into short-term borrowings in certain quartersin order to make distributions to our shareholders, and we can provide no assurances that suchborrowings will be available on favorable terms, if at all. Consequently, volatility in our financialperformance resulting from the seasonality of the lodging industry could have a material adverse effecton us.
The cyclical nature of the lodging industry may cause fluctuations in our operating performance, which couldhave a material adverse effect on us.
The lodging industry historically has been highly cyclical in nature. Fluctuations in lodging demandand, therefore, operating performance, are caused largely by general economic and local marketconditions, which subsequently affect levels of business and leisure travel. In addition to generaleconomic conditions, new hotel room supply is an important factor that can affect the lodgingindustry’s performance, and overbuilding has the potential to further exacerbate the negative impact of
21

an economic recession. Room rates and occupancy, and thus RevPAR, tend to increase when demandgrowth exceeds supply growth. We can provide no assurances regarding whether, or the extent to which,lodging demand will rebound or whether any such rebound will be sustained. An adverse change inlodging fundamentals could result in returns that are substantially below our expectations or result inlosses, which could have a material adverse effect on us.
Our acquisition, redevelopment, repositioning, renovation and re-branding activities are subject to variousrisks, any of which could, among other things, result in disruptions to our hotel operations, strainmanagement resources and materially and adversely affect our business.
We intend to continue to acquire, redevelop, reposition, renovate and re-brand hotels, subject tothe availability of attractive hotels or projects and our ability to undertake such activities on satisfactoryterms. In deciding whether to undertake such activities, we will make certain assumptions regarding theexpected future performance of the hotel or project. However, newly acquired, redeveloped, renovated,repositioned or re-branded hotels may fail to perform as expected and the costs necessary to bring suchhotels up to franchise standards may exceed our expectations, which may result in the hotels’ failure toachieve projected returns.
In particular, to the extent that we engage in the activities described above, they could pose thefollowing risks to our ongoing operations:
• we may abandon such activities and may be unable to recover expenses already incurred inconnection with exploring such opportunities;
• acquired, redeveloped, renovated or re-branded hotels may not initially be accretive to ourresults of operations, and we and the hotel management companies may not successfully managenewly acquired, renovated, redeveloped, repositioned or re-branded hotels to meet ourexpectations;
• we may be unable to quickly, effectively and efficiently integrate new acquisitions, particularlyacquisitions of portfolios of hotels, into our existing operations;
• our redevelopment, repositioning, renovation or re-branding activities may not be completed onschedule, which could result in increased debt service and other costs and lower revenues; and
• management attention may be diverted by our acquisition, redevelopment, repositioning orrebranding activities, which in some cases may turn out to be less compatible with our growthstrategy than originally anticipated.
The occurrence of any of the foregoing events, among others, could materially and adversely affect ourbusiness.
Certain of our hotels are subject to ground leases that contain provisions that may impact our ability to sellsuch hotels.
Our ground lease agreements with respect to certain of our hotels require the consent of the lessoror sub-lessor prior to transferring our interest in the ground lease. These provisions may impact ourability to sell our hotels which, in turn, could adversely impact the price realized from any such sale. Inaddition, at any given time, investors may be disinterested in buying properties subject to a groundlease and may pay a lower price for such properties than for a comparable property in fee simple orthey may not purchase such properties at any price. Accordingly, we may find it difficult to sell aproperty subject to a ground lease or may receive lower proceeds from any such sale.
22

If we are found to be in breach of a ground lease or are unable to renew a ground lease, we could bematerially and adversely affected.
As of December 31, 2012, seven of our hotels were on land subject to ground leases. Accordingly,we only own a long-term leasehold or similar interest in those seven hotels. If we are found to be inbreach of a ground lease, we could lose the right to use the hotel. In addition, unless we can purchasea fee interest in the underlying land and improvements or extend the terms of these leases before theirexpiration, as to which no assurance can be given, we will lose our right to operate these properties andour interest in the improvements upon expiration of the leases. Our ability to exercise any extensionoptions relating to our ground leases is subject to the condition that we are not in default under theterms of the ground lease at the time that we exercise such options, and we can provide no assurancesthat we will be able to exercise any available options at such time. Furthermore, we can provide noassurances that we will be able to renew any ground lease upon its expiration. If we were to lose theright to use a hotel due to a breach or non-renewal of the ground lease, we would be unable to deriveincome from such hotel and would be required to purchase an interest in another hotel to attempt toreplace that income, which could materially and adversely affect us.
We will not recognize any increase in the value of the land or improvements subject to our ground leases andmay only receive a portion of compensation paid in any eminent domain proceeding with respect to the hotel.
Unless we purchase a fee interest in the land and improvements subject to our ground leases, wewill not have any economic interest in the land or improvements at the expiration of our ground leasesand therefore we will not share in any increase in value of the land or improvements beyond the termof a ground lease, notwithstanding our capital outlay to purchase our interest in the hotel or fundimprovements thereon, and will lose our right to use the hotel. Furthermore, if the state or federalgovernment seizes a hotel subject to a ground lease under its eminent domain power, we may only beentitled to a portion of any compensation awarded for the seizure.
The increasing use of Internet travel intermediaries by consumers may materially and adversely affect ourprofitability.
Although a majority of rooms sold on the Internet are sold through websites maintained by thehotel franchisors and managers, including Marriott and Hilton, some of our hotel rooms will be bookedthrough Internet travel intermediaries. Typically, these Internet travel intermediaries purchase rooms ata negotiated discount from participating hotels, which could result in lower room rates than thefranchisor or manager otherwise could have obtained. As these Internet bookings increase, theseintermediaries may be able to obtain higher commissions, reduced room rates or other significantcontract concessions from us and any hotel management companies that we engage. Moreover, some ofthese Internet travel intermediaries are attempting to offer hotel rooms as a commodity, by increasingthe importance of price and general indicators of quality, such as ‘‘three-star downtown hotel,’’ at theexpense of brand identification or quality of product or service. If consumers develop brand loyalties toInternet reservations systems rather than to the brands under which our hotels are franchised, the valueof our hotels could deteriorate and our business could be materially and adversely affected. Althoughmost of the business for our hotels is expected to be derived from traditional channels, if the amountof sales made through Internet intermediaries increases significantly, room revenues may flatten ordecrease and our profitability may be materially and adversely affected.
Technology is used in our operations, and any material failure, inadequacy, interruption or security failure ofthat technology could harm the business.
We and our hotel managers and franchisors rely on information technology networks and systems,including the Internet, to process, transmit and store electronic information, and to manage or supporta variety of business processes, including financial transactions and records, personal identifying
23

information, reservations, billing and operating data. Although we believe we and our hotel managersand franchisors have taken commercially reasonable steps to protect the security of our systems, therecan be no assurance that such security measures will prevent failures, inadequacies or interruptions insystem services, or that system security will not be breached. Any failure to maintain proper function,security and availability of information systems could interrupt operations, damage reputation, subjectus to liability claims or regulatory penalties and could have a material adverse effect on our business,financial condition and results of operations.
The need for business-related travel and, thus, demand for rooms in our hotels may be materially andadversely affected by the increased use of business-related technology.
The increased use of teleconference and video-conference technology by businesses could result indecreased business travel as companies increase the use of technologies that allow multiple parties fromdifferent locations to participate at meetings without traveling to a centralized meeting location, such asour hotels. To the extent that such technologies play an increased role in day-to-day business and thenecessity for business-related travel decreases, demand for our hotel rooms may decrease and we couldbe materially and adversely affected.
Future terrorist attacks or changes in terror alert levels could materially and adversely affect us.
Previous terrorist attacks and subsequent terrorist alerts have adversely affected the U.S. travel andhospitality industries over the past several years, often disproportionately to the effect on the overalleconomy. The extent of the impact that actual or threatened terrorist attacks in the U.S. or elsewherecould have on domestic and international travel and our business in particular cannot be determined,but any such attacks or the threat of such attacks could have a material adverse effect on travel andhotel demand and our ability to insure our hotels, which could materially and adversely affect us.
The outbreak of influenza or other widespread contagious disease could reduce travel and adversely affecthotel demand, which would have a material adverse effect on us.
The widespread outbreak of an infectious or contagious disease in the U.S., such as the H1N1virus, could reduce travel and adversely affect demand within the lodging industry. If demand at ourhotels decreases significantly or for a prolonged period of time as a result of an outbreak of aninfectious or contagious disease, our revenue would be adversely affected, which could have a materialadverse effect on us.
Risks Related to Our Organization and Structure
The share ownership limits imposed by the Code for REITs and our declaration of trust may restrict sharetransfers and/or business combination opportunities, particularly if our management and board of trustees donot favor a combination proposal.
In order for us to maintain our qualification as a REIT under the Code, not more than 50% invalue of our outstanding shares may be owned, directly or indirectly, by five or fewer individuals (asdefined in the Code to include certain entities) at any time during the last half of each taxable yearfollowing our first year. Our declaration of trust, with certain exceptions, authorizes our board oftrustees to take the actions that are necessary and desirable to preserve our qualification as a REIT.Unless exempted by our board of trustees, no person or entity (other than a person or entity who hasbeen granted an exception) may directly or indirectly, beneficially or constructively, own more than9.8% of the aggregate of our outstanding common shares, by value or by number of shares, whicheveris more restrictive, or 9.8% of the aggregate of the outstanding preferred shares of any class or series,by value or by number of shares, whichever is more restrictive.
24

Our board may, in its sole discretion, grant an exemption to the share ownership limits, subject tocertain conditions and the receipt by our board of certain representations and undertakings. Our boardof trustees has granted an exemption from our ownership limits to certain shareholders who receivedcommon shares in our formation transactions. During the time that such waiver is effective, theexcepted holders will be subject to an increased ownership limit. As a condition to granting suchexcepted holder limit, the excepted holders were required to make representations and warranties tous, which are intended to ensure that we will continue to meet the REIT ownership requirements. Theexcepted holders must inform us if any of these representations becomes untrue or is violated, in whichcase such excepted holder will lose its exemption from the ownership limit.
In addition, our board of trustees may change the share ownership limits. Our declaration of trustalso prohibits any person from (1) beneficially or constructively owning, as determined by applyingcertain attribution rules of the Code, our shares if that would result in us being ‘‘closely held’’ underSection 856(h) of the Code or otherwise cause us to fail to qualify as a REIT, including, but not limitedto, as a result of any ‘‘eligible independent contractor’’ that operates a ‘‘qualified lodging facility’’ (eachas defined in the Code) on behalf of a TRS failing to qualify as such, or us having significantnon-qualifying income from ‘‘related’’ parties, or (2) transferring shares if such transfer would result inour shares being owned by fewer than 100 persons. The share ownership limits contained in ourdeclaration of trust key off the ownership at any time by any ‘‘person,’’ which term includes entities,and take into account direct and indirect ownership as determined under various ownership attributionrules in the Code. The share ownership limits also might delay or prevent a transaction or a change inour control that might involve a premium price for our common shares or otherwise be in the bestinterests of our shareholders.
Our authorized but unissued common shares and preferred shares may prevent a change in our control thatmight involve a premium price for our common shares or otherwise be in the best interests of ourshareholders.
Our declaration of trust authorizes us to issue additional authorized but unissued common orpreferred shares. In addition, our board of trustees may, without shareholder approval, amend ourdeclaration of trust to increase the aggregate number of our common shares or the number of sharesof any class or series of preferred shares that we have authority to issue and classify or reclassify anyunissued common shares or preferred shares and set the preferences, rights and other terms of theclassified or reclassified shares. As a result, our board of trustees may establish a series of commonshares or preferred shares that could delay or prevent a transaction or a change in our control thatmight involve a premium price for our common shares or otherwise be in the best interests of ourshareholders.
Certain provisions of Maryland law could inhibit changes in control.
Certain provisions of the Maryland General Corporation Law, or MGCL, that are applicable toMaryland real estate investment trusts may have the effect of deterring a third party from making aproposal to acquire us or of impeding a change in our control under circumstances that otherwise couldprovide the holders of our common shares with the opportunity to realize a premium over thethen-prevailing market price of our common shares, including:
• ‘‘business combination’’ provisions that, subject to limitations, prohibit certain businesscombinations between us and an ‘‘interested shareholder’’ (defined generally as any person whobeneficially owns, directly or indirectly, 10% or more of the voting power of our voting shares oran affiliate or associate of ours who was the beneficial owner, directly or indirectly, of 10% ormore of the voting power of our then outstanding voting shares at any time within the two-yearperiod immediately prior to the date in question) for five years after the most recent date on
25

which the shareholder becomes an interested shareholder, and thereafter impose fair priceand/or supermajority and shareholder voting requirements on these combinations; and
• ‘‘control share’’ provisions that provide that ‘‘control shares’’ of our company (defined as votingshares that, when aggregated with other shares controlled by the shareholder, entitle theshareholder to exercise one of three increasing ranges of voting power in electing trustees)acquired in a ‘‘control share acquisition’’ (defined as the direct or indirect acquisition ofownership or control of issued and outstanding ‘‘control shares’’) have no voting rights except tothe extent approved by our shareholders by the affirmative vote of at least two-thirds of all thevotes entitled to be cast on the matter, excluding all interested shares.
As permitted by Maryland law, we have elected, by resolution of our board of trustees, to opt outof the business combination provisions of the MGCL and, pursuant to a provision in our bylaws, toexempt any acquisition of our shares from the control share provisions of the MGCL. However, ourboard of trustees may by resolution elect to repeal the exemption from the business combinationprovisions of the MGCL and may by amendment to our bylaws opt into the control share provisions ofthe MGCL at any time in the future.
Certain provisions of the MGCL applicable to Maryland real estate investment trusts permit ourboard of trustees, without shareholder approval and regardless of what is currently provided in ourdeclaration of trust or bylaws, to adopt certain mechanisms, some of which (for example, a classifiedboard) we do not have. These provisions may have the effect of limiting or precluding a third partyfrom making an acquisition proposal for us or of delaying, deferring or preventing a change in ourcontrol under circumstances that otherwise could provide the holders of our common shares with theopportunity to realize a premium over the then current market price.
Certain advance notice provisions of our bylaws inhibit changes in control.
Our bylaws provide that (a) with respect to an annual meeting of shareholders, nominations ofindividuals for election to our board of trustees and the proposal of other business to be considered byshareholders may be made only (i) pursuant to our notice of the meeting, (ii) by the board of trusteesor (iii) by a shareholder who was a shareholder of record at the time of the notice of the meeting andat the time of the annual meeting, who is entitled to vote at the meeting and has complied with theadvance notice procedures set forth in the bylaws and (b) with respect to special meetings ofshareholders, only the business specified in our notice of meeting may be brought before the meetingof shareholders and nominations of individuals for election to the board of trustees may be made only(A) pursuant to our notice of the meeting, (B) by the board of trustees or (C) provided that the boardof trustees has determined that directors shall be elected at such meeting, by a shareholder who was ashareholder of record at the time of the notice of the meeting and at the time of the special meeting,who is entitled to vote at the meeting and has complied with the advance notice provisions set forth inthe bylaws. These advance notice provisions may have the effect of delaying, deferring or preventing atransaction or a change in control of our company that might involve a premium to the market price ofour common stock or otherwise be in our shareholders’ best interests.
Conflicts of interest could arise between the interests of our shareholders and the interests of holders of OPunits in our operating partnership, which may impede business decisions that could benefit our shareholders.
Conflicts of interest could arise as a result of the relationships between us, on the one hand, andour operating partnership or any limited partner thereof, on the other. Our trustees and officers haveduties to us and our shareholders under applicable Maryland law in connection with their managementof our company. At the same time, we, as general partner of our operating partnership, have fiduciaryduties and obligations to our operating partnership and its limited partners under Delaware law andthe partnership agreement of our operating partnership in connection with the management of our
26

operating partnership. Our duties as general partner to our operating partnership and its partners maycome into conflict with the duties of our trustees and officers to our company and our shareholders.These conflicts may be resolved in a manner that is not in the best interests of our shareholders.
Our conflict of interest policy may not be successful in eliminating the influence of future conflicts of interestthat may arise between us and our trustees, officers and employees.
We have adopted a policy that any transaction, agreement or relationship in which any of ourtrustees, officers or employees has a material direct or indirect pecuniary interest must be approved bya majority of our disinterested trustees. Other than this policy, however, we may not adopt additionalformal procedures for the review and approval of conflict of interest transactions generally. As such,our policies and procedures may not be successful in eliminating the influence of conflicts of interest.
Certain provisions in the partnership agreement for our operating partnership may delay or preventunsolicited acquisitions of us.
Provisions in the partnership agreement for our operating partnership may delay or make moredifficult unsolicited acquisitions of us or changes in our control. These provisions could discourage thirdparties from making proposals involving an unsolicited acquisition of us or a change in our control,although some shareholders might consider such proposals, if made, desirable.
Our operating partnership may issue OP units to third parties without the consent of our shareholders, whichwould reduce our ownership percentage in our operating partnership and would have a dilutive effect on theamount of distributions made to us by our operating partnership and, therefore, the amount of distributionswe can make to our shareholders.
As of December 31, 2012, we owned 99.2% of the outstanding OP units in our operatingpartnership. We may, in connection with our acquisition of hotels or otherwise, issue OP units to thirdparties in the future. Such issuances would reduce our ownership percentage in our operatingpartnership and affect the amount of distributions made to us by our operating partnership and,therefore, the amount of distributions we can make to our shareholders. Because shareholders will notdirectly own OP units, shareholders will not have any voting rights with respect to any such issuances orother partnership level activities of our operating partnership.
Termination of the employment agreements with our executive officers could be costly and prevent a change inour control.
The employment agreements that we entered into with each of our executive officers provide that,if their employment with us terminates under certain circumstances (including upon a change in ourcontrol), we are required to pay them significant amounts of severance compensation, includingaccelerated vesting of equity awards, thereby making it costly to terminate their employment.Furthermore, these provisions could delay or prevent a transaction or a change in our control thatmight involve a premium paid for our common shares or otherwise be in the best interests of ourshareholders.
Our declaration of trust contains provisions that make removal of our trustees difficult, which could make itdifficult for our shareholders to effect changes to our management.
Our declaration of trust provides that, subject to the rights of holders of one or more classes orseries of preferred shares to elect or remove one or more trustees, a trustee may be removed only forcause and only by the affirmative vote of holders of at least two-thirds of the votes entitled to be castin the election of trustees and that our board of trustees has the exclusive power to fill vacanttrusteeships, even if the remaining trustees do not constitute a quorum. These provisions make it more
27

difficult to change our management by removing and replacing trustees and may delay or prevent achange in our control that is in the best interests of our shareholders.
We may change our operational policies, investment guidelines and our investment and growth strategieswithout shareholder consent, which may subject us to different and more significant risks in the future, whichcould materially and adversely affect us.
Our board of trustees determines our operational policies, investment guidelines and ourinvestment and growth strategies. Our board of trustees may make changes to, or approve transactionsthat deviate from, those policies, guidelines and strategies without a vote of, or notice to, ourshareholders. This could result in us conducting operational matters, making investments or pursuingdifferent investment or growth strategies than those contemplated in this Annual Report on Form 10-K.Under any of these circumstances, we may expose ourselves to different and more significant risks inthe future, which could materially and adversely affect us.
Our rights and the rights of our shareholders to take action against our trustees and officers are limited,which could limit our shareholders’ recourse in the event of actions not in our shareholders’ best interests.
Under Maryland law generally, a trustee is required to perform his or her duties in good faith, in amanner he or she reasonably believes to be in our best interest and with the care that an ordinarilyprudent person in a like position would use under similar circumstances. Under Maryland law, trusteesare presumed to have acted with this standard of care. In addition, our declaration of trust limits theliability of our trustees and officers to us and our shareholders for money damages, except for liabilityresulting from:
• actual receipt of an improper benefit or profit in money, property or services; or
• active and deliberate dishonesty by the trustee or officer that was established by a final judgmentas being material to the cause of action adjudicated.
Our declaration of trust and bylaws obligate us, to the fullest extent permitted by Maryland law ineffect from time to time, to indemnify and to pay or reimburse reasonable expenses in advance of finaldisposition of a proceeding to any present or former trustee or officer who is made or threatened to bemade a party to the proceeding by reason of his or her service to us in that capacity. In addition, wemay be obligated to advance the defense costs incurred by our trustees and officers. As a result, we andour shareholders may have more limited rights against our trustees and officers than might otherwiseexist absent the current provisions in our declaration of trust and bylaws or that might exist with othercompanies.
If we fail to maintain an effective system of integrated internal controls, we may not be able to accuratelyreport our financial results.
In connection with operating as a public company, we are required to provide reliable financialstatements and reports to our shareholders. To monitor the accuracy and reliability of our financialreporting, we have established an internal audit function that oversees our internal controls. We canprovide no assurances that such procedures will be adequate to provide reasonable assurance to ourshareholders regarding the reliability of our financial reporting and the preparation of our financialstatements. In addition, we have developed policies and procedures with respect to company-widebusiness processes and cycles in order to implement effective internal control over financial reporting.We have established, or caused our third-party hotel management companies to establish, controls andprocedures designed to ensure that hotel revenues and expenses are properly recorded at our hotels.While we have undertaken substantial work to comply with Section 404 of the Sarbanes-Oxley Act of2002, we cannot be certain that we will be successful in maintaining effective internal control over ourfinancial reporting and may determine in the future that our existing internal controls need
28

improvement. If we fail to comply with proper overall controls, we could be materially harmed or wecould fail to meet our reporting obligations. In addition, the existence of a material weakness orsignificant deficiency in our internal controls could result in errors in our financial statements thatcould require a restatement, cause us to fail to meet our reporting obligations, result in increased coststo remediate any deficiencies, attract regulatory scrutiny or lawsuits and cause investors to loseconfidence in our reported financial information, leading to a substantial decline in the market price ofour common shares.
Risks Related to the Real Estate Industry
The illiquidity of real estate investments could significantly impede our ability to respond to changingeconomic, financial, and investment conditions or changes in the operating performance of our properties,which could adversely affect our cash flows and results of operations.
Real estate investments, including the focused-service and compact full-service hotels in ourportfolio, are relatively illiquid. As a result, we may not be able to sell a hotel or hotels quickly or onfavorable terms in response to changing economic, financial and investment conditions or changes inthe hotel’s operating performance when it otherwise may be prudent to do so. Current conditions inthe U.S. economy and stock and credit markets have made it difficult to sell hotels at attractive prices.We cannot predict whether we will be able to sell any hotel we desire to sell for the price or on theterms set by us or whether any price or other terms offered by a prospective purchaser would beacceptable to us. We also cannot predict the length of time needed to find a willing purchaser and toclose the sale of a hotel. We may be required to expend funds to correct defects or to makeimprovements before a hotel can be sold, and we cannot provide any assurances that we will havefunds available to correct such defects or to make such improvements. Our inability to dispose of assetsat opportune times or on favorable terms could adversely affect our cash flows and results ofoperations.
Moreover, the Code imposes restrictions on a REIT’s ability to dispose of properties that are notapplicable to other types of real estate companies. In particular, the tax laws applicable to REITsrequire that we hold our hotels for investment, rather than primarily for sale in the ordinary course ofbusiness, which may cause us to forego or defer sales of hotels that otherwise would be in our bestinterests. Therefore, we may not be able to vary our portfolio promptly in response to economic orother conditions or on favorable terms, which may adversely affect our cash flows, our ability to makedistributions to shareholders and the market price of our common shares.
In addition, our ability to dispose of some of our hotels could be constrained by their taxattributes. Hotels that we own for a significant period of time or that we may acquire in the futurethrough tax deferred contribution transactions in exchange for OP units in our operating partnershipmay have low tax bases. If we dispose of these hotels outright in taxable transactions, we may berequired to distribute the taxable gain to our shareholders under the requirements of the Codeapplicable to REITs or to pay tax on that gain, either of which, in turn, would impact our cash flowand increase our leverage. In some cases, we may be restricted from disposing of properties contributedto us in the future in exchange for our OP units under tax protection agreements with contributorsunless we incur additional costs related to indemnifying those contributors. To dispose of low basis ortax-protected hotels efficiently, we may from time to time use like-kind exchanges, which qualify fornon-recognition of taxable gain, but can be difficult to consummate and result in the hotel for whichthe disposed assets are exchanged inheriting their low tax bases and other tax attributes.
Many real estate costs are fixed, even if revenue from our hotels decreases.
Many costs, such as real estate taxes, insurance premiums and maintenance costs, generally are notreduced even when a hotel is not fully occupied, room rates decrease or other circumstances cause a
29

reduction in revenues. In addition, newly acquired hotels may not produce the revenues we anticipateimmediately, or at all, and the hotel’s operating cash flow may be insufficient to pay the operatingexpenses and debt service associated with these new hotels. If we are unable to offset real estate costswith sufficient revenues across our portfolio, our financial performance and liquidity could be materiallyand adversely affected.
Uninsured and underinsured losses at our hotels could materially and adversely affect us.
We maintain comprehensive insurance on each of our hotels and intend to maintaincomprehensive insurance on any hotels that we acquire, including liability, fire and extended coverage,of the type and amount we believe are customarily obtained for or by hotel owners. There are noassurances that coverage will be available at reasonable rates. Various types of catastrophic losses, likewindstorms, earthquakes and floods, losses from foreign terrorist activities such as those onSeptember 11, 2001, or losses from domestic terrorist activities such as the Oklahoma City bombing onApril 19, 1995, may not be insurable or may not be economically insurable. Even when insurable, thesepolicies may have high deductibles and/or high premiums. Lenders may require such insurance and ourfailure to obtain such insurance could constitute a default under loan agreements, which could have amaterial adverse effect on us.
In the event of a substantial loss, our insurance coverage may not be sufficient to cover the fullcurrent market value or replacement cost of our lost investment. Should an uninsured loss or a loss inexcess of insured limits occur, we could lose all or a portion of the capital we have invested in a hotel,as well as the anticipated future revenue from the hotel. In that event, we might nevertheless remainobligated for any mortgage debt or other financial obligations related to the hotel. Inflation, changes inbuilding codes and ordinances, environmental considerations and other factors might also keep us fromusing insurance proceeds to replace or renovate a hotel after it has been damaged or destroyed. Underthose circumstances, the insurance proceeds we receive might be inadequate to restore our economicposition on the damaged or destroyed hotel, which could have a material adverse effect on us.
In addition, insurance risks associated with potential acts of terrorism could sharply increase thepremiums we pay for coverage against property and casualty claims. With the enactment of the TerrorismRisk Insurance Program Reauthorization Act of 2007, United States insurers cannot exclude conventionalchemical, biological, nuclear and radiation terrorism losses. These insurers must make terrorism insuranceavailable under their property and casualty insurance policies; however, this legislation does not regulatethe pricing of such insurance. In many cases, mortgage lenders have begun to insist that commercialproperty owners purchase coverage against terrorism as a condition of providing mortgage loans. Suchinsurance policies may not be available at a reasonable cost, which could inhibit our ability to finance orrefinance our hotels. In such instances, we may be required to provide other financial support, eitherthrough financial assurances or self-insurance, to cover potential losses. We may not have adequatecoverage for such losses, which could have a material adverse effect on us.
We may be subject to unknown or contingent liabilities related to recently acquired hotels and the hotels thatwe may acquire in the future, which could have a material adverse effect on us.
Our recently acquired hotels, and the hotels that we may acquire in the future, may be subject tounknown or contingent liabilities for which we may have no recourse, or only limited recourse, againstthe sellers. In general, the representations and warranties provided under the transaction agreementsrelated to the purchase of hotels we acquire may not survive the completion of the transactions.Furthermore, indemnification under such agreements may be limited and subject to various materialitythresholds, a significant deductible or an aggregate cap on losses. As a result, there is no guaranteethat we will recover any amounts with respect to losses due to breaches by the sellers of theirrepresentations and warranties. In addition, the total amount of costs and expenses that may beincurred with respect to liabilities associated with these hotels may exceed our expectations, and wemay experience other unanticipated adverse effects, all of which may materially and adversely affect us.
30

Compliance or failure to comply with the Americans with Disabilities Act and other safety regulations andrequirements could result in substantial costs.
Under the Americans with Disabilities Act of 1990 and the Accessibility Guidelines promulgatedthereunder, which we refer to collectively as the ADA, all public accommodations must meet variousfederal requirements related to access and use by disabled persons. Compliance with the ADA’srequirements could require removal of access barriers, and non-compliance could result in the U.S.government imposing fines or in private litigants winning damages. In 2008, the ADA Amendments Actwas enacted to expand the scope of the ADA. In September 2010, the Department of Justice publishedrevised regulations that adopted revised enforceable accessibility standards called the 2010 ADAStandards for Accessible Design. These standards generally became effective on March 15, 2012. Thenew standards could cause some of our hotels to incur costly measures to become fully compliant. If weare required to make substantial modifications to the hotels that we acquire, whether to comply withthe ADA or other changes in governmental rules and regulations, we could be materially and adverselyaffected.
Our hotels also are subject to various federal, state and local regulatory requirements, such as stateand local fire and life safety requirements. If we fail to comply with these requirements, we could incurfines or private damage awards. We do not know whether existing requirements will change or whethercompliance with future requirements would require significant unanticipated expenditures that wouldaffect our cash flow and results of operations. If we incur substantial costs to comply with the ADA orother safety regulations and requirements, our financial condition, results of operations, the marketprice of our common shares, cash flows and our ability to satisfy our debt obligations and to makedistributions to our shareholders could be adversely affected.
We could incur significant, material costs related to government regulation and litigation with respect toenvironmental matters, which could have a material adverse effect on us.
Our hotels are subject to various U.S. federal, state and local environmental laws that imposeliability for contamination. Under these laws, governmental entities have the authority to require us, asthe current owner of a hotel, to perform or pay for the clean-up of contamination (including hazardoussubstances, asbestos and asbestos-containing materials, waste or petroleum products) at, on, under oremanating from the hotel and to pay for natural resource damages arising from such contamination.Such laws often impose liability without regard to whether the owner or operator or other responsibleparty knew of, or caused such contamination, and the liability may be joint and several. Because theselaws also impose liability on persons who owned or operated a property at the time it becamecontaminated, it is possible we could incur cleanup costs or other environmental liabilities even afterwe sell or no longer operate hotels. Contamination at, on, under or emanating from our hotels alsomay expose us to liability to private parties for costs of remediation and/or personal injury or propertydamage. In addition, environmental laws may create liens on contaminated sites in favor of thegovernment for damages and costs it incurs to address such contamination. If contamination isdiscovered on our properties, environmental laws also may impose restrictions on the manner in whichthe properties may be used or businesses may be operated, and these restrictions may requiresubstantial expenditures. Moreover, environmental contamination can affect the value of a propertyand, therefore, an owner’s ability to borrow funds using the property as collateral or to sell theproperty on favorable terms or at all. Furthermore, persons who sent waste to a waste disposal facility,such as a landfill or an incinerator, may be liable for costs associated with cleanup of that facility.
In addition, our hotels are subject to various federal, state, and local environmental, health andsafety laws and regulations that address a wide variety of issues, including, but not limited to, storagetanks, air emissions from emergency generators, storm water and wastewater discharges, lead-basedpaint, mold and mildew, and waste management. Some of our hotels routinely handle and usehazardous or regulated substances and wastes as part of their operations, which substances and wastes
31

are subject to regulation (e.g., swimming pool chemicals). Our hotels incur costs to comply with theseenvironmental, health and safety laws and regulations and could be subject to fines and penalties fornon-compliance with applicable requirements.
Certain of our hotels contain, and those that we acquire in the future may contain, or may havecontained, asbestos-containing material, or ACM. Federal, state and local environmental, health andsafety laws require that ACM be properly managed and maintained, and include requirements toundertake special precautions, such as removal or abatement, if ACM would be disturbed duringmaintenance, renovation or demolition of a building. Such laws regarding ACM may impose fines andpenalties on building owners, employers and operators for failure to comply with these requirements. Inaddition, third parties may seek recovery from owners or operators for personal injury associated withexposure to asbestos-containing building materials.
When excessive moisture accumulates in buildings or on building materials, mold growth mayoccur, particularly if the moisture problem remains undiscovered or is not addressed over a period oftime. Some molds may produce airborne toxins or irritants. Indoor air quality issues can also stem frominadequate ventilation, chemical contamination from indoor or outdoor sources, and other biologicalcontaminants such as pollen, viruses and bacteria. Indoor exposure to airborne toxins or irritants abovecertain levels can be alleged to cause a variety of adverse health effects and symptoms, includingallergic or other reactions. As a result, the presence of significant mold or other airborne contaminantsat any of our hotels could require us to undertake a costly remediation program to contain or removethe mold or other airborne contaminants from the affected property or increase indoor ventilation. Inaddition, the presence of significant mold or other airborne contaminants could expose us to liability tothird parties if property damage or personal injury occurs.
Liabilities and costs associated with environmental contamination at, on, under or emanating fromour properties, defending against claims related to alleged or actual environmental issues, or complyingwith environmental, health and safety laws could be material and could materially and adversely affectus. We can make no assurances that changes in current laws or regulations or future laws or regulationswill not impose additional or new material environmental liabilities or that the current environmentalcondition of our hotels will not be affected by our operations, the condition of the properties in thevicinity of our hotels, or by third parties unrelated to us. The discovery of material environmentalliabilities at our properties could subject us to unanticipated significant costs, which could significantlyreduce or eliminate our profitability and the cash available for distribution to our shareholders.
We face possible risks associated with the physical effects of climate change.
We cannot predict with certainty whether climate change is occurring and, if so, at what rate.However, the physical effects of climate change could have a material adverse effect on us. Forexample, many of our properties are located along the Gulf and East coasts. To the extent climatechange causes changes in weather patterns, our markets could experience increases in storm intensityand rising sea-levels. Over time, these conditions could result in declining hotel demand or our inabilityto operate the affected hotels at all. Climate change also may have indirect effects on our business byincreasing the cost of (or making unavailable) property insurance on terms we find acceptable,increasing the cost of energy and increasing the cost of snow removal at our properties. There can beno assurance that climate change will not have a material adverse effect on us.
We may incur significant costs complying with various regulatory requirements, which could materially andadversely affect us.
Our properties are subject to various federal, state and local regulatory requirements, such as stateand local fire and life safety requirements. If we fail to comply with these various requirements, wecould incur governmental fines or private damage awards. In addition, existing requirements could
32

change and future requirements might require us to make significant unanticipated expenditures, whichcould materially and adversely affect us.
Risks Related to Our Status as a REIT
Qualifying as a REIT involves highly technical and complex provisions of the Code.
Our qualification as a REIT involves the application of highly technical and complex Codeprovisions for which only limited judicial and administrative authorities exist. Even a technical orinadvertent violation could jeopardize our REIT qualification. Moreover, new legislation, courtdecisions or administrative guidance, in each case possibly with retroactive effect, may make it moredifficult or impossible for us to qualify as a REIT. Maintaining our qualification as a REIT will dependon our satisfaction of certain asset, income, organizational, distribution, shareholder ownership andother requirements on a continuing basis. Our ability to satisfy the REIT income and asset testsdepends upon our analysis of the characterization and fair market values of our assets, some of whichare not susceptible to a precise determination and for which we will not obtain independent appraisals,and upon our ability to successfully manage the composition of our income and assets on an ongoingbasis. In addition, our ability to satisfy the requirements to maintain our qualification as a REITdepends in part on the actions of third parties over which we have no control or only limited influence,including in some cases where we own an equity interest in an entity that is classified as a partnershipfor U.S. federal income tax purposes.
Legislative or regulatory tax changes related to REITs could materially and adversely affect us.
There are a number of issues associated with an investment in a REIT that are related to thefederal income tax laws, including, but not limited to, the consequences of a company’s failing toqualify or to continue to qualify as a REIT and the tax rates applicable to REITs and theirshareholders. At any time, the federal income tax laws governing REITs or the administrativeinterpretations of those laws may be amended or modified. Any new laws or interpretations may takeeffect retroactively and could materially and adversely affect us.
If we do not qualify as a REIT or if we fail to remain qualified as a REIT, we will be subject to U.S. federalincome tax and potentially state and local taxes, which would reduce our earnings and the amount of cashavailable for distribution to our shareholders.
We have been organized, operate, and intend to continue to operate, in a manner that will enableus to qualify as a REIT for U.S. federal income tax purposes commencing with the taxable year endedDecember 31, 2011 and thereafter. Our qualification as a REIT depends on our satisfaction of therequirements described above under ‘‘—Qualifying as a REIT involves highly technical and complexprovisions of the Code.’’
If we were to fail to qualify as a REIT in any taxable year and any available relief provisions donot apply, we would be subject to U.S. federal and state corporate income tax, including any applicablealternative minimum tax, on our taxable income at regular corporate rates, and dividends paid to ourshareholders would not be deductible by us in computing our taxable income. Unless we were entitledto statutory relief under certain Code provisions, we also would be disqualified from taxation as aREIT for the four taxable years following the year in which we failed to qualify as a REIT.
Any determination that we do not qualify as a REIT would have a material adverse effect on ourresults of operations and could materially reduce the value of our common shares. Our additional taxliability could be substantial and would reduce our net earnings available for investment, debt service ordistributions to shareholders. Furthermore, we would no longer be required to make any distributionsto shareholders as a condition to REIT qualification and all of our distributions to shareholders wouldbe taxable as ordinary C corporation dividends to the extent of our current and accumulated earnings
33
and profits. This means that our shareholders currently taxed as individuals would be taxed on thosedividends at capital gain rates and our corporate shareholders generally would be entitled to thedividends received deduction with respect to such dividends, subject in each case, to applicablelimitations under the Code. Our failure to qualify as a REIT also could cause an event of defaultunder loan documents governing our debt.
REIT distribution requirements could adversely affect our ability to execute our business plan or cause us tofinance our needs during unfavorable market conditions.
We generally must distribute annually at least 90% of our REIT taxable income, subject to certainadjustments and excluding any net capital gain, in order for U.S. federal corporate income tax not toapply to earnings that we distribute. To the extent that we satisfy this distribution requirement butdistribute less than 100% of our taxable income, we will be subject to U.S. federal corporate incometax on our undistributed taxable income. In addition, we will be subject to a 4% nondeductible excisetax if the actual amount that we pay out to our shareholders in a calendar year is less than a minimumamount specified under U.S. federal tax laws. We intend to make distributions to our shareholders tocomply with the REIT requirements of the Code.
From time to time, we may generate taxable income greater than our income for financialreporting purposes prepared in accordance with accounting principles generally accepted in the UnitedStates of America, or GAAP. In addition, differences in timing between the recognition of taxableincome and the actual receipt of cash may occur. As a result, we may find it difficult or impossible tomeet distribution requirements in certain circumstances. In particular, where we experience differencesin timing between the recognition of taxable income and the actual receipt of cash, the requirement todistribute a substantial portion of our taxable income could cause us to: (1) sell assets in adversemarket conditions; (2) incur debt or issue additional equity on unfavorable terms; (3) distributeamounts that would otherwise be invested in future acquisitions, capital expenditures or repayment ofdebt; or (4) make a taxable distribution of our common shares as part of a distribution in whichshareholders may elect to receive our common shares or (subject to a limit measured as a percentageof the total distribution) cash, in order to comply with REIT requirements. These alternatives couldincrease our costs or dilute our equity. In addition, because the REIT distribution requirement preventsus from retaining earnings, we generally will be required to refinance debt at its maturity withadditional debt or equity. Thus, compliance with the REIT requirements may hinder our ability togrow, which could adversely affect the market price of our common shares.
We may in the future choose to pay dividends in the form of our own common shares, in which caseshareholders may be required to pay income taxes in excess of the cash dividends they receive.
We may seek in the future to distribute taxable dividends that are payable in cash and ourcommon shares, at the election of each shareholder. Taxable shareholders receiving such dividends willbe required to include the full amount of the dividend as ordinary income to the extent of our currentand accumulated earnings and profits for U.S. federal income tax purposes. As a result, shareholdersmay be required to pay income taxes with respect to such dividends in excess of the cash dividendsreceived. If a U.S. shareholder sells the common shares that it receives as a dividend in order to paythis tax, the sales proceeds may be less than the amount included in income with respect to thedividend, depending on the market price of our common shares at the time of the sale. In addition, insuch case, a U.S. shareholder could have a capital loss with respect to the common shares sold thatcould not be used to offset such dividend income. Furthermore, with respect to certain non-U.S.shareholders, we may be required to withhold U.S. federal income tax with respect to such dividends,including in respect of all or a portion of such dividend that is payable in common shares. In addition,such a taxable share dividend could be viewed as equivalent to a reduction in our cash distributions,and that factor, as well as the possibility that a significant number of our shareholders could determine
34

to sell our common shares in order to pay taxes owed on dividends, may put downward pressure on themarket price of our common shares.
Dividends payable by REITs do not qualify for the reduced tax rates available for some dividends.
For taxable years beginning on or after January 1, 2013, the maximum tax rate applicable to‘‘qualified dividends’’ paid to U.S. shareholders that are individuals, trusts and estates is 23.8% (takinginto account the 3.8% Medicare tax applicable to net investment income) . Dividends payable byREITs, however, generally are not eligible for the reduced rates and will continue to be subject to taxat rates applicable to ordinary income, which will be as high as 43.4% (taking into account the 3.8%Medicare tax applicable to net investment income). The more favorable tax rates applicable to regularcorporate qualified dividends could cause investors who are individuals, trusts and estates to perceiveinvestments in REITs to be relatively less attractive than investments in the shares of non-REITcorporations that pay dividends, which could adversely affect the value of the shares of REITs,including our common shares.
Even if we qualify as a REIT, we may face other tax liabilities that reduce our cash flow.
Even if we qualify for taxation as a REIT, we may be subject to certain U.S. federal, state andlocal taxes, including payroll taxes, taxes on any undistributed income, taxes on income from someactivities conducted as a result of a foreclosure, a 100% excise tax on any transactions with a TRS thatare not conducted on an arm’s-length basis, and state or local income, property and transfer taxes. Inaddition, we could, in certain circumstances, be required to pay an excise or penalty tax (which couldbe significant in amount) in order to utilize one or more relief provisions under the Code to maintainour qualification as a REIT. In addition, our TRSs will be subject to U.S. federal, state and localcorporate income taxes on their net taxable income, if any. To the extent that we conduct operationsoutside of the United States, our operations would subject us to applicable foreign taxes, as well. Anyof these taxes would decrease cash available for the payment of our debt obligations and distributionsto shareholders.
If our leases are not respected as true leases for federal income tax purposes, we would likely fail to qualify asa REIT.
To qualify as a REIT, we must satisfy two gross income tests, pursuant to which specifiedpercentages of our gross income must be passive income, such as rent. For the rent paid pursuant tothe hotel leases with our TRSs, which we currently expect will continue to constitute substantially all ofour gross income, to qualify for purposes of the gross income tests, the leases must be respected astrue leases for federal income tax purposes and must not be treated as service contracts, joint venturesor some other type of arrangement. We believe that the leases will be respected as true leases forfederal income tax purposes. There can be no assurance, however, that the IRS will agree with thischaracterization. If the leases were not respected as true leases for federal income tax purposes, wewould not be able to satisfy either of the two gross income tests applicable to REITs and would likelylose our REIT status.
Rents paid to us by each of our TRSs may not be based on the net income or profits of anyperson, or they would not be treated as ‘‘rents from real property,’’ in which case we would likely failto qualify for taxation as a REIT. We receive ‘‘percentage rents’’ calculated based on the gross revenuesof the hotels subject to leases with our TRSs, but not on net income or profits. We believe our leaseshave customary terms and rents, reflect normal business practices and do not provide for rent based onnet income or profits, but there can be no assurance the IRS will agree.
The IRS has conducted audits of other lodging REITs, and in at least one case has focused onintercompany hotel leases between the REIT and its TRSs which purportedly reflect market terms. The
35

IRS proposed transfer pricing adjustments in connection with this audit. We believe our leases havecustomary terms and rents and reflect normal business practices in this regard and comply with thearms-length requirement, but there can be no assurance that the IRS will agree. While it would notaffect our REIT status, the IRS could adjust rents related to our leases which would cause us to incura 100% excise tax on the potential adjustment.
If our TRSs fail to qualify as ‘‘taxable REIT subsidiaries’’ under the Code, we would likely fail to qualify as aREIT.
Rent paid by a lessee that is a ‘‘related party tenant’’ will not be qualifying income for purposes ofthe two gross income tests applicable to REITs. We lease and expect to continue to lease substantiallyall of our hotels to our TRSs, which will not be treated as ‘‘related party tenants’’ so long as theyqualify as ‘‘taxable REIT subsidiaries’’ under the Code. To qualify as such, most significantly, a taxableREIT subsidiary cannot engage in the operation or management of hotels or health care properties. Webelieve that our TRSs will qualify to be treated as taxable REIT subsidiaries for federal income taxpurposes. There can be no assurance, however, that the IRS will not challenge the status of a TRS forfederal income tax purposes or that a court would not sustain such a challenge. If the IRS weresuccessful in disqualifying any of our TRSs from treatment as a taxable REIT subsidiary, it is likely thatwe would fail to meet the asset tests applicable to REITs and substantially all of our income would failto qualify for the gross income tests. If we failed to meet either the asset tests or the gross incometests, we would likely lose our REIT status.
If any hotel management companies that we engage do not qualify as ‘‘eligible independent contractors,’’ or ifour hotels are not ‘‘qualified lodging facilities,’’ we would likely fail to qualify as a REIT.
Rent paid by a lessee that is a ‘‘related party tenant’’ of ours generally will not be qualifyingincome for purposes of the two gross income tests applicable to REITs. An exception is provided,however, for leases of ‘‘qualified lodging facilities’’ to a TRS so long as the hotels are managed by an‘‘eligible independent contractor’’ and certain other requirements are satisfied. We intend to takeadvantage of this exception. We lease and expect to lease all or substantially all of our hotels to TRSlessees, which are disregarded subsidiaries of the TRSs, and to engage hotel management companiesthat are intended to qualify as ‘‘eligible independent contractors.’’ Among other requirements, in orderto qualify as an eligible independent contractor, the hotel management company must not own, directlyor through its shareholders, more than 35% of our outstanding shares, and no person or group ofpersons can own more than 35% of our outstanding shares and the shares (or ownership interest) ofthe hotel management company (taking into account certain ownership attribution rules and, withrespect to our shares and the outstanding shares of any publicly traded hotel management company,only the shares owned by persons who own, directly or indirectly, more than 5% of a publicly tradedclass of shares). The ownership attribution rules that apply for purposes of these 35% thresholds arecomplex, and monitoring actual and constructive ownership of our shares by the hotel managementcompanies and their owners may not be practical. Accordingly, there can be no assurance that theseownership levels will not be exceeded.
In addition, for a hotel management company to qualify as an eligible independent contractor,such company or a related person must be actively engaged in the trade or business of operating‘‘qualified lodging facilities’’ (as defined below) for one or more persons not related to the REIT or itsTRSs at each time that such company enters into a hotel management contract with a TRS or its TRSlessee. As of the date hereof, we believe the hotel management companies operate qualified lodgingfacilities for certain persons who are not related to us or our TRS. However, no assurances can beprovided that this will continue to be the case or that any other hotel management companies that wemay engage in the future will in fact comply with this requirement in the future. Failure to comply with
36

this requirement would require us to find other managers for future contracts, and, if we hired amanagement company without knowledge of the failure, it could jeopardize our status as a REIT.
Finally, each hotel with respect to which our TRS lessees pay rent must be a ‘‘qualified lodgingfacility.’’ A ‘‘qualified lodging facility’’ is a hotel, motel, or other establishment more than one-half ofthe dwelling units in which are used on a transient basis, including customary amenities and facilities,provided that no wagering activities are conducted at or in connection with such facility by any personwho is engaged in the business of accepting wagers and who is legally authorized to engage in suchbusiness at or in connection with such facility. As of the date hereof, we believe that all of the hotelsleased to our TRS lessees will be qualified lodging facilities. Although we intend to monitor futureacquisitions and improvements of hotels, the REIT provisions of the Code provide only limitedguidance for making determinations under the requirements for qualified lodging facilities, and therecan be no assurance that these requirements will be satisfied in all cases.
Our ownership of taxable REIT subsidiaries is limited, and our transactions with our taxable REITsubsidiaries will cause us to be subject to a 100% penalty tax on certain income or deductions if thosetransactions are not conducted on arm’s length terms.
A REIT may own up to 100% of the stock of one or more taxable REIT subsidiaries. A taxableREIT subsidiary may hold assets and earn income that would not be qualifying assets or income if heldor earned directly by a REIT. Both the subsidiary and the REIT must jointly elect to treat thesubsidiary as a taxable REIT subsidiary. A corporation of which a taxable REIT subsidiary directly orindirectly owns more than 35% of the voting power or value of the stock will automatically be treatedas a taxable REIT subsidiary. Overall, no more than 25% of the value of a REIT’s assets may consistof stock or securities of one or more taxable REIT subsidiaries. In addition, the rules applicable totaxable REIT subsidiaries limit the deductibility of interest paid or accrued by a taxable REITsubsidiary to its parent REIT to assure that the taxable REIT subsidiary is subject to an appropriatelevel of corporate taxation. The rules also impose a 100% excise tax on ‘‘redetermined rent’’ or‘‘redetermined deductions’’ to the extent rent paid by a taxable REIT subsidiary exceeds an arm’s-length amount.
Our TRSs will pay U.S. federal, state and local income taxes on their net taxable income, and theirafter-tax net income will be available for distribution to us but is not required to be distributed. Weanticipate that the aggregate value of the stock and securities of our TRSs will be less than 25% of thevalue of our total assets (including the stock and securities of our TRSs). Furthermore, we will monitorthe value of our respective investments in our TRSs for the purpose of ensuring compliance with theownership limitations applicable to taxable REIT subsidiaries. In addition, we will scrutinize all of ourtransactions with our TRSs to ensure that they are entered into on arm’s-length terms to avoidincurring the 100% excise tax described above. There can be no assurance, however, that we will beable to comply with the 25% limitation discussed above or to avoid application of the 100% excise taxdiscussed above. While we believe our leases have customary terms and reflect normal businesspractices and that the rents paid thereto reflect market terms, there can be no assurance that the IRSwill agree.
Complying with REIT requirements may force us to forgo and/or liquidate otherwise attractive investmentopportunities.
To qualify as a REIT, we must ensure that we meet the REIT gross income tests annually and thatat the end of each calendar quarter, at least 75% of the value of our assets consists of cash, cash items,government securities and qualified real estate assets. The remainder of our investment in securities(other than government securities and qualified real estate assets) generally cannot include more than10% of the outstanding voting securities of any one issuer or more than 10% of the total value of theoutstanding securities of any one issuer. In addition, in general, no more than 5% of the value of our
37
assets (other than government securities and qualified real estate assets) can consist of the securities ofany one issuer, and no more than 25% of the value of our total assets can be represented by securitiesof one or more taxable REIT subsidiaries. If we fail to comply with these requirements at the end ofany calendar quarter, we must correct the failure within 30 days after the end of the calendar quarteror qualify for certain statutory relief provisions to avoid losing our REIT qualification and sufferingadverse tax consequences. As a result, we may be required to liquidate from our portfolio, orcontribute to a taxable REIT subsidiary, otherwise attractive investments in order to maintain ourqualification as a REIT. These actions could have the effect of reducing our income and amountsavailable for distribution to our shareholders. In addition, we may be required to make distributions toshareholders at disadvantageous times or when we do not have funds readily available for distribution,and may be unable to pursue investments that would otherwise be advantageous to us in order tosatisfy the source of income or asset diversification requirements for qualifying as a REIT. Thus,compliance with the REIT requirements may hinder our ability to make, and, in certain cases, maintainownership of, certain attractive investments.
If the IRS were to challenge successfully our operating partnership’s status as a partnership for federal incometax purposes, we would cease to qualify as a REIT and suffer other adverse consequences.
Our operating partnership will be treated as a separate entity for federal income tax purposes,rather than as an entity that is disregarded as separate from us. We believe, and will take steps tostructure any ownership of OP units so that, our operating partnership will be treated as a partnershipfor federal income tax purposes, rather than as a corporation. As a partnership, it will not be subject tofederal income tax on its income. Instead, each of its partners, including our company, will be requiredto pay tax on such partner’s allocable share of its income. No assurance can be provided, however, thatthe IRS will not challenge our operating partnership’s status as a partnership for federal income taxpurposes, or that a court would not sustain such a challenge. If the IRS were successful in treating ouroperating partnership as a corporation for federal income tax purposes, our company would fail tomeet the gross income tests and certain of the asset tests applicable to REITs and, accordingly, wouldcease to qualify as a REIT.
As a result of our formation transactions, our TRSs may be limited in using certain tax benefits.
If a corporation undergoes an ‘‘ownership change’’ within the meaning of Section 382 of the Codeand the Treasury Regulations thereunder, such corporation’s ability to use net operating losses, orNOLs, generated prior to the time of that ownership change may be limited. To the extent the affectedcorporation’s ability to use NOLs is limited, such corporation’s taxable income may increase. As ofDecember 31, 2012, we had approximately $50.4 million of NOLs (all of which are attributable to ourTRSs) which will begin to expire in 2026 for federal tax purposes and during the period from 2016 to2026 for state tax purposes if not utilized. In general, an ownership change occurs if one or more largeshareholders, known as ‘‘5% shareholders,’’ including groups of shareholders that may be aggregatedand treated as a single 5% shareholder, increase their aggregate percentage interest in a corporation bymore than 50% over their lowest ownership percentage during the preceding three-year period. Theformation transactions caused an ownership change within the meaning of Section 382 of the Code withrespect to the TRSs of the REITs of Funds II and III. Accordingly, to the extent such TRSs havetaxable income in future years, their ability to use NOLs incurred prior to our formation transactions infuture years will be limited, and they may have greater taxable income as a result of such limitation.
38

Risks Related to Our Common Shares
Our cash available for distribution to shareholders may not be sufficient to pay distributions at expected orrequired levels, and we may need to borrow funds or rely on other external sources in order to make suchdistributions, or we may not be able to make such distributions at all, which could cause the market price ofour common shares to decline significantly.
We intend to continue to pay regular quarterly distributions to holders of our common shares. Alldistributions will be made at the discretion of our board of trustees and will depend on our historicaland projected results of operations, EBITDA, FFO, liquidity and financial condition, REITqualification, debt service requirements, capital expenditures and operating expenses, prohibitions andother restrictions under financing arrangements and applicable law and other factors as our board oftrustees may deem relevant from time to time. No assurance can be given that our projections willprove accurate or that any level of distributions or particular yield will be made or sustained. We maynot be able to make distributions in the future or may need to fund such distributions throughborrowings or other external financing sources, which may be available only at commerciallyunattractive terms, if at all. Any of the foregoing could cause the market price of our common sharesto decline significantly.
Future issuances of debt securities, which would rank senior to our common shares upon our liquidation, andfuture issuances of equity securities (including OP units), which would dilute the holdings of our existingcommon shareholders and may be senior to our common shares for the purposes of making distributions,periodically or upon liquidation, may negatively affect the market price of our common shares.
In the future, we may issue debt or equity securities or incur other borrowings. Upon ourliquidation, holders of our debt securities and other loans and preferred shares will receive adistribution of our available assets before common shareholders. If we incur debt in the future, ourfuture interest costs could increase, and adversely affect our liquidity, FFO and results of operations.We are not required to offer any additional equity securities to existing common shareholders on apreemptive basis. Therefore, additional common share issuances, directly or through convertible orexchangeable securities (including OP units), warrants or options, will dilute the holdings of ourexisting common shareholders and such issuances or the perception of such issuances may reduce themarket price of our common shares. Our preferred shares, if issued, would likely have a preference ondistribution payments, periodically or upon liquidation, which could eliminate or otherwise limit ourability to make distributions to common shareholders. Because our decision to issue debt or equitysecurities or incur other borrowings in the future will depend on market conditions and other factorsbeyond our control, we cannot predict or estimate the amount, timing, nature or success of our futurecapital raising efforts. Thus, common shareholders bear the risk that our future issuances of debt orequity securities or our incurrence of other borrowings will negatively affect the market price of ourcommon shares.
The number of common shares available for future issuance or sale could adversely affect the per sharetrading price of our common shares.
As of February 20, 2013, we had 106,540,971 common shares outstanding. In addition, as of suchdate, 894,000 OP units in our operating partnership were outstanding, which are redeemable for cashor, at our option, for a like number of our common shares. We cannot predict the effect, if any, offuture resales of our common shares or OP units, or the perception of such resales, on the marketprice of our common shares. Any such future resales, or the perception that such resales might occur,could adversely affect the market price of our common shares and may also make it more difficult forus to sell equity or equity-related securities in the future at times and upon terms that we deemappropriate.
39

In addition, subject to applicable law, our board of trustees has the authority, without furthershareholder approval, to issue additional common shares and preferred shares on the terms and for theconsideration it deems appropriate. We may issue from time to time additional common shares or OPunits in connection with hotel acquisitions and may grant registration rights in connection with suchissuances, pursuant to which we would agree to register the resale of such securities under theSecurities Act. Furthermore, in the future we may issue common shares and securities convertible into,or exchangeable or exercisable for, our common shares under our equity incentive plan. The marketprice of our common shares may decline significantly upon future issuances of equity under our equityincentive plan or in connection with hotel acquisitions.
The trading volume and market price of our common shares may be volatile and could decline substantiallyin the future.
The market price of our common shares may be volatile in the future. In addition, the tradingvolume in our common shares may fluctuate and cause significant price variations to occur. We cannotassure shareholders that the market price of our common shares will not fluctuate or declinesignificantly in the future, including as a result of factors unrelated to our operating performance orprospects. In particular, the market price of our common shares could be subject to wide fluctuationsin response to a number of factors, including, among others, the following:
• actual or anticipated differences in our operating results, liquidity, or financial condition;
• changes in our revenues, EBITDA, FFO or earnings estimates;
• publication of research reports about us, our hotels or the lodging or overall real estate industry;
• additions and departures of key personnel;
• the performance and market valuations of other similar companies;
• the passage of legislation or other regulatory developments that adversely affect us or ourindustry;
• the realization of any of the other risk factors presented in this Annual Report on Form 10-K;
• speculation in the press or investment community;
• changes in accounting principles;
• terrorist acts; and
• general market and economic conditions, including factors unrelated to our operatingperformance.
In the past, securities class action litigation has often been instituted against companies followingperiods of volatility in the market price of their common shares. If the market price of our commonshares is volatile and this type of litigation is brought against us, it could result in substantial costs anddivert our management’s attention and resources, which could have a material adverse effect on us.
Increases in market interest rates may reduce demand for our common shares and result in a decline in themarket price of our common shares.
The market price of our common shares may be influenced by the distribution yield on ourcommon shares (i.e., the amount of our annual distributions as a percentage of the market price of ourcommon shares) relative to market interest rates. An increase in market interest rates, which arecurrently low compared to historical levels, may lead prospective purchasers of our common shares toexpect a higher distribution yield, which we may not be able, or may choose not, to provide. Higherinterest rates would also likely increase our borrowing costs and decrease our operating results andcash available for distribution. Thus, higher market interest rates could cause the market price of ourcommon shares to decline.
Item 1B. Unresolved Staff Comments
None.
40

Item 2. Properties
Our Hotels
The following table provides a comprehensive list of our hotels as of December 31, 2012. Thetable includes key metrics such as each hotel’s brand, franchise affiliation, service level and geographicregion:
FranchiseYear Parent
Hotel State Region Opened(1) Rooms company Brand Service Level
Courtyard AtlantaBuckhead . . . . . . . . . GA South 1996 181 Marriott Courtyard Focused Service
Courtyard Austin Airport . TX South 2006 150 Marriott Courtyard Focused ServiceCourtyard Austin
Downtown/ConventionCenter(2) . . . . . . . . . TX South 2006 270 Marriott Courtyard Focused Service
Courtyard AustinNorthwest/Arboretum . TX South 1996 102 Marriott Courtyard Focused Service
Courtyard Austin South . . TX South 1996 110 Marriott Courtyard Focused ServiceCourtyard Austin-
University Area . . . . . TX South 1987 198 Marriott Courtyard Focused ServiceCourtyard Benton Harbor
St. Joseph . . . . . . . . . MI Midwest 1988 98 Marriott Courtyard Focused ServiceCourtyard Boulder
Longmont . . . . . . . . . CO West 2002 78 Marriott Courtyard Focused ServiceCourtyard Boulder
Louisville . . . . . . . . . CO West 1996 154 Marriott Courtyard Focused ServiceCourtyard Charleston
Historic District(2) . . . SC South 1961 176 Marriott Courtyard Focused ServiceCourtyard Chicago
Downtown/MagnificentMile . . . . . . . . . . . . IL Midwest 2003 306 Marriott Courtyard Focused Service
Courtyard ChicagoMidway Airport . . . . . IL Midwest 1997 174 Marriott Courtyard Focused Service
Courtyard ChicagoSchaumburg . . . . . . . . IL Midwest 2005 162 Marriott Courtyard Focused Service
Courtyard ChicagoSoutheast/Hammond,IN . . . . . . . . . . . . . . IN Midwest 1997 85 Marriott Courtyard Focused Service
Courtyard DallasMesquite . . . . . . . . . TX South 1998 101 Marriott Courtyard Focused Service
Courtyard DenverSouthwest/Lakewood . . CO West 1999 90 Marriott Courtyard Focused Service
Courtyard Denver West/Golden . . . . . . . . . . . CO West 2000 110 Marriott Courtyard Focused Service
Courtyard DetroitPontiac/Bloomfield . . . MI Midwest 1998 110 Marriott Courtyard Focused Service
Courtyard FortLauderdale SW/Miramar . . . . . . . . . . FL South 2006 128 Marriott Courtyard Focused Service
Courtyard Fort Wayne . . . IN Midwest 1989 142 Marriott Courtyard Focused ServiceCourtyard Goshen . . . . . IN Midwest 1989 91 Marriott Courtyard Focused ServiceCourtyard Grand Junction CO West 2007 136 Marriott Courtyard Focused ServiceCourtyard Grand Rapids
Airport . . . . . . . . . . . MI Midwest 1997 84 Marriott Courtyard Focused ServiceCourtyard Houston by
The Galleria . . . . . . . TX South 2007 190 Marriott Courtyard Focused ServiceCourtyard Houston Sugar
Land . . . . . . . . . . . . TX South 1997 112 Marriott Courtyard Focused Service
41

FranchiseYear Parent
Hotel State Region Opened(1) Rooms company Brand Service Level
Courtyard Indianapolis atthe Capitol . . . . . . . . IN Midwest 1997 124 Marriott Courtyard Focused Service
Courtyard LouisvilleNortheast . . . . . . . . . KY South 2004 114 Marriott Courtyard Focused Service
Courtyard Merrillville . . . IN Midwest 1987 112 Marriott Courtyard Focused ServiceCourtyard New York
Manhattan / UpperEast Side . . . . . . . . . NY Northeast 2006 226 Marriott Courtyard Focused Service
Courtyard Salt Lake CityAirport . . . . . . . . . . . UT West 1999 154 Marriott Courtyard Focused Service
Courtyard San AntonioAirport/North Star Mall TX South 1996 78 Marriott Courtyard Focused Service
Courtyard South BendMishawaka . . . . . . . . IN Midwest 1995 78 Marriott Courtyard Focused Service
Courtyard TampaBrandon . . . . . . . . . . FL South 1997 90 Marriott Courtyard Focused Service
Courtyard Valparaiso . . . IN Midwest 1985 111 Marriott Courtyard Focused ServiceFairfield Inn & Suites
Austin South . . . . . . . TX South 1995 63 Marriott Fairfield Inn & Suites Focused ServiceFairfield Inn & Suites
Austin-University Area . TX South 1995 63 Marriott Fairfield Inn & Suites Focused ServiceFairfield Inn & Suites
Chicago MidwayAirport . . . . . . . . . . . IL Midwest 1997 114 Marriott Fairfield Inn & Suites Focused Service
Fairfield Inn & SuitesChicago Southeast/Hammond, IN . . . . . . IN Midwest 1997 94 Marriott Fairfield Inn & Suites Focused Service
Fairfield Inn & SuitesDenver Cherry Creek . . CO West 1986 134 Marriott Fairfield Inn & Suites Focused Service
Fairfield Inn & SuitesIndianapolis Airport . . IN Midwest 1994 86 Marriott Fairfield Inn & Suites Focused Service
Fairfield Inn & Suites KeyWest . . . . . . . . . . . . FL South 1986 106 Marriott Fairfield Inn & Suites Focused Service
Fairfield Inn & SuitesMemphis . . . . . . . . . TN South 1995 63 Marriott Fairfield Inn & Suites Focused Service
Fairfield Inn & SuitesMerrillville . . . . . . . . IN Midwest 1990 112 Marriott Fairfield Inn & Suites Focused Service
Fairfield Inn & Suites SanAntonio Airport/NorthStar Mall . . . . . . . . . TX South 1996 120 Marriott Fairfield Inn & Suites Focused Service
Fairfield Inn & Suites SanAntonio Downtown/Market Square . . . . . . TX South 1995 110 Marriott Fairfield Inn & Suites Focused Service
Fairfield Inn & SuitesTampa Brandon . . . . . FL South 1997 107 Marriott Fairfield Inn & Suites Focused Service
Fairfield Inn & SuitesValparaiso . . . . . . . . . IN Midwest 1996 63 Marriott Fairfield Inn & Suites Focused Service
Fairfield Inn & SuitesWashington, DC/Downtown . . . . . . . . DC South 1986 198 Marriott Fairfield Inn & Suites Focused Service
Louisville MarriottDowntown(2) . . . . . . . KY South 2005 616 Marriott Marriott Full Service
Auburn Hills MarriottPontiac at Centerpoint . MI Midwest 2000 290 Marriott Marriott Compact Full Service
Austin Marriott South . . . TX South 2001 211 Marriott Marriott Compact Full ServiceChicago Marriott Midway IL Midwest 2002 200 Marriott Marriott Compact Full ServiceDenver Airport Marriott
at Gateway Park . . . . . CO West 1998 238 Marriott Marriott Compact Full Service
42

FranchiseYear Parent
Hotel State Region Opened(1) Rooms company Brand Service Level
Denver Marriott South atPark Meadows . . . . . . CO West 2003 279 Marriott Marriott Compact Full Service
Renaissance BoulderFlatiron Hotel . . . . . . CO West 2002 232 Marriott Renaissance Compact Full Service
Renaissance FortLauderdale-PlantationHotel . . . . . . . . . . . . FL South 2002 250 Marriott Renaissance Compact Full Service
Renaissance PittsburghHotel . . . . . . . . . . . . PA Northeast 2001 300 Marriott Renaissance Compact Full Service
Residence Inn AustinDowntown/ConventionCenter(2) . . . . . . . . . TX South 2006 179 Marriott Residence Inn Focused Service
Residence Inn AustinNorth/Parmer Lane . . . TX South 2000 88 Marriott Residence Inn Focused Service
Residence Inn AustinNorthwest/Arboretum . TX South 1996 84 Marriott Residence Inn Focused Service
Residence Inn AustinRound Rock . . . . . . . TX South 1999 96 Marriott Residence Inn Focused Service
Residence Inn AustinSouth . . . . . . . . . . . . TX South 1996 66 Marriott Residence Inn Focused Service
Residence Inn BethesdaDowntown . . . . . . . . MD South 1986 187 Marriott Residence Inn Focused Service
Residence Inn BoulderLongmont . . . . . . . . . CO West 2002 84 Marriott Residence Inn Focused Service
Residence Inn BoulderLouisville . . . . . . . . . CO West 2000 88 Marriott Residence Inn Focused Service
Residence Inn ChicagoNaperville/Warrenville . IL Midwest 2003 130 Marriott Residence Inn Focused Service
Residence Inn ChicagoOak Brook(2) . . . . . . IL Midwest 2003 156 Marriott Residence Inn Focused Service
Residence Inn ChicagoSchaumburg . . . . . . . . IL Midwest 2001 125 Marriott Residence Inn Focused Service
Residence Inn ChicagoSoutheast/Hammond,IN . . . . . . . . . . . . . . IN Midwest 1998 78 Marriott Residence Inn Focused Service
Residence Inn Columbia . MD South 1998 108 Marriott Residence Inn Focused ServiceResidence Inn Denver
Southwest/Lakewood . . CO West 1998 102 Marriott Residence Inn Focused ServiceResidence Inn Denver
West/Golden . . . . . . . CO West 2000 88 Marriott Residence Inn Focused ServiceResidence Inn Detroit
Novi . . . . . . . . . . . . MI Midwest 2003 107 Marriott Residence Inn Focused ServiceResidence Inn Detroit
Pontiac/Auburn Hills . . MI Midwest 1998 114 Marriott Residence Inn Focused ServiceResidence Inn Fort
Lauderdale Plantation . FL South 1996 138 Marriott Residence Inn Focused ServiceResidence Inn Fort
Lauderdale SW/Miramar . . . . . . . . . . FL South 2006 130 Marriott Residence Inn Focused Service
Residence Inn GrandJunction . . . . . . . . . . CO West 2007 104 Marriott Residence Inn Focused Service
Residence Inn Houston byThe Galleria . . . . . . . TX South 1994 146 Marriott Residence Inn Focused Service
Residence Inn HoustonSugar Land . . . . . . . . TX South 1997 78 Marriott Residence Inn Focused Service
Residence InnIndianapolis Airport . . IN Midwest 1994 95 Marriott Residence Inn Focused Service
43

FranchiseYear Parent
Hotel State Region Opened(1) Rooms company Brand Service Level
Residence InnIndianapolis Carmel . . IN Midwest 2002 120 Marriott Residence Inn Focused Service
Residence InnIndianapolis Downtownon the Canal . . . . . . . IN Midwest 1997 134 Marriott Residence Inn Focused Service
Residence InnIndianapolis Fishers . . . IN Midwest 1996 78 Marriott Residence Inn Focused Service
Residence Inn LouisvilleDowntown . . . . . . . . KY South 2005 140 Marriott Residence Inn Focused Service
Residence Inn LouisvilleNortheast . . . . . . . . . KY South 2000 102 Marriott Residence Inn Focused Service
Residence Inn Merrillville IN Midwest 1996 78 Marriott Residence Inn Focused ServiceResidence Inn National
Harbor Washington,DC . . . . . . . . . . . . . MD South 2008 162 Marriott Residence Inn Focused Service
Residence Inn Salt LakeCity Airport . . . . . . . . UT West 1999 104 Marriott Residence Inn Focused Service
Residence Inn SanAntonio Downtown/Market Square . . . . . . TX South 1995 95 Marriott Residence Inn Focused Service
Residence Inn SilverSpring . . . . . . . . . . . MD South 2005 130 Marriott Residence Inn Focused Service
Residence Inn SouthBend . . . . . . . . . . . . IN Midwest 1988 80 Marriott Residence Inn Focused Service
SpringHill Suites AustinNorth/Parmer Lane . . . TX South 2002 132 Marriott SpringHill Suites Focused Service
SpringHill Suites AustinSouth . . . . . . . . . . . . TX South 2000 152 Marriott SpringHill Suites Focused Service
SpringHill SuitesBakersfield . . . . . . . . CA West 2007 119 Marriott SpringHill Suites Focused Service
SpringHill Suites BoulderLongmont . . . . . . . . . CO West 2005 90 Marriott SpringHill Suites Focused Service
SpringHill Suites ChicagoSchaumburg . . . . . . . . IL Midwest 2001 132 Marriott SpringHill Suites Focused Service
SpringHill Suites DenverNorth/Westminster . . . CO West 2002 164 Marriott SpringHill Suites Focused Service
SpringHill Suites DetroitSouthfield . . . . . . . . . MI Midwest 2003 84 Marriott SpringHill Suites Focused Service
SpringHill SuitesGainesville . . . . . . . . FL South 2007 126 Marriott SpringHill Suites Focused Service
SpringHill SuitesIndianapolis Carmel . . IN Midwest 2002 126 Marriott SpringHill Suites Focused Service
SpringHill SuitesLouisville Hurstbourne/North . . . . . . . . . . . . KY South 2001 142 Marriott SpringHill Suites Focused Service
SpringHill Suites SouthBend Mishawaka . . . . IN Midwest 2001 87 Marriott SpringHill Suites Focused Service
Doubletree HotelColumbia . . . . . . . . . MD South 1982 152 Hilton Doubletree Compact Full Service
Doubletree MetropolitanHotel New York City(3) NY Northeast 1962 764 Hilton Doubletree Compact Full Service
Embassy Suites BostonWaltham . . . . . . . . . . MA Northeast 1989 275 Hilton Embassy Suites Compact Full Service
Embassy Suites Columbus OH Midwest 1984 221 Hilton Embassy Suites Compact Full ServiceEmbassy Suites Fort
Myers—Estero . . . . . . FL South 2006 150 Hilton Embassy Suites Compact Full ServiceEmbassy Suites Los
Angeles—Downey . . . . CA West 1985 219 Hilton Embassy Suites Compact Full Service
44

FranchiseYear Parent
Hotel State Region Opened(1) Rooms company Brand Service Level
Embassy Suites Tampa—Downtown ConventionCenter . . . . . . . . . . . FL South 2006 360 Hilton Embassy Suites Compact Full Service
Embassy Suites West PalmBeach—Central . . . . . FL South 1983 194 Hilton Embassy Suites Compact Full Service
Hampton Inn Chicago-Midway Airport . . . . . IL Midwest 1990 170 Hilton Hampton Inn Focused Service
Hampton Inn Ft. WaltonBeach . . . . . . . . . . . FL South 2000 100 Hilton Hampton Inn Focused Service
Hampton Inn GardenCity(2) . . . . . . . . . . . NY Northeast 2006 143 Hilton Hampton Inn Focused Service
Hampton InnHouston-Near theGalleria . . . . . . . . . . TX South 1995 176 Hilton Hampton Inn Focused Service
Hampton Inn Merrillville . IN Midwest 1995 64 Hilton Hampton Inn Focused ServiceHampton Inn West Palm
Beach Central Airport . FL South 2004 105 Hilton Hampton Inn Focused ServiceHampton Inn & Suites
Clearwater/St. Petersburg-Ulmerton Hampton Inn &Road . . . . . . . . . . . . FL South 2007 128 Hilton Suites Focused Service
Hampton Inn & Suites Hampton Inn &Denver Tech Center . . CO West 1999 123 Hilton Suites Focused Service
Hampton Inn & SuitesLas Vegas-Red Rock/ Hampton Inn &Summerlin . . . . . . . . NV West 2007 106 Hilton Suites Focused Service
Hilton Mystic . . . . . . . . CT Northeast 1986 182 Hilton Hilton Compact Full ServiceHilton New York/Fashion
District . . . . . . . . . . . NY Northeast 2010 280 Hilton Hilton Compact Full ServiceHilton Garden Inn
Bloomington(2) . . . . . IN Midwest 2006 168 Hilton Hilton Garden Inn Focused ServiceHilton Garden Inn
Chicago/MidwayAirport . . . . . . . . . . . IL Midwest 2005 174 Hilton Hilton Garden Inn Focused Service
Hilton Garden Inn LosAngeles / Hollywood . . CA West 1975 160 Hilton Hilton Garden Inn Focused Service
Hilton Garden Inn NewOrleans ConventionCenter . . . . . . . . . . . LA South 2000 286 Hilton Hilton Garden Inn Focused Service
Hilton Garden Inn NewYork/West 35th Street . NY Northeast 2009 298 Hilton Hilton Garden Inn Focused Service
Hilton Garden InnPittsburgh UniversityPlace . . . . . . . . . . . . PA Northeast 1970 202 Hilton Hilton Garden Inn Focused Service
Hilton Garden InnRaleigh-Durham/Research Triangle Park . NC South 1989 177 Hilton Hilton Garden Inn Focused Service
Hilton Garden Inn SanFrancisco / OaklandBay Bridge . . . . . . . . CA West 1971 278 Hilton Hilton Garden Inn Focused Service
Hilton Garden InnSt. George . . . . . . . . UT West 2005 150 Hilton Hilton Garden Inn Focused Service
Hilton Garden Inn WestPalm Beach Airport . . . FL South 2007 100 Hilton Hilton Garden Inn Focused Service
Homewood Suites byHilton Tampa-Brandon . FL South 2006 126 Hilton Homewood Suites Focused Service
Homewood Suites byHilton Washington . . . DC South 2001 175 Hilton Homewood Suites Focused Service
45

FranchiseYear Parent
Hotel State Region Opened(1) Rooms company Brand Service Level
Hyatt House Austin/Arboretum(4) . . . . . . TX South 1999 130 Hyatt Hyatt House Focused Service
Hyatt House ColoradoSprings(4) . . . . . . . . . CO West 2000 125 Hyatt Hyatt House Focused Service
Hyatt House Dallas/Lincoln Park(4) . . . . . TX South 2000 155 Hyatt Hyatt House Focused Service
Hyatt House Dallas/Richardson(4) . . . . . . TX South 1997 130 Hyatt Hyatt House Focused Service
Hyatt House Dallas/Uptown(4) . . . . . . . . TX South 2000 141 Hyatt Hyatt House Focused Service
Hyatt House Houston/Galleria(4) . . . . . . . . TX South 2000 147 Hyatt Hyatt House Focused Service
Holiday Inn Austin-NWPlaza/Arboretum Area . TX South 1984 194 InterContinental Holiday Inn Compact Full Service
Holiday Inn GrandRapids Airport . . . . . . MI Midwest 2003 148 InterContinental Holiday Inn Compact Full Service
Holiday Inn ExpressChicago—MidwayAirport . . . . . . . . . . . IL Midwest 1999 104 InterContinental Holiday Inn Express Focused Service
Holiday Inn ExpressMerrillville . . . . . . . . IN Midwest 1995 62 InterContinental Holiday Inn Express Focused Service
Hotel Indigo New OrleansGarden District . . . . . LA South 1955 132 InterContinental Indigo Focused Service
Sleep Inn Midway Airport IL Midwest 1995 121 Choice Hotels Sleep Inn Focused Service
(1) Represents the year that each hotel was initially constructed and opened.
(2) This hotel is subject to a ground lease.
(3) This hotel is owned through a joint venture in which we own a 95% economic interest. We are the managing member ofthis joint venture and control all material decisions related to this hotel. Our joint venture partner is affiliated with thehotel’s property manager.
(4) During the first quarter of 2012, Hyatt Summerfield Suites changed the brand name to Hyatt House
Our Hotel Management Agreements
In order to qualify as a REIT, we cannot directly or indirectly operate any of our hotels. We leaseour hotels to TRS lessees, which in turn engage property managers to manage our hotels. Each of ourhotels is operated pursuant to a hotel management agreement with one of 16 independent hotelmanagement companies. Each hotel management company receives a base management fee and is alsoeligible to receive an incentive management fee upon the achievement of certain financial benchmarksset forth in each applicable management agreement. The incentive management fee is generallycalculated as a percentage of hotel operating profit after we have received a priority return on ourinvestment in the hotel. WLS, a fully-integrated owner, developer and manager of premium-brandhotels, is the management company for 104 of our hotels and the remaining hotels are managed by15 other hotel management companies located in the United States. Below is a summary of theprincipal terms of the hotel management agreements with WLS and a general overview of ournon-WLS hotel management agreements.
WLS Hotel Management Agreements
Our TRS lessees, as lessees of the respective hotels, have entered into hotel managementagreements with WLS for 104 of our hotels. This summary is qualified in its entirety by reference tothe form of the WLS hotel management agreement included as an exhibit to this Annual Report onForm 10-K.
46

Term
Ninety-nine of our WLS hotel management agreements contain initial terms of 20 years (with anaverage remaining term of approximately 14 years) and are subject to two automatic renewal terms of10 years each, while the remaining five WLS hotel management agreements contain initial terms of10 years (with an average remaining term of approximately six years) and are subject to two automaticrenewal terms of five years each.
Amounts Payable under our WLS Hotel Management Agreements
Under the WLS hotel management agreements, WLS receives a base management fee and, ifcertain financial thresholds are met or exceeded, an incentive management fee. The base managementfee ranges between 3.0% and 3.5% of gross hotel revenues for the applicable hotel. Gross hotelrevenue is calculated as all hotel revenue before subtracting expenses. The incentive management fee,which is calculated on a per hotel basis, is 15% of operating profit (as defined in the applicablemanagement agreements) remaining after we receive an annual return equal to 11% of our total capitalinvestment, including debt, in the applicable hotels. We also pay certain computer support andaccounting service fees to WLS, as reflected in each hotel management agreement.
Termination Events
Performance Termination. We have structured our WLS management agreements to align ourinterests with those of WLS by providing us with a right to terminate a WLS management agreement ifWLS fails to achieve certain criteria relating to the performance of a hotel under WLS management, asmeasured with respect to any two consecutive fiscal years. We may initiate a performance terminationif, during any two consecutive year period, (1) an independent hotel consulting expert, agreed to byboth WLS and us, determines that the operating profit of the affected hotel is less than the operatingprofit of comparable hotels as determined by the independent hotel consulting expert, and (2) theRevPAR penetration index fails to exceed a specified RevPAR penetration index threshold, as set forthin the applicable management agreement. WLS has the right, which can be exercised no more thanthree times per hotel, to avoid a performance termination by paying an amount equal to the amountthat the operating profit fell below the annual operating budgets for the relevant performancetermination period, as reflected in each WLS management agreement, or by agreeing to offset theoperating budget difference against future management fees due to WLS.
Early Termination for Casualty/Condemnation or Cause. Subject to certain qualifications andapplicable cure periods, the hotel management agreements are generally terminable by either partyupon material casualty or condemnation of the hotel or the occurrence of certain customary events ofdefault, including, among others: the bankruptcy or insolvency of either party; the failure of eitherparty to make a payment when due, and failure to cure such non-payment after due notice; failure byus to provide WLS with sufficient working capital to operate the hotel after due notice; breach byeither party of covenants or obligations under a WLS hotel management agreement; and failure by usto complete work approved or required under the terms of the hotel’s franchise agreement and theapplicable WLS management agreement.
If an event of default occurs and continues beyond the grace period set forth in the WLS hotelmanagement agreement, the non-defaulting party generally has, among other remedies, the option ofterminating the applicable hotel management agreement, upon at least 30 days’ written notice to theother party.
Early Termination by WLS—Liquidated Damages. In the event that WLS elects to terminate aWLS hotel management agreement due to an event of default by us, WLS may elect to recover atermination fee, as liquidated damages, equal to 2.5 times the actual base management fee and
47
incentive management fee earned by WLS under that hotel management agreement in the fiscal yearimmediately preceding the fiscal year in which such termination occurred.
Sale of a Hotel
Each WLS hotel management agreement provides that we cannot sell the applicable hotel to anyunrelated third party or engage in certain change of control actions (1) if we are in default under thehotel management agreement or (2) with or to a person or entity that is known in the community asbeing of bad moral character or has been convicted of a felony or is in control of or controlled bypersons convicted of a felony or would be in violation of any franchise agreement requirementsapplicable to us. Each WLS hotel management agreement further requires that any future owner of theapplicable hotel, at the option of WLS, assume the WLS hotel management agreement or enter into anew WLS hotel management agreement for such hotel.
Other Hotel Management Agreements
As of the date of this Annual Report on Form 10-K, 41 of our hotels are managed by 15 hotelmanagement companies other than WLS. Each of these hotels is subject to a hotel managementagreement that contains customary terms and conditions that generally are similar to the provisionsfound in the WLS hotel management agreements described above. The hotel management agreementsgenerally have initial terms that range from one to ten years, and some provide for one or twoautomatic extension periods ranging from five to ten years. In addition, each hotel managementcompany receives a base management fee ranging from 2.0% to 7.0% of gross hotel revenues and anincentive management fee ranging from 10% to 25% of available cash flow (or other similar metric) asset forth in the applicable management agreement, calculated on a per hotel basis, generally equal tothe operating profit of the hotel after deducting a priority return to us based upon a percentage of ourtotal capital investment in the hotels. Each of the non-WLS hotel management agreements alsoprovides us with a right to terminate such management agreement if the hotel management companyfails to reach certain performance targets (as provided in the applicable management agreement) orprovides us with a right to terminate the management agreement in our sole and absolute discretion. Inaddition, certain management agreements give us the right to terminate the management agreementupon the sale of the hotel or for any reason upon payment of a stipulated termination fee. Theperformance targets vary, but generally provide us with the right to terminate the applicable hotelmanagement agreement if the operating profit of the hotel is less than 90% to 95% of the budgettargets set forth pursuant to such management agreement and/or the RevPAR is less than 90% to115% of comparable hotels. The hotel management agreements are also generally terminable by eitherparty upon material casualty or condemnation of the hotel or the occurrence of certain customaryevents of default.
Franchise Agreements
As of December 31, 2012, 102, 31 and six of our hotels operated under franchise agreements withMarriott, Hilton and Hyatt, respectively. Five of these hotels receive the benefits of a franchiseagreement pursuant to management agreements with Marriott. The remaining six hotels that we own asof December 31, 2012 operate under existing franchise agreements with brands other than Marriott,Hilton or Hyatt.
Franchisors provide a variety of benefits to franchisees, including centralized reservation systems,national advertising, marketing programs and publicity designed to increase brand awareness, trainingof personnel and maintenance of operational quality at hotels across the brand system. The franchiseagreements generally specify management, operational, record-keeping, accounting, reporting andmarketing standards and procedures with which our TRS lessees, as the franchisees, must comply. Thefranchise agreements obligate our TRS lessees to comply with the franchisors’ standards and
48

requirements, including training of operational personnel, safety, maintaining specified insurance, thetypes of services and products ancillary to guest room services that may be provided by the TRS lessee,display of signage and the type, quality and age of furniture, fixtures and equipment included in guestrooms, lobbies and other common areas. Each of the existing franchise agreements for our hotelsrequire that we pay a royalty fee of between 3% and 6% of the gross room revenue of the hotels and,for certain full service hotels, on food and beverage revenue. We also must pay marketing, reservationor other program fees ranging between 1.0% and 4.3% of gross room revenue. In addition, undercertain of our franchise agreements, the franchisor may require that we renovate guest rooms andpublic facilities from time to time to comply with then-current brand standards.
The franchise agreements also provide for termination at the applicable franchisor’s option uponthe occurrence of certain events, including failure to pay royalties and fees or to perform otherobligations under the franchise license, bankruptcy and abandonment of the franchise or a change incontrol. The TRS lessee that is the franchisee is responsible for making all payments under theapplicable franchise agreement to the franchisor; however we are required to guarantee the obligationsunder each of the franchise agreements. In addition, many of our existing franchise agreements providethe franchisor with a right of first offer in the event of certain sales or transfers of a hotel and providethat the franchisor has the right to approve any change in the hotel management company engaged tomanage the hotel.
TRS Leases
In order for us to qualify as a REIT, neither our company nor any of our subsidiaries, includingthe operating partnership, may directly or indirectly operate our hotels. Subsidiaries of our operatingpartnership, as lessors, lease our hotels to our TRS lessees, which, in turn, are parties to the existinghotel management agreements with third-party hotel management companies for each of our hotels.The TRS leases for our hotels contain the provisions described below. We intend that leases withrespect to hotels acquired in the future will contain substantially similar provisions to those describedbelow; however, we may, in our discretion, alter any of these provisions with respect to any particularlease.
Lease Terms
Leases have initial terms that range from three to five years and a majority of the leases can berenewed by our TRS lessees for three successive five-year renewal terms unless the lessee is in defaultat the expiration of the then-current term. In addition, our TRS leases are subject to early terminationby us in the event that we sell the hotel to an unaffiliated party, a change in control occurs orapplicable provisions of the Code are amended to permit us to operate our hotels. Our leases are alsosubject to early termination upon the occurrence of certain events of default and/or other contingenciesdescribed in the lease.
Amounts Payable under the Leases
During the term of each TRS lease, our TRS lessees are obligated to pay us a fixed annual baserent plus a percentage rent and certain other additional charges that our TRS lessees agree to payunder the terms of the respective TRS lease. Percentage rent is calculated based on revenues generatedfrom guest rooms, food and beverage sales, and certain other sources, including meeting rooms andmovie rentals. Base rent is paid to us monthly, any percentage rent is paid to us quarterly, and anyadditional charges are paid to us when due.
Other than certain capital expenditures for the building and improvements, which are obligationsof the lessor, the leases require our TRS lessees to pay rent, all costs and expenses, franchise fees,ground rent (if applicable), property taxes and certain insurance, and all utility and other charges
49

incurred in the operation of the hotels they lease. The leases also provide for rent reductions andabatements in the event of damage to, or destruction or a partial taking of, any hotel.
All of the above mentioned transactions eliminate in consolidation.
Maintenance and Modifications
Under each TRS lease, the TRS lessee may, at its expense, make additions, modifications orimprovements to the hotel that it deems desirable and that we approve. In addition, our TRS lesseesare required, at their expense, to maintain the hotels in good order and repair, except for ordinarywear and tear, and to make repairs that may be necessary and appropriate to keep the hotel in goodorder and repair. Under the TRS lease, we are responsible for maintaining, at our cost, anyunderground utilities or structural elements, including exterior walls and the roof of the hotel(excluding, among other things, windows and mechanical, electrical and plumbing systems). Each TRSlessee, when and as required to meet the standards of the applicable hotel management agreement, anyapplicable hotel franchise agreement or to satisfy the requirements of any lender, must establish anFF&E reserve in an amount equal to up to 5% of room revenue for the purpose of periodicallyrepairing, replacing or refurbishing furnishings and equipment.
Events of Default
Events of default under each of the leases include, among others: the failure by a TRS lessee topay rent when due; the breach by a TRS lessee of a covenant, condition or term under the lease,subject to the applicable cure period; the bankruptcy or insolvency of a TRS lessee; cessation ofoperations by a TRS lessee of the leased hotel for more than 30 days, except as a result of damage,destruction, or a partial or complete condemnation; or the default by a TRS lessee under a franchiseagreement subject to any applicable cure period.
Termination of Leases on Disposition of the Hotels or Change of Control
In the event that we sell a hotel to a non-affiliate or a change of control occurs, we generally havethe right to terminate the lease by paying the applicable TRS lessee a termination fee to be governedby the terms and conditions of the lease.
Ground Leases
As of December 31, 2012, seven of our hotels were subject to ground leases that cover the landunderlying the respective hotels:
• The Residence Inn Chicago Oak Brook is subject to a ground lease with an initial term thatexpires on March 6, 2100. During the initial term of the ground lease, the total rent is$1.56 million, which was paid in a lump sum upon commencement of the ground lease in 2001.After the initial term, we may extend the ground lease for an additional renewal term of99 years for $1. Under certain circumstances set forth in the ground lease, we have the option toacquire the land underlying the Residence Inn Chicago Oak Brook.
• The Courtyard Austin Downtown/Convention Center and the Residence Inn Austin Downtown/Convention Center, which are situated on the same parcel of land, are subject to a single groundlease with a term that expires on November 14, 2100. In addition to an aggregate base annualrent of $0.4 million, we must pay annual percentage rent in the amount by which 3.25% of thetotal amount of rents for all guest rooms, meeting rooms or conference room exceeds totalannual base rent. Under certain circumstances set forth in the ground lease, we will need toobtain the consent of the ground lessor prior to transferring our interest in the ground lease.
50

• The Hilton Garden Inn Bloomington is subject to a ground lease with an initial term thatexpires on January 30, 2053. During the initial term of the ground lease, the total rent is $490,payable in 10 equal annual installments of $49 each, commencing on December 2, 2024. Afterexpiration of the initial term, the ground lease will be automatically extended for five successive10-year renewal terms unless we give notice of non-renewal or there is an uncured event ofdefault (as defined in the ground lease) at the expiration of the then-current term. Undercertain circumstances set forth in the ground lease, we will need to obtain the consent of theground lessor prior to transferring our interest in the ground lease. The Hilton Garden InnBloomington is also subject to an agreement to lease parking spaces with an initial termextending out to 2033. The agreement to lease parking spaces may be extended if certain eventsoccur. The agreement provides for a monthly rental payment based on city ordinance rates (atDecember 31, 2012 the rate was approximately $2 per month) and the number of parking spacesreserved for the exclusive use of the hotel, plus amounts based on actual usage in excess of thereserved spaces.
• The Louisville Marriott Downtown is subject to a ground lease with an initial term that expireson June 25, 2053. The annual rent for the initial term of the ground lease is $1 plus a profitsparticipation payment equal to 25% of the amount that net income during any year during thelease term exceeds a specified investment return as calculated based on the terms of the groundlease. After expiration of the initial term, the ground lease will be automatically extended forfour successive 25-year terms unless we give notice of non-renewal or there is an uncured eventof default (as defined in the ground lease) at the expiration of the then-current term. Undercertain circumstances set forth in the ground lease, we will need to obtain the consent of theground lessor prior to transferring our interest in the ground lease.
• The Hampton Inn Garden City is subject to a sublease of a ground lease with a term thatexpires on December 31, 2016. The sublease is associated with an agreement for payment in lieuof taxes and will revert to fee simple ownership at the end of the ground lease. The annual rentfor the term of the sublease is $1. In addition, an annual compliance fee of $1,000 is requiredunder the terms of the ground lease. Under certain circumstances set forth in the sub-sublease,we will need to obtain the consent of the ground sub-sublessor prior to transferring our interestin the sub-sublease.
• A portion of the site of the Courtyard Charleston Historic District is subject to a ground leasewith a term that expires on October 1, 2096. The current annual base rent of $0.8 millioncontinues until 2021, after which the annual base rent increases periodically during the term ofthe ground lease to a maximum of $1.0 million. In addition to base rent, we are required to pay,as percentage rent, 1.5% of gross quarterly collected room revenue (from no more than126 rooms per night). We are also responsible for paying all taxes, utilities and other costsassociated with the ownership and operation of the property. All FF&E is deemed to be part ofthe leased premises. The ground lessor has a security interest in FF&E, which will become theproperty of the ground lessor upon termination or expiration of ground lease. We and theground lessor each have the right to match any offer to purchase the hotel should the otherparty desire to sell their interest in the property. We are required to obtain the ground lessor’sconsent (which may not be unreasonably withheld) in connection with any change in the hotelmanagement company.
The foregoing ground leases and ground subleases generally require us to pay all charges, costs,expenses, assessments and liabilities relating to ownership and operation of the properties, includingreal property taxes and utilities, and to obtain and maintain insurance covering the subject property.
51

Item 3. Legal Proceedings
The nature of the operations of our hotels exposes our hotels, the Company and the operatingpartnership to the risk of claims and litigation in the normal course of business. Other than routinelitigation arising out of the ordinary course of business, the Company is not presently subject to anymaterial litigation nor, to the Company’s knowledge, is any material litigation threatened against theCompany.
Item 4. Mine Safety Disclosures
Not applicable.
52

PART II
Item 5. Market for Registrant’s Common Equity, Related Shareholder Matters and Issuer Purchasesof Equity Securities
Our common shares are traded on the New York Stock Exchange, or the NYSE, under the symbol‘‘RLJ.’’ Below is a summary of the high and low prices of our common shares for each quarterly periodsince the date of our initial public offering, or the IPO, as reported on the NYSE and distributionspaid by us with respect to each quarterly period.
2012 High Low Distribution
January 1, 2012–March 31, 2012 . . . . . . . . . . . . . . . . . $19.11 $16.58 $0.165April 1, 2012–June 30, 2012 . . . . . . . . . . . . . . . . . . . . $19.75 $16.74 $0.165July 1, 2012–September 30, 2012 . . . . . . . . . . . . . . . . $19.45 $16.61 $0.165October 1, 2012–December 31, 2012 . . . . . . . . . . . . . . $19.66 $16.86 $0.205
2011 High Low Distribution
May 16, 2011–June 30, 2011(1) . . . . . . . . . . . . . . . . . . $18.38 $16.65 $0.08July 1, 2011–September 30, 2011 . . . . . . . . . . . . . . . . $17.89 $11.70 $0.15October 1, 2011–December 31, 2011 . . . . . . . . . . . . . . $17.35 $11.66 $0.15
(1) We completed an initial public offering of our common shares on May 16, 2011
On December 31, 2012 and February 20, 2013, the closing price of our common shares as reportedon the NYSE was $19.37 and $20.72, respectively.
53

21FEB201322120129
Share Return Performance
The following graph compares the total shareholder return on our common shares against thecumulative total returns of the Standard & Poor’s Corporation Composite 500 Index and the MorganStanley Capital International United States REIT Index, or the MSCI US REIT Index for the periodfrom May 11, 2011, the date of the initial listing of our common shares of beneficial interest on theNYSE to December 31, 2012. The graph assumes an initial investment of $100 in our common sharesand in each of the indices, and also assumes the reinvestment of dividends.
$120.00
$105.00
$110.00
$115.00
$100.00
$95.00
$90.00May 11, 2011
RLJ Lodging Trust S&P 500 Index MSCI US REIT Index
Dec 31, 2012Dec 31, 2011
Value of Initial Value ofInitial Investment at Investment at Investment at
Name May 11, 2011 Dec 31, 2011 Dec 31, 2012
RLJ Lodging Trust . . . . . . . . . . $100.00 $97.64 $116.67S&P 500 Index . . . . . . . . . . . . . $100.00 $95.05 $110.26MSCI US REIT Index . . . . . . . $100.00 $97.87 $115.32
This performance graph shall not be deemed ‘‘filed’’ for the purposes of Section 18 of theSecurities Exchange Act of 1934, as amended, or incorporated by reference into any filing by us underthe Securities Act of 1933, as amended, or the Securities Exchange Act except as shall be expressly setforth by specific reference in such filing.
Shareholder Information
At February 20, 2013, we had 94 holders of record of our common shares. However, because manyof our common shares are held by brokers and other institutions on behalf of shareholders, we believethere are substantially more beneficial holders of our common shares than record holders. AtFebruary 20, 2013, there were four holders (other than our company) of our OP units. Our OP unitsare redeemable for cash or, at our election, for our common shares.
In order to comply with certain requirements related to our qualification as a REIT, ourdeclaration of trust provides that, subject to certain exceptions, no person or entity (other than aperson or entity who has been granted an exception) may directly or indirectly, beneficially orconstructively, own more than 9.8% of the aggregate of our outstanding common shares, by value or by
54

number of shares, whichever is more restrictive, or 9.8% of the aggregate of the outstanding preferredshares of any class or series, by value or by number of shares, whichever is more restrictive.
Distribution Information
We intend, over time, to make regular quarterly distributions to our common shareholders. Inorder to qualify and maintain our qualification for taxation as a REIT, we intend to make annualdistributions to our shareholders of at least 90% of our taxable income, determined without regard tothe deduction for dividends paid and excluding any net capital gain.
The credit agreement governing our $300 million unsecured revolving credit facility and our$275 million unsecured term loan limits our ability to pay cash dividends. However, so long as nodefault or event of default exists, the credit agreement allows us to pay cash dividends with respect toany period of four fiscal quarters in an amount not to exceed (i) 95% of adjusted funds fromoperations (as defined in the credit agreement), (ii) the amount required for us to maintain our statusas a REIT (including the right to distribute 100% of net capital gain) under Sections 856 through 860of the Code, and (iii) the amount necessary for us to avoid income or excise tax under the Code. Ifcertain defaults or events of default exist, we may pay cash dividends with respect to any fiscal year inan aggregate amount not to exceed the greater of (x) the minimum amount required for us to maintainour status as a REIT under Sections 856 through 860 of the Code, or (y) the amount necessary toavoid income or excise tax under the Code. In addition, the term loan agreement governing ourunsecured term loan of $125 million contains the same restrictions related to payment of dividends ascontained in the credit agreement described above.
Any future distributions will be at the sole discretion of our board of trustees, and their form,timing and amount, if any, will depend upon a number of factors, including our actual and projectedfinancial condition, liquidity, EBITDA, FFO and results of operations, the revenue we actually receivefrom our properties, our operating expenses, our debt service requirements, our capital expenditures,prohibitions and other limitations under our financing arrangements, as described above, our REITtaxable income, the annual REIT distribution requirements, applicable law and such other factors asour board of trustees deems relevant. To the extent that our cash available for distribution is less than90% of our REIT taxable income, we may consider various means to cover any such shortfall, includingborrowing under our unsecured revolving credit facility or other loans, selling certain of our assets orusing a portion of the net proceeds we receive from offerings of equity, equity-related or debt securitiesor declaring taxable share dividends.
Unregistered Sales of Equity Securities
The Company did not sell any securities during the fiscal year ended December 31, 2012 that werenot registered under the Securities Act of 1933, as amended.
Issuer Purchases of Equity Securities
During the year ended December 31, 2012, certain of our employees surrendered common sharesowned by them to satisfy their statutory minimum federal and state tax obligations associated with thevesting of restricted common shares of beneficial interest issued under our 2011 Equity Incentive Plan,or the 2011 Plan.
55

The following table summarizes all of these repurchases during the year ended December 31, 2012.
Total number of Maximum numbershares purchased of shares that may
Total number as part of publicly yet be purchasedof shares Average price announced plans under the plans or
Period purchased paid per share or programs programs
January 1, 2012 through January 31,2012 . . . . . . . . . . . . . . . . . . . . . . . . . — — N/A N/A
February 1, 2012 through February 29,2012 . . . . . . . . . . . . . . . . . . . . . . . . . 24,128(1) $18.15 — N/A
March 1, 2012 through March 31, 2012 . 536(1) $17.44 — N/AApril 1, 2012 through April 30, 2012 . . . — — N/A N/AMay 1, 2012 through May 31, 2012 . . . . 25,264(1) $18.44 — N/AJune 1, 2012 through June 30, 2012 . . . . 9,537(1) $17.29 — N/AJuly 1, 2012 through July 31, 2012 . . . . . — — N/A N/AAugust 1, 2012 through August 31, 2012 25,368(1) $17.60 — N/ASeptember 1, 2012 through
September 30, 2012 . . . . . . . . . . . . . . 10,085(1) $17.90 — N/AOctober 1, 2012 through October 31,
2012 . . . . . . . . . . . . . . . . . . . . . . . . . — — N/A N/ANovember 1, 2012 through
November 30, 2012 . . . . . . . . . . . . . . 26,841(1) $17.19 — N/ADecember 1, 2012 through
December 31, 2012 . . . . . . . . . . . . . . 10,072(1) $18.59 — N/A
Total year ended December 31, 2012 . . . 131,831
(1) The number of shares purchased represents common shares surrendered by certain of ouremployees to satisfy their statutory minimum federal and state tax obligations associated with thevesting of restricted common shares of beneficial interest issued under our 2011 Equity IncentivePlan. With respect to these shares, the price paid per share is based on the closing price of ourcommon shares as of the date of the determination of the statutory minimum federal and state taxobligations.
Share Repurchase Plan
In November 2011, our Board of Trustees authorized a share repurchase plan to acquire up to$100.0 million of our common shares. Under this plan, we may repurchase our own common sharesfrom time to time, in amounts and prices, as we deem appropriate, all subject to market conditions andother considerations, including available investment alternatives and capital availability. Under theterms of the share repurchase program, repurchases can be made in the open market or in privatelynegotiated transactions, including from our legacy investors. The program does not obligate us toacquire any specified amount of common shares and, may be modified or suspended at any time at ourdiscretion. We did not elect to repurchase any shares under the share repurchase plan in 2012.
56
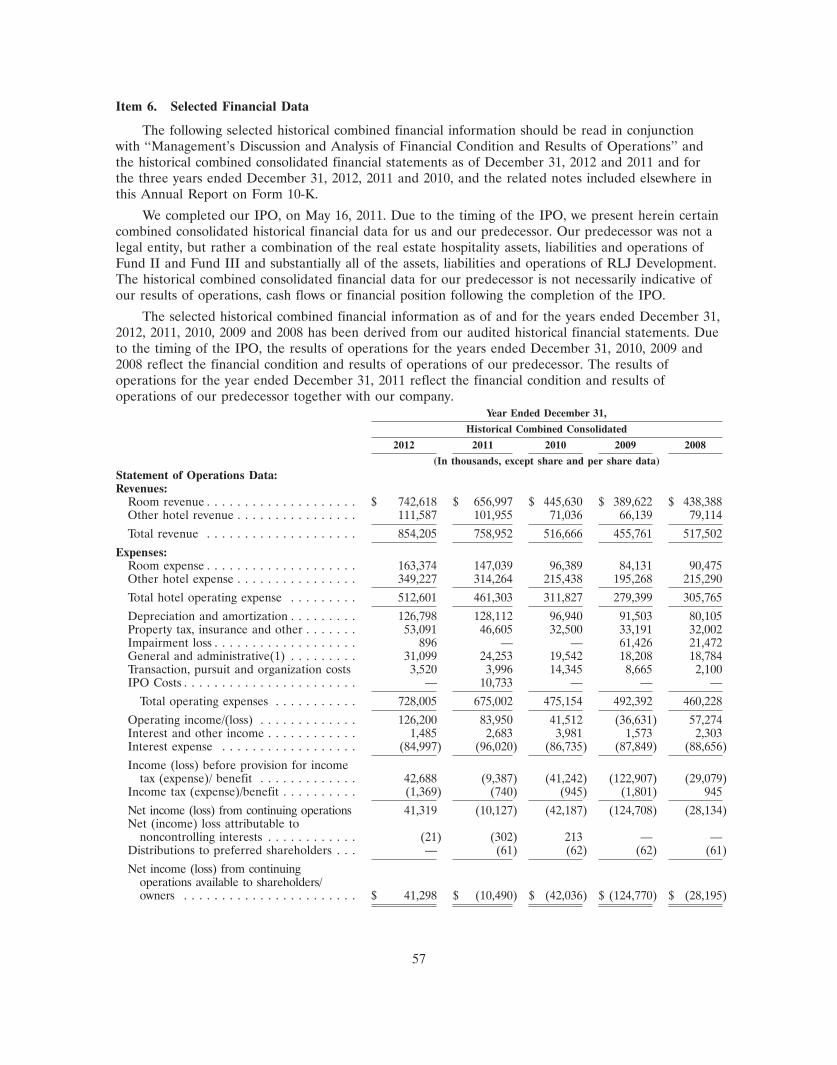
Item 6. Selected Financial Data
The following selected historical combined financial information should be read in conjunctionwith ‘‘Management’s Discussion and Analysis of Financial Condition and Results of Operations’’ andthe historical combined consolidated financial statements as of December 31, 2012 and 2011 and forthe three years ended December 31, 2012, 2011 and 2010, and the related notes included elsewhere inthis Annual Report on Form 10-K.
We completed our IPO, on May 16, 2011. Due to the timing of the IPO, we present herein certaincombined consolidated historical financial data for us and our predecessor. Our predecessor was not alegal entity, but rather a combination of the real estate hospitality assets, liabilities and operations ofFund II and Fund III and substantially all of the assets, liabilities and operations of RLJ Development.The historical combined consolidated financial data for our predecessor is not necessarily indicative ofour results of operations, cash flows or financial position following the completion of the IPO.
The selected historical combined financial information as of and for the years ended December 31,2012, 2011, 2010, 2009 and 2008 has been derived from our audited historical financial statements. Dueto the timing of the IPO, the results of operations for the years ended December 31, 2010, 2009 and2008 reflect the financial condition and results of operations of our predecessor. The results ofoperations for the year ended December 31, 2011 reflect the financial condition and results ofoperations of our predecessor together with our company.
Year Ended December 31,
Historical Combined Consolidated
2012 2011 2010 2009 2008
(In thousands, except share and per share data)Statement of Operations Data:Revenues:
Room revenue . . . . . . . . . . . . . . . . . . . . $ 742,618 $ 656,997 $ 445,630 $ 389,622 $ 438,388Other hotel revenue . . . . . . . . . . . . . . . . 111,587 101,955 71,036 66,139 79,114
Total revenue . . . . . . . . . . . . . . . . . . . . 854,205 758,952 516,666 455,761 517,502
Expenses:Room expense . . . . . . . . . . . . . . . . . . . . 163,374 147,039 96,389 84,131 90,475Other hotel expense . . . . . . . . . . . . . . . . 349,227 314,264 215,438 195,268 215,290
Total hotel operating expense . . . . . . . . . 512,601 461,303 311,827 279,399 305,765
Depreciation and amortization . . . . . . . . . 126,798 128,112 96,940 91,503 80,105Property tax, insurance and other . . . . . . . 53,091 46,605 32,500 33,191 32,002Impairment loss . . . . . . . . . . . . . . . . . . . 896 — — 61,426 21,472General and administrative(1) . . . . . . . . . 31,099 24,253 19,542 18,208 18,784Transaction, pursuit and organization costs 3,520 3,996 14,345 8,665 2,100IPO Costs . . . . . . . . . . . . . . . . . . . . . . . — 10,733 — — —
Total operating expenses . . . . . . . . . . . 728,005 675,002 475,154 492,392 460,228
Operating income/(loss) . . . . . . . . . . . . . 126,200 83,950 41,512 (36,631) 57,274Interest and other income . . . . . . . . . . . . 1,485 2,683 3,981 1,573 2,303Interest expense . . . . . . . . . . . . . . . . . . (84,997) (96,020) (86,735) (87,849) (88,656)
Income (loss) before provision for incometax (expense)/ benefit . . . . . . . . . . . . . 42,688 (9,387) (41,242) (122,907) (29,079)
Income tax (expense)/benefit . . . . . . . . . . (1,369) (740) (945) (1,801) 945
Net income (loss) from continuing operations 41,319 (10,127) (42,187) (124,708) (28,134)Net (income) loss attributable to
noncontrolling interests . . . . . . . . . . . . (21) (302) 213 — —Distributions to preferred shareholders . . . — (61) (62) (62) (61)
Net income (loss) from continuingoperations available to shareholders/owners . . . . . . . . . . . . . . . . . . . . . . . $ 41,298 $ (10,490) $ (42,036) $ (124,770) $ (28,195)
57

Year Ended December 31,
Historical Combined Consolidated
2012 2011 2010 2009 2008
(In thousands, except share and per share data)Balance Sheet Data:
Investment in hotels, net . . . . . . . . . . . . . $ 3,073,483 $ 2,820,457 $2,626,690 $1,877,583 $1,905,653Cash and cash equivalents . . . . . . . . . . . . 115,861 310,231 267,454 151,382 156,181Total assets . . . . . . . . . . . . . . . . . . . . . . 3,346,385 3,290,018 3,045,824 2,202,865 2,213,108Total debt . . . . . . . . . . . . . . . . . . . . . . . 1,413,651 1,341,735 1,747,077 1,598,991 1,448,872Total other liabilities . . . . . . . . . . . . . . . 124,823 114,295 75,014 118,127 143,504Total owners’ equity . . . . . . . . . . . . . . . . 1,807,911 1,833,988 1,223,733 485,747 620,732
Per Share Data:Basic income (loss) from continuing
operations per share . . . . . . . . . . . . . . $ 0.38 $ (0.11)Diluted income (loss) from continuing
operations per share(2) . . . . . . . . . . . . $ 0.38 $ (0.11)Weighted average shares outstanding—
basic . . . . . . . . . . . . . . . . . . . . . . . . . 105,423,604 95,340,666Weighted average shares outstanding—
diluted(2) . . . . . . . . . . . . . . . . . . . . . 105,748,686 95,340,666Dividends declared per share . . . . . . . . . . $ 0.70 $ 0.38
(1) The general and administrative expense includes non-cash share compensation expense amortization forrestricted share grants of $8,626 and $3,284 for the years ended December 31, 2012 and 2011, respectively.
(2) Income (loss) allocated to noncontrolling interest in our operating partnership has been excluded from thenumerator, and OP units of our operating partnership have been omitted from the denominator, since theeffect of including these amounts in the numerator and denominator would have no impact.
58

Item 7. Management’s Discussion and Analysis of Financial Condition and Results of Operations.
The following discussion and analysis should be read in conjunction with the accompanyingconsolidated financial statements, related notes included thereto and Item 1.A., ‘‘Risk Factors’’,appearing elsewhere in this Annual Report on Form 10-K.
Overview
We are a self-advised and self-administered Maryland real estate investment trust, which acquiresprimarily premium-branded, focused-service and compact full-service hotels. As of December 31, 2012,we owned 145 hotels in 21 states and the District of Columbia comprising 21,617 suites/rooms. We areone of the largest U.S. publicly-traded lodging REITs in terms of both number of hotels and number ofrooms. Our hotels are concentrated in urban and dense suburban markets that we believe generallyexhibit multiple demand generators and high barriers to entry.
Our strategy is to acquire primarily premium-branded, focused-service and compact full-servicehotels. Focused-service hotels typically generate most of their revenue from room rentals, have limitedfood and beverage outlets and meeting space and require fewer employees than traditional full-servicehotels. We believe premium-branded, focused-service and compact full-service hotels have the potentialto generate attractive returns relative to other types of hotels due to their ability to achieve RevPARlevels at or close to those achieved by traditional full-service hotels while achieving higher profitmargins due to their more efficient operating model and less volatile cash flows.
We recognize the challenging geopolitical environment and the possibility that the currenteconomic recovery might not be as robust as anticipated or that economic conditions could deteriorate.However, with growth in lodging supply expected to be below historical averages for the next few yearsand corporate profits rising, we currently do not anticipate any significant slowdown in lodgingfundamentals. Accordingly, we remain cautiously optimistic that we are in the midst of a multiyearlodging recovery.
Furthermore, we believe that attractive acquisition opportunities that meet our investment profileremain available in the market. We believe our cash on hand and expected access to capital (includingavailability under our unsecured revolving credit facility) along with our senior management team’sexperience, extensive industry relationships and asset management expertise, will enable us to competeeffectively for such acquisitions and enable us to generate additional internal and external growth.
Our Customers
Substantially all of our hotels consist of premium-branded focused-service and compact full-servicehotels. As a result of this property profile, the majority of our customers are transient in nature.Transient business typically represents individual business or leisure travelers. The majority of ourhotels are located in the business districts and suburban markets of major metropolitan areas.Accordingly, business travelers represent the majority of the transient demand at our hotels. As aresult, macroeconomic factors impacting business travel have a greater effect on our business thanfactors impacting leisure travel.
Group business is typically defined as a minimum of 10 guestrooms booked together as part of thesame piece of business. Group business may or may not use the meeting space at any given hotel.Given the limited meeting space at the majority of our hotels, group business represents a smallercomponent of our customer base.
A number of our hotels are affiliated with brands marketed toward extended-stay customers.Extended-stay customers are generally defined as those staying five nights or longer. Reasons forextended-stays may include, but are not limited to, training and/or special project business, relocation,litigation and insurance claims.
59

Our Revenues and Expenses
Our revenue is derived from hotel operations, including the sale of rooms, food and beveragerevenue and other operating department revenue, which consist of telephone, parking and other guestservices.
Our operating costs and expenses consist of the costs to provide hotel services, including roomexpense, food and beverage expense, management fees and other hotel expenses. Room expenseincludes housekeeping wages and payroll taxes, reservation systems, room supplies, laundry services andfront desk costs. Food and beverage expense primarily includes the cost of food, the cost of beveragesand associated labor costs. Other hotel expenses include labor and other costs associated with the otheroperating department revenue, as well as labor and other costs associated with administrativedepartments, franchise fees, sales and marketing, repairs and maintenance and utility costs. Our hotelsare managed by independent, third-party management companies under long-term agreements underwhich the management companies typically earn base and incentive management fees based on thelevels of revenues and profitability of each individual hotel. We generally receive a cash distributionfrom the hotel management companies on a monthly basis, which reflects hotel-level sales less hotel-level operating expenses.
Key Indicators of Operating Performance
We use a variety of operating and other information to evaluate the operating performance of ourbusiness. These key indicators include financial information that is prepared in accordance with GAAPas well as other financial measures that are non-GAAP measures. In addition, we use other informationthat may not be financial in nature, including industry standard statistical information and comparativedata. We use this information to measure the operating performance of our individual hotels, groups ofhotels and/or business as a whole. We also use these metrics to evaluate the hotels in our portfolio andpotential acquisitions to determine each hotel’s contribution to cash flow and its potential to provideattractive long-term total returns. These key indicators include:
• Occupancy—Occupancy represents the total number of hotel rooms sold in a given perioddivided by the total number of rooms available. Occupancy measures the utilization of ourhotels’ available capacity. We use occupancy to measure demand at a specific hotel or group ofhotels in a given period. Additionally, occupancy levels help us determine achievable ADRlevels.
• Average Daily Rate (ADR)—ADR represents total hotel room revenues divided by total numberof rooms sold in a given period. ADR measures average room price attained by a hotel andADR trends provide useful information concerning the pricing environment and the nature ofthe customer base of a hotel or group of hotels. We use ADR to assess the pricing levels thatwe are able to generate, as changes in rates have a greater impact on operating margins andprofitability than changes in occupancy.
• Revenue Per Available Room (RevPAR)—RevPAR is the product of ADR and occupancy. RevPARdoes not include non-room revenues such as food and beverage revenue or other operatingdepartment revenues. We use RevPAR to identify trend information with respect to roomrevenues from comparable properties and to evaluate hotel performance on a regional basis.
RevPAR changes that are primarily driven by changes in occupancy have different implicationsfor overall revenues and profitability than changes that are driven primarily by changes in ADR.For example, an increase in occupancy at a hotel would lead to additional variable operatingcosts (including housekeeping services, utilities and room supplies) and could also result inincreased other operating department revenue and expense. Changes in ADR typically have a
60

greater impact on operating margins and profitability as they only have a limited effect onvariable operating costs.
Occupancy, ADR and RevPAR are commonly used measures within the lodging industry toevaluate operating performance. RevPAR is an important statistic for monitoring operatingperformance at the individual hotel level and across our entire business. We evaluate individual hotelRevPAR performance on an absolute basis with comparisons to budget and prior periods, as well as ona regional and company-wide basis. ADR and RevPAR include only room revenue. Room revenuecomprised approximately 86.9% of our total revenue for the year ended December 31, 2012 and isdictated by demand (as measured by occupancy), pricing (as measured by ADR) and our availablesupply of hotel rooms.
Another commonly used measure in the lodging industry is the RevPAR penetration index, whichmeasures a hotel’s RevPAR in relation to the average RevPAR of that hotel’s competitive set. Likeother lodging companies, we use the RevPAR penetration index as an indicator of a hotel’s marketshare in relation to its competitive set. However, the RevPAR penetration index for a particular hotel isnot necessarily reflective of that hotel’s relative share of any particular lodging market. The RevPARpenetration index for a particular hotel is calculated as the quotient of (1) the subject hotel’s RevPARdivided by (2) the average RevPAR of the hotels in the subject hotel’s competitive set, multiplied by100. For example, if a hotel’s RevPAR is $90 and the average RevPAR of the hotels in its competitiveset is $90, the RevPAR penetration index would be 100, which would indicate that the subject hotel iscapturing its fair market share in relation to its competitive set (i.e., the hotel’s RevPAR is, on average,the same as its competitors). If, however, a hotel’s RevPAR is $110 and the average RevPAR of thehotels in its competitive set is $90, the RevPAR penetration index of the subject hotel would be 122.2,which would indicate that the subject hotel maintains a RevPAR premium of approximately 22.2%(and, therefore, a market share premium) in relation to its competitive set.
One critical component in this calculation is the determination of a hotel’s competitive set, whichconsists of a small group of hotels in the relevant market that we and the third-party hotelmanagement company that manages the hotel believe are comparable for purposes of benchmarkingthe performance of such hotel. A hotel’s competitive set is mutually agreed upon by us and the hotel’smanagement company. Factors that we consider when establishing a competitive set include geographicproximity, brand affiliations and rate structure, as well as the level of service provided at the hotel.Competitive set determinations are highly subjective, however, and our methodology for determining ahotel’s competitive set may differ materially from those used by other hotel owners and/or managementcompanies.
For the year ended December 31, 2012, the portfolio wide RevPAR penetration index of our hotelswas 111.2 which indicates that, on average, our hotels maintained a market share premium ofapproximately 11.2% in relation to their competitive set.
We also use FFO, Adjusted FFO, EBITDA and Adjusted EBITDA as non-GAAP measures of theoperating performance of our business. See ‘‘—Non-GAAP Financial Measures.’’
Principal Factors Affecting Our Results of Operations
The principal factors affecting our operating results include overall demand for hotel roomscompared to the supply of available hotel rooms, and the ability of our third-party managementcompanies to increase or maintain revenues while controlling expenses.
• Demand—The demand for lodging, especially business travel, generally fluctuates with the overalleconomy. Historically, periods of declining demand are followed by extended periods ofrelatively strong demand, which typically occurs during the growth phase of the lodging cycle.
61

• Supply—The development of new hotels is driven largely by construction costs, the availability offinancing and expected performance of existing hotels.
We expect that our ADR, occupancy and RevPAR performance will be impacted bymacroeconomic factors such as regional and local employment growth, personal income and corporateearnings, office vacancy rates and business relocation decisions, airport activity, business and leisuretravel demand, new hotel construction and the pricing strategies of competitors. In addition, our ADR,occupancy and RevPAR performance are dependent on the continued success of the Marriott, Hiltonand Hyatt brands.
• Revenue—Substantially all of our revenue is derived from the operation of hotels. Specifically,our revenue is comprised of:
• Room revenue—Occupancy and ADR are the major drivers of room revenue. Room revenueaccounts for the substantial majority of our total revenue.
• Food and beverage revenue—Occupancy and the type of customer staying at the hotel are themajor drivers of food and beverage revenue (i.e., group business typically generates morefood and beverage business through catering functions when compared to transient business,which may or may not utilize the hotel’s food and beverage outlets).
• Other operating department revenue—Occupancy and the nature of the property are the maindrivers of other ancillary revenue, such as telephone, parking and other guest services. Somehotels, due to the limited focus of the services offered and size or space limitations, may nothave facilities that generate other operating department revenue.
• Hotel Operating Expenses—The following presents the components of our hotel operatingexpenses:
• Room expense—These costs include housekeeping wages and payroll taxes, reservationsystems, room supplies, laundry services and front desk costs. Like room revenue, occupancyis the major driver of room expense and, therefore, room expense has a significantcorrelation to room revenue. These costs can increase based on increases in salaries andwages, as well as the level of service and amenities that are provided.
• Food and beverage expense—These expenses primarily include food, beverage and laborcosts. Occupancy and the type of customer staying at the hotel (i.e., catered functionsgenerally are more profitable than restaurant, bar or other on-property food and beverageoutlets) are the major drivers of food and beverage expense, which correlates closely withfood and beverage revenue.
• Management fees—Base management fees are computed as a percentage of gross revenue.Incentive management fees generally are paid when operating profits exceed certainthreshold levels. See ‘‘Our Properties—Our Hotel Management Agreements.’’
• Other hotel expenses—These expenses include labor and other costs associated with the otheroperating department revenue, as well as labor and other costs associated withadministrative departments, franchise fees, sales and marketing, repairs and maintenanceand utility costs.
Most categories of variable operating expenses, including labor costs such as housekeeping,fluctuate with changes in occupancy. Increases in occupancy are accompanied by increases in mostcategories of variable operating expenses, while increases in ADR typically only result in increases inlimited categories of operating costs and expenses, such as franchise fees, management fees and creditcard processing fee expenses which are based on hotel revenues. Thus, changes in ADR have a moresignificant impact on operating margins than changes in occupancy.
62

Results of Operations
At December 31, 2012, 2011 and 2010, we owned 145, 141 and 131 hotels, respectively (excludingone hotel and seven hotels carried as discontinued operations for the years ended December 31, 2011and 2010, respectively). All hotels owned during these periods, excluding discontinued operations, havebeen included in our results of operations during those respective periods or since their date ofacquisition. Operating results for certain hotels are not comparable for the years ended December 31,2012, 2011 and 2010. The hotels listed in the table below are hereafter referred to as non-comparablehotels.
Noncomparable hotel for theyears ended years ended
December 31, December 31,Hotel Location Acquisition Date 2012 and 2011 2011 and 2010
Fairfield Inn & SuitesWashington DC/Downtown(1) . . . . . . . . . Washington DC June 1, 2010 x x
Hotel Indigo New OrleansGarden District(2) . . . . . . New Orleans, LA October 26, 2010 x x
Embassy Suites Columbus . . Columbus, OH January 11, 2011 xRenaissance Pittsburgh
Hotel . . . . . . . . . . . . . . . Pittsburgh, PA January 12, 2011 xCourtyard Atlanta Buckhead . Atlanta, GA January 18, 2011 xDoubletree Hotel Columbia . Columbia, MD January 18, 2011 xDenver Airport Marriott at
Gateway Park . . . . . . . . . Denver, CO January 18, 2011 xEmbassy Suites West Palm
Beach-Central . . . . . . . . . West Palm Beach, FL January 18, 2011 xHilton Garden Inn Raleigh
Durham-Research TrianglePark . . . . . . . . . . . . . . . . Durham, NC January 24, 2011 x
Hilton Garden InnPittsburgh UniversityPlace . . . . . . . . . . . . . . . . Pittsburgh, PA January 24, 2011 x
Hampton Inn Houston-Nearthe Galleria . . . . . . . . . . . Houston, TX March 14, 2011 x x
Courtyard CharlestonHistoric District . . . . . . . . Charleston, SC October 27, 2011 x x
Residence Inn BethesdaHotel Downtown . . . . . . . Bethesda, MD May 29, 2012 x n/a
Courtyard New York/Manhattan Upper EastSide . . . . . . . . . . . . . . . . New York, NY May 30, 2012 x n/a
Hilton Garden Inn SanFrancisco/Oakland BayBridge . . . . . . . . . . . . . . . Emeryville, CA June 11, 2012 x n/a
Embassy Suites Boston/Waltham . . . . . . . . . . . . . Waltham, MA November 13, 2012 x n/a
(1) Property was closed for renovation from December 18, 2010 until March 29, 2011.
(2) Property was closed for renovation until December 27, 2012.
63

Comparison of the Year Ended December 31, 2012 to the Year Ended December 31, 2011
Income from continuing operations for the year ended December 31, 2012 was $41.3 millioncompared to a loss from continuing operations of $10.1 million for the year ended December 31, 2011,representing an increase of $51.4 million. This improved performance was primarily due to a$95.3 million, or 12.6%, increase in total revenue (including $42.0 million arising from non-comparablehotels), partially offset by the net impact of a $51.3 million, or 11.1%, increase in hotel operatingexpenses, an increase of $2.1 million or 1.0% in other operating expenses, a decrease in other incomeof $0.6 million and a decrease in interest expense of $11.0 million, or 11.5%.
For the year endedDecember 31,
2012 2011 $ change % change
(amounts in thousands)
RevenueHotel operating revenue
Room revenue . . . . . . . . . . . . . . . . . . . . . . . . . . . . . $742,618 $656,997 $ 85,621 13.0%Food and beverage revenue . . . . . . . . . . . . . . . . . . . . 87,610 81,781 5,829 7.1%Other operating department revenue . . . . . . . . . . . . . 23,977 20,174 3,803 18.9%
Total revenue . . . . . . . . . . . . . . . . . . . . . . . . . . . . . . . . 854,205 758,952 95,253 12.6%
ExpenseHotel operating expense
Room . . . . . . . . . . . . . . . . . . . . . . . . . . . . . . . . . . . . 163,374 147,039 16,335 11.1%Food and beverage . . . . . . . . . . . . . . . . . . . . . . . . . . 60,508 56,606 3,902 6.9%Management fees . . . . . . . . . . . . . . . . . . . . . . . . . . . 30,075 26,056 4,019 15.4%Other hotel expenses . . . . . . . . . . . . . . . . . . . . . . . . . 258,644 231,602 27,042 11.7%
Total hotel operating expense . . . . . . . . . . . . . . . . . 512,601 461,303 51,298 11.1%Depreciation and amortization . . . . . . . . . . . . . . . . . . . 126,798 128,112 (1,314) (1.0)%Impairment loss . . . . . . . . . . . . . . . . . . . . . . . . . . . . . . 896 — 896 —Property tax, insurance and other . . . . . . . . . . . . . . . . . 53,091 46,605 6,486 13.9%General and administrative . . . . . . . . . . . . . . . . . . . . . . 31,099 24,253 6,846 28.2%Transaction and pursuit costs . . . . . . . . . . . . . . . . . . . . 3,520 3,996 (476) (11.9)%IPO Costs . . . . . . . . . . . . . . . . . . . . . . . . . . . . . . . . . . — 10,733 (10,733) (100.0)%
Total operating expense . . . . . . . . . . . . . . . . . . . . . 728,005 675,002 53,003 7.9%
Operating income . . . . . . . . . . . . . . . . . . . . . . . . . . . . . 126,200 83,950 42,250 50.3%Other income . . . . . . . . . . . . . . . . . . . . . . . . . . . . . . 433 1,001 (568) (56.7)%Interest income . . . . . . . . . . . . . . . . . . . . . . . . . . . . . 1,686 1,682 4 0.2%Interest expense . . . . . . . . . . . . . . . . . . . . . . . . . . . . (84,997) (96,020) 11,023 (11.5)%Loss on disposal . . . . . . . . . . . . . . . . . . . . . . . . . . . . (634) — (634) —
Income (loss) from continuing operations before incometaxes . . . . . . . . . . . . . . . . . . . . . . . . . . . . . . . . . . . . . . 42,688 (9,387) 52,075 554.8%
Income tax expense . . . . . . . . . . . . . . . . . . . . . . . . . . (1,369) (740) (629) 85.0%
Income (loss) from continuing operations . . . . . . . . . . . . . 41,319 (10,127) 51,446 (508.0)%Income from discontinued operations . . . . . . . . . . . . . — 21,836 (21,836) (100.0)%
Net income . . . . . . . . . . . . . . . . . . . . . . . . . . . . . . . . . . . 41,319 11,709 29,610 252.9%Net (income) loss attributable to non-controlling interests
Noncontrolling interest in joint venture . . . . . . . . . . . . . 404 (47) 451 (959.6)%Noncontrolling interest in common units of Operating
Partnership . . . . . . . . . . . . . . . . . . . . . . . . . . . . . . . . (425) (255) (170) (66.7)%
Net income attributable to the Company . . . . . . . . . . . . . . 41,298 11,407 29,891 262.0%Distributions to preferred unitholders . . . . . . . . . . . . . . . . — (61) 61 (100.0)%Net income attributable to common shareholders . . . . . . . $ 41,298 $ 11,346 $ 29,952 264.0%
64

Revenue
Total revenue increased $95.3 million, or 12.6%, to $854.2 million for the year endedDecember 31, 2012 from $759.0 million for the year ended December 31, 2011. The increase was aresult of $42.0 million in revenue attributable to non-comparable hotels and the effects of improvingeconomic conditions as demonstrated by a 6.8% increase in RevPAR for properties held for theentirety of both periods.
The following are the key hotel operating statistics for hotels owned at December 31, 2012 and2011, respectively, for our ownership period:
For the year endedDecember 31,
2012 2011 % Change
Number of hotels (at end of period) . . . . . . . . . . . 145 141 2.8%Occupancy % . . . . . . . . . . . . . . . . . . . . . . . . . . . . 72.6% 71.5% 1.6%ADR . . . . . . . . . . . . . . . . . . . . . . . . . . . . . . . . . . $133.35 $124.50 7.1%RevPAR . . . . . . . . . . . . . . . . . . . . . . . . . . . . . . . . $ 96.82 $ 88.99 8.8%
Portfolio RevPAR increased to $96.82 from $88.99, representing an 8.8% increase. For thecomparable hotels, RevPAR increased 6.8% and was driven by a 1.1% increase in occupancy and a5.7% increase in ADR. The addition of new hotels to the portfolio drove occupancy up by 0.3% andincreased ADR by $2.24 for a total RevPAR impact of $2.05.
Room Revenue—Our portfolio consists primarily of premium-branded focused-service and compactfull-service hotels that generate the majority of their revenues through room sales. Room revenueincreased $85.6 million, or 13.0%, to $742.6 million for the year ended December 31, 2012 from$657.0 million for the year ended December 31, 2011. The increase was primarily due to $37.3 millionof room revenue from non-comparable hotels and a 6.8% RevPAR growth at comparable hotels.
Food and Beverage Revenue—Food and beverage revenue increased $5.8 million, or 7.1%, to$87.6 million for the year ended December 31, 2012 from $81.8 million for the year endedDecember 31, 2011. The increase includes $3.0 million in food and beverage revenue arising fromnon-comparable hotels.
Other Operating Department Revenue—Other operating department revenue, which includes revenuederived from ancillary sources such as telephone charges and parking fees, increased $3.8 million, or18.9%, to $24.0 million for the year ended December 31, 2012 from $20.2 million for the year endedDecember 31, 2011. The increase is the result of $1.7 million in other operating revenue fromnon-comparable hotels, an increase of $1.5 million of parking revenue across the portfolio and anincrease of $0.6 million of other operating revenue.
Hotel Operating Expense
Hotel operating expense increased $51.3 million, or 11.1%, to $512.6 million for the year endedDecember 31, 2012 from $461.3 million for the year ended December 31, 2011. The increase includes$22.5 million in hotel operating expense attributed to non-comparable hotels. The remaining increasewas primarily attributable to higher room expense, other operating department costs, and managementand franchise fees. Room expense and other operating department costs were driven by higheroccupancy at hotels not under renovation. Management fees and franchise fees, which are computed asa percentage of gross revenue and room revenue, respectively, increased as a result of higher revenues.
65
Depreciation and Amortization
Depreciation and amortization expense decreased $1.3 million, or 1.0%, to $126.8 million for theyear ended December 31, 2012 from $128.1 million for the year ended December 31, 2011. Thedecrease is partially attributable to a net decrease of $2.9 million of accelerated depreciation. For theyears ended 2012 and 2011, we recorded accelerated depreciation on furniture, fixtures and equipmentof $4.7 million and $7.6 million, respectively, in conjunction with brand conversions under our 2011capital improvement plan. Additionally, the decrease reflects approximately $69.3 million of furniture,fixtures and equipment that were fully depreciated during 2012. This decrease was offset by a$3.7 million increase in depreciation and amortization expense attributable to non-comparable hotelsand a $9.1 million increase in depreciation on building and furniture, fixtures and equipment forproperty improvement capital expenditures made during 2012.
Impairment Loss
Impairment loss increased $0.9 million to $0.9 million for the year ended December 31, 2012 fromzero for the year ended December 31, 2011, related to an impairment charge on the Fairfield InnMemphis.
Property Tax, Insurance and Other
Property tax, insurance and other expense increased $6.5 million, or 13.9%, to $53.1 million for theyear ended December 31, 2012 from $46.6 million for the year ended December 31, 2011. The increaseincludes $3.2 million in property tax, insurance and other expense attributable to non-comparablehotels. The remaining increase of $3.3 million is the net impact of increasing property tax assessmentsoffset by favorable resolution of property tax appeals.
General and Administrative
General and administrative expense increased $6.8 million, or 28.2%, to $31.1 million for the yearended December 31, 2012 from $24.3 million for the year ended December 31, 2011. The increase ingeneral and administrative expense is attributable to an increase in amortization of restricted shareawards of $5.3 million, an increase in filing fees and other expenses of being a publicly traded companyof $0.4 million and an increase in professional fees of $1.2 million.
Transaction and Pursuit Costs
Transaction and pursuit costs decreased $0.5 million, or 11.9%, to $3.5 million for the year endedDecember 31, 2012 from $4.0 million for the year ended December 31, 2011. There were fouracquisitions in 2012, which resulted in transaction costs of $3.4 million in 2012. The ten acquisitions in2011 resulted in transaction costs of $3.8 million incurred in 2011. Additionally, there was a netincrease of $0.1 million of costs associated with unsuccessful acquisition efforts during the periods.Costs associated with unsuccessful acquisitions totaled $0.3 million in 2012 compared to $0.2 millionin 2011.
IPO Costs
Non-recurring IPO and related formation transaction costs totaled $10.7 million for the year endedDecember 31, 2011. Such costs primarily arose as a result of the transfer and assumption ofindebtedness and other contractual obligations of our predecessor in connection with the IPO and ourformation transactions. There were no such costs for the year ended December 31, 2012.
66

Interest Expense
Interest expense decreased $11.0 million, or 11.5%, to $85.0 million for the year endedDecember 31, 2012 from $96.0 million for the year ended December 31, 2011. The decrease wasprimarily due to a decrease in interest expense on mortgage loans of $4.8 million, a decrease in interestexpense on credit facilities and term loans of $2.8 million and the expiration of unfavorable interestrate hedges resulting in a decrease in hedge driven interest expense of $3.6 million. Additionally, in2012, $1.5 million was incurred for the prepayment of mortgage indebtedness, compared to $2.9 millionin 2011. Partially offsetting this decrease was $1.8 million that was reclassified from accumulated othercomprehensive loss to interest expense related to hedges that were ineffective in offsetting variablecash flows.
Income Tax Expense
Income tax expense increased $0.7 million, or 85.0%, to $1.4 million for the year endedDecember 31, 2012 from $0.7 million for the year ended December 31, 2011. Tax expense incurred for2012 was higher than 2011 due to the recording of a one-time benefit during 2011 related to thedisposal of an acquired tax attribute of $0.6 million. As part of our structure, we own TRSs that aresubject to federal and state income taxes. The TRSs’ 2012 and 2011 effective tax rate was 6.2% and1.7%, respectively.
Income from Discontinued Operations
Income from discontinued operations decreased $21.8 million to zero for the year endedDecember 31, 2012 from $21.8 million for the year ended December 31, 2011. Net income fromdiscontinued operations for 2011 consisted of $21.8 million in net income, including a $23.5 milliongain on extinguishment of indebtedness, from the New York LaGuardia Airport Marriott.
67

Comparison of the Year Ended December 31, 2011 to the Year Ended December 31, 2010
Net loss from continuing operations for the year ended December 31, 2011 was $10.1 millioncompared to a net loss from continuing operations of $42.2 million for the year ended December 31,2010, representing a decrease of $32.1 million. This improved performance was primarily due to a$242.3 million, or 46.9%, increase in total revenue (including $210.3 million arising fromnon-comparable hotels), partially offset by the net impact of a $149.5 million, or 47.9%, increase inhotel operating expenses, an increase of $50.4 million or 30.1% in other operating expenses, anincrease in other income of $0.4 million and an increase in interest expense of $9.3 million, or 10.7%.
For the year endedDecember 31,
2011 2010 $ change % change
RevenueHotel operating revenue
Room revenue . . . . . . . . . . . . . . . . . . . . . . . . . . . . . $656,997 $445,630 $211,367 47.4%Food and beverage revenue . . . . . . . . . . . . . . . . . . . . 81,781 57,710 24,071 41.7%Other operating department revenue . . . . . . . . . . . . . 20,174 13,326 6,848 51.4%
Total revenue . . . . . . . . . . . . . . . . . . . . . . . . . . . . . . . . 758,952 516,666 242,286 46.9%
ExpenseHotel operating expense
Room . . . . . . . . . . . . . . . . . . . . . . . . . . . . . . . . . . . 147,039 96,389 50,650 52.5%Food and beverage . . . . . . . . . . . . . . . . . . . . . . . . . . 56,606 37,798 18,808 49.8%Management fees . . . . . . . . . . . . . . . . . . . . . . . . . . . 26,056 18,373 7,683 41.8%Other hotel expenses . . . . . . . . . . . . . . . . . . . . . . . . 231,602 159,267 72,335 45.4%
Total hotel operating expense . . . . . . . . . . . . . . . . . 461,303 311,827 149,476 47.9%Depreciation and amortization . . . . . . . . . . . . . . . . . . . 128,112 96,940 31,172 32.2%Property tax, insurance and other . . . . . . . . . . . . . . . . . 46,605 32,500 14,105 43.4%General and administrative . . . . . . . . . . . . . . . . . . . . . . 24,253 19,542 4,711 24.1%Transaction and pursuit costs . . . . . . . . . . . . . . . . . . . . 3,996 14,345 (10,349) (72.1)%IPO Costs . . . . . . . . . . . . . . . . . . . . . . . . . . . . . . . . . . 10,733 — 10,733 —
Total operating expense . . . . . . . . . . . . . . . . . . . . . 675,002 475,154 199,848 42.1%
Operating income . . . . . . . . . . . . . . . . . . . . . . . . . . . . 83,950 41,512 42,438 102.2%Other income . . . . . . . . . . . . . . . . . . . . . . . . . . . . . . 1,001 629 372 59.1%Interest income . . . . . . . . . . . . . . . . . . . . . . . . . . . . 1,682 3,352 (1,670) (49.8)%Interest expense . . . . . . . . . . . . . . . . . . . . . . . . . . . . (96,020) (86,735) (9,285) 10.7%
Loss from continuing operations before income taxes . . . . (9,387) (41,242) 31,855 (77.2)%Income tax expense . . . . . . . . . . . . . . . . . . . . . . . . . (740) (945) 205 (21.7)%
Loss from continuing operations . . . . . . . . . . . . . . . . . . . (10,127) (42,187) 32,060 (76.0)%Income from discontinued operations . . . . . . . . . . . . 21,836 19,571 2,265 11.6%
Net income (loss) . . . . . . . . . . . . . . . . . . . . . . . . . . . . . . 11,709 (22,616) 34,325 (151.8)%Net loss (income) attributable to non-controlling interests
Noncontrolling interest in joint venture . . . . . . . . . . . . . (47) 213 (260) (122.1)%Noncontrolling interest in common units of Operating
Partnership . . . . . . . . . . . . . . . . . . . . . . . . . . . . . . . . (255) — (255) —
Net income (loss) attributable to the Company . . . . . . . . . 11,407 (22,403) 33,810 (150.9)%Distributions to preferred unitholders . . . . . . . . . . . . . . . . (61) (62) 1 (1.6)%
Net income (loss) attributable to common shareholders . . $ 11,346 $(22,465) $ 33,811 (150.5)%
68

Revenue
Total revenue increased $242.3 million, or 46.9%, to $759.0 million for the year endedDecember 31, 2011 from $516.7 million for the year ended December 31, 2010. The increase was aresult of $210.3 million in revenue attributable to ten hotels acquired in 2011 and fifteen hotelsacquired in 2010 and the effects of improving economic conditions as demonstrated by a 7.4% increasein RevPAR for comparable hotels.
The following are the key hotel operating statistics for hotels owned at December 31, 2011 and2010, respectively, for our ownership period:
For the Year EndedDecember 31,
2011 2010 % Change
Number of hotels (at end of period) . . . . . . . . . . . 141 131 7.6%Occupancy % . . . . . . . . . . . . . . . . . . . . . . . . . . . . 71.5% 68.0% 5.2%ADR . . . . . . . . . . . . . . . . . . . . . . . . . . . . . . . . . . $124.50 $110.98 12.2%RevPAR . . . . . . . . . . . . . . . . . . . . . . . . . . . . . . . . $ 88.99 $ 75.43 18.0%
Portfolio RevPAR increased to $88.99 from $75.43, representing an 18.0% increase. For thecomparable hotels, RevPAR increased 7.4% and was driven by a 3.4% increase in occupancy and a3.9% increase in ADR. The addition of new hotels to the portfolio drove occupancy up by 1.1% andincreased ADR by $11.27 for a total RevPAR impact of $9.35.
Room Revenue—Our portfolio consists primarily of premium-branded focused-service and compactfull-service hotels that generate the majority of their revenues through room sales. Room revenueincreased $211.4 million, or 47.4%, to $657.0 million for the year ended December 31, 2011 from$445.6 million for the year ended December 31, 2010. The increase was primarily due to $130.6 millionof room revenue from non-comparable hotels. The remaining increase was the result of a 7.4%RevPAR growth at comparable hotels.
Food and Beverage Revenue—Food and beverage revenue increased $24.1 million, or 41.7%, to$81.8 million for the year ended December 31, 2011 from $57.7 million for the year endedDecember 31, 2010. The increase includes $21.9 million in food and beverage revenue arising fromnon-comparable hotels.
Other Operating Department Revenue—Other operating department revenue, which includes revenuederived from ancillary sources, increased $6.8 million, or 51.4%, to $20.2 million for the year endedDecember 31, 2011 from $13.3 million for the year ended December 31, 2010. The increase is theresult of $7.0 million in other operating revenue from non-comparable hotels.
Hotel Operating Expense
Hotel operating expense increased $149.5 million, or 47.9%, to $461.3 million for the year endedDecember 31, 2011 from $311.8 million for the year ended December 31, 2010. The increase includes$131.5 million in hotel operating expense attributed to non-comparable hotels. The remaining increasewas primarily attributable to variable costs associated with increases in business activity, as reflected byour increase in occupancy of 3.4%.
Depreciation and Amortization
Depreciation and amortization expense increased $31.2 million, or 32.2%, to $128.1 million for theyear ended December 31, 2011 from $96.9 million for the year ended December 31, 2010. The increasereflects a $26.3 million increase in depreciation and amortization expense attributable tonon-comparable hotels, a $10.1 million increase in depreciation on building and furniture, fixtures and
69
equipment for property improvement capital expenditures made during 2011, and an increase of$7.6 million related to the accelerated depreciation of furniture, fixtures and equipment at certainhotels that underwent renovations during the year. The increase was partially offset primarily due toapproximately $124.7 million of furniture, fixtures and equipment that were fully depreciatedduring 2011.
Property Tax, Insurance and Other
Property tax, insurance and other expense increased $14.1 million, or 43.4%, to $46.6 million forthe year ended December 31, 2011 from $32.5 million for the year ended December 31, 2010. Theincrease includes $12.6 million in property tax, insurance and other expense attributable tonon-comparable hotels. The remaining increase of $1.5 million is the net impact of increasing propertytax assessments offset by favorable resolution of property tax appeals.
General and Administrative
General and administrative expense increased $4.7 million, or 24.1%, to $24.3 million for the yearended December 31, 2011 from $19.5 million for the year ended December 31, 2010. The majority ofthe increase in general and administrative expense is the result of our IPO and is attributable toamortization of restricted share awards of $3.3 million related to restricted shares issued in 2011, anincrease in salaries and associated payroll taxes of $0.9 million, filing fees and other expenses of beinga publicly traded company of $0.5 million and an increase in professional fees of $0.4 million. Thisincrease was partially offset by a decrease in legal fees of $0.6 million related to the settlement andreinstatement of our investment in loans in 2010.
Transaction and Pursuit Costs
Transaction and pursuit costs decreased $10.3 million, or 72.1%, to $4.0 million for the year endedDecember 31, 2011 from $14.3 million for the year ended December 31, 2010. There were24 acquisitions in 2010 and the first quarter of 2011, which resulted in transaction costs of $13.2 millionin 2010. The ten acquisitions in 2011 resulted in transaction costs of $3.8 million incurred in 2011.Additionally, there was a net decrease of $1.0 million of costs associated with unsuccessful acquisitionefforts during the periods. Costs associated with unsuccessful acquisitions totaled $0.2 million in 2011compared to $1.2 million in 2010.
IPO Costs
Non-recurring IPO and related formation transaction costs totaled $10.7 million for the year endedDecember 31, 2011. Such costs primarily arose as a result of the transfer and assumption ofindebtedness and other contractual obligations of our Predecessor in connection with the IPO and ourformation transactions. There were no such costs for the year ended December 31, 2010.
Interest Income
Interest income decreased $1.7 million, or 49.8%, to $1.7 million for the year ended December 31,2011 from $3.4 million for the year ended December 31, 2010. This decrease was primarily due to a$1.4 million decline in interest income recognized for the year ended December 31, 2011 arising frominterest on our investment in loans in 2010, including $0.8 million of default interest.
Interest Expense
Interest expense increased $9.3 million, or 10.7%, to $96.0 million for the year endedDecember 31, 2011 from $86.7 million for the year ended December 31, 2010. Interest expenseincreased as a result of $14.9 million in additional interest expense arising from the net impact of debt
70

incurred related to hotel acquisitions during the periods. In addition, interest expense increased yearover year as a result of an increase in amortization of deferred financing fees of $1.7 million, intereston the term loan of $4.5 million, unused fee incurred on our prior credit facility of $0.5 million and$3.3 million of expenses related to the payoff of variable rate indebtedness. The partially offsettingdecrease was primarily due to the expiration of unfavorable interest rate hedges resulting in a decreasein hedge driven interest expense of $7.9 million and a decrease in interest expense of $7.7 million dueto the payoff of variable rate indebtedness.
Income Tax Expense
Income tax expense decreased $0.2 million, or 21.7%, to $0.7 million for the year endedDecember 31, 2011 from $0.9 million for the year ended December 31, 2010. Tax expense incurred for2011 was less than 2010 due to the reversal of acquired deferred tax liabilities for which the relevantassets were disposed of in the fourth quarter. As part of our structure, we own TRSs that are subject tofederal and state income taxes. The TRSs’ 2011 and 2010 effective tax rate was 1.7% and 3.5%,respectively.
Income from Discontinued Operations
Net income from discontinued operations increased $2.3 million to $21.8 million for the yearended December 31, 2011 from $19.6 million for the year ended December 31, 2010. Net income fromdiscontinued operations for 2011 consists of $21.8 million in net income, including a $23.5 million gainon extinguishment of indebtedness, from the New York LaGuardia Airport Marriott. Included in netincome from discontinued operations for 2010 is net income of $19.6 million, including $23.7 milliongain on sale of the six hotels sold in 2010 which was offset by a net loss of $1.6 million from the sixhotels sold in 2010 and a net loss of $2.5 million from the New York LaGuardia Airport Marriott.
Non-GAAP Financial Measures
We consider the following non-GAAP financial measures useful to investors as key supplementalmeasures of our performance: (1) FFO, (2) Adjusted FFO, (3) EBITDA, and (4) Adjusted EBITDA.These non-GAAP financial measures should be considered along with, but not as alternatives to, netincome or loss as a measure of our operating performance. FFO, Adjusted FFO, EBITDA andAdjusted EBITDA, as calculated by us, may not be comparable to FFO, Adjusted FFO, EBITDA andAdjusted EBITDA as reported by other companies that do not define such terms exactly as we definesuch terms.
Funds From Operations
We calculate FFO in accordance with standards established by the National Association of RealEstate Investment Trusts, or NAREIT, which defines FFO as net income or loss (calculated inaccordance with GAAP), excluding gains or losses from sales of real estate, items classified by GAAPas extraordinary, the cumulative effect of changes in accounting principles, plus depreciation andamortization, and adjustments for unconsolidated partnerships and joint ventures. Historical costaccounting for real estate assets implicitly assumes that the value of real estate assets diminishespredictably over time. Since real estate values instead have historically risen or fallen with marketconditions, most real estate industry investors consider FFO to be helpful in evaluating a real estatecompany’s operations. We believe that the presentation of FFO provides useful information to investorsregarding our operating performance by excluding the effect of depreciation and amortization, gains orlosses from sales for real estate, extraordinary items and the portion of items related to unconsolidatedentities, all of which are based on historical cost accounting, and that FFO can facilitate comparisons ofoperating performance between periods and between REITs, even though FFO does not represent anamount that accrues directly to common shareholders. Our calculation of FFO may not be comparable
71

to measures calculated by other companies who do not use the NAREIT definition of FFO or do notcalculate FFO per diluted share in accordance with NAREIT guidance. Additionally, FFO may not behelpful when comparing us to non-REITs. We present FFO attributable to common shareholders, whichincludes our OP units, because our OP units are redeemable for common shares. We believe it ismeaningful for the investor to understand FFO attributable to all common shares and OP units.
We further adjust FFO for certain additional items that are not in NAREIT’s definition of FFO,such as hotel transaction and pursuit costs, the amortization of share-based compensation, legalexpenses that we consider outside the normal course of business, loan default penalties and fees andcertain other expenses that were the result of the IPO and related formation transactions. We believethat Adjusted FFO provides investors with another financial measure that may facilitate comparisons ofoperating performance between periods and between REITs.
The following is a reconciliation of our GAAP net income (loss) to FFO and Adjusted FFO forthe years ended December 31, 2012, 2011 and 2010 (in thousands):
For the year ended December 31,
2012 2011 2010
Net income (loss)(1) . . . . . . . . . . . . . . . . . . . . . . . $ 41,319 $ 11,709 $(22,616)Depreciation and amortization . . . . . . . . . . . . . . . . 126,798 128,112 96,940Depreciation and amortization, discontinued
operations . . . . . . . . . . . . . . . . . . . . . . . . . . . . . — 2,602 3,853Distributions to preferred unitholders . . . . . . . . . . . — (61) (62)Gain on sale of properties . . . . . . . . . . . . . . . . . . . — — (23,710)Loss on disposal . . . . . . . . . . . . . . . . . . . . . . . . . . 634 — —Gain on extinguishment of indebtedness(2) . . . . . . . — (23,515) —Impairment loss . . . . . . . . . . . . . . . . . . . . . . . . . . 896 — —Noncontrolling interest in joint venture . . . . . . . . . 404 (47) 213Adjustments related to joint venture(3) . . . . . . . . . (451) (308) (30)
FFO attributable to common shareholders . . . . . 169,600 118,492 54,588Transaction and pursuit costs . . . . . . . . . . . . . . . . . 3,520 3,996 14,345IPO Costs(4) . . . . . . . . . . . . . . . . . . . . . . . . . . . . — 10,733 —Amortization of share based compensation . . . . . . . 8,626 3,284 —Loan related costs(5)(6)(7) . . . . . . . . . . . . . . . . . . 3,451 4,303 —Other expenses(8)(9) . . . . . . . . . . . . . . . . . . . . . . . 436 1,362 3,126
Adjusted FFO . . . . . . . . . . . . . . . . . . . . . . . . . . $185,633 $142,170 $ 72,059
(1) Includes net income from discontinued operations.
(2) Includes the gain on the transfer of title to the New York LaGuardia Marriott hotel tothe lenders pursuant to a deed in lieu of foreclosure. The gain is included inDiscontinued Operations.
(3) Includes depreciation and amortization expense allocated to the noncontrolling interest injoint venture.
(4) Includes expenses related to the transfer and assumption of indebtedness and othercontractual obligations of our predecessor in connection with the IPO and our formationtransactions.
(5) Includes $0.7 million for the year ended December 31, 2012 of default interest andpenalties incurred in connection with Springhill Suites Southfield, Michigan mortgageloan.
72

(6) Includes $1.4 million for the year ended December 31, 2012 of accelerated amortizationof deferred financing fees related to the amendment and restatement of the credit facility.
(7) Includes $1.4 million and $4.3 million for the years ended December 31, 2012 and 2011,respectively, of incremental interest expense related to the accelerated payoff of mortgageindebtedness.
(8) Includes $0.4 million for the year ended December 31, 2012 of legal expenses outside thenormal course of operations.
(9) Includes $1.4 million for the year ended December 31, 2011 of certain compensationobligations of our predecessor not continued.
Earnings Before Interest, Taxes, Depreciation and Amortization
EBITDA is defined as net income or loss excluding: (1) interest expense; (2) provision for incometaxes, including income taxes applicable to sale of assets; and (3) depreciation and amortization. Weconsider EBITDA useful to an investor in evaluating and facilitating comparisons of our operatingperformance between periods and between REITs by removing the impact of our capital structure(primarily interest expense) and asset base (primarily depreciation and amortization) from ouroperating results. In addition, EBITDA is used as one measure in determining the value of hotelacquisitions and dispositions. We present EBITDA attributable to common shareholders, which includesour OP units, because our OP units are redeemable for common shares. We believe it is meaningful forthe investor to understand EBITDA attributable to all common shares and OP units.
We further adjust EBITDA for certain additional items such as discontinued operations, hoteltransaction and pursuit costs, the amortization of share-based compensation, disposal of assets, legalexpenses that we consider outside the normal course of business and certain other expenses that werethe result of the IPO and related formation transactions. We believe that Adjusted EBITDA providesinvestors with another financial measure that can facilitate comparisons of operating performancebetween periods and between REITs.
73

The following is a reconciliation of our GAAP net income (loss) to EBITDA and AdjustedEBITDA for the years ended December 31, 2012, 2011 and 2010 (in thousands):
For the year ended December 31,
2012 2011 2010
Net income (loss)(1) . . . . . . . . . . . . . . . . . . . . . . . $ 41,319 $ 11,709 $(22,616)Depreciation and amortization . . . . . . . . . . . . . . . 126,798 128,112 96,940Depreciation and amortization, discontinued
operations . . . . . . . . . . . . . . . . . . . . . . . . . . . . — 2,602 3,853Distributions to preferred unitholders . . . . . . . . . . — (61) (62)Interest expense, net(2) . . . . . . . . . . . . . . . . . . . . . 84,939 95,966 84,970Interest expense, net, discontinued operations . . . . — 488 5,646Income tax expense . . . . . . . . . . . . . . . . . . . . . . . 1,369 740 945Income tax expense, discontinued operations . . . . . — — 270Noncontrolling interest in joint venture . . . . . . . . . 404 (47) 213Adjustments related to joint venture(3) . . . . . . . . . (1,199) (1,007) (45)
EBITDA . . . . . . . . . . . . . . . . . . . . . . . . . . . . . . 253,630 238,502 170,114Transaction and pursuit costs . . . . . . . . . . . . . . . . . 3,520 3,996 14,345IPO costs(4) . . . . . . . . . . . . . . . . . . . . . . . . . . . . . — 10,733 —Gain on sale of properties . . . . . . . . . . . . . . . . . . . — — (23,710)Gain on extinguishment of indebtedness(5) . . . . . . — (23,515) —Impairment loss . . . . . . . . . . . . . . . . . . . . . . . . . . 896 — —Loss on disposal . . . . . . . . . . . . . . . . . . . . . . . . . . 634 — —Amortization of share based compensation . . . . . . . 8,626 3,284 —Other expenses(6)(7) . . . . . . . . . . . . . . . . . . . . . . 436 1,363 3,126
Adjusted EBITDA . . . . . . . . . . . . . . . . . . . . . . . $267,742 $234,363 $163,875
(1) Includes net income from discontinued operations.
(2) Excludes amounts attributable to investment in loans of $1.6 million, $1.6 million and$1.2 million for the years ended December 31, 2012, 2011 and 2010, respectively.
(3) Includes depreciation, amortization and interest expense allocated to the noncontrollinginterest in joint venture.
(4) Includes expenses related to the transfer and assumption of indebtedness and othercontractual obligations of our predecessor in connection with the IPO and our formationtransactions.
(5) Includes the gain on the transfer of title to the New York LaGuardia Marriott hotel tothe lenders pursuant to a deed in lieu of foreclosure. The gain is included inDiscontinued Operations.
(6) Includes $0.4 million for the year ended December 31, 2012 of legal expenses outside thenormal course of operations.
(7) Includes $1.4 million for the year ended December 31, 2011 of certain compensationobligations of our predecessor not continued.
74

Liquidity and Capital Resources
Our short-term liquidity requirements consist primarily of funds necessary to pay for operatingexpenses and other expenditures directly associated with our hotels, including:
• recurring maintenance and capital expenditures necessary to maintain our hotels in accordancewith brand standards;
• interest expense and scheduled principal payments on outstanding indebtedness;
• distributions necessary to qualify for taxation as a REIT; and
• capital expenditures to improve our hotels, including capital expenditures required by ourfranchisors in connection with our formation transactions and recent hotel acquisitions.
We expect to meet our short-term liquidity requirements generally through net cash provided byoperations, existing cash balances and, if necessary, short-term borrowings under our unsecuredrevolving credit facility.
Our long-term liquidity requirements consist primarily of funds necessary to pay for the costs ofacquiring additional hotels and redevelopments, renovations, expansions and other capital expendituresthat need to be made periodically with respect to our hotels and scheduled debt payments. We expectto meet our long-term liquidity requirements through various sources of capital, including ourunsecured revolving credit facility and future equity (including OP units) or debt offerings, existingworking capital, net cash provided by operations, long-term hotel mortgage indebtedness and othersecured and unsecured borrowings. However, there are a number of factors that may have a materialadverse effect on our ability to access these capital sources, including the current state of overall equityand credit markets, our degree of leverage, the value of our unencumbered assets and borrowingrestrictions imposed by lenders, general market conditions for REITs, our operating performance andliquidity and market perceptions about us. The success of our business strategy will depend, in part, onour ability to access these various capital sources.
Our hotels will require periodic capital expenditures and renovation to remain competitive. Inaddition, acquisitions, redevelopments or expansions of hotels will require significant capital outlays. Wemay not be able to fund such capital improvements solely from net cash provided by operationsbecause we must distribute annually at least 90% of our REIT taxable income, determined withoutregard to the deductions for dividends paid and excluding net capital gain, to qualify and maintain ourqualification as a REIT, and we are subject to tax on any retained income and gain. As a result, ourability to fund capital expenditures, acquisitions or hotel redevelopment through retained earnings isvery limited. Consequently, we expect to rely heavily upon the availability of debt or equity capital forthese purposes. If we are unable to obtain the necessary capital on favorable terms, or at all, ourfinancial condition, liquidity, results of operations and prospects could be materially and adverselyaffected.
Revolving Credit Facility and Term Loans
We entered into a credit agreement on November 20, 2012 that provides for (i) an unsecuredrevolving credit facility of up to $300.0 million with a scheduled maturity date of November 20, 2016with a one year extension option, or the Revolver, and (ii) an unsecured term loan of $275.0 millionwith a scheduled maturity date of November 20, 2017, or the Five-Year Term Loan. The creditagreement amends and restates in its entirety our unsecured revolving credit facility, which wasoriginally entered into as of June 20, 2011. In addition, on November 20, 2012 we also entered into anunsecured term loan of $125.0 million with a scheduled maturity date of November 20, 2019, or theSeven-Year Term Loan.
75

The credit agreement requires that a group of no less than 20 of our hotel properties remainunencumbered by outstanding indebtedness. The credit agreement contains certain financial covenantsrelating to our maximum leverage ratio, minimum fixed charge coverage ratio, minimum tangible networth and maximum secured indebtedness. If an event of default exists we are not permitted to makedistributions to shareholders, other than those required to qualify for and maintain REIT status. As ofDecember 31, 2012, we were in compliance with all financial covenants.
Borrowings under the Revolver, the Five-Year Term Loan and the Seven-Year Term Loan bearinterest at variable rates equal to the London InterBank Offered Rate, or LIBOR, plus an applicablemargin. The margin ranges from 1.70% to 3.00%, depending on our leverage ratio, as calculated underthe terms of the Revolver and each term loan. We incur an unused facility fee on the Revolver ofbetween 0.25% and 0.35%, based on the amount by which the maximum borrowing amount exceeds thetotal principal balance of outstanding borrowings.
For the year ended December 31, 2012, we incurred an unused commitment fee on the Revolverof approximately $0.1 million. At December 31, 2012, outstanding borrowings on the Revolver, theFive-Year Term Loan and the Seven-Year Term Loan were $16.0 million, $275.0 million and$125.0 million, respectively. For the year ended December 31, 2012, interest expense incurred on theRevolver, the Five-Year Term Loan and the Seven-Year Term Loan was $40,000, $0.7 million and$0.4 million, respectively.
76

Our Outstanding Mortgage Indebtedness
As of December 31, 2012 and 2011, we were subject to the following mortgage loans (inthousands):
Principal balance at,Number Interest rate atof Assets December 31, Maturity December 31, December 31,
Lender Encumbered 2012 Date 2012 2011
Keybank . . . . . . . . . . . . . . . . April 2012(1) $ — $ 48,000State Street Bank . . . . . . . . . . April 2012(1) — 37,000Wells Fargo . . . . . . . . . . . . . . June 2013(2) — 60,000Wells Fargo . . . . . . . . . . . . . . Oct 2013(2) — 40,000Wells Fargo . . . . . . . . . . . . . . Oct 2013(2) — 31,000Wells Fargo . . . . . . . . . . . . . . Dec 2013(2) — 150,000Blackstone . . . . . . . . . . . . . . . Dec 2013(2) — 50,000Wells Fargo . . . . . . . . . . . . . . 1 4.60%(3)(4) Oct 2014(5) 68,500 68,500Wells Fargo . . . . . . . . . . . . . . 1 3.81%(4) Oct 2014(5) 17,500 17,500Wells Fargo . . . . . . . . . . . . . . 1 3.81%(4) Oct 2014(5) 21,000 21,000Wells Fargo . . . . . . . . . . . . . . 1 3.81%(4) Oct 2014(5) 11,000 11,000Wells Fargo . . . . . . . . . . . . . . 1 3.81%(4) Oct 2014(5) 24,000 24,000Capmark Financial Group . . . . 1 6.12% April 2015 4,202 4,327Capmark Financial Group . . . . 1 5.55% May 2015 11,298 11,656VFC Partners 20 LLC . . . . . . . 1 5.50% June 2015 5,014 5,014Capmark Financial Group . . . . 1 5.55% June 2015 4,901 5,057Barclay’s Bank . . . . . . . . . . . . 1 5.55% June 2015 2,561 2,642Barclay’s Bank . . . . . . . . . . . . 1 5.55% June 2015 4,203 4,336Barclay’s Bank . . . . . . . . . . . . 1 5.55% June 2015 9,798 10,107Barclay’s Bank . . . . . . . . . . . . 1 5.55% June 2015 8,745 9,020Barclay’s Bank . . . . . . . . . . . . 1 5.55% June 2015 7,839 8,084Barclay’s Bank . . . . . . . . . . . . 1 5.60% June 2015 5,434 5,603Barclay’s Bank . . . . . . . . . . . . 1 5.60% June 2015 8,422 8,707Barclay’s Bank . . . . . . . . . . . . 1 5.55% June 2015 5,134 5,296Barclay’s Bank . . . . . . . . . . . . 1 5.55% June 2015 34,042 35,115Barclay’s Bank . . . . . . . . . . . . 1 5.60% June 2015 6,466 6,669Barclay’s Bank . . . . . . . . . . . . 1 5.55% June 2015 5,762 5,943Barclay’s Bank . . . . . . . . . . . . 1 5.55% June 2015 6,621 6,830Barclay’s Bank . . . . . . . . . . . . 1 5.60% June 2015 8,437 8,701Barclay’s Bank . . . . . . . . . . . . 1 5.55% June 2015 6,614 6,821Barclay’s Bank . . . . . . . . . . . . 1 5.55% June 2015 7,280 7,508Barclay’s Bank . . . . . . . . . . . . 1 5.55% June 2015 6,621 6,830Barclay’s Bank . . . . . . . . . . . . 1 5.55% June 2015 7,558 7,796Barclay’s Bank . . . . . . . . . . . . 1 5.55% June 2015 9,484 9,783Capmark Financial Group . . . . 1 5.50% July 2015 6,673 6,883Barclay’s Bank . . . . . . . . . . . . 1 5.44% Sept 2015 10,883 11,223PNC Bank(6) . . . . . . . . . . . . . 7 2.56%(4) May 2016(7) 85,000 —Merrill Lynch . . . . . . . . . . . . . 1 6.29% July 2016 9,180 9,294Merrill Lynch . . . . . . . . . . . . . 1 6.29% July 2016 5,531 5,552Merrill Lynch . . . . . . . . . . . . . 1 6.29% July 2016 7,684 7,780Merrill Lynch . . . . . . . . . . . . . 1 6.29% July 2016 9,194 9,307Wachovia Securities(8) . . . . . . . 43 6.29% July 2016 487,296 493,358Wachovia Securities . . . . . . . . . 1 6.29% July 2016 6,582 6,664Wells Fargo/Morgan Stanley . . . 2 6.29% July 2016 34,823 35,256Wells Fargo/Morgan Stanley . . . 1 6.29% July 2016 6,753 6,837Wells Fargo/Morgan Stanley . . . 1 6.29% July 2016 9,616 9,736
88 $997,651 $1,341,735
(1) The Keybank and State Street Bank loans were paid off with borrowings on the prior credit facility at maturity onApril 9, 2012.
(2) The Wells Fargo/Blackstone loans were paid off on November 20, 2012 with borrowings on the Five-Year Term Loanand Seven-Year Term Loan.
(3) Interest rate at December 31, 2012 gives effect to interest rate swaps and LIBOR floors.
77

(4) Requires payments of interest only until the commencement of the extension period(s).
(5) Maturity date may be extended for up to two additional one-year terms at our option (subject to our priorsatisfaction of certain conditions and advance notice of the exercise of our option).
(6) The seven hotels encumbered by the PNC Bank Loans are cross-collateralized.
(7) Maturity date may be extended for one one-year term at our option (subject to our prior satisfaction of certainconditions and advance notice of the exercise of our option).
(8) The 43 Wachovia Securities loans are cross-collateralized.
Sources and Uses of Cash
As of December 31, 2012, we had $115.9 million of cash and cash equivalents compared to$310.2 million at December 31, 2011 and $267.5 million at December 31, 2010.
Cash flows from Operating Activities
Net cash flow provided by operating activities totaled $176.1 million for the year endedDecember 31, 2012. Net income of $41.2 million included significant non-cash expenses, including$126.8 million of depreciation and amortization, $8.6 million of amortization of share-basedcompensation, $5.5 million of amortization of deferred financing costs, $1.0 million of amortization ofdeferred management fees, $0.9 million loss on impairment, $0.6 million loss on disposal, $0.5 millionunrealized gain on interest rate swaps and $0.2 million of expense related to the grant of shares to ourtrustees. In addition, changes in operating assets and liabilities due to the timing of cash receipts andpayments from our hotels resulted in net cash outflow of $9.2 million.
Net cash flow provided by operating activities totaled $134.1 million for the year endedDecember 31, 2011. Net income of $11.7 million included significant non-cash expenses, including$130.7 million of depreciation, $5.8 million of amortization of deferred financing costs, $1.0 million ofamortization of deferred management fees and $3.3 million of amortization of share-basedcompensation. In addition, there was a gain on the extinguishment of indebtedness of $23.5 million andchanges in operating assets and liabilities due to the timing of cash receipts and payments from ourhotels, which resulted in net cash inflow of $5.5 million.
Net cash flow provided by operating activities totaled $64.1 million for the year endedDecember 31, 2010. Net loss of $22.6 million was due in significant part to non-cash expenses,including $100.8 million of depreciation and $3.1 million of amortization of deferred financing costs,partially offset by a $23.7 million gain on the sale of six hotels. In addition, changes in operating assetsand liabilities due to the timing of cash receipts and payments from our hotels resulted in net cashinflow of $5.6 million.
Cash flows from Investing Activities
Net cash flow used in investing activities totaled $363.8 million for the year ended December 31,2012 primarily due to $247.0 million used for the purchase of four hotels, $9.9 million in purchasedeposits paid, $0.3 million paid for additions to property and equipment and $129.2 million inimprovements and additions to hotels. These were partially offset by $0.2 million of principal paymentson investment in loans and the net releases from restricted cash reserves of $22.5 million in conjunctionwith the completion of renovation projects.
Net cash flow used in investing activities totaled $347.0 million for the year ended December 31,2011 primarily due to $236.9 million used for the purchase of nine hotels, $93.5 million inimprovements and additions to hotels, and the net funding of restricted cash reserves of $16.8 million.
Net cash flow used in investing activities totaled $786.6 million for the year ended December 31,2010 primarily due to $828.9 million used for the purchase of 15 hotels, $15.9 million in improvements
78

and additions to hotels, a purchase deposit paid of $8.5 million and the net funding of restricted cashreserves of $16.1 million, partially offset by $72.7 million from the sale of six hotels.
Cash flows from Financing Activities
Net cash flow used in financing activities totaled $6.7 million for the year ended December 31,2012 primarily due to $429.1 million of mortgage loan repayments, $85.0 million repayment of the priorcredit facility, $68.8 million in payment of distributions to shareholders and unitholders, $6.9 millionpaid for deferred financing fees and $2.3 million of shares acquired to satisfy the statutory minimumfederal and state tax obligations of certain employees in connection with the vesting of restrictedcommon shares of beneficial interest issued to such employees under our 2011 Plan. This was offset by$400.0 million of aggregate proceeds from the Five-Year Term Loan and Seven-Year Term Loan,$85.0 million in borrowings on the prior credit facility, $85.0 million in proceeds from mortgage loansand $16.0 million in borrowings on the Revolver.
Net cash flow provided by financing activities totaled $255.7 million for the year endedDecember 31, 2011 primarily due to $567.7 of proceeds from the issuance and sale of common sharesof beneficial interest, $142.0 million in proceeds from mortgage loans, $140.0 million in proceeds fromthe term loan and $126.7 million in net contributions from partners. This was offset by $489.3 millionof mortgage loan repayments, $140.0 million repayment of the term loan, $39.4 million paid foroffering costs related to the issuance and sale of common shares of beneficial interest, $16.3 million ofpartners’ distributions, $24.7 million in payment of distributions to shareholders and unitholders,$6.2 million paid for deferred financing fees, $3.1 million in payment of member distributions,$0.5 million of payments for the redemption of preferred units, a $0.5 million distribution related to thejoint venture noncontrolling interest and $0.7 million of shares acquired to satisfy the statutoryminimum federal and state tax obligations of certain employees in connection with the vesting ofrestricted common shares of beneficial interest issued to such employees under our 2011 Plan.
Net cash flow provided by financing activities totaled $838.6 million for year ended December 31,2010 primarily due to $589.1 million of borrowing under our predecessor’s credit facility, $331.0 millionin proceeds from mortgage loans, $801.8 million in net contributions from partners, offset by$735.1 million of repayments under our predecessor’s credit facility, $79.7 million of mortgage loanrepayments, $29.0 million in payment of member distributions, $31.0 million in payment of partnersdistributions and $8.4 million paid for deferred financing fees.
Capital Expenditures and Reserve Funds
We maintain each of our hotels in good repair and condition and in conformity with applicablelaws and regulations, franchise agreements and management agreements. The cost of all such routineimprovements and alterations are paid out of furniture, fixture and equipment, or FF&E, reserves,which are funded by a portion of each hotel’s gross revenues. Routine capital expenditures areadministered by the hotel management companies. However, we have approval rights over the capitalexpenditures as part of the annual budget process for each of our hotels.
From time to time, certain of our hotels may be undergoing renovations as a result of our decisionto upgrade portions of the hotels, such as guestrooms, public space, meeting space, and/or restaurants,in order to better compete with other hotels in our markets. In addition, upon acquisition of a hotel weoften are required to complete a property improvement plan in order to bring the hotel up to therespective franchisor’s standards. If permitted by the terms of the management agreement, funding fora renovation will first come from the FF&E reserves. To the extent that the FF&E reserves are notavailable or adequate to cover the cost of the renovation, we will fund all or the remaining portion ofthe renovation with cash and cash equivalents on hand, our unsecured revolving credit facility and/orother sources of available liquidity.
79

We initiated an extensive two-year capital program in 2011 largely focused on upgrading and/orrepositioning 24 hotels we acquired in 2010 and 2011, including rebranding of seven hotels. Thebalance of the renovations included brand related upgrades at other select hotels.
In 2012, we upgraded and/or repositioned 45 hotels for approximately $95.0 million. In aggregate,we invested approximately $210.0 million at 93 hotels during the two years ended December 31, 2012.
With respect to some of our hotels that are operated under franchise agreements with majornational hotel brands and for some of our hotels subject to first mortgage liens, we are obligated tomaintain FF&E reserve accounts for future capital expenditures at these hotels. The amount fundedinto each of these reserve accounts is generally determined pursuant to the management agreements,franchise agreements and/or mortgage loan documents for each of the respective hotels, and typicallyranges between 2.0% and 5.0% of the respective hotel’s total gross revenue. As of December 31, 2012,approximately $41.6 million was held in FF&E reserve accounts for future capital expenditures.
Off-Balance Sheet Arrangements
As of December 31, 2012, we had no off-balance sheet arrangements.
Contractual Obligations
The following table sets forth our contractual obligations as of December 31, 2012 (in thousands):
Amount of commitment expiration per period
Obligations and Commitments 2013 2014 2015 2016 2017 Thereafter Total
Mortgage loans and interest(1) . . $56,678 $197,777 $239,032 $682,728 $ — $ — $1,176,215Borrowings under credit
facilities(2) . . . . . . . . . . . . . . . 9,072 9,072 9,072 25,016 282,789 130,633 465,654Ground rent . . . . . . . . . . . . . . . 1,150 1,150 1,150 1,150 1,150 103,460 109,210Operating lease obligations . . . . . 864 887 914 — — — 2,665
$67,764 $208,886 $250,168 $708,894 $283,939 $234,093 $1,753,744
(1) Amounts include principal and interest payments. Interest payments have been included in thelong-term debt obligations based on the interest rate at December 31, 2012, considering the effectof interest rate swaps and caps, as applicable.
(2) Amounts include principal and interest payments. Interest expense is calculated based on thevariable rate as of December 31, 2012. It is assumed that the outstanding debt as of December 31,2012 will be repaid upon maturity with interest�only payments until then.
Critical Accounting Policies
Our discussion and analysis of the historical financial condition and results of operations is basedon our combined consolidated financial statements. The preparation of financial statements inconformity with GAAP requires management to make estimates and assumptions that affect thereported amount of assets and liabilities at the date of our financial statements and the reportedamounts of revenues and expenses during the reporting period. Actual amounts may differ significantlyfrom these estimates and assumptions. We have provided a summary of our significant accountingpolicies in the notes to the historical combined consolidated financial statements. We have set forthbelow those accounting policies that we believe require material subjective or complex judgments andhave the most significant impact on our financial condition and results of operations. We evaluate ourestimates, assumptions and judgments on an ongoing basis, based on information that is then available
80

to us, our experience and various matters that we believe are reasonable and appropriate forconsideration under the circumstances.
Investment in Hotel Properties
Hotel acquisitions consist almost exclusively of land, land improvements, buildings, buildingimprovements, furniture, fixtures and equipment and inventory. We record the purchase price amongthese asset classes based on their respective fair values. When we acquire hotels, we acquire them foruse. Generally, we do not acquire any significant in-place leases or other intangible assets(e.g., management agreements, franchise agreements or trademarks) when hotels are acquired. Theonly intangible assets acquired through December 31, 2012 consist of favorable lease agreements andmiscellaneous operating agreements, which are short-term in nature. In conjunction with the acquisitionof a hotel, we typically negotiate new franchise and management agreements with the selected brandand manager.
Our investments in hotels are carried at cost and are depreciated using the straight-line methodover estimated useful lives of 15 years for land improvements, 15 years for building improvements,40 years for buildings and three to five years for furniture, fixtures and equipment. Intangible assetsarising from favorable or unfavorable leases are amortized using the straight-line method over the termof the non-cancelable term of the agreement. Maintenance and repairs are expensed and majorrenewals or improvements are capitalized. Upon the sale or disposition of a fixed asset, the asset andrelated accumulated depreciation are removed from the accounts and the related gain or loss isincluded in discontinued operations.
We assess the carrying values of each hotel whenever events or changes in circumstances indicatethat the carrying amounts of these hotels may not be fully recoverable. Recoverability of the hotel ismeasured by comparison of the carrying amount of the hotel to the estimated future undiscounted cashflows, which take into account current market conditions and our intent with respect to holding ordisposing of the hotel. If our analysis indicates that the carrying value of the hotel is not recoverable onan undiscounted cash flow basis, we recognize an impairment charge for the amount by which thecarrying value exceeds the fair value of the hotel. Fair value is determined through various valuationtechniques, including internally developed discounted cash flow models or comparable markettransactions. In some cases third-party appraisals are obtained when considered necessary.
The use of projected future cash flows is based on assumptions that are consistent with a marketparticipant’s future expectations for the travel industry and economy in general and our strategic plansto manage the underlying hotels. However, assumptions and estimates about future cash flows andcapitalization rates are complex and subjective. Changes in economic and operating conditions and ourultimate investment intent that occur subsequent to a current impairment analysis could impact theseassumptions and result in future impairment charges of the hotels.
Revenue Recognition
Our revenue comprises hotel operating revenue, such as room revenue, food and beverage revenueand revenue from other hotel operating departments (such as telephone, parking and business centers).These revenues are recorded net of any sales and occupancy taxes collected from guests. All rebates ordiscounts are recorded as a reduction to revenue, and there are no material contingent obligations withrespect to rebates and discounts offered by the hotels. All revenues are recorded on an accrual basis asearned. Appropriate allowances are made for doubtful accounts and are recorded as bad debt expense.The allowances are calculated as a percentage of aged accounts receivable, based on individual hotelmanagement company policy. Cash received prior to guest arrival is recorded as an advance from theguest and recognized as revenue at the time of occupancy.
81

Income Taxes
We have elected to be taxed as a real estate investment trust under Sections 856 through 860 ofthe Internal Revenue Code, as amended, commencing with the taxable year ended December 31, 2011.To qualify as a REIT, we must meet a number of organizational and operational requirements,including a requirement that we currently distribute at least 90% of our REIT taxable income, subjectto certain adjustments and excluding any net capital gain. Our current intention is to adhere to theserequirements and maintain the qualification for taxation as a REIT. As a REIT, we generally are notsubject to federal corporate income tax on that portion of net income that is currently distributed. Ifwe fail to qualify for taxation as a REIT in any taxable year, we will be subject to federal income taxesat regular corporate rates (including any applicable alternative minimum tax) and may not be able toqualify as a REIT for four subsequent taxable years. Even if we qualify for taxation as a REIT, we maybe subject to certain state and local taxes on our income and property, and to federal income andexcise taxes on undistributed taxable income.
Taxable income from non-REIT activities managed through taxable REIT subsidiaries is subject tofederal, state and local income taxes. As a wholly-owned subsidiary of the Operating Partnership, thetaxable REIT subsidiary is required to pay income taxes at the applicable rates. Our consolidatedincome tax provision or benefit includes the income tax provision or benefit related to the operationsof the taxable REIT subsidiary as well as state income taxes incurred.
Where required, deferred income taxes are accounted for using the asset and liability method.Under this method, deferred income taxes are recognized for temporary differences between thefinancial reporting bases of assets and liabilities and their respective income tax bases and for operatingloss, capital loss and tax credit carryforwards based on enacted income tax rates expected to be ineffect when such amounts are realized or settled. However, deferred tax assets are recognized only tothe extent that is more likely than not they will be realized based on consideration of availableevidence, including future reversals of existing taxable temporary differences, future projected taxableincome and tax planning strategies.
We perform an annual review for any uncertain tax positions and, if necessary, will record expectedfuture tax consequences of uncertain tax positions in the financial statements. At December 31, 2012and 2011, we did not identify any uncertain tax positions.
Share-Based Compensation
We may issue equity-based awards to officers, employees, non-employee trustees and other eligiblepersons under the 2011 Plan. The 2011 Plan provides for a maximum of 5,000,000 common shares ofbeneficial interest to be issued in the form of share options, share appreciation rights, restricted shareawards, unrestricted share awards, share units, dividend equivalent rights, long-term incentive units,other equity-based awards and cash bonus awards. In addition, the maximum number of commonshares subject to awards of any combination that may be granted under the 2011 Plan during anycalendar year to any one individual is limited to 1,000,000 shares. The exercise price of share options isdetermined by the Board of Trustees, but may not be less than 100% of the fair market value of thecommon shares on the date of grant. For grantees that own greater than ten percent of the totalcombined voting power of all classes of outstanding voting securities of our shares, the exercise price ofshare options may not be less than 110% of the fair market value of the common shares on the date ofgrant. The fair market value for all other types of share awards is determined by the closing price onthe date of grant.
82

Inflation
We rely entirely on the performance of the hotels and their ability to increase revenues to keeppace with inflation. Increases in the costs of operating our hotels due to inflation would adversely affectthe operating performance of our TRS, which in turn, could inhibit the ability of our TRS to makerequired rent payments to us. Hotel management companies, in general, possess the ability to adjustroom rates daily to reflect the effects of inflation. However, competitive pressures may limit the abilityof our hotel management companies to raise room rates.
Seasonality
Depending on a hotel’s location and market, operations for the hotel may be seasonal in nature.This seasonality can be expected to cause fluctuations in our quarterly operating performance. Forhotels located in non-resort markets, demand is generally lower in the winter months due to decreasedtravel and higher in the spring and summer months during the peak travel season. Accordingly, weexpect that we will have lower revenue, operating income and cash flow in the first and fourth quartersand higher revenue, operating income and cash flow in the second and third quarters.
Item 7A. Quantitative and Qualitative Disclosures about Market Risk
Market risk includes risks that arise from changes in interest rates, equity prices and other marketchanges that affect market sensitive instruments. Our primary market risk exposure is to changes ininterest rates on our variable rate debt. As of December 31, 2012, we had approximately $643.0 millionof total variable debt outstanding (or 45.5% of total indebtedness) with a weighted average interest rateof 2.67% per annum. If market rates of interest on our variable rate debt outstanding as ofDecember 31, 2012 were to increase by 1.00%, or 100 basis points, interest expense would decreasefuture earnings and cash flows by approximately $5.7 million annually, taking into account our existingcontractual hedging arrangements.
Our interest rate risk objectives are to limit the impact of interest rate fluctuations on earningsand cash flows and to lower our overall borrowing costs. To achieve these objectives, we manage ourexposure to fluctuations in market interest rates through the use of fixed rate debt instruments to theextent that reasonably favorable rates are obtainable. We have entered into derivative financialinstruments such as interest rate swaps or caps to mitigate our interest rate risk or to effectively lockthe interest rate on a portion of our variable rate debt. We do not enter into derivative or interest ratetransactions for speculative purposes.
The following table provides information about our financial instruments that are sensitive tochanges in interest rates. For debt obligations outstanding as of December 31, 2012, the following tablepresents principal repayments and related weighted average interest rates by contractual maturity dates(in thousands):
2013 2014 2015 2016 2017 Thereafter Total
Fixed rate debt . . . . . . . . . . . . . . . $— $ — $193,992 $576,659 $ — $ — $ 770,651Weighted average interest rate . . . — — 5.56% 6.29% — — 6.11%
Variable rate debt . . . . . . . . . . . . . . $— $142,000 $ — $101,000 $275,000 $125,000 $ 643,000Weighted average interest rate . . . — 4.19% — 2.49% 2.06% 2.46% 2.67%
Total . . . . . . . . . . . . . . . . . . . . . . $— $142,000 $193,992 $677,659 $275,000 $125,000 $1,413,651
The foregoing table reflects indebtedness outstanding as of December 31, 2012 and does notconsider indebtedness, if any, incurred or repaid after that date. Our ultimate realized gain or loss withrespect to interest rate fluctuations will depend on the exposures that arise during future periods,prevailing interest rates, and our hedging strategies at that time.
83

Changes in market interest rates on our fixed rate debt impact the fair value of the debt, but suchchanges have no impact on our combined consolidated financial statements. If interest rates rise, andour fixed rate debt balance remains constant, we expect the fair value of our debt to decrease. As ofDecember 31, 2012, the estimated fair value of our fixed rate debt was $745.3 million, which is basedon having the same debt service requirements that could have been borrowed at the date presented, atprevailing current market interest rates.
Item 8. Financial Statements and Supplementary Data
See Index to the Financial Statements on page F-1.
Item 9. Changes In and Disagreements with Accountants on Accounting and Financial Disclosures
None.
Item 9A. Controls and Procedures
Evaluation of Disclosure Controls and Procedures
The Company’s management has evaluated, under the supervision and with the participation of theCompany’s Chief Executive Officer and Chief Financial Officer, the effectiveness of the disclosurecontrols and procedures (as defined in Rules 13a-15(e) and 15d-15(e) under the Securities ExchangeAct of 1934, as amended, or the Exchange Act), as required by paragraph (b) of Rules 13a-15 and15d-15 of the Exchange Act. Based on this evaluation, the Company’s Chief Executive Officer andChief Financial Officer have concluded that as of December 31, 2012, the Company’s disclosurecontrols and procedures were effective to ensure that information we are required to disclose in reportsfiled or submitted with the Securities and Exchange Commission (i) is recorded, processed, summarizedand reported within the time periods specified in the Securities and Exchange Commission’s rules andforms and (ii) is accumulated and communicated to our management, including our Chief ExecutiveOfficer and Chief Financial Officer, as appropriate to allow timely decisions regarding disclosure.
Management’s Annual Report on Internal Control over Financial Reporting
The Company’s management is responsible for establishing and maintaining adequate internalcontrol over financial reporting (as defined in Rule 13a-15(f) and 15d-15(f) of the Exchange Act). TheCompany’s internal control over financial reporting is a process designed to provide reasonableassurance regarding the reliability of financial reporting and the preparation of financial statements forexternal purposes in accordance with accounting principles generally accepted in the United Statesof America.
Because of its inherent limitations, internal control over financial reporting may not prevent ordetect misstatements. Also, projections of any evaluations of effectiveness to future periods are subjectto the risk that controls may become inadequate because of changes in conditions, or that the degreeof compliance with the policies or procedures may deteriorate.
The Company’s management assessed the effectiveness of its internal control over financialreporting as of December 31, 2012. In making this assessment, management used the criteria set forthby the Committee of Sponsoring Organizations of the Treadway Commission, or COSO, in InternalControl-Integrated Framework. Based on this assessment, management has concluded that, as ofDecember 31, 2012, our internal control over financial reporting is effective based on those criteria.
The effectiveness of the Company’s internal control over financial reporting as of December 31,2012 has been audited by PricewaterhouseCoopers LLP, an independent registered public accountingfirm, as stated in their report which appears on page F-2 of this Annual Report on Form 10-K.
84

Changes in Internal Control over Financial Reporting
There have been no changes in our internal control over financial reporting (as defined inRules 13a-15(f) and 15d-15(f) of the Exchange Act) during the quarter ended December 31, 2012 thathave materially affected, or are reasonably likely to materially affect, our internal control over financialreporting.
Item 9B. Other Information
None.
PART III
Item 10. Directors, Executive Officers of the Registrant and Corporate Governance
The information called for by this Item is contained in our definitive Proxy Statement for our2013 Annual Meeting of Shareholders, and is incorporated herein by reference.
Item 11. Executive Compensation
The information called for by this Item is contained in our definitive Proxy Statement for our2013 Annual Meeting of Shareholders, and is incorporated herein by reference.
Item 12. Security Ownership of Certain Beneficial Owners and Management and Related ShareholderMatters
The information called for by this Item is contained in our definitive Proxy Statement for our2013 Annual Meeting of Shareholders, or in Item 5 of this Annual Report on Form 10-K for the yearended December 31, 2012, and is incorporated herein by reference.
Item 13. Certain Relationships, Related Transactions and Director Independence
The information called for by this Item is contained in our definitive Proxy Statement for our2013 Annual Meeting of Shareholders, and is incorporated herein by reference.
Item 14. Principal Accountant Fees and Services
The information called for by this Item is contained in our definitive Proxy Statement for our2013 Annual Meeting of Shareholders, and is incorporated herein by reference.
PART IV
Item 15. Exhibits and Financial Statement Schedules
The following is a list of documents filed as a part of this report:
(1) Financial Statements
Included herein at pages F-1 through F-46.
(2) Financial Statement Schedules
The following financial statement schedule is included herein at pages F-47 through F-52:
Schedule III—Real Estate and Accumulated Depreciation for RLJ Lodging Trust
All other schedules for which provision is made in Regulation S-X are either not required to beincluded herein under the related instructions, are inapplicable or the related information is included inthe footnotes to the applicable financial statement and, therefore, have been omitted.
(3) Exhibits
The exhibits required to be filed by Item 601 of Regulation S-K are listed in the Exhibit Index onpages 87 and 88 of this report, which is incorporated by reference herein.
85

SIGNATURES
Pursuant to the requirements of Section 13 or 15(d) of the Securities Exchange Act of 1934, theregistrant has duly caused this report to be signed on its behalf by the undersigned, thereunto dulyauthorized on February 28, 2013.
RLJ LODGING TRUST
By: /s/ THOMAS J. BALTIMORE, JR.
Thomas J. Baltimore, Jr.President, Chief Executive Officer and Trustee
Pursuant to the requirements of the Securities Exchange Act of 1934, this report has been signedbelow by the following persons on behalf of the registrant and in the capacities and on the datesindicated.
Signature Title Date
/s/ ROBERT L. JOHNSONExecutive Chairman and Trustee February 28, 2013
Robert L. Johnson
/s/ THOMAS J. BALTIMORE, JR. President, Chief Executive Officer and February 28, 2013Trustee (principal executive officer)Thomas J. Baltimore, Jr.
/s/ LESLIE D. HALE Chief Financial Officer February 28, 2013(principal financial officer)Leslie D. Hale
/s/ CHRISTOPHER A. GORMSEN Chief Accounting Officer February 28, 2013(principal accounting officer)Christopher A. Gormsen
/s/ EVAN BAYHTrustee February 28, 2013
Evan Bayh
/s/ NATHANIEL A. DAVISTrustee February 28, 2013
Nathaniel A. Davis
/s/ ROBERT M. LA FORGIATrustee February 28, 2013
Robert M. La Forgia
/s/ GLENDA G. MCNEALTrustee February 28, 2013
Glenda G. McNeal
/s/ JOSEPH RYANTrustee February 28, 2013
Joseph Ryan
86

EXHIBIT INDEX
ExhibitNumber Exhibit Description
2.1(1) Merger Agreement, dated as of February 1, 2011, by and among RLJ Lodging Fund II, L.P.,RLJ Lodging Fund II (PF #1), L.P., RLJ Lodging Trust and RLJ Capital Partners II, LLC
2.2(1) Merger Agreement, dated as of February 1, 2011, by and among RLJ Real EstateFund III, L.P., RLJ Real Estate Fund III (PF #1), L.P., RLJ Lodging Trust and RLJ CapitalPartners III, LLC
2.3(1) Contribution Agreement, dated as of February 1, 2011, by and between RLJ Lodging Trustand RLJ Development, LLC
2.4(3) First Amendment to Contribution Agreement, dated as of April 25, 2011, by and betweenRLJ Lodging Trust and RLJ Development, LLC
3.1(4) Articles of Amendment and Restatement of Declaration of Trust of RLJ Lodging Trust3.2(4) Amended and Restated Bylaws of RLJ Lodging Trust4.1(3) Form of Specimen Common Share Certificate4.2(5) Registration Rights Agreement, dated May 16, 2011, by and among RLJ Lodging Trust and
the persons listed on Schedule I thereto4.3(5) Registration Rights Agreement, dated May 16, 2011, by and among RLJ Lodging Trust and
the persons listed on Schedule I thereto10.1(5) Amended and Restated Agreement of Limited Partnership, dated May 13, 201110.2(5) Indemnification Agreement, dated May 16, 2011, between RLJ Lodging Trust and
Thomas J. Baltimore, Jr.10.3(5) Indemnification Agreement, dated May 16, 2011, between RLJ Lodging Trust and Evan Bayh10.4(5) Indemnification Agreement, dated May 16, 2011, between RLJ Lodging Trust and
Ross H. Bierkan10.5(5) Indemnification Agreement, dated May 16, 2011, between RLJ Lodging Trust and
Nathaniel Davis10.6(5) Indemnification Agreement, dated May 16, 2011, between RLJ Lodging Trust and
Leslie D. Hale10.7(5) Indemnification Agreement, dated May 16, 2011, between RLJ Lodging Trust and
Robert L. Johnson10.8(5) Indemnification Agreement, dated May 16, 2011, between RLJ Lodging Trust and
Robert M. La Forgia10.9(5) Indemnification Agreement, dated May 16, 2011, between RLJ Lodging Trust and
Glenda McNeal10.10(5) Indemnification Agreement, dated May 16, 2011, between RLJ Lodging Trust and
Julio E. Morales10.11(5) Indemnification Agreement, dated May 16, 2011, between RLJ Lodging Trust and
Joseph Ryan10.12(4) RLJ Lodging Trust 2011 Equity Incentive Plan10.13(4) Form of Restricted Share Agreement10.14(4) Form of Restricted Share Agreement for Trustees10.15(2) Form of Non-Qualified Option Agreement10.16(2) Form of Share Units Agreement10.17(4) Employment Agreement dated as of April 27, 2011 by and among RLJ Lodging Trust,
RLJ Lodging Trust, L.P. and Robert L. Johnson10.18(4) Employment Agreement dated as of April 27, 2011 by and among RLJ Lodging Trust,
RLJ Lodging Trust, L.P. and Thomas J. Baltimore, Jr.10.19(4) Employment Agreement dated as of April 27, 2011 by and among RLJ Lodging Trust,
RLJ Lodging Trust, L.P. and Leslie D. Hale10.20(4) Employment Agreement dated as of April 27, 2011 by and among RLJ Lodging Trust,
RLJ Lodging Trust, L.P. and Ross H. Bierkan
87

ExhibitNumber Exhibit Description
10.21(2) Form of the Wachovia Mortgage10.22(2) Form of the Wachovia Note10.23(6) Amended and Restated Credit Agreement, dated as of November 20, 2012, by and among the
Operating Partnership, the Company, Wells Fargo Bank National Association, asAdministrative Agent, Bank of America, N.A., as Syndication Agent, PNC Bank, NationalAssociation, as Documentation Agent, Compass Bank, an Alabama corporation, DeutscheBank Securities Inc., and U.S. Bank National Association, as Senior Managing Agents, RoyalBank of Canada and Sumitomo Mitsui Banking Corporation, as Managing Agents, Wells FargoSecurities LLC and Merrill Lynch, Pierce, Fenner & Smith Incorporated, as Joint LeadArrangers and Joint Bookrunners and the other lenders party thereto
10.24(6) Amended and Restated Guaranty, dated as of November 20, 2012, by the Company andcertain subsidiaries of the Company party thereto
10.25(2) Form of WLS Management Agreement21.1* List of Subsidiaries of RLJ Lodging Trust23.1* Consent of PricewaterhouseCoopers LLP31.1* Certification of Chief Executive Officer pursuant to Rule 13a-14(a)/15d-14(a) of the Securities
Exchange Act of 1934, as amended, as adopted pursuant to Section 302 of the Sarbanes-OxleyAct of 2002
31.2* Certification of Chief Financial Officer pursuant to Rule 13a-14(a)/15d-14(a) of the SecuritiesExchange Act of 1934, as amended, as adopted pursuant to Section 302 of the Sarbanes-OxleyAct of 2002
32.1* Certification of Chief Executive Officer and Chief Financial Officer pursuant to18 U.S.C. 1350, as adopted pursuant to Section 906 of the Sarbanes-Oxley Act of 2002
101.INS XBRL Instance DocumentSubmitted electronically with this report
101.SCH XBRL Taxonomy Extension Schema DocumentSubmitted electronically with this report
101.CAL XBRL Taxonomy Calculation Linkbase DocumentSubmitted electronically with this report
101.DEF XBRL Taxonomy Extension Definition Linkbase DocumentSubmitted electronically with this report
101.LAB XBRL Taxonomy Label Linkbase DocumentSubmitted electronically with this report
101.PRE XBRL Taxonomy Presentation Linkbase DocumentSubmitted electronically with this report
* Filed herewith
(1) Previously filed with Registration Statement on Form S-11/A filed by the Registrant with theSecurities and Exchange Commission on March 15, 2011.
(2) Previously filed with Registration Statement on Form S-11/A filed by the Registrant with theSecurities and Exchange Commission on April 13, 2011.
(3) Previously filed with Registration Statement on Form S-11/A filed by the Registrant with theSecurities and Exchange Commission on April 29, 2011.
(4) Previously filed with Registration Statement on Form S-11/A filed by the Registrant with theSecurities and Exchange Commission on May 5, 2011.
(5) Previously filed with the Current Report on Form 8-K filed by the Registrant with the Securities andExchange Commission on May 19, 2011.
(6) Previously filed with the Current Report on Form 8-K filed by the Registrant with the Securities andExchange Commission on November 27, 2012.
88

Item 8. Financial Statements and Supplementary Data
INDEX TO FINANCIAL STATEMENTS
RLJ Lodging Trust:Reports of Independent Registered Public Accounting Firm . . . . . . . . . . . . . . . . . . . . . . . . . . . F-2Combined Consolidated Financial Statements . . . . . . . . . . . . . . . . . . . . . . . . . . . . . . . . . . . . .
Balance Sheets as of December 31, 2012 and 2011 . . . . . . . . . . . . . . . . . . . . . . . . . . . . . . . . F-3Statements of Operations and Comprehensive Income for the years ended December 31,
2012, 2011 and 2010 . . . . . . . . . . . . . . . . . . . . . . . . . . . . . . . . . . . . . . . . . . . . . . . . . . . . F-4Statements of Changes in Owners’ Equity for the years ended December 31, 2012, 2011
and 2010 . . . . . . . . . . . . . . . . . . . . . . . . . . . . . . . . . . . . . . . . . . . . . . . . . . . . . . . . . . . . F-5Statements of Cash Flows for the years ended December 31, 2012, 2011 and 2010 . . . . . . . . . F-8Notes to Combined Consolidated Financial Statements . . . . . . . . . . . . . . . . . . . . . . . . . . . . . F-9Schedule III—Real Estate and Accumulated Depreciation as of December 31, 2012 . . . . . . . . F-47
F-1

REPORT OF INDEPENDENT REGISTERED PUBLIC ACCOUNTING FIRM
The Board of Trustees and ShareholdersRLJ Lodging Trust:
In our opinion, the combined consolidated financial statements listed in the accompanying indexpresent fairly, in all material respects, the financial position of RLJ Lodging Trust and its subsidiaries(the ‘‘Company’’) as of December 31, 2012 and 2011 and the results of their operations and their cashflows for each of the three years in the period ended December 31, 2012 in conformity with accountingprinciples generally accepted in the United States of America. In addition, in our opinion, the financialstatement schedule listed in the accompanying index presents fairly, in all material respects, theinformation set forth therein when read in conjunction with the related combined consolidated financialstatements. Also in our opinion, the Company maintained, in all material respects, effective internalcontrol over financial reporting as of December 31, 2012, based on criteria established in InternalControl—Integrated Framework issued by the Committee of Sponsoring Organizations of the TreadwayCommission (COSO). The Company’s management is responsible for these financial statements andfinancial statement schedule, for maintaining effective internal control over financial reporting and forits assessment of the effectiveness of internal control over financial reporting, included inManagement’s Annual Report on Internal Control over Financial Reporting appearing under Item 9A.Our responsibility is to express opinions on these financial statements, on the financial statementschedule and on the Company’s internal control over financial reporting based on our audits (whichwas an integrated audit in 2012). We conducted our audits in accordance with the standards of thePublic Company Accounting Oversight Board (United States). Those standards require that we planand perform the audits to obtain reasonable assurance about whether the financial statements are freeof material misstatement and whether effective internal control over financial reporting was maintainedin all material respects. Our audits of the financial statements included examining, on a test basis,evidence supporting the amounts and disclosures in the financial statements, assessing the accountingprinciples used and significant estimates made by management, and evaluating the overall financialstatement presentation. Our audit of internal control over financial reporting included obtaining anunderstanding of internal control over financial reporting, assessing the risk that a material weaknessexists, and testing and evaluating the design and operating effectiveness of internal control based onthe assessed risk. Our audits also included performing such other procedures as we considerednecessary in the circumstances. We believe that our audits provide a reasonable basis for our opinions.
A company’s internal control over financial reporting is a process designed to provide reasonableassurance regarding the reliability of financial reporting and the preparation of financial statements forexternal purposes in accordance with generally accepted accounting principles. A company’s internalcontrol over financial reporting includes those policies and procedures that (i) pertain to themaintenance of records that, in reasonable detail, accurately and fairly reflect the transactions anddispositions of the assets of the company; (ii) provide reasonable assurance that transactions arerecorded as necessary to permit preparation of financial statements in accordance with generallyaccepted accounting principles, and that receipts and expenditures of the company are being made onlyin accordance with authorizations of management and directors of the company; and (iii) providereasonable assurance regarding prevention or timely detection of unauthorized acquisition, use, ordisposition of the company’s assets that could have a material effect on the financial statements.
Because of its inherent limitations, internal control over financial reporting may not prevent ordetect misstatements. Also, projections of any evaluation of effectiveness to future periods are subjectto the risk that controls may become inadequate because of changes in conditions, or that the degreeof compliance with the policies or procedures may deteriorate.
/s/ PricewaterhouseCoopers LLP
McLean, VirginiaFebruary 28, 2013
F-2

RLJ Lodging Trust
Combined Consolidated Balance Sheets
(Amounts in thousands, except share and per share data)
December 31, December 31,2012 2011
AssetsInvestment in hotel properties, net . . . . . . . . . . . . . . . . . . . . . . . . . . . . . . . . . . . $3,073,483 $2,820,457Investment in loans . . . . . . . . . . . . . . . . . . . . . . . . . . . . . . . . . . . . . . . . . . . . . 12,426 12,633Cash and cash equivalents . . . . . . . . . . . . . . . . . . . . . . . . . . . . . . . . . . . . . . . . . 115,861 310,231Restricted cash reserves . . . . . . . . . . . . . . . . . . . . . . . . . . . . . . . . . . . . . . . . . . 64,787 87,288Hotel receivables, net of allowance of $194 and $150, respectively . . . . . . . . . . . . . 22,738 20,081Deferred financing costs, net . . . . . . . . . . . . . . . . . . . . . . . . . . . . . . . . . . . . . . . 11,131 9,639Deferred income tax asset . . . . . . . . . . . . . . . . . . . . . . . . . . . . . . . . . . . . . . . . . 2,206 1,369Purchase deposits . . . . . . . . . . . . . . . . . . . . . . . . . . . . . . . . . . . . . . . . . . . . . . 9,910 —Prepaid expense and other assets . . . . . . . . . . . . . . . . . . . . . . . . . . . . . . . . . . . . 33,843 28,320
Total assets . . . . . . . . . . . . . . . . . . . . . . . . . . . . . . . . . . . . . . . . . . . . . . . . . $3,346,385 $3,290,018
Liabilities and EquityBorrowings under revolving credit facilities . . . . . . . . . . . . . . . . . . . . . . . . . . . . . $ 16,000 $ —Mortgage loans . . . . . . . . . . . . . . . . . . . . . . . . . . . . . . . . . . . . . . . . . . . . . . . . 997,651 1,341,735Term loans . . . . . . . . . . . . . . . . . . . . . . . . . . . . . . . . . . . . . . . . . . . . . . . . . . . 400,000 —Interest rate swap liability . . . . . . . . . . . . . . . . . . . . . . . . . . . . . . . . . . . . . . . . . 470 1,796Accounts payable and accrued expense . . . . . . . . . . . . . . . . . . . . . . . . . . . . . . . . 87,105 86,213Deferred income tax liability . . . . . . . . . . . . . . . . . . . . . . . . . . . . . . . . . . . . . . . 4,064 3,314Advance deposits and deferred revenue . . . . . . . . . . . . . . . . . . . . . . . . . . . . . . . 8,508 4,781Accrued interest . . . . . . . . . . . . . . . . . . . . . . . . . . . . . . . . . . . . . . . . . . . . . . . 2,284 2,115Distributions payable . . . . . . . . . . . . . . . . . . . . . . . . . . . . . . . . . . . . . . . . . . . . 22,392 16,076
Total liabilities . . . . . . . . . . . . . . . . . . . . . . . . . . . . . . . . . . . . . . . . . . . . . . . 1,538,474 1,456,030
Commitments and Contingencies (Note 10)
EquityShareholders’ equity:
Preferred shares of beneficial interest, $0.01 par value, 50,000,000 sharesauthorized; zero shares issued and outstanding at December 31, 2012 and 2011,respectively. . . . . . . . . . . . . . . . . . . . . . . . . . . . . . . . . . . . . . . . . . . . . . . . — —
Common shares of beneficial interest, $0.01 par value, 450,000,000 sharesauthorized; 106,565,516 and 106,279,049 shares issued and outstanding atDecember 31, 2012 and 2011, respectively. . . . . . . . . . . . . . . . . . . . . . . . . . . 1,066 1,063
Additional paid-in-capital . . . . . . . . . . . . . . . . . . . . . . . . . . . . . . . . . . . . . . . . 1,841,449 1,835,011Accumulated other comprehensive loss . . . . . . . . . . . . . . . . . . . . . . . . . . . . . . — (1,782)Distributions in excess of net earnings . . . . . . . . . . . . . . . . . . . . . . . . . . . . . . . (52,681) (18,960)
Total shareholders’ equity . . . . . . . . . . . . . . . . . . . . . . . . . . . . . . . . . . . . . . 1,789,834 1,815,332Noncontrolling interest
Noncontrolling interest in joint venture . . . . . . . . . . . . . . . . . . . . . . . . . . . . . . 6,766 7,170Noncontrolling interest in Operating Partnership . . . . . . . . . . . . . . . . . . . . . . . . 11,311 11,486
Total noncontrolling interest . . . . . . . . . . . . . . . . . . . . . . . . . . . . . . . . . . . . 18,077 18,656
Total equity . . . . . . . . . . . . . . . . . . . . . . . . . . . . . . . . . . . . . . . . . . . . . . . 1,807,911 1,833,988
Total liabilities and equity . . . . . . . . . . . . . . . . . . . . . . . . . . . . . . . . . . . . . $3,346,385 $3,290,018
The accompanying notes are an integral part of these combined consolidated financial statements.
F-3

RLJ Lodging Trust
Combined Consolidated Statements of Operations and Comprehensive Income
(Amounts in thousands, except share and per share data)
For the year ended December 31,
2012 2011 2010
RevenueHotel operating revenue
Room revenue . . . . . . . . . . . . . . . . . . . . . . . . . . . . . . . . . . . . . . . . . . . . . $ 742,618 $ 656,997 $445,630Food and beverage revenue . . . . . . . . . . . . . . . . . . . . . . . . . . . . . . . . . . . . . 87,610 81,781 57,710Other operating department revenue . . . . . . . . . . . . . . . . . . . . . . . . . . . . . . . 23,977 20,174 13,326
Total revenue . . . . . . . . . . . . . . . . . . . . . . . . . . . . . . . . . . . . . . . . . . . . . . . 854,205 758,952 516,666
ExpenseHotel operating expense
Room . . . . . . . . . . . . . . . . . . . . . . . . . . . . . . . . . . . . . . . . . . . . . . . . . . 163,374 147,039 96,389Food and beverage . . . . . . . . . . . . . . . . . . . . . . . . . . . . . . . . . . . . . . . . . . 60,508 56,606 37,798Management fees . . . . . . . . . . . . . . . . . . . . . . . . . . . . . . . . . . . . . . . . . . . 30,075 26,056 18,373Other hotel expenses . . . . . . . . . . . . . . . . . . . . . . . . . . . . . . . . . . . . . . . . . 258,644 231,602 159,267
Total hotel operating expense . . . . . . . . . . . . . . . . . . . . . . . . . . . . . . . . . . 512,601 461,303 311,827Depreciation and amortization . . . . . . . . . . . . . . . . . . . . . . . . . . . . . . . . . . . . . 126,798 128,112 96,940Impairment loss . . . . . . . . . . . . . . . . . . . . . . . . . . . . . . . . . . . . . . . . . . . . . . 896 — —Property tax, insurance and other . . . . . . . . . . . . . . . . . . . . . . . . . . . . . . . . . . . 53,091 46,605 32,500General and administrative . . . . . . . . . . . . . . . . . . . . . . . . . . . . . . . . . . . . . . . 31,099 24,253 19,542Transaction and pursuit costs . . . . . . . . . . . . . . . . . . . . . . . . . . . . . . . . . . . . . . 3,520 3,996 14,345IPO costs . . . . . . . . . . . . . . . . . . . . . . . . . . . . . . . . . . . . . . . . . . . . . . . . . . — 10,733 —
Total operating expense . . . . . . . . . . . . . . . . . . . . . . . . . . . . . . . . . . . . . . 728,005 675,002 475,154
Operating income . . . . . . . . . . . . . . . . . . . . . . . . . . . . . . . . . . . . . . . . . . . . 126,200 83,950 41,512Other income . . . . . . . . . . . . . . . . . . . . . . . . . . . . . . . . . . . . . . . . . . . . . . 433 1,001 629Interest income . . . . . . . . . . . . . . . . . . . . . . . . . . . . . . . . . . . . . . . . . . . . . 1,686 1,682 3,352Interest expense . . . . . . . . . . . . . . . . . . . . . . . . . . . . . . . . . . . . . . . . . . . . (84,997) (96,020) (86,735)Loss on disposal . . . . . . . . . . . . . . . . . . . . . . . . . . . . . . . . . . . . . . . . . . . . (634) — —
Income (loss) from continuing operations before income taxes . . . . . . . . . . . . . . . . . . 42,688 (9,387) (41,242)Income tax expense . . . . . . . . . . . . . . . . . . . . . . . . . . . . . . . . . . . . . . . . . . (1,369) (740) (945)
Income (loss) from continuing operations . . . . . . . . . . . . . . . . . . . . . . . . . . . . . . . 41,319 (10,127) (42,187)Income from discontinued operations . . . . . . . . . . . . . . . . . . . . . . . . . . . . . . . — 21,836 19,571
Net income (loss) . . . . . . . . . . . . . . . . . . . . . . . . . . . . . . . . . . . . . . . . . . . . . . 41,319 11,709 (22,616)Net (income) loss attributable to non-controlling interests
Noncontrolling interest in joint venture . . . . . . . . . . . . . . . . . . . . . . . . . . . . . . . 404 (47) 213Noncontrolling interest in common units of Operating Partnership . . . . . . . . . . . . . . (425) (255) —
Net income (loss) attributable to the Company . . . . . . . . . . . . . . . . . . . . . . . . . . . . 41,298 11,407 (22,403)Distributions to preferred unitholders . . . . . . . . . . . . . . . . . . . . . . . . . . . . . . . . . . — (61) (62)
Net income (loss) attributable to common shareholders . . . . . . . . . . . . . . . . . . . . . . . $ 41,298 $ 11,346 $(22,465)
Basic per common share data:Net income (loss) per share attributable to common shareholders before discontinued
operations . . . . . . . . . . . . . . . . . . . . . . . . . . . . . . . . . . . . . . . . . . . . . . . . . $ 0.38 $ (0.11)Discontinued operations . . . . . . . . . . . . . . . . . . . . . . . . . . . . . . . . . . . . . . . . . . — 0.23
Net income per share attributable to common shareholders . . . . . . . . . . . . . . . . . . . . $ 0.38 $ 0.12
Weighted-average number of common shares . . . . . . . . . . . . . . . . . . . . . . . . . . . . . 105,423,604 95,340,666
Diluted per common share data:Net income (loss) per share attributable to common shareholders before discontinued
operations . . . . . . . . . . . . . . . . . . . . . . . . . . . . . . . . . . . . . . . . . . . . . . . . . $ 0.38 $ (0.11)Discontinued operations . . . . . . . . . . . . . . . . . . . . . . . . . . . . . . . . . . . . . . . . . . — 0.23
Net income per share attributable to common shareholders . . . . . . . . . . . . . . . . . . . . $ 0.38 $ 0.12
Weighted-average number of common shares . . . . . . . . . . . . . . . . . . . . . . . . . . . . . 105,748,686 95,340,666
Comprehensive incomeNet income (loss) attributable to the Company . . . . . . . . . . . . . . . . . . . . . . . . . . . . $ 41,298 $ 11,407Unrealized gain on interest rate derivatives . . . . . . . . . . . . . . . . . . . . . . . . . . . . . . 1,782 2,024
Comprehensive income attributable to the Company . . . . . . . . . . . . . . . . . . . . . . . . . $ 43,080 $ 13,431
The accompanying notes are an integral part of these combined consolidated financial statements.
F-4

F-5
RL
J L
odgi
ng T
rust
Com
bine
d C
onso
lida
ted
Stat
emen
t of
Cha
nges
in
Equ
ity
(Am
ount
s in
tho
usan
ds,
exce
pt s
hare
dat
a)
Part
ners
’ C
apit
alA
ccum
ulat
edFu
nd I
IFu
nd I
IIM
embe
rs’
Oth
erTo
tal
Cap
ital
Pre
ferr
ed U
nits
Gen
eral
Lim
ited
Gen
eral
Lim
ited
Com
preh
ensi
veN
onco
ntro
llin
gO
wne
rs’
Part
ner
Part
ners
Part
ner
Part
ners
Cla
ss A
Cla
ss B
Fund
II
Fund
III
Los
sIn
tere
stE
quit
y
Bal
ance
at
Dec
embe
r 31
, 20
09.
..
..
..
..
..
..
$(11
,440
)$4
59,9
03$(
17,8
52)
$50
,163
$13
,643
$5,
807
$189
$190
$(14
,856
)$
—$
485,
747
Com
pone
nts
of c
ompr
ehen
sive
los
s:N
et (
loss
) in
com
e.
..
..
..
..
..
..
..
..
.(2
0)(2
6,85
9)(8
)(1
6,37
9)15
,658
5,20
5—
——
(213
)(2
2,61
6)R
ecla
ssifi
catio
n ad
just
men
t fo
r ga
ins
incl
uded
in n
et l
oss
..
..
..
..
..
..
..
..
..
..
.—
——
——
——
—(5
8)—
(58)
Unr
ealiz
ed g
ain
on i
nter
est
rate
der
ivat
ives
.—
——
——
——
—11
,108
—11
,108
Tota
l co
mpr
ehen
sive
los
s.
..
..
..
..
..
..
..
(11,
566)
Part
ners
’ con
trib
utio
ns.
..
..
..
..
..
..
..
.6,
697
8,64
68,
243
778,
165
——
——
——
801,
751
Part
ners
’ dis
trib
utio
ns.
..
..
..
..
..
..
..
..
(8,6
46)
(8,6
46)
(13,
711)
——
——
——
—(3
1,00
3)M
embe
rs’ d
istr
ibut
ions
..
..
..
..
..
..
..
..
——
——
(22,
709)
(6,2
61)
——
——
(28,
970)
Non
cont
rolli
ng i
nter
est
reco
rded
upo
n th
eD
oubl
etre
e M
etro
polit
an h
otel
acq
uisi
tion
..
——
——
——
——
—7,
836
7,83
6D
istr
ibut
ions
to
pref
erre
d un
ithol
ders
..
..
..
—(3
1)—
(31)
——
——
——
(62)
Bal
ance
at
Dec
embe
r 31
, 20
10.
..
..
..
..
..
..
$(13
,409
)$4
33,0
13$(
23,3
28)
$811
,918
$6,
592
$4,
751
$189
$190
$(3
,806
)$7
,623
$1,2
23,7
33
The
acc
ompa
nyin
g no
tes
are
an i
nteg
ral
part
of
thes
e co
mbi
ned
cons
olid
ated
fin
anci
al s
tate
men
ts.

F-6
RL
J L
odgi
ng T
rust
Com
bine
d C
onso
lida
ted
Stat
emen
t of
Cha
nges
in
Equ
ity
(Con
tinu
ed)
(Am
ount
s in
tho
usan
ds,
exce
pt s
hare
dat
a)
Shar
ehol
ders
’ E
quit
yPa
rtne
rs’
Cap
ital
Com
mon
Sto
ckN
onco
ntro
llin
g In
tere
sts
Acc
umul
ated
Tota
lFu
nd I
IFu
nd I
IIM
embe
rs’
Add
itio
nal
Dis
trib
utio
nsO
ther
Con
soli
date
dTo
tal
Ow
ners
’/C
apit
alP
refe
rred
Uni
tsG
ener
alL
imit
edG
ener
alL
imit
edPa
id-i
n-in
exc
ess
ofC
ompr
ehen
sive
Ope
rati
ngJo
int
Non
cont
roll
ing
Shar
ehol
ders
Part
ner
Part
ners
Part
ner
Part
ners
Cla
ss A
Cla
ss B
Fund
II
Fund
III
Shar
esPa
r Va
lue
Cap
ital
net
earn
ings
Los
sPa
rtne
rshi
pVe
ntur
eIn
tere
sts
Equ
ity
Bal
ance
at
Dec
embe
r 31
, 20
10.
..
..
..
.$(
13,4
09)
$43
3,01
3$(
23,3
28)
$81
1,91
8$
6,59
2$
4,75
1$
189
$19
0—
$—
$—
$—
$(3,
806)
$—
$7,6
23$
7,62
3$1
,223
,733
Com
pone
nts
of c
ompr
ehen
sive
inc
ome:
Net
inc
ome
(los
s).
..
..
..
..
..
.(7
)(9
,444
)—
(234
)(2
56)
(85)
——
——
—21
,433
—25
547
302
11,7
09U
nrea
lized
gai
n on
int
eres
t ra
tede
riva
tives
..
..
..
..
..
..
..
——
——
——
——
——
——
2,02
4—
——
2,02
4
Tota
l co
mpr
ehen
sive
inc
ome
..
..
..
..
13,7
33Pa
rtne
rs’ c
ontr
ibut
ions
..
..
..
..
..
.4,
258
3,29
15,
031
114,
141
——
——
——
——
——
——
126,
721
Part
ners
’ dis
trib
utio
ns.
..
..
..
..
..
(3,2
30)
(4,8
76)
(3,7
98)
(4,3
92)
——
——
——
——
——
——
(16,
296)
Mem
bers
’ dis
trib
utio
ns.
..
..
..
..
.—
——
—(2
,547
)(5
57)
——
——
——
——
——
(3,1
04)
Proc
eeds
fro
m s
ale
of c
omm
on s
tock
, net
-.
——
——
——
—31
,595
,000
316
527,
977
——
—52
8,29
3Is
suan
ce o
f re
stri
cted
sto
ck.
..
..
..
.—
——
——
——
—1,
120,
830
11(1
1)—
——
——
—A
mor
tizat
ion
of s
hare
bas
ed c
ompe
nsat
ion-
——
——
——
——
—3,
284
——
—3,
284
Shar
e gr
ants
to
trus
tees
..
..
..
..
..
——
——
——
——
7,81
0—
120
——
——
—12
0Sh
ares
acq
uire
d to
sat
isfy
min
imum
requ
ired
fed
eral
and
sta
te t
ax w
ithho
ldin
gon
ves
ting
rest
rict
ed s
tock
..
..
..
..
——
——
——
——
(47,
542)
—(7
02)
——
——
—(7
02)
Forf
eitu
re o
f re
stri
cted
sto
ck.
..
..
..
.—
——
——
——
—(3
,000
)—
——
——
——
—E
xcha
nge
of o
wne
rs’ e
quity
for
com
mon
stoc
k an
d un
its.
..
..
..
..
..
..
12,3
88(4
21,9
60)
22,0
95(9
21,3
96)
(3,7
89)
(4,1
09)
6160
73,6
05,9
5173
61,
304,
343
——
11,5
71—
11,5
71—
Dis
trib
utio
ns t
o JV
par
tner
..
..
..
..
——
——
——
——
——
——
——
(500
)(5
00)
(500
)D
istr
ibut
ions
to
pref
erre
d un
ithol
ders
..
.—
(24)
—(3
7)—
——
——
——
——
——
—(6
1)R
edem
ptio
n of
pre
ferr
ed u
nits
..
..
..
.—
——
——
—(2
50)
(250
)—
——
——
——
—(5
00)
Dis
trib
utio
ns o
n co
mm
on s
hare
s an
d un
its-
——
——
——
——
——
—(4
0,39
3)—
(340
)—
(340
)(4
0,73
3)
Bal
ance
at
Dec
embe
r 31
, 20
11.
..
..
..
.$
—$
—$
—$
—$
—$
—$
—$
—10
6,27
9,04
9$1
,063
$1,8
35,0
11$(
18,9
60)
$(1,
782)
$11,
486
$7,1
70$1
8,65
6$1
,833
,988
The
acc
ompa
nyin
g no
tes
are
an i
nteg
ral
part
of
thes
e co
mbi
ned
cons
olid
ated
fin
anci
al s
tate
men
ts.

F-7
RL
J L
odgi
ng T
rust
Com
bine
d C
onso
lida
ted
Stat
emen
t of
Cha
nges
in
Equ
ity
(Con
tinu
ed)
(Am
ount
s in
tho
usan
ds,
exce
pt s
hare
dat
a)
Shar
ehol
ders
’ E
quit
yN
onco
ntro
llin
g In
tere
sts
Com
mon
Sto
ckA
ccum
ulat
edA
ddit
iona
lD
istr
ibut
ions
Oth
erC
onso
lida
ted
Tota
lPa
id-i
n-in
exc
ess
ofC
ompr
ehen
sive
Ope
rati
ngJo
int
Non
cont
roll
ing
Shar
esPa
r Va
lue
Cap
ital
net
earn
ings
Los
sPa
rtne
rshi
pVe
ntur
eIn
tere
sts
Tota
l E
quit
y
Bal
ance
at
Dec
embe
r 31
, 20
11.
..
..
..
..
..
106,
279,
049
$1,0
63$1
,835
,011
$(18
,960
)$(
1,78
2)$1
1,48
6$7
,170
$18,
656
$1,8
33,9
88N
et i
ncom
e (l
oss)
..
..
..
..
..
..
..
..
..
——
—41
,298
—42
5(4
04)
2141
,319
Unr
ealiz
ed g
ain
on i
nter
est
rate
der
ivat
ive
..
——
——
1,78
2—
——
1,78
2Is
suan
ce o
f re
stri
cted
sto
ck.
..
..
..
..
..
.43
6,64
64
(4)
——
——
——
Am
ortiz
atio
n of
sha
re b
ased
com
pens
atio
n.
.—
—8,
626
——
——
—8,
626
Shar
e gr
ants
to
trus
tees
..
..
..
..
..
..
..
8,53
0—
160
——
——
—16
0Sh
ares
acq
uire
d to
sat
isfy
min
imum
req
uire
dfe
dera
l an
d st
ate
tax
with
hold
ing
on v
estin
gre
stri
cted
sto
ck.
..
..
..
..
..
..
..
..
.(1
31,8
31)
(1)
(2,3
44)
——
——
—(2
,345
)Fo
rfei
ture
of
rest
rict
ed s
tock
..
..
..
..
..
.(2
6,87
8)—
——
——
——
—D
istr
ibut
ions
on
com
mon
sha
res
and
units
..
——
—(7
5,01
9)—
(600
)—
(600
)(7
5,61
9)
Bal
ance
at
Dec
embe
r 31
, 20
12.
..
..
..
..
..
106,
565,
516
$1,0
66$1
,841
,449
$(52
,681
)$
—$1
1,31
1$6
,766
$18,
077
$1,8
07,9
11
The
acc
ompa
nyin
g no
tes
are
an i
nteg
ral
part
of
thes
e co
mbi
ned
cons
olid
ated
fin
anci
al s
tate
men
ts.

RLJ Lodging Trust
Combined Consolidated Statements of Cash Flows
(Amounts in thousands)
For the year ended December 31,
2012 2011 2010
Cash flows from operating activities:Net income (loss) . . . . . . . . . . . . . . . . . . . . . . . . . . . . . . . . . . . . . . . . . . . . . . . $ 41,319 $ 11,709 $ (22,616)
Adjustments to reconcile net income (loss) to cash flow provided by operating activities:Gain on sale of properties . . . . . . . . . . . . . . . . . . . . . . . . . . . . . . . . . . . . . . . — — (23,710)Gain on extinguishment of indebtedness . . . . . . . . . . . . . . . . . . . . . . . . . . . . . . — (23,515)Depreciation and amortization . . . . . . . . . . . . . . . . . . . . . . . . . . . . . . . . . . . . 126,798 130,714 100,793Amortization of deferred financing costs . . . . . . . . . . . . . . . . . . . . . . . . . . . . . . 5,452 5,842 3,083Amortization of deferred management fees . . . . . . . . . . . . . . . . . . . . . . . . . . . . 1,000 1,000 1,000Impairment loss . . . . . . . . . . . . . . . . . . . . . . . . . . . . . . . . . . . . . . . . . . . . . 896 — —Loss on disposal . . . . . . . . . . . . . . . . . . . . . . . . . . . . . . . . . . . . . . . . . . . . . 634 — —Share grants to trustees . . . . . . . . . . . . . . . . . . . . . . . . . . . . . . . . . . . . . . . . 160 120 —Amortization of share based compensation . . . . . . . . . . . . . . . . . . . . . . . . . . . . 8,626 3,284 —Unrealized gain (loss) on interest rate swaps . . . . . . . . . . . . . . . . . . . . . . . . . . . 456 — (58)Deferred income taxes . . . . . . . . . . . . . . . . . . . . . . . . . . . . . . . . . . . . . . . . . (87) 1,945 —Changes in assets and liabilities:
Hotel receivables, net . . . . . . . . . . . . . . . . . . . . . . . . . . . . . . . . . . . . . . . . (2,493) 31 (7,431)Prepaid expense and other assets . . . . . . . . . . . . . . . . . . . . . . . . . . . . . . . . . (5,851) (6,723) 2,048Accounts payable and accrued expense . . . . . . . . . . . . . . . . . . . . . . . . . . . . . (4,448) 12,618 8,247Advance deposits and deferred revenue . . . . . . . . . . . . . . . . . . . . . . . . . . . . . 3,503 (1,525) 342Accrued interest . . . . . . . . . . . . . . . . . . . . . . . . . . . . . . . . . . . . . . . . . . . 169 (1,380) 2,380
Net cash flow provided by operating activities . . . . . . . . . . . . . . . . . . . . . . . . . . 176,134 134,120 64,078
Cash flows from investing activities:Acquisition of hotel properties, net of cash acquired . . . . . . . . . . . . . . . . . . . . . . (247,049) (236,858) (828,872)Purchase deposit . . . . . . . . . . . . . . . . . . . . . . . . . . . . . . . . . . . . . . . . . . . . . (9,910) — (8,500)Proceeds from principal payments on investment in loans . . . . . . . . . . . . . . . . . . . 207 207 68Improvements and additions to hotel properties . . . . . . . . . . . . . . . . . . . . . . . . . (129,235) (93,477) (15,984)Additions to property and equipment . . . . . . . . . . . . . . . . . . . . . . . . . . . . . . . . (342) (116) (80)Advances from related parties . . . . . . . . . . . . . . . . . . . . . . . . . . . . . . . . . . . . — — 10,103Proceeds from sale of hotel properties . . . . . . . . . . . . . . . . . . . . . . . . . . . . . . . — — 72,747Releases from (funding of) restricted cash reserves, net . . . . . . . . . . . . . . . . . . . . 22,501 (16,768) (16,089)
Net cash flow used in investing activities . . . . . . . . . . . . . . . . . . . . . . . . . . . . . . (363,828) (347,012) (786,607)
Cash flows from financing activities:Borrowings under credit facility . . . . . . . . . . . . . . . . . . . . . . . . . . . . . . . . . . . 101,000 — 589,146Repayments under credit facility . . . . . . . . . . . . . . . . . . . . . . . . . . . . . . . . . . . (85,000) — (735,129)Proceeds from term loans . . . . . . . . . . . . . . . . . . . . . . . . . . . . . . . . . . . . . . . 400,000 140,000 —Repayments of term loan . . . . . . . . . . . . . . . . . . . . . . . . . . . . . . . . . . . . . . . — (140,000) —Proceeds from mortgage loans . . . . . . . . . . . . . . . . . . . . . . . . . . . . . . . . . . . . 85,000 142,000 331,000Payment of mortgage principal . . . . . . . . . . . . . . . . . . . . . . . . . . . . . . . . . . . . (429,084) (489,342) (79,706)Distributions to noncontrolling interest . . . . . . . . . . . . . . . . . . . . . . . . . . . . . . — (500) —Repurchase of common shares . . . . . . . . . . . . . . . . . . . . . . . . . . . . . . . . . . . . (2,344) (702) —Distributions on common shares . . . . . . . . . . . . . . . . . . . . . . . . . . . . . . . . . . . (68,752) (24,451) —Distributions on OP units . . . . . . . . . . . . . . . . . . . . . . . . . . . . . . . . . . . . . . . (551) (206) —Payment of preferred unitholder distributions . . . . . . . . . . . . . . . . . . . . . . . . . . — (61) (62)Payment of deferred financing costs . . . . . . . . . . . . . . . . . . . . . . . . . . . . . . . . (6,944) (6,183) (8,424)Payment of members’ distributions . . . . . . . . . . . . . . . . . . . . . . . . . . . . . . . . . — (3,104) (28,971)Proceeds from partners’ contributions . . . . . . . . . . . . . . . . . . . . . . . . . . . . . . . — 126,721 801,750Payment of partners’ distributions . . . . . . . . . . . . . . . . . . . . . . . . . . . . . . . . . . — (16,296) (31,003)Redemption of preferred units . . . . . . . . . . . . . . . . . . . . . . . . . . . . . . . . . . . . — (500) —Proceeds from issuance of common shares . . . . . . . . . . . . . . . . . . . . . . . . . . . . — 567,672 —Shares acquired to satisfy withholding on vested restricted stock . . . . . . . . . . . . . . . (1) — —Payment of offering costs . . . . . . . . . . . . . . . . . . . . . . . . . . . . . . . . . . . . . . . — (39,379) —
Net cash flow (used in) provided by financing activities . . . . . . . . . . . . . . . . . . . . (6,676) 255,669 838,601
Net change in cash and cash equivalents . . . . . . . . . . . . . . . . . . . . . . . . . . . . . . . . (194,370) 42,777 116,072Cash and cash equivalents, beginning of period . . . . . . . . . . . . . . . . . . . . . . . . . . . . 310,231 267,454 151,382
Cash and cash equivalents, end of period . . . . . . . . . . . . . . . . . . . . . . . . . . . . . . . . $ 115,861 $ 310,231 $ 267,454
The accompanying notes are an integral part of these combined consolidated financial statements.
F-8

RLJ Lodging Trust
Notes to the Combined Consolidated Financial Statements
1. Organization
RLJ Lodging Trust (the ‘‘Company’’) was formed as a Maryland real estate investment trust(‘‘REIT’’) on January 31, 2011. The Company is a self-advised and self-administered REIT thatacquires primarily premium-branded, focused-service and compact full-service hotels. The Companycompleted the initial public offering of its common shares of beneficial interest (the ‘‘IPO’’) on May 16,2011. The IPO resulted in the sale of 27,500,000 common shares at a price per share of $18.00 andgenerated gross proceeds of $495.0 million. The aggregate proceeds to the Company, net ofunderwriters’ discounts in connection with the IPO, were approximately $464.1 million. On June 3,2011, the Company issued and sold an additional 4,095,000 common shares at a price per share of$18.00 upon exercise of the underwriters’ overallotment option (the ‘‘Overallotment’’), generating grossproceeds of approximately $73.7 million. The Company received aggregate proceeds, net ofunderwriters’ discounts, in connection with the Overallotment of approximately $69.1 million.Subsequent to the IPO, the Company contributed the net proceeds from the IPO, including proceedsreceived from the Overallotment, to the Company’s operating partnership, RLJ Lodging Trust, L.P. (the‘‘Operating Partnership’’), which was formed as a Delaware limited partnership on January 31, 2011, inexchange for units of limited partnership interest in the Operating Partnership (‘‘OP units’’). TheOperating Partnership holds substantially all of the Company’s assets and conducts substantially all ofits business. Upon completion of the IPO, the Company owned approximately 99.1% of the aggregateOP units. The Company qualified and elected to be taxed as a REIT, for U.S. federal income taxpurposes, commencing with the portion of its taxable year ending December 31, 2011.
Upon completion of the IPO and related formation transactions, the Company succeeded to theoperations and hotel investment and ownership platform of RLJ Development, LLC (‘‘RLJDevelopment’’), and the lodging assets of RLJ Lodging Fund II, L.P. (and its parallel fund) (‘‘Fund II’’)and RLJ Real Estate Fund III, L.P. (and its parallel fund) (‘‘Fund III’’), which collectively comprise theCompany’s predecessor (the ‘‘RLJ Predecessor’’). Accordingly, the RLJ Predecessor was not a separatelegal entity. RLJ Development, Fund II and Fund III were entities under the common control ofRobert L. Johnson, the Company’s Executive Chairman, and were formed for the purpose of acquiringand operating hotel properties. Upon completion of the IPO and formation transactions, all of theexisting investors in RLJ Development, Fund II and Fund III received common shares or OP units, asapplicable, as consideration for their respective interests in RLJ Development, Fund II and Fund III,and as a result became equity owners of the Company and/or the Operating Partnership, as applicable.
Due to the timing of the IPO and the formation transactions, the Company’s results of operationsas of and for the year ended December 31, 2010 reflect the financial condition and results ofoperations of the RLJ Predecessor. The Company’s results of operations for the year endedDecember 31, 2011 reflect the results of operations of the RLJ Predecessor together with theCompany. The financial condition as of December 31, 2012 and December 31, 2011, as well as theresults of operations for the year ended December 31, 2012 reflects solely the Company.
Substantially all of the Company’s assets are held by, and all of its operations are conductedthrough, the Operating Partnership. The Company is the sole general partner of the OperatingPartnership. The Company owned, through a combination of direct and indirect interests, 99.2% of theOP units at December 31, 2012. See Note 11 for additional disclosures on OP units.
As of December 31, 2012, the Company owned interests in 145 hotels with 21,617 rooms located in21 states and the District of Columbia, interests in land parcels located adjacent to certain hotels andan interest in two mortgage loans secured by hotels. The Company, through wholly-owned subsidiaries,
F-9

RLJ Lodging Trust
Notes to the Combined Consolidated Financial Statements (Continued)
1. Organization (Continued)
owned a 100% interest in all of its assets, with the exception of the Doubletree Metropolitan HotelNew York City, in which the Company, through wholly-owned subsidiaries, owned a 95% interest in ajoint venture, DBT Met Hotel Venture, LP, which was formed to engage in hotel operations related tothe Doubletree Metropolitan hotel. An independent hotel operator manages each hotel.
2. Summary of Significant Accounting Policies
Basis of Presentation and Principles of Consolidation
The combined consolidated financial statements have been prepared on the accrual basis ofaccounting in accordance with accounting principles generally accepted in the United States of America(‘‘GAAP’’).
The combined consolidated financial statements include the accounts of the Company, theOperating Partnership and its wholly-owned subsidiaries, including joint ventures. All significantintercompany balances have been eliminated in consolidation.
The combined consolidated financial statements for the periods prior to the May 16, 2011 IPO ofRLJ Lodging Trust include the accounts of Fund II, Fund III, and RLJ Development and theirrespective wholly-owned subsidiaries. RLJ Development, Fund II and Fund III were entities under thecommon control of Robert L. Johnson and were formed for the purpose of acquiring and operatinghotel properties. As part of the IPO and related formation transactions, the Company acquired certainof the assets of RLJ Development, including employees, furniture, fixtures and equipment (‘‘FF&E’’)and leases, which represented substantially all of RLJ Development’s business. Since these threeentities were under common control and the Company succeeded to their operations and businesses,the combined entities of Fund II, Fund III and RLJ Development, for the periods prior to the May 16,2011 IPO, are presented as the RLJ Predecessor and referred to as the Company. All significantintercompany balances have been eliminated in consolidation.
Use of Estimates
The preparation of the financial statements and accompanying notes in conformity with GAAPrequires management to make estimates and assumptions that affect the reported amounts of certainassets and liabilities and the amounts of contingent assets and liabilities at the balance sheet date andthe reported amounts of revenues and expenses during the reporting period. Actual results could differfrom those estimates.
Reporting Periods
As of December 31, 2012, the Company owned five hotels that are managed by affiliates ofMarriott International (‘‘Marriott’’). The Company’s hotels managed by Marriott are accounted for ona fiscal year comprised of 52 or 53 weeks ending on the Friday closest to December 31. The Company’sresults for the years ended December 31, 2012, 2011 and 2010 include the results of operations for theCompany’s Marriott-managed hotels for the 52-week periods ending December 28, 2012, December 30,2011 and December 31, 2010, respectively.
F-10

RLJ Lodging Trust
Notes to the Combined Consolidated Financial Statements (Continued)
2. Summary of Significant Accounting Policies (Continued)
Risks and Uncertainties
During the last economic recession, the Company experienced reduced demand for its hotel roomsand services. While uncertainty over the continued economic recovery may impact the lodging industryand the Company’s financial results and growth, the Company remains cautiously optimistic that itsfuture financial results and growth will benefit from current economic conditions and favorable lodgingfundamentals.
At December 31, 2012, the Company owned five, 21 and 17 hotels located in the New York, NewYork; Chicago, Illinois; and Austin, Texas metropolitan areas, respectively, that accounted for 15.8%,12.1% and 10.5% of our total revenue, respectively. As a result, the Company is susceptible to adversemarket conditions in these areas, including industry downturns, relocation of businesses and anyoversupply of hotel rooms or a reduction in lodging demand.
At December 31, 2012, the Company owned 102 and 31 hotels that operate under Marriott andHilton brands, respectively. As a result, the Company is subject to the potential risks associated withthe concentration of its hotels under a limited number of brands. A negative public image or otheradverse event that becomes associated with either of these brands could adversely affect hotelsoperated under the respective brand. If either of these brands suffers a significant decline in appeal tothe traveling public, the revenues and profitability of the Company’s branded hotels could be adverselyaffected.
The Company owns 104 hotels that are managed by White Lodging Services Corporation(‘‘WLS’’). As a result, the Company is subject to the potential risks associated with the concentration ofthe majority of our hotels under a single management company. A negative public image or otheradverse event that becomes associated with or impacts WLS could adversely affect the revenues andprofitability of hotels that are managed by them.
Revenue Recognition
The Company’s revenue comprises hotel operating revenue, such as room revenue, food andbeverage revenue and revenue from other hotel operating departments (such as telephone, parking andbusiness centers). These revenues are recorded net of any sales and occupancy taxes collected fromguests. All rebates or discounts are recorded as a reduction in revenue, and there are no materialcontingent obligations with respect to rebates and discounts offered by the hotels. All revenues arerecorded on an accrual basis as earned. Appropriate allowances are made for doubtful accounts andare recorded as bad debt expense. The allowances are calculated as a percentage of aged accountsreceivable, based on individual hotel management company policy. Cash received prior to guest arrivalis recorded as an advance from the guest and recognized as revenue at the time of occupancy.
Incentive payments received pursuant to entry into management agreements are deferred andamortized into income over the life of the respective agreements. In May 2012, the Company receivedan incentive payment of $4.0 million related to purchasing a hotel and entering into a franchiseagreement, which will be recognized over the remaining term of the franchise agreement. As ofDecember 31, 2012, there is approximately $3.9 million remaining to be recognized.
F-11

RLJ Lodging Trust
Notes to the Combined Consolidated Financial Statements (Continued)
2. Summary of Significant Accounting Policies (Continued)
Fair Value of Financial Instruments
The estimated fair values of financial instruments have been determined by the Company usingavailable market information and appropriate valuation methods. Considerable judgment is required ininterpreting market data to develop the estimates of fair value. Accordingly, the estimates presentedherein are not necessarily indicative of the amounts that the Company could realize in a currentmarket exchange. The use of different market assumptions and/or estimation methods may have amaterial effect on the estimated fair value amounts. The Company used the following marketassumptions and/or estimation methods:
• Cash and cash equivalents, hotel receivables, accounts payable and accrued expenses—Thecarrying amounts reported in the combined consolidated balance sheets for these financialinstruments approximate fair value because of their short maturities.
• Investment in collateralized loans—Fair value is determined by discounting the futurecontractual cash flows to the present value using a current market interest rate. The market rateis determined by giving consideration to one or both of the following criteria, as appropriate:(1) interest rates for loans of comparable quality and maturity, and (2) the value of theunderlying collateral. The fair values of the Company’s investment in collateralized loans aregenerally classified within Level 3 of the valuation hierarchy. The fair value estimated atDecember 31, 2012 and 2011 was $23.0 million and $22.6 million, respectively.
• Interest rate swaps and caps—The fair value of interest rate swaps and caps is determined asdiscussed in Note 9 to these financial statements.
• Variable rate mortgage notes payable and borrowings under the credit facility—The carryingamounts reported in the combined consolidated balance sheets for these financial instrumentsapproximate fair value. The Company estimates the fair value of its variable rate debt by usingquoted market rates for similar loans with similar terms. As a result, the Company determinedthat its variable rate mortgage notes payable in their entirety are classified in Level 2 of the fairvalue hierarchy.
• Fixed rate mortgage notes payable—The fair value estimated at December 31, 2012 and 2011 of$745.3 million and $771.5 million, respectively, is calculated based on the net present value ofpayments over the term of the loans using estimated market rates for similar mortgage loanswith similar terms and loan to value ratios, which is a Level 3 input. As a result, the Companydetermined that its fixed rate mortgage notes payable in their entirety are classified in Level 3 ofthe fair value hierarchy. The carrying value of fixed rate mortgage notes payable atDecember 31, 2012 and 2011 was $770.7 million and $783.7 million, respectively.
Investment in Hotel Properties
Hotel acquisitions consist almost exclusively of land, land improvements, buildings, buildingimprovements, furniture, fixtures and equipment and inventory. The Company records the purchaseprice among these asset classes based on their respective fair values. When the Company acquiresproperties, they are acquired for use. Generally, the Company does not acquire any significant in-placeleases or other intangible assets (e.g., management agreements, franchise agreements or trademarks)when hotels are acquired. The only intangible assets acquired through December 31, 2012 consisted offavorable lease agreements and miscellaneous operating agreements, which are short-term in nature. In
F-12

RLJ Lodging Trust
Notes to the Combined Consolidated Financial Statements (Continued)
2. Summary of Significant Accounting Policies (Continued)
conjunction with the acquisition of a hotel, the Company typically negotiates new franchise andmanagement agreements with the selected brand and manager.
The Company’s investments in hotels are carried at cost and are depreciated using the straight-linemethod over estimated useful lives of 15 years for land improvements, 15 years for buildingimprovements, 40 years for buildings and three to five years for furniture, fixtures and equipment.Intangible assets arising from favorable or unfavorable leases are amortized using the straight-linemethod over the non-cancelable portion of the term of the agreement. Maintenance and repairs areexpensed and major renewals or improvements are capitalized. Upon the sale or disposition of a fixedasset, the asset and related accumulated depreciation are removed from the accounts and the relatedgain or loss is included in discontinued operations.
The Company considers each individual hotel to be an identifiable component of the business. Inaccordance with the impairment or disposal of long-lived assets guidance, the Company does notconsider a hotel as ‘‘held for sale’’ until it is probable that the sale will be completed within one yearand the other requisite criteria for such classification have been met. Once a hotel is designated as‘‘held for sale’’ the operations for that hotel are included in discontinued operations. The Companydoes not depreciate hotel assets so long as they are classified as ‘‘held for sale.’’ Upon designation of ahotel as being ‘‘held for sale’’ and quarterly thereafter, the Company reviews the realizability of thecarrying value, less cost to sell, in accordance with the guidance. Any such adjustment in the carryingvalue of a hotel classified as ‘‘held for sale’’ is reflected in discontinued operations.
The Company assesses the carrying values of each hotel whenever events or changes incircumstances indicate that the carrying amounts of these hotels may not be fully recoverable.Recoverability of the hotel is measured by comparison of the carrying amount of the hotel to theestimated future undiscounted cash flows which take into account current market conditions and theCompany’s intent with respect to holding or disposing of the hotel. If the Company’s analysis indicatesthat the carrying value of the hotel is not recoverable on an undiscounted cash flow basis, it recognizesan impairment charge for the amount by which the carrying value exceeds the fair value of the hotel.Fair value is determined through various valuation techniques, including internally developeddiscounted cash flow models, comparable market transactions and third party appraisals, whereconsidered necessary.
The use of projected future cash flows is based on assumptions that are consistent with a marketparticipant’s future expectations for the travel industry and economy in general and the Company’splans to manage the underlying hotels. However, assumptions and estimates about future cash flowsand capitalization rates are complex and subjective. Changes in economic and operating conditions andthe Company’s ultimate investment intent that occur subsequent to a current impairment analysis couldimpact these assumptions and result in future impairment charges of the hotels.
Investment in Loans
The Company holds investments in two collateralized mortgage loans. The loans are collateralizedby the related hotels and were recorded at acquisition at their initial investment, which includes theamount paid to the seller plus any fees paid or less any fees received. The acquired loans were of adeteriorated credit quality as the loans were already in default, as of the date they were acquired bythe Company and therefore the amounts paid for the loans reflected the Company’s determination that
F-13

RLJ Lodging Trust
Notes to the Combined Consolidated Financial Statements (Continued)
2. Summary of Significant Accounting Policies (Continued)
it was probable the Company would be unable to collect all amounts due pursuant to the loan’scontractual terms.
The Company considers expected prepayments, and estimates the amount and timing ofundiscounted expected principal, interest and other cash flows. The Company determines any excess ofthe loan’s scheduled contractual principal and contractual interest payments over all cash flowsexpected at acquisition as an amount that should not be accreted. The remaining amount, representingthe excess of the loan’s cash flows expected to be collected over the amount paid to acquire the loan isaccreted into interest income over the remaining life of the loan. The Company will regularlyre-estimate cash flows expected to be collected over the life of the loan. Any increases in future cashflows expected to be collected will result in a prospective adjustment to the interest yield which will berecognized over the loan’s remaining life. Any decreases in cash flows expected to be collected afterloan acquisition will result in an impairment charge. A reserve will be established if the present valueof payments expected to be received, observable market prices, or the estimated fair value of thecollateral (for loans that are dependent on the collateral for repayment) of an impaired loan is lowerthan the carrying value of that loan. As of December 31, 2012 and 2011, no reserves for loan losseswere deemed necessary.
Cash and Cash Equivalents
All highly liquid investments with a maturity of three months or less when purchased areconsidered to be cash equivalents. The Company maintains cash balances in domestic banks, which, attimes, may exceed the limits of amounts insured by the Federal Deposit Insurance Corporation.
Restricted Cash Reserves
All cash that is required to be maintained in a reserve escrow account by a managementagreement, franchise agreement and/or a mortgage agreement for replacement of furniture, fixtures andequipment and funding of real estate taxes and insurance is considered to be restricted cash reserves.
Hotel Receivables
Hotel receivables consist mainly of hotel guest and meeting and banquet room rental receivables.The Company does not generally require collateral, as ongoing credit evaluations are performed and anallowance for doubtful accounts is established against any receivable that is estimated to beuncollectible.
Deferred Financing Fees
Deferred financing fees relate to costs incurred to obtain long-term financing. Deferred financingfees are recorded at cost and are amortized using the straight-line method, which approximates theeffective interest method, over the respective terms of the financing agreement, as applicable (seeNote 7) and are included as a component of interest expense. The Company expenses unamortizeddeferred financing fees when the associated financing agreement is refinanced or repaid beforematurity, unless criteria are met that would allow for the carryover of such costs to the refinancedagreement. For the years ended December 31, 2012, 2011 and 2010, approximately $5.5 million,$5.8 million and $2.5 million (excluding discontinued operations), respectively, of amortization expensewas recorded as a component of interest expense. Accumulated amortization at December 31, 2012 and
F-14

RLJ Lodging Trust
Notes to the Combined Consolidated Financial Statements (Continued)
2. Summary of Significant Accounting Policies (Continued)
2011 was approximately $17.7 million and $16.8 million (excluding discontinued operations),respectively.
Deferred Management Fees
In June 2006, in consideration for the agreement of WLS to enter into new managementagreements on terms favorable to Fund II, a subsidiary of Fund II made a one-time payment of$20.0 million to WLS. This payment was recorded at cost, and is being amortized as a component ofmanagement fee expense over the 20-year initial term of the management agreement. For the yearsended December 31, 2012, 2011 and 2010, $1.0 million of amortization expense was recorded in eachyear with respect to deferred management fees. As of December 31, 2012 and 2011, accumulatedamortization was approximately $6.6 million and $5.6 million, respectively.
Comprehensive Income (Loss)
Comprehensive income (loss) includes net income (loss) and other comprehensive income (loss).Other comprehensive income (loss) is comprised of unrealized gains and losses resulting from hedgingactivities.
Advertising Costs
The Company expenses advertising costs as incurred. Advertising expense was approximately$4.4 million, $4.0 million and $2.2 million for the years ended December 31, 2012, 2011 and 2010,respectively, (excluding discontinued operations) and is included in other hotel operating expenses.
Transaction and Pursuit Costs
The Company incurs costs during the review of potential property acquisitions, including legal fees,architectural costs, environmental reviews and market studies. These costs are expensed as incurred.
Derivative Financial Instruments
In the normal course of business, the Company is exposed to the effects of interest rate changes.As of December 31, 2012 and 2011, 45.5% and 41.6%, respectively, of the Company’s borrowings weresubject to variable rates. As of December 31, 2012 and 2011, after taking into consideration the effectof interest rate swaps and caps, 40.6% and 25.1%, respectively, of the Company’s borrowings weresubject to variable rates. The Company limits the risks associated with interest rate changes byfollowing the Company’s established risk management policies and procedures, including the use ofderivatives. The Company utilizes derivative financial instruments to manage, or hedge, interest raterisk. The Company attempts to require that hedging derivative instruments be effective in reducing theinterest rate risk exposure that they are designated to hedge. This effectiveness is essential in order toqualify for hedge accounting. Instruments that meet these hedging criteria are formally designated ashedges at the inception of the derivative contract. When the terms of an underlying transaction aremodified, or when the underlying hedged item ceases to exist, all changes in the fair value of theinstrument are marked-to-market with changes in value included in net income each period until theinstrument matures.
F-15

RLJ Lodging Trust
Notes to the Combined Consolidated Financial Statements (Continued)
2. Summary of Significant Accounting Policies (Continued)
The Company utilizes a variety of borrowing vehicles including an unsecured revolving creditfacility and medium and long-term financings. To reduce the Company’s susceptibility to interest ratevariability, the Company uses interest rate instruments, typically interest rate swaps and caps, to converta portion of variable rate debt to fixed rate debt.
Interest rate differentials that arise under interest rate swap and cap contracts are recognized ininterest expense over the life of the contracts. Interest rate swap and cap agreements contain a creditrisk that counterparties may be unable to fulfill the terms of the agreement. The Company hasminimized that risk by evaluating the creditworthiness of its counterparties, who are limited to majorbanks and financial institutions, and it does not anticipate nonperformance by the counterparties.
Gains and losses on swap and cap agreements determined to be effective hedges are reported inother comprehensive income (loss) and are reclassified to earnings in the period in which earnings areaffected by the underlying hedged item. The ineffective portion of all hedged items is recognized inearnings in the current period. At December 31, 2012 and 2011, the aggregate fair value ofapproximately $0.5 million and $1.8 million, respectively, of the swap and cap agreements was recordedas a liability in the accompanying combined consolidated financial statements.
Distributions by the RLJ Predecessor
Fund II was required to make quarterly distributions to the Fund II General Partner and Fund II’slimited partners in accordance with the Fund II LP Agreements. Distributable proceeds wereapportioned among the Fund II General Partner and the Fund II limited partners in proportion totheir respective percentage interests and then distributed to each partner (i) first, to partners until eachhas received a hurdle return of 9%, (ii) second, to partners until each partners’ respective unreturnedinvested equity is reduced to zero, and (iii) thereafter 80% to limited partners and 20% to the Fund IIGeneral Partner. As of December 31, 2010 and through the date of the closing of the IPO on May 16,2011, an aggregate of approximately $158.8 million (excluding advisory fees, see Note 12) had beendistributed to partners.
Fund III was required to make quarterly distributions to the Fund III General Partner and FundIII’s limited partners in accordance with the Fund III LP Agreements. Distributable proceeds wereapportioned among the Fund III General Partner and the Fund III LP limited partners in proportionto their respective percentage interests and then distributed to each partner (i) first, to partners untileach has received a hurdle return of 9%, (ii) second, to partners until each partners’ respectiveunreturned invested equity is reduced to zero, (iii) third, 80% to partners and 20% to the Fund IIIGeneral Partner, until each partner has received an internal rate of return of 11%, (iv) fourth, 60% topartners and 40% to the Fund III General Partner until the aggregate amount under (i) and(iii) distributed to the Fund III General Partner equals 20% of the aggregate amount distributed to thepartners, and (v) thereafter 80% to limited partners and 20% to the Fund III General Partner. As ofDecember 31, 2010 and through the date of the closing of the IPO on May 16, 2011, no distributionshad been made to partners (excluding advisory fees, see Note 12).
Fund II, through wholly-owned subsidiaries, made distributions to preferred unitholderssemi-annually on June 30 and December 31 each year. As of December 31, 2010 and through the dateof the closing of the IPO on May 16, 2011, an aggregate of approximately $0.1 million had beendistributed to preferred unitholders.
F-16
RLJ Lodging Trust
Notes to the Combined Consolidated Financial Statements (Continued)
2. Summary of Significant Accounting Policies (Continued)
Fund III, through wholly-owned subsidiaries, made distributions to preferred unitholderssemi-annually on June 30 and December 31 each year. As of December 31, 2010 and through the dateof the closing of the IPO on May 16, 2011, an aggregate of approximately $0.1 million had beendistributed to preferred unitholders.
Pursuant to the terms of the RLJ Development’s Limited Liability Company Agreement (the‘‘LLC Agreement’’), distributions were made at the discretion of the managing member. Distributionswere made to Members in the following priority; (i), first to Class A Members who are entitled toreceive any unpaid preferred return until the unpaid preferred return is reduced to zero; (ii), next toeach Member, an amount equal to the excess of the tax rate percentage (as defined by the LLCAgreement) multiplied by the aggregate amount of net profits allocated to such members; (iii), next toClass A Members in proportion to the respective amounts of their unreturned capital (as defined bythe LLC Agreement), until the unreturned capital of all Class A Members is reduced to zero; (iv),thereafter, among the Members in proportion to their respective membership percentage interests.
Distributions by the Company
The Company’s Board of Trustees determines the amount of future distributions based uponvarious factors including operating results, economic conditions, other operating trends, our financialcondition and capital requirements, as well as minimum REIT distribution requirements. TheCompany’s ability to make distributions is dependent on our receipt of quarterly distributions from theOperating Partnership and the Operating Partnership’s ability to make distributions is dependent uponthe results of operations of our hotels.
Allocation of Profits and Losses
Profits and losses of Fund II were allocated to the Fund II General Partner and Fund II’s limitedpartners in accordance with the Fund II LP Agreements. Profits and losses were apportioned amongthe Fund II General Partner and the Fund II limited partners in proportion to their respectivepercentage interests (i) first, to partners until each has received a hurdle return of 9%, (ii) second, topartners until each partners’ respective unreturned invested equity is reduced to zero, and(iii) thereafter 80% to limited partners and 20% to the Fund II General Partner.
Profits and losses of Fund III were allocated to the Fund III General Partner and Fund III’slimited partners in accordance with the Fund III LP Agreements. Profits and losses were apportionedamong the Fund III General Partner and the Fund III limited partners in proportion to their respectivepercentage interests (i) first, to partners until each has received a hurdle return of 9%, (ii) second, topartners until each partners’ respective unreturned invested equity is reduced to zero, (iii) third, 80%to partners and 20% to the Fund III General Partner, until each partner has received an internal rateof return of 11%, (iv) fourth, 60% to partners and 40% to the Fund III General Partner until theaggregate amount under (i) and (iii) distributed to the Fund III General Partner equals 20% of theaggregate amount distributed to the partners, and (v) thereafter 80% to limited partners and 20% tothe Fund III General Partner.
Profits of RLJ Development were allocated in accordance with the LLC Agreement: (i) first, toMembers who received allocations of losses for earlier periods in proportion to the cumulative amountof those losses; (ii) next, to Class A Members in proportion to their respective percentage interests,until those Members have received cumulative allocation of profits for the current year and all prior
F-17

RLJ Lodging Trust
Notes to the Combined Consolidated Financial Statements (Continued)
2. Summary of Significant Accounting Policies (Continued)
years not offset by losses allocated to them equal to the cumulative amount of their annual preferredreturn; and (iii) thereafter, to the Members in proportion to their respective membership percentageinterests. Losses of RLJ Development were allocated to Members in the following order or priority:(i) first, to Members who received allocations of profits in earlier fiscal years in proportion to thecumulative amount of profits previously allocated to them; (ii) next, to Members who have a positivecapital account in proportion to the respective amounts of their positive capital accounts until theaccounts are reduced to zero; and (iii) thereafter, to the Members in proportion to their respectivepercentage interests.
Noncontrolling Interests
The combined consolidated financial statements include all subsidiaries controlled by theCompany. For controlled subsidiaries that are not wholly-owned, the noncontrolling interests in thesesubsidiaries are presented separately in the combined consolidated financial statements. As ofDecember 31, 2012, the Company consolidated DBT Met Hotel Venture, LP, a majority-ownedpartnership that has a third-party, noncontrolling 5.0% ownership interest. The third-party partnershipinterest is included in noncontrolling interest in joint venture on the balance sheet. Profits and lossesare allocated in proportion to each party’s respective ownership interest.
As of December 31, 2012, the Company consolidates RLJ Lodging Trust, LP, the OperatingPartnership, which is a majority-owned partnership that has a third-party, noncontrolling 0.8%ownership interest. The third-party partnership interest is included in noncontrolling interest inoperating partnership on the balance sheet. Profits and losses are allocated in proportion to eachparty’s respective ownership interest.
Income Taxes
The Company has elected to be taxed as a real estate investment trust under Sections 856 through860 of the Internal Revenue Code, as amended, commencing with the taxable year endedDecember 31, 2011. To qualify as a REIT, the Company must meet a number of organizational andoperational requirements, including a requirement that it currently distribute at least 90% of its REITtaxable income, subject to certain adjustments and excluding any net capital gain. The Company’scurrent intention is to adhere to these requirements and maintain the qualification for taxation as aREIT. As a REIT, the Company generally is not subject to federal corporate income tax on thatportion of net income that is currently distributed. If the Company fails to qualify for taxation as aREIT in any taxable year, it will be subject to federal income taxes at regular corporate rates (includingany applicable alternative minimum tax) and may not be able to qualify as a REIT for four subsequenttaxable years. Even if the Company qualifies for taxation as a REIT, it may be subject to certain stateand local taxes on income and property, and to federal income and excise taxes on undistributedtaxable income.
Taxable income from non-REIT activities managed through taxable REIT subsidiaries is subject tofederal, state and local income taxes. The taxable REIT subsidiary is required to pay income taxes atthe applicable rates. The consolidated income tax provision or benefit includes the income tax provisionor benefit related to the operations of the taxable REIT subsidiary as well as state income taxesincurred.
F-18

RLJ Lodging Trust
Notes to the Combined Consolidated Financial Statements (Continued)
2. Summary of Significant Accounting Policies (Continued)
Where required, deferred income taxes are accounted for using the asset and liability method.Under this method, deferred income taxes are recognized for temporary differences between thefinancial reporting bases of assets and liabilities and their respective income tax bases and for operatingloss, capital loss and tax credit carryforwards based on enacted income tax rates expected to be ineffect when such amounts are realized or settled. However, deferred tax assets are recognized only tothe extent that is more likely than not they will be realized based on consideration of availableevidence, including future reversals of existing taxable temporary differences, future projected taxableincome and tax planning strategies.
The Company performs an annual review for any uncertain tax positions and, if necessary, willrecord expected future tax consequences of uncertain tax positions in the financial statements. AtDecember 31, 2012 and 2011, the Company did not identify any uncertain tax positions.
Earnings Per Share
Basic earnings per common share is calculated by dividing net income attributable to commonshareholders by the weighted-average number of common shares outstanding during the periodexcluding the weighted average number of unvested restricted shares outstanding during the period.Diluted earnings per common share is calculated by dividing net income attributable to commonshareholders by the weighted average number of common shares outstanding during the period, plusany shares that could potentially be outstanding during the period. Potential shares consist of unvestedrestricted share grants and unvested performance units, calculated using the treasury stock method. Anyanti-dilutive shares have been excluded from the diluted earnings per share calculation.
Share-based Compensation
From time to time, the Company may issue share-based awards under the 2011 Equity IncentivePlan (the ‘‘2011 Plan’’), as compensation to officers, employees and non-employee trustees (seeNote 12). The vesting of awards issued to officers and employees is based on either continuedemployment (time-based) or based on the relative total shareholder returns of the Company andcontinued employment (performance-based), as determined by the Board of Trustees at the date ofgrant. For time-based awards, the Company recognizes compensation expense for non-vested shares ona straight-line basis over the vesting period based upon the fair market value of the shares on the dateof grant, adjusted for forfeitures. For performance-based awards, the Company recognizescompensation expense over the requisite service period for each award, based on the fair market valueof the shares on the date of grant, as determined using a Monte Carlo simulation, adjusted forforfeitures.
Environmental
The Company is subject to various Federal, state and local environmental regulations related to itsproperty ownership and operation. The Company has performed environmental assessments of itsproperties, the results of which have not revealed any environmental liability that the Company believeswould have a materially adverse effect on its financial position, operations or liquidity.
F-19

RLJ Lodging Trust
Notes to the Combined Consolidated Financial Statements (Continued)
2. Summary of Significant Accounting Policies (Continued)
Recent Accounting Pronouncements
Recently Adopted
In May 2011, the FASB issued Accounting Standards Update (‘‘ASU’’) No. 2011-04, ‘‘Fair ValueMeasurement (Topic 820): Amendments to Achieve Common Fair Value Measurement and Disclosurerequirements in U.S.GAAP and IFRSs’’ (‘‘ASU 2011-04’’). ASU 2011-04 provides new guidanceconcerning fair value measurements and disclosure. The new guidance is the result of joint efforts bythe FASB and the International Accounting Standards Board (‘‘IASB’’) to develop a single, convergedfair value framework on how to measure fair value and the necessary disclosures concerning fair valuemeasurements. The guidance is to be applied prospectively and is effective for interim and annualperiods beginning after December 15, 2011. This ASU did not have a material effect on the Company’sfinancial position, results of operations, or cash flows.
In June 2011, the FASB issued ASU No. 2011-05, ‘‘Comprehensive Income (ASC 220):Presentation of Comprehensive Income’’ (‘‘ASU 2011-05’’). ASU 2011-05 revised guidance over themanner in which entities present comprehensive income in the financial statements. This guidanceremoves the previous presentation options and provides that entities must report comprehensiveincome in either a continuous statement of comprehensive income or two separate but consecutivestatements. This guidance does not change the items that must be reported in other comprehensiveincome nor does it require incremental disclosures in addition to those previously required. Theguidance is effective for fiscal years, and interim periods within those years, beginning afterDecember 15, 2011. In February 2013, the FASB issued ASU 2013-02 ‘‘Reporting of AmountsReclassified Out of Accumulated Other Comprehensive Income’’ This amendment to ASC 220‘‘Comprehensive Income’’ requires the presentation, in one place, of information about significantamounts reclassified out of accumulated other comprehensive income. The guidance is effective forfiscal years and interim periods beginning after December 15, 2012. These ASUs did not and will nothave a material effect on the Company’s financial position, results of operations, or cash flows.
In December 2011, the FASB issued ASU No. 2011-10, ‘‘Property, Plant, and Equipment (Topic360): Derecognition of in Substance Real Estate-a Scope Clarification’’ (‘‘ASU No. 2011-10’’) whichrepresents the consensus reached in EITF Issue No. 10-E, ‘‘Derecognition of in Substance RealEstate.’’ The objective of ASU 2011-10 is to resolve the diversity in practice about whether theguidance in ASC 360-20, ‘‘Property, Plant, and Equipment—Real Estate Sales,’’ of ASC 360, Property,Plant, and Equipment, applies to a parent that ceases to have a controlling financial interest in asubsidiary that is in substance real estate as a result of default on the subsidiary’s nonrecourse debt.
ASU 2011-10 provides that when a parent (reporting entity) ceases to have a controlling financialinterest in a subsidiary that is in substance real estate as a result of default on the subsidiary’snonrecourse debt, the reporting entity should apply the guidance in ASC 360-20 to determine whetherit should derecognize the in substance real estate. Generally, a reporting entity would not satisfy therequirements to derecognize the in substance real estate before the legal transfer of the real estate tothe lender and the extinguishment of the related nonrecourse indebtedness. That is, even if thereporting entity ceases to have a controlling financial interest under ASC 810-10, the reporting entitywould continue to include the real estate, debt, and the results of the subsidiary’s operations in itsconsolidated financial statements until legal title to the real estate is transferred to legally satisfy thedebt.
F-20

RLJ Lodging Trust
Notes to the Combined Consolidated Financial Statements (Continued)
2. Summary of Significant Accounting Policies (Continued)
This guidance should be applied on a prospective basis to deconsolidation events occurring afterthe effective date; with prior periods not adjusted even if the reporting entity has continuinginvolvement with previously derecognized in substance real estate entities. The guidance is effective forfiscal years, and interim periods within those years, beginning on or after June 15, 2012. This ASU didnot have a material effect on the Company’s financial position, results of operations, or cash flows.
3. Acquisition of Hotel Properties
During the year ended December 31, 2012, the Company acquired the following hotels, which werefunded through a combination of cash available on the Company’s balance sheet and borrowings underits credit facility:
Purchase %Hotel Location Acquisition Date Management Company Rooms Price Interest
Residence Inn Bethesda . . . . . Bethesda, MD May 29, 2012 Marriott International 187 $ 64.5 million 100%
Courtyard New YorkManhattan/Upper East Side . New York, NY May 30, 2012 Highgate Hotels 226 82.0 million 100%
Hilton Garden Inn SanFrancisco/Oakland BayBridge . . . . . . . . . . . . . . Emeryville, CA June 11, 2012 Davidson Hotels and Resorts 278 36.2 million 100%
Embassy Suites Boston/Waltham . . . . . . . . . . . . . Waltham, MA November 13, 2012 HEI Hotels and Resorts 275 64.5 million 100%
966 $247.2 million
During the year ended December 31, 2011, the Company, through wholly-owned subsidiaries,acquired the following hotels, which were funded by capital contributions or with cash on hand:
Purchase %Hotel Location Acquisition Date Management Company Rooms Price Interest
Embassy Suites Columbus . . . Columbus, OH January 11, 2011 Crescent Hotels and Resorts 221 $ 9.5 million 100%
Renaissance Pittsburgh Hotel . Pittsburgh, PA January 12, 2011 Sage Hospitality 300 47.1 million 100%
Courtyard Atlanta Buckhead . . Atlanta, GA January 18, 2011 Noble Management Group, LLC 181 27.0 million 100%
Doubletree Hotel Columbia . . Columbia, MD January 18, 2011 Urgo Hotels 152 10.5 million 100%
Denver Airport Marriott atGateway Park . . . . . . . . . . Denver, CO January 18, 2011 Sage Hospitality 238 46.0 million 100%
Embassy Suites West PalmBeach-Central . . . . . . . . . West Palm Beach, FL January 18, 2011 Windsor Capital Group 194 16.0 million 100%
Hilton Garden Inn RaleighDurham-Research TrianglePark . . . . . . . . . . . . . . . . Durham, NC January 24, 2011 Noble Management Group, LLC 177 7.0 million 100%
Hilton Garden Inn PittsburghUniversity Place . . . . . . . . Pittsburgh, PA January 24, 2011 Urgo Hotels 202 21.2 million 100%
Hampton Inn Houston-Nearthe Galleria . . . . . . . . . . . Houston, TX March 14, 2011 Interstate Hotels and Resorts 176 20.3 million 100%
Courtyard Charleston HistoricDistrict . . . . . . . . . . . . . . Charleston, SC October 27, 2011 Noble Management Group, LLC 176 42.0 million 100%
2,017 $246.6 million
F-21

RLJ Lodging Trust
Notes to the Combined Consolidated Financial Statements (Continued)
3. Acquisition of Hotel Properties (Continued)
The allocation of purchase price for the hotel properties acquired and liabilities assumed was asfollows (in thousands):
For the year endedDecember 31,
2012 2011
Land and land improvements . . . . . . . . . . . . . . . . . . . . . . . . . $ 46,980 $ 31,845Buildings and improvements . . . . . . . . . . . . . . . . . . . . . . . . . 191,751 191,823Furniture, fixtures and equipment . . . . . . . . . . . . . . . . . . . . . 8,427 24,791Intangibles . . . . . . . . . . . . . . . . . . . . . . . . . . . . . . . . . . . . . . — 559Deferred tax liabilities assumed . . . . . . . . . . . . . . . . . . . . . . . — (2,438)
Total Purchase Price . . . . . . . . . . . . . . . . . . . . . . . . . . . . . . . $247,158 $246,580
There were no contingent consideration arrangements associated with these acquisitions nor wasany goodwill recognized. See Note 19 for detail of non-cash prorations assumed at acquisition dates.
For the years ended December 31, 2012 and 2011, the Company included $116.8 million and$69.4 million of total revenue, respectively, and $12.0 million and ($3.2 million) of net income (loss),respectively, in the accompanying combined consolidated statements of operations related to the hotelsacquired in 2012 and 2011.
The following unaudited condensed pro forma financial information presents the results ofoperations as if the 2012 acquisitions had taken place on January 1, 2011and the 2011 acquisitions hadtaken place on January 1, 2010.
The condensed pro forma financial information excludes discontinued operations and is notnecessarily indicative of what actual results of operations of the Company would have been assumingthe 2012 and 2011 acquisitions had taken place on January 1, 2011 and 2010, respectively, nor does itpurport to represent the results of operations for future periods. The unaudited condensed pro formafinancial information, excluding discontinued operations, is as follows, (in thousands, except share andper share data):
For the year endedDecember 31,
2012 2011
Revenue . . . . . . . . . . . . . . . . . . . . . . . . . . . . . . . . . . . $ 884,874 $ 817,724Net income (loss) . . . . . . . . . . . . . . . . . . . . . . . . . . . . $ 49,311 $ (577)Net income (loss) per share attributable to common
shareholders—basic . . . . . . . . . . . . . . . . . . . . . . . . . $ 0.47 $ (0.01)
Net income (loss) per share attributable to commonshareholders—diluted . . . . . . . . . . . . . . . . . . . . . . . $ 0.47 $ (0.01)
Weighted average number of shares outstanding—basic . 105,423,604 93,340,666
Weighted average number of shares outstanding—diluted . . . . . . . . . . . . . . . . . . . . . . . . . . . . . . . . . . 105,748,686 93,340,666
F-22

RLJ Lodging Trust
Notes to the Combined Consolidated Financial Statements (Continued)
4. Discontinued Operations
On November 16, 2009, RLJ Development, through wholly-owned subsidiaries, entered into apurchase and sale agreement to sell six hotels. The assets were reclassified as held for sale and theoperating results for the hotels were reclassified to discontinued operations. On April 23, 2010, RLJDevelopment completed the sale of the six hotels for a total sale price of $73.5 million. The saleresulted in a gain of approximately $23.7 million.
On April 23, 2010, the Company defeased five individual mortgages associated with theaforementioned six hotels sold on April 23, 2010 by replacing the original collateral with governmentsecurities. These loans carried an outstanding balance of $34.0 million at April 23, 2010. On April 28,2010, the Company fully repaid the remaining outstanding $8.5 million mortgage loan associated withthe six hotels sold on April 23, 2010, including a mortgage prepayment penalty totaling $0.2 million.
In February 2010, Fund II received a notice of event of default for failure to make the requiredmonthly payment on its mortgage loan secured by the New York LaGuardia Airport Marriott locatedin New York, NY. The mortgage loan matured in July 2010. In April 2011, Fund II escrowed anexecuted deed in lieu of foreclosure agreement for the benefit of the lenders. On August 5, 2011, theCompany transferred title to the hotel to the lenders pursuant to the deed in lieu of foreclosurearrangement. The Company recorded a gain on extinguishment of indebtedness of approximately$23.5 million to discontinued operations in August 2011 and removed the hotel’s net assets andliabilities from its combined consolidated balance sheet at that time.
Operating results of discontinued operations were as follows (in thousands):
For the year endedDecember 31,
2011 2010
Net revenues . . . . . . . . . . . . . . . . . . . . . . . . . . . . . . . . . . . . . . $16,917 $35,673Operating expenses . . . . . . . . . . . . . . . . . . . . . . . . . . . . . . . . . 18,108 34,165Impairment loss . . . . . . . . . . . . . . . . . . . . . . . . . . . . . . . . . . . . — —
Operating (loss) income . . . . . . . . . . . . . . . . . . . . . . . . . . . . . . (1,191) 1,508Interest expense . . . . . . . . . . . . . . . . . . . . . . . . . . . . . . . . . . . . (488) (5,647)
Net loss from discontinued operations, before gain on sale . . . (1,679) (4,139)Gain on extinguishment of indebtedness . . . . . . . . . . . . . . . . . . 23,515 —Gain on sale of properties . . . . . . . . . . . . . . . . . . . . . . . . . . . . — 23,710
Net income from discontinued operations . . . . . . . . . . . . . . . . . $21,836 $19,571
F-23

RLJ Lodging Trust
Notes to the Combined Consolidated Financial Statements (Continued)
5. Investment in Hotel Properties
Investment in hotel properties as of December 31, 2012 and 2011 consisted of the following (inthousands):
December 31,
2012 2011
Land and land improvements . . . . . . . . . . . . . . . . . . . . . . $ 563,524 $ 515,957Buildings and improvements . . . . . . . . . . . . . . . . . . . . . . . 2,655,086 2,392,669Furniture, fixtures and equipment . . . . . . . . . . . . . . . . . . . 438,807 375,561Intangibles . . . . . . . . . . . . . . . . . . . . . . . . . . . . . . . . . . . . 1,857 1,857
3,659,274 3,286,044Accumulated depreciation and amortization . . . . . . . . . . . . (585,791) (465,587)
Investment in hotel properties, net . . . . . . . . . . . . . . . . . . $3,073,483 $2,820,457
For the years ended December 31, 2012, 2011 and 2010, depreciation and amortization expenserelated to investment in hotel properties was approximately $126.4 million, $127.2 million and$96.0 million (excluding discontinued operations), respectively. During the years ended December 31,2012 and 2011, the Company accelerated approximately $4.7 million and $7.6 million, respectively, ofdepreciation on furniture, fixtures and equipment in conjunction with brand conversions under the 2011capital improvement program.
Impairment
During the year ended December 31, 2012, the Company recorded an impairment loss of$0.9 million related to the Fairfield Inn Memphis. The Company evaluated the recoverability of thehotel’s carrying value given deteriorating operating results. Based on an analysis of estimatedundiscounted net cash flow, the Company concluded that the carrying value of the hotel was notrecoverable. The Company estimated the fair value of the hotel using a discounted cash flow analysis.In the analysis, the Company estimated the future net cash flows from the hotel, the expected usefullife and holding period, and applicable capitalization and discount rates.
During each of the years ended December 31, 2011 and 2010, the Company determined there wasno impairment on its investment in hotels.
6. Investment in Loans
On November 3, 2009, Fund III purchased two mortgage loans collateralized by the SpringHillSuites Houston Medical Park and the Residence Inn Atlanta Midtown for a total purchase price of$12.7 million. The loans mature on September 6, 2017 and amortize based on a 30 year term. Theacquired loans were of deteriorated credit quality as the loans were already in default at the date ofthe Company’s acquisition of the loans, and therefore the amounts paid for the loans reflected theCompany’s determination that it was probable the Company would be unable to collect all amountsdue pursuant to the loan’s contractual terms.
F-24

RLJ Lodging Trust
Notes to the Combined Consolidated Financial Statements (Continued)
6. Investment in Loans (Continued)
Investment in loans as of December 31, 2012 and 2011 consisted of the following (in thousands):
December 31,
2012 2011
Note secured by SpringHill Suites Houston Medical Park . . . . . . $13,876 $14,057Note secured by Residence Inn Atlanta Midtown . . . . . . . . . . . . 10,490 10,634
Face Value . . . . . . . . . . . . . . . . . . . . . . . . . . . . . . . . . . . . . . . . $24,366 $24,691
Carrying amount of loans . . . . . . . . . . . . . . . . . . . . . . . . . . . . . $12,426 $12,633
December 31,
2012 2011
Accretable yield balance at beginning of year . . . . . . . . . . . . . . . . $7,120 $7,169Reclassification from nonaccretable difference . . . . . . . . . . . . . . . . 64 62Accretion . . . . . . . . . . . . . . . . . . . . . . . . . . . . . . . . . . . . . . . . . . (117) (111)
Accretable yield balance at end of year . . . . . . . . . . . . . . . . . . . . . $7,067 $7,120
The SpringHill Suites Houston Medical Park and Residence Inn Atlanta Midtown loans eachrequire monthly payments of principal and interest of $0.1 million. For the years ended December 31,2012, 2011 and 2010, interest income from the loans was $1.6 million, $1.6 million and $2.2 million,respectively. For the year ended December 31, 2010, interest income included $0.8 million of defaultinterest.
7. Debt
Revolving Credit Facility and Term Loans
The Company entered into a credit agreement on November 20, 2012 that provides for (i) anunsecured revolving credit facility of up to $300.0 million with a scheduled maturity date ofNovember 20, 2016 with a one-year extension option (the ‘‘Revolver’’), and (ii) an unsecured term loanof $275.0 million with a scheduled maturity date of November 20, 2017 (the ‘‘Five-Year Term Loan’’).The credit agreement amends and restates in its entirety the Company’s prior unsecured revolvingcredit facility, which was originally entered into as of June 20, 2011. In addition, on November 20, 2012the Company also entered into an unsecured term loan of $125.0 million with a scheduled maturitydate of November 20, 2019 (the ‘‘Seven-Year Term Loan’’).
The credit agreement requires that a group of no less than 20 of the Company’s hotel propertiesremain unencumbered by outstanding indebtedness. The credit agreement contains certain financialcovenants relating to the Company’s maximum leverage ratio, minimum fixed charge coverage ratio,minimum tangible net worth and maximum secured indebtedness. If an event of default exists theCompany is not permitted to make distributions to shareholders, other than those required to qualifyfor and maintain REIT status. As of December 31, 2012, the Company was in compliance with allfinancial covenants
The Company incurred $5.2 million in fees related to the credit agreement and the Seven-YearTerm Loan which are being deferred and amortized over the term of the Revolver, the Five-Year TermLoan and the Seven-Year Term Loan, respectively.
F-25

RLJ Lodging Trust
Notes to the Combined Consolidated Financial Statements (Continued)
7. Debt (Continued)
Borrowings under the Revolver, the Five-Year Term Loan and the Seven-Year Term Loan bearinterest at variable rates equal to the London InterBank Offered Rate (‘‘LIBOR’’) plus an applicablemargin. The margin ranges from 1.70% to 3.00%, depending on the Company’s leverage ratio, ascalculated under the terms of each facility. The Company incurs an unused facility fee on the Revolverof between 0.25% and 0.35%, based on the amount by which the maximum borrowing amount exceedsthe total principal balance of outstanding borrowings.
Under the terms of the credit agreement, one or more standby letters of credit, up to a maximumaggregate outstanding balance of $30.0 million, may be issued on behalf of the Company by the lendersholding the unsecured revolving credit facility. The Company will incur a fee of 0.125% of the value ofeach standby letter of credit that is issued on its behalf. Any outstanding standby letters of credit wouldreduce the available borrowings on the unsecured revolving credit facility by a corresponding amount.No standby letters of credit were outstanding at December 31, 2012. The Company also may borrow upto a maximum aggregate outstanding balance of $40.0 million of swingline loans. Any outstandingswingline loans would reduce the available borrowings on the credit facility by a corresponding amount.No swingline loans were outstanding at December 31, 2012.
For the year ended December 31, 2012, the Company incurred an unused commitment fee on theRevolver of approximately $0.1 million. At December 31, 2012, outstanding borrowings on theRevolver, the Five-Year Term Loan and the Seven-Year Term Loan were $16.0 million, $275.0 millionand $125.0 million, respectively. For the year ended December 31, 2012, interest expense incurred onthe Revolver, the Five-Year Term Loan and the Seven-Year Term Loan was $40,000, $0.7 million and$0.4 million, respectively.
Prior Credit Facility
The Company entered into an unsecured revolving credit facility on June 20, 2011, that providedfor maximum borrowings of up to $300.0 million. The credit facility required that a group of no lessthan 15 of the Company’s hotel properties remain unencumbered by outstanding indebtedness. Thecredit facility contained certain financial covenants relating to the Company’s maximum leverage ratio,minimum fixed charge coverage ratio, minimum tangible net worth and maximum secured indebtedness.If an event of default existed the Company was not permitted to make distributions to shareholders,other than those required to qualify for and maintain REIT status. As of December 31, 2011, theCompany was in compliance with all financial covenants. On November 20, 2012, the unsecuredrevolving credit facility agreement was amended and restated in its entirety with the Revolver andFive-Year Term Loan as discussed above.
The Company incurred $3.0 million in fees related to the credit facility which were being deferredand amortized over the term of the credit facility. On November 20, 2012, when the unsecuredrevolving credit facility agreement was amended and restated in its entirety, approximately $1.7 millionof the fees unamortized at the time of the amendment and restatement were transferred to theRevolver and will be amortized over the term of that credit facility.
Borrowings under the credit facility bore interest at variable rates equal to LIBOR plus anapplicable margin. The margin ranged from 2.25% to 3.25%, depending on the Company’s leverageratio, as calculated under the terms of the credit facility. The Company incurred an unused facility feeof between 0.30% and 0.40%, based on the amount by which the maximum borrowing amountexceeded the total principal balance of outstanding borrowings.
F-26

RLJ Lodging Trust
Notes to the Combined Consolidated Financial Statements (Continued)
7. Debt (Continued)
The Company did not incur any interest expense on the credit facility for the year endedDecember 31, 2011. For the years ended December 31, 2012 and 2011, the Company incurred anunused commitment fee of approximately $0.8 and $0.7 million, respectively. For the year endedDecember 31, 2012, the Company incurred interest expense of $1.6 million. There were no borrowingsoutstanding at December 31, 2011.
RLJ Predecessor Credit Facility
Fund III, through wholly-owned subsidiaries, maintained a credit facility that provided formaximum borrowings of up to $200.0 million. The credit facility was collateralized by Fund III’spartners’ committed and uncalled capital and was guaranteed by Fund III. Borrowings under the creditfacility bore interest at variable rates equal to the LIBOR plus a margin of 0.75%. For the year endedDecember 31, 2010 the weighted average interest rate for borrowings under the credit facility wasapproximately 1.04%. The credit facility matured on January 31, 2011.
Fund III incurred interest expense related to the credit facility of approximately $1.0 million forthe year ended December 31, 2010. No interest expense related to the credit facility was incurred forthe year ended December 31, 2011. Additionally, there was an unused commitment fee of 0.15% of theunused portion of the credit facility. For the years ended December 31, 2011 and 2010, Fund IIIincurred an unused commitment fee of approximately $12,000 and $0.2 million, respectively.
Term Loan
On January 14, 2011, Fund III entered into a $140.0 million unsecured term loan. Fund III agreedto maintain an unencumbered asset pool of ten hotel properties during the term of the term loan. Theterm loan had an original maturity date of September 30, 2011, with two six month extension options,and bore interest at LIBOR plus 4.25%, with a LIBOR floor of 1.00%. For the year endedDecember 31, 2011, the Company incurred $5.1 million of interest expense, related to the term loan.On September 30, 2011, the Company amended the term loan to extend the maturity date toNovember 15, 2011, with one extension to December 31, 2011, at the Company’s option. OnOctober 21, 2011, the term loan was fully repaid.
F-27

RLJ Lodging Trust
Notes to the Combined Consolidated Financial Statements (Continued)
7. Debt (Continued)
Mortgage Loans
As of December 31, 2012 and 2011, the Company was subject to the following mortgage loans (inthousands):
Principal balance at,Number Interest rate atof Assets December 31, Maturity December 31, December 31,
Lender Encumbered 2012 Date 2012 2011
Keybank . . . . . . . . . . . . . . . . . . . . . . . . April 2012(1) $ — $ 48,000State Street Bank . . . . . . . . . . . . . . . . . . April 2012(1) — 37,000Wells Fargo . . . . . . . . . . . . . . . . . . . . . . June 2013(2) — 60,000Wells Fargo . . . . . . . . . . . . . . . . . . . . . . Oct 2013(2) — 40,000Wells Fargo . . . . . . . . . . . . . . . . . . . . . . Oct 2013(2) — 31,000Wells Fargo . . . . . . . . . . . . . . . . . . . . . . Dec 2013(2) — 150,000Blackstone . . . . . . . . . . . . . . . . . . . . . . Dec 2013(2) — 50,000Wells Fargo . . . . . . . . . . . . . . . . . . . . . . 1 4.60%(3)(4) Oct 2014(5) 68,500 68,500Wells Fargo . . . . . . . . . . . . . . . . . . . . . . 1 3.81%(4) Oct 2014(5) 17,500 17,500Wells Fargo . . . . . . . . . . . . . . . . . . . . . . 1 3.81%(4) Oct 2014(5) 21,000 21,000Wells Fargo . . . . . . . . . . . . . . . . . . . . . . 1 3.81%(4) Oct 2014(5) 11,000 11,000Wells Fargo . . . . . . . . . . . . . . . . . . . . . . 1 3.81%(4) Oct 2014(5) 24,000 24,000Capmark Financial Group . . . . . . . . . . . . . 1 6.12% April 2015 4,202 4,327Capmark Financial Group . . . . . . . . . . . . . 1 5.55% May 2015 11,298 11,656VFC Partners 20 LLC . . . . . . . . . . . . . . . 1 5.50% June 2015 5,014 5,014Capmark Financial Group . . . . . . . . . . . . . 1 5.55% June 2015 4,901 5,057Barclay’s Bank . . . . . . . . . . . . . . . . . . . . 1 5.55% June 2015 2,561 2,642Barclay’s Bank . . . . . . . . . . . . . . . . . . . . 1 5.55% June 2015 4,203 4,336Barclay’s Bank . . . . . . . . . . . . . . . . . . . . 1 5.55% June 2015 9,798 10,107Barclay’s Bank . . . . . . . . . . . . . . . . . . . . 1 5.55% June 2015 8,745 9,020Barclay’s Bank . . . . . . . . . . . . . . . . . . . . 1 5.55% June 2015 7,839 8,084Barclay’s Bank . . . . . . . . . . . . . . . . . . . . 1 5.60% June 2015 5,434 5,603Barclay’s Bank . . . . . . . . . . . . . . . . . . . . 1 5.60% June 2015 8,422 8,707Barclay’s Bank . . . . . . . . . . . . . . . . . . . . 1 5.55% June 2015 5,134 5,296Barclay’s Bank . . . . . . . . . . . . . . . . . . . . 1 5.55% June 2015 34,042 35,115Barclay’s Bank . . . . . . . . . . . . . . . . . . . . 1 5.60% June 2015 6,466 6,669Barclay’s Bank . . . . . . . . . . . . . . . . . . . . 1 5.55% June 2015 5,762 5,943Barclay’s Bank . . . . . . . . . . . . . . . . . . . . 1 5.55% June 2015 6,621 6,830Barclay’s Bank . . . . . . . . . . . . . . . . . . . . 1 5.60% June 2015 8,437 8,701Barclay’s Bank . . . . . . . . . . . . . . . . . . . . 1 5.55% June 2015 6,614 6,821Barclay’s Bank . . . . . . . . . . . . . . . . . . . . 1 5.55% June 2015 7,280 7,508Barclay’s Bank . . . . . . . . . . . . . . . . . . . . 1 5.55% June 2015 6,621 6,830Barclay’s Bank . . . . . . . . . . . . . . . . . . . . 1 5.55% June 2015 7,558 7,796Barclay’s Bank . . . . . . . . . . . . . . . . . . . . 1 5.55% June 2015 9,484 9,783Capmark Financial Group . . . . . . . . . . . . . 1 5.50% July 2015 6,673 6,883Barclay’s Bank . . . . . . . . . . . . . . . . . . . . 1 5.44% Sept 2015 10,883 11,223PNC Bank(6) . . . . . . . . . . . . . . . . . . . . . 7 2.56%(4) May 2016(7) 85,000 —Merrill Lynch . . . . . . . . . . . . . . . . . . . . . 1 6.29% July 2016 9,180 9,294Merrill Lynch . . . . . . . . . . . . . . . . . . . . . 1 6.29% July 2016 5,531 5,552Merrill Lynch . . . . . . . . . . . . . . . . . . . . . 1 6.29% July 2016 7,684 7,780Merrill Lynch . . . . . . . . . . . . . . . . . . . . . 1 6.29% July 2016 9,194 9,307Wachovia Securities(8) . . . . . . . . . . . . . . . 43 6.29% July 2016 487,296 493,358Wachovia Securities . . . . . . . . . . . . . . . . . 1 6.29% July 2016 6,582 6,664Wells Fargo/Morgan Stanley . . . . . . . . . . . 2 6.29% July 2016 34,823 35,256Wells Fargo/Morgan Stanley . . . . . . . . . . . 1 6.29% July 2016 6,753 6,837Wells Fargo/Morgan Stanley . . . . . . . . . . . 1 6.29% July 2016 9,616 9,736
88 $997,651 $1,341,735
(1) The Keybank and State Street Bank loans were paid off with borrowings on the prior credit facility at maturity on April 9,2012.
F-28

RLJ Lodging Trust
Notes to the Combined Consolidated Financial Statements (Continued)
7. Debt (Continued)
(2) The Wells Fargo/Blackstone loans were paid off on November 20, 2012 with borrowings on the Five-Year Term Loan andSeven-Year Term Loan.
(3) Interest rate at December 31, 2012 gives effect to interest rate swaps and LIBOR floors.
(4) Requires payments of interest only until the commencement of the extension period(s).
(5) Maturity date may be extended for up to two additional one-year terms at the Company’s option (subject to the Company’sprior satisfaction of certain conditions and advance notice of the exercise of the Company’s option).
(6) The seven hotels encumbered by the PNC Bank Loans are cross-collateralized.
(7) Maturity date may be extended for one one-year term at the Company’s option (subject to the Company’s prior satisfactionof certain conditions and advance notice of the exercise of the Company’s option).
(8) The 43 Wachovia loans are cross-collateralized.
Some mortgage agreements are subject to customary financial covenants. The Company was incompliance with these covenants at both December 31, 2012 and 2011.
In November 2011, the Company elected to cease the subsidization of debt service on themortgage loan secured by the SpringHill Suites Southfield, Michigan. The loan matures in June 2015.In January 2012, the Company received notice of an event of default for failure to make the requiredmonthly payment on its mortgage loan secured by the SpringHill Suites Southfield. Under the terms ofthe mortgage loan, the lender receives the monthly net cash from operations from the hotel.
In December 2012, the Company entered into a deed in lieu of foreclosure agreement with thelender, providing for a consensual transfer of the property to the lender or its designee. Thistransaction is expected to close in March 2013. As of December 31, 2012, the principal balanceoutstanding was $5.0 million for the SpringHill Suites Southfield loan.
In November 2011, the Company elected to cease the subsidization of debt service on themortgage loan secured by the Courtyard Goshen, Indiana. The loan matures in July 2016. In December2011, the Company received notice of an event of default for failure to make the required monthlypayment on its mortgage loan secured by the Courtyard Goshen. Under the terms of the mortgageloan, the lender receives the monthly net cash from operations from the hotel. In May 2012, an OrderAppointing Receiver (the ‘‘Order’’) was entered in the Elkhart County, Indiana, Superior Court No. 1.In June 2012, the receiver, pursuant to the Order, took control of the property for the benefit of thelender of the mortgage loan. As of December 31, 2012, the principal balance outstanding was$5.5 million for the Courtyard Goshen loan. In February 2013, the lender filed suit against theCompany claiming amounts due from the Company in its capacity as a guarantor of certain borrowerobligations. The Company disputes the lender’s claim and intends to defend itself against the claim.
F-29

RLJ Lodging Trust
Notes to the Combined Consolidated Financial Statements (Continued)
7. Debt (Continued)
Future Minimum Principal Payments
As of December 31, 2012, future minimum principal payments on debt are as follows (inthousands):
2013 . . . . . . . . . . . . . . . . . . . . . . . . . . . . . . . . . . . . . . . . . . . . . . . . $ 14,2112014 . . . . . . . . . . . . . . . . . . . . . . . . . . . . . . . . . . . . . . . . . . . . . . . . 157,0952015 . . . . . . . . . . . . . . . . . . . . . . . . . . . . . . . . . . . . . . . . . . . . . . . . 189,4852016 . . . . . . . . . . . . . . . . . . . . . . . . . . . . . . . . . . . . . . . . . . . . . . . . 652,8602017 . . . . . . . . . . . . . . . . . . . . . . . . . . . . . . . . . . . . . . . . . . . . . . . . 275,000
Thereafter . . . . . . . . . . . . . . . . . . . . . . . . . . . . . . . . . . . . . . . . . . . . . 125,000
$1,413,651
8. Financial Instruments: Derivatives and Hedging
The Company employs interest rate swaps and caps to hedge against interest rate fluctuations.Unrealized gains and losses are reported in other comprehensive loss with no effect recognized inearnings as long as the characteristics of the swap and the hedged item are closely matched. Theineffective portion of all hedges is recognized in earnings in the current period. As of December 31,2012 and 2011, 45.5% and 41.6%, respectively, of the Company’s borrowings were subject to variablerates. As of December 31, 2012 and 2011, after taking into consideration the effect of interest rateswaps and caps, 40.6% and 25.1%, respectively, of the Company’s borrowings were subject to variablerates.
As of December 31, 2012 and 2011, the Company held the following interest rate swaps and caps(in thousands):
Notional value at Fair value at
December 31, December 31, Hedge December 31, December 31,Hedge type 2012 2011 interest rate Maturity 2012 2011
Interest rate cap . . . . . . . . . . . . . . . . . $ — $ 48,000 6.00% 4/9/2012 $ — $ —Interest rate cap . . . . . . . . . . . . . . . . . — 37,000 6.00% 4/9/2012 — —Interest rate cap . . . . . . . . . . . . . . . . . — 60,000 5.00% 6/29/2012 — —Interest rate cap . . . . . . . . . . . . . . . . . — 50,000 3.50% 12/23/2012 — 3Swap-cash flow . . . . . . . . . . . . . . . . . . — 150,000 1.15% 12/23/2012 — (1,145)Swap-cash flow . . . . . . . . . . . . . . . . . . 40,000 40,000 1.00% 10/6/2013 (265) (369)Swap-cash flow . . . . . . . . . . . . . . . . . . 31,000 31,000 1.00% 10/6/2013 (205) (285)Interest rate cap . . . . . . . . . . . . . . . . . 60,000 — 1.00% 6/29/2013 — —
$131,000 $416,000 $(470) $(1,796)
As of December 31, 2012 and 2011, there was approximately zero and $1.8 million, respectively, inunrealized losses included in accumulated other comprehensive loss, a component of shareholders’equity, related to interest rate hedges that are effective in offsetting the variable cash flows. For theyear ended December 31, 2012, approximately $1.8 million was reclassified from accumulated othercomprehensive loss to interest expense due to the discontinuance of hedge accounting on theoutstanding interest rate swaps. There were no ineffective hedges during the year ended December 31,2011.
F-30

RLJ Lodging Trust
Notes to the Combined Consolidated Financial Statements (Continued)
9. Fair Value
Fair Value Measurement
Fair value is defined as the price that would be received to sell an asset or paid to transfer aliability in an orderly transaction between market participants at the measurement date in the principalor most advantageous market. The fair value hierarchy has three levels of inputs, both observable andunobservable:
• Level 1—Inputs include quoted market prices in an active market for identical assets orliabilities.
• Level 2—Inputs are market data, other than Level 1, that are observable either directly orindirectly. Level 2 inputs include quoted market prices for similar assets or liabilities, quotedmarket prices in an inactive market, and other observable information that can be corroboratedby market data.
• Level 3—Inputs are unobservable and corroborated by little or no market data.
Recurring Fair Value Measurements: The following table presents the Company’s fair valuehierarchy for those financial assets and liabilities measured at fair value on a recurring basis as ofDecember 31, 2012 (in thousands).
Fair Value at December 31, 2012
Level 1 Level 2 Level 3 Total
Interest rate swap and cap liability . . . . . . . . . . . . . . . . . . . . . . . . . . $— $(470) $— $(470)
Total . . . . . . . . . . . . . . . . . . . . . . . . . . . . . . . . . . . . . . . . . . . . . . . . $— $(470) $— $(470)
The fair values of the derivative financial instruments are determined using widely acceptedvaluation techniques including discounted cash flow analysis on the expected cash flows of eachderivative. The Company determined that the significant inputs, such as interest yield curves anddiscount rates, used to value its derivatives fall within Level 2 of the fair value hierarchy and that thecredit valuation adjustments associated with the Company’s counterparties and its own credit risk utilizeLevel 3 inputs, such as estimates of current credit spreads to evaluate the likelihood of default by itselfand its counterparties. As of December 31, 2012, the Company assessed the significance of the impactof the credit valuation adjustments on the overall valuation of its derivative positions and determinedthat the credit valuation adjustments were not significant to the overall valuation of its derivatives. As aresult, the Company’s derivative valuations in their entirety are classified in Level 2 of the fair valuehierarchy.
Non-recurring Fair Value Measurement
For purposes of determining impairment charges, investments in hotel properties were valued usinginputs including projected cash flows, and discount and capitalization rates. These valuations aregenerally classified within Level 3 of the valuation hierarchy.
F-31

RLJ Lodging Trust
Notes to the Combined Consolidated Financial Statements (Continued)
10. Commitments and Contingencies
Ground Leases
The Residence Inn Chicago Oak Brook is subject to a ground lease with an initial term thatexpires on March 6, 2100. During the initial term of the ground lease, the total rent is $1.56 million,which was paid in a lump sum upon commencement of the ground lease in 2001. After the initial term,we may extend the ground lease for an additional renewal term of 99 years for $1. Under certaincircumstances set forth in the ground lease, we have the option to acquire the land underlying theResidence Inn Chicago Oak Brook.
The Louisville Marriott Downtown is subject to a ground lease with an initial term extending outto 2053. The ground lease may be extended for up to four additional twenty-five year terms at theCompany’s option. The annual ground rent is one dollar; however, the property is subject to an annualprofit participation payment based on net income as calculated based on the terms of the ground lease.For the years ended December 31, 2012, 2011 and 2010, no liability was incurred for profitparticipation.
The Courtyard Austin Downtown/Convention Center and Residence Inn Austin Downtown/Convention Center are subject to a ground lease with a term extending to 2100. The annual groundrent is $0.4 million; however, the properties are subject to an annual profit participation payment basedon gross revenue as calculated based on the terms of the ground lease. For the years ended December,31, 2012, 2011 and 2010, approximately $0.3 million, $0.2 million and $0.2 million, respectively wasincurred for contingent rent.
The Hilton Garden Inn Bloomington is subject to a ground lease with an initial term extending to2053. The ground lease automatically extends for up to five additional ten-year terms unless certainconditions are met. A de minimis minimum rent payment is to be paid in ten equal annual installmentscommencing with the twentieth anniversary of the leases’ inception. No other payments are requiredunder the terms of the ground lease.
The Hilton Garden Inn Bloomington is subject to an agreement to lease parking spaces with aninitial term extending to 2033. The agreement to lease parking spaces may be extended if certain eventsoccur. The agreement provides for a monthly rental payment based on city ordinance rates (atDecember 31, 2012, 2011 and 2010 the rate was de minimis) and the number of parking spacesreserved for the exclusive use of the hotel, plus amounts based on actual usage in excess of thereserved spaces. For each of the years ended December 31, 2012, 2011 and 2010, approximately$0.1 million of rent was paid.
The Hampton Inn Garden City is subject to a ground lease with an initial term extending to 2016.The lease is associated with an agreement for payment in lieu of taxes and will revert to fee simpleownership at the end of the ground lease. A de minimus rent payment is to be paid annually. Inaddition, an annual compliance fee of $1 is required under the terms of the ground lease.
The Courtyard Charleston Historic District is subject to a ground lease with a term extending to2096. The annual ground rent is $0.8 million until 2021, after which the annual base rent increasesperiodically during the term of the ground lease to a maximum of $1.0 million. The annual ground rentexpense is recognized on a straight-line basis. In addition to base rent, the property is subject to acontingent rent payment based on gross quarterly collected room revenue (for no more than 126 roomsper night), as calculated based on the terms of the ground lease. For the years ended December 31,2012 and 2011, approximately $0.3 million and $16,000, respectively, was incurred for contingent rent.
F-32

RLJ Lodging Trust
Notes to the Combined Consolidated Financial Statements (Continued)
10. Commitments and Contingencies (Continued)
As of December 31, 2012, future minimum ground lease payments are as follows:
Amount of commitment expiration per period
2013 2014 2015 2016 2017 Thereafter Total
Minimum ground rent . . . . . . . . . . . . . . $1,150 $1,150 $1,150 $1,150 $1,150 $103,460 $109,210
Restricted Cash Reserves
The Company is obligated to maintain reserve funds for capital expenditures at the hotels(including the periodic replacement or refurbishment of furniture, fixtures and equipment) asdetermined pursuant to the management agreements, franchise agreements and/or mortgage loandocuments. The management agreements, franchise agreements and/or mortgage loan documentsrequire the Company to reserve restricted cash ranging from 1.0% to 5.0% of the individual hotel’srevenues and maintain the reserves in restricted cash reserve escrows. Amounts will be capitalized asincurred. Any unexpended amounts will remain the property of the Company upon termination of themanagement agreements, franchise agreements or mortgage loan documents. Additionally, somemortgage agreements require the Company to reserve restricted cash for the periodic payment of realestate taxes and insurance. As of December 31, 2012 and 2011, approximately $64.8 million and$87.3 million, respectively, was available in restricted cash reserves for future capital expenditures, realestate taxes and insurance.
As of December 31, 2010, the New York LaGuardia Airport Marriott was in default on its mortgageloan. Under the terms of the mortgage loan, the lender received the monthly net cash from operationsfrom the hotel. As of December 31, 2010, approximately $4.6 million in cash was held by the lender. TheCompany transferred title to the New York LaGuardia Airport Marriott to the lenders pursuant to adeed in lieu of foreclosure arrangement on August 5, 2011, and the cash was retained by the lender.
F-33

RLJ Lodging Trust
Notes to the Combined Consolidated Financial Statements (Continued)
10. Commitments and Contingencies (Continued)
Management Agreements
As of December 31, 2012, all of the Company’s hotel properties are operated pursuant tolong-term agreements with terms ranging from 5 to 25 years, with 16 management companies asfollows:
Number ofManagement Company Properties
Aimbridge Hospitality . . . . . . . . . . . . . . . . . . . . . . . . . . . . . . . . . . . . . . 2Concord Hospitality Enterprises Company . . . . . . . . . . . . . . . . . . . . . . . 1Crescent Hotels and Resorts . . . . . . . . . . . . . . . . . . . . . . . . . . . . . . . . . 3Crestline Hotels and Resorts . . . . . . . . . . . . . . . . . . . . . . . . . . . . . . . . . 1Davidson Hotels and Resorts . . . . . . . . . . . . . . . . . . . . . . . . . . . . . . . . . 1Embassy Suites Management . . . . . . . . . . . . . . . . . . . . . . . . . . . . . . . . . 3HEI Hotels and Resorts . . . . . . . . . . . . . . . . . . . . . . . . . . . . . . . . . . . . . 1Highgate Hotels . . . . . . . . . . . . . . . . . . . . . . . . . . . . . . . . . . . . . . . . . . 4Interstate Hotels and Resorts(1) . . . . . . . . . . . . . . . . . . . . . . . . . . . . . . . 11K Partners Hospitality Group . . . . . . . . . . . . . . . . . . . . . . . . . . . . . . . . . 1Marriott Hotel Services . . . . . . . . . . . . . . . . . . . . . . . . . . . . . . . . . . . . . 5Sage Hospitality . . . . . . . . . . . . . . . . . . . . . . . . . . . . . . . . . . . . . . . . . . 2Stonebridge Realty Advisors . . . . . . . . . . . . . . . . . . . . . . . . . . . . . . . . . . 1Urgo Hotels . . . . . . . . . . . . . . . . . . . . . . . . . . . . . . . . . . . . . . . . . . . . . 4Windsor Capital Group . . . . . . . . . . . . . . . . . . . . . . . . . . . . . . . . . . . . . 1WLS . . . . . . . . . . . . . . . . . . . . . . . . . . . . . . . . . . . . . . . . . . . . . . . . . . . 104
145
(1) Includes agreements entered into with Noble Management Group, LLC, a wholly-ownedsubsidiary of Interstate Hotels and Resorts.
Each management company receives a base management fee generally between 2.0% and 7.0% ofhotel revenues. The management companies are also eligible to receive an incentive management fee ifhotel operating income, as defined in the management agreements, exceeds certain thresholds. Theincentive management fee is generally calculated as a percentage of hotel operating income after theCompany has received a priority return on their investment in the hotel.
For the years ended December 31, 2012, 2011 and 2010, the Company incurred management feeexpense, including amortization of deferred management fees, of approximately $30.1 million,$26.1 million and $18.4 million, respectively, (excluding discontinued operations).
Franchise Agreements
As of December 31, 2012, 140 of the Company’s hotel properties are operated under franchiseagreements with terms ranging from 9 to 30 years. The franchise agreements for these hotels allow theproperties to operate under the respective brands. Pursuant to the franchise agreements, the Companypays a royalty fee, generally between 3.0% and 6.0% of room revenue, plus additional fees formarketing, central reservation systems and other franchisor costs that amount to between 1.0% and4.3% of room revenue. Certain hotels are also charged a royalty fee of between 1.0% and 3.0% of food
F-34

RLJ Lodging Trust
Notes to the Combined Consolidated Financial Statements (Continued)
10. Commitments and Contingencies (Continued)
and beverage revenues. For the years ended December 31, 2012, 2011 and 2010, the Company incurredfranchise fee expense of approximately $55.7 million, $48.6 million and $33.0 million, respectively,(excluding discontinued operations).
Litigation
Neither the Company nor any of its subsidiaries are currently involved in any regulatory or legalproceedings that management believes will have a material adverse effect on the financial position,operations or liquidity of the Company.
Purchase Commitments
As of December 31, 2012 the Company, through wholly-owned subsidiaries, is subject to threepurchase and sale agreements to purchase five properties. The Company intends to consummate thetransactions pursuant to the terms of the agreements. However, if the Company fails to consummate, itcould be required to forfeit its deposits of $9.9 million.
11. Equity
Common Shares of Beneficial Interest
Under the original declaration of trust of the Company, the total number of shares initiallyauthorized for issuance was 100,000 common shares. At formation, the Company issued to each of itstwo initial shareholders 500 common shares at $1 per share, which shares were subsequently redeemed.On May 5, 2011, the declaration of trust was amended to authorize the issuance of up to 450,000,000common shares.
On May 16, 2011, RLJ Lodging Trust completed its IPO and formation transactions. The IPOresulted in the sale of 27,500,000 common shares of beneficial interest, $0.01 par value per share, at$18.00 per share, for total gross proceeds of $495.0 million. The aggregate proceeds to the Company,net of underwriters’ discounts, were approximately $464.1 million. The Company used the net proceedsfrom the IPO and cash on hand to repay approximately $472.6 million of secured indebtedness. TheCompany recorded costs incurred in connection with the IPO as a reduction of additional paid-incapital in shareholders’ equity. Costs incurred in connection with the formation transactions for thetransfer and assumption of indebtedness and other contractual obligations of the RLJ Predecessor wereexpensed as incurred and are included in IPO costs. In connection with the formation transactions, theCompany issued 73,605,951 common shares of beneficial interest as consideration to certain entities fortheir interest in certain entities that merged with and into the Company or the Company’s subsidiariesin the formation transactions.
On June 3, 2011, the Company issued and sold an additional 4,095,000 common shares ofbeneficial interest, $0.01 par value per share, at a price per share of $18.00 upon exercise of theOverallotment, for total gross proceeds of $73.7 million. The Company received aggregate net proceedsof approximately $69.1 million in connection with the Overallotment. The Company used the netproceeds from the Overallotment for general corporate purposes.
Preferred Shares of Beneficial Interest
Under the declaration of trust of the Company, the total number of shares initially authorized forissuance was 10,000 preferred shares. On May 5, 2011, the declaration of trust was amended toauthorize the issuance of up to 50,000,000 preferred shares. As of both December 31, 2012 and 2011,respectively, there were no preferred shares of beneficial interest outstanding.
F-35

RLJ Lodging Trust
Notes to the Combined Consolidated Financial Statements (Continued)
11. Equity (Continued)
Noncontrolling Interest in Joint Venture
As of December 31, 2012, the Company consolidated DBT Met Hotel Venture, LP, a majority-owned limited partnership that has a third-party partner that owns a noncontrolling 5.0% ownershipinterest. The third-party partnership interest is included in noncontrolling interest in joint venture onthe balance sheet.
Noncontrolling Interest in Operating Partnership
The Company consolidates its Operating Partnership, a majority owned limited partnership thathas a noncontrolling ownership interest and is included in noncontrolling interest in OperatingPartnership on the balance sheet. As of December 31, 2012, the Operating Partnership had 107,459,516OP units outstanding, of which 99.2% were owned by the Company and its subsidiaries and 0.8% wereowned by other limited partners.
The outstanding OP units held by limited partners are redeemable for cash, or at the option of theCompany, for a like number of common shares of beneficial interest of the Company.
Partners’ Capital
As of May 16, 2011, the Fund II partners had made aggregate capital contributions ofapproximately $726.2 million. In addition, $16.9 million of advisory fees, which reduced limited partnercapital commitments, had been paid by the limited partners to the Fund II General Partner.Accordingly, 100.0% of total capital commitments had been committed as of May 16, 2011. As ofMay 16, 2011, Fund II had made distributions of approximately $162.0 million, in aggregate, includingapproximately $26.5 million of advisory fees distributed to the Fund II General Partner on behalf of thelimited partners. On May 16, 2011, Fund II was merged into the Company.
As of May 16, 2011, the Fund III partners had made aggregate capital contributions ofapproximately $917.3 million. In addition, $50.1 million of advisory fees, which reduced limited partnercapital commitments, had been paid by the limited partners to the Fund III General Partner.Accordingly, 81.2% of total capital commitments had been deployed as of May 16, 2011. As of May 16,2011, Fund III had made no distributions, except for advisory fees (see Note 14). On May 16, 2011,Fund III was merged into the Company.
On May 16, 2011, in conjunction with the IPO, the partners of Fund II and Fund III received73,605,951 common shares of beneficial interest, $0.01 par value per share, at $18.00 per share, for atotal gross amount of $1,324.9 million, in exchange for their partnership interests in Fund II andFund III.
Members’ Capital
The rights and obligations of the equity holders of RLJ Development (the ‘‘Members’’) weregoverned by the limited liability company agreement of RLJ Development, dated December 19, 2000and amended January 1, 2002 (the ‘‘Operating Agreement’’). Each Member’s interest in the Companyis equal to the percentage of capital initially contributed by that Member. The Class A Member held a75% ownership interest and the two Class B Members held a total interest of 25%. The Class AMember made capital contributions totaling $115.3 million, none of which were contributed during theperiod from January 1, 2011 through May 16, 2011 or the year ended December 31, 2010. The Class B
F-36

RLJ Lodging Trust
Notes to the Combined Consolidated Financial Statements (Continued)
11. Equity (Continued)
Members were not required to make, nor did they make any, capital contributions during the periodfrom January 1, 2011 through May 16, 2011 or the year ended December 31, 2010.
On May 16, 2011, in conjunction with the IPO, the Members of RLJ Development received894,000 OP Units, at $18.00 per unit, for a total gross amount of $16.1 million, in exchange for theircontribution to the Operating Partnership of substantially all of the assets and liabilities of RLJDevelopment.
Preferred Distributions
Fund II, through wholly-owned subsidiaries, made distributions to preferred unitholderssemi-annually on June 30 and December 31 each year. As of May 16, 2011, an aggregate ofapproximately $0.1 million had been distributed or was payable to preferred unitholders. On May 16,2011, in conjunction with the IPO, the Fund II unitholders interests in Fund II were redeemed. TheCompany paid the unitholders the liquidation value of $0.3 million plus accumulated and unpaiddividends of approximately $12,000 and a redemption premium of approximately $12,000.
Fund III, through wholly-owned subsidiaries, made distributions to preferred unitholderssemi-annually on June 30 and December 31 each year. As of May 16, 2011, an aggregate ofapproximately $0.1 million had been distributed or was payable to preferred unitholders. On May 16,2011, in conjunction with the IPO, the Fund III unitholders interests in Fund III were redeemed. TheCompany paid the unitholders the liquidation value of $0.3 million plus accumulated and unpaiddividends of approximately $12,000 and a redemption premium of approximately $24,000.
12. Equity Incentive Plan
The Company may issue equity-based awards to officers, employees, non-employee trustees andother eligible persons under the 2011 Plan. The 2011 Plan provides for a maximum of 5,000,000common shares of beneficial interest to be issued in the form of share options, share appreciationrights, restricted share awards, unrestricted share awards, share units, dividend equivalent rights,long-term incentive units, other equity-based awards and cash bonus awards. In addition, the maximumnumber of common shares subject to awards of any combination that may be granted under the 2011Plan during any calendar year to any one individual is limited to 1,000,000 shares. The exercise price ofshare options is determined by the Board of Trustees, but may not be less than 100% of the fairmarket value of the common shares on the date of grant. For grantees that own greater than tenpercent of the total combined voting power of all classes of outstanding voting securities of theCompany, the exercise price of share options may not be less than 110% of the fair market value ofthe common shares on the date of grant. The fair market value for all other types of share awards isdetermined by the closing price on the date of grant.
Non-vested Restricted Share Awards
From time to time, the Company may award non-vested shares under the 2011 Plan, ascompensation to officers, employees and non-employee trustees. The shares issued to officers andemployees vest over a period of time as determined by the Board of Trustees at the date of grant. TheCompany recognizes compensation expense for non-vested shares on a straight-line basis over thevesting period based upon the fair market value of the shares on the date of issuance, adjusted forforfeitures.
F-37

RLJ Lodging Trust
Notes to the Combined Consolidated Financial Statements (Continued)
12. Equity Incentive Plan (Continued)
A summary of the non-vested shares as of December 31, 2012 and 2011 is as follows:
2012 2011
Weighted WeightedNumber of Average Grant Number of Average Grant
Shares Date Fair Value Shares Date Fair Value
Unvested at January 1 . . . . . . 970,288 $17.93 — $ —Granted . . . . . . . . . . . . . . . . . 436,646 17.57 1,120,830 17.93Vested . . . . . . . . . . . . . . . . . . (366,383) 17.86 (147,542) 17.93Forfeited . . . . . . . . . . . . . . . . (26,878) 17.80 (3,000) 17.53
Unvested at December 31 . . . . 1,013,673 $17.80 970,288 $17.93
For the years ended December 31, 2012 and 2011, the Company recognized approximately$6.7 million and $3.3 million, respectively, of share-based compensation expense related to theserestricted share awards. As of December 31, 2012, there was $17.3 million of total unrecognizedcompensation costs related to non-vested share awards. As of December 31, 2012, these costs wereexpected to be primarily recognized over a weighted-average period of 2.6 years. The total fair value ofshares vested (calculated as number of shares multiplied by vesting date share price) during the yearsended December 31, 2012 and 2011 was approximately $6.5 million and $2.6 million, respectively.
Performance Units
The Company awarded performance units to certain employees under the 2011 Plan. Theperformance units vest over a four-year period, including three years of performance-based vesting(‘‘measurement period’’) plus an additional one year of time-based vesting. The performance units mayconvert into restricted shares at a range of 50% to 150% of the number of performance units grantedcontingent upon the Company achieving a total shareholder return over the measurement period atspecified percentiles of the peer group, as defined by the award. If at the end of the measurementperiod the performance criterion is met, 50% of the restricted shares will vest immediately. Theremaining 50% will vest one year later. The award recipients will not be entitled to receive anydividends prior to the date of conversion. For any restricted shares issued upon conversion, the awardrecipient will be entitled to receive payment of an amount equal to all dividends that would have beenpaid if such restricted shares had been issued at the beginning of the measurement period. The fairvalue of the performance units is determined using a Monte Carlo simulation with the followingassumptions: risk-free interest rate of 0.31%, volatility of 38.92%, and an expected term equal to therequisite service period for the awards. The Company determined compensation expense for theperformance units on a straight line basis using a calculation that recognizes 50% of the grant date fairvalue over three years and 50% of the grant date fair value over four years.
F-38

RLJ Lodging Trust
Notes to the Combined Consolidated Financial Statements (Continued)
12. Equity Incentive Plan (Continued)
A summary of the performance units is as follows:
WeightedNumber of Average Grant
Units Date Fair Value
Unvested at January 1, 2012 . . . . . . . . . . . . . . . . . . . . . . — $ —Granted . . . . . . . . . . . . . . . . . . . . . . . . . . . . . . . . . . . . . 1,000,000 15.36
Unvested at December 31, 2012 . . . . . . . . . . . . . . . . . . . 1,000,000 $15.36
For the year ended December 31, 2012, the Company recognized $1.9 million of share-basedcompensation expense related to performance unit awards. There was no share-based compensationexpense in 2011 related to the performance units as they were granted in 2012. As of December 31,2012, there was $13.4 million of total unrecognized compensation cost related to the performance unitsand these costs are expected to be recognized over a weighted-average period of 3.1 years.
As of December 31, 2012, there were 3,456,062 common shares available for future grant underthe 2011 Plan. Any performance units that convert into restricted shares will reduce the number ofcommon shares available for future grant under the 2011 Plan.
13. Earnings per Common Share
Basic earnings per common share is calculated by dividing net income attributable to commonshareholders by the weighted-average number of common shares outstanding during the periodexcluding the weighted average number of unvested restricted shares outstanding during the period.Diluted earnings per common share is calculated by dividing net income attributable to commonshareholders by the weighted average number of common shares outstanding during the period, plusany shares that could potentially be outstanding during the period. Potential shares consist of unvestedrestricted share grants and unvested performance units, calculated using the treasury stock method. Anyanti-dilutive shares have been excluded from the diluted earnings per share calculation.
Unvested share-based payment awards that contain non-forfeitable rights to dividends or dividendequivalents (whether paid or unpaid) are participating shares and are considered in the computation ofearnings per share pursuant to the two-class method. If there were any undistributed earnings allocableto participating shares, they would be deducted from net income attributable to common shareholdersutilized in the basic and diluted earnings per share calculations.
For the year ended December 31, 2012, no earnings representing undistributed earnings wereallocated to participating shares because the Company paid dividends in excess of net income. For theyear ended December 31, 2011, diluted weighted average common shares did not include the impact ofunvested compensation-related shares because the effect of these items on diluted earnings per sharewould have been anti-dilutive. For the year ended December 31, 2011 there were 970,288 anti-dilutivecompensation-related shares outstanding.
The limited partners’ outstanding limited partnership units in the Operating Partnership (whichmay be redeemed for common shares of beneficial interest under certain circumstances) have beenexcluded from the diluted earnings per share calculation as there was no effect on the amounts for theyears ended December 31, 2012 and 2011, since the limited partners’ share of income would also beadded back to net income attributable to common shareholders.
F-39

RLJ Lodging Trust
Notes to the Combined Consolidated Financial Statements (Continued)
13. Earnings per Common Share (Continued)
The computation of basic and diluted earnings per common share is as follows (in thousands,except share and per share data):
For the year ended,
December 31, December 31,2012 2011
Numerator:Net income (loss) attributable to common shareholders before
discontinued operations . . . . . . . . . . . . . . . . . . . . . . . . . . . . . . . . . . . $ 41,298 $ (10,490)Add: Income from discontinued operations . . . . . . . . . . . . . . . . . . . . . . . — 21,836
Net income attributable to common shareholders . . . . . . . . . . . . . . . . . . 41,298 11,346Less: Dividends paid on unvested restricted shares . . . . . . . . . . . . . . . . . (802) (392)Net income attributable to common shareholders excluding amounts
attributable to unvested restricted shares . . . . . . . . . . . . . . . . . . . . . . . $ 40,496 $ 10,954
Denominator:Weighted-average number of common shares—basic . . . . . . . . . . . . . . . . 105,423,604 95,340,666Unvested restricted shares . . . . . . . . . . . . . . . . . . . . . . . . . . . . . . . . . . . 59,587 —Performance units . . . . . . . . . . . . . . . . . . . . . . . . . . . . . . . . . . . . . . . . . 265,495 —
Weighted-average number of common shares—diluted . . . . . . . . . . . . . . . 105,748,686 95,340,666
Net income (loss) per share attributable to common shareholders—basic . $ 0.38 $ (0.11)
Discontinued operations . . . . . . . . . . . . . . . . . . . . . . . . . . . . . . . . . . . . . — 0.23
Net income per share attributable to common shareholders—basic . . . . . . $ 0.38 $ 0.12
Net income (loss) per share attributable to common shareholders—diluted . $ 0.38 $ (0.11)
Discontinued operations . . . . . . . . . . . . . . . . . . . . . . . . . . . . . . . . . . . . . — 0.23
Net income per share attributable to common shareholders—diluted . . . . $ 0.38 $ 0.12
14. Advisory Fees
Pursuant to the terms of the Fund II LP Agreements, the Fund II General Partner was entitled toreceive annual advisory fees directly from the limited partners in consideration for the Fund II GeneralPartner providing and managing the day-to-day operations and expenditures of Fund II. Total advisoryfees due to the Fund II General Partner from limited partners, including advisory fees due from thelimited partners admitted during subsequent closes, for the years ended December 31, 2011 and 2010,were approximately $3.2 million and $8.6 million, respectively. As of December 31, 2011 all advisoryfees due had been paid by the limited partners.
Pursuant to the terms of the Fund III LP Agreements, the Fund III General Partner was entitledto receive annual advisory fees directly from the limited partners in consideration for the Fund IIIGeneral Partner providing and managing the day-to-day operations and expenditures of Fund III. Totaladvisory fees due to the Fund III General Partner from limited partners, including advisory fees duefrom the limited partners admitted during subsequent closes, for the years ended December 31, 2011
F-40

RLJ Lodging Trust
Notes to the Combined Consolidated Financial Statements (Continued)
14. Advisory Fees (Continued)
and 2010, were approximately $3.8 million and $13.7 million, respectively. As of December 31, 2011 alladvisory fees due had been paid by the limited partners.
The combined consolidated financial statements of the Company reflect these advisory fees ascontributions and distributions within the respective partner accounts. As a result of the combination ofRLJ Development with Fund II and Fund III and after elimination entries, the actual expensesassociated with operating Fund II and Fund III have been reflected in these financial statements. Uponcompletion of the IPO and related formation transactions, the advisory fee obligations of the limitedpartners ceased to exist.
15. Related Party Transactions
The RLJ Predecessor paid monthly fees for management advisory services to the managingmember of RLJ Development, which are included in general and administrative expense. Such feesamounted to $0.9 million and $2.3 million for years ended December 31, 2011 and 2010, respectively.Upon completion of the IPO and related formation transactions, the management fee obligation of theRLJ Predecessor ceased to exist.
RLJ Companies LLC and its affiliates, a related party, periodically provide or receive services orpay or collect certain amounts to or from the Company. At December 31, 2012 and 2011, there wasapproximately $45,000 and $28,000, respectively, due from RLJ Companies, LLC which was included inother assets.
For the years ended December 31, 2012, 2011 and 2010, the Company made charitablecontributions to various foundations and charitable organizations totaling $0.3 million, $0.2 million and$0.3 million, respectively, which are included in general and administrative expense. For the yearsended December 31, 2012, 2011 and 2010, zero, $25,000 and $0.1 million, respectively, of thesecharitable contributions were paid to organizations directed by related parties.
16. Income Taxes
For federal income tax purposes, the cash distributions paid for the years ended December 31,2012 and 2011 are characterized as follows:
For the YearsEnded
December 31,
2012 2011
Common distributionsOrdinary income . . . . . . . . . . . . . . . . . . . . . . . . . . . . . . . . . . . . 100.0% 100.0%Return of capital . . . . . . . . . . . . . . . . . . . . . . . . . . . . . . . . . . . . — —Capital gains . . . . . . . . . . . . . . . . . . . . . . . . . . . . . . . . . . . . . . . — —
100.0% 100.0%
Preferred distributionsOrdinary income . . . . . . . . . . . . . . . . . . . . . . . . . . . . . . . . . . . . — 100.0%Return of capital . . . . . . . . . . . . . . . . . . . . . . . . . . . . . . . . . . . . — —Capital gains . . . . . . . . . . . . . . . . . . . . . . . . . . . . . . . . . . . . . . . — —
— 100.0%
F-41

RLJ Lodging Trust
Notes to the Combined Consolidated Financial Statements (Continued)
16. Income Taxes (Continued)
The components of the income tax provision from continuing operations are as follows (inthousands):
For the Years EndedDecember 31,
2012 2011 2010
Current:Federal . . . . . . . . . . . . . . . . . . . . . . . . . . . . . . . . . . . $ (50) $ (1) $ —State . . . . . . . . . . . . . . . . . . . . . . . . . . . . . . . . . . . . . (1,381) (1,232) (945)
Deferred:Federal . . . . . . . . . . . . . . . . . . . . . . . . . . . . . . . . . . . 64 443 —State . . . . . . . . . . . . . . . . . . . . . . . . . . . . . . . . . . . . . (2) 50 —
Total net tax expense . . . . . . . . . . . . . . . . . . . . . . . . . $(1,369) $ (740) $(945)
The provision for income taxes differs from the amount of income tax determined by applying theapplicable U.S. statutory federal income tax rate to pretax income from continuing operations for theyears ended December 31, 2012, 2011 and 2010 as a result of the following differences (in thousands):
For the Years EndedDecember 31,
2012 2011 2010
‘‘Expected’’ federal tax benefit at statutory rate . . . . $(14,952) $ (4,398) $ 13,932Tax impact of passthrough entities . . . . . . . . . . . . . — — (5,850)Tax impact of REIT election . . . . . . . . . . . . . . . . . 22,618 19,619 1,992
Expected tax benefit at TRS . . . . . . . . . . . . . . . . . . 7,666 15,221 10,074Change in valuation allowance . . . . . . . . . . . . . . . . (8,741) (17,045) (11,291)State income (expense) benefit, net of federal tax
benefit . . . . . . . . . . . . . . . . . . . . . . . . . . . . . . . . 595 1,411 143Impact of rate change . . . . . . . . . . . . . . . . . . . . . . 146 — —Other permanent items . . . . . . . . . . . . . . . . . . . . . (394) (436) (116)Impact of acquired tax attributes . . . . . . . . . . . . . . (361) — —Impact of provision to return . . . . . . . . . . . . . . . . . (280) 109 245
Income tax expense . . . . . . . . . . . . . . . . . . . . . . . . $ (1,369) $ (740) $ (945)
F-42

RLJ Lodging Trust
Notes to the Combined Consolidated Financial Statements (Continued)
16. Income Taxes (Continued)
Deferred income taxes represent the tax effect from continuing operations of the differencesbetween the book and tax basis of assets and liabilities. Deferred tax assets (liabilities) include thefollowing (in thousands):
December 31,
2012 2011
Property and equipment . . . . . . . . . . . . . . . . . . . . . . . . . . . . . $ (2,633) $ (2,319)Prepaid expenses . . . . . . . . . . . . . . . . . . . . . . . . . . . . . . . . . . (1,431) (995)
Gross deferred tax liabilities . . . . . . . . . . . . . . . . . . . . . . . . . $ (4,064) $ (3,314)
Property and equipment . . . . . . . . . . . . . . . . . . . . . . . . . . . . . $ 4,997 $ 5,853Deferred revenue—key money . . . . . . . . . . . . . . . . . . . . . . . . 1,933 —Incentive and vacation accrual . . . . . . . . . . . . . . . . . . . . . . . . 1,562 1,554Allowance for doubtful accounts . . . . . . . . . . . . . . . . . . . . . . . 77 58Other . . . . . . . . . . . . . . . . . . . . . . . . . . . . . . . . . . . . . . . . . . 204 168Other carryforwards . . . . . . . . . . . . . . . . . . . . . . . . . . . . . . . . 108 28Net operating loss carryforwards . . . . . . . . . . . . . . . . . . . . . . . 50,463 42,105Valuation allowance . . . . . . . . . . . . . . . . . . . . . . . . . . . . . . . . (57,138) (48,397)
Gross deferred tax assets . . . . . . . . . . . . . . . . . . . . . . . . . . . . $ 2,206 $ 1,369
The Company recorded a valuation allowance of approximately $57.1 million and $48.4 millionrelated to its net operating loss, or NOL, carryforwards and other deferred tax assets at December 31,2012 and 2011, respectively, as the Company believed it was more likely than not that it would notrealize the benefits associated with these NOLs and other deferred tax assets. The ability to carryforward the NOLs of approximately $50.5 million will begin to expire in 2026 for federal tax purposesand during the period from 2016 to 2026 for state tax purposes if not utilized. If the Company’s TRSentities were to experience a change in control as defined in Section 382 of the Code, the TRS’s abilityto utilize NOLs in the years after the change in control would be limited.
The Company owns subsidiary TRSs which are not part of a consolidated tax return, thesedeferred tax assets and liabilities are presented on a combined basis and are not subject to a valuationallowance.
The net current and non-current components of deferred income taxes included in the combinedconsolidated balance sheets are as follows (in thousands):
December 31,
2012 2011
Current net deferred tax assets . . . . . . . . . . . . . . . . . . . . . . . . . $ 193 $ 71Current net deferred tax liabilities . . . . . . . . . . . . . . . . . . . . . . . (1,431) (995)Non-current net deferred tax assets . . . . . . . . . . . . . . . . . . . . . . 2,013 1,298Non-current net deferred tax liabilities . . . . . . . . . . . . . . . . . . . . (2,633) (2,319)
Net deferred tax liability . . . . . . . . . . . . . . . . . . . . . . . . . . . . . . $(1,858) $(1,945)
F-43

RLJ Lodging Trust
Notes to the Combined Consolidated Financial Statements (Continued)
16. Income Taxes (Continued)
The Company had no accruals for tax uncertainties as of December 31, 2012 and December 31,2011. One of our predecessor entities was under examination by the Internal Revenue Service for theperiod ended December 31, 2009. The examination concluded in September 2012, and no adjustmentswere proposed or made as a result of the examination.
17. Comprehensive Income (Loss)
For the years ended December 31, 2012 and 2011, comprehensive income was approximately$43.1 million and $13.7 million, respectively. For the year ended December 31, 2010 comprehensive losswas approximately $11.6 million. As of December 31, 2012 and 2011, the Company’s accumulated othercomprehensive loss was approximately zero and $1.8 million, respectively. The accumulated othercomprehensive loss resulted entirely from the Company’s unrealized losses on its interest rate derivativeinstruments.
18. Segment Information
The Company separately evaluates the performance of each of its hotels. However, because eachof the hotels has similar economic characteristics, facilities, and services, the properties have beenaggregated into a single operating segment.
F-44

RLJ Lodging Trust
Notes to the Combined Consolidated Financial Statements (Continued)
19. Supplemental Information to Statements of Cash Flows (in thousands)
For the year ended December 31,
2012 2011 2011
Interest paid . . . . . . . . . . . . . . . . . . . . . . . . . . . . . . . . . . . . . . . . . . $ 79,376 $ 91,558 $ 83,670
Income taxes paid . . . . . . . . . . . . . . . . . . . . . . . . . . . . . . . . . . . . . . $ 1,598 $ 1,392 $ 1,934
Supplemental investing and financing transactions:In conjunction with the hotel acquisitions, the Company assumed
the following assets and liabilities:Purchase of real estate . . . . . . . . . . . . . . . . . . . . . . . . . . . . . . . . . $247,158 $249,018 $833,080Accounts receivable . . . . . . . . . . . . . . . . . . . . . . . . . . . . . . . . . . . 164 556 878Other assets . . . . . . . . . . . . . . . . . . . . . . . . . . . . . . . . . . . . . . . . 728 1,040 6,942Advance deposits . . . . . . . . . . . . . . . . . . . . . . . . . . . . . . . . . . . . . (224) (379) (624)Non-controlling interest . . . . . . . . . . . . . . . . . . . . . . . . . . . . . . . . — — (7,836)Accounts payable and accrued expenses . . . . . . . . . . . . . . . . . . . . (777) (2,439) (3,568)Application of purchase deposit . . . . . . . . . . . . . . . . . . . . . . . . . . — (8,500) —Deferred tax liabilities assumed . . . . . . . . . . . . . . . . . . . . . . . . . . — (2,438) —
Acquisition of hotel properties . . . . . . . . . . . . . . . . . . . . . . . . . . . $247,049 $236,858 $828,872
In conjunction with the hotel disposals, the Company disposed ofthe following assets and liabilities:
Sale of real estate . . . . . . . . . . . . . . . . . . . . . . . . . . . . . . . . . . . . $ — $(31,534) $(49,452)Other assets . . . . . . . . . . . . . . . . . . . . . . . . . . . . . . . . . . . . . . . . — (8,007) (286)Other liabilities . . . . . . . . . . . . . . . . . . . . . . . . . . . . . . . . . . . . . . — 5,056 701Gain on sale of property . . . . . . . . . . . . . . . . . . . . . . . . . . . . . . . — — (23,710)Gain on extinguishment of indebtedness . . . . . . . . . . . . . . . . . . . . — (23,515) —Forgiveness of indebtedness . . . . . . . . . . . . . . . . . . . . . . . . . . . . . — 58,000 —
Disposition of hotel properties . . . . . . . . . . . . . . . . . . . . . . . . . . . $ — $ — $(72,747)
Supplemental non-cash transactions:Change in fair market value of interest rate swaps . . . . . . . . . . . . . $ 1,326 $ 2,024 $ 11,109
Accrued capital expenditures . . . . . . . . . . . . . . . . . . . . . . . . . . . . $ 4,563 $ 12,801 $ —
Distributions payable . . . . . . . . . . . . . . . . . . . . . . . . . . . . . . . . . . $ 22,392 $ 16,076 $ —
20. Subsequent Events
On January 15, 2013, the Company paid a dividend of $0.205 per common share of beneficialinterest to shareholders of record at December 31, 2012.
21. Quarterly Operating Results (unaudited)
The Company’s unaudited condensed consolidated quarterly operating data for the years endedDecember 31, 2012 and 2011 follows (in thousands, except share and per share data). In the opinion ofmanagement, all adjustments (consisting of normal recurring accruals) necessary for a fair presentationof quarterly results have been reflected in the data. It is also management’s opinion, however, thatquarterly operating data for hotels enterprises are not indicative of results to be achieved in succeedingyears or quarters. In order to obtain a more accurate indication of performance, there should be areview of operating results, changes in shareholders’ equity and cash flows for a period of several years.
F-45
RLJ Lodging Trust
Notes to the Combined Consolidated Financial Statements (Continued)
21. Quarterly Operating Results (unaudited) (Continued)
Depreciation expense for the fourth quarter of 2011 includes an out-of-period adjustment torecord an increase to depreciation expense of $3.1 million, of which approximately $2.8 million relatedto under reporting of depreciation expense in the first three quarters of 2011 and $0.3 million relatedto an underreporting of depreciation in the fourth quarter of 2010. The Company believes that boththe actual depreciation expense errors and the correction of those errors out of period in the fourthquarter of 2011 are not material.
Year ended December 31, 2012
First Quarter Second Quarter Third Quarter Fourth Quarter
Total revenue . . . . . . . . . . . . . . . . . . . . . . . . . . . . $ 183,193 $ 223,257 $ 225,217 $ 222,538Income (loss) from continuing operations . . . . . . . . . $ (6,921) $ 19,019 $ 15,301 $ 13,920Discontinued operations . . . . . . . . . . . . . . . . . . . . $ — $ — $ — $ —Net income (loss) attributable to common
shareholders . . . . . . . . . . . . . . . . . . . . . . . . . . . $ (6,513) $ 18,885 $ 15,196 $ 13,730Comprehensive income (loss) . . . . . . . . . . . . . . . . . $ (6,519) $ 19,266 $ 15,585 $ 14,748
Basic per share data:Income (loss) from continuing operations . . . . . . . $ (0.07) $ 0.18 $ 0.15 $ 0.13Discontinued operations . . . . . . . . . . . . . . . . . . . $ — $ — $ — $ —Net income (loss) attributable to common
shareholders . . . . . . . . . . . . . . . . . . . . . . . . . $ (0.06) $ 0.18 $ 0.14 $ 0.13
Diluted per share data:Income (loss) from continuing operations . . . . . . . $ (0.07) $ 0.18 $ 0.15 $ 0.13Discontinued operations . . . . . . . . . . . . . . . . . . . $ — $ — $ — $ —Net income (loss) attributable to common
shareholders . . . . . . . . . . . . . . . . . . . . . . . . . $ (0.06) $ 0.18 $ 0.14 $ 0.13
Basic weighted average common shares outstanding 105,332,812 105,388,743 105,453,978 105,517,515Diluted weighted average common shares
outstanding . . . . . . . . . . . . . . . . . . . . . . . . . . 105,332,812 105,454,679 105,509,104 105,865,104
Year ended December 31, 2011
First Quarter Second Quarter Third Quarter Fourth Quarter
Total revenue . . . . . . . . . . . . . . . . . . . . . . . . . . . . $168,169 $ 204,271 $ 197,251 $ 189,261Income (loss) from continuing operations . . . . . . . . . $ (15,304) $ (2,301) $ 8,677 $ (1,199)Discontinued operations . . . . . . . . . . . . . . . . . . . . . $ (972) $ (160) $ 22,970 $ (2)Net income (loss) attributable to common
shareholders . . . . . . . . . . . . . . . . . . . . . . . . . . . $ (16,132) $ (2,568) $ 31,319 $ (1,273)Comprehensive income (loss) . . . . . . . . . . . . . . . . . $ (14,936) $ (2,952) $ 32,001 $ (743)
Basic and diluted per share data:Income (loss) from continuing operations . . . . . . . n/a $ (0.03) $ 0.08 $ (0.01)Discontinued operations . . . . . . . . . . . . . . . . . . . n/a $ (0.00) $ 0.22 $ (0.00)Net income (loss) attributable to common
shareholders . . . . . . . . . . . . . . . . . . . . . . . . . . n/a $ (0.03) $ 0.30 $ (0.01)
Basic weighted average common shares outstanding n/a 88,767,570 105,228,305 105,280,964Diluted weighted average common shares
outstanding . . . . . . . . . . . . . . . . . . . . . . . . . . n/a 88,767,570 105,228,305 105,280,964
F-46

F-47
RL
J L
odgi
ng T
rust
Rea
l E
stat
e an
d A
ccum
ulat
ed D
epre
ciat
ion
Dec
embe
r 31
, 20
12
(Dol
lars
in
thou
sand
s)
Init
ial
Cos
tsSu
bseq
uent
Cos
ts C
apit
aliz
edG
ross
Am
ount
at
Dec
embe
r 31
, 20
12
Lan
d &
Bui
ldin
g &
Lan
d &
Bui
ldin
g &
Lan
d &
Bui
ldin
gs &
Acc
umul
ated
Dat
eD
epre
ciat
ion
Des
crip
tion
Deb
tIm
prov
emen
tsIm
prov
emen
tsIm
prov
emen
tsIm
prov
emen
tsIm
prov
emen
tsIm
prov
emen
tsTo
tal
Dep
reci
atio
nA
cqui
red
Lif
e
Mar
riot
t A
irpo
rt A
ustin
Sou
th.
..
..
.$
21,5
21$
2,25
3$
16,5
22$
—$
1,43
0$
2,25
3$
17,9
52$
20,2
05$
2,86
220
0615
- 4
0 ye
ars
Mar
riot
t D
enve
r So
uth
@ P
ark
Mea
dow
38,2
265,
385
39,4
88—
1,82
75,
385
41,3
1546
,700
6,59
420
0615
- 4
0 ye
ars
Mar
riot
t L
ouis
ville
Dow
ntow
n.
..
..
.68
,500
—89
,541
—1,
587
—91
,128
91,1
2814
,749
2006
15 -
40
year
sM
arri
ott
Pont
iac
..
..
..
..
..
..
..
13,4
793,
438
25,2
24—
125
3,43
825
,349
28,7
874,
157
2006
15 -
40
year
sM
arri
ott
Mid
way
..
..
..
..
..
..
..
27,3
624,
464
32,7
36—
1,76
64,
464
34,5
0238
,966
5,51
220
0615
- 4
0 ye
ars
Ren
aiss
ance
Bou
lder
Sui
tes
@ F
latir
on.
18,3
864,
440
32,5
57—
1,54
24,
440
34,0
9938
,539
5,40
620
0615
- 4
0 ye
ars
Ren
aiss
ance
Pla
ntat
ion
..
..
..
..
..
24,7
594,
842
35,5
17—
1,75
74,
842
37,2
7442
,116
5,91
720
0615
- 4
0 ye
ars
Hol
iday
Inn
Aus
tin N
W P
laza
..
..
..
—1,
546
11,3
37—
489
1,54
611
,826
13,3
721,
925
2006
15 -
40
year
sC
ourt
yard
Aus
tin C
entr
al.
..
..
..
..
—1,
894
13,8
91—
911
1,89
414
,802
16,6
962,
355
2006
15 -
40
year
sC
ourt
yard
Aus
tin N
W P
arm
er L
ane
..
.12
,249
1,44
310
,585
31,
277
1,44
611
,862
13,3
081,
842
2006
15 -
40
year
sC
ourt
yard
Aus
tin S
outh
..
..
..
..
..
5,13
41,
530
11,2
223
1,21
01,
533
12,4
3213
,965
1,89
920
0615
- 4
0 ye
ars
Cou
rtya
rd B
ento
n H
arbo
r.
..
..
..
.2,
534
345
2,53
4—
181
345
2,71
53,
060
430
2006
15 -
40
year
sC
ourt
yard
Bra
ndon
..
..
..
..
..
..
10,3
661,
036
7,59
9—
1,35
31,
036
8,95
29,
988
1,60
620
0615
- 4
0 ye
ars
Cou
rtya
rd C
hica
go D
ownt
own
Mag
Mile
..
..
..
..
..
..
..
..
..
..
34,0
428,
140
59,6
96—
2,27
18,
140
61,9
6770
,107
9,84
920
0615
- 4
0 ye
ars
Cou
rtya
rd F
ort
Way
ne.
..
..
..
..
..
9,48
21,
143
8,38
9—
316
1,14
38,
705
9,84
81,
406
2006
15 -
40
year
sC
ourt
yard
Gol
den
..
..
..
..
..
..
.6,
466
1,32
59,
716
—60
91,
325
10,3
2511
,650
1,58
720
0615
- 4
0 ye
ars
Cou
rtya
rd G
oshe
n.
..
..
..
..
..
..
5,53
135
62,
614
—11
635
62,
730
3,08
655
520
0615
- 4
0 ye
ars
Cou
rtya
rd G
rand
Rap
ids
Air
port
..
..
4,20
270
65,
185
—14
270
65,
327
6,03
384
720
0615
- 4
0 ye
ars
Cou
rtya
rd H
amm
ond
..
..
..
..
..
.7,
684
1,03
87,
616
271
11,
040
8,32
79,
367
1,29
620
0615
- 4
0 ye
ars
Cou
rtya
rd I
ndy
Cap
ital
..
..
..
..
..
17,2
892,
482
18,2
07—
1,14
02,
482
19,3
4721
,829
3,04
920
0615
- 4
0 ye
ars
Cou
rtya
rd L
akew
ood
..
..
..
..
..
.2,
561
536
3,93
1—
569
536
4,50
05,
036
649
2006
15 -
40
year
sC
ourt
yard
Lon
gmon
t/Bou
lder
..
..
..
5,76
21,
192
8,74
5—
834
1,19
29,
579
10,7
711,
469
2006
15 -
40
year
sC
ourt
yard
Lou
isvi
lle.
..
..
..
..
..
.8,
745
1,64
012
,025
280
51,
642
12,8
3014
,472
1,99
520
0615
- 4
0 ye
ars
Cou
rtya
rd L
ouis
ville
NE
..
..
..
..
.9,
224
1,37
410
,079
275
21,
376
10,8
3112
,207
1,69
920
0615
- 4
0 ye
ars
Cou
rtya
rd M
erri
llvill
e.
..
..
..
..
..
8,92
753
73,
943
—35
753
74,
300
4,83
797
320
0615
- 4
0 ye
ars
Cou
rtya
rd M
esqu
ite.
..
..
..
..
..
.7,
064
942
6,91
5—
9794
27,
012
7,95
41,
147
2006
15 -
40
year
sC
ourt
yard
Mid
way
..
..
..
..
..
..
.9,
034
2,17
215
,927
31,
791
2,17
517
,718
19,8
933,
314
2006
15 -
40
year
sC
ourt
yard
Mis
haw
aka/
Sout
h B
end
..
..
6,85
764
04,
699
260
364
25,
302
5,94
41,
010
2006
15 -
40
year
sC
ourt
yard
Pon
tiac
..
..
..
..
..
..
.6,
746
482
3,54
3—
126
482
3,66
94,
151
843
2006
15 -
40
year
sC
ourt
yard
Sal
t L
ake
City
Air
port
..
..
17,7
412,
333
17,1
10—
923
2,33
318
,033
20,3
662,
825
2006
15 -
40
year
s
F-48
Init
ial
Cos
tsSu
bseq
uent
Cos
ts C
apit
aliz
edG
ross
Am
ount
at
Dec
embe
r 31
, 20
12
Lan
d &
Bui
ldin
g &
Lan
d &
Bui
ldin
g &
Lan
d &
Bui
ldin
gs &
Acc
umul
ated
Dat
eD
epre
ciat
ion
Des
crip
tion
Deb
tIm
prov
emen
tsIm
prov
emen
tsIm
prov
emen
tsIm
prov
emen
tsIm
prov
emen
tsIm
prov
emen
tsTo
tal
Dep
reci
atio
nA
cqui
red
Lif
e
Cou
rtya
rd S
an A
nton
io A
irpo
rtN
orth
star
..
..
..
..
..
..
..
..
.9,
616
1,19
68,
768
41,
032
1,20
09,
800
11,0
001,
521
2006
15 -
40
year
sC
ourt
yard
Sug
arla
nd.
..
..
..
..
..
.8,
056
1,21
78,
931
—1,
084
1,21
710
,015
11,2
321,
511
2006
15 -
40
year
sC
ourt
yard
Val
para
iso
..
..
..
..
..
.4,
579
248
1,82
5—
186
248
2,01
12,
259
482
2006
15 -
40
year
sC
ourt
yard
Sch
aum
burg
..
..
..
..
..
—2,
078
15,2
39—
967
2,07
816
,206
18,2
842,
391
2007
15 -
40
year
sC
ourt
yard
Mir
amar
..
..
..
..
..
..
—1,
619
11,8
72—
425
1,61
912
,297
13,9
161,
634
2007
15 -
40
year
sC
ourt
yard
Aus
tin D
ownt
own
..
..
..
.—
6,04
944
,361
—1,
476
6,04
945
,837
51,8
865,
853
2007
15 -
40
year
sC
ourt
yard
Gra
nd J
unct
ion
..
..
..
..
—1,
576
11,7
54—
—1,
576
11,7
5413
,330
1,29
920
0815
- 4
0 ye
ars
Cou
rtya
rd A
ustin
Air
port
..
..
..
..
.—
1,69
112
,404
581,
246
1,74
913
,650
15,3
991,
652
2007
15 -
40
year
sR
esid
ence
Inn
Aus
tin N
W.
..
..
..
.11
,205
1,40
310
,290
—67
1,40
310
,357
11,7
601,
699
2006
15 -
40
year
sR
esid
ence
Inn
Aus
tin S
outh
Air
port
..
.6,
691
802
5,88
3—
788
802
6,67
17,
473
988
2006
15 -
40
year
sR
esid
ence
Inn
Aus
tin P
arm
er L
ane
..
.7,
558
1,48
310
,872
—26
31,
483
11,1
3512
,618
1,77
520
0615
- 4
0 ye
ars
Res
iden
ce I
nn C
arm
el.
..
..
..
..
..
8,43
71,
646
12,0
76—
1,08
21,
646
13,1
5814
,804
2,01
720
0615
- 4
0 ye
ars
Res
iden
ce I
nn F
ishe
rs.
..
..
..
..
..
8,13
899
87,
322
—84
599
88,
167
9,16
51,
230
2006
15 -
40
year
sR
esid
ence
Inn
Gol
den
..
..
..
..
..
.6,
614
1,22
28,
963
—69
1,22
29,
032
10,2
541,
462
2006
15 -
40
year
sR
esid
ence
Inn
Ham
mon
d.
..
..
..
..
6,75
398
07,
190
—72
698
07,
916
8,89
61,
216
2006
15 -
40
year
sR
esid
ence
Inn
Gal
leri
a.
..
..
..
..
.17
,189
2,66
519
,549
—21
2,66
519
,570
22,2
353,
220
2006
15 -
40
year
sR
esid
ence
Inn
Ind
iana
polis
Air
port
..
.—
786
5,77
2—
304
786
6,07
66,
862
1,11
820
0615
- 4
0 ye
ars
Res
iden
ce I
nn I
ndia
napo
lis C
anal
..
..
17,5
342,
670
19,5
88—
1,75
22,
670
21,3
4024
,010
3,30
820
0615
- 4
0 ye
ars
Res
iden
ce I
nn L
akew
ood
..
..
..
..
.4,
203
986
7,23
0—
2498
67,
254
8,24
01,
177
2006
15 -
40
year
sR
esid
ence
Inn
Lon
gmon
t.
..
..
..
..
6,62
11,
407
10,3
21—
780
1,40
711
,101
12,5
081,
694
2006
15 -
40
year
sR
esid
ence
Inn
Lou
isvi
lle.
..
..
..
..
8,23
11,
298
9,51
9—
122
1,29
89,
641
10,9
391,
573
2006
15 -
40
year
sR
esid
ence
Inn
Lou
isvi
lle N
E.
..
..
..
7,28
01,
319
9,67
5—
711,
319
9,74
611
,065
1,58
020
0615
- 4
0 ye
ars
Res
iden
ce I
nn M
erri
llvill
e.
..
..
..
.6,
943
595
4,37
2—
1,18
159
55,
553
6,14
81,
057
2006
15 -
40
year
sR
esid
ence
Inn
Nov
i.
..
..
..
..
..
.6,
673
1,42
710
,445
—24
1,42
710
,469
11,8
961,
701
2006
15 -
40
year
sR
esid
ence
Inn
Oak
broo
k.
..
..
..
..
10,8
83—
20,4
36—
831
—21
,267
21,2
673,
341
2006
15 -
40
year
sR
esid
ence
Inn
Pla
ntat
ion
..
..
..
..
.19
,470
2,18
316
,021
7977
42,
262
16,7
9519
,057
3,02
920
0615
- 4
0 ye
ars
Res
iden
ce I
nn P
ontia
c.
..
..
..
..
..
10,2
5332
02,
354
—16
332
02,
517
2,83
795
120
0615
- 4
0 ye
ars
Res
iden
ce I
nn R
ound
Roc
k.
..
..
..
.11
,292
1,68
412
,349
—15
11,
684
12,5
0014
,184
2,04
220
0615
- 4
0 ye
ars
Res
iden
ce I
nn S
alt
Lak
e C
ity.
..
..
..
9,18
087
56,
416
—45
875
6,46
17,
336
1,06
220
0615
- 4
0 ye
ars
Res
iden
ce I
nn S
an A
nton
io D
ownt
own
.—
1,82
213
,360
—88
1,82
213
,448
15,2
702,
205
2006
15 -
40
year
s

F-49
Init
ial
Cos
tsSu
bseq
uent
Cos
ts C
apit
aliz
edG
ross
Am
ount
at
Dec
embe
r 31
, 20
12
Lan
d &
Bui
ldin
g &
Lan
d &
Bui
ldin
g &
Lan
d &
Bui
ldin
gs &
Acc
umul
ated
Dat
eD
epre
ciat
ion
Des
crip
tion
Deb
tIm
prov
emen
tsIm
prov
emen
tsIm
prov
emen
tsIm
prov
emen
tsIm
prov
emen
tsIm
prov
emen
tsTo
tal
Dep
reci
atio
nA
cqui
red
Lif
e
Res
iden
ce I
nn S
chau
mbu
rg.
..
..
..
.10
,112
1,79
013
,124
—27
11,
790
13,3
9515
,185
2,18
520
0615
- 4
0 ye
ars
Res
iden
ce I
nn S
outh
Ben
d.
..
..
..
.3,
310
603
4,42
5—
459
603
4,88
45,
487
752
2006
15 -
40
year
sR
esid
ence
Inn
Sug
arla
nd.
..
..
..
..
7,32
21,
100
8,07
3—
1,29
51,
100
9,36
810
,468
1,39
320
0615
- 4
0 ye
ars
Res
iden
ce I
nn C
hica
go N
aper
ville
..
..
9,48
41,
923
14,1
01—
823
1,92
314
,924
16,8
472,
337
2006
15 -
40
year
sR
esid
ence
Inn
Dow
ntow
n L
ouis
ville
..
.—
1,81
513
,308
—56
31,
815
13,8
7115
,686
2,01
120
0715
- 4
0 ye
ars
Res
iden
ce I
nn M
iram
ar.
..
..
..
..
.—
1,69
212
,409
—11
21,
692
12,5
2114
,213
1,70
820
0715
- 4
0 ye
ars
Res
iden
ce I
nn G
rand
Jun
ctio
n.
..
..
.—
870
9,19
7—
887
09,
205
10,0
751,
065
2008
15 -
40
year
sR
esid
ence
Inn
Aus
tin D
ownt
own
..
..
—3,
767
27,6
26—
604
3,76
728
,230
31,9
973,
640
2007
15 -
40
year
sSp
ring
Hill
Sui
tes
Nor
th P
arm
er L
ane
..
6,62
11,
957
14,3
51—
577
1,95
714
,928
16,8
852,
349
2006
15 -
40
year
sSp
ring
Hill
Sui
tes
Aus
tin S
outh
Air
port
.11
,775
1,60
511
,768
—11
41,
605
11,8
8213
,487
1,94
820
0615
- 4
0 ye
ars
Spri
ngH
ill S
uite
s C
arm
el.
..
..
..
..
8,42
21,
816
13,3
20—
849
1,81
614
,169
15,9
852,
236
2006
15 -
40
year
sSp
ring
Hill
Sui
tes
Lou
isvi
lle H
urst
bour
ne7,
839
1,89
013
,869
—74
01,
890
14,6
0916
,499
2,31
920
0615
- 4
0 ye
ars
Spri
ngH
ill S
uite
s M
isha
wak
a So
uth
Ben
d.
..
..
..
..
..
..
..
..
..
5,43
498
37,
217
—21
398
37,
430
8,41
31,
330
2006
15 -
40
year
sSp
ring
Hill
Sui
tes
Scha
umbu
rg.
..
..
.9,
884
1,55
411
,396
—82
91,
554
12,2
2513
,779
1,93
720
0615
- 4
0 ye
ars
Spri
ngH
ill S
uite
s So
uthf
ield
..
..
..
.5,
014
379
2,78
2—
1737
92,
799
3,17
877
820
0615
- 4
0 ye
ars
Spri
ngH
ill S
uite
s W
estm
inst
er.
..
..
.9,
798
2,40
917
,670
—1,
120
2,40
918
,790
21,1
992,
935
2006
15 -
40
year
sSp
ring
Hill
Sui
tes
Lon
gmon
t.
..
..
..
—1,
144
8,38
8—
112
1,14
48,
500
9,64
41,
260
2007
15 -
40
year
sFa
irfie
ld I
nn A
ustin
Cen
tral
..
..
..
.—
556
4,07
8—
142
556
4,22
04,
776
676
2006
15 -
40
year
sFa
irfie
ld I
nn A
ustin
Sou
th.
..
..
..
.4,
195
505
3,70
2—
186
505
3,88
84,
393
612
2006
15 -
40
year
sFa
irfie
ld I
nn B
rand
on.
..
..
..
..
..
9,83
292
66,
795
—11
792
66,
912
7,83
81,
380
2006
15 -
40
year
sFa
irfie
ld I
nn &
Sui
tes
Che
rry
Cre
ek.
..
—1,
203
8,82
3—
629
1,20
39,
452
10,6
551,
467
2006
15 -
40
year
sFa
irfie
ld I
nn H
amm
ond
..
..
..
..
..
6,58
272
25,
301
—27
972
25,
580
6,30
290
620
0615
- 4
0 ye
ars
Fair
field
Inn
Ind
iana
polis
Air
port
..
..
—65
74,
820
—29
965
75,
119
5,77
692
920
0615
- 4
0 ye
ars
Fair
field
Inn
& S
uite
s K
ey W
est
..
..
.—
1,80
319
,325
—25
11,
803
19,5
7621
,379
3,01
820
0615
- 4
0 ye
ars
Fair
field
Inn
Mem
phis
..
..
..
..
..
.—
5541
1—
108
5551
957
424
920
0615
- 4
0 ye
ars
Fair
field
Inn
Mer
rillv
ille
..
..
..
..
..
7,30
276
85,
636
—28
776
85,
923
6,69
194
420
0615
- 4
0 ye
ars
Fair
field
Inn
Mid
way
..
..
..
..
..
.4,
901
1,42
510
,449
—58
1,42
510
,507
11,9
321,
725
2006
15 -
40
year
sFa
irfie
ld I
nn S
an A
nton
io A
irpo
rt.
..
.9,
194
1,14
08,
363
—14
21,
140
8,50
59,
645
1,38
920
0615
- 4
0 ye
ars
Fair
field
Inn
San
Ant
onio
Dow
ntow
n.
.—
1,37
810
,105
—61
81,
378
10,7
2312
,101
1,67
220
0615
- 4
0 ye
ars
Fair
field
Inn
Val
para
iso
..
..
..
..
..
2,21
315
71,
157
—13
515
71,
292
1,44
927
220
0615
- 4
0 ye
ars
F-50
Init
ial
Cos
tsSu
bseq
uent
Cos
ts C
apit
aliz
edG
ross
Am
ount
at
Dec
embe
r 31
, 20
12
Lan
d &
Bui
ldin
g &
Lan
d &
Bui
ldin
g &
Lan
d &
Bui
ldin
gs &
Acc
umul
ated
Dat
eD
epre
ciat
ion
Des
crip
tion
Deb
tIm
prov
emen
tsIm
prov
emen
tsIm
prov
emen
tsIm
prov
emen
tsIm
prov
emen
tsIm
prov
emen
tsTo
tal
Dep
reci
atio
nA
cqui
red
Lif
e
Hol
iday
Inn
Sel
ect
Ken
twoo
d.
..
..
.3,
958
582
4,27
4—
258
24,
276
4,85
886
020
0615
- 4
0 ye
ars
Ham
pton
Inn
Mer
rillv
ille
..
..
..
..
.5,
646
665
4,87
9—
657
665
5,53
66,
201
827
2006
15 -
40
year
sH
olid
ay I
nn E
xpre
ss M
erri
llvill
e.
..
..
5,03
654
54,
005
—87
545
4,09
24,
637
669
2006
15 -
40
year
sH
ampt
on I
nn C
hica
go M
idw
ay A
irpo
rt.
16,1
632,
747
20,1
43—
719
2,74
720
,862
23,6
093,
359
2006
15 -
40
year
sH
ilton
Gar
den
Inn
Mid
way
..
..
..
..
20,9
102,
978
21,8
42—
402,
978
21,8
8224
,860
3,59
720
0615
- 4
0 ye
ars
Slee
p In
n M
idw
ay A
irpo
rt.
..
..
..
.10
,081
1,18
98,
718
—16
21,
189
8,88
010
,069
1,69
820
0615
- 4
0 ye
ars
Hol
iday
Inn
Exp
ress
Hot
el &
Sui
tes
Mid
way
Air
port
..
..
..
..
..
..
.12
,587
1,87
413
,742
—23
21,
874
13,9
7415
,848
2,28
820
0615
- 4
0 ye
ars
Hom
ewoo
d Su
ites
Bra
ndon
..
..
..
..
—1,
377
10,0
99—
136
1,37
710
,235
11,6
121,
289
2007
15 -
40
year
sH
ilton
Gar
den
Inn
Blo
omin
gton
..
..
.17
,500
—18
,945
——
—18
,945
18,9
451,
895
2009
15 -
40
year
sT
GIF
rida
y’s
..
..
..
..
..
..
..
..
.2,
264
829
6,13
9—
170
829
6,30
97,
138
1,00
920
0615
- 4
0 ye
ars
Mar
riot
t L
aGua
rdia
..
..
..
..
..
..
——
——
——
——
—20
0715
- 4
0 ye
ars
Hilt
on G
arde
n In
n St
. Geo
rge
..
..
..
—1,
822
13,3
63—
171,
822
13,3
8015
,202
1,89
520
0715
- 4
0 ye
ars
Spri
ngH
ill S
uite
s B
aker
sfie
ld.
..
..
..
—1,
560
8,83
8—
31,
560
8,84
110
,401
1,45
320
0715
- 4
0 ye
ars
Spri
ngH
ill S
uite
s G
aine
svill
e.
..
..
..
—4,
018
12,1
18—
—4,
018
12,1
1816
,136
1,65
820
0715
- 4
0 ye
ars
Ham
pton
Inn
& S
uite
s C
lear
wat
er.
..
.—
1,10
612
,721
—16
21,
106
12,8
8313
,989
1,73
720
0715
- 4
0 ye
ars
Ham
pton
Inn
Gar
den
City
..
..
..
..
—5,
691
22,7
647
266
5,69
823
,030
28,7
283,
144
2007
15 -
40
year
sH
ampt
on I
nn &
Sui
tes
Las
Veg
as /
Sum
mer
lin.
..
..
..
..
..
..
..
.—
2,34
14,
609
—3
2,34
14,
612
6,95
374
220
0715
- 4
0 ye
ars
Cou
rtya
rd H
oust
on G
alle
ria
..
..
..
.21
,000
3,06
922
,508
—10
3,06
922
,518
25,5
873,
049
2007
15 -
40
year
sH
ampt
on I
nn F
ort
Wal
ton
Bea
ch.
..
.—
8,77
46,
109
3568
58,
809
6,79
415
,603
817
2007
15 -
40
year
sH
ilton
Mys
tic.
..
..
..
..
..
..
..
.—
6,09
29,
111
104
336
6,19
69,
447
15,6
431,
200
2007
15 -
40
year
sE
mba
ssy
Suite
s D
owne
y.
..
..
..
..
.22
,000
4,85
729
,943
—2,
240
4,85
732
,183
37,0
403,
803
2008
15 -
40
year
sH
yatt
Hou
se C
olor
ado
Spri
ngs
..
..
..
4,50
01,
453
8,23
4—
—1,
453
8,23
49,
687
926
2008
15 -
40
year
sH
yatt
Hou
se A
ustin
..
..
..
..
..
..
10,3
002,
813
15,9
40—
542,
813
15,9
9418
,807
1,79
820
0815
- 4
0 ye
ars
Hya
tt H
ouse
Dal
las
Lin
coln
Par
k.
..
.17
,400
3,16
917
,958
4623
73,
215
18,1
9521
,410
2,04
020
0815
- 4
0 ye
ars
Hya
tt H
ouse
Dal
las
Upt
own
..
..
..
.12
,300
2,24
112
,698
3328
2,27
412
,726
15,0
001,
433
2008
15 -
40
year
sH
yatt
Hou
se D
alla
s R
icha
rdso
n.
..
..
5,50
01,
445
8,18
694
511,
539
8,23
79,
776
933
2008
15 -
40
year
sH
yatt
Hou
se H
oust
on.
..
..
..
..
..
13,0
002,
976
16,8
66—
110
2,97
616
,976
19,9
521,
905
2008
15 -
40
year
sH
ilton
Gar
den
Inn
New
Yor
k/W
est
35th
Str
eet
..
..
..
..
..
..
..
..
—24
,244
96,9
785
513
24,2
4997
,491
121,
740
9,52
520
0915
- 4
0 ye
ars
Em
bass
y Su
ite T
ampa
Dow
ntow
nC
onve
ntio
n C
ente
r.
..
..
..
..
..
—2,
161
71,0
1798
807
2,25
971
,824
74,0
834,
946
2010
15 -
40
year
sFa
irfie
ld I
nn a
nd S
uite
s W
ashi
ngto
n, D
C—
16,2
1422
,265
893,
840
16,3
0326
,105
42,4
081,
876
2010
15 -
40
year
s

F-51
Init
ial
Cos
tsSu
bseq
uent
Cos
ts C
apit
aliz
edG
ross
Am
ount
at
Dec
embe
r 31
, 20
12
Lan
d &
Bui
ldin
g &
Lan
d &
Bui
ldin
g &
Lan
d &
Bui
ldin
gs &
Acc
umul
ated
Dat
eD
epre
ciat
ion
Des
crip
tion
Deb
tIm
prov
emen
tsIm
prov
emen
tsIm
prov
emen
tsIm
prov
emen
tsIm
prov
emen
tsIm
prov
emen
tsTo
tal
Dep
reci
atio
nA
cqui
red
Lif
e
Em
bass
y Su
ites
Fort
Mye
rs E
ster
o.
..
.—
2,81
67,
862
1715
42,
833
8,01
610
,849
620
2010
15 -
40
year
sH
omew
ood
Suite
s W
ashi
ngto
n D
C.
..
—23
,139
34,1
88—
189
23,1
3934
,377
57,5
162,
159
2010
15 -
40
year
sH
ilton
New
Yor
k /
Fash
ion
Dis
tric
t.
..
—35
,592
82,3
922
325
35,5
9482
,717
118,
311
4,82
520
1015
- 4
0 ye
ars
Ham
pton
Inn
& S
uite
s D
enve
r Te
chC
ente
r.
..
..
..
..
..
..
..
..
.—
2,37
39,
180
3299
12,
405
10,1
7112
,576
684
2010
15 -
40
year
sG
arde
n D
istr
ict
Hot
el.
..
..
..
..
..
—1,
901
3,86
512
812
,333
2,02
916
,198
18,2
2771
2010
15 -
40
year
sR
esid
ence
Inn
Col
umbi
a.
..
..
..
..
—1,
993
11,4
872
1,46
21,
995
12,9
4914
,944
759
2010
15 -
40
year
sR
esid
ence
Inn
Nat
iona
l H
arbo
rW
ashi
ngto
n D
C.
..
..
..
..
..
..
—7,
457
37,0
465
657,
462
37,1
1144
,573
2,04
020
1015
- 4
0 ye
ars
Res
iden
ce I
nn S
ilver
Spr
ing
..
..
..
.11
,000
3,94
518
,896
2285
63,
967
19,7
5223
,719
1,18
320
1015
- 4
0 ye
ars
Hilt
on G
arde
n In
n N
ew O
rlea
nsC
onve
ntio
n C
ente
r.
..
..
..
..
..
—3,
405
20,7
50—
3,08
33,
405
23,8
3327
,238
1,38
120
1015
- 4
0 ye
ars
Ham
pton
Inn
Wes
t Pa
lm B
each
Cen
tral
Air
port
..
..
..
..
..
..
..
..
..
—2,
280
9,76
9—
436
2,28
010
,205
12,4
8559
920
1015
- 4
0 ye
ars
Hilt
on G
arde
n In
n W
est
Palm
Bea
chA
irpo
rt.
..
..
..
..
..
..
..
..
.—
1,20
610
,811
921
21,
215
11,0
2312
,238
623
2010
15 -
40
year
sH
olly
woo
d H
eigh
ts H
otel
..
..
..
..
.—
5,30
319
,136
754,
972
5,37
824
,108
29,4
861,
333
2010
15 -
40
year
sD
oubl
etre
e M
etro
polit
an H
otel
New
Yor
k C
ity.
..
..
..
..
..
..
..
..
—14
0,33
218
8,01
485
14,3
2014
0,41
720
2,33
434
2,75
110
,448
2010
15 -
40
year
sE
mba
ssy
Suite
s C
olum
bus
..
..
..
..
—1,
274
6,80
517
069
71,
444
7,50
28,
946
434
2011
15 -
40
year
sR
enai
ssan
ce P
ittsb
urgh
Hot
el.
..
..
..
—3,
274
39,9
3442
902
3,31
640
,836
44,1
522,
076
2011
15 -
40
year
sC
ourt
yard
Atla
nta
Buc
khea
d.
..
..
..
—2,
860
21,6
68—
1,11
52,
860
22,7
8325
,643
1,15
420
1115
- 4
0 ye
ars
Dou
blet
ree
Hot
el C
olum
bia
..
..
..
.—
1,93
36,
486
682,
817
2,00
19,
303
11,3
0451
620
1115
- 4
0 ye
ars
Mar
riot
t D
enve
r A
irpo
rt a
t G
atew
ayPa
rk.
..
..
..
..
..
..
..
..
..
.24
,000
3,08
338
,356
141,
068
3,09
739
,424
42,5
212,
047
2011
15 -
40
year
sE
mba
ssy
Suite
s W
est
Palm
Bea
ch-
Cen
tral
..
..
..
..
..
..
..
..
..
—3,
656
9,61
410
64,
117
3,76
213
,731
17,4
9383
720
1115
- 4
0 ye
ars
Hilt
on G
arde
n In
n R
alei
gh D
urha
m.
.—
1,75
14,
763
454,
995
1,79
69,
758
11,5
5465
720
1115
- 4
0 ye
ars
Hilt
on G
arde
n In
n U
nive
rsity
Pla
ce.
..
—1,
975
18,4
9058
5,82
72,
033
24,3
1726
,350
1,38
020
1115
- 4
0 ye
ars
Ham
pton
Inn
Hou
ston
Nea
r th
eG
alle
ria
..
..
..
..
..
..
..
..
..
—9,
326
9,22
069
568
9,39
59,
788
19,1
8352
020
1115
- 4
0 ye
ars
Cou
rtya
rd C
harl
esto
n H
isto
ric
Dis
tric
t.
—2,
714
35,8
289
275
2,72
336
,103
38,8
261,
119
2011
15 -
40
year
sR
esid
ence
Inn
Bet
hesd
a.
..
..
..
..
.—
8,15
452
,750
——
8,15
452
,750
60,9
0495
220
1215
- 4
0 ye
ars
Cou
rtya
rd U
pper
Eas
t Si
de.
..
..
..
.—
20,6
5460
,223
67
20,6
6060
,230
80,8
901,
034
2012
15 -
40
year
sH
ilton
Gar
den
Inn
Em
eryv
ille
..
..
..
—11
,902
22,7
581
511
,903
22,7
6434
,666
351
2012
15 -
40
year
sE
mba
ssy
Suite
s W
alth
am.
..
..
..
..
—6,
267
56,0
252
—6,
269
56,0
2562
,294
247
2012
15 -
40
year
s
$997
,651
$561
,888
$2,5
25,5
67$1
,636
$129
,519
$563
,524
$2,6
55,0
86$3
,218
,610
$295
,397

A) The change in total cost of properties for the years ended December 31, 2012, 2011, and 2010 is asfollows:
2012 2011 2010
Reconciliation of Land and Buildings andImprovements
Balance at beginning of period . . . . . . . . . . . $2,908,626 $2,676,184 $1,875,767Add: Acquisitions . . . . . . . . . . . . . . . . . . . . . 238,731 223,668 797,065Add: Improvements . . . . . . . . . . . . . . . . . . . . 72,149 41,188 57,188Less: Disposition of properties . . . . . . . . . . . . — (32,414) (53,836)
Balance at end of period before impairmentcharges . . . . . . . . . . . . . . . . . . . . . . . . . . . 3,219,506 2,908,626 2,676,184
Impairment charges on real estate assetsowned at end of period . . . . . . . . . . . . . . . (896) — —
Balance at end of period . . . . . . . . . . . . . . . . $3,218,610 $2,908,626 $2,676,184
B) The change in accumulated depreciation of real estate assets for the years ended December 31,2011, 2010 and 2009 is as follows:
2012 2011 2010
Reconciliation of Accumulated DepreciationBalance at beginning of period . . . . . . . . . . . . . $(228,809) $(175,432) $(141,560)Add: Depreciation for the period . . . . . . . . . . . . (66,588) (58,743) (44,272)Less: Disposition of properties . . . . . . . . . . . . . — 5,366 10,400
Balance at end of period . . . . . . . . . . . . . . . . . . $(295,397) $(228,809) $(175,432)
F-52

Urban Markets
ValUable brands
ProdUct diVersificationBrands (Number of Hotels) Lodging Segments (% of Rooms)
RL J Lodging TRusT oveRview
CoRpoRaTe addRessRLJ Lodging Trust3 Bethesda Metro CenterSuite 1000Bethesda, MD 20814(301) 280-7777(301) 280-7750 (fax)Visit our website at: www.rljlodgingtrust.com
independenT audiToRsPricewaterhouseCoopers LLPMcLean, Virginia
LegaL CounseLHogan Lovells US LLPWashington, DC
TRansfeR agenTWells Fargo Bank, N.A.Shareowner Services161 North Concord ExchangeSouth St. Paul, MN 55075 (800) 468-9716 or for outside the U.S. (651) 450-4064.
exeCuTive offiCeRsRobeRT L. JohnsonExecutive Chairman of the Board
Thomas J. baLTimoRe, JR.President, Chief Executive Officer and Trustee
Ross h. bieRkanChief Investment Officer and Executive Vice President
LesLie d. haLeChief Financial Officer, Treasurer and Executive Vice President
independenT boaRd of TRusTeessenaToR evan bayhFormer U.S. Senator and Governor State of IndianaPartnerMcGuireWoods, LLC
naThanieL a. davisManaging Director RANDD Advisory Group
RobeRT m. La foRgiaPrincipal Apertor Hospitality, LLC
gLenda g. mCneaLExecutive Vice President and General Manager Global Client Group in Global Merchant ServicesAmerican Express Company
Joseph RyanRLJ Lead Independent DirectorChairman and Chief Executive Officer Ryan Investments, LLC and Joseph Ryan and Associates
seC foRm 10-k and oTheR infoRmaTionRequests for additional copies of the Company’s 2012 Annual Report on Form 10-K, charters of the board committees, code of ethics and corporate governance guidelines are made available on our website or in print by sending requests to:
RL J Lodging TRusTInvestor Relations Department3 Bethesda Metro CenterSuite 1000Bethesda, MD 20814
annuaL meeTing of shaRehoLdeRsThe 2013 Annual Meeting of Shareholders will be held on Thursday, May 2, 2013 at 11:00 a.m. local time, at the Residence Inn Bethesda Downtown, 7335 Wisconsin Avenue, Bethesda, Maryland 20814.
sToCk LisTingRLJ Lodging Trust is traded on the New York Stock Exchange under the symbol “RLJ”. The number of shareholders of record as of February 20, 2013 was 94.
dividendsThe Company declared cash dividends of $0.70 on its commonstock in 2012.
CoRpoRaTe infoRmaTion
Note: Information displayed as of December 31, 2012

2012 Annual Report
Green: C=88 M=45 Y=90 K=56 1Gray: C=0 M=0 Y=0 K=70
Green: C=88 M=45 Y=90 K=56 1Gray: C=0 M=0 Y=0 K=70
3 Bethesda Metro Centersuite 1000Bethesda, Md 20814(301) 280-7777rljlodgingtrust.CoM
rlj lo
dg
ing
tru
st | 2012 a
nn
ua
l re
Po
rt