
Risk Evaluation for Carbon Tetrachloride - gov.epa.cfpub - US ...
390
EPA Document# EPA-740-R1-8014 United States October 2020 Environmental Protection Agency Office of Chemical Safety and Pollution Prevention Risk Evaluation for Carbon Tetrachloride (Methane, Tetrachloro-) CASRN: 56-23-5 October 2020
-
Upload
khangminh22 -
Category
Documents
-
view
2 -
download
0
Transcript of Risk Evaluation for Carbon Tetrachloride - gov.epa.cfpub - US ...

EPA Document# EPA-740-R1-8014
United States October 2020
Environmental Protection Agency Office of Chemical Safety and Pollution Prevention
Risk Evaluation for
Carbon Tetrachloride
(Methane, Tetrachloro-)
CASRN: 56-23-5
October 2020
Page 2 of 390
TABLE OF CONTENTS
ACKNOWLEDGEMENTS ....................................................................................................................10
ABBREVIATIONS ..................................................................................................................................11
EXECUTIVE SUMMARY .....................................................................................................................15
1 INTRODUCTION ............................................................................................................................29
Physical and Chemical Properties ...............................................................................................30 Uses and Production Volume ......................................................................................................31 Regulatory and Assessment History ...........................................................................................32
Scope of the Evaluation...............................................................................................................34
Specialty Uses – Aerospace Industry ............................................................................... 39 Manufacturing of Pharmaceuticals ................................................................................... 40 Exclusions During Problem Formulation ......................................................................... 40
Systematic Review ......................................................................................................................54
2 EXPOSURES ....................................................................................................................................61
Fate and Transport .......................................................................................................................61
Environmental Releases ..............................................................................................................66
Environmental Exposures ...........................................................................................................67
Methodology for Modeling Surface water Concentrations from Facilities releases (E-
FAST 2014) ...................................................................................................................... 67 2.3.1.1.1 E-FAST Calculations .............................................................................................. 68
2.3.1.1.2 Model Inputs ........................................................................................................... 69
Human Exposures .......................................................................................................................73
Process Description .......................................................................................................... 76 Number of Workers and ONUs ........................................................................................ 76 General Inhalation Exposure Assessment Approach and Methodology .......................... 77 General Dermal Exposure Assessment Approach and Methodology .............................. 81 Consideration of Engineering Controls and Personal Protective Equipment ................... 83 Regrouping of Conditions of Use for Engineering Assessment ....................................... 86 Inhalation Exposure Assessment ...................................................................................... 90

Page 3 of 390
2.4.1.7.1 Domestic Manufacturing ......................................................................................... 90
2.4.1.7.2 Import and Repackaging ......................................................................................... 93
2.4.1.7.3 Processing as a Reactant or Intermediate ................................................................ 96
2.4.1.7.4 Specialty Uses - Department of Defense Data ........................................................ 99
2.4.1.7.5 Reactive Ion Etching ............................................................................................. 101
2.4.1.7.6 Industrial Processing Agent/Aid ........................................................................... 103
2.4.1.7.7 Additive ................................................................................................................. 105
2.4.1.7.8 Laboratory Chemicals ........................................................................................... 106
2.4.1.7.9 Disposal/Recycling................................................................................................ 108
2.4.1.7.10 Summary of Occupational Inhalation Exposure Assessment ............................. 110
Dermal Exposure Assessment ........................................................................................ 115
Other Exposure Considerations .................................................................................................120
3 HAZARDS.......................................................................................................................................121
Environmental Hazards .............................................................................................................121
Human Health Hazards .............................................................................................................124
Non-Cancer Hazards ...................................................................................................... 133
Genotoxicity and Cancer Hazards .................................................................................. 135 3.2.4.2.1 Genotoxicity .......................................................................................................... 135
3.2.4.2.2 Carcinogenicity ..................................................................................................... 136
MOA for Carcinogenicity .............................................................................................. 150 3.2.4.3.1 Mode of Action for Liver Tumors......................................................................... 150
3.2.4.3.2 Mode of Action for Adrenal Gland and Brain Tumors ......................................... 152
3.2.4.3.3 Overall Cancer MOA Conclusions ....................................................................... 154
3.2.4.3.4 Classification of Carcinogenicity .......................................................................... 155
Selection of Studies for Dose-Response Assessment ..................................................... 155 3.2.5.1.1 Toxicity After Acute Inhalation Exposures in Humans ........................................ 155
3.2.5.1.2 Toxicity from Chronic Inhalation Exposures ........................................................ 157
3.2.5.1.3 Toxicity from Dermal Exposures .......................................................................... 158
Derivation of PODs and UFs for Benchmark Margins of Exposure (MOEs) ................ 159
3.2.5.2.1 PODs for Acute Inhalation Exposure .................................................................... 159

Page 4 of 390
3.2.5.2.2 PODs for Chronic Inhalation Exposure ................................................................ 160
3.2.5.2.3 PODs for Acute Dermal Exposures ...................................................................... 162
3.2.5.2.4 PODs for Chronic Dermal Exposure ..................................................................... 162
3.2.5.2.5 Cancer Inhalation Unit Risk and Dermal Slope Factor ......................................... 163
3.2.5.2.6 Cancer Inhalation and Dermal PODs and Benchmark MOEs .............................. 166
PODs for Human Health Hazard Endpoints and Confidence Levels ............................. 167 Potentially Exposed or Susceptible Subpopulations ...................................................... 169
4 RISK CHARACTERIZATION ....................................................................................................171
Environmental Risk ...................................................................................................................171
Human Health Risk ...................................................................................................................186
Potentially Exposed or Susceptible Subpopulations .................................................................219
Assumptions and Key Sources of Uncertainty ..........................................................................220
Risk Characterization Confidence Levels .................................................................................226
Aggregate or Sentinel Exposures ..............................................................................................227
5 UNREASONABLE RISK DETERMINATION ..........................................................................228
Overview ...................................................................................................................................228
5.1.1.1 Non-Cancer Risk Estimates ............................................................................................ 229
5.1.1.2 Cancer Risk Estimates .................................................................................................... 229 5.1.1.3 Determining Unreasonable Risk of Injury to Health ...................................................... 230
5.1.2.1 Determining Unreasonable Risk of Injury to the Environment ...................................... 231 Detailed Unreasonable Risk Determinations by Conditions of Use .........................................232
5.2.1.1 Manufacture – Domestic Manufacture – Domestic Manufacture (Domestic manufacture) .
..................................................................................................................... 234
5.2.1.2 Manufacture – Import – Import (Import) ........................................................................ 235
Page 5 of 390
5.2.1.3 Processing – Processing as a reactant in the production of hydrochlorofluorocarbon,
hydrofluorocarbon, hydrofluoroolefin, and perchloroethylene ...................................... 236
5.2.1.4 Processing – Processing as reactant/intermediate in reactive ion etching ...................... 237 5.2.1.5 Processing – Incorporation into formulation, mixture or reaction products-
Petrochemicals-derived manufacturing, agricultural products manufacturing, and other
basic organic and inorganic chemical manufacturing .................................................... 237 5.2.1.6 Processing – Repackaging of carbon tetrachloride for use in laboratory chemicals ...... 238
5.2.1.7 Processing – Recycling (Processing as recycling) .......................................................... 239 5.2.1.8 Distribution in Commerce............................................................................................... 240 5.2.1.9 Industrial/Commercial Use – Industrial processing aid in the manufacture of
petrochemicals-derived products and agricultural products ........................................... 241 5.2.1.10 Industrial/Commercial Use – Additive ......................................................................... 242
5.2.1.11 Industrial/Commercial Use – Other Basic Organic and Inorganic Chemical
Manufacturing (manufacturing of chlorinated compounds used in solvents for cleaning
and degreasing, adhesives and sealants, paints and coatings, asphalt, and elimination of
nitrogen trichloride in the production of chlorine and caustic) ...................................... 243 5.2.1.12 Industrial/Commercial Use – Metal Recovery ............................................................. 245 5.2.1.13 Industrial/Commercial Use – Specialty Uses – Department of Defense ...................... 246 5.2.1.14 Industrial/Commercial Use – Laboratory Chemical ..................................................... 247
5.2.1.15 Disposal – Disposal....................................................................................................... 247
Changes to the Unreasonable Risk Determination from Draft Risk Evaluation to Final Risk
Evaluation .................................................................................................................................249 Unreasonable Risk Determination Conclusion .........................................................................250
6 REFERENCES ...............................................................................................................................253
7 APPENDICES.................................................................................................................................276
Appendix A REGULATORY HISTORY ........................................................................................ 276
Appendix B LIST OF SUPPLEMENTAL DOCUMENTS ............................................................ 287
Appendix C FATE AND TRANSPORT........................................................................................... 289
Appendix D RELEASES TO THE ENVIRONMENT ................................................................... 304
Appendix E SURFACE WATER ANALYSIS FOR CARBON TETRACHLORIDE ................ 305
Appendix F ENVIRONMENTAL HAZARDS & RISK ................................................................ 314

Page 6 of 390
Appendix G HUMAN HEALTH HAZARDS .................................................................................. 343
Appendix H GENOTOXICITY......................................................................................................... 354
Appendix I CANCER MOA ANALYSIS FOR LIVER AND ADRENAL TUMORS ............... 361
Appendix J METHODOLOGIES AND FINDINGS FROM KEY TOXICOLOGICAL
STUDIES ....................................................................................................................... 373
Appendix K EVIDENCE ON LINEARITY OF THE PBPK MODEL ......................................... 381
Appendix L SUMMARY OF PUBLIC COMMENTS / RESPONSE TO COMMENTS ........... 383
LIST OF TABLES
Table 1-1. Physical and Chemical Properties of Carbon Tetrachloride .................................................... 30 Table 1-2. Production Volume of Carbon Tetrachloride in Chemical Data Reporting (CDR) Reporting
Period (2012 to 2015)a ...................................................................................................... 31
Table 1-3. Assessment History of Carbon Tetrachloride .......................................................................... 33 Table 1-4. Categories and Subcategories of Conditions of Use Included in the Scope of the Risk
Evaluation ......................................................................................................................... 36 Table 2-1. Environmental Fate Characteristics of Carbon Tetrachloride ................................................. 65 Table 2-2. Summary of Estimated Surface Water Concentrations from Facility Carbon Tetrachloride
Release .............................................................................................................................. 71
Table 2-3. Summary of Facility Carbon Tetrachloride Monitoring Data and Estimated Surface Water
Concentrations .................................................................................................................. 72 Table 2-4. Assigned Protection Factors for Respirators in OSHA Standard 29 CFR § 1910.134 ........... 84
Table 2-5. Exposure Control Efficiencies and Protection Factors for Different Dermal ......................... 86 Table 2-6. Crosswalk of Subcategories of Use Listed in Table 1-4 and the Sections Assessed for
Occupational Exposure ..................................................................................................... 87 Table 2-7. Estimated Number of Workers Potentially Exposed to Carbon Tetrachloride During
Manufacturing ................................................................................................................... 91 Table 2-8. Summary of Worker Inhalation Exposure Monitoring Data for Manufacture of Carbon
Tetrachloride ..................................................................................................................... 92 Table 2-9. Summary of ONU Inhalation Exposure Monitoring Data for Manufacture of Carbon
Tetrachloride ..................................................................................................................... 92 Table 2-10. Estimated Number of Workers Potentially Exposed to Carbon Tetrachloride During Import
and Repackaging ............................................................................................................... 95
Table 2-11. Summary of Exposure Results for Import and Repackaging ................................................ 96 Table 2-12. Estimated Number of Workers Potentially Exposed to Carbon Tetrachloride During
Processing as a Reactant or Intermediate.......................................................................... 98 Table 2-13. DoD Inhalation Monitoring Results .................................................................................... 100 Table 2-14. Summary of Worker Inhalation Exposure Monitoring Data for Specialty Use of Carbon
Tetrachloride ................................................................................................................... 101
Page 7 of 390
Table 2-15. Estimated Number of Workers Potentially Exposed to Carbon Tetrachloride During Use as a
RIE .................................................................................................................................. 102
Table 2-16. List of Approved Uses of Carbon Tetrachloride as a Process Agent in the MP Side
Agreement, Decision X/14: Process Agents1.................................................................. 103 Table 2-17. Estimated Number of Workers Potentially Exposed to Carbon Tetrachloride During Use as a
Processing Agent/Aid ..................................................................................................... 105 Table 2-18. Estimated Number of Workers Potentially Exposed to Carbon Tetrachloride when used as
an Additive ...................................................................................................................... 106 Table 2-19. Estimated Number of Workers Potentially Exposed to Carbon Tetrachloride During Use as a
Laboratory Chemical ...................................................................................................... 108 Table 2-20. Estimated Number of Workers Potentially Exposed to Carbon Tetrachloride During Waste
Handling .......................................................................................................................... 110
Table 2-21. Summary of Occupational Inhalation Exposure Assessment for Workers ......................... 111 Table 2-22. Summary and Ranking of Occupational Exposure of Carbon Tetrachloride for Various
Conditions of Use ........................................................................................................... 113
Table 2-23. IHSkinPerm© Output Data for Carbon Tetrachloride under Various Dermal Exposure
Scenarios ......................................................................................................................... 117 Table 2-24. Estimated Dermal Acute and Chronic Retained Doses for Workers for All Conditions of Use
......................................................................................................................................... 119
Table 3-1. Summary of Aquatic Toxicity Studies and Hazard Ranges Evaluated for Carbon
Tetrachloride ................................................................................................................... 123
Table 3-2. Acceptable Epidemiological Studies on Non-Cancer Effects from Repeated Exposures not
Evaluated in Previous EPA Assessments ....................................................................... 127 Table 3-3. Acceptable Toxicologic Studies Available for Evaluation ................................................... 129
Table 3-4. Epidemiologic Studies of Carbon Tetrachloride and Cancer After 2010 EPA IRIS Assessment
......................................................................................................................................... 137
Table 3-5. PODs for Acute Inhalation Exposures based on Human Data .............................................. 159
Table 3-6. PODs for Chronic Inhalation Exposures based on Animal Data .......................................... 161
Table 3-7. PODs for Acute Dermal Exposures (non-occluded) ............................................................. 162 Table 3-8. PODs for Chronic Dermal Exposures ................................................................................... 163
Table 3-9. Incidence of liver tumors in F344 rats exposed to carbon tetrachloride vapor for 104 weeks (6
hours/day, 5 days/week)a ................................................................................................ 164 Table 3-10. Incidence of liver and adrenal tumors in BDF1 mice exposed to carbon tetrachloride vapor
for 104 weeks (6 hours/day, 5 days/week)a .................................................................... 165 Table 3-11. IUR Estimate for Male Mouse Pheochromocytoma Data Using Linear Low-Dose
Extrapolation Approach .................................................................................................. 165
Table 3-12. Summary of PODs for Evaluating Human Health Hazards from Acute and Chronic
Inhalation and Dermal Exposure Scenarios .................................................................... 168 Table 4-1. Concentrations of Concern (COCs) for Environmental Toxicity.......................................... 173 Table 4-2. Modeled Facilities Showing Risk to Aquatic and Sediment-dwelling Organisms from the
Release of Carbon Tetrachloride; RQs Greater Than One are Shown in Bold .............. 175 Table 4-3. Use Scenarios, Populations of Interest and Toxicological Endpoints for Assessing
Occupational Risks Following Acute Inhalation Exposures to Carbon Tetrachloride ... 186
Table 4-4. Use Scenarios, Populations of Interest and Toxicological Endpoints for Assessing
Occupational Risks Following Chronic Inhalation Exposures to Carbon Tetrachloride 187 Table 4-5. Use Scenarios, Populations of Interest and Toxicological Endpoints for Assessing
Occupational Risks Following Acute Dermal Exposures to Carbon Tetrachloride ....... 187

Page 8 of 390
Table 4-6. Use Scenarios, Populations of Interest and Toxicological Endpoints for Assessing
Occupational Risks Following Chronic Dermal Exposures to Carbon Tetrachloride .... 188
Table 4-7. Risk Estimates for Acute Inhalation Exposures based on a POD of 360 mg/m3 – 8hrs (= 310
mg/m3-12 hrs) and Benchmark MOE of 10 .................................................................... 191 Table 4-8. Risk Estimates for Chronic Inhalation Exposures based on a POD of 31.1 mg/m3 - 8 hrs (=
26.4 mg/m3 - 12 hrs) and Benchmark MOE of 30 .......................................................... 194 Table 4-9. Risk Estimates for Acute Dermal Exposures ........................................................................ 196
Table 4-10. Risk Estimates from Chronic Dermal Exposures ................................................................ 197 Table 4-11. Risk Estimates for Cancer Effects from Chronic Inhalation Exposures for Workers Based on
IUR of 6 × 10⁻⁶ per μg/m3 and Benchmark Risk = 1 in 104 ............................................ 199 Table 4-12. Risk Estimates for Cancer Effects from Chronic Inhalation Exposures for Workers Based on
Liver Cancer POD of 6 mg/m3 and Benchmark MOE = 300 ......................................... 201
Table 4-13. Risk Estimates for Cancer Effects from Chronic Dermal Exposures for Workers; Benchmark
Risk = 1 in 104 ................................................................................................................ 205 Table 4-14. Risk Estimates for Cancer Effects from Chronic Dermal Exposures for Workers Based on
Liver Cancer POD and Benchmark MOE = 300 ............................................................ 205 Table 4-15. Summary of Estimated Non-cancer and Cancer Risks from Inhalation and Dermal
Exposures1....................................................................................................................... 207 Table 5-1. Categories and Subcategories of Conditions of Use Included in the Scope of the Risk
Evaluation ....................................................................................................................... 232 Table 5-2. Updates in Presentation of Unreasonable Risk Determinations Between Draft and Final Risk
Evaluations ...................................................................................................................... 250
LIST OF FIGURES
Figure 1-1. Carbon Tetrachloride Life Cycle Diagram ............................................................................ 35
Figure 1-2. Carbon Tetrachloride Conceptual Model for Industrial/Commercial Activities and Uses:
Potential Exposures and Hazards........................................................................................... 52
Figure 1-3. Carbon Tetrachloride Conceptual Model for Environmental Releases and Wastes: Potential
Exposures and Hazards .......................................................................................................... 53
Figure 1-4. Key/Supporting Data Sources for Environmental Fate and Transport .................................. 56 Figure 1-5. Key/Supporting Data Sources for Releases and Occupational Exposures ............................. 57 Figure 1-6. Key/Supporting Sources for Environmental Exposures ........................................................ 58
Figure 1-7. Key/Supporting Sources for Environmental Hazards ............................................................ 59 Figure 1-8. Key/Supporting Data Sources for Human Health Hazards .................................................... 60 Figure 2-1. General Process Flow Diagram for Import and Repackaging ............................................... 94 Figure 2-2. General Laboratory Use Process Flow Diagram .................................................................. 107
Figure 2-3. Typical Waste Disposal Process .......................................................................................... 109 Figure 2-4. Conceptual Diagram Showing Various Key Factors that Influence Dermal Exposures in the
Event of Carbon Tetrachloride Releases. (modified after (Chattopadhyay and Taft, 2018))
............................................................................................................................................. 116 Figure 3-1. Hazard Identification and Dose-Response Process .............................................................. 124 Figure 4-1. Cancer Risk Estimates for Occupational Use (i.e., Workers) of Carbon Tetrachloride in
Manufacturing and Processing as Reactant/Intermediate Based on Monitoring Data 8 hr
TWA .................................................................................................................................... 203 Figure 4-2. Cancer Risk Estimates for Occupational Use (i.e., Workers) of Carbon Tetrachloride in
Manufacturing and Processing as Reactant/Intermediate Based on Monitoring Data 12 hr
TWA .................................................................................................................................... 203

Page 9 of 390
Figure 4-3. Cancer Risk Estimates for Occupational Use (i.e., Workers) of Carbon Tetrachloride in
Import, Processing Agent, Additive and Disposal/Recycling Based on Surrogate Modeling
Data ...................................................................................................................................... 204 Figure 4-4. Cancer Risk Estimates for Occupational Use (i.e., Workers) of Carbon Tetrachloride in
Specialty Uses-DoD Based on Monitoring Data ................................................................. 204
LIST OF APPENDIX TABLES
Table A-1. Federal Laws and Regulations .............................................................................................. 276 Table A-2. State Laws and Regulations .................................................................................................. 284 Table A-3. Regulatory Actions by Other Governments and Tribes ....................................................... 285 Table C-1. Biodegradation Study Summary for Carbon Tetrachloride .................................................. 289 Table C-2. Photolysis Study Summary for Carbon Tetrachloride .......................................................... 291
Table C-3. Hydrolysis Study Summary for Carbon Tetrachloride ......................................................... 291 Table C-4. Sorption Study Summary for Carbon Tetrachloride ............................................................. 292
Table C-5. Other Fate Endpoints Study Summary for Carbon Tetrachloride ........................................ 302 Table D-1. Summary of Carbon Tetrachloride Releases to the Environment Reported in 2018 TRI (lbs)
......................................................................................................................................... 304 Table E-1. E-FAST Model Input Parameters Used to Estimate Carbon Tetrachloride Surface Water
Concentrations ................................................................................................................ 305 Table E-2. Releases of Carbon Tetrachloride to Surface Watersa .......................................................... 306
Table E-3. Surface Water Carbon Tetrachloride Concentrations for Acute (20 day) and Chronic (250
day) Scenarios and Comparison with Amphibian Concentration of Concerna .............. 308 Table E-4. Surface Water Carbon Tetrachloride Concentrations for Acute (20 day) and Chronic (250
day) Scenarios and Comparison with Algal Concentration of Concerna ........................ 310 Table E-5. Surface Water Carbon Tetrachloride Concentrations for Acute (20 day) and Chronic (250
day) Scenarios and Comparison with Algal Concentration of Concerna ........................ 312
Table F-1. Aquatic Toxicity Studies Evaluated for Carbon Tetrachloride ............................................. 315
Table G-1. Summary of Reviewed Human Health Animal Studies for Carbon Tetrachloride .............. 344 Table G-2. Summary of Reviewed Genotoxicity Studies for Carbon Tetrachloride .............................. 353
Table H-1. Bacterial mutagenesis data in systems believed relevant to detection of oxidative damage to
DNA – excerpted from the EPA IRIS Assessment ......................................................... 356 Table H-2. Chromosomal changes in in vitro studies mammalian cells from liver, kidney or lung; or
cells with CYP2E1 genetic capability added – excerpted from the EPA IRIS Assessment
......................................................................................................................................... 357 Table I-1. Subchronic and Chronic Inhalation and Oral Studies Showing that Carbon Tetrachloride
Produces Hepatic Toxicity and Regenerative Responses ............................................... 363
Table K-1. Table Summarizing PBPK Model results in the IRIS Assessment Tables C-6 and C-10 .... 381 Table L-1. Summary of Reviewed Genotoxicity Studies for Carbon Tetrachloride .............................. 390
LIST OF APPENDIX FIGURES
Figure E-1. Total Annual Facility Releases of Carbon Tetrachloride per Discharge Monitoring Report
Data ................................................................................................................................. 314 Figure F-1. Species Sensitivity Distribution (SSD) for Amphibian Species Using LC50s ..................... 338
Page 10 of 390
ACKNOWLEDGEMENTS
This report was developed by the United States Environmental Protection Agency (U.S. EPA), Office of
Chemical Safety and Pollution Prevention (OCSPP), Office of Pollution Prevention and Toxics (OPPT).
Acknowledgements
The OPPT Assessment Team gratefully acknowledges participation or input from Intra-agency
reviewers that included multiple offices within EPA, Inter-agency reviewers that included multiple
Federal agencies, and assistance from EPA contractors GDIT (Contract No. CIO-SP3,
HHSN316201200013W), ERG (Contract No. EP-W-12-006), Versar (Contract No. EP-W-17-006), ICF
(Contract No. EPC14001), and SRC (Contract No. EP-W-12-003).
Docket
Supporting information can be found in public docket: EPA-HQ-OPPT-2016-0733.
Disclaimer
Reference herein to any specific commercial products, process or service by trade name, trademark,
manufacturer or otherwise does not constitute or imply its endorsement, recommendation or favoring by
the United States Government.
Authors
Stan Barone (Deputy Division Director), Karen Eisenreich (Management Lead), Doritza Pagan-
Rodriguez (Staff Lead), Thomas Bateson, Eliane Catilina, Sandip Chattopadhyay, Jeff Gallagher, Ume
Hassan, Tim McMahon, Claudia Menasche, Amelia Nguyen, Khoa Nguyen, Nerija Orentas, Alan Sasso,
Molly Shuman-Goodier, Tameka Taylor, Elizabeth Thaler, Susanna Wegner, Cindy Wheeler, Paul
White, Steve Witkin, Edmund Wong
Contributors
Ingrid Druwe (EPA/ORD), Johanna Congleton (EPA/ORD), Margaret Pratt (EPA/ORD), Suryanarayana
Vulimiri (EPA/ORD), Andre Weaver (EPA/ORD), Anu Mudipalli (EPA/ORD), Channa Keshava
(EPA/ORD), Jeff Dean (EPA/ORD), John Stanek (EPA/ORD), Erin Yost (EPA/ORD), Sidrah Khan
(EPA/OCSPP/OPPT/RAD on detail from Region 6) Anthony Luz (EPA/OCSPP/OPPT/RAD), Yashfin
Mahid (EPA/OCSPP/OPPT/RAD), Eric Jackson (EPA/OCSPP/OPPT/RAD)
Page 11 of 390
ABBREVIATIONS
°C Degrees Celsius
AAL Allowable Ambient Levels
ACGIH American Conference of Government Industrial Hygienists
ACR Acute to Chronic Ratio
ADC Average Daily Concentration
AEC Acute Exposure Concentration
AIA Aerospace Industries Association
AIHA American Industrial Hygiene Association
ALT Alanine Aminotransferase
APF Assigned Protection Factor
atm Atmosphere(s)
ATSDR Agency for Toxic Substances and Disease Registries
AWQC Ambient Water Quality Criteria
BCF Bioconcentration Factor
BLS Bureau of Labor Statistics
BUN Blood Urea Nitrogen
CAA Clean Air Act
CASRN Chemical Abstract Service Registry Number
CBI Confidential Business Information
CCl4 Carbon Tetrachloride
CDR Chemical Data Reporting
CEHD Chemical Exposure Health Data
CERCLA Comprehensive Environmental Response, Compensation and Liability Act
CFC Chlorofluorocarbon
cm2 Square Centimeter(s)
cm3 Cubic Centimeter(s)
CPN Chronic Progressive Nephropathy
CNS Central Nervous System
COC Concentration of Concern
CoRAP Community Rolling Action Plan
CPSC Consumer Product Safety Commission
CS2 Carbon Disulfide
CSATAM Community-Scale Air Toxics Ambient Monitoring
CSCL Chemical Substances Control Law
CSF Cancer Slope Factor
CSM Chlorosulphonated Polyolefin
CYP450 Cytochrome P450
CWA Clean Water Act
DMR Discharge Monitoring Report
DNA Deoxyribonucleic Acid
DoD Department of Defense
DT50 Dissipation Time for 50% of the compound to dissipate
EC European Commission
ECHA European Chemicals Agency
EDC Ethylene Dichloride
ELCR Excess Lifetime Cancer Risk
EPA Environmental Protection Agency
Page 12 of 390
EPCRA Emergency Planning and Community Right-to-Know Act
ESD Emission Scenario Document
EU European Union
FDA Food and Drug Administration
FFDCA Federal Food, Drug and Cosmetic Act
FHSA Federal Hazardous Substance Act
FIFRA Federal Insecticide, Fungicide, and Rodenticide Act
g Gram(s)
GS Generic scenario
HAP Hazardous Air Pollutant
HCFC Hydrochlorofluorocarbons
HCl Hydrochloric Acid
HFC Hydrofluorocarbon
HFO Hydrofluoroolefin
HSIA Halogenated Solvents Industry Alliance
HVLP High Volume, Low Pressure
IBC Intermediate Bulk Containers
IDLH Immediately Dangerous to Life and Health
IMAP Inventory Multi-Tiered Assessment and Prioritisation
IRIS Integrated Risk Information System
ISHA Industrial Safety and Health Act
kg Kilogram(s)
km Kilometer(s)
L Liter(s)
LADC Lifetime Average Daily Concentration
lb Pound
LOD Limit of Detection
log Koc Logarithmic Soil Organic Carbon:Water Partitioning Coefficient
log Kow Logarithmic Octanol:Water Partition Coefficient
m3 Cubic Meter(s)
MACT Maximum Achievable Control Technology
MCL Maximum Contaminant Level
MCLG Maximum Contaminant Level Goal
MEMA Motor and Equipment Manufacturer Association
mg Milligram(s)
mmHg Millimeter(s) of Mercury
MP Montreal Protocol
mPa·s Millipascal(s)-Second
NAC/AEGL National Advisory Committee for Acute Exposure Guideline Levels
NAICS North American Industrial Classification System
NATA National Air Toxics Assessment
NATTS National Air Toxics Trends Stations
NEI National Emissions Inventory
NESHAP National Emission Standards
NHANES National Health and Nutrition Examination Survey
NIOSH National Institute for Occupational Safety and Health
NPDES National Pollutant Discharge Elimination System
NPDWR National Primary Drinking Water Regulations

Page 13 of 390
NTP National Toxicology Program
NWQMC National Water Quality Monitoring Council
OARS Occupational Alliance for Risk Science
OBOD Open Burn/Open Detection
OCSPP Office of Chemical Safety and Pollution Prevention
ODS Ozone Depleting Substance
OECD Organisation for Economic Co-operation and Development
OELs Occupational Exposure Limits/Levels
ONU Occupational Non-Users
OPPT Office of Pollution Prevention and Toxics
OSHA Occupational Safety and Health Administration
OW Office of Water
PCE Perchloroethylene
PDM Probabilistic Dilution Model
PEL Permissible Exposure Limit
PESS Potentially Exposed or Susceptible Subpopulations
PF Protection Factor
POD Point of Departure
POTW Publicly Owned Treatment Works
ppm Part(s) per Million
PPE Personal Protective Equipment
QC Quality Control
REACH Registration, Evaluation, Authorisation and Restriction of Chemicals
RCRA Resource Conservation and Recovery Act
REL Recommended Exposure Limit
RFI Reporting Forms and Instructions
RIE Reactive Ion Etching
SDS Safety Data Sheet
SDWA Safe Drinking Water Act
SIAP Screening Information Dataset Initial Assessment Profile
SIDS Screening Information Dataset
SOC Standard Occupational Classification
STEL Short-term Exposure Limit
SUSB Statistics of US Businesses
SYR Six-year Review
TCCR Transparent, Clear, Consistent and Reasonable
TCLP Toxicity Characteristic Leaching Procedure
TLV Threshold Limit Value
TRI Toxics Release Inventory
TSCA Toxic Substances Control Act
TSDF Treatment, Storage and Disposal Facilities
TURA Toxic Use Reduction Act
TWA Time-Weighted Average
UATMP Urban Air Toxics Monitoring Program
UNEP United Nations Environment Programme
U.S. United States
USGS United States Geological Survey
VOC Volatile Organic Compounds

Page 14 of 390
WEEL Workplace Environmental Exposure Limit
WHO World Health Organization
WQP Water Quality Portal
Yderm Weight fraction of the chemical of interest in the liquid phase

Page 15 of 390
EXECUTIVE SUMMARY
This risk evaluation for carbon tetrachloride was performed in accordance with the Frank R. Lautenberg
Chemical Safety for the 21st Century Act and is being issued following public comment and peer
review. The Frank R. Lautenberg Chemical Safety for the 21st Century Act amended the Toxic
Substances Control Act (TSCA), the Nation’s primary chemicals management law, in June 2016. Under
the amended statute, EPA is required, under TSCA § 6(b), to conduct risk evaluations to determine
whether a chemical substance presents unreasonable risk of injury to health or the environment, under
the conditions of use, without consideration of costs or other non-risk factors, including an unreasonable
risk to potentially exposed or susceptible subpopulations, identified as relevant to the risk evaluation.
Also, as required by TSCA Section (6)(b), EPA established, by rule, a process to conduct these risk
evaluations. Procedures for Chemical Risk Evaluation Under the Amended Toxic Substances Control
Act (82 FR 33726). (Risk Evaluation Rule).
This risk evaluation is in conformance with TSCA Section 6(b), and the Risk Evaluation Rule, and is to
be used to inform risk management decisions. In accordance with TSCA Section 6(b), if EPA finds
unreasonable risk from a chemical substance under its conditions of use in any final risk evaluation, the
Agency will propose actions to address those risks within the timeframe required by TSCA. However,
any proposed or final determination that a chemical substance presents unreasonable risk under TSCA
Section 6(b) is not the same as a finding that a chemical substance is “imminently hazardous” under
TSCA Section 7. The conclusions, findings, and determinations in this final risk evaluation are for the
purpose of identifying whether the chemical substance presents unreasonable risk or no unreasonable
risk under the conditions of use, in accordance with TSCA Section 6, and are not intended to represent
any findings under TSCA Section 7.
TSCA Sections 26(h) and (i) require EPA, when conducting risk evaluations, to use scientific
information, technical procedures, measures, methods, protocols, methodologies and models consistent
with the best available science and to base its decisions on the weight of the scientific evidence1. To
meet these TSCA Section 26 science standards, EPA used the TSCA systematic review process
described in Application of Systematic Review in TSCA Risk Evaluations (U.S. EPA, 2018a). The data
collection, evaluation, and integration stages of the systematic review process are used to develop the
exposure, fate, and hazard assessments for risk evaluations.
Carbon tetrachloride [CASRN: 56-23-5] is a high production volume solvent. Previously, carbon
tetrachloride was a high production solvent in consumer and fumigant products, including as a solvent to
make refrigerants and propellants for aerosol cans, as a solvent for oils, fats, lacquers, varnishes, rubber
waxes, and resins, and as a grain fumigant and dry-cleaning agent. The Montreal Protocol and Title VI
of the Clean Air Act (CAA) led to a phase-out of carbon tetrachloride production in the United States for
most non-feedstock domestic uses in 1996. The Consumer Product Safety Commission (CPSC) banned
the use of carbon tetrachloride in consumer products (with the exception of “unavoidable manufacturing
residues of carbon tetrachloride in other chemicals that under reasonably foreseeable conditions of use
do not result in an atmospheric concentration of carbon tetrachloride greater than 10 parts per million”)
1 Weight of the scientific evidence means a systematic review method, applied in a manner suited to the nature of the
evidence or decision, that uses a pre-established protocol to comprehensively, objectively, transparently, and consistently
identify and evaluate each stream of evidence, including strengths, limitations, and relevance of each study and to integrate
evidence as necessary and appropriate based upon strengths, limitations, and relevance.
Page 16 of 390
in 1970.2 Currently, carbon tetrachloride is used as a feedstock in the production of hydrochloro-
fluorocarbons (HCFCs), hydrofluorocarbons (HFCs) and hydrofluoroolefins (HFOs). EPA has identified
information on the regulated use of carbon tetrachloride as a process agent in the manufacturing of
petrochemicals-derived and agricultural products and other chlorinated compounds such as chlorinated
paraffins, chlorinated rubber and others that may be used downstream in the formulation of solvents for
degreasing and cleaning, adhesives, sealants, paints, coatings, rubber, cement and asphalt formulations.
The use of carbon tetrachloride for non-feedstock uses (i.e., process agent, laboratory chemical) is
regulated in accordance with the Montreal Protocol.
Carbon tetrachloride has been reportable to the Toxics Release Inventory (TRI) chemical under Section
313 of the Emergency Planning and Community Right-to-Know Act (EPCRA) since 1987. It is
designated a Hazardous Air Pollutant (HAP) under the Clean Air Act (CAA), and is a hazardous
substance under the Comprehensive Environmental Response, Compensation and Liability Act
(CERCLA). It is subject to National Primary Drinking Water Regulations (NPDWR) under the Safe
Drinking Water Act (SDWA) and designated as a toxic pollutant under the Clean Water Act (CWA) and
as such is subject to effluent limitations.
Approach
EPA used reasonably available information (defined in 40 CFR 702.33 in part as “information that EPA
possesses or can reasonably generate, obtain, and synthesize for use in risk evaluations, considering the
deadlines . . . for completing such evaluation”) in a “fit-for-purpose” approach, to develop a risk
evaluation that relies on the best available science and is based on the weight of the scientific evidence.
EPA used previous analyses as a starting point for identifying key and supporting studies to inform the
exposure, fate, and hazard assessments. EPA also evaluated other studies that were published since these
reviews. EPA reviewed the information and evaluated the quality of the methods and reporting of results
of the individual studies using the evaluation strategies described in Application of Systematic Review in
TSCA Risk Evaluations (U.S. EPA, 2018a). To satisfy requirements in TSCA Section 26(j)(4) and 40
CFR 702.51(e), EPA has provided a list of studies considered in carrying out the risk evaluation and the
results of those studies in Appendix C, Appendix F, Appendix G, and several supplemental files.
In the problem formulation document (U.S. EPA, 2018c), EPA identified the carbon tetrachloride
conditions of use and presented two conceptual models and an analysis plan for this current risk
evaluation. These have been updated in the risk evaluation to remove two activities that are no longer
considered conditions of use because they consist of outdated industrial/commercial processes that are
not known, intended, or reasonably foreseen to occur, and/or fall outside TSCA’s definition of
“chemical substance” (see Section 1.4.2).
EPA has quantitatively evaluated the risk to the environment and human health, using both monitoring
data and modeling approaches, for the conditions of use identified in Section 1.4.1 of this risk
evaluation. EPA used environmental fate parameters, physical-chemical properties, modeling, and
monitoring data to assess ambient water exposure to aquatic and sediment-dwelling organisms. While
carbon tetrachloride is present in various environmental media, such as groundwater, surface water, and
2 EPA did not identify any “legacy uses” (i.e., circumstances associated with activities that do not reflect ongoing or
prospective manufacturing, processing, or distribution) or “associated disposal” (i.e., future disposal from legacy uses) of
carbon tetrachloride, as those terms are described in EPA’s Risk Evaluation Rule, 82 FR 33726, 33729 (July 20, 2017).
Therefore, no such uses or disposals were added to the scope of the risk evaluation for carbon tetrachloride following the
issuance of the opinion in Safer Chemicals, Healthy Families v. EPA, 943 F.3d 397 (9th Cir. 2019). EPA did not evaluate
“legacy disposal” (i.e., disposals that have already occurred) in the risk evaluation, because legacy disposal is not a
“condition of use” under Safer Chemicals, 943 F.3d 397.

Page 17 of 390
air, EPA determined during problem formulation that no further analysis beyond what was presented in
the problem formulation document would be done for environmental exposure pathways. However, in
the final risk evaluation, EPA qualitatively evaluated the soil and land-applied biosolid pathway leading
to exposure to terrestrial organisms, and quantitatively and qualitatively evaluated risk to sediment-
dwelling organisms considering one low quality ecotoxicity paper on Chironomus tentans (Lee et al.,
2006) and acceptable aquatic invertebrate data. EPA also quantitatively evaluated the risk to aquatic
organisms from surface water further refining the assessment presented in the problem formulation
document and draft risk evaluation. Results from these analyses were presented in the final risk
evaluation and used to inform the risk determination section. EPA also quantitatively evaluated the risk
to workers, from inhalation and dermal exposures, and occupational non-users (ONUs)3, from inhalation
exposures, by comparing the estimated exposures to acute and chronic human health hazards.
Exposures
EPA used environmental monitoring data to assess ambient water exposure to aquatic organisms
including sediment organisms. While carbon tetrachloride is present in various environmental media,
such as groundwater, surface water, and air, EPA stated in the problem formulation that EPA did not
expect to include in the risk evaluation certain exposure pathways that are under the jurisdiction of other
EPA-administered statutes, and stated that EPA expected to conduct no further analysis beyond what
was presented in the problem formulation document for the environmental exposure pathways that
remained in the scope of this risk evaluation. Exposures to terrestrial organisms from air were
considered out of scope due to its coverage under the jurisdiction of the Clean Air Act. Exposures to
terrestrial organisms from water were not further analyzed because carbon tetrachloride is identified as a
priority pollutant under Section 304(a) of the Clean Water Act regulating releases to water and the
expectation that any releases to water under the regulation will volatilize into air based on its physical-
chemical properties.
Exposures to terrestrial organisms from the suspended soils and biosolids pathway was qualitatively
evaluated. However, no further analyses were conducted because the physical-chemical and fate
properties of carbon tetrachloride provide evidence indicating that exposures to terrestrial organisms
from the soil and biosolids pathways are negligible. These analyses are described in Sections 2.1, 2.3
and 4.1 and Appendix E.
EPA evaluated exposures to carbon tetrachloride in occupational settings for the conditions of use
(COUs) included in the scope of the risk evaluation, listed in Section 1.4 (Scope of the Evaluation). In
occupational settings, EPA evaluated acute and chronic inhalation exposures to workers and ONUs, and
acute and chronic dermal exposures to workers. EPA used inhalation monitoring data where reasonably
available and that met data evaluation criteria, as well as modeling approaches where reasonably
available to estimate potential inhalation exposures. For some of the COUs (import/repackaging,
industrial processing aid, additive, disposal, specialty uses) there is uncertainty in the ONU inhalation
risk estimate since the data did not distinguish between worker and ONU inhalation exposure estimates.
While the difference between the exposures of ONUs and the exposures of workers directly handling the
carbon tetrachloride generally cannot be quantified, ONU inhalation exposures are expected to be lower
than inhalation exposures for workers directly handling the chemical. EPA considered the ONU
exposures to be equal to the central tendency risk estimates for workers when determining ONU risk
attributable to inhalation. While this is likely health protective as it assumes ONU exposure is greater
than that of 50% of the workers, this is uncertain, and EPA describes these uncertainties and its
3 ONUs are workers who do not directly handle carbon tetrachloride but perform work in an area where carbon tetrachloride
is present.

Page 18 of 390
confidence in exposure estimates for ONUs in Section 2.4. Dermal exposures are not expected because
ONUs do not typically directly handle the carbon tetrachloride. Dermal doses for workers were
estimated in these scenarios because dermal monitoring data was not reasonably available. These
analyses are described in Section 2.4 of this risk evaluation.
Based on the information identified by EPA, carbon tetrachloride is not a direct reactant or additive in
the formulation of any consumer products. However, trace amounts of residual carbon tetrachloride
could be present in commercially available solvents for cleaning and degreasing, adhesives and sealants
or paints and coatings manufactured with chlorinated compounds derived from carbon tetrachloride.
Because industrial, commercial, and consumer use of such products (solvents for cleaning/degreasing,
adhesives/sealants, and paints/coatings) would present only de minimis exposure or otherwise
insignificant risk, EPA has determined that consumer and occupational exposures to those products do
not warrant evaluation based on EPA’s discretionary authority in TSCA Section 6(b)(4)(D) to exclude
from the scope of the risk evaluation conditions of use for which exposures are expected to be de
minimis (see Section 1.4.2.3). Furthermore, consumer products with measurable amounts of carbon
tetrachloride have not been identified in the Washington State Product Testing Data list, the State of
Vermont list of Chemicals in Children’s Products or the State of California consumer product database
(Safer Consumer Products Information Management System) and no consumer uses are listed in the
CDR (Vermont Department of Health, 2020; State of Washington, 2019; State of California, 2013; U.S.
EPA, 2016d).
EPA has also exercised its authority in TSCA Section 6(b)(4)(D) to exclude from the scope of this risk
evaluation conditions of use associated with carbon tetrachloride generated as a byproduct. Carbon
tetrachloride generated as a byproduct during the manufacture of 1,2-dichloroethane will be assessed in
the risk evaluation for 1,2-dichloroethane (see Final Scope of the Risk Evaluation for 1,2-
Dichloroethane, EPA-HQ-OPPT-2018-0427-0048).
Spills and leaks generally are not included within the scope of TSCA risk evaluations because in general
they are not considered to be circumstances under which a chemical substance is intended, known or
reasonably foreseen to be manufactured, processed, distributed, used, or disposed of. To the extent there
may be potential exposure from spills and leaks, EPA is also declining to evaluate environmental
exposure pathways addressed by other EPA-administered statutes and associated regulatory programs.
First, EPA does not identify carbon tetrachloride spills or leaks as “conditions of use.” EPA does not
consider carbon tetrachloride spills or leaks to constitute circumstances under which carbon tetrachloride
is manufactured, processed, distributed, used, or disposed of, within TSCA’s definition of “conditions of
use.” Congress specifically listed discrete, routine chemical lifecycle stages within the statutory
definition of “conditions of use” and EPA does not believe it is reasonable to interpret “circumstances”
under which carbon tetrachloride is manufactured, processed, distributed, used, or disposed of to include
uncommon and unconfined spills or leaks for purposes of the statutory definition. Further, EPA does not
generally consider spills and leaks to constitute “disposal” of a chemical for purposes of identifying a
COU in the conduct of a risk evaluation.
In addition, even if spills or leaks of carbon tetrachloride could be considered part of the listed lifecycle
stages of carbon tetrachloride, EPA has “determined” that spills and leaks are not circumstances under
which carbon tetrachloride is intended, known or reasonably foreseen to be manufactured, processed,
distributed, used, or disposed of, as provided by TSCA’s definition of “conditions of use,” and EPA is
therefore exercising its discretionary authority under TSCA Section 3(4) to exclude carbon tetrachloride
Page 19 of 390
spills and leaks from the scope of the carbon tetrachloride risk evaluation. The exercise of that authority
is informed by EPA’s experience in developing scoping documents and risk evaluations, and on various
TSCA provisions indicating the intent for EPA to have some discretion on how best to address the
demands associated with implementation of the full TSCA risk evaluation process. Specifically, since
the publication of the Risk Evaluation Rule, EPA has gained experience by conducting ten risk
evaluations and designating forty chemical substances as low- and high-priority chemical substances.
These processes have required EPA to determine whether the case-specific facts and the reasonably
available information justify identifying a particular activity as a “condition of use.”
With the experience EPA has gained, it is better situated to discern circumstances that are appropriately
considered to be outside the bounds of “circumstances…under which a chemical substance is intended,
known, or reasonably foreseen to be manufactured, processed, distributed in commerce, used, or
disposed of” and to thereby meaningfully limit circumstances subject to evaluation. Because of the
expansive and potentially boundless impacts that could result from including spills and leaks as part of
the risk evaluation (e.g., due to the unpredictable and irregular scenarios that would need to be
accounted for, including variability in volume, frequency, and geographic location of spills and leaks;
potential application across multiple exposure routes and pathways affecting myriad ecological and
human receptors; and far-reaching analyses that would be needed to support assessments that account
for uncertainties but are based on best available science), which could make the conduct of the risk
evaluation untenable within the applicable deadlines, spills and leaks are determined not to be
circumstances under which carbon tetrachloride is intended, known or reasonably foreseen to be
manufactured, processed, distributed, used, or disposed of, as provided by TSCA’s definition of
“conditions of use.”
Exercising the discretion to not identify spills and leaks of carbon tetrachloride as a COU is consistent
with the discretion Congress provided in a variety of provisions to manage the challenges presented in
implementing TSCA risk evaluation. See e.g., TSCA Sections 3(4), 3(12), 6(b)(4)(D), 6(b)(4)(F). In
particular, TSCA Section 6(b)(4)(F)(iv) instructs EPA to factor into TSCA risk evaluations “the likely
duration, intensity, frequency, and number of exposures under the conditions of use...,” suggesting that
activities for which duration, intensity, frequency, and number of exposures cannot be accurately
predicted or calculated based on reasonably available information, including spills and leaks, were not
intended to be the focus of TSCA risk evaluations. And, as noted in the preamble to the Risk Evaluation
Rule, EPA believes that Congress intended there to be some reasonable limitation on TSCA risk
evaluations, expressly indicated by the direction in TSCA Section 2(c) to “carry out [TSCA] in a
reasonable and prudent manner.” For these reasons, EPA is exercising this discretion to not consider
spills and leaks of carbon tetrachloride to be COUs.
Second, even if carbon tetrachloride spills or leaks could be identified as exposures from a COU in some
cases, these are not types of exposure that EPA expects to consider in the carbon tetrachloride risk
evaluation. TSCA Section 6(b)(4)(D) requires EPA, in developing the scope of a risk evaluation, to
identify the hazards, exposures, conditions of use, and potentially exposed or susceptible subpopulations
the Agency “expects to consider” in a risk evaluation. This language suggests that EPA is not required to
consider all conditions of use, hazards, or exposure pathways in risk evaluations. EPA has chosen to
tailor the scope of the risk evaluation to exclude spills and leaks in order to focus analytical efforts on
those exposures that present the greatest potential for risk.
In the problem formulation documents for many of the first 10 chemicals undergoing risk evaluation,
EPA applied the same authority and rationale to certain exposure pathways, explaining that “EPA is
Page 20 of 390
planning to exercise its discretion under TSCA 6(b)(4)(D) to focus its analytical efforts on exposures
that are likely to present the greatest concern and consequently merit a risk evaluation under TSCA....”
This approach is informed by the legislative history of the amended TSCA, which supports the Agency’s
exercise of discretion to focus the risk evaluation on areas that raise the greatest potential for risk. See
June 7, 2016 Cong. Rec., S3519-S3520.
In addition to TSCA Section 6(b)(4)(D), the Agency also has discretionary authority under the first
sentence of TSCA Section 9(b)(1) to “coordinate actions taken under [TSCA] with actions taken under
other Federal laws administered in whole or in part by the Administrator.” TSCA Section 9(b)(1)
provides EPA authority to coordinate actions with other EPA offices, including coordination on tailoring
the scope of TSCA risk evaluations to focus on areas of greatest concern rather than exposure pathways
addressed by other EPA-administered statutes and regulatory programs, which does not involve a risk
determination or public interest finding under TSCA Section 9(b)(2). EPA has already tailored the scope
of this risk evaluation using such discretionary authorities with respect to exposure pathways covered
under the jurisdiction of other EPA-administered statutes and associated regulatory programs (see
section 1.4.3).
Following coordination with EPA’s Office of Land and Emergency Management (OLEM), EPA has
found that exposures of carbon tetrachloride from spills and leaks fall under the jurisdiction of RCRA.
See 40 CFR 261.33(d) (defining in part a hazardous waste as “any residue or contaminated soil, water or
other debris resulting from the cleanup of a spill into or on any land or water of any commercial
chemical product or manufacturing chemical intermediate having the generic name listed [40 CFR
261.33(e) or (f)], or any residue or contaminated soil, water or other debris resulting from the cleanup of
a spill, into or on any land or water, of any off-specification chemical product and manufacturing
chemical intermediate which, if it met specifications, would have the generic name listed in [40 CFR
261.33(e) or (f)]”); 40 CFR 261.33(f) (listing carbon tetrachloride as hazardous waste no. U211). As a
result, EPA believes it is both reasonable and prudent to tailor the TSCA risk evaluation for carbon
tetrachloride by declining to evaluate potential exposures from spills and leaks, rather than attempt to
evaluate and regulate potential exposures from spills and leaks under TSCA.
Hazards
EPA reviewed the environmental hazard data using the data quality review evaluation metrics and the
rating criteria described in the Application of Systematic Review in TSCA Risk Evaluations (U.S. EPA,
2018a). EPA included a quantitative assessment of carbon tetrachloride exposure from surface water and
sediments. EPA concluded that carbon tetrachloride poses a hazard to environmental aquatic receptors
with amphibians being the most sensitive taxa for acute and chronic exposures. Algal endpoints are
considered separately from the other taxa and not incorporated into acute or chronic concentrations of
concern (COCs) because durations normally considered acute for other species (e.g., 48, 72, or 96 hours)
can encompass several generations of algae. Distinct COCs were calculated for algal and sediment
invertebrate toxicities. The results of the environmental hazard assessment are in Section 3.1.
EPA evaluated reasonably available information for human health hazards and identified hazard
endpoints including acute and chronic toxicity for non-cancer effects and cancer. EPA used the
Framework for Human Health Risk Assessment to Inform Decision Making (U.S. EPA, 2014b) to
interpret, extract, and integrate carbon tetrachloride’s human health hazard and dose-response
information. EPA reviewed key and supporting information from previous hazard assessments [EPA
IRIS Toxicologic Review (U.S. EPA, 2010), an ATSDR Toxicological Profile (ATSDR, 2005) and
NAC Acute Exposure Guideline Levels (AEGL) (NRC, 2014) and other international assessments listed
Page 21 of 390
in Table 1-3. EPA also screened and evaluated new studies that were published since these reviews (i.e.,
from 2010 – 2018).
EPA developed a hazard and dose-response analysis using endpoints observed in inhalation and oral
hazard studies, evaluated the weight of the scientific evidence considering EPA and National Research
Council (NRC) risk assessment guidance and selected the points of departure (POD) for acute and
chronic, non-cancer endpoints, and inhalation unit risk and cancer slope factors for cancer risk estimates.
Potential health effects of carbon tetrachloride exposure described in the literature include effects on the
central nervous system (CNS), liver, kidney, as well as skin irritation, and cancer. EPA identified acute
PODs for inhalation exposures based on acute CNS effects observed in humans (Davis, 1934). The
chronic POD for inhalation exposures are based on a study observing increased fatty changes in rodent
livers (Nagano et al., 2007a). EPA identified a limited number of toxicity studies by the dermal route
that were not adequate for dose-response assessment. Therefore, the dermal candidate values were
derived by route-to-route extrapolation from the inhalation PODs mentioned above.
In accordance with U.S. EPA (U.S. EPA, 2005a) Guidelines for Carcinogen Risk Assessment, carbon
tetrachloride is classified “likely to be carcinogenic to humans” based on sufficient evidence in animals
and sufficient evidence in humans. EPA calculated cancer risk with a linear model using cancer slope
factors for low dose exposures of carbon tetrachloride, which is EPA’s baseline approach to risk
assessment when the MOA is unknown (i.e., adrenal gland and brain tumors in animal and human data,
respectively). A general correspondence has been observed between hepatocellular cytotoxicity and
regenerative hyperplasia and the induction of liver tumors as a potential MOA. As indicated in the EPA
IRIS Assessment (U.S. EPA, 2010), this MOA appears to play a significant role at relatively high
exposures above the POD, driving the steep increase in liver tumors in this exposure range. Therefore,
EPA presents in this final risk evaluation two approaches for assessment of carcinogenic risk from
carbon tetrachloride: a threshold approach for assessing risks for liver tumors based on a cytotoxicity
and regenerative hyperplasia, in conjunction with the liner extrapolation approach for the adrenal gland
and brain tumors. This is based on considerations for the modes of action for the different cancers
evaluated. The results of these analyses are described in Section 3.2.
Human Populations Considered in This Risk Evaluation
EPA assumed those who use carbon tetrachloride would be adults (workers) of either sex (>16 years
old), including pregnant women, and evaluated risks to individuals who do not use carbon tetrachloride
but may be indirectly exposed due to their proximity to the user who is directly handling carbon
tetrachloride.
The risk evaluation is based on potential central nervous system depression, which can lead to
workplace accidents and which is a precursor to more severe central nervous system effects such as
incapacitation, loss of consciousness, and death, as well as liver toxicity and cancer as sensitive
endpoints. The risk evaluation also assesses the risk to other potentially exposed or susceptible
subpopulations, including people with pre-existing conditions and people with genetic variations that
make them more susceptible. Exposures that do not present risks based on sensitive toxicity endpoints
are not expected to present risks for other potential health effects of carbon tetrachloride because other
health effects occur at levels of exposure higher than the sensitive toxicity endpoints.
Risk Characterization
This risk evaluation characterizes the environmental and human health risks from carbon tetrachloride
under the conditions of use, including manufacture, processing, distribution, use and disposal. This risk

Page 22 of 390
characterization identifies potential risks that are used in the identification of unreasonable risks in the
risk determination.
Environmental Risk: For environmental risk, EPA utilized a risk quotient (RQ) to compare the
environmental concentration to the effect level to characterize the risk to aquatic and sediment-dwelling
organisms. EPA included a quantitative assessment describing carbon tetrachloride exposure from
ambient water to aquatic and sediment-dwelling organisms. Carbon tetrachloride is not expected to
accumulate in sediments, and could be mobile in soil, and migrate to water or volatilize to air. The
results of the risk characterization are in Section 4.1, including a table that summarizes the RQs for
acute and chronic risks.
EPA identified expected environmental exposures for aquatic species under the conditions of use in the
scope of the risk evaluation. While the estimated releases from specific facilities result in modeled
surface water concentrations that were equal to or exceed the aquatic benchmark (RQ ≥ 1), other
facilities had acute RQs < 1, algae RQ < 1 and < 20 days exceedance, or chronic RQs < 1 indicating that
exposures resulting from environmental concentrations were less than the effect concentration, or the
concentration of concern. Details of these estimates are in Section 4.1.2.
Human Health Risks: For human health risks to workers, EPA identified potential cancer and non-
cancer human health risks from chronic inhalation exposures. EPA did not identify risks from acute
exposures for central nervous system depression. For dermal exposures, EPA identified potential risks
for non-cancer liver effects and cancer for chronic exposures.
For workers and ONUs, EPA estimated potential cancer risk for tumors other than liver from chronic
exposures to carbon tetrachloride using an inhalation unit risk value or dermal cancer slope factor
multiplied by the chronic exposure for each COU. The potential cancer risks for liver tumors were
estimated by calculating Margins of Exposure (MOEs) for chronic inhalation and dermal exposures
based on a threshold approach. For workers and ONUs, EPA also estimated potential non-cancer (liver)
risks resulting from acute or chronic inhalation or dermal exposures and used an MOE approach. For
workers, EPA estimated risks using several occupational exposure scenarios, which varied assumptions
regarding the expected use of personal protective equipment (PPE) for respiratory and dermal exposures
for workers directly handling carbon tetrachloride. More information on respiratory and dermal
protection, including EPA’s approach regarding the occupational exposure scenarios for carbon
tetrachloride, is in Section 2.4.1.1.
For workers, chronic non-cancer risks were indicated for high-end inhalation exposures for
manufacturing, processing, import, additive, processing aid and disposal COUs and cancer risks were
indicated for both high-end and central tendency inhalation exposures for all COUs except central
tendency exposures for DOD uses if PPE was not used. With use of PPE during relevant COUs, worker
exposures were estimated to be reduced such that MOEs were greater than benchmark MOEs and cancer
risks were below the benchmark cancer risk. EPA’s estimates for worker risks for each occupational
exposure scenario are presented in Section 4.2 and summarized in Table 4-15Table 4-15. Non-cancer
risks and cancer risks for workers were identified for high-end and central tendency dermal exposures
for all COUs (see Section 4.2.7). Dermal exposures are reduced with the use of gloves resulting in
MOEs above the benchmark MOE. Cancer risks for dermal exposures with gloves use (up to PF = 20)
remain below the benchmark cancer risk for all COUs with exposures. (see Sections 4.2.4, 4.2.5)
Page 23 of 390
For ONUs, non-cancer risks were indicated for high-end inhalation exposures during manufacturing and
processing COUs and cancer risks were indicated for inhalation exposure scenarios for all COUs, except
for DOD uses. ONUs are not assumed to be using PPE to reduce exposures to carbon tetrachloride.
ONUs are not dermally exposed to carbon tetrachloride and dermal risks to ONUs were not identified.
EPA’s estimates for ONU risks for each occupational exposure scenario are presented in Section 4.2 and
summarized in Table 4-15.
Strengths, Limitations and Uncertainties in the Risk Characterization
Key assumptions and uncertainties in the environmental risk estimation include the uncertainty around
modeled releases that have surface water concentrations greater than the highest concentration of
concern for aquatic organisms.
For the human health risk estimation, key assumptions and uncertainties are related to the estimates for
ONU inhalation exposures, because monitoring data were not reasonably available for many of the
conditions of use evaluated. Surrogate monitoring data were used for COUs without monitoring data for
ONUs. An additional source of uncertainty in the dermal risk assessment is the inhalation to dermal
route-to-route extrapolations. Another source of uncertainty for the human health hazard is the evidence
in support of a MOA for carcinogenesis of carbon tetrachloride for the different types of tumors
observed in animal and human studies. Based on reasonably available data, regenerative hyperplasia is
the cancer MOA identified for the development liver tumors in animals exposed to high doses of carbon
tetrachloride. Therefore, a threshold cancer risk model was used to calculate risks for liver tumors. A
low dose linear cancer risk model for carbon tetrachloride was used to calculate cancer risk for tumors
others than liver. Assumptions and key sources of uncertainty are detailed in Section 4.4.
EPA’s assessments, risk estimations, and risk determinations account for uncertainties throughout the
risk evaluation. EPA used reasonably available information, in a fit-for-purpose approach, to develop a
risk evaluation that relies on the best available science and is based on the weight of the scientific
evidence. Systematic review was conducted to identify reasonably available information related to
carbon tetrachloride hazards and exposures. The consideration of uncertainties supports the Agency’s
risk determinations, each of which is supported by substantial evidence, as set forth in detail in later
sections of this final risk evaluation.
Potentially Exposed or Susceptible Subpopulations (PESS)
TSCA Section 6(b)(4) requires that EPA conduct risk evaluations to determine whether a chemical
substance presents unreasonable risk under the conditions of use, including unreasonable risk to a
potentially exposed or susceptible subpopulation identified as relevant to the risk evaluation. TSCA
Section 3(12) defines “potentially exposed or susceptible subpopulation” as a group of individuals
within the general population identified by the Administrator who, due to either greater susceptibility or
greater exposure, may be at greater risk than the general population of adverse health effects from
exposure to a chemical substance or mixture, such as infants, children, pregnant women, workers, or the
elderly.
In developing the risk evaluation, EPA analyzed reasonably available information to ascertain whether
some human receptor groups among the worker and ONU may have greater exposure or greater
susceptibility than the general population of workers or ONUs to the hazard posed by carbon
tetrachloride. For consideration of the most highly exposed groups, EPA considered carbon tetrachloride
exposures to be higher among workers using carbon tetrachloride and ONUs in the vicinity of carbon
tetrachloride use. Additionally, variability of susceptibility to carbon tetrachloride may be correlated

Page 24 of 390
with genetic polymorphism in its metabolizing enzymes. Factors other than polymorphisms that regulate
CYP2E1 induction may have greater influence on the formation of the toxic metabolic product of carbon
tetrachloride exposure. The CYP2E1 enzyme is easily induced by many substances, resulting in
increased metabolism. For example, moderate to heavy alcohol drinkers may have increased
susceptibility to carbon tetrachloride (NRC, 2014). To account for variation in sensitivity within human
populations intraspecies uncertainty factors (UFs) were applied for non-cancer effects. The UF values
selected are described in Section 3.2.5.2. EPA’s decision for unreasonable risk are based on high-end
exposure estimates for workers in order to capture individuals who are PESS.
Aggregate and Sentinel Exposures
Section 6(b)(4)(F)(ii) of TSCA requires the EPA, as a part of the risk evaluation, to describe whether
aggregate or sentinel exposures under the conditions of use were considered and the basis for their
consideration. The EPA has defined aggregate exposure as “the combined exposures to an individual
from a single chemical substance across multiple routes and across multiple pathways” (40 CFR §
702.33). Exposures to carbon tetrachloride were evaluated by inhalation and dermal routes separately.
Inhalation and dermal exposures are assumed to occur simultaneously for workers. EPA chose not to
employ simple additivity of exposure pathways at this time within a condition of use, because it would
result in an overestimate of risk. In addition, inhalation and dermal exposures are conservative estimates
and combining them would generate unrealistic combined estimates. See additional discussions in
Section 4.6.
EPA defines sentinel exposure as “the exposure from a single chemical substance that represents the
plausible upper bound of exposure relative to all other exposures within a broad category of similar or
related exposures” (40 CFR § 702.33). In this risk evaluation, EPA considered sentinel exposure the
highest exposure given the details of the conditions of use and the potential exposure scenarios. Sentinel
exposures for workers are the high-end no PPE within each OES. In cases where sentinel exposures
result in MOEs greater than the benchmark or cancer risk lower than the benchmark, EPA did no further
analysis because sentinel exposures represent the worst-case scenario. EPA’s decision for unreasonable
risk are based on high-end exposure estimates to capture individuals with sentinel exposure. See further
information on aggregate and sentinel exposures in Section 4.6.
Unreasonable Risk Determination: In each risk evaluation under TSCA Section 6(b), EPA determines
whether a chemical substance presents an unreasonable risk of injury to health or the environment, under
the conditions of use. The determination does not consider costs or other non-risk factors. In making this
determination, EPA considers relevant risk-related factors, including, but not limited to: the effects of
the chemical substance on health and human exposure to such substance under the conditions of use
(including cancer and non-cancer risks); the effects of the chemical substance on the environment and
environmental exposure under the conditions of use; the population exposed (including any potentially
exposed or susceptible subpopulations, as determined by EPA); the severity of hazard (including the
nature of the hazard, the irreversibility of the hazard); and uncertainties. EPA also takes into
consideration the Agency’s confidence in the data used in the risk estimate. This includes an evaluation
of the strengths, limitations, and uncertainties associated with the information used to inform the risk
estimate and the risk characterization. The rationale for the unreasonable risk determination is discussed
in Section 5.2. The Agency’s risk determinations are supported by substantial evidence, as set forth in
detail in later Sections of this final risk evaluation.
Unreasonable Risk of Injury to the Environment: EPA modeled industrial discharges of carbon
tetrachloride to surface water to estimate surface water concentrations. The estimated surface water
Page 25 of 390
concentrations did not exceed the acute COC for any of the sites assessed. None of the sites analyzed
had more than 20 days where the chronic and algal COCs were exceeded. EPA considered the biological
relevance of the species to determine the concentrations of concern, as well as time and seasonality of
the exposures, and uncertainties of the limited number of data points above the RQ. EPA determined
that there is no unreasonable risk to aquatic organisms from all conditions of use. With respect to
sediment-dwelling aquatic species, carbon tetrachloride is not expected to partition to or be retained in
sediment and is expected to remain in aqueous phase due to its water solubility and low partitioning to
organic matter. EPA quantitatively assessed risks posed by carbon tetrachloride to sediment-dwelling
aquatic organisms and has determined that there is no unreasonable environmental risk to sediment-
dwelling species from the conditions of use for carbon tetrachloride. Based on its physical-chemical
properties, carbon tetrachloride does not partition to or accumulate in soils. Therefore, EPA determined
that there is no unreasonable risk to terrestrial organisms from all conditions of use from exposure to
carbon tetrachloride through soil and land-applied biosolids.
Based on the risk estimates, the environmental effects of carbon tetrachloride, the exposures, physical-
chemical properties of carbon tetrachloride, and consideration of uncertainties, EPA determined that
there is no unreasonable risk of injury to the environment from all conditions of use of carbon
tetrachloride.
Unreasonable Risks of Injury to Health: EPA’s determination of unreasonable risk for specific
conditions of use of carbon tetrachloride listed below are based on health risks to workers and
occupational non-users. As described below, EPA did not evaluate unreasonable risk to consumers,
bystanders, or to the general population in this risk evaluation. For acute exposures, EPA evaluated
unreasonable risks of central nervous system effects that are temporarily disabling, such as dizziness.
For chronic exposures, EPA evaluated unreasonable risks of liver toxicity and cancer. Cancer risks were
assessed using two approaches: linear extrapolation and threshold. This is based on considerations for
the modes of action for the different cancers evaluated. The unreasonable risk determination is based on
the risk estimates derived from both approaches.
Unreasonable Risk of Injury to Health of the General Population: General population exposures to
carbon tetrachloride may occur from industrial and/or commercial uses; industrial releases to air, water
or land; and other conditions of use. During the course of the risk evaluation process for carbon
tetrachloride, OPPT worked closely with the offices within EPA that administer and implement
regulatory programs under the Clean Air Act (CAA), the Safe Drinking Water Act (SDWA), the Clean
Water Act (CWA), the Resource Conservation and Recovery Act (RCRA), and the Comprehensive
Environmental Response, Compensation, and Liability Act (CERCLA). Through this intra-agency
coordination, EPA determined that carbon tetrachloride exposures to the general population via surface
water, drinking water, ambient air and sediment pathways fall under the jurisdiction of other
environmental statutes, administered by EPA, i.e., CAA, SDWA, CWA, RCRA, and CERCLA. As
explained in more detail in Section 1.4.3, EPA believes it is both reasonable and prudent to tailor TSCA
risk evaluations when other EPA offices have expertise and experience to address specific
environmental media, rather than attempt to evaluate and regulate potential exposures and risks from
those media under TSCA. EPA believes that coordinated action on exposure pathways and risks
addressed by other EPA-administered statutes and regulatory programs is consistent with the statutory
text and legislative history, particularly as they pertain to TSCA’s function as a “gap-filling” statute, and
also furthers EPA aims to efficiently use Agency resources, avoid duplicating efforts taken pursuant to
other Agency programs, and meet the statutory deadlines for completing risk evaluations. EPA has
therefore tailored the scope of the risk evaluation for carbon tetrachloride using authorities in TSCA

Page 26 of 390
Sections 6(b) and 9(b)(1). EPA did not evaluate hazards or exposures to the general population in this
risk evaluation, and as such the unreasonable risk determinations for relevant conditions of use do not
account for exposures to the general population.
Unreasonable Risk of Injury to Health of Workers: EPA evaluated cancer and non-cancer effects from
acute and chronic inhalation and dermal occupational exposures to determine if there was unreasonable
risk of injury to workers’ health. The drivers for EPA’s determination of unreasonable risk of injury for
workers are cancer resulting from chronic dermal exposures.
EPA generally assumes compliance with OSHA requirements for protection of workers including the
implementation of the hierarchy of controls. In support of this assumption, EPA used reasonably
available information indicating that some employers, particularly in the industrial setting, are providing
appropriate engineering, administrative controls, or PPE to their employees consistent with OSHA
requirements. While EPA does not have reasonably available information to support this assumption for
each condition of use, EPA does not believe that the Agency must presume, in the absence of such
information, a lack of compliance with existing regulatory programs and practices. Rather, EPA assumes
there is compliance with worker protection standards unless case-specific facts indicate otherwise, and
therefore existing OSHA regulations for worker protection and hazard communication will result in use
of appropriate PPE in a manner that achieves the stated Assigned Protection Factor (APF) for respirators
or Protection Factor (PF) for gloves. EPA’s decisions for unreasonable risk to workers are based on
high-end exposure estimates in order to account for the uncertainties related to whether or not workers
are using PPE. EPA’s approach for evaluating risk to workers and ONUs is to use the reasonably
available information and professional judgment to construct exposure scenarios that reflect the
workplace practices involved in the conditions of use of the chemicals and address uncertainties
regarding availability and use of PPE.
An APF is a term used by the OSHA to determine how well a respirator/filter combination will protect
an individual from chemical exposure. APFs are used to select the appropriate class of respirators that
will provide the necessary level of protection. There are certain levels used for different types of masks.
An APF of 10 means that no more than one-tenth of the contaminants to which the worker is exposed
will leak into the inside of the mask. An APF of 100 means only one percent leakage. Elastomeric full
facepiece respirators have an APF of 50 (see Table 2-4 for additional details). For each occupational
condition of use of carbon tetrachloride, EPA assumes worker use of a respirator with an APF of 50.
Similarly, EPA assumes worker use of gloves with PF of 20 in commercial and industrial settings.
The unreasonable risk determinations reflect the severity of the effects associated with the occupational
exposures to carbon tetrachloride and incorporate EPA assumptions of PPE use. A full description of
EPA’s unreasonable risk determination for each condition of use is in Section 5.2.
Unreasonable Risk of Injury to Health of Occupational Non-Users (ONUs): ONUs are workers who do
not directly handle carbon tetrachloride but perform work in an area where carbon tetrachloride is
present. EPA evaluated cancer and non-cancer effects to ONUs from acute and chronic inhalation
exposures to determine if there was unreasonable risk of injury to ONU’s health. The unreasonable risk
determinations reflect the severity of the effects associated with the occupational exposures to carbon
tetrachloride and the assumed absence of PPE for ONUs, since ONUs do not directly handle the chemical
and are instead doing other tasks in the vicinity of carbon tetrachloride use. Non-cancer effects and
cancer from dermal occupational exposures to ONUs were not evaluated because ONUs are not dermally
exposed to carbon tetrachloride. For inhalation exposures, EPA, where possible, estimated ONUs’
Page 27 of 390
exposures and described the risks separately from workers directly exposed. When the difference
between ONUs’ exposures and workers’ exposures cannot be quantified, EPA assumed that ONU’s
inhalation exposures are lower than inhalation exposures for workers directly handling the chemical
substance, and EPA considered the central tendency risk estimate when determining ONU risk. A full
description of EPA’s unreasonable risk determination for each condition of use is in Section 5.2.
Unreasonable Risk of Injury to Health of Consumers and Bystanders: As explained in the problem
formulation document for carbon tetrachloride, EPA did not include any consumer conditions of use
among the conditions of use within the scope of the risk evaluation for carbon tetrachloride and did not
evaluate exposures to consumers and bystanders from contaminant exposure in the risk evaluation. The
Consumer Product Safety Commission (CPSC) banned the use of carbon tetrachloride in consumer
products (excluding unavoidable residues not exceeding 10 ppm atmospheric concentration) in 1970. As
a result of CPSC’s ban, EPA does not consider the use of carbon tetrachloride-containing consumer
products produced before 1970 to be known, intended, or reasonably foreseen. While carbon
tetrachloride is used in the manufacturing of other chlorinated compounds that may be subsequently
added to commercially available products, EPA expects that consumer use of such products would
present only negligible exposure to carbon tetrachloride given the high volatility of carbon tetrachloride
and the extent of reaction and efficacy of the separation/purification process for purifying final products.
As discussed in Section 1.4.2.3, EPA had sufficient basis to conclude during problem formulation that
industrial, commercial, and consumer uses of carbon tetrachloride in commercially available aerosol and
non-aerosol adhesives and sealants, paints and coatings, and cleaning and degreasing solvent products
would present only de minimis exposures or otherwise insignificant risks and did not warrant further
evaluation or inclusion in the risk evaluation. Therefore, EPA did not evaluate hazards or exposures to
consumers or bystanders in this risk evaluation, and there is no unreasonable risk determination for these
populations.
Summary of Unreasonable Risk Determinations: In conducting risk evaluations, “EPA will determine
whether the chemical substance presents an unreasonable risk of injury to health or the environment
under each condition of use within the scope of the risk evaluation…” 40 CFR 702.47. Pursuant to
TSCA Section 6(i)(1), a determination of “no unreasonable risk” shall be issued by order and considered
to be final agency action. Under EPA’s implementing regulations, “[a] determination by EPA that the
chemical substance, under one or more of the conditions of use within the scope of the risk evaluation,
does not present an unreasonable risk of injury to health or the environment will be issued by order and
considered to be a final Agency action, effective on the date of issuance of the order.” 40 CFR
702.49(d).
EPA has determined that the following conditions of use of carbon tetrachloride do not present an
unreasonable risk of injury to health or the environment. These determinations are considered final
agency action and are being issued by order pursuant to TSCA Section 6(i)(1). The details of these
determinations are in Section 5.2, and the TSCA Section 6(i)(1) order is contained in Section 5.4.1 of
this final risk evaluation.
Conditions of Use that Do Not Present an Unreasonable Risk
• Processing as a reactant/intermediate in reactive ion etching (i.e., semiconductor
manufacturing)
• Distribution in commerce

Page 28 of 390
EPA has determined that the following conditions of use of carbon tetrachloride present an unreasonable
risk of injury. EPA will initiate TSCA Section 6(a) risk management actions on these conditions of use
as required under TSCA Section 6(c)(1). Pursuant to TSCA Section 6(i)(2), the unreasonable risk
determinations for these conditions of use are not considered final agency action. The details of these
determinations are in Section 5.4.1.
Manufacturing that Presents an Unreasonable Risk
• Domestic manufacture
• Import (including loading/unloading and repackaging)
Processing that Presents an Unreasonable Risk
• Processing as a reactant in the production of hydrochlorofluorocarbons, hydrofluorocarbon,
hydrofluoroolefin, and perchloroethylene
• Processing for incorporation into formulation, mixtures or reaction products (petrochemicals-
derived manufacturing; agricultural products manufacturing; other basic organic and inorganic
chemical manufacturing)
• Repackaging for use in laboratory chemicals
• Recycling
Industrial and Commercial Uses4 that Present an Unreasonable Risk
• Industrial/commercial use as an industrial processing aid in the manufacture of petrochemicals-
derived products and agricultural products
• Industrial/commercial use as an additive
• Industrial/commercial use in the manufacture of other basic chemicals (including chlorinated
compounds used in solvents, adhesives, asphalt, and paints and coatings)
• Industrial/commercial use in metal recovery
• Specialty uses by the Department of Defense
• Industrial/commercial use as a laboratory chemical
Disposal
• Disposal
4 Although EPA has identified both industrial and commercial uses here for purposes of distinguishing scenarios in this
analysis, the Agency interprets the authority over “any manner or method of commercial use” under TSCA section 6(a)(5) to
reach both.

Page 29 of 390
1 INTRODUCTION This document presents the final risk evaluation for carbon tetrachloride under the Frank R. Lautenberg
Chemical Safety for the 21st Century Act. The Frank R. Lautenberg Chemical Safety for the 21st
Century Act amended the Toxic Substances Control Act, the Nation’s primary chemicals management
law, in June 2016.
The Environmental Protection Agency (EPA) published the Scope of the Risk Evaluation for Carbon
Tetrachloride (U.S. EPA, 2017e) in June 2017, and the problem formulation in June 2018 (U.S. EPA,
2018c), which represented the analytical phase of risk evaluation whereby “the purpose for the
assessment is articulated, the problem is defined, and a plan for analyzing and characterizing risk is
determined” as described in Section 2.2 of the Framework for Human Health Risk Assessment to Inform
Decision Making. The problem formulation identified conditions of use and presented three conceptual
models and an analysis plan. Based on EPA’s analysis of the conditions of use, physical-chemical and
fate properties, environmental releases, and exposure pathways, the problem formulation preliminarily
concluded that further analysis was necessary for exposure pathways to workers and ONUs. EPA
subsequently published a draft risk evaluation for carbon tetrachloride and has taken public and peer
review comments. The conclusions, findings, and determinations in this final risk evaluation are for the
purpose of identifying whether the chemical substance presents unreasonable risk or no unreasonable
risk under the conditions of use, in accordance with TSCA Section 6, and are not intended to represent
any findings under TSCA Section 7.
As per EPA’s final rule, Procedures for Chemical Risk Evaluation Under the Amended Toxic
Substances Control Act (82 FR 33726 (July 20, 2017)), the draft risk evaluation was subject to both
public comment and peer review, which are distinct but related processes. EPA provided 60 days for
public comment on any and all aspects of the draft risk evaluation, including the submission of any
additional information that might be relevant to the science underlying the risk evaluation and the
outcome of the systematic review associated with carbon tetrachloride. This satisfies TSCA (15 U.S.C.
2605(b)(4)(H)), which requires EPA to provide public notice and an opportunity for comment on a draft
risk evaluation prior to publishing a final risk evaluation.
Peer review was conducted in accordance with EPA's regulatory procedures for chemical risk
evaluations, including using the EPA Peer Review Handbook and other methods consistent with the
science standards laid out in Section 26 of TSCA (See 40 CFR 702.45). As explained in the Risk
Evaluation Rule (82 FR 33726 (July 20, 2017)), the purpose of peer review is for the independent
review of the science underlying the risk assessment. As such, peer review addressed aspects of the
underlying science as outlined in the charge to the peer review panel such as hazard assessment,
assessment of dose-response, exposure assessment, and risk characterization.
As EPA explained in the Risk Evaluation Rule (82 FR 33726 (July 20, 2017)), it is important for peer
reviewers to consider how the underlying risk evaluation analyses fit together to produce an integrated
risk characterization, which forms the basis of an unreasonable risk determination. EPA believed peer
reviewers were most effective in this role if they received the benefit of public comments on the draft
risk evaluations prior to peer review. For this reason, and consistent with standard Agency practice, the
public comment period preceded peer review. The final risk evaluation changed in response to public
comments received on the draft risk evaluation and in response to peer review. EPA responded to public
and peer review comments received on the draft risk evaluation and explained changes made in response
to those comments in this final risk evaluation and the associated response to comments document.

Page 30 of 390
This document is structured such that the Introduction (Section 0) presents the basic physical-chemical
properties of carbon tetrachloride, and background information on its regulatory history, conditions of
use and conceptual models, with emphasis on any changes since the publication of the problem
formulation. This section also includes a discussion of the systematic review process utilized in this risk
evaluation. Exposures (Section 2) provides a discussion and analysis of both human and environmental
exposures that can be expected based on the conditions of use for carbon tetrachloride. Hazards (Section
3) discusses environmental and human health hazards of carbon tetrachloride. The Risk characterization
(Section 4) integrates and assesses reasonably available information on human health and environmental
hazards and exposures, as required by TSCA (15 U.S.C 2605(b)(4)(F)). This section also includes a
discussion of any uncertainties and how they impact the risk evaluation. As required under TSCA 15
U.S.C. 2605(b)(4), a determination of whether the risk posed by this chemical substance under its
conditions of use is unreasonable is presented in the Risk Determination (see Section 5).
EPA solicited input on the first 10 chemicals as it developed use dossiers, scope documents, problem
formulations, and draft risk evaluations. At each step, EPA received information and comments specific
to individual chemicals and of a more general nature relating to various aspects of the risk evaluation
process, technical issues, and the regulatory and statutory requirements. EPA has considered comments
and information received at each step in the process and factored in the information and comments as
the Agency deemed appropriate and relevant including comments on the published problem formulation
and draft risk evaluation of carbon tetrachloride.
Physical and Chemical Properties
Physical-chemical properties influence the environmental behavior and the toxic properties of a
chemical, thereby informing the potential conditions of use, exposure pathways and routes and hazards
being evaluated. A summary of the physical-chemical properties of carbon tetrachloride are listed in
Table 1-1.
Carbon tetrachloride is a colorless liquid at room temperature with a sweet, aromatic and ethereal odor
resembling chloroform (Merck, 1996); (U.S. Coast Guard, 1985). It is water miscible, has a melting
point of -23 °C, a boiling point of 76.8 °C and its’ density is 1.4601 g/cm3 at 20°C (Lide, 1999). Carbon
tetrachloride has a Henry’s Law Constant of 0.0276 atm m3/mole and a log Kow value of 2.83(Leighton
and Calo, 1981); (Hansch et al., 1995). Other pertinent physical-chemical properties are listed below in
Table 1-1.
Table 1-1. Physical and Chemical Properties of Carbon Tetrachloride
Property Valuea References
Molecular formula CCl4
Molecular weight 153.82
Physical form Colorless liquid with sweet odor (Merck, 1996); (U.S.
Coast Guard, 1985)
Melting point -23°C (Lide, 1999)
Boiling point 76.8°C (Lide, 1999)
Density 1.4601 g/cm3 at 20°C (Lide, 1999)
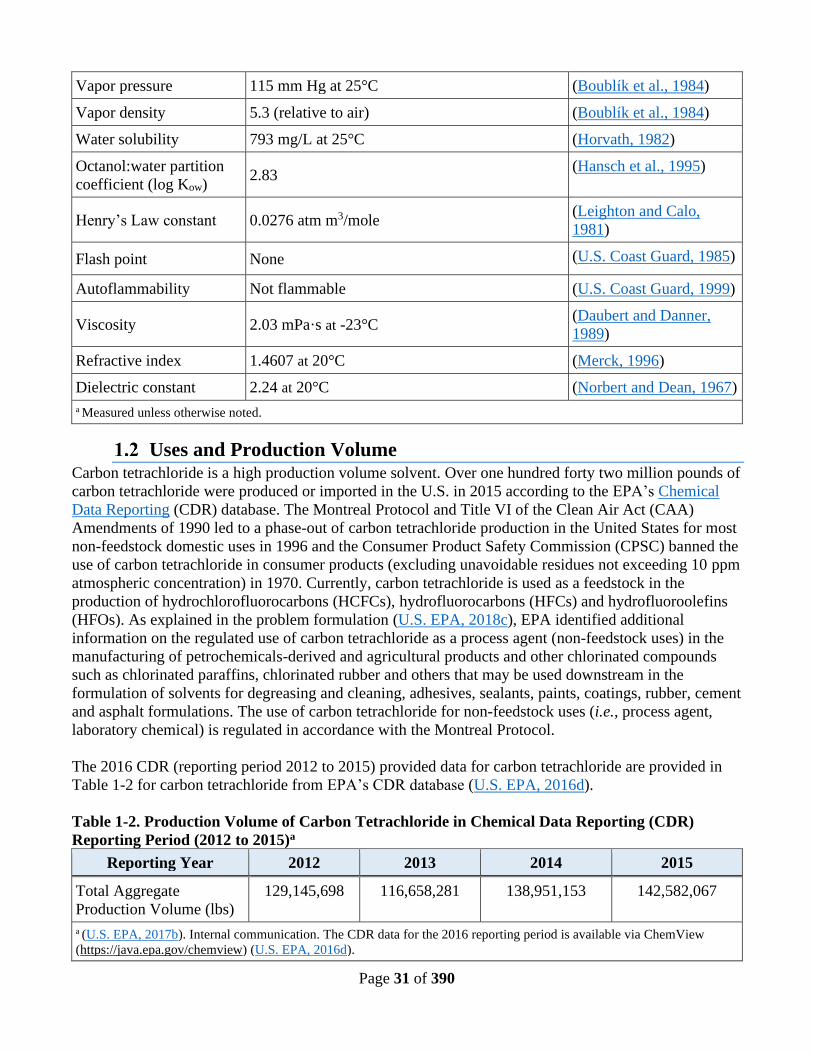
Page 31 of 390
Vapor pressure 115 mm Hg at 25°C (Boublik et al., 1984)
Vapor density 5.3 (relative to air) (Boublik et al., 1984)
Water solubility 793 mg/L at 25°C (Horvath, 1982)
Octanol:water partition
coefficient (log Kow) 2.83
(Hansch et al., 1995)
Henry’s Law constant 0.0276 atm m3/mole (Leighton and Calo,
1981)
Flash point None (U.S. Coast Guard, 1985)
Autoflammability Not flammable (U.S. Coast Guard, 1999)
Viscosity 2.03 mPa·s at -23°C (Daubert and Danner,
1989)
Refractive index 1.4607 at 20°C (Merck, 1996)
Dielectric constant 2.24 at 20°C (Norbert and Dean, 1967)
a Measured unless otherwise noted.
Uses and Production Volume Carbon tetrachloride is a high production volume solvent. Over one hundred forty two million pounds of
carbon tetrachloride were produced or imported in the U.S. in 2015 according to the EPA’s Chemical
Data Reporting (CDR) database. The Montreal Protocol and Title VI of the Clean Air Act (CAA)
Amendments of 1990 led to a phase-out of carbon tetrachloride production in the United States for most
non-feedstock domestic uses in 1996 and the Consumer Product Safety Commission (CPSC) banned the
use of carbon tetrachloride in consumer products (excluding unavoidable residues not exceeding 10 ppm
atmospheric concentration) in 1970. Currently, carbon tetrachloride is used as a feedstock in the
production of hydrochlorofluorocarbons (HCFCs), hydrofluorocarbons (HFCs) and hydrofluoroolefins
(HFOs). As explained in the problem formulation (U.S. EPA, 2018c), EPA identified additional
information on the regulated use of carbon tetrachloride as a process agent (non-feedstock uses) in the
manufacturing of petrochemicals-derived and agricultural products and other chlorinated compounds
such as chlorinated paraffins, chlorinated rubber and others that may be used downstream in the
formulation of solvents for degreasing and cleaning, adhesives, sealants, paints, coatings, rubber, cement
and asphalt formulations. The use of carbon tetrachloride for non-feedstock uses (i.e., process agent,
laboratory chemical) is regulated in accordance with the Montreal Protocol.
The 2016 CDR (reporting period 2012 to 2015) provided data for carbon tetrachloride are provided in
Table 1-2 for carbon tetrachloride from EPA’s CDR database (U.S. EPA, 2016d).
Table 1-2. Production Volume of Carbon Tetrachloride in Chemical Data Reporting (CDR)
Reporting Period (2012 to 2015)a
Reporting Year 2012 2013 2014 2015
Total Aggregate
Production Volume (lbs)
129,145,698 116,658,281 138,951,153 142,582,067
a (U.S. EPA, 2017b). Internal communication. The CDR data for the 2016 reporting period is available via ChemView
(https://java.epa.gov/chemview) (U.S. EPA, 2016d).
Page 32 of 390
Carbon tetrachloride had several uses in the past, primarily as a feedstock for the production of
chlorofluorocarbons. Current uses are now confined by the Montreal Protocol to be in contained
processes. Sherry et al. (2018) reported global industrial production of carbon tetrachloride in 2014 was
consumed in: (i) incineration (29 gigagram [Gg], while 1Gg = 2.205x10⁶ lbs); (ii) as a perchloroethylene
feedstock (64 Gg); (iii) as hydrofluorocarbon feedstock (58 Gg); (iv) in methyl chloride production
(26Gg); (v) in divinyl acid chloride production (23 Gg); and (vi) for use as process agent and laboratory
purposes (3 Gg). Sherry et al. (2018) estimated 13 Gg year-1 of global emissions from unreported non-
feedstock emissions from chloromethane and perchloroethylene plants as the key carbon tetrachloride
source. Additionally, 2 Gg year-1 are estimated as fugitive emissions from the usage of carbon
tetrachloride as feedstock and possibly up to 10 Gg year-1 from legacy emissions and chlor-alkali plants.
To resolve the budget discrepancy, Park et al. (2018) used a tracer–tracer correlation method based on a
top-down interpretation of emissions of carbon tetrachloride by measuring continuous, high frequency,
high-precision, atmospheric carbon tetrachloride concentrations at the Gosan station (33° N, 126° E) on
Jeju Island, South Korea during 2008–2015. These authors reported that 89% ± 6% of carbon
tetrachloride emissions are from the production of methyl chloride, dichloromethane, chloroform, and
tetrachloroethylene and its usage as a feedstock and process agent in chemical manufacturing industries.
Butler et al. (2016) suggested biological sink for carbon tetrachloride in surface or near-surface waters
of the ocean is responsible for removing ~18% of the carbon tetrachloride in the atmosphere. Though
carbon tetrachloride hydrolyzes in seawater, the hydrolysis rates of gaseous carbon tetrachloride are too
slow to support undersaturation based on air–sea gas exchange rates. The undersaturation in
intermediate depth waters associated with reduced oxygen levels indicated that carbon tetrachloride
could be consumed at ocean mid-depth by microbiota. Butler et al. (2016) also recognized the
discrepancy remaining between potential emissions based on the data on carbon tetrachloride production
and destruction and emissions computed from atmospheric lifetime, and estimated emission discrepancy
of the order of 10–20 Gg year-1. Hu et al. (2016) performed national-scale emissions of carbon
tetrachloride based on inverse modeling of atmospheric observations at multiple sites across the U.S.
These authors estimated an annual average U.S. emission of 4.0 (2.0–6.5) Gg year-1 during 2008–2012,
which was almost two orders of magnitude larger than reported in TRI (mean of 0.06 Gg year-1) but only
8% (3–22%) of global carbon tetrachloride emissions during these years. Hu et al. (2016) concluded that
the emission distribution derived for carbon tetrachloride throughout the U.S. is more consistent with the
distribution of industrial activities included in the TRI than with the distribution of other potential
carbon tetrachloride sources such as uncapped landfills or activities that may generate carbon
tetrachloride (e.g., result of reactions of chlorine-containing bleach with surfactant, soap, or other
organics).
Regulatory and Assessment History
Regulatory History
EPA conducted a search of existing domestic and international laws, regulations and assessments
pertaining to carbon tetrachloride. EPA compiled this summary from data available from federal, state,
international and other government sources, as cited in Appendix A. EPA evaluated and considered the
impact of existing laws and regulations (e.g., regulations on landfill disposal, design, and operations) in
the problem formulation step to determine what, if any, further analysis might be necessary as part of the
risk evaluation (see Section 2.5.3.2 in (U.S. EPA, 2018c)).
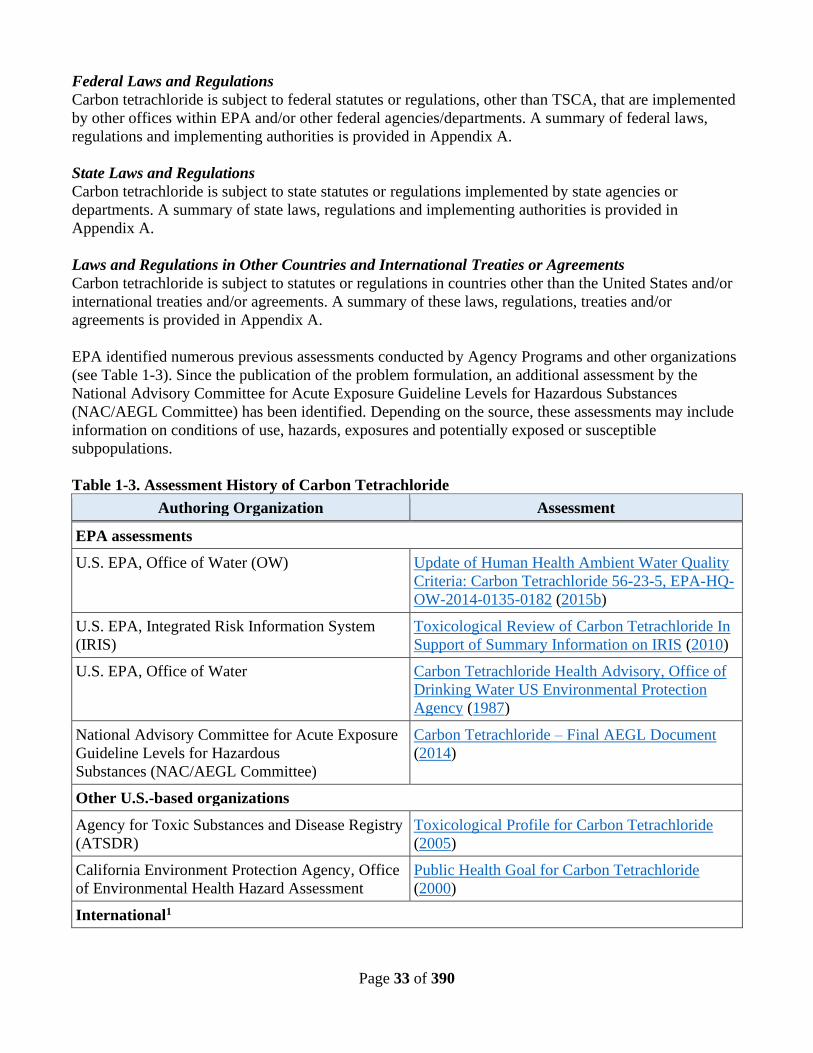
Page 33 of 390
Federal Laws and Regulations
Carbon tetrachloride is subject to federal statutes or regulations, other than TSCA, that are implemented
by other offices within EPA and/or other federal agencies/departments. A summary of federal laws,
regulations and implementing authorities is provided in Appendix A.
State Laws and Regulations
Carbon tetrachloride is subject to state statutes or regulations implemented by state agencies or
departments. A summary of state laws, regulations and implementing authorities is provided in
Appendix A.
Laws and Regulations in Other Countries and International Treaties or Agreements
Carbon tetrachloride is subject to statutes or regulations in countries other than the United States and/or
international treaties and/or agreements. A summary of these laws, regulations, treaties and/or
agreements is provided in Appendix A.
EPA identified numerous previous assessments conducted by Agency Programs and other organizations
(see Table 1-3). Since the publication of the problem formulation, an additional assessment by the
National Advisory Committee for Acute Exposure Guideline Levels for Hazardous Substances
(NAC/AEGL Committee) has been identified. Depending on the source, these assessments may include
information on conditions of use, hazards, exposures and potentially exposed or susceptible
subpopulations.
Table 1-3. Assessment History of Carbon Tetrachloride
Authoring Organization Assessment
EPA assessments
U.S. EPA, Office of Water (OW) Update of Human Health Ambient Water Quality
Criteria: Carbon Tetrachloride 56-23-5, EPA-HQ-
OW-2014-0135-0182 (2015b)
U.S. EPA, Integrated Risk Information System
(IRIS)
Toxicological Review of Carbon Tetrachloride In
Support of Summary Information on IRIS (2010)
U.S. EPA, Office of Water Carbon Tetrachloride Health Advisory, Office of
Drinking Water US Environmental Protection
Agency (1987)
National Advisory Committee for Acute Exposure
Guideline Levels for Hazardous
Substances (NAC/AEGL Committee)
Carbon Tetrachloride – Final AEGL Document
(2014)
Other U.S.-based organizations
Agency for Toxic Substances and Disease Registry
(ATSDR)
Toxicological Profile for Carbon Tetrachloride
(2005)
California Environment Protection Agency, Office
of Environmental Health Hazard Assessment
Public Health Goal for Carbon Tetrachloride
(2000)
International1
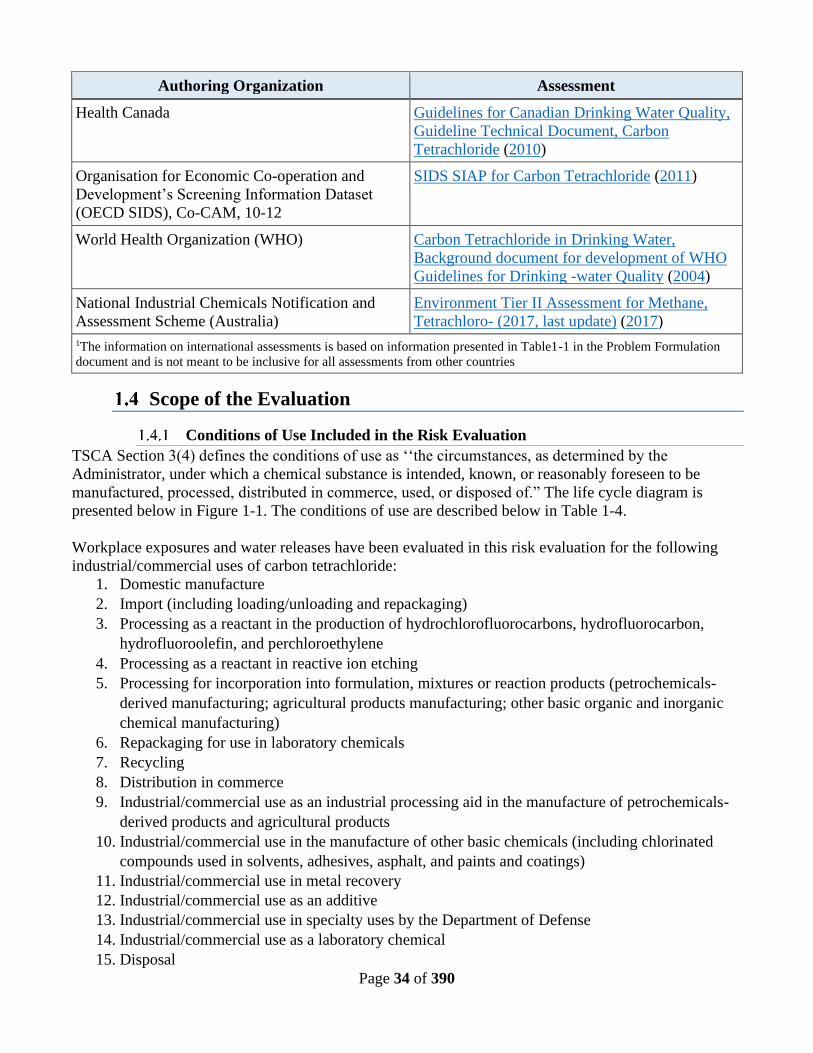
Page 34 of 390
Authoring Organization Assessment
Health Canada Guidelines for Canadian Drinking Water Quality,
Guideline Technical Document, Carbon
Tetrachloride (2010)
Organisation for Economic Co-operation and
Development’s Screening Information Dataset
(OECD SIDS), Co-CAM, 10-12
SIDS SIAP for Carbon Tetrachloride (2011)
World Health Organization (WHO) Carbon Tetrachloride in Drinking Water,
Background document for development of WHO
Guidelines for Drinking -water Quality (2004)
National Industrial Chemicals Notification and
Assessment Scheme (Australia)
Environment Tier II Assessment for Methane,
Tetrachloro- (2017, last update) (2017)
1The information on international assessments is based on information presented in Table1-1 in the Problem Formulation
document and is not meant to be inclusive for all assessments from other countries
Scope of the Evaluation
Conditions of Use Included in the Risk Evaluation
TSCA Section 3(4) defines the conditions of use as ‘‘the circumstances, as determined by the
Administrator, under which a chemical substance is intended, known, or reasonably foreseen to be
manufactured, processed, distributed in commerce, used, or disposed of.” The life cycle diagram is
presented below in Figure 1-1. The conditions of use are described below in Table 1-4.
Workplace exposures and water releases have been evaluated in this risk evaluation for the following
industrial/commercial uses of carbon tetrachloride:
1. Domestic manufacture
2. Import (including loading/unloading and repackaging)
3. Processing as a reactant in the production of hydrochlorofluorocarbons, hydrofluorocarbon,
hydrofluoroolefin, and perchloroethylene
4. Processing as a reactant in reactive ion etching
5. Processing for incorporation into formulation, mixtures or reaction products (petrochemicals-
derived manufacturing; agricultural products manufacturing; other basic organic and inorganic
chemical manufacturing)
6. Repackaging for use in laboratory chemicals
7. Recycling
8. Distribution in commerce
9. Industrial/commercial use as an industrial processing aid in the manufacture of petrochemicals-
derived products and agricultural products
10. Industrial/commercial use in the manufacture of other basic chemicals (including chlorinated
compounds used in solvents, adhesives, asphalt, and paints and coatings)
11. Industrial/commercial use in metal recovery
12. Industrial/commercial use as an additive
13. Industrial/commercial use in specialty uses by the Department of Defense
14. Industrial/commercial use as a laboratory chemical
15. Disposal

Page 35 of 390
Figure 1-1. Carbon Tetrachloride Life Cycle Diagram
The life cycle diagram depicts the conditions of use that are within the scope of the risk evaluation during various life cycle stages including
manufacturing, processing, use (industrial/commercial), distribution and disposal. The production volumes shown are for reporting year 2015
from the 2016 CDR reporting period (U.S. EPA, 2016d). Activities related to distribution (e.g., loading, unloading) will be considered
throughout the carbon tetrachloride life cycle, rather than using a single distribution scenario. a See Table 1-4 for additional uses not mentioned specifically in this diagram. b Disposal refers to the following activities - Industrial pre-treatment, Industrial wastewater treatment, publicly owned treatment works (POTW), Underground injection,
Municipal landfill, Hazardous landfill, Other land disposal, Municipal waste incinerator, Hazardous waste incinerator, Off-site waste transfer
MFG/IMPORT PROCESSING INDUSTRIAL, COMMERCIAL USES a RELEASES and WASTE DISPOSAL
Manufacture(includes import) (142.6 Million lbs)
Processing as Reactant/Intermediate
(Volume CBI)e.g. Intermediate for
refrigerant manufacture; other chlorinated
compounds (PCE); reactive ion etching
Disposal b
Petrochemical-derived and Agricultural Products
Manufacturing (Volume CBI or not reported)
(uses listed in Montreal Protocol’s (MP) Decision X/14 Directive).
Incorporated into Formulation, Mixture, or Reaction Products(Volume not reported)
Recycling
Repackaging(Volume not reported)
Other Usese.g., metal recovery; specialty uses
Processing
Manufacture (includes Import)
Industrial/commercial use
Laboratory Chemicalse.g. extraction solvent
Other Basic Organic and Inorganic Chemical Manufacturing
(Volume CBI or not reported)e.g. Manufacturing of organic and inorganic
compounds as listed in MP Decision X/14 Directive, some of which can be used in
manufacturing of Solvents for Cleaning and Degreasing, Adhesives, Sealants, Paints and
Coatings.
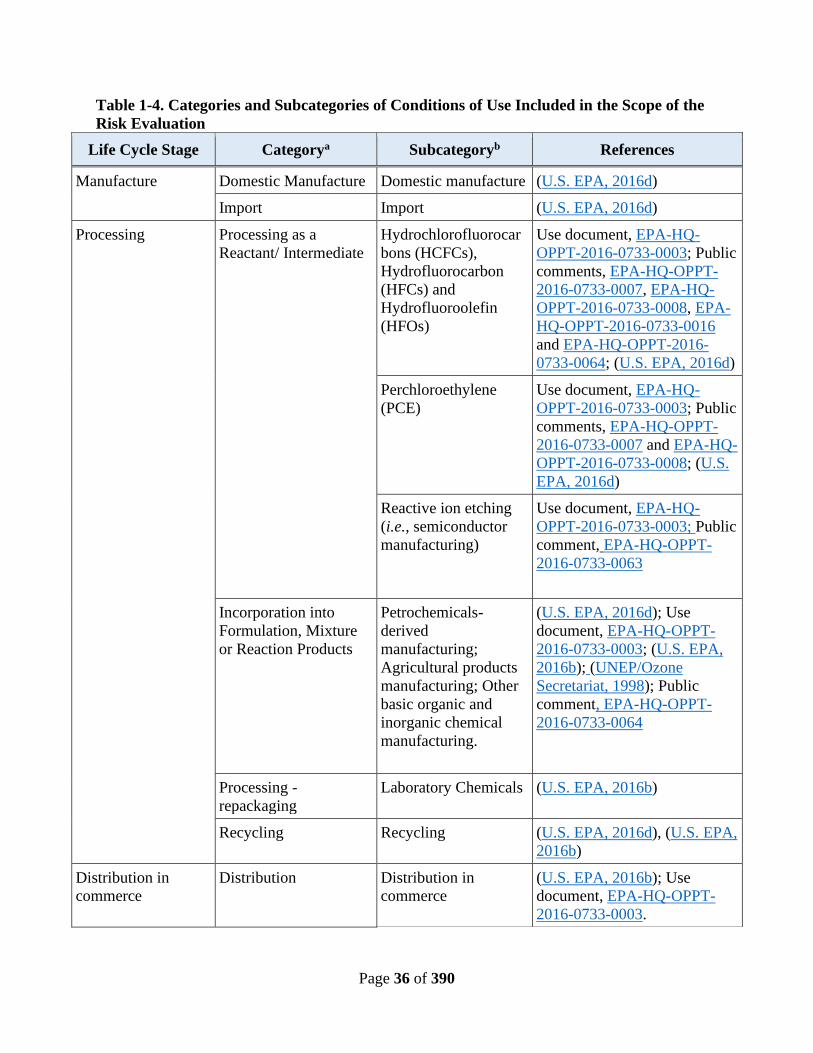
Page 36 of 390
Table 1-4. Categories and Subcategories of Conditions of Use Included in the Scope of the
Risk Evaluation
Life Cycle Stage Categorya Subcategoryb References
Manufacture Domestic Manufacture Domestic manufacture (U.S. EPA, 2016d)
Import Import (U.S. EPA, 2016d)
Processing Processing as a
Reactant/ Intermediate
Hydrochlorofluorocar
bons (HCFCs),
Hydrofluorocarbon
(HFCs) and
Hydrofluoroolefin
(HFOs)
Use document, EPA-HQ-
OPPT-2016-0733-0003; Public
comments, EPA-HQ-OPPT-
2016-0733-0007, EPA-HQ-
OPPT-2016-0733-0008, EPA-
HQ-OPPT-2016-0733-0016
and EPA-HQ-OPPT-2016-
0733-0064; (U.S. EPA, 2016d)
Perchloroethylene
(PCE)
Use document, EPA-HQ-
OPPT-2016-0733-0003; Public
comments, EPA-HQ-OPPT-
2016-0733-0007 and EPA-HQ-
OPPT-2016-0733-0008; (U.S.
EPA, 2016d)
Reactive ion etching
(i.e., semiconductor
manufacturing)
Use document, EPA-HQ-
OPPT-2016-0733-0003; Public
comment, EPA-HQ-OPPT-
2016-0733-0063
Incorporation into
Formulation, Mixture
or Reaction Products
Petrochemicals-
derived
manufacturing;
Agricultural products
manufacturing; Other
basic organic and
inorganic chemical
manufacturing.
(U.S. EPA, 2016d); Use
document, EPA-HQ-OPPT-
2016-0733-0003; (U.S. EPA,
2016b); (UNEP/Ozone
Secretariat, 1998); Public
comment, EPA-HQ-OPPT-
2016-0733-0064
Processing -
repackaging
Laboratory Chemicals (U.S. EPA, 2016b)
Recycling Recycling (U.S. EPA, 2016d), (U.S. EPA,
2016b)
Distribution in
commerce
Distribution Distribution in
commerce
(U.S. EPA, 2016b); Use
document, EPA-HQ-OPPT-
2016-0733-0003.
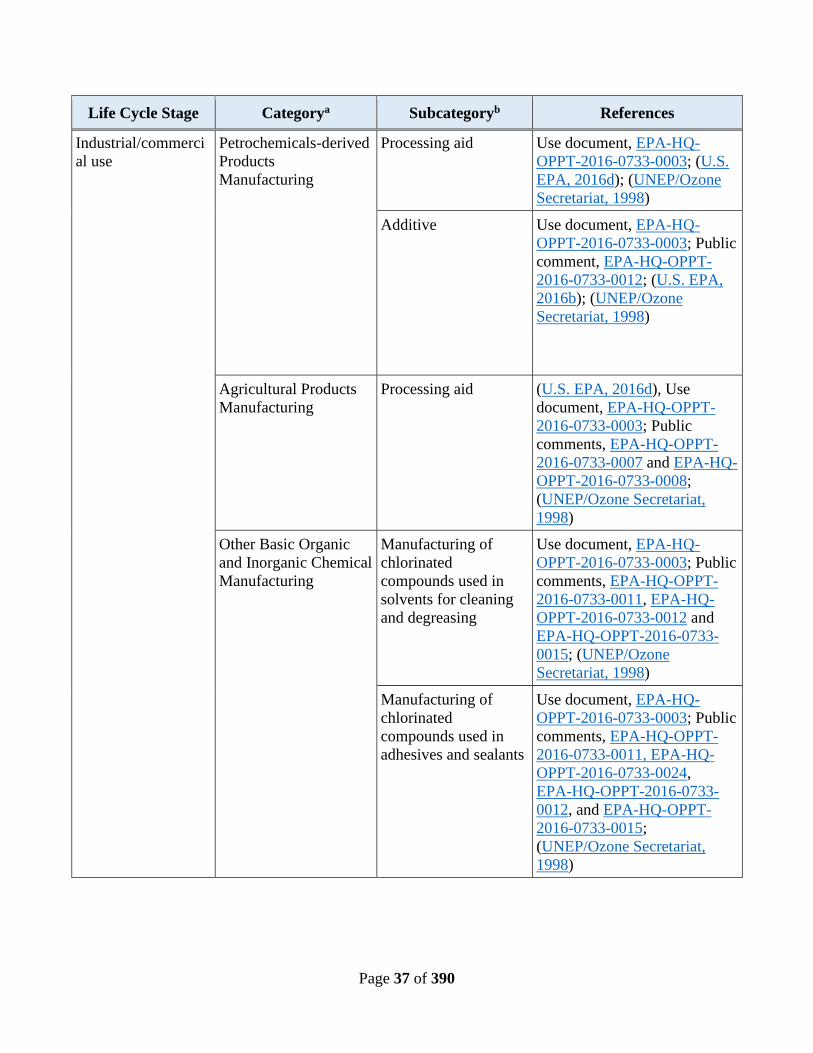
Page 37 of 390
Life Cycle Stage Categorya Subcategoryb References
Industrial/commerci
al use
Petrochemicals-derived
Products
Manufacturing
Processing aid
Use document, EPA-HQ-
OPPT-2016-0733-0003; (U.S.
EPA, 2016d); (UNEP/Ozone
Secretariat, 1998)
Additive Use document, EPA-HQ-
OPPT-2016-0733-0003; Public
comment, EPA-HQ-OPPT-
2016-0733-0012; (U.S. EPA,
2016b); (UNEP/Ozone
Secretariat, 1998)
Agricultural Products
Manufacturing
Processing aid (U.S. EPA, 2016d), Use
document, EPA-HQ-OPPT-
2016-0733-0003; Public
comments, EPA-HQ-OPPT-
2016-0733-0007 and EPA-HQ-
OPPT-2016-0733-0008;
(UNEP/Ozone Secretariat,
1998)
Other Basic Organic
and Inorganic Chemical
Manufacturing
Manufacturing of
chlorinated
compounds used in
solvents for cleaning
and degreasing
Use document, EPA-HQ-
OPPT-2016-0733-0003; Public
comments, EPA-HQ-OPPT-
2016-0733-0011, EPA-HQ-
OPPT-2016-0733-0012 and
EPA-HQ-OPPT-2016-0733-
0015; (UNEP/Ozone
Secretariat, 1998)
Manufacturing of
chlorinated
compounds used in
adhesives and sealants
Use document, EPA-HQ-
OPPT-2016-0733-0003; Public
comments, EPA-HQ-OPPT-
2016-0733-0011, EPA-HQ-
OPPT-2016-0733-0024,
EPA-HQ-OPPT-2016-0733-
0012, and EPA-HQ-OPPT-
2016-0733-0015;
(UNEP/Ozone Secretariat,
1998)

Page 38 of 390
Life Cycle Stage Categorya Subcategoryb References
Manufacturing of
chlorinated
compounds used in
paints and coatings
Use document, EPA-HQ-
OPPT-2016-0733-0003 Public
comment, EPA-HQ-OPPT-
2016-0733-0024;
(UNEP/Ozone Secretariat,
1998)
Manufacturing of
inorganic chlorinated
compounds (i.e.,
elimination of nitrogen
trichloride in the
production of chlorine
and caustic)
Public comment, EPA-HQ-
OPPT-2016-0733-0027;
(UNEP/Ozone Secretariat,
1998)
Manufacturing of
chlorinated
compounds used in
asphalt
Use document, EPA-HQ-
OPPT-2016-0733-0003;
(UNEP/Ozone Secretariat,
1998)
Other Uses (i.e.,
Specialty Uses)
Processing aid (i.e.,
metal recovery, DoD
uses).
Use document, EPA-HQ-
OPPT-2016-0733-0003
Laboratory Chemicals Laboratory chemical Use document, EPA-HQ-
OPPT-2016-0733-0003; (U.S.
EPA, 2016d), Public
comments, EPA-HQ-OPPT-
2016-0733-0007; EPA-HQ-
OPPT-2016-0733-0013 and
EPA-HQ-OPPT-2016-0733-
0063
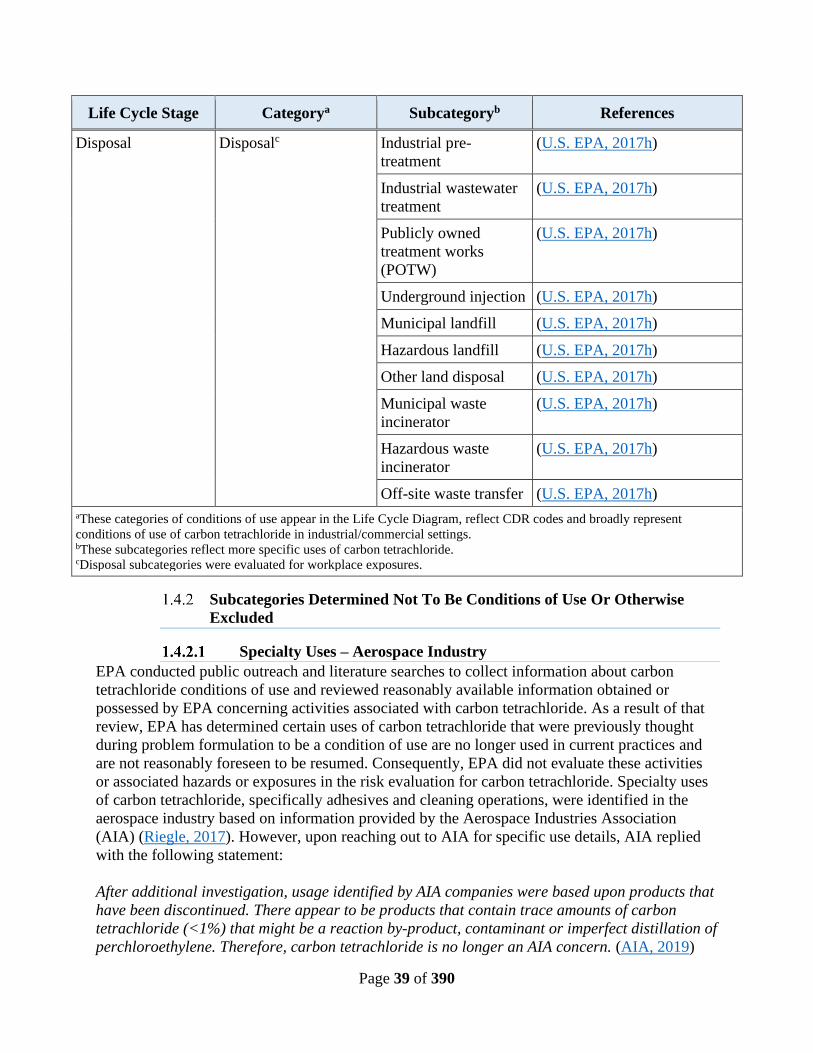
Page 39 of 390
Life Cycle Stage Categorya Subcategoryb References
Disposal Disposalc Industrial pre-
treatment
(U.S. EPA, 2017h)
Industrial wastewater
treatment
(U.S. EPA, 2017h)
Publicly owned
treatment works
(POTW)
(U.S. EPA, 2017h)
Underground injection (U.S. EPA, 2017h)
Municipal landfill (U.S. EPA, 2017h)
Hazardous landfill (U.S. EPA, 2017h)
Other land disposal (U.S. EPA, 2017h)
Municipal waste
incinerator
(U.S. EPA, 2017h)
Hazardous waste
incinerator
(U.S. EPA, 2017h)
Off-site waste transfer (U.S. EPA, 2017h)
aThese categories of conditions of use appear in the Life Cycle Diagram, reflect CDR codes and broadly represent
conditions of use of carbon tetrachloride in industrial/commercial settings. bThese subcategories reflect more specific uses of carbon tetrachloride. cDisposal subcategories were evaluated for workplace exposures.
Subcategories Determined Not To Be Conditions of Use Or Otherwise
Excluded
Specialty Uses – Aerospace Industry
EPA conducted public outreach and literature searches to collect information about carbon
tetrachloride conditions of use and reviewed reasonably available information obtained or
possessed by EPA concerning activities associated with carbon tetrachloride. As a result of that
review, EPA has determined certain uses of carbon tetrachloride that were previously thought
during problem formulation to be a condition of use are no longer used in current practices and
are not reasonably foreseen to be resumed. Consequently, EPA did not evaluate these activities
or associated hazards or exposures in the risk evaluation for carbon tetrachloride. Specialty uses
of carbon tetrachloride, specifically adhesives and cleaning operations, were identified in the
aerospace industry based on information provided by the Aerospace Industries Association
(AIA) (Riegle, 2017). However, upon reaching out to AIA for specific use details, AIA replied
with the following statement:
After additional investigation, usage identified by AIA companies were based upon products that
have been discontinued. There appear to be products that contain trace amounts of carbon
tetrachloride (<1%) that might be a reaction by-product, contaminant or imperfect distillation of
perchloroethylene. Therefore, carbon tetrachloride is no longer an AIA concern. (AIA, 2019)

Page 40 of 390
EPA did not evaluate the use of carbon tetrachloride in cleaning operations (vapor degreasing,
etc.) or use as an adhesive in the aerospace industry as there are no reasonably available data
supporting distinct specialty uses of carbon tetrachloride in the aerospace industry. Rather, EPA
determined that any use in the aerospace industry would fall within the more generalized
category of industrial/commercial uses of commercially available adhesives/sealants and
cleaning/degreasing solvent products that may contain trace amounts of carbon tetrachloride. As
explained in Section 1.4.2.3, EPA previously excluded those uses from the scope of the risk
evaluation during problem formulation because they would present only de minimis exposures or
otherwise insignificant risks. Additionally, there are current regulatory actions (under the
Montreal Protocol and CAA Title VI) that prohibit the direct use of carbon tetrachloride in the
formulation of commercially available products for industrial/commercial/consumer uses
(including aerosol and non-aerosol adhesives/sealants, paints/coatings, and cleaning/degreasing
solvent products), except as a laboratory chemical (Problem Formulation Section 2.2.2.1) (U.S.
EPA, 2018c). Therefore, EPA concluded that there are no known, intended, or reasonably
foreseen specialty uses in the aerospace industry, and that any commercially available products
used in aerospace or other industries would present only de minimis exposures or otherwise
insignificant risks and did not warrant inclusion in the risk evaluation (see further discussion of
the exclusion of such products in Section 1.4.2.3).
Manufacturing of Pharmaceuticals
While use of carbon tetrachloride as a process solvent in the manufacture of pharmaceuticals was
included in the problem formulation, upon further analysis, EPA has determined that this use
falls outside TSCA’s definition of “chemical substance.” Under TSCA Section 3(2)(B)(vi), the
definition of “chemical substance” does not include any food, food additive, drug, cosmetic, or
device (as such terms are defined in section 201 of the Federal Food, Drug, and Cosmetic Act)
when manufactured, processed, or distributed in commerce for use as a food, food additive, drug,
cosmetic, or device. EPA has concluded that carbon tetrachloride use as a process solvent during
pharmaceutical manufacturing falls within the afore-mentioned definitional exclusion and is not
a “chemical substance” under TSCA.5
Exclusions During Problem Formulation
TSCA Section 3(2) defines “chemical substance” and specifies that the term does not include
any mixture; any pesticide when manufactured, processed, or distributed in commerce for use as
a pesticide; tobacco or tobacco product, source material, special nuclear material, or byproduct
material, any article the sale of which is subject to the tax imposed by the Internal Revenue Code
§ 4181 of 1986 and any component of such an article, or any food, food additive, drug, cosmetic,
or device when manufactured, processed, or distributed in commerce for use as a food, food
additive, drug, cosmetic, or device. Therefore, any conclusions of unreasonable risk do not
extend to substances that are not defined as chemical substances under TSCA Section 3(2).
5 Furthermore, EPA does not have any evidence that carbon tetrachloride is still being used in the manufacture of ibuprofen or
any other pharmaceuticals or that such use is reasonably foreseen to resume. The Science History Institute published an article
titled, The Greening of Chemistry, which explains that ibuprofen was once manufactured with the use of multiple solvents, one of
which was carbon tetrachloride. It continues to explain, “…in the early 1990s ibuprofen got a makeover. Using catalysts rather
than excess reagents to drive the reactions, chemists halved the number of stages in the ibuprofen manufacturing process and
eliminated carbon tetrachloride, a toxic solvent, from the process” (Hoag, 2016). Though advertisements posted in the internet by
the distributors of carbon tetrachloride cited pharmaceutical manufacturing as one of the uses of the chemical substance, the
information does not by itself indicate that it is being used for this purpose.
Page 41 of 390
EPA has excluded from the scope of this risk evaluation conditions of use associated with carbon
tetrachloride generated as a byproduct. In exercising its discretion under TSCA Section
6(b)(4)(D) to identify the conditions of use that EPA expects to consider in a risk evaluation,
EPA believes it is important for the Agency to have the discretion to make reasonable,
technically sound scoping decisions. EPA anticipates that any risks presented by the presence of
carbon tetrachloride as a byproduct formed during the manufacturing, processing or use of the
parent compound will be considered in the scope of the risk evaluation of the parent compound.
For example, EPA plans to assess risks of carbon tetrachloride generated as a byproduct during
the manufacture of 1,2-dichloroethane in the TSCA risk evaluation for 1,2-dichloroethane (see
Final Scope of the Risk Evaluation for 1,2-Dichloroethane, EPA-HQ-OPPT-2018-0427-0048).
In the problem formulation, EPA removed from the risk evaluation certain activities and
conditions of use that EPA concluded do not warrant inclusion in the risk evaluation.
Consequently, EPA did not evaluate these activities and conditions of use or associated hazards
or exposures in the risk evaluation for carbon tetrachloride.
First, for one activity that was listed as a "condition of use" in the scope document, incorporation
of carbon tetrachloride into an article, EPA had insufficient information following the further
investigations during problem formulation to find that it is a circumstance under which the
chemical is actually "intended, known, or reasonably foreseen to be manufactured, processed,
distributed in commerce, used, or disposed of." (U.S. EPA, 2018c) Accordingly, EPA does not
consider incorporation into an article to be a condition of use of carbon tetrachloride.
Second, there are conditions of use for which EPA had sufficient basis to conclude during
problem formulation would present only de minimis exposures or otherwise insignificant risks
and that did not warrant inclusion in the risk evaluation. These conditions of use consist of
industrial/commercial/consumer uses of carbon tetrachloride in commercially available aerosol
and non-aerosol adhesives/sealants, paints/coatings, and cleaning/degreasing solvent products.
Based on information obtained by EPA, there are current regulatory actions that prohibit the
direct use of carbon tetrachloride as a reactant or additive in the formulation of commercially
available products for industrial/commercial/consumer uses (including aerosol and non-aerosol
adhesives/sealants, paints/coatings, and cleaning/degreasing solvent products), except as a
laboratory chemical. The use of carbon tetrachloride (and mixtures containing it) in household
products has also been banned by CPSC since 1970, with the exception of “unavoidable
manufacturing residues of carbon tetrachloride in other chemicals that under reasonably foreseen
conditions of use do not result in an atmospheric concentration of carbon tetrachloride greater
than 10 parts per million.” 16 CFR 1500.17(a)(2). As a result of the CPSC ban, carbon
tetrachloride is not identified in either the Washington State Product Testing Data list, the State
of Vermont list of Chemicals in Children’s Products or the State of California consumer product
database (Safer Consumer Products Information Management System) and no consumer uses are
listed in the CDR (Vermont Department of Health, 2020; State of Washington, 2019; State of
California, 2013).
Consumer products and/or commercial products containing chlorinated compounds made with
carbon tetrachloride as a process agent are available for public purchase at common retailers

Page 42 of 390
[EPA-HQ-OPPT-2016-0733-0003, Sections 3 and 4, (U.S. EPA, 2017d)]. However, these
products are not expected to contain measurable amounts of carbon tetrachloride because carbon
tetrachloride is not used in the manufacturing of the actual products. Trace levels of carbon
tetrachloride in the chlorinated substances used to manufacture the products are expected to
volatilize during the product manufacturing process. Furthermore, background concentrations to
carbon tetrachloride are assessed under the EPA National Air Toxics Assessment (NATA).
The domestic and international use of carbon tetrachloride as a process agent is addressed under
the Montreal Protocol (MP) side agreement, Decision X/14: Process Agents (UNEP/Ozone
Secretariat, 1998). This decision lists a limited number of specific manufacturing uses of carbon
tetrachloride as a process agent (non-feedstock use) in which carbon tetrachloride may not be
destroyed in the production process. Based on the process agent applications, carbon
tetrachloride is used in the manufacturing of other chlorinated compounds that may be
subsequently added to commercially available products (i.e., solvents for cleaning/degreasing,
adhesives/sealants, and paints/coatings). Given the high volatility of carbon tetrachloride and the
extent of reaction and efficacy of the separation/purification process for purifying final products,
EPA expects insignificant or unmeasurable concentrations of carbon tetrachloride as a
manufacturing residue in the chlorinated substances in the commercially available products. In
its regulations on the protection of stratospheric ozone at 40 CFR part 82, EPA excludes from the
definition of controlled substance the inadvertent or coincidental creation of insignificant
quantities of a listed substance (including carbon tetrachloride) resulting from the substance’s
use as a process agent (40 CFR 82.3). These expectations and current regulations are consistent
with public comments received by EPA, EPA-HQ-OPPT-2016-0733-0005 and EPA-HQ-OPPT-
2016-0733-0017, stating that carbon tetrachloride may be present in a limited number of
industrial products with chlorinated ingredients at a concentration of less than 0.003% by weight.
Additional resources are available in Preliminary Information on Manufacturing, Processing,
Distribution, Use, and Disposal: Carbon Tetrachloride (see Table 1 of Support document for
Docket EPA-HQ-OPPT-2016-0733).
Based on the reasonably available information identified by EPA, carbon tetrachloride is not a
direct reactant or additive in the formulation of solvents for cleaning and degreasing, adhesives
and sealants or paints and coatings. Because industrial, commercial, and consumer use of such
products (solvents for cleaning/degreasing, adhesives/sealants, and paints/coatings) would
present only de minimis exposure to or otherwise insignificant risk from manufacturing residues
of carbon tetrachloride in chlorinated compounds, EPA determined during problem formulation
that these conditions of use did not warrant evaluation, and excluded these conditions of use
from the scope of the risk evaluation in the exercise of EPA’s discretionary authority under
TSCA Section 6(b)(4)(D). Accordingly, EPA has not evaluated these conditions of use or
associated hazards or exposures in the risk evaluation for carbon tetrachloride.
Exposure Pathways and Risks Addressed by Other EPA-Administered
Statutes
In its TSCA Section 6(b) risk evaluations, EPA is coordinating action on certain exposure
pathways and risks falling under the jurisdiction of other EPA-administered statutes or regulatory
programs. More specifically, EPA is exercising its TSCA authorities to tailor the scope of its risk
evaluations, rather than focusing on environmental exposure pathways addressed under other
EPA-administered statutes or regulatory programs or risks that could be eliminated or reduced to

Page 43 of 390
a sufficient extent by actions taken under other EPA-administered laws. EPA considers this
approach to be a reasonable exercise of the Agency’s TSCA authorities, which include:
• TSCA Section 6(b)(4)(D): “The Administrator shall, not later than 6 months after the
initiation of a risk evaluation, publish the scope of the risk evaluation to be conducted,
including the hazards, exposures, conditions of use, and the potentially exposed or
susceptible subpopulations the Administrator expects to consider…”
• TSCA Section 9(b)(1): “The Administrator shall coordinate actions taken under this
chapter with actions taken under other Federal laws administered in whole or in part by
the Administrator. If the Administrator determines that a risk to health or the environment
associated with a chemical substance or mixture could be eliminated or reduced to a
sufficient extent by actions taken under the authorities contained in such other Federal
laws, the Administrator shall use such authorities to protect against such risk unless the
Administrator determines, in the Administrator’s discretion, that it is in the public interest
to protect against such risk by actions taken under this chapter.”
• TSCA Section 9(e): “…[I]f the Administrator obtains information related to exposures or
releases of a chemical substance or mixture that may be prevented or reduced under
another Federal law, including a law not administered by the Administrator, the
Administrator shall make such information available to the relevant Federal agency or
office of the Environmental Protection Agency.”
• TSCA Section 2(c): “It is the intent of Congress that the Administrator shall carry out this
chapter in a reasonable and prudent manner, and that the Administrator shall consider the
environmental, economic, and social impact of any action the Administrator takes or
proposes as provided under this chapter.”
• TSCA Section 18(d)(1): “Nothing in this chapter, nor any amendment made by the Frank
R. Lautenberg Chemical Safety for the 21st Century Act, nor any rule, standard of
performance, risk evaluation, or scientific assessment implemented pursuant to this
chapter, shall affect the right of a State or a political subdivision of a State to adopt or
enforce any rule, standard of performance, risk evaluation, scientific assessment, or any
other protection for public health or the environment that— (i) is adopted or authorized
under the authority of any other Federal law or adopted to satisfy or obtain authorization
or approval under any other Federal law…”
TSCA authorities supporting tailored risk evaluations and intra-agency referrals
TSCA Section 6(b)(4)(D)
TSCA Section 6(b)(4)(D) requires EPA, in developing the scope of a risk evaluation, to identify
the hazards, exposures, conditions of use, and potentially exposed or susceptible subpopulations
the Agency “expects to consider” in a risk evaluation. This language suggests that EPA is not
required to consider all conditions of use, hazards, or exposure pathways in risk evaluations.
In the problem formulation documents for many of the first 10 chemicals undergoing risk
evaluation, EPA applied this authority and rationale to certain exposure pathways, explaining
that “EPA is planning to exercise its discretion under TSCA 6(b)(4)(D) to focus its analytical
efforts on exposures that are likely to present the greatest concern and consequently merit a risk
evaluation under TSCA, by excluding, on a case-by-case basis, certain exposure pathways that

Page 44 of 390
fall under the jurisdiction of other EPA-administered statutes.” This approach is informed by the
legislative history of the amended TSCA, which supports the Agency’s exercise of discretion to
focus the risk evaluation on areas that raise the greatest potential for risk. See June 7, 2016 Cong.
Rec., S3519-S3520. Consistent with the approach articulated in the problem formulation
documents, and as described in more detail below, EPA is exercising its authority under TSCA
to tailor the scope of exposures evaluated in TSCA risk evaluations, rather than focusing on
environmental exposure pathways addressed under other EPA-administered, media-specific
statutes and regulatory programs.
TSCA Section 9(b)(1)
In addition to TSCA Section 6(b)(4)(D), the Agency also has discretionary authority under the
first sentence of TSCA Section 9(b)(1) to “coordinate actions taken under [TSCA] with actions
taken under other Federal laws administered in whole or in part by the Administrator.” This
broad, freestanding authority provides for intra-agency coordination and cooperation on a range
of “actions.” In EPA’s view, the phrase “actions taken under [TSCA]” in the first sentence of
Section 9(b)(1) is reasonably read to encompass more than just risk management actions, and to
include actions taken during risk evaluation as well. More specifically, the authority to
coordinate intra-agency actions exists regardless of whether the Administrator has first made a
definitive finding of risk, formally determined that such risk could be eliminated or reduced to a
sufficient extent by actions taken under authorities in other EPA-administered Federal laws,
and/or made any associated finding as to whether it is in the public interest to protect against
such risk by actions taken under TSCA. TSCA Section 9(b)(1) therefore provides EPA authority
to coordinate actions with other EPA offices without ever making a risk finding or following an
identification of risk. This includes coordination on tailoring the scope of TSCA risk evaluations
to focus on areas of greatest concern rather than exposure pathways addressed by other EPA-
administered statutes and regulatory programs, which does not involve a risk determination or
public interest finding under TSCA Section 9(b)(2).
In a narrower application of the broad authority provided by the first sentence of TSCA Section
9(b)(1), the remaining provisions of Section 9(b)(1) provide EPA authority to identify risks and
refer certain of those risks for action by other EPA offices. Under the second sentence of Section
9(b)(1), “[i]f the Administrator determines that a risk to health or the environment associated
with a chemical substance or mixture could be eliminated or reduced to a sufficient extent by
actions taken under the authorities contained in such other Federal laws, the Administrator shall
use such authorities to protect against such risk unless the Administrator determines, in the
Administrator’s discretion, that it is in the public interest to protect against such risk by actions
taken under [TSCA].” Coordination of intra-agency action on risks under TSCA Section 9(b)(1)
therefore entails both an identification of risk, and a referral of any risk that could be eliminated
or reduced to a sufficient extent under other EPA-administered laws to the EPA office(s)
responsible for implementing those laws (absent a finding that it is in the public interest to
protect against the risk by actions taken under TSCA).
Risk may be identified by OPPT or another EPA office, and the form of the identification may
vary. For instance, OPPT may find that one or more conditions of use for a chemical substance
present(s) a risk to human or ecological receptors through specific exposure routes and/or
Page 45 of 390
pathways. This could involve a quantitative or qualitative assessment of risk based on reasonably
available information (which might include, e.g., findings or statements by other EPA offices or
other federal agencies). Alternatively, risk could be identified by another EPA office. For
example, another EPA office administering non-TSCA authorities may have sufficient
monitoring or modeling data to indicate that a particular condition of use presents risk to certain
human or ecological receptors, based on expected hazards and exposures. This risk finding could
be informed by information made available to the relevant office under TSCA Section 9(e),
which supports cooperative actions through coordinated information-sharing.
Following an identification of risk, EPA would determine if that risk could be eliminated or
reduced to a sufficient extent by actions taken under authorities in other EPA-administered laws.
If so, TSCA requires EPA to “use such authorities to protect against such risk,” unless EPA
determines that it is in the public interest to protect against that risk by actions taken under
TSCA. In some instances, EPA may find that a risk could be sufficiently reduced or eliminated
by future action taken under non-TSCA authority. This might include, e.g., action taken under
the authority of the Safe Drinking Water Act to address risk to the general population from a
chemical substance in drinking water, particularly if the Office of Water has taken preliminary
steps such as listing the subject chemical substance on the Contaminant Candidate List. This sort
of risk finding and referral could occur during the risk evaluation process, thereby enabling EPA
to use more a relevant and appropriate authority administered by another EPA office to protect
against hazards or exposures to affected receptors.
Legislative history on TSCA Section 9(b)(1) supports both broad coordination on current intra-
agency actions, and narrower coordination when risk is identified and referred to another EPA
office for action. A Conference Report from the time of TSCA’s passage explained that Section
9 is intended “to assure that overlapping or duplicative regulation is avoided while attempting to
provide for the greatest possible measure of protection to health and the environment.” S. Rep.
No. 94-1302 at 84. See also H. Rep. No. 114-176 at 28 (stating that the 2016 TSCA amendments
“reinforce TSCA’s original purpose of filling gaps in Federal law,” and citing new language in
Section 9(b)(2) intended “to focus the Administrator's exercise of discretion regarding which
statute to apply and to encourage decisions that avoid confusion, complication, and
duplication”). Exercising TSCA Section 9(b)(1) authority to coordinate on tailoring TSCA risk
evaluations is consistent with this expression of Congressional intent.
Legislative history also supports a reading of Section 9(b)(1) under which EPA coordinates intra-
agency action, including information-sharing under TSCA Section 9(e), and the appropriately
positioned EPA office is responsible for the identification of risk and actions to protect against
such risks. See, e.g., Senate Report 114-67, 2016 Cong. Rec. S3522 (under TSCA Section 9, “if
the Administrator finds that disposal of a chemical substance may pose risks that could be
prevented or reduced under the Solid Waste Disposal Act, the Administrator should ensure that
the relevant office of the EPA receives that information”); H. Rep. No. 114-176 at 28, 2016
Cong. Rec. S3522 (under Section 9, “if the Administrator determines that a risk to health or the
environment associated with disposal of a chemical substance could be eliminated or reduced to
a sufficient extent under the Solid Waste Disposal Act, the Administrator should use those
authorities to protect against the risk”). Legislative history on Section 9(b)(1) therefore supports
coordination with and referral of action to other EPA offices, especially when statutes and

Page 46 of 390
associated regulatory programs administered by those offices could address exposure pathways
or risks associated with conditions of use, hazards, and/or exposure pathways that may otherwise
be within the scope of TSCA risk evaluations.
TSCA Sections 2(c) & 18(d)(1)
Finally, TSCA Sections 2(c) and 18(d) support coordinated action on exposure pathways and
risks addressed by other EPA-administered statutes and regulatory programs. Section 2(c) directs
EPA to carry out TSCA in a “reasonable and prudent manner” and to consider “the
environmental, economic, and social impact” of its actions under TSCA. Legislative history from
around the time of TSCA’s passage indicates that Congress intended EPA to consider the context
and take into account the impacts of each action under TSCA. S. Rep. No. 94-698 at 14 (“the
intent of Congress as stated in this subsection should guide each action the Administrator takes
under other sections of the bill”).
Section 18(d)(1) specifies that state actions adopted or authorized under any Federal law are not
preempted by an order of no unreasonable risk issued pursuant to TSCA Section 6(i)(1) or a rule
to address unreasonable risk issued under TSCA Section 6(a). Thus, even if a risk evaluation
were to address exposures or risks that are otherwise addressed by other federal laws and, for
example, implemented by states, the state laws implementing those federal requirements would
not be preempted. In such a case, both the other federal and state laws, as well as any TSCA
Section 6(i)(1) order or TSCA Section 6(a) rule, would apply to the same issue area. See also
TSCA Section 18(d)(1)(A)(iii). In legislative history on amended TSCA pertaining to Section
18(d), Congress opined that “[t]his approach is appropriate for the considerable body of law
regulating chemical releases to the environment, such as air and water quality, where the states
have traditionally had a significant regulatory role and often have a uniquely local concern.” Sen.
Rep. 114-67 at 26.
EPA’s careful consideration of whether other EPA-administered authorities are available and
more appropriate for addressing certain exposures and risks is consistent with Congress’ intent to
maintain existing federal requirements and the state actions adopted to locally and more
specifically implement those federal requirements, and to carry out TSCA in a reasonable and
prudent manner. EPA believes it is both reasonable and prudent to tailor TSCA risk evaluations
in a manner reflective of expertise and experience exercised by other EPA and State offices to
address specific environmental media, rather than attempt to evaluate and regulate potential
exposures and risks from those media under TSCA. This approach furthers Congressional
direction and EPA aims to efficiently use Agency resources, avoid duplicating efforts taken
pursuant to other Agency and State programs, and meet the statutory deadline for completing
risk evaluations.
EPA-administered statutes and regulatory programs that address specific exposure pathways
and/or risks
During the course of the risk evaluation process for carbon tetrachloride, OPPT worked closely
with the offices within EPA that administer and implement regulatory programs under the Clean
Air Act (CAA), the Safe Drinking Water Act (SDWA), the Clean Water Act (CWA) and the

Page 47 of 390
Resource Conservation and Recovery Act (RCRA). Through intra-agency coordination, EPA
determined that specific exposure pathways are well-regulated by the EPA statutes and
regulations described in the following paragraphs.
Ambient Air Pathway
The CAA contains a list of hazardous air pollutants (HAP) and provides EPA with the authority
to add to that list pollutants that present, or may present, a threat of adverse human health effects
or adverse environmental effects. For stationary source categories emitting HAP, the CAA
requires issuance of technology-based standards and, if necessary, additions or revisions to
address developments in practices, processes, and control technologies, and to ensure the
standards adequately protect public health and the environment. The CAA thereby provides EPA
with comprehensive authority to regulate emissions to ambient air of any hazardous air pollutant.
Carbon tetrachloride is a HAP. See 42 U.S.C. 7412. EPA has issued a number of technology-
based standards for source categories that emit carbon tetrachloride to ambient air and, as
appropriate, has reviewed, or is in the process of reviewing remaining risks. See 40 CFR part 63;
Appendix A. Because stationary source releases of carbon tetrachloride to ambient air are
addressed under the CAA, EPA is not evaluating emissions to ambient air from commercial and
industrial stationary sources or associated inhalation exposure of the general population or
terrestrial species in this TSCA risk evaluation.
Drinking Water Pathway
EPA has regular analytical processes to identify and evaluate drinking water contaminants of
potential regulatory concern for public water systems under the Safe Drinking Water Act
(SDWA). Under SDWA, EPA must also review existing national primary drinking water
regulations every 6 years, and subsequently revise them as appropriate.
EPA has promulgated National Primary Drinking Water Regulations (NPDWRs) for carbon
tetrachloride under SDWA. See 40 CFR part 141; Appendix A. EPA has set an enforceable
Maximum Contaminant Level (MCL) as close as feasible to a health based, non-enforceable
Maximum Contaminant Level Goal (MCLG). Feasibility refers to both the ability to treat water
to meet the MCL and the ability to monitor water quality at the MCL. Public water systems are
required to monitor for the regulated chemical based on a standardized monitoring schedule to
ensure compliance with the maximum contaminant level (MCL).
Hence, because the drinking water exposure pathway for carbon tetrachloride is currently
addressed in the NPDWR, EPA is not evaluating exposures to the general population from the
drinking water exposure pathway in the risk evaluation for carbon tetrachloride under TSCA.
Ambient Water Pathway
EPA develops recommended water quality criteria under Section 304(a) of the CWA for
pollutants in surface water that are protective of aquatic life or human health designated uses.
EPA develops and publishes water quality criteria based on priorities of states and others that
Page 48 of 390
reflect the latest scientific knowledge. A subset of these chemicals is identified as “priority
pollutants” (103 human health and 27 aquatic life). The CWA requires states adopt numeric
criteria for priority pollutants for which EPA has published recommended criteria under Section
304(a), the discharge or presence of which in the affected waters could reasonably be expected to
interfere with designated uses adopted by the state. When states adopt criteria that EPA approves
as part of state’s regulatory water quality standards, exposure is considered when state permit
writers determine if permit limits are needed and at what level for a specific discharger of a
pollutant to ensure protection of the designated uses of the receiving water. Once states adopt
criteria as water quality standards, the CWA requires that National Pollutant Discharge
Elimination System (NPDES) discharge permits include effluent limits as stringent as necessary
to meet standards. CWA Section 301(b)(1)(C). This is the process used under the CWA to
address risk to human health and aquatic life from exposure to a pollutant in ambient waters.
EPA has identified carbon tetrachloride as a priority pollutant and has developed recommended
water quality criteria for protection of human health for carbon tetrachloride which are available
for adoption into state water quality standards for the protection of human health and are
available for use by NPDES permitting authorities in deriving effluent limits to meet state
criteria.6 See, e.g., 40 CFR part 423, Appendix A; 40 CFR 131.11(b)(1); 40 CFR
122.44(d)(1)(vi). As such, EPA is not evaluating exposures to the general population from the
surface water exposure pathway in the risk evaluation under TSCA.
Land application of biosolids and general population exposure
As wastewater undergoes treatment, some wastewater treatment facilities such as publicly-
owned treatment works (POTWs) use the remaining sludge as biosolids for land application.
These biosolids could have residual carbon tetrachloride. Carbon tetrachloride in biosolids that
are land applied could be transported via runoff from rainwater to surface waters. However,
surface waters drawn for drinking water are treated, tested and under the Safe Drinking Water
Act, regulated via NPDWRs. EPA promulgates NPDWRs under SDWA when the Agency
concludes a contaminant may have adverse health effects, occurs or is substantially likely to
occur in public water systems at a level of concern and that regulation, in the sole judgement of
the Administrator, presents a meaningful opportunity for health risk reduction. For each
contaminant with NPDWRs, EPA sets an enforceable MCL as close as feasible to a health based,
non-enforceable MCLG or establishes a treatment technique. The MCL for any residual levels of
carbon tetrachloride that could result in exposure to the general population is 0.005mg/L.
Residual concentrations of carbon tetrachloride in surface waters not used for drinking water are
covered by the CWA Ambient Water Quality Criteria for human health consumption of water
and organisms (0.4 µg/L). CWA Section 304(a)(1). States and tribal governments may adopt the
EPA Clean Water Act Section 304(a) recommended criteria or may adopt their own criteria that
differ from EPA’s recommendations, subject to EPA’s approval, using scientifically defensible
methods. States are required to adopt and implement EPA-approved criteria as part of their
regulatory water quality standards, and compliance with these criteria is considered by states in
permits and water quality assessment decisions. Thus, general population exposure via the
biosolid pathway is not evaluated in the final risk evaluation.
6 See https://www.regulations.gov/document?D=EPA-HQ-OW-2014-0135-0182.

Page 49 of 390
Onsite Releases to Land Pathway
The Comprehensive Environmental Response, Compensation, and Liability Act – otherwise
known as CERCLA or Superfund – provides EPA with broad authority to address uncontrolled
or abandoned hazardous-waste sites as well as accidents, spills, and other releases of hazardous
substances, pollutants and contaminants into the environment. Through CERCLA, EPA is
provided authority to conduct a response action and seek reimbursement of cleanup costs from
potentially responsible parties, or in certain circumstances, order a potentially responsible party
to conduct a cleanup.
CERCLA Section 101(14) defines “hazardous substance” by referencing other environmental
statutes, including toxic pollutants listed under CWA Section 307(a); hazardous substances
designated pursuant to CWA Section 311(b)(2)(A); hazardous air pollutants listed under CAA
Section 112; imminently hazardous substances with respect to which EPA has taken action
pursuant to TSCA Section 7; and hazardous wastes having characteristics identified under or
listed pursuant to RCRA Section 3001. See 40 CFR 302.4. CERCLA Section 102(a) also
authorizes EPA to promulgate regulations designating as hazardous substances those substances
which, when released into the environment, may present substantial danger to the public health
or welfare or the environment. EPA must also promulgate regulations establishing the quantity of
any hazardous substance the release of which must be reported under Section 103. Section 103
requires persons in charge of vessels or facilities to report to the National Response Center if
they have knowledge of a release of a hazardous substance above the reportable quantity
threshold.
Carbon tetrachloride is a hazardous substance under CERCLA. Releases of carbon tetrachloride
in excess of 10 pounds within a 24-hour period must be reported (40 CFR 302.4, 302.6). The
scope of this EPA TSCA risk evaluation does not include on-site releases to the environment of
carbon tetrachloride at Superfund sites and subsequent exposure of the general population or
non-human species.
Disposal Pathways
Carbon tetrachloride is included on the list of hazardous wastes pursuant to RCRA Section 3001
(40 CFR Sections 261.31, 261.33) as a listed waste on the F and U lists (F001 and U211). The
general standard in RCRA Section 3004(a) for the technical criteria that govern the management
(treatment, storage, and disposal) of hazardous waste are those "necessary to protect human
health and the environment," RCRA 3004(a). The regulatory criteria for identifying
“characteristic” hazardous wastes and for “listing” a waste as hazardous also relate solely to the
potential risks to human health or the environment. 40 C.F.R. §§ 261.11, 261.21-261.24. RCRA
statutory criteria for identifying hazardous wastes require EPA to “tak[e] into account toxicity,
persistence, and degradability in nature, potential for accumulation in tissue, and other related
factors such as flammability, corrosiveness, and other hazardous characteristics.” Subtitle C
controls cover not only hazardous wastes that are landfilled, but also hazardous wastes that are
incinerated (subject to joint control under RCRA Subtitle C and the CAA hazardous waste

Page 50 of 390
combustion MACT) or injected into UIC Class I hazardous waste wells (subject to joint control
under Subtitle C and SDWA).
EPA is not evaluating on-site releases to land from RCRA Subtitle C hazardous waste landfills
or exposures of the general population or terrestrial species from such releases in the TSCA
evaluation. Design standards for Subtitle C landfills require double liner, double leachate
collection and removal systems, leak detection system, run on, runoff, and wind dispersal
controls, and a construction quality assurance program. They are also subject to closure and post-
closure care requirements including installing and maintaining a final cover, continuing
operation of the leachate collection and removal system until leachate is no longer detected,
maintaining and monitoring the leak detection and groundwater monitoring system. Bulk liquids
may not be disposed in Subtitle C landfills. Subtitle C landfill operators are required to
implement an analysis and testing program to ensure adequate knowledge of waste being
managed, and to train personnel on routine and emergency operations at the facility. Hazardous
waste being disposed in Subtitle C landfills, including carbon tetrachloride (listed as a hazardous
waste in 40 CFR 261.31, 261.33), must also meet RCRA waste treatment standards before
disposal. See 40 CFR part 264; Appendix A.
EPA is not evaluating on-site releases to land from RCRA Subtitle D municipal solid waste
(MSW) landfills or exposures of the general population or terrestrial species from such releases
in the TSCA evaluation. While permitted and managed by the individual states, municipal solid
waste landfills are required by federal regulations to implement some of the same requirements
as Subtitle C landfills. MSW landfills generally must have a liner system with leachate collection
and conduct groundwater monitoring and corrective action when releases are detected. MSW
landfills are also subject to closure and post-closure care requirements and must have financial
assurance for funding of any needed corrective actions. MSW landfills have also been designed
to allow for the small amounts of hazardous waste generated by households and very small
quantity waste generators (less than 220 lbs per month). Bulk liquids, such as free solvent, may
not be disposed of at MSW landfills. See 40 CFR part 258.
EPA is not evaluating on-site releases to land from industrial non-hazardous waste and
construction/demolition waste landfills or associated exposures to the general population or
terrestrial species in the carbon tetrachloride risk evaluation. Industrial non-hazardous and
construction/demolition waste landfills are primarily regulated under authorized state regulatory
programs. States must also implement limited federal regulatory requirements for siting,
groundwater monitoring and corrective action and a prohibition on open dumping and disposal
of bulk liquids. States may also establish additional requirements such as for liners, post-closure
and financial assurance, but are not required to do so. See, e.g., RCRA Section 3004(c), 4007; 40
CFR part 257.
EPA is not evaluating emissions to ambient air from municipal and industrial waste incineration
and energy recovery units or associated exposures to the general population or terrestrial species
in the risk evaluation, as these emissions are regulated under Section 129 of the Clean Air Act.
CAA Section 129 requires EPA to review and, if necessary, add provisions to ensure the
standards adequately protect public health and the environment. Thus, combustion by-products
from incineration treatment of carbon tetrachloride wastes would be subject to these regulations,
as would carbon tetrachloride burned for energy recovery. See 40 CFR part 60.

Page 51 of 390
EPA is not evaluating on-site releases to land that go to underground injection or associated
exposures to the general population or terrestrial species in its risk evaluation. Environmental
disposal of carbon tetrachloride injected into Class I hazardous well types are covered under the
jurisdiction of RCRA and SDWA and disposal of carbon tetrachloride via underground injection
is not likely to result in environmental and general population exposures. See 40 CFR part 144.
Conceptual Models
EPA considered the potential for hazards to human health and the environment resulting from
exposure pathways outlined in the preliminary conceptual models of the carbon tetrachloride
scope document (U.S. EPA, 2017e). The preliminary conceptual models were refined in the
problem formulation document (U.S. EPA, 2018c). Based on review and evaluation of
reasonably available data for carbon tetrachloride, EPA determined in the problem formulation
that no further analysis of the environmental release pathways outlined in the conceptual models
was necessary due to a qualitative assessment of the physical-chemical properties and fate of
carbon tetrachloride in the environment, and a quantitative comparison of hazards and exposures
for aquatic organisms.
Upon further evaluation of the reasonably available hazard data of carbon tetrachloride after the
problem formulation phase, EPA decreased the environmental hazard chronic COC from 7 µg/L
to 3 µg/L and conducted further analysis of the aquatic pathway to evaluate risk to aquatic
organisms from carbon tetrachloride. EPA found in problem formulation that no further analysis
was necessary for the soil and land-applied biosolid pathway leading to exposure to terrestrial
and aquatic organisms. However, EPA qualitatively evaluated risk to terrestrial organisms from
exposure to soil and biosolids in the final risk evaluation to consider the influence of carbon
tetrachloride’s physical chemical and fate properties in this exposure pathway.
The conceptual models for this risk evaluation are shown below in Figure 1-2 and Figure 1-3.
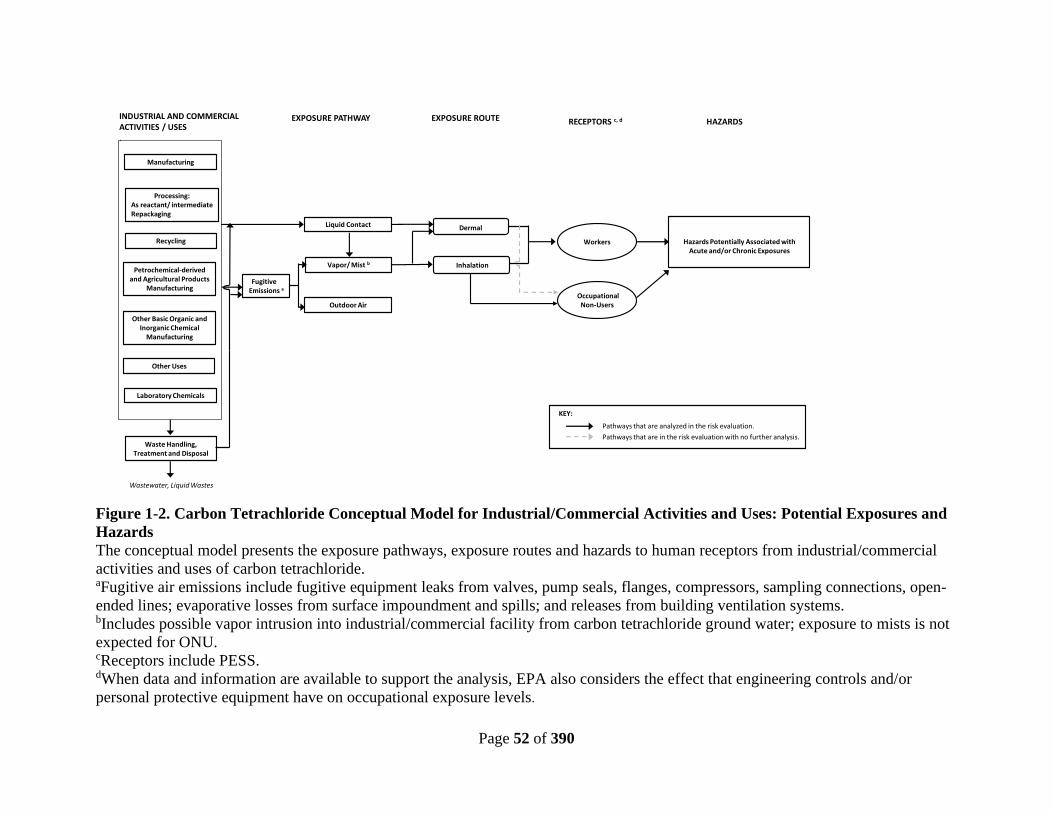
Page 52 of 390
Figure 1-2. Carbon Tetrachloride Conceptual Model for Industrial/Commercial Activities and Uses: Potential Exposures and
Hazards
The conceptual model presents the exposure pathways, exposure routes and hazards to human receptors from industrial/commercial
activities and uses of carbon tetrachloride. aFugitive air emissions include fugitive equipment leaks from valves, pump seals, flanges, compressors, sampling connections, open-
ended lines; evaporative losses from surface impoundment and spills; and releases from building ventilation systems. bIncludes possible vapor intrusion into industrial/commercial facility from carbon tetrachloride ground water; exposure to mists is not
expected for ONU. cReceptors include PESS. dWhen data and information are available to support the analysis, EPA also considers the effect that engineering controls and/or
personal protective equipment have on occupational exposure levels.
Manufacturing
Processing:As reactant/ intermediateRepackaging
Vapor/ Mist b
Outdoor Air
Wastewater, Liquid Wastes
Inhalation
Workers
Other Basic Organic and Inorganic Chemical
Manufacturing
Hazards Potentially Associated with Acute and/or Chronic Exposures
Petrochemical-derived and Agricultural Products
ManufacturingFugitive
Emissions a
DermalLiquid Contact
Recycling
Waste Handling, Treatment and Disposal
EXPOSURE PATHWAY
Other Uses
EXPOSURE ROUTE RECEPTORS c, d HAZARDSINDUSTRIAL AND COMMERCIALACTIVITIES / USES.
Laboratory Chemicals
Occupational Non-Users
KEY:
Pathways that are analyzed in the risk evaluation.
Pathways that are in the risk evaluation with no further analysis.
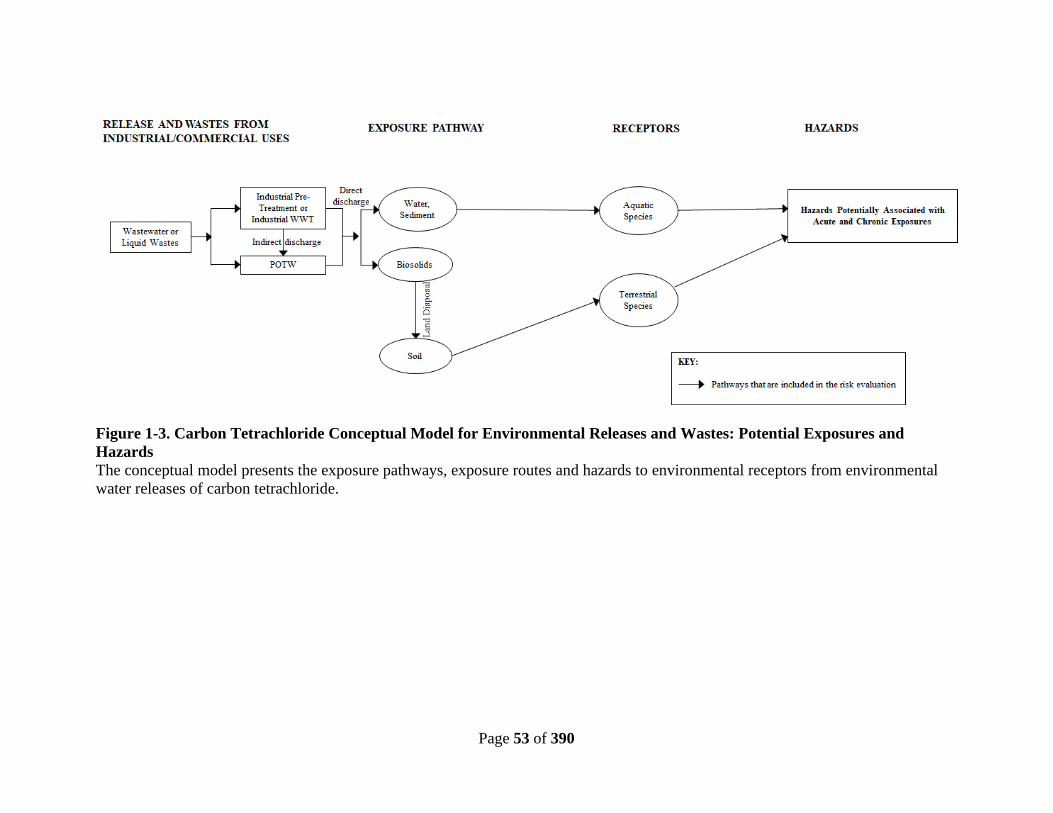
Page 53 of 390
Figure 1-3. Carbon Tetrachloride Conceptual Model for Environmental Releases and Wastes: Potential Exposures and
Hazards
The conceptual model presents the exposure pathways, exposure routes and hazards to environmental receptors from environmental
water releases of carbon tetrachloride.

Page 54 of 390
Systematic Review TSCA requires EPA to use scientific information, technical procedures, measures, methods,
protocols, methodologies and models consistent with the best available science and base
decisions under TSCA Section 6 on the weight of scientific evidence. Within the TSCA risk
evaluation context, the weight of the scientific evidence is defined as “a systematic review
method, applied in a manner suited to the nature of the evidence or decision, that uses a pre-
established protocol to comprehensively, objectively, transparently, and consistently identify and
evaluate each stream of evidence, including strengths, limitations, and relevance of each study
and to integrate evidence as necessary and appropriate based upon strengths, limitations, and
relevance” (40 C.F.R. 702.33).
To meet the TSCA science standards, EPA was guided by the systematic review process
described in the Application of Systematic Review in TSCA Risk Evaluations document (U.S.
EPA, 2018a). The process complements the risk evaluation process in that the data collection,
data evaluation and data integration stages of the systematic review process are used to develop
the exposure and hazard assessments based on reasonably available information. EPA defines
“reasonably available information” to mean information that EPA possesses, or can reasonably
generate, obtain and synthesize for use in risk evaluations, considering the deadlines for
completing the evaluation (40 C.F.R. 702.33).
EPA is implementing systematic review methods and approaches within the regulatory context
of the amended TSCA. Although EPA will make an effort to adopt as many best practices as
practicable from the systematic review community, EPA expects modifications to the process to
ensure that the identification, screening, evaluation and integration of data and information can
support timely regulatory decision making under the aggressive timelines of the statute.
Data and Information Collection
EPA planned and conducted a literature search based on key words related to the different
discipline-specific evidence supporting the risk evaluation (e.g., environmental fate and
transport; engineering releases and occupational exposure; environmental exposure; and
environmental and human health hazard). EPA then developed and applied inclusion and
exclusion criteria during the title and abstract screening to identify information potentially
relevant for the risk evaluation process. The literature and screening strategy as specifically
applied to carbon tetrachloride is described in the Application of Systematic Review in TSCA Risk
Evaluations (U.S. EPA, 2018a) and results of screening were published in Carbon tetrachloride
(CASRN 56-23-5) Bibliography: Supplemental File for the TSCA Scope Document (U.S. EPA,
2017a).
For studies determined to be on-topic (or relevant) after title and abstract screening, EPA
conducted a full text screening to further exclude references that were not relevant to the risk
evaluation. Screening decisions were made based on eligibility criteria documented in the form
of the populations, exposures, comparators, and outcomes (PECO) framework or a modified

Page 55 of 390
framework.7 Data sources that met the criteria were carried forward to the data evaluation stage.
The inclusion and exclusion criteria for full text screening for carbon tetrachloride are available
in Appendix F of the Problem Formulation of the Risk Evaluation for Carbon Tetrachloride
(U.S. EPA, 2018c).
In addition to the comprehensive literature search and screening process described above, EPA
leveraged the information presented in previous assessments,8 when identifying relevant key and
supporting data,9 and information for developing the carbon tetrachloride risk evaluation. This is
discussed in the Strategy for Conducting Literature Searches for Carbon Tetrachloride:
Supplemental Document to the TSCA Scope Document (EPA-HQ-OPPT-2016-0733-0050). In
general, many of the key and supporting data sources were identified in the comprehensive
Carbon tetrachloride (CASRN 56-23-5) Bibliography: Supplemental File for the TSCA Scope
Document (U.S. EPA, 2017a). However, there were instances that EPA missed relevant
references that were not captured in the initial categorization of the on-topic references. EPA
found additional relevant data and information using backward reference searching, which was a
technique that will be included in future search strategies. This issue was discussed in Section 4
of the Application of Systematic Review for TSCA Risk Evaluations (U.S. EPA, 2018a). Other
key and supporting references were identified through targeted supplemental searches to support
the analytical approaches and methods in the carbon tetrachloride risk evaluation (e.g., to locate
specific information for exposure modeling) or to identify new data and information published
after the date limits of the initial search.
EPA used previous chemical assessments to quickly identify relevant key and supporting
information as a pragmatic approach to expedite the quality evaluation of the data sources, but
many of those data sources were already captured in the comprehensive literature search as
explained above. EPA also considered newer information not taken into account by previous
chemical assessments as described in the Strategy for Conducting Literature Searches for
Carbon Tetrachloride: Supplemental Document to the TSCA Scope Document (EPA-HQ-OPPT-
2016-0733-0050). EPA then evaluated the confidence of this information rather than evaluating
the confidence of all the underlying evidence ever published on carbon tetrachloride’s fate and
transport, environmental releases, and environmental and human exposure and hazard potential.
Such a comprehensive evaluation of all the data and information ever published for a chemical
substance would be extremely labor intensive and could not be achieved under the TSCA
statutory deadlines for most chemical substances, especially those that have a data rich database.
EPA also considered how this approach to data gathering would change the conclusions
presented in the previous assessments.
7 A PESO statement was used during the full text screening of environmental fate and transport data sources. PESO stands for
Pathways and Processes, Exposure, Setting or Scenario, and Outcomes. A RESO statement was used during the full text
screening of the engineering and occupational exposure literature. RESO stands for Receptors, Exposure, Setting or Scenario,
and Outcomes. 8 Examples of existing assessments are EPA’s chemical assessments (e.g., previous work plan risk assessments, problem
formulation documents), ATSDR’s Toxicological Profiles, EPA’s IRIS assessments and ECHA’s dossiers. This is described in
more detail in the Strategy for Conducting Literature Searches for Carbon Tetrachloride: Supplemental File for the TSCA
Scope Document (EPA-HQ-OPPT-2016-0733-0050). 9 Key and supporting data and information are those that support key analyses, arguments, and/or conclusions in the risk
evaluation.

Page 56 of 390
Using this pragmatic approach, EPA maximized the scientific and analytical efforts of other
regulatory and non-regulatory agencies by accepting for the most part, the relevant scientific
knowledge gathered and analyzed by others, except for influential information sources that may
impact the weight of the scientific evidence underlying EPA’s findings. This influential
information (i.e., key/supporting studies) came from a smaller pool of information sources
subjected to the rigor of the TSCA systematic review process to ensure that the best available
science is incorporated into the weight of the scientific evidence used to support the carbon
tetrachloride risk evaluation.
The literature flow diagrams shown in Figure 1-4 through Figure 1-8 highlight the results
obtained for each scientific discipline based on this approach. Each diagram provides the total
number of references considered at the start of each systematic review stage (i.e., data search,
data screening, data evaluation, data extraction/data integration) and those excluded based on
criteria guiding EPA’s screening and data quality evaluation decisions.
EPA made the decision to bypass the data screening step for data sources that were highly
relevant to the risk evaluation as described above. These data sources are depicted as
“key/supporting data sources” in the literature flow diagrams. Note that the number of
“key/supporting data sources” were excluded from the total count during the data screening stage
and added, for the most part, to the data evaluation stage depending on the discipline-specific
evidence. The exception was the engineering releases and occupational exposure data sources
that were subject to a combined data extraction and evaluation step (Figure 1-5).
Figure 1-4. Key/Supporting Data Sources for Environmental Fate and Transport
The number of publications considered in each step of the systematic review of the carbon
tetrachloride’s fate and transport literature is summarized in Figure 1-4. Literature on the
environmental fate and transport of carbon tetrachloride were gathered and screened as described
in Appendix C of the Application of Systematic Review in TSCA Risk Evaluations (U.S. EPA,
2018a). Additional information regarding the literature search and screening strategy for carbon

Page 57 of 390
tetrachloride is provided in EPA’s Strategy for Conducting Literature Searches for Carbon
Tetrachloride: Supplemental File for the TSCA Scope Document (EPA-HQ-OPPT-2016-0733-
0050). The results of this screening are published in the Carbon tetrachloride (CASRN 56-23-5)
Bibliography: Supplemental File for the TSCA Scope Document (U.S. EPA, 2017a).
Figure 1-5. Key/Supporting Data Sources for Releases and Occupational Exposures
As shown in Figure 1-5, the literature search strategy for carbon tetrachloride’s environmental
releases and occupational exposures yielded 5,143 data sources. Of these data sources, 141 were
determined to be relevant to the risk evaluation through the data screening process. These
relevant data sources were entered to the data extraction/evaluation phase. After data
extraction/evaluation, EPA identified several data gaps and performed a supplemental targeted
search to address these gaps (e.g., to locate information needed for exposure modeling). The
supplemental search yielded nine relevant data sources that bypassed the data screening step and
were evaluated and extracted in accordance with Appendix D of Data Quality Criteria for
Occupational Exposure and Release Data of the Application of Systematic Review in TSCA Risk
Evaluations (U.S. EPA, 2018a). Of the 150 sources from which data were extracted and
evaluated, 94 sources only contained data that were rated as unacceptable based on flaws
detected during the evaluation. Of the 56 sources forwarded for data integration, data from nine
sources were integrated, and 47 sources contained data that were not integrated (e.g., lower
quality data that were not needed due to the existence of higher quality data, data for release
media that were removed from scope after data collection).

Page 58 of 390
Figure 1-6. Key/Supporting Sources for Environmental Exposures
The number of data and information sources considered in each step of the systematic review of
carbon tetrachloride literature on environmental exposure is summarized in Figure 1-6. The
literature search results for environmental exposures yielded 393 data sources. Of these data
sources, none were determined to be relevant to the risk evaluation through the data screening
process.
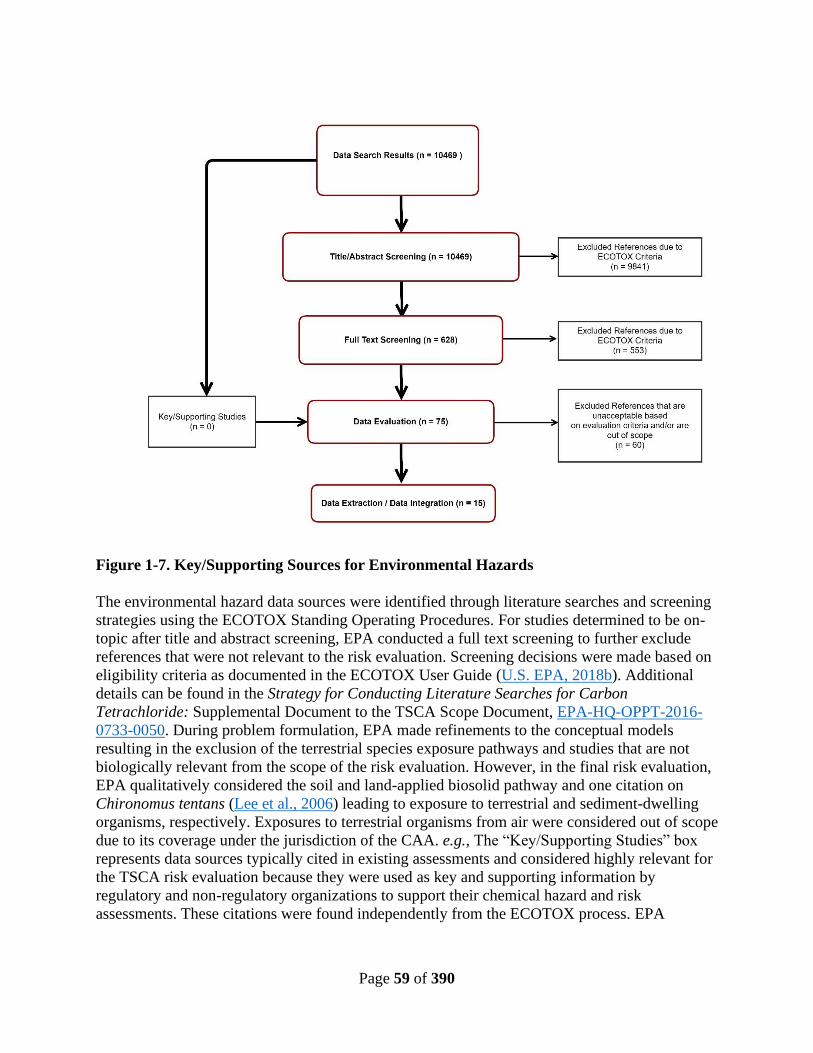
Page 59 of 390
Figure 1-7. Key/Supporting Sources for Environmental Hazards
The environmental hazard data sources were identified through literature searches and screening
strategies using the ECOTOX Standing Operating Procedures. For studies determined to be on-
topic after title and abstract screening, EPA conducted a full text screening to further exclude
references that were not relevant to the risk evaluation. Screening decisions were made based on
eligibility criteria as documented in the ECOTOX User Guide (U.S. EPA, 2018b). Additional
details can be found in the Strategy for Conducting Literature Searches for Carbon
Tetrachloride: Supplemental Document to the TSCA Scope Document, EPA-HQ-OPPT-2016-
0733-0050. During problem formulation, EPA made refinements to the conceptual models
resulting in the exclusion of the terrestrial species exposure pathways and studies that are not
biologically relevant from the scope of the risk evaluation. However, in the final risk evaluation,
EPA qualitatively considered the soil and land-applied biosolid pathway and one citation on
Chironomus tentans (Lee et al., 2006) leading to exposure to terrestrial and sediment-dwelling
organisms, respectively. Exposures to terrestrial organisms from air were considered out of scope
due to its coverage under the jurisdiction of the CAA. e.g., The “Key/Supporting Studies” box
represents data sources typically cited in existing assessments and considered highly relevant for
the TSCA risk evaluation because they were used as key and supporting information by
regulatory and non-regulatory organizations to support their chemical hazard and risk
assessments. These citations were found independently from the ECOTOX process. EPA
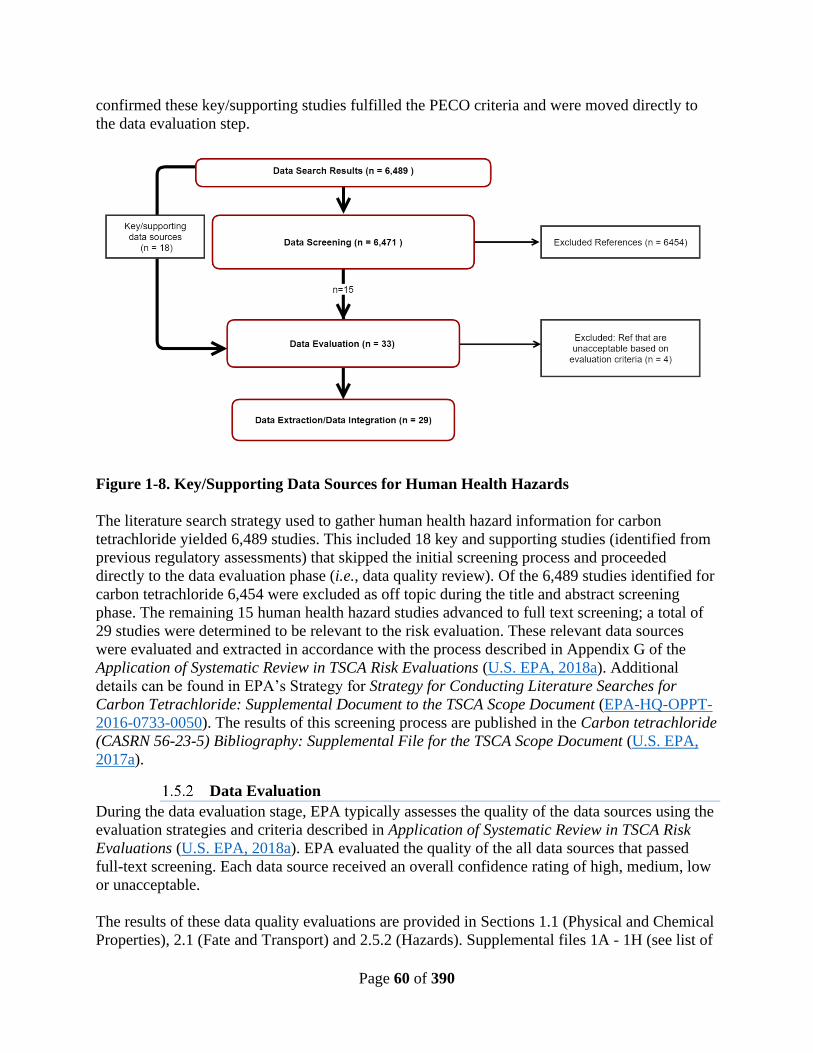
Page 60 of 390
confirmed these key/supporting studies fulfilled the PECO criteria and were moved directly to
the data evaluation step.
Figure 1-8. Key/Supporting Data Sources for Human Health Hazards
The literature search strategy used to gather human health hazard information for carbon
tetrachloride yielded 6,489 studies. This included 18 key and supporting studies (identified from
previous regulatory assessments) that skipped the initial screening process and proceeded
directly to the data evaluation phase (i.e., data quality review). Of the 6,489 studies identified for
carbon tetrachloride 6,454 were excluded as off topic during the title and abstract screening
phase. The remaining 15 human health hazard studies advanced to full text screening; a total of
29 studies were determined to be relevant to the risk evaluation. These relevant data sources
were evaluated and extracted in accordance with the process described in Appendix G of the
Application of Systematic Review in TSCA Risk Evaluations (U.S. EPA, 2018a). Additional
details can be found in EPA’s Strategy for Strategy for Conducting Literature Searches for
Carbon Tetrachloride: Supplemental Document to the TSCA Scope Document (EPA-HQ-OPPT-
2016-0733-0050). The results of this screening process are published in the Carbon tetrachloride
(CASRN 56-23-5) Bibliography: Supplemental File for the TSCA Scope Document (U.S. EPA,
2017a).
Data Evaluation
During the data evaluation stage, EPA typically assesses the quality of the data sources using the
evaluation strategies and criteria described in Application of Systematic Review in TSCA Risk
Evaluations (U.S. EPA, 2018a). EPA evaluated the quality of the all data sources that passed
full-text screening. Each data source received an overall confidence rating of high, medium, low
or unacceptable.
The results of these data quality evaluations are provided in Sections 1.1 (Physical and Chemical
Properties), 2.1 (Fate and Transport) and 2.5.2 (Hazards). Supplemental files 1A - 1H (see list of
Page 61 of 390
supplemental files in Appendix B) also provide details of the data evaluations including
individual metric scores and the overall study score for each data source.
Data Integration
During data integration and analysis, EPA considers quality, consistency, relevancy, coherence
and biological plausibility to make final conclusions regarding the weight of the scientific
evidence. As stated in Application of Systematic Review in TSCA Risk Evaluations (U.S. EPA,
2018a), data integration involves transparently discussing the significant issues, strengths, and
limitations as well as the uncertainties of the reasonably available information and the major
points of interpretation (U.S. EPA, 2018d).
EPA used previous assessments to identify key and supporting information and then analyzed
and synthesized available evidence regarding carbon tetrachloride’s physical-chemical
properties, environmental fate and transport properties and its potential for exposure and hazard.
EPA’s analysis also considered recent data sources that were not considered in the previous
assessments (Section 1.5.1) as well as reasonably available information on potentially exposed or
susceptible subpopulations.
The exposures and hazards sections describe EPA’s analysis of the relevant lines of evidence that
were found acceptable for the risk evaluation based on the data quality reviews provided in the
supplemental files.
2 EXPOSURES
This section describes EPA’s approach to assessing environmental and human exposures. First,
the fate and transport of carbon tetrachloride in the environment is characterized. Then, carbon
tetrachloride’s environmental releases are assessed. This information is then integrated into an
assessment of environmental exposures. Last, occupational exposures (including potentially
exposed or susceptible subpopulations) are assessed. For all exposure-related disciplines, EPA
screened, evaluated, extracted and integrated reasonably available empirical data. In addition,
EPA used models to estimate exposures. Both empirical data and modeled estimates were
considered when selecting values for use in the exposure assessment.
Fate and Transport
Fate and Transport Approach and Methodology
EPA gathered and evaluated environmental fate information according to the process described
in the Application of Systematic Review in TSCA Risk Evaluations (U.S. EPA, 2018a).
Reasonably available environmental fate data were selected for use in the current evaluation.
Furthermore, EPA used previous regulatory and non-regulatory chemical assessments to inform
the environmental fate and transport information discussed in this section and Appendix C. EPA
had confidence in the information used in the previous assessments to describe the
environmental fate and transport of carbon tetrachloride and thus used it to make scoping
decisions.

Page 62 of 390
EPA conducted a comprehensive search and screening process as described in Section 1.5. Using
this pragmatic approach, EPA evaluated the confidence of the key and supporting data sources of
previous assessments as well as newer information instead of evaluating the confidence of all the
underlying evidence ever published on environmental fate and transport for carbon tetrachloride.
This allowed EPA to maximize the scientific and analytical efforts of other regulatory and non-
regulatory agencies by accepting for the most part the scientific knowledge gathered and
analyzed by others except for influential information sources. Those exceptions would constitute
a smaller pool of sources subject to the rigor of the TSCA systematic review process to ensure
that the risk evaluation uses the best available science and the weight of the scientific evidence.
Other fate estimates were based on modeling results from EPI Suite™ (U.S. EPA, 2012a), a
predictive tool for physical-chemical and environmental fate properties. The data evaluation
tables describing their review can be found in the supplemental document, Final Risk Evaluation
for Carbon Tetrachloride, Systematic Review Supplemental File: Data Quality Evaluation of
Environmental Fate and Transport Studies (U.S. EPA, 2019f).
The carbon tetrachloride environmental fate characteristics and physical-chemical properties
used in fate assessment are presented in Table 2-1. EPA used EPI Suite™ estimations and
reasonably available fate data to characterize the environmental fate and transport of carbon
tetrachloride. Please note that this section and Appendix C may also cite other data sources as
part of the reasonably available evidence on the fate and transport properties of carbon
tetrachloride. EPA did not subject these other data sources to the later phases of the systematic
review process (i.e., data evaluation and integration) based on the approach explained above.
Fate and Transport
Environmental fate includes both transport and transformation processes. Environmental
transport is the movement of the chemical within and between environmental media.
Transformation occurs through the degradation or reaction of the chemical with other species in
the environment. Hence, knowledge of the environmental fate of the chemical informs the
determination of the specific exposure pathways and potential human and environmental
receptors EPA considered in the risk evaluation. Table 2-1 provides environmental fate data that
EPA identified and considered in developing the scope for carbon tetrachloride. This information
has not changed from that provided in the scope and problem formulation documents (U.S. EPA,
2018c).
During problem formulation, EPA considered volatilization during wastewater treatment,
volatilization from lakes and rivers followed by upward diffusion in the troposphere,
biodegradation rates, and soil organic carbon:water partition coefficient (log KOC) when making
changes to the conceptual models, as described in Section 2.5.3.1 of the problem formulation
document (U.S. EPA, 2018c).
EPI Suite™ (U.S. EPA, 2012a) modules were used to predict volatilization of carbon
tetrachloride from wastewater treatment plants, lakes, and rivers. The EPI Suite™ module that
estimates chemical removal in sewage treatment plants (“STP” module) was run using default
settings to evaluate the potential for carbon tetrachloride to volatilize to air or adsorb to sludge
during wastewater treatment. The STP module estimates that about 90% of carbon tetrachloride
in wastewater will be removed by volatilization and 2% by adsorption. This estimation can be
confirmed with a wastewater treatment removal study showing that carbon tetrachloride
Page 63 of 390
partitioned to the water column for greater than 99% and the range of <10 to 0.1% was
distributed in sludge (Chen et al., 2014).
Based on the results of the STPWIN model, in which removal of carbon tetrachloride from
wastewater is dominated by volatilization, concentrations of carbon tetrachloride in land-applied
biosolids are expected to be lower than concentrations in wastewater treatment plant effluents.
Level III fugacity modeling as implemented in EPI Suite™ using 100% emission to soil as a
proxy for land application of biosolids estimates that approximately 87% of carbon tetrachloride
volatilizes to air, 12% remains in soil, and 0.5% is transported to water. However, the model
assumes constant emissions rather than a pulse as land application of biosolids would occur;
thus, those model results likely overstate how much carbon tetrachloride would remain in soil.
Although similar dissipation would be expected, pulse applications of biosolids to land would
result in varying dissipation rates allowing for greater portioning from soil to air. Overall, based
on physical and chemical properties and fate endpoints, along with the estimated results of the
models, surface and drinking water exposures from land-applied biosolids are likely negligible.
Overall, carbon tetrachloride is expected to have limited accumulation potential in wastewater
biosolids, soil, sediment, and biota. Carbon tetrachloride released to surface water or soil is likely
to volatilize to the atmosphere, where it will slowly photooxidize. Carbon tetrachloride may
migrate to groundwater, where it may be removed via various anaerobic and abiotic degradation
pathways.
EPI Suite™ (U.S. EPA, 2012a) module that estimates volatilization from lakes and rivers
(“WVol”) was run using inputs to evaluate the volatilization half-lives of carbon tetrachloride in
various compartments. Given the measured vapor pressure of 115 mm Hg at 20°C and a
calculated Henry’s law constant of 2.76 × 10⁻² atm-m3/mol, these physical-chemical property
inputs to the WVol model in EPISuite indicates that carbon tetrachloride will volatilize from a
model river with a half-life on the order of 1.3 hours and from a model lake on the order of
approximately 5 days. Although volatilization is expected to be rapid, a Level III Fugacity model
predicted that when carbon tetrachloride is continuously released to water, 80% of the mass will
partition to water, 19% to air, < 1% to soil and < 1% to sediment. Level III fugacity modeling
results are impacted by which compartments (air, water or soil) receive the chemical releases so
a second scenario was run assuming equal releases of carbon tetrachloride to all three
compartments. The model predicted that when carbon tetrachloride is continuously released to
air, water, and soil, 50% of the mass partitions to water, 47.3% to air, 2.5% to soil and < 1% to
sediment. Intermittent or pulse releases of carbon tetrachloride are not expected to result in long-
term presence in the aquatic compartment and would allow for greater partitioning from the soil
to air compartments.
The EPI Suite™ module that predicts biodegradation rates (“BIOWIN” module) was run using
default settings to estimate biodegradation rates of carbon tetrachloride under aerobic conditions.
Three of the models built into the BIOWIN module (BIOWIN 1, 2 and 6) estimate that carbon
tetrachloride will not rapidly biodegrade in aerobic environments. However, BIOWIN 5 shows
moderate biodegradation under aerobic conditions. On the other hand, the model that estimates
Page 64 of 390
anaerobic biodegradation (BIOWIN 7) predicts that carbon tetrachloride will biodegrade
moderately under anaerobic conditions.
In water, under aerobic conditions, a negative result has been reported for a ready
biodegradability test according to OECD TG 301C MITI (I) (Ministry of International Trade and
Industry, Japan) test method. This test method, however, uses high concentrations of the test
substance so that toxicity to aerobic bacteria may have occurred, which may have prevented or
limited biodegradation (ECHA, 2012). The overwhelming evidence suggests that aerobic
biodegradation is very slow and anaerobic biodegradation is moderate to rapid (ECHA, 2012;
OECD, 2011; ATSDR, 2005; CalEPA, 2000).
Based on the available environmental fate data, carbon tetrachloride is likely to biodegrade
slowly under aerobic conditions with pathways that are environment- and microbial population-
dependent. Anaerobic degradation has been observed to be faster than aerobic degradation under
some conditions with acclimated microbial populations. Anaerobic biodegradation could be a
significant degradation mechanism in soil and ground water. Studies have shown the formation
of degradation products such as chloroform, methylene chloride, methyl chloride, and phosgene
under various environmental conditions. Under sulfate reducing conditions, partial complete
dechlorination of carbon tetrachloride has been observed (de Best et al., 1997). Carbon
tetrachloride has been found to degrade under anaerobic conditions to methane, carbon dioxide
and carbon monoxide through various metabolic pathways (Van Eekert et al., 1998).
Additionally, abiotic transformation has been observed to play an important role in degradation
of carbon tetrachloride to carbon disulfide, however substitutive and oxidative dechlorination
processes forming carbon dioxide from degradants may also serve as a potential pathway to
producing safe degradation products (Van Eekert et al., 1998).
The log KOC reported in the carbon tetrachloride scoping document were measured values in the
range of 1.69 – 2.16, while the estimated value range using EPI Suite™ is 1.6 – 2.5. These
values are supported by the basic principle of environmental chemistry which states that the KOC
is typically within one order of magnitude (one log unit) of the octanol:water partition coefficient
(KOW). Indeed, the log KOW reported for carbon tetrachloride in Table 2-1 is a measured value of
2.83, which is within the expected range. Further, the KOC could be approximately one order of
magnitude larger than predicted by EPI Suite™ before sorption would be expected to
significantly impact the mobility of carbon tetrachloride in groundwater. The log KOC and log
KOW reported in previous assessments of carbon tetrachloride were in the range of 1.69 – 2.16
and 2.64 – 2.83, respectively (ECHA, 2012; OECD, 2011; ATSDR, 2005), while measured
values found in studies via the process of systematic review of highly rated literatures are in the
range of 1.11 – 2.43 for various surface soil types; 0.79 – 1.93 for aquifer sediments; 1.67 for
marine and estuary sediments (Riley et al., 2010; Roose et al., 2001; Zhao et al., 1999; Duffy et
al., 1997; Rogers and McFarlane, 1981), and these values are associated with low sorption to soil
and sediment.

Page 65 of 390
Table 2-1. Environmental Fate Characteristics of Carbon Tetrachloride
Property or Endpoint Valuea References
Direct photodegradation Minutes (atmospheric-stratospheric) (OECD, 2011)
Indirect photodegradation >330 years (atmospheric) (OECD, 2011);
(Cox et al., 1976)
Hydrolysis half-life 7000 years at 1 ppm (OECD, 2011);
(Mabey and Mill, 1978)
Abiotic soil degradation 5 days (autoclaved soils) (Anderson et al., 1991)
Biodegradation 6 to 12 months (soil - estimated)b
7 days to 12 months (aerobic water, based
on multiple studies)
3 days to 4 weeks (anaerobic water, based
on multiple studies)
13 days to 19 months (anaerobic
wastewater treatment, based on multiple
studies)
7 days (aerobic wastewater treatment)
(OECD, 2011);
(ECHA, 2012);
(ATSDR, 2005);
(HSDB, 2005);
(Van Eekert et al., 1998);
(Bouwer and McCarty,
1983);
(Doong and Wu, 1992);
(Tabak et al., 1981); (de
Best et al., 1997)
Wastewater Treatment Mass distribution/partition:
Water – >99%
Sludge – >10 – 0.1%
(Chen et al., 2014)
Bioconcentration factor
(BCF)
30 bluegill sunfish
40 rainbow trout
(OECD, 2011)
Bioaccumulation factor
(BAF)
19 (estimated) (U.S. EPA, 2012a)
Soil organic carbon:water
partition coefficient (log Koc)
1.11 – 2.43 (from various soil types)
0.79 – 1.93 (aquifer sediments)
1.67 (marine and estuary sediments)
(ECHA, 2012);
(OECD, 2011); (Duffy et
al., 1997); (Rogers and
McFarlane, 1981) (Roose
et al., 2001); (Zhao et al.,
1999); (Riley et al., 2010)
aMeasured unless otherwise noted. bThis figure (6 to 12 months) represents a half-life estimate based on the estimated aqueous aerobic biodegradation half-life
of carbon tetrachloride.
Carbon tetrachloride shows minimal susceptibility to indirect photolysis by hydroxyl radicals in
the troposphere, where its estimated tropospheric half-life exceeds 330 years. Ultimately, carbon
tetrachloride diffuses upward into the stratosphere where it is photodegraded to form the
trichloromethyl radical and chlorine atoms (OECD, 2011). Carbon tetrachloride is efficiently
Page 66 of 390
degraded by direct photolysis under stratospheric conditions and the DT50 (Dissipation Time for
50% of the compound to dissipate) value is in the order of minutes. However, the troposphere to
the stratosphere migration of carbon tetrachloride is very long and this migration time limits the
dissipation. The rate of photodegradation increases at altitudes >20 km and beyond.
Carbon tetrachloride dissolved in water does not photodegrade or oxidize in any measurable
amounts, with a calculated hydrolysis half-life of 7,000 years based on experimental data at a
concentration of 1 ppm (OECD, 2011). Removal mechanisms from water could include
volatilization due to the Henry’s Law constant and anaerobic degradation in subsurface
environment.
Estimated and measured BCF and BAF values ranging from 19 – 40 indicate that carbon
tetrachloride has low bioaccumulation potential in fish (U.S. EPA, 2012a; OECD, 2011).
Environmental Releases Releases to the environment from the conditions of use (e.g., industrial/commercial processes or
commercial uses resulting in down-the-drain releases) are a source of potential exposure and
may be derived from reported data that are obtained through direct measurement, calculations
based on empirical data and/or assumptions, and models.
Water Release Assessment Approach and Methodology
EPA reviewed reported carbon tetrachloride data from the 2018 Toxics Release Inventory (TRI)
(U.S. EPA, 2018e) and multiple years (2014 through 2018) of Discharge Monitoring Report
(DMR) data as found in the EPA ECHO database pollutant loading tool to provide a basis for
estimating releases (U.S. EPA, 2014a). Facilities are only required to report to TRI if the facility
has 10 or more full-time employees, is included in an applicable North American Industry
Classification System (NAICS) code, and manufactures, processes, or uses the chemical in
quantities greater than a certain threshold (25,000 pounds for manufacturers and processors of
carbon tetrachloride and 10,000 pounds for users of carbon tetrachloride). Due to these
limitations, some sites that manufacture, process, or use carbon tetrachloride may not report to
TRI and are therefore not included in these datasets. 7Appendix D presents a summary of the
2018 TRI reported releases of carbon tetrachloride to various media.
For the DMR data, EPA used the Water Pollutant Loading Tool within EPA’s Enforcement and
Compliance History Online (ECHO), https://echo.epa.gov/trends/loading-tool/water-pollution-
search/, to query all carbon tetrachloride point source water discharges for five years: 2014,
2015, 2016, 2017, and 2018 (U.S. EPA, 2014a).The carbon tetrachloride loadings as reported in
DMR were averaged over the five year period for use in estimating carbon tetrachloride surface
water concentrations. DMR data are submitted by National Pollutant Discharge Elimination
System (NPDES) permit holders to states or directly to the EPA according to the monitoring
requirements of the facility’s permit. States are only required to load major discharger data into
DMR and thus, may or may not load minor discharger data. The definition of major versus minor
discharger is set by each state and could be based on discharge volume or facility size. Due to
these limitations, some sites that discharge carbon tetrachloride may not be included in the DMR
dataset.
Page 67 of 390
Environmental Exposures In the problem formulation (U.S. EPA, 2018c), EPA presented an analysis and preliminary
conclusions on environmental exposures to aquatic species based on releases to surface water,
and from sediments and suspended biosolids. No additional information regarding environmental
exposures was received or identified by the EPA following the publication of the problem
formulation that would alter the preliminary conclusions about environmental exposures
presented in the problem formulation (U.S. EPA, 2018c). As reviewed during problem
formulation, carbon tetrachloride is present in environmental media such as groundwater, surface
water, and air. EPA conducted analysis of the environmental release pathways to aquatic
receptors based on a qualitative assessment of the fate and transport properties of carbon
tetrachloride in the environment (described in Section 2.1), and a quantitative comparison of
hazards and exposures for aquatic organisms as described in Sections 2.3.1, 2.3.2, 3.1, 4.1.2 and
4.1.3 below.
Environmental Exposures – Aquatic Pathway
As explained in Section 2.5.3.1 of the Problem Formulation document (U.S. EPA, 2018c), EPA
conducted a qualitative assessment of carbon tetrachloride exposures to aquatic species from
sediments and suspended solids and determined that it was not necessary to further analyze these
exposures quantitatively. The qualitative assessment explains that due to the log Koc (1.7 – 2.16)
and high solubility of 793 mg/L at 25°C, sorption of carbon tetrachloride to sediments and
suspended solids is unlikely.
After publication of the problem formulation, EPA identified additional data on ecological
hazards requiring an update of the analysis of carbon tetrachloride releases and surface water
concentrations. In order to update this analysis, EPA modeled industrial discharges to surface
water to estimate surface water concentration using the five year average (2014 through 2018) of
EPA NPDES permit Discharge Monitoring Report (DMR) data for the highest carbon
tetrachloride releasing facilities based on the reported annual loadings (lbs/year). The 21
facilities (see Appendix E) represent, on average, 94% of total annual carbon tetrachloride
discharges in the United States. EPA used the Probabilistic Dilution Model (PDM) within EPA’s
Exposure and Fate Assessment Screening Tool, version 2014 (E-FAST 2014) to estimate surface
water concentrations resulting from facilities reported annual release/loading amounts. Further
information on the releases of carbon tetrachloride to surface water and the estimated surface
water carbon tetrachloride concentrations for acute and chronic scenarios based on E-FAST can
be found in Table 2-2 and Appendix E.
Methodology for Modeling Surface water Concentrations from
Facilities releases (E-FAST 2014)
Surface water concentrations resulting from wastewater releases of carbon tetrachloride from
facilities that use, manufacture, or process the chemical were modeled using EPA’s E-FAST,
Version 2014 (U.S. EPA, 2007). As appropriate, two scenarios were modeled per release: release
of the annual load over an estimated maximum number of operating days (250 days/year) and
over 20 days/year. E-FAST 2014 is a model that estimates chemical concentrations in water to
which aquatic life may be exposed using upper percentile and/or mean exposure parametric
values, resulting in possible conservative exposure estimates. Advantages to this model are that it
requires minimal input parameters and it has undergone extensive peer review by experts outside

Page 68 of 390
of EPA. To obtain more detailed information on the E- FAST 2014 tool from the user
guide/background document, visit this web address: https://www.epa.gov/tsca-screening-tools/e-
fast-exposure-and-fate-assessment-screening-tool-version-2014.
Overall Confidence in Estimated Water Surface Concentrations
EPA has medium confidence in the estimated water surface concentrations because the modeled
estimates are based on conservative assumptions and parameters explained above (i.e., averaging
data from top discharging facilities), which could result in overestimation or underestimation of
the water concentrations, in addition to the uncertainties associated with the E-FAST model and
DMR dataset (see Section 4.4.2).
2.3.1.1.1 E-FAST Calculations
Surface Water Concentrations
EPA used E-FAST 2014 to estimate site-specific surface water concentrations for discharges to
both free-flowing water bodies (i.e., rivers and streams) and for still water bodies (i.e., bays,
lakes, and estuaries).
For free-flowing water body assessments, E-FAST 2014 calculates surface water concentrations
for four streamflow conditions (7Q10, harmonic mean, 30Q5, and 1Q10 flows) using the
following equation:
𝑺𝑾𝑪 =𝑾𝑾𝑹 ×𝑪𝑭𝟏 × (𝟏−
𝑾𝑾𝑻
𝟏𝟎𝟎)
𝑺𝑭 ×𝑪𝑭𝟐 (Eq. 2-1)
where:
SWC = Surface water concentration (parts per billion (ppb) or µg/L)
WWR = Chemical release to wastewater (kg/day)
WWT = Removal from wastewater treatment (%)
SF = Estimated flow of the receiving stream (million liters/day (MLD))
CF1 = Conversion factor (109 µg/kg)
CF2 = Conversion factor (106 L/day/MLD)
For still water body assessments, no simple streamflow value represents dilution in these types of
water bodies. As such, E-FAST 2014 accounts for dilution by incorporating an acute or chronic
dilution factor for the water body of interest instead of stream flows. Dilution factors in E-FAST
2014 are typically 1 (representing no dilution) to 200, based on NPDES permits or regulatory
policy. The following equation is used to calculate surface water concentrations in still water
bodies:
𝑺𝑾𝑪 = 𝑾𝑾𝑹×(𝟏−
𝑾𝑾𝑻
𝟏𝟎𝟎)×𝑪𝑭𝟏
𝑷𝑭×𝑪𝑭𝟐×𝑫𝑭 (Eq. 2-2)
where:
SWC = Surface water concentration (ppb or µg/L)
WWR = Chemical release to wastewater (kg/day)
WWT = Removal from wastewater treatment (%)
PF = Effluent flow of the discharging facility (MLD)
DF = Acute or chronic dilution factor (DF) used for the water body

Page 69 of 390
(typically, between 1 and 200)
CF1 = Conversion factor (109 µg/kg)
CF2 = Conversion factor (106 L/day/MLD)
Outputs
There are two main outputs from E-FAST that EPA used in characterizing environmental exposures:
surface water concentration estimates, and the number of days a certain surface water concentration
was exceeded. Site-specific surface water concentration estimates for free-flowing water bodies are
reported for the 7Q10 stream flows. The 7Q10 stream flow is the lowest consecutive 7-day average
flow during any 10-year period. This stream flow represents a conservative scenario as low
stream flow would result in higher carbon tetrachloride surface water estimates. Site-specific
surface water concentration estimates for still water bodies are reported for calculations using the
acute dilution factors. In cases where site-specific flow/dilution data were not available, the
releases were modeled using stream flows of a representative industry sector, as calculated from
all facilities assigned to the industry sector in the E-FAST database (discussed below). Estimates
from this calculation method are reported for the 10th percentile 7Q10 stream flows.
The PDM portion of E-FAST 2014 was also run for free-flowing water bodies. The PDM
predicts the number of days/yr a chemical’s COC in an ambient water body will be exceeded.
COCs are threshold concentrations below which adverse effects on aquatic life are expected to
be minimal. The model is based on a simple mass balance approach presented by (Di Toro,
1984) that uses probability distributions as inputs to reflect that streams follow a highly variable
seasonal flow pattern and there are numerous variables in a manufacturing process that can affect
the chemical concentration and flow rate of the effluent. PDM does not estimate exceedances for
chemicals discharged to still waters, such as lakes, bays, or estuaries. For these water bodies, the
days of exceedance is assumed to be zero unless the predicted surface water concentration
exceeds the COC. In these cases, the days of exceedance is set to the number of release days/yr
(see required inputs in Section 2.3.1.1.2).
2.3.1.1.2 Model Inputs
Individual model inputs and accompanying considerations for the surface water modeling are described
in this Section.
Chemical Release to Wastewater (WWR)
Annual wastewater loading estimates (kg/site/year or lb/site/year) were obtained from 2014-2018 DMR
data and averaged over the 5 year period, as discussed in Section 2.2. To model these releases within
E-FAST 2014, the annual release is converted to a daily release using an estimated days of release per
year. Below is an example calculation:
WWR (kg/day) = Annual loading (kg/site/year) / Days released per year (days/year) (Eq. 2-3)
Release Days (days/yr)
The number of days/yr that the chemical is discharged is used to calculate a daily release amount from
annual loading estimates (see above). Current regulations do not require facilities to report the number
of days associated with reported releases. Therefore, two release scenarios were modeled for direct
discharging facilities to provide upper and lower bounds for the range of surface water concentrations
predicted by E-FAST 2014. The two scenarios modeled were a 250 days of release per year scenario
Page 70 of 390
based on estimates specific to the facility’s condition of use (see Section 2.2.1 for more details) and a 20
days of release per year scenario. The 250 days of release scenario yields the minimum estimated
surface water concentrations for a given facility, and the 20 days of release scenario yields the
maximum estimated surface water concentrations for a given facility. For indirect dischargers, only
the maximum estimated days of release per year was modeled because it was assumed that the actual
release to surface water would mostly occur at receiving treatment facilities, which were assumed to
typically operate greater than 20 days/yr.
Removal from Wastewater Treatment (WWT%)
The WWT% is the percentage of the chemical removed from wastewater during treatment before
discharge to a body of water. As discussed in Section 2.1, the WWT% for carbon tetrachloride
was estimated as 92% using the “STP” module within EPI Suite™, which was run using default
settings to evaluate the potential for carbon tetrachloride to volatilize to air or sorb to sludge
during wastewater treatment. A WWT% of zero was used for direct releasing facilities because
the release reported in DMR already accounts for any wastewater treatment which may have
occurred.
Facility or Industry Sector
The required site-specific stream flow or dilution factor information for a given facility is
contained in the E-FAST 2014 database and is selected by searching by a facility’s NPDES permit
number, name, or the known discharging waterbody reach code. For facilities that directly discharge to
surface water (i.e., “direct dischargers”), the NPDES code of the direct discharger was selected from the
database. For facilities that indirectly discharge to surface water (i.e., “indirect dischargers” because the
release is sent to a WWTP prior to discharge to surface water), the NPDES of the receiving WWTP was
selected. If a facility NPDES was not available in the E-FAST-2014 database, the release was modeled
using water body data for a surrogate NPDES code (preferred) or an industry sector, as described below.
In cases where the site-specific NPDES code was not available in the E-FAST 2014 database, the
preferred alternative was to select the NPDES for a nearby facility that discharges to the same
waterbody. The surrogate NPDES was chosen to best represent flow conditions in the waterbody
that both the carbon tetrachloride releasing facility and surrogate facility discharge to and not
actual releases associated with the surrogate facility NPDES.
Environmental Exposure Results
Summary
As discussed in Section 2.2, releases of carbon tetrachloride were estimated for an average over
5 years (2014-2018). For the maximum days of release scenarios (250 days), estimated carbon
tetrachloride surface water concentrations under 7Q10 flow conditions ranged from 4.0E-06 to
10 ppb. For the minimum release scenario (20 days), surface water concentrations ranged from
4.9E-05 to 130 ppb. On a per facility basis, the 20-day release scenario yielded higher surface
water concentrations than the maximum day of release scenario. Wastewater treatment facilities
(POTWs) operate year- round and were modeled using the maximum days of release scenario.
The minimum release scenario (20 days) is not applicable to these facilities and is noted in Table
2-2 with N/A. Additional facility data is presented in Appendix E.

Page 71 of 390
Table 2-2. Summary of Estimated Surface Water Concentrations from Facility Carbon
Tetrachloride Release
NPDES Facility Name
Annual
Release by
Facility
(kg/site-yr)
Surface Water Concentration
(7Q10 Flow)
(µg/L)
5yr Meana (20 day
Scenario)
(250 day
Scenario)
TX0021458 Fort Bend County WCID2 25 N/A 10
AL0001961 AKZO Chemicals, Inc. 115 3.1E-01 2.5E-02
LA0000329 Honeywell, Baton Rouge 4.0 8.1E-04 6.5E-05
LA0005401 ExxonMobil, Baton Rouge 2.0 4.0E-04 3.2E-05
OH0029149 Gabriel Performance 3.8 45 3.6
WV0004359 Natrium Plant 5.9 3.4E-02 2.9E-03
CA0107336 Sea World, San Diego 1.2 1.5E-01 1.2E-02
OH0007269 Dover Chemical Corpb 7.2 25 2.0
LA0006181 Honeywell, Geismar 3.7 7.3E-04 6.1E-05
LA0038245 Clean Harbors, Baton Rouge 6.6 1.3E-03 1.0E-04
TX0119792 Equistar Chemicals LP 13.6 4.4 3.5E-01
WV0001279 Chemours Chemicals LLC 2.1 1.1E-02 8.0E-04
TX0007072 Eco Services Operations 5.3 49 3.9
KY0024082 Barbourville STP 1.8 N/A 3.5E-01
WA0030520 Central Kitsap WWTP 1.2 7.0E+01 5.8E-01
MO0002526 Bayer Cropscience 1.0 5.9E-01 4.7E-02
KY0027979 Eddyville STP 1.3 N/A 1.0
KY0103357 Richmond Silver Creek STP 0.64 N/A 3.1E-01
KY0003603 Arkema Inc. 0.44 9.5E-04 8.7E-05
KY009161 Caveland Environmental Auth 0.59 8.4E-02 5.6E-03
LA0002933 Occidental Chem Corp,
Geismar
0.23 4.9E-05 4.0E-06
aThe five-year mean is the average of discharges reported in EPA ECHO database for the years 2014 through 2018
and if applicable, includes years of reported zero kg of carbon tetrachloride discharges. b
The Dover facility’s mean discharge was averaged over a four-year period: 2015-2018. 2014 discharges were not
included since a spill was reported and is not in scope for the TSCA risk evaluation.

Page 72 of 390
In response to SACC and public comments, releases from five of the facilities with larger
average discharges were further investigated to determine when during the year these releases
occurred. Depending on permit requirements for each discharger, facilities are required to report
releases and sample pollutant loads such as carbon tetrachloride, several times per year.
However, monitoring/reporting frequency and data availability varies greatly between the five
facilities. The times of year most relevant for amphibians were spring and summer and those
monitoring data were used to estimate stream concentrations using E-FAST 2014 for the 20-day
release scenario scenarios described in Section 2.2 above.
Table 2-3. Summary of Facility Carbon Tetrachloride Monitoring Data and Estimated
Surface Water Concentrations
NPDES Facility Name Monitoring
Perioda
Average Daily
Release Per
Facility
(kg/day)
Surface Water
Concentration
(7Q10 Flow)
(µg/L)
TX0021458 Fort Bend County WCID2 5/31/2014 1.2E-01 12
8/31/2014 1.5E-01 16
7/31/3015 1.4E-01 14
4/30/2016 3.0E-02 3.1
7/31/2016 3.3E-02 3.5
4/30/2017 2.3E-02 2.4
7/31/2017 1.7E-02 1.8
4/30/2018 2.4 2.5
7/31/2018 3.3 3.5
OH0029149 Gabriel Performance 3/31/2014 4.6E-05 1.1E-02
6/30/2014 4.2E-02 9.9
3/31/2015 7.8E-02 18
6/30/2017 1.2E-02 2.8
3/31/2018 1.2E-02 2.8
OH0007269 Dover Chemical Corp 4/30/2014 1.4 97
4/30/2015 8.6E-02 6.0
7/31/2017 0.70 48
TX0119792 Equistar Chemicals LP 8/31/2016 9.1E-02 5.9E-01
8/31/2017 1.5E-02 9.8E-02
8/31/2018 6.0E-02 3.9E-01
TX0007072 Eco Services Operations 7/31/2016 1.8E-02 3.3
Page 73 of 390
3/31/2017 2.2E-02 4.2
9/30/2018 2.7E-02 5.0 a Spring and summer months are included (3/31 through 9/30) as available. Missing time periods within one permit
represent either no discharge of carbon tetrachloride or no sampling data reported.
Terrestrial Environmental Exposure
Terrestrial species populations living near industrial or commercial facilities using carbon
tetrachloride may be exposed to the chemical through environmental media, including ambient
air, surface water and ground water. During problem formulation EPA determined that carbon
tetrachloride present in various media pathways (i.e., air, water, land) fall under the jurisdiction
of existing regulatory programs and associated analytical processes carried out under other EPA-
administered statutes (see Section 2.5.3.2 of the problem formulation document) (U.S. EPA,
2018c). However, in the final risk evaluation, exposures to terrestrial organisms from soil and
biosolids were qualitatively analyzed. Exposures to terrestrial organisms from air were not
evaluated in the final risk evaluation due to existing coverage under the Clean Air Act. EPA has
identified carbon tetrachloride as a priority pollutant under Section 304(a) of the CWA and has
developed water quality criteria for protection of human health. EPA determined during problem
formulation that exposures to terrestrial organisms from water do not need further evaluation due
to the current regulation of carbon tetrachloride water releases and the expectation that releases
to water will volatilize into air based on its physical-chemical properties.
Human Exposures
Occupational Exposures
Occupational exposures could be direct or indirect and the magnitude of exposure for an
occupational worker could be a function of duration, proximity and intensity of exposures. The
duration of exposure, which partially depends on worker mobility, could vary for different
employee groups. EPA considers workers at the facility who neither directly perform activities
near the carbon tetrachloride source area nor regularly handle carbon tetrachloride to be
occupational non-users (ONUs). Workers who are directly handling carbon tetrachloride and/or
perform activities near sources of carbon tetrachloride are in the near field and are called workers
throughout this risk evaluation. The near-field is reported to be conceptualized as a volume of air
within one-meter in any direction of the worker’s head and the far-field comprised the remainder
of the room (Tielemans et al., 2008). The source area/exposure zone could be judged by several
factors such as the chemical inventory, ventilation of the facility, vapor pressure and emission
potential of the chemical, process temperature, size of the room, job tasks, and modes of
chemical dispersal from activities (Leblanc et al., 2018). Corn and Esmen (1979) indicated that
the assignment of zones is a professional judgment and not a scientific exercise.
The job classifications for ONUs could be dependent on the conditions of use. For example,
ONUs for manufacturing include supervisors, managers, and tradesmen who may be in the
manufacturing area, but do not perform tasks that result in the same level of exposures as
production workers. It could be challenging to characterize direct and indirect exposures for
some conditions of use since it is not uncommon for employees at a facility to perform multiple
types of tasks throughout the workday. Workers could perform activities that bring them into
direct contact with carbon tetrachloride and also perform additional tasks as ONUs. The
Page 74 of 390
groupings of employees are not necessarily distinct as workers perform a variety of tasks over
the course of the day that could result in direct exposure and indirect exposure. Indirect
exposures of employees working near contaminants could be difficult to separate due to
overlapping tasks that makes it difficult to delineate exposures of workers and ONUs.
Carbon tetrachloride storage and handling are reported to be performed in closed and secure
vessel (OxyChem, 2014). In addition, samples can only be taken (potential release source) from
the closed systems that have built-in capabilities to handle vents, provide nitrogen, process
unused liquid volume and results in a sample in a closed container (OxyChem, 2014). Oxychem
(OxyChem, 2018) reported closed loop unloading systems are designed to minimize solvent
vapor emissions during transfer by exchanging the liquid solvent in the trailer with the storage
tank vapors. In addition, it was also reported that the closed system cuts the water usage
(resource needs) and release of carbon tetrachloride (Cheremisinoff and Rosenfeld, 2009).
Carbon tetrachloride has no flash point, it is not flammable. Decomposition of carbon
tetrachloride requires ≥ 730°C, a temperature at which phosgene could form from carbon
tetrachloride (Noweir et al., 1973). However, phosgene, typically formed otherwise, is not stable
at temperatures above 250°C, decomposes to form mixtures of carbon monoxide, chlorine,
carbon dioxide, and carbon tetrachloride (ACC, 2018). Carbon tetrachloride should be stored in
labelled, airtight containers in a well-ventilated place protected from light and at a temperature
below 30°C. It must be stored separated from chemically active metals. Disposal of carbon
tetrachloride contaminated wastes via incineration is not recommended due to the non-
flammability of carbon tetrachloride and to the formation of phosgene, hydrogen chloride and
other toxic gases on heating. Caustic scrubber could reduce phosgene emissions in exhaust gases.
EPA assessed occupational exposures following the analysis plan published in Section 2.6.1.2 of
the problem formulation document (U.S. EPA, 2018c). EPA evaluated acute and chronic
inhalation exposures to workers and ONUs associated with carbon tetrachloride manufacturing,
import and repackaging, its use in industrial applications as a reactant/ intermediate and process
agent, laboratory chemicals and disposal. Appendix F of the problem formulation document
(U.S. EPA, 2018c) provides additional detail on the mapping of the conditions of use to the
Occupational Exposure Scenario (OES) groups used in this risk evaluation. EPA used inhalation
monitoring data when available and that met data evaluation criteria (see Section 1.5); and
modeling approaches to estimate potential inhalation exposures when inhalation monitoring data
were not reasonably available. Specific inhalation assessment methodology is described in
further detail below for each type of assessment.
EPA also estimated dermal doses for workers in these scenarios since dermal monitoring data
was not reasonably available. EPA modeled dermal doses using the EPA Dermal Exposure to
Volatile Liquids Model which improves upon the existing EPA 2-Hand Dermal Exposure model
by accounting for the effect of evaporation on dermal absorption for volatile chemicals and the
potential exposure reduction due to glove use. More information about this model and how it was
used may be found in Section 2.4.1.4. EPA does not expect dermal exposures for occupational
non-users due to no direct contact with the chemical.
Page 75 of 390
Components of the Occupational Exposure Assessment
The occupational exposure assessment of each condition of use comprises the following
components:
• Process Description: A description of the condition of use, including the role of the
chemical in the use; process vessels, equipment, and tools used during the condition of
use.
• Number of Sites: The sites that use the chemical for the given condition of use.
• Worker Activities: Descriptions of the worker activities, including an assessment for
potential points of worker exposure and environmental releases.
• Number of Workers and Occupational Non-Users: An estimate of the number of sites,
number of workers and occupational non-users potentially exposed to the chemical for
the given condition of use. Unless mentioned otherwise in this report, the total number of
workers and ONUs are number of personnel per site per day. See Appendix A of the
supplemental document Final Risk Evaluation for Carbon Tetrachloride, Supplemental
Information on Releases and Occupational Exposure Assessment (U.S. EPA, 2019c) for a
discussion of EPA’s approach for determining an estimation for the number of affected
workers.
• Inhalation Exposure: Central tendency and high-end estimates of inhalation exposure to
workers and occupational non-users. See Appendix B and Appendix C of the
supplemental document Final Risk Evaluation for Carbon Tetrachloride, Supplemental
Information on Releases and Occupational Exposure Assessment (U.S. EPA, 2019c).
• Dermal Exposure: It estimates for multiple scenarios, accounting for simultaneous
absorption and evaporation, and different protection factors of glove use. A separate
dermal exposure Section (2.4.1.8) is included that provides estimates of the dermal
exposures for all the assessed conditions of use. EPA assessed dermal exposure to
workers using the Dermal Exposure to Volatile Liquids Model. The dermal exposure
scenarios consider impact of glove use. Dermal exposure assessment is described in more
detail Appendix E of the document Final Risk Evaluation for Carbon Tetrachloride,
Supplemental Information on Releases and Occupational Exposure Assessment (U.S.
EPA, 2019c).
The OSHA Personal Protective Equipment (PPE) Standard, 29 CFR Section 1910.132, requires
that employers conduct a hazard assessment of the workplace to identify all the hazards that exist
and determine what methods to use to protect workers from these identified hazards. PPE is one
of the options that may be utilized to protect employees from hazardous exposures based on the
findings of the hazard assessment. The OSHA determines the technological and economic
feasibility of implementing engineering controls on the basis of the best available evidence.
The OSHA respirator protection standard, 29 CFR Section 1910.134, requires employers utilize
the hierarchy of controls for reducing or removing chemical hazards. Based on the hierarchy of
controls, the most effective controls are elimination, substitution, or engineering controls. These
are followed by administrative controls and finally the use of PPE. The respiratory protection
standard requires the use of feasible engineering controls as the primary means to control air
contaminants. Respirators are required when effective engineering controls are not feasible and
are the last means of worker protection in the hierarchy of controls. When effective engineering
and administrative controls are not feasible to adequately protect workers and maintain
Page 76 of 390
compliance with other OSHA statutory and regulatory requirements under 29 CFR Section
1910.1000, employers should utilize respirator protective equipment. (29 CFR Section
1910.134(a)(1)).
If information and data indicate that use or handling of a chemical cannot, under worst-case
conditions, release concentrations of a respiratory hazard above a level that would trigger the
need for a respirator or require use of a more protective respirator, employees would not be
assumed to wear them. Employers also use engineering or administrative controls to bring
employee exposures below permissible exposure limits for airborne contaminants. Respirators
would be used to supplement engineering and administrative controls only when these controls
cannot be feasibly implemented to reduce employee exposure to permissible levels.
Occupational Exposures Approach and Methodology
To assess inhalation exposure, EPA reviewed workplace inhalation monitoring data collected by
government agencies such as OSHA and NIOSH, monitoring data submitted by industry
organizations through public comments, and monitoring data found in published literature (i.e.,
personal exposure monitoring data and area monitoring data). Studies were evaluated using the
evaluation strategies laid out in the Application of Systematic Review in TSCA Risk Evaluations
(U.S. EPA, 2018a).
For several conditions of use, the EPA modeled exposure in occupational settings. The models
were used to either supplement existing exposure monitoring data or to provide exposure
estimates where data are insufficient. For example, the EPA developed the Tank Truck and
Railcar Loading and Unloading Release and Inhalation Exposure Model to estimate worker
exposure during container and truck unloading activities that occur at industrial facilities.
• Using the time-weighted average (TWA) exposure concentrations obtained from
monitoring data or modeling, EPA calculated the Acute Concentration (AC), Average
Daily Concentrations (ADC) and Lifetime Average Daily Concentration (LADC) to
assess risk. The AC, ADC, and LADC equations are described in Final Risk Evaluation
for Carbon Tetrachloride, Supplemental Information on Releases and Occupational
Exposure Assessment (U.S. EPA, 2019c).
See Appendix E of the supplemental document Risk Evaluation for Carbon Tetrachloride,
Supplemental Information on Releases and Occupational Exposure Assessment (U.S. EPA,
2019c) for a discussion of EPA’s statistical analysis approach for assessing dermal exposure.
Process Description
EPA performed a literature search to find descriptions of processes involved in each condition of
use to identify worker activities that could potentially result in occupational exposures. Where
process descriptions were unclear or not available, EPA referenced relevant Emission Scenario
Documents (ESD’s) or Generic Scenarios (GS’s). Process descriptions for each condition of use
can be found in Section 2.4.1.3.
Number of Workers and ONUs
Where available, EPA used CDR data to provide a basis to estimate the number of workers and
ONUs. EPA supplemented the available CDR data with U.S. economic data using the following
Page 77 of 390
method:
1. Identify the North American Industry Classification System (NAICS) codes for the
industry sectors associated with these uses by reviewing Chemical Data Reporting (CDR)
data, Toxics Release Inventory (TRI) data, and EPA Generic Scenarios (GS’s) and
Organisation for Economic Co-operation and Development (OECD) Emission Scenario
Documents (ESDs) for the chemical.
2. Estimate total employment by industry/occupation combination using the Bureau of
Labor Statistics’ Occupational Employment Statistics data (BLS Data).
3. Refine the Occupational Exposure Scenarios (OES) estimates where they are not
sufficiently granular by using the U.S. Census’s Statistics of US Businesses (SUSB) data
(SUSB Data) on total employment by 6-digit NAICS.
4. Use market penetration data to estimate the percentage of employees likely to be using
carbon tetrachloride instead of other chemicals. If no market penetration data were
available, estimate of the number of sites using carbon tetrachloride from given NAICS
code and multiply by the estimated workers and ONUs/site provided in BLS data.
5. Combine the data generated in Steps 1 through 5 to produce an estimate of the number of
employees using carbon tetrachloride in each industry/occupation combination, and sum
these to arrive at a total estimate of the number of employees with exposure.
There are a few uncertainties surrounding the estimated number of workers potentially exposed
to carbon tetrachloride, as outlined below. Most of these uncertainties regarding worker exposure
to carbon tetrachloride are specific to site/facility and may not be uniform depending on the
information available, activities performed and industrial process variables across the industry
and/or within the same company. There are inherent limitations to the use of CDR data as they
are reported by manufacturers and importers of carbon tetrachloride. CDR may not capture all
sites and workers associated with any given chemical. There are also uncertainties with BLS
data. First, BLS’s OES employment data for each industry/occupation combination are only
available at the 3-, 4-, or 5-digit NAICS level, rather than the full 6-digit NAICS level. This lack
of granularity could result in an overestimate of the number of exposed workers if some 6-digit
NAICS are included in the less granular BLS estimates but are not likely to use carbon
tetrachloride for the assessed applications. EPA addressed this issue by refining the OES
estimates using total employment data from the U.S. Census’s SUSB. However, this approach
assumes that the distribution of occupation types (SOC codes) in each 6-digit NAICS is equal to
the distribution of occupation types at the parent 5-digit NAICS level. If the distribution of
workers in occupations with carbon tetrachloride exposure differs from the overall distribution of
workers in each NAICS, then this approach could result in inaccuracy. The judgments about
which industries (represented by NAICS codes) and occupations (represented by SOC codes) are
associated with the uses assessed in this report are based on EPA’s understanding of how carbon
tetrachloride is used in each industry. Designations of which industries and occupations have
potential exposures is nevertheless subjective, and some industries/occupations with few
exposures might erroneously be included, or some industries/occupations with exposures might
erroneously be excluded. This would result in inaccuracy but would be unlikely to systematically
either overestimate or underestimate the count of exposed workers.
General Inhalation Exposure Assessment Approach and Methodology
EPA provided occupational exposure results representative of central tendency conditions and
Page 78 of 390
high-end conditions. A central tendency could be representative of occupational exposures in the
center of the distribution for a given condition of use. For risk evaluation, EPA may use the 50th
percentile (median), mean (arithmetic or geometric), mode, or midpoint values of a distribution
as representative of the central tendency scenario. EPA’s preference is to provide the 50th
percentile of the distribution. However, if the full distribution is not known, the mean, mode, or
midpoint of the distribution represents the central tendency depending on the statistics available
for the distribution.
A high-end could be representative of occupational exposures that occur at probabilities above
the 90th percentile but below the exposure of the individual with the highest exposure (U.S. EPA,
1992a). For the risk evaluation, EPA provided high-end results at the 95th percentile. If the 95th
percentile is not available, EPA may use a different percentile greater than or equal to the 90th
percentile but less than or equal to the 99.9th percentile, depending on the statistics available for
the distribution. If the full distribution is not known and the preferred statistics are not available,
EPA may estimate a maximum or bounding estimate in lieu of the high-end.
For occupational exposures, EPA may use measured or estimated air concentrations to calculate
exposure concentration metrics required for the risk assessment, such as average daily
concentration and lifetime average daily concentration. These calculations require additional
parameter inputs, such as years of exposure, exposure duration and frequency, and lifetime years.
EPA may estimate exposure concentrations from monitoring data, modeling, or occupational
exposure limits.
For the final exposure result metrics, each of the input parameters (e.g., air concentrations,
working years, exposure frequency, lifetime years) may be a point estimate (i.e., a single
descriptor or statistic, such as central tendency or high-end) or a full distribution. EPA will
consider three general approaches for estimating the final exposure result metrics:
• Deterministic calculations: EPA will use combinations of point estimates of each
parameter to estimate a central tendency and high-end for each final exposure metric
result. EPA will document the method and rationale for selecting parametric
combinations to be representative of central tendency and high-end.
• Probabilistic (stochastic) calculations: EPA will pursue Monte Carlo simulations using
the full distribution of each parameter to calculate a full distribution of the final exposure
metric results and selecting the 50th and 95th percentiles of this resulting distribution as
the central tendency and high-end, respectively.
• Combination of deterministic and probabilistic calculations: EPA may have full
distributions for some parameters but point estimates of the remaining parameters. For
example, EPA may pursue Monte Carlo modeling to estimate exposure concentrations,
but only have point estimates of working years of exposure, exposure duration and
frequency, and lifetime years. In this case, EPA will document the approach and rationale
for combining point estimates with distribution results for estimating central tendency
and high-end results.

Page 79 of 390
EPA follows the following hierarchy in selecting data and approaches for assessing inhalation
exposures:
1. Monitoring data:
a. Personal and directly applicable
b. Area and directly applicable
c. Personal and potentially applicable or similar
d. Area and potentially applicable or similar
2. Modeling approaches:
a. Surrogate monitoring data
b. Fundamental modeling approaches
c. Statistical regression modeling approaches
3. Occupational exposure limits:
a. OSHA Permissible Exposure Limits (PEL)
b. Company-specific OELs (for site-specific exposure assessments, e.g., there is only one
manufacturer who provides to EPA their internal OEL but does not provide monitoring
data)
c. Voluntary limits (ACGIH TLV, NIOSH REL, Occupational Alliance for Risk Science
(OARS) workplace environmental exposure level (WEEL) [formerly by AIHA])
Exposures are calculated from the datasets provided in the sources depending on the size of the
dataset. For datasets with six or more data points, central tendency and high-end exposures were
estimated using the 50th percentile and 95th percentile. For datasets with three to five data points,
central tendency exposure was calculated using the 50th percentile and the maximum was
presented as the high-end exposure estimate. For datasets with two data points, the midpoint was
presented as a midpoint value and the higher of the two values was presented as a higher value.
Finally, data sets with only one data point presented the value as a what-if exposure. EPA cannot
determine the statistical representativeness of the values for the small sample size. For datasets
including exposure data that were reported as below the limit of detection (LOD), EPA estimated
the exposure concentrations for these data, following EPA’s Guidelines for Statistical Analysis of
Occupational Exposure Data (U.S. EPA, 1994) which recommends using the 𝐿𝑂𝐷
√2 if the
geometric standard deviation of the data is less than 3.0 and 𝐿𝑂𝐷
2 if the geometric standard
deviation is 3.0 or greater. Specific details related to each condition of use can be found in
Section 2.4.1.7. For each condition of use, these values were used to calculate chronic (non-
cancer and cancer) exposures. Equations and sample calculations for chronic exposures can be
found in the supplemental document Risk Evaluation for Carbon Tetrachloride, Supplemental
Information on Releases and Occupational Exposure Assessment (U.S. EPA, 2019c).
EPA used exposure monitoring data and exposure models to estimate inhalation exposures for all
conditions of use. When directly applicable exposure monitoring data was not available for a
specific condition of use, EPA assessed exposure for that use through potentially applicable or
similar monitoring data, also referred to as surrogate monitoring data. Specific details related to
the use of monitoring data for each condition of use can be found in Section 2.4.1.7.
Page 80 of 390
A summary of the key occupational acute and chronic inhalation exposure concentration models
for carbon tetrachloride are presented below. The supplemental document Final Risk Evaluation
for Carbon Tetrachloride, Supplemental Information on Releases and Occupational Exposure
Assessment (U.S. EPA, 2019c) provides detailed discussion on the values of the exposure
parameters and air concentrations input into these models.
Acute and Chronic Inhalation Exposure Concentrations Models
A key input to the acute and chronic models for occupational assessment is 8-hr time-weighted
average air concentration (TWA). The 8-hr TWA air concentrations are time averaged to
calculate acute exposure, average daily concentration (ADC) for chronic, non-cancer risks, and
lifetime average daily concentration (LADC) for chronic, cancer risks.
Acute workplace exposures are assumed to be equal to the contaminant concentration in air (8-hr
TWA), per Equation 2-1.
Equation 2-1
𝑨𝑬𝑪 =𝑪 × 𝑬𝑫
𝑨𝑻𝒂𝒄𝒖𝒕𝒆
Where:
𝑨𝑬𝑪 = acute exposure concentration [mg/m3]
𝑪 = contaminant concentration in air (8-hour TWA) [mg/m3]
𝑬𝑫 = exposure duration [hr/day]
𝑨𝑻𝒂𝒄𝒖𝒕𝒆 = acute averaging time [hr/day]
ADC and LADC are used to estimate workplace chronic exposures for non-cancer and cancer
risks, respectively. These exposures are estimated as follows:
Equation 2-2
𝑨𝑫𝑪 𝒐𝒓 𝑳𝑨𝑫𝑪 = 𝑪 × 𝑬𝑫 × 𝑬𝑭 × 𝑾𝒀
𝑨𝑻 𝒐𝒓 𝑨𝑻𝑪
Where:
ADC = average daily concentration (8-hr TWA) used for chronic non-cancer risk
calculations
LADC = lifetime average daily concentration (8-hr TWA) used for chronic cancer risk
calculations
C = contaminant concentration in air (8-hr TWA)
ED = exposure duration (8 hr/day)
EF = exposure frequency (250 days/yr)
WY = exposed working years per lifetime (tenure values used to represent: 50th
percentile = 31; 95th percentile = 40)
AT = averaging time, non-cancer risks (WY × 250 days/yr × 8 hr/day)
ATc = averaging time, cancer risks (lifetime (LT) x 365 days/year x 24 hr/day; where
LT = 78 years)

Page 81 of 390
General Dermal Exposure Assessment Approach and Methodology
Dermal exposure data were not readily available for the conditions of use in the assessment.
Because carbon tetrachloride is a volatile liquid, the dermal absorption of carbon tetrachloride
depends on the type and duration of exposure. Where exposure is without gloves, only a fraction
of carbon tetrachloride that comes into contact with the skin will be absorbed as the chemical
readily evaporates from the skin. Specific details used to calculate the dermal exposure to carbon
tetrachloride can be found in Section 2.4.1.8.
A summary of the key occupational dermal dose models for carbon tetrachloride are presented
below. The supplemental document Final Risk Evaluation for Carbon Tetrachloride,
Supplemental Information on Releases and Occupational Exposure Assessment (U.S. EPA,
2019c) provides detailed discussion on the values of the exposure parameters input into these
models.
Key Dermal Exposure Dose Models
Current EPA dermal models do not incorporate the evaporation of material from the dermis. The
dermal potential dose rate, Dexp (mg/day), is calculated as (U.S. EPA, 2015a):
Equation 2-3
𝑫𝒆𝒙𝒑 = 𝑺 × 𝑸𝒖 × 𝒀𝒅𝒆𝒓𝒎 × 𝑭𝑻
Where:
S is the surface area of contact: 535 cm2 (central tendency) and 1,070 cm2 (high end),
representing the total surface area of one and two hands, respectively (note that EPA has no
data on actual surface area of contact for any OES and that the value is assumed to represent
an adequate proxy for a high-end surface area of contact with liquid that may sometimes
include exposures to much of the hands and other areas of the body (wrists, forearms, and
neck) depending scenarios.
Qu is the quantity remaining on the skin: 1.4 mg/cm2-event (central tendency) and 2.1 mg/cm2-
event (high end). These are the midpoint value and high end of range default value,
respectively, used in the EPA’s dermal contact with liquids models.
Yderm is the weight fraction of the chemical of interest in the liquid: EPA will assess a unique
value of this parameter for each occupational scenario or group of similar occupational
scenarios (0 ≤ Yderm ≤ 1).
FT is the frequency of events (integer number per day; 1 event/day).
Here Qu does not represent the quantity remaining after evaporation, but represents the quantity
remaining after the bulk liquid has fallen from the hand that cannot be removed by wiping the
skin (e.g., the film that remains on the skin).
One way to account for evaporation of a volatile solvent would be to add a multiplicative factor
to the EPA model to represent the proportion of chemical that remains on the skin after
evaporation, fabs (0 ≤ fabs ≤ 1):
Equation 2-4
𝑫𝒆𝒙𝒑 = 𝑺 × ( 𝑸𝒖 × 𝒇𝒂𝒃𝒔) × 𝒀𝒅𝒆𝒓𝒎 × 𝑭𝑻

Page 82 of 390
This approach simply removes the evaporated mass from the calculation of dermal uptake.
Evaporation is not instantaneous, but the EPA model already has a simplified representation of
the kinetics of dermal uptake. More information about this approach is presented in the
supplemental document Final Risk Evaluation for Carbon Tetrachloride, Supplemental
Information on Releases and Occupational Exposure Assessment (U.S. EPA, 2019c).
Safety equipment manufacturers recommend Silver Shield®/4H®, Viton (synthetic rubber and
fluoropolymer elastomer), Viton/Butyl and Nitrile for gloves and DuPont Tychem® BR and LV,
Responder® and TK; ONESuit® TEC; and Kappler Zytron® 300, 400, and 500 as protective
materials for clothing. Most nitrile gloves have a breakthrough time of only a few minutes and
thus offer little protection when exposed to carbon tetrachloride. For operations involving the use
of larger amounts of carbon tetrachloride, when transferring carbon tetrachloride from one
container to another or for other potentially extended contact, the only gloves recommended are
Viton. The gloves should not be assumed to provide full protection. Regarding glove use, data
about the frequency of effective glove use – that is, the proper use of effective gloves – is very
limited in industrial settings. The literature review indicated absence of data to estimate a
probability distribution for effective glove use for carbon tetrachloride or relevant industrial
practices. Instead, the impact of effective glove use was explored by considering different
percentages of effectiveness (e.g., 25% vs. 50% effectiveness).
EPA also made assumptions about glove use and associated protection factors. Where workers
wear gloves, workers are exposed to carbon tetrachloride-based product that may penetrate the
gloves, such as seepage through the cuff from improper donning of the gloves, and if the gloves
occlude the evaporation of carbon tetrachloride from the skin. Where workers do not wear
gloves, workers are exposed through direct contact with carbon tetrachloride.
Gloves only offer barrier protection until the chemical breaks through the glove material. Using a
conceptual model, Cherrie (2004) proposed a glove workplace protection factor – the ratio of
estimated uptake through the hands without gloves to the estimated uptake though the hands
while wearing gloves: this protection factor is driven by flux, and thus varies with time. The
European Centre For Ecotoxicology and Toxicology of Chemicals Targeted Risk Assessment
(ECETOC TRA) model represents the protection factor of gloves as a fixed, assigned protection
factor equal to 5, 10, or 20 (Marquart et al., 2017), where, similar to the APR for respiratory
protection, the inverse of the protection factor is the fraction of the chemical that penetrates the
glove. Dermal doses without and with glove use are estimated in the occupational exposure
sections below and summarized in Table 2-24.
For most scenarios, EPA did not find enough data to determine statistical distributions of the
actual exposure parameters and concentration inputs to the inhalation and dermal models
described above. Within the distributions, central tendencies describe 50th percentile or the
substitute that most closely represents the 50th percentile. The high-end of a distribution
describes the range of the distribution above 90th percentile (U.S. EPA, 1992b). Ideally, EPA
would use the 50th and 95th percentiles for each parameter. Where these statistics were unknown,
the mean or median (mean is preferable to median) served as substitutes for 50th percentile and
the high-end of ranges served as a substitute for 95th percentile. However, these substitutes were
Page 83 of 390
highly uncertain and not ideal substitutes for the percentiles. EPA could not determine whether
these substitutes were suitable to represent statistical distributions of various scenarios.
Consideration of Engineering Controls and Personal Protective
Equipment
OSHA requires and NIOSH recommends employers utilize the hierarchy of controls to address
hazardous exposures in the workplace. The hierarchy of controls strategy outlines, in descending
order of priority, the use of elimination, substitution, engineering controls, administrative controls,
and lastly PPE. The hierarchy of controls prioritizes the most effective measures first which is to
eliminate or substitute the harmful chemical (e.g., use a different process, substitute with a less
hazardous material), thereby preventing or reducing exposure potential. Following elimination
and substitution, the hierarchy recommends engineering controls to isolate employees from the
hazard, followed by administrative controls, or changes in work practices to reduce exposure
potential (e.g., source enclosure, local exhaust ventilation systems, temperature). Administrative
controls are policies and procedures instituted and overseen by the employer to protect worker
exposures. The respirators do not replace engineering controls and they are implemented in
addition to feasible engineering controls (29 CFR Section 1910.134(a)(1)). As the last means of
control, the use of PPE (e.g., respirators, gloves) is recommended, when the other control
measures cannot reduce workplace exposure to an acceptable level.
Respiratory Protection
OSHA’s Respiratory Protection Standard (29 CFR Section 1910.134) requires employers in
certain industries to address workplace hazards by implementing engineering control measures
and, if these are not feasible, provide respirators that are applicable and suitable for the purpose
intended. Engineering and administrative controls must be implemented whenever employees are
exposed to carbon tetrachloride concentrations above the PEL. If engineering and administrative
controls do not reduce exposures to below the PEL, respirators must be worn. Respirator
selection provisions are provided in Section 1910.134(d) and require that appropriate respirators
are selected based on the respiratory hazard(s) to which the worker will be exposed and
workplace and user factors that affect respirator performance and reliability. Assigned protection
factors (APFs) are provided in Table 1 under § 1910.134(d)(3)(i)(A) (see below in Table 2-4)
and refer to the level of respiratory protection that a respirator or class of respirators could be
provided to employees when the employer implements a continuing, effective respiratory
protection program. Implementation of a full respiratory protection program requires employers
to provide training, appropriate selection, fit testing, cleaning, and change-out schedules in order
to have confidence in the efficacy of the respiratory protection.
The United States has several regulatory and non-regulatory exposure limits for carbon
tetrachloride. The OSHA Permissible Exposure Limit (PEL) is 10 ppm time-weighted average
(TWA) and the Ceiling limit is 25 ppm and the 5-minute acceptable maximum peak allowed in
any four hours is 200 ppm. The short-term exposure limit (STEL) is 25 ppm for five minutes
once every four hours. The NIOSH Recommended Exposure Limit (REL) is 2 ppm (12.6 mg/m3)
for a 60-minute Short-term Exposure Limit (STEL) (OSHA, 2017). NIOSH indicates that carbon
tetrachloride has an immediately dangerous to life or health (IDLH) value of 200 ppm (ATSDR,
2017; Barnes and Jones, 1967; AIHA, 1961; Kirk-Othmer, 1964; Doney et al., 2005) based on
acute inhalation toxicity data in humans. OSHA’s other occupational safety and health standards
that would apply to carbon tetrachloride exposures that exceed these levels include hazard
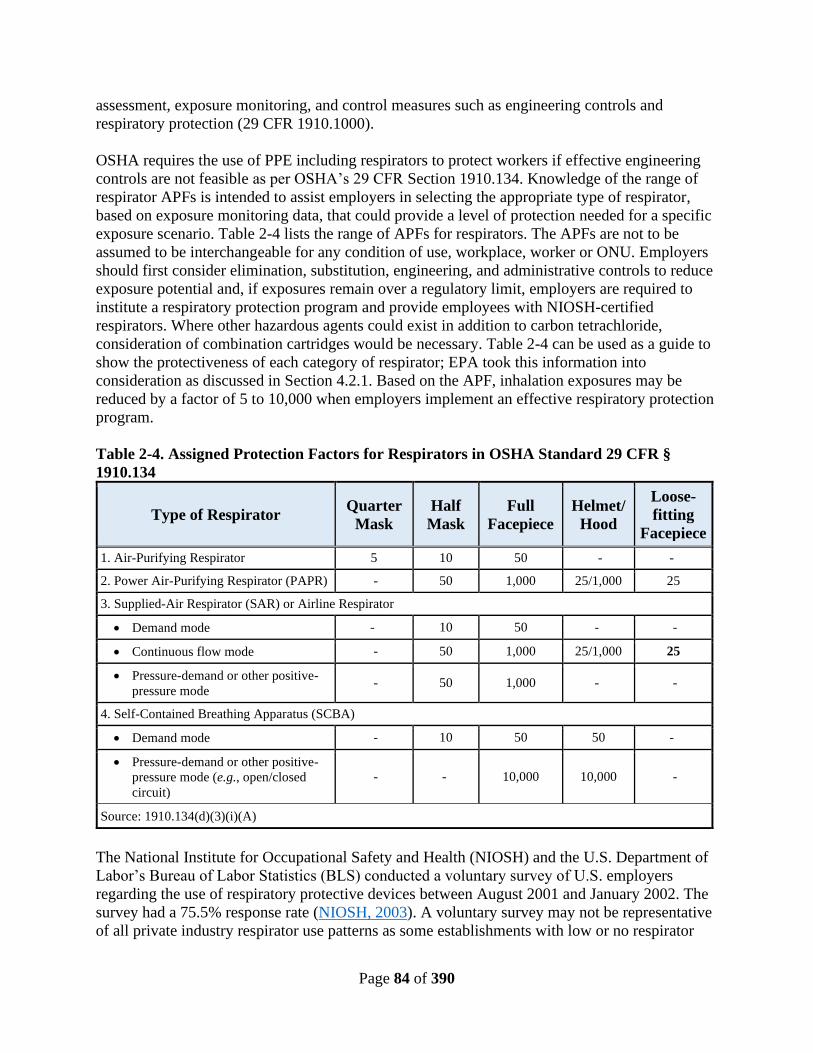
Page 84 of 390
assessment, exposure monitoring, and control measures such as engineering controls and
respiratory protection (29 CFR 1910.1000).
OSHA requires the use of PPE including respirators to protect workers if effective engineering
controls are not feasible as per OSHA’s 29 CFR Section 1910.134. Knowledge of the range of
respirator APFs is intended to assist employers in selecting the appropriate type of respirator,
based on exposure monitoring data, that could provide a level of protection needed for a specific
exposure scenario. Table 2-4 lists the range of APFs for respirators. The APFs are not to be
assumed to be interchangeable for any condition of use, workplace, worker or ONU. Employers
should first consider elimination, substitution, engineering, and administrative controls to reduce
exposure potential and, if exposures remain over a regulatory limit, employers are required to
institute a respiratory protection program and provide employees with NIOSH-certified
respirators. Where other hazardous agents could exist in addition to carbon tetrachloride,
consideration of combination cartridges would be necessary. Table 2-4 can be used as a guide to
show the protectiveness of each category of respirator; EPA took this information into
consideration as discussed in Section 4.2.1. Based on the APF, inhalation exposures may be
reduced by a factor of 5 to 10,000 when employers implement an effective respiratory protection
program.
Table 2-4. Assigned Protection Factors for Respirators in OSHA Standard 29 CFR §
1910.134
Type of Respirator Quarter
Mask
Half
Mask
Full
Facepiece
Helmet/
Hood
Loose-
fitting
Facepiece
1. Air-Purifying Respirator 5 10 50 - -
2. Power Air-Purifying Respirator (PAPR) - 50 1,000 25/1,000 25
3. Supplied-Air Respirator (SAR) or Airline Respirator
• Demand mode - 10 50 - -
• Continuous flow mode - 50 1,000 25/1,000 25
• Pressure-demand or other positive-
pressure mode - 50 1,000 - -
4. Self-Contained Breathing Apparatus (SCBA)
• Demand mode - 10 50 50 -
• Pressure-demand or other positive-
pressure mode (e.g., open/closed
circuit)
- - 10,000 10,000 -
Source: 1910.134(d)(3)(i)(A)
The National Institute for Occupational Safety and Health (NIOSH) and the U.S. Department of
Labor’s Bureau of Labor Statistics (BLS) conducted a voluntary survey of U.S. employers
regarding the use of respiratory protective devices between August 2001 and January 2002. The
survey had a 75.5% response rate (NIOSH, 2003). A voluntary survey may not be representative
of all private industry respirator use patterns as some establishments with low or no respirator
Page 85 of 390
use could have chosen to not respond to the survey. Therefore, results of the survey could
potentially be biased towards higher respirator use. NIOSH and BLS estimated about 619,400
establishments used respirators for voluntary or required purposes (including emergency and
non-emergency uses). About 281,800 establishments (45%) were estimated to have had
respirator use for required purposes in the 12 months prior to the survey. The 281,800
establishments estimated to have had respirator use for required purposes were estimated to be
approximately 4.5% of all private industry establishments in the U.S. at the time (NIOSH, 2003).
Various surveys and studies indicated that the performance of respiratory protective equipment
programs varied across industry. In a more recent article, Bell et al. (2012) reported cross-
industry analysis for 20 companies, the majority representing small- or medium-sized
enterprises, across various sectors. Four distinct groups emerged from the 20 sites, ranging from
learners (low theoretical competence and practical control - 4 sites), developers (acceptable
theoretical competence and low practical control - 5 sites), and fortuitous (low theoretical
competence and acceptable practical control - two sites), to proficient (acceptable theoretical
competence and practical control - nine sites). None of the companies were achieving optimal
control using the respiratory protective equipment. Widespread inadequacies were found with
program implementation, particularly training, supervision, and maintenance. In a separate study,
the University of Pittsburgh, CDC, and RAND Corporation used the OSHA data base to examine
all inspections in manufacturing in 47 states from 1999 through 2006 (Mendeloff et al., 2013);
the examination starts with 1999 because an expanded OSHA respiratory program standard
became effective in late 1998. The article identified inspections and establishments at which
respiratory protection violations were cited, and it compares the prevalence of violations by
industry with the prevalence reported in the BLS survey of respirator use. The pattern of
noncompliance across industries mostly mirrored the survey findings about the prevalence of
requirements for respirator use. The probability of citing a respiratory protection violation was
similar across establishment size categories, except for a large drop for establishments with over
200 workers. The presence of a worker accompanying the inspector increased the probability that
a respiratory program violation could be cited; the presence of a union slightly decreased it.
Additional studies have recognized the needs of appropriate training and maintenance when
respirators are used. OSHA’s fatality reports from 1990 to 2012 were analyzed by Cowan et al.
(2017) to characterize historical trends in fatalities associated with respirators. Industry- and
time-specific trends were evaluated to determine the effect on respirator-related fatalities. Cowan
et al. (2017) reported 174 respirator related deaths, and 79% of the fatalities were associated with
asphyxia associated with improper employee use or lack of employer compliance.
Dermal Protection
Based on a hazard assessment, employers must also determine whether employees are exposed to
skin hazards (29 CFR Section 1910.132(d)). The Hand Protection section of OSHA’s Personal
Protective Equipment Standard (29 CFR Section 1910.138) indicates employers to select and
require workers to wear gloves to prevent exposure to harmful substances identified in the hazard
assessment. The gloves of appropriate material of chemical resistance are used to prevent
employee exposures to skin hazards. Employers base selection of gloves on the type of
hazardous chemical(s) encountered, conditions during use, tasks performed and factors that
affect performance and wear ability. Gloves, if proven chemically resistant, and if worn on clean
hands and replaced when contaminated or compromised, could provide employees with
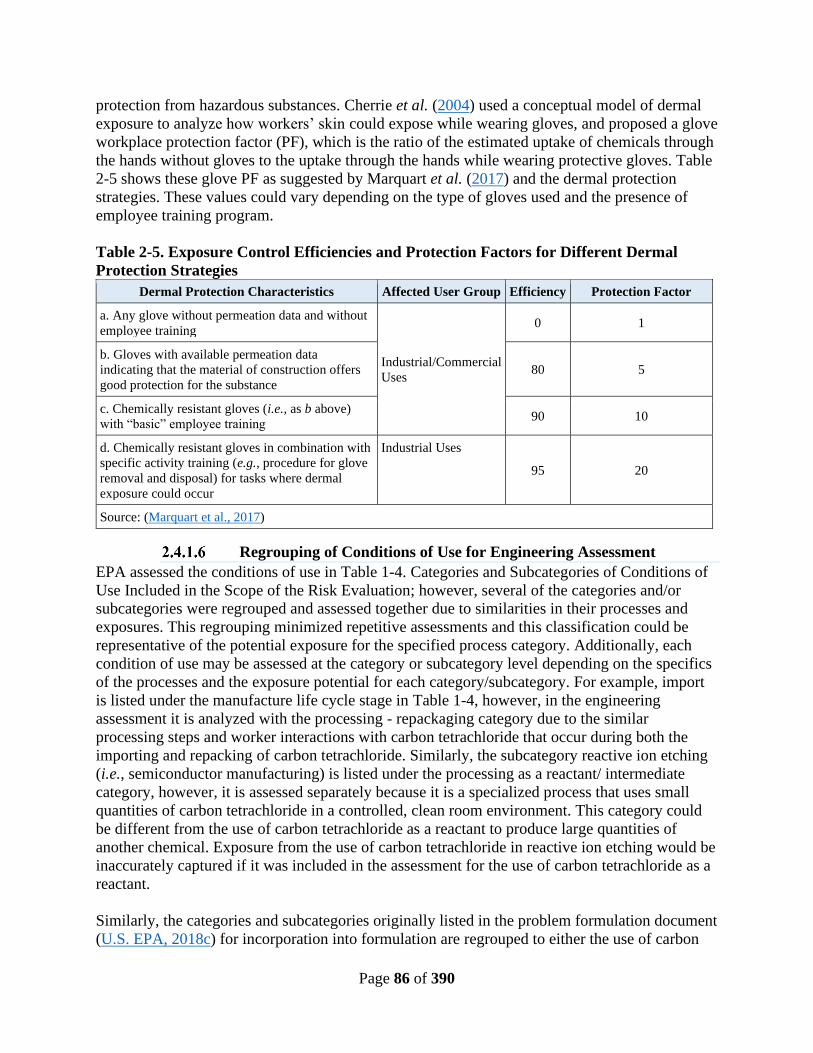
Page 86 of 390
protection from hazardous substances. Cherrie et al. (2004) used a conceptual model of dermal
exposure to analyze how workers’ skin could expose while wearing gloves, and proposed a glove
workplace protection factor (PF), which is the ratio of the estimated uptake of chemicals through
the hands without gloves to the uptake through the hands while wearing protective gloves. Table
2-5 shows these glove PF as suggested by Marquart et al. (2017) and the dermal protection
strategies. These values could vary depending on the type of gloves used and the presence of
employee training program.
Table 2-5. Exposure Control Efficiencies and Protection Factors for Different Dermal
Protection Strategies
Dermal Protection Characteristics Affected User Group Efficiency Protection Factor
a. Any glove without permeation data and without
employee training
Industrial/Commercial
Uses
0 1
b. Gloves with available permeation data
indicating that the material of construction offers
good protection for the substance
80 5
c. Chemically resistant gloves (i.e., as b above)
with “basic” employee training 90 10
d. Chemically resistant gloves in combination with
specific activity training (e.g., procedure for glove
removal and disposal) for tasks where dermal
exposure could occur
Industrial Uses
95 20
Source: (Marquart et al., 2017)
Regrouping of Conditions of Use for Engineering Assessment
EPA assessed the conditions of use in Table 1-4. Categories and Subcategories of Conditions of
Use Included in the Scope of the Risk Evaluation; however, several of the categories and/or
subcategories were regrouped and assessed together due to similarities in their processes and
exposures. This regrouping minimized repetitive assessments and this classification could be
representative of the potential exposure for the specified process category. Additionally, each
condition of use may be assessed at the category or subcategory level depending on the specifics
of the processes and the exposure potential for each category/subcategory. For example, import
is listed under the manufacture life cycle stage in Table 1-4, however, in the engineering
assessment it is analyzed with the processing - repackaging category due to the similar
processing steps and worker interactions with carbon tetrachloride that occur during both the
importing and repacking of carbon tetrachloride. Similarly, the subcategory reactive ion etching
(i.e., semiconductor manufacturing) is listed under the processing as a reactant/ intermediate
category, however, it is assessed separately because it is a specialized process that uses small
quantities of carbon tetrachloride in a controlled, clean room environment. This category could
be different from the use of carbon tetrachloride as a reactant to produce large quantities of
another chemical. Exposure from the use of carbon tetrachloride in reactive ion etching would be
inaccurately captured if it was included in the assessment for the use of carbon tetrachloride as a
reactant.
Similarly, the categories and subcategories originally listed in the problem formulation document
(U.S. EPA, 2018c) for incorporation into formulation are regrouped to either the use of carbon

Page 87 of 390
tetrachloride as a reactant to manufacturing a chlorinated compound that is subsequently
formulated into a product or as a processing aid/agent used to aid in the manufacture of
formulated products (agricultural chemicals, petrochemicals-derived products, and any other
basic organic and inorganic chemical manufacturing). The former case (i.e., reactant used
upstream in manufacturing of formulated product) is evaluated in the reactant section and the
latter (i.e., processing aid/agent in manufacturing of formulated products) in the processing aid
section.
A crosswalk of all the conditions of use listed in Table 1-4 to the conditions of use assessed for
occupational exposures is provided in Table 2-6 below.
Table 2-6. Crosswalk of Subcategories of Use Listed in Table 1-4 and the Sections
Assessed for Occupational Exposure
Life Cycle Stage
Category
Reported in
Table 1-4
Subcategory
Reported in
Table 1-410
Category in Current
Engineering Assessment
Manufacture Domestic
manufacture
Domestic
manufacture
Domestic Manufacturing
(Section 2.4.1.7.1)
Import Import
Import and Repackaging
(Section 2.4.1.7.2)
Processing
Processing as a
reactant/
intermediate
Hydrochlorofluorocar
bons (HCFCs),
Hydrofluorocarbon
(HFCs) and
Hydrofluoroolefin
(HFOs)
Processing as a Reactant or
Intermediate (Section 2.4.1.7.3)
Perchloroethylene
(PCE)
Reactive ion etching
(i.e., semiconductor
manufacturing)
Reactive Ion Etching (Section
2.4.1.7.5)
Incorporation
into
Formulation,
Mixture or
Reaction
products
Petrochemicals-
derived
manufacturing;
Agricultural products
manufacturing; Other
basic organic and
inorganic chemical
manufacturing.
Industrial Processing Agent/Aid
(Section 2.4.1.7.6)
Additive (Section 2.4.1.7.7)
Processing as a Reactant or
Intermediate (Section 2.4.1.7.3)
10 These subcategories reflect more specific uses of carbon tetrachloride.
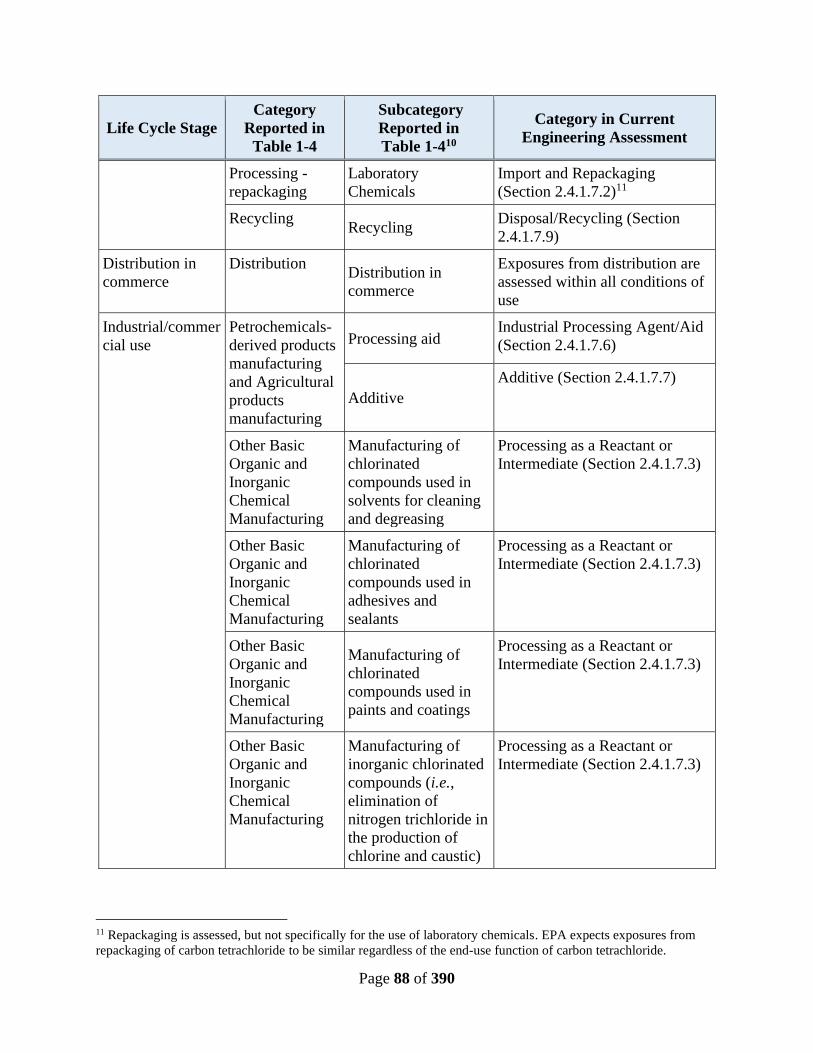
Page 88 of 390
Life Cycle Stage
Category
Reported in
Table 1-4
Subcategory
Reported in
Table 1-410
Category in Current
Engineering Assessment
Processing -
repackaging
Laboratory
Chemicals
Import and Repackaging
(Section 2.4.1.7.2)11
Recycling Recycling
Disposal/Recycling (Section
2.4.1.7.9)
Distribution in
commerce
Distribution Distribution in
commerce
Exposures from distribution are
assessed within all conditions of
use
Industrial/commer
cial use
Petrochemicals-
derived products
manufacturing
and Agricultural
products
manufacturing
Processing aid Industrial Processing Agent/Aid
(Section 2.4.1.7.6)
Additive
Additive (Section 2.4.1.7.7)
Other Basic
Organic and
Inorganic
Chemical
Manufacturing
Manufacturing of
chlorinated
compounds used in
solvents for cleaning
and degreasing
Processing as a Reactant or
Intermediate (Section 2.4.1.7.3)
Other Basic
Organic and
Inorganic
Chemical
Manufacturing
Manufacturing of
chlorinated
compounds used in
adhesives and
sealants
Processing as a Reactant or
Intermediate (Section 2.4.1.7.3)
Other Basic
Organic and
Inorganic
Chemical
Manufacturing
Manufacturing of
chlorinated
compounds used in
paints and coatings
Processing as a Reactant or
Intermediate (Section 2.4.1.7.3)
Other Basic
Organic and
Inorganic
Chemical
Manufacturing
Manufacturing of
inorganic chlorinated
compounds (i.e.,
elimination of
nitrogen trichloride in
the production of
chlorine and caustic)
Processing as a Reactant or
Intermediate (Section 2.4.1.7.3)
11 Repackaging is assessed, but not specifically for the use of laboratory chemicals. EPA expects exposures from
repackaging of carbon tetrachloride to be similar regardless of the end-use function of carbon tetrachloride.

Page 89 of 390
Life Cycle Stage
Category
Reported in
Table 1-4
Subcategory
Reported in
Table 1-410
Category in Current
Engineering Assessment
Other Basic
Organic and
Inorganic
Chemical
Manufacturing
Manufacturing of
chlorinated
compounds used in
asphalt
Processing as a Reactant or
Intermediate (Section 2.4.1.7.3)
Other uses
Processing aid (i.e.,
metal recovery).
Industrial Processing Agent/Aid
(Section 2.4.1.7.6)
Specialty uses (i.e.,
DoD uses)
Specialty Uses – DoD Data
(Section 2.4.1.7.4)
Laboratory
chemicals Laboratory chemical
Laboratory Chemicals (Section
2.4.1.7.8)
Disposal Disposal Industrial pre-
treatment
Disposal/Recycling (Section
2.4.1.7.9)12
Industrial wastewater
treatment
Publicly owned
treatment works
(POTW)
Underground
injection
Municipal landfill
Hazardous landfill
Other land disposal
Municipal waste
incinerator
Hazardous waste
incinerator
Off-site waste
transfer
12 Each of the conditions of use of carbon tetrachloride may generate waste streams of the chemical that are
collected and transported to third-party sites for disposal, treatment, or recycling. Industrial sites that treat, dispose,
or directly discharge onsite wastes that they themselves generate are assessed in each condition of use assessment.
This Section only assesses wastes of carbon tetrachloride that are generated during a condition of use and sent to a
third-party site for treatment, disposal, or recycling.

Page 90 of 390
The following Sections contain process descriptions and the specific details (worker activities,
analysis for determining number of workers, and exposure assessment approach and results) for
the assessment of the regrouped conditions of use, and provide a summary of the engineering
assessments focusing on results. Additional details on how EPA arrived at the results can be
found in the supplemental Final Risk Evaluation for Carbon Tetrachloride, Supplemental
Information on Releases and Occupational Exposure Assessment (U.S. EPA, 2019c).
Inhalation Exposure Assessment
The following sections present inhalation exposure estimates for each condition of use.
2.4.1.7.1 Domestic Manufacturing
Process Description
Currently, most carbon tetrachloride is manufactured using one of three methods:
1. Chlorination of Hydrocarbons or Chlorinated Hydrocarbons
2. Oxychlorination of Hydrocarbons
3. CS2 Chlorination (Holbrook, 2000)
EPA assessed the import of carbon tetrachloride separate from domestic manufacturing (see
2.4.1.7.2) in order to account for differences in the expected industrial operations and the
associated worker activities which would otherwise be inaccurately captured if included in this
scenario.
Worker Activities
Worker activities at manufacturing facilities may involve manually adding raw materials or
connecting/disconnecting transfer lines used to unload containers into storage or reaction vessels,
rinsing/cleaning containers and/or process equipment, collecting and analyzing quality control
(QC) samples, manually loading carbon tetrachloride product, or connecting/disconnecting
transfer lines used to load carbon tetrachloride product into containers.
ONUs for manufacturing include supervisors, managers, and tradesmen that may be in the same
area as exposure sources but may not perform tasks that result in the same level of exposures as
workers. The presence and activities of the worker or ONUs near/far away from the source or the
performance of ventilation units could have a considerable influence on the flow field around the
person and thus on the dispersion of the chemical from the source to the breathing zone.
Number of Workers and Occupational Non-Users
The CDR Rule under TSCA (40 CFR Part 711) requires that U.S. manufacturers and importers
provide EPA with information on chemicals they manufacture (including imports). For the 2016
CDR cycle, data collected for each chemical include the company name, volume of each
chemical manufactured/imported, the number of workers employed at each site, and information
on whether the chemical is used in the commercial, industrial, and/or consumer sector. Based on
activity information reported in the 2016 CDR and 2016 TRI, EPA identified seven sites that
domestically manufacture carbon tetrachloride.
To determine the total number of workers and ONUs, EPA used the reported number of workers
range from each CDR entry. Since a range is presented in CDR, EPA determined a low-end and
high-end of number of exposed workers and ONUs. Six sites reported 100 to 500 workers and
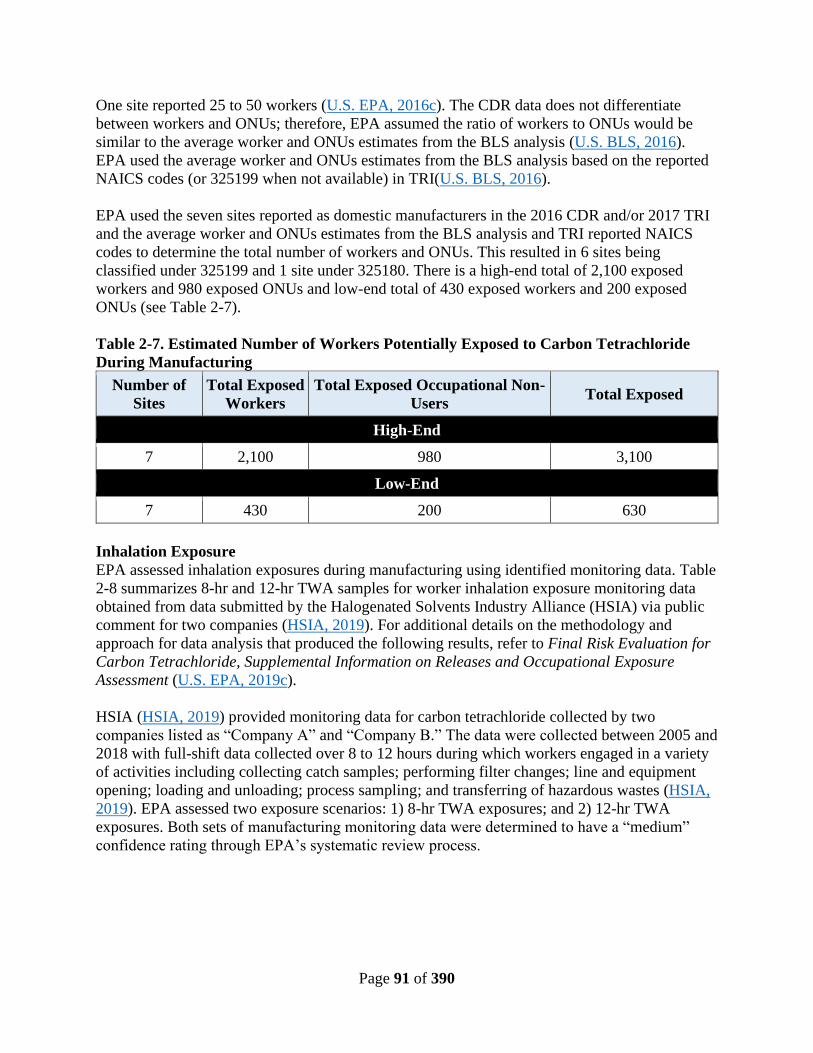
Page 91 of 390
One site reported 25 to 50 workers (U.S. EPA, 2016c). The CDR data does not differentiate
between workers and ONUs; therefore, EPA assumed the ratio of workers to ONUs would be
similar to the average worker and ONUs estimates from the BLS analysis (U.S. BLS, 2016).
EPA used the average worker and ONUs estimates from the BLS analysis based on the reported
NAICS codes (or 325199 when not available) in TRI(U.S. BLS, 2016).
EPA used the seven sites reported as domestic manufacturers in the 2016 CDR and/or 2017 TRI
and the average worker and ONUs estimates from the BLS analysis and TRI reported NAICS
codes to determine the total number of workers and ONUs. This resulted in 6 sites being
classified under 325199 and 1 site under 325180. There is a high-end total of 2,100 exposed
workers and 980 exposed ONUs and low-end total of 430 exposed workers and 200 exposed
ONUs (see Table 2-7).
Table 2-7. Estimated Number of Workers Potentially Exposed to Carbon Tetrachloride
During Manufacturing
Number of
Sites
Total Exposed
Workers
Total Exposed Occupational Non-
Users Total Exposed
High-End
7 2,100 980 3,100
Low-End
7 430 200 630
Inhalation Exposure
EPA assessed inhalation exposures during manufacturing using identified monitoring data. Table
2-8 summarizes 8-hr and 12-hr TWA samples for worker inhalation exposure monitoring data
obtained from data submitted by the Halogenated Solvents Industry Alliance (HSIA) via public
comment for two companies (HSIA, 2019). For additional details on the methodology and
approach for data analysis that produced the following results, refer to Final Risk Evaluation for
Carbon Tetrachloride, Supplemental Information on Releases and Occupational Exposure
Assessment (U.S. EPA, 2019c).
HSIA (HSIA, 2019) provided monitoring data for carbon tetrachloride collected by two
companies listed as “Company A” and “Company B.” The data were collected between 2005 and
2018 with full-shift data collected over 8 to 12 hours during which workers engaged in a variety
of activities including collecting catch samples; performing filter changes; line and equipment
opening; loading and unloading; process sampling; and transferring of hazardous wastes (HSIA,
2019). EPA assessed two exposure scenarios: 1) 8-hr TWA exposures; and 2) 12-hr TWA
exposures. Both sets of manufacturing monitoring data were determined to have a “medium”
confidence rating through EPA’s systematic review process.

Page 92 of 390
Table 2-8. Summary of Worker Inhalation Exposure Monitoring Data for Manufacture of
Carbon Tetrachloride
Exposure
Calculation
Number of
Samples
Central Tendency
(mg/m3)
High-End
(mg/m3)
Confidence Rating of Associated Air
Concentration Data
8-hr TWA Results for Company A and B
Full-Shift TWA
113
0.76 4.0
Medium AC 0.76 4.0
ADC 0.76 4.0
LADC 0.069 0.47
12-hr TWA Results for Company A and B
Full-Shift TWA
243
0.50 4.8
Medium AC 0.50 4.8
ADC 0.50 4.8
LADC 0.069 0.85
Equations and parameters for calculation of the ADC and LADC are described in supplemental document Final Risk
Evaluation for Carbon Tetrachloride, Supplemental Information on Releases and Occupational Exposure
Assessment.
Additional information was submitted by HSIA to specify that some of the originally submitted
HSIA data were for ONU exposure (HSIA, 2019). EPA incorporated the additional information
and used it to evaluate ONU exposure during manufacture of carbon tetrachloride. Table 2-9.
summarizes 8-hr and 12-hr TWA samples for ONU inhalation exposure monitoring data
obtained from data submitted by the Halogenated Solvents Industry Alliance (HSIA) via public
comment for two companies (HSIA, 2019).
Table 2-9. Summary of ONU Inhalation Exposure Monitoring Data for Manufacture of
Carbon Tetrachloride
Exposure
Calculation
Number of
Samples
Central Tendency
(mg/m3)
High-End
(mg/m3)
Confidence Rating of Associated Air
Concentration Data
8-hr TWA Results
Full-Shift TWA
14
0.50 1.0
Medium AC 0.50 1.0
ADC 0.50 1.0
LADC 0.046 0.12
12-hr TWA Results
Full-Shift TWA
3
0.66 1.3
Medium AC 0.66 1.3
ADC 0.66 1.3
LADC 0.090 0.23
Equations and parameters for calculation of the ADC and LADC are described in supplemental document Final Risk
Evaluation for Carbon Tetrachloride, Supplemental Information on Releases and Occupational Exposure
Assessment
Page 93 of 390
2.4.1.7.2 Import and Repackaging
Domestic production and importation of carbon tetrachloride is currently prohibited under
regulations implementing the Montreal Protocol (MP) and CAA Title VI, except when
transformed (used and entirely consumed, except for trace quantities, in the manufacture of other
chemicals for commercial purposes), destroyed (including destruction after use as a catalyst or
stabilizer), or used for essential laboratory and analytical uses. (40 CFR Part 82, 60 FR 24970,
24971 (May 10, 1995)). Therefore, once imported or manufactured, carbon tetrachloride will be
handled again either on-site or by another facility for the identified uses described in detail in the
following Sections.
The import and repackaging scenarios cover only those sites that purchase carbon tetrachloride
from domestic and/or foreign suppliers and repackage the carbon tetrachloride from bulk
containers into smaller containers for resale (i.e., laboratory chemicals). It does not include sites
that import carbon tetrachloride and either: (1) store the chemical in a warehouse and resell
directly without repackaging; (2) act as the importer of record for carbon tetrachloride but carbon
tetrachloride is never present at the site13; or (3) import the chemical and process or use the
chemical directly at the site. In (1), there is little or negligible opportunity for exposures or
releases as the containers are never opened. In (2), the potential for exposure and release is at the
site receiving carbon tetrachloride, not the “import” site and exposures/releases at the site
receiving carbon tetrachloride are assessed in the relevant scenario based on the condition of use
for carbon tetrachloride at the site. Similarly, in (3), the potential for exposure and release at
these sites are evaluated in the relevant scenario depending on the condition of use for carbon
tetrachloride at the site.
Process Description
EPA assessed the import and repackaging of carbon tetrachloride together because both uses
share similar operations and worker activities that are expected to result in similar exposures.
In general, commodity chemicals are imported into the United States in bulk via water, air, land,
and intermodal shipments (Tomer and Kane, 2015). These shipments take the form of
oceangoing chemical tankers, railcars, tank trucks, and intermodal tank containers. Chemicals
shipped in bulk containers may be repackaged into smaller containers for resale, such as drums
or bottles. Domestically manufactured commodity chemicals may be shipped within the United
States in liquid cargo barges, railcars, tank trucks, tank containers, intermediate bulk containers
(IBCs)/totes, and drums. Both import and domestically manufactured commodity chemicals may
be repackaged by wholesalers for resale; for example, repackaging bulk packaging into drums or
bottles.
For this risk evaluation, EPA assesses the repackaging of carbon tetrachloride from bulk
packaging to drums and bottles at wholesale repackaging sites (see Figure 2-1).
13 In CDR, the reporting site is the importer of record which could be a corporate site or other entity that facilitates
the import of the chemical but never actually receives the chemical. The chemical could be shipped directly to the
site for processing or handling the chemical.

Page 94 of 390
Not to scale.
Figure 2-1. General Process Flow Diagram for Import and Repackaging
Worker Activities
Based on EPA’s knowledge of the chemical industry, worker activities at import and
repackaging sites are potentially exposed while connecting and disconnecting hoses and transfer
lines to containers and packaging to be unloaded (e.g., railcars, tank trucks, totes), intermediate
storage vessels (e.g., storage tanks, pressure vessels), analyzing QC samples, and final packaging
containers (e.g., drums, bottles).
ONUs for repackaging include supervisors, managers, and tradesmen that may be in the
repackaging area but do not perform tasks that result in the same level of exposures as
repackaging workers.
Number of Workers and Occupational Non-Users
Upon review of CDR data, EPA determined one import site. None of the CDR submissions
reported a repackaging activity in the industrial processing and use section. The number of
potentially exposed workers was estimated based on data from the BLS for NAICS code 424690
(U.S. BLS, 2016; U.S. Census Bureau, 2015).
In the 2017 TRI data (U.S. EPA, 2018e), one submission reported an import activity and one
submission reported a repackaging activity. The site reporting import in the 2017 TRI also
reported use of carbon tetrachloride as a processing aid and is included in the assessment of use
of carbon tetrachloride as a processing aid. The TRI entry marked for repackaging has primary
NAICS code 562211, Hazardous Waste Treatment and Disposal, and is most likely a waste
disposal facility so it is included in the waste handling/recycling assessment.
Based on the information reported in the 2016 CDR and 2017 TRI, EPA assesses one possible
import/repackaging site for carbon tetrachloride (U.S. EPA, 2017f, 2016c). EPA identified the
NAICS code 424690, Other Chemical and Allied Products Merchant Wholesalers, as the code
could include sites importing and repackaging carbon tetrachloride. EPA assesses the number of
potentially exposed workers based on data from the BLS for NAICS code 424690 and related
SOC codes. There is a total of one potentially exposed workers and one ONU for sites under this
NAICS code (see Table 2-10) (U.S. BLS, 2016; U.S. Census Bureau, 2015).
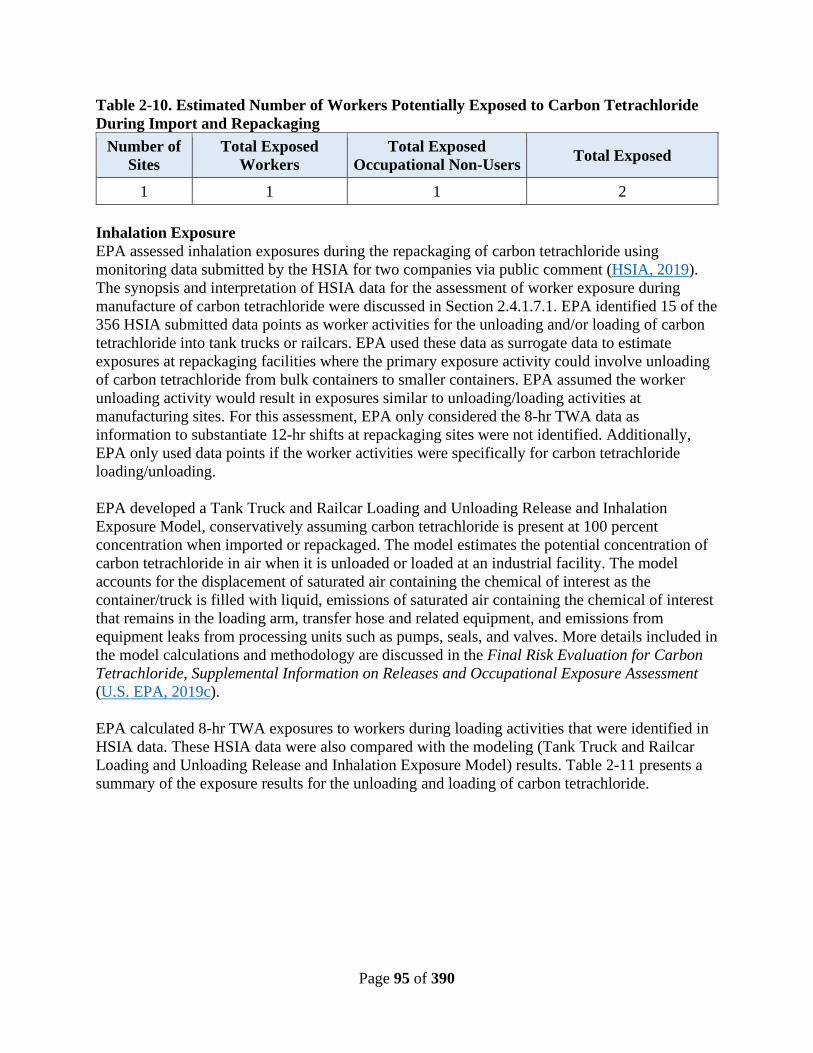
Page 95 of 390
Table 2-10. Estimated Number of Workers Potentially Exposed to Carbon Tetrachloride
During Import and Repackaging
Number of
Sites
Total Exposed
Workers
Total Exposed
Occupational Non-Users Total Exposed
1 1 1 2
Inhalation Exposure
EPA assessed inhalation exposures during the repackaging of carbon tetrachloride using
monitoring data submitted by the HSIA for two companies via public comment (HSIA, 2019).
The synopsis and interpretation of HSIA data for the assessment of worker exposure during
manufacture of carbon tetrachloride were discussed in Section 2.4.1.7.1. EPA identified 15 of the
356 HSIA submitted data points as worker activities for the unloading and/or loading of carbon
tetrachloride into tank trucks or railcars. EPA used these data as surrogate data to estimate
exposures at repackaging facilities where the primary exposure activity could involve unloading
of carbon tetrachloride from bulk containers to smaller containers. EPA assumed the worker
unloading activity would result in exposures similar to unloading/loading activities at
manufacturing sites. For this assessment, EPA only considered the 8-hr TWA data as
information to substantiate 12-hr shifts at repackaging sites were not identified. Additionally,
EPA only used data points if the worker activities were specifically for carbon tetrachloride
loading/unloading.
EPA developed a Tank Truck and Railcar Loading and Unloading Release and Inhalation
Exposure Model, conservatively assuming carbon tetrachloride is present at 100 percent
concentration when imported or repackaged. The model estimates the potential concentration of
carbon tetrachloride in air when it is unloaded or loaded at an industrial facility. The model
accounts for the displacement of saturated air containing the chemical of interest as the
container/truck is filled with liquid, emissions of saturated air containing the chemical of interest
that remains in the loading arm, transfer hose and related equipment, and emissions from
equipment leaks from processing units such as pumps, seals, and valves. More details included in
the model calculations and methodology are discussed in the Final Risk Evaluation for Carbon
Tetrachloride, Supplemental Information on Releases and Occupational Exposure Assessment
(U.S. EPA, 2019c).
EPA calculated 8-hr TWA exposures to workers during loading activities that were identified in
HSIA data. These HSIA data were also compared with the modeling (Tank Truck and Railcar
Loading and Unloading Release and Inhalation Exposure Model) results. Table 2-11 presents a
summary of the exposure results for the unloading and loading of carbon tetrachloride.
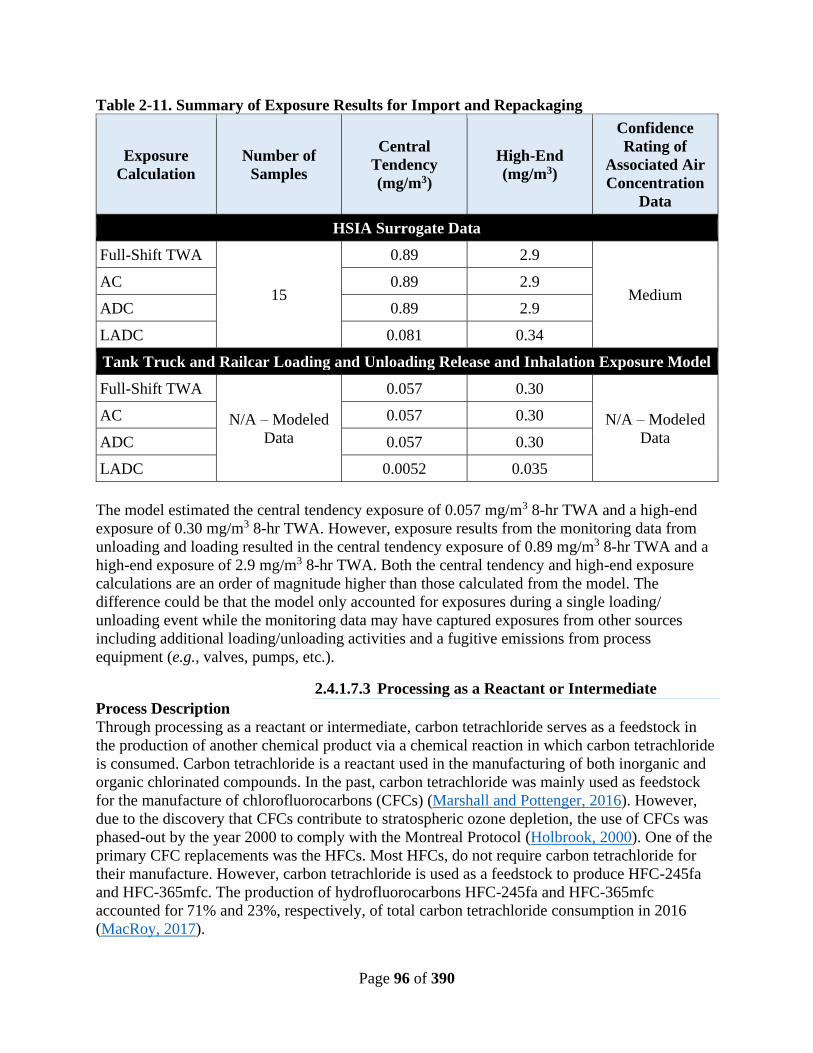
Page 96 of 390
Table 2-11. Summary of Exposure Results for Import and Repackaging
Exposure
Calculation
Number of
Samples
Central
Tendency
(mg/m3)
High-End
(mg/m3)
Confidence
Rating of
Associated Air
Concentration
Data
HSIA Surrogate Data
Full-Shift TWA
15
0.89 2.9
Medium AC 0.89 2.9
ADC 0.89 2.9
LADC 0.081 0.34
Tank Truck and Railcar Loading and Unloading Release and Inhalation Exposure Model
Full-Shift TWA
N/A – Modeled
Data
0.057 0.30
N/A – Modeled
Data
AC 0.057 0.30
ADC 0.057 0.30
LADC 0.0052 0.035
The model estimated the central tendency exposure of 0.057 mg/m3 8-hr TWA and a high-end
exposure of 0.30 mg/m3 8-hr TWA. However, exposure results from the monitoring data from
unloading and loading resulted in the central tendency exposure of 0.89 mg/m3 8-hr TWA and a
high-end exposure of 2.9 mg/m3 8-hr TWA. Both the central tendency and high-end exposure
calculations are an order of magnitude higher than those calculated from the model. The
difference could be that the model only accounted for exposures during a single loading/
unloading event while the monitoring data may have captured exposures from other sources
including additional loading/unloading activities and a fugitive emissions from process
equipment (e.g., valves, pumps, etc.).
2.4.1.7.3 Processing as a Reactant or Intermediate
Process Description
Through processing as a reactant or intermediate, carbon tetrachloride serves as a feedstock in
the production of another chemical product via a chemical reaction in which carbon tetrachloride
is consumed. Carbon tetrachloride is a reactant used in the manufacturing of both inorganic and
organic chlorinated compounds. In the past, carbon tetrachloride was mainly used as feedstock
for the manufacture of chlorofluorocarbons (CFCs) (Marshall and Pottenger, 2016). However,
due to the discovery that CFCs contribute to stratospheric ozone depletion, the use of CFCs was
phased-out by the year 2000 to comply with the Montreal Protocol (Holbrook, 2000). One of the
primary CFC replacements was the HFCs. Most HFCs, do not require carbon tetrachloride for
their manufacture. However, carbon tetrachloride is used as a feedstock to produce HFC-245fa
and HFC-365mfc. The production of hydrofluorocarbons HFC-245fa and HFC-365mfc
accounted for 71% and 23%, respectively, of total carbon tetrachloride consumption in 2016
(MacRoy, 2017).

Page 97 of 390
Currently, carbon tetrachloride is used as a reactant to manufacture a variety of chlorinated
compounds including:
• HCFCs
• HFCs
• Hydrofluoroolefins (HFO)s
• Vinyl Chloride
• Ethylene Dichloride (EDC)
• Perchloroethylene (PCE)
• Chloroform
• Hafnium Tetrachloride
• Thiophosgene
• Methylene Chloride (Krock, 2017; U.S. EPA, 2017d; Marshall and Pottenger,
2016; Weil et al., 2006; Holbrook, 2003).
The listed chlorinated compounds may then be used in solvents for cleaning and degreasing,
adhesives and sealants, paints and coatings, and asphalt.
Worker Activities
Similar to when manufacturing carbon tetrachloride, workers are potentially exposed while
connecting and disconnecting hoses and transfer lines to containers and packaging to be
unloaded (e.g., railcars, tank trucks, totes) and manually adding raw materials into intermediate
storage vessels (e.g., storage tanks, pressure vessels) when processing carbon tetrachloride as a
reactant.
ONUs for processing as a reactant include supervisors, managers, and tradesmen that may be in
the same area as exposure sources but do not perform tasks that result in the same level of
exposures as workers.
Number of Workers and Occupational Non-Users
The number of workers and occupational non-users potentially exposed to carbon tetrachloride at
sites processing carbon tetrachloride as a reactant were assessed using 2016 CDR data, 2017 TRI
data, BLS Data and SUSB Data. From the 2016 CDR data, seven submitters reported eight
records of processing carbon tetrachloride as a reactant with each record reporting fewer than 10
sites that process carbon tetrachloride as a reactant. However, five of the eight CDR records are
also reported manufacture locations of carbon tetrachloride. EPA assessed these five records
among the manufacturing Section (Section 2.4.1.7.1). EPA assesses the remaining three reports
from CDR in this Section. Upon review of 2017 TRI, EPA found eight sites reported using
carbon tetrachloride as a reactant (U.S. EPA, 2017f), and five of these sites are reported
manufacturers of carbon tetrachloride in CDR. This falls within the range reported for number of
sites from the 2016 CDR. EPA assessed three of the listed TRI submissions that use carbon
tetrachloride as a reactant. Between CDR and TRI, EPA assessed a range of six to thirty sites.
To determine the high-end total number of workers and ONUs, EPA used the high-end of ranges
reported for number of sites (nine sites) in the three 2016 CDR reports. The CDR data does not
differentiate between workers and ONUs; therefore, EPA considered that the ratio of workers to
ONUs could be similar as determined by NAICS code in the BLS data (U.S. BLS, 2016; U.S.
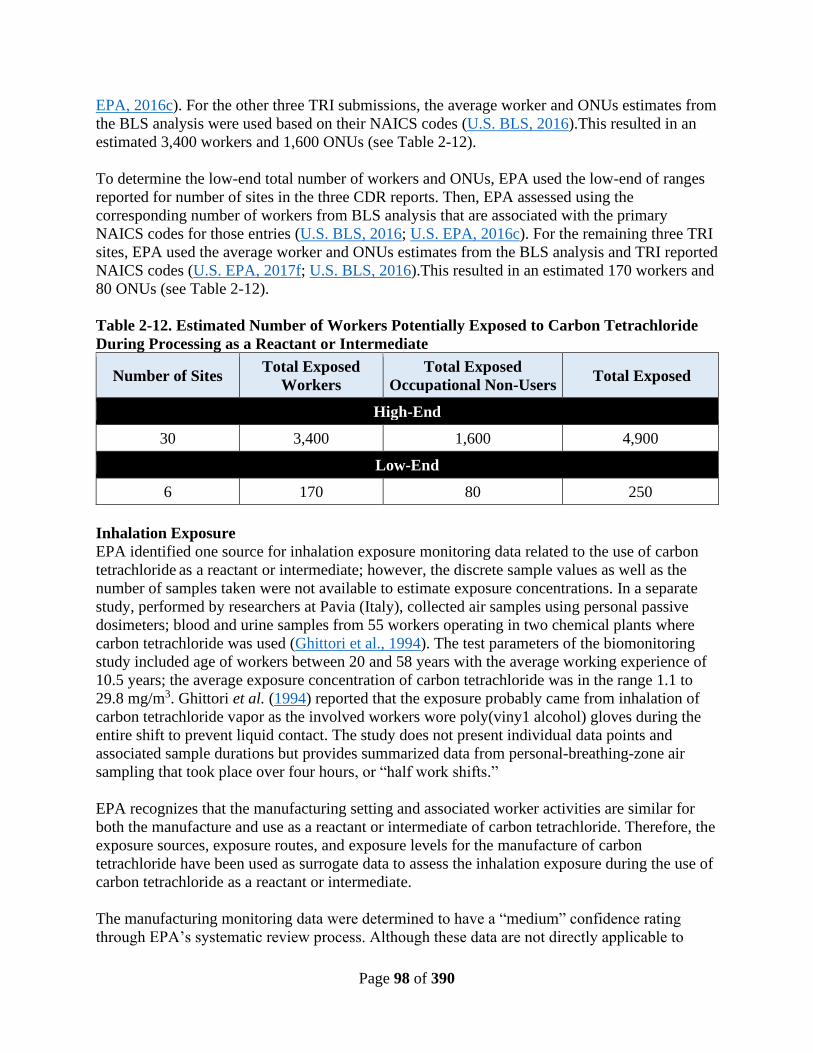
Page 98 of 390
EPA, 2016c). For the other three TRI submissions, the average worker and ONUs estimates from
the BLS analysis were used based on their NAICS codes (U.S. BLS, 2016).This resulted in an
estimated 3,400 workers and 1,600 ONUs (see Table 2-12).
To determine the low-end total number of workers and ONUs, EPA used the low-end of ranges
reported for number of sites in the three CDR reports. Then, EPA assessed using the
corresponding number of workers from BLS analysis that are associated with the primary
NAICS codes for those entries (U.S. BLS, 2016; U.S. EPA, 2016c). For the remaining three TRI
sites, EPA used the average worker and ONUs estimates from the BLS analysis and TRI reported
NAICS codes (U.S. EPA, 2017f; U.S. BLS, 2016).This resulted in an estimated 170 workers and
80 ONUs (see Table 2-12).
Table 2-12. Estimated Number of Workers Potentially Exposed to Carbon Tetrachloride
During Processing as a Reactant or Intermediate
Number of Sites Total Exposed
Workers
Total Exposed
Occupational Non-Users Total Exposed
High-End
30 3,400 1,600 4,900
Low-End
6 170 80 250
Inhalation Exposure
EPA identified one source for inhalation exposure monitoring data related to the use of carbon
tetrachloride as a reactant or intermediate; however, the discrete sample values as well as the
number of samples taken were not available to estimate exposure concentrations. In a separate
study, performed by researchers at Pavia (Italy), collected air samples using personal passive
dosimeters; blood and urine samples from 55 workers operating in two chemical plants where
carbon tetrachloride was used (Ghittori et al., 1994). The test parameters of the biomonitoring
study included age of workers between 20 and 58 years with the average working experience of
10.5 years; the average exposure concentration of carbon tetrachloride was in the range 1.1 to
29.8 mg/m3. Ghittori et al. (1994) reported that the exposure probably came from inhalation of
carbon tetrachloride vapor as the involved workers wore poly(viny1 alcohol) gloves during the
entire shift to prevent liquid contact. The study does not present individual data points and
associated sample durations but provides summarized data from personal-breathing-zone air
sampling that took place over four hours, or “half work shifts.”
EPA recognizes that the manufacturing setting and associated worker activities are similar for
both the manufacture and use as a reactant or intermediate of carbon tetrachloride. Therefore, the
exposure sources, exposure routes, and exposure levels for the manufacture of carbon
tetrachloride have been used as surrogate data to assess the inhalation exposure during the use of
carbon tetrachloride as a reactant or intermediate.
The manufacturing monitoring data were determined to have a “medium” confidence rating
through EPA’s systematic review process. Although these data are not directly applicable to

Page 99 of 390
processing of carbon tetrachloride as a reactant, EPA expects a high degree of overlap of worker
tasks at both manufacturing sites and sites processing carbon tetrachloride as a reactant. Based
on this expectation and the strength of the monitoring data, EPA has a medium to high level of
confidence in the assessed exposures. See Section 2.4.1.7.2 for the assessment of worker
exposure from chemical manufacturing activities.
2.4.1.7.4 Specialty Uses - Department of Defense Data
EPA reached out to the Department of Defense (DoD) for monitoring data for the first 10
chemical substances. The DoD provided monitoring data from its Defense Occupational and
Environmental Health Readiness System – Industrial Hygiene (DOEHRS-IH), which collects
occupational and environmental health risk data from each service branch. The DoD provided
inhalation monitoring data for three branches of the military: The Army, Air Force, and Navy
(Defense Occupational and Environmental Health Readiness System - Industrial Hygiene
(DOEHRS-IH), 2018). The composite DoD data do not identify whether they are specifically
used by the Army, Air Force, and Navy.
The following subsections provide an overview of the DoD data. EPA only used the Open
Burn/Open Detonation (OBOD) clean-up data in this assessment as these were the only data
EPA could use to assess 8-hr TWA exposures. The sampling results for the remaining six
processes were measured over a period less than 50 percent of the duration of the process (or an
8-hr shift if the process duration was not specified). No extrapolation of data was performed to
estimate 8-hr TWA exposure using those data that were sampled only a fraction of the process
time (or an 8-hr shift).
Data Overview
The data provided by DoD includes 105 data points for carbon tetrachloride from personal
breathing zone samples taken during seven processes:
1. OBOD Clean-Up
2. Detonation Chamber
3. Mobile Detonation Test Facility
4. Plastics/Modeling (Thermoforming)
5. Solvent Extraction of Explosive Samples
6. Glue Sound Dampening Material to Torpedo Body
7. Spray Painting – High Volume, Low Pressure (HVLP) Spray Gun
The personal breathing zone samples for the DoD activities are summarized in Table 2-13. All
sample results are indicated as less than a value, which is considered to be the limit of detection
(LOD). The DoD data stated that all workers monitored worked an 8-hr shift. For some
processes, the DoD data do not provide the process duration.
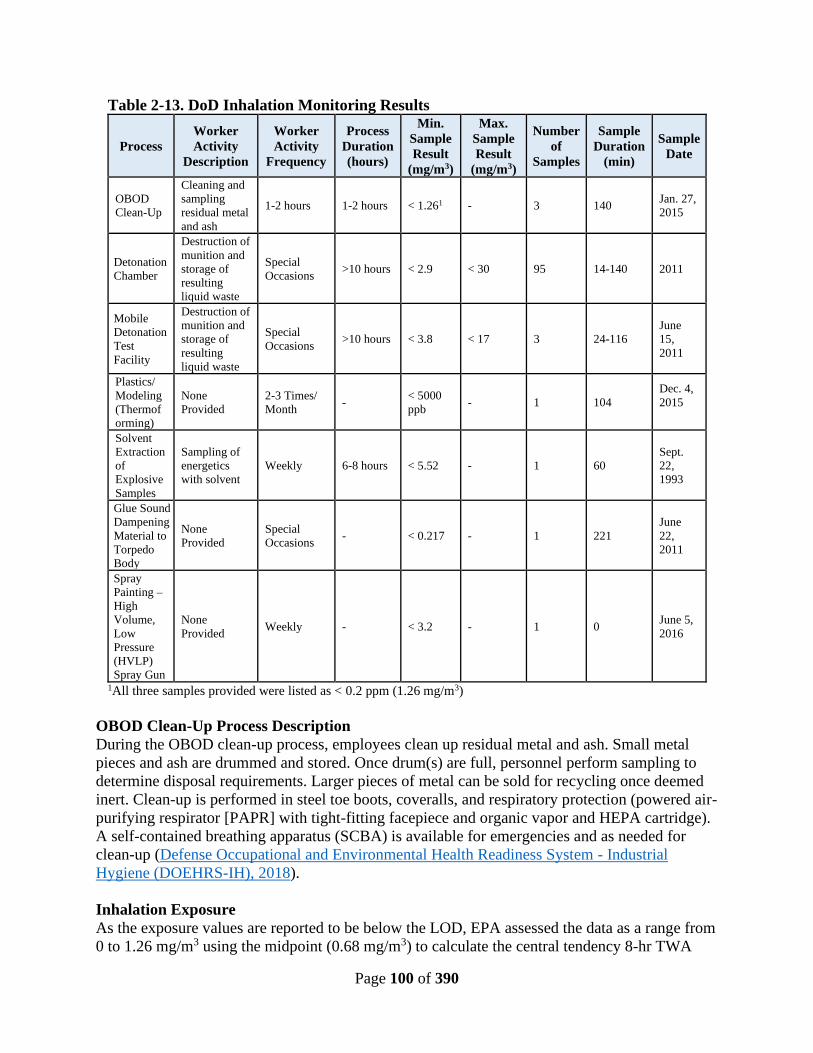
Page 100 of 390
Table 2-13. DoD Inhalation Monitoring Results
Process
Worker
Activity
Description
Worker
Activity
Frequency
Process
Duration
(hours)
Min.
Sample
Result
(mg/m3)
Max.
Sample
Result
(mg/m3)
Number
of
Samples
Sample
Duration
(min)
Sample
Date
OBOD
Clean-Up
Cleaning and
sampling
residual metal
and ash
1-2 hours 1-2 hours < 1.261 - 3 140 Jan. 27,
2015
Detonation
Chamber
Destruction of
munition and
storage of
resulting
liquid waste
Special
Occasions >10 hours < 2.9 < 30 95 14-140 2011
Mobile
Detonation
Test
Facility
Destruction of
munition and
storage of
resulting
liquid waste
Special
Occasions >10 hours < 3.8 < 17 3 24-116
June
15,
2011
Plastics/
Modeling
(Thermof
orming)
None
Provided
2-3 Times/
Month -
< 5000
ppb - 1 104
Dec. 4,
2015
Solvent
Extraction
of
Explosive
Samples
Sampling of
energetics
with solvent
Weekly 6-8 hours < 5.52 - 1 60
Sept.
22,
1993
Glue Sound
Dampening
Material to
Torpedo
Body
None
Provided
Special
Occasions - < 0.217 - 1 221
June
22,
2011
Spray
Painting –
High
Volume,
Low
Pressure
(HVLP)
Spray Gun
None
Provided Weekly - < 3.2 - 1 0
June 5,
2016
1All three samples provided were listed as < 0.2 ppm (1.26 mg/m3)
OBOD Clean-Up Process Description
During the OBOD clean-up process, employees clean up residual metal and ash. Small metal
pieces and ash are drummed and stored. Once drum(s) are full, personnel perform sampling to
determine disposal requirements. Larger pieces of metal can be sold for recycling once deemed
inert. Clean-up is performed in steel toe boots, coveralls, and respiratory protection (powered air-
purifying respirator [PAPR] with tight-fitting facepiece and organic vapor and HEPA cartridge).
A self-contained breathing apparatus (SCBA) is available for emergencies and as needed for
clean-up (Defense Occupational and Environmental Health Readiness System - Industrial
Hygiene (DOEHRS-IH), 2018).
Inhalation Exposure
As the exposure values are reported to be below the LOD, EPA assessed the data as a range from
0 to 1.26 mg/m3 using the midpoint (0.68 mg/m3) to calculate the central tendency 8-hr TWA
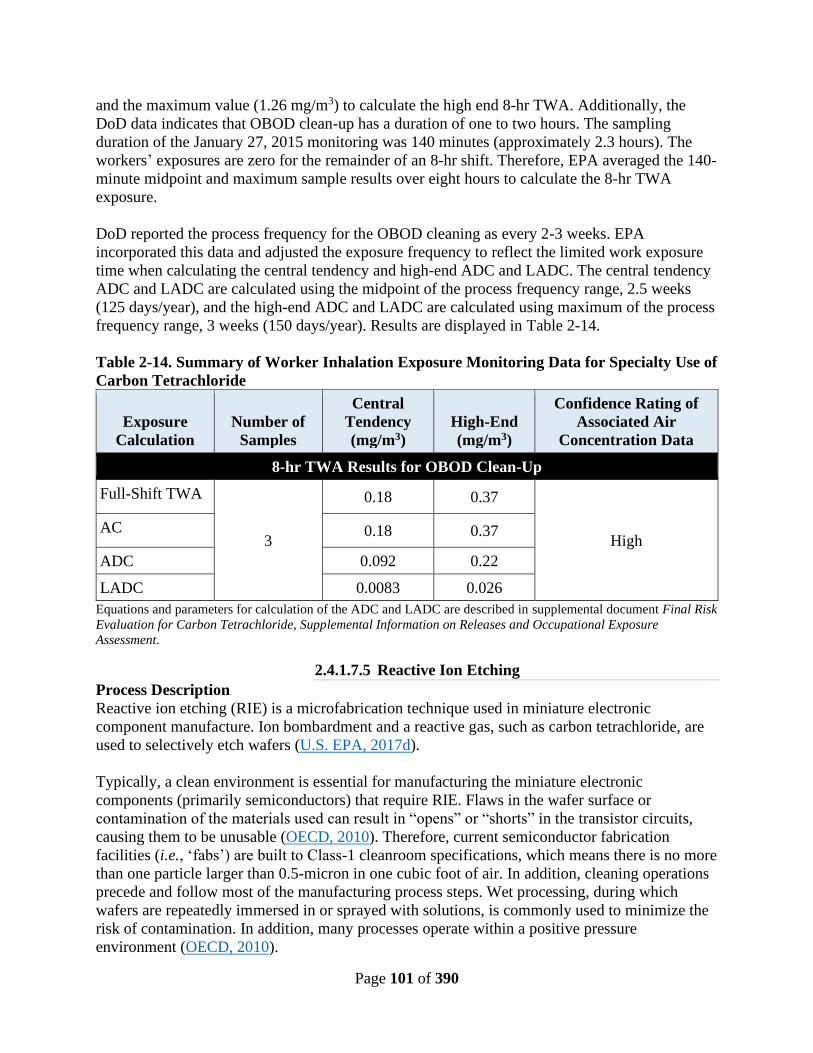
Page 101 of 390
and the maximum value (1.26 mg/m3) to calculate the high end 8-hr TWA. Additionally, the
DoD data indicates that OBOD clean-up has a duration of one to two hours. The sampling
duration of the January 27, 2015 monitoring was 140 minutes (approximately 2.3 hours). The
workers’ exposures are zero for the remainder of an 8-hr shift. Therefore, EPA averaged the 140-
minute midpoint and maximum sample results over eight hours to calculate the 8-hr TWA
exposure.
DoD reported the process frequency for the OBOD cleaning as every 2-3 weeks. EPA
incorporated this data and adjusted the exposure frequency to reflect the limited work exposure
time when calculating the central tendency and high-end ADC and LADC. The central tendency
ADC and LADC are calculated using the midpoint of the process frequency range, 2.5 weeks
(125 days/year), and the high-end ADC and LADC are calculated using maximum of the process
frequency range, 3 weeks (150 days/year). Results are displayed in Table 2-14.
Table 2-14. Summary of Worker Inhalation Exposure Monitoring Data for Specialty Use of
Carbon Tetrachloride
Exposure
Calculation
Number of
Samples
Central
Tendency
(mg/m3)
High-End
(mg/m3)
Confidence Rating of
Associated Air
Concentration Data
8-hr TWA Results for OBOD Clean-Up
Full-Shift TWA
3
0.18 0.37
High AC 0.18 0.37
ADC 0.092 0.22
LADC 0.0083 0.026
Equations and parameters for calculation of the ADC and LADC are described in supplemental document Final Risk
Evaluation for Carbon Tetrachloride, Supplemental Information on Releases and Occupational Exposure
Assessment.
2.4.1.7.5 Reactive Ion Etching
Process Description
Reactive ion etching (RIE) is a microfabrication technique used in miniature electronic
component manufacture. Ion bombardment and a reactive gas, such as carbon tetrachloride, are
used to selectively etch wafers (U.S. EPA, 2017d).
Typically, a clean environment is essential for manufacturing the miniature electronic
components (primarily semiconductors) that require RIE. Flaws in the wafer surface or
contamination of the materials used can result in “opens” or “shorts” in the transistor circuits,
causing them to be unusable (OECD, 2010). Therefore, current semiconductor fabrication
facilities (i.e., ‘fabs’) are built to Class-1 cleanroom specifications, which means there is no more
than one particle larger than 0.5-micron in one cubic foot of air. In addition, cleaning operations
precede and follow most of the manufacturing process steps. Wet processing, during which
wafers are repeatedly immersed in or sprayed with solutions, is commonly used to minimize the
risk of contamination. In addition, many processes operate within a positive pressure
environment (OECD, 2010).
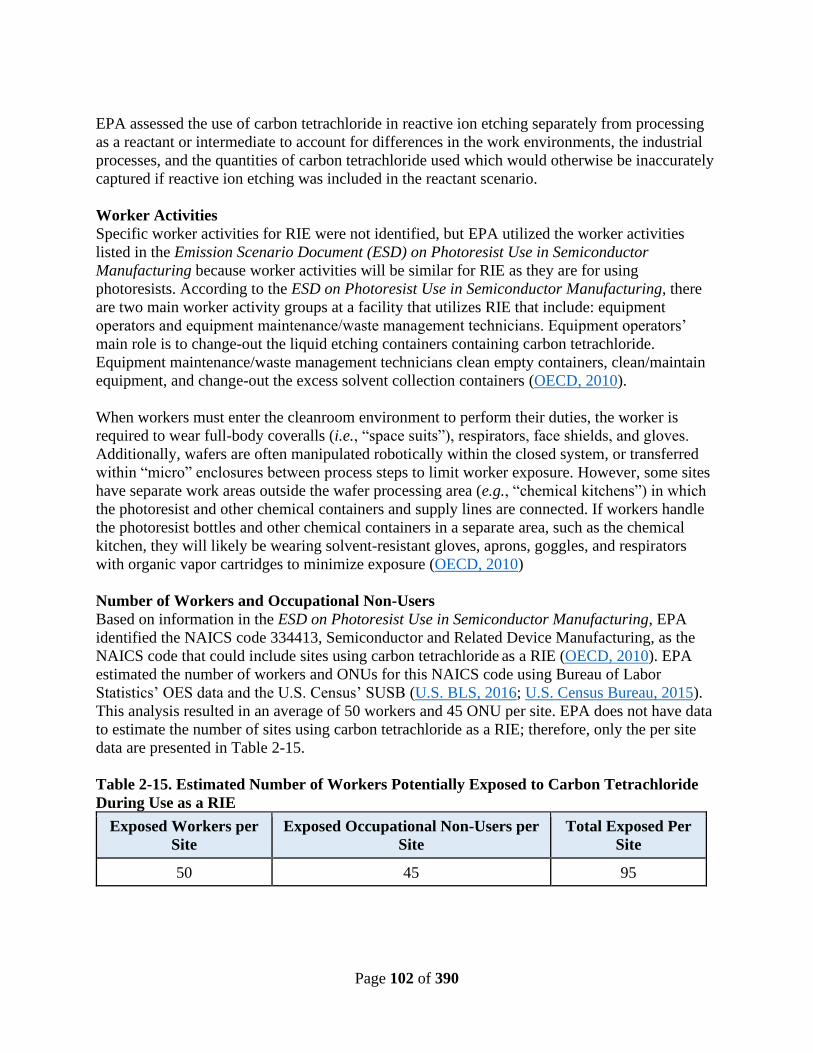
Page 102 of 390
EPA assessed the use of carbon tetrachloride in reactive ion etching separately from processing
as a reactant or intermediate to account for differences in the work environments, the industrial
processes, and the quantities of carbon tetrachloride used which would otherwise be inaccurately
captured if reactive ion etching was included in the reactant scenario.
Worker Activities
Specific worker activities for RIE were not identified, but EPA utilized the worker activities
listed in the Emission Scenario Document (ESD) on Photoresist Use in Semiconductor
Manufacturing because worker activities will be similar for RIE as they are for using
photoresists. According to the ESD on Photoresist Use in Semiconductor Manufacturing, there
are two main worker activity groups at a facility that utilizes RIE that include: equipment
operators and equipment maintenance/waste management technicians. Equipment operators’
main role is to change-out the liquid etching containers containing carbon tetrachloride.
Equipment maintenance/waste management technicians clean empty containers, clean/maintain
equipment, and change-out the excess solvent collection containers (OECD, 2010).
When workers must enter the cleanroom environment to perform their duties, the worker is
required to wear full-body coveralls (i.e., “space suits”), respirators, face shields, and gloves.
Additionally, wafers are often manipulated robotically within the closed system, or transferred
within “micro” enclosures between process steps to limit worker exposure. However, some sites
have separate work areas outside the wafer processing area (e.g., “chemical kitchens”) in which
the photoresist and other chemical containers and supply lines are connected. If workers handle
the photoresist bottles and other chemical containers in a separate area, such as the chemical
kitchen, they will likely be wearing solvent-resistant gloves, aprons, goggles, and respirators
with organic vapor cartridges to minimize exposure (OECD, 2010)
Number of Workers and Occupational Non-Users
Based on information in the ESD on Photoresist Use in Semiconductor Manufacturing, EPA
identified the NAICS code 334413, Semiconductor and Related Device Manufacturing, as the
NAICS code that could include sites using carbon tetrachloride as a RIE (OECD, 2010). EPA
estimated the number of workers and ONUs for this NAICS code using Bureau of Labor
Statistics’ OES data and the U.S. Census’ SUSB (U.S. BLS, 2016; U.S. Census Bureau, 2015).
This analysis resulted in an average of 50 workers and 45 ONU per site. EPA does not have data
to estimate the number of sites using carbon tetrachloride as a RIE; therefore, only the per site
data are presented in Table 2-15.
Table 2-15. Estimated Number of Workers Potentially Exposed to Carbon Tetrachloride
During Use as a RIE
Exposed Workers per
Site
Exposed Occupational Non-Users per
Site
Total Exposed Per
Site
50 45 95
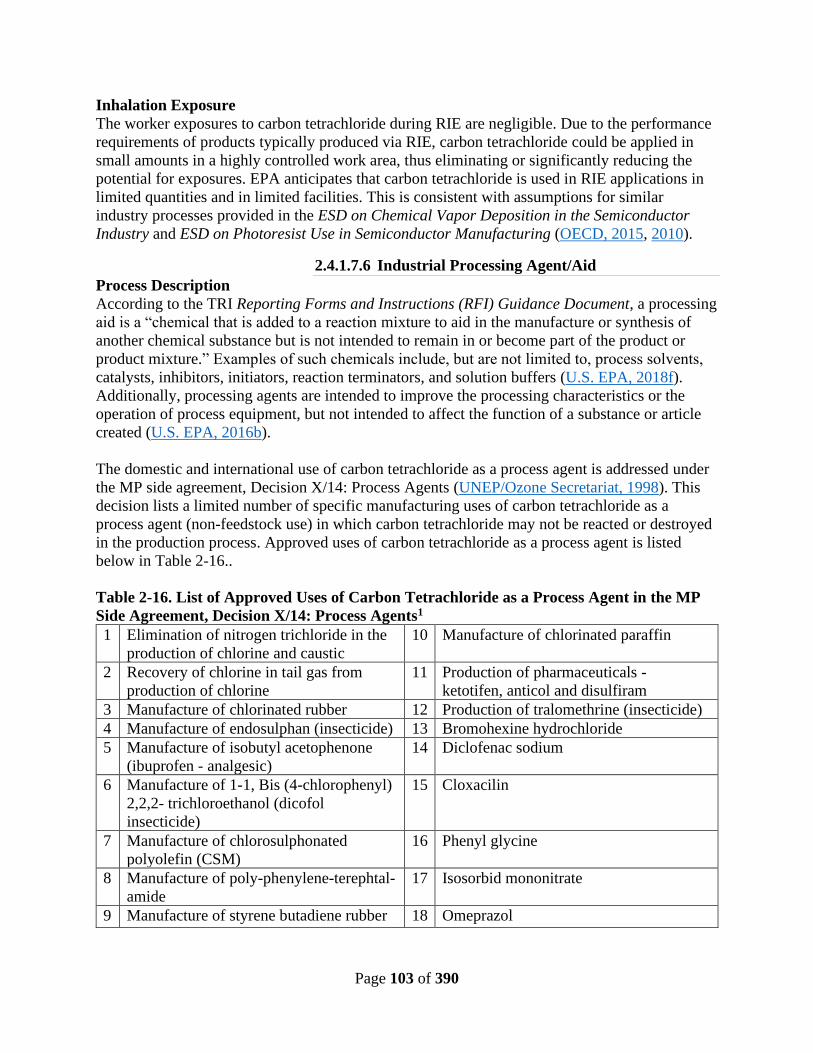
Page 103 of 390
Inhalation Exposure
The worker exposures to carbon tetrachloride during RIE are negligible. Due to the performance
requirements of products typically produced via RIE, carbon tetrachloride could be applied in
small amounts in a highly controlled work area, thus eliminating or significantly reducing the
potential for exposures. EPA anticipates that carbon tetrachloride is used in RIE applications in
limited quantities and in limited facilities. This is consistent with assumptions for similar
industry processes provided in the ESD on Chemical Vapor Deposition in the Semiconductor
Industry and ESD on Photoresist Use in Semiconductor Manufacturing (OECD, 2015, 2010).
2.4.1.7.6 Industrial Processing Agent/Aid
Process Description
According to the TRI Reporting Forms and Instructions (RFI) Guidance Document, a processing
aid is a “chemical that is added to a reaction mixture to aid in the manufacture or synthesis of
another chemical substance but is not intended to remain in or become part of the product or
product mixture.” Examples of such chemicals include, but are not limited to, process solvents,
catalysts, inhibitors, initiators, reaction terminators, and solution buffers (U.S. EPA, 2018f).
Additionally, processing agents are intended to improve the processing characteristics or the
operation of process equipment, but not intended to affect the function of a substance or article
created (U.S. EPA, 2016b).
The domestic and international use of carbon tetrachloride as a process agent is addressed under
the MP side agreement, Decision X/14: Process Agents (UNEP/Ozone Secretariat, 1998). This
decision lists a limited number of specific manufacturing uses of carbon tetrachloride as a
process agent (non-feedstock use) in which carbon tetrachloride may not be reacted or destroyed
in the production process. Approved uses of carbon tetrachloride as a process agent is listed
below in Table 2-16..
Table 2-16. List of Approved Uses of Carbon Tetrachloride as a Process Agent in the MP
Side Agreement, Decision X/14: Process Agents1
1 Elimination of nitrogen trichloride in the
production of chlorine and caustic
10 Manufacture of chlorinated paraffin
2 Recovery of chlorine in tail gas from
production of chlorine
11 Production of pharmaceuticals -
ketotifen, anticol and disulfiram
3 Manufacture of chlorinated rubber 12 Production of tralomethrine (insecticide)
4 Manufacture of endosulphan (insecticide) 13 Bromohexine hydrochloride
5 Manufacture of isobutyl acetophenone
(ibuprofen - analgesic)
14 Diclofenac sodium
6 Manufacture of 1-1, Bis (4-chlorophenyl)
2,2,2- trichloroethanol (dicofol
insecticide)
15 Cloxacilin
7 Manufacture of chlorosulphonated
polyolefin (CSM)
16 Phenyl glycine
8 Manufacture of poly-phenylene-terephtal-
amide
17 Isosorbid mononitrate
9 Manufacture of styrene butadiene rubber 18 Omeprazol
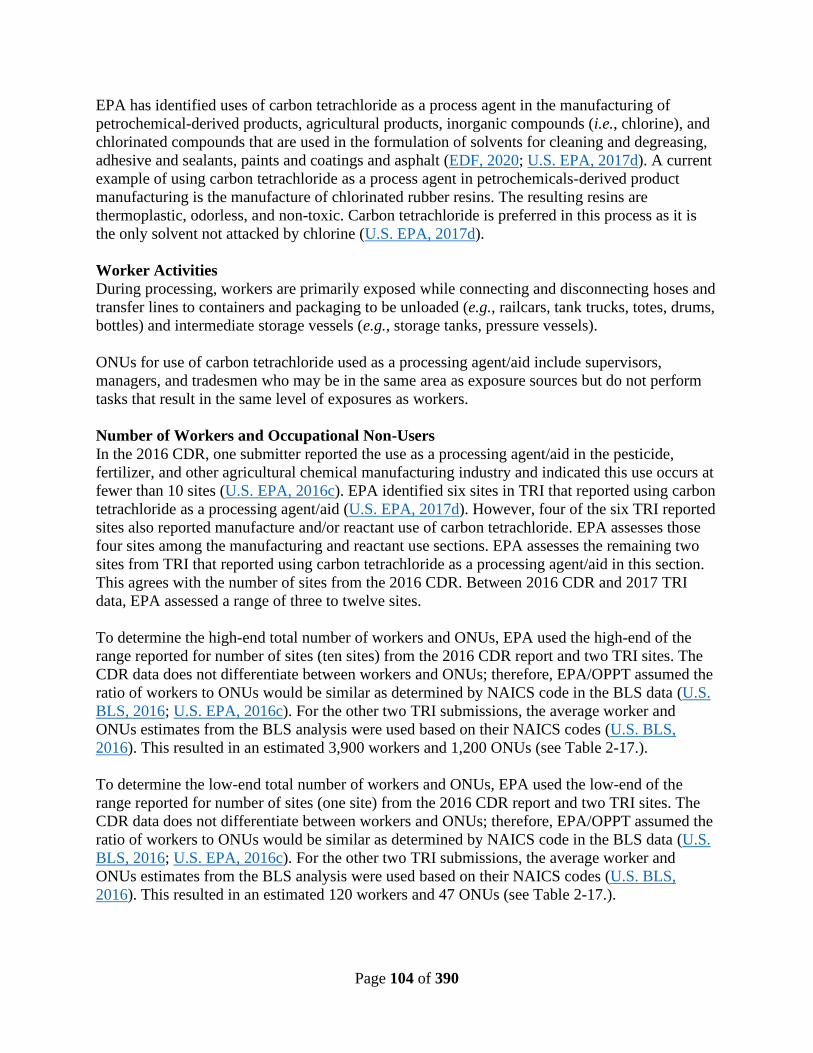
Page 104 of 390
EPA has identified uses of carbon tetrachloride as a process agent in the manufacturing of
petrochemical-derived products, agricultural products, inorganic compounds (i.e., chlorine), and
chlorinated compounds that are used in the formulation of solvents for cleaning and degreasing,
adhesive and sealants, paints and coatings and asphalt (EDF, 2020; U.S. EPA, 2017d). A current
example of using carbon tetrachloride as a process agent in petrochemicals-derived product
manufacturing is the manufacture of chlorinated rubber resins. The resulting resins are
thermoplastic, odorless, and non-toxic. Carbon tetrachloride is preferred in this process as it is
the only solvent not attacked by chlorine (U.S. EPA, 2017d).
Worker Activities
During processing, workers are primarily exposed while connecting and disconnecting hoses and
transfer lines to containers and packaging to be unloaded (e.g., railcars, tank trucks, totes, drums,
bottles) and intermediate storage vessels (e.g., storage tanks, pressure vessels).
ONUs for use of carbon tetrachloride used as a processing agent/aid include supervisors,
managers, and tradesmen who may be in the same area as exposure sources but do not perform
tasks that result in the same level of exposures as workers.
Number of Workers and Occupational Non-Users
In the 2016 CDR, one submitter reported the use as a processing agent/aid in the pesticide,
fertilizer, and other agricultural chemical manufacturing industry and indicated this use occurs at
fewer than 10 sites (U.S. EPA, 2016c). EPA identified six sites in TRI that reported using carbon
tetrachloride as a processing agent/aid (U.S. EPA, 2017d). However, four of the six TRI reported
sites also reported manufacture and/or reactant use of carbon tetrachloride. EPA assesses those
four sites among the manufacturing and reactant use sections. EPA assesses the remaining two
sites from TRI that reported using carbon tetrachloride as a processing agent/aid in this section.
This agrees with the number of sites from the 2016 CDR. Between 2016 CDR and 2017 TRI
data, EPA assessed a range of three to twelve sites.
To determine the high-end total number of workers and ONUs, EPA used the high-end of the
range reported for number of sites (ten sites) from the 2016 CDR report and two TRI sites. The
CDR data does not differentiate between workers and ONUs; therefore, EPA/OPPT assumed the
ratio of workers to ONUs would be similar as determined by NAICS code in the BLS data (U.S.
BLS, 2016; U.S. EPA, 2016c). For the other two TRI submissions, the average worker and
ONUs estimates from the BLS analysis were used based on their NAICS codes (U.S. BLS,
2016). This resulted in an estimated 3,900 workers and 1,200 ONUs (see Table 2-17.).
To determine the low-end total number of workers and ONUs, EPA used the low-end of the
range reported for number of sites (one site) from the 2016 CDR report and two TRI sites. The
CDR data does not differentiate between workers and ONUs; therefore, EPA/OPPT assumed the
ratio of workers to ONUs would be similar as determined by NAICS code in the BLS data (U.S.
BLS, 2016; U.S. EPA, 2016c). For the other two TRI submissions, the average worker and
ONUs estimates from the BLS analysis were used based on their NAICS codes (U.S. BLS,
2016). This resulted in an estimated 120 workers and 47 ONUs (see Table 2-17.).
Page 105 of 390
Table 2-17. Estimated Number of Workers Potentially Exposed to Carbon Tetrachloride
During Use as a Processing Agent/Aid
Number of
Sites
Total Exposed
Workers
Total Exposed
Occupational Non-Users Total Exposed
High-End
12 3,900 1,200 5,100
Low-End
3 120 47 170
Inhalation Exposure
EPA did not find any exposure data for use of carbon tetrachloride as a processing agent/aid;
therefore, exposures from incorporation into formulation activities were assessed with surrogate
data from HSIA using data that have similar worker activities.
See Section 2.4.1.7.2 for the assessment of worker exposure from chemical unloading activities.
The exposure sources, routes, and exposure levels are similar to those at an import/repackaging
facility, where unloading and handling are the key worker activities. Inhalation exposure for
processing of carbon tetrachloride as a processing agent/aid is estimated using the surrogate data
from HSIA as described in the import/repackaging scenario.
2.4.1.7.7 Additive
Process Description
Additives are chemicals combined with a chemical product to enhance the properties of the
product. Additives typically stay mixed within the finished product and remain unreacted.
This section includes the assessment of the use of carbon tetrachloride as an additive for
petrochemicals-derived products manufacturing and agricultural products manufacturing.
Specific uses of carbon tetrachloride as an additive include both an additive used in plastic
components used in the automotive industry (HSIA, 2017) and a fuel additive (U.S. EPA,
2017d).
Worker Activities
Similar to manufacturing facilities, worker activities use of carbon tetrachloride as an additive
may involve manually adding raw materials or connecting/disconnecting transfer lines used to
unload containers into storage or reaction vessels, rinsing/cleaning containers and/or process
equipment, collecting and analyzing quality control (QC) samples, and packaging formulated
products into containers and tank trucks. The exact activities and associated level of exposure
will differ depending on the degree of automation, presence of engineering controls, and use of
PPE at each facility.
ONUs for use of carbon tetrachloride as an additive include supervisors, managers, and
tradesmen that may be in the same area as exposure sources but do not perform tasks that result
in the same level of exposures as workers.

Page 106 of 390
Number of Workers and Occupational Non-Users
Upon review of the 2017 TRI data, EPA found that one site reported the use of carbon
tetrachloride as a formulation component (U.S. EPA, 2018e). EPA determined the number of
workers using the related SOC codes from BLS analysis that are associated with the primary
NAICS code, 325211, listed in TRI. This resulted in an estimated 27 workers and 12 ONUs
potentially exposed at sites using carbon tetrachloride as an additive (see Table 2-18).
Table 2-18. Estimated Number of Workers Potentially Exposed to Carbon Tetrachloride
when used as an Additive
Number
of Sites
Total Exposed
Workers
Total Exposed Occupational
Non-Users Total Exposed
1 27 12 39
Inhalation Exposure
EPA did not find any exposure monitoring data for use of carbon tetrachloride as an additive;
therefore, exposures from incorporation into formulation activities were assessed with surrogate
data from HSIA using data that have similar worker activities.
See Section 2.4.1.7.2 for the assessment of worker exposure from chemical unloading activities.
The exposure sources, routes, and exposure levels are similar to those at an import/ repackaging
facility, where unloading and handling are the key worker activities. Inhalation exposure
assessment for processing of carbon tetrachloride as a processing agent/aid is estimated using the
surrogate data from HSIA as described in the import/repackaging scenario.
2.4.1.7.8 Laboratory Chemicals
Process Description
Carbon tetrachloride is used in a variety of laboratory applications, which include, but are not
limited to, the following:
• Chemical reagent;
• Extraction solvent; and
• Reference material or solvent in analytical procedures, such as spectroscopic
measurements (U.S. EPA, 2017d).
Specific process descriptions for how carbon tetrachloride is used in each of these applications is
not known. In general, carbon tetrachloride is typically received in small containers and used in
small quantities on a lab bench in a fume cupboard or hood. After use, waste carbon tetrachloride
is collected and disposed or recycled. Figure 2-2 depicts this general process.
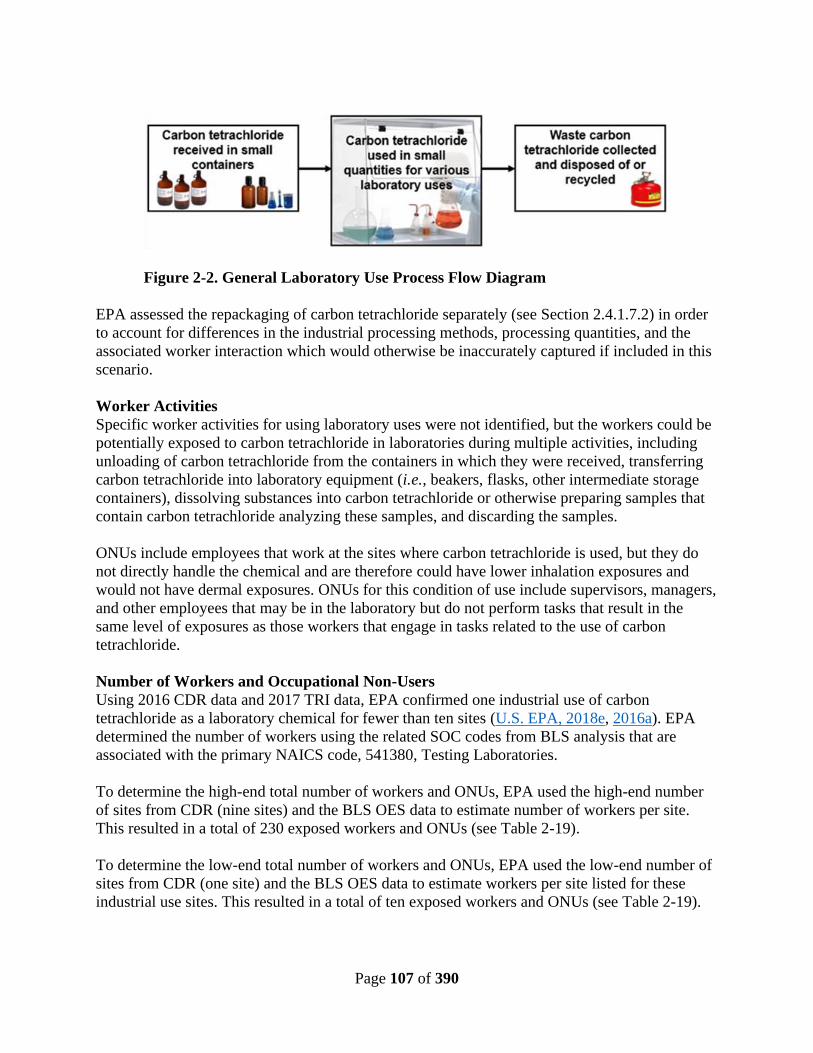
Page 107 of 390
Figure 2-2. General Laboratory Use Process Flow Diagram
EPA assessed the repackaging of carbon tetrachloride separately (see Section 2.4.1.7.2) in order
to account for differences in the industrial processing methods, processing quantities, and the
associated worker interaction which would otherwise be inaccurately captured if included in this
scenario.
Worker Activities
Specific worker activities for using laboratory uses were not identified, but the workers could be
potentially exposed to carbon tetrachloride in laboratories during multiple activities, including
unloading of carbon tetrachloride from the containers in which they were received, transferring
carbon tetrachloride into laboratory equipment (i.e., beakers, flasks, other intermediate storage
containers), dissolving substances into carbon tetrachloride or otherwise preparing samples that
contain carbon tetrachloride analyzing these samples, and discarding the samples.
ONUs include employees that work at the sites where carbon tetrachloride is used, but they do
not directly handle the chemical and are therefore could have lower inhalation exposures and
would not have dermal exposures. ONUs for this condition of use include supervisors, managers,
and other employees that may be in the laboratory but do not perform tasks that result in the
same level of exposures as those workers that engage in tasks related to the use of carbon
tetrachloride.
Number of Workers and Occupational Non-Users
Using 2016 CDR data and 2017 TRI data, EPA confirmed one industrial use of carbon
tetrachloride as a laboratory chemical for fewer than ten sites (U.S. EPA, 2018e, 2016a). EPA
determined the number of workers using the related SOC codes from BLS analysis that are
associated with the primary NAICS code, 541380, Testing Laboratories.
To determine the high-end total number of workers and ONUs, EPA used the high-end number
of sites from CDR (nine sites) and the BLS OES data to estimate number of workers per site.
This resulted in a total of 230 exposed workers and ONUs (see Table 2-19).
To determine the low-end total number of workers and ONUs, EPA used the low-end number of
sites from CDR (one site) and the BLS OES data to estimate workers per site listed for these
industrial use sites. This resulted in a total of ten exposed workers and ONUs (see Table 2-19).
Page 108 of 390
Table 2-19. Estimated Number of Workers Potentially Exposed to Carbon Tetrachloride
During Use as a Laboratory Chemical
Number of
Sites
Total Exposed
Workers
Total Exposed
Occupational Non-Users Total Exposed
High-End
9 23 200 230
Low-End
1 1 9 10
Inhalation Exposure
EPA does not have monitoring data to assess worker exposures to carbon tetrachloride during
laboratory use. Following workplace safety protocols for the use of chemicals in laboratories,
carbon tetrachloride is generally handled in small amounts as required for reactions or analyses.
Carbon tetrachloride is handled under a fume hood as per good laboratory practices, thus
reducing the potential for inhalation exposures.
2.4.1.7.9 Disposal/Recycling
This scenario is meant to include sites like hazardous waste treatment sites (TSDFs), including
incinerators, landfills, other forms of treatment, and solvent or other material reclamation or
recycling. These are sites largely covered under RCRA (e.g., RCRA permitted TSDFs) but also
include municipal waste combustors and landfills.
Process Description
Each of the conditions of use of carbon tetrachloride may generate waste streams of the chemical
that are collected and transported to third-party sites for disposal, treatment, or recycling.
Industrial sites that treat or dispose onsite wastes that they themselves generate are assessed in
each condition of use assessment in Sections 2.4.1.7.1 to 2.4.1.7.8. Wastes of carbon
tetrachloride that are generated during a condition of use and sent to a third-party site for
treatment, disposal, or recycling may include the following:
• Wastewater: Carbon tetrachloride may be contained in wastewater discharged to POTW
or other, non-public treatment works for treatment. Industrial wastewater containing
carbon tetrachloride discharged to a POTW may be subject to EPA or authorized NPDES
state pretreatment programs.
• Solid Wastes: Solid wastes are defined under RCRA as any material that is discarded by
being: abandoned; inherently waste-like; a discarded military munition; or recycled in
certain ways (certain instances of the generation and legitimate reclamation of secondary
materials are exempted as solid wastes under RCRA). Solid wastes may subsequently
meet RCRA’s definition of hazardous waste by either being listed as a waste at 40 CFR
§§ 261.30 to 261.35 or by meeting waste-like characteristics as defined at 40 CFR §§
261.20 to 261.24. Solid wastes that are hazardous wastes are regulated under the more
stringent requirements of Subtitle C of RCRA, whereas non-hazardous solid wastes are
regulated under the less stringent requirements of Subtitle D of RCRA.
o Carbon tetrachloride is both a listed and a characteristic hazardous waste. Carbon
tetrachloride is a non-specific-source listed hazardous waste under waste number
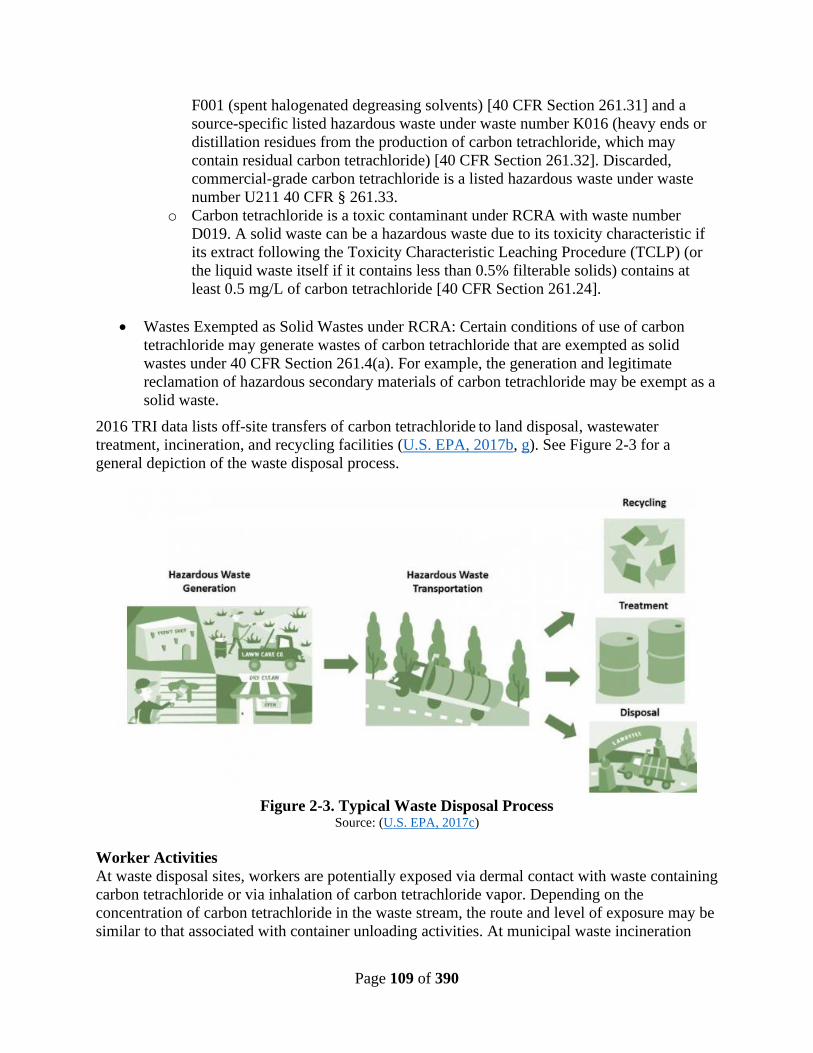
Page 109 of 390
F001 (spent halogenated degreasing solvents) [40 CFR Section 261.31] and a
source-specific listed hazardous waste under waste number K016 (heavy ends or
distillation residues from the production of carbon tetrachloride, which may
contain residual carbon tetrachloride) [40 CFR Section 261.32]. Discarded,
commercial-grade carbon tetrachloride is a listed hazardous waste under waste
number U211 40 CFR § 261.33.
o Carbon tetrachloride is a toxic contaminant under RCRA with waste number
D019. A solid waste can be a hazardous waste due to its toxicity characteristic if
its extract following the Toxicity Characteristic Leaching Procedure (TCLP) (or
the liquid waste itself if it contains less than 0.5% filterable solids) contains at
least 0.5 mg/L of carbon tetrachloride [40 CFR Section 261.24].
• Wastes Exempted as Solid Wastes under RCRA: Certain conditions of use of carbon
tetrachloride may generate wastes of carbon tetrachloride that are exempted as solid
wastes under 40 CFR Section 261.4(a). For example, the generation and legitimate
reclamation of hazardous secondary materials of carbon tetrachloride may be exempt as a
solid waste.
2016 TRI data lists off-site transfers of carbon tetrachloride to land disposal, wastewater
treatment, incineration, and recycling facilities (U.S. EPA, 2017b, g). See Figure 2-3 for a
general depiction of the waste disposal process.
Figure 2-3. Typical Waste Disposal Process
Source: (U.S. EPA, 2017c)
Worker Activities
At waste disposal sites, workers are potentially exposed via dermal contact with waste containing
carbon tetrachloride or via inhalation of carbon tetrachloride vapor. Depending on the
concentration of carbon tetrachloride in the waste stream, the route and level of exposure may be
similar to that associated with container unloading activities. At municipal waste incineration

Page 110 of 390
facilities, there may be one or more technicians present on the tipping floor to oversee
operations, direct trucks, inspect incoming waste, or perform other tasks as warranted by
individual facility practices. At landfills, typical worker activities may include operating refuse
vehicles to weigh and unload the waste materials, operating bulldozers to spread and compact
wastes, and monitoring, inspecting, and surveying a landfill site [California Department of
Resources Recycling and Recovery (CalRecycle, 2018)].
Number of Workers and Occupational Non-Users
The 2016 CDR uses did not show any submissions for waste handling, so EPA reviewed the
2017 TRI data and found twelve sites reported using carbon tetrachloride during waste handling
(U.S. EPA, 2018e, 2017b, 2016d).
EPA determined the number of workers using the related SOC codes from BLS analysis that are
associated with the primary NAICS codes listed in TRI (U.S. BLS, 2016). This analysis resulted
in 130 workers and 63 ONUs potentially exposed at sites using carbon tetrachloride during waste
handling (see Table 2-20).
Table 2-20. Estimated Number of Workers Potentially Exposed to Carbon Tetrachloride
During Waste Handling
Number of
Sites
Total Exposed
Workers
Total Exposed Occupational
Non-Users Total Exposed
12 130 63 188
Inhalation Exposure
EPA did not find any exposure monitoring data for waste handling of carbon tetrachloride;
therefore, exposures from waste handling activities were assessed with surrogate data from HSIA
using data that have similar worker activities.
The assessments of worker exposure from chemical unloading activities are described in the
Section 2.4.1.7.2. The exposure sources, routes, and exposure levels are similar to those at an
import/repackaging facility, where unloading and handling are the key worker activities.
Inhalation exposure assessment for processing of carbon tetrachloride as a processing agent/aid
is estimated using the surrogate data from HSIA as described in the import/repackaging scenario.
2.4.1.7.10 Summary of Occupational Inhalation Exposure
Assessment
Table 2-21 presents the occupational exposure assessment summary for the conditions of use
described by the previous sections of this risk evaluation.
For additional information on the developmental details, methodology, approach, and results of
any part of the occupational exposure determination process, refer to the supplemental document
Final Risk Evaluation for Carbon Tetrachloride, Supplemental Information on Releases and
Occupational Exposure Assessment (U.S. EPA, 2019c).

Page 111 of 390
The summary and ranking of occupational exposure of carbon tetrachloride indicating strengths, challenges, whether modelling or
monitoring preformed, representativeness and confidence of data assessed, hierarchy of data, and overall rating for various conditions
of use are shown in Table 2-22.
Table 2-21. Summary of Occupational Inhalation Exposure Assessment for Workers
Condition of Use Category
Eight-Hour or
Twelve-Hour TWA
Exposures
Acute Exposures Chronic, Non-Cancer
Exposures Chronic, Cancer
Exposures TWA
Data
Points
Data Type CCCl4, 8 or 12-hr TWA
(mg/m3) ACCCl4 TWA (mg/m3) ADCCCl4 TWA (mg/m3) LADCCCl4 TWA (mg/m3)
High-
End
Central
Tendency
High-
End
Central
Tendency
High-
End
Central
Tendency High-End
Central
Tendency
Manufacturing - 8-
hr TWA Worker 4.0 0.76 4.0 0.76 4.0 0.76 0.47 0.069 113
Monitoring
Data
Manufacturing - 12-
hr TWA Worker 4.8 0.50 4.8 0.50 4.8 0.50 0.85 0.069 243
Monitoring
Data
Manufacturing - 8-
hr TWA ONU 1.0 0.50 1.0 0.50 1.0 0.50 0.12 0.046 14
Monitoring
Data
Manufacturing - 12-
hr TWA ONU 1.3 0.66 1.3 0.66 1.3 0.66 0.15 0.060 3
Monitoring
Data
Import/Repackaging Worker 2.92 0.89 2.92 0.89 2.92 0.89 0.342 0.081 15
Surrogate
Monitoring
Data
Import/Repackaging ONUa 2.92 0.89 2.92 0.89 2.92 0.89 0.342 0.081 15
Surrogate
Monitoring
Data
Processing as
Reactant - 8-hr
TWA Worker 4.0 0.76 4.0 0.76 4.0 0.76 0.47 0.069 113
Surrogate
Monitoring
Data
Processing as
Reactant- 12-hr
TWA Worker 4.8 0.50 4.8 0.50 4.8 0.50 0.85 0.069 243
Surrogate
Monitoring
Data
Processing as
Reactant - 8-hr
TWA ONU 1.0 0.50 1.0 0.50 1.0 0.50 0.18 0.069 14
Surrogate
Monitoring
Data
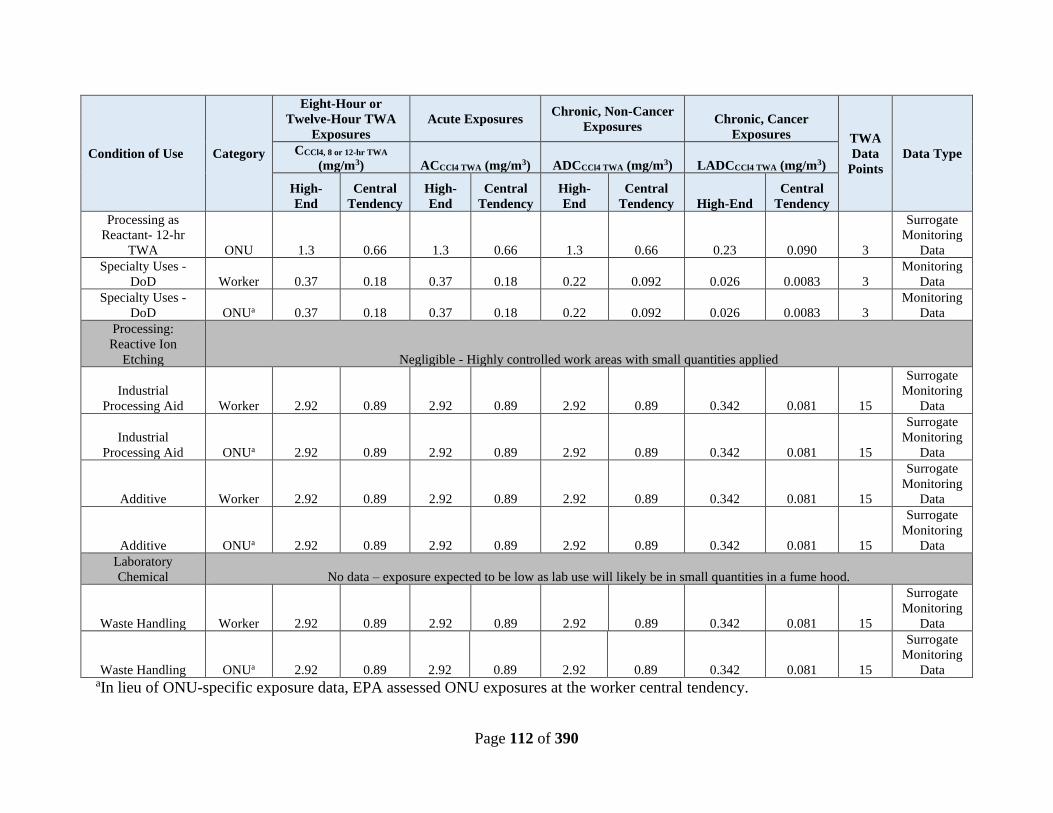
Page 112 of 390
Condition of Use Category
Eight-Hour or
Twelve-Hour TWA
Exposures
Acute Exposures Chronic, Non-Cancer
Exposures Chronic, Cancer
Exposures TWA
Data
Points
Data Type CCCl4, 8 or 12-hr TWA
(mg/m3) ACCCl4 TWA (mg/m3) ADCCCl4 TWA (mg/m3) LADCCCl4 TWA (mg/m3)
High-
End
Central
Tendency
High-
End
Central
Tendency
High-
End
Central
Tendency High-End
Central
Tendency
Processing as
Reactant- 12-hr
TWA ONU 1.3 0.66 1.3 0.66 1.3 0.66 0.23 0.090 3
Surrogate
Monitoring
Data
Specialty Uses -
DoD Worker 0.37 0.18 0.37 0.18 0.22 0.092 0.026 0.0083 3
Monitoring
Data
Specialty Uses -
DoD ONUa 0.37 0.18 0.37 0.18 0.22 0.092 0.026 0.0083 3
Monitoring
Data
Processing:
Reactive Ion
Etching Negligible - Highly controlled work areas with small quantities applied
Industrial
Processing Aid Worker 2.92 0.89 2.92 0.89 2.92 0.89 0.342 0.081 15
Surrogate
Monitoring
Data
Industrial
Processing Aid ONUa 2.92 0.89 2.92 0.89 2.92 0.89 0.342 0.081 15
Surrogate
Monitoring
Data
Additive Worker 2.92 0.89 2.92 0.89 2.92 0.89 0.342 0.081 15
Surrogate
Monitoring
Data
Additive ONUa 2.92 0.89 2.92 0.89 2.92 0.89 0.342 0.081 15
Surrogate
Monitoring
Data
Laboratory
Chemical No data – exposure expected to be low as lab use will likely be in small quantities in a fume hood.
Waste Handling Worker 2.92 0.89 2.92 0.89 2.92 0.89 0.342 0.081 15
Surrogate
Monitoring
Data
Waste Handling ONUa 2.92 0.89 2.92 0.89 2.92 0.89 0.342 0.081 15
Surrogate
Monitoring
Data aIn lieu of ONU-specific exposure data, EPA assessed ONU exposures at the worker central tendency.
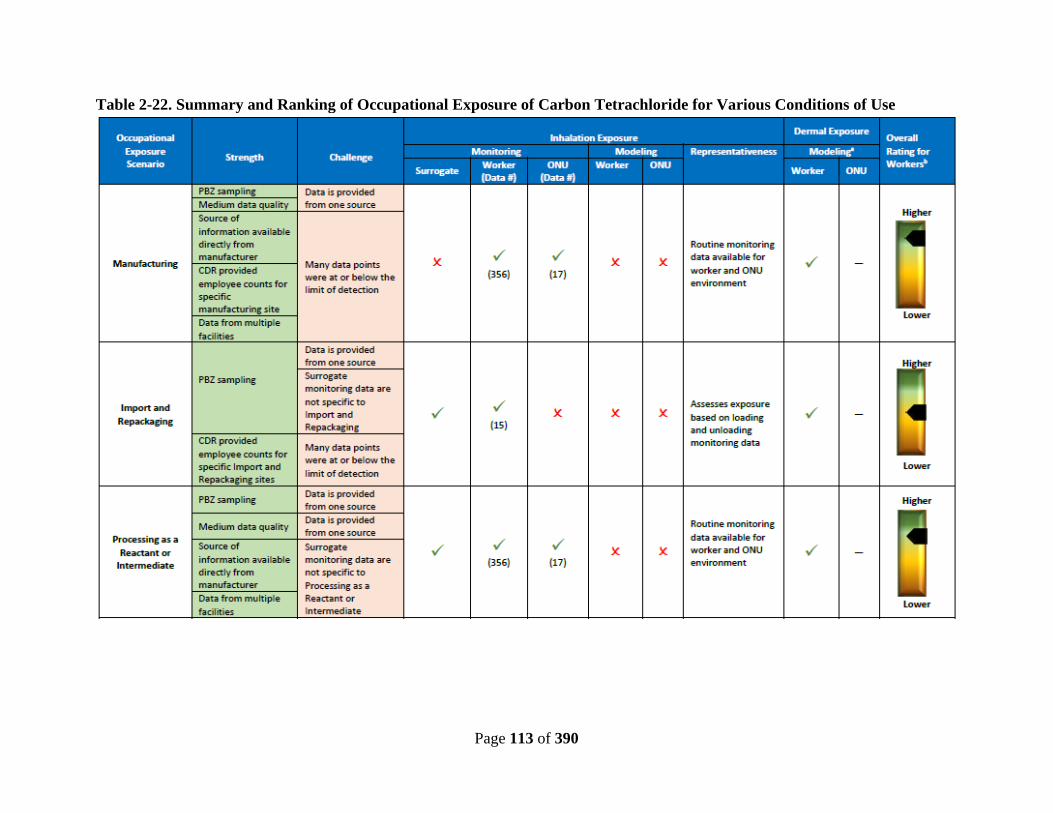
Page 113 of 390
Table 2-22. Summary and Ranking of Occupational Exposure of Carbon Tetrachloride for Various Conditions of Use

Page 114 of 390
aDermal exposure estimates, which are based on high-end/central tendency parameters and commercial/industrial settings, have medium level of confidence. bONU exposure estimates, which are based on central tendency paraments, have low levels of confidence.

Page 115 of 390
Dermal Exposure Assessment
Because carbon tetrachloride is a volatile liquid, the dermal absorption of carbon tetrachloride
depends on the type and duration of exposure. Where exposure is without gloves, only a fraction
of carbon tetrachloride that comes into contact with the skin will be retained as the chemical
readily evaporates from the skin. However, dermal exposure may be significant in cases of
occluded exposure, repeated contacts, or dermal immersion. For example, work activities with a
high degree of splash potential may result in carbon tetrachloride liquids trapped inside the
gloves, inhibiting the evaporation of carbon tetrachloride and increasing the exposure duration.
Specific methodology for dermal exposure estimation is detailed in the document Final Risk
Evaluation for Carbon Tetrachloride, Supplemental Information on Releases and Occupational
Exposure Assessment (U.S. EPA, 2019c).
Dermal exposure is the absorption and transport of carbon tetrachloride from the outer surface of
the skin to the inner layers of the skin (Figure 2-4). The relatively thin epidermis lacks
vascularization and is generally considered the primary barrier to uptake of carbon tetrachloride
encountered in the workplace or general environment. The dermis is vascularized and contains
the sweat glands and hair follicles. Dermal interactions of chemical through the skin could occur
with or without being noticed by the worker. The rate of dermal absorption depends largely on
the outer layer of the skin called the stratum corneum. The stratum corneum serves an important
barrier function by keeping molecules from passing into and out of the skin, thus protecting the
lower layers of skin. Theoretical equations and models have been developed to describe the
transport of a diffusing chemical through the skin. Carbon tetrachloride could permeate the skin's
diffusional barriers and enter the systemic circulation via capillaries at the dermo-epidermal
junction. The process begins with diffusion through the dead stratum corneum and could involve
metabolic processes during traversal of the living epidermis. The released chemical that
encounters skin could undergo many processes including:
a) evaporation from the surface of the skin;
b) uptake (absorption) into the stratum corneum, followed by reversible or irreversible
binding;
c) penetration into the viable epidermis, followed by metabolism.
There are various factors that influence the dermal absorption of an exposed chemical, and the
key factors are shown in Figure 2-4 (Eleftheriadou et al., 2019; WHO, 2006; Semple, 2004). The
factors affecting dermal exposure could vary as the working conditions, process operations and
work practices, type and conditions of chemical releases, and other site-specific conditions.
Various models have been developed to address various factors impacted by risk assessors;
pharmaceutical, cosmetics, chemicals, and other industries (Almeida et al., 2019; Eleftheriadou
et al., 2019; Kissel et al., 2018; Sugibayashi, 2017; Chittenden and Riviere, 2015; Frasch and
Bunge, 2015; Chittenden et al., 2014; Gajjar and Kasting, 2014; Nitsche and Kasting, 2013;
Mitragotri et al., 2011). IHSkinPerm©, developed by the American Industrial Hygiene
Association (AIHA), is one of the available tools that estimates dermal absorption using the
dermal loading, the exposure duration, and physical-chemical properties of chemicals. This
model takes into account losses to evaporation and estimates the mass that is absorbed. IH
SkinPerm© computes dermal risk assessment for four types of occupational skin exposures
found in work environments: a) deposition over time (e.g., from repeated or continuous

Page 116 of 390
emission); b) instantaneous deposition (e.g., from a splash); c) skin absorption from airborne
vapors, and d) estimating absorption of carbon tetrachloride in water. The scenario output
parameters are shown in Table 2-23.
Figure 2-4. Conceptual Diagram Showing Various Key Factors that Influence Dermal
Exposures in the Event of Carbon Tetrachloride Releases. (modified after (Chattopadhyay
and Taft, 2018))

Page 117 of 390
Table 2-23. IHSkinPerm© Output Data for Carbon Tetrachloride under Various Dermal
Exposure Scenarios
Parameter Unit
Scenario
Deposition over
time (8hr) Instantaneous
Vapor to
skin
Water
solution
Total deposition Mg 8560 100 1.91E-03 165
Fraction absorbed % 8.18E-04 4.12E-04 99.9 99.9
Amount absorbed Mg 7.00E-02 4.12E-04 1.91E-02 165
Kp-lipids (vehicle water)1 cm/hr 2.69E-2
Kp-lipids (vehicle air) 2 cm/hr 2.22E-2
Kp-keratins (vehicle water) 3 cm/hr 4.54E-05
Kp-keratins (vehicle air) 4 cm/hr 3.74E-05
Diffusivity of stratum corneum5 cm2/hr 4.55E-06
Kp-stagnant air6 cm/hr 2.53E+02
Skin/water partition ratio Dimensionless
11.9
(12.4 ± 0.6 based on test data reported by Mattie et al. (Mattie
et al., 1994))
Skin/air partition ratio Dimensionless 9.78
Permeation coefficient water7 cm/hr 2.70E-02
Permeation coefficient air8 cm/hr 2.22E-02
1: Kp-lipids (vehicle water) = permeability coefficient is a constant that describes the speed at which carbon tetrachloride diffuses
through the lipid mortar between skin cells.
2: Kp-lipids (vehicle air) = the estimated permeation coefficient of carbon tetrachloride as vapor in air, valid for the stratum
corneum lipid mortar.
3: Kp-keratins (vehicle water) = permeability coefficient is a constant that describes the speed at which carbon tetrachloride
diffuses through the dead skin cells. Keratins are a group of tough, fibrous proteins that form the structural framework of
epithelial cells that make up tissues such as the hair, skin, and nails.
4: Kp-keratins (vehicle air) = the estimated permeation coefficient of carbon tetrachloride as vapor in air, valid for the dead
corneocytes of the stratum corneum.
5: Diffusivity of stratum corneum is a dependent variable describing the effective diffusion of carbon tetrachloride through the
stratum corneum.
6: Kp-stagnant air layer = permeability coefficient of carbon tetrachloride at the air boundary layer of the skin.
7: Permeation coefficient water = an estimate of the carbon tetrachloride dermally absorbed into the stratum corneum from water.
8: Permeation coefficient air = an estimate of the carbon tetrachloride dermally absorbed from vapor in air.
Section 2.4.1.4 describes the modeling the dermal absorption of carbon tetrachloride via a liquid
vehicle (e.g., liquid carbon tetrachloride on skin or a liquid formulation containing carbon
tetrachloride on skin). Table 2-24 presents the estimated dermal retained dose for workers in
various exposure scenarios, focusing on what-if scenarios for glove use. The dose estimates
assume one exposure event (applied dose) per workday and that approximately four percent of
the applied dose is absorbed through the skin during industrial settings. The conditions of use for
carbon tetrachloride are industrial uses that occur in closed systems where dermal exposure is
likely limited to chemical loading/unloading activities (e.g., connecting hoses) and taking quality

Page 118 of 390
control samples. Across all types of uses, the maximum possible exposure concentration (Yderm)
exists during industrial uses that generally occur in closed systems. Therefore, all conditions of
use for carbon tetrachloride are assessed at the maximum Yderm, or 1. In addition to the what-if
scenarios for glove use, EPA considered the potential for occluded dermal exposures; however,
based on the worker activities for the condition of use for carbon tetrachloride, EPA determined
occluded exposures to be unlikely. Occluded scenarios are generally expected where workers
come into contact with bulk liquid carbon tetrachloride during use in open systems (e.g., during
solvent changeout in vapor degreasing and dry cleaning). Occluded scenarios are not expected in
closed systems (e.g., during connection/disconnection of hoses used in loading of bulk containers
in manufacturing). For further description of the applicable scenarios, see Appendix E of Final
Risk Evaluation for Carbon Tetrachloride, Supplemental Information on Releases and
Occupational Exposure Assessment (U.S. EPA, 2019c). EPA assesses the following what-if
glove use scenarios for all conditions of use of carbon tetrachloride for workers:
• No gloves used: Operators in these industrial uses, while working around closed-
system equipment, may not wear gloves or may wear gloves for abrasion
protection or gripping that are not chemical resistant.
• Gloves used with a protection factor of 5, 10, and 20: Operators may wear
chemical-resistant gloves when taking quality control samples or when
connecting and disconnecting hoses during loading/unloading activities. The
gloves could offer a range of protection, depending on the type of glove and
employee training provided.
• Scenarios not assessed: EPA does not assess occlusion as workers in these
industries are not likely to come into contact with bulk liquid carbon tetrachloride
that could lead to chemical permeation under the cuff of the glove or excessive
liquid contact time leading to chemical permeation through the glove.
The skin is a very complex and dynamic human organ composed of an outer epidermis and inner
dermis with functions well beyond that of just a barrier to the external environment. Dermal
absorption depends largely on the barrier function of the stratum corneum, the outermost
superficial layer of the epidermis, and is modulated by factors such as skin integrity, hydration,
density of hair follicles and sebaceous glands, thickness at the site of exposure assessment,
physiochemical properties of the substance, chemical exposure concentration, and duration of
exposure. The workplace protection factor for gloves is based on the ratio of uptake through the
unprotected skin to the corresponding uptake through the hands when protective gloves are worn.
The exposure assessments were conducted considering vapor pressure and other physical-
chemical properties of carbon tetrachloride. The key barrier of the skin is located in the
outermost layer of the skin, the stratum corneum, which consists of corneocytes surrounded by
lipid regions. Due to increased area of contact and reduced skin barrier properties, repeated skin
contact with chemicals could have even higher than expected exposure if evaporation of the
chemical occurs and the concentration of chemical in contact with the skin increases. In the
workplace the wearing of gloves could have important consequences for dermal uptake. If the
worker is handling a chemical without any gloves, a splash of the liquid or immersion of the
hand in the chemical may overwhelm the skin contamination layer so that the liquid chemical
essentially comprises the skin contamination layer. If the material is undiluted, then uptake could
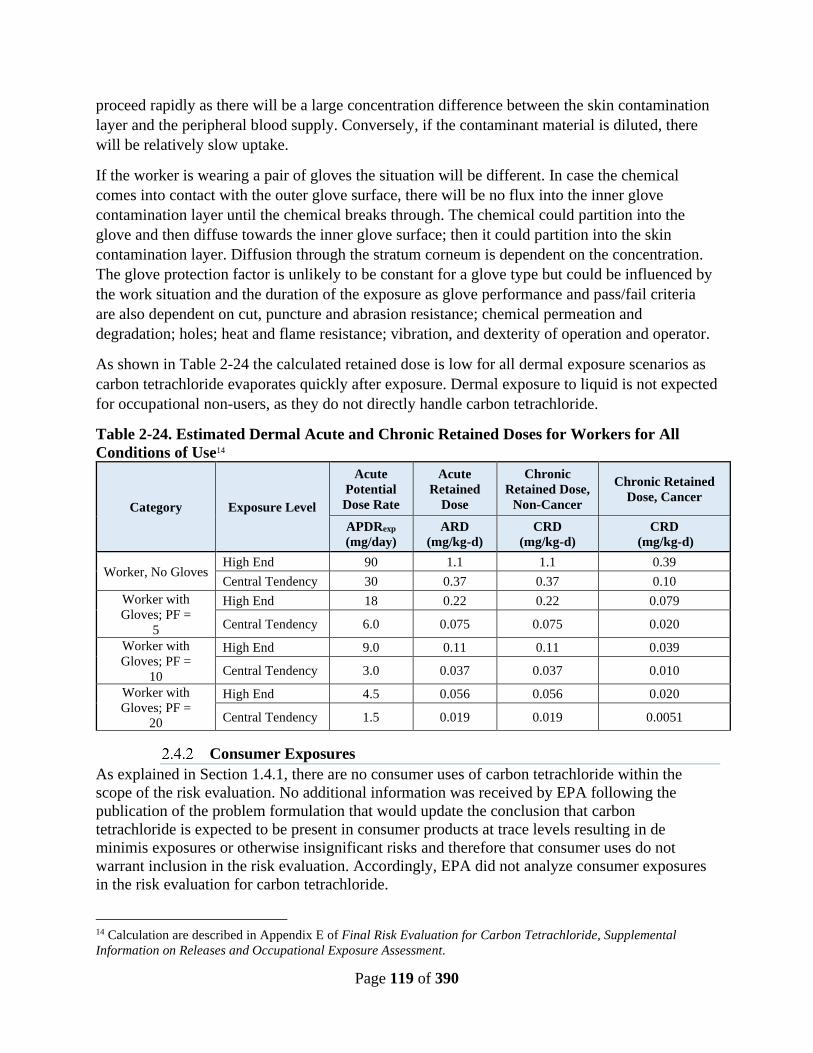
Page 119 of 390
proceed rapidly as there will be a large concentration difference between the skin contamination
layer and the peripheral blood supply. Conversely, if the contaminant material is diluted, there
will be relatively slow uptake.
If the worker is wearing a pair of gloves the situation will be different. In case the chemical
comes into contact with the outer glove surface, there will be no flux into the inner glove
contamination layer until the chemical breaks through. The chemical could partition into the
glove and then diffuse towards the inner glove surface; then it could partition into the skin
contamination layer. Diffusion through the stratum corneum is dependent on the concentration.
The glove protection factor is unlikely to be constant for a glove type but could be influenced by
the work situation and the duration of the exposure as glove performance and pass/fail criteria
are also dependent on cut, puncture and abrasion resistance; chemical permeation and
degradation; holes; heat and flame resistance; vibration, and dexterity of operation and operator.
As shown in Table 2-24 the calculated retained dose is low for all dermal exposure scenarios as
carbon tetrachloride evaporates quickly after exposure. Dermal exposure to liquid is not expected
for occupational non-users, as they do not directly handle carbon tetrachloride.
Table 2-24. Estimated Dermal Acute and Chronic Retained Doses for Workers for All
Conditions of Use14
Category Exposure Level
Acute
Potential
Dose Rate
Acute
Retained
Dose
Chronic
Retained Dose,
Non-Cancer
Chronic Retained
Dose, Cancer
APDRexp
(mg/day)
ARD
(mg/kg-d)
CRD
(mg/kg-d)
CRD
(mg/kg-d)
Worker, No Gloves High End 90 1.1 1.1 0.39
Central Tendency 30 0.37 0.37 0.10
Worker with
Gloves; PF =
5
High End 18 0.22 0.22 0.079
Central Tendency 6.0 0.075 0.075 0.020
Worker with
Gloves; PF =
10
High End 9.0 0.11 0.11 0.039
Central Tendency 3.0 0.037 0.037 0.010
Worker with
Gloves; PF =
20
High End 4.5 0.056 0.056 0.020
Central Tendency 1.5 0.019 0.019 0.0051
Consumer Exposures
As explained in Section 1.4.1, there are no consumer uses of carbon tetrachloride within the
scope of the risk evaluation. No additional information was received by EPA following the
publication of the problem formulation that would update the conclusion that carbon
tetrachloride is expected to be present in consumer products at trace levels resulting in de
minimis exposures or otherwise insignificant risks and therefore that consumer uses do not
warrant inclusion in the risk evaluation. Accordingly, EPA did not analyze consumer exposures
in the risk evaluation for carbon tetrachloride.
14 Calculation are described in Appendix E of Final Risk Evaluation for Carbon Tetrachloride, Supplemental
Information on Releases and Occupational Exposure Assessment.
Page 120 of 390
General Population Exposures
As explained above in Section 1.4.3, EPA is not including in this risk evaluation exposure
pathways under programs of other environmental statutes administered by EPA. Therefore,
based on information obtained by EPA and presented in Section 2.5.3.2 of the problem
formulation document (U.S. EPA, 2018c), EPA is not evaluating any exposure pathways to
human receptors (i.e., general population) from environmental releases and waste streams
associated with industrial/commercial activities for carbon tetrachloride which result in releases
to the following pathways: ambient air pathway (carbon tetrachloride is listed as a Hazardous Air
Pollutant (HAP) in the Clean Air Act (CAA), drinking water pathway (National Primary
Drinking Water Regulations (NPDWRs) are promulgated for carbon tetrachloride under the Safe
Drinking Water Act (SDWA)), ambient water pathways (carbon tetrachloride is a priority
pollutant with recommended water quality criteria for protection of human health under the
Clean Water Act (CWA)), biosolids pathways (carbon tetrachloride in biosolids is currently
being addressed in the CWA regulatory analytical process), and disposal pathways (carbon
tetrachloride disposal pathways are subject to regulation under the RCRA, CERCLA, SDWA,
and CAA). Because there are no other exposure pathways impacting the general population, EPA
did not analyze general population exposures in this risk evaluation.
Other Exposure Considerations
Potentially Exposed or Susceptible Subpopulations
TSCA Section 6(b)(4)(A) requires that a risk evaluation “determine whether at chemical
substance presents an unreasonable risk of injury to health or the environment, without
consideration of cost or other non-risk factors, including an unreasonable risk to a potentially
exposed or susceptible subpopulation identified as relevant to the risk evaluation by the
Administrator, under the conditions of use.” TSCA Section 3(12) states that “the term
‘potentially exposed or susceptible subpopulation’ means a group of individuals within the
general population identified by the Administrator who, due to either greater susceptibility or
greater exposure, may be at greater risk than the general population of adverse health effects
from exposure to a chemical substance or mixture, such as infants, children, pregnant women,
workers, or the elderly.”
In developing the risk evaluation, the EPA analyzed the reasonably available information to
ascertain whether some human receptor groups may have greater exposure or susceptibility than
the general population to the hazard posed by a chemical. During problem formulation, the EPA
identified the following potentially exposed or susceptible subpopulations based on their greater
exposure to carbon tetrachloride: workers and occupational non-users. Accordingly, EPA has
assessed potential risks to these two subpopulations in this risk evaluation. Section 3.2.5.2
describes the hazard information identifying susceptibility to the toxic effects of carbon
tetrachloride in individuals with histories of alcohol usage.
Aggregate and Sentinel Exposures
As a part of risk evaluation, Section 6(b)(4)(F)(ii) of TSCA requires EPA to describe whether
aggregate or sentinel exposures were considered under the identified conditions of use and the
basis for their consideration. EPA has defined aggregate exposure as “the combined exposures to
an individual from a single chemical substance across multiple routes and across multiple
pathways.” (40 C.F.R. 702.33). EPA defines sentinel exposure as “exposure from a single

Page 121 of 390
chemical substance that represents the plausible upper bound of exposure relative to all other
exposures within a broad category of similar or related exposures.” (40 C.F.R. 702.33). EPA
considered sentinel exposure in the form of high-end estimates for occupational exposure
scenarios which incorporate dermal and inhalation exposure, as these routes are expected to
present the highest exposure potential based on details provided for the manufacturing,
processing and use scenarios discussed in the previous section. The exposure calculation used to
estimate dermal exposure to liquid is conservative for high-end occupational scenarios where it
assumes full contact of both hands and no glove use. See further information on aggregate and
sentinel exposures in Section 4.6.
3 HAZARDS
Environmental Hazards EPA conducted comprehensive searches for data on the environmental hazards of carbon
tetrachloride, as described in the Strategy for Conducting Literature Searches for Carbon
Tetrachloride: Supplemental File for the TSCA Scope Document (EPA-HQ-OPPT-2016-0733-
0050). Based on an initial screening, EPA analyzed the hazards of carbon tetrachloride identified
in this risk evaluation document. The relevance of each hazard endpoint within the context of a
specific exposure scenario was judged for appropriateness. For example, hazards that occur only
as a result of chronic exposures may not be applicable for acute exposure scenarios. This means
that it is unlikely that every identified hazard was analyzed for every exposure scenario.
Further, EPA focused in the risk evaluation process on conducting timely, relevant, high-quality,
and scientifically credible risk evaluations. See 82 FR 33726, 33728 (July 20, 2017). Each risk
evaluation is "fit-for-purpose," meaning the level of refinement will vary as necessary to
determine whether the chemical substance presents an unreasonable risk. Given the nature of the
evidence, for the conditions of use of the specific chemical substance, and when information and
analysis are sufficient to make a risk determination using assumptions, uncertainty factors, and
models or screening methodologies, EPA may decide not to refine its analysis further (40 CFR
702.41(a)(6), (7); see also 82 FR at 33739-40).
Approach and Methodology
As part of the problem formulation, EPA reviewed and characterized the environmental hazards
associated with carbon tetrachloride (see Sections 2.4.1 and 2.5.3.1 of the problem formulation
document) (U.S. EPA, 2018c). EPA identified the following sources of environmental hazard
data for carbon tetrachloride: ECHA (ECHA, 2017b), OECD SIDS Initial Assessment Profile
(SIAP) (OECD, 2011), and Australia’s 2017 National Industrial Chemicals Notification and
Assessment Scheme (NICNAS). In addition, scientific studies were identified in a literature
search for carbon tetrachloride (Carbon tetrachloride (CASRN 56-23-5) Bibliography:
Supplemental File for the TSCA Scope Document, EPA-HQ-OPPT-2016-0733) and were
evaluated based on data quality evaluation metrics and rating criteria described in the
Application of Systematic Review in TSCA Risk Evaluations (U.S. EPA, 2018a) and Strategy for
Assessing Data Quality in TSCA Risk Evaluation (U.S. EPA, 2018d). Only studies with data
quality evaluation ratings of ‘high’, ‘medium’, and ‘low’ were available to characterize the
environmental hazards; no studies with ‘unacceptable’ ratings were used. The Agency attempted
Page 122 of 390
but was not able to obtain the full scientific publications listed in ECHA, SIAP, and NICNAS.
As a result, these data could not be systematically reviewed and were not used in the risk
evaluation. Even if the Agency had obtained the full studies and considered them acceptable,
EPA determined that the ecotoxicity values presented in ECHA, SIAP, and NICNAS would not
have resulted in a more conservative environmental hazard assessment. The robust summary
endpoints from these sources align with the dataset EPA used to assess the hazards of carbon
tetrachloride. Furthermore, the acute and chronic COCs for carbon tetrachloride were based on
the lowest toxicity value in the dataset.
Of the 75 on-topic environmental hazard sources identified by the ECOTOX process, 60
citations were considered out of scope and/or unacceptable in data quality based on the data
quality evaluation metrics and the rating criteria described in the Application of Systematic
Review in TSCA Risk Evaluations (U.S. EPA, 2018a). The data quality evaluation results for the
remaining 15 on-topic studies for carbon tetrachloride environmental hazard are presented in the
document Risk Evaluation for Carbon Tetrachloride, Systematic Review Supplemental File:
Data Quality Evaluation of Environmental Hazard Studies(U.S. EPA, 2019g). Relevant aquatic
toxicity data are summarized in Table 3-1. as ranges (min-max).
Hazard Identification-Toxicity to Aquatic Organisms
EPA identified and evaluated carbon tetrachloride environmental hazard data for fish, aquatic
invertebrates, amphibians, and algae across acute and chronic exposure durations. During
problem formulation, terrestrial species exposure pathways were considered to be covered under
programs of other environmental statutes administered by EPA (e.g., RCRA, CERCLA and
CAA). For the final risk evaluation, EPA conducted a qualitative assessment of exposure to
terrestrial organisms through soil and land application of biosolids by examining physical-
chemical and fate properties. EPA did not assess exposure to terrestrial organisms through
ambient air because this exposure pathway is covered under the jurisdiction of the CAA. Further
analysis was not conducted for exposures to terrestrial organisms from water as carbon
tetrachloride is identified as a priority pollutant under Section 304(a) of the CWA regulating
releases to water and the expectation that any releases to water under the regulation will
volatilize into air based on its physical-chemical properties.
As a result of a screening-level comparison of the reasonably available environmental hazard
data with exposure concentrations, it was determined that no further hazard analyses were
necessary (see Section 2.5.3.1 of the problem formulation document) (U.S. EPA, 2018c). Upon
further evaluation of the reasonably available hazard data of carbon tetrachloride after the
problem formulation phase, EPA decreased the environmental hazard chronic COC from 7 µg/L
to 3 µg/L. Consequently, EPA assessed the risk to aquatic organisms in this risk evaluation. The
derived acute COC (90 µg/L) and chronic COC (3 µg/L) are based on environmental toxicity
endpoint values (e.g., EC50) from (Brack and Rottler, 1994) and (Black et al., 1982; Birge et al.,
1980), respectively. The data represent the lowest bound of all carbon tetrachloride data
available in the public domain and provide the most conservative hazard values.
Previously, algal endpoints were considered together with data from other taxa in the acute and
chronic COC calculations. Now, algal endpoints are considered separately from the other taxa
and not incorporated into acute or chronic COCs because durations normally considered acute
for other species (e.g., 48, 72, or 96 hours) can encompass several generations of algae. A

Page 123 of 390
distinct COC is calculated for algal toxicity. A summary of the environmental studies and hazard
ranges considered for carbon tetrachloride are available in Table 3-1..
In the problem formulation phase, EPA eliminated the sediment exposure pathway from further
analysis based on physical-chemical and fate properties of carbon tetrachloride. However, in the
final risk evaluation, EPA quantitatively estimated toxicity to sediment-dwelling organisms to
improve the risk characterization of carbon tetrachloride exposure to sediment-dwelling aquatic
organisms. EPA considered one low quality study on Chironomus tentans (Lee et al., 2006) and
used aquatic invertebrates (e.g., Gammarus pseudolimnaeus and Daphnia magna) as a surrogate
species to provide an additional line of evidence. Daphnia, which feed through the entire water
column, were deemed to be an acceptable surrogate species for sediment invertebrates because
carbon tetrachloride is not expected to sorb to sediment and will instead remain in pore water.
Table 3-1. Summary of Aquatic Toxicity Studies and Hazard Ranges Evaluated for Carbon
Tetrachloride Exposure
Duration Test organism Endpoint
Hazard
valuea Units Effect Endpoint Referencesb
Acute
Fish LC50 10.40 –
150.0 mg/L Mortality
(Brooke, 1987) (high);
(Freitag et al., 1994)
(high); (Schell, 1987)
(high); (Kimball, 1978)
(high); (Geiger et al.,
1990) (high); (Buccafusco
et al., 1981) (low);
(Dawson et al., 1977)
(medium)
Aquatic
invertebrates L/EC50
11.10 –
301.0 mg/L
Mortality/
immobilization
(Brooke, 1987) (high);
(LeBlanc, 1980) (high);
(Freitag et al., 1994)
(high); (Khangarot and
Das, 2009) (high); (Richie
et al., 1984) (high);
Sediment-
dwelling
Organism
LOELc 2 mg/L Biomass (Lee et al., 2006) (low)
Amphibians LC50 0.900 –
22.42 mg/L
Teratogenesis
Leading to
Mortalityd
(Birge et al., 1980) (high);
(Black et al., 1982) (high)
Acute COC 0.09 mg/L
Chronic
Fish LC50 1.970 mg/L Mortality (Black et al., 1982) (high)
Aquatic
invertebrates
Chronic
value
1.100
(ACR10) mg/L
Growth and
reproduction (Brooke, 1987) (high)
Sediment-
dwelling
Organism
Chronic
value
0.2
(ACR10) mg/L Biomass (Lee et al., 2006) (low)
Amphibians LC10 0.025-
0.436 mg/L
Teratogenesis
Leading to
Mortality
(Birge et al., 1980) (high);
(Black et al., 1982) (high)
Chronic COC 0.003 mg/L
Algae
EC10 0.070 mg/L
Biomass (Brack and Rottler, 1994)
(high)

Page 124 of 390
Exposure
Duration Test organism Endpoint
Hazard
valuea Units Effect Endpoint Referencesb
EC50
0.250 –
23.59 mg/L
Biomass/growth
rate
(Brack and Rottler, 1994)
(high); (Freitag et al.,
1994) (high); (Tsai and
Chen, 2007) (high)
Algae COC 0.007 mg/L
aValues in bold were used to derive the COC. bData quality evaluation scores for each citation are in the parenthesis. c Lowest Observed Effect Level dThe study authors defined embryo-larval teratogenesis as the percent of survivors with gross and debilitating
abnormalities likely to result in eventual mortality.
Overall Confidence in COCs
EPA has high confidence in the environmental hazard data for carbon tetrachloride and high
confidence that the data incorporates the most conservative (highest toxicity)/environmentally
protective acute and chronic concentrations of concern (as described above).
Human Health Hazards
Approach and Methodology
EPA used the approach described in Section 1.5 to evaluate, extract and integrate carbon
tetrachloride’s human health hazard and dose-response information. Figure 3-1 presents the steps
for the hazard identification and dose response process used by EPA in this risk evaluation. After
implementation of this approach and methodology, EPA redesigned the weight of evidence
(WOE) narrative for the identified non-cancer hazards for carbon tetrachloride to improve clarity
and transparency based on recommendations from the Science Advisory Committee on
Chemicals (SACC), a TSCA peer review committee.
Figure 3-1. Hazard Identification and Dose-Response Process

Page 125 of 390
The new on-topic studies and key and supporting studies from previous hazard assessments were
screened against inclusion criteria in the PECO statement. Relevant studies were further
evaluated using the data quality criteria in the Application of Systematic Review in TSCA Risk
Evaluations (U.S. EPA, 2018a).
In the data evaluation step (Step 1), the key and supporting studies from previous hazard
assessments and new on-topic studies were evaluated using the data evaluation criteria for
human, animal, and in vitro studies described in the Application of Systematic Review in TSCA
Risk Evaluations (U.S. EPA, 2018a). Specifically, EPA reviewed key and supporting information
from previous EPA hazard assessments, such as U.S. EPA (U.S. EPA, 2010), the ATSDR
Toxicological Profile (ATSDR, 2005) and previous assessments listed in Table 1-3 as a starting
point. EPA also screened and evaluated new studies that were published since these assessments,
as identified in the literature search conducted by the Agency for carbon tetrachloride (Carbon
tetrachloride (CASRN 56-23-5) Bibliography: Supplemental File for the TSCA Scope Document,
EPA-HQ-OPPT-2016-0733).
In the data extraction step (Step 2), data is evaluated for consistency and relevance and
summarized according to each endpoint in an evidence table, which can be found in the
supplemental files for this risk evaluation (see Appendix B). In the data integration step (Step 3),
the strengths and limitations of the data are evaluated for each endpoint and a weight of the
scientific evidence narrative is developed. In the dose-response analysis (Step 4), data for each
selected hazard endpoint is modeled to determine the dose-response relationship. The results are
summarized, and the uncertainties are presented in Section 3.2.5.
EPA considered new studies with information on acute, non-cancer and cancer endpoints if the
study was found to meet the quality criteria with an overall data quality rating of high, medium,
or low. Studies found to be acceptable and rated high, medium or low were used for hazard
identification. EPA has not developed data quality criteria for all types of relevant information
(e.g., toxicokinetics data). Therefore, EPA is using these data to support the risk evaluation.
Information on human health hazard endpoints for all acceptable studies (with high, medium or
low scores) evaluated is presented in Appendix G.
Adverse health effects associated with exposure to carbon tetrachloride were identified by
considering the quality and weight of the scientific evidence to identify the most sensitive
hazards or key endpoints. Based on the systematic review of the reasonably available data, EPA
narrowed the focus of the carbon tetrachloride hazard characterization to liver toxicity,
neurotoxicity, kidney toxicity, reproductive/ developmental toxicity, and cancer. In addition, a
summary of key studies and endpoints carried forward in the risk evaluation can be found in
Appendix G, including the no-observed- or lowest-observed-adverse-effect levels (NOAEL and
LOAEL) for health endpoints by target organ/system, the corresponding benchmark dose lower
confidence limits (BMDLs), when available, and the corresponding human equivalent
concentrations (HECs), and uncertainty factors (UFs).
These key studies provided the dose-response information necessary for selection of points of
departure (PODs). The EPA defines a POD as the dose-response point that marks the beginning
of a low-dose extrapolation. This point can be the lower bound on the dose for an estimated
Page 126 of 390
incidence, or a change in response level from a dose-response model (e.g., benchmark dose or
BMD), a NOAEL, or a LOAEL for an observed incidence, or a change in the level (i.e., severity)
of a given response. PODs were adjusted as appropriate to conform to the specific exposure
scenarios evaluated.
The potential mode of action (MOA) for cancer was evaluated according to the framework for
MOA analysis described in the EPA Guidelines for Carcinogen Risk Assessment (U.S. EPA,
2005b). The evidence for genotoxicity is summarized in Appendix H. The dose-response
assessment used for selection of PODs for cancer and non-cancer endpoints and the benchmark
dose analysis used in the risk evaluation are found in Section 3.2.5.
Given that inhalation and dermal exposures are the exposures of concern in this risk evaluation,
studies conducted via these two routes of exposure were considered for POD derivation.
Nevertheless, oral exposure data are presented below for weight of evidence support in the
selection of hazard endpoints and PODs. Acceptable toxicological data by the dermal route and
physiologically based pharmacokinetic/ pharmacodynamic (PBPK/PD) models that would
facilitate route-to-route extrapolation to the dermal route have not been identified for carbon
tetrachloride. Therefore, inhalation PODs were extrapolated for use via the dermal route using
assumptions about absorption in this risk evaluation.
The EPA consulted Guidelines for Developmental Toxicity Risk Assessment (U.S. EPA, 1991)
when making the decision to use developmental toxicity studies to evaluate risks that may be
associated with acute exposure to carbon tetrachloride during occupational exposure scenarios.
This decision is based on the EPA’s policy, which is based on the health-protective assumption
that a single exposure during a critical window of fetal development may produce adverse
developmental effects. The EPA guidelines state that for developmental toxic effects, a primary
assumption is that a single exposure at a critical time in development may produce an adverse
developmental effect, i.e., repeated exposures is not a necessary prerequisite for developmental
toxicity to be manifested (U.S. EPA, 1991). However, limited evidence from gestational
exposure studies for carbon tetrachloride in rats suggest that developmental effects are likely
associated with the sustained lower maternal weight over gestation days 6-15 rather than the
result of exposure to carbon tetrachloride on a single day of the study (NRC, 2014) (see Sections
3.2.4.1 and 3.2.5.1).
A summary table which includes all endpoints considered for this risk evaluation, the NOAEL
and LOAEL for health endpoints by target organ/system and the results of the data evaluation is
provided in Appendix G. The Sections below present the analysis, synthesis and integration of
the hazard information resulting from those data sources that have low, medium or high overall
data quality.
Acceptable Studies Reasonably Available for Evaluation
The database for carbon tetrachloride has comprehensive information on non-cancer and cancer
effects in experimental animals and humans, through the inhalation and oral routes, but lacks an
adequate study for reproductive toxicity. The majority of the animal toxicology studies have
been described and evaluated in previous hazard assessments and toxicological profiles for
carbon tetrachloride.

Page 127 of 390
The systematic review process evaluated the data quality of the key subchronic and chronic
studies in (U.S. EPA, 2010), which identifies the following subchronic oral gavage studies
supporting the derivation of the RfD for carbon tetrachloride, (Condie et al., 1986), (Allis et al.,
1990) and (Hayes et al., 1986). (Bruckner et al., 1986) was the principal study for the derivation
of the RfD and was rated as a high data quality subchronic oral study in rats in the systematic
review for this risk evaluation.
The principal study for the derivation of the IRIS RfC is (Nagano et al., 2007a), which consists
of a chronic study using two species and preceded by a 13-week subchronic study. This chronic
study was rated as a high quality study during the systematic review process. Other key
subchronic inhalation studies of acceptable data quality are presented in Table 3-3, below.
Similarly, the key study used to derive the acute exposure inhalation guidelines by NAC-AEGL
(NRC, 2014) was found to be of acceptable low data quality in the systematic review. Other
epidemiological studies with acute exposures were not evaluated for data quality because they
were found to lack reliable quantitative exposure data by NAC-AEGL.
Epidemiological studies presented in the EPA IRIS Assessment (U.S. EPA, 2010) were deemed
inadequate to show an association between carbon tetrachloride exposure and carcinogenicity by
the IRIS program. However, epidemiological studies with acceptable data quality according to
the systematic review process and that were published following the cut-off time of the data
evaluation period in the IRIS assessment review are considered adequate to show an association
between exposures to carbon tetrachloride and carcinogenicity during data evaluation and
integration processes for this risk evaluation (see Section 3.2.4.2.2 and Table 3-4). Specifically,
three of four epidemiologic studies of brain cancer showed statistically significant increases in
risk of brain tumors ((Heineman et al., 1994); (Nelson et al., 2012); (Neta et al., 2012)). The
limited number of recent epidemiological studies assessing non-cancer (i.e., Parkinson’s disease,
autism) endpoints and with acceptable data quality do not show association between exposure
and non-cancer hazard effects (see Table 3-2).
Further information on the methodology and findings of the key toxicological studies with
acceptable data quality that were taken into consideration for hazard identification are presented
in Section 3.2.4 and Appendix G.
Table 3-2. Acceptable Epidemiological Studies on Non-Cancer Effects from Repeated
Exposures not Evaluated in Previous EPA Assessments
Outcome/
Endpoint Study Population Exposure Results Reference
Data Quality
Evaluation
Parkinson's
Disease (PD)
99 male twin pairs 35-
84 years of age from
US National Academy
of Sciences/National
Research Council
World War II Veteran
Twins Registry, 1993-
1995
Self-reported
exposure to
carbon
tetrachloride
A non-significant
association was
observed between
Parkinson Disease and
exposure to carbon
tetrachloride
(Goldman et
al., 2012) High
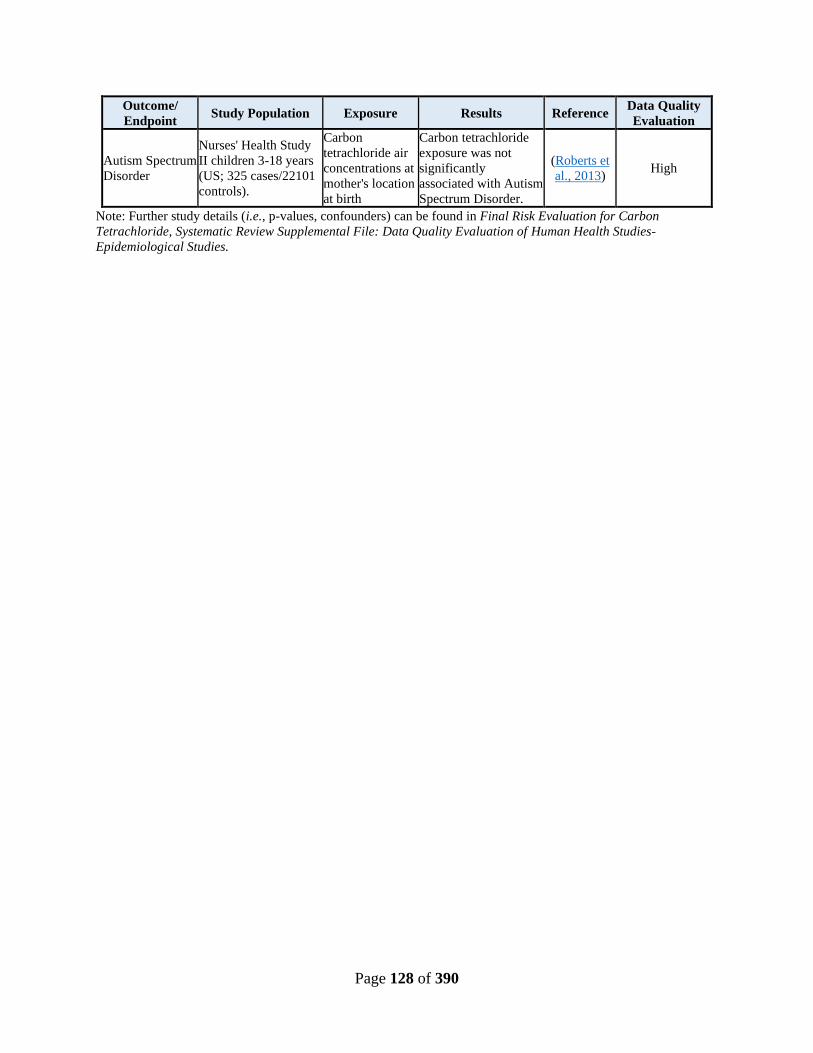
Page 128 of 390
Outcome/
Endpoint Study Population Exposure Results Reference
Data Quality
Evaluation
Autism Spectrum
Disorder
Nurses' Health Study
II children 3-18 years
(US; 325 cases/22101
controls).
Carbon
tetrachloride air
concentrations at
mother's location
at birth
Carbon tetrachloride
exposure was not
significantly
associated with Autism
Spectrum Disorder.
(Roberts et
al., 2013) High
Note: Further study details (i.e., p-values, confounders) can be found in Final Risk Evaluation for Carbon
Tetrachloride, Systematic Review Supplemental File: Data Quality Evaluation of Human Health Studies-
Epidemiological Studies.
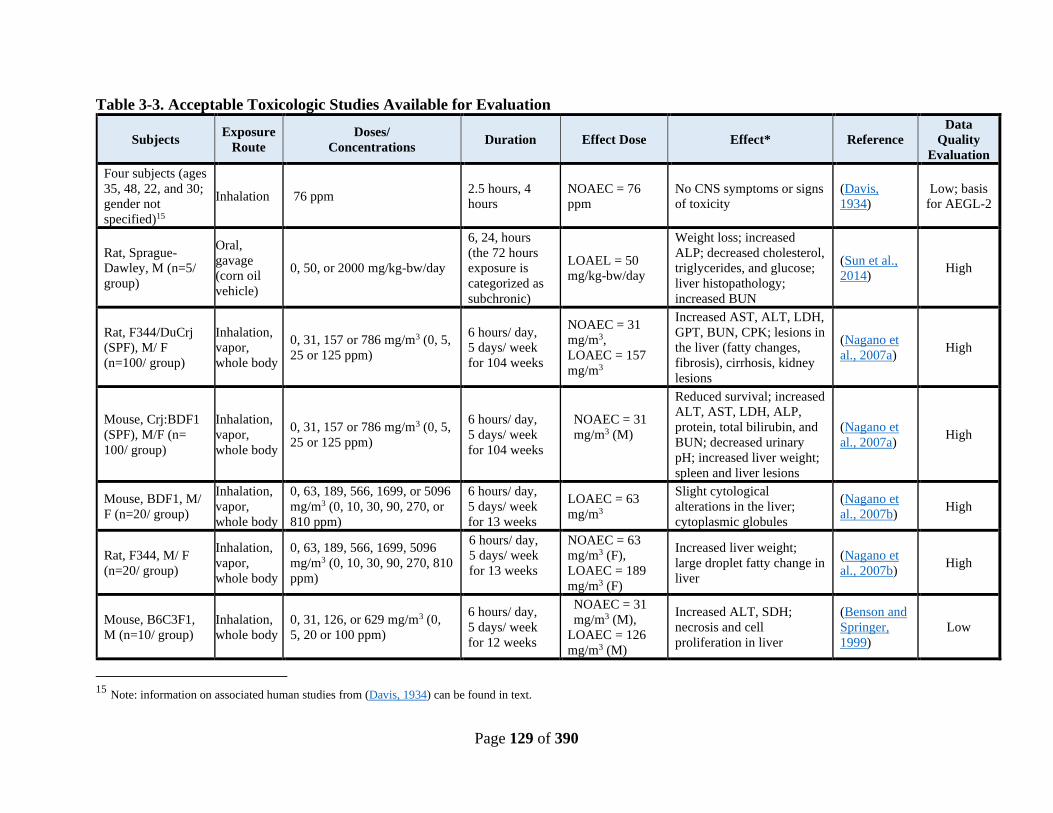
Page 129 of 390
Table 3-3. Acceptable Toxicologic Studies Available for Evaluation
Subjects Exposure
Route
Doses/
Concentrations Duration Effect Dose Effect* Reference
Data
Quality
Evaluation
Four subjects (ages
35, 48, 22, and 30;
gender not
specified)15
Inhalation 76 ppm 2.5 hours, 4
hours
NOAEC = 76
ppm
No CNS symptoms or signs
of toxicity
(Davis,
1934)
Low; basis
for AEGL-2
Rat, Sprague-
Dawley, M (n=5/
group)
Oral,
gavage
(corn oil
vehicle)
0, 50, or 2000 mg/kg-bw/day
6, 24, hours
(the 72 hours
exposure is
categorized as
subchronic)
LOAEL = 50
mg/kg-bw/day
Weight loss; increased
ALP; decreased cholesterol,
triglycerides, and glucose;
liver histopathology;
increased BUN
(Sun et al.,
2014) High
Rat, F344/DuCrj
(SPF), M/ F
(n=100/ group)
Inhalation,
vapor,
whole body
0, 31, 157 or 786 mg/m3 (0, 5,
25 or 125 ppm)
6 hours/ day,
5 days/ week
for 104 weeks
NOAEC = 31
mg/m3,
LOAEC = 157
mg/m3
Increased AST, ALT, LDH,
GPT, BUN, CPK; lesions in
the liver (fatty changes,
fibrosis), cirrhosis, kidney
lesions
(Nagano et
al., 2007a) High
Mouse, Crj:BDF1
(SPF), M/F (n=
100/ group)
Inhalation,
vapor,
whole body
0, 31, 157 or 786 mg/m3 (0, 5,
25 or 125 ppm)
6 hours/ day,
5 days/ week
for 104 weeks
NOAEC = 31
mg/m3 (M)
Reduced survival; increased
ALT, AST, LDH, ALP,
protein, total bilirubin, and
BUN; decreased urinary
pH; increased liver weight;
spleen and liver lesions
(Nagano et
al., 2007a) High
Mouse, BDF1, M/
F (n=20/ group)
Inhalation,
vapor,
whole body
0, 63, 189, 566, 1699, or 5096
mg/m3 (0, 10, 30, 90, 270, or
810 ppm)
6 hours/ day,
5 days/ week
for 13 weeks
LOAEC = 63
mg/m3
Slight cytological
alterations in the liver;
cytoplasmic globules
(Nagano et
al., 2007b) High
Rat, F344, M/ F
(n=20/ group)
Inhalation,
vapor,
whole body
0, 63, 189, 566, 1699, 5096
mg/m3 (0, 10, 30, 90, 270, 810
ppm)
6 hours/ day,
5 days/ week
for 13 weeks
NOAEC = 63
mg/m3 (F),
LOAEC = 189
mg/m3 (F)
Increased liver weight;
large droplet fatty change in
liver
(Nagano et
al., 2007b) High
Mouse, B6C3F1,
M (n=10/ group)
Inhalation,
whole body
0, 31, 126, or 629 mg/m3 (0,
5, 20 or 100 ppm)
6 hours/ day,
5 days/ week
for 12 weeks
NOAEC = 31
mg/m3 (M),
LOAEC = 126
mg/m3 (M)
Increased ALT, SDH;
necrosis and cell
proliferation in liver
(Benson and
Springer,
1999)
Low
15 Note: information on associated human studies from (Davis, 1934) can be found in text.
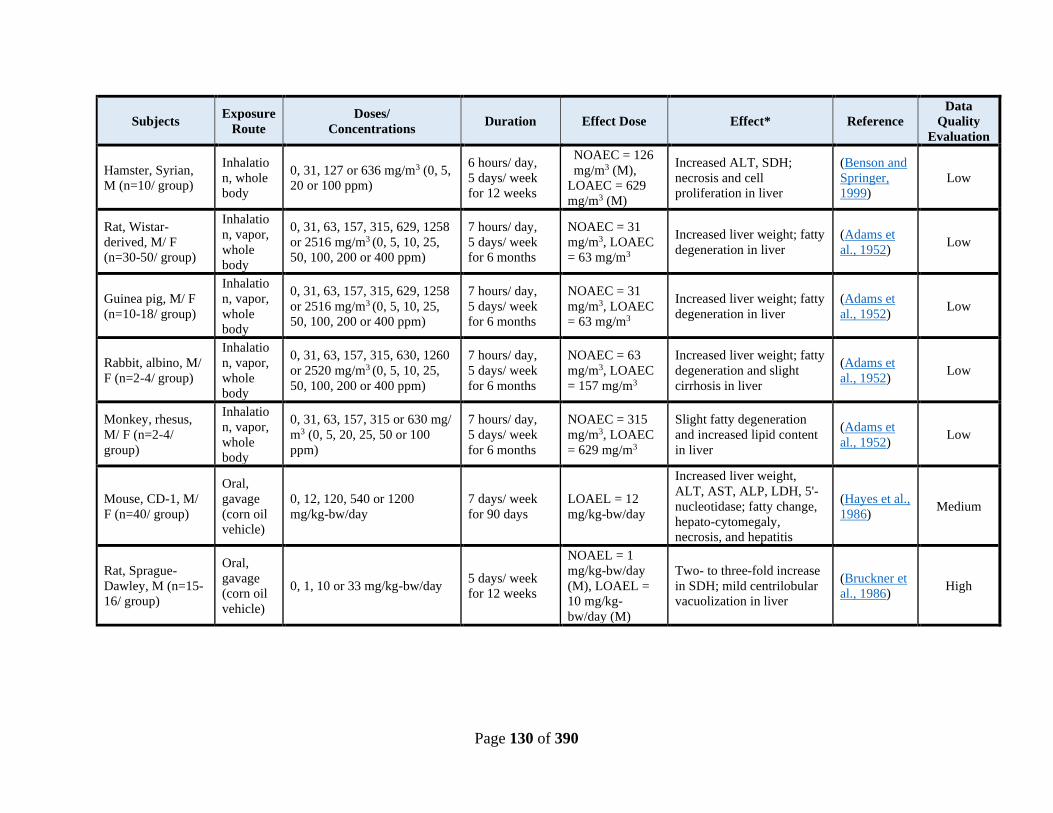
Page 130 of 390
Subjects Exposure
Route
Doses/
Concentrations Duration Effect Dose Effect* Reference
Data
Quality
Evaluation
Hamster, Syrian,
M (n=10/ group)
Inhalatio
n, whole
body
0, 31, 127 or 636 mg/m3 (0, 5,
20 or 100 ppm)
6 hours/ day,
5 days/ week
for 12 weeks
NOAEC = 126
mg/m3 (M),
LOAEC = 629
mg/m3 (M)
Increased ALT, SDH;
necrosis and cell
proliferation in liver
(Benson and
Springer,
1999)
Low
Rat, Wistar-
derived, M/ F
(n=30-50/ group)
Inhalatio
n, vapor,
whole
body
0, 31, 63, 157, 315, 629, 1258
or 2516 mg/m3 (0, 5, 10, 25,
50, 100, 200 or 400 ppm)
7 hours/ day,
5 days/ week
for 6 months
NOAEC = 31
mg/m3, LOAEC
= 63 mg/m3
Increased liver weight; fatty
degeneration in liver
(Adams et
al., 1952) Low
Guinea pig, M/ F
(n=10-18/ group)
Inhalatio
n, vapor,
whole
body
0, 31, 63, 157, 315, 629, 1258
or 2516 mg/m3 (0, 5, 10, 25,
50, 100, 200 or 400 ppm)
7 hours/ day,
5 days/ week
for 6 months
NOAEC = 31
mg/m3, LOAEC
= 63 mg/m3
Increased liver weight; fatty
degeneration in liver
(Adams et
al., 1952) Low
Rabbit, albino, M/
F (n=2-4/ group)
Inhalatio
n, vapor,
whole
body
0, 31, 63, 157, 315, 630, 1260
or 2520 mg/m3 (0, 5, 10, 25,
50, 100, 200 or 400 ppm)
7 hours/ day,
5 days/ week
for 6 months
NOAEC = 63
mg/m3, LOAEC
= 157 mg/m3
Increased liver weight; fatty
degeneration and slight
cirrhosis in liver
(Adams et
al., 1952) Low
Monkey, rhesus,
M/ F (n=2-4/
group)
Inhalatio
n, vapor,
whole
body
0, 31, 63, 157, 315 or 630 mg/
m3 (0, 5, 20, 25, 50 or 100
ppm)
7 hours/ day,
5 days/ week
for 6 months
NOAEC = 315
mg/m3, LOAEC
= 629 mg/m3
Slight fatty degeneration
and increased lipid content
in liver
(Adams et
al., 1952) Low
Mouse, CD-1, M/
F (n=40/ group)
Oral,
gavage
(corn oil
vehicle)
0, 12, 120, 540 or 1200
mg/kg-bw/day
7 days/ week
for 90 days
LOAEL = 12
mg/kg-bw/day
Increased liver weight,
ALT, AST, ALP, LDH, 5'-
nucleotidase; fatty change,
hepato-cytomegaly,
necrosis, and hepatitis
(Hayes et al.,
1986) Medium
Rat, Sprague-
Dawley, M (n=15-
16/ group)
Oral,
gavage
(corn oil
vehicle)
0, 1, 10 or 33 mg/kg-bw/day 5 days/ week
for 12 weeks
NOAEL = 1
mg/kg-bw/day
(M), LOAEL =
10 mg/kg-
bw/day (M)
Two- to three-fold increase
in SDH; mild centrilobular
vacuolization in liver
(Bruckner et
al., 1986) High

Page 131 of 390
Subjects Exposure
Route
Doses/
Concentrations Duration Effect Dose Effect* Reference
Data
Quality
Evaluation
Rat, F344, M
(n=48/ group; 6/
group at sacrifice
time; sacrificed at
intervals from 1 to
15 days post
exposure)
Oral,
gavage
(corn oil
vehicle)
0, 20 or 40 mg/kg-bw/day 5 days/ week
for 12 weeks
LOAEL = 20
mg/kg-bw/day
(M)
Increased liver weight,
ALT, AST, LDH; reduced
liver CYP450; cirrhosis,
necrosis, and degeneration
in liver
(Allis et al.,
1990) Medium
Mouse, CD-1, M/
F (n=24/ group)
Oral,
gavage
(corn oil
vehicle)
0, 1.2, 12 or 120 mg/kg-
bw/day
5 days/ week
for 12 weeks
NOAEL = 1.2
mg/kg-bw/day,
LOAEL = 12
mg/kg-bw/day
Increased ALT; mild to
moderate hepatic lesions
(hepato-cytomegaly,
necrosis, inflammation)
(Condie et
al., 1986) High
Mouse, CD-1, M/
F (n=24/ group)
Oral,
gavage
(1%
Tween-
60
vehicle)
0, 1.2, 12 or 120 mg/kg-
bw/day
5 days/ week
for 12 weeks
NOAEL = 12
mg/kg-bw/day,
LOAEL = 120
mg/kg-bw/day
Increased liver weight,
ALT, AST, LDH; hepato-
cytomegaly, vacuolation,
inflammation, necrosis, and
fibrosis in liver
(Condie et
al., 1986) High
Rat, F344, F
(n=12-14/ group)
Oral,
gavage
(corn oil
vehicle or
10%
Emulphor
vehicle)
0, 25, 50 or 75 mg/kg-bw/day GDs 6-15
NOAEL = 25
mg/kg-bw/day
(F), LOAEL =
50 mg/kg-
bw/day (F)
Piloerection; markedly
increased full-litter
resorption
(Narotsky et
al., 1997) High
Rat, Sprague-
Dawley, F (n=24-
28/ group)
Inhalatio
n, whole
body
0, 300, or 1,000 ppm for 7
hours/day GDs 6-15
LOAEC = 300
ppm; NOAEC
not determined
Decreased fetal body
weight and crown-rump
length; increased sternebral
anomalies
(Schwetz et
al., 1974)
High
Guinea pig, gender
not specified
(n=20)
Dermal 0.5 or 2.0 mL
Single
application;
contact for 5
days
LOAEL = 260
mg/cm2 (0.5
mL)
5 of 20 animals died at 0.5
mL; 13 of 20 animals died
at 2.0 mL (first animal
death on day 1 at 2.0 mL)
(Wahlberg
and Boman,
1979)
Medium
* Effect acronyms: ALP = Alkaline Phosphatase, ALT = Alanine Transaminase, AST = Aspartate Transaminase, BUN = Blood Urea Nitrogen, CPK = Creatine
Phosphokinase, GPT = Glutamic-Pyruvate Transaminase, LDH = Lactate Dehydrogenase, SDH = Sorbitol Dehydrogenase
Page 132 of 390
Toxicokinetics
The toxicokinetics of carbon tetrachloride have been comprehensively described in previous
toxicological assessments (see Table 1-3). In summary, the IRIS assessment describes that
carbon tetrachloride is rapidly absorbed by any route of exposure. However, it is noted that the
dermally absorbed fraction would be negligible for exposures to carbon tetrachloride vapor
(Mccollister et al., 1951).
Once absorbed, carbon tetrachloride is widely distributed among tissues, especially those with
high lipid content, reaching peak concentrations in <1–6 hours, depending on exposure
concentration or dose. Animal studies show that volatile metabolites are released in exhaled air,
whereas nonvolatile metabolites are excreted in feces and to a lesser degree, in urine.
In (Sanzgiri and Bruckner, 1997), the comparison of tissue distribution of inhaled carbon
tetrachloride to the equivalent oral dose show that maximal levels in fat were considerably in
excess of the maximal levels in other tissues, regardless of route of exposure. Among tissues
other than fat, distribution kinetics were generally similar for the tissues, except that maximal
levels were higher and attained more quickly in the liver than in other tissues following bolus
oral administration.
The metabolism of carbon tetrachloride has been extensively studied in in vivo and in vitro
mammalian systems. Carbon tetrachloride is metabolized in the body, primarily by the liver, but
also in the kidney, lung, and other tissues containing CYP450 enzymes. Based on reasonably
available information, the initial step in biotransformation of carbon tetrachloride is reductive
dehalogenation: reductive cleavage of one carbon-chlorine bond to yield chloride ion and the
trichloromethyl radical. Biotransformation of carbon tetrachloride to reactive metabolites,
including the trichloromethyl radical, is hypothesized to be a key event in the toxicity of carbon
tetrachloride. The fate of the trichloromethyl radical depends on the availability of oxygen and
includes several alternative pathways for anaerobic or aerobic conditions. Anaerobic
dimerization forms hexachloroethane, while aerobic trapping by oxygen forms a trichloromethyl
peroxy radical. The trichloromethyl peroxy radical is the primary initiator of lipid peroxidation
that occurs from exposure to carbon tetrachloride (Rao and Recknagel, 1969).
Cytochromes CYP2E1 and CYP2B, the primary enzymes responsible for biotransformation of
carbon tetrachloride in rodents, were measured in all exposed and control animals in the
metabolic studies by (Benson and Springer, 1999). In all species, microsomal measurement of
these enzymes indicated that while enzyme induction increased several fold as dose increased,
catalytic activity was not significantly altered. In addition, the rate of carbon tetrachloride
metabolism was measured in rat, mouse and hamster species. The metabolic rate of carbon
tetrachloride did not vary more than two-fold between the three species (Benson and Springer,
1999).
(Thrall et al., 2000) and (Benson and Springer, 1999) used in vitro data on metabolism of
carbon tetrachloride by human liver microsomes and in vitro and in vivo rodent data to estimate
the in vivo human metabolic rate constants. Estimated rate constants were used by the IRIS
Program for interspecies extrapolation (i.e., rat-to-human, mouse-to-human) and route-to-route
extrapolation of carbon tetrachloride inhalation dosimetry using a human PBPK model, which
Page 133 of 390
has been described in (Paustenbach et al., 1988), (Thrall et al., 2000) and (Benson and Springer,
1999).
Hazard Identification
Non-Cancer Hazards
The high hepatoxicity potential of carbon tetrachloride is well documented in the literature, and
carbon tetrachloride is recognized as a model hepatotoxicant in animal and in vitro studies.
Carbon tetrachoride is used as a reference compound to compare the hepatoxicity of other
halogenated solvents and as a positive control for liver damage in the study of potential
therapeutic effects of other compounds (Song et al., 2011; Martínez et al., 1995; Sagai and
Tappel, 1978). In addition to its high hepatoxicity potential, carbon tetrachloride is also known to
affect the CNS and the kidney.
Most of the human case reports of acute inhalation exposure to carbon tetrachloride describe a
consistent pattern of carbon tetrachloride toxicity that includes initial dizziness and nausea,
followed by abdominal discomfort, liver and kidney effects and subsequent renal failure and
death (Manno et al., 1996; Ruprah et al., 1985; New et al., 1962). Despite consistent findings
across human acute studies, most case reports lack reliable quantitative data. However, EPA
notes that Davis (1934) provides a series of controlled human experiments in which dose regimes
were serially adjusted based on previous experimental observations. Because carbon
tetrachloride concentrations were determined in those studies on the basis of the room volume
and the amount of carbon tetrachloride necessary to achieve the desired concentration, OPPT
considers that the identified NOAEC for reversible CNS effect (i.e., dizziness) is a health
protective effect and presents an effect level that is applicable for this risk evaluation.
There are no human data on the reproductive toxicity and very limited human data on the
developmental toxicity of carbon tetrachloride, which consists of a prospective cohort study with
limited power that found no association between occupational exposure to carbon tetrachloride
and the risk of infants small for gestational age (Seidler et al., 1999). Limited evidence from
gestational exposure studies in animals suggest that developmental toxicity is not an acute effect
nor the most sensitive effect for carbon tetrachloride. Developmental toxicity has been observed
at oral and inhalation doses accompanied by some degree of maternal toxicity (Narotsky et al.,
1997; Narotsky and Kavlock, 1995; Schwetz et al., 1974; Wilson, 1954). Observations from the
only high quality developmental toxicity study by the inhalation route (Schwetz et al., 1974)
suggests that developmental effects (i.e., decreased fetal body weight and crown-rump length,
increase in sternebral anomalies) of carbon tetrachloride occur at concentrations toxic to the
mother and at exposure concentrations higher than those associated with liver and kidney
toxicity. EPA considers that developmental effects from inhalation exposures to carbon
tetrachloride (i.e., decreased fetal body weight and crown-rump length, increase in sternebral
anomalies) are not single dose effects and are likely associated with maternal toxicity. Inhalation
exposures to carbon tetrachloride during gestation have not been associated with resorptions and
mortality, which are effects that can occur following a single exposure during a sensitive
developmental stage and are considered a relevant endpoint for acute effects (van Raaij et al.,
2003).

Page 134 of 390
Epidemiological data on non-cancer effects from subchronic and chronic inhalation exposures is
also limited. The limited dataset includes a medium quality study by Tomenson et al. (1995),
which was used as supportive evidence in the development of the IRIS RfC on liver effects as
was noted in the IRIS Toxicologic Review (U.S. EPA, 2010). This cross-sectional study on
hepatic function in workers exposed to carbon tetrachloride provides suggestive evidence of
hepatic effects from workplace inhalation exposures.
There are no epidemiological data or human case reports on long term oral exposures to carbon
tetrachloride. In contrast, repeated-dose oral and inhalation studies with carbon tetrachloride in
rodents (mice, rats and guinea pigs) is quite extensive, but with limited information on
reproductive and developmental effects (see discussion of (Schwetz et al., 1974), above). The
inhalation database includes a high quality chronic (104 week) inhalation toxicity study in rats
and mice by (Nagano et al., 2007a) showing increased incidence and severity of nonneoplastic
kidney and liver lesions (i.e., fatty change, fibrosis, cirrhosis) and serum enzyme levels in
exposed rats and mice. This chronic study, and its associated 13-week subchronic study,
examined an extensive set of non-cancer endpoints showing consistency in hazard levels and
effects over time for mice and rats. In agreement with IRIS conclusions, OPPT considers the
fatty changes in rat livers as the most sensitive endpoint indicative of adverse effect in the liver
and this endpoint was chosen for dose-response analysis for inhalation exposures. As liver
toxicity is identified as the most sensitive effect from repeated inhalation exposures to carbon
tetrachloride, OPPT assumes, that similarly to developmental toxicity, potential reproductive
effects from carbon tetrachloride exposure are, at worst, secondary to liver toxicity. For instance,
effects on the reproductive organs (e.g., testes, uterus, etc.) have not been observed in subchronic
and chronic animal studies, which suggests that carbon tetrachloride is not likely to be a
reproductive toxicant, and that any potential reproductive effects could be only induced at much
higher doses than liver toxicity. EPA has also concluded that carbon tetrachloride immunological
effects were, at least in part, secondary to hepatotoxicity and the process of hepatic repair, which
produces adverse effects on T-cell-dependent immunity at doses that are hepatotoxic.
Moderate primary irritation hazard in rabbits and guinea pigs from acute dermal exposures has
been identified for carbon tetrachloride (ATSDR, 2005). Guinea pigs also exhibited degenerative
change in epidermal cells and edema (ATSDR, 2005). In the murine local lymph node assay,
carbon tetrachloride showed weak dermal sensitization potential (OECD, 2011). However, there
are limited reasonably available studies by the dermal route for carbon tetrachloride, making it
difficult to identify adequate quantitative information on effects levels inducing non-local
effects. Data on the absorption of carbon tetrachloride demonstrate that compound in liquid form
is systematically absorbed via all routes of exposure, including dermal. Therefore, induction of
toxic effects by internal doses from dermal exposures is expected. Furthermore, the very limited
available dermal exposure data suggest that liver changes can be induced by exposure to carbon
tetrachloride through the skin in animals. Among the few dermal studies, (Kronevi et al., 1979)
(data quality rating = unacceptable due to lack of negative controls and small number of animals)
is the only available animal dermal study that includes histopathological observations of the liver
and kidney in addition to skin tissue. There were no reported kidney changes following dermal
exposure to carbon tetrachloride in this study, but liver necrosis was observed in guinea pigs
after occluded application of 1 mL carbon tetrachloride for 16 hours, but not for 15 minutes, 1
hour, or 4 hours. The results of the dermal study by (Wahlberg and Boman, 1979) (data quality
Page 135 of 390
rating = medium) also suggest that short term (4 hours) application of ≤ 1 mL carbon
tetrachloride has low potential for induction of adverse effects. In Wahlberg and Boman, one
guinea pig exposed to 0.5 mL died on day 3, and a total of five animals died by the end of the
observation period (21 days). Faster and higher rate of mortality was observed for animals in the
highest exposure group.
Because quantitative information on the effects of carbon tetrachloride via the dermal route in
humans and animals is limited or absent, route-to-route extrapolation is considered in this risk
evaluation with the assumption that inhalation is the most relevant route for extrapolation. This
assumption is based on the fact that carbon tetrachloride undergoes first-pass metabolism in the
liver following oral exposures, which results in lower peak exposure at the target site.
Alternatively, there is more opportunity for extrahepatic distribution of carbon tetrachloride
following inhalation and dermal exposures, as these exposure routes bypass first-pass
metabolism in the liver.
Genotoxicity and Cancer Hazards
3.2.4.2.1 Genotoxicity
As documented in the EPA IRIS Toxicological Review of carbon tetrachloride (U.S. EPA,
2010), a substantial body of publications have studied genotoxic effects of carbon tetrachloride.
The systematic review for this risk evaluation did not identify additional genetic toxicity studies
with carbon tetrachloride rated of medium or high overall quality. The main conclusions and
limitations of the in vitro and in vivo genotoxicity databases for carbon tetrachloride are
described below.
OPPT has concluded that there is little direct evidence that carbon tetrachloride induces
intragenic or point mutations in mammalian systems. Multiple studies have characterized the
formation of endogenously produced DNA adducts, chromosomal aberrations, and micronucleus
formation, primarily in the presence of cellular toxicity. Lipid peroxidation, one of the key
events in the proposed MOA, products generate compounds (i.e., reactive aldehydes) that may
covalently bind to DNA. There is strong evidence of increases in DNA adducts formed from
reactive oxygen species (i.e., 8-hydroxy-2’-deoxyguonosine) and lipid peroxidation products
such as malondialdehyde and 4-hydroxynonenal in the liver of rodents following administration
of carbon tetrachloride. There is limited evidence, however, for the formation of DNA adducts
derived directly from carbon tetrachloride. There is no evidence of unscheduled DNA synthesis
in the livers of carbon tetrachloride-treated rats or mice even when tested under conditions
producing significant hepatotoxicity.
Based on the weight of evidence, EPA has concluded that genotoxic effects have been observed
in a consistent and close relationship with cytotoxicity, lipid peroxidation, and/or oxidative DNA
damage.16 Mutagenic effects, if they occur, are likely to be generated through genotoxicity
mechanisms resulting from oxidative stress or lipid peroxidation products. Under highly
cytotoxic conditions, bioactivated carbon tetrachloride can exert genotoxic effects. These tend to
16 However, EPA acknowledges that there are important methodologic gaps in the genotoxicity database for carbon
tetrachloride, which are described in Appendix H
Page 136 of 390
be modest in magnitude and are manifested primarily as DNA breakage and related sequelae.
Chromosome loss leading to aneuploidy may also occur to a limited extent.
In vitro Genotoxicity
The in vitro genotoxicity database for carbon tetrachloride, while large in number of studies, is
not diverse in the type of assays contained to examine the genotoxicity potential of carbon
tetrachloride. The studies identified in Appendix H, while not definitive, provide indications of
mutational or chromosomal changes that may be relevant to the MOA of carbon tetrachloride
carcinogenesis.
In vivo Genotoxicity
Assessment of potential genotoxic effects of carbon tetrachloride should focus first on effects in
the liver, as CYP2E1 activity largely resides in the liver. Data from other tissues (i.e., lung and
kidney) may supplement the liver data to a degree, as these tissues have lesser but maybe
relevant levels of CYP2E1 activity.17 It is not apparent that data for other tissues will reflect the
CYP2E1 metabolism of carbon tetrachloride.
The carbon tetrachloride database is sparse for in vivo studies of mutation and chromosomal
changes in liver tissue. Available studies as cited in EPA IRIS Assessment (U.S. EPA, 2010) are
presented in Appendix H.
3.2.4.2.2 Carcinogenicity
Epidemiological Data on Carcinogenicity
General Overview of reasonably Available Epidemiological Data
The most recent EPA IRIS assessment (U.S. EPA, 2010) did not indicate that studies in humans
showed an association between exposure to carbon tetrachloride and carcinogenicity based on
the literature available at that time. The assessment presented some limited evidence for certain
types of cancer in occupational populations exposed to carbon tetrachloride, including brain
cancer, breast cancer, cervical cancer, esophageal cancer, lymphatic leukemia, lymphosarcoma,
non-Hodgkin’s lymphoma, and rectal cancer (U.S. EPA, 2010). Table 3-4 presents
epidemiological studies of acceptable data quality published after completion of the 2010 EPA
IRIS assessment (U.S. EPA, 2010). Among those 11 new studies published since 2010, there was
one study of breast cancer, one study of head/neck cancer, one study of kidney cancer, two
studies of lung cancer, two studies of lymphohematopoietic cancers, three studies of brain
cancers, and one study of neuroblastoma.
Combining these with the several studies noted in the IRIS assessment, there was little evidence
of an association between carbon tetrachloride exposure and the lymphohematopoietic cancers
(non-Hodgkin lymphoma, lymphosarcoma, lymphatic leukemia, multiple myeloma, and mycosis
fungoides – the most common form of cutaneous T-cell lymphoma), breast cancer, head/neck
cancer, kidney cancer, or lung cancer.
17 Yoon (2007) has estimated CYP2E1 activity (Vmax – nmole/min/g) in the lung and kidney as approximately 6%
and 5% of that in the liver.

Page 137 of 390
However, three of these newer studies report results for cancers of the brain – as did one study
from the 2010 IRIS assessment (Heineman et al., 1994). All four of these brain cancer studies
were of brain tumors which include astrocytomas, gliomas, glioblastomas and glioblastoma
multiforme and occur in adults. The brain cancer studies were critically and comprehensively
reviewed below, as was a single study on neuroblastoma – the most common cancer in infants
and most commonly found in the adrenal glands, which is concordant in organ site with the
pheochromocytomas findings in mice (see Section 3.2.5.2.5).
Table 3-4. Epidemiologic Studies of Carbon Tetrachloride and Cancer After 2010 EPA
IRIS Assessment
Cancer
Endpoint Study Population Exposure Results Reference
Data
Quality
Evaluation
Brain
(Glioblastoma
multiforme)
8,006 men of Japanese
descent from the
Honolulu Heart
Program and Honolulu-
Asia Aging Study
cohorts, aged 45-68
years at initial
examination (1965-
1968) and followed
through 1998. Nine
glioblastoma cases.
Occupational
histories reviewed
by NIOSH
industrial hygienists
who assigned levels
of exposure.
Crude rate of
astrocytic brain cancer
among men exposed to
carbon tetrachloride
(n=2) was 10-fold
higher than among
unexposed men (n=7;
p=0.012). A positive,
statistically significant
association was found
between glioblastoma
and high occupational
exposure to carbon
tetrachloride (n=1) vs.
no exposure
(HR=26.59; 95% CI:
2.9, 243.5).
(Nelson et
al., 2012)
Medium
Brain
(Glioma)
Hospitalized patients
including 489 glioma
cases, 197 meningioma
cases, and 799 controls
from three hospitals in
Boston, Pittsburgh and
Phoenix.
Occupational
histories reviewed
by NCI industrial
hygienist who
assigned levels of
exposure. Proxy
interviews were
conducted for 16%
(n=78) of glioma
cases, 8% (n=15) of
meningioma cases,
and 3% (n=23) of
controls.
Carbon tetrachloride
was associated with a
decreased risks of
glioma when the
reference group was
the unexposed, but a
significantly increased
in risk when the
reference group was
the ‘low’ exposed
group for average
weekly exposure
above the median
(OR=7.1; 95% CI: 1.1,
45.2) compared to
exposure below the
median. Additional
adjustment for
exposure to lead and
magnetic field was
also significantly
increased (OR=60.2;
95% CI: 2.4, 1533.8)
compared to below the
(Neta et
al., 2012)
High

Page 138 of 390
Cancer
Endpoint Study Population Exposure Results Reference
Data
Quality
Evaluation
median. No
association with
meningioma.
Brain
(Glioma)
Non-farm workers from
the Upper Midwest
Health Study including
798 cases and 1,141
controls from Iowa,
Michigan, Minnesota,
and Wisconsin 1995-
1997.
Occupational
histories reviewed
by NCI industrial
hygienist who
assigned levels of
exposure. Of 798
glioma cases, 360
interviews (45%)
were conducted
with proxies
because the cases
were deceased.
None of the control
interviews were
conducted with
proxies.
Excluding proxy-only
interviews: ‘Ever’ vs.
‘never’ having carbon
tetrachloride exposure
was not associated
with a risk of glioma
per ppm-yr (OR=0.82;
95% CI: 0.64, 1.06)
and cumulative
exposure was
associated with
decreased risk of
gliomas per ppm-year
(OR=0.98; 95% CI:
0.96, 1.00).
Including proxy-only
interviews: Results
were similar to those
excluding proxy-only
interviews (OR=0.98;
95% CI: 0.96, 0.99).
(Ruder et
al., 2013)
High
Breast Participants in the
California Teacher
Study, 1995-2011,
(n=112,378 women).
National-Scale Air
Toxics Assessment
modeled air
concentrations.
Borderline significant
increase in risk of
breast cancer
incidence associated
with 5th quintile
carbon tetrachloride
exposure compared to
1st quintile exposure
(HR=1.08; 95% CI:
(1.00, 1.18).
Significant trend
across quintiles
(p=0.03).
(Garcia et
al., 2015)
High
Head/Neck Case-control, women
only, 296 cases, 775
controls, diagnosed
2001-2007, general
population, aged 18-85
years, subset of ICARE
cohort.
Carbon
tetrachloride,
exposure
qualitatively stated
as ever (job with
likely exposure
>1month) or never.
No statistically
significant association
between carbon
tetrachloride and
head/neck cancers
(OR=0.36; 95% CI:
0.09, 1.55).
(Carton et
al., 2017)
Medium
Kidney General population
case-control study of
kidney cancer (1,217
cases; 1,235 controls).
Job exposure matrix
was used to
determine years
exposed, average
weekly exposure
and cumulative
No statistically
significant
associations observed
between exposure to
carbon tetrachloride
and kidney cancer
(Purdue et
al., 2016)
High
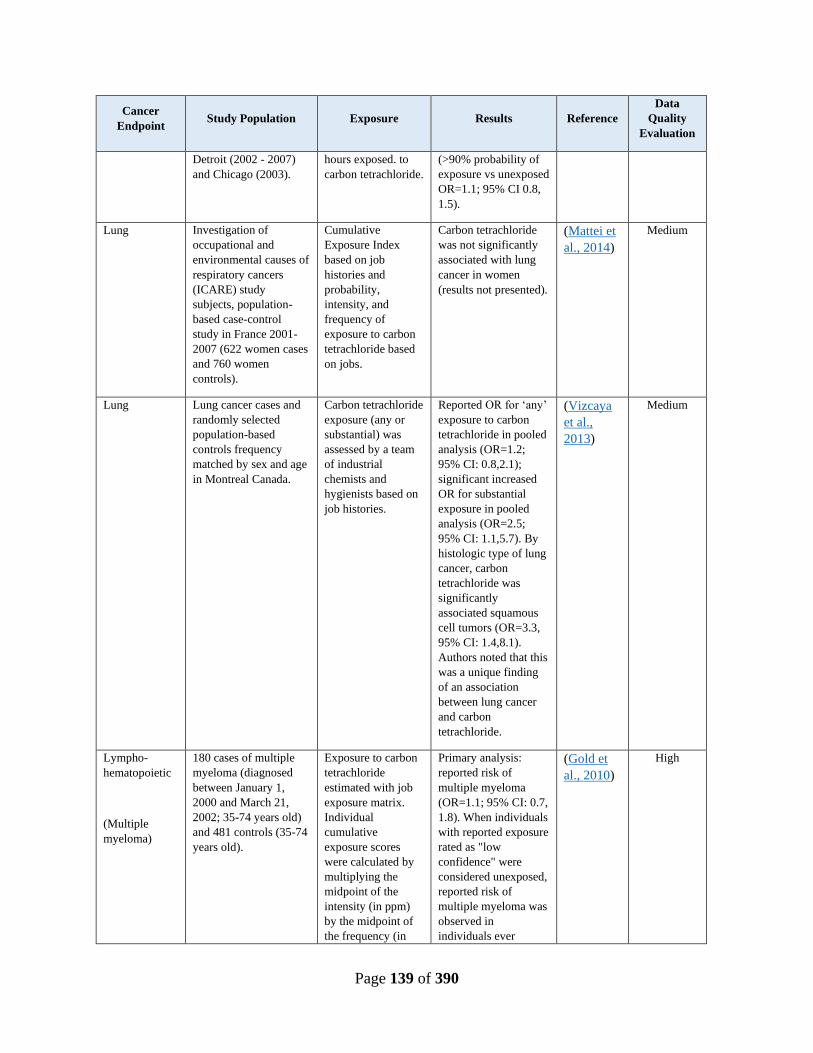
Page 139 of 390
Cancer
Endpoint Study Population Exposure Results Reference
Data
Quality
Evaluation
Detroit (2002 - 2007)
and Chicago (2003).
hours exposed. to
carbon tetrachloride.
(>90% probability of
exposure vs unexposed
OR=1.1; 95% CI 0.8,
1.5).
Lung Investigation of
occupational and
environmental causes of
respiratory cancers
(ICARE) study
subjects, population-
based case-control
study in France 2001-
2007 (622 women cases
and 760 women
controls).
Cumulative
Exposure Index
based on job
histories and
probability,
intensity, and
frequency of
exposure to carbon
tetrachloride based
on jobs.
Carbon tetrachloride
was not significantly
associated with lung
cancer in women
(results not presented).
(Mattei et
al., 2014)
Medium
Lung Lung cancer cases and
randomly selected
population-based
controls frequency
matched by sex and age
in Montreal Canada.
Carbon tetrachloride
exposure (any or
substantial) was
assessed by a team
of industrial
chemists and
hygienists based on
job histories.
Reported OR for ‘any’
exposure to carbon
tetrachloride in pooled
analysis (OR=1.2;
95% CI: 0.8,2.1);
significant increased
OR for substantial
exposure in pooled
analysis (OR=2.5;
95% CI: 1.1,5.7). By
histologic type of lung
cancer, carbon
tetrachloride was
significantly
associated squamous
cell tumors (OR=3.3,
95% CI: 1.4,8.1).
Authors noted that this
was a unique finding
of an association
between lung cancer
and carbon
tetrachloride.
(Vizcaya
et al.,
2013)
Medium
Lympho-
hematopoietic
(Multiple
myeloma)
180 cases of multiple
myeloma (diagnosed
between January 1,
2000 and March 21,
2002; 35-74 years old)
and 481 controls (35-74
years old).
Exposure to carbon
tetrachloride
estimated with job
exposure matrix.
Individual
cumulative
exposure scores
were calculated by
multiplying the
midpoint of the
intensity (in ppm)
by the midpoint of
the frequency (in
Primary analysis:
reported risk of
multiple myeloma
(OR=1.1; 95% CI: 0.7,
1.8). When individuals
with reported exposure
rated as "low
confidence" were
considered unexposed,
reported risk of
multiple myeloma was
observed in
individuals ever
(Gold et
al., 2010)
High
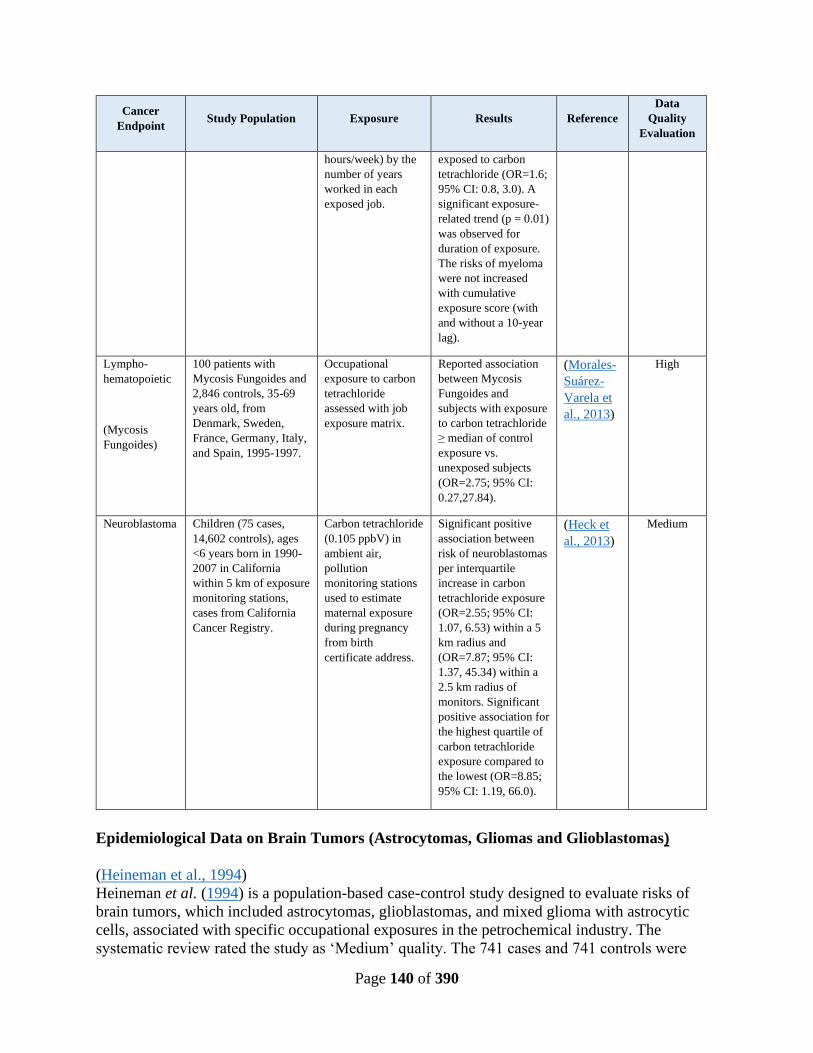
Page 140 of 390
Cancer
Endpoint Study Population Exposure Results Reference
Data
Quality
Evaluation
hours/week) by the
number of years
worked in each
exposed job.
exposed to carbon
tetrachloride (OR=1.6;
95% CI: 0.8, 3.0). A
significant exposure-
related trend (p = 0.01)
was observed for
duration of exposure.
The risks of myeloma
were not increased
with cumulative
exposure score (with
and without a 10-year
lag).
Lympho-
hematopoietic
(Mycosis
Fungoides)
100 patients with
Mycosis Fungoides and
2,846 controls, 35-69
years old, from
Denmark, Sweden,
France, Germany, Italy,
and Spain, 1995-1997.
Occupational
exposure to carbon
tetrachloride
assessed with job
exposure matrix.
Reported association
between Mycosis
Fungoides and
subjects with exposure
to carbon tetrachloride
≥ median of control
exposure vs.
unexposed subjects
(OR=2.75; 95% CI:
0.27,27.84).
(Morales-
Suárez-
Varela et
al., 2013)
High
Neuroblastoma Children (75 cases,
14,602 controls), ages
<6 years born in 1990-
2007 in California
within 5 km of exposure
monitoring stations,
cases from California
Cancer Registry.
Carbon tetrachloride
(0.105 ppbV) in
ambient air,
pollution
monitoring stations
used to estimate
maternal exposure
during pregnancy
from birth
certificate address.
Significant positive
association between
risk of neuroblastomas
per interquartile
increase in carbon
tetrachloride exposure
(OR=2.55; 95% CI:
1.07, 6.53) within a 5
km radius and
(OR=7.87; 95% CI:
1.37, 45.34) within a
2.5 km radius of
monitors. Significant
positive association for
the highest quartile of
carbon tetrachloride
exposure compared to
the lowest (OR=8.85;
95% CI: 1.19, 66.0).
(Heck et
al., 2013)
Medium
Epidemiological Data on Brain Tumors (Astrocytomas, Gliomas and Glioblastomas)
(Heineman et al., 1994)
Heineman et al. (1994) is a population-based case-control study designed to evaluate risks of
brain tumors, which included astrocytomas, glioblastomas, and mixed glioma with astrocytic
cells, associated with specific occupational exposures in the petrochemical industry. The
systematic review rated the study as ‘Medium’ quality. The 741 cases and 741 controls were
Page 141 of 390
selected from U.S. locations with high proportions of workers in these industries in order to
increase the likelihood of exposures to chlorinated aliphatic hydrocarbons (including carbon
tetrachloride) in the source populations that gave rise to both the cases and the controls. Controls
were randomly selected from white male residents who died of causes other than brain tumor,
CVD, epilepsy, suicide and homicide and were frequency matched on age, year of death, and
location. Next-of-kin were located for 88% of cases (n=654) and 83% of controls (n=612).
Among those cases whose proxies completed the interview, 300 were confirmed as astrocytic
brain tumor cases with hospital diagnoses and 320 controls whose proxies completed the
interview were confirmed not to have other conditions potentially related to chlorinated aliphatic
hydrocarbons.
Trained interviewers, who were blinded to the case status of the interviewed family members,
administered standardized questionnaires recording all study members’ occupations since the age
of 15 years including job title, job tasks, name and location of the company, the type of
industry/products, employment dates and hours worked per week. These data were coded
according to standardized classifications and linked by an industrial hygienist from the U.S.
National Cancer Institute (NCI) to specific exposure profiles for each occupation to develop
specific exposure profiles for each study participant. Results were presented at varying levels of
specificity of exposure from ‘ever’ exposed (yes/no), by qualitative levels of probability of
exposure, by average intensity of exposures, by duration of exposures, and by cumulative
exposure score – with results stratified by different exposure metrics.
• OR (i.e., odds ratio) for ‘ever’ being exposed to carbon tetrachloride was 1.2 (95% CI: 0.9,
1.7).
• No clear pattern of results by ‘probability’ of exposure
• Strongest results among the ‘Medium probability’ group
• Multi-pollutant model showed similar results
• Increasing OR trend with increasing cumulative exposure scores (p < 0.05)
• Increasing OR trend with increasing duration of exposure (p < 0.05)
• Increasing OR trend with increased ‘average intensity’ in high duration workers (p < 0.05)
• Higher ‘Average intensity’ had increased risks; OR = 2.9 (95% CI: 1.2, 7.1)
• Higher ‘Average intensity’ and duration had increased risk; OR = 3.1 (95% CI: 0.7, 15.3)
Selection bias: No concern that selection was differentially related to exposure or outcome.
Information bias: No specific concern for recall bias about carbon tetrachloride or other exposure
misclassification related to outcome (i.e., no differential misclassification) because study
participants were asked about individuals’ occupational histories which were then coded to
specific exposures – respondents are unlikely to know how expert industrial hygienists would
code those occupational histories for carbon tetrachloride; some concern that random exposure
misclassification caused bias towards the null.
Confounding: Some concern for potential confounding of the association between carbon
tetrachloride and astrocytic brain cancer by methylene chloride; however, to be a confounder,
methylene chloride must itself be a cause of brain cancer and be more strongly associated with
brain cancer then carbon tetrachloride to completely explain the reported carbon tetrachloride
association. Comparing the effect sizes for the most specific exposure characterization using
Page 142 of 390
‘High’ average intensity and 20+ years duration, the methylene chloride results (OR = 6.1; 95%
CI: 1.5, 28.3) were stronger than the analogous result for carbon tetrachloride (OR = 3.1; 95%
CI: 0.7, 15.3). Additional analyses restricted to those workers with 20+ years duration and High
average intensity of exposure across all ‘probabilities’, multivariate exposure models showed
higher risks for methylene chloride (OR = 6.7; 95% CI: 1.3, 47.4) vs. carbon tetrachloride (OR =
1.8; 0.7, 4.6). However, among only those with ‘High probability’, the OR was higher for carbon
tetrachloride (OR= ∞; 2 cases and no controls) compared to methylene chloride (OR = 8.8; 95%
CI: 1.0, 200). In other analyses, the effect of methylene chloride was greater than for carbon
tetrachloride when adjusting for other chlorinated aliphatic hydrocarbons in addition to age,
study area, employment in electronics-related occupations or industries, and the duration and
intensity of exposure to three other solvents, but the wide confidence intervals overlapped. In this
study, methylene chloride appears to be confounding the association of carbon tetrachloride with
risk of astrocytic brain cancer. If methylene chloride were a cause of brain cancer, this would
imply that the apparent association between carbon tetrachloride and this cancer was due to the
correlation between these two exposures; however, if methylene chloride is not a cause of
astrocytic brain cancer, then other explanations for the apparent confounding may involve more
complicated issues of correlations among mixture of exposures and their measurement errors.
(Neta et al., 2012)
Neta et al. (2012) is a hospital-based case-control study designed to evaluate risks of brain
tumors from occupational exposures to six chlorinated solvents. The systematic review rated the
study as ‘High’ quality. The 484 glioma cases with 797 controls were enrolled during 1994-1998
from hospitals in three cities (Boston, Pittsburgh, and Phoenix) that were regional referral centers
for brain cancer cases. Controls were patients with non-malignant conditions. Participation rates
were high with 92% of glioma cases and 86% of controls participating. Proxy interviews were
conducted for 16% of gliomas and 3% of controls. Controls were frequency matched by sex, age
at interview, race/ethnicity, hospital, and proximity to the hospital. Patients were interviewed by
trained research nurses using a computer-based questionnaire about their lifetime occupational
histories. An expert industrial hygienist from the U.S. NCI converted the occupational histories
into estimated exposures for ‘probability’, ‘frequency’ and ‘intensity’ for six chlorinated
solvents.
Results for five of the chlorinated solvents including dichloromethane, chloroform, 1,1,1-
trichloroethane, trichloroethylene and perchloroethylene) showed no evidence of increased risks
of glioma. There was suggestive evidence of an association between exposure to carbon
tetrachloride and increased risk of glioma.
Results for carbon tetrachloride exposures were presented in two ways: with the ‘unexposed’ as
the reference group, and with the ‘low’ exposure group as the reference. The authors explained:
“The latter analyses accounted for the possibility that unexposed persons may be substantially
different from exposed persons in ways that cannot be adjusted for in our analysis. Thus,
comparing highly exposed subjects with those who had lower exposure levels may be a more
accurate comparison for evaluating risks, assuming that a dose–response relationship exists.”
Including the unexposed participants as the reference group:
• OR for ‘possible’ exposure was 0.7 (95% CI: 0.5, 0.9)

Page 143 of 390
• OR for ‘probable’ exposure was 0.6 (95% CI: 0.3, 1.2)
• For years exposed, Low had OR of 0.5 (0.2, 1.2); High had OR of 0.9 (0.3, 2.2)
• For cumulative exposure, Low had OR of 0.4 (0.1, 1.1); High had OR of 0.9 (0.4, 2.0)
• For average exposure, Low had OR of 0.3 (0.1, 0.9); High had OR of 1.1 (0.5, 2.4)
• For highest exposure, Low had OR of 0.3 (0.1, 1.0); High had OR of 1.0 (0.4, 2.2)
Using the lower exposed participant as the reference group:
• For years exposed, High (8 cases; 7 controls) had OR of 1.6 (0.4, 7.5)
• For cumulative exposure, High (10 cases; 5 controls) had OR of 2.8 (0.6, 14.4)
• For average exposure, High (11 cases; 4 controls) had OR of 7.1 (1.1, 45.2)
• For highest exposure, High (11 cases; 4 controls) had OR of 3.2 (0.6, 17.2)
All four analyses comparing High (above median carbon tetrachloride exposure) to Low (below
median exposure) were elevated, but only the above median ‘average’ exposures were
statistically significantly increased. (Neta et al., 2012) noted that earlier studies of occupational
exposures to chlorinated solvents “did not identify specific aetiological agents or disentangle the
effects of potentially correlated occupational exposures, such as non-ionising electromagnetic
radiation, lead and other chemical agents.” Thus, (Neta et al., 2012) further adjusted for
occupational exposures to lead and magnetic fields. For the other five chlorinated solvents, (Neta
et al., 2012) reported no meaningful changes in estimated risk; however, for carbon tetrachloride,
further adjustment for exposures to lead and magnetic fields increased the estimated risks for
average weekly exposure above median exposures from OR = 7.1 (95% CI: 1.1, 45.2; p-value =
0.04) to OR = 60.2 (95% CI: 2.4 to 1533.8). Similarly, the estimated risks for cumulative
exposure above median exposures from OR = 2.8 (95% CI: 0.6, 14.4) to OR = 56.4 (95% CI: 1.9
to 1686.2). Results were not reported for analyses adjusted for insecticide or herbicides.
Selection bias: Some concern that the ‘unexposed’ people were substantially different from the
‘exposed’ people. Since exposures were assessed based on occupational histories, only those
people who were employed outside the home could have been considered to have been exposed
– and people with worse health and shorter occupational histories would have had fewer
opportunities for exposure. Workers are known to be healthier than the general population. Thus,
both the healthy worker effect and the healthy worker survivor effect may explain why the
results using the unexposed as the reference group yielded what appeared to be health protective
effects while the comparisons with the low exposed group appeared to show increased risk.
Because the participating hospitals were referral centers for brain cancer, it was possible that the
brain cancer cases were drawn from a larger catchment area than the controls which could have
induced some selection bias; however, the percentages of cases and controls who lived more than
50 miles from the hospital were equivalent (10.5% vs 10.8%), and thus there is little concern for
this type of selection bias.
Information bias: No specific concern for recall bias about carbon tetrachloride or other exposure
misclassification related to outcome (i.e., no differential misclassification); some concern that
random exposure misclassification caused bias towards the null.
Confounding: No concern for potential confounding by other chlorinated solvents, including by
methylene chloride in this study; none of the other solvents were significantly associated with
Page 144 of 390
increased risks of brain cancer in any of the analyses including the analyses with ‘Low’ exposure
as the referent or when controlling for lead and magnetic fields. Given the large upward change
in effect size of carbon tetrachloride when adjusting for exposures to lead and magnetic fields,
there appear to have been either some strong confounding by those covariates, or a chance
finding based on small numbers – although those results were statistically significant. If lead and
magnetic fields were confounders and were positive risk factors for gliomas, then there must
have been a negative correlation between carbon tetrachloride and those exposures.
Nevertheless, the observed effect of higher carbon tetrachloride compared to lower exposure was
statistically significant both with, and without control of exposure to lead and magnetic fields.
Chance: The main finding was a seven-fold increase in risks of glioma associated with High
average carbon tetrachloride exposure. This result was supported by the finding of elevated risks
in the three other carbon tetrachloride exposure metrics, but only the High average exposure
metric was statistically significantly increased. However, the extremely high risks reported in the
a priori sub-analyses controlling for exposures to lead and magnetic fields were also highly
unstable with wide confidence intervals, that while excluding the null value of 1.00, could be due
to chance or an overly stratified model controlling for lead and magnetic fields in addition to five
baseline covariates with 14 highly exposed cases and 11 highly exposed controls.
(Ruder et al., 2013)
Ruder (2013) is a case-control study designed to evaluate risks of non-farm related occupational
exposures to chlorinated solvents in four states with large farm populations and above-average
rates of brain cancer. The systematic review rated the study as ‘High’ quality. The 798 cases with
glioma were ascertained through participating medical facilities and comprised 78% of all cases
in those states during the collection period. The 1,175 population controls were residents of those
states and were frequency matched on age and sex. Participation rates were high with 91% of
cases and 70% of controls participating. All participants lived in non-metropolitan counties.
Cases were interviewed when possible with next-of-kin proxies as needed (45%). All of the
controls were interviewed without proxies. Interviewers were highly trained, used a standardized
protocol, and were blinded to the study hypotheses. An expert industrial hygienist from the U.S.
NCI, who was blinded to case-control status, converted the occupational histories into estimated
exposures. Results were presented in two ways: with and without the cases with proxy
interviews. Including the case-proxies, Ruder (2013) found a decreased risk with ‘ever/never’
exposure (OR = 0.79; 95% CI: 0.65, 0.97). Excluding the case-proxies, they found similar risks
(OR = 0.82; 95% CI: 0.64, 1.06).
Selection bias: Some concern that the controls were significantly older than the cases and thus
began their occupational exposures in earlier times and consequently had greater opportunity for
increased exposure to carbon tetrachloride. Although age was adjusted for in the analyses, the
result of this imbalance in age may have been to exert a downward bias on the effect estimates.
Information bias: No specific concern for recall bias about carbon tetrachloride. Some concern
that while the investigators used appropriate methods for interviewing the study participants,
45% of case interviews were with proxies while none of the control interviews were with
proxies. The investigators make the point that “possible poor recall by case respondents could
have affected the analysis if work details that might be associated with chlorinated solvent
Page 145 of 390
exposure were less specific for case than for control responses.” The result of this differential
measurement error bias may have been to exert a downward bias on the effect estimates by
comparing more accurate exposure information from controls with less accurate exposure
information from cases.
Confounding: No concern for potential confounding by other chlorinated solvents; none of the
other solvents were significantly associated with increased risks of brain cancer in any of the
analyses. In fact, all of the solvents were uniformly associated with the same magnitude of
decreased risk which raises the possibility of a common methodological issue.
(Nelson et al., 2012)
Nelson et al. (2012) is a prospective cohort study of the Honolulu Heart Program that followed
the health of 8,009 men for 30 years. The systematic review rated the study as ‘Medium’ quality.
The investigators ascertained exposure to carbon tetrachloride based on review of occupational
histories by three industrial hygienists from the National Institute for Occupational Safety and
Health (Charles et al., 2006 as cited in (Nelson et al., 2012)). A ‘High’ score reflected
confidence that the occupational exposures were frequent and at least sometimes near the OSHA
PEL; a ‘medium’ score reflected likely exposures that were below the PEL. The OSHA PEL is
10 ppm for an eight hour time-weighted average. Results are presented for ‘selected’ variables
including demographics, biomarkers, diet and occupational exposures. The only occupational
exposures reported were for ‘solvents’ and carbon tetrachloride which appears to have been
selectively reported due to the statistical significance of the association – although the
investigators reported that they found no effects for metals or pesticides. Such an association
should be interpreted with caution as it is unclear how many other exposures were evaluated, but
not reported. Nevertheless, the incidence rate of glioblastoma multiforme, a type of brain cancer,
among the cohort without occupational exposure to carbon tetrachloride was 7 cases per 191,469
person-years (p-y) or 3.7 per 100,000 p-y. The rate of glioblastoma multiforme among the cohort
with occupational exposure to carbon tetrachloride was 2 cases per 5,421 p-y or 36.9 cases per
100,000 p-y. This yields a rate ratio of 10.09 with a p-value of 0.012. The investigators also
reported a hazard ratio for carbon tetrachloride of 26.59 (95% CI: 2.90, 243.50) based on a single
case with ‘high’ exposure (p-value of 0.004) for this association.
Selection bias: No concern as the cohort was enrolled between 1965-68 with occupational
histories taken at the initial enrollment and followed up for mortality through 1998. Only 5 of
8,006 participants were lost to follow-up.
Information bias: No concern that exposure measurement error could have been differential with
respect to the outcome as this was a prospective cohort study. Three industrial hygienists from
the National Institute for Occupational Safety and Health identified several occupations as being
associated with exposure to carbon tetrachloride.
Confounding: No concern as there were no effects reported for metals or pesticides and no other
results from other occupational exposures were presented (no results presented for carbon
disulfide, the only other specific solvent mentioned) other than ‘solvents’, this study does not
provide evidence to suggest confounding.

Page 146 of 390
Chance: As noted in (Nelson et al., 2012), the known causes of glioblastoma were limited to
ionizing radiation and genetic disorders and the objective of this study was to generate
hypotheses. Chance is always a potential explanation for any individual finding and the apparent
selective reporting of results needs to be considered in the evidence integration across all the
available epidemiologic studies.
Evidence Integration for Studies on Brain Tumors (Astrocytomas, Gliomas and Glioblastomas)
While all four studies on brain tumors were evaluated during systematic review as either ‘high’
or ‘medium’ quality, there were distinctive differences in some study quality elements that were
not reflected in the overall scores. The case-control study by Ruder et al. (2013) found no
evidence of increased risk of brain cancer − but there were two methodological issues that could
have resulted in downward biases: first, while the methods appeared to be sound, the controls
happened to be significantly older than the cases making them potentially more likely to have
had occupational exposures to carbon tetrachloride and to greater extent; second, with 45% of
case interviews conducted with proxies compared to none of the controls, there is a strong
potential for exposure measurement error to be differentially associated with the outcome.
The prospective cohort study (Nelson et al., 2012) was well designed, but the results appear to
have been selectively presented as carbon tetrachloride exposure was the only specific
occupational exposure presented – possibly because the results were highly statistically
significant. This does not change those results, but suggests that the statistical significance
should be evaluated in context. Nevertheless, the finding that those subjects exposed to carbon
tetrachloride were 10 times more likely to die of brain cancer and that the one highly exposed
case generated a more than 26-fold increase in risks cannot be completely set aside.
Heineman et al. (1994) provided the most thorough evaluation across a variety of exposure
measures with different levels of specificity including results by ‘ever’ exposed, probability of
exposure, average intensity of exposure, cumulative exposure, and exposure duration, with
results provided for combinations of these exposures. The study was the only one that targeted
populations with higher likelihoods of being exposed to carbon tetrachloride associated with
occupations in the petrochemical industry. Results for the cruder metrics of exposure (‘ever’ and
probability of exposure) did not show increased risks, while the more specific metrics of average
intensity of exposure showed increased risk at the highest level (OR = 2.9; 95% CI: 1.2, 7.1) as
well as statistically significant trends with increasing cumulative exposure and duration of
exposure. The strongest results were for the highest average intensity for the longer duration of
exposure (OR = 3.1; 95% CI: 0.7 – 15.3). However, while methylene chloride appears to have
been a potential confounder, methylene chloride is not a known cause of astrocytic brain cancer
and therefore cannot be a confounder.
Neta et al. (2012) reported an unexpectedly health protective effect when analyses used the
unexposed as the reference group but reported increased risks for carbon tetrachloride when
using the ‘low’ exposed group as the reference group. Such results can arise when the unexposed
people are different from the exposed people in other ways that may be related to the outcome,
thus a comparison between participants with industrial occupational exposures to non-industrial
occupations may attenuate risks due to difference in underlying health status. The set of results
that the investigators considered to be more accurate showed a statistically significant increased

Page 147 of 390
risk for average weekly exposure greater than the median (OR = 7.1; 95% CI: 1.1, 45.2)
compared to below the median. Further, additional analyses controlling for exposure to lead and
magnetic fields (selected as additional variables a priori) show an even stronger association for
high average weekly exposure (OR = 60.2; 95% CI: 2.4 to 1533.8). Similarly, the estimated risks
for cumulative exposure above median exposures from OR = 2.8 (95% CI: 0.6, 14.4; p-value =
0.04) to OR = 56.4 (95% CI: 1.9 to 1686.2).
There are only four epidemiological studies in the literature that evaluate the associations
between carbon tetrachloride exposure and risks of brain cancer; one prospective cohort study
and three case-control studies. All four studies were of adequate quality and all have evaluated
occupational exposures based on job histories according to standard practices of industrial
hygienists at the U.S. National Cancer Institute or the U.S. National Institute for Occupational
Safety and Health. Three studies reported increased risks of brain tumors associated with
exposures to carbon tetrachloride while one did not. Within a small database, three of four show
consistency; and all three showed some evidence of strong associations with carbon tetrachloride
exposures preceding brain cancer, and two showed exposure-response trends. It is plausible that
carbon tetrachloride can cause brain cancer because carbon tetrachloride has been shown to be a
liver carcinogen in rats, mice, and hamsters by oral and inhalation exposure (U.S. EPA, 2010) as
well as causing pheochromocytomas in mice by oral and inhalation exposure and neuroblastomas
by inhalation exposure in humans (Heck et al., 2013). Considerable research in animals further
supports the biological plausibility for these demonstrated associations from epidemiological
studies. Carbon tetrachloride can pass through the blood-brain barrier (Thrall et al., 2000), is
rapidly absorbed by the brain and liver (Szymonik-Lesiuk et al., 2003), causes oxidative stress in
the brain (Ritesh et al., 2015), and is metabolized in the brain (Navarro-Mabarak et al., 2018).
Selection bias cannot explain these positive results, nor can information bias − although these
two potential biases might explain the one study that did not report a positive association. There
was evidence that methylene chloride appeared to have been a potential confounder in Heineman
et al. (1994), but there does not appear to be any evidence of systematic confounding across the
studies that would provide an alternative explanation for the observed associations of carbon
tetrachloride exposure with increased risk of astrocytic brain cancer consistently observed in
these studies. Chance may explain an association in a single study, but is highly unlikely to
explain how three of four studies, including two with exposure-response relationships – albeit
limited, all reported increased risks of brain cancer with exposure to carbon tetrachloride with
two reporting large magnitude ORs for a rare cancer in two different study designs and among
three different populations from Japanese-American men in Honolulu to hospitalized people in
Boston, Pittsburg, and Phoenix to men working in areas with large petrochemical industries in
northern New Jersey, Philadelphia, and southern Louisiana.
Causal Evaluation
The causal evaluation for carbon tetrachloride exposure and the risk of brain cancer placed the
greatest weight on five particular considerations: 1) the generally consistent increases in risk
observed across a set of High and Medium confidence results with varied study designs and
populations; 2) the strength of the association showing increases in risk; 3) the reported
exposure-response relationships showing that increased exposure to carbon tetrachloride were
associated with increased risk of brain cancer; 4) a biologically coherent temporal relationship
Page 148 of 390
consistent with a pattern of exposure to carbon tetrachloride and subsequent brain cancer; and 5)
reasonable confidence that alternative explanations are ruled out, including chance, bias and
confounding within individual studies or across studies.
Overall Conclusions on Cancer Hazard Based on Epidemiological Data for Brain Tumors
(Astrocytomas, Gliomas, and Glioblastomas)
The available epidemiologic studies provide evidence of an association between carbon
tetrachloride exposure and increased risk of brain cancer that demonstrates suggestive
carcinogenic potential to humans. This epidemiologic evidence did not reach the level of
convincing evidence (i.e., “Carcinogenic to humans”) of a causal association between human
exposure and cancer due to the limited number of available epidemiological studies which did
have some individual limitations even if their overall study quality rating were above an
acceptable threshold.
Epidemiological Data on Neuroblastoma
There is only one study of neuroblastoma in the epidemiological literature which evaluated risks
associated with maternal or in utero exposure to carbon tetrachloride. Neuroblastoma is the most
common cancer in infants and is most commonly found in the adrenal glands. Heck et al. (2013)
is a ‘Medium’ quality case-control study designed to evaluate risks of neuroblastoma in infants
associated with a variety of air toxics, including carbon tetrachloride, based on in utero
exposures. The 75 cases and 14,602 controls were selected from locations in California within 5
km of an air toxics monitoring station. Controls were frequency matched on birth year. The birth
date and birth address were used to estimate OR for living within different radii of the nearest
monitor. Monitors are “primarily positioned either near heavily trafficked highways, in industrial
areas, or in agriculturally intense rural regions.”(Heck et al., 2013). Results were presented for
interquartile change (IQR) in entire pregnancy average exposure (IQR = 75th% minus 25th% =
0.034 ppbV carbon tetrachloride) within different radii from the monitoring station.
• OR for the 4th quartile of exposure vs. the lowest quartile was 8.85 (95% CI: 1.19, 66.0)
• OR per IQR for living within 5 km of the nearest monitor was 2.65 (95% CI: 1.07, 6.53)
• OR per IQR for living within 4 km of the nearest monitor was 3.72 (95% CI: 1.20, 11.6)
• OR per IQR for living within 3 km of the nearest monitor was 6.52 (95% CI: 1.54, 27.6)
• OR per IQR for living within 2.5 km of the nearest monitor was 7.87 (95% CI: 1.37, 45.3)
Selection bias: No concern that selection was differentially related to exposure or outcome as all
cases and controls had to have been born within 5 km of the nearest air toxics station.
Information bias: No concern for recall bias since residential address was the basis of the
exposure assessment or other exposure misclassification related to outcome (i.e., no differential
misclassification); some concern that exposure misclassification due to changes of address
during pregnancy – although the investigators noted that most moves were local thereby
somewhat limiting any bias or measurement error. The observation that the magnitude of the
adverse effect of one IQR change in exposure increased with proximity to the air toxics monitors
may reflect increased precision in the exposure estimate – or it may reflect closer proximity to
the sources of the air toxics.
Page 149 of 390
Confounding: No concern for potential confounding by other air toxics as none of the other
toxics were as strongly associated with increased risks of neuroblastoma in any of the analyses.
Chance: This was an exploratory study which evaluated risks for 27 air toxics and thus there
were many comparisons which Heck stated (2013) “increased the likelihood of spurious
associations,” but cited (Goldberg and Silbergeld, 2011) who argue along with others like
Rothman (1990) that “it is not appropriate to adjust for multiple comparisons” and they restate
from (Hill, 1965) that “we do not want to obscure our ability to detect associations that should be
confirmed or strengthened by further study, as this philosophy is one that encourages inaction in
the face of important risks to health.”
Overall Conclusions on Cancer Hazard Based on Neuroblastoma Epidemiological Data
There is only this one study of maternal or in utero exposure to carbon tetrachloride and the risk
of neuroblastoma. However, with the knowledge that carbon tetrachloride has been shown to
cause pheochromocytomas in mice by oral and inhalation exposure (pheochromocytomas are
benign tumors of the adrenal glands), a strong association between neuroblastoma and carbon
tetrachloride in a single well-conducted epidemiological study in the same organ provides
suggestive evidence of an association between carbon tetrachloride exposure and increased risk
of neuroblastoma that raises concern for potential carcinogenic effects in humans.
General Overview of Database of Animal Studies - Bioassays
As discussed in (U.S. EPA, 2010), several chronic toxicity and carcinogenicity studies for carbon
tetrachloride conducted in experimental strains of rats, mice, and hamsters by the oral route
identified the liver as a primary target organ of carbon tetrachloride toxicity and carcinogenicity
(Della Porta et al., 1961; Edwards and Dalton, 1942; Edwards et al., 1942; Edwards, 1941).
These early studies used only single dose levels of oral administration, and so did not provide
information on the relationship of dose and liver tumors. If there were enough single dose
studies, those could all be plotted on the same graph and a dose-response function could have
been derived.
Studies conducted by the National Cancer Institute (NCI, 1977, 1976a, b) did employ two dose
levels of carbon tetrachloride by oral gavage to rats and mice, but high early mortality observed
in these studies, particularly at the high dose, limited interpretation of the results. In the rat study,
incidence of liver tumors was low in all groups (hepatocellular carcinoma in 1/99 pooled control,
2/49 low-dose, and 2/50 high-dose males and in 0/98 pooled control, 4/49 low-dose, and 2/49
high-dose females). In the mouse study, hepatocellular carcinomas were observed at almost
100% incidence (49/49 low-dose males, 47/48 high-dose males, 40/41 low-dose females, and
43/45 high-dose females). In pooled controls, incidence was only 5/77 (6%) in males and 1/80
(1%) in females. The incidence of adrenal adenoma and pheochromocytoma was also increased
in male mice (concurrent control: 0/18, low-dose: 28/49, high-dose: 27/48) and female mice
(concurrent control: 0/18, low-dose: 15/41, high-dose: 10/45).
EPA has identified the (Nagano et al., 2007a) bioassays in mice and rats with carbon
tetrachloride by the inhalation route as the most detailed study of both chronic toxicity and
Page 150 of 390
carcinogenicity of carbon tetrachloride available by the most relevant route of exposure. In this
inhalation study, groups of F344/DuCrj rats (50/sex/group) were exposed (whole-body) to 0, 5,
25, or 125 ppm (0, 31.5, 157, or 786 mg/m3) of carbon tetrachloride (99.8% pure) vapor for 6
hours/day, 5 days/week for 104 weeks. These same researchers also conducted a 2-year study
using Crj:BDF1 mice. Groups of Crj:BDF1 mice (50/sex/group) were exposed to 0, 5, 25, or 125
ppm (0, 31.5, 157, or 786 mg/m3) of carbon tetrachloride (99% pure) vapor for 6 hours/day, 5
days/week for 104 weeks. Endpoints monitored were the same as for the 2-year rat study. In
these bioassays, carbon tetrachloride produced a statistically significant increase in
hepatocellular adenomas and carcinomas in rats and mice of both sexes, and adrenal
pheochromocytomas in mice of both sexes.
MOA for Carcinogenicity
This section summarizes available information on MOA for carbon tetrachloride carcinogenicity
based on the MOA analysis performed in the 2010 EPA IRIS assessment (U.S. EPA, 2010) and
additional information made available since 2010. The Guidelines for Carcinogen Risk
Assessment (U.S. EPA, 2005a) identifies steps for determining whether a hypothesized MOA is
operative. The steps include an outline of the sequence of events leading to cancer, identification
of the key events, and determination of whether there is a causal relationship between events and
cancer.
3.2.4.3.1 Mode of Action for Liver Tumors
In the case of carbon tetrachloride, experimental data are available to describe the MOA for
production of liver tumors observed from exposure to carbon tetrachloride in experimental
animal studies. Thus, the purpose of this section is to present the postulated MOA for carbon
tetrachloride induced liver carcinogenesis in laboratory animals and the evidence that supports it.
When relying on laboratory animal data, two critical assumptions govern cancer risk assessment.
In the absence of information to the contrary, it is generally assumed that (1) experimental data
on animal tumors are predictive of human cancer, and (2) that the animal tumor effects found at
high experimental doses can be used to predict human risk at lower exposures.
A postulated MOA is a biologically plausible hypothesis for describing the sequence of events
leading to an observed adverse outcome (in this case, liver tumors). It identifies “key” cellular
and biochemical events—i.e., those that are both measurable (quantifiable) and critical to the
observed adverse response. Mode of action contrasts with mechanism of action which generally
implies a more detailed description of the molecular and biochemical basis for an effect. The key
events analysis presented below and Appendix I for carbon tetrachloride follows a mode of
action framework developed by the International Programme on Chemical Safety (IPCS) and the
U.S. EPA in the Guidelines for Carcinogen Risk Assessment (i.e., EPA cancer risk guidelines)
(U.S. EPA, 2005b) which is used by other regulatory agencies and international organizations
(e.g., the World Health Organization, Expert Panel of the Joint Meeting on Pesticide Residues).
The analysis presented below and in Appendix I is based on the Bradford Hill criteria for
causality, originally developed for application in epidemiological investigations (Hill, 1965).
Both EPA and IPCS have emphasized that this framework “is not a checklist of criteria, but
rather presents an analytical approach to considering the weight-of-evidence of a MOA and
whether a precursor event is shown to be causally linked to the tumor response.”

Page 151 of 390
EPA has qualitatively evaluated the weight of evidence for several proposed MOAs for liver
carcinogenicity using the framework outlined in EPA cancer risk guidelines (U.S. EPA, 2005a).
This analysis considers the MOA analysis previously conducted by the IRIS program (U.S. EPA,
2010), more recent evidence identified through the systematic review process for this risk
evaluation, and information submitted to EPA through public comments EPA-HQ-OPPT-2016-
0733-0066 and EPA-HQ-OPPT-2016-0733-0088 (see 0) to evaluate supporting and
counterfactual evidence for proposed MOAs.
A general correspondence has been observed between hepatocellular cytotoxicity and
regenerative hyperplasia and the induction of liver tumors. At lower exposure levels, this
correspondence is less consistent (U.S. EPA, 2010). A hypothesized carcinogenic MOA for
carbon tetrachloride-induced liver tumors has been proposed and includes the following key
events (U.S. EPA, 2010):
(1) metabolism to the trichloromethyl radical by CYP2E1 and subsequent formation of the
trichloromethyl peroxy radical,
(2) radical-induced mechanisms leading to hepatocellular cytotoxicity, and
(3) sustained regenerative and proliferative changes in the liver in response to hepatotoxicity,
(4) resulting cellular proliferation increases the probability of tumor formation through
replicative processes that increase the probability of mutations becoming fixed or increase the
rate of clonal expansion of cells carrying somatic mutations - in both cases without
hypothesizing a direct mutagenic effect from carbon tetrachloride or its metabolites.
In this MOA, biotransformation of carbon tetrachloride to the trichloromethyl radical and
trichloromethyl peroxy radical have been identified in in vitro studies. The formation of these
radicals has been shown to be a required step in the MOA. However, due the high reactivity of
the radicals, the concentration-response relationship between the amount of radical formation
associated with cytotoxicity is not known. Similarly, available in vitro studies only used high
concentrations of carbon tetrachloride to evidence lipid peroxidation caused by trichloromethyl
and trichloromethyl peroxy radicals, making quantitative dose-response concordance challenging
(U.S. EPA, 2010).
A MOA analysis for liver tumors, including the qualitative and quantitative evidence on the
identified key events, formation of radicals, lipid peroxidation, cytotoxicity and regenerative
proliferation are described in Appendix I.
Conclusions on the MOA for Liver Tumors
Based on the MOA analysis presented in Appendix I, there is robust evidence supporting the
inference that metabolism of carbon tetrachloride to reactive compounds is responsible for its
primary biological activities including hepatocellular toxicity. This metabolic activation would
be consistent with other possible MOAs as well as the hypothesized MOA based on sustained
regenerative proliferation. Examining the most relevant evidence for the present cancer risks
assessment (the subchronic and chronic bioassays of (Nagano et al., 2007a; 2007b) robust
evidence is not available to support the occurrence of continued cell killing and regeneration
over the lifetime of carbon tetrachloride exposure. Studies in another mouse strain from another
Page 152 of 390
laboratory (Benson and Springer, 1999) provide direct evidence of cytotoxic processes and
enhanced cell replication in carbon tetrachloride treated mice in a relevant air concentration
range (20-100 ppm), however findings of this study with regard to serum levels of liver enzymes
and necrosis appear inconsistent with the findings of (Nagano et al., 2007b). Considerations of
temporal concordance are consistent with the proposed cancer MOA in that they draw on
findings from subchronic studies (the cause proceeds proposed effect), but that does not
contribute much additional weight to the hypothesis. Due to the limited toxic effects reported,
dose-response evaluation provides little information when limited to the results of the Nagano
studies. However, results of the Benson and Springer studies, in the different mouse strain, do
indicate a sharp increase in toxicity and cell proliferation at a dose of 20 ppm and above, as
consistent with the Nagano tumor findings. However, in (Nagano et al., 2007a) liver adenomas
were significantly elevated at the 5 ppm dose level, a finding that was supported by comparison
with historical controls in the same laboratory. Available data do not indicate occurrence of
cytotoxic or regenerative processes in mice at dose levels of 5 ppm (or 10 ppm). While the
proposed role of metabolism in causing carbon tetrachloride toxicity has been effectively
challenged and supported in a range of studies, no studies to challenge the proposal of carbon
tetrachloride cytotoxicity as a cause of liver cancer are available. Finally, while data are complex
and not conclusive, other MOAs resulting from the interaction of reactive carbon tetrachloride
metabolites with biomolecules may be relevant. Despite the presence of a numerically large
database of studies on genotoxicity, the potential for carbon tetrachloride metabolites or
oxidative radicals resulting from subsequent lipid peroxidation to induce genotoxicity cannot be
fully evaluated.
In summary there is biological support for the involvement of the hypothesized MOA of
sustained cytotoxicity and regenerative cell proliferation as key events in the hepatocellular
mode of action for carbon tetrachloride exposure in the mouse. However, important uncertainties
and inconsistencies exist. The hypothesized MOA by itself is not consistent with observations of
increased hepatocellular adenomas in the mouse at 5 ppm. This evaluation suggests that while
cytotoxicity and regenerative proliferation may strongly influence dose response at higher doses,
these processes may not reflect the potential for carcinogenic action of this compound at lower
doses. Despite a massive database of historical studies on the toxicity of carbon tetrachloride, it
should be noted that there has been relatively little study of this compound using more modern
methods (e.g., for the study of dose response for specific adducts to DNA or other
macromolecules or through use of genomic endpoints) thus limiting important lines of evidence
that could further define the carcinogenic MOA for carbon tetrachloride.
3.2.4.3.2 Mode of Action for Adrenal Gland and Brain
Tumors
Key Events and Reasonably Available Information on MOAs for Other Tumor Types
Adrenal Gland Tumors: Pheochromocytomas and Neuroblastomas
In addition to liver tumors observed from exposure to carbon tetrachloride, an increased
incidence of pheochromocytomas (a neuroendocrine tumor of adrenal chromaffin cells-derived
from neural crest stem cells) associated with carbon tetrachloride administration has been
observed in male and female mice by oral (NTP, 2007; NCI, 1977, 1976a, b) and inhalation
exposure (Nagano et al., 2007a), but not in rats by either route of exposure.
Page 153 of 390
Some data suggests that carbon tetrachloride metabolism plays a role in the induction of toxicity
in the adrenal gland as it does in the liver (Colby et al., 1994). Metabolism of carbon
tetrachloride leads to the production of free peroxy radicals which induce oxidative stress which
can damage proteins, DNA and lipids. In vitro studies in (Colby et al., 1994) showed that
preincubation of adrenal microsomes with 1-aminobenzotriazole, a CYP450 suicide inhibitor,
prevented the effects of carbon tetrachloride on lipid peroxidation and covalent binding.
Nevertheless, there is not sufficient information to elucidate the other key events for cancer
induction in the adrenal gland. Similarly, there are no reasonably available information
demonstrating cytotoxic regenerative hyperplasia responses in the induction of adrenal gland
tumors at doses that do not cause hepatotoxic effects in animals or humans.
Conclusions on Cancer MOA and Biological Relevance of Adrenal Tumors
(Pheochromocytomas) in Mice
In the review of the draft carbon tetrachloride risk evaluation, the SACC suggested consideration
of the extent that MOA hypotheses for liver tumors may also be relevant to the adrenal
pheochromocytomas that were also observed in mice in Nagano (2007a). Based on the MOA
analysis presented in Appendix I for adrenal gland tumors, biological support exists to infer that
the metabolism of carbon tetrachloride to reactive compounds is responsible for toxicity in the
adrenal gland. However, this hypothesis cannot be confirmed due to the lack of mechanistic data
for adrenal tumors. However, the process of metabolic activation would be consistent with other
possible MOAs as well as the hypothesized MOA based on sustained regenerative proliferation.
The Nagano studies (Nagano et al., 2007a; 2007b) are the most relevant studies for evaluating
the hypothesized MOA because the adrenal gland was examined after subchronic and chronic
exposures of mice (and rats) to carbon tetrachloride. However, these studies did not report
noncancer pathological effects in the adrenal gland. High dose exposures to carbon tetrachloride
cause necrosis in guinea pigs, but rats appear more resistant. Historical reports indicate that high
dose carbon tetrachloride can cause adrenal toxicity in humans.
In summary, while carbon tetrachloride can cause cytotoxicity under certain conditions, mice
under the cancer bioassay dose conditions did not have reported adrenal toxicity and thus there is
little support for the proposed MOA. The available bioassay data can be seen to provide
substantial data against a hypothesized MOA based on cytotoxicity and regenerative
proliferation. There are few data upon which to develop alternate MOA proposals specific to the
adrenal gland, however, processes resulting from the interaction of reactive carbon tetrachloride
metabolites with biomolecules are relevant. Despite the presence of a numerically large database
of studies on genotoxicity, the potential for carbon tetrachloride metabolites or oxidative radicals
resulting from subsequent lipid peroxidation to induce genotoxicity cannot be fully evaluated.
EPA has determined that the pheochromocytomas incidence data in mice from the Nagano
(2007a) have biological relevance and are adequate for extrapolating cancer hazard to humans.
This determination is based on the following:
• While the survival rates of rats are associated with non-cancer effect (i.e., severe chronic
progressive nephropathy), the reduction in survival rate of mice was clearly linked to
cancer effects (i.e., hepatocellular neoplasia) only.

Page 154 of 390
• In NTP studies, mice have a low spontaneous incidence of pheochromocytomas and are
known to have a lower susceptibility to chemical induction of pheochromocytomas
compared to rats (Greaves, 2012).
• The designation of the adrenal gland lesions by Nagano (2007a) as benign cannot be
considered evidence of lack of relevance towards predicting human risk due in part to
variability in the diagnoses of non-neoplastic changes accompanying neoplastic
incidences in rodent cancer bioassays.
• The incidence data on pheochromocytomas in mice provide information on the carbon
tetrachloride-induced carcinogenic process.
Brain Tumors (Astrocytomas, Gliomas, and Glioblastomas)
Among the human epidemiological studies showing an association between carbon tetrachloride
exposure and brain tumors (astrocytoma, glioma, and glioblastoma), there are no specific data
supporting a MOA for the induction of these tumors. Although it is known that the brain contains
cytochrome P450, including CYP2E1 [i.e., (Ferguson and Tyndale, 2011)], total levels are in the
range of 0.5-2.0% of those in the liver. However, there is high heterogenicity of P450 enzymes
content and metabolic capacity in the different brain regions, suggesting that CYP2E1 is highly
localized within the brain. This suggests that carbon tetrachloride metabolism plays a role in the
induction of toxicity in the brain. Nevertheless, there is not sufficient information to elucidate the
other key events for cancer induction in the glial-derived brain tissues. There is also lack of
evidence demonstrating cellular injury cytotoxicity in nervous system and regenerative response
leading to cancer.
3.2.4.3.3 Overall Cancer MOA Conclusions
Based on information presented in Section 3.2.4.3.1, EPA has concluded that there is evidence
for a cytotoxic regenerative hyperplasia mode of action for liver cancers in animal models. In the
absence of a cytotoxic regenerative hyperplasia MOA for carbon tetrachloride to explain other
tumor responses at doses that do not cause hepatotoxic effects in animal or humans, and in the
absence of other MOAs to explain carbon tetrachloride-induced tumors of adrenal gland (i.e.,
pheochromocytoma tumors in mice and neuroblastoma in humans) and brain tumors (i.e.,
astrocytomas, gliomas, and glioblastomas) in humans at all doses, a linear extrapolation
approach for assessment of carcinogenic risk is presented in this risk evaluation in conjunction
with a threshold approach for assessing risks for liver tumors.
This conclusion is based on general considerations for MOA analysis in the Guidelines for
Carcinogen Risk Assessment (U.S. EPA, 2005b) for addressing data limitations informing the
cancer MOA in different tumor types. These general considerations are relevant for carbon
tetrachloride given the data limitations in adrenal glands and brain acknowledged by both EPA
and SACC for carbon tetrachloride. MOA analysis considerations in (U.S. EPA, 2005b)
recognize the possibility of an agent working by more than one MOA at different tumor sites and
at the same tumor site to indicate that the cancer MOA cannot be generalized to other tissues or
cell types without additional analyses.

Page 155 of 390
3.2.4.3.4 Classification of Carcinogenicity
Based on the previously evaluated animal data and new epidemiological information and under
the Guidelines for Carcinogen Risk Assessment (U.S. EPA, 2005b), EPA classifies carbon
tetrachloride as "likely to be carcinogenic to humans" based on: (1) suggestive evidence of
carcinogenicity in humans and (2) sufficient evidence in animals.
The available epidemiologic studies provide evidence of an association between carbon
tetrachloride exposure and increased risk of brain cancer and neuroblastoma that demonstrates
carcinogenic potential to humans. This evidence did not reach the level of convincing evidence
(i.e., “Carcinogenic to humans”) of a causal association between human exposure and cancer
due to the limited number of available epidemiological studies which did have some individual
limitations even if their overall study quality rating were above an acceptable threshold.
With the knowledge that carbon tetrachloride has been shown to cause pheochromocytomas in
male and female mice by oral and inhalation exposure (pheochromocytomas are tumors of the
adrenal glands), and a strong association between neuroblastoma and carbon tetrachloride in a
single well-conducted epidemiological study in the same organ raises concern for potential
carcinogenic effects in humans and is “likely to be carcinogenic to humans.”
Evidence of cancers from multiple species (humans, rats, mice) and multiple tumors types (e.g.,
liver tumors, pheochromocytomas and brain cancers) in both sexes and by multiple routes of
exposures (e.g., oral and inhalation) contribute to the weight of the scientific evidence for overall
cancer classification of carcinogenic effects which is “likely to be carcinogenic to humans.”
Dose-Response Assessment
Selection of Studies for Dose-Response Assessment
EPA evaluated data from studies described in Sections 3.2.2 and 3.2.4 to characterize the dose-
response relationships of carbon tetrachloride and selected studies and endpoints to quantify risks
for specific exposure scenarios. The selected studies had adequate information to select PODs.
3.2.5.1.1 Toxicity After Acute Inhalation Exposures in
Humans
For the characterization of the dose-response of acute inhalation exposures to carbon
tetrachloride, EPA considered human reports, controlled human studies, animal acute and
developmental toxicity studies described in the 2014 NAC Acute Exposure Guideline Levels
(AEGL) (NRC, 2014). The key study (Davis, 1934) used for the development of the AEGL-2
value was rated of acceptable low data quality in the systematic review for this risk evaluation.
The systematic review did not identify additional reasonably available acute or developmental
toxicity data for carbon tetrachloride based on the criteria in the Application of Systematic
Review in TSCA Risk Evaluations (U.S. EPA, 2018a).
Acute inhalation exposures to carbon tetrachloride above the AEGL-2 values are expected to
induce immediate and temporary CNS effects, which consist of escape-impairing symptoms in
occupational settings (i.e., dizziness). Acute inhalation human data were used by the AEGL
program for the identification of a NOAEL for transient CNS effects of 76 ppm in humans
exposed carbon tetrachloride for 4 hours (Davis, 1934). EPA considers that the acute NOAEL
Page 156 of 390
identified by the AEGL program is adequate for assessing acute effects in inhalation
occupational exposure scenarios for TSCA conditions of use of carbon tetrachloride. EPA
reviewed the acute dose-response information in the AEGL report (NRC, 2014), including the
identification of the PODs and uncertainty factors identified for CNS effects, but did not conduct
further dose-response analysis.
The endpoint and effect level identified by NAC/AEGL for the AEGL-2 values are considered to
provide both a relevant effect and robust POD because the values represent the concentration
above which it is predicted that irreversible or other serious, long-lasting adverse health effects
or an impaired ability to escape can be experienced by workers. On the other hand, the AEGL-2
values protect from life-threatening health effects or death, which are appropriate for emergency
or accidental releases of the chemical.
Developmental toxicity studies were also considered in the derivation of acute toxicity values as
adverse effects in the fetus may be related to the unique susceptibility of the fetus at discrete
times during gestation (U.S. EPA, 1991). Therefore, EPA conservatively assumes that the
adverse fetal effects observed in a developmental toxicity study that includes exposures across
multiple days of embryonic or fetal development, or even throughout gestation, could have
occurred as the result of exposure on a single day of the study (U.S. EPA, 1991). EPA has
concluded that the observed developmental effects (i.e., decreased fetal body weight and crown-
rump length) are likely associated with the sustained lower maternal weight over gestation days
6-15 rather than the result of exposure to carbon tetrachloride on a single day of the study.
Oral studies are considered less relevant for route-to-route extrapolation for this risk evaluation
because oral exposures to carbon tetrachloride undergo first-pass metabolism in the liver, the
organ with the highest concentration of CYP2E1 enzymes involved in the generation of carbon
tetrachloride’s toxic metabolites.18 This major difference in the metabolism of carbon
tetrachloride between oral and inhalation routes of exposure limits the usefulness of
extrapolating a developmental inhalation POD from the oral developmental study, given that
different developmental toxicity processes may be involved between the two routes of exposure.
For instance, while the oral developmental studies by Narotsky et al., (1997), which were rated
of high quality in the systematic review, identified a developmental NOAEL of 25 mg/kg-d
based on observed full-litter resorption at 50 mg/kg-d, a developmental toxicity study in rats by
Schwetz et al. (Schwetz et al., 1974) (data quality rating = high) identified less severe effects that
correlate with maternal toxicity (i.e., decreased fetal body weight (7%) and decreased crown-
rump length (3.5%) at 300 ppm).
18 The EPA IRIS assessment (U.S. EPA, 2010) indicates that among the PBPK models developed for carbon tetrachloride, the
model by (Yoon et al., 2007) is the only one that addressed extrahepatic metabolism of carbon tetrachloride. (Yoon et al., 2007)
reported that no metabolic activity was detected in the fat, brain, or skin. The proportion of liver metabolism estimated for the
lung and kidney was quite small, 0.79 and 0.93%, respectively, based on the microsomal studies. The EPA IRIS assessment also
indicates that the human kidney has been reported by multiple laboratories to not express any detectable CYP2E1 protein.
Considerations taken for determining the subchronic to chronic UF in the EPA IRIS assessment included the observation of early
onset of toxicity following oral exposure. For instance, assessment reviewers commented that oral exposure leads to first-pass
metabolism in the liver resulting in peak exposure at the target site after oral exposures while more opportunity for extrahepatic
targeting is expected from inhalation exposures.
Page 157 of 390
EPA’s POD for acute inhalation exposures in this risk evaluation is 360 mg/m3 – 8 hours for
disabling effects (i.e., CNS effects such as dizziness) from elevated, but short inhalation
exposures. For 12-hours of exposure, the acute inhalation POD is 310 mg/m3 (49 ppm) based on
temporal scaling using the equation Cn × t = k, where an empirical value of n was determined to
be 2.5 on the basis of rat lethality data (NRC, 2014). A benchmark MOE of 10 is used for
intraspecies variability to account for susceptible individuals, such as moderate to heavy alcohol
users, in agreement with the AEGL program conclusions. (NRC, 2014) explains that the
intraspecies uncertainty factor of 10 was retained for protection of susceptible individuals due to
the known variability in the metabolic disposition of carbon tetrachloride that may result in an
altered toxic response.
The dose response assessment for the acute inhalation exposures to carbon tetrachloride is based
on the conclusions and key studies presented in (NRC, 2014). NAC/AEGL’s key study for the
development of the AEGL-2 values, (Davis, 1934) (data quality = low), consist of a series of
human controlled experiments that provide a reasonable characterization of the exposure
concentrations and hazard effects. The main data quality limitation on these studies is based on
the fact that the studies were conducted prior to the development of the current guidelines for
inhalation toxicity studies and/or exposure characterization. Even though, the database for
carbon tetrachloride contains a large number of human reports on acute exposures, the systematic
review did not identify additional acute human toxicity information with better data quality
and/or characterization of exposure concentrations according to the criteria in the Application of
Systematic Review in TSCA Risk Evaluations (U.S. EPA, 2018a). Other considerations for
characterizing dose response for acute inhalation exposures (i.e., developmental toxicity) are in
agreement with the NAC/AEGL program conclusions.
3.2.5.1.2 Toxicity from Chronic Inhalation Exposures
The 13-week and 104-week inhalation studies by Nagano et al., (Nagano et al., 2007a; Nagano et
al., 2007b) were rated as high data quality in the systematic review for this risk evaluation. The
basis for the chronic inhalation PODs is the 104-week inhalation study with F344/DuCrj rats
(Nagano et al., 2007b), in which the lowest exposure concentration (i.e., 5 ppm) was considered
a NOAEC based on liver and kidney toxicity at ≥25 ppm.
Reliance on Nagano bioassays (Nagano et al., 2007a) for dose-response characterization of
chronic exposures is supported by the high data quality rantings of the 2 year bioassays and
associated 13-week subchronic studies. Furthermore, information collected in these studies is
considered comprehensive because both mice and rats of both sexes were used, and an extensive
set of endpoints was examined.
Fatty change in the liver of rats was selected as the endpoint for dose-response analysis because
this histopathologic lesion, which is indicative of cellular damage, was a more sensitive endpoint
than other histopathologic changes that were also observed in rats exposed to 25 ppm from the
(Nagano et al., 2007a) study.
The only histopathological change observed in the 5 ppm group in the chronic rat study
is an increase in eosinophilic granules in the nasal cavity of the female rats. This
histopathological change is not considered an adverse effect by itself because it is not
Page 158 of 390
accompanied by any other evidence of adversity in the nasal cavity. Furthermore, while severe
renal and hepatic effects are observed in the high-exposure group, the nasal lesion is only of
moderate severity in the high-exposure group.
The dose response analysis included the use of the PBPK model and BMD modeling
methodology used in the IRIS Toxicological Review (U.S. EPA, 2010) to estimate internal doses
and analyze the relationship between the estimated internal doses and fatty change (i.e.,
response). The resulting BMDL values were converted to estimates of equivalent human
exposure concentrations (HECs) by applying a human PBPK model.
Estimated values for HECs corresponding to BMDL10 values for fatty changes of the liver for
alternative values of VmaxC in the rat and human are presented in in Tables 5-6 and 5-7 of the
IRIS Toxicological Review (U.S. EPA, 2010). A human VmaxC estimated from in vitro human
data can reasonably be presumed to be more relevant than a human VmaxC based entirely on
rodent data. Because the MOA for carbon tetrachloride-induced hepatotoxicity involves
metabolism to reactive metabolites in the liver, HECs based on the mean rate of metabolism in
the liver (MRAMKL) dose metric is the most proximate to the critical effect. The resulting
BMCL10[HEC] based on data for the male rat is 14.3 mg/m3 for continuous exposures.
3.2.5.1.3 Toxicity from Dermal Exposures
Due to the lack of repeated-dose dermal toxicity data and the irritating properties of carbon
tetrachloride (i.e., irritation is associated with increased dermal absorption for repeated dermal
exposures), the limited acute dermal data with histopathology observations and information on
dermal absorption rate were considered in the derivation of PODs for acute and chronic dermal
exposures.
The limited information on non-cancer effects after acute dermal toxicity from carbon
tetrachloride includes an acute toxicity study with histopathological information on liver and
kidney tissues (Kronevi et al., 1979). The study was found to be unacceptable in the systematic
review due to the lack of negative controls and small number of animals per dose group.
Therefore, EPA extrapolated a POD for acute dermal exposures by multiplying the derived POD
for chronic dermal exposures by a factor of 10 to account for the chronic-to-acute extrapolation.
Extrapolation of the acute dermal POD from the acute inhalation POD was not performed
because the critical acute inhalation effects of neurotoxicity are influenced by the accessibility to
brain tissue by inhaled carbon tetrachloride.
PODs for chronic dermal exposures were derived using reasonably available inhalation data.
Extrapolation from oral exposure data is not recommended due to differences in the
biotransformation process between the oral, dermal and inhalation routes of exposure for carbon
tetrachloride. First-pass metabolism and activation of carbon tetrachloride in the liver is only a
metabolic step for oral exposures to the chemical.
The chronic inhalation HEC was first converted to a dermal human equivalent dose (HED), then
the dermal HED was used to derive a dermal POD for retained doses by accounting for 63%
absorption of the inhalation HEC or 63% of the retained inhalation dose. This derivation is
necessary because dermal exposures are presented in this risk evaluation as dermal retained
doses.
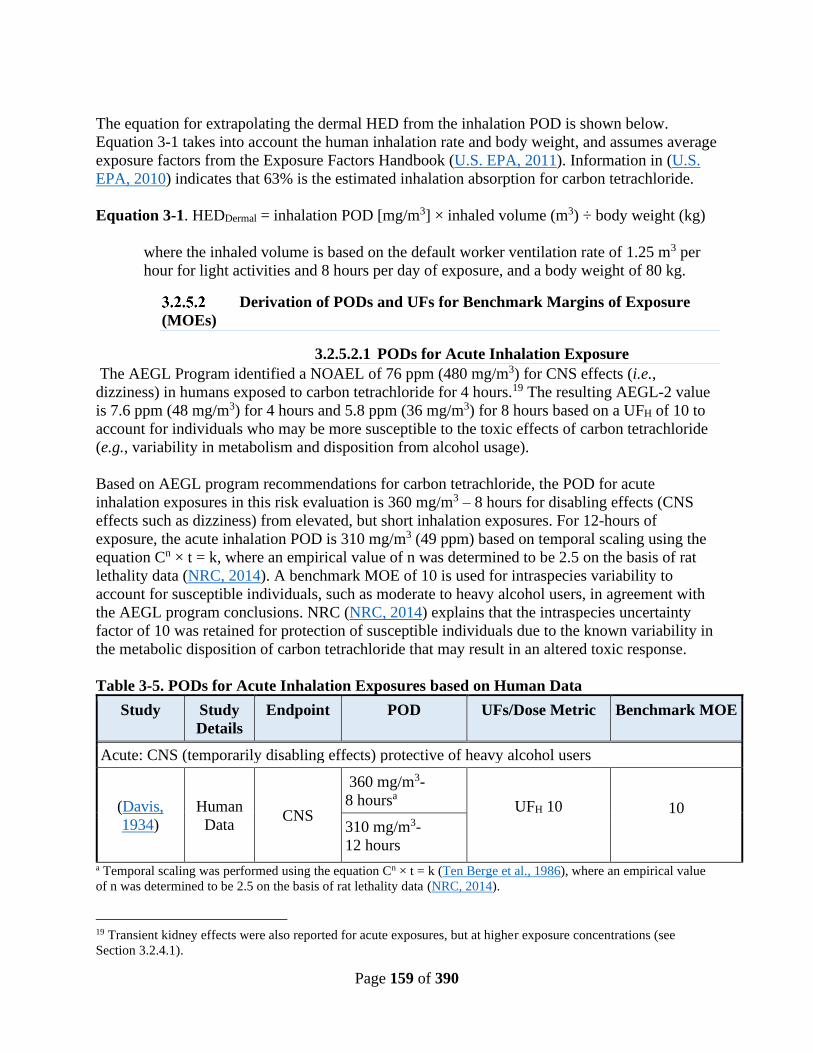
Page 159 of 390
The equation for extrapolating the dermal HED from the inhalation POD is shown below.
Equation 3-1 takes into account the human inhalation rate and body weight, and assumes average
exposure factors from the Exposure Factors Handbook (U.S. EPA, 2011). Information in (U.S.
EPA, 2010) indicates that 63% is the estimated inhalation absorption for carbon tetrachloride.
Equation 3-1. HEDDermal = inhalation POD [mg/m3] × inhaled volume (m3) ÷ body weight (kg)
where the inhaled volume is based on the default worker ventilation rate of 1.25 m3 per
hour for light activities and 8 hours per day of exposure, and a body weight of 80 kg.
Derivation of PODs and UFs for Benchmark Margins of Exposure
(MOEs)
3.2.5.2.1 PODs for Acute Inhalation Exposure
The AEGL Program identified a NOAEL of 76 ppm (480 mg/m3) for CNS effects (i.e.,
dizziness) in humans exposed to carbon tetrachloride for 4 hours.19 The resulting AEGL-2 value
is 7.6 ppm (48 mg/m3) for 4 hours and 5.8 ppm (36 mg/m3) for 8 hours based on a UFH of 10 to
account for individuals who may be more susceptible to the toxic effects of carbon tetrachloride
(e.g., variability in metabolism and disposition from alcohol usage).
Based on AEGL program recommendations for carbon tetrachloride, the POD for acute
inhalation exposures in this risk evaluation is 360 mg/m3 – 8 hours for disabling effects (CNS
effects such as dizziness) from elevated, but short inhalation exposures. For 12-hours of
exposure, the acute inhalation POD is 310 mg/m3 (49 ppm) based on temporal scaling using the
equation Cn × t = k, where an empirical value of n was determined to be 2.5 on the basis of rat
lethality data (NRC, 2014). A benchmark MOE of 10 is used for intraspecies variability to
account for susceptible individuals, such as moderate to heavy alcohol users, in agreement with
the AEGL program conclusions. NRC (NRC, 2014) explains that the intraspecies uncertainty
factor of 10 was retained for protection of susceptible individuals due to the known variability in
the metabolic disposition of carbon tetrachloride that may result in an altered toxic response.
Table 3-5. PODs for Acute Inhalation Exposures based on Human Data
Study Study
Details
Endpoint POD UFs/Dose Metric Benchmark MOE
Acute: CNS (temporarily disabling effects) protective of heavy alcohol users
(Davis,
1934)
Human
Data CNS
360 mg/m3-
8 hoursa UFH 10
10
310 mg/m3-
12 hours
a Temporal scaling was performed using the equation Cn × t = k (Ten Berge et al., 1986), where an empirical value
of n was determined to be 2.5 on the basis of rat lethality data (NRC, 2014).
19 Transient kidney effects were also reported for acute exposures, but at higher exposure concentrations (see
Section 3.2.4.1).

Page 160 of 390
EPA applied a composite UF of 10 for the acute inhalation benchmark MOE, based on the
following considerations:
1) Interspecies uncertainty/variability factor (UFA) of 1. Accounting for differences
between animals and humans is not needed because the POD is based on data from
humans.
2) Intraspecies uncertainty/variability factor (UFH) of 10 to account for variation in
sensitivity within human populations due to limited information regarding the degree to
which human variability may impact the disposition of or response to carbon
tetrachloride, including reasonably available quantitative information on human variability in
CYP2E1 enzyme in adults.
3.2.5.2.2 PODs for Chronic Inhalation Exposure
The basis for the chronic inhalation PODs is the 104-week inhalation study with F344/DuCrj rats
(Nagano et al., 2007a), in which the lowest exposure concentration (i.e., 5 ppm) was considered
a NOAEC based on liver and kidney toxicity at ≥25 ppm. The dose response analysis included
the use of the PBPK model and BMD modeling methodology used in the IRIS Toxicological
Review (U.S. EPA, 2010) to estimate internal doses and analyze the relationship between the
estimated internal doses and fatty changes in the liver. Using this approach, the BMDL10[HEC] for
fatty changes of the liver is 14.3 mg/m3 for continuous exposures.
Because the relationship between the PBPK-estimated internal dose metric and the external
concentration is linear, a periodic time adjustment of the 24-hour chronic HEC would produce a
nearly equivalent result as running the PBPK model assuming periodic exposures. While
additional nonlinearities in the model can be introduced when simulating periodic (as opposed to
continuous) exposures, the difference is small for chemicals that are rapidly absorbed and cleared
from the body. Such is the case with carbon tetrachloride. The linearity of the PBPK model was
determined by analysis of Tables C-6 and C-10 of the IRIS assessment (see Appendix K). These
tables presented the external:internal dose ratios for the human PBPK model over a span of
concentrations, using the model assumptions adopted by the IRIS assessment (i.e., model
parameter VmaxC = 1.49 mg/hr/kg BW0.70, continuous 24 hour/day, 7 days/week exposure).
Table C-6 presented PBPK model results for the mean arterial concentration (MCA) internal
dose metric, while Table C-10 presented results for the MRAMKL (mean rate of metabolism in
the liver) internal dose metric. An adaptation of these tables is presented in Appendix K. The
MRAMKL dose metric was used for RfC derivation in the IRIS assessment. For the inhalation
unit risk derivation, the MCA dose metric was used. For the MRAMKL internal dose metric, the
external:internal dose ratio remains relatively constant (within 10% of the value estimated at the
lowest simulated concentration) at external concentrations below 95 mg/m3. The value of the 24-
hour continuous BMDL10[HEC] used for RfC derivation was 14.3 mg/m3, and thus is within the
linear range. Therefore, in this lower dose exposure regimen (i.e., below 95 mg/m3), where the
pharmacokinetic metrics are essentially proportional to inhaled concentration, a direct
proportioning of risk between continuous exposures and periodic occupational exposures is
appropriate. However, in this risk evaluation, periodic time adjustments of the 24-hour chronic
HEC are based on the Haber’s law equation, Cn × t = k. This alternative approach for estimation

Page 161 of 390
of HEC values for non-continuous exposures was reviewed by SACC and no modifications to
this approach were presented by the committee.
U.S. EPA (U.S. EPA, 2002) notes that extrapolation from longer to shorter time durations will
result in a higher extrapolated exposure concentration value when using downward slope
equations such as Cn × t = k, especially when n = 1 or 0.8. When n = 3 in the equation, the
downward slope is less appreciable than for n = 1 or 0.8. For instance, the slope for the equation
with n = 2.5 (equation for carbon tetrachloride) is -0.1, while the slopes for the equations with n
= 3 and n = 1 are -0.07 and -2, respectively, based on a k value of 343. The slope of -0.1 for n =
2.5 suggests that the extrapolated concentrations of carbon tetrachloride for shorter times of
exposure are less shifted to higher values because they are influenced by a much lower
downward slope.
Conservatively, the BMDL10 value for continuous exposures was extrapolated to shorter
occupational exposure durations (8 hours/day and 12 hours/day) using the equation Cn × t = k,
where an empirical value of n was determined to be 2.5 on the basis of rat lethality data. Further
information on this temporal scaling equation can be found in (NRC, 2014).
Table 3-6. PODs for Chronic Inhalation Exposures based on Animal Data
Study Study
Details Endpoint POD UFs/Dose Metric
Benchmark
MOE
(Nagano et
al., 2007a)
Chronic
inhalation
rat
Fatty
changes in
the liver
BMCL10[HEC]: 14.3
mg/m3 for continuous
exposures, which is
equivalent to 31.1 mg/m3
for 8 hours/day and 5
days per week of
exposure and 26.4
mg/m3 for 12 hours/day
and 5 days per week*
UFH 10
UFA 3
30
* Time adjustments based on Cn × t = k, where n = 2.5 and adjustment for 5 days/week exposures.
EPA applied a composite UF of 30 for the chronic inhalation benchmark MOE, based on the
following considerations:
1) Interspecies uncertainty/variability factor (UFA) of 3. To account for species
differences in animal to human extrapolation, an interspecies uncertainty/variability
factor (UFA) of 3 was applied for toxicodynamic differences between species. This UF is
comprised of two separate areas of uncertainty to account for differences in the
toxicokinetics and toxicodynamics of animals and humans. In this assessment, the
toxicokinetic uncertainty was accounted for by the PBPK modeling. As the toxicokinetic
differences are accounted for, only the toxicodynamic uncertainties in extrapolating from
animals to humans remain, and an UFA of 3 is retained to account for this uncertainty.
2) Intraspecies uncertainty/variability factor (UFH) of 10 to account for variation in
sensitivity within human populations due to limited information regarding the degree to
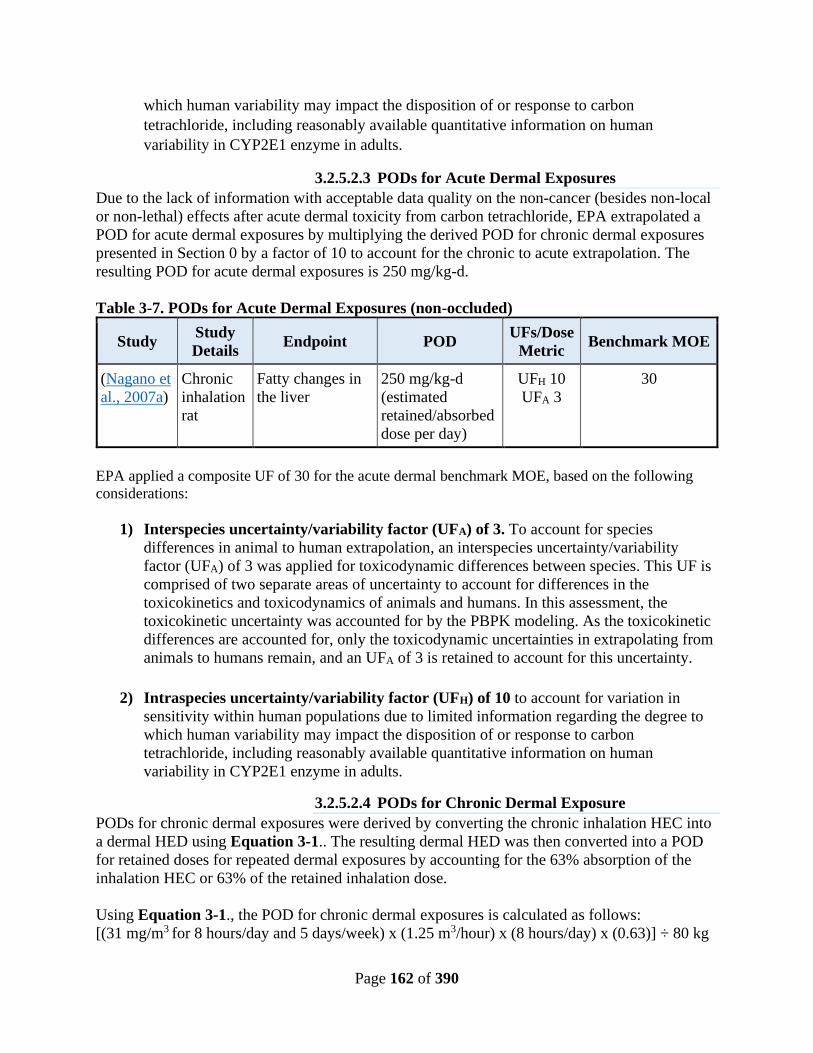
Page 162 of 390
which human variability may impact the disposition of or response to carbon
tetrachloride, including reasonably available quantitative information on human
variability in CYP2E1 enzyme in adults.
3.2.5.2.3 PODs for Acute Dermal Exposures
Due to the lack of information with acceptable data quality on the non-cancer (besides non-local
or non-lethal) effects after acute dermal toxicity from carbon tetrachloride, EPA extrapolated a
POD for acute dermal exposures by multiplying the derived POD for chronic dermal exposures
presented in Section 0 by a factor of 10 to account for the chronic to acute extrapolation. The
resulting POD for acute dermal exposures is 250 mg/kg-d.
Table 3-7. PODs for Acute Dermal Exposures (non-occluded)
Study Study
Details Endpoint POD
UFs/Dose
Metric Benchmark MOE
(Nagano et
al., 2007a)
Chronic
inhalation
rat
Fatty changes in
the liver
250 mg/kg-d
(estimated
retained/absorbed
dose per day)
UFH 10
UFA 3
30
EPA applied a composite UF of 30 for the acute dermal benchmark MOE, based on the following
considerations:
1) Interspecies uncertainty/variability factor (UFA) of 3. To account for species
differences in animal to human extrapolation, an interspecies uncertainty/variability
factor (UFA) of 3 was applied for toxicodynamic differences between species. This UF is
comprised of two separate areas of uncertainty to account for differences in the
toxicokinetics and toxicodynamics of animals and humans. In this assessment, the
toxicokinetic uncertainty was accounted for by the PBPK modeling. As the toxicokinetic
differences are accounted for, only the toxicodynamic uncertainties in extrapolating from
animals to humans remain, and an UFA of 3 is retained to account for this uncertainty.
2) Intraspecies uncertainty/variability factor (UFH) of 10 to account for variation in
sensitivity within human populations due to limited information regarding the degree to
which human variability may impact the disposition of or response to carbon
tetrachloride, including reasonably available quantitative information on human
variability in CYP2E1 enzyme in adults.
3.2.5.2.4 PODs for Chronic Dermal Exposure
PODs for chronic dermal exposures were derived by converting the chronic inhalation HEC into
a dermal HED using Equation 3-1.. The resulting dermal HED was then converted into a POD
for retained doses for repeated dermal exposures by accounting for the 63% absorption of the
inhalation HEC or 63% of the retained inhalation dose.
Using Equation 3-1., the POD for chronic dermal exposures is calculated as follows:
[(31 mg/m3 for 8 hours/day and 5 days/week) x (1.25 m3/hour) x (8 hours/day) x (0.63)] ÷ 80 kg
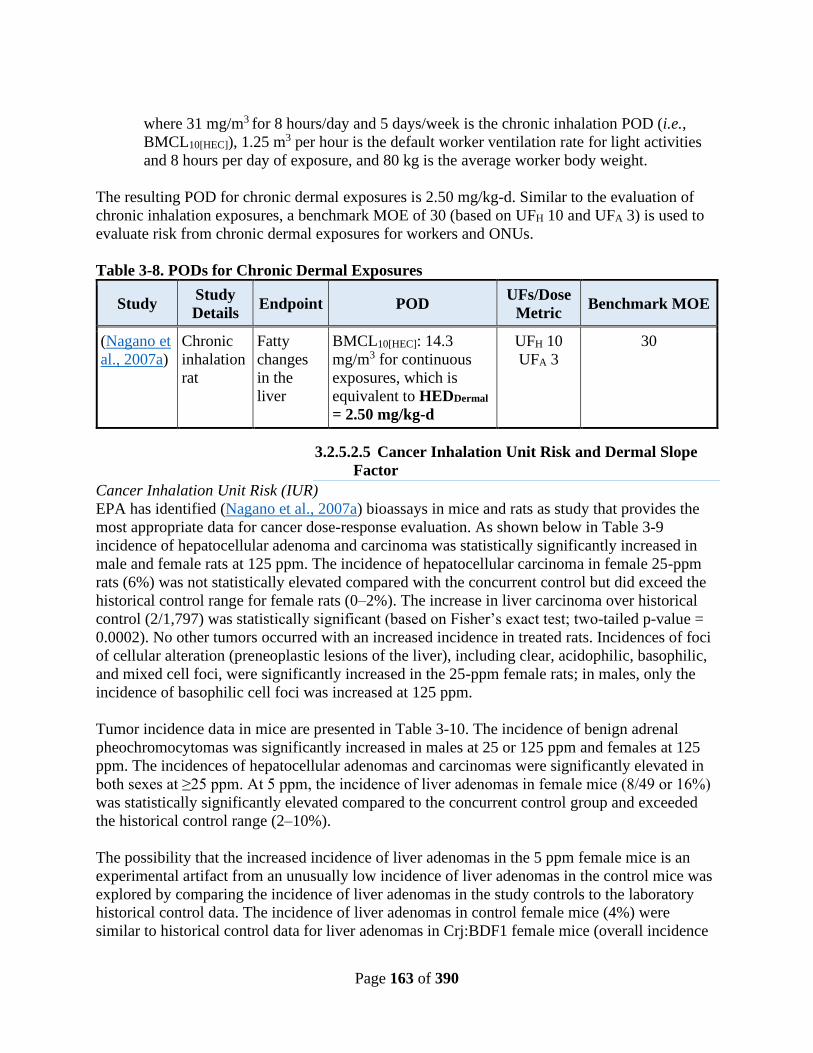
Page 163 of 390
where 31 mg/m3 for 8 hours/day and 5 days/week is the chronic inhalation POD (i.e.,
BMCL10[HEC]), 1.25 m3 per hour is the default worker ventilation rate for light activities
and 8 hours per day of exposure, and 80 kg is the average worker body weight.
The resulting POD for chronic dermal exposures is 2.50 mg/kg-d. Similar to the evaluation of
chronic inhalation exposures, a benchmark MOE of 30 (based on UFH 10 and UFA 3) is used to
evaluate risk from chronic dermal exposures for workers and ONUs.
Table 3-8. PODs for Chronic Dermal Exposures
Study Study
Details Endpoint POD
UFs/Dose
Metric Benchmark MOE
(Nagano et
al., 2007a)
Chronic
inhalation
rat
Fatty
changes
in the
liver
BMCL10[HEC]: 14.3
mg/m3 for continuous
exposures, which is
equivalent to HEDDermal
= 2.50 mg/kg-d
UFH 10
UFA 3
30
3.2.5.2.5 Cancer Inhalation Unit Risk and Dermal Slope
Factor
Cancer Inhalation Unit Risk (IUR)
EPA has identified (Nagano et al., 2007a) bioassays in mice and rats as study that provides the
most appropriate data for cancer dose-response evaluation. As shown below in Table 3-9
incidence of hepatocellular adenoma and carcinoma was statistically significantly increased in
male and female rats at 125 ppm. The incidence of hepatocellular carcinoma in female 25-ppm
rats (6%) was not statistically elevated compared with the concurrent control but did exceed the
historical control range for female rats (0–2%). The increase in liver carcinoma over historical
control (2/1,797) was statistically significant (based on Fisher’s exact test; two-tailed p-value =
0.0002). No other tumors occurred with an increased incidence in treated rats. Incidences of foci
of cellular alteration (preneoplastic lesions of the liver), including clear, acidophilic, basophilic,
and mixed cell foci, were significantly increased in the 25-ppm female rats; in males, only the
incidence of basophilic cell foci was increased at 125 ppm.
Tumor incidence data in mice are presented in Table 3-10. The incidence of benign adrenal
pheochromocytomas was significantly increased in males at 25 or 125 ppm and females at 125
ppm. The incidences of hepatocellular adenomas and carcinomas were significantly elevated in
both sexes at ≥25 ppm. At 5 ppm, the incidence of liver adenomas in female mice (8/49 or 16%)
was statistically significantly elevated compared to the concurrent control group and exceeded
the historical control range (2–10%).
The possibility that the increased incidence of liver adenomas in the 5 ppm female mice is an
experimental artifact from an unusually low incidence of liver adenomas in the control mice was
explored by comparing the incidence of liver adenomas in the study controls to the laboratory
historical control data. The incidence of liver adenomas in control female mice (4%) were
similar to historical control data for liver adenomas in Crj:BDF1 female mice (overall incidence
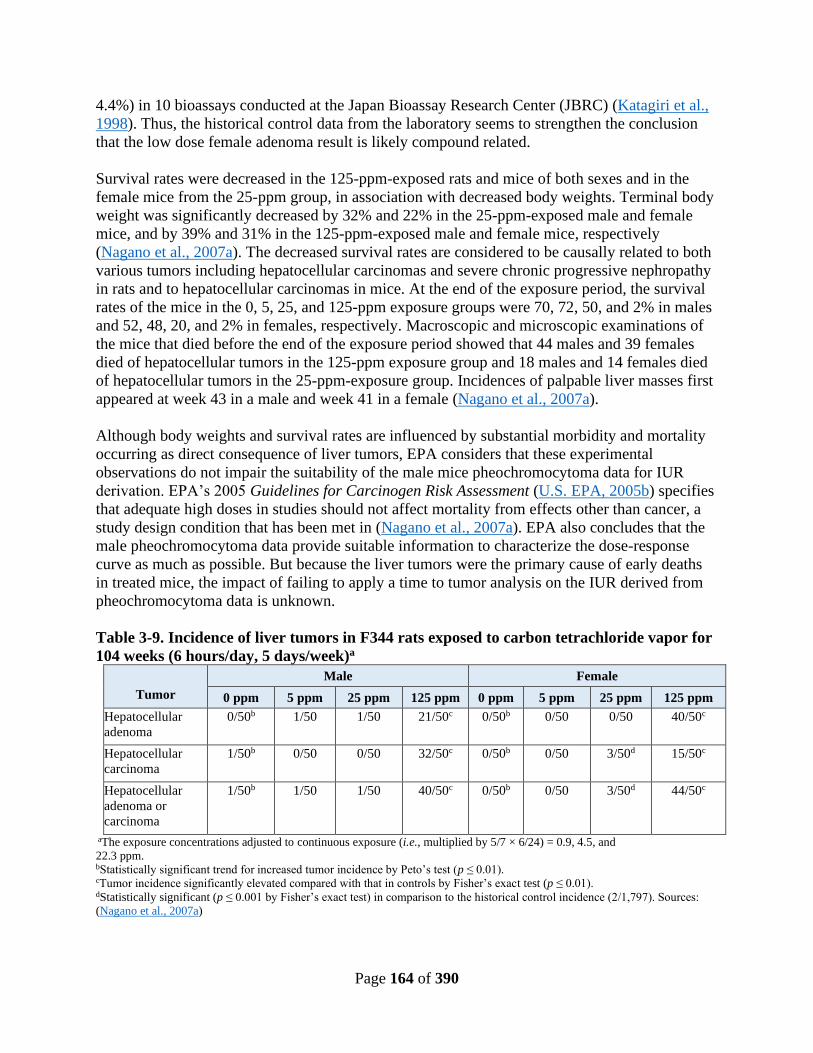
Page 164 of 390
4.4%) in 10 bioassays conducted at the Japan Bioassay Research Center (JBRC) (Katagiri et al.,
1998). Thus, the historical control data from the laboratory seems to strengthen the conclusion
that the low dose female adenoma result is likely compound related.
Survival rates were decreased in the 125-ppm-exposed rats and mice of both sexes and in the
female mice from the 25-ppm group, in association with decreased body weights. Terminal body
weight was significantly decreased by 32% and 22% in the 25-ppm-exposed male and female
mice, and by 39% and 31% in the 125-ppm-exposed male and female mice, respectively
(Nagano et al., 2007a). The decreased survival rates are considered to be causally related to both
various tumors including hepatocellular carcinomas and severe chronic progressive nephropathy
in rats and to hepatocellular carcinomas in mice. At the end of the exposure period, the survival
rates of the mice in the 0, 5, 25, and 125-ppm exposure groups were 70, 72, 50, and 2% in males
and 52, 48, 20, and 2% in females, respectively. Macroscopic and microscopic examinations of
the mice that died before the end of the exposure period showed that 44 males and 39 females
died of hepatocellular tumors in the 125-ppm exposure group and 18 males and 14 females died
of hepatocellular tumors in the 25-ppm-exposure group. Incidences of palpable liver masses first
appeared at week 43 in a male and week 41 in a female (Nagano et al., 2007a).
Although body weights and survival rates are influenced by substantial morbidity and mortality
occurring as direct consequence of liver tumors, EPA considers that these experimental
observations do not impair the suitability of the male mice pheochromocytoma data for IUR
derivation. EPA’s 2005 Guidelines for Carcinogen Risk Assessment (U.S. EPA, 2005b) specifies
that adequate high doses in studies should not affect mortality from effects other than cancer, a
study design condition that has been met in (Nagano et al., 2007a). EPA also concludes that the
male pheochromocytoma data provide suitable information to characterize the dose-response
curve as much as possible. But because the liver tumors were the primary cause of early deaths
in treated mice, the impact of failing to apply a time to tumor analysis on the IUR derived from
pheochromocytoma data is unknown.
Table 3-9. Incidence of liver tumors in F344 rats exposed to carbon tetrachloride vapor for
104 weeks (6 hours/day, 5 days/week)a
Tumor
Male Female
0 ppm 5 ppm 25 ppm 125 ppm 0 ppm 5 ppm 25 ppm 125 ppm
Hepatocellular
adenoma
0/50b 1/50 1/50 21/50c 0/50b 0/50 0/50 40/50c
Hepatocellular
carcinoma
1/50b 0/50 0/50 32/50c 0/50b 0/50 3/50d 15/50c
Hepatocellular
adenoma or
carcinoma
1/50b 1/50 1/50 40/50c 0/50b 0/50 3/50d 44/50c
aThe exposure concentrations adjusted to continuous exposure (i.e., multiplied by 5/7 × 6/24) = 0.9, 4.5, and
22.3 ppm. bStatistically significant trend for increased tumor incidence by Peto’s test (p ≤ 0.01). cTumor incidence significantly elevated compared with that in controls by Fisher’s exact test (p ≤ 0.01). dStatistically significant (p ≤ 0.001 by Fisher’s exact test) in comparison to the historical control incidence (2/1,797). Sources:
(Nagano et al., 2007a)
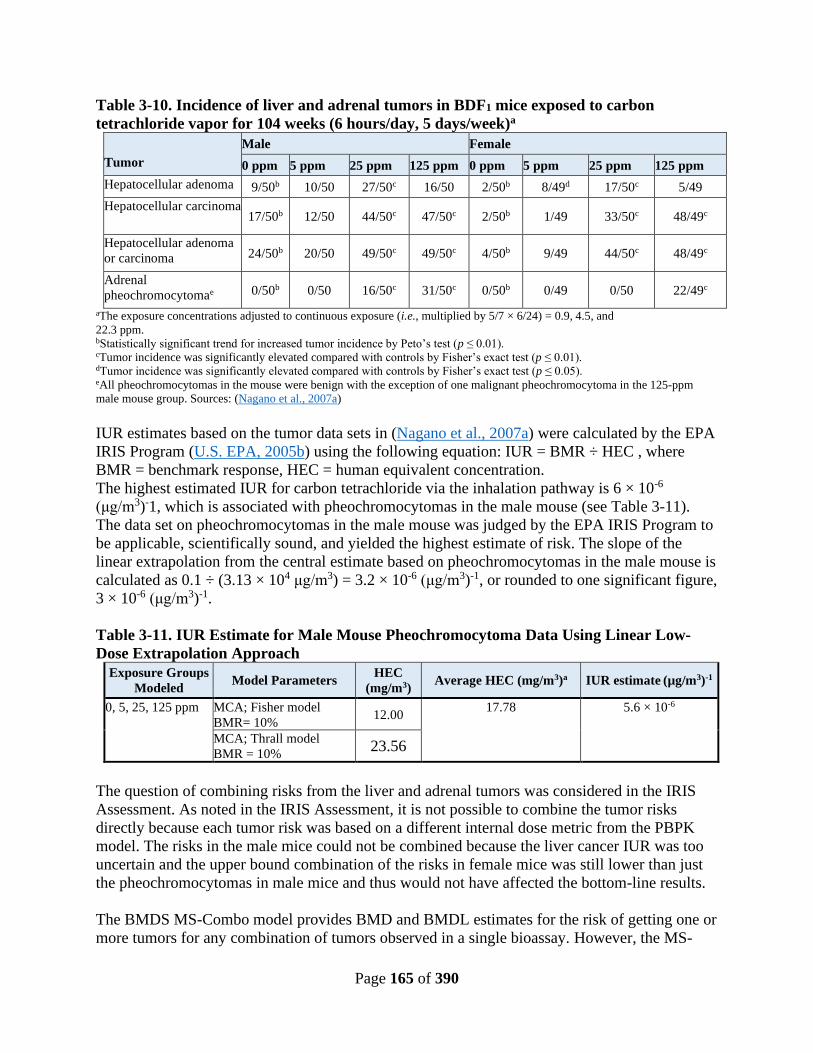
Page 165 of 390
Table 3-10. Incidence of liver and adrenal tumors in BDF1 mice exposed to carbon
tetrachloride vapor for 104 weeks (6 hours/day, 5 days/week)a
Tumor
Male Female
0 ppm 5 ppm 25 ppm 125 ppm 0 ppm 5 ppm 25 ppm 125 ppm
Hepatocellular adenoma 9/50b 10/50 27/50c 16/50 2/50b 8/49d 17/50c 5/49
Hepatocellular carcinoma 17/50b 12/50 44/50c 47/50c 2/50b 1/49 33/50c 48/49c
Hepatocellular adenoma
or carcinoma 24/50b 20/50 49/50c 49/50c 4/50b 9/49 44/50c 48/49c
Adrenal
pheochromocytomae 0/50b 0/50 16/50c 31/50c 0/50b 0/49 0/50 22/49c
aThe exposure concentrations adjusted to continuous exposure (i.e., multiplied by 5/7 × 6/24) = 0.9, 4.5, and
22.3 ppm. bStatistically significant trend for increased tumor incidence by Peto’s test (p ≤ 0.01). cTumor incidence was significantly elevated compared with controls by Fisher’s exact test (p ≤ 0.01). dTumor incidence was significantly elevated compared with controls by Fisher’s exact test (p ≤ 0.05). eAll pheochromocytomas in the mouse were benign with the exception of one malignant pheochromocytoma in the 125-ppm
male mouse group. Sources: (Nagano et al., 2007a)
IUR estimates based on the tumor data sets in (Nagano et al., 2007a) were calculated by the EPA
IRIS Program (U.S. EPA, 2005b) using the following equation: IUR = BMR ÷ HEC , where
BMR = benchmark response, HEC = human equivalent concentration.
The highest estimated IUR for carbon tetrachloride via the inhalation pathway is 6 × 10⁻⁶
(μg/m3)-1, which is associated with pheochromocytomas in the male mouse (see Table 3-11).
The data set on pheochromocytomas in the male mouse was judged by the EPA IRIS Program to
be applicable, scientifically sound, and yielded the highest estimate of risk. The slope of the
linear extrapolation from the central estimate based on pheochromocytomas in the male mouse is
calculated as 0.1 ÷ (3.13 × 10⁴ μg/m3) = 3.2 × 10⁻⁶ (μg/m3)-1, or rounded to one significant figure,
3 × 10⁻⁶ (μg/m3)-1.
Table 3-11. IUR Estimate for Male Mouse Pheochromocytoma Data Using Linear Low-
Dose Extrapolation Approach
Exposure Groups
Modeled Model Parameters
HEC
(mg/m3) Average HEC (mg/m3)a IUR estimate (µg/m3)-1
0, 5, 25, 125 ppm MCA; Fisher model
BMR= 10%
12.00 17.78 5.6 × 10⁻⁶
MCA; Thrall model
BMR = 10% 23.56
The question of combining risks from the liver and adrenal tumors was considered in the IRIS
Assessment. As noted in the IRIS Assessment, it is not possible to combine the tumor risks
directly because each tumor risk was based on a different internal dose metric from the PBPK
model. The risks in the male mice could not be combined because the liver cancer IUR was too
uncertain and the upper bound combination of the risks in female mice was still lower than just
the pheochromocytomas in male mice and thus would not have affected the bottom-line results.
The BMDS MS-Combo model provides BMD and BMDL estimates for the risk of getting one or
more tumors for any combination of tumors observed in a single bioassay. However, the MS-
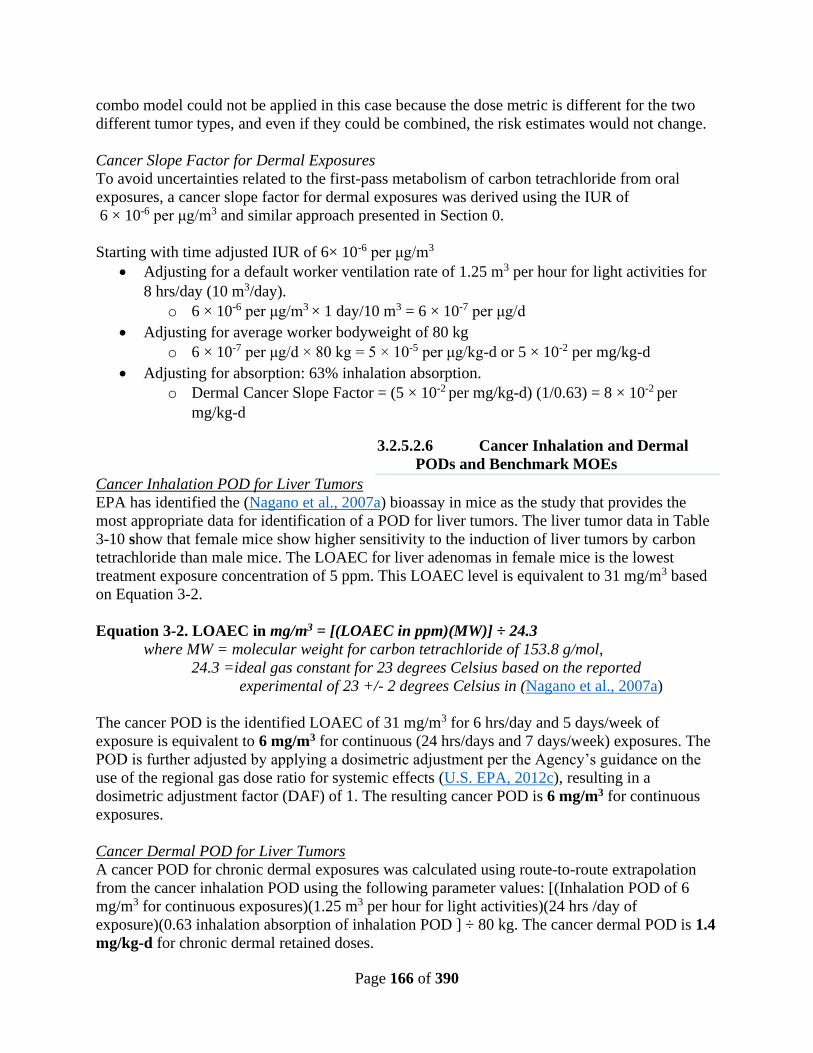
Page 166 of 390
combo model could not be applied in this case because the dose metric is different for the two
different tumor types, and even if they could be combined, the risk estimates would not change.
Cancer Slope Factor for Dermal Exposures
To avoid uncertainties related to the first-pass metabolism of carbon tetrachloride from oral
exposures, a cancer slope factor for dermal exposures was derived using the IUR of
6 × 10⁻⁶ per μg/m3 and similar approach presented in Section 0.
Starting with time adjusted IUR of 6× 10⁻⁶ per μg/m3
• Adjusting for a default worker ventilation rate of 1.25 m3 per hour for light activities for
8 hrs/day (10 m3/day).
o 6 × 10⁻⁶ per μg/m3 × 1 day/10 m3 = 6 × 10⁻⁷ per μg/d
• Adjusting for average worker bodyweight of 80 kg
o 6 × 10⁻⁷ per μg/d × 80 kg = 5 × 10⁻⁵ per μg/kg-d or 5 × 10⁻² per mg/kg-d
• Adjusting for absorption: 63% inhalation absorption.
o Dermal Cancer Slope Factor = (5 × 10⁻² per mg/kg-d) (1/0.63) = 8 × 10⁻² per
mg/kg-d
3.2.5.2.6 Cancer Inhalation and Dermal
PODs and Benchmark MOEs
Cancer Inhalation POD for Liver Tumors
EPA has identified the (Nagano et al., 2007a) bioassay in mice as the study that provides the
most appropriate data for identification of a POD for liver tumors. The liver tumor data in Table
3-10 show that female mice show higher sensitivity to the induction of liver tumors by carbon
tetrachloride than male mice. The LOAEC for liver adenomas in female mice is the lowest
treatment exposure concentration of 5 ppm. This LOAEC level is equivalent to 31 mg/m3 based
on Equation 3-2.
Equation 3-2. LOAEC in mg/m3 = [(LOAEC in ppm)(MW)] ÷ 24.3
where MW = molecular weight for carbon tetrachloride of 153.8 g/mol,
24.3 =ideal gas constant for 23 degrees Celsius based on the reported
experimental of 23 +/- 2 degrees Celsius in (Nagano et al., 2007a)
The cancer POD is the identified LOAEC of 31 mg/m3 for 6 hrs/day and 5 days/week of
exposure is equivalent to 6 mg/m3 for continuous (24 hrs/days and 7 days/week) exposures. The
POD is further adjusted by applying a dosimetric adjustment per the Agency’s guidance on the
use of the regional gas dose ratio for systemic effects (U.S. EPA, 2012c), resulting in a
dosimetric adjustment factor (DAF) of 1. The resulting cancer POD is 6 mg/m3 for continuous
exposures.
Cancer Dermal POD for Liver Tumors
A cancer POD for chronic dermal exposures was calculated using route-to-route extrapolation
from the cancer inhalation POD using the following parameter values: [(Inhalation POD of 6
mg/m3 for continuous exposures)(1.25 m3 per hour for light activities)(24 hrs /day of
exposure)(0.63 inhalation absorption of inhalation POD ] ÷ 80 kg. The cancer dermal POD is 1.4
mg/kg-d for chronic dermal retained doses.
Page 167 of 390
Cancer Inhalation and Dermal Benchmark MOE for Liver Tumors
A cancer benchmark MOE of 300 for inhalation and dermal exposures has been identified based
on:
• A default 10-fold UF for intraspecies differences to account for variability among
members of the human population.
• A non-default three-fold UF for interspecies extrapolation to account for potential
differences between mice and humans. The non-default value of 3 accounts for the
toxicodynamic component of the interspecies UF. The toxicokinetic component was
reduced to 1 because a dosimetric adjustment was applied, per the Agency’s guidance on
the use of the regional gas dose ratio for systemic effects.
• A default 10-fold UF for extrapolation from a LOAEC to a NOAEC.
• A UF of 1 for extrapolation from a subchronic to a chronic exposure duration based on
identification of a cancer POD from a study using a chronic exposure protocol.
PODs for Human Health Hazard Endpoints and Confidence Levels
Section 3.2.5.2 summarizes the PODs derived for evaluating human health hazards from acute
and chronic inhalation scenarios, acute dermal scenarios and PODs extrapolated from inhalation
studies to evaluate human health hazards from chronic dermal scenarios. EPA has also
determined confidence levels for the acute, non-cancer chronic and cancer chronic values used in
the risk evaluation. These confidence levels consider the data quality ratings of the study chosen
as the basis of dose-response modeling and also consider the strengths and limitations of the
body of evidence including the strengths and limitations of the human, animal and MOA
information to support the endpoint both qualitatively and quantitatively.
Confidence Levels
NAS/AEGL considered several reports providing data on nonlethal effects of acute exposure of
humans to carbon tetrachloride to establish an AEGL-2 value. Some of the reports include Davis
(Davis, 1934), which includes a series of controlled exposure experiments that allowed the
determination of a no-effect level for non-lasting CNS effects (i.e., dizziness). The data set was
determined to provide suitable data to derive AEGL-2 values by NAS/AEGL. Overall, there is
high confidence in this endpoint because the quantitative dataset consists of a series of controlled
exposure experiments that identify a no-effect level for CNS effects in humans. EPA found that
this study is an acceptable study with low data quality based upon our review using the
systematic review protocol. Further information on the data quality evaluation of this study can
be found in the Final Risk Evaluation for Carbon Tetrachloride, Systematic Review
Supplemental File: Data Quality Evaluation of Human Health Studies - Epidemiological Studies
(U.S. EPA, 2019j).
For the chronic non-cancer endpoint, confidence in the principal study (Nagano et al., 2007a) is
high. According to EPA (U.S. EPA, 2010) and systematic review for this risk evaluation, this
chronic study was well conducted, using two species and 50 animals/sex/group. The chronic
study was preceded by a 13-week subchronic study, and an extensive set of endpoints was
examined in both studies. Thus, EPA has high confidence in the chronic non-cancer endpoint
based on liver effects.
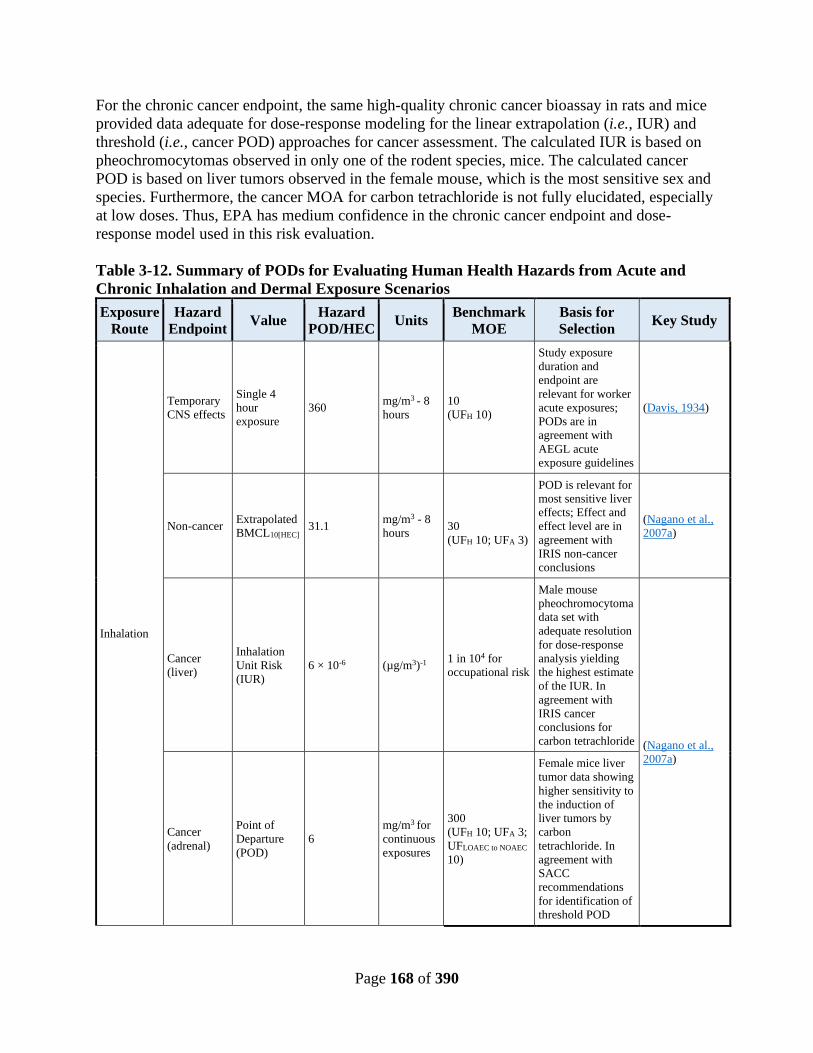
Page 168 of 390
For the chronic cancer endpoint, the same high-quality chronic cancer bioassay in rats and mice
provided data adequate for dose-response modeling for the linear extrapolation (i.e., IUR) and
threshold (i.e., cancer POD) approaches for cancer assessment. The calculated IUR is based on
pheochromocytomas observed in only one of the rodent species, mice. The calculated cancer
POD is based on liver tumors observed in the female mouse, which is the most sensitive sex and
species. Furthermore, the cancer MOA for carbon tetrachloride is not fully elucidated, especially
at low doses. Thus, EPA has medium confidence in the chronic cancer endpoint and dose-
response model used in this risk evaluation.
Table 3-12. Summary of PODs for Evaluating Human Health Hazards from Acute and
Chronic Inhalation and Dermal Exposure Scenarios
Exposure
Route Hazard
Endpoint Value
Hazard
POD/HEC Units
Benchmark
MOE Basis for
Selection Key Study
Inhalation
Temporary
CNS effects
Single 4
hour
exposure 360 mg/m3 - 8
hours 10
(UFH 10)
Study exposure
duration and
endpoint are
relevant for worker
acute exposures;
PODs are in
agreement with
AEGL acute
exposure guidelines
(Davis, 1934)
Non-cancer Extrapolated
BMCL10[HEC] 31.1
mg/m3 - 8
hours
30
(UFH 10; UFA 3)
POD is relevant for
most sensitive liver
effects; Effect and
effect level are in
agreement with
IRIS non-cancer
conclusions
(Nagano et al.,
2007a)
Cancer
(liver)
Inhalation
Unit Risk
(IUR) 6 × 10⁻⁶ (µg/m3)-1 1 in 104 for
occupational risk
Male mouse
pheochromocytoma
data set with
adequate resolution
for dose-response
analysis yielding
the highest estimate
of the IUR. In
agreement with
IRIS cancer
conclusions for
carbon tetrachloride (Nagano et al.,
2007a)
Cancer
(adrenal)
Point of
Departure
(POD)
6
mg/m3 for
continuous
exposures
300
(UFH 10; UFA 3;
UFLOAEC to NOAEC
10)
Female mice liver
tumor data showing
higher sensitivity to
the induction of
liver tumors by
carbon
tetrachloride. In
agreement with
SACC
recommendations
for identification of
threshold POD
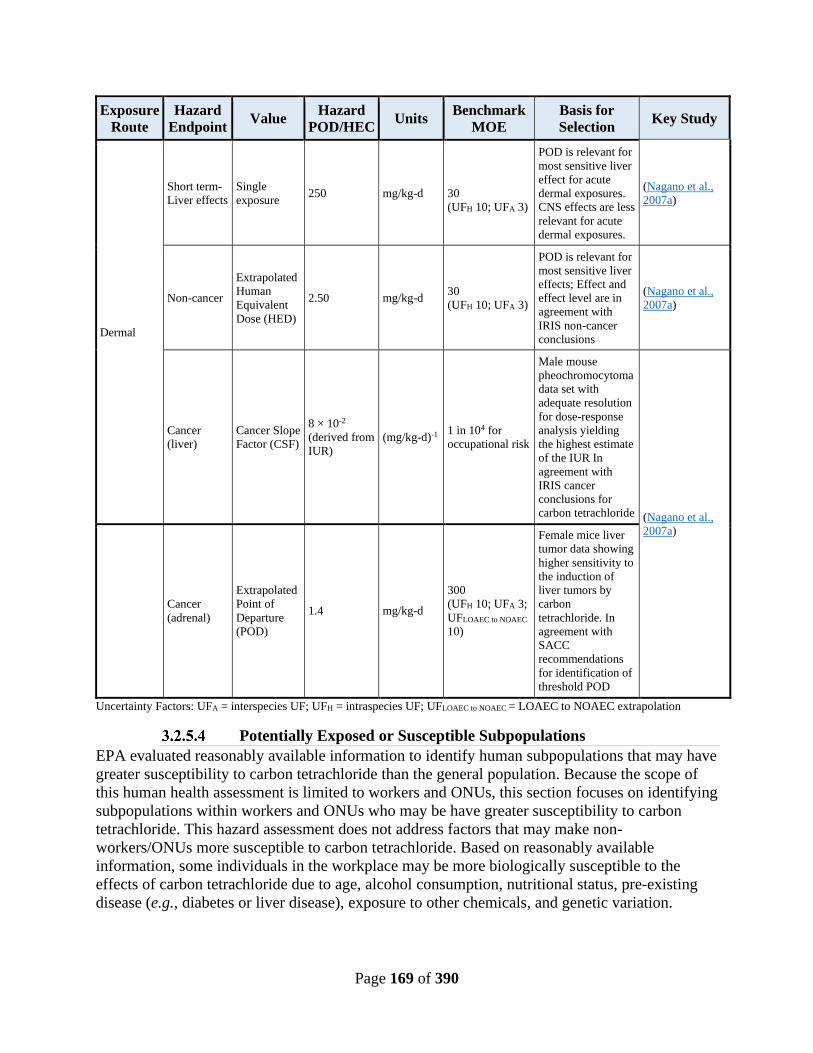
Page 169 of 390
Exposure
Route Hazard
Endpoint Value
Hazard
POD/HEC Units
Benchmark
MOE Basis for
Selection Key Study
Dermal
Short term-
Liver effects Single
exposure 250 mg/kg-d
30
(UFH 10; UFA 3)
POD is relevant for
most sensitive liver
effect for acute
dermal exposures.
CNS effects are less
relevant for acute
dermal exposures.
(Nagano et al.,
2007a)
Non-cancer
Extrapolated
Human
Equivalent
Dose (HED)
2.50 mg/kg-d 30
(UFH 10; UFA 3)
POD is relevant for
most sensitive liver
effects; Effect and
effect level are in
agreement with
IRIS non-cancer
conclusions
(Nagano et al.,
2007a)
Cancer
(liver) Cancer Slope
Factor (CSF)
8 × 10⁻²
(derived from
IUR)
(mg/kg-d)-1 1 in 104 for
occupational risk
Male mouse
pheochromocytoma
data set with
adequate resolution
for dose-response
analysis yielding
the highest estimate
of the IUR In
agreement with
IRIS cancer
conclusions for
carbon tetrachloride (Nagano et al.,
2007a)
Cancer
(adrenal)
Extrapolated
Point of
Departure
(POD)
1.4 mg/kg-d
300
(UFH 10; UFA 3;
UFLOAEC to NOAEC
10)
Female mice liver
tumor data showing
higher sensitivity to
the induction of
liver tumors by
carbon
tetrachloride. In
agreement with
SACC
recommendations
for identification of
threshold POD
Uncertainty Factors: UFA = interspecies UF; UFH = intraspecies UF; UFLOAEC to NOAEC = LOAEC to NOAEC extrapolation
Potentially Exposed or Susceptible Subpopulations
EPA evaluated reasonably available information to identify human subpopulations that may have
greater susceptibility to carbon tetrachloride than the general population. Because the scope of
this human health assessment is limited to workers and ONUs, this section focuses on identifying
subpopulations within workers and ONUs who may be have greater susceptibility to carbon
tetrachloride. This hazard assessment does not address factors that may make non-
workers/ONUs more susceptible to carbon tetrachloride. Based on reasonably available
information, some individuals in the workplace may be more biologically susceptible to the
effects of carbon tetrachloride due to age, alcohol consumption, nutritional status, pre-existing
disease (e.g., diabetes or liver disease), exposure to other chemicals, and genetic variation.
Page 170 of 390
Metabolism of carbon tetrachloride to reactive metabolites by cytochrome P450 enzymes
(particularly CYP2E1 and CYP3A) is hypothesized to be a key event in the toxicity of this
compound. Therefore, heterogeneity in the human population distribution of microsomal
enzymes metabolizing carbon tetrachloride has influence in the susceptibility to carbon
tetrachloride toxicity. Reasonably available quantitative information on the variation in human
hepatic levels of the main metabolic enzyme, CYP2E1, demonstrates considerable intrahuman
variability. For example, (Lipscomb et al., 1997) reported a seven-fold range in activity of
CYP2E1 among hepatic microsomal samples from 23 subjects. Snawder and Lipscomb (2000)
demonstrated 12-fold differences in CYP2E1 protein content between the highest and lowest
samples from 40 samples of microsomes from adult human liver organ donors. Consideration of
this PESS quantitative information is incorporated in the uncertainty factors used for risk
characterization.
In addition to differences in the metabolism due to alcohol consumption (see below and Section
3.2.5.2 for quantitative information on effect and associated alcohol usage), exposure to other
chemicals, age, nutritional status, genetic variability in CYP expression, or impaired liver
function due to liver disease can increase susceptibility to carbon tetrachloride (U.S. EPA, 2010).
For example, alcohol is known to induce CYP2E1 expression. Cases of acute toxicity from
occupational exposures indicate that heavy drinkers are more susceptible to carbon tetrachloride
and this observation has been verified in numerous animal studies. Exposure to other chemicals
that induce P450 enzymes, including isopropanol, methanol, acetone, methyl ethyl ketone,
methyl isobutyl ketone, 2-butanone, phenobarbital, methamphetamine, nicotine,
trichloroethylene, polychlorinated and polybrominated biphenyls, DDT, mirex, and chlordecone
have also been shown to potentiate carbon tetrachloride liver toxicity (U.S. EPA, 2010; ATSDR,
2005).
The AEGL-2 values (see Section 3.2.4.1), which are the basis for the PODs for acute inhalation
exposures in this risk evaluation, were derived using an intraspecies uncertainty factor of 10 to
account for individuals who may be more susceptible to the toxic effects of carbon tetrachloride,
including greater potential of carbon tetrachloride-induced toxicity in individuals with histories
of alcohol usage. Susceptibility to carbon tetrachloride due to elevated (i.e., moderate to high)
alcohol use is in agreement with the known dispositional potentiation of carbon tetrachloride
toxicity by inducers of cytochrome CYP2E1 enzymes. The AEGL document states that the
variability in response to carbon tetrachloride is emphasized by the fact that an estimated
exposure at 63 ppm-h was fatal in a heavy drinker whereas controlled exposures at 190 ppm-h
were without effect for individuals not categorized as heavy drinkers. This exposure information
indicates that a three-fold exposure reduction to the NOEC value produces an extreme toxic
response in heavy drinkers, suggesting that a UF of 10 for intraspecies variability is protective of
heavy drinkers.
Age can influence susceptibility to carbon tetrachloride due to differences in metabolism,
antioxidant responses, and reduced kidney function in older adults. While lower CYP expression
may reduce susceptibility of older adults to carbon tetrachloride in some tissues, reduced kidney
function and increased CYP3A activity in the liver (indicated by animal studies) suggest that
older populations could be at greater risk of carbon tetrachloride-associated kidney damage (U.S.
EPA, 2010).
Page 171 of 390
Nutrition has also been shown to influence susceptibility to carbon tetrachloride in animals. Food
restriction has been shown to increase liver toxicity of carbon tetrachloride. Diets low in
antioxidants increase lipid peroxidation and liver damage in following carbon tetrachloride
exposure (reversed with antioxidant supplementation) and zinc deficient diets increase carbon
tetrachloride-induced liver toxicity (U.S. EPA, 2010).
4 RISK CHARACTERIZATION
Environmental Risk EPA integrated fate, exposure, and environmental hazard information when characterizing the
environmental risk of carbon tetrachloride. As stated in Section 2.1, carbon tetrachloride is not
expected to bioconcentrate in biota or accumulate in wastewater biosolids, soil, sediment, or
biota. Releases of carbon tetrachloride to the environment are likely to volatilize into the
atmosphere, where it will photodegrade under stratospheric conditions. It may migrate to
groundwater, where it will slowly hydrolyze. Section 2.1 also explains that the bioconcentration
potential of carbon tetrachloride is low. EPA modeled environmental exposure with surface
water concentrations of carbon tetrachloride ranging from 4.9E-05 µg/L to 1.3E+02 µg/L for
acute exposures and 4.1E-06 µg/L to 1.0E+01 µg/L for chronic exposures from facilities
releasing the chemical to surface water. The modeled data represent estimated concentrations
near facilities that are actively monitoring and reporting carbon tetrachloride releases to surface
receiving water via EPA’s Discharge Monitoring Reports as required under the National
Pollutant Discharge Elimination System (NPDES) permitting rules.
EPA concluded that carbon tetrachloride poses a hazard to environmental aquatic receptors
(Section 3.1). Amphibians were the most sensitive taxa for acute and chronic exposures. For
acute exposures, a hazard (toxicity) value of 0.9 mg/L was established for amphibians using data
on teratogenesis leading to lethality in frog embryos and larvae. Additionally, acute exposures of
carbon tetrachloride to fish, freshwater aquatic invertebrates, and sediment invertebrates resulted
in hazard values as low as 10.4 mg/L, 11.1 mg/L, and 2 mg/L, respectively. For chronic
exposures, carbon tetrachloride has a hazard value for amphibians of 0.03 mg/L based on
teratogenesis and lethality in frog embryos and larvae. Furthermore, chronic exposures of carbon
tetrachloride to fish, freshwater aquatic invertebrates, and sediment invertebrates resulted in
hazard values as low as 1.97 mg/L, 1.1 mg/L (acute to chronic ratio of 10), and 0.2 mg/L (acute
to chronic ratio of 10), respectively. In algal studies, carbon tetrachloride has hazard values
ranging from 0.07 to 23.59 mg/L.
EPA considered the biological relevance of the species that the COCs were based on when
integrating the COCs with surface water concentration data to produce risk quotients (RQs). For
example, life-history and the habitat-use influence the likelihood of exposure above the hazard
benchmark in an aquatic environment. In general, amphibian distribution is typically limited to
freshwater environments. Larvae of the amphibian species (Lithobates sp. and Rana sp.)
evaluated for hazards from sub-chronic exposure (Appendix 7F.2) can occupy a wide range of
freshwater habitats including wetlands, lakes, springs, and streams throughout development and
metamorphosis. However, as adults, these species are semi-aquatic and may interact with surface

Page 172 of 390
water for fewer days per year. In contrast, fish occupy a wide range of freshwater habitats
throughout their entire life cycle. If hazard benchmarks are exceeded by both larval amphibians
and fish from a modeled and estimated chronic exposure, it provides additional evidence that the
site-specific releases could affect that specific aquatic environment.
A total of 15 aquatic environmental hazard studies were reviewed and determined to have
acceptable data quality for carbon tetrachloride. EPA’s data quality evaluation of these studies
resulted in either high, medium, or low data quality rating for each of the studies (Appendix
7F.1). The document Final Risk Evaluation for Carbon Tetrachloride, Systematic Review
Supplemental File: Data Quality Evaluation of Environmental Hazard Studies (U.S. EPA,
2019g) presents details of the data evaluations for each study, including scores for each metric
and the overall study score.
For this risk evaluation, EPA conducted a multi-year analysis of 21 facilities that released the
highest concentration of carbon tetrachloride from 2014-2018 as reported in the EPA Discharge
Monitoring Reports (see Table 2-2 in Section 2.3.2 above). These facility releases represent, on
average, 94% of total annual carbon tetrachloride releases. Environmental releases of carbon
tetrachloride occur through disposal from industrial/commercial facilities as well as from
POTWs. Sources of carbon tetrachloride from POTWs releases may not be tied to a specific
condition of use given that POTWs may have multiple release sources. However, EPA is
confident that the risks from releases of carbon tetrachloride include all conditions of use
considered within the scope of the risk evaluation because EPA used the worst-case, high end
exposures and modeled surface water concentrations.
Exposure pathways to terrestrial species through ambient air were determined to fall under the
jurisdiction of the CAA. This pathway was excluded from the scope of this risk evaluation.
Exposures to terrestrial organisms from the suspended soils and biosolids pathway were
qualitatively evaluated by examining physical-chemical and fate properties.
Aquatic and Sediment Pathways
To assess environmental risk, EPA evaluates environmental hazard and exposure data.
Although EPA did not calculate risks to the aquatic environment at problem formulation, EPA
conducted further analysis of the environmental release pathway in this risk evaluation during
data quality evaluation. The results of the analyses are presented below and in Appendix E.
The environmental risk of carbon tetrachloride is characterized by calculating risk quotients or
RQs (U.S. EPA, 1998). The RQ is defined as:
RQ = Environmental Concentration / Effect Level
An RQ equal to 1 indicates that the exposures are the same as the concentration that causes
effects. If the RQ is above 1, the exposure is greater than the effect concentration. If the RQ is
below 1, the exposure is less than the effect concentration. The Concentrations of Concern
(COCs) for aquatic organisms shown in Table 4-1 were used to calculate RQs.

Page 173 of 390
Table 4-1. Concentrations of Concern (COCs) for Environmental Toxicity
Environmental
Toxicity Most Sensitive Test
Assessment Factor **/
Acute to Chronic
Ratio (ACR)
Concentration of
Concern (COC)*
Acute Toxicity,
aquatic organisms 9-day amphibian LC50 10 90 µg/L
Chronic Toxicity,
aquatic organisms 9-day amphibians LC10 10 3 µg/L
Algae 72-hour algal EC10 10 7 µg/L
Acute Toxicity,
sediment-dwelling
organisms
48-hour LOEL 5 400 µg/L
Chronic Toxicity,
sediment-dwelling
organisms
48-hour LOEL 10 (ACR) 40 µg/L
*The Concentration of Concern is derived from the most sensitive acute, chronic, and algal toxicity values (hazard
values) divided by an assessment factor of 10.
**Assessment factors are applied to account for variation within and across taxa.
As described in Appendix E and Appendix F, EPA used model exposure data that was calculated
from E-FAST, monitored data from Discharge Monitoring Reports (DMR), and aquatic and
sediment-dwelling organisms COCs from the available hazard data to determine the risk of
carbon tetrachloride to aquatic and sediment-dwelling organisms using the RQ method.
EPA quantitatively evaluated risk to aquatic organisms from exposure to surface water and
assessed the available monitoring data for carbon tetrachloride to adequately evaluate any
potential environmental risk to aquatic organisms posed by carbon tetrachloride. The results of
the review are summarized in Appendix E. All facilities were modeled in E-FAST. Facilities
with an RQ ≥ 1 for the acute COC, RQ ≥ 1 and 20 days or more of exceedance for the algae
COCs, or a RQ ≥ 1 for the chronic COC (based on a developmental endpoint) suggest the
potential for environmental risks posed by carbon tetrachloride. The 20-day exceedance time
frame was derived from partial life cycle tests (e.g., daphnid chronic and fish early life stage
tests) that typically range from 21 to 28 days in duration.
EPA derived the acute COC (90 µg/L), chronic COC (3 µg/L), and algal COC (7 µg/L) based on
LC50 data from (Brack and Rottler, 1994), LC10 data from (Black et al., 1982; Birge et al., 1980),
and EC10 data from (Brack and Rottler, 1994), respectively. These three studies were rated high
quality and represented the lowest bound of carbon tetrachloride data available in the public
domain.
EPA estimated carbon tetrachloride concentrations in surface water resulting from individual
industrial direct discharges as well as from indirect discharges that receive and treat wastewater
from multiple facilities and sources such as the municipal POTWs. EPA compiled five years of
carbon tetrachloride NPDES permit Discharge Monitoring Report (DMR) release data (2014
through 2018). The total annual facility releases of carbon tetrachloride per DMR data indicated
that 2019 and 2017 data were similar (7Appendix E); and analyzing DMR data from 2015 to
2019 would not change EPA’s findings. This expanded data set provides a range of facilities and
Page 174 of 390
a range of discharge amounts for this time period within the United States. EPA used E-FAST to
estimate site-specific receiving water concentrations of carbon tetrachloride at the point of
discharge. Based on physical-chemical properties, EPA anticipates that in surface waters, carbon
tetrachloride will dissipate and volatilize. The E-FAST model, however, did not include these
processes in surface water estimates, thereby providing conservative estimates. Two release
scenarios were modeled for direct discharging facilities to provide upper and lower bounds for the range
of surface water concentrations estimated by E-FAST 2014. The two scenarios modeled were a 250
days of release scenario (which yields the minimum estimated surface water concentrations for a
given facility) and a 20 days of release scenario (which yields the maximum estimated surface water
concentrations for a given facility). Days of exceedance, the number of days per year that the
surface water concentrations were estimated to exceed the COCs, were also calculated using the
Probabilistic Dilution Model (PDM) in E-FAST. Surface water concentrations and days of
exceedance are summarized in Table 4-2 below.

Page 175 of 390
Table 4-2. Modeled Facilities Showing Risk to Aquatic and Sediment-dwelling Organisms from the Release of Carbon
Tetrachloride; RQs Greater Than One are Shown in Bold
NPDES Facility Name Days of
Release
Scenario
(PDM) a
Amount
Discharged
(kg/day)
Stream Conc.
(µg/L)
Concentration of
Concern (COC)
Type
COC
(µg/L)
Days
Exceedance
RQ
(days/year,
PDM)
TX0021458 Fort Bend
County WCID2a
20 N/A N/A Acute Amphibian 90 N/A N/A
Chronic Amphibian 3 N/A N/A
Acute Sediment 400 N/A N/A
Chronic Sediment 40 N/A N/A
Algae 7 N/A N/A
250 1.0E-01 10 Chronic Amphibian 3 0 3.4E+00
Chronic Sediment 40 0 2.6E-01
Algae 7 0 1.5E+00
AL0001961 AKZO Chemicals,
Inc.
20 5.7 3.1E-01 Acute Amphibian 90 0 3.4E-03
Chronic Amphibian 3 0 1.0E-01
Acute Sediment 400 0 7.8E-04
Chronic Sediment 40 0 7.8E-03
Algae 7 0 4.4E-02
250 4.6E-01 2.5E-02 Chronic Amphibian 3 0 8.3E-03
Chronic Sediment 40 0 6.2E-04
Algae 7 0 3.5E-03
LA0000329 Honeywell, Baton
Rouge
20 2.0E-01 8.1E-04 Acute Amphibian 90 0 9.0E-06
Chronic Amphibian 3 0 2.7E-04
Acute Sediment 400 0 2.0E-06

Page 176 of 390
NPDES Facility Name Days of
Release
Scenario
(PDM) a
Amount
Discharged
(kg/day)
Stream Conc.
(µg/L)
Concentration of
Concern (COC)
Type
COC
(µg/L)
Days
Exceedance
RQ
(days/year,
PDM)
Chronic Sediment 40 0 2.0E-05
Algae 7 0 1.2E-04
250 2.0E-02 8.1E-04 Chronic Amphibian 3 0 2.2E-05
Chronic Sediment 40 0 1.6E-06
Algae 7 0 9.3E-06
LA0005401 ExxonMobil,
Baton Rouge
20 1.0E-02 4.0E-04 Acute Amphibian 90 0 4.5E-06
Chronic Amphibian 3 0 1.3E-04
Acute Sediment 400 0 1.0E-06
Chronic Sediment 40 0 1.0E-05
Algae 7 0 5.7E-05
250 1.0E-02 3.2E-05 Chronic Amphibian 3 0 1.1E-05
Chronic Sediment 40 0 8.1E-07
Algae 7 0 4.6E-06
OH0029149 Gabriel
Performance
20 1.9E-01 45 Acute Amphibian 90 0 5.0E-01
Chronic Amphibian 3 4 1.5E+01
Acute Sediment 400 0 1.1E-01
Chronic Sediment 40 0 1.1E+00
Algae 7 2 6.4E+00
250 2.0E-02 3.6 Chronic Amphibian 3 2 1.2E+00
Chronic Sediment 40 0 8.9E-02
Algae 7 0 5.1E-01
WV0004359 Natrium Plant 20 2.9E-01 3.4E-02 Acute Amphibian 90 0 3.8E-04

Page 177 of 390
NPDES Facility Name Days of
Release
Scenario
(PDM) a
Amount
Discharged
(kg/day)
Stream Conc.
(µg/L)
Concentration of
Concern (COC)
Type
COC
(µg/L)
Days
Exceedance
RQ
(days/year,
PDM)
Chronic Amphibian 3 0 1.2E-02
Acute Sediment 400 0 8.6E-05
Chronic Sediment 40 0 8.6E-04
Algae 7 0 4.9E-03
250 2.0E-02 2.9E-03 Chronic Amphibian 3 0 9.5E-04
Chronic Sediment 40 0 7.2E-05
Algae 7 0 4.1E-04
CA0107336 Sea World, San
Diegoc,d
20 6.3E-02 1.5E-01 Acute Amphibian 3 N/A 5.0E-02
Chronic Amphibian 400 N/A 0.0E+00
Acute Sediment 40 N/A 3.8E-04
Chronic Sediment 7 N/A 2.0E-02
Algae 3 N/A 5.0E-02
250 5.0E-03 1.2E-02 Chronic Amphibian 40 N/A 4.0E-03
Chronic Sediment 7 N/A 3.0E-04
Algae 3 N/A 1.7E-03
OH0007269 Dover Chemical
Corp
20 0.36 25 Acute Amphibian 90 13 2.8E-01
Chronic Amphibian 3 8 8.3E+00
Acute Sediment 400 0 6.0E-02
Chronic Sediment 40 0 6.3E-01
Algae 7 0 3.6E+00
250 2.9E-02 2E+00 Chronic Amphibian 3 15 6.7E-01
Chronic Sediment 40 0 0.0E+00
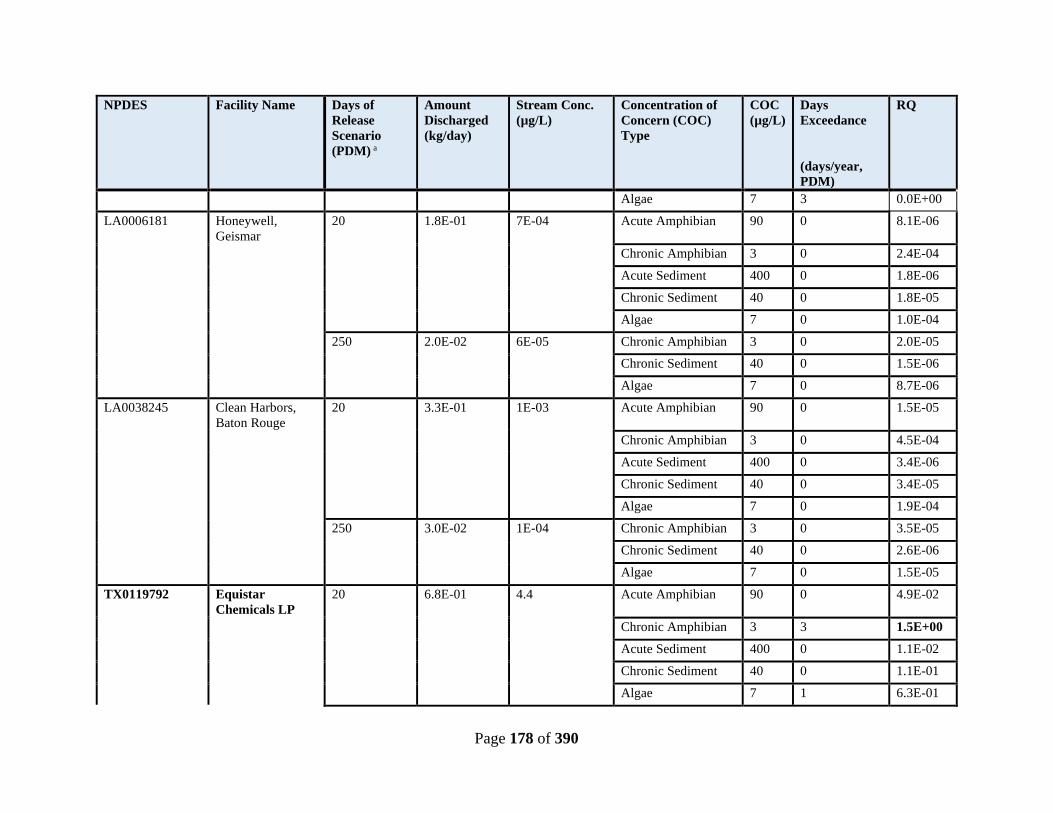
Page 178 of 390
NPDES Facility Name Days of
Release
Scenario
(PDM) a
Amount
Discharged
(kg/day)
Stream Conc.
(µg/L)
Concentration of
Concern (COC)
Type
COC
(µg/L)
Days
Exceedance
RQ
(days/year,
PDM)
Algae 7 3 0.0E+00
LA0006181 Honeywell,
Geismar
20 1.8E-01 7E-04 Acute Amphibian 90 0 8.1E-06
Chronic Amphibian 3 0 2.4E-04
Acute Sediment 400 0 1.8E-06
Chronic Sediment 40 0 1.8E-05
Algae 7 0 1.0E-04
250 2.0E-02 6E-05 Chronic Amphibian 3 0 2.0E-05
Chronic Sediment 40 0 1.5E-06
Algae 7 0 8.7E-06
LA0038245 Clean Harbors,
Baton Rouge
20 3.3E-01 1E-03 Acute Amphibian 90 0 1.5E-05
Chronic Amphibian 3 0 4.5E-04
Acute Sediment 400 0 3.4E-06
Chronic Sediment 40 0 3.4E-05
Algae 7 0 1.9E-04
250 3.0E-02 1E-04 Chronic Amphibian 3 0 3.5E-05
Chronic Sediment 40 0 2.6E-06
Algae 7 0 1.5E-05
TX0119792 Equistar
Chemicals LP
20 6.8E-01 4.4 Acute Amphibian 90 0 4.9E-02
Chronic Amphibian 3 3 1.5E+00
Acute Sediment 400 0 1.1E-02
Chronic Sediment 40 0 1.1E-01
Algae 7 1 6.3E-01
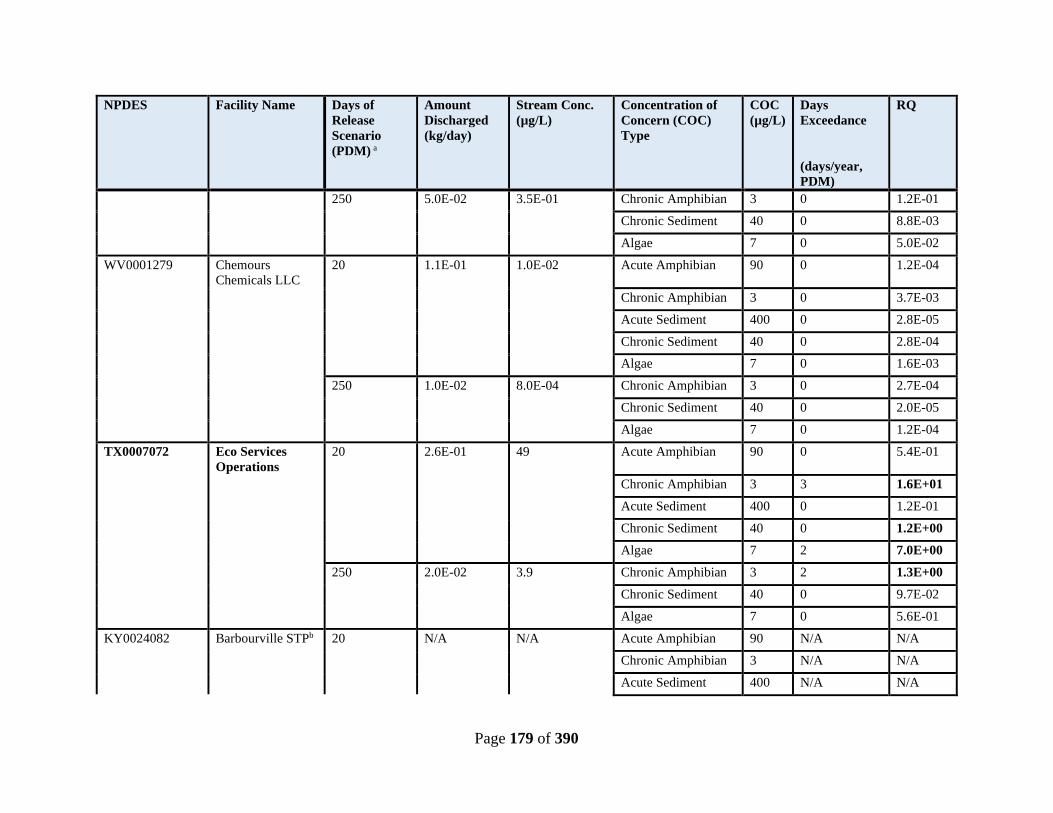
Page 179 of 390
NPDES Facility Name Days of
Release
Scenario
(PDM) a
Amount
Discharged
(kg/day)
Stream Conc.
(µg/L)
Concentration of
Concern (COC)
Type
COC
(µg/L)
Days
Exceedance
RQ
(days/year,
PDM)
250 5.0E-02 3.5E-01 Chronic Amphibian 3 0 1.2E-01
Chronic Sediment 40 0 8.8E-03
Algae 7 0 5.0E-02
WV0001279 Chemours
Chemicals LLC
20 1.1E-01 1.0E-02 Acute Amphibian 90 0 1.2E-04
Chronic Amphibian 3 0 3.7E-03
Acute Sediment 400 0 2.8E-05
Chronic Sediment 40 0 2.8E-04
Algae 7 0 1.6E-03
250 1.0E-02 8.0E-04 Chronic Amphibian 3 0 2.7E-04
Chronic Sediment 40 0 2.0E-05
Algae 7 0 1.2E-04
TX0007072 Eco Services
Operations
20 2.6E-01 49 Acute Amphibian 90 0 5.4E-01
Chronic Amphibian 3 3 1.6E+01
Acute Sediment 400 0 1.2E-01
Chronic Sediment 40 0 1.2E+00
Algae 7 2 7.0E+00
250 2.0E-02 3.9 Chronic Amphibian 3 2 1.3E+00
Chronic Sediment 40 0 9.7E-02
Algae 7 0 5.6E-01
KY0024082 Barbourville STPb 20 N/A N/A Acute Amphibian 90 N/A N/A
Chronic Amphibian 3 N/A N/A
Acute Sediment 400 N/A N/A
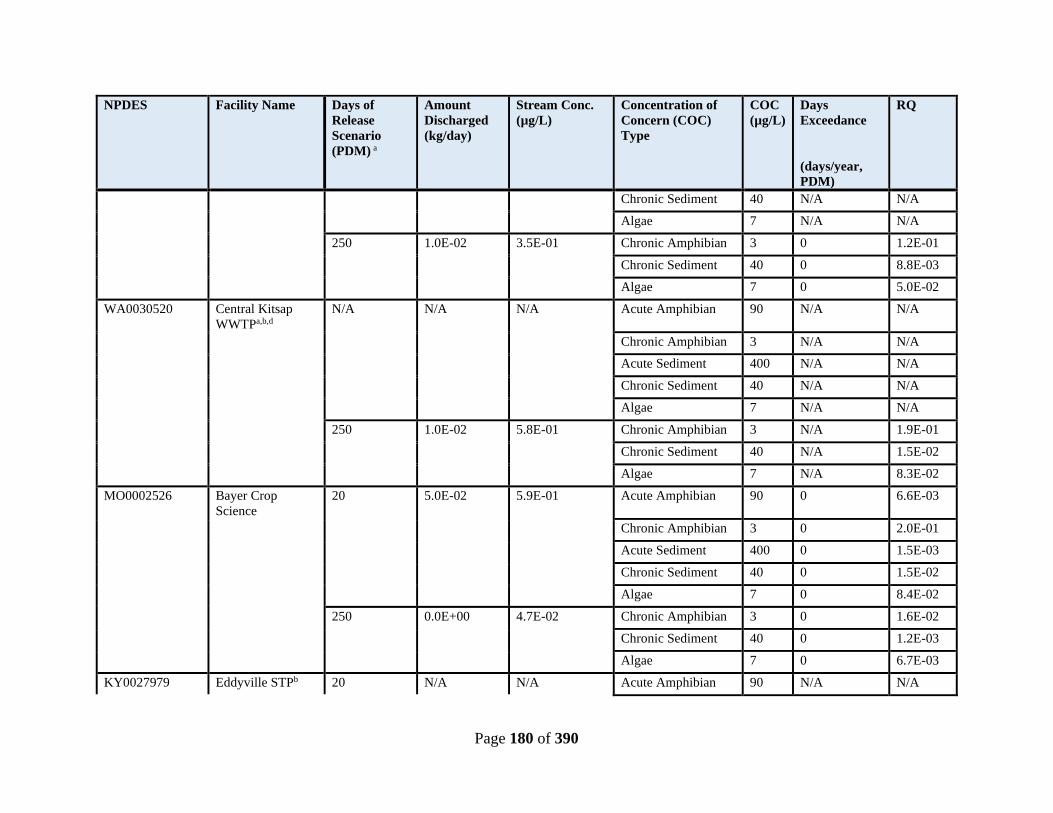
Page 180 of 390
NPDES Facility Name Days of
Release
Scenario
(PDM) a
Amount
Discharged
(kg/day)
Stream Conc.
(µg/L)
Concentration of
Concern (COC)
Type
COC
(µg/L)
Days
Exceedance
RQ
(days/year,
PDM)
Chronic Sediment 40 N/A N/A
Algae 7 N/A N/A
250 1.0E-02 3.5E-01 Chronic Amphibian 3 0 1.2E-01
Chronic Sediment 40 0 8.8E-03
Algae 7 0 5.0E-02
WA0030520 Central Kitsap
WWTPa,b,d
N/A N/A N/A Acute Amphibian 90 N/A N/A
Chronic Amphibian 3 N/A N/A
Acute Sediment 400 N/A N/A
Chronic Sediment 40 N/A N/A
Algae 7 N/A N/A
250 1.0E-02 5.8E-01 Chronic Amphibian 3 N/A 1.9E-01
Chronic Sediment 40 N/A 1.5E-02
Algae 7 N/A 8.3E-02
MO0002526 Bayer Crop
Science
20 5.0E-02 5.9E-01 Acute Amphibian 90 0 6.6E-03
Chronic Amphibian 3 0 2.0E-01
Acute Sediment 400 0 1.5E-03
Chronic Sediment 40 0 1.5E-02
Algae 7 0 8.4E-02
250 0.0E+00 4.7E-02 Chronic Amphibian 3 0 1.6E-02
Chronic Sediment 40 0 1.2E-03
Algae 7 0 6.7E-03
KY0027979 Eddyville STPb 20 N/A N/A Acute Amphibian 90 N/A N/A
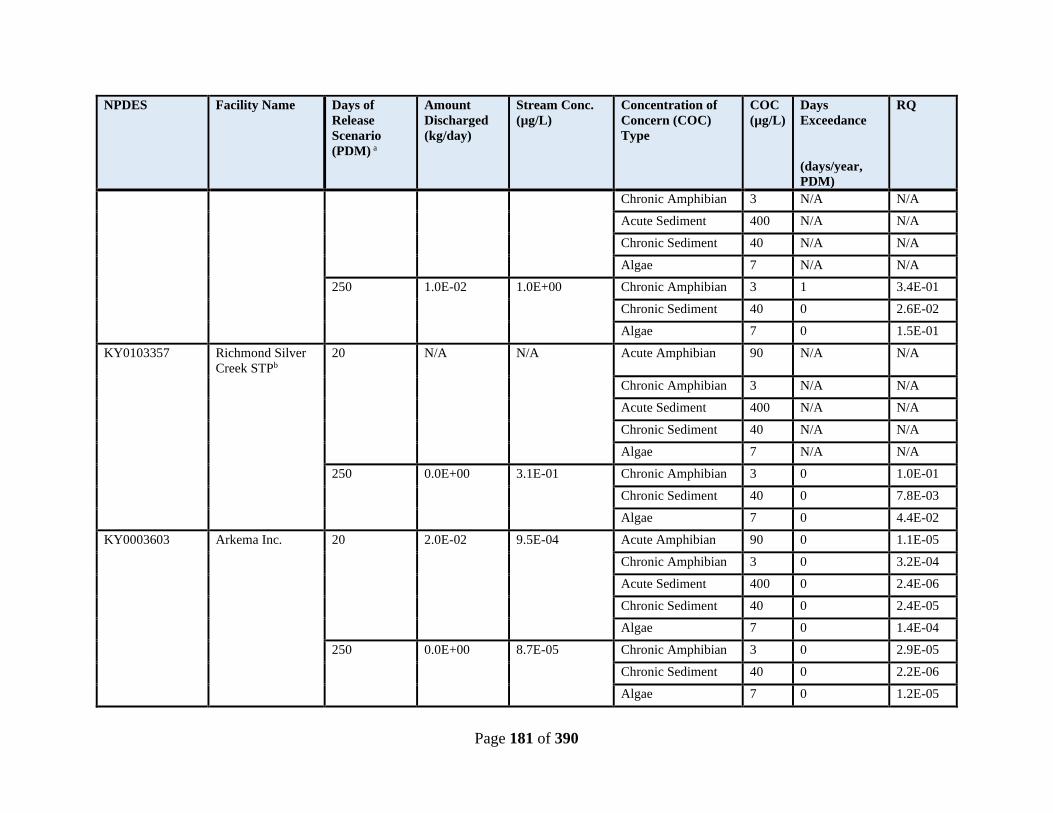
Page 181 of 390
NPDES Facility Name Days of
Release
Scenario
(PDM) a
Amount
Discharged
(kg/day)
Stream Conc.
(µg/L)
Concentration of
Concern (COC)
Type
COC
(µg/L)
Days
Exceedance
RQ
(days/year,
PDM)
Chronic Amphibian 3 N/A N/A
Acute Sediment 400 N/A N/A
Chronic Sediment 40 N/A N/A
Algae 7 N/A N/A
250 1.0E-02 1.0E+00 Chronic Amphibian 3 1 3.4E-01
Chronic Sediment 40 0 2.6E-02
Algae 7 0 1.5E-01
KY0103357 Richmond Silver
Creek STPb
20 N/A N/A Acute Amphibian 90 N/A N/A
Chronic Amphibian 3 N/A N/A
Acute Sediment 400 N/A N/A
Chronic Sediment 40 N/A N/A
Algae 7 N/A N/A
250 0.0E+00 3.1E-01 Chronic Amphibian 3 0 1.0E-01
Chronic Sediment 40 0 7.8E-03
Algae 7 0 4.4E-02
KY0003603 Arkema Inc. 20 2.0E-02 9.5E-04 Acute Amphibian 90 0 1.1E-05
Chronic Amphibian 3 0 3.2E-04
Acute Sediment 400 0 2.4E-06
Chronic Sediment 40 0 2.4E-05
Algae 7 0 1.4E-04
250 0.0E+00 8.7E-05 Chronic Amphibian 3 0 2.9E-05
Chronic Sediment 40 0 2.2E-06
Algae 7 0 1.2E-05

Page 182 of 390
NPDES Facility Name Days of
Release
Scenario
(PDM) a
Amount
Discharged
(kg/day)
Stream Conc.
(µg/L)
Concentration of
Concern (COC)
Type
COC
(µg/L)
Days
Exceedance
RQ
(days/year,
PDM)
KY009161 Caveland
Environmental
Auth
20 3.0E-02 8.4E-02 Acute Amphibian 90 0 9.3E-04
Chronic Amphibian 3 0 2.8E-02
Acute Sediment 400 0 2.1E-04
Chronic Sediment 40 0 2.1E-03
Algae 7 0 1.2E-02
250 0.0E+00 5.6E-03 Chronic Amphibian 3 0 1.9E-03
Chronic Sediment 40 0 1.4E-04
Algae 7 0 8.0E-04
LA0002933 Occidental Chem
Corp, Geismar
20 1.0E-02 4.9E-05 Acute Amphibian 90 0 5.4E-07
Chronic Amphibian 3 0 1.6E-05
Acute Sediment 400 0 1.2E-07
Chronic Sediment 40 0 1.2E-06
Algae 7 0 6.9E-06
250 0.0E+00 4.0E-06 Chronic Amphibian 3 0 1.4E-06
Chronic Sediment 40 0 1.0E-07
Algae 7 0 5.8E-07
aBecause acute RQs were all < 1 under the 20 days of release scenario (corresponding to the maximum estimated surface water concentrations), acute RQs for the
250day release (minimum estimated surface water concentrations, RQs all < 1) were not included in the table. bDays of release were assumed to be over 20 days for POTW facilities, because these facilities operate continuously. Thus, 20-day release probabilistic dilution
models (PDM) were not run for POTW facilities, and RQs are N/A under the 20-day release scenario. cSan Diego Sea World facility (CA0107336) was not available in the NPDES in database in EFAST so CA0107409 San Diego WWT was used as proxy to
model surface water dProbabilistic dilution models (PDM) were not well suited to the release data provided for these facilities (and not run) because the locations released to
saltwater. E-FAST treats ocean/bays differently and specifies a dilution of 1 (i.e., no dilution). Days of exceedance are N/A for these facilities.
Page 183 of 390
Risk Estimation for Aquatic Environment
To characterize potential risk from exposures to carbon tetrachloride, EPA calculated RQs based
on modeled data from E-FAST for sites that had surface water discharges according to carbon
tetrachloride DMR data (Appendix E). The predicted exposure concentrations in surface water of
carbon tetrachloride (from 4.9E-05 µg/L to 1.3E+02 µg/L for acute exposures and 4.1E-06 µg/L
to 1.0E+1 µg/L for chronic exposures; see Appendix E) were based on conservative assumptions,
including 0% removal of carbon tetrachloride by the waste water treatment facility. As explained
in Section 2.1, the EPI Suite™ STP module estimates that about 90% of carbon tetrachloride in
wastewater will be removed by volatilization and 2% by adsorption. Also due to its physical-
chemical properties, carbon tetrachloride is not anticipated to bioaccumulate in fish (BCF 30- 40)
thus there is no bioconcentration or bioaccumulation concern.
All facilities assessed in this risk evaluation were modeled in E-FAST, and the RQs are
presented in Table 4-2. There were five facilities that indicated risk for aquatic organisms (RQ ≥
1 for the acute COC, RQ ≥ 1 and 20 days or more of exceedance for the algae COCs, or a RQ ≥
1 for the chronic COC based on a developmental endpoint). Other facilities had acute RQs < 1,
algae RQ < 1 and < 20 days exceedance, or chronic RQs < 1, indicating they do not present risk
to aquatic organisms from acute and chronic exposure. At one facility, Dover Chemical in Ohio
(OH0007269), EPA identified an elevated environmental release of carbon tetrachloride in 2014
due to an unexpected chemical spill. Because spills and leaks are not included within the scope
of TSCA risk evaluations, the 2014 release was not included in the analysis. Other releases from
the facility, not due to the chemical spill, were evaluated.
EPA’s analysis did not identify risk from acute exposure to aquatic organisms (acute RQ ≥ 1) for
any facilities (summarized in Table 4-2). EPA’s initial analysis did not indicate risk from chronic
exposure to aquatic organisms (chronic RQ ≥ 1 and 20 days or more of exceedance of the
chronic COC). However, because the chronic COC is based on mortality observed during
amphibian development, and exposures during development have the potential to cause long-
term adverse effects (e.g., malformations) from short exposure periods (i.e., < 20 days), EPA
calculated a lower bracket of chronic risk (where RQs were ≥ 1). This scenario was compared to
the traditional EPA assessment methodology for chronic endpoints (where chronic RQ ≥ 1 and
20 days or more exceedance). Under this conservative scenario, which accounted for the
possibility that short exposures during developmental could produce adverse chronic effects
(chronic RQ ≥ 1), EPA identified risk to development of aquatic organisms from chronic
exposure to carbon tetrachloride near five facilities: Fort Bend in Texas (TX0021458), Gabriel
Performance in Ohio (OH0029149), Dover Chemical in Ohio (OH0007269), Equistar Chemicals
in Texas (TX0119792), and Eco Services Operations in Texas (TX000707072). Risk quotients
and days of exceedance are summarized in Table 4-2.
To determine if amphibian development could realistically be affected at each of the five
facilities where risk from chronic exposure was identified, EPA further refined the assessment by
examining the time of year when exposure was predicted to occur. Timing of exposure is
important to consider because amphibian development is constrained seasonally throughout the
U.S., and typically spans only 2-4 months out of any given year. Thus, EPA examined whether
releases occurred during the months relevant to amphibian development (April – September at
the Ohio facilities or March – September in Texas facilities). Where releases occurred and data
Page 184 of 390
were available, EPA calculated surface water concentrations using E-FAST and associated, site-
specific RQs to determine whether risk was or was not indicated at the facilities during these key
time periods. Risk was not indicated during time periods relevant to amphibian development at
Eco Services Operations Facility (RQs < 1 for the three years where monitoring information was
available). At the other four facilities, risk was indicated (RQs > 1) during the time periods
relevant to amphibian development for at least 2 separate reporting periods. At the OH 0028149
and the TX0007072 facilities, the 20-day stream concentrations also exceed the unadjusted
amphibian endpoint (e.g., 30 µg/L the amphibian LC10) . However, because risk was not consistent
or predictable across years or facilities (e.g., some years, no releases of carbon tetrachloride
occurred, or RQs < 1), it is important to acknowledge that the timing of future exposures is an
uncertainty in the risk evaluation. Facilities may not release carbon tetrachloride consistently
throughout the year, which makes it difficult to predict whether risk will/will not occur during
months key to amphibian development in future years. Seasonal release information and
associated RQs for each of the five sites that indicated risk for development from chronic
exposures to carbon tetrachloride are available in 7F.10.
EPA’s analysis did not indicate risk from exposure to carbon tetrachloride for algae (RQ ≥ 1 and
20 days or more of exceedance of the chronic COC). EPA considered algal endpoints separately
from the other taxa and used a sensitive hazard endpoint (EC10) instead of an acute endpoint
(EC50) to generate a concentration of concern relevant to algae (see Section 3.1). EPA’s approach
considered point effects beyond mortality (e.g., reductions in growth, yield, etc.) that are
observed to effect at most 10% of an algae population and, as such, was protective of acute
exposures to algae. In addition, the PDM model estimates the total number of days out of 1 year
that the COC is exceeded in surface water, and the days are not necessarily consecutive. Thus,
the 20-day exceedance criterion was considered protective of algae.
Risk Estimation for Sediment
EPA quantitatively analyzed exposure to sediment-dwelling aquatic organisms. Only one low
quality study on Chironomus tentans (Lee et al., 2006) was available for sediment-dwelling
organisms. Lee et al., examined body weight and expression of two genes that are general
biomarkers for stress (i.e., heat shock protein and hemoglobin) after an acute exposure to carbon
tetrachloride. The lowest effect level (LOEL) for mRNA expression of the heat shock protein
and hemoglobin genes in larvae was 0.02 mg/L carbon tetrachloride; the LOEL for dry body
weight was 2 mg/L carbon tetrachloride. Since the heat shock protein and hemoglobin genes are
general biomarkers that cannot be attributed to an adverse outcome pathway, the sediment-
dwelling organism COC were calculated based on body dry weight and an AF of 5 for acute
COC and an ACR of 10 for chronic COC.
Acute COC
The acute COC = (2.0 mg/L) / (AF of 5) = 0.4 mg/L x 1,000 = 400 µg/L or 400 ppb
Chronic COC
400 µg/L / (ACR of 10) = 40 µg/L or 40 ppb
The acute COC of 400 µg/L and chronic COC of 40 µg/L, derived from an experimental
sediment-dwelling endpoint, are used as the conservative (screening-level) hazard levels for the
sedimental pathway in this risk evaluation for carbon tetrachloride. Because only one low quality
Page 185 of 390
study was available for sediment-dwelling organisms, EPA also generated acute and chronic
COCs using aquatic invertebrates (e.g., Gammarus pseudolimnaeus and Daphnia magna) as a
surrogate species to provide an additional line of evidence to estimate toxicity to sediment-dwelling
organisms in the final TSCA risk evaluation. Daphnia, which feed through the entire water column,
were deemed to be an acceptable surrogate species for sediment invertebrates because carbon
tetrachloride is not expected to sorb to sediment and will instead remain in pore water. EPA
calculated an acute aquatic invertebrate COC of 2,220 ppb, and a chronic aquatic invertebrate COC
of 110 ppb. These COCs were greater than the COCs based on (Lee et al., 2006) and indicate that
carbon tetrachloride may be more toxic to sediment-dwelling species.
Carbon tetrachloride concentrations in sediment and pore water were expected to be similar to or
less than the concentrations in the overlying water, and concentrations of carbon tetrachloride in
the deeper part of sediment, where anaerobic conditions prevail, are expected to be lower due to
its water solubility (793 mg/L), low partitioning to organic matter (log KOC = 0.79 – 1.93
(aquifer sediments) and marine and estuary sediments (log KOC = 1.67), and biodegradability in
anaerobic environments (see Section 2.1).
Given that the COCs for acute and chronic exposure of carbon tetrachloride to Chironomus
tentans were less toxic than the COCs for amphibian acute and chronic toxicity and algal
toxicity, EPA did not calculate exposure numbers specific for sedimental dwelling organisms.
EPA used modeled surface water concentrations to estimate the concentration of carbon
tetrachloride in pore water near facilities. Based on the COCs generated from both (Lee et al.,
2006) and from the use of aquatic invertebrates as a surrogate, risks to sediment-dwelling
organisms were not indicated for acute or chronic exposures to carbon tetrachloride (RQs
derived from (Lee et al., 2006) are listed in Table 4-2).
Risk Estimation for Terrestrial Organisms
During Problem Formulation, EPA conducted a screening level analysis to consider whether
pathways of exposure for terrestrial organisms should be further analyzed and determined that
terrestrial organism exposures to carbon tetrachloride was not of concern partially based on
estimates of soil concentrations several orders of magnitude below concentrations observed to
cause effects in terrestrial organisms. For the final risk evaluation, EPA conducted a qualitative
assessment of exposure to terrestrial organisms from soil and land application of biosolids by
examining physical-chemical and fate properties. EPA identified carbon tetrachloride as a
priority pollutant under Section 304(a) of the CWA and has developed water quality criteria for
protection of human health. EPA determined during problem formulation that exposures to
terrestrial organisms from water do not need further evaluation due to the current regulation of
carbon tetrachloride water releases and the expectation of releases to water will volatilize into air
based on its physical-chemical properties. EPA did not assess exposure to terrestrial organisms
from ambient air because this exposure pathway is covered under jurisdiction of the CAA.
Carbon tetrachloride is not expected to partition to or accumulate in soil; rather, it is expected to
volatilize to air or migrate through soil into groundwater based on its physical-chemical
properties (log KOC = 2.83, Henry’s Law constant = 0.0276 atm-m3 /mole, vapor pressure = 115
mmHg at 25°C). Carbon tetrachloride is not anticipated to be retained in biosolids (processed
sludge) obtained through wastewater treatment. Furthermore, carbon tetrachloride is not
anticipated to remain in soil, as it is expected to either volatilize into air or migrate through soil
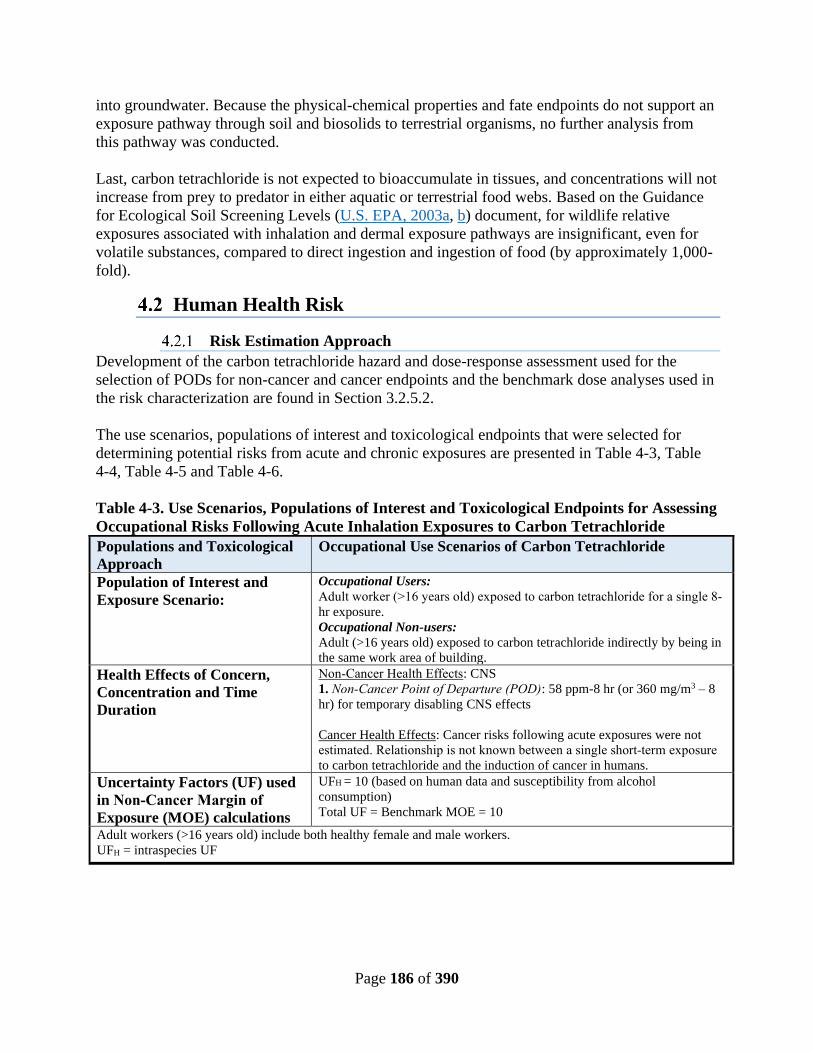
Page 186 of 390
into groundwater. Because the physical-chemical properties and fate endpoints do not support an
exposure pathway through soil and biosolids to terrestrial organisms, no further analysis from
this pathway was conducted.
Last, carbon tetrachloride is not expected to bioaccumulate in tissues, and concentrations will not
increase from prey to predator in either aquatic or terrestrial food webs. Based on the Guidance
for Ecological Soil Screening Levels (U.S. EPA, 2003a, b) document, for wildlife relative
exposures associated with inhalation and dermal exposure pathways are insignificant, even for
volatile substances, compared to direct ingestion and ingestion of food (by approximately 1,000-
fold).
Human Health Risk
Risk Estimation Approach
Development of the carbon tetrachloride hazard and dose-response assessment used for the
selection of PODs for non-cancer and cancer endpoints and the benchmark dose analyses used in
the risk characterization are found in Section 3.2.5.2.
The use scenarios, populations of interest and toxicological endpoints that were selected for
determining potential risks from acute and chronic exposures are presented in Table 4-3, Table
4-4, Table 4-5 and Table 4-6.
Table 4-3. Use Scenarios, Populations of Interest and Toxicological Endpoints for Assessing
Occupational Risks Following Acute Inhalation Exposures to Carbon Tetrachloride
Populations and Toxicological
Approach
Occupational Use Scenarios of Carbon Tetrachloride
Population of Interest and
Exposure Scenario:
Occupational Users:
Adult worker (>16 years old) exposed to carbon tetrachloride for a single 8‐
hr exposure.
Occupational Non-users:
Adult (>16 years old) exposed to carbon tetrachloride indirectly by being in
the same work area of building.
Health Effects of Concern,
Concentration and Time
Duration
Non‐Cancer Health Effects: CNS
1. Non‐Cancer Point of Departure (POD): 58 ppm-8 hr (or 360 mg/m3 – 8
hr) for temporary disabling CNS effects
Cancer Health Effects: Cancer risks following acute exposures were not
estimated. Relationship is not known between a single short‐term exposure
to carbon tetrachloride and the induction of cancer in humans.
Uncertainty Factors (UF) used
in Non‐Cancer Margin of
Exposure (MOE) calculations
UFH = 10 (based on human data and susceptibility from alcohol
consumption)
Total UF = Benchmark MOE = 10
Adult workers (>16 years old) include both healthy female and male workers.
UFH = intraspecies UF
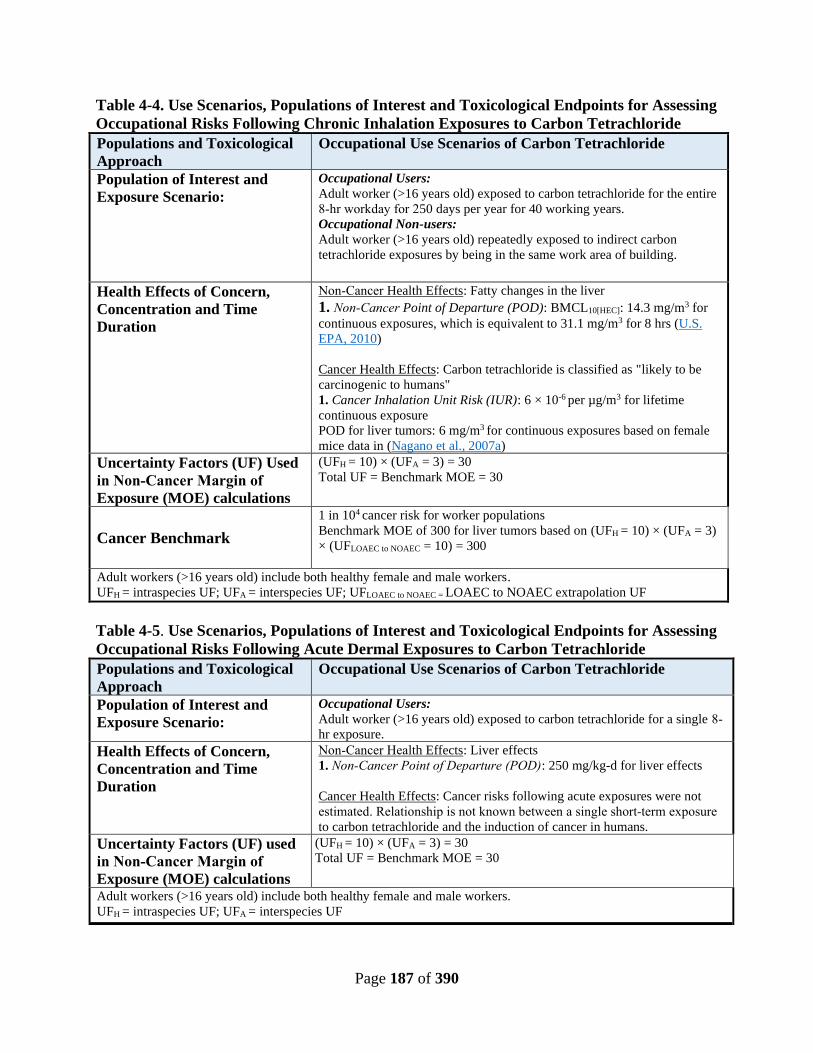
Page 187 of 390
Table 4-4. Use Scenarios, Populations of Interest and Toxicological Endpoints for Assessing
Occupational Risks Following Chronic Inhalation Exposures to Carbon Tetrachloride
Populations and Toxicological
Approach
Occupational Use Scenarios of Carbon Tetrachloride
Population of Interest and
Exposure Scenario:
Occupational Users:
Adult worker (>16 years old) exposed to carbon tetrachloride for the entire
8‐hr workday for 250 days per year for 40 working years.
Occupational Non-users:
Adult worker (>16 years old) repeatedly exposed to indirect carbon
tetrachloride exposures by being in the same work area of building.
Health Effects of Concern,
Concentration and Time
Duration
Non‐Cancer Health Effects: Fatty changes in the liver
1. Non‐Cancer Point of Departure (POD): BMCL10[HEC]: 14.3 mg/m3 for
continuous exposures, which is equivalent to 31.1 mg/m3 for 8 hrs (U.S.
EPA, 2010)
Cancer Health Effects: Carbon tetrachloride is classified as "likely to be
carcinogenic to humans"
1. Cancer Inhalation Unit Risk (IUR): 6 × 10⁻⁶ per µg/m3 for lifetime
continuous exposure
POD for liver tumors: 6 mg/m3 for continuous exposures based on female
mice data in (Nagano et al., 2007a)
Uncertainty Factors (UF) Used
in Non‐Cancer Margin of
Exposure (MOE) calculations
(UFH = 10) × (UFA = 3) = 30
Total UF = Benchmark MOE = 30
Cancer Benchmark
1 in 104 cancer risk for worker populations
Benchmark MOE of 300 for liver tumors based on (UFH = 10) × (UFA = 3)
× (UFLOAEC to NOAEC = 10) = 300
Adult workers (>16 years old) include both healthy female and male workers.
UFH = intraspecies UF; UFA = interspecies UF; UFLOAEC to NOAEC = LOAEC to NOAEC extrapolation UF
Table 4-5. Use Scenarios, Populations of Interest and Toxicological Endpoints for Assessing
Occupational Risks Following Acute Dermal Exposures to Carbon Tetrachloride
Populations and Toxicological
Approach
Occupational Use Scenarios of Carbon Tetrachloride
Population of Interest and
Exposure Scenario:
Occupational Users:
Adult worker (>16 years old) exposed to carbon tetrachloride for a single 8‐
hr exposure.
Health Effects of Concern,
Concentration and Time
Duration
Non‐Cancer Health Effects: Liver effects
1. Non‐Cancer Point of Departure (POD): 250 mg/kg-d for liver effects
Cancer Health Effects: Cancer risks following acute exposures were not
estimated. Relationship is not known between a single short‐term exposure
to carbon tetrachloride and the induction of cancer in humans.
Uncertainty Factors (UF) used
in Non‐Cancer Margin of
Exposure (MOE) calculations
(UFH = 10) × (UFA = 3) = 30
Total UF = Benchmark MOE = 30
Adult workers (>16 years old) include both healthy female and male workers.
UFH = intraspecies UF; UFA = interspecies UF

Page 188 of 390
Table 4-6. Use Scenarios, Populations of Interest and Toxicological Endpoints for Assessing
Occupational Risks Following Chronic Dermal Exposures to Carbon Tetrachloride
Populations and Toxicological
Approach
Occupational Use Scenarios of Carbon Tetrachloride
Population of Interest and Exposure
Scenario:
Occupational Users:
Adult worker (>16 years old) exposed to carbon tetrachloride for
the entire 8‐hr workday for 250 days per year for 40 working years.
Health Effects of Concern,
Concentration and Time Duration
Non‐cancer Health Effects: Fatty changes in the liver
1. Non‐Cancer Point of Departure (POD): 2.50 mg/kg-d based on
route-to-route extrapolation from BMCL10[HEC]: 14.3 mg/m3 for
continuous exposures.
Cancer Health Effects: Carbon tetrachloride is classified as "likely
to be carcinogenic to humans"
1. Cancer Slope factor derived from Inhalation Unit Risk (IUR) of
6 × 10⁻⁶ per µg/m3 for lifetime continuous exposure
POD for liver tumors: 6 mg/m3 for continuous exposures based on
female mice data in (Nagano et al., 2007a)
Uncertainty Factors (UF) Used in
Non‐Cancer Margin of Exposure
(MOE) calculations
(UFH = 10) × (UFA = 3) = 30
Total UF = Benchmark MOE = 30
Cancer Benchmark 1 in 104 cancer risk for worker populations
Benchmark MOE of 300 for liver tumors based on (UFH = 10) ×
(UFA = 3) × (UFLOAEC to NOAEC = 10) = 300
Adult workers (>16 years old) include both healthy female and male drinking workers. The risk evaluation for
repeated exposures focused on the most sensitive life stage in humans, which is alcohol drinkers (see Section
3.2.4.1)
UFH = intraspecies UF; UFA = interspecies UF; UFLOAEC to NOAEC = LOAEC to NOAEC extrapolation UF
EPA used a Margin of Exposure (MOE) approach to identify potential non-cancer risks. The
MOE is the ratio of the non-cancer POD divided by a human exposure, which is then compared
to a benchmark MOE. If the calculated MOE is less than the benchmark MOE, this indicates
potential risk to human health, whereas if the calculated MOE is equal to or greater than the
benchmark MOE, it suggests that the risks are negligible.
Acute or chronic MOEs (MOEacute or MOEchronic) were used in this assessment to estimate non‐
cancer risks using Equation 4-1..
Equation 4-1. Equation to Calculate Non‐Cancer Risks Following Acute or Chronic
Exposures Using Margin of Exposures
𝑴𝑶𝑬𝒂𝒄𝒖𝒕𝒆 𝒐𝒓 𝒄𝒉𝒓𝒐𝒏𝒊𝒄 = 𝑵𝒐𝒏−𝒄𝒂𝒏𝒄𝒆𝒓 𝑯𝒂𝒛𝒂𝒓𝒅 V𝒂𝒍𝒖𝒆 (𝑷𝑶𝑫)
𝑯𝒖𝒎𝒂𝒏 𝑬𝒙𝒑𝒐𝒔𝒖𝒓𝒆
Where:
MOE = Margin of exposure (unitless)
Hazard value (POD) = NOAEC or HEC (mg/m3)
Human Exposure = Exposure estimate (in mg/m3) from occupational
exposure assessment

Page 189 of 390
The Acute Exposure Concentration (AEC) was used to estimate acute/short-term inhalation risks,
whereas the Average Daily Concentration/Dose (ADC)/D) was used to estimate chronic non‐
cancer inhalation/dermal.
EPA used MOEs20 to estimate acute and chronic risks for non‐cancer based on the following:
1. the HECs/HEDs identified for the highest quality studies within each health effects domain;
2. the endpoint/study‐specific UFs applied to the HECs/HEDs per the review of the EPA
Reference Dose and Reference Concentration Processes (U.S. EPA, 2002); and
3. the exposure estimates calculated for carbon tetrachloride conditions under the conditions
of use (see Section 2.4).
MOEs allow for the presentation of a range of risk estimates. The occupational exposure
scenarios considered both acute and chronic exposures. Different adverse endpoints were used
based on the expected exposure durations. For occupational exposure calculations, the 8-hour
and 12-hour TWAs were used to calculate MOEs for risk estimates for acute and chronic
exposures. The occupational inhalation exposure scenarios considered both acute and chronic
exposures. For non‐cancer effects, risks for transient CNS effects were evaluated for acute
(short‐term) exposures, whereas risks for toxicity to the liver was evaluated for repeated
(chronic) exposures to carbon tetrachloride because of their human relevance and relevance to
occupational exposures as discussed in Section 3.2.4.
The total UF for each non‐cancer POD was the benchmark MOE used to interpret the MOE risk
estimates for each use scenario. The MOE estimate was interpreted as human health risk if the
MOE estimate was less than the benchmark MOE (i.e., the total UF). On the other hand, the
MOE estimate indicated negligible concerns for adverse human health effects if the MOE
estimate exceeded the benchmark MOE. Typically, the larger the MOE, the more unlikely it is
that a non‐cancer adverse effect would occur.
To determine the level of personal protection needed by workers to reduce the high-end exposures
to below the level of concern for non-cancer risks, EPA evaluated the impact of respirator use.
Typical APF values of 10, 25 and 50 were compared to the calculated MOE and the benchmark
MOE to determine the level of APF required to reduce exposure so that risk is below the level of
concern for non-cancer risks (i.e., calculated MOE ≥ benchmark MOE).
EPA estimated potential cancer risks from chronic exposures to carbon tetrachloride using
probabilistic approaches, which consisted of calculating the added cancer risk. Each of these
approaches is discussed below.
Added cancer risks for repeated exposures to carbon tetrachloride were estimated using Equation
4-2. Equation to Calculate Cancer Risks. Estimates of added cancer risks should be interpreted as
the incremental probability of an individual developing cancer over a lifetime as a result of
exposure to the potential carcinogen (i.e., incremental or added individual lifetime cancer risk).
20 Margin of Exposure (MOE) = (Non‐cancer hazard value, POD) ÷ (Human Exposure) Equation 4-1.. The
benchmark MOE is used to interpret the MOEs and consists of the total UF.
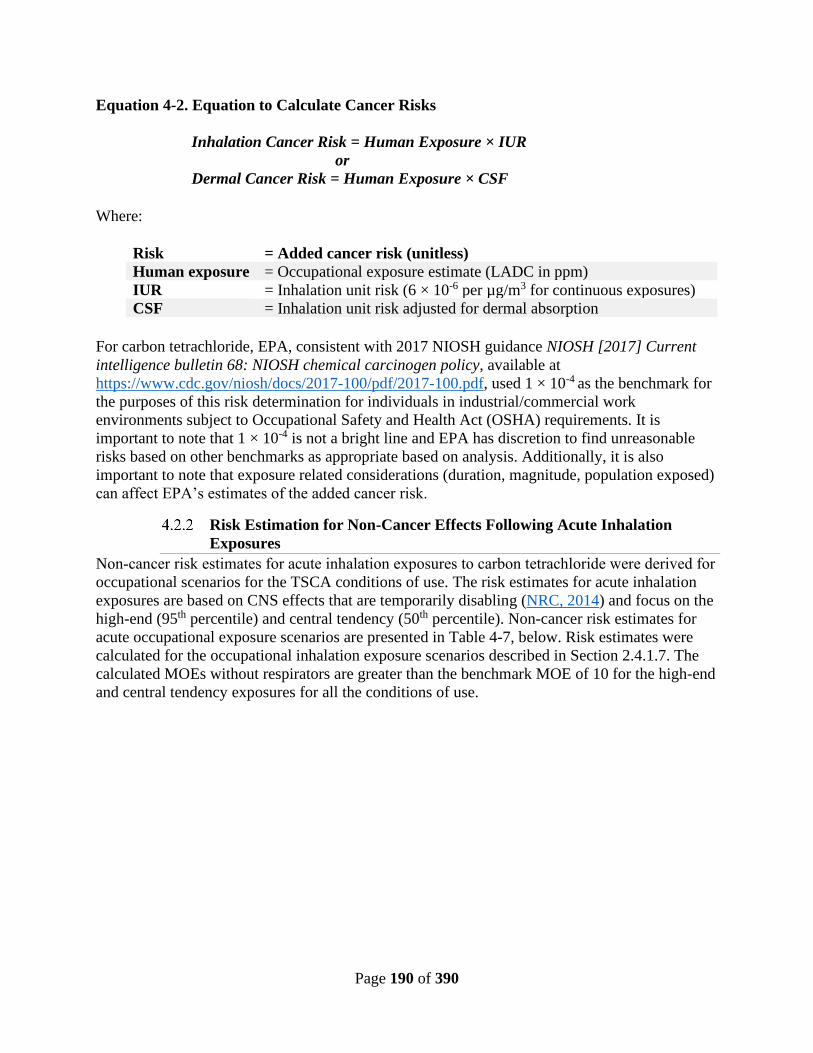
Page 190 of 390
Equation 4-2. Equation to Calculate Cancer Risks
Inhalation Cancer Risk = Human Exposure × IUR
or
Dermal Cancer Risk = Human Exposure × CSF
Where:
Risk = Added cancer risk (unitless)
Human exposure = Occupational exposure estimate (LADC in ppm)
IUR = Inhalation unit risk (6 × 10⁻⁶ per µg/m3 for continuous exposures)
CSF = Inhalation unit risk adjusted for dermal absorption
For carbon tetrachloride, EPA, consistent with 2017 NIOSH guidance NIOSH [2017] Current
intelligence bulletin 68: NIOSH chemical carcinogen policy, available at
https://www.cdc.gov/niosh/docs/2017-100/pdf/2017-100.pdf, used 1 × 10⁻⁴ as the benchmark for
the purposes of this risk determination for individuals in industrial/commercial work
environments subject to Occupational Safety and Health Act (OSHA) requirements. It is
important to note that 1 × 10⁻⁴ is not a bright line and EPA has discretion to find unreasonable
risks based on other benchmarks as appropriate based on analysis. Additionally, it is also
important to note that exposure related considerations (duration, magnitude, population exposed)
can affect EPA’s estimates of the added cancer risk.
Risk Estimation for Non-Cancer Effects Following Acute Inhalation
Exposures
Non‐cancer risk estimates for acute inhalation exposures to carbon tetrachloride were derived for
occupational scenarios for the TSCA conditions of use. The risk estimates for acute inhalation
exposures are based on CNS effects that are temporarily disabling (NRC, 2014) and focus on the
high-end (95th percentile) and central tendency (50th percentile). Non-cancer risk estimates for
acute occupational exposure scenarios are presented in Table 4-7, below. Risk estimates were
calculated for the occupational inhalation exposure scenarios described in Section 2.4.1.7. The
calculated MOEs without respirators are greater than the benchmark MOE of 10 for the high-end
and central tendency exposures for all the conditions of use.
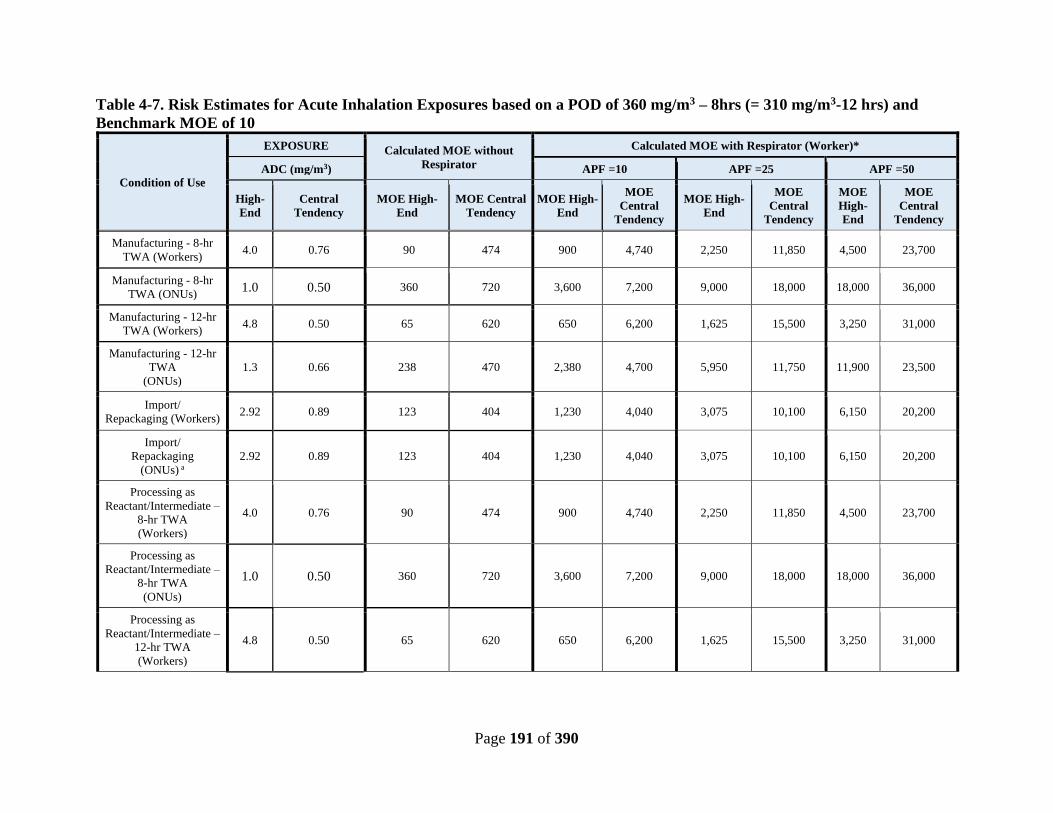
Page 191 of 390
Table 4-7. Risk Estimates for Acute Inhalation Exposures based on a POD of 360 mg/m3 – 8hrs (= 310 mg/m3-12 hrs) and
Benchmark MOE of 10
Condition of Use
EXPOSURE Calculated MOE without
Respirator
Calculated MOE with Respirator (Worker)*
ADC (mg/m3) APF =10 APF =25 APF =50
High-
End
Central
Tendency
MOE High-
End
MOE Central
Tendency
MOE High-
End
MOE
Central
Tendency
MOE High-
End
MOE
Central
Tendency
MOE
High-
End
MOE
Central
Tendency
Manufacturing - 8-hr
TWA (Workers) 4.0 0.76 90 474 900 4,740 2,250 11,850 4,500 23,700
Manufacturing - 8-hr
TWA (ONUs) 1.0 0.50 360 720 3,600 7,200 9,000 18,000 18,000 36,000
Manufacturing - 12-hr
TWA (Workers) 4.8 0.50 65 620 650 6,200 1,625 15,500 3,250 31,000
Manufacturing - 12-hr
TWA
(ONUs)
1.3 0.66 238 470 2,380 4,700 5,950 11,750 11,900 23,500
Import/
Repackaging (Workers) 2.92 0.89 123 404 1,230 4,040 3,075 10,100 6,150 20,200
Import/
Repackaging
(ONUs) a
2.92 0.89 123 404 1,230 4,040 3,075 10,100 6,150 20,200
Processing as
Reactant/Intermediate –
8-hr TWA
(Workers)
4.0 0.76 90 474 900 4,740 2,250 11,850 4,500 23,700
Processing as
Reactant/Intermediate –
8-hr TWA
(ONUs)
1.0 0.50 360 720 3,600 7,200 9,000 18,000 18,000 36,000
Processing as
Reactant/Intermediate –
12-hr TWA
(Workers)
4.8 0.50 65 620 650 6,200 1,625 15,500 3,250 31,000

Page 192 of 390
Processing as
Reactant/Intermediate –
12-hr TWA
(ONUs)
1.3 0.66 238 470 2,380 4,700 5,950 11,750 11,900 23,500
Industrial Processing Aid
(Workers) 2.92 0.89 123 404 1,230 4,040 3,075 10,100 6,150 20,200
Industrial Processing Aid
(ONUs) a 2.92 0.89 123 404 1,230 4,040 3,075 10,100 6,150 20,200
Additive
(Workers) 2.92 0.89 123 404 1,230 4,040 3,075 10,100 6,150 20,200
Additive
(ONUs) a 2.92 0.89 123 404 1,230 4,040 3,075 10,100 6,150 20,200
Disposal: Waste
Handling
(Workers)
2.92 0.89 123 404 1,230 4,040 3,075 10,100 6,150 20,200
Disposal: Waste
Handling
(ONUs) a
2.92 0.89 123 404 1,230 4,040 3,075 10,100 6,150 20,200
Specialty Uses-DoD
(Workers) 0.37 0.18 973 2,000 9,730 20,000 24,325 50,000 48,650 100,000
Specialty Uses-DoD
(ONUs) a 0.37 0.18 973 2,000 9,730 20,000 24,325 50,000 48,650 100,000
Reactive Ion Etching Negligible – highly controlled work areas with small quantities applied.
Laboratory Chemicals No data – exposure is low as laboratory typically uses small quantities inside a fume hood.
* MOEs with respirator use were calculated by multiplying the MOE without a respirator by the respirator APF.
a In lieu of ONU-specific exposure data, EPA assessed ONU exposures at the worker central tendency.

Page 193 of 390
Risk Estimation for Non-Cancer Effects Following Chronic Inhalation
Exposures
Chronic non‐cancer risk estimates for inhalation exposures to carbon tetrachloride were derived
for occupational scenarios using estimated inhalation average daily concentrations (ADCs). The
risk estimates for chronic non-cancer health effects are based on the BMCL10[HEC] for liver
effects: 14.3 mg/m3 for continuous exposures, which is equivalent to 31.1 mg/m3 for 8 hrs of
exposure and 26.4 mg/m3 for 12 hrs.21 Non-cancer risk estimates for chronic exposures for each
occupational use scenario are presented in Table 4-8 below.
The calculated MOEs are below the benchmark MOE of 30 for the high-end exposures without
respirator use for manufacturing and processing as reactant/intermediate, industrial processing
aid, additive, import/repackaging and disposal COUs for workers, and for manufacturing and
processing COUs for ONUs. The high-end exposures with MOEs below the benchmark MOE
have exposure reductions during use of respirator with APF 10 that result in MOEs greater than
the benchmark MOE.
21 Time adjustment from continuous exposure to 5 days per week and to 8 or 12 hrs/day
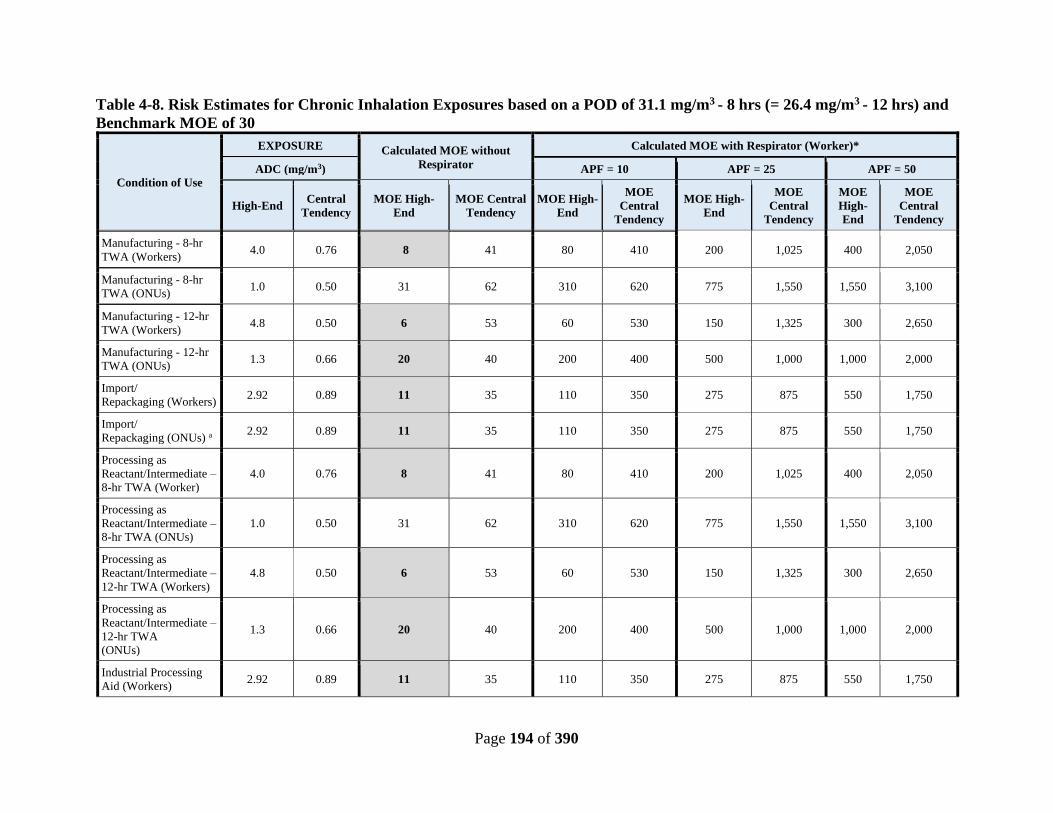
Page 194 of 390
Table 4-8. Risk Estimates for Chronic Inhalation Exposures based on a POD of 31.1 mg/m3 - 8 hrs (= 26.4 mg/m3 - 12 hrs) and
Benchmark MOE of 30
Condition of Use
EXPOSURE Calculated MOE without
Respirator
Calculated MOE with Respirator (Worker)*
ADC (mg/m3) APF = 10 APF = 25 APF = 50
High-End Central
Tendency
MOE High-
End
MOE Central
Tendency
MOE High-
End
MOE
Central
Tendency
MOE High-
End
MOE
Central
Tendency
MOE
High-
End
MOE
Central
Tendency
Manufacturing - 8-hr
TWA (Workers) 4.0 0.76 8 41 80 410 200 1,025 400 2,050
Manufacturing - 8-hr
TWA (ONUs) 1.0 0.50 31 62 310 620 775 1,550 1,550 3,100
Manufacturing - 12-hr
TWA (Workers) 4.8 0.50 6 53 60 530 150 1,325 300 2,650
Manufacturing - 12-hr
TWA (ONUs) 1.3 0.66 20 40 200 400 500 1,000 1,000 2,000
Import/
Repackaging (Workers) 2.92 0.89 11 35 110 350 275 875 550 1,750
Import/
Repackaging (ONUs) a 2.92 0.89 11 35 110 350 275 875 550 1,750
Processing as
Reactant/Intermediate –
8-hr TWA (Worker)
4.0 0.76 8 41 80 410 200 1,025 400 2,050
Processing as
Reactant/Intermediate –
8-hr TWA (ONUs)
1.0 0.50 31 62 310 620 775 1,550 1,550 3,100
Processing as
Reactant/Intermediate –
12-hr TWA (Workers)
4.8 0.50 6 53 60 530 150 1,325 300 2,650
Processing as
Reactant/Intermediate –
12-hr TWA
(ONUs)
1.3 0.66 20 40 200 400 500 1,000 1,000 2,000
Industrial Processing
Aid (Workers) 2.92 0.89 11 35 110 350 275 875 550 1,750
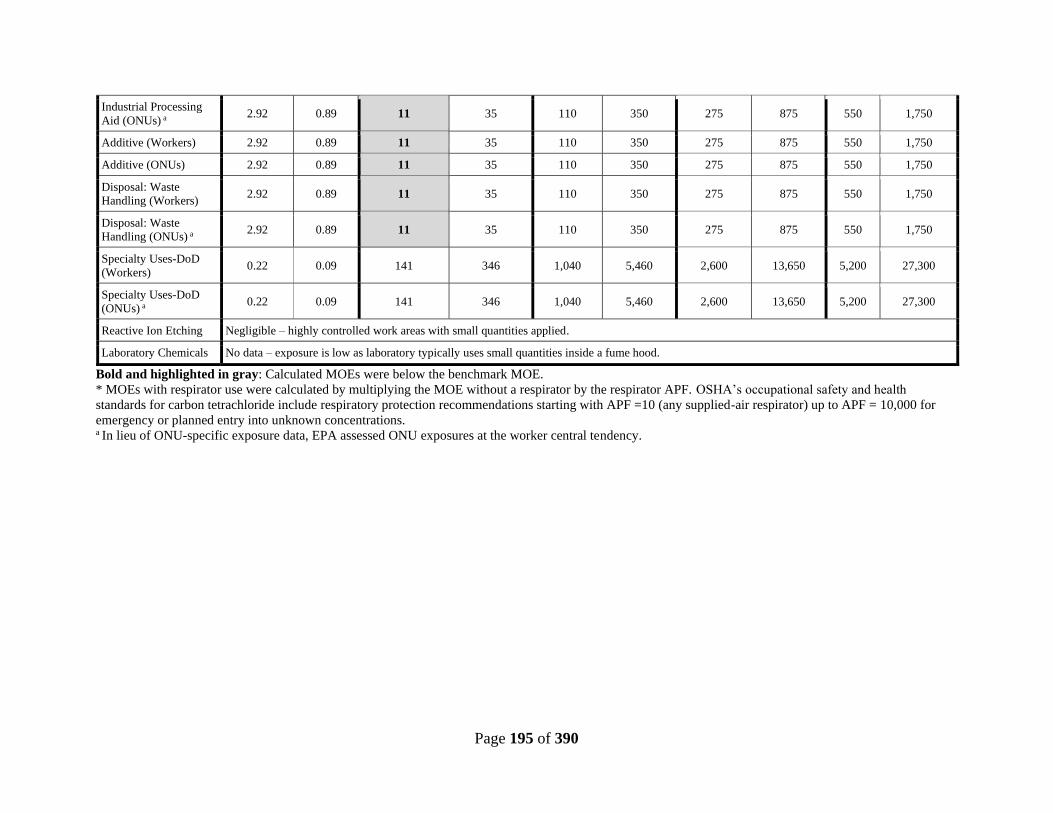
Page 195 of 390
Industrial Processing
Aid (ONUs) a 2.92 0.89 11 35 110 350 275 875 550 1,750
Additive (Workers) 2.92 0.89 11 35 110 350 275 875 550 1,750
Additive (ONUs) 2.92 0.89 11 35 110 350 275 875 550 1,750
Disposal: Waste
Handling (Workers) 2.92 0.89 11 35 110 350 275 875 550 1,750
Disposal: Waste
Handling (ONUs) a 2.92 0.89 11 35 110 350 275 875 550 1,750
Specialty Uses-DoD
(Workers) 0.22 0.09 141 346 1,040 5,460 2,600 13,650 5,200 27,300
Specialty Uses-DoD
(ONUs) a 0.22 0.09 141 346 1,040 5,460 2,600 13,650 5,200 27,300
Reactive Ion Etching Negligible – highly controlled work areas with small quantities applied.
Laboratory Chemicals No data – exposure is low as laboratory typically uses small quantities inside a fume hood.
Bold and highlighted in gray: Calculated MOEs were below the benchmark MOE.
* MOEs with respirator use were calculated by multiplying the MOE without a respirator by the respirator APF. OSHA’s occupational safety and health
standards for carbon tetrachloride include respiratory protection recommendations starting with APF =10 (any supplied-air respirator) up to APF = 10,000 for
emergency or planned entry into unknown concentrations.
a In lieu of ONU-specific exposure data, EPA assessed ONU exposures at the worker central tendency.
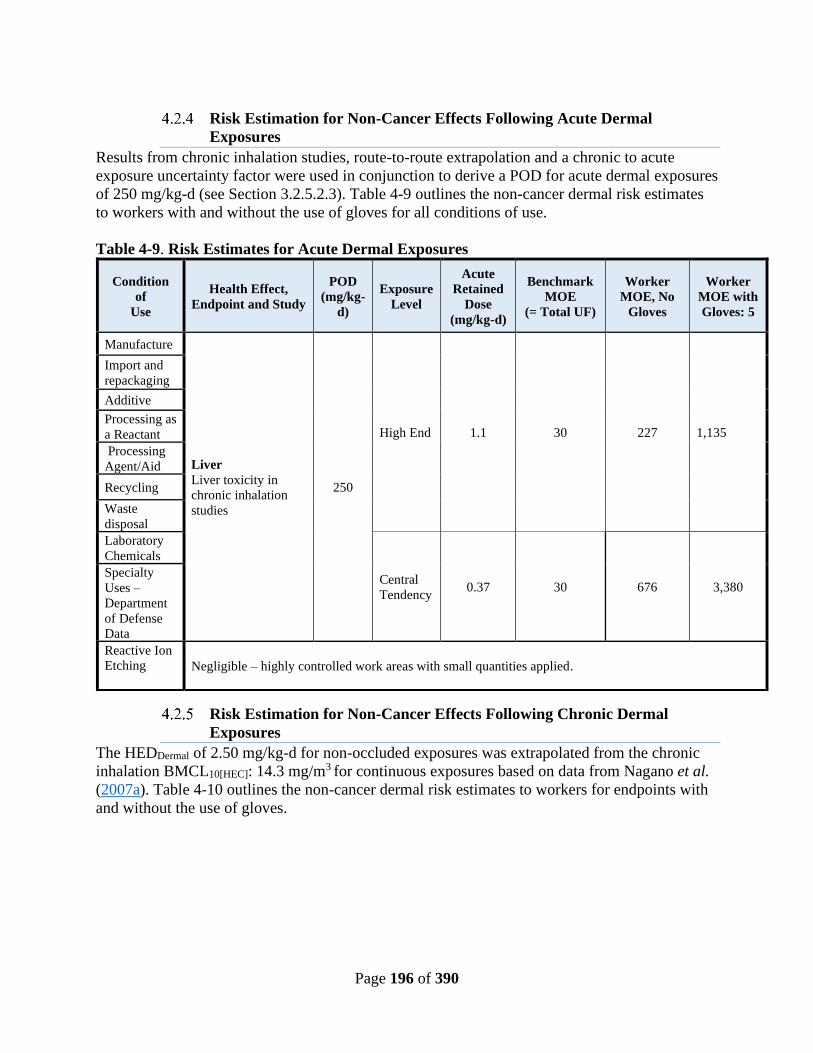
Page 196 of 390
Risk Estimation for Non-Cancer Effects Following Acute Dermal
Exposures
Results from chronic inhalation studies, route-to-route extrapolation and a chronic to acute
exposure uncertainty factor were used in conjunction to derive a POD for acute dermal exposures
of 250 mg/kg-d (see Section 3.2.5.2.3). Table 4-9 outlines the non-cancer dermal risk estimates
to workers with and without the use of gloves for all conditions of use.
Table 4-9. Risk Estimates for Acute Dermal Exposures
Condition
of
Use
Health Effect,
Endpoint and Study
POD
(mg/kg-
d)
Exposure
Level
Acute
Retained
Dose
(mg/kg-d)
Benchmark
MOE
(= Total UF)
Worker
MOE, No
Gloves
Worker
MOE with
Gloves: 5
Manufacture
Liver
Liver toxicity in
chronic inhalation
studies
250
High End 1.1 30 227 1,135
Import and
repackaging
Additive
Processing as
a Reactant
Processing
Agent/Aid
Recycling
Waste
disposal
Laboratory
Chemicals
Central
Tendency 0.37 30 676 3,380
Specialty
Uses –
Department
of Defense
Data
Reactive Ion
Etching Negligible – highly controlled work areas with small quantities applied.
Risk Estimation for Non-Cancer Effects Following Chronic Dermal
Exposures
The HEDDermal of 2.50 mg/kg-d for non-occluded exposures was extrapolated from the chronic
inhalation BMCL10[HEC]: 14.3 mg/m3 for continuous exposures based on data from Nagano et al.
(2007a). Table 4-10 outlines the non-cancer dermal risk estimates to workers for endpoints with
and without the use of gloves.
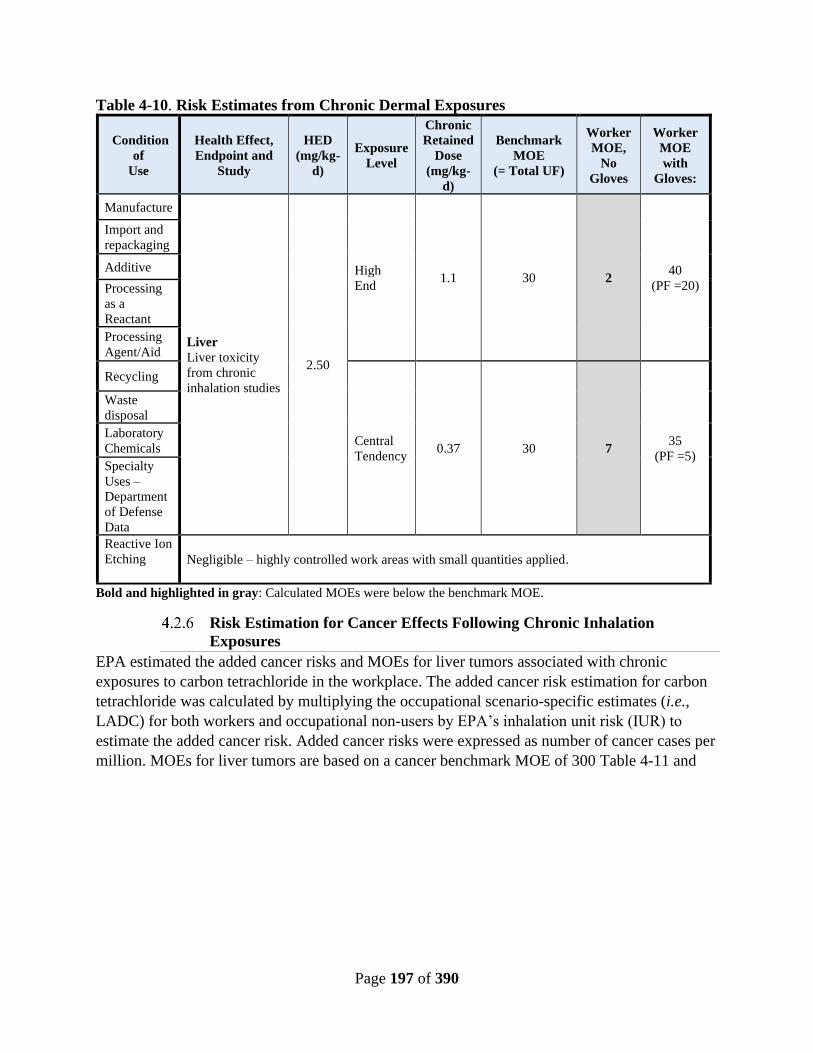
Page 197 of 390
Table 4-10. Risk Estimates from Chronic Dermal Exposures
Condition
of
Use
Health Effect,
Endpoint and
Study
HED
(mg/kg-
d)
Exposure
Level
Chronic
Retained
Dose
(mg/kg-
d)
Benchmark
MOE
(= Total UF)
Worker
MOE,
No
Gloves
Worker
MOE
with
Gloves:
Manufacture
Liver
Liver toxicity
from chronic
inhalation studies
2.50
High
End 1.1 30 2
40
(PF =20)
Import and
repackaging
Additive
Processing
as a
Reactant
Processing
Agent/Aid
Recycling
Central
Tendency 0.37 30 7
35
(PF =5)
Waste
disposal
Laboratory
Chemicals
Specialty
Uses –
Department
of Defense
Data
Reactive Ion
Etching Negligible – highly controlled work areas with small quantities applied.
Bold and highlighted in gray: Calculated MOEs were below the benchmark MOE.
Risk Estimation for Cancer Effects Following Chronic Inhalation
Exposures
EPA estimated the added cancer risks and MOEs for liver tumors associated with chronic
exposures to carbon tetrachloride in the workplace. The added cancer risk estimation for carbon
tetrachloride was calculated by multiplying the occupational scenario-specific estimates (i.e.,
LADC) for both workers and occupational non-users by EPA’s inhalation unit risk (IUR) to
estimate the added cancer risk. Added cancer risks were expressed as number of cancer cases per
million. MOEs for liver tumors are based on a cancer benchmark MOE of 300 Table 4-11 and

Page 198 of 390
Table 4-12 outline the cancer risk estimates to workers from inhalation exposures for the
conditions of use for carbon tetrachloride.
In general terms, the exposure frequency (i.e., the amount of days per year for workers or
occupational non-users exposed to carbon tetrachloride) was considered to be 250 days per year
and the occupational exposure duration was 40 years over a 70‐year lifespan. It is recognized that
these exposure assumptions are likely yielding conservative cancer risk estimates, but EPA does
not have additional information for further refinement.
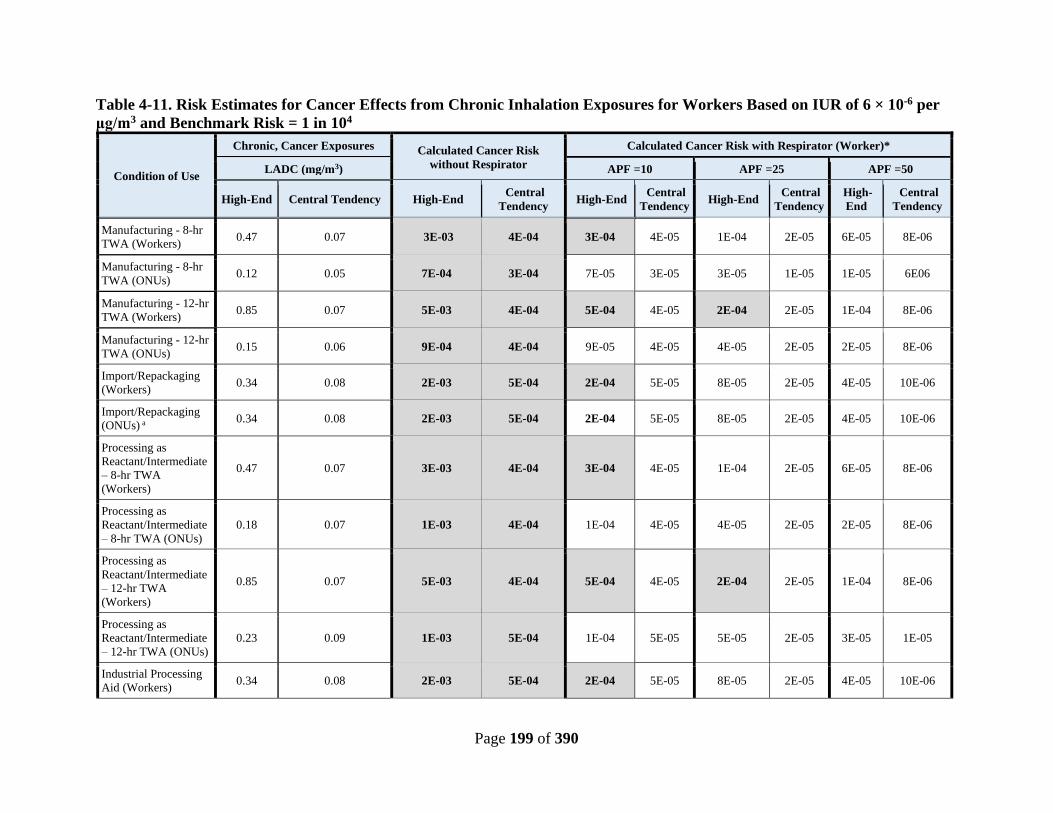
Page 199 of 390
Table 4-11. Risk Estimates for Cancer Effects from Chronic Inhalation Exposures for Workers Based on IUR of 6 × 10⁻⁶ per
μg/m3 and Benchmark Risk = 1 in 104
Condition of Use
Chronic, Cancer Exposures Calculated Cancer Risk
without Respirator
Calculated Cancer Risk with Respirator (Worker)*
LADC (mg/m3) APF =10 APF =25 APF =50
High-End Central Tendency High-End Central
Tendency High-End
Central
Tendency High-End
Central
Tendency
High-
End
Central
Tendency
Manufacturing - 8-hr
TWA (Workers) 0.47 0.07 3E-03 4E-04 3E-04 4E-05 1E-04 2E-05 6E-05 8E-06
Manufacturing - 8-hr
TWA (ONUs) 0.12 0.05 7E-04 3E-04 7E-05 3E-05 3E-05 1E-05 1E-05 6E06
Manufacturing - 12-hr
TWA (Workers) 0.85 0.07 5E-03 4E-04 5E-04 4E-05 2E-04 2E-05 1E-04 8E-06
Manufacturing - 12-hr
TWA (ONUs) 0.15 0.06 9E-04 4E-04 9E-05 4E-05 4E-05 2E-05 2E-05 8E-06
Import/Repackaging
(Workers) 0.34 0.08 2E-03 5E-04 2E-04 5E-05 8E-05 2E-05 4E-05 10E-06
Import/Repackaging
(ONUs) a 0.34 0.08 2E-03 5E-04 2E-04 5E-05 8E-05 2E-05 4E-05 10E-06
Processing as
Reactant/Intermediate
– 8-hr TWA
(Workers)
0.47 0.07 3E-03 4E-04 3E-04 4E-05 1E-04 2E-05 6E-05 8E-06
Processing as
Reactant/Intermediate
– 8-hr TWA (ONUs)
0.18 0.07 1E-03 4E-04 1E-04 4E-05 4E-05 2E-05 2E-05 8E-06
Processing as
Reactant/Intermediate
– 12-hr TWA
(Workers)
0.85 0.07 5E-03 4E-04 5E-04 4E-05 2E-04 2E-05 1E-04 8E-06
Processing as
Reactant/Intermediate
– 12-hr TWA (ONUs)
0.23 0.09 1E-03 5E-04 1E-04 5E-05 5E-05 2E-05 3E-05 1E-05
Industrial Processing
Aid (Workers) 0.34 0.08 2E-03 5E-04 2E-04 5E-05 8E-05 2E-05 4E-05 10E-06

Page 200 of 390
Condition of Use
Chronic, Cancer Exposures Calculated Cancer Risk
without Respirator
Calculated Cancer Risk with Respirator (Worker)*
LADC (mg/m3) APF =10 APF =25 APF =50
High-End Central Tendency High-End Central
Tendency High-End
Central
Tendency High-End
Central
Tendency
High-
End
Central
Tendency
Industrial Processing
Aid (ONUs) a 0.34 0.08 2E-03 5E-04 2E-04 5E-05 8E-05 2E-05 4E-05 10E-06
Additive (Workers) 0.34 0.08 2E-03 5E-04 2E-04 5E-05 8E-05 2E-05 4E-05 10E-06
Additive (ONUs) a 0.34 0.08 2E-03 5E-04 2E-04 5E-05 8E-05 2E-05 4E-05 10E-06
Disposal: Waste
Handling (Workers) 0.34 0.08 2E-03 5E-04 2E-04 5E-05 8E-05 2E-05 4E-05 10E-06
Disposal: Waste
Handling (ONUs) a 0.34 0.08 2E-03 5E-04 2E-04 5E-05 8E-05 2E-05 4E-05 10E-06
Specialty Uses-DoD
(Workers) 0.026 0.008 2E-04 5E-05 2E-05 5E-06 8E-06 2E-06 4E-06 1E-06
Specialty Uses-DoD
(ONUs)a 0.026 0.008 2E-04 5E-05 2E-05 5E-06 8E-06 2E-06 4E-06 1E-06
Reactive Ion Etching Negligible - Highly controlled work areas with small quantities applied
Laboratory Chemicals No data – exposure is low as laboratory typically uses small quantities inside a fume hood.
Bold and highlighted in gray: Calculated extra-cancer risk are greater than the benchmark cancer. Extra cancer risk was calculated as follows: “Central Tendency LADC
(µg/m3)” or “High-end LADC (µg/m3)” × IUR (i.e., 6 × 10⁻⁶ per µg/m3)
*Cancer risks with respirator use were calculated by dividing the cancer risk without a respirator by the respirator APF. aIn lieu of ONU-specific exposure data, EPA assessed ONU exposures at the worker central tendency.
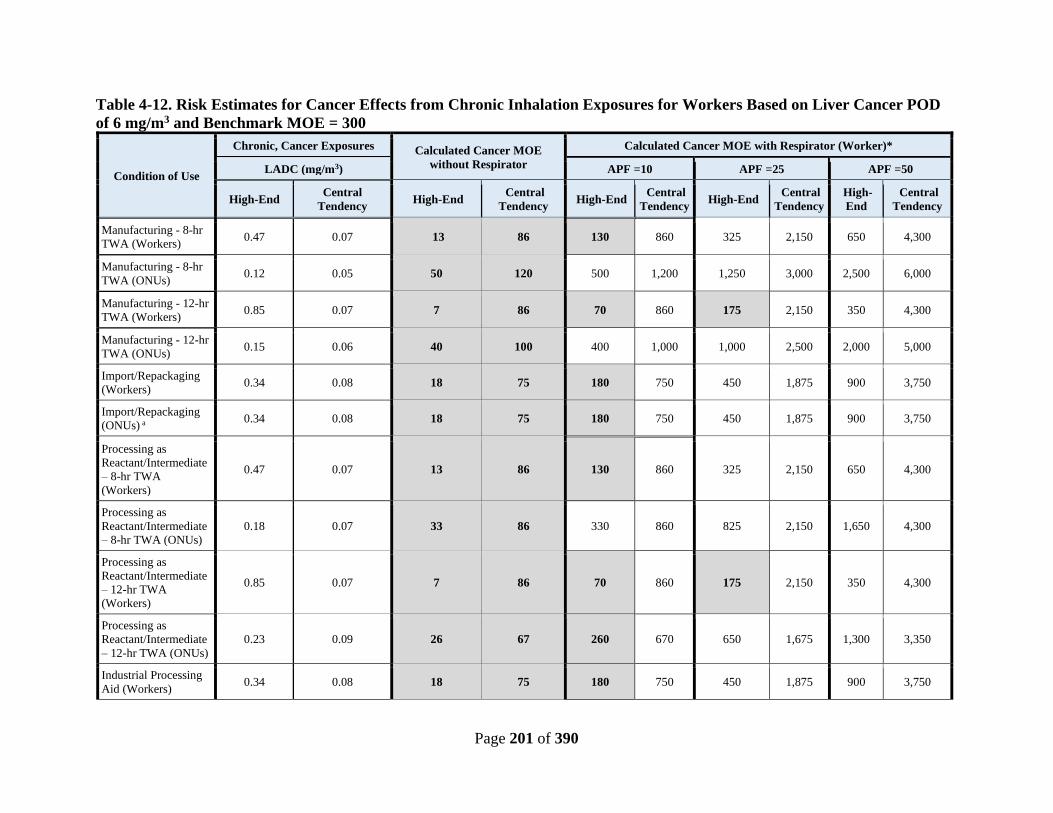
Page 201 of 390
Table 4-12. Risk Estimates for Cancer Effects from Chronic Inhalation Exposures for Workers Based on Liver Cancer POD
of 6 mg/m3 and Benchmark MOE = 300
Condition of Use
Chronic, Cancer Exposures Calculated Cancer MOE
without Respirator
Calculated Cancer MOE with Respirator (Worker)*
LADC (mg/m3) APF =10 APF =25 APF =50
High-End Central
Tendency High-End
Central
Tendency High-End
Central
Tendency High-End
Central
Tendency
High-
End
Central
Tendency
Manufacturing - 8-hr
TWA (Workers) 0.47 0.07 13 86 130 860 325 2,150 650 4,300
Manufacturing - 8-hr
TWA (ONUs) 0.12 0.05 50 120 500 1,200 1,250 3,000 2,500 6,000
Manufacturing - 12-hr
TWA (Workers) 0.85 0.07 7 86 70 860 175 2,150 350 4,300
Manufacturing - 12-hr
TWA (ONUs) 0.15 0.06 40 100 400 1,000 1,000 2,500 2,000 5,000
Import/Repackaging
(Workers) 0.34 0.08 18 75 180 750 450 1,875 900 3,750
Import/Repackaging
(ONUs) a 0.34 0.08 18 75 180 750 450 1,875 900 3,750
Processing as
Reactant/Intermediate
– 8-hr TWA
(Workers)
0.47 0.07 13 86 130 860 325 2,150 650 4,300
Processing as
Reactant/Intermediate
– 8-hr TWA (ONUs)
0.18 0.07 33 86 330 860 825 2,150 1,650 4,300
Processing as
Reactant/Intermediate
– 12-hr TWA
(Workers)
0.85 0.07 7 86 70 860 175 2,150 350 4,300
Processing as
Reactant/Intermediate
– 12-hr TWA (ONUs)
0.23 0.09 26 67 260 670 650 1,675 1,300 3,350
Industrial Processing
Aid (Workers) 0.34 0.08 18 75 180 750 450 1,875 900 3,750

Page 202 of 390
Condition of Use
Chronic, Cancer Exposures Calculated Cancer MOE
without Respirator
Calculated Cancer MOE with Respirator (Worker)*
LADC (mg/m3) APF =10 APF =25 APF =50
High-End Central
Tendency High-End
Central
Tendency High-End
Central
Tendency High-End
Central
Tendency
High-
End
Central
Tendency
Industrial Processing
Aid (ONUs) a 0.34 0.08 18 75 180 750 450 1,875 900 3,750
Additive (Workers) 0.34 0.08 18 75 180 750 450 1,875 900 3,750
Additive (ONUs) a 0.34 0.08 18 75 180 750 450 1,875 900 3,750
Disposal: Waste
Handling (Workers) 0.34 0.08 18 75 180 750 450 1,875 900 3,750
Disposal: Waste
Handling (ONUs) a 0.34 0.08 18 75 180 750 450 1,875 900 3,750
Specialty Uses-DoD
(Workers) 0.026 0.008 231 750 2,310 7,500 5,775 18,750 11,550 37,500
Specialty Uses-DoD
(ONUs)a 0.026 0.008 231 750 2,310 7,500 5,775 18,750 11,550 37,500
Reactive Ion Etching Negligible - Highly controlled work areas with small quantities applied
Laboratory Chemicals No data – exposure is low as laboratory typically uses small quantities inside a fume hood.
Bold and highlighted in gray: Calculated MOEs are below the benchmark MOE. MOE was calculated as follows: Cancer POD ÷ “Central Tendency LADC (mg/m3)” or “High-
end LADC (mg/m3)”
* MOEs with respirator use were calculated by multiplying the MOE without a respirator by the respirator APF. a In lieu of ONU-specific exposure data, EPA assessed ONU exposures at the worker central tendency.
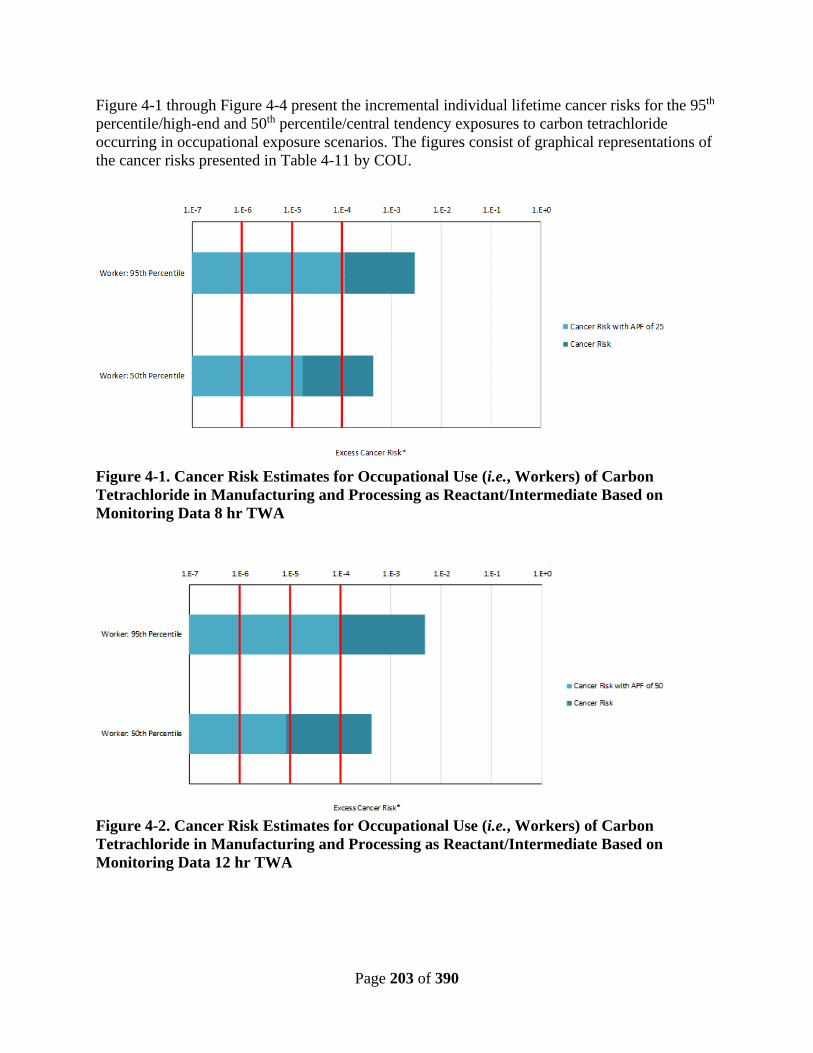
Page 203 of 390
Figure 4-1 through Figure 4-4 present the incremental individual lifetime cancer risks for the 95th
percentile/high-end and 50th percentile/central tendency exposures to carbon tetrachloride
occurring in occupational exposure scenarios. The figures consist of graphical representations of
the cancer risks presented in Table 4-11 by COU.
Figure 4-1. Cancer Risk Estimates for Occupational Use (i.e., Workers) of Carbon
Tetrachloride in Manufacturing and Processing as Reactant/Intermediate Based on
Monitoring Data 8 hr TWA
Figure 4-2. Cancer Risk Estimates for Occupational Use (i.e., Workers) of Carbon
Tetrachloride in Manufacturing and Processing as Reactant/Intermediate Based on
Monitoring Data 12 hr TWA
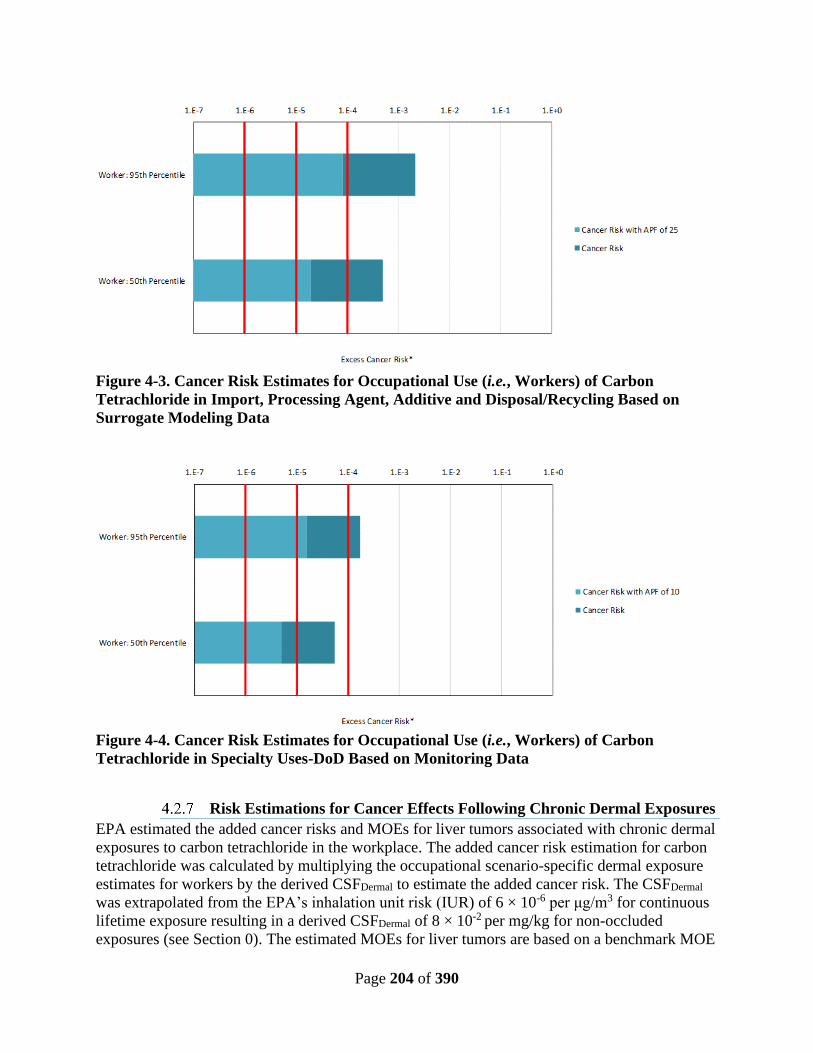
Page 204 of 390
Figure 4-3. Cancer Risk Estimates for Occupational Use (i.e., Workers) of Carbon
Tetrachloride in Import, Processing Agent, Additive and Disposal/Recycling Based on
Surrogate Modeling Data
Figure 4-4. Cancer Risk Estimates for Occupational Use (i.e., Workers) of Carbon
Tetrachloride in Specialty Uses-DoD Based on Monitoring Data
Risk Estimations for Cancer Effects Following Chronic Dermal Exposures
EPA estimated the added cancer risks and MOEs for liver tumors associated with chronic dermal
exposures to carbon tetrachloride in the workplace. The added cancer risk estimation for carbon
tetrachloride was calculated by multiplying the occupational scenario-specific dermal exposure
estimates for workers by the derived CSFDermal to estimate the added cancer risk. The CSFDermal
was extrapolated from the EPA’s inhalation unit risk (IUR) of 6 × 10⁻⁶ per μg/m3 for continuous
lifetime exposure resulting in a derived CSFDermal of 8 × 10⁻² per mg/kg for non-occluded
exposures (see Section 0). The estimated MOEs for liver tumors are based on a benchmark MOE
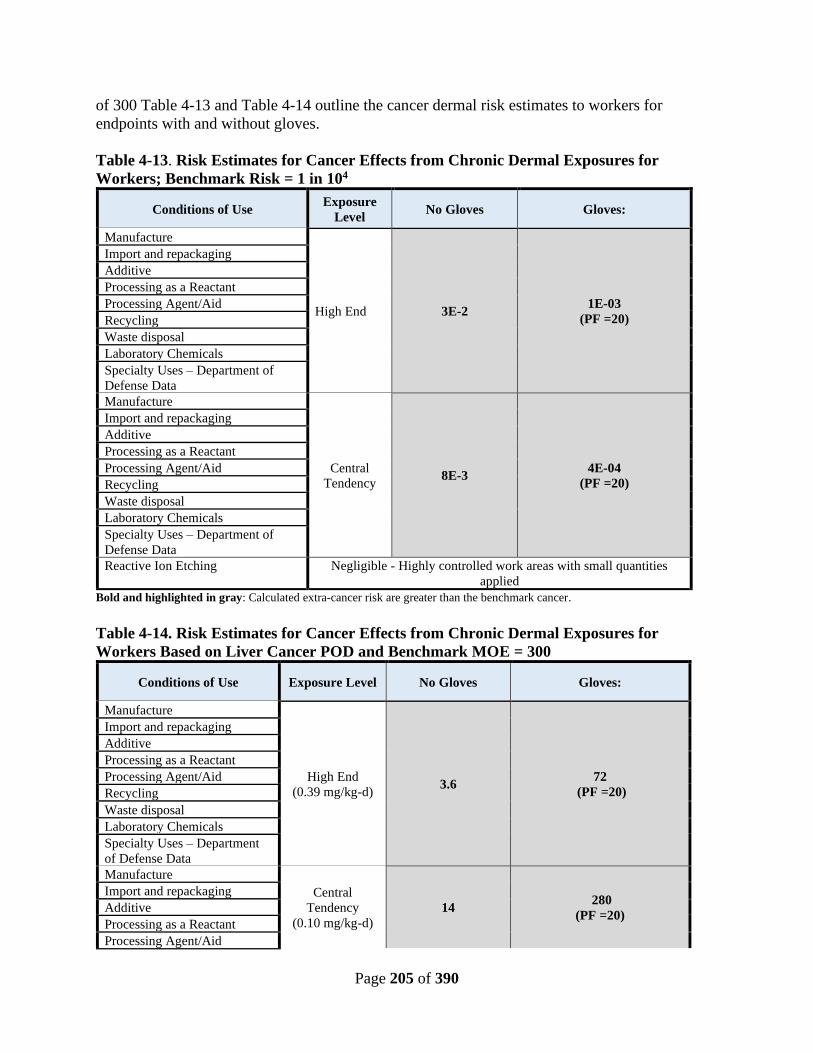
Page 205 of 390
of 300 Table 4-13 and Table 4-14 outline the cancer dermal risk estimates to workers for
endpoints with and without gloves.
Table 4-13. Risk Estimates for Cancer Effects from Chronic Dermal Exposures for
Workers; Benchmark Risk = 1 in 104
Conditions of Use Exposure
Level No Gloves Gloves:
Manufacture
High End 3E-2 1E-03
(PF =20)
Import and repackaging
Additive
Processing as a Reactant
Processing Agent/Aid
Recycling
Waste disposal
Laboratory Chemicals
Specialty Uses – Department of
Defense Data
Manufacture
Central
Tendency 8E-3
4E-04
(PF =20)
Import and repackaging
Additive
Processing as a Reactant
Processing Agent/Aid
Recycling
Waste disposal
Laboratory Chemicals
Specialty Uses – Department of
Defense Data
Reactive Ion Etching Negligible - Highly controlled work areas with small quantities
applied
Bold and highlighted in gray: Calculated extra-cancer risk are greater than the benchmark cancer.
Table 4-14. Risk Estimates for Cancer Effects from Chronic Dermal Exposures for
Workers Based on Liver Cancer POD and Benchmark MOE = 300
Conditions of Use Exposure Level No Gloves Gloves:
Manufacture
High End
(0.39 mg/kg-d) 3.6
72
(PF =20)
Import and repackaging
Additive
Processing as a Reactant
Processing Agent/Aid
Recycling
Waste disposal
Laboratory Chemicals
Specialty Uses – Department
of Defense Data
Manufacture
Central
Tendency
(0.10 mg/kg-d)
14 280
(PF =20)
Import and repackaging
Additive
Processing as a Reactant
Processing Agent/Aid

Page 206 of 390
Conditions of Use Exposure Level No Gloves Gloves:
Recycling
Waste disposal
Laboratory Chemicals
Specialty Uses – Department
of Defense Data
Reactive Ion Etching Negligible - Highly controlled work areas with small quantities applied
Bold and highlighted in gray: Calculated MOEs are below the benchmark MOE
Summary of Non-cancer and Cancer Estimates for Inhalation and Dermal
Exposures
Table 4-15 presents a summary of the MOEs and estimated cancer risks for the inhalation and
dermal exposures from the COUs for carbon tetrachloride.

Page 207 of 390
Table 4-15. Summary of Estimated Non-cancer and Cancer Risks from Inhalation and Dermal Exposures1
Life Cycle
Stage
Category
Reported in
Table 1-4
Subcategory
Reported in
Table 1-4
Occupational
Exposure
Scenario/
Category in
Current
Engineering
Assessment
(Table 2-6)
Exposure
Type
and
Population
Exposure
Levels
Risk estimates for No-PPE Risk estimates with PPE (Workers Only)**
Acute Non-
cancer
(inhalation
benchmark
MOE = 10;
dermal
benchmark
MOE = 30)
Chronic Non-
cancer
(inhalation
/dermal
benchmark
MOE = 30)
Cancer Risk
(CR) or
Cancer
MOE
(cancer risk
benchmark
1 in 104;
benchmark
MOE = 300)
Acute Non-
cancer
(inhalation
benchmark
MOE = 10;
dermal
benchmark
MOE = 30)
Chronic
Non-cancer
(inhalation/d
ermal
benchmark
MOE = 30)
Cancer Risk
(CR) of 1 in
104; Cancer
Benchmark
MOE = 300
Manufacturing Domestic
Manufacture
Domestic
Manufacture
Domestic
Manufacturing (Section
2.4.1.7.1)
8-hr TWA
(Workers) Central Tendency
474 41 CR = 4E-04
MOE = 86 N/A N/A
CR = 4E-05
(APF =10); MOE = 860
(APF =10)
High -End 90 8 CR = 3E-03
MOE = 13 N/A
80
(APF =10)
CR = 1E-04
(APF =25);
MOE = 325 (APF = 25)
12-hr TWA
(Workers) Central
Tendency 620 53
CR = 4E-04
MOE = 86 N/A N/A
CR = 4E-05
(APF =10);
MOE = 860 (APF = 10)
High -End 65 6 CR = 5E-03
MOE = 7 N/A
60
(APF = 10)
CR = 1E-04 (APF = 50);
MOE = 350
(APF = 50)
8-hr TWA (ONUs)
Central Tendency
720 62 CR = 3E-04
MOE = 120 N/A N/A N/A
High -End 360 31 CR = 7E-04
MOE = 50 N/A N/A N/A
12 hr TWA
(ONUs)
Central
Tendency 470 40
CR = 4E-04
MOE = 100 N/A N/A N/A
High -End 238 20 CR = 9E-04
MOE = 40 N/A
N/A N/A

Page 208 of 390
Life Cycle
Stage
Category
Reported in
Table 1-4
Subcategory
Reported in
Table 1-4
Occupational
Exposure
Scenario/
Category in
Current
Engineering
Assessment
(Table 2-6)
Exposure
Type
and
Population
Exposure
Levels
Risk estimates for No-PPE Risk estimates with PPE (Workers Only)**
Acute Non-
cancer
(inhalation
benchmark
MOE = 10;
dermal
benchmark
MOE = 30)
Chronic Non-
cancer
(inhalation
/dermal
benchmark
MOE = 30)
Cancer Risk
(CR) or
Cancer
MOE
(cancer risk
benchmark
1 in 104;
benchmark
MOE = 300)
Acute Non-
cancer
(inhalation
benchmark
MOE = 10;
dermal
benchmark
MOE = 30)
Chronic
Non-cancer
(inhalation/d
ermal
benchmark
MOE = 30)
Cancer Risk
(CR) of 1 in
104; Cancer
Benchmark
MOE = 300
Dermal
(Workers)
Central
Tendency 676 7
CR = 8E-03
MOE =14 N/A
35
(PF = 5)
CR = 4E-04
(PF = 20);
MOE =280
(PF = 20)
High -End 227 2 CR = 3E-02
MOE = 3.6 N/A
40 (PF = 20)
CR = 1E-03
(PF =20);
MOE = 72
(PF = 20)
Import Import Import and
Repackaging (Section
2.4.1.7.2)
8 hr TWA
(Workers)
Central Tendency
404 35 CR = 5E-04
MOE = 75 N/A N/A
CR = 5E-05
(APF =10); MOE = 750
(APF = 10)
High -End 123 11 CR = 2E-03
MOE = 18 N/A
110
(APF =10)
CR = 8E-05
(APF =25);
MOE = 450 (APF = 25)
8 hr TWA
(ONUs) Central
Tendencya 404 35
CR = 5E-04
MOE = 75 N/A N/A N/A
High -
Enda 123 11
CR = 2E-03
MOE = 18 N/A N/A N/A
Dermal
(Workers)
Central
Tendency 676 7
CR = 8E-03
MOE =14 N/A
35
(PF = 5)
CR = 4E-04
(PF = 20);
MOE =280
(PF = 20)
High -End 227 2 CR = 3E-02
MOE = 3.6 N/A
40
(PF = 20)
CR = 1E-03
(PF =20);
MOE = 72
(PF = 20)
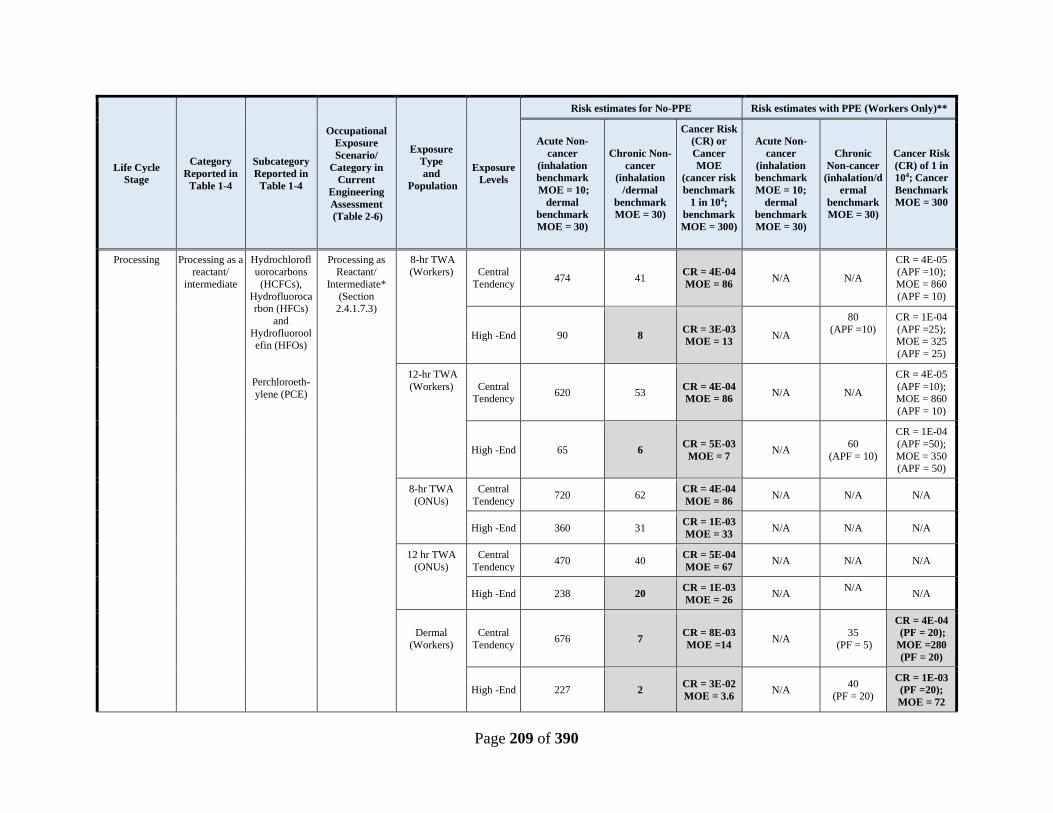
Page 209 of 390
Life Cycle
Stage
Category
Reported in
Table 1-4
Subcategory
Reported in
Table 1-4
Occupational
Exposure
Scenario/
Category in
Current
Engineering
Assessment
(Table 2-6)
Exposure
Type
and
Population
Exposure
Levels
Risk estimates for No-PPE Risk estimates with PPE (Workers Only)**
Acute Non-
cancer
(inhalation
benchmark
MOE = 10;
dermal
benchmark
MOE = 30)
Chronic Non-
cancer
(inhalation
/dermal
benchmark
MOE = 30)
Cancer Risk
(CR) or
Cancer
MOE
(cancer risk
benchmark
1 in 104;
benchmark
MOE = 300)
Acute Non-
cancer
(inhalation
benchmark
MOE = 10;
dermal
benchmark
MOE = 30)
Chronic
Non-cancer
(inhalation/d
ermal
benchmark
MOE = 30)
Cancer Risk
(CR) of 1 in
104; Cancer
Benchmark
MOE = 300
Processing Processing as a
reactant/
intermediate
Hydrochlorofl
uorocarbons
(HCFCs),
Hydrofluorocarbon (HFCs)
and
Hydrofluoroolefin (HFOs)
Perchloroeth-
ylene (PCE)
Processing as
Reactant/
Intermediate*
(Section 2.4.1.7.3)
8-hr TWA
(Workers) Central
Tendency 474 41
CR = 4E-04
MOE = 86 N/A N/A
CR = 4E-05
(APF =10);
MOE = 860
(APF = 10)
High -End 90 8 CR = 3E-03
MOE = 13 N/A
80
(APF =10)
CR = 1E-04
(APF =25); MOE = 325
(APF = 25)
12-hr TWA
(Workers) Central Tendency
620 53 CR = 4E-04
MOE = 86 N/A N/A
CR = 4E-05
(APF =10); MOE = 860
(APF = 10)
High -End 65 6 CR = 5E-03
MOE = 7 N/A
60
(APF = 10)
CR = 1E-04
(APF =50);
MOE = 350 (APF = 50)
8-hr TWA
(ONUs)
Central
Tendency 720 62
CR = 4E-04
MOE = 86 N/A N/A N/A
High -End 360 31 CR = 1E-03
MOE = 33 N/A N/A N/A
12 hr TWA
(ONUs)
Central
Tendency 470 40
CR = 5E-04
MOE = 67 N/A N/A N/A
High -End 238 20 CR = 1E-03
MOE = 26 N/A
N/A N/A
Dermal
(Workers)
Central
Tendency 676 7
CR = 8E-03
MOE =14 N/A
35
(PF = 5)
CR = 4E-04
(PF = 20);
MOE =280
(PF = 20)
High -End 227 2 CR = 3E-02
MOE = 3.6 N/A
40
(PF = 20)
CR = 1E-03
(PF =20);
MOE = 72
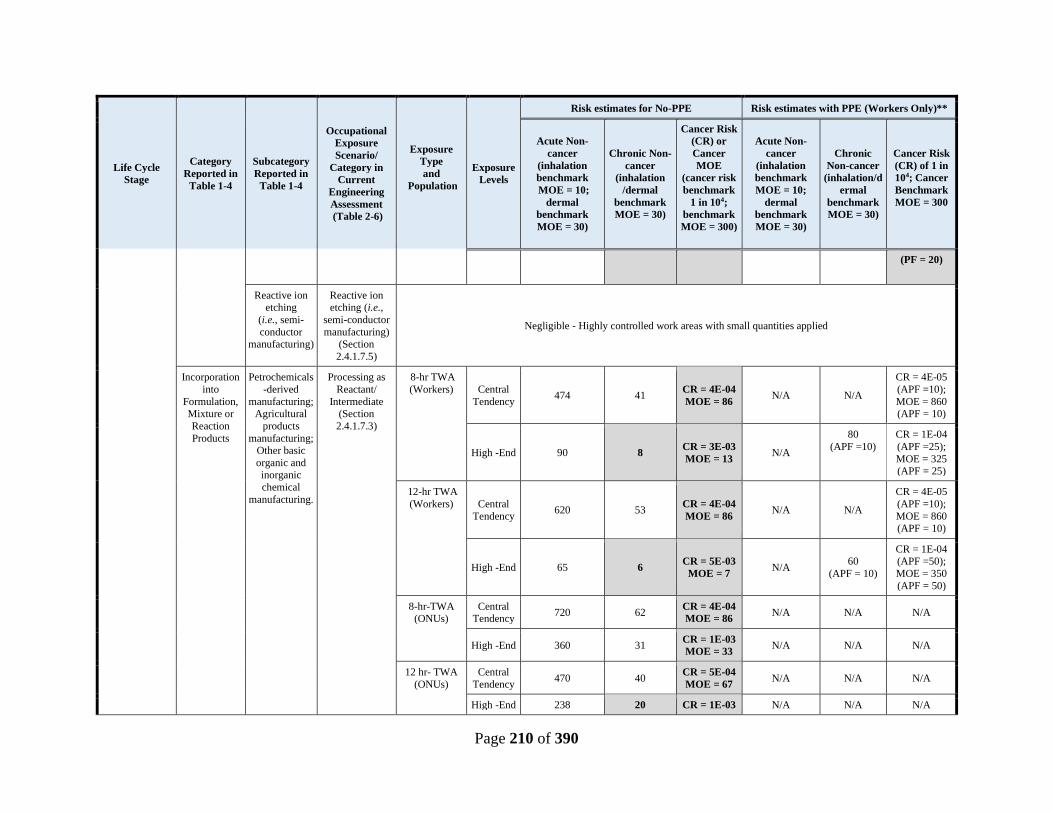
Page 210 of 390
Life Cycle
Stage
Category
Reported in
Table 1-4
Subcategory
Reported in
Table 1-4
Occupational
Exposure
Scenario/
Category in
Current
Engineering
Assessment
(Table 2-6)
Exposure
Type
and
Population
Exposure
Levels
Risk estimates for No-PPE Risk estimates with PPE (Workers Only)**
Acute Non-
cancer
(inhalation
benchmark
MOE = 10;
dermal
benchmark
MOE = 30)
Chronic Non-
cancer
(inhalation
/dermal
benchmark
MOE = 30)
Cancer Risk
(CR) or
Cancer
MOE
(cancer risk
benchmark
1 in 104;
benchmark
MOE = 300)
Acute Non-
cancer
(inhalation
benchmark
MOE = 10;
dermal
benchmark
MOE = 30)
Chronic
Non-cancer
(inhalation/d
ermal
benchmark
MOE = 30)
Cancer Risk
(CR) of 1 in
104; Cancer
Benchmark
MOE = 300
(PF = 20)
Reactive ion etching
(i.e., semi-
conductor manufacturing)
Reactive ion etching (i.e.,
semi-conductor
manufacturing) (Section
2.4.1.7.5)
Negligible - Highly controlled work areas with small quantities applied
Incorporation
into
Formulation, Mixture or
Reaction
Products
Petrochemicals
-derived
manufacturing; Agricultural
products
manufacturing; Other basic
organic and inorganic
chemical
manufacturing.
Processing as
Reactant/
Intermediate (Section
2.4.1.7.3)
8-hr TWA
(Workers) Central
Tendency 474 41
CR = 4E-04
MOE = 86 N/A N/A
CR = 4E-05
(APF =10);
MOE = 860 (APF = 10)
High -End 90 8 CR = 3E-03
MOE = 13 N/A
80
(APF =10)
CR = 1E-04
(APF =25);
MOE = 325 (APF = 25)
12-hr TWA
(Workers) Central
Tendency 620 53
CR = 4E-04
MOE = 86 N/A N/A
CR = 4E-05
(APF =10);
MOE = 860 (APF = 10)
High -End 65 6 CR = 5E-03
MOE = 7 N/A
60
(APF = 10)
CR = 1E-04 (APF =50);
MOE = 350
(APF = 50)
8-hr-TWA
(ONUs)
Central
Tendency 720 62
CR = 4E-04
MOE = 86 N/A N/A N/A
High -End 360 31 CR = 1E-03
MOE = 33 N/A N/A N/A
12 hr- TWA
(ONUs)
Central
Tendency 470 40
CR = 5E-04
MOE = 67 N/A N/A N/A
High -End 238 20 CR = 1E-03 N/A N/A N/A
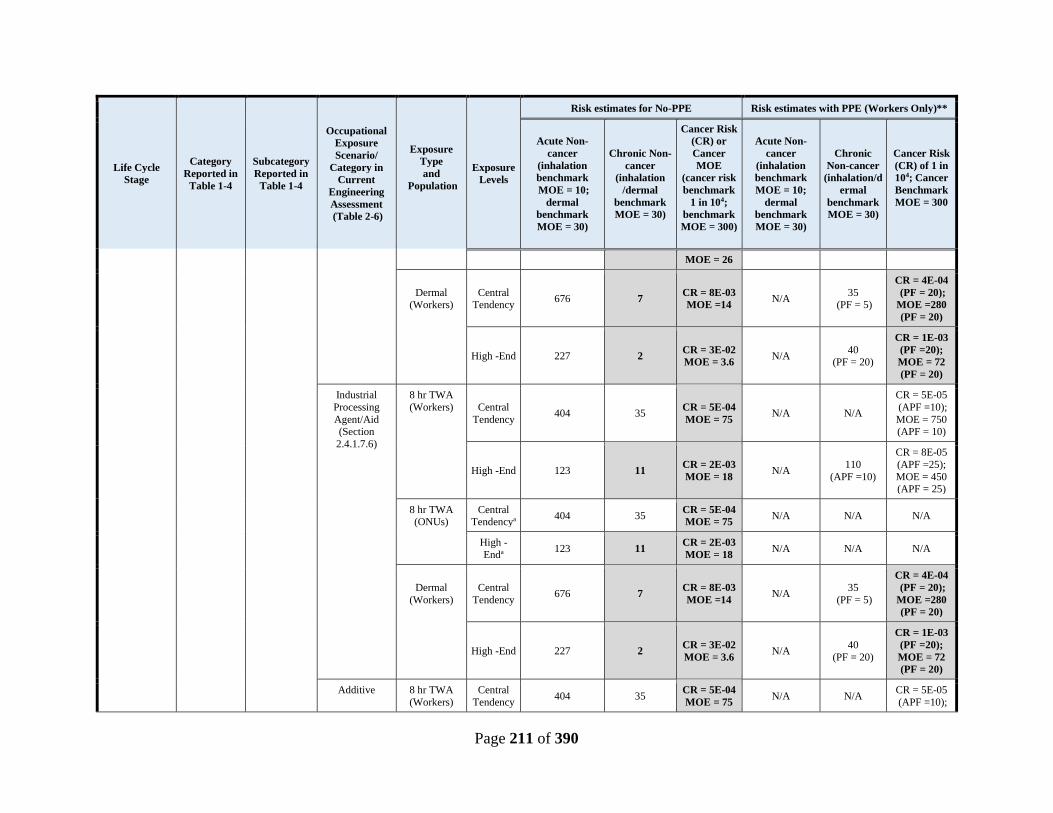
Page 211 of 390
Life Cycle
Stage
Category
Reported in
Table 1-4
Subcategory
Reported in
Table 1-4
Occupational
Exposure
Scenario/
Category in
Current
Engineering
Assessment
(Table 2-6)
Exposure
Type
and
Population
Exposure
Levels
Risk estimates for No-PPE Risk estimates with PPE (Workers Only)**
Acute Non-
cancer
(inhalation
benchmark
MOE = 10;
dermal
benchmark
MOE = 30)
Chronic Non-
cancer
(inhalation
/dermal
benchmark
MOE = 30)
Cancer Risk
(CR) or
Cancer
MOE
(cancer risk
benchmark
1 in 104;
benchmark
MOE = 300)
Acute Non-
cancer
(inhalation
benchmark
MOE = 10;
dermal
benchmark
MOE = 30)
Chronic
Non-cancer
(inhalation/d
ermal
benchmark
MOE = 30)
Cancer Risk
(CR) of 1 in
104; Cancer
Benchmark
MOE = 300
MOE = 26
Dermal (Workers)
Central Tendency
676 7 CR = 8E-03
MOE =14 N/A
35 (PF = 5)
CR = 4E-04
(PF = 20);
MOE =280
(PF = 20)
High -End 227 2 CR = 3E-02
MOE = 3.6 N/A
40 (PF = 20)
CR = 1E-03
(PF =20);
MOE = 72
(PF = 20)
Industrial
Processing
Agent/Aid (Section
2.4.1.7.6)
8 hr TWA
(Workers) Central
Tendency 404 35
CR = 5E-04
MOE = 75 N/A N/A
CR = 5E-05
(APF =10);
MOE = 750 (APF = 10)
High -End 123 11 CR = 2E-03
MOE = 18 N/A
110
(APF =10)
CR = 8E-05
(APF =25);
MOE = 450 (APF = 25)
8 hr TWA (ONUs)
Central Tendencya
404 35 CR = 5E-04
MOE = 75 N/A N/A N/A
High -
Enda 123 11
CR = 2E-03
MOE = 18 N/A N/A N/A
Dermal
(Workers)
Central
Tendency 676 7
CR = 8E-03
MOE =14 N/A
35
(PF = 5)
CR = 4E-04
(PF = 20);
MOE =280
(PF = 20)
High -End 227 2 CR = 3E-02
MOE = 3.6 N/A
40
(PF = 20)
CR = 1E-03
(PF =20);
MOE = 72
(PF = 20)
Additive 8 hr TWA
(Workers)
Central
Tendency 404 35
CR = 5E-04
MOE = 75 N/A N/A
CR = 5E-05
(APF =10);
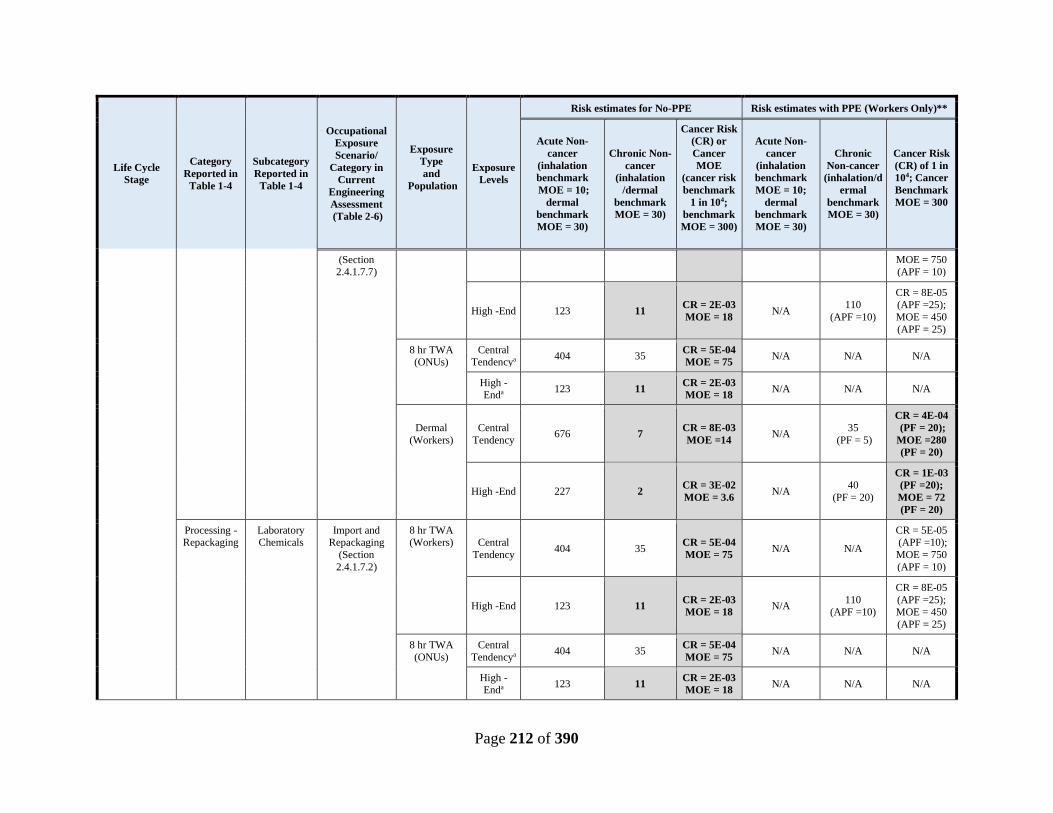
Page 212 of 390
Life Cycle
Stage
Category
Reported in
Table 1-4
Subcategory
Reported in
Table 1-4
Occupational
Exposure
Scenario/
Category in
Current
Engineering
Assessment
(Table 2-6)
Exposure
Type
and
Population
Exposure
Levels
Risk estimates for No-PPE Risk estimates with PPE (Workers Only)**
Acute Non-
cancer
(inhalation
benchmark
MOE = 10;
dermal
benchmark
MOE = 30)
Chronic Non-
cancer
(inhalation
/dermal
benchmark
MOE = 30)
Cancer Risk
(CR) or
Cancer
MOE
(cancer risk
benchmark
1 in 104;
benchmark
MOE = 300)
Acute Non-
cancer
(inhalation
benchmark
MOE = 10;
dermal
benchmark
MOE = 30)
Chronic
Non-cancer
(inhalation/d
ermal
benchmark
MOE = 30)
Cancer Risk
(CR) of 1 in
104; Cancer
Benchmark
MOE = 300
(Section
2.4.1.7.7)
MOE = 750
(APF = 10)
High -End 123 11 CR = 2E-03
MOE = 18 N/A
110
(APF =10)
CR = 8E-05 (APF =25);
MOE = 450
(APF = 25)
8 hr TWA (ONUs)
Central Tendencya
404 35 CR = 5E-04
MOE = 75 N/A N/A N/A
High -Enda
123 11 CR = 2E-03
MOE = 18 N/A N/A N/A
Dermal
(Workers)
Central
Tendency 676 7
CR = 8E-03
MOE =14 N/A
35
(PF = 5)
CR = 4E-04
(PF = 20);
MOE =280
(PF = 20)
High -End 227 2 CR = 3E-02
MOE = 3.6 N/A
40
(PF = 20)
CR = 1E-03
(PF =20);
MOE = 72
(PF = 20)
Processing -Repackaging
Laboratory Chemicals
Import and Repackaging
(Section
2.4.1.7.2)
8 hr TWA (Workers)
Central
Tendency 404 35
CR = 5E-04
MOE = 75 N/A N/A
CR = 5E-05 (APF =10);
MOE = 750
(APF = 10)
High -End 123 11 CR = 2E-03
MOE = 18 N/A
110 (APF =10)
CR = 8E-05
(APF =25); MOE = 450
(APF = 25)
8 hr TWA
(ONUs)
Central
Tendencya 404 35
CR = 5E-04
MOE = 75 N/A N/A N/A
High -Enda
123 11 CR = 2E-03
MOE = 18 N/A N/A N/A
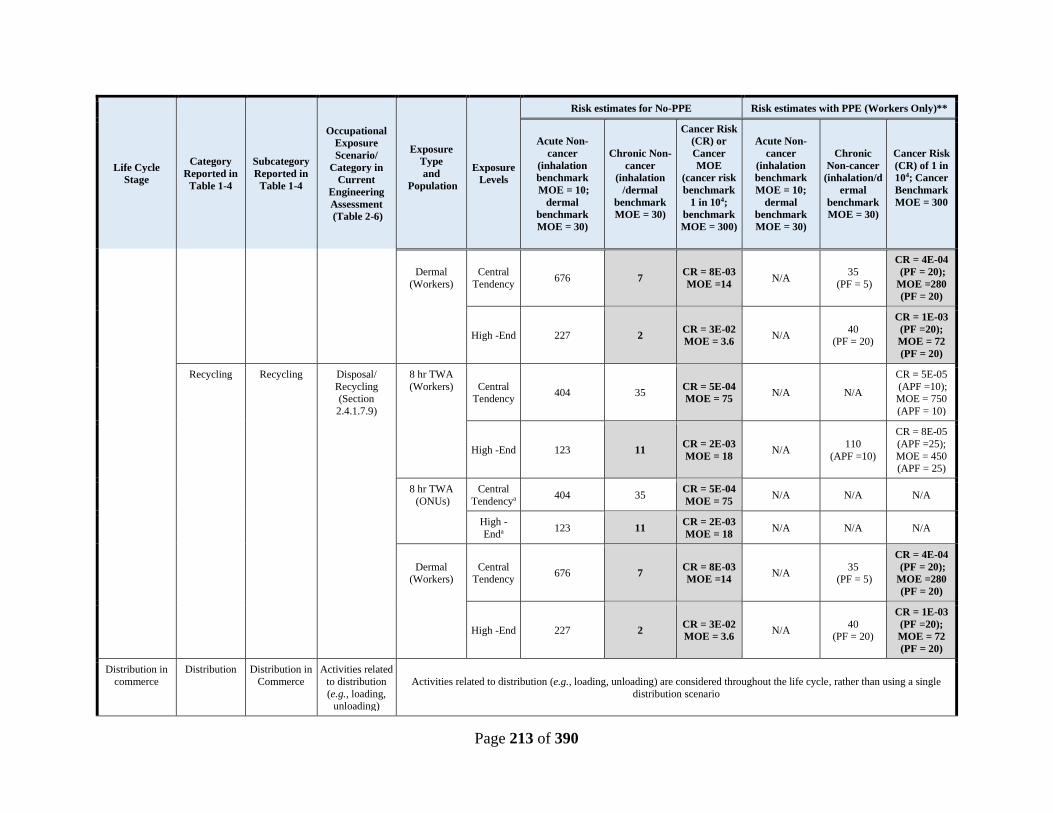
Page 213 of 390
Life Cycle
Stage
Category
Reported in
Table 1-4
Subcategory
Reported in
Table 1-4
Occupational
Exposure
Scenario/
Category in
Current
Engineering
Assessment
(Table 2-6)
Exposure
Type
and
Population
Exposure
Levels
Risk estimates for No-PPE Risk estimates with PPE (Workers Only)**
Acute Non-
cancer
(inhalation
benchmark
MOE = 10;
dermal
benchmark
MOE = 30)
Chronic Non-
cancer
(inhalation
/dermal
benchmark
MOE = 30)
Cancer Risk
(CR) or
Cancer
MOE
(cancer risk
benchmark
1 in 104;
benchmark
MOE = 300)
Acute Non-
cancer
(inhalation
benchmark
MOE = 10;
dermal
benchmark
MOE = 30)
Chronic
Non-cancer
(inhalation/d
ermal
benchmark
MOE = 30)
Cancer Risk
(CR) of 1 in
104; Cancer
Benchmark
MOE = 300
Dermal
(Workers)
Central
Tendency 676 7
CR = 8E-03
MOE =14 N/A
35
(PF = 5)
CR = 4E-04
(PF = 20);
MOE =280
(PF = 20)
High -End 227 2 CR = 3E-02
MOE = 3.6 N/A
40 (PF = 20)
CR = 1E-03
(PF =20);
MOE = 72
(PF = 20)
Recycling Recycling Disposal/
Recycling (Section
2.4.1.7.9)
8 hr TWA
(Workers) Central Tendency
404 35 CR = 5E-04
MOE = 75 N/A N/A
CR = 5E-05
(APF =10); MOE = 750
(APF = 10)
High -End 123 11 CR = 2E-03
MOE = 18 N/A
110
(APF =10)
CR = 8E-05
(APF =25);
MOE = 450 (APF = 25)
8 hr TWA
(ONUs)
Central
Tendencya 404 35
CR = 5E-04
MOE = 75 N/A N/A N/A
High -
Enda 123 11
CR = 2E-03
MOE = 18 N/A N/A N/A
Dermal (Workers)
Central Tendency
676 7 CR = 8E-03
MOE =14 N/A
35 (PF = 5)
CR = 4E-04
(PF = 20);
MOE =280
(PF = 20)
High -End 227 2 CR = 3E-02
MOE = 3.6 N/A
40 (PF = 20)
CR = 1E-03
(PF =20);
MOE = 72
(PF = 20)
Distribution in
commerce
Distribution Distribution in
Commerce
Activities related
to distribution
(e.g., loading, unloading)
Activities related to distribution (e.g., loading, unloading) are considered throughout the life cycle, rather than using a single
distribution scenario

Page 214 of 390
Life Cycle
Stage
Category
Reported in
Table 1-4
Subcategory
Reported in
Table 1-4
Occupational
Exposure
Scenario/
Category in
Current
Engineering
Assessment
(Table 2-6)
Exposure
Type
and
Population
Exposure
Levels
Risk estimates for No-PPE Risk estimates with PPE (Workers Only)**
Acute Non-
cancer
(inhalation
benchmark
MOE = 10;
dermal
benchmark
MOE = 30)
Chronic Non-
cancer
(inhalation
/dermal
benchmark
MOE = 30)
Cancer Risk
(CR) or
Cancer
MOE
(cancer risk
benchmark
1 in 104;
benchmark
MOE = 300)
Acute Non-
cancer
(inhalation
benchmark
MOE = 10;
dermal
benchmark
MOE = 30)
Chronic
Non-cancer
(inhalation/d
ermal
benchmark
MOE = 30)
Cancer Risk
(CR) of 1 in
104; Cancer
Benchmark
MOE = 300
Industrial/comm
ercial use
Petrochemical
s-derived
products
and agricultural
products
manufacturing
Processing
Aid
Industrial
Processing
Agent/
Aid (Section
2.4.1.7.6)
8 hr TWA
(Workers) Central
Tendency 404 35
CR = 5E-04
MOE = 75 N/A N/A
CR = 5E-05
(APF =10);
MOE = 750
(APF = 10)
High -End 123 11 CR = 2E-03
MOE = 18 N/A
110 (APF =10)
CR = 8E-05
(APF =25); MOE = 450
(APF = 25)
8 hr TWA
(ONUs)
Central
Tendencya 404 35
CR = 5E-04
MOE = 75 N/A N/A N/A
High -
Enda 123 11
CR = 2E-03
MOE = 18 N/A N/A N/A
Dermal
(Workers)
Central
Tendency 676 7
CR = 8E-03
MOE =14 N/A
35
(PF = 5)
CR = 4E-04
(PF = 20);
MOE =280
(PF = 20)
High -End 227 2 CR = 3E-02
MOE = 3.6 N/A
40 (PF = 20)
CR = 1E-03
(PF =20);
MOE = 72
(PF = 20)
Additive Additive
(Section 2.4.1.7.72.4.1.7.
7)
8 hr TWA
(Workers) Central Tendency
404 35 CR = 5E-04
MOE = 75 N/A N/A
CR = 5E-05
(APF =10); MOE = 750
(APF = 10)
High -End 123 11 CR = 2E-03
MOE = 18 N/A
110 (APF =10)
CR = 8E-05
(APF =25); MOE = 450
(APF = 25)
8 hr TWA
(ONUs)
Central
Tendencya 404 35
CR = 5E-04
MOE = 75 N/A N/A N/A
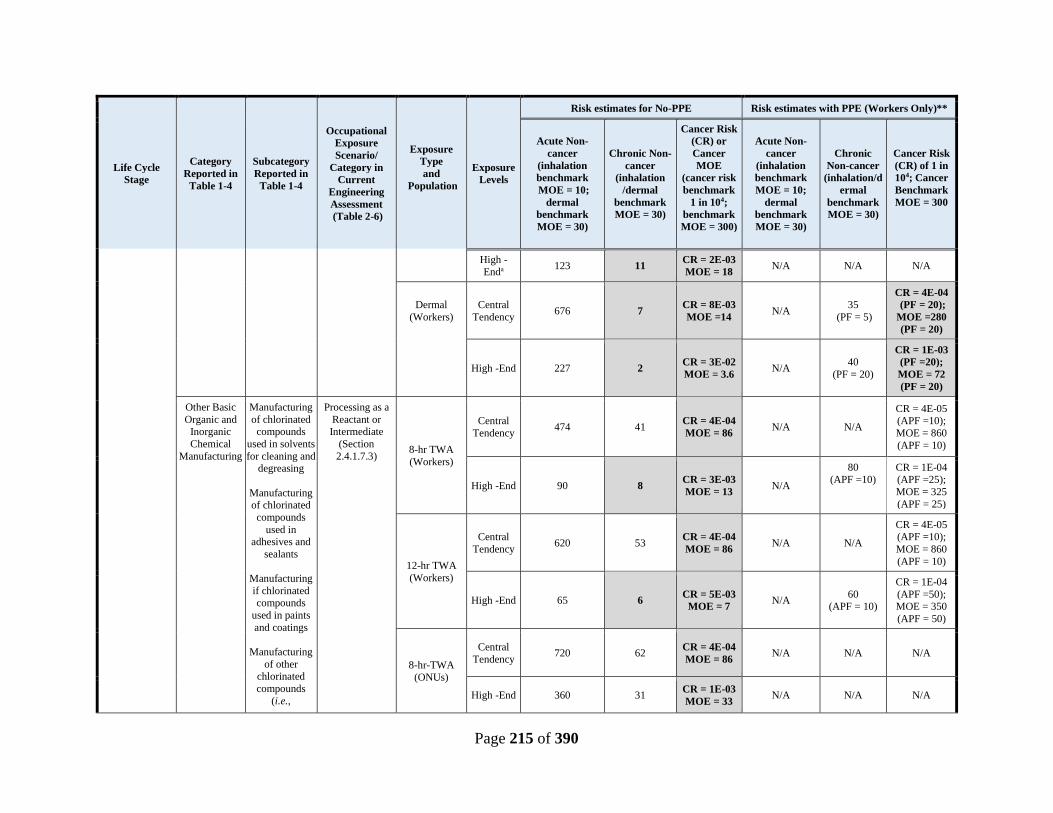
Page 215 of 390
Life Cycle
Stage
Category
Reported in
Table 1-4
Subcategory
Reported in
Table 1-4
Occupational
Exposure
Scenario/
Category in
Current
Engineering
Assessment
(Table 2-6)
Exposure
Type
and
Population
Exposure
Levels
Risk estimates for No-PPE Risk estimates with PPE (Workers Only)**
Acute Non-
cancer
(inhalation
benchmark
MOE = 10;
dermal
benchmark
MOE = 30)
Chronic Non-
cancer
(inhalation
/dermal
benchmark
MOE = 30)
Cancer Risk
(CR) or
Cancer
MOE
(cancer risk
benchmark
1 in 104;
benchmark
MOE = 300)
Acute Non-
cancer
(inhalation
benchmark
MOE = 10;
dermal
benchmark
MOE = 30)
Chronic
Non-cancer
(inhalation/d
ermal
benchmark
MOE = 30)
Cancer Risk
(CR) of 1 in
104; Cancer
Benchmark
MOE = 300
High -
Enda 123 11
CR = 2E-03
MOE = 18 N/A N/A N/A
Dermal
(Workers)
Central
Tendency 676 7
CR = 8E-03
MOE =14 N/A
35
(PF = 5)
CR = 4E-04
(PF = 20);
MOE =280
(PF = 20)
High -End 227 2 CR = 3E-02
MOE = 3.6 N/A
40
(PF = 20)
CR = 1E-03
(PF =20);
MOE = 72
(PF = 20)
Other Basic
Organic and Inorganic
Chemical
Manufacturing
Manufacturing
of chlorinated compounds
used in solvents
for cleaning and degreasing
Manufacturing of chlorinated
compounds
used in adhesives and
sealants
Manufacturing
if chlorinated compounds
used in paints
and coatings
Manufacturing
of other chlorinated
compounds
(i.e.,
Processing as a
Reactant or Intermediate
(Section
2.4.1.7.3) 8-hr TWA
(Workers)
Central
Tendency 474 41
CR = 4E-04
MOE = 86 N/A N/A
CR = 4E-05 (APF =10);
MOE = 860
(APF = 10)
High -End 90 8 CR = 3E-03
MOE = 13 N/A
80 (APF =10)
CR = 1E-04 (APF =25);
MOE = 325
(APF = 25)
12-hr TWA
(Workers)
Central
Tendency 620 53
CR = 4E-04
MOE = 86 N/A N/A
CR = 4E-05 (APF =10);
MOE = 860
(APF = 10)
High -End 65 6 CR = 5E-03
MOE = 7 N/A
60 (APF = 10)
CR = 1E-04
(APF =50); MOE = 350
(APF = 50)
8-hr-TWA
(ONUs)
Central
Tendency 720 62
CR = 4E-04
MOE = 86 N/A N/A N/A
High -End 360 31 CR = 1E-03
MOE = 33 N/A N/A N/A

Page 216 of 390
Life Cycle
Stage
Category
Reported in
Table 1-4
Subcategory
Reported in
Table 1-4
Occupational
Exposure
Scenario/
Category in
Current
Engineering
Assessment
(Table 2-6)
Exposure
Type
and
Population
Exposure
Levels
Risk estimates for No-PPE Risk estimates with PPE (Workers Only)**
Acute Non-
cancer
(inhalation
benchmark
MOE = 10;
dermal
benchmark
MOE = 30)
Chronic Non-
cancer
(inhalation
/dermal
benchmark
MOE = 30)
Cancer Risk
(CR) or
Cancer
MOE
(cancer risk
benchmark
1 in 104;
benchmark
MOE = 300)
Acute Non-
cancer
(inhalation
benchmark
MOE = 10;
dermal
benchmark
MOE = 30)
Chronic
Non-cancer
(inhalation/d
ermal
benchmark
MOE = 30)
Cancer Risk
(CR) of 1 in
104; Cancer
Benchmark
MOE = 300
elimination of
nitrogen
trichloride in
the production of chlorine and
caustic)
Manufacturing
of chlorinated
compounds used in asphalt
12 hr- TWA (ONUs)
Central
Tendency 470 40
CR = 5E-04
MOE = 67 N/A N/A N/A
High -End 238 20 CR = 1E-03
MOE = 26 N/A
N/A N/A
Dermal
(Workers)
Central
Tendency 676 7
CR = 8E-03
MOE =14 N/A
35
(PF = 5)
CR = 4E-04
(PF = 20);
MOE =280
(PF = 20)
High -End 227 2 CR = 3E-02
MOE = 3.6 N/A
40
(PF = 20)
CR = 1E-03
(PF =20);
MOE = 72
(PF = 20)
Other uses Processing aid
(i.e., metal recovery)
Industrial
Processing Agent/Aid
(Section
2.4.1.7.6)
8 hr TWA
(Workers) Central Tendency
404 35 CR = 5E-04
MOE = 75 N/A N/A
CR = 5E-05
(APF =10); MOE = 750
(APF = 10)
High -End 123 11 CR = 2E-03
MOE = 18 N/A
110 (APF =10)
CR = 8E-05
(APF =25); MOE = 450
(APF = 25)
8 hr TWA
(ONUs)
Central
Tendencya 404 35
CR = 5E-04
MOE = 75 N/A N/A N/A
High -
Enda 123 11
CR = 2E-03
MOE = 18 N/A N/A N/A
Dermal (Workers)
Central Tendency
676 7 CR = 8E-03
MOE =14 N/A
35 (PF = 5)
CR = 4E-04
(PF = 20);
MOE =280
(PF = 20)
High -End 227 2 CR = 3E-02 N/A 40 CR = 1E-03

Page 217 of 390
Life Cycle
Stage
Category
Reported in
Table 1-4
Subcategory
Reported in
Table 1-4
Occupational
Exposure
Scenario/
Category in
Current
Engineering
Assessment
(Table 2-6)
Exposure
Type
and
Population
Exposure
Levels
Risk estimates for No-PPE Risk estimates with PPE (Workers Only)**
Acute Non-
cancer
(inhalation
benchmark
MOE = 10;
dermal
benchmark
MOE = 30)
Chronic Non-
cancer
(inhalation
/dermal
benchmark
MOE = 30)
Cancer Risk
(CR) or
Cancer
MOE
(cancer risk
benchmark
1 in 104;
benchmark
MOE = 300)
Acute Non-
cancer
(inhalation
benchmark
MOE = 10;
dermal
benchmark
MOE = 30)
Chronic
Non-cancer
(inhalation/d
ermal
benchmark
MOE = 30)
Cancer Risk
(CR) of 1 in
104; Cancer
Benchmark
MOE = 300
MOE = 3.6 (PF = 20) (PF =20);
MOE = 72
(PF = 20)
Specialty uses
(i.e., DoD
uses)
Specialty Uses-
DoD Data
(Section 2.4.1.7.4)
8 hr TWA
(Workers)
Central
Tendency 2,000 346
CR = 5E-05
MOE = 750 N/A N/A N/A
High -End 973 141 CR = 2E-04
MOE = 231 N/A N/A
CR = 2E-05
(APF =10); MOE = 2,310
(APF = 10)
8 hr TWA
(ONUs)
Central
Tendencya 2,000 346
CR = 5E-05
MOE = 750 N/A N/A N/A
High -
Enda 973 141
CR = 2E-04
MOE = 231 N/A N/A N/A
Dermal (Workers)
Central Tendency
676 7 CR = 8E-03
MOE =14 N/A
35 (PF = 5)
CR = 4E-04
(PF = 20);
MOE =280
(PF = 20)
High -End 227 2 CR = 3E-02
MOE = 3.6 N/A
40 (PF = 20)
CR = 1E-03
(PF =20);
MOE = 72
(PF = 20)
Laboratory
chemicals
Laboratory
Chemicals
Laboratory
Chemicals
(Section
2.4.1.7.8)
Dermal
(Workers)
Central
Tendency 676 7
CR = 8E-03
MOE =14 N/A
35
(PF = 5)
CR = 4E-04
(PF = 20);
MOE =280
(PF = 20)
High -End 227 2 CR = 3E-02
MOE = 3.6 N/A
40
(PF = 20)
CR = 1E-03
(PF =20);
MOE = 72
(PF = 20)
Disposal Disposal Industrial pre-
treatment
Disposal/
Recycling
8 hr TWA
(Workers)
Central
Tendency 404 35
CR = 5E-04
MOE = 75 N/A N/A
CR = 5E-05
(APF =10);

Page 218 of 390
Life Cycle
Stage
Category
Reported in
Table 1-4
Subcategory
Reported in
Table 1-4
Occupational
Exposure
Scenario/
Category in
Current
Engineering
Assessment
(Table 2-6)
Exposure
Type
and
Population
Exposure
Levels
Risk estimates for No-PPE Risk estimates with PPE (Workers Only)**
Acute Non-
cancer
(inhalation
benchmark
MOE = 10;
dermal
benchmark
MOE = 30)
Chronic Non-
cancer
(inhalation
/dermal
benchmark
MOE = 30)
Cancer Risk
(CR) or
Cancer
MOE
(cancer risk
benchmark
1 in 104;
benchmark
MOE = 300)
Acute Non-
cancer
(inhalation
benchmark
MOE = 10;
dermal
benchmark
MOE = 30)
Chronic
Non-cancer
(inhalation/d
ermal
benchmark
MOE = 30)
Cancer Risk
(CR) of 1 in
104; Cancer
Benchmark
MOE = 300
Industrial
wastewater
treatment
(Section
2.4.1.7.9)
MOE = 750
(APF = 10)
Publicly owned
treatment works
(POTW) High -End 123 11
CR = 2E-03
MOE = 18 N/A
110
(APF =10)
CR = 8E-05
(APF =25);
MOE = 450 (APF = 25)
Underground
injection
8 hr TWA
(ONUs) Central
Tendencya 404 35
CR = 5E-04
MOE = 75 N/A N/A N/A
Municipal
landfill
Hazardous
landfill
High -
Enda 123 11
CR = 2E-03
MOE = 18 N/A N/A
N/A
Other land
disposal
Dermal (Workers)
Central
Tendency 676 7
CR = 8E-03
MOE =14
N/A
35 (PF = 5)
CR = 4E-04
(PF = 20);
MOE =280
(PF = 20)
Municipal waste
incinerator
Hazardous
waste
incinerator High -End 227 2 CR = 3E-02
MOE = 3.6 N/A
40
(PF = 20)
CR = 1E-03
(PF =20);
MOE = 72
(PF = 20) Off-site waste transfer
Bold and highlighted in gray: Calculated MOEs are below the benchmark MOE or cancer risk is greater than benchmark cancer risk.
1This table presents a summary of the risks for inhalation and dermal exposures by combining the risk findings for the COUs listed in Table 4-7 to Table 4-14 and the associated lifecycle stages as listed in Table 1-4 and Figure 1-1.
*Incorporation into Reaction, Mixture and Reaction Products was regrouped and accessed under Industrial Processing Agent/Aid and Processing as a Reactant or Intermediate (see Section 1.4.1, Table
1-4 and Section 2.4.1.6). **Risk estimates were calculated for the respirator with the lowest APF that reduces exposure to levels with MOEs greater than benchmark MOE or cancer risk lower than benchmark cancer risk. aIn lieu of ONU-specific exposure data, EPA assessed ONU exposures at the worker central tendency.
Page 219 of 390
Potentially Exposed or Susceptible Subpopulations TSCA requires that the determination of whether a chemical substance presents an unreasonable
risk include consideration of unreasonable risk to “a potentially exposed or susceptible
subpopulation identified as relevant to the risk evaluation” by EPA. TSCA § 3(12) states that
“the term ‘potentially exposed or susceptible subpopulation’ means a group of individuals within
the general population identified by the Administrator who, due to either greater susceptibility or
greater exposure, may be at greater risk than the general population of adverse health effects
from exposure to a chemical substance or mixture, such as infants, children, pregnant women,
workers, or the elderly.”
In developing the exposure assessment for carbon tetrachloride, EPA analyzed reasonably
available information to identify groups that may have greater exposure or susceptibility than the
general population to the hazard posed by carbon tetrachloride. Exposures of carbon
tetrachloride could be higher amongst workers and ONUs who use or are exposed to carbon
tetrachloride as part of typical processes.
The scope of this human health assessment is limited to workers and ONUs. Thus, this Section
focuses on identifying subpopulations within workers and ONUs who may have greater
susceptibility to carbon tetrachloride. Assessment of susceptible subpopulations does not include
children or non-workers/non-ONUs.
Some workers and ONUs may be more biologically susceptible to the effects of carbon
tetrachloride due to age, alcohol consumption, nutritional status, pre-existing disease (e.g.,
diabetes or liver disease), exposure to other chemicals, and genetic variation (described in more
detail in Section 3.2.5.4).
Metabolism of carbon tetrachloride to reactive metabolites by cytochrome P450 enzymes
(particularly CYP2E1 and CYP3A) is hypothesized to be a key event in the toxicity of this
compound. Therefore, heterogeneity in the human population distribution of microsomal
enzymes metabolizing carbon tetrachloride has influence in the susceptibility to carbon
tetrachloride toxicity. Reasonably available quantitative information on the variation in human
hepatic levels of the main metabolic enzyme, CYP2E1, demonstrates considerable intrahuman
variability. For example, (Lipscomb et al., 1997) reported a seven-fold range in activity of
CYP2E1 among hepatic microsomal samples from 23 subjects. Snawder and Lipscomb
(Snawder and Lipscomb, 2000) demonstrated 12-fold differences in CYP2E1 protein content
between the highest and lowest samples from 40 samples of microsomes from adult human liver
donors. Consideration of this PESS quantitative information is incorporated in the uncertainty
factors used for risk characterization.
In addition to differences in the metabolism due to alcohol consumption ( see below and Section
3.2.5.2 for quantitative information on toxic effects from alcohol usage), exposure to other
chemicals, age, nutritional status, genetic variability in CYP expression, or impaired liver
function due to liver disease can increase susceptibility to carbon tetrachloride (U.S. EPA, 2010).
For example, alcohol is known to induce CYP2E1 expression. Cases of acute toxicity from
occupational exposures indicate that heavy drinkers are more susceptible to carbon tetrachloride
Page 220 of 390
and this observation has been verified in numerous animal studies. Exposure to other chemicals
that induce P450 enzymes, including isopropanol, methanol, acetone, methyl ethyl ketone,
methyl isobutyl ketone, 2-butanone, phenobarbital, methamphetamine, nicotine,
trichloroethylene, polychlorinated and polybrominated biphenyls, DDT, mirex, and chlordecone
have also been shown to potentiate carbon tetrachloride liver toxicity (U.S. EPA, 2010; ATSDR,
2005).
The AEGL-2 values (See Section 3.2.4.1), which are the basis for the PODs for acute inhalation
exposures in this risk evaluation, were derived using an intraspecies uncertainty factor of 10 to
account for individuals who may be more susceptible to the toxic effects of carbon tetrachloride,
including greater potential of carbon tetrachloride-induced toxicity in individuals with histories
of alcohol usage. Susceptibility to carbon tetrachloride due to elevated (i.e., moderate to high)
alcohol use is in agreement with the known dispositional potentiation of carbon tetrachloride
toxicity by inducers of cytochrome CYP2E1 enzymes. The AEGL document states that the
variability in response to carbon tetrachloride is emphasized by the fact that an estimated
exposure at 63 ppm-h was fatal in a heavy drinker whereas controlled exposures at 190 ppm-h
were without effect for individuals not categorized as heavy drinkers. This exposure information
indicates that a three-fold exposure reduction to the NOEC value produces an extreme toxic
response in heavy drinkers, suggesting that a UF of 10 for intraspecies variability is protective of
heavy drinkers.
Age can influence susceptibility to carbon tetrachloride due to differences in metabolism,
antioxidant responses, and reduced kidney function in older adults. While lower CYP expression
may reduce susceptibility of older adults to carbon tetrachloride in some tissues, reduced kidney
function and increased CYP3A activity in the liver (indicated by animal studies) suggest that
older populations could be at greater risk of carbon tetrachloride-associated kidney damage (U.S.
EPA, 2010).
Nutrition has also been shown to influence susceptibility to carbon tetrachloride in animals. Food
restriction has been shown to increase liver toxicity of carbon tetrachloride. Diets low in
antioxidants increase lipid peroxidation and liver damage in following carbon tetrachloride
exposure (reversed with antioxidant supplementation) and zinc deficient diets increase carbon
tetrachloride-induced liver toxicity (U.S. EPA, 2010).
EPA identified groups of individuals with greater inhalation exposure as workers in occupational
scenarios. EPA examined worker exposures in this risk evaluation for several occupational
scenarios (see Section 2.4.1 for these exposure scenarios).
To account for variation in sensitivity within human populations intraspecies UFs were applied
for non-cancer effects. The UF values selected are described in Section 3.2.5.2.
Assumptions and Key Sources of Uncertainty The characterization of assumptions, variability and uncertainty may raise or lower the
confidence of the risk estimates. This Section describes the assumptions and uncertainties in the
exposure assessment, hazard/dose‐response and risk characterization.
Page 221 of 390
Occupational Exposure Assumptions and Uncertainties
EPA addressed variability in models by identifying key model parameters to apply a statistical
distribution that mathematically defines the parameter’s variability. EPA defined statistical
distributions for parameters using documented statistical variations where available. Uncertainty
is “the lack of knowledge about specific variables, parameters, models, or other factors” and can
be described qualitatively or quantitatively (U.S. EPA, 2001). The following Sections discuss
uncertainties in each of the assessed carbon tetrachloride use scenarios.
One overarching uncertainty is that exposures to carbon tetrachloride from outside the
workplaces are not included in the occupational assessment, which could lead to an
underestimate of occupational exposure. Another overarching uncertainty is that inhalation and
dermal exposures were assessed separately, which could lead to an underestimation of
occupational exposure. EPA considered the reasonably available information and used the best
available science to determine whether to consider aggregate or sentinel exposures for carbon
tetrachloride. There is low confidence in the result of aggregating the dermal and inhalation risks
for carbon tetrachloride in case of using an additive approach, due to the uncertainty in the data.
EPA does not have data that could be reliably modeled into the aggregate.
Number of Workers
There are a number of uncertainties surrounding the estimated number of workers potentially
exposed to carbon tetrachloride, as outlined below.
First, BLS’s OES employment data for each industry/occupation combination are only available
at the 3-, 4-, or 5-digit NAICS level, rather than the full 6-digit NAICS level. This lack of
granularity could result in an overestimate of the number of exposed workers if some 6-digit
NAICS are included in the less granular BLS estimates but are not, in reality, likely to use
carbon tetrachloride for the assessed applications. EPA addressed this issue by refining the OES
estimates using total employment data from the U.S. Census’s SUSB. However, this approach
considers that the distribution of occupation types (SOC codes) in each 6-digit NAICS is equal to
the distribution of occupation types at the parent 5-digit NAICS level. If the distribution of
workers in occupations with carbon tetrachloride exposure differs from the overall distribution of
workers in each NAICS, then this approach will result in inaccuracy.
Second, EPA’s judgments about which industries (represented by NAICS codes) and
occupations (represented by SOC codes) are associated with the uses assessed in this report are
based on EPA’s understanding of how carbon tetrachloride is used in each industry. Designations
of which industries and occupations have potential exposures is nevertheless subjective, and
some industries/occupations with few exposures might erroneously be included, or some
industries/occupations with exposures might erroneously be excluded. This would result in
inaccuracy but would be unlikely to systematically either overestimate or underestimate the
count of exposed workers.
Worker Activities
There are various potential worker activities and/or sites within each OES that could have
varying levels of exposures. If the exposure estimate is based on one or very few worker
Page 222 of 390
activities or sites within the OES, it could potentially underestimate or overestimate exposures
for other workers included in the same OES.
Occupational non-users (ONUs)
Exposures for occupational non-users could vary. Most data sources do not describe the
proximity of these employees to the exposure source. Exposure levels for the “occupational non-
user” category could have high variability depending on the specific work activity performed. It
is possible that some employees categorized as “occupational non-user” have exposures similar
to those in the “worker” category depending on their specific work activity pattern. ONUs are
likely a heterogeneous population of workers, and some could be exposed more than just
occasionally to high concentrations. It is unknown whether these uncertainties overestimate or
underestimate exposures.
EPA evaluated inhalation risks for acute and chronic exposures for ONUs. However, EPA did
not separately calculate inhalation risk estimates for ONUs and workers for some OES where
monitoring data was unavailable. There is uncertainty in the ONU inhalation risk estimate since
the modeled data does not distinguish between worker and ONU inhalation exposure estimates.
While the difference between the exposures of ONUs and the exposures of workers directly
handling the chemical generally cannot be quantified, ONU inhalation exposures are expected to
be lower than inhalation exposures for workers directly handling the chemical. When ONU
exposure data were not identified, EPA considered the ONU exposures to be equal to the central
tendency risk estimates for workers when determining ONU risk attributable to inhalation. While
this is likely health protective as it assumes ONU exposure is greater than that of 50% of the
workers, this is highly uncertain, and EPA has low confidence in these exposure estimates for
ONUs.
Analysis of Exposure Monitoring Data
This risk evaluation uses existing worker exposure monitoring data to assess exposure to carbon
tetrachloride during manufacturing. Some data sources may be inherently biased. For example,
bias may be present if exposure monitoring was conducted to address concerns regarding adverse
human health effects reported following exposures during use.
Some scenarios have limited exposure monitoring data in literature, if any. Where there are few
data points available, it is unlikely the results will be representative of worker exposure across
the industry.
Where sufficient data were available, the 95th and 50th percentile exposure concentrations were
calculated using available data. The 95th percentile exposure concentration is intended to
represent a high-end exposure level, while the 50th percentile exposure concentration represents
typical exposure level. The underlying distribution of the data, and the representativeness of the
available data, are not known. Where discrete data was not available, EPA used reported
statistics (i.e., median, mean, 90th percentile, etc.). Since EPA could not verify these values,
there is an added level of uncertainty.
EPA generally calculated ADC and LADC values assuming a high-end exposure duration of 250
days per year over 40 years and a typical exposure duration of 250 days per year over 31 years.
Page 223 of 390
This assumes the workers and occupational non-users are regularly exposed during their entire
working lifetime, which likely results in an overestimate. Individuals may change jobs during the
course of their career such that they are no longer exposed to carbon tetrachloride, resulting in
actual ADC and LADC values that are lower than the estimates presented.
Using Surrogate Monitoring Data to Assess Inhalation Exposures
Where EPA lacked inhalation monitoring data for a specific OES, EPA attempted to identify
surrogate monitoring data for a carbon tetrachloride OES where the worker activities and
industrial setting were expected to be similar to the OES being assessed. Due to these
similarities, EPA assumed the surrogate data was representative of exposure sources, routes, and
concentrations at the OES being assessed. There is some uncertainty as to the representativeness
of surrogate data, EPA expects the use of such data will provide a reasonable estimate of
exposure to workers.
Modeling Inhalation Exposures
The Tank Truck and Railcar Loading and Unloading Release and Inhalation Exposure Model
was created to estimate the airborne concentration associated with generic chemical loading
scenarios at industrial facilities. Specific uncertainties associated with this model are described
below:
• After each loading event, the model assumes saturated air containing carbon tetrachloride
that remains in the transfer hose and/or loading arm is released to air. The model
calculates the quantity of saturated air using design dimensions of loading systems
published in the OPW Engineered Systems catalog and engineering judgment. These
dimensions may not be representative of the whole range of loading equipment used at
industrial facilities handling carbon tetrachloride.
• The model estimates fugitive emissions from equipment leaks using total organic
compound emission factors from EPA’s Protocol for Equipment Leak Emission
Estimates (U.S. EPA, 1995), and engineering judgment on the likely equipment type used
for transfer (e.g., number of valves, seals, lines, and connections). The applicability of
these emission factors to carbon tetrachloride, and the accuracy of EPA’s assumption on
equipment type are not known.
• The model assumes the use of a vapor balance system to minimize fugitive emissions.
Although most industrial facilities are likely to use a vapor balance system when
loading/unloading volatile chemicals, EPA does not know whether these systems are used
by all facilities that potentially handle carbon tetrachloride.
• The model does not account for other potential sources of exposure at industrial facilities,
such as sampling, equipment cleaning, and other process activities that can contribute to a
worker’s overall 8-hr daily exposure. These model uncertainties could result in an
underestimate of the worker 8-hr exposure.
Modeling Dermal Exposures
To assess dermal exposure, EPA used a modified equation from the EPA/OPPT 2-Hand Dermal
Exposure to Liquids Model to calculate the dermal absorbed dose for both non-occluded and
occluded scenarios. The modified equation incorporates a “fraction absorbed (fabs)” parameter
to account for the evaporation of volatile chemicals and a “protection factor (PF)” to account for
Page 224 of 390
glove use. PF values will vary depending on the type of glove used and the presence of employee
training program.
The model considers an infinite dose scenario and does not account for the transient exposure
and exposure duration effect, which likely overestimates exposures. The model assumes one
exposure event per day, which likely underestimates exposure as workers often come into repeat
contact with the chemical throughout their workday. Surface areas of skin exposure are based on
skin surface area of hands from EPA’s Exposure Factors Handbook, but actual surface areas with
liquid contact are unknown and uncertain for all occupational exposure scenarios. For many
scenarios, the assumption of contact over the full area of two hands likely overestimates
exposures. Weight fractions are usually reported to CDR and shown in other literature sources as
ranges, and EPA assessed only upper ends of ranges. While the glove protection factors are
based on the ECETOC TRA model as described in Section 2.4.1.5 they are “what-if”
assumptions and are highly uncertain. EPA does not know the actual frequency, type, and
effectiveness of glove use in specific workplaces of the occupational exposure scenarios. Except
where specified above, it is unknown whether most of these uncertainties overestimate or
underestimate exposures. The representativeness of the modeling results toward the true
distribution of dermal doses for the occupational scenarios is uncertain.
More details on the dermal methodology are discussed in the supplemental document Final Risk
Evaluation for Carbon Tetrachloride, Supplemental Information on Releases and Occupational
Exposure Assessment (U.S. EPA, 2019c).
Environmental Exposure Assumptions and Uncertainties
As described in Appendix E and Section 2.3.1, a screening-level aquatic exposure assessment
was undertaken to evaluate ecological exposures in the U.S. that may be associated with releases
of carbon tetrachloride to surface waters. This assessment was intended as a first-tier, or
screening-level, evaluation. The top ten (by annual release/discharge amount) facilities as
reported in EPA’s Discharge Monitoring Reports (DMRs) were selected for use in exposure
modeling for each of five years from 2014 through 2018. Thus, not all reporting sites were
modeled, and the selected sites were not cross-walked with the conditions of use included in the
occupational engineering assessment.
For the purposes of this assessment, the number of release days were either 20 days or 250 days.
The reported annual release amounts from DMR were divided by these numbers of release days
to obtain the necessary kg/site-day release input. These assumptions are not based on associated
industry-specific data or standards, but on the assumptions to capture conservative environmental
concentrations for acute and chronic release scenarios. The 20 days of release is the assumption
for a chronic scenario, appropriate for comparison against a chronic COC, whereas 250 days of
release may be more typical for facilities that operate and release effluent frequently, such as
POTWs or treatment plants.
Uncertainties in the modeled surface water concentration estimates include the variable amount
of releases of carbon tetrachloride captured in the DMR database and regulated by the Office of
Water’s NPDES permitting process.

Page 225 of 390
Lastly, some facilities releasing carbon tetrachloride, such as POTWs, may not be associated
with a TSCA condition of use covered in this risk evaluation. Use of facility data to estimate
environmental exposures is constrained by a number of other uncertainties including: the
heterogeneity of processes and releases among facilities grouped within a given sector;
assumptions made regarding sector definitions used to select facilities covered under the scope;
and fluctuations in the level of production and associated environmental releases incurred as a
result of changes in standard operating procedures. Nevertheless, it is important to note that the
DMR dataset is based on the most comprehensive, best reasonably available data at a nationwide
scale. DMR is based on representative pollutant monitoring data at facility outfalls and
corresponding wastewater discharges. Any exceedances of permit levels are referred to EPA’s
Office Enforcement and Compliance Assurance.
Environmental Hazard Assumptions and Uncertainties
While the EPA has determined that sufficient data are available to characterize the overall
environmental hazards of carbon tetrachloride, uncertainties exist. To begin, while reasonable
attempts were made, the Agency was not able to obtain all the full scientific reports listed in
ECHA, SIAP, and NICNAS on carbon tetrachloride due to challenges that include ownership of
the studies by foreign sources. EPA did not use its information collection authority to obtain the
full scientific reports or translate foreign language studies listed in ECHA, SIAP, and NICNAS
because the robust summary endpoints from these sources align with the dataset EPA used to
assess the hazards of carbon tetrachloride. Additionally, EPA has successfully obtained the full
study reports for the most conservative endpoint values in the scientific literature that are driving
the acute and chronic concentrations of concern.
Furthermore, EPA used sub-chronic data, measuring a developmental effect in embryo and
larvae, to calculate the amphibian chronic COC, which introduces some uncertainty about
whether EPA is overestimating or underestimating chronic risk. Assessment factors (AFs) were
used to calculate the acute and chronic concentrations of concern for carbon tetrachloride. As
described in Appendix F, AFs account for differences in inter- and intra-species variability, as
well as laboratory-to-field variability and are routinely used within TSCA for assessing the
hazard of new industrial chemicals (with very limited environmental test data). Therefore, there
is uncertainty associated with the use of the specific AFs used in the hazard assessment. For
example, a standard AF has not been established for amphibians by the EPA under TSCA,
because there are few amphibian studies for industrial chemicals. It is unclear whether using an
assessment factor of 10 to calculate the acute COC value for amphibians using the sub-chronic
embryo-larvae test data is sufficiently protective or is overly protective of amphibian exposures
to carbon tetrachloride. There are additional factors that affect the potential for adverse effects in
aquatic organisms. Life-history factors and the habitat of aquatic organisms influence the
likelihood of exposure above the hazard benchmark in an aquatic environment.
Human Health Hazard Assumptions and Uncertainties
Toxicity data are limited for dermal exposures to carbon tetrachloride and for developmental
toxicity by the inhalation route. The available developmental toxicity by the inhalation route
suggests that carbon tetrachloride does not induce developmental effects from single exposures
during gestation (see Section 3.2.5.1.1). The available dermal data were used in a weight of
evidence approach to derive points of departures (POD) for occupational dermal exposures and
estimates of dermal absorption.
Page 226 of 390
The main source of uncertainty for the human health hazard is the lack of evidence in support of
a MOA for carcinogenesis of carbon tetrachloride for the different types of tumors observed in
animal and human studies. Therefore, a low dose linear cancer risk model for carbon
tetrachloride was used to calculate cancer risk for tumors other than liver, which is EPA’s
baseline approach to risk assessment when the MOA is unknown or not sufficiently supported by
the evidence. A threshold cancer risk model was used to calculate cancer risk for liver tumors
based on a regenerative hyperplasia cancer MOA for liver cancer.
Several uncertainties affected the dermal risk assessment. Evaporation from skin could occur (if
in an aqueous solution, evaporation may be less likely). Route-to-route extrapolation was used to
calculate a human equivalent dermal dose for acute and chronic exposures. Inhalation to dermal
route-to-route extrapolation assumes that the inhalation route of exposure is most relevant to
dermal exposures, as carbon tetrachloride undergoes first-pass metabolism in the liver for oral
exposures.
The BMDL10 value for continuous inhalation exposures was extrapolated to shorter exposure
durations using the equation Cn × t = k, where an empirical value of n was determined to be 2.5
based on rat lethality data (NRC, 2014; Ten Berge et al., 1986). The validity of this extrapolation
is supported by similar time scaling processes conducted in the generation of AEGL values.
Uncertainties associated to this extrapolation are discussed in U.S. EPA, (U.S. EPA, 2002) (see
Section 3.2.5.2.2).
Risk Characterization Confidence Levels
Environmental Risk
EPA has moderate confidence in the risk estimates from the TSCA conditions of use and
exposure pathways within the scope of the risk evaluation for carbon tetrachloride. EPA used
high end exposures and modeled surface water concentrations and the most sensitive taxonomic
groups (highest toxicity)/environmentally protective acute and chronic COCs. Uncertainties
associated with risk estimates are described in Sections 4.1, 4.4.2, and 4.4.3.
Human Health Risk
There is medium to high confidence in the risk estimates for inhalation exposures. The PODs for
non-cancer and cancer effects from acute or chronic exposures are rated with at least medium
confidence (see Section 3.2.5.3). Exposure estimates from monitoring/surrogate monitoring data
(i.e., manufacturing and processing COUs) are based on a robust monitoring dataset (i.e., > 100
data points), reflecting high confidence in resulting exposure estimates. Exposure estimates for
all the other COUs are based on modeling or monitoring data with limited datapoints (i.e.,
OBOD cleanup process in DoD). There is congruency between the exposure estimates based on
the limited monitoring data for the OBOD cleanup (i.e., a process that last 1-2 hrs/day) and
estimates based on the Tank Truck and Railcar Loading and Unloading Release and Inhalation
Exposure Model for worker exposure during container and truck unloading activities that occur
at industrial facilities. The fact that there is congruency in the resulting exposure estimates
suggest at least medium confidence in those exposure estimates.

Page 227 of 390
There is low confidence in the risk estimates for dermal exposures. The lack of quantitative data
on dermal absorption for carbon tetrachloride affects the derivation of accurate dermal PODs and
the modeling of dermal exposures. The conservative assumptions used to derive the PODs and
exposure estimate are likely to result in risk overestimations.
Aggregate or Sentinel Exposures Section 6(b)(4)(F)(ii) of TSCA requires the EPA, as a part of the risk evaluation, to describe
whether aggregate or sentinel exposures under the conditions of use were considered and the
basis for their consideration. The EPA has defined aggregate exposure as “the combined
exposures to an individual from a single chemical substance across multiple routes and across
multiple pathways” (40 CFR § 702.33). In this risk evaluation exposure is limited to exposure to
carbon tetrachloride by both inhalation and dermal contact only. Inhalation exposure is specified
by the air concentration encountered as a function of time during the workday. Dermal contact is
characterized by the surface area of skin (hands) exposed, and the duration of the dermal
exposure. For workplace exposures inhalation and dermal exposures are assumed to be only
simultaneous (both end at the end of the task, shift, or workday).
Quantitative information on the dermal absorption of carbon tetrachloride is limited. This data
limitation hinders the accuracy of estimated internal doses from dermal exposures. On the other
hand, carbon tetrachloride is identified and labeled as a skin irritant and sensitizer, which
suggests that workers are less likely to not be wearing gloves when handling the chemical. Based
on this assumption, the occurrence of aggregate exposures including dermal exposures without
gloves is expected to be highly unlikely especially for chronic aggregate exposures.
EPA has determined that using the high-end risk estimate for inhalation and dermal risks
separately as the basis for the unreasonable risk determination is a best available science
approach. There is low confidence in the result of aggregating the dermal and inhalation risks for
this chemical if EPA uses an additive approach, due to the uncertainty in the data. EPA does not
have data that could be reliably modeled for the aggregate exposure, which would be a more
accurate approach than adding, such as through a PBPK model. Using an additive approach to
aggregate risk in this case could result in an overestimate of risk. Given all the limitations that
exist with the data, EPA’s approach is the best available science.
The EPA defines sentinel exposure as “the exposure from a single chemical substance that
represents the plausible upper bound of exposure relative to all other exposures within a broad
category of similar or related exposures” (40 CFR § 702.33). In this risk evaluation, the EPA
considered sentinel exposure the highest exposure given the details of the conditions of use and
the potential exposure scenarios – for example, workers who perform activities with higher
exposure potential, or certain physical factors like body weight or skin surface area exposed.
EPA characterized high-end exposures in evaluating exposure using both monitoring data and
modeling approaches. Where statistical data are available, EPA typically uses the 95th percentile
value of the available dataset to characterize high-end exposure for a given condition of use.
Greater inhalation exposures to carbon tetrachloride are estimated for the Domestic
Manufacturing and Processing as Reactant/Intermediate COUs than all the other COUs in this
risk evaluation (see Table 4-7 and Table 4-8).
Page 228 of 390
5 Unreasonable Risk Determination
Overview
In each risk evaluation under TSCA Section 6(b), EPA determines whether a chemical substance
presents an unreasonable risk of injury to health or the environment, under the conditions of use.
These determinations do not consider costs or other non-risk factors. In making these
determinations, EPA considers relevant risk-related factors, including, but not limited to: the
effects of the chemical substance on health and human exposure to such substance under the
conditions of use (including cancer and non-cancer risks); the effects of the chemical substance
on the environment and environmental exposure under the conditions of use; the population
exposed (including any potentially exposed or susceptible subpopulations (PESS)); the severity
of hazard (including the nature of the hazard, the irreversibility of the hazard); and uncertainties.
EPA also takes into consideration the Agency’s confidence in the data used in the risk estimate.
This includes an evaluation of the strengths, limitations, and uncertainties associated with the
information used to inform the risk estimate and the risk characterization. This approach is in
keeping with the Agency’s final rule, Procedures for Chemical Risk Evaluation Under the
Amended Toxic Substances Control Act (82 FR 33726).22
This section describes the final unreasonable risk determinations for the conditions of use in the
scope of the risk evaluation. The final unreasonable risk determinations are based on the risk
estimates in the final risk evaluation, which may differ from the risk estimates in the draft risk
evaluation due to peer review and public comments. Therefore, the final unreasonable risk
determinations of some conditions of use may differ from those in the draft risk evaluation.
Human Health
EPA’s risk evaluation identified liver toxicity and cancer adverse effects from chronic inhalation and
dermal exposures to carbon tetrachloride. EPA did not identify risks from acute exposures for central
nervous system depression, which is the most sensitive endpoint for non-cancer effects from acute
exposures. The health risk estimates for all conditions of use are in Section 4.5 (Table 4-8 and Table
4-11).
For the carbon tetrachloride risk evaluation, EPA identified as Potentially Exposed or Susceptible
Subpopulations: workers and ONUs, including men, women of reproductive age, and adolescents, who
metabolize carbon tetrachloride to reactive metabolites faster than others, including those with elevated
(moderate-high) alcohol usage, older adults, and those with antioxidant or zinc deficient diets.
EPA evaluated exposures to workers and ONUs using reasonably available monitoring and modeling
data for inhalation and dermal exposures, as applicable. For example, EPA assumed that ONUs do not
have direct contact with carbon tetrachloride; therefore, non-cancer effects and cancer from dermal
exposures to carbon tetrachloride are not expected and were not evaluated. The description of the data
22 This risk determination is being issued under TSCA Section 6(b) and the terms used, such as unreasonable risk,
and the considerations discussed are specific to TSCA. Other statutes have different authorities and mandates and
may involve risk considerations other than those discussed here.
Page 229 of 390
used for human health exposure is in Section 2.4. Uncertainties in the analysis are discussed in Section
4.4 and considered in the unreasonable risk determination for each condition of use presented below,
including the fact that the dermal model used does not address variability in exposure duration and
frequency.
EPA did not evaluate risks to the general population from any conditions of use and the unreasonable
risk determinations do not account for any risks to the general population. Additional details regarding
the general population are in Section 1.4.3.
5.1.1.1 Non-Cancer Risk Estimates
The risk estimates of non-cancer effects, described with MOEs, refers to adverse health effects
associated with health endpoints other than cancer, including to the body’s organ systems, such as
reproductive/developmental effects, cardiac and lung effects, and kidney and liver effects. The MOE is
the point of departure (POD) (an approximation of the no-observed adverse effect level (NOAEL) or
benchmark dose level (BMDL)) for a specific health endpoint divided by the exposure concentration for
the specific scenario of concern. Section3.2.5 presents the PODs for non-cancer effects for carbon
tetrachloride and Section 4.2 presents the MOEs for non-cancer effects.
The MOEs are compared to a benchmark MOE. The benchmark MOE accounts for the total uncertainty
in a POD, including, as appropriate: (1) the variation in sensitivity among the members of the human
population (i.e., intrahuman/intraspecies variability); (2) the uncertainty in extrapolating animal data to
humans (i.e., interspecies variability); (3) the uncertainty in extrapolating from data obtained in a study
with less-than-lifetime exposure to lifetime exposure (i.e., extrapolating from subchronic to chronic
exposure); and (4) the uncertainty in extrapolating from a lowest observed adverse effect level (LOAEL)
rather than from a NOAEL. A lower benchmark MOE (e.g., 30) indicates greater certainty in the data
(because fewer of the default UFs relevant to a given POD as described above were applied). A higher
benchmark MOE (e.g., 1000) would indicate more uncertainty for specific endpoints and scenarios.
However, these are often not the only uncertainties in a risk evaluation. The benchmark MOE for acute
and chronic non-cancer risks for carbon tetrachloride is 10 and 30, respectively (accounting for
interspecies and intraspecies variability). Additional information regarding the benchmark MOE is in
Section 4.2.1.
5.1.1.2 Cancer Risk Estimates
EPA presents in this risk evaluation two approaches for assessment of carcinogenic risk from carbon
tetrachloride: a linear extrapolation approach for adrenal gland and brain tumors in conjunction with a
threshold approach for assessing risks for liver tumors. This is based on considerations for the modes of
action for the different cancers evaluated. More information on the reasons for the two approaches and
the overall cancer mode of action conclusions are in Section 3.2.4.3.
For adrenal gland and brain tumors, EPA used a linear extrapolation approach. The basis for this
approach is described in detail in Section 3.2.4.3.2, with the cancer inhalation unit risk and dermal slope
factor described in Section 3.2.5.2.5. Using this approach, cancer risk estimates represent the
incremental increase in probability of an individual in an exposed population developing cancer over a
lifetime (excess lifetime cancer risk (ELCR)) following exposure to the chemical. Standard cancer
benchmarks used by EPA and other regulatory agencies are an increased cancer risk above benchmarks

Page 230 of 390
ranging from 1 in 1,000,000 to 1 in 10,000 (i.e., 1x10⁻⁶ to 1x10⁻⁴) depending on the subpopulation
exposed.23
EPA, consistent with 2017 NIOSH guidance,24 used 1x10⁻⁴ as the benchmark for the purposes of this
unreasonable risk determination for individuals in industrial and commercial work environments. It is
important to note that 1x10⁻⁴ is not a bright line and EPA has discretion to make unreasonable risk
determinations based on other cancer risk benchmarks as appropriate.
For liver tumors, EPA used a threshold approach for assessing risks. Section 3.2.5.2.6 presents the PODs
for liver cancer effects for carbon tetrachloride and Section 4.2 presents the MOEs for liver cancer
effects. Like non-cancer effects, the MOE for cancer effects are compared to a benchmark MOE. The
benchmark MOE for liver cancer risks for carbon tetrachloride is 300 (accounting for interspecies and
intraspecies variability).
5.1.1.3 Determining Unreasonable Risk of Injury to Health
Calculated risk estimates (MOEs or added cancer risk estimates) can provide a risk profile by presenting
a range of estimates for different health effects for different conditions of use. A calculated MOE that is
less than the benchmark MOE supports a determination of unreasonable risk of injury to health, based
on non-cancer or certain cancer effects. Similarly, a calculated added cancer risk estimate that is greater
than the cancer benchmark supports a determination of unreasonable risk of injury to health from cancer.
Whether EPA makes a determination of unreasonable risk depends upon other risk-related factors, such
as the endpoint under consideration, the reversibility of effect, exposure-related considerations (e.g.,
duration, magnitude, or frequency of exposure, or population exposed), and the confidence in the
information used to inform the hazard and exposure values. A calculated MOE greater than the
benchmark MOE or a calculated added cancer risk estimate less than the benchmark, alone do not
support a determination of no unreasonable risk, since EPA may consider other risk-based factors when
making an unreasonable risk determination.
When making an unreasonable risk determination based on injury to workers’ health (who are one
example of PESS), EPA also makes assumptions regarding workplace practices and the implementation
of the required hierarchy of controls from OSHA. EPA assumes that feasible exposure controls,
including engineering controls, administrative controls, or use of personal protective equipment (PPE)
are implemented in the workplace. EPA’s decisions for unreasonable risk to workers are based on high
end exposure estimates, in order to capture not only exposures for PESS but also to account for the
uncertainties related to whether or not workers are using PPE. However, EPA does not consider that
23 As an example, when EPA’s Office of Water in 2017 updated the Human Health Benchmarks for Pesticides, the
benchmark for a “theoretical upper-bound excess lifetime cancer risk” from pesticides in drinking water was
identified as 1 in 1,000,000 to 1 in 10,000 over a lifetime of exposure (EPA. Human Health Benchmarks for
Pesticides: Updated 2017 Technical Document (pp.5). (EPA 822-R -17 -001). Washington, DC: U.S. Environmental
Protection Agency, Office of Water. January 2017. https://www.epa.gov/sites/production/files/2015-
10/documents/hh-benchmarks-techdoc.pdf). Similarly, EPA’s approach under the Clean Air Act to evaluate residual
risk and to develop standards is a two-step approach that “includes a presumptive limit on maximum individual
lifetime [cancer] risk (MIR) of approximately 1 in 10 thousand” and consideration of whether emissions standards
provide an ample margin of safety to protect public health “in consideration of all health information, including the
number of persons at risk levels higher than approximately 1 in 1 million, as well as other relevant factors” (54 FR
38044, 38045, September 14, 1989). 24 NIOSH Current intelligence bulletin 68: NIOSH chemical carcinogen policy (Whittaker et al., 2016).
Page 231 of 390
ONUs use PPE. EPA recognizes that OSHA’s PEL for carbon tetrachloride is 10 ppm. California
adopted a PEL of 2 ppm and the American Conference of Governmental Industrial Hygienists
(ACGIH™) adopted a Threshold Limit Value™ (TLV™) of 5 ppm. For each condition of use, based on
the reasonably available information and professional judgment, EPA assumes the use of respirators
with an APF of 50, and gloves with a PF of 5. Once EPA has applied the appropriate PPE assumption
for a particular condition of use in each unreasonable risk determination, EPA also assumes that the PPE
is used in a manner that achieves the stated APF or PF.
In the carbon tetrachloride risk characterization, central nervous system effects and liver toxicity were
identified as the most sensitive endpoints for non-cancer adverse effects from acute or chronic inhalation
and dermal exposures for all conditions of use. EPA also considered cancer risks estimates from chronic
dermal or inhalation exposures in the unreasonable risk determination. The carbon tetrachloride risk
determination considers the uncertainties associated with the reasonably available information to justify
the linear cancer dose-response model and the threshold dose-response model when compared to other
available models. The cancer analysis is described in Section3.2.5.
When making a determination of unreasonable risk, the Agency has a higher degree of confidence where
uncertainty is low. Similarly, EPA has high confidence in the hazard and exposure characterizations
when, for example, the basis for characterizations is measured or monitoring data or a robust model and
the hazards identified for risk estimation are relevant for conditions of use. Where EPA has made
assumptions in the scientific evaluation, whether or not those assumptions are protective is also a
consideration. Additionally, EPA considers the central tendency and high-end exposure levels when
determining the unreasonable risk. High-end risk estimates (e.g., 95th percentile) are generally intended
to cover individuals or sub-populations with greater exposure (PESS) and central tendency risk
estimates are generally estimates of average or typical exposure. EPA may make a determination of no
unreasonable risk for conditions of use where the substance’s hazard and exposure potential, or where
the risk-related factors described previously, lead the Agency to determine that the risks are not
unreasonable.
Environment
EPA calculated a risk quotient (RQ) to compare environmental concentrations against an effect level.
The environmental concentration is determined based on the levels of the chemical released to the
environment (e.g., surface water, sediment, soil, biota) under the conditions of use, based on the fate
properties, release potential, and reasonably available environmental monitoring data. The effect level is
calculated using concentrations of concern that represent hazard data for aquatic and sediment-dwelling,
organisms. Section 4.1 provides more detail regarding the risk quotient for carbon tetrachloride.
5.1.2.1 Determining Unreasonable Risk of Injury to the Environment
An RQ equal to 1 indicates that the exposures are the same as the concentration that causes effects. An
RQ less than 1, when the exposure is less than the effect concentration, supports a determination that
there is no unreasonable risk of injury to the environment. An RQ greater than 1, when the exposure is
greater than the effect concentration, supports a determination that there is unreasonable risk of injury to
the environment. Consistent with EPA’s human health evaluations, other risk-based factors may be
considered (e.g., confidence in the hazard and exposure characterization, duration, magnitude,
uncertainty) for purposes of making an unreasonable risk determination.
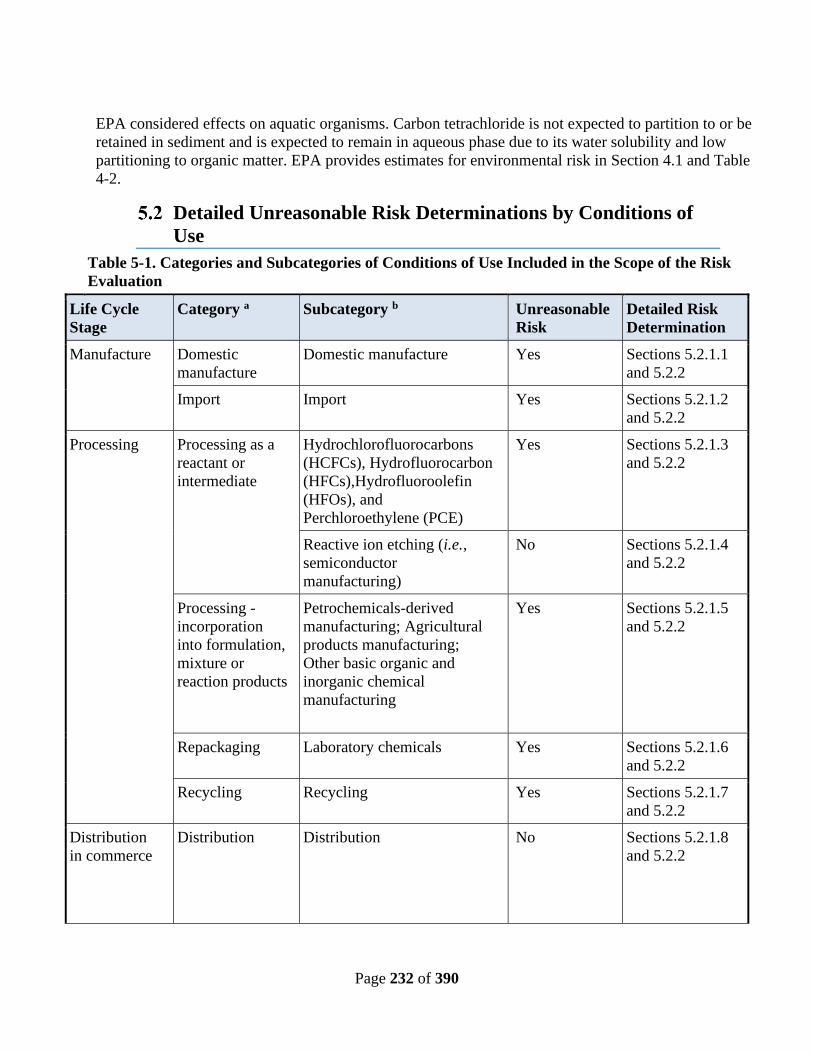
Page 232 of 390
EPA considered effects on aquatic organisms. Carbon tetrachloride is not expected to partition to or be
retained in sediment and is expected to remain in aqueous phase due to its water solubility and low
partitioning to organic matter. EPA provides estimates for environmental risk in Section 4.1 and Table
4-2.
Detailed Unreasonable Risk Determinations by Conditions of
Use
Table 5-1. Categories and Subcategories of Conditions of Use Included in the Scope of the Risk
Evaluation
Life Cycle
Stage
Category a Subcategory b Unreasonable
Risk
Detailed Risk
Determination
Manufacture Domestic
manufacture
Domestic manufacture Yes Sections 5.2.1.1
and 5.2.2
Import Import Yes Sections 5.2.1.2
and 5.2.2
Processing Processing as a
reactant or
intermediate
Hydrochlorofluorocarbons
(HCFCs), Hydrofluorocarbon
(HFCs),Hydrofluoroolefin
(HFOs), and
Perchloroethylene (PCE)
Yes Sections 5.2.1.3
and 5.2.2
Reactive ion etching (i.e.,
semiconductor
manufacturing)
No Sections 5.2.1.4
and 5.2.2
Processing -
incorporation
into formulation,
mixture or
reaction products
Petrochemicals-derived
manufacturing; Agricultural
products manufacturing;
Other basic organic and
inorganic chemical
manufacturing
Yes Sections 5.2.1.5
and 5.2.2
Repackaging Laboratory chemicals Yes Sections 5.2.1.6
and 5.2.2
Recycling Recycling Yes Sections 5.2.1.7
and 5.2.2
Distribution
in commerce
Distribution Distribution No Sections 5.2.1.8
and 5.2.2
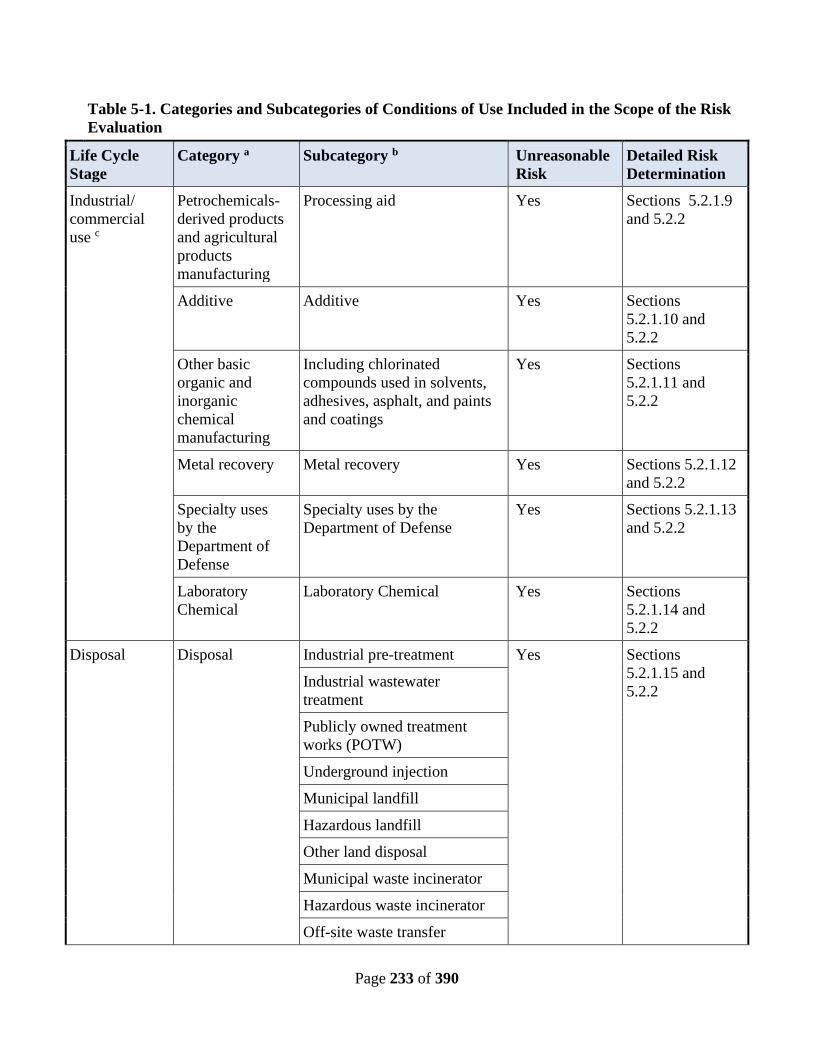
Page 233 of 390
Table 5-1. Categories and Subcategories of Conditions of Use Included in the Scope of the Risk
Evaluation
Life Cycle
Stage
Category a Subcategory b Unreasonable
Risk
Detailed Risk
Determination
Industrial/
commercial
use c
Petrochemicals-
derived products
and agricultural
products
manufacturing
Processing aid Yes Sections 5.2.1.9
and 5.2.2
Additive Additive Yes Sections
5.2.1.10 and
5.2.2
Other basic
organic and
inorganic
chemical
manufacturing
Including chlorinated
compounds used in solvents,
adhesives, asphalt, and paints
and coatings
Yes Sections
5.2.1.11 and
5.2.2
Metal recovery Metal recovery Yes Sections 5.2.1.12
and 5.2.2
Specialty uses
by the
Department of
Defense
Specialty uses by the
Department of Defense
Yes Sections 5.2.1.13
and 5.2.2
Laboratory
Chemical
Laboratory Chemical Yes Sections
5.2.1.14 and
5.2.2
Disposal Disposal Industrial pre-treatment Yes Sections
5.2.1.15 and
5.2.2
Industrial wastewater
treatment
Publicly owned treatment
works (POTW)
Underground injection
Municipal landfill
Hazardous landfill
Other land disposal
Municipal waste incinerator
Hazardous waste incinerator
Off-site waste transfer
Page 234 of 390
Table 5-1. Categories and Subcategories of Conditions of Use Included in the Scope of the Risk
Evaluation
Life Cycle
Stage
Category a Subcategory b Unreasonable
Risk
Detailed Risk
Determination a
These categories of conditions of use appear in the Life Cycle Diagram, reflect CDR codes, and broadly represent additional
information regarding all conditions of use of carbon tetrachloride. b
These subcategories reflect more specific information regarding the conditions of use of carbon
tetrachloride. c Although EPA has identified both industrial and commercial uses here for purposes of distinguishing scenarios in this
document, the Agency interprets the authority over “any manner or method of commercial use” under TSCA Section 6(a)(5)
to reach both.
Human Health
Manufacture – Domestic Manufacture – Domestic Manufacture
(Domestic manufacture)
Section 6(b)(4)(A) unreasonable risk determination for domestic manufacture of carbon tetrachloride:
Presents an unreasonable risk of injury to health (workers and ONUs).
For workers, EPA found that there was an unreasonable risk of cancer effects from dermal
exposures at the central tendency and high-end, even when assuming use of PPE. For
ONUs, EPA found that there was an unreasonable risk of cancer from chronic inhalation
exposures at the central tendency and high-end and non-cancer effects from chronic (liver
toxicity) inhalation exposures at the high-end.
EPA’s determination that the domestic manufacturing of carbon tetrachloride presents an
unreasonable risk is based on the comparison of the risk estimates for non-cancer effects and
cancer to the benchmarks (Table 4-15) and other considerations. As explained in Section 5.1,
EPA considered the health effects of carbon tetrachloride, the exposures from the condition of
use, and the uncertainties in the analysis (Section 4.4):
• For workers, when assuming use of gloves with PF of 20, the risk estimates of cancer effects
(from both approaches) for dermal exposures at the high-end support an unreasonable risk
determination.
• For workers, when assuming the use of respirators with APF of 50, the risk estimates of cancer
effects (from both approaches) and non-cancer effects from chronic inhalation exposures at the
high-end do not support an unreasonable risk determination. The risk estimates of non-cancer
effects from acute inhalation exposures at the central tendency and high-end do not support an
unreasonable risk determination.
• For ONUs, the risk estimates of cancer effects (from both approaches) at the central
tendency and high-end support an unreasonable risk determination.
• For ONUs, the risk estimates of non-cancer effects from acute (CNS) inhalation exposures at the
high-end do not support an unreasonable risk determination.
• Cancer risks were assessed using two approaches: linear extrapolation and threshold. The
unreasonable risk determination is based on the risk estimates derived from both approaches.

Page 235 of 390
• Inhalation exposures were assessed using personal breathing zone monitoring data from
two sources for workers and ONUs. The data are directly applicable to this condition of
use; however, the data may not be representative of exposures across the range of
facilities that manufacture carbon tetrachloride.
• Dermal exposures were assessed using modeled data.
In summary, the risk estimates, the health effects of carbon tetrachloride, the exposures, and
consideration of uncertainties support EPA’s determination that there is an unreasonable risk of injury to
health (workers and ONUs) from domestic manufacturing of carbon tetrachloride.
Manufacture – Import – Import (Import)
Section 6(b)(4)(A) unreasonable risk determination for import of carbon tetrachloride: Presents an
unreasonable risk of injury to health (workers and ONUs).
For workers, EPA found that there was an unreasonable risk of cancer effects from dermal
exposures at the central tendency and high-end, even when assuming use of PPE. For
ONUs, EPA found that there was an unreasonable risk of cancer from chronic inhalation
exposures at the central tendency.
EPA’s determination that the import of carbon tetrachloride presents an unreasonable risk is based on
the comparison of the risk estimates for non-cancer effects and cancer to the benchmarks (Table 4-15)
and other considerations. As explained in Section 5.1, EPA considered the health effects of carbon
tetrachloride, the exposures from the condition of use, and the uncertainties in the analysis (Section 4.4),
including uncertainties related to the exposures for ONUs:
• For workers, when assuming use of gloves with PF of 20, the risk estimates of cancer effects
(from both approaches) for dermal exposures at the high-end support an unreasonable risk
determination.
• For workers, when assuming the use of respirators with APF of 50, the risk estimates of cancer
effects (from both approaches) and non-cancer effects from chronic inhalation exposures at the
high-end do not support an unreasonable risk determination. The risk estimates of non-cancer
effects from acute inhalation exposures at the central tendency and high-end do not support an
unreasonable risk determination.
• For ONUs, the risk estimates of cancer effects (from both approaches) at the central tendency
support an unreasonable risk determination.
• For ONUs, the risk estimates of non-cancer effects from acute (CNS) and chronic (liver toxicity)
inhalation exposures at the central tendency do not support an unreasonable risk determination.
• Based on EPA’s analysis, the data for worker and ONU inhalation exposures could not be
distinguished; however, ONU inhalation exposures are assumed to be lower than inhalation
exposures for workers directly handling the chemical substance. To account for this uncertainty,
EPA considered the workers’ central tendency risk estimates from inhalation exposures when
determining ONUs’ unreasonable risk.
• Cancer risks were assessed using two approaches: linear extrapolation and threshold. The
unreasonable risk determination is based on the risk estimates derived from both approaches.
• Inhalation exposures were assessed using surrogate data from two sources. Carbon tetrachloride
may be imported into the United States in bulk containers and may be repackaged into smaller

Page 236 of 390
containers for resale. EPA assumed the worker unloading activity will result in exposures similar
to unloading/loading activities at manufacturing sites; however, the data may not be
representative of the work activities and exposures across the range of importing facilities.
• Dermal exposures were assessed using modeled data.
In summary, the risk estimates, the health effects of carbon tetrachloride, the exposures, and
consideration of uncertainties support EPA’s determination that there is an unreasonable risk of injury to
health (workers and ONUs) from import of carbon tetrachloride.
Processing – Processing as a reactant in the production of
hydrochlorofluorocarbon, hydrofluorocarbon, hydrofluoroolefin, and
perchloroethylene
Section 6(b)(4)(A) unreasonable risk determination for processing carbon tetrachloride as a reactant in
the production of hydrochlorofluorocarbon, hydrofluorocarbon, hydrofluoroolefin, and
perchloroethylene: Presents an unreasonable risk of injury to health (workers and ONUs).
For workers, EPA found that there was an unreasonable risk of cancer effects from dermal
exposures at the central tendency and high-end, even when assuming use of PPE. For
ONUs, EPA found that there was an unreasonable risk of cancer from chronic inhalation
exposures at the central tendency and high-end and non-cancer effects from chronic (liver
toxicity) inhalation exposures at the high-end.
EPA’s determination that the processing of carbon tetrachloride as a reactant in the production of
hydrochlorofluorocarbon, hydrofluorocarbon, hydrofluoroolefin, and perchloroethylene presents an
unreasonable risk is based on the comparison of the risk estimates for non-cancer effects and cancer to
the benchmarks (Table 4-15) and other considerations. As explained in Section 5.1, EPA considered the
health effects of carbon tetrachloride, the exposures from the condition of use, and the uncertainties in
the analysis (Section 4.4):
• For workers, when assuming use of gloves with PF of 20, the risk estimates of cancer effects
(from both approaches) for dermal exposures at the high-end support an unreasonable risk
determination.
• For workers, when assuming the use of respirators with APF of 50, the risk estimates of cancer
effects (from both approaches) and non-cancer effects from chronic inhalation exposures at the
high-end do not support an unreasonable risk determination. The risk estimates of non-cancer
effects from acute inhalation exposures at the central tendency and high-end do not support an
unreasonable risk determination.
• For ONUs, the risk estimates of cancer effects (from both approaches) at the central tendency
and high-end support an unreasonable risk determination.
• For ONUs, the risk estimates of non-cancer effects from acute (CNS) inhalation exposures at the
high-end do not support an unreasonable risk determination.
• Cancer risks were assessed using two approaches: linear extrapolation and threshold. The
unreasonable risk determination is based on the risk estimates derived from both approaches.
• EPA recognizes that the manufacturing setting and associated worker activities are
similar for both the manufacture and processing as a reactant or intermediate of carbon
tetrachloride. Therefore, inhalation exposures for this condition of use were assessed
Page 237 of 390
using personal breathing zone monitoring data from two sources for workers and ONUs
in a manufacturing setting; however, the data may not be representative of the work
activities and exposures across the range of processing facilities.
• Dermal exposures were assessed using modeled data.
In summary, the risk estimates, the health effects of carbon tetrachloride, the exposures, and
consideration of uncertainties support EPA’s determination that there is unreasonable risk of injury to
health (workers and ONUs) from processing carbon tetrachloride as a reactant in the production of
hydrochlorofluorocarbon, hydrofluorocarbon, hydrofluoroolefin, and perchloroethylene.
Processing – Processing as reactant/intermediate in reactive ion
etching
Section 6(b)(4)(A) unreasonable risk determination for processing of carbon tetrachloride as a
reactant/intermediate in reactive ion etching (e.g., semiconductor manufacture): Does not present an
unreasonable risk of injury to health (workers and ONUs).
A quantitative evaluation of the occupational exposures attributable to this condition of use is not
included in the risk evaluation because EPA estimates that worker exposures to carbon tetrachloride
during reactive ion etching are negligible. Due to the performance requirements of products typically
produced using this technique, carbon tetrachloride is typically applied in small quantities under a fume
hood and/or inside a highly controlled work area (a Class 1 clean room), thus eliminating or
significantly reducing the potential for exposures (Section 2.4.1.7.5).
Processing – Incorporation into formulation, mixture or reaction
products-Petrochemicals-derived manufacturing, agricultural products
manufacturing, and other basic organic and inorganic chemical manufacturing
Section 6(b)(4)(A) unreasonable risk determination for processing carbon tetrachloride into a
formulation, mixture or reaction product – Petrochemicals-derived manufacturing; Agricultural products
manufacturing; Other basic organic and inorganic chemical manufacturing: Presents an unreasonable
risk of injury to health (workers and ONUs).
For workers, EPA found that there was an unreasonable risk of cancer effects from dermal
exposures at the central tendency and high-end, even when assuming use of PPE. For
ONUs, EPA found that there was an unreasonable risk of cancer from chronic inhalation
exposures at the central tendency and high-end and non-cancer effects from chronic (liver
toxicity) inhalation exposures at the high-end.
Page 238 of 390
EPA’s determination that the processing of carbon tetrachloride into a formulation, mixture or reaction
product (petrochemicals-derived manufacturing; agricultural products manufacturing; other basic
organic and inorganic chemical manufacturing) presents an unreasonable risk is based on the
comparison of the risk estimates for non-cancer effects and cancer to the benchmarks (Table 4-15) and
other considerations. As explained in Section 5.1, EPA considered the health effects of carbon
tetrachloride, the exposures from the condition of use, and the uncertainties in the analysis (Section 4.4):
• For workers, when assuming use of gloves with PF of 20, the risk estimates of cancer effects
(from both approaches) for dermal exposures at the high-end support an unreasonable risk
determination.
• For workers, when assuming the use of respirators with APF of 50, the risk estimates of cancer
effects (from both approaches) and non-cancer effects from chronic inhalation exposures at the
high-end do not support an unreasonable risk determination. The risk estimates of non-cancer
effects from acute inhalation exposures at the central tendency and high-end do not support an
unreasonable risk determination.
• For ONUs, the risk estimates of cancer effects (from both approaches) at the central
tendency and high-end support an unreasonable risk determination.
• For ONUs, the risk estimates of non-cancer effects from acute (CNS) inhalation exposures at the
high-end do not support an unreasonable risk determination.
• Cancer risks were assessed using two approaches: linear extrapolation and threshold. The
unreasonable risk determination is based on the risk estimates derived from both approaches.
• EPA recognizes that the manufacturing setting and associated worker activities are
similar for the manufacture of carbon tetrachloride, processing as a reactant or
intermediate, and processing of carbon tetrachloride into a formulation, mixture or
reaction product. Therefore, to assess inhalation exposures, EPA assessed this condition
of use under the Processing as a Reactant exposure scenario using personal breathing
zone monitoring data from two sources for workers and ONUs in a manufacturing setting;
however, the data may not be representative of the work activities and exposures across the range
of processing facilities.
• Dermal exposures were assessed using modeled data.
In summary, the risk estimates, the health effects of carbon tetrachloride, the exposures, and
consideration of uncertainties support EPA’s determination that there is unreasonable risk of injury to
health (workers and ONUs) from processing of carbon tetrachloride into a formulation, mixture or
reaction product (other basic organic and inorganic chemical manufacturing).
Processing – Repackaging of carbon tetrachloride for use in
laboratory chemicals
Section 6(b)(4)(A) unreasonable risk determination for repackaging of carbon tetrachloride for use in
laboratory chemicals: Presents an unreasonable risk of injury to health (workers and ONUs).
For workers, EPA found that there was an unreasonable risk of cancer effects from dermal
exposures at the central tendency and high-end, even when assuming use of PPE. For
ONUs, EPA found that there was an unreasonable risk of cancer from chronic inhalation
exposures at the central tendency.
Page 239 of 390
EPA’s determination that the repackaging of carbon tetrachloride for use in laboratory chemicals
presents an unreasonable risk is based on the comparison of the risk estimates for non-cancer effects and
cancer to the benchmarks (Table 4-15) and other considerations. As explained in Section 5.1, EPA
considered the health effects of carbon tetrachloride, the exposures from the condition of use, and the
uncertainties in the analysis (Section 4.4), including uncertainties related to the exposures for ONUs:
• For workers, when assuming use of gloves with PF of 20, the risk estimates of cancer effects
(from both approaches) for dermal exposures at the high-end support an unreasonable risk
determination.
• For workers, when assuming the use of respirators with APF of 50, the risk estimates of cancer
effects (from both approaches) and non-cancer effects from chronic inhalation exposures at the
high-end do not support an unreasonable risk determination. The risk estimates of non-cancer
effects from acute inhalation exposures at the central tendency and high-end do not support an
unreasonable risk determination.
• For ONUs, the risk estimates of cancer effects (from both approaches) at the central
tendency support an unreasonable risk determination.
• For ONUs, the risk estimates of non-cancer effects from acute (CNS) and chronic (liver toxicity)
inhalation exposures at the central tendency do not support an unreasonable risk determination.
• Based on EPA’s analysis, the data for worker and ONU inhalation exposures could not be
distinguished; however, ONU inhalation exposures are assumed to be lower than inhalation
exposures for workers directly handling the chemical substance. To account for this uncertainty,
EPA considered the workers’ central tendency risk estimates from inhalation exposures when
determining ONUs’ unreasonable risk.
• Cancer risks were assessed using two approaches: linear extrapolation and threshold. The
unreasonable risk determination is based on the risk estimates derived from both approaches.
• Inhalation exposures were assessed using surrogate data from two sources. The exposure
sources, routes, and exposure levels are similar to those at an import/repackaging facility, where
unloading and handling are the key worker activities. Carbon tetrachloride may be imported into
the United States in bulk containers and may be repackaged into smaller containers for resale.
EPA assumed the worker unloading activity will result in exposures similar to unloading/loading
activities at manufacturing sites; however, the data may not be representative of the work
activities and exposures across the range of repackaging facilities.
• Dermal exposures were assessed using modeled data.
In summary, the risk estimates, the health effects of carbon tetrachloride, the exposures, and
consideration of uncertainties support EPA’s determination that there is an unreasonable risk of injury to
health (workers and ONUs) from repackaging of carbon tetrachloride for use in laboratory chemicals.
Processing – Recycling (Processing as recycling)
Section 6(b)(4)(A) unreasonable risk determination for recycling of carbon tetrachloride: Presents an
unreasonable risk of injury to health (workers and ONUs).
For workers, EPA found that there was an unreasonable risk of cancer effects from dermal
exposures at the central tendency and high-end, even when assuming use of PPE. For
Page 240 of 390
ONUs, EPA found that there was an unreasonable risk of cancer from chronic inhalation
exposures at the central tendency.
EPA’s determination that the recycling of carbon tetrachloride presents an unreasonable risk is based on
the comparison of the risk estimates for non-cancer effects and cancer to the benchmarks (Table 4-15)
and other considerations. As explained in Section 5.1, EPA considered the health effects of carbon
tetrachloride, the exposures from the condition of use, and the uncertainties in the analysis (Section 4.4),
including uncertainties related to the exposures for ONUs:
• For workers, when assuming use of gloves with PF of 20, the risk estimates of cancer effects
(from both approaches) for dermal exposures at the high-end support an unreasonable risk
determination.
• For workers, when assuming the use of respirators with APF of 50, the risk estimates of cancer
effects (from both approaches) and non-cancer effects from chronic inhalation exposures at the
high-end do not support an unreasonable risk determination. The risk estimates of non-cancer
effects from acute inhalation exposures at the central tendency and high-end do not support an
unreasonable risk determination.
• For ONUs, the risk estimates of cancer effects (from both approaches) at the central
tendency support an unreasonable risk determination.
• For ONUs, the risk estimates of non-cancer effects from acute (CNS) and chronic (liver toxicity)
inhalation exposures at the central tendency do not support an unreasonable risk determination.
• Based on EPA’s analysis, the data for worker and ONU inhalation exposures could not be
distinguished; however, ONU inhalation exposures are assumed to be lower than inhalation
exposures for workers directly handling the chemical substance. To account for this uncertainty,
EPA considered the workers’ central tendency risk estimates from inhalation exposures when
determining ONUs’ unreasonable risk.
• Cancer risks were assessed using two approaches: linear extrapolation and threshold. The
unreasonable risk determination is based on the risk estimates derived from both approaches.
• Inhalation exposures were assessed using surrogate data from two sources. The exposure
sources, routes, and exposure levels are similar to those at an import/repackaging facility, where
unloading and handling are the key worker activities. Carbon tetrachloride may be imported into
the United States in bulk containers and may be repackaged into smaller containers for resale.
EPA assumed the worker unloading activity will result in exposures similar to unloading/loading
activities at manufacturing sites; however, the data may not be representative of the work
activities and exposures across the range of recycling facilities.
• Dermal exposures were assessed using modeled data.
In summary, the risk estimates, the health effects of carbon tetrachloride, the exposures, and
consideration of uncertainties support EPA’s determination that there is an unreasonable risk of injury to
health (workers and ONUs) from recycling of carbon tetrachloride.
Distribution in Commerce
Section 6(b)(4)(A) unreasonable risk determination for distribution in commerce of carbon tetrachloride:
Does not present an unreasonable risk of injury to health (workers and ONUs).
Page 241 of 390
For the purposes of the unreasonable risk determination, distribution in commerce of carbon
tetrachloride is the transportation associated with the moving of carbon tetrachloride in
commerce. The loading and unloading activities are associated with other conditions of use. EPA
assumes transportation of carbon tetrachloride is in compliance with existing regulations for the
transportation of hazardous materials, and emissions are therefore minimal (with the exception of
spills and leaks, which are outside the scope of the risk evaluation). Based on the limited
emissions from the transportation of chemicals, EPA determines there is no unreasonable risk of
injury to health (workers and ONUs) from the distribution in commerce of carbon tetrachloride.
Industrial/Commercial Use – Industrial processing aid in the
manufacture of petrochemicals-derived products and agricultural products
Section 6(b)(4)(A) unreasonable risk determination for the industrial and commercial use of carbon
tetrachloride as an industrial processing aid in the manufacture of petrochemicals-derived products and
agricultural products: Presents an unreasonable risk of injury to health (workers and ONUs).
For workers, EPA found that there was an unreasonable risk of cancer effects from dermal
exposures at the central tendency and high-end, even when assuming use of PPE. For
ONUs, EPA found that there was an unreasonable risk of cancer from chronic inhalation
exposures at the central tendency.
EPA’s determination that the industrial and commercial use of carbon tetrachloride in the manufacture
of petrochemicals-derived products and agricultural products presents an unreasonable risk is based on
the comparison of the risk estimates for non-cancer effects and cancer to the benchmarks (Table 4-15)
and other considerations. As explained in Section 5.1, EPA considered the health effects of carbon
tetrachloride, the exposures from the condition of use, and the uncertainties in the analysis (Section 4.4),
including uncertainties related to the exposures for ONUs:
• For workers, when assuming use of gloves with PF of 20, the risk estimates of cancer effects
(from both approaches) for dermal exposures at the high-end support an unreasonable risk
determination.
• For workers, when assuming the use of respirators with APF of 50, the risk estimates of cancer
effects (from both approaches) and non-cancer effects from chronic inhalation exposures at the
high-end do not support an unreasonable risk determination. The risk estimates of non-cancer
effects from acute inhalation exposures at the central tendency and high-end do not support an
unreasonable risk determination.
• For ONUs, the risk estimates of cancer effects (from both approaches) at the central
tendency support an unreasonable risk determination.
• For ONUs, the risk estimates of non-cancer effects from acute (CNS) and chronic (liver toxicity)
inhalation exposures at the central tendency do not support an unreasonable risk determination.
• Based on EPA’s analysis, the data for worker and ONU inhalation exposures could not be
distinguished; however, ONU inhalation exposures are assumed to be lower than inhalation
exposures for workers directly handling the chemical substance. To account for this uncertainty,
EPA considered the workers’ central tendency risk estimates from inhalation exposures when
determining ONUs’ unreasonable risk.
• Cancer risks were assessed using two approaches: linear extrapolation and threshold. The
unreasonable risk determination is based on the risk estimates derived from both approaches.
Page 242 of 390
• Inhalation exposures were assessed using surrogate data from two sources. The exposure
sources, routes, and exposure levels are similar to those at an import/repackaging facility, where
unloading and handling are the key worker activities. Carbon tetrachloride may be imported into
the United States in bulk containers and may be repackaged into smaller containers for resale.
EPA assumed the worker unloading activity will result in exposures similar to unloading/loading
activities at manufacturing sites; however, the data may not be representative of the work
activities and exposures across the range of facilities using carbon tetrachloride as a processing
aid.
• Dermal exposures were assessed using modeled data.
In summary, the risk estimates, the health effects of carbon tetrachloride, the exposures, and
consideration of uncertainties support EPA’s determination that there is an unreasonable risk of injury to
health (workers and ONUs) from the industrial and commercial use of carbon tetrachloride as an
industrial processing aid in the manufacture of petrochemicals-derived products and agricultural
products.
Industrial/Commercial Use – Additive
Section 6(b)(4)(A) unreasonable risk determination for the industrial and commercial use of carbon
tetrachloride as an additive: Presents an unreasonable risk of injury to health (workers and ONUs).
For workers, EPA found that there was an unreasonable risk of cancer effects from dermal
exposures at the central tendency and high-end, even when assuming use of PPE. For
ONUs, EPA found that there was an unreasonable risk of cancer from chronic inhalation
exposures at the central tendency.
EPA’s determination that the industrial and commercial use of carbon tetrachloride as an additive
presents an unreasonable risk is based on the comparison of the risk estimates for non-cancer effects and
cancer to the benchmarks (Table 4-15) and other considerations. As explained in Section 5.1, EPA
considered the health effects of carbon tetrachloride, the exposures from the condition of use, and the
uncertainties in the analysis (Section 4.4), including uncertainties related to the exposures for ONUs:
• For workers, when assuming use of gloves with PF of 20, the risk estimates of cancer effects
(from both approaches) for dermal exposures at the high-end support an unreasonable risk
determination.
• For workers, when assuming the use of respirators with APF of 50, the risk estimates of cancer
effects (from both approaches) and non-cancer effects from chronic inhalation exposures at the
high-end do not support an unreasonable risk determination. The risk estimates of non-cancer
effects from acute inhalation exposures at the central tendency and high-end do not support an
unreasonable risk determination.
• For ONUs, the risk estimates of cancer effects (from both approaches) at the central
tendency support an unreasonable risk determination.
• For ONUs, the risk estimates of non-cancer effects from acute (CNS) and chronic (liver toxicity)
inhalation exposures at the central tendency do not support an unreasonable risk determination.
• Based on EPA’s analysis, the data for worker and ONU inhalation exposures could not be
distinguished; however, ONU inhalation exposures are assumed to be lower than inhalation
exposures for workers directly handling the chemical substance. To account for this uncertainty,
Page 243 of 390
EPA considered the workers’ central tendency risk estimates from inhalation exposures when
determining ONUs’ unreasonable risk.
• Cancer risks were assessed using two approaches: linear extrapolation and threshold. The
unreasonable risk determination is based on the risk estimates derived from both approaches.
• Inhalation exposures were assessed using surrogate data from two sources. The exposure
sources, routes, and exposure levels are similar to those at an import/repackaging facility, where
unloading and handling are the key worker activities. Carbon tetrachloride may be imported into
the United States in bulk containers and may be repackaged into smaller containers for resale.
EPA assumed the worker unloading activity will result in exposures similar to unloading/loading
activities at manufacturing sites; however, the data may not be representative of the work
activities and exposures across the range of facilities using carbon tetrachloride as an additive.
• Dermal exposures were assessed using modeled data.
In summary, the risk estimates, the health effects of carbon tetrachloride, the exposures, and
consideration of uncertainties support EPA’s determination that there is an unreasonable risk of injury to
health (workers and ONUs) from the industrial and commercial use of carbon tetrachloride as an
additive.
Industrial/Commercial Use – Other Basic Organic and Inorganic
Chemical Manufacturing (manufacturing of chlorinated compounds used in
solvents for cleaning and degreasing, adhesives and sealants, paints and coatings,
asphalt, and elimination of nitrogen trichloride in the production of chlorine and
caustic)
Section 6(b)(4)(A) unreasonable risk determination for the industrial and commercial use of carbon
tetrachloride in other basic organic and inorganic chemical manufacturing (manufacturing of chlorinated
compounds used in solvents for cleaning and degreasing, adhesives and sealants, paints and coatings,
asphalt, and elimination of nitrogen trichloride in the production of chlorine and caustic): Presents an
unreasonable risk of injury to health (workers and ONUs).
For workers, EPA found that there was an unreasonable risk of cancer effects from dermal
exposures at the central tendency and high-end, even when assuming use of PPE. For
ONUs, EPA found that there was an unreasonable risk of cancer from chronic inhalation
exposures at the central tendency and high-end and non-cancer effects from chronic (liver
toxicity) inhalation exposures at the high-end.
Page 244 of 390
EPA’s determination that the industrial and commercial use of carbon tetrachloride in other basic
organic and inorganic chemical manufacturing (manufacturing of chlorinated compounds used in
solvents for cleaning and degreasing, adhesives and sealants, paints and coatings, asphalt, and
elimination of nitrogen trichloride in the production of chlorine and caustic) presents an unreasonable
risk is based on the comparison of the risk estimates for non-cancer effects and cancer to the
benchmarks (Table 4-15) and other considerations. As explained in Section 5.1, EPA considered the
health effects of carbon tetrachloride, the exposures from the condition of use, and the uncertainties in
the analysis (Section 4.4):
• For workers, when assuming use of gloves with PF of 20, the risk estimates of cancer effects
(from both approaches) for dermal exposures at the high-end support an unreasonable risk
determination.
• For workers, when assuming the use of respirators with APF of 50, the risk estimates of cancer
effects (from both approaches) and non-cancer effects from chronic inhalation exposures at the
high-end do not support an unreasonable risk determination. The risk estimates of non-cancer
effects from acute inhalation exposures at the central tendency and high-end do not support an
unreasonable risk determination.
• For ONUs, the risk estimates of cancer effects (from both approaches) at the central
tendency and high-end support an unreasonable risk determination.
• For ONUs, the risk estimates of non-cancer effects from acute (CNS) inhalation exposures at the
high-end do not support an unreasonable risk determination.
• Cancer risks were assessed using two approaches: linear extrapolation and threshold. The
unreasonable risk determination is based on the risk estimates derived from both approaches.
• EPA recognizes that the manufacturing setting and associated worker activities are
similar for the manufacture of carbon tetrachloride, processing as a reactant or
intermediate, and industrial and commercial use of carbon tetrachloride in other basic
organic and inorganic chemical manufacturing. Therefore, to assess inhalation exposures,
EPA assessed this condition of use under the Processing as a Reactant exposure scenario
using personal breathing zone monitoring data from two sources for workers and ONUs
in a manufacturing setting; however, the data may not be representative of the work
activities and exposures across the range of facilities that use carbon tetrachloride in
chemical manufacturing.
• Dermal exposures were assessed using modeled data.
In summary, the risk estimates, the health effects of carbon tetrachloride, the exposures, and
consideration of uncertainties support EPA’s determination that there is an unreasonable risk of injury to
health (workers and ONUs) from the industrial and commercial use of carbon tetrachloride in other
basic organic and inorganic chemical manufacturing (manufacturing of chlorinated compounds used in
solvents for cleaning and degreasing, adhesives and sealants, paints and coatings, asphalt, and
elimination of nitrogen trichloride in the production of chlorine and caustic).
Page 245 of 390
Industrial/Commercial Use – Metal Recovery
Section 6(b)(4)(A) unreasonable risk determination for the industrial and commercial use of carbon
tetrachloride in metal recovery: Presents an unreasonable risk of injury to health (workers and
ONUs).
For workers, EPA found that there was an unreasonable risk of cancer effects from dermal
exposures at the central tendency and high-end, even when assuming use of PPE. For
ONUs, EPA found that there was an unreasonable risk of cancer from chronic inhalation
exposures at the central tendency.
EPA’s determination that the industrial and commercial use of carbon tetrachloride in metal recovery
presents an unreasonable risk is based on the comparison of the risk estimates for non-cancer effects and
cancer to the benchmarks (Table 4-15) and other considerations. As explained in Section 5.1, EPA
considered the health effects of carbon tetrachloride, the exposures from the condition of use, and the
uncertainties in the analysis (Section 4.4), including uncertainties related to the exposures for ONUs:
• For workers, when assuming use of gloves with PF of 20, the risk estimates of cancer effects
(from both approaches) for dermal exposures at the high-end support an unreasonable risk
determination.
• For workers, when assuming the use of respirators with APF of 50, the risk estimates of cancer
effects (from both approaches) and non-cancer effects from chronic inhalation exposures at the
high-end do not support an unreasonable risk determination. The risk estimates of non-cancer
effects from acute inhalation exposures at the central tendency and high-end do not support an
unreasonable risk determination.
• For ONUs, the risk estimates of cancer effects (from both approaches) at the central
tendency support an unreasonable risk determination.
• For ONUs, the risk estimates of non-cancer effects from acute (CNS) and chronic (liver toxicity)
inhalation exposures at the central tendency do not support an unreasonable risk determination.
• Based on EPA’s analysis, the data for worker and ONU inhalation exposures could not be
distinguished; however, ONU inhalation exposures are assumed to be lower than inhalation
exposures for workers directly handling the chemical substance. To account for this uncertainty,
EPA considered the workers’ central tendency risk estimates from inhalation exposures when
determining ONUs’ unreasonable risk.
• Cancer risks were assessed using two approaches: linear extrapolation and threshold. The
unreasonable risk determination is based on the risk estimates derived from both approaches.
• Inhalation exposures were assessed using surrogate data from two sources. The exposure
sources, routes, and exposure levels are similar to those at an import/repackaging facility, where
unloading and handling are the key worker activities. Carbon tetrachloride may be imported into
the United States in bulk containers and may be repackaged into smaller containers for resale.
EPA assumed the worker unloading activity will result in exposures similar to unloading/loading
activities at manufacturing sites; however, the data may not be representative of the work
activities and exposures across the range of facilities that use carbon tetrachloride in metal
recovery.
• Dermal exposures were assessed using modeled data.

Page 246 of 390
In summary, the risk estimates, the health effects of carbon tetrachloride, the exposures, and
consideration of uncertainties support EPA’s determination that there is an unreasonable risk of
injury to health (workers and ONUs) from the industrial and commercial use of carbon
tetrachloride in metal recovery.
Industrial/Commercial Use – Specialty Uses – Department of Defense
Section 6(b)(4)(A) unreasonable risk determination for the industrial and commercial use of carbon
tetrachloride in specialty uses by the Department of Defense: Presents an unreasonable risk of injury
to health (workers).
For workers, EPA found that there was an unreasonable risk of cancer effects from dermal
exposures at the central tendency and high-end, even when assuming use of PPE. For ONUs, EPA
did not identify an unreasonable risk of cancer from chronic inhalation exposures and non-cancer effects
(CNS and liver toxicity) from acute and chronic inhalation exposures.
EPA’s determination that the industrial and commercial use of carbon tetrachloride in specialty uses by
Department of Defense presents an unreasonable risk is based on the comparison of the risk estimates
for non-cancer effects and cancer to the benchmarks (Table 4-15) and other considerations. As explained
in Section 5.1, EPA considered the health effects of carbon tetrachloride, the exposures from the
condition of use, and the uncertainties in the analysis (Section 4.4), including uncertainties related to the
exposures for ONUs:
• For workers, when assuming use of gloves with PF of 20, the risk estimates of cancer effects
(from both approaches) for dermal exposures at the high-end support an unreasonable risk
determination.
• For workers, when assuming the use of respirators with APF of 50, the risk estimates of cancer
effects (from both approaches) and non-cancer effects from chronic inhalation exposures at the
high-end do not support an unreasonable risk determination. The risk estimates of non-cancer
effects from acute inhalation exposures at the central tendency and high-end do not support an
unreasonable risk determination.
• For ONUs, the risk estimates of cancer effects (from both approaches) for inhalation exposures
and non-cancer effects from acute (CNS) and chronic (liver toxicity) inhalation exposures at the
central tendency do not support an unreasonable risk determination.
• Cancer risks were assessed using two approaches: linear extrapolation and threshold. The
unreasonable risk determination is based on the risk estimates derived from both approaches.
• Based on EPA’s analysis, the data for worker and ONU inhalation exposures could not be
distinguished; however, ONU inhalation exposures are assumed to be lower than inhalation
exposures for workers directly handling the chemical substance. To account for this uncertainty,
EPA considered the workers’ central tendency risk estimates from inhalation exposures when
determining ONUs’ unreasonable risk.
• Inhalation exposures were assessed using personal breathing zone monitoring data provided by
the Department of Defense.
• Dermal exposures were assessed using modeled data.
In summary, the risk estimates, the health effects of carbon tetrachloride, the exposures, and
consideration of uncertainties support EPA’s determination that there is an unreasonable risk of injury to

Page 247 of 390
health (workers) from the industrial and commercial use of carbon tetrachloride in specialty uses by
Department of Defense.
Industrial/Commercial Use – Laboratory Chemical
Section 6(b)(4)(A) unreasonable risk determination for the industrial and commercial use of carbon
tetrachloride as a laboratory chemical: Presents an unreasonable risk of injury to health (workers).
For workers, EPA found that there was an unreasonable risk of cancer effects from dermal
exposures at the central tendency and high-end, even when assuming use of PPE.
Due to expected safety practices when using carbon tetrachloride in a laboratory setting, where carbon
tetrachloride is applied in small quantities under a fume hood, EPA does not expect there to be
inhalation exposures to workers and ONUs. Thus, EPA did not evaluate inhalation exposures to workers
or ONUs for this condition of use. EPA’s determination that the industrial and commercial use of carbon
tetrachloride as a laboratory chemical presents an unreasonable risk is based on the comparison of the
dermal risk estimates for non-cancer effects and cancer to the benchmarks (Table 4-15) and other
considerations. As explained in Section 5.1, EPA considered the health effects of carbon tetrachloride,
the exposures from the condition of use, and the uncertainties in the analysis (Section 4.4):
• For workers, when assuming use of gloves with PF of 20, the risk estimates of cancer effects
(from both approaches) for dermal exposures at the high-end support an unreasonable risk
determination.
• Cancer risks were assessed using two approaches: linear extrapolation and threshold. The
unreasonable risk determination is based on the risk estimates derived from both approaches.
• Dermal exposures were assessed using modeled data.
In summary, the risk estimates, the health effects of carbon tetrachloride, the exposures, and
consideration of uncertainties support EPA’s determination that there is an unreasonable risk of injury to
health (workers) from the industrial and commercial use of carbon tetrachloride as a laboratory
chemical.
Disposal – Disposal
Section 6(b)(4)(A) unreasonable risk determination for the disposal of carbon tetrachloride: Presents an
unreasonable risk of injury to health (workers and ONUs).
For workers, EPA found that there was an unreasonable risk of cancer effects from dermal
exposures at the central tendency and high-end, even when assuming use of PPE. For
ONUs, EPA found that there was an unreasonable risk of cancer from chronic inhalation
exposures at the central tendency.
EPA’s determination that the disposal of carbon tetrachloride presents an unreasonable risk is based on
the comparison of the risk estimates for non-cancer effects and cancer to the benchmarks (Table 4-15)
and other considerations. As explained in Section 5.1, EPA considered the health effects of carbon
tetrachloride, the exposures from the condition of use, and the uncertainties in the analysis (Section 4.4),
including uncertainties related to the exposures for ONUs:
Page 248 of 390
• For workers, when assuming use of gloves with PF of 20, the risk estimates of cancer effects
(from both approaches) for dermal exposures at the high-end support an unreasonable risk
determination.
• For workers, when assuming the use of respirators with APF of 50, the risk estimates of cancer
effects (from both approaches) and non-cancer effects from chronic inhalation exposures at the
high-end do not support an unreasonable risk determination. The risk estimates of non-cancer
effects from acute inhalation exposures at the central tendency and high-end do not support an
unreasonable risk determination.
• For ONUs, the risk estimates of cancer effects (from both approaches) at the central tendency
support an unreasonable risk determination.
• For ONUs, the risk estimates of non-cancer effects from acute (CNS) and chronic (liver toxicity)
inhalation exposures at the central tendency do not support an unreasonable risk determination.
• Based on EPA’s analysis, the data for worker and ONU inhalation exposures could not be
distinguished; however, ONU inhalation exposures are assumed to be lower than inhalation
exposures for workers directly handling the chemical substance. To account for this uncertainty,
EPA considered the workers’ central tendency risk estimates from inhalation exposures when
determining ONUs’ unreasonable risk.
• Cancer risks were assessed using two approaches: linear extrapolation and threshold. The
unreasonable risk determination is based on the risk estimates derived from both approaches.
• Inhalation exposures were assessed using surrogate data from two sources. The exposure
sources, routes, and exposure levels are similar to those at an import/repackaging facility, where
unloading and handling are the key worker activities. Carbon tetrachloride may be imported into
the United States in bulk containers and may be repackaged into smaller containers for resale.
EPA assumed the worker unloading activity will result in exposures similar to unloading/loading
activities at manufacturing sites; however, the data may not be representative of the work
activities and exposures across the range of disposal facilities
• Dermal exposures were assessed using modeled data.
In summary, the risk estimates, the health effects of carbon tetrachloride, the exposures, and
consideration of uncertainties support EPA’s determination that there is an unreasonable risk of injury to
health (workers and ONUs) from the disposal of carbon tetrachloride.
Environment
6(b)(4)(A) unreasonable risk determination for all conditions of use of carbon tetrachloride: Does not
present an unreasonable risk of injury to the environment.
For all conditions of use, the RQ values (Table 4-2) do not support an unreasonable risk determination in
water for acute and chronic exposures to carbon tetrachloride for amphibians, fish, and aquatic
invertebrates. To characterize the exposure to carbon tetrachloride by aquatic organisms, modeled data
were used to represent surface water concentrations near facilities actively releasing carbon tetrachloride
to surface water. EPA considered the biological relevance of the species to determine the concentrations
of concern for the location of surface water concentration data to produce RQs, as well as timing and
seasonality of the exposure. While the RQ was exceeded (RQ>1) from chronic exposure of carbon
tetrachloride to amphibians at five facilities, additional characterization of risk based on seasonable
exposure data indicated one of the exceedances did not occur during time periods relevant to amphibian
Page 249 of 390
development. For the four facilities with RQ exceedances relevant to amphibian development during
two separate reporting periods, risk was not consistent across facilities, and it is not possible to predict
with any certainty whether risk will or will not occur during months key to amphibian development in
future years. Uncertainties related to these particular estimates are discussed in section 4.4.2 and 4.4.3.
EPA’s analysis indicates that significant environmental exposures are not expected to exceed the acute
and chronic COCs for aquatic species, as presented in Section 4.1.1.
The toxicity of carbon tetrachloride to sediment-dwelling invertebrates is similar to the toxicity to
aquatic invertebrates. Carbon tetrachloride is most likely present in the pore waters and not absorbed to
the sediment organic matter because carbon tetrachloride has low partitioning to organic matter. The
concentrations in sediment pore water are similar to or less than the concentrations in the overlying
water, and concentrations in the deeper part of sediment are lower than the concentrations in the
overlying water. Therefore, for sediment-dwelling organisms the risk estimates, based on the highest
ambient surface water concentration, do not support an unreasonable risk determination to sediment-
dwelling organisms from acute or chronic exposures. While EPA identified one low quality study on
sediment-dwelling organisms, there is uncertainty due to the lack of ecotoxicity studies specifically for
sediment-dwelling organisms and limited sediment monitoring data.
Based on its physical-chemical properties, carbon tetrachloride does not partition to or accumulate in
soil. Therefore, the physical-chemical properties of carbon tetrachloride do not support an unreasonable
risk determination to terrestrial organisms from exposure to carbon tetrachloride through soil and land-
applied biosolids.
In summary, the risk estimates, the environmental effects of carbon tetrachloride, the exposures,
physical-chemical properties of carbon tetrachloride and consideration of uncertainties support a
determination that there is no unreasonable risk for the environment from all conditions of use of
carbon tetrachloride.
Changes to the Unreasonable Risk Determination from Draft
Risk Evaluation to Final Risk Evaluation
In this final risk evaluation, EPA made changes to the unreasonable risk determination for
carbon tetrachloride, as a result of the analysis following peer review and public comment. There
are four types of changes: an updated dermal model, the addition of a threshold approach for
cancer risks, use of surrogate data in place of modeled data, refinement of the unreasonable risk
determination for injury to the environment for all conditions of use, and clarification of the
unreasonable risk determinations for processing carbon tetrachloride for incorporation into
formulation, mixtures, or reaction products.
In the final risk evaluation, EPA used a dermal model for all conditions of use that was updated
from the draft risk evaluation based on peer review comments, which resulted in changes from
the preliminary unreasonable risk determinations for most conditions of use. Peer review
recommendations also included identifying a threshold POD for cancer. EPA found that the
threshold approach is most relevant for liver carcinogenicity, while the linear extrapolation
approach (consistent with draft risk evaluation) is most appropriate for adrenal gland and brain

Page 250 of 390
carcinogenicity. The risk determinations for cancer for all conditions of use are therefore based
on the risk estimates for both of these approaches.
Additionally, in the draft risk evaluation, EPA evaluated the import/repackaging of carbon
tetrachloride using modeled data; however, the surrogate data provided by HSIA was found to be
adequate for this condition of use and other conditions of use with similar worker activities. EPA
has developed an occupational scenario using this surrogate data, and therefore the
import/repackaging of carbon tetrachloride as well as conditions of use with similar worker
activities have a final unreasonable risk determination that is different from the preliminary
unreasonable risk determination in the draft risk evaluation.
EPA has also further refined the final unreasonable risk determination for all conditions of use
for risk of injury to the environment, and therefore provides greater detail regarding
unreasonable risks to the environment than the preliminary determination presented in the draft
risk evaluation. Specifically, in the final risk evaluation, EPA qualitatively evaluated the soil and
land-applied biosolids pathways and is now issuing a risk determination for terrestrial organisms.
EPA uses representative Occupational Exposure Scenarios to generate risk estimates. Sometimes
the same Exposure Scenario is used for several conditions of use, and sometimes unreasonable
risk determinations are based on multiple exposure scenarios. EPA makes an unreasonable risk
determination for each condition of use within the scope of the risk evaluation. For further
clarity, EPA is now issuing a single unreasonable risk determination for Processing –
Incorporation into formulation, mixture or reaction products-Petrochemicals-derived
manufacturing, agricultural products manufacturing, and other basic organic and inorganic
chemical manufacturing, for which two preliminary unreasonable risk determinations were
presented in the draft risk evaluation. This condition of use was evaluated under two exposure
scenarios, both of which used HSIA monitoring data.
Table 5-2. Updates in Presentation of Unreasonable Risk Determinations Between Draft
and Final Risk Evaluations
Unreasonable Risk Determinations in Final
Risk Evaluation
Unreasonable Risk Determinations in Draft Risk Evaluation
(emphasis added)
• Processing for incorporation into
formulation, mixtures or reaction
products (Petrochemicals-derived
manufacturing; Agricultural
products manufacturing; Other
basic organic and inorganic
chemical manufacturing)
• Processing for incorporation into formulation,
mixtures or reaction products (Petrochemicals-
derived manufacturing; Agricultural products
manufacturing)
• Processing for incorporation into formulation,
mixtures or reaction products (Other basic organic
and inorganic chemical manufacturing)
Unreasonable Risk Determination Conclusion
No Unreasonable Risk Determinations
Page 251 of 390
TSCA Section 6(b)(4) requires EPA to conduct risk evaluations to determine whether chemical
substances present unreasonable risk under their conditions of use. In conducting risk
evaluations, “EPA will determine whether the chemical substance presents an unreasonable risk
of injury to health or the environment under each condition of use within the scope of the risk
evaluation…” 40 CFR 702.47. Pursuant to TSCA Section 6(i)(1), a determination of “no
unreasonable risk” shall be issued by order and considered to be final agency action. Under
EPA’s implementing regulations, “[a] determination by EPA that the chemical substance, under
one or more of the conditions of use within the scope of the risk evaluations, does not present an
unreasonable risk of injury to health or the environment will be issued by order and considered to
be a final Agency action, effective on the date of issuance of the order.” 40 CFR 702.49(d).
EPA has determined that the following conditions of use of carbon tetrachloride do not present an
unreasonable risk of injury to health or the environment:
• Processing as a reactant/intermediate in reactive ion etching (i.e., semiconductor manufacturing)
(Section 5.2.1.4, Section 5.2.2, Section 4, Section 3, and Section 2.4.1.7.5)
• Distribution in commerce (Section 5.2.1.8, Section 5.2.2, Section 4, Section 3)
This subsection of the final risk evaluation therefore constitutes the order required under TSCA
Section 6(i)(1), and the “no unreasonable risk” determinations in this subsection are considered
to be final agency action effective on the date of issuance of this order. All assumptions that went
into reaching the determinations of no unreasonable risk for these conditions of use, including
any considerations excluded for these conditions of use, are incorporated into this order.
The support for each determination of “no unreasonable risk” is set forth in Section 5.2 of the
final risk evaluation, “Detailed Unreasonable Risk Determinations by Condition of Use.” This
subsection also constitutes the statement of basis and purpose required by TSCA Section 26(f).
Unreasonable Risk Determinations
EPA has determined that the following conditions of use of carbon tetrachloride present an unreasonable
risk of injury:
• Domestic Manufacture
• Import (including loading/unloading and repackaging)
• Processing as a reactant in the production of hydrochlorofluorocarbons,
hydrofluorocarbon, hydrofluoroolefin, and perchloroethylene
• Processing for incorporation into formulation, mixtures or reaction products
(petrochemicals-derived manufacturing; agricultural products manufacturing; other basic
organic and inorganic chemical manufacturing)
• Repackaging for use in laboratory chemicals
• Recycling
• Industrial/commercial use as an industrial processing aid in the manufacture of
petrochemicals-derived products and agricultural products
• Industrial/commercial use as an additive
• Industrial/commercial use in the manufacture of other basic chemicals (including
chlorinated compounds used in solvents, adhesives, asphalt, and paints and coatings)

Page 252 of 390
• Industrial/commercial use in metal recovery
• Specialty uses by the Department of Defense
• Industrial/commercial use as a laboratory chemical
• Disposal
EPA will initiate TSCA Section 6(a) risk management actions on these conditions of use as
required under TSCA Section 6(c)(1). Pursuant to TSCA Section 6(i)(2), the “unreasonable risk”
determinations for these conditions of use are not considered final agency action.

Page 253 of 390
6 REFERENCES ACC. (2018). Properties of Phosgene.
https://www.americanchemistry.com/ProductsTechnology/Phosgene/Phosgene-Safe-
Practice-Guidelines/PDF-Properties-of-Phosgene.pdf
Adams, EM; Spencer, HC; Rowe, VK; Mccollister, DD; Irish, DD. (1952). Vapor toxicity of
carbon tetrachloride determined by experiments on laboratory animals. Arch Environ
Occup Health 6: 50-66.
AIA (Aerospace Industries Association). (2019). AIA email with statement on CCl4 Use.
AIHA. (1961). Carbon tetrachloride (revised 1961) (pp. 22:507-509). American Industrial
Hygiene Association.
Allis, JW; Ward, TR; Seely, JC; Simmons, JE. (1990). Assessment of hepatic indicators of
subchronic carbon tetrachloride injury and recovery in rats. Fundam Appl Toxicol 15:
558-570. http://dx.doi.org/10.1016/0272-0590(90)90041-H
Almeida, RN; Costa, P; Pereira, J; Cassel, E; Rodrigues, AE. (2019). Evaporation and
Permeation of Fragrance Applied to the Skin. Industrial & Engineering Chemistry 58:
9644-9650. http://dx.doi.org/10.1021/acs.iecr.9b01004
Anderson, TA; Beauchamp, JJ; Walton, BT. (1991). FATE OF VOLATILE AND
SEMIVOLATILE ORGANIC-CHEMICALS IN SOILS - ABIOTIC VERSUS BIOTIC
LOSSES. J Environ Qual 20: 420-424.
Araki, A; Kamigaitao, N; Sasaki, T; Matsushima, T. (2004). Mutagenicity of carbon
tetrachloride and chloroform in Salmonella typhimurium TA98, TA100, TA1535, and
TA1537, and Escherichia coli WP2uvrA/pKM101 and WP2/pKM101, using a gas
exposure method. Environ Mol Mutagen 43: 128-133.
http://dx.doi.org/10.1002/em.20005
ATSDR. (2005). Toxicological profile for carbon tetrachloride (CAS# 56–23–5) [ATSDR Tox
Profile]. Atlanta, GA: U.S. Department of Health and Human Services, Public Health
Service. http://www.atsdr.cdc.gov/toxprofiles
ATSDR. (2017). Case studies in environmental medicine: Carbon Tetrachloride Toxicity. Silver
Spring, MD. https://www.atsdr.cdc.gov/csem/csem.asp?csem=35&po=8
Barnes, R; Jones, RC. (1967). Carbon tetrachloride poisoning. Am Ind Hyg Assoc J 28: 557-560.
Barrows, ME; Petrocelli, SR; Macek, KJ; Carroll, JJ. (1980). Bioconcentration and elimination
of selected water pollutants by bluegill sunfish (Lepomis macrochirus). In R Haque (Ed.),
Dynamics, exposure and hazard assessment of toxic chemicals (pp. 379-392). Ann Arbor,
MI: Ann Arbor Science.
Bauder, MB; Palace, VP; Hodson, PV. (2005). Is oxidative stress the mechanism of blue sac
disease in retene-exposed trout larvae? Environ Toxicol Chem 24: 694-702.
http://dx.doi.org/10.1897/04-23R.1
Bechtold, MM; Gee, DL; Bruenner, U. (1982). Carbon tetrachloride-mediated expiration of
pentane and chloroform by the intact rat: the effects of pretreatment with diethyl maleate,
SKF-525A and phenobarbital. Toxicol Lett 11: 165-171.
Bell, N; Vaughan, NP; Morris, L; Griffin, P. (2012). An assessment of workplace programmes
designed to control inhalation risks using respiratory protective equipment. Ann Occup
Hyg 56: 350-361. http://dx.doi.org/10.1093/annhyg/mer109
Benedetti, A; Ferrali, M; Chieli, E; Comporti, M. (1974). A study of the relationships between
carbon tetrachloride-induced lipid peroxidation and liver damage in rats pretreated with
Page 254 of 390
vitamin E. Chem Biol Interact 9: 117-134. http://dx.doi.org/10.1016/0009-
2797(74)90004-0
Benson, JM; Springer, DL. (1999). Improved risk estimates for carbon tetrachloride. Final report.
(DE-FC04-96AL76406). Albuquerque, New Mexico: U.S. Department of Energy.
Birge, WJ; Black, JA; Kuehne, RA. (1980). Effects of organic compounds on amphibian
reproduction. (PB80147523. KWRRI Research Report 121). Lexington, KY: Kentucky
Water Resources Research Institute. http://dx.doi.org/10.13023/kwrri.rr.121
Black, JA; Birge, WJ; McDonnell, WE; Westerman, AG; Ramey, BA; Bruser, DM. (1982). The
aquatic toxicity of organic compounds to embryo-larval stages of fish and amphibians
(pp. 61). (KWRRI Research Report No. 133). Lexington, KY: University of Kentucky.
Kentucky Water Resources Research Institute. http://dx.doi.org/10.13023/kwrri.rr.133
Boll, M; Weber, LWD; Becker, E; Stampfl, A. (2001). Pathogenesis of Carbon Tetrachloride-
Induced Hepatocyte Injury Bioactivation of CCl4 by Cytochrome P450 and Effects on
Lipid Homeostasis. 56.
Boublik, T; Vojtech, F; Hala, E. (1984). The vapor pressures of pure substances: selected values
of the temperature dependence of the vapour pressures of some pure substances in the
normal and low pressure region. Amsterdam, Netherlands: Elsevier Sci Publ.
Bouwer, EJ; McCarty, PL. (1983). Transformations of 1- and 2-carbon halogenated aliphatic
organic compounds under methanogenic conditions. Appl Environ Microbiol 45: 1286-
1294.
Brack, W; Rottler, H. (1994). Toxicity testing of highly volatile chemicals with green algae: A
new assay. Environ Sci Pollut Res Int 1: 223-228.
Brogan, WC; Eacho, PI; Hinton, DE; Colby, HD. (1984). Effects of carbon tetrachloride on
adrenocortical structure and function in guinea pigs. Toxicol Appl Pharmacol 75: 118-
127. http://dx.doi.org/10.1016/0041-008X(84)90082-6
Brooke, L. (1987). Report of the flow-through and static acute test comparisons with fathead
minnows and acute tests with an amphipod and a cladoceran. Superior, WI: Center for
Lake Superior Environmental Studies, University of Wisconsin.
Bruckner, JV; Mackenzie, WF; Muralidhara, S; Luthra, R; Kyle, GM; Acosta, D. (1986). Oral
toxicity of carbon tetrachloride: Acute, subacute, and subchronic studies in rats. Fundam
Appl Toxicol 6: 16-34.
Bruckner, JV; Kim, HJ; Muralidhara, S; Gallo, JM. (1990). Influence of route and pattern
exposure on the pharmacokinetics and hepatotoxicity of carbon tetrachloride. In TR
Gerrity; CJ Henry (Eds.), Principle of route to route extrapolation for risk assessment (pp.
271-284). New York, NY: Elsevier Science Publishing Co.
Buccafusco, RJ; Ells, SJ; LeBlanc, GA. (1981). Acute toxicity of priority pollutants to bluegill
(Lepomis macrochirus). Bull Environ Contam Toxicol 26: 446-452.
http://dx.doi.org/10.1007/BF01622118
Burke, DA; Wedd, DJ; Herriott, D; Bayliss, MK; Spalding, DJM; Wilcox, P. (1994). Evaluation
of pyrazole and ethanol induced S9 fraction in bacterial mutagenicity testing.
Mutagenesis 9: 23-29.
Butler, JH; Yvon-Lewis, SA; Lobert, JM; King, DB; Montzka, SA; Bullister, JL; Koropalov, V;
Elkins, JW; Hall, BD; Hu, Le; Liu, Y. (2016). A comprehensive estimate for loss of
atmospheric carbon tetrachloride (CCl4) to the ocean. Atmos Chem Phys 16: 10899-
10910. http://dx.doi.org/10.5194/acp-16-10899-2016

Page 255 of 390
Cabbar, HC. (1999). Effects of humidity and soil organic matter on the sorption of chlorinated
methanes in synthetic humic-clay complexes. J Hazard Mater 68: 217-226.
Cabbar, HC; Varol, N; Mccoy, BJ. (1998). Sorption and diffusion of chlorinated methanes in
moist clay. AIChE J 44: 1351-1355.
Cabré, M; Camps, J; Paternáin, JL; Ferré, N; Joven, J. (2001). Time-course of changes in hepatic
lipid peroxidation and glutathione metabolism in rats with carbon tetrachloride-induced
cirrhosis. Clin Exp Pharmacol Physiol 27: 694-699.
CalEPA. (2000). Public health goals for chemicals in drinking water: Carbon tetrachloride.
Sacramento, CA: Office of Environmental Health Hazard Assessment.
https://oehha.ca.gov/media/downloads/water/chemicals/phg/carbtet_0.pdf
CalRecycle. (2018). Beyond 2000: California's Continuing Need for Landfills [Website].
https://www.calrecycle.ca.gov/SWFacilities/Landfills/NeedFor
Carton, M; Barul, C; Menvielle, G; Cyr, D; Sanchez, M; Pilorget, C; Trétarre, B; Stücker, I;
Luce, D; Group, IS. (2017). Occupational exposure to solvents and risk of head and neck
cancer in women: a population-based case-control study in France. BMJ Open 7:
e012833. http://dx.doi.org/10.1136/bmjopen-2016-012833
Castro, GD; Diaz Gomez, MI; Castro, JA. (1989). Species differences in the interaction between
CCl4 reactive metabolites and liver DNA or nuclear protein fractions. Carcinogenesis 10:
289-294. http://dx.doi.org/10.1093/carcin/10.2.289
Castro, JA; Castro, CRD; Dacosta, N; Ferreyra, EC; Fenos, OMD; Diazgome.Mi. (1972).
Carbon-tetrachloride effect on rat-liver and adrenals related to their mixed-function
oxygenase content. Biochem Biophys Res Commun 47: 315-&.
http://dx.doi.org/10.1016/0006-291X(72)90714-0
Chattopadhyay, S; Taft, S. (2018). Exposure Pathways to High-Consequence Pathogens in the
Wastewater Collection and Treatment Systems [EPA Report]. (EPA/600/R-18/221).
Washington, DC: U.S. Environmental Protection Agency.
https://cfpub.epa.gov/si/si_public_record_report.cfm?dirEntryId=341856&Lab=NHSRC
Chen, CY; Wooster, GA; Bowser, PR. (2004). Comparative blood chemistry and histopathology
of tilapia infected with Vibrio vulnificus or Streptococcus iniae or exposed to carbon
tetrachloride, gentamicin, or copper sulfate. Aquaculture 239: 421-443.
http://dx.doi.org/10.1016/j.aquaculture.2004.05.033
Chen, WH; Yang, WB; Yuan, CS; Yang, JC; Zhao, QL. (2014). Fates of chlorinated volatile
organic compounds in aerobic biological treatment processes: the effects of aeration and
sludge addition. Chemosphere 103: 92-98.
http://dx.doi.org/10.1016/j.chemosphere.2013.11.039
Cheremisinoff, NP; Rosenfeld, R. (2009). Handbook of Pollution Prevention and Cleaner
Production Vol. 1: Best Practices in the Petroleum Industry (1st ed.). Burlington, MA:
Elsevier.
Cherrie, JW; Semple, S; Brouwer, D. (2004). Gloves and Dermal Exposure to Chemicals:
Proposals for Evaluating Workplace Effectiveness. Ann Occup Hyg 48: 607-615.
http://dx.doi.org/10.1093/annhyg/meh060
Chittenden, JT; Brooks, JD; Riviere, JE. (2014). Development of a Mixed-Effect
Pharmacokinetic Model for Vehicle Modulated In Vitro Transdermal Flux of Topically
Applied Penetrants. J Pharm Sci 103: 1002-1012.
http://dx.doi.org/https://doi.org/10.1002/jps.23862Get
Page 256 of 390
Chittenden, JT; Riviere, JE. (2015). Quantification of vehicle mixture effects on in vitro
transdermal chemical flux using a random process diffusion model. J Control Release
217: 74-81. http://dx.doi.org/https://doi.org/10.1016/j.jconrel.2015.08.023
Civo Institute Tno. (1985). Fixed versus variable levels of exposure in inhalation toxicity testing
with reference to the workplace studies with acetaltehyde and carbon tetrachloride. (OTS:
OTS0000413-0; 8EHQ Num: FYI-AX-0685-0413; DCN: NA; TSCATS RefID: 35053;
CIS: NA).
Colby, HD; Brogan, WC; Miles, PR. (1981). Carbon tetrachloride-induced changes in adrenal
microsomal mixed-function oxidases and lipid peroxidation. Toxicol Appl Pharmacol 60:
492-499.
Colby, HD; Purcell, H; Kominami, S. (1994). Adrenal activation of carbon tetrachloride: role of
microsomal P450 isozymes. . Toxicology 94: 31-40.
Comporti, M. (1985). Biology of disease: Lipid peroxidation and cellular damage in toxic liver
injury. Lab Invest 53: 599-623.
Comporti, M; Benedetti, A; Ferrali, M. (1984). Reactive aldehydes (4-hydroxyalkenals)
originating from the peroxidation of liver microsomal lipids: Biological effects and
evidence for their binding to microsomal protein in CCl4 or BrCCl3 intoxication. In P
Gentilini; MU Dianzani (Eds.), Frontiers of Gastrointestinal Research, Vol 8 (pp. 46-62).
Basel, Switzerland: Karger Publishers.
http://dx.doi.org/https://doi.org/10.1159/000408417
Condie, LW; Laurie, RD; Mills, T; Robinson, M; Bercz, JP. (1986). Effect of gavage vehicle on
hepatotoxicity of carbon tetrachloride in CD-1 mice: corn oil versus Tween-60 aqueous
emulsion. Toxicol Sci 7: 199-206.
Connor, HD; Thurman, RG; Galizi, MD; Mason, RP. (1986). The formation of a novel free
radical metabolite from CCl4 in the perfused rat liver and in vivo. J Biol Chem 261:
4542-4548.
Cowan, DM; Benson, SM; Cheng, TJ; Hecht, S; Boulos, NM; Henshaw, J. (2017). Evaluation of
reported fatality data associated with workers using respiratory protection in the United
States (1990-2012). Arch Environ Occup Health 72: 235-246.
http://dx.doi.org/10.1080/19338244.2016.1205546
Cox, RA; Derwent, RG; Eggleton, AEJ; Lovelock, JE. (1976). Photochemical oxidation of
halocarbons in the troposphere. Atmos Environ 10: 305-308.
http://dx.doi.org/10.1016/0004-6981(76)90170-0
Curtis, HJ; Tilley, J. (1968). Chromosome aberrations in liver forced to regenerate by chemical
or surgical methods. J Gerontol A Biol Sci Med Sci 23: 140-141.
Daubert, TE; Danner, RP. (1989). Physical and thermodynamic properties of pure chemicals:
Data compilation. Washington, DC: Taylor & Francis.
Davis, PA. (1934). Carbon tetrachloride as an industrial hazard. J Am Med Assoc 103: 962-966.
http://dx.doi.org/10.1001/jama.1934.02750390006003
Dawson, GW; Jennings, AL; Drozdowski, D; Rider, E. (1977). The acute toxicity of 47
industrial chemicals to fresh and saltwater fishes. J Hazard Mater 1: 303-318.
http://dx.doi.org/10.1016/0304-3894(75)80003-3
de Best, JH; Salminen, E; Doddema, HJ; Janssen, DB; Harder, W. (1997). Transformation of
carbon tetrachloride under sulfate reducing conditions. Biodegradation 8: 429-436.
http://dx.doi.org/10.1023/A:1008262225760
Page 257 of 390
De Flora, S; Zanacchi, P; Camoirano, A; Bennicelli, C; Badolati, GS. (1984). Genotoxic activity
and potency of 135 compounds in the Ames reversion test and in a bacterial DNA-repair
test [Review]. Mutat Res 133: 161-198. http://dx.doi.org/10.1016/0165-1110(84)90016-2
de Vera, MP; Pocsidio, GN. (1998). Potential protective effect of calcium carbonate as liming
agent against copper toxicity in the African tilapia Oreochromis mossambicus. Sci Total
Environ 214: 193-202. http://dx.doi.org/10.1016/S0048-9697(98)00065-5
De Zwart, LL; Venhorst, J; Groot, M; Commandeur, JNM; Hermanns, RCA; Meerman, JHM;
Van Baar, BLM; Vermeulen, NPE. (1997). Simultaneous Determination of Eight Lipid
Peroxidation Degradation Products in Urine of Rats Treated with Carbon Tetrachloride
using Gas Chromatography with Electron-Capture Detection. J Chromatogr B Analyt
Technol Biomed Life Sci 694: 277-287.
Dean, BJ; Hodson-Walker, G. (1979). An in vitro chromosome assay using cultured rat-liver
cells. DNA Repair 64: 329-337.
Defense Occupational and Environmental Health Readiness System - Industrial Hygiene
(DOEHRS-IH). (2018). Email between DOD and EPA: RE: [Non-DoD Source] Update:
DoD exposure data for EPA risk evaluation - EPA request for additional information.
Washington, D.C.: U.S. Department of Defense.
Della Porta, G; Terracini, B; Shubik, P. (1961). Induction with carbon tetrachloride of liver-cell
carcinomas in hamsters. J Natl Cancer Inst 26: 855-863.
http://dx.doi.org/10.1093/jnci/26.4.855
Di Toro, DM. (1984). Probability model of stream quality due to runoff. J Environ Eng 110: 607-
628. http://dx.doi.org/10.1061/(ASCE)0733-9372(1984)110:3(607)
Diaz Gomez, MI; Castro, JA. (1980). Covalent binding of carbon tetrachloride metabolites to
liver nuclear DNA, proteins, and lipids. Toxicol Appl Pharmacol 56: 199-206.
Direnzo, AB; Gandolei, AJ; Sipes, IG. (1982). Microsomal Bioactivation and Covalent Binding
of Aliphatic Halides to DNA. Toxicol Lett 11: 243-252.
Dobbs, RA; Wang, L; Govind, R. (1989). Sorption of toxic organic compounds on wastewater
solids: Correlation with fundamental properties. Environ Sci Technol 23: 1092-1097.
http://dx.doi.org/10.1021/es00067a004
Doherty, AT; Ellard, S; Parry, EM; Parry, JM. (1996). An investigation into the activation and
deactivation of chlorinated hydrocarbons to genotoxins in metabolically competent
human cells. Mutagenesis 11: 247-274. http://dx.doi.org/10.1093/mutage/11.3.247
Doney, BC; Groce, DW; Campbell, DL; Greskevitch, MF; Hoffman, WA; Middendorf, PJ;
Syamlal, G; Bang, KM. (2005). A Survey of Private Sector Respirator Use in the United
States: An Overview of Findings. J Occup Environ Hyg 2: 267/276.
Doong, RA; Wu, SC. (1992). Reductive dechlorination of chlorinated hydrocarbons in aqueous
solutions containing ferrous and sulfide ions. Chemosphere 24: 1063-1075.
http://dx.doi.org/10.1016/0045-6535(92)90197-Y
Duffy, CC; McCallister, DL; Renken, RR. (1997). Carbon tetrachloride retention by modern and
buried soil A horizons. J Environ Qual 26: 1123-1127.
http://dx.doi.org/10.2134/jeq1997.00472425002600040025x
Eastmond, DA. (2008). Evaluating genotoxicity data to identify a mode of action and its
application in estimating cancer risk at low doses: A case study involving carbon
tetrachloride [Review]. Environ Mol Mutagen 49: 132-141.
http://dx.doi.org/10.1002/em.20368
Page 258 of 390
ECHA. (2012). Carbon tetrachloride. Substance evaluation – CoRAP.
https://echa.europa.eu/information-on-chemicals/evaluation/community-rolling-action-
plan/corap-table/-/dislist/details/0b0236e1807e392b
ECHA. (2017a). Adsorption/desorption: Carbon tetrachloride. Helsinki, Finland. Retrieved from
https://echa.europa.eu/registration-dossier/-/registered-dossier/14940/5/5/2
ECHA. (2017b). Substance information: Carbon tetrachloride [Fact Sheet]. Helsinki, Finland.
https://echa.europa.eu/substance-information/-/substanceinfo/100.000.239
EDF. (2020). Environmental Defense Fund Comments for Toxic Substances Control Act
(TSCA) Science Advisory Committee on Chemicals Review of the Draft Risk Evaluation
of Carbon Tetrachloride. https://beta.regulations.gov/document/EPA-HQ-OPPT-2019-
0499-0026
Edwards, JE. (1941). Hepatomas in mice induced with carbon tetrachloride. J Natl Cancer Inst 2:
197-199.
Edwards, JE; Dalton, AJ. (1942). Induction of cirrhosis of the liver and of hepatomas in mice
with carbon tetrachloride. J Natl Cancer Inst 3: 19-41.
http://dx.doi.org/10.1093/jnci/3.1.19
Edwards, JE; Heston, WE; Dalton, AJ. (1942). Induction of the carbon tetrachloride hepatoma in
strain L mice. J Natl Cancer Inst 3: 297-301. http://dx.doi.org/10.1093/jnci/3.3.297
Eleftheriadou, D; Luette, S; and Kneuer, C. (2019). In silico prediction of dermal absorption of
pesticides – an evaluation of selected models against results from in vitro testing. SAR
QSAR Environ Res 30: 561-585. http://dx.doi.org/10.1080/1062936X.2019.1644533.
Endo, S; Grathwohl, P; Haderlein, SB; Schmidt, TC. (2008). Compound-specific factors
influencing sorption nonlinearity in natural organic matter. Environ Sci Technol 42:
5897-5903. http://dx.doi.org/10.1021/es8001426
Eschenbrenner, AB; Miller, E. (1946). Liver necrosis and the induction of carbon tetrachloride
hepatomas in strain A mice. J Natl Cancer Inst 6: 325-341.
http://dx.doi.org/10.1093/jnci/6.6.325
Esmen, N; Corn, M; Hammad, Y; Whittier, D; Kotsko, N. (1979). Summary of measurements of
employee exposure to airborne dust and fiber in sixteen facilities producing man-made
mineral fibers. Am Ind Hyg Assoc J 40: 108-117.
Etterson, M. (2019). Species Sensitivity Distribution (SSD) Toolbox. Duluth, MN: US
Environmental Protection Agency.
Ferguson, CS; Tyndale, RF. (2011). Cytochrome P450 enzymes in the brain: emerging evidence
of biological significance [Review]. Trends Pharmacol Sci 32: 708-714.
Fraga, CG; Leibovitz, BE; Tappel, AL. (1987). Halogenated compounds as inducers of lipid
peroxidation in tissue slices. Free Radic Biol Med 3: 119-123.
Frasch, HF; Bunge, AL. (2015). The transient dermal exposure II: post-exposure absorption and
evaporation of volatile compounds. J Pharm Sci 104: 1499-1507.
http://dx.doi.org/10.1002/jps.24334
Freitag, D; Ballhorn, L; Behechti, A; Fischer, K; Thumm, W. (1994). Structural configuration
and toxicity of chlorinated alkanes. Chemosphere 28: 253-259.
http://dx.doi.org/10.1016/0045-6535(94)90122-8
Gajjar, RM; Kasting, GB. (2014). Absorption of ethanol, acetone, benzene and 1,2-
dichloroethane through human skin in vitro: a test of diffusion model predictions. Toxicol
Appl Pharmacol 281: 109-117. http://dx.doi.org/10.1016/j.taap.2014.09.013

Page 259 of 390
Galelli, ME; Castro, JA. (1998). Effect of trichloromethyl and trichloromethyl peroxyl free
radicals on protein sulfhydryl content studies in model and enzymatic carbon
tetrachloride activation systems. Res Commun Mol Pathol Pharmacol 100: 227-238.
Garberg, P; Akerblom, EL; Bolcsfoldi, G. (1988). Evaluation of a genotoxicity test measuring
DNA-strand breaks in mouse lymphoma cells by alkaline unwinding and hydroxyapatite
elution. Mutat Res 203: 155-176. http://dx.doi.org/10.1016/0165-1161(88)90101-X
Garcia, E; Hurley, S; Nelson, DO; Hertz, A; Reynolds, P. (2015). Hazardous air pollutants and
breast cancer risk in California teachers: a cohort study. Environ Health 14: 14.
http://dx.doi.org/10.1186/1476-069X-14-14
Gassó, M; Rubio, M; Varela, G; Cabré, M; Caballería, J; Alonso, E; Deulofem, R; Camps, J;
Giménez, A; Pajares, M; Parés, A; Mato, JM; Rodés, J. (1996). Effect of S-
adenosylmethionine on lipid peroxidation and liver fibrogenesis in carbon tetrachloride-
induced cirrhosis. J Hepatol 25: 200-205. http://dx.doi.org/10.1016/S0168-
8278(96)80074-2
Gatehouse, D; Haworth, S; Cebula, T; Gocke, E; Kier, L; Matsushima, T; Melcion, C; Nohmi, T;
Ohta, T; Venitt, S. (1994). Recommendations for the performance of bacterial mutation
assays [Review]. Mutat Res 312: 217-233. http://dx.doi.org/10.1016/0165-
1161(94)90037-X
Gee, DL; Bechtold, MM; Tappel, AL. (1981). Carbon tetrachloride-induced lipid peroxidation:
simultaneous in vivo measurements of pentane and chloroform exhaled by the rat. .
Toxicol Lett 8: 299-306.
Geiger, DL; Brooke, LT; Call, DJ. (1990). Acute toxicities of organic chemicals to fathead
minnows (Pimephales promelas): Volume V. Superior, WI: University of Wisconsin-
Superior, Center for Lake Superior Environmental Studies.
Ghittori, S; Saretto, G; Imbriani, M. (1994). Biological monitoring of workers exposed to carbon
tetrachloride vapor. Appl Occup Environ Hyg 9: 353-357.
http://dx.doi.org/https://doi.org/10.1080/1047322X.1994.10388326
Gold, LS; Stewart, PA; Milliken, K; Purdue, M; Severson, R; Seixas, N; Blair, A; Hartge, P;
Davis, S; De Roos, AJ. (2010). The relationship between multiple myeloma and
occupational exposure to six chlorinated solvents. Occup Environ Med 68: 391-399.
http://dx.doi.org/10.1136/oem.2009.054809
Goldberg, M; Silbergeld, E. (2011). On multiple comparisons and on the design and
interpretation of epidemiological studies of many associations [Editorial]. Environ Res
111: 1007-1009. http://dx.doi.org/10.1016/j.envres.2011.08.010
Goldman, SM; Quinlan, PJ; Ross, GW; Marras, C; Meng, C; Bhudhikanok, GS; Comyns, K;
Korell, M; Chade, AR; Kasten, M; Priestley, B; Chou, KL; Fernandez, HH; Cambi, F;
Langston, JW; Tanner, CM. (2012). Solvent exposures and parkinson disease risk in
twins. Ann Neurol 71: 776-784. http://dx.doi.org/10.1002/ana.22629
Greaves, P. (2012). Histopathology of preclinical toxicity studies: Interpretation and relevance in
drug safety evaluation (4th ed.). Amsterdam, Netherlands: Elsevier Science.
http://www.sciencedirect.com/science/book/9780444538567
Hachiya, N; Motohashi, Y. (2000). Examination of lacZ mutant induction in the liver and testis
of Muta(TM)Mouse following injection of halogenated aliphatic hydrocarbons classified
as human carcinogens. Ind Health 38: 213-220.
http://dx.doi.org/10.2486/indhealth.38.213
Page 260 of 390
Hansch, C; Leo, A; Hoekman, D. (1995). Exploring QSAR: Hydrophobic, electronic, and steric
constants. In C Hansch; A Leo; DH Hoekman (Eds.), Exploring QSAR: Hydrophobic,
Electronic, and Steric Constants. Washington, DC: American Chemical Society.
Happell, JD; Mendoza, Y; Goodwin, K. (2014). A reassessment of the soil sink for atmospheric
carbon tetrachloride based upon static flux chamber measurements. J Atmos Chem 71:
113-123. http://dx.doi.org/10.1007/s10874-014-9285-x
Happell, JD; Roche, MP. (2003). Soils: A global sink of atmospheric carbon tetrachloride.
Geophys Res Lett 30: 1088. http://dx.doi.org/10.1029/2002GL015957
Harmon, TC; Semprini, L; Roberts, PV. (1992). SIMULATING SOLUTE TRANSPORT
USING LABORATORY-BASED SORPTION PARAMETERS. J Environ Eng 118:
666-689.
Hayes, JR; Condie, LW; Borzelleca, JF. (1986). Acute, 14-day repeated dosing, and 90-day
subchronic toxicity studies of carbon tetrachloride in CD-l mice. Fundam Appl Toxicol 7:
454-463. http://dx.doi.org/10.1016/0272-0590(86)90095-3
Health Canada. (2010). Guidelines for Canadian drinking water quality: Guideline technical
document – carbon tetrachloride. Ottawa, Ontario. https://www.canada.ca/en/health-
canada/services/publications/healthy-living/guidelines-canadian-drinking-water-quality-
guideline-technical-document-carbon-tetrachloride.html
Heck, JE; Park, AS; Qiu, J; Cockburn, M; Ritz, B. (2013). An exploratory study of ambient air
toxics exposure in pregnancy and the risk of neuroblastoma in offspring. Environ Res
127: 1-6. http://dx.doi.org/10.1016/j.envres.2013.09.002
Heineman, EF; Cocco, P; Gomez, MR; Dosemeci, M; Stewart, PA; Hayes, RB; Zahm, SH;
Thomas, TL; Blair, A. (1994). Occupational exposure to chlorinated aliphatic
hydrocarbons and risk of astrocytic brain cancer. Am J Ind Med 26: 155-169.
http://dx.doi.org/10.1002/ajim.4700260203
Hill, AB. (1965). The environment and disease: Association or causation? Proc R Soc Med 58:
295-300.
Hoag, H. (2016). The Greening of Chemistry.
Holbrook, MT. (2000). Carbon tetrachloride. In Kirk-Othmer Encyclopedia of Chemical
Technology. Hoboken, NJ: John Wiley and Sons, Inc.
Holbrook, MT. (2003). Methylene chloride. In Kirk-Othmer Encyclopedia of Chemical
Technology (4th ed.). New York, NY: John Wiley & Sons.
http://dx.doi.org/10.1002/0471238961.1305200808151202.a02.pub2
Horvath, AL. (1982). Halogenated hydrocarbons: Solubility-miscibility with water. New York,
NY: Marcel Dekker, Inc.
HSDB. (2005). Carbon tetrachloride. CASRN: 56-23-5. Bethesda, MD: U.S. National Library of
Medicine, Toxicology Data Network (TOXNET). https://toxnet.nlm.nih.gov/cgi-
bin/sis/search2/f?./temp/~p4QCRF:1
HSIA. (2017). HSIA comments to U.S. EPA. Washington, D.C.
https://www.regulations.gov/document?D=EPA-HQ-OPPT-2016-0733-0013
HSIA. (2019). HSIA comments to U.S. EPA. (EPA-HQ-OPPT-2016-0773).
Hu, L; Montzka, SA; Miller, BR; Andrews, AE; Miller, JB; Lehman, SJ; Sweeney, C; Miller,
SM; Thoning, K; Siso, C; Atlas, EL; Blake, DR; de Gouw, J; Gilman, JB; Dutton, G;
Elkins, JW; Hall, B; Chen, H; Fischer, ML; Mountain, ME; Nehrkorn, T; Biraud, SC;
Moore, FL; Tans, P. (2016). Continued emissions of carbon tetrachloride from the United

Page 261 of 390
States nearly two decades after its phaseout for dispersive uses. Proc Natl Acad Sci USA
113: 2880-2885. http://dx.doi.org/10.1073/pnas.1522284113
Hubrich, C; Stuhl, F. (1980). The ultraviolet absorption of some halogenated methanes and
ethanes of atmospheric interest. J Photochem 12: 93-107. http://dx.doi.org/10.1016/0047-
2670(80)85031-3
Ichinose, T; Miller, MG; Shibamoto, T. (1994). Determination of free malonaldehyde formed in
liver microsomes upon CCl4 oxidation. J Appl Toxicol 14: 453-455.
http://dx.doi.org/10.1002/jat.2550140611
Jia, R; Cao, L; Du, J; Xu, P; Jeney, G; Yin, G. (2013). The protective effect of silymarin on the
carbon tetrachloride (CCl4)-induced liver injury in common carp (Cyprinus carpio). In
Vitro Cellular and Developmental Biology 49: 155-161.
http://dx.doi.org/10.1007/s11626-013-9587-3
Jia, R; Cao, LP; Du, JL; Wang, JH; Liu, YJ; Jeney, G; Xu, P; Yin, GJ. (2014). Effects of carbon
tetrachloride on oxidative stress, inflammatory response and hepatocyte apoptosis in
common carp (Cyprinus carpio). Aquat Toxicol 152: 11-19.
http://dx.doi.org/10.1016/j.aquatox.2014.02.014
Katagiri, T; Nagano, K; Aiso, S; Senoh, H; Sakura, Y; Takeuchi, T; Okudaira, M. (1998). A
pathological study on spontaneous hepatic neoplasms in BDF1 mice. J Toxicol Pathol 11:
21-25. http://dx.doi.org/10.1293/tox.11.21
Khangarot, BS; Das, S. (2009). Acute toxicity of metals and reference toxicants to a freshwater
ostracod, Cypris subglobosa Sowerby, 1840 and correlation to EC(50) values of other test
models. J Hazard Mater 172: 641-649. http://dx.doi.org/10.1016/j.jhazmat.2009.07.038
Kile, DE; Chiou, CT; Zhou, HD; Li, H; Xu, OY. (1995). PARTITION OF NONPOLAR
ORGANIC POLLUTANTS FROM WATER TO SOIL AND SEDIMENT ORGANIC
MATTERS. Environ Sci Technol 29: 1401-1406.
Kimball, G. (1978). The effects of lesser known metals and one organic to fathead minnows
(Pimephales promelas) and Daphnia magna. Minneapolis, MN: University of Minnesota,
Department of Entomology, Fisheries and Wildlife.
Kirk-Othmer. (1964). Carbon tetrachloride [Type of Work] (2nd ed.). New York, NY: John
Wiley & Sons.
Kissel, JC; Bunge, AL; Frasch, HF; Kasting, GB. (2018). Dermal Exposure and Absorption of
Chemicals. In CA McQueen (Ed.), (3rd ed., pp. 112-127). Oxford, UK: Elsevier Ltd.
http://dx.doi.org/10.1016/B978-0-08-046884-6.00105-6
Klaassen, CD. (1986). Principles of toxicology. In CD Klaassen; MO Amdur; J Doull (Eds.),
(3rd ed ed.). New York, NY: MacMillan Publishing Co., Inc.
Koporec, KP; Kim, HK; Mackenzie, WF; Bruckner, JV. (1995). Effect of oral dosing vehicles on
the subchronic hepatotoxicity of carbon tetrachloride in the rat. J Toxicol Environ Health
44: 13-27. http://dx.doi.org/10.1080/15287399509531940
Koskinen, H; Pehkonen, P; Vehniainen, E; Krasnov, A; Rexroad, C; Afanasyev, S; Molsa, H;
Oikari, A. (2004). Response of Rainbow Trout Transcriptome to Model Chemical
Contaminants. Arch Biochem Biophys 320: 745-753.
http://dx.doi.org/10.1016/j.bbrc.2004.06.024
Kotsanis, N; Metcalfe, CD. (1988). Accelerating an in vivo trout carcinogenesis assay with
carbon tetrachloride and partial hepatectomy. Paper presented at 15th Annual Aquatic
Toxicity Workshop, November 28-30, 1988, Montreal, Quebec, Canada.
Page 262 of 390
Kriegman-King, MR; Reinhard, M. (1991). Abiotic transformation of carbon tetrachloride in the
presence of sulfide and mineral surfaces. (EPA/600/R-94/018). Kriegman-King, MR;
Reinhard, M.
Krock, R. (2017). Comment submitted by Richard Krock, Vice President, Regulatory and
Technical Affairs, The Vinyl Institute (VI), Part 2. Available online at
https://www.regulations.gov/document?D=EPA-HQ-OPPT-2016-0733-0027
Kronevi, T; Wahlberg, J; Holmberg, B. (1979). Histopathology of skin, liver, and kidney after
epicutaneous administration of five industrial solvents to guinea pigs. Environ Res 19:
56-69. http://dx.doi.org/10.1016/0013-9351(79)90034-3
Lai, EK; Mccay, PB; Noguchi, T; Fong, KL. (1979). In vivo spin-trapping of trichloromethyl
radicals formed from CCl4. Biochem Pharmacol 28: 2231-2235.
Larsen, T; Kjeldsen, P; Christensen, TH. (1992). Sorption of hydrophobic hydrocarbons on three
aquifer materials in a flow through system. Chemosphere 24: 439-451.
http://dx.doi.org/10.1016/0045-6535(92)90419-R
LeBlanc, GA. (1980). Acute toxicity of priority pollutants to water flea (Daphnia magna). Bull
Environ Contam Toxicol 24: 684-691. http://dx.doi.org/10.1007/BF01608174
Leblanc, M; Allen, JG; Herrick, RF; Stewart, JH. (2018). Comparison of the near field/far field
model and the advanced reach tool (ART) model V1.5: exposure estimates to benzene
during parts washing with mineral spirits. Int J Hyg Environ Health 221: 231-238.
http://dx.doi.org/10.1016/j.ijheh.2017.10.016
Lee, PY; McCay, PB; Hornbrook, KR. (1982). Evidence for carbon tetrachloride-induced lipid
peroxidation in mouse liver. . Biochem Pharmacol 31: 405-409.
Lee, SM; Lee, SB; Park, CH; Choi, J. (2006). Expression of heat shock protein and hemoglobin
genes in Chironomus tentans (Diptera, chironomidae) larvae exposed to various
environmental pollutants: A potential biomarker of freshwater monitoring. Chemosphere
65: 1074-1081. http://dx.doi.org/10.1016/j.chemosphere.2006.02.042
Leighton, DT, Jr; Calo, JM. (1981). Distribution coefficients of chlorinated hydrocarbons in
dilute air-water systems for groundwater contamination applications. Journal of Chemical
and Engineering Data 26: 382-585. http://dx.doi.org/10.1021/je00026a010
Letteron, P; Labbe, G; Degott, C; Berson, A; Fromenty, B; Delaforge, M; Larrey, D; Pessayre,
D. (1990). Mechanism for the protective effects of silymarin against carbon tetrachloride-
induced lipid peroxidation and hepatotoxicity in mice. Evidence that silymarin acts both
as an inhibitor of metabolic activation and as a chain-breaking antioxidant. Biochem
Pharmacol 39: 2027-2034.
Lide, DR. (1999). CRC handbook of chemistry and physics: A ready-reference book of chemical
and physical data (80th ed.). Boca Raton, FL: CRC Press.
Lipscomb, JC; Garrett, CM; Snawder, JE. (1997). Cytochrome P450-dependent metabolism of
trichloroethylene: Interindividual differences in humans. Toxicol Appl Pharmacol 142:
311-318. http://dx.doi.org/10.1006/taap.1996.8040
Liu, Y; Cao, L; Du, J; Jia, R; Wang, J; Xu, P; Yin, G. (2015). Protective effects of Lycium
barbarum polysaccharides against carbon tetrachloride-induced hepatotoxicity in
precision-cut liver slices in vitro and in vivo in common carp (Cyprinus carpio L.). Comp
Biochem Physiol C Toxicol Pharmacol 169: 65-72.
http://dx.doi.org/10.1016/j.cbpc.2014.12.005

Page 263 of 390
Ma, X; Burken, JG. (2002). VOCs fate and partitioning in vegetation: Use of tree cores in
groundwater analysis. Environ Sci Technol 36: 4663-4668.
http://dx.doi.org/10.1021/es025795j
Mabey, W; Mill, T. (1978). Critical review of hydrolysis of organic compounds in water under
environmental conditions [Review]. J Phys Chem Ref Data 7: 383-415.
Mackay, DM; Bianchi-Mosquera, G; Kopania, AA; Kianjah, H; Thorbjarnarson, KW. (1994). A
forced‐gradient experiment on solute transport in the Borden aquifer: 1. Experimental
methods and moment analyses of results. Water Resour Res 30: 369-383.
http://dx.doi.org/10.1029/93WR02651
MacRoy, P. (2017). Comment submitted by Patrick MacRoy, Safer Chemicals, Healthy Families
(SCHF), Environmental Health Strategy Center and Healthy Building Network, Part 2.
Available online at https://www.regulations.gov/document?D=EPA-HQ-OPPT-2016-
0733-0023
Manno, M; Rezzadore, M; Grossi, M; Sbrana, C. (1996). Potentiation of occupational carbon
tetrachloride toxicity by ethanol abuse. Hum Exp Toxicol 15: 294-300.
http://dx.doi.org/10.1177/096032719601500404
Marquart, H; Franken, R; Goede, H; Fransman, W; Schinkel, J. (2017). Validation of the dermal
exposure model in ECETOC TRA. Ann Work Expo Health 61: 854-871.
http://dx.doi.org/10.1093/annweh/wxx059
Marshall, KA; Pottenger, LH. (2016). Chlorocarbons and chlorohydrocarbons. In Kirk-Othmer
Encyclopedia of Chemical Technology (4th ed.). New York, NY: John Wiley & Sons.
Martínez, A; Urios, A; Blanco, M. (2000). Mutagenicity of 80 chemicals in Escherichia coli
tester strains IC203, deficient in OxyR, and its oxyR(+) parent WP2 uvrA/pKM101:
detection of 31 oxidative mutagens. Mutat Res 467: 41-53.
http://dx.doi.org/10.1016/S1383-5718(00)00020-6
Martínez, M; Mourelle, M; Muriel, P. (1995). Protective effect of colchicine on acute liver
damage induced by CCl4. Role of cytochrome P-450. J Appl Toxicol 15: 49-52.
Martins, J; Soares, ML; Saker, ML; Olivateles, L; Vasconcelos, VM. (2007a). Phototactic
behavior in Daphnia magna Straus as an indicator of toxicants in the aquatic
environment. Ecotoxicol Environ Saf 67: 417-422.
http://dx.doi.org/10.1016/j.ecoenv.2006.11.00
Martins, JC; Saker, ML; Teles, LF; Vasconcelos, VM. (2007b). Oxygen consumption by
Daphnia magna Straus as a marker of chemical stress in the aquatic environment. Environ
Toxicol Chem 26: 1987-1991. http://dx.doi.org/10.1897/07-051R.
Mattei, F; Guida, F; Sanchez, M; Cénée, S; Févotte, J; Luce, D; Stücker, I. (2014). 0139
Occupational exposure to chlorinated solvents and lung cancer: results from the ICARE
study. Occup Environ Med 71 Suppl 1: A17. http://dx.doi.org/10.1136/oemed-2014-
102362.52
Mattie, DR; Grabau, JH; McDougal, JN. (1994). Significance of the dermal route of exposure to
risk assessment [Review]. Risk Anal 14: 277-284.
Mccay, PB; Lai, EK; Poyer, JL. (1984). Oxygen- and carbon-centered free radical formation
during carbon tetrachloride metabolism. Observations of lipid radicals in vivo and in
vitro. J Biol Chem 259: 2135-2143.
Mccollister, DD; Beamer, WH; Atchison, GJ; Spencer, HC. (1951). The absorption, distribution
and elimination of radioactive carbon tetrachloride by monkeys upon exposure to low
vapor concentrations. J Pharmacol Exp Ther 102: 112-124.

Page 264 of 390
Mendeloff, J; D’Alessandro, M; Liu, H; Steiner, E; Kopsic, J; Burns, R. (2013). Using OSHA
inspection data to analyze respirator protection program compliance. (Monthly Labor
Review). U.S. Bureau of Labor Statistics. https://doi.org/10.21916/mlr.2013.37.
Merck. (1996). The Merck index: An encyclopedia of chemicals, drugs, and biologicals. In S
Budavari (Ed.), (12th ed.). Rahway, NJ: Merck & Co., Inc.
Mico, BA; Pohl, LR. (1983). Reductive oxygenation of carbon tetrachloride.
Trichloromethylperoxyl radical as a possible intermediate in the conversion of carbon
tetrachloride to electrophilic chlorine. . Arch Biochem Biophys 225: 596-609.
Mirsalis, JC; Monforte, JA; Winegar, RA. (1994). Transgenic animal models for measuring
mutations in vivo [Review]. Crit Rev Toxicol 24: 255-280.
http://dx.doi.org/10.3109/10408449409021608
Mitragotri, S; Anissimov, Y; Bunge, A; Frasch, F; Guy, R; Kasting, G; Lane, M; Roberts, M.
(2011). Mathematical Models of Skin Permeability: An Overview. Int J Pharm 418: 115-
129. http://dx.doi.org/10.1016/j.ijpharm.2011.02.023
Molina, MJ; Rowland, FS. (1974). Predicted present stratospheric abundances of chlorine
species from photodissociation of carbon tetrachloride. Geophys Res Lett 1: 309-312.
http://dx.doi.org/10.1029/GL001i007p00309
Morales-Suárez-Varela, MM; Olsen, J; Villeneuve, S; Johansen, P; Kaerlev, L; Llopis-González,
A; Wingren, G; Hardell, L; Ahrens, W; Stang, A; Merletti, F; Gorini, G; Aurrekoetxea,
JJ; Févotte, J; Cyr, D; Guénel, P. (2013). Occupational exposure to chlorinated and
petroleum solvents and mycosis fungoides. J Occup Environ Med 55: 924-931.
http://dx.doi.org/10.1097/JOM.0b013e3182941a1c
Mourelle, M; Villalon, C; Amezcua, J. (1988). Protective effect of colchicine on acute liver
damage induced by carbon tetrachloride. Hepatology 6: 337-342.
Nagano, K; Sasaki, T; Umeda, Y; Nishizawa, T; Ikawa, N; Ohbayashi, H; Arito, H; Yamamato,
S; S, F. (2007a). Inhalation carcinogenicity and chronic toxicity of carbon tetrachloride in
rats and mice. Inhal Toxicol 19: 1089-1103.
http://dx.doi.org/10.1080/08958370701628770
Nagano, K; Umeda, Y; Saito, M; Nishizawa, T; Ikawa, N; Arito, H; Yamamoto, S; Fukushima,
S. (2007b). Thirteen-week inhalation toxicity of carbon tetrachloride in rats and mice. J
Occup Health 49: 249-259.
Narotsky, MG; Kavlock, RJ. (1995). A multidisciplinary approach to toxicological screening: II.
Developmental toxicity. J Toxicol Environ Health 45: 145-171.
http://dx.doi.org/10.1080/15287399509531987
Narotsky, MG; Pegram, RA; Kavlock, RJ. (1997). Effect of dosing vehicle on the developmental
toxicity of bromodichloromethane and carbon tetrachloride in rats. Fundam Appl Toxicol
40: 30-36. http://dx.doi.org/10.1093/toxsci/40.1.30
Navarro-Mabarak, C; Camacho-Carranza, R; Espinosa-Aguirre, JJ. (2018). Cytochrome P450 in
the central nervous system as a therapeutic target in neurodegenerative diseases
[Review]. Drug Metab Rev 50: 95-108.
http://dx.doi.org/10.1080/03602532.2018.1439502
NCI. (1976a). Carcinogenesis bioassay of trichloroethylene. (NCI-CG-TR-2). Bethesda, MD:
U.S. Department of Health, Education, and Welfare, Public Health Service, National
Institutes of Health. http://ntp.niehs.nih.gov/ntp/htdocs/LT_rpts/tr002.pdf
Page 265 of 390
NCI. (1976b). Report on the carcinogenesis bioassay of chloroform (pp. 1-60). (ISSN 0163-
7185; DHEWPUBNIH761279). Bethesda, MD: National Institutes of Health.
http://ntp.niehs.nih.gov/ntp/htdocs/LT_rpts/trchloroform.pdf
NCI. (1977). Bioassay of 1,1,1-trichloroethane for possible carcinogenicity (pp. 1-77). (ISSN
0163-7185; 3). Bethesda, MD.
https://search.proquest.com/docview/83713779?accountid=171501
Nelson, JS; Burchfiel, CM; Fekedulegn, D; Andrew, ME. (2012). Potential risk factors for
incident glioblastoma multiforme: the Honolulu Heart Program and Honolulu-Asia Aging
Study. J Neurooncol 109: 315-321. http://dx.doi.org/10.1007/s11060-012-0895-3
Neta, G; Stewart, PA; Rajaraman, P; Hein, MJ; Waters, MA; Purdue, MP; Samanic, C; Coble,
JB; Linet, MS; Inskip, PD. (2012). Occupational exposure to chlorinated solvents and
risks of glioma and meningioma in adults. Occup Environ Med 69: 793-801.
http://dx.doi.org/10.1136/oemed-2012-100742
New, PS; Lubash, GD; Scherr, L; Rubin, AL. (1962). Acute renal failure associated with carbon
tetrachloride intoxication. JAMA 181: 903-906.
NICNAS. (2017). IMAP: Environment tier II assessment for methane, tetrachloro.
https://www.nicnas.gov.au/chemical-information/imap-assessments/imap-
assessments/tier-ii-environment-assessments/carbon-tetrachloride
NIOSH. (2003). Respirator Usage in Private Sector Firms. Washington D.C.: United States
Department of Labor, Bureau of Labor Statistics and National Institute for Occupational
Safety and Health. https://www.cdc.gov/niosh/docs/respsurv/
Nitsche, JM; Kasting, GB. (2013). A microscopic multiphase diffusion model of viable
epidermis permeability. Biophys J 104: 2307-2320.
http://dx.doi.org/10.1016/j.bpj.2013.03.056
Norbert, AL; Dean, JA. (1967). Lange's handbook of chemistry (10th ed ed.). New York, NY:
McGraw-Hill.
Norpoth, K; Reisch, A; Heinecke, A. (1980). Biostatistics of Ames-test data. In K Norpoth; RC
Garner (Eds.), (pp. 312-322). New York, NY: Springer-Verlag.
http://dx.doi.org/10.1007/978-3-642-67202-6_24
Noweir, MH; Pfitzer, EA; Hatch, TF. (1973). Thermal decomposition of carbon tetrachloride
vapors at its industrial threshold limit concentration. Am Ind Hyg Assoc J 34: 25-37.
NRC. (2014). Acute exposure guideline levels for selected airborne chemicals: Volume 17.
Washington, DC: National Academies Press. http://dx.doi.org/10.17226/18796
OECD. (2010). Emission Scenario Document on Photoresist Use in Semiconductor
Manufacturing. Paris: OECD Environmental Health and Safety Publications.
http://dx.doi.org/10.1787/9789264221161-en
OECD. (2011). SIDS initial assessment profile: Carbon tetrachloride [OECD SIDS]. (CoCAM 1,
10-12 October 2011). Paris, France.
http://webnet.oecd.org/Hpv/UI/handler.axd?id=cada8da2-6884-48f1-bf42-470f2872837d
OECD. (2015). Emission scenario document (ESD) on chemical vapour deposition in the
semiconductor industry. Paris, France: Organisation for Economic Co-operation and
Development, OECD Environment Directorate, Environment, Health and Safety
Division.
http://www.oecd.org/officialdocuments/publicdisplaydocumentpdf/?cote=ENV/JM/MON
O(2015)5&doclanguage=en
Page 266 of 390
Onfelt, A. (1987). Spindle disturbances in mammalian cells: III: Toxicity, c-mitosis and
aneuploidy with 22 different compounds: Specific and unspecific mechanisms. Mutat Res
Environ Mutagen Relat Subj 182: 135-154. http://dx.doi.org/10.1016/0165-
1161(87)90067-7
OSHA. (2017). Permissible exposure limits: OSHA annotated Z-2 table. Washington, DC: U.S.
Department of Labor, Occupational Safety and Health Administration.
https://www.osha.gov/dsg/annotated-pels/tablez-2.html
OxyChem. (2014). Chlorinated Organics Handbook.
https://www.oxy.com/OurBusinesses/Chemicals/Products/Documents/ChlorinatedOrganc
is/ChlorinatedOrganicsHandbook.pdf
OxyChem. (2018). Chlorinated Organics Closed Loop Unloading of Solvent Tank Trailers.
https://www.oxy.com/OurBusinesses/Chemicals/Products/Documents/ChlorinatedOrganc
is/ClosedLoopUnloadingSolventTankTrailers.pdf
Packer, JE; Slater, TF; Willson, RL. (1978). Reactions of the carbon tetrachloride-related peroxy
free radical (CCl3O.2) with amino acids: pulse radiolysis evidence. Life Sci 23: 2617-
2620. http://dx.doi.org/10.1016/0024-3205(78)90378-8
Park, D. (2018). Review for Retrospective Exposure Assessment Methods Used in
Epidemiologic Cancer Risk Studies of Semiconductor Workers: Limitations and
Recommendations. Saf Health Work 9: 249-256.
http://dx.doi.org/10.1016/j.shaw.2018.05.005
Paustenbach, DJ; III, CH; Gargas, ML; Andersen, ME. (1988). A physiologically based
pharmacokinetic model for inhaled carbon tetrachloride. Toxicol Appl Pharmacol 96:
191-211.
Peng, DL; Dural, NH. (1998). Multicomponent adsorption of chloroform, carbon tetrachloride,
and 1,1,1-trichloroethane on soils. Journal of Chemical and Engineering Data 43: 283-
288.
Pohl, LR; Schulick, RD; Highet, RJ. (1984). Reductive-oxygenation mechanism of metabolism
of carbon tetrachloride to phosgene by cytochrome P-450. . Mol Pharmacol 25: 318-321.
Poyer, JL; Floyd, RA; McCay, PB. (1978). Spin-trapping of the trichloromethyl radical produced
during enzymic NADPH oxidation in the presence of carbon tetrachloride or
bromotrichloromethane. . Biochim Biophys Acta 539: 402-409.
Poyer, JL; McCay, PB; Lai, EK; Janzen, EG; Davis, ER. (1980). Confirmation of assignment of
the trichloromethyl radical spin adduct detected by spin trapping during 13C-carbon
tetrachloride metabolism in vitro and in vivo. Biochem Biophys Res Commun 94: 1154-
1160. http://dx.doi.org/10.1016/0006-291x(80)90540-9
Prendergast, JA, Jones, r. A., Jenkins, L. J., Jr. & Siegel, J. . (1967). Chlorinated hydrocarbon
inhalation: Effects on experimental animals of long-term inhalation of trichloroethylene,
carbon tetrachloride, 1,1,1-trichloroethane, dichlorodifluoromethane, and 1,1-
dichloroethylene. . Food Cosmet Toxicol 6: 669-670.
Ptacek, CJ; Gillham, RW. (1992). Laboratory and field measurements of non-equilibrium
transport in the Borden aquifer, Ontario, Canada. J Contam Hydrol 10: 119-158.
http://dx.doi.org/10.1016/0169-7722(92)90026-B
Purdue, MP; Stewart, PA; Friesen, MC; Colt, JS; Locke, SJ; Hein, MJ; Waters, MA; Graubard,
BI; Davis, F; Ruterbusch, J; Schwartz, K; Chow, WH; Rothman, N; Hofmann, JN.
(2016). Occupational exposure to chlorinated solvents and kidney cancer: a case-control
study. Occup Environ Med 74: 268-274. http://dx.doi.org/10.1136/oemed-2016-103849
Page 267 of 390
Rao, KS; Recknagel, RO. (1969). Early incorporation of carbon-labeled carbon tetrachloride into
rat liver particulate lipids and proteins. Exp Mol Pathol 10: 219-228.
Recknagel, RO; Glende, EA. (1973). Carbon tetrachloride hepatotoxicity: an example of lethal
cleavage. . Crit Rev Toxicol 2: 263-297.
Reinke, LA; Janzen, EG. (1991). Detection of spin adducts in blood after administration of
carbon tetrachloride to rats. Chem Biol Interact 78: 155�165.
Richie, JP, Jr.; Mills, BJ; Lang, CA. (1984). The verification of a mammalian toxicant
classification using a mosquito screening method. Fundam Appl Toxicol 4: 1029-1035.
Riegle, L. (2017). Comment submitted by Leslie Riegle, Director, Environmental Policy,
Aerospace Industries Association (AIA). Available online at
https://www.regulations.gov/document?D=EPA-HQ-OPPT-2016-0733-0011
Riley, RG; Szecsody, JE; Sklarew, DS; Mitroshkov, AV; Gent, PM; Brown, CF; Thompson, CJ.
(2010). Desorption behavior of carbon tetrachloride and chloroform in contaminated low
organic carbon aquifer sediments. Chemosphere 79: 807-813.
http://dx.doi.org/10.1016/j.chemosphere.2010.03.005
Ritesh, KR; Suganya, A; Dileepkumar, HV; Rajashekar, Y; Shivanandappa, T. (2015). A single
acute hepatotoxic dose of CCl4 causes oxidative stress in the rat brain. Toxicology
Reports 2: 891-895. http://dx.doi.org/10.1016/j.toxrep.2015.05.012
Roberts, AL; Lyall, K; Hart, JE; Laden, F; Just, AC; Bobb, JF; Koenen, KC; Ascherio, A;
Weisskopf, MG. (2013). Perinatal air pollutant exposures and autism spectrum disorder
in the children of Nurses' Health Study II participants. Environ Health Perspect 121: 978-
984. http://dx.doi.org/10.1289/ehp.1206187
Rocchi, P; Prodi, G; Grilli, S; Ferreri, AM. (1973). In vivo and in vitro binding of carbon
tetrachloride with nucleic acids and proteins in rats and mouse liver. Int J Cancer 11: 419-
425. http://dx.doi.org/10.1002/ijc.2910110219
Rogers, RD; McFarlane, JC. (1981). Sorption of carbon tetrachloride, ethylene dibromide, and
trichloroethylene on soil and clay. Environ Monit Assess 1: 155-162.
http://dx.doi.org/10.1007/BF00395120
Roose, P; Dewulf, J; Brinkman, UAT; Van Langenhove, H. (2001). Measurement of volatile
organic compounds in sediments of the Scheldt Estuary and the Southern North Sea.
Water Res 35: 1478-1488. http://dx.doi.org/10.1016/S0043-1354(00)00410-3
Rothman, KJ. (1990). No adjustments are needed for multiple comparisons. Epidemiology 1: 43-
46.
Roudabush, RL; Terhaar, CJ; Fassett, DW; Dziuba, SP. (1965). Comparative acute effects of
some chemicals on the skin of rabbits and guinea pigs. Toxicol Appl Pharmacol 7: 559-
565.
Ruder, AM; Yiin, JH; Waters, MA; Carreon, T; Hein, MJ; Butler, MA; Calvert, GM; Davis-
King, KE; Schulte, PA; Mandel, JS; Morton, RF; Reding, DJ; Rosenman, KD; Stewart,
PA; Grp, BCCS. (2013). The Upper Midwest Health Study: gliomas and occupational
exposure to chlorinated solvents. Occup Environ Med 70: 73-80.
http://dx.doi.org/10.1136/oemed-2011-100588
Ruprah, M; Mant, TGK; Flanagan, RJ. (1985). Acute carbon tetrachloride poisoning in 19
patients: implications for diagnosis and treatment. Lancet 1: 1027-1029.
Rutherford, DW; Chiou, CT. (1992). Effect of water saturation in soil organic matter on the
partition of organic compounds. Environ Sci Technol 26: 965-970.
http://dx.doi.org/10.1021/es00029a015
Page 268 of 390
Rutherford, DW; Chiou, CT; Kile, DE. (1992). Influence of soil organic matter composition on
the partition of organic compounds. Environ Sci Technol 26: 336-340.
http://dx.doi.org/10.1021/es00026a014
Sagai, M; Tappel, AL. (1978). Effect of vitamin E on carbon tetrachloride-induced lipid
peroxidation as demonstrated by in vivo pentane production. Toxicol Lett 2: 149-155.
http://dx.doi.org/10.1016/0378-4274(78)90089-9
Sanzgiri, UY; Bruckner, JV. (1997). Effect of Emulphor, an emulsifier, on the pharmacokinetic
and hepatotoxicity of oral carbon tetrachloride in the rat. Fundam Appl Toxicol 36: 54-
61. http://dx.doi.org/10.1006/faat.1997.2290
Sawada, S; Yamanaka, T; Yamatsu, K; Furihata, C; Matsushima, T. (1991). Chromosome
aberrations, micronuclei and sister-chromatid exchanges (SCEs) in rat liver induced in
vivo by hepatocarcinogens including heterocyclic amines. Mutat Res 251: 59-69.
Schell, JD, Jr. (1987) Interactions of halogenated hydrocarbon mixtures in the embryo of the
Japanese medaka (Oryzias latipes). (Doctoral Dissertation). Rutgers University, New
Brunswick, NJ.
Schwetz, BA; Leong, BKJ; Gehring, PJ. (1974). Embryo- and fetotoxcitiy of inhaled carbon
tetrachloride 1,1-dichloroethane and methyl ethyl ketone in rats. 28: 452-464.
Seidler, A; Raum, E; Arabin, B; Hellenbrand, W; Walter, U; Schwartz, FW. (1999). Maternal
occupational exposure to chemical substances and the risk of infants small-for-
gestational-age. Am J Ind Med 36: 213-222. http://dx.doi.org/10.1002/(SICI)1097-
0274(199907)36:1<213::AID-AJIM30>3.0.CO;2-A
Semple, S. (2004). Dermal exposure to chemicals in the workplace: just how important is skin
absorption? Occup Environ Med 61: 376-382.
http://dx.doi.org/10.1136/oem.2003.010645
Sherry, D; McCulloch, A; Liang, Q; Reimann, S; Newman, PA. (2018). Current sources of
carbon tetrachloride (CCl4) in our atmosphere. Environ Res Lett 13.
http://dx.doi.org/10.1088/1748-9326/aa9c87
Siegers, CP; Steffen, B; Younes, M. (1988). Antidotal effects of deferrioxamine in experimental
liver injury--role of lipid peroxidation. Pharmacol Res Comm 20: 337-343.
http://dx.doi.org/10.1016/s0031-6989(88)80070-5
Slater, TF. (1982). Activation of carbon tetrachloride: chemical principles and biological
significance. In Free radicals, lipid peroxidation and cancer. New York, NY: Academic
Press.
Snawder, JE; Lipscomb, JC. (2000). Interindividual variance of cytochrome P450 forms in
human hepatic microsomes: correlation of individual forms with xenobiotic metabolism
and implications in risk assessment. Regul Toxicol Pharmacol 32: 200-209.
http://dx.doi.org/10.1006/rtph.2000.1424
Song, J; Zhao, J; Wang, X; Dai, Y; Deng, Z; Yi, J. (2011). [Protective effects of shaoganduogan
on hepatocyte mitochondria in subacute liver injury rat induced by carbon tetrachloride].
Zhongguo Zhong Yao Za Zhi 36: 931-934.
State of California. (2013). Consumer Products Information Management System, Carbon
Tetrachloride [Website]. https://calsafer.dtsc.ca.gov/cms/candidatechemical/?rid=21394
State of Washington. (2019). Product Testing Data [Website].
https://apps.ecology.wa.gov/ptdbreporting/
Stoyanovsky, DA; Cederbaum, AL. (1999). Metabolism of carbon tetrachloride to
trichloromethyl radical: An ESR and HPLC-EC study. Chem Res Toxicol 12: 730-736.
Page 269 of 390
Sugibayashi, K. (2017). Skin Permeation and Disposition of Therapeutic and Cosmeceutical
Compounds. Springer. https://link.springer.com/book/10.1007/978-4-431-56526-0
Sun, J; Schmitt, T; Schnackenberg, LK; Pence, L; Ando, Y; Greenhaw, J; Yang, X, i; Slavov, S;
Davis, K; Salminen, WF; Mendrick, DL; Beger, RD. (2014). Comprehensive analysis of
alterations in lipid and bile acid metabolism by carbon tetrachloride using integrated
transcriptomics and metabolomics. Metabolomics 10: 1293-1304.
http://dx.doi.org/10.1007/s11306-014-0665-7
Szymonik-Lesiuk, S; Czechowska, G; Stryjecka-Zimmer, M; Słomka, M; Madro, A; Celiński, K;
Wielosz, M. (2003). Catalase, superoxide dismutase, and glutathione peroxidase activities
in various rat tissues after carbon tetrachloride intoxication. Journal of Hepato-Biliary-
Pancreatic Surgery 10: 309-315. http://dx.doi.org/10.1007/s00534-002-0824-5
Tabak, HH; Quave, SA; Mashni, CI; Barth, EF. (1981). Biodegradability studies with organic
priority pollutant compounds. J Water Pollut Control Fed 53: 1503-1518.
Ten Berge, WF; Zwart, A; Appelman, LM. (1986). Concentration-time mortality response
relationship of irritant and systemically acting vapours and gases. J Hazard Mater 13:
301-309. http://dx.doi.org/10.1016/0304-3894(86)85003-8
Thibaud, C; Erkey, C; Akgerman, A. (1992). Investigation of adsorption equilibria of volatile
organics on soil by frontal analysis chromatography. Environ Sci Technol 26: 1159-1164.
http://dx.doi.org/10.1021/es50002a603
Thrall, KD; Vucelick, ME; Gies, RA; Benson, JM. (2000). Comparative metabolism of carbon
tetrachloride in rats, mice, and hamsters using gas uptake and PBPK modeling. J Toxicol
Environ Health A 60: 531-548.
Tielemans, E; Schneider, T; Goede, H; Tischer, M; Warren, N; Kromhout, H; Van Tongeren, M;
Van Hemmen, J; Cherrie, JW. (2008). Conceptual model for assessment of inhalation
exposure: Defining modifying factors. Ann Occup Hyg 52: 577-586.
http://dx.doi.org/10.1093/annhyg/men059
Tognotti, L; Flytzani-Stephanopoulos, M; Sarofim, AF; Kopsinis, H; Stoukides, M. (1991).
STUDY OF ADSORPTION DESORPTION OF CONTAMINANTS ON SINGLE SOIL
PARTICLES USING THE ELECTRODYNAMIC THERMOGRAVIMETRIC
ANALYZER. Environ Sci Technol 25: 104-109.
Tomasi, A; Albano, E; Banni, S; Botti, B; Corongiu, F; Dessi, MA; Iannone, A; Vannini, V;
Dianzani, MU. (1987). Free-radical metabolism of carbon tetrachloride in rat liver
mitochondria. A study of the mechanism of activation. Biochem J 246: 313-317.
Tombolan, F; Renault, D; Brault, D; Guffroy, M; Perin, F; Thybaud, V. (1999). Effect of
mitogenic or regenerative cell proliferation on lacz mutant frequency in the liver of
MutaTMMice treated with 5, 9-dimethyldibenzo[c,g]carbazole. Carcinogenesis 20: 1357-
1362. http://dx.doi.org/10.1093/carcin/20.7.1357
Tomenson, JA; Baron, CE; O'Sullivan, JJ; Edwards, JC; Stonard, MC; Walker, RJ; Fearnley,
DM. (1995). Hepatic function in workers occupationally exposed to carbon tetrachloride.
Occup Environ Med 52: 508-514.
Tomer, A; Kane, J. (2015). The great port mismatch. U.S. goods trade and international
transportation. The Global Cities Initiative. A joint project of Brookings and JPMorgon
Chase. https://www.brookings.edu/wp-
content/uploads/2015/06/brgkssrvygcifreightnetworks.pdf
Tribble, DL; Aw, TY; Jones, DP. (1987). The pathophysiological significance of lipid
peroxidation in oxidative cell injury [Review]. Hepatology 7: 377-386.
Page 270 of 390
Tsai, KP; Chen, CY. (2007). An algal toxicity database of organic toxicants derived by a closed-
system technique. Environ Toxicol Chem 26: 1931-1939. http://dx.doi.org/10.1897/06-
612R.1
Tsujimura, K; Ichinose, F; Hara, T; Yamasaki, K; Otsuka, M; Fukushima, S. (2008). The
inhalation exposure of carbon tetrachloride promote rat liver carcinogenesis in a medium-
term liver bioassay. Toxicol Lett 176: 207-214.
http://dx.doi.org/10.1016/j.toxlet.2007.11.007
U.S. BLS. (2016). May 2016 Occupational Employment and Wage Estimates: National Industry-
Specific Estimates [Website]. http://www.bls.gov/oes/tables.htm
U.S. Census Bureau. (2015). Statistics of U.S. Businesses (SUSB).
https://www.census.gov/data/tables/2015/econ/susb/2015-susb-annual.html
U.S. Coast Guard. (1985). CHRIS hazardous chemical data: Volume II. Washington, DC:
Government Printing Office.
U.S. Coast Guard. (1999). Carbon tetrachloride. Chemical Hazards Response Information
System (CHRIS) Hazardous Chemical Data. Washington, DC: Department of
Transportation.
U.S. EPA. (1987). Health advisories for carbon tetrachloride [EPA Report]. Washington, DC:
Office of Drinking Water.
U.S. EPA. (1991). Guidelines for developmental toxicity risk assessment (pp. 1-71).
(EPA/600/FR-91/001). Washington, DC: U.S. Environmental Protection Agency, Risk
Assessment Forum. http://cfpub.epa.gov/ncea/cfm/recordisplay.cfm?deid=23162
U.S. EPA. (1992a). Guidelines for Exposure Assessment [EPA Report]. In Risk Assessment
Forum. (EPA/600/Z-92/001). Washington, DC: U. S. Environmental Protection Agency.
https://cfpub.epa.gov/ncea/risk/recordisplay.cfm?deid=15263
U.S. EPA. (1992b). Guidelines for exposure assessment. Federal Register 57(104):22888-22938
[EPA Report]. (EPA/600/Z-92/001). Washington, DC.
http://cfpub.epa.gov/ncea/cfm/recordisplay.cfm?deid=15263
U.S. EPA. (1994). Guidelines for Statistical Analysis of Occupational Exposure Data: Final.
United States Environmental Protection Agency :: U.S. EPA.
U.S. EPA. (1995). Protocol for Equipment Leak Emission Estimates. (EPA-453/R-95-017).
Research Triangle Park, NC: Office of Air and Radiation, Office of Air Quality and
Planning Standards. https://www3.epa.gov/ttn/chief/efdocs/equiplks.pdf
U.S. EPA. (1998). Guidelines for ecological risk assessment [EPA Report]. (EPA/630/R-
95/002F). Washington, DC: U.S. Environmental Protection Agency, Risk Assessment
Forum. https://www.epa.gov/risk/guidelines-ecological-risk-assessment
U.S. EPA. (2001). Risk assessment guidance for superfund: Volume III - Part A, Process for
conducting probabilistic risk assessment [EPA Report]. (EPA 540-R-02-002).
Washington, DC: U.S. Environmental Protection Agency, Office of Emergency and
Remedial Response.
U.S. EPA. (2002). A review of the reference dose and reference concentration processes.
(EPA/630/P-02/002F). Washington, DC: U.S. Environmental Protection Agency, Risk
Assessment Forum. https://www.epa.gov/sites/production/files/2014-12/documents/rfd-
final.pdf
U.S. EPA. (2003a). Attachment 1-3 Guidance for Developing Ecological Soil Screening Levels
(Eco-SSLs): Evaluation of Dermal Contact and Inhalation Exposure Pathways for the
Purpose of Setting Eco-SSLs. (OSWER9285755E). Washington, DC: .S. Environmental
Page 271 of 390
Protection Agency, Office of Solid Waste and Emergency Response.
https://www.epa.gov/sites/production/files/2015-09/documents/ecossl_attachment_1-
3.pdf
U.S. EPA. (2003b). Guidance for developing ecological soil screening levels (Eco-SSLs):
Review of background concentration for metals - Attachment 1-4 [EPA Report].
(OSWER Directive 92857-55). Washington, DC.
U.S. EPA. (2005a). Guidelines for carcinogen risk assessment [EPA Report]. (EPA/630/P-
03/001F). Washington, DC: U.S. Environmental Protection Agency, Risk Assessment
Forum. https://www.epa.gov/sites/production/files/2013-
09/documents/cancer_guidelines_final_3-25-05.pdf
U.S. EPA. (2005b). Guidelines for carcinogen risk assessment. Risk Assessment Forum,
Washington, DC; EPA/630/P-03/001B. U.S. EPA. http://www.epa.gov/iris/backgr-d.htm
U.S. EPA. (2010). Toxicological review of carbon tetrachloride (CAS No. 56-23-5) in support of
summary information on the Integrated Risk Information System (IRIS) [EPA Report].
(EPA/635/R-08/005F). Washington, DC.
U.S. EPA. (2011). Exposure factors handbook: 2011 edition [EPA Report]. (EPA/600/R-
090/052F). Washington, DC.
http://cfpub.epa.gov/ncea/cfm/recordisplay.cfm?deid=236252
U.S. EPA. (2012a). Estimation Programs Interface Suite™ for Microsoft® Windows, v 4.11
[Computer Program]. Washington, DC. Retrieved from https://www.epa.gov/tsca-
screening-tools/epi-suitetm-estimation-program-interface
U.S. EPA. (2012b). Sustainable futures P2 framework manual [EPA Report]. (EPA-748-B12-
001). Washington DC. http://www.epa.gov/sustainable-futures/sustainable-futures-p2-
framework-manual
U.S. EPA. (2012c). Advances in inhalation gas dosimetry for derivation of a reference
concentration (RfC) and use in risk assessment (pp. 1-140). (EPA/600/R-12/044).
Washington, DC.
https://cfpub.epa.gov/ncea/risk/recordisplay.cfm?deid=244650&CFID=50524762&CFT
OKEN=17139189
U.S. EPA. (2013). Interpretive assistance document for assessment of discrete organic chemicals.
Sustainable futures summary assessment [EPA Report]. Washington, DC.
http://www.epa.gov/sites/production/files/2015-05/documents/05-
iad_discretes_june2013.pdf
U.S. EPA. (2014a). Discharge monitoring report (DMR) pollutant loading tool . Washington,
DC. https://cfpub.epa.gov/dmr/index.cfm
U.S. EPA. (2014b). Framework for human health risk assessment to inform decision making.
Final [EPA Report]. (EPA/100/R-14/001). Washington, DC: U.S. Environmental
Protection, Risk Assessment Forum. https://www.epa.gov/risk/framework-human-health-
risk-assessment-inform-decision-making
U.S. EPA. (2015a). ChemSTEER user guide - Chemical screening tool for exposures and
environmental releases. Washington, D.C.
https://www.epa.gov/sites/production/files/2015-05/documents/user_guide.pdf
U.S. EPA. (2015b). Update of human health ambient water quality criteria: Carbon tetrachloride
56-23-5. (EPA 820-R-15-023). https://www.regulations.gov/document?D=EPA-HQ-OW-
2014-0135-0182
Page 272 of 390
U.S. EPA. (2016a). Chemical Data Reporting (CDR) Results. Carbon Tetrachloride (CAS # 56-
23-5); Reporting Year 2016. Washington, DC. https://www.epa.gov/chemical-data-
reporting/2016-chemical-data-reporting-results#access
U.S. EPA. (2016b). Instructions for reporting 2016 TSCA chemical data reporting. Washington,
DC: Office of Pollution Prevention and Toxics. https://www.epa.gov/chemical-data-
reporting/instructions-reporting-2016-tsca-chemical-data-reporting
U.S. EPA. (2016c). Non-confidential 2016 Chemical Data Reporting (CDR) database.
Washington, DC: US Environmental Protection Agency, Office of Pollution Prevention
and Toxics. Retrieved from https://www.epa.gov/chemical-data-reporting
U.S. EPA. (2016d). Public database 2016 chemical data reporting (May 2017 release).
Washington, DC: US Environmental Protection Agency, Office of Pollution Prevention
and Toxics. Retrieved from https://www.epa.gov/chemical-data-reporting
U.S. EPA. (2017a). Carbon Tetrachloride (CASRN: 56‐23‐5) bibliography: Supplemental file for
the TSCA Scope Document [EPA Report].
https://www.epa.gov/sites/production/files/2017-06/documents/ccl4_comp_bib_0.pdf
U.S. EPA. (2017b). Internal communication. Washington, DC: U.S. Environmental Protection
Agency, Office of Pollution Prevention and Toxics.
U.S. EPA. (2017c). Learn the Basics of Hazardous Waste. https://www.epa.gov/hw/learn-basics-
hazardous-waste
U.S. EPA. (2017d). Preliminary information on manufacturing, processing, distribution, use, and
disposal: Carbon tetrachloride [Comment]. Washington, DC.
https://www.regulations.gov/document?D=EPA-HQ-OPPT-2016-0733-0003
U.S. EPA. (2017e). Scope of the risk evaluation for Carbon Tetrachloride (methane, tetrachloro-
). CASRN: 56-23-5 [EPA Report]. (EPA-740-R1-7010).
https://www.epa.gov/sites/production/files/2017-06/documents/ccl4_scope_06-22-17.pdf
U.S. EPA. (2017g). Toxics Release Inventory (TRI) Program. Basic Plus Data Files: Carbon
Tetrachloride (CAS # 56-23-5) Reporting Year 2016. Washington, DC: U.S.
Environmental Protection Agency Toxics Release Inventory Program.
https://www.epa.gov/toxics-release-inventory-tri-program/tri-basic-plus-data-files-
calendar-years-1987-2017
U.S. EPA. (2017h). Toxics Release Inventory (TRI), reporting year 2015. Retrieved from
https://www.epa.gov/toxics-release-inventory-tri-program/tri-data-and-tools
U.S. EPA. (2018a). Application of systematic review in TSCA risk evaluations. (740-P1-8001).
Washington, DC: U.S. Environmental Protection Agency, Office of Chemical Safety and
Pollution Prevention. https://www.epa.gov/sites/production/files/2018-
06/documents/final_application_of_sr_in_tsca_05-31-18.pdf
U.S. EPA. (2018b). ECOTOX user guide: ECOTOXicology database system. Version 5.0.
Washington, DC: U.S. Environmental Protection Agency. https://cfpub.epa.gov/ecotox/
U.S. EPA. (2018c). Problem formulation of the risk evaluation for carbon tetrachloride
(methane, tetrachloro-). (EPA-740-R1-7020). Washington, DC: Office of Chemical
Safety and Pollution Prevention, United States Environmental Protection Agency.
https://www.epa.gov/sites/production/files/2018-
06/documents/ccl4_problem_formulation_05-31-18.pdf
U.S. EPA. (2018d). Strategy for assessing data quality in TSCA risk evaluations. Washington
DC: U.S. Environmental Protection Agency, Office of Pollution Prevention and Toxics.

Page 273 of 390
U.S. EPA. (2018e). Toxics Release Inventory (TRI), reporting year 2017. Retrieved from
https://www.epa.gov/toxics-release-inventory-tri-program/tri-data-and-tools
U.S. EPA. (2018f). TRI Reporting Forms and Instructions (RFI) Guidance Document.
https://ofmpub.epa.gov/apex/guideme_ext/f?p=guideme_ext:41:0::NO:::
U.S. EPA. (2019a). Benchmark Dose Software (BMDS). Version 3.1.2 [BMDS] (3.1.2 ed.).
https://www.epa.gov/bmds/benchmark-dose-software-bmds-version-312-download
U.S. EPA. (2019b). Final Risk Evaluation for Carbon Tetrachloride Supplemental File
Occupational Exposure Risk Calculator
U.S. EPA. (2019c). Final Risk Evaluation for Carbon Tetrachloride, Supplemental Information
on Releases and Occupational Exposure Assessment
U.S. EPA. (2019d). Final Risk Evaluation for Carbon Tetrachloride Supplemental File:
Benchmark Dose Modeling and Source Code for PBPK Model for Derivation of the IRIS
Reference Concentration (POD for Chronic Inhalation Exposures) and Inhalation Unit
Risk.
U.S. EPA. (2019e). Final Risk Evaluation for Carbon Tetrachloride Systematic Review
Supplemental File: Data Quality Evaluation for Human Health Hazard Studies - Animal
and In Vitro Studies
U.S. EPA. (2019f). Final Risk Evaluation for Carbon Tetrachloride Systematic Review
Supplemental File: Data Quality Evaluation of Environmental Fate and Transport Studies
U.S. EPA. (2019g). Final Risk Evaluation for Carbon Tetrachloride Systematic Review
Supplemental File: Data Quality Evaluation of Environmental Hazard Studies
U.S. EPA. (2019h). Final Risk Evaluation for Carbon Tetrachloride Systematic Review
Supplemental File: Data Quality Evaluation of Environmental Release and Occupational
Exposure Data.
U.S. EPA. (2019i). Final Risk Evaluation for Carbon Tetrachloride Systematic Review
Supplemental File: Data Quality Evaluation of Environmental Release and Occupational
Exposure Data Common Sources
U.S. EPA. (2019j). Final Risk Evaluation for Carbon Tetrachloride Systematic Review
Supplemental File: Data Quality Evaluation of Human Health Hazard Studies -
Epidemiological Studies
U.S. EPA. (2019k). Final Risk Evaluation for Carbon Tetrachloride Systematic Review
Supplemental File: Data Quality Evaluation of Physical-Chemical Properties Studies
Washington, D.C.: U.S. Environmental Protection Agency. Office of Chemical Safety
and Pollution Prevention.
U.S. EPA. (2019l). Final Risk Evaluation for Carbon Tetrachloride Systematic Review
Supplemental File: Updates to the Data Quality Criteria for Epidemiological Studies
(Docket # EPA-HQ-OPPT-2019-0236).
UNEP/Ozone Secretariat. (1998). The Montreal protocol on substances that deplete the ozone
layer. Tenth meeting of the parties (Cairo, 23-24 November 1998). Decision X/14:
Process agents. In Handbook for the Montreal Protocol on Substances that Deplete the
Ozone Layer. (Decision X/14: Process Agents). Nairobi, Kenya.
http://ozone.unep.org/en/handbook-montreal-protocol-substances-deplete-ozone-
layer/706
Urano, K; Murata, C. (1985). Adsorption of principal chlorinated organic compounds on soil.
Chemosphere 14: 293-299. http://dx.doi.org/10.1016/0045-6535(85)90057-8
Page 274 of 390
Uryvaeva, IV; Delone, GV. (1995). An improved method of mouse liver micronucleus analysis:
an application to age-related genetic alteration and polyploidy study. Mutat Res 334: 71-
80.
Van Eekert, MHA; Schröder, TJ; Stams, AJM; Schraa, G; Field, JA. (1998). Degradation and
fate of carbon tetrachloride in unadapted methanogenic granular sludge. Appl Environ
Microbiol 64: 2350-2356.
Van Goethem, F; de Stoppelaar, J; Hoebee, B; Kirsch-Volders, M. (1995). Identification of
clastogenic and/or aneugenic events during the preneoplastic stages of experimental rat
hepatocarcinogenicity by fluorescence in site hybridization. Carcinogenesis 16: 1825-
1834.
Van Goethem, F; Ghahroudi, MA; Castelain, P; Kirsch-Volders, M. (1993). Frequency and DNA
content of micronuclei in rat parenchymal liver cells during experimental
hepatocarcinogenesis. Carcinogenesis 14: 2397-2406.
van Raaij, MTM; Jansen, PAH; Piersma, AH. (2003). The relevance of developmental toxicity
endpoints for acute limit setting. (601900004). Bilthoven: RIVM.
Vermont Department of Health. (2020). Chemicals in Children’s Products [Website].
https://www.healthvermont.gov/environment/children/chemicals-childrens-products
Vizcaya, D; Christensen, KY; Lavoue, J; Siemiatycki, J. (2013). Risk of lung cancer associated
with six types of chlorinated solvents: results from two case-control studies in Montreal,
Canada. Occup Environ Med 70: 81-85. http://dx.doi.org/10.1136/oemed-2012-101155
Wahlberg, JE; Boman, A. (1979). Comparative percutaneous toxicity of ten industrial solvents in
the guinea pig. Scand J Work Environ Health 5: 345-351.
Walton, BT; Anderson, TA; Hendricks, MS; Talmage, SS. (1989). Physicochemical properties as
predictors of organic chemical effects on soil microbial respiration. Environ Toxicol
Chem 8: 53-63. http://dx.doi.org/10.1002/etc.5620080107
Walton, BT; Hendricks, MS; Anderson, TA; Griest, WH; Merriweather, R; Beauchamp, JJ;
Francis, CW. (1992). Soil sorption of volatile and semivolatile organic compounds in a
mixture. J Environ Qual 21: 552-558.
http://dx.doi.org/10.2134/jeq1992.00472425002100040005x
Weber, LJ; Gingerich, WH; Pfeifer, KF. (1979). Alterations in rainbow trout liver function and
body fluids following treatment with carbon tetrachloride or monochlorobenzene. In
MAQ Khan; JJ Lech; JJ Menn (Eds.), ACS Symposium Series, vol 99 (pp. 401-413).
Washington, DC: American Chemical Society. http://dx.doi.org/10.1021/bk-1979-
0099.ch024
Weddle, CE; Hornbrook, KR; Mccay, PB. (1976). Lipid peroxidation and alteration of
membrane lipids in isolated hepatocytes exposed to carbon tetrachloride. J Biol Chem
251: 4973-4978.
Weil, ED; Sandler, SR; Gernon, M. (2006). Sulfur compounds. In Kirk-Othmer Encyclopedia of
Chemical Technology. New York, NY: John Wiley & Sons.
http://dx.doi.org/10.1002/0471238961.1921120623050912.a01.pub2
Weisburger, EK. (1977). Carcinogenicity studies on halogenated hydrocarbons. Environ Health
Perspect 21: 7-16. http://dx.doi.org/10.1289/ehp.77217
Whittaker, C; Rice, F; McKernan, L; Dankovic, D; Lentz, T; Macmahon, K; Kuempel, E;
Zumwalde, R; Schulte, P. (2016). Current Intelligence Bulletin 68: NIOSH Chemical
Carcinogen Policy. US Department of Health and Human Services.
https://ntrl.ntis.gov/NTRL/dashboard/searchResults/titleDetail/PB2017101413.xhtml

Page 275 of 390
WHO. (2004). Carbon tetrachloride in drinking-water. Background document for development
of WHO guidelines for drinking-water quality. (WHO/SDE/WSH/03.04/82).
http://www.who.int/water_sanitation_health/dwq/chemicals/carbontetrachloride.pdf
WHO. (2006). Protecting groundwater for health: Managing the quality of drinking-water
sources. London, UK.
http://apps.who.int/iris/bitstream/10665/43186/1/9241546689_eng.pdf
Wilson, JG. (1954). Influence of the offspring of altered physiologic states during pregnancy in
the rat. Ann N Y Acad Sci 57: 517-525. http://dx.doi.org/10.1111/j.1749-
6632.1954.tb36427.x
Yang, WS; Stockwell, BR. (2016). Ferroptosis: Death by Lipid Peroxidation. Trends Cell Biol
26: 165-176. http://dx.doi.org/10.1016/j.tcb.2015.10.014
Yoon, M; Madden, MC; Barton, HA. (2007). Extrahepatic metabolism by CYP2E1 in PBPK
modeling of lipophilic volatile organic chemicals: Impacts on metabolic parameter
estimation and prediction of dose metrics. J Toxicol Environ Health A 70: 1527-1541.
http://dx.doi.org/10.1080/15287390701384684
Yoshioka, Y; Ose, Y; Sato, T. (1985). Testing for the toxicity of chemicals with Tetrahymena
pyriformis. Sci Total Environ 43: 149-157.
Yoshioka, Y; Ose, Y; Sato, T. (1986). Correlation of the five test methods to assess chemical
toxicity and relation to physical properties. Ecotoxicol Environ Saf 12: 15-21.
Younes, M; Siegers, CP. (1985). The Role of Iron in the Paracetamol and Carbon Tetrachloride-
induced Lipid Peroxidation and Hepatotoxicity (pp. 327-334). (BIOSIS/86/15408).
Zhao, X; Wallace, RB; Hyndman, DW; Dybas, MJ; Voice, TC. (2005). Heterogeneity of
chlorinated hydrocarbon sorption properties in a sandy aquifer. J Contam Hydrol 78: 327-
342. http://dx.doi.org/10.1016/j.jconhyd.2005.06.002
Zhao, XD; Szafranski, MJ; Maraqa, MA; Voice, TC. (1999). Sorption and bioavailability of
carbon tetrachloride in a low organic content sandy soil. Environ Toxicol Chem 18:
1755-1762. http://dx.doi.org/10.1002/etc.5620180821

Page 276 of 390
7 APPENDICES
Appendix A REGULATORY HISTORY
Federal Laws and Regulations Table A-1. Federal Laws and Regulations
Statutes/Regulations Description of Authority/Regulation Description of Regulation
EPA Regulations
TSCA - Section 6(b) EPA is directed to identify and begin
risk evaluations on 10 chemical
substances drawn from the 2014 update
of the TSCA Work Plan for Chemical
Assessments.
Carbon tetrachloride is on the
initial list of chemicals to be
evaluated for unreasonable risk
under TSCA (81 FR 91927,
December 19, 2016).
TSCA - Section 8(a) The TSCA Section 8(a) CDR Rule
requires manufacturers (including
importers) to give EPA basic exposure-
related information on the types,
quantities and uses of chemical
substances produced domestically and
imported into the United States.
Carbon tetrachloride
manufacturing (including
importing), processing and use
information is reported under
the CDR Rule (76 FR 50816,
August 16, 2011).
TSCA - Section 8(b) EPA must compile, keep current and
publish a list (the TSCA Inventory) of
each chemical substance manufactured,
processed, or imported in the United
States.
Carbon tetrachloride was on
the initial TSCA Inventory and
therefore was not subject to
EPA’s new chemicals review
process under TSCA Section 5
(60 FR 16309, March 29,
1995).
TSCA - Section 8(d) Provides EPA with authority to issue
rules requiring producers, importers
and (if specified) processors of a
chemical substance or mixture to
submit lists and/or copies of health and
safety studies.
Two submissions received
(1947-1994) (U.S. EPA,
ChemView. Accessed April
13, 2017).
TSCA - Section 8(e) Manufacturers (including imports),
processors and distributors must
immediately notify EPA if they obtain
information that supports the
conclusion that a chemical substance or
mixture presents a substantial risk of
injury to health or the environment.
Three submissions received
(1992-2010) (U.S. EPA,
ChemView. Accessed April
13, 2017).

Page 277 of 390
Statutes/Regulations Description of Authority/Regulation Description of Regulation
TSCA - Section 4 Provides EPA with authority to issue
rules and orders requiring
manufacturers (including importers)
and processors to test chemical
substances and mixtures.
Seven Section 4 notifications
received for carbon
tetrachloride: two acute aquatic
toxicity studies, one
bioaccumulation report and
four monitoring reports
(1978-1980) (U.S. EPA,
ChemView. Accessed April
13, 2017).
EPCRA - Section 313 Requires annual reporting from
facilities in specific industry sectors
that employ 10 or more full time
equivalent employees and that
manufacture, process, or otherwise use
a TRI-listed chemical in quantities
above threshold levels.
Carbon tetrachloride is a listed
substance subject to reporting
requirements under 40 CFR
372.65 effective as of January
1, 1987.
Federal Insecticide,
Fungicide, and
Rodenticide Act
(FIFRA) - Sections 3
and 6
FIFRA governs the sale, distribution
and use of pesticides. Section 3 of
FIFRA generally requires that pesticide
products be registered by EPA prior to
distribution or sale. Pesticides may only
be registered if, among other things,
they do not cause “unreasonable
adverse effects on the environment.”
Section 6 of FIFRA provides EPA with
the authority to cancel pesticide
registrations if either (1) the pesticide,
labeling, or other material does not
comply with FIFRA; or (2) when used
in accordance with widespread and
commonly recognized practice, the
pesticide generally causes unreasonable
adverse effects on the environment.
Use of carbon tetrachloride as
a grain fumigant was banned
under FIFRA in 1986 (51 FR
41004, November 12, 1986).
Federal Food, Drug,
and Cosmetic Act
(FFDCA) - Section
408
FFDCA governs the allowable residues
of pesticides in food. Section 408 of the
FFDCA provides EPA with the
authority to set tolerances (rules that
establish maximum allowable residue
limits), or exemptions from the
requirement of a tolerance, for all
residues of a pesticide (including both
active and inert ingredients) that are in
or on food. Prior to issuing a tolerance
EPA removed carbon
tetrachloride from its list of
pesticide product inert
ingredients used in pesticide
products in 1998 (63 FR
34384, June 24, 1998).

Page 278 of 390
Statutes/Regulations Description of Authority/Regulation Description of Regulation
or exemption from tolerance, EPA must
determine that the tolerance or
exemption is “safe.” Sections 408(b)
and (c) of the FFDCA define “safe” to
mean the Agency has a reasonable
certainty that no harm will result from
aggregate exposures to the pesticide
residue, including all dietary exposure
and all other exposure (e.g., non-
occupational exposures) for which there
is reliable information. Pesticide
tolerances or exemptions from
tolerance that do not meet the FFDCA
safety standard are subject to
revocation. In the absence of a
tolerance or an exemption from
tolerance, a food containing a pesticide
residue is considered adulterated and
may not be distributed in interstate
commerce.
CAA - Section 112(b) This Section lists 189 HAPs that must
be addressed by EPA and includes
authority for EPA to add or delete
pollutants. EPA may, by rule, add
pollutants that present, or may present,
a threat of adverse human health effects
or adverse environmental effects.
Lists carbon tetrachloride as a
HAP (70 FR 75047, December
19, 2005).
CAA - Section 112(d) Directs EPA to establish, by rule,
National Emission Standards
(NESHAPs) for each category or
subcategory of major sources and area
sources of HAPs. The standards must
require the maximum degree of
emission reduction that EPA
determines is achievable by each
particular source category. This is
generally referred to as maximum
achievable control technology
(MACT).
There are a number of source-
specific NESHAPs for carbon
tetrachloride, including:
Rubber tire manufacturing (67
FR 45588, July 9, 2002)
Chemical Manufacturing Area
Sources (74 FR 56008,
October 29, 2009)
Organic HAP from the
Synthetic Organic Chemical
Manufacturing and Other
Processes (59 FR 19402, April
22,1994),
Halogenated solvent cleaning
operations (59 FR 61801,
December 2, 1994)
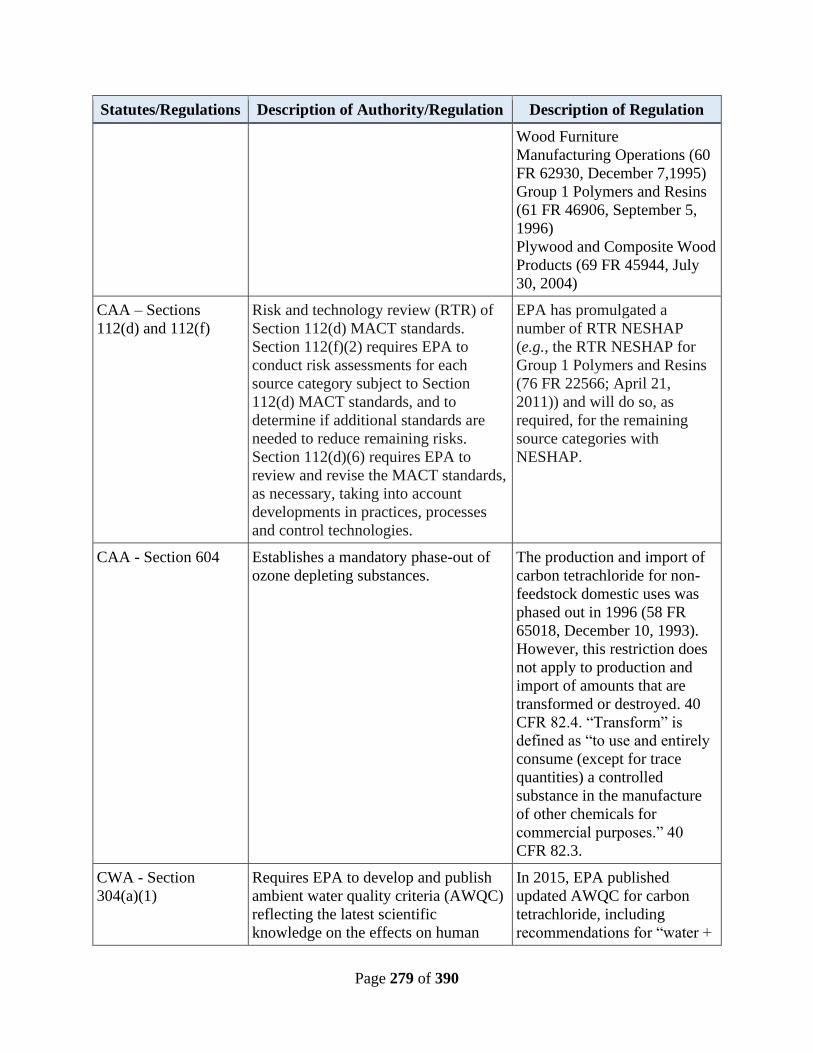
Page 279 of 390
Statutes/Regulations Description of Authority/Regulation Description of Regulation
Wood Furniture
Manufacturing Operations (60
FR 62930, December 7,1995)
Group 1 Polymers and Resins
(61 FR 46906, September 5,
1996)
Plywood and Composite Wood
Products (69 FR 45944, July
30, 2004)
CAA – Sections
112(d) and 112(f)
Risk and technology review (RTR) of
Section 112(d) MACT standards.
Section 112(f)(2) requires EPA to
conduct risk assessments for each
source category subject to Section
112(d) MACT standards, and to
determine if additional standards are
needed to reduce remaining risks.
Section 112(d)(6) requires EPA to
review and revise the MACT standards,
as necessary, taking into account
developments in practices, processes
and control technologies.
EPA has promulgated a
number of RTR NESHAP
(e.g., the RTR NESHAP for
Group 1 Polymers and Resins
(76 FR 22566; April 21,
2011)) and will do so, as
required, for the remaining
source categories with
NESHAP.
CAA - Section 604 Establishes a mandatory phase-out of
ozone depleting substances.
The production and import of
carbon tetrachloride for non-
feedstock domestic uses was
phased out in 1996 (58 FR
65018, December 10, 1993).
However, this restriction does
not apply to production and
import of amounts that are
transformed or destroyed. 40
CFR 82.4. “Transform” is
defined as “to use and entirely
consume (except for trace
quantities) a controlled
substance in the manufacture
of other chemicals for
commercial purposes.” 40
CFR 82.3.
CWA - Section
304(a)(1)
Requires EPA to develop and publish
ambient water quality criteria (AWQC)
reflecting the latest scientific
knowledge on the effects on human
In 2015, EPA published
updated AWQC for carbon
tetrachloride, including
recommendations for “water +

Page 280 of 390
Statutes/Regulations Description of Authority/Regulation Description of Regulation
health that may be expected from the
presence of pollutants in any body of
water.
organism” and “organism
only” human health criteria for
states and authorized tribes to
consider when adopting
criteria into their water quality
standards. See 80 FR 36986
(June 29, 2015);
https://www.regulations.gov/d
ocument?D=EPA-HQ-OW-
2014-0135-0182.
CWA – Sections
301(b), 304(b), 306,
and 307(b)
Requires establishment of Effluent
Limitations Guidelines and Standards
for conventional, toxic, and
non-conventional pollutants. For toxic
and non-conventional pollutants, EPA
identifies the best available technology
that is economically achievable for that
industry after considering statutorily
prescribed factors and sets regulatory
requirements based on the performance
of that technology.
CWA - Section 307(a) Establishes a list of toxic pollutants or
combination of pollutants under the
CWA. The statute specifies a list of
families of toxic pollutants also listed in
the Code of Federal Regulations at 40
CFR 401.15. The “priority pollutants”
specified by those families are listed in
40 CFR part 423, Appendix A. These
are pollutants for which best available
technology effluent limitations must be
established on either a national basis
through rules, see Section 301(b),
304(b), 307(b), 306, or on a case-by-
case best professional judgment basis in
NPDES permits. CWA 402(a)(1)(B).
Carbon tetrachloride is
designated as a toxic pollutant
under Section 307(a)(1) of the
CWA and as such is subject to
effluent limitations.
SDWA - Section 1412 Requires EPA to publish a non-
enforceable maximum contaminant
level goals (MCLGs) for a contaminant
which EPA makes a determination that
the contaminant 1. may have an adverse
effect on the health of persons; 2. is
known to occur or there is a substantial
Carbon tetrachloride is subject
to National Primary Drinking
Water Regulations (NPDWR)
under SDWA and EPA has set
a MCLG of zero and an
enforceable MCL of 0.005
mg/L (40 CFR 141.50; 40 CFR
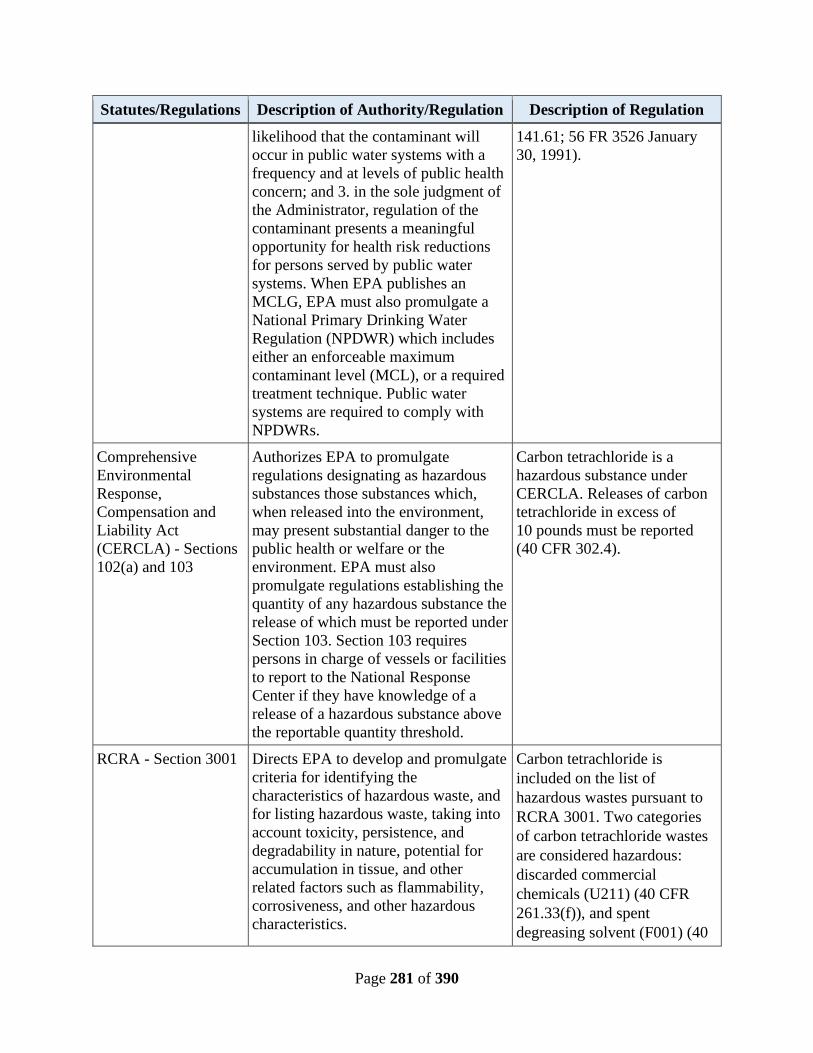
Page 281 of 390
Statutes/Regulations Description of Authority/Regulation Description of Regulation
likelihood that the contaminant will
occur in public water systems with a
frequency and at levels of public health
concern; and 3. in the sole judgment of
the Administrator, regulation of the
contaminant presents a meaningful
opportunity for health risk reductions
for persons served by public water
systems. When EPA publishes an
MCLG, EPA must also promulgate a
National Primary Drinking Water
Regulation (NPDWR) which includes
either an enforceable maximum
contaminant level (MCL), or a required
treatment technique. Public water
systems are required to comply with
NPDWRs.
141.61; 56 FR 3526 January
30, 1991).
Comprehensive
Environmental
Response,
Compensation and
Liability Act
(CERCLA) - Sections
102(a) and 103
Authorizes EPA to promulgate
regulations designating as hazardous
substances those substances which,
when released into the environment,
may present substantial danger to the
public health or welfare or the
environment. EPA must also
promulgate regulations establishing the
quantity of any hazardous substance the
release of which must be reported under
Section 103. Section 103 requires
persons in charge of vessels or facilities
to report to the National Response
Center if they have knowledge of a
release of a hazardous substance above
the reportable quantity threshold.
Carbon tetrachloride is a
hazardous substance under
CERCLA. Releases of carbon
tetrachloride in excess of
10 pounds must be reported
(40 CFR 302.4).
RCRA - Section 3001 Directs EPA to develop and promulgate
criteria for identifying the
characteristics of hazardous waste, and
for listing hazardous waste, taking into
account toxicity, persistence, and
degradability in nature, potential for
accumulation in tissue, and other
related factors such as flammability,
corrosiveness, and other hazardous
characteristics.
Carbon tetrachloride is
included on the list of
hazardous wastes pursuant to
RCRA 3001. Two categories
of carbon tetrachloride wastes
are considered hazardous:
discarded commercial
chemicals (U211) (40 CFR
261.33(f)), and spent
degreasing solvent (F001) (40
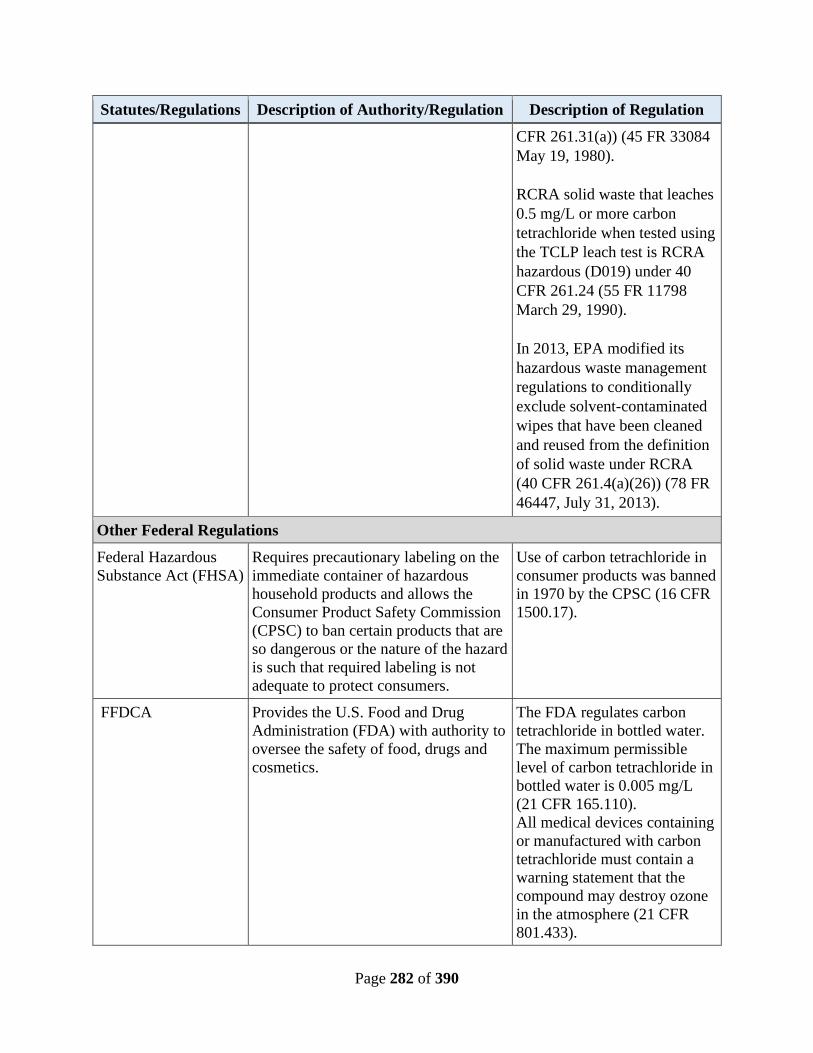
Page 282 of 390
Statutes/Regulations Description of Authority/Regulation Description of Regulation
CFR 261.31(a)) (45 FR 33084
May 19, 1980).
RCRA solid waste that leaches
0.5 mg/L or more carbon
tetrachloride when tested using
the TCLP leach test is RCRA
hazardous (D019) under 40
CFR 261.24 (55 FR 11798
March 29, 1990).
In 2013, EPA modified its
hazardous waste management
regulations to conditionally
exclude solvent-contaminated
wipes that have been cleaned
and reused from the definition
of solid waste under RCRA
(40 CFR 261.4(a)(26)) (78 FR
46447, July 31, 2013).
Other Federal Regulations
Federal Hazardous
Substance Act (FHSA)
Requires precautionary labeling on the
immediate container of hazardous
household products and allows the
Consumer Product Safety Commission
(CPSC) to ban certain products that are
so dangerous or the nature of the hazard
is such that required labeling is not
adequate to protect consumers.
Use of carbon tetrachloride in
consumer products was banned
in 1970 by the CPSC (16 CFR
1500.17).
FFDCA Provides the U.S. Food and Drug
Administration (FDA) with authority to
oversee the safety of food, drugs and
cosmetics.
The FDA regulates carbon
tetrachloride in bottled water.
The maximum permissible
level of carbon tetrachloride in
bottled water is 0.005 mg/L
(21 CFR 165.110).
All medical devices containing
or manufactured with carbon
tetrachloride must contain a
warning statement that the
compound may destroy ozone
in the atmosphere (21 CFR
801.433).
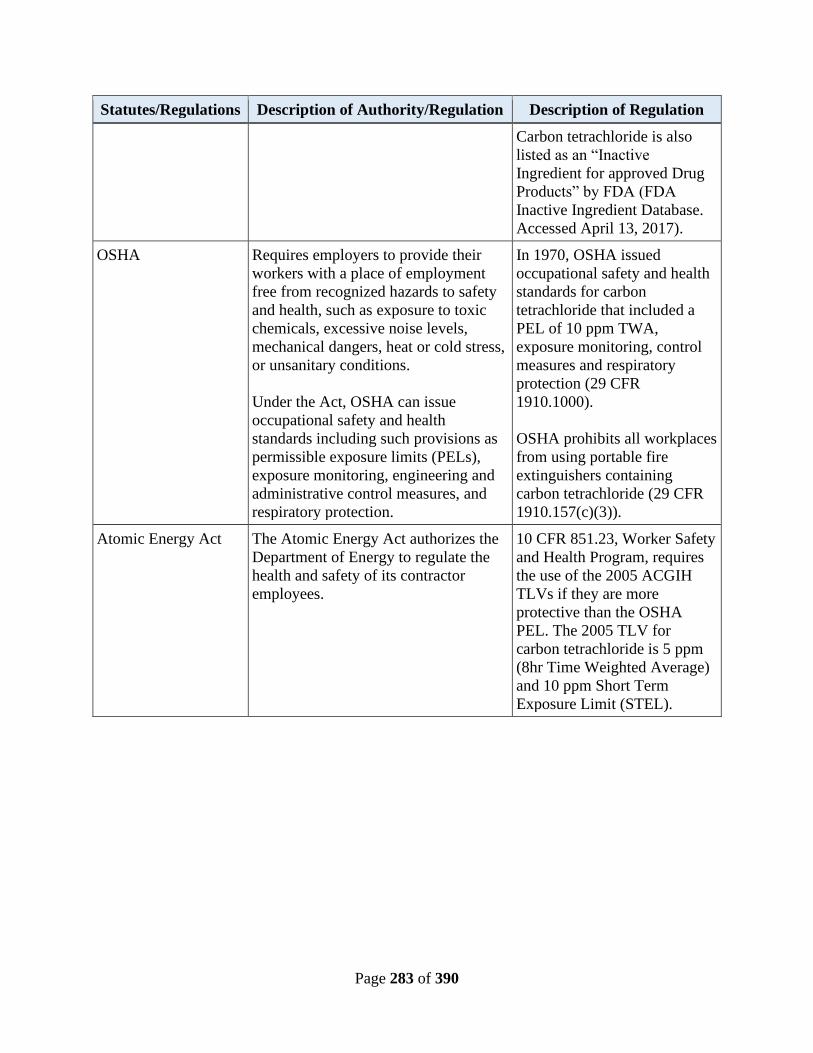
Page 283 of 390
Statutes/Regulations Description of Authority/Regulation Description of Regulation
Carbon tetrachloride is also
listed as an “Inactive
Ingredient for approved Drug
Products” by FDA (FDA
Inactive Ingredient Database.
Accessed April 13, 2017).
OSHA Requires employers to provide their
workers with a place of employment
free from recognized hazards to safety
and health, such as exposure to toxic
chemicals, excessive noise levels,
mechanical dangers, heat or cold stress,
or unsanitary conditions.
Under the Act, OSHA can issue
occupational safety and health
standards including such provisions as
permissible exposure limits (PELs),
exposure monitoring, engineering and
administrative control measures, and
respiratory protection.
In 1970, OSHA issued
occupational safety and health
standards for carbon
tetrachloride that included a
PEL of 10 ppm TWA,
exposure monitoring, control
measures and respiratory
protection (29 CFR
1910.1000).
OSHA prohibits all workplaces
from using portable fire
extinguishers containing
carbon tetrachloride (29 CFR
1910.157(c)(3)).
Atomic Energy Act The Atomic Energy Act authorizes the
Department of Energy to regulate the
health and safety of its contractor
employees.
10 CFR 851.23, Worker Safety
and Health Program, requires
the use of the 2005 ACGIH
TLVs if they are more
protective than the OSHA
PEL. The 2005 TLV for
carbon tetrachloride is 5 ppm
(8hr Time Weighted Average)
and 10 ppm Short Term
Exposure Limit (STEL).
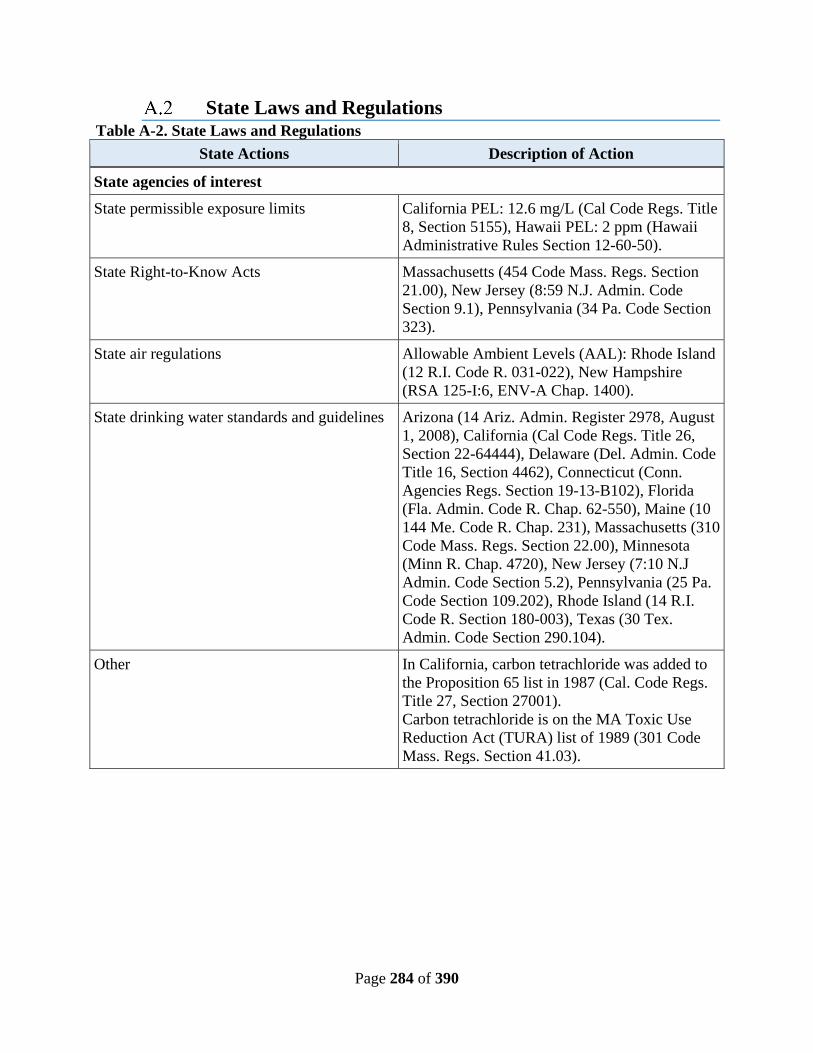
Page 284 of 390
State Laws and Regulations Table A-2. State Laws and Regulations
State Actions Description of Action
State agencies of interest
State permissible exposure limits California PEL: 12.6 mg/L (Cal Code Regs. Title
8, Section 5155), Hawaii PEL: 2 ppm (Hawaii
Administrative Rules Section 12-60-50).
State Right-to-Know Acts Massachusetts (454 Code Mass. Regs. Section
21.00), New Jersey (8:59 N.J. Admin. Code
Section 9.1), Pennsylvania (34 Pa. Code Section
323).
State air regulations Allowable Ambient Levels (AAL): Rhode Island
(12 R.I. Code R. 031-022), New Hampshire
(RSA 125-I:6, ENV-A Chap. 1400).
State drinking water standards and guidelines Arizona (14 Ariz. Admin. Register 2978, August
1, 2008), California (Cal Code Regs. Title 26,
Section 22-64444), Delaware (Del. Admin. Code
Title 16, Section 4462), Connecticut (Conn.
Agencies Regs. Section 19-13-B102), Florida
(Fla. Admin. Code R. Chap. 62-550), Maine (10
144 Me. Code R. Chap. 231), Massachusetts (310
Code Mass. Regs. Section 22.00), Minnesota
(Minn R. Chap. 4720), New Jersey (7:10 N.J
Admin. Code Section 5.2), Pennsylvania (25 Pa.
Code Section 109.202), Rhode Island (14 R.I.
Code R. Section 180-003), Texas (30 Tex.
Admin. Code Section 290.104).
Other In California, carbon tetrachloride was added to
the Proposition 65 list in 1987 (Cal. Code Regs.
Title 27, Section 27001).
Carbon tetrachloride is on the MA Toxic Use
Reduction Act (TURA) list of 1989 (301 Code
Mass. Regs. Section 41.03).

Page 285 of 390
International Laws and Regulations Table A-3. Regulatory Actions by Other Governments and Tribes
Country/Organization Requirements and Restrictions
Regulatory Actions by other Governments and Tribes
Montreal Protocol Carbon tetrachloride is considered an ozone depleting substance
(ODS) and its production and use are controlled under the 1987
Montreal Protocol on Substances That Deplete the Ozone Layer and
its amendments (Montreal Protocol Annex B – Group II).
Canada Carbon tetrachloride is on the Canadian List of Toxic Substances
(CEPA 1999 Schedule 1). Other regulations include:
Federal Halocarbon Regulations, 2003 (SOR/2003-289).
ODS Regulations, 1998 (SOR/99-7).
European Union (EU) Carbon tetrachloride was evaluated under the 2012 Community
rolling action plan (CoRAP) under regulation (European Commission
[EC]) No 1907/2006 - REACH (Registration, Evaluation,
Authorisation and Restriction of Chemicals) ECHA database.
Accessed April 18, 2017).
Carbon tetrachloride is restricted by regulation (EC) No 2037/2000 on
substances that deplete the ozone layer.
Australia Carbon tetrachloride was assessed under Environment Tier II of the
Inventory Multi-Tiered Assessment and Prioritisation (IMAP), and
there have been no reported imports of the chemical as a feedstock in
the last 10 years (National Industrial Chemicals Notification and
Assessment Scheme, NICNAS, 2017, Environment Tier II Assessment
for Methane, Tetrachloro-. Accessed April 18, 2017).
Japan Carbon tetrachloride is regulated in Japan under the following
legislation:
• Industrial Safety and Health Act (ISHA)
• Act on the Evaluation of Chemical Substances and Regulation
of Their Manufacture, etc. (Chemical Substances Control Law
(CSCL))
• Act on Confirmation, etc. of Release Amounts of Specific
Chemical Substances in the Environment and Promotion of
Improvements to the Management Thereof
• Poisonous and Deleterious Substances Control Act
• Act on the Protection of the Ozone Layer through the Control
of Specified Substances and Other Measures
• Air Pollution Control Law
• Water Pollution Control Law
• Soil Contamination Countermeasures Act
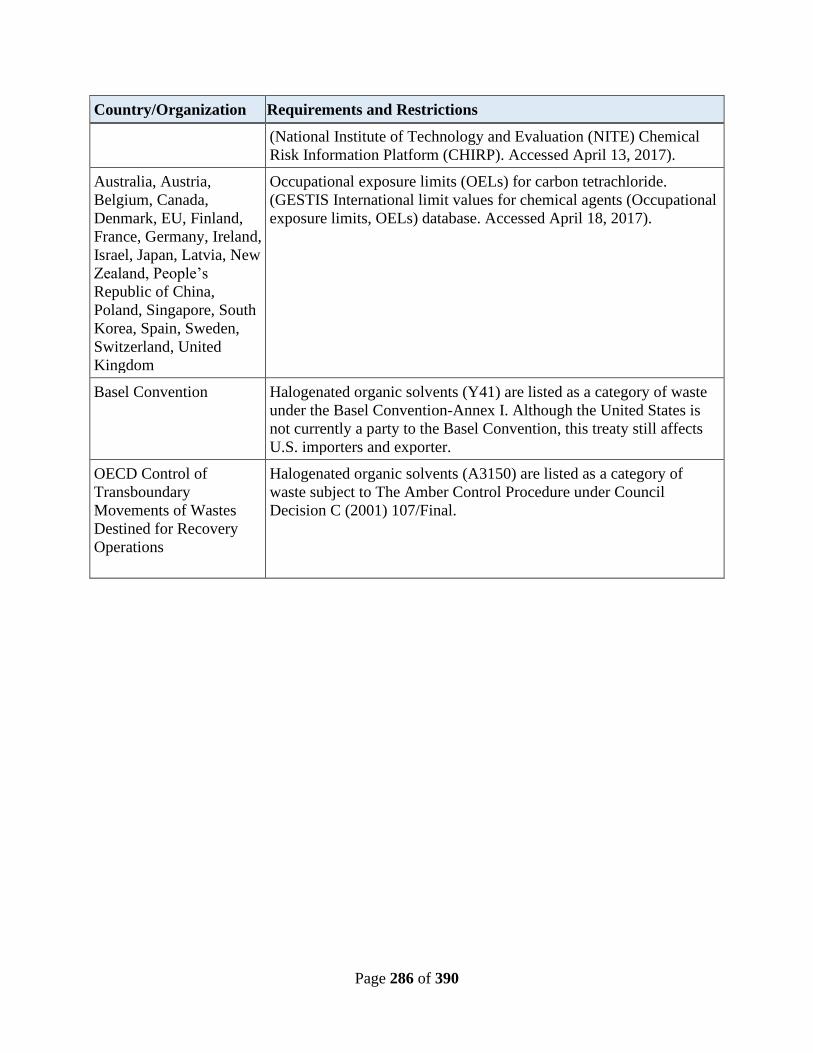
Page 286 of 390
Country/Organization Requirements and Restrictions
(National Institute of Technology and Evaluation (NITE) Chemical
Risk Information Platform (CHIRP). Accessed April 13, 2017).
Australia, Austria,
Belgium, Canada,
Denmark, EU, Finland,
France, Germany, Ireland,
Israel, Japan, Latvia, New
Zealand, People’s
Republic of China,
Poland, Singapore, South
Korea, Spain, Sweden,
Switzerland, United
Kingdom
Occupational exposure limits (OELs) for carbon tetrachloride.
(GESTIS International limit values for chemical agents (Occupational
exposure limits, OELs) database. Accessed April 18, 2017).
Basel Convention Halogenated organic solvents (Y41) are listed as a category of waste
under the Basel Convention-Annex I. Although the United States is
not currently a party to the Basel Convention, this treaty still affects
U.S. importers and exporter.
OECD Control of
Transboundary
Movements of Wastes
Destined for Recovery
Operations
Halogenated organic solvents (A3150) are listed as a category of
waste subject to The Amber Control Procedure under Council
Decision C (2001) 107/Final.

Page 287 of 390
Appendix B LIST OF SUPPLEMENTAL DOCUMENTS
1. Associated Systematic Review Data Quality Evaluation and Data Extraction Documents-
Provides additional detail and information on individual study evaluations and data
extractions including criteria and scoring results.
a. Final Risk Evaluation for Carbon Tetrachloride, Systematic Review Supplemental
File: Data Quality Evaluation of Environmental Fate and Transport Studies.
Docket EPA-HQ-OPPT-2019-0499 (U.S. EPA, 2019f).
b. Final Risk Evaluation for Carbon Tetrachloride, Systematic Review Supplemental
File: Data Quality Evaluation of Physical Chemical Properties Studies Docket
EPA-HQ-OPPT-2019-0499 (U.S. EPA, 2019k).
c. Final Risk Evaluation for Carbon Tetrachloride, Systematic Review
Supplemental File: Data Quality Evaluation of Environmental Releases and
Occupational Exposure Data Common Sources. Docket EPA-HQ-OPPT-2019-
0499 (U.S. EPA, 2019i).
d. Final Risk Evaluation for Carbon Tetrachloride, Systematic Review
Supplemental File: Data Quality Evaluation of Environmental Releases and
Occupational Exposure Data. Docket EPA-HQ-OPPT-2019-0499 (U.S. EPA,
2019h).
e. Final Risk Evaluation for Carbon Tetrachloride, Systematic Review Supplemental
File: Data Quality Evaluation of Environmental Hazard Studies. Docket EPA-
HQ-OPPT-2019-0499 (U.S. EPA, 2019g).
f. Final Risk Evaluation for Carbon Tetrachloride, Systematic Review Supplemental
File: Data Quality Evaluation of Human Health Hazard Studies – Animal and
Invitro Studies. Docket EPA-HQ-OPPT-2019-0499 (U.S. EPA, 2019e).
g. Final Risk Evaluation for Carbon Tetrachloride, Systematic Review Supplemental
File: Data Quality Evaluation of Human Health Hazard Studies -
Epidemiological Studies. Docket EPA-HQ-OPPT-2019-0499 (U.S. EPA, 2019j).
h. Final Risk Evaluation for Carbon Tetrachloride, Systematic Review Supplemental
File: Updates to the Data Quality Criteria for Epidemiological Studies. Docket
EPA-HQ-OPPT-2019-0499 (U.S. EPA, 2019l).
2. Final Risk Evaluation for Carbon Tetrachloride, Supplemental File on Releases and
Occupational Exposure Assessment, EPA-HQ-OPPT-2019-0499 (U.S. EPA, 2019c) - provides
additional details and information on the environmental release and occupational exposure
assessment, including process information, estimates of number of sites and workers,
summary of monitoring data, and exposure modeling equations, inputs and outputs.

Page 288 of 390
3. Final Risk Evaluation for Carbon Tetrachloride, Supplemental File on Occupational
Exposure Risk Calculator, EPA-HQ-OPPT-2019-0499 (U.S. EPA, 2019b).
4. Final Risk Evaluation for Carbon Tetrachloride Supplemental File: Benchmark Dose
Modeling and Source Code for PBPK Model for Derivation of the IRIS Reference
Concentration (POD for Chronic Inhalation Exposures) and Inhalation Unit Risk, EPA-HQ-
OPPT-2019-0499 (U.S. EPA, 2019d).

Page 289 of 390
Appendix C FATE AND TRANSPORT
Table C-1. Biodegradation Study Summary for Carbon Tetrachloride
Study Type
(year)
Initial
Concentration
Inoculum
Source
(An)aerobic
Status Duration Result Comments
Affiliated
Reference
Data Quality
Evaluation
Results of
Full Study
Report
Water
Anaerobic
biodegradation
using unadapted
methanogenic
granular sludge
both with and
without a co-
substrate.
<7.5 µmol/L
activated
sludge,
industrial,
nonadapted
anaerobic 15 days
Biodegradation
parameter: percent
removal: 100%/5-
11d in unadapted
sludge;
100%/5-8d in
unadapted sludge +
cosubstrate;
100%/15-16d in
autoclaved sludge
The
reviewer
agreed with
this study's
overall
quality
level.
(Van
Eekert et
al., 1998)
High
Other ≤149 µg/L
activated
sludge,
adapted
anaerobic 54 days
Biodegradation
parameter: percent
removal by
radiolabel:
100%/16d
The
reviewer
agreed with
this study's
overall
quality
level.
(Bouwer
and
McCarty,
1983)
High
Other ≤16 µg/L
activated
sludge,
adapted
anaerobic 19 months
Biodegradation
parameter:
concentration in
column effluent
(initial
concentration: 16
µg/L, liquid
retention: 2 days):
<0.1 µg/L
The
reviewer
agreed with
this study's
overall
quality
level.
(Bouwer
and
McCarty,
1983)
High

Page 290 of 390
Study Type
(year)
Initial
Concentration
Inoculum
Source
(An)aerobic
Status Duration Result Comments
Affiliated
Reference
Data Quality
Evaluation
Results of
Full Study
Report
Static-culture,
flask-screening
method
5 mg/L
sewage,
domestic,
non-
adapted
Aerobic
7 days, then
three
additional 7-
day periods
for
"subcultures"
(total test
time was 28
days)
Biodegradation
parameter: percent
removal:
Avg. 89%/7 days
The
reviewer
agreed with
this study's
overall
quality
level.
(Tabak et
al., 1981) High
Transformation
under sulfate
reducing
conditions in an
anaerobic
continuously fed
packed-bed
reactor
2.5-56.6
µmol/L
anaerobic
micro-
organisms
anaerobic
13 days
(variable
electron
donors); 27
days to 30
weeks(inhibit
ion - variable
concentration
)
Biodegradation
parameter: percent
removal via
dechlorination:
100%/30 weeks;
transformation
products included
chloroform and
dichloro-methane.
The
reviewer
agreed with
this study's
overall
quality
level.
(de Best et
al., 1997) High
Soil
Other 100 mg/kg
Microbial
colonies on
agar plates
revealed
that
autoclave
controls
were
devoid of
microbial
activity.
not specified 7 days
Biodegradation
parameter: half-
life:
50%/5 days
The
reviewer
agreed with
this study's
overall
quality
level.
(Anderson
et al.,
1991)
Medium
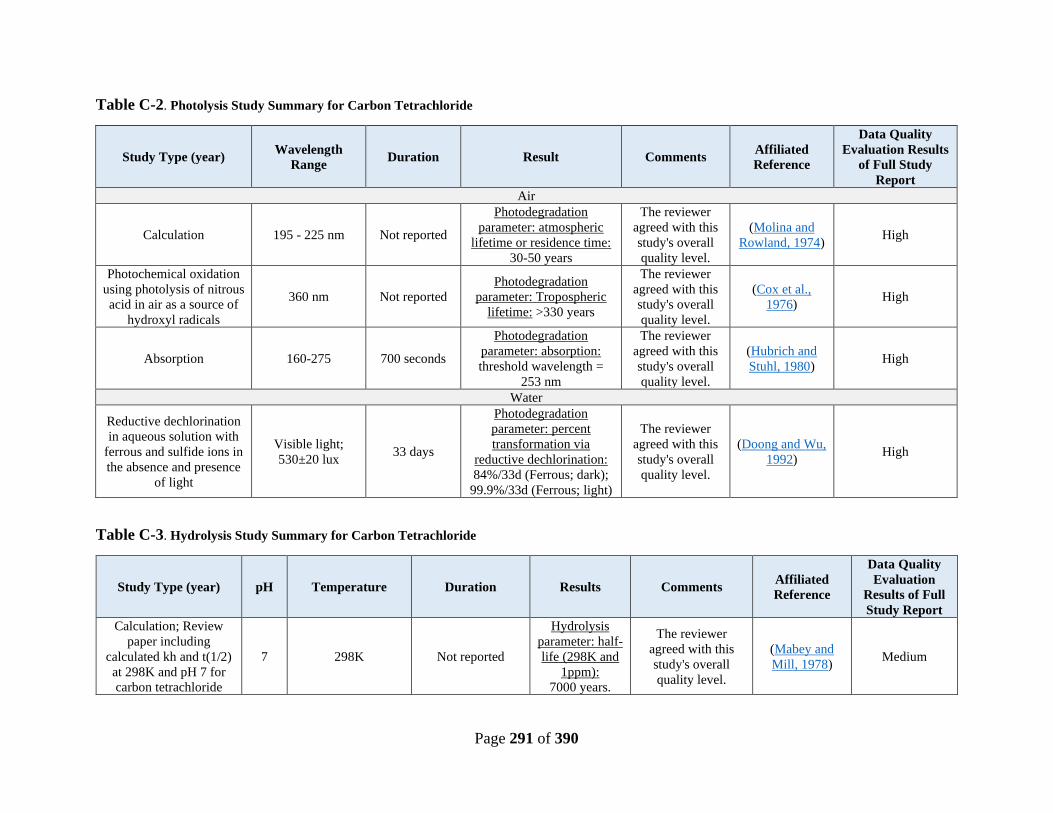
Page 291 of 390
Table C-2. Photolysis Study Summary for Carbon Tetrachloride
Study Type (year) Wavelength
Range Duration Result Comments
Affiliated
Reference
Data Quality
Evaluation Results
of Full Study
Report
Air
Calculation 195 - 225 nm Not reported
Photodegradation
parameter: atmospheric
lifetime or residence time:
30-50 years
The reviewer
agreed with this
study's overall
quality level.
(Molina and
Rowland, 1974) High
Photochemical oxidation
using photolysis of nitrous
acid in air as a source of
hydroxyl radicals
360 nm Not reported
Photodegradation
parameter: Tropospheric
lifetime: >330 years
The reviewer
agreed with this
study's overall
quality level.
(Cox et al.,
1976) High
Absorption 160-275 700 seconds
Photodegradation
parameter: absorption:
threshold wavelength =
253 nm
The reviewer
agreed with this
study's overall
quality level.
(Hubrich and
Stuhl, 1980) High
Water
Reductive dechlorination
in aqueous solution with
ferrous and sulfide ions in
the absence and presence
of light
Visible light;
530±20 lux 33 days
Photodegradation
parameter: percent
transformation via
reductive dechlorination:
84%/33d (Ferrous; dark);
99.9%/33d (Ferrous; light)
The reviewer
agreed with this
study's overall
quality level.
(Doong and Wu,
1992) High
Table C-3. Hydrolysis Study Summary for Carbon Tetrachloride
Study Type (year) pH Temperature Duration Results Comments Affiliated
Reference
Data Quality
Evaluation
Results of Full
Study Report
Calculation; Review
paper including
calculated kh and t(1/2)
at 298K and pH 7 for
carbon tetrachloride
7 298K Not reported
Hydrolysis
parameter: half-
life (298K and
1ppm):
7000 years.
The reviewer
agreed with this
study's overall
quality level.
(Mabey and
Mill, 1978) Medium

Page 292 of 390
Table C-4. Sorption Study Summary for Carbon Tetrachloride
Study Type (year) Sorbent Source
Sorbent
Qualities
(clay/silt/sand,
OC, pH)
Duration Results Comments Affiliated
Reference
Data
Quality
Evaluation
Results of
Full Study
Report
Partitioning based on
measurements in
sediments of Scheldt
Estuary and water
Southern North Sea
Water salinity
range 1.45-20.8
g/L
Scheldt estuary
and Belgian
continental shelf
sediments
Not reported
Sorption parameter: log
Koc(sw,eq.):
1.67
The reviewer agreed
with this study's overall
quality level.
(Roose et
al., 2001) High
Equilibrium and two-
site models applied to
field and laboratory
experiments to
determine transport
behavior (including
Kd)
Breakthrough
curves measured
under water-
saturated, steady-
flow conditions
in glass columns
with aquifer
material from site
at Borden,
Ontario and
synthetic
groundwater
prepared from
organic-free
water; field
experiments at
site in Borden,
Ontario
organic carbon
0.018-0.020
wt%, pH 8.2-
8.3
Sorption parameter: Kd:
0.019-0.168 (g/g);
Retardation factors
obtained from column
experiments conducted at
high velocities were
lower than those obtained
at low velocities
The reviewer agreed
with this study's overall
quality level.
(Ptacek and
Gillham,
1992)
High
Sorption isotherms in
lignite and peat soil
lignite sample
collected from
Oberlausitz area
in Saxony,
Germany;
Carbon content
lignite: 53.5%
peat 46.1%;
moisture
content
Sorption parameter: log
Kf: lignite and peat,
respectively: 2.29, 1/n =
0.916 and 1.59, 1/n =
0.879
The reviewer agreed
with this study's overall
quality level.
(Endo et
al., 2008) High
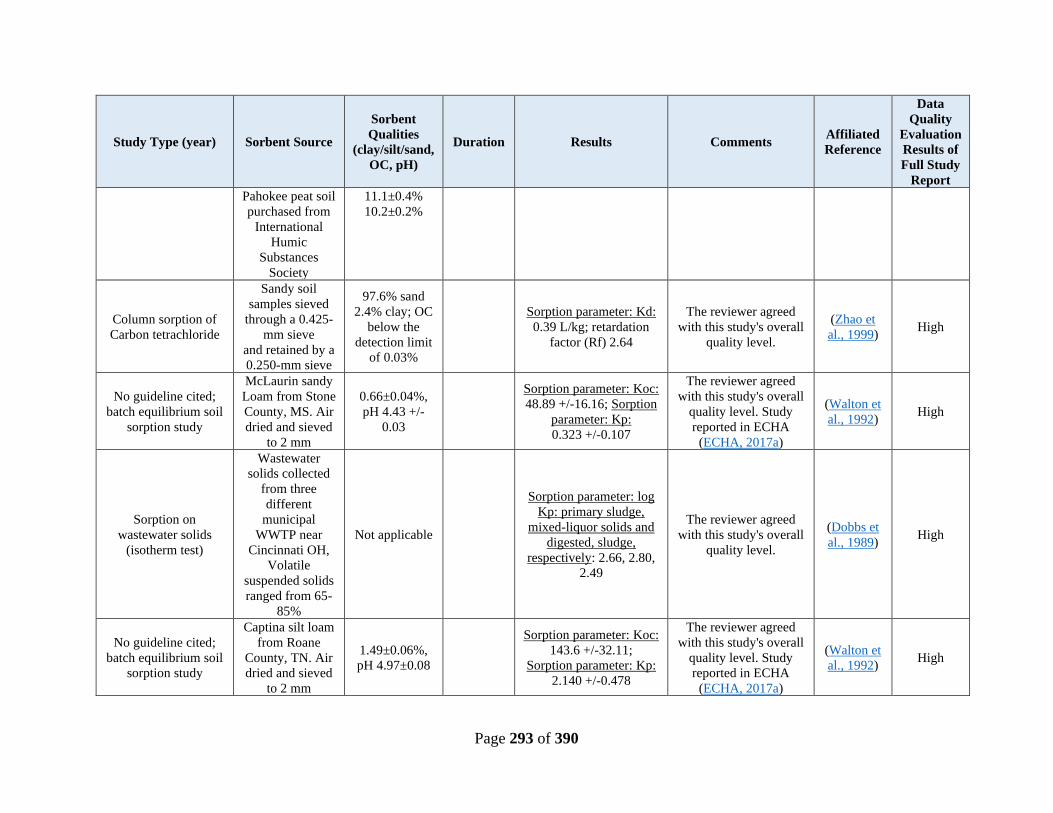
Page 293 of 390
Study Type (year) Sorbent Source
Sorbent
Qualities
(clay/silt/sand,
OC, pH)
Duration Results Comments Affiliated
Reference
Data
Quality
Evaluation
Results of
Full Study
Report
Pahokee peat soil
purchased from
International
Humic
Substances
Society
11.1±0.4%
10.2±0.2%
Column sorption of
Carbon tetrachloride
Sandy soil
samples sieved
through a 0.425-
mm sieve
and retained by a
0.250-mm sieve
97.6% sand
2.4% clay; OC
below the
detection limit
of 0.03%
Sorption parameter: Kd:
0.39 L/kg; retardation
factor (Rf) 2.64
The reviewer agreed
with this study's overall
quality level.
(Zhao et
al., 1999) High
No guideline cited;
batch equilibrium soil
sorption study
McLaurin sandy
Loam from Stone
County, MS. Air
dried and sieved
to 2 mm
0.66±0.04%,
pH 4.43 +/-
0.03
Sorption parameter: Koc:
48.89 +/-16.16; Sorption
parameter: Kp:
0.323 +/-0.107
The reviewer agreed
with this study's overall
quality level. Study
reported in ECHA
(ECHA, 2017a)
(Walton et
al., 1992) High
Sorption on
wastewater solids
(isotherm test)
Wastewater
solids collected
from three
different
municipal
WWTP near
Cincinnati OH,
Volatile
suspended solids
ranged from 65-
85%
Not applicable
Sorption parameter: log
Kp: primary sludge,
mixed-liquor solids and
digested, sludge,
respectively: 2.66, 2.80,
2.49
The reviewer agreed
with this study's overall
quality level.
(Dobbs et
al., 1989) High
No guideline cited;
batch equilibrium soil
sorption study
Captina silt loam
from Roane
County, TN. Air
dried and sieved
to 2 mm
1.49±0.06%,
pH 4.97±0.08
Sorption parameter: Koc:
143.6 +/-32.11;
Sorption parameter: Kp:
2.140 +/-0.478
The reviewer agreed
with this study's overall
quality level. Study
reported in ECHA
(ECHA, 2017a)
(Walton et
al., 1992) High

Page 294 of 390
Study Type (year) Sorbent Source
Sorbent
Qualities
(clay/silt/sand,
OC, pH)
Duration Results Comments Affiliated
Reference
Data
Quality
Evaluation
Results of
Full Study
Report
Column desorption
study using
contaminated aquifer
sediments
T17; T18; T19: 3
sediment cores
from aquifer in
Hanford known
to contain ` and
CHCl3; samples
were stored at
4degC; OC
determined using
ASTM standard
procedure;
groundwater from
Hanford site
T17; T18; T19:
OC 0.059%,
0.017%,
0.088%; gravel
58.97%,
1.85%, 8.16%;
Sand 25.6%,
835.%, 9.53%;
silt 6.02%,
10.2%, 45.5%;
clay: 1.97%,
4.42%, 36.7%,
respectively
Sorption parameter: Kd:
T17 core sample and T18
core sample, respectively:
0.367, 1.44
The reviewer agreed
with this study's overall
quality level.
(Riley et
al., 2010) High
Batch equilibration
studies in a
stratigraphic column
for the determination
of sorption
coefficients Koc and
Kd in soils
representing three
horizons
Soil samples
from University
of Nebraska's
South Central
Research and
Extension Center
in Clay County,
NE; hasting
series: fine,
montmorillonitic,
mesic Udic
Argiustoll
% silt and sand
not reported.
Total clay
content (g/kg)
= 265.7±22.6
Modern A
horizon,
330.4±16.2
Buried A,
273.7±30.4
Loess C
horizon.
Organic carbon
(g/kg):
14.9±2.6
Modern A,
5.3±0.6 Buried
A, 1.4±0.5
Loess C
Sorption parameter: log
Koc: Modern A horizon,
Buried A and Loess C
horizon sites,
respectively: 1.74
(±0.04), 1.89 (±0.10),
2.43 (±0.18)
The reviewer agreed
with this study's overall
quality level.
(Duffy et
al., 1997) High

Page 295 of 390
Study Type (year) Sorbent Source
Sorbent
Qualities
(clay/silt/sand,
OC, pH)
Duration Results Comments Affiliated
Reference
Data
Quality
Evaluation
Results of
Full Study
Report
Vapor sorption of
carbon tetrachloride in
high organic soils
Peat reference
sample from
International
Humic
Substances
Society collected
from Everglades
Fl; extracted peat
from 0.1M NaOH
extraction of
reference peat
soil; muck soil
from Michigan
State University
Research Farm
Lainsburg, MI
Carbon content
(from cited
source):
extracted peat
64.0%, peat
57.1%, muck
53.1%,
cellulose
44.4%; oxygen
content:
extracted peat
28.9%, peat
33.9%, muck
37.5%,
cellulose
49.4%; ash
content:
extracted peat
15.0%, peat
13.6%, muck
18.5%
Sorption parameter:
Kom: peat and muck
respectively:
44.6, 27.8
The reviewer agreed
with this study's overall
quality level. A previous
study was cited for
several details, HERO
ID 3566467,
Rutherford, D. W., et al.
(1992). "Influence of
soil organic matter
composition on the
partition of organic
compounds."
(Rutherford
and Chiou,
1992)
High
Sorption of Carbon
tetrachloride in high
organic soil and
cellulose
Peat reference
sample from
International
Humic
Substances
Society collected
from Everglades,
Fl; extracted peat
from 0.1M NaOH
extraction of
reference peat
soil; muck soil
from Michigan
Carbon
content:
extracted peat
64.0%, peat
57.1%, muck
53.1%,
cellulose
44.4%; oxygen
content:
extracted peat
28.9%, peat
33.9%, muck
37.5%,
Sorption parameter:
Kom: peqt, peat, muck,
and cellulose
respectively:
73.5, 44.6, 27.8, and 1.75
The reviewer agreed
with this study's overall
quality level.
(Rutherford
et al.,
1992)
High
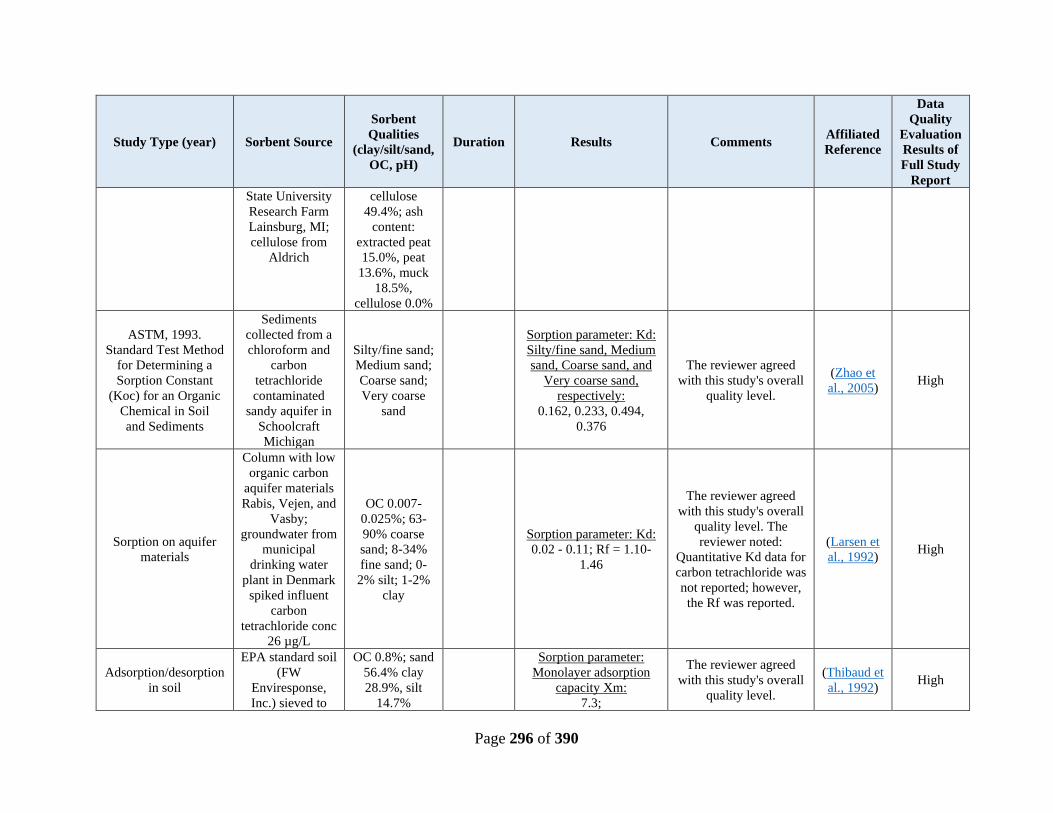
Page 296 of 390
Study Type (year) Sorbent Source
Sorbent
Qualities
(clay/silt/sand,
OC, pH)
Duration Results Comments Affiliated
Reference
Data
Quality
Evaluation
Results of
Full Study
Report
State University
Research Farm
Lainsburg, MI;
cellulose from
Aldrich
cellulose
49.4%; ash
content:
extracted peat
15.0%, peat
13.6%, muck
18.5%,
cellulose 0.0%
ASTM, 1993.
Standard Test Method
for Determining a
Sorption Constant
(Koc) for an Organic
Chemical in Soil
and Sediments
Sediments
collected from a
chloroform and
carbon
tetrachloride
contaminated
sandy aquifer in
Schoolcraft
Michigan
Silty/fine sand;
Medium sand;
Coarse sand;
Very coarse
sand
Sorption parameter: Kd:
Silty/fine sand, Medium
sand, Coarse sand, and
Very coarse sand,
respectively:
0.162, 0.233, 0.494,
0.376
The reviewer agreed
with this study's overall
quality level.
(Zhao et
al., 2005) High
Sorption on aquifer
materials
Column with low
organic carbon
aquifer materials
Rabis, Vejen, and
Vasby;
groundwater from
municipal
drinking water
plant in Denmark
spiked influent
carbon
tetrachloride conc
26 µg/L
OC 0.007-
0.025%; 63-
90% coarse
sand; 8-34%
fine sand; 0-
2% silt; 1-2%
clay
Sorption parameter: Kd:
0.02 - 0.11; Rf = 1.10-
1.46
The reviewer agreed
with this study's overall
quality level. The
reviewer noted:
Quantitative Kd data for
carbon tetrachloride was
not reported; however,
the Rf was reported.
(Larsen et
al., 1992) High
Adsorption/desorption
in soil
EPA standard soil
(FW
Enviresponse,
Inc.) sieved to
OC 0.8%; sand
56.4% clay
28.9%, silt
14.7%
Sorption parameter:
Monolayer adsorption
capacity Xm:
7.3;
The reviewer agreed
with this study's overall
quality level.
(Thibaud et
al., 1992) High

Page 297 of 390
Study Type (year) Sorbent Source
Sorbent
Qualities
(clay/silt/sand,
OC, pH)
Duration Results Comments Affiliated
Reference
Data
Quality
Evaluation
Results of
Full Study
Report
210-250 um
analyzed by Soil
Testing
Laboratory of
Texas A&M
University
Sorption parameter:
adsorption capacity at
saturation Xa:
39.2
Forced gradient test
Sand aquifer in
Borden, Ontario
composed of fine
to medium
grained sand;
aquifer is
unconfined, water
table fluctuates
over the year;
aquifer is 10 m
thick underlain
by thick silty clay
aquitard, within
2-3m of the
aquifer is a plume
of contaminants
silty clay Sorption parameter: Kd:
0.03-0.24, Rf: .2-2.3
The reviewer agreed
with this study's overall
quality level.
(Mackay et
al., 1994) High
Calculation; Carbon
tetrachloride
concentrations in air
and soil gas for
determination of soil
flux and partial
atmospheric lifetime
Site
characteristics:
boreal, temperate,
and tropical
forests, temperate
grasslands
Not reported
2 weeks
monitorin
g data
Sorption parameter: τ-soil
(partial lifetime of
atmospheric carbon
tetrachloride due to soil
removal):
90 years
The reviewer agreed
with this study's overall
quality level; partial
lifetime calculation
based on 2 weeks
monitoring data from
several different
regions.
(Happell
and Roche,
2003)
High
Calculation; Carbon
tetrachloride
concentrations in air
and soil gas for
boreal forest soil
in Alberta,
Canada; sub-
tropical forest
Not reported
Sorption parameter: τ-soil
(partial lifetime of
atmospheric carbon
The reviewer agreed
with this study's overall
quality level.
(Happell et
al., 2014) High
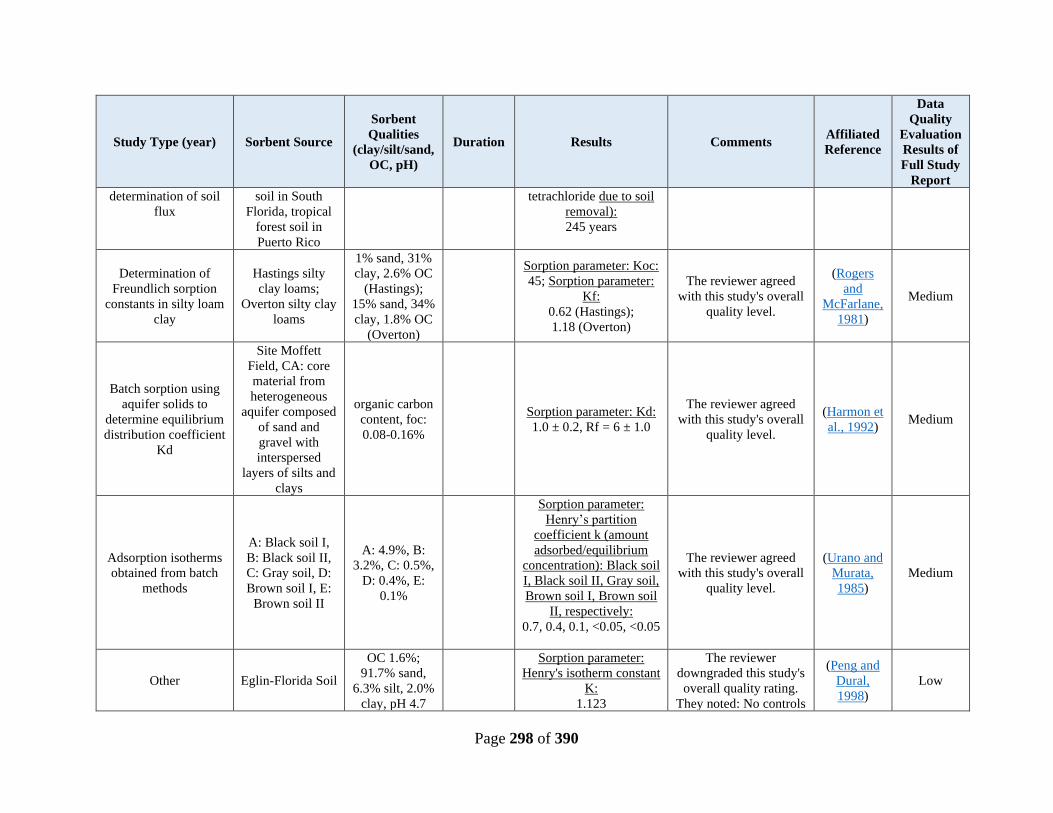
Page 298 of 390
Study Type (year) Sorbent Source
Sorbent
Qualities
(clay/silt/sand,
OC, pH)
Duration Results Comments Affiliated
Reference
Data
Quality
Evaluation
Results of
Full Study
Report
determination of soil
flux
soil in South
Florida, tropical
forest soil in
Puerto Rico
tetrachloride due to soil
removal):
245 years
Determination of
Freundlich sorption
constants in silty loam
clay
Hastings silty
clay loams;
Overton silty clay
loams
1% sand, 31%
clay, 2.6% OC
(Hastings);
15% sand, 34%
clay, 1.8% OC
(Overton)
Sorption parameter: Koc:
45; Sorption parameter:
Kf:
0.62 (Hastings);
1.18 (Overton)
The reviewer agreed
with this study's overall
quality level.
(Rogers
and
McFarlane,
1981)
Medium
Batch sorption using
aquifer solids to
determine equilibrium
distribution coefficient
Kd
Site Moffett
Field, CA: core
material from
heterogeneous
aquifer composed
of sand and
gravel with
interspersed
layers of silts and
clays
organic carbon
content, foc:
0.08-0.16%
Sorption parameter: Kd:
1.0 ± 0.2, Rf = 6 ± 1.0
The reviewer agreed
with this study's overall
quality level.
(Harmon et
al., 1992) Medium
Adsorption isotherms
obtained from batch
methods
A: Black soil I,
B: Black soil II,
C: Gray soil, D:
Brown soil I, E:
Brown soil II
A: 4.9%, B:
3.2%, C: 0.5%,
D: 0.4%, E:
0.1%
Sorption parameter:
Henry’s partition
coefficient k (amount
adsorbed/equilibrium
concentration): Black soil
I, Black soil II, Gray soil,
Brown soil I, Brown soil
II, respectively:
0.7, 0.4, 0.1, <0.05, <0.05
The reviewer agreed
with this study's overall
quality level.
(Urano and
Murata,
1985)
Medium
Other Eglin-Florida Soil
OC 1.6%;
91.7% sand,
6.3% silt, 2.0%
clay, pH 4.7
Sorption parameter:
Henry's isotherm constant
K:
1.123
The reviewer
downgraded this study's
overall quality rating.
They noted: No controls
(Peng and
Dural,
1998)
Low
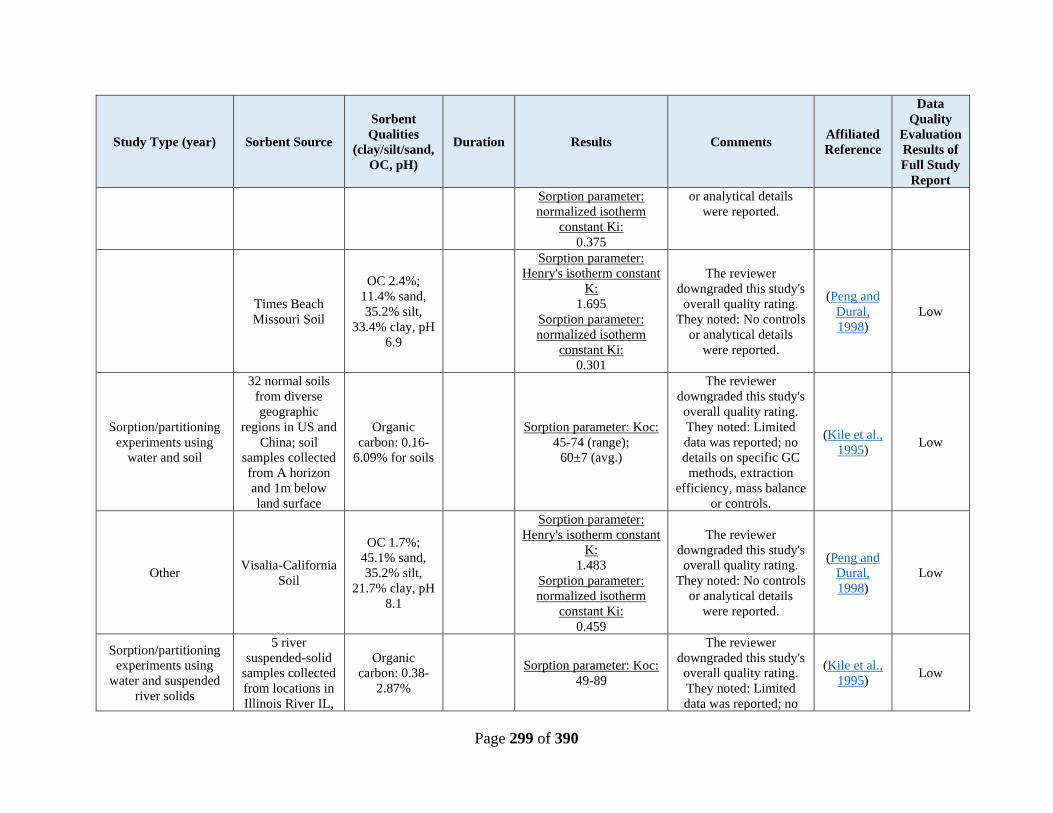
Page 299 of 390
Study Type (year) Sorbent Source
Sorbent
Qualities
(clay/silt/sand,
OC, pH)
Duration Results Comments Affiliated
Reference
Data
Quality
Evaluation
Results of
Full Study
Report
Sorption parameter:
normalized isotherm
constant Ki:
0.375
or analytical details
were reported.
Times Beach
Missouri Soil
OC 2.4%;
11.4% sand,
35.2% silt,
33.4% clay, pH
6.9
Sorption parameter:
Henry's isotherm constant
K:
1.695
Sorption parameter:
normalized isotherm
constant Ki:
0.301
The reviewer
downgraded this study's
overall quality rating.
They noted: No controls
or analytical details
were reported.
(Peng and
Dural,
1998)
Low
Sorption/partitioning
experiments using
water and soil
32 normal soils
from diverse
geographic
regions in US and
China; soil
samples collected
from A horizon
and 1m below
land surface
Organic
carbon: 0.16-
6.09% for soils
Sorption parameter: Koc:
45-74 (range);
60±7 (avg.)
The reviewer
downgraded this study's
overall quality rating.
They noted: Limited
data was reported; no
details on specific GC
methods, extraction
efficiency, mass balance
or controls.
(Kile et al.,
1995) Low
Other Visalia-California
Soil
OC 1.7%;
45.1% sand,
35.2% silt,
21.7% clay, pH
8.1
Sorption parameter:
Henry's isotherm constant
K:
1.483
Sorption parameter:
normalized isotherm
constant Ki:
0.459
The reviewer
downgraded this study's
overall quality rating.
They noted: No controls
or analytical details
were reported.
(Peng and
Dural,
1998)
Low
Sorption/partitioning
experiments using
water and suspended
river solids
5 river
suspended-solid
samples collected
from locations in
Illinois River IL,
Organic
carbon: 0.38-
2.87%
Sorption parameter: Koc:
49-89
The reviewer
downgraded this study's
overall quality rating.
They noted: Limited
data was reported; no
(Kile et al.,
1995) Low
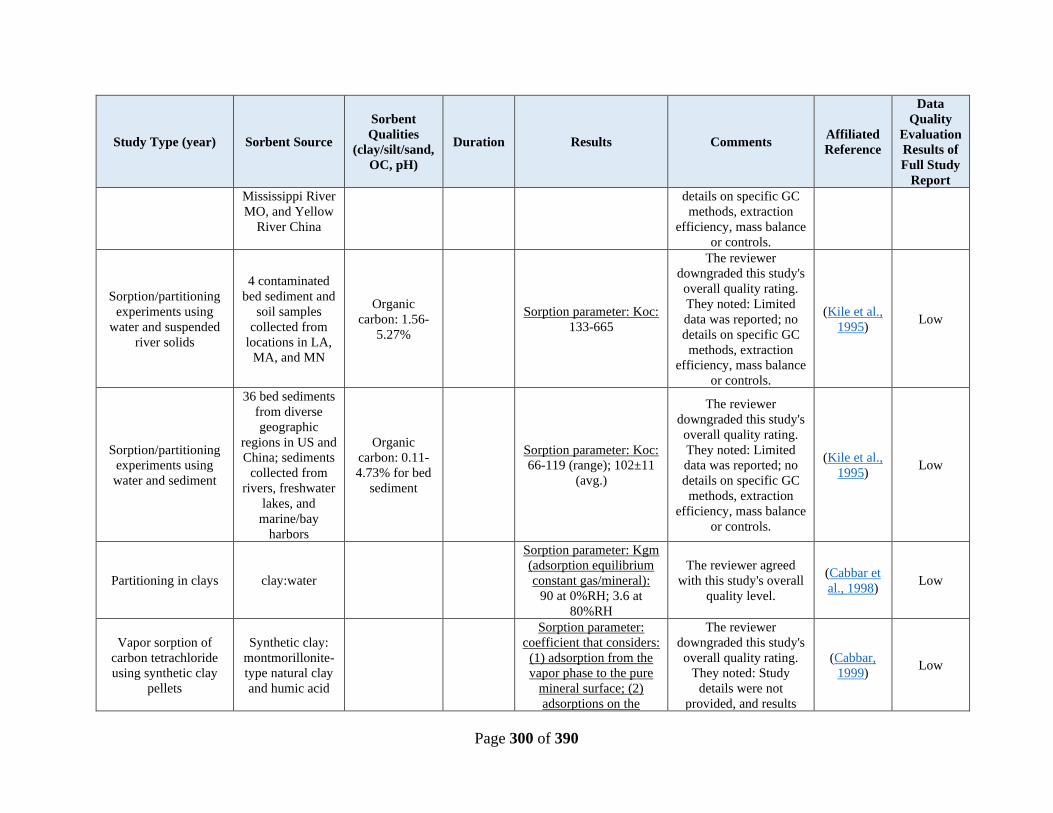
Page 300 of 390
Study Type (year) Sorbent Source
Sorbent
Qualities
(clay/silt/sand,
OC, pH)
Duration Results Comments Affiliated
Reference
Data
Quality
Evaluation
Results of
Full Study
Report
Mississippi River
MO, and Yellow
River China
details on specific GC
methods, extraction
efficiency, mass balance
or controls.
Sorption/partitioning
experiments using
water and suspended
river solids
4 contaminated
bed sediment and
soil samples
collected from
locations in LA,
MA, and MN
Organic
carbon: 1.56-
5.27%
Sorption parameter: Koc:
133-665
The reviewer
downgraded this study's
overall quality rating.
They noted: Limited
data was reported; no
details on specific GC
methods, extraction
efficiency, mass balance
or controls.
(Kile et al.,
1995) Low
Sorption/partitioning
experiments using
water and sediment
36 bed sediments
from diverse
geographic
regions in US and
China; sediments
collected from
rivers, freshwater
lakes, and
marine/bay
harbors
Organic
carbon: 0.11-
4.73% for bed
sediment
Sorption parameter: Koc:
66-119 (range); 102±11
(avg.)
The reviewer
downgraded this study's
overall quality rating.
They noted: Limited
data was reported; no
details on specific GC
methods, extraction
efficiency, mass balance
or controls.
(Kile et al.,
1995) Low
Partitioning in clays clay:water
Sorption parameter: Kgm
(adsorption equilibrium
constant gas/mineral):
90 at 0%RH; 3.6 at
80%RH
The reviewer agreed
with this study's overall
quality level.
(Cabbar et
al., 1998) Low
Vapor sorption of
carbon tetrachloride
using synthetic clay
pellets
Synthetic clay:
montmorillonite-
type natural clay
and humic acid
Sorption parameter:
coefficient that considers:
(1) adsorption from the
vapor phase to the pure
mineral surface; (2)
adsorptions on the
The reviewer
downgraded this study's
overall quality rating.
They noted: Study
details were not
provided, and results
(Cabbar,
1999) Low
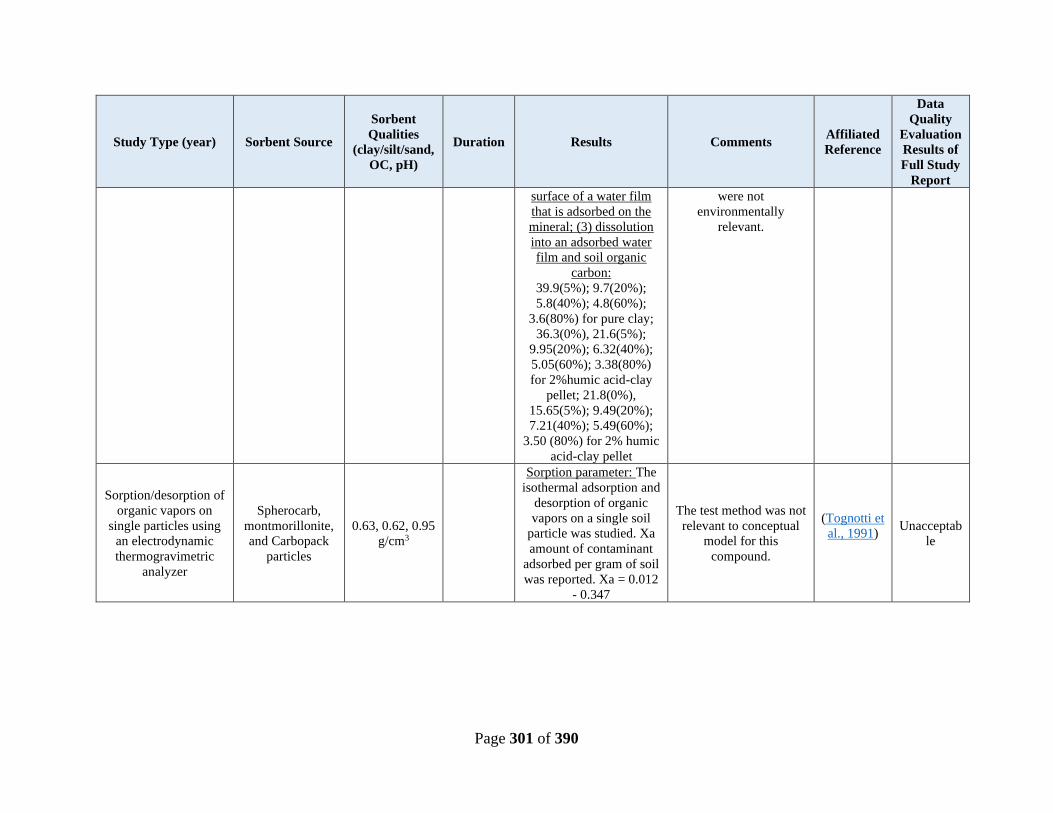
Page 301 of 390
Study Type (year) Sorbent Source
Sorbent
Qualities
(clay/silt/sand,
OC, pH)
Duration Results Comments Affiliated
Reference
Data
Quality
Evaluation
Results of
Full Study
Report
surface of a water film
that is adsorbed on the
mineral; (3) dissolution
into an adsorbed water
film and soil organic
carbon:
39.9(5%); 9.7(20%);
5.8(40%); 4.8(60%);
3.6(80%) for pure clay;
36.3(0%), 21.6(5%);
9.95(20%); 6.32(40%);
5.05(60%); 3.38(80%)
for 2%humic acid-clay
pellet; 21.8(0%),
15.65(5%); 9.49(20%);
7.21(40%); 5.49(60%);
3.50 (80%) for 2% humic
acid-clay pellet
were not
environmentally
relevant.
Sorption/desorption of
organic vapors on
single particles using
an electrodynamic
thermogravimetric
analyzer
Spherocarb,
montmorillonite,
and Carbopack
particles
0.63, 0.62, 0.95
g/cm3
Sorption parameter: The
isothermal adsorption and
desorption of organic
vapors on a single soil
particle was studied. Xa
amount of contaminant
adsorbed per gram of soil
was reported. Xa = 0.012
- 0.347
The test method was not
relevant to conceptual
model for this
compound.
(Tognotti et
al., 1991)
Unacceptab
le

Page 302 of 390
Table C-5. Other Fate Endpoints Study Summary for Carbon Tetrachloride
System Study Type (year) Results Comments Affiliated Reference Data Quality Evaluation
Results of Full Study Report
Non-guideline;
Sorption/desorption in
Biomass: Air-biomass
and water-biomass
(wood) partitioning
Partitioning measured
using tree cores and
tree cuttings from
hybrid poplar tree
trunks; Kaw:
Partitioning between
air and biomass
(organic matter from
trees); Klw:
partitioning between
water (internal
aqueous solution) and
biomass (dry wood)
Parameter: Kaw(L/g):
air:tree-core (sorption):
0.055±0.008; air:tree-
cutting (sorption):
0.042±0.007; air:tree-
cutting (desorption):
0.072±0.008;
Parameter: Klw(L/g):
water:biomass:
0.0593±0.0066
(measured) 0.0239
(calculated)
The reviewer agreed
with this study's
overall quality level.
(Ma and Burken,
2002) High
Non-guideline; Lab-
scale batch
experiments using a
bioreactor to simulate
the fate of VOCs in
wastewater treatment
plants (WWTP) and
fugacity model
predictions of VOCs
in WWTP
Concentrations in air,
water and sludge
phases analyzed under
four different
operational
circumstances
evaluating single and
combined effects of
aeration and sludge
addition on phase
distributions; sludge
added prior to
experiments; aeration
3rd-10th hr.
Parameter: partitioning:
The concentrations of
the VOCs
in the air, water, and
sludge phases of the
bioreactor were
analyzed regularly.
Mass distributions
indicated that carbon
tetrachloride was
mainly present in the
water phase throughout
the four treatment
stages; less than 0.1% of
the total mass was
subject to biological
sorption and/or
degradation by the
sludge; water aeration
resulted in increased
partitioning to the air
phase with a negative
impact on biological
The reviewer agreed
with this study's
overall quality level.
(Chen et al., 2014) High
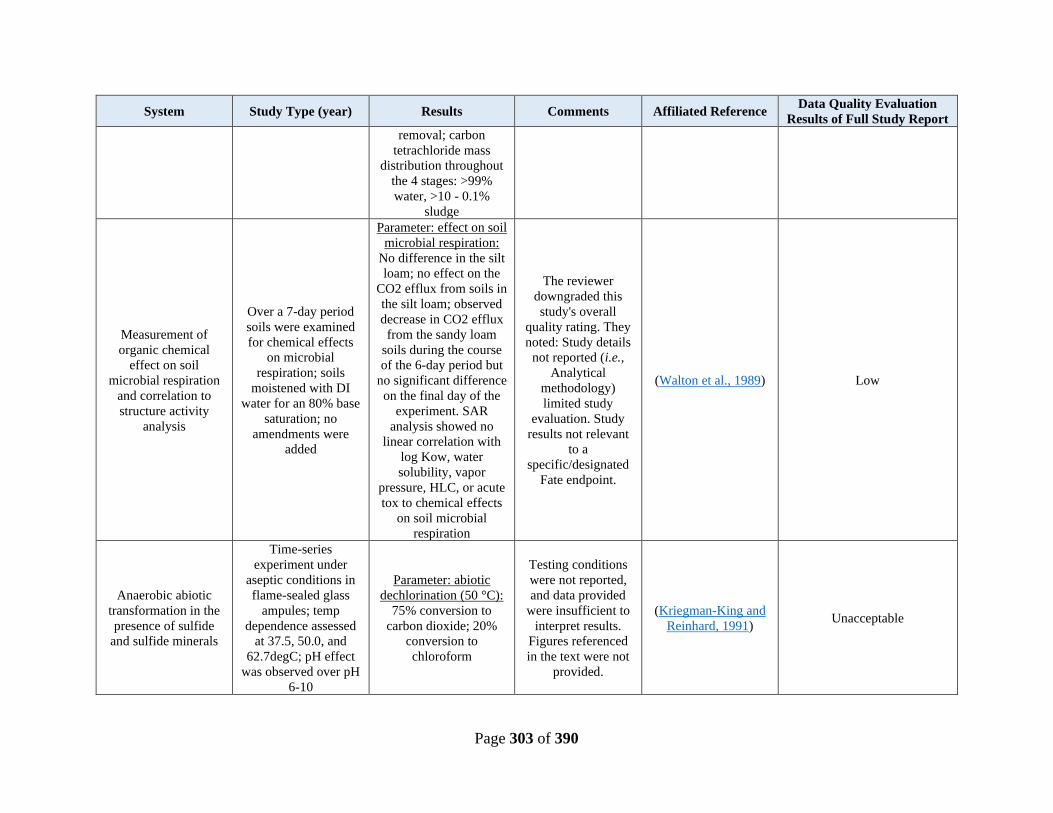
Page 303 of 390
System Study Type (year) Results Comments Affiliated Reference Data Quality Evaluation
Results of Full Study Report
removal; carbon
tetrachloride mass
distribution throughout
the 4 stages: >99%
water, >10 - 0.1%
sludge
Measurement of
organic chemical
effect on soil
microbial respiration
and correlation to
structure activity
analysis
Over a 7-day period
soils were examined
for chemical effects
on microbial
respiration; soils
moistened with DI
water for an 80% base
saturation; no
amendments were
added
Parameter: effect on soil
microbial respiration:
No difference in the silt
loam; no effect on the
CO2 efflux from soils in
the silt loam; observed
decrease in CO2 efflux
from the sandy loam
soils during the course
of the 6-day period but
no significant difference
on the final day of the
experiment. SAR
analysis showed no
linear correlation with
log Kow, water
solubility, vapor
pressure, HLC, or acute
tox to chemical effects
on soil microbial
respiration
The reviewer
downgraded this
study's overall
quality rating. They
noted: Study details
not reported (i.e.,
Analytical
methodology)
limited study
evaluation. Study
results not relevant
to a
specific/designated
Fate endpoint.
(Walton et al., 1989) Low
Anaerobic abiotic
transformation in the
presence of sulfide
and sulfide minerals
Time-series
experiment under
aseptic conditions in
flame-sealed glass
ampules; temp
dependence assessed
at 37.5, 50.0, and
62.7degC; pH effect
was observed over pH
6-10
Parameter: abiotic
dechlorination (50 °C):
75% conversion to
carbon dioxide; 20%
conversion to
chloroform
Testing conditions
were not reported,
and data provided
were insufficient to
interpret results.
Figures referenced
in the text were not
provided.
(Kriegman-King and
Reinhard, 1991) Unacceptable

Page 304 of 390
Appendix D RELEASES TO THE ENVIRONMENT
This appendix provides a summary of the releases of carbon tetrachloride to the environment
reported in 2018 TRI.
Table D-1. Summary of Carbon Tetrachloride Releases to the Environment Reported in
2018 TRI (lbs)
Number
of
Facilities
Air Releases
Water
Releases
Land Disposal
Other
Releasesa
Total On-
and Off-Site
Disposal or
Other
Releasesb, c
Stack Air
Releases
Fugitive
Air
Releases
Class I
Under-
ground
Injection
RCRA
Subtitle C
Landfills
All other
Land
Disposala
Totals
2018
49 116,710 59,355 1,704 15,088 29,140 29,532 146 251, 674
176,065 73,760
Data source: 2018 TRI Data (U.S. EPA, 2018e) covering the 2017 reporting cycle. a Terminology used in these columns may not match the more detailed data element names used in the TRI public data and analysis access points. b These release quantities do include releases due to one-time events not associated with production such as remedial actions or earthquakes. c Counts release quantities once at final disposition, accounting for transfers to other TRI reporting facilities that ultimately dispose of the chemical waste.
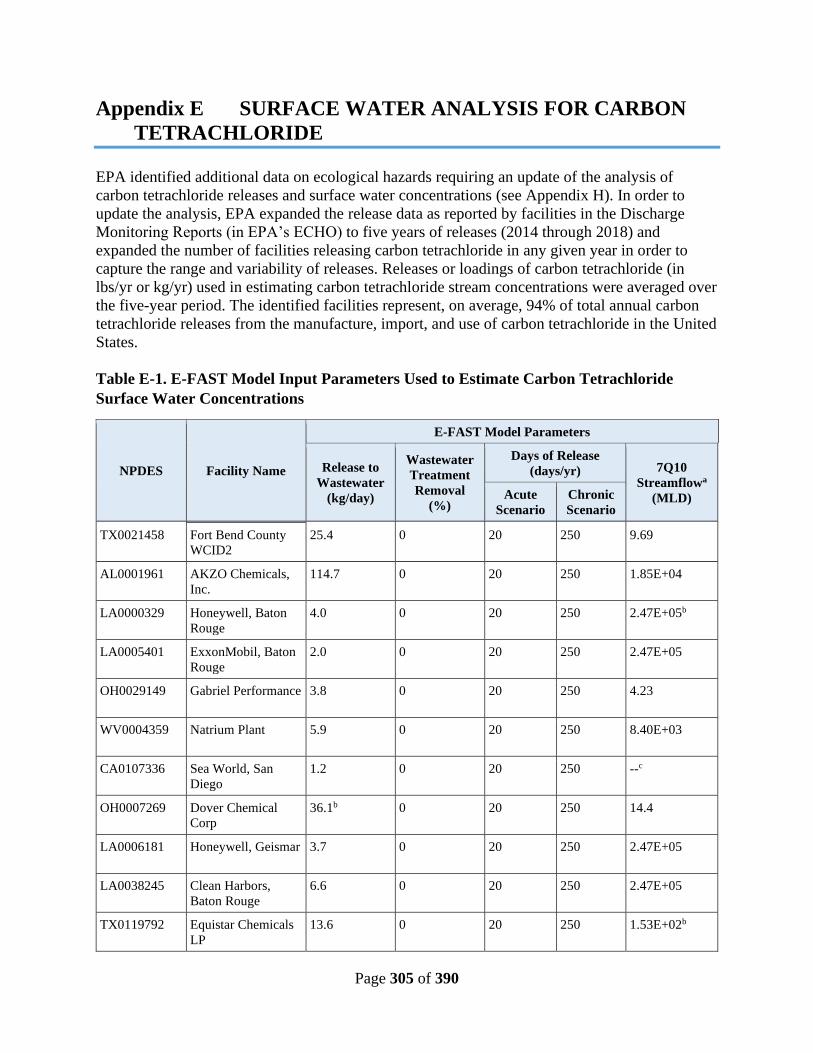
Page 305 of 390
Appendix E SURFACE WATER ANALYSIS FOR CARBON
TETRACHLORIDE
EPA identified additional data on ecological hazards requiring an update of the analysis of
carbon tetrachloride releases and surface water concentrations (see Appendix H). In order to
update the analysis, EPA expanded the release data as reported by facilities in the Discharge
Monitoring Reports (in EPA’s ECHO) to five years of releases (2014 through 2018) and
expanded the number of facilities releasing carbon tetrachloride in any given year in order to
capture the range and variability of releases. Releases or loadings of carbon tetrachloride (in
lbs/yr or kg/yr) used in estimating carbon tetrachloride stream concentrations were averaged over
the five-year period. The identified facilities represent, on average, 94% of total annual carbon
tetrachloride releases from the manufacture, import, and use of carbon tetrachloride in the United
States.
Table E-1. E-FAST Model Input Parameters Used to Estimate Carbon Tetrachloride
Surface Water Concentrations
NPDES Facility Name
E-FAST Model Parameters
Release to
Wastewater
(kg/day)
Wastewater
Treatment
Removal
(%)
Days of Release
(days/yr) 7Q10
Streamflowa
(MLD) Acute
Scenario
Chronic
Scenario
TX0021458 Fort Bend County
WCID2
25.4 0 20 250
9.69
AL0001961 AKZO Chemicals,
Inc.
114.7 0 20 250
1.85E+04
LA0000329 Honeywell, Baton
Rouge
4.0 0 20 250
2.47E+05b
LA0005401 ExxonMobil, Baton
Rouge
2.0 0 20 250
2.47E+05
OH0029149 Gabriel Performance 3.8 0 20 250
4.23
WV0004359 Natrium Plant 5.9 0 20 250
8.40E+03
CA0107336 Sea World, San
Diego
1.2 0 20 250
--c
OH0007269 Dover Chemical
Corp
36.1b 0 20 250
14.4
LA0006181 Honeywell, Geismar 3.7 0 20 250
2.47E+05
LA0038245 Clean Harbors,
Baton Rouge
6.6 0 20 250
2.47E+05
TX0119792 Equistar Chemicals
LP
13.6 0 20 250
1.53E+02b
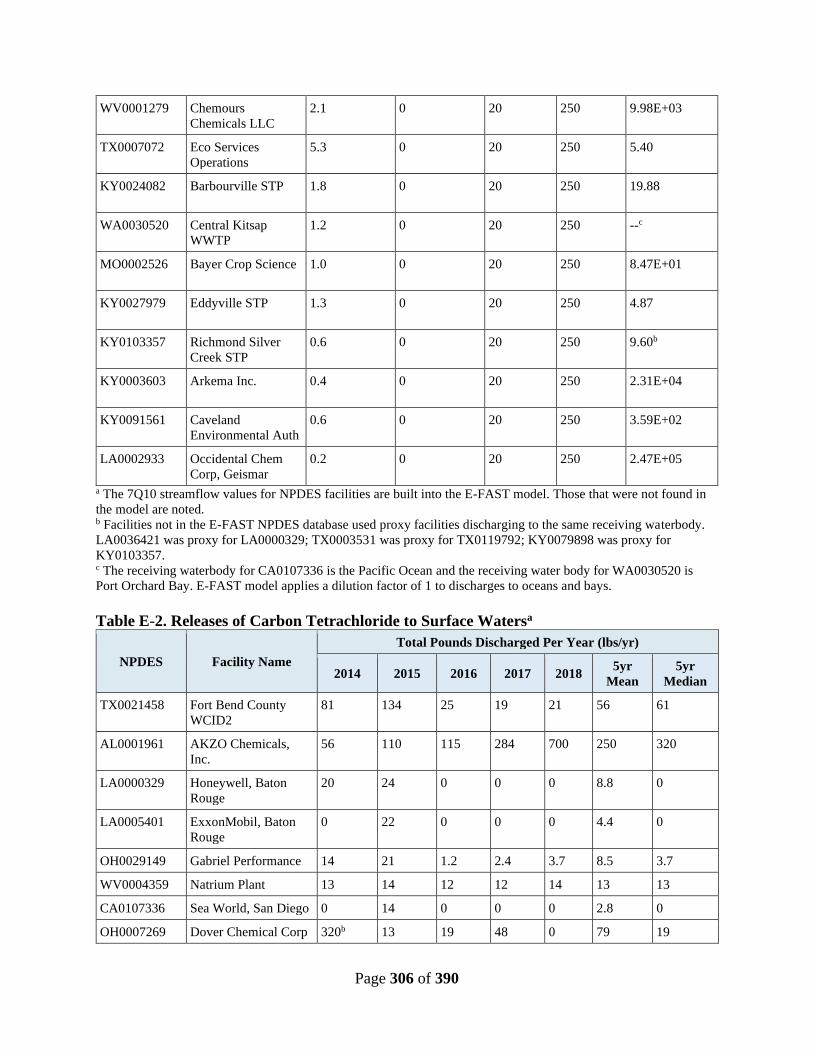
Page 306 of 390
WV0001279 Chemours
Chemicals LLC
2.1 0 20 250
9.98E+03
TX0007072 Eco Services
Operations
5.3 0 20 250
5.40
KY0024082 Barbourville STP 1.8 0 20 250
19.88
WA0030520 Central Kitsap
WWTP
1.2 0 20 250
--c
MO0002526 Bayer Crop Science 1.0 0 20 250
8.47E+01
KY0027979 Eddyville STP 1.3 0 20 250
4.87
KY0103357 Richmond Silver
Creek STP
0.6 0 20 250
9.60b
KY0003603 Arkema Inc. 0.4 0 20 250
2.31E+04
KY0091561 Caveland
Environmental Auth
0.6 0 20 250
3.59E+02
LA0002933 Occidental Chem
Corp, Geismar
0.2 0 20 250
2.47E+05
a The 7Q10 streamflow values for NPDES facilities are built into the E-FAST model. Those that were not found in
the model are noted. b Facilities not in the E-FAST NPDES database used proxy facilities discharging to the same receiving waterbody.
LA0036421 was proxy for LA0000329; TX0003531 was proxy for TX0119792; KY0079898 was proxy for
KY0103357. c The receiving waterbody for CA0107336 is the Pacific Ocean and the receiving water body for WA0030520 is
Port Orchard Bay. E-FAST model applies a dilution factor of 1 to discharges to oceans and bays.
Table E-2. Releases of Carbon Tetrachloride to Surface Watersa
NPDES Facility Name
Total Pounds Discharged Per Year (lbs/yr)
2014 2015 2016 2017 2018 5yr
Mean
5yr
Median
TX0021458 Fort Bend County
WCID2
81 134 25 19 21 56 61
AL0001961 AKZO Chemicals,
Inc.
56 110 115 284 700 250 320
LA0000329 Honeywell, Baton
Rouge
20 24 0 0 0 8.8 0
LA0005401 ExxonMobil, Baton
Rouge
0 22 0 0 0 4.4 0
OH0029149 Gabriel Performance 14 21 1.2 2.4 3.7 8.5 3.7
WV0004359 Natrium Plant 13 14 12 12 14 13 13
CA0107336 Sea World, San Diego 0 14 0 0 0 2.8 0
OH0007269 Dover Chemical Corp 320b 13 19 48 0 79 19
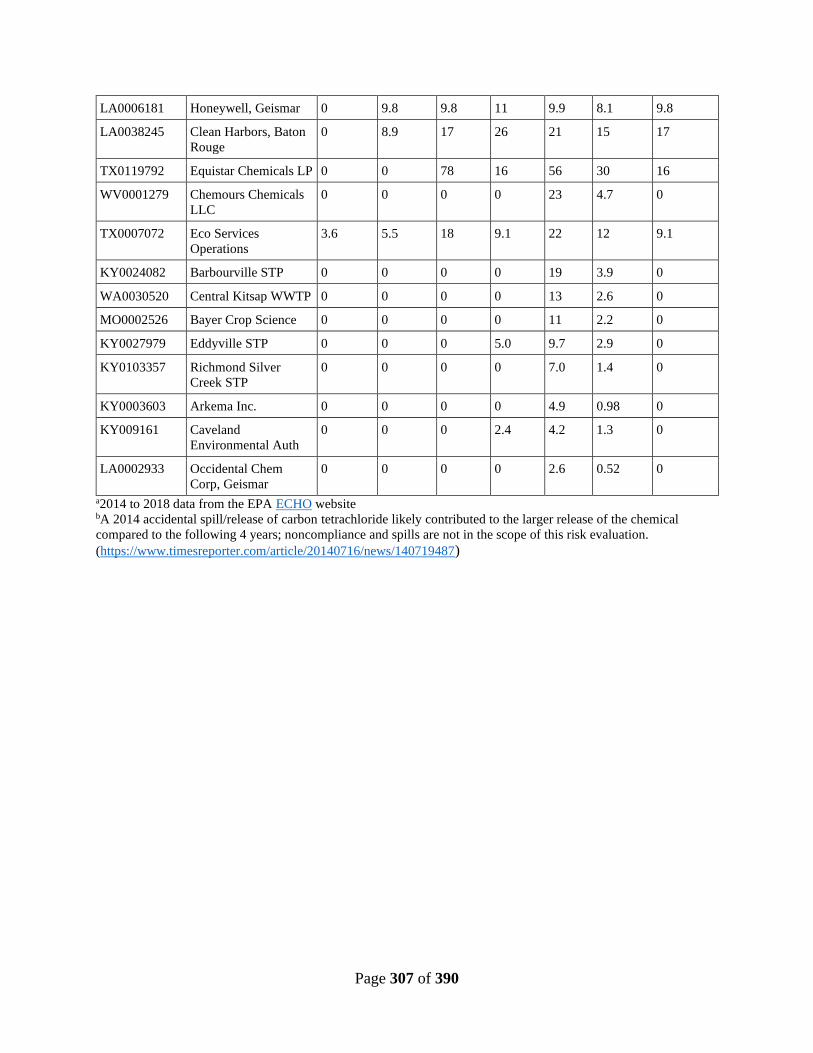
Page 307 of 390
LA0006181 Honeywell, Geismar 0 9.8 9.8 11 9.9 8.1 9.8
LA0038245 Clean Harbors, Baton
Rouge
0 8.9 17 26 21 15 17
TX0119792 Equistar Chemicals LP 0 0 78 16 56 30 16
WV0001279 Chemours Chemicals
LLC
0 0 0 0 23 4.7 0
TX0007072 Eco Services
Operations
3.6 5.5 18 9.1 22 12 9.1
KY0024082 Barbourville STP 0 0 0 0 19 3.9 0
WA0030520 Central Kitsap WWTP 0 0 0 0 13 2.6 0
MO0002526 Bayer Crop Science 0 0 0 0 11 2.2 0
KY0027979 Eddyville STP 0 0 0 5.0 9.7 2.9 0
KY0103357 Richmond Silver
Creek STP
0 0 0 0 7.0 1.4 0
KY0003603 Arkema Inc. 0 0 0 0 4.9 0.98 0
KY009161 Caveland
Environmental Auth
0 0 0 2.4 4.2 1.3 0
LA0002933 Occidental Chem
Corp, Geismar
0 0 0 0 2.6 0.52 0
a2014 to 2018 data from the EPA ECHO website bA 2014 accidental spill/release of carbon tetrachloride likely contributed to the larger release of the chemical
compared to the following 4 years; noncompliance and spills are not in the scope of this risk evaluation.
(https://www.timesreporter.com/article/20140716/news/140719487)

Page 308 of 390
Table E-3. Surface Water Carbon Tetrachloride Concentrations for Acute (20 day) and Chronic (250 day) Scenarios and
Comparison with Amphibian Concentration of Concerna
NPDES Facility Name
Amount
Discharged
for 20 days
(kg/day)
20 Day Stream
Conc. (µg/L)
Days Acute
COCb
Exceeded
(PDM)
Amount
Discharged
for 250 days
(kg/day)
250 Day
Stream Conc.
(µg/L)
Days Chronic
COCc
Exceeded
(PDM)
TX0021458 Fort Bend County WCID2 N/A N/A N/A 0.10 10 0
AL0001961 AKZO Chemicals, Inc. 5.7 3.1E-01 0 0.46 2.5E-02 0
LA0000329 Honeywell, Baton Rouge 0.20 8.1E-04 0 0.02 6.5E-05 0
LA0005401 ExxonMobil, Baton Rouge 0.01 4.0E-04 0 0.01 3.2E-05 0
OH0029149 Gabriel Performance 0.19 45 0 0.02 3.6 2
WV0004359 Natrium Plant 0.29 3.4E-02 0 0.02 2.9E-03 0
CA0107336 Sea World, San Diego 6.3E-02 1.5E-01 0 5.0E-03 1.2E-02 0
OH0007269 Dover Chemical Corp 1.8 1.3E+2 0 0.14 10 15
LA0006181 Honeywell, Geismar 0.18 7.3E-04 0 0.02 6.1E-05 0
LA0038245 Clean Harbors, Baton
Rouge
0.33 1.3E-03 0 0.03 1.0E-04 0
TX0119792 Equistar Chemicals LP 0.68 4.4 0 0.05 3.5E-01 0
WV0001279 Chemours Chemicals LLC 0.11 1.1E0-02 0 0.01 8.0E-04 0
TX0007072 Eco Services Operations 0.26 49 0 0.02 3.9 2
KY0024082 Barbourville STP N/A N/A N/A 0.01 3.5E-01 0
WA0030520 Central Kitsap WWTP 0.06 7.0E+01 N/A 0.01 5.8E-01 0
MO0002526 Bayer Crop Science 0.05 5.9E-01 0 0.0 4.7E-02 0
KY0027979 Eddyville STP N/A N/A N/A 0.01 1.0 1
KY0103357 Richmond Silver Creek
STP
N/A N/A N/A 0.0 3.1E-01 0
KY0003603 Arkema Inc. 0.02 9.5E-04 0 0.0 8.7E-05 0
KY009161 Caveland Environmental
Auth
0.03 8.4E-02 0 0.0 5.6E-03 0
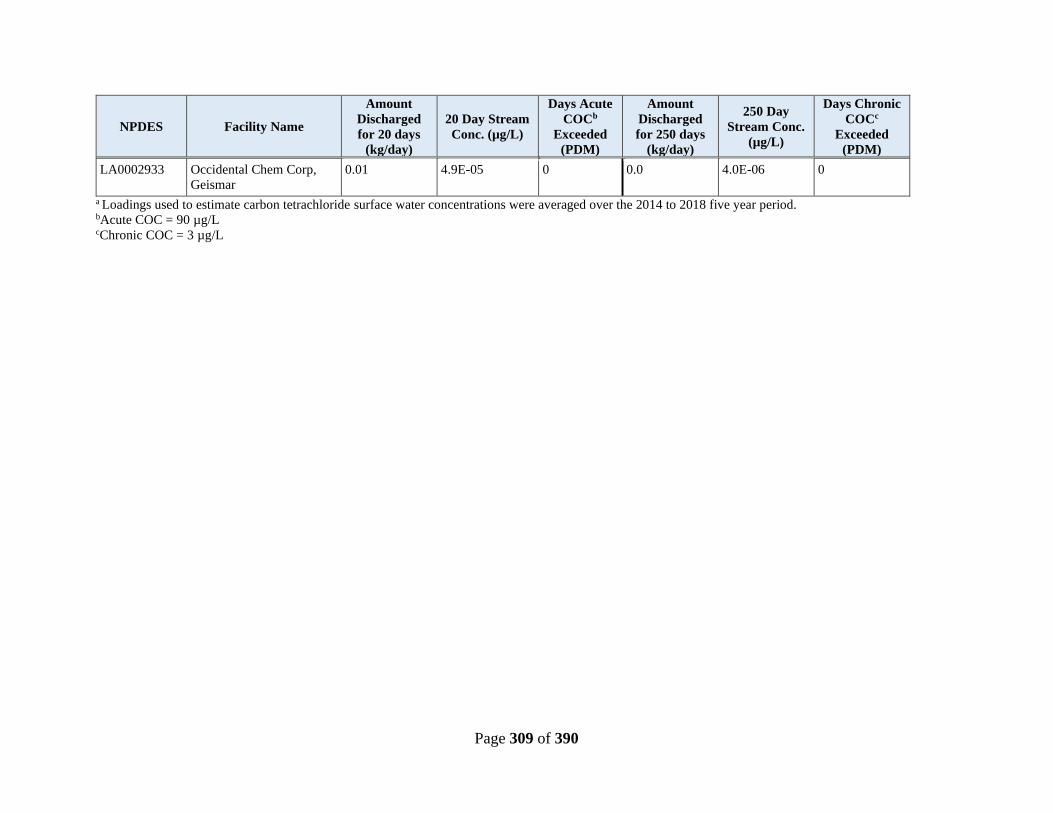
Page 309 of 390
NPDES Facility Name
Amount
Discharged
for 20 days
(kg/day)
20 Day Stream
Conc. (µg/L)
Days Acute
COCb
Exceeded
(PDM)
Amount
Discharged
for 250 days
(kg/day)
250 Day
Stream Conc.
(µg/L)
Days Chronic
COCc
Exceeded
(PDM)
LA0002933 Occidental Chem Corp,
Geismar
0.01 4.9E-05 0 0.0 4.0E-06 0
a Loadings used to estimate carbon tetrachloride surface water concentrations were averaged over the 2014 to 2018 five year period. bAcute COC = 90 µg/L cChronic COC = 3 µg/L
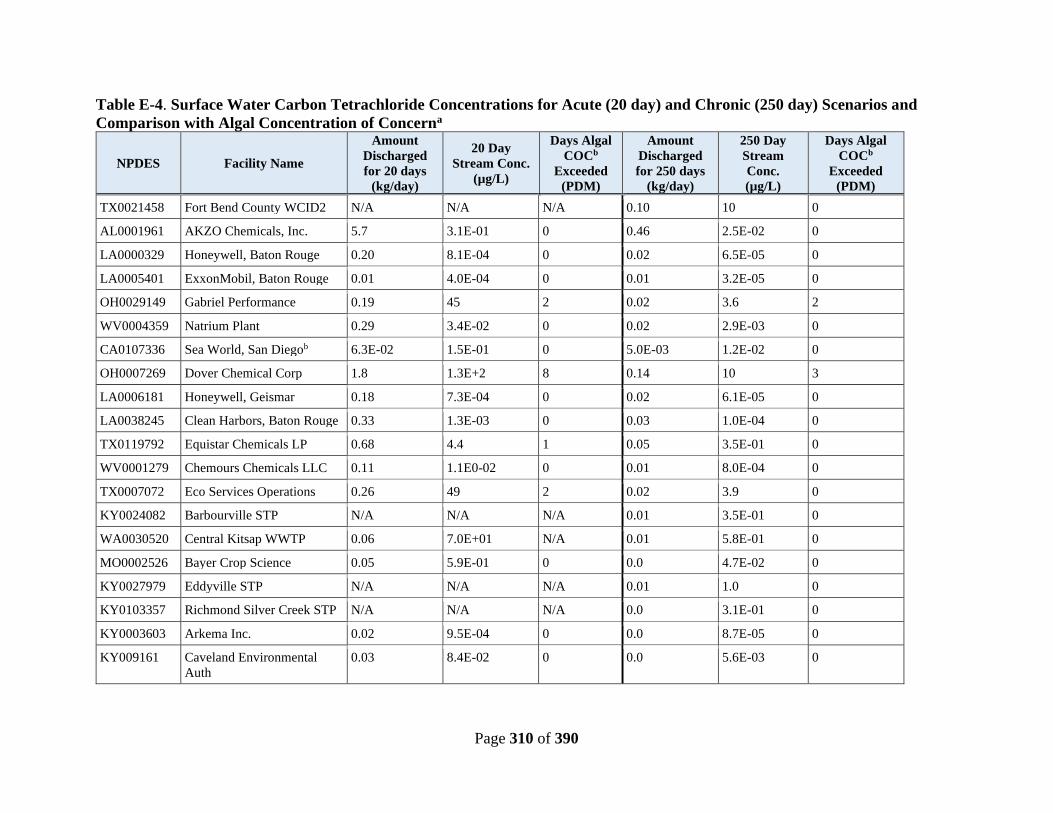
Page 310 of 390
Table E-4. Surface Water Carbon Tetrachloride Concentrations for Acute (20 day) and Chronic (250 day) Scenarios and
Comparison with Algal Concentration of Concerna
NPDES Facility Name
Amount
Discharged
for 20 days
(kg/day)
20 Day
Stream Conc.
(µg/L)
Days Algal
COCb
Exceeded
(PDM)
Amount
Discharged
for 250 days
(kg/day)
250 Day
Stream
Conc.
(µg/L)
Days Algal
COCb
Exceeded
(PDM)
TX0021458 Fort Bend County WCID2 N/A N/A N/A 0.10 10 0
AL0001961 AKZO Chemicals, Inc. 5.7 3.1E-01 0 0.46 2.5E-02 0
LA0000329 Honeywell, Baton Rouge 0.20 8.1E-04 0 0.02 6.5E-05 0
LA0005401 ExxonMobil, Baton Rouge 0.01 4.0E-04 0 0.01 3.2E-05 0
OH0029149 Gabriel Performance 0.19 45 2 0.02 3.6 2
WV0004359 Natrium Plant 0.29 3.4E-02 0 0.02 2.9E-03 0
CA0107336 Sea World, San Diegob 6.3E-02 1.5E-01 0 5.0E-03 1.2E-02 0
OH0007269 Dover Chemical Corp 1.8 1.3E+2 8 0.14 10 3
LA0006181 Honeywell, Geismar 0.18 7.3E-04 0 0.02 6.1E-05 0
LA0038245 Clean Harbors, Baton Rouge 0.33 1.3E-03 0 0.03 1.0E-04 0
TX0119792 Equistar Chemicals LP 0.68 4.4 1 0.05 3.5E-01 0
WV0001279 Chemours Chemicals LLC 0.11 1.1E0-02 0 0.01 8.0E-04 0
TX0007072 Eco Services Operations 0.26 49 2 0.02 3.9 0
KY0024082 Barbourville STP N/A N/A N/A 0.01 3.5E-01 0
WA0030520 Central Kitsap WWTP 0.06 7.0E+01 N/A 0.01 5.8E-01 0
MO0002526 Bayer Crop Science 0.05 5.9E-01 0 0.0 4.7E-02 0
KY0027979 Eddyville STP N/A N/A N/A 0.01 1.0 0
KY0103357 Richmond Silver Creek STP N/A N/A N/A 0.0 3.1E-01 0
KY0003603 Arkema Inc. 0.02 9.5E-04 0 0.0 8.7E-05 0
KY009161 Caveland Environmental
Auth
0.03 8.4E-02 0 0.0 5.6E-03 0
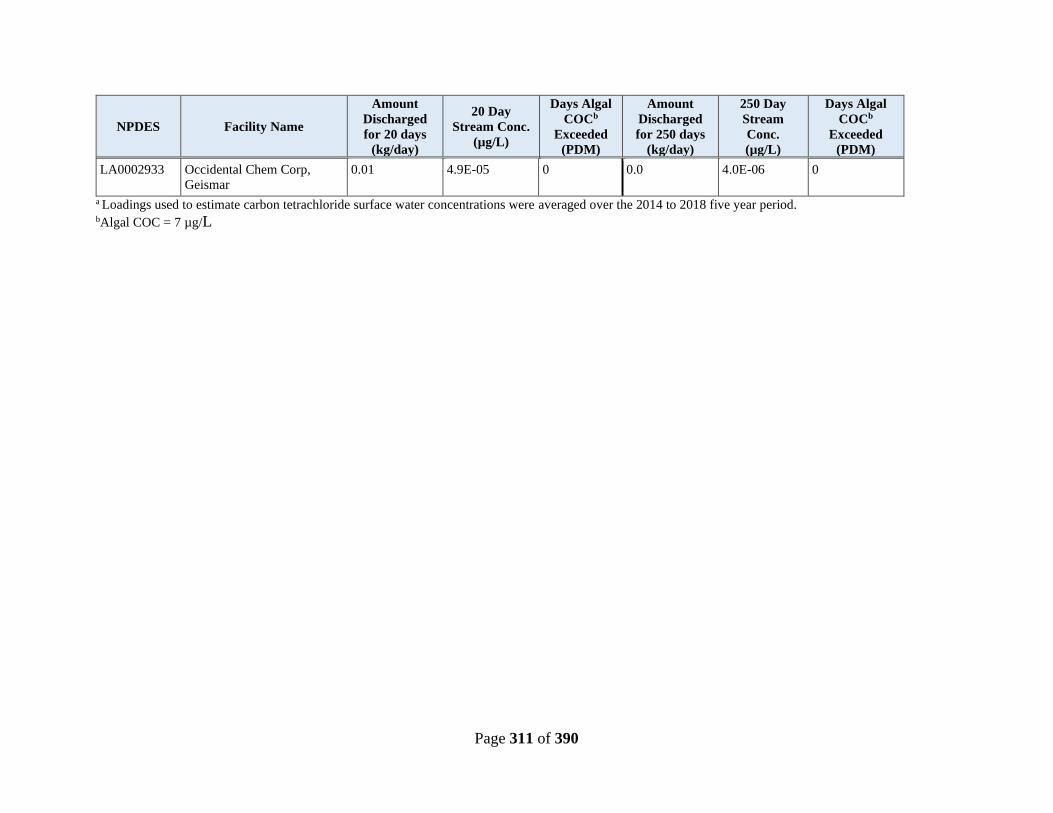
Page 311 of 390
NPDES Facility Name
Amount
Discharged
for 20 days
(kg/day)
20 Day
Stream Conc.
(µg/L)
Days Algal
COCb
Exceeded
(PDM)
Amount
Discharged
for 250 days
(kg/day)
250 Day
Stream
Conc.
(µg/L)
Days Algal
COCb
Exceeded
(PDM)
LA0002933 Occidental Chem Corp,
Geismar
0.01 4.9E-05 0 0.0 4.0E-06 0
a Loadings used to estimate carbon tetrachloride surface water concentrations were averaged over the 2014 to 2018 five year period. bAlgal COC = 7 µg/L
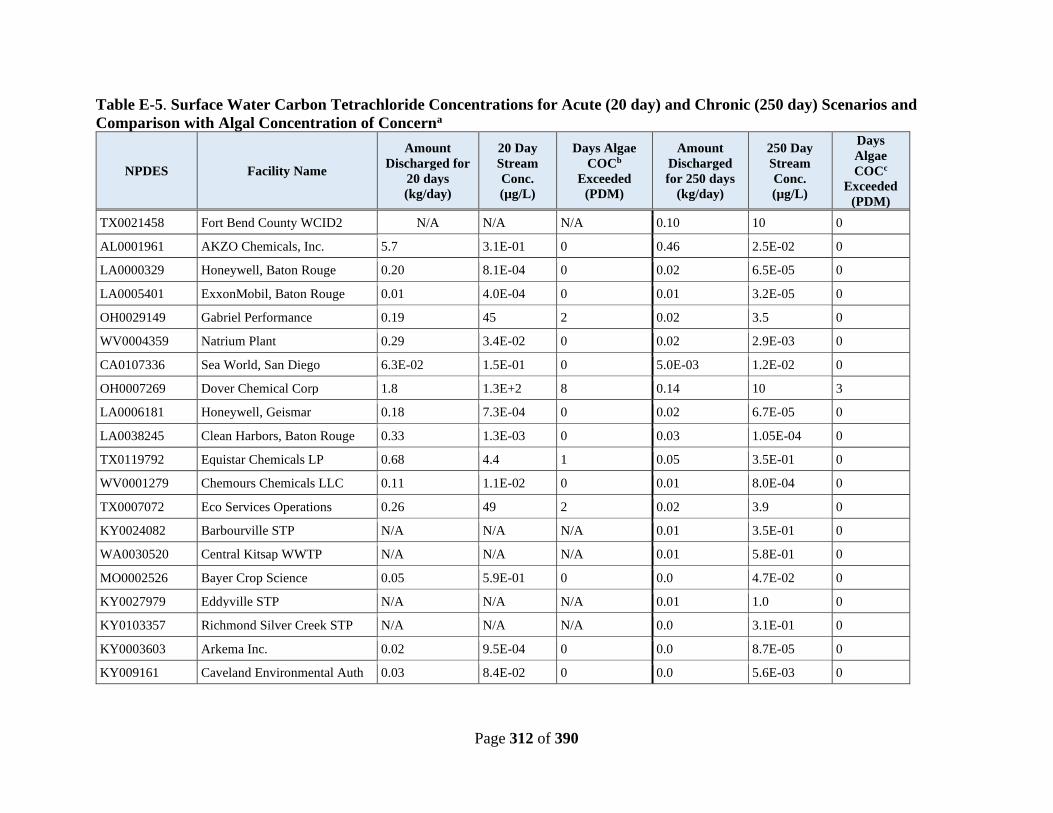
Page 312 of 390
Table E-5. Surface Water Carbon Tetrachloride Concentrations for Acute (20 day) and Chronic (250 day) Scenarios and
Comparison with Algal Concentration of Concerna
NPDES Facility Name
Amount
Discharged for
20 days
(kg/day)
20 Day
Stream
Conc.
(µg/L)
Days Algae
COCb
Exceeded
(PDM)
Amount
Discharged
for 250 days
(kg/day)
250 Day
Stream
Conc.
(µg/L)
Days
Algae
COCc
Exceeded
(PDM)
TX0021458 Fort Bend County WCID2 N/A N/A N/A 0.10 10 0
AL0001961 AKZO Chemicals, Inc. 5.7 3.1E-01 0 0.46 2.5E-02 0
LA0000329 Honeywell, Baton Rouge 0.20 8.1E-04 0 0.02 6.5E-05 0
LA0005401 ExxonMobil, Baton Rouge 0.01 4.0E-04 0 0.01 3.2E-05 0
OH0029149 Gabriel Performance 0.19 45 2 0.02 3.5 0
WV0004359 Natrium Plant 0.29 3.4E-02 0 0.02 2.9E-03 0
CA0107336 Sea World, San Diego 6.3E-02 1.5E-01 0 5.0E-03 1.2E-02 0
OH0007269 Dover Chemical Corp 1.8 1.3E+2 8 0.14 10 3
LA0006181 Honeywell, Geismar 0.18 7.3E-04 0 0.02 6.7E-05 0
LA0038245 Clean Harbors, Baton Rouge 0.33 1.3E-03 0 0.03 1.05E-04 0
TX0119792 Equistar Chemicals LP 0.68 4.4 1 0.05 3.5E-01 0
WV0001279 Chemours Chemicals LLC 0.11 1.1E-02 0 0.01 8.0E-04 0
TX0007072 Eco Services Operations 0.26 49 2 0.02 3.9 0
KY0024082 Barbourville STP N/A N/A N/A 0.01 3.5E-01 0
WA0030520 Central Kitsap WWTP N/A N/A N/A 0.01 5.8E-01 0
MO0002526 Bayer Crop Science 0.05 5.9E-01 0 0.0 4.7E-02 0
KY0027979 Eddyville STP N/A N/A N/A 0.01 1.0 0
KY0103357 Richmond Silver Creek STP N/A N/A N/A 0.0 3.1E-01 0
KY0003603 Arkema Inc. 0.02 9.5E-04 0 0.0 8.7E-05 0
KY009161 Caveland Environmental Auth 0.03 8.4E-02 0 0.0 5.6E-03 0
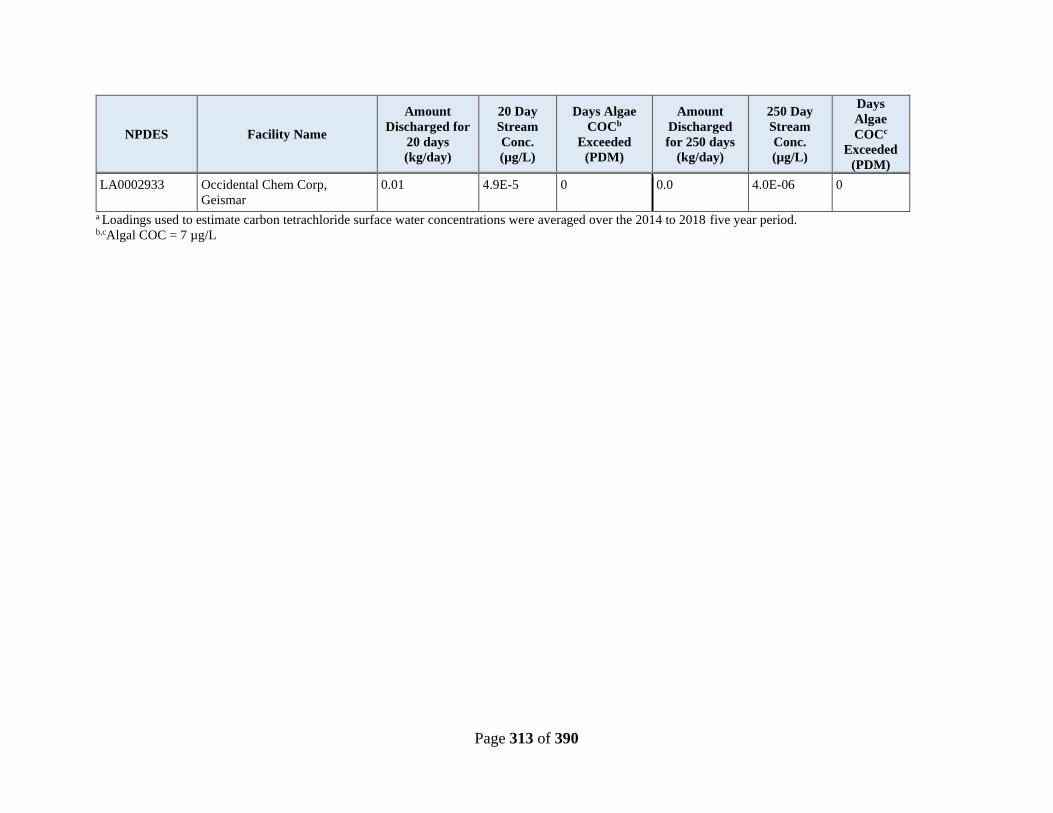
Page 313 of 390
NPDES Facility Name
Amount
Discharged for
20 days
(kg/day)
20 Day
Stream
Conc.
(µg/L)
Days Algae
COCb
Exceeded
(PDM)
Amount
Discharged
for 250 days
(kg/day)
250 Day
Stream
Conc.
(µg/L)
Days
Algae
COCc
Exceeded
(PDM)
LA0002933 Occidental Chem Corp,
Geismar
0.01 4.9E-5 0 0.0 4.0E-06 0
a Loadings used to estimate carbon tetrachloride surface water concentrations were averaged over the 2014 to 2018 five year period. b,cAlgal COC = 7 µg/L

Page 314 of 390
In addition to the facilities listed above, there are other facilities that also discharge carbon
tetrachloride as reported in the Discharge Monitoring Report database. However, only two other
facilities to those listed in Table E-1. E-FAST Model Input Parameters Used to Estimate Carbon
Tetrachloride Surface Water Concentrations discharge for more than one year and in general,
over the five-year period, a total of 196 facilities report discharges only for one year. For each
year, the number of facilities discharging carbon tetrachloride varies: 31 facilities in 2014, 38 in
2015, 41, in 2016 to 49 in 2017 and 42 in 2018 and 39 in 2019. The total annual surface water
releases per year for 2014 through 2019 are presented below in Figure E-1.
Figure E-1. Total Annual Facility Releases of Carbon Tetrachloride per Discharge
Monitoring Report Data
Appendix F ENVIRONMENTAL HAZARDS & RISK
Systematic Review EPA reviewed ecotoxicity studies for carbon tetrachloride according to the data quality
evaluation criteria found in the Application of Systematic Review in TSCA Risk Evaluations (U.S.
EPA, 2018a). The detailed data quality evaluation results of the 15 on-topic studies for carbon
tetrachloride environmental hazard are presented in the document Risk Evaluation for Carbon
Tetrachloride, Systematic Review Supplemental File: Data Quality Evaluation of Environmental
Hazard Studies (U.S. EPA, 2019g). The data quality extraction results for carbon tetrachloride
environmental hazard are presented in Table F-1.
0
200
400
600
800
1000
1200
2014 2015 2016 2017 2018 2019
Rel
ease
(lb
s/yr)
Year
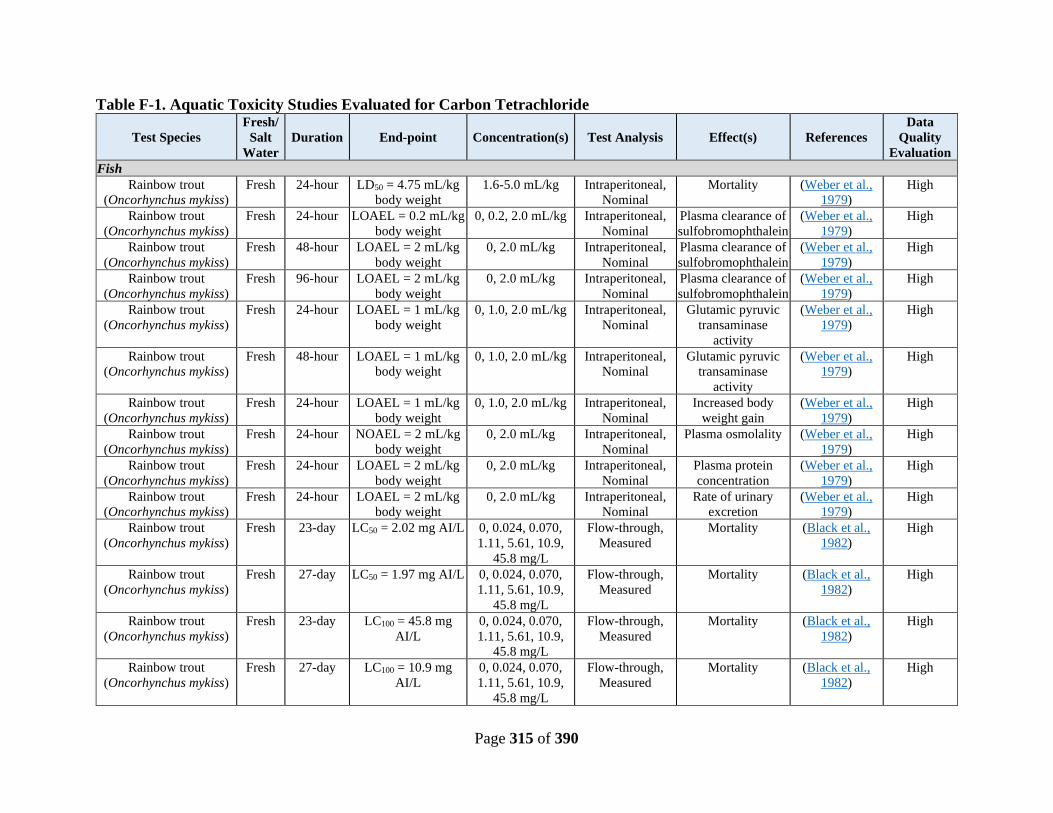
Page 315 of 390
Table F-1. Aquatic Toxicity Studies Evaluated for Carbon Tetrachloride
Test Species
Fresh/
Salt
Water
Duration End-point Concentration(s) Test Analysis Effect(s) References
Data
Quality
Evaluation
Fish
Rainbow trout
(Oncorhynchus mykiss)
Fresh 24-hour LD50 = 4.75 mL/kg
body weight
1.6-5.0 mL/kg Intraperitoneal,
Nominal
Mortality (Weber et al.,
1979)
High
Rainbow trout
(Oncorhynchus mykiss)
Fresh 24-hour LOAEL = 0.2 mL/kg
body weight
0, 0.2, 2.0 mL/kg Intraperitoneal,
Nominal
Plasma clearance of
sulfobromophthalein
(Weber et al.,
1979)
High
Rainbow trout
(Oncorhynchus mykiss)
Fresh 48-hour LOAEL = 2 mL/kg
body weight
0, 2.0 mL/kg Intraperitoneal,
Nominal
Plasma clearance of
sulfobromophthalein
(Weber et al.,
1979)
High
Rainbow trout
(Oncorhynchus mykiss)
Fresh 96-hour LOAEL = 2 mL/kg
body weight
0, 2.0 mL/kg Intraperitoneal,
Nominal
Plasma clearance of
sulfobromophthalein
(Weber et al.,
1979)
High
Rainbow trout
(Oncorhynchus mykiss)
Fresh 24-hour LOAEL = 1 mL/kg
body weight
0, 1.0, 2.0 mL/kg Intraperitoneal,
Nominal
Glutamic pyruvic
transaminase
activity
(Weber et al.,
1979)
High
Rainbow trout
(Oncorhynchus mykiss)
Fresh 48-hour LOAEL = 1 mL/kg
body weight
0, 1.0, 2.0 mL/kg Intraperitoneal,
Nominal
Glutamic pyruvic
transaminase
activity
(Weber et al.,
1979)
High
Rainbow trout
(Oncorhynchus mykiss)
Fresh 24-hour LOAEL = 1 mL/kg
body weight
0, 1.0, 2.0 mL/kg Intraperitoneal,
Nominal
Increased body
weight gain
(Weber et al.,
1979)
High
Rainbow trout
(Oncorhynchus mykiss)
Fresh 24-hour NOAEL = 2 mL/kg
body weight
0, 2.0 mL/kg Intraperitoneal,
Nominal
Plasma osmolality (Weber et al.,
1979)
High
Rainbow trout
(Oncorhynchus mykiss)
Fresh 24-hour LOAEL = 2 mL/kg
body weight
0, 2.0 mL/kg Intraperitoneal,
Nominal
Plasma protein
concentration
(Weber et al.,
1979)
High
Rainbow trout
(Oncorhynchus mykiss)
Fresh 24-hour LOAEL = 2 mL/kg
body weight
0, 2.0 mL/kg Intraperitoneal,
Nominal
Rate of urinary
excretion
(Weber et al.,
1979)
High
Rainbow trout
(Oncorhynchus mykiss)
Fresh 23-day LC50 = 2.02 mg AI/L 0, 0.024, 0.070,
1.11, 5.61, 10.9,
45.8 mg/L
Flow-through,
Measured
Mortality (Black et al.,
1982)
High
Rainbow trout
(Oncorhynchus mykiss)
Fresh 27-day LC50 = 1.97 mg AI/L 0, 0.024, 0.070,
1.11, 5.61, 10.9,
45.8 mg/L
Flow-through,
Measured
Mortality (Black et al.,
1982)
High
Rainbow trout
(Oncorhynchus mykiss)
Fresh 23-day LC100 = 45.8 mg
AI/L
0, 0.024, 0.070,
1.11, 5.61, 10.9,
45.8 mg/L
Flow-through,
Measured
Mortality (Black et al.,
1982)
High
Rainbow trout
(Oncorhynchus mykiss)
Fresh 27-day LC100 = 10.9 mg
AI/L
0, 0.024, 0.070,
1.11, 5.61, 10.9,
45.8 mg/L
Flow-through,
Measured
Mortality (Black et al.,
1982)
High
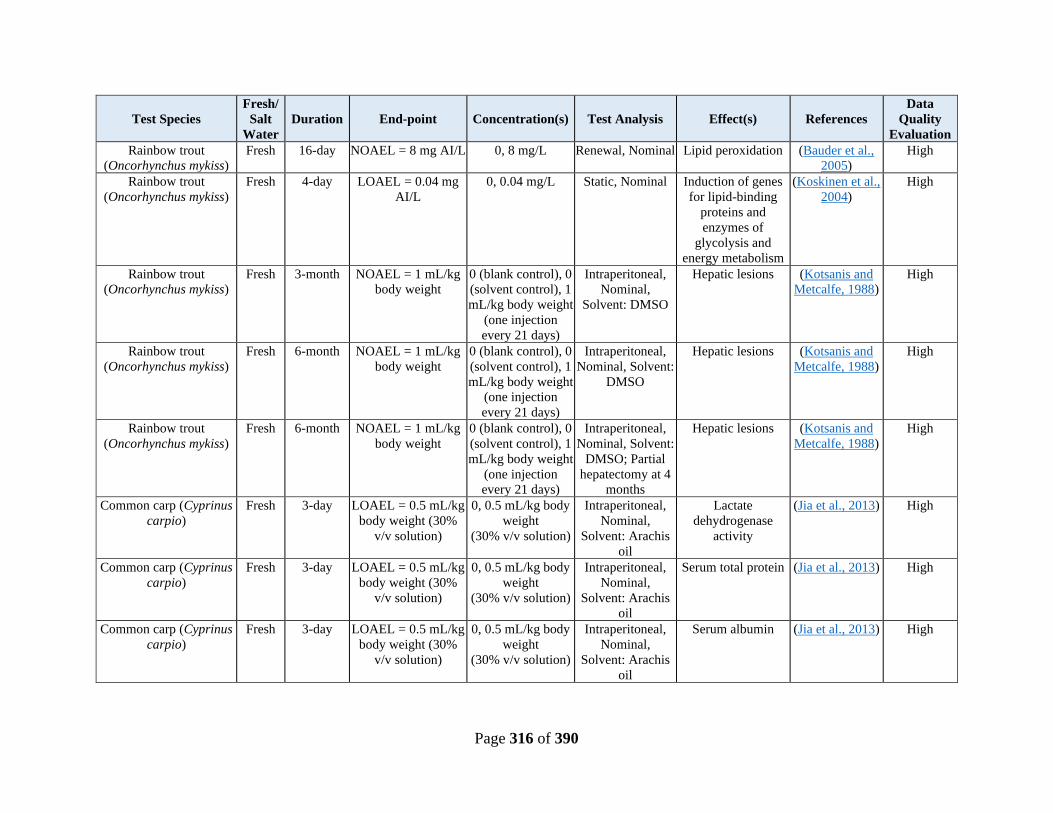
Page 316 of 390
Test Species
Fresh/
Salt
Water
Duration End-point Concentration(s) Test Analysis Effect(s) References
Data
Quality
Evaluation
Rainbow trout
(Oncorhynchus mykiss)
Fresh 16-day NOAEL = 8 mg AI/L 0, 8 mg/L Renewal, Nominal Lipid peroxidation (Bauder et al.,
2005)
High
Rainbow trout
(Oncorhynchus mykiss)
Fresh 4-day LOAEL = 0.04 mg
AI/L
0, 0.04 mg/L Static, Nominal Induction of genes
for lipid-binding
proteins and
enzymes of
glycolysis and
energy metabolism
(Koskinen et al.,
2004)
High
Rainbow trout
(Oncorhynchus mykiss)
Fresh 3-month NOAEL = 1 mL/kg
body weight
0 (blank control), 0
(solvent control), 1
mL/kg body weight
(one injection
every 21 days)
Intraperitoneal,
Nominal,
Solvent: DMSO
Hepatic lesions (Kotsanis and
Metcalfe, 1988)
High
Rainbow trout
(Oncorhynchus mykiss)
Fresh 6-month NOAEL = 1 mL/kg
body weight
0 (blank control), 0
(solvent control), 1
mL/kg body weight
(one injection
every 21 days)
Intraperitoneal,
Nominal, Solvent:
DMSO
Hepatic lesions (Kotsanis and
Metcalfe, 1988)
High
Rainbow trout
(Oncorhynchus mykiss)
Fresh 6-month NOAEL = 1 mL/kg
body weight
0 (blank control), 0
(solvent control), 1
mL/kg body weight
(one injection
every 21 days)
Intraperitoneal,
Nominal, Solvent:
DMSO; Partial
hepatectomy at 4
months
Hepatic lesions (Kotsanis and
Metcalfe, 1988)
High
Common carp (Cyprinus
carpio)
Fresh 3-day LOAEL = 0.5 mL/kg
body weight (30%
v/v solution)
0, 0.5 mL/kg body
weight
(30% v/v solution)
Intraperitoneal,
Nominal,
Solvent: Arachis
oil
Lactate
dehydrogenase
activity
(Jia et al., 2013) High
Common carp (Cyprinus
carpio)
Fresh 3-day LOAEL = 0.5 mL/kg
body weight (30%
v/v solution)
0, 0.5 mL/kg body
weight
(30% v/v solution)
Intraperitoneal,
Nominal,
Solvent: Arachis
oil
Serum total protein (Jia et al., 2013) High
Common carp (Cyprinus
carpio)
Fresh 3-day LOAEL = 0.5 mL/kg
body weight (30%
v/v solution)
0, 0.5 mL/kg body
weight
(30% v/v solution)
Intraperitoneal,
Nominal,
Solvent: Arachis
oil
Serum albumin (Jia et al., 2013) High

Page 317 of 390
Test Species
Fresh/
Salt
Water
Duration End-point Concentration(s) Test Analysis Effect(s) References
Data
Quality
Evaluation
Common carp (Cyprinus
carpio)
Fresh 3-day LOAEL = 0.5 mL/kg
body weight (30%
v/v solution)
0, 0.5 mL/kg body
weight
(30% v/v solution)
Intraperitoneal,
Nominal,
Solvent: Arachis
oil
Superoxide
dismutase activity
(Jia et al., 2013) High
Common carp (Cyprinus
carpio)
Fresh 3-day LOAEL = 0.5 mL/kg
body weight (30%
v/v solution)
0, 0.5 mL/kg body
weight
(30% v/v solution)
Intraperitoneal,
Nominal,
Solvent: Arachis
oil
Catalase activity (Jia et al., 2013) High
Common carp (Cyprinus
carpio)
Fresh 3-day LOAEL = 0.5 mL/kg
body weight (30%
v/v solution)
0, 0.5 mL/kg body
weight
(30% v/v solution)
Intraperitoneal,
Nominal,
Solvent: Arachis
oil
Glutathione
peroxidase activity
(Jia et al., 2013) High
Common carp (Cyprinus
carpio)
Fresh 3-day LOAEL = 0.5 mL/kg
body weight (30%
v/v solution)
0, 0.5 mL/kg body
weight
(30% v/v solution)
Intraperitoneal,
Nominal,
Solvent: Arachis
oil
Total antioxidant
capacity
(Jia et al., 2013) High
Common carp (Cyprinus
carpio)
Fresh 3-day LOAEL = 0.5 mL/kg
body weight (30%
v/v solution)
0, 0.5 mL/kg body
weight
(30% v/v solution)
Intraperitoneal,
Nominal,
Solvent: Arachis
oil
Concentration of
reduced glutathione
in blood
(Jia et al., 2013) High
Common carp (Cyprinus
carpio)
Fresh 3-day LOAEL = 0.5 mL/kg
body weight (30%
v/v solution)
0, 0.5 mL/kg body
weight
(30% v/v solution)
Intraperitoneal,
Nominal,
Solvent: Arachis
oil
Concentration of
malondialdehyde in
blood
(Jia et al., 2013) High
Common carp (Cyprinus
carpio)
Fresh 3-day LOAEL = 0.5 mL/kg
body weight (30%
v/v solution)
0, 0.5 mL/kg body
weight
(30% v/v solution)
Intraperitoneal,
Nominal,
Solvent: Arachis
oil
Liver weight
(relative to body
weight)
(Jia et al., 2013) High
Common carp (Cyprinus
carpio)
Fresh 3-day LOAEL = 0.5 mL/kg
body weight (30%
v/v solution)
0, 0.5 mL/kg body
weight
(30% v/v solution)
Intraperitoneal,
Nominal,
Solvent: Arachis
oil
Glutamic pyruvic
transaminase
activity
(Jia et al., 2013) High
Common carp (Cyprinus
carpio)
Fresh 3-day LOAEL = 0.5 mL/kg
body weight (30%
v/v solution)
0, 0.5 mL/kg body
weight
(30% v/v solution)
Intraperitoneal,
Nominal,
Solvent: Arachis
oil
Glutamic-
oxaloacetic
transaminase
activity
(Jia et al., 2013) High
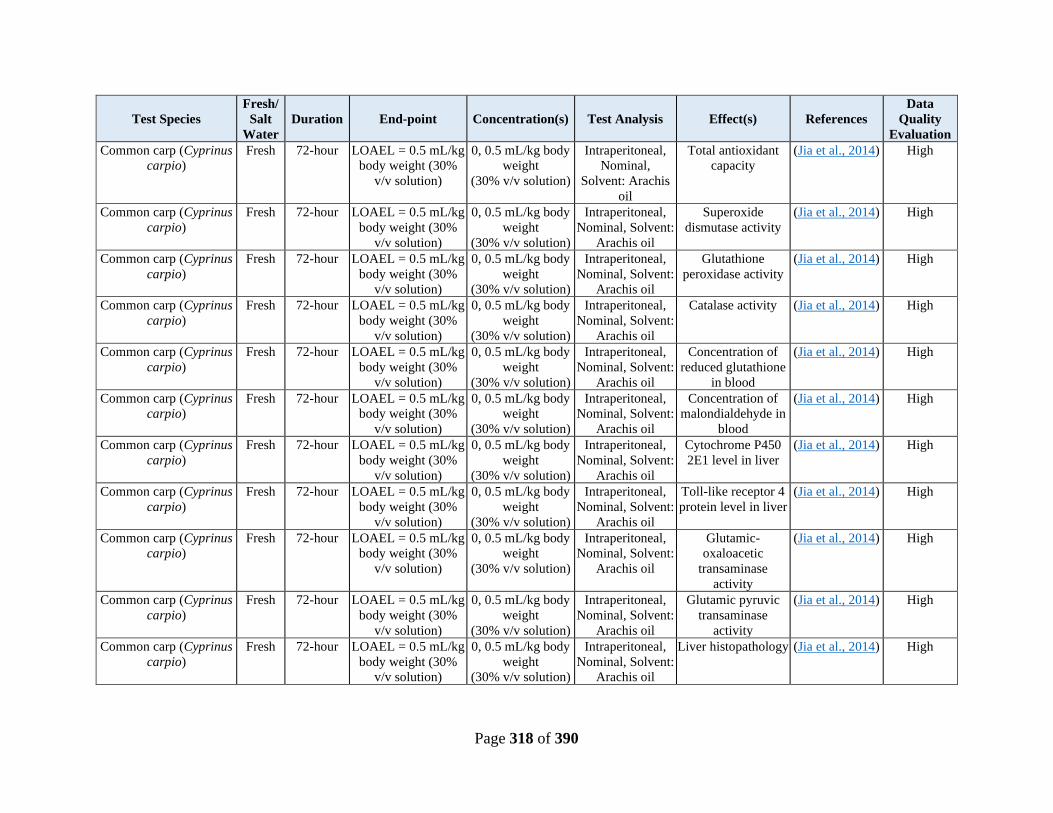
Page 318 of 390
Test Species
Fresh/
Salt
Water
Duration End-point Concentration(s) Test Analysis Effect(s) References
Data
Quality
Evaluation
Common carp (Cyprinus
carpio)
Fresh 72-hour LOAEL = 0.5 mL/kg
body weight (30%
v/v solution)
0, 0.5 mL/kg body
weight
(30% v/v solution)
Intraperitoneal,
Nominal,
Solvent: Arachis
oil
Total antioxidant
capacity
(Jia et al., 2014) High
Common carp (Cyprinus
carpio)
Fresh 72-hour LOAEL = 0.5 mL/kg
body weight (30%
v/v solution)
0, 0.5 mL/kg body
weight
(30% v/v solution)
Intraperitoneal,
Nominal, Solvent:
Arachis oil
Superoxide
dismutase activity
(Jia et al., 2014) High
Common carp (Cyprinus
carpio)
Fresh 72-hour LOAEL = 0.5 mL/kg
body weight (30%
v/v solution)
0, 0.5 mL/kg body
weight
(30% v/v solution)
Intraperitoneal,
Nominal, Solvent:
Arachis oil
Glutathione
peroxidase activity
(Jia et al., 2014) High
Common carp (Cyprinus
carpio)
Fresh 72-hour LOAEL = 0.5 mL/kg
body weight (30%
v/v solution)
0, 0.5 mL/kg body
weight
(30% v/v solution)
Intraperitoneal,
Nominal, Solvent:
Arachis oil
Catalase activity (Jia et al., 2014) High
Common carp (Cyprinus
carpio)
Fresh 72-hour LOAEL = 0.5 mL/kg
body weight (30%
v/v solution)
0, 0.5 mL/kg body
weight
(30% v/v solution)
Intraperitoneal,
Nominal, Solvent:
Arachis oil
Concentration of
reduced glutathione
in blood
(Jia et al., 2014) High
Common carp (Cyprinus
carpio)
Fresh 72-hour LOAEL = 0.5 mL/kg
body weight (30%
v/v solution)
0, 0.5 mL/kg body
weight
(30% v/v solution)
Intraperitoneal,
Nominal, Solvent:
Arachis oil
Concentration of
malondialdehyde in
blood
(Jia et al., 2014) High
Common carp (Cyprinus
carpio)
Fresh 72-hour LOAEL = 0.5 mL/kg
body weight (30%
v/v solution)
0, 0.5 mL/kg body
weight
(30% v/v solution)
Intraperitoneal,
Nominal, Solvent:
Arachis oil
Cytochrome P450
2E1 level in liver
(Jia et al., 2014) High
Common carp (Cyprinus
carpio)
Fresh 72-hour LOAEL = 0.5 mL/kg
body weight (30%
v/v solution)
0, 0.5 mL/kg body
weight
(30% v/v solution)
Intraperitoneal,
Nominal, Solvent:
Arachis oil
Toll-like receptor 4
protein level in liver
(Jia et al., 2014) High
Common carp (Cyprinus
carpio)
Fresh 72-hour LOAEL = 0.5 mL/kg
body weight (30%
v/v solution)
0, 0.5 mL/kg body
weight
(30% v/v solution)
Intraperitoneal,
Nominal, Solvent:
Arachis oil
Glutamic-
oxaloacetic
transaminase
activity
(Jia et al., 2014) High
Common carp (Cyprinus
carpio)
Fresh 72-hour LOAEL = 0.5 mL/kg
body weight (30%
v/v solution)
0, 0.5 mL/kg body
weight
(30% v/v solution)
Intraperitoneal,
Nominal, Solvent:
Arachis oil
Glutamic pyruvic
transaminase
activity
(Jia et al., 2014) High
Common carp (Cyprinus
carpio)
Fresh 72-hour LOAEL = 0.5 mL/kg
body weight (30%
v/v solution)
0, 0.5 mL/kg body
weight
(30% v/v solution)
Intraperitoneal,
Nominal, Solvent:
Arachis oil
Liver histopathology (Jia et al., 2014) High
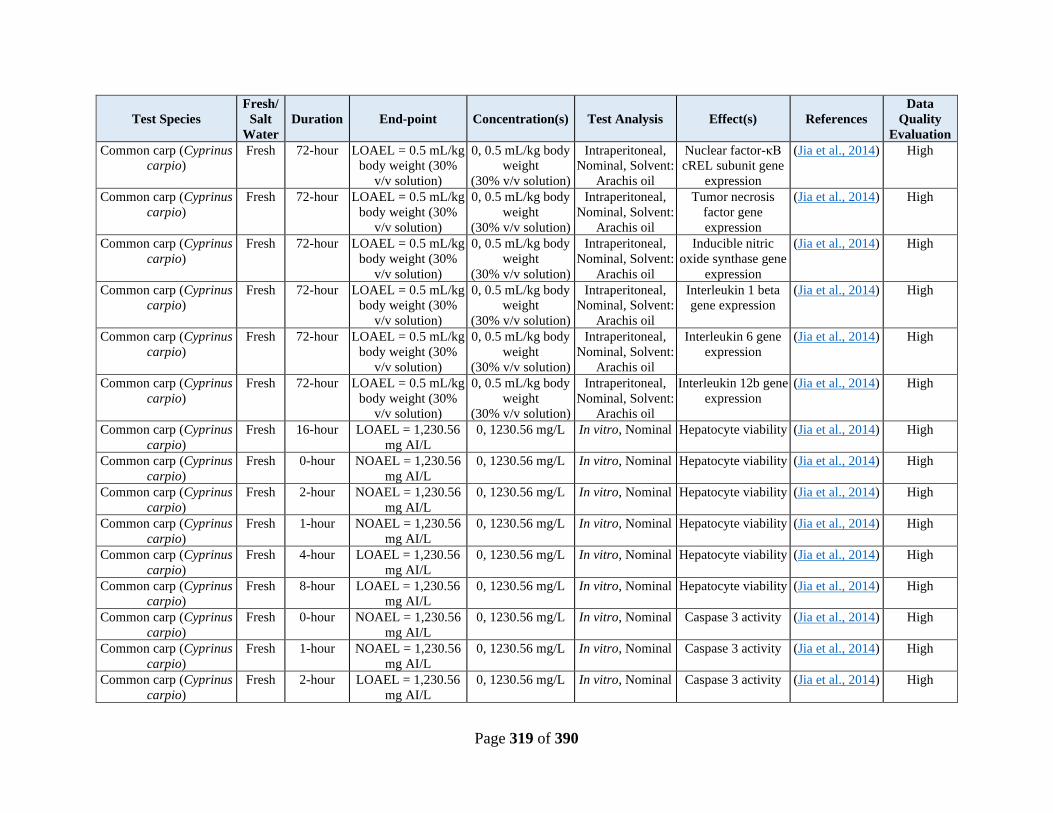
Page 319 of 390
Test Species
Fresh/
Salt
Water
Duration End-point Concentration(s) Test Analysis Effect(s) References
Data
Quality
Evaluation
Common carp (Cyprinus
carpio)
Fresh 72-hour LOAEL = 0.5 mL/kg
body weight (30%
v/v solution)
0, 0.5 mL/kg body
weight
(30% v/v solution)
Intraperitoneal,
Nominal, Solvent:
Arachis oil
Nuclear factor-κB
cREL subunit gene
expression
(Jia et al., 2014) High
Common carp (Cyprinus
carpio)
Fresh 72-hour LOAEL = 0.5 mL/kg
body weight (30%
v/v solution)
0, 0.5 mL/kg body
weight
(30% v/v solution)
Intraperitoneal,
Nominal, Solvent:
Arachis oil
Tumor necrosis
factor gene
expression
(Jia et al., 2014) High
Common carp (Cyprinus
carpio)
Fresh 72-hour LOAEL = 0.5 mL/kg
body weight (30%
v/v solution)
0, 0.5 mL/kg body
weight
(30% v/v solution)
Intraperitoneal,
Nominal, Solvent:
Arachis oil
Inducible nitric
oxide synthase gene
expression
(Jia et al., 2014) High
Common carp (Cyprinus
carpio)
Fresh 72-hour LOAEL = 0.5 mL/kg
body weight (30%
v/v solution)
0, 0.5 mL/kg body
weight
(30% v/v solution)
Intraperitoneal,
Nominal, Solvent:
Arachis oil
Interleukin 1 beta
gene expression
(Jia et al., 2014) High
Common carp (Cyprinus
carpio)
Fresh 72-hour LOAEL = 0.5 mL/kg
body weight (30%
v/v solution)
0, 0.5 mL/kg body
weight
(30% v/v solution)
Intraperitoneal,
Nominal, Solvent:
Arachis oil
Interleukin 6 gene
expression
(Jia et al., 2014) High
Common carp (Cyprinus
carpio)
Fresh 72-hour LOAEL = 0.5 mL/kg
body weight (30%
v/v solution)
0, 0.5 mL/kg body
weight
(30% v/v solution)
Intraperitoneal,
Nominal, Solvent:
Arachis oil
Interleukin 12b gene
expression
(Jia et al., 2014) High
Common carp (Cyprinus
carpio)
Fresh 16-hour LOAEL = 1,230.56
mg AI/L
0, 1230.56 mg/L In vitro, Nominal Hepatocyte viability (Jia et al., 2014) High
Common carp (Cyprinus
carpio)
Fresh 0-hour NOAEL = 1,230.56
mg AI/L
0, 1230.56 mg/L In vitro, Nominal Hepatocyte viability (Jia et al., 2014) High
Common carp (Cyprinus
carpio)
Fresh 2-hour NOAEL = 1,230.56
mg AI/L
0, 1230.56 mg/L In vitro, Nominal Hepatocyte viability (Jia et al., 2014) High
Common carp (Cyprinus
carpio)
Fresh 1-hour NOAEL = 1,230.56
mg AI/L
0, 1230.56 mg/L In vitro, Nominal Hepatocyte viability (Jia et al., 2014) High
Common carp (Cyprinus
carpio)
Fresh 4-hour LOAEL = 1,230.56
mg AI/L
0, 1230.56 mg/L In vitro, Nominal Hepatocyte viability (Jia et al., 2014) High
Common carp (Cyprinus
carpio)
Fresh 8-hour LOAEL = 1,230.56
mg AI/L
0, 1230.56 mg/L In vitro, Nominal Hepatocyte viability (Jia et al., 2014) High
Common carp (Cyprinus
carpio)
Fresh 0-hour NOAEL = 1,230.56
mg AI/L
0, 1230.56 mg/L In vitro, Nominal Caspase 3 activity (Jia et al., 2014) High
Common carp (Cyprinus
carpio)
Fresh 1-hour NOAEL = 1,230.56
mg AI/L
0, 1230.56 mg/L In vitro, Nominal Caspase 3 activity (Jia et al., 2014) High
Common carp (Cyprinus
carpio)
Fresh 2-hour LOAEL = 1,230.56
mg AI/L
0, 1230.56 mg/L In vitro, Nominal Caspase 3 activity (Jia et al., 2014) High

Page 320 of 390
Test Species
Fresh/
Salt
Water
Duration End-point Concentration(s) Test Analysis Effect(s) References
Data
Quality
Evaluation
Common carp (Cyprinus
carpio)
Fresh 8-hour NOAEL = 1,230.56
mg AI/L
0, 1230.56 mg/L In vitro, Nominal Caspase 3 activity (Jia et al., 2014) High
Common carp (Cyprinus
carpio)
Fresh 4-hour LOAEL = 1,230.56
mg AI/L
0, 1230.56 mg/L In vitro, Nominal Caspase 3 activity (Jia et al., 2014) High
Common carp (Cyprinus
carpio)
Fresh 16-hour NOAEL = 1,230.56
mg AI/L
0, 1230.56 mg/L In vitro, Nominal Caspase 3 activity (Jia et al., 2014) High
Common carp (Cyprinus
carpio)
Fresh 0-hour NOAEL = 1,230.56
mg AI/L
0, 1230.56 mg/L In vitro, Nominal Caspase 8 activity (Jia et al., 2014) High
Common carp (Cyprinus
carpio)
Fresh 1-hour NOAEL = 1,230.56
mg AI/L
0, 1230.56 mg/L In vitro, Nominal Caspase 8 activity (Jia et al., 2014) High
Common carp (Cyprinus
carpio)
Fresh 2-hour LOAEL = 1,230.56
mg AI/L
0, 1230.56 mg/L In vitro, Nominal Caspase 8 activity (Jia et al., 2014) High
Common carp (Cyprinus
carpio)
Fresh 4-hour LOAEL = 1,230.56
mg AI/L
0, 1230.56 mg/L In vitro, Nominal Caspase 8 activity (Jia et al., 2014) High
Common carp (Cyprinus
carpio)
Fresh 8-hour LOAEL = 1,230.56
mg AI/L
0, 1230.56 mg/L In vitro, Nominal Caspase 8 activity (Jia et al., 2014) High
Common carp (Cyprinus
carpio)
Fresh 16-hour NOAEL = 1,230.56
mg AI/L
0, 1230.56 mg/L In vitro, Nominal Caspase 8 activity (Jia et al., 2014) High
Common carp (Cyprinus
carpio)
Fresh 0-hour NOAEL = 1,230.56
mg AI/L
0, 1230.56 mg/L In vitro, Nominal Caspase 9 activity (Jia et al., 2014) High
Common carp (Cyprinus
carpio)
Fresh 1-hour NOAEL = 1,230.56
mg AI/L
0, 1230.56 mg/L In vitro, Nominal Caspase 9 activity (Jia et al., 2014) High
Common carp (Cyprinus
carpio)
Fresh 2-hour LOAEL = 1,230.56
mg AI/L
0, 1230.56 mg/L In vitro, Nominal Caspase 9 activity (Jia et al., 2014) High
Common carp (Cyprinus
carpio)
Fresh 4-hour LOAEL = 1,230.56
mg AI/L
0, 1230.56 mg/L In vitro, Nominal Caspase 9 activity (Jia et al., 2014) High
Common carp (Cyprinus
carpio)
Fresh 8-hour LOAEL = 1,230.56
mg AI/L
0, 1230.56 mg/L In vitro, Nominal Caspase 9 activity (Jia et al., 2014) High
Common carp (Cyprinus
carpio)
Fresh 16-hour NOAEL = 1,230.56
mg AI/L
0, 1230.56 mg/L In vitro, Nominal Caspase 9 activity (Jia et al., 2014) High
Common carp (Cyprinus
carpio)
Fresh 4-hour LOAEL = 1,845.84
mg AI/L
0, 1,845.84 mg/L In vitro, Nominal Adenosine
triphosphate in liver
(Liu et al., 2015) High
Common carp (Cyprinus
carpio)
Fresh 4-hour LOAEL = 1,845.84
mg AI/L
0, 1,845.84 mg/L In vitro, Nominal Glutamic pyruvic
transaminase
activity
(Liu et al., 2015) High

Page 321 of 390
Test Species
Fresh/
Salt
Water
Duration End-point Concentration(s) Test Analysis Effect(s) References
Data
Quality
Evaluation
Common carp (Cyprinus
carpio)
Fresh 4-hour LOAEL = 1,845.84
mg AI/L
0, 1,845.84 mg/L In vitro, Nominal Glutamic-
oxaloacetic
transaminase
activity
(Liu et al., 2015) High
Common carp (Cyprinus
carpio)
Fresh 4-hour LOAEL = 1,845.84
mg AI/L
0, 1,845.84 mg/L In vitro, Nominal Alkaline
phosphatase activity
(Liu et al., 2015) High
Common carp (Cyprinus
carpio)
Fresh 4-hour LOAEL = 1,845.84
mg AI/L
0, 1,845.84 mg/L In vitro, Nominal Lactate
dehydrogenase
activity
(Liu et al., 2015) High
Common carp (Cyprinus
carpio)
Fresh 4-hour LOAEL = 1,845.84
mg AI/L
0, 1,845.84 mg/L In vitro, Nominal Malondialdehyde
content in liver
(Liu et al., 2015) High
Common carp (Cyprinus
carpio)
Fresh 4-hour LOAEL = 1,845.84
mg AI/L
0, 1,845.84 mg/L In vitro, Nominal Superoxide
dismutase activity
(Liu et al., 2015) High
Common carp (Cyprinus
carpio)
Fresh 4-hour LOAEL = 1,845.84
mg AI/L
0, 1,845.84 mg/L In vitro, Nominal Glutathione
peroxidase activity
(Liu et al., 2015) High
Common carp (Cyprinus
carpio)
Fresh 4-hour LOAEL = 1,845.84
mg AI/L
0, 1,845.84 mg/L In vitro, Nominal Glutathione S-
transferase activity
(Liu et al., 2015) High
Common carp (Cyprinus
carpio)
Fresh 4-hour LOAEL = 1,845.84
mg AI/L
0, 1,845.84 mg/L In vitro, Nominal Catalase activity (Liu et al., 2015) High
Common carp (Cyprinus
carpio)
Fresh 4-hour LOAEL = 1,845.84
mg AI/L
0, 1,845.84 mg/L In vitro, Nominal Concentration of
reduced glutathione
in liver
(Liu et al., 2015) High
Common carp (Cyprinus
carpio)
Fresh 4-hour LOAEL = 1,845.84
mg AI/L
0, 1,845.84 mg/L In vitro, Nominal Total antioxidant
capacity
(Liu et al., 2015) High
Common carp (Cyprinus
carpio)
Fresh 72-hour LOAEL = 5 mL/kg
body weight
(30% v/v solution)
0, 5 mL/kg body
weight
(30% v/v solution)
Intraperitoneal,
Nominal, Solvent:
Olive oil
Catalase activity (Liu et al., 2015) High
Common carp (Cyprinus
carpio)
Fresh 72-hour LOAEL = 5 mL/kg
body weight
(30% v/v solution)
0, 5 mL/kg body
weight
(30% v/v solution)
Intraperitoneal,
Nominal, Solvent:
Olive oil
Total antioxidant
capacity
(Liu et al., 2015) High
Common carp (Cyprinus
carpio)
Fresh 72-hour LOAEL = 5 mL/kg
body weight
(30% v/v solution)
0, 5 mL/kg body
weight
(30% v/v solution)
Intraperitoneal,
Nominal, Solvent:
Olive oil
Superoxide
dismutase activity
(Liu et al., 2015) High
Common carp (Cyprinus
carpio)
Fresh 72-hour LOAEL = 5 mL/kg
body weight
(30% v/v solution)
0, 5 mL/kg body
weight
(30% v/v solution)
Intraperitoneal,
Nominal, Solvent:
Olive oil
Malondialdehyde
content in liver
(Liu et al., 2015) High
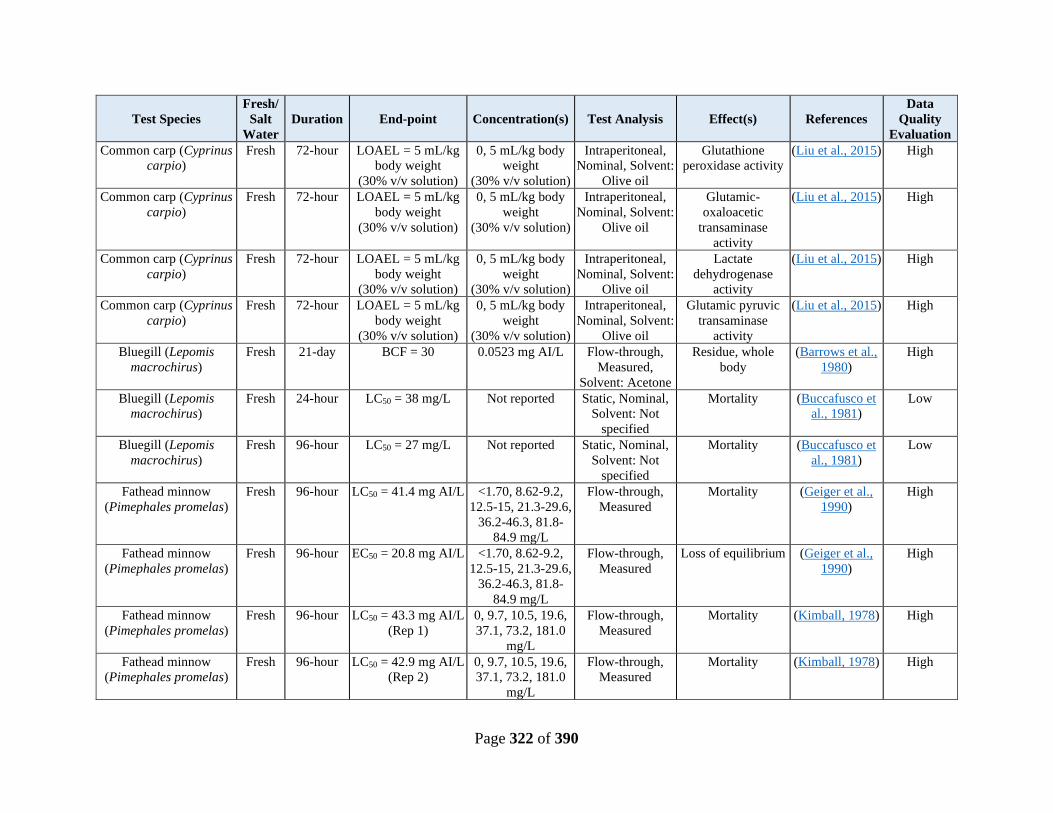
Page 322 of 390
Test Species
Fresh/
Salt
Water
Duration End-point Concentration(s) Test Analysis Effect(s) References
Data
Quality
Evaluation
Common carp (Cyprinus
carpio)
Fresh 72-hour LOAEL = 5 mL/kg
body weight
(30% v/v solution)
0, 5 mL/kg body
weight
(30% v/v solution)
Intraperitoneal,
Nominal, Solvent:
Olive oil
Glutathione
peroxidase activity
(Liu et al., 2015) High
Common carp (Cyprinus
carpio)
Fresh 72-hour LOAEL = 5 mL/kg
body weight
(30% v/v solution)
0, 5 mL/kg body
weight
(30% v/v solution)
Intraperitoneal,
Nominal, Solvent:
Olive oil
Glutamic-
oxaloacetic
transaminase
activity
(Liu et al., 2015) High
Common carp (Cyprinus
carpio)
Fresh 72-hour LOAEL = 5 mL/kg
body weight
(30% v/v solution)
0, 5 mL/kg body
weight
(30% v/v solution)
Intraperitoneal,
Nominal, Solvent:
Olive oil
Lactate
dehydrogenase
activity
(Liu et al., 2015) High
Common carp (Cyprinus
carpio)
Fresh 72-hour LOAEL = 5 mL/kg
body weight
(30% v/v solution)
0, 5 mL/kg body
weight
(30% v/v solution)
Intraperitoneal,
Nominal, Solvent:
Olive oil
Glutamic pyruvic
transaminase
activity
(Liu et al., 2015) High
Bluegill (Lepomis
macrochirus)
Fresh 21-day BCF = 30 0.0523 mg AI/L Flow-through,
Measured,
Solvent: Acetone
Residue, whole
body
(Barrows et al.,
1980)
High
Bluegill (Lepomis
macrochirus)
Fresh 24-hour LC50 = 38 mg/L Not reported Static, Nominal,
Solvent: Not
specified
Mortality (Buccafusco et
al., 1981)
Low
Bluegill (Lepomis
macrochirus)
Fresh 96-hour LC50 = 27 mg/L Not reported Static, Nominal,
Solvent: Not
specified
Mortality (Buccafusco et
al., 1981)
Low
Fathead minnow
(Pimephales promelas)
Fresh 96-hour LC50 = 41.4 mg AI/L <1.70, 8.62-9.2,
12.5-15, 21.3-29.6,
36.2-46.3, 81.8-
84.9 mg/L
Flow-through,
Measured
Mortality (Geiger et al.,
1990)
High
Fathead minnow
(Pimephales promelas)
Fresh 96-hour EC50 = 20.8 mg AI/L <1.70, 8.62-9.2,
12.5-15, 21.3-29.6,
36.2-46.3, 81.8-
84.9 mg/L
Flow-through,
Measured
Loss of equilibrium (Geiger et al.,
1990)
High
Fathead minnow
(Pimephales promelas)
Fresh 96-hour LC50 = 43.3 mg AI/L
(Rep 1)
0, 9.7, 10.5, 19.6,
37.1, 73.2, 181.0
mg/L
Flow-through,
Measured
Mortality (Kimball, 1978) High
Fathead minnow
(Pimephales promelas)
Fresh 96-hour LC50 = 42.9 mg AI/L
(Rep 2)
0, 9.7, 10.5, 19.6,
37.1, 73.2, 181.0
mg/L
Flow-through,
Measured
Mortality (Kimball, 1978) High

Page 323 of 390
Test Species
Fresh/
Salt
Water
Duration End-point Concentration(s) Test Analysis Effect(s) References
Data
Quality
Evaluation
Fathead minnow
(Pimephales promelas)
Fresh >7 days NOAEL = 37.1 mg
AI/L
0, 9.7, 10.5, 19.6,
37.1, 73.2, 181.0
mg/L
Flow-through,
Measured
Mortality (Kimball, 1978) High
Fathead minnow
(Pimephales promelas)
Fresh >7 days LOAEL = 73.2 mg
AI/L
0, 9.7, 10.5, 19.6,
37.1, 73.2, 181.0
mg/L
Flow-through,
Measured
Mortality (Kimball, 1978) High
Fathead minnow
(Pimephales promelas)
Fresh >7 days MATC = 52.1 mg
AI/L
0, 9.7, 10.5, 19.6,
37.1, 73.2, 181.0
mg/L
Flow-through,
Measured
Mortality (Kimball, 1978) High
Fathead minnow
(Pimephales promelas)
Fresh >7 days LC100 = 73.2 mg
AI/L
0, 9.7, 10.5, 19.6,
37.1, 73.2, 181.0
mg/L
Flow-through,
Measured
Mortality (Kimball, 1978) High
Fathead minnow
(Pimephales promelas)
Fresh 96-hour LC50 = 10.4 mg AI/L Not reported Static, Measured Mortality (Brooke, 1987) High
Fathead minnow
(Pimephales promelas)
Fresh 96-hour LC50 = 41.4 mg AI/L Not reported Flow-through,
Measured
Mortality (Brooke, 1987) High
Fathead minnow
(Pimephales promelas)
Fresh 5-day LC100 = 62.8 mg
AI/L
0, 0.015, 0.065,
0.72, 9.32, 24.2,
45.0, 62.8 mg/L
Flow-through,
Measured
Mortality (Black et al.,
1982)
High
Fathead minnow
(Pimephales promelas)
Fresh 9-day LC100 = 62.8 mg
AI/L
0, 0.015, 0.065,
0.72, 9.32, 24.2,
45.0, 62.8 mg/L
Flow-through,
Measured
Mortality (Black et al.,
1982)
High
Fathead minnow
(Pimephales promelas)
Fresh 5-day LC50 = 16.25 mg
AI/L
0, 0.015, 0.065,
0.72, 9.32, 24.2,
45.0, 62.8 mg/L
Flow-through,
Measured
Mortality (Black et al.,
1982)
High
Fathead minnow
(Pimephales promelas)
Fresh 9-day LC50 = 4 mg AI/L 0, 0.015, 0.065,
0.72, 9.32, 24.2,
45.0, 62.8 mg/L
Flow-through,
Measured
Mortality (Black et al.,
1982)
High
Japanese medaka
(Oryzias latipes)
Fresh 10-day LC50 = 96 mg AI/L 0, 58, 70, 84, 101,
121, 145 mg/L
Renewal, Nominal Mortality (Schell, 1987) High
Japanese medaka
(Oryzias latipes)
Fresh 10-day LC100 = 145 mg AI/L 0, 58, 70, 84, 101,
121, 145 mg/L
Renewal, Nominal Mortality (Schell, 1987) High
Japanese medaka
(Oryzias latipes)
Fresh 10-day NOEC = 70 mg
AI/L; LOEC = 84 mg
AI/L
0, 58, 70, 84, 101,
121, 145 mg/L
Renewal, Nominal Mortality (Schell, 1987) High
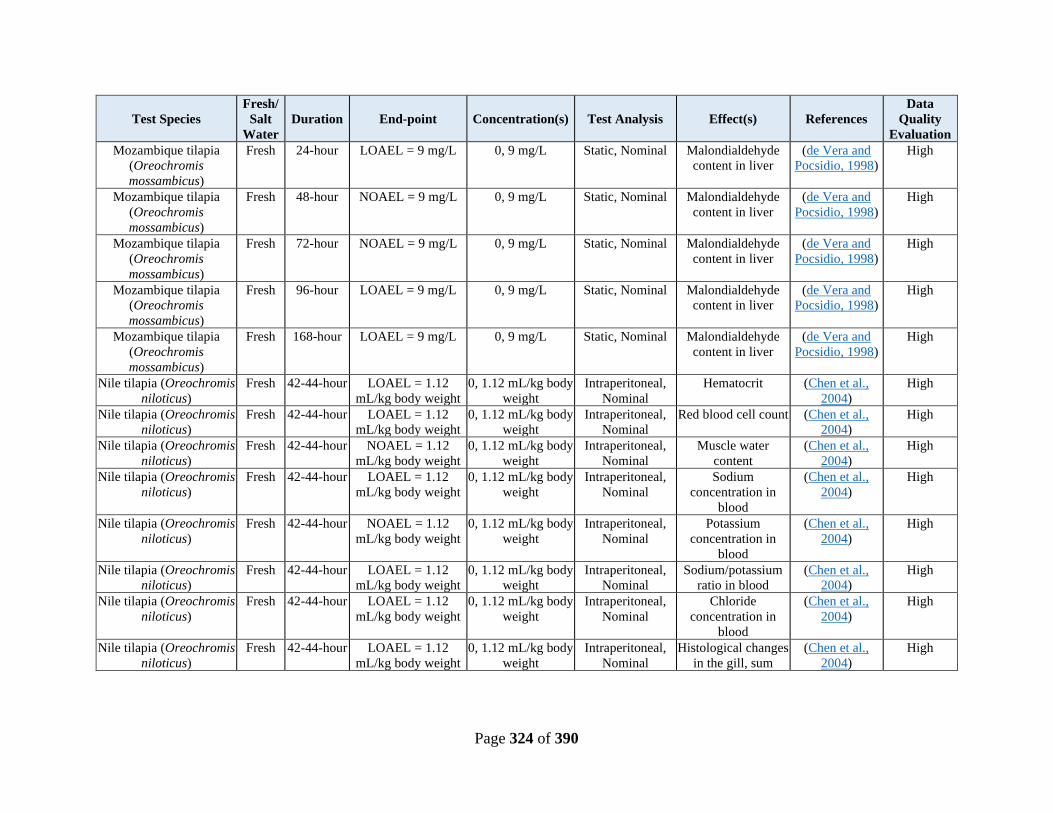
Page 324 of 390
Test Species
Fresh/
Salt
Water
Duration End-point Concentration(s) Test Analysis Effect(s) References
Data
Quality
Evaluation
Mozambique tilapia
(Oreochromis
mossambicus)
Fresh 24-hour LOAEL = 9 mg/L 0, 9 mg/L Static, Nominal Malondialdehyde
content in liver
(de Vera and
Pocsidio, 1998)
High
Mozambique tilapia
(Oreochromis
mossambicus)
Fresh 48-hour NOAEL = 9 mg/L 0, 9 mg/L Static, Nominal Malondialdehyde
content in liver
(de Vera and
Pocsidio, 1998)
High
Mozambique tilapia
(Oreochromis
mossambicus)
Fresh 72-hour NOAEL = 9 mg/L 0, 9 mg/L Static, Nominal Malondialdehyde
content in liver
(de Vera and
Pocsidio, 1998)
High
Mozambique tilapia
(Oreochromis
mossambicus)
Fresh 96-hour LOAEL = 9 mg/L 0, 9 mg/L Static, Nominal Malondialdehyde
content in liver
(de Vera and
Pocsidio, 1998)
High
Mozambique tilapia
(Oreochromis
mossambicus)
Fresh 168-hour LOAEL = 9 mg/L 0, 9 mg/L Static, Nominal Malondialdehyde
content in liver
(de Vera and
Pocsidio, 1998)
High
Nile tilapia (Oreochromis
niloticus)
Fresh 42-44-hour LOAEL = 1.12
mL/kg body weight
0, 1.12 mL/kg body
weight
Intraperitoneal,
Nominal
Hematocrit (Chen et al.,
2004)
High
Nile tilapia (Oreochromis
niloticus)
Fresh 42-44-hour LOAEL = 1.12
mL/kg body weight
0, 1.12 mL/kg body
weight
Intraperitoneal,
Nominal
Red blood cell count (Chen et al.,
2004)
High
Nile tilapia (Oreochromis
niloticus)
Fresh 42-44-hour NOAEL = 1.12
mL/kg body weight
0, 1.12 mL/kg body
weight
Intraperitoneal,
Nominal
Muscle water
content
(Chen et al.,
2004)
High
Nile tilapia (Oreochromis
niloticus)
Fresh 42-44-hour LOAEL = 1.12
mL/kg body weight
0, 1.12 mL/kg body
weight
Intraperitoneal,
Nominal
Sodium
concentration in
blood
(Chen et al.,
2004)
High
Nile tilapia (Oreochromis
niloticus)
Fresh 42-44-hour NOAEL = 1.12
mL/kg body weight
0, 1.12 mL/kg body
weight
Intraperitoneal,
Nominal
Potassium
concentration in
blood
(Chen et al.,
2004)
High
Nile tilapia (Oreochromis
niloticus)
Fresh 42-44-hour LOAEL = 1.12
mL/kg body weight
0, 1.12 mL/kg body
weight
Intraperitoneal,
Nominal
Sodium/potassium
ratio in blood
(Chen et al.,
2004)
High
Nile tilapia (Oreochromis
niloticus)
Fresh 42-44-hour LOAEL = 1.12
mL/kg body weight
0, 1.12 mL/kg body
weight
Intraperitoneal,
Nominal
Chloride
concentration in
blood
(Chen et al.,
2004)
High
Nile tilapia (Oreochromis
niloticus)
Fresh 42-44-hour LOAEL = 1.12
mL/kg body weight
0, 1.12 mL/kg body
weight
Intraperitoneal,
Nominal
Histological changes
in the gill, sum
(Chen et al.,
2004)
High
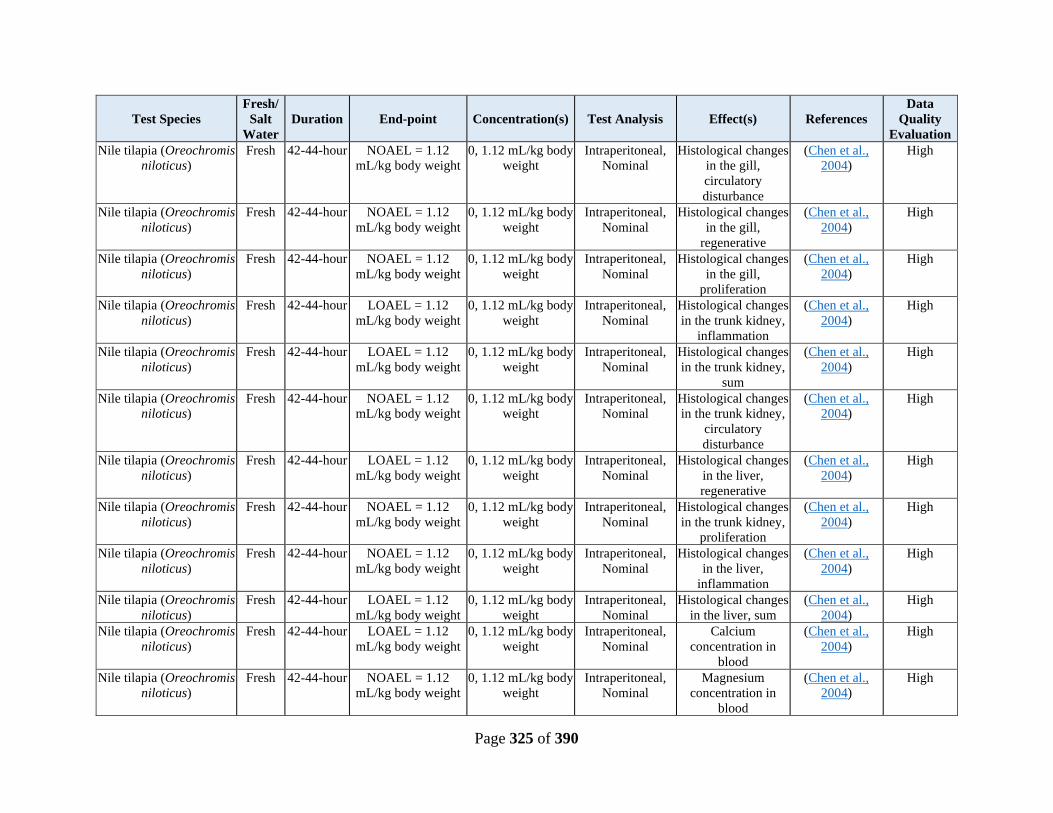
Page 325 of 390
Test Species
Fresh/
Salt
Water
Duration End-point Concentration(s) Test Analysis Effect(s) References
Data
Quality
Evaluation
Nile tilapia (Oreochromis
niloticus)
Fresh 42-44-hour NOAEL = 1.12
mL/kg body weight
0, 1.12 mL/kg body
weight
Intraperitoneal,
Nominal
Histological changes
in the gill,
circulatory
disturbance
(Chen et al.,
2004)
High
Nile tilapia (Oreochromis
niloticus)
Fresh 42-44-hour NOAEL = 1.12
mL/kg body weight
0, 1.12 mL/kg body
weight
Intraperitoneal,
Nominal
Histological changes
in the gill,
regenerative
(Chen et al.,
2004)
High
Nile tilapia (Oreochromis
niloticus)
Fresh 42-44-hour NOAEL = 1.12
mL/kg body weight
0, 1.12 mL/kg body
weight
Intraperitoneal,
Nominal
Histological changes
in the gill,
proliferation
(Chen et al.,
2004)
High
Nile tilapia (Oreochromis
niloticus)
Fresh 42-44-hour LOAEL = 1.12
mL/kg body weight
0, 1.12 mL/kg body
weight
Intraperitoneal,
Nominal
Histological changes
in the trunk kidney,
inflammation
(Chen et al.,
2004)
High
Nile tilapia (Oreochromis
niloticus)
Fresh 42-44-hour LOAEL = 1.12
mL/kg body weight
0, 1.12 mL/kg body
weight
Intraperitoneal,
Nominal
Histological changes
in the trunk kidney,
sum
(Chen et al.,
2004)
High
Nile tilapia (Oreochromis
niloticus)
Fresh 42-44-hour NOAEL = 1.12
mL/kg body weight
0, 1.12 mL/kg body
weight
Intraperitoneal,
Nominal
Histological changes
in the trunk kidney,
circulatory
disturbance
(Chen et al.,
2004)
High
Nile tilapia (Oreochromis
niloticus)
Fresh 42-44-hour LOAEL = 1.12
mL/kg body weight
0, 1.12 mL/kg body
weight
Intraperitoneal,
Nominal
Histological changes
in the liver,
regenerative
(Chen et al.,
2004)
High
Nile tilapia (Oreochromis
niloticus)
Fresh 42-44-hour NOAEL = 1.12
mL/kg body weight
0, 1.12 mL/kg body
weight
Intraperitoneal,
Nominal
Histological changes
in the trunk kidney,
proliferation
(Chen et al.,
2004)
High
Nile tilapia (Oreochromis
niloticus)
Fresh 42-44-hour NOAEL = 1.12
mL/kg body weight
0, 1.12 mL/kg body
weight
Intraperitoneal,
Nominal
Histological changes
in the liver,
inflammation
(Chen et al.,
2004)
High
Nile tilapia (Oreochromis
niloticus)
Fresh 42-44-hour LOAEL = 1.12
mL/kg body weight
0, 1.12 mL/kg body
weight
Intraperitoneal,
Nominal
Histological changes
in the liver, sum
(Chen et al.,
2004)
High
Nile tilapia (Oreochromis
niloticus)
Fresh 42-44-hour LOAEL = 1.12
mL/kg body weight
0, 1.12 mL/kg body
weight
Intraperitoneal,
Nominal
Calcium
concentration in
blood
(Chen et al.,
2004)
High
Nile tilapia (Oreochromis
niloticus)
Fresh 42-44-hour NOAEL = 1.12
mL/kg body weight
0, 1.12 mL/kg body
weight
Intraperitoneal,
Nominal
Magnesium
concentration in
blood
(Chen et al.,
2004)
High

Page 326 of 390
Test Species
Fresh/
Salt
Water
Duration End-point Concentration(s) Test Analysis Effect(s) References
Data
Quality
Evaluation
Nile tilapia (Oreochromis
niloticus)
Fresh 42-44-hour NOAEL = 1.12
mL/kg body weight
0, 1.12 mL/kg body
weight
Intraperitoneal,
Nominal
Bicarbonate
concentration in
blood
(Chen et al.,
2004)
High
Nile tilapia (Oreochromis
niloticus)
Fresh 42-44-hour LOAEL = 1.12
mL/kg body weight
0, 1.12 mL/kg body
weight
Intraperitoneal,
Nominal
Phosphate
concentration in
blood
(Chen et al.,
2004)
High
Nile tilapia (Oreochromis
niloticus)
Fresh 42-44-hour LOAEL = 1.12
mL/kg body weight
0, 1.12 mL/kg body
weight
Intraperitoneal,
Nominal
Iron concentration in
blood
(Chen et al.,
2004)
High
Nile tilapia (Oreochromis
niloticus)
Fresh 42-44-hour NOAEL = 1.12
mL/kg body weight
0, 1.12 mL/kg body
weight
Intraperitoneal,
Nominal
Total iron binding
capacity
(Chen et al.,
2004)
High
Nile tilapia (Oreochromis
niloticus)
Fresh 42-44-hour NOAEL = 1.12
mL/kg body weight
0, 1.12 mL/kg body
weight
Intraperitoneal,
Nominal
Percent saturation of
iron binding
(Chen et al.,
2004)
High
Nile tilapia (Oreochromis
niloticus)
Fresh 42-44-hour NOAEL = 1.12
mL/kg body weight
0, 1.12 mL/kg body
weight
Intraperitoneal,
Nominal
Anion gap (Chen et al.,
2004)
High
Nile tilapia (Oreochromis
niloticus)
Fresh 42-44-hour NOAEL = 1.12
mL/kg body weight
0, 1.12 mL/kg body
weight
Intraperitoneal,
Nominal
Total protein (Chen et al.,
2004)
High
Nile tilapia (Oreochromis
niloticus)
Fresh 42-44-hour NOAEL = 1.12
mL/kg body weight
0, 1.12 mL/kg body
weight
Intraperitoneal,
Nominal
Glucose (Chen et al.,
2004)
High
Nile tilapia (Oreochromis
niloticus)
Fresh 42-44-hour NOAEL = 1.12
mL/kg body weight
0, 1.12 mL/kg body
weight
Intraperitoneal,
Nominal
Cholesterol (Chen et al.,
2004)
High
Nile tilapia (Oreochromis
niloticus)
Fresh 42-44-hour NOAEL = 1.12
mL/kg body weight
0, 1.12 mL/kg body
weight
Intraperitoneal,
Nominal
Bilirubin (Chen et al.,
2004)
High
Nile tilapia (Oreochromis
niloticus)
Fresh 42-44-hour NOAEL = 1.12
mL/kg body weight
0, 1.12 mL/kg body
weight
Intraperitoneal,
Nominal
Alanine
transaminase
activity
(Chen et al.,
2004)
High
Nile tilapia (Oreochromis
niloticus)
Fresh 42-44-hour NOAEL = 1.12
mL/kg body weight
0, 1.12 mL/kg body
weight
Intraperitoneal,
Nominal
Aspartate
aminotransferase
activity
(Chen et al.,
2004)
High
Nile tilapia (Oreochromis
niloticus)
Fresh 42-44-hour NOAEL = 1.12
mL/kg body weight
0, 1.12 mL/kg body
weight
Intraperitoneal,
Nominal
Alkaline
phosphatase activity
(Chen et al.,
2004)
High
Nile tilapia (Oreochromis
niloticus)
Fresh 42-44-hour NOAEL = 1.12
mL/kg body weight
0, 1.12 mL/kg body
weight
Intraperitoneal,
Nominal
Creatine kinase
activity
(Chen et al.,
2004)
High
Nile tilapia (Oreochromis
niloticus)
Fresh 42-44-hour NOAEL = 1.12
mL/kg body weight
0, 1.12 mL/kg body
weight
Intraperitoneal,
Nominal
Histological changes
in the liver,
circulatory
disturbance
(Chen et al.,
2004)
High
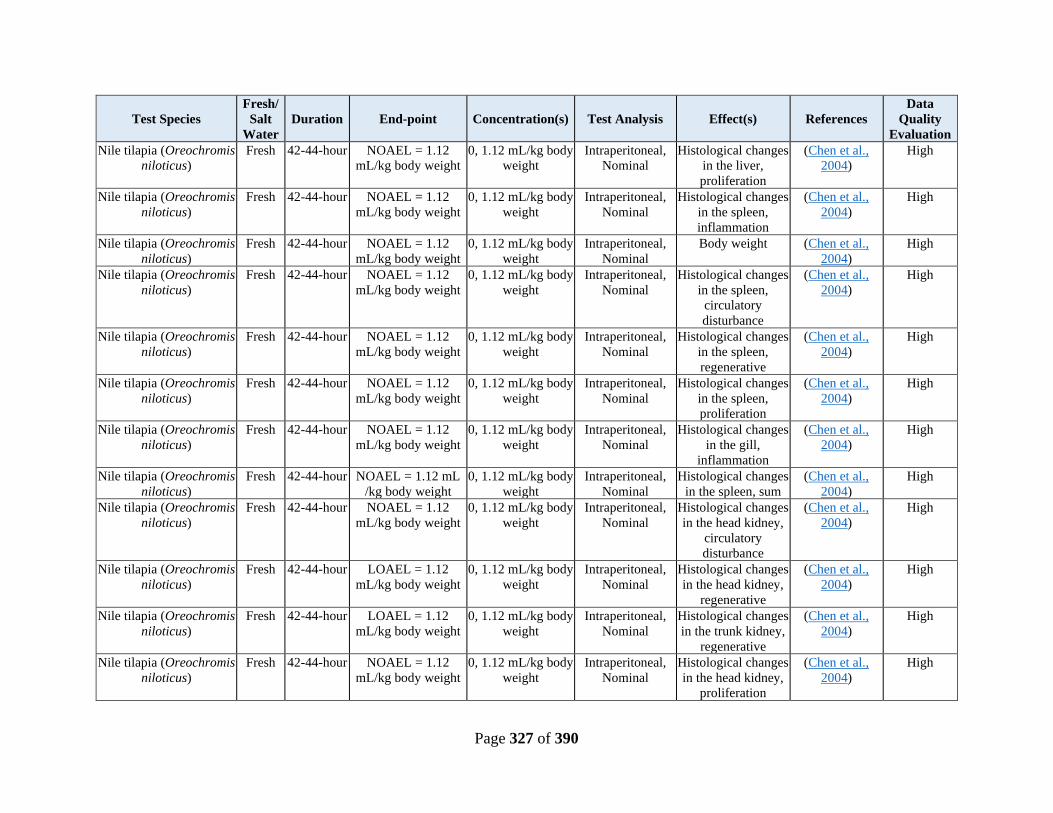
Page 327 of 390
Test Species
Fresh/
Salt
Water
Duration End-point Concentration(s) Test Analysis Effect(s) References
Data
Quality
Evaluation
Nile tilapia (Oreochromis
niloticus)
Fresh 42-44-hour NOAEL = 1.12
mL/kg body weight
0, 1.12 mL/kg body
weight
Intraperitoneal,
Nominal
Histological changes
in the liver,
proliferation
(Chen et al.,
2004)
High
Nile tilapia (Oreochromis
niloticus)
Fresh 42-44-hour NOAEL = 1.12
mL/kg body weight
0, 1.12 mL/kg body
weight
Intraperitoneal,
Nominal
Histological changes
in the spleen,
inflammation
(Chen et al.,
2004)
High
Nile tilapia (Oreochromis
niloticus)
Fresh 42-44-hour NOAEL = 1.12
mL/kg body weight
0, 1.12 mL/kg body
weight
Intraperitoneal,
Nominal
Body weight (Chen et al.,
2004)
High
Nile tilapia (Oreochromis
niloticus)
Fresh 42-44-hour NOAEL = 1.12
mL/kg body weight
0, 1.12 mL/kg body
weight
Intraperitoneal,
Nominal
Histological changes
in the spleen,
circulatory
disturbance
(Chen et al.,
2004)
High
Nile tilapia (Oreochromis
niloticus)
Fresh 42-44-hour NOAEL = 1.12
mL/kg body weight
0, 1.12 mL/kg body
weight
Intraperitoneal,
Nominal
Histological changes
in the spleen,
regenerative
(Chen et al.,
2004)
High
Nile tilapia (Oreochromis
niloticus)
Fresh 42-44-hour NOAEL = 1.12
mL/kg body weight
0, 1.12 mL/kg body
weight
Intraperitoneal,
Nominal
Histological changes
in the spleen,
proliferation
(Chen et al.,
2004)
High
Nile tilapia (Oreochromis
niloticus)
Fresh 42-44-hour NOAEL = 1.12
mL/kg body weight
0, 1.12 mL/kg body
weight
Intraperitoneal,
Nominal
Histological changes
in the gill,
inflammation
(Chen et al.,
2004)
High
Nile tilapia (Oreochromis
niloticus)
Fresh 42-44-hour NOAEL = 1.12 mL
/kg body weight
0, 1.12 mL/kg body
weight
Intraperitoneal,
Nominal
Histological changes
in the spleen, sum
(Chen et al.,
2004)
High
Nile tilapia (Oreochromis
niloticus)
Fresh 42-44-hour NOAEL = 1.12
mL/kg body weight
0, 1.12 mL/kg body
weight
Intraperitoneal,
Nominal
Histological changes
in the head kidney,
circulatory
disturbance
(Chen et al.,
2004)
High
Nile tilapia (Oreochromis
niloticus)
Fresh 42-44-hour LOAEL = 1.12
mL/kg body weight
0, 1.12 mL/kg body
weight
Intraperitoneal,
Nominal
Histological changes
in the head kidney,
regenerative
(Chen et al.,
2004)
High
Nile tilapia (Oreochromis
niloticus)
Fresh 42-44-hour LOAEL = 1.12
mL/kg body weight
0, 1.12 mL/kg body
weight
Intraperitoneal,
Nominal
Histological changes
in the trunk kidney,
regenerative
(Chen et al.,
2004)
High
Nile tilapia (Oreochromis
niloticus)
Fresh 42-44-hour NOAEL = 1.12
mL/kg body weight
0, 1.12 mL/kg body
weight
Intraperitoneal,
Nominal
Histological changes
in the head kidney,
proliferation
(Chen et al.,
2004)
High

Page 328 of 390
Test Species
Fresh/
Salt
Water
Duration End-point Concentration(s) Test Analysis Effect(s) References
Data
Quality
Evaluation
Nile tilapia (Oreochromis
niloticus)
Fresh 42-44-hour NOAEL = 1.12
mL/kg body weight
0, 1.12 mL/kg body
weight
Intraperitoneal,
Nominal
Histological changes
in the head kidney,
inflammation
(Chen et al.,
2004)
High
Nile tilapia (Oreochromis
niloticus)
Fresh 42-44-hour LOAEL = 1.12
mL/kg body weight
0, 1.12 mL/kg body
weight
Intraperitoneal,
Nominal
Histological changes
in the head kidney,
sum
(Chen et al.,
2004)
High
Nile tilapia (Oreochromis
niloticus)
Fresh 42-44-hour NOAEL = 1.12
mL/kg body weight
0, 1.12 mL/kg body
weight
Intraperitoneal,
Nominal
Histological changes
in the intestine,
regenerative
(Chen et al.,
2004)
High
Nile tilapia (Oreochromis
niloticus)
Fresh 42-44-hour NOAEL = 1.12
mL/kg body weight
0, 1.12 mL/kg body
weight
Intraperitoneal,
Nominal
Histological changes
in the intestine,
circulatory
disturbance
(Chen et al.,
2004)
High
Nile tilapia (Oreochromis
niloticus)
Fresh 42-44-hour NOAEL = 1.12
mL/kg body weight
0, 1.12 mL/kg body
weight
Intraperitoneal,
Nominal
Histological changes
in the intestine,
proliferation
(Chen et al.,
2004)
High
Nile tilapia (Oreochromis
niloticus)
Fresh 42-44-hour NOAEL = 1.12
mL/kg body weight
0, 1.12 mL/kg body
weight
Intraperitoneal,
Nominal
Histological changes
in the intestine,
inflammation
(Chen et al.,
2004)
High
Nile tilapia (Oreochromis
niloticus)
Fresh 42-44-hour NOAEL = 1.12
mL/kg body weight
0, 1.12 mL/kg body
weight
Intraperitoneal,
Nominal
Histological changes
in the intestine, sum
(Chen et al.,
2004)
High
Tidewater silversides
(Menidia beryllina)
Salt 96-hour LC50 = 150 mg/L 0, 75, 100, 125,
200, 320 mg/L
Static, Nominal,
Solvent: Not
specified
Mortality (Dawson et al.,
1977)
Medium
Bluegill (Lepomis
macrochirus)
Fresh 96-hour LC50 = 125 mg/L 0, 75, 100, 125,
200, 320 mg/L
Static, Nominal,
Solvent: Not
specified
Mortality (Dawson et al.,
1977)
Medium
Fish (species not
reported)
Not
reported
48-hour LC50 = 38 mg AI/L Not reported Static, Measured Mortality (Freitag et al.,
1994)
High
Aquatic Invertebrates
Water flea (Daphnia
magna)
Fresh 24-hour LC50 = 35 mg AI/L Not reported Static, Nominal,
Solvent:
Unknown
Mortality (LeBlanc, 1980) High
Water flea (Daphnia
magna)
Fresh 48-hour LC50 = 35 mg AI/L Not reported Static, Nominal,
Solvent:
Unknown
Mortality (LeBlanc, 1980) High

Page 329 of 390
Test Species
Fresh/
Salt
Water
Duration End-point Concentration(s) Test Analysis Effect(s) References
Data
Quality
Evaluation
Water flea (Daphnia
magna)
Fresh 48-hour NOEC = 7.7 mg
AI/L
Not reported Static, Nominal,
Solvent:
Unknown
Mortality (LeBlanc, 1980) High
Water flea (Daphnia
magna)
Fresh 0.25-hour NOAEL = 37.5 mg
AI/L LOAEL = 75
mg AI/L
0, 2.34375, 4.6875,
9.375, 18.75, 37.5,
75 mg/L
Static, Nominal Phototactic response (Martins et al.,
2007a)
High
Water flea (Daphnia
magna)
Fresh 3.5-hour NOAEL = 37.5 mg
AI/L LOAEL = 75
mg AI/L
0, 2.34375, 4.6875,
9.375, 18.75, 37.5,
75 mg/L
Static, Nominal Phototactic response (Martins et al.,
2007a)
High
Water flea (Daphnia
magna)
Fresh 24-hour LOAEL = 2.3 mg
AI/L
0, 2.34375, 4.6875,
9.375, 18.75, 37.5,
75 mg/L
Static, Nominal Phototactic response (Martins et al.,
2007a)
High
Water flea (Daphnia
magna)
Fresh 48-hour NOAEL = 18.75 mg
AI/L LOAEL = 37.5
mg AI/L
0, 2.34375, 4.6875,
9.375, 18.75, 37.5,
75 mg/L
Static, Nominal Phototactic response (Martins et al.,
2007a)
High
Water flea (Daphnia
magna)
Fresh 3.5-hour LC0 = 75 mg AI/L 0, 75 mg/L Static, Nominal Mortality (Martins et al.,
2007b)
High
Water flea (Daphnia
magna)
Fresh 3.5-hour NOAEL = 75 mg
AI/L
0, 75 mg/L Static, Nominal Oxygen
consumption
(Martins et al.,
2007b)
High
Water flea (Daphnia
magna)
Fresh 15-minute NOAEL = 75 mg
AI/L
0, 75 mg/L Static, Nominal Oxygen
consumption
(Martins et al.,
2007b)
High
Water flea (Daphnia
magna)
Fresh 24-hour EC50 = 20 mg AI/L Not reported Static, Measured Immobilization (Freitag et al.,
1994)
High
Scud
(Gammarus
pseudolimnaeus)
Fresh 96-hour LC50 = 11.1 mg AI/L Not reported Flow-through,
Measured
Mortality (Brooke, 1987) High
Ostracod
(Cypris subglobosa)
Fresh 24-hour EC50 = 301 mg AI/L Not reported Renewal, Nominal Immobilization (Khangarot and
Das, 2009)
High
Ostracod (Cypris
subglobosa)
Fresh 48-hour EC50 = 181 mg AI/L Not reported Renewal, Nominal Immobilization (Khangarot and
Das, 2009)
High
Flatworm (Dugesia
japonica)
Fresh 7-day LC50 = 0.2 mg AI/L Not reported Renewal, Nominal Mortality (Yoshioka et al.,
1986)
Unacceptable
Flatworm (Dugesia
japonica)
Fresh 7-day EC50 = 1.5 mg AI/L Not reported Renewal, Nominal Abnormal
regeneration
(Yoshioka et al.,
1986)
Unacceptable
Ciliate (Tetrahymena
pyriformis)
Fresh 24-hour EC50 = 830 mg AI/L Not reported Static, Nominal,
Solvent: unknown
Population growth
rate
(Yoshioka et al.,
1985)
Unacceptable

Page 330 of 390
Test Species
Fresh/
Salt
Water
Duration End-point Concentration(s) Test Analysis Effect(s) References
Data
Quality
Evaluation
Midge (Chironomus
tentans)
Fresh 24-hour LOAEL = 0.02 mg
AI/L
0, 0.02, 0.2, 2 mg/L Static, Nominal,
Solvent: acetone
Gene expression -
heat shock protein
and hemoglobin
(Lee et al.,
2006)
Low
Midge (Chironomus
tentans)
Fresh 48-hour NOAEL = 2 mg AI/L 0, 0.02, 0.2, 2 mg/L Static, Nominal,
Solvent: acetone
Body fresh weight (Lee et al.,
2006)
Low
Midge (Chironomus
tentans)
Fresh 48-hour NOAEL = 0.2 mg
AI/L LOAEL = 2 mg
AI/L
0, 0.02, 0.2, 2 mg/L Static, Nominal,
Solvent: acetone
Body dry weight (Lee et al.,
2006)
Low
Yellow fever mosquito
(Aedes aegypti)
Fresh 24-hour LC50 = 224 mg AI/L Not reported Static, Nominal Mortality (Richie et al.,
1984)
High
Yellow fever mosquito
(Aedes aegypti)
Fresh 0.5-hour LC50 = 467 mg AI/L Not reported Static, Nominal Mortality (Richie et al.,
1984)
High
Yellow fever mosquito
(Aedes aegypti)
Fresh 1-hour LC50 = 375 mg AI/L Not reported Static, Nominal Mortality (Richie et al.,
1984)
High
Algae
Green algae
(Chlamydomonas
reinhardtii)
Fresh 72-hour EC50 = 0.25 mg AI/L Not reported Static, Measured Biomass (Brack and
Rottler, 1994)
High
Green algae
(Chlamydomonas
reinhardtii)
Fresh 72-hour EC10 = 0.07 mg AI/L Not reported Static, Measured Biomass (Brack and
Rottler, 1994)
High
Green algae
(Pseudokirchneriella
subcapitata)
Fresh 48-hour EC50 = 23.59 mg
AI/L
Not reported Static, Nominal Growth (Tsai and Chen,
2007)
High
Algae
(Desmodesmus
subspicatus)
Fresh 72-hour EC50 = 21 mg/L Not reported Static, Measured Inhibition (Freitag et al.,
1994)
High
Marine bacterium
(Photobacterium
phosphoreum)
Salt 15-minute EC50 = 5 mg/L Not reported Static, Measured Bioluminescence (Freitag et al.,
1994)
Medium
Activated sludge
microorganisms
Fresh 5-day EC50 > 1000 mg/L Not reported Static, Measured O2 consumption (Freitag et al.,
1994)
High
Amphibians
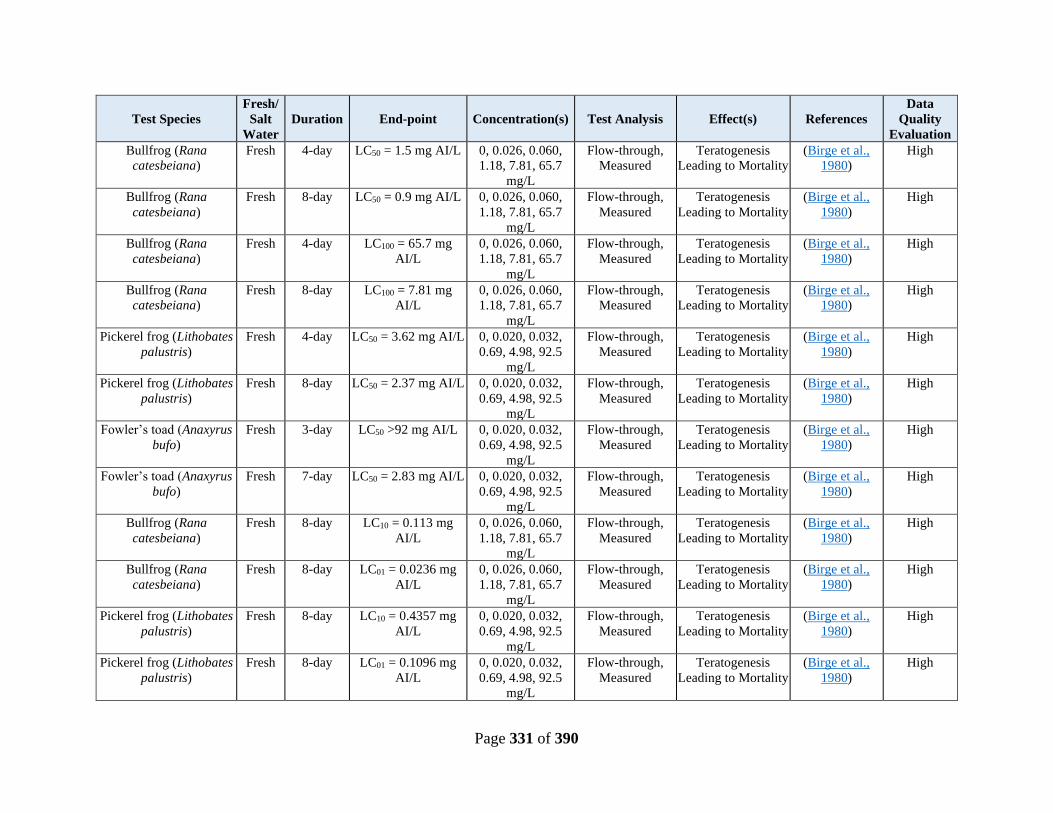
Page 331 of 390
Test Species
Fresh/
Salt
Water
Duration End-point Concentration(s) Test Analysis Effect(s) References
Data
Quality
Evaluation
Bullfrog (Rana
catesbeiana)
Fresh 4-day LC50 = 1.5 mg AI/L 0, 0.026, 0.060,
1.18, 7.81, 65.7
mg/L
Flow-through,
Measured
Teratogenesis
Leading to Mortality
(Birge et al.,
1980)
High
Bullfrog (Rana
catesbeiana)
Fresh 8-day LC50 = 0.9 mg AI/L 0, 0.026, 0.060,
1.18, 7.81, 65.7
mg/L
Flow-through,
Measured
Teratogenesis
Leading to Mortality
(Birge et al.,
1980)
High
Bullfrog (Rana
catesbeiana)
Fresh 4-day LC100 = 65.7 mg
AI/L
0, 0.026, 0.060,
1.18, 7.81, 65.7
mg/L
Flow-through,
Measured
Teratogenesis
Leading to Mortality
(Birge et al.,
1980)
High
Bullfrog (Rana
catesbeiana)
Fresh 8-day LC100 = 7.81 mg
AI/L
0, 0.026, 0.060,
1.18, 7.81, 65.7
mg/L
Flow-through,
Measured
Teratogenesis
Leading to Mortality
(Birge et al.,
1980)
High
Pickerel frog (Lithobates
palustris)
Fresh 4-day LC50 = 3.62 mg AI/L 0, 0.020, 0.032,
0.69, 4.98, 92.5
mg/L
Flow-through,
Measured
Teratogenesis
Leading to Mortality
(Birge et al.,
1980)
High
Pickerel frog (Lithobates
palustris)
Fresh 8-day LC50 = 2.37 mg AI/L 0, 0.020, 0.032,
0.69, 4.98, 92.5
mg/L
Flow-through,
Measured
Teratogenesis
Leading to Mortality
(Birge et al.,
1980)
High
Fowler’s toad (Anaxyrus
bufo)
Fresh 3-day LC50 >92 mg AI/L 0, 0.020, 0.032,
0.69, 4.98, 92.5
mg/L
Flow-through,
Measured
Teratogenesis
Leading to Mortality
(Birge et al.,
1980)
High
Fowler’s toad (Anaxyrus
bufo)
Fresh 7-day LC50 = 2.83 mg AI/L 0, 0.020, 0.032,
0.69, 4.98, 92.5
mg/L
Flow-through,
Measured
Teratogenesis
Leading to Mortality
(Birge et al.,
1980)
High
Bullfrog (Rana
catesbeiana)
Fresh 8-day LC10 = 0.113 mg
AI/L
0, 0.026, 0.060,
1.18, 7.81, 65.7
mg/L
Flow-through,
Measured
Teratogenesis
Leading to Mortality
(Birge et al.,
1980)
High
Bullfrog (Rana
catesbeiana)
Fresh 8-day LC01 = 0.0236 mg
AI/L
0, 0.026, 0.060,
1.18, 7.81, 65.7
mg/L
Flow-through,
Measured
Teratogenesis
Leading to Mortality
(Birge et al.,
1980)
High
Pickerel frog (Lithobates
palustris)
Fresh 8-day LC10 = 0.4357 mg
AI/L
0, 0.020, 0.032,
0.69, 4.98, 92.5
mg/L
Flow-through,
Measured
Teratogenesis
Leading to Mortality
(Birge et al.,
1980)
High
Pickerel frog (Lithobates
palustris)
Fresh 8-day LC01 = 0.1096 mg
AI/L
0, 0.020, 0.032,
0.69, 4.98, 92.5
mg/L
Flow-through,
Measured
Teratogenesis
Leading to Mortality
(Birge et al.,
1980)
High

Page 332 of 390
Test Species
Fresh/
Salt
Water
Duration End-point Concentration(s) Test Analysis Effect(s) References
Data
Quality
Evaluation
Pickerel frog (Lithobates
palustris)
Fresh 4-day LC100 = 92.5 mg
AI/L
0, 0.020, 0.032,
0.69, 4.98, 92.5
mg/L
Flow-through,
Measured
Teratogenesis
Leading to Mortality
(Birge et al.,
1980)
High
Pickerel frog (Lithobates
palustris)
Fresh 8-day LC100 = 92.5 mg
AI/L
0, 0.020, 0.032,
0.69, 4.98, 92.5
mg/L
Flow-through,
Measured
Teratogenesis
Leading to Mortality
(Birge et al.,
1980)
High
Fowler’s toad (Anaxyrus
bufo)
Fresh 7-day LC100 = 92.5 mg
AI/L
0, 0.020, 0.032,
0.69, 4.98, 92.5
mg/L
Flow-through,
Measured
Teratogenesis
Leading to Mortality
(Birge et al.,
1980)
High
Bullfrog (Rana
catesbeiana)
Fresh 8-day LOEC = 0.060 mg
AI/L
0, 0.026, 0.060,
1.18, 7.81, 65.7
mg/L
Flow-through,
Measured
Teratogenesis
Leading to Mortality
(Birge et al.,
1980)
High
Pickerel frog (Lithobates
palustris)
Fresh 8-day LOEC = 92.5 mg
AI/L
0, 0.020, 0.032,
0.69, 4.98, 92.5
mg/L
Flow-through,
Measured
Teratogenesis
Leading to Mortality
(Birge et al.,
1980)
High
Fowler’s toad (Anaxyrus
bufo)
Fresh 7-day LOEC = 92.5 mg
AI/L
0, 0.020, 0.032,
0.69, 4.98, 92.5
mg/L
Flow-through,
Measured
Teratogenesis
Leading to Mortality
(Birge et al.,
1980)
High
Pickerel frog (Lithobates
palustris)
Fresh 4.5-day LC50 = 3.62 mg AI/L Not reported Flow-through,
Measured
Teratogenesis
Leading to Mortality
(Black et al.,
1982)
High
Pickerel frog (Lithobates
palustris)
Fresh 8.5-day LC50 = 2.37 mg AI/L Not reported Flow-through,
Measured
Teratogenesis
Leading to Mortality
(Black et al.,
1982)
High
Fowler’s toad (Anaxyrus
bufo)
Fresh 3-day LC50 > 92 mg AI/L Not reported Flow-through,
Measured
Teratogenesis
Leading to Mortality
(Black et al.,
1982)
High
Fowler’s toad (Anaxyrus
bufo)
Fresh 7-day LC50 = 2.83 mg AI/L Not reported Flow-through,
Measured
Teratogenesis
Leading to Mortality
(Black et al.,
1982)
High
European common frog
(Rana temporaria)
Fresh 9-day LC50 = 1.16 mg AI/L 0, 0.010, 0.076,
0.67, 10.7, 24.0,
41.2 mg/L
Flow-through,
Measured
Teratogenesis
Leading to Mortality
(Black et al.,
1982)
High
European common frog
(Rana temporaria)
Fresh 9-day LC100 = 41.2 mg
AI/L
0, 0.010, 0.076,
0.67, 10.7, 24.0,
41.2 mg/L
Flow-through,
Measured
Teratogenesis
Leading to Mortality
(Black et al.,
1982)
High
European common frog
(Rana temporaria)
Fresh 9-day LC10 = 0.025 mg
AI/L
0, 0.010, 0.076,
0.67, 10.7, 24.0,
41.2 mg/L
Flow-through,
Measured
Teratogenesis
Leading to Mortality
(Black et al.,
1982)
High
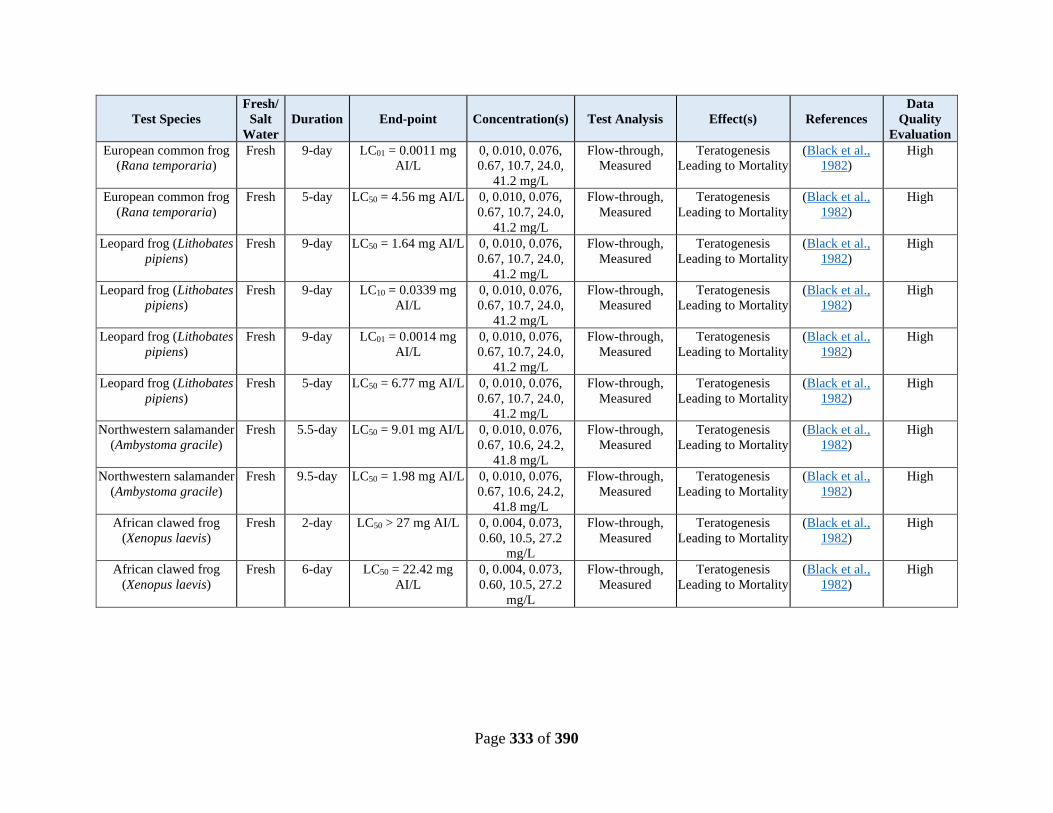
Page 333 of 390
Test Species
Fresh/
Salt
Water
Duration End-point Concentration(s) Test Analysis Effect(s) References
Data
Quality
Evaluation
European common frog
(Rana temporaria)
Fresh 9-day LC01 = 0.0011 mg
AI/L
0, 0.010, 0.076,
0.67, 10.7, 24.0,
41.2 mg/L
Flow-through,
Measured
Teratogenesis
Leading to Mortality
(Black et al.,
1982)
High
European common frog
(Rana temporaria)
Fresh 5-day LC50 = 4.56 mg AI/L 0, 0.010, 0.076,
0.67, 10.7, 24.0,
41.2 mg/L
Flow-through,
Measured
Teratogenesis
Leading to Mortality
(Black et al.,
1982)
High
Leopard frog (Lithobates
pipiens)
Fresh 9-day LC50 = 1.64 mg AI/L 0, 0.010, 0.076,
0.67, 10.7, 24.0,
41.2 mg/L
Flow-through,
Measured
Teratogenesis
Leading to Mortality
(Black et al.,
1982)
High
Leopard frog (Lithobates
pipiens)
Fresh 9-day LC10 = 0.0339 mg
AI/L
0, 0.010, 0.076,
0.67, 10.7, 24.0,
41.2 mg/L
Flow-through,
Measured
Teratogenesis
Leading to Mortality
(Black et al.,
1982)
High
Leopard frog (Lithobates
pipiens)
Fresh 9-day LC01 = 0.0014 mg
AI/L
0, 0.010, 0.076,
0.67, 10.7, 24.0,
41.2 mg/L
Flow-through,
Measured
Teratogenesis
Leading to Mortality
(Black et al.,
1982)
High
Leopard frog (Lithobates
pipiens)
Fresh 5-day LC50 = 6.77 mg AI/L 0, 0.010, 0.076,
0.67, 10.7, 24.0,
41.2 mg/L
Flow-through,
Measured
Teratogenesis
Leading to Mortality
(Black et al.,
1982)
High
Northwestern salamander
(Ambystoma gracile)
Fresh 5.5-day LC50 = 9.01 mg AI/L 0, 0.010, 0.076,
0.67, 10.6, 24.2,
41.8 mg/L
Flow-through,
Measured
Teratogenesis
Leading to Mortality
(Black et al.,
1982)
High
Northwestern salamander
(Ambystoma gracile)
Fresh 9.5-day LC50 = 1.98 mg AI/L 0, 0.010, 0.076,
0.67, 10.6, 24.2,
41.8 mg/L
Flow-through,
Measured
Teratogenesis
Leading to Mortality
(Black et al.,
1982)
High
African clawed frog
(Xenopus laevis)
Fresh 2-day LC50 > 27 mg AI/L 0, 0.004, 0.073,
0.60, 10.5, 27.2
mg/L
Flow-through,
Measured
Teratogenesis
Leading to Mortality
(Black et al.,
1982)
High
African clawed frog
(Xenopus laevis)
Fresh 6-day LC50 = 22.42 mg
AI/L
0, 0.004, 0.073,
0.60, 10.5, 27.2
mg/L
Flow-through,
Measured
Teratogenesis
Leading to Mortality
(Black et al.,
1982)
High

Page 334 of 390
Hazard Identification- Aquatic Relevant data from the screened literature are summarized in Table 3-1 as ranges (min-max) in
the risk evaluation. Studies with data quality evaluation results of ‘medium’ to ‘high’ were used
to characterize the environmental hazards of carbon tetrachloride. Table 3-1 provides the
species, media, duration, endpoint, effects, etc. for all toxicity studies that were evaluated.
Toxicity to Aquatic Organisms
For the aquatic environment, the hazard endpoint for fish, from acute exposure durations (24-
96-h LC50) to carbon tetrachloride, ranges from 10.4 - 150 mg/L (data quality evaluation scores
for each citation are in the parenthesis) (Freitag et al., 1994) (high); (Schell, 1987) (high);
(Brooke, 1987) (high); (Kimball, 1978) (high); (Geiger et al., 1990) (high); (Buccafusco et al.,
1981) (low); and (Dawson et al., 1977) (medium). The hazard endpoint for aquatic
invertebrates, from acute exposure durations (24-48-h L/EC50) to carbon tetrachloride, ranges
from 11.1 - 301 mg/L (LeBlanc, 1980) (high); (Freitag et al., 1994) (high); (Brooke, 1987)
(high); (Khangarot and Das, 2009) (high); and (Richie et al., 1984) (high). The hazard endpoint
for aquatic plants, from acute exposure durations (72-hr EC50) to carbon tetrachloride, ranges
from 0.25 – 23.59 mg/L (Brack and Rottler, 1994) (high); (Freitag et al., 1994) (high); and
(Tsai and Chen, 2007) (high).
There were no chronic studies that encompassed amphibian metamorphoses and adult
reproductive stages of the amphibian life-cycle. However, amphibian embryo and larvae were
the most sensitive organisms to sub-chronic exposures of carbon tetrachloride in the aquatic
environment. In two sub-chronic studies that EPA assigned an overall quality level of high,
amphibian embryos and larvae were exposed to carbon tetrachloride for 2 to 9 days under flow-
through conditions (Black et al., 1982; Birge et al., 1980). The study authors combined embryo-
larval lethality and teratogenesis effect concentrations to establish a 10% impairment value
(LC10). The LC10 hazard endpoint for amphibian embryo-larval stages, from sub-chronic
exposure durations to carbon tetrachloride, ranges from 0.025 to 0.436 mg/L (Birge et al.,
1980); and (Black et al., 1982).
The hazard endpoint for fish, from chronic exposure durations (27-day LC50) to carbon
tetrachloride, is 1.97 mg/L (Black et al., 1982) (high). The hazard endpoint for aquatic
invertebrates, from chronic exposure durations to carbon tetrachloride, is 1.1 mg/L. This is
calculated by applying an acute to chronic ratio (ACR) of 10 to the lowest acute aquatic
invertebrate endpoint value (11.1 mg/L (Brooke, 1987) (high)). The hazard endpoint for algae,
from chronic exposure durations (72-hr EC10) to carbon tetrachloride, is 0.07 mg/L (Brack and
Rottler, 1994) (high).
Toxicity to Sediment and Terrestrial Organisms
All of the limited number of environmental toxicity studies for carbon tetrachloride on sediment
and terrestrial organisms were determined to contain data or information not relevant (off-topic)
for the risk evaluation, except one low quality study on Chironomus tentans (Lee et al., 2006).
Lee et al., examined body weight and expression of two genes that are general biomarkers for
stress (i.e., heat shock protein and hemoglobin) after an acute exposure to carbon tetrachloride.
The lowest effect level (LOEL) for mRNA expression of the heat shock protein and hemoglobin
Page 335 of 390
genes in larvae was 0.02 mg/L carbon tetrachloride; the LOEL for dry body weight was 2 mg/L
carbon tetrachloride. Since the heat shock protein and hemoglobin genes are general biomarkers
that cannot be attributed to an adverse outcome pathway, the sediment-dwelling organism COC
were calculated based on body dry weight and an AF of 5 for acute COC and an ACR of 10 for
chronic COC.
No relevant (on-topic) toxicity data were available for carbon tetrachloride to birds. There were
limited hazard studies for sediment and terrestrial organisms because exposure to carbon
tetrachloride by these organisms was not likely due to the physical- chemical, and fate properties
of the chemical.
Weight of the Scientific Evidence During the data integration stage of systematic review, EPA analyzed, synthesized, and
integrated the data/information. This involved weighing the scientific evidence for quality and
relevance, using a Weight of the Scientific Evidence (WoE) approach (U.S. EPA, 2018a).
During data evaluation, studies were rated high, medium, low, or unacceptable for quality based
on the TSCA criteria described in the Application of Systematic Review in TSCA Risk
Evaluations (U.S. EPA, 2018a). Only data/information rated as high, medium, or low for quality
was used for the environmental risk assessment (unless otherwise noted). Any information rated
as unacceptable was not used. While integrating environmental hazard data for carbon
tetrachloride, EPA gave more weight to relevant data/information rated high or medium for
quality. The ecological risk assessor decided if data/information were relevant based on whether
it has biological, physical-chemical, and environmental relevance (U.S. EPA, 1998):
• Biological relevance: correspondence among the taxa, life stages, and processes
measured or observed and the assessment endpoint.
• Physical-chemical relevance: correspondence between the chemical or physical agent
tested and the chemical or physical agent constituting the stressor of concern.
• Environmental relevance: correspondence between test conditions and conditions in the
region of concern (U.S. EPA, 1998).
This WoE approach was used to assess hazard data (Appendix F.2) and develop COCs as
described in Appendix F.4. Where high or medium quality studies were available for a
taxonomic group, low quality studies were not used to derive COCs. Additionally, where
multiple toxicity values were reported within a study for the same species (e.g., multiple EC50s
with different durations), they were summarized as ranges (min-max) in the Appendix Table F-2
and the higher quality or more relevant citation was used. If quality and relevance were equal,
the lowest toxicity endpoint value for acute and chronic exposures were used to derive acute and
chronic COCs.
Certain environmental studies on carbon tetrachloride were of high quality but were not
biologically relevant for purposes of environmental hazard assessment due to the reported
endpoints (e.g., glutamic pyruvic transaminase activity, serum total protein, catalase activity,
sodium concentration in blood, whole body residue). These studies (Chen et al., 2004); (de Vera
and Pocsidio, 1998); (Barrows et al., 1980); (Liu et al., 2015); (Jia et al., 2013); (Kotsanis and
Metcalfe, 1988); (Weber et al., 1979); (Koskinen et al., 2004); (Bauder et al., 2005); (Martins et
Page 336 of 390
al., 2007a)) are contained within the on-topic data evaluation section of Appendix F.1, but were
not used within the risk evaluation process. During risk evaluation, EPA made refinements to the
conceptual models resulting in the elimination of the terrestrial exposure pathway and studies
that are not biologically relevant from further analysis. Thus, environmental hazard data sources
on terrestrial organisms and on metabolic endpoints were considered out of scope and excluded
from data quality evaluation.
Environmental test data are reported from the Japanese Ministry of the Environment (MOE).
EPA obtained the Japanese MOE test data in Japanese (not English). Since studies in a foreign
language are generally excluded from evaluation (although there are exceptions on a case-by-
case basis) and the Japanese test data are not driving the environmental assessment, EPA decided
not to translate the Japanese test data into English or use the test data in this risk evaluation. EPA
acknowledges the studies exist and are included in carbon tetrachloride’s docket.
To assess aquatic toxicity from acute exposures, data for four taxonomic groups were available:
amphibians, fish, aquatic invertebrates, and algae. For each taxonomic group, data were available
for multiple species, and were summarized in Table 3-1. as ranges (min-max).
There were no chronic studies that encompassed amphibian metamorphoses and adult
reproductive stages of the amphibian life-cycle. However, amphibian embryo and larvae were
the most sensitive life stages to sub-chronic exposures of carbon tetrachloride in the aquatic
environment. In two sub-chronic studies that EPA assigned an overall quality level of high,
amphibian embryos and larvae were exposed to carbon tetrachloride for 2 to 9 days under flow-
through conditions (Black et al., 1982; Birge et al., 1980). The study authors combined embryo-
larval lethality and teratogenesis effect concentrations to establish a 10% impairment value
(LC10) in Lithobates palustris (Birge et al., 1980) and Rana temporaria and Lithobates pipiens
(Black et al., 1982), at carbon tetrachloride concentrations ranging from 0.025 – 0.436 mg/L.
EPA considered the sub-chronic hazard LC50s and LC10s for amphibians for teratogenicity
leading to mortality to estimate acute and chronic hazard values for amphibians, respectively. To
assess aquatic toxicity from acute and chronic exposures, EPA used and rounded the lowest LC50
to 0.9 mg/L and LC10 to 0.03 mg/L, respectively, from two high quality 9-day amphibian studies
(Black et al., 1982; Birge et al., 1980). When comparing these values to the other acute and
chronic data from fish and aquatic invertebrates, amphibians were again the most sensitive
taxonomic group. Therefore, the amphibian 9-day lowest LC50 of 0.9 mg/L and LC10 of 0.03
mg/L were used to derive an acute COC in Appendix Section F.6 and chronic COC in Appendix
Section F.7. These values were from two scientific articles that EPA assigned an overall quality
level of high and represented seven amphibian species with LC50 values, and four amphibian
species with LC10 values.
The 72-hour algal EC10 of 0.072 mg/L represented the most sensitive toxicity value derived from
the available algal toxicity data to carbon tetrachloride and this value was used to derive an algal
COC as described in Appendix Section F.8. This value is from one algal study that EPA assigned
an overall quality of high.
Page 337 of 390
Lastly, a LOEL of 2 mg/L for body dry weight from one low quality study on Chironomus
tentans (Lee et al., 2006) was used to support the risk characterization of sediment-dwelling
organisms.
Benchmark Dose Modeling and Species Sensitivity
Distributions Benchmark Dose Modeling
Benchmark dose modeling is the preferred method used in human health fields to predicting
toxicity effect values for a given endpoint and study. It's utility translates to ecotoxicity studies,
where it can be used to generate LCx or ECx values that remove biases due to experimental
design (e.g., what concentrations are chosen), provide for the inclusion of all toxicity data points,
and allow for model fitting specific to the shape of different dose-response curves, as compared
to traditional LOEC/NOEC methodologies. EPA examined whether benchmark dose modeling
could be applied to the toxicity data from (Black et al., 1982; Birge et al., 1980) used to derive
the acute and chronic concentrations of concern using the peer reviewed BMDS software (U.S.
EPA, 2019a). Because the BMDS software requires a measure of error for model calculation, it
was not possible to apply these methods with the data provided by (Birge et al., 1980) and (Black
et al., 1982). Specifically, EPA was not able to back-calculate a measure of error for either paper
because the experiments utilized one tank replicate per concentration. However, EPA has high
confidence in the toxicity values provided by both papers because the study authors applied an
appropriate modeling technique (log-probit analysis) to generate their LC10 and LC50 point of
departure estimates for fish and amphibian species.
Species Sensitivity Distributions
Amphibians were the most sensitive taxa to carbon tetrachloride exposure. Because little is
known about differences in sensitivity for amphibians, EPA explored the use of species
sensitivity distributions (SSDs) as an additional line of evidence for how carbon tetrachloride
exposure could affect this vulnerable taxonomic group. SSDs utilize toxicity estimates (ECx,
LCx) from multiple, single-species tests to predict a hazardous concentration (HCp) protective of
a certain percentage (p) of the larger taxonomic group and can be used to examine the
distribution of a toxicity dataset.
To examine the amphibian toxicity data, SSDs were generated using the SSD Toolbox, a
resource created by EPA’s Office of Research and Development (ORD) (Etterson, 2019).There
was insufficient data (n = 4 species) to examine the LC10 data used to calculate the chronic
concentration of concern for amphibians using an SSD. There was enough data (n = 7 species) to
examine LC50 from the 4-days post-hatch exposure. Using the three best-fitting distributions, the
model averaged HC5 (the predicted hazardous concentration intended to be protective of 95% of
amphibians) was = 0.42 mg/L +/- 0.36 SE. Although 7 species were not enough to capture the
total variation in sensitivity to carbon tetrachloride across amphibians, the SSD showed that the
model frog Xenopus laevis appeared to be less sensitive than other species (Figure F-1). The
American bullfrog (Rana catesbiana) and the European common frog (Rana temporaria) were
the most sensitive species in the dataset (Figure F-1). The SSD provided a useful line of evidence
that EPA used to visually assess the distribution of the available amphibian toxicity data.
However, due to underlying uncertainties including unknown total variation in amphibian
sensitivity, a small sample size (n = 7 species, from n = 2 studies), large variation surrounding

Page 338 of 390
the HC5, and possible differences across amphibian life stages, EPA used the more conservative
concentration of concern (0.09 mg/L versus the HC5 of 0.42 mg/L) generated by the traditional
approach to assess risk due to acute exposure.
Figure F-1. Species Sensitivity Distribution (SSD) for Amphibian Species Using LC50s
From (Etterson, 2019)
Note: The data in this figure includes LC50s for seven amphibian species from (Birge et al.,
1980) and (Black et al., 1982). A black dot indicates the toxicity value reported for a given
species. Colored lines represent model fit with log, normal, or triangular distributions. The dotted
horizontal lines represent the 95% confidence intervals around the modeled HC5. The HC5 was
calculated using a model average of the best-fitting log, normal, and triangular distributions.
Concentrations of Concern EPA calculated screening-level acute and chronic COCs for aquatic species based on the
environmental hazard data for carbon tetrachloride, using EPA methods (U.S. EPA, 2012b);
(U.S. EPA, 2013). While there was data representing amphibians, fish, aquatic invertebrates, and
aquatic plants, the data were not robust enough to apply species sensitivity distribution analyses.
Therefore, EPA chose to establish the COC as protective cut-off standards above which
exposures to carbon tetrachloride are expected to cause effects for each taxonomic group in the
aquatic environment. The acute, chronic, and algal COCs for carbon tetrachloride are based on
the lowest toxicity value in the dataset. For the aquatic environment, EPA derived acute and a
chronic COCs for amphibians as well as a COC for algae to serve as representative COCs for all
aquatic taxa.
After weighing the scientific evidence and selecting the appropriate toxicity values from the
integrated data to calculate COCs, EPA applied an assessment factor (AF) according to EPA
methods (U.S. EPA, 2012b); (U.S. EPA, 2013), when possible. The application of AFs provides
a lower bound effect level that would likely encompass more sensitive species not represented by
the available experimental data. AFs also account for differences in inter- and intra-species
variability, as well as laboratory-to-field variability. These assessment factors are dependent

Page 339 of 390
upon the availability of datasets that can be used to characterize relative sensitivities across
multiple species within a given taxa or species group. The assessment factors are standardized in
risk assessments conducted under TSCA, since the data available for most industrial chemicals
are limited. For fish and aquatic invertebrates (e.g., Daphnia sp.), the acute hazard values were
divided by an AF of 5 and the chronic hazard values were divided by an AF of 10. For algal
species, the hazard values were divided by an AF of 10. For amphibians, EPA does not have a
standardized AF. The greater level of uncertainty (i.e., unknown inter-species variability)
associated with the sub-chronic endpoints in the amphibian studies necessitates the use of a more
protective AF of 10. As such, for the acute and chronic COCs derived from amphibian data, an
AF of 10 was used (U.S. EPA, 2013, 2012b).
Hazard Estimation for Acute Exposure Durations The lowest acute toxicity value for aquatic organisms (i.e., most sensitive species) for carbon
tetrachloride is from a 9-day amphibian toxicity study where the LC50 is 0.9 mg/L (Black et al.,
1982; Birge et al., 1980). The lowest value was then divided by the AF of 10.
Acute COC
The acute COC = (0.9 mg/L) / (AF of 10) = 0.09 mg/L x 1,000 = 90 µg/L or 90 ppb
The acute COC of 90 µg/L, derived from an experimental amphibian endpoint, is used as the
conservative (screening-level) hazard level in this risk evaluation for carbon tetrachloride.
Hazard Estimation for Chronic Exposure Durations The lowest chronic toxicity value for aquatic organisms (i.e., most sensitive species) for carbon
tetrachloride is from a 9-day amphibian toxicity study where the LC10 is 0.03 mg/L (Black et al.,
1982). The chronic COC was derived from the lowest chronic toxicity value from the amphibian
LC10 (for developmental effects and mortality in frogs). Throughout the systematic review
process, these two studies were both assigned a quality level of high (Black et al., 1982; Birge et
al., 1980). The LC10 was then divided by an assessment factor of 10, and then multiplied by
1,000 to convert from mg/L to µg/L, or ppb.
Chronic COC
The chronic COC = (0.03 mg/L) / (AF of 10) = 0.003 mg/L x 1,000 = 3 µg/L or ppb
The amphibian chronic COC for carbon tetrachloride is 3 µg/L is used as the lower bound hazard
level in this risk evaluation for carbon tetrachloride.
Hazard Estimation for Algal Toxicity
Given that the hazard endpoints for aquatic plants (72-hr EC10/NOEC)) exposed to carbon
tetrachloride ranges from ranges from 0.0717 - 2.2 mg/L (Brack and Rottler, 1994), the chronic
COC is derived by dividing the 72-hr algal EC10 of 0.0717 mg/L (the lowest chronic value in the
dataset) by an assessment factor of 10:
Page 340 of 390
Algal Toxicity COC
The 72-hr algal toxicity value = (0.0717 mg/L) / AF of 10 = 0.007 mg/L or 7 µg/L.
The chronic COC of 7 µg/L, derived from an experimental algal endpoint, is used as the lower
bound hazard level for algal toxicity in this risk evaluation for carbon tetrachloride.
Hazard Estimation for Sediment-Dwelling Organism
Toxicity
Only one low quality study on Chironomus tentans (Lee et al., 2006) was available for sediment-
dwelling organisms. Since the heat shock protein and hemoglobin genes are general biomarkers
that cannot be attributed to an adverse outcome pathway, the sediment-dwelling organism COC
were calculated based on a 2 mg/L carbon tetrachloride LOEL for body dry weight and an AF of
5 for acute COC and an ACR of 10 for chronic COC.
Acute COC
The acute COC = (2.0 mg/L) / (AF of 5) = 0.4 mg/L x 1,000 = 400 µg/L or 400 ppb
Chronic COC
400 µg/L / (ACR of 10) = 40 µg/L or 40 ppb
Summary of Environmental Hazard Assessment The derived amphibian acute COC (90 µg/L) and chronic COC (3 µg/L) are based on
environmental toxicity endpoint values from (Black et al., 1982; Birge et al., 1980) and algal
COC (7 µg/L) is based on environmental toxicity endpoint values from (Brack and Rottler,
1994). The data represent the lowest bound of all carbon tetrachloride data available in the public
domain and provide the most conservative hazard values. The full study reports for all on-topic
citations in this risk evaluation were systematically reviewed and described in the Risk
Evaluation for Carbon Tetrachloride, Systematic Review Supplemental File: Data Quality
Evaluation of Environmental Hazard Studies (U.S. EPA, 2019g).
Site-Specific Seasonal Risk Determination for Chronic
Exposure
For the five facilities where chronic risk to aquatic organisms was identified, EPA examined
whether releases occurred during months the were ecologically relevant to amphibian
development (April – August at the Ohio facilities or March – August in Texas facilities). Where
releases occurred, EPA calculated surface water concentrations using E-FAST and associated,
site-specific RQs to determine whether risk was/was not indicated at the facilities during these
key time periods. Risk was not indicated during time periods relevant to amphibian development
at Eco Services Operations Facility (RQs < 1 for the three years where monitoring information
was available). At the other four facilities, risk was indicated (RQs > 1) during the time periods
relevant to amphibian development for at least 2 separate reporting periods. At the OH 0028149
and the TX0007072 facilities, the 20-day stream concentrations also exceed the unadjusted
amphibian endpoint (e.g., 30 µg/L the amphibian LC10) . However, risk was not consistent or

Page 341 of 390
predictable across years or facilities (e.g., some years no releases of carbon tetrachloride
occurred, or RQs < 1). Thus, it is important to acknowledge that the timing of future exposures is
an uncertainty in the risk evaluation. Facilities do not release carbon tetrachloride consistently
throughout the year, and it is not possible to predict whether risk will or will not occur during
months key to amphibian development in future years. The specific seasonal release information
and associated RQs for each of the five sites that indicated risk for development from chronic
exposures to carbon tetrachloride are available in Table F-2.

Page 342 of 390
Table F-2. Seasonal Risk Determinations for the Five Facilities Indicating Risk to Amphibian Development from Chronic
Exposure to Carbon Tetrachloride
NPDES Facility Name Monitoring
Perioda
Monitoring
Period
Duration
(Days)
Days of
Release
Scenario
(PDM)
Avg
Daily
Value
(kg/day)
Stream
Conc.
(µg/L)
COC
Type
COC
(µg/L)
Days
COC
Exceeded
RQb
(PDM)
TX0021458 Fort Bend County
WCID2
5/31/2014 92 20 1.2E-01 1.24E+01 Chronic
Amphibian
3 0 4.1E+00
8/31/2014 92 1.5E-01 1.55E+01 0 5.2E+00
7/31/2015 92 1.5E-01 1.45E+01 0 4.8E+00
4/30/2016 89 3.0E-02 3.09E+00 0 1.0E+00
7/31/2016 92 3.0E-02 3.46E+00 0 1.2E+00
4/30/2017 89 2.0E-02 2.38E+00 0 7.9E-01
7/31/2017 92 2.0E-02 1.83E+00 0 6.1E-01
4/30/2018 89 2.0E-02 2.48E+00 0 8.3E-01
7/31/2018 92 3.0E-02 3.46E+00 0 1.2E+00
OH00029149 Gabriel Performance 3/31/2014 31 20.0 0.0E+00 1.00E-02 Chronic
Amphibian
3 0 3.6E-03
6/30/2014 30 4.0E-02 9.93E+00 1 3.3E+00
3/31/2015 31 8.0E-02 1.84E+01 2 6.2E+00
6/30/2017 30 1.0E-02 2.84E+00 0 9.5E-01
3/31/2018 31 1.0E-02 2.84E+00 0 9.5E-01
OH0007269 Dover Chemical Corp 4/30/2015 30 20 9.0E-02 5.97E+00 Chronic
Amphibian
3 0 2.0E+00
7/31/2017 31 7.0E-01 4.86E+01 7 1.6E+01
TX0119792 Equistar Chemicals LP 8/31/2016 365 20 0.0E+00 5.9E-01 Chronic
Amphibian
3 0 2.0E-01
8/31/2017 365 0.0E+00 9.78E-02 0 3.0E-02
8/31/2018 365 0.0E+00 3.9E-01 0 1.3E-01
TX0007072 Eco Services Operations 7/31/2014 181 20 1.0E-02 1.68E+00 Chronic
Amphibian
3 0 5.6E-01
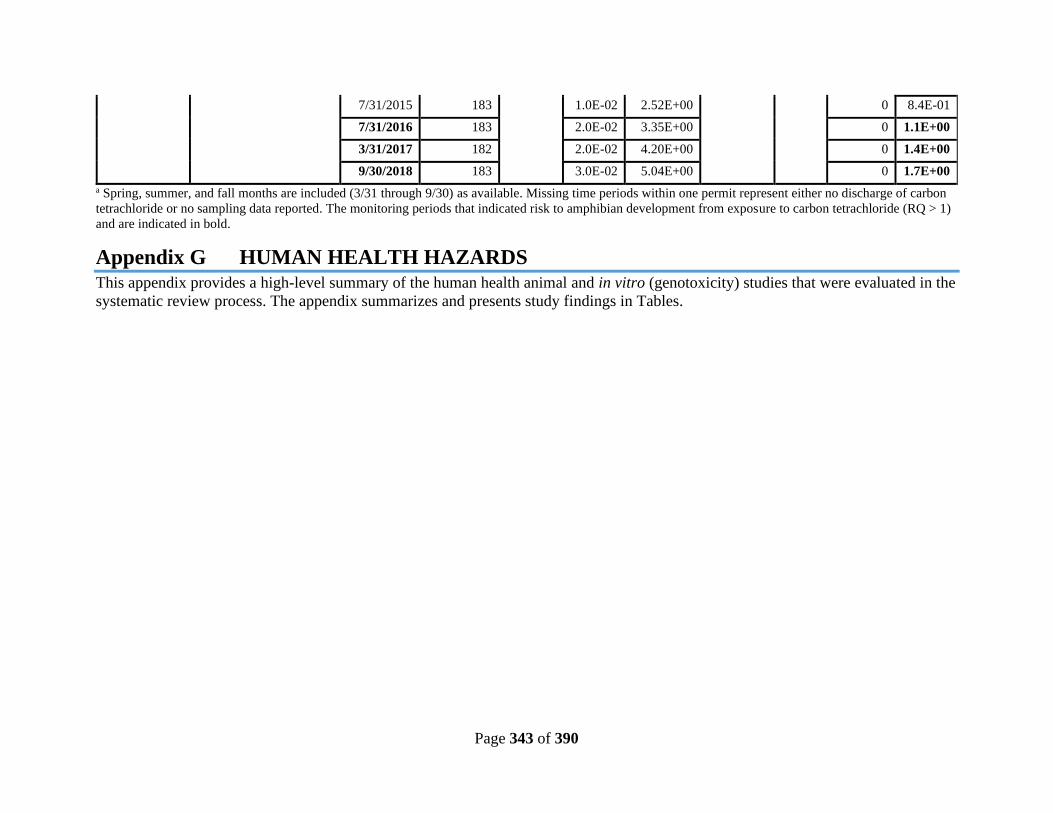
Page 343 of 390
7/31/2015 183 1.0E-02 2.52E+00 0 8.4E-01
7/31/2016 183 2.0E-02 3.35E+00 0 1.1E+00
3/31/2017 182 2.0E-02 4.20E+00 0 1.4E+00
9/30/2018 183 3.0E-02 5.04E+00 0 1.7E+00
a Spring, summer, and fall months are included (3/31 through 9/30) as available. Missing time periods within one permit represent either no discharge of carbon
tetrachloride or no sampling data reported. The monitoring periods that indicated risk to amphibian development from exposure to carbon tetrachloride (RQ > 1)
and are indicated in bold.
Appendix G HUMAN HEALTH HAZARDS This appendix provides a high-level summary of the human health animal and in vitro (genotoxicity) studies that were evaluated in the
systematic review process. The appendix summarizes and presents study findings in Tables.

Page 344 of 390
Table G-1. Summary of Reviewed Human Health Animal Studies for Carbon Tetrachloride
Target
Organ/
System1
Study
Type
Species/
Strain/Sex
(Number/
group)2
Exposure
Route
Doses/
Concentrations3 Duration4
Effect Dose or
Concentration
(Sex)
Effect6 Reference
Data
Quality
Evaluation8
Mortality Chronic Mouse,
Crj:BDF1
(SPF), M/ F
(n=100/
group)
Inhalation,
vapor,
whole body
0, 32, 160, 801
mg/m3 (0, 5, 25,
125 ppm)
6 hours/
day,
5 days/
week for
104 weeks
NOAEL = 32
mg/m3 (F),
LOAEL = 160
mg/m3 (F)
Reduced
survival late in
study (because
of liver
tumors)
(Nagano
et al.,
2007a)
High
Mortality Short-term
(1-30 days)
Rat, Wistar,
M
(n=10/group)
Inhalation 0, 63,80 mg/kg-
bw/day
6
hours/day,
5
days/week
for 4 weeks
NOAEL = 80
mg/m3
No effect on
general
condition of
rats; no
significant
effects on
body weight
that were
considered
treatment-
related.
(Civo
Institute
Tno,
1985)
High
Mortality Other Guinea pig
(n=20)
Dermal 0.5 or 2.0 mL
(260 mg/cm3)
Once;
contact for
5 days
LOAEL = 260
mg/ cm3 i
5 of 20
animals died
(Wahlberg
and
Boman,
1979)
Medium
Mortality Other Guinea pig,
Hartley, M
(n=~4/group)
Dermal
(intact and
abraded
skin)
0.5 mL undiluted
(15,000 mg/kg)
Once LD50 = 15,000
mg/kg-bw/day
Reduced
survival
(Roudabus
h et al.,
1965)
Unacceptable
Mortality Other Rabbit,
white, M/ F
(n=~4/group)
Dermal
(abraded
skin)
0.5 mL undiluted
(15,000 mg/kg)
Once LD50= 15,000
mg/kg-day iii
Reduced
survival
(Roudabus
h et al.,
1965)
Unacceptable
Hepatic Chronic Mouse,
Crj:BDF1
(SPF), M/ F
(n=100/
group)
Inhalation,
vapor,
whole body
0, 32, 160, 801
mg/m3 (0, 5, 25,
125 ppm)
6 hours/
day,
5 days/
week for
104 weeks
NOAEL = 32
mg/m3, LOAEL
= 160 mg/m3
Incidence of
hepatocellular
adenoma or
carcinoma
(Nagano
et al.,
2007a)
High
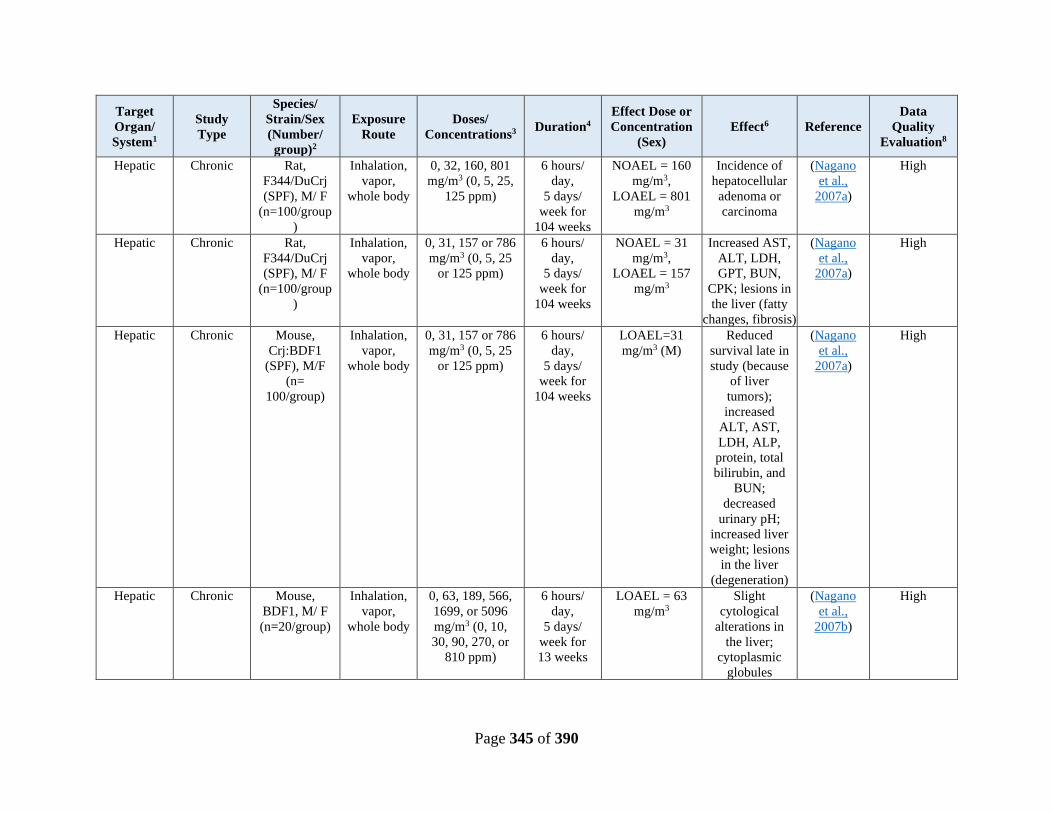
Page 345 of 390
Target
Organ/
System1
Study
Type
Species/
Strain/Sex
(Number/
group)2
Exposure
Route
Doses/
Concentrations3 Duration4
Effect Dose or
Concentration
(Sex)
Effect6 Reference
Data
Quality
Evaluation8
Hepatic Chronic Rat,
F344/DuCrj
(SPF), M/ F
(n=100/group
)
Inhalation,
vapor,
whole body
0, 32, 160, 801
mg/m3 (0, 5, 25,
125 ppm)
6 hours/
day,
5 days/
week for
104 weeks
NOAEL = 160
mg/m3,
LOAEL = 801
mg/m3
Incidence of
hepatocellular
adenoma or
carcinoma
(Nagano
et al.,
2007a)
High
Hepatic Chronic Rat,
F344/DuCrj
(SPF), M/ F
(n=100/group
)
Inhalation,
vapor,
whole body
0, 31, 157 or 786
mg/m3 (0, 5, 25
or 125 ppm)
6 hours/
day,
5 days/
week for
104 weeks
NOAEL = 31
mg/m3,
LOAEL = 157
mg/m3
Increased AST,
ALT, LDH,
GPT, BUN,
CPK; lesions in
the liver (fatty
changes, fibrosis)
(Nagano
et al.,
2007a)
High
Hepatic Chronic Mouse,
Crj:BDF1
(SPF), M/F
(n=
100/group)
Inhalation,
vapor,
whole body
0, 31, 157 or 786
mg/m3 (0, 5, 25
or 125 ppm)
6 hours/
day,
5 days/
week for
104 weeks
LOAEL=31
mg/m3 (M)
Reduced
survival late in
study (because
of liver
tumors);
increased
ALT, AST,
LDH, ALP,
protein, total
bilirubin, and
BUN;
decreased
urinary pH;
increased liver
weight; lesions
in the liver
(degeneration)
(Nagano
et al.,
2007a)
High
Hepatic Chronic Mouse,
BDF1, M/ F
(n=20/group)
Inhalation,
vapor,
whole body
0, 63, 189, 566,
1699, or 5096
mg/m3 (0, 10,
30, 90, 270, or
810 ppm)
6 hours/
day,
5 days/
week for
13 weeks
LOAEL = 63
mg/m3
Slight
cytological
alterations in
the liver;
cytoplasmic
globules
(Nagano
et al.,
2007b)
High
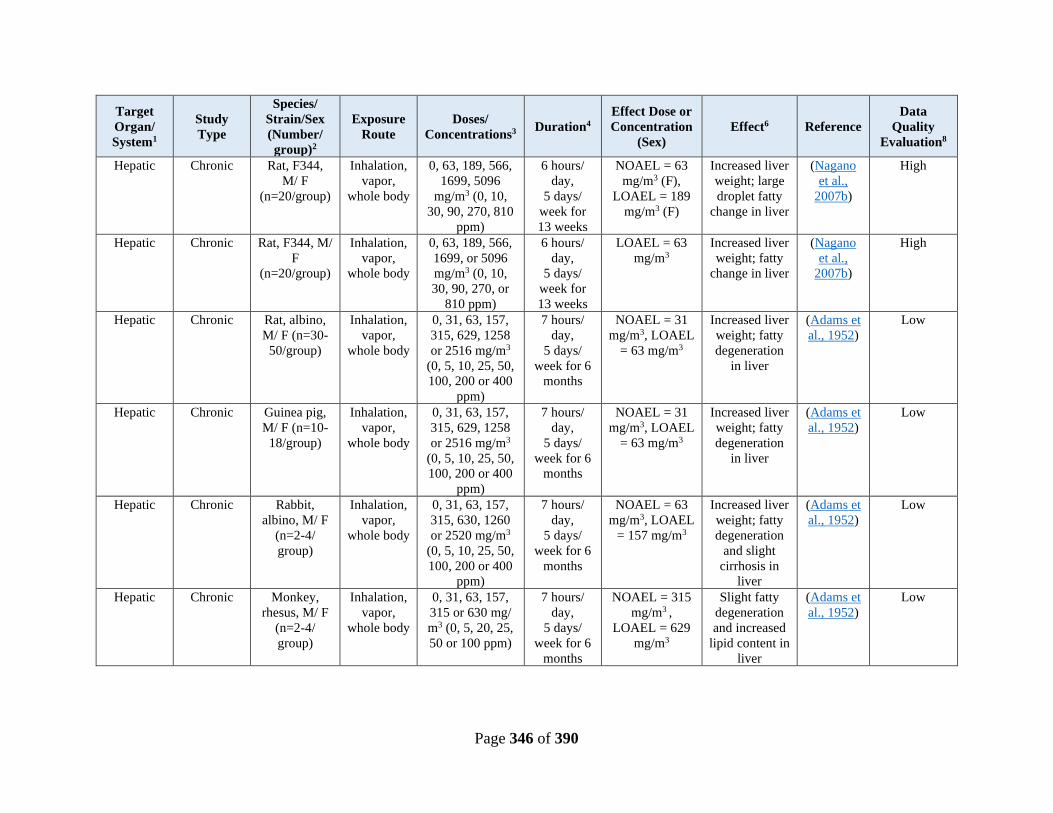
Page 346 of 390
Target
Organ/
System1
Study
Type
Species/
Strain/Sex
(Number/
group)2
Exposure
Route
Doses/
Concentrations3 Duration4
Effect Dose or
Concentration
(Sex)
Effect6 Reference
Data
Quality
Evaluation8
Hepatic Chronic Rat, F344,
M/ F
(n=20/group)
Inhalation,
vapor,
whole body
0, 63, 189, 566,
1699, 5096
mg/m3 (0, 10,
30, 90, 270, 810
ppm)
6 hours/
day,
5 days/
week for
13 weeks
NOAEL = 63
mg/m3 (F),
LOAEL = 189
mg/m3 (F)
Increased liver
weight; large
droplet fatty
change in liver
(Nagano
et al.,
2007b)
High
Hepatic Chronic Rat, F344, M/
F
(n=20/group)
Inhalation,
vapor,
whole body
0, 63, 189, 566,
1699, or 5096
mg/m3 (0, 10,
30, 90, 270, or
810 ppm)
6 hours/
day,
5 days/
week for
13 weeks
LOAEL = 63
mg/m3
Increased liver
weight; fatty
change in liver
(Nagano
et al.,
2007b)
High
Hepatic Chronic Rat, albino,
M/ F (n=30-
50/group)
Inhalation,
vapor,
whole body
0, 31, 63, 157,
315, 629, 1258
or 2516 mg/m3
(0, 5, 10, 25, 50,
100, 200 or 400
ppm)
7 hours/
day,
5 days/
week for 6
months
NOAEL = 31
mg/m3, LOAEL
= 63 mg/m3
Increased liver
weight; fatty
degeneration
in liver
(Adams et
al., 1952)
Low
Hepatic Chronic Guinea pig,
M/ F (n=10-
18/group)
Inhalation,
vapor,
whole body
0, 31, 63, 157,
315, 629, 1258
or 2516 mg/m3
(0, 5, 10, 25, 50,
100, 200 or 400
ppm)
7 hours/
day,
5 days/
week for 6
months
NOAEL = 31
mg/m3, LOAEL
= 63 mg/m3
Increased liver
weight; fatty
degeneration
in liver
(Adams et
al., 1952)
Low
Hepatic Chronic Rabbit,
albino, M/ F
(n=2-4/
group)
Inhalation,
vapor,
whole body
0, 31, 63, 157,
315, 630, 1260
or 2520 mg/m3
(0, 5, 10, 25, 50,
100, 200 or 400
ppm)
7 hours/
day,
5 days/
week for 6
months
NOAEL = 63
mg/m3, LOAEL
= 157 mg/m3
Increased liver
weight; fatty
degeneration
and slight
cirrhosis in
liver
(Adams et
al., 1952)
Low
Hepatic Chronic Monkey,
rhesus, M/ F
(n=2-4/
group)
Inhalation,
vapor,
whole body
0, 31, 63, 157,
315 or 630 mg/
m3 (0, 5, 20, 25,
50 or 100 ppm)
7 hours/
day,
5 days/
week for 6
months
NOAEL = 315
mg/m3 ,
LOAEL = 629
mg/m3
Slight fatty
degeneration
and increased
lipid content in
liver
(Adams et
al., 1952)
Low
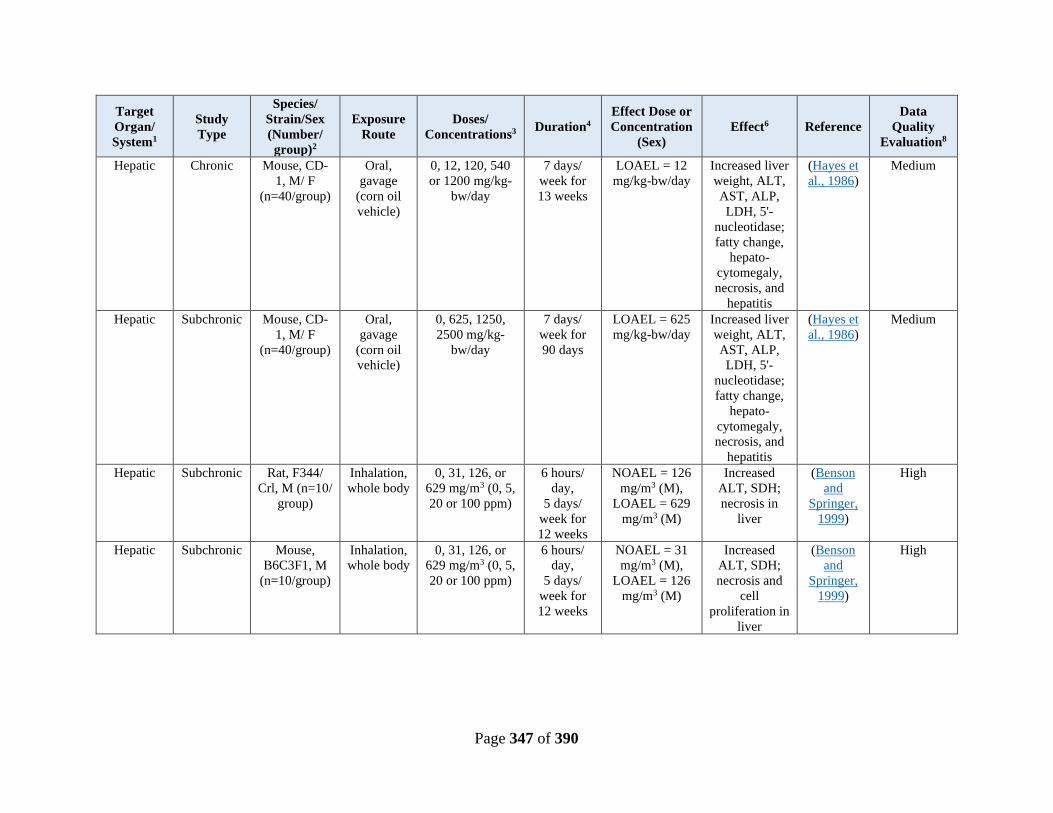
Page 347 of 390
Target
Organ/
System1
Study
Type
Species/
Strain/Sex
(Number/
group)2
Exposure
Route
Doses/
Concentrations3 Duration4
Effect Dose or
Concentration
(Sex)
Effect6 Reference
Data
Quality
Evaluation8
Hepatic Chronic Mouse, CD-
1, M/ F
(n=40/group)
Oral,
gavage
(corn oil
vehicle)
0, 12, 120, 540
or 1200 mg/kg-
bw/day
7 days/
week for
13 weeks
LOAEL = 12
mg/kg-bw/day
Increased liver
weight, ALT,
AST, ALP,
LDH, 5'-
nucleotidase;
fatty change,
hepato-
cytomegaly,
necrosis, and
hepatitis
(Hayes et
al., 1986)
Medium
Hepatic Subchronic Mouse, CD-
1, M/ F
(n=40/group)
Oral,
gavage
(corn oil
vehicle)
0, 625, 1250,
2500 mg/kg-
bw/day
7 days/
week for
90 days
LOAEL = 625
mg/kg-bw/day
Increased liver
weight, ALT,
AST, ALP,
LDH, 5'-
nucleotidase;
fatty change,
hepato-
cytomegaly,
necrosis, and
hepatitis
(Hayes et
al., 1986)
Medium
Hepatic Subchronic Rat, F344/
Crl, M (n=10/
group)
Inhalation,
whole body
0, 31, 126, or
629 mg/m3 (0, 5,
20 or 100 ppm)
6 hours/
day,
5 days/
week for
12 weeks
NOAEL = 126
mg/m3 (M),
LOAEL = 629
mg/m3 (M)
Increased
ALT, SDH;
necrosis in
liver
(Benson
and
Springer,
1999)
High
Hepatic Subchronic Mouse,
B6C3F1, M
(n=10/group)
Inhalation,
whole body
0, 31, 126, or
629 mg/m3 (0, 5,
20 or 100 ppm)
6 hours/
day,
5 days/
week for
12 weeks
NOAEL = 31
mg/m3 (M),
LOAEL = 126
mg/m3 (M)
Increased
ALT, SDH;
necrosis and
cell
proliferation in
liver
(Benson
and
Springer,
1999)
High
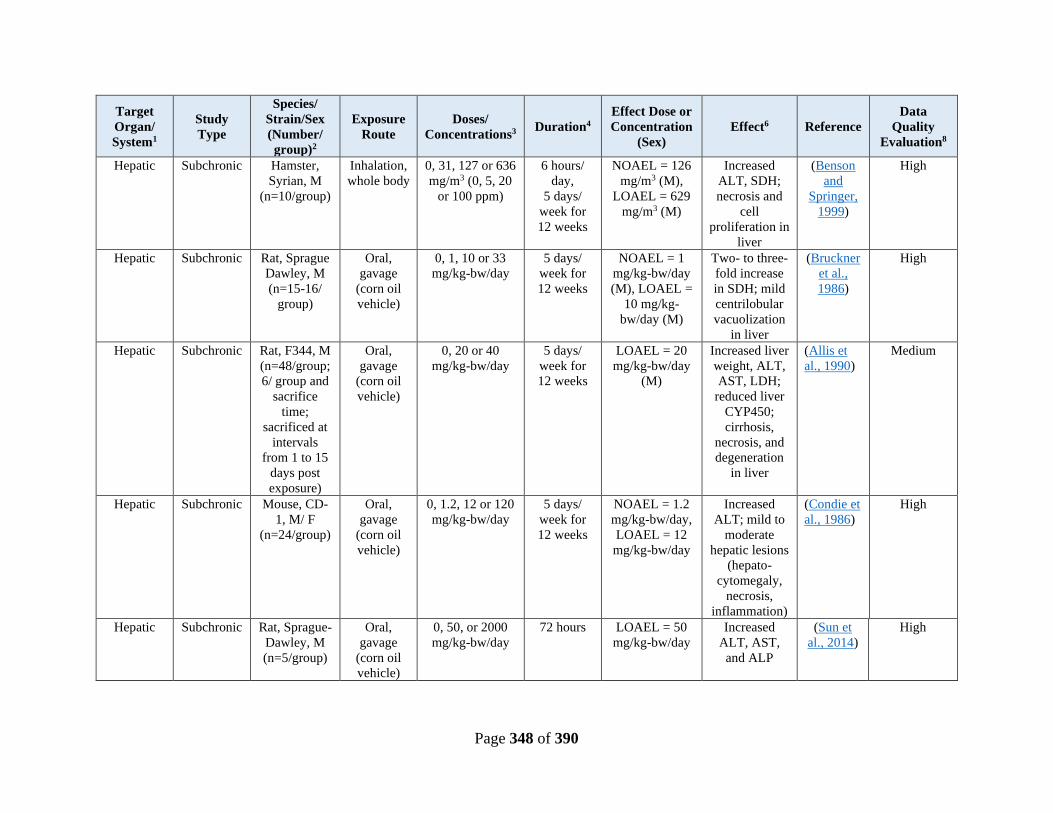
Page 348 of 390
Target
Organ/
System1
Study
Type
Species/
Strain/Sex
(Number/
group)2
Exposure
Route
Doses/
Concentrations3 Duration4
Effect Dose or
Concentration
(Sex)
Effect6 Reference
Data
Quality
Evaluation8
Hepatic Subchronic Hamster,
Syrian, M
(n=10/group)
Inhalation,
whole body
0, 31, 127 or 636
mg/m3 (0, 5, 20
or 100 ppm)
6 hours/
day,
5 days/
week for
12 weeks
NOAEL = 126
mg/m3 (M),
LOAEL = 629
mg/m3 (M)
Increased
ALT, SDH;
necrosis and
cell
proliferation in
liver
(Benson
and
Springer,
1999)
High
Hepatic Subchronic Rat, Sprague
Dawley, M
(n=15-16/
group)
Oral,
gavage
(corn oil
vehicle)
0, 1, 10 or 33
mg/kg-bw/day
5 days/
week for
12 weeks
NOAEL = 1
mg/kg-bw/day
(M), LOAEL =
10 mg/kg-
bw/day (M)
Two- to three-
fold increase
in SDH; mild
centrilobular
vacuolization
in liver
(Bruckner
et al.,
1986)
High
Hepatic Subchronic Rat, F344, M
(n=48/group;
6/ group and
sacrifice
time;
sacrificed at
intervals
from 1 to 15
days post
exposure)
Oral,
gavage
(corn oil
vehicle)
0, 20 or 40
mg/kg-bw/day
5 days/
week for
12 weeks
LOAEL = 20
mg/kg-bw/day
(M)
Increased liver
weight, ALT,
AST, LDH;
reduced liver
CYP450;
cirrhosis,
necrosis, and
degeneration
in liver
(Allis et
al., 1990)
Medium
Hepatic Subchronic Mouse, CD-
1, M/ F
(n=24/group)
Oral,
gavage
(corn oil
vehicle)
0, 1.2, 12 or 120
mg/kg-bw/day
5 days/
week for
12 weeks
NOAEL = 1.2
mg/kg-bw/day,
LOAEL = 12
mg/kg-bw/day
Increased
ALT; mild to
moderate
hepatic lesions
(hepato-
cytomegaly,
necrosis,
inflammation)
(Condie et
al., 1986)
High
Hepatic Subchronic Rat, Sprague-
Dawley, M
(n=5/group)
Oral,
gavage
(corn oil
vehicle)
0, 50, or 2000
mg/kg-bw/day
72 hours LOAEL = 50
mg/kg-bw/day
Increased
ALT, AST,
and ALP
(Sun et
al., 2014)
High
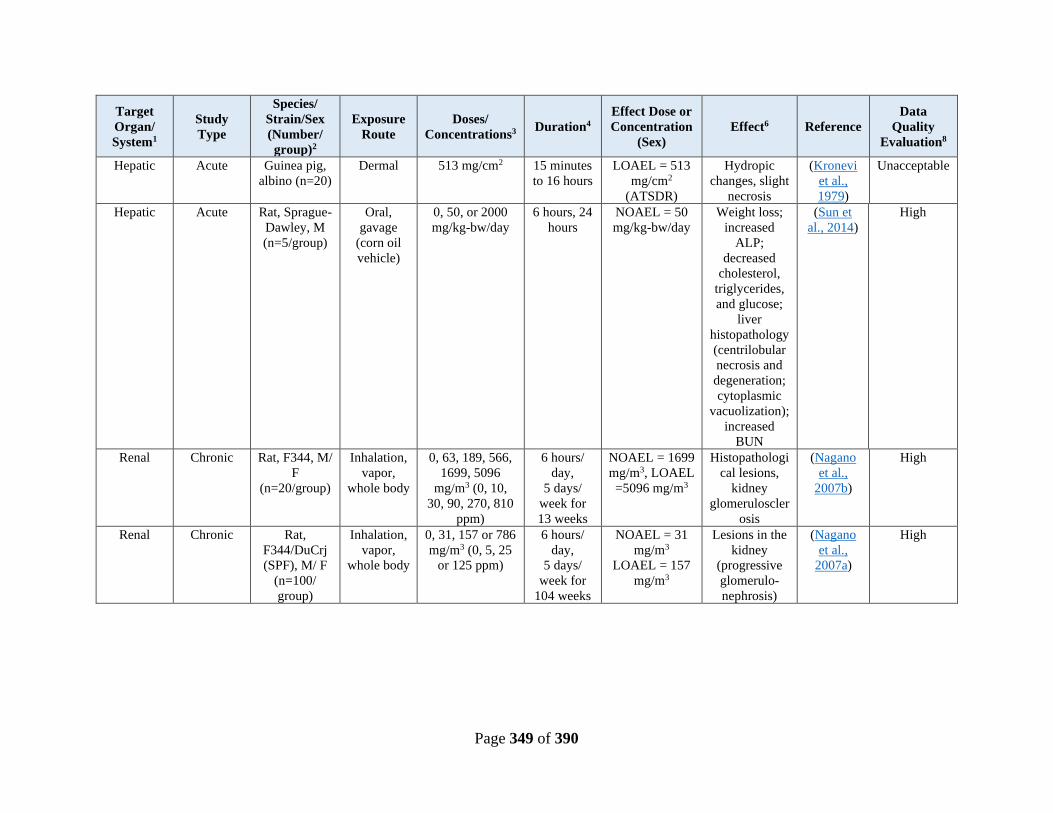
Page 349 of 390
Target
Organ/
System1
Study
Type
Species/
Strain/Sex
(Number/
group)2
Exposure
Route
Doses/
Concentrations3 Duration4
Effect Dose or
Concentration
(Sex)
Effect6 Reference
Data
Quality
Evaluation8
Hepatic Acute Guinea pig,
albino (n=20)
Dermal 513 mg/cm2 15 minutes
to 16 hours
LOAEL = 513
mg/cm2
(ATSDR)
Hydropic
changes, slight
necrosis
(Kronevi
et al.,
1979)
Unacceptable
Hepatic Acute Rat, Sprague-
Dawley, M
(n=5/group)
Oral,
gavage
(corn oil
vehicle)
0, 50, or 2000
mg/kg-bw/day
6 hours, 24
hours
NOAEL = 50
mg/kg-bw/day
Weight loss;
increased
ALP;
decreased
cholesterol,
triglycerides,
and glucose;
liver
histopathology
(centrilobular
necrosis and
degeneration;
cytoplasmic
vacuolization);
increased
BUN
(Sun et
al., 2014)
High
Renal Chronic Rat, F344, M/
F
(n=20/group)
Inhalation,
vapor,
whole body
0, 63, 189, 566,
1699, 5096
mg/m3 (0, 10,
30, 90, 270, 810
ppm)
6 hours/
day,
5 days/
week for
13 weeks
NOAEL = 1699
mg/m3, LOAEL
=5096 mg/m3
Histopathologi
cal lesions,
kidney
glomeruloscler
osis
(Nagano
et al.,
2007b)
High
Renal Chronic Rat,
F344/DuCrj
(SPF), M/ F
(n=100/
group)
Inhalation,
vapor,
whole body
0, 31, 157 or 786
mg/m3 (0, 5, 25
or 125 ppm)
6 hours/
day,
5 days/
week for
104 weeks
NOAEL = 31
mg/m3
LOAEL = 157
mg/m3
Lesions in the
kidney
(progressive
glomerulo-
nephrosis)
(Nagano
et al.,
2007a)
High

Page 350 of 390
Target
Organ/
System1
Study
Type
Species/
Strain/Sex
(Number/
group)2
Exposure
Route
Doses/
Concentrations3 Duration4
Effect Dose or
Concentration
(Sex)
Effect6 Reference
Data
Quality
Evaluation8
Renal Chronic Mouse,
Crj:BDF1
(SPF), M/ F
(n=100/
group)
Inhalation,
vapor,
whole body
0, 31, 157 or 786
mg/m3 (0, 5, 25
or 125 ppm)
6 hours/
day,
5 days/
week for
104 weeks
NOAEL = 31
mg/m3,
LOAEL = 157
mg/m3
Increased
ALT, AST,
LDH, ALP,
protein, total
bilirubin, and
BUN; lesions
in the kidney
(protein casts);
benign
pheochro-
mocytoma
(males)
(Nagano
et al.,
2007a)
High
Renal Acute (<24
hr)
Rat, Sprague-
Dawley, M
(n=5/group)
Oral,
gavage
(corn oil
vehicle)
Oral, gavage
(corn oil vehicle)
Not
Reported
NOAEL = 50
mg/kg-bw/day
Weight loss;
increased
ALP;
decreased
cholesterol,
triglycerides,
and glucose;
liver
histopathology
(centrilobular
necrosis and
degeneration;
cytoplasmic
vacuolization);
increased
BUN
(Sun et
al., 2014)
High
Skin Other Guinea pig,
albino (n=20)
Dermal 513 mg/cm2 15 minutes
to 16 hours
LOAEL = 513
mg/cm2
Karyopynosis,
spongiosis,
perinuclear
edema
(Kronevi
et al.,
1979)
Unacceptable
Skin Other Guinea pig,
Hartley, M
(n=6/group)
Dermal
(intact and
abraded
skin)
120 mg/kg-
bw/day
Once, 24
hours
LOAEL = 120
mg/kg-bw/day
Primary
irritation
(Roudabus
h et al.,
1965)
Unacceptable
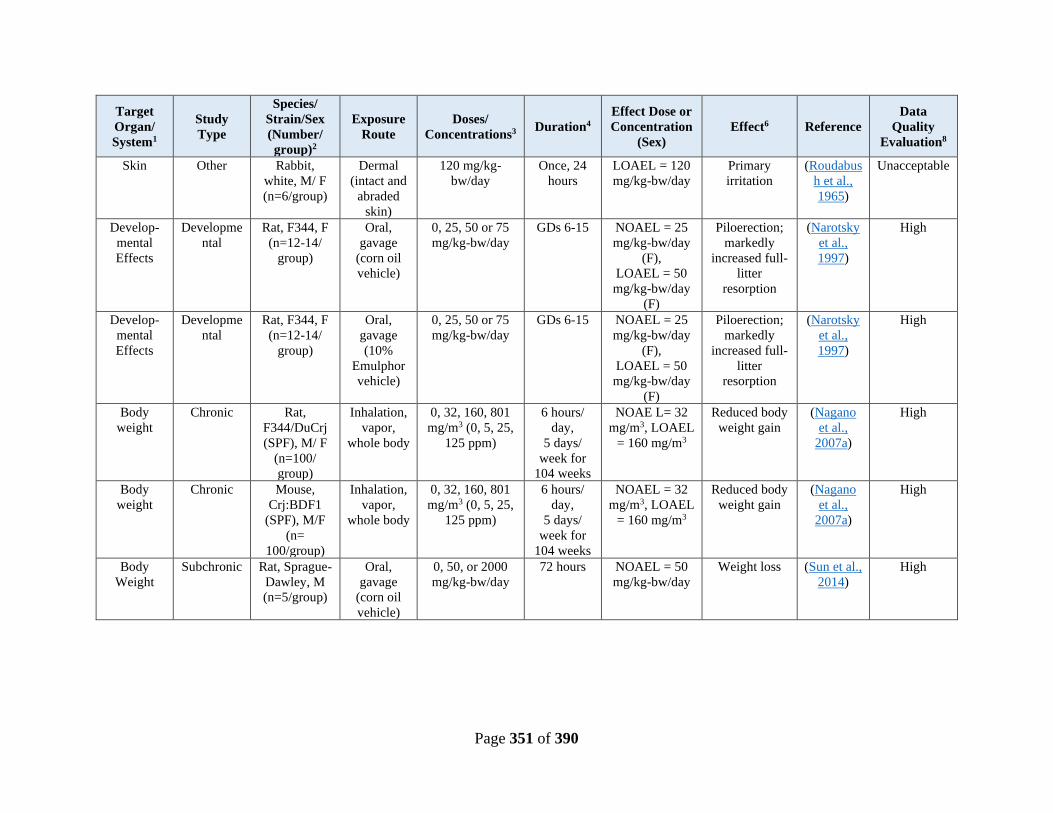
Page 351 of 390
Target
Organ/
System1
Study
Type
Species/
Strain/Sex
(Number/
group)2
Exposure
Route
Doses/
Concentrations3 Duration4
Effect Dose or
Concentration
(Sex)
Effect6 Reference
Data
Quality
Evaluation8
Skin Other Rabbit,
white, M/ F
(n=6/group)
Dermal
(intact and
abraded
skin)
120 mg/kg-
bw/day
Once, 24
hours
LOAEL = 120
mg/kg-bw/day
Primary
irritation
(Roudabus
h et al.,
1965)
Unacceptable
Develop-
mental
Effects
Developme
ntal
Rat, F344, F
(n=12-14/
group)
Oral,
gavage
(corn oil
vehicle)
0, 25, 50 or 75
mg/kg-bw/day
GDs 6-15 NOAEL = 25
mg/kg-bw/day
(F),
LOAEL = 50
mg/kg-bw/day
(F)
Piloerection;
markedly
increased full-
litter
resorption
(Narotsky
et al.,
1997)
High
Develop-
mental
Effects
Developme
ntal
Rat, F344, F
(n=12-14/
group)
Oral,
gavage
(10%
Emulphor
vehicle)
0, 25, 50 or 75
mg/kg-bw/day
GDs 6-15 NOAEL = 25
mg/kg-bw/day
(F),
LOAEL = 50
mg/kg-bw/day
(F)
Piloerection;
markedly
increased full-
litter
resorption
(Narotsky
et al.,
1997)
High
Body
weight
Chronic Rat,
F344/DuCrj
(SPF), M/ F
(n=100/
group)
Inhalation,
vapor,
whole body
0, 32, 160, 801
mg/m3 (0, 5, 25,
125 ppm)
6 hours/
day,
5 days/
week for
104 weeks
NOAE L= 32
mg/m3, LOAEL
= 160 mg/m3
Reduced body
weight gain
(Nagano
et al.,
2007a)
High
Body
weight
Chronic Mouse,
Crj:BDF1
(SPF), M/F
(n=
100/group)
Inhalation,
vapor,
whole body
0, 32, 160, 801
mg/m3 (0, 5, 25,
125 ppm)
6 hours/
day,
5 days/
week for
104 weeks
NOAEL = 32
mg/m3, LOAEL
= 160 mg/m3
Reduced body
weight gain
(Nagano
et al.,
2007a)
High
Body
Weight
Subchronic Rat, Sprague-
Dawley, M
(n=5/group)
Oral,
gavage
(corn oil
vehicle)
0, 50, or 2000
mg/kg-bw/day
72 hours NOAEL = 50
mg/kg-bw/day
Weight loss (Sun et al.,
2014)
High
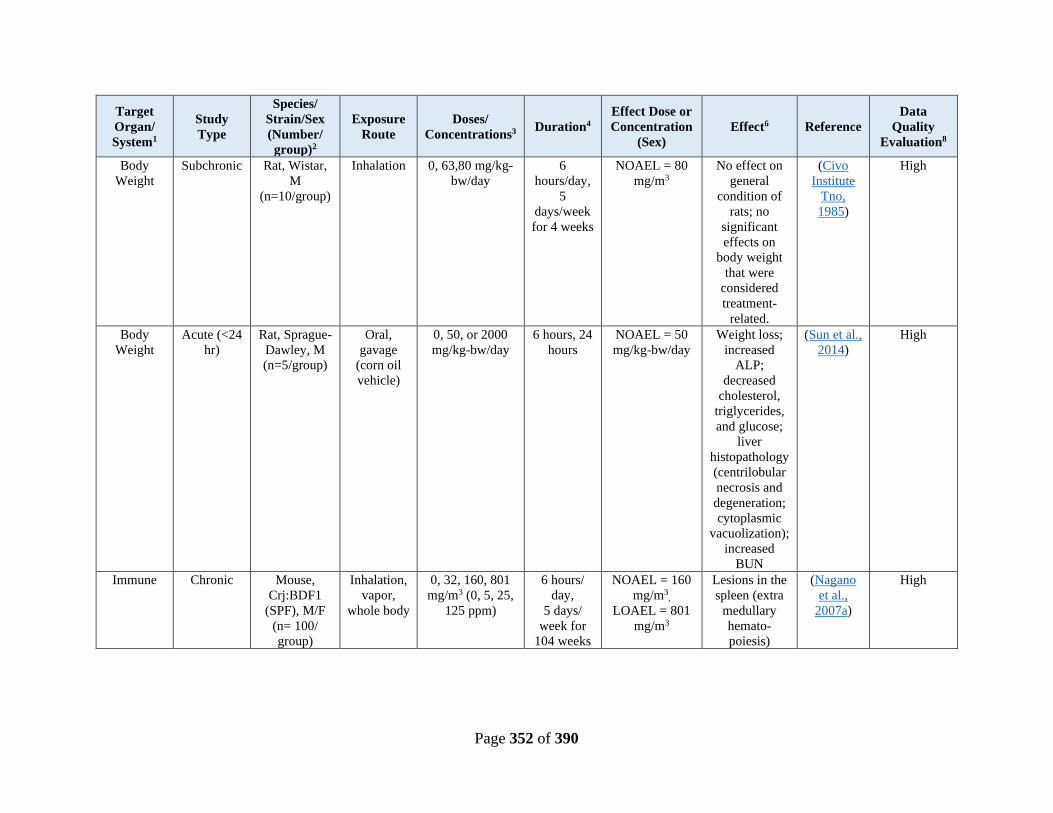
Page 352 of 390
Target
Organ/
System1
Study
Type
Species/
Strain/Sex
(Number/
group)2
Exposure
Route
Doses/
Concentrations3 Duration4
Effect Dose or
Concentration
(Sex)
Effect6 Reference
Data
Quality
Evaluation8
Body
Weight
Subchronic Rat, Wistar,
M
(n=10/group)
Inhalation 0, 63,80 mg/kg-
bw/day
6
hours/day,
5
days/week
for 4 weeks
NOAEL = 80
mg/m3
No effect on
general
condition of
rats; no
significant
effects on
body weight
that were
considered
treatment-
related.
(Civo
Institute
Tno,
1985)
High
Body
Weight
Acute (<24
hr)
Rat, Sprague-
Dawley, M
(n=5/group)
Oral,
gavage
(corn oil
vehicle)
0, 50, or 2000
mg/kg-bw/day
6 hours, 24
hours
NOAEL = 50
mg/kg-bw/day
Weight loss;
increased
ALP;
decreased
cholesterol,
triglycerides,
and glucose;
liver
histopathology
(centrilobular
necrosis and
degeneration;
cytoplasmic
vacuolization);
increased
BUN
(Sun et al.,
2014)
High
Immune Chronic Mouse,
Crj:BDF1
(SPF), M/F
(n= 100/
group)
Inhalation,
vapor,
whole body
0, 32, 160, 801
mg/m3 (0, 5, 25,
125 ppm)
6 hours/
day,
5 days/
week for
104 weeks
NOAEL = 160
mg/m3,
LOAEL = 801
mg/m3
Lesions in the
spleen (extra
medullary
hemato-
poiesis)
(Nagano
et al.,
2007a)
High

Page 353 of 390
Table G-2. Summary of Reviewed Genotoxicity Studies for Carbon Tetrachloride
Target
Organ/
System
Study
Type
Species/Strain/C
ell Type
(Number/group
if relevant)
Exposure
Route
Doses/
Concentrations Duration
Effect
Concentration/
Result
Effect Measured Reference Data Quality
Evaluation
Genotoxi
city
Acute Mouse
lymphoma
L5178/TK+/-
cells
In vitro 0, 4.38, 6.55, 8.76
mmol/L (+S9)
3 hours Positive at 6.55
and 8.76 mmol/La
(at relative
toxicities of 6%
and 16%,
respectively)
Alkaline
unwinding of
DNA (ratio of
ssDNA and
dsDNA); cell
viability
(Garberg et
al., 1988)
Unacceptable
Genotoxi
city
Acute Salmonella
typhimurium
strains TA 98,
TA 100, TA
1535, TA 1537
<3 replicates
/group
In vitro 0, 0.005, 0.01, 0.05,
0.1, 0.2, 0.5, 1, 2,
5% (±S9)b
24 hours Weakly positivec
in TA 98 (-S9) at
≥ 1%; negative in
TA 98 (+S9);
negative in TA
100, TA 1535,
and TA 1537 (±
S9)
Reverse mutation
(gas exposure
method)
(Araki et al.,
2004)
High
Genotoxi
city
Acute Escherichia coli
strains
WP2/uvrA/pKM
101,
WP2/pKM101
<3 replicates
/group
In vitro 0, 0.005, 0.01, 0.05,
0.1, 0.2, 0.5, 1, 2,
5% (±S9)b
24 hours Weakly positivec
at 2% in
WP2/uvrA/pKM1
01 (±S9); positive
at ≥ 0.1% (-S9)
and ≥ 0.2% (+S9)
in WP2/pKM101d
Reverse mutation
(gas exposure
method)
(Araki et al.,
2004)
High
a The test substance was positive at toxic concentrations only. However, the criteria for a positive response in this assay included increases in the relative fraction of ssDNA that is
greater than the increase in relative toxicity (at toxicities of 5% to 50%), if this occurs at two or more concentrations. b Tests were also conducted with glutathione-supplemented S9 mix. c A result was considered positive if a two-fold increase in the number of revertants was observed. d Data for E.coli strain WP2/pKM101 were based on <3 measurements (statistical analyses were not performed).
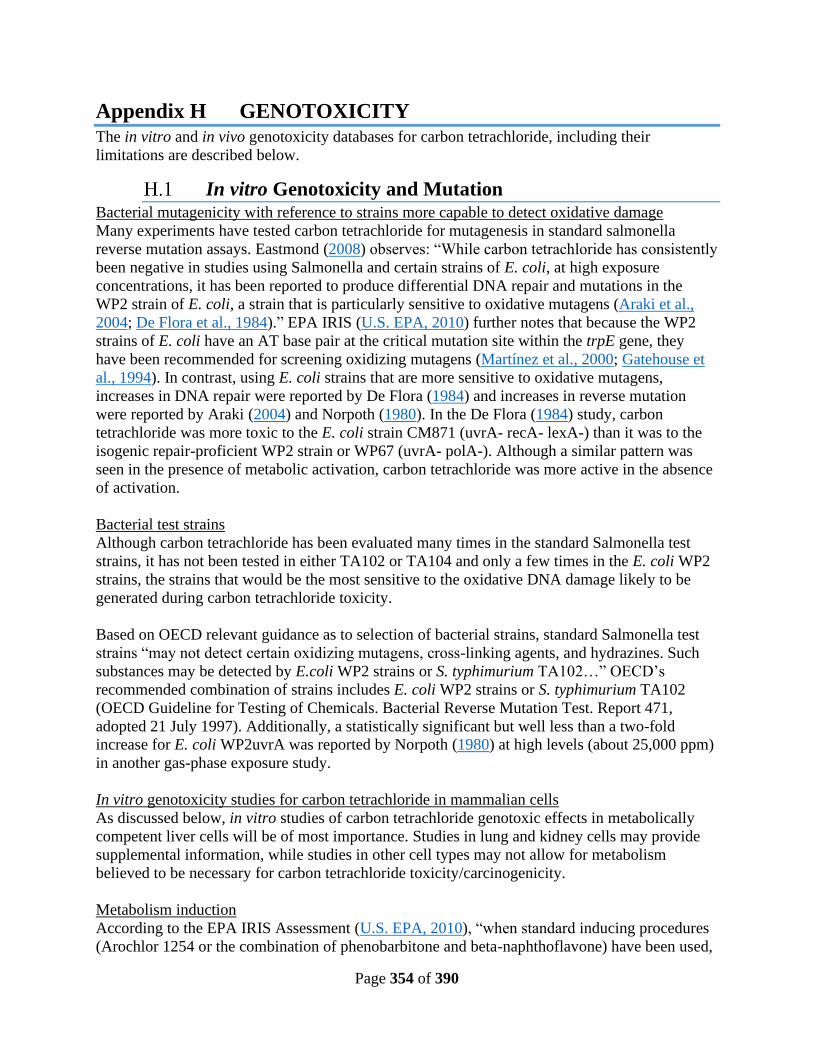
Page 354 of 390
Appendix H GENOTOXICITY
The in vitro and in vivo genotoxicity databases for carbon tetrachloride, including their
limitations are described below.
In vitro Genotoxicity and Mutation Bacterial mutagenicity with reference to strains more capable to detect oxidative damage
Many experiments have tested carbon tetrachloride for mutagenesis in standard salmonella
reverse mutation assays. Eastmond (2008) observes: “While carbon tetrachloride has consistently
been negative in studies using Salmonella and certain strains of E. coli, at high exposure
concentrations, it has been reported to produce differential DNA repair and mutations in the
WP2 strain of E. coli, a strain that is particularly sensitive to oxidative mutagens (Araki et al.,
2004; De Flora et al., 1984).” EPA IRIS (U.S. EPA, 2010) further notes that because the WP2
strains of E. coli have an AT base pair at the critical mutation site within the trpE gene, they
have been recommended for screening oxidizing mutagens (Martínez et al., 2000; Gatehouse et
al., 1994). In contrast, using E. coli strains that are more sensitive to oxidative mutagens,
increases in DNA repair were reported by De Flora (1984) and increases in reverse mutation
were reported by Araki (2004) and Norpoth (1980). In the De Flora (1984) study, carbon
tetrachloride was more toxic to the E. coli strain CM871 (uvrA- recA- lexA-) than it was to the
isogenic repair-proficient WP2 strain or WP67 (uvrA- polA-). Although a similar pattern was
seen in the presence of metabolic activation, carbon tetrachloride was more active in the absence
of activation.
Bacterial test strains
Although carbon tetrachloride has been evaluated many times in the standard Salmonella test
strains, it has not been tested in either TA102 or TA104 and only a few times in the E. coli WP2
strains, the strains that would be the most sensitive to the oxidative DNA damage likely to be
generated during carbon tetrachloride toxicity.
Based on OECD relevant guidance as to selection of bacterial strains, standard Salmonella test
strains “may not detect certain oxidizing mutagens, cross-linking agents, and hydrazines. Such
substances may be detected by E.coli WP2 strains or S. typhimurium TA102…” OECD’s
recommended combination of strains includes E. coli WP2 strains or S. typhimurium TA102
(OECD Guideline for Testing of Chemicals. Bacterial Reverse Mutation Test. Report 471,
adopted 21 July 1997). Additionally, a statistically significant but well less than a two-fold
increase for E. coli WP2uvrA was reported by Norpoth (1980) at high levels (about 25,000 ppm)
in another gas-phase exposure study.
In vitro genotoxicity studies for carbon tetrachloride in mammalian cells
As discussed below, in vitro studies of carbon tetrachloride genotoxic effects in metabolically
competent liver cells will be of most importance. Studies in lung and kidney cells may provide
supplemental information, while studies in other cell types may not allow for metabolism
believed to be necessary for carbon tetrachloride toxicity/carcinogenicity.
Metabolism induction
According to the EPA IRIS Assessment (U.S. EPA, 2010), “when standard inducing procedures
(Arochlor 1254 or the combination of phenobarbitone and beta-naphthoflavone) have been used,

Page 355 of 390
the levels of CYP2E1 in the rat liver are markedly suppressed (Burke et al., 1994). This would
lead to a decrease in CYP2E1 in the S9 used for the test and could potentially contribute to the
observed negative results.” However, mammalian cell test strains using lymphocytes, ovary
cells, lung cells, or kidney cells may not closely resemble liver cells in the ability to metabolize
carbon tetrachloride. The kidney and lung do have P450 metabolic capability that has been
evaluated for carbon tetrachloride and this has been used in the development of PBPK models.
Using in vitro measurements with p-nitrophenol as a reference compound, (Yoon et al., 2007)
has estimated CYP2E1 activity (Vmax – nmole/min/g) in the lung and kidney as approximately
6% and 5% of that in the liver. Accordingly, cells from these other tissues may not be similar to
liver cells in the metabolism of carbon tetrachloride.
Mammalian cell mutagenesis tests
There are no mutagenesis tests identified in mammalian liver, kidney or lung cells in vitro.
OECD now recommends in vitro mammalian cell gene mutation tests using the hprt or xprt
genes (OECD TG 476). The OECD cited tests include lung cell lines (V79 and CHL) that could
be examined for CYP2E1 competence.
Chromosomal changes
In the absence of mutation studies, the current review focuses on chromosomal aberration and
micronucleus studies in mammalian cells in vitro – using cells from (1) liver, (2) kidney, or lung
which also show some CYP2E1 activity, or (3) cells with CYP2E1 capability is added. These are
extracted from EPA IRIS Assessment (U.S. EPA, 2010) below.

Page 356 of 390
Table H-1. Bacterial mutagenesis data in systems believed relevant to detection of oxidative damage to DNA – excerpted from the
EPA IRIS Assessment
“+” = positive results; “-” = negative results; “±” = equivocal or weakly positive; “ND” = No Data a Results similar with or without GSH added to the S9 mix. Positive response is based on the magnitude of response as statistical analyses were not performed.
Test system Endpoint Test conditions
Results
with
metabolic
activation
Results
without
metabolic
activation
Reference
Escherichia coli
WP2uvrA/pKM101
Reverse mutation Gas phase exposure in a gas
sampling bag for 24 hrs
± ± 10,000 ppm (Araki et al.,
2004)
E. coli WP2/pKM101 Reverse mutation Gas phase exposure in a gas
sampling bag for 24 hrs
+ +a 5,000 ppm (Araki et al.,
2004)
E. coli WP2uvrA Reverse mutation Gas phase exposure in a
desiccator
ND ± 25,000 ppm (Norpoth et al.,
1980)
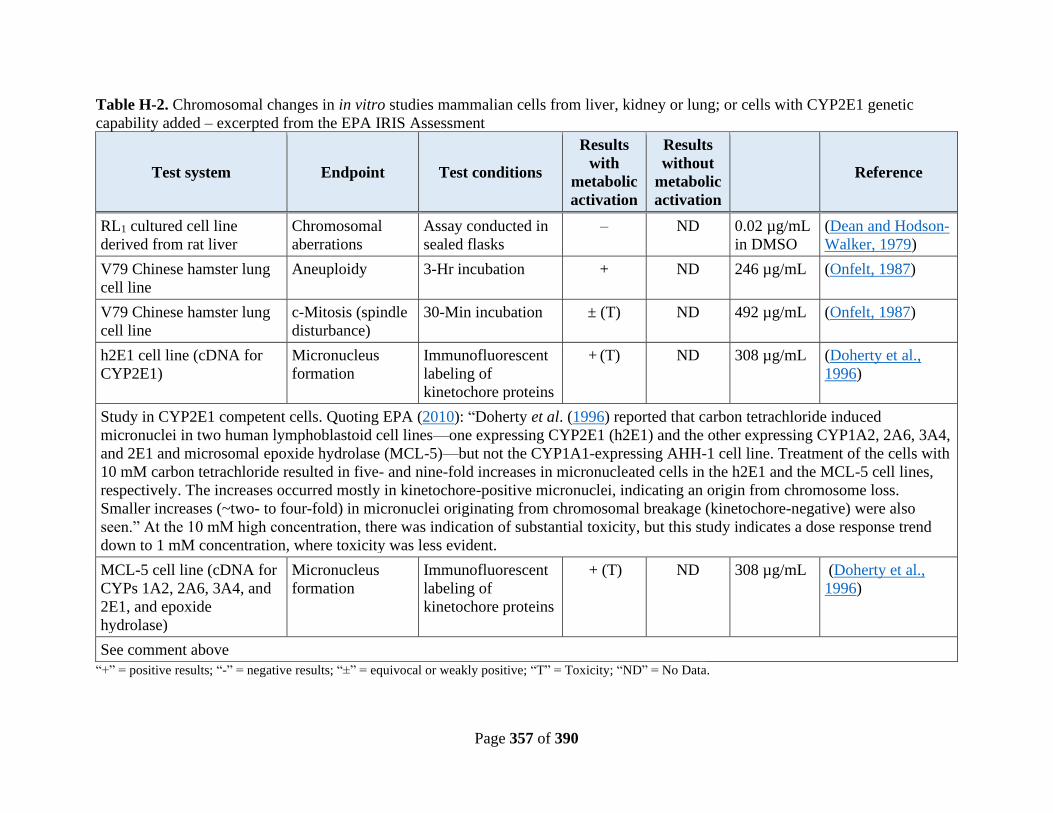
Page 357 of 390
Table H-2. Chromosomal changes in in vitro studies mammalian cells from liver, kidney or lung; or cells with CYP2E1 genetic
capability added – excerpted from the EPA IRIS Assessment
Test system Endpoint Test conditions
Results
with
metabolic
activation
Results
without
metabolic
activation
Reference
RL1 cultured cell line
derived from rat liver
Chromosomal
aberrations
Assay conducted in
sealed flasks
– ND 0.02 µg/mL
in DMSO
(Dean and Hodson-
Walker, 1979)
V79 Chinese hamster lung
cell line
Aneuploidy 3-Hr incubation + ND 246 µg/mL (Onfelt, 1987)
V79 Chinese hamster lung
cell line
c-Mitosis (spindle
disturbance)
30-Min incubation ± (T) ND 492 µg/mL (Onfelt, 1987)
h2E1 cell line (cDNA for
CYP2E1)
Micronucleus
formation
Immunofluorescent
labeling of
kinetochore proteins
+ (T) ND 308 µg/mL (Doherty et al.,
1996)
Study in CYP2E1 competent cells. Quoting EPA (2010): “Doherty et al. (1996) reported that carbon tetrachloride induced
micronuclei in two human lymphoblastoid cell lines—one expressing CYP2E1 (h2E1) and the other expressing CYP1A2, 2A6, 3A4,
and 2E1 and microsomal epoxide hydrolase (MCL-5)—but not the CYP1A1-expressing AHH-1 cell line. Treatment of the cells with
10 mM carbon tetrachloride resulted in five- and nine-fold increases in micronucleated cells in the h2E1 and the MCL-5 cell lines,
respectively. The increases occurred mostly in kinetochore-positive micronuclei, indicating an origin from chromosome loss.
Smaller increases (~two- to four-fold) in micronuclei originating from chromosomal breakage (kinetochore-negative) were also
seen.” At the 10 mM high concentration, there was indication of substantial toxicity, but this study indicates a dose response trend
down to 1 mM concentration, where toxicity was less evident.
MCL-5 cell line (cDNA for
CYPs 1A2, 2A6, 3A4, and
2E1, and epoxide
hydrolase)
Micronucleus
formation
Immunofluorescent
labeling of
kinetochore proteins
+ (T) ND 308 µg/mL (Doherty et al.,
1996)
See comment above
“+” = positive results; “-” = negative results; “±” = equivocal or weakly positive; “T” = Toxicity; “ND” = No Data.
Page 358 of 390
In vivo Genotoxicity Mutation studies
Three studies using the lacL or lacZ genes in the liver in transgenic mice are available and
reported negative or inconclusive results. These studies use single or in one case five exposures
to carbon tetrachloride, a limitation for a study methodology in which longer term exposures are
generally recommended. Additionally, two studies reported an increase in mutation frequency
after single exposures, increases that while limited in magnitude, indicate a need for more
definitive studies.
Chromosomal studies
Two studies reported positive results in micronucleus experiments, while two others were
negative. Two studies of chromosomal aberration or damage after single high dose carbon
tetrachloride exposures were negative. Use of maximal doses may not increase (or even reduce)
sensitivity due to reduction of CYP2E1 activity with high carbon tetrachloride doses.
DNA breakage
A number of in vivo comet and other DNA breakage assays have been performed with rodent
liver cell lines and appear mostly, but not uniformly, negative. These studies were primarily
conducted using high single dose injection or gavage dosing. There are general reservations
about interpreting DNA breakage data in the presence of toxicity. OECD Test Guideline 489
notes that “Fragmentation of the DNA can be caused not only by chemically-induced
genotoxicity, but also during the process of cell death, i.e., apoptosis and necrosis. It is difficult
to distinguish between genotoxicity and apoptosis/necrosis by the shape of the nucleus and
comet tail after electrophoresis…”
Unscheduled DNA Synthesis (UDS)
A number of rodent experiments assessed UDS in the liver, generally after single oral or
injection exposures. Test results were generally, but not uniformly, negative. OECD test
guideline 486 notes that the UDS test responds positively only to substances that induce DNA
damage that is repaired by nucleotide excision repair. It is not clear that this is a sensitive test for
potential carbon tetrachloride induced DNA damage, including oxidative damage. The OECD
guideline also comments that “The UDS test should not be considered as a surrogate test for a
gene mutation test.”
Summary of in vivo genotoxicity evidence
Optimal in vivo studies of carbon tetrachloride mutagenesis or chromosomal alterations are not
available. While the available in vivo database does not on balance demonstrate carbon
tetrachloride genotoxicity, neither does it represent a fully sensitive body of studies to test for
such effects.
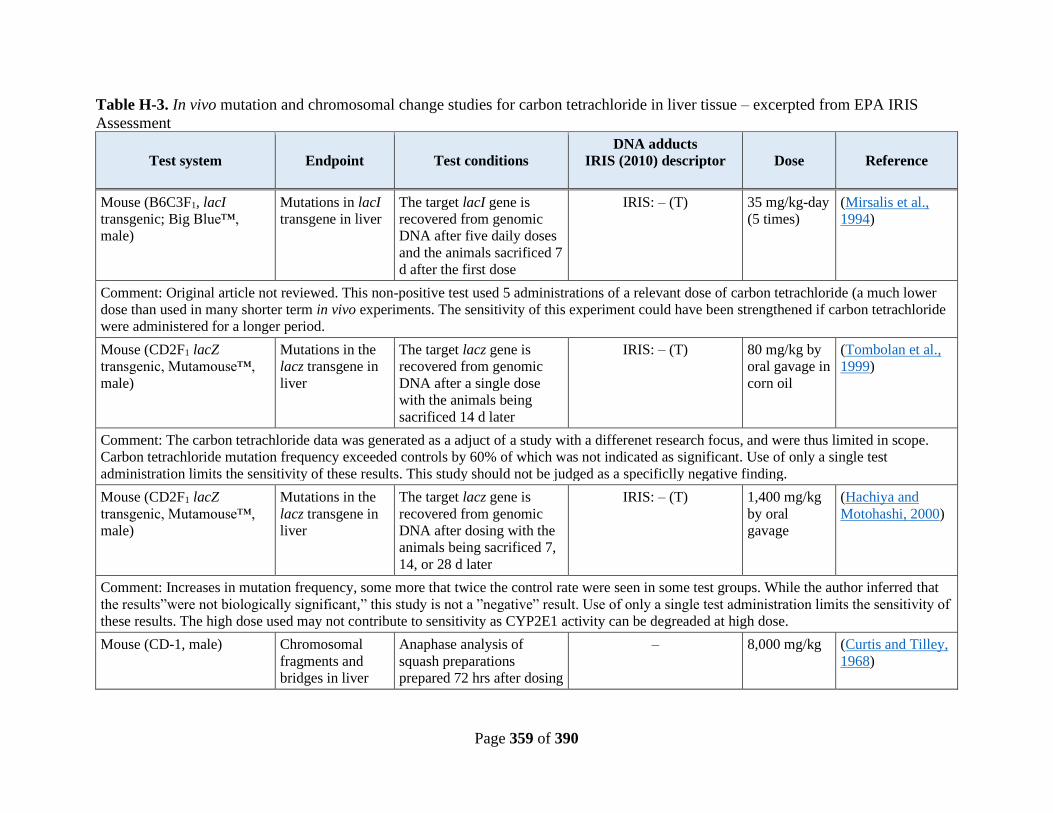
Page 359 of 390
Table H-3. In vivo mutation and chromosomal change studies for carbon tetrachloride in liver tissue – excerpted from EPA IRIS
Assessment
Test system Endpoint Test conditions
DNA adducts
IRIS (2010) descriptor
Dose Reference
Mouse (B6C3F1, lacI
transgenic; Big Blue™,
male)
Mutations in lacI
transgene in liver
The target lacI gene is
recovered from genomic
DNA after five daily doses
and the animals sacrificed 7
d after the first dose
IRIS: – (T) 35 mg/kg-day
(5 times)
(Mirsalis et al.,
1994)
Comment: Original article not reviewed. This non-positive test used 5 administrations of a relevant dose of carbon tetrachloride (a much lower
dose than used in many shorter term in vivo experiments. The sensitivity of this experiment could have been strengthened if carbon tetrachloride
were administered for a longer period.
Mouse (CD2F1 lacZ
transgenic, Mutamouse™,
male)
Mutations in the
lacz transgene in
liver
The target lacz gene is
recovered from genomic
DNA after a single dose
with the animals being
sacrificed 14 d later
IRIS: – (T)
80 mg/kg by
oral gavage in
corn oil
(Tombolan et al.,
1999)
Comment: The carbon tetrachloride data was generated as a adjuct of a study with a differenet research focus, and were thus limited in scope.
Carbon tetrachloride mutation frequency exceeded controls by 60% of which was not indicated as significant. Use of only a single test
administration limits the sensitivity of these results. This study should not be judged as a specificlly negative finding.
Mouse (CD2F1 lacZ
transgenic, Mutamouse™,
male)
Mutations in the
lacz transgene in
liver
The target lacz gene is
recovered from genomic
DNA after dosing with the
animals being sacrificed 7,
14, or 28 d later
IRIS: – (T)
1,400 mg/kg
by oral
gavage
(Hachiya and
Motohashi, 2000)
Comment: Increases in mutation frequency, some more that twice the control rate were seen in some test groups. While the author inferred that
the results”were not biologically significant,” this study is not a ”negative” result. Use of only a single test administration limits the sensitivity of
these results. The high dose used may not contribute to sensitivity as CYP2E1 activity can be degreaded at high dose.
Mouse (CD-1, male) Chromosomal
fragments and
bridges in liver
Anaphase analysis of
squash preparations
prepared 72 hrs after dosing
– 8,000 mg/kg (Curtis and Tilley,
1968)

Page 360 of 390
Test system Endpoint Test conditions
DNA adducts
IRIS (2010) descriptor
Dose Reference
Rat (F344, male) Chromosomal
aberrations in
liver
Analyzed primary
hepatocytes cultured for 48
hrs from rats sacrificed 0–
72 hrs after dosing
– 1,600 mg/kg
by oral
gavage in
corn oil
(Sawada et al.,
1991)
Rat (F344, male) Micronucleus
formation in liver
Analyzed primary
hepatocytes cultured for 48
hrs from rats sacrificed 0–
72 hrs after dosing
– 1,600 mg/kg
by oral
gavage in
corn oil
(Sawada et al.,
1991)
Rat (Wistar, male) Micronucleus
formation in liver
Analyzed primary
hepatocytes harvested 72
hrs after dosing, an optimal
time to detect micronuclei.
± (T) 3,200 mg/kg
by oral
gavage in
corn oil
(Van Goethem et
al., 1993)
Rat (Wistar, male) Micronucleus
formation in liver
Analyzed primary
hepatocytes harvested 72
hrs after dosing, an optimal
time to detect micronuclei.
Increase was in both
centromere-lacking (5.5-
fold) and centromere-
containing (3.6-fold)
micronuclei.
+ (T) 3,200 mg/kg
by oral
gavage in
corn oil
(Van Goethem et
al., 1995)
Mouse (CBAxC575BL/6,
male)
Micronucleus
formation and
ploidy levels in
liver
Analyzed primary
hepatocytes from rats
sacrificed 5 d after dosing
and compared with a
partially hepatectomized
control.
– 15-Min
inhalation at
0.05–
0.1 mL/5 L
(Uryvaeva and
Delone, 1995)
“+” = positive results; “-” = negative results; “±” = equivocal or weakly positive; “T” = Toxicity
Page 361 of 390
Appendix I CANCER MOA ANALYSIS FOR LIVER AND
ADRENAL TUMORS
Cancer MOA Analysis for Liver Tumors
The MOA for carbon tetrachloride-induced liver tumors is supported by experimental evidence
which is presented below for each of the key events in the MOA as stated above. The evidence in
support of the MOA for carbon tetrachloride-induced liver tumors is summarized below from the
2010 IRIS Toxicological Review for carbon tetrachloride.
1) Metabolism to the trichloromethyl radical by CYP2E1 and subsequent formation of the
trichloromethyl peroxy radical
The metabolism of carbon tetrachloride to trichloromethyl and trichloromethyl peroxy radicals is
an obligatory step in carbon tetrachloride’s MOA. There is considerable evidence that the initial
step in biotransformation of carbon tetrachloride is reductive dehalogenation: reductive cleavage
of one carbon-chlorine bond to yield chloride ion and the trichloromethyl radical (Reinke and
Janzen, 1991; Tomasi et al., 1987; Mccay et al., 1984; Mico and Pohl, 1983; Slater, 1982; Poyer
et al., 1980; Lai et al., 1979; Poyer et al., 1978). The fate of the trichloromethyl radical is
dependent on the availability of oxygen and includes several alternative pathways for anaerobic
or aerobic conditions. Under aerobic conditions, the trichloromethyl radical can be trapped by
oxygen to form the trichloromethyl peroxy radical, which can bind to tissue proteins (Galelli and
Castro, 1998; Packer et al., 1978) or decompose to form phosgene (COCl2) (Pohl et al., 1984)
and an electrophilic form of chlorine (Pohl et al., 1984). The trichloromethyl peroxy radical is
the primary initiator of lipid peroxidation that occurs from exposure to carbon tetrachloride (Boll
et al., 2001; Mccay et al., 1984; Rao and Recknagel, 1969).
Further support for metabolism of carbon tetrachloride as a key event is based on the following:
(1) reactive metabolites are present in the liver (Stoyanovsky and Cederbaum, 1999; Connor et
al., 1986), (2) CYP450 inhibitors prevent carbon tetrachloride-induced liver damage (Martínez et
al., 1995; Letteron et al., 1990; Mourelle et al., 1988; Bechtold et al., 1982; Weddle et al., 1976),
(3) treatment of knockout mice specific for CYP2El (cyp2el-/-) with carbon tetrachloride does
not result in hepatocellular cytotoxicity as compared to wild type (cyp2el+/+) mice, and (4)
treatment with compounds that induce CYP450s result in potentiating effects to carbon
tetrachloride-induced toxicity.
2) Radical-induced mechanisms leading to hepatocellular cytotoxicity
Under aerobic conditions, the trichloromethyl radical is converted to the more reactive
trichloromethyl peroxy radical. The trichloromethyl peroxy radical can attack polyenoic
(polyunsaturated) fatty acids in the cellular membrane, forming fatty acid free radicals that
initiate subsequent autocatalytic lipid peroxidation through a chain reaction.
Numerous studies have demonstrated the occurrence of lipid peroxidation following carbon
tetrachloride exposure, either by detection of conjugated dienes (a characteristic marker of lipid

Page 362 of 390
peroxidation) in liver lipids (Tribble et al., 1987; Lee et al., 1982; Recknagel and Glende, 1973;
Rao and Recknagel, 1969), increased exhalation of ethane or pentane (end degradation products
of peroxidized Τ-3 and Τ-6 polyunsaturated fatty acids, respectively) in treated rats (Younes and
Siegers, 1985; Gee et al., 1981), or occurrence of reactive aldehydes, such as malonaldehyde and
4-hydroxyalkenals, frequently measured as thiobarbituric acid-reactive substances (TBARS) (De
Zwart et al., 1997; Gassó et al., 1996; Ichinose et al., 1994; Fraga et al., 1987; Comporti, 1985;
Comporti et al., 1984). TBARS form when the oxidation of the fatty acid progresses from the
hydroperoxide, facilitated by the oxidation of Fe2+ to Fe3+ in a Fenton reaction, leading to breaks
in the fatty acid chain and the formation of aldehydes from the fatty acid fragments (Klaassen,
1986). Among the many different aldehydes formed from lipid peroxidation are 4-
hydroxynonenal and malondialdehyde.
Evidence of the relationship between hepatotoxicity and lipid peroxidation was also reported by
(Younes and Siegers, 1985). These researchers found that administration of an iron-chelating
agent, deferoxamine, suppressed both lipid peroxidation (ethane exhalation) and hepatotoxicity
(serum ALT and SDH levels) in GSH-depleted mice treated with carbon tetrachloride. This
result suggests that the observed hepatotoxic effect was secondary to lipid peroxidation.
Administration of the antioxidant vitamin E (α-tocopherol) was shown to reduce lipid
peroxidation (pentane exhalation) and metabolism (chloroform generation) in another rat study
(Gee et al., 1981).
3) Sustained regenerative and proliferative changes in the liver in response to hepatotoxicity
As summarized below, several subchronic inhalation and oral studies demonstrate that carbon
tetrachloride produces hepatic toxicity and regenerative responses. In rodents exposed to carbon
tetrachloride vapor for 12 weeks to 6 months, LOAELs for tissue damage were reported at
concentrations ranging from 4 to 42 ppm (adjusted to continuous exposure) and for hyperplasia/
regeneration at concentrations ranging from 4 to 20 ppm (adjusted). Thus, results of subchronic
exposure studies are consistent with results of the Nagano study in rats, showing cytotoxicity at
≥10 ppm (≥2 ppm adjusted) and hyperplasia/proliferation at ≥30 ppm (≥5.4 ppm adjusted) after
13 weeks of exposure (Nagano et al., 2007b) and cytotoxicity and hyperplasia/regeneration at
≥25 ppm (≥4.5 ppm adjusted) after 104 weeks of exposure (Nagano et al., 2007a). In rats and
mice exposed orally to carbon tetrachloride for 12–17 weeks, LOAELs for tissue necrosis ranged
from 8.6 to 80 mg/kg-d and for hyperplasia/regeneration ranged from 12 to 71 mg/kg-d.
Durations of the subchronic studies were too short to evaluate tumor formation; thus, data from
subchronic studies do not allow for further definition of the dose-response relationship and time
course for cytotoxicity and tumor formation.

Page 363 of 390
Table I-1. Subchronic and Chronic Inhalation and Oral Studies Showing that Carbon
Tetrachloride Produces Hepatic Toxicity and Regenerative Responses
Species Exposure
Regimen
Hepatic
Effects
Hyperplasia/
Regenerative
Effects
Reference
Sprague-Dawley
rat
Oral, 12 weeks,
24 mg/kg/day
Necrosis Bile duct
hyperplasia
(Bruckner et al., 1986)
Fischer 344 rat Oral, 12 weeks,
14 mg/kg/day
Necrosis (Allis et al., 1990)
Sprague-Dawley
rat (male)
Oral, 13 weeks,
71/mg/kg/day
Necrosis Nodular
hepatic, bile
duct, and oval
cell hyperplasia
(Koporec et al., 1995)
CD-1 mouse Oral, 13 wks
12 mg/kg-d
Necrosis Bile duct
hyperplasia
(Hayes et al., 1986)
CD-1 mouse Oral, 12 wks
8.6 mg/kg/day
Necrosis (Condie et al., 1986)
Strain A mouse Oral, 120 d (30
doses)
80 mg/kg/day
Necrosis (Eschenbrenner and
Miller, 1946)
B6C3F1 mouse
Oral, 78 wks,
892 mg/kg/day
Bile duct
proliferation
(NCI, 1977, 1976a, b)
Fischer 344 rat
(male)
Inhalation, 12
wks
18 ppm
Necrosis BrdU-negative
hepatocytes
(Benson and Springer,
1999)
B6C3F1 mouse
(male)
Inhalation, 12
wks
4 ppm
Necrosis BrdU-positive
hepatocytes
(Benson and Springer,
1999)
Syrian hamster
(male)
Inhalation, 12
wks
18 ppm
Necrosis BrdU-positive
hepatocytes
(Benson and Springer,
1999)
Wistar rat Inhalation, 6
months
42 ppm
Necrosis (Adams et al., 1952)
Hartley guinea
pig
Inhalation, 13
wks
10 ppm
(continuous)
Hepatocellular
degeneration
Hepatocellular
regeneration
(Prendergast, 1967)

Page 364 of 390
Hartley guinea
pig; Sprague-
Dawley or Long-
Evans rat
Inhalation, 6 wks
20 ppm
Necrosis,
hepatocellular
degeneration
Hepatocellular
regeneration,
bile duct
proliferation
(Prendergast, 1967)
Fischer 344 rat Inhalation, 13
wks
2 ppm
Mitosis, bile
duct
proliferation,
foci
(Nagano et al., 2007b)
BDF1 mouse Inhalation, 13
wks
5–48 ppm
Bile duct
proliferation: 5
ppm, female; 16
ppm, male;
mitosis: 16
ppm, male; 48
ppm, female;
foci: 48 ppm
both sexes
(Nagano et al., 2007b)
Fischer 344 rat Inhalation, 104
wks
5–22 ppm
Foci: 5 ppm,
female;
22 ppm, male
(Nagano et al., 2007a)
BDF1 mouse Inhalation, 104
wks
5 ppm
Degeneration
in males;
necrosis in
females
(Nagano et al., 2007a)
Based on the reasonably available information described above, EPA has concluded that there is
significant evidence to support key events (1) and (2) for being broadly responsible for carbon
tetrachloride’s main biological effects and toxicity in the liver.
A complication in this MOA sequence is that CYP450 metabolism of carbon tetrachloride to
reactive radicals and subsequent processes of lipid peroxidation leading to the formation of
additional radicals (linked to carbon tetrachloride through chemical processes, but not direct
metabolites of carbon tetrachloride) could be proposed as a key event for other potential MOAs
that may be considered. Specifically, these reactive radicals have the ability to chemically
interact with DNA, and thus metabolism of carbon tetrachloride would likely be a first step in
hypotheses about potential genotoxic effects of carbon tetrachloride (discussed further below).
Metabolism of carbon tetrachloride to reactive molecules is thus not necessarily probative of the
nature of the subsequent biological effects that lead to the development of cancer. Additionally,
as discussed in some detail in the EPA IRIS Assessment (U.S. EPA, 2010), the specific
biological interactions between the reactive compounds resulting from carbon tetrachloride
Page 365 of 390
exposure and the occurrence of cytotoxicity has itself a complicated and long history in the study
of carbon tetrachloride toxicology. Strong inferences can be made in favor of lipid peroxidation
being the product interaction of carbon tetrachloride metabolites with constituents of
cellular/intracellular lipid membranes and a proximate cause of carbon tetrachloride cytotoxicity.
While other data indicates importance of direct interactions of carbon tetrachloride metabolites
with biomolecules, for example those within the endoplasmic reticulum where highly reactive
carbon tetrachloride metabolites will have direct potential for chemical interactions. Biological
processes subsequent to damage induced by free radical interactions including disruption of
calcium homeostasis have also been proposed as more proximate causes of cytotoxicity, and yet
there remain questions regarding whether, changes in calcium homeostasis are a cause of
cytotoxicity or are themselves the result of cytotoxic processes.
Accordingly, the evaluation of the evidence in support of a cytotoxicity and regenerative
proliferation based MOA for carbon tetrachloride induced liver tumors depends primarily on an
empirical examination of evidence of association of those processes and not on a more detailed
(mechanistic) understanding of the specific biological processes involved in toxicity.
Carbon tetrachloride is one of the most classical liver toxicants in studies using high single or
limited duration dosing (e.g., gavage or intraperitoneal doses in the range of 0.5-5 g/kg-d have
been amply demonstrated to induce acute carbon tetrachloride hepatotoxicity, and indeed are
often used in mechanistic studies specifically as a reliable tool to induce such toxicity. However,
chronic bioassays of carbon tetrachloride tumorigenesis utilize lower doses, e.g., calculated
alveolar inhaled doses of carbon tetrachloride in the Nagano (2007a) cancer bioassay were equal
or less than approximately 100 mg/kg-d in the rat and 200 mg/kg-d in the mouse (calculated for
illustration of magnitude of dose ranges, not as a metric for quantitative risk assessment).
Additionally, while the inhaled carbon tetrachloride delivered in the Nagano (2007a) bioassay
was delivered over a daily period of 6 hours, a larger number of toxicity studies used a gavage
dosing technique which would lead to different dosing dynamics than would an inhalation study.
For example, in a study by Bruckner (1990) peak blood concentrations and hepatotoxicity were
substantially higher in rats receiving gastric bolus doses of carbon tetrachloride than those
receiving more prolonged gastric (both gastric exposures using an aqueous vehicle) or receiving
equivalent calculated alveolar doses of carbon tetrachloride by inhalation exposures. The authors
suggest that caution is needed in inferring comparability of toxicity finding in studies using bolus
administration of carbon tetrachloride versus those using a continuous means of administration.
A subchronic exposure study from the same laboratory (Koporec et al., 1995) reported similar
toxicity for carbon tetrachloride delivered by either corn oil or aqueous gavage infusion.
Accordingly, the review here addressing cancer MOA specifically with reference to the (Nagano
et al., 2007a) inhalation study will focus observations from the major inhalation studies of the
toxicity of this compound and specifically, the Nagano subchronic and chronic bioassays as well
as the subchronic study of (Benson and Springer, 1999).
Accordingly, the focus here is an evaluation of data regarding whether "sustained regenerative
and proliferative changes in the liver in response to hepatotoxicity" is a key event for cancer
development. That is the focused of the analysis on whether the observed compound related
tumors resulted from this hypothesized MOA and its key events. The Cancer Guidelines
framework review if organized as follows:

Page 366 of 390
(1) Describe the empirical data that support the occurrence the proposed key events under
conditions that have been found to be carcinogenic
The (Nagano et al., 2007a) inhalation cancer bioassay is accompanied by the (Nagano et al.,
2007b) subchronic (13 week) toxicity study. This study specifically investigated toxicity in the
same strains of rodents, sourced contemporaneously with the cancer study it represents the most
valuable data on sustained toxic responses. At that time frame, transient effects from acute lower
level exposures will have resolved and may not be relevant to chronic exposures representing
conditions that result from sustained exposures across the animal's lifespans.
The toxicological findings from the cancer bioassay itself while important reflect end of life
phenomena and in the case of carbon tetrachloride a large fraction of the animals in the higher
dose groups developed tumors, sometimes reported to have involved essentially the entire liver,
thus blurring inferences on MOA from liver pathology.
This high incidence of tumors in the Nagano bioassays makes examination of the subchronic
study for both mice and rats important. In these subchronic studies inhaled doses of 10, 30, 90,
270, and 810 ppm were used while the cancer bioassay (again for both sexes and species) used
inhaled doses of 5, 25, and 125 ppm. Thus, while these dose ranges overlap there is not exact
correspondence and the higher doses in the subchronic study far exceed bioassay doses and
higher doses (270 and 810 ppm) may not be informative for effects that occurred in the cancer
bioassay.
For mice the subchronic study reported serum enzymes AST, ALT, and ALP for which elevated
levels can be indicative of liver toxicity and at higher levels infer frank toxicity and cell killing.
In males AST was only elevated (2x or less) in the high dose groups (270 and 810 ppm) and was
not elevated in females. ALT was not elevated in the 10 or 30 ppm groups of either sex but was
significantly elevated (roughly 3x) in both males and females at 90 ppm and increased
moderately at the high concentrations. ALP was significantly, but only slightly increased (<2x)
in male mice at 30 ppm and above and was not significantly elevated in females. Both male and
female mice had high incidence of tumors at 25 and 125 ppm concentrations in (Nagano et al.,
2007a). The serum enzyme markers did not provide a strong indication for sustained cytotoxicity
(or cell death) in those dose ranges.
Histopathological examination in the subchronic study reported cytoplasmic globules and large
droplet fatty change frequently in mice at 10 ppm and above. In female mice these effects were
reported at 30 ppm and above. A phenomenon termed "collapse" was common in both male and
female mice at 30 ppm and above. The authors state that collapse “was characterized by the
shrunken parenchymal tissue over the centrilobular area, presumably resulting from the necrotic
loss of hepatocytes" and note that collapse "was accompanied by both proliferation of the bile
ducts and oval cells and deposition of ceroid-like yellow pigment.”
At high concentrations (270 and 810 ppm) nuclear enlargement with atypia was reported while in
males altered cell foci were seen at these concentrations, with the latter being a potentially
preneoplastic effect rather than an indication of cytotoxicity. More severe liver pathology e.g.,
necrosis or cirrhosis was not reported in these mice. The reported pathology was indicative of
cellular changes due to carbon tetrachloride, but did not indicate ongoing frank cytotoxicity, cell
Page 367 of 390
killing, or regenerative processes. The authors description of the "collapse" phenomenon and
associated bile duct proliferation suggests that some necrotic processes may have occurred in
these animals.
In the (Nagano et al., 2007a) chronic study, AST and ALT were strongly elevated (10x or more
in some cases) in the male and female 25 and 125 ppm test groups; LDH was also significantly
elevated but to a lesser degree as compared with controls. However, liver tumors were prevalent
in these dose groups and may themselves have impacted these results. Liver histopathology in
this study reported presence of ceroid, a yellow pigment, which literature indicates may result
from peroxidation processes but may occur in the absence of necrosis and more severe pathology
(Greaves, 2012). Hydropic change (cellular swelling) was noted in centrilobular hepatocytes at
these doses. Bile duct proliferation, again at the 25 and 125 ppm doses, was significantly
elevated in both sexes, but was more prevalent in the males. Neither necrosis nor cirrhosis was
reported in these mice.
(Benson and Springer, 1999) exposed male mice to 0, 5, 20 or 100 ppm carbon tetrachloride 6
hours/day, 5 days/week - matching the exposure protocol of the Nagano studies but with a
different mouse strain (B6C3F1 as compared to BDF1 used by Nagano). Animals were killed
after 1, 4 and 12 weeks of exposure. The serum enzymes ALT and SDH were reported to be
significantly elevated at all three time points at the 20 and 100 ppm concentration levels. For
these groups ALT levels were generally at least 10x higher than the corresponding controls (only
results for ALT were reported and only in figure form). These authors also used an automated
procedure to estimate fraction of liver area and found that the percent of the hepatic parenchyma
that was necrotic was significantly increased in mice at the 20 and 100 ppm dose levels for all
three time points. Interestingly the strongest results were seen at the 20 ppm dose level at one
week where approximately 12% of the liver was scored as necrotic. By 12 weeks, both the 20
and 100 ppm concentration groups were scored at 3-4% necrotic tissue. Finally, these authors
used a BrdU technique as an indicator of replicating cells. Mice in the 20 and 100 ppm groups
had significantly elevated fractions of cells BrdU positive, with levels at 20 ppm being roughly
5-10 times control levels and 20-30 times control levels at 100 ppm. (Benson and Springer,
1999) reported no significant changes in mice exposed to 5 ppm carbon tetrachloride as
compared with controls.
In summary, results from the (Nagano et al., 2007b) 13-week study provided quite limited
evidence for an ongoing process of cell killing and regeneration without strongly elevated serum
enzymes or observed necrosis, but with proliferative indications from bile duct proliferation and
the authors description of shrunken parenchymal tissue. The (Nagano et al., 2007a) chronic study
reported elevation of liver enzymes in serum and bile duct proliferation but did not report
necrosis. As mentioned, given the high prevalence of tumors in the same dose groups it is not
feasible to interpret the toxicology findings in terms of providing data on key events for cancer
development. The 12-week data from (Benson and Springer, 1999) in a different mouse strain,
by contrast demonstrated strongly elevated serum enzyme levels indicative of cellular
damage/killing at the 20 and 100 ppm dose levels. These results appear to be in conflict with the
Nagano 13-week data which found much less indication of elevated serum levels of liver
enzymes. (Benson and Springer, 1999) also reported a positive scoring of necrotic liver areas (3-
4% by area at 12 weeks) in both the 20 and 100 ppm groups. In addition, these authors measured

Page 368 of 390
an index of cell replication indicating a large increase in replicating hepatocytes at the same dose
levels.
(2) Examine the temporal and dose-response concordance between the measures of proposed
events and observed tumors
A. Temporal concordance.
To prove causality an event must necessarily precede resulting events, and therefore data from
time points prior to the onset of tumors are critical for consideration of a temporal relationship.
For the MOA under consideration, sustained effects on cellular proliferation are hypothesized.
The subchronic duration studies comport well with these needs as both being well before
observed carcinogenesis and reflecting a non-acute, presumably continuing biological process.
Temporal considerations validate the relevance of the comparison between subchronic study
results and carcinogenic processes as presented above. However, the fact that certain biological
effects are observed at ~13 weeks and tumors are observed ~2 years is qualifying rather than
probative of causation - varied biological responses may be seen in a subchronic study without
generally leading to inferences about chronic tumor risks.
B. Dose response correspondence.
As the (Nagano et al., 2007b) 13-week study did not provide strong evidence of cell killing or
proliferative processes, only limited dose response comparisons may be made. The liver tumors
in both male and female mice were very strongly elevated in both male and female mice at both
the 25 and 125 ppm doses. To the extent that (modest) increases in liver enzymes in serum were
seen, they suggested a lesser response at 30 than 90 ppm, not consistent with the tumor pattern.
The phenomena called "collapse" where shrunken parenchymal tissue was observed (said,
without data shown, to be associated with bile duct proliferation) showed a similar dose response
pattern to the tumors, but the relevance of this phenomena to the hypothesized MOA is unclear.
Importantly, at 5 ppm the female mice showed a statistically elevated (p≤0.05) incidence of
hepatocellular adenomas, a finding (as discussed elsewhere in this assessment) whose relevance
was supported by comparisons with historical control data for the same laboratory. Neither the
subchronic or chronic Nagano studies provided data on to suggest cell killing or regeneration at a
dose of 5 ppm or 10 ppm (subchronic study).
The findings of (Benson and Springer, 1999) in males of a different mouse strain show a dose-
response concordance with the higher dose cancer findings in (Nagano et al., 2007a). The levels
of ALT are strongly elevated at both the 20 and 100 ppm concentrations (with the levels of SDH
being reported to be similarly elevated, though not reported), at 12 weeks both these
concentration groups also show 3-4% increases in scored necrotic cells by area. However, the
BrdU cellular replication data from this study shows a different dose response with the level of
replication being much higher at 100 ppm than 20 ppm not indicative of the maximal tumor
response seen at those doses. The (Benson and Springer, 1999) study did not provide any data on
a toxic response at 5 ppm (males only examined), the dose where elevated adenomas were seen
in female, but not male mice.
(3) Direct experimental challenge to the MOA.
Studies with P450 metabolic inhibitors, P450 metabolic enhancers and P450 CYP2E1 knock out
mice have demonstrated the predicted relationship between modulating carbon tetrachloride
Page 369 of 390
metabolism and increasing (or decreasing) carbon tetrachloride liver toxicity. Thus, there is
strong evidence of experimental challenge in support of the hypothesis that P450 metabolism of
carbon tetrachloride is required for the occurrence of observed liver toxicity. However, as noted
above, metabolism of carbon tetrachloride may be expected to affect various processes (e.g.,
potential genotoxicity) of carbon tetrachloride and thus this line of evidence does not
substantially support a cytotoxicity-based MOA over other alternative MOAs that may also
involve carbon tetrachloride metabolism. There do not appear to be any studies providing and
experimental challenge to the hypothesis that cytotoxicity is a key event for carbon tetrachloride
carcinogenesis.
(4) Have the proposed key events been demonstrated to cause cancer in studies of other
chemicals?
The EPA Cancer Guidelines recognize cell killing followed by sustained regenerative
proliferation as a MOA for chemical carcinogenesis. Accordingly, no further review of the
general MOA has been conducted for this assessment.
(5) Other potential MOAs.
Due to the formation of reactive free radicals (both directly from the metabolism of carbon
tetrachloride and due to lipid peroxidation subsequent to interactions of carbon tetrachloride
metabolites with lipids) concerns have been raised about potential genotoxic effects from carbon
tetrachloride. Using radiolabeled 14C, carbon tetrachloride metabolites have been shown to bind
to DNA in simplified in vitro systems (Direnzo et al., 1982) and to bind to DNA in liver exposed
in vivo or ex vivo to carbon tetrachloride (Castro et al., 1989; Diaz Gomez and Castro, 1980;
Rocchi et al., 1973). However, such binding does not appear to have been chemically
characterized.
A number of positive results have been reported for the production of oxidative adducts by
carbon tetrachloride, suggesting a plausible genotoxic endpoint for this compound which is
known to induce lipid peroxidation. It should be noted that while such processes are "indirect" in
the sense that they do not result from direct interaction with carbon tetrachloride metabolites,
such oxidative radicals are proposed to result from chemical processes rapidly stimulated by
carbon tetrachloride after intake of the compound (Benedetti et al., 1974) and are not
"secondary" to toxicological damage. However, the existing database on oxidative adducts
induced by carbon tetrachloride is not fully consistent and would require further study. Finally,
as discussed elsewhere in this document, there are many studies of mutation and genotoxic
effects due to carbon tetrachloride. Much of this database is of questionable relevance to
potential effects of metabolites of carbon tetrachloride, and while a number of positive findings
have been reported, most of these studies were only conducted at high dose, often with observed
cellular toxicity. Despite the numerically large database, it is not possible conclude whether or
mutation or genotoxicity due to carbon tetrachloride may contribute to its carcinogenic MOA.
Cancer MOA Analysis for Adrenal Tumors
This section explores the extent to which the cytotoxicity/regenerative cell proliferation
hypothesis - the most explored MOA hypothesis for carbon tetrachloride induced liver tumors -
Page 370 of 390
may be supported for the pheochromocytoma endpoint. This hypothesized MOA would include
the following key events:
(1) metabolism to the trichloromethyl radical by CYP450 enzymes and subsequent
formation of the trichloromethyl peroxy radical,
(2) radical-induced mechanisms leading to adrenal toxicity and cell death, and
(3) sustained regenerative and proliferative changes in the adrenal gland in response to
cytotoxicity.
(4) Resulting cellular proliferation increases the probability of tumor formation through
replicative processes that increase the probability of mutations becoming fixed or
increase the rate of clonal expansion of cells carrying somatic mutations - in both
cases without hypothesizing a direct mutagenic effect from carbon tetrachloride or its
metabolites.
While much more limited than in the case of the liver, there is substantial evidence to support
event (1) as occurring in the adrenal gland with a range biochemical and biological events
resulting from the metabolism of carbon tetrachloride in the adrenal gland. However, studies
specific to carbon tetrachloride metabolism in the mouse were not identified. In the rat, Castro
(1972) found that single dose intraperitoneal injection of 14C labeled carbon tetrachloride
resulted in binding of the labeled compound to lipids in isolated adrenal microsomal
preparations. This binding, implying the formation of reactive metabolites of carbon
tetrachloride which have bound to lipids, and is comparable in magnitude to the binding seen in
the same study to rat liver microsomal lipids. This binding was also demonstrated in
mitochondrial lipids from the adrenal gland, where it was not identified for mitochondria from
the liver, demonstrating additional capabilities for metabolism. Kolby (1981) demonstrated that a
single high intraperitoneal dose of carbon tetrachloride leads to a substantial reduction of P450
protein content and a reduction of P450 enzymatic activities in microsomes subsequently
prepared from the adrenal gland. These results seen in the study for the guinea pig liver are in
agreement with the understanding that reactive metabolites of carbon tetrachloride can damage
and inactivate P450 enzymes. In vitro studies of carbon tetrachloride in adrenal microsomes in
Kolby (1981) supported these findings and also demonstrated that carbon tetrachloride treatment
of the adrenal microsomes increased lipid peroxidization, an effect that was substantiated by its
elimination after treatment with EDTA. In an in vivo study in guinea pigs exposed to a single
high intraperitoneal dose of carbon tetrachloride , Brogan et al., (1984) demonstrated that the
P450 activity with carbon tetrachloride was primarily present in the inner medulla tissues, with
microsomes from this region showing strong inhibition of xenobiotic metabolism activity, but
not reduction of steroid hydroxylase activity. In vitro studies in this publication showed binding
of 14C to microsomal proteins from inner medulla tissues as well as generation of malonaldehyde
as an indicator of lipid peroxidation inferred to result subsequent to P450 metabolism of carbon
tetrachloride. Further in vitro studies in Kolby (1994) demonstrated that carbon tetrachloride’s
inhibitory effect on P450 enzymes were specific to forms metabolizing xenobiotics and did not
similarly affect metabolism of steroids in the gland. Covalent binding of 14C labeled metabolites
to microsomal protein was also demonstrated in this study.
Data specific to the adrenal gland, together with the broader database on carbon tetrachloride
action in the liver and other organs plausibly supports the belief that metabolism in the adrenal

Page 371 of 390
gland is required for the occurrence of toxicity or other biological effects. However, the absence
of metabolic data specific to the mouse adrenal gland is a data gap in supporting this MOA step.
Additionally, there are no reasonably available experimental information challenging the
proposed causality between metabolism and adrenal toxicity for the adrenal gland such as there
were using knock out mice and inhibitor studies for liver toxicity.
Accordingly, the focus here is an evaluation of data regarding whether "sustained regenerative
and proliferative changes in the adrenal gland in response to cytotoxicity" is a key event for
cancer development. That is the analysis focuses on whether the observed compound related
pheochromocytomas in the mouse after carbon tetrachloride inhalation (particularly the findings
in Nagano (2007a)) resulted from this process.
The Cancer Guidelines framework review is organized as follows:
(1) Describe the empirical data that support the occurrence of the proposed key events under
conditions that have been found to be carcinogenic
The Nagano (2007a) inhalation cancer bioassay is accompanied by the Nagano (2007b)
subchronic (13 week) toxicity study. As this study specifically investigated toxic response in the
same strains of rodents, sourced contemporaneously with the cancer study it represents the most
valuable data on sustained toxic responses. At that time frame, transient effects from acute
exposure times will have settled while representing conditions that can be reasonably inferred to
be sustained through the animal's lifespans.
The Nagano (2007b) subchronic study (for both mice and rats) used inhaled doses of 10, 30, 90,
270, and 810 ppm, while the cancer bioassay (again for both sexes and species) used inhaled
doses of 5, 25, and 125 ppm. Thus, while these dose ranges overlap there is not exact
correspondence and the higher doses in the subchronic study far exceed bioassay doses and may
not be informative for effects that occurred in the bioassay. While Nagano (2007b) included a
pathological examination of the adrenal gland, no adverse histopathological findings were
reported.
Similarly, in the Nagano (2007a) chronic study, no pathological findings for the adrenal gland,
apart from the excess of pheochromocytomas, were reported. It is noted that adrenal gland
weights were increased in both male and female mice at the 25 and 125 ppm carbon tetrachloride
inhaled concentrations. Among these, the male groups at 25 and 125 ppm and the female group
at 125 ppm showed significant increase in pheochromocytomas and these groups showed
approximately a doubling or greater in mean adrenal weight - a finding that was likely influenced
by the tumor masses in these groups. However, the 25 ppm female group showed a significant,
approximately 20%, increase in adrenal weight in the absence of tumors. While appropriate to
note, these adrenal weight data don't provide information specific to the MOA under
consideration.
Other studies indicate that carbon tetrachloride at sufficiently high doses is toxic to the adrenal
gland. Brogan et al., (1984), using a single intraperitoneal dose of 640 mg/kg-d in guinea pigs
observed “transzonal cellular necrosis primarily in inner portions of the adrenal cortex and in the

Page 372 of 390
medulla.” No information is reasonably available regarding whether carbon tetrachloride can
induce adrenal tumors in guinea pigs. Castro (1972) administered a single intraperitoneal dose of
1600 mg/kg to Sprague-Dawley rats, conditions under which liver toxicity is readily observed,
with no histopathological changes in the adrenal glands. For comparison, at the airborne
concentrations mice where adrenal tumors were observed in Nagano (2007a), daily alveolar
inhaled doses of carbon tetrachloride were roughly 40 to 225 mg/kg. Weisburger (1977) reports
elevated incidence of pheochromocytomas in male and female mice receiving high doses (up to
2500 mg/kg-d) of carbon tetrachloride, however, this compound was utilized as a positive
control in this study of other carcinogens. Therefore, noncancer pathology for the positive
controls was not discussed in the study. Castro (1972) and Brogan et al., (1984) provide citations
to older literature indicating that human ingestion of carbon tetrachloride can cause adrenal gland
toxicity at high doses, and to additional studies in dogs, rats, and guinea pigs indicating the
potential of carbon tetrachloride to cause adrenal toxicity. However, no data in mice is
reasonably available to indicate adrenal toxicity. The subchronic (Nagano et al., 2007b) and
chronic (Nagano et al., 2007a) inhalation studies examined adrenal glands and did not report
necrosis or other toxicity. Accordingly, there are no data to support the hypothesis that carbon
tetrachloride produces adrenal cytotoxicity or produces regenerative effects under conditions of
the mouse cancer bioassay.
(2) Examine the temporal and dose-response concordance between the measures of proposed
events and observed tumors
For the MOA under consideration, sustained effects on cellular proliferation are hypothesized.
The design of the subchronic duration study of (Nagano et al., 2007b) fits well with the needs to
generate data of temporal relevance (providing data well before observed carcinogenesis and
having ability to reflect a non-acute, presumably continuing biological processes) and with
multiple doses consistent of the dose range of the carcinogenesis bioassay. However, as
noncancer adrenal histopathological findings were not identified in (Nagano et al., 2007b),
temporal or dose-response comparisons cannot support the hypothesized MOA.
(3) Direct experimental challenge to the MOA
In contrast with the database for the liver effects of carbon tetrachloride there are not
experimental studies to challenge and test the assumption that carbon tetrachloride metabolism is
required for adrenal toxicity, however as discussed above this is a plausible assumption. There
are no reasonably available information providing an experimental challenge to the hypothesis
that cytotoxicity (which has not been documented in mice) is a key event for carbon tetrachloride
carcinogenesis.
(4) Have the proposed key events been demonstrated to cause cancer in studies of other
chemicals?
The EPA Cancer Guidelines recognize cell killing followed by sustained regenerative
proliferation as a MOA for chemical carcinogenesis. Accordingly, no further review of the
general MOA has been conducted for this assessment.
Page 373 of 390
(5) Other potential MOAs
Due to the formation of reactive free radicals (both directly from the metabolism of carbon
tetrachloride and due to lipid peroxidation resulting from subsequent reactions with carbon
tetrachloride metabolites) concerns have been raised about potential genotoxic effects from
carbon tetrachloride. Using radiolabeled 14C, carbon tetrachloride metabolites have been shown
to bind to DNA in simplified in vitro systems (Direnzo et al., 1982) and to bind to DNA in liver
exposed in vivo or ex vivo to carbon tetrachloride (Castro et al., 1989; Diaz Gomez and Castro,
1980; Rocchi et al., 1973). However, such binding does not appear to have been chemically
characterized.
Positive results have been reported for the production of oxidative adducts by carbon
tetrachloride, suggesting a plausible genotoxic endpoint for this compound which is known to
induce lipid peroxidation. It should be noted that while such processes are "indirect" in the sense
that they do not result from direct interaction with carbon tetrachloride metabolites, such
oxidative radicals are proposed to result from chemical processes stimulated by carbon
tetrachloride very after intake of the compound rapidly (Benedetti et al., 1974) and are not
"secondary" to toxicological damage. However, the existing database on oxidative adducts
induced by carbon tetrachloride is not fully consistent and would require further study. Finally,
as discussed elsewhere in this document, there are many studies of mutation and genotoxic
effects due to carbon tetrachloride. Much of this database is of questionable relevance to
potential effects of metabolites of carbon tetrachloride, and while a number of positive findings
have been reported, most of these studies were only conducted at high dose, often with observed
cellular toxicity. Despite the numerically large database, it is not possible conclude whether or
mutation or genotoxicity due to carbon tetrachloride may contribute to its carcinogenic MOA.
Alternately it has been suggested that pheochromocytomas might result as a result in some
biological process secondary to the formation of liver tumors, as liver tumors were prevalent in
the (Nagano et al., 2007a) dose groups where these adrenal tumors were seen.
Appendix J METHODOLOGIES AND FINDINGS FROM KEY
TOXICOLOGICAL STUDIES
This appendix presents information on the methodologies and findings from the toxicological
studies with acceptable data quality that were taken into consideration for hazard
characterization.
(Adams et al., 1952)
(Adams et al., 1952) (data quality rating = low) conducted studies with Wistar-derived rats (15–
25/sex), outbred guinea pigs (5–9/sex), outbred rabbits (1–2/sex), and Rhesus monkeys (1–2 of
either sex) exposed to carbon tetrachloride vapor (>99% pure), 7 hours/day, 5 days/week for 6
months at concentrations of 5, 10, 25, 50, 100, 200, or 400 ppm (31, 63, 157, 315, 630, 1,260, or
2,520 mg/m3). Matched control groups included unexposed and air exposed. Animals were
observed frequently for appearance and general behavior and were weighed twice weekly.
Selected animals were used for hematological analyses periodically throughout the study.
Moribund animals and those surviving to scheduled sacrifice were necropsied. The lungs, heart,
liver, kidneys, spleen, and testes were weighed, and sections from these and 10 other tissues
were prepared for histopathological examination. Serum chemistry analyses were performed in

Page 374 of 390
terminal blood samples and part of the liver was frozen and used for lipid analyses. In this study,
the primary target of carbon tetrachloride in all species was the liver. In guinea pigs, liver effects
progressed from a slight, statistically significant increase in relative liver weight in females at 5
ppm to slight-to-moderate fatty degeneration and increases in liver total lipid, neutral fat, and
esterified cholesterol at 10 ppm, and cirrhosis at 25 ppm. However, the effect at the 5 ppm dose
was not considered adverse, as there were no histopathological changes in the liver at 5 ppm. In
the kidney, slight tubular degeneration was observed at 200 ppm and increased kidney weight
was noted at 400 ppm. Mortality was increased at ≥100 ppm. A similar progression of effects
was seen in rats (no effects at 5 ppm, mild liver changes at 10 ppm, cirrhosis at 50 ppm, and liver
necrosis, kidney effects, testicular atrophy, growth depression, and mortality at 200 ppm and
above). In rabbits, 10 ppm was without effect, 25 ppm produced an increase in liver weight and
mild liver changes (mild fatty degeneration), 50 ppm produced moderate liver changes, and 100
ppm produced growth depression. Monkeys were the least sensitive species tested, with evidence
of adverse effects (mild liver lesions and increased liver lipid) only at 100 ppm, the highest
concentration tested. This study identified NOAEL and LOAEL values, respectively, of 5 and 10
ppm in rats and guinea pigs, 10 and 25 ppm in rabbits, and 50 and 100 ppm in monkeys, all
based on hepatotoxic effects.
(Allis et al., 1990)
(Allis et al., 1990) (data quality rating = medium) conducted a study to investigate the ability of
rats to recover from toxicity induced by subchronic exposure to carbon tetrachloride. Groups of
48 60-day-old male F344 rats were given 0, 20, or 40 mg/kg of carbon tetrachloride 5 days/week
for 12 weeks (average daily doses of 0, 14.3, or 28.6 mg/kg-d) by oral gavage in corn oil. One
day after the end of exposure, significant dose-related changes were found for relative liver
weight, serum ALT, AST, and LDH (all increased), and liver CYP450 (decreased) in both dose
groups. In addition, serum ALP and cholesterol were increased in the high-dose group only. In
the low-dose group, histopathological examination of the liver revealed cirrhosis in 2/6 rats and
vacuolar degeneration and hepatocellular necrosis in 6/6 rats. In the high-dose group,
histopathological examination revealed cirrhosis (as well as degeneration and necrosis) in 6/6
rats. Serum enzyme levels and CYP450 returned to control levels within 8 days of the end of
exposure. Severity of microscopic lesions declined during the post-exposure period, but cirrhosis
persisted in the high-dose group through the end of the experiment. Relative liver weight
decreased during the post-exposure period but did not reach control levels in the high-dose group
even after 22 days. Neither of the radiolabeled tracer techniques detected a decreased functional
capacity in cirrhotic livers, a finding that could not be explained by the investigators. The low
dose of 14.3 mg/kg-d was a LOAEL for hepatic toxicity in this study.
(Benson and Springer, 1999)
(Benson and Springer, 1999) (data quality rating = high) exposed groups of F344/Crl rats,
B6C3F1 mice, and Syrian hamsters (10 males/species) by nose only inhalation to 0, 5, 20 or 100
ppm of carbon tetrachloride for 6 hours per day, 5 days per week for 1, 4 or 12 weeks. The
chamber concentrations were monitored throughout the exposure. According to study authors,
the objectives of the study were three-fold. The first objective was to evaluate the metabolism of
carbon tetrachloride to get an estimate of species sensitivity. These studies were conducted as
either whole-body exposures (for in vivo metabolism) or nose only exposures (for toxicokinetic
studies). In vitro studies using human liver microsomes were also conducted. The second
Page 375 of 390
objective was to assess the genotoxic or non-genotoxic mechanisms of liver tumors for carbon
tetrachloride exposure. The third objective was to compare in vitro and in vivo metabolism
studies to revise the model for uptake, fate and metabolism of carbon tetrachloride to provide an
estimate for a human metabolic rate constant. Cell proliferation was evaluated in these animals
by implanting a minipump containing bromodeoxyuridine (BrdU) in each animal prior to
necropsy. At sacrifice, blood was collected for ALT and SDH determinations, and liver sections
were collected for histopathological examination and BrdU detection. In summary, (Benson and
Springer, 1999) used in vitro data on metabolism of carbon tetrachloride by human liver
microsomes, together with in vitro and in vivo rodent data, to estimate the in vivo human
metabolic rate constants and generated experimental information that allowed expanding the rat
PBPK model of (Paustenbach et al., 1988) to include parameters for the hamster.
Following repeated carbon tetrachloride inhalation exposure in the (Benson and Springer, 1999)
studies, hepatocellular proliferation was reported along with necrosis and regenerative cell
proliferation at 20 and 100 ppm in mice. In rats, liver microsomal protein levels were increased
by 45% and 63% following 5-day inhalation exposure at 5 ppm without any change in the 12-
week exposure group. In hamsters, following carbon tetrachloride inhalation exposure (100
ppm), microsomal protein levels were decreased by 33% and 54% in both the 5-day and the 12-
week exposure groups. Mice did not exhibit any decrease in microsomal protein content at any
concentration of exposure. Significant increases in percent BrdU positive cells in the cell
proliferation assays were apparent at 20 and 100 ppm in mice and at 100 ppm in hamsters. Serum
levels of ALT and SDH were significantly increased in mice at ≥20 ppm and in rats and hamsters
at 100 ppm.
Cytochromes CYP2E1 and CYP2B, which are the primary enzymes responsible for
biotransformation of carbon tetrachloride in rodents, were measured in all exposed and control
animals in the metabolic studies (Benson and Springer, 1999). In all species, microsomal
measurement of these enzymes indicated that while enzyme induction increased several fold as
dose increased, catalytic activity was not significantly altered.
The rate of carbon tetrachloride metabolism was measured in rat, mouse and hamster species.
The metabolic rate of carbon tetrachloride did not vary more than two-fold between the three
species. A NOAEC of 5 ppm and a LOAEC of 20 ppm for hepatotoxicity was identified for
mice. Hamsters and rats were less sensitive than mice, with a NOAEC of 20 ppm and a LOAEC
of 100 ppm, respectively.
(Bruckner et al., 1986)
In a subchronic study by (Bruckner et al., 1986) (data quality rating = high) groups of 15–16
adult male Sprague-Dawley rats were given doses of 0, 1, 10, or 33 mg/kg of analytical-grade
carbon tetrachloride by oral gavage in corn oil 5 days/week (time-weighted average doses of 0,
0.71, 7.1, or 23.6 mg/kg-d) for 12 weeks. Body weight gain was significantly reduced by 6%
after 30 days and 17% after 90 days in the high dose group. In the high dose group (23.6 mg/kg-
d), liver enzymes, including ALT (up to 34 times control levels), SDH (up to 50 times control
levels), and ornithine-carbamyl transferase (OCT, up to 8 times control levels) were significantly
elevated from week 2 through the end of exposure. In addition, significantly increased relative
liver weight and degenerative lesions were observed. Reported liver lesions included lipid
Page 376 of 390
vacuolization, nuclear and cellular polymorphism, bile duct hyperplasia, and periportal fibrosis.
Severe degenerative changes, such as Councilman-like bodies (single-cell necrosis), deeply
eosinophilic cytoplasm, and pyknotic nuclei, were occasionally noted as well. No evidence of
nephrotoxicity was observed. At lower doses moderate effects were seen in animals. At 7.1
mg/kg-d, only a significant (two- to three-fold) elevation of SDH during the second half of the
exposure period and the presence of mild centrilobular vacuolization in the liver was observed.
Serum ALT and SDH levels returned towards control levels in both mid- and high-dose rats
following a 2-week recovery period although hepatic lesions of less severity with the exception
of fibrosis and bile duct hyperplasia were still present in both groups. No effects were observed
in rats exposed to 0.71 mg/kg-d. This study identified a NOAEL of 0.71 mg/kg-d and a LOAEL
of 7.1 mg/kg-d for carbon tetrachloride-induced liver toxicity.
(Condie et al., 1986)
A subchronic study conducted by (Condie et al., 1986) (data quality rating = high) compared the
effects of two different gavage vehicles on the toxicity of carbon tetrachloride in mice. CD-1
mice (12/sex/group) were treated with 0, 1.2, 12, or 120 mg/kg of carbon tetrachloride by oral
gavage in either corn oil or 1% Tween-60 aqueous emulsion 5 days/week for 12 weeks (average
daily doses of 0, 0.86, 8.6, or 86 mg/kg-d). Fifteen deaths occurred during the study (6 in male
mice, 9 in female mice). Of the total deaths, 8 were attributed to gavage (4 male and 4 female
mice). These deaths did not appear to influence the study outcome. In the high-dose group (86
mg/kg-d) relative liver weight was significantly elevated. In addition, liver enzymes were
significantly increased (ALT (77–89 times control levels in corn oil and 10–19 times control
levels in Tween-60), AST (14–15 times control levels in corn oil and 3–4 times control levels in
Tween-60), and LDH (12–15 times control levels in corn oil and 2–3 times control levels in
Tween-60). Histopathological findings include increased incidence and severity of hepatocellular
vacuolization, inflammation, hepatocytomegaly, necrosis, and portal bridging fibrosis. The only
difference between oral gavage vehicles observed at 86 mg/kg-d was a greater incidence and
severity of necrosis in mice given carbon tetrachloride in corn oil. The difference between
vehicles was more apparent at the middle dose of 8.6 mg/kg-d. This dose produced significantly
elevated ALT and mild-to-moderate liver lesions in mice gavaged with corn oil but was
identified as a NOAEL for mice gavaged with Tween-60. The low dose of 0.86 mg/kg-d was
identified as the NOAEL for mice gavaged with corn oil. In general, both sexes responded
similarly, with severity of histopathologic changes in males slightly greater than females.
(Davis, 1934)
NAC/AEGL evaluated a series of experiments conducted by (Davis, 1934) (data quality rating =
low) to determine their suitability to derive AEGL-2 values for carbon tetrachloride. In one
study, three human subjects were exposed to carbon tetrachloride at 317 ppm (concentration
calculated on the basis of room volume and amount of carbon tetrachloride) for 30 min. CNS
effects, including nausea, vomiting, dizziness, and headaches were reported by the subjects, but
clinical assessments (urinalysis, blood count, hemoglobin levels, blood pressure, and heart rate)
remained normal for up to 48 h post-exposure. Similar effects were reported by subjects exposed
at 1,191 ppm for 15 min, with the exception that one of the four subjects found the exposure to
be intolerable after 9 min (i.e., the subject experienced headache, nausea, and vomiting).
Exposures at 2,382 ppm for 3-7 min produced these effects in addition to dizziness, listlessness,
and sleepiness. The observed CNS effects were apparently not long-lasting but were considered

Page 377 of 390
severe enough to impair escape or normal function and, therefore, a conservative endpoint (i.e.,
hazard effect) for deriving AEGL-2 values by NAC/AEGL.
In the second experiment, four subjects (ages 35, 48, 22, and 30; gender not specified) were
exposed to a carbon tetrachloride at 76 ppm for 2.5 h. There were no symptoms or signs of
toxicity in any of the subjects. In a third experiment, the same subjects in the second experiment
were exposed 24 hours later to carbon tetrachloride at 76 ppm for 4 h and did not have signs or
symptoms. (Davis, 1934) also reported that renal effects were observed in a worker
experimentally exposed to carbon tetrachloride at 200 ppm for 8 h with renal function returning
to near normal 2 months after exposure.
The AEGL-2 values were derived on the basis of the highest no-effect level of 76 ppm for CNS
effects in humans exposed carbon tetrachloride for 4 h. The AEGL-2 values are derived using an
interspecies uncertainty factor of 1 because the study was conducted in humans, and an
intraspecies uncertainty factor of 10 to account for individuals who may be more susceptible to
the toxic effects of carbon tetrachloride, including greater potential of carbon tetrachloride-
induced toxicity in individuals with histories of alcohol usage.
(Hayes et al., 1986)
A subchronic study in mice was conducted at higher doses by (Hayes et al., 1986) (data quality
rating = medium). CD-1 mice (20/sex/group) received daily oral gavage doses of 0, 12, 120, 540,
or 1,200 mg/kg-d of carbon tetrachloride in corn oil for 90 days. An untreated control group of
20 male and 20 female mice was maintained as well. Dose-related effects including increases in
serum LDH, ALT, AST, ALP, and 5'-nucleotidase and a decrease in serum glucose were
observed in both sexes. Treatment-related lesions were observed in the liver, including fatty
change, hepatocytomegaly, karyomegaly, bile duct hyperplasia, necrosis, and chronic hepatitis
associated with increases in absolute and relative liver weight. Other changes in organ weight
include increases in spleen and thymus weights. No treatment-related lesions were observed in
the kidney. No changes were found in urinalysis or hematology parameters. It should be noted
that, compared with untreated controls, vehicle controls had significantly elevated serum LDH
and ALT, altered organ weights, and increased incidence of liver lesions (e.g., necrosis in 5/19 in
vehicle controls versus 0/20 in untreated controls and 20/20 in the 12 mg/kg-d group). This study
failed to identify a NOAEL. The low dose of 12 mg/kg-d was a LOAEL for hepatic effects.
(Nagano et al., 2007a; Nagano et al., 2007b)
The IRIS RfC is based on the findings from bioassays conducted by (Nagano et al., 2007b) (data
quality rating = high). In one of the subchronic inhalation studies in rats, F344/DuCrj rats
(10/sex/group) were subjected to whole body exposure of carbon tetrachloride vapor (purity:
99.8%) concentrations of 0, 10, 30, 90, 270, or 810 ppm (0, 63, 189, 566, 1,700, or 5,094 mg/m3)
for 6 hours/day, 5 days/week for 13 weeks. The lowest exposure concentration of 10 ppm was a
LOAEC for rats for hepatic effects including increased liver weight and histopathological effects
ranging from slight fatty change, cytological alteration, and granulation to ceroid deposits,
fibrosis, pleomorphism, proliferation of bile ducts and cirrhosis. While small fatty droplets were
not evident in male rats at any concentration, large droplets were significantly elevated at ≥ 30
ppm in both male and female rats. Different types of significantly altered cell foci (acidophilic,
Page 378 of 390
basophilic, clear cell, and mixed cell foci) was evident at 810 ppm in male rats and 270 ppm in
female rats. A NOAEC was not identified.
A similar whole body exposure to carbon tetrachloride (purity: 99.8%) vapor was conducted in
mice (Nagano et al., 2007b) (data quality rating = high) where groups of Crj:BDF1 mice
(10/sex/group) were exposed at concentrations of 0, 10, 30, 90, 270, or 810 ppm (0, 63, 189, 566,
1,700, or 5,094 mg/m3) for 6 hours/day, 5 days/week for 13 weeks. A similar set of endpoints as
that of the rat study were measured in mice. However, the incidence of altered cell foci was not
significantly elevated in male mice at <270 ppm and was not noted in female mice. Additional
liver lesions observed include nuclear enlargement with atypia and altered cell foci (≥270 ppm)
and collapse (possibly resulting from the necrotic loss of hepatocytes) at ≥30 ppm. The lowest
exposure level of 10 ppm is a LOAEC for hepatic effects (i.e., slight cytological alterations) in
male mice. Hepatic effects (i.e., fatty change, fibrosis and cirrhosis) were observed in female
mice exposed to ≥30 ppm.
Significant increases were observed in liver weights (≥10 ppm for males and ≥30 ppm for female
rats) and kidney weights (≥10 ppm for male rats and ≥90 ppm for female rats). Statistically
significant, exposure-related decreases in hemoglobin and hematocrit were observed at ≥90 ppm
in both males and females. At 810 ppm, red blood cell count was also significantly decreased in
both sexes. Serum chemistry changes included large, statistically significant, and exposure-
related increases in ALT, AST, LDH, ALP, and leucine aminopeptidase (LAP) in males at ≥270
ppm and females at ≥90 ppm. In general, female mice were less sensitive to hematological
alterations than male mice. Nephrotoxicity was observed at higher concentrations than toxicity to
the liver, although kidney weights were increased significantly at 10 ppm in male rats and ≥90
ppm in female rats. Glomerulosclerosis was observed only at the highest concentration (810
ppm) of exposure in rats. No histopathological changes were observed in the nasal cavity, larynx,
trachea or lungs of any carbon tetrachloride-exposed mouse or rat groups.
(Nagano et al., 2007a) (data quality rating = high) conducted studies with groups of F344/DuCrj
rats (50/sex/group) exposed whole body to 0, 5, 25, or 125 ppm (0, 31.5, 157, or 786 mg/m3) of
carbon tetrachloride (99.8% pure) vapor for 6 hours/day, 5 days/week for 104 weeks. An
increase in the severity of proteinuria in rats of both sexes was observed at the low exposure
concentration of 5 ppm; however, interpretation of the observed proteinuria and the renal lesions
in the F344 rat is difficult because this strain has a high spontaneous incidence of renal lesions.
Increases in the incidence and severity of nonneoplastic liver lesions (i.e., fatty change, fibrosis,
and cirrhosis) were seen at 25 and 125 ppm in both males and females. Therefore, 5 ppm was
considered a NOAEC based on liver toxicity at 25 and 125 ppm evidenced by serum chemistry
changes (including significant increases in ALT, AST, LDH, LAP, and GGT) and
histopathologic changes (i.e., fatty change, fibrosis, and cirrhosis). Kidney effects described
above were also considered for determining the NOAEC value, which is the basis of the EPA
IRIS RfC.
A similar 2-year (104 week) study was conducted by the same group in Crj:BDF1 mice (Nagano
et al., 2007a) (data quality rating = high). Groups of 50/sex were exposed to 0, 5, 25, or 125 ppm
(0, 31.5, 157, or 786 mg/m3) of carbon tetrachloride (99% pure) vapor for 6 hours/day, 5
days/week for 104 weeks. The 25 ppm concentration was the LOAEC in this study for effects on
Page 379 of 390
the liver (i.e., increased weight, serum chemistry changes indicative of damage, and lesions),
kidney (i.e., serum chemistry changes and lesions), and spleen (i.e., lesions); decreased growth;
and reduced survival. The 5 ppm concentration was the NOAEC.
(Narotsky et al., 1997)
(Narotsky et al., 1997) (data quality rating = high). In this study, groups of 12–14 timed-pregnant
F344 rats received carbon tetrachloride at doses of 0, 25, 50, or 75 mg/kg-d in either corn oil or
an aqueous emulsion (10% Emulphor) on GDs 6–15. Dose-related piloerection was observed in
dams at ≥50 mg/kg-d for both vehicles but was seen in more animals and for longer periods in
the corn oil groups. Dams exposed to 75 mg/kg-d in corn oil also exhibited kyphosis (rounded
upper back) and statistically significant weight loss. Dams exposed to 50 and 75 mg/kg-d in
aqueous emulsion showed only significantly reduced body weight gain. Full-litter resorption
occurred with an incidence of 0/13, 0/13, 5/12 (42%), and 8/12 (67%) in the control through
high-dose corn oil groups and 0/12, 0/12, 2/14 (14%), and 1/12 (8%) in the respective aqueous
groups. The difference between vehicles was statistically significant at the highest dose. Among
the surviving litters, there were no effects on gestation length, prenatal or postnatal survival, or
pup weight or morphology. The 25 mg/kg-d dose was a NOAEL for developmental and maternal
toxicity and the 50 mg/kg-d dose a LOAEL for full-litter resorption and maternal toxicity (i.e.,
reduced maternal weight gain, and piloerection) with either corn oil or aqueous vehicle, although
these effects were more pronounced with the corn oil vehicle. (U.S. EPA, 2010) noted that the
NOAEL in this developmental study (25 mg/kg-d) exceeds the POD for the RfD based on liver
effects by over six-fold and the LOAEL (50 mg/kg-d) by 13-fold and is consistent with
developmental toxicity endpoints as less sensitive than measures of hepatotoxicity.
(Schwetz et al., 1974)
The IRIS assessment identified (Schwetz et al., 1974) (data quality rating = high) as the most
detailed inhalation exposure developmental toxicity study available. In the study, groups of
pregnant Sprague-Dawley rats were exposed (whole-body) by inhalation to 0, 300, or 1,000 ppm
carbon tetrachloride vapor for 7 hours/day on days 6-15 of gestation. A significant increase in the
serum glutamic-pyruvic transaminase activity was observed in rats exposed to 300 and 1000 ppm
by the end of the exposure period. This effect was no longer observed by day 6 post exposure.
The developmental effects at the LOAEC of 300 ppm consisted of decreased fetal body weight
(7%) and decreased crown-rump length (3.5%). The same effects were observed at 1,000 ppm
(i.e., 14% decreased fetal body weight, 4.5% decreased crown-rump length) in addition to
increases in sternebral anomalies (13% at 1,000 ppm vs. 2% in controls). Maternal toxicity was
observed at 300 and 1,000 ppm. Food consumption and body weight were significantly reduced
in treated dams compared with controls. Hepatotoxicity was indicated by significantly elevated
serum ALT, gross changes in liver appearance (pale, mottled liver), and significantly increased
liver weight (26% at 300 ppm and 44% at 1,000 ppm).
(Sun et al., 2014)
In this study by (Sun et al., 2014) (data quality rating = high), a total of 30 male Sprague-Dawley
rats (5 rats/group) were given single oral gavage doses of carbon tetrachloride at 0, 50, or 2000
mg/kg. Rats were then sacrificed at either 6- or 24-hours post-dosing (5/group/time point). An
additional group of male rats (5/group) were given oral doses of vehicle (corn oil) or carbon
tetrachloride for 3-days at the same doses and sacrificed 24-hours after the third dose (72 hours).
Page 380 of 390
Rats lost weight 24-hours after a single exposure to 2,000 mg/kg (or after 3 daily doses at 2,000
mg/kg). Control and low-dose animals gained weight normally. Food consumption was also
decreased in high-dose rats. Significant, dose-related, increases in serum ALT (30-114%), AST
(15-213%), and ALP (37-137%) were observed in both dose groups following exposure for 3
days. Twenty-four hours after exposure, ALT was significantly increased by 15% at 50 mg/kg,
but not 2000 mg/kg. ALP was significantly increased by 78% at 2000 mg/kg after 24 hours.
Other significant potentially exposure-related findings were limited to the high-dose group and
included a 26-49% increase in BUN 6- or 24-hours after a single exposure, a 24-33% decrease in
cholesterol, and a 59-69% decrease in triglycerides 24-hours after one or three exposures, and a
12-23% decrease in glucose 6- or 24-hours after a single exposure. No other consistent clinical
chemistry findings were observed. No significant changes were observed in liver triglyceride
levels.
Centrilobular necrosis, centrilobular degeneration, and cytoplasmic vacuolization were observed
at 6- and 24-hours post-dose in all animals given a single dose of 2,000 mg/kg. In animals given
3 doses of 2,000 mg/kg carbon tetrachloride, 80% were observed with centrilobular
degeneration, while 100% were observed with centrilobular necrosis and cytoplasmic
vacuolization. Mean severity scores for centrilobular necrosis and degeneration were highest 24-
hours after a single exposure, whereas severity scores for cytoplasmic vacuolization were highest
after 3 exposures. Six hours after a single exposure to 50 mg/kg, 40% of animals (n = 2) showed
minimal centrilobular necrosis. Hepatic lesions were not observed at other time points following
exposure to 50 mg/kg. No hepatic lesions were observed in control groups at any time point. No
exposure-related kidney lesions were observed in any group.
(Wahlberg and Boman, 1979)
In (Wahlberg and Boman, 1979) (data quality rating = medium), guinea pigs (20 animals/dose)
were exposed to carbon tetrachloride by a single application of 0.5 or 2.0 ml to a 3.1 cm2 area of
skin. Application area was occluded to prevent inhalation and ingestion. Dermal contact with
carbon tetrachloride occurred for 5 consecutive days to the single applied dose under occluded
exposure conditions. For animals exposed to 0.5 mL, mortality was observed from day 3 (1 out
of 20 animals died) to day 14. Five animals died by the end of the observation period. Among
animals exposed to 2.0 mL, mortality was observed from day 1 (1 out of 20 animals died) to day
21. A total of 13 animals died in the 2.0 mL dose group by the end of the observation period.

Page 381 of 390
Appendix K EVIDENCE ON LINEARITY OF THE PBPK
MODEL
The appendix table below presents the external:internal dose ratios for the human PBPK model
over a span of concentrations, using the model assumptions adopted by the IRIS assessment
(model parameter VmaxC = 1.49 mg/hr/kg BW0.70, continuous 24 hour/day, 7 days/week
exposure), including PBPK model results for the MCA (mean arterial concentration) internal
dose metric and results for the MRAMKL (mean rate of metabolism in the liver) internal dose
metric. This appendix table is a modification of Tables C-6 and C-10 in the IRIS assessment.
Table K-1. Table Summarizing PBPK Model results in the IRIS Assessment Tables C-6
and C-10
EC
(ppm)
EC
(mg/m3)
MCA
(µmol/L) EC/MCA
%
change
MRAMKL
(µmol/hr/kg
liver)
EC/
MRAMKL % change
0.1 0.6290 0.007827 80.37 -- -- -- --
0.2 1.258 0.01566 80.35 -0.02 -- -- --
0.3 1.887 0.02349 80.33 -0.05 -- -- --
0.4 2.516 0.03133 80.31 -0.07 -- -- --
0.5 3.145 0.03917 80.29 -0.10 -- -- --
0.6 3.774 0.04702 80.27 -0.12 -- -- --
0.7 4.403 0.05487 80.25 -0.15 -- -- --
0.8 5.032 0.06272 80.23 -0.17 -- -- --
0.9 5.661 0.07058 80.21 -0.20 -- -- --
1 6.290 0.07844 80.19 -0.22 1.3834 4.547 --
2 12.58 0.1573 79.99 -0.47 2.749 4.577 0.66
3 18.87 0.2365 79.80 -0.71 4.095 4.608 1.34
4 25.16 0.3161 79.60 -0.96 5.423 4.640 2.05
5 31.45 0.3962 79.39 -1.22 6.731 4.672 2.75
6 37.74 0.4766 79.19 -1.47 8.020 4.706 3.50
7 44.03 0.5575 78.98 -1.73 9.289 4.740 4.24
8 50.32 0.6388 78.78 -1.98 10.537 4.776 5.04
9 56.61 0.7205 78.57 -2.24 11.764 4.812 5.83
10 62.90 0.8027 78.36 -2.50 12.971 4.850 6.66
20 125.8 1.650 76.24 -5.14 23.832 5.279 16.10
30 188.7 2.545 74.16 -7.73 32.48 5.810 27.78

Page 382 of 390
EC
(ppm)
EC
(mg/m3)
MCA
(µmol/L) EC/MCA
%
change
MRAMKL
(µmol/hr/kg
liver)
EC/
MRAMKL % change
40 251.6 3.482 72.26 -10.09 39.11 6.434 41.50

Page 383 of 390
Appendix L SUMMARY OF PUBLIC COMMENTS /
RESPONSE TO COMMENTS
COMMENTS ON MOA FOR CARCINOGENICITY
EPA has received public comments from the American Chemistry Council (ACC) that provide a
different evaluation scheme of the mode of action for liver tumors induced by carbon
tetrachloride. This submission illustrates a recently developed quantitative MOA weight of
evidence (WOE) scoring approach (EPA-HQ-OPPT-2016-0733-0066) by providing a case
example for the identification of the likely operative MOA for carbon tetrachloride induced
rodent liver tumor. The submission states that the case example is not intended to be a complete
discussion of all available and relevant studies and an in-depth systematic review of the available
literature was not conducted. The ACC submitted case example reaches a different conclusion of
the carbon tetrachloride MOA, evaluating the cytotoxicity MOA to have a high positive score in
their framework, while a mutagenicity MOA to have a highly negative score, which supports a
threshold cytotoxicity MOA.
The quantitative MOA weight of evidence (WOE) scoring approach is intended to be a
competitive evaluation of alternative MOA proposals stated in detail. In the case of carbon
tetrachloride this involves a proposed sequence of events for causation of cancer by carbon
tetrachloride cytotoxicity and alternately a proposed sequence of events for carbon tetrachloride
cancer induction by direct mutagenicity alone. ACC states: “This approach enables a side-by-
side comparison of numerical WOE confidence scores for each MOA to determine which MOA
is more likely to be operative.”
This approach for carbon tetrachloride does not address other important possibilities and areas of
uncertainty identified in the IRIS assessment including:
- carbon tetrachloride cancer indication involves contributions from both cytotoxicity and
mutagenicity. As oxidative damage to DNA has been implicated in carcinogenesis, EPA
believes there is direct potential for this compound to contribute to both of these
processes.
- Other processes not evaluated may be key to carbon tetrachloride carcinogenicity. Such
processes could include: oxidative damage to DNA resulting from carbon tetrachloride
metabolism and reactivity; epigenetic events related to carbon tetrachloride effects on
DNA methylation; or other as yet unidentified effects of carbon tetrachloride
- EPA’s (U.S. EPA, 2010) assessment concluded: (1) the MOA was unknown and (2) that
there was potential for a MOA that included both low dose genotoxic effects and higher
dose cytotoxicity. The submitted approach does not allow for consideration of these
possibilities.
EPA uses a Bradford Hill based evidence approach for MOA evaluation under its cancer
guidelines. Similarly, the submitted approach utilizes Bradford Hill considerations. However, the
submitted scoring system does not provide an appropriate evaluation system for datasets showing
extensive areas of uncertainty from confounding toxicity mechanisms:
I. Evaluation of the cytotoxicity MOA
Page 384 of 390
A. “Essentiality”
This criterion addresses the extent that the available experimental data challenge and
support the proposed causal key steps for cancer causation.
The submission cites the following experimental data as supporting qualitative evaluation of
the proposed MOA (paraphrased for succinctness):
(1) Metabolism of carbon tetrachloride has been demonstrated to produce free radicals
including CCl3•, which has been detected in spin trapping studies with the liver in
vivo, isolated liver cells, and microsomal preparations.
(2) Studies using a variety of methodologies show that carbon tetrachloride exposures
can cause lipid peroxidation in the liver.
(3) A study in CYP2E1 knockout mice found that these animals avoided liver toxicity.
Other studies using CYP450 inhibitors indicate that prevention of carbon
tetrachloride metabolism also prevents liver toxicity. Studies with co-administration
of free radical scavengers with carbon tetrachloride have reduced liver toxicity.
Conversely, there is increased carbon tetrachloride cytotoxicity in hepatocyte cell
lines that over express P450 enzymes.
(4) Studies using free radical scavengers or antioxidants in conjunction with carbon
tetrachloride administration have shown reduced liver toxicity or lipid peroxidation.
Co-administration of antioxidants (vitamin E) with carbon tetrachloride have reduced
liver peroxidation.
(5) Cytosolic calcium levels have been strongly increased by carbon tetrachloride
treatment.
(6) Carbon tetrachloride administration increases cell replication in liver tissue. A 1×
administration of 40 mg/kg carbon tetrachloride increased BrdU uptake by cells in the
peri-portal zone within one day, plateauing at 3 days.
(7) Altered hepatic foci [of the GST-P form that are believed to be indicative of
carcinogenic processes] were increased by 12 weeks of carbon tetrachloride
treatment. [Such foci are observed at the 25 ppm and 125 ppm inhalation exposures in
Tsujimura (2008), but not significantly elevated at 5 ppm or 1 ppm.]
(8) “Hepatocellular carcinomas appear only at the high dose in rats and mid and high
doses in mice, with an all or none response.”
However, while these study findings inform our understanding of carbon tetrachloride
carcinogenesis, much uncertainty remains.
(1) Metabolism of carbon tetrachloride to free radicals, at least substantially by CYP2E1,
is responsible for observed lipid peroxidation and liver toxicity of this compound, but
this does not establish relative role of cytotoxicity or genotoxicity in a cancer MOA –
both processes could be driven by carbon tetrachloride metabolites and/or
peroxidation products.
(2) These results suggest a hypothesis that lipid peroxidation is a specific cause of
observed liver toxicity, but it is not apparent that this hypothesis has been specifically
challenged. Direct liver toxicity from carbon tetrachloride metabolites is also
possible. Also, importantly, a recently discovered process termed ferroptosis
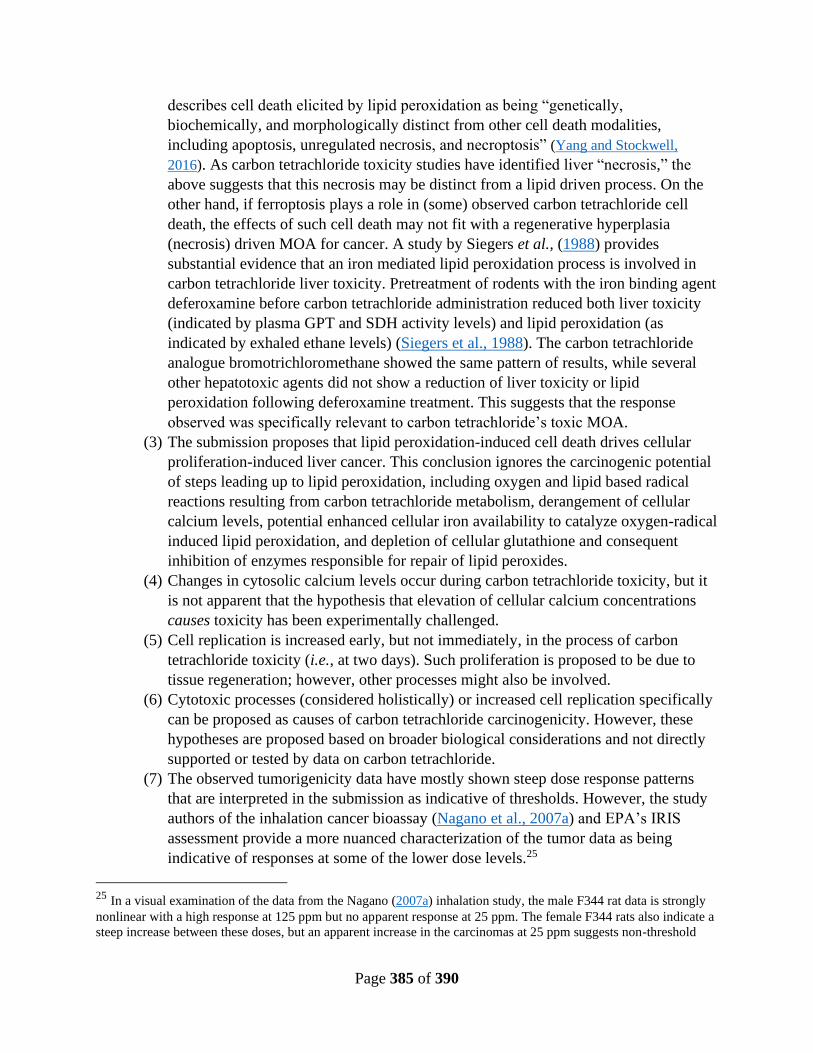
Page 385 of 390
describes cell death elicited by lipid peroxidation as being “genetically,
biochemically, and morphologically distinct from other cell death modalities,
including apoptosis, unregulated necrosis, and necroptosis” (Yang and Stockwell,
2016). As carbon tetrachloride toxicity studies have identified liver “necrosis,” the
above suggests that this necrosis may be distinct from a lipid driven process. On the
other hand, if ferroptosis plays a role in (some) observed carbon tetrachloride cell
death, the effects of such cell death may not fit with a regenerative hyperplasia
(necrosis) driven MOA for cancer. A study by Siegers et al., (1988) provides
substantial evidence that an iron mediated lipid peroxidation process is involved in
carbon tetrachloride liver toxicity. Pretreatment of rodents with the iron binding agent
deferoxamine before carbon tetrachloride administration reduced both liver toxicity
(indicated by plasma GPT and SDH activity levels) and lipid peroxidation (as
indicated by exhaled ethane levels) (Siegers et al., 1988). The carbon tetrachloride
analogue bromotrichloromethane showed the same pattern of results, while several
other hepatotoxic agents did not show a reduction of liver toxicity or lipid
peroxidation following deferoxamine treatment. This suggests that the response
observed was specifically relevant to carbon tetrachloride’s toxic MOA.
(3) The submission proposes that lipid peroxidation-induced cell death drives cellular
proliferation-induced liver cancer. This conclusion ignores the carcinogenic potential
of steps leading up to lipid peroxidation, including oxygen and lipid based radical
reactions resulting from carbon tetrachloride metabolism, derangement of cellular
calcium levels, potential enhanced cellular iron availability to catalyze oxygen-radical
induced lipid peroxidation, and depletion of cellular glutathione and consequent
inhibition of enzymes responsible for repair of lipid peroxides.
(4) Changes in cytosolic calcium levels occur during carbon tetrachloride toxicity, but it
is not apparent that the hypothesis that elevation of cellular calcium concentrations
causes toxicity has been experimentally challenged.
(5) Cell replication is increased early, but not immediately, in the process of carbon
tetrachloride toxicity (i.e., at two days). Such proliferation is proposed to be due to
tissue regeneration; however, other processes might also be involved.
(6) Cytotoxic processes (considered holistically) or increased cell replication specifically
can be proposed as causes of carbon tetrachloride carcinogenicity. However, these
hypotheses are proposed based on broader biological considerations and not directly
supported or tested by data on carbon tetrachloride.
(7) The observed tumorigenicity data have mostly shown steep dose response patterns
that are interpreted in the submission as indicative of thresholds. However, the study
authors of the inhalation cancer bioassay (Nagano et al., 2007a) and EPA’s IRIS
assessment provide a more nuanced characterization of the tumor data as being
indicative of responses at some of the lower dose levels.25
25 In a visual examination of the data from the Nagano (2007a) inhalation study, the male F344 rat data is strongly
nonlinear with a high response at 125 ppm but no apparent response at 25 ppm. The female F344 rats also indicate a
steep increase between these doses, but an apparent increase in the carcinomas at 25 ppm suggests non-threshold

Page 386 of 390
(8) Data on carbon tetrachloride increased GST-P liver foci in male rats are observed in
intermediate term experiments in male rats and follow a dose response pattern similar
to, but distinct from, the tumor dose response seen in male rats (foci were statistically
elevated at an inhaled concentration of 25 ppm, while a tumor response was not
observed at that dose). In other studies, this GST-P foci protocol has been suggested
as an practical indicator for carcinogenicity by either genotoxic or non-genotoxic
pathways. Thus, the observation of these foci provides qualitative supporting
evidence for carbon tetrachloride carcinogenicity and also support for an upward
curving (but not necessarily threshold) dose response relationship in male rats. The
role of this data in supporting a cytotoxic versus an alternative MOA for carbon
tetrachloride is not apparent. The occurrence of liver foci after carbon tetrachloride
treatment – without prior treatment by an initiating agent or use of a partial
hepatectomy may be interpreted to indicate that carbon tetrachloride is a “complete
carcinogen” (i.e., a compound that contributes to both tumor induction and
promotion).
The “Essentiality” criterion is scored in the submission as maximally high for all steps in
their proposed MOA. The resulting score contributes strongly to the highly positive ranking
they assign to the cytotoxicity MOA for tumors. However, a scoring problem is present in
this methodology. Specifically, the “essentiality” score for each proposed key event in a
pathway is assigned “the highest score achieved by any one of the unique Key Events in the
pathway.” This is a problematic approach because a MOA may (and usually does) involve
varied events with different degrees of experimental support. Assigning the maximum score
to all such events overstates the available evidence. In the case of carbon tetrachloride, this
numeric process leads to strongly over-scoring the degree of experimental evidence for the
cytotoxic MOA.
B. Dose-response concordance
The submission states: “Because the earlier key events are demonstrated via in vitro assays,
the concentrations do not align with the longer term in vivo studies. It is clear, however, that
the doses for the earlier key events are lower than those needed to elicit liver tumors … for
dose concordance the precursor key events must occur earlier and at lower doses than the
tumorigenic dose.”
This quote does not provide a strong argument in favor of a cytotoxicity MOA. First, it is not
clear to the reader that doses at which early events have been demonstrated are lower than the
experimental tumorigenic doses. While it is difficult to compare in vitro and in vivo systems,
with the available PK predictions, the authors could have undertaken some comparisons
between molar concentrations of carbon tetrachloride in liver tissue and those used in the in
behavior. In male BDF1 mice, there is a strong (essentially complete) tumor response at 25 and 125 ppm, without
observed increase at 5 ppm. However, the high control tumor response observed in these male mice (approximately
50 % combined adenoma and carcinoma risk) prevents sensitive determination potential compound response at low
dose. In the female BDF1 mice, there was likewise a high adenoma plus carcinoma tumor risk at the 25 ppm and
125 ppm doses, however, in this case there was also a statistically significant increased incidence of tumors
(primarily adenomas) at the subtoxic 5 ppm dose level – indicating no apparent threshold for tumorigenic response
in the female mice.
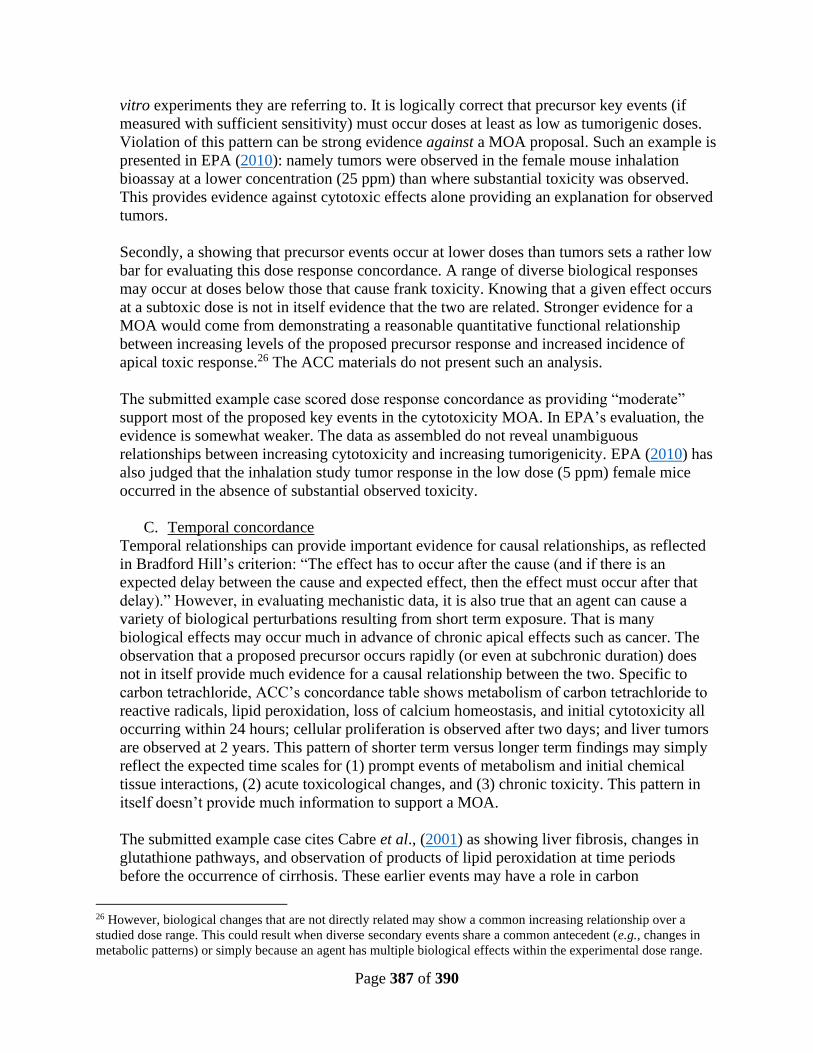
Page 387 of 390
vitro experiments they are referring to. It is logically correct that precursor key events (if
measured with sufficient sensitivity) must occur doses at least as low as tumorigenic doses.
Violation of this pattern can be strong evidence against a MOA proposal. Such an example is
presented in EPA (2010): namely tumors were observed in the female mouse inhalation
bioassay at a lower concentration (25 ppm) than where substantial toxicity was observed.
This provides evidence against cytotoxic effects alone providing an explanation for observed
tumors.
Secondly, a showing that precursor events occur at lower doses than tumors sets a rather low
bar for evaluating this dose response concordance. A range of diverse biological responses
may occur at doses below those that cause frank toxicity. Knowing that a given effect occurs
at a subtoxic dose is not in itself evidence that the two are related. Stronger evidence for a
MOA would come from demonstrating a reasonable quantitative functional relationship
between increasing levels of the proposed precursor response and increased incidence of
apical toxic response.26 The ACC materials do not present such an analysis.
The submitted example case scored dose response concordance as providing “moderate”
support most of the proposed key events in the cytotoxicity MOA. In EPA’s evaluation, the
evidence is somewhat weaker. The data as assembled do not reveal unambiguous
relationships between increasing cytotoxicity and increasing tumorigenicity. EPA (2010) has
also judged that the inhalation study tumor response in the low dose (5 ppm) female mice
occurred in the absence of substantial observed toxicity.
C. Temporal concordance
Temporal relationships can provide important evidence for causal relationships, as reflected
in Bradford Hill’s criterion: “The effect has to occur after the cause (and if there is an
expected delay between the cause and expected effect, then the effect must occur after that
delay).” However, in evaluating mechanistic data, it is also true that an agent can cause a
variety of biological perturbations resulting from short term exposure. That is many
biological effects may occur much in advance of chronic apical effects such as cancer. The
observation that a proposed precursor occurs rapidly (or even at subchronic duration) does
not in itself provide much evidence for a causal relationship between the two. Specific to
carbon tetrachloride, ACC’s concordance table shows metabolism of carbon tetrachloride to
reactive radicals, lipid peroxidation, loss of calcium homeostasis, and initial cytotoxicity all
occurring within 24 hours; cellular proliferation is observed after two days; and liver tumors
are observed at 2 years. This pattern of shorter term versus longer term findings may simply
reflect the expected time scales for (1) prompt events of metabolism and initial chemical
tissue interactions, (2) acute toxicological changes, and (3) chronic toxicity. This pattern in
itself doesn’t provide much information to support a MOA.
The submitted example case cites Cabre et al., (2001) as showing liver fibrosis, changes in
glutathione pathways, and observation of products of lipid peroxidation at time periods
before the occurrence of cirrhosis. These earlier events may have a role in carbon
26 However, biological changes that are not directly related may show a common increasing relationship over a
studied dose range. This could result when diverse secondary events share a common antecedent (e.g., changes in
metabolic patterns) or simply because an agent has multiple biological effects within the experimental dose range.

Page 388 of 390
tetrachloride carcinogenesis, however, this study doesn’t seem to provide evidence of a
cancer MOA.
The MOA scoring process attributed maximum scores for “temporal concordance” for all
five hypothesized key events in the cytotoxicity pathway, contributing heavily to high overall
score assigned to the MOA. However, we believe the cited data on temporal patterns for
carbon tetrachloride effects provides only marginal insight for evaluating the MOA for this
compound.
II. ACC evaluation of a mutagenicity MOA
This MOA as constructed calls for direct mutagenicity by carbon tetrachloride metabolites to
account for the observed cancer findings. As noted above, this inference does not agree with the
conclusions about a carbon tetrachloride MOA as described by EPA (2010). The IRIS
assessment suggested a multi-step MOA that may involve both mutagenicity and promotion by
cytotoxic effects. Such mutagenic effects of carbon tetrachloride need not be direct (in the sense
of a direct metabolite of carbon tetrachloride binding to DNA). A multistep MOA may involve
oxidative DNA adducts derived through lipid peroxidation resulting from carbon tetrachloride
metabolism. Such effects need not be limited to situations with carbon tetrachloride toxicity, as
chemical interactions leading to ROS formation may occur in the absence of toxicity. The
presence of cytotoxicity may quantitatively alter the dose response for production of DNA
oxidation; however, the specific effects of toxicity processes is unknown. High doses of carbon
tetrachloride may not produce maximal adduct response, as: (1) high carbon tetrachloride doses
can impair CYP2E1 metabolism to species causing lipid peroxidation, and (2) cell killing at high
doses will cause birth of cells not exposed to initial carbon tetrachloride doses – or prior
background conditions. While there are positive studies showing increased oxidative binding
following carbon tetrachloride exposure, this database is complex and sometimes inconsistent.
However, with the present state of knowledge, carbon tetrachloride induced oxidative adducts
may be an important contributor to carbon tetrachloride’s MOA for cancer. Feasible studies
using modern methods and quality assurance procedures could substantially resolve these
questions.
The submitted example case statement of a mutagenicity MOA is specific and calls for proof at
several stages for mutagenic processes:
(1) Metabolism of carbon tetrachloride to a reactive intermediate that leads to the formation
of carbon tetrachloride-induced pro-mutagenic DNA adducts
(2) Insufficient or mis-repair of carbon tetrachloride-induced DNA adducts
(3) Early mutations induced in cancer critical genes
(4) Clonal expansion/cell proliferation to form pre-neoplastic AHF
(5) Progression and late mutations
(6) Hepatocellular carcinoma
Given the current lack of resolution on the potential for carbon tetrachloride mutagenicity at
bioassay and human relevant exposure levels (see Table L-1 below) the resultant scoring for this
MOA was low. However, the score derived by ACC was driven by the choice of steps included
above. Note that step (1) includes both metabolism and production of pro-mutagenic DNA

Page 389 of 390
adducts. This compound step would demand much evidence to satisfy. This contrasts with the
accompanying hypothesized cytotoxicity MOA where step 1 was purely metabolic: “Metabolism
via CYP2E1 and formation of trichloromethyl peroxy radical.” Requiring that both metabolism
and DNA lesions be established in a first step for the mutagenic MOA reduces the scoring for
this MOA. The decision to separately include step (2) - establishing that DNA repair is
inadequate - seems both experimentally challenging and somewhat beside the point as step (3)
calls for specific data on completed mutations. Note also that step (3) specifically addresses
mutations in cancer critical genes, data that is rarely available from chemical mutagenesis
studies.
The practical challenge for evaluating a mutagenic MOA (or a role for mutation in a multi-step
MOA) is assessing the available data on mutagenesis. The attachments to this paper excerpt key
data from EPA (2010) for in vivo and in vitro genotoxicity toxicity studies. These tables seek to
show that while there is a large database of genotoxicity studies on carbon tetrachloride, there are
also major limitations in the database. In particular there are very limited in vitro data that
applicable to oxidative damage to DNA by carbon tetrachloride (i.e., positive but limited
findings in E. coli strains) and very limited in vivo mutagenesis data for carbon tetrachloride
metabolizing tissues. The submitted example case has judged the carbon tetrachloride database
as essentially demonstrating lack of a mutagenic effect. By comparison EPA (2010) emphasized
the available data do not allow characterization of the genotoxicity at low carbon tetrachloride
exposure levels or the role of such genotoxicity in a cancer MOA.
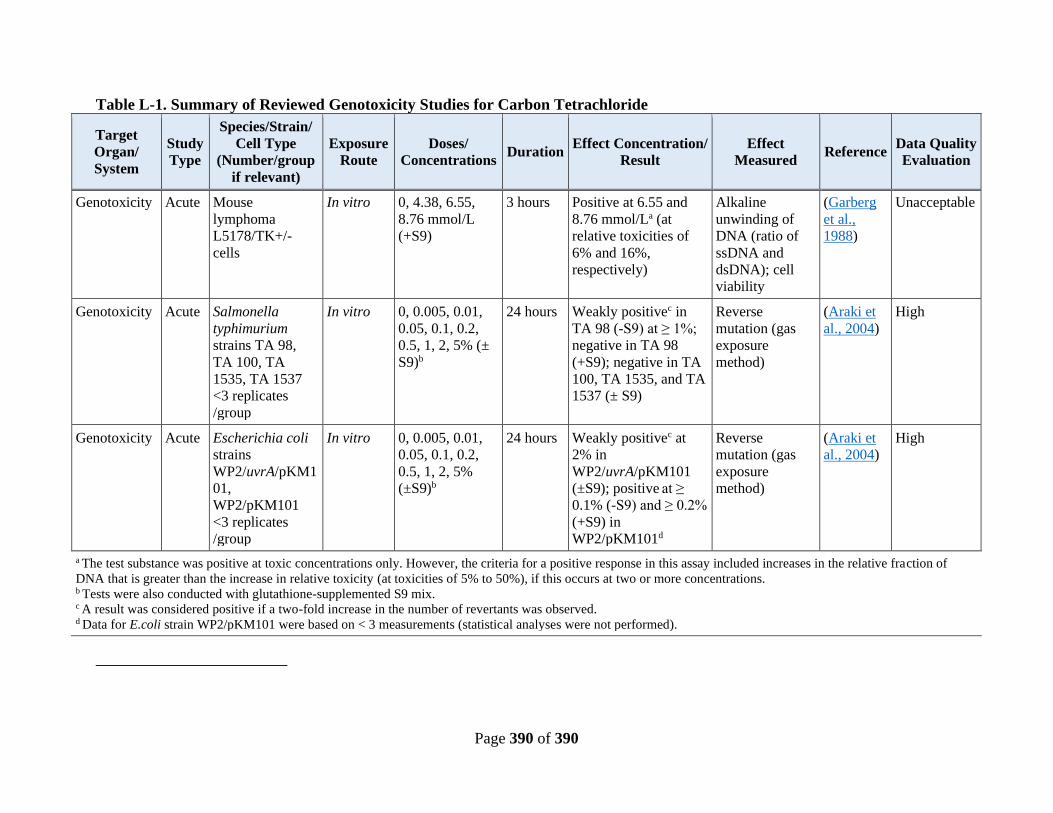
Page 390 of 390
Table L-1. Summary of Reviewed Genotoxicity Studies for Carbon Tetrachloride
Target
Organ/
System
Study
Type
Species/Strain/
Cell Type
(Number/group
if relevant)
Exposure
Route
Doses/
Concentrations Duration
Effect Concentration/
Result
Effect
Measured Reference
Data Quality
Evaluation
Genotoxicity Acute Mouse
lymphoma
L5178/TK+/-
cells
In vitro 0, 4.38, 6.55,
8.76 mmol/L
(+S9)
3 hours Positive at 6.55 and
8.76 mmol/La (at
relative toxicities of
6% and 16%,
respectively)
Alkaline
unwinding of
DNA (ratio of
ssDNA and
dsDNA); cell
viability
(Garberg
et al.,
1988)
Unacceptable
Genotoxicity Acute Salmonella
typhimurium
strains TA 98,
TA 100, TA
1535, TA 1537
<3 replicates
/group
In vitro 0, 0.005, 0.01,
0.05, 0.1, 0.2,
0.5, 1, 2, 5% (±
S9)b
24 hours Weakly positivec in
TA 98 (-S9) at ≥ 1%;
negative in TA 98
(+S9); negative in TA
100, TA 1535, and TA
1537 (± S9)
Reverse
mutation (gas
exposure
method)
(Araki et
al., 2004)
High
Genotoxicity Acute Escherichia coli
strains
WP2/uvrA/pKM1
01,
WP2/pKM101
<3 replicates
/group
In vitro 0, 0.005, 0.01,
0.05, 0.1, 0.2,
0.5, 1, 2, 5%
(±S9)b
24 hours Weakly positivec at
2% in
WP2/uvrA/pKM101
(±S9); positive at ≥
0.1% (-S9) and ≥ 0.2%
(+S9) in
WP2/pKM101d
Reverse
mutation (gas
exposure
method)
(Araki et
al., 2004)
High
a The test substance was positive at toxic concentrations only. However, the criteria for a positive response in this assay included increases in the relative fraction of
DNA that is greater than the increase in relative toxicity (at toxicities of 5% to 50%), if this occurs at two or more concentrations. b Tests were also conducted with glutathione-supplemented S9 mix. c A result was considered positive if a two-fold increase in the number of revertants was observed. d Data for E.coli strain WP2/pKM101 were based on < 3 measurements (statistical analyses were not performed).