Particulate organic carbon fluxes: compilation of results from the 1995 US JGOFS Arabian Sea Process...
13
Deep-Sea Research II 45 (1998) 2489 — 2501 Particulate organic carbon fluxes: compilation of results from the 1995 US JGOFS Arabian Sea Process Study By the Arabian Sea Carbon Flux Group C. Lee!,*, D.W. Murray", R.T. Barber#, K.O. Buesseler$, J. Dymond%, J.I. Hedges&, S. Honjo$, S.J. Manganini$, J. Marra’, C. Moser%, M.L. Peterson&, W.L. Prell", S.G. Wakeham) ! State University of New York, Stony Brook NY 11794-5000, USA " Brown University, Providence RI 02912-1846, USA # Duke University, Beaufort NC 28516-9721, USA $ Woods Hole Oceanographic Institution, Woods Hole MA 02543, USA % Oregon State University, Corvallis OR 96331, USA & University of Washington, Seattle WA 98195-7940, USA ’ Lamont-Doherty Earth Observatory, Palisades NY 10964, USA ) Skidaway Institute of Oceanography, Savannah GA 31411, USA Received 4 September 1997; received in revised form 30 April 1998; accepted 18 May 1998 Abstract Organic carbon fluxes in the Arabian Sea were measured as a function of depth, season and distance from the coast of Oman. We present here a compilation of measurements of primary production, water-column export flux and sediment accumulation of organic carbon over a full annual monsoon cycle on a 1500-km transect from the coast of Oman toward the central Arabian Sea. This represents an integration of measurements spanning one day (primary production) to 1000 yr (sediments) and gives a broad overview of organic carbon removal and remineralization in the highly productive, seasonally varying region of the northern Indian Ocean. Organic carbon fluxes decreased from the surface to the sediments by a factor of 500—10,000, with the largest rates of change in the upper ocean and at the sediment—seawater interface. Organic carbon fluxes generally decreased with distance offshore, with the largest gradient between surface and seafloor being at the offshore station. Sediment accumulation rates of organic carbon differed by a factor of 40 between nearshore and offshore, while primary productivity varied only by a factor of 2. The decrease in carbon flux with depth that occurs —————— *Corresponding author. Tel.: 001 516 632 8741; Fax: 001 516 632 8820; e-mail: cindylee@ccmail. sunysb.edu 0967-0645/98/$ — see front matter ( 1998 Elsevier Science Ltd. All rights reserved. PII: S 0 9 6 7 - 0 6 4 5 ( 9 8 ) 0 0 0 7 9 - 4
-
Upload
independent -
Category
Documents
-
view
5 -
download
0
Transcript of Particulate organic carbon fluxes: compilation of results from the 1995 US JGOFS Arabian Sea Process...
Deep-Sea Research II 45 (1998) 2489—2501
Particulate organic carbon fluxes: compilationof results from the 1995 US JGOFS Arabian Sea
Process Study
By the Arabian Sea Carbon Flux Group
C. Lee!,*, D.W. Murray", R.T. Barber#, K.O. Buesseler$,J. Dymond%, J.I. Hedges&, S. Honjo$, S.J. Manganini$, J. Marra',
C. Moser%, M.L. Peterson&, W.L. Prell", S.G. Wakeham)
! State University of New York, Stony Brook NY 11794-5000, USA" Brown University, Providence RI 02912-1846, USA# Duke University, Beaufort NC 28516-9721, USA
$ Woods Hole Oceanographic Institution, Woods Hole MA 02543, USA% Oregon State University, Corvallis OR 96331, USA
& University of Washington, Seattle WA 98195-7940, USA' Lamont-Doherty Earth Observatory, Palisades NY 10964, USA) Skidaway Institute of Oceanography, Savannah GA 31411, USA
Received 4 September 1997; received in revised form 30 April 1998; accepted 18 May 1998
Abstract
Organic carbon fluxes in the Arabian Sea were measured as a function of depth, season anddistance from the coast of Oman. We present here a compilation of measurements of primaryproduction, water-column export flux and sediment accumulation of organic carbon over a fullannual monsoon cycle on a 1500-km transect from the coast of Oman toward the centralArabian Sea. This represents an integration of measurements spanning one day (primaryproduction) to 1000 yr (sediments) and gives a broad overview of organic carbon removal andremineralization in the highly productive, seasonally varying region of the northern IndianOcean. Organic carbon fluxes decreased from the surface to the sediments by a factor of500—10,000, with the largest rates of change in the upper ocean and at the sediment—seawaterinterface. Organic carbon fluxes generally decreased with distance offshore, with the largestgradient between surface and seafloor being at the offshore station. Sediment accumulationrates of organic carbon differed by a factor of 40 between nearshore and offshore, while primaryproductivity varied only by a factor of 2. The decrease in carbon flux with depth that occurs
——————
*Corresponding author. Tel.: 001 516 632 8741; Fax: 001 516 632 8820; e-mail: [email protected]
0967-0645/98/$ — see front matter ( 1998 Elsevier Science Ltd. All rights reserved.PII: S 0 9 6 7 - 0 6 4 5 ( 9 8 ) 0 0 0 7 9 - 4

between the deepest traps and the sediment becomes a greater proportion of the total loss withincreasing distance from shore. Thus, the influence of processes at the sediment—water interfaceon the proportion of primary productivity preserved in the sediment increases offshore relativeto upper water column processes. Carbon fluxes changed greatly with season, with highestfluxes during the Southwest Monsoon. Export fluxes varied more with season than primaryproductivity or mid-water fluxes. ( 1998 Elsevier Science Ltd. All rights reserved.
1. Introduction
A major goal of the US Joint Global Ocean Flux Study (JGOFS) is to determineand understand processes controlling the time-varying fluxes of carbon in differentkey areas of the world ocean (US JGOFS, 1990). A critical task in support of this goalis to characterize carbon fluxes over various spatial and temporal scales. As part of theArabian Sea Process Study (ASPS), we measured surface-to-seafloor fluxes of organiccarbon over one year, including the Northeast and Southwest monsoons, on a tran-sect from the coast of Oman to the central Arabian Sea. This study included areasinfluenced by coastal upwelling and the strongly sheared Findlater Jet, a wind thatdrives major physical processes of the Arabian Sea. The Arabian Sea varies enor-mously in particulate carbon concentration and flux (Vinogradov and Voronina,1962; Krey and Babenerd, 1976; Nair et al., 1989; Haake et al., 1993). Large inter-annual differences in export flux have been reported during multi-year experiments(Haake et al., 1996). Our results report organic carbon fluxes during 1995. We soughtto determine the magnitude of the response of particulate organic carbon productionand removal rates throughout the water column and sediments to the strong mon-soonal forcing observed in this area. Organic carbon fluxes were measured as14C-primary productivity, export below 100 m using 234Th removal rates, mid-watertransport using moored time-series sediment traps, and sediment accumulation in thetop 5 cm. Fluxes reported thus represent measurements made over time scales fromone day (primary production) to 1000 yr (sedimentation). Our purpose here is to makethe organic carbon flux data we obtained easily accessible to modelers and others whowant to see a larger picture of flux results from the US JGOFS Arabian Sea ProcessStudy; complete descriptions and discussion of individual results are publishedseparately.
2. Methods
Fluxes were measured at five sites on a transect extending 1500 km from the coastof Oman. The location of the stations for primary productivity and Th export were S2,S3, S4, S7 and S15 (Smith et al., 1998a); the sediment trap mooring and sedimentcoring sites were M 1-5 (Fig. 1; Honjo et al., 1999). The trap (M) and hydrographic (S)stations were designed to be adjacent to each other; the offset between M and Sstations ranged between 12 and 54 km (Smith et al., 1998a). For comparison with
2490 C. Lee et al. / Deep-Sea Research II 45 (1998) 2489—2501
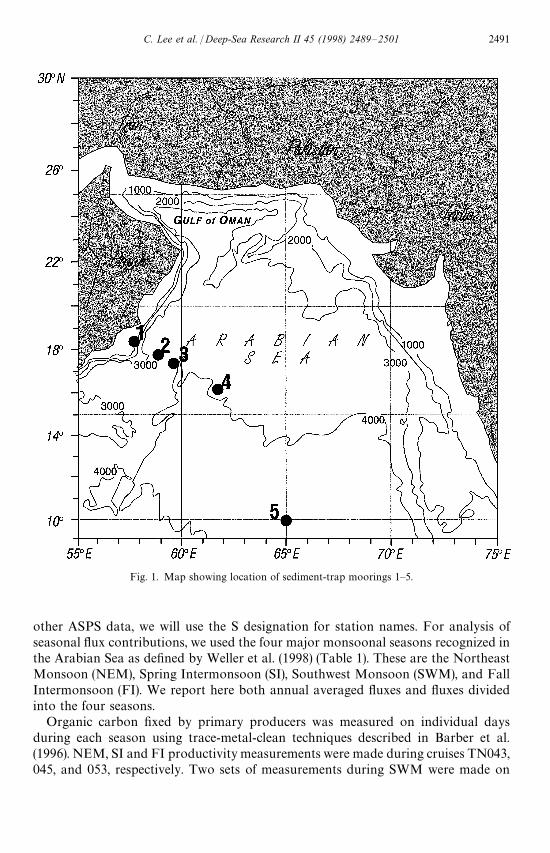
Fig. 1. Map showing location of sediment-trap moorings 1—5.
other ASPS data, we will use the S designation for station names. For analysis ofseasonal flux contributions, we used the four major monsoonal seasons recognized inthe Arabian Sea as defined by Weller et al. (1998) (Table 1). These are the NortheastMonsoon (NEM), Spring Intermonsoon (SI), Southwest Monsoon (SWM), and FallIntermonsoon (FI). We report here both annual averaged fluxes and fluxes dividedinto the four seasons.
Organic carbon fixed by primary producers was measured on individual daysduring each season using trace-metal-clean techniques described in Barber et al.(1996). NEM, SI and FI productivity measurements were made during cruises TN043,045, and 053, respectively. Two sets of measurements during SWM were made on
C. Lee et al. / Deep-Sea Research II 45 (1998) 2489—2501 2491
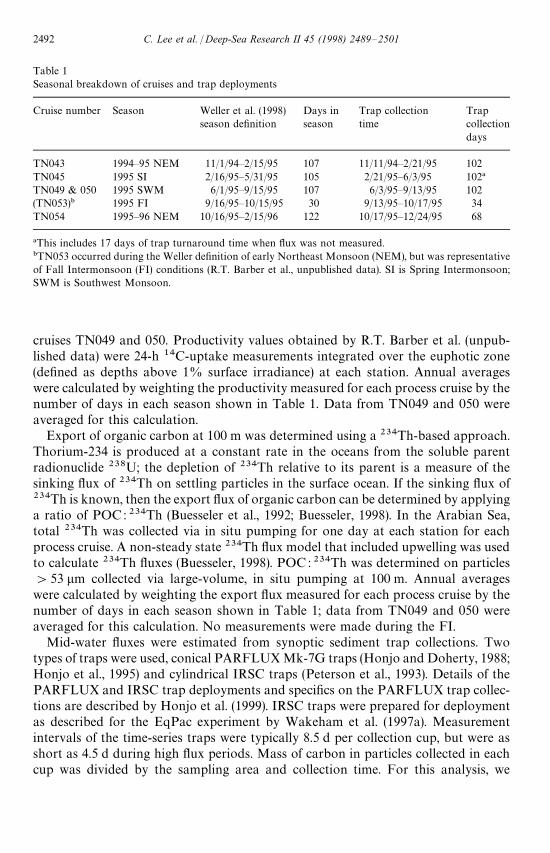
Table 1Seasonal breakdown of cruises and trap deployments
Cruise number Season Weller et al. (1998) Days in Trap collection Trapseason definition season time collection
days
TN043 1994—95 NEM 11/1/94—2/15/95 107 11/11/94—2/21/95 102TN045 1995 SI 2/16/95—5/31/95 105 2/21/95—6/3/95 102!
TN049 & 050 1995 SWM 6/1/95—9/15/95 107 6/3/95—9/13/95 102(TN053)" 1995 FI 9/16/95—10/15/95 30 9/13/95—10/17/95 34TN054 1995—96 NEM 10/16/95—2/15/96 122 10/17/95—12/24/95 68
!This includes 17 days of trap turnaround time when flux was not measured."TN053 occurred during the Weller definition of early Northeast Monsoon (NEM), but was representativeof Fall Intermonsoon (FI) conditions (R.T. Barber et al., unpublished data). SI is Spring Intermonsoon;SWM is Southwest Monsoon.
cruises TN049 and 050. Productivity values obtained by R.T. Barber et al. (unpub-lished data) were 24-h 14C-uptake measurements integrated over the euphotic zone(defined as depths above 1% surface irradiance) at each station. Annual averageswere calculated by weighting the productivity measured for each process cruise by thenumber of days in each season shown in Table 1. Data from TN049 and 050 wereaveraged for this calculation.
Export of organic carbon at 100 m was determined using a 234Th-based approach.Thorium-234 is produced at a constant rate in the oceans from the soluble parentradionuclide 238U; the depletion of 234Th relative to its parent is a measure of thesinking flux of 234Th on settling particles in the surface ocean. If the sinking flux of234Th is known, then the export flux of organic carbon can be determined by applyinga ratio of POC : 234Th (Buesseler et al., 1992; Buesseler, 1998). In the Arabian Sea,total 234Th was collected via in situ pumping for one day at each station for eachprocess cruise. A non-steady state 234Th flux model that included upwelling was usedto calculate 234Th fluxes (Buesseler, 1998). POC : 234Th was determined on particles'53 lm collected via large-volume, in situ pumping at 100 m. Annual averageswere calculated by weighting the export flux measured for each process cruise by thenumber of days in each season shown in Table 1; data from TN049 and 050 wereaveraged for this calculation. No measurements were made during the FI.
Mid-water fluxes were estimated from synoptic sediment trap collections. Twotypes of traps were used, conical PARFLUX Mk-7G traps (Honjo and Doherty, 1988;Honjo et al., 1995) and cylindrical IRSC traps (Peterson et al., 1993). Details of thePARFLUX and IRSC trap deployments and specifics on the PARFLUX trap collec-tions are described by Honjo et al. (1999). IRSC traps were prepared for deploymentas described for the EqPac experiment by Wakeham et al. (1997a). Measurementintervals of the time-series traps were typically 8.5 d per collection cup, but were asshort as 4.5 d during high flux periods. Mass of carbon in particles collected in eachcup was divided by the sampling area and collection time. For this analysis, we
2492 C. Lee et al. / Deep-Sea Research II 45 (1998) 2489—2501
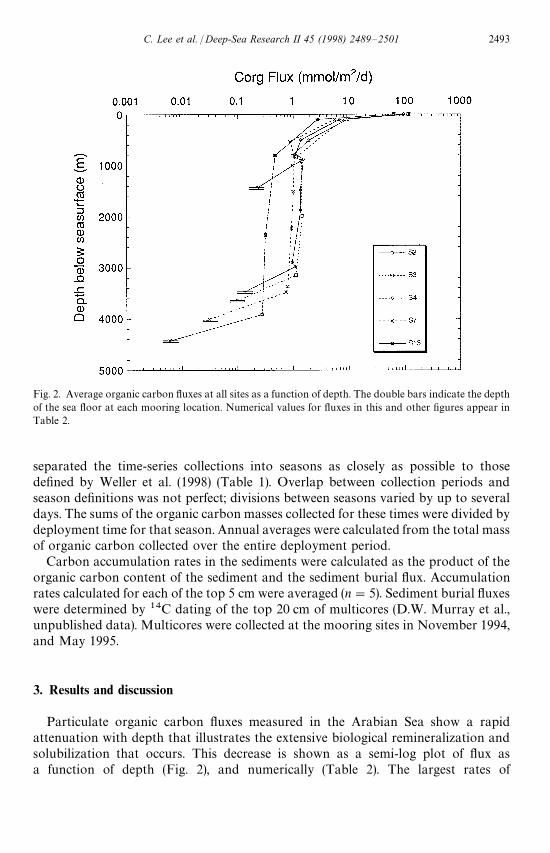
Fig. 2. Average organic carbon fluxes at all sites as a function of depth. The double bars indicate the depthof the sea floor at each mooring location. Numerical values for fluxes in this and other figures appear inTable 2.
separated the time-series collections into seasons as closely as possible to thosedefined by Weller et al. (1998) (Table 1). Overlap between collection periods andseason definitions was not perfect; divisions between seasons varied by up to severaldays. The sums of the organic carbon masses collected for these times were divided bydeployment time for that season. Annual averages were calculated from the total massof organic carbon collected over the entire deployment period.
Carbon accumulation rates in the sediments were calculated as the product of theorganic carbon content of the sediment and the sediment burial flux. Accumulationrates calculated for each of the top 5 cm were averaged (n"5). Sediment burial fluxeswere determined by 14C dating of the top 20 cm of multicores (D.W. Murray et al.,unpublished data). Multicores were collected at the mooring sites in November 1994,and May 1995.
3. Results and discussion
Particulate organic carbon fluxes measured in the Arabian Sea show a rapidattenuation with depth that illustrates the extensive biological remineralization andsolubilization that occurs. This decrease is shown as a semi-log plot of flux asa function of depth (Fig. 2), and numerically (Table 2). The largest rates of
C. Lee et al. / Deep-Sea Research II 45 (1998) 2489—2501 2493

Table 2Average annual and average seasonal organic carbon fluxes (mmol C/m2/d)
Depth Annual NEM" SI SWM FI(m)!
M1/S2PP 0 115.5 (5) 162.9 (1) 76.42 (1) 110.5 (2) 101.3 (1)Th Export 100 9.45 (4) 6.80 (1) 6.30 (1) 15.20 (2) — (0)IRSC 505 1.89 (23) 1.51 (7) 1.19 (5) 2.21 (6) 1.44 (2)Mk-7G 809 0.957 (26) 0.698 (9) 0.370 (5) 2.12 (8) 0.979 (2)IRSC 904 1.42 (23) 1.33 (7) 1.27 (5) 1.27 (6) — (2)Mk-7G 999 0.978# (32) 0.753 (13) 0.418 (9) 1.74 (10) — (0)Sediment 1435 0.227 (1)
M2/S3PP 0 114.8 (5) 150.0 (1) 87.50 (1) 114.5 (2) 87.25 (1)Th Export 100 8.04 (4) 7.30 (1) 3.70 (1) 13.05 (2) — (0)Mk-7G 839 1.12 (26) 1.40 (9) 0.599 (5) 1.904 (8) 1.04 (2)Mk-7G 914 1.40# (33) 1.60 (13) 0.776 (9) 1.720 (11) — (0)Mk-7G 1985 1.45# (34) 1.27 (13) 1.16 (9) 1.58 (11) — (0)Mk-7G 3150 1.11 (42) 0.853 (13) 0.918 (9) 1.12 (11) 3.29 (4)Sediment 3647 0.099 (1)
M3/S4PP 0 94.23 (5) 79.75 (1) 110.4 (1) 88.75 (2) 108.8 (1)Th Export 100 6.75 (4) 3.80 (1) 4.30 (1) 12.10 (2) — (0)IRSC 498 1.38 (21) 0.737 (7) 0.853 (5) 2.82 (6) 1.36 (2)Mk-7G 778 1.10 (26) 1.25 (9) 0.319 (5) 1.85 (8) 1.60 (2)Mk-7G 873 1.52# (25) 1.54 (12) — (0) 1.63 (11) — (0)IRSC 1478 1.34 (22) 1.19 (7) 0.770 (5) 2.16 (6) 1.55 (2)Mk-7G 1870 1.36 (42) 1.18 (13) 0.930 (9) 2.18 (11) 1.51 (5)IRSC 2896 0.955 (23) 0.675 (7) 0.870 (5) 1.52 (6) 1.31 (2)Mk-7G 2979 1.09 (39) 0.981 (11) 0.740 (9) 1.60 (11) 1.59 (4)Sediment 3478 0.13 (1)
M4/S7PP 0 117.1 (5) 144.4 (1) 89.17 (1) 123.5 (2) 94.58 (1)Th Export 100 5.54 (4) 4.30 (1) 1.40 (1) 10.85 (2) — (0)IRSC 531 0.878 (21) 0.054 (7) 0.843 (5) 1.50 (7) 1.42 (2)Mk-7G 814 1.05# (30) 0.800 (13) 0.859 (8) 1.50 (9) — (0)IRSC 1510 0.998 (21) 0.711 (7) 1.15 (5) 1.45 (7) 1.33 (2)Mk-7G 2222 0.926 (41) 0.658 (13) 1.001 (9) 1.16 (11) 1.38 (4)IRSC 3369 0.796 (21) 0.413 (7) 0.742 (5) 1.19 (7) 1.35 (2)Mk-7G 3484 0.739 (42) 0.578 (13) 0.870 (9) 0.83 (11) 0.981 (4)Sediment 4004 0.031 (1)
M5/S15PP 0 63.5 (5) 35.25 (1) 74.92 (1) 83.67 (2) 52.33 (1)Th Export 100 2.72 (4) 0.500 (1) 2.20 (1) 5.45 (2) — (0)Mk-7G 800 0.472# (9) 0.585 (5) 0.360 (4) — (0) — (0)Mk-7G 2363 0.316 (21) 0.357 (5) 0.286 (5) 0.402 (6) 0.255 (2)Mk-7G 3915 0.276 (21) 0.314 (5) 0.259 (5) 0.344 (6) 0.215 (2)Sediment 4426 0.006 (1)
Numbers in parentheses are the number of measurements averaged.!Mk-7G trap depths are averages of the two 6-month deployments."Only the 1994—95 NEM monsoon was considered in the seasonal averages.Annual averages included allmeasurements, however.#These annual flux averages do not include all seasons.
2494 C. Lee et al. / Deep-Sea Research II 45 (1998) 2489—2501

Table 3Percent of surface organic carbon production that reaches each depth on an annual flux basis
Water depth M1/S2 M2/S3 M3/S4 M4/S7 M5/S15
Surface 100 100 100 100 100100 m 8.2 7.0 7.2 4.7 4.3Mid-water 1.1 1.1 1.3 0.77 0.56Sediment 0.2 0.09 0.14 0.03 0.01
flux-decrease with depth occurred at the top and bottom boundaries of the watercolumn. On an annual average, only 4.3—8.2% of the carbon fixed by primaryproducers was exported to 100 m (Table 3). These ratios of export to production aresimilar to those found in the US JGOFS study in the Equatorial Pacific Ocean(EqPac) using the same methods; individual measurements in late SWM approach inmagnitude those found in the North Atlantic Bloom Experiment (Buesseler et al.,1992). Between 100 m and the mid-water traps, flux decreased by a factor of 7.5—7.7.Mid-water trap fluxes in Fig. 2 show less than a factor of 2 decrease between 1000 mand the deepest traps, suggesting that little organic carbon is remineralized between1000 and 3000 m. This does not imply that no transformations occur to alter thecomposition of the organic matter. A similar profile was produced for particulateorganic carbon fluxes during the EqPac study, where dramatic differences wereobserved in organic matter composition (Wakeham et al., 1997b). Only 2—18% of theflux measured in the deepest traps was buried in the surface sediments. The propor-tion of material reaching the sediment that is remineralized at the sediment—seawaterinterface is large relative to that in the water column just above the seafloor; this isprobably due to the longer residence time of material and more abundant biologicalactivity in surface sediments (e.g. Mayer, 1993; Dymond and Lyle, 1985, 1994).
Comparison of average seasonal carbon fluxes shows larger changes in export fluxamong seasons than in primary productivity (Fig. 3). The largest fraction of primaryproduction was exported during the SWM, presumably due to large diatom blooms atthat time (Buesseler et al., 1998; Honjo et al., 1999). Although differences amongmid-water fluxes averaged over an entire season were somewhat smaller than differ-ences in export fluxes for the same seasons (Table 2), trap fluxes measured over shorterperiods (4—8 d) ranged more widely, with differences in fluxes between consecutiveperiods of up to 6—7 mmol C/m2/d during SWM, up to 4—5 mmol C/m2/d duringNEM and FI, and up to 2—3 mmol C/m2/d during SI.
Organic carbon fluxes generally decreased with distance offshore, with the greatestchange occurring between the four onshore stations and the single offshore station(Fig. 4). Primary production decreased by about a factor of 2 between S2 and S15,while sediment accumulation of organic carbon decreased by a factor of 40; thus thefraction of surface-derived organic carbon preserved in the sediments also decreasedwith distance offshore. A comparison of fluxes shows that most of this preservationeffect must be at the sea floor. Export production is a smaller fraction of primaryproduction at S15 than at the near-shore stations (Table 3); this fraction might be
C. Lee et al. / Deep-Sea Research II 45 (1998) 2489—2501 2495
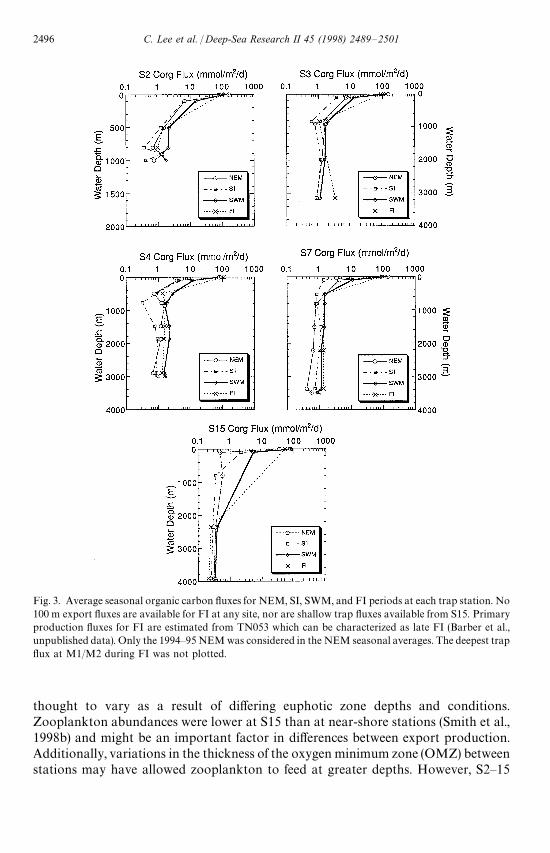
Fig. 3. Average seasonal organic carbon fluxes for NEM, SI, SWM, and FI periods at each trap station. No100 m export fluxes are available for FI at any site, nor are shallow trap fluxes available from S15. Primaryproduction fluxes for FI are estimated from TN053 which can be characterized as late FI (Barber et al.,unpublished data). Only the 1994—95 NEM was considered in the NEM seasonal averages. The deepest trapflux at M1/M2 during FI was not plotted.
thought to vary as a result of differing euphotic zone depths and conditions.Zooplankton abundances were lower at S15 than at near-shore stations (Smith et al.,1998b) and might be an important factor in differences between export production.Additionally, variations in the thickness of the oxygen minimum zone (OMZ) betweenstations may have allowed zooplankton to feed at greater depths. However, S2—15
2496 C. Lee et al. / Deep-Sea Research II 45 (1998) 2489—2501
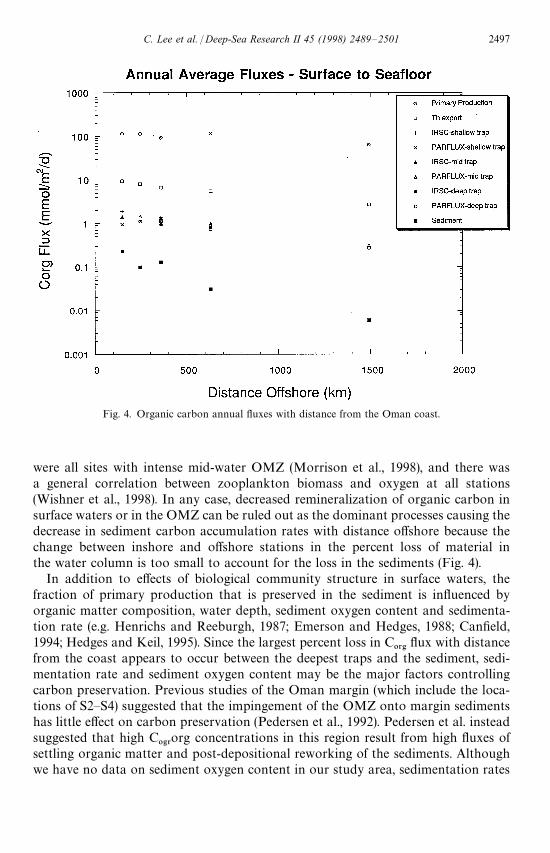
Fig. 4. Organic carbon annual fluxes with distance from the Oman coast.
were all sites with intense mid-water OMZ (Morrison et al., 1998), and there wasa general correlation between zooplankton biomass and oxygen at all stations(Wishner et al., 1998). In any case, decreased remineralization of organic carbon insurface waters or in the OMZ can be ruled out as the dominant processes causing thedecrease in sediment carbon accumulation rates with distance offshore because thechange between inshore and offshore stations in the percent loss of material inthe water column is too small to account for the loss in the sediments (Fig. 4).
In addition to effects of biological community structure in surface waters, thefraction of primary production that is preserved in the sediment is influenced byorganic matter composition, water depth, sediment oxygen content and sedimenta-tion rate (e.g. Henrichs and Reeburgh, 1987; Emerson and Hedges, 1988; Canfield,1994; Hedges and Keil, 1995). Since the largest percent loss in C
03'flux with distance
from the coast appears to occur between the deepest traps and the sediment, sedi-mentation rate and sediment oxygen content may be the major factors controllingcarbon preservation. Previous studies of the Oman margin (which include the loca-tions of S2—S4) suggested that the impingement of the OMZ onto margin sedimentshas little effect on carbon preservation (Pedersen et al., 1992). Pedersen et al. insteadsuggested that high C
0'3org concentrations in this region result from high fluxes of
settling organic matter and post-depositional reworking of the sediments. Althoughwe have no data on sediment oxygen content in our study area, sedimentation rates
C. Lee et al. / Deep-Sea Research II 45 (1998) 2489—2501 2497

decrease rapidly off shore (D.W. Murray et al., unpublished data). The decreasingsedimentation rates with distance from the coast lead to longer residence times ofcarbon in the surface sediment, thus contributing to more extensive remineralizationat the sediment—seawater interface. Also, because the carbon rain to the seafloordecreases offshore, the oxidative burden is somewhat less.
The flux profiles reported here are consistent with previous studies showing exten-sive mineralization in surface waters and at the sediment—water interface. However,we recognize that they are based on estimates from a variety of methods, each withinherent uncertainties. For example, the export ratios appear low relative to otherlocations (Eppley and Peterson, 1979; Berger et al., 1988). This could be a result ofdifferences in measurements of primary production and export fluxes in this andprevious studies, or to real differences in biological cycles. The sediment trap fluxesalso have uncertainties, particularly in the upper water column. Despite the remark-able agreement observed in fluxes measured using different trap designs, consistentwith previous trap intercomparisons (Honjo et al., 1992), some traps collected fluxesthat were slightly higher than traps above them. Although it is entirely possiblethat horizontal advection of particulate material caused real mid-depth increases influx, trapping efficiency can decrease in conical traps and increase in cylindricaltraps at high current velocities (Gardner, 1980; Butman, 1986). Current velocitiesmeasured on the trap arrays between 500 and 1000 m at S2 reached 40 cm/s at times(average 10.9 cm/s), suggesting that trapping efficiencies may have been affected at thisstation. Velocities were seldom above 15 cm/s and averaged 5.6—7.7 cm/s at the otherstations.
The methods we used to estimate fluxes are currently among the only possible waysof directly measuring flux. However, these estimates average flux values that werecollected over different time scales and use methods that collect different size particles.Primary production rates are measured over a single day and are based on particulatecarbon caught by GF/F filters. The 100-m export flux is based on particles of any sizethat scavenge Th (converted to POC export using C : Th for particles '53 lm); thismethod averages fluxes over about a month. Both of these fluxes were extrapolated toseasonal and annual bases based on one or two values for each season. Sediment trapscatch any particles or aggregates that sink into the traps; flux values were measuredweekly or monthly for the entire year and averaged for the seasonal and annualestimates. Sediment accumulation rates measure particles of any size that reach thesea floor and are not remineralized; these rates are average values spanning250—5000 yr of sediment deposition.
The consistency of carbon fluxes measured during the ASPS on both spatial andtemporal scales should allow more quantitative attempts at modeling and constrain-ing carbon budgets than previous US JGOFS studies. As pointed out by Honjo(1996), empirical equations (e.g., Suess, 1980; Martin et al., 1987; Pace et al., 1987;Berger et al., 1989) have been useful for initial approximations of export productionand mid-water fluxes, but do not reflect observed differences of particle size distribu-tion with depth. One probable reason for this is the difference between particles in theupper ocean and those in deep waters; in situ camera observations have shown thataggregates from deeper waters are more uniform and have smaller volumes than the
2498 C. Lee et al. / Deep-Sea Research II 45 (1998) 2489—2501
larger amorphous aggregates found in surface waters (Honjo et al., 1984). Presentempirical equations also do not account for different mechanisms of interconversionamong particle size classes. For example, zooplankton feeding is one importantmechanism in repackaging particles, and could be responsible for apparent increasedfluxes below the OMZ if the zooplankton carry particulate matter past shallowsediment traps. In the Arabian Sea, support for this hypothesis is the particleconsumption and repackaging by ¸ucicutia grandis and other zooplankton at thelower OMZ interface (Gowing and Wishner, 1998). Horizontal advection of materialfrom coastal regions or bottom features may also explain some of the higher fluxes atdepth. We hope that the flux data presented here, supported by bacterial andzooplankton mineralization studies in the ASPS, will foster the creation of a moremechanistic understanding of dynamics of carbon export and mineralization.
Acknowledgements
We thank all our JGOFS colleagues for their enthusiasm, discussions and hardwork throughout this study. We particularly thank Sharon Smith for organizing theexpedition, and the resulting workshops where this synthesis of flux data was begun.We thank Rob Armstrong for critical comments on several drafts of this manuscript.We would like to thank the Captains and crew of the R/V ¹hompson who spent a longyear in the Arabian Sea helping us obtain these data. Susan Kadar was especiallyinstrumental in ensuring the success of field operations. We thank the NationalScience Foundation for support of this research. This is US JGOFS ContributionNo. 423.
References
Barber, R.T., Sanderson, M.P., Lindley, S.T., Chai, F., Newton, J., Trees, C.C., Foley, D.G., Chavez, F.P.,1996. Primary productivity and its regulation in the equatorial Pacific during and following the1991—1992 El Nin8 o. Deep-Sea Research II 43, 933—969.
Berger, W.H., Fischer, K., Lai, C., Wu, G., 1988. Ocean carbon flux: global maps of primary production andexport production. In: Agegian, C.R. (Ed.), Biogeochemical Cycling and Fluxes Between the DeepEuphotic Zone and Other Oceanic Realms. NOAA NURP Research Report 88-1, pp. 131—176.
Berger, W.H., Smetacek,V.S., Wefer, G., 1989. Ocean productivity and paleoproductivity—an overview. In:W.H. Berger, V.S. Smetacek, Wefer, G. (Eds.), Productivity of the Ocean: Present and Past, Wiley, NewYork, pp. 1—34..
Buesseler, K.O., Bacon, M.P., Cochran, J.K., Livingston, H.D., 1992. Carbon and nitrogen export duringthe JGOFS North Atlantic Bloom Experiment estimated from 234Th:238U disequilibria. Deep-SeaResearch I 39, 1115—1137.
Buesseler, K.O., 1998. The decoupling of production and particulate export in the surface ocean. GlobalBiogeochemical Cycles 12, 297—310.
Buesseler, K.O., Ball, L., Andrews, J.H., Benitez-Nelson, C., Belastock, R., Chai, F., Chao, Y., 1998. Upperocean export of particulate organic carbon in the Arabian Sea derived from thorium-234. Deep-SeaResearch II 45, 2461—2487.
Butman, C.A., 1986. Sediment trap biases in turbulent flows: results from a laboratory flume study. Journalof Marine Research 44, 645—693.
C. Lee et al. / Deep-Sea Research II 45 (1998) 2489—2501 2499
Canfield, D.E., 1994. Factors influencing organic carbon preservation in marine sediments. ChemicalGeology 114, 315—329.
Dymond, J., Lyle, M., 1985. Flux comparisons between sediments and sediment traps in the eastern tropicalPacific: implications for atmospheric CO
2variations during the Pleistocene. Limnology and Oceanog-
raphy 30, 699—712.Dymond, J., Lyle, M., 1994. Particle fluxes in the ocean and implications for sources and preservation of
ocean sediments. In Material Fluxes on the Surface of the Earth. National Academy of Sciences,Washington, DC, pp. 125—142.
Emerson, S., Hedges, J.I., 1988. Process controlling the organic carbon content of open ocean sediments.Palaeoceanography 3, 621—634.
Eppley, R.W., Peterson, B.J., 1979. Particulate organic matter flux and planktonic new production in thedeep ocean. Nature 289, 677—680.
Gardner, W.D., 1980. Field assessment of sediment traps. Journal of Marine Research 38, 41—52.Gowing, M.M., Wishner, K.F., 1998. Feeding ecology of the copepod Lucicutia grandis near the lower
interface of the Arabian Sea oxygen minimum zone: implication for carbon flux. Deep-Sea Research II45, 2433—2459.
Haake, B., Ittekkot, V., Rixen, T., Ramaswamy, V., Nair, R.R., Curry, W.B., 1993. Seasonality andinterannual variability of particle fluxes to the deep Arabian Sea. Deep-Sea Research 40, 1323—1344.
Haake, B., Rixen, T., Reemtsma, T., Ramaswamy, V., Ittekkot, V., 1996. Processes determining seasonalityand interannual variability of settling particle fluxes to the deep Arabian Sea. In: Ittekkot, V., Schafer,P., Honjo, S., Depetris, P.J. (Eds.), Particle Flux in the Ocean, SCOPE vol. 57. Wiley, New York,pp. 251—270.
Hedges, J.I., Keil, R.G., 1995. Sedimentary organic matter preservation: an assessment and speculativesynthesis. Marine Chemistry 49, 81—115.
Henrichs, S.M., Reeburgh, W.S., 1987. Anaerobic mineralization of marine sediment organic matter: rates andthe role of anaerobic processes in the oceanic carbon economy. Geomicrobiology Journal 5, 191—237.
Honjo, S., 1996. Fluxes of particles to the interior of the open ocean. In: Ittekkot, V., Schafer, P., Honjo, S.,Depetris, P.J. (Eds.), Particle Flux in the Ocean, SCOPE vol. 57. Wiley, New York, pp. 91—154.
Honjo, S., Doherty, K.W., 1988. Large aperture time-series sediment traps: design objectives, constructionand application. Deep-Sea Research 35, 133—149.
Honjo, S., Doherty, K.W., Agrawal, Y.C., Asper, V.L., 1984. Direct optical assessment of macroscopicaggregates in the deep ocean. Deep-Sea Research 31, 67—76.
Honjo, S., Dymond, J., Collier, R., Manganini, S.J., 1995. Export production of particles to the interior ofthe equatorial Pacific Ocean during the 1992 EqPac experiment. Deep-Sea Research II 42, 831—870.
Honjo, S., Dymond, J., Prell, W., Ittekkott, V., 1999. Monsoon-controlled export fluxes to the interior of theArabian Sea: U.S. JGOFS 1994—95 experiment. Deep-Sea Research II (submitted).
Honjo, S., Spencer, D.W., Gardner, W.D., 1992. A sediment trap intercomparison experiment in thePanama Basin, 1979. Deep-Sea Research 39, 333—358.
Krey, J., Babenerd, B., 1976. Phytoplankton Production Atlas of the International Indian Ocean Expedi-tion. Intergovernmental Oceanographic Commission, Paris, 70 pp.
Martin, J.H., Knauer, G.A., Karl, D.M., Broenkow, W.W., 1987. VERTEX: carbon cycling in the northwestPacific. Deep-Sea Research 34, 267—286.
Mayer, L.M., 1993. Organic matter at the sediment-water interface. In: Engel, M.H., Macko, S.A. (Eds.),Organic Geochemistry. Principles and Applications. Plenum Press, New York, pp. 171—184.
Morrison, J., Codispoti, L.A., Gaurin, S., 1998. Seasonal variation of hydrographic and nutrient fieldsduring the US JGOFS Arabian Sea Process Study. Deep-Sea Research II 45, 2053—2101.
Nair, R.R., Ittekkot, V., Manganini, S., Ramaswamy, V., Haake, B., Degens, E., Desai, B., Honjo, S., 1989.Increased particle flux to the deep ocean related to monsoons. Nature 338, 749—751.
Pace, M.L., Knauer, G.A., Karl, D.M., Martin, J., 1987. Primary production, new production, and verticalflux in the eastern Pacific Ocean. Nature 325, 803—804.
Pederson, T.F., Shimmield, G.B., Price, N.B., 1992. Lack of enhanced preservation of organic matter insediments under the oxygen minimum on the Oman Margin. Geochimica et Cosmochimica Acta 56,545—551.
2500 C. Lee et al. / Deep-Sea Research II 45 (1998) 2489—2501
Peterson, M.L., Hernes, P.J., Thoreson, D.S., Hedges, J.I., Lee, C., Wakeham, S.G., 1993. Field evaluation ofa valved sediment trap. Limnology and Oceanography 38, 1741—1761.
Smith, S.L., Codispoti, L.A., Morrison, J.M., 1998a. The 1994—1996 Arabian Sea Expedition: An integrated,interdisciplinary investigation of the response of the northwestern Indian Ocean to monsoonal forcing.Deep-Sea Research II 45, 1905—1915.
Smith, S.L., Roman, M., Wishner, K.F., Gowing, M.M., Codispoti, L., Barber, R., Marra, J., Prusova, I.,Flagg, C., 1998b. Seasonal response of mesozooplankton to monsoonal reversals in the Arabian Sea.Deep-Sea Research II 45, 2369—2403.
Suess, D., 1980. Particulate organic carbon flux in the oceans — surface productivity and oxygen utilization.Nature 288, 260—263.
U.S. JGOFS, 1990. U.S. Joint Global Ocean Flux Study Long Range Plan. Planning Report No. 11, U.S.JGOFS Planning Office, Woods Hole, MA, 199pp.
Vinogradov, M.E., Voronina, N.M., 1962. Influence of the oxygen deficit on the distribution of plankton inthe Arabian Sea. Deep-Sea Research 9, 523—530.
Wakeham, S.G., Hedges, J.I., Lee, C., Peterson, M.L., Hernes, P.J., 1997a. Compositions and transport oflipid biomarkers through the water column and surficial sediments of the Equatorial Pacific Ocean.Deep-Sea Research II 44, 2131—2162.
Wakeham, S.G., Lee, C., Hedges, J.I., Hernes, P.J., Peterson, M.L., 1997b. Molecular indicators ofdiagenetic status in marine organic matter. Geochimica et Cosmochimica Acta 61, 5363—5369.
Weller, R.A., Baumgartner, M.F., Fischer, A.S., Kindle, J., 1998. Atmospheric forcing in the Arabian Seaduring 1994—1995: observations and comparisons with climatology and models. Deep-Sea Research II45, 1961—1999.
Wishner, K.F., Gowing, M.M., Gelfman, C., 1998. Mesozooplankton biomass in the upper 1000 m in theArabian Sea: overall seasonal and geographic patterns, and the relationship to oxygen gradients.Deep-Sea Research II 45, 2405—2432.
C. Lee et al. / Deep-Sea Research II 45 (1998) 2489—2501 2501