Molecular-level transformation of dissolved organic matter ...
Upload
independentCategory
view
2download
0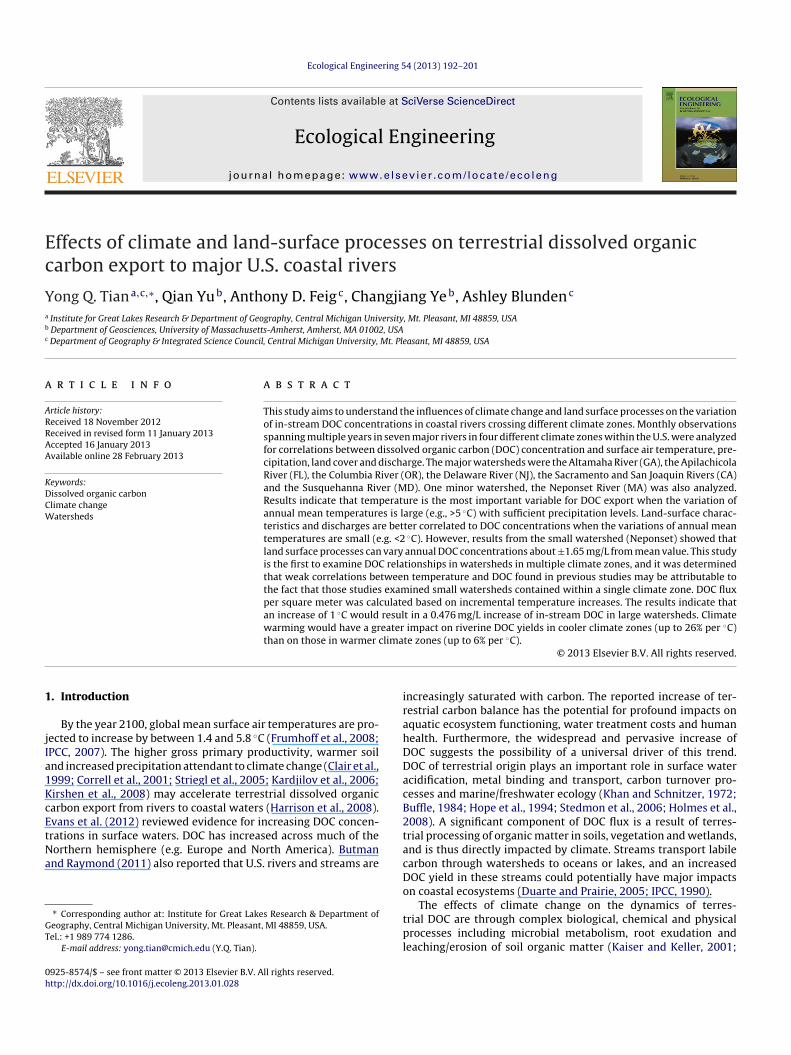
Ec
Ya
b
c
a
ARRAA
KDCW
1
jIa1KcEtNa
GT
0h
Ecological Engineering 54 (2013) 192ndash 201
Contents lists available at SciVerse ScienceDirect
Ecological Engineering
j o ur nal homep age wwwelsev ier com locate eco leng
ffects of climate and land-surface processes on terrestrial dissolved organicarbon export to major US coastal rivers
ong Q Tianaclowast Qian Yub Anthony D Feigc Changjiang Yeb Ashley Blundenc
Institute for Great Lakes Research amp Department of Geography Central Michigan University Mt Pleasant MI 48859 USADepartment of Geosciences University of Massachusetts-Amherst Amherst MA 01002 USADepartment of Geography amp Integrated Science Council Central Michigan University Mt Pleasant MI 48859 USA
r t i c l e i n f o
rticle historyeceived 18 November 2012eceived in revised form 11 January 2013ccepted 16 January 2013vailable online 28 February 2013
eywordsissolved organic carbonlimate changeatersheds
a b s t r a c t
This study aims to understand the influences of climate change and land surface processes on the variationof in-stream DOC concentrations in coastal rivers crossing different climate zones Monthly observationsspanning multiple years in seven major rivers in four different climate zones within the US were analyzedfor correlations between dissolved organic carbon (DOC) concentration and surface air temperature pre-cipitation land cover and discharge The major watersheds were the Altamaha River (GA) the ApilachicolaRiver (FL) the Columbia River (OR) the Delaware River (NJ) the Sacramento and San Joaquin Rivers (CA)and the Susquehanna River (MD) One minor watershed the Neponset River (MA) was also analyzedResults indicate that temperature is the most important variable for DOC export when the variation ofannual mean temperatures is large (eg gt5 C) with sufficient precipitation levels Land-surface charac-teristics and discharges are better correlated to DOC concentrations when the variations of annual meantemperatures are small (eg lt2 C) However results from the small watershed (Neponset) showed thatland surface processes can vary annual DOC concentrations about plusmn165 mgL from mean value This studyis the first to examine DOC relationships in watersheds in multiple climate zones and it was determined
that weak correlations between temperature and DOC found in previous studies may be attributable tothe fact that those studies examined small watersheds contained within a single climate zone DOC fluxper square meter was calculated based on incremental temperature increases The results indicate thatan increase of 1 C would result in a 0476 mgL increase of in-stream DOC in large watersheds Climatewarming would have a greater impact on riverine DOC yields in cooler climate zones (up to 26 per C)
lima
irahDDacB2
than on those in warmer c
Introduction
By the year 2100 global mean surface air temperatures are pro-ected to increase by between 14 and 58 C (Frumhoff et al 2008PCC 2007) The higher gross primary productivity warmer soilnd increased precipitation attendant to climate change (Clair et al999 Correll et al 2001 Striegl et al 2005 Kardjilov et al 2006irshen et al 2008) may accelerate terrestrial dissolved organicarbon export from rivers to coastal waters (Harrison et al 2008)vans et al (2012) reviewed evidence for increasing DOC concen-
rations in surface waters DOC has increased across much of theorthern hemisphere (eg Europe and North America) Butmannd Raymond (2011) also reported that US rivers and streams are
lowast Corresponding author at Institute for Great Lakes Research amp Department ofeography Central Michigan University Mt Pleasant MI 48859 USAel +1 989 774 1286
E-mail address yongtiancmichedu (YQ Tian)
tacDo
tpl
925-8574$ ndash see front matter copy 2013 Elsevier BV All rights reservedttpdxdoiorg101016jecoleng201301028
te zones (up to 6 per C)copy 2013 Elsevier BV All rights reserved
ncreasingly saturated with carbon The reported increase of ter-estrial carbon balance has the potential for profound impacts onquatic ecosystem functioning water treatment costs and humanealth Furthermore the widespread and pervasive increase ofOC suggests the possibility of a universal driver of this trendOC of terrestrial origin plays an important role in surface watercidification metal binding and transport carbon turnover pro-esses and marinefreshwater ecology (Khan and Schnitzer 1972uffle 1984 Hope et al 1994 Stedmon et al 2006 Holmes et al008) A significant component of DOC flux is a result of terres-rial processing of organic matter in soils vegetation and wetlandsnd is thus directly impacted by climate Streams transport labilearbon through watersheds to oceans or lakes and an increasedOC yield in these streams could potentially have major impactsn coastal ecosystems (Duarte and Prairie 2005 IPCC 1990)
The effects of climate change on the dynamics of terres-rial DOC are through complex biological chemical and physicalrocesses including microbial metabolism root exudation and
eachingerosion of soil organic matter (Kaiser and Keller 2001
Engine
Jcatimiiia(
tw(fieaateam
p((t(iusil
dorwznacltSfi
clawictdp
bstdcr
rmtatcrgzisswb
2
2
Ustawaez(mzclh
ffaUttna
em2i3outtir
mSJD
YQ Tian et al Ecological
ones et al 2009) For example live vegetation contributes signifi-ant amounts of DOC to terrestrial stream water through leaf litternd the subsequent leaching of that litter as well as of the vege-ation itself (France et al 1996 Mcdowell and Fisher 1976) Thiss an example of the DOC contribution of a well-understood pri-
ary land surface process What is not well understood howevers how climate conditions alter the origin function and fate of DOCn coastal watersheds In light of these climate change questions its also important to understand what temporal and spatial scalesre appropriate to study climate impacts on biochemical cyclingHaei et al 2010) ie carbon export
Current efforts to study the impacts of climate change on terres-rial DOC dynamics have been largely based on watershed systemsithin single climate zones (Correll et al 2001) Huang and Chen
2009) and Tian et al (2012) analyzed two yearsrsquo worth of monthlyeld data collected from a small urban watershed in the northeast-rn US They reported that climate-related factors (temperaturend precipitation) control DOC end-members in salt marsh forestgricultural industrial and residential lands These work concludedhat annual variation in temperature is the major driver of carbonxport along with precipitation In their studies Clair et al (1994)nd Correll et al (2001) concluded that precipitation alone is theajor driver of carbon exportIn contrast Hruska et al (2009) suggested that climate has
layed no role in observed DOC changes over a 14-year period1993ndash2007) in the two catchments they studied Chow et al2006) reported that a significant amount of DOC was produced inhe surface soil under constantly flooded hydrological conditionsas opposed to being directly impacted by climate factors) Onenference that can be made from these contrasting studies is thatnderstanding the impacts of climate change on DOC export to aingle watershed requires field measurements over decades evenf that watershed is in a single-landscape system eg homogenousand cover
Some efforts have examined multiple adjacent watersheds fromifferent landscape systems in order to study the impact of climaten DOC Raymond and Oh (2007) examined climate controls oniverine carbon export from three major river watersheds Theseatersheds were of differing landscape systems within one climate
one type Continental Humid They reported that temperature wasot as significant as land surface processes (in this case inter-nnual stream discharge) to DOC export Raymond and Oh (2007)oncluded that physical processes are more significant than bio-ogical processes since water redistributes DOC from terrestrialo riverine systems However other workers (Ciais et al 1995chaeffer et al 2011 Miller and Zepp 1995) reported that sur-ace temperature is a key factor for controlling biological processesn terms of primary productivity
The conflicting nature of the results of prior work indicate thatonsiderable uncertainties exist regarding the processes control-ing DOC delivery to streams particularly under differing climaticnd land surface process conditions Arguably the focus of priorork has been too localized in terms of watershed character-
stics and climate zones to produce a more holistic picture ofarbon export Further the temporal requirements for data collec-ion in carbon-export studies are uncertain For some watershedsecadal-scale datasets may be appropriate multi-watershed com-arisons may require finer (or coarser) resolutions
The objective of this study is to understand the impacts on car-on export not only of climate factors but also land cover andtream discharge across different climate zones We took advan-
ages of field observations from several major river watersheds ofifferent climate regions and explored the relationship betweenlimate factors (surface temperatures and precipitations) and ter-estrial DOC export to rivers We further studied the observed
24Td
ering 54 (2013) 192ndash 201 193
iverine carbon-export processes in small watersheds over 24onths and explored if climate factors maintain the important con-
rols compared to land surface variables (hydrological propertiesnd land use) within a single climate region The study confirmshat the effect of climate factors (surface air temperature pre-ipitation) on in-stream DOC concentrations in a small watershedequires observations of a larger number of years Therefore lon-itudinal observations in major rivers crossing multiple climateones are excellent for exploring the effects of climate on river-ne DOC dynamics The observations of small numbers of years inmall rivers located in a single climate zone are good to study landurface effects Ultimately addressing these issues and questionsill be particularly beneficial for understanding the land-water
iogeochemical dynamics that are influenced by climate change
Methods
1 Study and sampling sites
We selected seven major (gt33000 km2) watersheds along theS west and east coasts Four of the seven major river watersheds
elected are in the east coast the Delaware in New Jersey (NJ)he Susquehanna in Maryland (MD) the Altamaha in Georgia (GA)nd the Apalachicola in Florida (FL) The other three major riveratersheds are in the west coast the Columbia in Oregon (OR)
nd the Sacramento and San Joaquin both in California (CA) Thentire drainage areas of these rivers cover four dominant climateones Hot Humid Continental (NJ and MD) Subtropical HumidGA and FLA) Warm Summer Mediterranean (OR) and Hot Sum-
er Mediterranean (CA) The rivers located cross four climaticones have necessary environments for studying the impacts oflimate change on soil DOC leaching ecology Fig 1a shows theirocations and Table 1 lists the abbreviations used for the riversereafter used in this article
We obtained climate data (mean precipitation and temperature)rom the National Climatic Data Center (NCDC 2011) Data wererom 1996 to 2010 and at different temporal scales These data wereveraged at multiple NCDC stations within each watershed in theS It should be noted that the COL watershed lies within both
he US and Canada However the Canadian portion is sim15 of theotal basin area and precipitation decreases significantly from theorthwestern part of the basin We argue therefore that the errorssociated with this unsampled Canadian portion is minimal
The surface air temperatures at individual watersheds gen-rally rise from south to north with increasing latitude Annualean temperatures of all watershed sites (Fig 7) ranged from 6 to
3 C (43ndash73 F) Annual mean precipitation (Fig 3) varies signif-cantly among these watersheds Drainage areas ranged between3152 km2 (DEL) and 670000 km2 (COL) (Table 2) The proportionsf land cover types are similar among the watersheds (Table 2) Wetilized the 2001 National Land Cover Data (NCLD) (EPA 2001) fromhe US Environmental Protection Agency Our study areas con-ained thirteen NLCD land coverland use types which we mergednto four major land cover classes (Table 3) The percentages of eacheclassified land cover type are listed in Table 2
DOC concentrations and associated stream discharges wereonitored at gauge stations maintained by the USGS National
tream Quality Network (NASQAN) program (Hooper et al 2001ones et al 2003) Gauge station data are listed in Table 4 MonthlyOC concentration measurements were available for a range of
ndash14 years depending on the watershed We collected a total of53 samples Table 4 lists the distribution of samples by watershedhe seven selected NASQAN gauge stations also reported dischargeata with the exception of that for the Altamaha River (NASQAN
194 YQ Tian et al Ecological Engineering 54 (2013) 192ndash 201
Fig 1 (a) Climate zones in US and sampling stations at the seven major coastal rivers in USGS NASQAN program The associated watersheds of each outlet are shadedpolygons The river networks are shown as dark-blue polylines (b) The Neponset River watershed south of Boston Drainage area is sim370 km2
YQ Tian et al Ecological Engineering 54 (2013) 192ndash 201 195
Table 1River names abbreviations used in this study and climate zones States in which a majority of each watershed is located are also listed This study categorizes watershedsas either major or minor
River name Abbreviation State Climate zone Category
Altamaha ALT Georgia Subtropical Humid MajorApilachicola API Florida Subtropical Humid MajorColumbia COL Oregon Warm Summer Mediterranean MajorDelaware DEL New Jersey Hot Humid Continental MajorNeponset NEP Massachusetts Hot Humid Continental MinorSacramento SAC California Hot Summer Mediterranean MajorSan Joaquin SJQ California Hot Summer Mediterranean MajorSusquehanna SUS Maryland Hot Humid Continental Major
Table 2Land cover data for watersheds and climate zone distributions (CZD) in this study For CZD watersheds either cover multiple climate zones (M) or are contained withinsingle climate zones (S) Data are from the time period 1997 to 2010 For the Neponset River see Fig 10b
ALT API COL DEL NEP SAC SJQ SUS
Wetland 1306 1464 206 572 1157 276 326 238 Forest 5048 502 7357 6706 5177 4506 6242 6245 Agriculture 2637 2577 2094 1699 085 4362 2914 2743 Developed 1008 94 329
Drainage area (km2) 35224 49728 670000
CZD S S M
Table 3NLCD land useland cover types of the watersheds and the merged reclassificationsused in this study
NLCD land useland cover type Reclassification used in this study
Developed-Open Space DevelopedDeveloped-Low Intensity DevelopedDeveloped-Medium Intensity DevelopedBarren Land ForestDeciduous Forest ForestEvergreen Forest ForestMixed Forest ForestPastureHay AgricultureCultivated Crops AgriculturePalustrine Forested Wetland Wetland
Ini
NupwaOl1oFp
(adsa
2
sittvo
3
3
mtsAfa
TU
Palustrine ScrubShrub Wetland WetlandOpen Water Wetland
D 02226160) Instead we used the discharge data collected at aearby USGS water gauge station (ID 02226000) The difference
n drainage areas between these two stations is lt003This study includes an additional minor river watershed the
eponset River watershed (370 km2 sim2 m3s discharge) This is anrban estuary located south of Boston MA We collected 480 sam-les over four years within 12 sub-basins of the Neponset Riveratershed southeast of Boston MA (Fig 1b) DOC concentrations
t selected outlets were measured monthly from March 2006 toctober 2010 However due to instrument malfunctions in our
aboratory samples from 2008 were stored frozen for longer than
2 months For this reason we eliminated all 2008 samples fromur dataset and use only those from 2006 2007 2009 and 2010urther details concerning the Neponset River sites and laboratoryrocedures are described in Huang and Chen (2009) and Tian et al
swli
able 4SGS gauge station and drainage data pertaining to collected samples (453 samples total
River and gauge info Site ID Latitude Lon
Altamaha R near Everett City GA 02226160 3139prime16primeprime minus81Apilachicola R near Sumatra FL 02359170 2956prime57primeprime minus85Columbia near Beaver Army Terminal OR 14246900 4610prime55primeprime minus12Delaware R at Trenton NJ 01463500 4013prime18primeprime minus74Sacramento R at Freeport CA 11447650 3827prime22primeprime minus12San Joaquin R near Vernalis CA 11303500 3740prime34primeprime minus12Susquehanna R at Conowingo MD 01578310 3939prime281primeprime minus76
1023 3582 853 517 77433152 370 59570 35058 70189S S S S S
2012) We include NEP samples in this study to examine whethernd how DOC responses to climate change in small watershedsiffer from those in larger watersheds NEP data were collectedeparately from those data for other rivers and may be considered
nested case study within our larger study
2 Statistical analyses
We conducted linear regression analysis using SPSS statisticaloftware to identify significant variables associated with variationn DOC concentrations Variables were deemed significant whenhe P value was less than 005 We used the coefficient of mul-iple determinations R2 to measure how well the environmentalariables of temperature precipitation and land use explainedbserved DOC variations
Results
1 Temperature comparisons
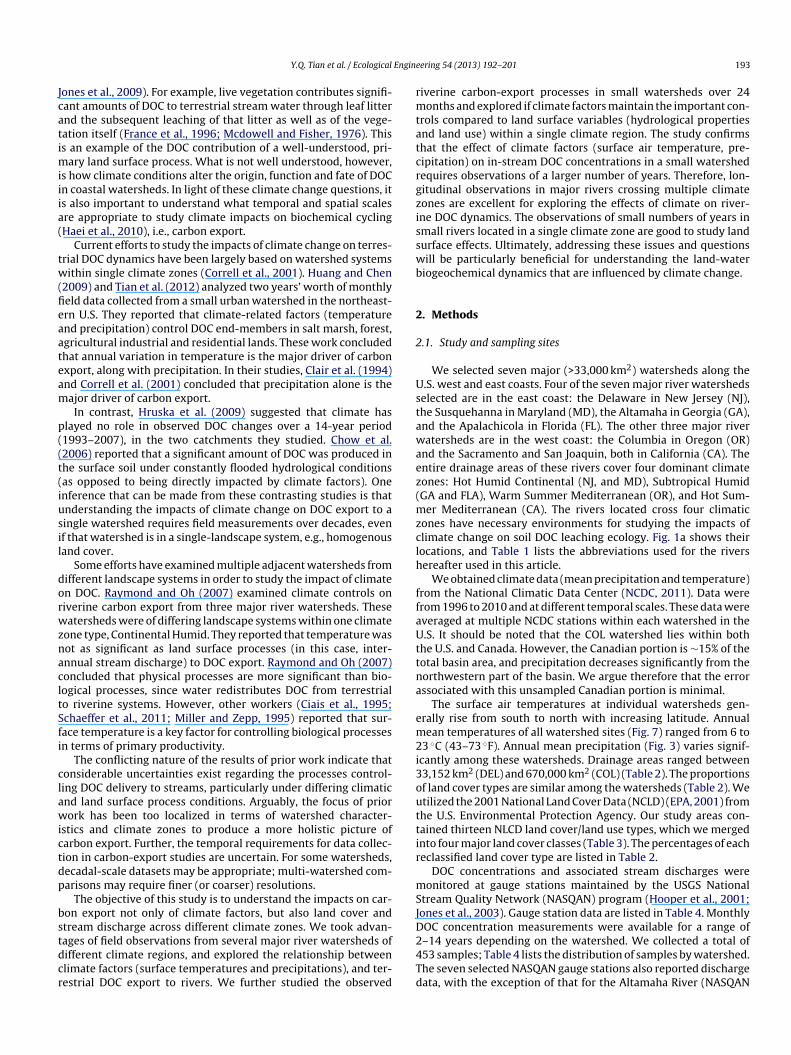
Surface air temperatures were very different across the sevenajor watersheds Fig 2 shows the averaged variations of monthly
emperatures over the study period of the seven major water-heds API has the highest annual mean temperature of sim207 Cnnual mean temperatures in the other five watersheds ranged
rom 92 to 164 C The mean monthly temperatures of the SACnd SJQ watersheds in the summer season (June July August)
how little differences from those of the DEL and SUS Howeverinter (December January February) temperatures differences are
arger between US east and west coasts ALT and API display sim-lar seasonal temperature variations with a fairly consistent 3 C
)
gitude Drainage (mi2) Samples Start year End year
49prime41primeprime 14000 27 2007 201000prime56primeprime 19200 22 2008 2010310prime50primeprime 256900 131 1995 201046prime41primeprime 6780 69 1998 2010130prime01primeprime 23000 97 1996 2010115prime55primeprime 13536 77 1997 201010prime282primeprime 27100 30 2004 2010
196 YQ Tian et al Ecological Engineering 54 (2013) 192ndash 201
Fa
dst
3
mtnifaai
Fwe
Fw
mpsurh
Fnde
ig 2 Mean monthly surface temperature averaged over the period 1996ndash2010nd over each of the seven major coastal river watersheds
ifference Western watersheds (COL SAC SJQ) share similar sea-onal temperature patterns with a maximum difference of sim67 Chroughout the year
2 Precipitation and discharge relationships
Fig 3a shows annual mean precipitation data for the sevenajor watersheds and Fig 3b shows average monthly precipita-
ion data for these watersheds Annual precipitation patterns doot correlate well with annual mean surface temperatures which
s unsurprising given that the watersheds are located in four dif-
erent climate zones API and COL received annual precipitationmounts of 132 and 135 cm respectively DEL ALT and SUS annualverages were comparable at sim117 cm SAC and SJQ are locatedn the Hot Summer Mediterranean climate zone and thus receive
ig 3 (a) Annual mean precipitation averaged over the period 1996ndash2010 for eachatershed (b) Monthly precipitation averaged over past the period 1996ndash2010 in
ach watershed
i(eFDoaa(itc
FyJ
ig 4 Annual mean river flows normalized by drainage area of corresponding riveratershed (m3m2year)
uch lower levels of precipitation (Fig 3a) Averaging the monthlyrecipitation data (Fig 3b) divides the seven major watersheds intoeasonal groups The dry summer group has low precipitation val-es JunendashSeptember and includes the watersheds SAC and SJQ Theemaining watersheds are in the wet summer group which hasigh precipitation values JunendashSeptember
Discharge rates for the seven major watersheds are shown inig 4 Watersheds with high levels of annual precipitation didot necessarily have a high annual average streamflow per unitrainage area (m3m2year) We attribute this to infiltration andvaporation For instance API receives the highest annual precip-tation of the four east coast watersheds However its streamflowm3) per m2 was the lowest This may be due in part to the pres-nce of wetlands in the catchment and their ability to retain waterurthermore despite receiving the same annual precipitation ALTEL and SUS (east coast) all have very different streamflows per m2
ver the study period (Fig 4) ALT had higher surface temperaturend its annual streamflow per m2 is lower than that of both DELnd SUS Similar results were obtained for west coast watersheds
Figs 3a and 4) Correlations between precipitation and river flown multiple-climate-zone watersheds remain controversial unlikehe positive relationship in watersheds contained within a singlelimate zone (Raymond and Oh 2007) It should be noted that
ig 5 Monthly DOC concentrations averaged over periods ranging from 2 to 14ears in each of the seven major watersheds (no data were available for ALT fromuly to September nor for API from November to December nor for SAC in March)
YQ Tian et al Ecological Engineering 54 (2013) 192ndash 201 197
Fig 6 Correlations between river discharges and DOC concentrations in the seven major rivers (a) DEL (b) SUS (c) ALT (d) API (e) COL (f) SAC and (g) SJQ DOC samplesin the SAC and API were collected only during either high or low flow ends The lack of sampling during medium flow periods left a gap in the scatter plots (Fig 5d and f)The discharges at the sub-basin level of a small watershed explained about 44 of in-stream DOC concentrations in a linear regression model (5 h)
1 Engineering 54 (2013) 192ndash 201
ii
3
rvCtccmet(wgus
3
(it(tTttsHlDttttass
3
assptDvsimapfinzDf
ad
Fig 7 Mean annual DOC concentrations versus mean surface air temperatures intWs
mFehb(ttDepflfiCd
3
Annual mean DOC concentrations within NEP (the additionalwatershed) show a relatively weaker correlation to annual mean
98 YQ Tian et al Ecological
n this study inter-annual discharge appears strongly related tonter-annual precipitation within each watershed
3 DOC concentrations and correlations to discharge
Fig 5 shows monthly DOC concentrations in the seven majorivers averaged over periods ranging from 2 to 14 years The largestariations in monthly DOC concentrations were in API and ALTOL SAC and SUS show the lowest DOC variations DOC concen-rations show similar seasonal trends for watersheds in the samelimate zone Fig 6andashf displays correlations between DOC and dis-harge for the seven major rivers A positive correlation betweenean DOC concentration and annual discharge exists in all rivers
xcept SJQ The flow of this river is altered significantly by agricul-ural irrigation For SAC discharge explains sim80 of in-stream DOCR2 = 08) However for other rivers this correlation is much lowerith R2 ranging between 01 and 03 Our results (see below) sug-
est that relationships between DOC and discharge are dependentpon other factors such as precipitation temperature and water-hed drainage area
4 Seasonal variation and DOC
The strong seasonal patterns of mean surface temperatureFig 2) did not match well with riverine DOC concentrations forndividual watersheds (Fig 5) However seasonal DOC concentra-ion trends are similar for watersheds in the same climate zoneFig 5) For example DEL and SUS are in the Hot Humid Continen-al climate zone and have a similar pattern throughout the yearhese rivers have their lowest concentrations in January whichhen increase to their highest concentrations in December Forhese two rivers DOC concentration patterns did not vary in theame way temperature patterns did For both Warm Summer andot Summer Mediterranean climate zones hot temperatures and
ow precipitation rates in summer were accompanied by decreasedOC concentrations for COL SAC and SJQ ALT and API in the Sub-
ropical Humid climate zone have similar seasonal DOC patternso those of the Mediterranean climates with minor differences inhe magnitudes of DOC concentrations Overall temperature pat-erns did not match DOC seasonal variations in the Subtropicalnd Mediterranean climate zones As a result we infer that mea-urement and analysis of the impacts of climate on in-stream DOChould be at an annual scale and not a seasonal scale
5 Temperature and DOC
Fig 7 shows regression analysis of mean surface temperaturesgainst mean riverine DOC concentrations In the collective analy-is of all seven major watersheds (in different climate zones) meanurface temperatures are highly correlated with DOC (R2 gt 064
lt 001) The mean annual surface temperatures ranged from 89o 211 C with a range in latitude of 29ndash46 north Mean annualOC concentrations range from 1 to 75 mgL For most rivers DOCariations are below 2 mgL except for ALT and API which are3 mgL Annual mean DOC concentrations generally increase in
linear fashion with annual mean surface temperatures Tem-erature explains sim89 of the observed DOC concentrations inve watersheds (ALT API COL DEL and SUS) This group doesot include watersheds in the Hot Summer Mediterranean climateones (Fig 7) Our results indicate that the magnitude of terrestrialOC yields is more strongly controlled by temperature than other
actors such as discharge latitude and seasonal precipitationFor each of the seven major watersheds we determined mean
nnual DOC flux in terms of mgm2 and increments of flux peregree C (Fig 8) The two components of flux calculation are annual
Fbd
he seven major rivers The dashed line regression describes climates that are notarm Summer Mediterranean (SAC and SJQ) The solid regression line describes
amples from all seven rivers including SAC and SJQ
ean DOC concentration and annual discharge (flow shown inig 4) Our calculations show that ALT and API have the high-st annual DOC fluxes of the seven major watersheds (Fig 8) SJQad the lowest DOC yields per unit area The linear relationshipetween annual temperature and in-stream DOC concentrationsFig 7) demonstrates that a 1 C rise of average annual surfaceemperatures would increase annual mean in-stream DOC concen-rations in the seven studied rivers by 0476 mgL This increase inOC concentration would lead to a subsequent increase in DOCxport in the range of 0135ndash0327 g of carbon per square meterer year in the seven study watersheds The percentages of DOCux increments in response to a 1 C temperature increase ranged
rom 6 to 26 (Fig 8) Temperature increases impact the DOC yieldsn northern US rivers more so than in southern US rivers 26 forOL versus 6 for ALT and 7 for API The increment percentagesecrease from north to south for all rivers except SAC
6 Neponset River trends
ig 8 Mean annual DOC flux mminus2 (solid bars) and increment mminus2 yearminus1 (patternedars on top) in response to 1 C increase of mean annual surface temperature Labelsenote increment by percentage
YQ Tian et al Ecological Engine
FcR
sI2stttdss
Fsmo
aDs
4
(pLswpcv
4
ttaDs
ig 9 Correlations of annual mean in-stream DOC concentrations to annual pre-ipitation as well as to annual mean temperatures over four years in the Neponsetiver watershed PCP = precipitation and TMP = temperature
urface temperature than to annual mean precipitation (Fig 9)nter-annual temperature variation over four years was less thanC (right Y axis in Fig 9) The DOC in this small urban water-
hed yielded a stronger correlation to annual mean precipitationhan it did to temperature (left Y axis in Fig 9) Fig 10a showshe range of variation of DOC concentrations (simplusmn165 mgL from
he mean) This minor watershed in a local climate zone containsiverse land uses in each sub-basin Fig 10b shows land use for theampled sub-basins which average sim30 km2 in area In a previoustudy Tian et al (2012) reported that vegetation types drainage
ig 10 (a) Variation of annual mean DOC concentrations in each of the first orderub-basins in the Neponset River watershed The mean is 485 mgL and the maxi-um difference is plusmn165 mgL (b) Distribution of land use types in each of the first
rder sub-basins in the Neponset River watershed
itaitSwcedeesia2ti2
4
ddtampceajh(rmpuTbiu
ering 54 (2013) 192ndash 201 199
rea discharge and seasons were strong predictors to in-streamOC concentrations in this minor watershed (R2 = 076 and 064 at
easonal and annual scales respectively)
Discussion
The significant variations of mean annual DOC concentrationsFig 7) between catchments from different climate zones are drivenrimarily by climate conditions (temperature and precipitation)and surface processes (land-use type and density hydrology andoil properties) are secondary factors However in the case ofatersheds located within a single climate zone land surfacerocesses are the primary factors controlling riverine DOC con-entrations especially where the inter-annual mean temperatureariation is small (less than 2 C)
1 The importance of temperature on DOC
Two things that we learned from this study are that surfaceemperature is a more important control on riverine DOC fluxhan land surface processes and that it is appropriate to apply annnual temporal scale to quantify DOCndashtemperature relationshipsOC dynamics in rivers were correlated better with watershed
urface temperatures in three climate zones (R2 = 089) withoutncluding Hot Summer Mediterranean which has low precipita-ion during summers This suggests that the effects of temperaturend precipitation are major drivers of DOC flux The low precip-tation in the Hot Summer Mediterranean climate zone explainshe weaker temperaturendashDOC linear relationship (R2 lt 064) whenAC and SJQ are included in the analysis (Fig 7) Temperature andater are the essential conditions together with Photosyntheti-
ally Active Radiation ndash PAR for gross primary productivity (Guot al 2007) and precipitation levels (or hydrological properties)etermine a soilrsquos water availability (Curtin et al 2011 Winterdahlt al 2011) It follows that biological processes have a greaterffect on DOC yields than physical processes do when elevatedurface temperature is combined with sufficient water availabilityn soil Furthermore higher annual surface temperature is usu-lly associated with longer growing degree days (Hinchliffe et al011) Given sufficient precipitation growing degree days con-ribute to enhanced gross primary productivity which ultimatelys the source of DOC yields in rivers (Dierig and Crafts-Brandner011)
2 Land cover and DOC
Our monthly measurements in the Neponset River watershedemonstrated land use are very important to terrestrial DOCynamics Especially they are the dominant factors when the varia-ions of annual mean temperatures are small (eg lt2 C) Andersson
Nyberg (2008) reported that a small percentage of wetlands in theatchment can contribute large amounts of DOC to rivers Laudont al (2011) quantitatively described that as much of 50 of DOC in
catchment can originate from wetlands even when they occupyust 10 of the catchment area In our study ALT and API had theighest DOC export and also the highest percentage of wetlandsFig 7 and Table 2) However the differences of the annual meaniverine DOC concentrations between the seven major rivers areore likely driven by climate factors instead of land use since the
ercentages of each land use (ie forest agriculture wetland andrban area) among the seven major watersheds are very similar
herefore impacts of land uses on DOC concentrations should note significantly different between these watersheds At the least
mpacts of land use on annual riverine DOC concentrations arenlikely to be linear along the latitudinal temperature gradient For
2 Engine
epma7aotcaTps
4
opsimiwsv
tivcbsmtzaTwttnltH
4
a(anpsHeaTdi
4
ff
aopmitdlp(ey
4
hhncihwmiAorco
CaprTisbaaetta
5
tcbcrmuovtc
00 YQ Tian et al Ecological
xample DEL has the highest latitude of the eastern rivers but theercentage of its watershed that is wetland is 575 which is theedian of wetland percentage of the eastern rivers The percent-
ge of forested cover of the seven watersheds was between 45 and36 with no direct linear relationship between latitude (temper-ture gradient) and forested cover SAC has the highest percentagef agricultural land but its annual DOC concentration is close tohe average of the seven major rivers The random nature of landover distribution (wetland forest developed agricultural) wouldct to weaken the linear temperaturendashDOC relationship (Fig 7)herefore the correlation coefficient between annual surface tem-erature and mean in-stream DOC concentration should be eventronger without the interfering effects of land cover
3 Land cover temperature and DOC in NEP
In the NEP precipitation varied from 1000 to 1350 mmyearver four years (2006ndash2007 and 2009ndash2010) In this watershedrecipitation variation is well-correlated with DOC and explains51 of the DOC variation at an annual scale (Fig 9) Since precip-
tation drives land surface characteristics (ie discharge) in smallatersheds within particular climate zones surface characteristics
uch as land cover are more important than temperature in NEPersus the other watersheds
For the seven major watersheds at annual time scales tempera-ure and precipitation are strongly correlated to riverine DOC andt is clear that temperature was the key factor driving the largeariations in DOC when the variation of temperature is signifi-ant However in the NEP (Fig 9) results for the relationshipsetween DOC temperature and surface processes indicate that ateasonal and annual scales flow drainage area and land cover areore important variables than temperature (R2 = 022) Tempera-
ure is important for large watersheds that cross multiple climateones but the NEP temperature variation is small with a maximumnnual temperature variation of 161 C over five years (Fig 9)his type of low temperature variation would be expected foratersheds in a single climate zone Further this small range in
emperature is difficult to examine statistically for relationshipso DOC concentration We therefore conclude that temperature isot as significant a control on DOC in small watersheds as it is in
arge watersheds This may explain the lack of correlation betweenemperature and DOC in past studies eg Chow et al (2006) andruska et al (2009)
4 DOC stream discharge and land cover
In the seven major watersheds discharges per unit areare weakly correlated to temperature and annual precipitationFigs 3b and 4) Our analysis demonstrated that in the case of ALTnd API in the Subtropical Humid climate zone precipitation doesot necessarily lead to high flow In these settings evapotrans-iration and infiltration affected by temperature vegetation andoil properties alter discharge rates as precipitation takes placeowever in extra-tropical climates acceleration of terrestrial DOCxport will be attendant to acceleration of the hydrologic cyclend thus highly sensitive to discharge or precipitation as in NEPherefore the correlations between in-stream DOC and riverineischarges or land cover are appropriate to study at sub-basin levels
nstead of at basin levels of small river watersheds
5 Temporal scales for capturing DOC biological processes
The quantitative relationships between riverine DOC and sur-ace temperatures were strongest at the annual scale This was trueor both the seven major watersheds and the NEP samples Our
dt
a
ering 54 (2013) 192ndash 201
nnual-scale results strongly support the notion that the responsef riverine DOC to climate variables is a biological process Tem-erature and water determine primary productivity which is theajor source of riverine DOC flux Rising temperature may also
ncrease decomposition of soil organic matter (SOM) which mayhen increase DOC released to freshwaters However the plantecaydecomposition process and thus the DOC transport from
and to rivers could take longer than one year since these involvelant growth and conversion of accumulated organic matter to DOCHansson et al 2010) Therefore we have integrated the long-termffect of temperature on DOC yield with data averages of multipleears
6 Spatial distribution of climate impacts on DOC
It is important to understand where climate change wouldave greater impacts on annual increments in DOC flux sinceigh annual increments in DOC flux are expected to have a sig-ificant impact on aquatic ecosystems Our results indicate thatlimate change (ie increased temperature) would cause higherncreases in riverine DOC flux in low temperature areas than inigh temperature areas (Fig 8) For COL (Fig 8) an increase of 1 Could result in a rise of 26 of DOC flux the highest of the sevenajor rivers COL also is in the coolest climate zone The lowest
ncrement of DOC flux in response to every 1 C raise is 6 in theLT (Fig 8) which has the highest measured DOC concentrationf the seven rivers and is in the hottest climate zone The inverseelationship between incremental DOC flux and climate zoneDOConcentration suggests that warming would have greater impactsn watersheds in high latitudescooler climate zones
A large component of DOC in freshwaters eventually ends up asO2 in the atmosphere (Butman and Raymond 2011) A significantmount of carbon contained in land which first is absorbed bylants through the air leaks into streams and rivers and is theneleased into the atmosphere before reaching coastal waterwayshis process is a source of carbon dioxide The evidence of increas-ng in-stream DOC flux at large scales explains why rivers andtreams in the United States are releasing substantially more car-on dioxide into the atmosphere than previously thought (Butmannd Raymond 2011) As the climate warms there will be more rainnd snow in some areas This increase in precipitation will result inven more terrestrial carbon flowing into rivers and streams andhus being released into the atmosphere Therefore more predic-ive and precise models of carbon uptake versus carbon releasedt global scales must include the carbon in streams and rivers
Conclusion
This study is the first to examine the impacts of tempera-ure on terrestrial DOC exports using study sites across multiplelimate zones Our results yielded a strong linear relationshipetween mean surface temperatures and mean in-stream DOC con-entrations at the annual scale for seven major watersheds Theesults confirmed that climate change (temperature) is the pri-ary factor driving terrestrial DOC flux We conducted our analysis
sing monthly field observations in multiple years Furthermoreur study yields evidence that landscape factors are secondaryariables controlling terrestrial DOC exports when annual meanemperature variation is sufficiently large ie gt5 C Thereforelimate change may have significant impacts on riverine DOC
ynamics in areas where annual surface temperature is high andhat have sufficient precipitation
It is important to understand that a 1 C warming would increasennual mean DOC concentrations in large rivers by 0476 mgL
Engine
AawtwlonyfltPgfm
A
NfWoS
R
A
B
B
C
C
C
C
C
C
D
D
E
E
F
F
G
H
H
H
H
H
H
H
H
H
I
I
J
J
K
K
K
K
L
M
M
N
R
S
S
S
T
YQ Tian et al Ecological
n increase in global mean surface air temperature between 14nd 58 C by the year 2100 as projected by Frumhoff et al (2008)ould result in a 067ndash276 mgL rise of riverine DOC concentra-
ion The impacts of climate warming on terrestrial DOC exportould be greater in watersheds in high latitudes than those in
ower latitudes An increase of 1 C could lead to a DOC exportf up to 26 per square meter per year from watersheds in theorthern US and an increase of up to 6 per square meter perear in the southern US The percent-increment of annual DOCux per square meter is mainly controlled by the variation ofemperature as well as land surface processes such as dischargerecipitation increases terrestrial DOC sources through increasedross primary productivity and provides energy to drive DOCrom the landscape to rivers via surface runoff and groundwater
ovement
cknowledgements
This study was supported by a grant from the US Office ofaval Research (N000140910346) and two collaborative grants
rom the National Science Foundation (1025546 and 1025547)e appreciate the data and advice kindly provided by hydrol-
gist Dr Mark Zimmerman of the United States Geologicalurvey
eferences
ndersson JO Nyberg L 2008 Spatial variation of wetlands and flux of dis-solved organic carbon in boreal headwater streams Hydrol Process 22 (12)1965ndash1975 httpdxdoiorg101002hyp6779
uffle J 1984 Natural organic-matter and metal-organic interactions in aquaticsystems Met Ions Biol Syst 18 165ndash221
utman D Raymond PA 2011 Significant efflux of carbon dioxide fromstreams and rivers in the United States Nat Geosci 4 (12) 839ndash842httpdxdoiorg101038NGEO1294
how AT Tanji KK Gao SD Dahlgren RA 2006 Temperature water con-tent and wet-dry cycle effects on DOC production and carbon mineralizationin agricultural peat soils Soil Biol Biochem 38 (3) 477ndash488
iais P White JWC Jouzel J Petit JR 1995 The origin of present-day Antarcticprecipitation from surface snow deuterium excess data J Geophys Res Atmos100 (D9) 18917ndash18927
lair TA Ehrman JM Higuchi K 1999 Changes in freshwater carbon exportsfrom Canadian terrestrial basins to lakes and estuaries under a 2xCO (2) atmo-spheric scenario Glob Biogeochem Cycl 13 1091ndash1097
lair TA Pollock TL Ehrman JM 1994 Exports of carbon and nitrogen from riverbasins in Canadarsquos Atlantic Provinces Glob Biogeochem Cycl 8 441ndash450
orrell DL Jordan TE Weller DE 2001 Effects of precipitation air temperatureand land use on organic carbon discharges from Rhode River watersheds WaterAir Soil Pollut 128 139ndash159
urtin D Beare MH Chantigny MH Greenfield LG 2011 Controls on theextractability of soil organic matter in water over the 20 to 80 C temperaturerange Soil Sci Soc Am J 75 (4) 1423ndash1430
ierig DA Crafts-Brandner SJ 2011 The relationship of temperature to plantmorphology of Lesquerella Crop Sci 51 (5) 2165ndash2173
uarte CM Prairie YT 2005 Prevalence of heterotrophy and atmospheric CO2
emissions from aquatic ecosystems Ecosystems 8 862ndash870nvironmental Protection Agency 2001 National Land Cover Data
httphttpwwwepagovmrlcnlcd-2001html Retrieved December 2011vans CD Jones TG Burden A Ostle N Zielinski P Cooper MDA Peacock
M Clark JM Oulehle F Cooper D Freeman C 2012 Acidity controls ondissolved organic carbon mobility in organic soils Glob Change Biol 18 (11)3317ndash3331 httpdxdoiorg101111j1365-2486201202794x
rance R Culbert H Peters R 1996 Decreased carbon and nutrient input to boreallakes from particulate organic matter following riparian clear-cutting EnvironManage 20 (4) 579ndash583 httpdxdoiorg101007BF01474657
rumhoff PC McCarthy JJ Melillo JM Moser SC Wuebbles DJ Wake CSpanger-Siegfried E 2008 An integrated climate change assessment for theNortheast United States Mitig Adapt Strat Glob Change 13 (5ndash6) 419ndash423httpdxdoiorg101007s11027-007-9138-x
uo LD Ping CL Macdonald RW 2007 Mobilization pathways of organic carbonfrom permafrost to arctic rivers in a changing climate Geophys Res Lett 34 (13)
httpdxdoiorg1010292007GL030689 (Article Number L13603)
aei M Oquist MG Buffam I Agren A Blomkvist P Bishop K Lofve-nius MO Laudon H 2010 Cold winter soils enhance dissolved organiccarbon concentrations in soil and stream water Geophys Res Lett 37httpdxdoiorg1010292010GL042821 (Article Number L08501)
W
ering 54 (2013) 192ndash 201 201
ansson K Kleja DB Kalbitz K Larsson H 2010 Amounts of carbon mineralizedand leached as DOC during decomposition of Norway spruce needles and fineroots Soil Biol Biochem 42 (2) 178ndash185
arrison AF Taylor K Scott A Poskitt J Benham D Grace J Chaplow JRowland P 2008 Potential effects of climate change on DOC release fromthree different soil types on the Northern Pennines UK examination using fieldmanipulation experiments Glob Change Biol 14 687ndash702
inchliffe DJ Meredith WR Delhom CD Thibodeaux DP Fang DD 2011Elevated growing degree days influence transition stage timing during cottonfiber development resulting in increased fiber-bundle strength Crop Sci 51 (4)1683ndash1692
olmes RM McClelland JW Raymond PA Frazer BB Peterson BJ StieglitzM 2008 Lability of DOC transported by Alaskan rivers to the Arctic oceanGeophys Res Lett 35 (3) httpdxdoiorg1010292007GL032837 (ArticleNumber L03402)
ooper RP Aulenbach BT Kelly VJ 2001 The National Stream Quality Account-ing Network a flux-based approach to monitoring the water quality of largerivers Hydrol Process 15 (7) 1089ndash1106 httpdxdoiorg101002hyp205
ope D Billett MF Cresser MS 1994 A Review of the Export Of Carbon in RiverWater - Fluxes and Processes Environ Pollut 84 (3) 301ndash324
ruska J Kram P Mcdowell WH Oulehle F 2009 Increased dissolved organiccarbon (DOC) in Central European streams is driven by reductions in ionicstrength rather than climate change or decreasing acidity Environ Sci Technol43 (12) 4320ndash4326
uang W Chen RF 2009 Sources and transformations of chromophoric dissolvedorganic matter in the Neponset River watershed J Geophys Res Biogeosci 114G00F05
PCC 1990 In Houghton JT Jenkins GJ Ephraums JJ (Eds) IPCC First Assess-ment Report 1990 Climate Change Cambridge University Press CambridgeUK
PCC 2007 Climate Change 2007 Impacts Adaptation and Vulnerability Summaryfor Policymakers Cambridge University Press Cambridge UK
ones JB Stanley EH Mulholland PJ 2003 Long-term decline in carbon dioxidesupersaturation in rivers across the contiguous United States Geophys Res Lett30 (10) httpdxdoiorg1010292003GL017056 (Article Number 1495)
ones TG Freeman C Lloyd A Mills G 2009 Impacts of elevated atmosphericozone on peatland below-ground DOC characteristics Ecol Eng 35 (6) 971ndash977httpdxdoiorg101016jecoleng200808009
aiser FG Keller C 2001 Disclosing situational constraints to ecological behaviora confirmatory application of the mixed Rasch model Eur J Psychol Assess 17(3) 212ndash221 httpdxdoiorg1010271015-5759173212
ardjilov MI Gislason SR Gisladottir G 2006 The effect of gross primary pro-duction net primary production and net ecosystem exchange on the carbonfixation by chemical weathering of basalt in northeastern Iceland J GeochemExplor 88 292ndash295
han SU Schnitzer M 1972 Permanganate oxidation of humic acidsextracted from a gray wooded soil under different cropping systemsand fertilizer treatments Geoderma 7 (1ndash2) 113 httpdxdoiorg1010160016-7061(72)90057-2
irshen P Watson C Gontz A Douglas E Lee J Tian YQ 2008 Coastal floodingin the Northeastern USA under climate change Mitig Adapt Strat Glob Change13 430ndash451
audon H Berggren M Agren A Buffam I Bishop K Grabs T Jansson MKohler S 2011 Patterns and dynamics of dissolved organic carbon (DOC) inboreal streams the role of processes connectivity and scaling Ecosystems 14(6) 880ndash893 httpdxdoiorg101007s10021-011-9452-8
cdowell WH Fisher SG 1976 Autumnal processing of dissolved organic-matterin a small woodland stream ecosystem Ecology 57 (3) 561ndash569
iller WL Zepp RG 1995 Photochemical production of dissolved inor-ganic carbon from terrestrial organic-matter ndash significance to the oceanicorganic-carbon cycle Geophys Res Lett 22 (4) 417ndash420 httpdxdoiorg10102994GL03344
ational Climate Data Center (NCDC) 2011 httpwwwncdcnoaagovoancdchtml Retrieved December 2011
aymond PA Oh NH 2007 An empirical study of climatic controls on river-ine C export from three major US watersheds Glob Biogeochem Cycl 21 (2)httpdxdoiorg1010292006GB002783 (Article Number GB2022)
chaeffer BA Conmy RN Aukamp J Craven G Ferer EJ 2011 Organic and inor-ganic matter in Louisiana coastal waters Vermilion Atchafalaya TerrebonneBarataria and Mississippi regions Mar Pollut Bull 62 (2) 415ndash422
tedmon CA Markager S Sondergaard M Vang T Laubel A Borch NHWindelin A 2006 Dissolved organic matter (DOM) export to a temperate estu-ary seasonal variations and implications of land use Estuar Coasts 29 388ndash400
triegl RG Aiken GR Dornblaser MM Raymond PA Wickland KP2005 A decrease in discharge-normalized DOC export by the YukonRiver during summer through autumn Geophys Res Lett 32 L21413httpdxdoiorg1010292005GL024413
ian YQ Wang DW Chen RF Huang W 2012 Using modeled runoff to studyDOC dynamics in stream and river flow a case study of an urban watershedsoutheast of Boston Massachusetts Ecol Eng 42 212ndash222
interdahl M Futter M Kohler S Laudon H Seibert J Bishop K 2011Riparian soil temperature modification of the relationship between flowand dissolved organic carbon concentration in a boreal stream WaterResour Res 47 httpdxdoiorg1010292010WR010235 (Article NumberW08532)
Engine
Jcatimiiia(
tw(fieaateam
p((t(iusil
dorwznacltSfi
clawictdp
bstdcr
rmtatcrgzisswb
2
2
Ustawaez(mzclh
ffaUttna
em2i3outtir
mSJD
YQ Tian et al Ecological
ones et al 2009) For example live vegetation contributes signifi-ant amounts of DOC to terrestrial stream water through leaf litternd the subsequent leaching of that litter as well as of the vege-ation itself (France et al 1996 Mcdowell and Fisher 1976) Thiss an example of the DOC contribution of a well-understood pri-
ary land surface process What is not well understood howevers how climate conditions alter the origin function and fate of DOCn coastal watersheds In light of these climate change questions its also important to understand what temporal and spatial scalesre appropriate to study climate impacts on biochemical cyclingHaei et al 2010) ie carbon export
Current efforts to study the impacts of climate change on terres-rial DOC dynamics have been largely based on watershed systemsithin single climate zones (Correll et al 2001) Huang and Chen
2009) and Tian et al (2012) analyzed two yearsrsquo worth of monthlyeld data collected from a small urban watershed in the northeast-rn US They reported that climate-related factors (temperaturend precipitation) control DOC end-members in salt marsh forestgricultural industrial and residential lands These work concludedhat annual variation in temperature is the major driver of carbonxport along with precipitation In their studies Clair et al (1994)nd Correll et al (2001) concluded that precipitation alone is theajor driver of carbon exportIn contrast Hruska et al (2009) suggested that climate has
layed no role in observed DOC changes over a 14-year period1993ndash2007) in the two catchments they studied Chow et al2006) reported that a significant amount of DOC was produced inhe surface soil under constantly flooded hydrological conditionsas opposed to being directly impacted by climate factors) Onenference that can be made from these contrasting studies is thatnderstanding the impacts of climate change on DOC export to aingle watershed requires field measurements over decades evenf that watershed is in a single-landscape system eg homogenousand cover
Some efforts have examined multiple adjacent watersheds fromifferent landscape systems in order to study the impact of climaten DOC Raymond and Oh (2007) examined climate controls oniverine carbon export from three major river watersheds Theseatersheds were of differing landscape systems within one climate
one type Continental Humid They reported that temperature wasot as significant as land surface processes (in this case inter-nnual stream discharge) to DOC export Raymond and Oh (2007)oncluded that physical processes are more significant than bio-ogical processes since water redistributes DOC from terrestrialo riverine systems However other workers (Ciais et al 1995chaeffer et al 2011 Miller and Zepp 1995) reported that sur-ace temperature is a key factor for controlling biological processesn terms of primary productivity
The conflicting nature of the results of prior work indicate thatonsiderable uncertainties exist regarding the processes control-ing DOC delivery to streams particularly under differing climaticnd land surface process conditions Arguably the focus of priorork has been too localized in terms of watershed character-
stics and climate zones to produce a more holistic picture ofarbon export Further the temporal requirements for data collec-ion in carbon-export studies are uncertain For some watershedsecadal-scale datasets may be appropriate multi-watershed com-arisons may require finer (or coarser) resolutions
The objective of this study is to understand the impacts on car-on export not only of climate factors but also land cover andtream discharge across different climate zones We took advan-
ages of field observations from several major river watersheds ofifferent climate regions and explored the relationship betweenlimate factors (surface temperatures and precipitations) and ter-estrial DOC export to rivers We further studied the observed
24Td
ering 54 (2013) 192ndash 201 193
iverine carbon-export processes in small watersheds over 24onths and explored if climate factors maintain the important con-
rols compared to land surface variables (hydrological propertiesnd land use) within a single climate region The study confirmshat the effect of climate factors (surface air temperature pre-ipitation) on in-stream DOC concentrations in a small watershedequires observations of a larger number of years Therefore lon-itudinal observations in major rivers crossing multiple climateones are excellent for exploring the effects of climate on river-ne DOC dynamics The observations of small numbers of years inmall rivers located in a single climate zone are good to study landurface effects Ultimately addressing these issues and questionsill be particularly beneficial for understanding the land-water
iogeochemical dynamics that are influenced by climate change
Methods
1 Study and sampling sites
We selected seven major (gt33000 km2) watersheds along theS west and east coasts Four of the seven major river watersheds
elected are in the east coast the Delaware in New Jersey (NJ)he Susquehanna in Maryland (MD) the Altamaha in Georgia (GA)nd the Apalachicola in Florida (FL) The other three major riveratersheds are in the west coast the Columbia in Oregon (OR)
nd the Sacramento and San Joaquin both in California (CA) Thentire drainage areas of these rivers cover four dominant climateones Hot Humid Continental (NJ and MD) Subtropical HumidGA and FLA) Warm Summer Mediterranean (OR) and Hot Sum-
er Mediterranean (CA) The rivers located cross four climaticones have necessary environments for studying the impacts oflimate change on soil DOC leaching ecology Fig 1a shows theirocations and Table 1 lists the abbreviations used for the riversereafter used in this article
We obtained climate data (mean precipitation and temperature)rom the National Climatic Data Center (NCDC 2011) Data wererom 1996 to 2010 and at different temporal scales These data wereveraged at multiple NCDC stations within each watershed in theS It should be noted that the COL watershed lies within both
he US and Canada However the Canadian portion is sim15 of theotal basin area and precipitation decreases significantly from theorthwestern part of the basin We argue therefore that the errorssociated with this unsampled Canadian portion is minimal
The surface air temperatures at individual watersheds gen-rally rise from south to north with increasing latitude Annualean temperatures of all watershed sites (Fig 7) ranged from 6 to
3 C (43ndash73 F) Annual mean precipitation (Fig 3) varies signif-cantly among these watersheds Drainage areas ranged between3152 km2 (DEL) and 670000 km2 (COL) (Table 2) The proportionsf land cover types are similar among the watersheds (Table 2) Wetilized the 2001 National Land Cover Data (NCLD) (EPA 2001) fromhe US Environmental Protection Agency Our study areas con-ained thirteen NLCD land coverland use types which we mergednto four major land cover classes (Table 3) The percentages of eacheclassified land cover type are listed in Table 2
DOC concentrations and associated stream discharges wereonitored at gauge stations maintained by the USGS National
tream Quality Network (NASQAN) program (Hooper et al 2001ones et al 2003) Gauge station data are listed in Table 4 MonthlyOC concentration measurements were available for a range of
ndash14 years depending on the watershed We collected a total of53 samples Table 4 lists the distribution of samples by watershedhe seven selected NASQAN gauge stations also reported dischargeata with the exception of that for the Altamaha River (NASQAN
194 YQ Tian et al Ecological Engineering 54 (2013) 192ndash 201
Fig 1 (a) Climate zones in US and sampling stations at the seven major coastal rivers in USGS NASQAN program The associated watersheds of each outlet are shadedpolygons The river networks are shown as dark-blue polylines (b) The Neponset River watershed south of Boston Drainage area is sim370 km2
YQ Tian et al Ecological Engineering 54 (2013) 192ndash 201 195
Table 1River names abbreviations used in this study and climate zones States in which a majority of each watershed is located are also listed This study categorizes watershedsas either major or minor
River name Abbreviation State Climate zone Category
Altamaha ALT Georgia Subtropical Humid MajorApilachicola API Florida Subtropical Humid MajorColumbia COL Oregon Warm Summer Mediterranean MajorDelaware DEL New Jersey Hot Humid Continental MajorNeponset NEP Massachusetts Hot Humid Continental MinorSacramento SAC California Hot Summer Mediterranean MajorSan Joaquin SJQ California Hot Summer Mediterranean MajorSusquehanna SUS Maryland Hot Humid Continental Major
Table 2Land cover data for watersheds and climate zone distributions (CZD) in this study For CZD watersheds either cover multiple climate zones (M) or are contained withinsingle climate zones (S) Data are from the time period 1997 to 2010 For the Neponset River see Fig 10b
ALT API COL DEL NEP SAC SJQ SUS
Wetland 1306 1464 206 572 1157 276 326 238 Forest 5048 502 7357 6706 5177 4506 6242 6245 Agriculture 2637 2577 2094 1699 085 4362 2914 2743 Developed 1008 94 329
Drainage area (km2) 35224 49728 670000
CZD S S M
Table 3NLCD land useland cover types of the watersheds and the merged reclassificationsused in this study
NLCD land useland cover type Reclassification used in this study
Developed-Open Space DevelopedDeveloped-Low Intensity DevelopedDeveloped-Medium Intensity DevelopedBarren Land ForestDeciduous Forest ForestEvergreen Forest ForestMixed Forest ForestPastureHay AgricultureCultivated Crops AgriculturePalustrine Forested Wetland Wetland
Ini
NupwaOl1oFp
(adsa
2
sittvo
3
3
mtsAfa
TU
Palustrine ScrubShrub Wetland WetlandOpen Water Wetland
D 02226160) Instead we used the discharge data collected at aearby USGS water gauge station (ID 02226000) The difference
n drainage areas between these two stations is lt003This study includes an additional minor river watershed the
eponset River watershed (370 km2 sim2 m3s discharge) This is anrban estuary located south of Boston MA We collected 480 sam-les over four years within 12 sub-basins of the Neponset Riveratershed southeast of Boston MA (Fig 1b) DOC concentrations
t selected outlets were measured monthly from March 2006 toctober 2010 However due to instrument malfunctions in our
aboratory samples from 2008 were stored frozen for longer than
2 months For this reason we eliminated all 2008 samples fromur dataset and use only those from 2006 2007 2009 and 2010urther details concerning the Neponset River sites and laboratoryrocedures are described in Huang and Chen (2009) and Tian et al
swli
able 4SGS gauge station and drainage data pertaining to collected samples (453 samples total
River and gauge info Site ID Latitude Lon
Altamaha R near Everett City GA 02226160 3139prime16primeprime minus81Apilachicola R near Sumatra FL 02359170 2956prime57primeprime minus85Columbia near Beaver Army Terminal OR 14246900 4610prime55primeprime minus12Delaware R at Trenton NJ 01463500 4013prime18primeprime minus74Sacramento R at Freeport CA 11447650 3827prime22primeprime minus12San Joaquin R near Vernalis CA 11303500 3740prime34primeprime minus12Susquehanna R at Conowingo MD 01578310 3939prime281primeprime minus76
1023 3582 853 517 77433152 370 59570 35058 70189S S S S S
2012) We include NEP samples in this study to examine whethernd how DOC responses to climate change in small watershedsiffer from those in larger watersheds NEP data were collectedeparately from those data for other rivers and may be considered
nested case study within our larger study
2 Statistical analyses
We conducted linear regression analysis using SPSS statisticaloftware to identify significant variables associated with variationn DOC concentrations Variables were deemed significant whenhe P value was less than 005 We used the coefficient of mul-iple determinations R2 to measure how well the environmentalariables of temperature precipitation and land use explainedbserved DOC variations
Results
1 Temperature comparisons
Surface air temperatures were very different across the sevenajor watersheds Fig 2 shows the averaged variations of monthly
emperatures over the study period of the seven major water-heds API has the highest annual mean temperature of sim207 Cnnual mean temperatures in the other five watersheds ranged
rom 92 to 164 C The mean monthly temperatures of the SACnd SJQ watersheds in the summer season (June July August)
how little differences from those of the DEL and SUS Howeverinter (December January February) temperatures differences are
arger between US east and west coasts ALT and API display sim-lar seasonal temperature variations with a fairly consistent 3 C
)
gitude Drainage (mi2) Samples Start year End year
49prime41primeprime 14000 27 2007 201000prime56primeprime 19200 22 2008 2010310prime50primeprime 256900 131 1995 201046prime41primeprime 6780 69 1998 2010130prime01primeprime 23000 97 1996 2010115prime55primeprime 13536 77 1997 201010prime282primeprime 27100 30 2004 2010
196 YQ Tian et al Ecological Engineering 54 (2013) 192ndash 201
Fa
dst
3
mtnifaai
Fwe
Fw
mpsurh
Fnde
ig 2 Mean monthly surface temperature averaged over the period 1996ndash2010nd over each of the seven major coastal river watersheds
ifference Western watersheds (COL SAC SJQ) share similar sea-onal temperature patterns with a maximum difference of sim67 Chroughout the year
2 Precipitation and discharge relationships
Fig 3a shows annual mean precipitation data for the sevenajor watersheds and Fig 3b shows average monthly precipita-
ion data for these watersheds Annual precipitation patterns doot correlate well with annual mean surface temperatures which
s unsurprising given that the watersheds are located in four dif-
erent climate zones API and COL received annual precipitationmounts of 132 and 135 cm respectively DEL ALT and SUS annualverages were comparable at sim117 cm SAC and SJQ are locatedn the Hot Summer Mediterranean climate zone and thus receive
ig 3 (a) Annual mean precipitation averaged over the period 1996ndash2010 for eachatershed (b) Monthly precipitation averaged over past the period 1996ndash2010 in
ach watershed
i(eFDoaa(itc
FyJ
ig 4 Annual mean river flows normalized by drainage area of corresponding riveratershed (m3m2year)
uch lower levels of precipitation (Fig 3a) Averaging the monthlyrecipitation data (Fig 3b) divides the seven major watersheds intoeasonal groups The dry summer group has low precipitation val-es JunendashSeptember and includes the watersheds SAC and SJQ Theemaining watersheds are in the wet summer group which hasigh precipitation values JunendashSeptember
Discharge rates for the seven major watersheds are shown inig 4 Watersheds with high levels of annual precipitation didot necessarily have a high annual average streamflow per unitrainage area (m3m2year) We attribute this to infiltration andvaporation For instance API receives the highest annual precip-tation of the four east coast watersheds However its streamflowm3) per m2 was the lowest This may be due in part to the pres-nce of wetlands in the catchment and their ability to retain waterurthermore despite receiving the same annual precipitation ALTEL and SUS (east coast) all have very different streamflows per m2
ver the study period (Fig 4) ALT had higher surface temperaturend its annual streamflow per m2 is lower than that of both DELnd SUS Similar results were obtained for west coast watersheds
Figs 3a and 4) Correlations between precipitation and river flown multiple-climate-zone watersheds remain controversial unlikehe positive relationship in watersheds contained within a singlelimate zone (Raymond and Oh 2007) It should be noted that
ig 5 Monthly DOC concentrations averaged over periods ranging from 2 to 14ears in each of the seven major watersheds (no data were available for ALT fromuly to September nor for API from November to December nor for SAC in March)
YQ Tian et al Ecological Engineering 54 (2013) 192ndash 201 197
Fig 6 Correlations between river discharges and DOC concentrations in the seven major rivers (a) DEL (b) SUS (c) ALT (d) API (e) COL (f) SAC and (g) SJQ DOC samplesin the SAC and API were collected only during either high or low flow ends The lack of sampling during medium flow periods left a gap in the scatter plots (Fig 5d and f)The discharges at the sub-basin level of a small watershed explained about 44 of in-stream DOC concentrations in a linear regression model (5 h)
1 Engineering 54 (2013) 192ndash 201
ii
3
rvCtccmet(wgus
3
(it(tTttsHlDttttass
3
assptDvsimapfinzDf
ad
Fig 7 Mean annual DOC concentrations versus mean surface air temperatures intWs
mFehb(ttDepflfiCd
3
Annual mean DOC concentrations within NEP (the additionalwatershed) show a relatively weaker correlation to annual mean
98 YQ Tian et al Ecological
n this study inter-annual discharge appears strongly related tonter-annual precipitation within each watershed
3 DOC concentrations and correlations to discharge
Fig 5 shows monthly DOC concentrations in the seven majorivers averaged over periods ranging from 2 to 14 years The largestariations in monthly DOC concentrations were in API and ALTOL SAC and SUS show the lowest DOC variations DOC concen-rations show similar seasonal trends for watersheds in the samelimate zone Fig 6andashf displays correlations between DOC and dis-harge for the seven major rivers A positive correlation betweenean DOC concentration and annual discharge exists in all rivers
xcept SJQ The flow of this river is altered significantly by agricul-ural irrigation For SAC discharge explains sim80 of in-stream DOCR2 = 08) However for other rivers this correlation is much lowerith R2 ranging between 01 and 03 Our results (see below) sug-
est that relationships between DOC and discharge are dependentpon other factors such as precipitation temperature and water-hed drainage area
4 Seasonal variation and DOC
The strong seasonal patterns of mean surface temperatureFig 2) did not match well with riverine DOC concentrations forndividual watersheds (Fig 5) However seasonal DOC concentra-ion trends are similar for watersheds in the same climate zoneFig 5) For example DEL and SUS are in the Hot Humid Continen-al climate zone and have a similar pattern throughout the yearhese rivers have their lowest concentrations in January whichhen increase to their highest concentrations in December Forhese two rivers DOC concentration patterns did not vary in theame way temperature patterns did For both Warm Summer andot Summer Mediterranean climate zones hot temperatures and
ow precipitation rates in summer were accompanied by decreasedOC concentrations for COL SAC and SJQ ALT and API in the Sub-
ropical Humid climate zone have similar seasonal DOC patternso those of the Mediterranean climates with minor differences inhe magnitudes of DOC concentrations Overall temperature pat-erns did not match DOC seasonal variations in the Subtropicalnd Mediterranean climate zones As a result we infer that mea-urement and analysis of the impacts of climate on in-stream DOChould be at an annual scale and not a seasonal scale
5 Temperature and DOC
Fig 7 shows regression analysis of mean surface temperaturesgainst mean riverine DOC concentrations In the collective analy-is of all seven major watersheds (in different climate zones) meanurface temperatures are highly correlated with DOC (R2 gt 064
lt 001) The mean annual surface temperatures ranged from 89o 211 C with a range in latitude of 29ndash46 north Mean annualOC concentrations range from 1 to 75 mgL For most rivers DOCariations are below 2 mgL except for ALT and API which are3 mgL Annual mean DOC concentrations generally increase in
linear fashion with annual mean surface temperatures Tem-erature explains sim89 of the observed DOC concentrations inve watersheds (ALT API COL DEL and SUS) This group doesot include watersheds in the Hot Summer Mediterranean climateones (Fig 7) Our results indicate that the magnitude of terrestrialOC yields is more strongly controlled by temperature than other
actors such as discharge latitude and seasonal precipitationFor each of the seven major watersheds we determined mean
nnual DOC flux in terms of mgm2 and increments of flux peregree C (Fig 8) The two components of flux calculation are annual
Fbd
he seven major rivers The dashed line regression describes climates that are notarm Summer Mediterranean (SAC and SJQ) The solid regression line describes
amples from all seven rivers including SAC and SJQ
ean DOC concentration and annual discharge (flow shown inig 4) Our calculations show that ALT and API have the high-st annual DOC fluxes of the seven major watersheds (Fig 8) SJQad the lowest DOC yields per unit area The linear relationshipetween annual temperature and in-stream DOC concentrationsFig 7) demonstrates that a 1 C rise of average annual surfaceemperatures would increase annual mean in-stream DOC concen-rations in the seven studied rivers by 0476 mgL This increase inOC concentration would lead to a subsequent increase in DOCxport in the range of 0135ndash0327 g of carbon per square meterer year in the seven study watersheds The percentages of DOCux increments in response to a 1 C temperature increase ranged
rom 6 to 26 (Fig 8) Temperature increases impact the DOC yieldsn northern US rivers more so than in southern US rivers 26 forOL versus 6 for ALT and 7 for API The increment percentagesecrease from north to south for all rivers except SAC
6 Neponset River trends
ig 8 Mean annual DOC flux mminus2 (solid bars) and increment mminus2 yearminus1 (patternedars on top) in response to 1 C increase of mean annual surface temperature Labelsenote increment by percentage
YQ Tian et al Ecological Engine
FcR
sI2stttdss
Fsmo
aDs
4
(pLswpcv
4
ttaDs
ig 9 Correlations of annual mean in-stream DOC concentrations to annual pre-ipitation as well as to annual mean temperatures over four years in the Neponsetiver watershed PCP = precipitation and TMP = temperature
urface temperature than to annual mean precipitation (Fig 9)nter-annual temperature variation over four years was less thanC (right Y axis in Fig 9) The DOC in this small urban water-
hed yielded a stronger correlation to annual mean precipitationhan it did to temperature (left Y axis in Fig 9) Fig 10a showshe range of variation of DOC concentrations (simplusmn165 mgL from
he mean) This minor watershed in a local climate zone containsiverse land uses in each sub-basin Fig 10b shows land use for theampled sub-basins which average sim30 km2 in area In a previoustudy Tian et al (2012) reported that vegetation types drainage
ig 10 (a) Variation of annual mean DOC concentrations in each of the first orderub-basins in the Neponset River watershed The mean is 485 mgL and the maxi-um difference is plusmn165 mgL (b) Distribution of land use types in each of the first
rder sub-basins in the Neponset River watershed
itaitSwcedeesia2ti2
4
ddtampceajh(rmpuTbiu
ering 54 (2013) 192ndash 201 199
rea discharge and seasons were strong predictors to in-streamOC concentrations in this minor watershed (R2 = 076 and 064 at
easonal and annual scales respectively)
Discussion
The significant variations of mean annual DOC concentrationsFig 7) between catchments from different climate zones are drivenrimarily by climate conditions (temperature and precipitation)and surface processes (land-use type and density hydrology andoil properties) are secondary factors However in the case ofatersheds located within a single climate zone land surfacerocesses are the primary factors controlling riverine DOC con-entrations especially where the inter-annual mean temperatureariation is small (less than 2 C)
1 The importance of temperature on DOC
Two things that we learned from this study are that surfaceemperature is a more important control on riverine DOC fluxhan land surface processes and that it is appropriate to apply annnual temporal scale to quantify DOCndashtemperature relationshipsOC dynamics in rivers were correlated better with watershed
urface temperatures in three climate zones (R2 = 089) withoutncluding Hot Summer Mediterranean which has low precipita-ion during summers This suggests that the effects of temperaturend precipitation are major drivers of DOC flux The low precip-tation in the Hot Summer Mediterranean climate zone explainshe weaker temperaturendashDOC linear relationship (R2 lt 064) whenAC and SJQ are included in the analysis (Fig 7) Temperature andater are the essential conditions together with Photosyntheti-
ally Active Radiation ndash PAR for gross primary productivity (Guot al 2007) and precipitation levels (or hydrological properties)etermine a soilrsquos water availability (Curtin et al 2011 Winterdahlt al 2011) It follows that biological processes have a greaterffect on DOC yields than physical processes do when elevatedurface temperature is combined with sufficient water availabilityn soil Furthermore higher annual surface temperature is usu-lly associated with longer growing degree days (Hinchliffe et al011) Given sufficient precipitation growing degree days con-ribute to enhanced gross primary productivity which ultimatelys the source of DOC yields in rivers (Dierig and Crafts-Brandner011)
2 Land cover and DOC
Our monthly measurements in the Neponset River watershedemonstrated land use are very important to terrestrial DOCynamics Especially they are the dominant factors when the varia-ions of annual mean temperatures are small (eg lt2 C) Andersson
Nyberg (2008) reported that a small percentage of wetlands in theatchment can contribute large amounts of DOC to rivers Laudont al (2011) quantitatively described that as much of 50 of DOC in
catchment can originate from wetlands even when they occupyust 10 of the catchment area In our study ALT and API had theighest DOC export and also the highest percentage of wetlandsFig 7 and Table 2) However the differences of the annual meaniverine DOC concentrations between the seven major rivers areore likely driven by climate factors instead of land use since the
ercentages of each land use (ie forest agriculture wetland andrban area) among the seven major watersheds are very similar
herefore impacts of land uses on DOC concentrations should note significantly different between these watersheds At the least
mpacts of land use on annual riverine DOC concentrations arenlikely to be linear along the latitudinal temperature gradient For
2 Engine
epma7aotcaTps
4
opsimiwsv
tivcbsmtzaTwttnltH
4
a(anpsHeaTdi
4
ff
aopmitdlp(ey
4
hhncihwmiAorco
CaprTisbaaetta
5
tcbcrmuovtc
00 YQ Tian et al Ecological
xample DEL has the highest latitude of the eastern rivers but theercentage of its watershed that is wetland is 575 which is theedian of wetland percentage of the eastern rivers The percent-
ge of forested cover of the seven watersheds was between 45 and36 with no direct linear relationship between latitude (temper-ture gradient) and forested cover SAC has the highest percentagef agricultural land but its annual DOC concentration is close tohe average of the seven major rivers The random nature of landover distribution (wetland forest developed agricultural) wouldct to weaken the linear temperaturendashDOC relationship (Fig 7)herefore the correlation coefficient between annual surface tem-erature and mean in-stream DOC concentration should be eventronger without the interfering effects of land cover
3 Land cover temperature and DOC in NEP
In the NEP precipitation varied from 1000 to 1350 mmyearver four years (2006ndash2007 and 2009ndash2010) In this watershedrecipitation variation is well-correlated with DOC and explains51 of the DOC variation at an annual scale (Fig 9) Since precip-
tation drives land surface characteristics (ie discharge) in smallatersheds within particular climate zones surface characteristics
uch as land cover are more important than temperature in NEPersus the other watersheds
For the seven major watersheds at annual time scales tempera-ure and precipitation are strongly correlated to riverine DOC andt is clear that temperature was the key factor driving the largeariations in DOC when the variation of temperature is signifi-ant However in the NEP (Fig 9) results for the relationshipsetween DOC temperature and surface processes indicate that ateasonal and annual scales flow drainage area and land cover areore important variables than temperature (R2 = 022) Tempera-
ure is important for large watersheds that cross multiple climateones but the NEP temperature variation is small with a maximumnnual temperature variation of 161 C over five years (Fig 9)his type of low temperature variation would be expected foratersheds in a single climate zone Further this small range in
emperature is difficult to examine statistically for relationshipso DOC concentration We therefore conclude that temperature isot as significant a control on DOC in small watersheds as it is in
arge watersheds This may explain the lack of correlation betweenemperature and DOC in past studies eg Chow et al (2006) andruska et al (2009)
4 DOC stream discharge and land cover
In the seven major watersheds discharges per unit areare weakly correlated to temperature and annual precipitationFigs 3b and 4) Our analysis demonstrated that in the case of ALTnd API in the Subtropical Humid climate zone precipitation doesot necessarily lead to high flow In these settings evapotrans-iration and infiltration affected by temperature vegetation andoil properties alter discharge rates as precipitation takes placeowever in extra-tropical climates acceleration of terrestrial DOCxport will be attendant to acceleration of the hydrologic cyclend thus highly sensitive to discharge or precipitation as in NEPherefore the correlations between in-stream DOC and riverineischarges or land cover are appropriate to study at sub-basin levels
nstead of at basin levels of small river watersheds
5 Temporal scales for capturing DOC biological processes
The quantitative relationships between riverine DOC and sur-ace temperatures were strongest at the annual scale This was trueor both the seven major watersheds and the NEP samples Our
dt
a
ering 54 (2013) 192ndash 201
nnual-scale results strongly support the notion that the responsef riverine DOC to climate variables is a biological process Tem-erature and water determine primary productivity which is theajor source of riverine DOC flux Rising temperature may also
ncrease decomposition of soil organic matter (SOM) which mayhen increase DOC released to freshwaters However the plantecaydecomposition process and thus the DOC transport from
and to rivers could take longer than one year since these involvelant growth and conversion of accumulated organic matter to DOCHansson et al 2010) Therefore we have integrated the long-termffect of temperature on DOC yield with data averages of multipleears
6 Spatial distribution of climate impacts on DOC
It is important to understand where climate change wouldave greater impacts on annual increments in DOC flux sinceigh annual increments in DOC flux are expected to have a sig-ificant impact on aquatic ecosystems Our results indicate thatlimate change (ie increased temperature) would cause higherncreases in riverine DOC flux in low temperature areas than inigh temperature areas (Fig 8) For COL (Fig 8) an increase of 1 Could result in a rise of 26 of DOC flux the highest of the sevenajor rivers COL also is in the coolest climate zone The lowest
ncrement of DOC flux in response to every 1 C raise is 6 in theLT (Fig 8) which has the highest measured DOC concentrationf the seven rivers and is in the hottest climate zone The inverseelationship between incremental DOC flux and climate zoneDOConcentration suggests that warming would have greater impactsn watersheds in high latitudescooler climate zones
A large component of DOC in freshwaters eventually ends up asO2 in the atmosphere (Butman and Raymond 2011) A significantmount of carbon contained in land which first is absorbed bylants through the air leaks into streams and rivers and is theneleased into the atmosphere before reaching coastal waterwayshis process is a source of carbon dioxide The evidence of increas-ng in-stream DOC flux at large scales explains why rivers andtreams in the United States are releasing substantially more car-on dioxide into the atmosphere than previously thought (Butmannd Raymond 2011) As the climate warms there will be more rainnd snow in some areas This increase in precipitation will result inven more terrestrial carbon flowing into rivers and streams andhus being released into the atmosphere Therefore more predic-ive and precise models of carbon uptake versus carbon releasedt global scales must include the carbon in streams and rivers
Conclusion
This study is the first to examine the impacts of tempera-ure on terrestrial DOC exports using study sites across multiplelimate zones Our results yielded a strong linear relationshipetween mean surface temperatures and mean in-stream DOC con-entrations at the annual scale for seven major watersheds Theesults confirmed that climate change (temperature) is the pri-ary factor driving terrestrial DOC flux We conducted our analysis
sing monthly field observations in multiple years Furthermoreur study yields evidence that landscape factors are secondaryariables controlling terrestrial DOC exports when annual meanemperature variation is sufficiently large ie gt5 C Thereforelimate change may have significant impacts on riverine DOC
ynamics in areas where annual surface temperature is high andhat have sufficient precipitation
It is important to understand that a 1 C warming would increasennual mean DOC concentrations in large rivers by 0476 mgL
Engine
AawtwlonyfltPgfm
A
NfWoS
R
A
B
B
C
C
C
C
C
C
D
D
E
E
F
F
G
H
H
H
H
H
H
H
H
H
I
I
J
J
K
K
K
K
L
M
M
N
R
S
S
S
T
YQ Tian et al Ecological
n increase in global mean surface air temperature between 14nd 58 C by the year 2100 as projected by Frumhoff et al (2008)ould result in a 067ndash276 mgL rise of riverine DOC concentra-
ion The impacts of climate warming on terrestrial DOC exportould be greater in watersheds in high latitudes than those in
ower latitudes An increase of 1 C could lead to a DOC exportf up to 26 per square meter per year from watersheds in theorthern US and an increase of up to 6 per square meter perear in the southern US The percent-increment of annual DOCux per square meter is mainly controlled by the variation ofemperature as well as land surface processes such as dischargerecipitation increases terrestrial DOC sources through increasedross primary productivity and provides energy to drive DOCrom the landscape to rivers via surface runoff and groundwater
ovement
cknowledgements
This study was supported by a grant from the US Office ofaval Research (N000140910346) and two collaborative grants
rom the National Science Foundation (1025546 and 1025547)e appreciate the data and advice kindly provided by hydrol-
gist Dr Mark Zimmerman of the United States Geologicalurvey
eferences
ndersson JO Nyberg L 2008 Spatial variation of wetlands and flux of dis-solved organic carbon in boreal headwater streams Hydrol Process 22 (12)1965ndash1975 httpdxdoiorg101002hyp6779
uffle J 1984 Natural organic-matter and metal-organic interactions in aquaticsystems Met Ions Biol Syst 18 165ndash221
utman D Raymond PA 2011 Significant efflux of carbon dioxide fromstreams and rivers in the United States Nat Geosci 4 (12) 839ndash842httpdxdoiorg101038NGEO1294
how AT Tanji KK Gao SD Dahlgren RA 2006 Temperature water con-tent and wet-dry cycle effects on DOC production and carbon mineralizationin agricultural peat soils Soil Biol Biochem 38 (3) 477ndash488
iais P White JWC Jouzel J Petit JR 1995 The origin of present-day Antarcticprecipitation from surface snow deuterium excess data J Geophys Res Atmos100 (D9) 18917ndash18927
lair TA Ehrman JM Higuchi K 1999 Changes in freshwater carbon exportsfrom Canadian terrestrial basins to lakes and estuaries under a 2xCO (2) atmo-spheric scenario Glob Biogeochem Cycl 13 1091ndash1097
lair TA Pollock TL Ehrman JM 1994 Exports of carbon and nitrogen from riverbasins in Canadarsquos Atlantic Provinces Glob Biogeochem Cycl 8 441ndash450
orrell DL Jordan TE Weller DE 2001 Effects of precipitation air temperatureand land use on organic carbon discharges from Rhode River watersheds WaterAir Soil Pollut 128 139ndash159
urtin D Beare MH Chantigny MH Greenfield LG 2011 Controls on theextractability of soil organic matter in water over the 20 to 80 C temperaturerange Soil Sci Soc Am J 75 (4) 1423ndash1430
ierig DA Crafts-Brandner SJ 2011 The relationship of temperature to plantmorphology of Lesquerella Crop Sci 51 (5) 2165ndash2173
uarte CM Prairie YT 2005 Prevalence of heterotrophy and atmospheric CO2
emissions from aquatic ecosystems Ecosystems 8 862ndash870nvironmental Protection Agency 2001 National Land Cover Data
httphttpwwwepagovmrlcnlcd-2001html Retrieved December 2011vans CD Jones TG Burden A Ostle N Zielinski P Cooper MDA Peacock
M Clark JM Oulehle F Cooper D Freeman C 2012 Acidity controls ondissolved organic carbon mobility in organic soils Glob Change Biol 18 (11)3317ndash3331 httpdxdoiorg101111j1365-2486201202794x
rance R Culbert H Peters R 1996 Decreased carbon and nutrient input to boreallakes from particulate organic matter following riparian clear-cutting EnvironManage 20 (4) 579ndash583 httpdxdoiorg101007BF01474657
rumhoff PC McCarthy JJ Melillo JM Moser SC Wuebbles DJ Wake CSpanger-Siegfried E 2008 An integrated climate change assessment for theNortheast United States Mitig Adapt Strat Glob Change 13 (5ndash6) 419ndash423httpdxdoiorg101007s11027-007-9138-x
uo LD Ping CL Macdonald RW 2007 Mobilization pathways of organic carbonfrom permafrost to arctic rivers in a changing climate Geophys Res Lett 34 (13)
httpdxdoiorg1010292007GL030689 (Article Number L13603)
aei M Oquist MG Buffam I Agren A Blomkvist P Bishop K Lofve-nius MO Laudon H 2010 Cold winter soils enhance dissolved organiccarbon concentrations in soil and stream water Geophys Res Lett 37httpdxdoiorg1010292010GL042821 (Article Number L08501)
W
ering 54 (2013) 192ndash 201 201
ansson K Kleja DB Kalbitz K Larsson H 2010 Amounts of carbon mineralizedand leached as DOC during decomposition of Norway spruce needles and fineroots Soil Biol Biochem 42 (2) 178ndash185
arrison AF Taylor K Scott A Poskitt J Benham D Grace J Chaplow JRowland P 2008 Potential effects of climate change on DOC release fromthree different soil types on the Northern Pennines UK examination using fieldmanipulation experiments Glob Change Biol 14 687ndash702
inchliffe DJ Meredith WR Delhom CD Thibodeaux DP Fang DD 2011Elevated growing degree days influence transition stage timing during cottonfiber development resulting in increased fiber-bundle strength Crop Sci 51 (4)1683ndash1692
olmes RM McClelland JW Raymond PA Frazer BB Peterson BJ StieglitzM 2008 Lability of DOC transported by Alaskan rivers to the Arctic oceanGeophys Res Lett 35 (3) httpdxdoiorg1010292007GL032837 (ArticleNumber L03402)
ooper RP Aulenbach BT Kelly VJ 2001 The National Stream Quality Account-ing Network a flux-based approach to monitoring the water quality of largerivers Hydrol Process 15 (7) 1089ndash1106 httpdxdoiorg101002hyp205
ope D Billett MF Cresser MS 1994 A Review of the Export Of Carbon in RiverWater - Fluxes and Processes Environ Pollut 84 (3) 301ndash324
ruska J Kram P Mcdowell WH Oulehle F 2009 Increased dissolved organiccarbon (DOC) in Central European streams is driven by reductions in ionicstrength rather than climate change or decreasing acidity Environ Sci Technol43 (12) 4320ndash4326
uang W Chen RF 2009 Sources and transformations of chromophoric dissolvedorganic matter in the Neponset River watershed J Geophys Res Biogeosci 114G00F05
PCC 1990 In Houghton JT Jenkins GJ Ephraums JJ (Eds) IPCC First Assess-ment Report 1990 Climate Change Cambridge University Press CambridgeUK
PCC 2007 Climate Change 2007 Impacts Adaptation and Vulnerability Summaryfor Policymakers Cambridge University Press Cambridge UK
ones JB Stanley EH Mulholland PJ 2003 Long-term decline in carbon dioxidesupersaturation in rivers across the contiguous United States Geophys Res Lett30 (10) httpdxdoiorg1010292003GL017056 (Article Number 1495)
ones TG Freeman C Lloyd A Mills G 2009 Impacts of elevated atmosphericozone on peatland below-ground DOC characteristics Ecol Eng 35 (6) 971ndash977httpdxdoiorg101016jecoleng200808009
aiser FG Keller C 2001 Disclosing situational constraints to ecological behaviora confirmatory application of the mixed Rasch model Eur J Psychol Assess 17(3) 212ndash221 httpdxdoiorg1010271015-5759173212
ardjilov MI Gislason SR Gisladottir G 2006 The effect of gross primary pro-duction net primary production and net ecosystem exchange on the carbonfixation by chemical weathering of basalt in northeastern Iceland J GeochemExplor 88 292ndash295
han SU Schnitzer M 1972 Permanganate oxidation of humic acidsextracted from a gray wooded soil under different cropping systemsand fertilizer treatments Geoderma 7 (1ndash2) 113 httpdxdoiorg1010160016-7061(72)90057-2
irshen P Watson C Gontz A Douglas E Lee J Tian YQ 2008 Coastal floodingin the Northeastern USA under climate change Mitig Adapt Strat Glob Change13 430ndash451
audon H Berggren M Agren A Buffam I Bishop K Grabs T Jansson MKohler S 2011 Patterns and dynamics of dissolved organic carbon (DOC) inboreal streams the role of processes connectivity and scaling Ecosystems 14(6) 880ndash893 httpdxdoiorg101007s10021-011-9452-8
cdowell WH Fisher SG 1976 Autumnal processing of dissolved organic-matterin a small woodland stream ecosystem Ecology 57 (3) 561ndash569
iller WL Zepp RG 1995 Photochemical production of dissolved inor-ganic carbon from terrestrial organic-matter ndash significance to the oceanicorganic-carbon cycle Geophys Res Lett 22 (4) 417ndash420 httpdxdoiorg10102994GL03344
ational Climate Data Center (NCDC) 2011 httpwwwncdcnoaagovoancdchtml Retrieved December 2011
aymond PA Oh NH 2007 An empirical study of climatic controls on river-ine C export from three major US watersheds Glob Biogeochem Cycl 21 (2)httpdxdoiorg1010292006GB002783 (Article Number GB2022)
chaeffer BA Conmy RN Aukamp J Craven G Ferer EJ 2011 Organic and inor-ganic matter in Louisiana coastal waters Vermilion Atchafalaya TerrebonneBarataria and Mississippi regions Mar Pollut Bull 62 (2) 415ndash422
tedmon CA Markager S Sondergaard M Vang T Laubel A Borch NHWindelin A 2006 Dissolved organic matter (DOM) export to a temperate estu-ary seasonal variations and implications of land use Estuar Coasts 29 388ndash400
triegl RG Aiken GR Dornblaser MM Raymond PA Wickland KP2005 A decrease in discharge-normalized DOC export by the YukonRiver during summer through autumn Geophys Res Lett 32 L21413httpdxdoiorg1010292005GL024413
ian YQ Wang DW Chen RF Huang W 2012 Using modeled runoff to studyDOC dynamics in stream and river flow a case study of an urban watershedsoutheast of Boston Massachusetts Ecol Eng 42 212ndash222
interdahl M Futter M Kohler S Laudon H Seibert J Bishop K 2011Riparian soil temperature modification of the relationship between flowand dissolved organic carbon concentration in a boreal stream WaterResour Res 47 httpdxdoiorg1010292010WR010235 (Article NumberW08532)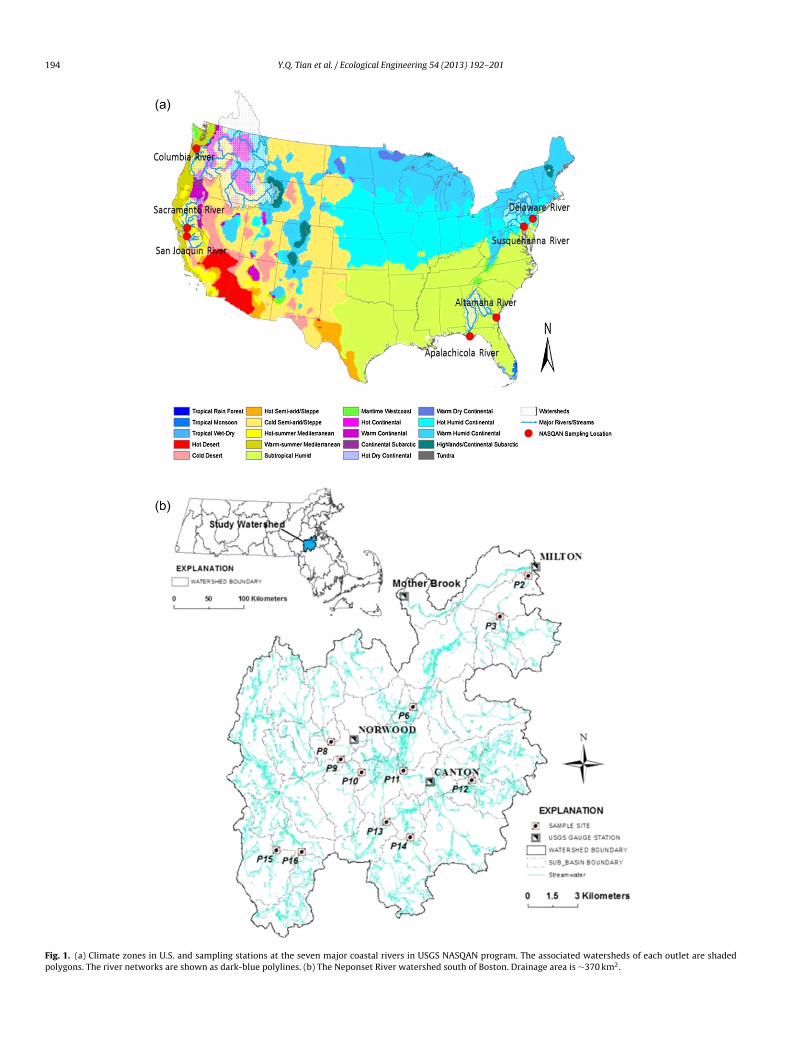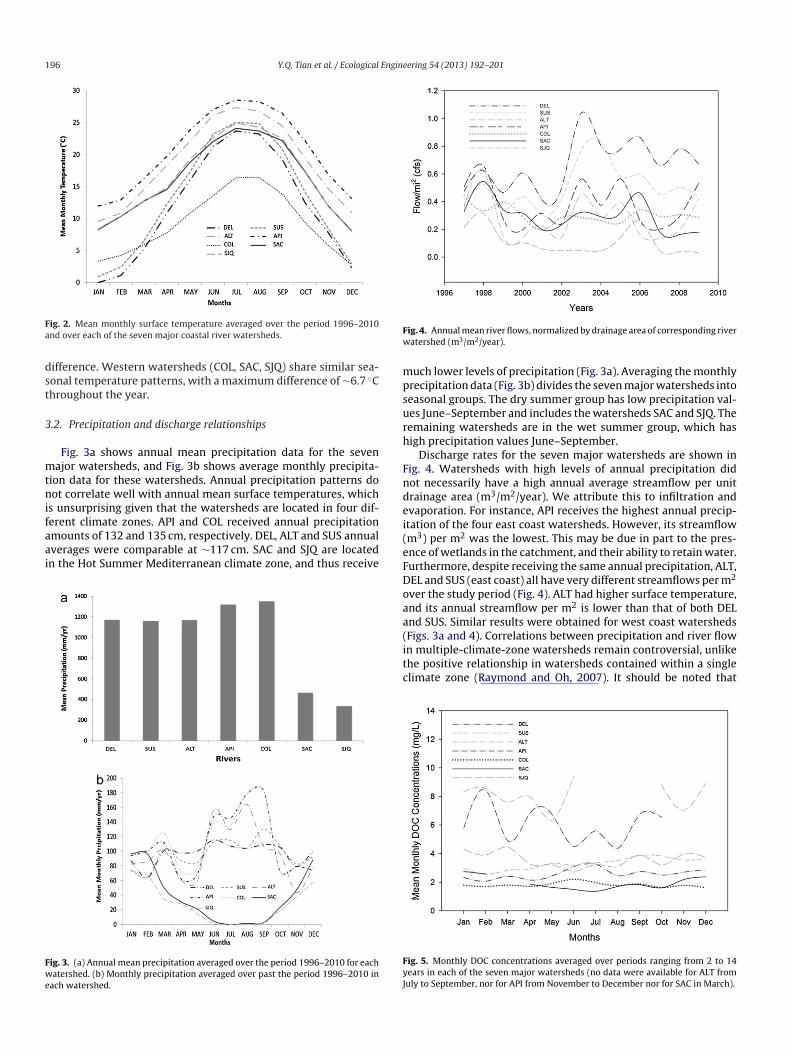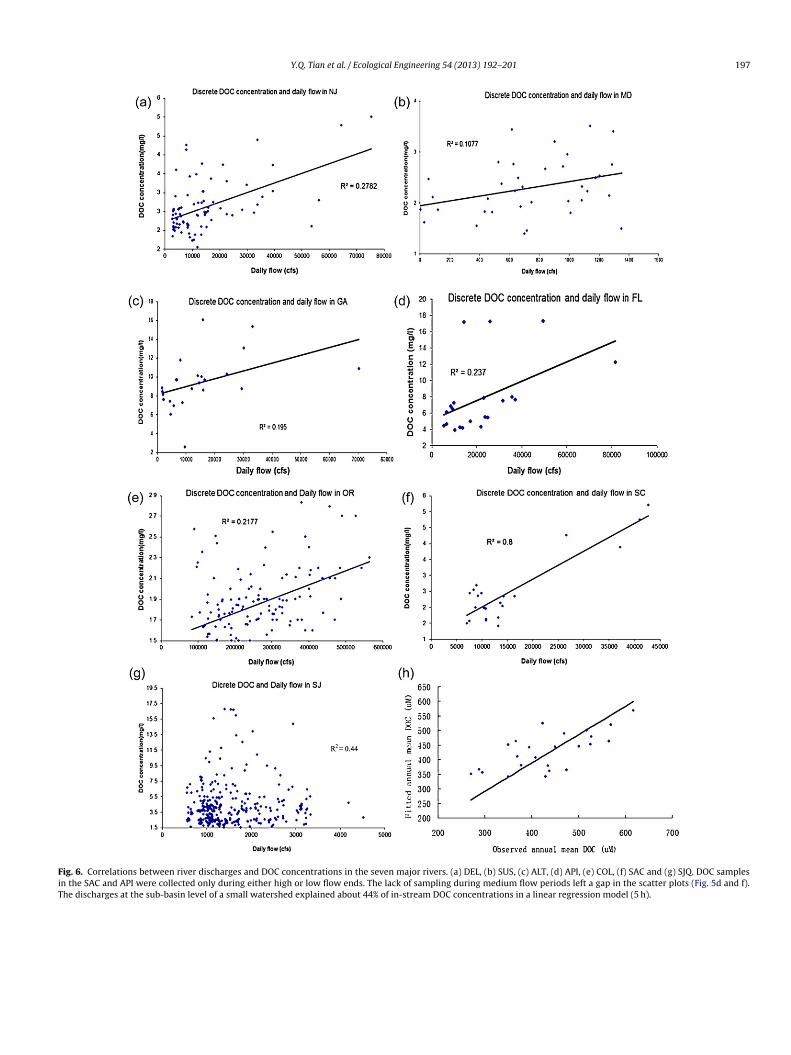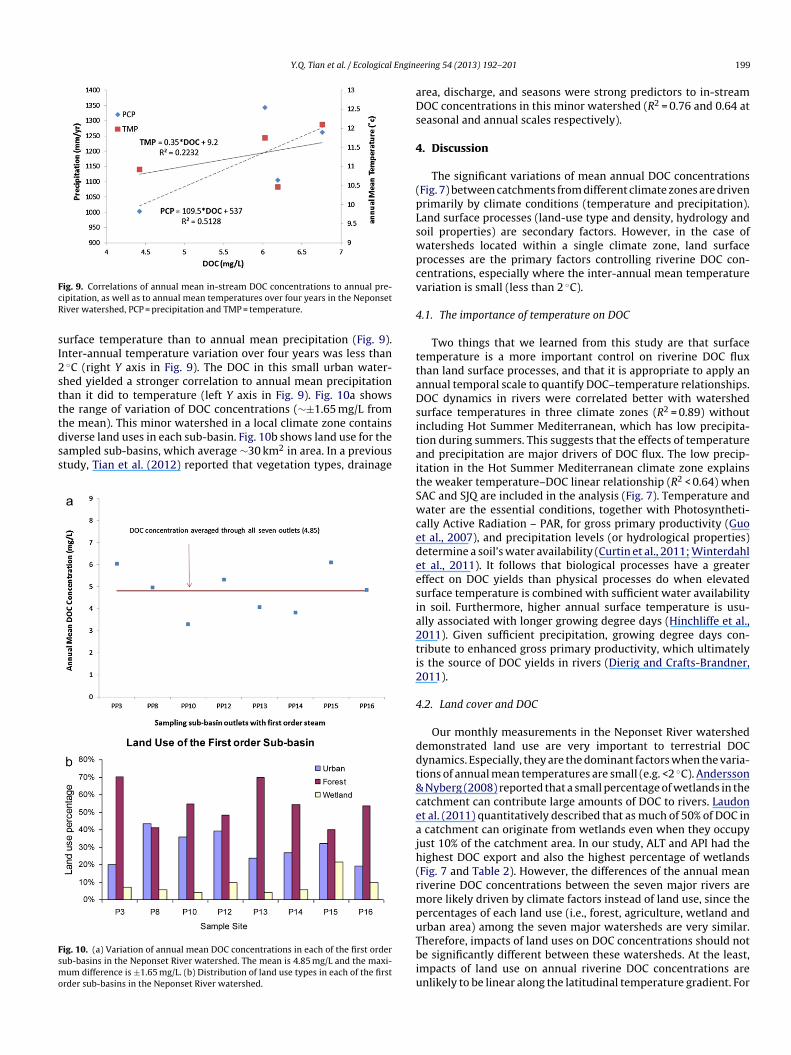
Copyright © 2022 FDOKUMEN