Risk-Based Assessment of Appropriate Fuel Hydrocarbon Cleanup Strategies for the Base Exchange...
39
Environmental Protection Department Environmental Restoration Division Lawrence Livermore National Laboratory University of California Livermore, California 94551 Risk-Based Assessment of Appropriate Fuel Hydrocarbon Cleanup Strategies for Area 43 MWR Gas Station Marine Corp Base, Camp Pendleton, California Authors: Walt W. McNab, Jr. David W. Rice Stephen J. Cullen* Lorne G. Everett* Paul C. Johnson** William E. Kastenberg*** Michael C. Kavanaugh**** Matthew C. Small***** Tina M. Carlsen Submitted to the U.S. Navy, Southwest Division Naval Facilities Engineering Command, San Diego, California *University of California, Santa Barbara **Arizona State University, Tempe ***University of California, Berkeley ****Malcolm Pirnie, Inc., Oakland *****U.S. Environmental Protection Agency, San Francisco, California January 1998 UCRL-AR-128220
-
Upload
independent -
Category
Documents
-
view
3 -
download
0
Transcript of Risk-Based Assessment of Appropriate Fuel Hydrocarbon Cleanup Strategies for the Base Exchange...

Environmental Protection DepartmentEnvironmental Restoration Division
Lawrence Livermore National LaboratoryUniversity of CaliforniaLivermore, California 94551
Risk-Based Assessment of AppropriateFuel Hydrocarbon Cleanup Strategies for
Area 43 MWR Gas StationMarine Corp Base, Camp Pendleton, California
Authors:
Walt W. McNab, Jr.David W. Rice
Stephen J. Cullen*Lorne G. Everett*Paul C. Johnson**
William E. Kastenberg***Michael C. Kavanaugh****
Matthew C. Small*****Tina M. Carlsen
Submitted to the U.S. Navy, Southwest DivisionNaval Facilities Engineering Command, San Diego, California
*University of California, Santa Barbara**Arizona State University, Tempe
***University of California, Berkeley****Malcolm Pirnie, Inc., Oakland
*****U.S. Environmental Protection Agency, San Francisco, California
January 1998
UCRL-AR-128220
Environmental Protection DepartmentEnvironmental Restoration Division
UCRL-AR-128220
Submitted to the U.S. Navy, Southwest DivisionNaval Facilities Engineering Command, San Diego, California
January 1998
Authors:
Walt W. McNab, Jr.David W. Rice
Stephen J. Cullen*Lorne G. Everett*Paul C. Johnson**
William E. Kastenberg***Michael C. Kavanaugh****
Matthew C. Small*****Tina M. Carlsen
*University of California, Santa Barbara**Arizona State University, Tempe
***University of California, Berkeley****Malcolm Pirnie, Inc., Oakland
*****U.S. Environmental Protection Agency, San Francisco, California
Risk-Based Assessment of AppropriateFuel Hydrocarbon Cleanup Strategies for
Area 43 MWR Gas StationMarine Corp Base, Camp Pendleton, California

Work performed under the auspices of the U. S. Department of Energy by Lawrence Livermore National Laboratoryunder Contract W-7405-Eng-48.

Acknowledgments
This study is part of the DoD Petroleum Hydrocarbon Demonstration Program (PHCDP). Fundingfor this work was provided by the U.S. Navy, Southwest Division Naval Facilities EngineeringCommand, San Diego, California
A number of dedicated individuals have contributed to the preparation of this report. The authorswould like to thank the following individuals for their dedication, expertise, and hard work:
D. BishopR. DepueB. DooherV. Garelick
C. KuksM. Parker
S. PelmulderR. RagainiT. SahagunT. Zugsay
UCRL-AR-128220 Cleanup Strategies for Camp Pendleton, Area 43 January 1998
1-98 ERD 128220:rtd

UCRL-AR-128220 Cleanup Strategies for Camp Pendleton, Area 43 January 1998
1-98 ERD 128220:rtd i
Table of Contents1. Program Overview ... . . . . . . . . . . . . . . . . . . . . . . . . . . . . . . . . . . . . . . . . . . . . . . . . . . . . . . . . . . . . . . . . . . . . . . . . . . . . . . . . . . . . .1
1.1. Introduction.. . . . . . . . . . . . . . . . . . . . . . . . . . . . . . . . . . . . . . . . . . . . . . . . . . . . . . . . . . . . . . . . . . . . . . . . . . . . . . . . . . . . . . . . . . .1
1.2. LUFT Demonstration Cleanup Program... . . . . . . . . . . . . . . . . . . . . . . . . . . . . . . . . . . . . . . . . . . . . . . . . . . . . . . . .1
1.2.1 Background ... . . . . . . . . . . . . . . . . . . . . . . . . . . . . . . . . . . . . . . . . . . . . . . . . . . . . . . . . . . . . . . . . . . . . . . . . . . . . . . . . . . . . . . .1
1.2.2. Risk-Based Corrective Action.. . . . . . . . . . . . . . . . . . . . . . . . . . . . . . . . . . . . . . . . . . . . . . . . . . . . . . . . . . . . . . . . .2
1.2.3. The Appropriate Use of Passive Bioremediation .. . . . . . . . . . . . . . . . . . . . . . . . . . . . . . . . . . . . . . . . . . .3
1.2.4. The DOD LUFT Demonstration Cleanup Program Steps .. . . . . . . . . . . . . . . . . . . . . . . . . . . . . . . . .4
2. Site Overview ... . . . . . . . . . . . . . . . . . . . . . . . . . . . . . . . . . . . . . . . . . . . . . . . . . . . . . . . . . . . . . . . . . . . . . . . . . . . . . . . . . . . . . . . . . . .5
2.1. Background ... . . . . . . . . . . . . . . . . . . . . . . . . . . . . . . . . . . . . . . . . . . . . . . . . . . . . . . . . . . . . . . . . . . . . . . . . . . . . . . . . . . . . . . . . .5
2.2. Site Conceptual Model .. . . . . . . . . . . . . . . . . . . . . . . . . . . . . . . . . . . . . . . . . . . . . . . . . . . . . . . . . . . . . . . . . . . . . . . . . . . . . .5
2.2.1. Geology and Hydrogeology ... . . . . . . . . . . . . . . . . . . . . . . . . . . . . . . . . . . . . . . . . . . . . . . . . . . . . . . . . . . . . . . . . .5
2.2.2. Distribution of Contaminants.. . . . . . . . . . . . . . . . . . . . . . . . . . . . . . . . . . . . . . . . . . . . . . . . . . . . . . . . . . . . . . . . . .6
3. Risk Analyses and Management .. . . . . . . . . . . . . . . . . . . . . . . . . . . . . . . . . . . . . . . . . . . . . . . . . . . . . . . . . . . . . . . . . . . . . . . .7
3.1. Sources .. . . . . . . . . . . . . . . . . . . . . . . . . . . . . . . . . . . . . . . . . . . . . . . . . . . . . . . . . . . . . . . . . . . . . . . . . . . . . . . . . . . . . . . . . . . . . . . .7
3.1.1. Primary Source(s) . . . . . . . . . . . . . . . . . . . . . . . . . . . . . . . . . . . . . . . . . . . . . . . . . . . . . . . . . . . . . . . . . . . . . . . . . . . . . . . .7
3.1.2. Secondary Source(s) . . . . . . . . . . . . . . . . . . . . . . . . . . . . . . . . . . . . . . . . . . . . . . . . . . . . . . . . . . . . . . . . . . . . . . . . . . . . .7
3.2. Receptors.. . . . . . . . . . . . . . . . . . . . . . . . . . . . . . . . . . . . . . . . . . . . . . . . . . . . . . . . . . . . . . . . . . . . . . . . . . . . . . . . . . . . . . . . . . . . . .7
3.2.1. Present and Anticipated Future Human Health Receptors.. . . . . . . . . . . . . . . . . . . . . . . . . . . . . . . . .7
3.2.2. Ecological Risk Receptors .. . . . . . . . . . . . . . . . . . . . . . . . . . . . . . . . . . . . . . . . . . . . . . . . . . . . . . . . . . . . . . . . . . . . .7
3.3. Exposure Pathways .. . . . . . . . . . . . . . . . . . . . . . . . . . . . . . . . . . . . . . . . . . . . . . . . . . . . . . . . . . . . . . . . . . . . . . . . . . . . . . . . . .8
3.3.1. Factors Influencing Groundwater Hydrocarbon Plume... . . . . . . . . . . . . . . . . . . . . . . . . . . . . . . . . . .8
3.3.2. Hydrocarbon Vapor Migration .. . . . . . . . . . . . . . . . . . . . . . . . . . . . . . . . . . . . . . . . . . . . . . . . . . . . . . . . . . . . . . . .9
3.4. Remedial Goals .. . . . . . . . . . . . . . . . . . . . . . . . . . . . . . . . . . . . . . . . . . . . . . . . . . . . . . . . . . . . . . . . . . . . . . . . . . . . . . . . . . . . 10
3.4.1. Remedial Technology or Process Selection .. . . . . . . . . . . . . . . . . . . . . . . . . . . . . . . . . . . . . . . . . . . . . . . 11
4. Summary and Recommendations.. . . . . . . . . . . . . . . . . . . . . . . . . . . . . . . . . . . . . . . . . . . . . . . . . . . . . . . . . . . . . . . . . . . . . 12
5. References .. . . . . . . . . . . . . . . . . . . . . . . . . . . . . . . . . . . . . . . . . . . . . . . . . . . . . . . . . . . . . . . . . . . . . . . . . . . . . . . . . . . . . . . . . . . . . . . 14
FiguresFigure 1. Interpolated concentrations of total BTEX (log µg/L) in Area 43 MWR Gas Station
wells and cone penetrometer groundwater samples (March–April 1997).
Figure 2. Interpolated concentrations of total MTBE (log µg/L) in Area 43 MWR Gas Stationwells and cone penetrometer groundwater samples (March–April 1997).
AppendicesAppendix A. Site Assessment Review to Apply Risk Based Corrective Action at Site 43 Area
Gas Station Camp Pendleton, Marine Corps Base, California
Appendix B. Assessing Ecological Impacts
Appendix C. Evaluation of Hydrocarbon Passive Bioremediation in Groundwater

UCRL-AR-128220 Cleanup Strategies for Camp Pendleton, Area 43 January 1998
1-98 ERD 128220:rtd 1
1. Program Overview
1.1. Introduction
In June 1994, the State Water Resource Control Board (SWRCB) contracted with theLawrence Livermore National Laboratory/University of California (LLNL/UC) LeakingUnderground Fuel Tank (LUFT) Team to study the cleanup of LUFTs in California. The studyconsisted of data collection and analysis from LUFT cases and a review of other studies onLUFT cleanups. Two final reports were submitted to the SWRCB in October andNovember 1995. These reports were entitled: Recommendations To Improve the CleanupProcess for California’s Leaking Underground Fuel Tanks (LUFTs) (Rice et al., 1995a); andCalifornia Leaking Underground Fuel Tank (LUFT) Historical Case Analysis (Rice et al.,1995b).
1.2. LUFT Demonstration Cleanup Program
1.2.1. Background
One of the important recommendations of this study was to identify a series of LUFTdemonstration sites and to form a panel of experts made up of scientific professionals fromuniversities, private industry, and Federal and State regulatory agencies. This panel wouldprovide professional interpretations and recommendations regarding LUFT evaluations andclosures at demonstration sites.
As a result of this recommendation, ten Department of Defense (DOD) sites were selected.Site selection was coordinated through the California Military Environmental CoordinationCommittee (CMECC) Water Process Action Team (PAT). Sites were selected to represent eachbranch of the military services with bases in California, as well as a number of Regional WaterQuality Control Boards (RWQCB) and the diverse hydrogeologic settings in California wherefuel hydrocarbon contaminant (FHC) cleanup problems occur. The Camp Pendleton MarineCorps Base, Area 43 gas station, within the San Diego RWQCB, is one of the sites selected toparticipate in the DOD Petroleum Hydrocarbon Cleanup Demonstration (PHCD) Program. Thisprogram will be refered to as the DOD LUFT Demonstration Cleanup Progam.
The other sites selected and their corresponding RWQCB region are:
• Army Presidio at San Francisco, San Francisco RWQCB.
• Barstow Marine Corps Logistic Center, Lahontan RWQCB.
• Castle Air Force Base, Central Valley RWQCB.
• China Lake Naval Weapons Center, Lahontan RWQCB.
• El Toro Marine Corps Air Station, Santa Ana RWQCB.
• George Air Force Base, Lahontan RWQCB.
• Port Hueneme Naval Construction Battalion Center, Los Angeles RWQCB.
• Travis Air Force Base, San Francisco RWQCB.
• Vandenberg Air Force Base, Central Coast RWQCB.
The Expert Committee (EC) selected to evaluate the selected demonstration sites are:

UCRL-AR-128220 Cleanup Strategies for Camp Pendleton, Area 43 January 1998
1-98 ERD 128220:rtd 2
• Mr. David W. Rice, LLNL, Environmental Scientist; Project Director SWRCB LUFTRe-evaluation Project; LLNL/UC LUFT Team member; DOD FHC DemonstrationProgram Coordinator.
• Dr. Walt McNab, LLNL, Hydrogeochemist, with expertise in the evaluation of passivebioremediation processes.
• Dr. William E. Kastenberg, UC, Berkeley, Professor and Chairman, Department ofNuclear Engineering; member of LLNL/UC LUFT Team, with expertise inenvironmental decision making and decision analysis processes.
• Dr. Lorne Everett, UC, Santa Barbara, Hydrogeologist; head of the Vadose ZoneResearch Laboratory and member of LLNL/UC LUFT Team, with expertise in vadosezone FHC transport mechanisms and passive bioremediation processes.
• Dr. Stephen Cullen, UC, Santa Barbara, Hydrogeologist; member of LLNL/UC LUFTTeam with expertise in vadose zone FHC transport mechanisms and passivebioremediation processes.
• Dr. Paul Johnson, Arizona State University, Chemical Engineer; primary author ofAmerican Society for Testing and Materials (ASTM) RBCA guidance, with expertise inchemical fate and transport.
• Dr. Michael Kavanaugh, former Chairman, National Research Council Alternatives forGroundwater Cleanup Committee; Vice President, Malcolm Pirnie, Inc., with expertise inevaluation of groundwater remediation alternatives and environmental decision makingprocesses.
• Mr. Matthew Small, U.S. EPA Region IX, Hydrogeologist; Co-Chairman of U.S. EPARemediation by Natural Attenuation Committee, with expertise in risk-based correctiveaction and passive bioremediation.
1.2.2. Risk-Based Corrective Action
The LLNL/UC recommendations report concluded that risk-based corrective action (RBCA)provides a framework to link cleanup decisions to risk. The DOD LUFT Demonstration CleanupProgram provides a series of sites where the application of a risk-based cleanup approach can bedemonstrated.
For a risk to exist, there must be a source of a hazard, a receptor, and a pathway that connectsthe two. All three factors must be addressed to determine whether a LUFT release poses a risk tohuman health, safety, or the environment. If the source, pathway, or receptor are at all timesabsent, there is, by definition, no risk. The distinction between sources, pathways, and receptorsmay be context-dependent in many cases and therefore must be carefully defined. For purposesof the present assessment, definitions of these terms are developed by working backward fromthe receptor to the source:
Receptor : Human or ecological risk receptors which may potentially be subject to damageby exposure to hydrocarbons via ingestion, inhalation, or absorption. This definition alsospecifically includes water-supply wells because it must be assumed that humans will beingesting the water from these wells.
Pathways : Physical migration routes of contaminants from sources to risk receptors. Thisdefinition specifically includes the groundwater environment downgradient of the source whichprovides a medium through which dissolved contaminants may migrate to water-supply wells, aswell as to surface water bodies which may serve as ecological risk pathways. The definition alsoincludes the vadose zone in the immediate vicinity of the source, where vapor migration routes tonearby human receptors may exist.

UCRL-AR-128220 Cleanup Strategies for Camp Pendleton, Area 43 January 1998
1-98 ERD 128220:rtd 3
Sources : Points of entry of contaminants into possible exposure pathways. In the case ofhydrocarbon releases associated with LUFT sites, separate-phase hydrocarbon product which caneither dissolve into the aqueous phase or volatilize into the gaseous phase constitutes a source.Primary sources will include underground tanks and associated piping; secondary sources willinclude any separate-phase hydrocarbon or free product material residing within sediment pores.
From a mathematical viewpoint, sources and receptors represent boundary conditions for theproblem of interest (influx and outflux, respectively); pathways represent the problem domain.Thus, in some special situations, the dissolved plume in groundwater may represent a source,such as in the case of Henry’s law partitioning of contaminants from the aqueous phase into thegaseous phase. On the other hand, hydrocarbons which have adsorbed onto sediment surfacesfrom the aqueous phase cannot be regarded as potential sources in most situations according tothis definition, but rather exist as part of the pathway.
Risk characterization is defined as an information synthesis and summary about a potentiallyhazardous situation that addresses the needs and interests of decision makers and of interestedand affected parties. Risk characterization is a prelude to cleanup decision making and dependson an iterative, analytic, and deliberative process. This process attempts to gather all relevantdata so the decision makers may then choose the best risk-management approach.
1.2.3. The Appropriate Use of Passive Bioremediation
The Recommendations Report also concluded that with rare exceptions, petroleum fuelreleases will naturally degrade (passively bioremediate) in California’s subsurface environments.The DOD LUFT Demonstration Cleanup Program provides sites where the appropriate use ofpassive bioremediation can be evaluated.
Passive bioremediation can control groundwater contamination in two distinct ways:
• First, passive bioremediation substantially lowers the risk posed to downgradient riskreceptors through plume stabilization1.
• Second, passive bioremediation actively destroys fuel hydrocarbon mass in thesubsurface, leading to remediation of contamination over time (e.g., eventual contaminantconcentration decline and depletion of the dissolved hydrocarbon plume). From a riskmanagement viewpoint, the stabilization of the dissolved plume and associated reductionin exposure potential is the most important contribution of passive bioremediation.
The role of passive bioremediation in controlling the behavior of dissolved hydrocarbonplumes may be evaluated through both primary and secondary field evidence.
• Primary evidence includes quantitative evaluation of plume stability or plume shrinkagebased upon trends in historical groundwater contaminant concentration data.
• Secondary evidence includes indirect indicators of passive bioremediation, such asvariations in key geochemical parameters (dissolved oxygen, nitrate, sulfate, iron,manganese, methane, alkalinity/carbon dioxide, Eh, pH) between measurements in fuelhydrocarbon-impacted areas and background.
Although primary evidence of plume stability or decline generally provides the strongestarguments to support natural attenuation at a given site, such evidence may not be availablebecause adequate historical groundwater monitoring may not exist. In these cases, short-termmonitoring data providing secondary lines of evidence, in conjunction with modeling where 1 Even in the presence of a continuous constant source of fuel hydrocarbons (e.g., dissolution of residual free product components
trapped in the soil matrix), a groundwater plume subject to passive bioremediation will reach a steady-state condition in whichplume length becomes stable. This will occur when the rate of hydrocarbon influx from dissolution of the residual freeproduct source is balanced by the rate of mass loss via passive bioremediation, integrated across the entire spatial extent of theplume.

UCRL-AR-128220 Cleanup Strategies for Camp Pendleton, Area 43 January 1998
1-98 ERD 128220:rtd 4
appropriate, may support a hypothesis for the occurrence of passive bioremediation.Consequently, means for assessing the role of passive bioremedation in controlling risk bysecondary lines of evidence should be fully explored at such sites.
Appropriate use of passive bioremediation as a remedial alternative requires the same careand professional judgment as the use of any other remedial alternative. This includes sitecharacterization, assessment of potential risks, comparison with other remedial alternatives,evaluation of cost effectiveness, and the potential for bioremediation to reach remedial goals.Monitoring process and contingency planning must be considered as well.
Passive bioremediation may be implemented at a given petroleum release site either as astand-alone remedial action or in combination with other remedial actions. The need for activesource removal must also be addressed on a site-by-site basis. Source removal includesremoving leaking tanks and associated pipelines, and any remaining free product and petroleumfuel saturated soil, as much as economically and technically feasible. When properly used,passive bioremediation can help manage risk and achieve remedial goals.
1.2.4. The DOD LUFT Demonstration Cleanup Program Steps
The demonstration program process can be summarized in the following nine steps:
Step 1: Site scoping meeting with site staff, regulators, and EC staff representatives.Develop and discuss site conceptual model. Identify and discuss pathways andreceptors of concern.
Step 2: RBCA training for DOD Petroleum Hydrocarbon Cleanup Demonstration Program(PHCDP) participants.
Step 3: Site staff and contractors prepare the data package. EC staff reviews available dataand identifies data gaps needed to apply a risk-based cleanup approach.
Step 4: EC visits site and receives briefing, on site characterization, conceptual model, andpathways and receptors of concern. Site tour is included in this briefing. FollowingEC’s visit, a site characterization report is prepared by the EC containingrecommendations for further data collection, if needed (See Appendix A).
Step 5: EC staff applies a risk based cleanup approach to the site using best available data.
Step 6: EC staff evaluates the natural attenuation potential for the site using best availabledata. An estimate of the time to clean up and the uncertainty associated with thisestimate will be made. Sampling and monitoring procedures to support intrinsicbioremediation for the site will be identified.
Step 7: Based on the concept of applied source, pathways, and receptors as to potentialhazards, site specific findings regarding natural attenuation potential, and discussionwith regulators, the EC shall provide its recommendations for an appropriate risk-management strategy at the site and the set of actions needed to achieve site closure.The EC will present its recommendations at an appropriate forum.
Step 8: The EC will provide a DOD LUFT Demonstration Cleanup Program overallevaluation comparing the effectiveness of risk based cleanup at each site in theprogram. An estimation of the cost savings using risk based cleanup protocols willbe compared to baseline approaches. An estimation of the value of the remediatedwater will be made.
UCRL-AR-128220 Cleanup Strategies for Camp Pendleton, Area 43 January 1998
1-98 ERD 128220:rtd 5
Step 9: The EC Staff will produce a DOD Risk Execution Strategy for Clean-Up of theEnvironment (RESCUE) implementation guide and accompanying proceduresmanual (Phase I, Petroleum) that can be used in California and in other states bymilitary bases.
2. Site Overview
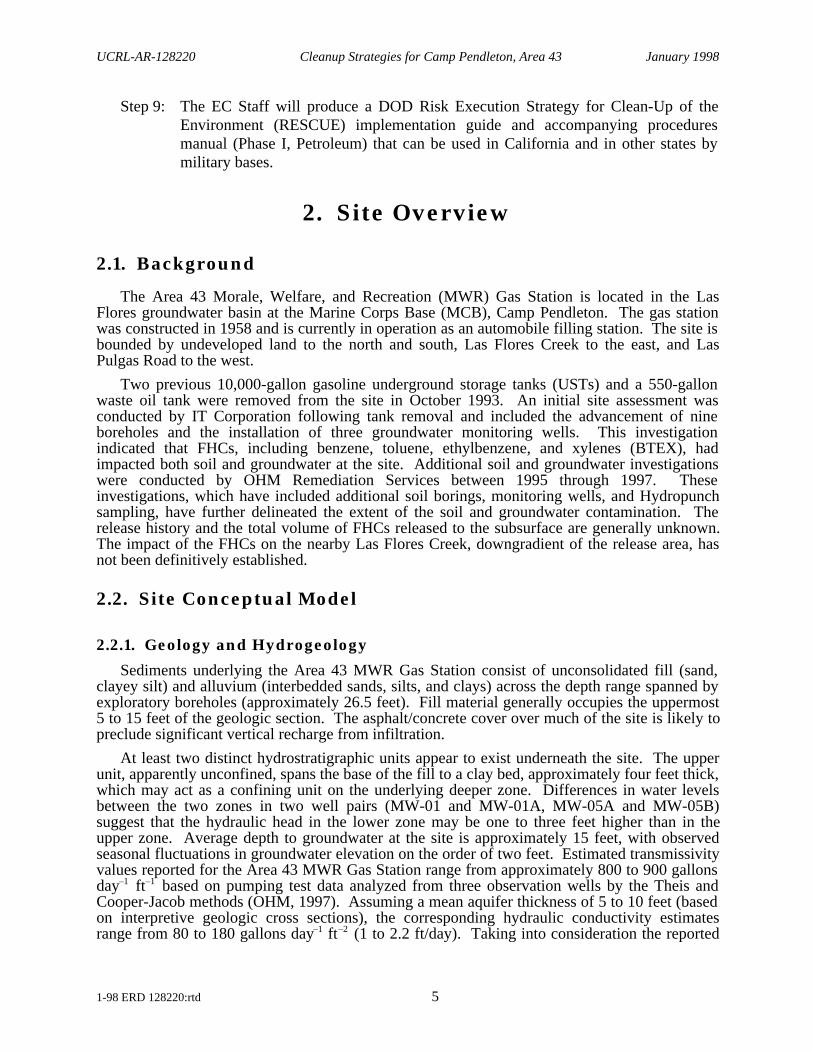
2.1. Background
The Area 43 Morale, Welfare, and Recreation (MWR) Gas Station is located in the LasFlores groundwater basin at the Marine Corps Base (MCB), Camp Pendleton. The gas stationwas constructed in 1958 and is currently in operation as an automobile filling station. The site isbounded by undeveloped land to the north and south, Las Flores Creek to the east, and LasPulgas Road to the west.
Two previous 10,000-gallon gasoline underground storage tanks (USTs) and a 550-gallonwaste oil tank were removed from the site in October 1993. An initial site assessment wasconducted by IT Corporation following tank removal and included the advancement of nineboreholes and the installation of three groundwater monitoring wells. This investigationindicated that FHCs, including benzene, toluene, ethylbenzene, and xylenes (BTEX), hadimpacted both soil and groundwater at the site. Additional soil and groundwater investigationswere conducted by OHM Remediation Services between 1995 through 1997. Theseinvestigations, which have included additional soil borings, monitoring wells, and Hydropunchsampling, have further delineated the extent of the soil and groundwater contamination. Therelease history and the total volume of FHCs released to the subsurface are generally unknown.The impact of the FHCs on the nearby Las Flores Creek, downgradient of the release area, hasnot been definitively established.
2.2. Site Conceptual Model
2.2.1. Geology and Hydrogeology
Sediments underlying the Area 43 MWR Gas Station consist of unconsolidated fill (sand,clayey silt) and alluvium (interbedded sands, silts, and clays) across the depth range spanned byexploratory boreholes (approximately 26.5 feet). Fill material generally occupies the uppermost5 to 15 feet of the geologic section. The asphalt/concrete cover over much of the site is likely topreclude significant vertical recharge from infiltration.
At least two distinct hydrostratigraphic units appear to exist underneath the site. The upperunit, apparently unconfined, spans the base of the fill to a clay bed, approximately four feet thick,which may act as a confining unit on the underlying deeper zone. Differences in water levelsbetween the two zones in two well pairs (MW-01 and MW-01A, MW-05A and MW-05B)suggest that the hydraulic head in the lower zone may be one to three feet higher than in theupper zone. Average depth to groundwater at the site is approximately 15 feet, with observedseasonal fluctuations in groundwater elevation on the order of two feet. Estimated transmissivityvalues reported for the Area 43 MWR Gas Station range from approximately 800 to 900 gallonsday–1 ft–1 based on pumping test data analyzed from three observation wells by the Theis andCooper-Jacob methods (OHM, 1997). Assuming a mean aquifer thickness of 5 to 10 feet (basedon interpretive geologic cross sections), the corresponding hydraulic conductivity estimatesrange from 80 to 180 gallons day–1 ft–2 (1 to 2.2 ft/day). Taking into consideration the reported

UCRL-AR-128220 Cleanup Strategies for Camp Pendleton, Area 43 January 1998
1-98 ERD 128220:rtd 6
mean hydraulic gradient of 0.08 ft/ft and assuming a porosity on the order of 0.30, thegroundwater pore velocity under the site should be on the order of approximately 0.3 to0.6 ft/day. Groundwater flow direction is toward the southeast.
The site is located in the Las Flores groundwater basin, with surface drainage generallydirected toward the west-southwest. The site lies approximately 100 feet to the north of the LasFlores Creek. Given the depth to groundwater at the site and the apparent elevation of the creekrelative to the gas station, it is possible that the creek acts as an effluent stream (i.e., gainingwater from subsurface discharge). However, the hydrostratigraphic relationship between theupper water-bearing zone and the creek remains unclear; it is possible that the FHC-impactedaquifer may pass underneath the creek bed.
2.2.2. Distribution of Contaminants
The current extent of FHC soil and groundwater contamination has been delineated by13 soil borings, eight groundwater monitoring wells, and eight Hydropunch samples. Soilcontamination (TPH as gasoline, BTEX constituents) has been observed in 8 soil borings, withconcentrations of TPH-G ranging up to 5,300 mg/Kg (at a depth of 8 ft in B-2 as well as at 15 ftin B-9 - above water table). While much of the soil contamination appears to be associated withthe former tank locations, the FHC detections in B-1 and B-2 near the pump island locationsuggest that releases occurred from the piping system as well. The observed increases in soilconcentrations of TPH-G and BTEX components with depth in several borings, with the highestconcentrations immediately overlying the water table at 15 feet, may be explained by afluctuating groundwater table or a previous layer of floating free product. Synthetic precipitationleaching procedure (SPLP) tests have been conducted on site sediment samples in an attempt toquantify the potential for residual entrapped hydrocarbons to impact groundwater. Themaximum release concentration suggested by this analysis was 1,050 mg/L for benzene in a soilsample containing 4.89 mg/Kg benzene and 900 mg/Kg TPH-G (B-11 at a depth ofapproximately 15 ft). However, SPLP analyses showed little or no leachable FHCs in soilsamples collected from equivalent depths in MW-01A, B-13, HP-1, HP-2 (7 ppb benzene at14 ft), HP-3, HP-4, HP-5, and HP-7. Because of the highly localized nature of residual FHCsources implied by the SPLP analyses, the extent of the impact of leaching is very unclearbecause of expected spatial and temporal variability in the groundwater and soil water fluid flowfield.
FHCs have been historically detected in groundwater on a consistent basis only in monitoringwells MW-03 and MW-04. FHCs have also been detected in one round of sampling in therecently installed wells MW-01A, MW-05A, and MW-06. The highest FHC concentrationsnoted in site monitoring wells include 48 mg/L TPH-G and 3.1 mg/L benzene in MW-01 inSeptember 1995. Concentrations in this well have fallen to below detection limits in recentsampling events. Currently, the highest FHC concentrations are observed in MW-04 (25 mg/LTPH-G and 1.1 mg/L benzene). Groundwater samples obtained as part of a Hydropunch surveyconducted in March 1997, revealed that five out of a total of eight samples contained detectableconcentrations of FHCs, with the highest concentrations in HP-2 at 85 mg/L TPH-G and1.6 mg/L benzene. Free product has not been historically observed in site monitoring wells todate. Interpreted concentration contours for total BTEX concentrations in groundwater inMarch–April 1997, are shown on Figure 1.
The fuel-oxygenate methyl tertiary butyl ether (MTBE) has been detected in site groundwaterin association with the FHCs (MW-01, MW-01A, MW-02, MW-04, MW-05A, HP-2, HP-3,HP-4, HP-5, and HP-7). Interpreted concentration contours for MTBE concentrations ingroundwater in March–April 1997, are shown on Figure 2. The highest concentration detected todate has been approximately 2.8 mg/L in MW-05A in April 1997. Unlike FHCs, MTBE isknown to be currently present in the deeper water-bearing zone in one well (MW-01).

UCRL-AR-128220 Cleanup Strategies for Camp Pendleton, Area 43 January 1998
1-98 ERD 128220:rtd 7
Additional sediment and surface water samples were collected in 1997 to assess FHC impactto the Las Flores Creek. FHCs were detected in a hand-augered soil sample collected on thenorthwest creek bank adjacent to the service station at a depth of 14 ft (160 mg/L TPH-G and0.430 mg/L benzene). However, no FHCs were detected in either surface water samplescollected from the creek or in sediment samples collected from the creek bed area.
3. Risk Analyses and Management
3.1. Sources
3.1.1. Primary Source(s)
Primary sources of FHC contamination are defined as engineered structures such asunderground tanks, pipelines, and sumps which leak and release product into the subsurfaceenvironment. Primary sources at the Area 43 MWR Gas Station include the previous two10,000-gallon gasoline storage tanks and a 550-gallon waste oil tank, all of which were removedin October 1993. The underground piping system was also replaced during tank removal. Theextent of soil over-excavation associated with tank removal activities is unknown.
3.1.2. Secondary Source(s)
Secondary contamination sources include residual free product which could remain inunsaturated soils as well as on top of the water table even after primary sources have beenremoved. Free product has not been observed in site monitoring wells to date. Analyses of soilsamples, including synthetic precipitation leaching procedure (SPLP) testing, have suggested thatrelatively low concentrations of FHC or BTEX currently reside in the vadose zone. Mostdetections have been noted near the water table, where groundwater level fluctuations haveprobably acted to smear the contaminant profile about the vadose zone-saturated zone interface.
3.2. Receptors
3.2.1. Present and Anticipated Future Human Health Receptors
The nearest known existing water-supply wells are approximately four miles downgradientfrom the Area 43 MWR Gas Station. Because the release site and associated groundwater plumeare entirely within the MCB property boundary, it is expected that institutional controls willcontinue to be in place to assure that future water-supply wells are not installed in the vicinitywhere they would be at risk. Residential barracks exists across Las Pulgas Road, which mayconstitute theoretical FHC vapor receptors.
3.2.2. Ecological Risk Receptors
The Las Flores Creek and associated ecosystem, approximately 100 feet downgradient fromthe former tank area, constitutes an ecological receptor potentially at risk to FHC impact (fromaquifer discharge as well as vapor migration) from the site. The creek area includes the habitatof the endangered Least Bell’s vireo. See Appendix B for a discussion regarding the assessmentof ecological impacts.

UCRL-AR-128220 Cleanup Strategies for Camp Pendleton, Area 43 January 1998
1-98 ERD 128220:rtd 8
3.3. Exposure Pathways
To pose a human health or ecological risk, the source of contaminants (e.g., residual freeproduct) must be linked to receptors (e.g., water-supply wells) via pathways. At the Area 43MWR Gas Station, the groundwater pathway between the former tank area and the Las FloresCreek constitutes a possible exposure pathway. The pathway between the service station and theresidential barracks across Las Pulgas Road presents an additional theoretical vapor transportpathway.
3.3.1. Factors Influencing Groundwater Hydrocarbon Plume
Probability distribution functions of benzene plume lengths reported in the LUFT HistoricalCase Analysis (Rice et al., 1995) included a median (50th percentile) value of approximately100 feet and a 90th percentile value of approximately 260 feet. Many plumes evaluated by theLUFT Historical Case Analysis appeared to have stabilized into an apparent steady statecondition. This stability is likely a reflection of the interplay between transport processes andpassive bioremediation, where the input of dissolved FHCs from residual sources is balanced byFHC losses integrated across the spatial extent of the plume.
In the instance of the Area 43 MWR Gas Station, the proximity of the Las Flores Creek tothe FHC source (approximately 100 feet) implies that risk of FHC impact to the creek may besignificant. Therefore, contaminant fluxes should be quantified, and natural attenuationprocesses taken into account to evaluate the potential impact to the Las Flores Creek ecology.
3.3.1.1. Passive Bioremediation
Groundwater quality data are being collected to support a possible remediation-by-natural-attenuation alternative, as suggested by the San Diego Regional Water Quality Control Board(SDRWQCB) in a letter to the MCB dated June 19, 1996. However, given the relatively briefgroundwater monitoring period and the small number of monitoring points associated with theArea 43 MWR Gas Station, direct primary evidence of passive bioremediation is not available.Because of the apparent interaction of the plume with the creek bed area, and the potentialdamage to the creek bed that extensive plume delineation sampling may cause, an objectivemeasure of plume length is also unavailable for analysis. Nevertheless, secondary evidence ofFHC passive bioremediation in the form of geochemical indicator parameters is available.Dissolved oxygen, nitrate, sulfate, iron, methane, alkalinity, pH, and redox potential (Eh) weremeasured in a number of groundwater samples collected from monitoring wells and aHydropunch survey in March and April 1997. Statistical analyses of these data are stronglysuggestive that a number of passive bioremediation processes are active in groundwater at thesite, particularly sulfate reduction, iron reduction, and methanogenesis. These findings pertain toBTEX only and not to MTBE. To date, conclusive field evidence of MTBE biodegradation orabiotic transformation has not been reported in the literature.
Analyses of passive bioremediation signatures in groundwater are discussed in Appendix C.Soil gas survey results presented by OHM (1997) are consistent with the hypothesis that somedegree of FHC passive bioremediation is occurring with unsaturated soils as well, with elevatedconcentrations of carbon dioxide and depleted levels of oxygen in soil gas. Whether thesefindings reflect FHC biodegradation or microbial activity associated with other substrates isunclear.
3.3.1.2. Plume Migration and Impact to Stream
Based on pumping test results and the interpreted local hydraulic gradient, groundwater porevelocities at the Area 43 MWR Gas Station are on the order of 0.3 to 0.6 ft/day. At this rate,

UCRL-AR-128220 Cleanup Strategies for Camp Pendleton, Area 43 January 1998
1-98 ERD 128220:rtd 9
groundwater can migrate from the former tank area to the Las Flores Creek, some 100 feetdowngradient, in approximately 170 to 380 days (neglecting the effects of retardation).
Mean first-order degradation rates have been reported for BTEX plumes in the field by anumber of workers (e.g., MacIntyre et al., 1993; Wilson et al., 1995; Buscheck et al., 1996;Chapelle et al., 1996). A degradation rate of 0.8% day–1, a typical, if not high, value foranaerobic conditions, corresponds to a half-life of approximately 87 days. Thus, duringmigration from the source area to the Las Flores Creek, dissolved hydrocarbons could beexpected to degrade through some 2 to 4 half-lives, corresponding to a reduction in concentrationof 74% to 95%. Given the benzene concentrations ranging between 1 to 3 mg/L encountered inMW-04 and HP-4, this implies that the plume could still be characterized by benzeneconcentrations on the order of 0.50 to 0.790 mg/L in the vicinity of the creek (neglectingretardation as well as dispersive effects). Given this range of concentrations, the estimatedgroundwater velocity, mean aquifer thickness and an assumed contact length between the plumeand the creek bank of approximately 100 feet, these estimates would imply a mass discharge ofbenzene into (or under) the Las Flores Creek of approximately 100 to 2,000 mg/day. A greaterpotential for MTBE to enter the creek exists because MTBE does not undergo passivebioremediation to the vigorous extent observed with respect to FHCs.
Despite the potential for FHCs and MTBE to enter the creek bed, analyses of surface waterand creek sediment samples collected in the area of the service station failed to indicatedetectable levels of these contaminants. Several explanations may account for this observation:
• The FHC/MTBE plume passes underneath the creek bed, rather than the contaminatedwater-bearing zone discharging directly into the creek;
• Volatilization and dispersion processes rapidly dilute the contaminants below applicabledetection limits;
• Because of the dynamic, transient nature of flow and transport process in the creek,samples collected during the single sampling event simply missed locations wherecontaminants might have been present.
An additional round of sampling in the creek bed, both of surface water and sediments, iswarranted to confirm the preliminary findings. These samples should be collected some distancedowngradient to provide a greater chance of detecting FHCs if they are indeed present.However, care must be taken not to damage the creek ecosystem as a result of sampling activities(i.e., use of heavy equipment should be avoided).
3.3.1.3. Vertical Migration of Contaminants
Vertical migration of contaminants from the upper water-bearing zone into the lowerconstitutes an additional groundwater migration pathway. However, the existence of a clay layerbetween these two zones and an apparent hydraulic head difference which would opposedownward migration suggests that this is probably not a major pathway. Currently, FHCs arenot found in groundwater samples collected from the two wells screened in the deeper zone,MW-01 and MW-05B, although significant concentrations of TPH-G and BTEX were noted inMW-01 in 1995 and a trace level of TPH-G detected in October 1996. MTBE has been detectedin low levels in MW-01 which appear to be declining (0.097 mg/L in July 1996, 0.064 mg/L inOctober 1996, 0.048 mg/L in February 1997, and 0.047 mg/L in April 1997).
3.3.2. Hydrocarbon Vapor Migration
Given the relatively low concentrations of FHCs found in soil and groundwater at the Area43 MWR Gas Station and the absence of free product in site monitoring wells, the risk posed bymigration of hydrocarbon vapors from the release to nearby receptors is probably very low. The
UCRL-AR-128220 Cleanup Strategies for Camp Pendleton, Area 43 January 1998
1-98 ERD 128220:rtd 10
residential barracks is too far away from the source area (greater than 100 feet) to be affected byFHC vapors. The risk posed to the service station workers by exposure to vapors from therelease is very small in comparison to everyday workplace exposure levels encountered at gasstations and similar facilities. While there is some risk to human health associated with FHCvapors, such risks fall under the jurisdiction of occupational health and safety laws; the addedrisk from subsurface FHCs released to soils and groundwater is probability insignificant.
3.4. Remedial Goals
Cleanup requirements or standards are set by states to ensure that sufficient contamination isremoved to protect human health and the environment. Under this broad umbrella of concerns,state-specific considerations such as groundwater use, aquifer benefical use designation, cleanupcosts versus risks, technical feasibility of cleanup, available expertise, available funding,permitting, land use, and property transfers may also play a role in setting the these standards.
The cleanup standards set by states usually fall into one of three broad categories:
1. Technology based standards, which are based on the detection limits of analyticallaboratory equipment.
2. Subjective standards, which are often adopted based on technology limits or in theabsence of another mechanism; these standards may require cleanup to non-detectable orbackground levels.
3. Risk-based standards, which can be either an overall standard based on conservative yetrealistic exposure and toxicity analysis, or site-specific standards based on site-specificconditions, land use, and exposure scenarios.
To establish remedial goals, these standards are then applied either at all locations throughoutthe plume or at some boundary beyond which the plume cannot be allow to migrate. Remedialgoals may also include some time frame within which the goals must be met. If conditions at thesite do not exceed remedial goals, the site will usually receive a status of “no further actionrequired at this time.” However, if site conditions do exceed remedial goals, then several choicesexist (Small, 1993):
• Cleanup to background or non-detect: This approach is very protective of human healthand the environment, but can often prove to be prohibitively expensive or technicallyinfeasible.
• Cleanup to an overall or generic standard: This approach is also protective, feasible inmany cases, and generally less expensive than cleanup to background or non-detectlevels. However, these levels may still prove to be prohibitively expensive, or eventechnically infeasible for some sites.
• Cleanup to a site-specific standard: The protectiveness of this approach is usually basedon specified land uses and may need to be re-evaluated if changes occur. The cleanuplevels are often more feasible and generally less expensive to achieve. However, thisapproach requires potentially expensive site-specific exposure and risk assessment, todetermine threats and impacts.
• Risk management, or containment: When contaminant concentrations exceed safe levels,but cannot feasibly be cleaned up, or there are no current or future exposure pathways,then risk management through containment of contamination to prevent further migration
UCRL-AR-128220 Cleanup Strategies for Camp Pendleton, Area 43 January 1998
1-98 ERD 128220:rtd 11
may be an option. Active containment systems are often expensive to install andmaintain.
• No Action: In some instances monitoring may not be needed or may eventually bediscontinued. As with monitored natural attenuation, this approach may require site-specific exposure and risk assessment, to determine threats and impacts to public healthand the environment.
At Area 43 MWR Gas Station site, the potential impact of the FHC plume (or active effortsto remediate the plume) on the local aquatic ecosystem must be taken into account.
3.4.1. Remedial Technology or Process Selection
If contaminant concentrations exceed remedial goals and cleanup is required, then a cleanuptechnology must be selected based on the information obtained from site assessment andcharacterization. This technology should be selected based on the ability to meet remedial goals,site conditions, and physio-chemical properites of the contaminants. The technology should notcreate additional hazards (e.g., air sparging without soil vapor extraction that may potentiallytransport vapors into buildings).
The technology should ideally perform this task as quickly, efficiently, and cost-effectivelyas possible. It is also important to give some consideration to how the cleanup technology orprocess actually accomplishes concentration reductions and where the removed contaminants orby products are actually going. There are four basic alternatives:
1. Reuse/recycling.
2. Waste destruction (or conversion).
3. Media transfer.
4. Waste disposal.
Media transfer and disposal options may simply move the contamination to another locationwhere it will have to be cleaned up again. Whereas reuse, recycling, and destructiontechnologies or processes offer more long-term or permanent solutions.
Monitored natural attenuation or passive bioremediation may provide cost-effectivecontainment at some sites. In some instances where contamination exceeds remedial goals, butno immediate threats or impacts are identified, it may be acceptable to allow contamination toremain in place without active remediation. Monitored natural dilution, attenuation, anddegradation processes would thus be allowed to slowly reduce concentration levels. However,this approach may require site-specific exposure and risk assessment, to determine threats andimpacts to public health and the environment (Small, 1993).
3.4.2. Remedial Goals and Technology/Process Selection for Area 43 MWRGas Station
Remedial goals have not currently been clearly established for the site. However, we canmatch some possible remedial technologies with some possible remedial goals in the followinghypothetical examples:
Example (1)
Remedial Goal: Reduce concentrations at all points in the plume to a low value in a shortperiod of time.
Potential Remedial alternative: Excavation of soil below the groundwater in the core of theplume and groundwater extraction with above ground treatment for soil and groundwater.

UCRL-AR-128220 Cleanup Strategies for Camp Pendleton, Area 43 January 1998
1-98 ERD 128220:rtd 12
Monitored natural attenuation at the margins of the plume. Not only would this approach beextremely expensive, but excavation activities would almost certainly exert a detrimentaleffect on the Las Flores Creek ecology.
Example (2)
Remedial Goal: Reduce concentrations at all points in the plume to a low value in a longerperiod of time.
Potential Remedial Alternative (1): Enhanced and or engineered solutions to acceleratebiodegradation in the core of the plume and groundwater extraction with above groundtreatment for groundwater. Monitored natural attenuation at the margins of the plume. Thisapproach would potentially reduce the concentrations of FHCs entering the Las Flores Creek,if such a processes is actually occurring. However, the installation and operation of an activepump-and-treat is expensive (and potentially could impact the Las Flores Creek ecosystem),thus an associated benefit must be demonstrated to justify such a course of action. Clearly,such a benefit would be defined by the reduction of FHC concentrations in the surface waterof the creek. However, to date, FHCs have not been detected in the Las Flores Creek in thevicinity of the site. If FHC concentrations continue to remain below applicable detectionlimits in the surface water, then there is no real basis for a pump-and-treat system.
Potential Remedial Alternative (2): Source control solutions, working on concert withnatural attenuation processes, to deplete the plume over time. For the Area 43 MWR GasStation site, air sparging may offer a reasonably inexpensive alternative. This may requirethe installation of a new well or wells in the vicinity of B-9 and B-11, where the highest soilFHC concentrations have been detected near the water table.
Example (3)
Remedial Goal: Non-migration or containment of the plume, no demonstrable ecological orsurface water impacts.
Potential Remedial Alternative: Passive bioremediation and monitored natural attenuationfor the entire plume. Contingency plan for more active remediation should the plume beshown to measurably impact surface waters of the creek. However, a small-scale monitoringprogram could provide evidence that significant perturbations to the ecosystem as a result ofthe fuel hydrocarbon groundwater plume are not occurring.
4. Summary and Recommendations
Sources. Two 10,000-gallon gasoline storage tanks and one 550-gallon waste oil storagetank were removed from the Area 43 MWR Gas Station in 1993; associated piping was alsorepaired. Free product has not been observed in site groundwater monitoring wells and analysesof soil samples indicate that the remaining FHC concentrations are highly localized.
Pathways. Exposure pathways include groundwater and air (vapor). A potentialgroundwater exposure pathway clearly does exist with respect to the nearby Las Flores Creek,which is only some 100 feet downgradient of the source area. The vapor exposure pathway islimited as a result of the distance to nearby offsite buildings
Receptors. The primary at-risk receptor has been identified as the ecosystem supportingLeast Bell’s vireo population associated with the Las Flores Creek, which runs adjacent to thesite. The nearest human risk receptors with respect to groundwater are water-supply wellslocated some four miles downgradient. These wells are not considered threatened by the release.Institutional controls should be in place to prevent the installation of new water-supply wells inthe immediate vicinity of the FHC/MTBE plume. Risk receptors potentially exposed tohydrocarbon vapors would include occupants of residential barracks across Las Pulgas Road and

UCRL-AR-128220 Cleanup Strategies for Camp Pendleton, Area 43 January 1998
1-98 ERD 128220:rtd 13
onsite buildings. Vapor exposure to onsite workers from the subsurface FHC release is notexpected be significant in comparison to exposure associated with daily activities at gasolineservice stations in general.
In summary, three major risk managment considerations are recognized:
1. FHC and MTBE impact to the Las Flores Creek may be occurring, although preliminarysurface water sampling and analysis has failed to detect direct evidence of this. It is alsopossible that the FHC-impacted aquifer passes underneath the creek bed and thus doesnot pose as immediate a threat to the creek as direct discharge from the effluent aquifer.
2. Natural attenuation processes are indeed active at the site. Statistical evidence existswhich suggests that passive bioremediation of dissolved FHCs is occurring within theaquifer. However, it is unlikely that the rate of passive bioremediation is sufficientlyrapid to prevent impact to the creek, should the aquifer discharge directly into the creek.FHCs and/or MTBE which might be introduced into the creek will be attenuated throughdilution in the creek waters as well as by volatilization into the atmosphere (particularlywith respect to the more volatile FHC components such as BTEX).
3. Human risk receptors are not likely to be threatened. Given the potential discharge fromthe aquifer into the Las Flores Creek, ecological risk receptors could be threatened.However, it is probably not feasible to directly characterize or measure the extent of sucha threat. Data are generally not available pertaining to FHC or MTBE concentrationthresholds which could adversely impact the stream ecosystem. Given the probable lowlevels of FHCs or MTBE present in the system, detecting FHCs or MTBE in the surfacewater or in the tissues of local flora and fauna would be problematic. Furthermore, with alimited data set, identifying statistically significant indications of ecosystem damagewhich could be directly ascribed to FHC or MTBE contamination would also beextremely difficult. Finally, even if an FHC or MTBE footprint were somehow to beidentified in the creek ecosystem, it is not a straightforward issue to link such an impactwith subsurface releases when surface run-off from the asphalt cover to the servicestation could also play a role.
Thus, while a theoretical threat to the Las Flores Creek ecosystem in the vicinity of theArea 43 MWR Gas Station exists with regard to the FHCs and/or MTBE, the manifestations ofsuch a contamination problem are not likely to be noticed or even measured.
However, a small-scale monitoring program could provide evidence that significantperturbations to the ecosystem as a result of the fuel hydrocarbon groundwater plume are notoccurring. One way to define ecological value would be to relate it to the utility of the habitatfor Least Bell’s vireo populations. Ecological value would then be monitored through directmonitoring of vireo population abundance, or monitoring habitat components which make thehabitat attractive to vireo populations (abundance of typical food sources, appropriate vegetationfor suitable nesting sites, etc.). Data could be compared to a matched reference site along thecreek where contaminant impacts would not be expected.
It is likely that some kind of monitoring program for Least Bell’s vireo populations at CampPendleton may already exist. A Memorandum of Understanding (MOU) between the U.S. Fishand Wildlife Service and the Marine Corps was signed a 1989 for vireos within proposed criticalhabitat on Camp Pendleton. This MOU resulted in actions at Camp Pendleton to increase vireoabundance. Any monitoring program conducted as a result of this MOU could be potentiallymodified to monitor habitat value of Las Flores creek.
Thus, if plume containment is the remedial goal, it is our opinion that engineered remedialaction such as groundwater pump-and-treat or additional source removal is unwarranted becausethere are no immediate demonstrable benefits of such actions. Under such conditions, the plumewill slowly self-remediate over time as the source is exhausted. If the remedial goal involvesaccelerated plume diminishment, air-sparging as a means of source control, as opposed to active
UCRL-AR-128220 Cleanup Strategies for Camp Pendleton, Area 43 January 1998
1-98 ERD 128220:rtd 14
pump-and-treat, may offer some measurable benefit. Regardless of the remedial goal, we dorecommend at a minimum (1) continued monitoring of FHCs and MTBE at the site, particularlyin MW-04, on at least an annual basis to assure that the FHC influx is stable or declining withtime, (2) continued monitoring of MW-01A and/or MW-05B to assure that downward verticalmigration of FHCs or additional MTBE does not occur, and (3) at least one additional round ofsurface water sampling in the Las Flores Creek immediately downstream of the service station toconfirm the non-detections of FHCs and MTBE. We do not recommend extensive, invasivesampling in the creek area, as equipment and personnel would be likely to inflict damage to theecosystem which could easily surpass that conceivably created by any FHCs present in soil orwater.
5. References
Busheck, T. E., D. C. Wickland, and D. L. Kuehne (1996), “Multiple lines of evidence toDemonstrate Natural Attenuation of Petroleum Hydrocarbons,” in Proceedings from theConference on Petroleum Hydrocarbons and Organic Chemicals in Ground Water, NationalGround Water Association/API, Houston, Texas, November 13–15.
Chapelle, F. H., P. M. Bradley, D. R. Lovley, and D. A. Vroblesky (1996) “Measuring rates ofbiodegradation in a contaminated aquifer using field and laboratory methods,” GroundWater, 34(4), 691-698.
Lovley, D. R., M. J. Baedecker, D. J. Lonergan, I. M. Cozzarelli, E. J. P. Phillips, and D. I.Siegel (1989), Oxidation of Aromatic Contaminants Coupled to Microbial Iron Reduction,Nature, 339(5), 297–300.
MacIntyre, W. G., M. Boggs, C. P. Antworth, and T. B. Stauffer (1993), “Degradation Kineticsof Aromatic Organic Solutes Introduced Into a Heterogeneous Aquifer,” Water ResourcesResearch, v. 20, pp. 4045–4051.
OHM Remediation Services Corporation (1997), Expert Committee Briefing Package, PetroleumHydrocarbon Demonstration Program, 43 Area Morale, Welfare, and Recreation GasStation, Camp Pendleton MCB, California, May 29.
Rice, D. W., B. P. Dooher, S. J. Cullen, L. E. Everett, W. E. Kastenberg, R. D. Grose, and M. A.Marino (1995a), Recommendations to Improve the Cleanup Process for California's LeakingUnderground Fuel Tanks (LUFTs), Lawrence Livermore National Laboratory, Livermore,Calif. (UCRL-AR-121762).
Rice, D. W., R. D. Grose, J. C. Michaelson, B. P. Dooher, D. H. MacQueen, S. J. Cullen, W. E.Kastenberg, L. E. Everett, and M. A. Marino (1995b), California Leaking Underground FuelTank (LUFT) Historical Case Analyses , Lawrence Livermore National Laboratory (UCRL-AR-122207).
Small, M. C. (1993), “Ex-Situ Corrective Action Tehcnologies,” in Proceeding of the 5thAnnual UST/LUST Conference, San Antonio, Texas, March 22, 1993.
Wilson, J. T., G. Sewell, D. Caron, G. Doyle, and R. N. Miller (1995), “Intrinsic Bioremediationof Jet Fuel Contamination at George Air Force Base,” in Intrinsic Bioremediation, Hinchee,R. E., J. T. Wilson, and D. C. Downey (Eds.), Battelle Press, Richland, Washington, pp. 91–100.

UCRL-AR-128220
Figures


UCRL-AR-128220
Appendix A
Site Assessment Evaluation Letter

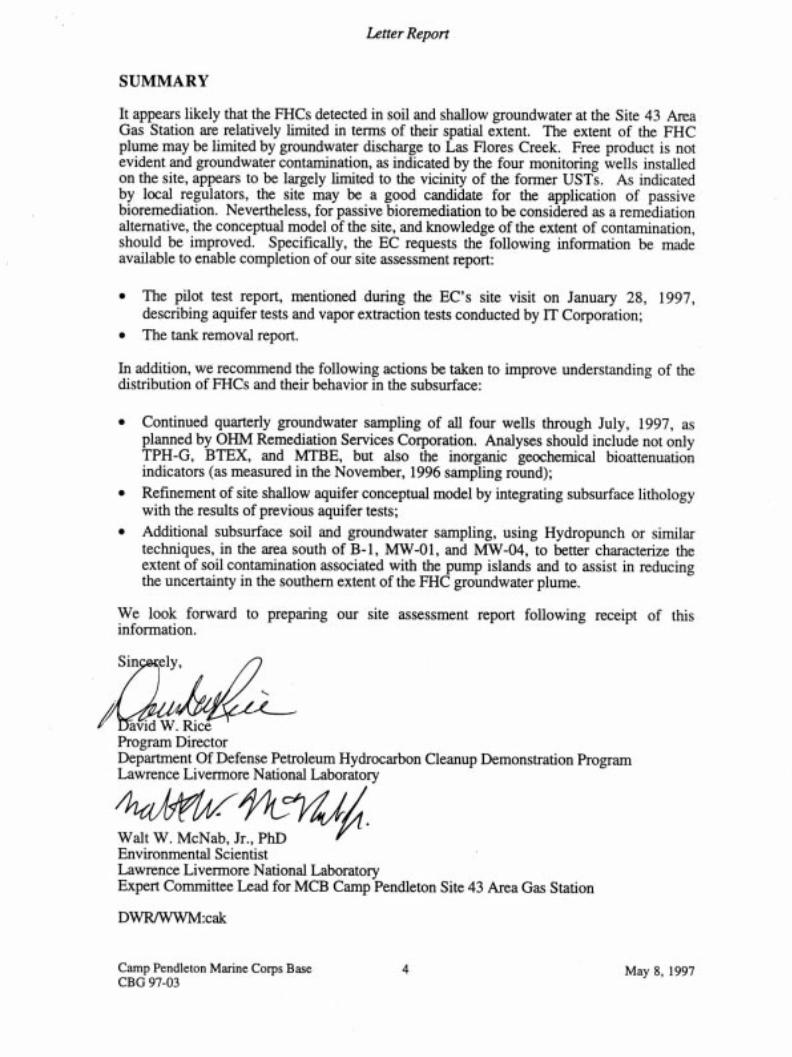
Letter Report
Camp Pendleton Marine Corps Base 1 May 8, 1997CBG 97-03
Lawrence Livermore National Laboratory
SITE ASSESSMENT REVIEW TOAPPLY RISK BASED CORRECTIVE ACTION
AT SITE 43 AREA GAS STATIONCAMP PENDLETON
MARINE CORPS BASE, CALIFORNIA
The Department of Defense California Petroleum Hydrocarbon Cleanup DemonstrationProgram Expert Committee (EC) has reviewed the methods and findings of the siteinvestigations conducted at the Site 43 Area Gas Station at the Marine Corps Base (MCB)Camp Pendleton with regard to releases of gasoline to subsurface soils and groundwater.These investigations have been conducted by OHM Remediation Services Corporation andothers. Included is our evaluation of the adequacy of the site conceptual model and riskcharacterization as a credible basis for applying risk-based corrective action (RBCA),emphasizing natural attenuation as a means of remediation, to achieve site closure.
This letter represents the first of two deliverable documents to be provided as part of ouroverall assessment. It is intended solely as a brief review of the existing data and riskcharacterization models; recommendations regarding additional data needed to complete thesite model review are provided. Specifically, the review included:
• An assessment of site characterization and the contaminant distribution model, basedupon conformance with standard environmental investigation practices and soundscientific judgment;
• A preliminary assessment of bioattenuation signatures, based upon presentation ofmultiple lines of evidence such as natural geochemical indicators and changes in plumecomposition over time;
• An assessment of risk characterization, based upon our judgment as to how significantuncertainties in risks posed to potential receptors have been characterized.
Detailed analyses of risk management key assumptions, an assessment of site-specificnatural attenuation, and recommendations concerning risk-management strategies will beprovided in a follow-up report as a separate deliverable item.
SITE CONCEPTUAL MODEL
Site History
The Site 43 Area Morale, Welfare, and Recreation (MWR) Gas Station is located in the LasFlores groundwater basin at the MCB. The Gas Station was constructed in 1958 and iscurrently operational. Two previous 10,000-gallon gasoline underground storage tanks(USTs) and one 550-gallon waste oil UST were removed from the site in October 1993.Fuel hydrocarbon compounds (FHCs) were detected in soil and groundwater associatedwith the site during an initial site assessment in 1994. The release history and releasevolume are not well known. Subsequent investigation activities, including drilling soilborings and installing groundwater monitoring wells, have been conducted in an effort todelineate the extent of contamination. No active remediation system is currently installed atthe site. Groundwater quality data are being collected to support a possible remediation-by-

Letter Report
Camp Pendleton Marine Corps Base 2 May 8, 1997CBG 97-03
natural-attenuation alternative, as suggested by the San Diego Regional Water QualityControl Board (SDRWQCB) in a letter to the MCB dated June 19, 1996.
Hydrogeologic Setting
The Site 43 Area Gas Station is located on approximately 15 feet of fill overlying the nativesediments. The underlying native sedimanets are unconsolidated alluvial materials(interbedded sands, silts, and clays) of Quaternary age. An east-west trending geologiccross section made available to the EC suggests considerable hydrostratigraphiccomplexity; the degree of interconnection between permeable strata, and betweenmonitoring points, is not immediately clear upon inspection. The results of an aquifer testpreviously conducted at the site would assist in clarifying the hydrostratigraphic model.
Average depth to groundwater at the site is approximately 15 feet, with observed seasonalfluctuations in groundwater elevation on the order of two feet. The aquifer is presumed tobe in an unconfined condition; the relationship between the shallow FHC-impacted strataand deeper water-bearing zones has not been defined. The asphalt cover over much of thesite is likely to preclude significant vertical recharge from infiltration. Groundwater flowdirection is to the southeast. The average groundwater gradient across the site isapproximately 0.032 ft/ft, which is considered to be quite high. However, hydraulicconductivity measurements obtained from the pumping test conducted in site wells were notavailable for the EC’s review, so the actual groundwater flow velocity is currentlyunspecified.
The site lies approximately 100 feet to the north of the Las Flores Creek. Given the depthto groundwater at the site and the apparent elevation of the creek relative to the gas station,it is possible that the creek acts as an effluent stream (i.e., gaining water from subsurfacedischarge), although direct evidence of this has not been made available to the EC. Avisual inspection of the embankment to the south and west of the gas station indicates nosign of springs or other surface discharge of groundwater.
Distribution of Contaminants
The current extent of FHC soil and groundwater contamination has been delineated by13 soil borings and four groundwater monitoring wells. Soil contamination (TPH asgasoline, BTEX constituents) has been observed in at least five borings, withconcentrations of TPH-G ranging up to 5,300 mg/Kg (at a depth of 8 ft in B-2, as well asat 15 ft in B-9 - above water table). While much of the soil contamination appears to beassociated with the former tank locations, the FHC detections in B-1 and B-2 near thepump island location suggest that releases occurred from the piping system as well. TheEC understands that the piping system was replaced during tank removal activities, but theextent of remaining soil contamination in association with the pump island is not wellknown.
It is the EC’s understanding that free product has not been observed in site monitoringwells. The increasing soil concentrations of TPH-G and BTEX components with depth inB-11, with the highest concentrations immediately overlying the water table at 15 feet,suggest that a free product layer on the water table may have existed at one time near thetank locations. Synthetic precipitation leaching procedure (SPLP) tests have beenconducted on site sediment samples in an attempt to quantify the potential for residualentrapped hydrocarbons in the vadose zone to impact groundwater.
FHCs have been detected in groundwater in MW-01 and MW-04 during 1995–1996sampling events. MW-04 lies immediately downgradient of the former tank location, while

Letter Report
Camp Pendleton Marine Corps Base 3 May 8, 1997CBG 97-03
MW-01 lies an additional 35 feet downgradient (toward the Las Flores Creek). The highesthistorical benzene concentration measured was approximately 3 mg/L in MW-04 inSeptember, 1995. FHC concentrations have generally declined in MW-01 and MW-04 insubsequent sampling rounds since September 1995, although concentrations appeared toincrease somewhat in November 1996, the most recent monitoring data available.
The decline in FHC concentrations between MW-01 and MW-04 provides some evidencethat the extent of the groundwater plume is limited at the site. Fuel hydrocarbons havegenerally not been detected in the cross-gradient well, MW-03, or in the upgradient well,MW-02, with the exception of a December 1993 sampling event which revealed 41 mg/Land 400 mg/L TPH-G, respectively, in these wells. These previous detections, particularlyin the upgradient well, are not easily explained in the context of the present understandingof the site. It should be recognized that the well density at the site, given the apparentlycomplex nature of the subsurface hydrostratigraphy and the high groundwater gradient,may fail to reveal preferential transport pathways or undiscovered sources which maycontribute to FHC impact to groundwater.
The fuel-oxygenate methyl tertiary butyl ether (MTBE) has been detected in sitegroundwater in association with the FHCs (MW-01 and MW-04). The highestconcentration detected to date has been approximately 1 mg/L in MW-04 in October 1996.
Natural Attenuation Indicators
Inorganic geochemical indicator parameters of biodegradation (dissolved oxygen, nitrate,sulfate, ferrous iron, sulfide, redox potential) have been measured in all four monitoringwells in November 1996. There is some indication of anaerobic activity in MW-01,MW-03, and MW-04 in comparison to MW-02 (e.g., depleted nitrate, presence of ferrousiron and sulfide and reduced redox potential in MW-03 and MW-04). However, given thesmall size of the sample set, the overall statistical significance of these observations must becarefully evaluated.
IDENTIFICATION OF RISK RECEPTORS
Human Risk Receptors
The gas station is currently active, with barracks, administration buildings, and warehouseswith 1000 feet. Local population density depends upon the nature of military deployments.Thus, there are theoretical vapor receptors in the area, although the apparent absence of freeproduct and the asphalt covering greatly diminishes the risk of exposure. No drinkingwater wells currently exist within four miles of the site
Ecological Risk Receptors
The Las Flores Creek, immediately downgradient of the release location, is home to theendangered Least Bell’s Vireo, and thus constitutes a potential ecological risk receptor,particularly if habitat is disrupted during characterization or remediation activities in thecreek bed. The potential for FHCs to impact the stream via discharging groundwaterwarrants evaluation and will be addressed by the EC in the forthcoming Risk ManagementReport.

UCRL-AR-128220
Appendix B
Assessing Ecological Impacts

UCRL-AR-128220 Cleanup Strategies for Camp Pendleton, Area 43 January 1998
1-98 ERD 128220:rtd B-1
Appendix B
Assessing Ecological Impacts
Determining the potential for ecological damage as a consequence of chemical releases intothe environment is recognized as a critical component of hazard assessment (Suter and Loar,1992; Carlsen 1996). Indeed, several federal statutes (such as CERCLA, RCRA, and FIFRA),require the identification and mitigation of ecological impacts associated with chemical releasesinto the environment. As a result, a variety of methods are available to estimate the ecologicalhazard from chemical releases. These methods range from the qualitative to quantitative(Solomon, 1996; USEPA, 1992; Warren-Hicks et al., 1989). Most of these methods share somebasic elements. Typically, an evaluation of the potential pathways in which ecological receptorscan be exposed to the chemical is conducted. The groups of exposed organisms are identifiedand the probable level of exposure determined. Finally, the ecological significance (if any) ofthis exposure is identified. While this last step is the most crucial, it is often the most difficult.While demonstrating exposure of an ecological receptor to a chemical is clearly necessary, it isnot sufficient to determine that an ecologically meaningful impact has occurred.
The exposure analysis will likely result in the identification of numerous species which couldpotentially be exposed to chemicals released into the environment. It is often necessary to groupthe biota into major ecological functional groups to simplify the initial exposure pathwayanalysis. Once the initial exposure pathway analysis is complete, specific groups of organismsmay be selected for in-depth hazard assessment. Organisms selected for the detailed analysis areoften considered “sentinel organisms” (Suter et al ., 1987; Grizzle et al., 1988; Rice et al., 1994).When evaluating ecological exposure, it is necessary to identify or consider (1) the organismsthat are actually or potentially exposed and the exposure level, (2) the significant routes ofexposure, (3) the spatial and temporal scales of exposure, and 4) the geophysical, physical andchemical properties that could affect exposure.
To determine the ecological significance of exposure to a chemical, it is necessary to selectecological endpoints to be examined. Endpoints are characteristics of an ecological component(such as fish mortality) that may be affected by exposure to a stressor (Suter, 1990; USEPA,1992). It is useful to distinguish between two types of endpoints, assessment endpoints andmeasurement endpoints. Assessment endpoints are explicit expressions of the actualenvironmental values that are to be protected (USEPA, 1992; Warren-Hicks et al., 1989).Measurement endpoints are the measurable responses to a stressor that are related to the valuedcharacteristics chosen as the assessment endpoint (Suter, 1990). In some cases, measurementendpoints and assessment endpoints are equivalent.
Although there are a number of ways to specifically define ecological assessment endpoints,in general they should (1) be relevant to society, (2) have biological or ecological relevance, (3)have an unambiguous operational definition, (4) be measurable or predictable, (5) be susceptibleto hazard, and (6) be logically related to the policy or remedial decisions. In the context ofevaluating the ecological impacts of petroleum hydrocarbon exposure, assessment endpoints

UCRL-AR-128220 Cleanup Strategies for Camp Pendleton, Area 43 January 1998
1-98 ERD 128220:rtd B-2
should be environmental characteristics that if significantly affected would indicate the need forsome type of action.
If endangered species are not involved, plants and animals are typically not valuedbiologically as individuals, and therefore the assessment endpoints are usually related to entirepopulations or communities (Warren-Hicks et al., 1989; Moriarty, 1983). An example of apopulation-based assessment endpoint would be “change in the abundance of aquatic oramphibian populations”. However, due to their rarity, individual members of endangeredspecies are considered essential to the survival of the species. In this case assessment endpointsrelated to individuals are appropriate.
As mentioned above, measurement endpoints are a quantitative expression of an observed ormeasured effect of a stressor that is related to the valued characteristic chosen as the assessmentendpoint. Measurement endpoints should have specific characteristics, depending on theproblem at hand. Most importantly, measurement endpoints should (1) correspond to or bepredictive of an assessment endpoint, (2) be readily measured, (3) be appropriate for the scale ofthe problem, (4) be appropriate to the exposure pathway, (5) be appropriate to temporaldynamics, (6) have low natural variability, and (7) be diagnostic of the contaminant of interest.
Continuing with the example given for an assessment endpoint, corresponding measurementendpoints might include “reduced number of fish eggs hatching.” This measurement endpointclearly relates to the assessment endpoint. However, such measurement endpoints can requiremaintaining large lab populations for a significant length of time or conducting lengthy fieldstudies. Recent research has focused on identifying biochemical changes which are precursors toreduced reproductive success. Examples include binding affinity to estrogen receptors andinduction of the mixed-function oxidase (MFO) enzyme system. However, care must be takenwhen using such biochemical measurement endpoints to show that they directly tie to theassessment endpoint.

UCRL-AR-128220 Cleanup Strategies for Camp Pendleton, Area 43 January 1998
1-98 ERD 128220:rtd B-3
References
Carlsen, T. M. 1996. Ecological Risks to Fossorial Vertebrates from Volatile OrganicCompounds in Soil. Risk Analysis 16 (2): 211–219.
Grizzle, J., Horowitz, S. and Strength, D. 1988. Caged Fish as Monitors of Pollution: Effects ofChlorinated Effluent from a Wastewater Treatment Plant. Water Res. Bull., 24: 951–9.
Moriarty, F. 1983. Ecotoxicology: The Study of Pollutants in Ecosystems. Academic Press, NewYork, N.Y.
Rice, D. W., Seltenrich, C. P., Keller, M. L., Spies, R. B., and Felton, J. S. 1994. Mixed-FunctionOxidase-Specific Activity in Wild and Caged Speckled Sanddabs, Citharichthys stigmaeus,in Elkhorn Slough, Moss Landing Harbor and Nearshore Monterey Bay, California. Environ.Pollut., 84: 179–188.
Solomon, K. R. 1996. Overview of Recent Developments in Ecotoxicological Risk Assessment.Risk Analysis 16(5): 627–633.
Suter II, G. W. 1990. Endpoints for Regional Ecological Risk Assessment. EnvironmentalManagement 14(1): 19–23.
Suter, G., Rosen, A., Linder, E., and Parkhurst, D. 1987. End-points for Responses of Fish toChronic Toxic Exposures. Environ. Toxicol. Chem., 6: 793–809.
U. S. Environmental Protection Agency (USEPA). 1992. Framework for Ecological RiskAssessment. EPA/630/R-92/001. U. S. Environmental Protection Agency, Washington, D.C.
Warren-Hicks, W., Parkhurst, G. R., and Baker, S. S., Jr., Eds. 1989. Ecological assessment ofHazardous Waste Sites: A Field and Laboratory Reference Document. EPA/600/3-89/013.U.S. Environmental Protection Agency, Washington, D.C.

UCRL-AR-128220
Appendix C
Evaluation of Hydrocarbon PassiveBioremediation in Groundwater

UCRL-AR-128220 Cleanup Strategies for Camp Pendleton, Area 43 January 1998
1-98 ERD 128220:rtd C-1
Appendix C
Evaluation of Hydrocarbon PassiveBioremediation in Groundwater
Spatial distribution patterns in certain geochemical biodegradation indicators correlatereasonably well with the distribution of total BTEX (e.g., Fig. C-1). To provide more quantitativeanalyses, statistical methods were also utilized to identify secondary evidence of passivebioremediation.
C-1. Background
Identifying evidence of FHC biodegradation from field data is a key element in formulating riskmanagement strategies that incorporate natural attenuation at groundwater contamination sites.Primary evidence of biodegradation (i.e., observed decline in total contaminant mass over time) isoften difficult to extract from monitoring data because of sparse sampling networks and shortsampling histories. Therefore, secondary lines of evidence must often be pursued. Typically,secondary evidence consists of an assessment of changes in groundwater geochemistry associatedwith the FHC plume which may reflect the oxidation of FHCs by microorganisms (e.g.,Vroblesky and Chapelle, 1994; Borden et al., 1995). For example, idealized mineralizationreactions of toluene, a common soluble and degradable FHC constituent, to yield carbon dioxidecould include:
C7H8 + 9O2 → 7CO2 + 4H2O (1)
C7H8 + 18MnO2 + 36H+ → 7CO2 + 18Mn2+ + 22H2O (2)
5C7H8 + 36NO3- + 36H+ → 35CO2 + 18N2(g) + 38H2O (3)
C7H8 + 36Fe(OH)3 + 72H+ → 7CO2 + 36Fe2+ + 94H2O (4)
2C7H8 + 9SO42- + 18H+ → 14CO2 + 9H2S + 8H2O (5)
2C7H8 + 10H2O→ 14CO2 + 9CH4 (6)
Laboratory studies have confirmed FHC biodegradation reactions by specific electron acceptors(e.g., Lovley et al., 1989; Beller et al., 1992; Lovley et al., 1995; Vroblesky et al., 1996). Thus,solution constituents which may serve as biodegradation indicators include electron acceptors(dissolved oxygen, nitrate, sulfate), reduced by-products of FHC oxidation reactions (ferrous iron,

UCRL-AR-128220 Cleanup Strategies for Camp Pendleton, Area 43 January 1998
1-98 ERD 128220:rtd C-2
manganese, methane), solution redox potential or Eh, and indicators of mineralization (bicarbonatealkalinity, pH via dissociation of carbonic acid). Sulfide, also a reduced by-product of FHCbiodegradation, is often not measurable because of the low solubility of sulfide-bearing mineralsunder typical Eh-pH conditions.
Each of these indicator parameters is subject to a certain degree of variability in backgroundconcentrations. Given the sparse monitoring well network often associated with FHC releasesites, it may often be difficult to discern patterns in spatial distributions of geochemical indicatorswhich offer unequivocal proof of biodegradation. In regard to this problem, two particular issueswarrant attention: (1) Which geochemical indicators are the most reliable, and (2) Which statisticalmethods are available that offer the most powerful means for extracting biodegradation signaturesfrom field data? To address these issues, geochemical indicator data were analyzed using a varietyof statistical methods to identify trends in the data with respect to measured FHC concentrations.Statistical tests included correlation analyses which quantify the relationship between geochemicalindicators (dissolved oxygen, nitrate, sulfate, iron, methane, alkalinity, Eh) and benzene, toluene,ethylbenzene, and xylenes (BTEX). Methods for testing for significant differences between twodata populations (e.g., geochemical indicators from BTEX-contaminated and noncontaminatedmonitoring wells) were also explored.
C-1.1. Correlation Analyses
Correlation analyses involve quantifying the degree to which geochemical indicator parametervalues reflect total BTEX concentrations in individual water samples (BTEX constituents beingamong the most soluble and most easily biodegraded among FHCs). Correlation coefficients near+1.0 or -1.0 reflect strong positive or negative relationships, respectively, implying thatbiodegradation reactions dominate the observed variance in the indicator being tested. Correlationcoefficients near 0.0 indicate no significant relationship and that biodegradation processes exertlittle or no measurable impact on observed variance, suggesting that other explanations such asbackground variability are more significant.
Two different approaches were used to quantify the correlation coefficient, R. The mostfamiliar form is the linear correlation coefficient given by the Pearson relationship,
R(X X )(Y Y )
(X X ) (Y Y )
i m i mi 1
N
i m2
i 1
N
i m2
i 1
N=
− −
− −
=
= =
∑
∑ ∑
(7)
where N is the number of samples, Xi and Yi the values of the independent and dependentvariables, respectively (i.e., total BTEX and the geochemical indicator value in sample i), and Xm
and Ym the respective mean values of the sample sets.
An alternative approach for quantifying the correlation coefficient is the nonparametricSpearman relationship (Langley, 1970; Miller and Freund, 1977),

UCRL-AR-128220 Cleanup Strategies for Camp Pendleton, Area 43 January 1998
1-98 ERD 128220:rtd C-3
R 16 d
N(N 1)
i2
i 1
N
2= −
−=∑
(8)
where di is the difference in ranks between two observations. If two or more data values are tied,they are each assigned the mean rank jointly occupied. The primary advantage of rank-basedapproach is that strong nonlinearities in the correlation relationship will not unduly skew theresulting estimated correlation coefficient. This is an important factor with regard to BTEXconcentrations, which tend to be lognormally distributed rather than normally distributed.
C-1.2. Hypotheses Testing Concerning Two Population Means
A second approach for assessing the relationship between BTEX and potential passivebioremediation indicators is to compare indicator values from both BTEX-contaminated anduncontaminated wells to test if the two data sets are distinct. The student’s t-test is one approachwhich may be used for such a comparison (Miller and Freund, 1977). The general student’s t-testevaluates the hypothesis that two sample sets have the same mean, assuming that they both arecharacterized by the same variance. The test statistic calculated by the general test is:
tX X
(X X ) (X X )
N N 2
1,m 2,m
i 1,m2
i 2,m2
i 1
N
i 1
N
1 2
21=
−
− + −
+ −==∑∑
(9)
where N1 and N2 are the respective number of observations in each sample set, X1 and X2 thevalues of individual observations (i.e., geochemical indicator values for BTEX-contaminated anduncontaminated wells, respectively) and X1,m and X2,m the respective mean values of the samplesets. The unpaired student’s t-test assumes that the two samples do not have the same variance.In this case, the test statistic is calculated by:
t =X1,m − X2,m
(X1,i −X 1,m )2
i =1
N1
∑N1 (N1 −1)
+(X 2,i − X2,m )2
i=1
N2
∑N 2(N 2 − 1)
12
(10)
The paired student’s t-test assumes that much of the variance in both samples is due to effectsthat are point-by-point identical in the two samples. Pairs of observations are randomly assembledand tested from each sample set, extra unpaired observations from the larger set are discarded. Thetest statistic for the paired test is given by:

UCRL-AR-128220 Cleanup Strategies for Camp Pendleton, Area 43 January 1998
1-98 ERD 128220:rtd C-4
t =X1,m − X2,m
(X1,i − X 1,m )2
i =1
N 1
∑N(N1 −1)
+(X 2,i −X2,m )2
i=1
N2
∑N(N 2 −1)
−2 (X1,i − X1,m )(X 2,i − X 2,m )i =1
N
∑
12
(11)
where N is the number of observation pairs.
For each method, the t-test statistic is calculated and compared with standard tables of criticaltest values. From these tables, the probability of the null hypothesis—the likelihood that bothsample sets exhibit the same mean value—may be quantified. Nonparametric tests may also beemployed. Rank-sum tests involve ranking observations in accordance with their magnitude, withtests performed on various combinations of ranks. The Mann-Whitney U-test statistic is given by,
U N N N (N 1)2
R1 2
1 11
= + + − (12)
where N1 and N2 are the respective sample sizes and R1 the sum of the ranks assigned to the valuesof the first sample (Miller and Freund, 1977). The U-test statistic may be compared with astandard table to assess probability of the null hypotheses of equal means.
C-2. Results
Total BTEX concentrations and geochemical biodegradation indicators in groundwater samplesfrom eight monitoring wells and eight cone penetrometer tests in March–April 1997 were includedin the analyses. Correlation coefficients are shown on Table C-1. Indicators are ranked indecreasing order of reliability by the Spearman test. Correlations estimated by the Parsonrelationship were calculated using both linear and logarithmic scales for total BTEX concentration.Correlation between BTEX and chloride ion, which would not be expected, is also presented forcomparison as a control.
Table C-1. R-values (correlation coefficients) between total BTEX and geochemicalbiodegradation indicators. Chloride is presented as a control.
Parameters Pearson Spearman
BTEX:Eh -0.675 -0.943
BTEX:CH4 0.360 0.723
BTEX:Alkalinity 0.650 0.718
BTEX:Fe(II) 0.554 0.698
BTEX:Dissolved O2 -0.495 -0.459
BTEX:SO42-
-0.423 -0.415
BTEX:NO3-
-0.135 -0.099
BTEX:Cl-
-0.102 -0.033

UCRL-AR-128220 Cleanup Strategies for Camp Pendleton, Area 43 January 1998
1-98 ERD 128220:rtd C-5
The trends in each of the indicator parameters are all consistent with expected variations inassociation with FHC passive bioremediation, although some species, particularly nitrate, exhibitpoor correlation. For example, concentrations of ferrous iron exhibit a positive correlation withtotal BTEX, suggesting that iron reduction and mobilization is occurring in groundwater at the site(Lovley et al., 1989), while the negative correlation between sulfate and BTEX suggests sulfatereduction. Correlation coefficients are highest for redox potential, ferrous iron, and methane. Thelow correlation coefficients which characterize oxygen, nitrate, and sulfate are probably indicativeof variability in background concentrations. As expected, chloride shows essentially no correlationwith total BTEX.
Null-hypothesis probabilities (i.e., the probability that the geochemical indicator observationsfrom BTEX-contaminated and noncontaminated water samples are taken from the same samplepopulation) are shown on Table C-2. Results are ranked in accordance with the Mann-WhitneyU-test probabilities. Regardless of the test method used, the null hypothesis does not appear to becorrect for most of the indicators (with the exceptions of nitrate and possibly sulfate). Thus, mostof the geochemical indicators appear to reflect different probability distribution functions betweenBTEX-contaminated and noncontaminated samples. For comparison, chloride samples from bothsample sets were also tested as a control. Results of each of the methods suggest that nosignificant difference exists between the chloride concentrations in contaminated andnoncontaminated wells, which is consistent with expectation.
Table C-2. Probabilities of equal means between geochemical indicator parametersmeasured in BTEX-contaminated and noncontaminated water samples; low probabilitiesimply a high likelihood that the two sample sets are distinct. Chloride is presented as acontrol.
Parameter General Unpaired Paired Mann-Whitney
Fe(II) 5% 5% 12% 0%
Eh 0% 0% 0% 0%
Alkalinity 2% 3% 6% 4%
CH4 13% 10% 11% 8%
Dissolved O2 6% 9% 6% 18%
SO42-
30% 26% 28% 32%
NO3-
98% 98% 97% 72%
Cl-
80% 81% 73% 86%
In summary, both statistical approaches, correlation analyses and hypothesis testing concerningpopulation means, suggest that FHC passive bioremediation is occurring to some degree in thesubsurface at the site. Beyond this assessment, it is difficult to quantify a mean degradation rate.A comparison between geochemical indicator concentrations in BTEX-contaminated andnoncontaminated wells would suggest that approximately one to two degradation half-livestranspire during groundwater residences times within the plume based on simple reactionstoichiometry. However, these estimates must be interpreted with great caution, since uncertaintydue to spatial variability of biodegradation reactions, residual BTEX and other FHC sources, and

UCRL-AR-128220 Cleanup Strategies for Camp Pendleton, Area 43 January 1998
1-98 ERD 128220:rtd C-6
other geochemical mechanisms not directly related to the FHCs probably exert major influences onthe groundwater chemistry.
It should be noted that the findings with regard to passive bioremediation pertain only to BTEXcompounds and not to MTBE. To date, conclusive field evidence of MTBE biodegradation orabiotic transformation has not been identified.
References
Beller, H. R., D. Grbic-Galic, and M. Reinhard (1992), “Microbial degradation of toluene undersulfate-reducing conditions and the influence of iron on the process,” Applied andEnvironmental Microbiology, 58 , 786–793.
Borden, R. C., C. A. Gomez, and M. T. Becker (1995), Geochemical indicators of intrinsicbioremediation, Ground Water, 33(2), 180–189.
Langley, R. (1970), Practical Statistics (Dover Publications, Inc., New York, New York),399 pp.
Lovley, D. R., M. J. Baedecker, D. J. Lonergan, I. M. Cozzarelli, E. J. P. Phillips, and D. I.Siegel (1989), “Oxidation of aromatic contaminants coupled to microbial iron reduction,”Nature, 339(5), 297–300.
Lovley, D. R., J. D. Coates, J. C. Woodward, and E. J. P. Phillips (1995), “Benzene oxidationcoupled to sulfate reduction,” Applied and Environmental Microbiology, 61 , 953–958.
Miller, I., and J. E. Freund (1977), Probability and Statistics for Engineers, Second Edition(Prentice-Hall, Inc., Englewood Cliffs, New Jersey), 529 pp.
Vroblesky, D. A., and F. H. Chapelle (1994), “Temporal and spatial changes of terminal electron-accepting processes in a petroleum hydrocarbon-contaminated aquifer and the significance forcontaminant biodegradation,” Water Resources Research, 30(5), 1561–1570.
Vroblesky, D. A., P. M. Bradley, and F. H. Chapelle (1996), “Influence of electron donor on theminimum sulfate concentration required for sulfate reduction in a petroleum hydrocarbon-contaminated aquifer,” Environmental Science and Technology, 30 , 1377–1381.