Guía Práctica 7: Rhizoctonia solani - Enfermedad: Pudrición radical por Rizoctonia
Upload
khangminh22Category
view
0download
0
Rhizoctonia disease of tulip:
characterization and dynamics of the pathogens

Promotor: dr. J.C. Zadoks Emeritus hoogleraar in de ecologische fytopathologie
Co-promotor: dr. N.J. Fokkema Hoofd Afdeling Mycologie en Bacteriologie, DLO-Instituut voor Plantenziektenkundig Onderzoek, IPO-DLO

J.H.M. Schneider
Rhizoctonia disease of tulip:
characterization and dynamics of the pathogens
Proefschrift ter verkrijging van de graad van doctor
op gezag van de rector magnificus van de Landbouwuniversiteit Wageningen,
dr. C.M. Karssen, in het openbaar te verdedigen
op maandag 15 juni 1998 des namiddags te vier uur in de Aula

Bibliographie data:
Schneider, J.H.M., 1998
Rhizoctonia disease of tulips: characterization and dynamics of the pathogens. PhD Thesis Wageningen Agricultural University, Wageningen, the Netherlands With references - With summary in English and Dutch - 173 pp.
ISBN 90-5485-8524
Bibliographic abstract
Rhizoctonia disease causes severe losses during the production cycle of tulip. The complex nature of the disease requires a precise characterization of the causal pathogens. Typical bare patches are caused by R. solani AG 2-t. Bulb rot symptoms are, apart from AG 2-t isolates, caused by R. solani AG 5. AG 4 isolates seem of little importance in field-grown tulips. Anastomosis behaviour showed AG 2-t to be a homogeneous group, closely related to the heterogeneous group of AG 2-1 isolates. Pectic enzyme patterns discriminated tulip infecting AG 2-t isolates from AG 2 isolates not pathogenic to tulip. Geographically separated AG 2-t and AG 2-1 isolates, both pathogenic to tulip, differ in nucleotide number and sequence of ITS rDNA. Differential interaction between AG 2-t isolates and tulip cultivars was highly influenced by experimental conditions. According to geostatistical analysis field sampling intensity could be reduced down to 10% and still provided adequate disease severity maps. Bare patches due to natural and artificial infestation declined during successive croppings of bulbs, whereas bulb rot tended to increase. Temporal niche differentiation is one explanation for the decline phenomenon.
The research described in this thesis was conducted at the DLO-Institute for Plant Protection (IPO-DLO), P.O. Box 9060, NL-6700 GW Wageningen, the Netherlands
Part of this research was financed by the Dutch Urgency Programme for Research on Diseases and Breeding of Flower Bulbs
BIBLIOTHEEK LANDBOUWUNIVERSITEIT
WAGENINGEN

Stellingen behorende bij het proefschrift
'Rhizoctonia disease of tulip: characterization and dynamics of the pathogens'
1) De aanduiding 'rhizoctonia ziekte' ('rhizoctonia disease') is weinig informatief, gaat voorbij aan het complex van pathogène Rhizoctonia soorten en dient dus vervangen te worden door de aanduiding 'rhizoctonia valplekken-ziekte' ('rhizoctonia bare patch') voor symptomen veroorzaakt door R. solani AG 2-t en de aanduiding rhizoctonia bolrot voor het complex van pathogène anastomosegroepen van R. solani. De aanduiding 'kwade grond' dient gereserveerd te blijven voor symptomen veroorzaakt door R. tuliparum. De aanduiding 'zomer kwade grond' voor R. solani AG 2-t gaat voorbij aan het ontstaan van schade bij lage temperaturen en is derhalve onjuist. (Dit proefschrift)
2) Bij de ontwikkeling van duurzame en effectieve bestrijding van het complex van pathogène anastomosegroepen van Rhizoctonia solani wordt de ontwikkeling van de microflora in relatie tot de ontwikkeling van de tulpeplant in het veld te weinig onderkend; dit aspect verdient nadere studie. (Dit proefschrift)
3) De mate van versmelten van hyfen als criterium voor de onderverdeling van subgroepen binnen Rhizoctonia solani AG 2 (Ogoshi, 1975) berust op een achterhaalde interpretatie van het anastomoseren van hyfen en is daarom niet meer geschikt als criterium voor identificatie. R. solani AG 2-2 dient derhalve als een aparte anastomosegroep te worden beschouwd en niet als subgroep binnen AG 2. (A. Ogoshi, 1975. Review Plant Protection Research 8: 93-103; dit proefschrift)
4) Op grond van verschillen in het DNA kunnen anastomosegroepen (AG) van Rhizoctonia solani als aparte soorten worden beschouwd, met als ongewenste consequentie dat minstens 12 soorten hetzelfde perfecte stadium hebben, Thanatephorus cucumeris. Het verdient de voorkeur de pathogène groepen binnen een AG met waardplant gerelateerde termen als variëteit, b.v. R. solani AG 2 var. tulipa, aan te duiden. Bij de opzet van een dergelijk classificatie-systeem dienen moleculaire en biochemische kenmerken in overweging te worden genomen. (A. Ogoshi, 1996. pp 1-10 in Sneh et al. (Eds) Rhizoctonia species: taxonomy, molecular biology, ecology, pathology and disease control, Kluwer, Dordrecht)
5) De suggestie van Yang et al. dat de expressie van pectine afbrekende enzymen van veldisolaten van Rhizoctonia solani door een complex van regulerende en modificerende genen wordt geregeld is genetisch niet onderbouwd en gaat voorbij aan het fenotypische karakter van het tot expressie komen van pathogeniteit. (H.A. Yang et al, 1994. J. Phytopathology 141: 259-266)
6) Van Peter Scheele is geen constructieve bijdrage aan de wetenschappelijke discussie over macro-evolutie te verwachten. Een oproep tot discussie omtrent dit thema lijkt eerder ingegeven te zijn uit promotionele en commerciële overwegingen. (Bionieuws (1997) 20: 2-3)
7) Precisielandbouw is eerder voer voor techneuten dan voor agrariërs. Een goede boer heeft het niet nodig en een minder goede boer zal het niet gebruiken. (LT Journaal (1998) 6: 4-5)
8) Bij iedere formule die je presenteert verlies je de helft van de toehoorders (C.G. Gilligan, pers comm.). Het is daarom niet verwonderlijk dat weinig studenten het statistisch onderwijs volgen buiten de verplichte vakken.
9) Vanuit het oogmerk van natuurbescherming dient eerder de toestroom van Ecuadorianen van het vaste land naar de Galapagos eilanden te worden gereguleerd, dan de toestroom van toeristen naar de Galapagos eilanden.
10) In zijn 'vision statement' gaat het International Potato Center (CIP) ten onrechte voorbij aan het bevorderen van de teelt van lokale wortel- en knolgewassen. (http://www.cipotato.org/org/vision.htm)
11) Een evenwichtig beheer van de biodiversiteit in de Noordzee is van belang voor een duurzame, productie-ecologisch verantwoorde exploitatie van de visstand. (naar aanleiding van J.W. Henfling in WUB (1998) 14: 5)
12) De dalende prijs van de PC en toenemende bezuinigingsdrift bij de overheid brengen het gevaar met zich mee dat onderzoek aan de 'Groene Ruimte' binnen korte tijd alleen nog in de 'Virtuele Ruimte' gedaan kan worden. 'Virtueel Onderzoeks Centrum' is een toepasselijke naam voor een dergelijk centrum.
13) Indien de dienstverlenende taken van de politie, zoals file-meldingen, kostendekkend aan de burger moeten worden aangeboden krijgt 'de gele prent' een heel andere kleur.
J.H.M. Schneider Wageningen, 15 juni 1998

CONTENTS
Chapter 1. General introduction
Chapter 2. Characterization of Rhizoctonia solani AG 2 isolates 17 causing bare patch in field-grown tulips in the Netherlands
Chapter 3. Identification of Rhizoctonia solani isolates associated 39 with field-grown tulips using ITS rDNA polymorphism and pectic zymograms
Chapter 4. Exploring differential interaction of Rhizoctonia solani 63 AG 2-t isolates on tulip cultivars
Chapter 5. Sampling efficiency of R/zz'zoctoma-infected tulip bulbs 89 as determined by means of geostatistics
Chapter 6. Spatial and temporal distribution of rhizoctonia disease 115 in four successive growing seasons
Chapter 7. General discussion 139
References 151
Summary 161
Samenvatting 165
Nawoord 169
List of publications 171
Curriculum vitae 173

Chapter 1
General introduction

General introduction
General introduction
The tulip
Tulip is the most important commercial flower bulb crop wor ldwide wi th the Nether lands as the market leader. Tulips cover approximately 50% of the Dutch flower bulb product ion area (Table 1). In 1996, the total Dutch flower bulb market share in world flower bulb production was approximately 65% (IBC, 1997). The majority of Dutch flower bulbs (75%) were exported. In 1996, the three major import ing countries were the USA, Japan and Germany (Table 2).
In 1993, the product ion value of the total flower bulb product ion was approximately 1030 million NLG, which was 8.3% of the horticultural p roduct ion value and 2.8% of the total agricultural and horticultural product ion value (Ministerie, 1995).
Table 1. Flower bulb production area in hectare in the Netherlands; production and export value.
Crop Year
90/91
7128
1652
933 726 506
91/92
7462
2359
2017
1533
878 738 501 475
95/96
9365
3580
1405
1480
1070
700 635 405
250
Tulip
Lily1
Gladiolus
Narcissus
Hyacinth
Iris
Crocus
Dahlia
Others
Total (ha) 15963 18890
Production value (min NLG) Export value (min NLG)
921
1102
1110 1363
1 The area for 'scale propagation' excluded.

Rhizoctonia disease
The tulip belongs to the family Liliaceae, Monocotyledonae. The genus Tulipa comprises two subgenera, Tulipa (formerly Leiostemones) and Eriostemones, of which the species could not be intercrossed until recently (Van Eijk et al, 1991). The present day tulips are classified according to their botanical origin, their outdoor flowering period and the perianth morphology (Classified List, 1987; Table 3).
The tulip, originating from Central Asia (Hoog, 1974), was probably cultivated as early as the 12th century near Persia (Botschantzeva, 1982). These tulips, classified as T. gesneriana (Le Nard and De Hertogh, 1993), were introduced into Europe via Turkey after the middle of the 16th century and brought to the Netherlands in 1571 (Botschantzeva, 1982). Within 25 years, the first tulips were brought to cultivation (Hoog, 1974). The tulip has become a major ornamental crop world wide with the Netherlands as the market leader.
Tulip development and growth In the Netherlands, tulips are grown for saleable bulbs and for cut flower production. The tulip has a complex annual replacement cycle of growth and senescence. Tulip seeds are used for breeding purposes only. Commercial propagation is based on the vegetative production of daughter bulbs. Usually there is one bud per scale. However, not all buds produce viable daughter bulbs and the average propagation rate is between 2 and 3 (Le Nard and De Hertogh, 1993).
Tulips are planted in the field from mid-October until mid-November. In autumn, root growth is rapid with only slight growth of shoot and daughter bulbs. By contrast the mother bulb scales are slowly senescing and the basal plate is relatively unchanged. In spring, all motherbulb organs senesce, whereas daughter bulbs develop most rapidly after flowering (Fig. 1). At harvest the bulb clusters, daughter bulbs connected to the basal plate, are peeled and graded by means of circumference sizes in centimetres, e.g. 7/8, 11/12, 12/up. The largest bulb sizes generally have the capacity to produce the largest saleable bulbs. Large bulbs, sizes 11/12 and 12/up, are individually sold for cut flower and pot flower production, whereas the smaller bulbs are sold by weight as planting stock.
Table 2. The five major export countries of flower bulbs by the Netherlands in 1990/91 and 1995/96. Value in millions NLG.
90/91 95/96
USA 154 230
Japan 67 226 Germany 183 213 France 119 114 Italy 165 109
10

General introduction
S o h .
O o 4>
cc
V o e 0) o 4) c
CC
Roots
July Harvest
Sept. J Nov. Planting
Jan. Mar. J May Flowering
July Harvest
Figure 1. Annual growth and senescence changes of major organs of a flowering tulip under Dutch climatic conditions. Hatched areas indicate uncertain growth periods of roots. It is unknown whether all root growth occurs in autumn or if some root growth occurs in spring (De Hertogh et ai, 1983 (reprinted with authors' permission)).
Flower bulbs are field-grown. Bulb flowers are produced under forcing conditions. Forcing implies that the flowering process is regulated through specific temperature treatments to control the annual development cycle. Cut flowers thus can be produced in the greenhouse from early December till mid-May. For tulip cultivars that can be forced, optimal forcing schedules have been developed. The market of cut cultivars is dynamic.
In the Netherlands, the majority of tulips is grown in short rotations on the sandy soils behind the dunes. Tulips are usually grown in short rotations such as tulip-narcissus-hyacinth-dahlia (iris, gladiolus) around the traditional Lisse area in the province South-Holland. A rotation of tulip-narcissus-crocus (iris, hyacinth)-lily is typical for the relatively recent growing area in North-Holland. In the Dutch Polders and on the clay soils in North-Holland tulips are grown in six year rotations with e.g. potato, wheat and sugar beet and vegetables.
11

Rhizoctonia disease
Table 3. Classification of tulips and production area in hectare per group in the 1990/91 and 1995/96 growing seasons. (Produktschap, 1994; 1996).
Taxonomical position
Subgenus: Tulipa
Section: Tulipa
Tulipa gesneriana
Early flowering tulips
Single early flowering tulips
Double early flowering tulips
Mid-season flowering
Triumph tulips
Darwin hybrid tulips
Late-flowering
Single late tulips
Lily-flowered tulips
Fringed tulips
Viridiflora tulips
Rembrandt tulips
Parrot tulips
Double late tulips
Abbreviation
S.E.T.
D.E.T.
T.T.
D.H.T.
S.L.T.
L.T.
F.T.
V.T.
R.T.
P.T.
D.L.T.
90/91
705
657
2650
1025
632
128
103
22
0
153
344
95/96
983
908
3817
1259
706
157
155
25
0
259
362
Species tulips
Section: Eichleres
T. kaufmanniana, varieties and hybrids KAU
T. fosteriana, varieties and hybrids FOS
T. greigii, varieties and hybrids GRE
Other species, their varieties and hybrids O.S.
119
164
287
154
108
149
282
194
Total 7128 9363
12

General introduction
Diseases and pests
The production cycle of tulips comprises several years of growth in soil. Tulip bulbs are usually grown in short rotations. The planting stock market is dynamic. Most of the bulbs and cut flowers are for export, which demands high standards for quality and plant health. Commercial propagation is vegetatively and slow. Soil-borne diseases and pests, therefore, can accumulate and cause severe losses once introduced in the production cycle. Major fungal diseases in tulips are caused by Botrytis tulipae, Fusarium oxysporum f.sp. tulipae, Pénicillium spp., Pythium spp., Rhizoctonia solani and R. tuliparum. Important viruses are tulip breaking virus (TBV), tobacco rattle virus (TRV) and tobacco necrosis virus (TNV). TBV is aphid borne, TNV is transmitted by the soil-borne fungus Olpidium brassicae, whereas TRV is transmitted by Trichodoridae nematodes. The nematodes Ditylenchus dipsaci and Pratylenchus penetrans and some insects do occur but are generally considered of less importance.
Until recently, most diseases and pests were chemically controlled, but for environmental reasons the input of broad-spectrum soil disinfestation chemicals, e.g. methylbromide and quintozeen, were banned in accordance with the "Multi-year Crop Protection Plan" (Ministerie, 1991). The use of a limited number of pesticides increases the risk that pathogens develop resistances. Strains of Pythium spp. have become resistant to furalaxyl and metalaxyl. Since the 17th century, breeders selected Tulipa hybrids according to flower characteristics and forcing ability, rather than to disease resistance (Le Nard and De Hertogh, 1993). The long juvenile period and the slow propagation of tulips seriously hamper breeding. Alternative control measures, therefore, have to be developed.
The flower bulb industry, aware of the implications of the "Multi-year Crop Protection Plan" joined forces and initiated research to solve the most urgent bottle necks in tulip production and breeding. The effort resulted in the Urgency Programme for Research on Diseases and Breeding of Flower bulbs, financed jointly by the Royal General Bulbgrowers Association (KAVB), the Dutch Bulb Exporters Association (BVB), the Commodity Board for Ornamental Plants (PVS) and the Dutch Ministry of Agriculture. The Urgency Programme intended to contribute to breeding for resistance against F. oxysporum in gladiolus and lily, improvement of breeding techniques and the development of control measures for Trichodoridae /TRV, Pythium and Rhizoctonia solani. This thesis describes part of the research carried out on Rhizoctonia disease of tulip.
13
Rhizoctonia disease
Rhizoctonia diseases of tulip
Rhizoctonia spp. have a long history of infecting bulbous crops. R. crocorum Pers. (DC), causing 'copper web' on saffron (Crocus sativus), was described in 1815 as the type species (De Candolle, 1815). At present, however, R. crocorum is not regarded as representative for the genus Rhizoctonia (Sneh et al, 1991). The teleomorph of R. crocorum is Helicobasidium purpureum Pat. (Buddin and Wakefield, 1927; 1929).
Rhizoctonia tuliparum Whetzel & Arthur causes 'grey bulb-rot' (Dutch: 'kwade grond') of tulips (Whetzel and Arthur, 1924; Boerema 1963). R. tuliparum infects the host during the winter (Gladders and Coley Smith, 1978) and the effect becomes visible in spring as distinct bare patches (Moore, 1939). In the Netherlands R. tuliparum is considered a problem in the flower bulbs and bulb flowers tulip and in flower bulbs hyacinth, iris and lily (Ministerie, 1990). Inundation of infested fields gives good control of grey bulb rot (Muller et al, 1988).
As early as 1928, Van Poeteren described bare patches caused by R. solani in both field-grown and glasshouse-grown tulips in California. In the Netherlands, bulb and stem rot of tulips was reported to be caused by R. solani in 1952 (Jaarsveld, 1952) and since then rhizoctonia disease has become increasingly problematic in the Dutch bulb growing areas (Muller, 1969).
In field-grown tulips, rhizoctonia disease occurs in patches which vary in space and time. Bare patches in tulip develop at low soil temperatures when the sprouts grow through the soil (Dijst and Schneider, 1996). At severe infection the sprouts hardly emerge. When less severe infection occurs, growth may be retarded and plants may show leaf blight and lesions on the stem. Severe infection of the sprout hampers the development of daughter bulbs. Daughter bulbs may be covered with lesions and bulb rot can occur. In iris, lesions and rot develop on the neck and the bulb (Sonderman and MacLean, 1949; Doornik, 1981). Other flower bulbs and bulb flowers, such as dahlia, gladiolus, hyacinth and lily are susceptible to rhizoctonia disease. Narcissus, however, was not infected by some R. solani isolates in greenhouse experiments (Doornik, 1981; Schneider et al, 1997), nor is rhizoctonia disease observed in field-grown narcissus by growers.
Rhizoctonia disease was mainly controlled by chemicals. However, the use of quitozeen has been banned since 1989 and methylbromide since 1991. The use of tolclofosmethyl poses a real threat of resistance development (Van Bruggen and Arneson, 1984). Soil disinfestation by inundation is not adequate for control of R. solani. Breeding tulips for resistance to R. solani has been neglected, and until today tulip cultivars with sufficient resistance to R. solani are unknown.
14

General introduction
The fungus Rhizoctonia solani
Rhizoctonia spp. are non-sporulating fungi. They are primarily classified by the number of nuclei into three major groups. Uninucleate and binucleate Rhizoctonia with their teleomorphs placed in Ceratobasidium, Tulasnella and Sebacina. Multinucleate Rhizoctonia have teleomorphs in Thanatephorus and Waitea. R. solani, described by Kühn in 1858, is multinucleate. Thanatephorus cucumeris (Frank (Donk)), the sexual stage of R. solani, is placed in the family Ceratobasidiaceae, Ceratobasidiales, subclass Holobasidiomycetidae, class Hymenomycetes, Basidiomycota.
Mycelial characteristics may be used for further identification of Rhizoctonia isolates. R. solani is characterized by branching near the distal septum and constriction of the branch and formation of a septum in the branch near the point of origin, and a prominent pore apparatus (Parmeter and Whitney, 1970).
R. solani is a heterogeneous species composed of genetically isolated subgroups (Anderson, 1982). Isolates of these subgroups, anastomosis groups (AG), are distinguished according to hyphal fusion with AG tester isolates. In general, hyphae of the same AG anastomose, whereas isolates of different AG do not. Anastomosis reactions have been reported to occur within R. solani as of 1921 (Matsumoto, 1921). Since then anastomosis reactions have been studied as a means to classify subgroups in R. solani. At present, twelve AG numbered AG 1 to AG 11 and AG BI, are recognized (Sneh et al., 1996). Some degree of host specificity may occur among AG.
R. solani AG 2 is the only AG which is subdivided according to hyphal fusion frequency. Ogoshi (1975) distinguished AG 2-1 and AG 2-2 as subgroups within AG 2. R. solani isolates from diseased field-grown and glasshouse-grown tulips, so-called 'cold preferring' isolates (Doornik, 1981), were identified as AG 2 (Loerakker and van Dreven, 1985). In addition, isolates of AG 2-1, AG 4 and AG 5 have been isolated from infected flower bulbs (Boerema and Hamers, 1988). The subgrouping of cold preferring AG 2 isolates (Doornik, 1981) remained unclear. No information was available on the abundance of other AG in flower bulb production.
Objectives and outline of the thesis
The reduced availability of chemicals to control rhizoctonia disease in combination with the risk of development of resistance of R. solani to fungicides and the lack of rhizoctonia resistant tulip cultivars urges the development of control strategies based on the ecology of R. solani. Therefore, a precise characterization of the causal AG and of temporal and spatial variability of the disease and causal AG are essential.
15

Rhizoctonia disease
Doornik (1981) paved the way by recognizing 'warmth and cold preferring' isolates. Later, Loeraker and Van Dreven (1985) reported 'warmth preferring isolates' to belong to AG 4 and 'cold preferring' isolates to belong to AG 2. R. solani AG 2, however, is about the most complex AG. The first objective was to characterize isolates collected from tulips infected early in the season. These isolates were characterized according to 'classical techniques'; hyphal fusion frequency, thiamine requirement and host range (Chapter 2). Identification according to anastomosis behaviour is time consuming and ambiguous. Therefore,more reliable and less laborious identification techniques were developed based on a biochemical technique, pectic zymography, and a molecular technique, ITS rDNA (Chapter 3). The use of resistant cultivars may be an important tool in disease management. Tulip cultivars with sufficient resistance to rhizoctonia disease are not known. A resistance breeding program should take into account any variability in the pathogen. A test for resistance was developed which gave a statistically significant isolate by cultivar interaction in greenhouse experiments. So far, unfortunately, the interaction was highly dependent on environmental factors (Chapter 4). In greenhouse and open-air experiments tulip and other flower bulb crops were infected by isolates of AG 2-2, AG 4 and AG 5 according to the species and cultivar. The abundance of these isolates in field-grown tulips was unknown. Therefore, experimental fields were laid out in Lisse and Zwaagdijk. Sampling efficiency was determined using geostatistics (Chapter 5). With reduced sampling intensity, spatial and temporal distribution of rhizoctonia disease and the causal pathogens could be studied. A possible explanation of temporal, within season, distribution of AG 2-t isolates is given (Chapter 6). Finally, the results and their implications are discussed (Chapter 7).
16

Chapter 2
Characterization of Rhizoctonia solani AG 2 isolates causing bare patch in field-grown tulips in the
Netherlands

Characterization
Characterization of Rhizoctonia solani AG 2 isolates causing bare patch in field-grown tulips in the Netherlands
Abstract
During a spring survey in 1991, 130 isolates of R. solani were collected in 25 commercial flower bulb fields from diseased plants occurring in bare patches. On the basis of hypnal fusion frequency and pathogenicity to flower bulbs, tulip isolates were provisionally assigned to AG 2-t to distinguish these isolates from AG 2-1 isolates which were non-pathogenic to bulbs. Hyphal fusion frequency of a subgroup of 7 AG 2-t isolates was highly variable when paired with 7 AG 2-1 isolates (2-75%), thus making assignment of AG 2-t isolates to AG 2-1 inconclusive. The mean hyphal fusion frequency among AG 2-t isolates was 65% (± 6%) indicating AG 2-t to be a relatively homogeneous group. Hyphal fusion frequency among AG 2-1 isolates was highly variable with a mean of 51% (± 25%) indicating AG 2-1 to be a heterogeneous group. The optimum growth temperature for AG 2-t and AG 2-1 isolates on malt peptone agar was 20-25 °C. The host range of AG 2-t and two AG 2-1 isolates comprised tulip, iris, hyacinth and lily at both 9 and 18 °C, and cruciferous, sugar beet and lettuce seedlings at 18 °C. Six other AG 2-1 isolates were pathogenic to cruciferous seedlings, but not to any of the bulbous crops. The tested narcissus, Tagetes patula, tomato, potato, wheat, leek and maize cultivars were not susceptible to AG 2-t and AG 2-1 isolates. Statistical analysis using a proportional-odds model revealed significant differences in aggressiveness between R. solani AG 2-t isolates and differences in susceptibility between tulip and iris cultivars. At 18 °C, but not at 9 °C, isolates representing AG 2-2, AG 4, AG 5 and AG BI were pathogenic to bulbous crops. In addition to bare patch causing AG 2-t isolates, other anastomosis groups may cause disease in field-grown tulips. For the development of optimal crop rotation schedules, the impact of bulb rot causing isolates under field conditions needs further study.
Introduction
Rhizoctonia solani Kühn (teleomorph: Thanatephorus cucumeris (Frank) Donk) is a plant pathogenic fungus, causing severe damage in many agricultural and horticultural crops worldwide (Ogoshi, 1987; Sneh et al., 1991). Isolates of R. solani are extremely variable in cultural morphology and host range. At present, R. solani is considered a species complex rather than a single species (Anderson, 1982). The species complex can be subdivided by means of hyphal anastomosis reactions between isolates into more homogeneous groups called anastomosis groups (AG). The AG are considered to be genetically isolated (Anderson, 1982; Kuninaga, 1996). To date, 12 AG of R. solani have been described (AG 1 to AG 11, plus AG BI) (Sneh et al, 1991; Carling et al, 1994). Within AG, subgroups are distinguished according to host range, colony morphology, thiamine requirement,
19

Rhizoctonia disease
and biochemical and molecular characteristics (Ogoshi, 1987; Sneh et ah, 1991). In the Netherlands, R. solani AG 1, AG 2, AG 3, AG 4, and AG 5 have been found (Loerakker & van Dreven, 1985), and AG 2, AG 4 and AG 5 have been reported in connection with 'rhizoctonia disease' in flower bulbs and bulb flowers (Boerema and Hamers, 1988). Isolates of AG 2, AG 4 and AG 5 can readily be identified as to AG using anastomosis tests. AG 2 is further subdivided according to relative hyphal fusion frequency, thiamine requirement, host range and etiology into AG 2-1, AG 2-2IIIB, AG 2-2IV (Ogoshi, 1975; 1987) and AG 2-3 (Naito and Kanematsu, 1994). R. solani AG 2-1 has a wide host range (Sneh et al, 1991), including tulip (Nakatomi and Kaneko, 1971). Isolates of R. solani causing leaf blight in tulip (Nakatomi and Kaneko, 1971) were classified as cultural type II according to Watanabe and Matsuda (1966). Later, Ogoshi (1975) assigned Watanabe and Matsuda's cultural type II isolates to AG 2-1. AG 2-2IIIB is pathogenic to Graminaceae (Ogoshi, 1987), gladiolus (Takano and Fujii, 1972) and various other crops (Sneh et al, 1991). AG 2-2IV is mainly pathogenic to Chenopodiaceae.
Among early reports on rhizoctonia disease there is mention of bulb and stem rot of tulips (Van Poeteren, 1928; MacLean, 1948), neck and bulb rot in iris (Sonderman and MacLean, 1949), and reduced growth, root rot (Bald et al, 1955) and yellow discoloration (McWorther, 1957) in glasshouse grown lily in the US. Van Poeteren (1928) described bare patches caused by R. solani in both field-grown and glasshouse grown tulips in California. In the Netherlands, bulb and stem rot of tulips was first reported in 1952 by Jaarsveld (1952) and since then rhizoctonia disease has become an increasing problem in the Dutch bulb growing areas (Muller, 1969). Rhizoctonia disease in field-grown tulips frequently occurs as bare patches, similarly to rhizoctonia bare patch disease of cereals (MacNish and Neate, 1996). Bare patches in tulip develop at low soil temperatures when the sprouts grow through the soil. Doornik (1981) described the temperature dependency of R. solani isolates infecting sprouts of tulip, hyacinth, lily, iris and anemone in glasshouse experiments as an intrinsic characteristic of the isolates. Her 'warmth preferring' isolates, infecting bulb crops only at > 13 °C, and 'cold preferring' isolates, infecting bulb crops mainly at < 13 °C, later were identified as different AG and assigned to AG 4 and to AG 2 respectively (Loerakker & Van Dreven, 1985). In addition to these isolates of AG 2 and AG 4, isolates of AG 2-1 and AG 5 have been associated with rhizoctonia disease in flower bulbs (Boerema and Hamers, 1988). However, the subgrouping of cold preferring AG 2 isolates (Doornik, 1981) remained unclear.
In order to develop crop protection strategies in field-grown flower bulbs based on the ecology of the pathogen including e.g. crop rotation, a precise characterization of R. solani isolates causing bare patch in tulip is essential. The present paper intends to characterize R. solani isolates causing bare patch in field-grown tulip using hyphal anastomosis, thiamine requirement, growth characteristics on agar and host range.
20

Characterization
Materials and Methods
Pathogen isolation and collection From April to June 1991, plants with Rhizoctonia symptoms were collected from bare patches in 26 bulb flower fields throughout the Netherlands. Pieces of infected bulb, stem, and leaf tissue were surface sterilized in 1% sodium-hypochlorite for 30 sec, rinsed once in sterile tap water for 1 min, plated on 1.5% tap water agar amended with 250 ppm chloramphenicol and 250 ppm metalaxyl (WACM) and incubated for 2 to 3 days at room temperature. After a second transfer to WACM, isolates were transferred to malt-peptone agar (MPA), containing 15 g Malt extract (Oxoid L39), 1.25 g special peptone (Oxoid L72), and 15 g agar (Oxoid L13) per litre of tapwater (Van den Boogert and Jager, 1984). Pure cultures were stored on MPA-slants at 10 °C. R. solani isolates obtained from bare patches in tulip and iris used in this study are listed in Table 1 and on the basis of the experimental data in this paper further referred to as AG 2-t. Isolates representing other AG are in table 2.
Preliminary identification of field isolates Out of 130 field isolates, 43 were selected according to the geographical location of the production field and the site of the lesions (leaf, stem or bulb). The AG identity of these 43 isolates was determined (see AG typing section) using anastomosis tester isolates of AG 1 through AG 5 (Table 2). In addition, these 43 isolates were tested for pathogenicity on tulip cv. 'Red Riding Hood'(see pathogenicity tests on flower bulbs section). For further experiments a subset of arbitrarily chosen isolates was used.
Anastomosis group typing Water agar coated slides were seeded with mycelial disks (5 mm in diameter) taken from the edge of growing colonies on MP A, placed on moist filter paper in large (20 cm in diameter) Petri dishes and incubated for 24-30 h at room temperature (Tu et al, 1969). Disks of field isolates and anastomosis tester isolates were spaced approximately 1 cm. When the colonies overlapped the area was examined microscopically (lOOx) for hyphal anastomosis. AG typing was scored positively (confirmed at 400x) when 5 or more hyphal anastomosis points were observed (Carling et al, 1987; Carling, 1996). Anastomosis subgrouping within AG 2 was determined on the basis of hyphal fusion frequency (FF) (Ogoshi, 1975; Carling and Sumner, 1992) using seven AG 2-t isolates and seven AG 2-1 isolates. Average values of FF per five microscopic fields in three pairings were calculated.
21

Rhizoctonia disease
Thiamine requirement Mycelial disks (5 mm in diameter) of 25 arbitrarily chosen AG 2-t isolates (Table 1) were transferred from the edge of actively growing cultures on Czapek-Dok agar to Petri dishes (9 cm in diameter) containing Czapek-Dok liquid medium without (A) or with (B) 10"5 M thiamine-hydrochloride. Anastomosis tester isolates of AG 2-1, AG 2-2, AG 3 and AG 5 (Table 2) were included for comparison. Observations on growth and pigmentation were made after 14 days of incubation at 25 °C. (Ogoshi and Ui, 1979; Rovira et al, 1986). Mycelial dry weights were determined after drying overnight at 110 °C. A value of the B/A ratio less than 1.5 indicates the prototrophic nature of the isolate (Carling et al, 1987).
Growth characteristics on malt peptone agar The average colony growth (A.C.G.) of 11 arbitrarily chosen isolates of AG 2-t (2tR002, 2tR105, 2tR114, 2tR118, 2tR123, 2tR124, 2tR128, 2tR135, 2tR138, 2tR139, 2tR144) was compared with the A.C.G. of nine isolates of AG 2-1 (21R01, 21R11, 21R12, 21R14, 21R21, 21R41, 21R51, 21R71, 21R91), and seven AG 4 isolates (4R08, 4R09, 4R10, 4R22, 4R61, 4R70, 4R71). Mycelial disks (5 mm in diameter) from the edge of actively growing cultures on MPA were placed in the centre of 9 cm Petri dishes containing MPA and incubated at 5,10, 15, 20, 25, 30, 35, and 40 °C. Two Petri dishes per isolate were seeded. The average colony diameter was assessed at 8 regularly spaced points per colony per isolate every other day until the colony had reached the edge of the plate. The average colony growth (mm day"1) per AG was plotted against temperature.
Pathogenicity tests on flower bulbs Tulipa cvs Red Riding Hood, Apeldoorn and Gander, Iris cvs Blue Magic, White Excelsior and prof. Blaauw, Hyacinthus cvs Pink Pearl and Jan Bos, Narcissus cv. Tête-à-Tête and Lilium cv. Enchantment were obtained from commercial farmers. The three tulip cvs are classified in three taxonomically different groups (Classified List, 1987). According to farmers experiences, tulip cultivars differ in susceptibility to R. solani (Van Keulen and Van Aartrijk, 1993). Tulips 'Red Riding Hood' and 'Gander' are more susceptible than 'Apeldoorn'. Differences in cultivar susceptibility for R. solani have not been reported for iris, hyacinth, lily and narcissus. According to farmers experiences, all cultivars of iris, hyacinth and lily are to some extent susceptible to R. solani, whereas cultivars of narcissus are not. For forcing, tulip bulbs were stored at 17 °C and pre-treated at 2 °C in a temperature controlled storage room during 10 weeks before planting in the glasshouse. Iris bulbs were stored at 30 °C, disinfected in 4% (v/v) formalin for 15 min to eliminate external contamination and pre-treated for 6 weeks at 17 °C in a temperature controlled storage room to break dormancy, and planted in the glasshouse. Hyacinth and narcissus bulbs were stored at 30 °C and pre-treated for 6 weeks at 5-9 °C in a temperature controlled storage room. Prior to planting hyacinth and narcissus were disinfected in 4% (v/v) formalin to eliminate surface contamination. Lily bulbs were covered with a peaty soil and stored at -2 °C until use. After storage, lily bulbs were planted immediately in the glasshouse.
22
Characterization
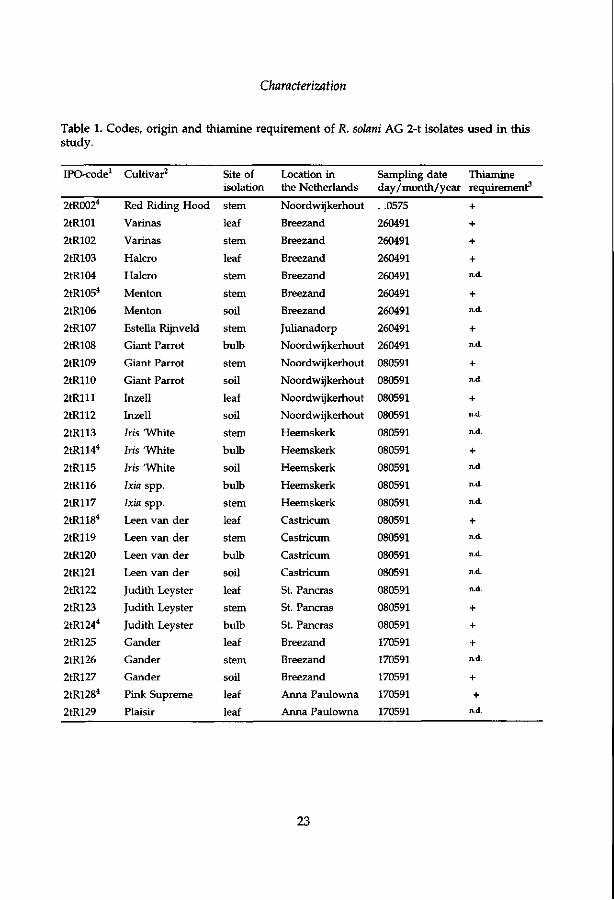
Table 1. Codes, origin and thiamine requirement of R. solani AG 2-t isolates used in this study.
IPO-code1
2tR0024
2tR101
2tR102
2tR103
2tR104
2tR1054
2tR106
2tR107
2tR108
2tR109
2tR110
2 tRl l l
2tR112
2tR113
2tR1144
2tR115
2tR116
2tR117
2tR1184
2tR119
2tR120
2tR121
2tR122
2tR123
2tR1244
2tR125
2tR126
2tR127
2tR1284
2tR129
Cultivar2
Red Riding Hood
Varinas
Varinas
Halcro
Halcro
Menton
Menton
Estella Rijnveld
Giant Parrot
Giant Parrot
Giant Parrot
Inzell
Inzell
Ms 'White
Ms 'White
Ms 'White
Ixia spp.
Ixia spp.
Leen van der
Leen van der
Leen van der
Leen van der
Judith Leyster
Judith Leyster
Judith Leyster
Gander
Gander
Gander
Pink Supreme
Plaisir
Site of isolation
stem
leaf
stem
leaf
stem
stem
soil
stem
bulb
stem
soil
leaf
soil
stem
bulb
soil
bulb
stem
leaf
stem
bulb
soil
leaf
stem
bulb
leaf
stem
soil
leaf
leaf
Location in the Netherlands
Noordwijkerhout
Breezand
Breezand
Breezand
Breezand
Breezand
Breezand
Julianadorp
Noordwijkerhout
Noordwijkerhout
Noordwijkerhout
Noordwijkerhout
Noordwijkerhout
Heemskerk
Heemskerk
Heemskerk
Heemskerk
Heemskerk
Castricum
Castricum
Castricum
Castricum
St. Paneras
St. Paneras
St. Paneras
Breezand
Breezand
Breezand
Anna Paulowna
Anna Paulowna
Sampling date day/month/year
. .0575
260491
260491
260491
260491
260491
260491
260491
260491
080591
080591
080591
080591
080591
080591
080591
080591
080591
080591
080591
080591
080591
080591
080591
080591
170591
170591
170591
170591
170591
Thiamine requirement3
+
+
+
+ n.d.
+
n.d.
+
n.d.
+
n.d.
+ n.d.
n.d.
+ n.d.
n.d.
n.d.
+ n.d.
n.d.
n.d.
n.d.
+
+
+
n.d.
+
+ n.d.
23
Rhizoctonia disease
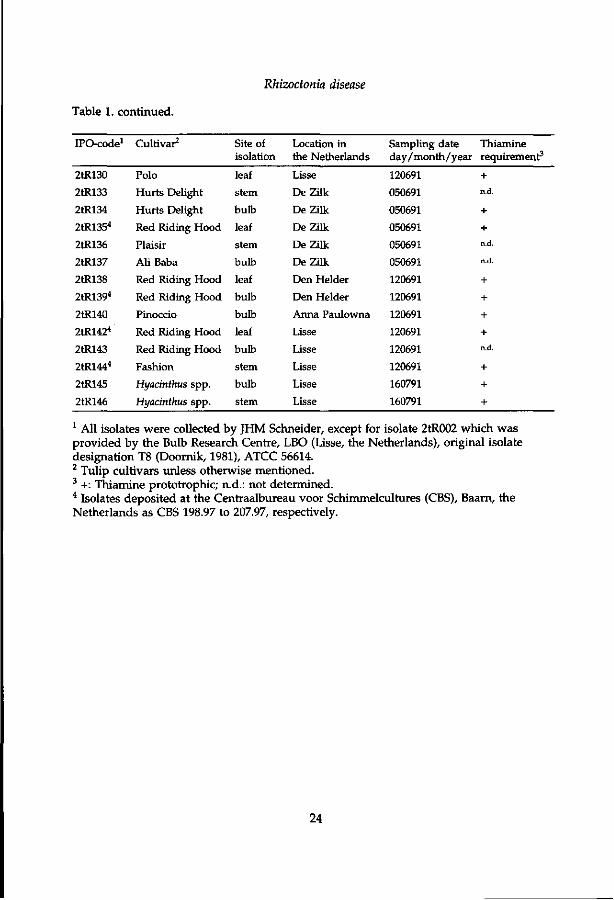
Table 1. continued.
IPO-code1
2tR130
2tR133
2tR134
2tR1354
2tR136
2tR137
2tR138
2tR1394
2tR140
2tR1424
2tR143
2tR1444
2tR145
2tR146
Cultivar2
Polo
Hurts Delight
Hurts Delight
Red Riding Hood
Plaisir
Ali Baba
Red Riding Hood
Red Riding Hood
Pinoccio
Red Riding Hood
Red Riding Hood
Fashion
Hyacinthus spp.
Hyacinthus spp.
Site of isolation
leaf
stem
bulb
leaf
stem
bulb
leaf
bulb
bulb
leaf
bulb
stem
bulb
stem
Location in the Netherlands
Lisse
De Zilk
DeZilk
De Zilk
DeZilk
DeZilk
Den Helder
Den Helder
Anna Paulowna
Lisse
Lisse
Lisse
Lisse
Lisse
Sampling date day/month/year
120691
050691
050691
050691
050691
050691
120691
120691
120691
120691
120691
120691
160791
160791
Thiamine requirement3
+
n.d.
+
+
n.d.
n.d.
+
+
+
+
n.d.
+
+
+
1 All isolates were collected by JHM Schneider, except for isolate 2tR002 which was provided by the Bulb Research Centre, LBO (Lisse, the Netherlands), original isolate designation T8 (Doornik, 1981), ATCC 56614. 2 Tulip cultivars unless otherwise mentioned. 3 +: Thiamine prototrophic; n.d.: not determined. 4 Isolates deposited at the Centraalbureau voor Schimmelcultures (CBS), Baarn, the Netherlands as CBS 198.97 to 207.97, respectively.
24

Characterization
The virulences of eleven AG 2-t isolates to tulip, iris, hyacinths and lily were compared with the virulences of some isolates belonging to AG 2-1, AG 2-2, AG 3, AG 4, and AG 5 in glasshouse tests. The experiments were conducted simultaneously at two temperatures, 9 and 18 °C, favourable for pathogenicity of AG 2-t and AG 4, respectively (Doornik, 1981). Three bulbs were planted per 1.5 1 pot filled with an unsterilised 2:1 sand:potting soil mixture and inoculated by placing two oat kernels colonized by the fungus onto the neck of each bulb (Doornik, 1981). Isolates of R. solani had been grown on sterilised oat kernels at 20 °C for two to three weeks. In control pots, sterilised non-infested oat kernels were used. After six weeks, tulip and hyacinth plants were evaluated for disease symptoms on the leaves and iris plants for disease symptoms on the bulb. Disease symptoms per plant were classified in one of five qualitative disease classes 0: healthy; 1: symptoms unclear; 2: slightly infected; 3; moderately infected; 4: heavily infected or dead. Isolates causing disease classes 0 and 1 were considered non-pathogenic under the prevailing conditions. For lily, pathogenicity of AG 2-t isolates was expressed as the mean percentage reduction of stem length per pot. The experimental design was a complete randomized block with four replications. Pathogenicity tests using all isolates, tulip 'Red Riding Hood', and iris 'Blue Magic' were repeated in a second experiment.
Pathogenicity tests on cruciferous and other seedlings AG 2-t and AG 2-1 isolates were screened for their ability to cause disease in cruciferous seedlings in glasshouse tests at 18 °C. Seedlings of cauliflower (Brassica oleracea var. botrytis) cv. Oberon, fodder radish (Raphanus sativus ssp. oleiferus) cv. Nemex, white mustard (Sinapis alba) cv. Maxi, oil-seed rape (B. napus spp. oleifera) cv. Jet Neuf, and swede (B. napus var. napobrassica) cv. Friese Gele, lettuce (Lactuca sativa) cv. Petty, leek (Allium porrum) cv. Joland, sugar beet (Beta vulgaris) cv. Hilde, potato (Solanum tuberosum) cv. Bildstar, tomato (Lycopersicon esculentum) cv. Moneymaker and Tagetes patula were tested. After germination, 8 seedlings were planted per pot (400 ml). Soil and inoculum were the same as used for the flower bulb tests. One week after transplanting, pots were infested with R. solani. Two oat kernels colonized with R. solani were placed in the centre of each pot. Four weeks after infestation, the number of healthy and diseased plants was evaluated. The experimental design was a randomized complete block with four replicates. In an additional experiment the pathogenicity tests of AG 2-t isolates on cauliflower and fodder radish were repeated and compared with the pathogenicity of AG 2-t isolates to wheat (Triticum aestivum) cv. Flevina, maize (Zea mays) cv. Brutus, and sugar beet cv. Accord.
Statistical analysis Significance of differences between variances of mean FF's of AG pairings was tested using a F-test (Sokal and Rohlf, 1981). Mean FF's of AG pairings were compared using an approximate t-test, considering unequal variances and unequal sample sizes (Sokal and Rohlf, 1981).
Differences in virulence and cultivar susceptibility to AG 2-t were analyzed using a proportional-odds model (McCullagh, 1980; McCullagh and Neider, 1989).
25

Rhizoctonia disease
Table 2. Codes and origin of Rhizoctonia solani AG 1 to AG 6 and AG BI isolates used in this study.
IPO-code
OlROl2
01R022
01R032
21R012
21R06
21R11
21R12
21R14
21R21
21R41
21R51
21R61
21R71
21R81
21R91
22R012
22R022
22R11
03R012
03R03
03R04
03R05
04R012
04R08
04R09
04R10
04R11
04R22
04R61
04R70
04R71
05R012
05R06
05R21
05R31
06R012
BIR012
AG typing
1-IA
1-IB
1-IC
2-1
2-1
2-1
2-1
2-1
2-1
2-1
2-1
2-1
2-1
2-1
2-1
2-2IIIB
2-2IV
2-2
3
3
3
3
4
4
4
4
4
4
4
4
4
5
5
5
5
6HG-1
BI
Host
rice
sugar beet
sugar beet
pea
tulip
cauliflower
cauliflower
cauliflower
cauliflower
swede
oil-seed rape
lily
turnip rape
lettuce
leek
mat rush
sugar beet
sugar beet
potato
potato
potato
potato
peanut
iris
lettuce
lettuce
bean
iris
spinach
anemone
cucumber
soybean
Uly
maize
soil
soil
soil
Origin
Japan
Japan
Japan
Japan
Japan
the Netherlands
the Netherlands
the Netherlands
the Netherlands
the Netherlands
the Netherlands
the Netherlands
the Netherlands
the Netherlands
the Netherlands
Japan
Japan
the Netherlands Japan
the Netherlands
the Netherlands
the Netherlands
Japan
Israel
the Netherlands
the Netherlands
the Netherlands
the Netherlands
the Netherlands
the Netherlands
the Netherlands
Japan
the Netherlands
the Netherlands
the Netherlands
Japan
Japan
Original isolate designation
CS-KA
B-19
BV-7
PS-4
TG-1
PD 80/710
PD 81/228
PD 86/723
PD 86/748
PD 81/130
PD 80/664
PD 83/866
PD 83/810
PD 83/909
PD 83/303
C-96
RI-64
PD 85/904
ST-11-6
36 AB65
09 ABa
05 AHa
AH-1
Iyot
SI
S2
PD 82/576
17
PD 83/418
PD 84/659
PD 84/762
GM-10
PD 82/741
PD 83/481
PD 84/865
OMT-1-1
Ts-2-4
Source1
Ogoshi
Ogoshi
Ogoshi
Ogoshi
Ogoshi
PD
PD
PD
PD
PD
PD
PD
PD
PD
PD
ATCC
ATCC
PD
Ogoshi
Jager
Jager
Jager
Ogoshi
LBO
LBO
LBO
PD
LBO
PD
PD
PD
Ogoshi
PD
PD
PD
Ogoshi
Ogoshi
1 PD: Plant Protection Service, Wageningen, the Netherlands. LBO: Bulb Research Centre, Lisse, the Netherlands. 2 Anastomosis tester isolates (Sneh et al, 1991).
26

Characterization
The model quantifies the effect of the disease rating by the construction of an underlying continuous scale on which the distribution for each isolate-cultivar combination (treatment) is logistic with standard deviation TC/V~3. For the five qualitative disease classes, four unknown cut-points provide a quantification of the differences between successive classes on the underlying scale. The model describes the relationship between numbers of observations up to a particular class. The model has the form ]n(y{:/(l-yi^))=Qç]ii where y« is the y01 cumulative probability for the Ith treatment. Or, y« is the probability that the response for a randomly chosen bulb falls in class j or lower. The ft's are the cutpoints and U; stands for the mean of treatment i on the underlying scale. As the mean on the underlying scale increases, the probability for a bulb being rated into the higher classes also increases. Treatment effects were assessed using differences between treatment means on the underlying scale. For the mean Uj a linear model was used with replication, isolate and host and isolate x cultivar interactions as explanatory variables. All effects were taken as fixed except the interactions. The interactions were taken as random to circumvent estimation problems for host-isolate combinations with all observations in an outer class. Dependence between observations on bulbs within pots was investigated by incorporating an additional random effect for differences between pots in the linear model. The random effects for interactions and pot are assumed to be independently and normally distributed. Estimates of cut-points, variance components and treatment effects were obtained by the Iteratively Reweighted Restricted Maximum Likelihood Method (IRREML, Engel and Keen, 1994; Keen, 1994) using the statistical programme Genstat 5 (Genstat 5 Committee, 1993). Fixed effects were tested using Wald-tests (Cox and Hinkley, 1974). Pairwise differences between treatment means on the underlying scale were tested using a normal approximation.
For statistical analysis of the pathogenicity of AG to lily, differences in aggressiveness of isolates within an AG were compared to the control using least significant differences (LSD). Differences in aggressiveness of isolates to cruciferous seedlings were compared to the control per AG and per cultivar using LSD values. Differences between average colony growth rates per AG per temperature were compared using LSD values.
Results
Anastomosis group typing Hyphae of all 43 selected AG 2-t isolates (Table 1) anastomosed with the AG 2 tester isolates (data not shown). A subset of seven arbitrarily chosen AG 2-t isolates was tested for subgrouping within AG 2. Hyphal fusion frequency (FF) of these AG 2-t isolates with AG 2-2IIIB and AG 2-2IV tester isolates was consistently less than 30% (data not shown). The average FF of these seven AG 2-t isolates with the Japanese tester isolate (21R01) varied from 9 - 56%, and from 2 - 62%
27

e o •J3 cB
I TJ
T J e «
TJ C
o, 3
<: X,
% V) ai m O
+-» CN
n <n M-H
o ^ . S«
.S PH U H ,
cj C ai
g< 01
•h d o
•3 ^ <n .e fc
j = ai
eB ÏH 01
> < en CU
X i CB H
X bO
Ol
is O
*—' Vi
(3 < O
bO
Î H
<B
a, » H
a, TJ 01 N
« p
i en
ai
ä •c m >
TJ
§ y v T l
CO
T - H
o PS t -H (N
NO O
i—l CN
i—1
PS 1—1 CN
i—i
T—1 <N
T-H
T-H CM
1—1
OS T—1
CN
T - H
00 DS CM
S T — 1
Dj CN
ON
co T - H
93 CN
00 CO t—l
SS CM
CD CN i—i
93 CN
00 T—1 t—1
93 CM
^ T - H
T - H
93 CN
i n o T-i
93 CN
ai 4-J
_CB
" o t / j
IN NO
m NO
• *
NO
00 i n
00 NO
i n NO
O in
cc co
3
NO m
i - H
i n
vO CS
<J>
00 co
r H
O PS T-H CN
T-H 1
CN
CN ND
I N NO
oo NO
00 NO
NO NO
• < *
CN i n
N C
i n
r-NC
i—i vO
vO N O
m tv.
• *
m
NO O PS T-H CN
t v I N
CT\ NO
T - H
IN.
T - H
NO
NO
O sC
IN i n
o
•*
I N
^t1
CO i - H
CT> 1 - H
• * T-H
PS T-H CN
NO NO
NO NO
I N NO
CO
CN co
o co
t N CN
o> T - H
• < *
ro
co T - H
- * l
CN
T - H
T - H
CM
§
l
CN I N
ON i n
CO T-H
i n CN
o \ • *
CO CN
N C CN
l - H
i n
-* co
T - H
CN
T - H
DS T-H CN
in CN
TJ en
"tf NO
ON
CN vC
CO m
• • *
m
sc i n
c-« m
CN T - H
I N T - H
T - H
NO PS T-H CN
T-H O NO
CB
>
NO NO
NO
m
m
"*
**
NO
CM
T - H
00 DS T-H CN
CO I N
•* NO
CN NO
00 i n
NO NO
I N NO
T - H
• *
5 T-H
93 CN
1
CN
ON
i n
Tt< I N
CN NO
I N NO
i n NO
NO NO
ON CO T-H
93 CN
i n NO
00 NO
co I N
T - H
I N
ON NO
00 CN T-H
PS •4H CN
i n NO
O I N
NO NO
O CN
CO CN T-H
93 CN
S
S ë °
i n NO
§ a>
Ë
C N NO
T - H
NO
NO NO
00 T-H T-H
PS CN
i—l CN
- •
TJ to
NO
T ! en
CN NO
• *
NO
T - H
T-H
93 CN
1 S >
00 CO
(0
>
NO I N
S T-H
93 CN
' CN * * TJ a, ft -r CB t in
i n ( j co.
1 CN
8 ^ ß?4
TJ y ° cN Ü STJ
P H K > S 1 o . H--" Ö O <V
•M PH 0 i ,
• " -ft? ^V <M • v CA C
^ -o "V «
CN 'T1 S o r i i (N w co ' J * T-H ai <C ^ '. y
Ï^S § Ë < 0 >
s o CB
I O o
fjü g a's
c cS
O
c 01 u 01
O *H "Ä ü Ol O * S " o u C " ° 3 Ö fi
•*H g 0O ^ f l ^3 ccï co en y.
•-" -V * • C a « es c •=!
• s « ü B
' S ^ g TJ
> NO J3 ^ "
V U " ^ » CB
ÇN < t ^ ai g <N ° % $ y Ä «S H » < - g o o •*- S B ) i £ . en ° -H » rH k
Ï c n ^ PH • < * \ ;
g ^ £ rH K
S ? § U A
01
PH ^
L<£

Characterization
when paired with Dutch AG 2-1 isolates (Table 3). Isolate 21R06, originating from tulip in Japan, fused in high frequency with AG 2-t isolates and AG 2-1 isolates, except for 21R81 (low frequency). The average hyphal fusion frequency among the seven tested AG 2-t isolates was over 50%, except for 2tR144 with 2tR105 (41%). The average FF among AG 2-1 isolates was also over 50%, except for isolate 21R81, which fused in high frequency with the tester isolate 21R01 and in self anastomosis, but in low frequency with all other AG 2-1 isolates. The average FF of AG 2-t with AG 2-t isolates varied from 41 - 74%. The average FF of AG 2-t with AG 2-1 isolates varied from 2 - 75%, and the average FF of AG 2-1 with AG 2-1 varied from 3 - 77%.
The mean FF, pooled average FF per AG pairing, of AG 2-t*2-t (65%) was significantly different from the mean FF of AG 2-t*2-l (34%; t-test, P<0.01) and from the mean of AG 2-l*AG 2-1 (51%; t-test, P<0.01). The variance of the mean FF of AG 2-t*2-t (38) was significantly different from the variance of the mean FF of AG 2-t*AG 2-1 (440) and from the variance of the mean FF AG 2-l*AG 2-1 (601; F-test, P<0.01). The mean FF's of AG 2-t*AG 2-1 (34%) and AG 2-1*2-1 (51%), were significantly different (t-test, P<0.01), whereas their variances, 440 and 601 respectively, were not significantly different (F-test, P>0.05) (Table 3).
Thiamine requirement The 25 tested AG 2-t isolates (Table 1), and anastomosis tester isolates of AG 2-1 and AG 3 grew equally well on both Czapek-Dok liquid medium with (B) or without (A) thiamine (B/A ratio 0.8-1.4) and developed a brown pigmentation of the hyphae, indicating thiamine prototrophy of AG 2-t isolates. Anastomosis tester isolates of AG 2-2 and AG 5 were confirmed to be thiamine auxotrophic.
Growth characteristics on agar Average growth curves of AG 2-t and AG 2-1 isolates were similar, but different from AG 4 (Fig. 1). Optimum growth for AG 2-t and AG 2-1 isolates occurred at 20-25 °C (12 mm d a y \ and for AG 4 isolates at 25-30 °C (18 mm day1). At 5 °C, isolates of AG 2-t and AG 4 grew significantly (P<0.01) slower (0.4 and 0.5 mm day"1 respectively) than AG 2-1 isolates (2.1 mm day'1). At 35 °C AG 2 isolates did not grow, whereas AG 4 isolates were still capable of growth. None of the isolates of any AG grew at 40 °C.
Pathogenicity tests on flower bulbs In preliminary experiments, all 44 isolates listed in Table 1 were pathogenic to tulip cv. Red Riding Hood. For further research on the host range, reported in this paper, eleven arbitrarily chosen AG 2-t isolates were used.
29

Rhizoctonia disease
Table 4. Average disease severity1 of four flower bulbs grown in soil infested with isolates of Rhizoctonia solani AG 2-t and AG 2-1 for six weeks in the glasshouse at 9 °C.
AG 2-t
2-1
Cv.2
Isolate 2tR002 2tR105 2tR114 2tR118 2tR123 2tR124 2tR128 2tR135 2tR138 2tR139 2tR144
cc.5
21R01 21R11 21R14 21R21 21R41 21R51 21R61 21R71
control
R
4 4 3 4 4 4 4 4 4 4 4
a
4 0 0 1 0 2 0 0
0
Tulip
G
4 4 4 3 4 3 3 4 4 3 3
b
4 0 0 0 0 2 0 0
0
A
3 3 3 2 2 2 2 3 3 2 2
c
2 1 0 0 0 2 0 0
0
Leaf
ci.4
abc abc n.i. a abc ab ab c bc abc abc
Hvacinth
PP JB
0 0 0 -0 -0 0 1 1 1
0 0 0 1 0 1 0 0
0
0 0 1 -0 -1 0 -1 0
0 0 0 0 0 1 0 0
0
BM
2 2 2 2 2 2 2 3 2 2 4
a
3 1 0 0 0 2 0 0
0
Bulb
Iris PB
2 3 3 2 2 2 2 3 2 2 4
a
1 1 0 1 0 3 0 0
0
WE
2 2 2 1 2 2 2 2 2 1 3
b
1 0 0 0 0 2 0 0
0
c.i.
ab bc bc a bc ab ab c bc ab d
LSDQQJ
LSD001
S.L.2
Lilv E
69 -
81 78
--
86 79 71 79 91
11
110 120 116 113 110 101 113 113
12
100
1 Disease severity ratings according to five classes with: 0: healthy, no symptoms, 1: few small lesions and/or symptoms unclear, 2: slightly infected, 3: moderately infected, 4: heavily infected, or sprout not emerged, -: not determined. 0 and 1 are considered as nonpathogenic under the test conditions. 5 S.L.: Stem Length of lily as percentage of the control. 3 R: Red Riding Hood; G: Gander; A: Apeldoorn; BM: Blue Magic; PB: Prof. Blaauw; WE: White Excelsior; PP: Pink Pearl; JB: Jan Bos; E: Enchantment. 4 c.i.: Isolates with same letters are not significantly different (P<0.05) after comparison of treatment means on the underlying scale using a normal approximation, n.i.: not included in the analysis. 5 c.c: Cultivars with same letters are not significantly different (P<0.05) after comparison of treatment means on the underlying scale using a normal approximation.
30

Characterization
Statistical data analysis using a proportional-odds model was done for combinations of AG 2-t isolates with tulip and iris cultivars separately per species and per temperature. First it was investigated whether interactions occurred between isolates and cultivars by fitting a mixed model with fixed effects for isolates and cultivars and random effects for interactions and for differences between pots. Fitting of the mixed model showed only a substantial component of variance for interaction for tulip at 9 °C, which was accounted for by the isolate*cultivar combination 2tR114*Red Riding Hood (data not shown). Excluding this combination from the analysis resulted in non-significant interactions effects. Therefore, in further data analysis the interactions were dropped from the model and a mixed model was used with fixed effects for isolate and cultivar and a random effect for pot differences. Differences in aggressiveness between isolates and differences in cultivar susceptibility were statistically tested using a normal approximation for the differences between the predicted means on the underlying scale.
At both 9 and 18 °C the tested AG 2-t isolates were highly virulent to the tulip cvs tested and less virulent to the iris cultivars (Tables 4 and 5). Only minor differences in virulence were observed between isolates. At both 9 and 18 °C, tulip cv. Apeldoorn was significantly (P<0.05) less susceptible to AG 2-t isolates than cvs Gander and Red Riding Hood. At 9 °C, disease severity in iris cv. White Excelsior was significantly (P<0.05) lower than in cvs Blue Magic and Prof. Blaauw. At 18 °C, cv. Prof. Blaauw was significantly (P<0.05) less diseased than cvs Blue Magic and White Excelsior. Between iris cultivars, differences in susceptibility to AG 2-t isolates were in general less pronounced at 9 °C. At 18 °C, however, differences in cultivar susceptibility were less pronounced for tulip and more pronounced for iris cvs. At both temperatures, the tested tulip and iris cultivars Blue Magic and White Excelsior were also infected by AG 2-1 isolates 21R01 and 21R51, but not by the other AG 2-1 isolates.
At 18 °C, AG 2-t isolates were only mildly virulent to hyacinth cv. Jan Bos, whereas at 9 °C neither hyacinth cv. was diseased by the AG 2-t isolates tested. At 9 °C, seven AG 2-t isolates reduced the stem growth of lily cv. Enchantment significantly (P<0.01) varying from 14-31%. At 18 °C, one isolate (2tR135) reduced the stem growth significantly (P<0.01) with 12%. The Japanese tester isolate 21R01 was not pathogenic to lily at either temperature. In narcissus no disease symptoms developed at either temperature.
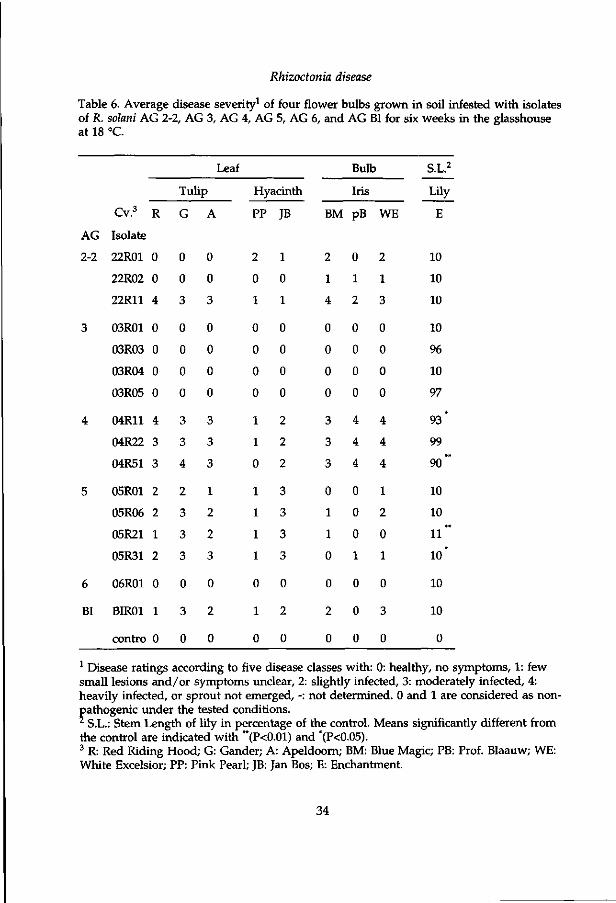
Isolates of AG 2-2, AG 3, AG 4, AG 5, AG 6 and AG BI did not cause any disease symptoms on bulbous crops at 9 °C. At 18 °C, however, isolates representing AG 2-2, AG 4, AG 5, and AG BI caused disease in tulip, iris and hyacinth cv. Jan Bos (Table 6), whereas isolates of AG 3 and AG 6 did not cause any symptoms.
The second experiment comprising all 34 isolates and tulip cv. Red Riding Hood and iris cv. Blue Magic gave the same results. Control plants remained free of R. solani symptoms.
31

to X CU «s
13 H
"o'o CO W
X a
^ ai
Ol <u co l—l
cu
« 00 o -
o U i
bO tu u
.g jy T3 £ as to i-i CU
. ' u 3
u tu >
^ * H
o CO bO G
tu 0) CO
TS
c CO
X 3 X i
tu
£ o
q3 L.
3 O
V4-i M - l
O
'h •c CU
> CU CO
CU CO
ta <u CO
'S cu
tB u CU
> < i n
Ja x
o X CO CO tO
"oO
CU
Xi + .
e ,—v CO
_g T3 CU cu CO
co
CU tu
t u 3 o •J5
,—, co
X
3 X
J2 01 cu
S _>< 'co f* O
M - )
T—1
tN
O < TS
c ö
-»-* CN
O < s ,« "S
CO CS
'S o
o
S «
H O
O
s° & Ë nf
5 5?
cu u
s % • J
Cy T l CU
S CAI
T l
S tp Cü ^ 3 Ct,
O 2 T3
l-H eu m
| g 1 s
11 0) X!
T3 «
ÜH £
• *-> • i CU
3 S cd o
U 53
CT) vX3 C7N t ^
X
cl CU
z e o CU
in o o o co o o o
o o o o o o o o
o o o o o o o o o o o o
o o o o o o o o o o o o
tó
O O O N C T \ O O N O O O Ô I-H
o o \ O O O N C j \ o o o o i r )
O O N Q O O O O O l ? ) co (N
Q en .-J
C O H r l l N N l N r f l H H C n
O T - H < - H O O O O O I - H O < N
03 i N r O t N r H M t N H C O H H t n
O N M O C O H N l N H N N
CO i-H O I i-H i-H O tN O O
, ß O O I O O O I - I O O
(O ( N O i O I-H O CO O <
. -H l -H . O T - t O T - t O O
»-t i-H t O O O i-i O O
<ï r o c o r o c o c o c o - ' t f c o r o c o c o ,£) r O i - H i i - H r - t i - n r o o o
O H / ^ - ^ ^ - H f t f T f t f ^ r o ^ ro ^ t o i o o o c o o o
^ * ^ * ^ * ' ^ ^ ^ co ^ ^ ^ * ^ ^ ^ * ^ ^ i H O CO O O
ct fc^ l^ )^coco• 'H^ooLncoa^ ' *J ,
+ J O O H H N N M M i T i r T } ' m J50i—"i—it-Hi-Hi—i .—i ,—i ,—I i—< I-H
( J h S c N i N C N N i N N c N Ä c N i N C S
. i N ^ i . .
. . . . . . . . ^ f . . . . . . . . . t N M M C M M M M c N t N i N
u £5 ;_3 ^ ;

Characterization
Pathogenicity tests on cruciferous and other seedlings All of the 11 AG 2-t and 10 AG 2-1 isolates tested caused damping-off in seedlings of cauliflower, fodder radish, white mustard, oil-seed rape and swede at 18 °C (Table 5). Damping-off in lettuce was variable and depended on the isolate tested. No damping-off was caused in leek, potato, tomato, sugar beet cv. Hilde, and Tagetes patula in this experiment. In the second experiment the same results were obtained for cauliflower and fodder radish. In wheat cv. Flevina and maize cv. Brutus no damping-off occurred. AG 2-t isolates caused damping-off in sugar beet cv. Accord, but the results (data not shown) were highly variable and isolate dependent. From some symptomless plants of Tagetes, sugar beet, wheat, maize, potato, and tomato AG 2-t could be re-isolated.
Discussion
For the development of environmentally friendly and effective control measures understanding of the dynamics of pathogenic R. solani populations in the field is essential. Hence, a precise characterization and identification of isolates that cause rhizoctonia bare patch in field-grown flower bulbs is a prerequisite. Variance of mean hyphal fusion frequency (FF) among AG 2-t isolates, suggested that R. solani AG 2-t isolates formed a relative homogeneous subgroup within AG 2 distinct from either AG 2-1 (Table 3) and AG 2-2. Variance of mean FF among R. solani AG 2-1 isolates indicated AG 2-1 a heterogeneous group. Due to great variability in FF it was not always possible to unambiguously distinguish individual AG 2-t isolates from AG 2-1 isolates (Table 3). In earlier reports 'cold-preferring' isolates from tulip (Doornik, 1981) were assigned to AG 2 (Loerakker and Van Dreven, 1985) and provisionally designated as AG 2-31. Our FF tests (Table 3) do not support previous suggestions (Loerakker and Van Dreven, 1985; Cruickshank, 1990) of a new AG 2 subgroup on the basis of FF only. In the earlier experiments (Loerakker, unpubl.), FF was determined between two tulip isolates and seven AG 2-1 Dutch isolates, and among six tulip isolates. The definition of FF was poor at that time. FF of the two tulip isolates with the AG 2-1 isolates varied mostly from 'no reaction' to 'not frequent' and was described as 'frequent' in one pairing only. The use of only two tulip isolates in pairings with AG 2-1 isolates in combination with the generally observed high variability of FF made the assignment of these two tulip isolates to a new AG 2 subgroup distinct from AG 2-1 premature. Our pathogenicity tests showed that all tested AG 2-t and two
1 Loerakker's provisionally designated AG-2-3 (Loerakker, pers comm.; Cruickshank, 1990) is not to be confused with soybean leaf infecting AG-2-3 isolates (Naito and Kanematsu, 1994). Soybean AG-2-3 isolates were not known when Loerakker's and our research was conducted.
33
Rhizoctonia disease
Table 6. Average disease severity1 of four flower bulbs grown in soil infested with isolates of R. solani AG 2-2, AG 3, AG 4, AG 5, AG 6, and AG BI for six weeks in the glasshouse at 18 °C.
AG
2-2
3
4
5
6
BI
Cv.3
Isolate
22R01
22R02
22R11
03R01
03R03
03R04
03R05
04R11
04R22
04R51
05R01
05R06
05R21
05R31
06R01
BIR01
contro
R
0
0
4
0
0
0
0
4
3
3
2
2
1
2
0
1
0
Leaf
Tulip
G
0
0
3
0
0
0
0
3
3
4
2
3
3
3
0
3
0
A
0
0
3
0
0
0
0
3
3
3
1
2
2
3
0
2
0
Hyacinth
PP JB
2
0
1
0
0
0
0
1
1
0
1
1
1
1
0
1
0
1
0
1
0
0
0
0
2
2
2
3
3
3
3
0
2
0
BM
2
1
4
0
0
0
0
3
3
3
0
1
1
0
0
2
0
Bulb
Iris
pB
0
1
2
0
0
0
0
4
4
4
0
0
0
1
0
0
0
WE
2
1
3
0
0
0
0
4
4
4
1
2
0
1
0
3
0
S.L.2
Lily
E
10
10
10
10
96
10
97
93*
99
90**
10
10
»* 11 10*
10
10
0
1 Disease ratings according to five disease classes with: 0: healthy, no symptoms, 1: few small lesions and/or symptoms unclear, 2: slightly infected, 3: moderately infected, 4: heavily infected, or sprout not emerged, -: not determined. 0 and 1 are considered as nonpathogenic under the tested conditions. * S.L.: Stem Length of lily in percentage of the control. Means significantly different from the control are indicated with **(P<0.01) and *(P<0.05). 3 R: Red Riding Hood; G: Gander; A: Apeldoorn; BM: Blue Magic; PB: Prof. Blaauw; WE: White Excelsior; PP: Pink Pearl; JB: Jan Bos; E: Enchantment.
34

Characterization
>-. M
•O B B
a o O
U
Temperature (°C)
Figure 1. Average colony growth rate of AG 2-t (—), AG 2-1 ( •) and AG 4 ( ) on Malt-Peptone Agar at 8 temperatures. Averages per temperature followed by the same letter are not significantly different (P<0.01).
AG 2-1 isolates (21R01 and 21R51) caused disease in the tested cruciferous and bulbous cultivars (Tables 4 and 5). In addition, isolate 21R06 originating from tulip in Japan was pathogenic to tulip in our experiments (Schneider, unpubl.). The other six Dutch AG 2-1 isolates were pathogenic to cruciferous crops but not to bulbous crops. Naito and Kanematsu (1994) assigned leaf spot isolates from soybean, fusing in high FF with AG 2-1 isolates, to AG 2-3 rather than to AG 2-1 using differences in thiamine requirement and host range as prevailing criteria. Therefore, we suggest designating AG 2 isolates infecting bulbous crops to AG 2-t, in order to distinguish them from other AG 2-1 isolates that are non-pathogenic to bulbous crops. Further research in our institute on characterization of AG 2 isolates using biochemical and molecular methods may provide the means to discriminate unambiguously AG 2-t isolates from AG 2-1 and reveal the (phylo)genetic relationship of AG 2-t and AG 2-1 with other AG 2 isolates.
The observed differences in aggressiveness between AG 2-t isolates (Tables 4 and 5) are in agreement with previous reports on AG 2 subgroups (Doornik, 1981; Kaminski and Verma, 1985; Yitbarek et ah, 1987) and other AG (Carling and Leiner, 1990; Philips, 1991; Carling et al., 1994). In our experiments AG 2-t isolates were in general as aggressive on tulip sprouts at 18 °C as at 9 °C, which is in contrast with Doornik who reported fewer sprouts with severe symptoms at 18 °C. Doornik (unpubl.) noticed considerable differences in symptom expression between years, especially at higher temperatures. A possible explanation for the
35

Rhizoctonia disease
discrepancy in observations may be explained by differences in susceptibility of bulbs due to storage (duration and other conditions) and treatment to break dormancy. Our experiments were conducted simultaneously at both 9 and 18 °C using the same plant material, inoculum and unsterilised soil mixture.
In our glasshouse tests tulip cv. Apeldoorn was less susceptible to R. solani AG 2-t than cvs Gander and Red Riding Hood. Tulip cultivars possessing resistance to R. solani have not been reported previously. The only noted differences in cultivar susceptibility are based on farmers experiences (Van Keulen and Van Aartrijk, 1993). For a classification of bulbous crops according to their susceptibility to rhizoctonia bare patch, appropriate experiments are necessary. In such studies the use of more than one isolate may be required, since isolates can differ in aggressiveness. In one isolate*cultivar combination interaction was found, meaning that the cultivar susceptibility depended on the isolates used. Interactions between AG 2-t isolates and tulip cvs under semi-field conditions and in the glasshouse are described in chapter 4.
In commercial bulb production fields, cruciferous crops like fodder radish, white mustard, and oil-seed rape are often used as a rotation crop of which the effects on rhizoctonia bare patch are unknown. Pathogenicity tests (Table 5) demonstrated that these crops were susceptible to AG 2-t. Therefore, they must be considered as potential hosts in the field and hence as potential inoculum sources, especially when these crops are used as a green manure. In addition to cruciferous crops, cruciferous weeds may provide alternative hosts in the field. In certain parts of the Netherlands, flower bulbs are grown in rotation with potato, wheat or maize. AG 2-t did not cause damping-off in seedlings of these crops at 18 °C. This finding does not imply, however, that AG 2-t is suppressed or cannot survive in the rhizosphere of these crops under commercial cropping conditions. In fact, AG 2-t isolates could readily be re-isolated from some symptomless seedlings in our glasshouse experiments. Our data suggested that sugar beets are a potential host for AG 2-t in the field, perhaps depending on the cultivar. The influence of rotation crops, both hosts and non-hosts, on the survival of AG 2-t requires further study in field experiments.
In our glasshouse experiments performed at 18 °C isolates of AG 2-2, AG 4, AG 5, and AG BI, in addition to isolates of AG 2-t, were found to be pathogenic to tulip. Isolate 22R11 caused disease tulip and iris in our glasshouse experiments. R. solani AG 2-2IIIB has been reported as a pathogen of gladiolus (Takano and Fujii, 1972) and of sugar beet (Watanabe and Matsuda, 1966). Because of stromatinia dry rot, gladiolus is grown on the same field once every 20-25 years. Since AG 2-2IIIB causes disease in both gladiolus and sugar beet, it is evident that cropping gladiolus in short rotation with sugar beet holds a risk for both crops. AG 3, a well known pathogen of potato, was non-pathogenic to bulbous crops in our experiments. Previously, AG 4 was demonstrated to be pathogenic to bulbous crops (Doornik, 1981). The isolates she used in her studies were obtained from glasshouse grown lettuce and iris, which is in line with the plurivorous nature of this anastomosis group. AG 5 has frequently been isolated from bulbous crops (Loerakker and Van Dreven, 1985; Boerema and Hamers, 1988) and is generally considered to be a weak pathogen of a great variety of hosts (Sneh et al., 1991).
36

Characterization
However, O'Sullivan and Kavanagh (1991) demonstrated the pathogenicity of AG 5 isolates to sugar beet seedlings in glasshouse experiments. Their AG 5 isolates were isolated from diseased sugar beet seedlings in the field. R. solani AG 6 and AG BI are generally considered to be non-pathogenic (Sneh et ah, 1991). Recently, AG 5 and 6 were found strongly pathogenic on apple roots and involved in the "apple replant disease" (Mazzola, 1996). To our knowledge, this is the first report which describes AG BI as a pathogen (Table 6). Whether AG 6 and AG BI occur in field-grown flower bulbs is unknown. It is concluded that, in addition to bare patch causing AG 2-t isolates, isolates representing AG 2-2, AG 4 and AG 5 can cause disease to flower bulbs in glasshouse experiments. Since these isolates are pathogenic at higher temperatures and not at lower temperatures, it is anticipated that these AG cause bulb rot rather than bare patch. Once the complex of AG and their impact on bulb production is unravelled, optimal crop rotation schedules, and other methods of environmentally friendly control can be developed.
37

Chapter 3
Identification of Rhizoctonia solani associated with field-grown tulips using ITS rDNA polymorphism and
pectic zymograms

Identification
Identification of Rhizoctonia solani associated with field-grown tulips using ITS rDNA polymorphism and pectic zymograms
Abstrac t
Methods based on internal transcribed spacers (ITS) ribosomal DNA (rDNA) polymorphism and pectic zymograms (ZG) were compared for their use in routine identification of Rhizoctonia solani isolates occurring in flower bulb fields. Thirty three AG 2-t isolates, pathogenic to tulips, could be distinguished from AG 1-IC, AG 2-2IIIB and AG 2-2IV, AG 3 and AG 5 by means of ITS rDNA fragment length and after digestion with EcoR I from AG 1-IB, AG 1-IC and AG 4. AG 2-t isolates and two Japanese isolates, pathogenic to crucifers and tulips, had an estimated fragment size of 710 bp, whereas Dutch AG 2-1 isolates, non-pathogenic to tulips, showed an estimated fragment size of 705 bp on agarose gel. Digestion of AG 2-t and AG 2-1 isolates with EcoR I, Sau3A I, Hoe III and Hinc II revealed four and five distinct ITS rDNA digestion patterns, respectively. In AG 2 isolates 2tR114, 21R14 and 21R61 a heterogeneous digestion pattern, indicating different ITS sequences within an isolate, was found. The observed ITS fragment length polymorphism between isolates pathogenic and non-pathogenic to tulips were considered too small to be used in routine screening of field isolates. Sequencing of AG 2 isolates 21R01, 21R06, 2tR002 and 2tR144 showed a total ITS rDNA fragment length of 715, 713, 714, and 728 bp. As an alternative to ITS rDNA fragment length polymorphism, pectic enzyme patterns were studied using a commercially available vertical gel-electrophoresis system and non-denaturing Polyacrylamide gels amended with pectin. Anastomosis tester isolates AG 1 to AG 11 revealed different ZG. Fifty AG 2-t isolates and four AG 2-1 isolates belonged to a homogeneous pectic zymogram group. We propose to assign AG 2 isolates pathogenic to crucifers and tulip to ZG5-1. AG 2-1 isolates, non-pathogenic to tulip, formed a heterogeneous group with 4 distinct ZG. Pectic zymography provides an easy, quick and unambiguous method for routine identification of large numbers of field isolates. Such a technique is needed for research on the dynamics of Rhizoctonia populations to develop environmentally friendly control measures of rhizoctonia disease in field-grown flower bulbs.
Introduction
Rhizoctonia solani Kühn (Thanatephorus cucumeris (Frank) Donk) is a destructive soil-borne plant pathogen affecting many agricultural crops worldwide (Parmeter, 1970; Ogoshi, 1987). In the Netherlands, the fungus is an important pathogen of potato and sugarbeet, and, during the last three decades, the pathogen has become an increasing problem in field-grown tulips. For environmental reasons, current chemical control has to be reduced and alternative control measures based on the ecology of the pathogen are being developed.
At present, isolates of R. solani are identified according to hyphal fusion with anastomosis tester isolates. Isolates are assigned to one of the current 12
41
Rhizoctonia disease
anastomosis groups (AG), designated AG 1 to AG 11 and AG BI (Sneh et al, 1991; Carling et al, 1994). AG are to some extent associated with cultural characteristics and host range, but within AG considerable variability occurs. AG can be subdivided according to host range, thiamine requirement and DNA homology. In total, 21 AG and subgroups have been identified (Sneh et al, 1996). AG 2 is the only AG of R. solani subdivided according to hyphal fusion frequency (FF) (Ogoshi, 1975; Carling and Sumner, 1992). A FF of 50% and more is regarded as high FF and it occurs only between isolates belonging to the same AG subgroup, whereas a FF of less than 30%, regarded as low FF, may occur between isolates representing different AG subgroups. To date, AG 2-1, AG 2-2 (Ogoshi, 1987), and AG 2-3 (Naito and Kanematsu, 1994) are recognized. Hyphae of isolates of AG 2-2 fuse in low frequency with isolates representing AG 2-1 and AG 2-3. Isolates representing AG 2-3 fuse in high frequency with AG 2-1 isolates, but are designated to AG 2-3 because of thiamine requirement and the host range.
Rhizoctonia disease of flower bulbs may be caused by several anastomosis groups. Isolates of AG 2-t, AG 2-2, AG 4 and AG 5 have been reported pathogenic to flower bulbs (Doornik, 1981; Schneider et ah, 1997). Typical bare patch symptoms in field-grown tulips are caused by a subgroup of R. solani, designated as AG 2-t (Schneider et al, 1997). These AG 2-t isolates affect both cruciferous crops and flower bulbs and, according to FF, are closely related to Dutch AG 2-1 isolates which affect cruciferous crops but not flower bulbs. Single R. solani AG 2-t isolates cannot be distinguished conclusively from AG 2-1 isolates due to high variability in FF. Since pathogenicity tests are laborious and time consuming, alternative identification methods for AG 2-t isolates are required.
Molecular approaches for identification of isolates of R. solani include genomic restriction fragment length polymorphism (Vilgalys and Gonzalez, 1990; Jabaji-Hare et al, 1990; O'Brien, 1994), random amplified polymorphic DNA (Duncan et al, 1993; Yang et al, 1995), polymorphism of the internal transcribed spacer (ITS) of the ribosomal DNA (rDNA) (Liu et al, 1992, 1993, 1995; Liu and Sinclair, 1993; Kanematsu and Naito, 1995), and pulsed field gel electrophoresis (Keijer et al, 1996). Liu et al. (1992) studied ITS rDNA polymorphism of AG 2 and distinguished AG 2-1, AG 2-2IIIB and AG 2-2IV, and two additional subgroups, 2D and 2E. Later, 2E was assigned to AG 3 (Stevens Johnk et al, 1993). Kanematsu and Naito (1995) used ITS rDNA polymorphism to demonstrate AG 2-3 being a genetically distinct subgroup within AG 2. The techniques mentioned revealed a high level of variation between AG, with potential for development of specific markers for AG.
Another technique, pectic zymograms (ZG), has been applied successfully to distinguish subgroups within AG 8. A pectic zymogram comprises a pattern of polygalacturonases, pectine esterases and lyases (Cruickshank and Wade, 1980). The ZG coding system is not analoguous to the AG coding system. For an overview of ZG within AG see MacNish et al (1994). Within AG 8, ZG 1-1 to 1-5 are distinguished which seem to be related to host range and specific disease symptoms in the field (Sweetingham et al, 1986; Neate et al. 1988; MacNish and Sweetingham, 1993). ZG1-1 to ZG1-5 cannot be distinguished by hyphal fusion frequency (Neate et al, 1988). Pectic zymograms are stable and reproducible
42

Identification
(MacNish and Sweetingham, 1993), and relatively easy to accomplish. Cruickshank (1990) reported zymogram patterns for AG 1 to AG 7 and AG BI, including one isolate designated as AG 2-3. This isolate was obtained from cold glasshouse-grown tulips in the Netherlands and should not be confused with the AG 2-3 isolates reported by Naito and Kanematsu (1994). The zymogram pattern of the tulip AG 2-3 isolate differed from the pattern of the tested AG 2-1 isolates. Further use of pectic zymograms for characterization of field isolates of R. solani has thus far been limited to Australia because of the specifically designed equipment which is not commercially available.
A detailed study of the ecology and the population dynamics of bare patch caused by AG 2-t isolates in tulip needs an unambiguous identification method. Pathogenicity tests are time-consuming and too costly to screen the numerous isolates obtained from field-grown flower bulbs. The present paper describes the possible use of ITS rDNA polymorphism and an adapted pectic zymography method for the identification of AG 2-t isolates in routine screening procedures.
Materials and Methods
Fungal isolates A summary of characteristics of R. solani isolates used in this study is presented in Tables 1 and 2. Pure cultures were maintained on Malt Peptone Agar (MPA) slants at 10 °C. MPA contained 15 g Malt extract (Oxoid L39), 1.25 g special peptone (Oxoid L72), and 15 g technical agar (Oxoid L13) per litre of tap water (Van den Boogert and Jager, 1984). Prior to further procedures, isolates were transferred via tap water agar amended with 250 ppm chloramphenicol to a defined nutrient medium (DNM) (Keijer et al, 1996). DNM-medium contained 15 g sucrose, 2 g asparagine, 0.6 g KH2PÓ4, 0.8 g K2HP04, micro salts (2.5 ug ZnS04, 2.5 ug H3BO3, 0.5 ug MnS04 . lH20, 1.7 ug NaFeEDTA, 0.3 ug CuS04.5H20 and 0.1 ug (NH4)6Mo7024.4H20), 0.01 g CaCl2, 1 g MgS04, and vitamins (1 ug thiamin, 1 ug niacin, 20 ng biotin, 0.05 ug Ca-pantothenate, 0.5 ug pyridoxine, and 0.1 ug p-aminobenzoic acid) per litre of ddH20. A solid medium, DNMA, was prepared by adding 1.5% (w/v) technical agar.
Isolation of DNA Thirty three arbitrarly chosen R. solani isolates (Table 1) were transferred from DNMA-plates to a 24 well tissue-culture plate with 1 ml DNM per well and incubated at 23 °C for 3-7 days. For each isolate, DNA was isolated as described in Keijer et al (1996). The mycelium was freeze-dried overnight, pulverized with a pestle in a reaction tube, suspended in extraction buffer (50 mM Tris-HCl, 100 mM EDTA and 1% sodium dodecyl sulphate), and incubated on ice for 5 min. Proteins and cell debris were precipitated by centrifugation for 10 min at 14000 rpm (Eppendorf 5414S).
43

Rhizoctonia disease
Table 1. Codes and origins of Rhizoctonia solani AG 2-t isolates used in this study.
IPO-code1
2tR002
2tR003
2tR004
2tR005
2tR006
2tR0073
2tR008
2tR009
2tR101
2tR102
2tR103
2tR104
2tR105
2tR106
2tR107
2tR108
2tR109
2tR110
2 tR l l l
2tR112
2tR113
2tR114
2tR115
2tR116
2tR117
2tR118
2tR119
2tR120
2tR121
2tR122
2tR123
2tR124
Cultivar2
Red Riding Hood
Balalaika
Tulipa kaufmanniana
Tulip
Verdi
Golden Apeldoorn
Tulip
Apeldoorn
Varinas
Varinas
Halcro
Halcro
Menton
Menton
Estella Rijnveld
Giant Parrot
Giant Parrot
Giant Parrot
Inzell
Inzell
Iris 'White Excelsior'
Iris 'White Excelsior'
Iris 'White Excelsior'
Ixia spp.
Ixia spp.
Leen van der Mark
Leen van der Mark
Leen van der Mark
Leen van der Mark
Judith Leyster
Judith Leyster
Judith Leyster
Site of isolation
Stem
Stem
Stem
Stem
Leaf
Bulb
Stem
Stem
Leaf
Stem
Leaf
Stem
Stem
Soil
Stem
Bulb
Stem
Soil
Leaf
Soil
Stem
Bulb
Soil
Bulb
Stem
Leaf
Stem
Bulb
Soil
Leaf
Stem
Bulb
Location in the Netherlands
Noordwijkerhout
Noordwijkerhout
Hillegom
Hillegom
Hillegom
Honselaarsdijk
unknown
Heemskerk
Breezand
Breezand
Breezand
Breezand
Breezand
Breezand
Julianadorp
Noordwijkerhout
Noordwijkerhout
Noordwijkerhout
Noordwijkerhout
Noordwijkerhout
Heemskerk
Heemskerk
Heemskerk
Heemskerk
Heemskerk
Castricum
Castricum
Castricum
Castricum
St. Paneras
St. Paneras
St. Paneras
44

Identification
Table 1. Continued.
IPO-code1
2tR125
2tR126
2tR127
2tR128
2tR129
2tR130
2tR133
2tR134
2tR135
2tR136
2tR137
2tR138
2tR139
2tR140
2tR142
2tR143
2tR144
2tR145
2tR146
Cultivar2
Gander
Gander
Gander
Pink Supreme
Plaisir
Polo
Hurts Delight
Hurts Delight
Red Riding Hood
Plaisir
AU Baba
Red Riding Hood
Red Riding Hood
Pinoccio
Red Riding Hood
Red Riding Hood
Fashion
Hyacinthus spp.
Hyacinthus spp.
Site of isolation
Leaf
Stem
Soil
Leaf
Leaf
Leaf
Stem
Bulb
Leaf
Stem
Bulb
Leaf
Bulb
Bulb
Leaf
Bulb
Stem
Bulb
Stem
Location in the Netherlands
Breezand
Breezand
Breezand
Anna Paulowna
Anna Paulowna
Lisse
DeZilk
DeZilk
DeZilk
DeZilk
DeZilk
Den Helder
Den Helder
Anna Paulowna
Lisse
Lisse
Lisse
Lisse
Lisse
1 All isolates were collected by J.H.M. Schneider, except isolates 2tR002 through 2tR009 which correspond to LBO codes T8, T10, Til, T12, T13 and PD codes PD 83/114 (CBS 343.84), PD 88/315, PD 82/37, respectively. LBO: Bulb Research Centre, Lisse, the Netherlands; PD: Plant Protection Service, Wageningen, the Netherlands; CBS: Centraalbureau voor Schimmelcultures, Baarn, the Netherlands. 2 Tulip cultivars unless otherwise mentioned. 3 All isolates displayed the same ZG5-1 pattern, except for isolate 2tR007.
45

Rhizoctonia disease
Table 2. Codes, anastomosis group (AG), pectic zymogram group (ZG) and origin of Rhizoctonia solani isolates AG 1 to AG 11 used in this study.
IPO-code.
01R01
01R02
01R03
01R11
01R21
01R31
01R41
21R01
21R04
21R06
21R11
21R12
21R14
21R21
21R31
21R41
21R51
21R61
21R71
21R81
21R91
21R92
21R93
22R01
22R02
22R10
22R11
22R13
22R15
22R16
22R17
AG and subgroup
1-IA
1-IB
1-IC
1
1
1
1
2-1
2-1
2-1
2-1
2-1
2-1
2-1
2-1
2-1
2-1
2-1
2-1
2-1
2-1
2-1
2-1
2-2IIIB
2-2IV
2-2
2-2
2-2
2-2
2-2
2-2
ZG
11-1
11-2
11-3
11-3
11-2
11-2
11-2
5-1
5-1
5-1
5-2
5-2
5-2
5-2
5-3
5-2
n.a.2
5-3
5-3
5-4
n.a.
n.a.
5-1
10-1
10-2
n.a.
n.a.
10-1
10-2
10-2
n.a.
Host
Rice
Sugar beet
Sugar beet
Gladiolus
Carrot
Lettuce
Grass
Pea
Barley
Tulip
Cauliflower
Cauliflower
Cauliflower
Cauliflower
Swede
Swede
Oil-seed
Lily
Turnip rape
Lettuce
Leek
unknown
Potato
Mat rush
Sugar beet
Sugar beet
Sugar beet
Vriesia
Cactus
Calluna
Maize
Origin
Japan
Japan
Japan
the Netherlands
the Netherlands
the Netherlands
the Netherlands
Japan
Japan
Japan
the Netherlands
the Netherlands
the Netherlands
the Netherlands
the Netherlands
the Netherlands
the Netherlands
the Netherlands
the Netherlands
the Netherlands
the Netherlands
the Netherlands
Alaska
Japan
Japan
the Netherlands
the Netherlands
the Netherlands
the Netherlands
the Netherlands
the Netherlands
Original isolate designation
CS-KA
B-19
BV-7
PD 77/679
PD 83/698
PD 80/426
PD 82/674
PS-4
HV
TG-1
PD 80/710
PD 81/228
PD 86/723
PD 86/748
PD 84/36
PD 81/130
PD 80/664
PD 83/866
PD 83/010
PD 83/909
PD 83/303
PD 84/376
F56L
C-96
RI-64
PD 83/585
PD 85/904
PD 83/327
PD 83/774
PD 83/842
PD 89/956
Source1
Ogoshi
Ogoshi
Ogoshi
PD
PD
PD
PD
Ogoshi
PD
Ogoshi
PD
PD
PD
PD
PD
PD
PD
PD
PD
PD
PD
PD
Carling
ATCC 76124
ATCC 76125
PD
PD
PD
PD
PD
PD
46

Identification
Table 2. Continued.
IPO-code.
23R01
23R02
23R03
03R01
03R03
03R04
03R05
03R06
03R08
03R09
03R12
03R13
03R14
03R15
03R16
04R02
04R03
04R06
04R08
04R09
04R10
04R11
04R22
04R61
04R70
04R71
04R90
04R91
04R92
AG and subgroup
2-3
2-3
2-3
3
3
3
3
3
3
3
3
3
3
3
3
4HG-I
4 HG-II
4
4
4
4
4
4
4
4
4
4
4
4
ZG
6-1
6-1
6-1
7
7
7
7
7
7
7
7
7
7
7
7
8-1
8-2
n.d.3
n.a.
n.a.
n.a.
8-2
8-2
n.a.
n.d.
n.a.
8-1
8-1
8-1
Host
Soybean
Soybean
Soybean
Potato
Potato
Potato
Potato
Potato
Potato
Potato
Potato
Potato
Potato
Potato
Potato
Peanut
Sugar beet
Iris
Iris
Lettuce
Lettuce
Bean
Iris
Spinach
Anemone
Cucumber
Spinach
Tomato
Tomato
Origin
Japan
Japan
Japan
Japan
the Netherlands
the Netherlands
the Netherlands
Japan
Germany
Norway
the Netherlands
the Netherlands
the Netherlands
the Netherlands
the Netherlands
Japan
Japan
the Netherlands
Israel
the Netherlands
the Netherlands
the Netherlands
the Netherlands
the Netherlands
the Netherlands
the Netherlands
USA
Bulgary
Bulgary
Original isolate designation
R-6
H4-38-S-1
H5-307
ST-11-6
36 AB65
09 ABa
05 AHa
ST9
CBS 363.82
R3/Sundheim
PD 80/102
PB3
3R11
3R12
3R13
AH-1
Rh-165
12
IYot
SI
S2
PD 82/576
17
PD 83/418
PD 84/659
PD 84/762
APK-SP1
149
106C3
Source1
Naito
Naito
Naito
Ogoshi
Jager
Jager
Jager
PD
Keijer
Keijer
PD
Boogert
Keijer
Keijer
Keijer
Ogoshi
Ogoshi
LBO
LBO
LBO
LBO
PD
LBO2
PD
PD
PD
Keinath
PD
PD
47

Rhizoctonia disease
Table 2. Continued.
IPO-code.
05R01
05R02
05R06
05R07
05R21
05R31
06R01
06R02
07R01
08R15
08R23
08R31
08R45
08R51
09R10
09R12
ÏOROI
11R02
AG and subgroup
5
5
5
5
5
5
6HG-I
6GV
7
8
8
8
8
8
9
9
10
11
ZG
12
12
12
12
12
12
13
13
14
1-1
1-2
1-3
1-4
1-5
15-1
15-2
9
3
Host
Soybean
Soil
Lily
Iris
Maize
Soil
Soil
Soil
Soil
Wheat
Barley
Barley
Barley
Triticali
unknown
unknown
Barley
Lupine
Origin
Japan
Japan
the Netherlands
the Netherlands
the Netherlands
the Netherlands
Japan
Japan
Japan
Western Australia
Western Australia
South Australia
Western Australia
Western Australia
Alaska
Alaska
USA
Western Australia
Original isolate designation
GM-10
CBS 143.82
PD 82/741
PD 82/384
PD 83/481
PD 84/865
OMT-1-1
NKN-2-1
HO-1556
93087
92630
1512
93305
91069
V12M
F57M
w-395
R1352
Source1
Ogoshi
PD
PD
PD
PD
PD
Ogoshi
Ogoshi
Ogoshi
MacNish
MacNish
MacNish
MacNish
MacNish
Carling
Carling
ATCC 76107
Carling
1 PD: Plant Protection Service, Wageningen, the Netherlands; LBO: Bulb Research Centre, Lisse, The Netherlands. 2 n.a.: Not assigned to ZG. 3 n.d.: Not determined.
The supernatant was transferred to a new tube and extracted once with phenol-chloroform-isoamylalcohol (25:24:1) and once with chloroform-isoamylalcohol (24:1) (Sambrook et al, 1989). RNA was removed by treating the samples with RNAse A (final concentration 50 ug/ml) for 30 min at 37 °C. DNA was precipitated by adjusting the samples to 250 mM NH4-acetate, addition of 2 vol of ice cold 96% ethanol, incubation for 10 min at -80 °C and centrifugation for 20 min at 4 °C. The pellet was rinsed with ice cold 70% ethanol and centrifuged for 20 min at 4 °C After drying, the DNA was resuspended in 50 ul ddHzO and stored until further use at -20 °C.
48

Identification
ITS rDNA polymorphism DNA amplification was slightly modified after Innis and Gelfand (1991) and Liu et al. (1992). PCR reaction tubes contained 1.5 mM MgCl2, buffer (50 mM KCl, 10 mM Tris/HCl (pH 8.3)), 0.05% Wl (Life Science Technologies, Bethesda, MD), 60 uM of each dATP, dCTP, dGTP, dTTP, 0.6 mM each of primer ITS1 5'(TCCGTAGGTGAACCTGCGG)3' and ITS4 5'(TCCTCCGCTTATTGATATGC)3' (White et al, 1991; Liu et al, 1992), 2 U Taq-DNA polymerase (Life Science Technologies (510-8038 SD)), and approximately 1-10 ng R. solani DNA. In all PCR-reaction sets a negative control without DNA was included.
PCR reaction mixtures were covered with oil to prevent evaporation and incubated in a thermal cycler (Perkin Elmer Cetus) using the following conditions: DNA- denaturization for 2 min at 94 °C, 30 cycles of DNA-denaturization for 1 min at 94 °C, primer annealing for 1 min at 57 °C and primer extension for 2 min at 72 °C. DNA-amplification was terminated by primer extension for 10 min at 72 °C and final incubation at 4 °C. DNA-amplification products (10 ul per sample) were loaded on a standard agarose gel (1.5%), separated by electrophoresis in 0.5x TBE buffer (45mM Tris-borate and 1 mM EDTA), stained with ethidium bromide, and visualised under UV light (Sambrook et al, 1989).
Differentiating digestion patterns of ITS rDNA fragments between anastomosis groups and between anastomosis subgroups were screened for by using restriction endonucleases Alu I, BamH I, Bgl II, Cla I, Dde I, Dra I, EcoR I, EcoR V, Hae III, Hinc II, Hinfl, Hha I, Kpn I, Mbo I, Msp I, Pst I, Pvu II, Rsa I, Sau3A I, Sst I, Sst II, Sty I, Taq I, Xba I, and Xho I under conditions as recommended by the manufacturer (Life Science Technologies or New England Biolabs). DNA restriction fragments were separated using agarose gel electrophoresis (Sambrook et ah, 1989) and visualised as described above.
Sequence analysis of the ITS region R. solani isolates 21R01, 21R06, 2tR002 and 2tR144 were used to study genetic variation in the ITS region as described previously for AG 4 (Boysen et al, 1996). First, single stranded DNA was obtained by asymmetric PCR and the use of primers ITS4 and ITS5 5'(GGAAGTAAAAGTCGTAACAAGG)3' in a 50:1 ratio (Gyllensten and Ehrlich, 1988), and alternatively, ITS1F 5'(CTTGGTCATTTAGAGGAAGTAA)3' and ITS4B 5'(CAGGAGACTTGTACACGGTC)3' (Gardes and Bruns, 1993). For each reaction, a 50 ul mixture contained 10 ng genomic DNA, 20 pmol one primer, 0.4 pmol another primer, 1.25 U Taq DNA polymerase (USB, Cleveland Ohio), 10 mM Tris-HCl (pH 8.3), 50 mM KCl, 2.5 mM MgCl2, 0.2 mM of each dATP, dCTP, dGTP and dTTP (Pharmacia, Sweden), 0.0025% Tween 20, and 10% dimethyl-sulphoxide (DMSO) in ddH 20 and was covered with mineral oil. Amplification was performed in an automated thermal cycler (Perkin Elmer Cetus Corp.) using the following conditions: initial denaturation for 2.5 min at 94 °C, followed by 40 cycles of denaturation for 15 sec at 94 °C, annealing for 30 sec at 53 °C for ITS4/ITS5 and at 55 °C for ITS1F/ITS4B, and 1.5 min extension at 72 °C. DNA-amplification was terminated by a final extension for 10 min at 72 °C and incubation at 4 °C. Prior to sequencing, excess primers and nucleotides were
49

Rhizoctonia disease
Table 4. Estimated length of digestion fragments of the ITS-region of Rhizoctonia solani AG 2-t, AG 2-1 and AG 4 isolates.
AG ITS- Restriction enzyme Isolates
type1 EcoRI Hae III Sau3A I Hmc II
2-t I 345 525 275 440 2tR002 2tR003 2tR004 2tR005 2tR008 285 120 250 270 2tR101 2tR102 2tR104 2tR105 2tR106 80 65 145 2tR107 2tR112 2tR114 2tR116 2tR117
40 2tR118 2tR120 2tR124 2tR125 2tR126 2tR127 2tR129 2tR130 2tR133 2tR134 2tR135 2tR139 2tR142 2tR143 2tR145 21R01 21R06
III
IV
2-1
III
IV
345 285 80
370 335
330 295 80
330 295 80
330 295 80
330 295 80
330 295 80
370 335
525 120 65
585 120
585 520 120 65
520 120 65
520 120 65
705
520 120 65
585 120
275 250 145 40
270 250 145 40
270 250 145 40
270 250 145 40
270 250 145 40
270 250 145 40
275 250 145 35
270 250 145 40
710 440 270
435 270
705
705
705 435 270
705
705
705
2tR144
2tR128
2tR007
21R12 21R21 21R41 21R91
21R14 21R71 21R31 21R92 21R61
21R11
21R51
21R81
52

Identification
Table 4. Continued
AG ITS- Restriction enzyme Isolates type1 EcoRI Hae III Sau3A I Hindi
HG-I n.d.2 590 n.d. 505 120 85
HG-II n.d. 590 n.d. 120
III n.d. 590 n.d. 120
IV n.d. 605 n.d. 115
430 280
710
430 280
720
04R02 04R61 04R08 04R91 04R09 04R10
04R03 04R22
04R70 04R71
04R11
1 The authors do not intend to present these ITS types as subgroups of AG, but use the codes in this paper for convenience only. 2 n.d.: Not determined.
Results
ITS rDNA polymorphism After amplification of the ITS rDNA using primers ITS1 and ITS4 the undigested DNA fragment lengths of the tested isolates varied from 685 to 740 bp (Table 3). One isolate representing AG 2-t, with an estimated fragment length of 710 bp, could clearly be distinguished from anastomosis tester isolates representing AG 1-IC (685 bp), AG 2-2IIIB (740) and 2-2IV (740 bp), AG 3 (700 bp), and AG 5 (690 bp). Estimated fragment lengths for anastomosis tester isolates AG 1-IA and IB, AG 2-1, and AG 4 and the AG 2-t isolate were approximately 710 bp under our laboratory conditions. After digestion with EcoR I, AG 2-t isolates could readily be distinguished from the AG 1 and AG 4 isolates. The AG 2-t isolate rendered the same digestion pattern as AG 2-1. An overview of digestion patterns and estimated fragment lengths is presented in Table 3. Endonucleases BamH I, Bgl II, EcoR V, Kpn I, Pst I, Rsa I, Sst I, Sst II, Xba I, and Xho I were not able to digest the amplified ITS region.
Comparison of 33 AG 2-t and 14 AG 2-1 isolates showed 2 Japanese isolates, 21R01 and 21R06, and 32 AG 2-t isolates with an estimated rDNA fragment size of 710 bp and 12 Dutch AG 2-1 isolates and 2tR128 with an estimated fragment size of 705 bp. No length polymorphism of amplified rDNA products was observed within the screened Dutch AG 2-1 and AG 2-t isolates,
53

Rhizoctonia disease
except for 2tR128. Within the AG 2-t and AG 2-1 isolates four and five ITS-types, respectively, could be distinguished after digestion with EcoR I, Sau3A I, Hae III and Hinc II (Figure 1; Table 4). Japanese isolates 21R01 and 21R06 revealed the same ITS-type as AG 2-t isolates. Digestion with EcoR I and Sau3A I yielded ITS rDNA-fragments for all tested AG 2-t and AG 2-1 isolates, with slightly different fragment sizes, thus distinguishing AG 2-t, 21R01, 21R06 and 21R51 from other AG 2-1 isolates and 2tR128. Isolate 2tR144 showed a double digestion pattern when digested with Hinc II. Isolates 2tR128 and 21R81 showed the same digestion pattern for EcoR I and Hae III, thus distinguishing these isolates from AG 2-t and AG 2-1 isolates. Isolate 2tR128 can be distinguished from 21R81 by Hinc II. Isolate 2tR007 revealed a pattern different from the other isolates after digestion with Hae III.
Within the 12 Dutch AG 2-1 isolates five ITS-types were distinguished according to restriction fragment sizes. Use of Hinc II revealed heterogeneous fragment digestion patterns in isolates 21R14, 21R31, 21R61, 21R71, 21R92, whereas in isolates 21R11, 21R12, 21R21, 21R41, 21R51, 21R81, and 21R91 no digestion occurred.
R. solani AG 2-2 isolates 22R01 and 22R02 showed an estimated ITS rDNA fragment length of 740 bp. Endonuclease Msp I differentiated AG 2-2IIIB (740 bp) from AG 2-2IV (580 and 160 bp) (Table 3). Isolates 22R10, 22R11, 22R15, and 22R16 also had a rDNA fragment length of 740 bp, whereas isolate 22R17 had a smaller (715 bp) rDNA fragment (data not shown). Isolates 22R10, 22R11, 22R15 and 22R16 showed two restriction fragments (580 and 160 bp) after digestion with Msp I. Isolate 22R13 was not digested by Msp I (data not shown).
The estimated length of the amplified rDNA fragment of AG 4 was approximately 710 bp for all tested isolates except for isolate 04R11, with an estimated ITS fragment length of 720 bp. Digestion with Hinc II and Hae III revealed three subgroups within AG 4. Hinc II gave two digestion patterns representing AG 4 HG-I and AG 4 HG-II. Hae III also showed two digestion patterns of which the Hae III pattern for 04R03 also occurred for isolates 04R70 and 04R71 (Table 4).
The estimated length of the amplified rDNA fragment was 700 bp for the AG 3 and 690 bp for the AG 5 isolates. No rDNA polymorphism was observed after digestion with endonucleases Hae III, Sau3A I and Hha I among the AG 3 and AG 5 isolates listed in Table 2. Of the tested endonucleases Dra I did not digest any of the tested AG 5 isolates.
Alignment of sequences Direct sequencing of PCR products showed a total ITS length of 715, 713, 714, and 728 bp for Japanese isolates 21R01 and 21R06 and Dutch AG-2-t isolates 2tR002 and 2tR144, respectively (Figure not shown). The ITS-b length was 273 nucleotides for isolates 21R01, 21R06, and 2tR002 and 279 bp for isolates 2tR144 (Figure 3). Furthermore, differences in nucleotides were observed thus enabling to distinguishtwo AG 2-t isolates from two Japanese AG 2-1 isolates.
54
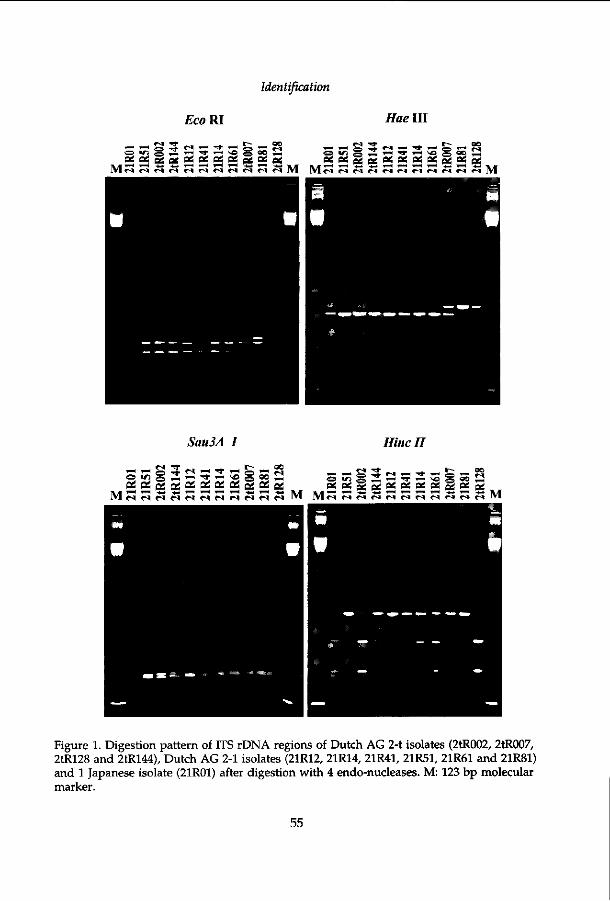
Identification
Eco RI Hae III
»—"• 1~* <—< -^f- C - l ^ ™ ^ T »"H , 1 T—" «^J
M M «^r^r^r^r^r - J t c^^c^^S IM <s vi s »-H *~* ^ ,—• *fi s » y
Sau3A 1 ffinc II
*—• ' "H £», . - * C** *"^ ^ 1"H ^ •—» —<•
M S « g 2 : 2 5 2 3 g S s
M
Figure 1. Digestion pattern of ITS rDNA regions of Dutch AG 2-t isolates (2tR002, 2tR007, 2tR128 and 2tR144), Dutch AG 2-1 isolates (21R12, 21R14, 21R41, 21R51, 21R61 and 21R81) and 1 Japanese isolate (21R01) after digestion with 4 endo-nucleases. M: 123 bp molecular marker.
55

Rhizoctonia disease
e as
e BS
e QÜ
e a!
e e 12 as f-< Cl
« 5 « o S o £ * 5£ f*> -W l— «S M (M
CÎ ^ * »•-< »-H ^ H *—i o « •*!• vo t - oo - -os as PS PS »
90 O ° 2 ° as as as
r< »S M
2 2 2 S é
s i § os os as
S! Ö Ö Ö « O f i — ' C ' H O N O S a S C Q O S ï p! 99 ES K ï OS i r i v o v o r - oo oo oo ao oo c\ o\
9. =5 as ce
0 PB • *
Ü PB <» V I
O PB vo
> 0 ^o 00 00 00 00
a. H Os
H
ao as i *-* ^ " ^ * i-« ^H *-H r i H H ID in
Figure 2. Pectic zymograms of Rhizoctonia solani anastomosis tester isolates, some AG 2-1 and AG 2-t isolates and isolate 2tR007 obtained with a commercial available vertical gel-electrophoresis system. The AG is displayed on top and the ZG on the bottom of the gels. Isolate 2tR007 was unassigned to zymogram groups.
56

Identification
Pectic zymograms The AG 2-t isolates except for 2tR007 (Table 1) and isolates 21R01, 21R04, 21R06, and 21R93 (Table 2) formed a homogeneous zymogram group (Tables 1 and 2; Figure 2). Twelve Dutch AG 2-1 isolates formed a heterogeneous group with five distinct ZG (Table 2; Figure 2). Isolate 2tR007 revealed a ZG different from these AG 2-t and AG 2-1 isolates (Figure 2).
Using the zymogram technique, AG 1 isolate 01R11 could be assigned to AG 1-IC, and isolates 01R21, 01R31 and 01R41 to AG 1-IB (Table 2). Among the tested AG 2-2 isolates, two ZG represented the known AG 2-2IIIB and AG 2-2IV (Table 2). Two other isolates showed a different ZG pattern but remained unassigned to a ZG (Table 2). Within AG 4 two ZG could be distinguished in accordance with rDNA homology subgrouping (Kuninaga and Yokosawa, 1984) and some isolates showed a different ZG pattern which remained unassigned (Table 2). No ZG heterogeneity was observed within the tested AG 3 and AG 5 isolates. Isolates of AG 6 to AG 11 showed different ZG, which coincided with the known AG and subgroups (Figure 2).
Discussion
ITS rDNA polymorphism within AG 2 For the development of control measures of bare patch in field-grown flower bulbs based on the ecology of the pathogens, unambiguous identification of the causal AG 2-t isolates is essential. R. solani AG 2 is the only AG that is subdivided by hyphal fusion frequency. Due to great variation in hyphal fusion frequency, each of AG 2-t isolates cannot be distinguished from Dutch AG 2-1 isolates nonpathogenic to tulips (Schneider et al, 1997). PCR showed small differences in ITS rDNA fragment size between AG 2-t isolates, pathogenic to crucifers and tulips, and Dutch AG 2-1 isolates, non-pathogenic to tulips (Tables 3 and 4). Hence, PCR of ITS rDNA supports previous results on hyphal fusion frequency and pathogenicity to assign AG 2 isolates infecting tulips to the subgroup of AG 2-t (Schneider et al, 1997). In our ITS-PCR experiments, AG 2-t isolates could not be distinguished from the Japanese anastomosis tester isolate (21R01) (Table 3; Figure 1), whereas Dutch AG 2-1 isolates differed slightly in ITS rDNA fragment length from the 21R01 isolate. Kanematsu and Naito (1995) reported their AG 2-3 isolates to have the same ITS rDNA fragment length (690 bp) as their AG 2-1 isolates. Our limited set of AG 2-t isolates displayed a high degree of ITS rDNA polymorphism and we anticipate more variation when screening numerous field isolates. Such variation may be useful for the study of the population structure of the pathogen but not for routine identification procedures. In the analysis of ITS rDNA polymorphism some AG 2-1 and AG 2-t isolates showed heterogeneous fragment digestion patterns using restriction endonuclease Hinc II (Table 4; Figure 1). The heterogeneous fragment digestion pattern seemed to consist of equal ratios of two patterns. Neither the use of additional enzyme, nor the use of
57

r- r- r- r-
En « E * *
O «
CN ^ H «> O •"* O O O >H oi oi oi ps rH iH -P 4J D N W OJ
CN ^ " H V O O ^ f O O O T-t Pi pi Pi pi H H JJ P CN CN CN (N
CN "3< H l D O - J O O O tH pi Pi Pi a r l H Ü Ü CN CN CN CN
CN • * i-H lO O "tf O O O iH Pi oi a; Pi rH ,H t ) AJ CN CN (N CN
CN *tf r-i \D O *& O O O H Pi Pi oi oi rH rH ±J U CN CN (N tN
S s « » g * - o o S s g g CL, o ™
J ? <U 4) fcl
O 'tn \ Ö O) £ H O G
t/J CÖ n>
W)H « co « tu S
•43 U „g - a
* * * r», 4 - , en
« 2 CD S P. .
a Si
&-&.S-S * '•? M -S
JD -tv « eu
-t-» , - ; T—I » I N Ç tN •a ^ o eu
t«
ÇU 41 tN u S « _ a q ta X P Ci —» °> " " în *
•*< Ö.K "Q •g S " <
fi o o JS 60 S2 ü- o ^ H ' , en ^ -^ to •**
c a
>a . S ai •a .-a % tn
ai s •S! O tC *J3 o .a .s a
tn
•y • * !
o tu
TS • S <l
Identification
extended incubation periods changed the digestion pattern, thus excluding partial digestion. Contamination was excluded since independent DNA isolations from pure cultures, that were repurified several times by hyphal tip transfer over WA with antibiotics (250 ppm chloramphenicol), by two individuals gave the same results. The heterogeneous fragment digestion pattern occurred only with Hinc II and not with other endonucleases. Heterogeneous fragment digestion patterns were not reported previously for R. solani, but different ITS sequences within an individual isolate were reported for JR. solani AG 4 (Boysen et al, 1996). Different ITS sequences within a single individual also have been reported for the nematode Meloidogyne hapla (Zijlstra et al, 1995). The three different heterogeneous digestion patterns that can be distinguished within R. solani AG 2 seem to appear at random and are not correlated with origin or pathogenicity. The occurrence of heterogeneous fragment digestion patterns can be explained by the heterokaryotic nature of R. solani, with one nucleus differing slightly from the other. It may indicate a step in evolutionary divergence. Whether this heterokaryotic nature originates from 'bridging phenomena' between isolates of different subgroups or is the result of genetic variation triggered by the teleomorph is unknown and requires further study. Another explanantion may be that different chromosomes comprise different ITS sequences.
Identification ofAG-2 isolates by means of pectic zymograms Pectic zymography has been successfully used for the identification of numerous field populations of R. solani (Neate et al., 1988; Sweetingham, 1990; MacNish et al, 1994). They used a non-commercial available horizontal poly-acrylamide gel system (Cruickshank and Wade, 1980). We made use of commercially available vertical poly-acrylamide gel system, thus making the zymogram grouping method accessible outside Australia. Using our ZG technique, AG 2-t isolates could easily be distinguished from AG 2-1 isolates which were non-pathogenic to tulips (Figure 2). R. solani AG 2-t isolates belonged to a homogeneous ZG that also included AG 2-1 isolates 21R01 and 21R06 originating from Japan (Figure 2) and isolate 21R93 from Alaska. Isolates 21R01 and 21R06 were pathogenic to tulips in greenhouse experiments (Schneider, unpubl.). The pathogenicity of isolate 21R93 has not been tested. ZG-typing is in agreement with our ITS rDNA results and show that our adapted pectic zymography is a reliable identification method for bare patch causing isolates of R. solani. The method can be used for research on Rhizoctonia populations and their dynamics e.g. in field experiments aimed at the development of environmentally friendly control measures of rhizoctonia disease in flower bulb production.
AG 2 isolates pathogenic to crucifers and flower bulbs constitute a distinct ZG within AG 2. In previous studies AG 2-1 isolates pathogenic to crucifers and legumes were shown to belong to ZG5 and ZG6, respectively (Sweetingham, 1990; MacNish et al, 1994). In addition, Cruickshank (1990) reported two isolates (21R01 and 21R06; Table 1) with the general characteristics of ZG5 which also were pathogenic to crucifers and tulips (Schneider et al, 1997; Schneider unpubl.). For these reasons and for consistency with the ZG-typing within AG 8, we propose to assign R. solani AG 2 isolates, affecting crucifers and tulips, to ZG5-1. Dutch
59
Rhizoctonia disease
R. solani AG 2-1 isolates affecting crucifers but not tulips gave different ZG patterns (Table 2, Figure 2). Three soybean leaf infecting AG 2-3 isolates (Naito and Kanematsu, 1994) gave a homogeneous ZG different from other AG 2 isolates. AG 2-1 isolates affecting legumes and barley in Australia show a ZG6 pattern (Sweetingham, 1990; MacNish et al, 1994). Since ZG6 isolates were not included in our study, their relation to AG 2-3 infecting soybean remains unclear. We propose to assign AG 2-3 isolates to ZG6-1.
R. solani isolate 2tR007 was confirmed to belong to a ZG other than isolates 21R01 and 21R06. Isolate 2tR007, isolated from cold glasshouse-grown tulips in the Netherlands, was previously designated as AG 2-3 (Cruickshank, 1990). Cruickshank also described isolate 2tR007 and two R. solani isolates obtained from Brassica oleracea in New Zealand, to have the same ZG pattern, but different from 21R01 and 21R06 in his study. Cruickshank (1990), however, did not assign any of the isolates to a ZG. In our ZG screening of isolates obtained from tulips, isolate 2tR007 gave a ZG-pattern different from all other isolates. Our ITS rDNA digestion pattern confirmed the genetic relation of isolate 2tR007 to AG 2 isolates. The pathogicity of isolate 2tR007 to tulips has not been tested, and therefore it remains unclear whether this isolate belongs to AG 2-t.
Identification of subgroups in AG 2 and AG 4 The distinction of AG 2-1 and AG 2-2 on the basis of low hyphal fusion frequency coincides with marked differences in DNA base homology (Kuninaga and Yokosawa, 1982) and ITS rDNA fragment lengths and polymorphism (Liu et al,, 1992) (Table 3), pectic zymography (Figure 2), cultural characteristics, and host range (Ogoshi, 1987). In addition, it has been observed that low-frequency fusion, bridging, can occur between AG 2 isolates and isolates belonging to AG 3, AG 8, AG 11 and AG BI (Kuninaga et ai, 1979; Neate et al, 1988; Carling et al, 1994; Carling, 1996). Therefore, it is questionable whether hyphal fusion frequency remains a reliable criterion to determine subgroups within AG 2 and whether AG 2-2 still has to be regarded as a subgroup of AG 2, rather than a distinct AG.
The clear distinction of biologically relevant subgroups within AG 2-1 using pectic zymography supports the suggestion of MacNish et al (1994) to use the ZG system for subgrouping within AG, especially since ZG do not seem to cross AG boundaries. ZG typing, both more practical and clearer than the use of hyphal fusion frequency, may be used as an alternative for other subgrouping techniques e.g. DNA homology or host range. An overview of zymogram groups distinguished in this paper is given in Table 2 and Figure 2. AG 2-2 is subdivided into AG 2-2IIIB and AG 2-2IV on the basis of pathogenicity. This division is supported by DNA base sequence homology (Kuninaga and Yokosawa, 1982) and ITS rDNA polymorphism (Liu et al, 1992; Table 3). Indeed, these two groups represent distinct ZG (Figure 2). In addition, one other ZG-pattern within AG 2-2 could be identified using our pectic zymography (Table 2). Within AG 4, subgroups AG 4 HG-I and AG 4 HG-II are distinguished on the basis of DNA-homology (Kuninaga and Yokosawa, 1984). This division was supported by our ITS rDNA polymorphism (Table 4). The HG-I and II subgroups were shown to belong to different ZG (Figure 2).
60

Identification
R. solani AG 2 isolates affecting both tulips and crucifers had the same ZG, regardless of their geographic origin. Sequence analysis revealed substantial differences between two AG 2-t and two Japanese AG 2-1 isolates. It is unclear whether AG 2 populations with the same ZG originated from the same gene centre or evolved independently at different geographical sites. Sequence data and phylogeny of AG 2-t and AG 2 isolates from different geographical areas are to be presented elsewhere (Salazar et al, unpubl.).
Our data underline the observations of Sweetingham et al. (1986) that ZG may be related to pathogenicity. However, conclusive experiments relating ZG to pathogenicity are lacking. Pectic zymograms comprise the patterns of different isozymes of polygalacturonase and pectin esterase (Cruickshank and Wade, 1980) and are supposed to reflect different genes. Polygalacturonase is a major enzyme in tissue maceration caused by R. solani (Bateman, 1963), produced in response to host exudates (Brookhouser and Weinhold, 1979) and related to virulence (Geypens, 1978). To justify the subgrouping of ZG within AG to pathogenicity and disease requires characterization of genes encoding different isozymes of polygalacturonase and subsequent confirmation of the role of polygalacturonase in pathogenesis. The clearance of such genes may provide molecular markers for the detection of host related R. solani isolates in plant material and in soil and the study of the dynamics of specific isolates in space and time.
61
Chapter 4
Exploring differential interaction of Rhizoctonia solani AG 2-t isolates on tulip cultivars

Differential interaction
Exploring differential interaction of Rhizoctonia solani AG 2-t isolates on tulip cultivars
Abstract
In 1994 and 1995, experiments were conducted to explore differential interaction of R. solani AG 2-t isolates for tulip cultivars in artificially infested soil under different experimental conditions. Comparison of residual variances obtained by ANOVA and AMMI showed that open-air experiments should be used for interpretation of isolate by cultivar interaction. In the biplot derived after AMMI-analysis over isolates by year and cultivars, isolates tended to occur in year clusters indicating a differential influence of year on disease expression. Two isolates occurred in isolate clusters thus accounting for a significant year by isolate by cultivar interaction. Three isolates were highly aggressive on all tested tulip cultivars and occurred in one cluster. Three contrasting isolates, low in aggressiveness, clustered too. Quantitative differential interaction patterns were found, but were significantly influenced by greenhouse conditions and type of inoculum carrier. Isolates of AG 2-1, AG 2-2, and AG 4 did not cause severe stem and leaf infection of tulips in an open-air experiment when the sprouts grew through the soil. At harvest, however, they had produced some lesions on the stems at the soil surface and some reduction of bulb weight. On average, reduction of fresh weights of bulb clusters by AG 2-1, AG 2-2 and AG 4 isolates was less than caused by AG 2-t isolates. In conclusion, differential interaction of AG 2-t isolates on tulip cultivars does occur, though it cannot yet be disentangled completely. We recommend that tulip cultivars are screened for their susceptibility to AG 2-t under commercial field conditions in conjunction with a thorough characterization of the indigenous R. solani population.
Introduction
The plant pathogenic fungus Rhizoctonia solani Kühn (teleomorph: Thanatephorus cucumeris (Frank) Donk) affects agricultural and horticultural crops world wide (Sneh et al, 1996). Isolates of the species R. solani vary considerably in cultural characteristics, host range and nutrient requirements. Since 1970 it was recognized that T. cucumeris is not a single species but a collective species (Talbot, 1970) composed of genetically isolated groups (Anderson, 1982). The most widely used and generally accepted method for identifying subgroups within R. solani is based on hyphal anastomosis reactions (Carling, 1996). To date, twelve anastomosis groups (AG), AG 1 to AG 11 and AG BI, are recognized (Sneh et al, 1996) which are more homogeneous in cultural characteristics and pathogenicity (Keijer et al, 1997) than the species at large. Studies using various DNA technologies support the AG concept and in addition have revealed more genetic variability within AG and AG subgroups. No genetic evidence for host specificity related to AG has
65

Rhizoctonia disease
been presented thusfar. Within AG, isolates vary in aggressiveness to specific cultivars and cultivars vary in susceptibility to specific isolates (Kaminski and Verma, 1985; Yitbarek et al, 1987; Carling and Leiner, 1990).
Tulips are field-grown for saleable bulbs, planting stock and cut flowers. The majority of cut flowers is produced in the greenhouse under forced conditions, meaning that the flowering process is controlled by specific temperature treatments. Tulip cultivars are classified according to their botanical origin, the perianth morphology and the flowering period (Classified List, 1987). Tulipa belongs to the Liliaceae family (Monocotyledonae). The genus Tulipa is divided into two major subgroups, the Leiostemones and Eriostemones. Most of today's cultivated tulips are placed in T. gesneriana, section Tulipa, subgenus Leiostemones. Two garden tulips, T. turkestanica and T. tarda belong to the section Biflores of the subgenus Eriostemones, and they do not intercross with T. gesneriana (Van Eijk et al, 1991). Since the 17th century, breeders selected Tulipa hybrids according to flower characteristics and forcing ability rather than to disease resistance (Le Nard and De Hertogh, 1993). The long juvenile period and the slow propagation of tulips seriously hamper breeding, it takes about 25 years to produce a new cultivar. Criteria for early selection of resistance to Fusarium oxysporum f.sp. tulipae in tulips have been developed (Van Eijk and Leegwater, 1975).
In the Netherlands, flower bulbs have been grown traditionally in the coastal area around Lisse, province South-Holland. More recently, tulips are also grown in the coastal area in the northern part of the province North-Holland and in smaller areas in other parts of the Netherlands. Tulips are grown in short rotations such as tulip-narcissus-hyacinth-dahlia (iris) around Lisse and tulip-narcissus-crocus-lily in the new growing area of North-Holland. In the Zuyderzee Polders tulips are grown in six year rotations with e.g. potato, wheat and sugar beet.
In field-grown tulips typical bare patches are caused by R. solani AG 2-t (Schneider et al, 1997a). Patches develop at low temperatures when the sprouts are growing through the soil. Depending on the severity of sprout infection, development of daughter bulbs will be hampered and upon harvest the bulb cluster may have decayed completely. Bulbrot, developing at higher soil temperatures later in the growing season, or in the greenhouse, may be caused by AG 2-t or other AG (Doornik, 1981, Schneider et al, 1997a). The impact of saprophytic Rhizoctonia's, capable of invading the plant without causing symptoms, and of weak pathogens, e.g. AG 5 on potato, on flower bulb and bulb flower production is not known.
Rhizoctonia bare patch can be controlled by disinfecting bulbs and by full field application of fungicides e.g. tolclophos-methyl. For environmental reasons, chemical input has to be reduced and control strategies based on the ecology of the pathogen are being developed (Dijst and Schneider, 1996). Another control strategy may be breeding for disease resistance. Differences in susceptibility of a limited group of tulip cultivars to R. solani and differences in aggressiveness have been demonstrated in greenhouse experiments (Doornik, 1981; Schneider et al, 1997a), not under field conditions. Thus far, however, tulip cultivars with
66

Differential interaction
resistance to R. solani are not known, and ranking of tulip cultivars for susceptibility to rhizoctonia disease under field conditions is based on farmers' experiences (Van Keulen en Van Aartrijk, 1993).
A procedure to screen tulip cultivars for susceptibility to AG 2-t isolates must take into account any variability for aggressiveness within a group of field isolates. Aggressiveness is the ability of a pathogen to attack a host and therefore it is influenced by the host's susceptibility. Aggressiveness is quantifiable as the degree of attack (Commissie, 1997) and is usually assessed on a range of host genotypes (Bos and Parlevliet, 1996). We consider differential interaction when the ranking of aggressiveness of isolates differs according to cultivars, with the possible implication of physiological specialization. Engelkes and Windels (1996) reported statistically significant interactions between 17 AG 2-2 isolates and 3 sugar beet cultivars and 3 bean crops in field experiments. For sugar beet a statistically significant between year, cultivar and isolate was found, but not for beans. Schneider et al. (1997a) reported on statistically significant interaction between 11 AG 2-t isolates and three tulip cultivars under greenhouse conditions, which was accounted for by one specific isolate x cultivar combination. Neither of these reports conclusively described differential interaction.
The population structure of R. solani has been described in terms of 'perfect' fusion reactions as "clones" (Ogoshi and Ui, 1983), AG and pectic zymograms (MacNish et al., 1994), and vegatatively compatibility populations (MacNish et al., 1997). AG 2-t isolates constitute a homogeneous anastomosis subgroup of AG 2 (Schneider et a/.,1997a,b). Lysis of hyphae of AG 2-t isolates, however, readily occurs even within hyphae of the same colony (Schneider and Van den Boogert unpub.), thus making anastomosis reactions, perfect and imperfect fusion, difficult to interpret. The objective of this study was to explore differential interaction of AG 2-t isolates on tulip cultivars with the possible implication of physiologic races. The consistency of the differential interaction pattern was studied over two years and over various experimental conditions.
Materials and methods
Fungal isolates and inoculum During a field survey in 1991, R. solani AG-2-t isolates were collected from commercial tulip fields in the Netherlands. Isolates were maintained on malt-peptone agar slants at 10°C, as described previously (Schneider et al, 1997a). Nineteen AG 2-t isolates, from different flower bulb hosts and geographic origins together with two AG 2-1, three AG 2-2 and three AG 4 isolates, were used in this study (Table 1). Inoculum was prepared by growing the isolates on autoclaved oat kernels (Doornik, 1981; Schneider et al, 1997a) or autoclaved perlite particles soaked in liquid malt peptone (PMP) (Van den Boogert and Jager, 1984) for two to three weeks at 20°C in the dark. In general, the isolates produced more and larger sclerotia on oat kernels than on PMP.
67

Table 1. Anastomosis group (AG), codes, and origins of R. solani isolates1 used in experiments 1, 2 and 3.
AG
2-1
2-1
2-t
2-t
2-t
2-t
2-t
2-t
2-t
2-t
2-t
2-t
2-t
2-t
2-t
2-t
2-t
2-t
2-t
2-t
2-t
2-2 niB
2-2 IV
2-2
4
4
4
IPO-code
21R51
21R61
2tR002
2tR101
2tR105
2tR107
2tR109
2 tRl l l
2tR114
2tR118
2tR123
2tR124
2tR125
2tR128
2tR130
2tR132
2tR133
2tR135
2tR139
2tR142
2tR144
22R01
22R02
22R11
4R11
4R22
4R51
Host2
Oil-seed rape
Lily
Red Riding Hood
Varinas
Menton
Estella Rijnveld
Giant Parrot
Inzell
Iris 'White Excelsior'
Leen van der Mark
Judith Leyster
Judith Leyster
Gander
Pink Supreme
Polo
Isis
Heart's Delight
Red Riding Hood
Red Riding Hood
Red Riding Hood
Fashion
Mat rush
Sugar beet
Sugar beet
Bean
Iris
Lettuce
Location
the Netherlands
the Netherlands
Noordwijkerhout (S)3
Breezand (N)3
Breezand (N)
Julianadorp (N)
Noordwijkerhout (S)
Noordwijkerhout (S)
Heemskerk (M)3
Castricum (M)
St. Paneras (N)
St. Paneras (N)
Breezand (N)
Anna Paulowna (N)
Lisse (S)
Lisse (S)
De Zilk (S)
De Zilk (S)
Den Helder (N)
Lisse (S)
Lisse (S)
Japan
Japan
the Netherlands
the Netherlands
the Netherlands
the Netherlands
1 Details on isolates are described elsewhere (Schneider et al, 1997a,b). 2 AG-2-t isolates were isolated from tulip cultivars except for isolate 2tR114, which was isolated from iris. 3 Locations in the Netherlands; S: the traditional bulb growing area near Lisse, province South-Holland; N: the 'new' bulb area in the northern part of the province North-Holland; M: the area between S and N.
68

Table 2. Taxonomical position1 of tulip cultivars and their susceptibility2 to rhizoctonia disease used in our experiments and cultivar of isolation in Table 1.
Taxonomy
Subgenus: Tulipa
Section: Tulipa
Tulipa gesneriana
Aladdin
Angélique
Apeldoorn
Christinas Marvel
Estella Rijnveld
Gander
Inzell
Isis
Judith Leyster
Leen van der Mark
Menton
Monte Carlo
Pink Supreme
Spring Green
Varinas
Section: Eichleres
T. greiggi
Giant Parrot
Red Riding Hood
T. kaufmanniana
Fashion
Hearts Delight
T. fosteriana
Polo
Subgenus: Eriostemones
Section: Biflores
T. tarda
T. turkestanica
Abbreviation
Ala
Ang
Apd
ChM
EsR
Gan
Inz
Isi
JuL
LvdM
Men
MoC
PiS
SpG
Var
GiP
RRH
Fas
HeD
Pol
Tar
Tur
Group1
LT
DLT
DTH
EVT
PT
ELT
TT
FT
ELT
TT
ELT
DVT
ELT
VFT
TT
GRE
GRE
KAU
KAU
FOS
OSP
OSP
Suscept.
2
4
2
3
5
3
4
-1
2
2
2
3
--
3
-
-3
-
--
Flowering
late
late
mid
early
late
late
mid
late
late
mid
late
early
late
late
mid
mid
early
mid
early
1 EVT: Single early; DVT: Double early; ELT: Single late; TT: Triumph; DTH: Darwin-hybrid; LT: Lily-flowered; FT: Fringed; VFT: Viridiflora; PT: Parrot; DLT: Double late; Tulipa species and their hybrids: KAU: Kaufmanniana; GRE: Greigii; FOS: Fosteriana; OSP: other species and their varieties and hybrids. Classification of tulips according to the Classified list (1987). 2 Susceptibility to rhizoctonia disease on a scale from 1: not susceptibible, to 5: very susceptible (Van Keulen and Van Aartrijk, 1993).
69

Rhizoctonia disease
Tulip cultivars Nineteen tulip cultivars (Table 2) were selected according to the 10 tulip groups within Tulipa gesneriana, botanical species and their hybrids (Classified List, 1987), and their production areas. Tulip bulbs were obtained from commercial breeders and stored according to breeders' practices at 17°C in the dark until planted in the field. Prior to use in greenhouse experiments, bulbs were pre-treated at 2°C in the dark during 10 weeks.
Open-air experiments Experiment 1 was conducted during the 1993/1994 growing season using nineteen AG 2-t, two AG 2-1, three AG 2-2 and three AG 4 isolates (Table 1) and 18 tulip cultivars (Table 2) in miniplots measuring 40x80 cm. To prevent cross contamination, miniplots were separated by polyethylene sheets down to 40 cm into the soil. Two bulbs of each of eighteen tulip cultivars were planted side by side at a depth of 8 cm in our standard 2:1 sand:potting soil mixture (Schneider et al, 1997a). At planting, two oat kernels infested with R. solani were placed near the neck of each bulb. The experimental design was a balanced completely randomized split plot with six blocks, using isolate as mainplot factor and cultivar as subplot factor. Isolate mainplots were spaced at least 30 cm. At flowering, about mid april, disease severity was rated on a 0 - 8 scale as described below. At harvest, the fresh weight of the bulb clusters (mother bulb and daughter bulbs) was determined. At planting, emergence, and flowering, plants were fertilized with a standard NPK mixture (Sporumix PG [Windmill Holland, Vlaardingen, the Netherlands]) according to farmers' practices.
Experiment 2, conducted during the 1994/1995 growing season, repeated part of experiment 1 using a limited set of AG 2-t isolates and cultivars (Tables 1 and 2). A selection of isolates and cultivars was made using preliminary results of a cluster analysis according to Corsten and Denis (1990). One bulb was planted in a plastic pot of 11x11x13 cm filled with our standard soil mixture as described above. Soil was infested by placing two R. solani infected oat kernels overgrown with the isolate in a corner of each pot. The experimental design was a balanced completely randomized split-plot design with six blocks, using isolate as mainplot factor and cultivar as subplot factor. All other experimental procedures were as in experiment 1. In a parallel experiment 3, the same cultivars and isolates were used, but the inoculum was prepared by culturing the fungus on PMP.
Greenhouse experiments Prior to use in greenhouse experiments 4 and 5, tulip bulbs were pre-treated at 2°C. Tulip cultivars were grown in controlled walk-in climate chambers for six weeks at 9°C (day and night). One bulb was planted per plastic pot of 7x7x9 cm filled with our standard soil mixture. Soil was infested with R. solani isolates by placing two oat kernels (experiment 4) or two PMP particles (experiment 5) on the neck of each bulb. Pots were irrigated by hand. Disease severity was rated on a 0 -8 scale (see disease assessment). The experimental set up was a balanced complete randomized split plot design with four blocks, using isolate as mainplot factor and cultivars as subplots factor.
70

Differential interaction
Disease assessment For all experiments, infection of above ground stem parts and leaves was rated on a 0-8 scale: 0=no symptoms; 1=0.1% infected leaf area, a few small lesions (1-5) on the leaves; 2=1%, several lesions (>5), or 1-2 larger lesions, but not more than 1% of the leaves infected; 3=5%, > 2 larger lesions and leaves distorted (gaps and/or frayed); 4=25%, distortion of leaves up to 25%, 1 leaf severely infected, or a strong growth reduction up to 25%; 5=50%, moderate to severe infection of the leaves; 6=75%, up to 75% of the sprout severely infected; 7=95%, severely infected sprout and no leaves developed; 8=100%, sprout severely infected and/or not emerged.
Statistical analysis Interaction within and between experiments was first analyzed by ANOVA. Second, interaction between AG 2-t isolates and tulip cultivars was explored using an additive main effects and multiplicative interaction effects model (AMMI, Gauch, 1988; Van Eeuwijk, 1995). In the AMMI-model interaction effects are written as a sum of multiplicative terms. The model reads
E(Yi) = v + aj+ßj+^2 okYtiô^r where E denotes the expectation of the observed
response Y~ of cultivar ; to isolate i, v the general mean, a ; (i=l...Z) and ß (/=1..J) the additive main effects for isolate i and cultivar ƒ, respectively. The value K is the number of multiplicative terms, also referred to as axes. yki and St- denote the multiplicative isolate and cultivar scores, respectively. The value ak, the singular value corresponding to axis k, can be interpreted as a measure of association between isolate and cultivar scores, indicating the importance of the axis. Squares of singular values, eigenvalues, are equal to the sum of squares explained by an axis. Identifiability constraints for the additive and multiplicative effects complete the model. Testing is usually based on the assumption of normality of the parameter under research.
In general, the first axis accounts for the largest amount of interaction and discriminates best between isolates, followed by the second axis, which is orthogonal to the first, and so on. The number of axes K, necessary for an adequate description of the interaction should preferably be low. The value K attains its maximum value when it is equal to the minimum of (M) and (J-l). In that case the model is equivalent to the ANOVA model with main effects and interactions. Usually, however, one to three axes give an adequate description with a substantial gain in parsimony in modelling the interaction. The number of axes to retain in the model was assessed by testing mean squares for individual axes against an estimate for error using F-tests (Gollob, 1968). The mean square for axis k is constructed from the ratio of the variance described by axis k, to be calculated by taking the square of ak, and the corresponding degrees of freedom (I+J-l-2k).
71

Rhizoctonia disease
Visualization of multiplicative interaction by means ofbiplots When two axes capture all or most of the relevant interaction, biplots can be used in exploring and interpreting isolate by cultivar interaction (Kempton, 1984; Gower and Hand, 1996). A biplot is a graphical representation in which isolate and cultivar scores are displayed simultaneously. The isolate and cultivar scores can be
scaled as Yh=Yuak and à'^ô^a^ w i th a scale factor 0<c<l. The obtained isolate
scores /;, and ft, are used as coordinates for a planar depiction of the isolates,
and the cultivar scores Sjj andà'2j for a similar depiction of the cultivar. In a biplot the scores determine the endpoints of the vectors starting at the
origin (0,0). Isolates with vector endpoints far removed from the origin contribute relatively more to the interaction than isolates with vector endpoints close to the origin. Pairs of isolates for which the endpoints of the vectors are far apart show considerable interaction. Isolates for which the directions of the vectors almost coincide have similar patterns of interaction. When the directions are almost opposite, the interaction patterns of the corresponding isolates show almost perfect negative correlation. If two isolate vectors are orthogonal the interaction patterns are unrelated.
The dependence of an isolate difference on a cultivar can be expressed by the tetrad value r^EKYj-EiY^-EiY^-EiY^) . Hence, for the AMMI-model
K rni/ / =5^ ^u'YuK^îg'à* two isolates i and i' behave additively on the total set of
cultivars when Y*H=Y'UI for all k. Pairs of isolates and pairs of cultivars for which the corresponding tetrad value is large show considerable interaction. The tetrad value equals the inproduct of two vectors, the vector of the difference between the vectors of isolate scores and the vector of difference between vectors of cultivar scores. The value of the tetrad is obtained by the product of two lengths, the length of the projection of one difference vector onto the other and the length of the difference vector on which projection took place. Hence, pairs of isolates and pairs of cultivars, which show considerable interaction, can be easily identified from a biplot by looking for pairs of isolate vectors and pairs of cultivar vectors for which the lengths of the difference vectors are large and for which the difference vectors are almost parallel. An extensive treatise of AMMI-analysis and its applications is given in Van Eeuwijk (1996).
Prior to AMMI-analysis, disease severity data (DS) were logit transformed as logit(DS)= log((DS+(l/12))/(8-(DS+l/2n))), with n the number of replications. Data on fresh weights of bulb clusters were not transformed. All statistics were done in Genstat release 5.3 (14). Consistency of the open-air experiments over years, open-air and greenhouse experiments, and the influence of the inoculum carrier were analyzed by AMMI-biplots. Genstat programs for AMMI-analysis and visualization in biplots were kindly provided by F.A. van Eeuwijk (AUW) and P.F.G. Vereijken (CPRO-DLO), respectively.
As a rule, conclusions from biplots are most reliable for isolates and cultivars with high non-additivity, as these are best represented in biplots. Isolates
72

Differential interaction
and cultivars closely to the origin contribute little to the interaction and cannot be discriminated from bias. Therefore, in preliminary exploration isolates and cultivars which showed no additivity were omitted from further analysis.
Results
Interactions in open-air experiments In experiment 1, during the 1993-1994 growing season, all 19 R. solani AG-2-t isolates affected leaves and stems of all 18 tulip genotypes. At flowering, average disease severity varied from 1.9 (several lesions) to 8.0 (sprout severely infected) (Table 3). Isolates 2tR002, 2tR132 and 2tR142 were highly aggressive on all tulip cultivars tested. Isolates 2tR105, 2tR114, 2tR144 were highly variable and on average low in aggressiveness towards the tested cultivars (Table 3). In a preliminary statistical analysis of the interaction, isolates 2tR107, 2tRll l , and 2tR125 and cultivars Angélique, Christmas Marvel, and Red Riding Hood were close to the origin on four ammi-axes indicating additivity rather than interaction and thus they were omitted from further analysis.
Analysis of variance using an AMMI-5 model on logit transformed disease severity data revealed that four ammi-axes seemed necessary for an adequate description of the interaction. The first four axes accounted for 38,18, 10 and 9% of the interaction sum of squares (SS), respectively (Table 4). The mean square error (MSE) estimated from the AMMI-4 analysis was (8.51+24.58)/(20+90)=0.30, which was remarkably close to 0.27, the residual error derived from ANOVA (data not shown).
An interpretation of the biplot should be based mainly on the isolates and cultivars with vector ends far apart. The longer the vector of an isolate, the greater is the relative amount of interaction due to that isolate. Considerable interaction occurred between isolates 2tR101-2tR132 as their vector ends are far apart on a logit scale with c=0.5 (Fig. 1). The same holds for isolate pairs 2tR101-2tR114, 2tR101-2tR144, 2tR132-2tR114 and 2tR105-2tR132 and for cultivar pairs of Inzell-Hearts Delight, Inzell-T. tarda, Inzell-Leen van der Mark, Hearts Delight-Varinas, Hearts Delight-T. tarda and Hearts Delight-Leen van der Mark. The interaction pattern, ignoring size, was quite comparable for isolate groups 2tR002-2tR132-2tR142, 2tR105-2tR124-2tR118, and 2tR123-2tR128-2tR130 as indicated by almost coinciding vector directions.
73

CN TS
6 § <3 Hrs
'S B
O fC
I'S 3 | O vil
.2 £
| 2 T3 o Si « e ü .a ai S Ë o u
»H + -
3 o
C oo
£ . 0 ^ ÏH CA
00 g
1 £ .9-1 2° O § (N
> <-> _ 5 D c « > - n i tu co «J (D co QJ W h 05 (Ö (Ö
^ .22 -S
„-H ÏH C/l
H .2 > ^ 3 o>
- 25 .§ § oi ö £ o X W •«
w U-a có Ë o ni «> U
.S -^ -ri a te o» H O «
U
r i ^ N q i n q o o N Ö Ö Ö C N T - H C N T - H T - H
•H, TO
U "o
LD tv
[V. tv
tv tv
tv tv
IV. tv
IV. tv
00 tv
tv tv
vO tv
in tv
tv tv
IV. tv
• *
tv
0
tv!
co tv
CM tv'
O tv
CO tv
T-H
tv
00 vÓ
CO tv
•* tv
in tv
co vó
• *
tv
LO tv
00
vó
0 tv
in
vó
VO
vó
O tv
O
vó
tv
vó
co vó
CN
vó
vo vó
00 in
CO in
•«f
vó
00
vó
0
vó
co tv
CN tv
ON
vó
00
vó
CN vó
CN tv
• *
^
CO tv
MD VD
ON
in
(N vÓ
tv in
T-H
VC
00
•*
CN tv
VO
vó
m VC
0
oó
0
oó
0 oó
CN tv!
co tv!
vO tv
O OÓ
Ov VÓ
CO VC
VC
tv
00
^
•«*<
VÓ
tv vÓ
VO in
tv in
CO
^
CN
^
00 CO
co vÓ
VC tv
in tv
in tv
T-H
tv
VO vÓ
m vÓ
• *
tv
00
MO
CO vÓ
tv iri
VO vÓ
O vÓ
O vÓ
CO vÓ
00 vÓ
Ov • *
Ov CO
CN CO
T-H
vÓ
00 tv
VO tv
T-H
tv
CO tv
00 vÓ
m vÓ
VO tv'
00 vÓ
00 vÓ
VO in
co in
T — 1
vÓ
in in
Ov in
Ov • *
00 • *
0 iri
Ov T-H
O vÓ
co tv
tv. tv
T-H
tv
O tv
vO tv
CO tv
Ov vÓ
O iri
00 iri
Ov vÓ
Ov iri
0 vÓ
Ov iri
tv
có
T-H
iri
Ov
co
00 iri
rt<
có
Ov iri
VO tv
in
tv!
0 tv
tv vÓ
CN tv
• *
VÓ
VO vÓ
T-H
tv
ON
"tf
O vÓ
O iri
CO vÓ
VO
>*
Ov • *
in iri
in iri
CO
^
00 CN
Ov iri
co tv
co IV
VO vÓ
vO vÓ
T-H
tv
tv tv
Ov iri
T — 1
VÓ
CN vÓ
co VÓ
00 • *
T-H
vÓ
T-H
iri
Ov
co
• *
• *
T — 1
iri
Ov iri
00 CO
00 iri
0 tv
00 vÓ
Ov vÓ
• *
tv
• *
vÓ
CN t-;
in tv
00 vÓ
in vÓ
co iri
in vÓ
in iri
in iri
in
có
Ov CO
in
co
in cri
00
-*
tv iri
tv tv
tv tv!
CO tv
CO VÓ
CN vÓ
VO vÓ
T-H
VÓ
CN vÓ
Ov • *
CN VÓ
tv vÓ
tv iri
• *
iri
CN • *
T-H
iri
CN
•"*
CN có
T-H
CN
VO iri
vO tv
VO
tv!
Ov
tv
tv vÓ
00 iri
CO vÓ
co iri
IV. VÓ
00 iri
co iri
1 — 1
vÓ
CN iri
VO • *
m • *
0
•*
tv T *
tv • *
CN CÓ
-* iri
VO tv
00 tv
CN tv
tv tv
J< tv
0 VÓ
VO iri
CO vÓ
CO iri
co • *
co tri
co <*
tv CÓ
00 iri
VO
•*
CO CN
T-H
CN
CO
có
Ttf
iri
m IV
IV. tv
-* IV
Ov vÓ
00 vÓ
CN iri
00 iri
co iri
00 vÓ
in
-*
Ov
^
00 iri
tv
có
vO • *
iv • *
• *
có
co •*
rt< CN
O iri
vO tv
VO tv
tv VÓ
in vÓ
CO vÓ
CN iri
IV vÓ
^ iri
Ov CN
Ov iri
0 vÓ
CN
có
vO • *
Ov CN
CN • *
00
có
T-H
CÓ
VO CN
0 iri
VO IV
00 tv
CN tv
co VÓ
VO VÓ
T-H
VÓ
VO T *
T-H
vÓ
T-H
iri
00
có
co • *
in iri
T *
CÓ
in
có
co CN
in • *
Ov T-H
00 CÓ
Ov
-*
in tv
VO tv
CN tv"
O vÓ
CO iri
0
•*
ON CÓ
CN vÓ
CO vÓ
O • *
O iri
co có
tv • *
0 iri
0 iri
OV CN
00 CN
ON T-H
Iv • *
00 IV
0
tv
00 vÓ
tv vÓ
T-H
vÓ
in
**
0 iri
0 iri
0 iri
tv
có
00 CN
CN CN
T-H
vÓ
CO vÓ
in CN
ON CÓ
T-H
CN
O CN
VO 'S*
00 IV
tv tv
00 iv;
CN • *
tv VÓ
CN vÓ
Ttf
iri
CO iri
tv có
in
có
CN T *
O CÓ
T-H
CÓ
T-H
• ^
ON
có
CO CN
0 CN
VO CN
00 iri
in tv
in tv
CN tv!
tv NÓ
tv NÓ
• *
vÓ
co vÓ
CO vÓ
VO iri
VO iri
in iri
CO iri
CN iri
Ov
"*
00 • *
CO • *
CN
^
in
có
T-H
ö
CN
ö
CN O
VO Ö
• *
Ö
CN T-i
co T-H
VO
Ö
co T-H
00 T-H
T *
T-Î
O CN
• < *
T-H
in T-H
VO T-H
in rH
00 CN
CO CN
as > 'E vU ÇN
a -*-* o 3 o in 00 co co CO CN CN CN CO
i n 00 H / H I m CO T-H T-H T H O
Ä O T - H T - H T - H T - H T - H T - H T - H T - H T - H T - H T - H T - H T - H T - H T - H T - H T - H T - H
C N C N C N C N C N C N C N C N C N C N C N C N C N C N C N C N C N C N C N
bÇ >H
< >

Differential interaction
0-
2tR114 HV
LS
2tR132 ira
2tR128 2tR123/
2tR130 '
Triumph LvdM
2tR101
HV
-2 0 2
Axis 1
Figure 1. Biplot (c=0.5) of the AG 2-t isolate x tulip cultivar interaction under open-air conditions on the logit transformed disease severity data of table 3 (experiment 1). AG 2-t isolates are represented by arrows, cultivars by squares. Abbreviations of cultivarnames as in table 2. The most outlying isolates contribute considerably to the interaction. Coinciding arrows indicate comparable interaction patterns. LA and HA: Low and Highly in Aggressiveness; IS and HS: Low and High Susceptibility.
Isolate 2tR132 was separated from 2tR002 and 2tR142 along the 3 r d axis (Fig. not shown). Since four ammi-axes seemed necessary for a sound description of the interaction s um of squares, we consider the biplot as a whole rather than explaining the interaction in terms of individual axes. To the left and to the bot tom of figure 1 are the highly aggressive (HA) isolates 2tR002, 2tR142, and 2tR132 and 2tR101 respectively. Isolates low in aggressiveness (LA) isolates, 2tR114, 2tR144 and 2tR105, are grouped to the upper right of figure 1.
75
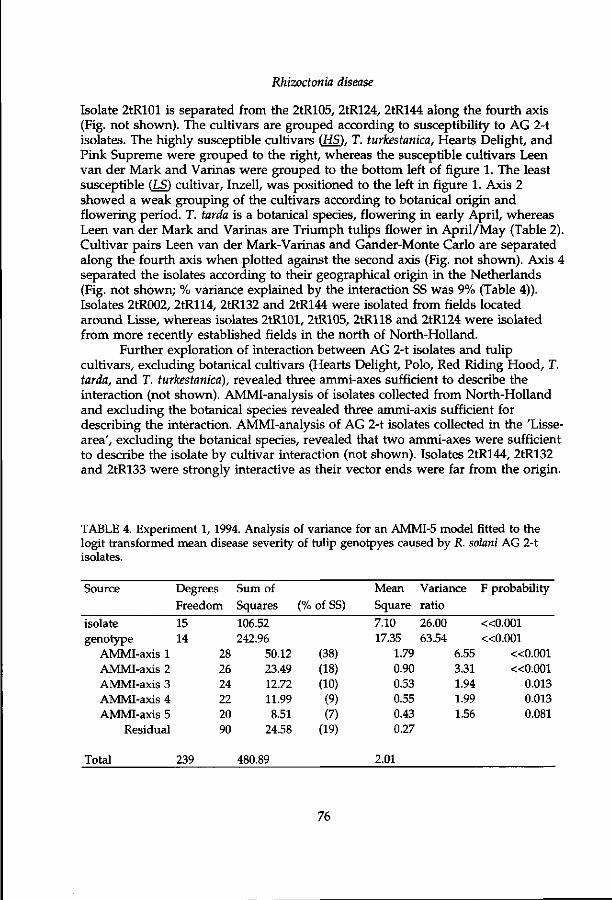
Rhizoctonia disease
Isolate 2tR101 is separated from the 2tR105, 2tR124, 2tR144 along the fourth axis (Fig. not shown). The cultivars are grouped according to susceptibility to AG 2-t isolates. The highly susceptible cultivars (HS), T. turkestanica, Hearts Delight, and Pink Supreme were grouped to the right, whereas the susceptible cultivars Leen van der Mark and Varinas were grouped to the bottom left of figure 1. The least susceptible (LS) cultivar, Inzell, was positioned to the left in figure 1. Axis 2 showed a weak grouping of the cultivars according to botanical origin and flowering period. T. tarda is a botanical species, flowering in early April, whereas Leen van der Mark and Varinas are Triumph tulips flower in April/May (Table 2). Cultivar pairs Leen van der Mark-Varinas and Gander-Monte Carlo are separated along the fourth axis when plotted against the second axis (Fig. not shown). Axis 4 separated the isolates according to their geographical origin in the Netherlands (Fig. not shown; % variance explained by the interaction SS was 9% (Table 4)). Isolates 2tR002, 2tR114, 2tR132 and 2tR144 were isolated from fields located around Lisse, whereas isolates 2tR101, 2tR105, 2tR118 and 2tR124 were isolated from more recently established fields in the north of North-Holland.
Further exploration of interaction between AG 2-t isolates and tulip cultivars, excluding botanical cultivars (Hearts Delight, Polo, Red Riding Hood, T. tarda, and T. turkestanica), revealed three ammi-axes sufficient to describe the interaction (not shown). AMMI-analysis of isolates collected from North-Holland and excluding the botanical species revealed three ammi-axis sufficient for describing the interaction. AMMI-analysis of AG 2-t isolates collected in the 'Lisse-area', excluding the botanical species, revealed that two ammi-axes were sufficient to describe the isolate by cultivar interaction (not shown). Isolates 2tR144, 2tR132 and 2tR133 were strongly interactive as their vector ends were far from the origin.
TABLE 4. Experiment 1, 1994. Analysis of variance for an AMMI-5 model fitted to the logit transformed mean disease severity of tulip genotpyes caused by R. solani AG 2-t isolates.
Source
isolate genotype
AMMI-axis 1 AMMI-axis 2 AMMI-axis 3 AMMI-axis 4 AMMI-axis 5
Residual
Total
Degrees Freedom
15 14
239
28 26 24 22 20 90
Sum of
Squares
106.52 242.96
50.12 23.49 12.72 11.99 8.51
24.58
480.89
(% of SS)
(38) (18) (10) (9) (7)
(19)
Mean
Square
7.10 17.35
1.79 0.90 0.53 0.55 0.43 0.27
2.01
Variance
ratio
26.00 63.54
6.55 3.31 1.94 1.99 1.56
F probability
«0 .001 «0 .001
«0 .001 «0 .001
0.013 0.013 0.081
76

Differential interaction
The four-dimensional structure underlying the biplot (Fig. 1) made tetrade-analysis difficult. Two tétrades were found. DS for isolate 2tR101 for cultivars Aladdin and Polo was 3.8 and 6.3 respectively, whereas DS for isolate 2tR132 was 6.6 and 4.4 for these cultivars, respectively (Table 3). Another tétrade revealed interaction between isolates 2tR109-2tR132-Aladdin-Polo (Table 3). Inspection of the biplot using AMMI-axis 1 and AMMI-axis 3 revealed interaction between isolate pairs 2tR105-2tR002, 2tR105-2tR109/ 2tR105-2tR132, 2tR109-2tR132 and 2tR132-2tR144 and cultivar pairs Polo-Aladdin, Inzell-Hearts Delight, and Polo-Hearts Delight (Fig. not shown).
At harvest, the fresh weights of all bulb clusters compared to the control without R. solani isolates varied from 7 to 112% (Table 5). For untransformed bulb weight data of AG 2-t isolates, the first four axes accounted for 30, 26, 18, and 12% of the interaction sum of squares (ANOVA for AMMI not shown). The MSE for AMMI-4 was 52, whereas MSE derived from ANOVA was 18. Two ammi-axes were used for identifying the interaction pattern in a biplot. Figure 2 shows that isolate pairs 2tR002-2tR124, 2tR002-2tR144, 2tR109-2tR124, 2tR109-2tR130, 2tR130-2tR144, and cultivar pairs Polo-Inzell, Polo-Hearts Delight, Polo-Judith Lijster, Polo-Leen van der Mark, Inzell-Hearts Delight, Inzell-T. tarda, Inzell-T. turkestanica contributed much to the interaction since their vector end points were far apart. The pattern of interaction was comparable for isolate groups 2tR105-2tR124, 2tR109-2tR139, and for cultivar group Pink Supreme-Hearts Delight. One tétrade indicating considerable interaction was found. Average bulb cluster weight reduction of isolate 2tR109 for cultivars Inzell and Polo was 84 and 33%, respectively, whereas average bulb cluster weight reduction for isolate 2tR130 for cultivars Inzell and Polo was 20 and 68%, respectively (Table 5). The third axis (not shown) showed interaction between 2tR139-2tR144-Gander-T. tarda (Table 5).
At flowering in experiment 1, isolates 21R51 and 21R61, and 3 isolates of AG-2-2 and 3 isolates of AG-4 had not caused distinct lesions on the leaves. At harvest, however, all of these isolates had caused small lesions on the stem base near the soil surface. In general, the fresh weight of the bulb clusters at harvest was less reduced by AG 2-1, AG 2-2 and AG 4 isolates than by AG-2-t isolates. The reduction of the cluster weight depended on the isolate by cultivar combination (Table 5). Since only a few isolates per AG were used, their interactions were not explored statistically.
Consistency of the interaction pattern in open-air experiments In experiment 2, during the 1994-1995 growing season, part of the experiment 1 was repeated using 9 AG 2-t isolates and 11 tulip genotypes (Tables 1 and 2). At flowering, all AG 2-t isolates had infected the tested tulip cultivars. Disease severity varied from 2.1 to 8.0 (Table 6). Analysis of variance on logit transformed DI of isolates and cultivars common to experiments 1 and 2, revealed a significant year x isolate x cultivar interaction (P<0.001; ANOVA data not shown). MSEs derived from ANOVA for isolates and cultivars common to 1994 and 1995 were 0.25 and 0.42, respectively. In 1994 the % residual sub-plot variance (%RsV) was 22 and in 1995 28. Both MSE and %RsV indicate that experimental conditions were better in 1994 than in 1995, but gave comparable results. Year by isolate by
77

:«
u
o
i f ) VO H •<# l O v u 0 \
ro tn ^ ^ ^ ^ T(I
>D N 0 0 N ^ H rt i - t ( N r H ( N <N ( N
Os vo \ 0 fTi N t s W l-H H r~i ^ CO CM CM
Os CM \£> CM ^ - ^ Q
« N ^ m w co co
CO H CO ^ N l O i < c o N c o c o c o H N
M O ' t CO CO N ^ r t< « * - * CO c o c o «tf
u- i O C M ' t f o o c o O N CN CO CO CO ( N CO CO
N H NO 0 0 r t i M H CO CM * ^ CO " ^ CO " *
N CO ^ * CO CO " O v u CS CO M CO CO CO ^
O H M ' l ' I O I f i l O N
l o i o i o m m i o i o i o
( O N O f M c o i n c o H C O ^ H N N N C O
C O M l O H C M l / l N N M C O T f C O C O \ O N N
* C O M » I O H O ( 0 C O C O N c O c O f O ^ C O
i n c o c o H N ' f i n N
^ - * c 0 ^ t ^ C O T j <
^ C O C O C O C O C O ' * ^
^ c o ^ ^ c o c o c o i r i
T f l O r H C M O O r H C M r H ^ ^ c o c o i n v O T j t ^
m o N o i o i o o c o • ^ T t i v û ^ i n c o ^ u o
^ C O O C M i n r H i n O O N O l N r H Q Q C M c o c o c o ^ c o i n c o t r i ^ L r i ' * ^ ^ 1 ^ ^
O N \ 0 Q CO ^ N - * Tf CO ^ i< ^ 10
O O C O ^ O C O ^ D C O N C O C O T f t T f ' ^ C O C O l O ' *
N O M o> w m H N CO CO CO ^ CO TH
IT) IO O H 00 \0 N co ^ co co in in
N IN oo co to co in CN CO \0 ^ CO ^ ^
i-H CM 00 00 o o -^ co •* ^ m ^ \o
C O ^ N Q O C O H r H C O
L n m ^ t n c o i s . N ü i n
0 0 ^ ^ \ Û O \ N I O O i r i C N ' ^ N ' t v û i n ^
c o m o o t N i n i - H O r H n i o c o i o N ^ o ^
r H
^ O O N C M r H V O t x O r H
C O ' ^ N I ' O H C O C O N C O H ^ N ^ N
c o ^ c o ^ o i n N i n ^ i n v û ^ N c o N S
OO r - i O 0 0 H r-1 T-H -HH i n C M T P \ o O N o o
oo IN. co CM in CM m in ^ ON ON oo oo oo
OO CO ^ i n 00 O ^ ^ N N CO CO CO ON
i t i n ^ N H O N O N O O ^ O t N O O O N O N C O C O
\ O ^ T - l O N 0 0 T f N O N £ > ^ D O N o o o o o N i n o N o o
I f i N N N i n i O ^ O N O O N O N O O O O O O t N O N
00 in
in T-H
NO in
o en
o m
co
ON en
o in
S
K
en NO
CM
m
o 00
00 in
S
00
NO
T-H
NO
in en
ON co
en
NO
IN en
?
3
ON
S
m
CM
CM m
NO
O N CM
00 CM
ON en
*
00 CO
T-H
s ex m
en NO
NO
en NO
NO NO
S3
R
en 00
t — t
o
o o T-H
CM T"H
S
T-H
00 O N
00 o T-H
a
en ND
NO en
T-H CM
T-H
en in
T-H
en
CM NO
00 in
en NO
R
m in
R
00 NO
in NO
o NO
ON NO
T-H ON
in T-H T-H
00 ON
T-H
m
CM
CM en
'S en
00 en
00 en
ON en
en
m
ex
00
ON
T-H
m
NO in
o NO
in NO
S
in 00
tx 00
R
T-H
(N O N
T-H
en
R
en NO
o 00
T-H IN
in 00
R
T-1
ON
R
£
en 00
T-H
00
ON
ON ON
O CM T-H
m O N
8 T—1
S T-H
00 O N
CM 00
en O N
T-H
o T-H
m o
T-H T-H T-H
o T-H
T-H T-H T-H
NO O N
CM ON
O T-H
ON O T-H
r-H
o T-H
NO ON
in o T-H
en o T-H
00 00
00 00
N0 00
T-H
o T-H
00 00
en 00
R
00
o
CM 00
ON ON
R
NO
00
o T-H
ON
T-H tx
CM ON
ON ON
tX 00
in ON
ON ON
ON
NO 00
ON
s
NO 00
CM
o
ON 00
en o T-H
T-H
o T-H
T-H T-H T-H
CM ON
O N
00
CM T-H T-H
ON ON
O T-H T-H
O en T-H
NO O T-H
tv ON
O O T-H
m o T-H
T-H T-H
m 00
ON ON
CM O T-H
T-H T-H
R
tx o T-H
o O N
IN ON
00
O T-H T-H
CM O T-H
R
l-H T-H
ON rH rH
in rH
in ON
T-H
tx ON
rH
fc
o o T-H
00 ON
en o
o ON
ON T-H T-H
O T-H
ON 00
o T-H
CM CM T-H
T-H CM T-H
NO ON
T-H
o T-H
T-H
en T-H
T-H T-H T-H
CO O N
> i i N c N O C C H r i i o a i n O N N - . ' • C - t j Q - t f C O C N O r H C O O C M C O O C O
T f T f c o i n c M c o ^ . _ _ _ _ . . . . _ . . . , _ - . ' < * C M C M O C O r H r H . - ^ * ^ & C } T - * T - * r - * T - * v - 4 i — < i - 4 r - * T - i T - < r - * r - l i - * T - l i - * i - l r - 4 t - * \J " J --> - v i ^ i n - , ND T-H T-H CM T-H
H H C M C M e M C M C M C M C M e M e M C M C M C M C M C M C M C M C M e M C M
« ! CM
CM CM CM T * *3< • *

Differential interaction
10 -10
0-
-10
LS .Pol
LV
LS Inz
Triumph 2tR144
r2tR124 2tR133/
2tRU\ \M™5
Ala. Botanical
>2tR130
2tR109 »R142 2 t R ° 0 2
HS
HV
-10 0
Axis 1
-10
Figure 2. Biplot (c=0.5) of the AG 2-t isolate x tulip cultivar interaction under open-air conditions on the fresh weights of bulb clusters of table 4 (experiment 1). AG 2-t isolates are represented by arrows, cultivars by points. Abbreviations of cultivars as in table 2. AG 2-t isolates are represented by arrows, cultivars by squares. Abbreviations of cultivars as in table 2. The most outlying isolates contribute considerably to the interaction. Coinciding arrows indicate similar interaction patterns. The same holds for cultivars.
cultivar interaction was further explored by AMMI. Four axes explained 35, 19, 14 and 13% of the interaction sum of squares. The first two ammi-axes were used to display interaction in a biplot. Isolates 2tR105, 2tR118, and 2tR144 tended to occur in year clusters (Fig. 3). Isolate 2tR144 e.g. reacted differently on Aladdin and T. tarda with a DS of 2.0 and 6.3 in 1994 and 5.2 and 4.6 in 1995 (Tables 3 and 6). Isolates 2tR002, 2tR130 en 2tR135 tended to occur in an isolate clusters, indicating no year effect (Fig. 3).
79

Rhizoctonia disease
en ' x
M>C
94-2tR105
T fiS
94-2tR144 1
Tar- \\ 94-2ÜU18 95-2tR135\l M94-21R114
94-2tR135^
LvdM. 9 5 -2 tR130^^ 94-2tR130 kT^ténS
95-2tR114^V^ 94-2tRK2.
94-2tR002 Inz
$5-2tR002\ \95-2tR142
\ P o /
Ala \
Tur
^95-2tR144
\i95-2tR118
Gan
95-2tR105
-2 0 2
Axis 1
Figure 3. Biplot (c=0.5) of the AG 2-t isolate x tulip cultivar interaction under open-air conditions in two years (experiment 1 and 2) on logit transformed disease class data of isolates and cultivars of common to experiment 1 (Table 3) and experiment 2 (Table 6). AG 2-t isolates by year combinations are represented by arrows, cultivars by squares. Abbreviations of cultivars as in table 2. The most outlying isolate by year combinations contribute considerably to the interaction. Coinciding arrows indicate comparable interaction patterns.
Isolates 2tR130-95 and 2tRl 14-95 were separated from isolates 2tR002-94, 2tR130-94 and 2tR142-94 along the 2nd and 3 r d ammi-axis (Fig. not shown). Isolates 2tR002 and 2tR144 were more aggressive on e.g. cultivars Ala, Inz, and Tar in 1994 than in 1995 (Tables 3 and 6). On average, isolate 2tR002 e.g., was more aggressive in 1994 than in 1995, with a mean DS of 7.4 and 5.6, respectively. On average, cultivar Monte Carlo reacted differently between years with a mean DS of 6.1 in 1994 and a mean DS of 3.7 in 1995.
80

Differential interaction
en
G-2tR114 G-2tR144
F-2tR002,
F-2tR130
F-2tR114
F-2tR142
-4
Axis 1
Figure 4. Biplot (c=l) of the AG 2-t isolate x tulip eultivar interaction on logit transformed disease class data of isolates and cultivars used in open-air (F) and greenhouse (G) experiments. Oat kernels were used as inoculum carrier. AG 2-t isolates by experimental condition (F or G) are represented by arrows. The most outlying arrow heads contribute considerably to the interaction. Coinciding arrows indicate similar interaction patterns.
Comparison of interactions in open-air and greenhouse experiments After six weeks of incubation in the greenhouse at 9°C, leaves and stems of all 10 tulip genotypes were affected by the 8 R. solani AG-2-t isolates tested, using oat kernels as an inoculum carrier (experiment 4). Disease severity varied from 2.0 to 7.0 (Table 7). Percentage RsV obtained by ANOVA was 23%. The experimental condition (open-air vs. greenhouse) interaction was explored by AMMI. The first four axes explained 30, 26, 15, and 11% of the interaction sum of squares. The first two axes of a biplot were used for inspection of the interaction.
81

Rhizoctonia disease
Table 6. Experiments 2 and 3, 1995. Disease severity1 of tulip cultivars grown in pots infested with isolates of R. solani AG 2-t. Isolates were provided with oat kernels (experiment 2) or PMP (experiment 3) as inoculum carrier. Disease severity from 0 (no symptoms) - 8 (sprout completely rotted) assessed at flowering under semi-field conditions. Abbreviations of cultivars as in table 2.
Inoculum Isolate
Oat 2tR142
2tR125
2tR002
2tR144
2tR105
2tR114
2tR135
2tR130
2tR118
AVG
PMP 2tR144
2tR002
2tR125
2tR142
2tR105
2tR114
2tR118
2tR130
2tR135
AVG
Tar
4.7
3.0
4.2
5.2
2.8
4.3
2.8
2.7
2.3
3.6
1.3
2.3
2.2
2.0
1.2
0.9
0.3
0.0
0.3
1.2
Inz
4.1
3.0
4.2
4.0
3.7
3.2
3.4
4.8
2.4
3.6
3.9
2.3
3.3
4.4
2.6
1.8
1.0
1.6
1.0
2.5
MoC
4.0
4.8
3.8
3.2
2.0
4.5
4.5
4.3
2.1
3.7
4.5
4.2
3.0
3.1
2.7
2.0
2.7
0.4
1.7
2.7
Ala
3.6
4.8
6.5
4.6
3.9
3.3
3.8
3.3
5.1
4.3
7.4
3.7
7.0
1.7
5.8
1.4
1.9
2.4
0.0
3.5
Gan
6.3
6.3
3.5
5.4
7.2
3.4
4.2
2.8
5.8
5.0
6.0
3.8
5.5
1.2
2.0
4.8
2.2
1.3
1.0
3.1
Men
6.3
5.8
5.5
3.5
5.2
5.5
3.6
5.6
3.8
5.0
4.2
2.2
4.7
4.7
7.7
3.2
1.8
0.3
0.8
3.3
Lvd
7.6
7.5
7.5
3.6
2.9
6.0
5.7
5.7
3.0
5.5
4.8
6.2
3.3
3.4
2.8
3.0
2.6
5.9
1.2
3.7
Pol
7.4
7.5
6.7
7.4
6.2
4.8
3.2
5.0
5.7
6.0
2.8
2.2
3.0
6.5
2.4
0.6
1.0
1.5
0.5
2.3
PiS
6.3
7.7
7.1
8.0
7.5
5.0
7.8
7.5
5.7
6.9
6.0
7.5
3.1
5.4
5.3
7.1
1.4
1.2
0.0
4.1
Fas
7.7
7.8
6.3
7.6
6.7
7.3
7.6
5.8
6.5
7.0
5.7
5.2
4.1
3.9
2.8
2.6
3.3
0.8
1.6
3.3
Tur
8.0
7.5
7.3
8.0
8.0
7.2
6.8
5.3
6.5
7.2
7.4
7.4
7.6
7.1
7.0
4.8
2.8
0.0
0.3
4.9
AVG
6.0
6.0
5.7
5.5
5.1
5.0
4.9
4.8
4.4
5.3
4.9
4.3
4.3
3.9
3.8
2.9
1.9
1.4
0.8
3.1
82

Differential interaction
In the open-air experiment isolates tended to occur in two clusers, whereas in the greenhouse the same isolates occurred in one cluster (Fig. 4), which indicates that the interaction pattern differed according to the experimental conditions.
Differential interaction by inoculum carrier In experiment 3, a set up parallel to experiment 2, PMP was used as inoculum carrier. On average, the 10 tulip genotypes inoculated by PMP were significantly less infected (ANOVA; P<0.001) by the 8 tested AG-2-t isolates than when oatkernels were used as inoculum. The residual variance was 0.42 and 0.56 when oat kernels and PMP were used as inoculum, respectively. Average disease severity varied from 0.0 to 7.5 (Table 5). The first four axes explained 31, 19,16, and 12% of the interaction sum of squares. In general, isolates tended to cluster in inoculum clusters (Fig. 5) indicating that the interaction pattern depended on the type of inoculum. To the upper right of figure 5 isolates grown on PMP prevail, whereas to the lower left isolates grown on oat kernels dominate. Isolate 2tR142 grown on PMP seems to occur between isolate clusters grown on oat kernels. Isolate p-2tR142, however, was separated from m-2tR114 and m-2tR142 along the third axis (Fig. not shown).
In experiment 5, %RsV obtained by ANOVA was 40% when PMP was used as an inoculum in the greenhouse, which was considerable more than when oat kernels (%RsV=24%) were used as inoculum. Therefore, experiment 5 was not further analyzed statistically.
Discussion
A strategy for sustainable control of rhizoctonia bare patch in field-grown tulips based on disease resistance management, requires insight in the variability of field isolates. The rationale for performing our experiments was to assess whether a previously reported statistical interaction between AG 2-t isolates and tulip cultivars in greenhouse experiments (Schneider et ah, 1997a) indicated a 'real' isolate by cultivar interaction, with the implication of physiological races within AG 2-t, or an interaction induced by environmental factors.
Comparison of MSE derived by ANOVA and AMMI for the different experiments shows that conclusions should be mainly based on the results of experiments 1 and 2. Experiment 2 was performed in pots and gave more variable results, which perhaps can be best explained by the different experimental conditions e.g. differences in root growth, micro-climatic conditions and soil infestation. In experiment 1 two oat kernels were placed to the neck of each bulb, so that soil as a growth medium hardly played a role, whereas in experiment 2 two oat kernels were placed in one corner of the pot, implying that the pathogen had to grow actively through the soil before infection of the bulb could take place. Differences in competitive saprophytic growth between isolates may partially explain variability in experiment 2.
83

Rhizoctonia disease 6.5
0.0
-6.5
0-20005,:
0-2tR144
P-2tR114 P-2tRH4
P-2tR002V. /
^ Q = 2 ^ 1 1 ^ t \ l T " 2 t R 1 0 5 P - 2 t R 1 1 8 Pf«130
__^__-—---^^/7Yä€l^tR002
/ / v ó - 2 4 1 1 1 3 0 ^ ^ 0-2tR142/ 0-2tR114 P-2tR135
P-2tR142
1
-6.5 0.0
Axis 1
6.5
Figure 5. Biplot (c=l) of the AG 2-t isolate x tulip cultivar interaction under open-air conditions in experiment 2 using oat kernels (O) and perlite-malt-peptone (P) as inoculum carriers on logit transformed disease class data of table 6. AG 2-t isolate by inoculum are represented by arrows. The most outlying arrow heads contribute considerably to the interaction. Coinciding arrows directions similar interaction patterns.
Differential interaction The statistical significance of four AMMI-axes indicated complex interactions. Significant interactions were observed between isolates and cultivars (Fig. 1), accounting for the first two AMMI-axes. A third AMMI-axis was accounted for by botanical species. Quantitative differential interactions for leaf infection were found for 2tR109-Ala-2tR101-Pol, 2tR132-Ala-2tR101-Pol and for 2tR144-2tR105-Tar-MoC (Table 3). Differential interaction may suggest a gradual evolution towards physiological specialization (Zadoks and van Leur, 1997). However, the genetic background, if any, is unknown. The observed interaction patterns for
84

Differential interaction
disease severity (Table 3) were not found again in the bulb weight data in table 5. The observed discrepancy between the two disease parameters may indicate that sprout and bulb infection are different pathogenic processes. Sprouts grow through the soil from early January to March, whereas tulips develop daughter bulbs between flowering in April and harvest in June.
The interaction between experiments 1 and 2 was in general due to a differential influence of years on the disease severity for tulip cultivars. Isolates tended to occur in year clusters (Fig. 3). Van Eeuwijk (1995) suggested horizontal resistance (Van der Planck, 1968) for this phenomenon when analysing the interaction between 4 Fusarium isolates and 17 wheat cultivars. Parlevliet and Zadoks (1977) had shown that horizontal resistance can be explained by polygenic resistance with individual genes operating on a gene for gene basis. Isolates 2tR130 and 2tR135 tended to occur in isolate clusters thus indicating the same interaction pattern for 2tR130 and 2tR135 in both years. Isolate clusters thus may indicate vertical resistance. Pathogenicity in R. solani has been shown to be polygenic (Garza-Chapa & Anderson, 1966). Genetic studies in our R. solani AG 2-t - tulip pathosystem are lacking. We therefore prefer to use the term quantitative differential interaction, indicating an environmentally infuenced partial resistance. Zadoks and Van Leur (1983) suggested the word 'training' for such a small interaction phenomenon. Thusfar, no breeding of tulip cultivars resistant to R. solani has been done and consequently no 'training' of isolates took place. It is worthwile to select isolates 2tR105, 2tR118, 2tR144, 2tR002 and 2tR130 and 2tR135, accounting for quantitative differential interaction, for further testing under commercial breeders' practices and for genetic studies.
Tétrade analysis yielded only some five highly interactive tetrads. In view of the many tétrades distinguishable significance could be due to chance effects only (ß-error). The tétrade interaction T. tarda-Gander x 2tR139-2tR144 was found twice, for DI and for bulb weight in experiment 3, so that only this differential interaction was confirmed.
Variability among R. solani AG 2-t isolates Highly aggressive isolates 2tR002-2tR132-2tR142, revealing the same interaction pattern (Fig. 1), originated from the traditional flower bulb area around Lisse (Table 1). Isolate cluster 2tR105-2tR118-2tR124, of which isolates 2tR105 and 2tR124 originated from flower bulb fields located in the newly established flower bulb growing area, showed an interaction pattern negatively correlated with isolate cluster 2tR002-2tR132-2tR142. Our tested AG 2-t isolates form a homogeneous subgroup according to hyphal fusion frequency (Schneider et al, 1997a), pectic zymography (Schneider et al, 1997b) and ITS rDNA sequence analysis (Salazar et aï., 1998). Minor differences in ITS rDNA restriction patterns and base pair sequences, however, were found (Schneider et al, 1997b, Salazar et al, 1998). Pectic zymograms seem to be related to pathogenicity of isolates (Sweetingham et al., 1986; Schneider et al, 1997b) and the production of polygalacturonase is said to be related to virulence (Geypens, 1978). Yang et al (1994) reported that the expression of pectic enzymes by field isolates involved multiple genes and that the variation in pectic enzyme patterns among homokaryotic strains could by explained by two
85

Rhizoctonia disease
types of nuclei. We could find no clear relation between the profile of our pectic enzyme pattern and the aggressiveness of AG 2-t isolates (Schneider, unpubl.). Field isolates of R. solani are multinucleate and heterokaryotic, and therefore the observed quantitative differential interaction was not unexpected.
Thusfar, the teleomorph of R. solani AG 2-t has not been found in the field. Doornik (1981) demonstrated that part of the mycelium of R. solani in infected tulip bulbs survived during storage and thus could act as a source of infection in the next planting. Variability in pathogenicity may have its origin in the introduction of subpopulations of R. solani into the new bulb growing areas by means of planting material. Natural populations spread over a large area hardly
Table 7. Experiments 4 and 5, 1995. Average disease severity of tulip cultivars grown in the greenhouse in pots infested with isolates of R. solani AG 2-t. Isolates were provided with oat kernels (experiment 4) or PMP (experiment 5) as inoculum carrier. Disease severity of 0 (no symptoms) - 8 (sprout completely rotted) assessed after six weeks of growth in the glasshouse at 9°C. Abbreviations of cultivars as in table 2.
Inoculum
Oat
Cultiva Isolate 2tR114
2tR105 2tR135
2tR118 2tR142
2tR130 2tR144
2tR002
LvdM
2.6 4.8
3.3 3.5 3.3
2.8 2.0
2.5
Gan
3.6 4.8 3.8
4.5 3.5
3.0 3.0
2.6
Ala
6.2
3.4
5.3 3.7
4.8
2.0
4.0 2.4
Inz
5.5 3.4
4.5 4.0
3.3 4.0
3.8
3.8
Pol
4.3 4.8
4.5 3.8 4.3
4.6 3.5
3.5
Men
6.4
5.3 3.3 4.4 4.1
3.4
3.1
3.5
Fas
6.8 7.0
7.0 4.7 7.4
3.1
2.8 5.5
RRH
5.0 6.3
7.0 6.3 4.0
6.8
7.0 5.7
PiS
7.5 7.3
6.8 6.0
6.3 6.9
6.3 4.4
Tur
7.3
7.0 7.0 7.0
7.3
7.3 7.0
7.0
AVG
5.5 5.4
5.2
4.8 4.8 4.4
4.2
4.1
AVG 3.1 3.6 4.0 4.0 4.1 4.2 5.5 6.0 6.4 7.1 4.8
PMP 2tR105 2tR002
2tR118 2tR142 2tR144
2tR130 2tR114
2tR135
2.0 2.0 2.3
2.0
1.8 2.3 2.0
1.8
2.0 1.8 2.5 2.0 2.3
2.8 1.0 1.3
2.9
2.0 1.4 2.0 0.5
0.6 1.5 1.5
2.0 2.3 2.3
1.8 2.5
2.0
1.8 2.0
2.5
2.5 2.5 3.0 1.8
2.5 2.8 2.0
3.0 2.3 2.5
1.7 3.0
2.3 2.0 2.8
4.0
2.5 3.0 3.3 2.8
2.8 3.3 2.5
4.7
2.8 1.8
3.3 2.3
1.3 2.5 2.5
2.0 1.9
2.3 2.5 3.0
2.8 3.3 3.4
4.9
6.0 4.3 3.4
4.0
4.0 2.3 0.9
3.0
2.6 2.5 2.5 2.4
2.3 2.2
2.0
AVG 2.0 1.9 1.6 2.1 2.4 2.4 3.0 2.6 2.7 3.7 2.4
86

Differential interaction
ever are genetically homogeneous (Crow, 1986). DNA fingerprinting techniques enable us to study the genetic variability of R. solani isolates in relation to e.g. pathogenicity and population structure. Once these relations have been unravelled we may be able to develop DNA-markers for detection of specific pathogenic isolates and the study of the origin of genetic heterogeneity.
Partial resistance In flower bulbs, breeding for disease resistance has been neglected for a long time, but for environmental reasons it becomes more important. Our data using a limited set of tulip cultivars demonstrated partial resistance in some cultivars, e.g. Aladdin, Inzel, Judith Leijster, Apeldoorn and T. tarda (Table 3). Thus breeding for resistance holds promise. Results of breeding, however, are to be expected only on the long term. Problems in tulip breeding are incompatibility in interspecific crosses (Van Raamsdonk et al., 1995), the low propagation rate, and the poor documentation on cultivar genealogies (Le Nard and De Hertogh, 1993). Biotechnology to overcome these problems is still in its infancy, but first results are encouraging (Wilmink, 1996). Partial resistance may have its merits. Partial resistance is characterized by a reduced rate of epidemic development in spite of a susceptible infection type (Parlevliet and Van Ommeren, 1975). When the level of partial resistance is high enough, partial resistant cultivars may reduce the amount of inoculum (Zadoks and Schein, 1979). Partial resistance often is polygenically determined and sensitive to environmental conditions (Zadoks and Schein, 1979). Selecting tulip cultivars for partial resistance may be difficult and could, perhaps, done be best under semi-commercial growing conditions as was suggested for the barley - leaf rust pathosystem by Parlevliet and Van Ommeren (1975). The most virulent isolates in our study may be used to develop rapid screening procedures and testing for resistance under commercial breeders' practices.
Impact of AG 2-1, AG-2-2 and AG-4 isolates Some isolates of AG 2-1, AG 2-2 and AG 4 infected the bulb clusters and stems at the soil surface in experiment 1. The sprout growing through the soil at low soil temperatures was, however, not infected. These observations are in line with reports on temperature dependency of pathogenicity of R. solani in greenhouse experiments (Doornik, 1981; Schneider et al, 1997a). Since only a few isolates per AG were tested, the interaction between AG and tulip cultivars was not further explored statistically. Our results indicate that severe losses in bulb cluster weight due to some isolates of AG 2-1, AG 2-2 and AG 4 may occur in field-grown tulips. The prevalence of these isolates in commercial fields, however, is unknown and requires further study.
Exogenous nutrients An understanding of inoculum sources that influence disease expression of plant pathogens may contribute to a more sustainable disease management. The isolate x cultivar interaction pattern was influenced by the inoculum carrier in both our open-air (Fig. 5) and greenhouse experiments (Fig. not shown). In fact, only isolate 2tR142 did not interact with inoculum source. To our knowledge, the present
87
Rhizoctonia disease
report is the first to describe differential interaction due to inoculum source for R. solani. Isolates of R. solani were more aggressive when oat kernels were used as an inoculum carrier than when PMP was used as an inoculum carrier with grand means of 5.3 and 3.1 for oat kernels and PMP, respectively (Table 6). These results are in line with previous observations (Schneider, unpublished) and reports of McCoy and Kraft (1984) and Weinhold et al. (1972). The latter showed that damping-off in cotton seedlings increased with an increasing asparagine concentration in the inoculum disks. They also demonstrated that aggressiveness of R. solani was influenced by nitrogen and carbon in the soil solution and by nutrients provided by host exudates. The former reported that virulence of inoculum depended on the inoculum source and that virulence was directly affected by sucrose and peptone concentrations. Furthermore, they observed that the overall rating of pea lines was independent of the inoculum source. We found that the overall rating of cultivar susceptibility differed by inoculum. Polo, e.g., had a mean DS of 6.0 when oatkernels was used as an inoculum but 2.3 when PMP was used (Table 6). Both inoculum carriers in our experiments were undefined media, but the observed influence on disease expression urges to conduct studies on inoculum sources and energy flow in the R. soZanz'-tulip pathosystem in the field.
In summary, our results showed that disease expression in 'open-air experiments' was quantitative and that interaction between AG 2-t isolates and tulip cultivars did occur, but was was environmentally influenced. So there are no reasons yet to assume physiological specialization of AG 2-t isolates to tulip cultivars. The genetics of both pathogen and host are poorly understood. It is therefore preferable to test partially resistant cultivars in 2 or more areas in concordance with a thorough characterization of the indigenous pathogenic R. solani population. In the end, an integrated use of partial resistance and biological control or light pesticide applications may provide an adequate controle of Rhizoctonia disease in field-grown tulips.

Chapter 5
Sampling efficiency of Rhizoctonia-infected tulip bulbs as determined by means of geostatistics

Sampling efficiency
Sampling efficiency of Rhizoctonia-inïected tulip bulbs as determined by means of geostatistics
Abstract
Geostatistics were applied to estimate the spatial distribution of Rhizoctonia bare patches in flower bulb fields with efficient sampling intensity. On a sandy and a clay soil two fields were planted per soil type with tulip bulbs. At each location one field was used to allow natural disease development whereas the other field was artificially infested to ensure bare patch development. Disease incidences of infected bulbs ranged from 0.03 to 0.22 and disease severities from 0.07 to 0.69. Semivariogram analysis for infected bulbs revealed spatial dependency in three fields and a random distribution in one field. The merits of efficient sampling was assessed by stepwise reduction of the observed dataset. A reduced sampling scheme was evaluated by considering the average maximum prediction error in conjunction with the percentage correctly predicted disease incidence or correctly predicted mean disease severity and by a visual inspection of these disease parameters in maps. For both disease incidence and mean disease severity the average maximum prediction error was minimized at a sampling intensity ranging from 7 to 25%. The percentages correctly predicted disease incidence and correctly predicted disease severity decreased with decreasing sampling intensity and differed considerably per field. Visual inspection of the maps revealed that sampling intensity could be reduced more when the infected bulbs were assessed for disease severity rather than assessed for disease incidence. In one field, a sampling intensity of as little as 10% of the observed data set still provided useful information on the spatial distribution of infected bulbs when disease severity was visualized in maps. In other fields higher sampling intensities reproduced adequate maps. Considering the dynamic nature of rhizoctonia disease, the value of the sampling strategy has to be assessed over successive years.
Introduction
The plant parasitic fungus Rhizoctonia solani (Kühn) (teleomorph: Thanathephorus cucumeris Frank (Donk)) severely limits production of many agricultural and horticultural crops world wide (Sneh et al, 1996). R. solani is a heterogeneous species composed of genetically isolated subgroups (Anderson, 1982). Isolates of R. solani are assigned to these subgroups, anastomosis groups (AG), according to hyphal fusion with AG tester isolates. In general, hyphae of the same AG anastomose, whereas isolates of different AG do not. Twelve AG are recognized, and within AG subgroups are distinguished based on the host range, colony morphology, thiamine requirement, biochemical and molecular characteristics (Ogoshi, 1987; Sneh et al, 1996).
In the Netherlands, rhizoctonia bare patch in field-grown tulips is caused by R. solani AG 2-t (Schneider et al, 1997). In the field, infection of tulip sprouts
91

Rhizoctonia disease
occurs at low soil temperatures and becomes visible upon emergence in early spring. In greenhouse experiments, R. solani AG 2-t caused bulb rot in iris and stem and leaf infection of tulip at temperatures varying from 2 to 20°C (Doornik, 1981; Schneider et al, 1997). These authors also demonstrated the pathogenicity of some isolates of AG 4, AG 2-2, and AG 5 to bulbous crops at higher temperatures, but not at lower temperatures. In experiments conducted under open-air conditions, some isolates of AG 2-2 and AG 4 caused bulb rot and stem infection, whereas no sprout infection occurred upon sprout growth through the soil (Schneider & Van den Boogert, 1998). The occurrence of AG 2-2, AG 4 and AG 5 isolates in flower bulb production fields is unknown.
Rhizoctonia disease in flower bulbs is mainly controlled by full field application of fungicides or by soil disinfestation. For environmental reasons, the input of fungicides has to be reduced and to develop effective management practices for rhizoctonia disease in flower bulbs, insight in the epidemiology and the patch dynamics of the pathogens is essential. Thusfar, the dynamics of rhizoctonia bare patch in flower bulbs has not been documented, but according to farmers patches may vary in size and number within one field between successive years.
Geostatistics, originally developed for the mining industry (Matheron, 1963; Journel & Huijbregts, 1978), is now widely used in soil science (Trangmar et al, 1985) e.g. for optimizing sampling designs (Webster & Burgess, 1984; Di et al, 1989) and for redeveloping soil with minimized effort (Staritsky et al, 1992). Geostatistics is based on the theory of regionalized variables (Matheron, 1963), meaning that the value of the variable under study depends on its spatial position (region). Geostatistics has become a popular tool in plant pathology for analyzing spatial structure in epidemics (Chellemi et al, 1988; Lecoustre et al, 1989; Munkvold et al, 1993; Stein et al, 1994; Dandurand et al, 1995; Larkin et al, 1995). The spatial analysis of disease data of soil-borne R. solani, however, has received little attention, though the patchy nature of many rhizoctonia diseases, e.g. black scurf in potato (Jager & Velvis, 1995), root and crown rot of sugar beet (Hyakumachi et al, 1990) and rhizoctonia bare patch of cereals (MacNish & Neate, 1996) in the field is well known (Neate & Schneider, 1996). Lannou & Savary (1991) applied geostatistics for mapping disease incidence of rhizoctonia blight in groundnut plot on two occasions. Gilligan et al (1996) used the joint-count statistic and Moran's index to describe the spatial distribution of diseased plants and disease severity, respectively, of R. solani infected potato plants.
Geostatistics uses an optimal interpolation method, kriging, with a minimized and known variance and is thus highly valuable for mapping. Quantitative knowledge of spatial variability enables the determination of required sampling intensity with a specified precision. The present study aimed to determine efficient sampling designs accounting for the spatial distribution of Rhizoctonia-inîected tulip plants in four experimental fields.
92

Sampling efficiency
Materials and methods
Experimental fields In the autumn of 1991, experimental fields were established at the Bulb Research Centre (LBO), Lisse, and at the experimental station 'Proeftuin Zwaagdijk', Zwaagdijk, the Netherlands. At each location two fields were used consisting of 7 beds of 10 x 1.5 m each. Tulip bulbs of cultivar Red Riding Hood were planted at a depth of approximately 8 cm in 4 rows per bed in Lisse and in 5 rows per bed in Zwaagdijk. Within-row distances were 22.5 cm in Lisse and 20 cm in Zwaagdijk. Planting density was approximately 100 bulbs per m2. The soil was a sandy soil with a clay content (fraction < 2u) of 1.5% in Lisse and a loamy soil with a clay content of 15.4% in Zwaagdijk. Crop husbandry, fertilization, application of fungicides to control fire blight of tulips caused by Botrytis tulipae Lind., and weed control were performed according to farmers' practices.
Soil infestation At both locations of the experimental fields, no information on R. solani in previous crops was available. Therefore, one field per location was used to allow natural development of rhizoctonia bare patch. These fields are referred to as Lisse-1 (L-l) and Zwaagdijk-1 (Z-l). To ensure the development of patches in at least one field at each location, six patches were created in the second field at each location on December 3, 1991. These fields are further referred to as Lisse-2 (L-2) and Zwaagdijk-2 (Z-2). The even beds were infested at 2.5 m and at 7.5 m in the middle of each bed.
Inoculum was prepared by growing R. solani AG 2-t isolate 2tR002 (Schneider et al, 1997) for 2 to 3 weeks on autoclaved oatkernels at 20 °C in the dark. The necks of the bulbs were uncovered between the inner two rows, and the soil was infested by regularly spreading 10 g inoculum over an area of 20 by 20 cm, followed by replacing the soil around the necks.
Disease assessment For accurate mapping, and to avoid disturbance and spread of inoculum by machinery, all bulbs were lifted by hand upon harvest. Mapping was done in units of 0.1 m. This implies that 0.1 m row length was considered as the sample unit. The positions of the sample units and the numbers of diseased and healthy bulbs in each unit were registered. Bulbs were stored at 4° C until disease assessment. Disease incidence (DI) was rated per 0.1 m row with 0 when no bulbs with distinct Rhizoctonia symptoms occurred and 1 when at least one infected bulb was found. Disease severity per bulb was rated on a scale from 0 to 8 with 0: 0% of the bulb surface area infected, no distinct R. solani symptoms visible; 1: up to 5% of the bulb surface covered with small R. solani lesions; 2: up to 12.5 % of the bulb surface covered with lesions; 3: up to 25 % of the bulb surface covered with lesions; 4: up to 50 % of the bulb surface covered with lesions, and/or one tunic disrupted; 5: > 50% of the bulb surface infected and/or at least 2 tunics disrupted; 6: no daughter bulbs developed; motherbulb apparently healthy; 7: bulb almost
93

Rhizoctonia disease
completely decayed; 8: bulb completely decayed, plant dead. Bulbs in disease classes 0 to 5 had developed a cluster of daughter bulbs, whereas for those in disease classes 6 to 8 apparently only one bulb had developed. Mean disease severity was calculated per 0.1 m row length (DS).
Geostatistical analysis Geostatistical analysis was conducted for DI and DS for each field using the FVARIOGRAM, MVARIOGRAM, and KRIGE directives of Genstat 5, Release 3.2 (Genstat 5, 1996). Semivariograms were calculated using DI and DS values from all four experimental fields. The semivariance (y) is a function of the lag, the distance between samples (h), as follows: y(h)=V£E{[Z(x+h)-Z(x)]2}, with Z(x) a set of regionalized variables and E the expectation of the random variable (Journel & Huijbregts, 1978). Ideally, the semivariogram passes through the origin, where the distance between sample units is zero. The nugget (C0) represents the unexplained or random semivariance caused by measurement errors or microvariability of the property under study. The range is the distance between sample units (h) at which the semivariance reaches a more or less constant value, called the sill. A pure nugget effect occurs when the semivariance appears solely as a discontinuity at the origin with Y(0)=0 or Y(h)=Co Gournel & Huijbregts, 1978). The semivariogram was used as a structural tool to study variation in the spatial distribution of DI or DS. If the semivariograms of two perpendicular directions have approximately the same parameters, the spatial variation is considered isotropic. If the semivariograms display e.g. different ranges, anisotropy prevails (Journel & Huijbregts, 1978; Burrough, 1987). The experimental semivariograms were fitted to linear, exponential and spherical models (Journel & Huijbregts, 1978). Both the highest percentage variance accounted for by the model and the lowest nugget variance were used to choose the model to be used in further analysis.
For optimum spatial interpolation, kriging, the semivariogram characteristics nugget, sill and range obtained from non-linear models or nugget and slope and gradient obtained from linear models were used. Kriging provides
JV
an interpolated value z*=J2Jijz( with Z = the parameter at sample site i,N = i - l
number of neighbouring sample sites and X{ = the weights applied to each Z,, so that Z is unbiased and with minimum variance (Journel & Huijbregts, 1978). The KRIGE directive of GENSTAT 5 Release 3.2 produces matrices of kriging interpolators for DI and DS and the accompanying estimation errors. Maps of DI and DS were produced using the interpolated matrices in Corel Presentations 6.0 (CorelDRAW 6.0, 1995).
The variation in the spatial distribution of DI and DS was studied by means of omnidirectional semivariograms and directional semivariograms, along rows (90°) and across rows (180°) with a tolerance of 45°. For mapping purposes, kriging was performed using omnidirectional semivariogram parameters.
The original data matrix contained DI and DS per 0.1 m row length. The effect of sampling intensity on the quality of the results obtained by kriging was studied by stepwise considering every 2nd, 3 rd, 4th, 5th, 10th, 15th and 20th 0.1 m row
94

Sampling efficiency
length as a sample unit. The sampling intensity was thus reduced to 50, 33, 25, 20, 10, 7 and 5% of the original data. One criterion of a good sampling scheme is that it minimizes the maximum prediction error (Webster, 1985). The maximum prediction error should be minimized at the most uncertain locations, which are the coordinates midway between neighbouring observations (Stein et ah, 1994). The maximum prediction error was assessed by excluding the kriging variance accompanying the observed values (all 0) from the prediction error matrix obtained by kriging. The quality of the kriging result was assessed by 1) graphing the mean maximum prediction error, o*m, to the sampling distance for DI and DS, 2) by comparing of the percentage correctly predicted DI, %cpDI, or the percentage correctly predicted DS, %cpDS, per experimental field, and 3) visually by inspecting the maps of DI and DS.
Results
Disease incidence and disease severity Upon emergence of the tulip sprouts in the first week of March 1992 most sprouts had been severely infected by R. solani in all 6 artificially infested patches in L-2 and in 5 out of 6 artificially patches in Z-2. Infection was light in the sixth patch of Z-2. At harvest all 12 artificially infested patches were visible as distinct bare patches. In addition, other bare patches, probably due to natural soil infestation, were visible in L-2 and, less distinctly in L-l. No bare patch occurred in Z-l. Upon harvest in mid June, tulip bulbs with R. solani symptoms were found outside bare patches in all 4 experimental fields. The percentages infected bulbs were 6.7, 16.9, 1.5, and 8.6%, for L-l, L-2, Z-l and Z-2, respectively. At harvest, DI (± s.d.) was 0.14±0.35, 0.22±0.41, 0.03+0.17, and 0.09±0.28 for L-l, L-2, Z-l, and Z-2, respectively (Table 1). The DS (± s.d.) was 0.35+1.0, 0.69±1.52, 0.07±0.45, and 0.25±0.89 for L-l, L-2, Z-l and Z-2, respectively (Table 2).
Spatial pattern analysis of the observed dataset Disease incidence. For omnidirectional and directional semivariograms a spherical model best fitted the semivariance over the lags for DI in L-l and L-2 (Table 1; Fig. 1). The spatial dependence of DI was weak for L-l (weak slope of the semivariogram) and strong for L-2 (strong slope). For omnidirectional semivariograms and along and across rows the nugget values were 0.11, 0.11, and 0.11 for L-l and 0.08, 0.08, and 0.07 for L-2, respectively. The sill values were 0.12, 0.12, and 0.12 for L-l and 0.18, 0.18, and 0.18 for L-2, respectively. The ranges for along and across rows were not statistically significant different (t-test; P=0.05) for DI for L-l and L-2 using all observations. Thus no pronounced spatial variation, anisotropy, occurred for DI in L-l and L-2 indicating that disease development was regular in all directions.
95
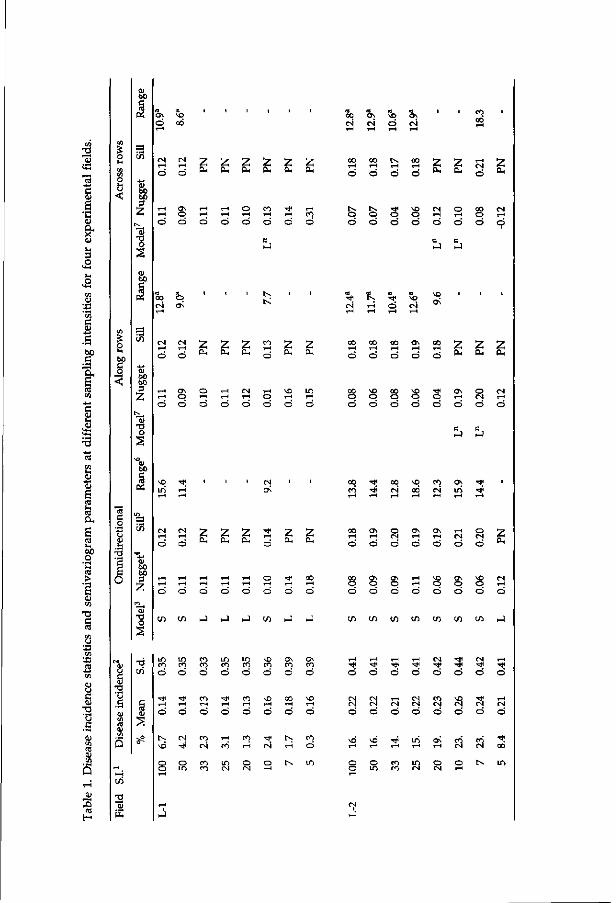
«5
CU
CU
o
CD
« <ù S CU
.a bo
.5 ô«
(A
o >H
C
g
01
s
S DO O
'C
>
TS G ca
8 •a •43 !"
c eu
' u c
X> CO H
2 2 2 2 2 2 CL, CL, C - CL, O H P H
i-H Ö
00 00
Ö Ö
t-. oo 5» i-< i-< £ t
O Ö
Ö s Ö Ö
2 2 2 2 2 S 2 Z Ö Ö C L , C L , C L , Ö C L , C L
es H
oo l-H Ö
00 00 1-1 1-1
Ö Ö
00 co CN
2 2 2 2 2 3 2 2
l - H i - I r t i - H l - H O ^ O O l - H i — I I — l i - H l — t ï - H i — < l-H
Ö Ö Ö Ö Ö Ö Ö Ö
C / 3 W 1 J I J H J C / ) I J I J cri en I / I en
-ri en
s?
in co ö
i — i
o
\6
o o
in 00
ö
^ H
O
CS
o in
co co ©
co
o
co CS
co co
in co
ö
^H
O
1—1
CO
in es
m \o o\ o\
i-H
ö
co ö
• *
o
CS CS
o
^0 1-1
o o
f o
CS CM
o
T-H
O in
CS
ö
S 3 2 Z Z ö ö CL, CL, C H
T-H
,—1
O
O
O
O
O
1—1
1—1
o
CS l-l
o
1—1 o o
1—,
o
m i-H
O
00
o o o o
00
o o
\0
o o 3 o
1-1
o
o CS o
CS 1-1
o
• *
• *
CN
Ö 2 CL,
OO
o o
(3\ O
o
OS O o
T-,
O
o o o
o o
o o
CN l-H o
• * CS i-H
Ö Ö Ö
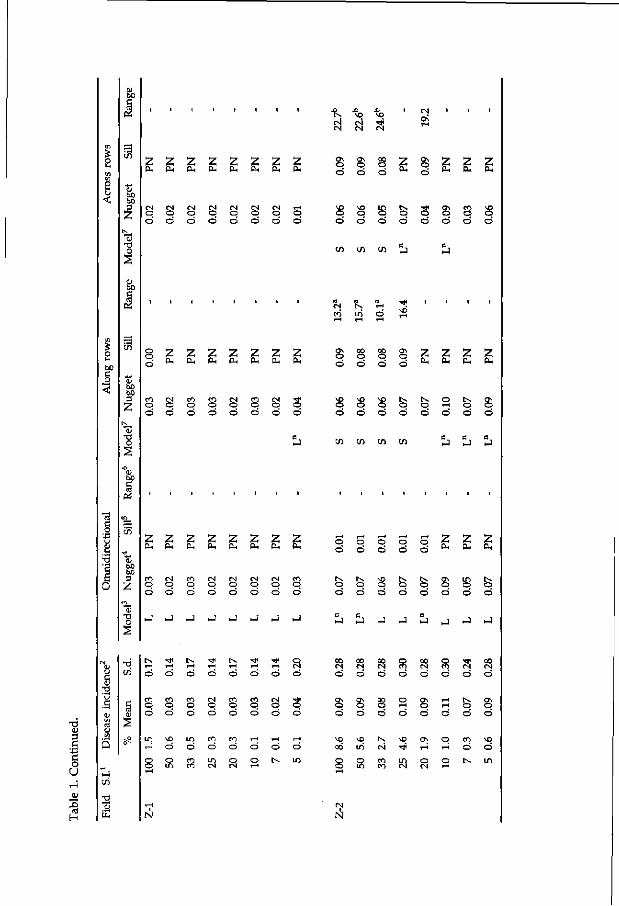
TS Ol =1 G
'43 G O U i-H
Ol
- Û
f-H
m o> m
n
' j j C/3
• r t
MH
«
04
«
2 z PH CH
2 PL,
2 2 PH PH
o ö
co co o o ö ö
a so
CM
os
2 2 2 2 2 2 PL, Pu PL, (X, PL, CH
O
ö ë 2 2 2
PH ft, e
CM O
O
CM O O
CM O
o
CM O
o
CM O
o
CM O
o
CM O
o
l-H
o o
SO
o o
SO
o o ö o
o o s o
Os
o o
co o o
SO
o o
C/1 (/i c/s
CM
cö ÎH ^
o £
2 2 2 2 2 2 PH PH PH PH PH PH
O O
2 2 2 2 OH PL, PH CL,
CO
o o
CM O
o
co o o
CO
o o
CM O
o
co o o
CM O
o
< * o o
o o
o o
s o
ex o o
ex o o
o rH o
o o
Os
o o
ai i/i in in
2 2 2 2 2 2 PH PH PH PH PL, PL,
CM CM CO O O O Ö Ö Ö
O Ö
O Ö
tv O Ö
O
o o ö
IN o ö
o ö
g 2 2 PH PH
in ts. o o ö ö
in
o
CM CO CO o o o ö ö ö
o ö
CO H H H
ö ö ö ö
OS O O
so co o o
os o o
VO
in o m
§ o
Cx CM
CO CO
o !-H o
SO • *
a
OS O
O
Os l-H
O CM
r H T-H
O
O i-i
O ,-H
tX O
o
co o IN.
OS
o o
sO O
in
N N

Rhizoctonia disease
Legend to Table 1.
1 Sampling intensity in % of the observed dataset. 2 %: Percentage 0.1 m row length with at least 1 infected bulb, mean and standard deviation (S.d.) per field. 3 Best fitting model for the experimental semivariogram, based on the % variance accounted for by the model and minimum nugget variance. S: spherical model; L: linear model. Ln: indicates negative semivariogram parameters for non-linear models. 4 Nugget: the variance near the origin representing microdistributional and measurement bias. 5 Sill for spherical and exponential models, slope for linear models, PN for 'pure nugget effect'. 6 Range: zone of influence for non-linear models; ranges for along and across rows followed by the same letter are not significantly different (t-test; P=0.05). 7 Model when different from the omnidirectional model.
98

Sampling efficiency
Legend to Table 2.
1 Sampling intensity in % of the observed dataset. 2 DS: disease severity. Mean and standard deviation (S.d.) per field. 3 Best fitting model for the experimental semivariogram, based on the % variance accounted for by the model and minimal nugget variance. S: spherical model; L: linear model. Ln: indicates negative semivariogram parameters for non-linear models. 4 Nugget: the variance near the origin representing microdistributional and measurement bias. 5 Sill for a spherical and exponential model, slope for a linear model, PN for 'pure nugget effect'. 6 Range: zone of influence for non-linear models; ranges for along and across rows followed by the same letter are not significantly different (t-test; P=0.05). 7 Model when different from the omnidirectional model.
99

Ol
e o>
O)
fr Ol U 3
.O
11 •J3
bO •S
ï ta
bo O
u '43 co
•43
C/5
O
bo 3
2
dl T3 O
O IH
60
g
I
M) bO
01 T3 o
05
c/3
bo bo
I -o o
o
• 7 NO
tN O ON O Ö rH
tN O [N NO
ö ö
2 2 e- CL,
ö
5 ^ CM
e s
K 00 ö
2 2 2 ft* OH BH
2 2 2 2 2 CH OH OH BH OH
2 2 2 2 2 OH OH OH OH OH
m co NO »-H ^ • * co co CM CM CN CM
CM 0 0 T *
H »"H T-ï
CM CM
2 OH
tN tN oo N B * Ö O i-i
ON tN vo i n co •<* co * f oo i n ö ö o ö ö
ON
2 "*
CO NO
r-i Ö
2 0 H
2 2 0H OH
2 0 H
CO CM i n co CÔ r-i
(N NO CN|
ON
m CN
co in CN|
CM in CM
in in (N
00 ^ H
CO
IN r-t CM
in NO CM
rO ON O
CM 00
o
t-t
o T-H
tN o T-H
-* rH T-H
tN in o
in NO
o
CO IN O
00 tN O
NO O O
t—1
o r-i
r-, O O
tN O T—1
c / i c / ) c n c / ) c n c / 5 c n c / i
'E 01 > oi
CM
01
H
s
2 's UH
X ! c/i
o p
in co o
o o
p
NO CO O
o in
l-H O
in co o
co co
o p
NO co o
S
tN ON
CO CO
o
s
NO O
O
o
o ï—1
CM
p
o
IN
CM O
ON CO
o
in
ON NO
o g o
oo NO o
tN NO
o
l-H IN O
ON tN O
NO NO O
CM NO O
m m <N CM T-i

«
ai
2 2 E E
IT) (-H t—I T-H
Ö Ö
T3
3
•J3
c o U (N 01
(0 H
% U
: • tn
T» <u
E
•ri en
§ S
N
2 PH
2 2 PH PH
t-H
Ö
o Ö
IN
? ? ? s ? ? PH PH PH ,_: PH PH
S £ 2 2 2 2 g 5 PH PH PH PH
Ö
f tN H T-H
3 O
OS i-H O
OS O O
tN O
2 2 2 2 2 2 BH PH PH PH PH PH
5 Ö
in
Ö
tN os
o <* OS OS
ö d
o IT)
2 2 PH PH
2 2 PH PH
8 o
1-H
o
o
o
00
o R o
^H tN O
tN SO O
SO cH O
OS T-H O
ö
5 3
o ö
IN
2 2 2 2 PH PH PH PH
O T-H IN Os Cv p SC> O O T-H O i-i
in m i/i i»
T-H T-H tN >y °. <=>. <=>. E O O O "
2 2 PH PH
oo r s |
o i n tN o
o o
I—1 Os
o i n tN o
o in
00
o tN tN O
t*s
m
Os
o K tN O
H
00 00
o i n CN o
o tN
O Os O
I S tN O
O T-H
OS SO O
IN T-H
O
tN
N

Rhizoctonia disease
In Z-l, the percentage of diseased plants was low (1.5%) (Table 1). An anisotropic pure nugget effect was observed, meaning randomness of DI for omnidirectional and directional semivariograms in Z-l. The slope of the curves was not significantly different from 0 (t-test, P=0.05), except for along rows. The slope for along rows (0.0002), though significantly different from 0 (t-test; P=0.05), was considered too weak to cause anisotropy. In Z-2 distinct patches only developed on the sites of infestation. A linear model best fitted DI for the omnidirectional semivariograms, whereas a spherical model best described spatial variation along and across rows. The nugget values were 0.06 and 0.06 for along and across rows. The sill values were 0.09 and 0.09 for along and across rows. The ranges, 13.2 for along rows, and 22.7 for across rows, were significantly different (t-test; P=0.05). Disease was spatially more dependent along rows than across rows.
Disease severity. For DS a linear model best fitted the omnidirectional semivariance and the semivariance across rows, whereas a spherical model best fitted the semivariance along rows for L-l using all observations (Table 2; Fig. 1). For L-2, a spherical model best fitted all experimental semivariances (Fig. 1). A strong isotropic spatial dependency was observed for L-2. Nugget and sill parameters were 0.49 and 2.76 for along rows and 0.36 and 2.45 for across rows, respectively. The ranges for along rows (12.2) and across rows (11.8) were not significantly different (t-test; P=0.05).
Table 3. Percentages correctly predicted disease incidence (%cpDI) and percentages correctly predicted disease severity per 0.1 m row (%cpDS) for the four experimental fields at different sampling intensities (S.I., in percentage of the observed data set).
S.I.
50
33
25
20
10
7
5
Lisse-1
%cpDI
97
96
96
96
95
94
95
% cpDS
88
86
81
85
77
71
71
Lisse-2
%cpDI
97
96
95
94
91
89
89
% cpDS
84
76
72
71
57
62
56
Zwaagdijk-
%cpDI
98
97
97
97
98
96
96
1
%cpDS
98
97
97
97
98
97
96
Zwaagdijk-2
%cpDI
97
96
95
95
94
93
94
%cpDS
90
87
82
83
76
80
74
102

Sampling efficiency
For Z-l a pure nugget effect was observed for DS for omnidirectional semivariograms (Table 2; Fig. 1). Along rows, the slope for the linear model (0.002), though significantly different from 0 (t-test; P=0.05), was considered too small to account for anisotropy. For Z-2, a linear model best fitted the observed data over DS in all directions, whereas a spherical model better described the semivariances for DS along and across rows. Nugget and sill parameters were 0.44 and 0.86 for along rows and 0.51 and 0.90 for across rows, respectively. The ranges along (10.8) and across rows (19.7) were significantly different (t-test; 0.05).
Reduced sampling intensity Efficiency in the study of the spatial distribution of disease may be obtained by reduced sampling intensity, without altering the characteristics of the disease distribution (Stein et al., 1994). The effect of reduced sampling intensity (s.i.) was studied by stepwise reducing the observed dataset. For the four experimental fields, a reduction of the observed dataset (s.i. = 100%) downto 5% altered the
semivariogram parameters distinctly for DI and DS (Tables 1 and 2). The oJ,m was graphed over the sampling intensity for DI and DS in all fields (Fig. 2). The graphs for DI and DS were similar, except for Z-l at high sampling intensities.
The sampling intensities with the lowest a2mm indicate the most accurate prediction
values for DI and DS. DS provided more accurate prediction values than DI. The most efficient sampling intensity appeared to be 20% for both DI and DS in L-l and L-2. In Z-l only few diseased bulbs occurred and, hence, the effect of reduced sampling was non-informative. For Z-2 a sampling intensity of 7% gave the lowest
2
The percentages of DI and DS correctly predicted (cp) also give information on the prediction quality (Stein et ah, 1994). DI was assessed on a scale from 0 and 1, DS on a scale of 0 through 8. In general, reduction of the sampling intensity decreased the prediction quality as measured by %cpDI less than as measured by %cpDS (Table 3). For L-l, %cpDI was not distinctly influenced when the sampling intensity was reduced to 5% (Table 3). For L-2, the %cpDI was 88% for a sampling intensity of 5%. For L-l, the %cpDS was 77 for a sampling intensity of 1%. For L-2, the %cpDS was 57% for a sampling intensity of 10%.
For Z-l both %cpDI and %cpDS were more than 95% over the whole range of sampling intensities, simply because of a low percentage diseased bulbs. For Z-2, when the observed dataset was reduced downto 5%, the %cpDI and %cpDS were 94% and 74%, respectively.
103

a -
Si tN
<u T3
l ^ u
30UEIJEAIUI3S 30UEUBMUI3S

<U I N
i-J
S Û-S
s 5
i •o
°
M
s S
S 4*
I s
s i x
•a u C
» « OJ
T3 »H
.s •d 00 (0
£ N C o
-o bo
« £ N eu
tu
3 1 o ca CA
<u
H O
•n -a (0 cj o
^ J
(0
.2 c tu
g •c. <u û . X ai o
S U
00 •i ta u •3
" O K.-
1 15 •S'S m O i ta eu £ 7 3
ai eu
bc ta
J .
4 <
r '
3DUEIJBMUI0S
T3 bo cS CO
N
00UEUEAIUI3S

Rhizoctonia disease
Lisse-l
» DI (10x)
Lisse-2
' DI (lOx)
2.00
1.60
1.20
0.80
0.40
0.00 100 50 33 25 20 10
Zwaagdijk-1
100 50 33 25 20 10 7 5 sampling intensity (%)
Zwaagdijk-2
» DI (lOx)
100 50 33 25 20 sampling intensity (%)
Figure 2. The average maximum prediction error plotted against the sampling intensity in percent for four experimental fields, and for disease incidence (DI) and disease severity (DS).
Insight in the location of disease on a map may be sufficient as a farmers' management tool. DI and DS were displayed in maps for different sampling intensities. In general, DS provided more representative maps at lower sampling intensities than DI. For L-l, sampling intensities of 50, 33, 25% (not shown) and 20% (Fig. 3) did not reproduce the observed patchy character for DI. Sampling intensities of 10% and lower (not shown) gave unacceptable maps. For L-2, DI at a sampling intensity of 20% (Fig. 3) provided representative maps for the spatial
106

Sampling efficiency
Lisse-1 S.I.=100% L i s s e _ 2
i ï Î .• S.I.=100%
=;• -i •'•. : ; i i
>£ '"•** tré r s.i. :o",, S.I.-2Ü"II
* * »
2 3 4 5 6 7 1 2 3 4 5 6 7
Figure 3. Spatial distribution of disease incidence (DI) at the Lisse location after kriging using the omnidirectional semivariogram parameters of figure 1 and 100% and 20% of the observed dataset. Lisse-1 was used to allow natural development of the disease, whereas Lisse-2 was artificially infested at six sites. Legend: p = path between beds, 0 = no infected bulbs, 1 = at least 1 infected bulb per 0.1 m row length, S.I. = sampling intensity. The arrows indicate artificially infested patches.
distribution of the disease whereas sampling intensities of 10% and lower (not shown) did not. For Z-l, due to low infection levels little information was obtained when reduced datasets for DI were displayed in maps (Fig. 4). For Z-2, DI at sampling intensities of 50% (Fig. 4) and lower (not shown) resulted in mis-representation of the observed patchy distribution.
107

Rhizoctonia disease
Zwaagdijk-1 S.I=100% Zwaagdijk-2 SJ=m%
\ -• H- -¥ :
:=r-F **f
S.I=33% S.I=20%
Figure 6. Spatial distribution of disease severity (DS) at the Zwaagdijk location after kriging using the omnidirectional semivariogram parameters of figure 1 and 100% and 33% or 20% of the observed dataset. Zwaagdijk-1 was used to allow natural development of the disease, whereas Zwaagdijk-2 was artificially infested at six sites. Legend: p = path between beds, 0 = no infected bulbs to 8 = bulbs completely decayed, S.I. = sampling intensity. The arrows indicate artificially infested patches.
110

Sampling efficiency
Discussion
Typical rhizoctonia bare patch symptoms, caused by R. solani AG 2-t (Schneider et al. 1997), vary in space and time (Dijst & Schneider, 1996). The present study was part of a larger field experiment designed to study the dynamics of rhizoctonia disease and the associated anastomosis groups in four experimental fields during four consecutive years (Schneider, unpubl.) with minimal sampling effort. In order to optimize sampling designs using geostatistics the semivariogram has to be known in advance (Webster & Burgess, 1984). The spatial distribution of rhizoctonia bare patch became evident after emergence and stem elongation. The spatial distribution of rhizoctonia infected bulbs could only be assessed at harvest. Tulips develop daughter bulbs between flowering (early April) and harvest (mid June), depending on the cultivar. Webster & Burgess (1984) suggested that to gain insight into the spatial distribution of a certain property sampling should be done as densely as possible on a regular grid. Therefore, we sampled all Rhizoctonia-infected bulbs at harvest. By means of the present study the authors intended to reduce future sampling effort on the basis of the spatial pattern of infected bulbs.
Disease incidence and disease severity Disease was more abundant on the sandy soil in Lisse with a low clay content than on the loamy soil in Zwaagdijk with a higher clay content. Both DI and DS were higher in L-l and L-2 than in Z-l and Z-2. DS was approximately 2 x DI for all four fields, which indicates that DI and DS are interrelated. The higher DI and DS for L-l and L-2 indicates that there was a higher natural indigenous Rhizoctonia population in Lisse than in Zwaagdijk and that disease expression by the introduced inoculum was more severe in L-2 than Z-2. In L-2 and Z-2 inoculum from the same batch was used. In Z-l the lowest number of Rfa'zocfom'a-infected bulbs were found, which indicates a less abundant indigenous Rhizoctonia population. Z-l and Z-2 were separated by 5 m and had the same cropping history without flower bulbs. Our observations are in line with farmers' observations. Generally speaking, rhizoctonia disease is more prevalent on the sandy soils than on the clay type soils in the Netherlands. One mechanism suggested by farmers is that on the sandy soils flower bulbs are grown in short rotation whereas on the clay soils a wider rotation is applied.
Spatial pattern analysis Omnidirectional and directional semivariograms for DI and DS in general gave similar results. We expected to find anisotropy in all fields because it was anticipated that the disease would spread more easily within rows, using bulbs as an nutritional source, than between rows. A comparison of directional semivariograms along and across rows for DI and DS revealed no significant anisotropy in L-l and L-2. Isotropy indicated that the spread of disease was the same along rows, with bulbs side by side, and across rows, with the bulbs separated approximately 23 cm, from which it could be concluded that growth of
111

Rhizoctonia disease
Rhizoctonia was not hampered by biotic and/or abiotic soil factors between rows, or that the fungus needs an nutritional source approximately every 23 cm within the row. The pure nugget effect found for DI and DS for Z-l indicated a random distribution of infected bulbs. Anisotropy was observed in Z-2 for both DI and DS. The range of spatial dependency for DS was significantly longer across rows than along rows. The semivariogram for across rows for Z-2 (Fig. lb) shows considerable variation in the data. This variation may indicate spatial dependency over different ranges for across rows, meaning that elongated patches with different width across and approximately the same length along rows occur in the field. The same holds for DI. Because of assessment of DI (0 and 1) was at a smaller scale than DS (0 through 8), the variation in the data is less distinct.
In the case of disease clusters, a pronounced spatial distribution is expected. For Z-l, in which little disease occurred, a pure nugget effect was found. In L-2 and Z-2, which were artificially infested, distinct patches (clusters) had developed. For both L-2 and Z-2 a pronounced spatial dependency was found. It is anticipated that the shape of the omnidirectional semivariogram in L-2 and Z-2 is largely determined by the focal character of the artificially created patches. This focal character may account for small nugget values and a spherical semivariogram. By contrast, a pure nugget effect or a slight spatial dependency of naturally occurring patches would indicate a patch with multiple infection sites within the patch and little fungal spread between plants. Analysis and comparison of artificial and natural patches warrants further study, but is beyond the scope of this paper.
Omnidirectional semivariogram parameters were used in kriging. For Z-2, a kriging model accounting for anisotropy should have been used. The semivariogram for along rows was distinctly spherical. Across rows a spherical model also fitted the data best, but less than along rows, thus suggesting anisotropy. In addition, the GENSTAT package allows only to account for anisotropy in kriging for linear models. For these reasons omnidirectional semivariogram parameters were used in kriging for all fields.
Reduced sampling intensity The influence of reduced sampling intensity on the kriging quality was assessed
by comparing o^, for DI and DS and %cpDI and %cpDS in conjunction with visual inspection of kriged maps. Our data show that sampling of as little as 10% of L-2 provides sound information on the spatial distribution of Rhizoctonia-infected bulbs (Fig. 4). Sampling less than 10% of any field gave poor maps. Probably this was due to a sampling grid with a lag beyond the range, the zone of spatial dependency. Furthermore, smaller percentages of correctly predicted DI or DS were observed, except for %cpDS for L-l (85), L-2 (57) and Z-2 (80) for a sampling intensity of 20, 7 and 5%, respectively (Table 3). Lecoustre et al. (1989) showed that a 7% sampling scheme was almost as informative as a 25% sampling scheme when analyzing and mapping African cassava mosaic virus. This paper shows that for indicating patches in maps in the case of L-2 a sampling intensity
112
Sampling efficiency
of 10% can be as informative as sampling 100% of the field. Patches ranging from 1 m2 to several m2s occur in commercial fields (Schneider, unpublished). The 10% level may be sufficient for farmer decision-making, e.g. patch specific disinfestation or growing non-hosts on localised infested areas.
The power of geostatistics in optimizing sampling designs was demonstrated by Webster & Burgess (1984) and Di et al. (1989) for certain soil properties and by Stein et al. (1994) for downy mildew in cabbage. In the papers of Webster & Burgess (1984) and Di et al. (1989) the prediction error obtained from block kriging was graphed against grid spacing and initially the prediction error decreased with increasing grid spacing to a minimum, after which the prediction error increased. The prediction error in our data sets tended to fluctuate with the nugget value (Tables 1 and 2; Fig. 2). The nugget variance is caused by bias in measurements and variability at a scale smaller than the grid spacing. Assuming that bias in measurements are the same for all sampling intensities, at minimum prediction error the grid spacing seems quite similar to the small scale variability and the prediction error is mostly accounted for by measurement bias.
With the exception of Z-l the curves for o ^ showed similar trends for DI and for DS. For Z-l the curve decreases rapidly between s.i. = 33 and s.i. = 25% One explanation might be that a few diseased bulbs, which were randomly distributed over the field, caused a high nugget value. At sampling intensities lower than 25% too few diseased bulbs were detected to estimate prediction errors correctly.
The maps of DI and DS show that the number of samples can be reduced to 10% of the observed dataset if disease severity was assessed rather than disease incidence (Figs 3 and 4). For the Lisse fields, L-l and L-2, sampling intensities of 20 and 10%, respectively, and bulbs rated for disease severity still provided useful information, whereas disease incidence provided less useful information on the spatial distribution of Rhizoctonia-iixîected bulbs. The same holds for the Zwaagdijk fields. Sampling disease severity at 25% and 20% for Z-l and Z-2, respectively, provided more useful information on the spatial distribution of Rhizoctonia-infected bulbs than disease incidence. Sampling intensities of 50 and 33% of disease incidence provided little information on the actual spatial distribution of infected bulbs (Figs 5 and 6). Our conclusion that disease severity provides better information than disease incidence is in line with similar observations of Kocks (unpubl.) in the black rot-cabbage pathosystem. Assessment of disease severity is somewhat more time consuming than assessment of disease incidence but the extra effort is more than compensated for by a lower sampling intensity. We therefore conclude that reduced sampling is more economical with disease severity than with disease incidence.
Care should be taken when interpreting the prediction error alone. The average maximum prediction error e.g. suggests for Z-2 that a sampling intensity of 7% is optimal (Fig. 2). However, the accompanying map was unacceptable (not shown). Therefore, on the basis of the maps, the kriging prediction error and the percentage correctly predicted DS, a sampling intensity of 20% seemed optimal for
113

Rhizoctonia disease
L-l and L-2, whereas a sampling intensity of 25% seemed optimal for Z-2. For Z-l no optimal sampling grid could be determined due to absence of disease patches.
Our observations refer to a single year only. Stein et al. (1994) attempted to design an optimal sampling plan for downey mildew in cabbage accounting for spatial and temporal variability within one growing season. They were only partially successful due to aggregation in disease incidence data, anisotropy, temporal non-stationarity and interacting foci. As more semivariograms of our experimental fields become available in successive years it may be possible to model some generalized form of semivariogram for each field (Webster & Nortcliff, 1984), perhaps without considering temporal variability when patches reoccur at the same sites in a field. The reduced sampling intensities reported here can be used as a guideline for sampling rhizoctonia disease in subsequent years at a known error level and thus help to economize on the sampling in our field experiments without loss of information.
114

Chapter 6
Spatial and seasonal distribution of rhizoctonia disease in tulip

Spatial and seasonal distribution
Spatial and seasonal distribution of rhizoctonia disease in tulip
Abstract
Rhizoctonia disease of tulips may accumulate over the years to cause severe losses during the production cycle of tulip. R. solani causes bare patches in tulip crops. The dynamics of the bare patch phenomenon are poorly understood. Causal anastomosis groups (AG) were identified and their dynamics studied in field and growth chamber experiments. In field experiments, artificial soil infestation with R. solani AG 2-t induced bare patches, which did not re-appear in the following cropping seasons. Naturally occurring bare patches slowly vanished during successive cropping of bulbs and did not re-appear in the fourth growing season. In one field, 1995, disease prevalence (DP) increased from 65% in February to 90% in March and decreased to 55% in May, 1995. The high DP did not result in bare patches. In all tulip cropping seasons, R. solani AG 2-t isolates were readily isolated early in the season, but could hardly be isolated at harvest. In contrast, AG 5 isolates were rarely found early in the season but were predominant at harvest. In a growth chamber experiment AG 5 could not account for replacement of AG 2-t. The same experiment showed that competition may partially explain replacement of AG 2-t isolates during the growing season since AG 4 prevented AG 2-t to colonise and infect iris bulbs at 18 °C after dual infestation of the soil. AG 4 isolates, however, were found in too low frequency to induce replacement of AG 2-t in the field. Rhizoctonia decline seemed AG specific induced. In contrast to bare patch, bulb rot tended to increase during four successive croppings of bulbs. AG 5 may largely account for the observed bulb rot. In one location bare patches due to R. tuliparum expanded within two seasons to cause severe damage in tulip bulbs.
Introduction
Rhizoctonia disease of flower bulbs causes severe losses in flower bulbs. Tulips are vegetatively propagated and it takes a production cycle of about five years before bulbs attain a flowering size. Small annual losses may accumulate considerably before flowering. In the Netherlands, bulbs are planted around mid October (autumn) and harvested the following year in June or July, according to cultivar.
Tulips may be infected by different soil-borne Rhizoctonia spp. (Dijst and Schneider, 1996). R. crocorum (De Candolle), teleomorph Helicobasidium purpureum, causes 'copper web' on crocus and is also pathogenic to tulip and other flower bulbs (Moore, 1939). R. tuliparum (Whetzel and Arthur) causes 'grey bulb disease' of tulips and other flower bulbs (Whetzel and Arthur, 1924; Boerema, 1963). 'Rhizoctonia disease' is caused by R. solani (Kühn), teleomorph Thanathephorus cucumeris ((Frank) Donk). Thusfar, binucleate Rhizoctonia spp. are not known to cause disease in flower bulbs.
117

Rhizoctonia disease
Different anastomosis groups (AG) of R. solani (Kühn) (Boerema and Hamers, 1988) are associated with rhizoctonia disease. Typical bare patch symptoms are caused by R. solani AG 2-t (Schneider et al., 1997a; Schneider and Kocks, 1998). Tulips get infected during sprout growth through the soil at low temperatures (Dijst and Schneider, 1996). Upon severe infection the sprouts hardly emerge and bare patches become visible in early spring. When less severely infected tulip plants show lesions on leaves and stems. In addition, AG 2-t isolates causes bulb rot.
Some isolates of R. solani AG 2-1, AG 2-2, AG 4, AG 5 and AG BI caused sprout infection on three tulip cultivars and bulb rot of iris when tested at 18 °C whereas the same isolates, except for AG 2-1 isolates, did not cause symptoms at 9 °C in greenhouse experiments (Doornik, 1981; Schneider et al, 1997a). In open-air experiments some isolates of AG 2-2 and AG 4 caused bulb rot and reduction of the fresh bulb weight of tulip cultivars, but no sprout and leaf infection (Chapter 4; Schneider et al, 1998). The occurrence of R. solani isolates other than AG 2-t and their impact on field-grown tulips thusfar remained undescribed.
The spatial distribution of bare patch, bulb rot and causal isolates in tulip fields is poorly understood. Information from commercial growers is contradictory. In some fields the disease may re-appear at a known site when a susceptible crop is grown, whereas in other fields disease occurence varies in space, time and intensity.
We observed that R. solani AG 2-t occurred in high incidence in early spring at low soil temperatures and in low incidence at harvest at higher temperatures. In contrast, R. solani AG 5 isolates occurred in low incidence in early spring and predominated at harvest (this paper). AG 2-t isolates can infect tulip sprouts at 9 and 18 °C in greenhouse experiments (Chapter 2; Doornik, 1981; Schneider et al, 1997a). The latter authors reported an optimum growth temperature between 20 and 25 °C for some AG 2-t isolates in a Petri dish experiment. R. solani AG 4 and AG 5 were reported to infect tulip sprouts at high temperatures and not at soil temperatures below 13 °C (Doornik, 1981; Schneider et al, 1997a). Thus the question arose whether AG 2-t is imposed to antagonism incited by resident microbiota at higher temperatures.
The objectives of this paper are to study spatial and seasonal distribution of bare patch and bulb rot symptoms and of the causal Rhizoctonia isolates. Competition between isolates of different AG at two temperatures was studied as a possible explanation for the predominance of AG 2-t in early spring at low soil temperatures.
Materials and methods
Experimental fields To study spatial and seasonal development of rhizoctonia disease and the causal Rhizoctonia spp., experimental fields were established in the autumn of 1991. At
118

Spatial and seasonal distribution
the Bulb Research Centre (LBO), Lisse, and at the experimental station 'Proeftuin Zwaagdijk', Zwaagdijk, the Netherlands two experimental fields were created. Flower bulbs had been grown before at the two locations, but the history of R. solani in previous (bulb) crops was not known. One field per location was used to allow natural development of rhizoctonia bare patch and rhizoctonia bulb rot. These fields are referred to as Lisse-1 (L-l) and Zwaagdijk-1 (Z-l). To ensure the development of patches in at least one field at each location, six patches were created by artificial infestation in the second field at each location. These fields are further referred to as Lisse-2 (L-2) and Zwaagdijk-2 (Z-2). In October 1991, all fields were planted with Tulipa greigii 'Red Riding Hood'. In June, 1992, all fields were harvested manually. Details of the experimental fields and of the artificial soil infestation are described elsewere (Chapter 5; Schneider and Kocks, 1998).
Crop rotation during four successive years To study spatial and seasonal distribution of rhizoctonia disease over four seasons tulip - iris - tulip - tulip were grown successively (Table 1). In November, 1991, al experimental fields were planted with T. greigii 'Red Riding Hood', to be harvested in June, 1992. In November, 1992, all experimental fields were planted with Iris 'Blue Magic', to be harvested in August, 1993. In November, 1993, all fields were planted again with T. greigii 'Red Riding Hood', to be harvested in June, 1994. In November, 1994, all fields were planted with T. kaufmanniana 'Giuseppe Verdi'. Planting density for all crops was approximately 100 bulbs per m2. Crop husbandry, fertilization, fungicides to control fire blight of tulips caused by Botrytis tulipae Lind., and weed control were performed according to farmers' practices. Between harvest and subsequent planting no crops were grown. Planting material was obtained from breeders without rhizoctonia bare patch and visualy inspected for disease symptoms by the LBO. To check for bulb-borne inoculum, some bulbs of the planting stock in the third and fourth year were randomly selected and planted in our standard soil mixture (Schneider et al., 1997).
Disease development within one growing season In 1995, each bed in L-2 was subdivided in quadrats of 1 m2, thus resulting in ten quadrats per bed and 70 per experimental field in total. From February to May, each quadrat was regularly sampled by random selection of four tulip plants, one per row. Disease incidence (DI) per field was assessed as the mean percentage of rhizoctonia infected tulips per quadrat. Disease prevalence (DP) was assessed as the mean percentage of quadrats per field with at least one rhizoctonia infected tulip. From all sampled bulbs, four per quadrat, Rhizoctonia spp. were isolated and identified as described below, which rendered the percentage (relative frequency) of isolation of AG 2-t. The disease parameters were analysed by ANOVA after an arcsin transformation.
Disease assessment At harvest bulbs were lifted by hand and stored at 4 °C until disease assessment. The sample unit was 0.1 m row length. The positions of the sample units and the
119

Rhizoctonia disease
numbers of diseased and healthy bulbs in each unit were registered. The results of geostatistical analysis on reduced sampling (Chapter 5) were not yet available in 1993 and 1994. In these years therefore, every third 0.1 m of all rows was used as a sample unit, the maximum amount which could be handled to assess disease severity and incidence of bare patch and bulb rot causing isolates. For 1995, a sampling intensity of 20%, one on five 0.1 m row length, was used in accordance with the geostatistical analysis of L-2 in 1991 (Schneider and Kocks, 1998). In all three years regular sampling (1:3 or 1:5) was applied, with the first sample unit varying regularly with the row to be sampled.
Disease severity per bulb was rated on a scale from 0 to 8. Bulbs in disease classes 0 to 5 had developed a cluster of daughter bulbs, whereas those in disease classes 6 to 8 apparently had developed only one bulb. Mean disease severity was calculated per sample unit (DS). For details on sampling and disease severity see chapter 5.
Table 1. Time schedule of planting, harvest, sampling and disease assessments (D), isolation of Rhizoctonia spp. (Is) and identification of Rhizoctonia spp. (Id).
Year
1991
1992
1993
1994
1995
Season
Summer
Autumn
Winter
Spring
Summer
Autumn
Winter
Spring
Summer
Autumn
Winter
Spring
Summer
Autumn
Winter
Spring
Summer
Period
October 25-30
December 3
June 18-24
November 1-5
August 15-20
November 2
June 15-20
November 1-7
June 6-9
Activity
Fallow
Planting T. greigii
Creating six patches
Harvest
Fallow
Planting iris 'Blue Magic'
D+Is
Harvest iris; D+Is
Planting T. greigii.
Harvest tulip; D+Is
D+Is
Planting T. kaufmanniana
Periodic sampling; D+Is; Id
Periodic sampling; D+Is; Id
Harvest; D+Is; Id
D+Is; Id
Field
L-l, L-2, Z-l, Z-2
L-2, Z-2
L-l, L-2, Z-l, Z-2
L-l, L-2, Z-l, Z-2
L-l, L-2, Z-l, Z-2
L-l, L-2, Z-l, Z-2
L-l, L-2, Z-l, Z-2
L-l, L-2, Z-l, Z-2
L-l, L-2, Z-l, Z-2
L-2,
L-2,
L-l, L-2, Z-l, Z-2
L-l, L-2, Z-l, Z-2
120

Spatial and seasonal distribution
Isolation and identification of Rhizoctonia spp. Isolates causing bare patch and bulb rot were obtained by plating out bulb bottoms of all sampled bulbs on water-agar amended with 250 ppm chloro-amphenicol and 250 ppm metalaxyl (WACM) (Schneider et al, 1997a). Isolates were stored on PDA at 4 °C until further identification. In general, one WACM plate was used per sample unit, 0.1 m row length (see disease assessment). Each R. solani-like isolate was brought to pure culture. Isolates were grouped according to colony habitus. Of each group some representative isolates were assigned to AG according to anastomosis with tester strains of AG 1 to AG 5 (Schneider et al, 1997a) and pectic zymography (Schneider et al, 1997b). The number of nuclei was counted after staining with DAPI (Martin, 1987). Isolates were assigned to AG 2-t, AG 4, AG 5, binucleate Rhizoctonia spp. or to a group of unidentified isolates. The percentage of isolation per group for each field or quadrat was assessed.
Mapping disease severities and isolates For visual evaluation of spatial and seasonal distribution of DS, 'kriged' maps were produced for all four experimental fields as described previously (Schneider and Kocks, 1998). Here, the procedure is explained briefly. First, experimental semivariograms were fitted to linear, exponential and spherical models (Journel and Huijbregts, 1978) using the FVARIOGRAM and MVARIOGRAM directives of Genstat 5, Release 3.2 (Genstat 5, 1996). The highest percentage variance accounted for by the model and the lowest nugget variance were both used to choose the model for further analysis. Second, for optimum spatial interpolation, 'kriging', the semivariogram characteristics nugget, sill and range obtained from non-linear models or nugget, slope and gradient obtained from linear models were used. The KRIGE directive of GENSTAT produces matrices of kriging interpolators for DS and the accompanying estimation errors. Maps (Figs 1 and 2) were produced using the interpolated DS matrices and isolate coordinates in Corel Presentations 6.0 (CorelDRAW 6.0, 1995). The shading with various intensities of grey, within and between plant rows (four per bed), is due to kriging. In other words, kriging provides a map as if every 0.1 m of the field had been planted. The coordinates of the sample units were used to display the spatial distribution of the isolates in maps using CorelDRAW 6.0 (1995).
Competition between R. solani AG 2-t and AG 4 or AG 5 During the research period we observed that AG 2-t isolates were abundant on infected tulip sprouts in early spring at low soil temperature. By contrast, AG 2-t isolates were sparse at harvest at higher soil temperatures. An experiment (Table 2) with four treatments (two temperatures and two inoculum carriers) and six replications, was performed to test the hypothesis that a high incidence of 'cold preferring' (Doornik, 1981) AG 2-t in early spring and a low incidence at harvest could be explained by competition between AG 2-t and soil micro-organisms. As possible competitors 'warmth preferring' R. solani AG 4 or AG 5 were chosen. AG 5 was observed in low incidence in early spring and in high incidence at harvest. R. solani isolates 2tR002 and 4R22 (Schneider et al, 1997a,b) and isolate 5R40, obtained from iris in L-2 in 1993, were used as representative isolates for
121

Rhizoctonia disease
AG 2-t, AG 4 and AG 5, respectively. Inoculum was prepared by growing the isolates on autoclaved oat kernels (Doornik, 1981; Schneider et al, 1997a) for two to three weeks at 20 °C in the dark.
One iris bulb cv. 'Blue Magic' was planted per 10x10x9 cm pot filled with a standard soil mixture (Chapter 2; Schneider et al, 1997a). Six pots (6 replications) with one bulb were used per treatment (four treatments). The experiment was carried out in climate chambers at two temperatures, 9 and 18 °C, favourable to AG 2-t and AG 4 or AG 5, respectively (Doornik, 1981; Schneider et al, 1997a). Watering was done by hand. After six weeks of incubation, iris bulbs were assessed for DS using an observation scale with 0) 0% infection, no symptoms; 1) 5% infection; 2) 20% infection; 3) 50% infection; 4) 75% infection, and 5) 100% infection. Per plant two pieces of each bulb bottom, bulb and stem, irrespective of the presence of lesions, were plated out on WACM to re-isolate R. solani. The experimental design was a complete randomized block. Statistical analysis was done by ANOVA in GENSTAT.
Table 2. Experimental lay-out to test competition between AG 2-t and AG 4 or AG 5 as possible explanation for a low incidence of AG 2-t at harvest. AG 2-t and AG 4 or AG 5 were applied together as a dual inoculation. As controls AG 2-t, AG 4 and AG 5 were inoculated separately. Treatments, numbered 1 to 4, were performed simultaneously in two climate chambers at 9 and 18 °C with six replications.
Treatments
Inoculum carrier
Oatkernels
PMP
9
1 2-t; 4; 5; 2-t + 4; 2-t +
2 2-t; 4; 5; 2-t + 4; 2-t +
5
5
Temperatu re°C
18
3 2-t; 4; 5; 2-t + 4; 2-t + 5
4 2-t; 4; 5; 2-t + 4; 2-t + 5
Results
Occurrence of bare patch The first growing season (1992) was used to determine sampling efficiency by means of geostatistics (Chapter 5; Schneider and Kocks, 1998). The results are summarised here in order to provide a complete picture of disease development from 1992 to 1995. Figures 1 and 2 show the kriged disease maps. The six panels represent years and infestation treatments (six fields). Each field contains seven beds seperated by six paths. Each bed consists of four rows. Sample units can be seen as regularly appearing pixels along the rows. Sample units are clearest in figures 3 and 4, which were constructed without
122
Spatial and seasonal distribution
kriging. Each pixel represents 0.1 m. The darker the pixels, the more severe the infection of the bulbs at harvest (Figs 1 and 2). Bulbs with a DS of 6, 7 or 8 (black pixels) were mostly found in bare patches, but also occurred at random in the field. A DS of 0, light grey pixels, indicates that no symptoms due to R. solani were found on the bulbs. Kriged maps were used for visualisation of the distribution of disease in a field. White to light grey pixels, indicating sample units with healthy or lightly infected bulbs, may occur within a darker, more severely infected, area. Kriging uses optimal spatial interpolation based on the semivariogram. Hence, DS maps (Figs 1 and 2) show areas varying in intensity of grey as a result of interpolation between white pixels (healthy sample units) and black pixels (DS=8; plant severly affected or dead).
No bare patch symptoms developed in planting stock grown in the greenhouse at 9°C from samples randomly per location in the third and fourth year.
In L-l, a few small (2-3 dm2) bare patches (indicated by short sequences of black pixels in figure 1), probably due to natural soil infestation, were visible at harvest in June 1992. At harvest in August, 1993, iris bulbs did not show any symptoms and therefore no maps are shown for 1993. In 1994, the size of two bare patches in bed nr 3 and 4, coded 1 and 2 (Fig. 1) had increased in L-l. In addition, few individual tulip plants severely infected were found scattered in L-l (indicated by a single black pixel). At harvest in 1995, no distinct bare patch occurred and only a few severely infected plants, with DS=6, 7 or 8, seemed randomly distributed in the field (indicated by individual dark pixels).
In L-2, all six artificially infested patches (indicated by black arrows orientated left) were visible as distinct bare patches at harvest in June, 1992 (Fig. 1). In addition, other bare patches (indicated by grey arrows orientated right), probably due to natural soil infestation, were visible. At harvest in August, 1993, iris bulbs did not show any symptoms and no maps are shown. In June, 1994, small bare patches had developed in beds 5, 6, and 7 (Fig. 1) at harvest. In June, 1995, no bare patches occurred in L-2, only some severely infected bulbs, apparently distributed at random. Since a mean DS per sample unit (0.1 m) is displayed, individual, severely infected bulbs are not clearly visible.
In Z-l, no bare patches were visible at harvest in June 1992 (Fig. 2). At harvest of the iris bulbs in August, 1993, no bare patch had developed and no symptoms were found on the bulbs (not shown). In June, 1994, no bare patches due to R. solani were found at harvest. As of February, 1994, a severe infection due to R. tuliparum with bare patches developed in Z-l as shown by dark shaded flecks. R. tuliparum forms thick black sclerotia on infected bulbs, whereas R. solani AG 2-t does not (Boerema, 1963). In 1995, no bare patch due to R. solani was found. By contrast, bare patch due to R. tuliparum had increased in abundance and severity in comparison to 1994.
123

T i
G tu
O
C8
O) — |H
° £ 2 a Si Ë a 2
a, .. Ë « > CL, tO
S OI
u tu
2 "ö
Is I'S
ni
tu en
T3 C es O
bO
to to
ta ^
« .a en
. os ON
tu > <u „
tu
o
en *; —- 3
^° .'S eu 2 tu £ s a-s • s . s
ta .t-»
-S (0
H
S
O
s
«
«
es
01 00 oo 3
z
T3 en
o o rH
CM in rH
in
o
00 CM o
Ö
•fk
(M CN
VO O vo IN O 00 H ö ö
3 ö
CM
g in
ö
IN
CO
Ö
z P H
in T-l
ö
o
T-l
in
ö
g
*t T-Î
Z R H
IN VO H
CM
IN
rH
CM
3 rH
VO CM 00 VO
OS Ï—i Ov VO
r-l TH O rH
t/5 cn tn t/i
co ov p ov CN co' ** ov
cr> t/5 tn in
N * S »
O ö
z PH
O ö
O VO CO 00 CM CM
rH CN rH
N N
CO r H rA VO
O rH Ö IT)
in co'
z PH
VO
Ö
es vo CM
IN in ö
z P H
00 rH
Ö
rH O
Ö
VO VO
Ö
r^
CO O T-^
00 i-A
IN r-i
00 I N
CM'
00 CO r-i
in OV csi
rH
rA
CO
o ö
CO CO CM
CN O
ö
CO
o CO
IN OV
^
CO CO
CO
CM vri
in CN
r^
•J
CO CM
CM
J
IN CM
,_ N
OV CN
CN
N
o CM
m OV
o CO
J-i
rJ
r H
CO
CM
Jl
in CO
^H
N
o • *
CN
N

Spatial and seasonal distribution
In Z-2, small bare patches had developed in 1992 at five sites where the soil had been artificially infested with R. solani AG 2-t (Fig. 2). At the site indicated with x in bed 4, bare patch had hardly developed. In August, 1993, no iris bulbs with symptoms were found at harvest. As of February, 1994, bare patches due to R. solani did not occur, but bare patches due to R. tuliparum were abundant in Z-2 as indicated by the dark shaded roundish patches. At harvest in June, 1995, no bare patches due to R. solani were found. Bare patch due to R. tuliparum, however, had increased in abundance and severity compared to 1994, as in Z-l.
The large roundish dark grey flecks in Z-l and Z-2 in 1994 and 1995, indicate bare patches due to R. tuliparum. The majority of short sequences of black pixels indicate bare patches due to R. tuliparum and a minority due to R. solani.
Spatial distribution of bulb rot In geostatistics clustering of the parameter under study is indicated by a spherical model and a random distribution by a pure nugget effect. Linear semivariograms suggest that the disease pattern is determined by a strong spatial dependence without a limiting value (Lecoustre et al, 1989).
At harvest, bulbs with rot were found in all tulip grown fields, but not in iris grown fields. Bulb rot was also found outside bare patches on bulbs with healthy stems and leaves. In general, the mean DS increased during the research period (Table 3).
In L-l, bulb rot was randomly (Table 3) distributed in the field in June, 1992 (Fig. 1). In 1994, a spherical semivariogram indicated a clustering of bulb rot in L-l (Table 3). Figure 1 shows that bulb rot occurred in two clusters but was also found outside the clusters in L-l. In June, 1995, bulb rot was randomly distributed in L-l. Mean DS had increased from 0.35 in 1992 to 3.0 in 1995 (Table 3).
In L-2, a spherical semivariogram was found in 1992 (Tabel 3) indicating clustering of bulb rot. Figure 1 shows that bulb rot also occurred outside the bare patches. In June, 1994, bulb rot occurred in clusters as indicated by the spherical semivariogram of L-2 (Table 3). Figure 1 shows these bulb rot clusters in beds 5, 6 and 7 of L-2 (indicated by grey arrows). At harvest in 1995, bulb rot was found randomly distributed (Table 3) in L-2. Mean DS in L-2 had increased from 0.69 in 1992 to 3.1 in 1995 (Table 3).
Legend to Table 3. 1 DS; Mean and standard deviation (S.d.) per field. 2 Best fitting model for the experimental semivariogram, based on the % variance accounted for by the model and minimal nugget variance. S: spherical model; L: linear model. Ln: indicates negative semivariogram parameters for non-linear models. 3 Nugget: the variance near the origin representing microdistributional and measurement bias. 4 Sill for a spherical and exponential model, slope for a linear model, PN for 'pure nugget effect'. 5 Range: zone of influence for non-linear models; ranges for along and across rows followed by the same letter are not significantly different (t-test; P=0.05). 6 Model when different from the omnidirectional model.
125

Rhizoctonia disease
In Z-l, bulb rot was found randomly distributed (Table 3), at low incidence (Fig 2). In 1994, bulb rot, mainly caused by R. tuliparum, in Z-l occurred in clusters as indicated by a spherical semivariogram (Table 3), but it was also found outside bare patches. In 1995, the situation in Z-l remained unchanged. Mean DS increased from 0.07 in 1992 to 3.5 in 1995.
In Z-2, a linear semivariogram indicated a strong spatial dependence (Table 3) for the distribution of bulb rot at harvest, 1992. Bulb rot was more prevalent across rows than along rows as indicated by a statistically significant difference (t-test; P<0.05) between the ranges with values of 19.7 and 10.8, respectively (Table 3). Outside the bare patches bulb rot was also found (Fig. 2). In 1994, bulb rot occurred clustered (Table 3). Spread of bulb rot was more prevalent along rows than across row, as indicated by a significant difference (t-test; P<0.05) between the ranges with values of 20.6 and 14.2, respectively. Bulb rot was also found outside bare patches (Fig. 2). In 1995, bulb rot was aggregated (Table 3).
Table 4. Mean percentage of Rhizoctonia solani and R. solani-like isolates from bulbs per sample unit per field in three consecutive years.
1993
L-l L-2 Z-l Z-2
1994
L-l L-2 Z-l Z-2
1995
L-l L-2 Z-l Z-2
SI1
33
33
20
Total2
758 1373
845 700
1176
424 648 508
254 188 238 220
AG2-t
0.3 10 3 3
1 3 0 0
11 17 0 0
AG 5
59 64 (0.5)6
52 (0.5)
45 (0.2)
90 (9.4)
80 (11)
83 (0.3)
79
81 (1.3)
74 (1.8)
60 65
B N R 3
14 24 (0.2)
27 28
1 2 6 5
6 8
21 14
AG 4
0 0.3 3 (0.2)
0.3
0 0 0 0.4
0 0 0 0.5
N.i.4
27 9 (0.1)
15 23
9 13 7
15
0 11 20 21
#n.i.5
9 9 4 4
4 4 4 4
0 1 7 8
1 SI: sampling intensity. 2 Total: total number of isolates. 3 BNR: binucleate rhizoctonia. 4 N.i.: not identified; R. solani (-like) isolates not identified to AG. 5 #n.i.: number of morphologically distinct groups in the unidentified group. 6 (): percentage of dual occurrence of AG 2-t isolates with other isolates.
126

Lisse-1
1992
Lisse-2
s.i.=100%
#<-•>"
M
• * «-s.
1994 s.i.=33%
r V- . > -m •<. : . K • :.
•-•• <v • i A â 1995
11 i i
i ï
1 2 3 4 5 6 7
Figure 1. Spatial distribution of bulb rot in Lisse-1 and Lisse-2 during three cropping seasons. Lisse-1 was used to allow natural development of the disease, whereas Lisse-2 was artificially infested at six sites indicated by black left oriented arrows. Bare patches due to natural soil infestation are indicated by grey right oriented arrows. Maps were produced after kriging using the omnidirectional semivariogram parameters of table 3. Legend: p = path between beds (1 to 7), 0 = no infected bulbs to 8 = bulbs completely decayed, s.i. = sampling intensity. Sample units (0.1 m) are represented by individual pixels which vary in color from light grey (DS=0 or 1) to black (DS=7 or 8).
127

Zwaagdijk-1
i
1992 Zwaagdijk-2 s.i ion0,,
i *... • i
"x::: è* -1 .
l . i
••
l < ï l u i>
* * • / - " *
1994 s.i.=33%
1995 s.i.=20%
2 3 4 5 6 7 1 2 3 4 5 6 7
Figure 2. Spatial distribution of bulb rot in Zwaagdijk-1 and Zwaagdijk-2 during three cropping seasons. Zwaagdijk-1 was used to allow natural development of the disease, whereas Zwaagdijk-2 was artificially infested at six sites. Maps were produced after kriging using the omnidirectional semivariogram parameters of table 3. Legend as of figure 1.
128

Lisse-1 Lisse-2 1993 s.i.=33%
24 + 5 AG 24 AG 4 5+BNR AG 5 BNR ni.
1994 s.i.=33%
1995 s.i.=20%
1 4 1
Figure 3. Spatial distribution of R. solani AG 2-t, AG 4 and AG 5, R. solani-like isolates (n.i.) and binucleate Rhizoctonia spp. isolates (BNR) in Lisse-1 and Lisse-2 during three consecutive cropping seasons, with iris 'Blue Magic', Tulipa greigii 'Red Riding Hood and T. kaufmanniana 'Giuseppe Verdi' as successive crops. Sample units are represented by individual pixels with shades of grey according to isolates found. Legend: s.i.: sampling intensity; p: path between beds (numbered 1 to 7). BNR: Binucleate Rhizoctonia spp.; n.i.: not identified as to AG.
129

Zwaagdij k-1 Zwaagdijk-2 1993 s.i.=33%
24 + 5 AG2-t AG 4 5 + BNR AG 5 BNR n.i. bed P
1994 s.i.=33%
1995 s.i.=20%
1 2 3 4 5 6 7 1 2 3 4 5 6 7
Figure 4. Spatial distribution of R. solani AG 2-t, AG 4 and AG 5, R. solani-hke isolates (n.i.) and binucleate Rhizoctonia spp. isolates (BNR) in Zwaagdijk-1 and Zwaagdijk-2 during three consecutive cropping seasons. See figure 3.
130
Spatial and seasonal distribution
Spread of bulb rot was more prevalent along than across rows, as indicated by a significant difference (t-test; P<0.05) between the ranges, with values of 23.3 and 16.1, respectively. Outside the bare patches bulb rot was also found in Z-2, June 1995. Mean DS had increased from 0.25 in 1992 to 4.0 in 1995 (Table 3).
Inter-season distribution of R. solani AG 2-t isolates At harvest of iris and tulip bulbs, bare patch causing AG 2-t isolates were isolated from bulbs inside and outside bare patches in low percentages (Table 4). The distribution of R. solani AG 2-t isolates is visualised per sample unit and per year (Figs 3 and 4). The black pixels indicate the sample units (0.1 m) were at least 1 AG 2-t isolate was found.
In L-l (Fig. 3), AG 2-t isolates constituted only 0.3% of the 758 Rhizoctonia spp. isolates from bulbs harvested in August 1993 (Table 4). In June, 1994, 1% of 1176 Rhizoctonia spp. isolates were identified as AG 2-t. In June, 1995,11% of 254 Rhizoctonia spp. isolates were AG 2-t. R. solani AG 2-t seems to be randomly distributed in L-l in the three successive years.
In L-2 (Fig. 3), 10 % out of 1373 isolated Rhizoctonia spp. was AG 2-t (Table 4) in 1993. In 1994 only 3% out of 424 Rhizoctonia spp. isolates was identified as AG 2-t. In 1995, 17% out of 188 Rhizoctonia spp. isolates was AG 2-t. Again, the spatial distribution seems random for AG 2-t isolates.
In Z-l, 3% out of 845 isolates were identified as AG 2-t (Table 4). R. solani AG 2-t isolates were not found again in 1994 and 1995. The spatial distribution of AG 2-t isolates (Fig. 4) seems random.
In Z-2, R. solani AG 2-t isolates were only found in 1993. In 1994 and 1995 no AG 2-t isolates were found again, as in Z-l. Once more, the spatial distribution of AG 2-t isolates (Fig. 4) seems random.
Inter-season distribution of other Rhizoctonia spp. Most isolates from iris and tulip bulbs in all fields and cropping seasons belonged to AG 5 (Table 4). In L-l, R. solani AG 5 constituted 59, 90 and 81% of the total numbers of Rhizoctonia spp. isolates in 1993,1994 and 1995, respectively. In L-2, AG 5 constituted 64, 80 and 74% of the total Rhizoctonia spp. isolates. In Z-l, AG 5 isolates comprised 52, 83 and 60% of the total Rhizoctonia spp. isolates. In Z-2, AG 5 isolates comprised 45, 79 and 65% of the total Rhizoctonia spp. isolates found. The distribution of AG 5 isolates is visualised in figures 3 and 4 as light grey pixels representing at least one isolate per sample unit. On average, relative more AG 5 was found in Lisse than in Zwaagdijk.
Binucleate Rhizoctonia spp. (BNR) were isolated primarily at harvest in June, 1993. In L-l, BNR isolates comprised 14% of the total Rhizoctonia spp. isolates found in 1993 and 1 and 6% at harvest in 1994 and 1995, respectively. In L-2, BNR isolates comprised 24, 2 and 8% in 1993,1994 and 1995, respectively. In Z-l, BNR isolates comprised 27, 6 and 21% of the total Rhizoctonia spp. isolates in 1993, 1994, and 1995, respectively. In Z-2, BNR had 28, 5 and 14% of the total isolates found in 1993, 1994 and 1995, respectively. On average, BNR was somewhat more frequent in Zwaagdijk than in Lisse.
131

Rhizoctonia disease
% AG 2-t
1 2 3 4 1 2 3 4
Sample date
1 2 3 4
Figure 5. Within season development of rhizoctonia disease in L-2 at four sample dates in 1995. Mean percentage of quadrats per field with rhizoctonia disease (DP), mean percentage of infected plants per quadrat (DI) and mean percentage of R. solani AG 2-t (%AG 2-t) isolated from the sampled (healthy and diseased) plants. For each parameter bars marked by the same letter are not significantly different (LSD<0.05) after an arcsin transformation. Sample dates in 1995: 1) 1402, 2) 1403; 3) 0504, 4) 0305.
Isolates of AG 4 occurred only sporadically in our fields (Table 4). In L-l, no AG 4 isolates were found in any year. In L-2, AG 4 isolates were found as 0.3% of the total isolates in 1993, and 0% in 1994 and 1995. In Z-l, AG 4 isolates were 3% of the total isolates in 1993 and absent in 1994 and 1995. In Z-2, AG 4 isolates formed 0.3, 0.4 and 0.5 of the total Rhizoctonia spp. isolates found in 1993, 1994 and 1995, respectively.
Some isolates remained unidentified as to AG, with a minimum of 0% for L-l in 1995 and a maximum percentage of 27 for L-l in 1993 of the total Rhizoctonia spp.. According to colony habitus these unidentified isolates may comprise several groups with a minimum of 1 in L-2 in 1995 and a maximum of 9 for L-l and L-2 in 1993.
R. solani AG 2-t isolates were found only in low incidence in dual occurrence, i.e. together with other Rhizoctonia spp. in one sample unit. A minimum of 0.2% was found in Z-2 in 1993 and a maximum of 11% in L-2 in 1994 (Table 4).
132

Spatial and seasonal distribution
The distribution of Rhizoctonia spp. isolates over the fields is displayed in figures 3 and 4. Sample units (0.1 m) with AG 5 isolates are visualised as light grey pixels, R. solani AG 2-t isolates as black pixels. Sample units with dual occurrence are rendered in black.
Intra-season distribution ofR. solani AG 2-t On February 14, 1995, tulips in L-2 showed symptoms due to R. solani with a disease prevalence (DP) of 69% (Fig. 5). A significant (P<0.05) increase of DP to 93% was found on March 14, but later DP decreased significantly to 57% on May 3, 1995. Disease incidence (DI) showed the same tendency. In February DI was 35% and a significant (P<0.05) increase to 50%, was reached on March 14 whereas DI decreased significantly (P<0.05) decreased to 22% on May 3. The percentage of plants from which AG 2-t was isolated was low (32%) in February, increased significantly (P<0.05) from 61% in March and decreased somewhat to 50% in May.
The remaining isolates were not identified to AG. Surprisingly, the relatively high incidence of infected tulips caused by AG 2-t did not result in bare patch at all in 1995.
Competition between R. solani AG 2-t and AG 4 or AG 5 At 9 °C, iris bulbs were severely infected by AG 2-t after six weeks of incubation (Table 5), when oatkernels were used as the inoculum carrier. Mean DS of iris bulbs was 4.2 for AG 2-t after single inoculation. In dual inoculation of iris bulbs with AG 2-t + AG 4 and AG 2-t + AG 5 a mean DS of 3.2 and 4.8 was found, respectively. In single inoculation AG 4 and AG 5 did not cause infection (DS=0) of iris at 9 °C. From iris bulbs grown at 9 °C, after single or dual inoculation, only AG 2-t was re-isolated, not AG 4 or AG 5. Thus in dual inoculation of AG 2-t + AG 4 or AG 2-t + AG 5 only AG 2-t could grow actively through the soil and cause disease on iris bulbs in six weeks time.
At 18 °C, iris bulbs were severely infected by single inoculations of AG 2-t and of AG 4 and by dual inoculations of AG 2-t + AG 4 and AG 2-t + AG 5 with a DS of 4.1, 4.5, 4.5, and 4.0 respectively (Table 5). Single inoculation with AG 5, in contrast, did not cause symptoms on iris bulbs (DS was 0.5). Isolates of AG 2-t, AG 4 and AG 5 could readily be re-isolated from the bulbs after single inoculation and thus all three isolates could grow actively through the soil to the bulb and infect. In dual inoculation of AG 2-t + AG 4, only AG 4 isolates were re-isolated from the iris bulb, not AG 2-t isolates. In dual inoculation of AG 2-t + AG 5, only AG 2-t could be re-isolated, not AG 5 (Table 5).
Discussion
Decline of artificially infested bare patches Our study shows that rhizoctonia bare patch in tulip can be initiated by artificial infestation of the soil with R. solani AG 2-t (Figs 1 and 2). These bare patches were more pronounced on the sandy soil in L-2 than on the loamy soil in Z-2. Abiotic and biotic differences may account for less pronounced patches in Z-2, where one
133
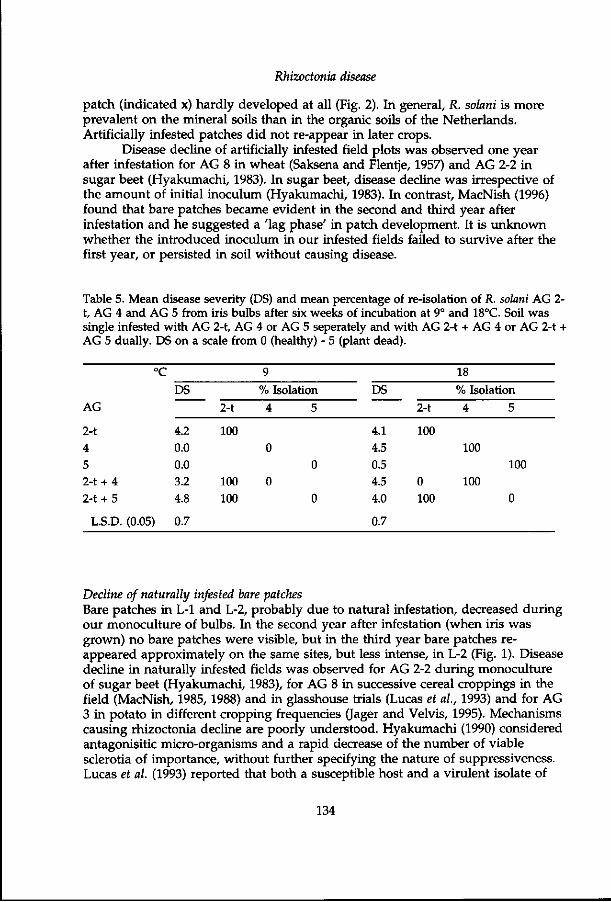
Rhizoctonia disease
patch (indicated x) hardly developed at all (Fig. 2). In general, R. solani is more prevalent on the mineral soils than in the organic soils of the Netherlands. Artificially infested patches did not re-appear in later crops.
Disease decline of artificially infested field plots was observed one year after infestation for AG 8 in wheat (Saksena and Flentje, 1957) and AG 2-2 in sugar beet (Hyakumachi, 1983). In sugar beet, disease decline was irrespective of the amount of initial inoculum (Hyakumachi, 1983). In contrast, MacNish (1996) found that bare patches became evident in the second and third year after infestation and he suggested a 'lag phase' in patch development. It is unknown whether the introduced inoculum in our infested fields failed to survive after the first year, or persisted in soil without causing disease.
Table 5. Mean disease severity (DS) and mean percentage of re-isolation of R. solani AG 2-t, AG 4 and AG 5 from iris bulbs after six weeks of incubation at 9° and 18°C. Soil was single infested with AG 2-t, AG 4 or AG 5 seperately and with AG 2-t + AG 4 or AG 2-t + AG 5 dually. DS on a scale from 0 (healthy) - 5 (plant dead).
AG
2-t
4
5 2-t+ 4
2-t+ 5
L.S.D.
°C
(0.05)
DS
4.2
0.0
0.0 3.2
4.8
0.7
2-t
100
100
100
9
% Isolation
4
0
0
5
0
0
DS
4.1
4.5
0.5
4.5
4.0
0.7
2-t
100
0
100
18
% Isolation
4 5
100
100
100
0
Decline of naturally infested bare patches Bare patches in L-l and L-2, probably due to natural infestation, decreased during our monoculture of bulbs. In the second year after infestation (when iris was grown) no bare patches were visible, but in the third year bare patches reappeared approximately on the same sites, but less intense, in L-2 (Fig. 1). Disease decline in naturally infested fields was observed for AG 2-2 during monoculture of sugar beet (Hyakumachi, 1983), for AG 8 in successive cereal croppings in the field (MacNish, 1985, 1988) and in glasshouse trials (Lucas et al, 1993) and for AG 3 in potato in different cropping frequencies (Jager and Velvis, 1995). Mechanisms causing rhizoctonia decline are poorly understood. Hyakumachi (1990) considered antagonisitic micro-organisms and a rapid decrease of the number of viable sclerotia of importance, without further specifying the nature of suppressiveness. Lucas et al. (1993) reported that both a susceptible host and a virulent isolate of
134
Spatial and seasonal distribution
AG 8 were necessary to induce disease suppressiveness. Roget (1995) and Wiseman et al. (1996) suggested a general microbial antagonism responsable for suppression of AG 8 in wheat. MacNish (1996) hypothesised that differences in patch configuration can be explained by differences in seasonal suppressiveness. For AG 3 in potato the mechanism for disease decline remains to be solved. Neither Verticilium biguttatum, an effective mycoparasite (Van den Boogert et ah, 1990), nor replacement of AG 3 by AG 5 were responsible for disease decline in field-grown potato.
The tulip - AG 2-t pathosystem differs from the above mentioned pathosystems. Tulips are planted in autumn and disease develops when the sprouts grow through the soil at low temperature. R. solani AG 2-t isolates had an optimum growth rate between 20 and 25 °C and could infect tulip sprouts at 18 °C in glasshouse experiments (Schneider et ah, 1996). The hypothesis is put forward that antagonism operating at higher temperatures but not at lower temperatures, regulates growth of AG 2-t, infection and subsequent its disease expression (see below). An increased antagonism may have led to a decrease in soil-borne inoculum of R. solani AG 2-t and to the disappearance of the bare patches.
Temporal niche differentiation of AG 2-t Our results (Table 5) show that R. solani AG 5 is a weak competitor of AG 2-t at 9 and 18 °C. It is not likely that an increase in AG 5 in soil induces decrease of bare patch isolates, which is in line with Jager and Velvis (1995). They showed that AG 5 did not replace AG 3 in potted potato experiments.
Competition by AG 4, however, perhaps induces replacement of AG 2-t isolates. In the presence of our AG 4 isolate, AG 2-t was unable to infect iris bulbs and cause disease at 18 °C in pot experiments. Neither was AG 2-t re-isolated from diseased iris bulbs after dual inoculation of AG 2-t + AG 4. As inoculum of both isolates was placed in one corner of the pot, the results suggest that AG 4 grew faster through soil than AG 2-t and colonised the iris bulb earlier, thus preventing AG 2-t to colonise the bulb and cause disease. Since R. solani AG 4 was found in low frequency in our fields it is not likely that AG 4 did replace AG 2-t. Indeed, AG 4 is generally known as a pathogen of warmer climates (Sneh et ah, 1991, 1996). Under the climatic conditions prevailing in the Netherlands AG 4 is not to be expected in high frequency, causing severe disease outbreaks in the field.
Micro-organisms other than Rhizoctonia spp., active at higher temperatures but not at lower temperatures, may cause replacement of AG 2-t. Harris and Moen (1985) noticed replacement of AG 8 on wheat seedlings by root-rot and minor pathogens. In addition to AG 5 and other R. solani-like fungi, colonies of Fusarium spp., Trichoderma spp. and Pénicillium spp. grew from healthy and diseased bulbs (Schneider, unpubl.). Their role in the bulb rot complex requires further study.
The physiological condition of the tulip plant may also be of importance. Tulip sprouts grow through the soil at low temperatures. Daugther bulbs are formed and roots and some bulb tissues senesce between flowering in April/May and harvest in June/July. This process, probably inducing activity of different micro-organisms at different temperatures, might initiate replacement of AG 2-t
135

Rhizoctonia disease
between flowering and harvest. R. solani AG 2-t is capable of infecting tulip sprouts at 18 °C and has an optimum growth rate betwen 20 - 25 °C (Schneider et al, 1997). We hypothesise that in the field the bulbs and their immediate environment change continuously in physical, chemical and biological aspects, because seasons change and the development of the tulip is a proces of growth, and senescence (Le Nard and De Hertogh, 1993). We suppose that accordingly micro-organisms, locally active, change continuously in a regular succession. If so,the niches available to pathogens vary in a regular pattern. Thus, we postulate a 'temporal niche differentiation' in contrast to a usual interpretation as being spatial, one niche besides the other. We think of one niche after the other at the same position. Temporal niche differentiation in relation to bulb development needs further reseach, which may yield interesting micro-organisms for reducing bare patch disease.
Decline of disease in L-2 within a season Much to our surprise, a high incidence of infected and symptom bearing tulips and a high frequencing of AG 2-t isolates early in February and March, 1995, did not result in any bare patch at all. In 1995, T. kaufmanniana 'Giuseppe Verdi' was grown, whereas in the previous three years T. greigii 'Red Riding Hood', iris 'Blue Magic' and T. greigii 'Red Riding Hood' were grown, respectively. Iris did not show any symptoms at harvest, though iris showed severe symptoms in glasshouse experiments when inoculated with AG 2-t isolates at 9 and 18 °C (Doornik, 1981; Schneider et al, 1997). T. kaufmanniana 'Giuseppe Verdi' is susceptible to AG 2-t and is frequently used in experiments at the Bulb Research Centre, Lisse (Koster pers. comm.). Schneider et al. (1998) (Chapter 4) demonstrated that differential interaction between tulip cultivars and AG 2-t isolates can be influenced by environmental conditions. From February to March, 1995, the number of quadrats containing at least one infected tulip showing symptoms, DP, increased significantly (Fig. 5). Since AG 2-t isolates were readily isolated from tulips early in the season it seems that aggressiveness of AG 2-t isolates had reduced. Daniels (1963) suggested that patches develop where there is a localised increase in aggressiveness. This hypothesis requires further research.
Rhizoctonia bulb rot In contrast to bare patches, DS of bulbs increased during successive culture of tulip (Table 3). AG 2-t isolates were found in too low frequencies (Table 4) to solely account for all bulb rot. AG 5 was the predominant AG found at harvest and the percentage of isolation tended to increase in three successive growing seasons (Table 4). AG 5 isolates are pathogenic to tulip at 18 °C but not at 9 °C in glasshouse experiments (Doornik, 1981; Schneider et al, 1997). Some AG 5 isolates, obtained from iris in 1993, caused weak symptoms on tulip sprouts in glasshouse tests (Schneider, unpubl.). AG 5 is generally considered a weak pathogen (Sneh et al, 1991) and it was less aggressive than AG 2-t in our glasshouse experiments at 18 °C (Schneider et al, 1997a).
In addition to AG 5, minor fungal pathogens may cause bulb rot. Their role in disease dynamics was not studied.
136

Spatial and seasonal distribution
Binucleate Rhizoctonia spp. (BNR) In addition to AG 5, BNR isolates were frequently found. BNR comprise 21 AG with teleomorphs in Ceratobasidium and 2 AG in Tulasnella (Sneh et al, 1991). Some BNR are well known pathogens, e.g. R. cerealis in cereals. Some BNR isolates obtained from iris in 1993 did not cause symptoms on tulip sprouts in glasshouse tests at 18 °C (Schneider, unpubl.). BNR isolates may represent various AG for different fields and years. Our observation that BNR isolates may not pathogenic to tulip is therefore of limited value.
BNR play role a role in disease suppression of R. solani (Sneh et al., 1986; Cardoso and Echandi, 1987; Jabaji-Haare, 1996) but this mechanism is not likely to induce decline of bare patch, since we found BNR isolates in too low frequency. Furthermore, an increase in bulb rot was found, not a decrease.
In 1993 a higher frequency of BNR isolates was obtained from iris bulbs than from tulip in 1994 and 1995. Different hosts may select different microorganisms around the bulb. Climatic conditions may also play a role, since iris was harvested in August, 1993, tulips were lifted in June, 1994 and 1995.
Rhizoctonia tuliparum Grey bulb disease did not occur on the sandy soil in Lisse but was more devastating than rhizoctonia disease in our fields at Zwaagdijk (Fig. 2). The disease was probably induced by our short rotation of bulbs. Z-2 was visited during the same sample periods as for L-2 (Fig. 5) to assess within season development of rhizoctonia and grey bulb disease. Analogous to AG 2-t in L-2, R. tuliparum was found at high incidence in early spring shortly after emergence of the sprouts but was not isolated at harvest (Schneider, unpubl.). In contrast to AG 2-t, R. tuliparum is a typical winter pathogen (Coley-Smith, 1978) and thus it may avoid antagonism. Effective environmental friendly control measures may be found in micro-organisms which antagonise R. tuliparum at low temperatures.
Conclusion Rhizoctonia bare patches could be induced by artificial infestation of the field with an AG 2-t isolate. Bare patches build up, re-appear and vanish. R. solani AG 5 was found at high incidence at harvest and accounts for the majority of bulbs with light to mild (DS 2 to 5) rot symptoms in the field. In contrast, AG 4 seemed only of minor importance. Two mechanisms are suggested to be involved in decline of bare patch, a reduction of aggressiveness of AG 2-t isolates and temporal niche differentiation. Both aspects require further study.
137

Chapter 7
General discussion
General discusion
General discussion
A thorough characterization of the causal anastomosis groups of rhizoctonia disease and their epidemiology is a prerequisite to develop an environmentally friendly and durable control strategy. This thesis describes bare patch and bulb rot causing AG of R. solani, tools to identify bare patch causing isolates within AG 2, some hosts of bare patch causing isolates, and aspects of the spatial and temporal variation of disease expression in the field. Prospects for management of rhizoctonia disease are indicated.
Anastomosis groups causing rhizoctonia disease
This thesis shows that rhizoctonia disease of tulips (Boerema and Hamers, 1988) comprises two disease syndroms, caused by a complex of R. solani AG. Rhizoctonia bare patch of tulip is caused by R. solani AG 2-t. Severe early infection of plants by AG 2-t causes poor development of daughter bulbs or even complete decay of bulbs. Isolates belonging to R. solani AG 2-t, AG 2-2, AG 4 and AG 5 may incite bulb rot. R. solani AG 2-2 caused bulb rot symptoms and some reduction of fresh weight in open-air experiments (Chapters 2 and 4). AG 4 isolates, reported as pathogens of bulb crops (Doornik, 1981; Schneider et al., 1997), were found in low frequency in field experiments (Chapter 6), and their impact on field-grown tulip seems limited. At harvest, AG 5 predominated in the field (Chapter 6).
Rhizoctonia bare patch causes loss of saleable bulbs and planting stock and the disease is seen as a problem by the grower. Bulb rot is known to occur, but it is less evident to the grower. Our experimental fields were harvested before the tunic had turned dark brown. Therefore, we could readily recognize bulb rot symptoms (Fig. 1). In farmers' fields tulip bulbs are harvested when the tunic has dark brown scales so that the symptoms are hard to recognize. Severe bulb rot causes disruption of the scales. Less severe bulb rot symptoms may be overlooked by the grower, and the impact of bulb rot underestimated.
Host range and crop rotation
Information on the host range contributes to optimal rotations to avoid disease problems. In the bulb growing areas in West-Friesland and the Dutch polders long rotations are used and rhizoctonia disease occurs at low prevalence.
141

Rhizoctonia disease
CV:Î*
Figure 1. Bulb rot disease classes of tulip. Bulbs in disease classes 1 to 5 had developed daugtherbulbs, whereas bulbs in disease classes 6 and 7 apparently had not. From bulbs in disease class 8 only some debris was found.
On the sandy soils in the provinces South-Holland and North-Holland flower bulbs are grown in short rotations. Because of high costs of the land, high value crops have to be grown and long rotations and fallows are no options for disease control in this region. Hyacinthus and Narcissus are poor hosts or non-hosts for AG 2-t (Doornik, 1983; Chapter 2) and therefore may be grown preferably prior to tulips. According to farmers rhizoctonia disease does not occur in Narcissus but appears in Hyacinthus at the stem base late in the season when the sprouts are fully developed. This 'late' infection of Hyacinthus may be due to AG 4 or AG 5 which are pathogenic at higher temperatures (Doornik, 1983; Chapter 2).
142

General discusion
Isolation and identification of R. solani from infected Hyacinthus in the field over several seasons is needed to verify this hypothesis.
Weeds seem to be of little importance for the survival of AG 2-t between growing seasons. In 1994, AG 2-t could not be isolated from the roots of some weeds e.g. Rorippa sylvestris, Cirsium arvense and Capsella bursa-pastoris occurring in and outside rhizoctonia bare patches. The role of alternative hosts, with less conspicuous symptoms, and weeds in the life cycle of the AG 2-t in the field is poorly understood and requires further research. In addition, a survey on the AG complex causing rhizoctonia disease in the various bulbous crops is recommended. The combined results could help to develop optimum rotation schedules.
Identification R. solani AG 2-t
Unambiguous identification of the causal AG of R. solani should be an essential component of any disease management program. R. solani AG differ in host range, ecology and susceptibility to fungicides. Assigning isolates to AG provides information on the host range for some AG. R. solani AG 2 is about the most complex AG in R. solani. When considered as one AG, it has a wide host range. Ogoshi (1975) distinguished two subgroups within AG 2, AG 2-1 and AG 2-2 on the basis of hyphal anastomosis frequency. But was Ogoshi (1975) not actually reporting on a 'bridging phenomenon' (Kuninaga et al, 1979)? AG 2-1 and AG 2-2 show more differences than similarities. In fact, the only common characteristic that the two subgroups share, is that hyphal fusion occurs in low frequency. At present it is recognized that 'bridging phenomena' occur even between distinct AG (Sneh et al, 1996). Hyphal fusion frequency within AG 2-1 and between AG 2-1 and AG 2-t isolates is highly variable (Chapter 2). I postulate that hyphal anastomosis frequency is not a valid criterion to discriminate subgroups within AG 2. This implies that AG 2-2 has to be regarded as a distinct AG. Excluding AG 2-2 as a subgroup, R. solani AG 2 now comprises AG 2-1, AG 2-t and AG 2-3 isolates, which cannot be discriminated according to anastomosis behaviour. AG 2-3 isolates differ from other AG 2 isolates in thiamine requirement, but recently this criterion for subgrouping in AG 2 was questioned (MacNish et al, 1994). What remains is an amalgamate of subgroups in AG 2(-l) consisting of AG 2-1 isolates pathogenic to crucifers, AG 2-t isolates pathogenic to crucifers and tulips, and AG 2-3 isolates pathogenic to soybean, but not to crucifers. I suggest to indicate the subgroups within AG 2 by codes reflecting their host preference in the field. Pectine is an essential component of the cell wall and pectic enzyme patterns are supposed to reflect host preference (Sweetingham et al, 1986). Sound scientific evidence for this assumption, however, is still lacking. The challenge is to link AG
2 isolates into groups homogeneous in anastomosis behaviour, pectic zymography, pathogenicity and characteristics using modern molecular techniques.
143

Rhizoctonia disease
100
* *
100
100
85
100
* *
21R61
21R21 21R41
90I21R91 ~ 2 1 R 9 3 .00 .
* * 1
9*7
— 2TR002 1 2TR114
?t5
r-2TR118 1 2TR139
— 2TR128 73p 2TR135 M 2TR142
121R06
AG 2-1
AG 2-1J
AG 2-t
AG BI
100
* *
100 * *
• 22R10 j - 22R2Ü f1 22R21
22R22 22R23 22R25 22R22 L 22R25L
1— 22R27 i GR1
901 IH96
100 * *
1 * VG1 VG1 L VG2 VG2L
yx !-H UBI
UBI L
AG 2-2
100 * *• 23R01
23R01L 23R02
23R03
**i '3
100 ^
I— 23
AG 2-3
L331 AG 1
Figure 2. Single most parsimonious phylogenetic tree generated from a branch and bound algorithm in PAUP 3.1.1, using clustal W for alignment. The numbers indicate the percentage corresponding to the frequency with a given branch appeared in a 1000 bootstrap replications. Two asterisks and one asterisk means branch points with confidence limits higher than 99% and 95% respectively. Horizontal lengths represents genetic distances. AG 1 was used as an outgroup. Anastomosis subgroups of the isolates are marked on the right. Isolate codes of AG 2-1, AG 2-t, AG 2-3 and AG-BI are explained in chapters 2 and 3. AG 2-1J indicates AG 2-1 isolates from Japan. Isolate 22R10 was isolated from sugar beet in the Netherlands, isolates 22R20 to 22R27 are isolated from grasses in Japan, isolates GR., VG., and UB., were isolated from sugar beet in the Netherlands.
144

General discusion
Dutch AG 2-t isolates are homogeneous in anastomosis behaviour, pectic zymography and pathogenicity (Chapters 2 and 3). Differences in PZ and ITS rDNA between Japanese AG 2-1 and Dutch AG 2-t isolates were small and the question arose how significant these differences are and how related these groups of isolates would be. A phylogenetic tree based on sequences of ITS rDNA (Salazar et al, 1998; Fig. 2) shows that AG 2-t, Dutch AG 2-1 and Japanese AG 2-1 isolates are distinct groups. The discrimination of Dutch AG 2-t and Japanese AG 2-1 isolates is interesting. The difference of the two subgroups could be the result of the world-wide trade in tulips and thereby the worldwide spread of the pathogen. Once established, the two geographically separated sub-populations could evolve independently, thus resulting in differences in ITS rDNA regions.
Differential interaction and partial resistance
The use of rhizoctonia resistant tulips is a desirable component of an environmentally friendly disease control strategy which in addition, will also reduce production costs for the grower. Before a breeding program can be started the genetic variability for resistance in the host species has to be studied. Similarly, the genetic variability in the pathogens must be explored to obtain a representative set of isolates. Reliable screening procedures are not yet available.
Differential interaction was found but it depended, at least in part, on the experimental conditions (Chapter 4). R. solani is a heterokaryotic fungus, and pathogenicity is polygenic (Garza-Chapa and Anderson, 1966), which may explain inconsistency in results. Inconsistency of test results between years may also be accounted for by factors such as the origin of the bulbs obtained from different growers in different years, or grown in different fields, and perhaps residues of various fungicides. Irrespective of the experimental conditions, three aggressive isolates could be identified to screen tulip cultivars for susceptibility to AG 2-t.
Comparison of partial resistance, as assessed in open-air experiments (Chapter 4) and as listed by Van Keulen and Van Aartrijk (1993), using common cultivars, showed no clear correlation (Fig. 3). The lack of correlation may in part be explained by differential interaction of cutivars x isolates in tulip. The data by Van Keulen and van Aartrijk (1993) reflects the perception of tulip growers ranking susceptibility for rhizoctonia in classes from 1 to 5. The list might help farmers to make decisions on which cultivars to grow in relation to the diseases to be expected. The list does, however, not account for the variability in pathogenicity of the pathogen. For some cultivars no susceptibility class could be given, because of insufficient or conflicting information from growers (Van Keulen and Van Aartrijk, 1993).
A resistance screening method should be rapid and easy to accomplish. In vitro assays seem to eliminate most of the environmental influences. In vitro assays are useful for studying mechanisms or components (Zadoks and Schein, 1979) of resistance.
145

Rhizoctonia disease
:94-o D :95-o
.S
Vi
a
A
A
8 D 0
A
û •
û
A
A
D
susceptibility in list
Figure 3. Comparison of mean disease classes (sprout infection) from open-air experiments (disease classes 1 to 8) and a susceptibility ranking (1-5) according to growers (van Keulen and Van Aartrijk, 1993).
It is questionable whether an in vitro assay will have predictive value for disease expression in the field, since differential interaction depended on the experimental conditions.
Tulip cultivars displayed partial resistance to R. solani AG 2-t (Chapter 4). Selecting cultivars for partial resistance is difficult and may be best be done under semi-field conditions (Parlevliet and Van Ommeren, 1975) using one well characterised aggressive isolate. Because of the environmental influence on disease expression, screening may be best be done over several years in each of the major bulb growing areas. The outcome of these experiments should be compared with the performance of partially resistant cultivars using naturally infested soil in conjunction with a thorough characterisation of the local R. solani population. A susceptibility list adjusted to the local or regional situation will provide the grower with a decision making tool on the short term.
Narcissus was not infected by AG 2-t (Doornik, 1981; Schneider et al, 1996) which was in line with farmers' observations. Narcissus therefore seems the bulb crop to look for resistance genes to AG 2-t. Modern molecular techniques may reveal resistance genes or at least quantitative treat loci. Genes so identified may then be introduced in tulip by genetic engineering. Tulips with the desired traits may be expected on the long term. Transformation of tulip is still in its infancy, but first results are encouraging (Wilmink, 1996).
146

General discusion
Epidemiology
Rhizoctonia disease may be bulb-borne or soil-borne. Bulb-borne inoculum seems of minor importance (Doornik, 1982). Viability of R. solani rapidly decreased during storage and only a small percentage of bulbs had viable mycelium of R. solani to act as an inoculum source after 14 weeks of storage. Bulb-borne inoculum was capable of infecting neighbouring bulbs in pot experiments, but the rate of disease spread in the field was not determined. Artificially infested patches did not re-appear in following years. It is unknown whether the introduced pathogen died or persisted in the soil without disease expression. Bulb-borne inoculum may in part account for a scattered appearance of the disease in an infested fields (Chapter 6), with the pattern changing from season to season.
Naturally infested patches gradually vanished during a four year period of field observations (Chapter 6). Antagonistic microflora (Hyakumachi, 1996) and microfauna (Hofman, 1988; Lootsma, 1997) may have reduced soil-borne inoculum and thereby induced decline of bare patch.
The ecologically obligate mycoparasite Verticillium biguttatum was isolated from soil samples taken inside and outside bare patches (Van den Boogert, pers. comm.) after enrichment of the soil samples with life mycelium of R. solani (Van den Boogert and Jager, 1983). V. biguttatum is active above 13 °C, whereas R. solani AG 2-t infects tulip sprouts in the field below 13 °C. If AG 2-t grows actively through the soil, V. biguttatum may be effective as a mycoparasite. If AG 2-t is dormant in the soil when the mycoparasite becomes active, the effect of the mycoparasite will be limited. At harvest, bulb rot and R. solani AG 5 were abundant and tended to increase during successive croppings. It seems unlikely that mycoparasites selectively induced decline of AG 2-t bare patches and not of bulb rot or AG 5.
Competition by micro-organisms possibly contributes to decline of bare patch (Chapter 6). AG 2-t is able to grow and infect tulip sprouts at high and low temperatures (Chapters 2, 4 and 6). At harvest, AG 2-t was isolated at low incidence from bulbs. Competition may have been involved (Chapter 6). Between flowering and harvest the fysiology of the bulbs changes drastically. Senescence of roots and development of new bulbs may cause quantitative and qualitative changes in the microflora around the bulb, which may lead to decline in AG 2-t inoculum, resulting in decline of bare patch. Identification of mechanisms which stimulate the microflora at low temperatures holds promise for reducing early sprout infection by AG 2-t. R. solani survives in crop debris between cropping seasons (Neate, 1987; Sumner, 1996). At harvest R. solani AG 2-t was hardly isolated from bulb scales and bulb bottoms (Chapter 6) and, when these plant parts were mixed through soil and planted with tulip, no bare patch symptoms occurred (Schneider, unpubl.). Between flowering and harvest roots senesce and their debris remains in soil and thus may act as an inoculum source for AG 2-t. If this holds true, research should be directed to antagonists successfully competing with AG 2-t for colonisation of decaying roots.
A high incidence of tulip infection by AG 2-t early in the season in 1995 did not result in bare patch at harvest (Chapter 6). The mechanism for reduced
147

Rhizoctonia disease
aggressiveness can only be speculated upon. Decline by hypovirulence of R. solani has been ascribed to double stranded RNA (dsRNA) occurring in the hyphae (Castanho and Butler, 1978; Castanho et ai, 1978), but the presence of dsRNA does not always causes hypovirulence (Finkler et al, 1985; Miyasaka et al, 1990). It is unknown whether extra-chromosomal particles occur in hyphae of AG 2-t isolates and whether these isolates exhibit hypovirulence.
Where to go from here?
On the short term growers could be provided with a list classifying tulips for their susceptibility to rhizoctonia disease. Combined with information on the prevailing AG in flower bulb crops and on their host ranges optimal rotation schedules can be developed.
What are the financial losses of bare patch to the individual grower? A few square metres of bare patch on a hectare probably is not worth the costs of control by full-field application of fungicides. Best advice seems to treat the patches with fungicides when they appear, as has been done by some growers, and to avoid the bare patches at harvest in order to prevent loss of quality of saleable bulbs and planting stock.
Bare patches seem to come and to disappear. What induces their build up and decline? A local increase in aggressiveness or by contrast, local hypovirulence, or local changes in antagonism by the microflora. Many antagonists are known. Probably even more inhabit the soil unknown to us, yet may be effective in colonising sclerotia or crop debris. How is antagonism related to partially resistant hosts? Do resistant cultivars select certain groups of antagonists thus explaining in part inconsistency between experiments?.
The period between flowering and harvest seems crucial in the epidemiology of AG 2-t. Where does the pathogen survive, dormant in crop debris or as sclerotia in soil? Or does the fungus survive saprophytically in soil in the absence of the host? Is the pathogen saprophytically active at low temperatures or is a dormant pathogen activated by sprout growth? If the pathogen is saprophytically active at low temperatures, its activity may be reduced by stimulating antagonists in that period. If the pathogen is dormant, the inoculum in the soil can be reduced by stimulatory effects on antagonism, at least at higher temperatures.
Bulb rot and AG 5 isolates tended to increase during continuously cropping of tulip. AG 5 is likely to decrease the quality of saleable bulbs and planting stock. It is unknown whether AG 5 increases in rotations with other bulbs. Perhaps bulb rot due to AG 5 needs a loger longer period to decline than the four years studied here. The mechanism inducing decline of AG 5, if existent, may be different from that inducing decline of bare patch. The ecologically obligate mycoparasite V. biguttatum may be an efficient control agent since both the mycoparasite and the pathogen are active at higher temperatures.
The answer to each of these questions makes a step forward to a durable and environmentally friendly control strategy.
148

References
Anderson NA, 1982. The genetics and pathology of Rhizoctonia solani. Annual Review of Phytopathology 20, 329-347.
Bald JG, Kofranek AM and Lunt OR, 1955. Leaf scorch and Rhizoctonia on croft lilies. Phytopathology 45: 156-162.
Bateman DF, 1963. The "Macerating Enzyme" of Rhizoctonia solani. Phytopathology 53: 1178-1186.
Boerema GH and Hamers MEC, 1988. Check-list for scientific names of common parasitic fungi. Series 3a: Fungi on bulbs: Liliaceae. Netherlands Journal of Plant Pathology 94. Supplement 1: 1-32.
Boerema GH, 1963. De veroorzaker van de 'kwade-grondziekte' bij bloembolgewassen: Rhizoctonia tuliparum Whetzel and Arthur. Verslagen en Mededelingen van de Plantenziektenkundige Dienst No. 141: 179-182.
Bos L and Parlevliet JE, 1995. Concepts and terminology on plant/pest relationships: towards consensus in Plant Pathology and crop protection. Annual Review of Phytopathology 33: 69-102.
Botschantzeva ZP, 1982. Tulips. Taxonomy, morphology, cytology, phytogeography and physiology. Balkema, Rotterdam.
Boysen M, Borja M, Del Moral C, Salazar O and Rubio V, 1996. Identification at strain level of Rhizoctonia solani AG 4 isolates by direct sequencing of asymmetric PCR products of the ITS regions. Current Genetics 29: 174-181.
Brookhouser LW and Weinhold AR, 1979. Induction of polygalacturonase from Rhizoctonia solani by cotton seed and hypocotyl exudates. Phytopathology 69: 599-602.
Buddin W and Wakefield EM, 1927. Studies on Rhizoctonia crocorum (Pers.) DC. and Helicobasidium purpureum (Tul.) Pat. Trans. Brit Myc. Soc. 12: 116-140.
Buddin W and Wakefield EM, 1929. Further notes on the connections between Rhizoctonia crocorum (Pers.) DC. and Helicobasidium purpureum (Tul.) Pat.. Trans. Brit Myc. Soc. 14: 97-99.
Burrough PA, 1987. Spatial aspects of ecological data. In: Jongman RHG, Ter Braak CJF and Van Tongeren OFR. eds. Data analysis in community and landscape ecology. Wageningen: The Netherlands, Pudoc, 213-251.
Cardoso JE and Echandi E, 1987. Nature of protection of bean seedlings from Rhizoctonia root rot by a binucleate Rhizoctonia-like fungus. Phytopathology 77:1548-1551.
Carling DE and Leiner RH, 1990. Virulence of isolates of Rhizoctonia solani AG-3 collected from potato plant organs and soil. Plant Disease 74: 901-903.
Carling DE and Sumner DR, 1992 Rhizoctonia. In: Singleton LL, Mihail JD and Rush CM (eds), 1992. Methods for research on soilborne phytopathogenic fungi (pp.157-165) APS. St.Paul, Minnesota.
Carling DE, 1996. Grouping in Rhizoctonia solani by hyphal anastomosis reaction. In: Sneh B, Jabaji-Hare S, Neate SM, and Dijst G, (eds). 1996. Rhizoctonia species: Taxonomy, Molecular Biology, Ecology, Pathology and Control (pp. 37-43) Kluwer, Dordrecht.
Carling DE, Rothrock CS, MacNish GC, Sweetingham MW, Brainard KA and Winters SW, 1994. Characterization of Anastomosis Group 11 (AG-11) of Rhizoctonia solani. Phytopathology 84: 1387-1393.
Carling DE, Kuninaga S and Leiner RH, 1988. Relatedness within and among intraspecific groups of Rhizoctonia solani: a comparison of grouping by anastomosis and by DNA hybridization. Phytoparasitica 16: 209-210.
151

Rhizoctonia disease
Castanho B and Butler EE, 1978. Rhizoctonia decline: a degenerative disease of Rhizoctonia solani. Phytopathology 86: 1505-1510.
Castanho B, Butler EE and Seperd RJ, 1978. The association of double stranded RNA with Rhizoctonia decline. Phytopathology 68:1515-1519.
Chellemi DO, Rohrbach G, Yost RS and Sonoda RM, 1988. Analysis of the spatial pattern of plant pathogens and diseased plants using geostatistics. Phytopathology 78, 221-226.
Classified List and International Register of Tulip names (1987) KAVB, Hillegom. Commissie voor de terminologie van de Koninklijke Nederlandse Planteziektenkundige
Vereniging. Lijst van gewasbeschermingskundige termen. Gewasbescherming 28. Supplement nr. 1.
CorelDRAW 6.0, 1995. Corel Corporation, Ottawa, Canada. Corsten LCA and Denis JB, 1990. Structuring interaction in two tables by clustering.
Biometrics 46: 207-215. Cox DR and Hinkley DV, 1974. Theoretical Statistics. Chapman and Hall, London. Crow JF, 1986. Basic concepts in population, quantitative, and evolutionary genetics.
Freeman, New York. Cruickshank RH (1990) Pectic zymograms as criteria in taxonomy of Rhizoctonia.
Mycological Research 94: 938-948. Cruickshank RH and Wade GC, 1980. Detection of pectic enzymes in pectin-acrylamide
gels. Analytical Biochemistry 107: 177-181. Dandurand LM, Knudsen GR and Schotzko DJ, 1995. Quantification of Pythium ultimum
var. sporangiiferum zoospore encystment patterns using geostatistics. Phytopathology 85, 186-190.
Daniels J, 1963. Saprophytic and parasitic activities of some isolates of Corticium solani. Transactions of the British Mycological Society 46: 485-501.
De Hertogh AA, Aung LH and Benschop M, 1983. The tulip: botany, usage, growth, and development. In: Janick J (ed) Horticultural Reviews Vol. 5 (pp 45-125), AVI, Westport, Connecticut.
De Candolle AP, 1815. Mémoire sur les rhizoctones, nouveau genre de champignon qui attaque les racines, des plantes et en particulier celle de la luzerne cultivée. Mém. Mus. d'Hist. Nat. 2: 209-216.
Di HJ, Trangmar BB, and Kemp RA, 1989. Use of geostatistics in designing sampling strategies for soil survey. Soil Sei. Soc. Am. ƒ., 53: 1163-1167.
Dijst G and Schneider JHM, 1996. Flower bulb diseases incited by Rhizoctonia species. In: Sneh B Jabaji-Hare S Neate SM and Dijst G (eds), 1996. Rhizoctonia species: Taxonomy, Molecular Biology, Ecology, Pathology and Control (pp. 279-288) Kluwer, Dordrecht, the Netherlands.
Doornik AW, 1981. Temperature dependence of the pathogenicity of several isolates of Rhizoctonia solani in some bulb crops as an intrinsic property of the isolate. Netherlands Journal of Plant Pathology 87, 139-147.
Doornik AW, 1982. Effect of storage duration and temperature on the survival of Rhizoctonia solani in tulip and iris bulbs. Netherlands Journal of Plant Pathology 88: 185-190.
Duncan S, Barton JE and O'Brien PA, 1993. Analysis of variation in isolates of Rhizoctonia solani by random amplified polymorphic DNA assay. Mycological Research 97: 1075-1082.
Engel B and Keen A, 1994. A simple approach for the analysis of generalized linear mixed models. Statistica Neerlandica 48: 1-22.
152

References
Engelkes CA, and Windels CE, 1996. Susceptibility of sugar beet and beans to Rhizoctonia solani AG-2-2 HIB and AG-2-2 IV. Plant Disease 80: 1413-1417.
Finkler A, Koltin T, Barash I, Sneh B and Pozniak D, 1985. Isolation of a virus from virulent strains of Rhizoctonia solani. Journal of General Virology 65: 1221-1232.
Flentje NT and Säksena H, 1957. Studies on Pellicularia filamentosa (Pat.) Rogers. II. Occurrence and distribution of pathogenic strains. Transactions of the British Mycological Society. 40: 95-108.
Gardes M and Bruns TD, 1993. ITS primers with enhanced specificity for basidiomycetes - application to the identification of mycorrhizae and rusts. Molecular Ecology 2: 113-118.
Garza-Chapa R and Anderson NA, 1966. Behaviour of single basidiospore isolates and heterokaryons of Rhizoctonia solani from flax. Phytopathology 56: 1260-1268.
Gauch HG, 1988. Model selection and validation for yield trials with interaction. Biometrics 44: 705-715.
Genstat 5 Committee. 1994. Genstat 5 Release 3 Reference Manual. Clarendon, Oxford. Geypens M, 1978. Enzymatic production and virulence of Rhizoctonia isolates. Annals of
Phytopathology 3: 355-363. Gilligan CA, Simons SA, and Hide GA, 1996. Inoculum density and spatial pattern of
Rhizoctonia solani in field plots of Solanum tuberosum: effects of cropping history. Plant Pathology 45: 232-244.
Gladders P and Coley-Smith JR, 1978. Rhizoctonia tuliparum: a winter active pathogen. Trans. Brit. Myc. Soc. 71: 129-139.
Gollob HF, 1968. A statistical model which combines features of factor analytic and analysis of variance techniques. Psychometrika 33: 73-115.
Gower JC and Hand DJ, 1996. Biplots. Chapman and Hall, London. Gyllensten UB and Erlich HA, 1988. Generation of single stranded DNA by the
polymerase chain reaction and its application to direct sequencing of the HLA-DQA locus. Proceedings of the National Academy of Science USA 85: 7652-7656.
Harris JR and Moen R, 1985. Replacement of Rhizoctonia solani on wheat seedlings by a succession of root rot-fungi. Transactions of the British Mycological Society 84: 11-20.
Hofman TW, 1998. Effects of granular nematicides on the infection of potatoes by Rhizoctonia solani. PhD thesis, Wageningen Agricultural University.
Hoog MH, 1974. De oorsprong van de Tulipa. In: Koninklijke Algemeene Vereeninging voor Bloembollencultuur. De veredeling van Tulpen, Hyacinthen, Narcissen en Irissen door J.F. Ch. Dix en De oorsprong van de Tulipa door M.H. Hoog. Koninklijke Algemeene Vereeninging voor Bloembollencultuur, Hillegom.
Hyakumachi M, 1983. Decline phenomenon of sugar beet root rot. Shokubutsu Boeki (Plant Protection) 37: 532-537.
Hyakumachi M, Kanzawa K, and Ui T, 1990. Rhizoctonia root rot decline in sugarbeet monoculture. In: Cook RJ, Henis Y, Ko WH, Rovira AD, Schippers B and Scott PR (eds). Biological control of soil-borne plant pathogens. Wallingford, UK: C.A.B., 227-247.
IBC info, 1997. Internationaal Bloembollen Centrum, voorlichtings brochure. IBC, Hillegom.
Innis MA and Gelfand DH, 1990. Optimization of PCRs. In: Innis MA, Gelfand DH, Sninsky JJ and White TJ (eds). PCR Protocols, A Guide to Methods and Applications (pp 3-12). Academic Press, San Diego, CA.
153

Rhizoctonia disease
Jaarsveld A, 1952. Jaarverslag van de Plantenziektenkundige Dienst, Wageningen 1951-1952: 201.
Jabaji-Hare SH, Meiler Y, Gill S and Charest PM, 1990. Investigation of genetic relatedness among anastomosis groups Rhizoctonia solani using cloned DNA probes. Canadian Journal of Plant Pathology 12: 393-404.
Jager G and Velvis H, 1995. Dynamics of Rhizoctonia solani (black scurf) in successive potato crops. European Journal of Plant Pathology 101: 467-478.
Journel AG, Huijbregts CJ, 1978. Mining Geostatistics. London, UK: Academic Press. Kaminski DA and Verma PR, 1985. Cultural characteristics, virulence, and in vitro
temperature effect on mycelial growth of Rhizoctonia isolates from rapeseed. Canadian Journal of Plant Pathology 7: 256-261.
Kanematsu S and Naito S, 1995. Genetic characterization of Rhizoctonia solani AG-2-3 by analyzing restriction fragment length polymorphisms of nuclear ribosomal DNA internal transcribed spacers. Annals of the Phytopathological Society of Japan 61: 18-21.
Keen A, 1994. Procedure CLASS. In: Genstat 5 GLW-DLO Procedure Library Manual release 3(1) (Eds Goedhart PW and Thissen JTNM). Report LWA-94-17. DLO-Agricultural Mathematics Group Wageningen, the Netherlands.
Keijer J, Houterman PM, Dullemans AM and Korsman MG (1996) Heterogeneity in electrophoretic karyotype within and between anastomosis groups of Rhizoctonia solani. Mycological Research 100: 789-797.
Kempten RA, 1984. The use of biplots in interpreting variety by environment interactions. Journal of Agricultural Science, Cambridge 103: 123-135.
Kühn JG, 1858. Die Krankheiten der Kulturegewächse, ihre Ursachen und ihre Verhütung. Gustav Bosselman, Berlin. 312 pp.
Kuninaga S, 1996. DNA base sequence complementary analyses. In: Sneh B, Jabaji-Hare S, Neate SM and Dijst G (eds), 1996. Rhizoctonia species: Taxonomy, Molecular Biology, Ecology, Pathology and Control (pp. 73-80) Kluwer, Dordrecht.
Kuninaga S and Yokosawa R, 1982. DNA base sequence homology in Rhizoctonia solani Kühn. II. Genetic relatedness within anastomosis group 2. Annals of the Phytopathological Society of Japan 48: 668-673.
Kuninaga S and Yokosawa R, 1984. DNA base sequence homology in Rhizoctonia solani Kühn. IV. Genetic relatedness within AG-4. Annals of the Phytopathological Society of Japan 50: 322-330.
Kuninaga S, Yokosawa R and Ogoshi A, 1979. Some properties of anastomosis group 6 and BI in Rhizoctonia solani Kühn. Annals of the Phytopathological Society of Japan 45: 207-217.
Laemmli UK, 1970. Cleavage of the structural proteins during the assembly of the head of bacteriophage T4. Nature 227: 680-685.
Lannou C, Savary S, 1991. The spatial structure of spontaneous epidemics of different diseases in a groundnut plot. Netherlands Journal of Plant Pathology 97, 355-368.
Larkin RP, Gumpertz ML and Ristiano JB, 1995. Geostatistical analysis of Phytophthora epidemic development in commercial bell pepper fields. Phytopathology 85, 191-203.
Le Nard, M., and De Hertogh, A.A. 1993. Tulipa. In: De Hertogh, A.A., and Le Nard, M. (eds). The physiology of flower bulbs (pp 617-682). Elsevier, Amsterdam.
Lecoustre R, Fargette D, Fauquet and de Reffye P, 1989. Analysis and mapping of the spatial spread of african cassava mosaic virus using geostatistics and the kriging technique. Phytopathology 79, 913-920.
154

References
Liu ZL and Sinclair JB, 1992. Genetic diversity of Rhizoctonia solani Anastomosis Group 2. Phytopathology 82: 778-787.
Liu ZL and Sinclair JB, 1993. Differentiation of intraspecific groups within anastomosis group 1 of Rhizoctonia solani using ribosomal DNA internal transcribed spacer and isozyme comparisons. Canadian Journal of Plant Pathology 15: 272-280.
Liu ZL, Domier LL and Sinclair JB, 1993. ISG-specific ribosomal DNA polymorphism of the Rhizoctonia solani species complex. Mycologia 85: 795-800.
Liu ZL, Domier LL and Sinclair JB, 1995. Polymorphism of genes coding for nuclear 18S rRNA indicates genetic distinctiveness of anastomosis group 10 from other groups in the Rhizoctonia solani species complex. Applied and Environmental Microbiology 61: 2659-2664.
Loerakker WM and Van Dreven F, 1985. In Nederland voorkomende "anastomosegroepen" van Rhizoctonia solani Kühn. Verslagen en mededelingen van de Plantenziektenkundige Dienst Wageningen 163 (Jaarboek 1984): 16-21.
Lootsma M, 1997. Control of Rhizoctonia stem and stolon canker of potato by harvest methods and enhancing mycophagous soil mesofauna. PhD thesis, Wageningen Agricultural University.
Lucas P, Smiley RW and Collins HP, 1993. Decline of Rhizoctonia root rot on wheat in soil infested with Rhizoctonia solani AG 8. Phytopathology 83: 260-265.
MacCoy RJ, and Kraft JM, 1984. Comparison of techniques and inoculum sources in evaluating peas (Pisutn sativum) for resistance to stem rot caused by Rhizoctonia solani. Plant Disease 68: 53-55.
MacLean NA, 1948. Rhizoctonia rot of tulips in the pacific northwest. Phytopathology 38: 156-157.
MacNish GC, 1985. Mapping Rhizoctonia patch in consecutive cereal crops in Western Australia. Plant Pathology 34: 164-174.
MacNish GC, 1988. Changes in take-all (Gaeumannomycis graminis var tritici), Rhizoctonia root rot (Rhizoctonia solani) and soil pH in continuous wheat with annual applications of notrogenous frtilizer in Western Australia. Aust. J. Exp. Agric. 28: 333-341.
MacNish GC, 1996. Patch dynamics and bare patch. In: Sneh B Jabaji-Hare S Neate SM and Dijst G (eds). Rhizoctonia species: Taxonomy, Molecular Biology, Ecology, Pathology and Control (pp. 217-226) Kluwer, Dordrecht.
MacNish GC and Neate SM, 1996. Rhizoctonia bare patch of cereals. An Australian perspective. Plant Disease 80: 965-971.
MacNish GC and Sweetingham MW, 1993. Evidence of stability of pectic zymogram groups within Rhizoctonia solani AG-8. Mycological Research 97: 1056-1058.
MacNish GC, Carling DE, and Brainard KA, 1997. Relationship of microscopic and macroscopic vegetative reactions in Rhizoctonia solani and the occurrence of vegetatively compatible populations (VCPs) in AG-8. Mycological Research 101: 61-68.
MacNish GC, Carling DE, Sweetingham MW and Brainard KA, 1994. Anastomosis group (AG) affinity of pectic isozyme (zymogram) groups (ZG) of Rhizoctonia solani from the Western Australian cereal-belt. Mycological Research 98: 1369-1375.
Martin SB, 1987. Rapid tentative identification of Rhizoctonia spp. associated with diseased turfgrasses. Plant Disease 71: 47-49.
Matheron G, 1963. Principles of Geostatistics. Economic Geology 58, 1246-1266. Matsumoto T, 1921. Studies in the physiology of the fungi. XII. Physiological specialization in Rhizoctonia solani Kühn. Ann. Missouri Botan. Garden 8: 1-62.
155

Rhizoctonia disease
Mazzola M, 1996. Classification and pathogenicity of Rhizoctonia spp. isolated from apple roots and orchard soil. Phytopathology 86 (in press).
McCullagh P, 1980. Regression models for ordinal data (with discussion). Journal of the Royal Statistical Society Series B 42: 109-142.
McCullagh P and Neider JA, 1989. Generalized Linear Models. Chapman and Hall, London.
McWorther FP, 1957. Association between Rhizoctonia and yellow coloration of easter lily bulbs. Phytopathology 47: 447-448.
Ministerie van landbouw, Natuurbeheer en Visserij (1990) Rapportage werkgroep bloembollenteelt. Achtergronddocument bij het meerjarenplan gewasbescherming. Min. LNV. Den Haag.
Ministerie van landbouw, Natuurbeheer en Visserij (1991) Multi Year Crop Protection Plan. Min. LNV. Den Haag.
Ministerie van landbouw, Natuurbeheer en Visserij (1995) Feiten en cijfers 1995. Kerngegevens over Landbouw, natuurbeheer en Visserij. Min. LNV. Den Haag.
Miyasaka A, Hashiba T, and Ehara T, 1990. Detection and properties of plasmid-like DNA in isolates from nine anastomosis and intraspecific groups of Rhizoctonia solani. Journal of General Microbiology 136: 1791-1798.
Moore WC, 1939. Diseases of bulbs. Ministry of Agriculture, Fisheries and Food, Bull. 117, London.
Muller PJ, 1969. Rhizoctonia solani Kühn als parasiet van tulpen. Mededelingen van de Rijksfaculteit voor Landbouwwetenschappen in Gent 34: 839-846.
Muller PJ, Vink P, and van Zaayen A, 1988. Flooding causes loss in viability and pathogenicity of sclerotia of Rhizoctonia tuliparum. Netherlands Journal of Plant Pathology 94: 45-47.
Munkvold GP, Duthie JA, and Marois JJ, 1993. Spatial patterns of grapevines with Eutypa dieback in vineyards with or without perithecia. Phytopathology 83, 1440-1448.
Naito S and Kanematsu S, 1994. Characterization and pathogenicity of a new anastomosis subgroup AG 2-3 of Rhizoctonia solani Kühn isolated from leaves of soybean. Annals of the Phytopathological Society of Japan 60: 681-690.
Nakatomi Y and Kaneko H, 1971. Ecology and control of leaf blight of tulip. Plant Protection Japan 25: 191-194.
Neate SM, 1987. Plant debris in soil as a source of inoculum of Rhizoctonia in wheat. Transaction of the British Mycological Society 88: 157-162.
Neate SM and Schneider JHM, 1996. Sampling and quantification of Rhizoctonia solani in soil. In: Sneh B, Jabaji-Hare S, Neate S and Dijst G, eds. Rhizoctonia Species: Taxonomy, Molecular Biology, Ecology, Pathology and Disease Control. Dordrecht, The Netherlands: Kluwer, 185-195.
Neate SM, Cruickshank RH and Rovira AD, 1988. Pectic enzyme patterns of Rhizoctonia solani isolates from agricultural soils in South Australia. Transactions of the British Mycological Society 90: 37-42.
O'Brien PA, 1994. Molecular markers in Australian isolates of Rhizoctonia solani. Myco logical Research 98: 665-671.
O'Sullivan E and Kavanagh JA, 1991. Characteristics and pathogenicity of isolates of Rhizoctonia spp. associated with damping-off of sugar beet. Plant Pathology 40: 128-135.
Ogoshi A, 1975. Grouping of Rhizoctonia solani Kühn and their perfect stages. Review of Plant Protection Research 8: 93-103.
156
References
Ogoshi A, 1987. Ecology and pathogenicity of anastomosis and intraspecific groups of Rhizoctonia solani Kühn. Annual Review of Phytopathology 25,125-143.
Ogoshi A and Ui T, 1979. Specificity in vitamin requirement among anastomosis groups of Rhizoctonia solani Kühn. Annals of the Phytopathological Society of Japan 45: 47-53.
Ogoshi A and Ui T, 1983. Diversity of clones within an anastomosis group of Rhizoctonia solani Kühn in a d. Annals of the Phytopathological Society of Japan 49: 239-245.
Parlevliet JE and Van Ommeren A, 1975. Partial resistance to leaf rust, Puccinia hordei. II. Relationship between field trials, micro plot tests and latent period. Euphytica 24: 293-303.
Parlevliet JE and Zadoks JC, 1977. The integrated concept of disease resistance; a new view including horizontal and vertical resistance in plants. Euphytica 26: 5-21.
Parmeter JR and Whitney H, 1970. Taxonomy and nomenclature of the imperfect state. In: Parmeter JR (ed) Biology and pathology of Rhizoctonia solani. University of California Press, Berkeley, pp: 7-19.
Parmeter JR (ed), 1970. Rhizoctonia solani: Biology and Pathology. University of California Press, Berkeley, CA, USA.
Philips AJL, 1991. Variation in virulence to dry beans, soybeans and maize among isolates of Rhizoctonia solani from beans. Annals of Applied Biology 118: 9-17.
Produktschap voor Siergewassen/Bloembollenkeuringsdienst (1996) Bloembollen. Voorjaarsbloeiers. Beplante oppervlakten 1990/'91 tot en met 1993/'94. PVS/KVB, Den Haag.
Produktschap voor Siergewassen/Bloembollenkeuringsdienst (1994) Bloembollen. Voorjaarsbloeiers. Beplante oppervlakten 1990/'91 tot en met 1993/'94. PVS/KVB, Den Haag.
Roget DK, 1995. Decline in root rot (Rhizoctonia solani AG 8) in wheat in a tillage and rotation experiment at Avon, South Australia. Australian Journal of Experimental Agriculture 35: 1009-1013.
Rovira AD, Ogoshi A and McDonald HJ, 1986. Characterization of isolates of Rhizoctonia solani from cereal roots in South Australia and New South Wales. Phytopathology 76: 1245-1248.
Salazar O, Schneider JHM, Keijer J and Rubio V, 1998. Phylogenetic relations within Rhizoctonia solani AG 2 using ITS rDNA sequences. Mycological Research.
Sambrook J, Fritsch EF and Maniatis T, 1989. Molecular cloning: A laboratory manual. Cold Spring Harbor Laboratory. Cold Spring Harbor, NY.
Sanger F, Nicklen S and Coulson AR, 1977. DNA sequencing with chain-terminating inhibitors. Proceedings of the National Academy of Science USA 74: 5463-5467.
Schneider JHM, Schilder MT and Dijst G, 1997a. Characterization of Rhizoctonia solani AG-2 in flower bulbs in the Netherlands. European Journal of Plant Pathology 103: 265-279.
Schneider JHM, Salazar O, Rubio V and Keijer J, 1997b. Identification of Rhizoctonia solani isolates associated with field-grown tulips using ITS rDNA polymorphism and pectic zymograms. European Journal of Plant Pathology 103:607-622.
Schneider JHM, Van den Boogert PHJF and Zadoks JC, 1998. Exploring diiferential interaction of Rhizoctonia solani AG 2-t isolates on tulip cultivars. Plant Disease (submitted).
Schneider JHM and Kocks CG, 1998. Sampling efficiency of Rhizoctonia-iniected tuilp bulbs as determined by means of geostatistics. Plant Pathology (submitted).
157

Rhizoctonia disease
Sneh B, Burpee L and Ogoshi A. 1991. Identification of Rhizoctonia species. APS, St Paul, Minnesota.
Sneh B, Jabaji-Hare S, Neate SM and Dijst G (eds), 1996. Rhizoctonia species: Taxonomy, Molecular Biology, Ecology, Pathology and Disease Control. Kluwer, Dordrecht.
Sneh B, Zeidan M, Ichielevich-Auster M and Barash I, 1986. Increased growth responses induced by a non pathogenic Rhizoctonia solani. Canadian Journal of Botany 64: 2372-2378.
Sokal RR and Rohlf FJ, 1981. Biometry. Freeman, New York. Sonderman CH, MacLean NA, 1949. Rhizoctonia neck and bulb rot of iris in the pacific
northwest. Phytopathology 39: 174-175. Staritsky IG, Sloot PHM, and Stein A, 1992. Spatial variability of cyanide polluted soil
on former galvanic factory premises. Water, Air, and Soil Pollution 61, 1-16. Stein A, Kocks CG, Zadoks JC, Frinking HD, Ruissen MA, and Myers DE, 1994. A
geostatistical analysis of the spatio-temporal development of downy mildew epidemics in cabbage. Phytopathology 84, 1227-1239.
Stevens Johnk J, Jones RK, Shew HD and Carling DE, 1993. Characterization of populations of Rhizoctonia solani AG-3 from potato and tobacco. Phytopathology 83: 854-858.
Sumner DR, 1996. Sclerotia formation by Rhizoctonia species and their survival. In: Sneh B, Jabaji-Hare S, Neate S and Dijst G, eds. Rhizoctonia Species: Taxonomy, Molecular Biology, Ecology, Pathology and Disease Control (pp. 207-215). Kluwer, Dordrecht, The Netherlands,
Sweetingham MW. 1990. Coping with brown spot and root rots of lupins. The Journal of Agriculture, Western Australia 31: 5-13.
Sweetingham MW, Cruickshank RH and Wong DH, 1986. Pectic zymograms and taxonomy and pathogenicity of the Ceratobasidiaceae. Transactions of the British Mycological Society 86: 305-311.
Takano K and Fujii N, 1972. On the sheath blight of gladiolus, a new disease. Annals of the Phytopathological society of Japan 38: 192.
Talbot PHB, 1970. Taxonomy and nomenclature of the perfect state. In: Rhizoctonia solani: Biology and Pathology. J.R. Parmeter, ed. University of California Press, Berkeley, CA, USA. pp. 20-31.
Trangmar BB, Yost RS, and Uehara G, 1985. Application of geostatistics to spatial studies of soil properties. Advances in Agronomy 38, 45-94.
Tu CC Roberts DA and Kimborough JW, 1969. Hyphal fusion, nuclear conditions and perfect stages of three species of Rhizoctonia. Mycologia 61: 775-783.
Van Bruggen AHC and Arneson PA, 1984. Resistance in Rhizoctonia solani to tolclofos-methyl. Netherlands Journal of Plant Pathology 90: 95-106.
Van Eeuwijk FA, 1995. Multiplicative interaction in generalized linear models. Biometrics 51: 1017-1032.
Van Eeuwijk FA, 1996. Between and beyond additivity and non-additivity; the statistical modelling of genotype by environment interaction in plant breeding. Ph.D. thesis. Wageningen Agricultural University. 293 pp.
Van Eijk JP and Leegwater J, 1975. Criteria for the early selection in tulip breeding. Acta Horticulturae 47: 179-185.
Van Eijk JP Van Raamsdonk LWD Eikelboom W and Bino RJ, 1991. Interspecific crosses between Tulipa gesneriana cultivars and wild Tulip species: a survey. Sexual Plant Reproduction 4: 1-5.
158
References
Van Raamsdonk LWD, Van Eijk JP and Eikelboom, W. 1995. Crossability analysis in subgenus Tulipa of the genus Tulipa L. Botanical Journal of the Linnean Society 117: 147-158.
Van Keulen H and Van Aartrijk J, 1993. Ziektegevoeligheid van cultivars van bloembolgewassen. Milieuplatform Bloembollensektor, Hillegom.
Van den Boogert PHJF and Jager G, 1984. Biological control of Rhizoctonia solani on potatoes by antagonists. 3. Inoculation of seed potatoes with different fungi. Netherlands Journal of Plant Pathology 90: 117-126.
Van den Boogert PHJF, Jager G and Velvis H, 1990. Verticillium biguttatum, an important mycoparasite for the control of Rhizoctonia solani in potato. In : Hornby D (ed) Biological Control of soil-borne paint pathogens (pp. 77-91) CAB International, Wallingford.
Van der Plank JE, 1968. Disease resistance in plants. Academic Press, New York. Van Poeteren N, 1928. Verslag over de werkzaamheden van de Plantenziektenkundige
Dienst in het jaar 1928: 27. Vilgalys R and Gonzalez D, 1990. Ribosomal DNA restriction fragment length
polymorphisms in Rhizoctonia solani. Phytopathology 80: 151-158. Watanabe B and Matsuda A, 1966. Studies on the grouping of Rhizoctonia solani (Kühn)
pathogenic to upland crops. Appointed experiment (Plant diseases and insect pests) 7: 1-131.
Webster R, 1985. Quantitative spatial analysis of soil in the field. In: Stewart BA, Advances in soil science, Volume 3. New York, USA: Springer 1-70.
Webster R, Burgess TM, 1984. Sampling and bulking strategies for estimating soil properties in small regions. Journal of Soil Science 35, 127-140.
Webster R, Nortcliff S, 1984. Improved estimation of micro nutrients in hectare plots of the Sonning Series. Journal of Soil Science 35, 667-672.
Weinhold AR, Dodman RL and Bowman T, 1972. Influence of exogenous nutrition on virulence of Rhizoctonia solani. Phytopathology 62: 278-281.
Whetzel HH and Arthur JM, 1924. The grey bulb-rot of tulips. Phytopathology 14: 30-31. White TJ, Bruns T, Lee S and Taylor J, 1990. Amplification and direct sequencing of
fungal ribosomal RNA genes for phylogenetics. In: Innis MA, Gelfand DH, Sninsky JJ and White TJ (eds) PCR Protocols, A Guide to Methods and Applications (pp. 315-322). Academic Press, San Diego, CA.
Wilmink A, 1996. Genetic modification of tulip by means of partical bombardment. PhD thesis. Katholic University of Nijmegen. 108 pp.
Wiseman BM, Neate, SM, Ophel Keller K and Smith SE, 1996. Suppression of Rhizoctonia solani anastomosis group 8 in Autralia and its biological nature. Soil Biological Biochemistry 28: 727-732.
Yang HA, Zhou J, Sivasithamparam K, Tommerup IC, Barton JE, and O'Brien PA, 1994. Genetic variability in pectic enzymes of Rhizoctonia solani isolates causing bare patch disease of cereals. Journal of Phytopathology 141: 259-266.
Yang HA, Sivasithamparam K, Barton JE and O'Brien PA, 1995. Characterization of cereal bare patch isolates of Rhizoctonia solani by random amplified polymorphic DNA analysis. Plant Pathology 44: 811-818.
Yitbarek SM, Verma PR and Morall RAA, 1987. Anastomosis groups, pathogenicity, and specificity of Rhizoctonia solani isolates from seedling and adult rapeseed/canola plants and soils in Saskatchewan. Canadian Journal of Plant Pathology 9: 6-13.
159

Rhizoctonia disease
Zadoks JC and van Leur JAG, 1983. Durable resistance and host-pathogen-environment interaction. In: Lambertine, F., Waller, J.M., and Van der Graaf, N.A. (eds) Durable resistance in crops. Plenum Publishing Corporation, pp 125-139.
Zadoks JC and RD Schein, 1979. Epidemiology and plant disease management. Oxford University Press, Oxford, U.K.
Zijlstra C, Lever AEM, Uenk BJ and Van Silfhout CH, 1995. Differences between ITS regions of root-knot nematodes Meloidogyne hapla and M. chitwoodi. Phytopathology 85: 1231-1237.
160

Summary
Tulip bulbs are vegetatively propagated and require several years of replanting in the field before the bulbs attain a flowering size. Small annual losses therefore may accumulate substantially during the production cycle.
Chapter 2 characterizes the bare patch causing AG by 'classical' methods. On the basis of hyphal fusion frequency and pathogenicity to flower bulbs, tulip isolates were assigned to AG 2-t to distinguish these isolates from AG 2-1 isolates which were non-pathogenic to flower bulbs. The pattern of hyphal fusion frequencies among AG 2-t isolates showed AG 2-t a relatively homogeneous group and closely related to AG 2-1. Hyphal fusion frequency among AG 2-1 isolates was highly variable indicating AG 2-1 a heterogeneous group. The optimum growth temperature for AG 2-t and AG 2-1 isolates in Petri dishes was 20-25 °C. The host range of AG 2-t and of two AG 2-1 isolates comprised hyacinth, iris, lily, tulip, and infected seedlings of cruciferous plants, lettuce and sugar beet. Six other AG 2-1 isolates were pathogenic to cruciferous seedlings, but not to any of the bulbous crops. Narcissus, Tagetes patula, tomato, potato, wheat, leek and maize cultivars were not susceptible to AG 2-t and AG 2-1 isolates. Isolates representing AG 2-2, AG 4, AG 5 and AG BI were pathogenic to bulbous crops at 18 °C. Hyphal anastomosis behaviour could not unambiguously discriminate AG 2-t from AG 2-1 isolates.
Chapter 3 compares methods based on internal transcribed spacer (ITS) ribosomal DNA (rDNA) polymorphism and pectic zymograms (ZG) for routine identification of R. solani isolates. ITS rDNA fragment lengths discriminated AG 2-t isolates, pathogenic to tulips, from AG 1-IC, AG 2-2IIIB and AG 2-2IV, AG 3 and AG 5. After digestion with EcoR I AG 2-t could be distinguished from AG 1-IA, AG 1-IB and AG 4. AG 2-t isolates and two Japanese isolates, pathogenic to crucifers and tulips differed in ITS rDNA fragment size from Dutch AG 2-1 isolates, non-pathogenic to tulips. Digestion of AG 2-t and AG 2-1 isolates revealed four and five distinct ITS rDNA digestion patterns, respectively. In some isolates a heterogeneous digestion pattern, indicating different ITS sequences within one isolate, was found. The observed ITS fragment length polymorphism between isolates pathogenic and non-pathogenic to tulips was considered too small to be used in routine screening of field isolates.
As an alternative to ITS rDNA fragment length polymorphism, pectic enzyme patterns were studied using a commercially available vertical gel-electrophoresis system and non-denaturing poly-acrylamide gels amended with pectin. Fifty AG 2-t isolates and four AG 2-1 isolates belonged to a homogeneous pectic zymogram group (ZG). We propose to assign AG 2 isolates pathogenic to crucifers and tulip to ZG5-1. AG 2-1 isolates, non-pathogenic to tulip, formed a heterogeneous group with 4 distinct ZG. Pectic zymography provides an easy, quick and unambiguous method for routine identification of large numbers of field isolates. Such a technique is needed for research on the dynamics of Rhizoctonia populations to develop environmentally friendly control measures of rhizoctonia disease in field-grown flower bulbs.
161

Rhizoctonia disease
A desirable component of durable and environmentally friendly control strategy is breeding for resistance. Tulips with high resistance levels to rhizoctonia disease are not known. A breeding strategy should take into account the genetic variability of the pathogen and the host. Chapter 4 describes experiments, conducted in 1994 and 1995, to explore differential interaction of R. solani AG 2-t isolates with tulip cultivars in artificially infested soil under different experimental conditions. Comparison of residual variances obtained by ANOVA and AMMI showed that open-air experiments should be used for the interpretation of isolate by cultivar interaction. In the biplot derived after AMMI-analysis over isolates by year and cultivars, isolates tended to occur in year clusters indicating a differential influence of year on disease expression. Two isolates occurred in isolate clusters thus accounting for a significant year by isolate by cultivar interaction. Three isolates were highly aggressive on all tested tulip cultivars and occurred in one cluster. Three contrasting isolates, low in aggressiveness, clustered too. Quantitative differential interaction patterns were found, but were significantly influenced by greenhouse conditions and type of inoculum carrier. Isolates of AG 2-1, AG 2-2, and AG 4 did not cause severe stem and leaf infection of tulips in an open-air experiment when the sprouts grew through the soil. At harvest, however, they had produced some lesions on the stems at the soil surface and some reduction of bulb weight. On average, reduction of fresh weights of bulb clusters due to AG 2-1, AG 2-2 and AG 4 isolates was less than caused by AG 2-t isolates. In conclusion, differential interaction of AG 2-t isolates on tulip cultivars does occur, though it cannot yet be explained to full satisfaction.
In order to obtain insight in spatial and seasonal development of rhizoctonia bare patch, bulb rot and the causal anastomosis groups, field experiments were started at Lisse and Zwaagdijk. Chapter 5 describes how geostatistics were applied to estimate the spatial distribution of Rhizoctonia bare patches in flower bulb fields with efficient sampling intensity. Semivariogram analysis for infected bulbs revealed spatial dependency in three fields and a random distribution in another field. The merits of efficient sampling were assessed by stepwise reduction of the observed dataset. A reduced sampling intensity was evaluated by considering the average maximum prediction error in conjunction with the percentage correctly predicted disease incidence or correctly predicted mean disease severity and by a visual inspection of these disease parameters in maps. In one field, a sampling intensity as low as 10% of the observed data set still provided useful information on the spatial distribution of infected bulbs when disease severity was visualized in maps. In other fields higher sampling intensities reproduced adequate maps.
The dynamics of the bare patch en bulb rot phenomena are poorly understood. Causal anastomosis groups were identified and their dynamics studied in field and growth chamber experiments (Chapter 6). In field experiments, artificial soil infestation with R. solani AG 2-t induced bare patches, which did not re-appear in the next cropping seasons. Naturally occurring bare patches slowly vanished during successive cropping of bulbs and did not re-appear in the fourth growing season. In one field, 1995, disease prevalence increased from 65% in February to 90% in March and decreased to 55% in May. Bare patches, however, did not develop in 1995. AG 2-t isolates may have been reduced in aggressiveness. In all
162

Summary
cropping seasons, R. solani AG 2-t isolates were readily isolated early in the season, but could hardly be isolated at harvest. In contrast, AG 5 isolates were rarely found early in the season but were predominant at harvest. In a growth chamber experiment AG 5 could not account for replacement of AG 2-t. The same experiment showed that competition may partially explain replacement of AG 2-t isolates during the growing season since AG 4 prevented AG 2-t to colonise and infect iris bulbs at 18°, and not at 9 °C, after dual infestation of the soil at one point in the pot. AG 4 isolates, however, were found in too low a frequency to induce replacement of AG 2-t in the field. In contrast to bare patch, bulb rot tended to increase during four successive crops of bulbs. AG 5 may largely account for the observed bulb rot. In one location bare patches due to R. tuliparum expanded within two seasons to cause severe damage in tulip bulbs.
In the general discussion (Chapter 7) the practical implications of the results are discussed. Directions for further research are indicated.
163

Samenvatting
Tulpenbollen moeten enkele jaren in het veld groeien voordat ze tot bloei komen. Gedurende deze vegetatieve groei groeit de hoofdbol en ontwikkelen zich nieuwe (kleinere) bollen. Kleine jaarlijkse verliezen kunnen daarom gedurende de ontwikkeling van bol tot bloem behoorlijk oplopen.
De veroorzaker van 'valplekken' in tulp en manieren om deze pathogène anastomosegroep (AG) van R. solani te herkennen worden beschreven in de hoofdstukken twee en drie. De AG die 'valplekken' veroorzaakt wordt in hoofdstuk 2 volgens 'klassieke' methoden beschreven. Valplekken veroorzakende AG 2-t isolaten worden vanwege de mate van versmelting van schimmeldraden en het ziek maken van bloembollen onderscheiden van AG 2-1 isolaten die niet ziekteverwekkend zijn voor tulp. Het patroon van de mate van versmelting tussen AG 2-t isolaten laat zien dat AG 2-t isolaten een homogene groep vormen die nauw verwant zijn aan AG 2-1. De mate van versmelting van schimmeldraden tussen AG 2-1 isolaten was zeer variabel waaruit bleek dat AG 2-1 een heterogene groep is. De optimale temperatuur voor groei van AG 2-t en AG 2-1 was 20 tot 25 °C in Petrischaal-experimenten. Tulp, iris, hyacint, lelie en zaailingen van suikerbiet en sla waren gevoelig voor de getoetste AG 2-t en twee AG 2-1 isolaten. Zes andere AG 2-1 isolaten waren pathogeen voor zaailingen van cruciferen, maar niet voor bolgewassen. Enkele cultivars van Narcis, afrikaantje, tomaat, aardappel, tarwe, prei en maïs waren niet gevoelig voor isolaten van AG 2-1 en AG 2-t. Isolaten van AG 2-2, AG 4 AG 5 en AG BI waren ziekteverwekkend in bolgewassen bij 18 °C. De mate van versmelting van schimmeldraden kon AG 2-t niet ondubbelzinnig van AG 2-1 onderscheiden.
In hoofdstuk 3 worden twee methoden voor routinematige identificatie vergeleken. Eén methode maakt gebruik van verschillen in het niet functioneel coderend DNA (ITS), dat ligt tussen de genen die coderen voor het RNA van de ribosomen (rDNA). Een andere methode maakt gebruik van pectine afbrekende enzymen. AG 2-t isolaten verschilden in lengte van het ITS rDNA fragment van AG 1-IC, AG 2-2IIIB, AG 2-2IV, AG 3 en AG 5 isolaten en na 'knippen' van het fragment ook van AG 1-IA en AG 1-IB en AG 4. AG 2-t isolaten en twee Japanse isolaten, allen ziekteverwekkend voor cruciferen en voor tulp, verschillen in lengte van het ITS rDNA fragment van nederlandse AG 2-1 isolaten welke niet ziekteverwekkend voor tulp waren. Na knippen werden voor AG 2-t vier en voor AG 2-1 vijf verschillende ITS rDNA knippatronen zichtbaar. Voor sommige isolaten werd een heterogeen knippatroon gevonden, hetgeen duidt op verschillende ITS sequenties binnen een isolaat. De verschillen in ITS rDNA gebied tussen voor tulp ziekteverwekkende en niet-ziekteverwekkende isolaten waren te gering voor routinematige identificatie van isolaten in het veld. Pectine zymogrammen (ZG) gebaseerd op een in de handel verkrijgbare verticaal gel-electroforese systeem en niet-denaturerende polyacryl-amide gelen waaraan pectine was toegevoegd werden bekeken als alternatief voor ITS rDNA fragment verschillen. Vijftig AG 2-t isolaten en vier AG 2-1 isolaten gaven eenzelfde pectine zymogram patroon. AG 2-1 isolaten, welke niet pathogeen voor tulp waren, bleken een heterogene groep met 4 verschillende ZG. De techniek van pectine
165

Rhizoctonia disease
zymogrammen is een makkelijke, snelle en ondubbelzinnige methode om grote hoeveelheden veldisolaten routinematig te identificeren. Een dergelijke techniek is bruikbaar in het onderzoek naar de dynamiek van Rhizoctonia populaties om milieuvriendelijke bestrijdingsmethoden van rhizoctonia ziekte van tulpenbollen te ontwikkelen.
Resistentieverdeling van gewassen is een belangrijke strategie voor een milieuvriendelijke ziektebeheersing. Tulpen met een voldoende resistentieniveau tegen rhizoctonia-ziekte zijn niet bekend. Een veredelingsstrategie dient rekening te houden met de genetische verscheidenheid in het pathogeen en de waardplant. In hoofdstuk 4 worden verschillende experimenten uit 1994 en 1995 beschreven die differentiële interactie van R. solani AG 2-t isolaten met tulpencultivars in kunstmatig besmette grond beschrijven. Vergelijking van de residuele varianties verkregen uit ANOVA en AMMI laat zien dat de resultaten van 'open-lucht' experimenten het meest geschikt zijn voor de interpretatie van de isolaat x cultivar interactie. De biplot verkregen na AMMI-analyse van isolaat x jaar x cultivar groepeert de meeste isolaten in jaarclusters, hetgeen duidt op een jaars-invloed op de ziekte-expressie. Twee isolaten werden in isolaatclusters gegroepeerd hetgeen een significante jaar x isolaat x cultivar interactie verklaarde. Drie isolaten, zeer agressief voor alle getoetste tulpen cultivars, vormden een cluster. Drie isolaten met een laag ziekteverwekkend vermogen vormden een contrasterend cluster. Er werden kwantitatieve differentiële interactie-patronen gevonden, maar deze werden duidelijk beïnvloed door kasomstandigheden en door de inoculumdrager. AG 2-1, AG 2-2 en AG 4 isolaten veroorzaakten geen ernstige stengel- en bladaantasting van tulpen in een 'open-lucht' proef toen de spruit door de grond groeide. Bij de oogst echter werden lesies op de stengelbasis bij het grondoppervlak gevonden en werd een lager bolgewicht gemeten. Gemiddeld genomen was de vermindering van het bolgewicht van de bolklisters door AG 2-1, AG 2-2 en AG 4 isolaten minder dan door AG 2-t isolaten. Geconcludeerd werd dat differentiële interactie van AG 2-t isolaten met tulpencultivars voorkomt, maar dat de interactie nog niet helemaal verklaard kan worden.
Om inzicht te krijgen in de ruimtelijke en seizoenmatige ontwikkeling van rhizoctonia valplekken, bolrot en de ziekteverwekkende anastomosegroepen werden veldproeven gedaan in Lisse en Zwaagdijk. Hoofdstuk 5 beschrijft hoe met behulp van geostatistiek een efficiënte bemonsteringsintensiteit wordt geschat en de ruimtelijke verdeling van rhizoctonia-valplekken wordt bepaald. Analyse van het semivariogram voor aangetaste bollen toont ruimtelijk afhankelijkheid in drie velden en een willekeurige verdeling in een ander veld. De kwaliteit van efficiënte bemonstering werd beoordeeld door het stapsgewijs verminderen van het databestand. De verminderde bemonsteringsintensiteit werd beoordeeld door de gemiddelde voorspellingsfout samen met het percentage goed voorspelde ziekte-intensiteiten te beoordelen en door een beoordeling op het oog van de kaarten met de ziekte. Het gebruik van ziekte-kaarten gaf in een veld met een bemonsteringsintensiteit van slechts 10% van het totale bestand nog bruikbare informatie over de ruimtelijke verdeling van geïnfecteerde bollen. In andere velden waren hogere bemonsteringsintensiteiten nodig.
166

Samenvatting
Er is weinig inzicht in de dynamiek van valplekken. Anastomosegroepen die de ziekte kunnen veroorzaken werden geïdentificeerd en hun dynamiek werd bestudeerd in veldproeven en de klimaatkamerproeven (Hoofdstuk 6). Kunstmatige besmetting van grond met R. solani AG 2-t in het veld veroorzaakte valplekken, die in de volgende teeltseizoenen niet meer op dezelfde plekken terugkwamen. Van nature voorkomende valplekken verdwenen langzaam gedurende de continuteelt van bolgewassen en werden niet meer in het laatste teelt seizoen waargenomen. In een veld in 1995 nam de ziekte-prevalentie toe van 65% in februari tot 90% in maart en weer af tot 55% in mei. Er ontwikkelden zich echter geen valplekken in 1995 in dit veld. AG 2-t isolaten werden misschien minder agressief. In alle teeltseizoenen kon R. solani AG 2-t gemakkelijk vroeg in het seizoen geïsoleerd worden, maar nauwelijks bij de oogst. AG 5 isolaten daarentegen werden nauwelijks vroeg in het seizoen geïsoleerd, maar waren bij de oogst volop aanwezig. AG 5 veroorzaakte geen 'vervanging' van AG 2-t, zoals bleek uit een klimaatkamer experiment. Dezelfde proef toonde aan dat competitie de vervanging van AG 2-t isolaten gedurende het groeiseizoen deels kon verklaren. AG 4 verhinderde de kolonisering en infectie van iris bollen door AG 2-t bij 18 °C, maar niet bij 9 °C, na gemeenschappelijke besmetting van de grond op één punt in de pot. Isolaten van AG 4 werden echter in te lage aantallen in het veld gevonden om AG 2-t te vervangen. In tegenstelling tot de valplekken breidde bolrot zich langzaam uit gedurende de vier opeenvolgende teelten van bollen. Waarschijnlijk veroorzaakt AG 5 het merendeel van het bolrot. In één locatie namen valplekken door R. tuliparum binnen twee seizoenen zo sterk toe dat zij ernstige schade aan de tulpenbollen veroorzaakten.
In de algemene discussie (Hoofdstuk 7) wordt de praktische toepassing van de resultaten besproken. De richtingen voor verder onderzoek worden aangegeven.
167

Nawoord
September 1990 werd op het IPO-DLO begonnen met het onderzoek naar Rhizoctonia solani in bloembollen. Uiteindelijk werden de resultaten beschreven in wetenschappelijke publicaties die de basis van dit proefschrift werden. Het hier beschreven werk was alleen niet uit te voeren. Thea van Beers bedank ik voor haar inzet en het enthousiasme bij aanvang van dit project. Maar Thea ging en Mirjam kwam. Mirjam Schilder, na je stage periode kon je al vrij snel bij ons op het lab terecht. Bedankt voor je tomeloze inzet en je altijd goede humeur. Je praktijk kennis van de bollen kwam ons goed van pas tijdens het veldwerk. De rhizoctonia-onderzoekers Paul van den Boogert, Gerda Dijst en Jaap Keijer (nu RIKILT-DLO) fungeerden allen op hun manier als 'begeleider op de werkvloer'. Ik wil hen graag bedanken voor de kritische beschouwingen en discussies van mijn werk. Het onderzoek werd in de eerste V/i jaar uitgevoerd in de sectie Bodemecologie met als sectiehoofd Paul Maas, en daarna voortgezet binnen de afdeling Ecologie en biologische bestrijding van schimmels (EBBS) van Nyckle Fokkema. Beiden wil ik bedanken voor hun kritische begeleiding en het in mij gestelde vertrouwen. Pieter Vereijken dank ik voor zijn bijdragen aan de statistische verwerking, uitleg en adviezen. Corné Kocks dank ik voor het wegwijs maken in de geostatistiek.
Onderzoek aan tulp kan niet zonder de mensen van het Laboratorium voor Bloembollenonderzoek (LBO). Amelita Doornik wil ik danken voor het wegwijs maken in het rhizoctonia-tulp pathosteem. Ook regelde Amelita de gewenste partijen irissen en tulpen en de vereiste voorbehandelingen. Hartelijk dank daarvoor. Jan van Aartrijk, Gera van Os, Aad Koster, Anne-Sophie van Bruggen (allen LBO) en Frans Zoon (IPO-DLO) wil ik bedanken voor hun inbreng tijdens de halfjaarlijkse bijeenkomsten van het 'ziektenprogramma'.
De mannen van de kassendienst van het IPO-DLO ben ik erkentelijk voor ondersteuning bij de kasproeven. Jan den Dunnen wist altijd ruimte vinden voor mijn 'proefjes'. Zelfs de aanleg van een 'kleine keukenhof' op het terrein van het IPO-DLO bleek mogelijk, waarvoor nagenoeg de gehele kassendienst gemobiliseerd werd. De inzet van Maarten Holdinga en Theo Vos bij de oogst van de veldproeven heb ik zeer gewaardeerd.
De afdeling mycologie van de Plantenziektenkundige Dienst bedank ik voor het beschikbaar stellen van Rhizoctonia solani isolaten en de inzage in ongepubliceerde Rhizoctonia gegevens. Dolf Straathof en Wim Eikelboom (CPRO-DLO) bedank voor informatie en practische adviezen over de tulp.
Bert Wijers van het LBO dank ik voor de aanleg en verzorging van de proefvelden op de proeftuin in Lisse. Johan Koss en Piet Bleeker dank ik voor de aanleg en verzorging van de proefvelden op Zwaagdijk en Creil.
De sectie Bodemecologie en later EBBS, was een prettige werkomgeving. Een aantal werkzaamheden zijn op het moleculaire lab verricht. Ik heb veel van de collega's daar geleerd. Ik wil hen bedanken voor de prettige werksfeer en discussies.
Nyckle, ik ben je zeer erkentelijk dat je mij de gelegenheid hebt gegeven om de publicaties en dit proefschrift op het IPO af te ronden nadat het rhizoctonia-project was beëindigd. Voorts dank ik je voor het snel en kritisch beoordelen van de manuscripten.
Geachte professor Zadoks, de snelheid en nauwkeurigheid waarmee u mijn manuscripten hebt doorgenomen verrasten mij telkens weer. Vooral in de laatste fase van het schrijven heb ik veel steun aan u gehad.
'Last but not least' dank ik mijn ouders, Joke en de kinderen. Sten, Tessa, Yord; het zit erop, ik heb weer tijd voor jullie!
169
List of publications
Dijst, G., and J.H.M. Schneider. 1996. Rhizoctonia species in flower bulbs. In: Sneh, B.et ah, Rhizoctonia species: Taxonomy, molecular biology, ecology, pathology and control. Kluwer, Dordrecht, pp 279-288.
Neate, S.M., and J.H.M. Schneider. 1996. Sampling and quantification of R. solani. In:Sneh,B. et al.,Rhizoctonia species: Taxonomy, molecular biology, ecology, pathology and control. Kluwer, Dordrecht, pp 185-195.
Salazar,0., J.H.M. Schneider, V. Rubio and J. Keijer. Phylogenetic relations in Rhizoctonia solani AG-2 based on ribosomal internal transcribed spacer (rITS) sequences. Mycological Research (submitted).
Schneider J.H.M., and M.T. Schilder. 1998. Spatial and seasonal distribution of rhizoctonia disease in four successive growing seasons. European Journal of Plant Pathology (submitted).
Schneider, J.H.M. and CG. Kocks. 1998. Sampling efficiency of rhizoctonia-infected tulip bulbs as determined by geostatistics. Plant Pathology (submitted).
Schneider, J.H.M., P.H.J.F. Van den Boogert and J.C. Zadoks. 1998. Exploring differential interaction of R. solani AG 2-t on tulip cultivars. Plant Disease (submitted).
Schneider, J.H.M., J.J. s'Jacob, and P.A. van de Pol. 1995. Rosa multiflora 'Ludiek', a rootstock with resistant features to the root lesion nematode Pratylenchus vulnus. Sciencia Horticulturae 63: 37-48.
Schneider, J.H.M., M.T. Schilder, and G. Dijst. 1997 Characterization of Rhizoctonia solani AG 2-t isolates causing bare patch in field grown tulips in the Netherlands. European Journal of Plant Pathology 103: 265-279.
Schneider, J.H.M., O. Salazar, J. Keijer and V. Rubio. 1997. Identification of Rhizoctonia solani associated with field-grown tulips using rITS-DNA polymorphism and pectic zymograms. European Journal of Plant Pathology 103: 607-622.
171
Curriculum vitae
Johannes Henri Marinus Schneider werd geboren op 16 januari 1960 te 's Gravenhage. In 1972 werd aan de MAVO in Zwijndrecht begonnen. Het diploma MAVO werd in 1977 in Steenbergen behaald en het diploma HAVO in 1980 in Bergen op Zoom. In 1982 werd het diploma behaald van de HBO-A opleiding zoölogie, ecologische studierichting aan het Ir. W. van den Broek Instituut te Amsterdam. Na het behalen van het colloquium doctum natuurkunde werd in september 1983 begonnen met de studie biologie aan de toenmalige Landbouwhogeschool in Wageningen. De doctoraal studie omvatte een verzwaard hoofdvak fytopathologie met een onderzoeksonderwerp en een literatuurstudie en een hoofdvak bosteelt en bosoecologie. Een onderzoeksonderwerp begonnen bij de vakgroep Nematologie werd afgesloten met een publicatie. De praktijktijd van 6 maanden werd doorgebracht op het CLP. Experimental Station in San Ramon, Peru. Het doctoraal diploma van de Landbouwuniversiteit werd in september 1989 behaald. December 1989 en januari 1990 verrichte hij tijdelijke werkzaamheden binnen het project 'ash wilt disease' van de vakgroep bosbouw (LUW). Van maart 1990 tot en met augustus 1990 verrichte hij tijdelijk onderzoek aan Fusarium in buxus, aardappel en chrysanth op de afdeling Mycologie van de Plantenziektenkundige Dienst in Wageningen. September 1990 werd begonnen als onderzoeker op het IPO-DLO aan het project R. solani in tulp en iris in het kader van het Urgentieprogramma Bloembollenziekten en Veredelingsonderzoek, hetgeen uiteindelijk leidde tot dit proefschrift. Sinds april 1997 is hij werkzaam op het Instituut voor Rationele Suikerproduktie (1RS) te Bergen op Zoom, waar hij onderzoek verricht naar R. solani in suikerbieten.
173
Copyright © 2022 FDOKUMEN