Revision 3, Addendum 2 Final Design Report - Records ...
248
Revision 3, Addendum 2 Final Design Report Conrail Railyard Superfund Site (Drag Strip 60 Percent Design) Elkhart, Indiana Submission Date: January 30, 2015 Prepared by: AECOM 525 Vine Street, Suite 1800 Cincinnati, OH 45202 On behalf of: Settling Parties: American Premier Underwriters, and Norfolk Southern Railway Company
-
Upload
khangminh22 -
Category
Documents
-
view
0 -
download
0
Transcript of Revision 3, Addendum 2 Final Design Report - Records ...

Revision 3, Addendum 2Final Design ReportConrail Railyard Superfund Site(Drag Strip 60 Percent Design)Elkhart, Indiana
Submission Date: January 30, 2015
Prepared by:AECOM525 Vine Street, Suite 1800Cincinnati, OH 45202
On behalf of:Settling Parties:American Premier Underwriters, andNorfolk Southern Railway Company

AECOM525 Vine Street, Suite 1800Cincinnati, Ohio 45202www.aecom.com
513.651.3440 tel877.660.7727 fax
January 30, 2015
Mr. Timothy DrexlerU.S. EPA, HSRL-6J77 West Jackson Blvd.Chicago, IL 60604-3590
Subject: Revision 3, Addendum 2 Final Design (Drag Strip 60 PercentDesign), andResponse to EPA Comment Letter dated November 4, 2014Second Remedial Design / Remedial ActionConrail Railyard Superfund SiteElkhart, Indiana
Dear Mr. Drexler:
On behalf of the Settling Parties, Norfolk Southern Railway Company (Norfolk Southern) andAmerican Premier Underwriters (APU)
1, AECOM
2is providing the referenced submittal, referred to as
the Drag Strip 60 Percent Design, to the United States Environmental Protection Agency (EPA). TheDrag Strip 60 Percent Design addresses EPA comments dated July 11, 2014. The Settling Partiespreviously responded to the July 11, 2014 EPA comments and developed a key element of the DragStrip design in, “Response to EPA July 11, 2014 Comments, and Technical Memorandum:Intermediate Remediation Goal (IRG) Calculation, Conrail Railyard Superfund Site, Elkhart, Indiana,”dated September 19, 2014 (IRG Tech Memo).
EPA provided comments dated November 4, 2014 regarding the Settling Parties’ IRG Tech Memosubmittal. On December 3, 2014, EPA, Indiana Department of Environmental Management (IDEM),S.S. Papadopulos and Associates (SSPA), the Settling Parties, and AECOM discussed the EPANovember 4, 2014 comments letter and the Settling Parties’ initial responses.
In addition to transmitting the Drag Strip 60 Percent Design, this letter provides the Settling Parties’formal responses to EPA’s November 4, 2014 comments letter. To assist in your review, quotationsfrom the EPA comments letter dated November 4, 2014 are presented in boldface italic type with theSettling Parties’ comments in plain-type text.
1. We consider that your responses, pending conclusive results obtained from themicrocosm studies, are adequate and sufficient for moving forward with field-scale pilot testing, as soon as possible.
Therefore:
• We accept the IRG calculation methodology, however, consistent withprevious EPA comments, data from and and Drag StripWest Source Area monitoring wells should be excluded from the attenuationfactor calculation; the IRGs calculated while excluding these data are 53.2 ug/Lfor CT and 14 ug/L for TCE;
1 Pursuant to the Consent Decree regarding the Conrail Rail Yard Superfund Site between the EPA, Consolidated RailCorporation (Conrail) and American Premier Underwriters, Inc. (APU), dated November 10, 1997, the “Settling Parties”are Conrail and APU. Norfolk Southern Railway Company (Norfolk Southern) is performing certain environmentalActivities at the site under the Consent Decree on behalf of Conrail. As such, for purposes of this correspondence,“Settling Parties” refers to Norfolk Southern on behalf of Conrail and APU.
2 URS Corporation (URS) has merged with AECOM, and URS is a wholly-owned subsidiary of AECOM.

Mr. Timothy DrexlerU.S. EPA, HSRL-6J
January 30, 2015Page 2
1. EPA’s previous comment is “General Comment 1.b” from the July 11, 2014 Letter:
“The proposed VISL calculation method uses grouped groundwater and residential air COCconcentrations; however, some of the wells identified to be used (MW-38S, DSMW-03, MW-56S) are near/within the West Source Area, and may have groundwater concentrations thatare higher than those that actually underlie the residences. This will produce groundwater-to-air attenuation factors that are potentially high (i.e. not conservative), and therefore lessprotective.”
As the Settling Parties have already stated to EPA in the September 19, 2014 IRG Tech Memo, thesebuildings are less than 150 ft. from wells and are therefore useable as data pairs, per the approvedVapor Monitoring Plan. Also, EPA is extrapolating a lower concentration beneath the buildingswithout any basis and using that uncertainty as rationale for rejecting valid data pairs for thesebuildings. With this logic, all data pairs would need to be rejected because none of the wells arelocated within buildings.
EPA expressed concern that the wells’ proximity to source areas made the groundwater dataunrepresentative and introduced bias that is not protective of human health or the environment. TheSettling Parties stated that the phenomenon being characterized is constituent concentrationattenuation between shallow groundwater and indoor air, which is wholly dependent on observedconcentrations from valid data pairs and only indirectly related to proximity to sources. The SettlingParties stated that rejecting these data based on perceived bias mischaracterizes the phenomenonthat is taking place in the Vistula neighborhood, and that they have worked diligently to describe sincemonitoring began in 1998. The Settling Parties informed EPA that the extensive and valuable datarecord from these two buildings and three monitoring wells represents a significant proportion (53percent) of the sample data available for this analysis. Furthermore, the EPA-required use of the 95
th
percentile statistic is inherently a biased approach because it considers only the most conservative(upper) tail of the distribution instead of the mean, which is an acceptable method for evaluations ofrisk.
Following the December 3, 2014 conference call and in the interest of maintaining progress with theDrag Strip remedial design, the Settling Parties agreed to remove the two buildings from the analysisand to use the revised IRGs required in EPA’s November 4, 2014 letter. The IRG Tech Memo hasalso been revised and is provided in the attached Drag Strip 60 Percent Design.
2. You should now submit, for EPA and IDEM approval, a Target Zone based on the95% upper confidence limit of the mean (UCL) concentrations of CT and TCEmeasured in samples from shallow wells over the last 2 years (March 2012-March2014) to serve as a basis for remedial design, using the current monitoring wellnetwork and the updated IRGs;
2. During the December 3, 2014 conference call, the Settling Parties reminded EPA that requiringTarget Zone establishment before the delineation task is inconsistent with the approach proposed inRevision 2, Addendum 2 Final Design Report, dated May 16, 2014 (30 Percent Design), “Additionaldelineation of COCs is needed at the Drag Strip in order to refine the current treatment areafootprint.” In order to accurately characterize nature and extent, the delineation task is needed. Inparticular, plume geometry is needed in order to focus the pilot testing on the plume core whileaccommodating EPA’s GCW operational requirement during pilot testing. EPA agreed that thedelineation task is necessary to establish the Target Zone, and EPA understands that access to theDrag Strip property is necessary to perform the delineation task.


Revision 3, Addendum 2 Final Design Report Table of Contents
14951501.11014 i Drag Strip 60 Percent Design
Table of Contents
Acronyms .......................................................................................................................................................iv
Executive Summary........................................................................................................................................iv
1.0 Introduction ..........................................................................................................................................11.1 Purpose: Revision 3 Addendum 2 to Final Design ....................................................................11.2 Report Organization...................................................................................................................2
2.0 Background to Drag Strip Final Remedy Selection..............................................................................32.1 Regulatory History.....................................................................................................................3
2.1.1 Drag Strip Pilot-Phase Remedy .................................................................................42.1.2 Third Five-Year Review ............................................................................................52.1.3 Railyard Remedy Upgrade.........................................................................................62.1.4 Drag Strip Remedy Finalization Activities ................................................................72.1.4.1 Drag Strip Remedial Action Objective-2011.............................................................82.1.4.2 Previously-Proposed Drag Strip Remedy and Performance Metrics .........................82.1.4.3 EPA Response to Proposed Approach.......................................................................82.1.4.4 Technical Rebuttals....................................................................................................92.1.4.5 Revised Drag Strip Contingency Remedy ...............................................................102.1.5 Drag Strip Access Prohibition .................................................................................11
3.0 Conceptual Site Model (CSM) ...........................................................................................................133.1 Environmental Setting .............................................................................................................13
3.1.1 Site-Wide Geology ..................................................................................................133.1.2 Drag Strip Geology..................................................................................................133.1.3 Hydrogeology ..........................................................................................................14
3.2 Known and Potential Source Areas .........................................................................................153.3 Identification and Extent of COCs...........................................................................................15
3.3.1 Groundwater Natural Attenuation Parameters .........................................................163.3.2 COCs Summary .......................................................................................................19
3.4 Definition of Primary Transport Mechanisms .........................................................................203.5 Identification of Potential Receptors and Exposure Points ......................................................21
3.5.1 Potentially Complete Exposure Pathways ...............................................................213.5.2 Incomplete Exposure Pathways ...............................................................................21
4.0 Risk Characterization .........................................................................................................................23
5.0 Drag Strip Remedial Design...............................................................................................................245.1 Design Parameters ...................................................................................................................245.2 Revised Drag Strip RAO .........................................................................................................255.3 Intermediate Remediation Goal ...............................................................................................255.4 Attainment of IRG and Closeout .............................................................................................265.5 Additional Delineation of COCs..............................................................................................27
5.5.1 Well Installation.......................................................................................................285.5.2 Sampling and Data Evaluation for COCs Delineation.............................................29
5.6 Bench-Scale Testing ................................................................................................................295.6.1 Recommended Injection Amendment......................................................................30
5.7 Pilot-Scale Injection Testing....................................................................................................315.7.1 “Rule-Authorize” Injection Wells Used for Site Clean-Up .....................................325.7.2 Pilot Test Basis ........................................................................................................325.7.3 Implementation ........................................................................................................33

Revision 3, Addendum 2 Final Design Report Table of Contents
14951501.11014 ii Drag Strip 60 Percent Design
5.7.4 Performance Monitoring..........................................................................................345.8 Full-Scale Injection Remedy Implementation .........................................................................345.9 Remedy Performance Monitoring............................................................................................35
6.0 Interim Remedial Action Report – Conrail Railyard Superfund Site .................................................386.1 Remedial Action Progress........................................................................................................386.2 PRP LR Requirements .............................................................................................................39
7.0 PRP Long-Term Response Monitoring ..............................................................................................407.1 Current Groundwater Monitoring Scope .................................................................................407.2 PRP LR Monitoring Objectives ...............................................................................................417.3 Railyard PRP LR Monitoring ..................................................................................................417.4 Drag Strip PRP LR Monitoring ...............................................................................................42
7.4.1 Contingency for IRG Exceedance ...........................................................................437.5 PRP LR Monitoring Reporting ................................................................................................45
7.5.1 Monthly Reporting...................................................................................................457.5.2 PRP LR Monitoring .................................................................................................457.5.3 Other Reports...........................................................................................................45
8.0 Project Schedule .................................................................................................................................46
9.0 References ..........................................................................................................................................47
TablesTable 1 Shallow and Intermediate-Depth Constituents of Concern Data
Table 2 Monitoring Parameters and Pilot Test Sampling Plan
Table 3 Drag Strip Remedy Performance Monitoring Scope
Table 4 Conceptual Project Schedule
FiguresFigure 1 Site Vicinity Map
Figure 2 Drag Strip Area Location Map
Figure 3 Drag Strip Area Map with Well and Soil Gas Sample Locations
Figure 4 Drag Strip Property With Cross-Section Locations
Figure 5a-g Geologic Cross Sections
Figure 6a-b Shallow and Intermediate Groundwater CT Isopleths, Drag Strip
Figure 7a-b Shallow and Intermediate Groundwater TCE Isopleths, Drag Strip
Figure 8 Conceptual Exposure Model
Figure 9 Proposed Well Nest Locations and Shallow Groundwater CT Isopleths
Figure 10 Pilot Test Layout
Figure 11 Pilot Study Wells Construction Diagrams
Figure 12 Remedy Performance Monitoring Well Locations
Figure 13 Railyard Remedy Layout

Revision 3, Addendum 2 Final Design Report Table of Contents
14951501.11014 iii Drag Strip 60 Percent Design
AppendicesAppendix A Addendum Final Design Report, June 30, 2011
Appendix B Summary of Groundwater Wet Chemistry Analytical and Field Parameter Results
Appendix C Revision 1, Technical Memorandum: Intermediate Remediation Goal Calculation
Appendix D Laboratory Biotreatability Study (SiREM)

Revision 3, Addendum 2 Final Design Report Acronyms
14951501.11014 iv Drag Strip 60 Percent Design
Acronyms
Acronym DescriptionAEM Analytical Element ModelAPU American Premier Underwriters, Inc.ft bgs Feet below ground surfaceCT Carbon tetrachlorideCD Consent DecreeCERCLA Comprehensive Environmental Response, Compensation, and Liability ActCF ChloroformCOD Chemical oxygen demandCOCs Constituents of concernConrail Consolidated Rail CorporationCQAO Construction Quality Assurance PlanCSM Conceptual site modelCVOCs Chlorinated volatile organic compoundsDNAPL Dense non-aqueous phase liquid1,1-DCE 1,1-dichloroethenecis-1,2-DCE cis-1,2-dichloroethenetrans-1,2-DCE trans-1,2-dichloroetheneDO Dissolved oxygenDrag Strip Osceola Drag StripEISB Enhanced In Situ BioremediationEPA United States Environmental Protection AgencyESTCP Environmental Security Technology Certification ProgramEVO Emulsified vegetable oilEVS Environmental Visualization SystemsFirst RD/RA First Remedial Design/Remedial Actionft/day Feet per dayGAC Granular activated carbonGCW Groundwater circulating wellGMP Groundwater Monitoring Plangpm Gallons per minuteGWIASLs Groundwater to indoor air screening levelsGWTP Groundwater Treatment PlantHI Hazard indexHQ Hazard quotientIAAL Indoor air action levelIASLs Indoor air screening levelsICs Institutional ControlsIDEM Indiana Department of Environmental ManagementIRA Interim Remedial ActionIRG Intermediate remediation goallbs PoundsLR Long-term responseMCLs Maximum contaminant levelsMicrobial Microbial Insightsmg/L Milligrams per liter

Revision 3, Addendum 2 Final Design Report Acronyms
14951501.11014 v Drag Strip 60 Percent Design
MNA Monitored Natural Attenuationmsl Mean sea levelmV MillivoltsNorfolk Southern Norfolk Southern Railway CompanyNPL National Priorities ListO&M Operations and MaintenanceORP Oxidation-reduction potentialPCE Tetrachloroetheneppbv Parts per billion by volumePetition Technical Impracticability Waiver and Request for Remedy Reconsiderationppbv Parts per billion by volumePRPs Potentially Responsible PartiesPRP LR PRP Long-Term ResponsePVC Polyvinyl chlorideQA/QC Quality assurance/quality controlRailyard Norfolk Southern Elkhart YardRAO Remedial Action ObjectiveRfC Inhalation reference concentrationRI/FS Remedial Investigation/Feasibility StudyROD Record of DecisionSAP Sampling and Analysis PlanSecond RD/RA Second Remedial Design/Remedial ActionSOW Statement of WorkSSSLs Sub-slab screening levelsSSPA S.S. Papadopulos & Associates, Inc.TCE TrichloroetheneTCOCs Total constituents of concernTestAmerica TestAmerica LaboratoriesTI Technical Impracticability WaiverTOC Total organic carbonTPG Three point gradient1,1,1-TCA 1,1,1-TrichloroetheneUCL Upper confidence limitUIC Underground injection controlµg/L Micrograms per literµS/cm Micro Siemens per centimeterVC Vinyl chlorideVFAs Volatile fatty acidsVFDs Variable frequency drivesVI Vapor intrusionVISL Vapor intrusion screening levelVOCs Volatile organic compoundsZVI Zero-valent iron

Revision 3, Addendum 2 Final Design Report Executive Summary
14951501.11014 iv Drag Strip 60 Percent Design
Executive SummaryThis document presents Revision 3 to Addendum 2 to the Final Design Report for the ConrailRailyard Superfund Site in Elkhart, Indiana (Site). One purpose of this Revision 3 Addendum 2is to present the design basis and intent for the revised remedy at the Drag Strip source areas. Thissubmittal is considered to be a 60 percent design document. The other purpose of this submittal isto provide a “roadmap” to future Superfund programmatic activities.
The Site consists of two separate groundwater remediation areas, and each of these areas has inplace an operational groundwater extraction and treatment system. The first is the groundwaterpumping and containment system located at the Norfolk Southern Elkhart Yard (Railyard), andthe second is the pilot-phase groundwater circulation well (GCW) located at the Osceola DragStrip (Drag Strip). The Site also has in place a vapor mitigation and indoor air monitoringprogram for buildings in the Vistula Area, located downgradient of the Drag Strip.
The focus of this document is the Drag Strip, and the Settling Parties’ continuing, significantefforts towards finalization of the remedial action in this portion of the Site. The revisions to theremedial action approach herein have been prepared resulting from comments and requirementsreceived by the Settling Parties from the United States Environmental Protection Agency (EPA)and the Indiana Department of Environmental Management (IDEM), and they represent asignificant change from the previously-proposed remedy. The previously-proposed remedyincluded a two-year performance evaluation. If the outcome of the performance evaluation wasthat further, active remediation of source mass was required, a contingency remedy, consisting ofGCW technology to target the core of the remaining enrichment mass, would be installed.
EPA required the Settling Parties to design and install a contingency remedy in the near termbecause of EPA’s concerns about downgradient risk for vapor intrusion (VI) and plumeinstability. A groundwater risk evaluation and plume stability analysis were submitted in late2013 to address EPA’s concerns.
In response to EPA’s requirement, the Settling Parties will proceed with further activeremediation of the Drag Strip source areas by installing a contingency remedy. In considerationof environmental, social, and economic factors, the Settling Parties have chosen to invest in asustainable remedy for the Drag Strip. This decision is in alignment with EPA’s efforts tosupport greener cleanups. As discussed with EPA during the meeting on February 12, 2014, thecontingency remedy will consist of an enhanced in-situ bioremediation technology instead of thepreviously-proposed GCW technology.
Because of potential VI risk to the Vistula Area, a hot-spot remedy at the Drag Strip source areasis necessary. The sole potentially-complete exposure pathway for contaminated groundwater isthe inhalation of vapor-phase constituents of concern (COCs) released from the shallowgroundwater zone to indoor air of residents and commercial workers downgradient of the DragStrip. This potential risk to human health is used to develop the design parameters for the revisedcontingency remedy, which are:
Revised Drag Strip remedial action objective (RAO) based on the shallowgroundwater to indoor air exposure pathway;
Development of an intermediate remediation goal (IRG) for the Drag Strip, using anupdated site-specific attenuation factor, EPA’s level of acceptable risk, and EPA’svapor intrusion screening level (VISL) Calculator; and

Revision 3, Addendum 2 Final Design Report Executive Summary
14951501.11014 v Drag Strip 60 Percent Design
Development of the attainment process for the IRG, and closeout process for vapormonitoring and mitigation program.
At this 60-percent design stage, the remedy includes the following physical design elements:
Additional delineation of total COCs to define current plume core for full-scaletreatment of the hot spot;
Bench- and pilot-scale testing to select effective injection amendments;
Full-scale implementation of hot-spot treatment remedy, including utilization of theexisting GCW to assist in distribution of amendments; and
Remedy performance monitoring.
Because of their dependence on the delineation of COCs, full development of the pilot-scaletesting program and the full-scale design will necessarily be provided in subsequent designsubmittals.
Prior to any onsite fieldwork for delineation, pilot testing, or full-scale construction andimplementation, access to the Drag Strip property is required. A complaint was filed in FederalCourt to enforce the terms of the 2001 Settlement Agreement and to obtain access to the DragStrip for installation of wells necessary for proceeding with the remedy proposed herein. TheDrag Strip property owner was named a potentially responsible party (PRP) by EPA in a letterdated November 19, 2012. The access issue is still being resolved, and it has will continue todelay implementation of the necessary fieldwork for the remedy.

Revision 3, Addendum 2 Final Design Report Introduction
14951501.11014 1 Drag Strip 60 Percent Design
1.0 IntroductionThis document presents Revision 3 to Addendum 2 to the Final Design Report (URS 2003a) forthe Conrail Railyard Superfund Site in Elkhart, Indiana (Site) (Figure 1). The Site is proceedingthrough the Second Remedial Design/Remedial Action (Second RD/RA). The United StatesEnvironmental Protection Agency (EPA) has established a groundwater remedial alternative forthe Site, which is presented in a Record of Decision (ROD) Amendment dated September 27,2000, and which modifies the Final ROD dated September 9, 1994. Work at the Site is beingconducted by the Settling Parties1 under the Consent Decree (CD), which was lodged with thecourt on August 12, 1997 and entered by the court on November 10, 1997 (referenced as CivilAction No. S90-56M). As will be explained in more detail in subsequent sections of thisdocument, EPA required the Settling Parties to design and install a contingency remedy in thenear term because of EPA’s concerns about downgradient risk for vapor intrusion (VI) andplume instability.
The Site remedial action consists of two separate groundwater remediation areas, and each ofthese areas has in place an operational groundwater extraction and treatment system. The first isthe groundwater pumping and containment system located at the Norfolk Southern ElkhartYard (Railyard), and the second is the pilot-phase groundwater circulation well (GCW) locatedat the Osceola Drag Strip (Drag Strip). The Drag Strip property owner was named a potentiallyresponsible party (PRP) by EPA in a letter dated November 19, 2012.
In addition to the groundwater monitoring program associated with the Railyard and DragStrip, the Site also has in place a vapor mitigation and indoor air monitoring program forbuildings in the Vistula Area, located downgradient of the Drag Strip.
The focus of this document is the Drag Strip, and the Settling Parties’ continuing, significantefforts towards finalization of the remedial action in this portion of the Site. The predecessorsto this document are:
Addendum 2, Final Design Report, dated November 9, 2012 (URS 2012a);
Revision 1, Addendum 2, Final Design Report dated April 17, 2013 (URS 2013a);and
Revision 2, Addendum 2, Final Design Report dated May 16, 2014 (URS 2014a).
The revisions herein have been prepared resulting from comments and requirements receivedby the Settling Parties from the EPA and the Indiana Department of EnvironmentalManagement (IDEM) dated July 11, 2014 (EPA 2014a) and November 4, 2014 (EPA 2014b).
1.1 Purpose: Revision 3 Addendum 2 to Final Design
Whereas the Site’s first addendum to the Final Design (URS 2011, see Appendix A)presented the design for the Railyard treatment system upgrades, the second addendumaddresses the Drag Strip groundwater remediation area, as well as subsequent Superfundprogrammatic activities during the Second RD/RA. One purpose of this Revision 3 Addendum 2is to present the next phase of design elements for the revised remedy at the Drag Strip source
1 Pursuant to the Consent Decree regarding the Conrail Rail Yard Superfund Site between the EPA, Consolidated Rail Corporation(Conrail) and American Premier Underwriters, Inc. (APU), dated November 10, 1997, the “Settling Parties” are Conrail and APU.Norfolk Southern Railway Company (Norfolk Southern) is performing certain environmental Activities at the site under the ConsentDecree on behalf of Conrail. As such, for purposes of this correspondence, “Settling Parties” refers to Norfolk Southern on behalf ofConrail and APU.

Revision 3, Addendum 2 Final Design Report Introduction
14951501.11014 2 Drag Strip 60 Percent Design
areas. Given the collaborative approach adopted by EPA and the Settling Parties fordevelopment of recent (since 2009) Site program documents, this submittal is considered to be a60 percent design document. The other purpose of this submittal is to provide a “roadmap” tofuture Superfund programmatic activities such as:
Drag Strip remediation system construction completions under the Second RD/RA;
Updates to the long-term groundwater monitoring program for the Site; and
Interim Remedial Action (IRA) reporting for the Site.
1.2 Report Organization
This submittal contains the following components in support of the Drag Strip remedialdesign and the proposed Superfund programmatic activities:
Background to Drag Strip Final Remedy Selection – Summarizes regulatory history, therequirements contained in the Superfund controlling documents, and the requirements in recentEPA communications.
Conceptual Site Model (CSM) – Presents Drag Strip and Site information regarding releases tothe environment, describes the environmental setting and spatial distribution of contaminants,and identifies potential receptors and potentially complete exposure pathways.
Risk Characterization – Summarizes the assessment of potentially complete exposure pathwaysneeded for the development of risk-based remedial decisions for the Drag Strip.
Drag Strip Remedial Design – Presents the proposed revision to the groundwater remediationcontingency remedy.
Interim Remedial Action (IRA) Report – Describes the content of the IRA Report that will besubmitted to the agencies upon completion of the Drag Strip Remedy.
Potentially Responsible Parties (PRPs) Long-Term Response (LR) Monitoring – Presents theconceptual groundwater monitoring program during the remedial action period followingremedy construction and startup.

Revision 3, Addendum 2 Final Design Report
Background to Drag Strip Final RemedySelection
14951501.11014 3 Drag Strip 60 Percent Design
2.0 Background to Drag Strip Final Remedy SelectionThis section summarizes regulatory history of the Site, the requirements for Drag Strip remedialaction contained in the Site’s controlling documents (CD and ROD Amendment), and therequirements in recent EPA communications.
The Drag Strip area is located on a 130-acre parcel of land south of County Road 16 and east ofAsh Road (Figures 2 and 3). This parcel is owned and operated as a motor vehicle racing business
. The Settling Parties have no ownership of this property, and have right ofaccess only through agreement with the property owner. Prior to 1967, the property was used asan air strip. Acreage in the eastern portion of the parcel is in agricultural use. An area in thesouthwestern portion of the property has been identified as being affected by groundwatercontamination, including two areas referred to as the East and West Source Areas where carbontetrachloride (CT) is present in the aquifer.
2.1 Regulatory History
The Site was first identified in 1986 when volatile organic compounds (VOCs) were identifiedin a residential well. Following initial assessments and investigations, the Site was proposed for theNational Priorities List (NPL) in 1988. Following three phases of investigation by EPA, remedialactions were identified for the Site in the Final ROD dated September 9, 1994. Subsequentnegotiations between the Settling Parties and EPA culminated in the CD and Statement of Work(SOW) in 1997.
For the Drag Strip Source Areas, the CD (Chapter VII, para. 18b) sets forth three conditions thatmust be true before remediation is required:
Condition (i): “…shall remediate…or contain any source areas to the extent such sourceareas…contain contaminants which exceed the performance standards set for the inTable 3 of the [Statement of Work] SOW” and;
Condition (ii): “…are determined by EPA to be recharging the known groundwaterplumes, or commingled plumes, at the Site” and;
Condition (iii): “…significantly delay the time, as determined by EPA, by which thecontaminated groundwater at the Site will achieve the standards set forth in Table 3 ofthe SOW.” The standards in Table 3 of the SOW are the maximum contaminant levels(MCLs) for the listed compounds.
To implement the SOW, the First Remedial Design/Remedial Action (First RD/RA) was completedbetween January 1998 and September 2000. During this period the following tasks werecompleted:
Source area investigations on the Railyard;
Source area investigations on the Drag Strip;
Vapor sampling throughout the Site and installation of vapor mitigation systems in somebuildings northwest of the Drag Strip; and
Ecological assessment of benthic macroinvertebrate on the St. Joseph River.

Revision 3, Addendum 2 Final Design Report
Background to Drag Strip Final RemedySelection
14951501.11014 4 Drag Strip 60 Percent Design
The results of these investigations and remedial work were submitted to the agencies in threemain reports:
Preliminary Design Report for the First RD/RA (dated September 1998, revisedDecember 18, 1998);
Addendum to the Preliminary Design Report for the First RD/RA (dated December 23,1998); and
Vapor Remediation Report (dated September 28, 1999).
The scope of work for the indoor air monitoring program for the Superfund Site, as requiredunder the 1994 Final ROD, was presented in the 95% Design for the First RemedialDesign/Remedial Action, dated December 1999 [95% Design Report] (URS Dames & Moore1999). Under this approved program, the Settling Parties have been monitoring indoor air inbuildings in the Vistula Area since 1999, and have installed sub slab venting systems in 10buildings in order to mitigate potential human health risk due to VI.
On August 13, 1999, the Settling Parties submitted a Petition for Technical Impracticability (TI)Waiver and Request for Remedy Reconsideration (Petition). This document was finalized onFebruary 3, 2000. EPA approved the Petition and the request, and the ROD Amendmentinitiating the Second RD/RA was then issued in September 2000. The ROD Amendmentmodified the Railyard remedy due to the technical impracticability of cleaning up the two densenon-aqueous phase liquid (DNAPL) source areas. Instead, that remedy was changed to hydrauliccontainment of the two Railyard source areas and natural gradient flushing of the dissolvedportion of plume downgradient of the Railyard.
In the 2000 ROD Amendment, EPA considered that all three conditions of the CD to be true, andtherefore, that remediation of the Drag Strip source areas was required. Specifically the RODAmendment states,
“Remedial action at the Drag Strip area could include removal of soil and/or drums,tanks, and containers and off-site disposal, soil vapor extraction, and/or hydrauliccontainment of the source area on the Drag Strip property.”
The other component of selected remedy in the ROD Amendment is natural gradient flushing forthe portion of the groundwater plume downgradient of the Railyard. Because the groundwaterplume flows beneath the Drag Strip, natural gradient flushing is also a remedial actioncomponent for the contaminated groundwater at the Drag Strip.
Pre-design studies for the Railyard and Drag Strip were initiated in 2000 under the SecondRD/RA, and the findings were reported in the Second RD/RA Preliminary Design Report (URS2002). The final design for the Railyard remediation system was presented in URS (2003a),and the design for the pilot phase GCW, located in the Western Source Area at the Drag Strip,was presented in Work Plan for Relocation and Pilot Testing of GCW Treatment System,Osceola Drag Strip, November 25, 2003 (URS 2003b). Construction of the Railyardremediation system and the Drag Strip pilot-phase remediation system occurred between 2003and 2004, and both systems started up in 2004.
2.1.1 Drag Strip Pilot-Phase Remedy
Based on the pre-design investigation findings presented in URS (2002) and the work planscope in URS (2003b), the Settling Parties installed a GCW as a pilot-phase, hydraulic containmentand treatment remedy. The groundwater circulating around a GCW consists of: a) upgradientwater being captured, b) captured groundwater being treated in a well head labyrinth air stripper,

Revision 3, Addendum 2 Final Design Report
Background to Drag Strip Final RemedySelection
14951501.11014 5 Drag Strip 60 Percent Design
and c) treated groundwater being re-circulated within a circulation cell prior to being dischargeddowngradient of and outside of the circulation cell.
The objective for the Drag Strip pilot-phase GCW is the removal of CT, chloroform [CF] (a CTdegradation product), and trichloroethene (TCE) from groundwater within the West Source Areaat the Drag Strip. In URS (2003b), a successful pilot test was defined as a sustained monthlyaverage removal rate of at least 0.5 pounds (lbs.) per day of system CT from groundwater. TheGCW system was also required to maintain an average total recirculation flow rate of at least 80gallons per minute (gpm), without excessive maintenance requirements, and at least 90 percentactual system operation time.
The GCW at the Drag Strip was installed in the West Source Area to a depth of 152 feet belowground surface (ft bgs). The GCW consists of a 10-inch well casing with three screened zones;the middle screen is the influent zone, and upper and lower screens are discharge zones. Thezones within the GCW casing are separated by packer units, allowing differential pressure to bedeveloped between the different screened zones. This flow configuration is referred to as “dualcell” or “stacked cell” because there are two individual flow cells developed in the aquifer. Asump pump provides flow to the lower screen. Flow to upper screen is by gravity overflow fromthe labyrinth stripper well head into the well casing and upper screen. Additional informationregarding the design and construction of the GCW is provided in the GCW Pilot Testing Report,(URS 2005a).
The GCW has been remediating the Western Source Area at the Drag Strip from 2004 to thepresent, and the GCW has removed an estimated cumulative total of 2,445 pounds of totalcompounds of concern (TCOCs), including 2,200 pounds CT, since system operations began atthe Drag Strip in 2004.
2.1.2 Third Five-Year Review
In 2009, EPA issued the Third Five-Year Review Report (EPA 2009), in which performanceissues for the Railyard and Drag Strip remediation systems were identified. EPA also issuedEvaluation of Indoor Air Monitoring, prepared by S.S. Papadopulos & Associates, Inc.(SSPA), (SSPA 2010) to evaluate the adequacy of the indoor air monitoring program. TheSettling Parties worked with EPA in developing the scope of work for an investigation toaddress these issues, culminating in Revision 4, Five-Year Review Investigation Work Plan,June 8, 2010, (URS 2010a) and the Response, Evaluation of Indoor Air Monitoring,December 3, 2010 (URS 2010b).
The Five-Year Review Investigation began in late 2009, and investigation, data analyses,and reporting activities continued through 2012. The technical evaluations performed aspart of the Five-Year Review Investigation confirmed the need to improve plume capture atthe Railyard. These evaluations are summarized in the Five-Year Review InvestigationReport, submitted to EPA on February 28, 2013 (URS 2013b). The Five-Year ReviewInvestigation Report also presented the Years 6, 7, and 8 Performance Evaluations for theSite, which included analytical results for the quarterly monitoring events conductedbetween September 2009 and June 2012.
As part of the Third Five-Year Review, EPA required two sets of supplemental indoor airinvestigations. The first set of investigations consisted of indoor air sampling for COCsfrom up to 52 residential and commercial buildings using updated sampling and analysisprocedures. The scope of work for the first supplemental investigation is presented in theEPA-approved Addendum 1, Vapor Monitoring Plan, dated February 29, 2012 (URS

Revision 3, Addendum 2 Final Design Report
Background to Drag Strip Final RemedySelection
14951501.11014 6 Drag Strip 60 Percent Design
2012c). The COCs for the supplemental indoor air monitoring events were changed to CT,TCE, CF, and vinyl chloride (VC), as required by EPA. Indoor air sampling results fromthe first set of investigations (conducted in the Spring and Fall 2012) are presented inAppendix M of URS (2013b).
The second set of supplemental investigations required by EPA consisted of paired indoorair and sub-slab vapor monitoring from up to 20 residential and commercial buildings.Under the existing, approved vapor monitoring program, no sub-slab vapor monitoring hadbeen performed in the study area. Rather, the Settling Parties used indoor air quality resultsmeasured directly in targeted structures to ensure protectiveness of occupants. In 2013,EPA and IDEM identified the lack of sub-slab vapor sample results as a data gap in theoverall VI pathway evaluation, and they required collection of the sub-slab vapor data. TheSettling Parties agreed to collect sub-slab samples from representative buildings over theshallow CT plume in accordance with the EPA-approved Addendum 2 to Vapor MonitoringPlan, Updated Sampling Procedures: Sub-Slab Vapor Sampling, dated April 17, 2013 (URS2013f). The approach to fill the data gap in the overall VI pathway evaluation is to collectindoor air and sub-slab vapor samples and compare the results with the CT action level andscreening levels previously proposed for this site. A site-specific indoor air action level(IAAL) for CT was established by EPA in 1999 at 3.0 parts-per-billion on a volume basis(ppbv). EPA revised this level to 0.65 ppbv on March 28, 2012. For the other COCs,indoor air screening levels (IASLs) and sub-slab screening levels (SSSLs) were proposed inURS (2013f). As stated in EPA (2014a), the IASLs and SSSLs are not yet approved byEPA.
Two rounds of paired indoor air and sub-slab vapor sampling took place. The first roundoccurred in the Spring of 2014, and the second round occurred in the Fall of 2014. Theresults of the Spring 2014 sampling event were presented in Technical Memorandum:Indoor Air and Sub-Slab Vapor Monitoring – Spring 2014 Event, dated December 9, 2014(URS, 2014e). EPA provided comments on this submittal in a letter dated January 16, 2015(EPA, 2015), in which EPA requested that the Spring and Fall 2014 results be combined.The Settling Parties are revising this submittal to combine the results of the Spring and Fall2014 sampling events, and this revised document will be provided separately. Based on theSpring 2014 and Fall 2014 data, observed sub-slab soil gas concentrations collecteddowngradient of the Drag Strip source area do not indicate a completed exposure pathwayto indoor air at concentrations requiring corrective action. These findings address the datagap for sub-slab soil gas data, and they demonstrate continued protectiveness of the existingindoor air monitoring program.
2.1.3 Railyard Remedy Upgrade
The Railyard remedy upgrade design is presented in the Addendum, Final Design Report,dated June 30, 2011 (URS 2011) (Appendix A). Railyard upgrade construction commencedon May 23, 2012. The construction activities were substantially complete on September 18,2012 and documented in the September 29, 2012 Substantial Completion Letter to EPA(URS 2012b). The final completion of the construction activities occurred during the weekof January 14, 2013. The report, Construction Completion Report, GroundwaterContainment Pumping and Treatment System Upgrades, dated July 25, 2013 (URS 2013c)was prepared to formally document the completion of the construction activities.
Revision 3, Addendum 2 Final Design Report
Background to Drag Strip Final RemedySelection
14951501.11014 7 Drag Strip 60 Percent Design
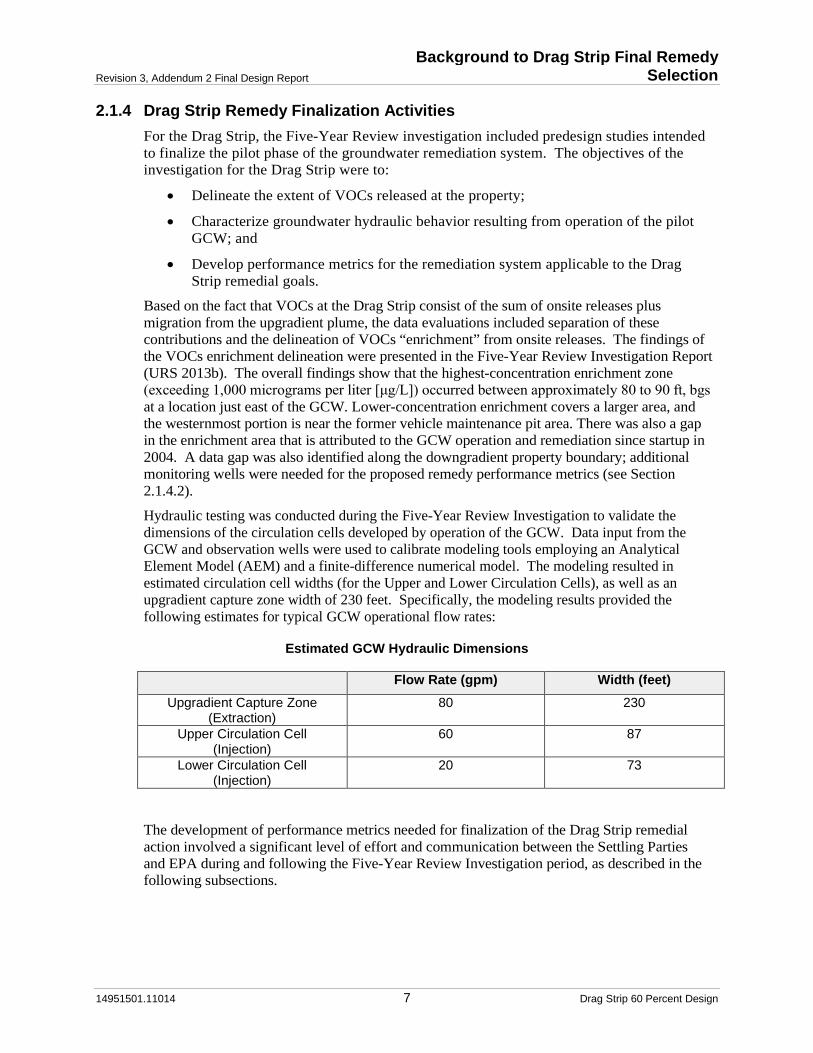
2.1.4 Drag Strip Remedy Finalization Activities
For the Drag Strip, the Five-Year Review investigation included predesign studies intendedto finalize the pilot phase of the groundwater remediation system. The objectives of theinvestigation for the Drag Strip were to:
Delineate the extent of VOCs released at the property;
Characterize groundwater hydraulic behavior resulting from operation of the pilotGCW; and
Develop performance metrics for the remediation system applicable to the DragStrip remedial goals.
Based on the fact that VOCs at the Drag Strip consist of the sum of onsite releases plusmigration from the upgradient plume, the data evaluations included separation of thesecontributions and the delineation of VOCs “enrichment” from onsite releases. The findings ofthe VOCs enrichment delineation were presented in the Five-Year Review Investigation Report(URS 2013b). The overall findings show that the highest-concentration enrichment zone(exceeding 1,000 micrograms per liter [μg/L]) occurred between approximately 80 to 90 ft, bgs at a location just east of the GCW. Lower-concentration enrichment covers a larger area, andthe westernmost portion is near the former vehicle maintenance pit area. There was also a gapin the enrichment area that is attributed to the GCW operation and remediation since startup in2004. A data gap was also identified along the downgradient property boundary; additionalmonitoring wells were needed for the proposed remedy performance metrics (see Section2.1.4.2).
Hydraulic testing was conducted during the Five-Year Review Investigation to validate thedimensions of the circulation cells developed by operation of the GCW. Data input from theGCW and observation wells were used to calibrate modeling tools employing an AnalyticalElement Model (AEM) and a finite-difference numerical model. The modeling resulted inestimated circulation cell widths (for the Upper and Lower Circulation Cells), as well as anupgradient capture zone width of 230 feet. Specifically, the modeling results provided thefollowing estimates for typical GCW operational flow rates:
Estimated GCW Hydraulic Dimensions
Flow Rate (gpm) Width (feet)
Upgradient Capture Zone(Extraction)
80 230
Upper Circulation Cell(Injection)
60 87
Lower Circulation Cell(Injection)
20 73
The development of performance metrics needed for finalization of the Drag Strip remedialaction involved a significant level of effort and communication between the Settling Partiesand EPA during and following the Five-Year Review Investigation period, as described in thefollowing subsections.

Revision 3, Addendum 2 Final Design Report
Background to Drag Strip Final RemedySelection
14951501.11014 8 Drag Strip 60 Percent Design
2.1.4.1 Drag Strip Remedial Action Objective-2011
The Settling Parties worked with EPA during the Five-Year Review Investigation to develop aremedial action objective (RAO) for a final Drag Strip remedy. The Drag Strip RAO wasderived from the CD’s condition (iii) which sets forth the concept that the Drag Strip sourcesmust not, “...significantly delay...” achievement of the overall Superfund Site RAO, which isattainment of MCLs in groundwater between the Railyard Line of Containment and the St.Joseph River. The “…significantly delay…” concept would be evaluated through thecomparison of upgradient to downgradient groundwater conditions. For example, if thedowngradient groundwater conditions are equivalent to upgradient conditions, then
1. The Drag Strip sources are not contributing mass to the plume;
2. There can be no “significant delay” in achieving the MCLs;
3. Condition (iii) of the CD is not true; and
4. Further remediation is not required under the CD.
The Drag Strip RAO, as agreed with EPA was, “Remediation of the Drag Strip sources to apoint of equivalence to the background or upgradient plume currently flowing onto the DragStrip property,” (EPA 2011).
2.1.4.2 Previously-Proposed Drag Strip Remedy and Performance Metrics
The performance metrics were presented in the Addendum 2, Final Design Report, datedNovember 9, 2012 (URS 2012a). In this document, the Settling Parties proposed to transitionthe Drag Strip GCW from pilot-phase to final remedy, because it complies with the CD andROD Amendment requirements, it is protective of human health, it builds upon the sourcecleanup accomplished by the GCW to date, and it is an appropriate response to the relativelysmall scale of remaining enrichment mass at the Drag Strip. The remedy performance metricsproposed for the GCW were intended to evaluate the GCW’s ability to:
Minimize potential risk to human health due to VI; and
Achieve the Drag Strip RAO.
The remedy performance metrics included an initial 2-year remedy performance evaluationperiod (with the GCW shut off) during which indoor air and groundwater sample results wouldbe used to build lines of evidence for the adequacy of groundwater remediation performed todate. To evaluate potential risk to human health due to VI, indoor air samples would becompared to the current IAAL for CT (0.65 ppbv). To evaluate achievement of the Drag StripRAO, groundwater sample data would be used in a mass flux analysis. Mass flux,(concentration times the groundwater flow velocity), would be calculated at predefinedboundaries within the evaluation domain, and the evaluation domain is an aquifer volume thatencompasses the southwestern portion of the Drag Strip property where the East and WestSource Areas are located. If the outcome of the two-year remedy performance evaluation wasthat further, active remediation of source mass was required, the Settling Parties proposed acontingency remedy, consisting of GCW technology to target the core of the remainingenrichment mass.
2.1.4.3 EPA Response to Proposed Approach
EPA responded to the Settling Parties proposed Drag Strip remedy finalization approach inletters dated July 12, 2013 and November 6, 2013. The following points summarize EPA’sposition:

Revision 3, Addendum 2 Final Design Report
Background to Drag Strip Final RemedySelection
14951501.11014 9 Drag Strip 60 Percent Design
1. Elevated upgradient VOCs concentrations seen in DSMW-07 and DSMW-08 that areflowing onto the Drag Strip represent new Site conditions, and they represent a concernfor VI in the neighborhood downgradient of Drag Strip (Vistula Area).
2. Shutting off the GCW for the performance evaluation is unacceptable because of thispotential VI risk to the Vistula Area.
3. EPA cannot allow an approach that makes remedial actions at the Drag Stripcontingent upon the concentration difference between the upgradient and downgradientmonitoring locations due to perceived unstable (i.e., increasing) upgradientconcentrations.
4. Complete capture of Railyard contaminants only began in March 2013; the operationalperiod from 2004-2013 produced incomplete capture; it is implied that the elevatedconcentrations seen in DSMW-07 and DSMW-08 result from incomplete capture at theRailyard.
5. Elevated upgradient concentrations seen in DSMW-07 and DSMW-08 representunstable plume conditions downgradient of the Railyard.
6. According to EPA’s interpretation of the ROD Amendment, incomplete capture at theRailyard invokes the ROD Amendment’s contingency remedy requirement, i.e., theprocess of designing and installing a contingency remedy, which consists of additionalGCW(s), would be triggered.
7. Hot-spot remediation of the Drag Strip sources is required at this time, by EPA’sauthority, as set forth in the following paragraphs in the CD:
o Paragraph 14 – EPA has made the determination that achievement of theoverall Superfund Site RAO (attainment of MCLs in Site groundwater) will besignificantly delayed;
o Paragraph 20 – EPA believes that the remedy as currently being implementedis not protective of human health and the environment; and
o Paragraph 22 – EPA has made the determination that the reopener conditionsin Paragraph 83 are satisfied. Specifically, conditions and information at theSite previously unknown to EPA have been discovered, and these unknownconditions and information indicate that the Remedial Action is not protectiveof human health or the environment.
In regards to the scope and data evaluation for the subslab vapor monitoring that wasmentioned in EPA’s November 6, 2013 Letter and discussed with EPA and IDEM during themeeting on February 12, 2014, EPA changed the scope for this work in an email datedFebruary 21, 2014 (EPA 2014). Due to technical and human health concerns with collectingsubslab samples from homes with operating abatement systems, EPA removed these housesfrom the subslab sampling scope, and instead required a minimum of 20 subslab samplelocations in houses without abatement systems and that are located over the core of the shallowCT plume.
2.1.4.4 Technical Rebuttals
EPA’s primary rationale for requiring immediate installation the contingency remedy at theDrag Strip is based on potential VI risk from extrapolated future groundwater concentrationsfrom a plume declared to be unstable. With this rationale, EPA has renounced the existing DragStrip RAO (Section 2.1.4.1) that the Settling Parties used to develop the Drag Strip Remedial

Revision 3, Addendum 2 Final Design Report
Background to Drag Strip Final RemedySelection
14951501.11014 10 Drag Strip 60 Percent Design
Design presented in the previous iterations of this Addendum 2 Final Design document. TheSettling Parties and EPA had previously agreed that this RAO was consistent with therequirements of the CD and the ROD Amendment.
To address EPA’s presumption of unacceptable risk due to VI, the Settling Parties submittedGroundwater Risk Evaluation, dated December 6, 2013 (URS 2013d) to support the positionsthat current and future risk falls within EPA’s acceptable range. As will be further described inSection 4.0, the VI pathway is controlled (individual vapor mitigation systems have beeninstalled in houses) or incomplete. Under current conditions (GCW operating), there is not apotential risk due to VI, based on the available groundwater and indoor air data. The calculatedrisks were within EPA’s acceptable risk range (excess cancer risk within one in one million andone in ten thousand and a hazard quotient (HQ) less than 1). Moreover, under hypotheticalfuture conditions (following GCW shutdown), there is not a potential risk due to VI. Thisconclusion is supported by indoor air monitoring data and shallow groundwater data collectedsince 1998, which demonstrates that a high level of attenuation is present at the site.
To address EPA’s statements about plume stability, the Settling Parties submitted TechnicalMemorandum: Groundwater Plume Stability Analysis, dated December 13, 2013 (URS 2013e,and revised per EPA comments in URS 2014b). The stability of the plume is importantbecause an unstable (i.e., expanding) plume would be evidence of failure of the natural gradientflushing component of the Site remedy. Specifically, if natural gradient flushing is performinginadequately, then the ROD Amendment requires a contingency remedy of additional offsiteextraction wells. Failure of natural gradient flushing would be shown by an expanding, unstableplume, but, as presented in the Technical Memorandum submittal, the plume is stable.
In its November 6, 2013 letter, EPA invoked the contingency requirement due to incompletecapture by the Railyard hydraulic containment system. The Settling Parties disagree withEPA’s interpretation of the requirements in the ROD Amendment. The ROD Amendment’sintent is that the contingency remedy is required for inadequate performance of natural gradientflushing and not incomplete capture by the hydraulic containment system. The Settling Partiesaddressed incomplete capture of the Railyard hydraulic containment system by constructing theremedy upgrades in 2012 (Section 2.1.3).
2.1.4.5 Revised Drag Strip Contingency Remedy
Resulting from these communications and in recognition of EPA’s authority in makingdeterminations regarding remedy requirements, the Settling Parties are proceeding with furtheractive remediation of the Drag Strip source areas by designing and installing a contingencyremedy. In consideration of environmental, economic, and social factors that characterize thepotential sustainability of such an endeavor, the Settling Parties have chosen to invest in a moresustainable remedial approach for the Drag Strip contingency remedy. This decision is inalignment with EPA’s efforts to support greener cleanups, as stated in EPA (2013d):
“Consideration of greener cleanup practices directly builds upon several ofthe Administrator's seven key themes for the future, including: making avisible difference in communities across the country; addressing climatechange and improving air quality; and working toward a sustainable future.”
As discussed with EPA during the meeting on February 12, 2014, the contingency remedy willconsist of an enhanced in-situ bioremediation technology instead of the previously-proposedGCW technology.
The 30 percent design submittal, Revision 2 Addendum 2 Final Design Report (URS 2014a)presented design information for the in-situ remediation approach, including bench-scale

Revision 3, Addendum 2 Final Design Report
Background to Drag Strip Final RemedySelection
14951501.11014 11 Drag Strip 60 Percent Design
microcosm testing, pilot-scale testing of amendments, and full-scale implementation. EPAprovided comments on the 30 percent design in a letter dated July 11, 2014 (EPA 2014a).Concurrent with EPA’s public meeting for the Fourth Five-Year Review in July 2014, theSettling Parties met with EPA to discuss the Drag Strip remedial action. During this meeting,the Settling Parties stated that a fundamental requirement for proceeding with the design andimplementation of the revised Drag Strip remedy is development of an acceptable interimremediation goal (IRG). The purposes of the IRG are to define the onsite treatment areafootprint and to evaluate performance of the revised contingency remedy for the Drag Strip, i.e.,attainment of the IRG will indicate completion of the contingency remedy for the Drag Stripsource areas.
To address this fundamental design requirement and to respond to EPA’s July 11, 2014Comments, the Settling Parties submitted Response to EPA July 11, 2014 Comments, andTechnical Memorandum: Intermediate Remediation Goal Calculation, dated September 19,2014 (IRG Tech Memo) (URS 2014c). EPA commented on the IRG Tech Memo in a letterdated November 4, 2014 (EPA 2014b), and EPA and the Settling Parties held a conference callon December 3, 2014 to discuss the EPA comments. Following this conference call, EPA andthe Settling Parties agreed to the following items, which will be incorporated into the Drag Stripcontingency remedy design herein:
Paired indoor air and shallow groundwater data from two addresses will be removedfrom the IRG calculation data pool (see Section 5.3);
The onsite treatment area footprint for the pilot test and the full-scale implementationwill be defined using newly-installed monitoring wells from the Additional Delineationof Total COCs task described in Section 5.5.
The 30 percent design submittal (URS 2014a) presented the bench-scale microcosm testing planas well as preliminary pilot-scale testing full-scale implementation approaches. The purpose ofthe bench-scale microcosm studies is to test a range of commercially available remedialamendments on CT and TCE-spiked groundwater and sediment samples collected from theDrag Strip. The objective is the identification of combinations of remedial amendments thatcould result in the complete degradation of a mixture of CT and TCE. As summarized inSection 5.6, the results of the bench-scale microcosm studies show in some cases the completereduction of a mixture of CT and TCE to innocuous end products in less than 80 days. Basedon this degradation, pilot studies are developed herein to evaluate the transferability of themicrocosm results to the field, where conditions may be substantially different than a controlledlaboratory environment.
2.1.5 Drag Strip Access Prohibition
On November 19, 2001, APU and Conrail entered into a Settlement Agreement with the Estateand Trust of and in her capacity as the PersonalRepresentative of the Estate and Trust. To facilitate future remedial action at the Drag Strip, theSettlement Agreement permitted Conrail and APU reasonable access to the Property toperform any response action that EPA requires Conrail and APU to perform.
In letters addressed to the Settling Parties dated August 17, 2011 and March 5, 2012,, through her attorney, advised that access to that property would no longer be allowed
for installing wells or construction. EPA sent a General Notice Letter, dated November 19,2012 to notifying her that she was now a PRP and that she may be responsibleunder the Comprehensive Environmental Response, Compensation, and Liability Act

Revision 3, Addendum 2 Final Design Report
Background to Drag Strip Final RemedySelection
14951501.11014 12 Drag Strip 60 Percent Design
(CERCLA) for cleanup of the Superfund Site or costs EPA has incurred in cleaning up theSuperfund Site.
A complaint was filed against to enforce the terms of the 2001 SettlementAgreement to obtain access to the Drag Strip for installation of wells necessary for proceedingwith the remedy proposed herein. The Notice of Complaint was filed in Federal District Courtfor the Northern District of Indiana on February 20, 2014. American Premier UnderwritersInc., et al. v. et al., Docket No. 3:14-cv-00351-JD-JEM (N.D. Ind. Feb. 20, 2014). Theinitial discovery phase ended on November 1, 2014, and the discovery phase was extended toMarch 1, 2015. Mediation occurred on November 18, 2014, and it was unsuccessful in endingthe dispute. The parties continue to serve discovery. It is clear that plans tocontinue contesting access to her property which is required to effectuate the EPA-approvedresponse action, in direct breach of the 2001 Settlement Agreement. A court resolution isanticipated to take up to a year, and potentially longer in the event of an appeal. The accessissue will continue to delay implementation of the necessary fieldwork for the remedy proposedherein.

Revision 3, Addendum 2 Final Design Report Conceptual Site Model (CSM)
14951501.11014 13 Drag Strip 60 Percent Design
3.0 Conceptual Site Model (CSM)To support the groundwater risk evaluation and design of the final in-situ remedy, informationfrom the Drag Strip area, along with more general Site data, has been incorporated into a CSM.The CSM includes five primary elements:
Environmental setting;
Identification and characterization of known and potential source areas;
Identification of constituents of concern (COCs) and their spatial distribution;
Definition of primary transport mechanisms; and
Identification of potential receptors and exposure points.
3.1 Environmental Setting
3.1.1 Site-Wide Geology
The Site lies in the floodplain of the St. Joseph River, which is underlain by a regionallyextensive glacial outwash deposit. Unconsolidated sediments of the Site consist of 140 to 170feet of glacial outwash deposits overlying approximately horizontally-bedded shale bedrock. Theglacial outwash deposits are predominantly poorly graded sand with discontinuous lenses of sandand gravel. Finer grained sediment, both clay and silt, are present as discontinuous lenses andlayers within the surrounding outwash sand and gravel.
During the First and Second RD/RA investigations, the proportion of fine grained silt/clay layerswas observed to increase to the north and east of the Railyard at depths of 10 to 40 feet. Thethicknesses of this interval of low-permeability layers range between 54 feet on the Railyard tomore than 100 feet to the north and east of the Railyard. The presence of the silt/clay layerslimits the transmissivity and acts as a semi-confining layer for this portion of the aquifer.Additional information regarding this low-permeability zone in the aquifer, as well as Railyard-specific lithology, is presented in the Second RD/RA Preliminary Design Report (URS 2002).
The bedrock units beneath the unconsolidated deposits are identified as the Coldwater shale ofMississippian age, and the Sunbury and Ellsworth Shales of Devonian and Mississippian age.The bedrock encountered during drilling consisted of bluish gray to greenish gray shale that wasunweathered, extremely dense and with no visible free water content. The bedrock surfaceelevation is approximately 600 feet mean sea level (msl). Top of bedrock elevations observedduring the 2001 investigations were consistent with an approximately level bedrock surface.Observed elevations across the site vary from 585 to 610 feet msl. At one location east of theDrag Strip in the River Shores neighborhood, residential water well drillers have made an isolatedreport of top of bedrock at elevations of approximately 545 feet msl. No reports were foundindicating greater depths to bedrock anywhere within the Site.
3.1.2 Drag Strip Geology
The geology of the Drag Strip property is consistent with the Site as a whole. In this area, thesilt/clay layer appears to be absent in favor of sands and gravels that extend from the groundsurface to the top of a clay bed lying on bedrock at a depth of approximately 170 feet. Shalebedrock underlies the clay at depths ranging from approximately 141 to greater than 177 feet.Boring logs for the Drag Strip soil borings and wells are provided in the Five-Year ReviewInvestigation Report (URS 2013b).

Revision 3, Addendum 2 Final Design Report Conceptual Site Model (CSM)
14951501.11014 14 Drag Strip 60 Percent Design
The soil lithology encountered at the Drag Strip is generally consistent with previously reportedsubsurface conditions. Figures 4 through 5g present lithologic cross sections through the sourceareas, along the upgradient property boundary, and offsite in the upgradient and downgradientdirections. The Drag Strip subsurface lithology is dominated by poorly-graded and well-gradedsand and gravelly sand from the surface to the top of a clay bed encountered at depths rangingfrom 137 to 170 feet. Isolated gravel beds occur within the sand units. The clay and shalecontacts are deepest near E07 and W08 and become shallower to the east toward U01.
3.1.3 Hydrogeology
The major surface water bodies in the vicinity of the study area are the St. Joseph River andBaugo Bay. The St. Joseph River flows westward and is located a little over a mile north of theSite. Baugo Bay connects to the St. Joseph River, and is located immediately to the west of theSite. Crawford Ditch originates at the Railyard, and flows intermittently to the St. Joseph River.Floodplains and wetland areas exist along both the St. Joseph River and Baugo Bay.
The regional unconsolidated outwash deposits form a major and prolific aquifer in theunconsolidated soils overlying bedrock. The bedrock is not considered an important source ofwater because of its depth and relatively low yield in comparison to the glacial outwash aquifer(EPA 1994). Groundwater flow data indicate that the St. Joseph River is hydraulically connectedto the outwash aquifer at the Site and is a discharge zone for this aquifer.
The aquifer has been divided into three groundwater zones at the Site. The shallow zone extendsfrom the water table, which occurs at an average depth of 12 ft bgs, to 35 ft bgs. Theintermediate zone is from 35 to 90 ft bgs. The deep zone extends from 90 ft bgs to the top ofbedrock. All groundwater zones generally flow northwest from the Railyard source areas to theDrag Strip and vicinity. Groundwater is unconfined at the Drag Strip, and it flows beneath theWest and East Source areas northwestward beneath the Vistula Area, and to the St. Joseph River.The lower-permeability zone to the north and east of the Railyard is anticipated to affect thedirection of groundwater flow in the vicinity of the Railyard, but not in the vicinity of the DragStrip.
Quarterly comprehensive water level measurements are analyzed with KT3D_H2O software andother data analysis tools as part of capture zone analyses for the Railyard. The horizontalhydraulic gradient is approximately 0.002 ft/ft. Vertical gradients observed in well clusters at andin the vicinity of the Drag Strip show a combination of upward and downward directions ofvertical groundwater flow. Although wells in the vicinity of the GCW show variability in thedirection and magnitude of the vertical gradients, in general, groundwater flows downward fromthe shallow zone to the intermediate zone. An upward gradient beneath the St. Joseph River,producing discharge from the aquifer to the St. Joseph River, was observed during the FirstRD/RA investigations in 1998.
Aquifer performance tests were performed in September 2010 and consisted of constant rate andrecovery tests on two wells at the Railyard extraction well system. Analytical method selectionwas based on the specific geologic and hydraulic conditions observed at each extraction well.The average hydraulic conductivity estimate of 310 feet per day (ft/day) was carried forward intosubsequent groundwater flow related evaluations for the Site. At the Drag Strip, GCW hydraulictesting was performed using field measurements and modeling simulations to validate thedimensions of the groundwater circulation cells. In order to develop realistic aquifer parametersfrom the observed head data, a small-scale numerical model was constructed using MODFLOW(McDonald and Harbaugh, 1988, Hill et.al, 2000) and the parameter estimation utility PEST(Doherty 2002). The weighted average for hydraulic conductivity of 380 ft/day from the

Revision 3, Addendum 2 Final Design Report Conceptual Site Model (CSM)
14951501.11014 15 Drag Strip 60 Percent Design
MODFLOW/PEST calibration is slightly greater than the value of 310 ft/day obtained for theRailyard.
Potentiometric contours, groundwater capture zones, and groundwater flow particle tracks aregenerated using KT3D_H2O from the comprehensive water level measurements. Particletracking indicates that the groundwater flow velocity is approximately 850 feet per year, and theaverage groundwater flow direction has an azimuth of 320 degrees.
Precipitation and the many private septic systems are the only known sources of significantrecharge to this outwash aquifer.
3.2 Known and Potential Source Areas
Subsurface investigations conducted during the Remedial Investigation/Feasibility Study (RI/FS),RD/RA, and Five-Year Review activities, have characterized source areas for groundwatercontamination at the Railyard and Drag Strip. Areas of groundwater contamination extend fromwithin the Railyard into residential areas designated as the County Road 1 Area and the VistulaArea (Figure 1). Remedial measures are being implemented at the Railyard, which includehydraulic containment of the two source areas (known as the Tracks 65-66 TCE Source Area andthe Track 69 CT Source Area) and natural gradient flushing of the groundwater contaminationplume downgradient of the hydraulic containment system.
At the Drag Strip, the first phase of the Drag Strip investigation included the installation ofapproximately 98 soil vapor sampling points (Dames & Moore and HSI GeoTrans, 1998).Results of soil vapor analyses delineated two distinct CT source areas identified as the EastSource Area and the West Source Area (Figure 3), which are in the vicinities of former hangarsand a former maintenance pit associated with the airstrip. No DNAPLs were detected in either ofthe source areas. The installation of four shallow monitoring wells confirmed the presence of thetwo CT source areas. Three of the four shallow monitoring wells contained at least one milligramper liter (mg/L) of CT in groundwater.
The predesign investigations performed during the Five-Year Review Investigation also indicatethat the COCs concentrations on the order of 1,000 µg/L are migrating onto the Drag Strip fromupgradient sources.
3.3 Identification and Extent of COCs
Through 2010, over 160 monitoring wells have been installed at and downgradient of the Site tocharacterize the nature and extent of groundwater releases. The compounds CT and TCE areunderstood to have been released at the Railyard, and CT is understood to have been releasedonsite at the Drag Strip. Currently at the Drag Strip, which is the focus of this report, quarterlygroundwater monitoring is conducted at 37 wells to monitor remedy performance for CT andTCE, their associated degradation products, and other compounds required in the SOW:
1,1,1-Trichloroethane (1,1,1-TCA);
1,1-Dichloroethene (1,1-DCE);
CT;
CF;
Chloromethane;
cis-1,2-Dichloroethene (cis-1,2-DCE);
Tetrachloroethene (PCE);

Revision 3, Addendum 2 Final Design Report Conceptual Site Model (CSM)
14951501.11014 16 Drag Strip 60 Percent Design
trans-1,2-Dichloroethene (trans-1,2-DCE);
TCE; and
VC.
The COCs that comprise the majority of the contaminant plume mass at the Drag Strip are CT,TCE, and CF. The current distribution of the COCs results from the discrete release andmigration characteristics that are known for CT and TCE, as well as operation of the GCW since2004. The contamination in groundwater beneath the East and West Source Areas is the sum ofcontributions from: 1) the contaminants flowing onto the Drag Strip property from upgradient,and 2) onsite CT releases to ground surface in the East and West Source Areas. The groundwaterplume flowing onto the Drag Strip property has been enriched2 by releases at the East and WestSource Areas of the Drag Strip.
Table 1 presents the shallow and intermediate-depth CT, TCE, and CF sample data for the DragStrip and Vistula Area for an eight quarter time period from 2012-2014, as requested in EPA(2014b), and it also presents the 95 percent upper confidence limit (UCL) of these data. Figures6a and 6b show the shallow and intermediate 2014 95 percent UCL concentration isopleths forCT. For CT, the majority of the plume mass is in the shallow and intermediate aquifer zone inthe vicinity of the West Source Area. Based on concentrations in well cluster DSMW-07 alongthe upgradient property boundary, there is also an apparent source of CT upgradient of this well.At the Drag Strip, concentrations in the core of the shallow and intermediate zones of the CTplume decrease by nearly an order of magnitude in the vicinity of the GCW. Downgradient of theDrag Strip, the core of the shallow and intermediate zones of the CT plume, shown by the 100µg/L contour, extends to the vicinity of MW-08S, and it parallels the locations of houses withsub-slab vapor mitigation systems.
Figures 7a and 7b show the shallow and intermediate 2014 95 percent UCL concentrationisopleths for TCE for the Drag Strip and Vistula Area. For TCE, the majority of the plume massis deeper than for CT and is located further east than the East Source Area. Based onconcentrations in well clusters along the upgradient property boundary and historical data fromwells located in the neighborhood between the Railyard and Drag Strip, the source of this TCE isupgradient of the Drag Strip and most likely related to the known Railyard release. At the DragStrip, concentrations in the core of the shallow zone of the TCE plume are an order of magnitudelower than for shallow CT, and they decrease by approximately one-half in the vicinity of theGCW. Downgradient of the Drag Strip, the core of the shallow and intermediate zones of theTCE plume is represented by the 10 µg/L contour.
3.3.1 Groundwater Natural Attenuation Parameters
As part of the Five-Year Review Investigation reported in URS (2013b), field measurements andlaboratory analyses were conducted to obtain a “snapshot” of existing biogeochemical conditionsas they may pertain to evaluation of the effects of operating the GCW, as well as the evaluation ofpotentially feasible alternative remedial approaches. Field measurements of specificconductance, pH, dissolved oxygen (DO), and oxidation-reduction potential (ORP) were recordedquarterly for five consecutive monitoring events in 2011 and 2012 at key well locations at theDrag Strip and vicinity to establish a baseline for these gross indicators of groundwater
2 Delineation of the enriched COCs was presented to EPA in the Five-Year Review Investigation Report (URS,2013b), and it was the design basis for the previous contingency remedy proposed in Revision 1 Addendum 2 FinalDesign (URS, 2013a). As discussed with EPA during the meeting on February 12, 2014, total COCs will be used asthe current design basis for the revised, in-situ remedy approach.

Revision 3, Addendum 2 Final Design Report Conceptual Site Model (CSM)
14951501.11014 17 Drag Strip 60 Percent Design
chemistry. Additionally, groundwater samples were collected in June 2011 for laboratoryanalyses of more direct indicators of groundwater chemistry: alkalinity, chemical oxygen demand(COD), chloride, ferrous iron, nitrate, sulfate, total organic carbon (TOC), and dissolvedmetabolic gases (ethene, ethane, and methane). Samples were collected at wells upgradient,cross-gradient, and downgradient of the GCW, and within and outside the extent of the enrichedCT plume. Field instrument measurements and laboratory analytical results are provided inAppendix B. An interpretation of the field instrument measurements and laboratory results isprovided in the Five-Year Review Report (URS 2013b), and conclusions regarding potentialinfluence of these parameters on natural attenuation processes are provided below.
pH
The pH readings at the selected monitoring wells were slightly above neutral for the measurementevents. The pH values averaged 7.3 units in the shallow, 7.4 units in the intermediate, and 7.5units in the deep wells. This range of pH values is suitable for virtually all physical andbiological attenuation processes, enhanced or otherwise.
Specific Conductance
Specific conductance values at the tested wells were generally between 500 and 1,000 micro-Siemens per centimeter (µS/cm), which is typical for groundwater from an unconfined sand andgravel aquifer. In general, the intermediate depth of the aquifer is characterized by a slightlyhigher average specific conductance (777 µS/cm) than the shallow (684 µS/cm) or deep (665µS/cm) intervals, suggesting a higher concentration of ionic species at this depth (possiblyattributable to an increase in pH and a decrease in DO with depth). The specific conductance atMW-05S was an outlier, with lower values between 138 and 229 µS/cm, possibly a reflection ofsurface water infiltration from a nearby small pond.
Oxidation-Reduction Potential (ORP)
At the tested monitoring wells, groundwater ORP values ranged from 360 millivolts [mV](indicating aerobic conditions) to -190 mV (indicating sulfate-reducing conditions). AverageORP values range from oxygen-reducing conditions in the shallow wells through iron-reducingconditions in the intermediate wells, and sulfate-reducing conditions in the deep wells. Similar toDO, the ORP values in MW-38 and MW-56 were higher than average, likely due to their locationin the GCW discharge zone.
Dissolved Oxygen (DO)
In general, oxygen concentrations decreased with depth as expected in an unperturbed aquifer. Atthe tested monitoring wells, DO concentrations ranged from about 0.2 mg/L in the deepermonitoring wells to near saturation in the shallower monitoring wells, averaging 5.63 mg/L inshallow, 0.83 mg/L in intermediate, and 0.65 mg/L in deeper groundwater. DSMW-03 and wellclusters MW-38 and MW-56 are in the GCW discharge zone, which is affected by oxygenatedGCW treatment effluent, so higher DO values detected in these wells were predictable. Theelevated concentration of DO exhibited in the MW-05 well cluster is likely due to its proximity tothe small pond that, as a surface water feature, is in contact with atmospheric oxygen andnaturally exhibits higher levels of DO. In general, the DO concentrations at the Drag Strip do notrepresent a significant barrier to the application and effectiveness of remediation technologies,e.g., those designed to enhance the biodegradation of CT and TCE.
Revision 3, Addendum 2 Final Design Report Conceptual Site Model (CSM)
14951501.11014 18 Drag Strip 60 Percent Design
Nitrate
Nitrate was detected at only two monitoring wells, DSMW-4I and DSMW-9I, at 0.18 mg/L and0.21 mg/L, near the laboratory detection limit of 0.10 mg/L. As such, nitrate would not be animpediment to bioremediation, and does not currently represent an impediment to thedechlorination of CT and TCE.
Ferrous Iron
Ferrous iron was detected in four deep wells at low, estimated concentrations between 0.020 and0.030 mg/L. These results, in combination with ORP values representative of iron-reducing andsulfate reducing conditions at several wells, indicate the paucity of total iron (all species) in thissetting.
Sulfate
Sulfate was detected at all of the selected monitoring wells at relatively low concentrationsranging from 18 to 30 mg/L. These sulfate concentrations do not represent a significantimpediment to the biodegradation of TCE, CT, and their daughter compounds. However, they dorepresent the largest “sink” for biodegradable organic compounds that might be introduced toenhance biodegradation. Accordingly, any enhanced bioremediation design would be basedlargely on the demand of the sulfate-reducing bacteria, i.e., an excess of organic carbon wouldneed to be applied in order to reduce analytes including oxygen, nitrate, manganese, iron, andsulfate prior to, or in conjunction with the reduction of TCE and CT.
Metabolic Gases
Metabolic gases (a.k.a., RSK 175 Gases, from the analytical method number) are dissolvedethene, ethane, and methane. The presence and abundance of ethene and ethane are evaluated asindicators of the complete dechlorination of chlorinated ethenes and chlorinated ethanes to etheneand ethane.
The presence and abundance of methane may be evaluated as an indicator of the decompositionof naturally-occurring or introduced biodegradable organic compounds by indigenous bacteria(methanogens) under anaerobic conditions, but is also an indicator of the complete dechlorinationof CT (through CF and methylene chloride daughter compounds).
Ethene and ethane were not detected at any of the four wells that were sampled in June 2011,indicating that the complete degradation of chlorinated ethenes, e.g., TCE to cis-1,2-DCE to VC,and finally, ethene and ethane, does not occur under current groundwater conditions in thevicinity of these wells. Methane was detected at very low concentrations just above thelaboratory quantitation limit of 0.002 mg/L at deep monitoring wells DSMW-8D and DSMW-9D,and at 0.031 mg/L in deep monitoring well DSMW-7D. The absence of methane suggests thatconditions that limit the complete reduction of CT, e.g., a lack of biodegradable organiccompounds, dominate in the deeper aquifer.
Alkalinity
The alkalinity of the shallow, intermediate, and deep groundwater sampled in June 2011 wastypical of a sand and gravel aquifer at 230 and 280 mg/L, indicating that the aquifer has low tomoderate buffering capacity.
Chloride
Chloride concentrations at the selected shallow, intermediate, and deep monitoring wells variedfrom 37 mg/L (at DSMW-09S) to 99 mg/L (at DSMW-07I), and chloride is consistently detectedat higher concentrations in the intermediate-depth wells. Overall, the concentration and spatial

Revision 3, Addendum 2 Final Design Report Conceptual Site Model (CSM)
14951501.11014 19 Drag Strip 60 Percent Design
distribution of chloride at the select monitoring wells was unremarkable, and does not appear toindicate substantial degradation of TCE or CT.
Total Organic Carbon (TOC)
The TOC values from the select monitoring wells were low (0.71J to 1.3 mg/L) and consistentwith those expected for the sand and gravel aquifer. The recommended minimum targetconcentration of bioavailable TOC is approximately 20 to 50 mg/L, and current conditionsindicate that insufficient TOC is available for sustained bioremediation. In general, the TOCsample values indicate that an anthropogenic source of organic carbon would need to be added tothe groundwater to result in meaningful biodegradation rates.
Chemical Oxygen Demand (COD)
With the exception of monitoring well DSMW-04D at 25 mg/L, the COD values at the site wellswere near or below the quantitation limits, indicating the paucity of oxidizable compounds ingroundwater.
Chlorinated Volatile Organic Compounds (CVOCs)
Groundwater from the selected monitoring wells was analyzed for TCE, cis-1,2-DCE, trans-1,2-DCE, and VC; as well as CT, CF, and methylene chloride to evaluate the extent to which abioticand biotic natural attenuation processes might be contributing to the reductive dehalogenation ofthe parent compounds TCE and CT. The analytical results for CVOCs are presented in Five-YearReview Investigation Report, dated February 28, 2013 (URS 2013b). In general, the abundanceof daughter compounds indicates significant natural attenuation, whereas the paucity of daughtercompounds indicates a limiting condition. These results are compared to other lines of evidencesuch as the biogeochemical indicators pH, ORP, DO, etc., to identify conditions that may beenhanced to promote natural attenuation processes.
The presence of daughter products CF (from CT), and cis-1,2-DCE and VC (from TCE) indicatethat natural attenuation is occurring to a limited extent. CF concentrations were generally 5 to 10percent of the corresponding CT concentrations in the same sample. TCE daughter products(primarily cis-1,2-DCE) were detected in approximately one third of the samples. Wheredetected, cis-1,2-DCE concentrations ranged from less than one percent to as much as 40 percentof TCE concentrations. Proportionally, the highest cis-1,2-DCE levels were observed at theintermediate depth from wells DSMW-04I and DSMW-07I. The deep wells from the DSMW-04,-07, -08, -09, and 10 clusters generally reported 2 to 6 percent cis-1,2-DCE of the correspondingTCE concentration.
Overall, the concentration of daughter compounds is low relative to the parent compounds (verylow with respect to secondary daughter compounds VC and methylene chloride, as well asethene, ethane, and methane end products), and thus current aquifer conditions are not consideredconducive to complete dechlorination.
With these considerations in mind, and combined with results of a microcosm study at theRailyard describing microbial processes that result in degradation of CT, it is possible to enhancethose processes by the addition of a source of organic carbon and nutrients for bacteria thatpromote the complete dechlorination of CT to innocuous end products.
3.3.2 COCs Summary
The following characteristics of the shallow groundwater contamination are relevant to theevaluation of risk due to VI and therefore to the development of a revised Drag Strip RAO andperformance metrics for the revised in-situ remedial action approach:
Revision 3, Addendum 2 Final Design Report Conceptual Site Model (CSM)
14951501.11014 20 Drag Strip 60 Percent Design
Shallow groundwater contamination in the vicinity of the Drag Strip property and in theVistula Area is shown in Figures 6a and 7a (represented by CT and TCE isopleths), and itresults from: 1) sources located at the Railyard, 2) a postulated intervening source locatedupgradient of DSMW-07; and, 3) the West and East Source Areas on the Drag Stripproperty;
Monitoring wells MW-38S and DSMW-03 are within the shallow discharge zone of theGCW. MW-56S is likely beyond the shallow discharge zone of the GCW. These wellsare in the vicinity of or are upgradient of at least three buildings in the Vistula Area forwhich VI is a potential concern;
The data gaps identified in the Groundwater Risk Evaluation Report (URS, 2013d),consisting of too few shallow monitoring wells, have been addressed; five additionalshallow monitoring wells and two three-well clusters of monitoring wells were installedin early 2014 in the Vistula Area to better characterize the exposure pathway through thecollection of paired shallow groundwater, sub-slab and indoor air samples;
Groundwater data from MW-38S, DSMW-03, MW-56S, and the newly-installed shallowwells (DSMW-11S, DSMW-12S, MW-57S, MW-58S, MW-59S, and MW-60S, Figure 2)were used to characterize attenuation between shallow groundwater and indoor air for thenearest downgradient buildings; and
Field measurements and laboratory analyses indicate that the primary impediment tonatural attenuation are the geochemical conditions that must initially be overcome toengender a pH-neutral, carbon-rich, anaerobic environment conducive to the bacteria thatcompletely degrade the COCs. There is insufficient organic carbon to furnish the “food”that indigenous or introduced bacteria would need to consume the available oxygen, todenitrify nitrates, to reduce sulfates, and to sustain the sulfate-reducing conditions that aremore favorable for complete reductive dechlorination. The pH levels are favorable, andin the deeper wells, ORP measurements are promisingly low.
3.4 Definition of Primary Transport Mechanisms
Groundwater migration is a potential off-Site transport pathway. Dissolved constituents ingroundwater may discharge to downgradient locations, including surface water and sediment ofthe St. Joseph River.
The VI of volatile constituents from shallow groundwater to the indoor air of overlying occupiedstructures is also a potential off-Site transport pathway. Transport of these constituents in thesubsurface may be controlled by four primary processes: diffusion, advection, phase partitioning,and degradation. In the subsurface away from a building, the dominant process for vaportransport is typically diffusion. However, both diffusion and advection processes may beimportant in the subsurface near a building (EPA, 2012b).
VOC concentrations in soil gas attenuate, or decrease, as the VOCs move from source areasthrough the soil and into indoor air. The extent of attenuation is related to site conditions,building properties, and chemical properties. As a result, the spatial proximity of overlyingstructures to potential VOC source areas is important in determining the potential for a completeVI pathway.
A site-wide indoor air evaluation was conducted in 1999 and repeated in 2012. Detectableconcentrations of contaminants were documented at several locations downgradient of the DragStrip. Vapor mitigation systems were installed at locations where indoor air action levels wereexceeded, and an EPA-approved vapor monitoring program has been implemented since 2000 to

Revision 3, Addendum 2 Final Design Report Conceptual Site Model (CSM)
14951501.11014 21 Drag Strip 60 Percent Design
evaluate performance of the mitigation systems and to assess additional buildings in the vicinityfor potential VI.
3.5 Identification of Potential Receptors and Exposure Points
Potential receptors are defined as human populations or individuals and environmental systemsthat are susceptible to constituent exposure from the Site. Both current and future land and wateruse conditions downgradient of the Drag Strip area were considered in determining exposurescenarios. As a result, off-Site residents and off-Site commercial workers are consideredpotential receptors. Likewise, ecological receptors (terrestrial and aquatic) in the St. Joseph Riverare also considered potential receptors.
Figure 8 depicts exposure pathways by which potential receptors may be exposed to COCs ingroundwater. An exposure pathway consists of the following:
Source of constituents;
Mechanism of constituent release to the environment;
Transport or exposure medium containing the constituents;
Exposure point where humans (receptors) can contact the exposure medium; and
Exposure route (e.g., inhalation or ingestion).
All of these elements must be present for an exposure to occur. The model in Figure 8 showsboth potentially complete and incomplete pathways, which are discussed below.
3.5.1 Potentially Complete Exposure Pathways
Potentially complete exposure pathways for groundwater are limited to the inhalation of vapor-phase chemicals released from shallow groundwater to indoor air for residents and commercialworkers downgradient of the Drag Strip. As noted earlier, an indoor air monitoring program is inplace for this area and a portion of the buildings have mitigation systems in place. In addition,Elkhart County requires that all new construction install a mitigation system in the area (ATSDR,2005).
3.5.2 Incomplete Exposure Pathways
Human Health
Under current conditions, groundwater is not used on or downgradient of the Drag Strip area forpotable purposes. Residences and businesses downgradient of the Site are connected to amunicipal water supply and private water supply wells were abandoned during the municipalwater supply connection work conducted between 1994 and 1996 by the Settling Parties. TheSettling Parties and EPA are developing institutional controls (ICs) in the form of restrictivecovenants and easements for both the Railyard and Drag Strip properties. The Settling Partiesand EPA have also recommended that a groundwater use restrictive ordinance be promulgated forElkhart County. St. Joseph County (on the Drag Strip western property boundary) already has inplace a groundwater use restrictive ordinance. Details of the institutional controls that areproposed or in place are presented in Revision 2, Institutional Controls Work Plan, (URS, 2010c).
Ecological
A 5-year study was conducted from 2000 through 2004 to assess potential impact to the St.Joseph River and Baugo Bay benthic macroinvertebrate communities that may have occurred as aresult of discharge of contaminated groundwater from the Site. The results of the study

Revision 3, Addendum 2 Final Design Report Conceptual Site Model (CSM)
14951501.11014 22 Drag Strip 60 Percent Design
concluded that the St. Joseph River in the project area is characterized by moderate taxa richness,and that the analytical data did not indicate measurable effects to the river system biota due tosediment concentrations of Site COCs. Details of the study are presented in Phase 4, Year 2004Benthic Macroinvertebrate Annual Sampling and 2000-2004 Cumulative Assessment in theVicinity of the Conrail Railyard Superfund Site, May 10, 2005, (URS, 2005b).
During the sampling period 2000-2004, the groundwater concentrations of CT and TCE at themonitoring well location MW-08S, which monitors the aquifer zone interfacing with the St.Joseph River system being evaluated, had a slight downward trend since 2001. The more recentdataset (involving sampling since 2004 through June 2013) confirms the previously indicateddownward trend in the groundwater CT and TCE concentrations at MW-08S. Groundwaterconcentrations at that location have continually decreased since 2001 and individual wellconcentrations are lower by as much as an order of magnitude in December 2013. Consequently,the overall conclusions regarding the previous benthic macroinvertebrate evaluations remainunaffected by the recent groundwater data.
Revision 3, Addendum 2 Final Design Report Risk Characterization
14951501.11014 23 Drag Strip 60 Percent Design
4.0 Risk CharacterizationFurther assessment of potentially complete VI exposure pathways was conducted to support risk-based remedial decisions for the Drag Strip. Assessment details are presented in the GroundwaterRisk Evaluation Report (URS 2013d).
The risk characterization was performed to evaluate potential risks under current (GCWoperation) and hypothetical near-future (GCW shutdown) conditions at the Drag Strip. For eachcondition, the evaluation included the following steps:
Quantitation of groundwater-to-indoor air risks using EPA’s VISL calculator withgeneric and site-specific attenuation;
Comparison of indoor air monitoring data to risk-based screening concentrations; and
Quantitation of indoor air risks using EPA’s VISL calculator.
Shallow groundwater monitoring data collected since 1987 has defined a narrow area ofcontamination downgradient of the Drag Strip. The pilot phase remedy (GCW) installed in 2004has effectively reduced contaminant mass in the Drag Strip West Source Area. Potentiallycomplete exposure pathways for potential receptors are limited to those involving VI. However,in several locations, the VI pathway is controlled (individual vapor mitigation systems have beeninstalled in residential houses) or incomplete.
Under current conditions (GCW operating), groundwater and indoor air data does not indicate apotential risk due to VI. Calculated risks were within EPA’s acceptable risk range (excess cancerrisk within 10-6 and 10-4 and HQ <1). Under hypothetical future conditions (following GCWshutdown), a potential risk is also not indicated when using historical maxima of shallowgroundwater concentrations. This conclusion is supported by indoor air monitoring data collectedsince 1998, which has demonstrated that attenuation and other subsurface conditions areinfluencing VI pathways at the Site. A groundwater and indoor air monitoring program iscurrently in place and will continue for a period of time following any future GCW shutdown toensure that the remedy remains protective of human health and the environment.

Revision 3, Addendum 2 Final Design Report Drag Strip Remedial Design
14951501.11014 24 Drag Strip 60 Percent Design
5.0 Drag Strip Remedial DesignTo comply with EPA’s statement in the November 6, 2013 letter (EPA 2013c): “EPA, inconsultation with IDEM, strongly believes that a complete and final hot spot remedy at the DragStrip should be implemented immediately,” the Settling Parties are proceeding with further activeremediation of the Drag Strip source areas by designing and installing a contingency remedy inthe Drag Strip hot spot. For the contingency remedy, the Settling Parties have chosen to invest ina more sustainable remedial approach, as discussed with EPA during the meeting on February 12,2014. In consideration of environmental, economic, and social factors that characterize thepotential sustainability of such an endeavor, the contingency remedy will consist of acombination of abiotic and microbial enhancements designed to accelerate in-situ bioremediationof the COCs, in lieu of the previously-proposed GCW technology. With regard to energyexpenditure, maintenance, and transportation and disposal, GCW systems are not as sustainableas in-situ remedies that have been developed and improved in recent years. With theseconsiderations in mind, the identified combination of enhanced abiotic and bioremediationapproaches discussed with EPA are more suitable to the project’s goals.
Bioremediation was evaluated beginning June 2013 in collaboration with Dr. Frank Loeffler ofthe University of Tennessee-Knoxville when the Settling Parties initiated a microcosm study ofRailyard sediments and groundwater. The study was intended to identify microbial processes thatare resulting in the substantial degradation of CT in the vicinity of extraction well EW-4 at theRailyard. The results of the study indicated that a fortuitous combination of microbial processesand abiotic processes are degrading CT, and that those processes may be enhanced by theaddition of a source of organic carbon and nutrients for bacteria that promote the completedechlorination of CT to innocuous end products.
5.1 Design Parameters
Because of potential VI risk to the Vistula Area, a hot spot remedy at the Drag Strip source areasis necessary. The sole potentially-complete exposure pathway for contaminated groundwater isthe inhalation of vapor-phase COCs released from the shallow groundwater zone to indoor air ofresidents and commercial workers downgradient of the Drag Strip. This potential risk to humanhealth is used to develop the design parameters for the revised contingency remedy, which are:
Revised Drag Strip RAO based on the shallow groundwater to indoor air exposurepathway;
Development of an IRG for the Drag Strip, using an updated site-specific attenuationfactor, EPA’s level of acceptable risk, and EPA’s VISL Calculator; and
Development of the attainment process for the IRG, and closeout process for vapormonitoring and mitigation program.
At this 60-percent design stage, the remedy includes the following physical design elements:
Additional delineation of total COCs: define current plume core for full-scale treatmentof the hot spot;
Bench-scale testing to select effective injection amendments;
Pilot-scale testing to assess injection effectiveness;

Revision 3, Addendum 2 Final Design Report Drag Strip Remedial Design
14951501.11014 25 Drag Strip 60 Percent Design
Full-scale implementation of hot-spot treatment remedy, including utilization of theexisting GCW to assist in distribution of amendments; and
Remedy performance monitoring.
Because of their dependence on the delineation of COCs and the necessary access to the DragStrip property, full development of the pilot-scale testing program and the full-scale design willnecessarily be provided in subsequent design submittals.
The design parameters and 60-percent design elements are described further in the followingsections.
5.2 Revised Drag Strip RAO
The definition of the Drag Strip RAO, with an unambiguous end point to the Drag Strip remedialaction, is the most significant requirement for the remedy finalization. Downgradient potentialVI risk is the primary concern for the Drag Strip, and as established in the Groundwater RiskEvaluation (URS 2013d). The revised Drag Strip RAO must also comply with the CD and RODAmendment.
The Drag Strip RAO is:
“Active remediation of the Drag Strip hot spot sources to the point at whichshallow groundwater migrating offsite no longer represents an unacceptablepotential risk for VI in the Vistula Area.”
The Drag Strip RAO complies with the CD’s requirements for active remediation of the DragStrip source areas that are described in Section 2.1.4.3. As an objective for treatment of thesources at the Drag Strip, the Drag Strip RAO also complies with the requirements for activeremediation stated in the ROD Amendment. Although the proposed in-situ technology differsfrom the possible remedial technologies listed in the ROD Amendment under Alternative 2,compliance with the ROD Amendment’s source remediation intent is clear.
5.3 Intermediate Remediation Goal
In their November 6, 2013 letter (EPA 2013c), EPA set forth the need for an IRG in thestatement:
“The practical intermediate remediation goal required by EPA, in consultationwith IDEM, as discussed with the Settling Parties, is to develop and achieve[groundwater to indoor air screening levels (GWIASLs)] that are protective at orbelow a 1x10⁻⁵ excess lifetime cancer risk. This would satisfy the establishedremedial action objective (RAO) to eliminate the potential for humanexposure.”
EPA’s use of the term “GWIASL” is consistent with previous usage in Revision 1, Addendum 2,Final Design Report (URS 2013a) and earlier submittals. However, as described in Section 4.1,the calculation of a site-specific attenuation factor has been updated to be consistent withassumptions used in EPA’s VI Database (EPA 2012). Also, EPA’s VISL Calculator (EPA2013a) is now used to derive the screening levels.
For the development of the IRG for the Drag Strip remedial action, the Settling Parties derived anupdated site-specific groundwater-to-indoor air attenuation factor using a data set containinggroundwater analytical data from the newly-installed shallow monitoring wells in the VistulaArea and current indoor air analytical data. The data set included groundwater data from wells

Revision 3, Addendum 2 Final Design Report Drag Strip Remedial Design
14951501.11014 26 Drag Strip 60 Percent Design
MW-38S, DSMW-03, MW-56S, DSMW-11S, DSMW-12S, MW-57S, MW-58S, MW-59S, andMW-60S, (Figure 2) and indoor air data from houses paired with the applicable wells.
This approach complies with EPA’s requirement from the November 6, 2013 letter (EPA 2013c),
“Determination of the GWIASLs, to be used to assess the attainment of theRAO for eliminating the potential for human exposure while natural gradientflushing takes place, will be pursued concurrently with the initiation of the finalDrag Strip hot spot source remedy. Groundwater concentrations will then bemonitored in the mixed commercial/residential area down gradient of the DragStrip using existing and planned wells, as previously discussed with the SettlingParties, to monitor achievement of the GWIASLs (see Attachment A).”
From the updated site-specific groundwater-to-indoor air attenuation factor, the Settling Partiesderived an updated site-specific VISL, which is established as the IRG.
The Settling Parties submitted Response to EPA July 11, 2014 Comments, and TechnicalMemorandum: Intermediate Remediation Goal Calculation, dated September 19, 2014 (IRGTech Memo) (URS 2014c). EPA commented on the IRG Tech Memo in a letter dated November4, 2014 (EPA 2014b), and EPA and the Settling Parties held a conference call on December 3,2014 to discuss the EPA comments. Following this conference call, EPA and the Settling Partiesagreed to the following items, which will be incorporated into the Drag Strip contingency remedydesign herein:
Paired indoor air and shallow groundwater data from two addresses will be removed fromthe IRG calculation data pool; and
The onsite treatment area footprint for the pilot test and the full-scale implementation willbe defined using newly-installed monitoring wells from the Additional Delineation ofTotal COCs task described in Section 5.5.
The Revision 1, IRG Tech Memo is presented in Appendix C. The VISLs developed in thisanalysis are:
AnalyteUpdated Site-
Specific VISLs andIRGs (µg/L)
CT 53.2
TCE 14.3
When viewed in the context of decreasing shallow groundwater concentrations and indoor airconcentrations below the CT IAAL and the TCE indoor air screening level, demonstrate that theyare conservative and protective. As set forth by EPA in the November 4, 2015 letter, these IRGswill be used to establish the onsite treatment area footprint for the Drag Strip contingencyremedy, and they will be used to evaluate performance of the remedy, i.e., attainment of the IRGwill indicate completion of the contingency remedy for the Drag Strip source areas.
5.4 Attainment of IRG and Closeout
This section describes the attainment process for the IRG, and closeout process for Drag Stripremedial action and the vapor monitoring and mitigation program. Contingency actions, in thecase of post-close out monitoring exceedances, are also introduced here and are described morefully in Section 5.8.

Revision 3, Addendum 2 Final Design Report Drag Strip Remedial Design
14951501.11014 27 Drag Strip 60 Percent Design
Implementation of the full-scale remedy, described below in Section 5.7, is expected to reducegroundwater COCs at the Drag Strip and in the Vistula Area to levels that no longer represent arisk to VI. Groundwater concentrations will be monitored quarterly, during and after full-scaleimplementation, in shallow wells on the Drag Strip property and in shallow wells in the VistulaArea located downgradient of the Drag Strip. Shallow groundwater will be monitored forachievement of the revised Drag Strip RAO (Section 5.2) through comparison of concentrationdata to the IRG (Section 5.3). The IRGs are the site-specific VISLs calculated in Section 5.3, andthey are 53.2 ug/L for CT and 14.3 ug/L for TCE.
Attainment of the IRG will be declared when:
The 95 percent UCL of shallow groundwater concentrations of COCs in the Vistula Areawells and the onsite Drag Strip wells remain below the IRGs for eight consecutivequarters; and
Indoor air concentrations in the buildings in the indoor air monitoring and mitigationprogram, as set forth in the Vapor Monitoring Plan (URS Dames & Moore, 1999), remainbelow the CT action level during this same time period.
Details of the remedy performance monitoring are presented below in Section 5.8.
Upon attainment of the IRG, the Settling Parties will petition EPA to close out the Drag Stripremedial action and to close out the indoor air monitoring and mitigation program.
Upon EPA approval of the Drag Strip remedial action closeout and the indoor air monitoring andremediation program closeout, groundwater monitoring for the Drag Strip and Vistula Areamonitoring wells will transition to the PRP Long-Term Response (PRP LR) monitoring program,as described below in Section 7.0. For buildings with sub-slab vapor mitigation systems, thesesystems will be deactivated, and the mitigation system components will be “mothballed” in casefuture reactivation is triggered under contingency actions.
For the Drag Strip, the PRP LR monitoring program will include quarterly groundwatermonitoring from shallow wells located on the Drag Strip property. These wells will continue tobe monitored for compliance with the Drag Strip RAO during PRP LR monitoring. Analyticalresults from the shallow monitoring wells within and just downgradient of the treatment area hotspot, delineated per Section 5.5 below, will be compared to IRGs. If there is no IRG exceedance,quarterly PRP LR monitoring will continue. If there is an IRG exceedance, contingency actionswill be triggered.
The contingency actions are designed to assess potential problems with Drag Strip remedyeffectiveness and with protectiveness of the remedy in the downgradient Vistula Area.Contingency actions will consist of a two-step sequence of monitoring events that propagates inthe downgradient direction as IRGs are exceeded. As described in Section 7.0, confirmedexceedances of IRGs could potentially result in:
Assessment of enhanced in-situ bioremediation effectiveness with reinjection ofamendments if needed; and
Indoor air and sub-slab vapor monitoring in the Vistula Area, withreactivation/installation of sub-slab vapor mitigation systems if needed.
5.5 Additional Delineation of COCs
For the physical design of the pilot test and subsequent full-scale remedy, additional groundwatercontamination delineation is needed in order to refine the current treatment area footprint.However, prior to any onsite fieldwork for delineation, pilot testing, or full-scale construction and

Revision 3, Addendum 2 Final Design Report Drag Strip Remedial Design
14951501.11014 28 Drag Strip 60 Percent Design
implementation, access to the Drag Strip property is required. As described in Section 2.1.5, acomplaint was filed in Federal Court to enforce the terms of the 2001 Settlement Agreement andto obtain access to the Drag Strip for installation of wells necessary for proceeding with theremedy proposed herein. The access issue is still being resolved, and it has the potential to delayimplementation of the necessary fieldwork for the remedy.
The COCs that comprise the majority of the contaminant plume mass at the Drag Strip are CT,TCE, and CF. As discussed with EPA during the meeting on February 12, 2014, total COCs willbe used as the current design basis for the revised, in-situ remedy approach.
Further delineation of total COCs will build upon the enrichment delineation work accomplishedduring the Five-Year Review Investigation in 2010. Additional monitoring wells are needed inthe vicinity of the East and West Source Areas to address the EPA-recommended groundwater toindoor air risk levels (i.e., excess cancer risk less than 1x10⁻⁵) and to define the plume core forpilot- and full-scale treatment of the hot spot.
Per the CSM (Section 3.3), the current distribution of the COCs results from the discrete releaseand migration characteristics that are known for CT and TCE, as well as operation of the GCWsince 2004. The contamination in groundwater beneath the East and West Source Areas is thesum of contributions from: 1) the contaminants flowing onto the Drag Strip property fromupgradient, and 2) onsite CT releases to ground surface in the East and West Source Areas.Figures 6a and 6b show the shallow and intermediate 2012-2014 95-percent UCL concentrationisopleths for CT. For CT, the majority of the plume mass is in the shallow and intermediateaquifer zone in the vicinity of the West Source Area. Figures 7a and 7b show the shallow andintermediate 2012-2014 95-percent UCL concentration isopleths for TCE for the Drag Strip andVistula Area. For TCE, the majority of the plume mass is deeper than for CT and is locatedfurther east than the East Source Area. Based on concentrations in wells along the upgradientproperty boundary and historical data from wells located in the neighborhood between theRailyard and Drag Strip, the source of this TCE is upgradient of the Drag Strip and is most likelyrelated to the known Railyard release.
Delineation of the current distribution of COCs is needed for the following areas:
The upgradient property boundary west of DSMW-07 and southwest of the West SourceArea;
The northern vicinities of the West Source Area and East Source Area; and
The upgradient property boundary east of DSMW-08.
To address these onsite Drag Strip data gaps, the Settling Parties propose to install up to sevenmonitoring well clusters in the vicinities of the existing Drag Strip East and West Source Areas atthe locations shown in Figure 9. Figure 9 also shows the shallow 2012-2014 95 percent ShallowCT isopleths.
5.5.1 Well Installation
Installation of additional monitoring wells presumes that access to the Drag Strip property will beprovided by the property owner.
Well installation methods will be consistent with Appendix A-1 of the approved Second RemedialDesign/Remedial Action Work Plan, Conrail Railyard Superfund Site, Elkhart, Indiana, datedJanuary 18, 2001 (Second RD/RA Work Plan, URS [2001]). Appendix A-1 of the SecondRD/RA Work Plan is the Sampling and Analysis Plan (SAP) for the Second RD/RA. Wellinstallation methods will include installations with two or three wells installed in a singleborehole and flush-mounted wellhead completions.

Revision 3, Addendum 2 Final Design Report Drag Strip Remedial Design
14951501.11014 29 Drag Strip 60 Percent Design
Utility clearance will include contacting Indiana’s public utility locating service (Indiana 811),which is generally limited to publically accessible areas. Additionally, a commercial locatorservice will be contracted to provide an underground utilities check for each proposed welllocation before drilling. The well clusters will be installed by rotosonic methods as two-well andthree-well clusters to characterize the groundwater plume. Shallow, intermediate, and deep wellswill be installed with 10-foot stainless steel screens at depths generally consistent with theexisting Drag Strip wells: 30, 80, and 160 feet below grade. Upon completion, the well locationsand elevations will be surveyed by a licensed Indiana land surveyor.
5.5.2 Sampling and Data Evaluation for COCs Delineation
The newly-installed Drag Strip delineation wells will be added to the list of monitored wells forthe next quarterly monitoring event following their installation. The schedule of this quarterlyevent may need to be adjusted to accommodate post-development equilibration of the new wells(typically two weeks, minimum). Groundwater samples will be collected and analyzed inaccordance with the procedures in the existing Groundwater Monitoring Plan (GMP) for the Site,i.e., Appendix G of URS (2003a).
Data evaluation will include preparation of:
Updated cross sections showing lithologic data from the newly-installed delineationwells;
Traditional groundwater concentration isopleth maps for the shallow, intermediate, anddeep zones of the aquifer; and
3D visualizations of the Drag Strip hot spot vicinity using Environmental VisualizationSystems (EVS).
These items will be used to update the CSM, refine the current treatment area footprint, and assistwith design of the pilot-scale injection system layout for the in-situ remedy. Specifically, thepilot-scale testing will target the high-concentration core of the current treatment area footprint.
The current treatment area footprint will be based on the areal extent of the IRG concentrationusing shallow zone groundwater data.
The lowest-concentration IRG in the shallow aquifer zone will be used to delineate the proposedtreatment area footprint. This approach is conservative because it will result in a larger arealextent for the treatment area delineation.
5.6 Bench-Scale Testing
The physical design of the enhanced in-situ bioremediation technology requires bench- and pilot-scale testing in order to evaluate and select amendments that will, 1) effectively degrade thetargeted COCs, and 2) be effectively distributed in the subsurface during and after injection. Asagreed with EPA during the February 12, 2014 meeting, the Settling Parties began bench-scaletesting of a variety of potential injection amendments in March 2014.
In March 2014, the Settling Parties collected 4 gallons of groundwater and sediment from theshallow and intermediate wells at the DSMW-07 and DSMW-08 well clusters. The water andsediment were shipped to SiREM of Guelph, Ontario, where microcosm studies were conductedover a 5-month test period. The microcosm studies evaluated several remediation amendmentsand the rate and extent of degradation of TCE and CT by indigenous bacteria, as well as KB-1®
Plus bacteria provided by SiREM. The studies included an evaluation of zero-valent iron (ZVI)and nutrient amendments that can be applied, in-situ, to substantially accelerate the rate ofbiological and abiotic degradation of CT and TCE at the Drag Strip.
Revision 3, Addendum 2 Final Design Report Drag Strip Remedial Design
14951501.11014 30 Drag Strip 60 Percent Design
The Settling Parties provided progress of the bench-scale microcosm studies in the Five-MonthInterim Report, Drag Strip Microcosm Study, Attachment 2 to the August 2014 Monthly ProgressReport, dated September 10, 2014 (Interim Report) (URS 2014d). EPA and IDEM commentedon the Interim Report in the November 4, 2014 Letter (EPA 2014b). SiREM prepared the finalmicrocosm study report in Laboratory Biotreatability Study to Evaluate Remediation of VOCs inGroundwater, dated December 18, 2014 (Microcosm Report), and this report is provided inAppendix D. The EPA and IDEM comments from EPA (2014b) are addressed either in theMicrocosm Report or they are discussed below.
The objective of the microcosm studies is to assess the feasibility of anaerobic biodegradation andchemical reduction of the Site COCs. Based on these findings, the Settling Parties identified theamendments for pilot testing that are likely to result in successful in situ treatment.
As detailed in the Microcosm Report (Appendix D), the tested amendments consisted ofcombinations of the following materials:
ZVI, provided as elemental iron with an average particle diameter of 2 micrometers;
EHC®-L, a proprietary organic carbon-based liquid amended with ferrous gluconate;
Ferrous Fumarate, a common form of bio-available iron;
SRS™, an emulsified vegetable oil product designed to release bio-available hydrogenover an extended period of time; and
KB-1® Plus, a natural microbial consortium containing microorganisms known to beresponsible for mediating dechlorination.
All microcosms were amended with a vitamin/nutrient mixture.
Incubation, spiking, sampling, and testing of the microcosms took place over a 123-day period.All of the tested combinations of amendments, as well as intermediate-depth intrinsic controlmicrocosms, degraded CT and TCE to various extents ranging from partial to completedechlorination. SiREM made the following conclusion: “The results of this study indicate thatboth SRS™ with and without the addition of a soluble iron source (ferrous fumarate or ferrousgluconate) and EHC®-L in combination with a vitamin/mineral amendment and with KB-1® Plusbioaugmentation has the potential to be an effective remedial approach for the Site.”
5.6.1 Recommended Injection Amendment
Based on the findings in the Microcosm Report, the Settling Parties have summarized theperformance characteristics of the treatment amendments, as follows:

Revision 3, Addendum 2 Final Design Report Drag Strip Remedial Design
14951501.11014 31 Drag Strip 60 Percent Design
Treatment Bench-Scale Performance Metrics
EffectiveTreatment
CT and TCEDegraded
(Yes / No)
CompleteDegradation?
(Yes / No)
MethaneProduction
(High /Low)
pH and ORPFavorable?
(Yes / No)
KB-1® PlusEnhancedReduction
(Yes / No)
ZVI Yes No Low Yes Yes No
ZVI +SRS™ +FerrousFumarate
Yes No High Yes Yes No
SRS™ +FerrousFumarate
Yes Yes High Yes Yes Yes
SRS™ Yes Yes High Yes Yes Yes
ZVI +EHC
®-L
Yes No Low Yes Yes No
EHC®-L Yes Yes High Yes Yes Yes
The findings indicated that supplemental ferrous iron may be advantageous for accelerating CTdegradation, therefore SRS™ without ferrous iron was eliminated from the field testconsideration. The laboratory results also suggested that the rate and completeness ofdegradation of COCs was better with SRS™+ferrous fumarate than EHC®-L, noting that at theconclusion of the microcosm study, at 123 days, only the microcosm containing SRSTM + ferrousfumarate + KB-1® Plus did not contain detectable COCs. Based on these findings and inconsideration of the observed performance of the treatments, the Settling Parties recommend thefollowing treatment be used for pilot testing and subsequent full-scale remedy implementation:
SRS™ + ferrous fumarate + KB-1® Plus
5.7 Pilot-Scale Injection Testing
The Settling Parties will conduct follow-on pilot-scale testing at the Drag Strip using therecommended amendments upon completion of the additional COCs delineation task (Section5.5), and with approval from EPA. Because the delineation task has not been started, the pilottest injection and monitoring well grid presented below is intended to be translatable, as a unit, tothe core of the shallow plume defined in the additional COCs delineation task.
The pilot studies will be conducted to, 1) evaluate the extent to which favorable results from thebench-scale studies, i.e., the complete degradation of comingled CT and TCE, are transferrable tothe in-situ application of similar amendments, and 2) to evaluate the deliverability, and advectiveand diffusive transport of remediation amendments over a 12-week test period. Based on thelithology of the aquifer sediments, i.e., unconsolidated sand and gravel deposits, the candidateremediation amendments are anticipated to be effectively delivered to the shallow andintermediate-zone aquifer via 1-inch diameter, injection wells.
Revision 3, Addendum 2 Final Design Report Drag Strip Remedial Design
14951501.11014 32 Drag Strip 60 Percent Design
The following subsections describe the injection permitting approach, pilot test basis, andimplementation and monitoring procedures.
5.7.1 “Rule-Authorize” Injection Wells Used for Site Clean-Up
EPA regulates shallow disposal systems that are used as part of site cleanup activities, perhttp://www.epa.gov/r5water/uic/classv/index.htm#remediation. The pilot test will includeinjection of approved amendments as well as injection of “chase water” to help distribute theamendments further into the aquifer after injection. The Settling Parties understand, and requestthe EPA confirm in writing, that EPA will “rule-authorize” the use of injection wells for thepurposes of the Superfund remedial action at the Drag Strip upon submittal of inventoryinformation about the wells to the Underground Injection Control (UIC) program.
The Settling Parties further understand that after the injection activity has been completed, theUIC program will need to be notified about when and how the wells were properly abandoned
5.7.2 Pilot Test Basis
The basis for the pilot-scale injection program was developed using Site data, i.e., hydraulicconductivity, effective porosity, soil bulk density, and geochemical parameters available from theCSM. These parameters were input to “The Substrate Estimating Tool for Enhanced AnaerobicBioremediation of Chlorinated Solvents,” (Parsons, 2011), which consists of a series of Excelspreadsheets developed under the Environmental Security Technology Certification Program(ESTCP) to estimate the mass of various remediation substrates (biodegradable organic carbon)that may be used, in-situ, to accelerate the dechlorination of a range of chlorinated ethenes,chlorinated ethanes, and chlorinated methanes. The Substrate Estimating Tool is designed toestimate the mass of commercially available vendor products necessary to engender conditionsfavorable for dechlorination to occur. These conditions include, but are not limited to, thedepletion of oxygen and the reduction of sulfate, both of which are usually the more significant“sinks” for biodegradable organic carbon products. A conservative design factor of three timesthe estimated organic carbon requirement was used to account for “sinks” other than thoseincluded in the Substrate Estimating Tool. Based on the output from the substrate estimating tool,the theoretical volume of 60-percent-by-weight emulsified vegetable oil (EVO) required fordechlorination of the shallow and intermediate-depth aquifer COCs is approximately 520 gallons(4,150 pounds).
It should be noted that EVO is not directly available to the bacteria that degrade CVOCs. Rather,EVO slowly ferments into volatile fatty acids (VFAs) that release hydrogen, which is thenutilized by a consortium of bacteria that degrade CVOCs. Because of the time it takes for EVO toferment, vendors of EVO products like SRS™ typically add a quick-release source ofbiodegradable organic carbon, such as sodium lactate, as well as yeast extract and other nutrients,to “jump-start” the microbial community. As indicated in Section 5.6, the products selected forthe pilot scale test include KB-1® Plus, ferrous fumarate, vitamin B2 and Terra Systems, Inc.’sSRS™, a emulsion containing 60 percent by weight vegetable oil, 6 percent by weight sodiumlactate, and low concentrations of yeast extract, vitamin B12, and a blend of sources of phosphateand nitrogen. The remainder of the SRS formulation is proprietary food grade emulsifiers andwater. These products performed well during the microcosm study, however their performancemay be further enhanced through the use of, 1) sodium sulfite or L-cysteine, reducing agents thathelp to scavenge oxygen, and generate the reducing conditions favored by dechlorinatingbacteria, and 2) red yeast rice extract, a newly developed product (patented by Provectus) thatinhibits methane-producing microorganisms. By suppressing the methanogenic microorganisms,red yeast rice extract may make more substrate available to the dechlorinating bacteria. After amore comprehensive literature review and vendor consultation regarding the potential efficacy of

Revision 3, Addendum 2 Final Design Report Drag Strip Remedial Design
14951501.11014 33 Drag Strip 60 Percent Design
L-cysteine, a combination of the aforementioned compounds will be co-injected along with EVOduring the pilot test.
As noted above, sodium sulfite or cysteine rapidly removes oxygen and creates favorablereducing conditions. Accordingly, bioaugmentation with KB-1® Plus will be conducted usinganaerobic water generated with sodium sulfite or cysteine and immediately following theinjection of the other substrates. Details regarding the extraction of groundwater, mixing ofremediation compounds, and injection and monitoring activities are presented below.
5.7.3 Implementation
The layout of the proposed pilot test injection and performance monitoring area is presented asFigure 10. The exact location of the pilot test is to be determined based on additional delineationactivities to be conducted at the Drag Strip pending approved access. As shown on Figure 10, thepilot test will be conducted in an area measuring approximately 50 x 50 feet, and it will includethe following components:
Extraction well cluster UP-1. This dual-purpose cluster of two 2-inch diameter, stainlesssteel extraction wells will, 1) provide geochemical data for the upgradient (untreated)shallow and intermediate zones of the aquifer, and 2) provide groundwater that will beamended with EVO prior to being injected into the pilot test treatment area. A wellconstruction diagram is provided on Figure 11;
Injection well clusters IW-1 and IW-2. These 1-inch diameter, injection wells will beconstructed of Schedule 40 polyvinyl chloride (PVC) with 20-slot screens at injectionintervals 30 – 50 feet bgs and 70 to 90 feet bgs as shown on Figure 11;
Radius-of-influence monitoring well clusters R-1, R-2, and VR. These wells will bemonitored to evaluate the radial distribution of EVO at the time of injection, as well asthe persistence of related TOC and VFAs thereafter;
Advection well clusters A15-1, A15-2, A30-1, and A30-2. These wells will be monitoredto evaluate the advective transport of EVO and related VFAs;
Advection/Diffusion well clusters AD15-1, AD15-2, AD30-1, and AD30-2. These wellswill be used to evaluate the advective and diffusive transport of EVO and related VFAs;and
Advection/Diffusion and radially overlapping well clusters ADV15, ADV30, andADV45. These wells will be used to evaluate the advective and diffusive transport ofEVO originating from overlapping radii of influence of injected EVO.
All of the extraction, injection, and monitoring wells will be installed as clusters of shallow andintermediate-depth wells. The thickness of the treated groundwater is approximately 80-feet (thetreatment target zone is from approximately 20 to 100 feet in depth).
The pilot test will be initiated by filling all mixing tanks with 10 parts groundwater (from UP-1,Figure 10) to 1 part SRS™ and nutrient amendments. The compounds will be thoroughly mixed,and then injected into shallow and intermediate-zone wells at rates of approximately 10 to 20gallons per minute. Approximately 130 gallons of SRS™ and 1300 gallons of groundwater willbe injected at each of wells IW-1S, IW-1I, IW-2S, and IW-2I. Once all of the amendments havebeen delivered, five liters of KB-1® Plus will be pumped into each injection well and “chased”with 250 gallons each of anaerobic groundwater that has an adjusted ORP of no greater than - 100mV. The injection program will be implemented adaptively at the locations shown on Figure 10,beginning with the intermediate-depth injection intervals, and finishing with the shallow injection

Revision 3, Addendum 2 Final Design Report Drag Strip Remedial Design
14951501.11014 34 Drag Strip 60 Percent Design
intervals. The time and duration of injection, applied pressure, volume of remediationamendments applied, and other notes will be documented in a field log.
5.7.4 Performance Monitoring
As outlined on Table 2, performance monitoring will be conducted to evaluate the deliverability,and subsequent advective and diffusive transport of EVO, VFAs, and nutrients, as well as thespatial and temporal changes in the concentration of COCs and microbial members over a 12-week period. This is the minimum time-frame for observing biological degradation effects, andthe need for continued monitoring will be evaluated after the week-12 analyses. Baselinegroundwater samples will be collected from all monitoring wells for VOCs analysisapproximately one week prior to conducting the pilot-scale injection program.
Performance monitoring events will be conducted at approximately 2, 4, 8, and 12 weeksfollowing completion of the pilot-scale injection program. Performance monitoring samples willbe collected at select wells for VOCs, RSK 175 gases (ethene, ethane, and methane), VFAs,TOC, sulfate, anions, ferrous iron, and microbial members at the frequencies and locations shownin Table 2 and Figure 10. All groundwater samples will be shipped to TestAmerica Laboratories(TestAmerica) of North Canton, Ohio and Microbial Insights (Microbial) of Knoxville,Tennessee (or SiREM of Guelph, Ontario). Dissolved (ferrous) iron concentrations will bemeasured in the field during each monitoring event using a Hach test kit. Sample collection andanalysis requirements, quality assurance, and quality control (QA/QC) will be met, as appropriateand relevant, in accordance with the approved SAP.
Field instrument measurements of temperature, pH, ORP, specific conductivity, and DOconcentration will be recorded at all pilot test extraction, injection, and monitoring wells on abiweekly basis. Water levels will be also be recorded on a biweekly basis.
Key elements to be evaluated by the pilot studies will include the following:
Injection well layout geometry and the ability to effectively inject and distributeremediation amendments throughout the targeted aquifer volume;
Advective dispersion of remediation amendments and related effects over the studyperiod; and
Initial indications of biodegradation which may include changes in ORP, formation ofCVOC or EVO degradation products, or detections of hydrocarbon gases.
In addition to the evaluations indicated above, the data may be helpful with assessing reactionkinetics (COC degradation rates) and dosages of remediation amendments necessary to fullydegrade COCs. Results of the pilot test will be provided in a written report along withrecommendations for full-scale application.
As indicated above, the layout of the pilot test injection and monitoring well grid (Figure 10)presented herein is intended to be translatable, as a unit, to the core of the shallow plume definedin the additional COCs delineation task. In addition, the location of the pilot test injection andmonitoring well grid will need to accommodate EPA’s requirement to maintain operation of theGCW during the pilot test.
5.8 Full-Scale Injection Remedy Implementation
The Settling Parties will conduct follow-on full-scale implementation of the in-situ remedy at theDrag Strip using:

Revision 3, Addendum 2 Final Design Report Drag Strip Remedial Design
14951501.11014 35 Drag Strip 60 Percent Design
Current treatment area footprint and core of the shallow total COCs plume, based onresults and findings of the COCs delineation task (Section 5.5);
Approved amendments that effectively destroy/degrade CT and TCE, based on resultsand findings from the bench-scale microcosms testing (Section 5.6.1); and
Injection well layout geometry and effective dosages of remediation amendments, bothbased on results and findings of the pilot-scale injection testing (Section 5.7).
At this stage in the remedy design process, it is envisioned that the full-scale remedy will consistof one or more arrays of injection wells and sufficient monitoring wells to evaluate performancetowards the IRG. Layout of the injection well array(s) will utilize the pilot-scale test wells, and itwill be expanded to provide sufficient coverage of the Drag Strip hot-spot sources. The layoutwill consider the estimated advective dispersion of remediation amendments and estimatedreaction kinetics relative to the observed groundwater flow velocity. The time frame forachieving the IRG at the Drag Strip, as discussed during the February 12, 2014 meeting, is 2-3years.
The array(s) of injection wells will remain in place at the Drag Strip throughout the PRP LRmonitoring period, in the event that contingency actions outlined in Section 5.4 include future,supplemental injections of amendments.
5.9 Remedy Performance Monitoring
During and after full-scale implementation of the in-situ remedy, groundwater concentrations willbe monitored quarterly in shallow wells on the Drag Strip property and in shallow wells in theVistula Area located downgradient of the Drag Strip. Concurrent with the full-scaleimplementation of the Drag Strip in-situ remedy, routine groundwater monitoring will also betaking place under the existing GMP for the Site, i.e., Appendix G of URS (2003a), which hasbeen modified to include additional wells needed to support the 2009 Five Year ReviewInvestigation and the Drag Strip remedial design efforts. Also, indoor air samples will continueto be collected under the ongoing indoor air monitoring and mitigation program, as set forth inthe Vapor Monitoring Plan (URS Dames & Moore, 1999). Analytical data from these samplingefforts will be used for remedy performance monitoring. Table 3 presents the list of wells thatwill be sampled under the remedy performance monitoring program, and it also presents the listof buildings that will be sampled for indoor air under the remedy performance monitoringprogram.
As described in Section 5.4, shallow groundwater will be monitored for achievement of therevised Drag Strip RAO through comparison of concentration data to the IRG. The IRGs are thesite-specific VISLs calculated in Section 5.3, and they are 53.2 ug/L for CT and 14.3 ug/L forTCE.

Revision 3, Addendum 2 Final Design Report Drag Strip Remedial Design
14951501.11014 36 Drag Strip 60 Percent Design
Attainment of the IRG will be declared when:
The 95 percent UCL of shallow groundwater concentrations of COCs in the Vistula Areawells and the onsite Drag Strip wells remain below the IRGs for eight consecutivequarters; and
Indoor air concentrations in the buildings in the indoor air monitoring and mitigationprogram, as set forth in the Vapor Monitoring Plan (URS Dames & Moore, 1999), remainbelow the CT action level during this same time period.
The locations of wells and buildings that will be used for remedy performance monitoring areshown in Figure 12, and the well IDs and building addresses are listed in Table 3. Only shallowmonitoring wells are used for testing for attainment of the IRG because the sole potentiallycomplete exposure pathway for groundwater is inhalation of vapor-phase COCs released fromshallow groundwater to indoor air for residents and commercial workers downgradient of theDrag Strip (Section 3.5.1).
For comparison to the IRG, the selection of shallow wells for UCL testing, (displayed with greenshading on Table 3), was based on their locations within and downgradient of the known extentof the treatment area footprint. Based on the findings of the COCs delineation task (Section 5.5),the selection of the UCL testing wells may be adjusted. Wells along the upgradient Drag Stripproperty boundary are not used for UCL testing because they are upgradient of the release areas(i.e., East and West Source Areas), but they will continue to be monitored as required by EPA(2013c).
Following full-scale injection of amendments into the arrays of injection wells, the 95-percentUCLs for CT, TCE and CF will be calculated using EPA’s Pro UCL software (currently version5.0) and using the most recent eight quarters of analytical data from the subset of UCL testingwells. As recommended by EPA (2009a) for corrective action monitoring, the null hypothesis ofthe presence of contamination is rejected when the entire confidence interval is below thestandard, or in other words, when the UCL is below the IRG. The false positive rate will be fixedat 0.05, which results in a confidence level of 95 percent for the tests. Furthermore, statisticalpower is increased by increasing the sample size to eight observations per test.
The wells used for UCL testing are:
Onsite Drag Strip UCLTesting Wells
Vistula Area UCLTesting Wells
DSMW-02 DSMW-11S
DSMW-03 DSMW-12S
DSMW-04S MW-57S
DSMW-09S MW-58S
DSMW-13S MW-59S
DSMW-14S MW-60S
DSMW-15S MW-08S
MW-56S
Indoor air CT concentrations from the buildings listed in Table 3 will be compared directly to theCT indoor air action level of 0.65 ppbv, established by EPA in March 2012, (EPA 2012a). Perthe Vapor Monitoring Plan (URS Dames & Moore, 1999), semiannual indoor air monitoring datawill continue to be used to test for potential risk due to VI. In accordance with the indoor airmonitoring program, if an exceedance of the CT IAAL occurs, confirmation sampling will occuras soon as practical, and if the exceedance is confirmed, a vapor mitigation system will beinstalled at the location.

Revision 3, Addendum 2 Final Design Report Drag Strip Remedial Design
14951501.11014 37 Drag Strip 60 Percent Design
The table below summarizes remedy performance monitoring criteria, possible outcomes for thestatistical testing and indoor air comparisons, and resulting decisions regarding the remedyperformance monitoring program.
Criteria Duration Outcome Decision RemedyPerformance
Monitoring Status
Site-specificIRGs forCOCs,
AND
IAAL forCT
For Close Out:Eight
ConsecutiveQuarters
Indoor Air > IAAL,AND
95% UCL > IRG,OR
95% UCL < IRG
Confirm IAALExceedance, perVapor Monitoring
Plan
Continue MonitoringProgram
Indoor Air < IAALAND
95% UCL > IRG
ShallowGroundwater
ContaminationRemains
Continue MonitoringProgram
Indoor Air < IAALAND
95% UCL < IRGIRG Attained
Petition EPA forClose Out
Upon attainment of the IRG, the Settling Parties will petition EPA to close out the Drag Stripremedial action and to close out the indoor air monitoring and mitigation program. Upon EPAapproval of the Drag Strip remedial action closeout and the indoor air monitoring and remediationprogram closeout, groundwater monitoring at and downgradient of the Drag Strip will transitionto the PRP LR monitoring program, as described below in Section 7.0. For buildings with sub-slab vapor mitigation systems, these systems will be deactivated, and the mitigation systemcomponents will be “mothballed” in case future reactivation is triggered under contingencyactions.
Drag Strip remedial action close out will also be the milestone at which the Site’s IRA Report isprepared and submitted, as described in the following section.

Revision 3, Addendum 2 Final Design Report
Interim Remedial Action Report –Conrail Railyard Superfund Site
14951501.11014 38 Drag Strip 60 Percent Design
6.0 Interim Remedial Action Report – Conrail RailyardSuperfund SiteFollowing demonstration that the hot-spot remediation is complete at the Drag Strip and that thecontainment objective is achieved at the Railyard, an IRA Report will be submitted to the EPA.Railyard groundwater treatment system expansion and upgrading was completed in 2013. DragStrip remedial action completion will be determined following the activities described in Section5.8. The IRA Report will be generally consistent with Superfund program requirements and willinclude discussion of the remediation systems as outlined in the following sections.
6.1 Remedial Action Progress
The IRA Report will include a summary of the progress to date for the Railyard and Drag Stripremediation systems. This section will provide general discussion of both systems frominstallation and startup in 2004 to IRA Report preparation.
The report will summarize the significant Drag Strip investigation findings and remedial actionsoutlined below.
Chronology of significant Drag Strip events, from the identification of elevated CT insoil gas in 1998 and 2001, to GCW construction activities and pilot-phase operationbeginning in 2004, to delineation of COC enrichment in the 2009 Five-Year ReviewInvestigation, and implementation of the in-situ remedy;
Discussion of performance standards and cleanup goals for Drag Strip hot spot aspresented in this design submittal, and as they relate to the 1997 CD, 2000 RODAmendment, and subsequent EPA requirements; and
Source remediation data analysis summary; comparison to the Drag Strip remedyperformance metrics and determination of remediation completion.
The report will summarize the significant Railyard investigation findings and remedial actionsoutlined below.
Chronology of significant Railyard events following the 2004 startup of the remedialsystem – including conclusions of hydraulic testing and capture analysis conductedduring the 2009 Five-Year Review Investigation, upgrade design information from the2011 Addendum to the 2003 Final Design, and construction of the upgradedgroundwater treatment plant (GWTP);
Discussion of performance standards and cleanup goals for Railyard source areas asdefined in the 1997 CD and 2000 ROD Amendment;
Discussion of the Railyard Construction Completion and Certification Reports, (2005and 2013); and
Discussion of progress towards achieving sitewide groundwater cleanup requirements,i.e., attainment of MCLs, per the 2000 ROD Amendment. The evaluation will includetrend analysis of relevant monitoring wells near the Line of Containment anddowngradient monitoring locations, demonstration of contaminant capture, anddemonstration of hydraulic capture.

Revision 3, Addendum 2 Final Design Report
Interim Remedial Action Report –Conrail Railyard Superfund Site
14951501.11014 39 Drag Strip 60 Percent Design
6.2 PRP LR Requirements
As can be seen in Section 6.1, the Drag Strip and Railyard remedial actions are proceedingindependently of each other and under separate timeframes: the Railyard remediation systemupgrade completion occurred before the Drag Strip remedy completion. It is anticipated that thePRP LR monitoring for the Railyard will begin first. Because the Settling Parties propose toprepare a single IRA Report for the Site, the IRA Report will address PRP LR progress for theRailyard conducted to date.

Revision 3, Addendum 2 Final Design Report PRP Long-Term Response Monitoring
14951501.11014 40 Drag Strip 60 Percent Design
7.0 PRP Long-Term Response MonitoringThis section presents a conceptual PRP LR monitoring scope for the Railyard and Drag Stripremedial actions. A revised GMP, which will provide a detailed scope of work for the PRP LRprogram, technical justification for sampling/monitoring optimization, and contingencies forconcerning results, will be provided separately.
In EPA’s Letter dated November 6, 2013, (EPA 2013c), the Settling Parties are required tocontinue the current sampling scope until after completion of the 2014 Five-Year Review.Implementation of the current site-wide groundwater monitoring scope will continue until it isreplaced by PRP LR monitoring, which will follow the implementation of the Railyard and DragStrip remedies and approval by EPA.
Because the Drag Strip and Railyard remedial actions are proceeding independently of each otherand under separate timeframes, the PRP LR monitoring will also be implemented in phases.These phases are described in Sections 7.3 and 7.4 as they relate to the progress of both remedialactions. The monitoring scope, including the locations and frequency of sampling, may bemodified based on the results and findings of the remedial activities leading up to full scaleimplementation of the in-situ remedy.
7.1 Current Groundwater Monitoring Scope
The current groundwater monitoring scope is a continuation of the first phase of restorationperformance monitoring described in the GMP (Appendix G to the 2003 Final Design). Themonitoring scope has evolved and expanded since system startup in 2004, and it is derived fromthe following sources:
First phase of Restoration Performance Monitoring: quarterly monitoring of selectedRailyard, neighborhood, and Drag Strip monitoring wells. The Restoration PerformanceMonitoring program is designed to confirm the effectiveness of the remedial action toeventually restore the aquifer outside of the TI Waiver Area, and to confirm that theregion of contaminated water is not expanding. The second phase of restorationperformance monitoring, consisting of a change in monitoring frequency to a 15-monthinterval, is in the GMP, but it has not been implemented yet;
Downgradient Groundwater Action Plan submitted to the EPA on February 16,2007 (URS 2007): maintain quarterly monitoring frequency and expand the scope of thesampled wells in response to EPA and IDEM concerns about COCs concentrations inthe MW-23/MW-41 vicinity;
Railyard remedy upgrade: addition of 14 non-GMP wells for potentiometricanalyses and water quality monitoring along the Line of Containment. Theextraction wells are located along the Line of Containment, which traces thehydraulically downgradient northern border of the TI Waiver Area (Figure 13);
Five-Year Review Investigation: maintain quarterly monitoring frequency, additionof 27 non-GMP wells to accumulate sufficient data to evaluate Drag Strip remedyperformance, mass flux, refined shallow groundwater COCs distribution, and potentialremedy alternatives; and
Drag Strip remedial design: addition of 10 non-GMP wells in the Vistula Area tocollect data that is co-located with indoor air monitoring buildings.

Revision 3, Addendum 2 Final Design Report PRP Long-Term Response Monitoring
14951501.11014 41 Drag Strip 60 Percent Design
The first phase of restoration performance monitoring described in the GMP also incorporates anannual reporting task. The annual Performance Evaluation Reports present the findings from thequarterly site-wide groundwater monitoring program, comprehensive groundwater potentiometryevents, and indoor air monitoring events for program years that span from September throughAugust of each calendar year since operations and maintenance (O&M) began in 2004.
7.2 PRP LR Monitoring Objectives
The objectives of the current groundwater monitoring scope have expanded from the objectivesof the original Restoration Performance Monitoring program in the GMP because of data needs insupport of EPA/IDEM concerns, the 2009 Five-Year Review Investigation, the Railyard remedyupgrade design, and the Drag Strip remedial design. With the Railyard upgrade constructioncomplete and following full-scale implementation of the Drag Strip in-situ remedy, all of theseexpanded objectives will no longer be necessary. Therefore, for the purposes of the PRP LRmonitoring program, the objectives will revert to those of the GMP, namely:
“To confirm the effectiveness of the remedial action to eventually restore theaquifer outside of the TI Waiver Area, and to confirm that the region ofcontaminated water is not expanding”
The performance standard for demonstrating containment will be based upon weight-of-evidenceanalysis, considering evaluation of potentiometric surface maps based on measured water levelsin the vicinity of the containment system, comparison of trends in concentration in upgradient anddowngradient wells, and groundwater modeling. The overall Superfund Site RAO remainsunchanged from that set forth in the CD and ROD Amendment, and it is:
“Attainment of MCLs in groundwater between the Railyard Line ofContainment and the St. Joseph River.”
The PRP LR monitoring will continue until the overall Superfund Site RAO is attained.
The PRP LR monitoring program will also undergo optimization with the intent to provideefficient data collection, in which sufficient data are collected in order to make accurate decisionsin a cost-effective manner. The optimization objective is to reduce temporal and spatialredundancy in the monitoring network while retaining sufficient data needed to evaluate the PRPLR monitoring objectives. The analytical scope will continue to be the Site COCs.
Because of the different remedial action alternatives in place for the Railyard (hydrauliccontainment and natural gradient flushing) and Drag Strip (in-situ enhanced bioremediation),different scopes of work and different performance metrics will be necessary, as described in thefollowing sections.
7.3 Railyard PRP LR Monitoring
The Railyard RAO, per the ROD Amendment, is containment of groundwater with significantconcentrations of TCE and CT from the Track 65-66 and Track 69 Source Areas, and naturalgradient flushing of the dissolved portion of the contaminant plume downgradient of the Line ofContainment (Figure 13).
The Railyard PRP LR Monitoring will commence upon EPA approval of the revised GMP. Forthe Railyard, PRP LR monitoring will be a modification of the second phase restorationperformance monitoring program from the existing GMP. The PRP LR monitoring will includecomprehensive potentiometric measurements from all accessible Site wells and groundwatersample collection from selected shallow, intermediate, and deep wells at and downgradient of theRailyard, along the upgradient Drag Strip property boundary, and along the St. Joseph River. The

Revision 3, Addendum 2 Final Design Report PRP Long-Term Response Monitoring
14951501.11014 42 Drag Strip 60 Percent Design
PRP LR monitoring will be conducted from selected wells on an optimized 15-month frequency,which will be set forth in the revised GMP. The findings from the contaminant and hydrauliccapture assessments will be reported on the same optimized frequency, and the report will besubmitted 90 days following the sampling event.
The performance of the Railyard remedy will be evaluated for the effectiveness of hydrauliccapture and concentration trends. Groundwater capture will be evaluated using the modelingprogram KT3D_H2O, and concentration trends will be reviewed to determine compliance withthe overall Superfund Site RAO.
Monthly O&M monitoring, set forth in the approved Final Design, will continue throughout thesystem’s operation. Monthly O&M monitoring will also include potentiometric measurementsfrom a subset of Railyard monitoring wells and three point gradient (TPG) analysis to monitor forwater level anomalies in the vicinity of the capture zones. The TPG techniques were used insupport of flow rate optimization efforts following startup of the upgraded Railyard system in2012 and 2013 (URS 2014). Anomalous TPG findings will trigger contingency actions includingconfirmation of water levels, review of applicable Railyard system operational data, review ofbackground water level transducer data, and potentially a comprehensive water levelmeasurement event with KT3D_H2O capture analysis. Contingency actions in the event ofconcentration anomalies and other concerning COCs analytical results may include similarhydraulic evaluations plus resampling the affected well(s), COCs data analyses, and potentiallyan interim sampling event for a larger group of monitoring wells.
7.4 Drag Strip PRP LR Monitoring
The Drag Strip RAO is:
“Active remediation of the Drag Strip hot spot sources to the point at whichshallow groundwater migrating offsite no longer represents an unacceptablepotential risk for VI in the Vistula Area.”
Upon attainment of the IRG, per the process in Section 5.9, the Settling Parties will petition EPAto close out the Drag Strip remedial action and to close out the indoor air monitoring andmitigation program. Upon EPA approval of the Drag Strip remedial action closeout and theindoor air monitoring and remediation program closeout, groundwater monitoring at anddowngradient of the Drag Strip will transition to the PRP LR monitoring program.
For the Drag Strip, the PRP LR monitoring program will include an initial 2-year period ofquarterly groundwater monitoring from all shallow wells located on the Drag Strip property.Following this initial period, and assuming no contingency action is triggered, the Drag StripPRP LR monitoring will revert to the same 15-month frequency as the Railyard PRP LRmonitoring program. The Drag Strip PRP LR monitoring will include comprehensivepotentiometric measurements from all accessible Site wells and groundwater sample collectionfrom selected shallow, intermediate, and deep wells located on the Drag Strip property and in theVistula Area.
The shallow Drag Strip wells will continue to be monitored for compliance with the Drag StripRAO during PRP LR monitoring. Analytical results from the shallow monitoring wells withinand just downgradient of the treatment area hot spot will be compared to IRGs. If there is noIRG exceedance, PRP LR monitoring will continue. If there is an IRG exceedance, contingencyactions will be triggered. The contingency actions are designed to assess potential problemswith Drag Strip remedy effectiveness and with protectiveness of the remedy in the downgradientVistula Area.

Revision 3, Addendum 2 Final Design Report PRP Long-Term Response Monitoring
14951501.11014 43 Drag Strip 60 Percent Design
7.4.1 Contingency for IRG Exceedance
An exceedance of an IRG in a Drag Strip shallow monitoring well will be confirmed byresampling the affected well. A confirmed exceedance of an IRG will trigger quarterlymonitoring of shallow wells in the Vistula Area for a period of eight quarters; the 2-year durationaccounts for the groundwater flow velocity of approximately 850 feet per year (Section 3.1.3),and the approximately 1,600-ft distance (along the direction of groundwater flow through theVistula Area) from the western edge of the West Source Area to the St. Joseph River. During this2-year contingency monitoring period, reassessment of the effectiveness of the Drag Strip hotspot remedy will also take place. The reassessment will include sample collection and dataevaluation intended to address:
Potential changes in upgradient COCs concentration trends for groundwater flowing ontothe Drag Strip property,
Potential changes in groundwater hydraulics; and
Potential changes in groundwater biogeochemistry.
Results and findings of the reassessment investigation(s) will be used to develop a course ofaction for maintaining protectiveness of the in-situ remedy, up to and including conducting asupplemental injection event.
An exceedance of an IRG in the Vistula Area will be confirmed by resampling the affected well.A confirmed exceedance of an IRG in the Vistula Area will trigger indoor air and sub-slab vaporsampling requests to the property owners within a 150-ft radius of the affected well. Whereproperty owners have agreed to indoor air and sub-slab sampling, indoor air samples will becollected in accordance with Addendum 1 Vapor Monitoring Plan, (URS 2012c), and sub-slabsamples will be collected in accordance with Addendum 2 Vapor Monitoring Plan, (URS 2013f).The validated sample results will be compared to the current IAAL for CT (0.65 ppbv), to IASLsfor TCE and VC, and to sub-slab screening levels (SSSLs). The IASLs and SSSLs wereproposed in Addendum 2 Vapor Monitoring Plan (URS 2013f).
The validated sub-slab and paired indoor air results will undergo the following comparisons:

Revision 3, Addendum 2 Final Design Report PRP Long-Term Response Monitoring
14951501.11014 44 Drag Strip 60 Percent Design
CT
Criteria Outcome Decision
IAAL: 0.65 ppbvSSSL: 32.5 ppbv
Indoor Air > IAAL,AND
Sub-Slab > SSSL,OR
Sub-Slab < SSSL
Confirm IAAL exceedance, perVapor Monitoring Plan*
requirements.
Indoor Air < IAALSub-Slab > 10xSSSL
Begin semi-annual monitoring atlocation
Indoor Air < IAALSub-Slab < 10xSSSL
No further action at location
* URS Dames & Moore, (1999)
TCE and VC
Criteria
Outcome DecisionCOC Residential** Industrial**
IASL SSSL IASL SSSL
TCEVC
0.40.62
2031
1.6110.8
8055.4e3
Indoor Air > IASLSub-Slab > SSSL
Re-inspect location,review groundwaterdata, resample (if
needed)
Indoor Air < IASLSub-Slab > 10xSSSL
Begin semi-annualmonitoring at location
Indoor Air < IASLSub-Slab < 10xSSSL
No further action atlocation
CF will be assessed on a case-by-case basis due to its prevalence in indoor air.** Screening levels will be based on the location type. Commercial locations will be compared to Industrial indoor air andsub-slab screening levels.
An exceedance of the indoor air action level for CT will be confirmed by resampling the affectedbuilding. A confirmed exceedance of the CT indoor air action level will trigger installation of (orreactivation of) a sub-slab vapor mitigation system in accordance with the indoor air monitoringand mitigation program (URS Dames & Moore, 1999).
Indoor air sample results will also be compared to the IASLs, and if an exceedance occurs for oneor more compounds, further evaluation of the specific situation will be implemented such as re-inspection of the premises, review of groundwater data, or confirmation sampling.
Sub-slab sample results will be compared to SSSLs for the COCs, and as shown in the matrixabove, an exceedance of 10-times the SSSL will trigger semiannual indoor air and sub-slabmonitoring at that location. Semiannual monitoring events will take place during the Winter andSummer seasons, and will occur for a minimum of 2 years following the last triggering sub-slabsample result.

Revision 3, Addendum 2 Final Design Report PRP Long-Term Response Monitoring
14951501.11014 45 Drag Strip 60 Percent Design
7.5 PRP LR Monitoring Reporting
7.5.1 Monthly Reporting
Monthly progress reporting will continue for the Superfund Site during LR period. Thisreport is submitted in compliance with Section XI of the CD, and it will include a summary ofremedial system performance, data and findings from remedial action activities, deliverables,significant project communications and contacts, anticipated project activities in the comingweeks, and a discussion of potential problems encountered that could impact the projectschedule. The monthly report will be submitted by the tenth day of every month during theimplementation of remedial actions.
7.5.2 PRP LR Monitoring
A groundwater monitoring report will be submitted after the completion of optimized-frequency Railyard groundwater sampling event. This report will present the findings from themonitoring activities within the reporting period. All groundwater analytical results,potentiometric data, TPG evaluations, and KT3D_H2O capture analyses will be provided.Railyard O&M summary will be included. The cumulative progress towards achievement ofsite-wide RAO will be reported, and the evaluation will include, at a minimum, analyses oftemporal trends of COCs.
7.5.3 Other Reports
Groundwater analytical data, potentiometric data, and O&M data will be uploaded to EPA’sonline EquIS database at approximately 6-month intervals.
The IC Report will be prepared in accordance with the approved IC Work Plan, dated April 1,2011.
Revision 3, Addendum 2 Final Design Report Project Schedule
14951501.11014 46 Drag Strip 60 Percent Design
8.0 Project Schedule
A conceptual project schedule is presented in Table 4 for the Railyard and Drag Strip remedialaction activities described herein. The anticipated schedule for the Railyard is simplebecause the only remaining task is preparation and submittal and EPA approval of a revisedGMP necessary for implementing the PRP LR monitoring program.
For the Drag Strip, the schedule is currently determined by the timing of access approvalnecessary for the installation of the proposed new delineation monitoring well clusters, asmentioned in Section 5.5. The durations of subsequent remedial action activities that can beestimated at this time are also shown in Table 4.

Revision 3, Addendum 2 Final Design Report References
14951501.11014 47 Drag Strip 60 Percent Design
9.0 ReferencesAgency for Toxic Substances Disease Registry (ATSDR). 2005. Public Health Assessment forConrail Rail Yard. Elkhart, Elkhart County, Indiana. EPA Facility ID: IND000715490. August11, 2005.
Dames & Moore, 1998. Preliminary Design Report for the First RD/RA, December 18, 1998.
Dames & Moore, 1998. Addendum to the Preliminary Design Report for the First RD/RA,December 23, 1998.
Dames & Moore and HSI GeoTrans. 1998. Preliminary Design Report, Conrail Superfund Site,Elkhart Indiana, prepared for the Settling Parties, September, 1998.
Doherty, J., 2002. PEST; Model-Independent Parameter Estimation Users’ Manual. 4th Edition.Watermark Numerical Computing. 279 p. January 2002.
EPA, 1990. National Contingency Plan for Superfund Site Remediation (National ContingencyPlan (NCP). 55 Fed. Reg. 8665-8865. March 8, 1990.
EPA, 1994. Remedial Investigation/Feasibility Study Conrail Site, Elkhart, Indiana, RemedialInvestigation Report. Ecology & Environment, March 31, 1994.
EPA, 2009. Third Five-Year Review Report. Conrail Railyard Superfund Site, Elkhart, Indiana.June 2009.
EPA, 2009a. Statistical Analysis of Groundwater Monitoring Data at RCRA Facilities, UnifiedGuidance, EPA 530/R-09-007, March 2009.
EPA, 2011. EPA (Tim Drexler) email to URS (Tony Limke) May 9, 2011, Drag Strip RemedialAction Objectives.
EPA, 2011a. Tim Drexler, EPA, Mass Flux Letter to Tony Limke, URS, October 11, 2011.
EPA, 2011b. Background Indoor Air Concentrations of Volatile Organic Compounds in NorthAmerican Residences (1990–2005): A Compilation of Statistics for Assessing Vapor Intrusion.June 2011.
EPA, 2012. Conceptual Model Scenarios for the Vapor Intrusion Pathway. EPA 530-R-10-003. February 2012.
EPA, 2012a. Revised Screening Levels for the Conrail Rail Yard Site, located in Elkhart,Indiana. Memorandum from Keith Fusinski to Tim Drexler. March 28, 2012.
EPA. 2012b. Conceptual Model Scenarios for the Vapor Intrusion Pathway. EPA 530-R-10-003. February 2012.
EPA, 2013. Regional Screening Levels (formerly PRGs),http://www.epa.gov/region9/superfund/prg, November 2013.
EPA, 2013a. Vapor Intrusion Screening Level (VISL) Calculator.http://www.epa.gov/oswer/vaporintrusion/guidance.html, December 2013.
EPA, 2013b. EPA Letter to URS, dated July 12, 2013
EPA, 2013c. EPA Letter to URS dated November 6, 2013

Revision 3, Addendum 2 Final Design Report References
14951501.11014 48 Drag Strip 60 Percent Design
EPA, 2013d. Memorandum from Mathy Stanislaus, Assistant Administrator to RegionalAdministrators I-X, and OSWER Office Directors: Encouraging Greener Cleanup Practicesthrough Use of ASTM International' s Standard Guide for Greener Cleanups, December 23,2013
EPA, 2014. EPA (Tim Drexler) email to URS (Tony Limke) February 21, 2014. Conrail SiteDrag Strip Area: Number and location of subslab samples.
EPA, 2014a. Comments Letter Regarding Revision 2, Addendum 2 Final Design, ConrailRailyard Superfund Site dated May 16, 2014 (30% Design Report), July 11, 2014.
EPA, 2014b. Comments Letter Regarding “September 19, 2014 Comments, and TechnicalMemorandum: Intermediate Remediation Goal Calculation, November 4, 2014.
EPA, 2015. Comments Letter Regarding Technical Memorandum: Indoor Air and Sub-SlabVapor Monitoring – Spring 2014 Event, Conrail Railyard Superfund Site, Elkhart, Indiana,dated December 9, 2014, January 16, 2015.
Hill, M., E. Banta, A. Harbaugh, and E. Anderman, 2000. MODFLOW-2000, The U.S.Geological Survey Modular Ground-Water Model; User Guide to the Observation, Sensitivity,and Parameter-Estimation Processes and Three Post-Processing Programs. Open-File Report00184. U.S. Geological Survey. Denver, CO.
ITRC 2007. Vapor Intrusion Pathway: A Practical Guideline.
McDonald, M.G. and Harbaugh, A.W., 1988. A Modular Three-Dimensional Finite-DifferenceGroundwater Flow Model. Book 6, Chapter A1. Techniques of Water-Resources Investigationsof the United States Geological Survey. U.S. Geological Survey. Reston VA.
Parsons, 2011. The Substrate Estimating Tool for Enhanced Anaerobic Bioremediation ofChlorinated Solvents.
S.S. Papadopoulos & Associates, Inc. (SSPA), 2010. Evaluation of Indoor Air Monitoring.Conrail Superfund Site, Elkhart, Indiana. May 7, 2010.
URS Dames & Moore, 1999. 95% Design for the First Remedial Design/Remedial Action,Conrail Superfund Site, Elkhart, Indiana, December 1999, (Vapor Monitoring Plan).
URS, 2001. Second Remedial Design/Remedial Action Work Plan, Conrail Railyard SuperfundSite, Elkhart, Indiana, dated January 18, 2001.
URS, 2002. Second RD/RA Preliminary Design Report.
URS, 2003a. Final Design Report Conrail Railyard Superfund Site Containment GroundwaterPumping and Treatment System, July 14, 2003.
URS, 2003b. Work Plan for Relocation and Pilot Testing of GCW Treatment System, OsceolaDrag Strip, Conrail Railyard Superfund Site, Elkhart, Indiana, November 25, 2003.
URS, 2005a. Pilot Testing of GCW Treatment System. Osceola Drag Strip. ConrailRailyard Superfund Site. January 20, 2005.
URS, 2005b. Phase 4, Year 2004 Benthic Macroinvertebrate Annual Sampling and 2000-2004 Cumulative Assessment in the Vicinity of the Conrail Railyard Superfund Site, May10, 2005.
URS, 2007. Downgradient Groundwater Action Plan, Second Remedial Design/RemedialAction. Conrail Railyard Superfund Site. February 16, 2007.

Revision 3, Addendum 2 Final Design Report References
14951501.11014 49 Drag Strip 60 Percent Design
URS, 2010a. Revision 4, Five-Year Review Investigation Work Plan, Conrail RailyardSuperfund Site, Elkhart, Indiana, June 8, 2010.
URS, 2010b. Response, Evaluation of Indoor Air Monitoring, December 3, 2010.
URS, 2010c. Revision 2, Institutional Controls Work Plan, Conrail Railyard Superfund Site,June 10, 2010.
URS, 2011. Addendum Final Design Report, Containment Groundwater Pumping andTreatment System, Conrail Railyard Superfund Site, Elkhart, Indiana, June 30, 2011.
URS, 2012a. Addendum 2, Final Design Report, Conrail Railyard Superfund Site ContainmentGroundwater Pumping and Treatment System, November 9, 2012 (Addendum 2 Final Design).
URS, 2012b. Substantial Completion Letter to EPA, dated September 29, 2012.
URS, 2012c. Addendum 1 to Vapor Monitoring Plan, 95 % Design For The First RemedialDesign/Remedial Action (RD/RA) Work Plan, Supplemental Scope and Updated SamplingProcedures, February 29, 2012.
URS, 2013a. Revision 1, Addendum 2, Final Design Report, Conrail Railyard Superfund SiteContainment Groundwater Pumping and Treatment System, April 17, 2013 (Revision 1,Addendum 2, Final Design).
URS, 2013b. Five-Year Review Investigation Report, Conrail Railyard Superfund Site,Elkhart, Indiana, February 28, 2013.
URS, 2013c. Construction Completion Report, Groundwater Containment Pumping andTreatment System Upgrades, Conrail Superfund Site, Elkhart, Indiana, July 25, 2013(Construction Completion Report).
URS, 2013d. Groundwater Risk Evaluation, Conrail Superfund Site, Elkhart, Indiana,December 6, 2013.
URS, 2013e. Technical Memorandum: Groundwater Plume Stability Analysis, December 13,2013.
URS, 2013f. Addendum 2 Vapor Monitoring Plan, 95 % Design For The First RemedialDesign/Remedial Action (RD/RA) Work Plan, Updated Sampling Procedures: Sub-Slab VaporSampling, Conrail Railyard Superfund Site, Elkhart, Indiana, April 17, 2013 (Addendum 2Vapor Monitoring Plan).
URS, 2014. Year 9 Performance Evaluation, Conrail Railyard Superfund Site, Elkhart, IN.April 30, 2014.
URS 2014a. Revision 2, Addendum 2, Final Design Report, Conrail Railyard SuperfundSite (30 Percent Design), May 16, 2014
URS, 2014b, Revision 1, Technical Memorandum: Groundwater Plume Stability Analysis,March 31, 2014.
URS, 2014c. Response to EPA July 11, 2014 Comments, and Technical Memorandum:Intermediate Remediation Goal Calculation, Conrail Railyard Superfund Site Elkhart,Indiana, September 19, 2014.
URS 2014d. Five-Month Interim Report, Drag Strip Microcosm Study, Attachment 2 to theAugust 2014 Monthly Progress Report, September 10, 2014.
URS 2014e – Technical Memorandum: Indoor Air and Sub-Slab Vapor Monitoring – Spring2014 Event, Conrail Railyard Superfund Site, Elkhart, Indiana, December 9, 2014.

Tables

Table 1
Shallow and Intermediate-Depth Constituents of Concern Data
Addendum 2 Final Design (60 Percent Design)
Conrail Railyard Superfund Site
Carbon Tetrachloride (CT)
Well ID 12/12/12 3/14/13 6/20/13 9/30/13 12/13/13 3/28/14 6/13/14 9/12/14 Mean
95%
Confidence
Interval
95% UCL,
CT
DSMW-01 70 73 51 61 63 53 49 56 59.5 3.55 63
DSMW-02 190 180 110 170 130 170 250 180 172 30.0 202
DSMW-03 35 32 67.5 88 52 29 41 67 51.4 9.71 61.1
DSMW-04I 680 990 970 450 510 820 660 700 722 76.8 799
DSMW-04S 710 500 470 630 610 610 440 680 581 61.3 643
DSMW-07I 1400 900 975 1250 1100 1300 1100 1500 1,191 115 1306
DSMW-07S 1300 890 700 1100 910 750 570 1000 902 113 1016
DSMW-08I 95 95.5 69 92 72 90 81 91 85.7 5.33 91
DSMW-08S 33 29 25 37 26 31 27 34 30.2 2.22 32.5
DSMW-09I 330 180 260 440 420 390 340 460 352 30.4 383
DSMW-09S 19 23 16 28 25 22 16 18 20.9 2.42 23.3
DSMW-10I 4.15 7 3.55 3.35 2.1 1.45 5 5 3.95 1.13 5.08
DSMW-10S 1 U 1 U 1 U 1 U 1 U 1 U 1 U 1 U 1 U - 1 U
DSMW-11I 280 390 335 76.2 411
DSMW-11S 68 130 99.0 43.0 142
DSMW-12I 180 330 255 104 359
DSMW-12S 9.3 13 11.2 2.56 13.7
MW-05D 8.2 7.6 7 8.7 9.5 8.2 7.4 11 8.45 0.946 9.4
MW-05S 1 U 1 U 1 U 1 U 1 U 1 U 1 U 1 U 1 U - 1 U
MW-07S 1 U 1 U 1 U 1 U 1 U 1 U 1 U 1 U 1 U - 1 U
MW-08D 80 84 66 79 80 67 56 63 71.9 6.05 77.9
MW-08S 100 77 72 87 92 29 40 53 68.8 16.5 85.2
MW-09S 1 U 1 U 1 U 1 U 1 U 1 U 1 U 1 U 1 U - 1 U
MW-38D 190 160 165 150 120 150 110 210 157 27.0 184
MW-38S 65 26 36 72 50 23 30 100 50.2 20.9 71.1
MW-56I 170 94 120 150 180 150 80 80 128 30.4 158
MW-56S 100 48 130 160 140 110 46 120 107 24.4 131
MW-57S 1 U 1 U 1 U 1 U - 1 U
MW-58S 91 75 89 85.0 8.05 93.1
MW-59S 1 U 1 U 1 U 1 U - 1 U
MW-60S 88 73 84 81.7 7.18 88.8
14951501.11014 Page 1 of 3 1/30/15

Table 1
Shallow and Intermediate-Depth Constituents of Concern Data
Addendum 2 Final Design (60 Percent Design)
Conrail Railyard Superfund Site
Trichloroethene (TCE)
Well ID 12/12/12 3/14/13 6/20/13 9/30/13 12/13/13 3/28/14 6/13/14 9/12/14 Mean
95%
Confidence
Interval
95% UCL,
TCE
DSMW-01 140 120 120 110 100 110 110 130 117 7.551268395 125
DSMW-02 20 25 13 19 12 22 25 17 19.1 3.43 22.6
DSMW-03 6.7 6.2 10.5 8.6 7.9 4.9 7.7 9 7.69 1.05 8.74
DSMW-04I 20 22 24 10 18 25 19 15 19.1 2.52 21.6
DSMW-04S 35 34 32 32 31 33 24 31 31.5 2.37 33.9
DSMW-07I 34 33 35.5 26.5 27 33 24 26 29.9 2.32 32.2
DSMW-07S 110 89 76 88 79 65 51 71 78.6 7.09 85.7
DSMW-08I 810 715 750 750 700 840 680 830 759 50.5 810
DSMW-08S 38 30 29 24 23 30 22 22 27.2 2.32 29.6
DSMW-09I 910 800 860 730 720 720 630 770 768 35.0 802
DSMW-09S 61 90 59 77 83 75 46 62 69.1 9.71 78.8
DSMW-10I 3200 2800 2700 2500 2300 2600 2500 2800 2,675 125 2,800
DSMW-10S 1.3 0.24 0.64 1.2 0.98 0.5 0.28 0.42 0.695 0.182 0.877
DSMW-11I 38 44 41.0 4.16 45.2
DSMW-11S 15 18 16.5 2.08 18.6
DSMW-12I 43 61 52.0 12.5 64.5
DSMW-12S 8.3 9.7 9.00 0.970 9.97
MW-05D 16 19 17 16 15 18 14 19 16.8 1.43 18.2
MW-05S 1 U 1 U 1 U 1 U 1 U 1 U 1 U 1 U 1 U - 1 U
MW-07S 0.5 0.5 0.5 0.5 0.5 0.45 0.5 0.5 0.494 0.015 0.509
MW-08D 13 12 12 11 10 10 11 10 11.1 0.300 11.4
MW-08S 12 7.4 11 19.7 8.8 2.6 4.3 6.9 9.09 1.65 10.7
MW-09S 0.5 0.5 0.5 0.5 0.5 0.22 0.5 0.71 0.491 0.121 0.612
MW-38D 28 25 21.5 15 17 11 10 15 17.8 1.98 19.8
MW-38S 7.3 5.1 6.2 8.3 8 4.4 5.1 12 7.05 2.07 9.12
MW-56I 22 18 14 14 17 17 13 9.2 15.5 2.25 17.8
MW-56S 11 8.1 13 14 12 11 7 13 11.1 1.58 12.7
MW-57S 1 U 1 U 1 U 1 U - 1 U
MW-58S 14 12 15 13.7 1.41 15.1
MW-59S 1 U 1 U 1 U 1 U - 1 U
MW-60S 9.3 8.3 10 9.20 0.789 9.99
14951501.11014 Page 2 of 3 1/30/15

Table 1
Shallow and Intermediate-Depth Constituents of Concern Data
Addendum 2 Final Design (60 Percent Design)
Conrail Railyard Superfund Site
Chloroform (CF)
Well ID 12/12/12 3/14/13 6/20/13 9/30/13 12/13/13 3/28/14 6/13/14 9/12/14 Mean
95%
Confidence
Interval
95% UCL,
CF
DSMW-01 3.2 3 3 2.6 2.9 2.2 2.8 3.1 2.85 0.232 3.08
DSMW-02 5.4 5 5.7 5.4 7.2 4.5 6.2 6.2 5.70 0.673 6.37
DSMW-03 11 11 18 15 13 12 13 14 13.4 0.490 13.9
DSMW-04I 91 110 120 82 94 120 100 100 102 6.82 109
DSMW-04S 37 37 34 35 31 39 23 33 33.6 3.97 37.6
DSMW-07I 31 32 36 45 56 74 71 91 54.5 8.61 63.1
DSMW-07S 21 21 15 12 12 13 11 14 14.9 0.775 15.6
DSMW-08I 17 15 18 17 17 20 16 20 17.5 1.24 18.7
DSMW-08S 2.6 2.6 3 3.1 2.8 3.1 2.6 3 2.85 0.133 2.98
DSMW-09I 33 36 40 42 47 50 42 47 42.1 1.99 44.1
DSMW-09S 1.8 1.9 1.5 2.2 2.2 2.2 1.4 2 1.90 0.227 2.13
DSMW-10I 4.15 7 3.55 3.35 1.2 1.45 5 5 3.84 1.27 5.11
DSMW-10S 1 U 1 U 1 U 1 U 1 U 1 U 1 U 1 U 1 U - 1 U
DSMW-11I 32 39 35.5 4.85 40.4
DSMW-11S 23 17 20.0 4.16 24.2
DSMW-12I 50 39 44.5 7.62 52.1
DSMW-12S 3.4 2.5 2.95 0.624 3.57
MW-05D 16 3.8 3.7 3.6 4 4.8 3.6 4.5 5.50 0.319 5.82
MW-05S 1 U 1 U 1 U 1 U 1 U 1 U 1 U 1 U 1 U - 1 U
MW-07S 1 U 1 U 1 U 1 U 1 U 1 U 1 U 1 U 1 U - 1 U
MW-08D 13 15 14 14 14 13 14 14 13.9 0.300 14.2
MW-08S 12 9.7 9 9.6 9.3 4.3 4.5 8 8.30 1.51 9.81
MW-09S 1 U 1 U 1 U 1 U 1 U 1 U 1 U 1 U 1 U - 1 U
MW-38D 28 38 34 17 15 15 10 20 22.1 2.45 24.6
MW-38S 7.3 15 18 14 15 13 16 15 14.2 0.755 14.9
MW-56I 22 23 16 16 16 18 15 12 17.2 1.50 18.8
MW-56S 11 12 14 17 15 11 11 16 13.4 1.58 15.0
MW-57S 1 U 1 U 1 U 1 U - 1 U
MW-58S 5.4 5.2 6.9 5.83 0.858 6.69
MW-59S 1 U 1 U 1 U 1 U - 1 U
MW-60S 11 11 13 11.7 1.07 12.7
UCL = Upper Confidence Level
U = Not detected at the reporting limit shown
"-" = Not detected
14951501.11014 Page 3 of 3 1/30/15

Table 2
Monitoring Parameters and Pilot Test Sampling Plan
Addendum 2 Final Design (60 Percent Design)
Conrail Railyard Superfund Site
Analyses
Extraction
Aqueous Chemistry UP-1 IW-1 IW-2 R-1 R-2 VR A15-1 A15-2 A30-1 A30-2 AD15-1 AD15-2 AD30-1 AD30-2 ADV15 ADV30 ADV45
COCs D
RSK-175 Gases D
VFAs D
TOC D
Anions* D
Ferrous Iron D
Bicarbonate Alkalinity nc
Microbial Members
DHC, DHB, DSM, DSB F
Field Monitoring
Temperature A
pH A
ORP A
Sp. Conductivity A
DO A
Notes:
Schedule A = Baseline, and every two weeks through week 12 Schedule D = Baseline, and at 8 and 12 weeks nc = not collected
Schedule B = Baseline, and at 2, 4, 8, and 12 weeks Schedule E = Baseline and at 12 weeks
Schedule C = Baseline, and at 4, 8, and 12 weeks Schedule F = Baseline only
COCs = Constituents of concern:
Carbon tetrachloride trans-1,2-Dichloroethene DHC - Dehalococcoides spp., including functional genes
Chloroform Tetrachloroethene DHB - Dehalobacter spp.
Chloromethane 1,1,1-Trichloroethane DSM - Desulfuromonas spp.
1,1-Dichloroethene Trichloroethene DSB - Desulfitobacterium spp.
cis-1,2-Dichloroethene Vinyl chloride
VFAs = Volatile fatty acids
ORP = Oxidation-reduction potential
*Anions = Chloride, Nitrate-N, Nitrite-N, Sulfate, Phosphate
Baseline = Before injection
RSK 175 gases are ethene, ethane, and methane
Inject = Delivery of selected compounds to the aquifer
Bioaugment = Injection of KB-1 Plus will be conducted at the time of injection and re-evaluated for reapplication based on microbial member analyses at 4 weeks.
NOTE 1: Field monitoring results will be used to evaluate pH and ORP, and to make adaptive modifications to the monitoring schedule as needed.
NOTE 2: The length of the pilot test may be shorter or longer than shown here depending on real-time evaluation of monitoring wells.
A
A
A
A
Microbial Members Include:
E nc nc nc
A
AA
A
A
A
A
A
A
A
A
E
A
E
A
A
A
B B
nc
C
B
B
C
B
C
C
C
D
C
C
B
C
C
C
D
A
A
C C
C C
B
E
AA
A
A
E
C
B
B
D
B
Pilot Test Monitoring Wells - Sampling Schedule For Shallow and Intermediate Zone Wells
C C C
ROI Overlap, Advection, andDiffusionAdvection and diffusionAdvectionRadius of InfluenceInjection
14951501.11014 1/30/15
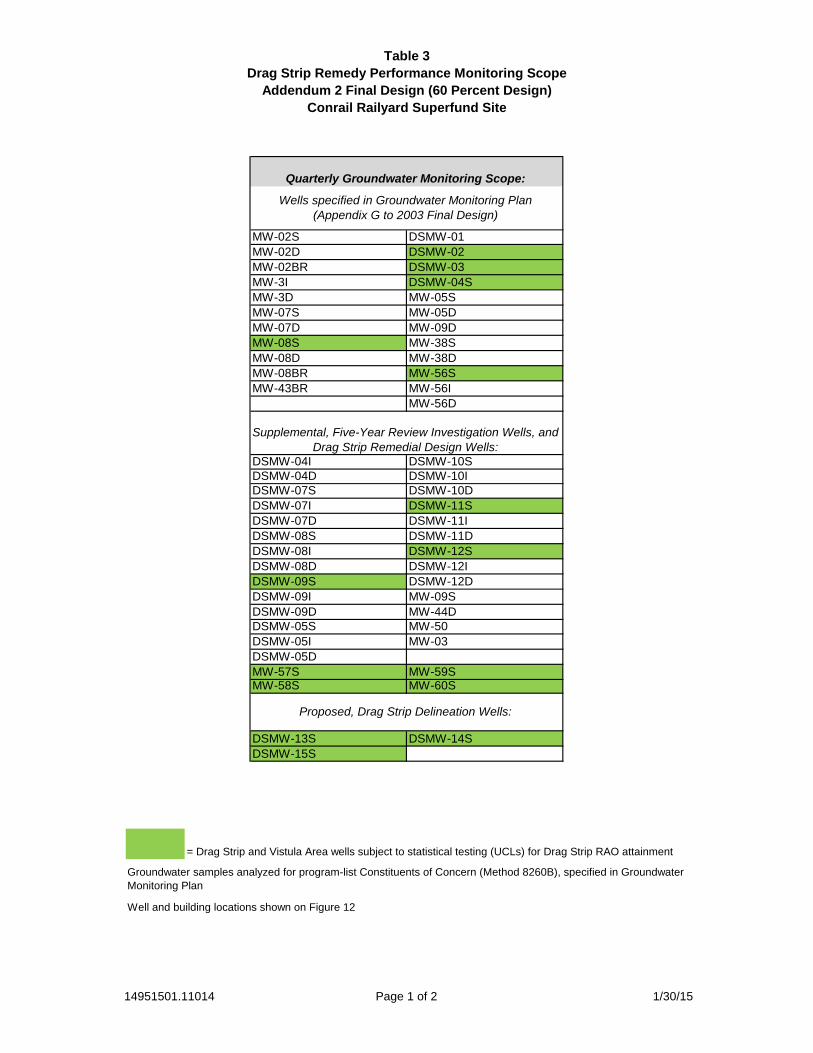
Table 3
Drag Strip Remedy Performance Monitoring Scope
Addendum 2 Final Design (60 Percent Design)
Conrail Railyard Superfund Site
MW-02S DSMW-01
MW-02D DSMW-02
MW-02BR DSMW-03
MW-3I DSMW-04S
MW-3D MW-05S
MW-07S MW-05D
MW-07D MW-09D
MW-08S MW-38S
MW-08D MW-38D
MW-08BR MW-56S
MW-43BR MW-56I
MW-56D
DSMW-04I DSMW-10SDSMW-04D DSMW-10IDSMW-07S DSMW-10D
DSMW-07I DSMW-11S
DSMW-07D DSMW-11I
DSMW-08S DSMW-11D
DSMW-08I DSMW-12S
DSMW-08D DSMW-12I
DSMW-09S DSMW-12D
DSMW-09I MW-09S
DSMW-09D MW-44DDSMW-05S MW-50
DSMW-05I MW-03
DSMW-05D
MW-57S MW-59SMW-58S MW-60S
DSMW-13S DSMW-14S
DSMW-15S
Well and building locations shown on Figure 12
Groundwater samples analyzed for program-list Constituents of Concern (Method 8260B), specified in Groundwater
Monitoring Plan
= Drag Strip and Vistula Area wells subject to statistical testing (UCLs) for Drag Strip RAO attainment
Quarterly Groundwater Monitoring Scope:
Wells specified in Groundwater Monitoring Plan(Appendix G to 2003 Final Design)
Supplemental, Five-Year Review Investigation Wells, andDrag Strip Remedial Design Wells:
Proposed, Drag Strip Delineation Wells:
14951501.11014 Page 1 of 2 1/30/15

TABLE 3 DRAG STRIP REMEDY PERFORMANCE MONITORING SCOPE
HAS BEEN REDACTED - ONE PAGE
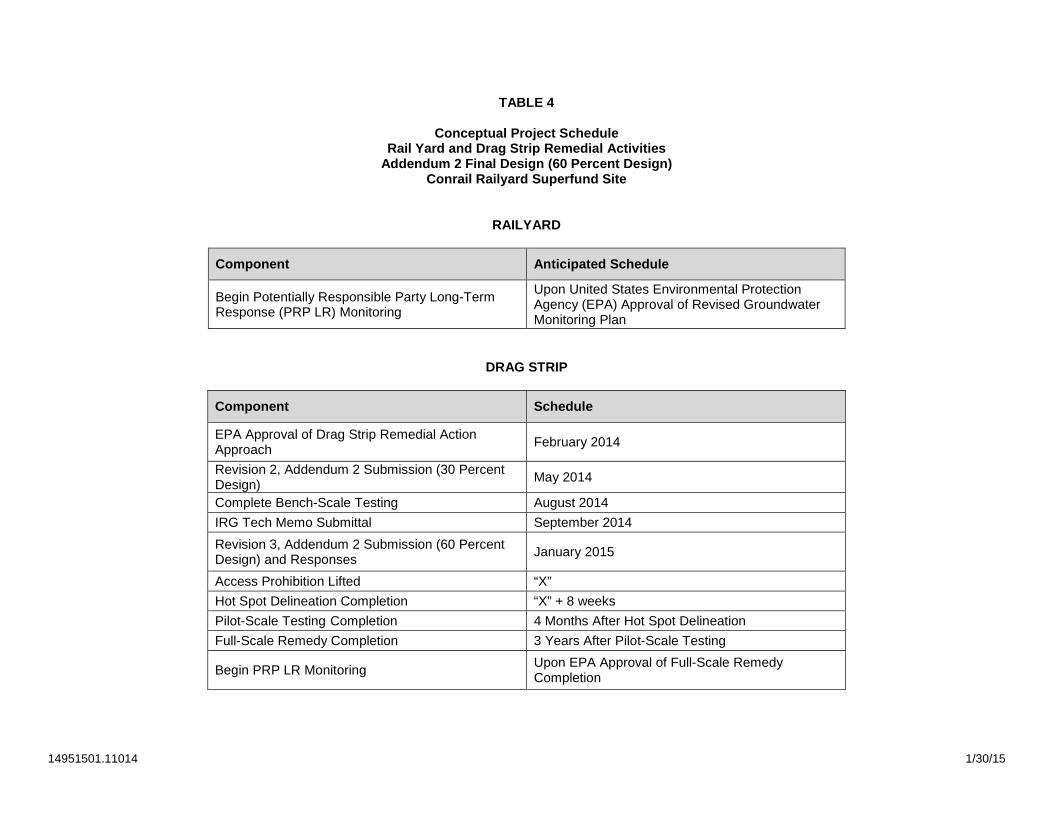
14951501.11014 1/30/15
TABLE 4
Conceptual Project ScheduleRail Yard and Drag Strip Remedial Activities
Addendum 2 Final Design (60 Percent Design)Conrail Railyard Superfund Site
RAILYARD
Component Anticipated Schedule
Begin Potentially Responsible Party Long-TermResponse (PRP LR) Monitoring
Upon United States Environmental ProtectionAgency (EPA) Approval of Revised GroundwaterMonitoring Plan
DRAG STRIP
Component Schedule
EPA Approval of Drag Strip Remedial ActionApproach
February 2014
Revision 2, Addendum 2 Submission (30 PercentDesign)
May 2014
Complete Bench-Scale Testing August 2014
IRG Tech Memo Submittal September 2014
Revision 3, Addendum 2 Submission (60 PercentDesign) and Responses
January 2015
Access Prohibition Lifted “X”
Hot Spot Delineation Completion “X” + 8 weeks
Pilot-Scale Testing Completion 4 Months After Hot Spot Delineation
Full-Scale Remedy Completion 3 Years After Pilot-Scale Testing
Begin PRP LR MonitoringUpon EPA Approval of Full-Scale RemedyCompletion

Figures

APPROXIMATE SCALE IN FEET
0 2,000 4,000
BASE MAP SOURCE: USGS 7½ minute topographic
quadrangle map Osceola, Indiana 1969, revised 1994.
QuadrangleLocation
IN
VISTULA A
REA
DRAG STRIP
RAIL YARD
J:\Project \E\Elkhart \14951501 NS Conrai l Elkhart Consul t ing Assistance 2014-2015\Data-Tech\TI\ f ig1. fh10
NN
LEGEND:
Approximate Osceola Drag StripProperty Boundary
Approximate NS RailyardProperty Boundary
FIGURE 1
SITE VICINITY MAP
JOB NO. 14951501
CONRAIL RAILYARD SITEELKHART, INDIANA
COUNTY ROAD 1
AREA

AAA
AAA
A
A
A
A
AA
A
AAAAAAAAA
AAA AAA
AAA
AAA
AAA
AAA
A
AA
AAA
AA
AA
AA
A
A
AAA
A
A
A
A
A
ÓÇ
MW-50
GCW-2
MW-56(S,I,D)
MW-44D
MW-38(S,D)
MW-37(S,D)
MW-09(S,D)MW-08S
MW-08D
MW-07S
MW-05(S,D)
MW-08BR
DSMW-02DSMW-01
DSMW-10(S,I,D)DSMW-09(S,I,D)
DSMW-08(S,I,D)
DSMW-03
DSMW-07(S,I,D)
DSMW-06(S,I,D)DSMW-05(S,I,D)
DSMW-04(S,I,D)
MW-3(I,D)
OSCEOLA DRAG STRIPMW-60S
MW-57S
DSMW-11 (S,I,D)
DSMW-12 (S,I,D)
MW-59S
MW-58S
Indiana
Wolf
Jefferson
Charles
Blaine
Lehman
Vistula
Alex
Neely
Edgewater
Ashwood Forest
Elizabeth
Sheri
dan
Rosewood
48th
Highland
49th
Pearly
Ryan
Burba
nkNeely
ELKHART
See Figure 3
ST. JOSEPH RIVER
BASE MAP SOURCE: U.S. Census Bureau,GIS Section, 2010.ST
. JOS
EPH
Docu
ment
Path:
J:\G
IS\Pr
ojects
\small
projec
ts\elk
hart\g
is\14
9515
01_1
1014
\Figu
re 2 D
ragstr
ip Lo
catio
n Map
.mxd 0 400 800
Scale in Feet
³
Legend
A Monitoring WellÓÇ Dragstrip Extraction Well
Property LinesCounty Line
CONRAIL RAILYARD SITEELKHART, INDIANA
FIGURE 2DRAG STRIP AREA LOCATION MAP
JOB NO. 14951501

FIGURE 3: DRAG STRIP AREA MAPWITH WELL AND SOIL GAS SAMPLE LOCATIONS
AND
FIGURE 4: DRAG STRIP PROPERTY WITHCROSS-SECTION LOCATIONS
HAVE BEEN REDACTED – TWO PAGES
CONTAINS POTENTIAL PERSONALLY-IDENTIFYING INFORMATION

J:\
Pro
jec
t\E
\Elk
ha
rt\1
49
51
50
1 N
S C
on
rail
E
lkh
art
C
on
su
ltin
g A
ss
ista
nc
e 2
01
4-2
01
5\D
ata
-Te
ch
\TI\
fig
5a
.fh
10
FIGURE 5A
CROSS-SECTION A-A' - SECTION 1
JOB NO. 14951501
CONRAIL RAILYARD SITEELKHART, INDIANA
EL
EV
AT
ION
(F
EE
T, M
SL
)
730
700
670
640
610
595
715
685
655
625
580
565
AWEST
550
745
SCALE IN FEET
VERTICAL EXAGGERATION = 3.33x
30
00 100
To A'EAST
GP Poorly-Graded Gravels
GW Well-Graded Gravels
Lower Spatially VariableUnit Sand/Gravel Mixtures
SP Poorly-Graded Sands
SW Well-Graded Sands
SM Silty Sands
NOTE:
� Cross-Section location shown on Figure 4.
� The depth and thickness of the strata
indicated on the subsurface section were
obtained by interpolating between test
borings. Information on actual conditions
exists only at the locations of the test
borings and it is possible that the conditions
may vary from those indicated.
EL
EV
AT
ION
(F
EE
T, M
SL
)
730
700
670
640
610
595
715
685
655
625
580
565
745
U01
DS
MW
-08S
, I, D
DS
MW
-07S
, I, D
W15
W18
Western Drag StripProperty Boundary
SC Sand with Clay
ML Silt
CL Clay
SH Shale
32 1306 63
42 1U 1U132 0.60 1U
86 1016 1630 32 3
810 91 19
Trichloroethene (TCE)Groundwater Concentration(µg/L)(95% UCL 2012-2014)
Carbon Tetrachloride (CT)Groundwater Reporting Limit andNon-Detect Flag (µg/L)
Chloroform Groundwater Concentration(µg/L)(95% UCL 2012-2014)
23
1U
36
LEGEND:Approximate Potentiometric Surface (MeasuredDecember 2013), Dashed Where Inferred
Monitoring Well Groundwater Sample
2010 Soil Boring Location (Dashed Where OnlyGroundwater Sample Collected, No LithologicCharacterization)
Well Location
Screened Interval

J:\
Pro
jec
t\E
\Elk
ha
rt\1
49
51
50
1 N
S C
on
rail
E
lkh
art
C
on
su
ltin
g A
ss
ista
nc
e 2
01
4-2
01
5\D
ata
-Te
ch
\TI\
fig
5b
.fh
10
FIGURE 5B
CROSS-SECTION B-B' - SECTION 1
JOB NO. 14951501
CONRAIL RAILYARD SITEELKHART, INDIANA
SCALE IN FEET
VERTICAL EXAGGERATION = 3.33x
30
00 100
Western Drag StripProperty Boundary
GW Well-Graded Gravels
Lower Spatially VariableUnit Sand/Gravel Mixtures
SP Poorly-Graded Sands
SW Well-Graded Sands
SM Silty Sands
To B'SOUTHEAST
NOTE:
� Cross-Section location shown on Figure 4.
� The depth and thickness of the strata
indicated on the subsurface section were
obtained by interpolating between test
borings. Information on actual conditions
exists only at the locations of the test
borings and it is possible that the conditions
may vary from those indicated.
EL
EV
AT
ION
(F
EE
T, M
SL
)
730
700
670
640
610
595
715
685
655
625
580
565
745
MW
-08S
, D
, B
R
DS
MW
-11S
,I,D
(Pro
jecte
d)
EL
EV
AT
ION
(F
EE
T, M
SL
)
730
700
670
640
610
595
715
685
655
625
580
565
BNORTHWEST
550
745
1.9 1U 1U
11 78 11
11 85 9.8
LEGEND:SC Sand with Clay
ML Silt
CL Clay
SH Shale
Approximate Potentiometric Surface (MeasuredDecember 2013), Dashed Where Inferred
Monitoring Well Groundwater Sample
2010 Soil Boring Location (Dashed Where OnlyGroundwater Sample Collected, No LithologicCharacterization)
Well Location
Screened Interval
Trichloroethene (TCE)Groundwater Concentration(µg/L)(95% UCL 2012-2014)
Carbon Tetrachloride (CT)Groundwater Reporting Limit andNon-Detect Flag (µg/L)
ChloroformGroundwater Concentration(µg/L)(95% UCL 2012-2014)
23
1U
36
19 142 24
45 411 40
26 45 155

J:\
Pro
jec
t\E
\Elk
ha
rt\1
49
51
50
1 N
S C
on
rail
E
lkh
art
C
on
su
ltin
g A
ss
ista
nc
e 2
01
4-2
01
5\D
ata
-Te
ch
\TI\
fig
5c
.fh
10
FIGURE 5C
CROSS-SECTION C-C'
JOB NO. 14951501
CONRAIL RAILYARD SITEELKHART, INDIANA
SCALE IN FEET
VERTICAL EXAGGERATION = 3.33x
30
00 100
Western Drag StripProperty Boundary
NOTE:
� Cross-Section location shown on Figure 4.
� The depth and thickness of the strata
indicated on the subsurface section were
obtained by interpolating between test
borings. Information on actual conditions
exists only at the locations of the test
borings and it is possible that the conditions
may vary from those indicated.
GW Well-Graded Gravels
Lower Spatially VariableUnit Sand/Gravel Mixtures
SP Poorly-Graded Sands
SW Well-Graded Sands
SC Sand with Clay
ML Silt
C'EAST
EL
EV
AT
ION
(F
EE
T, M
SL
)
730
700
670
640
610
595
715
685
655
625
580
565
745
550
LEGEND:Approximate Potentiometric Surface (MeasuredDecember 2013), Dashed Where Inferred
Monitoring Well Groundwater Sample
2010 Soil Boring Location (Dashed Where OnlyGroundwater Sample Collected,No Lithologic Characterization)
Well Location
Screened Interval
Trichloroethene (TCE)Groundwater Concentration(µg/L)(95% UCL 2012-2014)
Carbon Tetrachloride (CT)Groundwater Reporting Limit andNon-Detect Flag (µg/L)
ChloroformGroundwater Concentration(µg/L)(95% UCL 2012-2014)
23
1U
36
EL
EV
AT
ION
(F
EE
T, M
SL
)
730
700
670
640
610
595
715
685
655
625
580
565
CWEST
550
745
DS
MW
-09S
, I, D
/E
09 (
Pro
jecte
d)
E14
E12
E11
E06
E01
W12
GC
W-2
DS
MW
-04S
, I, D
W02
MW
-38S
, D
CL Clay
SH Shale
22 799
109
9.3 1U 0.5
34 643 38
79 23 2.1
802 383 44
42 1U 0.45
9.1 71 15
20 184 25

J:\
Pro
jec
t\E
\Elk
ha
rt\1
49
51
50
1 N
S C
on
rail
E
lkh
art
C
on
su
ltin
g A
ss
ista
nc
e 2
01
4-2
01
5\D
ata
-Te
ch
\TI\
fig
5d
.fh
10
SCALE IN FEET
VERTICAL EXAGGERATION = 3.33x
30
00 100
FIGURE 5D
CROSS-SECTION D-D'
JOB NO. 14951501
CONRAIL RAILYARD SITEELKHART, INDIANA
NOTE:
� Cross-Section location shown on Figure 4.
� The depth and thickness of the strata
indicated on the subsurface section were
obtained by interpolating between test
borings. Information on actual conditions
exists only at the locations of the test
borings and it is possible that the conditions
may vary from those indicated.
D'NORTHEAST
EL
EV
AT
ION
(F
EE
T, M
SL
)
730
700
670
640
610
595
715
685
655
625
580
565
745
550
LEGEND:Approximate Potentiometric Surface (MeasuredDecember 2013), Dashed Where Inferred
Monitoring Well Groundwater Sample
2010 Soil Boring Location (Dashed Where OnlyGroundwater Sample Collected,No Lithologic Characterization)
Well Location
Screened Interval
EL
EV
AT
ION
(F
EE
T, M
SL
)
730
700
670
640
610
595
715
685
655
625
580
565
DSOUTHWEST
550
745
W11
GC
W-2
DS
MW
-06S
, I, D
DS
MW
-05S
, I, D
W03
GW Well-Graded Gravels
Lower Spatially VariableUnit Sand/Gravel Mixtures
SP Poorly-Graded Sands
SW Well-Graded Sands
SM Silty Sands
CL Clay
SH Shale

J:\
Pro
jec
t\E
\Elk
ha
rt\1
49
51
50
1 N
S C
on
rail
E
lkh
art
C
on
su
ltin
g A
ss
ista
nc
e 2
01
4-2
01
5\D
ata
-Te
ch
\TI\
fig
5e
.fh
10
SCALE IN FEET
VERTICAL EXAGGERATION = 3.33x
30
00 100
FIGURE 5E
CROSS-SECTION E-E'
JOB NO. 14951501
CONRAIL RAILYARD SITEELKHART, INDIANA
NOTE:
� Cross-Section location shown on Figure 4.
� The depth and thickness of the strata
indicated on the subsurface section were
obtained by interpolating between test
borings. Information on actual conditions
exists only at the locations of the test
borings and it is possible that the conditions
may vary from those indicated.
GW Well-Graded Gravels
Lower Spatially VariableUnit Sand/Gravel Mixtures
SP Poorly-Graded Sands
SW Well-Graded Sands
E'NORTHEAST
730
700
670
640
610
595
715
685
655
625
580
565
745
550
LEGEND:Approximate Potentiometric Surface (MeasuredDecember 2013), Dashed Where Inferred
Monitoring Well Groundwater Sample
2010 Soil Boring Location (Dashed Where OnlyGroundwater Sample Collected,No Lithologic Characterization)
Well Location
Screened Interval
EL
EV
AT
ION
(F
EE
T, M
SL
)
730
700
670
640
610
595
715
685
655
625
580
565
ESOUTHWEST
550
745
E03 (
Pro
jecte
d)
W1
5
W1
6
W1
7
E11
E12
E14
SM Silty Sands
SC Sand with Clay
CL Clay
SH Shale

J:\
Pro
jec
t\E
\Elk
ha
rt\1
49
51
50
1 N
S C
on
rail
E
lkh
art
C
on
su
ltin
g A
ss
ista
nc
e 2
01
4-2
01
5\D
ata
-Te
ch
\TI\
fig
5f.
fh1
0
FIGURE 5F
CROSS-SECTION F-F'
JOB NO. 14951501
CONRAIL RAILYARD SITEELKHART, INDIANA
SCALE IN FEET
VERTICAL EXAGGERATION = 3.33x
30
00 100
DS
MW
-08
S, I, D
E15
E08
E07
E10
E11
E05
E04
E09
DS
MW
-09S
, I, D
Southern Drag StripProperty Boundary
NOTE:
� Cross-Section location shown on Figure 4.
� The depth and thickness of the strata
indicated on the subsurface section were
obtained by interpolating between test
borings. Information on actual conditions
exists only at the locations of the test
borings and it is possible that the conditions
may vary from those indicated.
� DSMW-09S, I and D were installed in
September 2010. July 2010 Groundwater
elevation data is interpolated at this well cluster.
Fill
GW Well-Graded Gravels
Lower Spatially VariableUnit Sand/Gravel Mixtures
SP Poorly-Graded Sands
SW Well-Graded Sands
SM Silty Sands
SC Sand with Clay
CL Clay
SH Shale
F'SOUTHEAST
EL
EV
AT
ION
(F
EE
T, M
SL
)
730
700
670
640
610
595
715
685
655
625
580
565
745
550
LEGEND:Approximate Potentiometric Surface (MeasuredDecember 2013), Dashed Where Inferred
Monitoring Well Groundwater Sample
2010 Soil Boring Location (Dashed Where OnlyGroundwater Sample Collected,No Lithologic Characterization)
Well Location
Screened Interval
EL
EV
AT
ION
(F
EE
T, M
SL
)
730
700
670
640
610
595
715
685
655
625
580
565
FNORTHWEST
550
745
Trichloroethene (TCE)Groundwater Concentration(µg/L)(95% UCL 2012-2014)
Carbon Tetrachloride (CT)Groundwater Reporting Limit andNon-Detect Flag (µg/L)
Chloroform Groundwater Concentration(µg/L)(95% UCL 2012-2014)
23
1U
36
79 23
2.1
802 383 44
42 1U 0.45
132 0.60 1U
810 91 19
30 32 3

J:\
Pro
jec
t\E
\Elk
ha
rt\1
49
51
50
1 N
S C
on
rail
E
lkh
art
C
on
su
ltin
g A
ss
ista
nc
e 2
01
4-2
01
5\D
ata
-Te
ch
\TI\
fig
5g
.fh
10
FIGURE 5G
CROSS-SECTION G-G'
JOB NO. 14951501
CONRAIL RAILYARD SITEELKHART, INDIANA
SCALE IN FEET
VERTICAL EXAGGERATION = 3.33x
30
00 100
Southern Drag StripProperty Boundary
NOTE:
� Cross-Section location shown on Figure 4.
� The depth and thickness of the strata
indicated on the subsurface section were
obtained by interpolating between test
borings. Information on actual conditions
exists only at the locations of the test
borings and it is possible that the conditions
may vary from those indicated.
GW Well-Graded Gravels
Lower Spatially VariableUnit Sand/Gravel Mixtures
SP Poorly-Graded Sands
SW Well-Graded Sands
SM Silty Sands
CL Clay
SH Shale
G'EAST
EL
EV
AT
ION
(F
EE
T, M
SL
)
730
700
670
640
610
595
715
685
655
625
580
565
745
550
LEGEND:Approximate Potentiometric Surface (MeasuredDecember 2013), Dashed Where Inferred
Monitoring Well Groundwater Sample
2010 Soil Boring Location (Dashed Where OnlyGroundwater Sample Collected,No Lithologic Characterization)
Well Location
Screened Interval
EL
EV
AT
ION
(F
EE
T, M
SL
)
730
700
670
640
610
595
715
685
655
625
580
565
GWEST
550
745
U01
E15
W20
W14
W1
9

FIGURES 6-A, 6-B, 7-A, AND 7-B
HAVE BEEN REDACTED – FOUR PAGES
CONTAINS POTENTIAL PERSONALLY-IDENTIFYING INFOMATION

�� � �� � � � � � � � � � � � � � � � � � � � � � � � � � � � � � � � � � � � � � � � � � � � � � � � � � � � � � �� � � � � � �� � � � � � ! � " � � #$ � �% & '( ) * +, -. , * / 0( 1 2 * 3 / - 4( ) * 5 -6 * 27 8 9 : 8; < = > ? < ? @ <
* 2 A B 1 ) 0C & . 6 & 1. 1

FIGURE 9: PROPOSED WELL NEST LOCATIONS AND SHALLOW GROUNDWATER CARBON TETRACHLORIDE (CT) ISOPLETHS
HAS BEEN REDACTED - ONE PAGE
CONTAINS POTENTIAL PERSONALLY-IDENTIFYING INFORMATION
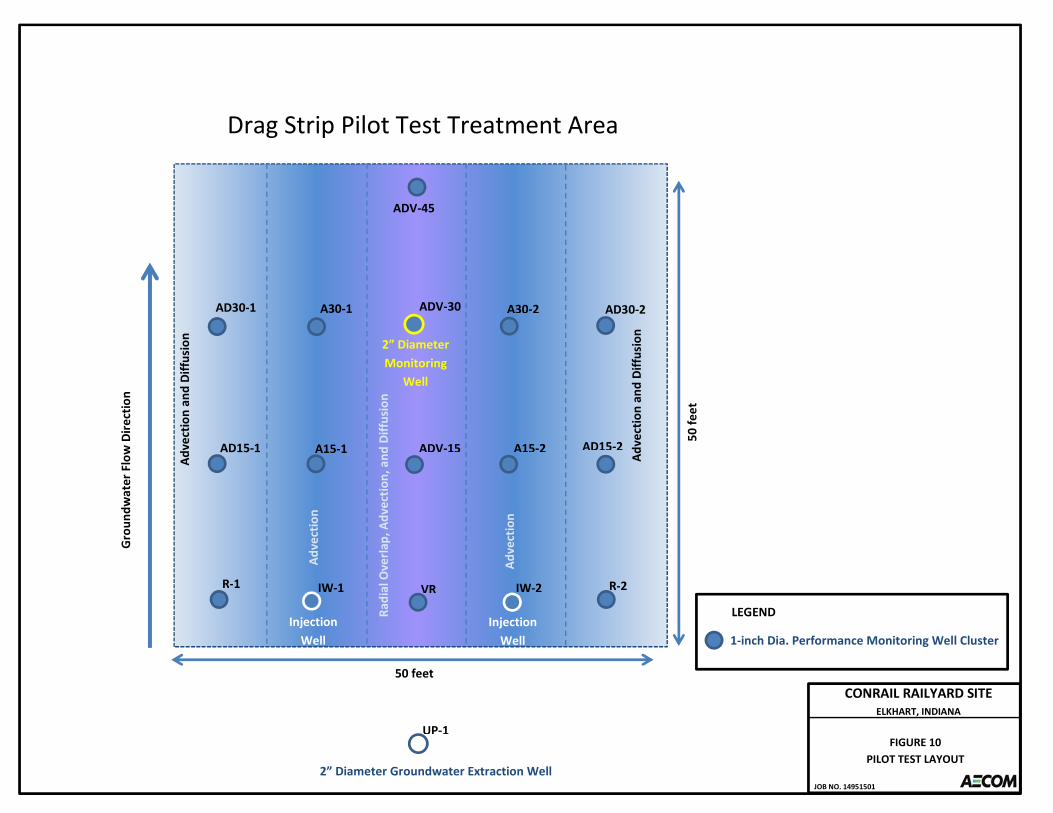
Injection
Well
Injection
Well
Ad
ve
ctio
n
Ad
ve
ctio
n
Ad
ve
ctio
n a
nd
Dif
fusi
on
Ad
ve
ctio
n a
nd
Dif
fusi
on
Ra
dia
l O
ve
rla
p,
Ad
ve
ctio
n,
an
d D
iffu
sio
n
Gro
un
dw
ate
r F
low
Dir
ect
ion
2” Diameter
Monitoring
Well
2” Diameter Groundwater Extraction Well
Drag Strip Pilot Test Treatment Area
50
fe
et
50 feet
1-inch Dia. Performance Monitoring Well Cluster
LEGEND
CONRAIL RAILYARD SITE
ELKHART, INDIANA
FIGURE 10
PILOT TEST LAYOUT
JOB NO. 14951501
ADV-45
AD30-1 A30-1 ADV-30 A30-2 AD30-2
ADV-15 A15-2 AD15-2 AD15-1 A15-1
R-1 R-2IW-1 IW-2VR
UP-1

CONRAIL RAILYARD SITE
ELKHART, INDIANA
FIGURE 11
PILOT STUDY WELLS
CONSTRUCTION DIAGRAMS
JOB NO. 14951501
EXTRACTION WELL CONSTRUCTION
1-INCH PVC OR 2-INCH
DIAMETER
STAINLESS STEEL
RISERS (2)
GROUND SURFACE
10-INCH DIAMETER
PRO CASING
BENTONITE-CEMENT
GROUT
BENTONITE SEAL
(2-FEET MINIMUM
20-FEET OF 1-INCH PVC OR
2-INCH DIAMETER
0.020-INCH SLOTTED
STAINLESS STEELWELL SCREEN
TEMPORARY 10-INCH
DIAMETER CASING
(REMOVED AFTER
WELL INSTALLATION)
SEDIMENT COLLECTION TRAP
1-INCH PVC OR 2-INCH
DIAMETER STAINLESS
STEEL CAP
MONITORING WELL CONSTRUCTION
3’ DIAMETER CONCRETE PAD
FLUSH-MOUNT SURFACE
COMPLETION
WITH LOCKING WELL CAPS
DRAWING TO SCALE EXCEPT FOR ROAD BOX (ENLARGED TO SHOW DETAIL)
2-INCH DIAMETER
STAINLESS STEEL RISERS (2)
1.5-INCH
DIAMETER DRAIN
GROUND SURFACE
10-INCH DIAMETER PRO CASING
6 INCHES CONCRETE
BENTONITE-CEMENT GROUT
BENTONITE SEAL (2-FEET MINIMUM )
20-FEET OF 2-INCH DIAMETER 0.020-INCH
SLOTTED STAINLESS STEEL WELL SCREEN
TEMPORARY 10-INCH DIAMETER CASING
(REMOVED AFTER WELL INSTALLATION)
SEDIMENT COLLECTION TRAP
2-INCH DIAMETER STAINLESS
STEEL CAP
24” X 24” X 24” H-20 LOAD-RATED
ROAD BOX WITH LOCKING HINGE
1-INCH DIAMETER
ANGULAR GRAVEL
2-INCH DIAMETER ANGULAR GRAVEL
COMPACTED IN SIX-INCH LIFTS
CONCRETE PAD
50’
90’
30’
70’
50’
90’
30’
70’
FILTER SAND PACK
FILTER SAND PACK
1-INCH DIAMETER
PVC RISERS (2)
1.5-INCH
DIAMETER DRAIN
GROUND SURFACE
1-INCH DIAMETER
CAMLOCK FITTINGS
4-INCH DIAMETER PRO CASING
6 INCHES CONCRETE
BENTONITE-CEMENT GROUT
20-FEET OF 1-INCH DIAMETER 0.020-INCH
SLOTTED PVC WELL SCREEN
TEMPORARY 4-INCH DIAMETER CASING
(REMOVED AFTER WELL INSTALLATION)
SEDIMENT COLLECTION TRAP1-INCH DIAMETER PVC CAP
INJECTION WELL CONSTRUCTION
24” X 24” X 24” H-20 LOAD-RATED
ROAD BOX WITH LOCKING HINGE
1-INCH DIAMETER
ANGULAR GRAVEL
2-INCH DIAMETER ANGULAR GRAVEL
COMPACTED IN SIX-INCH LIFTS
CONCRETE PAD
50’
90’
30’
70’
FILTER SAND PACK
BENTONITE SEAL (2-FEET MINIMUM )
BENTONITE SEAL (2-FEET MINIMUM )
BENTONITE SEAL
(2-FEET MINIMUM )
20-FEET OF 1-INCH DIAMETER 0.020-INCH
SLOTTED PVC WELL SCREEN20-FEET OF 2-INCH DIAMETER 0.020-INCH
SLOTTED STAINLESS STEEL WELL SCREEN
20-FEET OF 1-INCH PVC OR
2-INCH DIAMETER
0.020-INCH SLOTTED
STAINLESS STEELWELL SCREEN

FIGURE 12
REMEDY PERFORMANCE MONITORING WELL LOCATIONS
HAS BEEN REDACTE - ONE PAGE

Path:
J:\G
IS\Pr
ojects
\small
projec
ts\elk
hart\g
is\14
9515
01_1
1014
\Fig_
13_re
media
l_acti
on_c
ompo
nents
.mxd
ÓÇÓÇ
ÓÇ
ÓÇ
ÓÇ
A
A
A
AA
A
AA
A
A
A
MW-54
MW-53
MW-41
MW-16
MW-15
MW-14
MW-51IMW-51D
MW-23SMW-23D
MW-55Groundwater
Treatment Plant
Track 65/66TCE Source
Area
Track 69CT Source
Area
EW-1
EW-5
EW-4
EW-3(with 3" CP)
EW-2
6" CP 3" CP4" CP
4" CP (In 200' of Casing)
10" CP8" CP
4" CP
4" CP
4" CP
Craw
ford's
Ditc
h
Old US 33
Mishawaka
Elk
Elk Pa
rk
El Pa
co
La Rue
0 400 800
Scale in Feet
CONRAIL RAILYARD SITEELKHART, INDIANA
FIGURE 13RAILYARD REMEDY LAYOUT
JOB NO. 14951501³
LEGEND:Approximate Extent of Source AreaGroundwater Extraction andConveyance System (ApproximateLocation)
ÓÇ Groundwater Extraction Well (EW)
AOffsite Monitoring Well in MonitoringProgramTI Waiver AreaLine of Containment (2003 FinalDesign)Updated Line of ContainmentConveyance Piping(Double-Walled HDPE)CP

Appendix A
Addendum Final Design Report, June 30, 2011


AddendumFinal Design ReportConrail Railyard Superfund SiteContainment Groundwater Pumping and Treatment SystemElkhart, Indiana
Submission Date: June 30, 2011
Prepared by:URS36 East Seventh Street, Suite 2300Cincinnati, OH 45202
On behalf of:Settling Parties:American Premier Underwriters, andNorfolk Southern Railway Company

Addendum, Final Design Report
14949039.53000 i
Table of Contents
1.0 Introduction ............................................................................................................1
2.0 Background ............................................................................................................2
3.0 Remedial Action Objectives....................................................................................4
4.0 Remedial Design for Railyard Pumping and Treatment System Expansion .............54.1 Remedial Design Objectives...........................................................................54.2 Design Assumptions.......................................................................................54.3 Installation of Two Extraction Wells ..............................................................64.4 Treatment System Flow Capacity Upgrades ...................................................74.5 Pumping System Optimization .......................................................................84.6 Potential Modification of Screen Lengths in Existing Extraction Wells ..........84.7 Potential Extraction Well EW-2 Pump Upgrade .............................................94.8 Summary........................................................................................................9
5.0 Other Plans and Information .................................................................................105.1 Construction Quality Assurance Plan (CQAP)..............................................105.2 Health and Safety Plan (HASP) ....................................................................105.3 Contingency Plan .........................................................................................105.4 Air Registration Update................................................................................11
6.0 Cost Estimate........................................................................................................12
7.0 Project Schedule ...................................................................................................13
8.0 References ............................................................................................................14
Tables
Table 1 – Design Assumptions
Table 2 – Current Containment and Treatment System Capabilities
Table 3 – Proposed Containment and Treatment System Capacities
Table 4 – Chemical Profile Sample Locations
Table 5 – Cost Estimate
Table 6 – Anticipated Project Schedule
Figures
Figure 1 – Site Plan with Existing and Proposed Remedial Action Components
Figure 2 – Chemical Profiling Sample Locations
Appendix
Appendix A – Engineering Calculations

Addendum, Final Design Report
14949039.53000 1 June 30, 2011
1.0 Introduction
This document presents an Addendum to the Final Design Report (URS 2003) for thecontainment pumping and treatment system in operation at the Conrail Railyard Superfund Site inElkhart, Indiana (Site), and it is part of the Second Remedial Design/Remedial Action (SecondRD/RA). The system is a part of the United States Environmental Protection Agency’s (EPA’s)groundwater remedial alternative for the Site, as presented in a Record of Decision (ROD)Amendment dated September 28, 2000, and which modifies the Final ROD dated September 9,1994.
The Site consists of two separate groundwater remediation areas. The first is located at theElkhart Railyard, and the second is located at the Osceola Drag Strip (Drag Strip). The Railyardpumping and treatment system is shown on Figure 1. This addendum addresses the Railyardsystem, and does not include discussion of the Drag Strip system.
The purpose of this Addendum is to present the design basis and intent (including appropriatesupporting information and calculations) for an expansion of the current Railyard groundwaterremediation system. The current system includes three extraction wells (EW-2, EW-3, and EW-4) and a groundwater treatment system. Expansion of the Railyard system is being implementedin order to address EPA concerns associated with plume capture that have been identified in thetechnical evaluations performed as part of the Third Five-Year Review Investigation.

Addendum, Final Design Report
14949039.53000 2 June 30, 2011
2.0 Background
Site background information consisting of regulatory history, physical setting, and the nature andextent of groundwater impact are presented in detail in the Second RD/RA Preliminary DesignReport (URS 2002) and are not repeated herein.
Groundwater contamination, consisting of trichloroethene [TCE] (from the Track 65-66 SourceArea), carbon tetrachloride [CCl4] (from the Track 69 Source Area), and degradation products ofboth compounds, are present in the subsurface of the Railyard Classification Yard, where railcarsare processed and trains “built” before dispatch. The EPA-approved remedy includescontainment of groundwater with significant concentrations of the contaminants from the Track65-66 and Track 69 Source Areas. The estimated extents of these source areas are shown inFigure 1. The Final Design for the groundwater remediation system consists of installation of upto five extraction wells (for containment), pumping and conveyance of groundwater viaunderground conveyance lines to a treatment plant wherein the volatile constituents are removedby air stripping. The treated water is discharged to Crawford Ditch exhaust air from the stripperis treated by passing it through granular activated carbon (GAC) under the terms of IndianaDepartment of Environmental Management (IDEM) air registration R 039-18602-00596.
Construction of the remediation system is being performed in phases. The first phase wascompleted in 2004, and consisted of the construction of the treatment plant and installation ofthree extraction wells (EW-3, EW-4, and EW-2). System commissioning began June 28, 2004,and operational and equipment issues were resolved during the subsequent weeks, leading to theissuance of Substantial Completion Report on September 21, 2004. The Railyard system iscurrently in Year 7 of operation and maintenance (O&M).
The second phase of remediation system construction is addressed in this submittal. EPApublished the Third Five-Year Review Report for the Site on June 15, 2009, in which theperformance of the Railyard groundwater containment system was identified as needing furtherinvestigation. Other issues identified in EPA’s Five-Year Review Report, which are notaddressed herein, are related to the Drag Strip remediation area. To address the identified issues,the Settling Parties prepared four revisions to the Five-Year Review Investigation Work Plan, andimplemented the approved scope of work. Technical evaluations and reporting for the Five-YearReview Investigation are ongoing, including interim submittals of technical memoranda (TechMemos) to EPA.
For the Railyard performance evaluation, the Settling Parties conducted a hydraulic testing taskthat resulted in an updated estimate for hydraulic conductivity and estimates for groundwatercapture zones. The findings were submitted to EPA in two Tech Memos:
Analyses of Pumping and Recovery Tests at EW-2 and EW-4, Revision 1 for the ConrailRail Yard Site, Elkhart, Indiana, dated March 4, 2011 (Railyard Hydraulic Test TechMemo); and
Railyard Capture Zone Analysis, for the Conrail Rail Yard Site, Elkhart, Indiana, datedMarch 4, 2011 (Capture Zone Tech Memo).

Addendum, Final Design Report
14949039.53000 3 June 30, 2011
Using a weight-of-evidence approach, the Capture Zone Tech Memo concluded that incompletegroundwater capture of Track 65-66 TCE Source Area may be occurring. Although contaminantconcentrations in wells downgradient of the extraction wells and the timing of these changesindicate full capture of the Track 69 CCl4 Source Area, EPA has previously stated that itconsiders capture of this area to be incomplete based on a purely hydraulic evaluation.

Addendum, Final Design Report
14949039.53000 4 June 30, 2011
3.0 Remedial Action Objectives
The objective of the Remedial Action, consistent with the 2000 ROD Amendment, is containmentof groundwater with significant concentrations of TCE and CCl4 from the Track 65-66 and Track69 Source Areas at the Railyard, and natural gradient flushing of the dissolved portion of thecontaminant plume downgradient of the line of containment. As shown on Figure 1, the line ofcontainment is located parallel to the main rail track alignment near the north boundary of theRailyard.
The Settling Parties’ approach for achieving the Remedial Action objectives consists of thefollowing general steps:
1) Upgrade the current containment system through the installation of additional extractionwells, improvements to the groundwater conveyance system, and modifications to theinternal treatment plant piping and related components, and as necessary, well screenmodifications to the existing wells, and/or pump upgrade/replacement and controlimprovements.
2) Optimize the system collection scheme through adjustments to pumping/flow rates basedon potentiometric measurements and continuing evaluation of capture performance. Theupgrade of the containment system is intended to provide operational flexibility in orderto allow for system optimization as limited by flow capacities.
This approach represents direct and tangible progress towards addressing the containment issue,including infrastructure enhancement, an increase in containment and treatment volumes,additional operational flexibility, and performance data collection and evaluation. Theperformance evaluation methods, described in Revision 4, Five-Year Review Investigation WorkPlan (URS 2010), include the use of potentiometric measurements to evaluate potentiometriccontours and groundwater flow lines (i.e., from particle tracking). The performance evaluationmethods also rely on chemical concentration data, as part of an overall weight-of-evidenceapproach set forth in the approved Final Design.
It is understood that if system performance, as measured by weight-of-evidence standards, doesnot indicate achievement of the Remedial Action objectives, then the two general steps listedabove (or some applicable portion thereof) may need to be repeated or further refined.

Addendum, Final Design Report
14949039.53000 5 June 30, 2011
4.0 Remedial Design for Railyard Pumping and TreatmentSystem Expansion
Based on the findings of the Capture Zone Tech Memo, additional action in the form ofimprovements to the Railyard groundwater remediation system will be implemented. Theproposed improvements will consist of upgrades to the current containment system (installationof additional extraction wells, etc.), and optimization of the current collection scheme(pumping/flow rates). The design objectives and assumptions related to these improvements aredescribed in this section. In addition, preliminary design information and calculations aresummarized below. More detailed design activities will commence following approval of thedesign concepts in this submittal and are anticipated to be presented in the form of designdrawings and technical specifications.
4.1 Remedial Design Objectives
The following objectives have been developed for improvements to the Railyard groundwaterremediation system:
In order to improve hydraulic capture downgradient of the Track 65-66 TCE SourceArea, install two additional extraction wells, EW-1 and EW-5, on the western end of theline of containment.
Increase the current infrastructure capacity (i.e., conveyance and treatment systems) inorder to accommodate the additional flows from the upgraded EW-2 and the new EW-1and EW-5.
Optimize the pumping system through adjustments to pumping/flow rates in response topotentiometric measurements and continuing evaluation of capture performance.
If needed to further enhance contaminant removal while minimizing extraction of cleanwater, preferentially extract pump groundwater from the higher-contamination depthzones in the aquifer. This upgrade will entail modifying extraction depths for the existingpumping wells based on volatile organic compound (VOC) profiling data obtained fromobservation wells.
If needed to further improve hydraulic capture of downgradient of the Track 65-66 TCESource Area, increase extraction capacity at EW-2 through pumping and/or conveyance-system improvements.
The preliminary design information and associated design assumptions are further documentedbelow.
4.2 Design Assumptions
The design assumptions for the construction of the currently-operating containment pumping andtreatment system are presented in Section 3.0 of the Final Design. For the purposes of thisAddendum, Table 1 presents the assumptions associated with the remediation systemimprovements.

Addendum, Final Design Report
14949039.53000 6 June 30, 2011
4.3 Installation of Two Extraction Wells
Two new extraction wells (EW-1 and EW-5) will be installed on the western end of the current
line of containment (Figure 1). The line of containment was originally proposed in the TI Waiver Petition (GeoTrans 2000). This line was reproduced in the ROD Amendment, and it was
incorporated into the design basis for the 2003 Final Design for achieving the Railyard Remedial
Action objective stated in Section 3.0. For the location of EW-1, the Settling Parties propose to
adjust its position in response to IDEM concerns over groundwater concentrations in MW-41; this issue is described in the Downgradient Action Plan (URS 2007). Specifically, EW-1 is
proposed to be installed closer to MW-41 (west of the existing access road), which would result
in the updated line of containment shown in Figure 1. EW-5 will be installed at the location identified in the Second RD/RA Final Design. Figure 1 also shows the TI Waiver Area as
originally proposed in the TI Waiver Petition and reproduced in the ROD Amendment.
Pilot soil borings will be advanced to bedrock at each proposed location in order to characterize
lithology and contaminant distribution with depth. Borings will be advanced using a Rotosonic drill rig, and continuous soil cores will be collected for lithologic characterization. Select soil
samples will also be collected for grain size analysis. Groundwater profile sampling will be
conducted at each proposed location. Profiling data will be used for evaluation of potential screen isolation to preferentially pump groundwater from the higher-contamination depth zones
in the aquifer. Sample collection methods are described in the Construction Quality Assurance
Plan (CQAP) presented in the Second RD/RA Final Design (see also Section 5.1). Nested piezometers will be installed in each pilot boring after sampling activities are completed.
Piezometer construction will follow existing approved methods for the site, and screened
intervals will monitor the shallow, intermediate and deep portions of the aquifer, similarly to the
existing OW-wells.
Each extraction well will be installed at the pilot location using cable-tool methods. The well
boring will have a minimum diameter of 14 inches. Each extraction well will have an 8-inch
diameter casing, and will be constructed per the technical specifications outlined in Section
02011- Extraction Well Installation from the 2003 Railyard Bid Specification Package and its
associated documents. It is anticipated that the grain size analyses will confirm the original well
filtration design (i.e., 30-slot screen and Global #5 filter-pack) for the new wells. If the grain size data show significantly different characteristics than for the existing pumping well locations, then
the well filtration system design will be adjusted. It is anticipated that each well will be
constructed with a 100-foot length screened interval in order to provide operating flexibility
during extraction system optimization (including potential screen modifications as discussed in Section 4.6 below). Screened intervals, and screen length may be adjusted in the field, based on
lithologic observations during the pilot boring phase.
After well installation, each extraction well will be developed and tested for hydraulic performance. The performance testing will be conducted to estimate maximum sustained yield
for the completed installation. Based on a comparison of step-test data for EW-2 from 2003 to
pumping rate and water level data from 2009 and 2011, it is anticipated that the pumping depth to
water in the newly installed extraction wells will be approximately 15 to 20 feet below ground surface (bgs) for a pumping range of 250 to 250 gallons per minute (gpm). These values will be
refined as part of the performance testing process. Details of the development and performance
testing processes are outlined in Section 02011- Extraction Well Installation from the 2003 Railyard Bid Specification Package and its associated documents.

Addendum, Final Design Report
14949039.53000 7 June 30, 2011
During the detailed design activities, current uncertainties about contaminant distribution andlithologic characteristics will be further refined to support engineering of the pumping systemexpansion. Pumps will be selected for the new wells, and design activities related to the electricaland control systems will be conducted. The pumping capacity at EW-5 is constrained by theexisting 4-inch line beneath the railroad tracks (maximum rate of 350 gpm). At EW-1, a 6-inchline will be installed. Similar to EW-2, it is proposed that pumps with variable-frequency drives(VFDs) be installed at the new wells to allow for flow rates to be increased or decreased within adefined range. Currently, it is anticipated that the flow ranges from EW-1 and EW-5 each will be250 to 350 gpm.
4.4 Treatment System Flow Capacity Upgrades
The proposed infrastructure improvements consist of the installation of larger diameterconveyance piping (8-inch and 10-inch), larger diameter process piping (10-inch), and upgradesto the bag filter system to accommodate the larger process piping. As presented in Table 1, thetotal collection rate from the extraction well system is constrained by the capacity of thetreatment system. The collected groundwater enters the treatment building and flows via 6-inchpipe through a bag filter system and ultimately to an air stripper (with associated blowerequipment). Treated groundwater is discharged via a storm sewer to Crawford Ditch. Exhaustair from the stripper is treated by passing it through GAC under the terms of IDEM airregistration R 039-18602-00596.
The current system flow capacities are summarized in Table 2. As demonstrated by this table, theultimate capacity of the system to contain, collect, and treat groundwater at the Railyard is firstlimited by the pump and piping system capacities, followed by the capacities of the bag filters,blower, and ultimately the air stripper. The air stripper and blower are constrained by acombination of hydraulic and contaminant removal capacities. The downstream systemcomponents are the 10-inch gravity discharge piping to Crawford Ditch, and the outfall pipingunder the main tracks, which also receives the stormwater flows from the classification yard.These components are not anticipated to affect the system operational capacities.
A review of the current system pumping, conveyance and treatment capacities, physicallimitations of the groundwater treatment building, and general economic considerations indicatesthat a reasonable approach to system improvement is upgrade the extraction capacity to meet thecurrent system blower capacity (800 gpm). The remedial design objectives described in Section4.1 indicate that the pumping capacity at the western end of the line of containment should beincreased. Assuming that the operating flow rates of EW-3 and EW-4 are not modified (50 to200 gpm each well) this allows for a total of 400 gpm to 700 gpm to be collected from theremaining three extraction wells (existing well EW-2 and new wells EW-1 and EW-5).
Modifications to the conveyance system are proposed in order to improve capacity and reduceenergy consumption associated with velocity. The conveyance system upgrades will also enablefuture operational flexibility. The proposed locations of EW-1 and EW-5 and the proposedpiping system are depicted on Figure 1. Preliminary calculations have been developed toevaluate the system heads and are included in Appendix A. These calculations will be furtherdeveloped during the detailed design phase.
The installation of a new 8-inch line from EW-1 to EW-2 is proposed, and installation of a 10-inch line from EW-2 to the treatment system is also proposed. These lines will allow for flowrates in excess of 900 gpm. It should also be noted that it is proposed to leave the existing 6-inchline from EW-1 to the treatment system in place in order to allow future operational flexibility.

Addendum, Final Design Report
14949039.53000 8 June 30, 2011
Table 2 also presents the potential containment and treatment system capacities following theproposed upgrade activities. The proposed piping system capacities will exceed the currenttreatment/hydraulic capacity of the existing air stripper and associated blower. The system pipingupgrade will require the interior process piping and bag filter system for the treatment system toalso be upgraded. These treatment system upgrades will be implemented in order to furtherreduce energy use as well as accommodate higher flow rates used in this design.
In summary, the proposed infrastructure improvements consist of the installation of largerdiameter conveyance piping (8-inch and 10-inch), larger diameter process piping (10-inch), andupgrades to the bag filter system. These improvements will allow additional groundwater to becollected and treated at the air stripper (maximum capacity under current design assumptions is800 gpm).
4.5 Pumping System Optimization
In consideration of the Remedial Action objective of containment of groundwater with significantconcentrations of TCE and CCl4 from the Track 65-66 and Track 69 Source Areas at theRailyard, pumping rates for the expanded system will be optimized. Optimization will consist ofan iterative process of potentiometric measurements, containment/capture performanceassessment, and pumping rate adjustments. Capture performance assessment will be performedas described in the Capture Zone Tech Memo, (i.e, use of KT3D_H2O to display potentiometriccontours and particle tracks).
4.6 Potential Modification of Screen Lengths in Existing ExtractionWells
In an effort to enhance contaminant removal while minimizing extraction of clean water, thescreened intervals of the existing extraction wells (EW-2, EW-3, and EW-4) may be shortened topreferentially extract from the higher-contamination depth zones in the aquifer. To characterizethe contaminant profile at the existing pumping wells, groundwater samples will be collectedfrom the monitoring and observation wells in the vicinity of each extraction well using passivediffusion samplers during normal system operation. Table 3 contains the list of wells to besampled, which are also shown on Figure 2.
Analytical data will be used to construct a chemical “profile” for the shallow, intermediate, anddeep depths in the vicinity of each extraction well to assist with determining which zones in theaquifer are higher in contaminant concentration.
Screened interval modifications for each extraction well may be implemented based on thechemical “profile” data in consideration of the Remedial Action objective of containment ofgroundwater with significant concentrations of TCE and CCl4 from the Track 65-66 and Track 69Source Areas at the Railyard. If conducted, screened sections that are currently pumpinggroundwater containing contaminant concentrations below the site performance standards(Maximum Contaminant Levels [MCLs]) would be blanked off with removable steel casing. Theappropriate open screened length in each well will be maintained to ensure screen entrancevelocities are kept in laminar flow condition.
Potentiometric monitoring will be used to evaluate containment performance during screen lengthmodifications, as part of continuing pumping system optimization efforts. Potential containmentissues identified during optimization will be addressed as appropriate.

Addendum, Final Design Report
14949039.53000 9 June 30, 2011
4.7 Potential Extraction Well EW-2 Pump Upgrade
The pump currently installed at EW-2 is designed to operate at an average capacity of 150 gpm,with flows ranging from 50 to 200 gpm. Capture zone analysis suggests that containment of theTrack 65-66 TCE Source Area could be improved by increasing the pumping capacity at EW-2.Optimization findings will show whether or not EW-2 pumping capacity increases are necessary.
In order to maximize operational flexibility and given the information presented in Section 4.4, itis currently proposed to upgrade the piping diameter from EW-2 to the main piping system. Theinstallation of larger piping will allow the total collection rate from EW-2 to exceed 220 gpm.The pump selection activities will occur during detailed design. Currently it is anticipated thatthe upgraded pump will include a VFD to allow for flow rate adjustments during systemoperation. Flow rate adjustments would be based on potentiometric surface information andmonitoring data collected during continuing optimization efforts. The proposed range for thispump is anticipated to be 250 to 350 gpm, which may be further refined during detailed designactivities. The electrical and control system at EW-2 will also be improved to accommodate thenew pump.
4.8 Summary
The remedial action objectives presented in Section 3.0 are related to upgrades to the currentcontainment system and the optimization of flows from each extraction well. The designinformation presented in Section 4.0 defines the current system constraints and designassumptions and describes the proposed system improvements. The treatment capacity of thecurrent system is constrained by the air stripper system and associated blower under the currentdesign assumptions (800 gpm).
The proposed system improvements include the installation of new, larger diameter conveyancepiping to increase the capacity of this infrastructure (8- and 10-inch pipe), larger diametertreatment system process piping (10 inch) and upgrades to the existing bag filter system toaccommodate the increased flows and process piping. The proposed system improvements alsoinclude the installation of new wells and pumps at EW-1 and EW-5. The pumps at EW-1, EW-2,and EW-5 will be selected during the detailed design activities and are anticipated to consist ofpumps with VFDs to allow the flows from these wells to be adjusted between 250 and 350 gpm.The pumping capacity at EW-3 and EW-4 will remain unchanged and will vary between 50 and200 gpm. Based on system optimization efforts, it may be recommended to modify the screenlengths in the existing extraction wells and/or the upgrade the pump at EW-2.
The system pumping rates will then be optimized during operation such that the total containmentrate from all extraction wells meets the system operating capacity of 800 gpm. The estimatedconstruction costs to conduct these system improvements are presented in Section 6.0.

Addendum, Final Design Report
14949039.53000 10 June 30, 2011
5.0 Other Plans and Information
This section presents an overview of additional plans that are anticipated to be required in orderto implement the remedial design activities. These plans are intended to provide provisions tosupport:
1) The completion of construction activities in accordance with the future detailed designdocuments (technical specifications),
2) The implementation of construction and observation activities in a safe manner and inaccordance with applicable Federal, State, and client requirements, and
3) Emergency response activities in the event of spills or other site emergencies duringconstruction activities.
In addition, expansion of the groundwater treatment system at the Railyard will result in changesto the parameters underlying this system’s air registration.
5.1 Construction Quality Assurance Plan (CQAP)
The Second RD/RA Final Design provides a CQAP to document the minimum required qualitycontrol testing, observations and standards that are required to be implemented during theconstruction activities. The minimum standards provided in the existing, approved CQAP will beimplemented during the proposed remedial action activities for applicable components. Inaddition, the CQAP will be reviewed and updated during the detailed design activities to reflectadditional standards and requirements indicated in the technical specifications to be prepared aspart of those activities.
5.2 Health and Safety Plan (HASP)
URS will use the current HASP for the Conrail Railyard Superfund Site dated February 18, 2011as the Primary HASP for activities related to the system expansion and upgrades. An addendumto the Primary HASP will be prepared, if necessary, to address activities and potential associatedrisks not discussed in the primary HASP. The HASP Addendum, if required, will be prepared aspart of the detailed design activities and submitted to EPA for consideration.
All construction contractors and subcontractors will also be required to develop their own HASPsand will be responsible for implementation of their plans. These contractors will also beresponsible for compliance with applicable safety standards set forth by Norfolk Southern forwork at the Elkhart Railyard.
5.3 Contingency Plan
The contingency plan prepared as part of the Second RD/RA Final Design provides a descriptionof the actions that will be implemented in the event of a spill or other emergency. This plan isalso intended to prevent and minimize the impact of potential spills or other unplanned siteemergencies. The Contingency Plan will also be updated during detailed design activities, ifnecessary, and will be revised during the construction activities if warranted by changes in Siteconditions.

Addendum, Final Design Report
14949039.53000 11 June 30, 2011
5.4 Air Registration Update
Air registration R 039-18602-00596 was approved by the IDEM Office of Air Quality on May27, 2004. Per 325 IAC 2-5.5-6(d)(10), notification to IDEM within 30 days of the system changeis all that is required if estimated potential emissions from the upgraded system remain less than10 tons/year of any single hazardous air pollutant (HAP) and less than 25 tons/year of combinedHAPs. The Settling Parties anticipate that this will be the case.
The Settling Parties will estimate potential emissions from the groundwater treatment system withflow upgraded to 800 and 1,000 gpm, using estimated maximum contaminant concentrations forthe upgraded system.
The Settling Parties will then prepare a notification meeting the requirements of 325 IAC 2-5.5-6(d)(10), including: Company name and address, a description of the nature and location of theproposed construction or modification, the design capacity and typical operating schedule, adescription of the source and the emissions unit or units comprising the source, a description ofany emission control equipment, including design specifications, a schedule for construction ormodification of the source, information on the nature and amount of pollutants to be emitted, andthe required certification for signature by the authorized individual.

Addendum, Final Design Report
14949039.53000 12 June 30, 2011
6.0 Cost Estimate
The cost estimate provided in Table 4 has been developed to present a preliminary design level,order of magnitude estimate of the costs associated with implementation of the remedial designactivities. These costs are based on the estimated construction costs from 2003 Final Design bidpackage, with adjustments applied for inflation (2011 dollars) and for the proposed systemimprovements (such as increases in pipe size). Given the preliminary nature of this cost estimate,markups are also provided (engineering, miscellaneous, and contingency). Actual costs for thescope of work contained in this design addendum will be determined during the bidding process.

Addendum, Final Design Report
14949039.53000 13 June 30, 2011
7.0 Project Schedule
The anticipated project schedule is presented in Table 5. The critical path items associated withthe project schedule presented above are primarily related to approval of the Remedial DesignAddendum. The detailed design phase is anticipated to be conducted concurrently with thereview period, but comments on this submittal may result in a need to revise some designcomponents resulting in a delay to the bidding activities and subsequent activities. In addition,the construction duration is anticipated to be approximately 3 months and if construction cannotcommence on or about September 14, it is possible that there will be construction delays relatedto weather conditions.
The actual construction schedule will be provided by the Contractor as part of bidding activities.

Addendum, Final Design Report
14949039.53000 14 June 30, 2011
8.0 References
Army and Air Force Publication, March 1985. Sanitary and Industrial Wastewater Collection –Pumping Stations and Force Mains, (Army TM 5-814-2/Air Force AFM 88-11, Vol. 2,Army Publishing Directorate.)
HIS GeoTrans, Inc., 2000. Petition for a Technical Impracticability Waiver and Request forRemedy Reconsideration, Conrail Railyard Superfund Site, Elkhart, Indiana.
URS, 2002. Second Remedial Design/Remedial Action Preliminary Design Report, ConrailRailyard Superfund Site, Elkhart, Indiana.
URS, 2003. Final Design Report, Conrail Ralyard Superfund Site Containment GroundwaterPumping and Treatment System, Elkhart, Indiana.
URS, 2007. Downgradient Groundwater Action Plan, Second Remedial Design/RemedialAction, Conrail Railroad Superfund Site, Elkhart, Indiana.
URS, 2010. Revision 4, Five-Year Review Investigation Work Plan, Conrail Railyard SuperfundSite, Elkhart, Indiana.
URS, 2011. Technical Memorandum: Analyses of Pumping and Recovery Tests at EW-2 andEW-4, Revision 1for the Conrail Rail Yard Site, Elkhart, Indiana.
URS, 2011. Technical Memorandum: Railyard Capture Zone Analysis, for the Conrail RailYard Site, Elkhart, Indiana.
U.S. EPA, 2000. Superfund Record of Decision (ROD) Amendment: Conrail Railyard (Elkhart)EPA ID: IND000715490 OU 02, Elkhart, Indiana.

Tables

14949039.53000 June 30, 2011
Table 1Design Assumptions
Conrail Railyard Superfund SiteElkhart, Indiana
Assumption BasisVertical extent of contaminants in groundwater isfrom approximately 45 feet to 110 feet depthbelow ground surface (bgs), extending toapproximately 140 feet at pumping well EW-3.
Concentrations in groundwater within borings andmonitoring wells during investigations beginningin 1998 (URS 2002), and monitoring program datacontinuing through 2010.Depths will be confirmed via a profilinginvestigation using groundwater sample data fromobservation wells and monitoring wells in Table 4.
Influent total volatile organic compounds (VOCs)concentrations to plant estimated to range from 0.2to 1.5 milligrams per liter (mg/L)
Concentrations in treatment system influentbetween 2004 and 2011 range between 0.2 and 0.8mg/L. Focusing extraction from higher-concentration depths has the potential to increaseinfluent concentrations.
EW-1 location moved westward to addressgroundwater concentrations detected in MW-41.
Indiana Department of EnvironmentalManagement (IDEM) concerns over this issuedescribed in Downgradient Action Plan (URS2007).
Average long-term system total collection rate 800gallons per minute (gpm).
The total collection rate is constrained by thehydraulic capacity of the existing blower for theair stripper system for the influent concentrationsassumed in the Final Design (URS, 2003).
Collection rate for EW-5 and EW-1 variablebetween approximately 250 and 350 gpm.
The potential collection rate is constrained by theultimate hydraulic capacity of the treatment system(above) and the installed pumping, conveyance,and discharge systems. Design to allow for someflow adjustments during iterative systemoptimization activities in relation to the existingextraction wells.
Piping system design velocity 5.5 fps Based on the Army and Air Force publicationArmy TM 5-814-2/ AF AFM 88-11, piping systemdesign velocities will be limited to 2.5 fps(minimum to prevent sediment build-up) to 9 fps(maximum to avoid excessive energy use) with anaverage design velocity of 5.5 fps.

14949039.53000 June 30, 2011
Table 2Current and Proposed Containment and Treatment System Hydraulic Capacities
Conrail Railyard Superfund SiteElkhart, Indiana
Remediation SystemComponent
CurrentCollection andTreatmentSystemMaximumCapacity
Upgraded RemediationSystem Component
ProposedCollection andTreatment SystemMaximumCapacity
Extraction Well Pumps, EW-2,EW-3, EW-4
200 gpm/each well= 600 gpm
New Extraction Wells,EW-1, EW-5
250 to 350 gpm
3-inch Extraction Well Piping4-inch Extraction Well Piping6-inch Extraction Well Piping
200 gpm350 gpm800 gpm
EW-1 to EW-2 Piping (8-inch), includes flows fromEW-5
800 gpm
Treatment System Piping (6-inch)
800 gpm EW-2 to Treatment SystemPiping (10 inch),includes flows from EW-5,EW-1, EW-3 andEW-4
1,300 gpm
Blower 800 gpm Existing Blower 800 gpmAir Stripper 1000 gpm Existing Air Stripper 1000 gpm
gpm = gallons per minute

14949039.53000 June 30, 2011
Table 3Chemical Profile Sample Locations
Conrail Railyard Superfund SiteElkhart, Indiana
ExtractionWell ID
Screen Interval(feet bgs)
Sample Location IDScreen Interval
(feet bgs)
EW-2 42-142
OW2-3S 41-51
GS-2 75-85
OW2-3D 130-140
OW2-2S 41-51
OW2-2I 75-85
OW2-2D 130-140
EW-3*
49-59 - -
91-106 OW3-1I 91-101
126-136 OW3-1D 126-136
EW-4 51-144
OW4-1S 51-61
OW4-1I 90-100
OW4-1D 130-140
Well locations shown on Figure 2*EW-3 is a multi-screened well
bgs – below ground surface

14949039.53000 June 30, 2011
Table 4Cost Estimate
Conrail Railyard Superfund SiteElkhart, Indiana
Task Description Amount Unit Cost ($) Total ($)
1) Project Management (Submittals, Health and SafetyPlan (HASP), Coordination, etc.)
1 LS $10,000 $10,000
2) Installation of Two New Extraction Wells(EW-1 and EW-5)
Pilot Soil Borings and Sampling 2 LS $30,000 $60,000
Well Installation & Development 2 EA $50,000 $100,000
Pumps & Controls 2 EA $10,000 $20,000
3) Treatment System Flow Capacity Upgrade
Mobilization 1 LS $7,500 $7,500
Site Preparation and Restoration 1 LS $10,000 $10,000
New Extraction Wells (EW-1 & EW-5)Wellhead Completion, Manhole,Valves, & Meter
2 EA $15,000 $30,000
Electrical Service to EW-1 and EW-5 1 LS $20,000 $20,000
Conveyance Lines
2" Cleaning Water Line to EW-1 200 LF $20 $4,000
6" Line from EW-1 200 LF $50 $10,000
8" Line from EW-1/EW-5 to EW-2 500 LF $65 $32,500
10" Line from EW-2 to GWTP 600 LF $85 $51,000
Groundwater Treatment Plant (GWTP)
10" Process Water Line (inside GWTP) 200 LF $50 $10,000
Bag Filter System Replacement 1 LS $30,000 $30,000
Instrumentation Upgrades (Valves, FlowMeters, Etc.)
1 LS $20,000 $20,000
Optional Tasks
Pump Upgrade at EW-2 & Controls 1 LS $10,000 $10,000
Screen Blanking - EW-2, EW-3, EW-4 1 LS $50,000 $50,000
Subtotal: $475,000Budgetary estimates only; actual cost estimates will bebased on receipt of bids. Engineering (15%): $71,300
Contingency (20%): $95,000
Preliminary DesignTotal Estimated
Cost: $641,300

14949039.53000 June 30, 2011
Table 5Anticipated Project Schedule
Conrail Railyard Superfund SiteElkhart, Indiana
Component Anticipated Schedule
Design Addendum SubmissionJuly 1, 2011
Observation Well Profiling Investigation (Table 4)June 20 through July 1, 2011
Extraction Wells EW-1 and EW-5 ProfilingInvestigation
July 1 through August 1, 2011
Design Addendum ApprovalAugust 1, 2011
Detailed Design PhaseJuly 1 through August 15, 2011
BiddingAugust 15 through September 7, 2011
Bid Evaluation and Contract AwardSeptember 14, 2011
ConstructionSeptember 14 through December 15, 2011
System Start-up and TroubleshootingDecember 15, 2011 through January 15, 2012

Figures

Path:
J:\G
IS\Pr
ojects
\small
projec
ts\elk
hart\g
is\14
9490
39_5
3000
\reme
dial_a
ction
_com
pone
nts.m
xd
A
A
A
A
A
A
A
A
AA
A
A
AA
A
A
A
MW-54
MW-53
MW-41
MW-16
MW-15
MW-14
MW-51IMW-51D
MW-23SMW-23D
MW-55Groundwater
Treatment Plant
Track 65/66TCE Source
Area
Track 69CCl4 Source
Area
Proposed Locationof EW-1
Proposed Locationof EW-5
EW-4
EW-3(with 3" CP)
EW-2
Ex. 6" CP Ex. 3" CPEx. 4" CP
Ex. 4" CP (In 200' of Casing)
New 10" CPNew 8" CP
New 4" CP
New 4" CP
New 4" CP
Craw
ford's
Ditc
h
Old US 33
Mishawaka
Elk
Elk Pa
rk
El Pa
co
La Rue
Elk Pa
rk
0 400 800
Scale in Feet
CONRAIL RAILYARD SITEELKHART, INDIANA
FIGURE 1SITE PLAN WITH EXISTING
AND PROPOSED REMEDIALACTION COMPONENTS
JOB NO. 14949039
³LEGEND:
Proposed Groundwater Extraction and ConveyanceSystem (Approximate Location)
Existing Groundwater Extraction and ConveyanceSystem (Approximate Location)
Conveyance Piping (Double-Walled HDPE)CPGroundwater Extraction Well (EW)A
Approximate Extent of DNAPL Source Area
Existing Remedial Action ComponentEx.New Remedial Action ComponentNew
TI Waiver AreaLine of Containment (2003 Final Design)Updated Line of Containment
A Offsite Monitoring Well in Monitoring ProgramA Offsite Historic Monitoring Well

ÓÇÓÇ
ÓÇ
ÓÇÓÇ
A
A
AA
A
A
A
A AAA
AA
A
AAA
AAA
AAA
AAA
AAA
AA
AA
A
AAA AAAA
A
GS-4
GS-2
GS-1
EW-4
EW-3EW-2
MW-55
MW-15
GS-3IGS-3D
OW4-1S
OW4-1I
OW3-2IOW2-3S
OW2-3D
OW2-2S
OW2-2I
OW2-2D
NE-80SNE-80INE-80DNE-50S
NE-50INE-50D
NE-26SNE-26INE-26D
MW-51I
MW-51D
RAW-01S
RAW-01I
RAW-01D
OW4-1D
OW3-1I
OW3-1DOW2-1S
OW2-1IOW2-1D
MW-2
Old US 33
Elk Pa
rk
Craw
ford's
Ditc
h
CONRAIL RAILYARD SITEELKHART, INDIANA
JOB NO. 14949039
0 100 200
Scale in FeetBASE MAP SOURCE: Marshall, Miller and Associates. Bluefield, VA. December, 2007.
FIGURE 2CHEMICAL PROFILINGSAMPLE LOCATIONS³
Groundwater Treatment Building
J:GIS
\proje
cts\sm
allpro
jects\
elkha
rt\gis\
Files
ForE
PA\Fi
g_2_
Chem
icalPr
ofilin
gSam
pleLo
catio
ns.m
xd
LegendWELLSÓÇ ExtractionA MonitoringA ObservationA Historic
River / DrainageProperty LineTI Waiver Area
Rail LineRoadYard Perimeter
OW2-3D Sample Location
Extraction Well ID
Screen Interval (feet bgs) Sample Location ID Screen Interval
(feet bgs)
EW-2 42-142
OW2-3S 41-51 GS-2 75-85 OW2-3D 130-140 OW2-2S 41-51 OW2-2I 75-85 OW2-2D 130-140
EW-3 (screened at 3 different depths)
49-59 - - 91-106 OW3-1I 91-101 126-136 OW3-1D 126-136
EW-4 51-144 OW4-1S 51-61 OW4-1I 90-100 OW4-1D 130-140

Appendix A
Preliminary Engineering Calculations


Page 1 of 13
Job Conrail Elkhart 2009-2010 Asst Project No. 14949039 Sheet of
Description Total System Head Computed by SAR Date 5/27/2011
Calculations Checked by AS Date 6/9/2011
OBJECTIVE
The objective of these calculations is to estimate the total system head (static and dynamic) from each
extraction well to the treatment system at the Conrail Railyard Superfund Site, Containment
Groundwater Pumping and Treatment System, located in Elkhart, Indiana. These calculations have been
prepared as part of the preliminary design activities for planning purposes, and will ultimately support
the selection of pumps to be installed at existing extraction well EW-2 and new extraction wells EW-1
and EW-5 during the detailed design phase.
NOTE: Conceptual calculations. To be refined during detailed design phase.
METHODOLOGY
In pressure pipe systems, head losses are associated with either static head (absolute change in
elevation) or dynamic head (due to flow of fluid in the pipe). The static head will be estimated based on
actual field conditions. The dynamic head will be estimated using the Hazen-Williams formula.
ASSUMPTIONS
1. The extraction well pumps are installed approximately 40-feet below grade. The process water
piping within the Groundwater Treatment Building is above grade. Assume that the total static
head at each extraction well is approximately 50-feet.
2. Extraction wells EW-2, EW-3, and EW-4 are currently installed and operational. Extraction wells
EW-1 and EW-5 will be installed as part of the proposed upgrade activities. It is currently
assumed that the new EW-1 and EW-5 (and associated components) will be similar to those at
EW-2, EW-3 and EW-4.
3. The new extraction wells EW-1 and EW-5 will have wellheads similar to EW-2 and EW-3.
4. The line conveyance lines will be dual wall HDPE pipe with a working pressure of at least 150 psi.
5. The Hazen-Williams coefficient (C) is 150 for thermoplastic pipe (Plastics Pipe Institute, Technical
Release 14 – Page 2).
6. Fitting coefficients for use with the Equivalent Pipe Method are:
a. 180°-Elbow: 45
b. 90°-Elbow: 30
c. 45°-Elbow: 16
d. Outlet Tee Run/Run: 20
e. Outlet Tee Run/Branch: 60
f. Ball Valve: 6
g. Gate Valve: 8
ESTIMATATED HEAD LOSS
As part of this preliminary assessment, the total head resulting from the current system configurations
and also proposed or potential upgrades were evaluated. In general, these estimates were completed
by evaluating a range of flow rates (from each extraction well) and conveyance line sizes. The head loss
calculations will be further evaluated during the detailed design phase.

Page 2 of 13
Job Conrail Elkhart 2009-2010 Asst Project No. 14949039 Sheet of
Description Total System Head Computed by SAR Date 5/27/2011
Calculations Checked by AS Date 6/9/2011
As noted above, the friction losses have been calculated using the Hazen-Williams formula. This formula
can be expressed as (Uni-Bell Plastic Pipe Association PVC Pipe Handbook, Chapter 10):
� � 0.2083�100 � � .�� � � .�����.���
�����: � � ������ ! " ##, �! ���� � %&��� '�� 100 ���� � '�'� ( ��
100��) � *&+�! , ��""�&-# ." % � �������!� � � �" % �&��, �! /&"" !# '�� -�!0�� 1/'-2 �� � �!���!&" ��&-���� � '�'�, �! �!���# 1�!2
The estimated head loss will be used to select pumps for the upgrade of EW-2 and the new EW-1 and
EW-5.
CONCLUSIONS
The purpose of these calculations was to estimate and evaluate total system heads at the existing
Conrail Railyard Superfund Site, Containment Groundwater Pumping and Treatment System. The
estimates provided in this calculation are part of the preliminary design effort, and will be further
evaluated during the detailed design phase. The total system heads will ultimately be used to select and
prepare technical specifications for the extraction well pump systems.

EW-1 Page 3 of 13
EW-1 Well to Trunk
(4" Line)Location
Length or
Dia (in)
Length or
Dia (ft)
# of
Fittings
Fitting
Coefficient
Equivalent Pipe
Length (ft)
Pipe 122.5 1 1 123
Ball Valve Wellhead 3 0.25 1 6 2
90-deg Elbow Wellhead 3 0.25 4 30 30
45-deg Elbow Wellhead 3 0.25 0 16 0
Outlet Tee - run/run Wellhead 3 0.25 1 20 5
Outlet Tee - run/branch Wellhead 3 0.25 0 60 0
Ball Valve Line 4 0.33 0 6 0
90-deg Elbow Line 4 0.33 0 30 0
45-deg Elbow Line 4 0.33 0 16 0
Outlet Tee - run/run Line 4 0.33 1 20 7
Outlet Tee - run/branch Line 4 0.33 0 60 0
167
EW-1 Well to Trunk
(6" Line)Location
Length or
Dia (in)
Length or
Dia (ft)
# of
Fittings
Fitting
Coefficient
Equivalent Pipe
Length (ft)
Pipe 122.5 1 1 123
Ball Valve Wellhead 3 0.25 1 6 2
90-deg Elbow Wellhead 3 0.25 4 30 30
45-deg Elbow Wellhead 3 0.25 0 16 0
Outlet Tee - run/run Wellhead 3 0.25 1 20 5
Outlet Tee - run/branch Wellhead 3 0.25 0 60 0
Ball Valve Line 6 0.5 0 6 0
90-deg Elbow Line 6 0.5 0 30 0
45-deg Elbow Line 6 0.5 0 16 0
Outlet Tee - run/run Line 6 0.5 1 20 10
Outlet Tee - run/branch Line 6 0.5 0 60 0
170
Total Equivalent Pipe Length =
Total Equivalent Pipe Length =
14949039 Conrail Elkhart 2009-2010 Asst
casey_oakes
Text Box
Page 3 of 13

EW-2 Page 3 of 13
EW-2 Well to Trunk
(3" Line)Location
Length or
Dia (in)
Length or
Dia (ft)
# of
Fittings
Fitting
Coefficient
Equivalent Pipe
Length (ft)
Pipe 52.25 1 1 53
Ball Valve Wellhead 3 0.25 1 6 2
90-deg Elbow Wellhead 3 0.25 4 30 30
45-deg Elbow Wellhead 3 0.25 0 16 0
Outlet Tee - run/run Wellhead 3 0.25 1 20 5
Outlet Tee - run/branch Wellhead 3 0.25 0 60 0
Ball Valve Line 3 0.25 0 6 0
90-deg Elbow Line 3 0.25 0 30 0
45-deg Elbow Line 3 0.25 0 16 0
Outlet Tee - run/run Line 3 0.25 0 20 0
Outlet Tee - run/branch Line 3 0.25 1 60 15
105
EW-2 Well to Trunk
(4" Line)Location
Length or
Dia (in)
Length or
Dia (ft)
# of
Fittings
Fitting
Coefficient
Equivalent Pipe
Length (ft)
Pipe 52.25 1 1 53
Ball Valve Wellhead 3 0.25 1 6 2
90-deg Elbow Wellhead 3 0.25 4 30 30
45-deg Elbow Wellhead 3 0.25 0 16 0
Outlet Tee - run/run Wellhead 3 0.25 1 20 5
Outlet Tee - run/branch Wellhead 3 0.25 0 60 0
Ball Valve Line 4 0.33 0 6 0
90-deg Elbow Line 4 0.33 0 30 0
45-deg Elbow Line 4 0.33 0 16 0
Outlet Tee - run/run Line 4 0.33 0 20 0
Outlet Tee - run/branch Line 4 0.33 1 60 20
110
EW-2 Well to Trunk
(6" Line)Location
Length or
Dia (in)
Length or
Dia (ft)
# of
Fittings
Fitting
Coefficient
Equivalent Pipe
Length (ft)
Pipe 52.25 1 1 53
Ball Valve Wellhead 3 0.25 1 6 2
90-deg Elbow Wellhead 3 0.25 4 30 30
45-deg Elbow Wellhead 3 0.25 0 16 0
Outlet Tee - run/run Wellhead 3 0.25 1 20 5
Outlet Tee - run/branch Wellhead 3 0.25 0 60 0
Ball Valve Line 6 0.50 0 6 0
90-deg Elbow Line 6 0.50 0 30 0
45-deg Elbow Line 6 0.50 0 16 0
Outlet Tee - run/run Line 6 0.50 0 20 0
Outlet Tee - run/branch Line 6 0.50 1 60 30
120
Total Equivalent Pipe Length =
Total Equivalent Pipe Length =
Total Equivalent Pipe Length =
14949039 Conrail Elkhart 2009-2010 Asst
casey_oakes
Text Box
casey_oakes
Text Box
casey_oakes
Text Box
casey_oakes
Text Box
Page 4 of 13

EW-3 Page 3 of 13
EW-3 Well to Trunk
(3" Line)Location
Length or
Dia (in)
Length or
Dia (ft)
# of
Fittings
Fitting
Coefficient
Equivalent Pipe
Length (ft)
Pipe 26.5 1 1 27
Ball Valve Wellhead 3 0.25 1 6 2
90-deg Elbow Wellhead 3 0.25 4 30 30
45-deg Elbow Wellhead 3 0.25 0 16 0
Outlet Tee - run/run Wellhead 3 0.25 1 20 5
Outlet Tee - run/branch Wellhead 3 0.25 0 60 0
Ball Valve Line 3 0.25 0 6 0
90-deg Elbow Line 3 0.25 0 30 0
45-deg Elbow Line 3 0.25 0 16 0
Outlet Tee - run/run Line 3 0.25 0 20 0
Outlet Tee - run/branch Line 3 0.25 1 60 15
79Total Equivalent Pipe Length =
14949039 Conrail Elkhart 2009-2010 Asst
casey_oakes
Text Box
Page 5 of 13
casey_oakes
Text Box
Page 5 of 14

EW-4 Page 3 of 13
EW-4 Well to Trunk
(4" Line)Location
Length or
Dia (in)
Length or
Dia (ft)
# of
Fittings
Fitting
Coefficient
Equivalent Pipe
Length (ft)
Pipe 445 1 1 445
Ball Valve Wellhead 3 0.25 1 6 2
90-deg Elbow Wellhead 3 0.25 6 30 45
45-deg Elbow Wellhead 3 0.25 0 16 0
Outlet Tee - run/run Wellhead 3 0.25 1 20 5
Outlet Tee - run/branch Wellhead 3 0.25 0 60 0
Ball Valve Line 4 0.33 0 6 0
90-deg Elbow Line 4 0.33 1 30 10
45-deg Elbow Line 4 0.33 2 16 11
Outlet Tee - run/run Line 4 0.33 0 20 0
Outlet Tee - run/branch Line 4 0.33 1 60 20
538Total Equivalent Pipe Length =
14949039 Conrail Elkhart 2009-2010 Asst
casey_oakes
Text Box
Page 6 of 13

EW-5 Page 3 of 13
EW-5 Well to Trunk
(4" Line)Location
Length or
Dia (in)
Length or
Dia (ft)
# of
Fittings
Fitting
Coefficient
Equivalent Pipe
Length (ft)
Pipe 280.5 1 1 281
Ball Valve Wellhead 3 0.25 1 6 2
90-deg Elbow Wellhead 3 0.25 4 30 30
45-deg Elbow Wellhead 3 0.25 0 16 0
Outlet Tee - run/run Wellhead 3 0.25 1 20 5
Outlet Tee - run/branch Wellhead 3 0.25 0 60 0
Ball Valve Line 4 0.33 0 6 0
90-deg Elbow Line 4 0.33 1 30 10
45-deg Elbow Line 4 0.33 0 16 0
Outlet Tee - run/run Line 4 0.33 0 20 0
Outlet Tee - run/branch Line 4 0.33 1 60 20
348
EW-5 Well to Trunk
(6" Line)Location
Length or
Dia (in)
Length or
Dia (ft)
# of
Fittings
Fitting
Coefficient
Equivalent Pipe
Length (ft)
Pipe 280.5 1 1 281
Ball Valve Wellhead 3 0.25 1 6 2
90-deg Elbow Wellhead 3 0.25 4 30 30
45-deg Elbow Wellhead 3 0.25 0 16 0
Outlet Tee - run/run Wellhead 3 0.25 1 20 5
Outlet Tee - run/branch Wellhead 3 0.25 0 60 0
Ball Valve Line 6 0.50 0 6 0
90-deg Elbow Line 6 0.50 1 30 15
45-deg Elbow Line 6 0.50 0 16 0
Outlet Tee - run/run Line 6 0.50 0 20 0
Outlet Tee - run/branch Line 6 0.50 1 60 30
363
Total Equivalent Pipe Length =
Total Equivalent Pipe Length =
14949039 Conrail Elkhart 2009-2010 Asst
casey_oakes
Text Box
Page 7 of 13

Trunk to GWTP Page 3 of 13
Trunk Segment 1
(6" Line)Location
Length or
Dia (in)
Length or
Dia (ft)
# of
Fittings
Fitting
Coefficient
Equivalent Pipe
Length (ft)
Pipe 484 1 1 484
90-deg Elbow Line 6 0.50 0 30 0
45-deg Elbow Line 6 0.50 0 16 0
Outlet Tee - run/run Line 6 0.50 1 20 10
Outlet Tee - run/branch Line 6 0.50 0 60 0
494
Trunk Segment 1
(8" Line)Location
Length or
Dia (in)
Length or
Dia (ft)
# of
Fittings
Fitting
Coefficient
Equivalent Pipe
Length (ft)
Pipe 484 1 1 484
90-deg Elbow Line 8 0.67 0 30 0
45-deg Elbow Line 8 0.67 0 16 0
Outlet Tee - run/run Line 8 0.67 1 20 14
Outlet Tee - run/branch Line 8 0.67 0 60 0
498
Trunk to Segment 1
(10" Line)Location
Length or
Dia (in)
Length or
Dia (ft)
# of
Fittings
Fitting
Coefficient
Equivalent Pipe
Length (ft)
Pipe 484 1 1 484
90-deg Elbow Line 10 0.83 0 30 0
45-deg Elbow Line 10 0.83 0 16 0
Outlet Tee - run/run Line 10 0.83 1 20 17
Outlet Tee - run/branch Line 10 0.83 0 60 0
501
Trunk Segment 2
(6" Line)Location
Length or
Dia (in)
Length or
Dia (ft)
# of
Fittings
Fitting
Coefficient
Equivalent Pipe
Length (ft)
Pipe 494 1 1 494
90-deg Elbow Line 6 0.50 1 30 15
45-deg Elbow Line 6 0.50 0 16 0
Outlet Tee - run/run Line 6 0.50 1 20 10
Outlet Tee - run/branch Line 6 0.50 0 60 0
519
Trunk Segment 2
(8" Line)Location
Length or
Dia (in)
Length or
Dia (ft)
# of
Fittings
Fitting
Coefficient
Equivalent Pipe
Length (ft)
Pipe 494 1 1 494
90-deg Elbow Line 8 0.67 1 30 20
45-deg Elbow Line 8 0.67 0 16 0
Outlet Tee - run/run Line 8 0.67 1 20 14
Outlet Tee - run/branch Line 8 0.67 0 60 0
528
Trunk Segment 2
(10" Line)Location
Length or
Dia (in)
Length or
Dia (ft)
# of
Fittings
Fitting
Coefficient
Equivalent Pipe
Length (ft)
Pipe 494 1 1 494
90-deg Elbow Line 10 0.83 1 30 25
45-deg Elbow Line 10 0.83 0 16 0
Outlet Tee - run/run Line 10 0.83 1 20 17
Outlet Tee - run/branch Line 10 0.83 0 60 0
536
Total Equivalent Pipe Length =
Total Equivalent Pipe Length =
Total Equivalent Pipe Length =
Total Equivalent Pipe Length =
Total Equivalent Pipe Length =
Total Equivalent Pipe Length =
14949039 Conrail Elkhart 2009-2010 Asst
casey_oakes
Text Box
Page 8 of 13

Trunk to GWTP Page 4 of 13
Trunk Segment 3
(6" Line)Location
Length or
Dia (in)
Length or
Dia (ft)
# of
Fittings
Fitting
Coefficient
Equivalent Pipe
Length (ft)
Pipe 22 1 1 22
90-deg Elbow Line 6 0.50 0 30 0
45-deg Elbow Line 6 0.50 0 16 0
Outlet Tee - run/run Line 6 0.50 1 20 10
Outlet Tee - run/branch Line 6 0.50 0 60 0
32
Trunk Segment 3
(8" Line)Location
Length or
Dia (in)
Length or
Dia (ft)
# of
Fittings
Fitting
Coefficient
Equivalent Pipe
Length (ft)
Pipe 22 1 1 22
90-deg Elbow Line 8 0.67 0 30 0
45-deg Elbow Line 8 0.67 0 16 0
Outlet Tee - run/run Line 8 0.67 1 20 14
Outlet Tee - run/branch Line 8 0.67 0 60 0
36
Trunk Segment 3
(10" Line)Location
Length or
Dia (in)
Length or
Dia (ft)
# of
Fittings
Fitting
Coefficient
Equivalent Pipe
Length (ft)
Pipe 22 1 1 22
90-deg Elbow Line 10 0.83 0 30 0
45-deg Elbow Line 10 0.83 0 16 0
Outlet Tee - run/run Line 10 0.83 1 20 17
Outlet Tee - run/branch Line 10 0.83 0 60 0
39
Trunk Segment 4
(6" Line)Location
Length or
Dia (in)
Length or
Dia (ft)
# of
Fittings
Fitting
Coefficient
Equivalent Pipe
Length (ft)
Pipe 19 1 1 19
90-deg Elbow Line 6 0.50 1 30 15
45-deg Elbow Line 6 0.50 0 16 0
Outlet Tee - run/run Line 6 0.50 0 20 0
Outlet Tee - run/branch Line 6 0.50 0 60 0
34
Trunk Segment 4
(8" Line)Location
Length or
Dia (in)
Length or
Dia (ft)
# of
Fittings
Fitting
Coefficient
Equivalent Pipe
Length (ft)
Pipe 19 1 1 19
90-deg Elbow Line 8 0.67 1 30 20
45-deg Elbow Line 8 0.67 0 16 0
Outlet Tee - run/run Line 8 0.67 0 20 0
Outlet Tee - run/branch Line 8 0.67 0 60 0
39
Trunk Segment 4
(10" Line)Location
Length or
Dia (in)
Length or
Dia (ft)
# of
Fittings
Fitting
Coefficient
Equivalent Pipe
Length (ft)
Pipe 19 1 1 19
90-deg Elbow Line 10 0.83 1 30 25
45-deg Elbow Line 10 0.83 0 16 0
Outlet Tee - run/run Line 10 0.83 0 20 0
Outlet Tee - run/branch Line 10 0.83 0 60 0
44
Total Equivalent Pipe Length =
Total Equivalent Pipe Length =
Total Equivalent Pipe Length =
Total Equivalent Pipe Length =
Total Equivalent Pipe Length =
Total Equivalent Pipe Length =
14949039 Conrail Elkhart 2009-2010 Asst
casey_oakes
Text Box
Page 9 of 13

GWTP Internal - Bag 1 Path Page 3 of 13
GWTP Internal (6" Line) LocationLength or
Dia (in)
Length or
Dia (ft)
# of
Fittings
Fitting
Coefficient
Equivalent Pipe
Length (ft)
Pipe 79.5 1 1 80
Gate Valve GWTP 6 0.50 5 8 20
90-deg Elbow GWTP 6 0.50 10 30 150
180-deg Elbow GWTP 6 0.50 1 45 23
Outlet Tee - run/run GWTP 6 0.50 0 20 0
Outlet Tee - run/branch GWTP 6 0.50 3 60 90
363
GWTP Internal (8" Line) LocationLength or
Dia (in)
Length or
Dia (ft)
# of
Fittings
Fitting
Coefficient
Equivalent Pipe
Length (ft)
Pipe 79.5 1 1 80
Gate Valve GWTP 8 0.67 5 8 27
90-deg Elbow GWTP 8 0.67 10 30 200
180-deg Elbow GWTP 8 0.67 1 45 30
Outlet Tee - run/run GWTP 8 0.67 0 20 0
Outlet Tee - run/branch GWTP 8 0.67 3 60 120
457
GWTP Internal (10" Line) LocationLength or
Dia (in)
Length or
Dia (ft)
# of
Fittings
Fitting
Coefficient
Equivalent Pipe
Length (ft)
Pipe 79.5 1 1 80
Gate Valve GWTP 10 0.83 5 8 34
90-deg Elbow GWTP 10 0.83 10 30 250
180-deg Elbow GWTP 10 0.83 1 45 38
Outlet Tee - run/run GWTP 10 0.83 0 20 0
Outlet Tee - run/branch GWTP 10 0.83 3 60 150
552Total Equivalent Pipe Length =
Total Equivalent Pipe Length =
Total Equivalent Pipe Length =
14949039 Conrail Elkhart 2009-2010 Asst
casey_oakes
Text Box
Page 10 of 13

GWTP Internal - Bag 2 Path Page 3 of 13
GWTP Internal (6" Line) LocationLength or
Dia (in)
Length or
Dia (ft)
# of
Fittings
Fitting
Coefficient
Equivalent Pipe
Length (ft)
Pipe 81.75 1 1 82
Gate Valve GWTP 6 0.50 5 8 20
90-deg Elbow GWTP 6 0.50 11 30 165
180-deg Elbow GWTP 6 0.50 1 45 23
Outlet Tee - run/run GWTP 6 0.50 0 20 0
Outlet Tee - run/branch GWTP 6 0.50 2 60 60
350
GWTP Internal (8" Line) LocationLength or
Dia (in)
Length or
Dia (ft)
# of
Fittings
Fitting
Coefficient
Equivalent Pipe
Length (ft)
Pipe 81.75 1 1 82
Gate Valve GWTP 8 0.67 5 8 27
90-deg Elbow GWTP 8 0.67 11 30 220
180-deg Elbow GWTP 8 0.67 1 45 30
Outlet Tee - run/run GWTP 8 0.67 0 20 0
Outlet Tee - run/branch GWTP 8 0.67 2 60 80
439
GWTP Internal (10" Line) LocationLength or
Dia (in)
Length or
Dia (ft)
# of
Fittings
Fitting
Coefficient
Equivalent Pipe
Length (ft)
Pipe 81.75 1 1 82
Gate Valve GWTP 10 0.83 5 8 34
90-deg Elbow GWTP 10 0.83 11 30 275
180-deg Elbow GWTP 10 0.83 1 45 38
Outlet Tee - run/run GWTP 10 0.83 0 20 0
Outlet Tee - run/branch GWTP 10 0.83 2 60 100
529
Total Equivalent Pipe Length =
Total Equivalent Pipe Length =
Total Equivalent Pipe Length =
14949039 Conrail Elkhart 2009-2010 Asst
casey_oakes
Text Box
Page 11 of 13

Head Loss Page 3 of 13
SegmentPipe Diameter
(Inches)
Flow
(GPM)C-Value
Velocity
(FPS)
Vel Head
(FEET)
Head Loss
(FT/100')
Head Loss
(FT/1000')
Equivalent Pipe
Length (FT)
Head Loss
(FT)
Head Loss
(PSI)
4 50 150 1.28 0.03 0.16 1.60 167 0.27 0.12
4 100 150 2.55 0.10 0.58 5.77 167 0.96 0.42
4 150 150 3.83 0.23 1.22 12.21 167 2.04 0.88
6 50 150 0.57 0.00 0.02 0.22 170 0.04 0.02
6 100 150 1.13 0.02 0.08 0.80 170 0.14 0.06
6 150 150 1.70 0.04 0.17 1.69 170 0.29 0.13
3 50 150 2.27 0.08 0.65 6.49 105 0.68 0.30
3 100 150 4.54 0.32 2.34 23.41 105 2.46 1.07
3 150 150 6.81 0.72 4.96 49.56 105 5.20 2.26
4 50 150 1.28 0.03 0.16 1.60 110 0.18 0.08
4 100 150 2.55 0.10 0.58 5.77 110 0.63 0.28
4 150 150 3.83 0.23 1.22 12.21 110 1.34 0.58
6 50 150 0.57 0.00 0.02 0.22 120 0.03 0.01
6 100 150 1.13 0.02 0.08 0.80 120 0.10 0.04
6 150 150 1.70 0.04 0.17 1.69 120 0.20 0.09
3 50 150 2.27 0.08 0.65 6.49 79 0.51 0.22
3 100 150 4.54 0.32 2.34 23.41 79 1.85 0.80
3 150 150 6.81 0.72 4.96 49.56 79 3.92 1.70
4 50 150 1.28 0.03 0.16 1.60 538 0.86 0.37
4 100 150 2.55 0.10 0.58 5.77 538 3.10 1.35
4 150 150 3.83 0.23 1.22 12.21 538 6.57 2.85
4 50 150 1.28 0.03 0.16 1.60 348 0.56 0.24
4 100 150 2.55 0.10 0.58 5.77 348 2.01 0.87
4 150 150 3.83 0.23 1.22 12.21 348 4.25 1.84
6 50 150 0.57 0.00 0.02 0.22 363 0.08 0.03
6 100 150 1.13 0.02 0.08 0.80 363 0.29 0.13
6 150 150 1.70 0.04 0.17 1.69 363 0.62 0.27
6 100 150 1.13 0.02 0.08 0.80 494 0.40 0.17
6 200 150 2.27 0.08 0.29 2.89 494 1.43 0.62
6 300 150 3.40 0.18 0.61 6.11 494 3.02 1.31
8 100 150 0.64 0.01 0.02 0.20 498 0.10 0.04
8 200 150 1.28 0.03 0.07 0.71 498 0.35 0.15
8 300 150 1.91 0.06 0.15 1.51 498 0.75 0.33
10 100 150 0.41 0.00 0.01 0.07 501 0.03 0.01
10 200 150 0.82 0.01 0.02 0.24 501 0.12 0.05
10 300 150 1.23 0.02 0.05 0.51 501 0.25 0.11
6 150 150 1.70 0.04 0.17 1.69 519 0.88 0.38
6 300 150 3.40 0.18 0.61 6.11 528 3.23 1.40
6 450 150 5.11 0.40 1.29 12.94 536 6.93 3.01
8 150 150 0.96 0.01 0.04 0.42 519 0.22 0.09
8 300 150 1.91 0.06 0.15 1.51 528 0.79 0.34
8 450 150 2.87 0.13 0.32 3.19 536 1.71 0.74
10 150 150 0.61 0.01 0.01 0.14 519 0.07 0.03
10 300 150 1.23 0.02 0.05 0.51 528 0.27 0.12
10 450 150 1.84 0.05 0.11 1.07 536 0.58 0.25
Trunk to
GWTP
Segment 2
Trunk to
GWTP
Segment 1
EW-1
Pump to
Trunk
EW-2
Pump to
Trunk
EW-3
Pump to
Trunk
EW-4
Pump to
Trunk
EW-5
Pump to
Trunk
14949039 Conrail Elkhart 2009-2010 Asst
casey_oakes
Text Box
Page 12 of 13

Head Loss Page 4 of 13
SegmentPipe Diameter
(Inches)
Flow
(GPM)C-Value
Velocity
(FPS)
Vel Head
(FEET)
Head Loss
(FT/100')
Head Loss
(FT/1000')
Equivalent Pipe
Length (FT)
Head Loss
(FT)
Head Loss
(PSI)
6 200 150 2.27 0.08 0.29 2.89 32 0.09 0.04
6 400 150 4.54 0.32 1.04 10.40 36 0.37 0.16
6 600 150 6.81 0.72 2.20 22.02 39 0.86 0.37
8 200 150 1.28 0.03 0.07 0.71 32 0.02 0.01
8 400 150 2.55 0.10 0.26 2.56 36 0.09 0.04
8 600 150 3.83 0.23 0.54 5.43 39 0.21 0.09
10 200 150 0.82 0.01 0.02 0.24 32 0.01 0.00
10 400 150 1.63 0.04 0.09 0.86 36 0.03 0.01
10 600 150 2.45 0.09 0.18 1.83 39 0.07 0.03
6 250 150 2.84 0.12 0.44 4.36 34 0.15 0.06
6 500 150 5.67 0.50 1.57 15.72 39 0.61 0.27
6 750 150 8.51 1.12 3.33 33.28 44 1.46 0.64
8 250 150 1.60 0.04 0.11 1.07 34 0.04 0.02
8 500 150 3.19 0.16 0.39 3.87 39 0.15 0.07
8 750 150 4.79 0.36 0.82 8.20 44 0.36 0.16
10 250 150 1.02 0.02 0.04 0.36 34 0.01 0.01
10 500 150 2.04 0.06 0.13 1.31 39 0.05 0.02
10 750 150 3.06 0.15 0.28 2.77 44 0.12 0.05
6 250 150 2.84 0.12 0.44 4.36 363 1.58 0.69
6 500 150 5.67 0.50 1.57 15.72 363 5.71 2.48
6 750 150 8.51 1.12 3.33 33.28 363 12.08 5.24
8 250 150 1.60 0.04 0.11 1.07 457 0.49 0.21
8 500 150 3.19 0.16 0.39 3.87 457 1.77 0.77
8 750 150 4.79 0.36 0.82 8.20 457 3.75 1.63
10 250 150 1.02 0.02 0.04 0.36 552 0.20 0.09
10 500 150 2.04 0.06 0.13 1.31 552 0.72 0.31
10 750 150 3.06 0.15 0.28 2.77 552 1.53 0.66
6 250 150 2.84 0.12 0.44 4.36 350 1.53 0.66
6 500 150 5.67 0.50 1.57 15.72 350 5.50 2.39
6 750 150 8.51 1.12 3.33 33.28 350 11.65 5.06
8 250 150 1.60 0.04 0.11 1.07 439 0.47 0.20
8 500 150 3.19 0.16 0.39 3.87 439 1.70 0.74
8 750 150 4.79 0.36 0.82 8.20 439 3.60 1.56
10 250 150 1.02 0.02 0.04 0.36 529 0.19 0.08
10 500 150 2.04 0.06 0.13 1.31 529 0.69 0.30
10 750 150 3.06 0.15 0.28 2.77 529 1.46 0.63
Bag Filter - - - - - - - - 11.52 5
Trunk to
GWTP
Segment 3
Trunk to
GWTP
Segment 4
GWTP Bag
Filter 1
Path
GWTP Bag
Filter 2
Path
14949039 Conrail Elkhart 2009-2010 Asst
casey_oakes
Text Box
Page 13 of 13

Appendix B
Summary of Groundwater Wet Chemistry Analytical and FieldParameter Results

Well ID Alkalinity COD Chloride Ferrous Iron Nitrate Sulfate TOC Methane Ethane Ethene
06/11 06/11 06/11 06/11 06/11 06/11 06/11 06/11 06/11 06/11 06/11 09/11 12/11 3/12 06/12 06/11 09/11 12/11 3/12 06/12
DSMW-01 NA NA NA NA NA NA NA NA NA NA NA 55.63 50.04 53.58 57.5 NA 7.37 7.43 7.35 7.23
DSMW-02 NA NA NA NA NA NA NA NA NA NA NA 55.01 52.04 51.64 54.1 NA 7.31 7.37 6.61 7.25
DSMW-03 NA NA NA NA NA NA NA NA NA NA NA 57.58 51.47 51.41 56.6 NA 7.68 7.75 7.42 7.58
DSWM-04S 250 13 J 52 0.050 U HF 0.10 U 21 0.71 J 2.0 U 4.0 U 3.0 U 57.6 56.18 52.26 52.39 58.0 7.55 7.35 7.46 6.65 7.39
DSWM-04I 230 10 J 70 0.050 U HF 0.18 28 1.1 2.0 U 4.0 U 3.0 U 57.6 54.34 51.04 52.67 50.2 7.60 7.53 7.38 7.37 7.00
DSWM-04D 230 25 51 0.020 J HF 0.10 U 28 0.83 J 2.0 U 4.0 U 3.0 U 56.8 58.75 50.16 53.36 52.3 7.59 7.56 7.60 7.49 7.51
DSMW-07S 250 10 J 59 0.050 U HF 0.10 U 24 0.57 J 2.0 U 4.0 U 3.0 U 55.3 55.63 50.95 51.14 56.1 7.21 7.32 7.36 7.25 7.33
DSMW-07I 280 12 J 99 0.050 U HF 0.10 U 30 0.99 J 2.0 U 4.0 U 3.0 U 56.5 55.18 49.99 51.96 56.9 7.34 7.33 7.41 6.74 7.28
DSMW-07D 240 10 J 80 0.020 J HF 0.10 U 26 0.71 J 31 4.0 U 3.0 U 55.6 55.29 52.26 50.95 51.0 7.90 7.62 7.64 7.59 7.56
DSMW-08S 230 12 J 39 0.050 U HF 0.10 U 21 0.54 J 2.0 U 4.0 U 3.0 U 52.9 55.67 52.03 50.95 58.4 6.90 7.31 7.28 7.31 7.18
DSMW-08I 260 20 U 84 0.050 U HF 0.10 U 27 1.2 2.0 U 4.0 U 3.0 U 56.1 54.49 52.38 52.47 58.6 7.39 7.47 7.52 7.29 7.28
DSMW-08D 240 20 U 40 0.030 J HF 0.10 U 30 0.71 J 2.7 4.0 U 3.0 U 57.0 55.97 50.68 50.97 57.4 7.62 7.66 7.66 7.44 7.52
DSMW-09S 230 10 J 37 0.050 U HF 0.10 U 18 0.68 J 2.0 U 4.0 U 3.0 U 55.7 54.71 51.09 52.7 58.1 7.62 7.46 7.41 6.27 7.25
DSMW-09I 280 10 J 73 0.050 U HF 0.21 30 1.3 2.0 U 4.0 U 3.0 U 58.2 57.95 52.50 54.21 59.1 7.59 7.48 7.35 7.32 7.32
DSMW-09D 250 10 J 51 0.020 J HF 0.10 U 30 0.78 J 2.2 4.0 U 3.0 U 56.7 56.88 50.69 51.33 53.2 7.85 7.73 7.65 7.49 7.51
DSMW-10S NA NA NA NA NA NA NA NA NA NA 56.4 56.30 52.57 51.15 52.8 7.11 7.13 7.18 6.94 7.10
DSMW-10I NA NA NA NA NA NA NA NA NA NA 57.1 56.20 51.65 52.92 54.5 7.51 7.50 7.60 7.49 7.41
DSMW-10D NA NA NA NA NA NA NA NA NA NA 56.8 54.96 54.12 52.49 57.1 7.65 7.62 7.65 7.45 7.52
MW-05S NA NA NA NA NA NA NA NA NA NA NA 61.81 49.86 48.70 63.6 NA 7.83 7.97 7.24 7.83
MW-05D NA NA NA NA NA NA NA NA NA NA NA 56.94 49.98 53.26 62.2 NA 7.39 7.53 7.33 7.46
MW-09S NA NA NA NA NA NA NA NA NA NA NA 55.00 51.86 51.13 57.6 NA 7.31 7.42 7.20 7.27
MW-09D NA NA NA NA NA NA NA NA NA NA NA 57.04 53.21 63.01 55.4 NA 7.54 7.46 7.38 7.47
MW-38S NA NA NA NA NA NA NA NA NA NA NA 57.46 49.77 49.11 59.0 NA 7.42 7.46 7.29 7.34
MW-38D NA NA NA NA NA NA NA NA NA NA NA 53.65 49.17 51.67 55.1 NA 7.47 7.50 7.41 7.41
MW-44D NA NA NA NA NA NA NA NA NA NA NA 55.33 50.17 52.15 59.3 NA 7.49 7.46 7.36 7.41
MW-50 NA NA NA NA NA NA NA NA NA NA NA 56.09 50.15 53.46 56.5 NA 7.47 7.55 7.32 7.47
MW-56S NA NA NA NA NA NA NA NA NA NA NA 54.26 51.46 49.83 52.3 NA 7.41 7.52 7.28 7.33
MW-56I NA NA NA NA NA NA NA NA NA NA NA 54.19 52.65 51.13 56.1 NA 7.43 7.35 7.43 7.22
MW-56D NA NA NA NA NA NA NA NA NA NA NA 53.88 51.42 51.41 51.0 NA 7.51 7.55 7.36 7.40
Notes: Average
Samples collected and field parameters measured June 22-23, 2011, COD = chemical oxygen demand Shallow 7.285 omit 5S
September 20-21, 2011, December 13-16, 2011, March 21-25, 2012, and June 19, 2012. TOC = total organic carbon pH Intermediate 7.375
ºF = Degrees Fahrenheit ORP = oxidation-reduction potential Deep 7.526
SU = Standard units
mg/L = Milligrams per liter
µg/L = Micrograms per litermV = Millivolts
U = Not detected above the Reporting Limit shown
J = Estimated concentration
HF = Lab result for field parameter with a holding of 15 minutes
NA = Not analyzed
General Chemistry (mg/L) Dissolved Gases (µg/L)
Temperature (ºF) pH (SU)
Abbreviations
APPENDIX B
SUMMARY OF GROUNDWATER WET CHEMISTRY ANALYTICAL AND FIELD PARAMETER RESULTS
DRAG STRIP-SUPPLEMENTAL 2011-2012 GROUNDWATER MONITORING
CONRAIL RAILYARD SUPERFUND SITE - ELKHART, INDIANA
14951501.11014 Page 1 of 2 1/30/15

Well ID
06/11 09/11 12/11 3/12 06/12 06/11 09/11 12/11 3/12 06/12 06/11 09/11 12/11 3/12 06/12
DSMW-01 NA 807 808 832 808 NA 3.46 3.89 4.08 2.73 NA 136.6 83.5 131.2 224.7
DSMW-02 NA 736 729 503 739 NA 5.38 4.57 6.01 4.84 NA 136.5 49.3 361.3 228.9
DSMW-03 NA 703 693 777 647 NA 11.75 10.68 3.38 9.84 NA 110.3 156.2 5.3 148.5
DSWM-04S 680 664 694 514 734 3.15 5.14 3.03 5.72 5.84 265 180.4 165.1 315.3 175.5
DSWM-04I 698 772 791 858 962 0.57 0.75 0.36 0.50 0.49 132 -15.4 91.9 47.7 -151.6
DSWM-04D 665 630 655 732 628 0.00 0.45 0.22 0.46 0.56 -76 -58.7 23.2 -82.2 29.6
DSMW-07S 744 742 750 827 772 4.03 5.26 4.99 6.19 6.55 -50 -40.2 -28.5 1.6 37.0
DSMW-07I 874 934 948 710 977 0.51 0.68 0.35 0.60 0.51 106 115.0 141.8 61.3 160.0
DSMW-07D 661 696 685 723 681 0.39 0.49 0.31 0.64 0.37 -165 -149.7 -133.9 -187.3 -108.6
DSMW-08S 697 685 709 489 683 4.66 6.85 6.15 6.42 7.62 51 25.0 -10.3 8.4 2.6
DSMW-08I 815 811 873 972 928 0.32 0.59 0.06 0.68 0.41 119 78.3 148.1 146.3 250.6
DSMW-08D 608 636 634 662 595 0.24 0.40 0.19 0.58 0.31 -146 -139.7 -144.5 -144.8 -157.8
DSMW-09S 668 693 690 510 687 3.42 5.02 4.66 4.90 3.43 102 59.5 163.5 326.8 181.3
DSMW-09I 765 759 790 864 806 0.34 0.43 0.47 1.02 0.54 107 -12.9 45.9 -6.6 166.2
DSMW-09D 593 656 637 683 630 0.30 0.73 0.26 0.67 0.39 -160 -178.9 -156.7 -184.4 -109.0
DSMW-10S 726 744 714 829 691 4.42 8.51 6.33 2.38 6.98 217 145.4 107.9 179.3 115.2
DSMW-10I 617 675 662 500 685 0.23 0.73 0.23 0.19 0.30 -59 35.0 -48.5 -6.9 41.5
DSMW-10D 554 599 597 632 570 0.26 0.38 0.53 0.86 0.29 -114 -72.9 -55.7 -62.5 -70.5
MW-05S NA 229 228 138 215 NA 11.37* 10.53* 9.85* 10.54* NA 108.2 81.4 322.6 219.4
MW-05D NA 845 804 879 839 NA 2.16 2.24 3.14 2.69 NA 60.4 103.2 60.9 181.9
MW-09S NA 500 485 510 466 NA 4.15 6.59 5.88 3.44 NA 99.5 146.2 181.1 189.9
MW-09D NA 634 628 647 625 NA 0.68 0.40 0.75 0.50 NA 94.9 159.2 113.3 117.2
MW-38S NA 704 690 627 717 NA 12.63* 9.52 6.89 7.63 NA 156.8 131.4 168.9 183.3
MW-38D NA 691 703 491 728 NA 0.62 0.33 0.20 0.66 NA 100.1 123.8 182.2 201.3
MW-44D NA 756 759 776 696 NA 0.64 0.62 0.62 0.43 NA -9.0 -36.2 -61.1 -54.2
MW-50 NA 689 695 701 661 NA 1.85 1.71 1.59 1.57 NA 25.7 -10 -20.9 -12.9
MW-56S NA 694 691 686 718 NA 11.21* 9.64 5.72 9.56 NA 67.7 62.2 41.7 190.7
MW-56I NA 704 716 495 703 NA 12.01* 9.74 2.91 4.89 NA 98.4 115.2 144.6 158.3
MW-56D NA 686 651 665 583 NA 0.55 0.28 0.81 0.46 NA 107.4 22.0 74.3 205.5
Average Average Average
Shallow 684 omit 5S Shallow 5.629 omit 5S,38S,56S Shallow 124.994 omit 5S,38S,56S
Sp. Cond. Intermediate 777 DO Intermediate 0.838 omit 38D,56I ORP Intermediate 70.588 omit 38D,56I
Deep 665 Deep 0.647 omit 56D Deep -82.986 omit 56D
Notes:
Samples collected and field parameters measured June 22-23, 2011,September 20-21, 2011, December 13-16, 2011, March 21-25, 2012, and June 19, 2012. Shallow 8.160 Shallow 125.338
mg/L = Milligrams per liter Intermediate 2.764 Intermediate 140.488
mV = Millivolts Deep 0.525 Deep 102.300
NA = Not analyzed
ORP = Oxidation-reduction potential
* = Anomalous reading
MW-38, 56MW-38, 56
ORP (mV)Specific Conductance (µS/cm) Dissolved Oxygen (mg/L)
APPENDIX B (Continued)
14951501.11014 Page 2 of 2 1/30/15

Appendix C
Revision 1, Technical Memorandum: IntermediateRemediation Goal Calculation

TECHNICAL MEMORANDUM:
INTERIM REMEDIATION GOAL CALCULATION
HAS BEEN REDACTED – TEN PAGES

FIGURES

FIGURES 1-2
HAVE BEEN REDACTED – TWO PAGES
CONTAINS POTENIAL PERSONALLY-IDENTIFYING INFORMATION

14951501
CONRAIL RAILYARD SUPERFUND SITE
ELKHART, IN
FIGURE 3
COMPARISION OF CONCENTRATIONS VS. SCREENING LEVELS AND
ACTION LEVEL
0.1
1
10
100
1000
10000Ja
n-8
9
Jan
-91
Jan
-93
Jan
-95
Jan
-97
Jan
-99
Jan
-01
Jan
-03
Jan
-05
Jan
-07
Jan
-09
Jan
-11
Jan
-13
Jan
-15
Vistula Area Shallow GW, Max. CT
Max CT (ug/L)
CT VISL (ug/L)
0.1
1
10
100
1000
10000
Jan
-89
Jan
-91
Jan
-93
Jan
-95
Jan
-97
Jan
-99
Jan
-01
Jan
-03
Jan
-05
Jan
-07
Jan
-09
Jan
-11
Jan
-13
Jan
-15
Vistula Area Shallow GW, Max. TCE
Max. TCE (ug/L)
TCE VISL (ug/L)
0
0.1
0.2
0.3
0.4
0.5
0.6
0.7
0.8
0.9
1
Ap
r-1
2
Jul-
12
Oct
-12
Jan
-13
Ma
y-1
3
Au
g-1
3
No
v-1
3
Ma
r-1
4
Jun
-14
Se
p-1
4
Vistula Area Indoor Air, Max. CT
CT (ppbv)
CT, J-flag (ppbv)
CT, U-flag (ppbv)
CT IAAL (ppbv)
0
0.1
0.2
0.3
0.4
0.5
0.6
0.7
0.8
0.9
1
Ap
r-1
2
Jul-
12
Oct
-12
Jan
-13
Ma
y-1
3
Au
g-1
3
No
v-1
3
Ma
r-1
4
Jun
-14
Se
p-1
4
Vistula Area Indoor Air, Max. TCE
TCE, J-flag (ppbv)
TCE, U-flag (ppbv)
Proposed TCE IASL
(ppbv)

ATTACHMENT A
(PROVIDED ELECTRONICALLY)

ATTACHMENT B

0.01
0.1
1
10
100
CF/CT
CF/CT

DSMW-11S (21-26 ft), Carbon tetrachloride
0.1
1
10
100
1000
10000Jan-89
Jan-90
Jan-91
Jan-92
Jan-93
Jan-94
Jan-95
Jan-96
Jan-97
Jan-98
Jan-99
Jan-00
Jan-01
Jan-02
Jan-03
Jan-04
Jan-05
Jan-06
Jan-07
Jan-08
Jan-09
Jan-10
Jan-11
Jan-12
Jan-13
Jan-14
Jan-15
Jan-16
Co
nce
ntr
atio
n (
ug/
L)
Detections B-flag J-flag U-flag MCL

DSMW-12S (20-25 ft), Carbon tetrachloride
0.1
1
10
100
1000
10000Jan-89
Jan-90
Jan-91
Jan-92
Jan-93
Jan-94
Jan-95
Jan-96
Jan-97
Jan-98
Jan-99
Jan-00
Jan-01
Jan-02
Jan-03
Jan-04
Jan-05
Jan-06
Jan-07
Jan-08
Jan-09
Jan-10
Jan-11
Jan-12
Jan-13
Jan-14
Jan-15
Jan-16
Co
nce
ntr
atio
n (
ug/
L)
Detections B-flag J-flag U-flag MCL

MW-08S (14.5-34.5 ft), Carbon tetrachloride
0.1
1
10
100
1000
10000Jan-89
Jan-90
Jan-91
Jan-92
Jan-93
Jan-94
Jan-95
Jan-96
Jan-97
Jan-98
Jan-99
Jan-00
Jan-01
Jan-02
Jan-03
Jan-04
Jan-05
Jan-06
Jan-07
Jan-08
Jan-09
Jan-10
Jan-11
Jan-12
Jan-13
Jan-14
Jan-15
Jan-16
Co
nce
ntr
atio
n (
ug/
L)
Detections B-flag J-flag U-flag MCL

MW-38S (11-21 ft), Carbon tetrachloride
0.1
1
10
100
1000
10000Jan-89
Jan-90
Jan-91
Jan-92
Jan-93
Jan-94
Jan-95
Jan-96
Jan-97
Jan-98
Jan-99
Jan-00
Jan-01
Jan-02
Jan-03
Jan-04
Jan-05
Jan-06
Jan-07
Jan-08
Jan-09
Jan-10
Jan-11
Jan-12
Jan-13
Jan-14
Co
nce
ntr
atio
n (
ug/
L)
Detections B-flag J-flag U-flag MCL
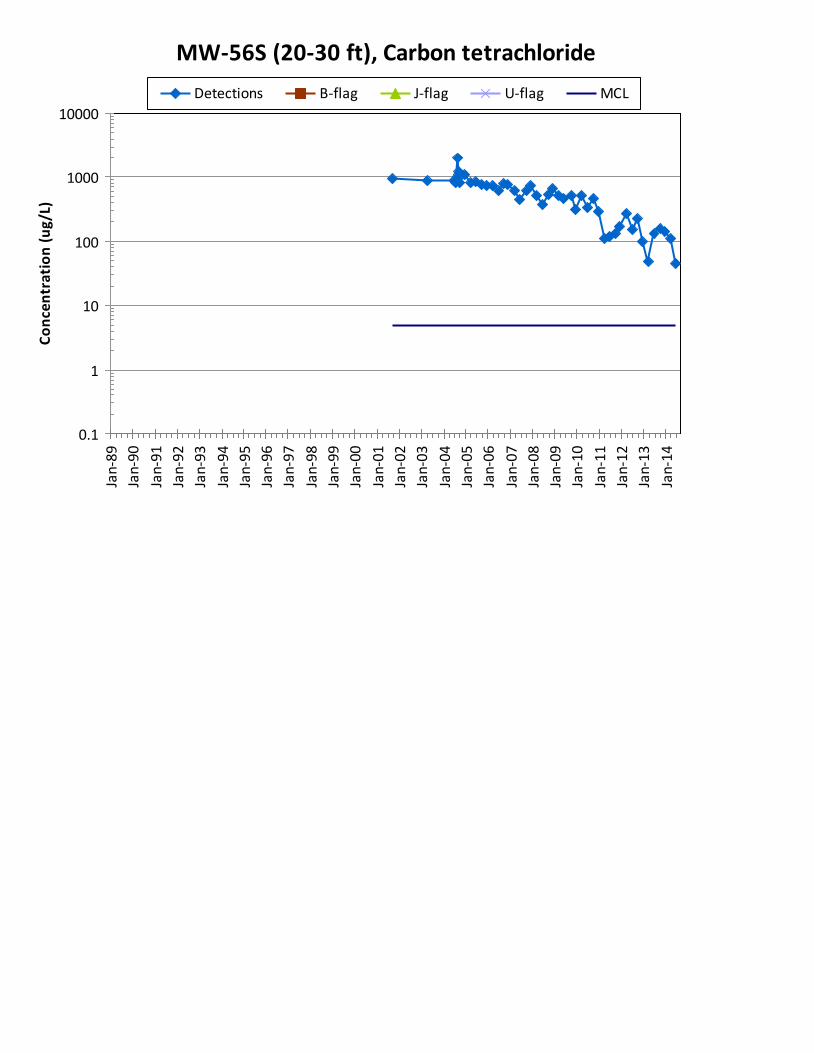
MW-56S (20-30 ft), Carbon tetrachloride
0.1
1
10
100
1000
10000Jan-89
Jan-90
Jan-91
Jan-92
Jan-93
Jan-94
Jan-95
Jan-96
Jan-97
Jan-98
Jan-99
Jan-00
Jan-01
Jan-02
Jan-03
Jan-04
Jan-05
Jan-06
Jan-07
Jan-08
Jan-09
Jan-10
Jan-11
Jan-12
Jan-13
Jan-14
Co
nce
ntr
atio
n (
ug/
L)
Detections B-flag J-flag U-flag MCL

MW-57S (14.5-24.5 ft), Carbon tetrachloride
0.1
1
10
100
1000
10000Jan-89
Jan-90
Jan-91
Jan-92
Jan-93
Jan-94
Jan-95
Jan-96
Jan-97
Jan-98
Jan-99
Jan-00
Jan-01
Jan-02
Jan-03
Jan-04
Jan-05
Jan-06
Jan-07
Jan-08
Jan-09
Jan-10
Jan-11
Jan-12
Jan-13
Jan-14
Jan-15
Jan-16
Co
nce
ntr
atio
n (
ug/
L)
Detections B-flag J-flag U-flag MCL

MW-58S (14.8-24.8 ft), Carbon tetrachloride
0.1
1
10
100
1000
10000Jan-89
Jan-90
Jan-91
Jan-92
Jan-93
Jan-94
Jan-95
Jan-96
Jan-97
Jan-98
Jan-99
Jan-00
Jan-01
Jan-02
Jan-03
Jan-04
Jan-05
Jan-06
Jan-07
Jan-08
Jan-09
Jan-10
Jan-11
Jan-12
Jan-13
Jan-14
Co
nce
ntr
atio
n (
ug/
L)
Detections B-flag J-flag U-flag MCL

MW-59S (15-25 ft), Carbon tetrachloride
0.1
1
10
100
1000
10000Jan-89
Jan-90
Jan-91
Jan-92
Jan-93
Jan-94
Jan-95
Jan-96
Jan-97
Jan-98
Jan-99
Jan-00
Jan-01
Jan-02
Jan-03
Jan-04
Jan-05
Jan-06
Jan-07
Jan-08
Jan-09
Jan-10
Jan-11
Jan-12
Jan-13
Jan-14
Co
nce
ntr
atio
n (
ug/
L)
Detections B-flag J-flag U-flag MCL

MW-60S (15-25 ft), Carbon tetrachloride
0.1
1
10
100
1000
10000Jan-89
Jan-90
Jan-91
Jan-92
Jan-93
Jan-94
Jan-95
Jan-96
Jan-97
Jan-98
Jan-99
Jan-00
Jan-01
Jan-02
Jan-03
Jan-04
Jan-05
Jan-06
Jan-07
Jan-08
Jan-09
Jan-10
Jan-11
Jan-12
Jan-13
Jan-14
Co
nce
ntr
atio
n (
ug/
L)
Detections B-flag J-flag U-flag MCL

ATTACHMENT C

x OSWER VAPOR INTRUSION ASSESSMENT
x Vapor Intrusion Screening Level (VISL) Calculator Version 3.3.1, May 2014 RSLs
x
x Parameter Symbol Value
x Exposure Scenario Scenario Residential
x Target Risk for Carcinogens TCR 1.00E-05
x Target Hazard Quotient for Non-Carcinogens THQ 1
x Average Groundwater Temperature (oC) Tgw 25
x
x
Is Chemical
Sufficiently Volatile
and Toxic to Pose
Inhalation Risk Via
Vapor Intrusion from
Soil Source?
Is Chemical
Sufficiently Volatile
and Toxic to Pose
Inhalation Risk Via
Vapor Intrusion from
Groundwater
Source?
Target Indoor Air
Conc. @ TCR =
10E-06 or THQ =
1
Toxicity
Basis
Target Sub-
Slab and
Exterior Soil
Gas Conc. @
TCR = 10E-06
or THQ = 1
Target Ground
Water Conc. @ TCR
= 10E-06 or THQ = 1
Is Target
Ground Water
Conc. < MCL?
Temperature
for
Groundwater
Vapor Conc.
Lower
Explosive
Limit** LE
LS
ou
rce
Inhalation Unit
Risk
IUR
Source*
Reference
Concentration
RFC
Source*
Mutagenic
Indicator
Target Indoor
Air Conc. for
Carcinogens
@ TCR = 10E-
06
Target Indoor
Air Conc. for
Non-
Carcinogens @
THQ = 1
x Cvp > Cia,target? Chc > Cia,target? MIN(Cia,c;Cia,nc) Csg Cgw Cgw<MCL? Tgw or 25 LEL IUR RfC i Cia,c Cia,nc
x CAS Chemical Name Yes/No Yes/No (ug/m3) C/NC (ug/m
3) (ug/L)
Yes/No
(MCL ug/L) C (% by vol) (ug/m3)-1
(mg/m3) (ug/m
3) (ug/m
3)
x 56-23-5 Carbon Tetrachloride Yes Yes 4.7E+00 C 4.7E+01 53.2 No (5) 25 6.00E-06 I 1.00E-01 I 4.7E+00 1.0E+02
Notes:
(1) Inhalation Pathway Exposure Parameters (RME): Units
Exposure Scenario Symbol Value Symbol Value Symbol Value
Averaging time for carcinogens (yrs) ATc_R 70 ATc_C 70 ATc 70
Averaging time for non-carcinogens (yrs) ATnc_R 26 ATnc_C 25 ATnc 26
Exposure duration (yrs) ED_R 26 ED_C 25 ED 26
Exposure frequency (days/yr) EF_R 350 EF_C 250 EF 350
Exposure time (hr/day) ET_R 24 ET_C 8 ET 24
(2) Generic Attenuation Factors:
Source Medium of Vapors Symbol Value Symbol Value Symbol Value
Groundwater ( - ) AFgw_R 7.79292E-05 AFgw_C 0.001 AFgw 7.793E-05
Sub-Slab and Exterior Soil Gas ( - ) AFss_R 0.1 AFss_C 0.1 AFss 0.1
(3) Formulas
Cia, target = MIN( Cia,c; Cia,nc)
Cia,c (ug/m3) = TCR x ATc x (365 days/yr) x (24 hrs/day) / (ED x EF x ET x IUR)
Cia,nc (ug/m3) = THQ x ATnc x (365 days/yr) x (24 hrs/day) x RfC x (1000 ug/mg) / (ED x EF x ET)
(4) Special Case Chemicals
Trichloroethylene Symbol Value Symbol Value Symbol Value
mIURTCE_R 1.00E-06 mIURTCE_C 0.00E+00 mIURTCE 1.00E-06
IURTCE_R 3.10E-06 IURTCE_C 4.10E-06 IURTCE 3.10E-06
Mutagenic Chemicals The exposure durations and age-dependent adjustment factors for mutagenic-mode-of-action are listed in the table below:
0 - 2 years 22 - 6 years 4
6 - 16 years 1016 - 26 years 10
Mutagenic-mode-of-action (MMOA) adjustment factor This factor is used in the equations for mutagenic chemicals.
Vinyl Chloride See the Navigation Guide equation for Cia,c for vinyl chloride.
Notation:NVT = Not sufficiently volatile and/or toxic to pose inhalation risk in selected exposure scenario for the indicated mediumC = CarcinogenicNC = Non-carcinogenicI = IRIS: EPA Integrated Risk Information System (IRIS). Available online at: http://www.epa.gov/iris/subst/index.html
P = PPRTV. EPA Provisional Peer Reviewed Toxicity Values (PPRTVs). Available online at: http://hhpprtv.ornl.gov/pprtv.shtmlA = Agency for Toxic Substances and Disease Registry (ATSDR) Minimum Risk Levels (MRLs). Available online at: http://www.atsdr.cdc.gov/mrls/index.htmlCA = California Environmental Protection Agency/Office of Environmental Health Hazard Assessment assessments. Available online at:H = HEAST. EPA Superfund Health Effects Assessment Summary Tables (HEAST) database. Available online at: http://epa-heast.ornl.gov/heast.shtmlS = See RSL User Guide, Section 5X = PPRTV AppendixE = The Engineering ToolBox. Available online at http://www.engineeringtoolbox.com/explosive-concentration-limits-d_423.htmlN = Centers for Disease Control and Prevention (CDC) National Institute for Occupational Safety and Health (NIOSH). Pocket Guide to Chemical Hazards. Available online at: http://www.cdc.gov/niosh/npg/default.htmlM = Chemical-specific MSDSMut = Chemical acts according to the mutagenic-mode-of-action, special exposure parameters apply (see footnote (4) above).VC = Special exposure equation for vinyl chloride applies (see Navigation Guide for equation).TCE = Special mutagenic and non-mutagenic IURs for trichloroethylene apply (see footnote (4) above).Yellow highlighting indicates site-specific parameters that may be edited by the user.Blue highlighting indicates exposure factors that are based on Risk Assessment Guidance for Superfund (RAGS) or EPA vapor intrusion guidance, which generally should not be changed.**Lower explosive limit is the minimum concentration of the compound in air (% by volume) that is needed for the gas to ignite and explode.
72
Residential Commercial
31
Note: This section applies to trichloroethylene and other mutagenic
chemicals, but not to vinyl chloride.
Exposure
Duration (years)Age Cohort
Age-dependent
adjustment factor
103
Selected (based on scenario in cell E5)
Instructions
Select residential or commercial scenario from pull down list
Enter target risk for carcinogens
Enter target hazard quotient for non-carcinogens
Residential Commercial
Residential Commercial
Enter average of the stabilized groundwater temperature to correct Henry's Law Constant for groundwater target concentrations
Selected (based on scenario in cell E5)
Selected (based on scenario in cell E5)
VISL Calculator Version 3.3.1, May 2014 RSLs Page 1 of 1

x OSWER VAPOR INTRUSION ASSESSMENT
x Vapor Intrusion Screening Level (VISL) Calculator Version 3.3.1, May 2014 RSLs
x
x Parameter Symbol Value
x Exposure Scenario Scenario Residential
x Target Risk for Carcinogens TCR 1.00E-05
x Target Hazard Quotient for Non-Carcinogens THQ 1
x Average Groundwater Temperature (oC) Tgw 25
x
x
Is Chemical
Sufficiently Volatile
and Toxic to Pose
Inhalation Risk Via
Vapor Intrusion from
Soil Source?
Is Chemical
Sufficiently Volatile
and Toxic to Pose
Inhalation Risk Via
Vapor Intrusion from
Groundwater
Source?
Target Indoor Air
Conc. @ TCR =
10E-06 or THQ =
1
Toxicity
Basis
Target Sub-
Slab and
Exterior Soil
Gas Conc. @
TCR = 10E-06
or THQ = 1
Target Ground
Water Conc. @ TCR
= 10E-06 or THQ = 1
Is Target
Ground Water
Conc. < MCL?
Temperature
for
Groundwater
Vapor Conc.
Lower
Explosive
Limit** LE
LS
ou
rce
Inhalation Unit
Risk
IUR
Source*
Reference
Concentration
RFC
Source*
Mutagenic
Indicator
Target Indoor
Air Conc. for
Carcinogens
@ TCR = 10E-
06
Target Indoor
Air Conc. for
Non-
Carcinogens @
THQ = 1
x Cvp > Cia,target? Chc > Cia,target? MIN(Cia,c;Cia,nc) Csg Cgw Cgw<MCL? Tgw or 25 LEL IUR RfC i Cia,c Cia,nc
x CAS Chemical Name Yes/No Yes/No (ug/m3) C/NC (ug/m
3) (ug/L)
Yes/No
(MCL ug/L) C (% by vol) (ug/m3)-1
(mg/m3) (ug/m
3) (ug/m
3)
x 79-01-6 Trichloroethylene Yes Yes 2.1E+00 NC 2.1E+01 14.3 No (5) 25 8 N see note I 2.00E-03 I TCE 4.8E+00 2.1E+00
Notes:
(1) Inhalation Pathway Exposure Parameters (RME): Units
Exposure Scenario Symbol Value Symbol Value Symbol Value
Averaging time for carcinogens (yrs) ATc_R 70 ATc_C 70 ATc 70
Averaging time for non-carcinogens (yrs) ATnc_R 26 ATnc_C 25 ATnc 26
Exposure duration (yrs) ED_R 26 ED_C 25 ED 26
Exposure frequency (days/yr) EF_R 350 EF_C 250 EF 350
Exposure time (hr/day) ET_R 24 ET_C 8 ET 24
(2) Generic Attenuation Factors:
Source Medium of Vapors Symbol Value Symbol Value Symbol Value
Groundwater ( - ) AFgw_R 0.000361151 AFgw_C 0.001 AFgw 0.0003612
Sub-Slab and Exterior Soil Gas ( - ) AFss_R 0.1 AFss_C 0.1 AFss 0.1
(3) Formulas
Cia, target = MIN( Cia,c; Cia,nc)
Cia,c (ug/m3) = TCR x ATc x (365 days/yr) x (24 hrs/day) / (ED x EF x ET x IUR)
Cia,nc (ug/m3) = THQ x ATnc x (365 days/yr) x (24 hrs/day) x RfC x (1000 ug/mg) / (ED x EF x ET)
(4) Special Case Chemicals
Trichloroethylene Symbol Value Symbol Value Symbol Value
mIURTCE_R 1.00E-06 mIURTCE_C 0.00E+00 mIURTCE 1.00E-06
IURTCE_R 3.10E-06 IURTCE_C 4.10E-06 IURTCE 3.10E-06
Mutagenic Chemicals The exposure durations and age-dependent adjustment factors for mutagenic-mode-of-action are listed in the table below:
0 - 2 years 22 - 6 years 4
6 - 16 years 1016 - 26 years 10
Mutagenic-mode-of-action (MMOA) adjustment factor This factor is used in the equations for mutagenic chemicals.
Vinyl Chloride See the Navigation Guide equation for Cia,c for vinyl chloride.
Notation:NVT = Not sufficiently volatile and/or toxic to pose inhalation risk in selected exposure scenario for the indicated mediumC = CarcinogenicNC = Non-carcinogenicI = IRIS: EPA Integrated Risk Information System (IRIS). Available online at: http://www.epa.gov/iris/subst/index.html
P = PPRTV. EPA Provisional Peer Reviewed Toxicity Values (PPRTVs). Available online at: http://hhpprtv.ornl.gov/pprtv.shtmlA = Agency for Toxic Substances and Disease Registry (ATSDR) Minimum Risk Levels (MRLs). Available online at: http://www.atsdr.cdc.gov/mrls/index.htmlCA = California Environmental Protection Agency/Office of Environmental Health Hazard Assessment assessments. Available online at:H = HEAST. EPA Superfund Health Effects Assessment Summary Tables (HEAST) database. Available online at: http://epa-heast.ornl.gov/heast.shtmlS = See RSL User Guide, Section 5X = PPRTV AppendixE = The Engineering ToolBox. Available online at http://www.engineeringtoolbox.com/explosive-concentration-limits-d_423.htmlN = Centers for Disease Control and Prevention (CDC) National Institute for Occupational Safety and Health (NIOSH). Pocket Guide to Chemical Hazards. Available online at: http://www.cdc.gov/niosh/npg/default.htmlM = Chemical-specific MSDSMut = Chemical acts according to the mutagenic-mode-of-action, special exposure parameters apply (see footnote (4) above).VC = Special exposure equation for vinyl chloride applies (see Navigation Guide for equation).TCE = Special mutagenic and non-mutagenic IURs for trichloroethylene apply (see footnote (4) above).Yellow highlighting indicates site-specific parameters that may be edited by the user.Blue highlighting indicates exposure factors that are based on Risk Assessment Guidance for Superfund (RAGS) or EPA vapor intrusion guidance, which generally should not be changed.**Lower explosive limit is the minimum concentration of the compound in air (% by volume) that is needed for the gas to ignite and explode.
72
Residential Commercial
31
Note: This section applies to trichloroethylene and other mutagenic
chemicals, but not to vinyl chloride.
Exposure
Duration (years)Age Cohort
Age-dependent
adjustment factor
103
Selected (based on scenario in cell E5)
Instructions
Select residential or commercial scenario from pull down list
Enter target risk for carcinogens
Enter target hazard quotient for non-carcinogens
Residential Commercial
Residential Commercial
Enter average of the stabilized groundwater temperature to correct Henry's Law Constant for groundwater target concentrations
Selected (based on scenario in cell E5)
Selected (based on scenario in cell E5)
VISL Calculator Version 3.3.1, May 2014 RSLs Page 1 of 1

Appendix D
Laboratory Biotreatibility Study (SiREM, January 2015)

Prepared for: Geosyntec 2240 Sutherland Avenue, Suite 107 Knoxville, TN 37919
Final
Laboratory Biotreatability Study to Evaluate Remediation of VOCs in Groundwater
Conrail Railyard Site, Elkhart, Indiana Prepared by: 130 Research Lane, Suite 2 Guelph, Ontario N1G 5G3
SiREM Ref: GR5218.08
14 January 2015

TABLE OF CONTENTS
Page
1. INTRODUCTION ................................................................................................................. 1
1.1 Summary of Degradation Processes ............................................................................... 1
1.1.1 Elemental Iron Reactions ..................................................................................... 2
1.1.2 Soluble Iron Reactions ......................................................................................... 2
1.1.3 Bioaugmentation .................................................................................................. 2
2. MATERIALS AND METHODS ............................................................................................. 3
2.1 Microcosm Construction and Incubation .......................................................................... 3
2.1.1 Microcosm Construction ....................................................................................... 3
2.1.2 Microcosm Amendments and Incubation ............................................................. 4
2.2 Microcosm Sampling and Analysis .................................................................................. 5
2.2.1 Microcosm Sampling ............................................................................................ 5
2.2.2 Analysis of VOCs and Dissolved Hydrocarbon Gases ......................................... 5
2.2.3 Analysis of Total Volatile Fatty Acids and Anions ................................................. 6
2.2.4 Analysis of Volatile Fatty Acids ............................................................................ 6
2.2.5 Analysis of pH ...................................................................................................... 7
2.2.6 Ferrous Iron Analysis ........................................................................................... 7
2.2.7 Visual Determination of Magnetically Susceptible Material ................................... 7
2.2.8 External Laboratory Analyses .............................................................................. 7
3. RESULTS AND CONCLUSIONS ........................................................................................ 8
3.1 Redox Processes ............................................................................................................ 8
3.1.1 Shallow Depth ...................................................................................................... 9
3.1.2 Intermediate Depth ............................................................................................ 10
3.2 cVOC Biodegradation Results ....................................................................................... 10
3.2.1 Sterile and Active Controls (Shallow and Intermediate Depth) ........................... 11
3.2.2 ZVI Amended/KB-1® Plus Bioaugmented Microcosms (Shallow and Intermediate depths) ............................................................................................................... 11
3.2.3 SRS™/ZVI/Ferrous Fumarate Amended/KB-1® Bioaugmented Microcosms (Shallow and Intermediate depths) ..................................................................... 12
3.2.4 SRS™/Ferrous Fumarate Amended/KB-1® Bioaugmented Microcosms (Shallow and Intermediate depths) ................................................................................... 12
TL0337.10 1/14/2015 pg. i

3.2.5 SRS™ Amended/KB-1® Bioaugmented Microcosms (Shallow and Intermediate
depths) ............................................................................................................... 13
3.2.6 EHC®-L Amended/KB-1® Plus Bioaugmented Microcosms (Shallow and Intermediate depths) .......................................................................................... 13
3.2.7 EHC®-L/ZVI Amended/KB-1® Plus Bioaugmented Microcosms (Shallow and Intermediate depths) .......................................................................................... 14
3.3 Degradation Half-Lives for cVOCs ................................................................................. 14
3.4 VFAs ............................................................................................................................. 15
3.5 pH Results ..................................................................................................................... 15
3.5.1 Shallow Depth .................................................................................................... 15
3.5.2 Intermediate Depth ............................................................................................ 15
4. CONCLUSIONS ................................................................................................................ 16
5. REFERENCES .................................................................................................................. 17
TL0337.10 1/14/2015 pg. ii

LIST OF TABLES
Table 1A: Summary of Microcosm Controls, Treatments and Amendments (Shallow Depth) Table 1B: Summary of Microcosm Controls, Treatments and Amendments (Intermediate
Depth) Table 2: Summary of Microcosm Chlorinated VOC and DHGs Results Table 3: Summary of Microcosm Anion Results Table 4: Summary of Microcosm VFA Results Table 5: Summary of Microcosm pH, and ORP Results Table 6: Half Lives (Days) of Chlorinated Compounds Detected in Microcosms
LIST OF FIGURES
Figure 1: Pathways for the Degradation of Chlorinated Methanes Figure 2: Pathways for the Degradation of Chlorinated Ethenes Figure 3: Chlorinated Ethene Degradation Pathways with ZVI Figure 4: Carbon Tetrachloride Degradation Pathways with ZVI Figure 5: Chlorinated Ethene and Methane Concentration Trends in Anaerobic Sterile
Control Microcosms (Shallow) Figure 6: Chlorinated Ethene and Methane Concentration Trends in Anaerobic Active
Control Microcosms (Shallow) Figure 7: Chlorinated Ethene and Methane Concentration Trends in ZVI Amended/ KB-1®
Plus Bioaugmented Microcosms (Shallow) Figure 8: Chlorinated Ethene and Methane Concentration Trends in SRS™/ZVI/Ferrous
Fumarate Amended/KB-1® Plus Bioaugmented Microcosms (Shallow) Figure 9: Chlorinated Ethene and Methane Concentration Trends in SRS™ and Ferrous
Fumarate Amended/KB-1® Plus Bioaugmented Microcosms (Shallow) Figure 10: Chlorinated Ethene and Methane Concentration Trends in SRS™ Amended/KB-
1® Plus Bioaugmented Microcosms (Shallow) Figure 11: Chlorinated Ethene and Methane Concentration Trends in EHC®-L Amended/KB-
1® Plus Bioaugmented Microcosms (Shallow) Figure 12: Chlorinated Ethene and Methane Concentration Trends in EHC®-L and ZVI
Amended/KB-1® Plus Bioaugmented Microcosms (Shallow) Figure 13: Chlorinated Ethene and Methane Concentration Trends Anaerobic Active Control
Microcosms (Intermediate) Figure 14: Chlorinated Ethene and Methane Concentration Trends in ZVI Amended/ KB-1®
Plus Bioaugmented Microcosms (Intermediate) Figure 15: Chlorinated Ethene and Methane Concentration Trends in SRS™/ZVI/Ferrous
Fumarate Amended/KB-1® Plus Bioaugmented Microcosms (Intermediate) Figure 16: Chlorinated Ethene and Methane Concentration Trends in SRS™ and Ferrous
Fumarate Amended/KB-1® Plus Bioaugmented Microcosms (Intermediate) Figure 17: Chlorinated Ethene and Methane Concentration Trends in SRS™ Amended/KB-
1® Plus Bioaugmented Microcosms (Intermediate) Figure 18: Chlorinated Ethene and Methane Concentration Trends in EHC®-L Amended/KB-
1® Plus Bioaugmented Microcosms (Intermediate) Figure 19: Chlorinated Ethene and Methane Concentration Trends in EHC®-L and ZVI
Amended/KB-1® Plus Bioaugmented Microcosms (Intermediate)
TL0337.10 1/14/2015 pg. iii

LIST OF APPENDICES
Appendix A: Chain of Custody Documentation Appendix B: Henry’s Law Calculation Appendix C: Ferrous Iron Testing Appendix D: External Reports and Results
TL0337.10 1/14/2015 pg. iv

LIST OF ABBREVIATIONS
1,1-DCE 1,1-dichloroethene CO2 carbon dioxide CTC carbon tetrachloride cVOC chlorinated volatile organic compound CF chloroform CM chloromethane cDCE cis-1,2-dichloroethene °C degrees Celsius °C/min degrees Celsius per minute DI deionized DCM dichloromethane DHG dissolved hydrocarbon gases ERD enhanced reductive dechlorination Fe2O3 hematite Fe3O4 magnetite Fe3+ ferric iron Fe2+ ferrous iron FeS2 pyrite GC gas chromatograph g/L grams per liter IC ion chromatograph Mn4+/Mn2+ manganese µL microliter µm micrometer min minutes mg/L milligrams per liter mL milliliters mL/min milliliters per minute mM millimolar mmol/bottle millimoles per microcosm bottle mV millivolts ORP oxidation reduction potential % percent PSI pounds per square inch QL quantitation limit RPM revolutions per minute SiREM SiREM Laboratory PCE tetrachloroethene TOC total organic carbon TCE trichloroethene URS URS Corporation VC vinyl chloride
TL0337.10 1/14/2015 pg. v

LIST OF ABBREVIATIONS (CONTINUED)
VFAs volatile fatty acids VOC volatile organic compound ZVI zero valent iron
TL0337.10 1/14/2015 pg. vi

1. INTRODUCTION
Geosyntec retained SiREM Laboratory (SiREM) on behalf of URS Corporation (URS) and the Settling Parties (Norfolk Southern Railway Company [NSRC] and American Premier Underwriters [APU]) to perform a laboratory treatability study. The potential for in situ bioremediation and zero valent iron (ZVI) to treat chlorinated volatile organic compounds (cVOCs) in groundwater was evaluated for the NSRC site in Elkhart, Indiana (the Site). The purpose of the study was to assess anaerobic biodegradation and chemical reduction of the Site chemicals of potential concern, namely carbon tetrachloride (CTC) and trichloroethene (TCE), and their breakdown products chloroform (CF), dichloromethane (DCM), and cis-1,2-dichloroethene (cDCE) and vinyl chloride (VC), respectively.
Site geologic material (soil) was collected from DSMW-11 on 27 February 2014 and was received at SiREM on 28 February 2014. The study was conducted using materials collected from two groundwater depth intervals (shallow and intermediate). Groundwater samples (which included well sediment) were collected from 2 shallow wells (DSMW-7S, DSMW-08S) and 2 intermediate wells (DSMW-7I, DSMW-08I) by URS personnel on 5 March 2014 and were received by SiREM on 7 March 2014. The chain of custody documentation received with the samples is provided in Appendix A.
The remainder of this report contains a summary of key degradation processes (Section 1.1), the experimental materials, methods, and visual appearances (Section 2), the results and discussion of the microcosm study (Section 3), conclusions (Section 4) and report references (Section 5).
1.1 Summary of Degradation Processes
The two main compounds (CTC and TCE) present in groundwater at the Site can be degraded by both abiotic and biotic processes. Biological CTC degradation is proposed to occur via reductive dechlorination to CF although is not typically observed. Reductive dechlorination of CF to DCM which is further degraded via an anaerobic fermentation pathway to carbon dioxide (CO2) and organic acids has been reported (Lee at al., 2011). Chloromethane (CM) and methane may also be produced, but are not the major degradation products typically observed. TCE is anaerobically degraded through reductive dechlorination to cDCE, VC and to the fully dechlorinated end product ethene. Figure 1 provides the biological degradation pathway for the chlorinated methanes, and Figure 2 provides the dechlorination pathways for the chlorinated ethenes. Abiotic degradation of TCE in the presence of iron occurs via two dominant pathways that involve hydrogenolysis and reductive β-elimination (Gillham et al., 2010). Abiotic degradation of CTC can occur via 2 main pathways: 1) hydrogenolysis to produce chloroform and 2) dichloroelimination forming a dichlorocarbene that can be hydrolysed to carbon monoxide and formate. These pathways are often accompanied by other parallel, complex microbially mediated processes, including those (carbene hydrolysis and carbene reduction) occurring in the presence of biologically activated minerals formed by iron-reducing bacteria (e.g.,
TL0337.10 1/14/2015 pg. 1

Geobacter metallireducens). 1 Figures 3 and 4 provide the ZVI mediated transformation mechanisms for TCE and CTC respectively. 1.1.1 Elemental Iron Reactions
After oxygen, silicon, and aluminium, iron is the fourth most abundant element in the earth’s crust, and is a commonly occurring metallic element at concentrations that can vary significantly, even within localized areas, based on soil type and the presence of other iron-bearing minerals. Iron typically occurs in either the divalent (ferrous or Fe+2) or trivalent (ferric or Fe+3) states under typical environmental conditions. The valence state is determined by the pH and ORP of the system, and the resultant iron-bearing compound is dependent upon the availability of other chemicals (e.g., sulfur is required to produce pyrite [FeS2]). Most of the iron in the earth’s crust is combined with oxygen in minerals such as hematite (Fe2O3) and magnetite (Fe3O4).
The presence of elemental (zero-valent) iron (ZVI, or Fe0), promotes direct abiotic dechlorination of chlorinated compounds. Under reducing conditions, elemental iron reacts with water (known as corrosion) to form Fe2+ and hydrogen, both of which are candidate reducing agents for contaminants such as chlorinated solvents. The corrosion of the ZVI also results in significantly reducing the groundwater redox conditions (on the order of tens to hundreds of millivolts (mV), depending on other species); the hydrogen generated may also be fortuitously used by bacteria for biological reduction of certain chlorinated organic solvents.
1.1.2 Soluble Iron Reactions
Soluble iron (ferrous gluconate) is part of the EHC®-L formulation to promote direct chemical reduction and abiotic degradation of CTC and TCE via microbially-mediated catalytic reduction processes. Similarly, SRS™, a 60 percent by weight emulsified vegetable oil-based product combined with sodium lactate, was tested individually and as combined with ZVI and soluble iron (ferrous fumarate) in this study so that the results of different combinations of amendments could be compared to observe the presence/formation of magnetically susceptible material and evaluate the effect of ZVI and soluble iron on the abiotic and biotic degradation of the target compounds at the Site.
1.1.3 Bioaugmentation
Bioaugmentation is the process in which a microbial population known to promote enhanced reductive dechlorination (ERD) or other biodegradation processes is introduced to groundwater to enhance the rate or extent of biodegradation. The KB-1® Plus formulation used in this study is a natural microbial consortium containing microorganisms (e.g., Dehalobacter) known to be responsible for mediating the dechlorination of CF to DCM (Grostern et al., 2010) and further to non-chlorinated end products (SiREM, unpublished). The consortium also contains other microorganisms (e.g., Dehalococcoides) known to be responsible for mediating the complete dechlorination of tetrachloroethene (PCE), TCE, cDCE, 1,1-dichloroethene (1,1-DCE) and VC to ethene (Major et al., 2002; Duhamel et al., 2002). The diverse microbial community of KB-1®
TL0337.10 1/14/2015 pg. 2

Plus also contains numerous other species that support reductive dechlorination, sulfate reduction and other community roles; these include: Desulforomonas (sulfate reduction) and Geobacter (iron reducers) that are also implicated in the abiotic and abiotic degradation of CTC and other chlorinated species.
2. MATERIALS AND METHODS
The following sections describe the materials and methods used for microcosm construction and incubation (Section 2.1), and microcosm sampling and analysis (Section 2.2).
2.1 Microcosm Construction and Incubation
2.1.1 Microcosm Construction
Biotreatability microcosms were constructed in a disposable anaerobic glove bag containing the Site groundwater and all the materials required to construct all treatment and control microcosms. The glove bag was purged with nitrogen gas to create an anaerobic environment and to protect any microorganisms present in the site materials from oxygen exposure. In consultation with Geosyntec and URS, samples from two depths were selected for evaluation: Shallow and Intermediate Depths. The Shallow Depth groundwater, which also contained aquifer fines (sediment), was collected from 2 wells (DSMW-7S and DSMW-8S). The Intermediate Depth groundwater, also containing some sediment, was collected from two wells (DSMW-7I and DSMW-8I). Three containers of site geological material (DSMW-11) were manually mixed together to improve reproducibility between replicates and was used as the aquifer material to construct both the Shallow and Intermediate Depth microcosms. During microcosm construction, the Site water was mixed in a 7L Nalgene container to ensure reproducibility between replicates.
Microcosms were constructed by filling sterile 250 milliliter (mL) (nominal volume) screw cap Boston round clear glass bottles (Systems Plus, New Hamburg, ON) with 30 mL (approximately 60 grams) of Site geologic materials and 200 mL of Site groundwater as outlined above. The bottles were capped with MininertTM (VICI Valco, Canada, Brockville, Ontario) closures to allow repetitive sampling with minimal chlorinated volatile organic compound loss and to allow nutrient amendment, as needed, throughout the incubation period. All controls and treatments were constructed in triplicate. Tables 1A (Shallow) and 1B (Intermediate) summarize the details of microcosm construction and the amendments used for the treatment and control microcosms.
Anaerobic sterile control microcosms were constructed to quantify potential abiotic and experimental cVOC losses from the microcosms. The sterile controls were constructed by autoclaving the Site geologic materials at 121 degrees Celsius (°C) and 15 pounds per square inch (PSI) pressure for 45 to 60 minutes (min). After autoclaving, the sterile control microcosms were returned to the anaerobic chamber, filled with 200 mL of Site groundwater and amended with mercuric chloride and sodium azide as described in Tables 1A and 1B. Note that only one set of Anaerobic Sterile Controls was prepared from Site water DSMW-7S and DSMW-8S, and site geologic materials DSMW-11.
TL0337.10 1/14/2015 pg. 3

2.1.2 Microcosm Amendments and Incubation
All microcosms were sampled and incubated in an anaerobic chamber (Coy Laboratory Products, Grass Lake, MI) filled with an atmosphere of approximately 80 percent (%) nitrogen, 10% CO2 and 10% hydrogen (Linde Gases, Guelph, ON). Hydrogen in the anaerobic chamber functions to scavenge trace oxygen via a palladium catalyst. Anaerobic conditions in the anaerobic chamber were verified using an indicator containing resazurin (Sigma, St. Louis, MO) in a mineral medium, which turns pink in the presence of oxygen. During quiescent incubation, all microcosms were covered to minimize photodegradation, and stored horizontally to minimize cVOC losses via the (submerged) MininertTM closure. Microcosms were incubated for a period of up to 123 days at approximately 22 °C (room temperature).
Geosyntec (in consultation with URS) specified that the initial CTC and TCE concentrations in the microcosms should be 2 milligrams per liter (mg/L), to represent concentrations measured at the Site. The initial concentrations measured in the prepared microcosms were not at these target concentrations; therefore, on 27 March 2014 (Day -1), the microcosms were amended with 562 microliters (µL) of a saturated CTC stock and 397 µL of a saturated TCE stock solution to reach the target concentrations in the microcosms. The measured concentration of CTC at time zero ranged from 1 to 2 mg/L and for TCE from 2.9 to 3.4 mg/L. The wider range of initial CTC concentrations may have resulted from instantaneous abiotic reactions. Lower concentrations were observed in the SRS amended microcosms, which contain oil that the CTC and TCE may partition into. Re-spiking with CTC to a target concentration of 2 mg/L to all treatments bottles (controls were omitted) occurred on Day 20. An additional CTC and TCE re-spike to target concentrations of 2 mg/L each occurred to the shallow treatment only on Day 90. The re-spikes were recorded in Tables 1A and 1B.
Treatment microcosms received amendments on 28 March 2014 (Day 0) as outlined in Table 1. Zero Valent Iron (ZVI) (Innovative Environmental Technologies, Pipersville, PA) was provided as elemental iron with an average particle diameter of 2 micrometers. The ZVI was amended at 1 g to target a final concentration of 5 grams per liter (g/L). EHC®-L (PeroxyChem, Philadelphia, PA) is a proprietary organic carbon-based liquid amended with ferrous gluconate and was amended from a 50 % stock solution (145,625 mg/L) at 1.373 mL targeting a final concentration of 1 g/L. Ferrous fumarate (Spectrum Chemical, California) is a common form of bio-available iron and was amended at 36 mg to target a final concentration of 180 mg/L (A 3X safety factor was used based on 60 mg/L calculation provided by URS). SRS™ (Terra Systems Inc., Wilmington, DE) is an emulsified vegetable oil designed to release bio-available hydrogen over an extended period of time. SRS™ was amended at 333 µL to a target concentration of 0.1 % as oil.
All microcosms were also amended with 2 mL of 100 X strength vitamin/nutrient mixture (provided by Terra Systems). The stock solution prepared by Terra Systems contained the following ingredients: 5,000 mg/L yeast extract, 1,000 mg/L ammonium nitrogen, 1,100 mg/L phosphate, 650 mg/L vitamin B12 and 376 mg/L vitamin B2.
One microcosm bottle from each active and control treatment was amended with resazurin (Sigma, St. Louis, MO) to monitor redox conditions. Resazurin turns from pink to clear in the
TL0337.10 1/14/2015 pg. 4

absence of oxygen and can be used to indicate the on-set of reducing conditions. Details of electron donor addition and resazurin amendment are provided in Table 1A and Table 1B.
Bioaugmentation may improve the extent and rate of TCE dechlorination. Microcosms are typically bioaugmented after reducing conditions required by the KB-1® Plus culture are achieved. Due to the low total organic carbon (TOC) concentration of 1.03 % (Appendix D), the low concentration of intrinsic bacteria (Microbial Insights report, not provided) indicated the need for bioaugmentation in all treatments as outlined in Table 1A and 1B. Suitable reducing conditions are typically achieved after electron donor addition and are indicated by oxidation reduction potentials (ORP) less than -75 mV. Negative ORP can also be assessed qualitatively by both changes in the resazurin indicator color (from pink to clear) and the on-set of sulfate reduction as indicated by the formation of black precipitates. After consultation with Geosyntec and URS, it was decided to bioaugment with KB-1® Plus (CF formulation) on 25 April 2014 (Day 28). Although the ORP values were not below -75 mV at the time of bioaugmentation, it was decided to bioaugment to accelerate the onset of reducing conditions. Refer to Table 5 for ORP values.
2.2 Microcosm Sampling and Analysis
2.2.1 Microcosm Sampling
Aqueous samples were collected from the control and treatment microcosms every two to three weeks for analysis of cVOCs, dissolved hydrocarbon gases (DHGs – ethene, ethane, propene and methane) and anions (sulfate, nitrate, nitrite, chloride, phosphate, bromide). Aqueous samples were also collected on a less frequent basis for analysis of volatile fatty acids (VFAs – lactate, acetate, propionate, formate, butyrate and pyruvate) and pH. The microcosms were sampled using gas-tight 1 mL Hamilton glass syringes. Separate sets of syringes were used for the bioaugmented and non-bioaugmented treatments to minimize the potential for transfer of KB-1® Plus microorganisms from bioaugmented to non-bioaugmented treatments. Syringes were cleaned with acidified water (pH ~2) and rinsed 10 times with deionized (DI) water between samples to ensure that VOCs and microorganisms were not transferred between different samples or treatments.
Following review of the Day 113 data, it was decided, in consultation with Geosyntec and URS, to continue to sample the microcosms from the Shallow Depth and to suspend sampling of the microcosms from the Intermediate Depth. This decision was to allow additional spiking and sampling events to obtain a better understanding of the conditions at the Site and to obtain a bigger picture on the effects of bioaugmentation and amendment additions. The analytical methods employed by SiREM are described below.
2.2.2 Analysis of VOCs and Dissolved Hydrocarbon Gases
This section describes the methods used to quantify the cVOCs. The quantitation limits (QL) for the chlorinated ethenes were typically 0.1 mg/L in the microcosms based on the lowest concentration standards that were included in the linear calibration trend.
Aqueous cVOC concentrations in the microcosms were measured using a Hewlett-Packard (Hewlett Packard 7890) gas chromatograph (GC) equipped with a flame ionization detector and
TL0337.10 1/14/2015 pg. 5

an auto sampler (Hewlett Packard G1888) programmed to heat each sample vial to 75°C for 45 min prior to headspace injection into a GSQ Plot column (0.53 millimeters x 30 meters, J&W) and a flame ionization detector. Sample vials were heated to ensure that all VOCs in the aqueous sample would partition into the headspace. The injector temperature was 200°C, and the detector temperature was 250°C. The oven temperature was programmed as follows: 35°C for 2 min, increased to 100°C at 30 degrees Celsius per minute (°C/min), then increased to 185°C at 25°C/min and held at 185°C for 7.0 min. The carrier gas was helium at a flow rate of 11 milliliters per minute (mL/min).
After withdrawing a 0.5 mL sample (as described in section 2.2.1), the sample was injected into a 10 mL auto sampler vial containing 5.5 mL of acidified de-ionized water (pH ~2). The water was acidified to inhibit microbial activity between microcosm sampling and GC analysis. The vial was sealed with an inert Teflon®-coated septum and aluminium crimp cap for automated injection of 3 mL of headspace onto the GC. One cVOC standard was analysed with each set of samples to verify instrument calibration. Calibration was performed using external standard solutions (Sigma, St Louis, MO). Measured volumes of standard solutions were added to acidified water in auto sampler vials and analysed as described above for microcosm samples. Data were integrated using Chemstation Software (Agilent Technologies, Santa Clara, CA).
2.2.3 Analysis of Total Volatile Fatty Acids and Anions
Anions and total VFA analysis was performed on a Thermo-Fisher ICS-2100 ion chromatograph (IC) equipped with a Thermo-Fisher AS-DV auto sampler and an AS18 column. The sample loop volume was 25 µL. An isocratic separation was performed using 33 millimolar (mM) reagent grade sodium hydroxide (Thermo Scientific, Oakville, ON) eluent for 15 min. One standard was analysed with each set of samples tested in order to verify the seven-point calibration using external standards of known concentrations. External standards were prepared gravimetrically using chemicals of the highest purity available (Sigma St Louis, MO or Bioshop, Burlington, ON). Data were integrated using Chromeleon 7 Chromatography software (Thermo Scientific, Oakville, ON). The QLs were as follows: 0.07 mg/L total VFA, 0.07 mg/L chloride, 0.09 mg/L nitrite, 0.09 mg/L nitrate, 0.07 mg/L sulfate, 0.07 mg/L phosphate and 0.08 mg/L bromide. The total VFA value includes lactate, formate, acetate, propionate, pyruvate and butyrate. The VFA method described below (Section 2.2.4) is used to quantify individual VFAs.
A 0.5 mL sample was withdrawn (as described in section 2.2.1), after which the sample was placed in a 1.5 mL micro-centrifuge tube. Samples were centrifuged for five minutes at 13,000 revolutions per minute (RPM) to remove solids. The supernatant was removed, diluted 50-fold in DI water and placed in a Thermo-Fisher auto sampler vial with a cap that filters the sample during automated injection onto the IC.
2.2.4 Analysis of Volatile Fatty Acids
Individual VFAs (lactate, acetate, propionate, formate, butyrate and pyruvate) analysis was performed on a Thermo-Fisher ICS-2100 IC equipped with a Thermo-Fisher AS-DV auto sampler and an AS11-HC column, the sample loop volume was 25 µL. A gradient separation was performed using the following eluent profile; 1.0 mM sodium hydroxide for 8.0 min to 15 mM at 18.0 min and proceeding to 30 mM at 28.0 min with a flow rate of 0.25 mL/min.
TL0337.10 1/14/2015 pg. 6

Calibration was performed using external standards of known concentrations. One standard was analysed with each set of samples to verify the instrument’s seven-point calibration curve produced using external standards of known concentrations. External standards were prepared gravimetrically using chemicals of the highest purity available (Sigma St Louis, MO or Bioshop, Burlington, ON). Data were integrated using Chromeleon 7 chromatography software (Thermo Scientific, Oakville, ON). The QLs were as follows: lactate 0.40 mg/L, acetate 0.54 mg/L, propionate 0.31 mg/L, formate 0.23 mg/L, butyrate 0.41 mg/L and pyruvate 0.69 mg/L.
A 0.5 mL sample was withdrawn (as described in section 2.2.1), after which the sample was placed in a 1.5 mL micro-centrifuge tube. Samples were centrifuged for five minutes at 13,000 RPM in a micro-centrifuge to remove solids. The supernatant was removed, diluted 50-fold in D water and placed in a Thermo-Fisher auto sampler vial with a cap that filters the sample during automated injection onto the IC.
2.2.5 Analysis of pH
The pH measurements were performed on the lab bench using an Oakton pH spear with combination pH electrode (Oakton, Vernon Hills, Illinois) which allowed measurement of small sample volumes compared to standard pH electrodes. A 500 microliter (µL) sample was collected using a 1,000 µL Hamilton glass syringe. Separate sets of syringes were used for the different reactors to reduce the potential for cross contamination. Syringes were cleaned with acidified water (pH ~2) and rinsed 10 times with DI water between samples. The pH spear was calibrated weekly according to the manufacturer’s instructions using pH 4.0, 7.0 and 10 standards.
2.2.6 Ferrous Iron Analysis
Samples for ferrous iron analysis were taken at baseline from both the Shallow and Intermediate Depths. 25 mL aqueous samples were removed from the sediment water and placed in a glass beaker. These samples were then filtered with a 0.45 micrometer (µm) filter (Fisher Scientific, Toronto). Ferrous iron was quantified using a HACH kit (Hach Company, Loveland, CO). Refer to Appendix C for the HACH Ferrous iron test kit procedure.
2.2.7 Visual Determination of Magnetically Susceptible Material
A rare earth magnet was held to the outside of the microcosms periodically throughout the incubation period to determine if magnetite was present, or potentially being formed. Magnetically susceptible material, assumed to be magnetite, appears to have formed in all of the microcosm bottles via the microbially-induced transformation of iron-bearing minerals in the sediment.
2.2.8 External Laboratory Analyses
Baseline Site geologic materials were sampled for total iron, manganese and TOC on 26 March 2014 and sent to SGS Environmental Services (Lakefield, Ontario) for analysis. Refer to Appendix D for results.
TL0337.10 1/14/2015 pg. 7

3. RESULTS AND CONCLUSIONS
The following sections present and discuss the results of the biotreatability study:
• Redox processes (Section 3.1),
• cVOC biodegradation results (Section 3.2),
• Degradation half-lives for cVOCs (Section 3.3),
• Anion and VFA Results (Section 3.4),
• pH Results (Section 3.5), and
• External Laboratory Results (Section 3.7)
Tables 2, 3, 4 and 5 provide cVOC, DHG, anion, VFA and pH data from the triplicate control and treatment microcosms over the incubation period (123 days) for the study. Variability between the triplicates is generally limited (<20%) and can attributed to sampling and analytical variability. In some cases differences in changes in cVOC concentrations amongst triplicates is observed and may be related to the heterogeneity of the homogenized Site geological materials used to construct the microcosms and the distribution of intrinsic microbes and reactive minerals. The averaged results were used for discussion of the observed trends. ORP results are also provided in Table 5 and were taken from single microcosms rather than triplicates due to the larger sample volumes required for this analysis.
All cVOC and DHG concentrations are presented in units of mg/L and millimoles per microcosm bottle (mmol/bottle) to demonstrate mass balances on a molar basis. Concentrations were converted from mg/L to mmol/bottle using Henry’s Law as demonstrated in Appendix B. Table 6 presents the cVOC half-lives. Figures 5 through 19 present trends in the concentrations of cVOCs and ethene in the control and treatment microcosms over the incubation period for the study. The external laboratory results are provided in D.
3.1 Redox Processes
The addition of electron donor typically results in microbial activity that promotes changes in the redox conditions in groundwater. Aerobic or mildly reducing redox conditions will be reduced, resulting in the more strongly reducing conditions required to support anaerobic degradation of cVOCs.
Measuring dissolved oxygen and ORP (primary indicators of redox status) directly in microcosms is challenging due to the high sample volume requirements for these analyses and the relatively small aqueous volumes associated with batch microcosms. ORP samples were collected from single microcosms from each treatment of each location on Day 42. The ORP for the sterile control was +230 mV, indicating aerobic conditions as expected due to the addition of mercuric chloride and sodium azide. Active controls from the shallow and intermediate depths had ORP values of -92 and -69 mV, respectively, indicating reducing conditions. The remaining treatments all had ORP values below -100 mV, clearly indicating that reducing conditions had
TL0337.10 1/14/2015 pg. 8

been established. Other indicators of reducing conditions (e.g., changes in redox sensitive chemical species) were also monitored during this biotreatability study.
The sequence of redox reactions in groundwater is well known (Appelo and Postma, 1994). Oxygen is first consumed, followed by nitrate (denitrification), manganese, iron, and sulfate reduction. Manganese (Mn4+) is reduced to manganese (Mn2+), ferric iron (Fe3+) is reduced to ferrous iron (Fe2+), and sulfate is reduced to sulfide. The final step is carbon dioxide reduction producing methane (methanogenesis). The consumption of each species in sequence indicates that conditions are becoming increasingly reducing. Dechlorination of chlorinated solvents typically occurs in the range of sulfate reducing to methanogenic conditions.
At Time 0, nitrate concentrations in the active control microcosms were low in both the shallow (12 mg/L) and intermediate (3.4 mg/L) depths. Sulfate concentrations in the active controls were 27 mg/L and 24 mg/L, respectively, for the shallow and intermediate depths (Table 3).
Low sulfate and nitrate concentrations throughout the study reflected a reduced environment from Day 0.
An initial manganese concentration of 140 µg/g was observed (SGS, Lakefield, Ontario) Aqueous ferrous iron in the Shallow and Intermediate groundwater was not detected at time 0. Refer to Appendix C for the Ferrous Iron Testing procedure and Appendix D for the External Laboratory Reports and Results.
Production of magnetic materials (indicative of ferric iron and/or ferrous oxide mineral) was observed in this study (Appendix E – photos) as well as in the published literature, to catalyze the abiotic reductive dechlorination of CTC to CF. The amount of material attracted to the magnet was not quantified; however all of the microcosms, including the anaerobic controls, appeared to contain magnetically susceptible materials – presumably magnetite. Additionally, the photos indicated that more magnetic material was observed on the non-sterile microcosms, than not. The photos also indicated that, visually, more magnetic material was present in the SRS/Ferrous iron bottles than any other. Darkening of the soil material typically associated with iron sulfide production was also observed.
3.1.1 Shallow Depth
In the shallow microcosms at Time 0, sulfate concentrations were approximately 27 mg/L. All of the treatments showed reduction of sulfate by Day 42 with the exception of the ZVI Amended/KB-1® Plus Bioaugmented microcosms and the SRS™/Ferrous Fumarate/KB-1® Plus Bioaugmented microcosms. Sulfate concentrations in both of these treatments remained stable. Nitrate concentrations, derived from the nutrient amendments, in the shallow depth microcosms at Time 0 were around 12 mg/L and decreased in all treatments by Day 42 to near non-detect levels.
Methane concentrations remained stable in the Sterile and Active controls indicating the absence of methanogenic microorganisms in the Site materials. Methane concentrations were observed to increase in all treatments. Increases in methane concentrations were approximately 25 times higher, on average, in the treatments that did not contain ZVI as follows:
TL0337.10 1/14/2015 pg. 9

SRS™/Ferrous Fumarate Amended/KB-1® Plus Bioaugmented, SRS™ Amended/ KB-1® Plus Bioaugmented and EHC®-L Amended/KB-1® Plus Bioaugmented Microcosms. Final methane concentrations were 11, 9.3 and 22 mg/L, respectively. These results suggest that methanogenic organisms were present in the microcosms and consumed a portion of the electron donor, and that the presence of ZVI and/or its reaction intermediates appeared to inhibit the formation of methane. The KB-1® Plus culture contains methanogens.
3.1.2 Intermediate Depth
In the intermediate microcosms at Time 0, sulfate concentrations were approximately 24 mg/L. Reduction to low levels was observed in all treatments by the Day 42 sampling event. Nitrate concentrations (again, derived from the addition of nutrients) in the intermediate depth microcosms at Time 0 were around 3.2 mg/L and decreased in all treatments by Day 42 to near non-detect levels.
Methane concentrations remained stable in the Sterile and Active controls indicating the absence of methanogenic microorganisms in the Site materials. Methane concentrations were observed to increase in all treatments with the greatest increases occurring in the following treatments: SRS™/Ferrous Fumarate Amended/KB-1® Plus Bioaugmented, SRS™ Amended/ KB-1® Plus Bioaugmented and EHC®-L Amended/KB-1® Plus Bioaugmented Microcosms. Final methane concentrations were 6.9, 6.1 and 5.5 mg/L, respectively. Final average methane concentrations in the ZVI amended treatments were observed to increase to only 0.11 mg/L, 0.18 mg/L, and 0.75 mg/L in the ZVI Amended/KB-1® Plus Bioaugmented, the SRS™/ZVI/Ferrous Fumarate Amended/KB-1® Bioaugmented, and the EHC®-L/ZVI Amended/KB-1® Plus Bioaugmented microcosms, respectively. These results suggest that methanogenic organisms were present in the microcosms and consumed a portion of the electron donor, and that the presence of ZVI appeared to inhibit the formation of methane. The KB-1® Plus culture contains methanogens.
The decrease in sulfate concentrations and increase in methane in the shallow and intermediate depth microcosms indicate that strongly reducing conditions required for cVOC dechlorination were achieved in the microcosms after electron donor addition and bioaugmentation with KB-1® Plus.
3.2 cVOC Biodegradation Results
All microcosms were spiked on Day 0 with CTC and TCE to target concentrations of 2 mg/L each, on Day 20 with CTC to 2 mg/L and on Day 90 (Shallow Depth only) with CTC and TCE to a target concentration of 2 mg/L each. Bioaugmentation with KB-1® Plus (CF formulation) occurred on Day 28 in all treatment microcosms. All microcosms, including the controls, were amended with 2 mL of a vitamin/mineral solution as previously outlined.
The following discussion of the cVOC biodegradation results will pair both the shallow and intermediate depths together as their results were similar.
Following review of the Day 113 results, it was decided, in consultation with Geosyntec and URS, to continue to sample the microcosms from the Shallow Depth and to put the microcosms from the Intermediate Depth on hold. This decision allowed additional spiking and sampling
TL0337.10 1/14/2015 pg. 10

events for the Shallow Depth microcosms to further study the effects of bioaugmentation and amendment additions.
3.2.1 Sterile and Active Controls (Shallow and Intermediate Depth)
The cVOC concentrations in the Sterile and Active Control microcosms (Shallow Depth) remained generally stable for the duration of the study. A slight drop in CTC concentrations and a small increase in CF concentrations were observed in the Active Control microcosms. Unlike the Shallow Depth microcosms, CTC in the Active Control Microcosms from the Intermediate Depth samples was rapidly reduced to non-detect levels (no sterile controls were constructed for the Intermediate Depth treatments). Slight increases in both CF and DCM were also observed suggesting that some limited biological degradation may have occurred. TCE concentrations also declined; however, increases in cDCE were not stoichiometric and no production of VC or ethene was observed within the incubation period (Table 2 and Figures 5, 6 and 13). The CTC and TCE losses in the absence of strong indicators of biological activity may be due to abiotic reactions with mineral species, e.g., iron and magnetite, naturally present in the Site materials.
In summary, in the Shallow Depth microcosms, there was little mass loss in the sterile and active controls attributable to abiotic degradation or experimental losses (e.g., sorption or loss through microcosm closures) during the incubation period. The mass loss observed in the active controls from the Intermediate Depth microcosms was primarily due to abiotic reactions.
3.2.2 ZVI Amended/KB-1® Plus Bioaugmented Microcosms (Shallow and Intermediate depths)
Results from microcosms from both the shallow and intermediate depths amended with ZVI, demonstrated an initial reduction of CTC to non-detect levels without the production of biological daughter products (i.e., CF and DCM). TCE was also reduced in the microcosms following the first spike, with low concentrations of cDCE and VC observed throughout the duration of the incubation period. Following a second spiking of CTC into the microcosms on Day 20, CTC was once again reduced to non-detect levels; however, the degradation product, DCM, was observed and remained throughout the remainder of the incubation period (Table 2, Figures 7 and 14). Bioaugmentation with KB-1® Plus was not effective at reducing DCM concentrations in these microcosms. The rapid dechlorination by ZVI reduced the cVOC concentrations and the remaining low concentrations of DCM may not have been high enough to support biological activity. Alternatively, given that DCM accumulated only in the microcosms containing ZVI, it is possible that the initial abiotic degradation of CTC created toxic or inhibitory byproducts, e.g., the trichloromethyl free radical, that inhibited bacteria that may otherwise have degraded DCM.
A third spiking of CTC and TCE occurred on Day 90 (shallow depth only) to assess the reactivity of the ZVI in the microcosms. Both CTC and TCE were substantially reduced with some increases in both DCM and cDCE.
In summary, the cVOC results for the ZVI amended treatments suggest that amendment with ZVI alone was capable of promoting reduction of both CTC and TCE (Figures 7 and 14). However, ZVI did not effectively reduce DCM, and biological degradation, whether by intrinsic or bioaugmented microorganisms, was not an effective complement for the degradation of DCM.
TL0337.10 1/14/2015 pg. 11

This is in contrast to the amendments without ZVI where complete DCM degradation was observed.
3.2.3 SRS™/ZVI/Ferrous Fumarate Amended/KB-1® Bioaugmented Microcosms (Shallow and Intermediate depths)
Following the first spike, results from microcosms from both depths that were amended with SRS™, ZVI and a soluble iron in the form of ferrous fumarate demonstrated a reduction of CTC to non-detect without the production of degradation products. Following a second spiking of CTC into both the Shallow and Intermediate Depth microcosms on Day 20, CTC was once again reduced to non-detect levels; however, this time the degradation product DCM was observed. DCM remained throughout the incubation period. A slight decrease in the DCM concentration occurred following the bioaugmentation with KB-1® Plus (CF formulation). TCE was reduced in the microcosms following the first spike, resulting in low concentrations of cDCE and VC. Following a second spike of TCE to the Shallow Depth microcosms, TCE decreased by the end of the incubation period without significant production of cDCE and VC.
Following a third spiking of CTC and TCE on Day 90 (shallow depth microcosms only) an initial increase and subsequent decrease in TCE was observed along with an increase in ethene. DCM was again observed to increase and remain stable.
These data (Figures 8 and 15) suggest that amendment with SRS™/ZVI and ferrous fumarate and bioaugmentation with KB-1® Plus was capable of promoting combined abiotic and biological reduction of both CTC and TCE but was not effective at reducing concentrations of DCM, potentially due to toxicity / inhibitory effects exhibited in all microcosms amended with ZVI as discussed in section 2.2.2 above.
3.2.4 SRS™/Ferrous Fumarate Amended/KB-1® Bioaugmented Microcosms (Shallow and Intermediate depths)
Results from microcosms from both depths that were amended with SRS™ and a soluble iron in the form of ferrous fumarate, demonstrated a reduction to non-detect levels of CTC (first spike) with the production of CF. Following a second CTC spiking event on Day 20, CTC was not detected and the CF concentration initially increased, and then decreased following the addition of KB-1® Plus on Day 28. Methane concentrations increased over the duration of the study to a final concentration of 11 mg/L in the Shallow Depth microcosms and 6.9 mg/L in the Intermediate Depth microcosms. A third spike of CTC and TCE (shallow depth only) resulted in increases in methane and ethene at the first sampling event (Day 104) following the spike. TCE showed a slight decrease in concentration following the first spike. It was not until after bioaugmentation with KB-1® Plus culture that TCE concentrations decreased to non-detect with the production of both cDCE and VC. Ethene concentrations increased to 0.46 mg/L in the Shallow Depth microcosms and 0.22 mg/L in the Intermediate Depth microcosms. Following a second spike of TCE to the Shallow Depth microcosms, TCE decreased by the end of the incubation period with production of cDCE and VC, as well as an increase in ethene concentrations.
TL0337.10 1/14/2015 pg. 12
In summary, the cVOC results for the SRS™/Ferrous Fumarate Amended/KB-1® Bioaugmented microcosms suggest that amendment with SRS™ and ferrous fumarate and bioaugmentation with KB-1® Plus were capable of promoting combined abiotic and biological reduction of both CTC and TCE to non-chlorinated end products (Figures 9 and 16).
3.2.5 SRS™ Amended/KB-1® Bioaugmented Microcosms (Shallow and Intermediate depths)
Results from microcosms from both depths amended with SRS™ demonstrated reduction of CTC concentrations to non-detect after the first spike with production of CF. Following a second CTC spiking event on Day 20, CTC was not detected and CF did not increase. CF decreased following the addition of KB-1® Plus on Day 28, and DCM did not accumulate. Methane concentrations increased over the duration of the study to a final concentration of 9.3 mg/L in the Shallow Depth microcosms and 6.1 mg/L in the Intermediate Depth microcosms. A third spike of CTC and TCE (shallow depth only) produced trace amounts of cDCE, ethene and a further increase in methane. TCE showed a slight decrease in concentration following the first spike. It was not until after bioaugmentation with KB-1® Plus culture that TCE decreased to non-detect levels with the production of both cDCE and VC. Ethene concentrations increased following decreases in cDCE and VC to 0.30 mg/L in the Shallow Depth microcosms and 0.26 mg/L in the Intermediate Depth microcosms.
In summary, the cVOC results for the SRS™ Amended/KB-1® Bioaugmented Microcosms suggest that amendment with SRS™ as an electron donor and KB-1® Plus promoted both abiotic and biological reduction of both CTC and TCE (Figures 10 and 17).
3.2.6 EHC®-L Amended/KB-1® Plus Bioaugmented Microcosms (Shallow and Intermediate depths)
Results from microcosms from both depths that were amended with EHC®-L demonstrated a reduction of CTC to non-detect levels with the production of CF. Following a second CTC spiking event on Day 20, CF and DCM concentrations increased. After the addition of KB-1® Plus on Day 28, both CF and DCM concentrations decreased, while methane concentrations increased. A methane concentration of 22 mg/L was reached in the Shallow Depth microcosms by the end of the study and 5.5 mg/L in the Intermediate Depth microcosms. A third spike of CTC (shallow depth only) resulted in production of trace amounts of cDCE and ethene and a further increase in methane concentrations. In the Shallow depth treatment microcosms, TCE concentrations did not decline until after bioaugmentation with KB-1® Plus with the production of cDCE, VC and ethene. TCE concentrations declined initially in the intermediate depth microcosms with production of cDCE. TCE and cDCE were rapidly degraded after bioaugmentation with KB-1® Plus on Day 28, with the subsequent increase of ethene over the remainder of the incubation period. Following a second spike of TCE to the Shallow Depth microcosms, TCE was not detected while low concentrations of cDCE and VC, along with an increase in ethene were observed.
TL0337.10 1/14/2015 pg. 13

In summary, the cVOC results for the EHC®-L Amended/KB-1® Plus Bioaugmented Microcosms suggest that amendment with EHC®-L as an electron donor was capable of promoting both abiotic and biotic reduction of CTC with production of CF and partial TCE reduction to cDCE (Figures 11 and 18). Addition of KB-1® Plus promoted complete biological reduction of CF and reductive dechlorination of TCE to ethene.
3.2.7 EHC®-L/ZVI Amended/KB-1® Plus Bioaugmented Microcosms (Shallow and Intermediate depths)
Results of microcosms from both depths amended with both EHC®-L and ZVI demonstrated reduction of CTC to non-detectable levels without the production of chlorinated degradation products. Following a second spiking of CTC into the microcosms on Day 20, CTC was once again reduced to non-detectable levels; however, this time, DCM was observed and remained throughout the incubation period as was also observed in the ZVI only treatment. DCM concentrations declined slightly following bioaugmentation with KB-1® Plus. Following a third spiking of CTC on Day 90 (Shallow Depth only), DCM concentrations increased and subsequently slightly decreased. This observation suggests that the presence of ZVI was not effective at reducing concentrations of DCM, potentially due to toxicity / inhibitory effects exhibited in all microcosms amended with ZVI as discussed in section 2.2.2 above.
TCE concentrations decreased following the first spike with low concentrations of cDCE and ethene being produced. Following bioaugmentation with KB-1® Plus, cDCE concentrations decreased, however, no increases in ethene were observed. Following a second spike of TCE to the Shallow Depth microcosms, only an increase in ethene was observed, indicating the TCE was rapidly dechlorinated to ethene.
In summary, the cVOC results for the EHC®-L/ZVI Amended/KB-1® Plus Bioaugmented suggest that amendment with EHC®-L/ZVI as an electron donor was capable of promoting reduction of both CTC and TCE; however, DCM was not reduced, even with the addition of KB-1® Plus (Figures 12 and 19). Addition of KB-1® Plus promoted reductive dechlorination of TCE to ethene after the second TCE spike.
3.3 Degradation Half-Lives for cVOCs
cVOC half-lives were calculated based on the average dechlorination observed in the treatment microcosms. First order reaction kinetics were assumed for all calculations as described in Newell et al, 2002. The half-lives were calculated using the following relationship:
Half-life = ln(2)
�ln�C2C1
�
t2−t1�
where,
C1 is the concentration at early time (t1 days)
C2 is the concentration at later time (t2 days)
TL0337.10 1/14/2015 pg. 14

Based on the data collected from each location, the dechlorination half-lives for CTC and TCE were calculated (Table 6). Half-lives of 225 and 343 days for CTC and TCE, respectively, were observed in the Shallow Depth sterile controls.
Losses of CTC observed in the Active controls are reflected in the half-life values of 93 days for the Shallow Depth location and 2.4 days for the Intermediate Depth location. CTC was degraded before bioaugmentation and its half-life was less than one day in all treatments (Table 6) for both locations. TCE half-life values in the Active controls were 724 days for the Shallow Depth location and 41 days for the Intermediate Depth location. Losses of TCE were observed in all treatments and were quantified before and after bioaugmentation. TCE half-life values before bioaugmentation ranged from 4.9 to 294 days in the various treatments and from 3.1 to 7.9 days after bioaugmentation (Table 6). TCE half-lives decreased in the treatments after bioaugmentation.
3.4 VFAs
Increased concentrations of total volatile fatty acids (Table 3) were observed in all treatment microcosms from Day 0 to Day 42, specifically increases in acetate, propionate and butyrate (Table 4). Acetate increased nominally in the ZVI only treatments. The largest increases in VFAs were observed in the SRSTM and EHC®-L amended treatments as expected. SRS™ contains 4% sodium lactate, providing a soluble and easily fermentable electron donor source to increase microbial activity when initially added. The fermentation of both lactate and soybean oil in SRS™ and soluble organic carbon in EHC®-L results in the production of hydrogen, which is the electron donor ultimately used by dechlorinating bacteria.
These results suggest that fermentation of the added electron donors occurred, and was at no time, rate-limiting throughout the study.
3.5 pH Results
The pH was monitored in all controls and treatment microcosms over the incubation period (Table 5) for both Site locations.
3.5.1 Shallow Depth
The initial pH of the groundwater in the constructed microcosms was approximately 6.58. The pH of the sterile and active controls remained relatively unchanged over the incubation period dropping slightly to 6.43 and 6.52, respectively. Throughout the incubation period and after several re-spikes, most pH values in the treatment microcosms dropped to around pH 6.3 and remained stable to Day 123. Both treatments amended with ZVI (ZVI and EHC®-L/ZVI) had final pH values slightly above the other treatments and closer to those values recorded from the controls at 6.51 and 6.58, respectively.
3.5.2 Intermediate Depth
The initial pH of the groundwater in the constructed microcosms was approximately 6.67. The pH of the active controls decreased slightly over the incubation period to 6.38. Throughout the incubation period and after only one re-spike, the pH values for most of the treatment
TL0337.10 1/14/2015 pg. 15

microcosms decreased to around 6.3 where they remained stable to Day 74. Both treatments amended with ZVI (ZVI and EHC®-L/ZVI) had slight increases to 7.01 and 6.77 over the incubation period, respectively.
These data indicate that the acid buffering properties of the Site groundwater were sufficient to maintain a pH just below neutral during reductive dechlorination and electron donor fermentation (both acid producing processes) for both Site locations. The optimum pH for reductive dechlorination is 6.8 to 7.5 (Middledorp et al., 1999) and complete dechlorination can occur between a pH range of 6.0 and 8.0 (SiREM, unpublished data).
4. CONCLUSIONS
The following conclusions can be drawn from the laboratory biotreatability study results:
1. Abiotic degradation of CTC and TCE under intrinsic conditions was observed at the Intermediate depth location only, suggesting that naturally occurring reduced minerals were capable of promoting conditions suitable for abiotic degradation.
2. ZVI amendment promoted rapid abiotic degradation of CTC and TCE in both the Shallow and Intermediate Depth locations with some production of DCM, which was not further degraded with the amendment of electron donor or bioaugmentation culture. The presence of ZVI or its degradation intermediates appeared to inhibit the biodegradation of DCM by KB-1® Plus. The ZVI amendment continued to promote rapid abiotic degradation following multiple additions of CTC and TCE.
3. The addition of a slow release electron donor (i.e., SRS™) both with and without added soluble iron and the KB-1® Plus bioaugmentation culture promoted both abiotic and biological degradation of the cVOCs to non-detectable concentrations in both the Shallow and Intermediate Depth locations.
4. The addition of EHC®-L (which contains soluble iron) and the KB-1® Plus bioaugmentation culture promoted both abiotic and biological degradation of the cVOCs to non-detectable concentrations in both the Shallow and Intermediate Depth locations.
5. The addition of KB-1® Plus resulted in reductive dechlorination of chlorinated ethenes to ethene and reductive dechlorination and fermentation of chlorinated methanes to non-chlorinated end products.
6. pH adjustment was not required to maintain the pH in the desired range for dechlorination (6.0 to 8.0).
7. Production of magnetic materials (indicative of ferrous/ferric iron oxide mineral) was observed in this study.
The results of this study indicate that both SRS™ with and without the addition of a soluble iron source (ferrous fumarate or ferrous gluconate) and EHC®-L in combination with a vitamin/mineral amendment and with KB-1® Plus bioaugmentation has the potential to be an effective remedial approach for the Site.
TL0337.10 1/14/2015 pg. 16

5. REFERENCES
Appelo, C.A.J and Postma, D. Geochemistry, groundwater and pollution. Rotterdam, Netherlands, A.A. Balkema, 1994.
Duhamel, M., S.D. Wehr, L. Yu, H. Rizvi, D. Seepersad, S. Dworatzek, E.E. Cox, and E.A. Edwards. 2002. Comparison of anaerobic dechlorinating enrichment cultures maintained on tetrachloroethene, trichloroethene, cis-1,2-dichloroethene and vinyl chloride. Water Research 36: 4193-4202.
Gillham, R., Vogan, J., Gui, L., Duchene, M. and Son, J. 2010. Iron barrier walls for chlorinated solvent remediation. In: Stroo, H. F.; Ward, C. H. (eds.), In Situ Remediation of Chlorinated Solvent Plumes. Springer Science+Business Media, New York, NY, p. 537.
Lee, M.; Low, A.; Zemb, O.; Koenig, J.; Michaelsen, A.; Manefield, M. Complete chloroform dechlorination by organochlorine respiration and fermentation. Environ. Microbiol. 2011, 14(4), 883-894.
Ma, Ming; Zhang, Yu; Guo, Zhirui; Gu, Ning (2013). "Facile synthesis of ultrathin magnetic iron oxide nanoplates by Schikorr reaction". Nanoscale Research Letters 8 (1): 16. doi:10.1186/1556-276X-8-16. Cite uses deprecated parameters (help)
Major, D.W., M.L. McMaster, E.E. Cox, E.A. Edwards, S.M. Dworatzek, E.R. Hendrickson, M.G. Starr, J.A. Payne, and L.W. Buonamici. 2002. Field demonstration of successful bioaugmentation to achieve dechlorination of tetrachloroethene to ethene. Environmental Science and Technology 36: 5106-5116.
McCormick M.L, and Adriaens P. 2004 Carbon tetrachloride transformation on the surface of nanoscale biogenic magnetite particles. Environ Sci Technol. 38, 1045-1053.
Middledorp, P.J.M., Luijten, M.L.G.C., van de Pas, B.A., van Eedert, M.H.A., Kengen, S.W.M.,Schraa, G., Stams, A.J.M. 1999. Anaerobic Microbial Reductive Dechlorination of Chlorinated Ethenes. Bioremediation J. 3:151-169.
TL0337.10 1/14/2015 pg. 17

TABLES
TL0337.10 1/14/2015

TABLE 1A: SUMMARY OF DECHLORINATION ASSAY CONTROL, TREATMENT AND AMENDMENTS (SHALLOW DEPTH)
Elkhart, Indiana
SiREM
Anaerobic Sterile Control 1 to 3 3 60 200 20Amended with 0.5
mL of a 5% solution.
Amended with 2.8 mL of a
2.7% solution
Amended Replicate #1 with 100 µL of a 1,000 mg/L
solution on Day 0.
Spiked with 397 µL of saturated CTC solution and with 562 µL of saturated TCE solution to target 2 mg/L of both compounds on Day -1.
Amended with 2 mL of a vitamin/mineral solution on
Day 0.NA NA NA NA NA
Anaerobic Active Control 4 to 6 3 60 200 20 NA NAAmended Replicate #1 with
100 µL of a 1,000 mg/L solution on Day 0.
Spiked with 397 µL of saturated CTC solution and with 562 µL of saturated TCE solution to target 2 mg/L of both compounds on Day -1. Re-spiked with CTC to a target concentration
of 2 mg/L on Day 20.
Amended with 2 mL of a vitamin/mineral solution on
Day 0.NA NA NA NA NA
ZVI Amended/KB-1® Plus Bioaugmented
7 to 9 3 60 200 20 NA NAAmended Replicate #1 with
100 µL of a 1,000 mg/L solution on Day 0.
Spiked with 397 µL of saturated CTC solution and with 562 µL of saturated TCE solution to target 2 mg/L of both compounds on Day -1. Re-spiked with CTC to a target concentration
of 2 mg/L on Day 20 and Day 90 and with TCE to a target concentration of 2 mg/L on
Day 90.
Amended with 2 mL of a vitamin/mineral solution on
Day 0.
Amended with 1.0 g of ZVI to target a final target
concentration of 5g/L on Day 0.
NA NA NABioaugmented with KB-1®
Plus on Day 28.
SRS®/ZVI and Ferrous
Fumarate Amended/KB-1®
Plus Bioaugmented
10 to 12 3 60 200 20 NA NAAmended Replicate #1 with
100 µL of a 1,000 mg/L solution on Day 0.
Spiked with 397 µL of saturated CTC solution and with 562 µL of saturated TCE solution to target 2 mg/L of both compounds on Day -1. Re-spiked with CTC to a target concentration
of 2 mg/L on Day 20 and Day 90 and with TCE to a target concentration of 2 mg/L on
Day 90.
Amended with 2 mL of a vitamin/mineral solution on
Day 0.
Amended with 1.0 g of ZVI to target a final target
concentration of 5g/L on Day 0.
Amended with 333 µL to target a final concentration of
0.1 % as oil on Day 0.
Amended with 36 mg of ferrous fumarate to target a final concentration of 180
mg/L on Day 7.
NABioaugmented with KB-1®
Plus on Day 28.
SRS® and Ferrous
Fumarate Amended/KB-1®
Plus Bioaugmented
13 to 15 3 60 200 20 NA NAAmended Replicate #1 with
100 µL of a 1,000 mg/L solution on Day 0.
Spiked with 397 µL of saturated CTC solution and with 562 µL of saturated TCE solution to target 2 mg/L of both compounds on Day -1. Re-spiked with CTC to a target concentration
of 2 mg/L on Day 20 and Day 90 and with TCE to a target concentration of 2 mg/L on
Day 90.
Amended with 2 mL of a vitamin/mineral solution on
Day 0.NA
Amended with 333 µL to target a final concentration of
0.1 % as oil on Day 0.
Amended with 36 mg of ferrous fumarate to target a final concentration of 180
mg/L on Day 0.
NABioaugmented with KB-1®
Plus on Day 28.
SRS® Amended/KB-1® Plus Bioaugmented
16 to 18 3 60 200 20 NA NAAmended Replicate #1 with
100 µL of a 1,000 mg/L solution on Day 0.
Spiked with 397 µL of saturated CTC solution and with 562 µL of saturated TCE solution to target 2 mg/L of both compounds on Day -1. Re-spiked with CTC to a target concentration
of 2 mg/L on Day 20 and Day 90 and with TCE to a target concentration of 2 mg/L on
Day 90.
Amended with 2 mL of a vitamin/mineral solution on
Day 0.NA
Amended with 333 µL to target a final concentration of
0.1 % as oil on Day 0.NA NA
Bioaugmented with KB-1® Plus on Day 28.
EHC®-L Amended/KB-1®
Plus Bioaugmented 19 to 21 3 60 200 20 NA NA
Amended Replicate #1 with 100 µL of a 1,000 mg/L
solution on Day 0.
Spiked with 397 µL of saturated CTC solution and with 562 µL of saturated TCE solution to target 2 mg/L of both compounds on Day -1. Re-spiked with CTC to a target concentration
of 2 mg/L on Day 20 and Day 90 and with TCE to a target concentration of 2 mg/L on
Day 90.
Amended with 2 mL of a vitamin/mineral solution on
Day 0.NA NA NA
Amended with 1.4 mL of EHC®-L to target a final
concentration of 1 g/L on Day 0.
Bioaugmented with KB-1® Plus on Day 28.
EHC®-L and ZVI
Amended/KB-1® Plus Bioaugmented
22 to 24 3 60 200 20 NA NAAmended Replicate #1 with
100 µL of a 1,000 mg/L solution on Day 0.
Spiked with 397 µL of saturated CTC solution and with 562 µL of saturated TCE solution to target 2 mg/L of both compounds on Day -1. Re-spiked with CTC to a target concentration
of 2 mg/L on Day 20 and Day 90 and with TCE to a target concentration of 2 mg/L on
Day 90.
Amended with 2 mL of a vitamin/mineral solution on
Day 0.
Amended with 1.0 g of ZVI to target a final target
concentration of 5g/L on Day 0.
NA NA
Amended with 1.4 mL of EHC®-L to target a final
concentration of 1 g/L on Day 0.
Bioaugmented with KB-1® Plus on Day 28.
Notes:% - percentµL - microlitersCF - chloroformCTC - carbon tetrachlorideg - gramsg/L - grams per litermg/L - milligrams per litermL - millilitersNA - not applicableTCE - trichloroetheneVOCs - volatile organic compounds
Headspace (mL) VOCsGroundwater
(mL)Soluble IronSRS®Sodium Azide
Mercuric
ChlorideRezasurin
Assigned
Bottle
Number
Number of
Microcosms
Geologic Material
(g)ZVIZone
Shallo
w D
epth
EHC®-LVitamin/Mineral Solution KB-1® PlusTreatment/Control
Table 1A Page 1 of 1

TABLE 1B: SUMMARY OF DECHLORINATION ASSAY CONTROL, TREATMENT AND AMENDMENTS (INTERMEDIATE DEPTH) Elkhart, Indiana
SiREM
Table 1B Page 1 of 1
Anaerobic Active Control 25 to 27 3 60 200 20 NA NAAmended Replicate #1 with
100 µL of a 1,000 mg/L solution on Day 0.
Spiked with 397 µL of saturated CTC solution and with 562 µL of saturated TCE solution to target 2
mg/L of both compounds on Day -1. Re-spiked with CTC to a target concentration of 2 mg/L on Day 20.
Amended with 2 mL of a vitamin/mineral solution on
Day 0.NA NA NA NA NA
ZVI Amended/KB-1® Plus Bioaugmented
28 to 30 3 60 200 20 NA NAAmended Replicate #1 with
100 µL of a 1,000 mg/L solution on Day 0.
Spiked with 397 µL of saturated CTC solution and with 562 µL of saturated TCE solution to target 2
mg/L of both compounds on Day -1. Re-spiked with CTC to a target concentration of 2 mg/L on Day 20.
Amended with 2 mL of a vitamin/mineral solution on
Day 0.
Amended with 1.0 g of ZVI to target a final target
concentration of 5g/L on Day 0.
NA NA NA Bioaugmented with KB-1® Plus on Day 28.
SRS®/ZVI and Ferrous Fumarate Amended/KB-1®
Plus Bioaugmented 31 to 33 3 60 200 20 NA NA
Amended Replicate #1 with 100 µL of a 1,000 mg/L
solution on Day 0.
Spiked with 397 µL of saturated CTC solution and with 562 µL of saturated TCE solution to target 2
mg/L of both compounds on Day -1. Re-spiked with CTC to a target concentration of 2 mg/L on Day 20.
Amended with 2 mL of a vitamin/mineral solution on
Day 0.
Amended with 1.0 g of ZVI to target a final target
concentration of 5g/L on Day 0.
Amended with 333 µL to target a final concentration of 0.1 % as oil on Day 0.
Amended with 36 mg of fumerous fumarate to target a final concentration of 180
mg/L on Day 7.
NA Bioaugmented with KB-1® Plus on Day 28.
SRS® and Ferrous Fumarate Amended/KB-1®
Plus Bioaugmented 34 to 36 3 60 200 20 NA NA
Amended Replicate #1 with 100 µL of a 1,000 mg/L
solution on Day 0.
Spiked with 397 µL of saturated CTC solution and with 562 µL of saturated TCE solution to target 2
mg/L of both compounds on Day -1. Re-spiked with CTC to a target concentration of 2 mg/L on Day 20.
Amended with 2 mL of a vitamin/mineral solution on
Day 0.NA
Amended with 333 µL to target a final concentration of 0.1 % as oil on Day 0.
Amended with 36 mg of fumerous fumarate to target a final concentration of 180
mg/L on Day 0.
NA Bioaugmented with KB-1® Plus on Day 28.
SRS® Amended/KB-1® Plus Bioaugmented
37 to 39 3 60 200 20 NA NAAmended Replicate #1 with
100 µL of a 1,000 mg/L solution on Day 0.
Spiked with 397 µL of saturated CTC solution and with 562 µL of saturated TCE solution to target 2
mg/L of both compounds on Day -1. Re-spiked with CTC to a target concentration of 2 mg/L on Day 20.
Amended with 2 mL of a vitamin/mineral solution on
Day 0.NA
Amended with 333 µL to target a final concentration of 0.1 % as oil on Day 0.
NA NA Bioaugmented with KB-1® Plus on Day 28.
EHC®-L Amended/KB-1®
Plus Bioaugmented 40 to 42 3 60 200 20 NA NA
Amended Replicate #1 with 100 µL of a 1,000 mg/L
solution on Day 0.
Spiked with 397 µL of saturated CTC solution and with 562 µL of saturated TCE solution to target 2
mg/L of both compounds on Day -1. Re-spiked with CTC to a target concentration of 2 mg/L on Day 20.
Amended with 2 mL of a vitamin/mineral solution on
Day 0.NA NA NA
Amended with 1.4 mL of EHC®-L to target a final
concentration of 1 g/L on Day 0.
Bioaugmented with KB-1® Plus on Day 28.
EHC®-L and ZVI Amended/KB-1® Plus
Bioaugmented 43 to 45 3 60 200 20 NA NA
Amended Replicate #1 with 100 µL of a 1,000 mg/L
solution on Day 0.
Spiked with 397 µL of saturated CTC solution and with 562 µL of saturated TCE solution to target 2
mg/L of both compounds on Day -1. Re-spiked with CTC to a target concentration of 2 mg/L on Day 20.
Amended with 2 mL of a vitamin/mineral solution on
Day 0.
Amended with 1.0 g of ZVI to target a final target
concentration of 5g/L on Day 0.
NA NA
Amended with 1.4 mL of EHC®-L to target a final
concentration of 1 g/L on Day 0.
Bioaugmented with KB-1® Plus on Day 28.
Notes:% - percentµL - microlitersCF - chloroformCTC - carbon tetrachlorideg - gramsg/L - grams per litermg/L - milligrams per litermL - millilitersNA - not applicableTCE - trichloroetheneVOCs - volatile organic compounds
Headspace (mL) VOCsGroundwater (mL) Soluble IronSRS®Sodium Azide Mercuric
Chloride RezasurinAssigned
Bottle Number
Number of Microcosms
Geologic Material (g) ZVIZone
Inte
rmed
iate
Dep
th
EHC®-LVitamin/Mineral Solution KB-1® PlusTreatment/Control

TABLE 2: SUMMARY OF MICROCOSM CHLORINATED VOC AND DHG RESULTS Elkhart, Indiana
SiREM
Table 2 Page 1 of 14
TCE cDCE VC Ethene Total Ethenes Ethane CTC CF DCM CM Methanemg/L mg/L mg/L mg/L mmol/bottle mg/L mg/L mg/L mg/L mg/L mg/L
Anaerobic Sterile Control 27-Mar-14 -1 Spiked with TCE and CTC to target concentrations of 2 mg/L each.(Shallow) 28-Mar-14 0 Amended the first replicate with 100 uL of resazurin.
Amended with 2 mL of a vitamin/mineral solution.Poisoned with mecuric chloride and sodium azide.
ANSC (Shallow)-1 3.2 <0.020 <0.020 <0.020 -- <0.020 1.4 <0.020 <0.020 <0.020 0.043ANSC (Shallow)-2 3.1 <0.020 <0.020 <0.020 -- <0.020 1.3 <0.020 <0.020 <0.020 0.041ANSC (Shallow)-3 3.0 <0.020 <0.020 <0.020 -- <0.020 1.3 <0.020 <0.020 <0.020 0.041
Average Concentration (mg/L) 3.1 ND ND ND -- ND 1.3 ND ND ND 0.042Standard Deviation (mmoles) 1.2E-04 0.0E+00 0.0E+00 0.0E+00 -- 0.0E+00 8.7E-05 0.0E+00 0.0E+00 0.0E+00 5.5E-05
Average Total mmoles 0.0050 ND ND ND 5.0E-03 ND 0.0019 ND ND ND 0.001904-Apr-14 7 ANSC (Shallow)-1 2.6 <0.020 <0.020 <0.020 -- <0.020 1.0 <0.020 <0.020 <0.020 0.041
ANSC (Shallow)-2 2.7 <0.020 <0.020 <0.020 -- <0.020 1.1 <0.020 <0.020 <0.020 0.039ANSC (Shallow)-3 2.8 <0.020 <0.020 <0.020 -- <0.020 1.1 0.044 <0.020 <0.020 0.039
Average Concentration (mg/L) 2.7 ND ND ND -- ND 1.1 0.015 ND ND 0.040Standard Deviation (mmoles) 2.0E-04 0.0E+00 0.0E+00 0.0E+00 -- 0.0E+00 9.6E-05 4.3E-05 0.0E+00 0.0E+00 4.4E-05
Average Total mmoles 0.0043 ND ND ND 4.3E-03 ND 0.0015 0.000025 ND ND 0.001825-Apr-14 28 ANSC (Shallow)-1 2.4 <0.020 <0.020 <0.020 -- <0.020 0.97 <0.020 <0.020 <0.020 0.044
ANSC (Shallow)-2 2.7 <0.020 <0.020 <0.020 -- <0.020 1.1 <0.020 <0.020 <0.020 0.051ANSC (Shallow)-3 2.7 <0.020 <0.020 <0.020 -- <0.020 1.1 <0.020 <0.020 <0.020 0.046
Average Concentration (mg/L) 2.6 ND ND ND -- ND 1.1 ND ND ND 0.047Standard Deviation (mmoles) 1.9E-04 0.0E+00 0.0E+00 0.0E+00 -- 0.0E+00 1.1E-04 0.0E+00 0.0E+00 0.0E+00 1.7E-04
Average Total mmoles 0.0041 ND ND ND 4.1E-03 ND 0.0015 ND ND ND 0.002223-May-14 56 ANSC (Shallow)-1 2.2 <0.020 <0.020 <0.020 -- <0.020 0.78 <0.020 <0.020 <0.020 0.054
ANSC (Shallow)-2 2.4 <0.020 <0.020 <0.020 -- <0.020 0.98 <0.020 <0.020 <0.020 0.042ANSC (Shallow)-3 2.6 <0.020 <0.020 <0.020 -- <0.020 1.0 <0.020 <0.020 <0.020 0.041
Average Concentration (mg/L) 2.4 ND ND ND -- ND 0.92 ND ND ND 0.046Standard Deviation (mmoles) 2.8E-04 0.0E+00 0.0E+00 0.0E+00 -- 0.0E+00 1.8E-04 0.0E+00 0.0E+00 0.0E+00 3.4E-04
Average Total mmoles 0.0038 ND ND ND 3.8E-03 ND 0.0013 ND ND ND 0.002129-Jul-14 123 ANSC (Shallow)-1 2.2 <0.020 <0.020 <0.020 -- <0.020 0.71 <0.020 <0.020 <0.020 0.057
ANSC (Shallow)-2 2.5 <0.020 <0.020 <0.020 -- <0.020 1.1 <0.020 <0.020 <0.020 0.043ANSC (Shallow)-3 2.6 <0.020 <0.020 <0.020 -- <0.020 1.1 <0.020 <0.020 <0.020 0.056
Average Concentration (mg/L) 2.4 ND ND ND -- ND 0.95 ND ND ND 0.052Standard Deviation (mmoles) 3.3E-04 0.0E+00 0.0E+00 0.0E+00 -- 0.0E+00 2.9E-04 0.0E+00 0.0E+00 0.0E+00 3.7E-04
Average Total mmoles 0.0039 ND ND ND 4.0E-03 ND 0.0013 ND ND ND 0.0024Anaerobic Active Control 27-Mar-14 -1 Spiked with TCE and CTC to target concentrations of 2 mg/L each.
(Shallow) 28-Mar-14 0 Amended with 2 mL of a vitamin/mineral solution.Amended the first replicate with 100 uL of resazurin.
ANAC (Shallow)-1 3.4 <0.020 <0.020 <0.020 -- <0.020 1.4 <0.020 <0.020 <0.020 0.043ANAC (Shallow)-2 3.4 <0.020 <0.020 <0.020 -- <0.020 1.4 <0.020 <0.020 <0.020 0.045ANAC (Shallow)-3 3.3 <0.020 <0.020 <0.020 -- <0.020 1.5 <0.020 <0.020 <0.020 0.047
Average Concentration (mg/L) 3.4 ND ND ND -- ND 1.4 ND ND ND 0.045Standard Deviation (mmoles) 1.2E-04 0.0E+00 0.0E+00 0.0E+00 -- 0.0E+00 6.9E-05 0.0E+00 0.0E+00 0.0E+00 9.4E-05
Average Total mmoles 0.0054 ND ND ND 5.4E-03 ND 0.0020 ND ND ND 0.002104-Apr-14 7 ANAC (Shallow)-1 3.2 <0.020 <0.020 <0.020 -- <0.020 1.1 <0.020 <0.020 <0.020 0.040
ANAC (Shallow)-2 3.1 <0.020 <0.020 <0.020 -- <0.020 1.2 0.020 <0.020 <0.020 0.042ANAC (Shallow)-3 3.0 <0.020 <0.020 <0.020 -- <0.020 1.2 0.023 <0.020 <0.020 0.044
Average Concentration (mg/L) 3.1 ND ND ND -- ND 1.2 0.014 ND ND 0.042Standard Deviation (mmoles) 1.5E-04 0.0E+00 0.0E+00 0.0E+00 -- 0.0E+00 7.9E-05 2.1E-05 0.0E+00 0.0E+00 9.7E-05
Average Total mmoles 0.0050 ND ND ND 5.0E-03 ND 0.0017 0.000024 ND ND 0.001917-Apr-14 20 ANAC (Shallow)-1 3.1 0.022 <0.020 <0.020 -- <0.020 0.99 0.030 <0.020 <0.020 0.047
ANAC (Shallow)-2 3.4 <0.020 <0.020 <0.020 -- <0.020 1.2 0.054 <0.020 <0.020 0.046ANAC (Shallow)-3 3.2 <0.020 <0.020 <0.020 -- <0.020 1.3 0.059 <0.020 <0.020 0.048
Average Concentration (mg/L) 3.2 0.0074 ND ND -- ND 1.2 0.048 ND ND 0.047Standard Deviation (mmoles) 2.0E-04 2.7E-05 0.0E+00 0.0E+00 -- 0.0E+00 2.1E-04 2.6E-05 0.0E+00 0.0E+00 3.4E-05
Average Total mmoles 0.0052 0.000016 ND ND 5.2E-03 ND 0.0016 0.000081 ND ND 0.0022Spiked with CTC to target concentrations of 2 mg/L.
25-Apr-14 28 ANAC (Shallow)-1 3.0 0.42 <0.020 <0.020 -- <0.020 1.2 0.024 <0.020 <0.020 0.050ANAC (Shallow)-2 3.0 <0.020 <0.020 <0.020 -- <0.020 1.1 0.031 0.021 <0.020 0.043ANAC (Shallow)-3 2.9 <0.020 <0.020 <0.020 -- <0.020 1.2 0.032 <0.020 <0.020 0.050
Average Concentration (mg/L) 3.0 0.14 ND ND -- ND 1.2 0.029 0.0070 ND 0.048Standard Deviation (mmoles) 7.4E-05 5.1E-04 0.0E+00 0.0E+00 -- 0.0E+00 4.2E-05 7.8E-06 3.0E-05 0.0E+00 1.8E-04
Average Total mmoles 0.0048 0.00030 ND ND 5.1E-03 ND 0.0016 0.000050 0.000017 ND 0.0022
Chlorinated EthanesCommentTreatment Date Day Replicate
Chlorinated Ethenes

TABLE 2: SUMMARY OF MICROCOSM CHLORINATED VOC AND DHG RESULTS Elkhart, Indiana
SiREM
Table 2 Page 2 of 14
TCE cDCE VC Ethene Total Ethenes Ethane CTC CF DCM CM Methanemg/L mg/L mg/L mg/L mmol/bottle mg/L mg/L mg/L mg/L mg/L mg/L
Chlorinated EthanesCommentTreatment Date Day Replicate
Chlorinated Ethenes
Anaerobic Active Control 23-May-14 56 ANAC (Shallow)-1 2.9 0.038 <0.020 <0.020 -- <0.020 0.98 0.025 0.025 <0.020 0.041(Shallow) ANAC (Shallow)-2 3.1 <0.020 <0.020 <0.020 -- <0.020 1.2 0.024 0.025 <0.020 0.042Continued ANAC (Shallow)-3 2.8 <0.020 <0.020 <0.020 -- <0.020 1.1 0.024 0.023 <0.020 0.043
Average Concentration (mg/L) 3.0 0.013 ND ND -- ND 1.1 0.024 0.024 ND 0.042Standard Deviation (mmoles) 2.3E-04 4.7E-05 0.0E+00 0.0E+00 -- 0.0E+00 1.5E-04 9.1E-07 3.9E-06 0.0E+00 4.8E-05
Average Total mmoles 0.0047 0.000027 ND ND 4.7E-03 ND 0.0015 0.000042 0.00006 ND 0.002029-Jul-14 123 ANAC (Shallow)-1 3.0 0.051 <0.020 <0.020 -- <0.020 0.86 0.040 0.034 <0.020 0.055
ANAC (Shallow)-2 3.1 <0.020 <0.020 <0.020 -- <0.020 0.84 0.065 0.030 <0.020 0.045ANAC (Shallow)-3 2.9 <0.020 <0.020 <0.020 -- <0.020 <0.020 0.11 0.028 <0.020 0.051
Average Concentration (mg/L) 3.0 0.017 ND ND -- ND 0.57 0.070 0.031 ND 0.050Standard Deviation (mmoles) 1.9E-04 6.3E-05 0.0E+00 0.0E+00 -- 0.0E+00 6.9E-04 5.6E-05 7.2E-06 0.0E+00 2.2E-04
Average Total mmoles 0.0048 0.000036 ND ND 4.8E-03 ND 0.00080 0.00012 0.000075 ND 0.0023ZVI Amended/KB-1® Plus Bioaugmented 27-Mar-14 -1 Spiked with TCE and CTC to target concentrations of 2 mg/L each.
(Shallow) 28-Mar-14 0 Amended the first replicate with 100 uL of resazurin.Amended with 2 mL of a vitamin/mineral solution.Amended with 1 g of ZVI to target a final concentration of 5 g/L.
ZVI (Shallow)-1 3.2 <0.020 <0.020 <0.020 -- <0.020 1.4 <0.020 <0.020 <0.020 0.051ZVI (Shallow)-2 3.3 <0.020 <0.020 <0.020 -- <0.020 1.4 <0.020 <0.020 <0.020 0.055ZVI (Shallow)-3 3.3 <0.020 <0.020 <0.020 -- <0.020 2.0 0.31 <0.020 <0.020 0.052
Average Concentration (mg/L) 3.3 ND ND ND -- ND 1.6 0.10 ND ND 0.052Standard Deviation (mmoles) 1.3E-04 0.0E+00 0.0E+00 0.0E+00 -- 0.0E+00 5.1E-04 3.0E-04 0.0E+00 0.0E+00 1.1E-04
Average Total mmoles 0.0052 ND ND ND 5.2E-03 ND 0.0023 0.00018 ND ND 0.002404-Apr-14 7 ZVI (Shallow)-1 2.2 <0.020 <0.020 0.046 -- 0.037 <0.020 <0.020 <0.020 <0.020 0.083
ZVI (Shallow)-2 1.8 0.031 <0.020 0.034 -- <0.020 <0.020 <0.020 <0.020 <0.020 0.065ZVI (Shallow)-3 2.2 0.11 <0.020 0.059 -- 0.036 <0.020 <0.020 <0.020 <0.020 0.081
Average Concentration (mg/L) 2.1 0.047 ND 0.046 -- 0.024 ND ND ND ND 0.076Standard Deviation (mmoles) 3.5E-04 1.2E-04 0.0E+00 1.7E-04 -- 4.2E-04 0.0E+00 0.0E+00 0.0E+00 0.0E+00 4.6E-04
Average Total mmoles 0.0033 0.00010 ND 0.00061 4.0E-03 0.00048 ND ND ND ND 0.003517-Apr-14 20 ZVI (Shallow)-1 0.89 0.028 <0.020 0.10 -- 0.056 <0.020 <0.020 <0.020 <0.020 0.094
ZVI (Shallow)-2 1.1 0.031 <0.020 0.09 -- 0.046 <0.020 <0.020 <0.020 <0.020 0.091ZVI (Shallow)-3 0.78 0.21 <0.020 0.10 -- 0.090 <0.020 <0.020 <0.020 <0.020 0.10
Average Concentration (mg/L) 0.93 0.088 ND 0.098 -- 0.064 ND ND ND ND 0.096Standard Deviation (mmoles) 2.8E-04 2.2E-04 0.0E+00 9.7E-05 -- 4.6E-04 0.0E+00 0.0E+00 0.0E+00 0.0E+00 3.1E-04
Average Total mmoles 0.0015 0.00019 ND 0.0013 3.0E-03 0.0013 ND ND ND ND 0.0045Spiked with CTC to target concentrations of 2 mg/L.
25-Apr-14 28 ZVI (Shallow)-1 0.33 0.020 <0.020 0.11 -- 0.067 <0.020 <0.020 0.41 0.031 0.14ZVI (Shallow)-2 0.55 0.026 <0.020 0.15 -- 0.13 <0.020 <0.020 0.45 <0.020 0.40ZVI (Shallow)-3 0.25 0.25 <0.020 0.12 -- 0.10 0.21 <0.020 0.45 0.029 0.10
Average Concentration (mg/L) 0.38 0.10 ND 0.13 -- 0.10 0.068 ND 0.43 0.020 0.21Standard Deviation (mmoles) 2.5E-04 2.8E-04 0.0E+00 2.4E-04 -- 6.5E-04 1.7E-04 0.0E+00 4.9E-05 6.9E-05 7.4E-03
Average Total mmoles 0.00060 0.00021 ND 0.0017 2.5E-03 0.0020 0.000096 ND 0.0011 0.000079 0.010Bioaugmented with KB-1® Plus (CF formulation).
09-May-14 42 ZVI (Shallow)-1 0.069 <0.020 <0.020 0.12 -- 0.065 <0.020 <0.020 0.33 0.023 0.11ZVI (Shallow)-2 0.25 0.022 <0.020 0.12 -- 0.053 <0.020 <0.020 0.35 0.022 0.091ZVI (Shallow)-3 0.028 0.30 <0.020 0.13 -- 0.11 <0.020 <0.020 0.38 0.027 0.10
Average Concentration (mg/L) 0.11 0.11 ND 0.13 -- 0.076 ND ND 0.35 0.024 0.10Standard Deviation (mmoles) 1.8E-04 3.5E-04 0.0E+00 8.1E-05 -- 5.9E-04 0.0E+00 0.0E+00 7.1E-05 1.2E-05 4.8E-04
Average Total mmoles 0.00018 0.00023 ND 0.0017 2.1E-03 0.0015 ND ND 0.00086 0.000096 0.004723-May-14 56 ZVI (Shallow)-1 <0.020 <0.020 <0.020 0.12 -- 0.063 <0.020 <0.020 0.25 0.023 0.098
ZVI (Shallow)-2 0.084 0.029 <0.020 0.13 -- 0.067 <0.020 <0.020 0.28 0.024 0.12ZVI (Shallow)-3 <0.020 0.28 <0.020 0.13 -- 0.12 <0.020 <0.020 0.33 0.025 0.12
Average Concentration (mg/L) 0.028 0.10 ND 0.13 -- 0.083 ND ND 0.29 0.024 0.11Standard Deviation (mmoles) 7.7E-05 3.3E-04 0.0E+00 1.2E-04 -- 6.1E-04 0.0E+00 0.0E+00 1.0E-04 4.7E-06 4.9E-04
Average Total mmoles 0.000045 0.00022 ND 0.0017 2.0E-03 0.0016 ND ND 0.00071 0.000096 0.005110-Jun-14 74 ZVI (Shallow)-1 <0.020 <0.020 <0.020 0.11 -- 0.076 <0.020 <0.020 0.19 <0.020 0.17
ZVI (Shallow)-2 0.031 <0.020 <0.020 0.12 -- 0.074 <0.020 <0.020 0.21 0.024 0.18ZVI (Shallow)-3 <0.020 0.32 <0.020 0.12 -- 0.13 <0.020 <0.020 0.29 <0.020 0.13
Average Concentration (mg/L) 0.010 0.11 ND 0.12 -- 0.094 ND ND 0.23 0.008 0.16Standard Deviation (mmoles) 2.9E-05 3.9E-04 0.0E+00 5.3E-05 -- 6.4E-04 0.0E+00 0.0E+00 1.2E-04 5.5E-05 1.2E-03
Average Total mmoles 0.000017 0.00022 ND 0.0016 1.8E-03 0.0019 ND ND 0.00056 0.000032 0.0075

TABLE 2: SUMMARY OF MICROCOSM CHLORINATED VOC AND DHG RESULTS Elkhart, Indiana
SiREM
Table 2 Page 3 of 14
TCE cDCE VC Ethene Total Ethenes Ethane CTC CF DCM CM Methanemg/L mg/L mg/L mg/L mmol/bottle mg/L mg/L mg/L mg/L mg/L mg/L
Chlorinated EthanesCommentTreatment Date Day Replicate
Chlorinated Ethenes
ZVI Amended/KB-1® Plus Bioaugmented 25-Jun-14 89 ZVI (Shallow)-1 <0.020 <0.020 <0.020 0.11 -- 0.076 <0.020 <0.020 0.14 <0.020 0.14(Shallow) ZVI (Shallow)-2 <0.020 <0.020 <0.020 0.12 -- 0.072 <0.020 <0.020 0.16 0.022 0.14Continued ZVI (Shallow)-3 <0.020 0.22 <0.020 0.15 -- 0.18 <0.020 <0.020 0.24 <0.020 0.16
Average Concentration (mg/L) ND 0.073 ND 0.13 -- 0.11 ND ND 0.18 0.0072 0.15Standard Deviation (mmoles) 0.0E+00 2.7E-04 0.0E+00 2.1E-04 -- 1.3E-03 0.0E+00 0.0E+00 1.3E-04 5.0E-05 5.8E-04
Average Total mmoles ND 0.00015 ND 0.0017 2.2E-03 0.0022 ND ND 0.00044 0.000029 0.006926-Jun-14 90 Spiked with TCE and CTC to target concentrations of 2 mg/L each.10-Jul-14 104 ZVI (Shallow)-1 0.54 0.023 <0.020 0.19 -- 0.077 <0.020 <0.020 0.47 0.032 0.16
ZVI (Shallow)-2 0.78 0.025 <0.020 0.20 -- 0.073 <0.020 <0.020 0.58 0.033 0.12ZVI (Shallow)-3 0.38 0.21 <0.020 0.23 -- 0.16 <0.020 <0.020 0.62 0.034 0.12
Average Concentration (mg/L) 0.57 0.087 ND 0.21 -- 0.10 ND ND 0.56 0.033 0.13Standard Deviation (mmoles) 3.2E-04 2.3E-04 0.0E+00 2.8E-04 -- 9.9E-04 0.0E+00 0.0E+00 1.8E-04 3.9E-06 1.0E-03
Average Total mmoles 0.00091 0.00018 ND 0.0027 3.8E-03 0.0021 ND ND 0.0014 0.00013 0.006129-Jul-14 123 ZVI (Shallow)-1 <0.020 0.18 <0.020 0.22 -- 0.21 <0.020 <0.020 0.49 0.039 0.19
ZVI (Shallow)-2 0.032 0.033 <0.020 0.20 -- 0.11 <0.020 <0.020 0.27 <0.020 0.16ZVI (Shallow)-3 <0.020 0.12 <0.020 0.19 -- 0.061 <0.020 <0.020 0.32 0.028 0.12
Average Concentration (mg/L) 0.011 0.11 ND 0.21 -- 0.13 ND ND 0.36 0.022 0.16Standard Deviation (mmoles) 2.9E-05 1.6E-04 0.0E+00 2.1E-04 -- 1.5E-03 0.0E+00 0.0E+00 2.8E-04 8.0E-05 1.8E-03
Average Total mmoles 0.000017 0.00024 ND 0.0027 3.0E-03 0.0025 ND ND 0.00088 0.000089 0.007327-Mar-14 -1 Spiked with TCE and CTC to target concentrations of 2 mg/L each.28-Mar-14 0 Amended with 2 mL of a vitamin/mineral solution.
(Shallow) Amended with 333 uL of SRS™ to target a final concentration of 0.1 % as oil.Amended the first replicate with 100 uL of resazurin.Amended with 1 g of ZVI to target a final concentration of 5 g/L.
SRS/ZVI (Shallow)-1 2.9 <0.020 <0.020 <0.020 -- <0.020 1.0 0.21 <0.020 <0.020 0.062SRS/ZVI (Shallow)-2 3.1 <0.020 <0.020 <0.020 -- <0.020 0.98 0.33 <0.020 <0.020 0.057SRS/ZVI (Shallow)-3 3.0 <0.020 <0.020 <0.020 -- <0.020 1.3 0.03 <0.020 <0.020 0.051
Average Concentration (mg/L) 3.0 ND ND ND -- ND 1.1 0.19 ND ND 0.057Standard Deviation (mmoles) 1.4E-04 0.0E+00 0.0E+00 0.0E+00 -- 0.0E+00 2.4E-04 2.6E-04 0.0E+00 0.0E+00 2.6E-04
Average Total mmoles 0.0048 ND ND ND 4.8E-03 ND 0.0015 0.00033 ND ND 0.002604-Apr-14 7 SRS/ZVI (Shallow)-1 2.1 <0.020 <0.020 0.034 -- 0.035 <0.020 0.025 <0.020 <0.020 0.074
SRS/ZVI (Shallow)-2 1.9 <0.020 <0.020 0.033 -- 0.024 <0.020 <0.020 <0.020 <0.020 0.067SRS/ZVI (Shallow)-3 1.9 <0.020 <0.020 0.038 -- 0.041 <0.020 <0.020 <0.020 <0.020 0.10
Average Concentration (mg/L) 2.0 ND ND 0.035 -- 0.033 ND 0.0085 ND ND 0.081Standard Deviation (mmoles) 2.1E-04 0.0E+00 0.0E+00 3.2E-05 -- 1.7E-04 0.0E+00 2.5E-05 0.0E+00 0.0E+00 9.0E-04
Average Total mmoles 0.0032 ND ND 0.00046 3.7E-03 0.00066 ND 0.000014 ND ND 0.0038Amended with 36 mg of fumerous fumarate to target a final concentration of 180 mg/L.
17-Apr-14 20 SRS/ZVI (Shallow)-1 0.93 0.026 <0.020 0.10 -- 0.093 <0.020 <0.020 <0.020 <0.020 0.22SRS/ZVI (Shallow)-2 0.87 0.031 <0.020 0.078 -- 0.042 <0.020 <0.020 <0.020 <0.020 0.079SRS/ZVI (Shallow)-3 0.53 0.080 <0.020 0.065 -- 0.038 <0.020 <0.020 <0.020 <0.020 0.073
Average Concentration (mg/L) 0.78 0.046 ND 0.081 -- 0.058 ND ND ND ND 0.13Standard Deviation (mmoles) 3.4E-04 6.3E-05 0.0E+00 2.5E-04 -- 6.1E-04 0.0E+00 0.0E+00 0.0E+00 0.0E+00 4.0E-03
Average Total mmoles 0.0012 0.000098 ND 0.0011 2.4E-03 0.0011 ND ND ND ND 0.0058Spiked with CTC to target concentrations of 2 mg/L.
25-Apr-14 28 SRS/ZVI (Shallow)-1 0.31 <0.020 <0.020 0.11 -- 0.071 <0.020 <0.020 0.34 0.027 0.094SRS/ZVI (Shallow)-2 0.38 0.052 <0.020 0.099 -- 0.047 <0.020 <0.020 0.35 <0.020 0.086SRS/ZVI (Shallow)-3 0.16 0.074 <0.020 0.075 -- 0.040 <0.020 <0.020 0.31 <0.020 0.081
Average Concentration (mg/L) 0.28 0.042 ND 0.094 -- 0.053 ND ND 0.33 0.0090 0.087Standard Deviation (mmoles) 1.8E-04 8.1E-05 0.0E+00 2.3E-04 -- 3.3E-04 0.0E+00 0.0E+00 4.4E-05 6.2E-05 3.2E-04
Average Total mmoles 0.00045 0.000089 ND 0.0012 1.7E-03 0.001 ND ND 0.00082 0.000036 0.0040Bioaugmented with KB-1® Plus (CF formulation).
09-May-14 42 SRS/ZVI (Shallow)-1 0.024 <0.020 <0.020 0.12 -- 0.082 <0.020 <0.020 0.3 0.027 0.13SRS/ZVI (Shallow)-2 0.059 0.061 <0.020 0.10 -- 0.055 <0.020 <0.020 0.32 0.023 0.13SRS/ZVI (Shallow)-3 <0.020 0.065 <0.020 0.077 -- 0.04 <0.020 <0.020 0.28 <0.020 0.12
Average Concentration (mg/L) 0.028 0.042 ND 0.10 -- 0.059 ND ND 0.3 0.0170 0.13Standard Deviation (mmoles) 4.7E-05 7.8E-05 0.0E+00 2.9E-04 -- 4.2E-04 0.0E+00 0.0E+00 5.4E-05 5.8E-05 2.6E-04
Average Total mmoles 0.000044 0.000089 ND 0.0013 1.4E-03 0.0012 ND ND 0.00073 0.000066 0.006023-May-14 56 SRS/ZVI (Shallow)-1 <0.020 <0.020 <0.020 0.12 -- 0.096 <0.020 <0.020 0.26 0.031 0.18
SRS/ZVI (Shallow)-2 <0.020 0.053 <0.020 0.096 -- 0.045 <0.020 <0.020 0.30 <0.020 0.12SRS/ZVI (Shallow)-3 <0.020 0.062 <0.020 0.077 -- 0.04 <0.020 <0.020 0.27 <0.020 0.13
Average Concentration (mg/L) ND 0.038 ND 0.099 -- 0.06 ND ND 0.28 0.010 0.14Standard Deviation (mmoles) 0.0E+00 7.1E-05 0.0E+00 3.1E-04 -- 6.1E-04 0.0E+00 0.0E+00 5.1E-05 7.1E-05 1.5E-03
Average Total mmoles ND 0.000081 ND 0.0013 1.4E-03 0.0012 ND ND 0.00067 0.000041 0.0065
SRS™/ZVI and Ferrous Fumarate Amended/KB-1®
Plus Bioaugmented

TABLE 2: SUMMARY OF MICROCOSM CHLORINATED VOC AND DHG RESULTS Elkhart, Indiana
SiREM
Table 2 Page 4 of 14
TCE cDCE VC Ethene Total Ethenes Ethane CTC CF DCM CM Methanemg/L mg/L mg/L mg/L mmol/bottle mg/L mg/L mg/L mg/L mg/L mg/L
Chlorinated EthanesCommentTreatment Date Day Replicate
Chlorinated Ethenes
10-Jun-14 74 SRS/ZVI (Shallow)-1 0.031 <0.020 <0.020 0.12 -- 0.091 <0.020 <0.020 0.19 <0.020 0.16SRS/ZVI (Shallow)-2 <0.020 0.065 <0.020 0.09 -- 0.047 <0.020 <0.020 0.26 <0.020 0.12
(Shallow) SRS/ZVI (Shallow)-3 <0.020 0.088 <0.020 0.081 -- 0.048 <0.020 <0.020 0.24 <0.020 0.16Continued Average Concentration (mg/L) 0.010 0.051 ND 0.096 -- 0.062 ND ND 0.23 ND 0.15
Standard Deviation (mmoles) 2.9E-05 9.8E-05 0.0E+00 2.6E-04 -- 5.0E-04 0.0E+00 0.0E+00 8.4E-05 0.0E+00 1.0E-03Average Total mmoles 0.000017 0.00011 ND 0.0013 1.4E-03 0.0012 ND ND 0.00056 ND 0.0070
25-Jun-14 89 SRS/ZVI (Shallow)-1 <0.020 <0.020 <0.020 0.12 -- 0.10 <0.020 <0.020 0.14 <0.020 0.16SRS/ZVI (Shallow)-2 <0.020 0.036 <0.020 0.093 -- 0.05 <0.020 <0.020 0.21 <0.020 0.12SRS/ZVI (Shallow)-3 <0.020 0.043 <0.020 0.086 -- 0.056 <0.020 <0.020 0.19 <0.020 0.18
Average Concentration (mg/L) ND 0.026 ND 0.10 -- 0.069 ND ND 0.18 ND 0.15Standard Deviation (mmoles) 0.0E+00 4.9E-05 0.0E+00 2.7E-04 -- 5.7E-04 0.0E+00 0.0E+00 8.4E-05 0.0E+00 1.3E-03
Average Total mmoles ND 0.000056 ND 0.0013 1.5E-03 0.0014 ND ND 0.00043 ND 0.007226-Jun-14 90 Spiked with TCE and CTC to target concentrations of 2 mg/L each.10-Jul-14 104 SRS/ZVI (Shallow)-1 0.29 0.089 <0.020 0.16 -- 0.052 <0.020 <0.020 0.40 0.041 0.099
SRS/ZVI (Shallow)-2 0.52 0.020 <0.020 0.18 -- 0.10 <0.020 <0.020 0.39 0.035 0.14SRS/ZVI (Shallow)-3 0.066 0.043 <0.020 0.13 -- 0.055 <0.020 <0.020 0.34 0.025 0.14
Average Concentration (mg/L) 0.29 0.051 ND 0.16 -- 0.069 ND ND 0.38 0.034 0.13Standard Deviation (mmoles) 3.6E-04 7.4E-05 0.0E+00 3.3E-04 -- 5.4E-04 0.0E+00 0.0E+00 8.1E-05 3.2E-05 1.1E-03
Average Total mmoles 0.00046 0.00011 ND 0.0021 2.7E-03 0.0014 ND ND 0.00092 0.00014 0.005929-Jul-14 123 SRS/ZVI (Shallow)-1 0.042 0.024 <0.020 0.22 -- 0.094 <0.020 <0.020 0.32 0.026 0.17
SRS/ZVI (Shallow)-2 0.12 <0.020 <0.020 0.22 -- 0.087 <0.020 <0.020 0.42 0.031 0.15SRS/ZVI (Shallow)-3 0.15 <0.020 <0.020 0.16 -- 0.071 <0.020 <0.020 0.25 0.020 0.18
Average Concentration (mg/L) 0.11 0.0080 ND 0.20 -- 0.084 ND ND 0.33 0.026 0.16Standard Deviation (mmoles) 9.1E-05 2.9E-05 0.0E+00 4.3E-04 -- 2.3E-04 0.0E+00 0.0E+00 2.1E-04 2.1E-05 7.0E-04
Average Total mmoles 0.00017 0.000017 ND 0.0026 2.8E-03 0.0017 ND ND 0.00080 0.00010 0.007627-Mar-14 -1 Spiked with TCE and CTC to target concentrations of 2 mg/L each.28-Mar-14 0 Amended the first replicate with 100 uL of resazurin.
(Shallow) Amended with 36 mg of fumerous fumarate to target a final concentration of 180 mg/L.Amended with 333 uL of SRS™to target a final concentration of 0.1 % as oil.Amended with 2 mL of a vitamin/mineral solution.
SRS/solFe (Shallow)-1 3.1 <0.020 <0.020 <0.020 -- <0.020 1.4 0.031 <0.020 <0.020 0.041SRS/solFe (Shallow)-2 3.0 <0.020 <0.020 <0.020 -- <0.020 1.4 0.033 <0.020 <0.020 0.042SRS/solFe (Shallow)-3 3.0 <0.020 <0.020 <0.020 -- <0.020 1.3 0.033 <0.020 <0.020 0.042
Average Concentration (mg/L) 3.0 ND ND ND -- ND 1.3 0.032 ND ND 0.042Standard Deviation (mmoles) 7.1E-05 0.0E+00 0.0E+00 0.0E+00 -- 0.0E+00 4.3E-05 2.3E-06 0.0E+00 0.0E+00 3.0E-05
Average Total mmoles 0.0048 ND ND ND 4.8E-03 ND 0.0019 0.000055 ND ND 0.001904-Apr-14 7 SRS/solFe (Shallow)-1 2.4 <0.020 <0.020 <0.020 -- <0.020 <0.020 0.45 <0.020 <0.020 0.043
SRS/solFe (Shallow)-2 2.3 <0.020 <0.020 <0.020 -- <0.020 <0.020 0.50 <0.020 <0.020 0.043SRS/solFe (Shallow)-3 2.4 <0.020 <0.020 <0.020 -- <0.020 <0.020 0.22 <0.020 <0.020 0.042
Average Concentration (mg/L) 2.4 ND ND ND -- ND ND 0.39 ND ND 0.043Standard Deviation (mmoles) 4.4E-05 0.0E+00 0.0E+00 0.0E+00 -- 0.0E+00 0.0E+00 2.5E-04 0.0E+00 0.0E+00 3.9E-05
Average Total mmoles 0.0038 ND ND ND 3.8E-03 ND ND 0.00067 ND ND 0.002017-Apr-14 20 SRS/solFe (Shallow)-1 2.4 <0.020 <0.020 <0.020 -- <0.020 <0.020 0.19 <0.020 <0.020 0.043
SRS/solFe (Shallow)-2 2.3 <0.020 <0.020 <0.020 -- <0.020 <0.020 0.12 <0.020 <0.020 0.045SRS/solFe (Shallow)-3 2.3 <0.020 <0.020 <0.020 -- <0.020 <0.020 0.028 <0.020 <0.020 0.044
Average Concentration (mg/L) 2.3 ND ND ND -- ND ND 0.11 ND ND 0.044Standard Deviation (mmoles) 8.9E-05 0.0E+00 0.0E+00 0.0E+00 -- 0.0E+00 0.0E+00 1.4E-04 0.0E+00 0.0E+00 3.9E-05
Average Total mmoles 0.0038 ND ND ND 3.8E-03 ND ND 0.00019 ND ND 0.0020Spiked with CTC to target concentrations of 2 mg/L.
25-Apr-14 28 SRS/solFe (Shallow)-1 2.4 <0.020 <0.020 <0.020 -- <0.020 <0.020 0.95 0.071 <0.020 0.042SRS/solFe (Shallow)-2 2.3 <0.020 <0.020 <0.020 -- <0.020 <0.020 0.45 <0.020 <0.020 0.042SRS/solFe (Shallow)-3 2.2 <0.020 <0.020 <0.020 -- <0.020 <0.020 0.93 0.094 <0.020 0.041
Average Concentration (mg/L) 2.3 ND ND ND -- ND ND 0.77 0.055 ND 0.042Standard Deviation (mmoles) 1.6E-04 0.0E+00 0.0E+00 0.0E+00 -- 0.0E+00 0.0E+00 4.8E-04 1.2E-04 0.0E+00 1.2E-05
Average Total mmoles 0.0037 ND ND ND 3.7E-03 ND ND 0.0013 0.00013 ND 0.0019Bioaugmented with KB-1® Plus (CF formulation).
09-May-14 42 SRS/solFe (Shallow)-1 2.2 0.021 <0.020 <0.020 -- <0.020 <0.020 <0.020 <0.020 <0.020 0.20SRS/solFe (Shallow)-2 2.0 0.069 <0.020 <0.020 -- <0.020 <0.020 <0.020 <0.020 <0.020 0.25SRS/solFe (Shallow)-3 2.1 0.069 <0.020 <0.020 -- <0.020 <0.020 <0.020 0.15 <0.020 0.15
Average Concentration (mg/L) 2.1 0.053 ND ND -- ND ND ND 0.051 ND 0.20Standard Deviation (mmoles) 1.8E-04 6.0E-05 0.0E+00 0.0E+00 -- 0.0E+00 0.0E+00 0.0E+00 2.2E-04 0.0E+00 2.4E-03
Average Total mmoles 0.0034 0.00011 ND ND 3.5E-03 ND ND ND 0.00013 ND 0.0093
SRS™/ZVI and Ferrous Fumarate Amended/KB-1®
Plus Bioaugmented
SRS™ and Ferrous Fumarate Amended/KB-1® Plus Bioaugmented

TABLE 2: SUMMARY OF MICROCOSM CHLORINATED VOC AND DHG RESULTS Elkhart, Indiana
SiREM
Table 2 Page 5 of 14
TCE cDCE VC Ethene Total Ethenes Ethane CTC CF DCM CM Methanemg/L mg/L mg/L mg/L mmol/bottle mg/L mg/L mg/L mg/L mg/L mg/L
Chlorinated EthanesCommentTreatment Date Day Replicate
Chlorinated Ethenes
23-May-14 56 SRS/solFe (Shallow)-1 <0.020 0.37 0.048 <0.020 -- <0.020 <0.020 <0.020 <0.020 <0.020 0.55SRS/solFe (Shallow)-2 <0.020 0.26 1.5 <0.020 -- <0.020 <0.020 <0.020 <0.020 <0.020 0.74
(Shallow) SRS/solFe (Shallow)-3 1.5 0.46 0.21 <0.020 -- <0.020 <0.020 <0.020 0.099 <0.020 0.14Continued Average Concentration (mg/L) 0.48 0.36 0.59 ND -- ND ND ND 0.033 ND 0.48
Standard Deviation (mmoles) 1.3E-03 2.0E-04 2.8E-03 0.0E+00 -- 0.0E+00 0.0E+00 0.0E+00 1.4E-04 0.0E+00 1.4E-02Average Total mmoles 0.00077 0.00077 0.0021 ND 3.6E-03 ND ND ND 0.000081 ND 0.022
10-Jun-14 74 SRS/solFe (Shallow)-1 <0.020 <0.020 <0.020 0.24 -- <0.020 <0.020 <0.020 <0.020 <0.020 5.3SRS/solFe (Shallow)-2 <0.020 <0.020 <0.020 0.21 -- <0.020 <0.020 <0.020 <0.020 <0.020 4.8SRS/solFe (Shallow)-3 <0.020 <0.020 0.047 0.21 -- <0.020 <0.020 <0.020 <0.020 <0.020 0.18
Average Concentration (mg/L) ND ND 0.016 0.22 -- ND ND ND ND ND 3.4Standard Deviation (mmoles) 0.0E+00 0.0E+00 9.5E-05 2.1E-04 -- 0.0E+00 0.0E+00 0.0E+00 0.0E+00 0.0E+00 1.3E-01
Average Total mmoles ND ND 0.000055 0.0029 3.0E-03 ND ND ND ND ND 0.1625-Jun-14 89 SRS/solFe (Shallow)-1 <0.020 <0.020 <0.020 0.23 -- <0.020 <0.020 <0.020 <0.020 <0.020 9.0
SRS/solFe (Shallow)-2 <0.020 <0.020 <0.020 0.19 -- <0.020 <0.020 <0.020 <0.020 <0.020 7.9SRS/solFe (Shallow)-3 <0.020 <0.020 <0.020 0.21 -- <0.020 <0.020 <0.020 <0.020 <0.020 0.28
Average Concentration (mg/L) ND ND ND 0.21 -- ND ND ND ND ND 5.8Standard Deviation (mmoles) 0.0E+00 0.0E+00 0.0E+00 2.8E-04 -- 0.0E+00 0.0E+00 0.0E+00 0.0E+00 0.0E+00 2.2E-01
Average Total mmoles ND ND ND 0.0027 2.8E-03 ND ND ND ND ND 0.2726-Jun-14 90 Spiked with TCE and CTC to target concentrations of 2 mg/L each.10-Jul-14 104 SRS/solFe (Shallow)-1 <0.020 <0.020 <0.020 0.45 -- <0.020 <0.020 <0.020 <0.020 <0.020 7.8
SRS/solFe (Shallow)-2 <0.020 <0.020 <0.020 0.42 -- <0.020 <0.020 <0.020 <0.020 <0.020 8.7SRS/solFe (Shallow)-3 <0.020 <0.020 <0.020 0.45 -- <0.020 <0.020 <0.020 <0.020 <0.020 0.68
Average Concentration (mg/L) ND ND ND 0.44 -- ND ND ND ND ND 5.7Standard Deviation (mmoles) 0.0E+00 0.0E+00 0.0E+00 2.3E-04 -- 0.0E+00 0.0E+00 0.0E+00 0.0E+00 0.0E+00 2.0E-01
Average Total mmoles ND ND ND 0.0058 5.8E-03 ND ND ND ND ND 0.2629-Jul-14 123 SRS/solFe (Shallow)-1 <0.020 <0.020 <0.020 0.49 -- <0.020 <0.020 <0.020 <0.020 <0.020 16
SRS/solFe (Shallow)-2 <0.020 <0.020 <0.020 0.42 -- <0.020 <0.020 <0.020 <0.020 <0.020 15SRS/solFe (Shallow)-3 <0.020 <0.020 <0.020 0.48 -- <0.020 <0.020 <0.020 <0.020 <0.020 3.1
Average Concentration (mg/L) ND ND ND 0.46 -- ND ND ND ND ND 11Standard Deviation (mmoles) 0.0E+00 0.0E+00 0.0E+00 4.5E-04 -- 0.0E+00 0.0E+00 0.0E+00 0.0E+00 0.0E+00 3.3E-01
Average Total mmoles ND ND ND 0.0061 6.1E-03 ND ND ND ND ND 0.52SRS™ Amended/KB-1® Plus Bioaugmented 27-Mar-14 -1 Spiked with TCE and CTC to target concentrations of 2 mg/L each.
(Shallow) 28-Mar-14 0 Amended with 2 mL of a vitamin/mineral solution.Amended the first replicate with 100 uL of resazurin.Amended with 333 uL of SRS™ to target a final concentration of 0.1 % as oil.
SRS (Shallow)-1 3.0 <0.020 <0.020 <0.020 -- <0.020 1.4 0.033 <0.020 <0.020 0.042SRS (Shallow)-2 3.2 <0.020 <0.020 <0.020 -- <0.020 1.4 0.033 <0.020 <0.020 0.041SRS (Shallow)-3 3.0 <0.020 <0.020 <0.020 -- <0.020 1.3 0.038 <0.020 <0.020 0.044
Average Concentration (mg/L) 3.1 ND ND ND -- ND 1.4 0.035 ND ND 0.042Standard Deviation (mmoles) 1.6E-04 0.0E+00 0.0E+00 0.0E+00 -- 0.0E+00 9.2E-05 4.7E-06 0.0E+00 0.0E+00 5.6E-05
Average Total mmoles 0.0049 ND ND ND 4.9E-03 ND 0.0019 0.000059 ND ND 0.002004-Apr-14 7 SRS (Shallow)-1 2.5 <0.020 <0.020 <0.020 -- <0.020 0.036 0.44 <0.020 <0.020 0.040
SRS (Shallow)-2 2.6 <0.020 <0.020 <0.020 -- <0.020 0.57 0.25 <0.020 <0.020 0.041SRS (Shallow)-3 2.7 <0.020 <0.020 <0.020 -- <0.020 0.049 0.60 <0.020 <0.020 0.041
Average Concentration (mg/L) 2.6 ND ND ND -- ND 0.22 0.43 ND ND 0.041Standard Deviation (mmoles) 1.0E-04 0.0E+00 0.0E+00 0.0E+00 -- 0.0E+00 4.2E-04 3.0E-04 0.0E+00 0.0E+00 3.3E-05
Average Total mmoles 0.0041 ND ND ND 4.1E-03 ND 0.00030 0.00073 ND ND 0.001917-Apr-14 20 SRS (Shallow)-1 2.4 <0.020 <0.020 <0.020 -- <0.020 <0.020 0.36 <0.020 <0.020 0.042
SRS (Shallow)-2 2.3 <0.020 <0.020 <0.020 -- <0.020 <0.020 0.18 <0.020 <0.020 0.023SRS (Shallow)-3 2.5 <0.020 <0.020 <0.020 -- <0.020 <0.020 0.52 <0.020 <0.020 0.047
Average Concentration (mg/L) 2.4 ND ND ND -- ND ND 0.35 ND ND 0.037Standard Deviation (mmoles) 1.7E-04 0.0E+00 0.0E+00 0.0E+00 -- 0.0E+00 0.0E+00 2.9E-04 0.0E+00 0.0E+00 5.9E-04
Average Total mmoles 0.0038 ND ND ND 3.8E-03 ND ND 0.00060 ND ND 0.0017Spiked with CTC to target concentrations of 2 mg/L.
25-Apr-14 28 SRS (Shallow)-1 2.3 <0.020 <0.020 <0.020 -- <0.020 <0.020 0.36 0.045 <0.020 0.041SRS (Shallow)-2 2.2 <0.020 <0.020 <0.020 -- <0.020 <0.020 0.31 0.13 <0.020 0.043SRS (Shallow)-3 2.4 <0.020 <0.020 <0.020 -- <0.020 <0.020 0.62 <0.020 <0.020 0.040
Average Concentration (mg/L) 2.3 ND ND ND -- ND ND 0.43 0.058 ND 0.041Standard Deviation (mmoles) 1.4E-04 0.0E+00 0.0E+00 0.0E+00 -- 0.0E+00 0.0E+00 2.8E-04 1.6E-04 0.0E+00 8.4E-05
Average Total mmoles 0.0036 ND ND ND 3.6E-03 ND ND 0.00073 0.00014 ND 0.0019Bioaugmented with KB-1® Plus (CF formulation).
SRS™ and Ferrous Fumarate Amended/KB-1® Plus Bioaugmented

TABLE 2: SUMMARY OF MICROCOSM CHLORINATED VOC AND DHG RESULTS Elkhart, Indiana
SiREM
Table 2 Page 6 of 14
TCE cDCE VC Ethene Total Ethenes Ethane CTC CF DCM CM Methanemg/L mg/L mg/L mg/L mmol/bottle mg/L mg/L mg/L mg/L mg/L mg/L
Chlorinated EthanesCommentTreatment Date Day Replicate
Chlorinated Ethenes
SRS™ Amended/KB-1® Plus Bioaugmented 09-May-14 42 SRS (Shallow)-1 2.1 <0.020 <0.020 <0.020 -- <0.020 <0.020 <0.020 <0.020 <0.020 0.072(Shallow) SRS (Shallow)-2 2.1 <0.020 <0.020 <0.020 -- <0.020 <0.020 <0.020 0.088 <0.020 0.059Continued SRS (Shallow)-3 2.2 <0.020 <0.020 <0.020 -- <0.020 <0.020 <0.020 <0.020 <0.020 0.070
Average Concentration (mg/L) 2.2 ND ND ND -- ND ND ND 0.029 ND 0.067Standard Deviation (mmoles) 8.0E-05 0.0E+00 0.0E+00 0.0E+00 -- 0.0E+00 0.0E+00 0.0E+00 1.2E-04 0.0E+00 3.1E-04
Average Total mmoles 0.0035 ND ND ND 3.5E-03 ND ND ND 0.000072 ND 0.003123-May-14 56 SRS (Shallow)-1 2.0 0.14 0.027 <0.020 -- <0.020 <0.020 <0.020 <0.020 <0.020 0.15
SRS (Shallow)-2 2.1 0.054 <0.020 <0.020 -- <0.020 <0.020 <0.020 0.038 <0.020 0.075SRS (Shallow)-3 <0.020 2.0 0.27 <0.020 -- <0.020 <0.020 <0.020 <0.020 <0.020 0.18
Average Concentration (mg/L) 1.4 0.74 0.1 ND -- ND ND ND 0.013 ND 0.14Standard Deviation (mmoles) 1.9E-03 2.4E-03 5.3E-04 0.0E+00 -- 0.0E+00 0.0E+00 0.0E+00 5.4E-05 0.0E+00 2.6E-03
Average Total mmoles 0.0022 0.0016 0.00035 ND 4.2E-03 ND ND ND 0.000031 ND 0.006310-Jun-14 74 SRS (Shallow)-1 <0.020 <0.020 1.6 0.053 -- <0.020 <0.020 <0.020 <0.020 <0.020 2.3
SRS (Shallow)-2 <0.020 <0.020 0.093 0.21 -- <0.020 <0.020 <0.020 <0.020 <0.020 1.0SRS (Shallow)-3 <0.020 <0.020 <0.020 0.20 -- <0.020 <0.020 <0.020 <0.020 <0.020 2.3
Average Concentration (mg/L) ND ND 0.57 0.16 -- ND ND ND ND ND 1.9Standard Deviation (mmoles) 0.0E+00 0.0E+00 3.2E-03 1.2E-03 -- 0.0E+00 0.0E+00 0.0E+00 0.0E+00 0.0E+00 3.4E-02
Average Total mmoles ND ND 0.0020 0.0021 4.1E-03 ND ND ND ND ND 0.08725-Jun-14 89 SRS (Shallow)-1 <0.020 <0.020 0.082 0.22 -- <0.020 <0.020 <0.020 <0.020 <0.020 6.7
SRS (Shallow)-2 <0.020 <0.020 <0.020 0.12 -- <0.020 <0.020 <0.020 <0.020 <0.020 5.9SRS (Shallow)-3 <0.020 <0.020 <0.020 0.21 -- <0.020 <0.020 <0.020 <0.020 <0.020 5.8
Average Concentration (mg/L) ND ND 0.027 0.18 -- ND ND ND ND ND 6.1Standard Deviation (mmoles) 0.0E+00 0.0E+00 1.7E-04 6.9E-04 -- 0.0E+00 0.0E+00 0.0E+00 0.0E+00 0.0E+00 2.4E-02
Average Total mmoles ND ND 0.000096 0.0024 2.8E-03 ND ND ND ND ND 0.2826-Jun-14 90 Spiked with TCE and CTC to target concentrations of 2 mg/L each.10-Jul-14 104 SRS (Shallow)-1 <0.020 <0.020 <0.020 0.44 -- <0.020 <0.020 <0.020 0.097 <0.020 8.2
SRS (Shallow)-2 <0.020 <0.020 <0.020 0.33 -- <0.020 <0.020 <0.020 <0.020 <0.020 6.3SRS (Shallow)-3 <0.020 <0.020 <0.020 0.42 -- <0.020 <0.020 <0.020 0.076 <0.020 7.2
Average Concentration (mg/L) ND ND ND 0.40 -- ND ND ND 0.058 ND 7.2Standard Deviation (mmoles) 0.0E+00 0.0E+00 0.0E+00 7.7E-04 -- 0.0E+00 0.0E+00 0.0E+00 1.2E-04 0.0E+00 4.5E-02
Average Total mmoles ND ND ND 0.0052 5.2E-03 ND ND ND 0.00014 ND 0.3429-Jul-14 123 SRS (Shallow)-1 <0.020 <0.020 <0.020 0.44 -- <0.020 <0.020 <0.020 0.073 <0.020 12
SRS (Shallow)-2 <0.020 <0.020 <0.020 0.054 -- <0.020 <0.020 <0.020 <0.020 <0.020 4.3SRS (Shallow)-3 <0.020 <0.020 <0.020 0.40 -- <0.020 <0.020 <0.020 <0.020 <0.020 11
Average Concentration (mg/L) ND ND ND 0.30 -- ND ND ND 0.024 ND 9.3Standard Deviation (mmoles) 0.0E+00 0.0E+00 0.0E+00 2.8E-03 -- 0.0E+00 0.0E+00 0.0E+00 1.0E-04 0.0E+00 2.0E-01
Average Total mmoles ND ND ND 0.0039 3.9E-03 ND ND ND 0.00006 ND 0.43EHC®-L Amended/KB-1® Plus Bioaugmented 27-Mar-14 -1 Spiked with TCE and CTC to target concentrations of 2 mg/L each.
(Shallow) 28-Mar-14 0 Amended the first replicate with 100 uL of resazurin.
Amended with 1.37 mL of EHC®
-L to target a final concentration of 1 g/L.Amended with 2 mL of a vitamin/mineral solution.
EHC (Shallow)-1 3.0 <0.020 <0.020 <0.020 -- <0.020 1.3 <0.020 <0.020 <0.020 0.041EHC (Shallow)-2 2.9 <0.020 <0.020 <0.020 -- <0.020 1.3 <0.020 <0.020 <0.020 0.041EHC (Shallow)-3 2.9 <0.020 <0.020 <0.020 -- <0.020 1.3 0.024 <0.020 <0.020 0.043
Average Concentration (mg/L) 2.9 ND ND ND -- ND 1.3 0.0081 ND ND 0.042Standard Deviation (mmoles) 4.0E-05 0.0E+00 0.0E+00 0.0E+00 -- 0.0E+00 2.5E-05 2.4E-05 0.0E+00 0.0E+00 5.8E-05
Average Total mmoles 0.0047 ND ND ND 4.7E-03 ND 0.0018 0.000014 ND ND 0.001904-Apr-14 7 EHC (Shallow)-1 2.8 <0.020 <0.020 <0.020 -- <0.020 <0.020 0.61 <0.020 <0.020 0.039
EHC (Shallow)-2 2.8 <0.020 <0.020 <0.020 -- <0.020 <0.020 0.49 <0.020 <0.020 0.040EHC (Shallow)-3 2.8 <0.020 <0.020 <0.020 -- <0.020 <0.020 0.59 <0.020 <0.020 0.041
Average Concentration (mg/L) 2.8 ND ND ND -- ND ND 0.57 ND ND 0.040Standard Deviation (mmoles) 3.8E-05 0.0E+00 0.0E+00 0.0E+00 -- 0.0E+00 0.0E+00 1.1E-04 0.0E+00 0.0E+00 4.0E-05
Average Total mmoles 0.0045 ND ND ND 4.5E-03 ND ND 0.00096 ND ND 0.001917-Apr-14 20 EHC (Shallow)-1 2.8 <0.020 <0.020 <0.020 -- <0.020 <0.020 0.089 <0.020 <0.020 0.047
EHC (Shallow)-2 2.8 0.023 <0.020 <0.020 -- <0.020 <0.020 0.14 <0.020 <0.020 0.042EHC (Shallow)-3 2.9 <0.020 <0.020 <0.020 -- <0.020 <0.020 0.24 <0.020 <0.020 0.046
Average Concentration (mg/L) 2.8 0.0078 ND ND -- ND ND 0.16 ND ND 0.045Standard Deviation (mmoles) 6.9E-05 2.9E-05 0.0E+00 0.0E+00 -- 0.0E+00 0.0E+00 1.3E-04 0.0E+00 0.0E+00 1.1E-04
Average Total mmoles 0.0045 0.000017 ND ND 4.5E-03 ND ND 0.00027 ND ND 0.0021Spiked with CTC to target concentrations of 2 mg/L.

TABLE 2: SUMMARY OF MICROCOSM CHLORINATED VOC AND DHG RESULTS Elkhart, Indiana
SiREM
Table 2 Page 7 of 14
TCE cDCE VC Ethene Total Ethenes Ethane CTC CF DCM CM Methanemg/L mg/L mg/L mg/L mmol/bottle mg/L mg/L mg/L mg/L mg/L mg/L
Chlorinated EthanesCommentTreatment Date Day Replicate
Chlorinated Ethenes
EHC®-L Amended/KB-1® Plus Bioaugmented 25-Apr-14 28 EHC (Shallow)-1 2.7 <0.020 <0.020 <0.020 -- <0.020 <0.020 0.19 0.12 0.025 0.042(Shallow) EHC (Shallow)-2 2.7 0.029 <0.020 <0.020 -- <0.020 <0.020 0.38 0.23 0.022 0.043Continued EHC (Shallow)-3 2.8 <0.020 <0.020 <0.020 -- <0.020 <0.020 0.55 0.077 <0.020 0.044
Average Concentration (mg/L) 2.8 0.0097 ND ND -- ND ND 0.37 0.14 0.016 0.043Standard Deviation (mmoles) 8.0E-05 3.6E-05 0.0E+00 0.0E+00 -- 0.0E+00 0.0E+00 3.0E-04 1.9E-04 5.5E-05 3.6E-05
Average Total mmoles 0.0044 0.000021 ND ND 4.4E-03 ND ND 0.00063 0.00035 0.000063 0.0020Bioaugmented with KB-1® Plus (CF formulation).
09-May-14 42 EHC (Shallow)-1 2.3 0.26 <0.020 <0.020 -- <0.020 <0.020 <0.020 <0.020 <0.020 1.4EHC (Shallow)-2 <0.020 1.8 <0.020 <0.020 -- <0.020 <0.020 <0.020 <0.020 <0.020 2.2EHC (Shallow)-3 <0.020 1.7 <0.020 <0.020 -- <0.020 <0.020 <0.020 <0.020 <0.020 1.9
Average Concentration (mg/L) 0.75 1.2 ND ND -- ND ND ND ND ND 1.8Standard Deviation (mmoles) 2.1E-03 1.8E-03 0.0E+00 0.0E+00 -- 0.0E+00 0.0E+00 0.0E+00 0.0E+00 0.0E+00 1.8E-02
Average Total mmoles 0.0012 0.0027 ND ND 3.9E-03 ND ND ND ND ND 0.08523-May-14 56 EHC (Shallow)-1 <0.020 <0.020 0.60 0.18 -- <0.020 <0.020 <0.020 <0.020 <0.020 2.5
EHC (Shallow)-2 <0.020 0.077 <0.020 0.24 -- <0.020 <0.020 <0.020 <0.020 <0.020 5.1EHC (Shallow)-3 <0.020 <0.020 <0.020 0.25 -- <0.020 <0.020 <0.020 <0.020 <0.020 4.5
Average Concentration (mg/L) ND 0.026 0.20 0.22 -- ND ND ND ND ND 4.0Standard Deviation (mmoles) 0.0E+00 9.4E-05 1.2E-03 4.5E-04 -- 0.0E+00 0.0E+00 0.0E+00 0.0E+00 0.0E+00 6.2E-02
Average Total mmoles ND 0.000054 0.00070 0.0029 3.7E-03 ND ND ND ND ND 0.1910-Jun-14 74 EHC (Shallow)-1 0.026 <0.020 <0.020 0.24 -- <0.020 <0.020 <0.020 <0.020 <0.020 7.3
EHC (Shallow)-2 0.059 <0.020 <0.020 0.23 -- <0.020 <0.020 <0.020 <0.020 <0.020 10EHC (Shallow)-3 0.16 <0.020 <0.020 0.25 -- <0.020 <0.020 <0.020 <0.020 <0.020 9.6
Average Concentration (mg/L) 0.082 ND ND 0.24 -- ND ND ND ND ND 9.1Standard Deviation (mmoles) 1.1E-04 0.0E+00 0.0E+00 1.6E-04 -- 0.0E+00 0.0E+00 0.0E+00 0.0E+00 0.0E+00 7.5E-02
Average Total mmoles 0.00013 ND ND 0.0032 3.3E-03 ND ND ND ND ND 0.4225-Jun-14 89 EHC (Shallow)-1 <0.020 <0.020 <0.020 0.22 -- <0.020 <0.020 <0.020 <0.020 <0.020 12
EHC (Shallow)-2 <0.020 <0.020 <0.020 0.21 -- <0.020 <0.020 <0.020 <0.020 <0.020 14EHC (Shallow)-3 <0.020 <0.020 <0.020 0.22 -- <0.020 <0.020 <0.020 <0.020 <0.020 14
Average Concentration (mg/L) ND ND ND 0.22 -- ND ND ND ND ND 13Standard Deviation (mmoles) 0.0E+00 0.0E+00 0.0E+00 1.2E-04 -- 0.0E+00 0.0E+00 0.0E+00 0.0E+00 0.0E+00 6.7E-02
Average Total mmoles ND ND ND 0.0029 2.9E-03 ND ND ND ND ND 0.6226-Jun-14 90 Spiked with TCE and CTC to target concentrations of 2 mg/L each.10-Jul-14 104 EHC (Shallow)-1 <0.020 <0.020 <0.020 0.44 -- <0.020 <0.020 <0.020 <0.020 <0.020 11
EHC (Shallow)-2 <0.020 <0.020 0.021 0.44 -- <0.020 <0.020 <0.020 <0.020 <0.020 13EHC (Shallow)-3 0.029 0.25 0.23 0.43 -- <0.020 <0.020 <0.020 0.060 <0.020 13
Average Concentration (mg/L) 0.0097 0.085 0.084 0.43 -- ND ND ND 0.020 ND 12Standard Deviation (mmoles) 2.7E-05 3.1E-04 4.5E-04 4.5E-05 -- 0.0E+00 0.0E+00 0.0E+00 8.5E-05 0.0E+00 6.9E-02
Average Total mmoles 0.000015 0.00018 0.00029 0.0057 6.2E-03 ND ND ND 0.000049 ND 0.5729-Jul-14 123 EHC (Shallow)-1 <0.020 <0.020 <0.020 0.42 -- <0.020 <0.020 <0.020 <0.020 <0.020 23
EHC (Shallow)-2 <0.020 <0.020 <0.020 0.43 -- <0.020 <0.020 <0.020 <0.020 <0.020 25EHC (Shallow)-3 <0.020 0.077 <0.020 0.48 -- <0.020 <0.020 <0.020 <0.020 <0.020 17
Average Concentration (mg/L) ND 0.026 ND 0.44 -- ND ND ND ND ND 22Standard Deviation (mmoles) 0.0E+00 9.5E-05 0.0E+00 4.8E-04 -- 0.0E+00 0.0E+00 0.0E+00 0.0E+00 0.0E+00 1.9E-01
Average Total mmoles ND 0.000055 ND 0.0058 5.9E-03 ND ND ND ND ND 1.027-Mar-14 -1 Spiked with TCE and CTC to target concentrations of 2 mg/L each.28-Mar-14 0 Amended with 2 mL of a vitamin/mineral solution.
(Shallow) Amended with 1 g of ZVI to target a final concentration of 5 g/L.
Amended with 1.37 mL of EHC®
-L to target a final concentration of 1 g/L.Amended the first replicate with 100 uL of resazurin.
EHC/ZVI (Shallow)-1 2.8 <0.020 <0.020 <0.020 -- <0.020 1.3 0.021 <0.020 <0.020 0.046EHC/ZVI (Shallow)-2 2.8 <0.020 <0.020 <0.020 -- <0.020 1.3 <0.020 <0.020 <0.020 0.048EHC/ZVI (Shallow)-3 2.8 <0.020 <0.020 0.024 -- <0.020 1.2 <0.020 <0.020 <0.020 0.057
Average Concentration (mg/L) 2.8 ND ND 0.0079 -- ND 1.3 0.007 ND ND 0.05Standard Deviation (mmoles) 1.6E-05 0.0E+00 0.0E+00 1.8E-04 -- 0.0E+00 6.3E-05 2.0E-05 0.0E+00 0.0E+00 2.8E-04
Average Total mmoles 0.0045 ND ND 0.0001 4.6E-03 ND 0.0018 0.000012 ND ND 0.002304-Apr-14 7 EHC/ZVI (Shallow)-1 2.0 0.027 <0.020 0.030 -- <0.020 <0.020 <0.020 0.083 <0.020 0.064
EHC/ZVI (Shallow)-2 2.4 <0.020 <0.020 0.022 -- <0.020 <0.020 <0.020 0.061 <0.020 0.059EHC/ZVI (Shallow)-3 2.1 0.026 <0.020 0.035 -- <0.020 <0.020 <0.020 <0.020 <0.020 0.066
Average Concentration (mg/L) 2.2 0.018 ND 0.029 -- ND ND ND 0.048 ND 0.063Standard Deviation (mmoles) 3.9E-04 3.3E-05 0.0E+00 8.3E-05 -- 0.0E+00 0.0E+00 0.0E+00 1.1E-04 0.0E+00 1.6E-04
Average Total mmoles 0.0035 0.000038 ND 0.00038 3.9E-03 ND ND ND 0.00012 ND 0.0029
EHC®-L and ZVI Amended/KB-1® Plus Bioaugmented

TABLE 2: SUMMARY OF MICROCOSM CHLORINATED VOC AND DHG RESULTS Elkhart, Indiana
SiREM
Table 2 Page 8 of 14
TCE cDCE VC Ethene Total Ethenes Ethane CTC CF DCM CM Methanemg/L mg/L mg/L mg/L mmol/bottle mg/L mg/L mg/L mg/L mg/L mg/L
Chlorinated EthanesCommentTreatment Date Day Replicate
Chlorinated Ethenes
17-Apr-14 20 EHC/ZVI (Shallow)-1 0.39 0.081 <0.020 0.079 -- 0.028 <0.020 <0.020 <0.020 <0.020 0.059EHC/ZVI (Shallow)-2 0.41 0.12 <0.020 0.093 -- 0.039 <0.020 <0.020 <0.020 <0.020 0.080
(Shallow) EHC/ZVI (Shallow)-3 0.53 0.067 <0.020 0.08 -- 0.032 <0.020 <0.020 <0.020 <0.020 0.069Continued Average Concentration (mg/L) 0.44 0.088 ND 0.084 -- 0.033 ND ND ND ND 0.070
Standard Deviation (mmoles) 1.3E-04 5.7E-05 0.0E+00 1.0E-04 -- 1.1E-04 0.0E+00 0.0E+00 0.0E+00 0.0E+00 4.8E-04Average Total mmoles 0.00071 0.00019 ND 0.0011 2.0E-03 0.00065 ND ND ND ND 0.0032
Spiked with CTC to target concentrations of 2 mg/L.25-Apr-14 28 EHC/ZVI (Shallow)-1 0.074 0.19 <0.020 0.084 -- 0.032 <0.020 <0.020 0.22 0.022 0.073
EHC/ZVI (Shallow)-2 0.06 0.12 <0.020 0.091 -- 0.035 <0.020 <0.020 0.18 0.024 0.071EHC/ZVI (Shallow)-3 0.11 0.072 <0.020 0.082 -- 0.034 <0.020 <0.020 0.21 0.034 0.081
Average Concentration (mg/L) 0.082 0.13 ND 0.086 -- 0.034 ND ND 0.20 0.027 0.075Standard Deviation (mmoles) 4.2E-05 1.3E-04 0.0E+00 5.9E-05 -- 3.6E-05 0.0E+00 0.0E+00 4.3E-05 2.7E-05 2.4E-04
Average Total mmoles 0.00013 0.00027 ND 0.0011 1.5E-03 0.00067 ND ND 0.00049 0.00011 0.0035Bioaugmented with KB-1® Plus (CF formulation).
09-May-14 42 EHC/ZVI (Shallow)-1 <0.020 0.055 <0.020 0.088 -- 0.034 <0.020 <0.020 0.18 <0.020 0.31EHC/ZVI (Shallow)-2 <0.020 0.075 <0.020 0.096 -- 0.041 <0.020 <0.020 0.15 <0.020 0.29EHC/ZVI (Shallow)-3 <0.020 <0.020 0.023 0.099 -- 0.057 <0.020 <0.020 0.18 0.032 0.25
Average Concentration (mg/L) ND 0.043 0.0077 0.094 -- 0.044 ND ND 0.17 0.011 0.28Standard Deviation (mmoles) 0.0E+00 8.3E-05 4.7E-05 7.8E-05 -- 2.2E-04 0.0E+00 0.0E+00 4.4E-05 7.4E-05 1.4E-03
Average Total mmoles ND 0.000092 0.000027 0.0012 1.3E-03 0.00087 ND ND 0.00042 0.000043 0.01323-May-14 56 EHC/ZVI (Shallow)-1 <0.020 0.045 0.022 0.090 -- 0.033 <0.020 <0.020 0.14 <0.020 0.29
EHC/ZVI (Shallow)-2 <0.020 0.054 0.022 0.098 -- 0.039 <0.020 <0.020 0.15 <0.020 0.27EHC/ZVI (Shallow)-3 2.3 <0.020 <0.020 <0.020 -- <0.020 <0.020 <0.020 <0.020 <0.020 0.047
Average Concentration (mg/L) 0.75 0.033 0.015 0.063 -- 0.024 ND ND 0.095 ND 0.20Standard Deviation (mmoles) 2.1E-03 6.1E-05 4.5E-05 7.2E-04 -- 4.1E-04 0.0E+00 0.0E+00 2.0E-04 0.0E+00 6.4E-03
Average Total mmoles 0.0012 0.000070 0.000051 0.00082 2.1E-03 0.00047 ND ND 0.00023 ND 0.009510-Jun-14 74 EHC/ZVI (Shallow)-1 0.072 0.03 0.022 0.094 -- 0.035 <0.020 <0.020 0.067 <0.020 0.33
EHC/ZVI (Shallow)-2 0.034 <0.020 <0.020 0.10 -- 0.05 <0.020 <0.020 0.13 <0.020 0.35EHC/ZVI (Shallow)-3 0.083 0.031 <0.020 0.092 -- 0.039 <0.020 <0.020 0.13 <0.020 0.19
Average Concentration (mg/L) 0.063 0.021 0.0072 0.095 -- 0.041 ND ND 0.11 ND 0.29Standard Deviation (mmoles) 4.2E-05 3.8E-05 4.4E-05 5.7E-05 -- 1.5E-04 0.0E+00 0.0E+00 8.8E-05 0.0E+00 3.9E-03
Average Total mmoles 0.00010 0.000044 0.000025 0.0013 1.5E-03 0.00082 ND ND 0.00026 ND 0.01325-Jun-14 89 EHC/ZVI (Shallow)-1 <0.020 0.030 <0.020 0.095 -- 0.044 <0.020 <0.020 <0.020 <0.020 0.37
EHC/ZVI (Shallow)-2 <0.020 0.037 <0.020 0.097 -- 0.047 <0.020 <0.020 0.095 <0.020 0.34EHC/ZVI (Shallow)-3 <0.020 0.024 <0.020 0.097 -- 0.039 <0.020 <0.020 0.098 <0.020 0.20
Average Concentration (mg/L) ND 0.030 ND 0.096 -- 0.043 ND ND 0.064 ND 0.30Standard Deviation (mmoles) 0.0E+00 1.4E-05 0.0E+00 1.6E-05 -- 7.3E-05 0.0E+00 0.0E+00 1.4E-04 0.0E+00 4.2E-03
Average Total mmoles ND 0.000065 ND 0.0013 1.6E-03 0.00086 ND ND 0.00016 ND 0.01426-Jun-14 90 Spiked with TCE and CTC to target concentrations of 2 mg/L each.10-Jul-14 104 EHC/ZVI (Shallow)-1 0.062 0.067 0.020 0.19 -- 0.053 <0.020 <0.020 0.20 0.025 0.36
EHC/ZVI (Shallow)-2 0.058 0.068 <0.020 0.19 -- 0.048 <0.020 <0.020 0.29 0.047 0.29EHC/ZVI (Shallow)-3 0.062 0.075 <0.020 0.22 -- 0.051 <0.020 <0.020 0.29 0.029 0.18
Average Concentration (mg/L) 0.060 0.070 0.0067 0.20 -- 0.05 ND ND 0.26 0.033 0.28Standard Deviation (mmoles) 3.6E-06 9.7E-06 4.0E-05 2.6E-04 -- 5.0E-05 0.0E+00 0.0E+00 1.3E-04 4.6E-05 4.1E-03
Average Total mmoles 0.000097 0.00015 0.000023 0.0026 2.9E-03 0.0010 ND ND 0.00064 0.00013 0.01329-Jul-14 123 EHC/ZVI (Shallow)-1 <0.020 0.052 0.021 0.20 -- 0.049 <0.020 <0.020 0.021 <0.020 0.37
EHC/ZVI (Shallow)-2 <0.020 0.054 <0.020 0.20 -- 0.053 <0.020 <0.020 0.21 0.023 0.34EHC/ZVI (Shallow)-3 0.027 0.058 <0.020 0.25 -- 0.06 <0.020 <0.020 0.24 0.021 0.22
Average Concentration (mg/L) 0.0091 0.055 0.0069 0.21 -- 0.054 ND ND 0.16 0.015 0.31Standard Deviation (mmoles) 2.5E-05 6.0E-06 4.2E-05 3.7E-04 -- 1.1E-04 0.0E+00 0.0E+00 2.9E-04 5.2E-05 3.8E-03
Average Total mmoles 0.000015 0.00012 0.000024 0.0028 3.0E-03 0.0011 ND ND 0.00038 6.0E-05 0.014Anaerobic Active Control 27-Mar-14 -1 Spiked with TCE and CTC to target concentrations of 2 mg/L each.
(Intermediate) 28-Mar-14 0 Amended the first replicate with 100 uL of resazurin.Amended with 2 mL of a vitamin/mineral solution.
ANAC (Intermediate)-1 3.2 <0.020 <0.020 <0.020 -- <0.020 1.3 0.039 <0.020 <0.020 0.046ANAC (Intermediate)-2 3.4 <0.020 <0.020 <0.020 -- <0.020 1.6 0.042 <0.020 <0.020 0.041ANAC (Intermediate)-3 3.3 <0.020 <0.020 <0.020 -- <0.020 1.6 0.039 <0.020 <0.020 0.043
Average Concentration (mg/L) 3.3 ND ND ND -- ND 1.5 0.040 ND ND 0.043Standard Deviation (mmoles) 2.1E-04 0.0E+00 0.0E+00 0.0E+00 -- 0.0E+00 1.9E-04 3.4E-06 0.0E+00 0.0E+00 1.0E-04
Average Total mmoles 0.0053 ND ND ND 5.3E-03 ND 0.0021 0.000068 ND ND 0.0020
EHC®-L and ZVI Amended/KB-1® Plus Bioaugmented

TABLE 2: SUMMARY OF MICROCOSM CHLORINATED VOC AND DHG RESULTS Elkhart, Indiana
SiREM
Table 2 Page 9 of 14
TCE cDCE VC Ethene Total Ethenes Ethane CTC CF DCM CM Methanemg/L mg/L mg/L mg/L mmol/bottle mg/L mg/L mg/L mg/L mg/L mg/L
Chlorinated EthanesCommentTreatment Date Day Replicate
Chlorinated Ethenes
Anaerobic Active Control 04-Apr-14 7 ANAC (Intermediate)-1 2.7 <0.020 <0.020 <0.020 -- <0.020 <0.020 0.45 <0.020 <0.020 0.042(Intermediate) ANAC (Intermediate)-2 3.1 <0.020 <0.020 <0.020 -- <0.020 0.26 0.17 <0.020 <0.020 0.041
Continued ANAC (Intermediate)-3 3.1 <0.020 <0.020 <0.020 -- <0.020 0.067 0.20 <0.020 <0.020 0.043Average Concentration (mg/L) 3.0 ND ND ND -- ND 0.11 0.27 ND ND 0.042
Standard Deviation (mmoles) 3.9E-04 0.0E+00 0.0E+00 0.0E+00 -- 0.0E+00 1.9E-04 2.6E-04 0.0E+00 0.0E+00 4.5E-05Average Total mmoles 0.0047 ND ND ND 4.7E-03 ND 0.00015 0.00046 ND ND 0.0020
17-Apr-14 20 ANAC (Intermediate)-1 2.6 <0.020 <0.020 <0.020 -- <0.020 <0.020 0.31 <0.020 <0.020 0.048ANAC (Intermediate)-2 3.0 <0.020 <0.020 <0.020 -- <0.020 <0.020 0.13 <0.020 <0.020 0.045ANAC (Intermediate)-3 3.1 <0.020 <0.020 <0.020 -- <0.020 <0.020 0.20 <0.020 <0.020 0.043
Average Concentration (mg/L) 2.9 ND ND ND -- ND ND 0.22 ND ND 0.045Standard Deviation (mmoles) 3.9E-04 0.0E+00 0.0E+00 0.0E+00 -- 0.0E+00 0.0E+00 1.6E-04 0.0E+00 0.0E+00 1.1E-04
Average Total mmoles 0.0047 ND ND ND 4.7E-03 ND ND 0.00037 ND ND 0.0021Spiked with CTC to target concentrations of 2 mg/L.
25-Apr-14 28 ANAC (Intermediate)-1 2.5 <0.020 <0.020 <0.020 -- <0.020 <0.020 0.30 0.081 <0.020 0.045ANAC (Intermediate)-2 3.0 <0.020 <0.020 <0.020 -- <0.020 <0.020 0.13 0.030 <0.020 0.044ANAC (Intermediate)-3 2.9 <0.020 <0.020 <0.020 -- <0.020 <0.020 0.19 0.021 <0.020 0.043
Average Concentration (mg/L) 2.8 ND ND ND -- ND ND 0.21 0.044 ND 0.044Standard Deviation (mmoles) 4.0E-04 0.0E+00 0.0E+00 0.0E+00 -- 0.0E+00 0.0E+00 1.4E-04 8.0E-05 0.0E+00 5.8E-05
Average Total mmoles 0.0045 ND ND ND 4.5E-03 ND ND 0.00035 0.00011 ND 0.0020Bioaugmented with KB-1® Plus (CF formulation).
23-May-14 56 ANAC (Intermediate)-1 2.5 <0.020 <0.020 <0.020 -- <0.020 <0.020 <0.020 <0.020 <0.020 0.046ANAC (Intermediate)-2 2.9 0.22 <0.020 <0.020 -- <0.020 <0.020 <0.020 0.043 <0.020 0.042ANAC (Intermediate)-3 2.7 0.14 <0.020 <0.020 -- <0.020 <0.020 0.14 0.044 <0.020 0.041
Average Concentration (mg/L) 2.7 0.12 ND ND -- ND ND 0.047 0.029 ND 0.043Standard Deviation (mmoles) 2.7E-04 2.3E-04 0.0E+00 0.0E+00 -- 0.0E+00 0.0E+00 1.4E-04 6.1E-05 0.0E+00 1.2E-04
Average Total mmoles 0.0043 0.00025 ND ND 4.6E-03 ND ND 0.00008 0.000071 ND 0.0020ZVI Amended/KB-1® Plus Bioaugmented 27-Mar-14 -1 Spiked with TCE and CTC to target concentrations of 2 mg/L each.
(Intermediate) 28-Mar-14 0 Amended the first replicate with 100 uL of resazurin.Amended with 1 g of ZVI to target a final concentration of 5 g/L.Amended with 2 mL of a vitamin/mineral solution.
ZVI (Intermediate)-1 3.1 <0.020 <0.020 <0.020 -- <0.020 1.5 0.038 <0.020 <0.020 0.074ZVI (Intermediate)-2 3.3 <0.020 <0.020 <0.020 -- <0.020 1.5 0.04 <0.020 <0.020 0.047ZVI (Intermediate)-3 3.1 <0.020 <0.020 <0.020 -- <0.020 1.4 0.037 <0.020 <0.020 0.049
Average Concentration (mg/L) 3.2 ND ND ND -- ND 1.5 0.038 ND ND 0.056Standard Deviation (mmoles) 1.7E-04 0.0E+00 0.0E+00 0.0E+00 -- 0.0E+00 5.3E-05 2.2E-06 0.0E+00 0.0E+00 7.1E-04
Average Total mmoles 0.0051 ND ND ND 5.1E-03 ND 0.0021 0.000065 ND ND 0.002604-Apr-14 7 ZVI (Intermediate)-1 2.5 <0.020 <0.020 0.032 -- 0.022 <0.020 <0.020 <0.020 <0.020 0.074
ZVI (Intermediate)-2 1.9 <0.020 <0.020 0.082 -- 0.12 <0.020 <0.020 <0.020 <0.020 <0.020ZVI (Intermediate)-3 2.4 <0.020 <0.020 0.032 -- 0.041 <0.020 <0.020 <0.020 <0.020 0.092
Average Concentration (mg/L) 2.3 ND ND 0.049 -- 0.062 ND ND ND ND 0.056Standard Deviation (mmoles) 4.8E-04 0.0E+00 0.0E+00 3.8E-04 -- 1.1E-03 0.0E+00 0.0E+00 0.0E+00 0.0E+00 2.3E-03
Average Total mmoles 0.0036 ND ND 0.00064 4.2E-03 0.0012 ND ND ND ND 0.002617-Apr-14 20 ZVI (Intermediate)-1 0.65 0.057 <0.020 0.052 -- 0.025 <0.020 <0.020 <0.020 <0.020 0.066
ZVI (Intermediate)-2 0.37 0.048 <0.020 0.075 -- 0.062 <0.020 <0.020 <0.020 <0.020 0.088ZVI (Intermediate)-3 0.41 0.063 <0.020 0.059 -- 0.04 <0.020 <0.020 <0.020 <0.020 0.079
Average Concentration (mg/L) 0.48 0.056 ND 0.062 -- 0.042 ND ND ND ND 0.078Standard Deviation (mmoles) 2.4E-04 1.6E-05 0.0E+00 1.6E-04 -- 3.6E-04 0.0E+00 0.0E+00 0.0E+00 0.0E+00 5.2E-04
Average Total mmoles 0.00076 0.00012 ND 0.00081 1.7E-03 0.00083 ND ND ND ND 0.0036Spiked with CTC to target concentrations of 2 mg/L.
25-Apr-14 28 ZVI (Intermediate)-1 0.11 0.064 <0.020 0.049 -- 0.024 <0.020 <0.020 0.28 0.037 0.072ZVI (Intermediate)-2 0.042 0.047 <0.020 0.072 -- 0.058 <0.020 <0.020 0.33 0.028 0.095ZVI (Intermediate)-3 0.041 0.07 <0.020 0.055 -- 0.036 <0.020 <0.020 0.33 0.028 0.082
Average Concentration (mg/L) 0.064 0.06 ND 0.059 -- 0.039 ND ND 0.31 0.031 0.083Standard Deviation (mmoles) 6.2E-05 2.6E-05 0.0E+00 1.6E-04 -- 3.5E-04 0.0E+00 0.0E+00 8.2E-05 2.1E-05 5.3E-04
Average Total mmoles 0.00010 0.00013 ND 0.00077 1.0E-03 0.00078 ND ND 0.00077 0.00012 0.0038Bioaugmented with KB-1® Plus (CF formulation).
09-May-14 42 ZVI (Intermediate)-1 <0.020 <0.020 <0.020 0.06 -- 0.038 <0.020 <0.020 0.25 0.031 0.13ZVI (Intermediate)-2 <0.020 0.028 <0.020 0.073 -- 0.042 <0.020 <0.020 0.24 <0.020 0.11ZVI (Intermediate)-3 <0.020 0.058 <0.020 0.056 -- 0.037 <0.020 <0.020 0.29 0.021 0.081
Average Concentration (mg/L) ND 0.029 ND 0.063 -- 0.039 ND ND 0.26 0.017 0.11Standard Deviation (mmoles) 0.0E+00 6.2E-05 0.0E+00 1.1E-04 -- 5.5E-05 0.0E+00 0.0E+00 6.4E-05 6.3E-05 1.0E-03
Average Total mmoles ND 0.000061 ND 0.00083 8.9E-04 0.00078 ND ND 0.00063 0.000069 0.0049
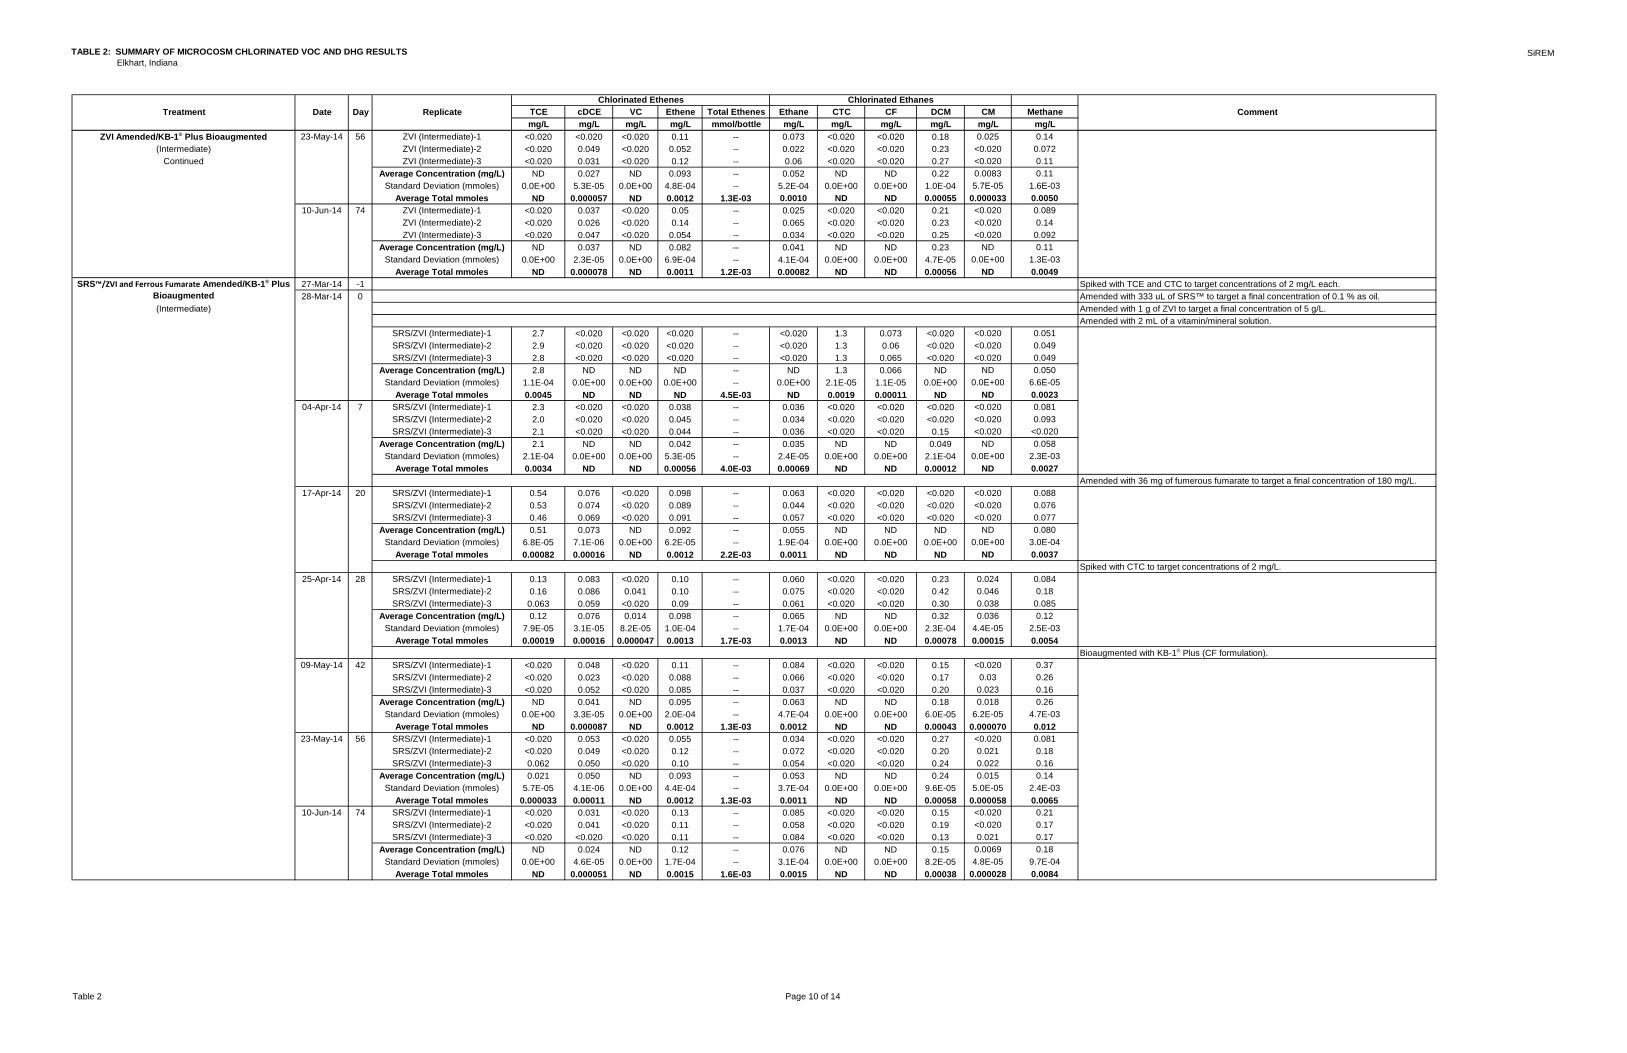
TABLE 2: SUMMARY OF MICROCOSM CHLORINATED VOC AND DHG RESULTS Elkhart, Indiana
SiREM
Table 2 Page 10 of 14
TCE cDCE VC Ethene Total Ethenes Ethane CTC CF DCM CM Methanemg/L mg/L mg/L mg/L mmol/bottle mg/L mg/L mg/L mg/L mg/L mg/L
Chlorinated EthanesCommentTreatment Date Day Replicate
Chlorinated Ethenes
ZVI Amended/KB-1® Plus Bioaugmented 23-May-14 56 ZVI (Intermediate)-1 <0.020 <0.020 <0.020 0.11 -- 0.073 <0.020 <0.020 0.18 0.025 0.14(Intermediate) ZVI (Intermediate)-2 <0.020 0.049 <0.020 0.052 -- 0.022 <0.020 <0.020 0.23 <0.020 0.072
Continued ZVI (Intermediate)-3 <0.020 0.031 <0.020 0.12 -- 0.06 <0.020 <0.020 0.27 <0.020 0.11Average Concentration (mg/L) ND 0.027 ND 0.093 -- 0.052 ND ND 0.22 0.0083 0.11
Standard Deviation (mmoles) 0.0E+00 5.3E-05 0.0E+00 4.8E-04 -- 5.2E-04 0.0E+00 0.0E+00 1.0E-04 5.7E-05 1.6E-03Average Total mmoles ND 0.000057 ND 0.0012 1.3E-03 0.0010 ND ND 0.00055 0.000033 0.0050
10-Jun-14 74 ZVI (Intermediate)-1 <0.020 0.037 <0.020 0.05 -- 0.025 <0.020 <0.020 0.21 <0.020 0.089ZVI (Intermediate)-2 <0.020 0.026 <0.020 0.14 -- 0.065 <0.020 <0.020 0.23 <0.020 0.14ZVI (Intermediate)-3 <0.020 0.047 <0.020 0.054 -- 0.034 <0.020 <0.020 0.25 <0.020 0.092
Average Concentration (mg/L) ND 0.037 ND 0.082 -- 0.041 ND ND 0.23 ND 0.11Standard Deviation (mmoles) 0.0E+00 2.3E-05 0.0E+00 6.9E-04 -- 4.1E-04 0.0E+00 0.0E+00 4.7E-05 0.0E+00 1.3E-03
Average Total mmoles ND 0.000078 ND 0.0011 1.2E-03 0.00082 ND ND 0.00056 ND 0.004927-Mar-14 -1 Spiked with TCE and CTC to target concentrations of 2 mg/L each.28-Mar-14 0 Amended with 333 uL of SRS™ to target a final concentration of 0.1 % as oil.
(Intermediate) Amended with 1 g of ZVI to target a final concentration of 5 g/L.Amended with 2 mL of a vitamin/mineral solution.
SRS/ZVI (Intermediate)-1 2.7 <0.020 <0.020 <0.020 -- <0.020 1.3 0.073 <0.020 <0.020 0.051SRS/ZVI (Intermediate)-2 2.9 <0.020 <0.020 <0.020 -- <0.020 1.3 0.06 <0.020 <0.020 0.049SRS/ZVI (Intermediate)-3 2.8 <0.020 <0.020 <0.020 -- <0.020 1.3 0.065 <0.020 <0.020 0.049
Average Concentration (mg/L) 2.8 ND ND ND -- ND 1.3 0.066 ND ND 0.050Standard Deviation (mmoles) 1.1E-04 0.0E+00 0.0E+00 0.0E+00 -- 0.0E+00 2.1E-05 1.1E-05 0.0E+00 0.0E+00 6.6E-05
Average Total mmoles 0.0045 ND ND ND 4.5E-03 ND 0.0019 0.00011 ND ND 0.002304-Apr-14 7 SRS/ZVI (Intermediate)-1 2.3 <0.020 <0.020 0.038 -- 0.036 <0.020 <0.020 <0.020 <0.020 0.081
SRS/ZVI (Intermediate)-2 2.0 <0.020 <0.020 0.045 -- 0.034 <0.020 <0.020 <0.020 <0.020 0.093SRS/ZVI (Intermediate)-3 2.1 <0.020 <0.020 0.044 -- 0.036 <0.020 <0.020 0.15 <0.020 <0.020
Average Concentration (mg/L) 2.1 ND ND 0.042 -- 0.035 ND ND 0.049 ND 0.058Standard Deviation (mmoles) 2.1E-04 0.0E+00 0.0E+00 5.3E-05 -- 2.4E-05 0.0E+00 0.0E+00 2.1E-04 0.0E+00 2.3E-03
Average Total mmoles 0.0034 ND ND 0.00056 4.0E-03 0.00069 ND ND 0.00012 ND 0.0027Amended with 36 mg of fumerous fumarate to target a final concentration of 180 mg/L.
17-Apr-14 20 SRS/ZVI (Intermediate)-1 0.54 0.076 <0.020 0.098 -- 0.063 <0.020 <0.020 <0.020 <0.020 0.088SRS/ZVI (Intermediate)-2 0.53 0.074 <0.020 0.089 -- 0.044 <0.020 <0.020 <0.020 <0.020 0.076SRS/ZVI (Intermediate)-3 0.46 0.069 <0.020 0.091 -- 0.057 <0.020 <0.020 <0.020 <0.020 0.077
Average Concentration (mg/L) 0.51 0.073 ND 0.092 -- 0.055 ND ND ND ND 0.080Standard Deviation (mmoles) 6.8E-05 7.1E-06 0.0E+00 6.2E-05 -- 1.9E-04 0.0E+00 0.0E+00 0.0E+00 0.0E+00 3.0E-04
Average Total mmoles 0.00082 0.00016 ND 0.0012 2.2E-03 0.0011 ND ND ND ND 0.0037Spiked with CTC to target concentrations of 2 mg/L.
25-Apr-14 28 SRS/ZVI (Intermediate)-1 0.13 0.083 <0.020 0.10 -- 0.060 <0.020 <0.020 0.23 0.024 0.084SRS/ZVI (Intermediate)-2 0.16 0.086 0.041 0.10 -- 0.075 <0.020 <0.020 0.42 0.046 0.18SRS/ZVI (Intermediate)-3 0.063 0.059 <0.020 0.09 -- 0.061 <0.020 <0.020 0.30 0.038 0.085
Average Concentration (mg/L) 0.12 0.076 0.014 0.098 -- 0.065 ND ND 0.32 0.036 0.12Standard Deviation (mmoles) 7.9E-05 3.1E-05 8.2E-05 1.0E-04 -- 1.7E-04 0.0E+00 0.0E+00 2.3E-04 4.4E-05 2.5E-03
Average Total mmoles 0.00019 0.00016 0.000047 0.0013 1.7E-03 0.0013 ND ND 0.00078 0.00015 0.0054Bioaugmented with KB-1® Plus (CF formulation).
09-May-14 42 SRS/ZVI (Intermediate)-1 <0.020 0.048 <0.020 0.11 -- 0.084 <0.020 <0.020 0.15 <0.020 0.37SRS/ZVI (Intermediate)-2 <0.020 0.023 <0.020 0.088 -- 0.066 <0.020 <0.020 0.17 0.03 0.26SRS/ZVI (Intermediate)-3 <0.020 0.052 <0.020 0.085 -- 0.037 <0.020 <0.020 0.20 0.023 0.16
Average Concentration (mg/L) ND 0.041 ND 0.095 -- 0.063 ND ND 0.18 0.018 0.26Standard Deviation (mmoles) 0.0E+00 3.3E-05 0.0E+00 2.0E-04 -- 4.7E-04 0.0E+00 0.0E+00 6.0E-05 6.2E-05 4.7E-03
Average Total mmoles ND 0.000087 ND 0.0012 1.3E-03 0.0012 ND ND 0.00043 0.000070 0.01223-May-14 56 SRS/ZVI (Intermediate)-1 <0.020 0.053 <0.020 0.055 -- 0.034 <0.020 <0.020 0.27 <0.020 0.081
SRS/ZVI (Intermediate)-2 <0.020 0.049 <0.020 0.12 -- 0.072 <0.020 <0.020 0.20 0.021 0.18SRS/ZVI (Intermediate)-3 0.062 0.050 <0.020 0.10 -- 0.054 <0.020 <0.020 0.24 0.022 0.16
Average Concentration (mg/L) 0.021 0.050 ND 0.093 -- 0.053 ND ND 0.24 0.015 0.14Standard Deviation (mmoles) 5.7E-05 4.1E-06 0.0E+00 4.4E-04 -- 3.7E-04 0.0E+00 0.0E+00 9.6E-05 5.0E-05 2.4E-03
Average Total mmoles 0.000033 0.00011 ND 0.0012 1.3E-03 0.0011 ND ND 0.00058 0.000058 0.006510-Jun-14 74 SRS/ZVI (Intermediate)-1 <0.020 0.031 <0.020 0.13 -- 0.085 <0.020 <0.020 0.15 <0.020 0.21
SRS/ZVI (Intermediate)-2 <0.020 0.041 <0.020 0.11 -- 0.058 <0.020 <0.020 0.19 <0.020 0.17SRS/ZVI (Intermediate)-3 <0.020 <0.020 <0.020 0.11 -- 0.084 <0.020 <0.020 0.13 0.021 0.17
Average Concentration (mg/L) ND 0.024 ND 0.12 -- 0.076 ND ND 0.15 0.0069 0.18Standard Deviation (mmoles) 0.0E+00 4.6E-05 0.0E+00 1.7E-04 -- 3.1E-04 0.0E+00 0.0E+00 8.2E-05 4.8E-05 9.7E-04
Average Total mmoles ND 0.000051 ND 0.0015 1.6E-03 0.0015 ND ND 0.00038 0.000028 0.0084
SRS™/ZVI and Ferrous Fumarate Amended/KB-1® Plus Bioaugmented

TABLE 2: SUMMARY OF MICROCOSM CHLORINATED VOC AND DHG RESULTS Elkhart, Indiana
SiREM
Table 2 Page 11 of 14
TCE cDCE VC Ethene Total Ethenes Ethane CTC CF DCM CM Methanemg/L mg/L mg/L mg/L mmol/bottle mg/L mg/L mg/L mg/L mg/L mg/L
Chlorinated EthanesCommentTreatment Date Day Replicate
Chlorinated Ethenes
27-Mar-14 -1 Spiked with TCE and CTC to target concentrations of 2 mg/L each.28-Mar-14 0 Amended with 36 mg of fumerous fumarate to target a final concentration of 180 mg/L.
(Intermediate) Amended the first replicate with 100 uL of resazurin.Amended with 2 mL of a vitamin/mineral solution.Amended with 333 uL of SRS™ to target a final concentration of 0.1 % as oil.
SRS/solFe (Intermediate)-1 2.8 <0.020 <0.020 <0.020 -- <0.020 1.2 0.085 <0.020 <0.020 0.043SRS/solFe (Intermediate)-2 2.9 <0.020 <0.020 <0.020 -- <0.020 1.3 0.059 <0.020 <0.020 0.042SRS/solFe (Intermediate)-3 2.9 <0.020 <0.020 <0.020 -- <0.020 1.4 0.057 <0.020 <0.020 0.044
Average Concentration (mg/L) 2.9 ND ND ND -- ND 1.3 0.067 ND ND 0.043Standard Deviation (mmoles) 1.5E-04 0.0E+00 0.0E+00 0.0E+00 -- 0.0E+00 9.3E-05 2.6E-05 0.0E+00 0.0E+00 3.9E-05
Average Total mmoles 0.0046 ND ND ND 4.6E-03 ND 0.0018 0.00011 ND ND 0.002004-Apr-14 7 SRS/solFe (Intermediate)-1 2.3 0.022 <0.020 <0.020 -- <0.020 <0.020 0.49 <0.020 <0.020 0.042
SRS/solFe (Intermediate)-2 2.4 <0.020 <0.020 <0.020 -- <0.020 <0.020 0.54 <0.020 <0.020 0.043SRS/solFe (Intermediate)-3 2.7 <0.020 <0.020 <0.020 -- <0.020 <0.020 0.63 <0.020 <0.020 0.041
Average Concentration (mg/L) 2.5 0.0074 ND ND -- ND ND 0.55 ND ND 0.042Standard Deviation (mmoles) 3.2E-04 2.7E-05 0.0E+00 0.0E+00 -- 0.0E+00 0.0E+00 1.2E-04 0.0E+00 0.0E+00 3.7E-05
Average Total mmoles 0.0039 0.000016 ND ND 3.9E-03 ND ND 0.00094 ND ND 0.002017-Apr-14 20 SRS/solFe (Intermediate)-1 2.3 <0.020 <0.020 <0.020 -- <0.020 <0.020 0.11 <0.020 <0.020 0.044
SRS/solFe (Intermediate)-2 2.4 <0.020 <0.020 <0.020 -- <0.020 <0.020 0.13 <0.020 <0.020 0.044SRS/solFe (Intermediate)-3 2.3 <0.020 <0.020 <0.020 -- <0.020 <0.020 0.097 <0.020 <0.020 0.044
Average Concentration (mg/L) 2.3 ND ND ND -- ND ND 0.11 ND ND 0.044Standard Deviation (mmoles) 8.5E-05 0.0E+00 0.0E+00 0.0E+00 -- 0.0E+00 0.0E+00 2.4E-05 0.0E+00 0.0E+00 1.3E-05
Average Total mmoles 0.0037 ND ND ND 3.7E-03 ND ND 0.00019 ND ND 0.0020Spiked with CTC to target concentrations of 2 mg/L.
25-Apr-14 28 SRS/solFe (Intermediate)-1 2.2 <0.020 <0.020 <0.020 -- <0.020 <0.020 0.51 0.16 <0.020 0.042SRS/solFe (Intermediate)-2 2.4 <0.020 <0.020 <0.020 -- <0.020 <0.020 0.67 0.13 <0.020 0.043SRS/solFe (Intermediate)-3 2.3 <0.020 <0.020 <0.020 -- <0.020 <0.020 0.32 0.17 0.031 0.041
Average Concentration (mg/L) 2.3 ND ND ND -- ND ND 0.50 0.15 0.010 0.042Standard Deviation (mmoles) 1.5E-04 0.0E+00 0.0E+00 0.0E+00 -- 0.0E+00 0.0E+00 3.0E-04 4.9E-05 7.2E-05 4.4E-05
Average Total mmoles 0.0037 ND ND ND 3.7E-03 ND ND 0.00084 0.00037 0.000041 0.0019Bioaugmented with KB-1® Plus (CF formulation).
09-May-14 42 SRS/solFe (Intermediate)-1 1.5 0.25 0.028 <0.020 -- <0.020 <0.020 0.031 0.042 <0.020 0.73SRS/solFe (Intermediate)-2 1.5 0.22 0.026 <0.020 -- <0.020 <0.020 0.023 0.055 <0.020 0.83SRS/solFe (Intermediate)-3 1.6 0.16 <0.020 <0.020 -- <0.020 <0.020 0.024 0.18 0.021 0.33
Average Concentration (mg/L) 1.5 0.21 0.018 ND -- ND ND 0.026 0.091 0.0070 0.63Standard Deviation (mmoles) 7.4E-05 9.0E-05 5.4E-05 0.0E+00 -- 0.0E+00 0.0E+00 7.7E-06 1.8E-04 4.9E-05 1.2E-02
Average Total mmoles 0.0025 0.00045 0.000063 ND 3.0E-03 ND ND 0.000045 0.00022 0.000028 0.02923-May-14 56 SRS/solFe (Intermediate)-1 <0.020 <0.020 <0.020 0.22 -- <0.020 <0.020 <0.020 <0.020 <0.020 2.7
SRS/solFe (Intermediate)-2 <0.020 <0.020 <0.020 0.24 -- <0.020 <0.020 <0.020 <0.020 <0.020 1.6SRS/solFe (Intermediate)-3 <0.020 <0.020 0.29 0.21 -- <0.020 <0.020 <0.020 0.096 <0.020 1.7
Average Concentration (mg/L) ND ND 0.096 0.22 -- ND ND ND 0.032 ND 2.0Standard Deviation (mmoles) 0.0E+00 0.0E+00 5.8E-04 2.0E-04 -- 0.0E+00 0.0E+00 0.0E+00 1.4E-04 0.0E+00 2.7E-02
Average Total mmoles ND ND 0.00034 0.003 3.3E-03 ND ND ND 0.000078 ND 0.09210-Jun-14 74 SRS/solFe (Intermediate)-1 <0.020 <0.020 <0.020 0.20 -- <0.020 <0.020 <0.020 <0.020 <0.020 7.8
SRS/solFe (Intermediate)-2 <0.020 <0.020 <0.020 0.24 -- <0.020 <0.020 <0.020 <0.020 <0.020 5.9SRS/solFe (Intermediate)-3 <0.020 0.021 <0.020 0.23 -- <0.020 <0.020 <0.020 <0.020 <0.020 7.0
Average Concentration (mg/L) ND 0.0071 ND 0.22 -- ND ND ND ND ND 6.9Standard Deviation (mmoles) 0.0E+00 2.6E-05 0.0E+00 2.2E-04 -- 0.0E+00 0.0E+00 0.0E+00 0.0E+00 0.0E+00 4.4E-02
Average Total mmoles ND 0.000015 ND 0.0029 2.9E-03 ND ND ND ND ND 0.32SRS™ Amended/KB-1® Plus Bioaugmented 27-Mar-14 -1 Spiked with TCE and CTC to target concentrations of 2 mg/L each.
(Intermediate) 28-Mar-14 0 Amended with 333 uL of SRS™ to target a final concentration of 0.1 % as oil.Amended the first replicate with 100 uL of resazurin.Amended with 2 mL of a vitamin/mineral solution.
SRS (Int)-1 3.0 <0.020 <0.020 <0.020 -- <0.020 1.4 0.064 <0.020 <0.020 0.042SRS (Int)-2 2.9 <0.020 <0.020 <0.020 -- <0.020 1.4 0.058 <0.020 <0.020 0.042SRS (Int)-3 3.0 <0.020 <0.020 <0.020 -- <0.020 1.5 0.064 <0.020 <0.020 0.043
Average Concentration (mg/L) 2.9 ND ND ND -- ND 1.4 0.062 ND ND 0.042Standard Deviation (mmoles) 1.2E-04 0.0E+00 0.0E+00 0.0E+00 -- 0.0E+00 7.4E-05 6.3E-06 0.0E+00 0.0E+00 2.6E-05
Average Total mmoles 0.0047 ND ND ND 4.7E-03 ND 0.0020 0.00011 ND ND 0.0020
SRS™ and Ferrous Fumarate Amended/KB-1® Plus Bioaugmented

TABLE 2: SUMMARY OF MICROCOSM CHLORINATED VOC AND DHG RESULTS Elkhart, Indiana
SiREM
Table 2 Page 12 of 14
TCE cDCE VC Ethene Total Ethenes Ethane CTC CF DCM CM Methanemg/L mg/L mg/L mg/L mmol/bottle mg/L mg/L mg/L mg/L mg/L mg/L
Chlorinated EthanesCommentTreatment Date Day Replicate
Chlorinated Ethenes
SRS™ Amended/KB-1® Plus Bioaugmented 04-Apr-14 7 SRS (Intermediate)-1 2.7 <0.020 <0.020 <0.020 -- <0.020 <0.020 0.74 <0.020 <0.020 0.043(Intermediate) SRS (Intermediate)-2 2.8 <0.020 <0.020 <0.020 -- <0.020 <0.020 0.67 <0.020 <0.020 0.042
Continued SRS (Intermediate)-3 2.7 <0.020 <0.020 <0.020 -- <0.020 <0.020 0.79 <0.020 <0.020 0.042Average Concentration (mg/L) 2.7 ND ND ND -- ND ND 0.73 ND ND 0.042
Standard Deviation (mmoles) 1.0E-04 0.0E+00 0.0E+00 0.0E+00 -- 0.0E+00 0.0E+00 1.1E-04 0.0E+00 0.0E+00 3.8E-05Average Total mmoles 0.0044 ND ND ND 4.4E-03 ND ND 0.0012 ND ND 0.0020
17-Apr-14 20 SRS (Intermediate)-1 2.5 0.024 <0.020 <0.020 -- <0.020 <0.020 0.31 <0.020 <0.020 0.043SRS (Intermediate)-2 2.5 <0.020 <0.020 <0.020 -- <0.020 <0.020 0.19 <0.020 <0.020 0.043SRS (Intermediate)-3 2.4 <0.020 <0.020 <0.020 -- <0.020 <0.020 <0.020 <0.020 <0.020 0.043
Average Concentration (mg/L) 2.5 0.0079 ND ND -- ND ND 0.17 ND ND 0.043Standard Deviation (mmoles) 2.2E-05 2.9E-05 0.0E+00 0.0E+00 -- 0.0E+00 0.0E+00 2.7E-04 0.0E+00 0.0E+00 1.7E-05
Average Total mmoles 0.0039 0.000017 ND ND 3.9E-03 ND ND 0.00028 ND ND 0.0020Spiked with CTC to target concentrations of 2 mg/L.
25-Apr-14 28 SRS (Intermediate)-1 1.5 0.98 <0.020 <0.020 -- <0.020 <0.020 0.20 0.3 <0.020 0.041SRS (Intermediate)-2 2.3 <0.020 <0.020 <0.020 -- <0.020 <0.020 0.42 0.22 0.026 0.041SRS (Intermediate)-3 2.3 <0.020 <0.020 <0.020 -- <0.020 <0.020 0.36 0.21 <0.020 0.041
Average Concentration (mg/L) 2.0 0.33 ND ND -- ND ND 0.33 0.24 0.0088 0.041Standard Deviation (mmoles) 7.3E-04 1.2E-03 0.0E+00 0.0E+00 -- 0.0E+00 0.0E+00 1.9E-04 1.2E-04 6.1E-05 2.2E-05
Average Total mmoles 0.0032 0.00070 ND ND 3.9E-03 ND ND 0.00055 0.00059 0.000035 0.0019Bioaugmented with KB-1® Plus (CF formulation).
09-May-14 42 SRS (Intermediate)-1 <0.020 0.70 0.39 0.075 -- <0.020 <0.020 <0.020 0.24 0.029 0.59SRS (Intermediate)-2 0.42 1.3 0.042 <0.020 -- <0.020 <0.020 <0.020 0.27 0.022 0.91SRS (Intermediate)-3 1.8 0.032 <0.020 <0.020 -- <0.020 <0.020 <0.020 0.16 <0.020 0.20
Average Concentration (mg/L) 0.73 0.69 0.14 0.025 -- ND ND ND 0.22 0.017 0.57Standard Deviation (mmoles) 1.5E-03 1.4E-03 7.5E-04 5.7E-04 -- 0.0E+00 0.0E+00 0.0E+00 1.4E-04 6.0E-05 1.6E-02
Average Total mmoles 0.0012 0.0015 0.00050 0.00033 3.5E-03 ND ND ND 0.00055 0.000068 0.02623-May-14 56 SRS (Intermediate)-1 <0.020 <0.020 <0.020 0.25 -- <0.020 <0.020 <0.020 0.31 <0.020 2.4
SRS (Intermediate)-2 <0.020 0.031 0.41 0.22 -- <0.020 <0.020 <0.020 0.34 <0.020 5.4SRS (Intermediate)-3 1.3 0.5 0.26 <0.020 -- <0.020 <0.020 <0.020 0.22 0.021 0.39
Average Concentration (mg/L) 0.44 0.18 0.22 0.16 -- ND ND ND 0.29 0.0070 2.7Standard Deviation (mmoles) 1.2E-03 5.9E-04 7.3E-04 1.8E-03 -- 0.0E+00 0.0E+00 0.0E+00 1.5E-04 4.9E-05 1.2E-01
Average Total mmoles 0.00070 0.00037 0.00079 0.0021 4.0E-03 ND ND ND 0.00070 0.000028 0.1310-Jun-14 74 SRS (Intermediate)-1 <0.020 0.025 <0.020 0.27 -- <0.020 <0.020 <0.020 <0.020 <0.020 6.9
SRS (Intermediate)-2 <0.020 <0.020 <0.020 0.23 -- <0.020 <0.020 <0.020 <0.020 <0.020 11SRS (Intermediate)-3 <0.020 0.11 <0.020 0.28 -- <0.020 <0.020 <0.020 <0.020 <0.020 0.8
Average Concentration (mg/L) ND 0.044 ND 0.26 -- ND ND ND ND ND 6.1Standard Deviation (mmoles) 0.0E+00 1.2E-04 0.0E+00 2.9E-04 -- 0.0E+00 0.0E+00 0.0E+00 0.0E+00 0.0E+00 2.3E-01
Average Total mmoles ND 0.000093 ND 0.0034 3.5E-03 ND ND ND ND ND 0.28EHC®-L Amended/KB-1® Plus Bioaugmented 27-Mar-14 -1 Spiked with TCE and CTC to target concentrations of 2 mg/L each.
(Intermediate) 28-Mar-14 0 Amended with 1.37 mL of EHC®
-L to target a final concentration of 1 g/L.Amended the first replicate with 100 uL of resazurin.Amended with 2 mL of a vitamin/mineral solution.
EHC(Intermediate)-1 3.1 <0.020 <0.020 <0.020 -- <0.020 1.4 0.073 <0.020 <0.020 0.042EHC(Intermediate)-2 3.1 <0.020 <0.020 <0.020 -- <0.020 1.4 0.055 <0.020 <0.020 0.042EHC(Intermediate)-3 3.1 <0.020 <0.020 <0.020 -- <0.020 1.5 0.062 <0.020 <0.020 0.044
Average Concentration (mg/L) 3.1 ND ND ND -- ND 1.4 0.063 ND ND 0.043Standard Deviation (mmoles) 7.2E-05 0.0E+00 0.0E+00 0.0E+00 -- 0.0E+00 1.3E-05 1.6E-05 0.0E+00 0.0E+00 4.6E-05
Average Total mmoles 0.0049 ND ND ND 4.9E-03 ND 0.0020 0.00011 ND ND 0.002004-Apr-14 7 EHC(Intermediate)-1 2.7 <0.020 <0.020 <0.020 -- <0.020 <0.020 0.63 <0.020 <0.020 0.036
EHC(Intermediate)-2 2.8 <0.020 <0.020 <0.020 -- <0.020 <0.020 0.61 <0.020 <0.020 0.040EHC(Intermediate)-3 2.9 <0.020 <0.020 <0.020 -- <0.020 <0.020 0.63 <0.020 <0.020 0.041
Average Concentration (mg/L) 2.8 ND ND ND -- ND ND 0.62 ND ND 0.039Standard Deviation (mmoles) 1.0E-04 0.0E+00 0.0E+00 0.0E+00 -- 0.0E+00 0.0E+00 2.2E-05 0.0E+00 0.0E+00 1.3E-04
Average Total mmoles 0.0045 ND ND ND 4.5E-03 ND ND 0.0011 ND ND 0.001817-Apr-14 20 EHC(Intermediate)-1 2.9 <0.020 <0.020 <0.020 -- <0.020 <0.020 0.25 <0.020 <0.020 0.043
EHC(Intermediate)-2 2.7 <0.020 <0.020 <0.020 -- <0.020 <0.020 0.25 <0.020 <0.020 0.041EHC(Intermediate)-3 0.48 2.0 <0.020 <0.020 -- <0.020 <0.020 0.15 <0.020 <0.020 0.043
Average Concentration (mg/L) 2.0 0.68 ND ND -- ND ND 0.22 ND ND 0.042Standard Deviation (mmoles) 2.1E-03 2.5E-03 0.0E+00 0.0E+00 -- 0.0E+00 0.0E+00 9.6E-05 0.0E+00 0.0E+00 4.0E-05
Average Total mmoles 0.0032 0.0014 ND ND 4.6E-03 ND ND 0.00037 ND ND 0.0020Spiked with CTC to target concentrations of 2 mg/L.

TABLE 2: SUMMARY OF MICROCOSM CHLORINATED VOC AND DHG RESULTS Elkhart, Indiana
SiREM
Table 2 Page 13 of 14
TCE cDCE VC Ethene Total Ethenes Ethane CTC CF DCM CM Methanemg/L mg/L mg/L mg/L mmol/bottle mg/L mg/L mg/L mg/L mg/L mg/L
Chlorinated EthanesCommentTreatment Date Day Replicate
Chlorinated Ethenes
EHC®-L Amended/KB-1® Plus Bioaugmented 25-Apr-14 28 EHC(Intermediate)-1 2.8 <0.020 <0.020 <0.020 -- <0.020 <0.020 0.23 0.12 0.041 0.042(Intermediate) EHC(Intermediate)-2 2.6 <0.020 <0.020 <0.020 -- <0.020 <0.020 0.26 0.14 <0.020 0.042
Continued EHC(Intermediate)-3 0.25 2.4 <0.020 <0.020 -- <0.020 <0.020 0.13 0.16 0.024 0.042Average Concentration (mg/L) 1.9 0.79 ND ND -- ND ND 0.21 0.14 0.022 0.042
Standard Deviation (mmoles) 2.3E-03 2.9E-03 0.0E+00 0.0E+00 -- 0.0E+00 0.0E+00 1.2E-04 4.6E-05 8.3E-05 1.2E-05Average Total mmoles 0.0030 0.0017 ND ND 4.7E-03 ND ND 0.00035 0.00033 0.000087 0.0019
Bioaugmented with KB-1® Plus (CF formulation).09-May-14 42 EHC(Intermediate)-1 1.3 0.46 0.099 <0.020 -- <0.020 <0.020 <0.020 0.051 <0.020 1.3
EHC(Intermediate)-2 <0.020 <0.020 <0.020 0.24 -- <0.020 <0.020 <0.020 0.084 <0.020 1.4EHC(Intermediate)-3 <0.020 <0.020 <0.020 0.24 -- <0.020 <0.020 <0.020 <0.020 <0.020 1.4
Average Concentration (mg/L) 0.45 0.15 0.033 0.16 -- ND ND ND 0.045 ND 1.4Standard Deviation (mmoles) 1.2E-03 5.7E-04 2.0E-04 1.8E-03 -- 0.0E+00 0.0E+00 0.0E+00 1.0E-04 0.0E+00 1.0E-03
Average Total mmoles 0.00072 0.00033 0.00012 0.0021 3.3E-03 ND ND ND 0.00011 ND 0.06323-May-14 56 EHC(Intermediate)-1 0.064 <0.020 <0.020 0.21 -- <0.020 <0.020 <0.020 <0.020 <0.020 2.4
EHC(Intermediate)-2 <0.020 <0.020 <0.020 0.23 -- <0.020 <0.020 <0.020 0.12 <0.020 1.5EHC(Intermediate)-3 <0.020 <0.020 <0.020 0.29 -- <0.020 <0.020 <0.020 <0.020 <0.020 1.8
Average Concentration (mg/L) 0.021 ND ND 0.24 -- ND ND ND 0.040 ND 1.9Standard Deviation (mmoles) 5.9E-05 0.0E+00 0.0E+00 5.6E-04 -- 0.0E+00 0.0E+00 0.0E+00 1.7E-04 0.0E+00 2.1E-02
Average Total mmoles 0.000034 ND ND 0.0032 3.2E-03 ND ND ND 0.000099 ND 0.08710-Jun-14 74 EHC(Intermediate)-1 <0.020 <0.020 <0.020 0.21 -- <0.020 <0.020 <0.020 <0.020 <0.020 5.7
EHC(Intermediate)-2 0.024 <0.020 <0.020 0.26 -- <0.020 <0.020 <0.020 <0.020 <0.020 5.5EHC(Intermediate)-3 0.075 <0.020 <0.020 0.28 -- <0.020 <0.020 <0.020 <0.020 <0.020 5.3
Average Concentration (mg/L) 0.033 ND ND 0.25 -- ND ND ND ND ND 5.5Standard Deviation (mmoles) 6.1E-05 0.0E+00 0.0E+00 4.7E-04 -- 0.0E+00 0.0E+00 0.0E+00 0.0E+00 0.0E+00 9.7E-03
Average Total mmoles 0.000053 ND ND 0.0033 3.4E-03 ND ND ND ND ND 0.2527-Mar-14 -1 Amended with 1.37 mL of EHC
®-L to target a final concentration of 1 g/L.
28-Mar-14 0 Spiked with TCE and CTC to target concentrations of 2 mg/L each.(Intermediate) Amended with 2 mL of a vitamin/mineral solution.
Amended the first replicate with 100 uL of resazurin.Amended with 1 g of ZVI to target a final concentration of 5 g/L.
EHC/ZVI (Intermediate)-1 2.9 <0.020 <0.020 0.04 -- <0.020 1.3 <0.020 <0.020 <0.020 0.061EHC/ZVI (Intermediate)-2 2.8 <0.020 <0.020 0.059 -- <0.020 1.4 0.056 <0.020 <0.020 0.076EHC/ZVI (Intermediate)-3 2.8 <0.020 <0.020 0.058 -- <0.020 1.1 0.18 <0.020 <0.020 0.070
Average Concentration (mg/L) 2.8 ND ND 0.052 -- ND 1.3 0.08 ND ND 0.069Standard Deviation (mmoles) 9.5E-05 0.0E+00 0.0E+00 1.4E-04 -- 0.0E+00 2.4E-04 1.6E-04 0.0E+00 0.0E+00 3.6E-04
Average Total mmoles 0.0045 ND ND 0.00069 5.2E-03 ND 0.0018 0.00014 ND ND 0.003204-Apr-14 7 EHC/ZVI (Intermediate)-1 2.3 0.031 <0.020 0.021 -- <0.020 <0.020 <0.020 <0.020 <0.020 0.052
EHC/ZVI (Intermediate)-2 2.5 0.026 <0.020 0.027 -- <0.020 <0.020 0.020 <0.020 <0.020 0.061EHC/ZVI (Intermediate)-3 2.3 0.025 <0.020 <0.020 -- <0.020 <0.020 <0.020 <0.020 <0.020 0.050
Average Concentration (mg/L) 2.3 0.027 ND 0.016 -- ND ND 0.0067 ND ND 0.054Standard Deviation (mmoles) 1.9E-04 6.9E-06 0.0E+00 1.9E-04 -- 0.0E+00 0.0E+00 2.0E-05 0.0E+00 0.0E+00 2.8E-04
Average Total mmoles 0.0038 0.000058 ND 0.00021 4.1E-03 ND ND 0.000011 ND ND 0.002517-Apr-14 20 EHC/ZVI (Intermediate)-1 0.50 0.087 <0.020 0.079 -- 0.031 <0.020 <0.020 <0.020 <0.020 0.067
EHC/ZVI (Intermediate)-2 0.72 0.072 <0.020 0.10 -- 0.054 <0.020 <0.020 <0.020 <0.020 0.11EHC/ZVI (Intermediate)-3 0.59 0.078 <0.020 0.079 -- 0.037 <0.020 <0.020 <0.020 <0.020 0.098
Average Concentration (mg/L) 0.60 0.079 ND 0.087 -- 0.041 ND ND ND ND 0.091Standard Deviation (mmoles) 1.8E-04 1.5E-05 0.0E+00 1.9E-04 -- 2.4E-04 0.0E+00 0.0E+00 0.0E+00 0.0E+00 1.0E-03
Average Total mmoles 0.00096 0.00017 ND 0.0011 2.2E-03 0.0008 ND ND ND ND 0.0042Spiked with CTC to target concentrations of 2 mg/L.
25-Apr-14 28 EHC/ZVI (Intermediate)-1 0.14 0.10 <0.020 0.085 -- 0.031 <0.020 <0.020 0.25 <0.020 0.063EHC/ZVI (Intermediate)-2 0.22 0.089 <0.020 0.12 -- 0.046 <0.020 <0.020 0.21 0.031 0.068EHC/ZVI (Intermediate)-3 0.14 0.088 <0.020 0.086 -- 0.034 <0.020 <0.020 0.23 0.020 0.070
Average Concentration (mg/L) 0.17 0.093 ND 0.096 -- 0.037 ND ND 0.23 0.017 0.067Standard Deviation (mmoles) 7.5E-05 1.8E-05 0.0E+00 2.4E-04 -- 1.6E-04 0.0E+00 0.0E+00 4.6E-05 6.4E-05 1.8E-04
Average Total mmoles 0.00027 0.00020 ND 0.0013 1.8E-03 0.00073 ND ND 0.00057 0.000069 0.0031Bioaugmented with KB-1® Plus (CF formulation).
09-May-14 42 EHC/ZVI (Intermediate)-1 <0.020 0.055 <0.020 0.076 -- 0.027 <0.020 <0.020 0.18 <0.020 0.83EHC/ZVI (Intermediate)-2 <0.020 0.056 <0.020 0.11 -- 0.036 <0.020 <0.020 0.14 0.021 0.43EHC/ZVI (Intermediate)-3 <0.020 0.047 <0.020 0.077 -- 0.026 <0.020 <0.020 0.15 <0.020 0.73
Average Concentration (mg/L) ND 0.052 ND 0.086 -- 0.03 ND ND 0.16 0.0072 0.66Standard Deviation (mmoles) 0.0E+00 1.1E-05 0.0E+00 2.2E-04 -- 1.1E-04 0.0E+00 0.0E+00 5.2E-05 5.0E-05 9.6E-03
Average Total mmoles ND 0.00011 ND 0.0011 1.2E-03 0.00059 ND ND 0.00038 0.000029 0.031
EHC®-L and ZVI Amended/KB-1® Plus Bioaugmented

TABLE 2: SUMMARY OF MICROCOSM CHLORINATED VOC AND DHG RESULTS Elkhart, Indiana
SiREM
Table 2 Page 14 of 14
TCE cDCE VC Ethene Total Ethenes Ethane CTC CF DCM CM Methanemg/L mg/L mg/L mg/L mmol/bottle mg/L mg/L mg/L mg/L mg/L mg/L
Chlorinated EthanesCommentTreatment Date Day Replicate
Chlorinated Ethenes
23-May-14 56 EHC/ZVI (Intermediate)-1 <0.020 0.047 0.040 0.089 -- 0.035 <0.020 <0.020 0.21 <0.020 0.91EHC/ZVI (Intermediate)-2 <0.020 0.062 0.035 0.13 -- 0.051 <0.020 <0.020 0.19 0.023 0.42
(Intermediate) EHC/ZVI (Intermediate)-3 <0.020 0.046 0.034 0.094 -- 0.034 <0.020 <0.020 0.21 <0.020 0.72Continued Average Concentration (mg/L) ND 0.052 0.036 0.11 -- 0.04 ND ND 0.20 0.0076 0.68
Standard Deviation (mmoles) 0.0E+00 2.0E-05 1.3E-05 3.2E-04 -- 1.9E-04 0.0E+00 0.0E+00 3.6E-05 5.2E-05 1.1E-02Average Total mmoles ND 0.00011 0.00013 0.0014 1.6E-03 0.00079 ND ND 0.00049 0.00003 0.032
10-Jun-14 74 EHC/ZVI (Intermediate)-1 0.049 0.042 0.044 0.094 -- 0.039 <0.020 <0.020 0.22 <0.020 1.0EHC/ZVI (Intermediate)-2 0.023 0.080 0.035 0.13 -- 0.051 <0.020 <0.020 0.17 <0.020 0.43EHC/ZVI (Intermediate)-3 0.037 0.037 0.031 0.093 -- 0.036 <0.020 <0.020 0.20 <0.020 0.77
Average Concentration (mg/L) 0.036 0.053 0.037 0.10 -- 0.042 ND ND 0.19 ND 0.75Standard Deviation (mmoles) 2.1E-05 5.0E-05 2.3E-05 2.5E-04 -- 1.7E-04 0.0E+00 0.0E+00 6.1E-05 0.0E+00 1.4E-02
Average Total mmoles 0.000058 0.00011 0.00013 0.0014 1.7E-03 0.00083 ND ND 0.00048 ND 0.035Notes:
-- - not analyzed% - percent< - compound not detected, the associated value is the detection limitµL - microlitersANAC - anaerobic active controlANSC - anaerobic sterile controlcDCE - cis-1,2-dichloroetheneCM - chloromethaneCTC - carbon tetrachlorideDCM - dichloromethanemg/L - milligrams per litermmoles - millimolesmmoles/bottle - millimoles per bottleND - not detectedSolFe - soluble ironTCE - trichloroetheneVC - vinyl chlorideZVI - zero valent iron
EHC®-L and ZVI Amended/KB-1® Plus Bioaugmented

TABLE 3: SUMMARY OF MICROCOSM ANION RESULTS Elkhart, Indiana
SiREM
Table 3 Page 1 of 3
Total VFAs Chloride Nitrite-N Nitrate-N Sulfate Phosphatemg/L mg/L mg/L mg/L mg/L mg/L
Anaerobic Sterile Control 28-Mar-14 0 ANSC-1 2.2 149 <0.09 11 29 20(Shallow Depth) ANSC-2 <0.07 126 <0.09 10 25 19
ANSC-3 0.08 151 <0.09 11 29 26Average Concentration 0.76 142 ND 11 28 22
Anaerobic Active Control 28-Mar-14 0 ANAC (Shallow)-1 <0.07 72 <0.09 12 26 16(Shallow Depth) ANAC (Shallow)-2 <0.07 75 <0.09 12 27 23
ANAC (Shallow)-3 <0.07 79 <0.09 12 28 21Average Concentration ND 75 ND 12 27 20
ZVI Amended/KB-1® Plus Bioaugmented 28-Mar-14 0 ZVI (Shallow)-1 0.08 76 <0.09 12 28 21(Shallow Depth) ZVI (Shallow)-2 <0.07 68 <0.09 11 25 16
ZVI (Shallow)-2 <0.07 77 <0.09 12 28 0.65Average Concentration 0.03 74 ND 12 27 13
9-May-14 42 ZVI (Shallow)-1 18 103 <0.09 0.26 29 0.11ZVI (Shallow)-2 17 100 <0.09 0.15 29 0.08ZVI (Shallow)-2 16 99 <0.09 0.28 28 0.10
Average Concentration 17 101 ND 0.23 29 0.10SRS™/ZVI and Ferrous Fumarate Amended/KB-1® Plus Bioaugmented 28-Mar-14 0 SRS/ZVI (Shallow)-1 28 79 <0.09 12 29 7.0
(Shallow Depth) SRS/ZVI (Shallow)-2 25 73 <0.09 12 27 2.0SRS/ZVI (Shallow)-3 29 104 <0.09 12 29 15
Average Concentration 28 85 ND 12 28 8.09-May-14 42 SRS/ZVI (Shallow)-1 167 98 <0.09 0.13 59 0.16
SRS/ZVI (Shallow)-2 98 97 <0.09 0.16 31 0.12SRS/ZVI (Shallow)-3 170 100 <0.09 0.14 2.7 <0.07
Average Concentration 145 98 ND 0.14 31 0.09SRS™ and Ferrous Fumarate Amended/KB-1® Plus Bioaugmented 28-Mar-14 0 SRS/solFe (Shallow)-1 25 76 <0.09 12 28 10
(Shallow Depth) SRS/solFe (Shallow)-2 25 69 <0.09 11 26 12SRS/solFe (Shallow)-3 26 68 <0.09 11 25 20
Average Concentration 26 71 ND 11 26 149-May-14 42 SRS/solFe (Shallow)-1 120 97 <0.09 0.16 0.45 <0.07
SRS/solFe (Shallow)-2 89 75 <0.09 0.21 0.95 0.28SRS/solFe (Shallow)-3 134 98 <0.09 0.13 0.60 0.07
Average Concentration 114 90 ND 0.17 0.67 0.12SRS™ Amended/KB-1® Plus Bioaugmented 28-Mar-14 0 SRS (Shallow)-1 29 77 <0.09 12 29 19
(Shallow Depth) SRS (Shallow)-2 29 76 <0.09 12 29 16SRS (Shallow)-3 29 77 <0.09 12 28 17
Average Concentration 29 77 ND 12 28 179-May-14 42 SRS (Shallow)-1 56 95 <0.09 0.14 13 <0.07
SRS (Shallow)-2 71 101 <0.09 0.37 15 0.50SRS (Shallow)-3 68 94 <0.09 0.12 16 0.25
Average Concentration 65 96 ND 0.21 14 0.25EHC-L® Amended/KB-1® Plus Bioaugmented 28-Mar-14 0 EHC (Shallow)-1 46 72 <0.09 11 27 12
(Shallow Depth) EHC (Shallow)-2 47 70 <0.09 11 27 10EHC (Shallow)-3 53 78 <0.09 12 30 11
Average Concentration 49 73 ND 12 28 11
Treatment ReplicateTreatment Date Day

TABLE 3: SUMMARY OF MICROCOSM ANION RESULTS Elkhart, Indiana
SiREM
Table 3 Page 2 of 3
Total VFAs Chloride Nitrite-N Nitrate-N Sulfate Phosphatemg/L mg/L mg/L mg/L mg/L mg/L
Treatment ReplicateTreatment Date Day
EHC-L® Amended/KB-1® Plus Bioaugmented 9-May-14 42 EHC (Shallow)-1 227 97 <0.09 0.14 0.69 0.27(Shallow Depth) EHC (Shallow)-2 258 101 <0.09 0.26 1.5 0.29
Continued EHC (Shallow)-3 241 96 <0.09 0.23 1.1 <0.07Average Concentration 242 98 ND 0.21 1.1 0.19
EHC-L® and ZVI Amended/KB-1® Plus Bioaugmented 28-Mar-14 0 EHC/ZVI (Shallow)-1 45 70 <0.09 11 27 5.4(Shallow Depth) EHC/ZVI (Shallow)-2 47 77 <0.09 12 30 6.4
EHC/ZVI (Shallow)-3 53 82 <0.09 13 31 14Average Concentration 48 76 ND 12 29 8.4
9-May-14 42 EHC/ZVI (Shallow)-1 264 102 <0.09 0.27 0.73 <0.07EHC/ZVI (Shallow)-2 253 98 <0.09 0.14 0.69 0.16EHC/ZVI (Shallow)-3 266 101 <0.09 0.39 0.94 0.21
Average Concentration 261 100 ND 0.27 0.79 0.12Anaerobic Active Control 28-Mar-14 0 ANAC (Intermediate)-1 12 64 <0.09 3.4 22 11
(Intermediate Depth) ANAC (Intermediate)-2 6.8 71 <0.09 3.5 26 19ANAC (Intermediate)-3 10 65 <0.09 3.2 23 8.9
Average Concentration 10 67 ND 3.4 24 13ZVI Amended/KB-1® Plus Bioaugmented 28-Mar-14 0 ZVI (Intermediate)-1 5.5 65 <0.09 3.2 23 15
(Intermediate Depth) ZVI (Intermediate)-2 5.9 61 <0.09 3.0 21 0.89ZVI (Intermediate)-3 8.1 67 <0.09 3.4 24 14
Average Concentration 6.5 64 ND 3.2 23 9.79-May-14 42 ZVI/Nut/Vit (Intermediate)-1 21 89 <0.09 0.11 1.3 0.16
ZVI/Nut/Vit (Intermediate)-2 38 92 <0.09 0.34 1.7 0.22ZVI/Nut/Vit (Intermediate)-3 24 88 <0.09 0.11 0.70 0.14Average Concentration 28 90 ND 0.19 1.2 0.18
SRS™/ZVI and Ferrous Fumarate Amended/KB-1® Plus Bioaugmented 28-Mar-14 0 SRS/ZVI (Intermediate)-1 36 66 <0.09 3.2 24 13(Intermediate Depth) SRS/ZVI (Intermediate)-2 41 70 <0.09 3.4 25 20
SRS/ZVI (Intermediate)-3 37 70 <0.09 3.3 24 16Average Concentration 38 69 ND 3.3 24 16
9-May-14 42 SRS/ZVI (Intermediate)-1 219 91 <0.09 0.39 1.2 0.11SRS/ZVI (Intermediate)-2 233 88 <0.09 0.39 0.93 0.11SRS/ZVI (Intermediate)-3 210 85 <0.09 0.15 0.62 0.25Average Concentration 221 88 ND 0.31 0.92 0.15
SRS™ and Ferrous Fumarate Amended/KB-1® Plus Bioaugmented 28-Mar-14 0 SRS/solFe (Intermediate)-1 45 68 <0.09 3.3 25 19(Intermediate Depth) SRS/solFe (Intermediate)-2 37 65 <0.09 3.1 24 14
SRS/solFe (Intermediate)-3 41 69 <0.09 3.3 24 14Average Concentration 41 67 ND 3.3 24 15
9-May-14 42 SRS/solFe (Intermediate)-1 199 86 <0.09 0.10 0.47 0.22SRS/solFe (Intermediate)-2 205 85 <0.09 <0.09 0.61 0.36SRS/solFe (Intermediate)-3 205 91 <0.09 0.23 1.1 0.33Average Concentration 203 87 ND 0.11 0.73 0.30
SRS™ Amended/KB-1® Plus Bioaugmented 28-Mar-14 0 SRS (Intermediate)-1 50 70 <0.09 3.3 24 12(Intermediate Depth) SRS (Intermediate)-2 38 67 <0.09 3.2 24 13
SRS (Intermediate)-3 28 51 <0.09 2.5 18 13Average Concentration 39 63 ND 3.0 22 13

TABLE 3: SUMMARY OF MICROCOSM ANION RESULTS Elkhart, Indiana
SiREM
Table 3 Page 3 of 3
Total VFAs Chloride Nitrite-N Nitrate-N Sulfate Phosphatemg/L mg/L mg/L mg/L mg/L mg/L
Treatment ReplicateTreatment Date Day
SRS™ Amended/KB-1® Plus Bioaugmented 9-May-14 42 SRS (Intermediate)-1 210 88 <0.09 0.29 0.76 0.12(Intermediate Depth) SRS (Intermediate)-2 205 89 <0.09 0.39 0.71 0.27
Continued SRS (Intermediate)-3 125 88 <0.09 0.16 0.88 0.44Average Concentration 180 89 ND 0.28 0.79 0.28
EHC-L® Amended/KB-1® Plus Bioaugmented 28-Mar-14 0 EHC(Intermediate)-1 61 68 <0.09 3.5 25 9.9(Intermediate Depth) EHC(Intermediate)-2 56 63 <0.09 3.1 23 5.1
EHC(Intermediate)-3 59 67 <0.09 3.3 25 6.6Average Concentration 59 66 ND 3.3 24 7.2
9-May-14 42 EHC(Intermediate)-1 255 91 <0.09 0.34 1.1 0.36EHC(Intermediate)-2 233 88 <0.09 <0.09 0.65 0.75EHC(Intermediate)-3 232 87 <0.09 0.17 0.71 0.33
Average Concentration 240 88 ND 0.17 0.81 0.48EHC-L® and ZVI Amended/KB-1® Plus Bioaugmented 28-Mar-14 0 EHC/ZVI (Intermediate)-1 50 63 <0.09 3.0 23 2.7
(Intermediate Depth) EHC/ZVI (Intermediate)-2 54 73 <0.09 3.5 26 2.1EHC/ZVI (Intermediate)-3 44 57 <0.09 2.8 21 2.4Average Concentration 49 64 ND 3.1 23 2.4
9-May-14 42 EHC/ZVI (Intermediate)-1 284 89 <0.09 <0.09 0.35 0.24EHC/ZVI (Intermediate)-2 252 89 <0.09 <0.09 0.77 0.22EHC/ZVI (Intermediate)-3 296 88 <0.09 0.302 0.60 0.23Average Concentration 277 89 ND 0.10 0.57 0.23
Notes:* All treatments were amended with the vitamin/nutrient mix on Day 0< - compound not detected, the associated value is the detection limitANAC - anaerobic active controlANSC - anaerobic sterile controlmg/L - milligrams per literND - not detectedsol Fe - soluble ironVFAs - total volatile fatty acids, calibrated as lactate but may include other VFAs such as formate, acetate, propionate, pyruvate and butyrateZVI - zero valent iron

TABLE 4: SUMMARY OF MICROCOSM VFA RESULTS Elkhart, Indiana
SiREM
Table 4 Page 1 of 3
Lactate Acetate Propionate Formate Butyrate Pyruvatemg/L mg/L mg/L mg/L mg/L mg/L
ZVI Amended/KB-1® Plus Bioaugmented 28-Mar-14 0 ZVI (Shallow)-1 0.60 1.7 <0.31 1.2 <0.41 <0.69(Shallow Depth) ZVI (Shallow)-2 0.56 2.7 <0.31 2.2 <0.41 <0.69
ZVI (Shallow)-2 0.89 1.7 <0.31 0.97 <0.41 <0.69Average Concentration 0.68 2.0 ND 1.4 ND ND
9-May-14 42 ZVI (Shallow)-1 <0.39 9.4 1.1 2.0 1.7 <0.69ZVI (Shallow)-2 <0.39 9.2 1.0 2.0 1.9 <0.69ZVI (Shallow)-2 <0.39 7.8 0.94 2.2 1.7 <0.69
Average Concentration ND 8.8 1.0 2.1 1.8 ND22-May-14 55 ZVI (Shallow)-1 <0.39 15 1.2 1.0 1.8 <0.69
ZVI (Shallow)-2 <0.39 50 1.1 0.88 1.9 <0.69ZVI (Shallow)-2 <0.39 8.6 1.1 1.2 1.9 <0.69
Average Concentration ND 24 1.1 1.0 1.8 NDSRS®/ZVI and Ferrous Fumarate Amended/KB-1® Plus Bioaugmented 28-Mar-14 0 SRS/ZVI (Shallow)-1 33 3.5 5.3 1.2 <0.41 <0.69
(Shallow Depth) SRS/ZVI (Shallow)-2 26 3.2 4.2 1.0 <0.41 <0.69SRS/ZVI (Shallow)-3 31 3.2 4.5 2.1 <0.41 <0.69
Average Concentration 30 3.3 4.7 1.4 ND ND9-May-14 42 SRS/ZVI (Shallow)-1 <0.39 156 43 2.7 7.2 <0.69
SRS/ZVI (Shallow)-2 <0.39 76 31 2.2 2.5 <0.69SRS/ZVI (Shallow)-3 <0.39 127 99 1.6 4.8 <0.69
Average Concentration ND 119 57 2.2 4.8 ND22-May-14 55 SRS/ZVI (Shallow)-1 <0.39 181 41 1.2 6.3 <0.69
SRS/ZVI (Shallow)-2 <0.39 103 105 0.56 2.5 <0.69SRS/ZVI (Shallow)-3 <0.39 143 102 0.60 4.8 <0.69
Average Concentration ND 142 83 0.80 4.6 NDSRS® and Ferrous Fumarate Amended/KB-1® Plus Bioaugmented 28-Mar-14 0 SRS/solFe (Shallow)-1 107 2.0 4.4 2.4 <0.41 2.9
(Shallow Depth) SRS/solFe (Shallow)-2 29 3.4 4.4 1.9 <0.41 <0.69SRS/solFe (Shallow)-3 31 3.5 4.7 1.9 <0.41 <0.69
Average Concentration 56 3.0 4.5 2.1 ND 0.969-May-14 42 SRS/solFe (Shallow)-1 <0.39 138 2.3 1.0 0.43 <0.69
SRS/solFe (Shallow)-2 <0.39 133 4.3 0.63 0.56 <0.69SRS/solFe (Shallow)-3 <0.39 102 0.95 0.36 2.1 <0.69
Average Concentration ND 124 2.5 0.66 1.0 ND22-May-14 55 SRS/solFe (Shallow)-1 <0.39 171 3.1 0.29 5.2 <0.69
SRS/solFe (Shallow)-2 <0.39 170 5.3 0.55 3.7 <0.69SRS/solFe (Shallow)-3 <0.39 186 1.7 0.30 3.5 <0.69
Average Concentration ND 176 3.3 0.38 4.1 NDSRS® Amended/KB-1® Plus Bioaugmented 28-Mar-14 0 SRS (Shallow)-1 31 3.4 4.5 1.6 <0.41 <0.69
(Shallow Depth) SRS (Shallow)-2 32 4.5 4.7 1.9 <0.41 <0.69SRS (Shallow)-3 32 3.6 4.8 1.6 <0.41 <0.69
Average Concentration 31 3.8 4.7 1.7 ND ND9-May-14 42 SRS (Shallow)-1 <0.39 59 <0.31 1.1 <0.41 <0.69
SRS (Shallow)-2 <0.39 72 <0.31 0.77 <0.41 <0.69SRS (Shallow)-3 <0.39 70 0.35 0.94 <0.41 <0.69
Average Concentration ND 67 0.12 0.93 ND ND22-May-14 55 SRS (Shallow)-1 <0.39 105 0.48 0.73 3.0 <0.69
SRS (Shallow)-2 <0.39 100 <0.31 0.30 <0.41 <0.69SRS (Shallow)-3 <0.39 113 0.60 0.58 5.6 <0.69
Average Concentration ND 106 0.36 0.54 2.9 NDEHC-L® Amended/KB-1® Plus Bioaugmented 28-Mar-14 0 EHC (Shallow)-1 <0.39 2.2 <0.31 2.2 0.65 <0.69
(Shallow Depth) EHC (Shallow)-2 <0.39 2.2 <0.31 2.6 0.62 <0.69EHC (Shallow)-3 <0.39 2.4 <0.31 2.7 0.70 <0.69
Average Concentration ND 2.3 ND 2.5 0.65 ND9-May-14 42 EHC (Shallow)-1 <0.39 244 15 0.93 32 <0.69
EHC (Shallow)-2 <0.39 263 61 0.51 11 <0.69EHC (Shallow)-3 <0.39 237 65 0.55 24 <0.69
Average Concentration ND 248 47 0.66 22 ND22-May-14 55 EHC (Shallow)-1 <0.39 293 14 0.63 42 <0.69
EHC (Shallow)-2 <0.39 370 58 0.27 43 <0.69EHC (Shallow)-3 <0.39 315 63 <0.22 38 <0.69
Average Concentration ND 326 45 0.30 41 ND
Treatment Date Day Treatment Replicate

TABLE 4: SUMMARY OF MICROCOSM VFA RESULTS Elkhart, Indiana
SiREM
Table 4 Page 2 of 3
Lactate Acetate Propionate Formate Butyrate Pyruvatemg/L mg/L mg/L mg/L mg/L mg/LTreatment Date Day Treatment Replicate
EHC-L® and ZVI Amended/KB-1® Plus Bioaugmented 28-Mar-14 0 EHC/ZVI (Shallow)-1 <0.39 2.3 <0.31 2.3 0.87 <0.69(Shallow Depth) EHC/ZVI (Shallow)-2 <0.39 2.4 <0.31 2.1 0.75 <0.69
EHC/ZVI (Shallow)-3 <0.39 2.5 <0.31 2.5 0.74 <0.69Average Concentration ND 2.4 ND 2.3 0.79 ND
9-May-14 42 EHC/ZVI (Shallow)-1 <0.39 290 43 1.6 7.0 <0.69EHC/ZVI (Shallow)-2 <0.39 221 83 1.4 42 <0.69EHC/ZVI (Shallow)-3 <0.39 271 73 1.9 20 <0.69
Average Concentration ND 260 66 1.6 23 ND22-May-14 55 EHC/ZVI (Shallow)-1 <0.39 297 44 0.69 6.7 <0.69
EHC/ZVI (Shallow)-2 <0.39 239 87 0.61 44 <0.69EHC/ZVI (Shallow)-3 <0.39 8.5 1.5 0.51 <0.41 <0.69
Average Concentration ND 182 44 0.60 17 NDZVI Amended/KB-1® Plus Bioaugmented 28-Mar-14 0 ZVI (Intermediate)-1 1.3 2.9 <0.31 2.1 <0.41 <0.69
(Intermediate Depth) ZVI (Intermediate)-2 0.41 2.8 <0.31 1.8 <0.41 <0.69ZVI (Intermediate)-3 1.2 2.9 <0.31 2.0 <0.41 <0.69
Average Concentration 1.0 2.9 ND 2.0 ND ND9-May-14 42 ZVI/Nut/Vit (Intermediate)-1 <0.39 17 2.9 1.0 <0.41 <0.69
ZVI/Nut/Vit (Intermediate)-2 <0.39 21 5.2 4.5 1.0 <0.69ZVI/Nut/Vit (Intermediate)-3 <0.39 15 2.2 2.9 0.50 <0.69Average Concentration ND 18 3.4 2.8 0.51 ND
22-May-14 55 ZVI/Nut/Vit (Intermediate)-1 <0.39 16 2.5 1.4 <0.41 <0.69ZVI/Nut/Vit (Intermediate)-2 <0.39 42 5.6 1.3 1.1 <0.69ZVI/Nut/Vit (Intermediate)-3 <0.39 25 2.5 2.1 0.61 <0.69Average Concentration ND 28 3.5 1.6 0.58 ND
SRS®/ZVI and Ferrous Fumarate Amended/KB-1® Plus Bioaugmented 28-Mar-14 0 SRS/ZVI (Intermediate)-1 25 3.8 3.8 2.0 <0.41 <0.69(Intermediate Depth) SRS/ZVI (Intermediate)-2 28 4.1 4.4 2.4 <0.41 <0.69
SRS/ZVI (Intermediate)-3 25 3.3 3.9 2.1 <0.41 <0.69Average Concentration 26 3.7 4.0 2.2 ND ND
9-May-14 42 SRS/ZVI (Intermediate)-1 <0.39 183 107 1.6 4.1 <0.69SRS/ZVI (Intermediate)-2 <0.39 201 120 1.9 4.7 <0.69SRS/ZVI (Intermediate)-3 <0.39 185 105 1.9 6.6 <0.69Average Concentration ND 189 111 1.8 5.1 ND
22-May-14 55 SRS/ZVI (Intermediate)-1 <0.39 211 111 0.68 4.2 <0.69SRS/ZVI (Intermediate)-2 <0.39 233 125 0.69 4.9 <0.69SRS/ZVI (Intermediate)-3 <0.39 210 105 1.0 6.7 <0.69Average Concentration ND 218 114 0.80 5.3 ND
SRS® and Ferrous Fumarate Amended/KB-1® Plus Bioaugmented 28-Mar-14 0 SRS/solFe (Intermediate)-1 31 4.3 4.6 2.5 <0.41 <0.69(Intermediate Depth) SRS/solFe (Intermediate)-2 24 3.9 4.0 2.3 <0.41 <0.69
SRS/solFe (Intermediate)-3 27 3.8 4.2 2.4 <0.41 <0.69Average Concentration 27 4.0 4.3 2.4 ND ND
9-May-14 42 SRS/solFe (Intermediate)-1 <0.39 178 86 0.54 4.7 <0.69SRS/solFe (Intermediate)-2 <0.39 100 47 0.57 9.4 <0.69SRS/solFe (Intermediate)-3 <0.39 178 78 0.62 10 <0.69Average Concentration ND 152 71 0.58 8.1 ND
22-May-14 55 SRS/solFe (Intermediate)-1 <0.39 258 84 <0.22 29 <0.69SRS/solFe (Intermediate)-2 <0.39 242 89 0.25 23 0.72SRS/solFe (Intermediate)-3 <0.39 234 76 <0.22 16 <0.69Average Concentration ND 245 83 0.08 23 0.24
SRS® Amended/KB-1® Plus Bioaugmented 28-Mar-14 0 SRS (Intermediate)-1 36 5.2 5.3 2.3 <0.41 <0.69(Intermediate Depth) SRS (Intermediate)-2 28 4.2 4.3 2.3 <0.41 <0.69
SRS (Intermediate)-3 26 4.3 4.1 2.5 <0.41 <0.69Average Concentration 30 4.6 4.6 2.4 ND ND
9-May-14 42 SRS (Intermediate)-1 <0.39 221 41 0.41 9.4 <0.69SRS (Intermediate)-2 <0.39 111 23 0.49 5.9 <0.69SRS (Intermediate)-3 <0.39 151 2.9 0.53 0.65 <0.69
Average Concentration ND 161 22 0.48 5.3 0.0022-May-14 55 SRS (Intermediate)-1 <0.39 297 43 0.28 26 <0.69
SRS (Intermediate)-2 <0.39 378 44 <0.22 45 <0.69SRS (Intermediate)-3 <0.39 178 2.2 0.36 <0.41 <0.69
Average Concentration ND 284 30 0.21 24 ND

TABLE 4: SUMMARY OF MICROCOSM VFA RESULTS Elkhart, Indiana
SiREM
Table 4 Page 3 of 3
Lactate Acetate Propionate Formate Butyrate Pyruvatemg/L mg/L mg/L mg/L mg/L mg/LTreatment Date Day Treatment Replicate
EHC-L® Amended/KB-1® Plus Bioaugmented 28-Mar-14 0 EHC(Intermediate)-1 <0.39 3.8 <0.31 3.3 <0.41 <0.69(Intermediate Depth) EHC(Intermediate)-2 <0.39 3.2 <0.31 2.6 <0.41 <0.69
EHC(Intermediate)-3 <0.39 3.4 <0.31 2.8 <0.41 <0.69Average Concentration ND 3.5 ND 2.9 ND ND
9-May-14 42 EHC(Intermediate)-1 <0.39 236 64 0.26 40 <0.69EHC(Intermediate)-2 <0.39 217 67 <0.22 37 <0.69EHC(Intermediate)-3 <0.39 235 55 0.25 31 <0.69
Average Concentration ND 230 62 0.17 36 0.0022-May-14 55 EHC(Intermediate)-1 <0.39 258 56 <0.22 34 <0.69
EHC(Intermediate)-2 <0.39 240 67 <0.22 31 <0.69EHC(Intermediate)-3 <0.39 245 55 <0.22 28 <0.69
Average Concentration ND 248 59 ND 31 0.00EHC-L® and ZVI Amended/KB-1® Plus Bioaugmented 28-Mar-14 0 EHC/ZVI (Intermediate)-1 2.2 3.8 <0.31 2.9 0.56 <0.69
(Intermediate Depth) EHC/ZVI (Intermediate)-2 <0.39 3.5 <0.31 2.8 0.55 <0.69EHC/ZVI (Intermediate)-3 <0.39 3.3 <0.31 2.7 0.54 <0.69Average Concentration 0.74 3.6 ND 2.8 0.55 ND
9-May-14 42 EHC/ZVI (Intermediate)-1 <0.39 284 91 0.72 13 <0.69EHC/ZVI (Intermediate)-2 <0.39 234 90 2.2 27 <0.69EHC/ZVI (Intermediate)-3 <0.39 312 64 1.1 13 <0.69Average Concentration ND 277 82 1.3 18 ND
22-May-14 55 EHC/ZVI (Intermediate)-1 <0.39 289 91 0.44 13 <0.69EHC/ZVI (Intermediate)-2 <0.39 226 86 0.46 25 <0.69EHC/ZVI (Intermediate)-3 <0.39 343 68 0.53 14 <0.69Average Concentration ND 286 82 0.48 17 ND
Notes:* All treatments were amended with the vitamin/nutrient mix on Day 0< - compound not detected, the associated value is the detection limitND - not detectedsol Fe - soluble ironZVI - zero valent iron

TABLE 5: SUMMARY OF MICROCOSM pH AND ORP RESULTS Elkhart, Indiana
SiREM
Table 5 Page 1 of 7
pH ORPStandard Units mV
Anaerobic Sterile Control 28-Mar-14 0 ANSC-1 6.56 --(Shallow Depth) ANSC-2 6.59 --
ANSC-3 6.58 --Average Concentration 6.58 --
4-Apr-14 7 ANSC-1 6.54 --ANSC-2 6.55 --ANSC-3 6.58 --
Average Concentration 6.56 --25-Apr-14 28 ANSC-1 6.47 --
ANSC-2 6.48 --ANSC-3 6.48 --
Average Concentration 6.48 --9-May-14 42 ANSC-1 -- --
ANSC-2 -- 230ANSC-3 -- --
Average Concentration -- --23-May-14 56 ANSC-1 6.34 --
ANSC-2 6.38 --ANSC-3 6.31 --
Average Concentration 6.34 --29-Jul-14 123 ANSC-1 6.44 --
ANSC-2 6.42 --ANSC-3 6.44 --
Average Concentration 6.43 --Anaerobic Active Control 28-Mar-14 0 ANAC (Shallow)-1 6.59 --
(Shallow Depth) ANAC (Shallow)-2 6.66 --ANAC (Shallow)-3 6.62 --
Average Concentration 6.62 --4-Apr-14 7 ANAC (Shallow)-1 6.67 --
ANAC (Shallow)-2 6.67 --ANAC (Shallow)-3 6.81 --
Average Concentration 6.72 --17-Apr-14 20 ANAC (Shallow)-1 6.55 --
ANAC (Shallow)-2 6.62 --ANAC (Shallow)-3 6.64 --
Average Concentration 6.60 --25-Apr-14 28 ANAC (Shallow)-1 6.57 --
ANAC (Shallow)-2 6.63 --ANAC (Shallow)-3 6.67 --
Average Concentration 6.62 --9-May-14 42 ANAC (Shallow)-1 -- --
ANAC (Shallow)-2 -- -92ANAC (Shallow)-3 -- --
Average Concentration -- --23-May-14 56 ANAC (Shallow)-1 6.47 --
ANAC (Shallow)-2 6.49 --ANAC (Shallow)-3 6.56 --
Average Concentration 6.51 --29-Jul-14 123 ANAC (Shallow)-1 6.61 --
ANAC (Shallow)-2 6.46 --ANAC (Shallow)-3 6.50 --
Average Concentration 6.52 --ZVI Amended/KB-1® Plus Bioaugmented 28-Mar-14 0 ZVI (Shallow)-1 6.69 --
(Shallow Depth) ZVI (Shallow)-2 6.61 --ZVI (Shallow)-2 6.63 --
Average Concentration 6.64 --4-Apr-14 7 ZVI (Shallow)-1 7.00 --
ZVI (Shallow)-2 6.66 --ZVI (Shallow)-2 6.74 --
Average Concentration 6.80 --17-Apr-14 20 ZVI (Shallow)-1 6.64 --
ZVI (Shallow)-2 6.57 --ZVI (Shallow)-2 6.61 --
Average Concentration 6.61 --25-Apr-14 28 ZVI (Shallow)-1 6.60 --
ZVI (Shallow)-2 6.61 --ZVI (Shallow)-2 6.55 --
Average Concentration 6.59 --9-May-14 42 ZVI (Shallow)-1 6.54 --
ZVI (Shallow)-2 6.65 -265ZVI (Shallow)-2 6.41 --
Average Concentration 6.53 --23-May-14 56 ZVI (Shallow)-1 6.64 --
ZVI (Shallow)-2 6.81 --ZVI (Shallow)-2 6.58 --
Average Concentration 6.68 --10-Jun-14 74 ZVI (Shallow)-1 6.55 --
ZVI (Shallow)-2 6.69 --ZVI (Shallow)-2 6.63 --
Average Concentration 6.62 --
Treatment Date Day Treatment Replicate

TABLE 5: SUMMARY OF MICROCOSM pH AND ORP RESULTS Elkhart, Indiana
SiREM
Table 5 Page 2 of 7
pH ORPStandard Units mVTreatment Date Day Treatment Replicate
ZVI Amended/KB-1® Plus Bioaugmented 25-Jun-14 89 ZVI (Shallow)-1 6.59 --(Shallow Depth) ZVI (Shallow)-2 6.65 --
Continued ZVI (Shallow)-2 6.52 --Average Concentration 6.59 --
10-Jul-14 104 ZVI (Shallow)-1 6.42 --ZVI (Shallow)-2 6.39 --ZVI (Shallow)-2 6.39 --
Average Concentration 6.40 --29-Jul-14 123 ZVI (Shallow)-1 6.49 --
ZVI (Shallow)-2 6.41 --ZVI (Shallow)-2 6.62 --
Average Concentration 6.51 --SRS™/ZVI and Ferrous Fumarate Amended/KB-1® Plus Bioaugmented 28-Mar-14 0 SRS/ZVI (Shallow)-1 6.59 --
(Shallow Depth) SRS/ZVI (Shallow)-2 6.62 --SRS/ZVI (Shallow)-3 6.60 --
Average Concentration 6.60 --4-Apr-14 7 SRS/ZVI (Shallow)-1 6.75 --
SRS/ZVI (Shallow)-2 6.80 --SRS/ZVI (Shallow)-3 6.74 --
Average Concentration 6.76 --17-Apr-14 20 SRS/ZVI (Shallow)-1 6.40 --
SRS/ZVI (Shallow)-2 6.54 --SRS/ZVI (Shallow)-3 6.74 --
Average Concentration 6.56 --25-Apr-14 28 SRS/ZVI (Shallow)-1 6.48 --
SRS/ZVI (Shallow)-2 6.62 --SRS/ZVI (Shallow)-3 6.82 --
Average Concentration 6.64 --9-May-14 42 SRS/ZVI (Shallow)-1 6.45 --
SRS/ZVI (Shallow)-2 6.46 -426SRS/ZVI (Shallow)-3 6.48 --
Average Concentration 6.46 --23-May-14 56 SRS/ZVI (Shallow)-1 6.37 --
SRS/ZVI (Shallow)-2 6.59 --SRS/ZVI (Shallow)-3 6.52 --
Average Concentration 6.49 --10-Jun-14 74 SRS/ZVI (Shallow)-1 6.30 --
SRS/ZVI (Shallow)-2 6.57 --SRS/ZVI (Shallow)-3 6.59 --
Average Concentration 6.49 --25-Jun-14 89 SRS/ZVI (Shallow)-1 6.47 --
SRS/ZVI (Shallow)-2 6.62 --SRS/ZVI (Shallow)-3 6.52 --
Average Concentration 6.54 --10-Jul-14 104 SRS/ZVI (Shallow)-1 6.25 --
SRS/ZVI (Shallow)-2 6.55 --SRS/ZVI (Shallow)-3 6.47 --
Average Concentration 6.42 --29-Jul-14 123 SRS/ZVI (Shallow)-1 6.24 --
SRS/ZVI (Shallow)-2 6.37 --SRS/ZVI (Shallow)-3 6.33 --
Average Concentration 6.31 --SRS™ and Ferrous Fumarate Amended/KB-1® Plus Bioaugmented 28-Mar-14 0 SRS/solFe (Shallow)-1 6.55 --
(Shallow Depth) SRS/solFe (Shallow)-2 6.55 --SRS/solFe (Shallow)-3 6.56 --
Average Concentration 6.55 --4-Apr-14 7 SRS/solFe (Shallow)-1 6.57 --
SRS/solFe (Shallow)-2 6.56 --SRS/solFe (Shallow)-3 6.56 --
Average Concentration 6.56 --17-Apr-14 20 SRS/solFe (Shallow)-1 6.62 --
SRS/solFe (Shallow)-2 6.61 --SRS/solFe (Shallow)-3 6.71 --
Average Concentration 6.65 --25-Apr-14 28 SRS/solFe (Shallow)-1 6.70 --
SRS/solFe (Shallow)-2 6.66 --SRS/solFe (Shallow)-3 6.67 --
Average Concentration 6.68 --9-May-14 42 SRS/solFe (Shallow)-1 6.48 --
SRS/solFe (Shallow)-2 6.49 -304SRS/solFe (Shallow)-3 6.51 --
Average Concentration 6.49 --23-May-14 56 SRS/solFe (Shallow)-1 6.52 --
SRS/solFe (Shallow)-2 6.50 --SRS/solFe (Shallow)-3 6.61 --
Average Concentration 6.54 --10-Jun-14 74 SRS/solFe (Shallow)-1 6.46 --
SRS/solFe (Shallow)-2 6.56 --SRS/solFe (Shallow)-3 6.50 --
Average Concentration 6.51 --

TABLE 5: SUMMARY OF MICROCOSM pH AND ORP RESULTS Elkhart, Indiana
SiREM
Table 5 Page 3 of 7
pH ORPStandard Units mVTreatment Date Day Treatment Replicate
SRS™ and Ferrous Fumarate Amended/KB-1® Plus Bioaugmented 25-Jun-14 89 SRS/solFe (Shallow)-1 6.21 --(Shallow Depth) SRS/solFe (Shallow)-2 6.25 --
Continued SRS/solFe (Shallow)-3 6.55 --Average Concentration 6.34 --
10-Jul-14 104 SRS/solFe (Shallow)-1 6.34 --SRS/solFe (Shallow)-2 6.33 --SRS/solFe (Shallow)-3 6.65 --
Average Concentration 6.44 --29-Jul-14 123 SRS/solFe (Shallow)-1 6.09 --
SRS/solFe (Shallow)-2 6.12 --SRS/solFe (Shallow)-3 6.39 --
Average Concentration 6.20 --SRS™ Amended/KB-1® Plus Bioaugmented 28-Mar-14 0 SRS (Shallow)-1 6.59 --
(Shallow Depth) SRS (Shallow)-2 6.62 --SRS (Shallow)-3 6.61 --
Average Concentration 6.61 --4-Apr-14 7 SRS (Shallow)-1 6.62 --
SRS (Shallow)-2 6.64 --SRS (Shallow)-3 6.66 --
Average Concentration 6.64 --17-Apr-14 20 SRS (Shallow)-1 6.64 --
SRS (Shallow)-2 6.61 --SRS (Shallow)-3 6.56 --
Average Concentration 6.60 --25-Apr-14 28 SRS (Shallow)-1 6.71 --
SRS (Shallow)-2 6.70 --SRS (Shallow)-3 6.72 --
Average Concentration 6.71 --9-May-14 42 SRS (Shallow)-1 6.45 --
SRS (Shallow)-2 6.47 -226SRS (Shallow)-3 6.48 --
Average Concentration 6.47 --23-May-14 56 SRS (Shallow)-1 6.73 --
SRS (Shallow)-2 6.56 --SRS (Shallow)-3 6.56 --
Average Concentration 6.62 --10-Jun-14 74 SRS (Shallow)-1 6.54 --
SRS (Shallow)-2 6.64 --SRS (Shallow)-3 6.58 --
Average Concentration 6.59 --25-Jun-14 89 SRS (Shallow)-1 6.43 --
SRS (Shallow)-2 6.21 --SRS (Shallow)-3 6.38 --
Average Concentration 6.34 --10-Jul-14 104 SRS (Shallow)-1 6.43 --
SRS (Shallow)-2 6.33 --SRS (Shallow)-3 6.37 --
Average Concentration 6.38 --29-Jul-14 123 SRS (Shallow)-1 6.15 --
SRS (Shallow)-2 6.15 --SRS (Shallow)-3 6.15 --
Average Concentration 6.15 --EHC-L® Amended/KB-1® Plus Bioaugmented 28-Mar-14 0 EHC (Shallow)-1 6.56 --
(Shallow Depth) EHC (Shallow)-2 6.53 --EHC (Shallow)-3 6.53 --
Average Concentration 6.54 --4-Apr-14 7 EHC (Shallow)-1 6.40 --
EHC (Shallow)-2 6.39 --EHC (Shallow)-3 6.41 --
Average Concentration 6.40 --17-Apr-14 20 EHC (Shallow)-1 6.49 --
EHC (Shallow)-2 6.49 --EHC (Shallow)-3 6.49 --
Average Concentration 6.49 --25-Apr-14 28 EHC (Shallow)-1 6.63 --
EHC (Shallow)-2 6.66 --EHC (Shallow)-3 6.65 --
Average Concentration 6.65 --9-May-14 42 EHC (Shallow)-1 6.49 --
EHC (Shallow)-2 6.52 -123EHC (Shallow)-3 6.53 --
Average Concentration 6.51 --23-May-14 56 EHC (Shallow)-1 6.57 --
EHC (Shallow)-2 6.53 --EHC (Shallow)-3 6.58 --
Average Concentration 6.56 --10-Jun-14 74 EHC (Shallow)-1 6.40 --
EHC (Shallow)-2 6.35 --EHC (Shallow)-3 6.37 --
Average Concentration 6.37 --

TABLE 5: SUMMARY OF MICROCOSM pH AND ORP RESULTS Elkhart, Indiana
SiREM
Table 5 Page 4 of 7
pH ORPStandard Units mVTreatment Date Day Treatment Replicate
EHC-L® Amended/KB-1® Plus Bioaugmented 25-Jun-14 89 EHC (Shallow)-1 6.24 --(Shallow Depth) EHC (Shallow)-2 6.23 --
Continued EHC (Shallow)-3 6.15 --Average Concentration 6.21 --
10-Jul-14 104 EHC (Shallow)-1 6.37 --EHC (Shallow)-2 6.34 --EHC (Shallow)-3 6.32 --
Average Concentration 6.34 --29-Jul-14 123 EHC (Shallow)-1 6.25 --
EHC (Shallow)-2 6.24 --EHC (Shallow)-3 6.15 --
Average Concentration 6.21 --EHC-L® and ZVI Amended/KB-1® Plus Bioaugmented 28-Mar-14 0 EHC/ZVI (Shallow)-1 6.52 --
(Shallow Depth) EHC/ZVI (Shallow)-2 6.53 --EHC/ZVI (Shallow)-3 6.53 --
Average Concentration 6.53 --4-Apr-14 7 EHC/ZVI (Shallow)-1 6.45 --
EHC/ZVI (Shallow)-2 6.50 --EHC/ZVI (Shallow)-3 6.46 --
Average Concentration 6.47 --17-Apr-14 20 EHC/ZVI (Shallow)-1 6.62 --
EHC/ZVI (Shallow)-2 6.62 --EHC/ZVI (Shallow)-3 6.70 --
Average Concentration 6.65 --25-Apr-14 28 EHC/ZVI (Shallow)-1 6.74 --
EHC/ZVI (Shallow)-2 6.76 --EHC/ZVI (Shallow)-3 6.75 --
Average Concentration 6.75 --9-May-14 42 EHC/ZVI (Shallow)-1 7.07 --
EHC/ZVI (Shallow)-2 6.55 -241EHC/ZVI (Shallow)-3 6.74 --
Average Concentration 6.79 --23-May-14 56 EHC/ZVI (Shallow)-1 6.72 --
EHC/ZVI (Shallow)-2 6.74 --EHC/ZVI (Shallow)-3 6.78 --
Average Concentration 6.75 --10-Jun-14 74 EHC/ZVI (Shallow)-1 6.60 --
EHC/ZVI (Shallow)-2 6.58 --EHC/ZVI (Shallow)-3 6.69 --
Average Concentration 6.62 --25-Jun-14 89 EHC/ZVI (Shallow)-1 6.95 --
EHC/ZVI (Shallow)-2 6.90 --EHC/ZVI (Shallow)-3 6.80 --
Average Concentration 6.88 --10-Jul-14 104 EHC/ZVI (Shallow)-1 6.55 --
EHC/ZVI (Shallow)-2 6.56 --EHC/ZVI (Shallow)-3 6.54 --
Average Concentration 6.55 --29-Jul-14 123 EHC/ZVI (Shallow)-1 6.75 --
EHC/ZVI (Shallow)-2 6.50 --EHC/ZVI (Shallow)-3 6.49 --
Average Concentration 6.58 --Anaerobic Active Control 28-Mar-14 0 ANAC (Intermediate)-1 6.66 --
(Intermediate Depth) ANAC (Intermediate)-2 6.66 --ANAC (Intermediate)-3 6.70 --
Average Concentration 6.67 --4-Apr-14 7 ANAC (Intermediate)-1 6.60 --
ANAC (Intermediate)-2 6.66 --ANAC (Intermediate)-3 6.64 --
Average Concentration 6.63 --17-Apr-14 20 ANAC (Intermediate)-1 6.70 --
ANAC (Intermediate)-2 6.63 --ANAC (Intermediate)-3 6.61 --
Average Concentration 6.65 --25-Apr-14 28 ANAC (Intermediate)-1 6.82 --
ANAC (Intermediate)-2 6.79 --ANAC (Intermediate)-3 6.77 --
Average Concentration 6.79 --9-May-14 42 ANAC (Intermediate)-1 -- --
ANAC (Intermediate)-2 -- -69ANAC (Intermediate)-3 -- --
Average Concentration -- --23-May-14 56 ANAC (Intermediate)-1 6.32 --
ANAC (Intermediate)-2 6.40 --ANAC (Intermediate)-3 6.42 --
Average Concentration 6.38 --ZVI Amended/KB-1® Plus Bioaugmented 28-Mar-14 0 ZVI (Intermediate)-1 6.63 --
(Intermediate Depth) ZVI (Intermediate)-2 6.75 --ZVI (Intermediate)-3 6.65 --
Average Concentration 6.68 --

TABLE 5: SUMMARY OF MICROCOSM pH AND ORP RESULTS Elkhart, Indiana
SiREM
Table 5 Page 5 of 7
pH ORPStandard Units mVTreatment Date Day Treatment Replicate
ZVI Amended/KB-1® Plus Bioaugmented 4-Apr-14 7 ZVI (Intermediate)-1 6.67 --(Intermediate Depth) ZVI (Intermediate)-2 6.64 --
Continued ZVI (Intermediate)-3 6.64 --Average Concentration 6.65 --
17-Apr-14 20 ZVI (Intermediate)-1 6.82 --ZVI (Intermediate)-2 6.74 --ZVI (Intermediate)-3 6.82 --
Average Concentration 6.79 --25-Apr-14 28 ZVI (Intermediate)-1 6.91 --
ZVI (Intermediate)-2 6.87 --ZVI (Intermediate)-3 6.92 --
Average Concentration 6.90 --9-May-14 42 ZVI (Intermediate)-1 6.71 --
ZVI (Intermediate)-2 6.76 -284ZVI (Intermediate)-3 6.68 --
Average Concentration 6.72 --23-May-14 56 ZVI (Intermediate)-1 6.54 --
ZVI (Intermediate)-2 6.51 --ZVI (Intermediate)-3 6.53 --
Average Concentration 6.53 --10-Jun-14 74 ZVI (Intermediate)-1 6.97 --
ZVI (Intermediate)-2 7.16 --ZVI (Intermediate)-3 6.91 --
Average Concentration 7.01 --SRS™/ZVI and Ferrous Fumarate Amended/KB-1® Plus Bioaugmented 28-Mar-14 0 SRS/ZVI (Intermediate)-1 6.62 --
(Intermediate Depth) SRS/ZVI (Intermediate)-2 6.67 --SRS/ZVI (Intermediate)-3 6.63 --Average Concentration 6.64 --
4-Apr-14 7 SRS/ZVI (Intermediate)-1 6.53 --SRS/ZVI (Intermediate)-2 6.58 --SRS/ZVI (Intermediate)-3 6.56 --Average Concentration 6.56 --
17-Apr-14 20 SRS/ZVI (Intermediate)-1 6.68 --SRS/ZVI (Intermediate)-2 6.79 --SRS/ZVI (Intermediate)-3 6.64 --Average Concentration 6.70 --
25-Apr-14 28 SRS/ZVI (Intermediate)-1 6.84 --SRS/ZVI (Intermediate)-2 6.75 --SRS/ZVI (Intermediate)-3 6.94 --Average Concentration 6.84 --
9-May-14 42 SRS/ZVI (Intermediate)-1 6.82 --SRS/ZVI (Intermediate)-2 6.65 -306SRS/ZVI (Intermediate)-3 6.78 --Average Concentration 6.75 --
23-May-14 56 SRS/ZVI (Intermediate)-1 6.57 --SRS/ZVI (Intermediate)-2 6.64 --SRS/ZVI (Intermediate)-3 6.52 --Average Concentration 6.58 --
10-Jun-14 74 SRS/ZVI (Intermediate)-1 6.49 --SRS/ZVI (Intermediate)-2 6.86 --SRS/ZVI (Intermediate)-3 6.63 --Average Concentration 6.66 --
SRS™ and Ferrous Fumarate Amended/KB-1® Plus Bioaugmented 28-Mar-14 0 SRS/solFe (Intermediate)-1 6.65 --(Intermediate Depth) SRS/solFe (Intermediate)-2 6.66 --
SRS/solFe (Intermediate)-3 6.63 --Average Concentration 6.65 --
4-Apr-14 7 SRS/solFe (Intermediate)-1 6.56 --SRS/solFe (Intermediate)-2 6.54 --SRS/solFe (Intermediate)-3 6.51 --Average Concentration 6.54 --
17-Apr-14 20 SRS/solFe (Intermediate)-1 6.68 --SRS/solFe (Intermediate)-2 6.63 --SRS/solFe (Intermediate)-3 6.64 --Average Concentration 6.65 --
25-Apr-14 28 SRS/solFe (Intermediate)-1 6.67 --SRS/solFe (Intermediate)-2 6.69 --SRS/solFe (Intermediate)-3 6.70 --Average Concentration 6.69 --
9-May-14 42 SRS/solFe (Intermediate)-1 6.51 --SRS/solFe (Intermediate)-2 6.50 -269SRS/solFe (Intermediate)-3 6.54 --Average Concentration 6.52 --
23-May-14 56 SRS/solFe (Intermediate)-1 6.46 --SRS/solFe (Intermediate)-2 6.48 --SRS/solFe (Intermediate)-3 6.47 --Average Concentration 6.47 --
10-Jun-14 74 SRS/solFe (Intermediate)-1 6.30 --SRS/solFe (Intermediate)-2 6.37 --SRS/solFe (Intermediate)-3 6.37 --Average Concentration 6.35 --

TABLE 5: SUMMARY OF MICROCOSM pH AND ORP RESULTS Elkhart, Indiana
SiREM
Table 5 Page 6 of 7
pH ORPStandard Units mVTreatment Date Day Treatment Replicate
SRS™ Amended/KB-1® Plus Bioaugmented 28-Mar-14 0 SRS (Intermediate)-1 6.66 --(Intermediate Depth) SRS (Intermediate)-2 6.68 --
SRS (Intermediate)-3 6.65 --Average Concentration 6.66 --
4-Apr-14 7 SRS (Intermediate)-1 6.47 --SRS (Intermediate)-2 6.51 --SRS (Intermediate)-3 6.56 --
Average Concentration 6.51 --17-Apr-14 20 SRS (Intermediate)-1 6.71 --
SRS (Intermediate)-2 6.65 --SRS (Intermediate)-3 6.69 --
Average Concentration 6.68 --25-Apr-14 28 SRS (Intermediate)-1 6.68 --
SRS (Intermediate)-2 6.53 --SRS (Intermediate)-3 6.74 --
Average Concentration 6.65 --9-May-14 42 SRS (Intermediate)-1 6.44 --
SRS (Intermediate)-2 6.49 -89SRS (Intermediate)-3 6.52 --
Average Concentration 6.48 --23-May-14 56 SRS (Intermediate)-1 6.35 --
SRS (Intermediate)-2 6.29 --SRS (Intermediate)-3 6.45 --
Average Concentration 6.36 --10-Jun-14 74 SRS (Intermediate)-1 6.26 --
SRS (Intermediate)-2 6.20 --SRS (Intermediate)-3 6.57 --
Average Concentration 6.34 --EHC-L® Amended/KB-1® Plus Bioaugmented 28-Mar-14 0 EHC(Intermediate)-1 6.56 --
(Intermediate Depth) EHC(Intermediate)-2 6.54 --EHC(Intermediate)-3 6.58 --
Average Concentration 6.56 --4-Apr-14 7 EHC(Intermediate)-1 6.36 --
EHC(Intermediate)-2 6.41 --EHC(Intermediate)-3 6.46 --
Average Concentration 6.41 --17-Apr-14 20 EHC(Intermediate)-1 6.49 --
EHC(Intermediate)-2 6.49 --EHC(Intermediate)-3 6.50 --
Average Concentration 6.49 --25-Apr-14 28 EHC(Intermediate)-1 6.64 --
EHC(Intermediate)-2 6.60 --EHC(Intermediate)-3 6.61 --
Average Concentration 6.62 --9-May-14 42 EHC(Intermediate)-1 6.42 --
EHC(Intermediate)-2 6.42 -140EHC(Intermediate)-3 6.44 --
Average Concentration 6.43 --23-May-14 56 EHC(Intermediate)-1 6.36 --
EHC(Intermediate)-2 6.40 --EHC(Intermediate)-3 6.44 --
Average Concentration 6.40 --10-Jun-14 74 EHC(Intermediate)-1 6.29 --
EHC(Intermediate)-2 6.41 --EHC(Intermediate)-3 6.45 --
Average Concentration 6.38 --EHC®-L and ZVI Amended/KB-1® Plus Bioaugmented 28-Mar-14 0 EHC/ZVI (Intermediate)-1 6.56 --
(Intermediate Depth) EHC/ZVI (Intermediate)-2 6.61 --EHC/ZVI (Intermediate)-3 6.65 --Average Concentration 6.61 --
4-Apr-14 7 EHC/ZVI (Intermediate)-1 6.40 --EHC/ZVI (Intermediate)-2 6.45 --EHC/ZVI (Intermediate)-3 6.46 --Average Concentration 6.44 --
17-Apr-14 20 EHC/ZVI (Intermediate)-1 6.78 --EHC/ZVI (Intermediate)-2 6.94 --EHC/ZVI (Intermediate)-3 6.78 --Average Concentration 6.83 --
25-Apr-14 28 EHC/ZVI (Intermediate)-1 6.91 --EHC/ZVI (Intermediate)-2 6.88 --EHC/ZVI (Intermediate)-3 6.91 --Average Concentration 6.90 --
9-May-14 42 EHC/ZVI (Intermediate)-1 6.78 --EHC/ZVI (Intermediate)-2 6.78 -190EHC/ZVI (Intermediate)-3 6.69 --Average Concentration 6.75 --
23-May-14 56 EHC/ZVI (Intermediate)-1 6.78 --EHC/ZVI (Intermediate)-2 6.65 --EHC/ZVI (Intermediate)-3 6.64 --Average Concentration 6.69 --

TABLE 5: SUMMARY OF MICROCOSM pH AND ORP RESULTS Elkhart, Indiana
SiREM
Table 5 Page 7 of 7
pH ORPStandard Units mVTreatment Date Day Treatment Replicate
EHC®-L and ZVI Amended/KB-1® Plus Bioaugmented 10-Jun-14 74 EHC/ZVI (Intermediate)-1 6.83 --(Intermediate Depth) EHC/ZVI (Intermediate)-2 6.74 --
Continued EHC/ZVI (Intermediate)-3 6.73 --Average Concentration 6.77 --
Notes:* All treatments were amended with the vitamin/nutrient mix on Day 0ANAC - anaerobic active controlANSC - anaerobic sterile controlORP - oxidation reduction potentialsol Fe - soluble ironZVI - zero valent iron
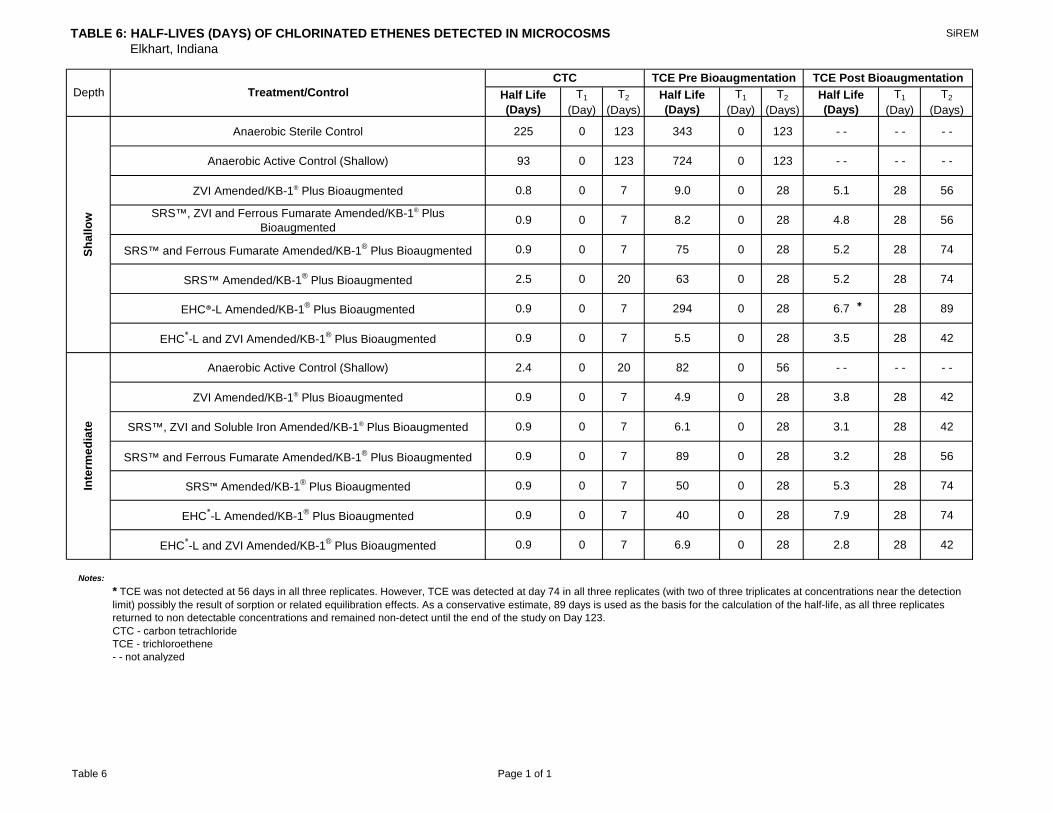
TABLE 6: HALF-LIVES (DAYS) OF CHLORINATED ETHENES DETECTED IN MICROCOSMS Elkhart, Indiana
SiREM
Table 6 Page 1 of 1
Half Life (Days)
T1
(Day)T2
(Days)Half Life (Days)
T1
(Day)T2
(Days)Half Life (Days)
T1
(Day)T2
(Days)
Anaerobic Sterile Control 225 0 123 343 0 123 - - - - - -
Anaerobic Active Control (Shallow) 93 0 123 724 0 123 - - - - - -
ZVI Amended/KB-1® Plus Bioaugmented 0.8 0 7 9.0 0 28 5.1 28 56
SRS™, ZVI and Ferrous Fumarate Amended/KB-1® Plus Bioaugmented 0.9 0 7 8.2 0 28 4.8 28 56
SRS™ and Ferrous Fumarate Amended/KB-1® Plus Bioaugmented 0.9 0 7 75 0 28 5.2 28 74
SRS™ Amended/KB-1® Plus Bioaugmented 2.5 0 20 63 0 28 5.2 28 74
EHC®-L Amended/KB-1® Plus Bioaugmented 0.9 0 7 294 0 28 6.7 28 89
EHC®-L and ZVI Amended/KB-1® Plus Bioaugmented 0.9 0 7 5.5 0 28 3.5 28 42
Anaerobic Active Control (Shallow) 2.4 0 20 82 0 56 - - - - - -
ZVI Amended/KB-1® Plus Bioaugmented 0.9 0 7 4.9 0 28 3.8 28 42
SRS™, ZVI and Soluble Iron Amended/KB-1® Plus Bioaugmented 0.9 0 7 6.1 0 28 3.1 28 42
SRS™ and Ferrous Fumarate Amended/KB-1® Plus Bioaugmented 0.9 0 7 89 0 28 3.2 28 56
SRS™ Amended/KB-1® Plus Bioaugmented 0.9 0 7 50 0 28 5.3 28 74
EHC®-L Amended/KB-1® Plus Bioaugmented 0.9 0 7 40 0 28 7.9 28 74
EHC®-L and ZVI Amended/KB-1® Plus Bioaugmented 0.9 0 7 6.9 0 28 2.8 28 42
Notes:
CTC - carbon tetrachlorideTCE - trichloroethene- - not analyzed
* TCE was not detected at 56 days in all three replicates. However, TCE was detected at day 74 in all three replicates (with two of three triplicates at concentrations near the detection limit) possibly the result of sorption or related equilibration effects. As a conservative estimate, 89 days is used as the basis for the calculation of the half-life, as all three replicates returned to non detectable concentrations and remained non-detect until the end of the study on Day 123.
Treatment/ControlTCE Post Bioaugmentation
Shal
low
Inte
rmed
iate
CTCDepth
TCE Pre Bioaugmentation
*

FIGURES
TL0337.10 1/14/2015

pa
thw
ay_
me
tha
ns_
2012
.ai
August 2014
Figure: 1
Pathways for the Degradation ofChlorinated Methanes
reductivedechlorination
reductivedechlorination
reductivedechlorination
cometabolism(methanotrophs)
oxidation(methylotrophs)
(denitrifiers)
oxidation(methylotrophs)
oxidation(methylotrophs)
CO2
CO2
CO2
CO2 (up to 30%)CO (1 to 5%)
CO2
CO2
CO2
acetateformic acid
denitrification
acetateCO2
methanethiol dimethyl sulfide
Carbon Tetrachloride (CTC)
Chloroform(CF)
Dichloromethane(DCM)
Chloromethane(CM)
Methane(CH4)
CS2
CS2
reduction in presenceof sulfate
reduction in presenceof sulfate
reduction in presenceof sulfate
reduction/
cometabolism
denitrification
acetogenesis
acetogenesis

pa
thw
ays
_ch
lorin
ate
d e
the
ne
s.a
i
August 2014
Figure: 2
Pathways for the Degradation of Chlorinated Ethenes
Trichloroethene(TCE)
cis-1,2-Dichloroethene(cis-1,2-DCE)
Vinyl Chloride(VC)
Ethene
cometabolism(methanotrophs)
(toluene oxidizers)(propane oxidizers)(ammonia oxidizers)
(phenol oxidizers)(ethene oxidizers)
oxidation
CO2
CO2
CO2
CO2
reductive dechlorination
reductive dechlorination
reductive dechlorination
reductive dechlorination
cometabolismtoluene oxidizers CO2
cometabolism(as for TCE)
cometabolism(as for TCE)
or oxidation
or oxidation
Anaerobic ConditionsAerobic Conditions
Tetrachloroethene(PCE)
CO2
CO2
CO2
anaerobic oxidation
anaerobic oxidation
(iron reducers)
anaerobic oxidation(manganese reducers)

(modified from Arnold and Roberts, 2000)
Chlorinated Ethene Degradation Pathways with ZVI
Sep 2014
Figure: 3
cis 1,2-DCE 1,1-DCE trans 1,2-DCE
VC
Ethene
Chloroacetylene
Dichloroacetylene
Acetylene
PCE
TCE
Ethane
Cl Cl
C=C Cl Cl
Cl Cl
C=C Cl H
Cl H
C=C Cl H
Cl H
C=C Cl Cl
Cl Cl
C=C H H
Cl H
C=C H H
H H
C=C H H
④
③
② ②
② ② ②
②
②
②
②
①
①
①
Cl─C C─Cl
① Reductive ß-elimination ② Hydrogenolysis ③ Hydrogenation

(Tamara and Butler, 2004)
Carbon Tetrachloride Degradation Pathways with ZVI
Sep 2014
Figure: 4
Pathways:
[a] and [i] Reductive dehalogenation [c], [e], and [f] Dichlorelimination, followed by hydrolysis

0.001
0.002
0.003
0.004
0.005
0.006
0.007C
hlor
inat
ed C
ompo
unds
(mm
oles
/bot
tle)
Chlorinated Ethene and Methane Concentration Trends in Anaerobic Sterile Control Microcosms
(Shallow)
Elkhart, IndianaSeptember 2014
Figure: 5
0.000
0.001
0 20 40 60 80 100 120 140
Chl
o
Time (Days)
TCE cDCE VC Ethene
CTC CF DCM Methane

0.001
0.002
0.003
0.004
0.005
0.006
0.007C
hlor
inat
ed C
ompo
unds
(mm
oles
/bot
tle)
Chlorinated Ethene and Methane Concentration Trends in Anaerobic Active Control Microcosms
(Shallow)
Elkhart, IndianaSeptember 2014
Figure: 6
0.000
0.001
0 20 40 60 80 100 120 140
Chl
o
Time (Days)
TCE cDCE VC Ethene
CTC CF DCM Methane

0.002
0.004
0.006
0.008
0.010
0.012
0.001
0.002
0.003
0.004
0.005
0.006
0.007
Met
hane
(mm
oles
/bot
tle)
Chl
orin
ated
Com
poun
ds (m
mol
es/b
ottle
)
Chlorinated Ethene and Methane Concentration Trends in ZVI Amended/ KB-1® Plus Bioaugmented Microcosms
(Shallow)
Elkhart, IndianaSeptember 2014
Figure: 7
0.000
0.002
0.000
0.001
0 20 40 60 80 100 120 140
Chl
o
Time (Days)TCEcDCEVCEtheneCTCCFDCMSpiked with CTC to 2 mg/LBioaugmented with KB-1® Plus Spiked with CTC and TCE to 2 mg/LMethane

0.001
0.002
0.003
0.004
0.005
0.006
0.007
0.008
0.001
0.002
0.003
0.004
0.005
0.006
0.007
Met
hane
(mm
oles
/bot
tle)
Chl
orin
ated
Com
poun
ds (m
mol
es/b
ottle
)
Chlorinated Ethene and Methane Concentration Trends in SRS™/ZVI/Ferrous Fumarate Amended/KB-1® Plus
Bioaugmented Microcosms (Shallow)
Elkhart, IndianaSeptember 2014
Figure: 8
0
0.001
0.000
0.001
0 20 40 60 80 100 120 140
Chl
o
Time (Days)TCEcDCEVCEtheneCTCCFDCMAmended with Ferrous FumarateSpiked with CTC to 2 mg/LBioaugmented with KB-1® Plus Spiked with CTC and TCE to 2 mg/L
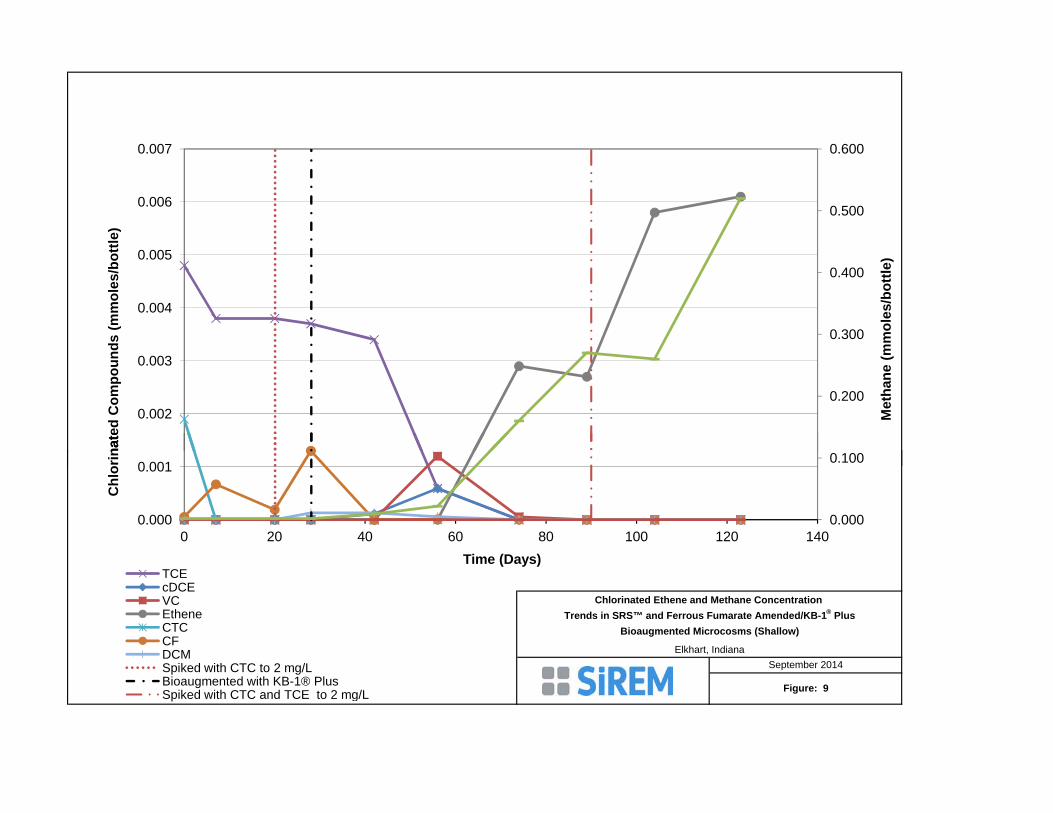
0.100
0.200
0.300
0.400
0.500
0.600
0 001
0.002
0.003
0.004
0.005
0.006
0.007
Met
hane
(mm
oles
/bot
tle)
rinat
ed C
ompo
unds
(mm
oles
/bot
tle)
Chlorinated Ethene and Methane Concentration Trends in SRS™ and Ferrous Fumarate Amended/KB-1® Plus
Bioaugmented Microcosms (Shallow)
Elkhart, IndianaSeptember 2014
Figure: 9
0.000
0.100
0.000
0.001
0 20 40 60 80 100 120 140
Chl
orin
ate
Time (Days)TCEcDCEVCEtheneCTCCFDCMSpiked with CTC to 2 mg/LBioaugmented with KB-1® Plus Spiked with CTC and TCE to 2 mg/L

0 05
0.1
0.15
0.2
0.25
0.3
0.35
0.4
0.45
0.5
0.001
0.002
0.003
0.004
0.005
0.006
0.007
Met
hane
(mm
oles
/bot
tle)
Chl
orin
ated
Com
poun
ds (m
mol
es/b
ottle
)
Chlorinated Ethene and Methane Concentration Trends in SRS™ Amended/KB-1® Plus Bioaugmented Microcosms
(Shallow)
Elkhart, IndianaSeptember 2014
Figure: 10
0
0.05
0.000
0.001
0 20 40 60 80 100 120 140
Chl
o
Time (Days)TCEcDCEVCEtheneCTCCFDCMSpiked with CTC to 2 mg/LBioaugmented with KB-1® Plus Spiked with CTC and TCE to 2 mg/LMethane

0.2
0.4
0.6
0.8
1
1.2
0.001
0.002
0.003
0.004
0.005
0.006
0.007
Met
hane
(mm
oles
/bot
tle)
Chl
orin
ated
Com
poun
ds (m
mol
es/b
ottle
)
Chlorinated Ethene and Methane Concentration Trends in EHC®-L Amended/KB-1® Plus Bioaugmented Microcosms
(Shallow)
Elkhart, IndianaSeptember 2014
Figure: 11
0
0.2
0.000
0.001
0 20 40 60 80 100 120 140
Chl
o
Time (Days)TCEcDCEVCEtheneCTCCFDCMSpiked with CTC to 2 mg/LBioaugmented with KB-1® Plus Spiked with CTC and TCE to 2 mg/LMethane
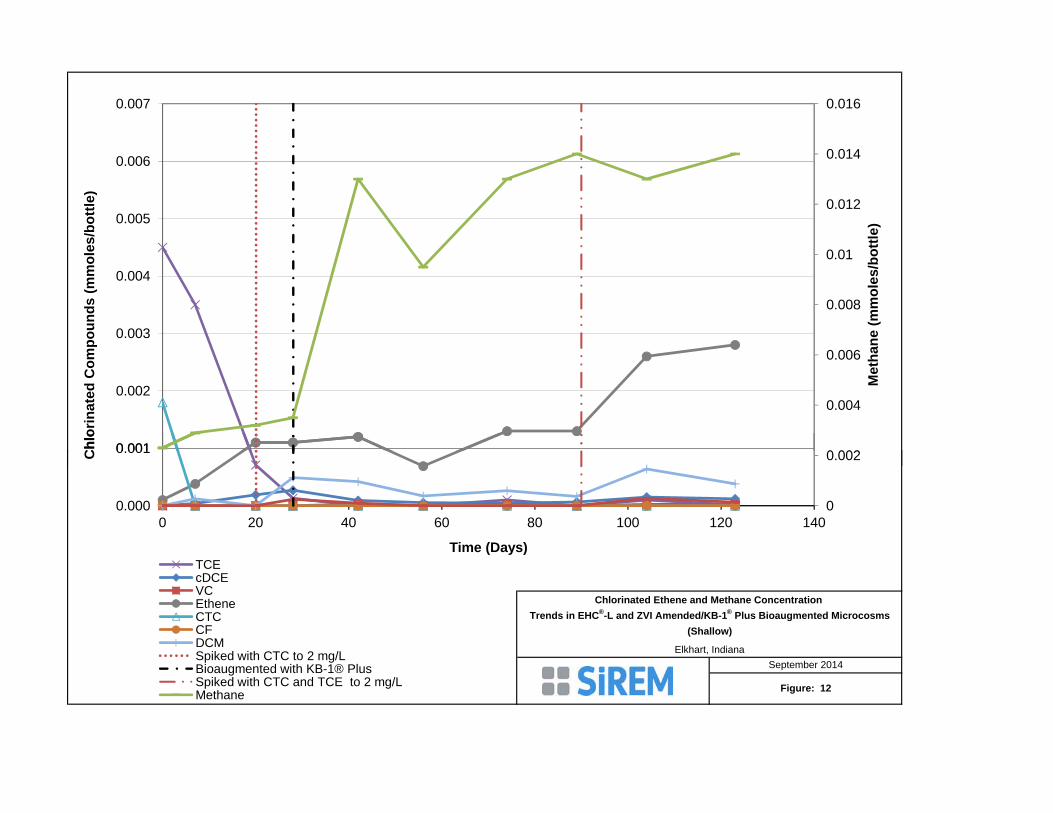
0.002
0.004
0.006
0.008
0.01
0.012
0.014
0.016
0.001
0.002
0.003
0.004
0.005
0.006
0.007
Met
hane
(mm
oles
/bot
tle)
Chl
orin
ated
Com
poun
ds (m
mol
es/b
ottle
)
Chlorinated Ethene and Methane Concentration Trends in EHC®-L and ZVI Amended/KB-1® Plus Bioaugmented Microcosms
(Shallow)
Elkhart, IndianaSeptember 2014
Figure: 12
0
0.002
0.000
0.001
0 20 40 60 80 100 120 140
Chl
o
Time (Days)TCEcDCEVCEtheneCTCCFDCMSpiked with CTC to 2 mg/LBioaugmented with KB-1® Plus Spiked with CTC and TCE to 2 mg/LMethane

0.001
0.002
0.003
0.004
0.005
0.006C
hlor
inat
ed C
ompo
unds
(mm
oles
/bot
tle)
Chlorinated Ethene and Methane Concentration Trends in Anaerobic Active Control Microcosms
(Intermediate)
Elkhart, IndianaSeptember 2014
Figure: 13
0.000
0.001
0 10 20 30 40 50 60
Chl
o
Time (Days)
TCE cDCE VC Ethene
CTC CF DCM Methane

0.001
0.002
0.003
0.004
0.005
0.006C
hlor
inat
ed C
ompo
unds
(mm
oles
/bot
tle)
Chlorinated Ethene and Methane Concentration Trends in ZVI Amended/ KB-1® Plus Bioaugmented Microcosms
(Intermediate)
Elkhart, IndianaSeptember 2014
Figure: 14
0.000
0.001
0 10 20 30 40 50 60 70 80
Chl
o
Time (Days)TCEcDCEVCEtheneCTCCFDCMMethaneSpiked with CTC to 2 mg/LBioaugmented with KB-1® Plus

0.002
0.004
0.006
0.008
0.01
0.012
0.014
0.001
0.002
0.003
0.004
0.005
0.006
Met
hane
(mm
oles
/bot
tle)
Chl
orin
ated
Com
poun
ds (m
mol
es/b
ottle
)
Chlorinated Ethene and Methane Concentration Trends in SRS™/ZVI/Ferrous Fumarate Amended/KB-1® Plus
Bioaugmented Microcosms (Intermediate)
Elkhart, IndianaSeptember 2014
Figure: 15
0
0.002
0.000
0.001
0 10 20 30 40 50 60 70 80
Chl
o
Time (Days)TCE cDCE
VC Ethene
CTC CF
DCM Spiked with CTC to 2 mg/L
Bioaugmented with KB-1® Plus Methane

0.05
0.1
0.15
0.2
0.25
0.3
0.35
0.001
0.002
0.003
0.004
0.005
0.006
Met
hane
(mm
oles
/bot
tle)
Chl
orin
ated
Com
poun
ds (m
mol
es/b
ottle
)
Chlorinated Ethene and Methane Concentration Trends in SRS™ and Ferrous Fumarate Amended/KB-1® Plus
Bioaugmented Microcosms (Intermediate)
Elkhart, IndianaSeptember 2014
Figure: 16
0
0.05
0.000
0.001
0 10 20 30 40 50 60 70 80
Chl
o
Time (Days)TCEcDCEVCEtheneCTCCFDCMSpiked with CTC to 2 mg/LBioaugmented with KB-1® Plus Methane

0.05
0.1
0.15
0.2
0.25
0.3
0.001
0.002
0.003
0.004
0.005
0.006
Met
hane
(mm
oles
/bot
tle)
Chl
orin
ated
Com
poun
ds (m
mol
es/b
ottle
)
Chlorinated Ethene and Methane Concentration Trends in SRS™ Amended/KB-1® Plus Bioaugmented Microcosms
(Intermediate)
Elkhart, IndianaSeptember 2014
Figure: 17
0
0.05
0.000
0.001
0 10 20 30 40 50 60 70 80
Chl
o
Time (Days)TCEcDCEVCEtheneCTCCFDCMSpiked with CTC to 2 mg/LBioaugmented with KB-1® Plus Methane

0.05
0.1
0.15
0.2
0.25
0.3
0.001
0.002
0.003
0.004
0.005
0.006
Met
hane
(mm
oles
/bot
tle)
Chl
orin
ated
Com
poun
ds (m
mol
es/b
ottle
)
Chlorinated Ethene and Methane Concentration Trends in EHC®-L Amended/KB-1® Plus Bioaugmented Microcosms
(Intermediate)
Elkhart, IndianaSeptember 2014
Figure: 18
0
0.05
0.000
0.001
0 10 20 30 40 50 60 70 80
Chl
o
Time (Days)TCEcDCEVCEtheneCTCCFDCMSpiked with CTC to 2 mg/LBioaugmented with KB-1® Plus Methane

0.005
0.01
0.015
0.02
0.025
0.03
0.035
0.04
0.001
0.002
0.003
0.004
0.005
0.006
Met
hane
(mm
oles
/bot
tle)
Chl
orin
ated
Com
poun
ds (m
mol
es/b
ottle
)
Chlorinated Ethene and Methane Concentration Trends in EHC®-L and ZVI Amended/KB-1® Plus Bioaugmented Microcosms
(Intermediate)
Elkhart, IndianaSeptember 2014
Figure: 19
0
0.005
0.000
0.001
0 10 20 30 40 50 60 70 80
Chl
o
Time (Days)TCEcDCEVCEtheneCTCCFDCMSpiked with CTC to 2 mg/LBioaugmented with KB-1® Plus Methane

APPENDIX A: Chain of Custody Documentation
TL0337.10 1/14/2015


APPENDIX B: Henry’s Law Calculation
TL0337.10 1/14/2015

The following Henry’s Law calculation was used to convert aqueous concentrations (Table 2) to total mmoles of each analyte per microcosm bottle (Figures 5 to 19): Total mmoles = Cliq x (Vliq + H x Vgas)__
Molecular Weight (mg/mmol)
Where Cliq = liquid concentration (mg/L) Vliq = liquid volume (0.230 L) per bottle Vgas = headspace volume (0.020 L) per bottle H = Henry’s Law constant (dimensionless) The Henry’s Law constants used are summarized in the table below.
Analyte Henry’s Law Constant a (dimensionless)
Trichloroethene 0.417 cis-1,2-Dichloroethene 0.184
Vinyl chloride 1.08 Carbon Tetrachloride 1.24
Chloroform 0.178 Dichloromethane 0.121 Chloromethane 0.495
Ethene 8.78 Ethane 20.47
Methane 27.27 a Source: Montgomery, J.H. 2000. Groundwater Chemicals Desk Reference, Third Edition. CRC Press LLC, Boca Raton, FL.
TL0337.10 1/14/2015

Appendix C: Ferrous Iron Test Method
TL0337.10 1/14/2015
• Iron, Ferrous, Test Kit1,10 Phenanthroline Iron Reagent Method
• Trousse d’analyse fer ferreuxMéthode réactif fer 1, 10 Phéanthroline
• Eisen, 2wertig Test Kit1,10 Phenanthrolin-Eisenreagenz Methode
• Kit de análisis para hierro ferrosoMétodo reactivo de fenatrolina de hierro 1,10
0.0 – 10.0 mg/L• Mod. IR-18C • # 26672-00
26672-88
• To ensure accurate results, read carefully before proceeding.• Pour obtenir des résultats exacts, lire attentivement le mode d’emploi avant d’utiliser la trousse.• Um genaue Ergebnisse zu gewährleisten, lesen Sie das Folgende bitte aufmerksam durch, bevor Sie fortfahren.• Para obtener resultados precisos, lea detenidamente las instrucciones antes de proceder al análisis.
WARNINGHandling chemical samples, standards, and reagents can
be dangerous. Review the Material Safety Data Sheets before handling any chemicals.
ATTENTIONLa manipulation des échantillons chimiques, étalons et
réactifs peut être dangereuse. Lire les fiches de données de sécurité des produits avant de manipuler tout
produit chimique.
WARNUNGDie Handhabung chemischer Proben, Standards und Reagenzien kann gefährlich sein. Bitte gehen Sie die
Materialsicherheitsdatenblätter durch, bevor Sie Chemikalien handhaben.
ADVERTENCIAEl manejo de sustancias químicas, patrones y reactivos,
puede resultar peligroso. Lea las fichas de informaciones de seguridad de materiales antes de manipular cualquier
producto químico.

IntroductionThe 1,10 phenanthroline indicator in the Ferrous Iron Reagent reacts with ferrous iron in the sample to form an orange color in proportion to the ferrous iron concentration. Ferric iron does not react. The ferric iron (Fe3+) concentration can be determined by subtracting the ferrous iron concentration from the results of a total iron test.
IntroductionL’indicateur 1,10 phénanthroline dans le réactif fer ferreux réagit avec le fer ferreux présent dans l’échantillon pour former une coloration orange proportionnelle à la concentration de fer ferreux. Le fer ferrique ne réagit pas. La concentration de fer ferrique (Fe3+) peut être déterminée en soustrayant la concentration de fer ferreux des résultats d’une analyse de fer total.
EinleitungDer 1,10 Phenantrolin Indikator im Eisen(II)-Reagenz reagiert mit Eisen(II) in der Probe durch Bildungen einer orangen Farbe, proprotional zur Konzentration des zweiwertigen Eisens. Eisen(III) reagiert nicht. Die Konzentration des dreiwertigen Eisen (Fe3+) kann bestimmt werden, indem man die Konzentration des zweiwertigen Eisens von den Ergebnissen eines Eisen Gesamt Tests subtrahiert.
IntroducciónEl indicador de 1,10-fenantrolina en el Reactivo para Hierro Ferroso reacciona con el hierro ferroso de la muestra para formar un color anaranjado en proporción con la concentración de hierro ferroso. El hierro férrico no reacciona. La concentración de hierro férrico (Fe3+) puede ser determinada restando la concentración de hierro ferroso de el resultado de una prueba de hierro total.
2

Measuring Hints and General Test Information• Wash all labware between tests. Contamination may alter test results. Clean with a
non-abrasive detergent or a solvent such as isopropyl alcohol. Use a soft cloth for wiping or drying. Do not use paper towels or tissue on plastic tubes as this may scratch them. Rinse with clean water (preferably deionized water).
• Rinse all viewing tubes thoroughly with the sample water before testing.• Use clippers to open plastic powder pillows.• For critical testing, reagent accuracy should be checked with each new lot of reagents.
Prepare a ferrous iron stock solution (100 mg/L Fe) by dissolving 0.702 grams of ferrous ammonium sulfate, hexahydrate, in one liter deionized water. Dilute 5.00 mL of this solution to 100 mL with deionized water to make a 5.0 mg/L standard solution. Prepare this immediately before use. Follow the ferrous iron test instructions using this solution instead of a water sample.
Conseils pour les mesures et informations générales sur l’analyse• Laver toute la verrerie entre les analyses. La contamination peut fausser les résultats
d’analyses. Laver avec un détergent non abrasif ou un solvant tel que l’isopropanol. Utiliser un tissu doux pour essuyer ou sécher. Ne pas utiliser de tissu ou papier d’essuyage sur les tubes en plastique pour ne pas les rayer. Rincer à l’eau propre (de préférence de l’eau désionisée).
• Rincer soigneusement tous les tubes colorimétriques avec l’échantillon d’eau avant l’analyse.
• Utiliser la pince coupante pour ouvrir les gélules en plastique.• Pour des analyses critiques, l’exactitude du réactif doit être vérifiée pour chaque
nouveau lot de réactifs. Préparer une solution-mère de fer ferreux (100 mg/L Fe) en dissolvant 0,702 grammes d’ammonium-fer (II) sulfate, hexahydrate, dans un litre d’eau désionisée. Diluer 3,00 mL de cette solution à 100 mL avec de l’eau désionisée pour obtenir une solution étalon à 3,0 mg/L. Préparer cette solution immédiatement avant emploi. Suivre les instructions d’analyse du fer ferreux en remplaçant l’échantillon par cette solution étalon.
3

Meßtips und allgemeine Testinformationen• Waschen Sie alle Laborartikel zwischen den Tests. Verunreinigung kann die
Testergebnisse verfälschen. Reinigen Sie sie mit einem nicht scharfen Detergent oder einem Lösungsmittel wie zum Beispiel Isopropylalkohol. Verwenden Sie für das Abwischen oder Abtrocknen ein weiches Tuch. Verwenden Sie bei den Plastikröhrchen keine Papierhandtücher oder Tissue-Papier, da dieses sie zerkratzen kann. Spülen Sie mit sauberem Wasser (vorzugsweise entsalztes Wasser).
• Spülen Sie alle Prüfröhrchen vor dem Test gründlich mit dem Probenwasser.• Verwenden Sie eine Schere zur Öffnung der Plastik-Pulverkissen.• Um genaue Bestimungen zu erzielen, sollte die Genauigkeit der Reagenzien für jede
neue Charge überprüft werden. Bereiten Sie eine Eisen-II Stammlösung (100mg/L Fe) auf, indem Sie 0,702 Gramm Eisen-II Ammoniumsulfat, hexahydrat, in einem Liter entsalzten Wasser lösen. 3,00 mL dieser Lösung werden mit 100 mL entsalztem Wasser verdünnt, so dass eine 3,0 mg/L Standardlösung entsteht. Diese Lösung wird unmittelbar vor Gebrauch angesetzt. Arbeiten Sie, unter Benutzung dieser Lösung anstelle einer Wasserprobe, gemäß den Anweisungen für den Eisen(II) Test.
Consejos para la medición e información general sobre el análisis• Lavar todo el material de laboratorio entre los análisis. La contaminación puede
alterar los resultados. Limpiar con un detergente no abrasivo o con un solvente como el alcohol isopropílico. Utilizar un paño suave para limpiar o secar. No utilizar ni toallitas ni pañuelos de papel para limpiar los tubos de plastico para no rayarlos. Aclarar con agua limpia (preferentemente agua desionizada).
• Enjuagar todos los tubos para colorimetría abundantemente con la muestra de agua antes de realizar el análisis.
• Utilice las pinzas cortantes para abrir las cápsulas de plástico.• Para pruebas exigentes o difficiles, la precisión del reactivo debe ser verificada cada
vez que se comienza con un nuevo lote. Preparar una solución de reserva de hierro ferroso (100 mg/L Fe), disolviendo 0,702 gs. de sulfato de amonio ferroso, hexahidrato, en un litro de agua desionizada. Diluya 3,00 mL de esta solución en 100 mL de agua desionizada para hacer una solución estándar de 3,00 mg/L. Esta debe ser preparada inmediatamente antes de usarla. Siga las instrucciones de la prueba de hierro ferroso empleando esta solución en vez de una muestra de agua.
4

• Procedure • Technique • Verfahren • Procedimiento
1. Fill a viewing tube to the first (5-mL) line with sample water. This is the blank.
♦ Remplir un tube colorimétrique jusqu’au premier trait (5 mL) avec l’échantillon d’eau. Ceci est le blanc.
♦ Füllen Sie ein Prüfröhrchen bis zur ersten (5 mL) Linie mit Probenwasser. Dieses ist die Blindprobe.
♦ Llene un tubo para colorimetría hasta la primera marca (5 mL) con la muestra de agua. Esto constituye el blanco.
2. Place this tube in the top left opening of the color comparator.
♦ Placer ce tube dans l’ouverture supérieure gauche du comparateur.
♦ Stellen Sie dieses Röhrchen in die obere linke Öffnung des Farbkomparators.
♦ Coloque este tubo en la abertura superior izquierda del comparador.
3. Fill the measuring vial to the 25-mL mark withsample water.
♦ Remplir le tube de mesure jusqu’au trait 25 mL avec l’échantillon d’eau.
♦ Füllen Sie das Messröhrchen bis zur 25 mL Markierung mit dem Probenwasser.
♦ Llene el frasco medidor hasta la marca de 25 mL con el agua de la muestra.
4. Add the contents of one Ferrous Iron Reagent Powder Pillow to the measuring vial.
♦ Ajouter le contenu d’une gélule de réactif du fer ferreux au tube de mesure.
♦ Geben Sie den Inhalt eines Eisen(II)-Reagenz-Pulverkissens in das Messröhrchen.
♦ Agregue el contenido de una cápsula del Reactivo para Hierro Ferroso al frasco medidor.
2
5
10
15
20
25
2
5
10
15
20
25
5

5. Swirl to mix. An orange color will develop if ferrous iron is present. Allow three minutes for full color development.
♦ Agiter pour mélanger. En présence de fer ferreux, une coloration orange se développe. Attendre le développement complet de la coloration.
♦ Schwenken Sie zum Vermischen. Ist Eisen(II) vorhanden, entwickelt sich eine orange Färbung. Warten Sie drei Minuten, bis sich die Farbe vollständig ausgebildet hat.
♦ Agite para mezclar. Se formará un color anaranjado en presencia de hierro ferroso. Deje pasar tres minutos para que el color se desarrolle completamente.
6. Fill another viewing tube to the first (5-mL) mark with the prepared sample.
♦ Remplir un autre tube jusqu’au premier trait (5 mL) avec l’échantillon préparé.
♦ Füllen Sie ein weiteres Prüfröhrchen bis zur ersten (5 mL-) Linie mit der vorbereiteten Probe.
♦ Llene otro tubo para colorimetría hasta la marca de 5mL con la muestra preparada en los puntos 4 y 5.
7. Place the second tube in the top right opening of the color comparator.
♦ Placer le second tube dans l’ouverture supérieure droite du comparateur.
♦ Setzen Sie das zweite Röhrchen in die obere rechte Öffnung des Farbkomparators.
♦ Coloque el segundo tubo en la abertura superior derecha del comparador.
2
5
10
15
20
25
2
5
10
15
20
25
6

8. Hold comparator up to a light source such as the sky, a window or a lamp. Look through the openings in front.
♦ Tenir le comparateur face à une surface uniformément éclairée (ciel, lampe, fenêtre) et regarder par les ouvertures de la face antérieure du comparateur.
♦ Halten Sie den Komparator gegen eine Lichtquelle wie zum Beispiel den Himmel, ein Fenster oder eine Lampe. Sehen Sie durch die Öffnungen vorn.
♦ Lleve el comparador hasta una fuente de luz, tal como el cielo, una ventana o una lámpara. Mire a través de las aberturas frontales del comparador.
9. Rotate the color disc until the color matches in the two openings.
♦ Tourner le disque jusqu’à égalité des teintes dans les deux ouvertures.
♦ Drehen Sie die Farbscheibe, bis die Farbe in den beiden Öffnungen übereinstimmt.
♦ Haga girar el disco de color hasta que el color coincida en ambas aberturas.
10. Read the mg/L ferrous iron in the scale window.♦ Lire la concentration du fer ferreux en mg/L dans la
fenêtre de l’échelle.
♦ Lesen Sie die mg/L Eisen(II) im Skalenfenster ab.
♦ Lea la concentración de hierro ferroso en mg/L en la ventanilla graduada.
7

REPLACEMENTSDescription Unit Cat. No.Clippers ................................................................................................... each...........968-00Color Comparator.................................................................................... each.........1732-00Color Disc, Iron Phenanthroline.............................................................. each.........1874-00Ferrous Iron Reagent Powder Pillows, 25 mL .................................. 100/pkg.........1037-69Instruction Card, IR-18C Test Kit ........................................................... each.......26672-88Vial, measuring, with 2, 5, 10, 15, 20 and 25-mL marks ........................ each.........2193-00Viewing Tube, plastic ............................................................................ 4/pkg.......46600-04Water, deionized ........................................................................................ 4 L...........272-56
REACTIFS ET PIECES DE RECHANGEDésignation Unité Réf. No
Pince coupante pour gélules moyennes........................................................ 1...........968-00Comparateur ................................................................................................. 1.........1732-00Disque coloré fer, phénanthroline ................................................................ 1.........1874-00Réactif du fer ferreux en gélules pour 25 mL ....................................100/paq.........1037-69Mode d’emploi de la trousse IR-18C ........................................................... 1.......26672-88Tube de mesure marqué 2, 5, 10, 15, 20 et 25 mL ....................................... 1.........2193-00Tube colorimétrique en plastique avec bouchon ....................................4/paq.......46600-04Eau désionisée ........................................................................................... 4 L...........272-56
VERBRAUCHSMATERIAL UND ERSATZTEILEBeschreibung Einheit Kat. Nr.Abschneider.................................................................................................. 1...........968-00Farbkomparator ............................................................................................ 1.........1732-00Farbscheibe, Eisenphenanthrolin.................................................................. 1.........1874-00Eisen(II) Reagenz-Pulverkissen, 25 mL........................................... 100/Stck.........1037-69Anleitungskarte, IR-18C Test Kit................................................................. 1.......26672-88Messröhrchen m. 2, 5, 10, 15, 20 und 25 mL Markierungen ....................... 1.........2193-00Farbprüfröhrchen, Plastik, mit Kappe .................................................. 4/Stck.......46600-04Entsalztes Wasser ...................................................................................... 4 L...........272-56
REACTIVOS Y MATERIALESDescripción Unidad No Ref.Pinzas cortantes para cápsulas intermedias .................................................. 1...........968-00Comparador de Colores................................................................................ 1.........1732-00Disco de colores, fenantrolina de hierro....................................................... 1.........1874-00Reactivo para Hierro Ferroso, Bolsas de Polvo, 25 mL .................... 100/lote.........1037-69Tarjeta de Instrucciones, Juego de Prueba IR-18C....................................... 1.......26672-88Frasco medidor, con marcas a 2, 5, 10, 15, 20 y 25 mL............................... 1.........2193-00Tubo para colorimetría de plástico, con tapa protectora ....................... 4/lote.......46600-04Agua desionizada ...................................................................................... 4 L...........272-56
8

OPTIONAL REAGENTS AND EQUIPMENTDescription Unit Cat. No.Caps, for plastic Color Viewing Tubes 46600-04 ................................. 4/pkg.......46600-14Ferrous Ammonium Sulfate, Hexahydrate............................................ 113 g.......11256-14Flask, volumetric, Class A, 100-mL........................................................ each.......26366-42Flask, volumetric, Class A, 1000-mL...................................................... each.......26366-53Pipet, volumetric, Class A, 5-mL............................................................ each.......14515-37Pipet Filler, safety bulb............................................................................ each.......14651-00
REACTIFS ET EQUIPEMENTS OPTIONNELSDésignation Unité Réf. No
Bouchons pour tubes en plastique 46600-04..........................................4/paq.......46600-14Ammonium, fer (II) sulfate, 6 H2O ACS .............................................. 113 g.......11256-14Fiole jaugée, classe A, 100ml....................................................................... 1.......26366-42Fiole jaugée, classe A, 1000 ml.................................................................... 1.......26366-53Pipette jaugée, classe A, 5,00ml................................................................... 1.......14515-37Poire à pipetter ............................................................................................. 1.......14651-00
ZUSÄTZLICHE REAGENZIEN UND ZUBEHÖRBeschreibung Einheit Kat. Nr.Kappen, für Plastik-Farbprüfröhrchen 46600-04 ................................. 4/Stck.......46600-14Eisen(II)-Ammoniumsulfat, hexahydrat ............................................... 113 g.......11256-14Messkolben, Klasse A, 100 mL.................................................................... 1.......26366-42Messkolben, Klasse A, 1000 mL.................................................................. 1.......26366-53Messpipette, Klasse A, 5mL ........................................................................ 1.......14515-37Pipettenfüller, Sicherheitsball....................................................................... 1.......14651-00
REACTIVOS Y EQUIPAMIENTO OPCIONALESDescripción Unidad No Ref.Tapas protectoras para tubos de plástico 46600-04............................... 4/lote.......46600-14Sulfato de Amonio Ferroso, Hexahidratado.......................................... 113 g.......11256-14Frasco volumétrico, clase A, 100-mL .......................................................... 1.......26366-42Frasco volumétrico, clase A, 1000-mL ........................................................ 1.......26366-53Pipeta volumétrica, clase A, 5-0 mL ............................................................ 1.......14515-37Bulbo de seguridad para llenador de pipeta. ................................................ 1.......14651-00
9

10

11

• Pour assistance technique, informations de prix ou informations pour commander, contactez HACH Company ou votre distributeur HACH.
• Technische Unterstützung, aktuelle Preisauskünfte und Bestellhilfe erhalten Sie bei Ihrer HACH Vertretung.
• Para obtener asistencia técnica asi como información sobre los precios y pedidos, ponerse en contacto con HACH Company o la agencia local de distribución.
© Hach Company, 1997. All rights reserved. Printed in U.S.A. te/dk 5/97 1ed

Appendix D: External Laboratory Reports
TL0337.10 1/14/2015

SiREM Laboratory Attn : Jennifer Webb
130 Research Lane, Suite 2, Guelph, N1G 5G3Phone: 519-822-2265, Fax:519-822-3151
16-April-2014
Date Rec. : 27 March 2014 LR Report: CA12685-MAR14 Reference: Elkhart
Copy: #1
CERTIFICATE OF ANALYSIS
Final Report Analysis 3:
AnalysisApproval
Date
4:AnalysisApproval
Time
5:Aquifer Soil
(Elkhart)
Sample Date & Time 26-Mar-14 10:0
Total Organic Carbon [ 16-Apr-14 08:28 1.03
Iron [µg/g] 07-Apr-14 14:41 5200
Manganese [µg/g] 07-Apr-14 14:41 140
__________________________
Brian Graham B.Sc.Project Specialist Environmental Services, Analytical
SGS Canada Inc. P.O. Box 4300 - 185 Concession St. Lakefield - Ontario - KOL 2HO Phone: 705-652-2000 FAX: 705-652-6365
OnL
ine
LIM
S 0000143951
Page 1 of 1 Data reported represents the sample submitted to SGS. Reproduction of this analytical report in full or in part is prohibited without prior written approval. Please refer to SGS
General Conditions of Services located at http://www.sgs.com/terms_and_conditions_service.htm. (Printed copies are available upon request.) Test method information available upon request. “Temperature Upon Receipt” is representative of the whole shipment and may not reflect the temperature of individual samples.