revised bart five factor analysis lake catherine steam ... - ADEQ
144
-
Upload
khangminh22 -
Category
Documents
-
view
1 -
download
0
Transcript of revised bart five factor analysis lake catherine steam ... - ADEQ

REVISED BART FIVE FACTOR ANALYSIS
LAKE CATHERINE STEAM ELECTRIC STATION
MALVERN, ARKANSAS (AFIN 30-00011)
Prepared By:
TRINITY CONSULTANTS, INC. 201 NW 63rd St., Suite 220
Oklahoma City, Oklahoma 73116
(405) 848-3724
TRINITY CONSULTANTS, INC. 977 Ridge Drive, Suite 380
Lenexa, Kansas 66219
(913) 894-4500
In conjunction with:
ENTERGY SERVICES, INC. 425 West Capitol Avenue
Little Rock, Arkansas 77203
(501) 377-4000
Trinity Project No. 123701.0053
June 2013

Entergy i Trinity Consultants
BART Analysis – Lake Catherine
TABLE OF CONTENTS
1. EXECUTIVE SUMMARY ........................................................................................ 1-1
2. INTRODUCTION AND BACKGROUND .................................................................... 2-1
3. MODELING METHODOLOGIES AND PROCEDURES ............................................. 3-1 3.1 CALMET AND CALPUFF ................................................................................... 3-1
3.2 CALPOST ............................................................................................................ 3-1
4. EXISTING EMISSIONS AND VISIBILITY IMPAIRMENT ......................................... 4-1 4.1 NOX, SO2, AND PM10 BASELINE EMISSION RATES ............................................... 4-1
4.2 BASELINE VISIBILITY IMPAIRMENT ....................................................................... 4-1
5. SO2 BART EVALUATION .................................................................................... 5-1
6. NOX BART EVALUATION ................................................................................... 6-1 6.1 IDENTIFICATION OF AVAILABLE RETROFIT NOX CONTROL TECHNOLOGIES ......... 6-1
6.2 ELIMINATE TECHNICALLY INFEASIBLE NOX CONTROL TECHNOLOGIES ............... 6-1
6.2.1 COMBUSTION CONTROLS .................................................................................... 6-2
6.2.1.1 Burners Out of Service (BOOS) .......................................................... 6-2
6.2.1.2 Flue Gas Recirculation (FGR) ............................................................. 6-2
6.2.1.3 Separated Overfire Air (SOFA) ........................................................... 6-2
6.2.1.4 Low NOX Burners ................................................................................ 6-2
6.2.2 POST COMBUSTION CONTROLS........................................................................... 6-3
6.2.2.1 Selective Catalytic Reduction (SCR) ................................................... 6-3
6.2.2.2 Selective Non-Catalytic Reduction (SNCR) ........................................ 6-3 6.3 RANK OF TECHNICALLY FEASIBLE NOX CONTROL OPTIONS BY EFFECTIVENESS .. 6-4
6.4 EVALUATION OF IMPACTS FOR FEASIBLE NOX CONTROLS ................................... 6-4
6.4.1 COST OF COMPLIANCE ........................................................................................ 6-4
6.4.2 ENERGY IMPACTS & NON-AIR IMPACTS ............................................................ 6-8
6.4.3 REMAINING USEFUL LIFE ................................................................................... 6-8 6.5 EVALUATION OF VISIBILITY IMPACT OF FEASIBLE NOX CONTROLS ..................... 6-8
6.6 PROPOSED BART FOR NOX .................................................................................. 6-14
7. PM10 BART EVALUATION .................................................................................. 7-1
APPENDIX A (SO2 AND NOX CONTROL COST CALCULATIONS)
APPENDIX B (CALMET MODELING PROTOCOL)
APPENDIX C (CEMS DATA FROM CAMD FOR 2001 TO 2003)
APPENDIX D (SARGENT & LUNDY NOX CONTROL TECHNOLOGY STUDY)

Entergy ii Trinity Consultants
BART Analysis – Lake Catherine
LIST OF TABLES
TABLE 1-1. EXISTING VISIBILITY IMPAIRMENT ATTRIBUTABLE TO UNIT 4 ....................................... 1-1
TABLE 3-1. ANNUAL AVERAGE BACKGROUND CONCENTRATION ..................................................... 3-3
TABLE 3-2. FL(RH) LARGE RH ADJUSTMENT FACTORS..................................................................... 3-3
TABLE 3-3. FS(RH) SMALL RH ADJUSTMENT FACTORS ..................................................................... 3-3
TABLE 3-4. FSS(RH) SEA SALT RH ADJUSTMENT FACTORS ............................................................... 3-3
TABLE 4-1. BASELINE MAXIMUM 24-HOUR SO2, NOX, AND PM10 EMISSION RATES (AS HOURLY
EQUIVALENTS) ................................................................................................................. 4-1
TABLE 4-2. BASELINE VISIBILITY IMPAIRMENT ATTRIBUTABLE TO LAKE CATHERINE, UNIT 4
BY POLLUTANT ................................................................................................................ 4-2
TABLE 6-1. AVAILABLE NOX CONTROL TECHNOLOGIES FOR UNIT 4 ................................................ 6-1
TABLE 6-2. CONTROL EFFECTIVENESS OF TECHNICALLY FEASIBLE NOX CONTROL
TECHNOLOGIES ................................................................................................................ 6-4
TABLE 6-3. LAKE CATHERINE UNIT 4 CAPACITY FACTORS ................................................................ 6-5
TABLE 6-4. SUMMARY OF COST EFFECTIVENESS FOR UNIT 4 NOX CONTROLS .................................. 6-7
TABLE 6-5. SUMMARY OF EMISSION RATES MODELED TO REFLECT BOOS FOR NOX CONTROL .... 6-10
TABLE 6-6. SUMMARY OF EMISSION RATES MODELED TO REFLECT LNB/SOFA FOR NOX
CONTROL ....................................................................................................................... 6-10
TABLE 6-7. SUMMARY OF EMISSION RATES MODELED TO REFLECT LNB/SOFA + SNCR FOR
NOX CONTROL ............................................................................................................... 6-10
TABLE 6-8. SUMMARY OF EMISSION RATES MODELED TO REFLECT LNB/SOFA + SCR FOR
NOX CONTROL ............................................................................................................... 6-10
TABLE 6-9. SUMMARY OF VISIBILITY IMPROVEMENT ASSOCIATED WITH NOX CONTROL
SYSTEM ON UNIT 4 (2001-2003) .................................................................................... 6-11
TABLE 6-10. INCREMENTAL COST EFFECTIVENESS FOR UNIT 4 WITH CLASS I AREA
IMPROVEMENT (2001-2003) ......................................................................................... 6-13

Entergy 1-1 Trinity Consultants
BART Analysis – Lake Catherine
1. EXECUTIVE SUMMARY
This report is a revision to the “BART Five Factor Analysis” submitted to ADEQ on March 4, 2013
and is being submitted to provide a comprehensive document that encompasses the determination of
the Best Available Retrofit Technology (BART) for Entergy Arkansas, Inc.’s (Entergy’s) BART-
affected electric generating unit (EGU), Unit 4 at the Lake Catherine plant including revisions made
in response to EPA’s comments and suggestions on the previous submittal. The BART determination
for each pollutant has not changed.
Unit 4 is a tangentially-fired boiler with a nominal net power rating of 558 MW and a nominal heat
input capacity of 5,850 million British thermal units per hour (MMBtu/hr) that is permitted to burn
natural gas and No. 6 fuel oil. Entergy does not project to burn fuel oil at Lake Catherine Unit 4 in
the foreseeable future, so emissions from fuel oil are not considered in this analysis. If conditions
change such that it becomes economic to burn fuel oil, a five factor analysis will be submitted for
approval in the State Implementation Plan (SIP). The combustion of fuel oil would not occur until
final SIP approval.
BART determinations for SO2 and PM10 based on the use of natural gas were approved in EPA’s
March 12, 2012 final rule. The determinations result in no SO2 or PM10 controls needed during
natural gas combustion.
Based on modeling performed for this analysis, combined emissions of nitrogen oxides (NOX), sulfur
dioxide (SO2), and particulate matter with a mass mean diameter smaller than ten microns (PM10)
from Lake Catherine Unit 4 are predicted to cause or contribute greater than 0.5 delta deciviews (∆dv)
to visibility impairment in four Class I Areas: Caney Creek Wilderness (CACR), Upper Buffalo
Wilderness (UPBU), Hercules Glades Wilderness (HERC), and Mingo Wilderness (MING)1. The
contributions of the SO2 and PM10 emissions to the visibility impairment are negligible when
compared to the contribution of NOX.
A summary of the existing visibility impairment attributable to the boiler based on the default natural
conditions is provided in Table 1-1. The visibility impairment summarized in Table 1-1 is based on
recent modeling conducted by Trinity Consultants (Trinity) using emissions data based on a
combination of stack testing, Continuous Emission Monitoring System (CEMS) data as reported to
EPA’s Clean Air Markets Database (CAMD), and AP-42 emission factors as further described in
Section 4 of this report.
TABLE 1-1. EXISTING VISIBILITY IMPAIRMENT ATTRIBUTABLE TO UNIT 4
CACR UPBU HERC MING
98th %
∆dv
Days >
0.5 ∆dv
98th %
∆dv
Days >
0.5 ∆dv
98th %
∆dv
Days >
0.5 ∆dv
98th %
∆dv
Days >
0.5 ∆dv
1.371 80 0.532 21 0.387 8 0.429 7
1 Sipsey Wilderness was included in the Arkansas Department of Environmental Quality's (ADEQ’s) original
BART analyses, but is not included in this analysis because the EPA-requested change in meteorological data (to a refined,
or "NO OBS = 0", dataset; see Section 3 and Appendix B) excludes Sipsey from the modeling domain.

Entergy 1-2 Trinity Consultants
BART Analysis – Lake Catherine
Trinity used the EPA’s BART guidelines in 40 CFR Part 512 to determine BART for Unit 4.
Specifically, Trinity conducted a five-step analysis to determine BART for NOX that included the
following:
1. Identifying all available retrofit control technologies;
2. Eliminating technically infeasible control technologies;
3. Evaluating the control effectiveness of remaining control technologies;
4. Evaluating impacts and document the results;
5. Evaluating visibility impacts.
The BART analysis concludes that for NOX, the achievement of an emission rate of 0.24 lb/MMBtu
through the installation and use of Burners Out of Service (BOOS) represents BART.3
2 The BART guidelines were published as amendments to the EPA’s Regional Haze Rule (RHR) in 40 CFR Part
51, Section 308 on July 6, 2005.
3 EPA recently issued a final rule allowing states that are subject to the Cross-State Air Pollution Rule (CSAPR)
trading program for seasonal NOX to rely on the reductions achieved through that trading program to satisfy the regional
haze program requirements for units subject to BART. “Regional Haze: Revisions to Provisions Governing Alternatives to
Source-Specific Best Available Technology (BART) Determinations, Limited SIP Disapprovals and Federal Implementation
Plans,” 77 Fed. Reg. 33651 (June 7, 2012). On August 21, 2012, the D.C. Circuit in a 2-1 decision vacated CSAPR (EME
Homer City Generation v. EPA, --F. 3d --, No. 11-1302 (D.C. Cir. 2012), and the Clean Air Interstate Rule (CAIR) remains
in effect until a replacement rule, if any, is promulgated. If CSAPR ultimately is upheld and implemented in Arkansas,
Entergy may rely on CSAPR to satisfy its NOX regional haze obligations at Unit 4. Alternatively, if CSAPR is vacated and
CAIR remains in place, Entergy may rely on CAIR to satisfy its NOX obligations under BART as EPA has previously
determined that the CAIR season NOX trading program provides greater visibility improvement than BART.

Entergy 2-1 Trinity Consultants
BART Analysis – Lake Catherine
2. INTRODUCTION AND BACKGROUND
In the 1977 amendments to the Clean Air Act (CAA), Congress set a national goal to restore national
parks and wilderness areas to pristine conditions by preventing any future, and remedying any
existing, man-made visibility impairment. On July 1, 1999, the U.S. EPA published the final
Regional Haze Rule (RHR). The objective of the RHR is to restore visibility to pristine conditions in
156 specific areas across the United States known as Class I areas. The CAA defines Class I areas as
certain national parks (larger than 6,000 acres), wilderness areas (larger than 5,000 acres), national
memorial parks (larger than 5,000 acres), and international parks that were in existence on August 7,
1977.
The RHR requires States to set goals that provide for reasonable progress towards achieving natural
visibility conditions for each Class I area in their state. On July 6, 2005, the EPA published
amendments to its 1999 RHR, often called the Best Available Retrofit Technology (BART) rule,
which included guidance for making source-specific BART determinations.4 The BART rule defines
BART-eligible sources as sources that meet the following criteria:
(1) Have potential emissions of at least 250 tons per year of a visibility-impairing pollutant;
(2) Began operation between August 7, 1962, and August 7, 1977; and
(3) Are included as one of the 26 listed source categories in the guidance.
A BART-eligible source is subject to BART if the source is “reasonably anticipated to cause or
contribute to visibility impairment in any federal mandatory Class I area.” EPA has determined that a
source is reasonably anticipated to cause or contribute to visibility impairment if the 98th percentile
visibility impacts from the source are modeled to be greater than 0.5 delta deciviews (∆dv) when
compared against a natural background.5 Air quality modeling is the tool that is used to determine a
source’s visibility impacts.
Once it is determined that a source is subject to BART, a BART determination must address air
pollution control measures for the source. The visibility regulations define BART as follows:
…an emission limitation based on the degree of reduction achievable through the
application of the best system of continuous emission reduction for each pollutant
which is emitted by…[a BART-eligible source]. The emission limitation must be
established on a case-by-case basis, taking into consideration the technology available,
the cost of compliance, the energy and non air quality environmental impacts of
compliance, any pollution control equipment in use or in existence at the source, the
remaining useful life of the source, and the degree of improvement in visibility which
may reasonably be anticipated to result from the use of such technology.
Specifically, the BART rule states that a BART determination should address the following five
statutory factors:
4 The BART guidelines were published as amendments to the EPA’s RHR in 40 CFR Part 51, Section 308.
5 The original modeling for Arkansas sources relied on screening met data and, as such, reviewed the maximum
impact rather than the 98th percentile impact. Use of the 98th percentile impact based on the use of refined met data (such as
that used in the modeling conducted as part of this BART analysis) is consistent with both the EPA’s 2005 BART rule and
the 2005 Central Regional Air Planning Association (CENRAP) BART modeling guidelines.

Entergy 2-2 Trinity Consultants
BART Analysis – Lake Catherine
1. Existing controls
2. Cost of controls
3. Energy and non-air quality environmental impacts
4. Remaining useful life of the source
5. Degree of visibility improvement as a result of controls
Further, the BART rule indicates that the five basic steps in a BART analysis can be summarized as
follows:
1. Identify all available retrofit control technologies;
2. Eliminate technically infeasible control technologies;
3. Evaluate the control effectiveness of remaining control technologies;
4. Evaluate impacts and document the results;
5. Evaluate visibility impacts.
A BART determination should be made for each visibility-affecting pollutant (VAP) by following the
five steps listed above for each VAP.
Unit 4 meets the three BART-eligibility criteria described above, and the existing visibility
impairment attributable to the boiler is greater than 0.5 ∆dv in at least one Class I area. Thus, Unit 4
is subject to BART. Details of the existing/baseline emissions and the contribution of the emissions
to visibility impairment can be found in Section 4. The VAPs emitted by the boiler include NOX,
SO2, and PM10 of various forms (filterable coarse particulate matter [PMc], filterable fine particulate
matter [PMf], elemental carbon [EC], inorganic condensable particulate matter [IOR CPM] as sulfates
[SO4], and organic condensable particulate matter [OR CPM] also referred to as secondary organic
aerosols [SOA]).

Entergy 3-1 Trinity Consultants
BART Analysis – Lake Catherine
3. MODELING METHODOLOGIES AND PROCEDURES
This section summarizes the dispersion modeling methodologies and procedures applied in this
BART analysis. All dispersion modeling has been conducted using the CALPUFF modeling system,
consisting of the CALPUFF dispersion model, the CALMET meteorological data processor, and the
CALPOST post-processing program. These methodologies and procedures are consistent with the
ADEQ modeling protocol submitted to EPA in June 2012.
CALPUFF is a multi-layer, multi-species, non-steady-state puff dispersion model, which can simulate
the effects of time and space varying meteorological conditions on pollutant transport, transformation,
and removal. CALPUFF uses three-dimensional meteorological fields developed by the CALMET
model. In addition to meteorological data, several other input files are used by the CALPUFF model
to specify source and receptor parameters. The selection and control of CALPUFF options are
determined by user-specific inputs contained in the control file. This file contains all of the necessary
information to define a model run (e.g., starting date, run length, grid specifications, technical
options, output options). CALPOST processes concentration, deposition, and visibility impacts based
on pollutant specific concentrations predicted by CALPUFF.
3.1 CALMET AND CALPUFF
The CALPUFF data and parameters are based on the 2005 BART modeling guidelines prepared for
CENRAP. The CALMET data and parameters are based on the modeling protocol included in
Appendix B. Note that the protocol included in Appendix B summarizes modeling methods and
procedures that were followed to predict visibility impairment as part of the BART analyses for
several BART-eligible sources located in Oklahoma, the first of which was Oklahoma Gas & Electric
in 2007. The CALMET dataset developed per this protocol has been used – and approved by EPA –
numerous times since its development.
3.2 CALPOST
The CALPOST visibility processing completed for this BART analysis is based on the October 2010
guidance from the Federal Land Managers Air Quality Related Values Workgroup (FLAG)6.
Visibility impairment is quantified using the light extinction coefficient (bext), which is expressed in
terms of the haze index expressed in deciviews (dv). The haze index (HI) is calculated as follows:
10ln10(dv) extb
HI
The impact of a source is determined by comparing the HI attributable to a source relative to
estimated natural background conditions. The change in the haze index, in deciviews, also referred to
6 The 2010 FLAG guidance, which was issued in draft form on July 8, 2008, and published as final guidance in
December 2010, makes technical revisions to the previous guidance issued in December 2000.
Entergy 3-2 Trinity Consultants
BART Analysis – Lake Catherine
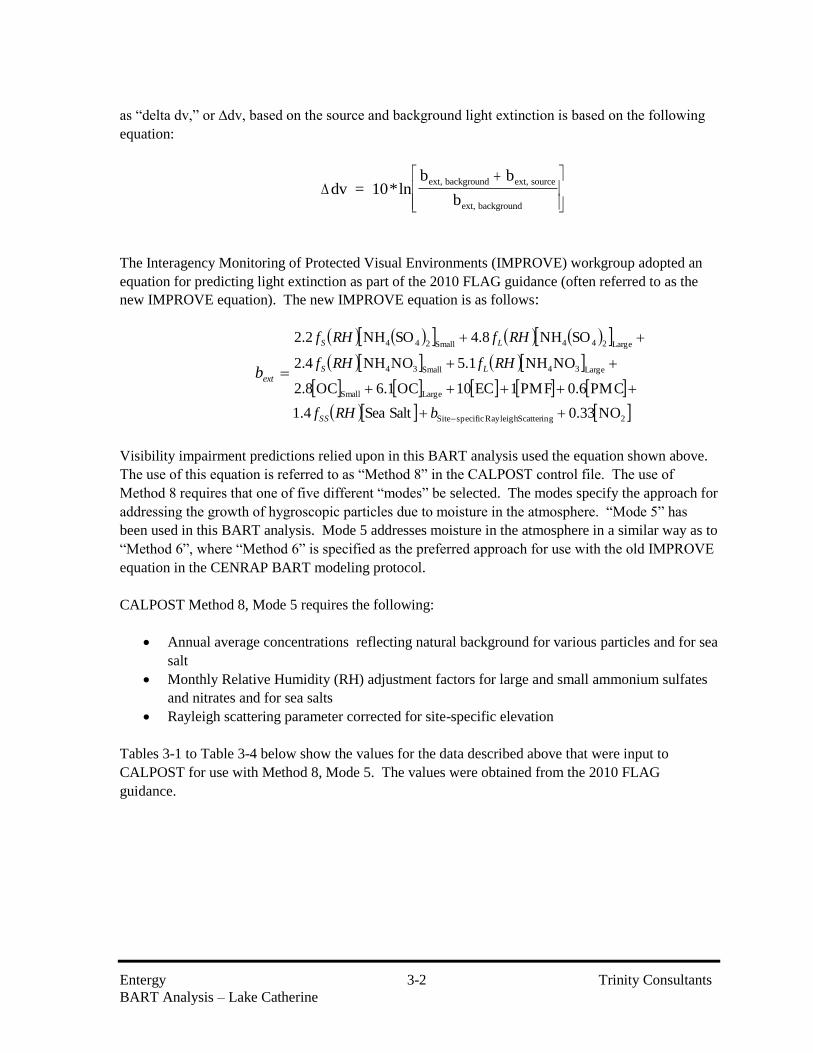
as “delta dv,” or ∆dv, based on the source and background light extinction is based on the following
equation:
dv = 10*lnb b
b
ext, background ext, source
ext, background
The Interagency Monitoring of Protected Visual Environments (IMPROVE) workgroup adopted an
equation for predicting light extinction as part of the 2010 FLAG guidance (often referred to as the
new IMPROVE equation). The new IMPROVE equation is as follows:
extb
2ScatteringRayleigh specificSite
LargeSmall
Large34Small34
Large244Small244
NO33.0Salt Sea4.1
PMC6.0PMF1EC10OC1.6OC8.2
NONH1.5NONH4.2
SONH8.4SONH2.2
bRHf
RHfRHf
RHfRHf
SS
LS
LS
Visibility impairment predictions relied upon in this BART analysis used the equation shown above.
The use of this equation is referred to as “Method 8” in the CALPOST control file. The use of
Method 8 requires that one of five different “modes” be selected. The modes specify the approach for
addressing the growth of hygroscopic particles due to moisture in the atmosphere. “Mode 5” has
been used in this BART analysis. Mode 5 addresses moisture in the atmosphere in a similar way as to
“Method 6”, where “Method 6” is specified as the preferred approach for use with the old IMPROVE
equation in the CENRAP BART modeling protocol.
CALPOST Method 8, Mode 5 requires the following:
Annual average concentrations reflecting natural background for various particles and for sea
salt
Monthly Relative Humidity (RH) adjustment factors for large and small ammonium sulfates
and nitrates and for sea salts
Rayleigh scattering parameter corrected for site-specific elevation
Tables 3-1 to Table 3-4 below show the values for the data described above that were input to
CALPOST for use with Method 8, Mode 5. The values were obtained from the 2010 FLAG
guidance.

Entergy 3-3 Trinity Consultants
BART Analysis – Lake Catherine
TABLE 3-1. ANNUAL AVERAGE BACKGROUND CONCENTRATION
Class I Area
(NH4)2SO4
(µg/m3)
NH4NO3
(µg/m3)
OM
(µg/m3)
EC
(µg/m3)
Soil
(µg/m3)
CM
(µg/m3)
Sea Salt
(µg/m3)
Rayleigh
(Mm-1
)
CACR 0.23 0.1 1.8 0.02 0.5 3 0.03 11
UPBU 0.23 0.1 1.8 0.02 0.5 3 0.03 11
HERC 0.23 0.1 1.8 0.02 0.5 3 0.02 11
MING 0.23 0.1 1.83 0.02 0.51 3.05 0.04 12
TABLE 3-2. FL(RH) LARGE RH ADJUSTMENT FACTORS
Class I Area Jan Feb Mar Apr May Jun Jul Aug Sep Oct Nov Dec
CACR 2.77 2.53 2.37 2.43 2.68 2.71 2.59 2.6 2.71 2.69 2.67 2.79
UPBU 2.71 2.48 2.31 2.33 2.61 2.64 2.57 2.59 2.71 2.58 2.59 2.72
HERC 2.7 2.48 2.3 2.3 2.57 2.59 2.56 2.6 2.69 2.54 2.57 2.72
MING 2.73 2.52 2.34 2.28 2.53 2.6 2.64 2.67 2.71 2.56 2.56 2.73
TABLE 3-3. FS(RH) SMALL RH ADJUSTMENT FACTORS
Class I Area Jan Feb Mar Apr May Jun Jul Aug Sep Oct Nov Dec
CACR 3.85 3.44 3.14 3.24 3.66 3.71 3.49 3.51 3.73 3.72 3.68 3.88
UPBU 3.73 3.33 3.03 3.07 3.54 3.57 3.43 3.5 3.71 3.51 3.52 3.74
HERC 3.7 3.33 3.01 3.01 3.47 3.48 3.41 3.51 3.67 3.43 3.46 3.73
MING 3.74 3.38 3.07 2.97 3.39 3.52 3.57 3.64 3.72 3.47 3.43 3.74
TABLE 3-4. FSS(RH) SEA SALT RH ADJUSTMENT FACTORS
Class I Area Jan Feb Mar Apr May Jun Jul Aug Sep Oct Nov Dec
CACR 3.9 3.52 3.31 3.41 3.83 3.88 3.69 3.68 3.82 3.76 3.77 3.93
UPBU 3.85 3.47 3.23 3.27 3.72 3.78 3.69 3.7 3.84 3.64 3.67 3.86
HERC 3.86 3.51 3.23 3.22 3.66 3.72 3.69 3.73 3.81 3.57 3.65 3.88
MING 3.92 3.58 3.3 3.19 3.58 3.72 3.8 3.82 3.85 3.61 3.66 3.9

Entergy 4-1 Trinity Consultants
BART Analysis – Lake Catherine
4. EXISTING EMISSIONS AND VISIBILITY IMPAIRMENT
This section summarizes the existing (i.e., baseline) visibility impairment attributable to Unit 4 based
on air quality modeling conducted by Trinity.
4.1 NOX, SO2, AND PM10 BASELINE EMISSION RATES
Table 4-1 summarizes the emission rates that were modeled for SO2, NOX, and PM10, including the
speciated PM10 emissions. The SO2 and NOX emission rates are the highest actual 24-hour emission
rates based on 2001-2003 continuous emissions monitoring system (CEMS).7 Please note that CEMS
data from these years is representative of burning only natural gas.
The emission rates for the PM10 species reflect the breakdown of the filterable and condensable PM10
determined from AP-42 Table 1.4-2 Combustion of Natural Gas. All filterable PM was assumed to
be elemental carbon, as this is the assumption that the National Park Service (NPS) uses for filterable
PM10 from natural gas fired combustion turbines, and the NPS does not have a speciation analysis
specific to gas fired boilers. All of the condensable PM was assumed to be SOA, except for a small
fraction of the condensable PM that was estimated to be SO4. One-third of the estimated SO2
emissions were separated and adjusted for differences in molecular weight to represent SO4
emissions. This essentially double counts some of the fuel sulfur based emissions as SO2 but also as
SO4. Since pipeline natural gas contains very little sulfur, both the SO2 and SO4 emission rates are
very low.
TABLE 4-1. BASELINE MAXIMUM 24-HOUR SO2, NOX, AND PM10 EMISSION RATES (AS HOURLY
EQUIVALENTS)
Unit SO28 NOX
9
Total
PM10 SO4 PMc PMf SOA EC
(lb/hr) (lb/hr) (lb/hr) (lb/hr) (lb/hr) (lb/hr) (lb/hr) (lb/hr)
Unit 4 3.1 2,456.4 44.3 1.5 0.0 0.0 31.8 11.0
4.2 BASELINE VISIBILITY IMPAIRMENT
Trinity conducted modeling to determine the visibility impairment attributable to Unit 4 in four Class
I Areas: Caney Creek Wilderness (CACR), Upper Buffalo Wilderness (UPBU), Hercules Glades
Wilderness (HERC), and Mingo Wilderness (MING) using the CALPUFF dispersion model. Table
4-2 provides a summary of the modeled visibility impairment attributable to Unit 4 at CACR, UPBU,
HERC, and MING based on the emission rates shown in Table 4-1. Table 4-2 the maximum
7 See Appendix C
8 The SO2 hourly rate was derived from EPA’s CAMD. The 2001-2003 max daily rate was 74 lb/day. See
Appendix C. 9 The NOx hourly rate was derived from EPA’s CAMD. The 2001-2003 max daily rate was 58,954 lb/day. See
Appendix C.

Entergy 4-2 Trinity Consultants
BART Analysis – Lake Catherine
impairment in Δdv, the 98th percentile impacts in Δdv, and the number of days with impacts greater
than 0.5 Δdv as well as the breakdown by pollutant species for the 98th percentile impact.
As BART is determined on a unit-by-unit basis, this baseline modeling is presented to show how the
BART proposed controls will cause improvement, at least on a relative basis.
All of the CALMET, CALPUFF, and CALPOST modeling files used to generate these results are
included as part of the electronic files submitted with this document.
TABLE 4-2. BASELINE VISIBILITY IMPAIRMENT ATTRIBUTABLE TO LAKE CATHERINE, UNIT 4
BY POLLUTANT
Year
Maximum
(Δdv)
98th
Percentile
(Δdv)
No. of Day
with Δdv ≥
0.5
98th
Percentile
% SO4
98th
Percentile
% NO3
98th
Percentile
% PM10
98th
Percentile
% NO2
Caney Creek Wilderness
2001 3.480 1.371 31 0.49 85.13 0.00 8.55
2002 3.318 0.909 21 0.31 92.53 0.00 4.18
2003 3.276 1.233 28 0.43 85.66 0.00 7.76
Upper Buffalo Wilderness
2001 1.478 0.489 7 0.33 89.54 0.00 5.99
2002 0.916 0.532 9 0.22 96.29 0.00 1.26
2003 2.044 0.412 5 0.21 97.36 0.00 0.30
Hercules Glades Wilderness
2001 0.760 0.387 4 0.30 91.12 0.00 4.92
2002 1.016 0.313 2 0.39 88.73 0.00 6.08
2003 0.881 0.311 2 0.38 93.27 0.00 2.57
Mingo Wilderness
2001 0.511 0.237 1 0.30 92.55 0.00 3.17
2002 0.763 0.429 5 0.32 96.25 0.00 0.44
2003 0.516 0.214 1 0.18 98.08 0.00 0.10

Entergy 5-1 Trinity Consultants
BART Analysis – Lake Catherine
5. SO2 BART EVALUATION
A BART determination for SO2 based on the use of natural gas was approved in EPA’s March 12,
2012, final rule. The determination results in no SO2 controls needed during natural gas
combustion.10
10 “Approval and Promulgation of Implementation Plans; Arkansas; Regional Haze State Implementation Plan;
Interstate Transport State Implementation Plan To Address Pollution Affecting Visibility and Regional Haze. Final Rule,”
77 Fed. Reg. 14604 (March 12, 2012).

Entergy 6-1 Trinity Consultants
BART Analysis – Lake Catherine
6. NOX BART EVALUATION
6.1 IDENTIFICATION OF AVAILABLE RETROFIT NOX CONTROL
TECHNOLOGIES
Nitrogen oxides, NOX, are produced during fuel combustion when nitrogen contained in both the fuel
and the combustion air is exposed to high temperatures. The origin of the nitrogen (i.e. fuel vs.
combustion air) has lead to the use of the terms “thermal” NOX and “fuel” NOX when describing NOX
emissions. Thermal NOX emissions are produced when elemental nitrogen in the combustion air is
exposed to a high temperature zone and oxidized. Fuel NOX emissions are created during the rapid
oxidation of nitrogen compounds contained in the fuel.
Nitrogen oxide (NO) is typically the predominant form of NOX from fossil fuel combustion. Nitrogen
dioxide (NO2) makes up the remainder of the NOX. The formation of NOX compounds in utility
boilers is sensitive to the method of firing. In tangentially-fired boilers, such as Unit 4, a single
rotating flame is created in the center of the furnace, rather than the discrete flames produced by
burners in the wall-fired boilers. Tangentially fired boilers typically have lower uncontrolled NOX
emissions than wall-fired boilers. Therefore baseline NOX emission rates can vary significantly from
plant to plant due to method of firing as well as several other factors.
Step 1 of the BART determination is the identification of all available retrofit NOX control
technologies. The available retrofit NOX control technologies are summarized in Table 6-1.
NOX emissions controls, as listed in Table 6-1, can be categorized as combustion or post-combustion
controls. Combustion controls, including Burners Out of Service (BOOS), flue gas recirculation
(FGR), overfire air / separated overfire air (SOFA), and Low NOx Burners (LNB), reduce the peak
flame temperature and excess air in the furnace which minimizes NOX formation. Post-combustion
controls, such as selective catalytic reduction (SCR) and selective non-catalytic reduction (SNCR),
convert NOX in the flue gas to molecular nitrogen and water.
TABLE 6-1. AVAILABLE NOX CONTROL TECHNOLOGIES FOR UNIT 4
NOX Control Technologies
Combustion Controls
Burners Out of Service (BOOS)
Flue Gas Recirculation (FGR)
Separated Overfire Air (SOFA)
Low NOx Burners (LNB)
Post-Combustion Controls Selective Catalytic Reduction (SCR)
Selective Non-Catalytic Reduction (SNCR)
6.2 ELIMINATE TECHNICALLY INFEASIBLE NOX CONTROL TECHNOLOGIES
Step 2 of the BART determination is to eliminate technically infeasible NOX control technologies that
were identified in Step 1.

Entergy 6-2 Trinity Consultants
BART Analysis – Lake Catherine
6.2.1 COMBUSTION CONTROLS
6.2.1.1 BURNERS OUT OF SERVICE (BOOS)
BOOS is a staged combustion technique whereby fuel is introduced though
operational burners in the lower furnace zone to create fuel-rich conditions,
while not introducing fuel to other burners. Additional air is then supplied to
the non-operational burners to complete combustion. By removing fuel from
certain zones, the temperature is reduced, and the production of thermal NOX is
also reduced. When operated without additional controls, the estimated
controlled NOX level for Unit 4 operating with BOOS is 0.24 lb/MMBtu.11
This control is a technically feasible option for the control of NOX from Unit 4.
6.2.1.2 FLUE GAS RECIRCULATION (FGR)
FGR uses flue gas as an inert material to reduce flame temperatures. In a
typical flue gas recirculation system, flue gas is collected from the combustion
chamber or stack and returned to the burner via a duct and blower. The
addition of flue gas reduces the oxygen content of the “combustion air” (air +
flue gas) in the burner. The lower oxygen level in the combustion zone reduces
flame temperatures; which in turn reduces thermal NOX formation. When
operated without additional controls, the estimated controlled NOX level for
Unit 4 operating with FGR is 0.19 lb/MMBtu.12 This control is a technically
feasible option for the control of NOX from Unit 4.
6.2.1.3 SEPARATED OVERFIRE AIR (SOFA)
SOFA diverts a portion of the total combustion air from the burners and injects
it through separate air ports above the top level of burners. Staging of the
combustion air creates an initial fuel-rich combustion zone with a lower peak
flame temperature. This reduces the formation of thermal NOX by lowering
combustion temperature and limiting the availability of oxygen in the
combustion zone where NOX is most likely to be formed. When operated
without additional controls, SOFA results in estimated NOX emissions for gas
fired boilers of 0.2-0.4 lb/MMBtu.13 This control is a technically feasible
option for the control of NOX from Unit 4.
6.2.1.4 LOW NOX BURNERS
LNB technology utilizes advanced burner design to reduce NOX formation
through the restriction of oxygen, lowering of flame temperature, and/or
reduced residence time. NOX creation rates typically peak at oxygen levels of
five to seven percent.14 LNB is a staged combustion process that is designed to
split fuel combustion into two zones. In the primary zone, NOX formation is
11Sargent & Lundy May 16, 2013 NOx Control Technology Cost and Performance Study (S&L 2013 Study).
12Id.
13“Controlling Nitrogen Oxides Under the Clean Air Act: A Menu of Options.” Utility Boiler section. July
1994.
14 http://www.energysolutionscenter.org/boilerburner/Workshop/RCTCombustion.htm.

Entergy 6-3 Trinity Consultants
BART Analysis – Lake Catherine
limited by one of two methods. Under staged fuel-rich conditions, low oxygen
levels limit flame temperatures resulting in less NOX formation. The primary
zone is then followed by a secondary zone in which the incomplete combustion
products formed in the primary zone act as reducing agents. Alternatively,
under staged fuel-lean conditions, excess air will reduce flame temperature to
reduce NOX formation. In the secondary zone, combustion products formed in
the primary zone act to lower the local oxygen concentration, resulting in a
decrease in NOX formation.
When operated without additional controls, LNB results in estimated NOX
emissions for gas fired boilers of approximately 0.25 lb/MMBtu.15 When
combined with SOFA, the estimated NOX control level is 0.19 lb/MMBtu.16
LNB systems are technically feasible for the control of NOX from Unit 4.
6.2.2 POST COMBUSTION CONTROLS
6.2.2.1 SELECTIVE CATALYTIC REDUCTION (SCR)
SCR refers to the process in which NOX is reduced by ammonia over a
heterogeneous catalyst in the presence of oxygen. The process is termed
selective because the ammonia preferentially reacts with NOX rather than
oxygen, although the oxygen enhances the reaction and is a necessary
component of the process. The overall reactions are:
4NO + 4NH3 + O2 4N2 + 6H2O
2NO2 + 4NH3 + O2 3N2 + 6H2O
The SCR process requires a reactor, a catalyst, and an ammonia storage and
injection system. The effectiveness of an SCR system is dependent on a variety
of factors, including the inlet NOX concentration, the exhaust temperature, the
ammonia injection rate, and the type of catalyst. When combined with SOFA
and LNB, the estimated NOX control level is 0.03 lb/MMBtu.17 This control is
a technically feasible option for the control of NOX from Unit 4.
6.2.2.2 SELECTIVE NON-CATALYTIC REDUCTION (SNCR)
In SNCR systems, a reagent is injected into the flue gas in the furnace within an
appropriate temperature window. The NOX and reagent (ammonia or urea)
react to form nitrogen and water. A typical SNCR system consists of reagent
storage, multi-level reagent-injection equipment, and associated control
instrumentation. The SNCR reagent storage and handling systems are similar
to those for SCR systems. However, both ammonia and urea SNCR processes
require three or four times as much reagent as SCR systems to achieve similar
NOX reductions. When combined with SOFA and LNB, the estimated NOX
15“Controlling Nitrogen Oxides Under the Clean Air Act: A Menu of Options.” Utility Boiler section. July 1994.
16 S&L 2013 Study.
17 Id.
Entergy 6-4 Trinity Consultants
BART Analysis – Lake Catherine
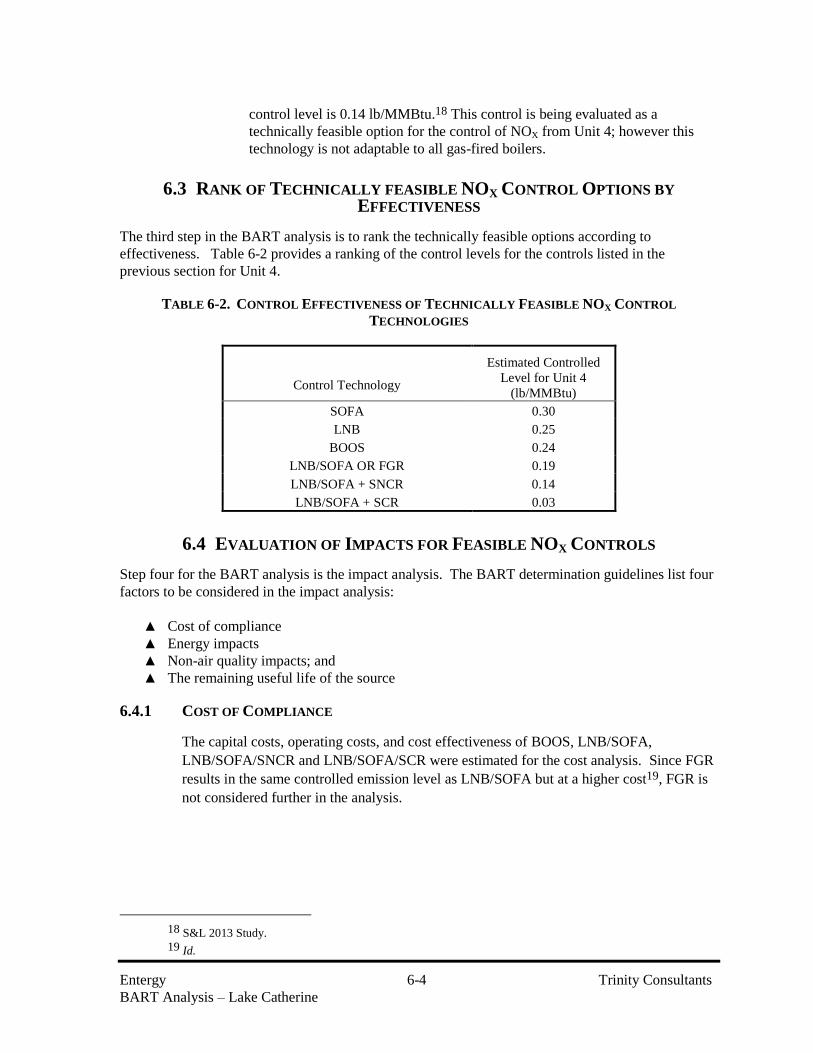
control level is 0.14 lb/MMBtu.18 This control is being evaluated as a
technically feasible option for the control of NOX from Unit 4; however this
technology is not adaptable to all gas-fired boilers.
6.3 RANK OF TECHNICALLY FEASIBLE NOX CONTROL OPTIONS BY
EFFECTIVENESS
The third step in the BART analysis is to rank the technically feasible options according to
effectiveness. Table 6-2 provides a ranking of the control levels for the controls listed in the
previous section for Unit 4.
TABLE 6-2. CONTROL EFFECTIVENESS OF TECHNICALLY FEASIBLE NOX CONTROL
TECHNOLOGIES
Control Technology
Estimated Controlled
Level for Unit 4
(lb/MMBtu)
SOFA 0.30
LNB 0.25
BOOS 0.24
LNB/SOFA OR FGR 0.19
LNB/SOFA + SNCR 0.14
LNB/SOFA + SCR 0.03
6.4 EVALUATION OF IMPACTS FOR FEASIBLE NOX CONTROLS
Step four for the BART analysis is the impact analysis. The BART determination guidelines list four
factors to be considered in the impact analysis:
▲ Cost of compliance
▲ Energy impacts
▲ Non-air quality impacts; and
▲ The remaining useful life of the source
6.4.1 COST OF COMPLIANCE
The capital costs, operating costs, and cost effectiveness of BOOS, LNB/SOFA,
LNB/SOFA/SNCR and LNB/SOFA/SCR were estimated for the cost analysis. Since FGR
results in the same controlled emission level as LNB/SOFA but at a higher cost19, FGR is
not considered further in the analysis.
18 S&L 2013 Study.
19 Id.

Entergy 6-5 Trinity Consultants
BART Analysis – Lake Catherine
Control Costs
Control costs were calculated using cost estimates developed by Sargent and Lundy. The
capital costs were annualized over a 15-year period and then added to the annual operating
costs to obtain the total annualized costs.
The capital and operating cost estimates are provided in Appendix A of this report.
Annual Tons Reduced
The annual tons reduced that were used in the cost effectiveness calculations were
determined by subtracting the estimated controlled annual emission rate from the baseline
annual emission rate.
The baseline annual emission rate was calculated using the baseline emission level of 0.48
lb/MMBtu and an annual heat input reflecting a ten percent capacity factor.20
EPA states in the BART guidelines that “The baseline emission rate should represent a
realistic depiction of anticipated annual emissions for the source.” While the average
annual capacity factor for Unit 4 from 2001-2003, which are the baseline years from which
the peak daily NOX emission rate was determined as described in Section 4 of this report,
was approximately 20 percent, Entergy anticipates that future utilization of Unit 4 will
remain in the range of 10 percent, which is consistent with the recent operating history of
the unit.
Table 6-3 below illustrates the annual capacity factor values for Unit 4 over the past ten
years (2003-2012). Typical utilization of this unit has been less than 5 percent on an
annual basis. Utilization in 2012 was slightly higher than 10 percent due to anomalous
grid reliability issues which resulted in a need for greater utilization. These issues are not
expected to arise in future years and future annual capacity factors are expected to be
comparable to those experienced by the unit in 2003-2011. EPA has stated that they agree
that the unit has historically operated at less than a 10 percent capacity factor and that a
source may calculate baseline emissions based on a continuation of past practice.21 A 10
percent capacity factor has been used for this analysis as a conservative estimate.
TABLE 6-3. LAKE CATHERINE UNIT 4 CAPACITY FACTORS
2003 2004 2005 2006 2007 2008 2009 2010 2011 2012
10.4 3.2 4.2 0.5 0.7 2.7 3.0 3.1 2.3 12.8
The controlled annual emission rates were based on lb/MMBtu levels believed to be
achievable from the control technologies multiplied by the annual heat input. The annual
heat input used to calculate the annual controlled emission rates was the same heat input
that was used to calculate baseline annual emissions.
20 The annual heat input reflecting a 10% annual capacity factor is 5,124,600 MMBtu/yr (5,850 MMBtu/hr *
8760 hrs/yr * 10% = 5,124,600 MMBtu/yr).
21 77 Fed. Reg. 14641.

Entergy 6-6 Trinity Consultants
BART Analysis – Lake Catherine
Cost Effectiveness
The cost effectiveness in dollars per ton of NOX reduced was determined by dividing the
annualized cost of control by the annual tons reduced. An incremental cost analyses was
also performed to show the incremental increase in the cost of controls when compared to
BOOS. The costs effectiveness analysis is summarized in Table 6-4.
In the BART guidelines, EPA calculated that for all types of boilers other than cyclone
boilers, combustion control technology is generally more cost-effective than post-
combustion controls. EPA estimates that approximately 75 percent of the BART units
(non-cyclone) could meet the presumptive NOX limits at a cost of $100 to $1,000 per ton of
NOX removed based on the use of combustion control technology.22 For the units that
could not meet the presumptive limits using combustion control technology, EPA estimates
that almost all of these sources could meet the presumptive limits using advanced
combustion controls. The EPA estimates that the costs of such controls are usually less
than $1,500 per ton of NOX removed.23
Table 6-4 indicates that the cost effectiveness of BOOS is approximately $150 per ton of
NOX removed. Further, the incremental cost effectiveness of LNB/SOFA over BOOS is
approximately $9,000/ton, while the incremental cost of LNB/SOFA/SNCR over
LNB/SOFA is approximately $17,000/ton and the incremental cost LNB/SOFA/SCR over
LNB/SOFA is approximately $14,000/ton.
Table 6-4 also summarizes the improvement in the maximum of the 98th percentile
visibility impairment results due to each control technology. Details of the post-control
modeling results are provided later in Section 6.5, but this summary is presented here for
convenience. As Table 6-4 clearly shows, BOOS results in over 0.5 Δdv of visibility
improvement when compared the baseline visibility impairment. While LNB/SOFA,
LNB/SOFA/SNCR, and LNB/SOFA/SCR offer some additional visibility improvement
over BOOS, up to a maximum of 0.672 Δdv of additional improvement for
LNB/SOFA/SCR, the very high incremental costs when compared to BOOS cannot be
justified.
22 “Regional Haze Regulations and Guidelines for Best Available Retrofit Technology (BART Determinations;
Final Rule.) 77 Fed. Reg. 39134-39135 (July 6, 2005).
23 Id.

Entergy 6-7 Trinity Consultants
BART Analysis – Lake Catherine
TABLE 6-4. SUMMARY OF COST EFFECTIVENESS FOR UNIT 4 NOX CONTROLS
Baseline
Emission
Rate
Controlled
Emission Level
Annual Heat
Input1
Controlled
Emission
Rate
NOx
Reduced Capital Cost
Annual
Capital Cost
Annual Fixed
O&M
Annualized
Variable O&M
Total Annual
Cost
Cost
Effectiveness
Incremental
Cost3
Incremental
Visbility
Improvement 2
(tpy) (lb/MMBtu) (MMBtu/yr) (tpy) (ton/yr) ($) ($/yr) ($/yr) ($/yr) ($/yr) ($/ton) ($/ton) (dv)
BOOS 1,236 0.24 5,124,600 618 618 893,000 71,964 21,000 0 92,964 150 - 0.536
LNB/SOFA 1,236 0.19 5,124,600 495 742 11,845,025 954,548 210,000 19,034 1,183,582 1,596 8,822 0.152
LNB/OFA/SNCR 1,236 0.14 5,124,600 371 865 29,295,494 2,360,819 489,000 462,000 3,311,819 3,827 17,214 0.306
LNB/OFA/SCR 1,236 0.03 5,124,600 77 1159 79,152,952 6,378,652 568,000 268,000 7,214,652 6,223 14,440 0.672
3. The incremental cost for LNB/SOFA is calculated in comparison to BOOS while the incremental costs for LNB/SOFA + SNCR and LNB/SOFA + SCR are calculated in comparison to LNB/SOFA alone.
1. The annual heat input reflects a 10% annual capacity factor (5,850 MMBtu/hr * 8760 hrs/yr * 10% = 5,124,600 MMBtu/yr)
2. The incremental visibility improvement for BOOS is the maximum visibility improvement in the 98th percentile impact compared to baseline (See Table 6-9). The incremental visibility improvement for LNB/OFA,
LNB/OFA/SNCR, and LNB/SOFA/SCR is the difference between the maximum improvement due to LNB/OFA, LNB/SOFA/SNCR or LNB/SOFA/SCR in the four Class I areas considered in the analysis less the maximum visibility
improvement in the four Class I areas from BOOS (See Table 6-9).

Entergy 6-8 Trinity Consultants
BART Analysis – Lake Catherine
6.4.2 ENERGY IMPACTS & NON-AIR IMPACTS
As noted in Table 6-4, SCR and SNCR systems are capable of achieving additional NOX
reductions when compared to combustion controls such as BOOS, LNB, or SOFA.
However, both SCR and SNCR systems create additional energy and/or non-air
environmental impacts. SCR and SNCR systems require electricity to operate the ancillary
equipment. The need for electricity to help power some of the ancillary equipment creates
a demand for energy that currently does not exist.
SCR and SNCR can potentially cause significant environmental impacts. The primary
avenue is related to the storage of ammonia. The storage of aqueous ammonia above
10,000 lbs is regulated by a risk management program (RMP), since the accidental release
of ammonia has the potential to cause serious injury and death to persons in the vicinity of
the release. Additionally, SCR and SNCR will likely also cause the release of unreacted
ammonia to the atmosphere. This is referred to as ammonia slip. Ammonia slip from
SCR and SNCR systems occurs either from ammonia injection at temperatures too low for
effective reaction with NOX, leading to an excess of unreacted ammonia, or from over-
injection of reagent leading to uneven distribution; which also leads to an excess of
unreacted ammonia. Ammonia released from SCR and SNCR systems will react with
sulfates and nitrates in the atmosphere to form ammonium sulfate and ammonium nitrate.
Together, ammonium sulfate and ammonium nitrate are the predominant sources of
regional haze.
Another environmental impact associated with SCR is the disposal of catalyst waste. To
maintain NOX-removal effectiveness, the catalyst in an SCR system must periodically be
cleaned, regenerated, or replaced. Cleaning and regeneration are preferred, but eventually
the catalyst reaches the end of its useful life and must be replaced. Ideally the exhausted
catalyst can be recycled for reuse, however, if the condition of the spent catalyst does not
warrant recycling or a market is unavailable, the old catalyst must be disposed of. Current
regulatory interpretations indicate spent SCR catalysts are exempted from hazardous waste
regulation via 40 CFR § 261.4(b)(4) (Bevill Exemption) as flue gas emission control
wastes. However, ongoing efforts by EPA to increase regulatory oversight of coal
combustion residuals could alter that exemption, and create the potential that spent SCR
catalysts would be characterized as hazardous wastes, hence increasing the cost of disposal.
Regardless of the regulatory treatment of the waste, the disposal creates additional
potential financial and environmental impacts associated with an SCR system.
6.4.3 REMAINING USEFUL LIFE
The remaining useful life of Unit 4 is sufficiently long such that it does not affect the
BART analysis.
6.5 EVALUATION OF VISIBILITY IMPACT OF FEASIBLE NOX CONTROLS
A final impact analysis was conducted to assess the visibility improvement for existing emission rates
when compared to the emission rates associated with BOOS, LNB/SOFA, LNB/SOFA/SNCR, and

Entergy 6-9 Trinity Consultants
BART Analysis – Lake Catherine
LNB/SOFA/SCR. Section 4 of this report documented the existing visibility impairment attributable
to Unit 4. In order to assess the visibility improvement associated with BOOS, LNB/SOFA, SCR and
SNCR systems, the NOX emission rates associated with the control systems were modeled using
CALPUFF. The controlled emission level associated with BOOS is 0.24 lb/MMBtu; the controlled
emission level associated with an LNB/SOFA system is 0.19 lb/MMBtu; the controlled emission
level associated with an LNB/SOFA/SNCR system is 0.14 lb/MMBtu, and the controlled emission
level associated with an LNB/SOFA/SCR system is 0.03 lb/MMBtu. These levels were multiplied by
the maximum heat input (5,850 MMBtu/hr) to derive hourly the hourly emission rates used in the
modeling.
Tables 6-5 through 6-8 summarize the NOX emission rates that were modeled to reflect the BOOS,
LNB/SOFA, LNB/SOFA/SNCR and LNB/SOFA/SCR control options. The emission rates for the
other pollutants shown in Tables 6-5 through 6-8 are the same as in the baseline modeling.

Entergy 6-10 Trinity Consultants
BART Analysis – Lake Catherine
TABLE 6-5. SUMMARY OF EMISSION RATES MODELED TO REFLECT BOOS FOR NOX CONTROL
SO2
(lb/hr)
SO4
(lb/hr) NOX
(lb/hr)
PMC
(lb/hr)
PMF
(lb/hr)
SOA
(lb/hr)
EC
(lb/hr)
PM10, total
(lb/hr)
Unit 4 3.1 1.5 1,404.0 0.0 0.0 31.8 11.0 44.3
TABLE 6-6. SUMMARY OF EMISSION RATES MODELED TO REFLECT LNB/SOFA FOR NOX
CONTROL
SO2
(lb/hr)
SO4
(lb/hr) NOX
(lb/hr)
PMC
(lb/hr)
PMF
(lb/hr)
SOA
(lb/hr)
EC
(lb/hr)
PM10, total
(lb/hr)
Unit 4 3.1 1.5 1,111.5 0.0 0.0 31.8 11.0 44.3
TABLE 6-7. SUMMARY OF EMISSION RATES MODELED TO REFLECT LNB/SOFA + SNCR FOR
NOX CONTROL
SO2
(lb/hr)
SO4
(lb/hr) NOX
(lb/hr)
PMC
(lb/hr)
PMF
(lb/hr)
SOA
(lb/hr)
EC
(lb/hr)
PM10, total
(lb/hr)
Unit 4 3.1 1.5 819.0 0.0 0.0 31.8 11.0 44.3
TABLE 6-8. SUMMARY OF EMISSION RATES MODELED TO REFLECT LNB/SOFA + SCR FOR NOX
CONTROL
SO2
(lb/hr)
SO4
(lb/hr) NOX
(lb/hr)
PMC
(lb/hr)
PMF
(lb/hr)
SOA
(lb/hr)
EC
(lb/hr)
PM10, total
(lb/hr)
Unit 4 3.1 1.5 175.5 0.0 0.0 31.8 11.0 44.3
Table 6-9 provides a comparison of the existing visibility impairment and the visibility impairment
associated with the addition of NOX controls on Unit 4 in all affected Class I areas, including the
maximum modeled visibility impact, 98th percentile modeled visibility impact, and the number of
days with a modeled visibility impact greater than 0.5 Δdv.

Entergy 6-11 Trinity Consultants
BART Analysis – Lake Catherine
TABLE 6-9. SUMMARY OF VISIBILITY IMPROVEMENT ASSOCIATED WITH NOX CONTROL SYSTEM ON UNIT 4 (2001-2003)
Caney Creek Wilderness Upper Buffalo Wilderness Hercules Glades Wilderness Mingo NWR
M
ax
imu
m
Imp
act
(Δ
dv
)
98
% I
mp
act
(Δd
v)
# D
ay
s >
0.5
Δd
v
Ma
xim
um
Imp
act
(Δ
dv
)
98
% I
mp
act
(Δd
v)
# D
ay
s >
0.5
Δd
v
Ma
xim
um
Imp
act
(Δ
dv
)
98
% I
mp
act
(Δd
v)
# D
ay
s >
0.5
Δd
v
Ma
xim
um
Imp
act
(Δ
dv
)
98
% I
mp
act
(Δd
v)
# D
ay
s >
0.5
Δd
v
Existing Emission Rate 3.480 1.371 80 2.044 0.532 21 1.016 0.387 8 0.763 0.429 7
BOOS 2.154 0.835 37 1.232 0.307 11 0.6 0.229 2 0.447 0.253 0
Post Control
Improvement 1.326 0.536 43 0.812 0.225 10 0.416 0.158 6 0.316 0.176 7
LNB/SOFA 1.759 0.683 28 0.996 0.25 9 0.482 0.185 0 0.358 0.204 0
Incremental Post
Control Improvement
over BOOS
0.395 0.152 9 0.236 0.057 2 0.118 0.044 2 0.089 0.049 0
LNB/SOFA/SNCR 1.349 0.529 16 0.755 0.193 4 0.362 0.141 0 0.268 0.154 0
Incremental Post
Control Improvement
over BOOS
0.805 0.306 21 0.477 0.114 7 0.238 0.088 2 0.179 0.099 0
LNB/SOFA/SCR 0.452 0.163 0 0.211 0.057 0 0.101 0.043 0 0.082 0.042 0
Incremental Post
Control Improvement
over BOOS
1.702 0.672 37 1.021 0.25 11 0.499 0.186 2 0.365 0.211 0
†The visibility improvement shown in the table has been calculated from 98th percentile baseline and controlled impacts that include more decimal places than what is
shown in the table. Due to rounding of the baseline and controlled 98th percentile impacts shown in the table, the visibility improvement calculated from the baseline and
controlled 98th percentile impacts shown in the table may be slightly different than the visibility improvement reflected in the table.

Entergy 6-12 Trinity Consultants
BART Analysis – Lake Catherine
As shown in Table 6-9, based on visibility predictions from the CALPUFF modeling system, the
operation of a BOOS will result in up to a 0.536 Δdv improvement (depending on the Class I area) to
the existing visibility impairment attributable to Unit 4. This visibility improvement increases by
0.152 Δdv for LNB/SOFA (0.835-0.683 = 0.152), 0.306 Δdv for LNB/SOFA/SNCR (0.835-0.529 =
0.306), and 0.672 Δdv for LNB/SOFA/SCR (.835-0.163 = 0.672).
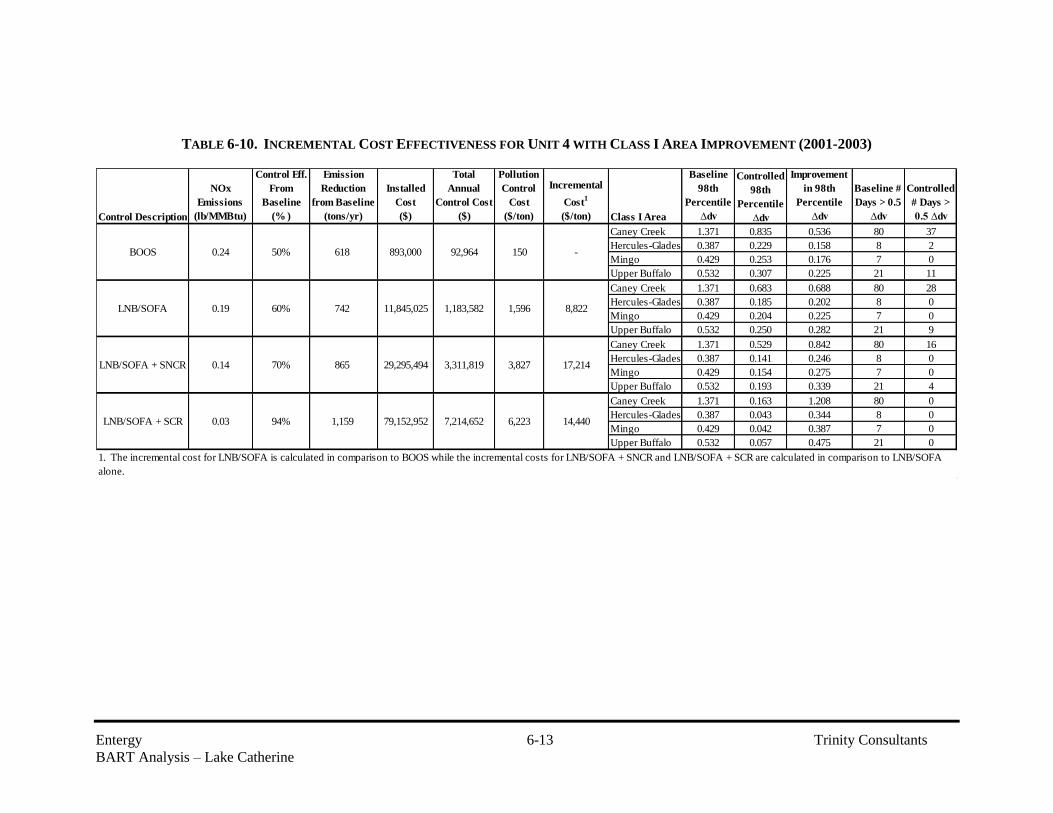
For convenience, Table 6-10 provides a condensed summary of these predicted improvements
alongside the estimated control costs. The incremental visibility benefit of going from BOOS to
either LNB/SOFA, LNB/SOFA/SCNR or LNB/SOFA/SCR is clearly not justified by the high
incremental cost difference. The control technologies are very expensive from an initial capital
investment and prohibitively more expensive from an incremental cost effectiveness standpoint than
BOOS.
Entergy 6-13 Trinity Consultants
BART Analysis – Lake Catherine
TABLE 6-10. INCREMENTAL COST EFFECTIVENESS FOR UNIT 4 WITH CLASS I AREA IMPROVEMENT (2001-2003)
Control Description
NOx
Emissions
(lb/MMBtu)
Control Eff.
From
Baseline
(% )
Emission
Reduction
from Baseline
(tons/yr)
Installed
Cost
($)
Total
Annual
Control Cost
($)
Pollution
Control
Cost
($/ton)
Incremental
Cost1
($/ton) Class I Area
Baseline
98th
Percentile
∆dv
Controlled
98th
Percentile
∆dv
Improvement
in 98th
Percentile
∆dv
Baseline #
Days > 0.5
∆dv
Controlled
# Days >
0.5 ∆dv
Caney Creek 1.371 0.835 0.536 80 37
Hercules-Glades 0.387 0.229 0.158 8 2
Mingo 0.429 0.253 0.176 7 0
Upper Buffalo 0.532 0.307 0.225 21 11
Caney Creek 1.371 0.683 0.688 80 28
Hercules-Glades 0.387 0.185 0.202 8 0
Mingo 0.429 0.204 0.225 7 0
Upper Buffalo 0.532 0.250 0.282 21 9
Caney Creek 1.371 0.529 0.842 80 16
Hercules-Glades 0.387 0.141 0.246 8 0
Mingo 0.429 0.154 0.275 7 0
Upper Buffalo 0.532 0.193 0.339 21 4
Caney Creek 1.371 0.163 1.208 80 0
Hercules-Glades 0.387 0.043 0.344 8 0
Mingo 0.429 0.042 0.387 7 0
Upper Buffalo 0.532 0.057 0.475 21 0
1. The incremental cost for LNB/SOFA is calculated in comparison to BOOS while the incremental costs for LNB/SOFA + SNCR and LNB/SOFA + SCR are calculated in comparison to LNB/SOFA
alone.
1,183,582 1,596 8,822
LNB/SOFA + SNCR 0.14 70% 865 29,295,494 3,311,819
LNB/SOFA 0.19 60% 742 11,845,025
14,440
3,827 17,214
LNB/SOFA + SCR 0.03 94% 1,159 79,152,952 7,214,652 6,223
893,000 92,964 150 -BOOS 0.24 50% 618

Entergy 6-14 Trinity Consultants
BART Analysis – Lake Catherine
6.6 PROPOSED BART FOR NOX
Entergy proposes a BART emission rate of 0.24 lb/MMBtu on a 30-day rolling average basis,
achievable through use of BOOS at Unit 4.24
24 If CSAPR is upheld and implemented in Arkansas, Entergy will rely on CSAPR to satisfy its regional haze
obligations at Lake Catherine. If CSAPR is vacated and CAIR remains in effect, EPA’s prior determination that the
reductions provided under CAIR’s seasonal NOX trading program provide greater visibility improvements than BART
should allow Entergy to rely on the seasonal CAIR program to satisfy its NOX obligations under BART.

Entergy 7-1 Trinity Consultants
BART Analysis – Lake Catherine
7. PM10 BART EVALUATION
A BART determination for PM10 based on the use of natural gas was approved in EPA’s March 12,
2012, final rule. The determination results in no PM10 controls needed during natural gas
combustion.25
25 “Approval and Promulgation of Implementation Plans; Arkansas; Regional Haze State Implementation Plan;
Interstate Transport State Implementation Plan To Address Pollution Affecting Visibility and Regional Haze. Final Rule,”
77 Fed. Reg. 14604 (March 12, 2012).

Entergy Trinity Consultants
BART Analysis – Lake Catherine
APPENDIX A
CONTROL COST CALCULATIONS

Entergy Trinity Consultants
BART Analysis – Lake Catherine
BOOS Capital and O&M Cost Estimate
Implementation Cost1
893,000
Capital Recovery Factor (CRF)2
0.08
Fixed O&M Costs3
21,000
Variable O&M Costs4
0
Annualized Implementation Cost 71,964
Total Annual Costs 92,964
3: The fixed O&M cost estimate for BOOS is based on the fixed O&M cost
estimate for BOOS as provided by Sargent & Lundy in the 5/16/2013 NOx
Control Technology Cost and Performance Study
4: The variable O&M cost estimate for BOOS is based on the variable O&M
cost estimate for BOOS as provided by Sargent & Lundy in the 5/16/2013
NOx Control Technology Cost and Performance Study
N/A
Annual Costs
Capital Cost
Operational Data
1: It is anticipated that BOOS can be implemented on the unit without any
capital expenditures. The one-time costs associated with BOOS
implementation would instead be incorporated into the facility’s O&M
budget for the fiscal year. In order to provide an apples-to-apples
comparison with the other NOx control options, these one-time additional
O&M costs were treated as if the cost were a capital expenditure. This cost
is is based the Sargent & Lundy 5/16/2013 NOx Control Technology Cost
and Performance Study.
2: CRF = [ I x (1+i)^a]/[(1+i)^a - 1], where I = interest rate, a = equipment life
Equipment CRF, 30-yr actual service life, 7% interest

Entergy Trinity Consultants
BART Analysis – Lake Catherine
LNB-SOFA Capital and O&M Cost Estimate
Maximum HI (MMBtu/hr) 5850
Average Annual Operating Hours, 2009-2011 1205
Installed Capital Cost1
11,845,025
Capital Recovery Factor (CRF)2
0.08
Fixed O&M Costs3
210,000
Variable O&M Costs4
19,034
Annualized Capital Cost 954,548
Total Annual Costs 1,183,582
Annual Costs
Capital Cost
Operational Data
2: CRF = [ I x (1+i)^a]/[(1+i)^a - 1], where I = interest rate, a = equipment life
1: The installed capital cost estimate for LNB/OFA + SNCR is based on the installed capital cost estimate
provided by Sargent & Lundy in the 5/16/2013 NOx Control Technology Cost and Performance Study
($8,762,000) plus additional cost not accounted for in the S&L cost estimate, including cost for permitting and
legal/regulatory support (estimated by Entergy to be $112,500), cost for Entergy employee labor and loaders
(estimated by Entergy to be $1,634,363), cost for capital suspense (estimated by Entergy to be $751,978), and
cost for AFUDC (estimated by Entergy to be $584,184) .
3: The fixed O&M cost estimate for LNB/OFA is based on the fixed O&M cost estimate for LNB/OFA as
provided by Sargent & Lundy in the 5/16/2013 NOx Control Technology Cost and Performance Study
Equipment CRF, 30-yr actual service life, 7% interest
4: The variable O&M cost estimate for LNB/OFA is based on an equation documented in the Eastern Research
Group report "Analysis of Combustion Controls for Reducing NOx Emissions from Coal-fired EGUs in the
WRAP Region" September 6, 2005. Section 4.3.1 and Appendix D as shown below.
Variable O&M = (0.027 mills/kW-hr/1000) x (1 kW-hr/10,000 Btu) x H x C x 10^6 Btu/mmBtu
Where:
H = Annual operating hours
C = Boiler design capacity (mmBtu/hr)
Note: The variable rate used for variable O&M costs was 0.027 mills/kW-hr. This is the rate listed in Appedix D

Entergy Trinity Consultants
BART Analysis – Lake Catherine
LNB-OFA + SNCR Capital and O&M Cost Estimate
Maximum HI (MMBtu/hr) 5850
Average Annual Operating Hours, 2009-2011 1205
Installed Capital Cost1
29,295,494
Capital Recovery Factor (CRF)2
0.08
Fixed O&M Costs 489,000
Variable O&M Costs 462,000
Annualized Capital Cost 2,360,819
Total Annual Costs 3,311,819
Capital Cost
Operational Data
4: The variable O&M cost estimates are based on the cost estimates provided by Sargent & Lundy in the 5/16/2013 NOx
Control Technology Cost and Performance Study. Adding LNB/OFA to SNCR makes the variable O&M costs less than that
of SNCR alone due to a lower NOx concentration and resulting less reagent usage.
1: The installed capital cost estimate for LNB/OFA + SNCR is based on the installed capital cost estimate provided by
Sargent & Lundy in the 5/16/2013 NOx Control Technology Cost and Performance Study ($24,269,000) plus additional cost
not accounted for in the S&L cost estimate, including cost for permitting and legal/regulatory support (estimated by Entergy
to be $112,500), cost for Entergy employee labor and loaders (estimated by Entergy to be $1,634,363), cost for capital
suspense (estimated by Entergy to be $1,821,939), and cost for AFUDC (estimated by Entergy to be $1,457,962 for each unit)
.
2: CRF = [ I x (1+i)^a]/[(1+i)^a - 1], where I = interest rate, a = equipment life
Equipment CRF, 30-yr actual service life, 7% interest
3: The fixed O&M cost estimate for LNB/OFA + SNCR is based on the fixed O&M cost estimate for LNB/OFA + SNCR as
provided by Sargent & Lundy in the 5/16/2013 NOx Control Technology Cost and Performance Study
Annual Costs3

Entergy Trinity Consultants
BART Analysis – Lake Catherine
LNB-OFA + SCR Capital and O&M Cost Estimate
Maximum HI (MMBtu/hr) 5850
Annual Operating Hours, 2009-2011 1205
Installed Capital Cost 79,152,952
Capital Recovery Factor (CRF)2
0.08
Fixed O&M Costs 568,000
Variable O&M Costs 268,000
Annualized Capital Cost 6,378,652
Total Annual Costs 7,214,652
Capital Costs1
Operational Data
4: The variable O&M cost estimates are based on the cost estimates provided by Sargent & Lundy in the 5/16/2013 NOx Control
Technology Cost and Performance Study. Adding LNB/OFA to SCR makes the variable O&M costs less than that of SCR alone
due to a lower NOx concentration and resulting less reagent usage.
1: The installed capital cost estimate for LNB/OFA + SCR is based on the installed capital cost estimate provided by Sargent &
Lundy in the 5/16/2013 NOx Control Technology Cost and Performance Study ($68,349,000) plus additional cost not accounted for
in the S&L cost estimate, including cost for permitting and legal/regulatory support (estimated by Entergy to be $387,500), cost for
Entergy employee labor and loaders (estimated by Entergy to be $1,634,363), cost for capital suspense (estimated by Entergy to be
$4,888,377 ), and cost for AFUDC (estimated by Entergy to be $3,956,212) .
2: CRF = [ I x (1+i)^a]/[(1+i)^a - 1], where I = interest rate, a = equipment life
Equipment CRF, 30-yr actual service life, 7% interest
3: All O&M cost estimateswere provided by Sargent & Lundy in the 5/16/2013 NOx Control Technology Cost and Performance
Study
Annual Costs3

Entergy Trinity Consultants
BART Analysis – Lake Catherine
APPENDIX B
MODELING PROTOCOL
As stated in Section 3.1, the meteorological data used in the analyses presented in this report was
originally developed in 2007 and was first used in a BART determination for Oklahoma Gas &
Electric. Because the development of a set of CALMET/CALPUFF meteorological data is so
intensive, this same dataset has been used numerous times since 2007 for various other BART
projects in EPA Region 6. The protocol that accompanied the original development has followed the
dataset in each case and is doing so here again.
Entergy Trinity Consultants
BART Analysis – Lake Catherine
APPENDIX C
CEMS DATA FROM CAMD FOR 2001 TO 2003

CALMET DATA PROCESSING PROTOCOL BART DETERMINATION
OKLAHOMA GAS & ELECTRIC
MUSKOGEE GENERATING STATION
SEMINOLE GENERATING STATION
SOONER GENERATING STATION
Prepared by:
Vern Choquette Principal Consultant
Eugene Chen, PE Senior Consultant
Jeremy Townley Consultant
TRINITY CONSULTANTS
120 East Sheridan
Suite 205
Oklahoma City, OK 73104
(405) 228-3292
January 23, 2008
Project 083701.0004

OG&E i Trinity Consultants CALMET Processing Protocol 083701.0004
TABLE OF CONTENTS
1. INTRODUCTION .................................................................................................... 1-1
1.1 BEST AVAILABLE RETROFIT TECHNOLOGY RULE BACKGROUND ......................... 1-1
1.2 OBJECTIVE ............................................................................................................ 1-2
1.3 LOCATION OF SOURCES AND RELEVANT CLASS I AREAS ...................................... 1-2
2. CALPUFF MODEL SYSTEM ............................................................................... 2-1
2.1 MODEL VERSIONS ................................................................................................. 2-1
2.2 MODELING DOMAIN ............................................................................................. 2-1
3. CALMET ............................................................................................................ 3-1
3.1 GEOPHYSICAL DATA ............................................................................................. 3-1
3.1.1 TERRAIN DATA ................................................................................................... 3-1
3.1.2 LAND USE DATA ................................................................................................. 3-2
3.1.3 COMPILING TERRAIN AND LAND USE DATA ....................................................... 3-3
3.2 METEOROLOGICAL DATA ..................................................................................... 3-3
3.2.1 MESOSCALE MODEL METEOROLOGICAL DATA ................................................. 3-3
3.2.2 SURFACE METEOROLOGICAL DATA ................................................................... 3-4
3.2.3 UPPER AIR METEOROLOGICAL DATA ................................................................. 3-5
3.2.4 PRECIPITATION METEOROLOGICAL DATA .......................................................... 3-6
3.2.5 BUOY METEOROLOGICAL DATA ......................................................................... 3-7
3.3 CALMET CONTROL PARAMETERS ....................................................................... 3-8
3.3.1 VERTICAL METEOROLOGICAL PROFILE .............................................................. 3-8
3.3.2 INFLUENCES OF OBSERVATIONS ......................................................................... 3-9
APPENDIX A- METEOROLOGICAL STATIONS
APPENDIX B – SAMPLE CALMET CONTROL FILE (CALPUFF VERSION 5.8)
APPENDIX C – SAMPLE CALMET CONTROL FILE (CALPUFF VERSION 6)
OG&E ii Trinity Consultants CALMET Processing Protocol 083701.0004
LIST OF TABLES
TABLE 1-1. BART-ELIGIBLE SOURCES ............................................................................................... 1-2
TABLE 1-2. DISTANCE FROM STATION TO SURROUNDING CLASS I AREAS ....................................... 1-2
TABLE 2-1. CALPUFF MODELING SYSTEM VERSIONS ..................................................................... 2-1
TABLE 3-1. VERTICAL LAYERS OF THE CALMET METEOROLOGICAL DOMAIN ................................ 3-9
TABLE A-1. LIST OF SURFACE METEOROLOGICAL STATIONS ........................................................... A-1
TABLE A-2. LIST OF UPPER AIR METEOROLOGICAL STATIONS ......................................................... A-5
TABLE A-3. LIST OF PRECIPITATION METEOROLOGICAL STATIONS .................................................. A-6
TABLE A-4. LIST OF OVER WATER METEOROLOGICAL STATIONS .................................................. A-14

OG&E iii Trinity Consultants CALMET Processing Protocol 083701.0004
LIST OF FIGURES
FIGURE 1-1. PLOT OF SOURCES AND NEAREST CLASS I AREAS ......................................................... 1-3
FIGURE 2-1. REFINED METEOROLOGICAL MODELING DOMAIN ......................................................... 2-2
FIGURE 3-1. PLOT OF LAND ELEVATION USING USGS TERRAIN DATA ............................................ 3-2
FIGURE 3-2. PLOT OF LAND USE USING USGS LULC DATA ............................................................. 3-3
FIGURE 3-3. PLOT OF SURFACE STATION LOCATIONS ........................................................................ 3-5
FIGURE 3-4. PLOT OF UPPER AIR STATIONS LOCATIONS ................................................................... 3-6
FIGURE 3-5. PLOT OF PRECIPITATION METEOROLOGICAL STATIONS ................................................. 3-7
FIGURE 3-6. PLOT OF BUOY METEOROLOGICAL STATIONS ................................................................ 3-8

OG&E 1-1 Trinity Consultants CALMET Processing Protocol 083701.0004
1. INTRODUCTION
Oklahoma Gas & Electric (OG&E) owns and operates three electric generating stations near
Muskogee, Oklahoma (Muskogee Generating Station), Seminole, Oklahoma (Seminole Generating
Station), and Stillwater, Oklahoma (Sooner Generating Station). These generating stations are
considered eligible to be regulated under the U.S. Environmental Protection Agency’s (EPA) Best
Available Retrofit Technology (BART) provisions of the Regional Haze Rule. This protocol
describes the proposed methodology for conducting the CALMET data processing for the refined
CALPUFF BART modeling analysis for OG&E’s Muskogee, Seminole, and Sooner Generating
Stations. A detailed CALPUFF BART modeling protocol will be submitted in the near future and
will include a discussion of the CALPUFF parameters as well as the post processing methodologies
to be used in the refined modeling analysis for each station.
1.1 BEST AVAILABLE RETROFIT TECHNOLOGY RULE BACKGROUND
On July 1, 1999, the U.S. Environmental EPA published the final Regional Haze Rule (RHR). The
objective of the RHR is to improve visibility in 156 specific areas across with United States, known
as Class I areas. The Clean Air Act defines Class I areas as certain national parks (over 6000 acres),
wilderness areas (over 5000 acres), national memorial parks (over 5000 acres), and international
parks that were in existence on August 7, 1977.
On July 6, 2005, the EPA published amendments to its 1999 RHR, often called the BART rule, which
included guidance for making source-specific Best Available Retrofit Technology (BART)
determinations. The BART rule defines BART-eligible sources as sources that meet the following
criteria:
(1) Have potential emissions of at least 250 tons per year of a visibility-impairing pollutant,
(2) Began operation between August 7, 1962 and August 7, 1977, and
(3) Are listed as one of the 26 listed source categories in the guidance.
A BART-eligible source is not automatically subject to BART. Rather, BART-eligible sources are
subject-to-BART if the sources are “reasonably anticipated to cause or contribute to visibility
impairment in any federal mandatory Class I area.” EPA has determined that sources are reasonably
anticipated to cause or contribute to visibility impairment if the visibility impacts from a source are
greater than 0.5 deciviews (dv) when compared against a natural background.
Air quality modeling is the tool that is used to determine a source’s visibility impacts. States have the
authority to exempt certain BART-eligible sources from installing BART controls if the results of the
dispersion modeling demonstrate that the source cannot reasonably be anticipated to cause or
contribute to visibility impairment in a Class I area. Further, states also have the authority to define
the modeling procedures for conducting modeling related to making BART determinations.
OG&E 1-2 Trinity Consultants CALMET Processing Protocol 083701.0004
1.2 OBJECTIVE
The objective of this document is to provide a protocol summarizing the modeling methods and
procedures that will be followed to conduct the CALMET data processing necessary to complete a
refined CALPUFF modeling analysis for the OG&E generating stations discussed above. The
modeling methods and procedures contained in this protocol and the CALPUFF protocol yet to be
submitted will be used to determine appropriate controls for OG&E’s BART-eligible sources that can
reasonably be anticipated to reduce the sources’ effects on or contribution to visibility impairment in
the surrounding Class I areas. It is OG&E’s intent to determine a combination of emissions controls
that will reduce the impact of each generating station to a degree that the 98th percentile of the
visibility impact predicted by the model due to all the BART eligible sources at each station
collectively is below EPA’s recommended visibility contribution threshold of 0.5 dv.
1.3 LOCATION OF SOURCES AND RELEVANT CLASS I AREAS
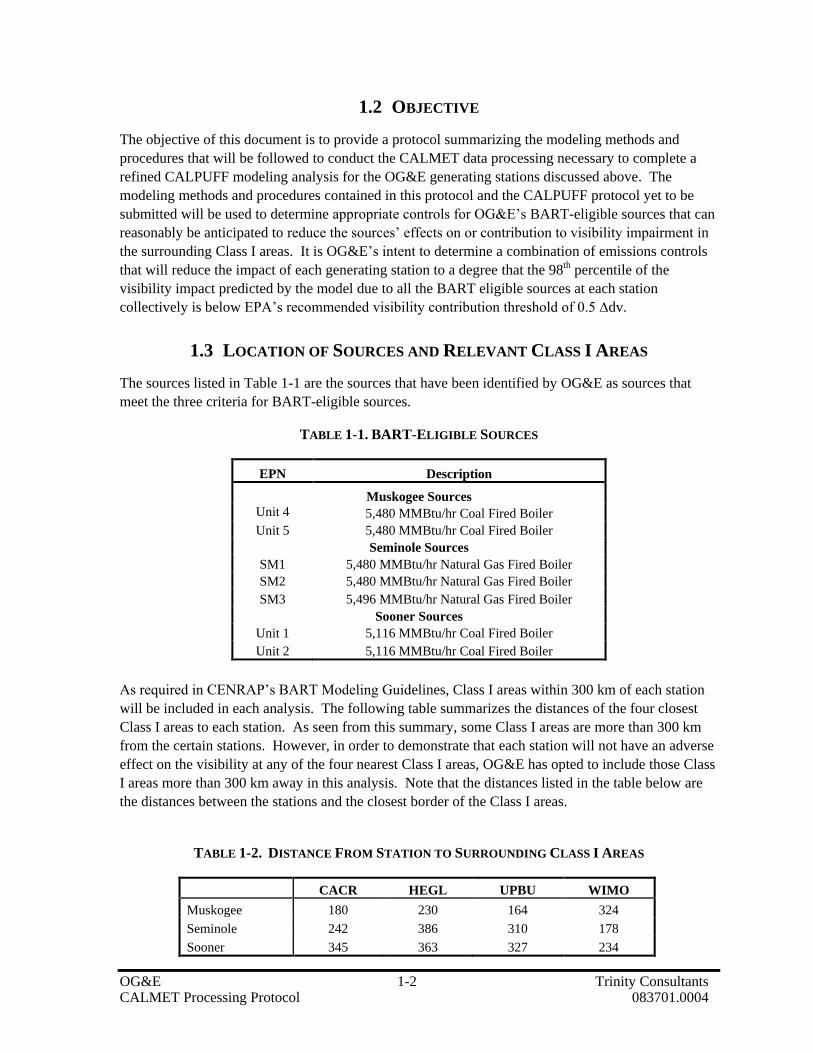
The sources listed in Table 1-1 are the sources that have been identified by OG&E as sources that
meet the three criteria for BART-eligible sources.
TABLE 1-1. BART-ELIGIBLE SOURCES
EPN Description
Muskogee Sources
Unit 4 5,480 MMBtu/hr Coal Fired Boiler
Unit 5 5,480 MMBtu/hr Coal Fired Boiler
Seminole Sources
SM1 5,480 MMBtu/hr Natural Gas Fired Boiler
SM2 5,480 MMBtu/hr Natural Gas Fired Boiler
SM3 5,496 MMBtu/hr Natural Gas Fired Boiler
Sooner Sources
Unit 1 5,116 MMBtu/hr Coal Fired Boiler
Unit 2 5,116 MMBtu/hr Coal Fired Boiler
As required in CENRAP’s BART Modeling Guidelines, Class I areas within 300 km of each station
will be included in each analysis. The following table summarizes the distances of the four closest
Class I areas to each station. As seen from this summary, some Class I areas are more than 300 km
from the certain stations. However, in order to demonstrate that each station will not have an adverse
effect on the visibility at any of the four nearest Class I areas, OG&E has opted to include those Class
I areas more than 300 km away in this analysis. Note that the distances listed in the table below are
the distances between the stations and the closest border of the Class I areas.
TABLE 1-2. DISTANCE FROM STATION TO SURROUNDING CLASS I AREAS
CACR HEGL UPBU WIMO
Muskogee 180 230 164 324
Seminole 242 386 310 178
Sooner 345 363 327 234

OG&E 1-3 Trinity Consultants CALMET Processing Protocol 083701.0004
A plot of the Class I areas with respect to the each station is provided in Figure 1-1.
FIGURE 1-1. PLOT OF SOURCES AND NEAREST CLASS I AREAS
-800 -600 -400 -200 0 200 400 600 800
LCC Easting (km)
-1600
-1400
-1200
-1000
-800
-600
-400
-200
LC
C N
ort
hin
g (
km
)
Seminole Station
Muskogee Station
Sooner Station
WIMOCACR
UPBU
HEGL
Class I Areas

OG&E 2-1 Trinity Consultants CALMET Processing Protocol 083701.0004
2. CALPUFF MODEL SYSTEM
The main components of the CALPUFF modeling system are CALMET, CALPUFF, and CALPOST.
CALMET is the meteorological model that generates hourly three-dimensional meteorological fields
such as wind and temperature. CALPUFF simulates the non-steady state transport, dispersion, and
chemical transformation of air pollutants emitted from a source in “puffs”. CALPUFF calculates
hourly concentrations of visibility affecting pollutants at each specified receptor in a modeling
domain. CALPOST is the post-processor for CALPUFF that computes visibility impacts from a
source based on the visibility affecting pollutant concentrations that were output by CALPUFF.
2.1 MODEL VERSIONS
The versions of the CALPUFF modeling system programs that are proposed for conducting OG&E’s
BART modeling are listed in Table 2-1. A detailed refined CALPUFF BART modeling protocol will
be submitted in the near future.
TABLE 2-1. CALPUFF MODELING SYSTEM VERSIONS
Processor Version Level
TERREL 3.3 030402
CTGCOMP 2.21 030402
CTGPROC 2.63 050128
MAKEGEO 2.2 030402
CALMET 5.53a 040716
CALPUFF 5.8 070623
POSTUTIL 1.3 030402
CALPOST 5.51 030709
2.2 MODELING DOMAIN
The CALPUFF modeling system utilizes three modeling grids: the meteorological grid, the
computational grid, and the sampling grid. The meteorological grid is the system of grid points at
which meteorological fields are developed with CALMET. The computational grid determines the
computational area for a CALPUFF run. Puffs are advected and tracked only while within the
computational grid. The meteorological grid is defined so that it covers the areas of concern and
gives enough marginal buffer area for puff transport and dispersion. A plot of the proposed
meteorological modeling domain with respect to the Class I areas being modeled is also provided in

OG&E 2-2 Trinity Consultants CALMET Processing Protocol 083701.0004
Figure 2-1. The computational domain will be set to extend at least 50 km in all directions beyond
the Muskogee, Seminole, and Sooner Generating Stations and the Class I areas of interest. Note that
the map projection for the modeling domain will be Lambert Conformal Conic (LCC) and the datum
will be the World Geodetic System 84 (WGS-84). The reference point for the modeling domain is
Latitude 40ºN, Longitude 97ºW. The southwest corner will be set to -951.547 km LCC, -1646.637
km LCC corresponding to Latitude 24.813 ºN and Longitude 87.778ºW. The meteorological grid
spacing will be 4 km, resulting in 462 grid points in the X direction and 376 grid points in the Y
direction.
FIGURE 2-1. REFINED METEOROLOGICAL MODELING DOMAIN
-800 -600 -400 -200 0 200 400 600 800
LCC Easting (km)
-1600
-1400
-1200
-1000
-800
-600
-400
-200
L C C N o r t h i n g ( k m )
Seminole Station
Muskogee Station
Sooner Station
WIMO CACR
UPBU
HEGL
Class I Areas
Meteorological Modeling Domain
Computational Modeling Domain 1

OG&E 3-1 Trinity Consultants CALMET Processing Protocol 083701.0004
3. CALMET
The EPA Approved Version of the CALMET meteorological processor will be used to generate the
meteorological data for CALPUFF. CALMET is the meteorological processor that compiles
meteorological data from raw observations of surface and upper air conditions, precipitation
measurements, mesoscale model output, and geophysical parameters into a single hourly, gridded
data set for input into CALPUFF. CALMET will be used to assimilate data for 2001- 2003 using
National Weather Service (NWS) surface station observations, upper air station observations,
precipitation station observations, buoy station observations (for overwater areas), and mesoscale
model output to develop the meteorological field.
3.1 GEOPHYSICAL DATA
CALMET requires geophysical data to characterize the terrain and land use parameters that
potentially affect dispersion. Terrain features affect flows and create turbulence in the atmosphere
and are potentially subjected to higher concentrations of elevated puffs. Different land uses exhibit
variable characteristics such as surface roughness, albedo, Bowen ratio, and leaf-area index that also
effect turbulence and dispersion.
3.1.1 TERRAIN DATA
Terrain data will be obtained from the United States Geological Survey (USGS) in
1-degree (1:250,000 scale or approximately 90 meter resolution) digital format. The
USGS terrain data will then be processed by the TERREL program to generate grid-cell
elevation averages across the modeling domain. A plot of the land elevations based on the
USGS data for the modeling domain is provided in Figure 3-1.

OG&E 3-2 Trinity Consultants CALMET Processing Protocol 083701.0004
FIGURE 3-1. PLOT OF LAND ELEVATION USING USGS TERRAIN DATA
3.1.2 LAND USE DATA
The land use land cover (LULC) data from the USGS North American land cover
characteristics data base in the Lambert Azimuthal equal area map projection will be used
in order to determine the land use within the modeling domain. The LULC data will be
processed by the CTGPROC program which will generate land use for each grid cell
across the modeling domain. A plot of the land use based on the USGS data for the
modeling domain is provided in Figure 3-2.
-800 -600 -400 -200 0 200 400 600 800
LCC Easting(km)
-1600
-1400
-1200
-1000
-800
-600
-400
-200
L C C N o r t h i n g ( k m )
Seminole Station
Muskogee Station
Sooner Station
0
982
1960
2950
3930
Terrain Elevation (m)

OG&E 3-3 Trinity Consultants CALMET Processing Protocol 083701.0004
FIGURE 3-2. PLOT OF LAND USE USING USGS LULC DATA
3.1.3 COMPILING TERRAIN AND LAND USE DATA
The terrain data files output by the TERELL program and the LULC files output by the
CTGPROC program will be uploaded into the MAKEGEO program to create a
geophysical data file that will be input into CALMET.
3.2 METEOROLOGICAL DATA
CALMET will be used to assimilate data for 2001, 2002, and 2003 using mesoscale model output and
National Weather Service (NWS) surface station observations, upper air station observations,
precipitation station observations, and National Oceanic and Atmosphere Administrations (NOAA)
buoy station observations to develop the meteorological field.
3.2.1 MESOSCALE MODEL METEOROLOGICAL DATA
Hourly mesoscale data will also be used as the initial guess field in developing the
CALMET meteorological data. It is OG&E’s intent to use the following 5th generation
mesoscale model meteorological data sets (or MM5 data) in the analysis:
2001 MM5 data at 12 km resolution generated by the U.S. EPA
2002 MM5 data at 36 km resolution generated by the Iowa DNR
-800 -600 -400 -200 0 200 400 600 800 LCC Easting (km)
-1600
-1400
-1200
-1000
-800
-600
-400
-200
L C C N o r t h i n g ( k m )
10
27.5
45
62.5
80
Land Use
Sooner Station
Muskogee Station
Seminole Station
OG&E 3-4 Trinity Consultants CALMET Processing Protocol 083701.0004
2003 MM5 data set at 36 km resolution generated by the Midwest RPO
The specific MM5 data that will be used are subsets of the data listed above. As the
contractor to CENRAP for developing the meteorological data sets for the BART
modeling, Alpine Geophysics extracted three subsets of MM5 data for each year from
2001 to 2003 from the data sets listed above using the CALMM5 extraction program. The
three subsets covered the northern, central, and southern portions of CENRAP. TXI is
proposing to use the southern set of the extracted MM5 data.
The 2001 southern subset of the extracted MM5 data includes 30 files that are broken into
10 to 11 day increments (3 files per month). The 2002 and 2003 southern subsets of
extracted MM5 data include 12 files each of which are broken into 30 to 31 day increment
files (1 file per month). Note that the 2001 to 2003 MM5 data extracted by Alpine
Geophysics will not be able to be used directly in the modeling analysis. To run the Alpine
Geophysics extracted MM data in the EPA approved CALMET program, each of the MM5
files will need to be adjusted by appending an additional six (6) hours, at a minimum, to
the end of each file to account for the shift in time zones from the Greenwich Mean Time
(GMT) prepared Alpine Geophysics data to Time Zone 6 for this analysis. No change to
the data will occur.
The time periods covered by the data in each of the MM5 files extracted by Alpine
Geophysics include a specific number of calendar days, where the data starts at Hour 0 in
GMT for the first calendar day and ends at Hour 23 in GMT on the last calendar day. In
order to run CALMET in the local standard time (LST), which is necessary since the
surface meteorological observations are recorded in LST, there must be hours of MM5 data
referenced in a CALMET run that match the LST observation hours. Since the LST hours
in Central Standard Time (CST) are 6 hours behind GMT, it is necessary to adjust the data
in each MM5 file so that the time periods covered in the files match CST.
Based on the above discussion, the Alpine Geophysics MM5 data will not be used directly.
Instead the data files will be modified to add 8 additional hours of data to the end of each
file from the beginning of the subsequent file. CALMET will then be run using the
appended MM5 data to generate a contiguous set of CALMET output files. The converted
MM5 data files occupy approximately 1.2 terabytes (TB) of hard drive space.
3.2.2 SURFACE METEOROLOGICAL DATA
Parameters affecting turbulent dispersion that are observed hourly at surface stations
include wind speed and direction, temperature, cloud cover and ceiling, relative humidity,
and precipitation type. It is OG&E’s intent to use the surface stations listed in Table A-1
of Appendix A. The locations of the surface stations with respect to the modeling domain
are shown in Figure 3-3. The stations were selected from the available data inventory to
optimize spatial coverage and representation of the domain. Data from the stations will be
processed for use in CALMET using EPA’s SMERGE program.

OG&E 3-5 Trinity Consultants CALMET Processing Protocol 083701.0004
FIGURE 3-3. PLOT OF SURFACE STATION LOCATIONS
3.2.3 UPPER AIR METEOROLOGICAL DATA
Observations of meteorological conditions in the upper atmosphere provide a profile of
turbulence from the surface through the depth of the boundary layer in which dispersion
occurs. Upper air data are collected by balloons launched simultaneously across the
observation network at 0000 Greenwich Mean Time (GMT) (6 o’clock PM in Oklahoma)
and 1200 GMT (6 o’clock AM in Oklahoma). Sensors observe pressure, wind speed and
direction, and temperature (among other parameters) as the balloon rises through the
atmosphere. The upper air observation network is less dense than surface observation
points since upper air conditions vary less and are generally not as affected by local effects
(e.g., terrain or water bodies). The upper air stations that are proposed for this analysis are
listed in Table A-2 of Appendix A. The locations of the upper air stations with respect to
the modeling domain are shown in Figure 3-4. These stations were selected from the
available data inventory to optimize spatial coverage and representation of the domain.
Data from the stations will be processed for use in CALMET using EPA’s READ62
program.
-800 -600 -400 -200 0 200 400 600 800
LCC Easting (km)
-1600
-1400
-1200
-1000
-800
-600
-400
-200
L C C N o r t h i n g ( k m )
Seminole Station
Muskogee Station
Sooner Station
WIMO CACR
UPBU
HEGL
Class I Areas Surface Stations

OG&E 3-6 Trinity Consultants CALMET Processing Protocol 083701.0004
FIGURE 3-4. PLOT OF UPPER AIR STATIONS LOCATIONS
-800 -600 -400 -200 0 200 400 600 800
LCC Easting (km)
-1600
-1400
-1200
-1000
-800
-600
-400
-200
LC
C N
ort
hin
g (
km
)
Seminole Station
Muskogee Station
Sooner Station
WIMOCACR
UPBU
HEGL
Class I Areas
Upper Air Stations
3.2.4 PRECIPITATION METEOROLOGICAL DATA
The effects of chemical transformation and deposition processes on ambient pollutant
concentrations will be considered in this analysis. Therefore, it is necessary to include
observations of precipitation in the CALMET analysis. The precipitation stations that are
proposed for this analysis are listed in Table A-3 of Appendix A. The locations of the
precipitation stations with respect to the modeling domain are shown in Figure 3-5. These
stations were selected from the available data inventory to optimize spatial coverage and
representation of the domain. Data from the stations will be processed for use in
CALMET using EPA’s PMERGE program.

OG&E 3-7 Trinity Consultants CALMET Processing Protocol 083701.0004
FIGURE 3-5. PLOT OF PRECIPITATION METEOROLOGICAL STATIONS
-800 -600 -400 -200 0 200 400 600 800
LCC Easting (km)
-1600
-1400
-1200
-1000
-800
-600
-400
-200
LC
C N
ort
hin
g (
km
)
Seminole Station
Muskogee Station
Sooner Station
WIMOCACR
UPBU
HEGL
Class I AreasPrecipitation Stations
3.2.5 BUOY METEOROLOGICAL DATA
The effects of land/sea breeze on ambient pollutant concentrations will be considered in
this analysis. Therefore, it is necessary to include observations of buoy stations in the
CALMET analysis. The buoy stations that are proposed for this analysis are listed in Table
A-4 of Appendix A. The locations of the buoy stations with respect to the modeling
domain are shown in Figure 3-6. These stations were selected from the available data
inventory to optimize spatial coverage and representation of the domain along the
coastline. Data from the stations will be prepared by filling missing hour records with the
CALMET missing parameter value (9999). No adjustments to the data will occur.

OG&E 3-8 Trinity Consultants CALMET Processing Protocol 083701.0004
FIGURE 3-6. PLOT OF BUOY METEOROLOGICAL STATIONS
-800 -600 -400 -200 0 200 400 600 800
LCC Easting (km)
-1600
-1400
-1200
-1000
-800
-600
-400
-200
LC
C N
ort
hin
g (
km
)
Seminole Station
Muskogee Station
Sooner Station
WIMOCACR
UPBU
HEGL
Class I AreasBuoy Stations
3.3 CALMET CONTROL PARAMETERS
Appendix B provides a sample CALMET input file used in OG&E’s modeling analysis. A few
details of the CALMET model setup for sensitive parameters are also discussed below.
3.3.1 VERTICAL METEOROLOGICAL PROFILE
The height of the top vertical layer will be set to 3,500 meters. This height corresponds to
the top sounding pressure level for which upper air observation data will be relied upon.
The vertical dimension of the domain will be divided into 12 layers with the maximum
elevations for each layer shown in Table 3-1. The vertical dimensions are weighted
towards the surface to resolve the mixing layer while using a somewhat coarser resolution
for the layers aloft.

OG&E 3-9 Trinity Consultants CALMET Processing Protocol 083701.0004
TABLE 3-1. VERTICAL LAYERS OF THE CALMET METEOROLOGICAL DOMAIN
Layer Elevation (m)
1 20
2 40
3 60
4 80
5 100
6 150
7 200
8 250
9 500
10 1000
11 2000
12 3500
CALMET allows for a bias value to be applied to each of the vertical layers. The bias
settings for each vertical layer determine the relative weight given to the vertically
extrapolated surface and upper air wind and temperature observations. The initial guess
fields are computed with an inverse distance weighting (1/r2) of the surface and upper air
data. The initial guess fields may be modified by a layer dependent bias factor. Values for
the bias factor may range from -1 to +1. A bias of -1 eliminates upper-air observations in
the 1/r2 interpolations used to initialize the vertical wind fields. Conversely, a bias of +1
eliminates the surface observations in the interpolations for this layer. Normally, bias is set
to zero (0) for each vertical layer, such that the upper air and surface observations are given
equal weight in the 1/r2 interpolations. The biases for each layer of the proposed modeling
domain will be set to zero.
CALMET allows for vertical extrapolation of surface wind observations to layers aloft to
be skipped if the surface station is close to the upper air station. Alternatively, CALMET
allows data from all surface stations to be extrapolated. The CALMET parameter that
controls this setting is IEXTRP. Setting IEXTRP to a value less than zero (0) means that
layer 1 data from upper air soundings is ignored in any vertical extrapolations. IEXTRP
will be set to -4 for this analysis (i.e., the similarity theory is used to extrapolate the surface
winds into the layers aloft, which provides more information on observed local effects to
the upper layers).
3.3.2 INFLUENCES OF OBSERVATIONS
Step 1 wind fields will be based on an initial guess using MM5 data and refined to reflect
terrain affects. Step 2 wind fields will adjust the Step 1 wind field by incorporating the
influence of local observations. An inverse distance method is used to determine the
influence of observations to the Step 1 wind field. RMAX1 and RMAX2 define the radius
of influence for data from surface stations to land in the surface layer and data from upper
air stations to land in the layers aloft. In general, RMAX1 and RMAX2 are used to
exclude observations from being inappropriately included in the development of the Step 2

OG&E 3-10 Trinity Consultants CALMET Processing Protocol 083701.0004
wind field if the distance from an observation station to a grid point exceeds the maximum
radius of influence.
If the distance from an observation station to a grid point is less than the value set for
RMAX, the observation data will be used in the development of the Step 2 wind field. R1
represents the distance from a surface observation station at which the surface observation
and the Step 1 wind field are weighted equally. R2 represents the comparable distance for
winds aloft. R1 and R2 are used to weight the observation data with respect to the MM5
data that was used to generate the Step 1 wind field. Large values for R1 and R2 give
more weight to the observations, where as small values give more weight to the MM5 data.
In this BART modeling analysis, RMAX 1 will be set to 20 km, and R1 will be set to 10
km. This will limit the influence of the surface observation data from all surface stations to
20 km from each station, and will equally weight the MM5 and observation data at 10 km.
RMAX2 will be set to 50 km, and R2 will be set to 25 km. This will limit the influence of
the upper air observation data from all surface stations to 50 km from each station, and will
equally weight the MM5 and observation data at 25 km. These settings of radius of
influence will allow for adequate weighting of the MM5 data and the observation data
across the modeling domain due to the vast domain to be modeled. RAMX 3 will be set to
500 km.

OG&E A-1 Trinity Consultants CALMET Processing Protocol 083701.0004
APPENDIX A- METEOROLOGICAL STATIONS
TABLE A-1. LIST OF SURFACE METEOROLOGICAL STATIONS
Number
Station
Acronym
Station
ID
LCC
East
(km)
LCC North
(km) Long Lat
1 KDYS 69019 -267.672 -834.095 96.9968 39.9925
2 KNPA 72222 932.565 -1020.909 97.0110 39.9908
3 KBFM 72223 857.471 -996.829 97.0101 39.9910
4 KGZH 72227 946.767 -899.515 97.0112 39.9919
5 KTCL 72228 870.843 -706.104 97.0103 39.9936
6 KNEW 53917 674.172 -1078.342 97.0080 39.9903
7 KNBG 12958 677.719 -1104.227 97.0080 39.9900
8 BVE 12884 741.996 -1153.463 97.0088 39.9896
9 KPTN 72232 550.88 -1124.295 97.0065 39.9898
10 KMEI 13865 774.911 -814.225 97.0092 39.9926
11 KPIB 72234 728.416 -915.165 97.0086 39.9917
12 KGLH 72235 557.072 -703.097 97.0066 39.9936
13 KHEZ 11111 540.777 -912.22 97.0064 39.9918
14 KMCB 11112 622.755 -949.618 97.0074 39.9914
15 KGWO 11113 640.102 -695.286 97.0076 39.9937
16 KASD 72236 692.381 -1043.261 97.0082 39.9906
17 KPOE 72239 363.294 -984.839 97.0043 39.9911
18 KBAZ 72241 -102.133 -1140.886 96.9988 39.9897
19 KGLS 72242 215.108 -1185.604 97.0025 39.9893
20 KDWH 11114 140.413 -1101.174 97.0017 39.9900
21 KIAH 12960 158.266 -1108.37 97.0019 39.9900
22 KHOU 72243 167.147 -1147.402 97.0020 39.9896
23 KEFD 12906 178.551 -1152.782 97.0021 39.9896
24 KCXO 72244 152.739 -1069.309 97.0018 39.9903
25 KCLL 11115 60.898 -1044.381 97.0007 39.9906
26 KLFK 93987 214.643 -969.355 97.0025 39.9912
27 KUTS 11116 136.056 -1026.773 97.0016 39.9907
28 KTYR 11117 150.451 -846.207 97.0018 39.9924
29 KCRS 72246 56.655 -882.642 97.0007 39.9920
30 KGGG 72247 214.572 -841.163 97.0025 39.9924
31 KGKY 11118 -9.365 -812.25 96.9999 39.9927
32 KDTN 72248 304.827 -821.713 97.0036 39.9926
33 KBAD 11119 312.743 -825.101 97.0037 39.9925
34 KMLU 11120 465.834 -816.211 97.0055 39.9926
35 KTVR 11121 561.446 -840.225 97.0066 39.9924
36 KTRL 11122 68.599 -806.417 97.0008 39.9927
37 KOCH 72249 216.81 -930.252 97.0026 39.9916
38 KBRO 12919 -44.167 -1571.387 96.9995 39.9858

OG&E A-2 Trinity Consultants CALMET Processing Protocol 083701.0004
Number
Station
Acronym
Station
ID
LCC
East
(km)
LCC North
(km) Long Lat
39 KALI 72251 -103.012 -1363.74 96.9988 39.9877
40 KLRD 12920 -246.548 -1381.603 96.9971 39.9875
41 KSSF 72252 -143.386 -1183.35 96.9983 39.9893
42 KRKP 11123 -4.965 -1324.914 96.9999 39.9880
43 KCOT 11124 -219.097 -1280.964 96.9974 39.9884
44 KLBX 11125 150.245 -1207.466 97.0018 39.9891
45 KSAT 12921 -143.024 -1160.935 96.9983 39.9895
46 KHDO 12962 -211.702 -1178.172 96.9975 39.9894
47 KSKF 72253 -154.625 -1177.555 96.9982 39.9894
48 KHYI 11126 -84.156 -1122.487 96.9990 39.9899
49 KTKI 72254 38.788 -754.791 97.0005 39.9932
50 KBMQ 11127 -118.39 -1027.031 96.9986 39.9907
51 KATT 11128 -67.587 -1075.97 96.9992 39.9903
52 KSGR 11129 131.478 -1151.702 97.0016 39.9896
53 KGTU 11130 -65.624 -1033.173 96.9992 39.9907
54 KVCT 12912 6.587 -1236.788 97.0001 39.9888
55 KPSX 72255 73.878 -1253.33 97.0009 39.9887
56 KACT 13959 -22.12 -929.156 96.9997 39.9916
57 KPWG 72256 -30.147 -944.073 96.9996 39.9915
58 KILE 72257 -65.288 -988.507 96.9992 39.9911
59 KGRK 11131 -79.643 -990.173 96.9991 39.9911
60 KTPL 11132 -38.203 -981.19 96.9996 39.9911
61 KPRX 13960 143.317 -703.663 97.0017 39.9936
62 KDTO 72258 -17.018 -752.974 96.9998 39.9932
63 KAFW 11133 -29.564 -777.061 96.9997 39.9930
64 KFTW 72259 -34.302 -795.502 96.9996 39.9928
65 KMWL 11134 -99.769 -798.767 96.9988 39.9928
66 KRBD 11135 12.453 -810.467 97.0002 39.9927
67 KDRT 11136 -384.069 -1170.59 96.9955 39.9894
68 KFST 22010 -566.418 -988.838 96.9933 39.9911
69 KGDP 72261 -739.127 -873.302 96.9913 39.9921
70 KSJT 72262 -333.338 -952.54 96.9961 39.9914
71 KMRF 23034 -676.265 -1042.616 96.9920 39.9906
72 KMAF 72264 -489.668 -878.107 96.9942 39.9921
73 KINK 23023 -586.882 -890.654 96.9931 39.9920
74 KABI 72265 -252.044 -836.353 96.9970 39.9924
75 KLBB 13962 -445.006 -689.313 96.9948 39.9938
76 KATS 11137 -696.818 -763.258 96.9918 39.9931
77 KCQC 11138 -785.757 -515.724 96.9907 39.9953
78 KROW 23009 -698.822 -712.898 96.9918 39.9936
79 KSRR 72268 -789.593 -686.226 96.9907 39.9938
80 KCNM 11139 -682.79 -822.109 96.9919 39.9926
81 KALM 36870 -838.056 -752.338 96.9901 39.9932
82 KLRU 72269 -931.527 -804.112 96.9890 39.9927
83 KTCS 72271 -952.353 -695.469 96.9888 39.9937

OG&E A-3 Trinity Consultants CALMET Processing Protocol 083701.0004
Number
Station
Acronym
Station
ID
LCC
East
(km)
LCC North
(km) Long Lat
84 KSVC 93063 -1042.03 -752.033 96.9877 39.9932
85 KDMN 72272 -1006.77 -799.231 96.9881 39.9928
86 KMSL 72323 854.846 -536.687 97.0101 39.9952
87 KPOF 72330 578.62 -336.733 97.0068 39.9970
88 KGTR 11140 779.065 -689.108 97.0092 39.9938
89 KTUP 93862 753.875 -600.337 97.0089 39.9946
90 KMKL 72334 727.051 -454.383 97.0086 39.9959
91 KLRF 72340 440.654 -550.661 97.0052 39.9950
92 KHKA 11141 643.365 -424.419 97.0076 39.9962
93 KHOT 72341 358.094 -604.603 97.0042 39.9945
94 KTXK 11142 278.022 -720.623 97.0033 39.9935
95 KLLQ 72342 488.655 -698.008 97.0058 39.9937
96 KMWT 72343 254.18 -599.224 97.0030 39.9946
97 KFSM 13964 237.97 -512.87 97.0028 39.9954
98 KSLG 72344 224.881 -419.064 97.0027 39.9962
99 KVBT 11143 248.074 -399.892 97.0029 39.9964
100 KHRO 11144 343.525 -405.601 97.0041 39.9963
101 KFLP 11145 404.239 -399.142 97.0048 39.9964
102 KBVX 11146 480.712 -457.853 97.0057 39.9959
103 KROG 11147 258.44 -397.685 97.0031 39.9964
104 KSPS 13966 -138.053 -664.886 96.9984 39.9940
105 KHBR 72352 -186.121 -551.123 96.9978 39.9950
106 KCSM 11148 -198.844 -513.911 96.9977 39.9954
107 KFDR 11149 -181.653 -625.205 96.9979 39.9944
108 KGOK 72353 -35.905 -458.97 96.9996 39.9959
109 KTIK 72354 -34.581 -506.938 96.9996 39.9954
110 KPWA 11150 -58.596 -493.951 96.9993 39.9955
111 KSWO 11151 -7.42 -425.828 96.9999 39.9962
112 KMKO 72355 146.972 -479.879 97.0017 39.9957
113 KRVS 72356 91.059 -438.276 97.0011 39.9960
114 KBVO 11152 87.136 -357.069 97.0010 39.9968
115 KMLC 11153 110.647 -563.566 97.0013 39.9949
116 KOUN 72357 -40.731 -527.298 96.9995 39.9952
117 KLAW 11154 -129.405 -600.222 96.9985 39.9946
118 KCDS 72360 -300.297 -610.668 96.9965 39.9945
119 KGNT 72362 -985.117 -475.563 96.9884 39.9957
120 KGUP 11155 -1059.48 -427.151 96.9875 39.9961
121 KAMA 23047 -425.319 -518.171 96.9950 39.9953
122 KBGD 72363 -395.603 -466.083 96.9953 39.9958
123 KFMN 72365 -993.449 -297.944 96.9883 39.9973
124 KSKX 72366 -770.464 -355.855 96.9909 39.9968
125 KTCC 23048 -597.271 -511.241 96.9930 39.9954
126 KLVS 23054 -732.565 -448.329 96.9914 39.9960
127 KEHR 72423 812.573 -199.695 97.0096 39.9982
128 KEVV 93817 822.929 -172.715 97.0097 39.9984
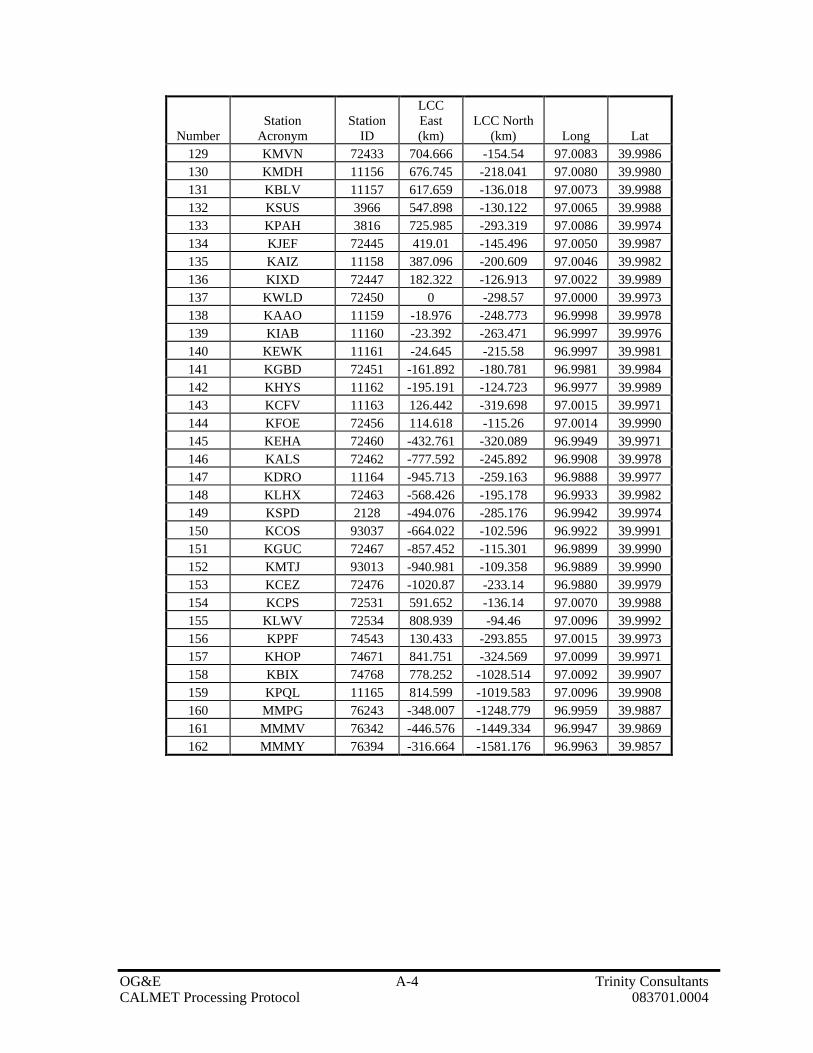
OG&E A-4 Trinity Consultants CALMET Processing Protocol 083701.0004
Number
Station
Acronym
Station
ID
LCC
East
(km)
LCC North
(km) Long Lat
129 KMVN 72433 704.666 -154.54 97.0083 39.9986
130 KMDH 11156 676.745 -218.041 97.0080 39.9980
131 KBLV 11157 617.659 -136.018 97.0073 39.9988
132 KSUS 3966 547.898 -130.122 97.0065 39.9988
133 KPAH 3816 725.985 -293.319 97.0086 39.9974
134 KJEF 72445 419.01 -145.496 97.0050 39.9987
135 KAIZ 11158 387.096 -200.609 97.0046 39.9982
136 KIXD 72447 182.322 -126.913 97.0022 39.9989
137 KWLD 72450 0 -298.57 97.0000 39.9973
138 KAAO 11159 -18.976 -248.773 96.9998 39.9978
139 KIAB 11160 -23.392 -263.471 96.9997 39.9976
140 KEWK 11161 -24.645 -215.58 96.9997 39.9981
141 KGBD 72451 -161.892 -180.781 96.9981 39.9984
142 KHYS 11162 -195.191 -124.723 96.9977 39.9989
143 KCFV 11163 126.442 -319.698 97.0015 39.9971
144 KFOE 72456 114.618 -115.26 97.0014 39.9990
145 KEHA 72460 -432.761 -320.089 96.9949 39.9971
146 KALS 72462 -777.592 -245.892 96.9908 39.9978
147 KDRO 11164 -945.713 -259.163 96.9888 39.9977
148 KLHX 72463 -568.426 -195.178 96.9933 39.9982
149 KSPD 2128 -494.076 -285.176 96.9942 39.9974
150 KCOS 93037 -664.022 -102.596 96.9922 39.9991
151 KGUC 72467 -857.452 -115.301 96.9899 39.9990
152 KMTJ 93013 -940.981 -109.358 96.9889 39.9990
153 KCEZ 72476 -1020.87 -233.14 96.9880 39.9979
154 KCPS 72531 591.652 -136.14 97.0070 39.9988
155 KLWV 72534 808.939 -94.46 97.0096 39.9992
156 KPPF 74543 130.433 -293.855 97.0015 39.9973
157 KHOP 74671 841.751 -324.569 97.0099 39.9971
158 KBIX 74768 778.252 -1028.514 97.0092 39.9907
159 KPQL 11165 814.599 -1019.583 97.0096 39.9908
160 MMPG 76243 -348.007 -1248.779 96.9959 39.9887
161 MMMV 76342 -446.576 -1449.334 96.9947 39.9869
162 MMMY 76394 -316.664 -1581.176 96.9963 39.9857

OG&E A-5 Trinity Consultants CALMET Processing Protocol 083701.0004
TABLE A-2. LIST OF UPPER AIR METEOROLOGICAL STATIONS
Number
Station
Acronym
Station
ID
LCC
East
(km)
LCC
North
(km) Long Lat
1 KABQ 23050 -869.46 -501.713 96.9897 39.9955
2 KAMA 23047 -425.319 -518.171 96.9950 39.9953
3 KBMX 53823 951.609 -702.935 97.0112 39.9936
4 KBNA 13897 920.739 -377.164 97.0109 39.9966
5 KBRO 12919 -44.167 -1571.39 96.9995 39.9858
6 KCRP 12924 -51.535 -1360.35 96.9994 39.9877
7 KDDC 13985 -259.352 -242.681 96.9969 39.9978
8 KDRT 22010 -384.069 -1170.59 96.9955 39.9894
9 KEPZ 3020 -914.558 -852.552 96.9892 39.9923
10 KFWD 3990 -28.034 -793.745 96.9997 39.9928
11 KJAN 3940 650.105 -826.452 97.0077 39.9925
12 KLCH 3937 364.461 -1089.15 97.0043 39.9902
13 KLZK 3952 432.063 -560.441 97.0051 39.9949
14 KMAF 23023 -489.668 -878.107 96.9942 39.9921
15 KOUN 3948 -40.731 -527.298 96.9995 39.9952
16 KSHV 13957 298.869 -831.166 97.0035 39.9925
17 KSIL 53813 698.079 -1054.03 97.0082 39.9905

OG&E A-6 Trinity Consultants CALMET Processing Protocol 083701.0004
TABLE A-3. LIST OF PRECIPITATION METEOROLOGICAL STATIONS
Number
Station
Acronym
Station
ID
LCC
East
(km)
LCC
North
(km) Long Lat
1 ADDI 10063 906.825 -601.428 97.0107 39.9946
2 ALBE 10140 917.606 -821.64 97.0108 39.9926
3 BERR 10748 892.454 -683.388 97.0105 39.9938
4 HALE 13620 881.928 -601.878 97.0104 39.9946
5 HAMT 13645 863.663 -612.725 97.0102 39.9945
6 JACK 14193 898.014 -915.623 97.0106 39.9917
7 MBLE 15478 851.953 -1022.41 97.0101 39.9908
8 MUSC 15749 880.113 -567.484 97.0104 39.9949
9 PETE 16370 935.558 -908.259 97.0110 39.9918
10 THOM 18178 900.858 -915.326 97.0106 39.9917
11 TUSC 18385 895.631 -713.223 97.0106 39.9936
12 VERN 18517 825.585 -685.773 97.0098 39.9938
13 BEEB 30530 462.394 -532.485 97.0055 39.9952
14 BRIG 30900 318.015 -554.857 97.0038 39.9950
15 CALI 31140 419.619 -731.44 97.0050 39.9934
16 CAMD 31152 386.546 -699.659 97.0046 39.9937
17 DIER 32020 268.114 -643.184 97.0032 39.9942
18 EURE 32356 286.738 -390.862 97.0034 39.9965
19 GILB 32794 383.362 -435.625 97.0045 39.9961
20 GREE 32978 450.594 -483.201 97.0053 39.9956
21 STUT 36920 509.943 -596.328 97.0060 39.9946
22 TEXA 37048 278.022 -720.623 97.0033 39.9935
23 ALAM 50130 -749.044 -267.856 96.9912 39.9976
24 ARAP 50304 -441.903 -152.324 96.9948 39.9986
25 COCH 51713 -819.794 -148.582 96.9903 39.9987
26 CRES 51959 -828.107 -119.911 96.9902 39.9989
27 GRAN 53477 -451.781 -203.82 96.9947 39.9982
28 GUNN 53662 -829.573 -141.995 96.9902 39.9987
29 HUGO 54172 -539.364 -81.948 96.9936 39.9993
30 JOHN 54388 -483.95 -201.915 96.9943 39.9982
31 KIM 54538 -544.501 -283.337 96.9936 39.9974
32 MESA 55531 -993.391 -256.696 96.9883 39.9977
33 ORDW 56136 -549.552 -55.741 96.9935 39.9995
34 OURA 56203 -904.197 -168.246 96.9893 39.9985
35 PLEA 56591 -1005.94 -229.472 96.9881 39.9979
36 PUEB 56740 -633.961 -176.872 96.9925 39.9984
37 TYE 57320 -662.095 -242.254 96.9922 39.9978
38 SAGU 57337 -790.269 -176.061 96.9907 39.9984

OG&E A-7 Trinity Consultants CALMET Processing Protocol 083701.0004
Number
Station
Acronym
Station
ID
LCC
East
(km)
LCC
North
(km) Long Lat
39 SANL 57428 -726.777 -285.47 96.9914 39.9974
40 SHEP 57572 -714.046 -252.189 96.9916 39.9977
41 TELL 58204 -920.205 -215.382 96.9891 39.9981
42 TERC 58220 -708.229 -296.023 96.9916 39.9973
43 TRIN 58429 -642.489 -293.805 96.9924 39.9973
44 TRLK 58436 -646.185 -295.727 96.9924 39.9973
45 WALS 58781 -654.989 -262.821 96.9923 39.9976
46 WHIT 58997 -619.615 -250.12 96.9927 39.9977
47 ASHL 110281 684.787 -169.285 97.0081 39.9985
48 CAIR 111166 697.177 -301.436 97.0082 39.9973
49 CARM 111302 772.938 -177.782 97.0091 39.9984
50 CISN 111664 758.146 -151.446 97.0090 39.9986
51 FLOR 113109 751.801 -139.837 97.0089 39.9987
52 HARR 113879 762.044 -246.62 97.0090 39.9978
53 KASK 114629 650.464 -239.886 97.0077 39.9978
54 LAWR 114957 829.038 -128.708 97.0098 39.9988
55 MTCA 115888 827.797 -149.966 97.0098 39.9986
56 MURP 115983 682.261 -251.649 97.0081 39.9977
57 NEWT 116159 766.098 -72.902 97.0090 39.9993
58 REND 117187 731.633 -185.058 97.0086 39.9983
59 SMIT 118020 770.027 -283.638 97.0091 39.9974
60 SPAR 118147 658.275 -185.973 97.0078 39.9983
61 VAND 118781 685.449 -127.048 97.0081 39.9989
62 WEST 119193 778.655 -147.215 97.0092 39.9987
63 EVAN 122738 842.476 -172.871 97.0100 39.9984
64 NEWB 126151 855.854 -223.713 97.0101 39.9980
65 PRIN 127125 836.901 -153.449 97.0099 39.9986
66 STEN 128442 859.099 -156.613 97.0101 39.9986
67 JTML 128967 788.703 -239.572 97.0093 39.9978
68 ARLI 140326 -101.734 -271.373 96.9988 39.9976
69 BAZI 140620 -210.423 -201.758 96.9975 39.9982
70 BEAU 140637 59.762 -288.39 97.0007 39.9974
71 BONN 140957 211.236 -103.29 97.0025 39.9991
72 CALD 141233 -32.689 -330.586 96.9996 39.9970
73 CASS 141351 54.006 -217.645 97.0006 39.9980
74 CENT 141404 170.503 -206.038 97.0020 39.9981
75 CHAN 141427 150.257 -286.094 97.0018 39.9974
76 CLIN 141612 155.623 -157.682 97.0018 39.9986
77 COLL 141730 -265.465 -156.95 96.9969 39.9986
78 COLU 141740 220.541 -316.555 97.0026 39.9971

OG&E A-8 Trinity Consultants CALMET Processing Protocol 083701.0004
Number
Station
Acronym
Station
ID
LCC
East
(km)
LCC
North
(km) Long Lat
79 CONC 141867 58.918 -175.589 97.0007 39.9984
80 DODG 142164 -226.497 -277.655 96.9973 39.9975
81 ELKH 142432 -400.112 -321.784 96.9953 39.9971
82 ENGL 142560 -264.927 -324.066 96.9969 39.9971
83 ERIE 142582 162.669 -291.383 97.0019 39.9974
84 FALL 142686 83.491 -288.177 97.0010 39.9974
85 GALA 142938 -136.931 -176.83 96.9984 39.9984
86 GARD 142980 -304.059 -215.308 96.9964 39.9981
87 GREN 143248 64.308 -307.161 97.0008 39.9972
88 HAYS 143527 -190.307 -161.342 96.9978 39.9985
89 HEAL 143554 -292.133 -175.921 96.9966 39.9984
90 HILL 143686 214.018 -174.006 97.0025 39.9984
91 INDE 143954 139.335 -315.058 97.0016 39.9972
92 IOLA 143984 153.451 -269.438 97.0018 39.9976
93 JOHR 144104 134.784 -203.41 97.0016 39.9982
94 KANO 144178 -50.289 -181.177 96.9994 39.9984
95 KIOW 144341 -113.967 -329.843 96.9987 39.9970
96 MARI 145039 -4.343 -195.712 97.0000 39.9982
97 MELV 145210 137.104 -186.781 97.0016 39.9983
98 MILF 145306 39.504 -106.05 97.0005 39.9990
99 MOUD 145536 152.624 -318.136 97.0018 39.9971
100 OAKL 145888 -306.378 -96.814 96.9964 39.9991
101 OTTA 146128 158.639 -178.635 97.0019 39.9984
102 POMO 146498 143.864 -176.707 97.0017 39.9984
103 SALI 147160 -29.426 -166.908 96.9997 39.9985
104 SMOL 147551 -34.639 -171.31 96.9996 39.9985
105 STAN 147756 225.026 -164.85 97.0027 39.9985
106 SUBL 147922 -303.514 -292.808 96.9964 39.9974
107 TOPE 148167 139.116 -104.91 97.0016 39.9991
108 TRIB 148235 -387.855 -180.643 96.9954 39.9984
109 UNIO 148293 211.43 -272.537 97.0025 39.9975
110 WALL 148535 -376.076 -152.432 96.9956 39.9986
111 WICH 148830 -23.729 -288.579 96.9997 39.9974
112 WILS 148946 -111.502 -156.22 96.9987 39.9986
113 BENT 150611 781.608 -348.109 97.0092 39.9969
114 CALH 151227 865.268 -261.635 97.0102 39.9976
115 CLTN 151631 749.287 -365.634 97.0088 39.9967
116 HERN 153798 859.01 -352.458 97.0101 39.9968
117 MADI 155067 854.116 -265.064 97.0101 39.9976
118 PADU 156110 753.185 -293.024 97.0089 39.9974
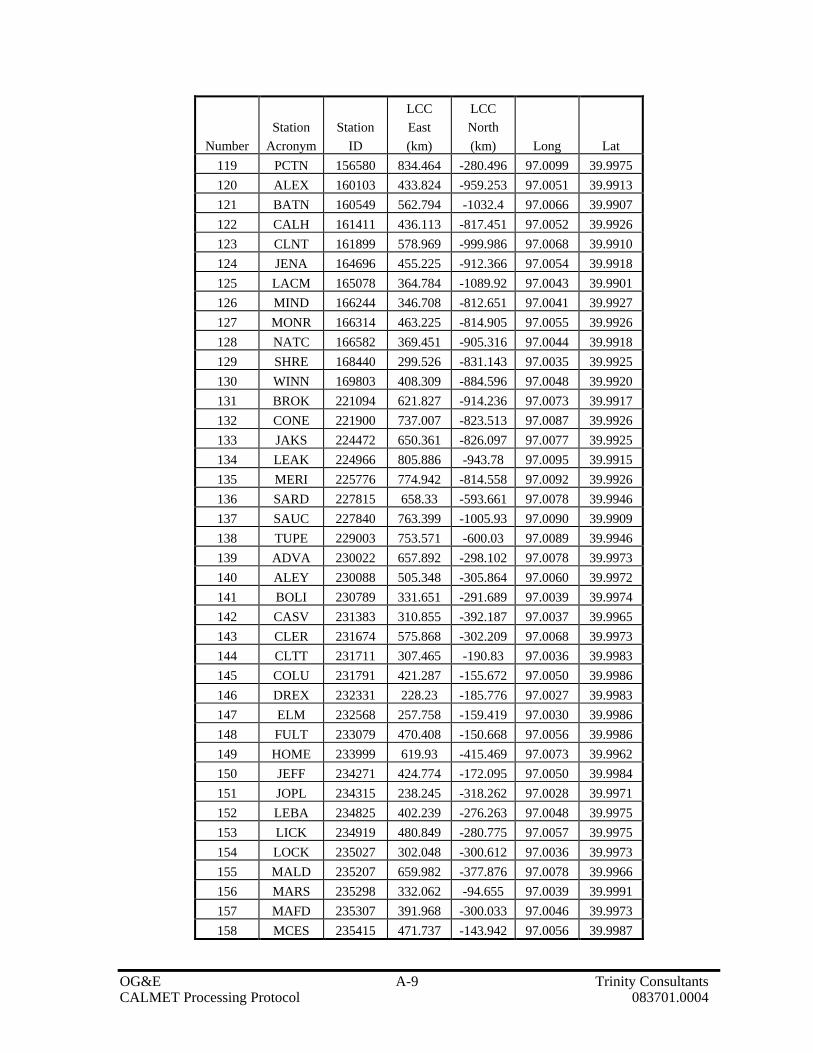
OG&E A-9 Trinity Consultants CALMET Processing Protocol 083701.0004
Number
Station
Acronym
Station
ID
LCC
East
(km)
LCC
North
(km) Long Lat
119 PCTN 156580 834.464 -280.496 97.0099 39.9975
120 ALEX 160103 433.824 -959.253 97.0051 39.9913
121 BATN 160549 562.794 -1032.4 97.0066 39.9907
122 CALH 161411 436.113 -817.451 97.0052 39.9926
123 CLNT 161899 578.969 -999.986 97.0068 39.9910
124 JENA 164696 455.225 -912.366 97.0054 39.9918
125 LACM 165078 364.784 -1089.92 97.0043 39.9901
126 MIND 166244 346.708 -812.651 97.0041 39.9927
127 MONR 166314 463.225 -814.905 97.0055 39.9926
128 NATC 166582 369.451 -905.316 97.0044 39.9918
129 SHRE 168440 299.526 -831.143 97.0035 39.9925
130 WINN 169803 408.309 -884.596 97.0048 39.9920
131 BROK 221094 621.827 -914.236 97.0073 39.9917
132 CONE 221900 737.007 -823.513 97.0087 39.9926
133 JAKS 224472 650.361 -826.097 97.0077 39.9925
134 LEAK 224966 805.886 -943.78 97.0095 39.9915
135 MERI 225776 774.942 -814.558 97.0092 39.9926
136 SARD 227815 658.33 -593.661 97.0078 39.9946
137 SAUC 227840 763.399 -1005.93 97.0090 39.9909
138 TUPE 229003 753.571 -600.03 97.0089 39.9946
139 ADVA 230022 657.892 -298.102 97.0078 39.9973
140 ALEY 230088 505.348 -305.864 97.0060 39.9972
141 BOLI 230789 331.651 -291.689 97.0039 39.9974
142 CASV 231383 310.855 -392.187 97.0037 39.9965
143 CLER 231674 575.868 -302.209 97.0068 39.9973
144 CLTT 231711 307.465 -190.83 97.0036 39.9983
145 COLU 231791 421.287 -155.672 97.0050 39.9986
146 DREX 232331 228.23 -185.776 97.0027 39.9983
147 ELM 232568 257.758 -159.419 97.0030 39.9986
148 FULT 233079 470.408 -150.668 97.0056 39.9986
149 HOME 233999 619.93 -415.469 97.0073 39.9962
150 JEFF 234271 424.774 -172.095 97.0050 39.9984
151 JOPL 234315 238.245 -318.262 97.0028 39.9971
152 LEBA 234825 402.239 -276.263 97.0048 39.9975
153 LICK 234919 480.849 -280.775 97.0057 39.9975
154 LOCK 235027 302.048 -300.612 97.0036 39.9973
155 MALD 235207 659.982 -377.876 97.0078 39.9966
156 MARS 235298 332.062 -94.655 97.0039 39.9991
157 MAFD 235307 391.968 -300.033 97.0046 39.9973
158 MCES 235415 471.737 -143.942 97.0056 39.9987

OG&E A-10 Trinity Consultants CALMET Processing Protocol 083701.0004
Number
Station
Acronym
Station
ID
LCC
East
(km)
LCC
North
(km) Long Lat
159 MILL 235594 309.516 -311.398 97.0037 39.9972
160 MTGV 235834 426.937 -310.43 97.0050 39.9972
161 NVAD 235987 243.915 -272.715 97.0029 39.9975
162 OZRK 236460 349.133 -390.626 97.0041 39.9965
163 PDTD 236777 334.055 -265.018 97.0039 39.9976
164 POTO 236826 572.215 -251.455 97.0068 39.9977
165 ROLL 237263 484.503 -253.958 97.0057 39.9977
166 ROSE 237300 500.59 -175.393 97.0059 39.9984
167 SALE 237506 498.94 -274.122 97.0059 39.9975
168 SENE 237656 233.959 -383.703 97.0028 39.9965
169 SPRC 237967 238.112 -373.616 97.0028 39.9966
170 SPVL 237976 332.385 -309.374 97.0039 39.9972
171 STEE 238043 503.354 -205.135 97.0059 39.9981
172 STOK 238082 310.911 -279.239 97.0037 39.9975
173 SWSP 238223 324.053 -150.325 97.0038 39.9986
174 TRKD 238252 340.418 -395.428 97.0040 39.9964
175 TRUM 238466 326.883 -197.796 97.0039 39.9982
176 UNIT 238524 238.567 -154.494 97.0028 39.9986
177 VIBU 238609 519.633 -267.258 97.0061 39.9976
178 VIEN 238620 470.383 -193.872 97.0056 39.9983
179 WAPP 238700 606.68 -358.746 97.0072 39.9968
180 WASG 238746 556.425 -164.993 97.0066 39.9985
181 WEST 238880 489.373 -377.809 97.0058 39.9966
182 ALBU 290234 -869.46 -501.713 96.9897 39.9955
183 ARTE 290600 -689.529 -773.897 96.9919 39.9930
184 AUGU 290640 -973.07 -598.391 96.9885 39.9946
185 CARL 291469 -680.335 -811.474 96.9920 39.9927
186 CARR 291515 -819.836 -665.132 96.9903 39.9940
187 CLAY 291887 -547.124 -374.102 96.9935 39.9966
188 CLOV 291939 -566.973 -599.296 96.9933 39.9946
189 CUBA 292241 -890.304 -392.495 96.9895 39.9965
190 CUBE 292250 -951.142 -489.293 96.9888 39.9956
191 DEMI 292436 -1007.99 -799.087 96.9881 39.9928
192 DURA 292665 -767.148 -577.618 96.9909 39.9948
193 EANT 292700 -735.089 -366.94 96.9913 39.9967
194 LAVG 294862 -738.245 -461.163 96.9913 39.9958
195 PROG 297094 -811.39 -578.971 96.9904 39.9948
196 RAMO 297254 -733.737 -615.175 96.9913 39.9944
197 ROSW 297610 -698.544 -712.921 96.9918 39.9936
198 ROY 297638 -644.735 -422.422 96.9924 39.9962

OG&E A-11 Trinity Consultants CALMET Processing Protocol 083701.0004
Number
Station
Acronym
Station
ID
LCC
East
(km)
LCC
North
(km) Long Lat
199 SANT 298085 -807.375 -445.708 96.9905 39.9960
200 SPRI 298501 -676.681 -374.272 96.9920 39.9966
201 STAY 298518 -810.491 -495.501 96.9904 39.9955
202 TNMN 299031 -912.488 -413.425 96.9892 39.9963
203 TUCU 299156 -604.359 -508.834 96.9929 39.9954
204 WAST 299569 -638.605 -820.288 96.9925 39.9926
205 WISD 299686 -856.967 -756.366 96.9899 39.9932
206 AIRS 340179 -212.731 -597.062 96.9975 39.9946
207 ARDM 340292 -12.242 -645.633 96.9999 39.9942
208 BENG 340670 174.368 -568.011 97.0021 39.9949
209 CANE 341437 71.857 -637.935 97.0009 39.9942
210 CHRT 341544 203.233 -632.067 97.0024 39.9943
211 CHAN 341684 10.494 -475.655 97.0001 39.9957
212 CHIK 341750 -83.175 -547.26 96.9990 39.9951
213 CCTY 342334 -165 -479.536 96.9981 39.9957
214 DUNC 342654 -88.38 -610.04 96.9990 39.9945
215 ELKC 342849 -216.769 -507.879 96.9974 39.9954
216 FORT 343281 -129.964 -541.113 96.9985 39.9951
217 GEAR 343497 -118.53 -482.187 96.9986 39.9956
218 HENN 344052 -31.964 -601.206 96.9996 39.9946
219 HOBA 344202 -189.062 -547.36 96.9978 39.9951
220 KING 344865 24.538 -664.103 97.0003 39.9940
221 LKEU 344975 141.702 -520.6 97.0017 39.9953
222 LEHI 345108 71.634 -612.05 97.0009 39.9945
223 MACI 345463 -254.63 -466.154 96.9970 39.9958
224 MALL 345589 -55.127 -425.644 96.9994 39.9962
225 MAYF 345648 -258.49 -512.583 96.9970 39.9954
226 MUSK 346130 149.764 -466.905 97.0018 39.9958
227 NOWA 346485 121.551 -364.038 97.0014 39.9967
228 OKAR 346620 -88.424 -473.338 96.9990 39.9957
229 OKEM 346638 63.188 -504.958 97.0008 39.9954
230 OKLA 346661 -54.198 -510.562 96.9994 39.9954
231 PAOL 346859 -23.665 -573.142 96.9997 39.9948
232 PAWH 346935 57.704 -369.174 97.0007 39.9967
233 PAWN 346944 16.927 -398.139 97.0002 39.9964
234 PONC 347196 -8.871 -363.068 96.9999 39.9967
235 PRYO 347309 150.763 -407.824 97.0018 39.9963
236 SHAT 348101 -256.963 -407.368 96.9970 39.9963
237 STIG 348497 171.02 -523.736 97.0020 39.9953
238 TULS 348992 99.361 -419.873 97.0012 39.9962

OG&E A-12 Trinity Consultants CALMET Processing Protocol 083701.0004
Number
Station
Acronym
Station
ID
LCC
East
(km)
LCC
North
(km) Long Lat
239 TUSK 349023 156.629 -592.395 97.0019 39.9946
240 WMWR 349629 -156.42 -581.308 96.9982 39.9947
241 WOLF 349748 30.212 -538.388 97.0004 39.9951
242 BOLI 400876 760.886 -500.256 97.0090 39.9955
243 BROW 401150 710.048 -480.346 97.0084 39.9957
244 CETR 401587 877.35 -456.294 97.0104 39.9959
245 DICS 402489 872.14 -391.132 97.0103 39.9965
246 DYER 402680 695.792 -409.316 97.0082 39.9963
247 GRNF 403697 760.795 -395.69 97.0090 39.9964
248 JSNN 404561 765.932 -476.414 97.0090 39.9957
249 LWER 405089 885.291 -487.757 97.0105 39.9956
250 LEXI 405210 790.003 -471.897 97.0093 39.9957
251 MASO 405720 694.163 -496.166 97.0082 39.9955
252 MEMP 405954 671.8 -522.492 97.0079 39.9953
253 MWFO 405956 681.292 -516.15 97.0080 39.9953
254 MUNF 406358 678.65 -495.241 97.0080 39.9955
255 SAMB 408065 697.077 -382.536 97.0082 39.9965
256 SAVA 408108 800.788 -498.682 97.0095 39.9955
257 UNCY 409219 711.595 -384.605 97.0084 39.9965
258 ABIL 410016 -251.753 -836.027 96.9970 39.9924
259 AMAR 410211 -425.302 -517.839 96.9950 39.9953
260 AUST 410428 -67.587 -1075.97 96.9992 39.9903
261 BRWN 411136 -43.861 -1571.39 96.9995 39.9858
262 COST 411889 60.611 -1044.72 97.0007 39.9906
263 COCR 412015 -51.832 -1360.01 96.9994 39.9877
264 CROS 412131 -204.599 -868.469 96.9976 39.9922
265 DFWT 412242 -1.867 -786.341 97.0000 39.9929
266 EAST 412715 -171.024 -840.253 96.9980 39.9924
267 ELPA 412797 -886.583 -860.763 96.9895 39.9922
268 HICO 414137 -97.323 -888.181 96.9989 39.9920
269 HUST 414300 157.976 -1108.38 97.0019 39.9900
270 KRES 414880 -434.746 -611.717 96.9949 39.9945
271 LKCK 414975 99.734 -693.521 97.0012 39.9937
272 LNGV 415348 220.962 -844.674 97.0026 39.9924
273 LUFK 415424 214.652 -969.69 97.0025 39.9912
274 MATH 415661 -86.438 -1330.47 96.9990 39.9880
275 MIDR 415890 -489.385 -878.123 96.9942 39.9921
276 MTLK 416104 -672.024 -1008.98 96.9921 39.9909
277 NACO 416177 223.065 -925.966 97.0026 39.9916
278 NAVA 416210 28.358 -892.028 97.0003 39.9919

OG&E A-13 Trinity Consultants CALMET Processing Protocol 083701.0004
Number
Station
Acronym
Station
ID
LCC
East
(km)
LCC
North
(km) Long Lat
279 NEWB 416270 239.111 -721.818 97.0028 39.9935
280 BPAT 417174 288.962 -1110.65 97.0034 39.9900
281 RANK 417431 -472.048 -959.488 96.9944 39.9913
282 SAAG 417943 -333.338 -952.54 96.9961 39.9914
283 SAAT 417945 -143.322 -1161.27 96.9983 39.9895
284 SHEF 418252 -463.759 -1019.19 96.9945 39.9908
285 STEP 418623 -112.988 -857.918 96.9987 39.9922
286 STER 418630 -376.683 -897.195 96.9956 39.9919
287 VALE 419270 -720.749 -1015.17 96.9915 39.9908
288 VICT 419364 6.882 -1236.45 97.0001 39.9888
289 WACO 419419 -21.834 -928.823 96.9997 39.9916
290 WATR 419499 -353.767 -916.015 96.9958 39.9917
291 WHEE 419665 57.489 -1008.99 97.0007 39.9909
292 WPDM 419916 262.792 -737.786 97.0031 39.9933
293 DORA 232302 433.256 -378.797 97.0051 39.9966
294 DIXN 112353 756.057 -267.193 97.0089 39.9976
295 DAUP 12172 864.408 -1050.41 97.0102 39.9905
296 FREV 123104 847.031 -117.884 97.0100 39.9989
297 WARR 18673 890.447 -788.703 97.0105 39.9929
298 MDTN 235562 493.264 -87.222 97.0058 39.9992

OG&E A-14 Trinity Consultants CALMET Processing Protocol 083701.0004
TABLE A-4. LIST OF OVER WATER METEOROLOGICAL STATIONS
Number
Station
ID
Input file
Name
LCC
East
(km)
LCC North
(km) Long Lat
1 42001 42001 746.874 -1541.35 89.67 25.9
2 42002 42002 265.486 -1650.616 94.42 25.19
3 42007 42007 795.674 -1063.667 88.77 30.09
4 42019 42019 163.178 -1342.917 95.36 27.91
5 42020 42020 30.212 -1453.738 96.7 26.94
6 42035 42035 254.465 -1193.539 94.41 29.25
7 42040 42040 859.497 -1160.066 88.21 29.18
8 BURL1 42045 743.116 -1202.117 89.43 28.9
9 DPIA1 42046 861.385 -1039.466 88.07 30.25
10 GDIL1 42047 687.984 -1164.910 89.96 29.27
11 PTAT2 42048 -4.980 -1353.398 97.05 27.83
12 SRST2 42049 288.163 -1175.682 94.05 29.67

Entergy Arkansas, Inc.Lake Catherine - Unit 4CEMS Data from CAMD
Date
SO2 (tons)
Avg. NOx Rate (lb/MMBtu)
NOx (tons)
Heat Input (MMBtu)
1/1/2001 0.014 0.202 4.787 46,0871/2/2001 0.015 0.2243 5.535 48,8311/3/2001 0.016 0.2324 6.465 54,8561/4/2001 0.015 0.2472 6.835 51,1501/5/2001 0.015 0.2295 5.827 48,7831/6/2001 0.014 0.2258 5.828 48,2531/7/2001 0.01 0.161 2.72 32,0701/8/2001 0.013 0.1819 4.203 41,7671/9/2001 0.014 0.207 5.35 45,700
1/10/2001 0.013 0.1957 4.699 43,5291/11/2001 0.012 0.1942 4.459 41,5731/12/2001 0.015 0.2103 6.049 50,3301/13/2001 0.013 0.1802 4.325 42,2661/14/2001 0.009 0.148 2.24 30,2691/15/2001 0.01 0.1638 2.999 34,3641/16/2001 0.012 0.1739 3.935 41,4891/17/2001 0.013 0.1896 4.397 41,6941/18/2001 0.015 0.2143 5.91 51,5591/19/2001 0.012 0.1832 3.987 40,0931/20/2001 0.01 0.1459 2.602 32,9911/21/2001 0.012 0.1796 4.014 41,4281/22/2001 0.013 0.1769 4.102 42,7971/23/2001 0.013 0.185 4.93 42,4991/24/2001 0.01 0.145 2.436 32,1771/25/2001 0.011 0.1736 3.66 37,8991/26/2001 0.013 0.1962 5.122 43,7151/27/2001 0.009 0.1487 2.3 29,9921/28/2001 0.008 0.1265 1.786 28,2311/29/2001 0.012 0.1878 4.319 39,7641/30/2001 0.01 0.1594 2.883 33,2061/31/2001 0.01 0.1529 2.646 32,0172/5/2001 0.006 0.086 1.466 20,1182/6/2001 0.016 0.2086 6.165 53,7442/7/2001 0.009 0.1866 3.213 31,084
2/18/2001 0.001 0.0188 0.038 3,9282/19/2001 0.007 0.0982 1.368 24,7182/20/2001 0.009 0.1274 1.913 29,7782/21/2001 0.01 0.1512 2.869 34,7782/22/2001 0.017 0.2335 7.695 56,6812/23/2001 0.012 0.1743 3.807 39,9052/24/2001 0.009 0.1102 1.623 29,044

Entergy Arkansas, Inc.Lake Catherine - Unit 4CEMS Data from CAMD
2/25/2001 0.009 0.13 1.917 29,4772/26/2001 0.009 0.1329 2.099 30,6162/27/2001 0.003 0.1306 0.7 10,5543/4/2001 0.001 0.0184 0.034 3,4333/5/2001 0.002 0.0515 0.267 7,0453/6/2001 0.014 0.221 6.083 48,1663/7/2001 0.015 0.1927 5.478 48,6453/8/2001 0.012 0.1555 3.269 38,9463/9/2001 0.015 0.1743 4.568 50,545
3/10/2001 0.011 0.1549 2.964 35,7613/11/2001 0.01 0.1379 2.435 33,2953/12/2001 0.012 0.158 3.691 39,6613/13/2001 0.012 0.1647 3.496 39,6473/14/2001 0.009 0.1211 1.73 28,5693/15/2001 0.01 0.141 2.735 33,7423/16/2001 0.009 0.1279 1.961 30,4033/17/2001 0.011 0.1602 3.19 36,8523/18/2001 0.009 0.119 1.786 29,5853/19/2001 0.014 0.207 5.529 47,1773/20/2001 0.018 0.2443 8.471 59,6773/21/2001 0.012 0.1685 3.87 39,5803/22/2001 0.01 0.142 2.625 33,8653/23/2001 0.012 0.1767 4.124 40,5573/24/2001 0.012 0.1817 4.169 40,5033/25/2001 0.011 0.1617 3.538 37,8193/26/2001 0.021 0.2919 11.813 68,9293/27/2001 0.018 0.2611 8.918 60,8963/28/2001 0.02 0.2639 10.097 67,0363/29/2001 0.014 0.1788 4.609 45,8383/30/2001 0.016 0.2006 5.744 52,1853/31/2001 0.011 0.159 3.131 37,1844/1/2001 0.013 0.1752 4.115 42,0334/2/2001 0.02 0.2338 8.676 66,8514/3/2001 0.02 0.2369 8.8 66,2414/4/2001 0.017 0.2038 6.068 55,4814/5/2001 0.018 0.2004 6.511 60,0514/6/2001 0.016 0.1907 5.821 52,9124/7/2001 0.018 0.2262 7.664 59,4234/8/2001 0.018 0.2364 8.721 58,7214/9/2001 0.023 0.2954 12.863 76,082
4/10/2001 0.019 0.2176 7.726 64,0864/11/2001 0.018 0.2098 6.773 58,3584/12/2001 0.016 0.2128 6.479 54,9404/13/2001 0.013 0.1945 4.508 42,639

Entergy Arkansas, Inc.Lake Catherine - Unit 4CEMS Data from CAMD
4/14/2001 0.013 0.1562 3.497 42,8014/15/2001 0.012 0.1644 3.577 40,0304/16/2001 0.018 0.251 9.291 61,3714/17/2001 0.014 0.167 4.133 45,2004/18/2001 0.016 0.2087 6.585 52,3194/19/2001 0.016 0.1903 5.171 51,7664/20/2001 0.015 0.1854 4.984 49,2244/21/2001 0.018 0.217 7.923 60,0624/22/2001 0.014 0.1674 4.429 45,0264/23/2001 0.022 0.3043 13.43 74,3614/24/2001 0.016 0.2062 5.866 52,1544/25/2001 0.011 0.1527 3.108 37,6954/26/2001 0.017 0.2286 7.555 56,0924/27/2001 0.016 0.2169 7.077 51,6774/28/2001 0.015 0.1953 5.461 48,9624/29/2001 0.014 0.1772 4.859 47,1244/30/2001 0.017 0.2 6.797 56,4525/1/2001 0.023 0.3154 14.69 78,1935/2/2001 0.022 0.2717 11.62 71,8445/3/2001 0.018 0.2036 7.091 61,2695/4/2001 0.016 0.2144 7.245 54,3515/6/2001 0.002 0.0339 0.123 5,0835/7/2001 0.015 0.1868 5.25 50,1205/8/2001 0.011 0.1553 3.234 37,6635/9/2001 0.017 0.2099 7.313 57,056
5/10/2001 0.021 0.2753 11.622 69,1005/11/2001 0.015 0.2005 5.819 51,0085/12/2001 0.014 0.1828 4.776 45,3915/13/2001 0.012 0.189 4.196 39,9705/14/2001 0.015 0.1792 5.128 50,5195/15/2001 0.02 0.2335 9.346 65,0475/16/2001 0.019 0.2378 9.333 63,1185/17/2001 0.02 0.2367 8.716 66,5855/18/2001 0.016 0.184 5.893 52,1475/19/2001 0.014 0.167 4.463 45,8115/20/2001 0.013 0.1558 3.867 44,2485/21/2001 0.011 0.1592 3.108 37,2425/22/2001 0.008 0.153 2.12 27,7215/23/2001 0.012 0.1763 3.876 39,5385/24/2001 0.01 0.1579 3.086 34,3195/25/2001 0.009 0.1198 1.699 28,3685/26/2001 0.013 0.1813 4.857 43,4335/27/2001 0.013 0.1806 4.355 42,5475/28/2001 0.011 0.1718 3.231 35,115

Entergy Arkansas, Inc.Lake Catherine - Unit 4CEMS Data from CAMD
5/29/2001 0.013 0.1931 5.097 43,1715/30/2001 0.012 0.1745 3.803 40,6855/31/2001 0.01 0.1417 2.62 33,5676/1/2001 0.012 0.1624 3.551 39,5726/2/2001 0.015 0.1946 5.796 49,3846/3/2001 0.013 0.1658 4.242 44,7946/4/2001 0.015 0.1862 5.395 50,7766/5/2001 0.014 0.1903 5.198 46,6816/6/2001 0.01 0.1415 2.706 34,8186/7/2001 0.01 0.147 2.676 34,1636/8/2001 0.013 0.1805 4.463 44,3476/9/2001 0.01 0.1477 2.744 33,898
6/10/2001 0.012 0.1572 3.357 38,6386/11/2001 0.017 0.2095 7.511 57,7356/12/2001 0.019 0.2257 8.151 62,4536/13/2001 0.019 0.2262 8.396 63,2876/14/2001 0.019 0.218 7.851 62,4026/15/2001 0.017 0.2161 7.572 57,1586/16/2001 0.017 0.2303 7.86 57,7676/17/2001 0.015 0.1928 5.518 50,9856/18/2001 0.011 0.154 3.944 37,5496/19/2001 0.003 0.0882 0.39 8,8417/4/2001 0 0.012 0.002 3407/5/2001 0.007 0.0781 1.602 24,1687/6/2001 0.017 0.2128 7.052 56,7757/7/2001 0.018 0.2179 7.562 60,5977/8/2001 0.012 0.1569 3.968 39,2267/9/2001 0.006 0.0961 1.025 21,338
7/10/2001 0.012 0.1546 4.264 41,6087/11/2001 0.019 0.2223 8.412 63,5787/12/2001 0.013 0.1621 4.021 43,4587/13/2001 0.011 0.157 3.255 37,2707/14/2001 0.013 0.1955 4.735 42,3807/15/2001 0.013 0.1699 4.156 41,9997/16/2001 0.019 0.2452 9.083 61,9727/17/2001 0.019 0.2417 9.109 64,8267/18/2001 0.016 0.2237 8.871 53,1517/19/2001 0.007 0.1258 2.653 23,3367/20/2001 0.019 0.249 9.25 64,2647/21/2001 0.02 0.2328 8.491 65,4637/22/2001 0.02 0.2443 9.321 68,2247/23/2001 0.02 0.224 8.157 65,9097/24/2001 0.02 0.2445 9.159 67,2997/25/2001 0.019 0.2355 8.694 64,989

Entergy Arkansas, Inc.Lake Catherine - Unit 4CEMS Data from CAMD
7/26/2001 0.013 0.1794 4.211 43,2367/27/2001 0.013 0.1774 4.508 44,3757/28/2001 0.019 0.2528 10.205 63,0647/29/2001 0.019 0.2475 9.877 63,1487/30/2001 0.022 0.2758 12.376 71,6717/31/2001 0.022 0.2781 12.547 72,8668/1/2001 0.019 0.2373 9.073 62,4258/2/2001 0.021 0.2795 12.222 69,4308/4/2001 0.016 0.1885 7.963 54,3738/5/2001 0.021 0.2535 11.118 69,3928/6/2001 0.025 0.2972 15.248 84,9788/7/2001 0.025 0.2612 12.576 82,8228/8/2001 0.025 0.3036 14.997 82,9838/9/2001 0.025 0.3064 14.974 82,680
8/10/2001 0.019 0.2215 8.202 63,4238/12/2001 0.013 0.1633 5.452 44,8248/13/2001 0.006 0.1483 1.688 19,4878/14/2001 0.002 0.0623 0.246 5,3378/15/2001 0.008 0.1385 2.604 25,4238/16/2001 0.018 0.2429 8.743 60,9108/17/2001 0.018 0.2434 9.046 60,5998/18/2001 0.015 0.1771 4.996 50,2628/19/2001 0.014 0.1915 5.261 48,0818/20/2001 0.018 0.2217 8.411 61,5148/21/2001 0.021 0.2575 11.024 69,1918/22/2001 0.017 0.2267 7.102 55,1328/23/2001 0.016 0.1806 5.129 51,9098/24/2001 0.022 0.2213 8.506 72,9748/25/2001 0.022 0.2256 8.811 72,1268/26/2001 0.02 0.2177 7.642 65,7538/27/2001 0.02 0.2303 7.848 66,0308/28/2001 0.021 0.2293 8.581 70,5048/29/2001 0.021 0.2264 8.509 71,1488/30/2001 0.022 0.2056 7.903 72,1198/31/2001 0.015 0.1776 4.423 48,5729/4/2001 0.017 0.1992 8.364 57,6359/5/2001 0.02 0.2337 9.682 65,3329/6/2001 0.024 0.2887 13.929 80,5089/7/2001 0.026 0.3046 15.043 87,6739/8/2001 0.019 0.2353 8.989 64,3719/9/2001 0.012 0.1626 3.702 40,954
9/10/2001 0.019 0.2765 11.064 64,4659/11/2001 0.015 0.2078 5.686 49,6489/12/2001 0.02 0.2698 11.86 67,987

Entergy Arkansas, Inc.Lake Catherine - Unit 4CEMS Data from CAMD
9/13/2001 0.023 0.287 13.566 75,2479/14/2001 0.015 0.2122 6.49 50,9879/15/2001 0.012 0.1745 4.057 41,5869/16/2001 0.01 0.1532 2.834 34,1439/17/2001 0.018 0.2053 7.027 59,8459/18/2001 0.017 0.1845 5.837 55,3409/19/2001 0.02 0.29 12.096 67,4469/20/2001 0.014 0.1873 5.165 48,0249/21/2001 0.015 0.1985 5.829 50,2949/22/2001 0.017 0.2183 7.653 56,8059/23/2001 0.009 0.1337 2.095 30,4649/24/2001 0.011 0.153 3.113 36,6869/25/2001 0.009 0.1394 2.293 31,1829/26/2001 0.009 0.1375 2.009 29,2129/27/2001 0.013 0.1991 4.898 43,8049/28/2001 0.011 0.1601 3.348 38,2499/29/2001 0.009 0.1273 1.879 29,5079/30/2001 0.009 0.1299 1.915 29,49410/1/2001 0.016 0.2279 7.078 54,47810/2/2001 0.02 0.2719 10.453 67,70410/3/2001 0.021 0.2808 11.517 70,49110/4/2001 0.018 0.217 7.058 59,23810/5/2001 0.017 0.2193 6.911 58,10110/6/2001 0.011 0.1701 3.541 37,09910/7/2001 0.012 0.173 4.088 40,90610/8/2001 0.018 0.2333 7.922 60,87810/9/2001 0.021 0.2618 10.653 71,124
10/10/2001 0.025 0.3041 14.046 84,84310/11/2001 0.022 0.2695 10.787 72,70510/12/2001 0.014 0.1858 4.721 46,01810/13/2001 0.009 0.1202 1.806 30,00510/14/2001 0.009 0.1397 2.083 29,82610/15/2001 0.014 0.1868 4.97 46,96310/16/2001 0.015 0.1948 5.346 50,10110/17/2001 0.014 0.1865 5.001 46,09410/18/2001 0.015 0.2042 5.707 49,98010/19/2001 0.016 0.1879 5.568 54,45410/20/2001 0.011 0.1695 3.665 38,30610/21/2001 0.014 0.2021 5.378 46,55010/22/2001 0.017 0.2118 7.204 57,91710/23/2001 0.019 0.2224 8.303 64,76610/24/2001 0.02 0.2506 9.924 68,04410/25/2001 0.014 0.1916 4.787 46,34410/26/2001 0.012 0.1569 3.256 39,305
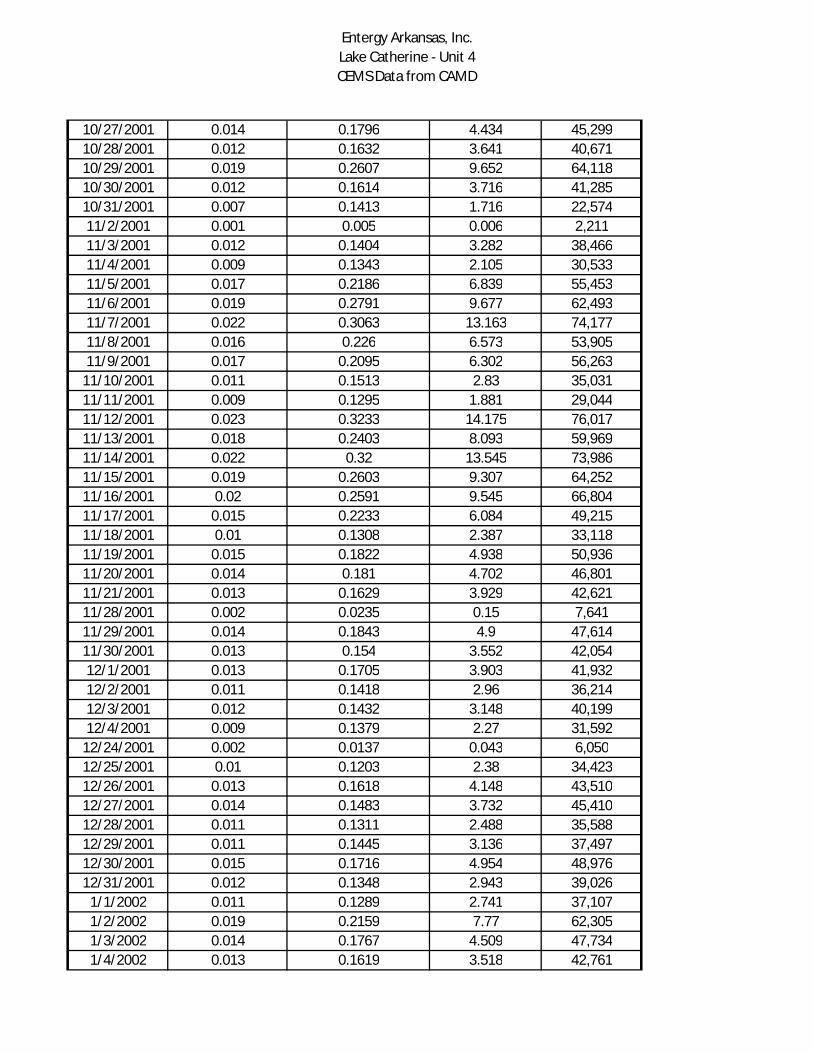
Entergy Arkansas, Inc.Lake Catherine - Unit 4CEMS Data from CAMD
10/27/2001 0.014 0.1796 4.434 45,29910/28/2001 0.012 0.1632 3.641 40,67110/29/2001 0.019 0.2607 9.652 64,11810/30/2001 0.012 0.1614 3.716 41,28510/31/2001 0.007 0.1413 1.716 22,57411/2/2001 0.001 0.005 0.006 2,21111/3/2001 0.012 0.1404 3.282 38,46611/4/2001 0.009 0.1343 2.105 30,53311/5/2001 0.017 0.2186 6.839 55,45311/6/2001 0.019 0.2791 9.677 62,49311/7/2001 0.022 0.3063 13.163 74,17711/8/2001 0.016 0.226 6.573 53,90511/9/2001 0.017 0.2095 6.302 56,263
11/10/2001 0.011 0.1513 2.83 35,03111/11/2001 0.009 0.1295 1.881 29,04411/12/2001 0.023 0.3233 14.175 76,01711/13/2001 0.018 0.2403 8.093 59,96911/14/2001 0.022 0.32 13.545 73,98611/15/2001 0.019 0.2603 9.307 64,25211/16/2001 0.02 0.2591 9.545 66,80411/17/2001 0.015 0.2233 6.084 49,21511/18/2001 0.01 0.1308 2.387 33,11811/19/2001 0.015 0.1822 4.938 50,93611/20/2001 0.014 0.181 4.702 46,80111/21/2001 0.013 0.1629 3.929 42,62111/28/2001 0.002 0.0235 0.15 7,64111/29/2001 0.014 0.1843 4.9 47,61411/30/2001 0.013 0.154 3.552 42,05412/1/2001 0.013 0.1705 3.903 41,93212/2/2001 0.011 0.1418 2.96 36,21412/3/2001 0.012 0.1432 3.148 40,19912/4/2001 0.009 0.1379 2.27 31,592
12/24/2001 0.002 0.0137 0.043 6,05012/25/2001 0.01 0.1203 2.38 34,42312/26/2001 0.013 0.1618 4.148 43,51012/27/2001 0.014 0.1483 3.732 45,41012/28/2001 0.011 0.1311 2.488 35,58812/29/2001 0.011 0.1445 3.136 37,49712/30/2001 0.015 0.1716 4.954 48,97612/31/2001 0.012 0.1348 2.943 39,026
1/1/2002 0.011 0.1289 2.741 37,1071/2/2002 0.019 0.2159 7.77 62,3051/3/2002 0.014 0.1767 4.509 47,7341/4/2002 0.013 0.1619 3.518 42,761

Entergy Arkansas, Inc.Lake Catherine - Unit 4CEMS Data from CAMD
1/5/2002 0.015 0.1869 4.642 49,1641/6/2002 0.011 0.1285 2.462 35,0851/7/2002 0.014 0.1835 4.424 46,3241/8/2002 0.012 0.1583 3.56 41,3831/9/2002 0.009 0.1222 1.888 28,4892/9/2002 0.016 0.011 0.296 52,507
2/10/2002 0.02 0.0207 0.606 66,6692/11/2002 0.011 0.1331 2.365 36,6242/12/2002 0.011 0.1611 3.084 36,8462/13/2002 0.01 0.1785 3.229 34,3972/14/2002 0.013 0.2097 4.987 43,3602/15/2002 0.014 0.2086 5.029 45,4592/16/2002 0.012 0.2087 4.505 41,5262/17/2002 0.01 0.1814 2.984 31,8802/18/2002 0.011 0.1988 3.921 37,4652/19/2002 0.014 0.1981 4.872 45,3802/20/2002 0.014 0.2173 5.256 45,2132/21/2002 0.017 0.2381 6.925 55,8512/22/2002 0.014 0.2127 5.232 46,5352/23/2002 0.014 0.2037 4.945 46,5752/24/2002 0.01 0.1896 3.281 32,9132/25/2002 0.009 0.1759 2.747 30,5822/26/2002 0.012 0.1834 3.845 41,0522/27/2002 0.013 0.1826 3.942 42,4932/28/2002 0.01 0.1566 2.711 34,0153/1/2002 0.006 0.2166 2.028 18,483
3/15/2002 0.002 0.0235 0.123 7,2533/16/2002 0.015 0.2207 5.787 49,5733/17/2002 0.013 0.2006 4.429 42,1173/18/2002 0.015 0.2198 5.663 49,0723/19/2002 0.013 0.2061 4.707 42,8933/20/2002 0.014 0.2145 5.842 47,8683/21/2002 0.018 0.2544 8.371 59,3453/22/2002 0.018 0.2707 9.128 58,5453/23/2002 0.011 0.192 3.909 37,6073/24/2002 0.011 0.1744 3.501 37,0513/25/2002 0.019 0.2433 8.382 62,0973/26/2002 0.018 0.2377 7.865 60,9673/27/2002 0.014 0.2157 5.6 47,3193/31/2002 0.001 0.0128 0.016 2,4984/1/2002 0.012 0.1843 4.136 40,6874/2/2002 0.014 0.2243 5.561 46,5084/3/2002 0.015 0.2472 6.462 49,7584/4/2002 0.014 0.2277 6.031 48,076

Entergy Arkansas, Inc.Lake Catherine - Unit 4CEMS Data from CAMD
4/5/2002 0.012 0.2001 4.283 40,2154/6/2002 0.011 0.191 3.747 37,0234/7/2002 0.011 0.1853 3.678 36,9884/8/2002 0.009 0.1468 2.22 30,2454/9/2002 0.01 0.172 2.907 32,815
4/10/2002 0.013 0.2167 4.962 43,8314/11/2002 0.016 0.2274 6.512 54,3194/12/2002 0.016 0.2247 6.09 51,7094/13/2002 0.017 0.2069 6.17 55,3814/14/2002 0.013 0.1926 4.747 44,0774/15/2002 0.018 0.2423 7.569 59,6824/16/2002 0.019 0.2365 7.739 63,1034/17/2002 0.02 0.2336 8.481 67,5064/18/2002 0.018 0.224 7.316 61,1684/19/2002 0.02 0.2517 8.836 65,0225/2/2002 0.001 0.0148 0.017 2,2115/3/2002 0.007 0.0993 1.714 24,8985/4/2002 0.012 0.1863 3.914 40,7815/5/2002 0.011 0.1728 3.337 37,4515/6/2002 0.018 0.2097 6.908 59,5945/7/2002 0.019 0.2303 8.425 64,1525/8/2002 0.023 0.2361 9.35 75,2245/9/2002 0.016 0.2122 5.898 52,439
5/10/2002 0.013 0.1986 4.614 44,1645/11/2002 0.014 0.1765 4.683 47,4445/12/2002 0.017 0.191 5.519 55,4825/13/2002 0.009 0.1702 2.581 30,2065/14/2002 0.009 0.161 2.348 29,1345/15/2002 0.011 0.173 3.44 37,3925/16/2002 0.021 0.2479 9.731 69,0295/17/2002 0.012 0.2209 5.043 41,2995/18/2002 0.01 0.188 3.206 33,4485/19/2002 0.009 0.1645 2.379 28,9295/20/2002 0.004 0.1594 1.021 12,6476/1/2002 0.002 0.0113 0.034 5,8476/2/2002 0.019 0.2273 9.398 63,7066/3/2002 0.024 0.2836 13.792 81,1766/4/2002 0.022 0.2306 9.943 73,1806/5/2002 0.018 0.2241 7.916 61,4596/6/2002 0.015 0.1971 5.382 48,6366/7/2002 0.013 0.1934 4.553 43,8486/8/2002 0.015 0.186 4.854 49,5056/9/2002 0.013 0.1597 3.658 44,556
6/10/2002 0.017 0.1751 5.207 55,339

Entergy Arkansas, Inc.Lake Catherine - Unit 4CEMS Data from CAMD
6/11/2002 0.016 0.1805 5.309 53,8656/12/2002 0.017 0.1882 5.673 55,9756/13/2002 0.017 0.1988 6.108 56,3756/14/2002 0.011 0.1794 3.37 36,0876/15/2002 0.013 0.1893 4.432 44,1306/16/2002 0.011 0.169 3.104 35,7206/17/2002 0.014 0.2101 5.291 47,7736/18/2002 0.014 0.2049 5.253 47,0766/19/2002 0.016 0.1944 5.498 52,0496/20/2002 0.016 0.1911 5.7 54,3486/21/2002 0.016 0.1905 5.506 53,3366/22/2002 0.016 0.1816 5.251 54,0996/23/2002 0.018 0.2016 6.77 59,2496/24/2002 0.022 0.2445 10.128 72,3976/25/2002 0.022 0.2426 10.262 72,0436/26/2002 0.018 0.1814 5.963 60,2446/27/2002 0.015 0.1849 4.94 50,5556/28/2002 0.015 0.1851 5.1 51,6466/29/2002 0.021 0.2412 9.898 69,0786/30/2002 0.021 0.2355 9.247 68,3817/1/2002 0.019 0.2164 7.691 64,3857/2/2002 0.018 0.197 6.338 59,6407/3/2002 0.017 0.1985 6.01 55,0297/4/2002 0.019 0.2203 7.709 62,4567/5/2002 0.021 0.2533 10.409 70,0917/6/2002 0.021 0.2369 9.529 69,8597/7/2002 0.02 0.2567 10.354 68,1537/8/2002 0.024 0.2977 13.867 78,8837/9/2002 0.022 0.2421 10.008 73,374
7/10/2002 0.019 0.2155 7.915 64,9697/11/2002 0.006 0.1143 1.23 18,8757/12/2002 0.013 0.168 3.94 43,9177/13/2002 0.013 0.1685 3.834 43,4607/14/2002 0.013 0.1713 3.981 42,7897/15/2002 0.018 0.2131 7.348 59,1427/16/2002 0.016 0.1863 5.406 53,1427/17/2002 0.015 0.1769 4.941 51,3547/18/2002 0.013 0.1603 3.517 42,5667/19/2002 0.015 0.1703 4.591 50,0017/20/2002 0.019 0.2103 7.674 63,3097/21/2002 0.02 0.211 8.165 66,0387/22/2002 0.018 0.1994 6.706 59,4497/23/2002 0.017 0.1995 6.439 56,3797/24/2002 0.014 0.1683 4.345 47,462

Entergy Arkansas, Inc.Lake Catherine - Unit 4CEMS Data from CAMD
7/25/2002 0.018 0.2057 7.026 59,3667/26/2002 0.019 0.2195 7.913 61,6707/27/2002 0.02 0.2344 9.085 65,7857/28/2002 0.02 0.2329 9.219 66,3197/29/2002 0.018 0.2211 7.091 60,1357/30/2002 0.019 0.1987 7.016 62,4137/31/2002 0.02 0.2116 8.065 67,1408/1/2002 0.02 0.2348 9.19 67,7238/2/2002 0.02 0.2204 8.544 65,9198/3/2002 0.021 0.233 9.727 71,1198/4/2002 0.022 0.2389 10.048 72,7098/5/2002 0.023 0.2528 11.034 76,4308/6/2002 0.022 0.2487 10.381 72,4198/7/2002 0.02 0.2277 8.971 66,0208/8/2002 0.016 0.1953 5.712 54,1348/9/2002 0.02 0.2207 8.389 66,924
8/10/2002 0.019 0.2229 8.173 63,2008/11/2002 0.019 0.2428 9.007 64,6458/12/2002 0.019 0.2223 8.197 63,3158/13/2002 0.015 0.177 4.992 51,5918/14/2002 0.013 0.1615 3.639 44,0288/15/2002 0.014 0.1525 3.574 45,9658/16/2002 0.014 0.178 4.527 47,6688/17/2002 0.02 0.2145 8.039 66,7758/18/2002 0.021 0.2241 9.121 71,3298/19/2002 0.022 0.2147 8.779 72,1908/20/2002 0.019 0.2123 8 64,0398/21/2002 0.021 0.2276 9.215 69,4328/22/2002 0.021 0.2321 9.377 71,4568/23/2002 0.023 0.235 9.958 75,0988/24/2002 0.023 0.2532 10.574 78,0078/25/2002 0.003 0.1184 0.839 9,3528/26/2002 0.016 0.1796 6.672 54,6408/27/2002 0.018 0.2074 7.099 59,1678/28/2002 0.017 0.2014 7.045 57,6698/29/2002 0.015 0.1921 5.529 51,0988/30/2002 0.017 0.2171 7.671 57,8048/31/2002 0.015 0.1841 5.165 51,1989/1/2002 0.014 0.1783 4.742 48,1879/2/2002 0.02 0.2379 9.75 67,0519/3/2002 0.022 0.2633 11.663 74,0269/4/2002 0.022 0.2336 10.178 73,4969/5/2002 0.021 0.2239 9.081 69,3509/6/2002 0.019 0.2164 8.132 63,607
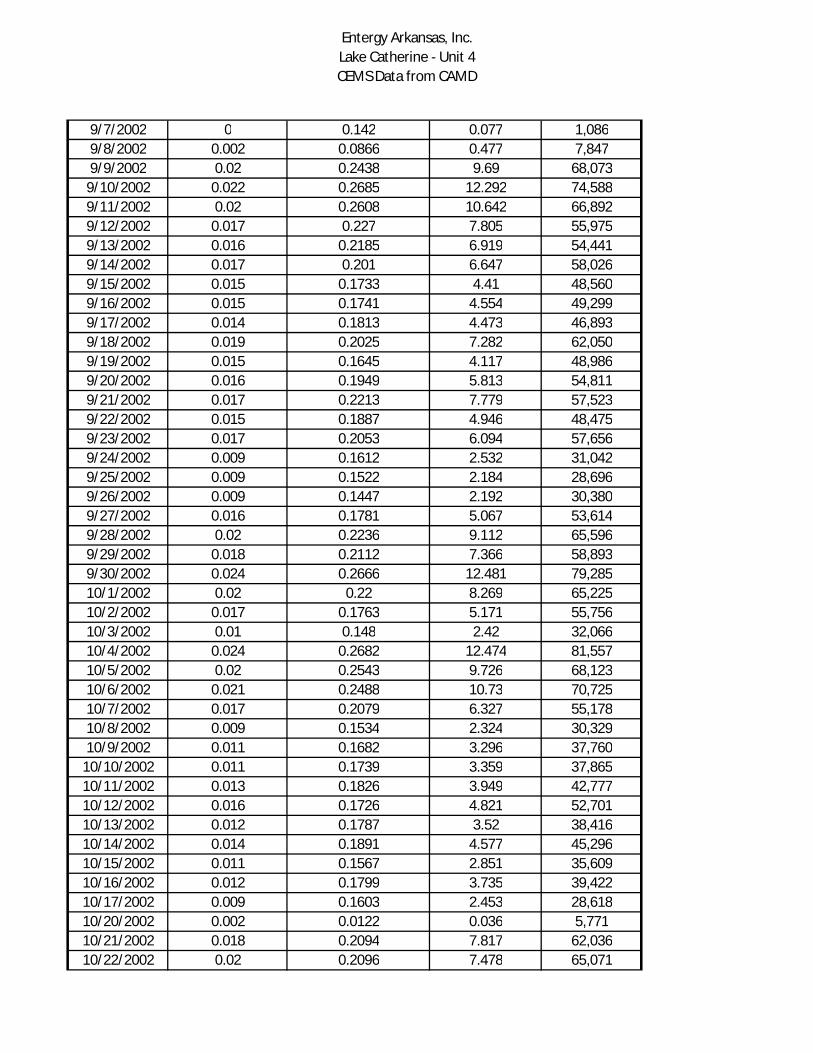
Entergy Arkansas, Inc.Lake Catherine - Unit 4CEMS Data from CAMD
9/7/2002 0 0.142 0.077 1,0869/8/2002 0.002 0.0866 0.477 7,8479/9/2002 0.02 0.2438 9.69 68,073
9/10/2002 0.022 0.2685 12.292 74,5889/11/2002 0.02 0.2608 10.642 66,8929/12/2002 0.017 0.227 7.805 55,9759/13/2002 0.016 0.2185 6.919 54,4419/14/2002 0.017 0.201 6.647 58,0269/15/2002 0.015 0.1733 4.41 48,5609/16/2002 0.015 0.1741 4.554 49,2999/17/2002 0.014 0.1813 4.473 46,8939/18/2002 0.019 0.2025 7.282 62,0509/19/2002 0.015 0.1645 4.117 48,9869/20/2002 0.016 0.1949 5.813 54,8119/21/2002 0.017 0.2213 7.779 57,5239/22/2002 0.015 0.1887 4.946 48,4759/23/2002 0.017 0.2053 6.094 57,6569/24/2002 0.009 0.1612 2.532 31,0429/25/2002 0.009 0.1522 2.184 28,6969/26/2002 0.009 0.1447 2.192 30,3809/27/2002 0.016 0.1781 5.067 53,6149/28/2002 0.02 0.2236 9.112 65,5969/29/2002 0.018 0.2112 7.366 58,8939/30/2002 0.024 0.2666 12.481 79,28510/1/2002 0.02 0.22 8.269 65,22510/2/2002 0.017 0.1763 5.171 55,75610/3/2002 0.01 0.148 2.42 32,06610/4/2002 0.024 0.2682 12.474 81,55710/5/2002 0.02 0.2543 9.726 68,12310/6/2002 0.021 0.2488 10.73 70,72510/7/2002 0.017 0.2079 6.327 55,17810/8/2002 0.009 0.1534 2.324 30,32910/9/2002 0.011 0.1682 3.296 37,760
10/10/2002 0.011 0.1739 3.359 37,86510/11/2002 0.013 0.1826 3.949 42,77710/12/2002 0.016 0.1726 4.821 52,70110/13/2002 0.012 0.1787 3.52 38,41610/14/2002 0.014 0.1891 4.577 45,29610/15/2002 0.011 0.1567 2.851 35,60910/16/2002 0.012 0.1799 3.735 39,42210/17/2002 0.009 0.1603 2.453 28,61810/20/2002 0.002 0.0122 0.036 5,77110/21/2002 0.018 0.2094 7.817 62,03610/22/2002 0.02 0.2096 7.478 65,071

Entergy Arkansas, Inc.Lake Catherine - Unit 4CEMS Data from CAMD
10/23/2002 0.013 0.1826 4.527 44,43710/24/2002 0.015 0.1721 4.372 49,48310/25/2002 0.014 0.1658 4.185 47,82410/26/2002 0.011 0.1546 2.944 35,93810/27/2002 0.013 0.1601 3.608 43,24010/28/2002 0.02 0.2088 7.729 65,11510/29/2002 0.016 0.194 5.532 54,36710/30/2002 0.015 0.188 4.794 48,86210/31/2002 0.011 0.1581 2.904 35,23111/1/2002 0.011 0.1485 2.819 36,57411/2/2002 0.01 0.145 2.383 31,90311/3/2002 0.011 0.1482 2.848 35,81111/4/2002 0.023 0.2648 12.133 78,25411/5/2002 0.021 0.2342 9.378 68,88911/6/2002 0.015 0.1738 4.608 49,17311/7/2002 0.02 0.2313 8.749 65,16111/8/2002 0.017 0.1781 5.178 56,52411/9/2002 0.009 0.136 2.161 31,346
11/10/2002 0.01 0.1448 2.362 31,88711/11/2002 0.013 0.1856 4.725 44,1362/14/2003 0.001 0.015 0.013 1,6992/16/2003 0.001 0.008 0.018 4,6052/17/2003 0.017 0.007 0.196 55,9322/18/2003 0.012 0.1238 2.05 41,0732/19/2003 0.003 0.1366 0.708 9,3953/28/2003 0.002 0.0242 0.107 7,5993/29/2003 0.013 0.1843 4.455 44,9103/30/2003 0.011 0.1648 3.195 37,6843/31/2003 0.011 0.1599 3.049 37,1234/1/2003 0.009 0.1645 2.533 30,6384/2/2003 0.009 0.1578 2.455 30,5914/3/2003 0.006 0.1202 1.32 19,5154/4/2003 0.005 0.102 0.967 15,4894/5/2003 0.009 0.1568 2.442 30,2364/6/2003 0.009 0.1436 2.17 29,9754/7/2003 0.011 0.15 3.071 37,4764/8/2003 0.012 0.1548 3.05 38,7384/9/2003 0.015 0.1841 5.177 50,011
4/10/2003 0.01 0.141 2.445 34,0694/11/2003 0.009 0.1414 2.113 29,9724/12/2003 0.009 0.1431 2.162 30,2964/13/2003 0.008 0.1405 1.976 28,1274/14/2003 0.01 0.1486 2.56 33,6214/15/2003 0.007 0.1452 1.758 24,188

Entergy Arkansas, Inc.Lake Catherine - Unit 4CEMS Data from CAMD
4/25/2003 0.003 0.0553 0.492 11,0354/26/2003 0.01 0.1436 2.364 32,8774/27/2003 0.01 0.1418 2.309 31,9854/28/2003 0.008 0.1336 1.711 25,6105/9/2003 0.004 0.0611 0.614 12,647
5/10/2003 0.017 0.2021 6.54 57,4055/11/2003 0.01 0.1643 2.778 32,8775/12/2003 0.01 0.17 3.027 34,4635/13/2003 0.01 0.1454 2.497 33,0675/14/2003 0.008 0.1238 1.727 27,9045/15/2003 0.009 0.1203 1.765 28,3495/16/2003 0.009 0.129 2.082 31,5515/17/2003 0.008 0.1178 1.644 27,9195/18/2003 0.01 0.1452 2.588 34,0935/19/2003 0.016 0.1815 4.992 51,7995/20/2003 0.004 0.1189 0.738 11,9756/1/2003 0.002 0.0204 0.091 7,8846/2/2003 0.01 0.125 2.122 33,7766/3/2003 0.009 0.1308 1.946 29,6936/4/2003 0.01 0.1464 2.454 32,2226/5/2003 0.007 0.1192 1.338 21,9336/6/2003 0.007 0.1182 1.317 21,7476/7/2003 0.006 0.1135 1.1 19,3806/8/2003 0.006 0.1165 1.136 19,4976/9/2003 0.002 0.1092 0.387 6,865
6/30/2003 0.002 0.0148 0.051 6,6667/1/2003 0.01 0.1128 1.846 32,0907/2/2003 0.01 0.1271 2.185 32,1817/3/2003 0.01 0.136 2.453 33,1237/4/2003 0.006 0.0813 1.036 21,6497/5/2003 0.007 0.1085 1.225 21,9437/6/2003 0.009 0.1127 1.813 29,1757/7/2003 0.012 0.138 3.41 40,6927/8/2003 0.011 0.1252 2.581 36,4357/9/2003 0.01 0.1078 2.01 34,360
7/10/2003 0.007 0.1007 1.228 23,0777/11/2003 0.01 0.1343 2.455 33,5187/12/2003 0.01 0.1307 2.379 32,9297/13/2003 0.009 0.1247 1.94 29,0037/14/2003 0.013 0.1405 3.51 43,0067/15/2003 0.015 0.185 4.892 50,7937/16/2003 0.014 0.1793 5.3 47,4577/17/2003 0.013 0.1686 3.913 42,7827/18/2003 0.013 0.165 4.07 43,826

Entergy Arkansas, Inc.Lake Catherine - Unit 4CEMS Data from CAMD
7/19/2003 0.008 0.1224 1.76 25,8047/20/2003 0.01 0.1375 2.73 34,1397/21/2003 0.013 0.1501 3.85 44,7377/22/2003 0.006 0.103 1.121 21,1047/23/2003 0.006 0.1008 1.011 19,9297/24/2003 0.006 0.1075 1.072 19,9357/25/2003 0.009 0.1438 2.495 31,0667/26/2003 0.011 0.1486 3.135 35,8017/27/2003 0.013 0.173 5.431 44,0647/28/2003 0.017 0.2069 6.998 58,0497/29/2003 0.011 0.1515 3.021 36,3947/30/2003 0.007 0.1108 1.516 24,2357/31/2003 0.009 0.1397 2.345 31,3818/1/2003 0.01 0.1266 2.392 34,0918/2/2003 0.006 0.092 0.892 19,3988/3/2003 0.006 0.0904 0.875 19,3608/4/2003 0.009 0.1192 2.303 30,7608/5/2003 0.01 0.1227 2.572 34,4558/6/2003 0.008 0.1203 1.763 26,2448/7/2003 0.008 0.1309 1.829 25,4448/8/2003 0.008 0.1298 2.097 27,4018/9/2003 0.007 0.1191 1.409 22,463
8/10/2003 0.006 0.1079 1.061 19,6608/11/2003 0.006 0.1075 1.061 19,7388/12/2003 0.006 0.1095 1.08 19,7258/13/2003 0.006 0.1065 1.048 19,6908/14/2003 0.008 0.1326 2.107 28,1518/15/2003 0.01 0.1322 2.58 33,8488/16/2003 0.013 0.1526 3.956 42,2168/17/2003 0.013 0.1577 4.289 43,0908/18/2003 0.014 0.1655 4.59 47,3828/19/2003 0.014 0.1708 5.163 46,9028/20/2003 0.015 0.1618 5.32 49,5078/21/2003 0.014 0.1881 5.674 48,2998/22/2003 0.012 0.166 3.744 41,5898/23/2003 0.01 0.1376 2.684 32,5188/24/2003 0.01 0.1334 2.577 33,7558/25/2003 0.014 0.1732 4.318 45,3808/26/2003 0.013 0.1547 3.525 42,8228/27/2003 0.01 0.1459 2.67 33,3318/28/2003 0.01 0.1498 2.62 32,4518/29/2003 0.013 0.1693 3.995 43,3748/30/2003 0.012 0.1627 3.506 40,5008/31/2003 0.006 0.0985 0.948 19,262

Entergy Arkansas, Inc.Lake Catherine - Unit 4CEMS Data from CAMD
9/1/2003 0.01 0.1333 2.529 33,3029/2/2003 0.008 0.1248 1.888 27,7579/3/2003 0.008 0.1173 1.595 25,0749/4/2003 0.008 0.1225 1.797 26,4589/5/2003 0.006 0.105 1.099 20,2219/6/2003 0.006 0.1046 1.019 19,4169/7/2003 0.006 0.1108 1.228 21,3829/8/2003 0.009 0.1403 2.307 29,5979/9/2003 0.01 0.1442 2.718 32,493
9/10/2003 0.009 0.1393 2.427 30,2849/11/2003 0.008 0.126 1.829 26,3139/12/2003 0.006 0.1015 0.992 19,3259/13/2003 0.009 0.1308 2.093 28,9549/14/2003 0.007 0.1298 1.696 24,1589/15/2003 0.007 0.129 1.71 24,8009/16/2003 0.007 0.1279 1.697 24,4749/17/2003 0.007 0.1288 1.716 24,2739/18/2003 0.007 0.1259 1.509 22,7369/19/2003 0.006 0.1163 1.157 19,5479/20/2003 0.008 0.1318 1.753 25,3929/21/2003 0.007 0.1188 1.465 23,2129/22/2003 0.01 0.1355 2.401 34,6809/23/2003 0.009 0.1447 2.381 31,3099/24/2003 0.01 0.1484 2.635 34,4589/25/2003 0.01 0.1461 2.608 32,1929/26/2003 0.011 0.1719 3.773 37,6709/27/2003 0.012 0.1762 4.114 40,7129/28/2003 0.006 0.1263 1.249 19,7739/29/2003 0.006 0.1286 1.388 21,1469/30/2003 0.007 0.1355 1.688 23,27310/1/2003 0.006 0.1358 1.542 21,62710/5/2003 0.002 0.0366 0.114 5,80810/6/2003 0.01 0.1548 2.763 32,21610/7/2003 0.013 0.1837 4.234 44,45010/8/2003 0.009 0.156 2.64 30,400
10/18/2003 0 0.0105 0.007 1,19610/19/2003 0.009 0.1316 2.367 28,41510/20/2003 0.015 0.1955 5.096 51,19310/21/2003 0.017 0.2215 7.467 57,79410/22/2003 0.028 0.3428 16.509 93,03610/23/2003 0.025 0.2927 12.561 82,67310/24/2003 0.024 0.2452 9.877 79,99010/25/2003 0.03 0.3455 17.916 98,84510/26/2003 0.023 0.2924 12.033 78,223

Entergy Arkansas, Inc.Lake Catherine - Unit 4CEMS Data from CAMD
10/27/2003 0.012 0.1688 3.629 38,96310/28/2003 0.012 0.1751 3.723 38,83810/29/2003 0.01 0.1726 3.271 34,78310/30/2003 0.008 0.1362 1.893 25,48510/31/2003 0.005 0.1143 1.042 17,44011/9/2003 0.002 0.0359 0.172 7,344
11/10/2003 0.006 0.1283 1.306 20,36311/11/2003 0.026 0.3002 15.338 85,15811/12/2003 0.037 0.4825 29.477 122,15311/13/2003 0.02 0.3162 14.539 67,70111/14/2003 0.016 0.2494 9.144 53,54311/15/2003 0.023 0.309 14.475 76,65811/16/2003 0.014 0.2057 7.065 47,59111/17/2003 0.011 0.1664 3.785 37,22011/18/2003 0.004 0.1328 0.842 11,83812/11/2003 0.001 0.024 0.051 3,99212/12/2003 0.008 0.1213 1.843 25,99812/13/2003 0.009 0.137 2.2 28,73812/14/2003 0.006 0.118 1.209 20,46012/15/2003 0.009 0.1466 2.348 30,084
Max (tpd) --> 0.037 29.477Max (lb/hr) --> 3.1 2456.4
Note: Dates with no operation/emissions not shown
Entergy Trinity Consultants
BART Analysis – Lake Catherine
APPENDIX D
SARGENT & LUNDY NOX CONTROL TECHNOLOGY STUDY

Prepared for Gill Elrod Ragon Owen & Sherman, P.A.
NOx Control Technology Cost and Performance Study
Entergy Services, Inc.
White Bluff & Lake Catherine
SL-011439 Final Report
Rev. 4
May 16, 2013 Project No.: 13027-001
Prepared by
55 East Monroe Street Chicago, IL 60603-5780 USA

Entergy Services, Inc. White Bluff & Lake Catherine Project No. 13027-001 NOx Control Technology Cost and Performance Study
SL-011439 Final Report Rev. 4 5/16/2013 Page No. ii
LEGAL NOTICE
This report (“Deliverable”) was prepared by Sargent & Lundy, L.L.C. ("S&L"), expressly for the sole use
of Gill Elrod Ragon Owen & Sherman, P.A. ("Client") in accordance with the agreement between S&L
and Client. This Deliverable was prepared using the degree of skill and care ordinarily exercised by
engineers practicing under similar circumstances. Client acknowledges: (1) S&L prepared this
Deliverable subject to the particular scope limitations, budgetary and time constraints, and business
objectives of the Client; (2) information and data provided by others may not have been independently
verified by S&L; and (3) the information and data contained in this Deliverable are time sensitive and
changes in the data, applicable codes, standards, and acceptable engineering practices may invalidate the
findings of this Deliverable. Any use or reliance upon this Deliverable by third parties shall be at their
sole risk.


Entergy Services, Inc. White Bluff & Lake Catherine Project No. 13027-001 NOx Control Technology Cost and Performance Study
SL-011439 Final Report Rev. 4 5/16/2013 Page No. v
1. INTRODUCTION.......................................................................................................................... 1
1.1. OBJECTIVE................................................................................................................................... 1
1.2. UNIT DESCRIPTIONS ................................................................................................................. 1
1.2.1. White Bluff - Units 1 & 2............................................................................................................... 1
1.2.2. White Bluff Auxiliary Boiler.......................................................................................................... 1
1.2.3. Lake Catherine - Unit 4 .................................................................................................................. 1
1.3. ESTIMATE METHODOLOGY .................................................................................................... 2
1.3.1. Capital Cost Estimates.................................................................................................................... 2
1.3.2. Operating and Maintenance Cost Estimates................................................................................... 3
1.4. DESIGN TARGET vs. COMPLIANCE NOX EMISSION RATES .............................................. 3
2. WHITE BLUFF - UNITS 1 & 2..................................................................................................... 4
2.1. FUEL SWITCHING OPTIONS..................................................................................................... 4
2.1.1. Natural Gas..................................................................................................................................... 4
2.1.2. Propane........................................................................................................................................... 4
2.2. COMBUSTION CONTROLS........................................................................................................ 4
2.2.1. Low NOx Burners and Over-Fire Air ............................................................................................ 4
2.2.2. Flue Gas Recirculation (FGR)........................................................................................................ 5
2.2.3. Neural Network .............................................................................................................................. 5
2.3. POST COMBUSTION CONTROLS............................................................................................. 6
2.3.1. Selective Non-Catalytic Reduction ................................................................................................ 6
2.3.2. Selective Catalytic Reduction......................................................................................................... 7
2.4. CAPITAL COSTS.......................................................................................................................... 8
2.5. OPERATING AND MAINTENANCE COSTS ............................................................................ 9
3. WHITE BLUFF AUXILIARY BOILER ..................................................................................... 11
3.1. FUEL SWITCHING..................................................................................................................... 11
3.2. COMBUSTION CONTROLS...................................................................................................... 11
3.2.1. Low NOx Burners + Over-Fire Air .............................................................................................. 11
3.2.2. Flue Gas Recirculation ................................................................................................................. 11
3.2.3. Low NOx Burners + Over-fire Air + Flue Gas Recirculation...................................................... 11
3.2.4. Neural Network ............................................................................................................................ 12
3.3. POST COMBUSTION CONTROLS........................................................................................... 12
3.3.1. Selective Non-Catalytic Reduction .............................................................................................. 12
3.3.2. Selective Catalytic Reduction....................................................................................................... 12

Entergy Services, Inc. White Bluff & Lake Catherine Project No. 13027-001 NOx Control Technology Cost and Performance Study
SL-011439 Final Report Rev. 4 5/16/2013 Page No. vi
3.4. CAPITAL COST ESTIMATES ................................................................................................... 13
3.5. OPERATING AND MAINTENANCE COST ESTIMATES ..................................................... 13
4. LAKE CATHERINE - UNIT 4.................................................................................................... 15
4.1. FUEL SWITCHING..................................................................................................................... 15
4.2. COMBUSTION CONTROLS...................................................................................................... 15
4.2.1. Burners-Out-Of-Service ............................................................................................................... 15
4.2.2. Low NOx Burners + Over-Fire Air .............................................................................................. 16
4.2.3. Flue Gas Recirculation ................................................................................................................. 16
4.2.4. Water Injection ............................................................................................................................. 16
4.2.5. Neural Network ............................................................................................................................ 17
4.3. POST COMBUSTION CONTROLS........................................................................................... 17
4.3.1. Selective Non-Catalytic Reduction .............................................................................................. 17
4.3.2. Selective Catalytic Reduction....................................................................................................... 17
4.4. CAPITAL COST ESTIMATES ................................................................................................... 18
4.5. OPERATING AND MAINTENANCE COST ESTIMATES ..................................................... 19
APPENDIX A: CAPITAL COST ESTIMATE........................................................................................ 2
1. BASIS OF ESTIMATES................................................................................................................ 2
2. CONCEPTUAL COST ESTIMATE SUMMARY SHEETS ........................................................ 2
APPENDIX B .............................................................................................................................................. 3
1. ESTIMATED PROJECT SCHEDULES........................................................................................ 3
APPENDIX C.............................................................................................................................................. 4
1. OPERATING AND MAINTENANCE COST ESTIMATES ....................................................... 4
APPENDIX D.............................................................................................................................................. 5
1. BOOS AT FULL UNIT LOAD ..................................................................................................... 5

Entergy Services, Inc. White Bluff & Lake Catherine Project No. 13027-001 NOx Control Technology Cost and Performance Study
SL-011439 Final Report Rev. 4 5/16/2013 Page No. 1
1. INTRODUCTION
1.1. OBJECTIVE
The intent of this study is to provide Gill Elrod Ragon Owen & Sherman, P.A. with a technology
evaluation and cost estimates for available methods of NOx control at two Entergy stations including:
White Bluff – Units 1 & 2, the White Bluff Auxiliary Boiler, and Lake Catherine – Unit 4. The
information developed in this study will be used to create a BART analysis, for compliance with
Arkansas DEQ regulations.
1.2. UNIT DESCRIPTIONS
1.2.1. White Bluff - Units 1 & 2
White Bluff - Units 1 & 2 are Alstom-designed, tangentially-fired, pulverized-coal fueled units, rated at
815 MWnet and 844 MWnet respectively. Powder River Basin coal is the primary fuel source for Units 1
& 2. Currently, the units have no NOx controls installed.
1.2.2. White Bluff Auxiliary Boiler
The White Bluff Auxiliary boiler is a small industrial boiler capable of producing 140,000 lb/hr of steam,
used for startup of the White Bluff coal units. The auxiliary boiler combusts No. 2 Diesel Oil, and does
not have any existing NOx controls.
1.2.3. Lake Catherine - Unit 4
Lake Catherine - Unit 4 is an Alstom-designed, tangentially-fired, natural gas fueled unit, capable of
generating 558 MWnet. The unit was originally designed as a dual-fuel unit, able to use natural gas or
No. 2 Fuel Oil as fuel. This evaluation will be for natural gas firing only. If No. 2 Fuel Oil is to be
combusted in the future, a separate BART analysis will be submitted. The unit currently has no NOx
controls.

Entergy Services, Inc. White Bluff & Lake Catherine Project No. 13027-001 NOx Control Technology Cost and Performance Study
SL-011439 Final Report Rev. 4 5/16/2013 Page No. 2
1.3. ESTIMATE METHODOLOGY
1.3.1. Capital Cost Estimates
S&L’s capital cost estimates for retrofit NOx control technologies for White Bluff Units 1&2, White
Bluff Auxiliary Boiler and Lake Catherine – Unit 4 encompass the equipment, material, labor, and all
other required direct costs. The underlying assumption is that the project will be implemented on a
multiple-contracting basis. The capital cost estimates provided herein are “total plant cost,” and include
the following:
Equipment and material
Installation labor
Indirect field costs and BOP engineering
Contingency (percentage varies with project size)
Erection contractor profit (at 10% of material and labor)
General and administration (at 5% of material and labor)
Freight on material (at 5% of material)
Freight on equipment (included with equipment costs)
Sales/use tax (not included)
Startup and commissioning (at 1% of construction cost)
Spare parts (included with equipment costs)
Consumables (0.5% of material and labor)
Owner’s engineering and other Owner’s costs were not included. Engineering, Procurement & Project
Services and Contingency varied depending on the size of the project. License fees and royalties are not
expected for the proposed control strategies. The Basis of Estimate and capital costs are summarized in
Appendix A.
Capital cost estimates were calculated in one of three ways. In some cases, vendors were contacted to
provide budgetary estimates for equipment and labor. These vendor’s costs were used to create Total
Installed Cost Estimates. In situations where Sargent & Lundy had performed cost estimates for these
units previously, the existing cost estimates were updated to reflect current equipment, labor, and
currency values. Remaining cost estimates were developed from similar projects that Sargent & Lundy
has completed and adjusted for unit size.

Entergy Services, Inc. White Bluff & Lake Catherine Project No. 13027-001 NOx Control Technology Cost and Performance Study
SL-011439 Final Report Rev. 4 5/16/2013 Page No. 3
1.3.2. Operating and Maintenance Cost Estimates
Operating and Maintenance Costs for White Bluff - Units 1 & 2 and Lake Catherine – Unit 4 were
developed from similar projects Sargent & Lundy has completed. Costs were applied to the units on a
$/kW basis, and assuming a 10% capacity factor for Lake Catherine – Unit 4, and 76% for White Bluff—
Units 1 & 2. Operating and Maintenance Costs include the following costs:
Fixed Operating and Maintenance
Variable Operating and Maintenance
Fuel Impact Costs
For the White Bluff Auxiliary boiler, costs were developed using Office of Air Quality Planning and
Standards (OAQPS) calculations, assuming a 10% capacity factor.
1.4. DESIGN TARGET vs. COMPLIANCE NOX EMISSION RATES
NOx control systems retrofit onto existing coal or gas-fired boilers are typically designed to achieve
varying levels of NOx removal efficiencies from 10%-94%, depending on the control technologies
selected. Controlled NOx emissions fluctuate during normal boiler operation in response to a number of
design/operating parameters including, but not necessarily limited to: inlet NOx concentrations, boiler
load, load changes, particulate matter loading, flue gas temperatures, flue gas velocities and mixing,
catalyst volume and surface area, NH3:NOx stoichiometric ratio, catalyst age and activity, and the
quantity of ammonia slip deemed to be acceptable.
The “design target” NOx emission rate is the rate that a NOx control technology vendor would be willing
to guarantee. Based on engineering judgment, and taking into consideration emissions data from existing
coal- and gas-fired sources, a compliance margin above the design target is recommended for high
removal efficiency/low emission rate technologies (such as SCR) to establish an enforceable permit limit
based on long-term (e.g., annual average) emissions. Additional compliance margin would be required to
establish enforceable permit limits based on shorter-term averaging times. For example, S&L
recommends a compliance margin of 0.02 to 0.03 lb/MMBtu for coal units and 0.01 to 0.02 lb/MMBtu
for gas units above the design target emission rate for permit limits based on a 30-day rolling average for
control strategies including SCR. The NOx control technology emission rates for strategies including
SCR in this report have been adjusted to include margin for compliance. The permit level NOx emission

Entergy Services, Inc. White Bluff & Lake Catherine Project No. 13027-001 NOx Control Technology Cost and Performance Study
SL-011439 Final Report Rev. 4 5/16/2013 Page No. 4
rates for SCR are higher by 0.02 to 0.03 lb/MMBtu for coal units and 0.01 to 0.02 lb/MMBtu for gas
units.
2. WHITE BLUFF - UNITS 1 & 2
2.1. FUEL SWITCHING OPTIONS
2.1.1. Natural Gas
For White Bluff Units 1 & 2, fuel switching is not a feasible option. Typically, units could be switched
from coal to natural gas or propane for NOx reductions. The nearest natural gas pipeline to the White
Bluff facility is approximately 20 miles away. Construction of a pipeline is currently estimated at $2M
per mile resulting in a cost of $40M to bring natural gas to the site, not including the additional upgrades
the boiler would require to burn natural gas instead of coal.
2.1.2. Propane
White Bluff – Units 1 & 2 are each over 800 MWnet. Units of this size require more heat input than can
practically be achieved with a propane delivery and storage system. Since a propane pipeline is not
available, fuel switching to propane is not a feasible option.
2.2. COMBUSTION CONTROLS
2.2.1. Low NOx Burners and Over-Fire Air
Low NOx burners (LNB) limit NOx formation by controlling both the stoichiometric and temperature
profiles of the combustion flame in each burner flame envelope. Control is achieved with design features
that regulate the aerodynamic distribution and mixing of the fuel and air, yielding reduced oxygen (O2) in
the primary combustion zone, reduced flame temperature, and reduced residence time at peak combustion
temperatures. The combination of these techniques produces lower NOx emissions during the combustion
process.
OFA involves injecting combustion air downstream of the fuel-rich primary combustion zone by using
over-fire air or side-fired air ports. The fuel-rich mixture that is fed to the burners reduces the flame

Entergy Services, Inc. White Bluff & Lake Catherine Project No. 13027-001 NOx Control Technology Cost and Performance Study
SL-011439 Final Report Rev. 4 5/16/2013 Page No. 5
temperature and oxygen concentration thus reducing the formation of thermal NOx. Generally, OFA is
more effective when used with low nitrogen content fuels such as natural gas and propane, since OFA is
more effective in controlling thermal NOx rather than fuel NOx.
LNB + OFA is a technically feasible retrofit solution for White Bluff - Units 1 & 2. The combination of
LNB + OFA is capable of achieving a NOx emission rate of 0.15 lb/MMBtu. From Unit 1’s baseline
emissions of 0.33 lb/MMBtu, this is approximately 54.5% NOx removal efficiency. A removal efficiency
of 61.5% can be expected for Unit 2, with a baseline NOx of 0.39 lb/MMBtu.
2.2.2. Flue Gas Recirculation (FGR)
NOx reduction efficiency data for coal-fired units with FGR are limited. The amount of NOx reduction
achievable with FGR depends primarily on the fuel nitrogen content and amount of FGR used. Generally,
FGR is more effective when used with low nitrogen content fuels such as natural gas and propane, since
FGR is more effective in controlling thermal NOx rather than fuel NOx. Industry experience with FGR on
coal-fired units for steam temperature control has shown very high maintenance on the gas recirculation
fans due to erosion and corrosion. Many of the units with FGR for steam temperature control have
removed the recirculation fans from service. The NOx control achievable on tangentially fired units like
White Bluff – Units 1&2 with LNB+OFA has been comparable to that of FGR at lower capital and O&M
cost. Currently, FGR technology is not offered by OEMs for coal-fired units. For these reasons, FGR is
not a feasible technology for the White Bluff coal-fired units.
2.2.3. Neural Network
Neural Network (NN) systems are on-line enhancements to digital control systems (DCS) and plant
information systems that improve boiler performance parameters such as heat rate, NOx emissions, and
CO levels. The Neural Network model is based on historical data and parametric test data. The software
applies an optimizing procedure to identify the best set points for the boiler, which are implemented
without operator intervention (closed loop), or, at the plant’s discretion, conveyed to the plant operators
for implementation (open loop).
A Neural Network system is a technically feasible retrofit option for the White Bluff units. A NN is
already installed for monitoring and controlling heat rate at White Bluff – Units 1&2. The reprogrammed

Entergy Services, Inc. White Bluff & Lake Catherine Project No. 13027-001 NOx Control Technology Cost and Performance Study
SL-011439 Final Report Rev. 4 5/16/2013 Page No. 6
NN would be optimized first for minimizing NOx emissions and second for heat rate. It is possible that
heat rate may increase as a result. Based on information available from vendors, it is expected that Neural
Network technology on a coal-fired boiler can maintain the guaranteed performance of low NOx burners
and potentially can achieve approximately 10% NOx reduction over a period of years, resulting in NOx
emission rates of 0.30 lb/MMBtu, at max load for Unit 1, and of 0.35 lb/MMBtu for Unit 2. The cost for
modifying the existing NNs at White Bluff is estimated to be approximately $250,000 per unit.
2.3. POST COMBUSTION CONTROLS
2.3.1. Selective Non-Catalytic Reduction
Selective non-catalytic reduction (SNCR) involves the direct injection of ammonia (NH3) or urea
(CO(NH2)2) into the furnace at high flue gas temperatures (approximately 1600 ºF – 2000 ºF). The
ammonia or urea reacts with NOx in the flue gas to produce N2 and water as shown in the following
equations:
(CO(NH2)2) + 2NO + ½O2 → 2H2O + CO2 + 2N2
2NH3 + 2NO + ½O2 → 2N2 + 3H2O
Flue gas temperature at the point of reactant injection can greatly affect NOx removal efficiencies and the
quantity of NH3 or urea that will pass through the furnace unreacted (referred to as NH3 slip). In general,
SNCR reactions are effective at a temperature range of 1600 ºF – 2000 ºF. At temperatures below the
desired operating range, the NOx reduction reactions diminish and unreacted NH3 emissions increase.
Above the desired temperature range, NH3 is oxidized to NOx resulting in low NOx reduction
efficiencies.
Mixing of the reactant and flue gas within the reaction zone is also an important factor to SNCR
performance. In large boilers, the physical distance over which reagent must be dispersed increases, and
the surface area/volume ratio of the convective pass decreases. Both of these factors make it difficult to
achieve good mixing of reagent and flue gas, delivery of reagent in the proper temperature window, and
sufficient residence time of the reactant and flue gas in that temperature window.

Entergy Services, Inc. White Bluff & Lake Catherine Project No. 13027-001 NOx Control Technology Cost and Performance Study
SL-011439 Final Report Rev. 4 5/16/2013 Page No. 7
The temperatures and residence times required for an SNCR system make it a feasible option for NOx
reduction for White Bluff - Units 1 & 2. Based on vendor input, a unit with no additional controls and a
baseline NOx of 0.33 lb/MMBtu could see a 26.5% NOx reduction, for an outlet rate of 0.24 lb/MMBtu
on Unit 1. For Unit 2, with a baseline NOx of 0.39 lb/MMBtu could see a 26.5% reduction to an outlet
rate of 0.29 lb/MMBtu.
SNCR systems can also be installed in conjunction with LNB + OFA controls. On these coupled systems,
the starting NOx of approximately 0.15 lb/MMBtu can be reduced to 0.13 lb/MMBtu, for a total reduction
(LNB + OFA + SNCR) of around 61% for Unit 1 and 67% for Unit 2. In addition to the SNCR
equipment, the process requires additional demineralized water at a rate of 170 gpm. An additional water
treatment system capable of providing the required flows is included in the capital cost. The cost of the
SNCR equipment for the combination technology would be approximately 10% lower based on the lower
starting NOx rate with LNB/OFA.
2.3.2. Selective Catalytic Reduction
Selective Catalytic Reduction (SCR) involves injecting ammonia into boiler flue gas in the presence of a
catalyst to reduce NOx to N2 and water. The overall SCR reactions are:
4NH3 + 4NO + O2 → 4N2 + 6H2O
8NH3 + 4NO2 + 2O2 → 6N2 + 12H2O
The optimal temperature range depends on the type of catalyst used, but is typically between 560 °F and
800 °F to maximize NOx reduction efficiency and minimize ammonium sulfate formation. Below this
range, ammonium sulfate is formed resulting in catalyst deactivation. Above the optimum temperature,
the catalyst will sinter and thus deactivate rapidly. Another factor affecting SCR performance is the
condition of the catalyst material. As the catalyst degrades over time or is damaged, NOx removal
decreases which is typically compensated by increased ammonia slip.
SCR has been installed on many large coal-fired and some gas-fired boilers and is considered a feasible
technology. Because of the expense of the reagent, SCR systems are usually installed on units with
existing LNB + OFA systems, or the upgrades are done simultaneously. At White Bluff, an
SCR+LNB/OFA system is capable of removing approximately 90% of NOx emissions on a continuous

Entergy Services, Inc. White Bluff & Lake Catherine Project No. 13027-001 NOx Control Technology Cost and Performance Study
SL-011439 Final Report Rev. 4 5/16/2013 Page No. 8
long-term basis. With a starting NOx of 0.33 lb/MMBtu (Unit 1) to 0.39 lb/MMBtu (Unit 2), an SCR can
be expected to achieve permitted emissions compliance at 0.055 lb/MMBtu.
2.4. CAPITAL COSTS
Capital costs for the technically feasible control options for the White Bluff coal units are listed in Table
2.1. The cost of SCR on White Bluff – Unit 1 is higher than for White Bluff – Unit 2 because the
ductwork arrangement is different and there is more total ductwork, support steel, and foundations for
Unit 1.

Entergy Services, Inc. White Bluff & Lake Catherine Project No. 13027-001 NOx Control Technology Cost and Performance Study
SL-011439 Final Report Rev. 4 5/16/2013 Page No. 9
Table 2.1: Expected NOx Emissions and Capital Costs, White Bluff Units 1 & 2
Controlled NOx
(lb/MMBTU) Technology
Unit 1 Unit 2
Unit 1 Total Installed Capital
Cost (2012$)
Unit 2 Total Installed Capital
Cost (2012$)
Baseline 0.33 0.39 NA NA
LNB + OFA 0.15 0.15 7,804,0001 11,831,000
Neural Network 0.30 0.35 250,0002 250,0002
SNCR 0.24 0.29 9,372,000 9,372,000
SNCR (+ LNB/OFA) 0.13 0.13 16,290,0001 20,317,000
SCR (+ LNB/OFA) 0.055 0.055 202,601,000 178,240,000
1. LNB/OFA material already purchased for Unit 1. The total cost to Entergy would be the same for Unit 1 as shown for Unit 2.
2. The cost for modifying the existing neural networks on Units 1 & 2.
2.5. OPERATING AND MAINTENANCE COSTS
Annual Operating and Maintenance costs for each of the feasible technologies for White Bluff Units 1 &
2 are shown in Table 2.2. Costs were calculated assuming full load operation, and a capacity factor (C.F.)
of 76%.

Entergy Services, Inc. White Bluff & Lake Catherine Project No. 13027-001 NOx Control Technology Cost and Performance Study
SL-011439 Final Report Rev. 4 5/16/2013 Page No. 10
Table 2.2: Operating and Maintenance Costs, White Bluff – Units 1 & 2 (Based on a C.F. of 76%)
Unit 1 Unit 2
Technology
Variable O&M1
Costs (2012$)
Fixed O&M Costs
(2012$)
Total O&M Costs
(2012$)
Variable O&M1 Costs
(2012$)
Fixed O&M Costs
(2012$)
Total O&M Costs
(2012$)
LNB + OFA -- 142,000 142,000 -- 142,000 142,000
Neural Network -- 50,000 50,000 -- 50,000 50,000
SNCR 5,658,000 169,000 5,827,000 6,671,000 169,000 6,840,000
SNCR (+ LNB/OFA) 4,538,000 311,000 4,849,000 4,542,000 311,000 4,853,000
SCR (+ LNB/OFA) 2,836,000 608,000 3,444,000 2,858,000 608,000 3,466,000
Note 1: Variable O&M includes fuel cost impacts.
Note 2: The current costs of ammonia and urea are highly volatile and may exceed the values used in this report.
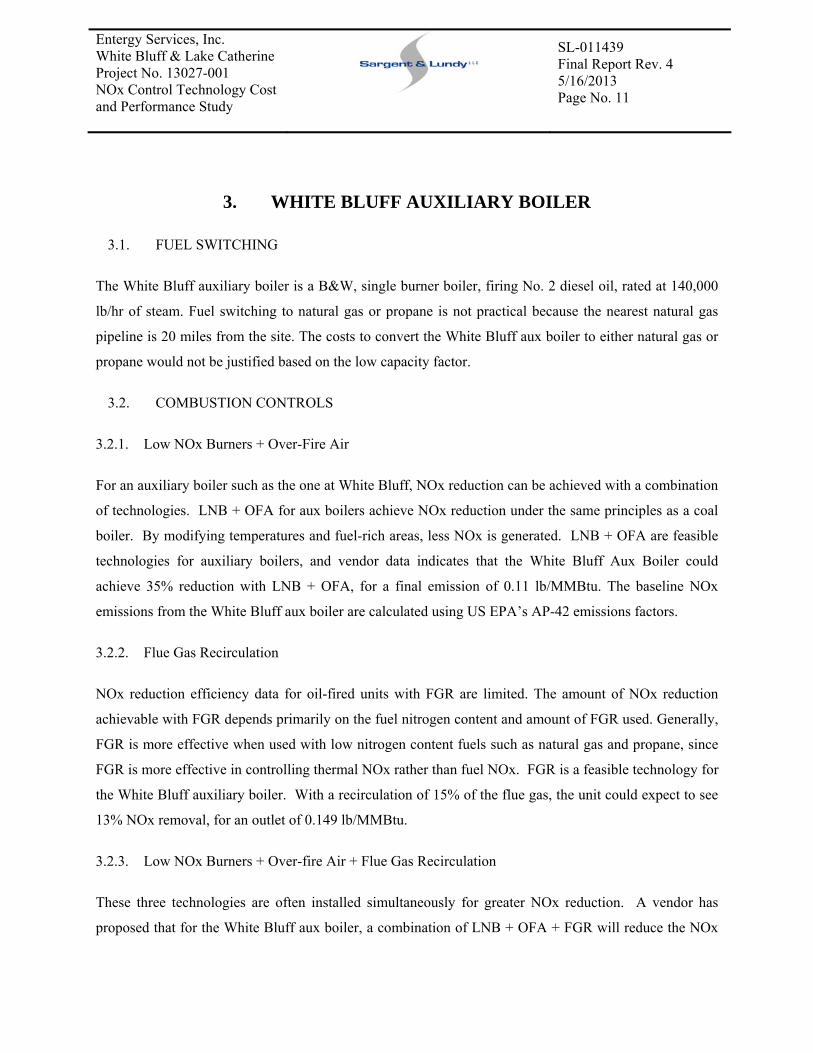
Entergy Services, Inc. White Bluff & Lake Catherine Project No. 13027-001 NOx Control Technology Cost and Performance Study
SL-011439 Final Report Rev. 4 5/16/2013 Page No. 11
3. WHITE BLUFF AUXILIARY BOILER
3.1. FUEL SWITCHING
The White Bluff auxiliary boiler is a B&W, single burner boiler, firing No. 2 diesel oil, rated at 140,000
lb/hr of steam. Fuel switching to natural gas or propane is not practical because the nearest natural gas
pipeline is 20 miles from the site. The costs to convert the White Bluff aux boiler to either natural gas or
propane would not be justified based on the low capacity factor.
3.2. COMBUSTION CONTROLS
3.2.1. Low NOx Burners + Over-Fire Air
For an auxiliary boiler such as the one at White Bluff, NOx reduction can be achieved with a combination
of technologies. LNB + OFA for aux boilers achieve NOx reduction under the same principles as a coal
boiler. By modifying temperatures and fuel-rich areas, less NOx is generated. LNB + OFA are feasible
technologies for auxiliary boilers, and vendor data indicates that the White Bluff Aux Boiler could
achieve 35% reduction with LNB + OFA, for a final emission of 0.11 lb/MMBtu. The baseline NOx
emissions from the White Bluff aux boiler are calculated using US EPA’s AP-42 emissions factors.
3.2.2. Flue Gas Recirculation
NOx reduction efficiency data for oil-fired units with FGR are limited. The amount of NOx reduction
achievable with FGR depends primarily on the fuel nitrogen content and amount of FGR used. Generally,
FGR is more effective when used with low nitrogen content fuels such as natural gas and propane, since
FGR is more effective in controlling thermal NOx rather than fuel NOx. FGR is a feasible technology for
the White Bluff auxiliary boiler. With a recirculation of 15% of the flue gas, the unit could expect to see
13% NOx removal, for an outlet of 0.149 lb/MMBtu.
3.2.3. Low NOx Burners + Over-fire Air + Flue Gas Recirculation
These three technologies are often installed simultaneously for greater NOx reduction. A vendor has
proposed that for the White Bluff aux boiler, a combination of LNB + OFA + FGR will reduce the NOx

Entergy Services, Inc. White Bluff & Lake Catherine Project No. 13027-001 NOx Control Technology Cost and Performance Study
SL-011439 Final Report Rev. 4 5/16/2013 Page No. 12
from 0.171 lb/MMBtu to 0.100 lb/MMBtu when burning No. 2 Fuel Oil. This reduction of 42% will
come from a new LNB and OFA system and the recirculation of 15% of the flue gas flow.
3.2.4. Neural Network
The White Bluff Auxiliary Boiler is not a candidate for a neural network (NN) because there are few
controllable variables to be optimized. The aux boiler also uses a relatively new PLC control system.
3.3. POST COMBUSTION CONTROLS
3.3.1. Selective Non-Catalytic Reduction
SNCR control has proven to be difficult to apply to industrial boilers because of the temperature and
mixing requirements, especially industrial boilers that modulate or cycle frequently. In order to
effectively reduce NOx emissions, the reactant (ammonia or urea) must be injected into the flue gas
within a specific flue gas temperature window, and must remain within that temperature window for a
sufficient residence time. In industrial boilers that cycle frequently, the location of the specific exhaust
gas temperature window is constantly changing. Thus, SNCR has not been effective on industrial boilers
that have high turndown capabilities and modulate or cycle frequently. Based on the temperature and
residence time requirements associated with effective NOx reduction, the planned use of the auxiliary
boiler, and the limited availability of SNCR control systems for industrial boilers, it has been determined
that SNCR is not technically feasible for the White Bluff auxiliary boiler.
3.3.2. Selective Catalytic Reduction
SCR for NOx control on auxiliary boilers is not common, because of their cycling operation, and the use
of fuel oil. SCRs have critical operating temperature ranges, which are difficult to achieve and maintain
in short periods of time. Because of the sulfur content of diesel oil, the SCR catalyst can become
poisoned, resulting in a lower NOx removal efficiency. With this lower efficiency and high cost, an SCR
is not considered a feasible technology.

Entergy Services, Inc. White Bluff & Lake Catherine Project No. 13027-001 NOx Control Technology Cost and Performance Study
SL-011439 Final Report Rev. 4 5/16/2013 Page No. 13
3.4. CAPITAL COST ESTIMATES
Capital costs for the technically feasible control options for the White Bluff Auxiliary Boiler are listed in
Table 3.1.
Table 3.1: Expected NOx Emissions and Capital Costs, White Bluff Units 1 & 2
Technology Controlled NOx Total Installed Capital Cost (2012$)
Baseline 0.171 --
LNB 0.111 255,000
OFA 0.137 231,000
FGR 0.149 366,000
LNB + OFA + FGR 0.100 852,000
3.5. OPERATING AND MAINTENANCE COST ESTIMATES
Annual Operating and Maintenance costs for each of the feasible technologies for White Bluff Units 1 &
2 are shown in Table 3.2. Costs were calculated assuming full load operation and a capacity factor (C.F.)
of 10%.

Entergy Services, Inc. White Bluff & Lake Catherine Project No. 13027-001 NOx Control Technology Cost and Performance Study
SL-011439 Final Report Rev. 4 5/16/2013 Page No. 14
Table 3.2: White Bluff Auxiliary Boiler Operating and Maintenance Costs (Based on a C.F. of 10%)
Technology Variable O&M Costs (2012$)
Fixed O&M Costs (2012$)
Total O&M Costs (2012$)
LNB 4,000 4,000 8,000
OFA 5,000 4,000 9,000
FGR 0 7,000 7,000
LNB + OFA + FGR 9,000 15,000 24,000

Entergy Services, Inc. White Bluff & Lake Catherine Project No. 13027-001 NOx Control Technology Cost and Performance Study
SL-011439 Final Report Rev. 4 5/16/2013 Page No. 15
4. LAKE CATHERINE - UNIT 4
4.1. FUEL SWITCHING
Lake Catherine - Unit 4 already combusts natural gas, which has the lowest NOx formation of potential
fuels. Because fuel switching would not result in a lower NOx emission rate, it is not a feasible option for
NOx control.
4.2. COMBUSTION CONTROLS
4.2.1. Burners-Out-Of-Service
Burners-Out-Of-Service (BOOS) allows operators to stop fuel flow to certain burners in the boiler
(typically the top level of burners), while air flow is maintained. By removing fuel from the top row of
burners, the combustion air becomes over-fire air and the production of thermal NOx is reduced. While
the reduction of NOx can be significant, the tradeoff is a reduced generating capacity, if no further
modifications to the firing system are made. BOOS is a feasible technology for Lake Catherine - Unit 4.
Testing of BOOS at Lake Catherine by Entropy Technology & Environmental Consultants, Inc. (ETEC)
with the top levels of burners out resulted in a maximum load of 405 MW, a 28% reduction in capacity,
and NOx levels of 0.12 lb/MMBtu, a reduction of 55% from the baseline while using the existing burners.
Recovery of the lost unit capacity is possible by increasing the fuel fired in the three levels of burners that
remain in service. The burners remaining in service would have to increase fuel throughput by 25%. The
natural gas piping to each burner may also have to be increased in size for the higher fuel flow rates.
ETEC, Inc. has experience with several units similar in design to Lake Catherine – Unit 4 that have been
able to achieve full capacity by increasing the original “high” burner header pressure (BHP) to increase
fuel flow to the burners (See Appendix D). The increase in BHP from 42 to 50 psig at Lake Catherine –
Unit 4 would increase fuel flow by 25% and the burners would be operated “fuel rich”, lowering NOx
formation. Using this approach would reduce NOx emissions at a small capital cost. The costs for BOOS
with recovery of full unit capacity were based on vendor cost information for a previous project adjusted
on a $/kW basis to Lake Catherine – Unit 4 and escalated to 2012. The cost provided does not include
any modifications to the boiler. A boiler OEM or consultant would need to evaluate the existing fuel
piping, superheat and reheat attemperation sprays, tube metal temperatures and burner tilt positions for

Entergy Services, Inc. White Bluff & Lake Catherine Project No. 13027-001 NOx Control Technology Cost and Performance Study
SL-011439 Final Report Rev. 4 5/16/2013 Page No. 16
the new operating conditions. The expected NOx reduction would range from 40% at low load to 50% at
full load and NOx levels of 0.24 lb/MMBtu.
4.2.2. Low NOx Burners + Over-Fire Air
Low NOx Burners and Over-Fire Air for a gas-fired unit function similarly to coal-fired boilers, as
discussed for White Bluff - Units 1 & 2. By controlling the temperature and stoichiometric profiles, the
NOx produced as a result of thermal processes is reduced.
LNB + OFA are commonly installed on gas-fired units of this size, and are a feasible retrofit technology
for Lake Catherine - Unit 4. With the installation of LNB + OFA, Lake Catherine could expect a 60%
reduction in NOx, from 0.4825 lb/MMBtu to 0.19 lb/MMBtu.
4.2.3. Flue Gas Recirculation
Flue Gas Recirculation (FGR) reduces NOx by recirculating flue gas to the furnace. This recirculated gas
has lower oxygen content than ambient air usually used for combustion. Lower oxygen and lower flame
temperatures reduces thermal NOx formation. FGR can be installed on a unit in two ways. Traditional
FGR installations require a new recirculation fan. Induced FGR, or IFGR, installs ductwork from the air
preheater outlet to the suction of the existing forced draft fan. IFGR does not require a separate fan, but
due to FD fan capacity restrictions, IFGR is not available at higher loads, because the forced draft fans
were not designed for the higher air and gas flow rate.
FGR is technically feasible on Lake Catherine - Unit 4 and can result in reductions of 60%. For Unit 4,
this would be equivalent to NOx emissions of 0.19 lb/MMBtu.
4.2.4. Water Injection
Water injection operates on similar principles to LNB + OFA and FGR. By injecting water into the
furnace, the temperature of the flue gas is reduced, thereby reducing the amount of thermal NOx formed.
Water injection is a feasible technology for Lake Catherine - Unit 4, and can reduce NOx emissions by
9% at full load. Water injection is typically used as a trimming technology at high load. On Unit 4, the
emissions would be lowered from the baseline of 0.4825 lb/MMBtu to 0.44 lb/MMBtu.

Entergy Services, Inc. White Bluff & Lake Catherine Project No. 13027-001 NOx Control Technology Cost and Performance Study
SL-011439 Final Report Rev. 4 5/16/2013 Page No. 17
4.2.5. Neural Network
Lake Catherine – Unit 4 could also install a neural network (NN) but for the low capacity factor and
current lack of NOx CEMS, a NN would not be practical. Several of the other technologies would provide
greater NOx reductions.
4.3. POST COMBUSTION CONTROLS
4.3.1. Selective Non-Catalytic Reduction
Selective Non-Catalytic Reduction for gas-fired units operates under the same principles as SNCR for
coal-fired units, with a few design changes. One of the keys of SNCR design is adequate chemical
distribution at the right temperature for the reaction. Lake Catherine - Unit 4 has horizontal superheat
platens, which requires multiple-nozzle lances to distribute the urea; the gas pattern does not provide
adequate distribution. The reaction and temperature requirements are the same for gas-fired boilers as
they are for coal-fired units.
SNCR has been installed on boilers such as Lake Catherine 4 and is considered a feasible technology,
although the residence time in the desired temperature zone is lower for a gas-fired unit and the
temperature window moves as unit load changes. The unit could expect to see reductions in NOx from
the baseline of 0.4825 lb/MMBtu to 0.29 lb/MMBtu, or approximately 40% reduction at full load. In
addition to the SNCR equipment, the process requires additional demineralized water at a rate of 85 gpm.
An additional water treatment system capable of providing the required flows is included in the capital
cost.
SNCR can be combined with LNB/OFA to achieve a combined NOx removal efficiency of 70% for an
outlet emission of approximately 0.14 lb/MMBtu,
4.3.2. Selective Catalytic Reduction
Selective Catalytic Reduction units are similar for gas and coal-fired units. Ammonia or urea reagent
reacts with NOx to form nitrogen and water, in the presence of a catalyst. Because gas boilers do not
have particulate control or sulfur dioxide control, they typically have a shorter distance from the
economizer outlet to the stack, which may result in long ductwork runs to and from the SCR.

Entergy Services, Inc. White Bluff & Lake Catherine Project No. 13027-001 NOx Control Technology Cost and Performance Study
SL-011439 Final Report Rev. 4 5/16/2013 Page No. 18
SCR is a feasible technology for Lake Catherine - Unit 4. Combined with a LNB + OFA installation,
which is typical of SCR installations, the unit could achieve a combined NOx removal efficiency of 94%,
for a permitted outlet NOx of 0.03 lb/MMBtu at full load. This includes a margin for compliance as
discussed in Section 1.4. Without the LNB + OFA installed, the SCR can also be designed to achieve
90% removal efficiency for an outlet emission of approximately 0.05 lb/MMBtu.
4.4. CAPITAL COST ESTIMATES
Capital costs for the technically feasible control options for Lake Catherine - Unit 4 are listed in Table
4.1.
Table 4.1: Expected NOx Emissions and Capital Costs, Lake Catherine Unit 4
Technology Controlled NOx
(lb/MMBtu)
Total Installed Capital Cost (2012$)
Baseline 0.4825(1) --
BOOS (at full capacity) 0.24 893,000
LNB / OFA 0.19 8,762,000
IFGR (below 500 MW) 0.39 2,166,000
FGR 0.19 11,489,000
Water Injection 0.44 2,177,000
SNCR 0.29 15,507,000
SNCR (+ LNB/OFA) 0.14 24,269,000
SCR 0.05 59,587,000
SCR (+ LNB/OFA) 0.03 68,349,000
Note 1: The baseline NOx rate is the maximum daily emission rate from the 2001-2003
baseline period.

Entergy Services, Inc. White Bluff & Lake Catherine Project No. 13027-001 NOx Control Technology Cost and Performance Study
SL-011439 Final Report Rev. 4 5/16/2013 Page No. 19
4.5. OPERATING AND MAINTENANCE COST ESTIMATES
Annual Operating and Maintenance costs for each of the feasible technologies for Lake Catherine - Unit 4
are shown in Table 4.2. Costs were calculated assuming full load operation, and a capacity factor (C.F. of
10%).
Table 4.2: Annual Operating and Maintenance Costs, Lake Catherine Unit 4 (Based on C.F. of 10%)
Technology
Variable O&M1,2
Costs (2012$)
Fixed O&M Costs
(2012$)
Total O&M Costs
(2012$)
BOOS -- 21,000 21,000
LNB + OFA -- 210,000 210,000
IFGR -- 52,000 52,000
FGR 142,000 207,000 349,000
Water Injection 486,000 52,000 538,000
SNCR 1,640,000 279,000 1,919,000
SNCR (+ LNB/OFA) 462,000 489,000 951,000
SCR 254,000 358,000 612,000
SCR (+ LNB/OFA) 268,000 568,000 836,000
Note 1: Variable O&M includes fuel cost impacts.
Note 2: The current costs of ammonia and urea are highly volatile and may exceed the values used in this report.

Entergy Services, Inc. White Bluff & Lake Catherine Project No. 13027-001 NOx Control Technology Cost and Performance Study
SL-011439 Final Report Rev. 4 5/16/2013 Page No. 2
APPENDIX A: CAPITAL COST ESTIMATE
1. BASIS OF ESTIMATES
2. CONCEPTUAL COST ESTIMATE SUMMARY SHEETS
Client: Entergy Preparer: A Hays Station: White Bluff/Lake Catherine Date: 09/04/2012 (Rev 0) Project No.: 13027‐001
Basis of Estimate Estimates: 31813A – Lake Catherine, Unit 4 - Low NOx Burners and Over Fired Air 31814A – Lake Catherine, Unit 4 - SCR 31815A – Lake Catherine, Unit 4 - SNCR 31816A – White Bluff, Unit 1 - Low NOx Burners and Over Fired Air 31817A – White Bluff, Unit 1 – SCR 31818A – White Bluff, Unit 2 – SCR 31819A – White Bluff, Units 1 and 2 – SNCR 31820A – White Bluff, Auxiliary Boiler – Low NOx Burners, Over Fired Air, and Flue Gas Recirculation 31832A – White Bluff, Unit 2 - Low NOx Burners and Over Fired Air
General Information Project Type – Compliance study for Lake Catherine Unit 4 and White Bluff Station Units 1&2. Type of estimates – Conceptual Cost Estimate for the SCR Case and Order of Magnitude Cost Estimates for all other cases. Project location – White Bluff: Close to Pine Bluff, Arkansas; Lake Catherine: Close to Mahern, AR MW rating: White Bluff Unit 1: 815 MW, Unit 2: 844 MW; Lake Catherine Unit 4: 558 MW Unique site issues – Existing Site. Contracting strategy – Multiple Lump Sum. The major components of the capital cost consist of equipment, field materials and supplies, direct labor, indirect field labor, and indirect construction costs. The capital cost was determined through the process of estimating the cost of equipment, components and bulk quantity. The cost estimates are based largely on Sargent & Lundy LLC experience on similar projects. Detailed engineering has not been performed to firm up the project details, and specific site characteristics have not been fully analyzed. We have attempted to assign allowances where necessary to cover issues that are likely to arise but are not clearly quantified at this time.
Estimate Development The cost estimates for the Low NOx Burners/Over Fired Air cases were based on a previous estimate prepared in 2011. Equipment costs were escalated to current pricing level. Also, material and labor have been updated to 2012 pricing. Cost estimates for the SNCR technology (two cases) were based on budgetary quotes received from engineering and on previous estimates. The cost estimates for the White Bluff SCR was mainly based on similar size and scope cost estimates from other projects and structural takeoffs from engineering. All equipment common to both Units was divided evenly between the two estimates. The cost estimate for Lake Catherine SCR was adjusted from another cost estimate for a gas fired power station. White Bluff’s auxiliary boiler cost estimate for Low NOx Burners/Over Fired Air/Flue Gas Recirculation was also adjusted from a similar project.
Pricing and Quantities The data used to develop these estimates is based on using material and equipment types and sizes typically used in a power plant. Equipment and material costs were estimated on the basis of S&L in house data, vendor catalogs, industry publications and other related projects. In most cases, the costs for bulk materials and equipment were derived from recent vendor or manufacturer’s quote for similar items on other projects. Where actual or specific information regarding equipment specifications was available, that information was used to size and quantify material and equipment requirements. Where information was not furnished or was not adequate, requirements were assumed and estimated based on information available from project estimates of similar type and size.
Page 1 of 3

Client: Entergy Preparer: A Hays Station: White Bluff/Lake Catherine Date: 09/04/2012 (Rev 0) Project No.: 13027‐001
Quantities contained herein are intended to be reasonable and representative of projects of this type. All quantity data was developed internally by S&L. Quantities were developed based on project experience of a plant of comparable size and then adjusted based on actual size and capacity differences and also taking into consideration the specific site layout based on the general arrangement drawing. While project specifics will certainly have an impact on these quantities, we feel they are appropriate for a study at this level.
Labor Wage Rates Labor Profile – Union Labor wage rate selected for the estimate - 2012 Union rates for Pine Bluff, Arkansas. Base craft rates are as published in RS Means Labor Rates for the Construction Industry, 2012 Edition. The craft rates are then incorporated into work crews appropriate for the activities by adding allowances for small tools, construction equipment, insurance, and site overheads to arrive at crew rates detailed in the cost estimate. A 1.15 regional labor productivity multiplier is included based on the Compass International Global Construction Yearbook. Labor Work Schedule and Incentives - Assumed 5x10 work week for regular work and 7x10 work week for outage work. 10% of the work is assumed to be outage related.
Project Direct & Construction Indirect Costs The estimate is constructed in such a manner where most of the direct construction costs are determined directly and several direct construction cost accounts are determined indirectly by taking a percentage of the directly determined costs and are identified as “Variable Accounts”. These percentages are based on our experience with similar type and size projects. Sales tax is specific to location. Listed below are the variable accounts.
Cost of overtime – 5-10’s Hour Days and Outage Work at a 7-10 Schedule Subsistence (per diem) – not included Consumables – 0.5% of material and labor Freight on Equipment - included with equipment cost Freight on Material @ 5% of material Spare Parts – included with equipment costs Contractors G&A Expense @ 10% Contractors Profit @ 5%
Project Indirect Costs Included are the following:
Engineering, Procurement & Project Services varied depending on the size of the project estimated. o 31813A @ 19% of construction cost o 31814A @ 8% of construction cost o 31815A @ 8% of construction cost o 31816A @ 16% of construction cost o 31817A @ 6% of construction cost o 31818A @ 6% of construction cost o 31819A @ 8% of construction cost o 31820A @ 12% of construction cost o 31832A @ 16% of construction cost
Construction Management varied depending on the size of the project estimated. o 31813A @ 6% of construction cost o 31814A @ 3% of construction cost o 31815A @ 2% of construction cost o 31816A @ 6% of construction cost o 31817A @ 2% of construction cost
Page 2 of 3

Client: Entergy Preparer: A Hays Station: White Bluff/Lake Catherine Date: 09/04/2012 (Rev 0) Project No.: 13027‐001
Page 3 of 3
o 31818A @ 2% of construction cost o 31819A @ 2% of construction cost o 31820A @ 0% of construction cost o 31832A @ 6% of construction cost
Craft start-up and commission support @ 1% of construction cost General Owner’s Costs, including Owners Engineering & Bond Fees – not included EPC Fee – not included
These percentages are based on our experience with similar type and size projects.
Escalation Not included.
Contingency The contingency rates vary for each project based on the project’s size. The rates are based on past history of similar projects. This rate relates to pricing and quantity variation in the specific scope estimated. The contingency does not cover new scope outside of what has been estimated, only the variation in the defined scope. This is a composite rate and already takes into account the plus and minuses of expected actual costs. The rate does not represent the high range of all costs, nor is it expected that the project will experience all actual costs be realized at the maximum value of their range of variation.
Exclusions There are items that have been specifically excluded from the estimate. In order to establish the overall project costs, the following items must also be accounted for. This list is for information only and is not intended to be all inclusive.
Permitting costs Rock excavation Remediation of soil for hazardous materials Power outage cost during construction
Assumptions
No rock excavation, no dewatering Assumed that asbestos removal or lead paint abatement will not be required. No obstruction for the ammonia pipe routing. 6” clearing & grubbing of existing terrain is included, no
tree removal. Directional boring underneath the existing railroad tracks is included, but with no major interferences or
obstructions. Electrical equipment and wiring installation is based on non-hazardous location. Adjustments for plant unit size were made based on good engineering practice. Actual design and
quantities may be significantly different than the quantities shown in the estimates.

ESTIMATE NO.: 31813A2 ENTERGY - LAKE CATHERINE
PROJECT NO.: 13027-001 LOW NOX BURNERS AND OVERFIRE AIR SYSTEMS - UNIT 4
ISSUE DATE: CONCEPTUAL ESTIMATEPREP./REV.: ADH/
APPROVED:
Estimate Totals
Description Amount TotalsLabor 331,677
Material 125,263
Subcontract 2,850,000
Equipment
Other 2,000,000
5,306,940 5,306,940 USD
91-1 Scaffolding 46,000
91-2 OT Working 5-10 Hour Days 41,000
91-3 OT Working 7-10 Hr Days
91-4 Per Diem
91-5 Consumables 2,000
91-6 Freight on Equipment
91-7 Freight on Special Equip.
91-8 Freight on Material 6,000
91-9 Freight on Process Equip. 100,000
91-10 Sales Tax
91-11 Contractor's G&A Expense 65,000
91-12 Contractor's Profit 32,000
292,000 5,598,940 USD
93-1 EP&P Services 1,064,000
93-2 CM Support 168,000
93-3 Start-Up/Commissioning 56,000
93-4 Start-Up/Spare Parts
93-5 Excess Liability Insur.
93-6 Sales Tax On Indirects
93-7 Owners Cost
93-8 EPC Fee
1,288,000 6,886,940 USD
94-1 Contingency on Equipment
94-2 Contingency on Engr Equip
94-3 Contingency on Material 50,000
94-4 Contingency on Labor 145,000
94-5 Contingency on Sub. 713,000
94-6 Contingency on Equipment 525,000
94-7 Contingency on Indirect 386,000
1,819,000 8,705,940 USD
96-1 Escalation on Equipment
96-2 Escalation on Engr Equip
96-3 Escalation on Material
96-4 Escalation on Labor
96-5 Escalation on Sub.
96-6 Escalation on Process Equ
96-7 Escalation on Indirect
8,705,940 USD
98 - Interest During Constr
8,705,940 USD
Total 8,705,940 USD
PRINT DATE 8/23/2012 4:24 PM Page 3
\\sltimberline\estimating\PROJECTS\ENTERGY\Lake Catherine - Confidential

ESTIMATE NO.: 31814A ENTERGY - LAKE CATHERINEPROJECT NO.: 13027-001 SCR SYSTEM - UNIT 4ISSUE DATE: 8/31/2012 CONCEPTUAL ESTIMATEPREP./REV.: ADH/APPROVED: MNO
Estimate Totals
Description Amount TotalsLabor 19,780,000
Material 15,815,652
Subcontract 2,590,000
Equipment
Other 8,290,000
46,475,652 46,475,652 USD
91-1 Scaffolding91-2 OT Working 5-10 Hour Days91-3 OT Working 7-10 Hr Days91-4 Per Diem91-5 Consumables91-6 Freight on Equipment91-7 Freight on Special Equip.91-8 Freight on Material91-9 Freight on Process Equip.91-10 Sales Tax91-11 Contractor's G&A Expense91-12 Contractor's Profit
46,475,652 USD
93-1 EP&P Services 3,718,10093-2 CM Support 1,394,30093-3 Start-Up/Commissioning 464,80093-4 Start-Up/Spare Parts93-5 Excess Liability Insur.93-6 Sales Tax On Indirects93-7 Owners Cost93-8 EPC Fee
5,577,200 52,052,852 USD
94-1 Contingency on Equipment94-2 Contingency on Engr Equip94-3 Contingency on Material 2,372,40094-4 Contingency on Labor 2,967,00094-5 Contingency on Sub. 388,50094-6 Contingency on Equipment 1,243,50094-7 Contingency on Indirect 836,600
7,808,000 59,860,852 USD
96-1 Escalation on Equipment96-2 Escalation on Engr Equip96-3 Escalation on Material96-4 Escalation on Labor96-5 Escalation on Sub.96-6 Escalation on Process Equ96-7 Escalation on Indirect
59,860,852 USD
98 - Interest During Constr59,860,852 USD
Total 59,860,852 USD
PRINT DATE 9/19/2012 10:49 AM Page 3\\sltimberline\estimating\PROJECTS\ENTERGY\Lake Catherine - Confidential

ESTIMATE NO.: 31815A ENTERGY - LAKE CATHERINE
PROJECT NO.: 13027-001 SNCR SYSTEM - UNIT 4
ISSUE DATE: 9/7/2012 CONCEPTUAL ESTIMATEPREP./REV.: ADH/
APPROVED: MNO
Estimate Totals
Description Amount TotalsLabor 2,629,958
Material 1,083,165
Subcontract 80,600
Equipment
Other 6,193,056
9,986,779 9,986,779 USD
91-1 Scaffolding 445,600
91-2 OT Working 5-10 Hour Days 311,700
91-3 OT Working 7-10 Hr Days 99,200
91-4 Per Diem
91-5 Consumables 18,600
91-6 Freight on Equipment
91-7 Freight on Special Equip.
91-8 Freight on Material 54,200
91-9 Freight on Process Equip.
91-10 Sales Tax
91-11 Contractor's G&A Expense 458,800
91-12 Contractor's Profit 229,500
1,617,600 11,604,379 USD
93-1 EP&P Services 928,400
93-2 CM Support 232,100
93-3 Start-Up/Commissioning 116,000
93-4 Start-Up/Spare Parts
93-5 Excess Liability Insur.
93-6 Sales Tax On Indirects
93-7 Owners Cost
93-8 EPC Fee
1,276,500 12,880,879 USD
94-1 Contingency on Equipment
94-2 Contingency on Engr Equip
94-3 Contingency on Material 390,000
94-4 Contingency on Labor 1,209,300
94-5 Contingency on Sub. 24,200
94-6 Contingency on Equipment 619,300
94-7 Contingency on Indirect 383,000
2,625,800 15,506,679 USD
96-1 Escalation on Equipment
96-2 Escalation on Engr Equip
96-3 Escalation on Material
96-4 Escalation on Labor
96-5 Escalation on Sub.
96-6 Escalation on Process Equ
96-7 Escalation on Indirect
15,506,679 USD
98 - Interest During Constr
15,506,679 USD
Total 15,506,679 USD
PRINT DATE 9/7/2012 3:39 PM Page 4
\\sltimberline\estimating\PROJECTS\ENTERGY\Lake Catherine - Confidential

ESTIMATE NO.: 31816A ENTERGY - WHITE BLUFF
PROJECT NO.: 13027-001 LOW NOX BURNERS AND OVERFIRE AIR SYSTEMS - UNIT 1
ISSUE DATE: 8/31/2012 CONCEPTUAL ESTIMATEPREP./REV.: ADH/
APPROVED: MNO
Estimate Totals
Description Amount TotalsLabor 653,648
Material 306,347
Subcontract 3,700,000
Equipment
Other
4,659,995 4,659,995 USD
91-1 Scaffolding 48,000
91-2 OT Working 5-10 Hour Days 77,000
91-3 OT Working 7-10 Hr Days 24,000
91-4 Per Diem
91-5 Consumables 5,000
91-6 Freight on Equipment
91-7 Freight on Special Equip.
91-8 Freight on Material 15,000
91-9 Freight on Process Equip.
91-10 Sales Tax
91-11 Contractor's G&A Expense 112,000
91-12 Contractor's Profit 55,000
336,000 4,995,995 USD
93-1 EP&P Services 799,000
93-2 CM Support 300,000
93-3 Start-Up/Commissioning 50,000
93-4 Start-Up/Spare Parts
93-5 Excess Liability Insur.
93-6 Sales Tax On Indirects
93-7 Owners Cost
93-8 EPC Fee
1,149,000 6,144,995 USD
94-1 Contingency on Equipment
94-2 Contingency on Engr Equip
94-3 Contingency on Material 110,000
94-4 Contingency on Labor 279,000
94-5 Contingency on Sub. 925,000
94-6 Contingency on Equipment
94-7 Contingency on Indirect 345,000
1,659,000 7,803,995 USD
96-1 Escalation on Equipment
96-2 Escalation on Engr Equip
96-3 Escalation on Material
96-4 Escalation on Labor
96-5 Escalation on Sub.
96-6 Escalation on Process Equ
96-7 Escalation on Indirect
7,803,995 USD
98 - Interest During Constr
7,803,995 USD
Total 7,803,995 USD
PRINT DATE 8/31/2012 10:32 AM Page 3
\\sltimberline\estimating\PROJECTS\ENTERGY\White Bluff - Confidential

ESTIMATE NO.: 31819A ENTERGY - WHITE BLUFF
PROJECT NO.: 13027-001 SNCR SYSTEM - UNIT 1
ISSUE DATE: 9/7/2012 CONCEPTUAL ESTIMATEPREP./REV.: ADH/
APPROVED: MNO
Estimate Totals
Description Amount TotalsLabor 2,255,791
Material 1,089,242
Subcontract 68,100
Equipment
Other 1,948,100
5,361,233 5,361,233 USD
91-1 Scaffolding 368,000
91-2 OT Working 5-10 Hour Days 267,300
91-3 OT Working 7-10 Hr Days 85,100
91-4 Per Diem
91-5 Consumables 16,700
91-6 Freight on Equipment
91-7 Freight on Special Equip.
91-8 Freight on Material 54,500
91-9 Freight on Process Equip.
91-10 Sales Tax
91-11 Contractor's G&A Expense 408,200
91-12 Contractor's Profit 204,100
1,403,900 6,765,133 USD
93-1 EP&P Services 541,200
93-2 CM Support 135,300
93-3 Start-Up/Commissioning 67,700
93-4 Start-Up/Spare Parts
93-5 Excess Liability Insur.
93-6 Sales Tax On Indirects
93-7 Owners Cost
93-8 EPC Fee
744,200 7,509,333 USD
94-1 Contingency on Equipment
94-2 Contingency on Engr Equip
94-3 Contingency on Material 392,100
94-4 Contingency on Labor 1,032,500
94-5 Contingency on Sub. 20,400
94-6 Contingency on Equipment 194,800
94-7 Contingency on Indirect 223,300
1,863,100 9,372,433 USD
96-1 Escalation on Equipment
96-2 Escalation on Engr Equip
96-3 Escalation on Material
96-4 Escalation on Labor
96-5 Escalation on Sub.
96-6 Escalation on Process Equ
96-7 Escalation on Indirect
9,372,433 USD
98 - Interest During Constr
9,372,433 USD
Total 9,372,433 USD
PRINT DATE 9/7/2012 3:11 PM Page 4
\\sltimberline\estimating\PROJECTS\ENTERGY\White Bluff - Confidential

ESTIMATE NO.: 31817A ENTERGY - WHITE BLUFF
PROJECT NO.: 13027-001 SCR - UNIT 1
ISSUE DATE: 8/31/2012 CONCEPTUAL ESTIMATEPREP./REV.: ADH/
APPROVED: MNO
Estimate Totals
Description Amount TotalsLabor 56,778,212
Material 34,013,262
Subcontract 8,156,000
Equipment
Other 21,324,260
120,271,734 120,271,734 USD
91-1 Scaffolding 2,270,000
91-2 OT Working 5-10 Hour Days 6,730,000
91-3 OT Working 7-10 Hr Days 2,142,000
91-4 Per Diem
91-5 Consumables 454,000
91-6 Freight on Equipment
91-7 Freight on Special Equip.
91-8 Freight on Material 1,701,000
91-9 Freight on Process Equip.
91-10 Sales Tax
91-11 Contractor's G&A Expense 10,238,000
91-12 Contractor's Profit 5,120,000
28,655,000 148,926,734 USD
93-1 EP&P Services 8,936,000
93-2 CM Support 2,979,000
93-3 Start-Up/Commissioning 1,489,000
93-4 Start-Up/Spare Parts
93-5 Excess Liability Insur.
93-6 Sales Tax On Indirects
93-7 Owners Cost
93-8 EPC Fee
13,404,000 162,330,734 USD
94-1 Contingency on Equipment
94-2 Contingency on Engr Equip
94-3 Contingency on Material 8,163,000
94-4 Contingency on Labor 15,726,000
94-5 Contingency on Sub. 1,631,000
94-6 Contingency on Equipment 4,265,000
94-7 Contingency on Indirect 2,681,000
32,466,000 194,796,734 USD
96-1 Escalation on Equipment
96-2 Escalation on Engr Equip
96-3 Escalation on Material
96-4 Escalation on Labor
96-5 Escalation on Sub.
96-6 Escalation on Process Equ
96-7 Escalation on Indirect
194,796,734 USD
98 - Interest During Constr
194,796,734 USD
Total 194,796,734 USD
PRINT DATE 8/31/2012 10:50 AM Page 3
\\sltimberline\estimating\PROJECTS\ENTERGY\White Bluff - Confidential

ESTIMATE NO.: 31832A ENTERGY - WHITE BLUFF
PROJECT NO.: 13027-001 LOW NOX BURNERS AND OVERFIRE AIR SYSTEMS - UNIT 2
ISSUE DATE: 8/31/2012 CONCEPTUAL ESTIMATEPREP./REV.: ADH/
APPROVED: MNO
Estimate Totals
Description Amount TotalsLabor 653,648
Material 306,347
Subcontract 3,700,000
Equipment
Other 2,600,000
7,259,995 7,259,995 USD
91-1 Scaffolding 48,000
91-2 OT Working 5-10 Hour Days 77,000
91-3 OT Working 7-10 Hr Days 24,000
91-4 Per Diem
91-5 Consumables 5,000
91-6 Freight on Equipment
91-7 Freight on Special Equip.
91-8 Freight on Material 15,000
91-9 Freight on Process Equip.
91-10 Sales Tax
91-11 Contractor's G&A Expense 112,000
91-12 Contractor's Profit 55,000
336,000 7,595,995 USD
93-1 EP&P Services 1,215,000
93-2 CM Support 456,000
93-3 Start-Up/Commissioning 76,000
93-4 Start-Up/Spare Parts
93-5 Excess Liability Insur.
93-6 Sales Tax On Indirects
93-7 Owners Cost
93-8 EPC Fee
1,747,000 9,342,995 USD
94-1 Contingency on Equipment
94-2 Contingency on Engr Equip
94-3 Contingency on Material 110,000
94-4 Contingency on Labor 279,000
94-5 Contingency on Sub. 925,000
94-6 Contingency on Equipment 650,000
94-7 Contingency on Indirect 524,000
2,488,000 11,830,995 USD
96-1 Escalation on Equipment
96-2 Escalation on Engr Equip
96-3 Escalation on Material
96-4 Escalation on Labor
96-5 Escalation on Sub.
96-6 Escalation on Process Equ
96-7 Escalation on Indirect
11,830,995 USD
98 - Interest During Constr
11,830,995 USD
Total 11,830,995 USD
PRINT DATE 8/31/2012 10:37 AM Page 3
\\sltimberline\estimating\PROJECTS\ENTERGY\White Bluff - Confidential

ESTIMATE NO.: 31840A ENTERGY - WHITE BLUFF
PROJECT NO.: 13027-001 SNCR SYSTEM - UNIT 2
ISSUE DATE: 9/7/2012 CONCEPTUAL ESTIMATEPREP./REV.: ADH/
APPROVED: MNO
Estimate Totals
Description Amount TotalsLabor 2,255,791
Material 1,089,242
Subcontract 68,100
Equipment
Other 1,948,100
5,361,233 5,361,233 USD
91-1 Scaffolding 368,000
91-2 OT Working 5-10 Hour Days 267,300
91-3 OT Working 7-10 Hr Days 85,100
91-4 Per Diem
91-5 Consumables 16,700
91-6 Freight on Equipment
91-7 Freight on Special Equip.
91-8 Freight on Material 54,500
91-9 Freight on Process Equip.
91-10 Sales Tax
91-11 Contractor's G&A Expense 408,200
91-12 Contractor's Profit 204,100
1,403,900 6,765,133 USD
93-1 EP&P Services 541,200
93-2 CM Support 135,300
93-3 Start-Up/Commissioning 67,700
93-4 Start-Up/Spare Parts
93-5 Excess Liability Insur.
93-6 Sales Tax On Indirects
93-7 Owners Cost
93-8 EPC Fee
744,200 7,509,333 USD
94-1 Contingency on Equipment
94-2 Contingency on Engr Equip
94-3 Contingency on Material 392,100
94-4 Contingency on Labor 1,032,500
94-5 Contingency on Sub. 20,400
94-6 Contingency on Equipment 194,800
94-7 Contingency on Indirect 223,300
1,863,100 9,372,433 USD
96-1 Escalation on Equipment
96-2 Escalation on Engr Equip
96-3 Escalation on Material
96-4 Escalation on Labor
96-5 Escalation on Sub.
96-6 Escalation on Process Equ
96-7 Escalation on Indirect
9,372,433 USD
98 - Interest During Constr
9,372,433 USD
Total 9,372,433 USD
PRINT DATE 9/7/2012 3:24 PM Page 4
\\sltimberline\estimating\PROJECTS\ENTERGY\White Bluff - Confidential

ESTIMATE NO.: 31818A ENTERGY - WHITE BLUFF
PROJECT NO.: 13027-001 SCR - UNIT 2
ISSUE DATE: CONCEPTUAL ESTIMATEPREP./REV.: ADH/
APPROVED: MNO
Estimate Totals
Description Amount TotalsLabor 48,597,255
Material 26,751,692
Subcontract 6,577,640
Equipment
Other 21,324,260
103,250,847 103,250,847 USD
91-1 Scaffolding 1,884,000
91-2 OT Working 5-10 Hour Days 5,759,000
91-3 OT Working 7-10 Hr Days 1,834,000
91-4 Per Diem
91-5 Consumables 377,000
91-6 Freight on Equipment
91-7 Freight on Special Equip.
91-8 Freight on Material 1,338,000
91-9 Freight on Process Equip.
91-10 Sales Tax
91-11 Contractor's G&A Expense 8,520,000
91-12 Contractor's Profit 4,261,000
23,973,000 127,223,847 USD
93-1 EP&P Services 7,633,000
93-2 CM Support 2,544,000
93-3 Start-Up/Commissioning 1,272,000
93-4 Start-Up/Spare Parts
93-5 Excess Liability Insur.
93-6 Sales Tax On Indirects
93-7 Owners Cost
93-8 EPC Fee
11,449,000 138,672,847 USD
94-1 Contingency on Equipment
94-2 Contingency on Engr Equip
94-3 Contingency on Material 6,421,000
94-4 Contingency on Labor 13,444,000
94-5 Contingency on Sub. 1,316,000
94-6 Contingency on Equipment 4,265,000
94-7 Contingency on Indirect 2,290,000
27,736,000 166,408,847 USD
96-1 Escalation on Equipment
96-2 Escalation on Engr Equip
96-3 Escalation on Material
96-4 Escalation on Labor
96-5 Escalation on Sub.
96-6 Escalation on Process Equ
96-7 Escalation on Indirect
166,408,847 USD
98 - Interest During Constr
166,408,847 USD
Total 166,408,847 USD
PRINT DATE 8/31/2012 10:45 AM Page 3
\\sltimberline\estimating\PROJECTS\ENTERGY\White Bluff - Confidential

Entergy Services, Inc. White Bluff & Lake Catherine Project No. 13027-001 NOx Control Technology Cost and Performance Study
SL-011439 Final Report Rev. 4 5/16/2013 Page No. 3
APPENDIX B
1. ESTIMATED PROJECT SCHEDULES

....Activity ID Activity Name Org Dur(months)
Entergy - NOx Strategy Study - Aux Boiler (LNB/OFA/FGR)Entergy - NOx Strategy Study - Aux Boiler (LNB/OFA/F... 15m
PermittingPermitting 12m
A1000 Project Authorization 0m
A1010 Air Permit - Prepare/Review/Approve 12m
EngineeringEngineering 8m
A1020 Engineering 8m
Procurement of Major EquipmentProcurement of Major Equipment 6m
A1030 LNB/OFA Spec - Prep/Bid/Eval/Award 3m
A1070 GWC Spec - Prep/Bid/Eval/Award 3m
Vendor Engineering/Fab/DeliveryVendor Engineering/Fab/Delivery 5m
A1040 LNB/OFA Vendor Engineering/Fabrication/Delivery 5m
InstallationInstallation 1m
A1050 Installation 1m
Commissioning & Start-UpCommissioning & Start-Up 2m
A1060 Commissioning & Start-Up 2m
1 2 3 4 5 6 7 8 9 10 11 12 13 14 15 16 17
Month
Run Date: 09-17-12 NOx Control Technology Cost and Performance Study for
Entergy Services, Inc. White Bluff and Lake Catherine
Aux Boiler Low NOx Burner/Over-Fire Air/Flue Gas Recirculation (LNB/OFA/FGR)

....Activity ID Activity Name Org Dur(months)
Entergy - NOx Strategy Study - Neural NetworkEntergy - NOx Strategy Study - Neural Network 24m
PermittingPermitting 8m
A1000 Project Authorization 0m
A1010 Air Permit - Prepare/Review/Approve 8m
EngineeringEngineering 3m
A1020 Engineering 3m
Procurement of Major EquipmentProcurement of Major Equipment 3m
A1030 Neural Network Spec - Prep/Bid/Eval/Award 3m
Vendor Engineering/Fab/DeliveryVendor Engineering/Fab/Delivery 6m
A1040 NN Vendor Engineering/Fabrication/Delivery 6m
InstallationInstallation 1m
A1050 Installation 1m
Commissioning & Start-UpCommissioning & Start-Up 12m
A1060 Commissioning & Start-Up 12m
-1 1 2 3 4 5 6 7 8 9 10 11 12 13 14 15 16 17 18 19 20 21 22 23 24 25 26 27
Month
Run Date: 09-17-12 NOx Control Technology Cost and Performance Study for
Entergy Services, Inc. White Bluff and Lake Catherine
Neural Network

....Activity ID Activity Name Org Dur(months)
Entergy - NOx Strategy Study - Low NOx Burners/Over Fire Air (LNB/OFA)Entergy - NOx Strategy Study - Low NOx Burners/Over ... 19m
PermittingPermitting 12m
A1000 Project Authorization 0m
A1010 Air Permit - Prepare/Review/Approve 12m
EngineeringEngineering 8m
A1020 Engineering 8m
Procurement of Major EquipmentProcurement of Major Equipment 7m
A1030 LNB/OFA Spec - Prep/Bid/Eval/Award 3m
A1070 GWC Spec - Prep/Bid/Eval/Award 3m
Vendor Engineering/Fab/DeliveryVendor Engineering/Fab/Delivery 6m
A1040 LNB/OFA Vendor Engineering/Fabrication/Delivery 6m
InstallationInstallation 3m
A1050 Installation 3m
Commissioning & Start-UpCommissioning & Start-Up 4m
A1060 Commissioning & Start-Up 4m
1 2 3 4 5 6 7 8 9 10 11 12 13 14 15 16 17 18 19 20 21 22
Month
Run Date: 09-17-12 NOx Control Technology Cost and Performance Study for
Entergy Services, Inc. White Bluff and Lake Catherine
Low NOx Burners/Over-Fire Air (LNB/OFA)

....Activity ID Activity Name Org Dur(months)
Entergy - NOx Strategy Study - Induced Flue Gas Recirculation (IFGR)Entergy - NOx Strategy Study - Induced Flue Gas Recir... 17m
PermittingPermitting 2m
A1000 Project Authorization 0m
A1010 Air Permit - Prepare/Review/Approve 2m
EngineeringEngineering 9m
A1020 BOP Engineering 9m
Procurement of Major EquipmentProcurement of Major Equipment 6m
A1140 FGR Duct Procurement Spec - Prep/Bid/Eval/Award 3m
A1030 Mech Install Spec - Prep/Bid/Eval/Award 3m
A1120 Elec Install Spec - Prep/Bid/Eval/Award 3m
Vendor Engineering/Fab/DeliveryVendor Engineering/Fab/Delivery 6m
A1040 FGR Duct Vendor Engineering/Fabrication/Delivery 6m
InstallationInstallation 4m
A1050 Installation 4m
Commissioning & Start-UpCommissioning & Start-Up 2m
A1060 Commissioning & Start-Up 2m
1 2 3 4 5 6 7 8 9 10 11 12 13 14 15 16 17 18 19
Month
Run Date: 09-17-12 NOx Control Technology Cost and Performance Study for
Entergy Services, Inc. White Bluff and Lake Catherine
Induced Flue Gas Recirculation (IFGR)

....Activity ID Activity Name Org Dur(months)
Entergy - NOx Strategy Study - Flue Gas Recirculation (FGR)Entergy - NOx Strategy Study - Flue Gas Recirculation ... 22m
PermittingPermitting 8m
A1000 Project Authorization 0m
A1010 Air Permit - Prepare/Review/Approve 8m
EngineeringEngineering 10m
A1020 BOP Engineering 10m
Procurement of Major EquipmentProcurement of Major Equipment 6m
A1150 FGR Fan Procurement Spec - Prep/Bid/Eval/Award 3m
A1140 FGR Duct Procurement Spec - Prep/Bid/Eval/Award 3m
A1030 Mech Install Spec - Prep/Bid/Eval/Award 3m
A1120 Elec Install Spec - Prep/Bid/Eval/Award 3m
Vendor Engineering/Fab/DeliveryVendor Engineering/Fab/Delivery 10m
A1040 FGR Duct Vendor Engineering/Fabrication/Delivery 6m
A1160 FGR Fan Vendor Engineering/Fabrication/Delivery 10m
InstallationInstallation 5m
A1050 Installation 5m
Commissioning & Start-UpCommissioning & Start-Up 2m
A1060 Commissioning & Start-Up 2m
1 2 3 4 5 6 7 8 9 10 11 12 13 14 15 16 17 18 19 20 21 22 23 24
Month
Run Date: 09-17-12 NOx Control Technology Cost and Performance Study for
Entergy Services, Inc. White Bluff and Lake Catherine
Flue Gas Recirculation (FGR)

....Activity ID Activity Name Org Dur(months)
Entergy - NOx Strategy Study - Selective Non-Catalytic Reduction (SNCR)Entergy - NOx Strategy Study - Selective Non-Catalytic ... 16m
PermittingPermitting 12m
A1000 Project Authorization 0m
A1010 Air Permit - Prepare/Review/Approve 12m
EngineeringEngineering 8m
A1020 BOP Engineering 8m
Procurement of Major EquipmentProcurement of Major Equipment 6m
A1030 SNCR Spec - Prep/Bid/Eval/Award 3m
A1070 Civil/Structural Installation Spec - Prep/Bid/Eval/Award 3m
A1080 Mech Installation Spec - Prep/Bid/Eval/Award 3m
A1090 Elec/I&C Installation Spec - Prep/Bid/Eval/Award 3m
Vendor Engineering/Fab/DeliveryVendor Engineering/Fab/Delivery 6m
A1040 SNCR Vendor Engineering/Fabrication/Delivery 6m
InstallationInstallation 3m
A1050 Installation 3m
Commissioning & Start-UpCommissioning & Start-Up 1m
A1060 Commissioning & Start-Up 1m
1 2 3 4 5 6 7 8 9 10 11 12 13 14 15 16 17
Month
Run Date: 09-14-12 NOx Control Technology Cost and Performance Study for
Entergy Services, Inc. White Bluff and Lake Catherine
Selective Non-Catalytic Reduction (SNCR)

....Activity ID Activity Name Org Dur(months)
Entergy - NOx Strategy Study - Selective Catalytic Reduction (SCR)Entergy - NOx Strategy Study - Selective Catalytic Red... 32m
PermittingPermitting 12m
A1000 Project Authorization 0m
A1010 Air Permit - Prepare/Review/Approve 12m
EngineeringEngineering 16m
A1020 BOP Engineering 16m
Procurement of Major EquipmentProcurement of Major Equipment 12m
A1140 Ammonia Injection System Procurement Spec - Prep/Bid/Eval/Award 3m
A1150 Catalyst Procurement Spec - Prep/Bid/Eval/Award 3m
A1170 Fan Spec - Prep/Bid/Eval/Award 3m
A1190 Ductwork Spec - Prep/Bid/Eval/Award 3m
A1130 Structural Steel Spec - Prep/Bid/Eval/Award 3m
A1030 Mech Install Spec - Prep/Bid/Eval/Award 3m
A1120 Elec Install Spec - Prep/Bid/Eval/Award 3m
Vendor Engineering/Fab/DeliveryVendor Engineering/Fab/Delivery 16m
A1160 Catalyst Vendor Engineering/Fabrication/Delivery 12m
A1210 Structural Steel Vendor Engineering/Fabrication/Delivery 7m
A1200 Ductwork Vendor Engineering/Fabrication/Delivery 10m
A1040 Ammonia Injection System Vendor Engineering/Fabrication/Delivery 16m
A1180 Fan Vendor Engineering/Fabrication/Delivery 12m
InstallationInstallation 18m
A1050 Installation 18m
Commissioning & Start-UpCommissioning & Start-Up 2m
A1060 Commissioning & Start-Up 2m
1 2 3 4 5 6 7 8 9 10 11 12 13 14 15 16 17 18 19 20 21 22 23 24 25 26 27 28 29 30 31 32 33 34
Month
Run Date: 09-17-12 NOx Control Technology Cost and Performance Study for
Entergy Services, Inc. White Bluff and Lake Catherine
Selective Catalytic Reduction (SCR)

Entergy Services, Inc. White Bluff & Lake Catherine Project No. 13027-001 NOx Control Technology Cost and Performance Study
SL-011439 Final Report Rev. 4 5/16/2013 Page No. 4
APPENDIX C
1. OPERATING AND MAINTENANCE COST ESTIMATES

NOx Control Technology Cost and Performance Study NOX Compliance Costs Project #13027-0015/20/2013
Unit Name White Bluff 1
Unit DataSize (Gross kW) 815,000 Aq.Ammonia $/t $700Average NOx Emission Rate (lb/MMBtu at full load) 0.33 An.Ammonia $/t $400Nominal Max. Boiler Heat Input (mmBtu/hr) 8,950.0 Urea $/t $350Avg. Heat Rate (Btu/kwh) 10,981.6 N/F-T Urea $/t $618Aux. Power (kw) - Coal Cost, $/Mbtu 2.650
Est. Capacity Factor (%) 76.00
Boiler Type T/FWater Cost, $/1000 gal (3) 2
Boiler Eff. (%) 84 Electricity, $/MWh 41.50Estimated NOx, tons/day Max 26.936Emission Limit, tons -NOx Sales/Buy rate, $/ton -Fuel - PRB
Seasonal Days 153
Basis 0Analysis - Enter "0" for Annual and 1 for Seasonal
CF For Variable O&M 76.00
Estimated Reduction from Baseline
Emission Rate After Control
Tons of NOx Emission, Seasonal/Annual
Tons of NOx Removed, season/annual Estimated Capital Cost Fixed O&M
Variable O&M, season or yr
Fuel Impact, season or yr
Technology % (lb/mmBtu) tons tons $/kW $/unit $/yr $/@CF $/@CFLNB + OFA (Note 5) 54.5 0.15 4,469 5,363 9.6 $7,804,000 $142,000 $0 $0Neural Net 10.0 0.30 8,848 983 0.3 $250,000 $50,000 $0 $0Full SNCR 26.5 0.24 7,229 2,602 11.5 $9,372,000 $169,000 $5,377,000 $281,000LNB+OFA+Full SNCR 61.4 0.13 3,799 6,033 20.0 $16,290,000 $311,000 $4,154,000 $384,000LNB+OFA+Full SCR 83.3 0.055 1,639 8,193 248.6 $202,601,000 $608,000 $2,836,000 $0
(1) Aux. Power cost is calculated based on variation in capacity factor(2) Assumed water cost of $2/1000 gallons.(3) Assumed that 15% urea will be used for SNCR technology.(4) Assumed that initial catalyst life is 12,000 hours (5) LNB/OFA material already purchased for Unit 1. The total cost to Entergy would be the same for Unit 1 as shown for Unit 2.(6) For SCR technology, the variable O&M costs are based on operating at NOx outlet emissions marginally below the compliance emission rate.
Reagent Costs
Operating & Maintenance Cost
Entergy - NOX Compliance Cost Worksheet - 051613/White Bluff 1 Page 1 of 3
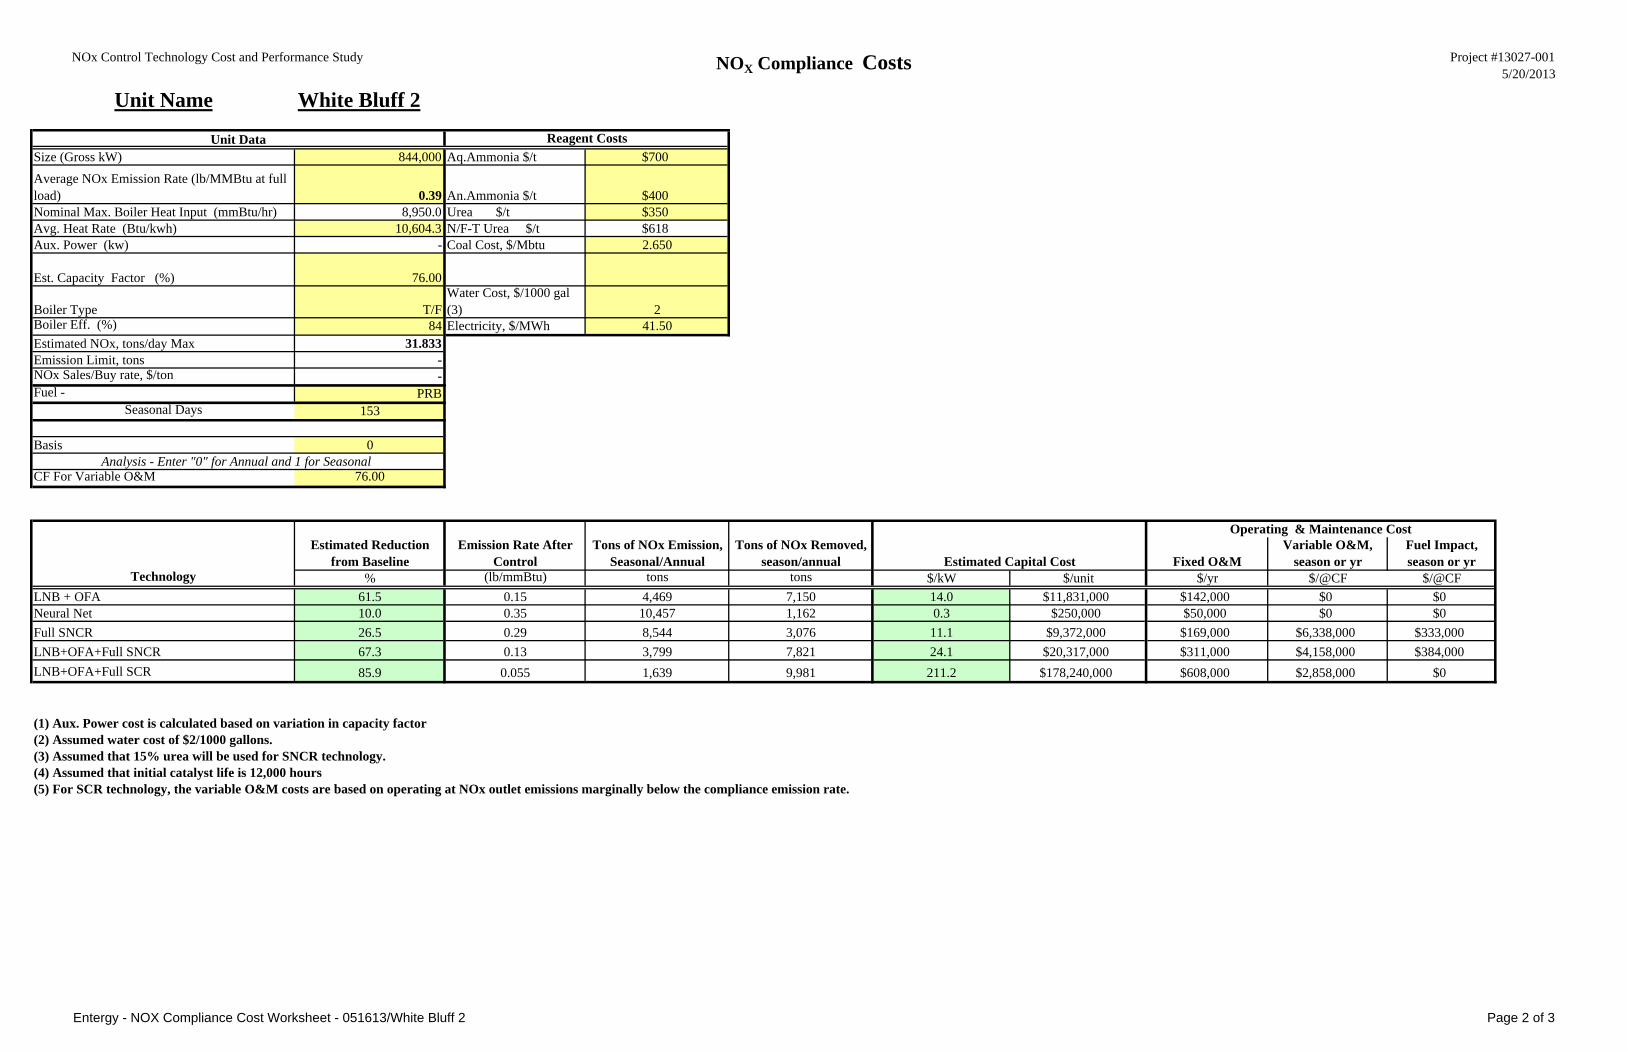
NOx Control Technology Cost and Performance Study NOX Compliance Costs Project #13027-0015/20/2013
Unit Name White Bluff 2
Unit DataSize (Gross kW) 844,000 Aq.Ammonia $/t $700Average NOx Emission Rate (lb/MMBtu at full load) 0.39 An.Ammonia $/t $400Nominal Max. Boiler Heat Input (mmBtu/hr) 8,950.0 Urea $/t $350Avg. Heat Rate (Btu/kwh) 10,604.3 N/F-T Urea $/t $618Aux. Power (kw) - Coal Cost, $/Mbtu 2.650
Est. Capacity Factor (%) 76.00
Boiler Type T/FWater Cost, $/1000 gal (3) 2
Boiler Eff. (%) 84 Electricity, $/MWh 41.50Estimated NOx, tons/day Max 31.833Emission Limit, tons -NOx Sales/Buy rate, $/ton -Fuel - PRB
Seasonal Days 153
Basis 0Analysis - Enter "0" for Annual and 1 for Seasonal
CF For Variable O&M 76.00
Estimated Reduction from Baseline
Emission Rate After Control
Tons of NOx Emission, Seasonal/Annual
Tons of NOx Removed, season/annual Estimated Capital Cost Fixed O&M
Variable O&M, season or yr
Fuel Impact, season or yr
Technology % (lb/mmBtu) tons tons $/kW $/unit $/yr $/@CF $/@CFLNB + OFA 61.5 0.15 4,469 7,150 14.0 $11,831,000 $142,000 $0 $0Neural Net 10.0 0.35 10,457 1,162 0.3 $250,000 $50,000 $0 $0Full SNCR 26.5 0.29 8,544 3,076 11.1 $9,372,000 $169,000 $6,338,000 $333,000LNB+OFA+Full SNCR 67.3 0.13 3,799 7,821 24.1 $20,317,000 $311,000 $4,158,000 $384,000LNB+OFA+Full SCR 85.9 0.055 1,639 9,981 211.2 $178,240,000 $608,000 $2,858,000 $0
(1) Aux. Power cost is calculated based on variation in capacity factor(2) Assumed water cost of $2/1000 gallons.(3) Assumed that 15% urea will be used for SNCR technology.(4) Assumed that initial catalyst life is 12,000 hours (5) For SCR technology, the variable O&M costs are based on operating at NOx outlet emissions marginally below the compliance emission rate.
Operating & Maintenance Cost
Reagent Costs
Entergy - NOX Compliance Cost Worksheet - 051613/White Bluff 2 Page 2 of 3

NOx Control Technology Cost and Performance Study NOX Compliance Costs Project #13027-0015/20/2013
Unit name Lake Catherine Unit 4
Unit DataSize (Gross kW) 558,000 Aq.Ammonia $/t $700
Average NOx Emission Rate (lb/MMBtu) 0.4825 An.Ammonia $/t $400 0.271 2011 Top 90% 0.275Nominal Max. Boiler Heat Input (mmBtu/hr) 5,850.0 Urea $/t $350 0.166 2010 Top 90% 0.169Avg. Heat Rate (Btu/kwh) 10,483.9 N/F-T Urea $/t $618 0.194 2011 Top 90% 0.197Aux. Power (kw) - Gas Cost, $/MBtu 4.900 0.210 0.214
Est. Capacity Factor (%) 10.00Water Cost, $/1000 gal (3) 2
Boiler Type T/F Electricity, $/MWh 41.50Boiler Eff. (%) 82Estimated NOx, tons/day Max 3.387Emission Limit, tons -NOx Sales/Buy rate, $/ton 2500.0Fuel Gas
Seasonal Days 153
Basis 0Analysis - Enter "0" for Annual and 1 for Seasonal
CF For Variable O&M 10.00
Estimated Reduction from Baseline
Emission Rate After Control
Tons of NOx Emission, Seasonal/Annual
Tons of NOx Removed, season/annual Estimated Capital Cost Fixed O&M
Variable O&M, season or yr
Fuel Impact, season or yr
Technology % (lb/mmBtu) tons tons $/kW $/unit $/yr $/@CF $/@CFBaseline 0 0.4825BOOS (at 558 MW) 50.0 0.24 618 618 1.6 $893,000 $21,000 $0 $0LNB + OFA 60.0 0.19 495 742 15.7 $8,762,000 $210,000 $0 $0SCR 90.0 0.05 124 1,113 106.8 $59,587,000 $358,000 $254,000 $0SNCR 40.0 0.29 742 495 27.8 $15,507,000 $279,000 $1,542,000 $98,000Water Injection 9.1 0.44 1,124 113 3.9 $2,177,000 $52,000 $18,000 $468,000IFGR (below 500 MW) 19.0 0.39 1,001 235 3.9 $2,166,000 $52,000 $0 $0FGR 60.0 0.19 495 742 20.6 $11,489,000 $207,000 $142,000 $0LNB/OFA + SNCR 70.0 0.14 371 865 43.5 $24,269,000 $489,000 $393,000 $69,000LNB/OFA + SCR 94.0 0.03 74 1,162 122.5 $68,349,000 $568,000 $268,000 $0
(1) Aux. Power cost is calculated based on variation in capacity factor(2) Assumed water cost of $2/1000 gallons.(3) Assumed that 15% urea will be used for SNCR technology.(4) Assumed that initial catalyst life is 40,000 hours.(5) Water Injection is used only for trimming at high load. Approximately 66% of Hours are affected.(6) For SCR technology, the variable O&M costs are based on operating at NOx outlet emissions marginally below the compliance emission rate.
Reagent Costs
Operating & Maintenance Cost
Entergy - NOX Compliance Cost Worksheet - 051613/LC4 '03 Data Page 3 of 3

Entergy Services, Inc. White Bluff & Lake Catherine Project No. 13027-001 NOx Control Technology Cost and Performance Study
SL-011439 Final Report Rev. 4 5/16/2013 Page No. 5
APPENDIX D
1. BOOS AT FULL UNIT LOAD

To: DAVID H PARK/Sargentlundy@Sargentlundy, Cc:Bcc:Subject: Fw: BOOS for NOx ControlFrom: STEVE M KATZBERGER/Sargentlundy - Thursday 03/28/2013 03:32 PM
From: Stephen Wood [mailto:[email protected]] Sent: Monday, March 25, 2013 2:20 PMTo: HANTZ, JOSEPHSubject: BOOS for NOx Control Joe, The attached PDF file contains background information on utilizing burners out of service for NOx control, as well as, predicted Lake Catherine Unit 4 burner header pressures and NOx emissions, utilizing the top burner elevation out of service (4BOOS). If you have any questions, please let me know. Regards, Steve WoodPrincipal OfficerEntropy Technology & Environmental Consultants, Inc. (ETEC Inc.)12337 Jones Rd. Suite 414Houston, TX 77070Ph: 281-807-7007Cell: 713-253-8230Fax: 281-807-1414Website: www.etecinc.net ************************************************************************This e-mail and any of its attachments may contain ETEC Inc. proprietaryinformation, which is privileged, confidential, or subject to copyrightbelonging to the ETEC Inc. This e-mail is intended solely for the use of theindividual or entity to which it is addressed. If you are not the intendedrecipient of this e-mail, you are hereby notified that any dissemination,distribution, copying, or action taken in relation to the contents of andattachments to this e-mail is strictly prohibited and may be unlawful. Ifyou have received this e-mail in error, please notify the sender immediatelyand permanently delete the original and any copy of this e-mail and anyprintout. Thank You.
******************************* BOOS for NOx Control.pdf BOOS for NOx Control.pdf

Combustion Modification (BOOS) for NOx Control Implementation of Burner Out Of Service (BOOS) operation is a practical and cost-effective means for achieving staged combustion (i.e., modifying burner stoichoimetry to reduce NOx emissions formation) on an existing gas/oil fired electric utility boiler. Utilizing BOOS operation for NOx control is well documented in the literature, e.g., EPA 456/F-99-006R "Nitrogen Oxides (NOx), Why And How They Are Controlled", November 1999, and EPRI TR-108181 "Retrofit NOx Control Guidelines for Gas- and Oil-Fired Boilers, Version 2.0", June 1997, among numerous others. The technique of BOOS operation involves terminating the fuel flow to selected burners on the top elevation while leaving the air registers open. The remaining burners operate fuel-rich, thereby limiting oxygen availability, lowering peak flame temperatures, and reducing NOx formation. The un-reacted products combine with the air from the above terminated-fuel burners to complete burnout before exiting the furnace. I have personally been involved with implementing BOOS operation on virtually every gas fired electric utility boiler design across the country since the mid 1970's. In almost every case, the original "high" burner header pressure (BHP) set point had to be increased to accommodate BOOS operation. No adverse operational or maintenance problems corresponding to BOOS implementation have been reported. BOOS operation can be a very effective NOx reduction technology, depending on the degree of staging, as shown for Ninemile Unit 4 (750 mw CE Tangential Fired) in Figure 1. The corresponding BOOS pattern is shown in Figure 2. The BHP corresponding to 4BOOS operation on Lake Catherine Unit 4 is shown in Figure 3. The "High" BHP set point would need to be increased from 42 to 50 psig. The predicted NOx emissions corresponding to 4BOOS operation are presented in Figure 4.
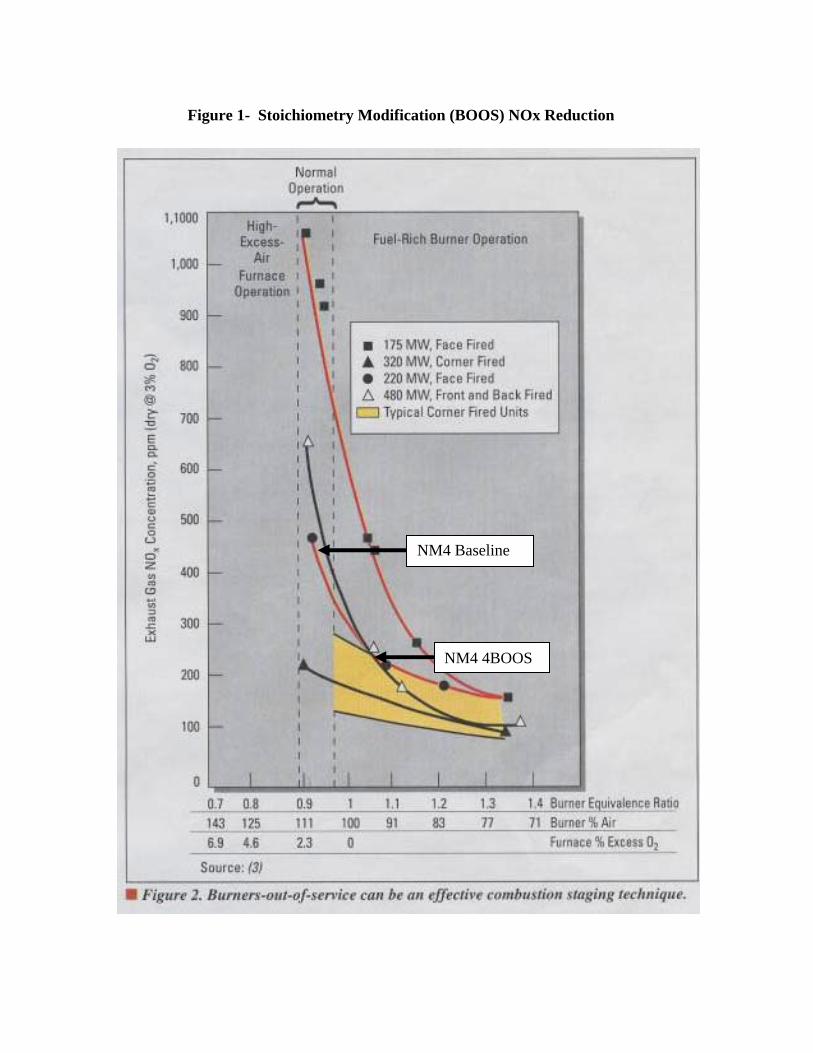
Figure 1- Stoichiometry Modification (BOOS) NOx Reduction
NM4 4BOOS
NM4 Baseline

Figure 2- Ninemile Units 4 and 5 BOOS Pattern (Top Elevation Out of Service & Air Registers Open)
Level 1
Level 5
Level 4
Level 3
Level 2
SW SE NW NE
BOOS BOOSBOOS BOOS

Figure 3- Lake Catherine Unit 4 Burner Header Pressure
0
5
10
15
20
25
30
35
40
45
0 50 100 150 200 250 300 350 400 450 500 550
BHP, psig
Load, mwn
Lake Catherine Unit 4 Burner Header Pressure
Baseline
4BOOS

Figure 4- Lake Catherine Unit 4 NOx Emissions Prediction
0
0.1
0.2
0.3
0.4
0.5
0.6
0 100 200 300 400 500 600
NOx, lb/m
mbtu
LOAD, MWG
Lake Catherine Unit 4 Predicted NOx with 4BOOS
Baseline
BOOS