Reviews of Scientific Evidence and Policies on Nutrition and ...
63
Written by ICF Consulting Services Ltd February 2018 Reviews of Scientific Evidence and Policies on Nutrition and Physical Activity Objective Area D: Early Warning Indicators
-
Upload
khangminh22 -
Category
Documents
-
view
2 -
download
0
Transcript of Reviews of Scientific Evidence and Policies on Nutrition and ...

Written by ICF Consulting Services Ltd
February 2018
Reviews of Scientific Evidence and Policies on Nutrition and Physical
Activity Objective Area D: Early Warning Indicators

EUROPEAN COMMISSION
Directorate-General for Health and Food Safety
Directorate C — Public health, country knowledge, crisis management
Unit C.4— Health Determinants and international relations
E-mail: [email protected]
European Commission
B-1049 Brussels

EUROPEAN COMMISSION
Directorate-General for Health and Food Safety
Directorate C— Public health, country knowledge, crisis management
February, 2018 EN
Reviews of Scientific
Evidence and Policies on Nutrition and Physical
Activity Objective Area D: Early Warning Indicators

Reviews of Scientific Evidence and Policies on Nutrition and Physical Activity
Europe Direct is a service to help you find answers to your questions about the European Union.
Freephone number (*):
00 800 6 7 8 9 10 11
(*) The information given is free, as are most calls (though some operators, phone boxes or hotels may charge you).
LEGAL NOTICE
This document has been prepared for the European Commission however it reflects the views only of the authors, and the Commission cannot be held responsible for any use which may be made of the information contained therein.
More information on the European Union is available on the Internet (http://www.europa.eu).
Luxembourg: Publications Office of the European Union, 2018
ISBN 978-92-79-97424-3 DOI 10.2875/035550 EW-03-18-467-EN-N
© European Union, 2018
Reproduction is authorised provided the source is acknowledged.
Reviews of Scientific Evidence and Policies on Nutrition and Physical Activity
i
Contents
Contents ........................................................................................................... i Preface ............................................................................................................. 2
About this project ............................................................................................... 2 About this series ................................................................................................. 2 Approach and purpose ......................................................................................... 2
Glossary ........................................................................................................... 4 Objective D: A comprehensive review of the early warning indicators of obesity and
physical (in)activity ........................................................................................... 7 1 Introduction ................................................................................................ 7
1.1 Research questions for this review ..................................................... 8 1.2 Scope of this review ......................................................................... 9
2 Methodology .............................................................................................. 10
2.1 Peer review method .........................................................................10 2.2 Grey literature method.....................................................................10
3 Findings and discussion ............................................................................... 11
3.1 Research Question 1: What factors are associated with overweight,
obesity and physical (in) activity? ........................................................................11 3.2 Research Question 2: What factors could be of use as early warning
indicators of overweight and obesity (and physical inactivity) prevalence and trends? 28 3.3 Conclusion ......................................................................................36
ANNEXES ........................................................................................................ 38 Annex 1 Peer reviewed literature review methodology .................................. 39
A1.1 Research questions for this review ....................................................39 A1.2 Peer-Reviewed Literature .................................................................39 A1.3 Stage 1: Conduct Searches and Document Results ..............................39 A1.4 Stage 2: Screening search results (title and abstract) for relevance .......40
Annex 2 Search terms .............................................................................. 44 Annex 3 Peer-reviewed literature bibliography ............................................. 46 Annex 4 Grey literature review .................................................................. 50
A4.1 Detailed search and review methodology ............................................50 A4.2 Stage 1: Conducting searches and documenting results .......................50 A4.3 Stage 2: Screen Search Results for Relevance ....................................52 A4.4 Stage 3: Screen results against inclusion/exclusion criteria, quality and
relevance 52 A4.5 Stage 4: Review and extraction of full texts ........................................54 A4.6 Stage 5: External expert reviews and input ........................................54 A4.7 Number of included and excluded references ......................................54
Annex 5 Grey literature bibliography .......................................................... 56

Reviews of Scientific Evidence and Policies on Nutrition and Physical Activity
2
Preface
About this project
Overweight, obesity and their related diseases represent a leading cause of morbidity
and mortality, and pose a major challenge for the sustainability of healthcare systems of
EU Member States. The growing prevalence of overweight and obesity among all age
groups across Europe constitutes a serious concern for policy makers. Tackling this issue
requires a comprehensive response that reflects the multifactorial and complex nature of
obesity and overweight. One particularly important area of focus has been on the
development of preventative strategies which include nutritional and physical activity
interventions.
The European Commission Directorate General for Health and Food Safety (DG SANTE)
recognises the significant challenges policy makers face in developing effective and
efficient policy interventions relating to diet and physical activity. One such challenge
includes the complexity and breadth of the evidence base. By providing independent,
accurate summaries of recent and relevant information and statistics on determinants of
diet and physical activity and their impact on health, this project aims to support policy
makers to continue to develop policy instruments which enable people to make healthier
lifestyle choices. In particular, this project aims to support the development of healthier
behaviours in vulnerable and/or at-risk subpopulations (including children, pregnant and
lactating women, and older adults) and low socio-economic status groups (including low
income and education).
About this series
This evidence review is one of eight reviews relating to different determinants of diet and
physical activity.
Seven of the reviews are of the scientific evidence and policies in the following areas:
Knowledge, attitudes and behaviours contributing to positive energy balance
(objective area A1);
Dietary and physical activity patterns in Europe (objective area B1);
Consumption of fruit juices, artificially and sugar-sweetened beverages and its
impact on weight status and health (objective area B2);
Consumption of high-fructose syrup and its impact on weight status and health
(objective area B3);
Relationship between weight status and physical activity with school and work
performance outcomes (objective area C);
Early warning indicators of obesity and physical inactivity trends (objective area
D);
Nutrition and physical activity guidelines for specific population groups (objective
area E).
Building on these seven reviews, the final review (objective area A2) examines
specifically the evidence for effective and efficient policies and interventions in terms of
promoting, supporting and improving nutritional and physical activity behaviours at both
individual and population level.
All reviews, and their summaries, are available on the DG SANTE webpage here.
Approach and purpose
The reviews have been designed to provide policymakers with summaries of recent and
relevant evidence in these key areas of interest. Given the broad scope of each of the
reviews, it should be stressed that they are not intended to be rigorous systematic
reviews of all literature published in this field. Rather, they are intended as pragmatic
reviews combining a comprehensive search methodology with expert academic input,
Reviews of Scientific Evidence and Policies on Nutrition and Physical Activity
3
facilitated through workshops, to provide a practical and accurate summary of key issues
and tackling broad lines of enquiry, with the greater aim of supporting the development
and improvement of policies in this area. Each of the project's eight methodologies and
analyses was reviewed by DG SANTE and academic experts in these topics.
While the methods to conduct this comprehensive literature review are systematic, it is
not a systematic review. This review does not systematically analyse literature to identify
all relevant published data and/or appraise its quality. Methods to conduct the literature
review consisted of five steps: (1) refining the research questions, (2) developing a
search approach and databases, (3) conducting literature searches, (4) screening articles
for inclusion; and (5) abstracting and synthesising relevant data.
To minimise bias, the literature search approach included identification of a priori search
parameters (also considered first level inclusion and exclusion criteria), agreed with DG
SANTE, to guide searches and inform screening and selection processes for data
inclusion. Due to the immense number of literature search results at step 3, the
application of quite limiting exclusion criteria at step 4 was deemed necessary. This may
however have resulted in not screening all potentially relevant literature. All relevant
articles that were found appropriate for inclusion were reviewed for relevance to each
objective area, and the scope of the specific research questions. Furthermore, the
inclusion of different types of scientific evidence (from systematic reviews and peer-
reviewed original articles down to BSc theses) and the presentation of this scientific
evidence next to grey literature information presented a challenge in terms of
maintaining an understanding of the quality and weight of the evidence. The authors
addressed this to some extent by structuring the document in such a way that peer-
reviewed and grey literature are clearly identified. The full methodology and steps taken
for each review is included in Annex of this document.
DG SANTE and the Joint Research Centre (JRC) provided input on all stages of the
project and comments on the literature reviews. Expert workshops were organised to
discuss findings, highlight additional relevant sources to fill gaps and improve the series
of reviews. Experts were carefully selected from academic and policy-making fields,
based on expertise of the specific topics addressed.
The methodology used across all eight reviews remained consistent, and within each
review a detailed summary of the approach is provided, along with a full bibliography for
further reading.
Reviews of Scientific Evidence and Policies on Nutrition and Physical Activity
4
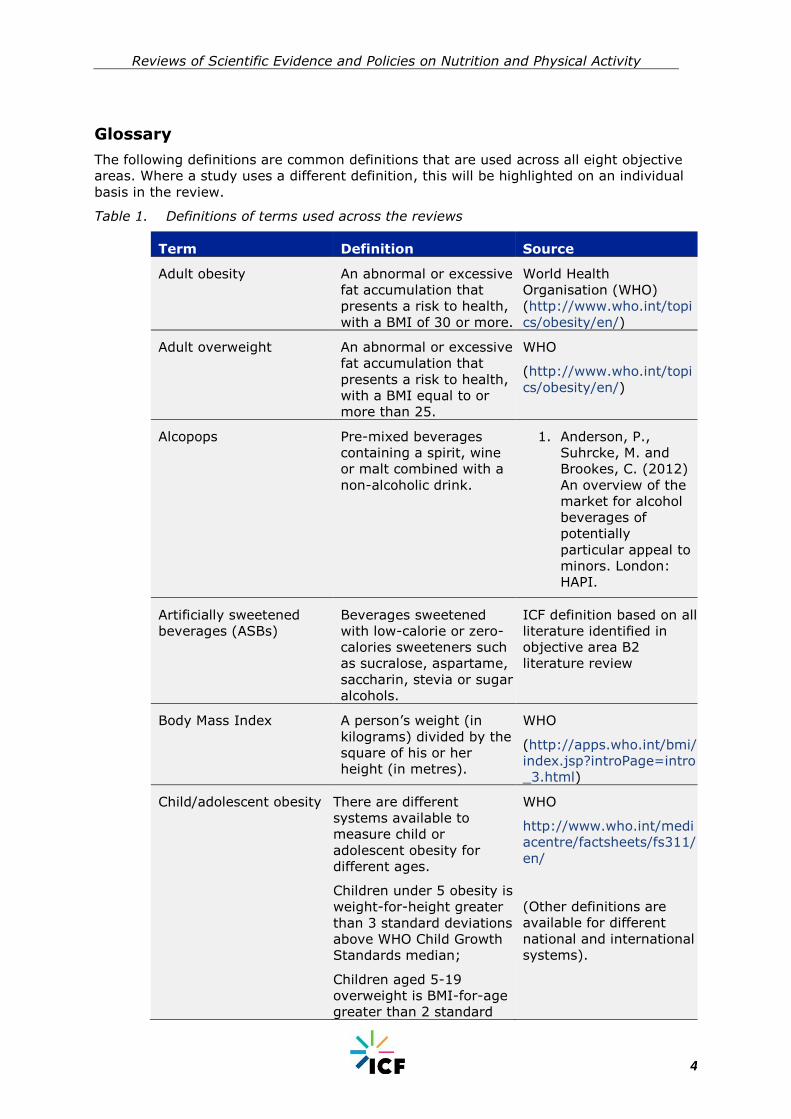
Glossary
The following definitions are common definitions that are used across all eight objective
areas. Where a study uses a different definition, this will be highlighted on an individual
basis in the review.
Table 1. Definitions of terms used across the reviews
Term Definition Source
Adult obesity An abnormal or excessive
fat accumulation that
presents a risk to health,
with a BMI of 30 or more.
World Health
Organisation (WHO)
(http://www.who.int/topi
cs/obesity/en/)
Adult overweight An abnormal or excessive
fat accumulation that
presents a risk to health,
with a BMI equal to or
more than 25.
WHO
(http://www.who.int/topi
cs/obesity/en/)
Alcopops Pre-mixed beverages
containing a spirit, wine
or malt combined with a
non-alcoholic drink.
1. Anderson, P.,
Suhrcke, M. and
Brookes, C. (2012)
An overview of the
market for alcohol
beverages of
potentially
particular appeal to
minors. London:
HAPI.
Artificially sweetened
beverages (ASBs)
Beverages sweetened
with low-calorie or zero-
calories sweeteners such
as sucralose, aspartame,
saccharin, stevia or sugar
alcohols.
ICF definition based on all
literature identified in
objective area B2
literature review
Body Mass Index A person’s weight (in
kilograms) divided by the
square of his or her
height (in metres).
WHO
(http://apps.who.int/bmi/
index.jsp?introPage=intro
_3.html)
Child/adolescent obesity There are different
systems available to
measure child or
adolescent obesity for
different ages.
Children under 5 obesity is
weight-for-height greater
than 3 standard deviations
above WHO Child Growth
Standards median;
Children aged 5-19
overweight is BMI-for-age
greater than 2 standard
WHO
http://www.who.int/medi
acentre/factsheets/fs311/
en/
(Other definitions are
available for different
national and international
systems).

Reviews of Scientific Evidence and Policies on Nutrition and Physical Activity
5
Term Definition Source
deviation above the WHO
Growth Reference median.
Child/adolescent
overweight
There are different
systems available to
measure child or
adolescent overweight for
different ages.
Children under 5
overweight is weight-for-
height greater than 2
standard deviations above
WHO Child Growth
Standards median;
Children aged 5-19
overweight is BMI-for-age
greater than 1 standard
deviation above the WHO
Growth Reference median.
WHO
http://www.who.int/medi
acentre/factsheets/fs311/
en/
(Other definitions are
available for different
national and international
systems).
Exercise Exercise, is a subcategory
of physical activity that is
planned, structured,
repetitive, and purposeful
in the sense that the
improvement or
maintenance of one or
more components of
physical fitness is the
objective.
WHO
(http://www.who.int/diet
physicalactivity/pa/en/)
Insufficient physical
activity
Physical activity that does
not meet WHO
recommended levels of at
least 60 minutes a day of
moderate-vigorous
activity for children and
adolescents and at least
150 minutes of
moderate-intensity
aerobic physical activity
throughout the week for
adults.
WHO
http://www.who.int/medi
acentre/factsheets/fs385/
en/
Physical activity Any bodily movement
produced by skeletal
muscles that requires
energy expenditure.
WHO
(http://www.who.int/topi
cs/physical_activity/en/)
Physical inactivity A lack of physical activity WHO
(http://www.who.int/diet
physicalactivity/pa/en/)

Reviews of Scientific Evidence and Policies on Nutrition and Physical Activity
6
Term Definition Source
Sedentary behaviour Any waking behaviour
characterized by an
energy
expenditure ≤1.5 metabo
lic equivalents (METs)
while in a sitting or
reclining posture.
Tremblay, M. S., et al.
(2017). Sedentary
Behavior Research
Network (SBRN) –
Terminology Consensus
Project process and
outcome. The
International Journal of
Behavioral Nutrition and
Physical Activity, 14, 75.
http://doi.org/10.1186/s
12966-017-0525-8
Sugar sweetened
beverages (SSBs)
Any beverage with added
sugars. This includes soft
drinks, soda, fruit drinks,
punch, sports drinks,
sweetened tea and coffee
drinks, energy drinks and
sweetened milk. These
beverages may be
sweetened with added
sugars such as sucrose
(table sugar) or high
fructose corn syrup,
which is what
distinguishes them from
100% fruit juice and
beverages with non-
caloric sweeteners (e.g.,
aspartame, saccharin or
sucralose).
US Department of
Agriculture. 2010. US
Department of Health and
Human Services. Dietary
guidelines for Americans,
2010. 7th edition,
Washington (DC): US
Government Printing
Office
Reviews of Scientific Evidence and Policies on Nutrition and Physical Activity
7
Objective D: A comprehensive review of the early warning indicators of obesity and physical (in)activity
This report presents the findings of a peer-reviewed literature and grey literature review on
factors associated with overweight and obesity and provides suggestions for reliable early
warning indicators for obesity and overweight in children and adolescents and in adults.
Because physical (in)activity is so strongly associated with the development of obesity,
factors that influence physical (in)activity that could also serve as early warning indicators
are also reviewed and explored. In addition, the findings from this review illustrate areas
where further research may be useful. The report includes the following sections.
Introduction, describing the scope of the reviews and the principal research
questions;
Methodology, describing how the reviews were undertaken and relevant findings
extracted;
Findings from the peer-reviewed and grey literature, presented according to each
research question; and
Conclusions drawn from the reviews overall and an assessment of the current
scientific evidence, including any gaps in the knowledge.
1 Introduction
Research indicates that there are multiple levels of influence contributing to the epidemic of
obesity. At the more sophisticated end of the spectrum, the UK Foresight obesity map
(Foresight 2007), provides a visual illustration of 108 variables associated with obesity and
their interdependencies, demonstrating the multidisciplinary and complex nature of the
issue. It highlights that there is not one single dominant influence; rather the different
variables are clustered into seven categories: physiology; individual psychology; food
consumption; food production; social psychology; individual physical activity and physical
activity environment. The map involves an intricate network of feedback loops between
variables and different clusters and the ‘engine’ at the centre, which is the energy balance
equation.
Other models provide a simpler way to conceptualise and comprehend obesity that
nevertheless emphasises the multiple influences, echoes these clusters and places the
individual at the centre. The Social Ecological theory is one of the most widely accepted
models for describing the multiple levels of influence on health (Bronfenbrenner, 1977) and
has been adapted to describe the multiple levels influencing obesity (CDC 2013). In this
model, an individual’s weight status is influenced by individual, interpersonal,
institutional/organisational, community and systems/policy levels. Figure 1 illustrates the
levels and factors included in each (CDC, 2013).

Reviews of Scientific Evidence and Policies on Nutrition and Physical Activity
8
Figure 1. Social Ecological Model – levels influencing obesity
Source: adapted from CDC 2013
Another useful conceptual model for obesity, identified by WHO (WHO Meeting Report 2013,
cited in WHO 2016 p.7) is the life-course model. This draws on scientific (animal and
human) studies that have shown how causal pathways for obesity begin in the early stages
of life and can persist throughout, before being passed onto offspring, affecting the ability to
respond to challenges such as an unbalanced diet and likelihood of storing excessive fat.
This model emphasises that earlier preventative interventions are more effective than
attempting to reduce risks or restore health in adults. This is due to particularly sensitive
periods of time when future health can either be adversely affected by unhealthy
environments and behaviours or conferred with long-term protection from risk. Pre-
conception, pregnancy and post-partum/infancy are established by this model as the
optimum times to intervene to prevent the obesity cycle continuing.
These latter two models are introduced here since they are pertinent to the research
questions, which consider the multiplicity of factors which are associated with obesity and
physical (in)activity, and their respective suitability as predictive factors of potential future
trends in obesity and physical inactivity. The socio-ecological model has also been embraced
as a way of understanding what drives physical activity and how best to promote it (Mehtälä
et al. 2014). It is therefore considered appropriate as a framework for exploring the findings
of this review with respect to both weight status and activity level determinants. The life-
course model provides a pathway for understanding how measuring certain early life
determinants may indicate future trends. For policy-makers, an ability to have timely
information that might indicate a change (e.g. an increase) in weight status and physical
(in)activity in populations would further support the introduction of important preventative
policies or interventions.
1.1 Research questions for this review
In this review, we focus on the most current literature (peer-reviewed original research and
systematic reviews, as well as grey literature) that examines factors associated with
overweight, obesity, and physical (in)activity structured according to the levels of influence
within the social ecological model. The review considers which factors and measures might
work as early warning indicators and potential monitoring systems to keep track of
prevalence and trends. The research addressed the following questions specified for the
review:
What factors are associated with overweight, obesity and physical (in)activity?
What factors could be of use as early warning indicators of overweight and obesity
and physical (in)activity prevalence and trends?
Systems/Policy: regulations or laws
Community: local infrastructure and
environmental characteristics
Institution/Organization: school, health care,
businesses, faith organizations, etc.
Interpersonal: individual relationships, support
groups, social networks
Individual: Attitudes, knowledge, behaviour or
genetic factors
Individual
Interpersonal
Institutional
Community
Systems/Policy

Reviews of Scientific Evidence and Policies on Nutrition and Physical Activity
9
How could a feasible, effective and efficient early warning monitoring mechanism be
put in place to keep track of these issues?
1.2 Scope of this review
This review considers determinants relating to child, adolescent and adult obesity and
subsequently, the determinants for physical (in)activity. Given the breadth of the first line of
enquiry some limitations were placed on scope. Particular food consumption patterns and
their relationship with obesity such as the consumption of sugar-sweetened beverages
(SSBs) and high-fructose corn syrup (HFSC) are discussed in other reviews in this series;
B2 and B3 respectively. We therefore considered only the role of diet in a broad way.
Similarly, in the A2 review different policies and interventions are considered which have
been found to be effective in promoting healthier behaviours. For this reason determinants
at the societal or policy level of the socio-ecological model were not considered; rather the
focus was on the individual, interpersonal (family and social), organisational (work and
school settings) and community (local neighbourhood or environmental) factors.
The concept of ‘early warning indicators’ was not a common one, although we did find
evidence for variables which may predict obesity in later life. We did not find many
examples of literature which discussed indicators and monitoring systems; or how these
might alert governments to, or predict, changes in obesity and physical (in)activity
prevalence. Two conceptual interpretations of ‘early warning’ are therefore presented. The
first, emerging in the peer-reviewed literature, discusses indicators that can be measured
using monitoring systems that provide more immediate, or ‘early’, data than official
statistical returns (which often involve a time lag). The second takes the life-course
approach discussed above, discussing variables of child obesity and physical (in)activity that
might be of use as potential indicators or predictors of trends yet to emerge in the adult
population.

Reviews of Scientific Evidence and Policies on Nutrition and Physical Activity
10
2 Methodology
The review is based mainly on peer reviewed literature, with grey literature used to
supplement any gaps. For each set of literature, specific search terms, inclusion and
exclusion criteria, and quality checks were carried out. The research questions and search
terms were confirmed with DG SANTE at the start of the process.
After the initial searching and extraction of literature, expert workshops (with experts from
relevant academic and policy-making fields) were conducted to discuss findings, highlight
additional relevant sources to fill gaps and improve the series of reviews.
More information on the methodology can be found in the Annexes.
2.1 Peer review method
To search for and extract the most relevant peer reviewed literature the following steps
were taken: refining the research questions; developing a search approach and databases;
conducting literature searches; screening articles for inclusion; and abstracting and
synthesizing relevant data.
A total of 4086 search hits were retrieved. A total of 1577 duplicates were found and
removed from the search hits resulting in 2509 search results for D. From the 2509, the
team screened 600 of the most recent titles and abstracts (200 for each of the three
research questions, to create a manageable amount of material within the resources for the
study; and on the premise that the most recent material was most relevant science). From
the 600 most recent titles and abstracts screened 70 were deemed of potential relevance
and reviewed as full texts. From these full texts 531 publications were selected for
inclusion, in this final review.
Search terms for the research questions and bibliography of included sources can be found
in Annex 1 and Annex 2.
2.2 Grey literature method
To search for and extract the most relevant grey literature the following steps were taken:
searching for publications using set keywords and databases; screening of search results
and exclusion of less relevant literature; and, extraction and review of remaining
documents. The grey literature search process was a more fluid and dynamic process,
where hand searching was also utilised to find the most relevant sources.
A total of 20645 search hits were retrieved and saved for D. From the 192 results identified
as potential sources and saved in the study library, 123 were excluded based on the
relevance to Objective D research questions. Following this, 69 results were extracted fully.
An additional 50 publications were then excluded based on inclusion/exclusion criteria,
quality of evidence and relevant to the research questions. Supplementary searches were
conducted and/or articles recommended by experts during the workshops: these were
looked at and four additional relevant references proposed by external experts were
included.
The full grey literature searching and extraction methodology is outlined in Annex 4.
1 The full list of references included from the peer-reviewed literature can be found in Annex 3 and includes one
additional publication recommended by the external expert review panel

Reviews of Scientific Evidence and Policies on Nutrition and Physical Activity
11
3 Findings and discussion
The findings are presented in response to each research question, with subsections relating
to different themes and illustrated by relevant findings from the peer-reviewed literature
review and the grey literature review. For question one, these relate to the different levels
of the social ecological model described above – but few variables were identified relating to
institutional or organisation level. These were restricted to variables with child obesity. Not
all themes emerged in the same way in the two reviews and as a consequence, analysis
from either review is presented in the order that best exemplifies the findings.
Where definitions for overweight, obesity and physical (in)activity were given, these are
noted in the text. The grey literature was not always specific in how it used those terms, nor
the ages that were associated with the terms ‘child’ or ‘adolescent.’ Indeed, the conclusions
presented in the grey literature tended to be more general than those of peer-reviewed
studies although specific information is presented where possible. A summary of key
messages for each research question is presented first for ease of understanding.
3.1 Research Question 1: What factors are associated with overweight, obesity and physical (in) activity?
3.1.1 Summary of key Findings
There is a wide variety of variables associated with overweight and obesity and
physical (in)activity in children, adolescents and adults. Some key highlights from
this section:
Individual factors that are associated with overweight and obesity among
children include:
- Genetic factors
- High birthweight
- Unhealthy diet
- Physical inactivity
Short sleep duration is associated with child overweight and obesity but the
nature of the association requires further investigation.
Interpersonal factors that are associated with overweight and obesity among
children are:
- Maternal pre-pregnancy overweight or obesity
- Maternal smoking or prenatal tobacco exposure or prenatal tobacco
exposure
- Excess maternal weight gain in pregnancy
- Breastfeeding,
- Authoritative parenting
- Modelling healthy behaviours
At an institutional level, in the school setting, physical activity opportunities
and healthy foods/beverages may be important for preventing obesity and
increasing physical activity.
Community-level factors such as access to stores where healthy foods are
available or land mix of neighbourhoods show some evidence of being
associated with obesity (either positively or inversely) but findings are
inconsistent.

Reviews of Scientific Evidence and Policies on Nutrition and Physical Activity
12
Adult overweight and obesity
Rapid weight gain and early adiposity rebound are positively associated with
adult overweight and obesity.
Maternal BMI and maternal weight gain during pregnancy both have strong
positive associations with adult overweight and obesity.
Maternal smoking has weak-moderate association with increased risk of
adult overweight and obesity.
Child and adolescent physical (in)activity
Physical (in)activity and sedentary behaviour among children and
adolescents is associated with age, gender and socio-economic status.
Parental behaviours (parental levels of inactivity, modelling of TV watching)
may have associations with child (in)activity at different ages but the
evidence is not conclusive.
Among children and adolescents, there was evidence of positive associations
between environmental factors and physical activity. These include: teacher
SES, specific school types, school facilities for physical activity, neighborhood
facilities for physical activity and traffic safety.
Adult physical (in)activity
Socio-economic status (particularly educational attainment) was also found
to be associated with physical activity levels in adults, but the relationship is
non-linear.
Being married/co-habiting is associated with more, and having children is
associated with less, sedentary time.
The factors that impact or influence overweight, obesity, and physical inactivity are
abundant and complex. The factors range from genetic influences, familial environment,
behaviour and conditions, and the external environment and represent the multiple levels of
influence illustrated in the social ecological model of health. Factors associated with child
and adolescent obesity and adult obesity are discussed separately; and the same for
physical activity.
3.1.2 Factors associated with obesity and overweight in children and adolescents
Individual-level correlates of child and adolescent obesity
The peer-reviewed and grey literature identified the following individual-level factors
associated with obesity in children and adolescents: genetics, birthweight, nutrition, socio-
economic status, ethnicity, sleep, and physical (in)activity.
Genetic factors
While genetic factors account for small effect sizes, they are strongly associated
with obesity in children. We found review and meta-analysis evidence, including
systematic review evidence, of the strong association between genetic factors and child
overweight or obesity.(Liu et al. 2013, Silvertoinen et al.2011, Choquet and Meyre 2011). A
systematic review and meta-analysis of international twin and adoption studies by
Silventoinen et al. (2010) found that among children genetic factors had a consistently
strong association with higher body mass index (BMI)2 no matter the age of the child.
2 Their review included nine twin and five adoption studies tracking youth up to age 18 and were based in the United
Kingdom, the U.S., Canada, Denmark and Korea. The number of families followed within each study ranged from 140

Reviews of Scientific Evidence and Policies on Nutrition and Physical Activity
13
The evidence for particular responsible gene markers is a growing field of research. Liu et
al.’s (2013) systematic review and meta-analysis of 23 international studies, published
between 2007 and 2013, revealed that the odds of being overweight or obese was 35%
higher among those participants (aged from six to 17 years) with the FTO gene variant
(Odds Ratio= 1.35 p<0.001).
One explanation (among many possible) for this put forward by Choquet and Meyre (2011),
in their overview of lessons learned from fifteen years in the field of genes and obesity
research, is that gene variants are also associated with decreased satiety and/or increased
feelings of hunger among children. Silvertoinen et al. emphasise that this genetic effect on
obesity is not independent of health behaviour but is likely to involve a complex relationship
between genetics, behaviour and environment.
Birthweight
Evidence suggests that there is a strong positive association between birthweight
and childhood overweight and obesity. We found evidence of this association in both
the peer-reviewed evidence (Kapral et al. 2017, Weng et al. 2012, Rooney et al.2011) and
the grey literature, which included a technical report from a Scottish national study (Parkes
et al. 2012) and a WHO review (Branca et al. 2007). Six of seven studies included in the
systematic review and meta-analysis by Weng et al (2012), of risk factors for childhood
overweight identifiable during infancy, found the association between high birthweight and
overweight later in childhood was significant and strong. In a linear and logistic analysis of
birthweight and obesity in later childhood Kapral et al. (2017) evaluated data from 10,186
term- or preterm children in the Early Childhood Longitudinal Study-Kindergarten Cohort
2011. They found significant relationships for higher birthweight (HBW) term children and
large-for-gestational age (LGA) pre-term children and later obesity3, from kindergarten-to-
second grade, compared with children classed as normal birth weight at term.
A birth cohort study by Rooney et al. (2011) found that birthweight was a key predictor of
child obesity (age 4 or 5). Predictors for obesity at three different developmental points
(childhood, adolescence and adulthood) were investigated among a cohort of 777 children
by following mothers before pregnancy and 10-15 years later. Birthweight was not the main
predictor of obesity in adolescence (age 9-14) but was significant again at early adulthood
(19-20 years old).
In the grey literature, a 2012 Scottish Government report from the Growing Up in Scotland
(GUS) study (Parkes et al. 2012) found a strong, statistically significant positive association
between greater birthweight and being either overweight or obese at age six4. Greater
birthweight values were strongly positively associated with being overweight or obese (p<
0.001) but the association was weaker between greater birthweight and being obese
(<0.1). When all potentially mediating factors (individual, parental and neighbourhood-
level) were examined simultaneously as part of a multivariate modelling analysis, the strong
positive association with higher birthweight still emerged. Branca et al. (2007) in a review
for WHO of the challenge of obesity in the European region, also found that higher
birthweight was associated with overweight status later in childhood in cohorts born in
Iceland, in 1988 and 1994. Children who weighed above the 85th percentile at birth were
more likely than others to be overweight at ages 6, 9 and 15 years.
to 375. Obesity was measured using the z-scores, a measure of relative weight adjusted or age and gender in children and adolescents aged 5-19 years, http://www.who.int/mediacentre/factsheets/fs311/en/. 3 Measured as higher BMI z-score,
4 The study uses the term ‘overweight’ to include all children at or above the 85
th BMI percentile (including those
classed as obese or morbidly obese) and ‘obese’ to include all children at or above the 95th percentile (including
those who are morbidly obese). Birthweights were standardised for gender and length of gestation.

Reviews of Scientific Evidence and Policies on Nutrition and Physical Activity
14
Nutritional behaviours
The impact of different nutritional behaviours on weight is a well-researched area. Two of
the reviews in this series consider aspects of this in more detail5, on the exact relationship
between SSBs and high-fructose corn syrup with body weight. These should be consulted
for more information. Here we focus on the broad evidence that emerged from our included
sources for these broader research questions relating to children.
Individual level nutritional behaviours such as unhealthy eating patterns are
positively associated with obesity. In a non-exhaustive review of epidemiologic evidence
published within the last decade, Hruby and Hu (2015) state that overweight and obesity
are generally positively associated with unrestricted access to food. The purpose of the
review was to examine the extent of the obesity epidemic and its risk factors. The factors
they identified as positively associated with overweight and obesity were: overall caloric
intake; increasing intake of potato chips and potatoes, sugar-sweetened beverages (SSB),
and processed and unprocessed red meats. The authors found caloric restriction (adhering
to any diet) and intake of vegetables, fruits, whole grains, nuts, and yogurt; were
negatively associated with overweight and obesity.
Breakfast may not be protective against excess adiposity but does not increase it.
Blondin et al (2016) reviewed 12 studies looking specifically at breakfast consumption and
excess adiposity in children and adolescents. While the authors concluded that the evidence
is inconclusive whether breakfast is protective against excess adiposity, their review
revealed that 10 of the studies did show such an effect. Additionally, they found that none
of the studies found that breakfast was associated with increased adiposity. Previously,
Rampersaud et al. (2005) found that in 16 of the 47 studies they reviewed on breakfast
consumption, children who reported eating breakfast on a consistent basis were less likely
to be overweight.
Fruit juice consumption is not positively associated with weight/BMI; however,
consumption of SSB is positively associated with weight/BMI. Both primary research
by Vågstrad, et al. (2009) and a systematic review by Crowe White et al. (2016), found
that there was no association between fruit juice6 consumption and weight/BMI. Vågstrand,
et al. (2009.) examined the relationship between BMI and fruit juice consumption among
Swedish adolescents (N=481). The authors did not find an association and hypothesise this
could be because adolescents replace beverage consumption, particularly fruit juice, with
meals/food. Crowe White et al. (2016) reviewed 22 studies published between 1995 and
2013 and focused on intake of 100% fruit juice and weight status of children between the
ages of 1 and 18 years. After controlling for energy intake, the authors did not find any
evidence of an association between weight status and 100% fruit juice consumption.
In contrast, positive associations between SSB consumption and body fat and/or weight
were found. Papandreou et al. (2013) found that children and adolescents aged 7 to 15
years (N=607) in schools in Thessaloniki, Greece, who consumed SSBs, were 2.57 times
more likely to become obese than their peers who did not consume SSBs. Consumption was
measured using a 24-hour recall technique over three days, measuring body weight by a
digital scale. The authors found no such association with 100% fruit juices and milk; they
contrast SSB’s “extra empty calories” and “no nutritional benefit” with the former
(Papandreou et al., 2013).
5 B2 and B3,
6 No definition provided for what author considered fruit juice.

Reviews of Scientific Evidence and Policies on Nutrition and Physical Activity
15
Ethnicity
Risk of obesity can vary with ethnicity but it is likely other variables present
explain this variation. Gurnani et al. (2015) indicated that members of certain ethnic
minorities (aboriginal, Hispanic, and South Asian) are more prone to obesity, in addition to
children in low-income neighbourhoods and those in urban areas. In the grey literature, a
recent update briefing from Public Health England (2016) on the National Child
Measurement Programme (NCMP) found that among the million children aged four to five
years (Reception year) and 10-11 years (Year Six), children in Black African communities
were at higher risk (compared to the English national average) of being overweight or
obese: 31.2% of children in Reception and 45.9% of children in Year Six (compared to
22.1% and 34.2% respectively). Among children from Indian backgrounds, obesity levels
were lowest at 14.5% of children in Reception but higher than average in children in Year
Six at 36.3%. A WHO working group evidence review (WHO 2016) found that in the USA
there was higher prevalence of obesity among children from Hispanic (22.4%) and non-
Hispanic black (20.2%) communities compared with white children (14.1%).
The grey literature suggested different reasons for this effect, which indicate that ethnicity
may not be the dominating risk factor. Loring and Robertson (2014) found that childhood
obesity among immigrant groups in Germany was due to socio-economic and environmental
reasons including lower maternal education and excess television viewing. WHO (2016)
attributed ethnic differences in rates of childhood obesity in high-income countries to
maternal obesity. They establish this on the basis that pre-pregnancy obesity is more
common among non-Hispanic black and Hispanic women, compared with non-Hispanic white
women in the USA; non-European migrants compared with European migrants in
Netherlands; and among black and south-Asian women (using an Asian-specific BMI
criterion) compared with white women in the United Kingdom.
Sleep duration
Short sleep duration is associated with obesity but the exact nature of this
association requires further investigation. We found meta-analysis (Cappuccio et al.
2008) systematic review (Patel and Hu 2008) and review evidence (Golem at al. 2014) of
an association between short sleep duration and obesity. Cappuccio et al (2008) conducted
a meta-analysis of studies looking at the effect of short sleep duration and obesity. They
found a significant association between short sleep duration (less than 10 hours) and
obesity in adolescents. The odds ratio of obesity to short sleep duration at 1.89 (1.46 to
2.43), was higher (though not statistically different) than that for adults which was 1.55
(1.43 to 1.68).Patel and Hu’s systematic review found consistent evidence from 11
international cross-sectional studies (from 1992 to 2006) and two cohort studies (from 2004
and 2006) of this association between short sleep duration and obesity for children.
Differences in study design, particularly whether sleep was investigated as a cause or
consequence of obesity and the definition of short sleep duration prevent further analysis of
this association. Golem et al' also reviewed 17 cross-sectional studies as part of a review
and found that this association between short sleep duration (multiple definitions) and
elevated weight status is found in different international settings and is not unique to one
culture.
Physical (in)activity
Physical activity is negatively associated with obesity, particularly moderate-to-
vigorous intensity activity. A systematic review and analysis by Janssen and Leblanc
(2010) examined the evidence on the association between physical activity and health

Reviews of Scientific Evidence and Policies on Nutrition and Physical Activity
16
outcomes among children and adolescents. In an analysis of the 25 different intervention
studies they reviewed, the authors found that the odds of being obese was 33% higher in
the least active group compared with the most active one.7 The studies used a variety of
measures of physical activity including self-report questionnaires, parent surveys,
pedometers, accelerometry and cardiorespiratory fitness/physical fitness.8 Janssen and
LeBlanc also noted that relationships between physical activity and obesity were strongest
and most consistent when moderate-to-vigorous physical activity was used as the measure
of physical activity.
In the grey literature, the GUS study (Parker al. 2012) found no significant relationship
between the weight of children in their sweep 6 birth cohort and two factors relating to
activity, i.e., meeting the recommended guidelines of 60 minutes or more of physical
activity per day and sedentary behaviour indicated by screen time of three or more hours
per day. This was still found to be the case after more sensitive analyses excluding school
physical activity and extended weekend screen time. The authors cite other studies which
did find a link between physical activity and obesity in children and this link is generally
accepted; the methodological limitations of relying on parental self-report for children’s
physical activity measures may explain this discrepancy.
Interpersonal correlates of child and adolescent obesity
A number of factors in an individual’s immediate environment can influence obesity and
obesity-related behaviours, particularly the home environment, parent behaviours and close
family/personal relationships. These findings are discussed below.
Parental health behaviours play a major role in children’s risk for obesity
particularly during gestation and infancy. We found peer-reviewed review evidence
(Brisbois et al. 2012, Baidal et al.2016, Weng et al.2012) and grey literature (Parkes et
al.2012) reporting that different parental factors (maternal or fraternal) during gestation
and infancy can increase the risk of overweight or obesity in children, e.g.:
Maternal pre-pregnancy overweight or obesity
Maternal smoking or pre-natal tobacco exposure or pre-natal tobacco exposure
Excess maternal weight gain in pregnancy
In their systematic review and meta-analysis, Weng et al (2012) found that maternal pre-
pregnancy overweight, and maternal smoking in pregnancy increase the likelihood of
childhood overweight. One of the studies in the review was Dubois & Girard (2006), in
which maternal smoking or high maternal BMI (overweight or obese) (as well as rapidly
gaining weight in the first five months of life) was shown to increase the risk of childhood
overweight. For their study, the authors analysed data from the Quebec Longitudinal Study
of child Development (1988-2002) and which included a sample of 1550 children aged four
and a half years. Results from their analysis showed that having a mother who smoked
during pregnancy and having a mother who was overweight or obese all increased the risk
of overweight by the age of four years.
7 Their review included 86 articles, 56 of which included outcomes related to obesity, of which 31 were observational
(cross-sectional, prospective cohort, case control or mixed) and 25 intervention studies. The studies involved samples of children and adolescents aged 6-19 from the U.S., Mexico, Canada, China, Portugal, Finland, Spain, Brazil, Europe (12 countries), Australia and Greece. 8 According to the Centers for Disease Control and Prevention, physical fitness is, “The ability to carry out daily tasks
with vigor and alertness, without undue fatigue, and with ample energy to enjoy leisure-time pursuits and respond to emergencies. Physical fitness includes a number of components consisting of cardiorespiratory endurance (aerobic power), skeletal muscle endurance, skeletal muscle strength, skeletal muscle power, flexibility, balance, speed of movement, reaction time, and body composition.” https://www.cdc.gov/physicalactivity/basics/glossary/

Reviews of Scientific Evidence and Policies on Nutrition and Physical Activity
17
Baidal et al. (2016) also found that (alongside high birthweight) high maternal BMI pre-
pregnancy, excess maternal weight gain in pregnancy, pre-natal tobacco exposure, and
rapid weight gain in infancy were consistently associated with childhood obesity. Their
review of 282 studies (prospective cohort studies with children between 6 months and 18
years of age) also found evidence to suggest that gestational diabetes, early introduction of
solid foods (before four months of age) and less strong mother-infant bonding could be risk
factors for child obesity (measured between age six months and 18 years) , although this
was not consistent across the studies reviewed.
In the grey literature, Parkes et al’s GUS report (2012) identified a number of statistically
significant associations between individual parental factors in infancy and children’s
overweight and/or obesity at age six. These included: maternal overweight or obesity,
maternal smoking during pregnancy (measured during sweep one), and poor maternal
physical health (ages one, three and five years).
Breastfeeding may have a moderate protective effect on children’s weight. In a
systematic review and meta-analysis of 25 international studies from 12 countries9, Yan et
al. (2014) found that obesity risk10 is lower among children who were breastfed. The
authors used data about feeding patterns in the first year of life (i.e., formula fed,
breastfed, partially breast fed)11 and weight status. Results from the meta-analysis showed
that among children who were breastfed the risk of childhood obesity was 22% lower than
those who were not. In addition, the authors noted a dose-response effect as children who
were breastfed for seven months or more had a lower risk of obesity than those who were
breast fed for a shorter amount of time and the protective effect gradually decreased as the
length of time a child was breastfed decreased. Weng et al. (2012) also found
breastfeeding12 during first year of life had a moderate protective effect against childhood
overweight.
Authoritative parenting is positively associated with healthy dietary behaviours
and negatively associated with child BMI. A systematic review by Berge et al. (2009)
found that authoritative parenting style (high levels of demandingness, high levels of
responsiveness) was positively associated with the child consumption of fruits, vegetables
and dairy products, lower consumption of sugar-sweetened beverages, higher levels of
physical activity and negatively associated with BMI. 81 articles published between 2000
and 2008 were reviewed to assess familial correlates of obesity among children and
adolescents13, thirteen of which assessed the association of parenting style and obesity. The
authors examined associations between authoritative14, authoritarian, permissive and
neglectful parenting styles and BMI, physical activity and dietary behaviour. They also
found that authoritarian and neglectful parenting styles were associated with positive
outcomes as findings indicated a negative association with BMI and negatively associated
with physical activity and fruit/vegetables consumption. Van der Horst et al.’s (2007)
systematic review examining correlates of dietary behaviour found a positive association
between controlling or restrictive parenting practices surrounding food and obesity. In their
9 Countries where the studies included in the meta-analysis took place: Germany (n=5), United States (n=5), Great
Britain, (n=3), Australia (n=3), China (n=2), Japan (n=1), Ireland (n=1), Greece (n=1), Brazil (n=1), the Netherlands (n=1), Czechoslovakia (n=1) and Canada (n=1). Ten studies were cross-sectional and 15 were cohort studies. 10
Measured at ages one to 18 years across the included studies. 11
Different studies looked at feeding patterns at different points up to age 12 months. 12
Children who were ‘ever breast fed’ included those who exclusively breastfed, ever breast fed, or fed a mixture of breast and formula milk during first year of life. 13
No information regarding the countries where the studies took place was readily available. 14
An authoritative parenting style balances high levels of demandingness and high levels of responsiveness; an authoritarian parenting style exhibits high levels of demandingness with low levels of responsiveness; a permissive parent expresses low levels of demandingness and high levels of responsiveness; and a neglectful parent exhibits low levels of demandingness and responsiveness.

Reviews of Scientific Evidence and Policies on Nutrition and Physical Activity
18
review of 58 studies focused on youth aged three to 18 years15, both of the two studies
examining parenting style and dietary behaviour found that an authoritative style was
associated with greater fruit and vegetable consumption.
More broadly, nutritional and physical activity practices modelled or permitted by
parents have an impact on the weight of their children.
Van der Horst et al.’s 2007 review also identified the role of parental modelling around fruit
and vegetable consumption in positively influence children’s behaviour, and their
encouragement to be an important factor in children’s consumption. The authors found an
inverse relationship for energy intake with encouragement, offering assistance and giving
prompts to increase intake during meals. Berge (2009) also noted the parents who had
regular family meals had children with a lower BMI and healthier dietary intake.
In the grey literature, Parkes et al. found that alongside the parental influences described
above, the following factors had a significantly strong relationship with overweight or
obesity age six:
nutritional practices of children (as controlled/permitted by parents): eating the main
meal in a room without a dining area (ages two and five years); Skipping breakfast
(age five years); use of a local takeaway restaurant (age six years);
sedentary behaviour (as controlled/permitted by parents): TV in child’s bedroom
(ages four and five years); Screen time (ages four to six years); and low levels of
parental supervision.
Parental low socio-economic status and educational attainment is associated with
increased risk for overweight/obesity and related health behaviours in their
children. In their secondary analysis of six cross-sectional European datasets16 to examine
overweight and obesity among pre-schoolers four to seven years of age, Van Stralen et al.
(2012) found an association between low parental SES (measured by parental education
level) and child overweight.
In the grey literature, a WHO (2017a) a report analysing trend data from the European
cross-national Health Behaviour in School-aged Children (HBSC) survey (from 2002 to
2014) found that obesity among European adolescents attributable to household
socioeconomic inequalities rose from 18% in 2002 to 22% in 2014. Adjusting for any other.
factors, Parkes et al (2012) found a significant association between lower maternal
educational attainment and other family constraints and a child being overweight or obese
at age six years. These included: the absence of a biological father in a household; low
average household income (bottom 40% for Scotland) at ages one to five years (only
significant for percentage of obese children); and whether the cost of food affected their
mother’s ability to prepare food (significant at age five years but not age two years). Data
from the English NCMP 2013/14 wave reported in Health and Social Care Information Centre
(HSCIC) 2015 found that boys and girls from the lowest quintiles (22 and 21 %) were most
likely to be obese, compared to boys and girls from the highest quintile (seven and six %
respectively). Mean BMI varied from 17.4 for boys and 17.5 for girls in the highest income
quintiles rising to 18.7 and 19.2 respectively in the lowest income quintile.
The direction of association between different aspects of socioeconomic status and
obesity in children can vary according to national context Hruby and Hu’s (2015)
review of epidemiological evidence on obesity published within the last decade found that
although wealth has historically been positively associated with obesity, this link has
reversed in high income countries . Those who are at or below the level of poverty
15
Studies included in the review took place in North America, Europe, Oceania and Asia and were published between 1980 and 2004. 16
Belgium (N=1,434); Bulgaria (N=726); Germany (N=2,956); Greece (N=708); Poland (N=375); Spain (N=273)

Reviews of Scientific Evidence and Policies on Nutrition and Physical Activity
19
appearing to have the highest rates of obesity. Higher education seems to play a protective
role in high income and transitioning countries.
Family dynamics and sibling behaviour can also influence weight status. De Vet
et.al’s (2011) review identified family cohesion as an important factor related to dietary
behavior in adolescents. Siblings appear to also influence weight status as well. Berge’s
(2009) systematic review of articles published between 2000 and 2008 that assessed
familial correlates of child and adolescent obesity found sibling weight teasing to
significantly impact emotional and physical health. Van der Horst et al.’s (2007) review also
identified sibling consumption to correlate with dietary behaviour.
Institutional and organizational level correlates of child and adolescent obesity
In contrast to individual and interpersonal factors, our review found limited evidence in the
peer reviewed literature relating to associations between different settings and child obesity.
No evidence was identified in the grey literature. The settings noted in the limited evidence
identified were in the school setting.
School opportunities show evidence of effective physical activity but the role of
the school environment is inconclusive. In a study by Drake et al. (2012) the authors
examined the influence of physical education, sports and active commuting on weight status
among a sample of 1718 adolescents aged eight to 12 years in the U.S. Adolescents were
surveyed about their sports team participation, hours of physical education classes,
extracurricular activities and commute to school as well as self-reported height and weight.
The authors found a negative association between sports team participation (> two teams
versus zero), active commuting (> three and a half days versus zero) and overweight and
obesity17 but no association between levels of physical education and overweight or obesity.
Katz et al. (2008) found that school-based nutrition and physical activity interventions
resulted in significant reductions in weight, particularly when both physical activity and
nutrition interventions were implemented together. They conducted a systematic review and
meta-analysis of 19 different international school-based obesity prevention approaches.18
Community level factors in child and adolescent obesity
Associations between the food environment and obesity were found in some
studies but not all. In a 2014 study by Cetateanu et al. (2014), the authors examined the
relationship between food environments, deprivation and childhood obesity in England,
finding a significant positive association between fast food density and obesity. Data from
the National Child Measurement Programme (NCMP) was used for the study focusing on
data collected in 2007-08 and 2009-2010. The study focused on children four or five years
old and 10 or 11 years old with an average of 186 four-five year olds and 192 10-11 year
per Middle Super Output Area (MSOA).19 Weight status was recorded at school and
measures of the food environment where calculated using a geographic information system
(GIS). Findings from Cetateanu et al.’s analysis showed significant positive associations
between fast food density and child obesity; however, the relationship was strongest in the
older age group (10-11 year olds). In examining the density of healthy food outlets, the
authors found an association with prevalence of obesity.
17
Defined as ≥85th percentile and ≥95
th percentile respectively
18 21 sources representing 19 studies were included in the review. The studies were focused on assessing the impact
of physical activity and/or nutrition interventions in elementary and middles schools in the U.S. (n=10), Thailand, England (n= two), Australia, Jerusalem, Greece, Chile, Taiwan and the United Kingdom. All studies measured BMI as the outcome except for three that used weight alone. 19
“The MSOA is a UK Census geography designed for small-area statistical analyses (ONS, 2011) with an average population of 7500.” (Cetetanua et al. 2014 p. 69)

Reviews of Scientific Evidence and Policies on Nutrition and Physical Activity
20
Cobb et al., (2015) conducted a systematic review of the literature examining the
relationship between the food environment and obesity. Twenty two of 71 included studies
were of children. Fast food outlets, supermarkets or convenience stores were the elements
of the food environment most commonly assessed using measured as counts or proximity.
The authors found that the majority of studies did not find a significant association between
the food environment and obesity overall. However, there was a significant positive
association observed between fast food density/proximity and obesity among low income
children.
Survey data in the grey literature indicates that higher levels of deprivation in the local
environment correlate with obesity. Data from UK national surveys (HSCIC 2016, Keenan et
al. 2011) looked at the NCMP in 2014/15 and identified a similar relationship to that
described in the peer-reviewed Cetateanu et al. (2014). 12% children in Reception year
(aged four or five years) in the most deprived areas were obese compared to six per cent in
the least deprived areas. Among children in Year Six (aged 10 or 11 years) this rose to 25%
of children in most deprived areas compared to 12% of children living in least deprived
areas. This difference in obesity prevalence among children living in different levels of
deprivation has increased over time; between the 2007/8 and 2014/15 waves of the NCMP,
the difference between obesity prevalence among children aged four or five in the most and
least deprived areas increased from 4.6 to 5.5 percentage points. Among children in Year
Six between the same two waves the difference increased from 8.9 to 12.0 percentage
points.
3.1.3 Factors associated with obesity and overweight in adults
Individual-level correlates of adult obesity
The peer-reviewed and grey literature identified a variety of individual-level factors
associated with obesity in adults, many of which closely resembled those found for children
and adolescents. The particular aspects of how they apply to adults are discussed below.
Birthweight
The evidence for an association between high birthweight and obesity is not
conclusive for adults. We found evidence of a positive relationship between high
birthweight and obesity in early adulthood from a systematic review and meta-analysis (Yu
et al. 2011) and cohort study (Rooney et al.2011). Another systematic review and meta-
analysis established a similar relationship between high birthweight and long-term
overweight risk but did not specify this as obesity (Schellong 2012). As part of their
systematic review Schellong et al. found that 94 of the 108 studies included (87%) reported
a positive association between birthweight and later risk of overweight while only 7 studies
(6.5%), reported no relation between birth weight and later risk of overweight. They
subsequently conducted a meta-analysis of 66 studies from 26 countries and five
continents, including 643,902 persons aged 1 to 75 years. This analysis found a significant
positive relationship between birth weight and later overweight risk (p<0.001). Rooney et
al. in their 2011 cohort study of 777 children found that higher birthweight was a main
predictor of obesity in young adulthood (19-20 years) (Rooney et al.2011). However, in
their systematic review of early markers of obesity Brisbois et al. (2011), found no clear
conclusion for a positive association between higher birth weight and either higher adult
BMI, overweight or obesity. While 25 studies they reviewed showed this positive
association, 18 did not.
The relationship between birthweight and adult obesity may vary by gender but
this is also not conclusive Jornayvaz et al (2016) looked at women and men in
Switzerland and found associations between low and high birthweight and a lower likelihood
to be normal weight as middle aged (35 – 75 years old) adults. Further, they found that
high birthweight was associated with a greater propensity for abdominal obesity in
adulthood. While they observed these findings for both women and men, the results were

Reviews of Scientific Evidence and Policies on Nutrition and Physical Activity
21
statistically significant only for women. However, Curhan et al (1996) did find that high
birthweight was associated with an increased risk of obesity in men.
Weight gain and obesity in early childhood
Rapid weight gain in early childhood, early adiposity rebound and childhood
obesity may have strong associations with adult overweight or obesity A review by
Brisbois et al. (2012) of potential early markers for adult obesity found a strong, consistent
association between rapid weight gain in early childhood, early adiposity rebound20 and
childhood obesity with obesity later on in life. They considered 16 studies which explored
child growth variables relating to children under 5 compared with adult cohorts aged 18-50.
All of them except one found some association between rapid growth in early childhood and
adult obesity. Two studies found this association for females only while others found it for
both sexes. Among the large number of studies reviewed about childhood obesity (n=24) a
consistently significant positive association was reported between childhood obesity aged
less than 5 years old and adult overweight or obesity. Both Brisbois et al. (2012) and Small
et al. (2007), highlight the adiposity rebound period during childhood as one of increased
risk for the development of obesity. If a child is already overweight when adiposity rebound
occurs or rapidly gains weight during this period, they have an increased risk of becoming
obese (Small et al. 2007). Additionally, adiposity rebound occurring before the age of 5
years is also associated with an increased risk of adult obesity.(Brisbois et al. 2012)
Medical conditions
Medical conditions and medications can make it difficult to maintain a healthy
weight for adults. In a clinical review of obesity prevalence and risk factors, Haslam et al.
(2008) identified diabetes and polycystic ovarian syndrome (PCOS) as possible medical
conditions that make it difficult to reduce one’s weight. Additionally, they found that mental
illnesses such as depression can make it difficult to maintain a healthy weight and the
medication used to treat mental conditions may also contribute to overweight and obesity.
This was reinforced by Gurnani et al. (2015) who identified antipsychotic and high dose
glucocorticoids as particular medications that may contribute to obesity.
Nutritional behaviours
We acknowledge there is a large body of evidence relating to different eating patterns and
their relationship with weight status. Therefore q we present here that the evidence which
emerged from our included sources. As with children and adolescents, the relationship
between certain nutritional behaviours and weight status is explored in further detail in two
other reviews in this series, B2 and B3.
A similar positive association between increased SSB consumption and increased
body fat and/or weight was found among adults. We found a systematic review and
longitudinal evidence that established this association in adults (Malik et al. 2016, Funtikova
et al. 2015). Malik et al. in a systematic review of research from 1966 to 2005 concluded
that, though there remained a need for more research, “sufficient evidence” exists linking
SSB consumption to weight gain and obesity.21 Funtikova et al. (2015) conducted a
longitudinal study in Girona, Spain that found an increase of 100 kcal of SSB consumption
20
Adiposity rebound is defined by Brisbois et al as the’ physiological milestone whereby child growth (BMI) reaches a minimum level (usually between 4 and 8 years of age), and then BMI starts to increase again.’Early adiposity rebound was classed as younger than 5 years of age by studies considered in this review. http://onlinelibrary.wiley.com/doi/10.1111/j.1467-789X.2011.00965.x/full 21
From 264 results (from MEDLINE keyword and Medical Subject Headings (MeSH) searches) they reviewed 30 English-language studies of at least six months’ duration that included at least one endpoint measurement of weight or body size. They avoided a quantitative meta-analysis, since the diversity of study designs (particularly between their samples and/or populations of interest) made useful comparisons difficult. Instead, they discussed common themes and gave particular attention to large cross-sectional (with over 10,000 participants), prospective cohort, and experimental studies.
Reviews of Scientific Evidence and Policies on Nutrition and Physical Activity
22
was associated with a 1.1 cm increase in waist circumference among 2,181 Spanish men
and women aged 25 to 74 years.22 The authors also found that substitution of 100 kcals of
SSBs with 100 kcal of milk was associated with a 1.3cm decrease in waist circumference
and substitution with 100kcal of juice was associated with a 1.1 cm decrease in waist
circumference.
The association between consumption of artificially sweetened beverages
(ASB)/diet soda and body fat appears less well established. Evidence from two
longitudinal studies (Fowler et al. 2015 and Ma et al. 2016) reported conflicting findings on
the association between artificially sweetened beverages (ASB)/diet soda consumption and
body fat. Fowler et al. were concerned strictly with the ASB consumption of an older (at
least 65 years of age) cohort (n=749), reporting a mean change in waist circumference over
the study period of almost three times as great among ASB consumers compared with non-
consumers; among daily consumers, this increase was four times as great. By comparison,
Ma et al. (2016) found a positive relationship between increased SSB consumption and body
fat (visceral abdominal adipose tissue (VAT) (p <0.001), but no relationship for ASB
(p=0.38). As these two studies on ASB incorporated different outcome measures (waist size
versus CT measurement of VAT) among different groups of people, they are presented to
highlight the complexity of the relationship between ASB consumption and overweight
and/or obesity, rather than make firm conclusions.
Socio-economic status
Socio-economic status was also highlighted as being an important determinant of
weight for adults, but potentially affected by gender as well as national socio-
economic influences. In our included grey literature findings we identified several sources
including a review of reviews and survey data that found the association between
socioeconomic status and obesity was stronger for women than men, and that national
context may affect whether this association is positive or negative. (Aguirre et al. 2016,
Health and Social Care Information Centre (HSCIC) 2016, HSCIC 2015,Loring and
Robertson 2014, Keenan et al.2011, Robertson et al.2007) Robertson et al. (2007) found
that over 20% of the obesity found among men and over 40% of the obesity found among
women was attributable to inequalities in socio-economic status.23 Loring and Robertson’s
(2014) report on obesity and inequities for WHO Regional Office for Europe found that
people in lower socio-economic groups (SEGs) are getting heavier at a faster rate than
those in higher SEGs, being more than two-thirds more likely to be obese; and that 50% of
obesity in women is associated with low educational attainment.
A UK statistical analysis of Health Survey for England (HES) 2014/15 data (Health and
Social Care Information Centre HSCIC) 2015, 2016)24 found no relationship between having
a lower income and higher mean BMI for men but found a stronger inverse association for
women, with women in the lower income quintiles having a higher mean BMI and also
higher waist circumferences. This pattern was also described in the Scottish Health Survey
(Keenan et al. 2011) special report on obesity which in its analysis of data from the 2008,
2009 and 2010 surveys found that income was more strongly associated with obesity in
women than men. The proportion of women with BMI>30 rose significantly as income
22
The sample was randomly generated and population-based and studied in 2000 and 2009, with 2,181 individuals participating in both rounds of examination. Assessments comprised of waist circumference measurements and self-reports of diet via a food frequency questionnaire listing 166 food items. 23
They conducted an evidence review for the European Commission of systematic reviews from 1997 to 2007 on obesity interventions (controlled and non-controlled studies). 24
HSCIC 2016 updates some of the information in HSCIC 2015 but not all the same areas are covered. Both reports are therefore discussed, indicating where information appears in both or only one.
Reviews of Scientific Evidence and Policies on Nutrition and Physical Activity
23
decreased, peaking in quintile four25, whereas there was a much weaker association in men,
with no clear pattern.
This particular impact on women was also emphasised in Aguirre et al.’s (2016) review (for
WHO Regional Office for Europe) on determinants of health for women. They caution though
that this gendered effect may not be evident across all EU Member States; they identified
Eurostat data which found higher rates of overweight adults and children in the richest
quintiles of eastern Europe.
Sleep duration
The relationship between short sleep duration and obesity in adults may be less
conclusive than for children. Cappuccio et al (2008), in their meta-analysis of studies
looking at the effect of short sleep duration and obesity, also found a significant association
between short sleep duration (less than 6 hours) and obesity in adults. The odds ratio of
obesity to short sleep duration was 1.55 (1.43 to 1.68). Patel and Hu (2008) in their
systematic review of cross-sectional studies of the link between sleep duration and weight
gain, did find the existence of an association between these variables for adults- there was
a clear association found in 11 of 19 studies reviewed. However, they found the findings to
be less consistent for adults than in the paediatric literature: the inconsistency in study
design, the nature of the association being modelled and differences in definition of sleep
duration led them to conclude that quantitative synthesis through meta-analysis was not
possible.
Interpersonal factors in adult obesity
The association between some parental influences and obesity is maintained into
adulthood. Of 42 variables that Brisbois et al. (2012) considered as part of their review of
potential early markers of obesity, they found seven to have consistent relationships with
adult obesity. Three maternal influences for adults had positive associations with adult
obesity: maternal BMI (significantly positively associated with development of adult obesity
in their children), maternal weight gain during pregnancy (strongly associated with higher
adult BMI) and maternal smoking (weakly-to moderately associated with increasing risk of
developing adult obesity for their children.) Father’s lower employment status (taken as a
proxy for SES, measured as type of employment).was also found to be associated with
increased risk of adult obesity in offspring. More evidence was found for the association
between maternal obesity and adult obesity and father’s employment and adult obesity, but
the associations identified in the studies relating to maternal smoking and maternal weight
gain was still of a consistent nature. Rooney et al. (2011) also found that maternal smoking
and maternal weight gain are main predictors of obesity in early adulthood (19 – 20 years).
Across their review of predictors of obesity at three developmental points, Rooney et al.
found that maternal obesity was the strongest predicator of obesity at all three points.
Community level factors in adult obesity
The variation in evidence for environmental influence on child obesity was also
found in literature looking at adult obesity. Among disadvantaged groups (low SES,
African ancestry, or Hispanic ethnicity) Lovasi et al. (2009), in a systematic review of 45 US
studies (from 1995 to 2009), found consistent associations between a number of
environmental correlates of obesity or related health behaviors and BMI. Studies examined
the following environmental features: food environment (presence of supermarkets,
convenience stores, restaurants and fast food) (n=20), walkability (n=10), places to
exercise (parks and trails, sidewalks) (n=18), or aesthetics and safety (n=15). These
environmental factors were assessed in relation to BMI, dietary intake (e.g., fruit and
vegetable consumption) and/or physical activity among these groups. The review found
25
Quintiles relate to Scottish Indices of Multiple Deprivation.
Reviews of Scientific Evidence and Policies on Nutrition and Physical Activity
24
fairly consistent associations between lack of supermarkets and higher BMI within
disadvantaged populations. In contrast, 47 of the 71 studies reviewed by Cobb et al. (2015)
examining the relationship between the food environment and obesity relating to adults did
not find a significant association between the food environment and obesity overall.
However, there was a trend toward a negative association between supermarket proximity
or density and adult obesity.
In the grey literature, data from UK national surveys (HSCIC 2016, Keenan et al. 2011)
found obesity prevalence increased with the level of area deprivation but was only
significant for women, thus mirroring the relationship between individual socioeconomic
status and obesity. Thirty-three per cent of women surveyed in the Health Survey for
England (HSE) 2014 who lived in the most deprived areas were obese compared to 22% of
women living in the least deprived areas.26 In the Scottish Health Survey (Keenan et al
2011) report on obesity, the proportion of women BMI>30 rose across deprivation quintiles.
The proportion with BMI>30 was approximately 50% higher in the most deprived quintile
than the least deprived quintile (33% vs. 19%). Men had a similar pattern but the increase
was of a lower magnitude.
3.1.4 Factors associated with physical (in)activity in children and adolescents
Individual-level factors in child and adolescent physical (in)activity
The peer-reviewed and grey literature identified a variety of individual-level factors
associated with physical activity. These included demographic and ethnic factors.
Demographic characteristics
Findings suggest that physical (in)activity and sedentary behaviour among
children and adolescents is associated with age, gender and socio-economic
status. Kopcakova et al. (2017), using data from the 2014/15 Health Behaviour in School-
aged Children (HBSC) survey, found that younger adolescents, boys, and adolescents from
families in higher socio-economic positions were more likely to meet physical activity
recommendations. They also found that older adolescents and boys tend to participate in
more excessive screen-based activities. They analysed data from 13,800 13 to 16-year-old
school children (average age 14.4, 49.4% male) in four countries (Czech Republic,
Germany, Poland, and Slovakia).
Ethnicity
The relationship between ethnicity and physical activity levels among children
appears inconclusive and highly varied in the grey literature. Analysing data from the
HES 2004, the UK National Obesity Observatory (Gatineau and Mathrani 2011) reported a
wide variation in physical activity and dietary patterns in minority ethnic groups, but that
there are particular issues affecting those of South Asian origin. The GUS study (Parkes et al
op. cit.) found that children age six years from minority groups in Scotland were
significantly less likely than their white counterparts to meet the recommended guidelines of
60 minutes physical activity per day (p<0.001) but given the very small sample of children
from ethnic minority backgrounds within the birth cohort being measured(3% of total
sample) , the strength of these findings is limited.
Interpersonal factors in child and adolescent physical (in)activity
Parental behaviours may have an association with child (in)activity at different
ages but the evidence is not conclusive. Ferreira et al. (2007) conducted a systematic
26
Based on UK Government’s Department of Communities and Local Government Index of Multiple Deprivation quintiles.

Reviews of Scientific Evidence and Policies on Nutrition and Physical Activity
25
review of 150 cross-sectional and longitudinal studies published between 1980 and 200427
to examine the environmental correlates of physical activity among youth. The authors
examined a variety of environmental factors including those in the home environment.
Considering parenting behaviour specifically, Ferriera et al. found evidence to suggest the
father’s physical activity behaviour is positively associated with child physical activity,
whether the child is male or female. However, findings examining the influence of mother’s
physical activity was more often associated with girls’ physical activity than boys’. Several
studies included in the review assessed the influence of parent behaviour on future physical
activity (prospective studies) and did not find an association but more research is needed.
In a 2015 systematic review of 37 studies from 1990-2014, examining sedentary behaviour
and socio-economic status, Gebremariam et al. found that parental modelling regarding
television viewing was an important correlate of children’s viewing behaviour and was also
correlated with socio-economic position. The studies included in the review were cross-
sectional and longitudinal and included samples of children and adolescents between the
ages of three and 17 from North American and Europe. Findings from the study indicate
that parents of lower socio-economic position are more likely to model higher levels of TC
viewing, more likely to spend time watching TV with their child and more likely to eat meals
in front of the TV all of which increase total sedentary time.
De Vet et al. (2011) conducted a systematic review of 18 reviews representing 671 studies
to identify environmental correlates of physical activity and diet among youth (children <12
years; adolescents >12 years). The authors found that parent modelling and support was
not consistently associated with physical activity. However, the three reviews examining if
child age moderated the relationship between parent physical activities/modelling and child
physical activity all found that parent activity seemed to have a consistent association
among children but not adolescents. With regard to parent modelling and dietary behaviour,
de Vet al al. found consistent positive associations with child dietary behaviors across the
reviews included in their synthesis. They also found modelling and parental monitoring to
correlate with physical activity.
In the grey literature, Parkes et al (2012.) also analysed links between parental factors and
physical activity levels (in terms of the recommended guidelines of 60 minutes or more per
day) and screen time of children (interestingly, they found no significant association
between maternal obesity levels and the physical activity behaviour of their children). For
physical (in)activity, of the many different variables and influences they analysed, they
found significant associations between:
Maternal levels of physical activity (less than the recommended levels, longer screen
time)28
Less warmth in the mother-child relationship
Maternal attitudes that less than 60 minutes per day? is sufficient activity for
children.
Community level factors in child and adolescent physical (in)activity
Among children and adolescents, two reviews found evidence of positive
associations between environmental factors and physical activity. De Vet et al.’s
(2011.) systematic review of 18 reviews examined a variety of interpersonal (e.g., SES,
family size, parental modeling, home environmental), school (school type [private versus
public], school facilities, school location) and neighbourhood environment (SES,
infrastructure, facilities, safety) factors, as well as climate and geographic location (e.g.,
27
Studies were conducted with children aged 3-12 years and adolescents aged >12-18 years from North America, Europe and Oceania. 28
This was measured at sweep 5

Reviews of Scientific Evidence and Policies on Nutrition and Physical Activity
26
rural/urban) for their relationship with physical activities. The review found the following
environmental factors as having consistent positive associations with physical activity
among children and adolescents: teacher SES, specific school types (i.e. public schools,
higher level schools), school facilities for physical activity, neighborhood facilities for
physical activity and traffic safety. In addition, school and neighborhood level factors were
more consistently related to physical activity than interpersonal factors, climate or
geographic location.
Kopcakova et al. (2017.) in their review of HBSC data found that a higher perception of the
environment as more activity-friendly was significantly associated with greater likelihood
that adolescents meet the recommendations for the amount of daily physical activity in the
four countries included. The perception of a more activity-friendly environment was also
associated with lower odds of excessive screen-based activities. The perceived environment
was measured using a five-item scale based on the European Youth Heart Study.
While the statistical bulletin did not speculate on reasons for this link, other grey literature
looked at environmental factors which may have a negative impact on levels of physical
activity. The GUS study (Parkes et al 2012.) found significant associations between
children’s physical (in)activity, their access to leisure facilities (green spaces and swimming
pools),their length of daily screen time and both access to a garden and parent’s rating of
neighbourhood facilities. Children aged six who were active for less than 60 minutes a day
(including school activity) were more likely to live in areas without playgrounds or parks
(p<0.05) and without swimming pools (p<0.01). Children aged six who had weekday screen
time of three hours or more: were less likely to have a garden (p <0.001); more likely to
live in areas that their parents felt did not have good green spaces; had fewer safe places to
play; and spaces that were less safe and child-friendly. (p<0.001). The methodological
difficulties, in ensuring consistent understanding of terms and rating of local areas by
parents makes these findings hard to replicate but they do illustrate how the local
environment can potentially impact on the health behaviours of children.
3.1.5 Factors associated with physical (in)activity in adults
Individual-level factors in adult physical (in)activity
Socio-economic status (particularly educational attainment) was also found to be
associated with physical activity levels in adults, but the relationship is non-linear.
Aguirre et al (2016) reviewed Eurostat data that showed women in selected countries in the
WHO Europe Region with only primary or lower-secondary education had lower rates of
physical activity than those with higher levels of education. However they also found that
women with tertiary education were less physically active than those with secondary,
suggesting that this relationship is not straightforward. A WHO 2006 (Cavill et al. eds.
2006) literature review reports that this is because people with lower incomes have less free
leisure time, poorer access to leisure facilities and living environments that do not support
physical activity. This environmental aspect is discussed further below in the section on
community-level factors.
Interpersonal factors in adult physical (in)activity
Social support has a positive influence on physical activity. In their national cross-
sectional panel survey of U.S. adults (n=5,914) over a three-month period, Blanchard et al.
(2005) measured the effect of weight, social support, self-efficacy, and access to workout
facilities on physical activity. The authors found that the level of social support received by
each weight group (healthy weight, overweight, obese) was similar and had a significant
positive association with physical activity for all three weight groups. Results also showed
that for normal weight and overweight individuals, as the level of social support increased,
the number of days of physical activity engagement was greater if they reported higher

Reviews of Scientific Evidence and Policies on Nutrition and Physical Activity
27
levels of self-efficacy. Self-efficacy was significantly lower in obese participants compared to
the normal weight and overweight participant groups.
Being married/co-habiting is associated with more, and having children is
associated with less, sedentary time. Wendel-Vos et al. (2007) reviewed 47 publications
to identify determinants of physical activity in adults. Social support and having a
companion for physical activity were found to be convincingly associated with different types
of physical activity. O’Donoghue et al. (2016) conducted a review of 74 studies to identify
determinants or correlates of physical inactivity (sedentary behaviors) among adults aged
18-65 years. A trend towards increased amounts of leisure screen time was identified in
those married or cohabiting while having children resulted in less total sitting time.
Community level factors in adult physical (in)activity
There is some evidence that environmental access influences physical activity
levels, however the relationship between varies in strength and measurement and
by population group. De Bourdeaudhuij et al. (2005) conducted a cross-sectional study
(N=526) in two cities, one in Portugal (n=526) and one in Belgium (n=279), to investigate
the environmental and psychosocial variables in explaining physical activity levels of adults.
Though there were differences in the two European cities, adults in both sites reported
environmental factors, such as sidewalk availability, higher connectivity of streets, and
higher residential density, as facilitators of walking or cycling for transportation, exercise,
and recreation. Leisure-time physical activity was more related to the presence of
recreational resources, either in the home or the community, as well as social support and
social norms that increased the pleasure of physical activity during leisure-time for adults in
both cities. De Bourdeaudhuij et al., also found that leisure time/ recreational physical
activity was also associated with perceived benefits and barriers and self-efficacy.
Wendel-Vos et al.’s (2007) systematic review of 47 international articles on determinants of
physical activity among adults found that access to trails was consistently associated with
greater active commuting and access to physical activity equipment was consistently
associated with vigorous activity. 29 Access, availability and convenience of recreational
opportunities was also positively associated with physical activity and this relationship
between the environment and physical activity did not differ by gender. Similar to other
reviews however, the authors noted the literature included in the review presents limitations
given that studies use a variety of environmental and behavioural measures to assess
relationships, some of which are not validated, and much of the research was focused on
cross-sectional designs.
In contrast to the associations described above, O’Donoghue et al. (2016) found
inconsistent associations between sedentary behavior and the following environmental
factors:
Neighborhood SES;
Highly walkable neighborhoods;
Presence of aesthetic features in the environment;
Close proximity/access to destinations or facilities; and
Perception of a safe environment.
29
Studies included in the review were conducted with adults 18 years or older and were based in the U.S. (n=23), Australia (n=12), Europe (n=6) Canada (n=3) and Indonesia (n=1). Across the studies included in the review, physical activity outcomes were assess as walking, general physical activity, moderate activity, vigorous activity, cycling and sedentary time. Environmental factors assessed in the studies included those in the physical environment (aesthetics, accessibility of facilities, availability of recreational facilities, urban sprawl, traffic volume/safety, or streetlights), socio-cultural environment (safety from crime, social support, unattended dogs), and economic environment (costs associated with physical activity, household income).

Reviews of Scientific Evidence and Policies on Nutrition and Physical Activity
28
However, the authors did find that presence or proximity of green space was negatively
associated with sedentary behavior; and weather, when reported as a barrier, was positively
associated with sedentary behaviour. The authors noted that some of the inconsistency in
findings across studies might be explained by the different measures of sedentary time,
physical activity and environmental factors used.
3.1.6 Early warning indicators
From this wide overview of different factors associated with child and adult overweight,
obesity and physical (in)activity, several appear to be more suitable for use as early
warning indicators for obesity, because either they link childhood characteristics with adult
obesity (e.g. early weight gain or early adiposity rebound) or a relationship with child
obesity continues into adulthood. (maternal BMI and maternal smoking). As birthweight is
only consistently associated with child rather than adult obesity, this has less value. There
are fewer obvious candidates for predicting physical inactivity. This is discussed further in
the next review question.
3.2 Research Question 2: What factors could be of use as early warning
indicators of overweight and obesity (and physical inactivity) prevalence and trends?
3.2.1.1 Summary
Little evidence was found in either the peer-reviewed or grey literature that
answered this question directly – the concept of an ‘early warning’ indication
system was not a common one.
One interpretation of ‘early warning’, following the life-course conceptual
framework, is that variables and measures of child overweight, obesity and
physical (in)activity prevalence and trends might serve as providing
indications of trends in the adult population yet to come.
The grey literature on obesity surveillance, ideal and existing, suggests some
variables which might be suitable for trend monitoring, but do not match
variables identified as suitable for predicting adult obesity
Determinants found to be predictors of adult obesity – maternal smoking and
maternal BMI are potentially suitable indicators if measured nationally.
Genetic variables have found to be unsuitable for measuring population
health trends while the association between socioeconomic factors and
ethnicity and obesity are not sufficiently closely associated to be suitable.
We might also consider measures of overweight, obesity and physical
(in)activity that can be measured using monitoring systems that provide
more immediate, or ‘early’, data than official statistical returns (which often
involve a time lag). The mechanisms for doing this are considered in relation
to question three.
These variables include BMI levels, adiposity rebound, nutritional and
physical activity behaviour, and greater birthweight of children.
Although the standard recommended measure, both the peer-reviewed and
grey literature express some caution on suitability of using BMI as a way of
measuring overweight and obesity, finding that it may produce false
categorisations of obesity among athletic individuals; other measures of

Reviews of Scientific Evidence and Policies on Nutrition and Physical Activity
29
overweight and obesity are considered instead.
The lack of evidence dealing with the concept of ‘early warning indicators’
would appear to be a gap that would benefit from further research and
analysis beyond the scope of this review.
Despite the extensive number of variables of overweight, obesity and physical (in)activity
discussed above relating to research question one, and some literature which explored
‘predictors’ or ‘early markers' of obesity, there was limited evidence in the peer-reviewed
and grey literature that discussed which of these variables might work as ‘early warning
indicators’. We therefore approached these questions in different ways by (i) considering
existing indicators of child obesity which might be understood (according to the life course
model), to be strongly predictive of adult obesity and (ii) discussing measures which might
provide ‘early’ information about obesity trends before release of official statistics. We did
not identify literature that discussed which variables can be used to predict physical activity
trends.
3.2.2 What are indicators?
A definition for indicators was provided in the grey literature. Drawing on lessons from the
wider literature Vershuuren et al. (2014), in their chapter on monitoring health in Rechel
and McKee’s (eds.) book on public health in Europe, define indicators as “a concise
definition of a concept meant to provide maximal information about an area of interest.”
(p.29). They stipulate therefore that indicators should:
Provide a specific target action; and
Do so in the most efficient way, using the “simplest possible numerical presentation,
calculated from basic data, to give a robust view of the situation.” (Vershuuren et al.
2014)
We concluded therefore that one way of understanding early warning indicators is via
evidence of factors (variables or behaviours) with a concise numerical relationship with
either child obesity or adult obesity whilst also suggesting a clear area for intervention.
3.2.3 Measures of child obesity and their suitability as early warning indicators
The peer reviewed literature considered that rapid growth or early adiposity
rebound may be important predictors of future obesity among children. Brisbois et
al found that the association between both rapid growth in infancy and early childhood and
early adiposity rebound with adult obesity was a strong one – the review by Small et al
(2007) also emphasised this association. Closely monitoring children’s growth patterns
during this period therefore may give parents and clinicians insight in to potential long term
risks for children to develop obesity - this could be the target action of this indicator.
3.2.3.1 Existing health indicators and their suitability as early warning indicators
In the grey literature, the 2013 evaluation of the European Core Health Indicators (ECHI)
(Public Health Evaluation and Impact Assessment 2013) found many health systems across
Europe use descriptive indicators for monitoring and forecasting, rather than action-
orientated indicators. These would therefore not necessarily require the specific target policy
actions described by Vershuuren et al. (2014.). The ECHI, which were developed between
1997 and 2002, cover all areas of public health. The indicators relating to obesity and
physical activity include BMI, fruit consumption; vegetable consumption; breastfeeding;
physical activity levels and social support, all of which we have described above in relation
to question one. The evaluation found that the indicators are general widely used across
Europe suggesting that monitoring these behaviours among children (including levels of
breastfeeding among their mothers) as early warning indicators of adult population trends
might be accessible and achievable for European Member States.
Reviews of Scientific Evidence and Policies on Nutrition and Physical Activity
30
NHS Health Scotland (Scottish Government 2016) introduced an Indicator Framework to
measure the success of their Prevention of Obesity Route Map. Indicators are categorised as
short-term, intermediate and long-term and include:
Prevalence of adult overweight and obesity (measured by BMI);
Prevalence of children at risk of overweight (including obesity);
Prevalence of Type 2 Diabetes
Total and saturated fat, added sugar consumption levels per household
Adult and child physical and sedentary activity levels
Volume of sales of soft drinks with added sugar; and confectionary biscuits, cakes
and pastries
Adult and child active travel to work and school
These indicators reflect the different levels of determinant discussed in question one, and
relate to information already collected by national surveys and agencies in Scotland.
While useful for understanding current trends, from our review in question one however, it
does not appear that any of these indicators can be used to predict adult obesity. They are
therefore not suitable as early warning indicators.
3.2.3.2 Variables with adult obesity and their suitability as early warning
indicators
Maternal BMI and maternal weight gain during pregnancy may be useful early
warning indicators given their strong associations found with both child and adult
obesity. Maternal BMI was highlighted by Brisbois et al. (2012) and Rooney et al. (2011) as
key predictor of obesity in adulthood (although this was young adulthood for Rooney et al.).
Brisbois et al. 2012 also found a strong association between maternal weight gain and
obesity in adulthood. Both these variables can be captured as simple numerical figures (BMI
or percentage weight gain) and suggest a key area for action – promoting good dietary and
physical activity among pregnant women.
Maternal smoking may have a weaker association with adult obesity but would be
easy to measure. Maternal smoking was also identified by both Brisbois et al and Rooney
et al as a key predictor of adult obesity but Brisbois et al found that across studies they
reviewed, the association was weak to moderate. Nevertheless, this is a health behaviour
that can be measured easily and numerically (numbers of women smoking at birth).It is
measured by at least one national surveillance systems e.g. Smoking Status at Time of
Delivery collection in England,(SATOD).(NHS Digital 2017)
Genetic factors placing individuals at greater risk for obesity have been identified
but do not seem to be an effective and efficient early warning indicator at this
time. In their articles on genetic testing and predicting obesity, Ng and Bowden (2013) note
that although genetic factors such as the FTO gene have shown significant associations with
obesity, the effect is small and varies among populations with different ancestral histories
(e.g., East Asians, South Asians, Europeans, Pima Indians, Hispanics, and African-
Americans). They conclude that assessment of obesity-associated genetic factors could be
useful in treating individuals but is not useful for predicting/assessing obesity at a
population level.
The associations between other variables and child, adolescent and adult
overweight and obesity are too complex to work as simple indicators. Given the
different relationships found in high-, low- and mid-income countries with relation to
socioeconomic factors and obesity, and the complicated relationship between ethnicity and
obesity it would not appear that measuring these variables (that is levels of deprivation and
size of different ethnic group populations) would serve as a straightforward indicators of
potential obesity trends. However, gathering this demographic information among sufficient
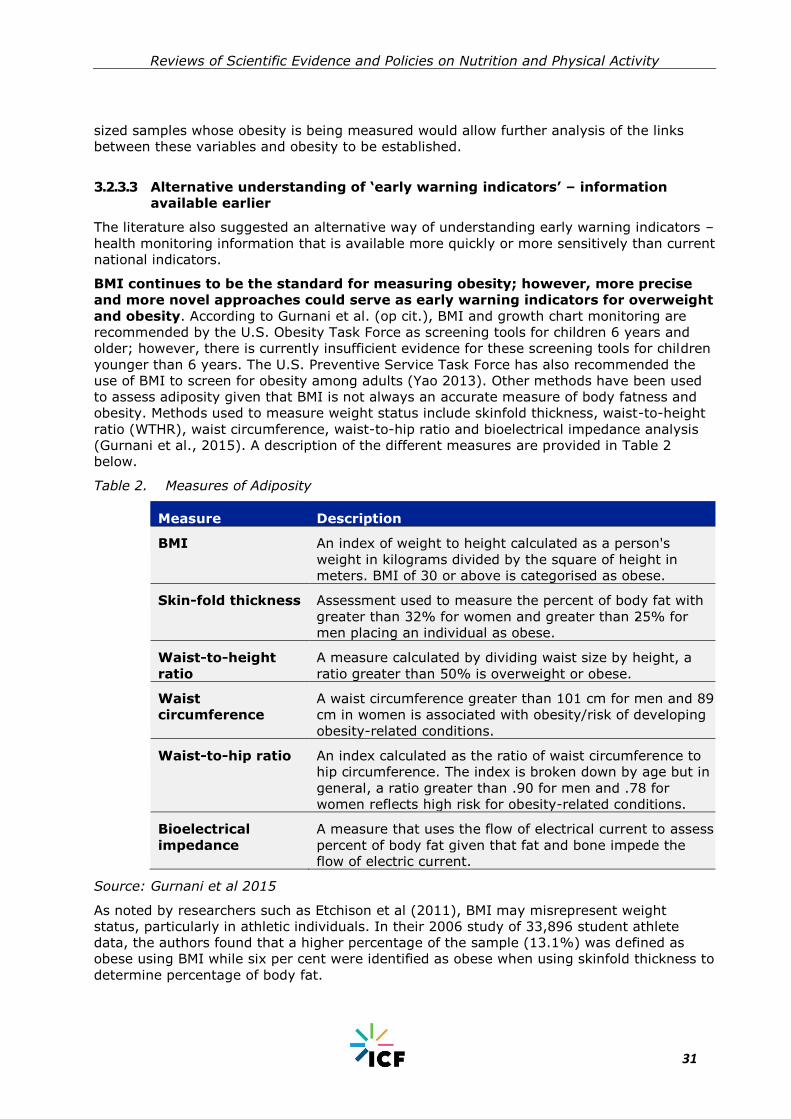
Reviews of Scientific Evidence and Policies on Nutrition and Physical Activity
31
sized samples whose obesity is being measured would allow further analysis of the links
between these variables and obesity to be established.
3.2.3.3 Alternative understanding of ‘early warning indicators’ – information
available earlier
The literature also suggested an alternative way of understanding early warning indicators –
health monitoring information that is available more quickly or more sensitively than current
national indicators.
BMI continues to be the standard for measuring obesity; however, more precise
and more novel approaches could serve as early warning indicators for overweight
and obesity. According to Gurnani et al. (op cit.), BMI and growth chart monitoring are
recommended by the U.S. Obesity Task Force as screening tools for children 6 years and
older; however, there is currently insufficient evidence for these screening tools for children
younger than 6 years. The U.S. Preventive Service Task Force has also recommended the
use of BMI to screen for obesity among adults (Yao 2013). Other methods have been used
to assess adiposity given that BMI is not always an accurate measure of body fatness and
obesity. Methods used to measure weight status include skinfold thickness, waist-to-height
ratio (WTHR), waist circumference, waist-to-hip ratio and bioelectrical impedance analysis
(Gurnani et al., 2015). A description of the different measures are provided in Table 2
below.
Table 2. Measures of Adiposity
Measure Description
BMI An index of weight to height calculated as a person's
weight in kilograms divided by the square of height in
meters. BMI of 30 or above is categorised as obese.
Skin-fold thickness Assessment used to measure the percent of body fat with
greater than 32% for women and greater than 25% for
men placing an individual as obese.
Waist-to-height
ratio
A measure calculated by dividing waist size by height, a
ratio greater than 50% is overweight or obese.
Waist
circumference
A waist circumference greater than 101 cm for men and 89
cm in women is associated with obesity/risk of developing
obesity-related conditions.
Waist-to-hip ratio An index calculated as the ratio of waist circumference to
hip circumference. The index is broken down by age but in
general, a ratio greater than .90 for men and .78 for
women reflects high risk for obesity-related conditions.
Bioelectrical
impedance
A measure that uses the flow of electrical current to assess
percent of body fat given that fat and bone impede the
flow of electric current.
Source: Gurnani et al 2015
As noted by researchers such as Etchison et al (2011), BMI may misrepresent weight
status, particularly in athletic individuals. In their 2006 study of 33,896 student athlete
data, the authors found that a higher percentage of the sample (13.1%) was defined as
obese using BMI while six per cent were identified as obese when using skinfold thickness to
determine percentage of body fat.

Reviews of Scientific Evidence and Policies on Nutrition and Physical Activity
32
■ Existing child health or obesity measurement systems give some insight
into what is possible, but there was limited implementation detail
available to assess their feasibility, effectiveness and efficiency
objectively.
■ Electronic health records (EHRs)/ electronic medical records (EMRs) can
be a promising approach to monitoring obesity/risk for obesity at the
population level, particularly given that height and weight are objectively
measured and demographic data may be readily available to track risk in
specific populations (e.g., low SES, pregnant women, minority groups,
etc.).
■ Developing systematic ways to collect physical activity holds promise
including regular fitness assessments in schools.
■ This is an area therefore that would warrant further qualitative
investigation or gathering of expert opinion.
However, in the grey literature, a briefing paper on obesity and overweight surveillance
from the National Obesity Observatory in England (Townsend 2009) argues that waist
measurements are susceptible to the same criticisms about insensitivity to variations in
body types, particularly among different ages and ethnicities. It argues that BMI remains
the best measure of obesity for population surveillance, due to its ease and prevalence of
use as well as the evidence base for the links between BMI and ill-health. Nonetheless, it
suggests that adding waist measures to population weight monitoring, along with BMI,
would enable more accurate description of trends with little difficulty or expense needed to
do so. This is also empathised in the report from the Scottish Health Survey (Keenan et
al2011.) with a special focus on obesity, which notes that combining BMI with waist
circumference measures (the WHO have introduced such a combined measure) enables
more accurate relative risks of type 2 diabetes, hypertension and CVD to be assessed. For
example, people who have BMI of 25-30 but normal waist circumferences30 have been
found to have no increased risk, and those with normal BMI but very high waist
circumferences31 have been found to have an increased risk.
From our limited findings, rapid weight gain in infancy or early adiposity rebound; maternal
BMI, maternal weight gain during pregnancy and maternal smoking appear to be most
suitable for use as early warning indicators, However, -the lack of evidence dealing with the
concept of ‘early warning indicators’ explicitly presents challenges for considering how these
indicators might be used for monitoring. This is explored in the next section of this review.
3.2.4 Research Question 3: How could a feasible, effective and efficient early
warning monitoring mechanism be put in place to keep track of these
issues?
3.2.4.1 Summary
Just as with the limited usage of the concept of ‘early warning indicators’ there was
therefore limited explicit evidence on how an effective and efficient monitoring mechanism
that uses such indicators could be implemented. However, in the sections below we
highlight examples of existing surveillance and/or monitoring systems that have been
implemented to track obesity/risk for obesity, and where available, the feasibility and
effectiveness of such system. . It is important to note that this kind of implementation detail
was not readily available in either the peer-reviewed literature or grey literature and did not
discuss monitoring systems for predicting physical activity trends.
30
Men WC <93cm, Women WC <81cm. 31
Men WC > 102cm, Women > 89cm

Reviews of Scientific Evidence and Policies on Nutrition and Physical Activity
33
As discussed, the analysis is framed by two different interpretations of ‘early warning’: one
looking at how child overweight and obesity trends can be understood to provide insight into
future adult trends. and the second, data that can be accessed more quickly than standard
national population health survey monitoring;
3.2.4.2 Different types of monitoring mechanisms for obesity
The peer-reviewed literature distinguished between measures that can be used for
screening (individual-level) or surveillance (population-level). A comparison using BMI as an
indicator is provided in Table 3 below, reproduced from Longjohn et al. 2010.
Table 3. Comparison of Body Mass Index (BMI) Screening and BMI Surveillance
BMI Screening BMI Surveillance
Purpose Clinical focus where an
individual’s BMI is measured
and used to compare against
benchmarks for diagnosis and
treatment of obesity. If data is
collected for BMI screening is
done systematically and
entered into a database, it
could also be used for
surveillance.
Public health focus where
BMI reported at a
population level can detect
trends, disparities and
causes when reported at
the population level.
Approach to
data collection
Routine screening of BMI
during appointments with
health providers. This practice
is recommended by many
professional medical
organizations.
Can be either collected
directly from individuals
and aggregated or come
from existing electronic
medical records or similar
databases (if data are
easily aggregated and
anonymised).
Benefits Inexpensive, quick, non-
invasive, sensitive screening
tool to assess health risk at the
individual level.
Associations and trends
with environmental
contexts (physical and/or
social) can be examined.
Surveillance data can also
be used to evaluate the
effects environmental and
policy change aimed at
addressing obesity
prevention.
Limitation Value of BMI in clinical setting
is low in that it only informs
weight status and possible risk
for chronic disease if in the
overweight or obese
categories. accumulated
High-quality,
representative data needed
to track trends or use for
the purposed of
evaluation.
Source: Longjohn et al. 2010

Reviews of Scientific Evidence and Policies on Nutrition and Physical Activity
34
3.2.4.3 Monitoring child obesity
For policy-makers, early warning indicators would be more effective as part of a surveillance
system. We identified some limited evidence of types of surveillance that might be
appropriate, but this was relating to the monitoring of child obesity in general rather than
variables of obesity.
Monitoring height and weight/BMI or BMI percentiles in the clinical or school
settings can be an effective and efficient mechanism to track child obesity and
identify obesity risk. Fayter et al. (2007) conducted a review of 31 studies up to July
2005 to determine the clinical impact and cost-effectiveness of routinely monitoring growth
(height and weight) in children between the ages of 4 and 11 years in order to identify
growth-related conditions, including obesity. Reviewed studies were broadly representative
of the U.K. population. Economic modelling based on the data from the studies included in
the review indicated that growth monitoring increased detection of conditions such as
obesity and was cost effective. This could potentially therefore be extended to include the
measurement of rapid weight gain among infants and early childhood.
In the grey literature a WHO (2012.) report on population approaches to
preventing child obesity suggests that monitoring and surveillance can be best
achieved using population health surveys. The grey literature included details of
several existing child obesity surveillance initiatives or health surveys which provide at least
some limited insights into what a feasible monitoring mechanism might look like. In the
main, the effectiveness and efficiency of these systems was not described in great detail –
the details below focus on methodological considerations and resource use where noted.
European Child Obesity Surveillance Initiative (COSI)
This initiative was developed by the WHO Regional for Europe and is described in Wijnhoven
et al. 2014 and the WHO regional Office for Europe website (WHO 2017b). The BMI
prevalence and other nutritional and physical activity measures of children32 aged 6.0-9.9
from countries across the WHO region was first collected in 2007/8 and the fourth wave of
collection took place across the 2015/6 school year. Nationally representative samples33 and
standardised weight and height measurements are used, with measurements and analyses
conducted according to common protocols. While it does not aim to replace national health,
body measurement and dietary surveillance projects, it seeks to enable a harmonisation of
data across the region in order to aid policy implementation and evaluation. Wijnhoven et al
(2014) also note that, at least when it was introduced, child nutritional surveillance was not
common across the Member States. Other grey literature (WHO 2012) highlighted that
intercountry comparisons of obesity trends can be hindered by differences in BMI
calculations so this standardisation process is to be welcomed.
Other useful elements of implementation detail include:
Informed consent is gathered from parents for their child’s voluntary enrolment in
the system on either an opt-in or opt-out basis (depending on local sensitivities).
Individual countries are also able to adapt the measurement period, professionals
undertaking the measurement and language of data collection and administrative
materials to their local circumstances.
Materials do not refer to overweight or obesity prevalence.
32
Including school and home environment factors: (school, mandatory).frequency of physical education lessons, availability of playgrounds, possibility of obtaining food and drink items on school premises, school healthy lifestyle initiatives; (School, optional) availability of safe routes to school, transport to school, availability of nutrition education or physical education in the curriculum, provisoin of school meals, availability of vending machines on school premises and the availability of fruit/vegetable/milk schemes; (home, voluntary) usual transport to school, membership of sport or dancing club, time outside and screen time, frequency of food consumption. 33
For most countries except Belgium and Malta, where whole populations were measured

Reviews of Scientific Evidence and Policies on Nutrition and Physical Activity
35
In order to sign up to COSI, a Member state identifies a particular national institute
to take on coordination responsibilities, and a principal investigator to serve as the
institute’s authorised COSI representative.
Technical support with implementation is provided by the WHO Regional Office, with
annual meetings held to share findings.
According to WHO (undated) the COSI system does not consume many resources.
National Child Measurement Programme (NCMP,England)
The NCMP was established in 2005 and is administered by Public Health England (PHE) (PHE
2016). The heights and weights of more than one million children in Reception (aged four or
five) and Year Six (aged 10 or 11) are taken each year, used to calculate their BMI and
recorded alongside their names, dates of birth, sex, ethnicity, address and National Health
Service (NHS) number. Guidance materials are provided to local authorities in England
whose responsibility it is to engage with schools, where the measurement takes place.
Other useful details of implementation include:
Explicit consent is not needed for children to take part in NCMP but local authorities
are required to ensure parents have a full understanding of the importance of having
their child measured and give them at least two weeks’ notice of measurement as an
opportunity to withdraw their children (template letters are available from PHE).
Registered health professionals, nurses or dietitians must manage the arrangements
of the programme, including training of staff, but measuring may be undertaken by
healthcare assistants or staff of a similar grade (who are not registered).
Standard equipment and a centralised IT system are used to record measurements.
It is only mandatory for state-maintained primary and middle schools – home
schooled children do not take part, while the participation of non-state-maintained
and special schools is encouraged.
A longitudinal study of the NCMP by the London School of Hygiene and Tropical Medicine
(reported in PHE 2016) found that 72% parents, after receiving NCMP feedback on their
children’s measurements, signalled their intention to change health-related behaviours and
55% reported a change in behaviour including an improved diet, less screen-time, less
health service use and increased physical activity. This indicates that a surveillance system
has the potential to act as intervention in itself (although the self-reporting methodology
limits the strength of these findings).
The literature did not comment on whether measurement of early weight gain or early
adiposity rebound could be incorporated into national monitoring mechanisms – this would
benefit from wider discussion.
3.2.4.4 Monitoring other potential early warning indicators
There was limited evidence for how to establish an effective and efficient
monitoring system of maternal level variables. We did not find examples of national
population-level surveillance of maternal BMI or maternal weight gain during pregnancy,
this appeared to be mainly done at an individual level. This is an area that would benefit
from further exploration. However, in England maternal smoking is measured by the
Smoking Status at Time of Delivery (SATOD) data collection.(NHS Digital 2017) Local health
authorities are subject to a mandatory requirement to send through the following figures
each quarter:
- Number of maternities (number of women giving birth at at least 24 weeks
gestation)
- Number of women known to be smokers at the time of delivery
- Number of women known to be non-smokers at the time of delivery
- Number of women whose smoking status was not known at the time of delivery
Reviews of Scientific Evidence and Policies on Nutrition and Physical Activity
36
Local health authorities are given the flexibility to decide on the mechanism for collecting
and sharing SATOD data. Further details were not available for assessing whether this is an
effective or efficient system; however – it does indicate that maternal smoking is something
that could potentially be incorporated into any early warning monitoring mechanism – as
good practice lessons could potentially be shared.
3.2.5 Systems enabling earlier access to information
Electronic medical record monitoring could serve as a real-time surveillance
system for obesity trends at a community or local population level. Birken et al.
(2017) used EMRALD, an electronic medical record database in Ontario, Canada, to examine
the prevalence of overweight and obesity in children 0-19 years old for 167 participating
family physicians. The authors abstracted the heights and weights for children having at
least one well-child visit between January 2010 and December 2011 and used the most
recent visit to determine those who were considered overweight and obese. Of the 20,083
well-child visits, 84.7% had a height and weight measurement. Rates of overweight and
obesity ranged from 12.1%-31.8% and 2.3% to 12%, respectively. This study
demonstrates that because of the high percentage of documented height and weight
measurements, this approach to surveillance of overweight and obesity prevalence may be
feasible. According to the authors, if this effort were to be scaled-up to include a larger
sample of primary care providers, it could provide a close to real-time data source to
conduct population-based surveillance of obesity in children.
Davidson et al., (2014) used electronic medical records from a network of urban ‘federally
qualified health centres’ (FQHCs) in Denver, Colorado to examine BMI measurements in
sequential outpatient visits over an eight year period to assess prevalence of overweight
and obese children. They examined children aged 2-11 who had at least two visits over the
study period. The authors used changes in BMI z-scores to assess change in weight over
time. Of the 33,542 children who had at least two measurements, more than one third of
children were overweight or obese. Seventy-five percent of these children stayed in same
weight status category from first to last visit; however, 40% of obese children saw a
decrease in their BMI z-score over the follow up period, and more obese children improved
their weight status as compared to overweight or normal weight children. These trends
would not be observed if the researchers only used the standard weight status categories
and this approach provides a more precise method to monitor children’s weight status
trends. According to the authors, EHR data provide community-level BMI trends that may
serve as an early warning system for obesity risk and eventual obesity-related costs.
These examples of health or obesity surveillance and monitoring programmes provide some
useful details of how a monitoring mechanism might be administered and what is feasible.
Further research into the concept of early warning indicators and how other variables might
be incorporated into a monitoring mechanism is needed to fully answer this question.
3.3 Conclusion
There is a wide variety of variables that have been found to correlate with overweight,
obesity and physical (in)activity, acting on different levels of the social ecological model
(Figure 1). The strongest evidence has been found for individual and interpersonal factors
such as birthweight, dietary and physical activity behaviours and parental (particularly
maternal) weight status and socioeconomic status. However, sex, ethnicity and location of
populations (in terms of national economic circumstances) may need to be taken into
consideration. High levels of inconsistencies in measures used (e.g. objective versus
subjective), for studying the relationship between overweight, obesity and physical
(in)activity and community level factors, (e.g. enablers of healthy eating or physical activity
in a neighbourhood) makes the evidence for associations at this level more complex. For
example, there is a particular difficulty in generalising conclusions from studies that

Reviews of Scientific Evidence and Policies on Nutrition and Physical Activity
37
measure neighbourhood determinants of physical (in)activity based on resident self-report
of their perceptions, rather than number of facilities available. Methodological variation may
explain why relationships found in the peer-reviewed literature differed in some cases with
those reported in the grey literature or individual rather than review studies.
Due to the limited amount of evidence found relating to the concept of ‘early warning
indicators’, it was not easy to identify suitable variables that might be used to give some
indications of future changes in weight status. However, based on the strength of
association with overweight and obesity in adulthood identified by the literature, we propose
that the following be considered as potential population-level measures:
early weight gain;
early adiposity rebound;
maternal BMI; and
maternal weight gain during pregnancy.
Despite a weaker association, maternal smoking status may also be suitable as an indicator
– this is measured by at least one national surveillance system.
While population health surveys have been recommended as the best monitoring
mechanisms for obesity and obesity-related behaviours, other methods such as electronic
health record monitoring may provide data at a quicker rate and give early indications of
trends yet to be established by national-level statistics. Meanwhile, at a population level,
existing child obesity surveillance initiatives provide some useful insights into how a feasible
early warning monitoring mechanism could be established, but more evidence on their
(cost) effectiveness is required. The feasibility of incorporating other potential early warning
indicators such as maternal BMI, maternal weight gain during pregnancy and maternal
smoking should also be explored in further primary research. Qualitative research methods
or seeking expert advice may be the most suitable methodology for establishing effective
best practice for implementation given the lack of research in both the current grey and
peer-reviewed literature.

Reviews of Scientific Evidence and Policies on Nutrition and Physical Activity
38
ANNEXES
Reviews of Scientific Evidence and Policies on Nutrition and Physical Activity
39
Annex 1 Peer reviewed literature review methodology
This sub-section describes the approach taken between March 2016 and January 2018
to gather and synthesise the evidence.
A1.1 Research questions for this review
In this comprehensive review, current literature was gathered and synthesised,
addressing objective D. This literature review provides a review of relevant, recent
studies using the methodology presented below to summarise this topic. While the
methods to conduct this comprehensive literature review are systematic it is not a
systematic review. Note that unlike a systematic review, this review does not
systematically analyse literature to identify all relevant published data and/or appraise
its quality
To explore the above stated topics, the literature review was conducted around the
following agreed upon questions.
What factors are associated with overweight and obesity, and physical
(in)activity?
What factors could be of use as early warning indicators of overweight and
obesity and physical (in)activity prevalence and trends?
How could a feasible, effective and efficient early warning monitoring
mechanism be put in place to keep track of these issues?
The methodology for the peer-reviewed literature is described in brief below, with
greater detail on search terms provided in other Annexes.
A1.2 Peer-Reviewed Literature
Methods to conduct the literature review consisted of five steps: (1) refining the
research questions, (2) developing a search approach and databases, (3) conducting
literature searches (Stage 1 below), (4) screening articles for inclusion (Stage 2
below); and (5) abstracting and synthesizing relevant data (Stage 3 below).
In step 1, in partnership with DG SANTE the research questions above were
confirmed. In step 2, the 3 stage approach noted below and databases were
confirmed. To minimise bias, the literature search approach included identification of a
priori search parameters (also considered first level inclusion and exclusion criteria) to
guide searches and inform screening and selection processes for data inclusion. Steps
3, 4 and 5 followed the process below:
Conduct searches and document results (Stage 1)
Screening search results (title and abstract) for relevance (Stage 2)
Review full publication and abstract key characteristics and study findings
(Stage 3)
Searches were conducted in multiple databases and screened following the procedures
below.
Following the literature review pilot, it was agreed to merge Stages 1 and 2.
A1.3 Stage 1: Conduct Searches and Document Results
In Stage 1, searches were conducted using search terms and criteria agreed with DG
SANTE, with filters set for databases to ensure accurate inclusion and exclusion of
literature, as shown in tables below. The search terms used were specific to each of
the 3 research questions. Literature searches were conducted in PubMed, EBSCO
(CINAHL, ERIC, PsycInfo) and Embase. Searches included publications with all
availability types (i.e. free full text and pay/subscription access).

Reviews of Scientific Evidence and Policies on Nutrition and Physical Activity
40
Table 1. Inclusion and Exclusion Criteria Applied at Stage 1
Set Database Filter to Include: Set Database filters to exclude:
Published between 1/1/2005-
5/31/2016
Articles published before 1/1/2005
Peer-reviewed scientific
publications
- Original research
- Systematic reviews
- Meta-analyses
- Human focused research
Editorial comments/commentaries
Dissertations
Theses
Opinion articles
Article published in English,
French, German, Italian Polish
and/or Spanish
Article not published in English,
French, German, Italian Polish
and/or Spanish
In addition to reviewing studies in databases noted above, in order to help ensure
inclusion of high quality literature (e.g., literature having gone through more formal
quality assessments) systematic reviews and meta-analyses were reviewed for
inclusion in the literature review. Searches for systematic reviews were conducted in
Cochrane Review and healthevidence.org.
As noted a separate search was carried out for each research question, resulting in 3
groups of publications for screening for D. After the searches, the results were
reviewed to ensure they accurately met search parameters and duplicates were
removed for screening in Stage 2.
A1.4 Stage 2: Screening search results (title and abstract) for relevance
At stage 2, two screening levels were used: level 1 quality check and level 2
screening. Stage 2 screenings were done simultaneously. These screening inclusion
and exclusion criteria are shown below.
A1.4.1 Stage 2 Level 1 Initial Screening (Quality check)
Search hits from all databases searched in Stage 1 were grouped by the 3 research
questions and search terms to which they were related. Duplicate hits were deleted,
and search hits by research question were organised from the most recent
publications in 2016 going back in time to 2005, saved in an Excel file for that specific
research question, and provided to reviewers for screening. These date parameters
were agreed with DG SANTE as part of the pragmatic approach to managing the
review material.
Using screening criteria in Table 1 reviewers screened the title and abstract of up to
the first 200 hits per research question in each Excel file to identify literature to move
forward for review. This was done to ensure the screening process was manageable
given project timelines yet captured the most recent and relevant literature.34
A1.4.2 Stage 2 Level 2 Subsequent Screening
Simultaneous with the Level 1 initial screening check, more detailed overall inclusion
and exclusion criteria were applied by the reviewers to the title and abstract to screen
34
Results for each research question were screened separately, however, as screening took place, team members considered if articles might be relevant to other research questions, and if so, coded the article as such.
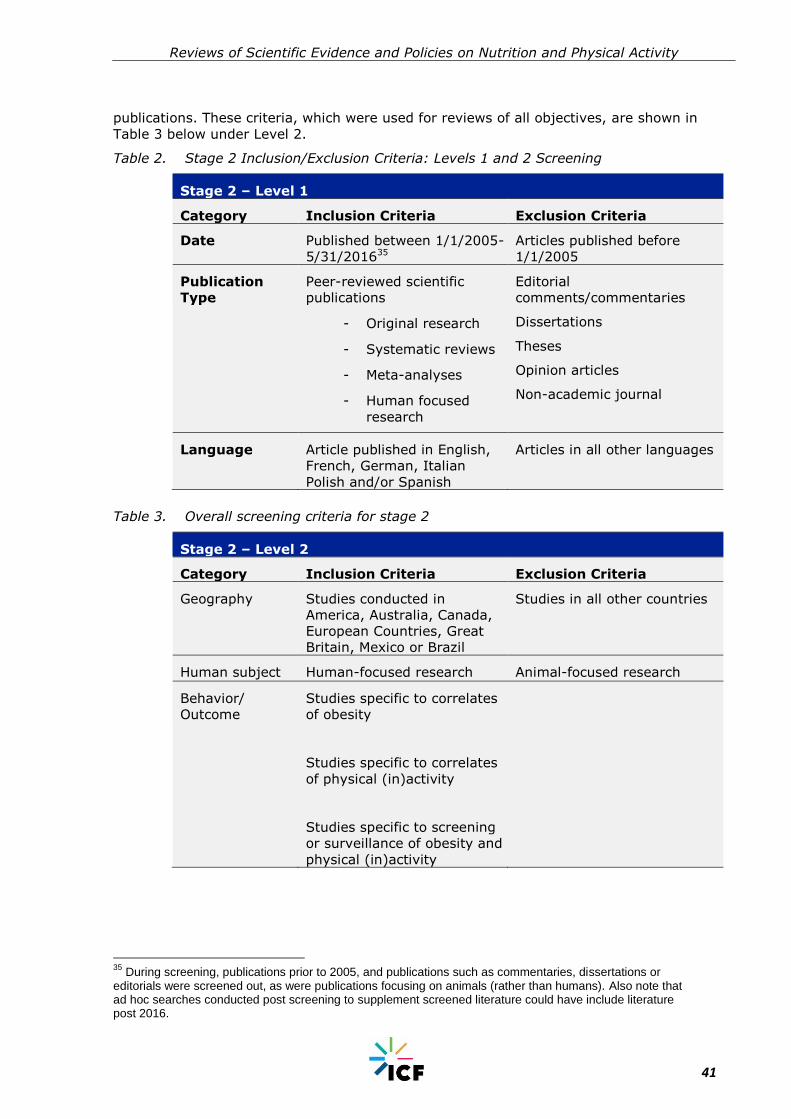
Reviews of Scientific Evidence and Policies on Nutrition and Physical Activity
41
publications. These criteria, which were used for reviews of all objectives, are shown in
Table 3 below under Level 2.
Table 2. Stage 2 Inclusion/Exclusion Criteria: Levels 1 and 2 Screening
Stage 2 – Level 1
Category Inclusion Criteria Exclusion Criteria
Date Published between 1/1/2005-
5/31/201635
Articles published before
1/1/2005
Publication
Type
Peer-reviewed scientific
publications
- Original research
- Systematic reviews
- Meta-analyses
- Human focused
research
Editorial
comments/commentaries
Dissertations
Theses
Opinion articles
Non-academic journal
Language Article published in English,
French, German, Italian
Polish and/or Spanish
Articles in all other languages
Table 3. Overall screening criteria for stage 2
Stage 2 – Level 2
Category Inclusion Criteria Exclusion Criteria
Geography Studies conducted in
America, Australia, Canada,
European Countries, Great
Britain, Mexico or Brazil
Studies in all other countries
Human subject Human-focused research Animal-focused research
Behavior/
Outcome
Studies specific to correlates
of obesity
Studies specific to correlates
of physical (in)activity
Studies specific to screening
or surveillance of obesity and
physical (in)activity
35
During screening, publications prior to 2005, and publications such as commentaries, dissertations or editorials were screened out, as were publications focusing on animals (rather than humans). Also note that ad hoc searches conducted post screening to supplement screened literature could have include literature post 2016.

Reviews of Scientific Evidence and Policies on Nutrition and Physical Activity
42
From 600 publications screened in stage 2, 70 publications were deemed of potential
relevance, coded as “Include” and selected for full article review after stage 2
screening.
A1.4.3 Stage 3: Full Article Review and Synthesis
70 were exported for review of full text in this D literature review. After reading the
full text, if the article was still deemed relevant for inclusion (based on consideration
of the objective and if the article helped answer research questions), it was saved for
use and reference in the bibliography. Following reading articles full text in this stage,
50 publications were selected for inclusion.
At each stage in this process, the team met to discuss successful strategies,
challenges, and recommendations to improve the literature review processes. Note
that although this is a comprehensive literature review and does not include a formal
quality assessment process commonly conducted in systematic reviews, the team
documented study designs (e.g., cross sectional, experimental) and the articles were
checked by reviewers for signs of bias and poor quality research design. Further, the
lead reviewer for each objective area conducted blind quality assurance checks for up
to 10% of the coded articles. Any disagreements were discussed as a group and
resolved with the review task lead.
A1.4.4 External expert reviews and input
Upon completion of the draft set of comprehensive literature reviews, expert
workshops were organised to discuss findings, highlight additional relevant sources to
fill gaps and improve the series of reviews. Experts were carefully selected from
academic and policy-making fields, based on expertise of the specific topics
addressed. As a result of this exercise, 7 additional references were screened and
incorporated into these reviews.
The diagram in Figure 2 below shows the number of articles identified in peer-
reviewed literature searches, and the filtering out of literature at successive stages to
arrive at the final number of 53 publications whose full text was reviewed and
summarised for this review. The diagram also includes additional relevant references
proposed by external experts, and incorporated into this final comprehensive review.

Reviews of Scientific Evidence and Policies on Nutrition and Physical Activity
43
Figure 2. Diagram showing number of included and excluded publications at each
stage – peer reviewed literature
As shown in Figure 2 above, a total of 4086 search hits were retrieved. A total of 1577
duplicates were found and removed from the search hits resulting in 2509 search
results for D. From the 2509, the team screened 600 of the most recent titles and
abstracts (200 for each of the three research questions, to create a manageable
amount of material within the resources for the study; and on the premise that the
most recent material was most relevant science). From the 600 most recent titles and
abstracts screened 70 were deemed of potential relevance and reviewed as full texts.
From these full texts 5336 publications were selected for inclusion, in this final review.
.
36
The full list of references included from the peer-reviewed literature can be found in Annex 3 and includes one additional publication recommended by the external expert review panel
Stage 1: Conduct searches and
document results N =4086
2509 unique results in library
Stage 2: Screening of most recent literature
N = 600
Stage 3: Full text screening publications
reviewed N=70
Final inclusions N=53 (46 in the initial E
review, and an additional 7 after Stage
4, for the final E literature review
Results examined against the search parameters, and 1577
duplicates removed
200 of the most recent publications per research
question search included in Stage 2
530 publications excluded based on inclusion/exclusion
criteria
24 publications excluded based
on relevance to Objective E research questions

Reviews of Scientific Evidence and Policies on Nutrition and Physical Activity
44
Annex 2 Search terms
Objective D Search Terms Per the 3 Research Questions
What variables correlate with overweight, obesity and physical (in) activity?
Primary Term Combined with:
"Exercise" [mh]
"Sedentary lifestyle" [mh]
"Exercise" [tiab]
"Physical Activity" [tiab]
"Leisure-Activit*" [tiab]
"Screen-time" [tiab]
"Sedentary-time" [tiab]
"Physical-Inactivity" [tiab]
"Leisure-time" [tiab]
"Obesity " [tiab]
"Obese" [tiab]
"Overweight" [tiab]
"Population
overweight" [tiab]
"Population obesity" [tiab]
"Sedentary" [tiab]
"Sedentary Lifestyle" [tiab]
"Correlates" [mh]
"Correlate" [mh]
"Predictor" [mh]
"factors associated with" [mh]
"Physiological
determinants" [mh]
"Environmental
determinants" [tiab]
"Social determinants" [tiab]
"Socio-economic
determinants" [tiab]
"Demographic" [tiab]
"Socio-economic factors" [tiab]
What variables could be of use as early warning indicators of overweight and
obesity (and physical inactivity)?
Primary Term Combined with:

Reviews of Scientific Evidence and Policies on Nutrition and Physical Activity
45
Objective D Search Terms Per the 3 Research Questions
"Exercise" [mh]
"Sedentary lifestyle" [mh]
"Exercise" [tiab]
"Physical Activity" [tiab]
"Leisure-Activit*" [tiab]
"Screen-time" [tiab]
"Sedentary-time" [tiab]
"Physical-Inactivity" [tiab]
"Leisure-time" [tiab]
"Obesity " [tiab]
"Obese" [tiab]
"Overweight" [tiab]
"Population
overweight" [tiab]
"Population obesity" [tiab]
"Sedentary" [tiab]
"Sedentary Lifestyle" [tiab]
"indicat*" [tiab]
"monitor*" [tiab]
"surveillance" [tiab]
"measur*" [tiab]
"assessment" [tiab]
"biomarker*" [tiab]
"Health Status Indicators" [mh]
"Risk Factors" [mh]
How could a feasible, effective and efficient early warning monitoring
mechanism be put in place to keep track of these issues?
Primary Term Combined with:
"Exercise" [mh]
"Sedentary lifestyle" [mh]
"Exercise" [tiab]
"Physical Activity" [tiab]
"Leisure-Activit*" [tiab]
"Screen-time" [tiab]
"Sedentary-time" [tiab]
"Physical-Inactivity" [tiab]
"Leisure-time" [tiab]
"Obesity " [tiab]
"Obese" [tiab]
"Overweight" [tiab]
"Population
overweight" [tiab]
"Population obesity" [tiab]
"Sedentary" [tiab]
"Sedentary Lifestyle" [tiab]
"indicat*" [tiab]
"monitor*" [tiab]
"surveillance" [tiab]
"measur*" [tiab]
"assessment" [tiab]
"biomarker*" [tiab]
"Health Status Indicators" [mh]
"Risk Factors" [mh]

Reviews of Scientific Evidence and Policies on Nutrition and Physical Activity
46
Annex 3 Peer-reviewed literature bibliography
Baidal, W, Locks, L, Cheng, E, Blake-Lamb, T, Perkins, M, Taveras, E. (2016) Risk
factors for childhood obesity in the first 1,000 days: A systematic review. 50(6)
pp.761-79.
Berge, J. M. (2009). A review of familial correlates of child and adolescent obesity:
what has the 21st century taught us so far? International Journal of Adolescent
Medicine and Health, 21(4), pp.457–483.
Birken, C. S., Tu, K., Oud, W., Carsley, S., Hanna, M., Lebovic, G., & Guttmann, A.
(2017). Determining rates of overweight and obese status in children using electronic
medical records: Cross-sectional study. Canadian Family Physician Medecin De Famille
Canadien, 63(2), e114–e122.
Blanchard, C, McGannon, K, Spence, J, Rhodes, E, Nehl, E, Baker, F, Bostwick J. Social
ecological correlates of physical activity in normal weight, overweight, and obese
individuals. Int J Obesity, 29, pp.720-726.
Blondin, S., Anzman-Frasca, S., Djang, H. and Economos, C. (2016) Breakfast
consumption and adiposity among children and adolescents: an updated review of the
literature. Pediatric Obesity, 11(5), pp.333-348.
Brisbois, T. D., Farmer, A. P., & McCargar, L. J. (2012). Early markers of adult
obesity: a review. Obesity Reviews: An Official Journal of the International Association
for the Study of Obesity, 13(4), pp.347–367. https://doi.org/10.1111/j.1467-
789X.2011.00965.
Cappuccio, F. P., Taggart, F. M., Kandala, N.-B., Currie, A., Peile, E., Stranges, S., &
Miller, M. A. (2008). Meta-Analysis of Short Sleep Duration and Obesity in Children
and Adults. Sleep, 31(5), pp.619–626.
Cetateanu, A, Jones, A. (2014) Understanding the relationship between food
environments, deprivation and childhood overweight and obesity: Wvidence from a
cross sectional England-wide study. Health & Place. 27 pp.68-76.
Crowe-White, K., O’Neil, C.E., Parrott, J.S., Benson-Davies, S., Droke, E., Gutschall,
M., Stote, K.K., Wolfram, T., Ziegler, P. (2016) Impact of 100% fruit juice
consumption on diet and weight status in children: An evidence based review. Crit Rev
Food Sci Nutr, 56(5) pp.871-874
Choquet, H., & Meyre, D. (2011). Genetics of Obesity: What have we Learned?
Current Genomics, 12(3), pp.169–179. http://doi.org/10.2174/138920211795677895
Cobb, L, Appel, L, Franco, M, Jones-Smith, J, Nur, A Anderson, C. (2015) The
Relationship of the Local Food Environment with Obesity: A Systematic Review of
Methods, Study Quality and Results. Obesity. 23(7) pp.1331-1344.
Davidson, A. J., McCormick, E. V., Dickinson, L. M., Haemer, M. A., Knierim, S. D., &
Hambidge, S. J. (2014). Population-level obesity surveillance: monitoring childhood
body mass index z-score in a safety-net system. Academic Pediatrics, 14(6), pp.632–
638. https://doi.org/10.1016/j.acap.2014.06.007
De Bourdeaudhuji, I, Lefevre, J, Deforche, B, Wijndale, K, Matton, L, Philippaerts, R.
(2005). Physical activity and psychological correlates in normal weight and overweight
11 to 19 year olds. Obes Res. 13(6): pp.1097-105.
de Vet, E., de Ridder, D. T. D., & de Wit, J. B. F. (2011). Environmental correlates of
physical activity and dietary behaviours among young people: a systematic review of
reviews. Obesity Reviews: An Official Journal of the International Association for the
Study of Obesity, 12(5), e130-142. https://doi.org/10.1111/j.1467-
789X.2010.00784.x

Reviews of Scientific Evidence and Policies on Nutrition and Physical Activity
47
Drake, K, Beach, M, Longacre, M, MacKenzie, T, Titus, L, Rundle, A, Dalton, M.
Influence of Sports, Physical education and active commuting to school on adolescent
weight status. Paediatrics. 130(2): e296-e304.
Dubois, L, Girard, M. (2006) Early determinants of overweight at 4.5 years in a
population-based longitudinal study. Int J Obes. 30: pp.610-617.
Etchison, W, Bloodgood, E, Minton, C, Thonpson, N, Collins, M, Hunter, S, Dai, H.
(2011). Body Mass index and percentage of body fat as indicators for obesity in
adolescent athletic population. Sports Health. 3(3):pp.249-252.
Fayter, D, Hartley, S, Rithalia, A, Butler, G, Rudolf, M, Glasziou, P, Bland, M, Strik, L,
Westwood, M. (2007). A systematic review of the routine monitoring of growth in
children of primary school age to identify growth-related conditions. NIHR Health
Technology Assessment programme: executive summaries. [ONLINE] Available at:
https://www.ncbi.nlm.nih.gov/books/NBK62229/ (Accessed
Ferreira, I., van der Horst, K., Wendel-Vos, W., Kremers, S., van Lenthe, F. J., & Brug,
J. (2007). Environmental correlates of physical activity in youth - a review and update.
Obesity Reviews: An Official Journal of the International Association for the Study of
Obesity, 8(2), pp.129–154. https://doi.org/10.1111/j.1467-789X.2006.00264.x
Fowler, S. P., Williams, K., & Hazuda, H. P. (2015). Diet soda intake is associated with
long-term increases in waist circumference in a bi-ethnic cohort of older adults: The
San Antonio Longitudinal Study of Aging. Journal of the American Geriatrics Society,
63(4), pp.708–715. https://doi.org/10.1111/jgs.13376
Funtikova, A. N., Subirana, I., Gomez, S. F., Fitó, M., Elosua, R., Benítez-Arciniega, A.
A., & Schröder, H. (2015). Soft Drink Consumption Is Positively Associated with
Increased Waist Circumference and 10-Year Incidence of Abdominal Obesity in
Spanish Adults. The Journal of Nutrition, 145(2), pp.328–334.
https://doi.org/10.3945/jn.114.205229
Gebremariam, M. K., Altenburg, T. M., Lakerveld, J., Andersen, L. F., Stronks, K.,
Chinapaw, M. J., & Lien, N. (2015). Associations between socio-economic position and
correlates of sedentary behaviour among youth: a systematic review. Obesity
Reviews: An Official Journal of the International Association for the Study of Obesity,
16(11), pp.988–1000. https://doi.org/10.1111/obr.12314
Golem, D. L., Martin-Biggers, J. T., Koenings, M. M., Davis, K. F., & Byrd-Bredbenner,
C. (2014). An Integrative Review of Sleep for Nutrition Professionals. Advances in
Nutrition, 5(6), pp.742–759. http://doi.org/10.3945/an.114.006809
Gurnani, M., Birken, C., & Hamilton, J. (2015). Childhood Obesity: Causes,
Consequences, and Management. Pediatric Clinics of North America, 62(4),pp. 821–
840. https://doi.org/10.1016/j.pcl.2015.04.001
Haslam, D. (2008). Understanding obesity in the older person: prevalence and risk
factors. British Journal of Community Nursing, 13(3), 115–116, 118, 120–122.
https://doi.org/10.12968/bjcn.2008.13.3.28675
Herzig, M., Dössegger, A., Mäder, U., Kriemler, S., Wunderlin, T., Grize, L., … Bringolf-
Isler, B. (2012). Differences in weight status and energy-balance related behaviors
among schoolchildren in German-speaking Switzerland compared to seven countries in
Europe. International Journal of Behavioral Nutrition and Physical Activity, 9, 139.
https://doi.org/10.1186/1479-5868-9-139
Hruby, A. and Hu, F. (2014) The Epidemiology of Obesity: A Big Picture.
PharmacoEconomics, 33(7), pp.673-689.
Janssen, I, Leblanc, AG. (2010). Systematic review of the health benefits of physical
activity and fitness in school-aged children and youth. Int J Behv Nutr & Phys Act.
7:40.

Reviews of Scientific Evidence and Policies on Nutrition and Physical Activity
48
Katz, D, O’Connell, M, Njike, V, Yeh, M, Nawaz, H. (2008) Strategies for the
prevention and control of obesity in the school setting: systematic review and meta-
analysis. Int J Obes, 32: pp.1780-1789.
Kapral, N., Miller, S. E., Scharf, R. J., Gurka, M. J., and DeBoer, M. D. (2017)
Associations between birthweight and overweight and obesity in school-age children.
Pediatric Obesity,[ONLINE} Epub ahead of print: Available at: doi:
10.1111/ijpo.12227.(Accessed 26 October 2017)
Kopcakova, J, Veselska, Z, Madarasova, A, Bucksch, J, Nalecz, H, Sigmundova, D,
Dijk, J, Reijneveld, S (2017). Is a perceived activity-friendly environment associated
with more physical activity and fewer screen-based activities in adolescents? Int J
Environ Res Public Health, 14(1), 39.
Liu, C, Mou, S, Cai, Y. (2013) FTO Gene Variant and Risk of Overweight and Obesity
among Children and Adolescents: a systematic review and meta-analysis. PLoS ONE
8(1): e82133. https://doi.10.1371/journal.pone.0082133
Longjohn, M, Sheon, A, Card-Higginson P, Nader, P, Mason, M. (2010). Learning from
state surveillance of childhood obesity, Health Affairs, 29(3):pp.463-472.
Lovasi, S, Hutson, M, Guerra, M, Neckerman. (2009) Built Environments and Obesity
in Disadvantaged Populations. Epi Reviews. 31: pp.7-20.
Ma, J., McKeown, N. M., Hwang, S.-J., Hoffman, U., Jacques, P. F., & Fox, C. S.
(2016). Sugar-Sweetened Beverage Consumption is Associated With Change of
Visceral Adipose Tissue Over 6 Years of Follow-Up. Circulation,
CIRCULATIONAHA.115.018704.
https://doi.org/10.1161/CIRCULATIONAHA.115.018704
Malik, V. S., Schulze, M. B., & Hu, F. B. (2006). Intake of sugar-sweetened beverages
and weight gain: a systematic review. The American Journal of Clinical Nutrition,
84(2), pp.274–288.
Mehtälä, M. A. K., Sääkslahti, A. K., Inkinen, M. E., & Poskiparta, M. E. H. (2014). A
socio-ecological approach to physical activity interventions in childcare: a systematic
review. The International Journal of Behavioral Nutrition and Physical Activity, 11, 22.
http://doi.org/10.1186/1479-5868-11-22
Ng, M., Bowden, D. (2013). Is genetic testing of value in predicting and treating
obesity, N C Med, 74(6): pp. 530-533.
O’Donoghue, G., Perchoux, C., Mensah, K., Lakerveld, J., van der Ploeg, H.,
Bernaards, C., … DEDIPAC Consortium. (2016). A systematic review of correlates of
sedentary behaviour in adults aged 18-65 years: a socio-ecological approach. BMC
Public Health, 16, 163. https://doi.org/10.1186/s12889-016-2841-3
Papandreou, D., Andreou, E., Heraclides, A., & Rousso, I. (2013). Is beverage intake
related to overweight and obesity in school children? Hippokratia, 17(1), pp.42–46.
Patel, S. R. and Hu, F. B. (2008), Short Sleep Duration and Weight Gain: A Systematic
Review. Obesity, 16 pp. 643–653. doi:10.1038/oby.2007.118
Rampersaud, G.C., et al. (2005) Breakfast Habits, Nutritional Status, Body Weight,
and Academic Performance in Children and Adolescents. Journal of the American
Dietetic Association, 105,pp. 743-760.
Rooney, B. L., Mathiason, M. A., & Schauberger, C. W. (2011). Predictors of obesity in
childhood, adolescence, and adulthood in a birth cohort. Maternal and Child Health
Journal, 15(8), pp.1166-1175. DOI: 10.1007/s10995-010-0689-1
Small, L., Anderson, D., & Melnyk, B. M. (2007). Prevention and early treatment of
overweight and obesity in young children: a critical review and appraisal of the
evidence. Pediatric Nursing, 33(2), pp.149–152, 155–161, 127.
Reviews of Scientific Evidence and Policies on Nutrition and Physical Activity
49
Schellong K, Schulz S, Harder T, Plagemann A (2012) Birth Weight and Long-Term
Overweight Risk: Systematic Review and a Meta-Analysis Including 643,902 Persons
from 66 Studies and 26 Countries Globally. PLoS ONE 7(10): e47776.
https://doi.org/10.1371/journal.pone.0047776
Silventoinen, K, Rokholm, B, Kaprio, J and Sorensen, T. (2010). The genetic and
environment influences on childhood obesity: a systematic review of twin and adoption
studies. Int J Obes. 34, pp.29-40.
Vågstrand, K., Linné, Y., Karlsson, J., Elfhag, K., & Lindroos, A. K. (2009). Correlates
of soft drink and fruit juice consumption among Swedish adolescents. The British
Journal of Nutrition, 101(10), pp.1541–1548.
https://doi.org/10.1017/S0007114508083542
Van der Horst, K., Oenema, A., Ferreira, I., Wendel-Vos, W., Giskes, K., van Lenthe,
F., & Brug, J. (2007). A systematic review of environmental correlates of obesity-
related dietary behaviors in youth. Health Education Research, 22(2), pp.203–226.
https://doi.org/10.1093/her/cyl069
van Stralen, M. M., te Velde, S. J., van Nassau, F., Brug, J., Grammatikaki, E., Maes,
L., … ToyBox-study group. (2012). Weight status of European preschool children and
associations with family demographics and energy balance-related behaviours: a
pooled analysis of six European studies. Obesity Reviews, 13,pp.29–41.
https://doi.org/10.1111/j.1467-789X.2011.00959.x
Wendel-Vos, W., Droomers, M., Kremers, S., Brug, J., & van Lenthe, F. (2007).
Potential environmental determinants of physical activity in adults: a systematic
review. Obesity Reviews: An Official Journal of the International Association for the
Study of Obesity, 8(5), pp.425–440. https://doi.org/10.1111/j.1467-
789X.2007.00370.
Weng SF, Redsell SA, Swift JA (2012) Systematic review and meta-analyses of risk
factors for childhood overweight identifiable during infancy Archives of Disease in
Childhood 97: pp.1019-1026.
Yan, J, Liu, L, Zhu, Y, Huang, G, Wang, P. (2014). The association between
breastfeeding and childhood obesity: a meta-analysis. BMC Public Health. 14: 1267.
Yao, A. (2013). Screening for and management of obesity in adults: U.S> Preventive
task force recommendation statement: a policy review. Ann Med Surg (Lonndon),
2(1): pp.18-21.
Additional reference used in introduction
Bronfenbrenner, U. (1977). Toward an experimental ecology of human development.
American Psychologist, 32(7), pp.513-531. http://dx.doi.org/10.1037/0003-
066X.32.7.513
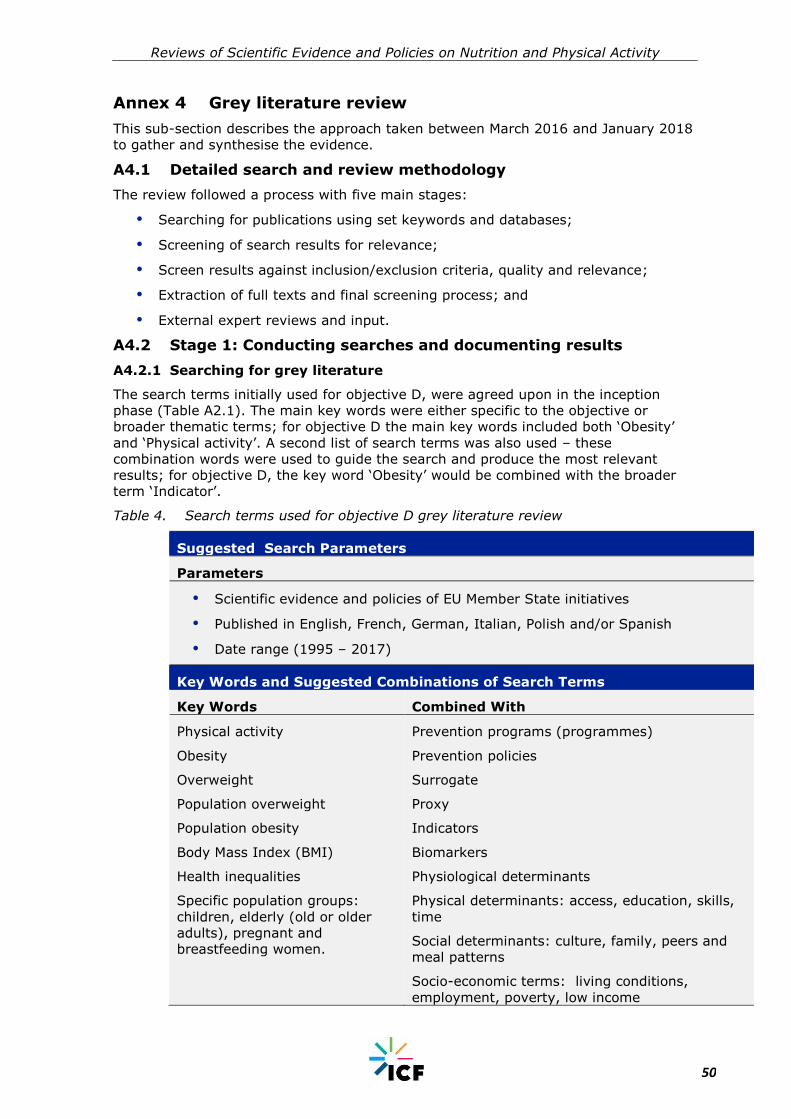
Reviews of Scientific Evidence and Policies on Nutrition and Physical Activity
50
Annex 4 Grey literature review
This sub-section describes the approach taken between March 2016 and January 2018
to gather and synthesise the evidence.
A4.1 Detailed search and review methodology
The review followed a process with five main stages:
Searching for publications using set keywords and databases;
Screening of search results for relevance;
Screen results against inclusion/exclusion criteria, quality and relevance;
Extraction of full texts and final screening process; and
External expert reviews and input.
A4.2 Stage 1: Conducting searches and documenting results
A4.2.1 Searching for grey literature
The search terms initially used for objective D, were agreed upon in the inception
phase (Table A2.1). The main key words were either specific to the objective or
broader thematic terms; for objective D the main key words included both ‘Obesity’
and ‘Physical activity’. A second list of search terms was also used – these
combination words were used to guide the search and produce the most relevant
results; for objective D, the key word ‘Obesity’ would be combined with the broader
term ‘Indicator’.
Table 4. Search terms used for objective D grey literature review
Suggested Search Parameters
Parameters
Scientific evidence and policies of EU Member State initiatives
Published in English, French, German, Italian, Polish and/or Spanish
Date range (1995 – 2017)
Key Words and Suggested Combinations of Search Terms
Key Words Combined With
Physical activity
Obesity
Overweight
Population overweight
Population obesity
Body Mass Index (BMI)
Health inequalities
Specific population groups:
children, elderly (old or older
adults), pregnant and
breastfeeding women.
Prevention programs (programmes)
Prevention policies
Surrogate
Proxy
Indicators
Biomarkers
Physiological determinants
Physical determinants: access, education, skills,
time
Social determinants: culture, family, peers and
meal patterns
Socio-economic terms: living conditions,
employment, poverty, low income
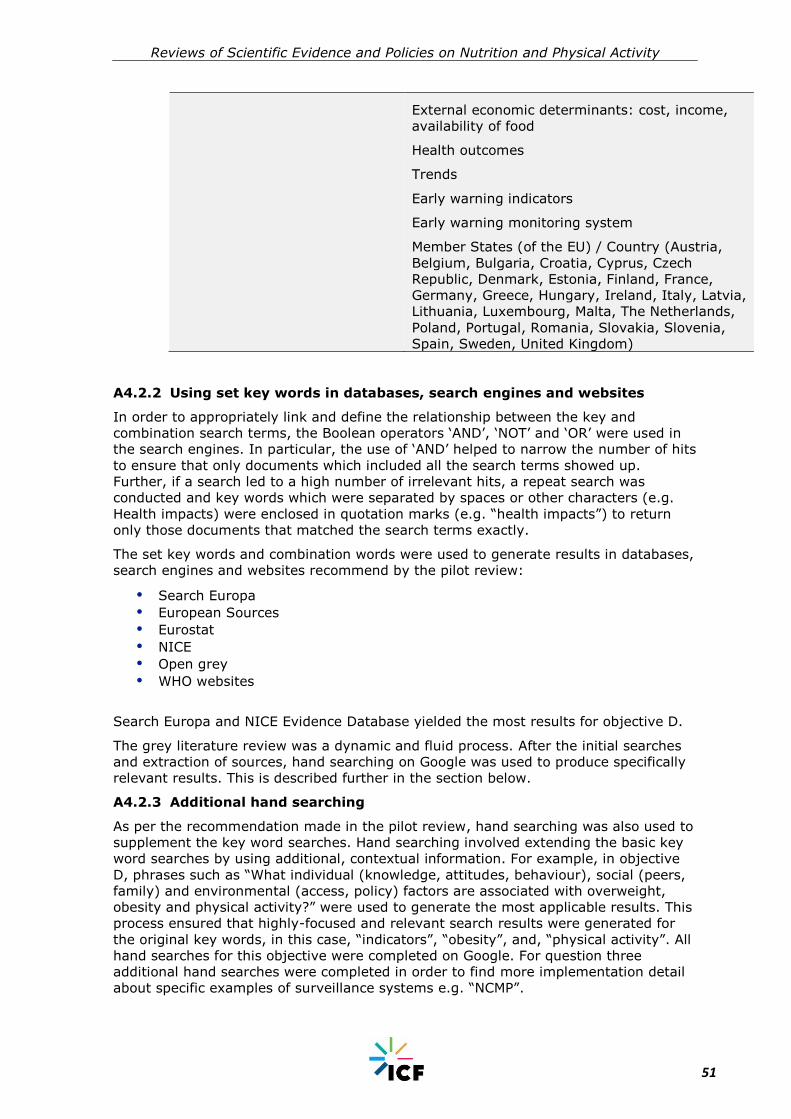
Reviews of Scientific Evidence and Policies on Nutrition and Physical Activity
51
External economic determinants: cost, income,
availability of food
Health outcomes
Trends
Early warning indicators
Early warning monitoring system
Member States (of the EU) / Country (Austria,
Belgium, Bulgaria, Croatia, Cyprus, Czech
Republic, Denmark, Estonia, Finland, France,
Germany, Greece, Hungary, Ireland, Italy, Latvia,
Lithuania, Luxembourg, Malta, The Netherlands,
Poland, Portugal, Romania, Slovakia, Slovenia,
Spain, Sweden, United Kingdom)
A4.2.2 Using set key words in databases, search engines and websites
In order to appropriately link and define the relationship between the key and
combination search terms, the Boolean operators ‘AND’, ‘NOT’ and ‘OR’ were used in
the search engines. In particular, the use of ‘AND’ helped to narrow the number of hits
to ensure that only documents which included all the search terms showed up.
Further, if a search led to a high number of irrelevant hits, a repeat search was
conducted and key words which were separated by spaces or other characters (e.g.
Health impacts) were enclosed in quotation marks (e.g. “health impacts”) to return
only those documents that matched the search terms exactly.
The set key words and combination words were used to generate results in databases,
search engines and websites recommend by the pilot review:
Search Europa
European Sources
Eurostat
NICE
Open grey
WHO websites
Search Europa and NICE Evidence Database yielded the most results for objective D.
The grey literature review was a dynamic and fluid process. After the initial searches
and extraction of sources, hand searching on Google was used to produce specifically
relevant results. This is described further in the section below.
A4.2.3 Additional hand searching
As per the recommendation made in the pilot review, hand searching was also used to
supplement the key word searches. Hand searching involved extending the basic key
word searches by using additional, contextual information. For example, in objective
D, phrases such as “What individual (knowledge, attitudes, behaviour), social (peers,
family) and environmental (access, policy) factors are associated with overweight,
obesity and physical activity?” were used to generate the most applicable results. This
process ensured that highly-focused and relevant search results were generated for
the original key words, in this case, “indicators”, “obesity”, and, “physical activity”. All
hand searches for this objective were completed on Google. For question three
additional hand searches were completed in order to find more implementation detail
about specific examples of surveillance systems e.g. “NCMP”.
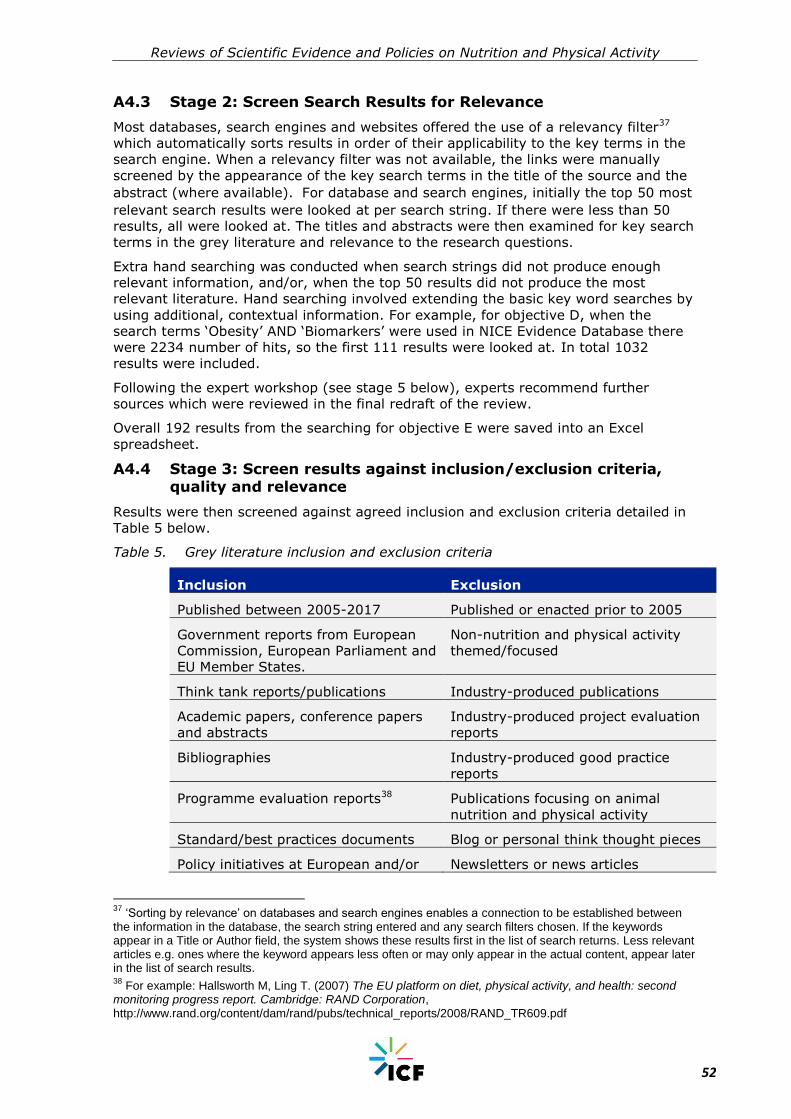
Reviews of Scientific Evidence and Policies on Nutrition and Physical Activity
52
A4.3 Stage 2: Screen Search Results for Relevance
Most databases, search engines and websites offered the use of a relevancy filter37
which automatically sorts results in order of their applicability to the key terms in the
search engine. When a relevancy filter was not available, the links were manually
screened by the appearance of the key search terms in the title of the source and the
abstract (where available). For database and search engines, initially the top 50 most
relevant search results were looked at per search string. If there were less than 50
results, all were looked at. The titles and abstracts were then examined for key search
terms in the grey literature and relevance to the research questions.
Extra hand searching was conducted when search strings did not produce enough
relevant information, and/or, when the top 50 results did not produce the most
relevant literature. Hand searching involved extending the basic key word searches by
using additional, contextual information. For example, for objective D, when the
search terms ‘Obesity’ AND ‘Biomarkers’ were used in NICE Evidence Database there
were 2234 number of hits, so the first 111 results were looked at. In total 1032
results were included.
Following the expert workshop (see stage 5 below), experts recommend further
sources which were reviewed in the final redraft of the review.
Overall 192 results from the searching for objective E were saved into an Excel
spreadsheet.
A4.4 Stage 3: Screen results against inclusion/exclusion criteria, quality and relevance
Results were then screened against agreed inclusion and exclusion criteria detailed in
Table 5 below.
Table 5. Grey literature inclusion and exclusion criteria
Inclusion Exclusion
Published between 2005-2017 Published or enacted prior to 2005
Government reports from European
Commission, European Parliament and
EU Member States.
Non-nutrition and physical activity
themed/focused
Think tank reports/publications Industry-produced publications
Academic papers, conference papers
and abstracts
Industry-produced project evaluation
reports
Bibliographies Industry-produced good practice
reports
Programme evaluation reports38 Publications focusing on animal
nutrition and physical activity
Standard/best practices documents Blog or personal think thought pieces
Policy initiatives at European and/or Newsletters or news articles
37
‘Sorting by relevance’ on databases and search engines enables a connection to be established between the information in the database, the search string entered and any search filters chosen. If the keywords appear in a Title or Author field, the system shows these results first in the list of search returns. Less relevant articles e.g. ones where the keyword appears less often or may only appear in the actual content, appear later in the list of search results. 38
For example: Hallsworth M, Ling T. (2007) The EU platform on diet, physical activity, and health: second monitoring progress report. Cambridge: RAND Corporation, http://www.rand.org/content/dam/rand/pubs/technical_reports/2008/RAND_TR609.pdf

Reviews of Scientific Evidence and Policies on Nutrition and Physical Activity
53
Inclusion Exclusion
national level- run by governments,
not-for profit organisations
Industry funded publications (As
regards the grey literature reviews,
particular care will be exerted in
assessing any inclusion of industry-
funded literature. These will be
justified and discussed with the client).
Theses and dissertations (2010 and
older)
Primary theme/focus is human
nutrition and physical activity
Publication available via accessible
databases
Published in English, French, German,
Italian, Polish and/or Spanish
Theses and dissertations (post-2010
only)
Due to the large number of results still returned after this screening the data
parameters were further refined to only include those reports published 2005-
2017.
Following this criteria screening and exclusion of search results, the remaining results
were checked for quality and relevance.
A4.4.1 Exclusion based on quality checklist
The quality check was based on the AACODS checklist (AACODS)39 which included:
Authority
- Is the author credible?
Accuracy
- Is the document supported by documented and authoritative references?
- Is there a clearly stated methodology?
- Is the document representative of work in the field?
Coverage
- Have limitations been imposed and are they clearly stated?
Objectivity
- Can bias be detected (if so the bias was clearly stated in the extraction
form)?
Date
- Does the document have a clearly stated date relating to the content?
Significance
- Is the document relevant?
- Would the document enrich the findings?
39
Please see the full outline of the AACODS checklist here: https://dspace.flinders.edu.au/jspui/bitstream/2328/3326/4/AACODS_Checklist.pdf
Reviews of Scientific Evidence and Policies on Nutrition and Physical Activity
54
A4.4.2 Exclusion based on relevance to research questions
The remaining grey literature was examined further so that only results most relevant
to the objective were extracted. In particular, each article was examined for text
relating to the key terms and questions under the objective. For example, in objective
D, the text was examined for reference to the research question ‘What variables could
be of use as early warning indicators of overweight and obesity (and physical
inactivity) prevalence and trends? ’In total 123 results were excluded during this
screening process; 69 results were extracted.
A4.5 Stage 4: Review and extraction of full texts
A data extraction template in Excel was used to capture the following categories of
information: 1) identifying information for each publication, 2) study design
characteristics, 3) sample characteristics, 4) intervention characteristics, 5) content
(behaviour/outcome) focus, 6) description of results, 7) assessment of rigour/bias and
8) objective specific information.
A4.5.1 Final screening process
After extraction, the review author read through all of the extracted data and a final
screening process excluded more results due to quality or a lack of enough relevant
information, now made obvious after extraction. Sources were also excluded from the
grey literature where this was superseded by either more rigorous peer reviewed
research on the same theme, or more recent statistics.
A thematic analysis was applied to the remaining extracted data and their findings
synthesised with those of the peer reviewed literature. Any identified bias in sources
which passed the inclusion criteria is highlighted in the analysis.
A4.6 Stage 5: External expert reviews and input
Upon completion of the draft set of comprehensive literature reviews, expert
workshops were organised to discuss findings, highlight additional relevant sources to
fill gaps and improve the series of reviews. Experts were carefully selected from
academic and policy-making fields, based on expertise of the specific topics
addressed. As a result of this exercise, four additional references were screened and
incorporated into these reviews.
A4.7 Number of included and excluded references
The diagram in Figure 3 below shows the number of articles identified in grey
literature searches, and the filtering out of literature at successive stages to arrive at
the final number of 23 publications whose full text was reviewed and summarised for
this review. The diagram also includes additional relevant references proposed by
external experts, and incorporated into this final comprehensive review.

Reviews of Scientific Evidence and Policies on Nutrition and Physical Activity
55
Figure 3. Diagram showing number of included and excluded grey literature
publications at each stage
As shown in Figure 3 above, a total of 20645 search hits were retrieved and saved for
D. From the 192 results saved in the library, 123 were excluded based on the
relevance to Objective D research questions. Following this, 69 results were extracted
fully. An additional 50 publications were then excluded based on inclusion/exclusion
criteria, quality of evidence and relevant to the research questions. In Stage 5,
supplementary searches were conducted and/or articles recommended by experts
during the workshops were looked at, and four additional relevant references proposed
by external experts were included.
Stage 1: Conduct searches and
document results N = 20645
192 unique results in the library
Stage 4: Extraction of full texts and final
screening
N = 69
Final inclusions N=23 (19 in the initial
A1 review, and four
additional texts after Stage 5), for the final D
literature review
Stage 2: Screen search results for relevance
Stage 3: 123 publications excluded based on relevance to research questions and inclusion
criteria
50 publications excluded based
on final quality check and relevance to objective
Reviews of Scientific Evidence and Policies on Nutrition and Physical Activity
56
Annex 5 Grey literature bibliography
Aguirre, I., Hanefeld, J., Nihlén, Å. and Simpson, S. (2016). Women's health and well-
being in Europe: beyond the mortality advantage.. [online] Copenhagen: WHO
Regional Office for Europe. Available at:
http://www.euro.who.int/__data/assets/pdf_file/0006/318147/Womens-health-well-
being-Europe-beyond-mortality-advantage.pdf [Accessed 8 Mar. 2017].
Branca, F., Nikogosian, H. and Lobstein, T. (2007). The challenge of obesity in the
WHO region and the strategies for response. [online] Copenhagen: WHO Regional
Office for Europe. Available at:
http://www.euro.who.int/__data/assets/pdf_file/0008/98243/E89858.pdf [Accessed 8
Mar. 2017].
Cavill, N., Kahlmeier, S. and Racioppo, F. (2006). Physical activity and health in
Europe: evidence for action. [online] Copenhagen: WHO Regional Office for Europe.
Available at: http://www.euro.who.int/__data/assets/pdf_file/0011/87545/E89490.pdf
[Accessed 8 Mar. 2017].
Centers for Disease Control and Prevention (CDC) (2013) Health Equity Resource
Toolkit for State Practitioners Addressing Obesity Disparities [ONLINE] Available at:
https://www.cdc.gov/nccdphp/dnpao/state-local-programs/health-equity/index.html
[Accessed 1 Feb 2017]
Foresight (2007) Foresight Tackling Obesities: Future Choices—Obesity System Atlas.
Government Office for Science, UK Government's Foresight Programme, [online]
Available at: http:www.foresight.gov.uk.Obesity11.pdf> Accessed 8 Jan 2018.
Gatineau, M. and Mathrani, S. (2011). Obesity and ethnicity. [online] Oxford: National
Obesity Observatory. [online] Available at:
http://webarchive.nationalarchives.gov.uk/20160805121933/http://www.noo.org.uk/
uploads/doc/vid_9444_Obesity_and_ethnicity_270111.pdf [Accessed 8 Mar. 2017].
Health and Social Care Information Centre (2015). Statistics on Obesity, Physical
Activity and Diet. [online] Available at:
http://digital.nhs.uk/catalogue/PUB16988/obes-phys-acti-diet-eng-2015.pdf
[Accessed 8 Mar.2017].
Health and Social Care Information Centre (2016). Statistics on Obesity, Physical
Activity and Diet. [online] Available at:
http://digital.nhs.uk/catalogue/PUB16988/obes-phys-acti-diet-eng-2015.pdf
[Accessed 28 Apr. 2017].
Keenan, K., Grant, I. and Ramsay, J. (2011). The Scottish Health Survey: Obesity.
[online] Edinburgh: Scottish Government. Available at:
http://www.gov.scot/Resource/Doc/361003/0122058.pdf [Accessed 8 Mar. 2017].
Loring, B. and Robertson, A. (2014). Obesity and inequities. [online] Copenhagen:
WHO Regional Office for Europe. [online] Available at:
http://ec.europa.eu/health/social_determinants/docs/policybrief_obesity_en.pdf
[Accessed 28 Apr. 2017].
NHS Digital (2017) Smoking Status at Time of Delivery Guidance.[online] NHS Digital.
Available at: http://content.digital.nhs.uk/media/23295/SATOD-
Guidance/pdf/SATOD_Guidance.pdf [Accessed 26 October 2017]
Parkes, A., Sweeting, H. and Wight, D. (2012). Growing up in Scotland: Overweight,
obesity and activity. [online] Scottish Government. Available at:
http://www.gov.scot/Resource/0039/00392688.pdf [Accessed 28 Apr. 2017].
Public Health England (2016). National Child Measurement Programme Operational
Guidance. [online] London: Public Health England. Available at:
Reviews of Scientific Evidence and Policies on Nutrition and Physical Activity
57
https://www.gov.uk/government/uploads/system/uploads/attachment_data/file/5318
78/NCMP-Operational-Guidance.pdf [Accessed 28 Apr. 2017].
Public Health Evaluation and Impact Assessment (PHEIA) (2013). Evaluation of the
use and impact of the European Community Health Indicators ECHI by Member
States: Final. [online] European Commission. Available at:
https://ec.europa.eu/health/sites/health/files/indicators/docs/echi_report_v20131031.
pdf [Accessed 28 Apr. 2017].
Robertson, A., Lobstein, T. and Knai, C. (2007). Obesity and socio-economic groups in
Europe: review and implications for action. [online] European Commission. Available
at:
http://ec.europa.eu/health/ph_determinants/life_style/nutrition/documents/ev200810
28_rep_en.pdf [Accessed 28 Apr. 2017].
Scottish Government (2016). Obesity Indicators: Monitoring Progress for the
Prevention of Obesity Route Map.. [online] Edinburgh: Scottish Government. Available
at: http://www.gov.scot/Resource/0051/00511096.pdf [Accessed 8 Mar. 2017].
Townsend, N. (2009). Obesity and Overweight Surveillence in England. [online]
Oxford: National Obesity Observatory. Available at:
http://webarchive.nationalarchives.gov.uk/20160805121933/http://www.noo.org.uk/
uploads/doc/vid_4483_Obesity_surveillance_data_-_Final_draft_12_11_09.pdf
[Accessed 28 Apr. 2017].
Verschuuren, M., Achterberg, P., Kramers, P. and van Oers, H. (2014). Monitoring the
health of the population. In: B. Rechel and M. McKee, ed., Facets of Public Health in
Europe, [online] New York: Open University Press, European Observatory on Health
Systems and Policies. Available at:
http://www.euro.who.int/__data/assets/pdf_file/0003/271074/Facets-of-Public-
Health-in-Europe.pdf?ua=1 [Accessed 8 Mar. 2017].
Wijnhoven, T., van Raaij, J. and Breda, J. (2014). WHO European Childhood Obesity
Surveillance Initiative Implementation of round 1 (2007/2008) and round 2
(2009/2010). [online] Copenhagen: WHO Regional Office for Europe. Available at:
http://www.euro.who.int/__data/assets/pdf_file/0004/258781/COSI-report-round-1-
and-2_final-for-web.pdf [Accessed 28 Apr. 2017].
WHO Regional Office for Europe (2017a) Adolescent obesity and related behaviours:
trends and inequalities in the WHO European Region, 2002–2014 [online] Available at:
http://www.hbsc.org/publications/international/ [Accessed 1 October 2017]
WHO Regional Office for Europe (2017b) WHO European Childhood Obesity
Surveillance Initiative (COSI). [online] Available at: http://www.euro.who.int/en/health-
topics/disease-prevention/nutrition/activities/monitoring-and-surveillance/who-
european-childhood-obesity-surveillance-initiative-cosi [Accessed 28 April 2017].
World Health Organisation (2016). Consideration of the evidence on childhood obesity
for the Commission on Ending Childhood Obesity: report of the ad hoc working group
on science and evidence for ending childhood obesity. [online] Geneva: WHO.
Available at:
http://apps.who.int/iris/bitstream/10665/206549/1/9789241565332_eng.pdf
[Accessed 28 Apr. 2017].
World Health Organisation (2012). Population-based approaches to childhood obesity
prevention. [online] Geneva: WHO Press. Available at:
http://apps.who.int/iris/bitstream/10665/80149/1/9789241504782_eng.pdf?ua=1
[Accessed 28 Apr. 2017]

EUROPEAN COMMISSION
HOW TO OBTAIN EU PUBLICATIONS
Free publications:
one copy:
via EU Bookshop (http://bookshop.europa.eu);
more than one copy or posters/maps:
from the European Union’s representations
(http://ec.europa.eu/represent_en.htm);
from the delegations in non-EU countries
(http://eeas.europa.eu/delegations/index_en.htm);
by contacting the Europe Direct service
(http://europa.eu/europedirect/index_en.htm) or calling 00 800 6 7 8 9 10 11
(freephone number from anywhere in the EU) (*).
(*) The information given is free, as are most calls (though some operators, phone boxes or hotels may charge you).
Priced publications:
via EU Bookshop (http://bookshop.europa.eu).
Priced subscriptions:
via one of the sales agents of the Publications Office of the European Union
(http://publications.europa.eu/others/agents/index_en.htm).

ISBN: 978-92-79-97424-3
doi:10.2875/035550