Reviewing methods and assumptions for high-resolution large ...
Upload
khangminh22Category
view
1download
0
Wahyuni and Gani: Reviewing the Firm Value ...
Jurnal Manajemen/Volume XXVI, No. 01, February 2022: 121-139
DOI: http://dx.doi.org/10.24912/jm.v26i1.837 121
Reviewing the Firm Value in terms of Profit, Debt, and
Growth
Nur Wahyuni1 and Achriansyah Achmad Gani2
1,2 Universitas Muslim Indonesia
Email Address:
[email protected]; [email protected]
Abstract: This study aims to examine the effect of Return on Equity (ROE), Return on
Assets (ROA), Non-Profit Margin (NPM), DER (Debt to Asset Ratio), Debt to Asset Ratio
(DAR), Asset Growth, and Market To Book Value of Equity (MBVE) to Price Book Value
(PBV). The population in this study is the consumer goods sub-sector manufacturing
companies listed on the Indonesia Stock Exchange in the observation period from 2019 to
2021. There are 42 companies. The total sample in this study is 33 financial statement data,
which was determined based on the purposive sampling method. The data were analyzed
using the Ordinary Least Square model using the Eviews Version 12 software. The results
found that ROE, ROA, Asset Growth, and Market To Book Value of Equity (MBVE)
positively and significantly affected firm value. Meanwhile, DER (Debt to Equity Ratio)
has a negative and significant effect on firm value. Meanwhile, DAR has no significant
adverse effect on firm value.
Keywords: ROE, ROA, DER, DAR, Asset Growth, MBVE, PBV.
Abstrak: Penelitian ini bertujuan untuk menguji pengaruh Return on Equity (ROE), Return
on Assets (ROA), Non-Profit Margin (NPM), DER (Debt to Asset Ratio), Debt to Asset
Ratio (DAR), Pertumbuhan Aset, dan Market To Book Value of Equity (MBVE) menjadi
Price Book Value (PBV). Populasi dalam penelitian ini adalah perusahaan manufaktur
subsektor barang konsumsi yang terdaftar di Bursa Efek Indonesia pada periode pengamatan
tahun 2019 sampai dengan tahun 2021 yang berjumlah 42 perusahaan. Jumlah sampel dalam
penelitian ini adalah 33 data laporan keuangan yang ditentukan berdasarkan metode
purposive sampling. Analisis data menggunakan model Ordinary Least Square
menggunakan software Eviews Versi 12. Hasil penelitian menemukan bahwa ROE, ROA,
Pertumbuhan Aset, dan Market To Book Value of Equity (MBVE) berpengaruh positif dan
signifikan terhadap nilai perusahaan. Sedangkan DER (Debt to Equity Ratio) berpengaruh
negatif dan signifikan terhadap nilai perusahaan. Sedangkan DAR tidak berpengaruh
signifikan terhadap nilai perusahaan.
Kata Kunci: ROE, ROA, DER, DAR, Asset Growth, MBVE, PBV.
Wahyuni and Gani: Reviewing the Firm Value ...
Jurnal Manajemen/Volume XXVI, No. 01, February 2022: 121-139
DOI: http://dx.doi.org/10.24912/jm.v26i1.837 122
INTRODUCTION
The growing number of processing industry companies and the stability of current
economic conditions have created intense competition between manufacturing companies
(Ahmad et al., 2018). The main goal of companies that have gone public is to increase the
owners' or shareholders' prosperity by increasing company value (Dewi and Abundanti,
2019). Furthermore, (Trisnadewi and Amlayasa, 2020) explained that good corporate value
reflects increasing shareholder wealth.
Optimization of firm value can be achieved if the effectiveness of financial
management implementation (Appelbaum et al., 2017; Ahmad et al., 2018). There are three
kinds of decisions in financial management, namely spending decisions, investment
decisions, and dividend policy decisions. Ahmad et al., 2018 explained that financial
decisions carried out by financial managers would impact firm value. There are three types
of valuation related to stocks: book value, market value, and intrinsic value. According to
the issuer's books, book value is the value of shares (Bawono et al., 2020). Market value is
the book value of shares in the stock market, and intrinsic value is the actual value of shares
(Desfiandi and Marantika, 2016).
One approach in determining the intrinsic value of a stock is the price-book value
(PBV). PBV or price-per-book value ratio is the relationship between stock market price
and book value per share. Price book value (PBV) is the ratio between the stock price and
the book value of a company that measures the value given by the financial market to the
management and organization of the company as a company that continues to grow. PBV
is also often used as a reference in determining the value of a stock relative to the market
price. The lower the PBV, the lower the stock price relative to its book value. On the
contrary, the higher the PBV, the higher the stock price. It indicates that a growing company
can be assessed from its stock price.
The high stock price illustrates the high value of the company. The fact reflects the
Price Book Value (PBV) of manufacturing companies from year to year experiencing
instability, as shown in table 1.
Table 1. Price Book Value (PBV) Company
No. Company Name Price Book Value (PBV)
2018 2019 2020
1 Semen Gresik 27,627 29,191 30,585
2 Citra Turbindo Tbk 29,485 24,915 15,847
3 Alaska Industrindo 11,199 10,048 0,7269
4 Alumindo Light Metal Industry 0,8355 0,9405 0,8338
5 Primarindo Asia Infrastructure 0,8834 19,658 10,387
6 Pelat Timah Nusantara 0,6958 0,8396 0,7972
Source: www.idx.co.id 2021
The instability of the company's Price Book Value (PBV) makes it very difficult for
investors to invest. Therefore, investors are not careless in investing their funds. They must
first consider various information, including the company's condition, which is reflected in
the company's performance, including similar industry conditions, fluctuations, exchange
Wahyuni and Gani: Reviewing the Firm Value ...
Jurnal Manajemen/Volume XXVI, No. 01, February 2022: 121-139
DOI: http://dx.doi.org/10.24912/jm.v26i1.837 123
rates, transaction volume, stock exchange conditions, and economic conditions. , social,
political, and national stability of a country. Based on this information, one of the essential
things before investors invest their capital is assessing the Price Book Value (PBV) through
its performance.
Several factors can affect firm value, including profitability, leverage, and growth
opportunity. Profitability is the ability of a company to generate profits at a certain level of
sales, assets, and share capital (Amin, 2015). Profitability describes the ability of a business
entity to generate profits by using all its capital. It illustrates that profitability is essential to
maintain the company's viability in the long term. It is because profitability contains
information about the company's prospects in the future (Ardiyanto et al., 2020). Thus, every
business entity will always try to increase its profitability because the higher the level of
profitability of an entity, the survival of the business entity will be more guaranteed (Sanjaya
and Rizky, 2018). Profitability is the ratio of management effectiveness based on the returns
generated from sales and investment. The profitability ratio consists of profit margin,
essential earning power, return on assets, and return on equity. This study measured the
profitability ratio by ROE, ROA, and NPM. ROE is a ratio that shows the company's ability
to generate net income for the return of shareholder equity.
ROE is a financial ratio used to measure the profitability of equity. The greater the
ROE, the better the company's performance. An increasing ratio indicates that management
performance increases in effectively managing sources of operational financing funds to
generate net income (Tumandung et al., 2017). The growth of ROE shows the company's
prospects are getting better because it means there is a potential for increased profits
(Simorangkir, 2019). Then, ROA describes the level of the company's ability to use all of
its assets to generate after-tax profits. The greater the ROA, the more efficient the company
is processing all company assets. In other words, with the same number of assets, more
significant profits can be generated and vice versa (Gunde et al., 2017).
In addition to earning profits from the asset or investment side, the company will also
optimize the ability to generate profits from the operational side or net profit margin (NPM).
(Faleria et al., 2017) suggested that NPM is a ratio used to show a company's ability to
generate net profits after tax. The more excellent the NPM, the more productive the
company's performance will be, increasing investor confidence to invest in the company
(Halik, 2018). Leverage is a proportion or comparison in determining the fulfillment of
company spending needs, whether by using debt, equity or by issuing shares (Yanti &
Darmayanti, 2019). Leverage is needed to increase the company's value because the
determination of leverage in the company's funding policy determines the profitability and
position of the company. Funding decisions projected Debt to Equity Ratio (DER). The
company will face the alternative of choosing to increase its capital or withdraw long-term
debt. If people choose funding by withdrawing long-term loans, of course, the company
becomes dependent on outside parties or creditors. Every company that wants to expand, of
course, requires significant capital. The study results (Sari and Priyadi, 2016) and (Kholis
et al., 2018) found that DER had a negative and significant effect on firm value. However,
(Utami and Prasetiono, 2016) DER has a significant positive effect on firm value.
Debt To Asset Ratio (DAR) shows how much the company's assets are financed by
total debt. This ratio emphasizes the importance of debt financing by showing the percentage
of company assets supported by debt (Pratama and Wahyudi, 2021). The higher the DAR
Wahyuni and Gani: Reviewing the Firm Value ...
Jurnal Manajemen/Volume XXVI, No. 01, February 2022: 121-139
DOI: http://dx.doi.org/10.24912/jm.v26i1.837 124
means, the greater the amount of capital used as investment capital so that the PBV
increases. Companies that predict that they will experience high growth in the future will
prefer to use shares to fund company operations (Chandra, 2017). Thus, companies that
have low growth opportunities will use long-term debt more. The growth opportunity for
each company is different. It causes differences in spending decisions taken by financial
managers. An increase in assets followed by an increase in operating results will further
increase the confidence of outsiders in the company (Danila et al., 2020), which impacts the
company's investing (Kusna and Setijani, 2018). The study results (Pasaribu et al., 2019)
found that asset growth had a positive and significant effect on firm value.
Each of these investment and financing decisions will affect the level, timing, and risk
of the company's cash flow, and ultimately the company's stock price, so managers must
make investment and financing decisions designed to maximize the company's share price
(Irdiana, 2016). The combination of its assets affects the value of the company. A high
Market To Book Value Of Equity (MBVE) indicates a company with good prospects in the
future so that investors can assume that investing in the company will get a more profitable
return. The study results (Khansakhalishah, 2021) in his research argues that MBVE has a
positive influence on firm value in the sense that if MBVE increases, the firm value also
increases. Therefore, this study aims to examine the effect of return on equity (ROE), return
on assets (ROA), Non-Profit Margin (NPM), DER (Debt to Asset Ratio), Debt to Asset
Ratio (DAR), Asset Growth, and Market To Book Value Of Equity (MBVE) to firm value.
THEORITICAL REVIEW
Agency theory assumes that all individuals act in their interests (Jensen & Smith,
2000). Shareholders as principals are assumed to be only interested in increasing financial
returns or their investment in the company. Meanwhile, agents are assumed to receive
satisfaction in financial compensation and the conditions that accompany the relationship
(Utomo, 2019). Shareholders as owners are assumed to be only interested in financial results
in increasing dividends. In contrast, the manager as an agent is assumed to receive
satisfaction in high financial compensation and the conditions that accompany the
relationship. This difference in interests triggers a conflict between the owner and the
manager. Agency theory is a model used to formulate problems in the form of conflicts
between shareholders as company owners and managers as parties appointed or authorized
by shareholders to run the company according to their interests (Panda and Leepsa, 2017). Signal theory suggests how a company should provide signals to users of financial
statements. (Sinaga, 2016) states that a signal is an action taken by the company's
management that provides clues for investors about how management views the company's
prospects. Companies with favorable prospects will avoid selling shares and seek new
capital in other ways, such as by using debt. Signaling theory emphasizes the importance of
information issued by the company on parties outside the company (Nurdin, 2018).
Information is an essential element for investors and business people because information
essentially presents information, notes, or descriptions for past, current, and future
conditions for a company's survival and how the securities market will be. Investors in the
capital market need complete, relevant, accurate, and timely information as an analytical
tool to make investment decisions (Damayanti et al., 2020).
Wahyuni and Gani: Reviewing the Firm Value ...
Jurnal Manajemen/Volume XXVI, No. 01, February 2022: 121-139
DOI: http://dx.doi.org/10.24912/jm.v26i1.837 125
Information published as an announcement will signal investors in making investment
decisions. If the announcement contains a positive value, it is expected that the market will
react when the market receives the announcement. When the information is announced and
all market participants have received the information, market participants first interpret and
analyze the information as a good signal (good news) or a wrong signal (bad news). If the
announcement of the information is a good signal for investors, there will be a change in
stock trading volume (Alexander and Kadafi, 2018). The annual report is one type of
information issued by a company that can signal parties outside, especially investors.
Information disclosed in the annual report can be in the form of accounting information,
namely information related to financial statements, and non-accounting information, namely
information not related to financial statements. The annual report should contain relevant
information and disclose information that is considered essential to be known by users of
the report, both internal and external parties. If a company wants its shares to be purchased
by investors, it must disclose its financial statements openly and transparently
(Puspitaningrum and Taswan, 2020). (Karo and Perlantino, 2017) put forward Signaling
theory about how a company should give signals to users of financial statements. Signals
can be in promotions or other information stating that the company is better than other
companies. Signal theory explains that managers do signaling to reduce information
asymmetry. Signaling theory can also help the company (agent), the owner (principal), and
parties outside the company reduce information asymmetry by producing quality or integrity
of financial statement information.
(Eriotis et al., 2007) suggests that the optimal debt ratio is determined based on the
balance between benefits and costs arising from the use of debt. In principle, the company
can still do additional debt as long as the benefits are still much more significant and fixed
assets are collateral. However, if the cost of debt is too high, the company should not add
more debt to avoid unwanted risks that can affect the company's value. On the other hand,
according to this theory, a company will not achieve optimal value if all funding is financed
by debt or does not use debt in financing the company's activities. Company managers must
carefully and precisely manage the company's capital composition. In addition, this theory
also states that there is a relationship between the use of debt, taxes, and bankruptcy costs
due to the capital structure decisions set by the company (Cortez and Susanto, 2012).
Although this trade-off has not been maximized in determining the optimal capital structure
of a company, from this theory, it can be concluded that companies that have a high level
of profit should use the amount of debt that is not too much to avoid unwanted risks.
Profitability is the company's ability to generate profits and measure the level of
operational efficiency and efficiency in using its assets (Suardana et al., 2018). The return
on equity is also known as the return on equity. This ratio examines the extent to which a
company uses its resources to provide a return on equity. According to (Purwanti, 2020),
Return on Equity (ROE) measures how much profit is the owner's right of his capital. In
other words, ROE shows the profit that shareholders will enjoy. The existence of ROE
growth shows the company's prospects are getting better because it means there is a
potential for increased profits. Investors capture it as a positive signal from the company
to increase investor confidence and make it easier for company management to attract
capital in shares. If there is an increase in the demand for a company's shares, it will
indirectly increase the share price in the capital market. The results of the study (Languju,
Wahyuni and Gani: Reviewing the Firm Value ...
Jurnal Manajemen/Volume XXVI, No. 01, February 2022: 121-139
DOI: http://dx.doi.org/10.24912/jm.v26i1.837 126
2016), (Lumoly et al., 2018) show that ROE has a significant effect on the direction of a
positive relationship to firm value (PBV). It means that when the company experiences an
increase in profits, the company's share price will also increase to increase the value of the
company.
H1: Return on Equity (ROE) has a positive and significant effect on firm value.
Return On Assets (ROA) is the ability of a business unit to earn a return on several
assets owned by the business unit and used to measure the rate of return on investment that
the company has made by using all its activities (Muhammad and Rahim, 2019). This ROA
can help management and investors see how well a company can convert its investment in
assets into profit (profit). This Return on Assets can also be considered a return on
investment for a company because capital assets are often the most significant investment
for most companies (Octaviany and Mutmainnah, 2019). The study results (Chasanah,
2018) show that ROA has a significant and positive effect on firm value (PBV). A positive
ROA indicates that the company can provide profits for the total assets used to operate. On
the other hand, a negative ROA indicates that the company is experiencing a loss.
H2: Return on Assets (ROA) has a positive and significant effect on firm value.
Net Profit Margin (NPM) or Net Profit Margin is a profitability ratio used to measure
the percentage of net profit in a company against its net sales (Nariswari and Nugraha,
2020). This Net Profit Margin shows the remaining sales after deducting all related costs.
Net Profit Margin is often referred to as the Profit Margin Ratio (Profit Margin Ratio). For
investors, this Net Profit Margin is usually used to measure how efficiently management
manages their company and estimates future profitability based on sales forecasts made by
their management (Pujiati and Maulidina, 2021). By comparing net income with total sales,
investors can see what percentage of income is used to pay operating and non-operating
costs and what percentage is left to pay dividends to shareholders or reinvest in the
company. The purpose of calculating Net Profit Margin is to measure the overall success
of a company's business. A high Net Profit Margin indicates the company is pricing its
products correctly and has managed costs well. The research results (Pasaribu and
Lumbantobing, 2017) and (Halik, 2018) NPM has a positive and significant effect on firm
value. This Net Profit Margin ratio will be beneficial when comparing competitors'
profitability in the same industry because they have the same business environment and
customer base and have almost the same cost structure.
H3: Net Profit Margin (NPM) has a positive and significant effect on firm value.
Leverage decisions will generate incentives for managers to take steps to increase
firm value (Berger et al., 1997). Debt policy can be measured using DER (Debt to Equity
Ratio). DER is a ratio that compares financing and financing through debt with funding
through equity. Companies with a high level of leverage mean that they are very dependent
on external loans in financing their assets. Meanwhile, companies with a low level of
leverage use their capital to finance their assets. The research results (RAI Sari and Priyadi,
Wahyuni and Gani: Reviewing the Firm Value ...
Jurnal Manajemen/Volume XXVI, No. 01, February 2022: 121-139
DOI: http://dx.doi.org/10.24912/jm.v26i1.837 127
2016) and (Kholis et al., 2018) have a negative and significant effect on firm value. The
more outstanding the Debt to Equity Ratio (DER) reflects the company's relatively high
risk. Investors try to avoid stocks with a high Debt to Equity Ratio (DER) value. If the
company uses debt, it will increase the risk borne by shareholders. When the amount of
debt experiences a large enough increase, the solvency level will decrease, which will have
an impact on decreasing the company's value. However, (Utami and Prasetiono, 2016) DER
has a significant positive effect on firm value.
H4: DER (Debt to Equity Ratio) has a negative and significant effect on firm value.
Debt to Assets Ratio (DAR) is a debt ratio used to measure how much the company's
assets are financed by debt or how much the company's debt affects asset management.
DAR is needed by companies in measuring the company's financial health, especially in
bearing debts. (Enekwe et al., 2014) suggests that the debt to asset ratio can be used to
measure how much a company's assets are financed by debt or how much company debt
can affect the management of corporate assets. The study results (Widodo, 2018) found
that the Debt to Assets Ratio (DAR) had a positive and significant effect on firm value.
Debt is a positive sign for the company. It will make a good impact on the value of the
company. If the company does not get a positive sign, it will make a harmful impact on the
company's value. It can be said that if the DAR is low, the company value will be low and
impact investors who will not give confidence to the company. Companies that have a lot
of assets and debt are not suitable for the company and vice versa. However, (Muzdalifah
and Soekotjo, 2018) found that the Debt to Assets Ratio (DAR) had a positive but
significant effect on firm value. Moreover, the study results (Cindy Sandra, 2021) found
that the negative was not significant to the firm value.
H5: DAR (Total Debts to Total Assets Ratio) has a negative and significant effect on firm
value.
Asset growth is the growth of total current assets plus the growth of non-current
assets. Current assets are cash and assets that can be expected to be disbursed or exchanged
into cash, sold, or consumed within a certain period (maximum one year in the average
turnover of the company's activities). (Suweta and Dewi, 2016) stated that high asset
growth will cause fluctuations in company value so that companies with high asset growth
rates have high dividends. It can be said that high asset growth will increase returns.
Internal and external parties highly expect asset growth because good asset growth
positively signals the company's development. Companies that have significant total assets
will find it easier to get attention from investors and creditors because it reflects that the
company can generate profits used to increase the number of assets, which can then
increase the company's value (Sukmayanti and Triaryati, 2019). The results of research
(Purwani and Oktavia, 2018) and (Limanjaya and Tanusdjaja, 2021) show that asset growth
has a positive effect on firm value.
H6: Asset Growth has a positive and significant effect on firm value.
Wahyuni and Gani: Reviewing the Firm Value ...
Jurnal Manajemen/Volume XXVI, No. 01, February 2022: 121-139
DOI: http://dx.doi.org/10.24912/jm.v26i1.837 128
Based on the results of research (Noradiva et al., 2016) suggests that the Market To
Book Value Of Equity (MBVE) is a company's investment decision in the form of a
combination of assets owned by the company (assets in place) and the company's investment
choices in the future with a positive Net Present Value (NPV) which will affect the value of
the company. (Hidayah, 2015) stated that MBVE is the company's value, the amount of
which depends on the expenses set by management in the future. However, at this time, it is
still an investment option that the company expects to generate a greater return.
In general, MBVE describes a company's breadth of investment opportunities, but it
depends on its future expenditures. When viewed from the signal theory, the occurrence of
spending on investment by the company will give a positive signal about the company's
growth in the future. It will increase the stock price, which indicates company value (Putri
and Setiawan, 2019). It is due to the perception of capital market players who see that
spending on investment shows the seriousness of management in developing the company.
The results of the study (Hamidah and Umdiana, 2017) and (Alamsyah and Malanua, 2021)
found that Market To Book Value Of Equity (MBVE) had a positive and significant effect
on firm value. It indicates that companies with high market value are considered suitable by
investors because they can provide good returns through high stock prices.
H7: Market To Book Value Of Equity (MBVE) has a positive and significant effect on Firm
Value.
METHODS
This type of research is quantitative research, where quantitative research emphasizes
theory testing through the measurement of variables and indicators of this research. The
population of this study is the consumer goods sub-sector manufacturing companies listed
on the Indonesia Stock Exchange in the observation period from 2019 to 2021, and there
are 42 companies. This study's sample selection and determination technique is purposive
sampling with criteria such as 1) Manufacturing companies listed on the Indonesia Stock
Exchange for at least 3 consecutive years during the observation period between 2019 and
2021. 2) sampled companies must provide data or complete information for research
analysis needs. 3) Listing companies before 2019. That a total sample of 33 financial
statement data from 11 companies in the consumer goods sector for 3 years.
This panel data combines time-series and cross-section data, where the time series collects observations within a specific period. While the cross-section is data collected
within a specific time from the sample through the website www.idx.co.id and analyzed
using multiple linear regression analysis methods with Ordinary Least Square model using
Eviews Version 12 software.
Y =α + β1X1 + β2X2 + β3X3 + β4X4 + β5X5 + β6X6 + β7X7 ….........…… (1)
Deskription :
Y : Firm Value
X1 : Return On Equity (ROE)

Wahyuni and Gani: Reviewing the Firm Value ...
Jurnal Manajemen/Volume XXVI, No. 01, February 2022: 121-139
DOI: http://dx.doi.org/10.24912/jm.v26i1.837 129
X2 : Return On Asset (ROA)
X3 : Net Profit Margin (NPM)
X4 : Debt To Equity Ratio (DER)
X5 : Debt to Asset Ratio (DAR)
X6 : Asset Growth
X7 : Market To Book Value Of Equity (MBVE)
RESULTS
The minimum value of Return On Equity (ROE) for consumption service industry
companies in 2019 until 2021 is -14.99 and the maximum 35.14. The average value of
12.4909 indicates that the Return On Equity (ROE) is a relatively strong influence. The
standard deviation of Return On Equity (ROE) is 11.7911681, the minimum value of Return
On Assets (ROA) in consumption service industry companies in 2019-2021 of -6.6794 and
the maximum of 25.4462. The average value of 9.657481 indicates that the Return On
Assets (ROA) is a relatively strong influence. The standard deviation of Return On Assets
(ROA) is 7.8311620. The minimum value of Net Profit Margin (NPM) for consumption
service industry companies in 2019-2021 is -23.9754, and the maximum is 37.8642. The
average value of 7.447548 indicates that the Net Profit Margin (NPM) has a high enough
effect. The standard deviation of Net Profit Margin (NPM) is 12.1831002. The minimum
value of the Debt Equity Ratio (DER) for consumption service industry companies in 2019
until 2021 is 0.1634, and the maximum is 1.8722. The average value of 0.819305 indicates
that the Debt Equity Ratio (DER) has a high enough effect. The standard deviation of the
Debt Equity Ratio (DER) is 0.4726126. The minimum value of Debt Asset Ratio (DAR) for
consumption service industry companies in 2019 until 2021 is 0.1404, and the maximum
value is 0.8518. The average value of 0.417195 indicates that the Debt Asset Ratio (DAR)
has a reasonably high effect. The standard deviation of the Debt Asset Ratio (DAR) is
0.1819226. The minimum value of Asset Growth in consumption service industry
companies in 2019-2021 is -0.1606, and the maximum value is 0.5617. The average value
of 0.101838 indicates that Asset Growth has a high enough effect. The standard deviation
of Asset Growth is 0.1204886. The minimum Market to Book Value of Equity (MBVE) for
consumption service industry companies in 2019 until 2021 is 0.7184, and the maximum
value is 6.8608. The average value of 3.056243 indicates that the Market to Book Value of
Equity (MBVE) has a reasonably high effect. The Market to Book Value of Equity (MBVE) standard deviation is 1.8113644. The minimum PBV value for consumption service industry
companies in 2019-2021 is 0.81, and the maximum PBV value is 27.34. The average value
of 8.014848 indicates that PBV has a high enough effect. The standard deviation of the PBV
is 8.7540587.
Wahyuni and Gani: Reviewing the Firm Value ...
Jurnal Manajemen/Volume XXVI, No. 01, February 2022: 121-139
DOI: http://dx.doi.org/10.24912/jm.v26i1.837 130
Table 3. Descriptive statistics
N Minimum Maximum Mean Std. Deviation
ROE 33 -14.9900 35.1400 12.490909 11.7911681
ROA 33 -6.6794 25.4462 9.657481 7.8311620
NPM 33 -23.9754 37.8642 7.447548 12.1831002
DER 33 .1634 1.8722 .819305 .4726126
DAR 33 .1404 .8518 .417195 .1819226
Asset Growth 33 -.1606 .5617 .101838 .1204886
MBVE 33 .7184 6.8608 3.056243 1.8113644
PBV 33 .8100 27.3400 8.014848 8.7540587
Valid N (listwise) 33
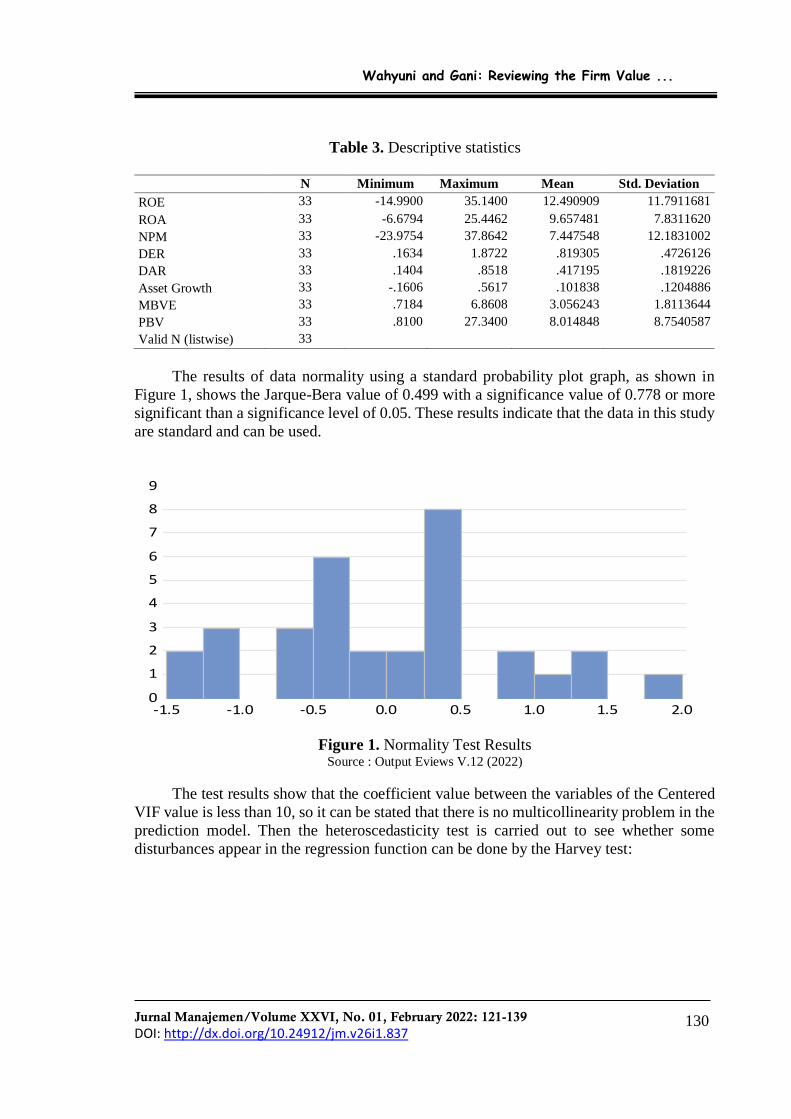
The results of data normality using a standard probability plot graph, as shown in
Figure 1, shows the Jarque-Bera value of 0.499 with a significance value of 0.778 or more
significant than a significance level of 0.05. These results indicate that the data in this study
are standard and can be used.
Figure 1. Normality Test Results Source : Output Eviews V.12 (2022)
The test results show that the coefficient value between the variables of the Centered
VIF value is less than 10, so it can be stated that there is no multicollinearity problem in the
prediction model. Then the heteroscedasticity test is carried out to see whether some
disturbances appear in the regression function can be done by the Harvey test:
0
1
2
3
4
5
6
7
8
9
-1.5 -1.0 -0.5 0.0 0.5 1.0 1.5 2.0
Series: Residuals
Sample 1 32
Observations 32
Mean -2.77e-15
Median -0.020436
Maximum 1.931376
Minimum -1.410244
Std. Dev. 0.818282
Skewness 0.272864
Kurtosis 2.722766
Jarque-Bera 0.499569
Probability 0.778969

Wahyuni and Gani: Reviewing the Firm Value ...
Jurnal Manajemen/Volume XXVI, No. 01, February 2022: 121-139
DOI: http://dx.doi.org/10.24912/jm.v26i1.837 131
Table 4. Heteroskedasticity Test Harvey Results
No Description Harvey Test
1 F. Statistik
Prob. F
1,593
0,384
2 Obs* R-Square
Prob. Chi-Square
1,781
0,552
Source: Output Eviews V.11 (2021)
Probability value. From F count 1.593 and Probability. The chi-Square count of 0.552
from all tests is greater than the 5 percent significance value. These results indicate that
there is no heteroscedasticity in the equation model.
Table 5. Partial Test Results
Variable Coefficient t Probability Note
ROE to PBV 1.377 3.207 0.003 Hipotesis 1 Accepted
ROA to PBV 2.061 2.224 0.002 Hipotesis 2 Accepted
NPM to PBV 1.176 3.498 0.001 Hipotesis 3 Accepted
DER to PBV -0.712 -1.958 0.005 Hipotesis 4 Accepted
DAR to PBV -4.662 -1.091 0.436 Hipotesis 5 Rejected
ASET GROWTH to PBV 0.920 4.125 0.001 Hipotesis 6 Accepted
MBVE to PBV 2.967 5.564 0.000 Hipotesis 7 Accepted
Source: Output Eviews V.11 (2021)
Table 5 shows that ROE, ROA, NPM, Asset Growth, and MBVE positively affect
firm value. Meanwhile, DER has a negative and significant effect on firm value. Meanwhile,
DAR has a negative and insignificant effect on firm value.
DISCUSSION
The results of testing the first hypothesis (H1) indicate that Return on Equity (ROE)
has a positive and significant effect on firm value. These results indicate that if the ROE in
a company increases, then the company's value will also increase. It is because ROE growth
is information for stakeholders about the company's prospects that are getting better because
of the potential for increased profits to be obtained. The results of this study support the
signal theory, which explains that investors will capture a good ROE value as a positive
signal from the company. It will increase investor confidence and make it easier for
company management to attract capital in shares. If there is an increase in the demand for a
company's shares, it will indirectly increase the share price in the capital market. This study
also supports agency theory, which assumes that all individuals act in their interests.
Shareholders as principals are assumed to be only interested in increasing financial returns
or their investment in the company. Meanwhile, agents are assumed to receive satisfaction
in financial compensation and the accompanying conditions in the relationship (Rahmawati,
2010). The results of this study support the results of research (Languju, 2016; Lumoly et
al., 2018), showing that ROE has a significant effect on the direction of a positive
Wahyuni and Gani: Reviewing the Firm Value ...
Jurnal Manajemen/Volume XXVI, No. 01, February 2022: 121-139
DOI: http://dx.doi.org/10.24912/jm.v26i1.837 132
relationship to firm value (PBV). It means that when the company experiences an increase
in profits, the company's share price will also increase to increase the value of the company.
The results of testing the second hypothesis (H2) show that Return on Assets (ROA)
has a positive and significant effect on firm value. These results indicate that if the
company's ability to earn profits increases on the number of assets it owns, it will also
increase the level of interest of investors to invest in the company, thereby increasing its
share price. The results of this study support the signal theory, which explains that investors
will capture a good ROA value as a positive signal from the company. It will increase
investor confidence and make it easier for company management to attract capital in shares.
If there is an increase in the demand for a company's shares, it will indirectly increase the
share price in the capital market. This study also supports agency theory, which assumes
that all individuals act in their interests. Shareholders as principals are assumed to be only
interested in increasing financial returns or their investment in the company. Meanwhile,
agents are assumed to receive satisfaction in financial compensation and the accompanying
conditions in the relationship (Rahmawati, 2010). The results of the study (Chasanah, 2018)
and (Sondakh et al., 2019) show that ROA has a significant and positive effect on firm value
(PBV). A positive ROA indicates that the company can provide profits for the total assets
used to operate. Meanwhile, (Suranto and Walandouw, 2017) and (Kadim and Sunardi,
2019) found that it was different from the findings of this study, namely that ROA had a
positive but not significant effect on firm value. (Putra and Wirawati, 2013) found on the
contrary that ROA had a negative and significant effect on firm value. A negative ROA
indicates that the company is experiencing a loss.
The results of testing the third hypothesis (H3) found that Net Profit Margin (NPM)
had a positive and significant effect on firm value. For Investors, Net Profit Margin is
usually used to measure how efficiently management manages their company and estimates
future profitability based on sales forecasts made by their management. Signal theory
explains that investors will capture a good NPM value as a positive signal. It will increase
investor confidence and make it easier for company management to attract capital in shares.
If there is an increase in the demand for a company's shares, it will indirectly increase the
share price in the capital market. Then, the results of this study also support agency theory
which assumes that all individuals act in their interests. Shareholders as principals are
assumed to be only interested in increasing financial returns or their investment in the
company. Meanwhile, agents are assumed to receive satisfaction in financial compensation
and the accompanying conditions in the relationship (Rahmawati, 2010). The research
results (Pasaribu and Lumbantobing, 2017) and (Halik, 2018) NPM has a positive and
significant effect on firm value. This Net Profit Margin ratio will be beneficial when
comparing competitors' profitability in the same industry because they have the same
business environment and customer base and have almost the same cost structure.
The results of testing the fourth hypothesis (H4) found that DER (Debt to Equity
Ratio) had a negative and significant effect on firm value. These results indicate that with
the increasing number of debts that the company must bear, the value will decrease. It is
significant because the company can cover the debt with its total equity or assets. Leverage
decisions will generate incentives for managers with the aim of managers taking steps to
increase the company's value. If the ratio value is higher, the greater the company will obtain
funds from outside. Conversely, if the value of the ratio is lower, the less the company uses

Wahyuni and Gani: Reviewing the Firm Value ...
Jurnal Manajemen/Volume XXVI, No. 01, February 2022: 121-139
DOI: http://dx.doi.org/10.24912/jm.v26i1.837 133
funds from outside. The results of this study are by signal theory (Yasar et al., 2020) where
information published as an announcement will signal investors in making investment
decisions. When the DER owned by the company is high, it will give a wrong signal (bad
news) for investors so that there is a change in the volume of stock trading, thereby reducing
the value of the company. The results of this study are also by the Trade-off Theory
proposed by (Hackbarth et al., 2007). According to (Hackbarth et al., 2007), the optimal
debt ratio is determined based on the balance between benefits and costs arising from the
use of debt. In principle, the company can still do additional debt as long as the benefits are
still much more significant and fixed assets are collateral. However, if the cost of debt is too
high, the company should not add more debt to avoid unwanted risks that can affect the
company's value. The results of this study support the research results (RAI Sari & Priyadi,
2016) and (Kholis et al., 2018) have a negative and significant effect on firm value. The
more outstanding the Debt to Equity Ratio (DER) reflects the company's relatively high
risk. Investors try to avoid stocks with a high Debt to Equity Ratio (DER) value. If the
company uses debt, it will increase the risk borne by shareholders. When the amount of debt
experiences a large enough increase, the solvency level will decrease, which will have an
impact on decreasing the company's value. However, in contrast to the results of research
(Utami & Prasetiono, 2016) DER has a significant positive effect on firm value.
The results of testing the fifth hypothesis (H5) indicate that the Debt to Assets Ratio
(DAR) has a negative and insignificant effect on firm value. These results explain that a
decrease or increase will not necessarily follow any increase or decrease in DAR in firm
value. The smaller debt to assets indicates that the company's debt is getting smaller. The
smaller the debt can prevent the company from the risk of bankruptcy. Investors will be
more interested in low DAR so that the company's value will likely increase. The results of
this study are by signal theory (Yasar et al., 2020) where information published as an
announcement will signal investors in making investment decisions. When the DER owned
by the company is high, it will give a wrong signal (bad news) for investors so that there is
a change in the volume of stock trading, thereby reducing the value of the company. The
results of this study are also by the Trade-off Theory proposed by Hackbarth et al., 2007).
According to Hackbarth et al., 2007) in Joni and Lina (2010), the optimal debt ratio is
determined based on the balance between benefits and costs arising from the use of debt. In
principle, the company can still do additional debt as long as the benefits are still much more
significant and fixed assets are collateral. However, if the cost of debt is too high, the
company should not add more debt to avoid unwanted risks that can affect the company's
value. These results support the research results (Cindy Sandra, 2021) which finds that a
negative DAR is not significant to firm value. However, in contrast to the study results
(Widodo, 2018), the Debt to Assets Ratio (DAR) had a significant effect on firm value. Debt
is a positive sign for the company. It will make a good impact on the value of the company.
If the company does not get a positive sign, it will make a harmful impact on the company's
value. It can be said that if the DAR is low, the company value will be low and impact
investors who will not give confidence to the company. Moreover, (Muzdalifah and
Soekotjo, 2018) found that the Debt to Assets Ratio (DAR) had a positive but not significant
effect on firm value. It shows that companies that have high debt will have an impact on
public confidence in the company. The company uses debt sources in the hope that it will
provide more benefits compared to the fixed burdens that must be borne.
Wahyuni and Gani: Reviewing the Firm Value ...
Jurnal Manajemen/Volume XXVI, No. 01, February 2022: 121-139
DOI: http://dx.doi.org/10.24912/jm.v26i1.837 134
The results of testing the sixth hypothesis (H6) found that asset growth was positive
and significant to firm value. It means that the greater the company's asset growth, the more
it will increase the value of the company. Companies with high asset growth tend to require
significant funding and will cause fluctuations in the company's value. Companies with high
asset growth rates have high dividends, which impacts company value. The results of this
study support the signal theory, which explains that good asset growth gives a positive signal
to the company's development. Companies that have significant total assets will find it easier
to get attention from investors and creditors because it reflects that the company can
generate profits used to increase the number of assets, which can then increase the
company's value. Companies with a high level of growth opportunities certainly require
more significant capital to realize these opportunities, and of course, investors will be
interested. The results of research by Chaidir (2015), Suastini, et al (2016), Gustian (2017),
and Purwani and Oktavia (2018) show that asset growth has a positive effect on a firm value.
Companies that predict that they will experience high growth in the future tend to prefer to
use shares to fund the company's operations to increase the value of the company.
The results of testing the seventh hypothesis (H7) found that Market To Book Value
Of Equity (MBVE) had a positive and significant effect on firm value. These results explain
that the increase in Market To Book Value Of Equity (MBVE) will increase the company's
value because MBVE shows that the company will continue to grow, which will attract
investors. When many investors enter and the company's performance is good, the profits
will be higher. High profits mean the value of the company will also be more significant.
From the investor's point of view, a company's growth is a sign that the company has a
beneficial aspect. Investors will also expect the rate of return from the investment made to
show good development. The results of this study support the signal theory, which explains
that when viewed from signal theory, the occurrence of spending on investment by the
company will give a positive signal about the company's growth in the future so that it will
increase stock prices which are indicators of company value (Suartawan and Gerianta,
2016). It is due to the perception of capital market players who see that spending on
investment shows the seriousness of management in developing the company. The results
of this study support the results found by (Hamidah and Umdiana, 2017) and Sudiani and
Wiksuana (2018) found that Market To Book Value Of Equity (MBVE) has a positive and
significant effect on firm value. It indicates that investors consider companies with high
market value reasonable because they can provide good returns through high stock prices.
CONCLUSION
The results of the study found that Return on Equity (ROE) had a positive and
significant effect on firm value. that the higher the return on equity, the better, because the
profits generated by the company will be greater and have an impact on the high value of
the company. Second, Return On Assets (ROA) has a positive and significant effect on firm
value. It means that every increase in Return On Assets (ROA) will increase its value
because the company is increasingly able to earn a return on several assets it owns. Third,
DER (Debt to Equity Ratio) has a negative and significant effect on firm value. The more
debt that the company must bear, the company's value will decrease. Fourth, DAR (Debt to
Asset Ratio) has a negative and insignificant effect on firm value. It means that a decrease
Wahyuni and Gani: Reviewing the Firm Value ...
Jurnal Manajemen/Volume XXVI, No. 01, February 2022: 121-139
DOI: http://dx.doi.org/10.24912/jm.v26i1.837 135
or increase will not follow any increase or decrease in DAR in company value. Fifth, asset
growth is positive and significant to firm value. It means that the greater the company's asset
growth, the more it will increase the value of the company. Sixth, Market To Book Value
Of Equity (MBVE) has a positive and significant effect on firm value. It means that the
increase in Market To Book Value Of Equity (MBVE) will increase the company's value
because MBVE shows that the company will continue to grow, which will attract investors.
REFERENCES
Alamsyah, M. F., dan Malanua, W. (2021). Pengaruh Investment Opportunity Set,
Corporate Social Responsibility, Dan Risiko Bisnis Terhadap Nilai Perusahaan.
Jurnal Fokus Manajemen Bisnis, 11(2), 154–172.
Alexander, A., dan Kadafi, M. A. (2018). Analisis abnormal return dan trading volume
activity sebelum dan sesudah stock split pada perusahaan yang terdaftar di bursa efek
indonesia. Jurnal Manajemen, 10(1), 1–6.
Amin, A. (2015). Pengaruh Perputaran Kas, Perputaran Persediaan, Pertumbuhan Penjualan
Terhadap Profitabilitas Pada Perusahaan Food And Beverage Yang Terdaftar Di
Bursa Efek Indonesia Periode 2012-2015. AKMEN Jurnal Ilmiah, 12(4).
Appelbaum, D., Kogan, A., Vasarhelyi, M., and Yan, Z. (2017). Impact of business analytics
and enterprise systems on managerial accounting. International Journal of
Accounting Information Systems, 25, 29–44.
Ardiyanto, A., Wahdi, N., dan Santoso, A. (2020). Pengaruh Return On Assets, Return On
Equity, Earning Per Share Dan Price To Book Value Terhadap Harga Saham. Jurnal
Bisnis & Akuntansi Unsurya, 5(1).
Bawono, A. D. B., Ramadhanti, M., and Kurniawati, L. (2020). Earnings and Cash Flow
Information on Its Value Relevance by The Book Value. Riset Akuntansi Dan
Keuangan Indonesia, 5(1), 46–53.
Berger, P. G., Ofek, E., and Yermack, D. L. (1997). Managerial entrenchment and capital
structure decisions. The Journal of Finance, 52(4), 1411–1438.
Chandra, A. F. (2017). Company Size, Profitability, Tangibilitas, Free Cash Flow, And
Growth Opportunity That Affect The Capital Structure In Manufacturing Company.
Jurnal Manajemen Bisnis Dan Kewirausahaan, 1(2).
Chasanah, A. N. (2018). Pengaruh Rasio Likuiditas, Profitabilitas, Struktur Modal Dan
Ukuran Perusahaan Terhadap Nilai Perusahaan Pada Perusahaan Manufaktur Yang Terdaftar Di Bei Tahun 2015-2017. Jurnal Penelitan Ekonomi Dan Bisnis, 3(1), 39–
47.
Cindy Sandra, J. (2021). Analisis Pengaruh The Firm Size, Profitability, Dan Leverage
Terhadap Nilai Perusahaan. Jurnal Paradigma Akuntansi, 3(1), 339–347.
Cortez, M. A., and Susanto, S. (2012). The determinants of corporate capital structure:
Evidence from Japanese manufacturing companies. Journal of International Business
Research, 11(3), 121.
Danila, N., Noreen, U., Azizan, N. A., Farid, M., and Ahmed, Z. (2020). Growth
Opportunities, Capital Structure and Dividend Policy in Emerging Market: Indonesia
Case Study. The Journal of Asian Finance, Economics, and Business, 7(10), 1–8.
Desfiandi, A., and Marantika, A. (2016). Model Stock Price Valuation Approach Based
Wahyuni and Gani: Reviewing the Firm Value ...
Jurnal Manajemen/Volume XXVI, No. 01, February 2022: 121-139
DOI: http://dx.doi.org/10.24912/jm.v26i1.837 136
Company Intrinsic Value In the National Logistics System Development (Sislognas).
International Conference on Information Technology and Business (ICITB), 127–134.
Dewi, L. S., and Abundanti, N. (2019). Pengaruh Profitabilitas, Likuiditas, Kepemilikan
Institusional Dan Kepemilikan Manajerial Terhadap Nilai Perusahaan. E-Jurnal
Manajemen Universitas Udayana, 8(10), 6099.
Enekwe, C. I., Agu, C. I., and Eziedo, K. N. (2014). The Effect Of Financial Leverage On
Financial Performance: Evidence Of Quoted Pharmaceutical Companies In Nigeria.
IOSR Journal of Economics and Finance, 5(3), 17–25.
Eriotis, N., Vasiliou, D., and Ventoura‐Neokosmidi, Z. (2007). How firm characteristics affect capital structure: an empirical study. Managerial Finance.
Faleria, R. E., Lambey, L., dan Walandouw, S. K. (2017). Pengaruh Current Ratio, Net
Profit Margin Dan Earning Per Share Terhadap Harga Saham Di Bursa Efek Indonesia
(Studi Kasus Pada Sub Sektor Food And Beverages). Going Concern: Jurnal Riset
Akuntansi, 12(2).
Gunde, Y. M., Murni, S., and Rogi, M. H. (2017). Analisis Pengaruh Leverage Terhadap
Profitabilitas Pada Perusahaan Manufaktur Sub Industri Food and Beverages Yang
Terdaftar Di Bei (Periode 2012-2015). Jurnal EMBA: Jurnal Riset Ekonomi,
Manajemen, Bisnis Dan Akuntansi, 5(3).
Hackbarth, D., Hennessy, C. A., & Leland, H. E. (2007). Can the trade-off theory explain
debt structure? The Review of Financial Studies, 20(5), 1389–1428.
Halik, A. C. (2018). Pengaruh Roa Dan Npm Terhadap Nilai Perusahaan Pada PT. Antam,
Tbk. Scientific Journal Of Reflection: Economic, Accounting, Management and
Business, 1(1), 1–10.
Hamidah, G., dan Umdiana, N. (2017). Pengaruh Profitabilitas dan Investment Opportunity
Set (IOS) terhadap Nilai Perusahaan dengan Harga Saham sebagai Variabel
Intervening. JAK (Jurnal Akuntansi) Kajian Ilmiah Akuntansi, 4(1).
Hidayah, N. (2015). Pengaruh investment opportunity set (IOS) dan kepemilikan manajerial
terhadap nilai perusahaan pada perusahaan property dan real estat di bursa efek
indonesia. Jurnal Akuntansi, 19(3), 420–432.
Irdiana, S. (2016). Analisis Faktor-Faktor yang Mempengaruhi Struktur Modal pada
Perusahaan Katagori Saham Blue Chips di Bursa Efek Indonesia Periode Tahun 2011-
2014. Wiga: Jurnal Penelitian Ilmu Ekonomi, 6(1), 15–26.
Kadim, A., dan Sunardi, N. (2019). Pengaruh Profitabilitas, Ukuran Perusahaan Terhadap
Leverage Implikasi Terhadap Nilai Perusahaan Cosmetics and Household yang
terdaftar di Bursa Efek Indonesia. Jurnal SEKURITAS (Saham, Ekonomi, Keuangan
Dan Investasi), 3(1), 22–32.
Karo, S. K., dan Perlantino, J. (2017). Pengaruh corporate governance, kualitas kap, firm
size, dan leverage terhadap integritas laporan keuangan pada perusahaan property dan
real estate yang terdaftar di Bursa Efek Indonesia periode 2013-2015. JAKPI-Jurnal
Akuntansi, Keuangan & Perpajakan Indonesia, 5(01).
KhansaKhalishah, I. (2021). Overconfidence And Firm Value. Turkish Journal of Computer
and Mathematics Education (TURCOMAT), 12(14), 2208–2216.
Kholis, N. K., Sumarmawati, E. D., dan Mutmainah, H. M. (2018). Faktor-Faktor Yang
Mempengaruhi Nilai Perusahaan. Jurnal Analisis Bisnis Ekonomi, 16(1), 19–25.
Languju, O. (2016). Pengaruh Return On Equity, Ukuran Perusahaan, Price Earning Ratio
Wahyuni and Gani: Reviewing the Firm Value ...
Jurnal Manajemen/Volume XXVI, No. 01, February 2022: 121-139
DOI: http://dx.doi.org/10.24912/jm.v26i1.837 137
Dan Struktur Modal Terhadap Nilai Perusahaan Property And Real Estate Terdaftar
Di Bursa Efek Indonesia. Jurnal Berkala Ilmiah Efisiensi, 16(2).
Limanjaya, A. C., dan Tanusdjaja, H. (2021). Pengaruh Profitability, Leverage Dan Growth
Terhadap Nilai Perusahaan LQ-45 BEI Periode 2016-2018. Jurnal Paradigma
Akuntansi, 3(3), 1200–1207.
Lumoly, S., Murni, S., dan Untu, V. N. (2018). Pengaruh Likuiditas, Ukuran Perusahaan
dan Profitabilitas terhadap Nilai Perusahaan (Studi pada Perusahaan Logam dan
Sejenisnya yang Terdaftar di Bursa Efek Indonesia). Jurnal EMBA: Jurnal Riset
Ekonomi, Manajemen, Bisnis Dan Akuntansi, 6(3).
Muhammad, T. T., dan Rahim, S. (2019). Pengaruh Tingkat Likuiditas Dan Profitabilitas
Terhadap Harga Saham Pada Perusahaan Manufaktur Yangterdaftar Di Bursa Efek
Indonesia (BEI). Jurnal Akuntansi Aktual, 3(2), 117–126.
Muzdalifah, A., dan Soekotjo, H. (2018). Pengaruh Ukuran Perusahaan, Struktur Modal,
Profitabilitas, Dan Solvabilitas Terhadap Nilai Perusahaan Pada Perusahaan
Telekomunikasi. Jurnal Ilmu Dan Riset Manajemen (JIRM), 7(1).
Nariswari, T. N., & Nugraha, N. M. (2020). Profit Growth: Impact Of Net Profit Margin,
Gross Profit Margin And Total Assests Turnover. International Journal of Finance &
Banking Studies (2147-4486), 9(4), 87–96.
Noradiva, H., Parastou, A., and Azlina, A. (2016). The effects of managerial ownership on
the relationship between intellectual capital performance and firm value. International
Journal of Social Science and Humanity, 6(7), 514.
Nurdin, E. (2018). Pengaruh kinerja keuangan terhadap return saham pada perusahaan
manufaktur yang terdaftar di bursa efek Indonesia. Mega Aktiva: Jurnal Ekonomi Dan
Manajemen, 6(1), 19–27.
Octaviany, F., dan Mutmainnah, N. (2019). Pengaruh Perputaran Kas Dan Perputaran
Piutang Terhadap Return On Assets (ROA) Pada Politeknik LP3I Jakarta Kampus
Jakarta Utara Tahun 2014-2018. Jurnal Lentera Akuntansi, 4(2), 1–13.
Panda, B., and Leepsa, N. M. (2017). Agency theory: Review of theory and evidence on
problems and perspectives. Indian Journal of Corporate Governance, 10(1), 74–95.
Pasaribu, D., & Lumbantobing, D. N. (2017). Analisis Pengaruh Struktur Modal,
Profitabilitas, Kebijakan Dividen Dan Ukuran Perusahaan Terhadap Nilai Perusahaan
Pada Perusahaan Farmasi Yang Terdaftar Di Bursa Efek Indonesia. Methosika: Jurnal
Akuntansi Dan Keuangan Methodist, 1(1), 32–44.
Pasaribu, U., Nuryartono, N., dan Andati, T. (2019). Pengaruh faktor internal dan eksternal
perusahaan terhadap nilai perusahaan. Jurnal Aplikasi Bisnis Dan Manajemen
(JABM), 5(3), 441.
Pratama, D. A., dan Wahyudi, S. (2021). Analisis Pengaruh Likuiditas Dan Leverage
Keuangan Terhadap Profitabilitas Dengan Firm Size Sebagai Variabel Control (Studi
Kasus Pada Perusahaan Tekstil dan Garmen yang Terdaftar di Bursa Efek Indonesia
(BEI) Tahun 2014–2019). Diponegoro Journal of Management, 10(5).
Pujiati, H., dan Maulidina, I. (2021). Pengaruh Net Profit Margin Dan Return On Assets
Terhadap Kinerja Keuangan Politeknik LP3i Jakarta Kampus Cilodong Raya.
Remittance: Jurnal Akuntansi Keuangan Dan Perbankan, 2(2), 55–64.
Purwani, T., dan Oktavia, O. (2018). Profitabilitas, Leverage, Kebijakan Dividen,
Kepemilikan Institusional dan Growth Terhadap Nilai Perusahaan. Jurnal Bisnis Dan
Wahyuni and Gani: Reviewing the Firm Value ...
Jurnal Manajemen/Volume XXVI, No. 01, February 2022: 121-139
DOI: http://dx.doi.org/10.24912/jm.v26i1.837 138
Ekonomi, 25(1).
Purwanti, P. (2020). Pengaruh ROA, ROE, dan NIM terhadap Harga Saham pada
Perusahaan Sektor Perbankan yang Terdaftar di BEI Periode 2015-2019. Jurnal
Aplikasi Manajemen, Ekonomi Dan Bisnis, 5(1), 75–84.
Puspitaningrum, W., dan Taswan, T. (2020). Pengaruh Ukuran Perusahaan, Likuiditas,
Leverage dan Profitabiltas terhadap Risk Management Disclosure. Jurnal Bisnis Dan
Ekonomi, 27(2), 163–178.
Putra, I., dan Wirawati, N. G. P. (2013). Pengaruh kepemilikan manajerial terhadap
hubungan antara kinerja dengan nilai perusahaan. E-Jurnal Akuntansi Universitas
Udayana, 5(3), 639–651.
Putri, R. A. A., dan Setiawan, M. A. (2019). Pengaruh Investment Opportunity Set (IOS),
kebijakan dividen, dan opportunistic behavior terhadap nilai perusahaan. Jurnal
Eksplorasi Akuntansi (JEA), 1(3), 1392–1410.
Sanjaya, S., dan Rizky, M. F. (2018). Analisis Profitabilitas Dalam Menilai Kinerja
Keuangan Pada PT. Taspen (Persero) Medan. KITABAH: Jurnal Akuntansi Dan
Keuangan Syariah.
Simorangkir, R. T. M. C. (2019). Pengaruh Kinerja Keuangan Terhadap Return Saham
Perusahaan Pertambangan. Jurnal Bisnis Dan Akuntansi, 21(2), 155–164.
Sinaga, A. P. D. S. J. (2016). The effect of capital structure, firm growth and dividend policy
on profitability and firm value of the oil palm plantation companies in Indonesia.
European Journal of Business and Management Www. Iiste. Org ISSN, 1905–2222.
Sondakh, P., Saerang, I., dan Samadi, R. (2019). Pengaruh Struktur Modal (ROA, ROE Dan
DER) Terhadap Nilai Perusahaan (PBV) Pada Perusahaan Sektor Properti Yang
Terdaftar di BEI (Periode 2013-2016). Jurnal EMBA: Jurnal Riset Ekonomi,
Manajemen, Bisnis Dan Akuntansi, 7(3).
Suardana, I. B. R., Astawa, I. N. D., and Martini, L. K. B. (2018). Influential factors towards
return on assets and profit change (study on all BPR in Bali province). International
Journal of Social Sciences and Humanities, 2(1), 105–116.
Sukmayanti, N. W. P., and Triaryati, N. (2019). Pengaruh Struktur Modal, Likuiditas dan
Ukuran Perusahaan terhadap Profitabilitas pada Perusahaan Property dan Real Estate.
E-Jurnal Manajemen, 8(1), 172–202.
Suranto, V. A. H. M., dan Walandouw, S. K. (2017). Analisis pengaruh struktur modal dan
kinerja keuangan terhadap nilai perusahaan pada perusahaan perbankan di bursa efek
indonesia. Jurnal EMBA: Jurnal Riset Ekonomi, Manajemen, Bisnis Dan Akuntansi,
5(2).
Suweta, N., and Dewi, M. R. (2016). Pengaruh Pertumbuhan Penjualan, Struktur Aktiva,
Dan Pertumbuhan Aktiva Terhadap Struktur Modal. E-Jurnal Manajemen Unud, 5(8),
5172–5199.
Tumandung, C. O., Murni, S., dan Baramuli, D. N. (2017). Analisis Pengaruh Kinerja
Keuangan terhadap Harga Saham pada Perusahaan Makanan dan Minuman yang
Terdaftar di Bei Periode 2011–2015. Jurnal EMBA: Jurnal Riset Ekonomi,
Manajemen, Bisnis Dan Akuntansi, 5(2).
Trisnadewi, A. E., & Amlayasa, A. (2020). Corporate Values: The Role Of Corporate Social
Responsibility, Managerial Ownership And Profitability In Indonesia. American
Journal of Humanities and Social Sciences Research (AJHSSR), 4(7), 279–287.
Wahyuni and Gani: Reviewing the Firm Value ...
Jurnal Manajemen/Volume XXVI, No. 01, February 2022: 121-139
DOI: http://dx.doi.org/10.24912/jm.v26i1.837 139
Utomo, M. N. (2019). Ramah Lingkungan dan Nilai Perusahaan. Jakad Media Publishing.
Widodo, A. (2018). Analisis Pengaruh Current Ratio (CR), Total Asset Turnover (TATO),
dan Debt to Asset Ratio (DAR) terhadap Return On Asset (ROA), serta dampaknya
terhadap Nilai Perusahaan. JIMF (Jurnal Ilmiah Manajemen Forkamma), 1(2).
Yasar, B., Martin, T., and Kiessling, T. (2020). An empirical test of signalling theory.
Management Research Review.
Copyright © 2022 FDOKUMEN