Review_1_2007_72dpi.pdf - ABB
80
1 / 2007 The corporate technical journal of the ABB Group www.abb.com/abbreview ABB Review a Human in the loop Intelligent alarming page 20 Spatial awareness page 40 Perpetual pioneering page 73
-
Upload
khangminh22 -
Category
Documents
-
view
4 -
download
0
Transcript of Review_1_2007_72dpi.pdf - ABB

1 / 2007
The corporate technical journal of the ABB Group
www.abb.com/abbreview
ABBReview
a
Human in the loop
Intelligent alarming page 20
Spatial awareness page 40
Perpetual pioneering page 73

The dictum, “it is human to err”, is attributed to Cicero – little could he foresee the emer-gence of automation systems. Machines can act autonomously and correctly under defined conditions, but when it comes to grasping the broader perspective and judging when intervention is appropriate, the human in the loop remains irreplaceable.
In Charlie Chaplin’s 1936 movie “Modern Times”, a machine imposes its repetitive and inflexible nature on workers, effectively making them to machines themselves. ABB believes machines should not restrict humans in their potential, but should enhance and support them.

3ABB Review 1/2007
Editorial
The global process industry loses $20 billion, or five per cent of annual production, due to unscheduled downtime and poor quality. ARC1) estimates that almost 80 percent of these losses are preventable and 40 percent are primarily the result of operator error. Blackouts in the power sector and meltdowns in nuclear plants are ominous words we have heard all too often during the last few decades. Rolling blackouts, resulting in heavy production losses within the affected region, give operators no chance to act because of the speed at which such disturbances propagate throughout an electrical network. The Three Mile Island accident in 1979 occurred because operators did not have all the infor-mation necessary to understand the real situation. The auto-mation of industrial processes has evolved into large and sophisticated systems giving the operators structured and ergonomically presented information for decision support. No one would like to fly on a passenger jet without pilots. Hence the responsibility to oversee the safe and efficient performance of complex processes remains with the opera-tors for now and the foreseeable future. How then can we prevent productivity losses caused by operator errors, industrial explosions and blackouts due to hurricanes and other devastating events? By providing better and more accurate information to the human in charge in a form easily accessible for quick decision mak-ing. Issues concerning the human in the loop are now seri-ously researched and are at the top of the agenda in many businesses including ABB’s. Exception management theo-ries deal with the human issue related to long spells of inactivity with sudden burts of high level actions; a typical scenario for many operators including pilots. Ergonomics and information visualization, decision support and ease-of-use are all areas that have developed over the years in response to finding better ways to communicate between man and his machine. Academic research in behavioral sciences and practical experiences are being fused into solutions for the optimal support of the human in the loop. In this issue of ABB Review we look at the research and development effort going on in these fields that are so vital to our portfolio of products and solutions. After a general overview of the science involved, this issue is organized into five sections; the first one of these, Operational profit-ability, is concerned with decision support. This section uses examples from the power sector (storm outages) and from process industries (electromagnetic stabilizers for galvanization). Smart alarming is a key research domain: Means are discussed of identifying and presenting only the most relevant alarms to the operator, permitting time-criti-cal decisons to be based on the right information. A case study from the oil and gas industry is presented to illustrate this. Forecasting methods are needed to avoid unwanted events from occurring, especially if the propagation of such
events is too fast for the human to act upon. A case study from Eastman Kodak is presented here to illustrate a possi-ble solution.
The next section, Capital productivity, reviews visualization as the crucial vehicle in presenting information in ergonomic fashions for ease of comprehension. A lead-in article pres-ents criteria adapted for system design with the human in the loop, and is followedby a number of articles describing how our own technology has advanced in this particular area. Examples from process and power industries are used. A look at how 3D graphics can enhance the understanding of the process information in the future is also included.
In the section on Ease-of-use, we explore the way in which drive technology from ABB epitomizes how the rapid devel-opment of ease of use in complex products can improve and broaden markets. Ambient intelligence is discussed in an article which also introduces the Smart&Lean product range from Busch Jaeger. Ease of use is also reflected in the development of tools permitting efficient identification of areas with improvement potential in plants, and also of tools for the enhancement of productivity in the engineering of substation standards. This section is concluded with the de-scription of packaging technology in power semiconductors.
Research activities of academic nature or in cooperation with universities are exemplified in the next section, where an area of great interest is related to technologies for natural language querying of automation systems for different sets of information such as loop status and alarm inquiry. Profes-sor on Drummond of Cambridge University, UK reviews how Augmented Reality can solve the issue of connecting the topological description of a plant with its real compo-nents – the binding problem as this is referred to.
The final section, Perpetual pioneering, introduces a series of historical articles covering the development of key ABB products over the last century. The initial historical overview presents the evolution our breaker technology has gone through since the early 20th century. We intend to present a historical review of a group of products in every issue in 2007 and 2008.
Enjoy your reading
Peter TerwieschChief Technology OfficerABB Ltd.
Footnote 1) ARC Advisory Group, News 2006
Human in the loop
4 ABB Review 1/2007
ABB Review 1/2007Human in the loop
Contents
The human factor
6Human in the loopHow can a system provide better support to the
operator, and how will the operator’s role change as
automation systems grow even more sophisticated?
Operational profitability
11The calm after the stormMajor storms can wreak havoc in electrical networks,
but inappropriate responses can make things worse
16Galvanizing supportMaking a surface perfectly smooth without touching it
20Intelligent alarmingAn alarm need not be cause for alarm – but
inappropriate alarms can have alarming consequences
24Peak performanceMastering process variability by understanding
plant-wide disturbances
Capital productivity
30Design methodsMaking better use of human strengths is about
improving their integration in the loop
34Case studyA case study using models and methods based
on an extended understanding of the human in the
loop
37Projections of productivityInteractive and well-presented displays give operators
easy access to the relevant information
40Spatial awarenessWhen a 2D schematic is not helpful, ABB can add a
dimension
44Mapping the weakest linkA new look at the visualization of a power network
Ease of use
49The drive for simplicityLower costs, fewer parts, more functions, more
productivity
53Ambient intelligenceBetter connectivity is helping everyday devices become
truly wired
56Room for improvementIdentifying the limiting factor in industrial processes

5ABB Review 1/2007
20
40
44
73
62Power semiconductorsPart two: Better performance through better housings,
and new materials for semiconductors of the future
Research activities
67Plainly speakingTalking to the computer in natural language
70Augmented realityFrom the living room to industrial control room, there’s a
pressing need to know which button does what
Perpetual pioneering
73Perpetual pioneeringABB Review is launching a series of historic articles to
celebrate the company’s pedigree of pioneering
75The circuit breakerLooking back over a century of breakthroughs
www.abb.com/abbreview

The human factor
Since the advent of computer control based industrial automation processes in the mid sixties, engineers have been continuously striving to minimize the discrepancies between a human’s cognitive model of what he wants to accom-plish and the control system’s understanding of the task. Continued success comes in the form of improved system performance and safety, and greater reliability. Such improvements have resulted in the gradual elimination of the mundane tasks previously accomplished by operators, thus allowing the human in the loop to handle the more challenging tasks of supervision, exception con-trol, optimization tasks and maintenance duties. Hence over the last 50 years a clear division of responsibilities between the human and the machine has evolved based on the optimal ability of each.
Maximising to the utmost this human-machine collaboration, however, depends on continued technology development in three major areas – decision support tools; ergonomics and visualization technologies; and ease-of-use of complex systems. The optimal synthesis of these three fields creates the state-of-the-art operator environment of modern automation systems.
Human in the loopThe human operator is a central figure in the design and operation of industrial automations systems John Pretlove, Charlotte Skourup
6 ABB Review 1/2007

7ABB Review 1/2007
The human factor
Over the last fifty years or so, greater performance and im-
proved reliability of industrial automa-tion systems has relieved operators of tasks that are tedious, repetitive or hazardous. Instead, human operators in highly complex industrial automa-tion systems such as electrical power networks, pulp and paper mills, power plants, and refineries now play a cen-tral role in tasks such as supervision, detection of abnormalities, mainte-nance, and process optimization. Despite the apparent paradox, it is clear that the human operator is an integral part of any automated control loop in almost all industrial applica-tions of any size. Therefore under-standing and maximising the collabo-ration between the control system and the human operator is essential. Adopting a systematic design ap-proach is crucial for reasons of safety and optimum system performance.
Humans as part of the automation systemIn the early days of industrial auto-mation, system designers attempted to automate everything and remove the human operator – whom they considered the weakest link in the process control loop – entirely. When this approach failed the human was assigned tasks the designer was unable to automate.
The skill sets associated with people as compared to machines were already well understood in the 1960s. The underlying principles were first described by Paul Fitts in 1951 [1]. Although his model was helpful in determining the allocation of func-tions between humans and machines, it did not consider the integration of both sets of skills nor how to improve the effectiveness of the human opera-tor through computer system support and cooperation. Rather than elimi-nate people in industrial process auto-mation, the trend nowadays is for substantial human involvement1). The reasons for this are:
The degree of control in a process is a function of the predictability of process behavior and the degree of complexity. For all but the sim-plest of elements, it is not possible to model a plant fully or with sufficient explicitness. Nor is it possible to consider how external influences can affect the control system.
Some processes could, from a tech-nical point of view, be fully auto-mated but the cost would be pro-hibitive. In any case, it is highly unlikely that the public would accept high-risk systems without humans taking overall responsi-bility. For example, the automation systems of a modern day passenger jet can handle both take-off and landing without pilot interaction. However, not many people would fly without a responsible pilot on board.
Important process characteristics that should be considered when designing a system with humans in the loop include: Process size and complexity The rate of change of the process The variability of the product schedule
The process impact on the environ-ment
The economic cost of shutdowns
The safety issue concerning people, equipment and the environment
Understanding and maximising the collabora-tion between the control system and the human operator, and adopting a systematic design approach is crucial for optimum system perfor-mance.
Humans are (largely) adept at dealing with the consequences of many of these factors. For example, they have the ability to recognise patterns and abnormal events based on large data-sets, devise procedures to suit a new situation, store large amounts of knowledge for long periods of time, and reason and exercise judgement. To perform these tasks effectively, human operators have to be aware of the current situation at all times. They need the “right” information at the “right” time to be able to understand the current situation and to make the “right” decision. For this to happen, suitable visual support is needed. The most effective way of presenting large amounts of information so that the
1 A380 cockpit – courtesy Airbus
Footnote1) Dividing the labor between large, complex and
dynamic industrial automation systems and
knowledgeable human operators is one thing.
The other more important thing is striking the
right balance.
Human in the loop

8 ABB Review 1/2007
salient points can be quickly absorbed in critical situations has been re-searched within the field of cognitive science. In addition the disciplines of ergonomics and design must be prop-erly applied to secure ease-of-use. The guinea pigs in these areas have been the cockpit of aircraft and the instrument panels of cars 1 .
Decision support“Decision support systems are a class of computer-based information systems or knowledge-based systems that, in a very different manner, sup-port decision making activities” [2].
An efficient decision support system for modern and complex industries needs to consider both the degree of automation and the human behavior. A significant part of most industrial processes are relatively straight for-ward to model and therefore to auto-mate. On the other hand human behavior is much more complex, unpredictable and almost impossible to model. Instead of modeling the human (with a view to replacing him) the purpose of decision support in large automation systems is to add value to the human by assisting in the decision making process concern-ing a specific situation or an acute issue. It is however critical that the human operator remains in charge 2 . The decision support system should not attempt to define what to do. Rather it should equip the user with enough information to enable him to fully comprehend an actual situation and predict the consequences of potential decisions. At the end of the day, it is the human in the loop who
must decide on the best possible course of action.
A large plant with 10,000 loops or more would, under normal steady state conditions, perform for hours without any human interaction. The concern today is how to get the oper-ator’s attention when something ab-normal and crucial suddenly happens. Again parallels can be drawn between the human reaction in this example and that of pilots in the airline indus-try. Intercontinental travel provides pilots with hours of no engagement. However if anything unusual happens, pilots are immediately jolted into action to quickly resolve any prob-lems. This is one of the most critical issues of human in the loop systems. On the one hand the operator moni-tors the system but with few “hands-on” actions required. On the other hand when something deviates from the normal, the operator is expected to not only be fully aware of the (cur-rent and recent) state of the process, but he must also know what manual actions are required to handle the situation.
It is critical that the human operator remains in charge. The decision support system should not attempt to define what to do.
Research has shown that one very im-portant area of support for the opera-tor is how information is distilled and
presented to provide an immediate and full overview of the situation. In a process plant environment for example, critical information such as: Initial alarms (but not the sequence of consequential alarms) should be easily and quickly identifiable.
Performance data should be re-duced into key statistical measures for quick assessment rather than displaying massive tables of data points.
The current situation should be compared with previous and similar situations including previous actions taken to resolve the issue.
The outcome or consequence of the operator’s decision should first of all be predicted to enhance his chance of making the “right” decision.
Decision support can vary from direct recommendations, which the system provides automatically, to manually sought possibilities expressed in terms of trends, statistical information and alarm prioritization. For example, to support the operator in complex alarm handling situations, the alarms in the decision support software are filtered and color-coded to direct the operator’s focus to the most important ones as the majority of them often represent follow-up alarms. Another example relates to root cause identifi-cation of a situation where alarms are assessed automatically and only the real cause of the problem is present-ed. It is becoming more common to provide case histories of similar oc-currences including their resolutions, and the operator uses these cases to extend his internal repository of expe-riences.
Ergonomics and information visualizationThe word ergonomics comes from the Greek word “ergon” meaning work. When related to process automation it refers to the operating environment in which humans work. Variables in such an environment include the room size, the color settings, the fur-niture and of course the visualization of the information produced by the systems. Many studies have helped to define the minimum requirements for good operator performance, which include adjustable tables and chairs,
The human factor
2 A control room from the 1950s
Human in the loop

9ABB Review 1/2007
A modern and complex oil and gas process plant
screens with dedicated and overview information, defined color usage in displays and backgrounds, recom-mended methods when searching for information and parameter changes. These requirements must be clearly defined and consistently used throughout a system. Complications arise if several different systems are used in the same room, each with dif-ferent ergonomic definitions. Interna-tional Standards such as ISO 92412) and 110643), combined with industry best practice help to harmonize these systems, leading to improved overall efficiency.
The control system is one of the main sources from which operators receive inputs reflecting the status of the industrial process.
Information visualization concerns how information is presented to the human operator. A more concise defi-nition describes it as “a branch of computer graphics and user interface which are concerned with the presen-tation of interactive or animated digi-tal images to users to understand data” [3].
The control system is one of the main sources from which operators receive inputs reflecting the status of the in-dustrial process. Therefore, it is essen-tial that information is presented in a way that allows the operator to thor-oughly understand and comprehend the current situation. Since it is impos-sible to accurately model and predict human behavior, it is even more im-portant to be aware of the power of correct presentation.
Information visualization incorporates a large range of different techniques, from conventional graphical user in-terface design to 3D/4D and virtual
reality interfaces. Within the automa-tion domain, information visualization covers everything from presenting (abstract) raw data on the operator screens and the interface design of human-machine interactions, to the special rooms equipped for remote collaboration. Traditionally, operator stations within the control room uti-lize piping and instrumentation dia-grams (P&IDs)4) as an overview of the automated industrial process. Alarms are often presented in a separate system. However, redesigning the overview display to focus on and visualize changes in the process and combining it with alarms allows the operators to get an immediate picture of the relationship between changes and alarms. Such visualization may even prevent alarms from occurring since the operator will notice when the process is approaching the alarm limit. Spatial data visualization – such as a 3D model of the industrial pro-cess – is another way of presenting the operators with an overview of the system. Such visualization represents the geographical locations of equip-ment and the special interrelationships
between such equipment. Further-more, this 3D process model can inte-grate information from other systems to provide a complete single interface to several industrial processes or pro-cess segments.
The design process: ease-of-use“Ease-of-use refers to the property of a product or thing that a user can operate without having to overcome a steep learning curve. Things with high ease-of-use will be intuitive to the average user in the target market for the product. The term is often used as a goal during the design of a product, as well as being used for marketing purposes.” [4].
The human operator is the key to success in the application of auto-mation technology to process control. The collaboration between the human in the loop and the advanced indus-trial automation system depends on how easy it is to use the multi-faceted functionality of modern control sys-tems. Sometimes, well over half of the control loops are manually oper-ated because it is simply too complex
The human factor
Footnotes2) Ergonomic requirements for office work with visual display terminals. ISO 9241 provides requirements and recommendations relating to the attributes of the hardware,
software and environment that contribute to usability, and the ergonomic principles underlying them.3) Ergonomic design of control centers. This eight part standard contains ergonomic principles, recommendations and guidelines.4) A schematic type diagram showing the functional relationship between piping, equipment and instrumentation within process units in chemical plants, power plants,
water treatment and similar plants. See http://en.wikipedia.org/wiki/Piping_and_instrumentation_diagram, retrieved 20 th October 2006.
Human in the loop

10 ABB Review 1/2007
to tune the regulators for optimal per-formance. It is therefore essential to focus each aspect of the control system’s capabilities onto the user and to design and develop the entire system with the human operator firm-ly at the center 3 . The basic design principles [5] include: Organizing technology around the user’s goals, tasks and abilities.
Organizing technology around the way users process information and make decisions.
Keeping the user in control and aware at all times of the state of the process through the technology.
Simplifying the steps needed to per-form an action is crucial if the control system’s capabilities are to be used effectively. Ease-of-use of a complex automation system starts with an in-depth understanding of the human in the loop. The designers must constant-ly and consistently understand the ac-tivities of the users whether they are super visors, operators or maintenance
engineers. Knowledge about human behavior helps to outline the basic architecture of the automation system based on the users’ goals, tasks and expectations.
It is essential that the design of the entire auto-mation system is such that any misinterpretation of data is completely avoided.
When an unexpected and unknown event occurs in the plant, the operator actively searches for information in order to get a picture of the process state. He is entirely dependent on and must trust the information which is accessible from the control system. Therefore it is essential that the design of the entire automation system is such that any misinterpre-tation of data, that could result in
wrong actions and potential serious consequences for the industrial pro-cess and people onsite, is completely avoided.
SummaryIt is a common fallacy to think of automation as either fully manual or fully automatic. The situation is rarely so simplistic or so clear-cut. Instead the reality is that for most industrial automation systems a continuum of control ranging from fully manual to fully automated is adopted. There can also be different modes of operation which may be automated to different extents. Humans play a central role in modern industrial automation systems and their role in the future will be more important than ever before. The human operator also represents the most vulnerable element in the system and the one most easily overlooked. Understanding and optimizing the overall performance of industrial pro-cess control systems relies on a sys-tematic and holistic approach, taking care both of the rapid development of technology and the special role that the human fulfills.
John Pretlove
Charlotte Skourup
ABB Strategic R&D Group for Oil & Gas
Oslo, Norway
References
[1] P. Fitts, “Human Engineering for an Effective Air Navigation and Traffic Control System.” National Academy of Sciences, Washington D.C. 1951.
[2] http://en.wikipedia.org/wiki/Decision_support_systems, retrieved 20th October 2006.
[3] http://en.wikipedia.org/wiki/Information_visualization, retrieved 20th October 2006.
[4] http://en.wikipedia.org/wiki/Ease_of_use, retrieved 20th October 2006.
[5] M. R. Endsley, B. Bolté, D. G. Jones, Designing for situation awareness – An approach to user-centered design. Taylor & Francis, London, 2003.
Further reading
L. Bainbridge, Ironies of Automation. Automatica 19 (1983) 6, 775–779.
T. B. Sheridan, Telerobotics, Automation, and Human Supervisory Control. The MIT Press, Massachusetts, 1992.
3 Today’s control systems have large-screen projections and individual operator workspaces
The human factor
Human in the loop

It’s a fact of life that interruptions in an electrical distribution utility hap-pen. Although they can be minimized, there are many times – especially during severe weather conditions or accidents – where they simply cannot be prevented. Whether high winds cause trees to fall onto overhead lines or poles to snap thus dislodging over-head lines from cross-arms, one thing is for certain: electrical service is disrupted until the physical facilities
can be replaced or repaired, and this almost always involves human labor. The speed and efficiency at which these repairs can be carried out depends largely on the type of deci-sion support systems or tools avail-able to the distribution utility.
One such support system is known, in general, as an Outage Management System (OMS). With increasing requirements on utilities to track and
report outages accurately, an OMS becomes a valuable and a necessary tool. ABB’s Network Manager is an industry-leading OMS that has been deployed in numerous diverse electric utilities. This article looks at how this and similar tools help repair teams restore power as quickly and efficiently as possible.
The calm after the stormHuman decision support in storm outage recoveryRafael Ochoa, Amitava Sen
11ABB Review 1/2007
Operational profitability

Service interruptions can occur even when the weather is not so bad,
such as heavy rain or strong winds. However, severe weather conditions such as hurricanes, ice and lightening storms have the potential to wreak havoc with electric utility transmission and distribution systems 1 and 2 . While a distribution utility’s goal is to restore service as quickly and safely as possible, severe storms can result in a massive number of customer out-ages that can take anywhere from days to weeks to repair, requiring hundreds or even thousands of field personnel. For example, large storms1) such as tropical hurricanes, major snowstorms and ice storms have re-quired up to two weeks of effort with a peak crew size of 10,000 to restore service to all customers. On top of this, total restoration costs have ex-ceeded US$100 million for a single storm.
In most cases, the repair process be-gins with customer calls or with some indication of service interruption such as the operation of automated devic-
es. Typically in some countries, distri-bution networks do not have exten-sive remote field monitoring or con-trol and often the only way a distribu-tion utility knows a problem exists with the system is when a customer calls to report an outage. The OMS collects (ie, analyzes) a set of outage calls, and from the pattern of calls received it can determine the likely location and a possible cause of the outage. A crew is sent to the location of the outage to investigate further and make repairs.
The best possible decision support tools or systems are required to restore power quickly and efficiently subject to the most stringent safety standards.
Prior to the introduction of computer-ized systems, the telephone calls re-ceived by the utility were either writ-ten up by hand on a “ticket” or en-tered into a computer and then print-ed. These tickets were manually sort-ed based on the circuit the customer was connected to, before being ana-lyzed to (a) determine the electrical location of each customer associated with the ticket and (b) attempt to identify the root cause of the outage. This process may work well in day-to-day operations where the volume of calls is light and the number of out-ages is small and if the expertise is available in house. However, a paper-based system easily becomes over-whelmed during large storms where more than a million customer tele-phone calls may be generated. Also, as experienced labor retires, this expertise is no longer available.
Apart from the physical damage, the damage caused by large storms has a
severe social impact. The human effort needed to carry out repairs requires the best possible decision support tools or systems that allow power to be restored as quickly and efficiently as possible subject to the most stringent safety standards.
Outage Management SystemsOne such system is an Outage Man-agement System (OMS). Utilities typi-cally have an OMS to help log cus-tomer calls Factbox 1 and dispatch crews to the source of an outage. To be as effective as possible, an OMS requires an accurate and complete connectivity model, from the distribution substa-tion breaker right down to the cus-tomer transformer. The low voltage
12 ABB Review 1/2007
The calm after the storm
Operational profitability
1 Severe ice or frost can play havoc with power lines
2 Hurricane Damage to electricity poles
Factbox 1 Outage Management System – an overview
An Outage Management System (OMS)
provides the capability to efficiently collect,
identify and resolve outages and generate
and report valuable historical information.
The OMS accepts inputs such as customer
phone calls, SCADA telemetry data, auto-
mated meter reading inputs and other real-
time data and determines the likely loca-
tions of the equipment failure or damage
that has caused the current set of outages.
This analysis substantially reduces the need
for humans to patrol distribution feeders to
locate the root causes of outages.
Furthermore, the OMS can automatically
create, dispatch and keep track of repair
crews, and it provides software tools to
secure their safety as they work. Graphical
tools in the system allow distribution control
room operators to visualize the state of the
network, the pattern of incoming calls,
confirmed outages, and the planned
location and tasks of the restoration crews.
It can interface with mobile crew dispatch
systems to keep track of and communicate
with mobile crews. The OMS also provides
a collection of advanced analytical tools –
such as load flow and short circuit calcula-
tions, fault location and restoration analysis
– that allow the utility to create efficient res-
toration plans and calculate Estimated Time
to Restore (ETR). With these the utility can
provide regular updates to the customer of
the outage situation and restoration status.
Footnotes1) The destruction caused by catastrophic events
such as Hurricane Katrina in the US in 2005 is not
included. 2) For more detailed information, please refer to
www.abb.com/industries/seitp408/
1592686e90c27d6ac1257026003981d2.aspx –
November 2006.

13ABB Review 1/2007
side is usually not modeled in the interests of reducing the overall net-work model size and the cost-effec-tiveness of collecting and maintaining this level of detailed data.
An OMS is characterized by a graphi-cal user interface (GUI) that can dis-play from one to several feeders at the same time. The entire distribution system, known as a “world map”, can also be shown in a single display. ABB’s Network Manager DMS2) is an industry-leading OMS and a typical graphical display is shown in 3 .
An Outage Management System provides the capability to efficiently col-lect, identify and resolve outages and generate and report valuable historical information.
The primary real-time inputs to the OMS are the trouble calls from cus-tomers or emergency personnel as well as indications from automated devices such as those controlled by systems typically known as Super-visory and Control Acquisition Systems (ie, SCADA). The OMS is capable of receiving anywhere from a single call to a very large volume of calls Factbox 2 which it then analyzes and groups together to form something that is easier to handle. The grouped calls are trans-formed into what is referred to as an outage and sent onto the GUI that
stored. The Outage Engine continu-ously analyzes the “as-operated” elec-trical network to define outages and keeps track of customers without power.
Characteristically in distribution sys-tems it is difficult to maintain up-to-date knowledge of the “as-operated” network given its very dynamic, ever changing nature. The “as-operated” network may be very different to the “as-designed” or to the “as-built” net-work. Information about the “as-de-signed” and “as-built” network may be available from other utility IT systems such as Geographic Information Sys-tems. If, however, a safe and efficient outage restoration is to be achieved, the current state of the network must be continuously maintained by the
Factbox 2 How to deal with large volumes of trouble calls
Trouble call volumes that were a rare
problem only a few years ago are now
commonplace. An OMS typically works in
conjunction with automated call-taking/
handling system typically referred to as an
Interactive Voice Response (IVR) system.
These systems can be further supported by
third-party high call-volume systems for an
overflow condition that overwhelms the utili-
ty call-taking system. One such third-party
vendor is capable of taking millions of calls
per hour.
4 The basic work flow for managing outages
Outage EngineCustomer
Inquiries & Call Backs
Trouble Calls
Work Orders &Crew Assignments
Repair StatusAffected Customers &
Estimated Time to Repair
FieldOperations
Circuit Changes
Field Crew AutomationWork Order Management,
Mobile Dispatch
Customer ContactsCall Center,
Interactive Voice Response
Automated Meter Reading Power Monitoring
Supervisory Control &Data Acquisition
presents not only the location of the individual calls, but more importantly, the results of the analysis. Although a dispatcher handling the outages may want to display only outages as op-posed to individual calls, the OMS can also display large call volumes in a geographic display in real-time, while at the same time providing the same information simultaneously to a large number of utility employees.
The basic work flow diagram for man-aging outages is shown in 4 . The Outage Engine lies at the core of the OMS and comprises the Trouble Call and Outage Analysis functions, and the associated crew dispatch tools. It identifies customers with outages and then assigns, dispatches and follows the crew process until power is re-
Operational profitability
The calm after the storm
3 Graphical user interface for outage management
Fault indication
AB123
AB117
AB010
Source side switsching
device
Line Segment Highlight

14 ABB Review 1/2007
software with the best telemetry and manual/voice inputs available.
Unlike transmission systems, a prob-lem peculiar to distribution networks is the ability to add temporary devic-es, such as line cuts and jumper lines. Such temporary devices are uncom-mon in transmission systems, but are very common in distribution systems. Since most distribution systems run in a radial configuration, it is often nec-essary to operate feeder tie switches to reconfigure feeders, either to re-store outages or to adjust to different loading situations. There is a need then to be able to (a) dynamically color lines according to the direction they are being energized from and (b) to color lines according to whether they are energized or not. Another characteristic of a distribution system is that change is the norm. For exam-ple, new residential developments, expanding towns and cities, and rou-tine maintenance means that the dis-tribution network model changes fre-quently. It is not uncommon for 10,000 or even 100,000 changes to occur in a single week! The ability to apply such changes incrementally while the software is up and running is a necessity.
Storm recoveryDistribution outage situations can be classified according to the scope of the damage and the number of cus-tomers impacted. Normal day-to-day outages due to minor storms, animal contact, and broken tree branches for example
sit at the lowest level. These are usually handled locally through conventional outage management processes.
The next level concerns outages that are caused by localized storms impacting a small area, damaging poles or primary equipment within an operating area and requiring more line crews than are normally scheduled. In cases where severe storms have impacted a wider area within the same operating area, extra “outside” resources may be required particularly if multiple feeders suffer mechanical damage.
The second highest outage level is reserved for storms that impact mul-tiple operating areas and where more than 10 percent of customers may be without power. In these sit-uations resources from other utility operating regions need to be called in.
At the highest impact level, central-ized storm management is needed after a severe storm to coordinate both internal crews and extra re-sources called in from other utilities or contracting agencies.
The work of restoring power effec-tively begins before a major storm has struck. The utility typically performs an assessment of the amount of dam-age it thinks may occur and where. Crews are then dispatched to staging areas to be in position to make repairs once the storm hits. When this even-tually happens, the utility starts to receive damage assessment reports from survey teams in the field. This
information pinpoints what portions of the circuit have been damaged and to where the dispatch maintenance crews must go. An example of the res-toration support tool is shown in 5 . It is highly likely that in a severe storm situation, all OMS decision support tools and services described in Factbox 1 are brought into play.
In a distribution system, change is the norm. It is not uncommon for 10,000 or even 100,000 changes to occur in a single week!
Two of these services, however, merit further elaboration. The first deals with the need to handle extraordinary restoration processes with a larger number of crews than usual. Dispatch and Crew Administration modules provide web-based capabilities to manage work orders and administer crew personnel, vehicles and equip-ment not only from the central control room but also from service centers or specially created “storm room” opera-tions. Under normal conditions the distribution system is typically man-aged from a central control room, which is responsible for all routine switching together with a number of dispersed service centers, which might dispatch crews locally under the coor-dination of the central control room. In the normal configuration it is likely that users of the OMS in the service centers have less authority than cen-
6 A temporal trend display provides call and outage trends on a system or district basis over any defined time period
5 A screen-shot taken from the restoration support tool
Traced restoration zone for selected isolation switch
Operational profitability
The calm after the storm

15ABB Review 1/2007
tral control room personnel. However, because of the massive increase in workload in a severe storm situation, the central control room may delegate much higher levels of switching and crew dis-patch authority to the service centers, thus allowing it to concentrate on dealing with high level coordination and planning tasks plus switching actions on major network backbone elements. An ex-tremely flexible and dynami-cally adjustable user authori-ty scheme forms the basis for this capability. Each user logs in with a specific user role and area of re-sponsibility. The user role is based on responsibilities and qualifications. Areas of responsibility define operat-ing boundaries for each user, from a single device to a specified geography (eg, group of postal codes) or a pre-defined segment of the network, for example a group of feeders. These user roles and areas of responsibility may be pre-defined or easily adapted by a system administrator to permit a flexible and coordinated storm re-sponse from the service centers and the central control room.
As the frequency at which large tropical storms occur is on the upswing, improving damage predic-tion is fast becoming a necessity.
The second service deals with the need to provide accurate and timely information to all appropriate utility employees, including the central man-agers responsible for informing the public. A suite of web based applica-tions in the OMS permit authorized users across the enterprise to view, query and act upon outage and opera-tional information. Users need only an internet browser and appropriate access authority to use these tools. Among these applications, an Execu-tive Information module provides a global view of the situation including summaries by district. Users can ac-cess sub-levels if detailed information
is required. The summary data will typically include the number of outag-es, the number of hazardous outages, total customers without power, total critical customers without power, cumulative hours of total outages, maximum outage duration, number of calls received, number of crews available and assigned, etc. A tempo-ral trend display is available to pro-vide call and outage trends on a system or district basis over any defined time period 6 .
The futureUpgrades and improvements are an inherent part of any software-based tool or system. However, as the fre-quency at which large tropical storms occur is on the upswing, many im-provements may be needed sooner rather than later. Improving damage prediction is perhaps a sensible place to begin as severe weather in the form of hurricanes and ice storms continue to plague large areas of the inhabited world. By better forecasting the amount of damage a storm will cause, the resources required for restoration and the time needed to restore service to customers, a utility can effectively plan a way of getting resources quick-ly into place or on stand-by.
Storm damage prediction is based on an accurate weather forecast of variables related to distribution circuit damage. Taking ice storms as an example, a typical variable could be the amount of ice accumulation on trees surrounding overhead lines or on overhead equipment itself. Wind speeds and gust durations could be two variables associated with hurri-
canes. In any case, expected damage can be predicted based on historical informa-tion and susceptibility mod-els, and this estimate would then allow crew require-ments to be directly com-puted.
The OMS circuit models can be extended to analyze the relationship between crew allocation, predicted and ver-ified damage as well as to calculate Estimated Time to Restore, ETR. During the res-toration process, managers
can not only use calculations based on these extended models to look at the trade-off between adding more resources and any resulting improve-ment in customer restoration times, but also to find the most cost effective use of the resources available.
By better forecasting the amount of damage a storm will cause, the resources required for restoration and the time needed to restore service to customers, a utility can effectively plan a way of getting resources quickly into place or on stand-by.
Future enhancements in storm outage management are discussed in greater detail in [1].
Rafael Ochoa
Amitava Sen
ABB Inc.
Network management business unit
Cary, NC, USA
References
[1] David Lubkeman, Danny E. Julian, Large Scale
Storm Outage Management, IEEE Power
Engineering Society General Meeting, June 2004
Operational profitability
The calm after the storm

In the exacting process of galvaniza-tion, any movement of the steel strip outside the expected path can lead to problems. If it moves relative to the air-knife that removes excess zinc, the coating will become uneven and may fail to meet quality requirements. Strip movement may also damage surrounding installations. To address this problem, ABB has developed an electromagnetic stabilizer that can reduce vibrations and oscillations at the air-knife, without touching the strip. This solution provides better control of the coating process, lead-ing to improved product quality and faster line speeds. The more even coating also provides cost savings through reductions in the amount of coating material used.
Following successful trials of the equipment at SSAB Tunnplåt AB in Sweden [1], the first electromagnetic stabilizer for a modern, high-speed, ferromagnetic-steel galvanizing line has now been installed and tested at Thyssen Krupp Stahl in Germany, with impressive results. The ABB EM Stabilizer was launched on the market in October 2006.
ABB Review 1/2007
Operational profitability
Galvanizing supportAn electromagnetic strip stabilizer to optimize zinc coatingPeter Lofgren, Mats Molander, Olof Sjodén
16

17ABB Review 1/2007
At the heart of a galvaniz-ing line is the zinc pot –
the area in which the steel strip is coated with a thin layer of zinc to protect it from corrosion. Everyday, operators are faced with the challenge of meeting quality requirements within specified cost-margins, while keeping up with production quotas. Apply too little zinc and the steel will be inadequately protected, apply too much and the costs will spiral.
Quality is heavily dependent on the level of vibration in the strip because excess zinc is removed by the action of an air-knife. Until now, there was neither a means of mea-suring this vibration, nor any way of dampening it. Opera-tors had to rely on visual in-spection of the strip surface and down-stream measure-ments of the zinc coating. If quality was found to be poor, the only solution was to slow production – an unpopular measure in any industry.
The ABB Electromagnetic (EM) Stabilizer offers another solution. It is capable not only of monitoring vibration levels in the steel strip, but also of dampening and main-taining them at a consistently low level.
Benefits of vibration controlReducing strip vibration improves the control of the air-knife action, making the final coating more uniform. This improved consistency means that the initial application of zinc can be re-duced, helping steel users to optimize their products with respect to cost, weight and quality.
Most of the vibration in galvanizing lines arises from a small number of sources. These are imperfections in the line’s mechanical components, from the long, free, unsupported strip path, the air blowers, and from the shape and properties of the strip it-self. The impact of these factors can be controlled to some extent by regu-
lar monitoring and maintenance of critical components and parameters eg, roll bearings and end-roller align-ment. But vibrations cannot be elimi-nated completely, and they are accen-tuated at higher line speeds and on longer unsupported strip paths.
The benefits of the ABB EM Stabilizer can be summarized as follows: Improved product quality resulting from a more even coating
Increased line speed with main-tained or improved coating quality
Quieter work environment: The reduction of strip vibrations allows the knife to be placed closer to the strip, thus requiring a lower air pres-sure and hence reduced noise level.
Cost savings: Additional zinc coating, required to accommodate strip vibra-tion, is in the range of 5–15 g/m2 and accounts for 5–10 percent of the process zinc consumption. Since zinc is expensive, even a slight reduction in usage will quickly com-pensate for the cost of the ABB EM Stabilizer.
The example in 1 illustrates how zinc saving can be achieved by reducing strip vibration. The left-hand part of the figure shows the pro-cess without stabilization and the right-hand part with stabilization. Without EM stabilization, a zinc margin of 5 percent is used, ie the average coating weight is 105 percent of that specified. This margin is chosen so that, despite variation in the coating weight (here, 105 ± 5 percent), at no point will the zinc layer be less than the specified thickness (100 percent). By reducing vibration, variations in the zinc coating are reduced from ± 5 percent to ± 3.75 percent. This allows the set point to be reduced from 105 percent to 103.75 per-cent, without the risk of falling below the stipulated coating weight. Hence, a total zinc saving of 1.25 per-
cent is achieved. This equates to a 25-percent reduction in wasted zinc.
The ABB EM Stabilizer system
EquipmentThe main components of the ABB EM Stabilizer are six electromagnets, a water-cooling station and a cubicle, containing three frequency converters and a PLC (programmable logic con-troller). The frequency converters each control the currents to one pair of electromagnets. The stabilizer is also equipped with several air-cooled position sensors to detect the strip po-sition as a function of both time and space. The stabilizer is operated from
1 Schematic graph showing the variation in weight of zinc coating with (right) and without (left) EM stabilization. A reduction
in variation from 10 percent to 7.5 percent, reducing the average coating (red line) from 105 percent to 103.75 percent of the
minimum (green line), leads to a potential saving of 1.25 percent zinc used.
Per
cent
age
coat
ing
wei
ght
(100
% =
min
imum
)
100%
107,5%
without EM stabilization
105%
110%
103,75%
100%
with EM stabilization
0 5 10time (s)
2 The ABB EM Stabilizer system
AirFlow
Positionmeasurements
WaterStation
FrequencyConverters
ControlUnit
Operational profitability
Galvanizing support

18 ABB Review 1/2007
the PLC panel with alarm handling and operation control 2 .
Each electromagnet consists of an iron core with electric windings. The wind-ings are series-connected and cooled by water. The magnet sections are enclosed in a stainless steel casing and are positioned in pairs to control for three-dimensional movement in the strip. One magnet from each pair is mounted at the front of the strip, with the other mounted at the back. Two pairs are arranged so that they cover the left- and the right-hand sides of the strip, and the third pair is located above or below the other two pairs. Position sensors are mount-ed on a guide in between the two magnet levels. The side magnets work together to remove left-right vibra-tions (twisting) and first mode oscilla-tions (ie string mode). The central magnets compensate for static defor-mations of the strip, typically cross-bows, but also to remove the flapping mode of oscillations.
This improved consisten-cy means that the initial application of zinc can be reduced, helping steel users to optimize their products with respect to cost, weight and quality.
FunctionThe ABB EM Stabilizer functions by exploiting the magnetic properties of ferromagnetic steel; it applies three “semi”-static magnetic fields to control the moving strip. The position sensors measure the discrepancy between the strip path and the optimum path line and feed these data to the PLC. Typical strip vibrations are in the range of 1–10 Hz; however, the con-trol algorithm needs to be much faster than this to achieve dampening.
InstallationThe mechanical mounting of the mag-nets is tailored to the line in question. Conceptual layouts for the installation of the ABB EM Stabilizer above the air-knife are shown in 3 and 4 . The
installation method in 3 was used in the first trials at SSAB Tunnplåt AB in Sweden.
To achieve maximum vibration damp-ening at the air-knife nozzles, the magnets should be located close to the air knife, as shown in 5 . If the magnets cannot be positioned close to the air-knife, they can be suspended from the overhead construction, as shown in 4 . Here, the lower magnets are approximately 1.8 m from the air-knife. This installation method was used at Thyssen Krupp Stahl (TKS) in Germany, to meet the criteria shown in the Factbox . One half of the ABB EM Stabilizer, suspended from the hot gauge platform, can be seen in 6 .
ResultsThe effect of the ABB EM Stabilizer was evaluated by comparing vibration levels and variations in the thickness of the zinc coating, with and without the use of the stabilizer. The stabilizer was tested on a variety of strips (eg galvannealed/galvanized, exposed/unexposed, thin/thick, narrow/wide) and line parameters (eg thin/thick coating, fast/slow strip speeds, high/low strip tensions). All evaluations were made on individual coils, one half of which was subject to EM stabi-lization, the other not. Whether the first or second half of the strip was stabilized was varied at random.
Variations in coating weight were measured using a cold gauge (ie mea-surements are taken after the strip has cooled), and strip vibrations, both with and without stabilization, were measured using either the sensors of the ABB EM Stabilizer or mobile sen-sors mounted on the air-knife beam.
Results presented here are typical of those obtained and can be considered
Factbox Line data TKS GL #4
Qualities Exposed/unexposedproduced automotive, galvanized/ galvannealedLine Speed Up to 180 m/minWidth 1100–2040 mmThickness range 0.6–1.6 mmYearly production 500,000 ton
6 Hot Gauge platform with ABB EM Stabilizer magnets
3 The ABB EM Stabilizer installed on a beam supported by two pillars
4 The stabilizer suspended from an overhead construction
5 The stabilizer installed close to air-knife
Operational profitability
Galvanizing support

19ABB Review 1/2007
as average results over the coils that were stabilized.
Vibrations and zinc variationsTypical strip vibrations, with and without stabilization, are presented in 7 . Stabilization typically reduced vibrations by a factor of two or more. It also reduced low frequency movements of the strip (“snaking”, with a period of several minutes).
The potential for saving zinc by strip stabilization was in-vestigated in great detail. 8 shows the distribution of zinc coating weight, with and without stabilization. The ABB EM Stabilizer reduces the varia-tion of coating weight significantly, leading to a reduction in the over-coating margin of 25 percent (from 4 g/m2 zinc to 3 g/m2) and an overall saving of two percent.
Other observationsABB EM Stabilizer was installed on a TKS automotive line. This line pro-duces a lot of exposed material, and hence extremely high quality surfaces are required. Because of this, the sta-bilizer could not be allowed to ad-versely affect the surface in any way. During these tests: no negative effect on the surface quality was detected, either by visu-al inspection or the use of stone tests1).
the distance between the magnets on each side of the strip was shown to be sufficient.
Results also confirmed that the ABB EM Stabilizer is well suited to the tough industrial environment of the zinc pot.
It can tolerate the presence of zinc dust and temperatures rising to 100 °C.
The current positioning of the stabiliz-er, approximately 1.8 m from the air-knife, produced significant results. Further performance improvements are expected from installations that are positioned closer to the knife.
The ABB EM Stabilizer reduces the variation of coating weight significant-ly, leading to a reduction in the over-coating margin of 25 percent (from 4 g/m2 zinc to 3 g/m2) and an overall saving of two percent.
In summaryThe installation of the ABB EM Stabilizer on a galvanizing line at TKS in Germany
has demonstrated the benefits of reducing vibration and snaking of steel strips during galvanization. Results from a substantial number of coils showed that significant im-provements in terms of cost savings and improved prod-uct quality can be made with no adverse effects being re-corded. These improvements were seen with the stabilizer installed approximately 1.8 m away from the air-knife. Fur-ther improvements would be expected from installations closer to the knife, where the stabilizing effect would be enhanced. The ABB EM Stabi-lizer was launched at the
Galvanizers’ Association meeting in Columbus, OH in October 2006.
Peter Löfgren
Mats Molander
ABB Corporate Research,
Västerås, Sweden
Olof Sjodén
ABB Automation Technology AB,
Västerås, Sweden
Footnote1) The stone test is a flatness test whereby a flat soft
sand stone is run along a surface. If the surface is
not sufficiently flat, the intensity of the resulting
scratches varies visibly.
Reference
[1] Olof Sjöden, Peter Löfgren, Hans Sollander,
Mats Molander, 2005 “Stabilizing influence,
No-contact vibration control of steel strips in
galvanization”. ABB Review, 4/2005
7 Typical strip vibrations without (blue) and with (red) stabilization
0 200 400 600 800 1000 1200 1400 1600 1800
0.9
0.8
0.7
0.6
0.5
0.4
0.3
0.2
0.1
0
-0.1
Def
lect
ion
(sen
sor
outp
ut, n
orm
aliz
ed u
nits
)
Time (s)
Operational profitability
8 Typical coating weight distribution without a and with b stabilization and potential zinc saving δ (no stab)-δ (stab). b has been adjusted for a possible decrease in zinc coating set point. (99 percent of the values are captured by the green bars, ie only 0.5 percent of the values are allowed to be larger or smaller.)
15
10
5
047 48 49 50 51 52 53 54 55 56
δ (no stab)
Zinc weight (g/m2)
%
15
10
5
047 48 49 50 51 52 53 54 55 56
δ (stab)
Zinc weight (g/m2)
%
a b
Galvanizing support

Intelligent alarmingEffective alarm management improves safety, fault diagnosis and quality controlMartin Hollender, Carsten Beuthel
As industrial plants become larger and more complex, an increasingly sophisticated alarm system is required to inform operators of potential malfunctions. With hundreds of different processes running at once, operators can be hard pushed to keep up with alarms, even under normal condi-tions. Without careful manage-ment, alarms can be ignored by even the most diligent of opera-tors. Persistently active alarms may even be disabled, leading to potentially disastrous conse-quences.
To ease the problem of operator overload, ABB offers a number of alarm management tools. Its Power Generation Information Management (PGIM) system incorporates alarm and event management functions, and the alarm hiding functions of System 800xA allow certain alarms to be hidden under certain conditions, thereby avoiding unnecessary distraction of operators. ABB Engineering Services, together with local ABB project groups, also provide alarm management consulting services.
ABB Review 1/2007
Operational profitability
20
Courtesy Chilten Air Support Unit, England
21ABB Review 1/2007
With modern digital control sys-tems (DCS), it has become very
easy to configure large numbers of isolated alarms. This often results in systems that generate many alarms (more than 2000 alarms per day and operator are typical for many industri-al processing plants) during normal operation, and even more during process upsets. It is unreasonable to expect an operator to respond to alarms arriving at this rate.
In the oil and gas industry, alarm management is a well-established practice and, in many cases, a legal requirement. Other industries, such as power generation, pulp and paper, and the chemicals industry, are fol-lowing suit. In 1999, the Engineering Equipment and Materials Users Asso-ciation (EEMUA) published a guide to the design, management and procure-ment of alarm systems, known as EEMUA 191 [1]. The document has since become the worldwide de facto standard for alarm management. Among its key messages are that every alarm should be useful and rel-evant to the operator, and that opera-tors can be realistically expected to deal with a long therm average alarm rate in steady operation of around one alarm every 10 minutes. It also states that all alarms should have predefined operator responses.
The basic recommendations [2] for alarm management are to: Measure alarm rates, and other alarm key performance indicators, and compare them with recommendations from EEMUA 191, or with values from reference plants.
Identify low hanging fruits – it is often possible to improve an alarm system significantly with very little effort.
Eliminate nuisance alarms. This might include tuning control loops, replacing faulty sensors and chang-ing the status of some indicators from alarms to events.
Measure the alarm performance indicators regularly to ensure they stay in the desired target area.
These cost-effective steps relate to normal operating conditions. Once they are well under control, the next
step is to reduce alarm floods during process upsets.
Current situationIn the control rooms of many existing plants, one can easily find symptoms of bad alarm management. These in-clude: Display screens persistently covered with alarms
Frequent alarms during normal operation, and even more during plant upsets
Alarms standing for long periods (days or weeks)
Bulk acknowledgement of alarms without investigation (“blind” acknowledgment)
Operators failing to value alarms as a support system
Audible alarms being disabled to avoid constant noise pollution
In Milford Haven, the operators (a team of two) received 275 different alarms in the 11 minutes before the explosion.
In extreme cases, the alarm system is completely ignored by the operators and the plant would run more effi-ciently if the DCS had no configured alarms at all!
In large safety-critical plants such as refineries or offshore platforms, alarm management is often required by law. A thorough analysis of accidents like the Texaco Refinery explosion at Mil-ford Haven (1994) has clearly shown that bad alarm management contrib-utes to accidents: In Milford Haven, the operators (a team of two) received 275 different alarms in the 11 minutes before the explosion. This is why a number of authorities, including the UK’s Health and Safety Executive and the Norwegian Petroleum Directorate [3], require safety-critical plants to implement systematic alarm manage-ment.
If critical situations can be stabilized and emergency shutdowns avoided, this not only increases the safety of a plant, but also offers substantial economic benefits – unplanned shut-downs are very expensive and better alarm management enhances process efficiency.
EEMUA 191 is a set of guidelines for alarm management, but its recommen-dations are not mandatory. However, the document does describe best practice and is used by a number of regulatory bodies. Standards such as Namur NA102 “Alarm Management” [4] and ISA RP18.2 “Management of Alarm Systems for the Process Indus-
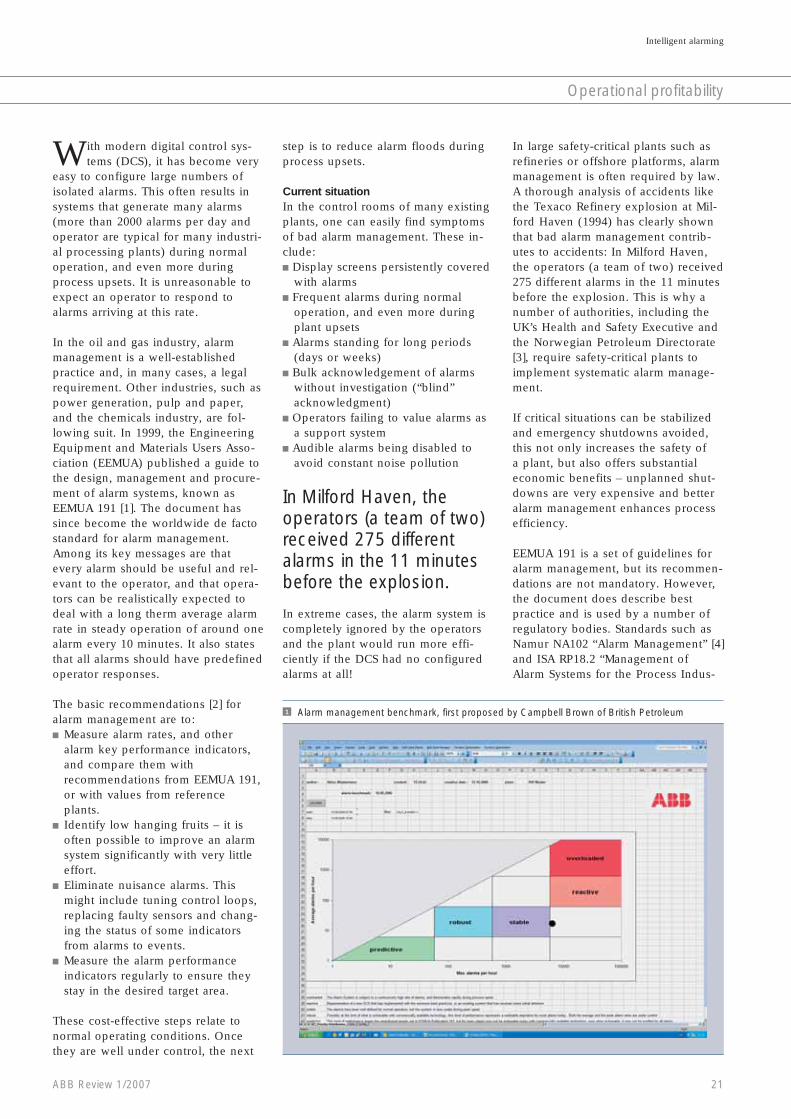
1 Alarm management benchmark, first proposed by Campbell Brown of British Petroleum
Operational profitability
Intelligent alarming

22 ABB Review 1/2007
tries” [7] are based on the ideas in EEMUA 191. The guidelines focus on the properties of the operator’s infor-mation processing capabilities and emphasize the usability of alarm sys-tems from the operator’s perspective. The old way of thinking was to blame malfunctions on human error if an operator had overlooked an important alarm. However, EEMUA 191 makes it clear that if the plant’s management has failed to reduce alarm rates to a reasonable level, then the operator cannot be held accountable.
EEMUA 191 specifies several measur-able performance indicators that can be used to assess the performance of a plant’s alarm system: The long term average alarm rate in steady operation should be less than one alarm in 10 minutes.
The number of alarms during the first 10 minutes of a major plant upset should be less than ten.
The recommended alarm priority distribution is high (5 percent), medium (15 percent), and low (80 percent).
The average number of standing alarms should be less than ten.
EEMUA 191 offers an affordable methodology to compare practices in individual plants with industry best practice.
Alarm management basicsAn important first step in alarm man-agement is to record all A&E (alarms and events) messages in an electronic database for further analysis. Alarm printers are still used in some plants, but they are expensive to maintain and can result in valuable information being buried in archives that nobody reads. Alarm management tools, like Power Generation Information Man-agement (PGIM), can connect to all kinds of different DCSs, for example with help of the OPC1) A&E standard, or by using a printer port. PGIM al-lows A&E messages that are stored in SQL2) server databases to be searched and filtered.
The old way of thinking was to blame malfunc-tions on human error if an operator had overlooked an important alarm.
The following steps are typical of an alarm management project (see eg [6] for a detailed description):
Benchmark Once a significant quantity of data has been collected from a plant, it can be compared with reference plant data
eg, as provided in EEMUA 191. Sub-sequent strategies can be devised according to certain key performance indicators 1 .
Alarm philosophy developmentIt is very important to have a single written document that describes a con-sistent, plant-wide, alarm philosophy. This document must define the meth-odology and rules for setting alarms, eg how alarms should be prioritized. It must describe operators’ roles and responsibilities and how changes in current practice should be managed. Such a document may already exist as part of the plant’s engineering strate-gy. If not, it must be created as part of the alarm management project.
Nuisance alarm removalNuisance alarms are alarms that serve no justifiable purpose, ie they are of no value to the operator. Such alarms exist in many plants and their removal can reduce the alarm rate significantly with very little effort. A very useful tool for the identification of nuisance alarms is the PGIM hit list, which sorts alarms by activation frequency. Many alarm management projects have shown that a small number of alarms often make a highly disproportionate contribution to the overall alarm rate.
Typical nuisance alarms are: Chattering alarms, caused by badly adjusted equipment, faulty sensors or process noise
Alarms that require no operator action, and should therefore be reconfigured as events
Alarm rationalizationThis is the process of reviewing alarms in the light of the plant’s alarm philosophy. It includes the determina-tion (and documentation) of each alarm’s rationale and design require-ments. The basis for the alarm setting, the consequence of deviation, and corrective action that can be taken by the operator may also be included, along with each alarm’s priority status. Priority is often based on the conse-quences of the alarm or on its allow-able response time.
Continuous improvementAs the plant changes over time, it is important to establish alarm manage-
2 System 800xA hiding mask
Operational profitability
Intelligent alarming

23ABB Review 1/2007
ment as a routine part of the plant’s procedures. (In the US, alarm man-agement is often seen in the context of “six sigma” programs that target process variations that lead to subse-quent breakdowns or failure of the process).
Nuisance alarms are alarms that serve no justi-fiable purpose, ie they are of no value to the opera-tor. Such alarms exist in many plants and their removal can reduce the alarm rate significantly with very little effort.
Hiding consequential alarmsAccidents like the one in Milford Haven show that operators can be overwhelmed by floods of alarms, especially in extreme situations. This is because a single root cause can have many different consequences, each of which triggers additional alarms. Basic alarm management, as described here, is not particularly helpful in such situations. In order to achieve EEMUA’s target of no more than 10 alarms during the first 10 min-utes of a process upset, a more rigor-ous approach must be taken. ABB’s 800xA control system offers an alarm-
hiding feature. This allows certain alarms (depending on process state or other active alarms) to be hidden from the standard alarm lists, but easily accessed when required 2 .
It is a demanding task to identify all the causal relations between alarms that are required for the configuration of alarm hiding rules. Some commer-cially available Alarm Management tools can compute correlation coeffi-cients between alarms. This analysis can be used as a basis for the configu-ration of alarm hiding rules. It is very important to note that those tools use binary data only (alarm on/off) and not the full richness of the original process data. It is obvious that by using historical process data more precise information about causal rela-tions can be found.
To better understand the potential of this approach several days of histori-cal data from two different plants was analyzed with Process Disturbance Analysis methods [6]. Some interesting causal relations have been identified which are currently being accessed together with process experts from the plants and shown in 3 .
Martin Hollender
ABB Corporate Research,
Ladenburg, Germany
Carsten Beuthel
ABB Power Generation,
Mannheim, Germany
References
[1] EEMUA 191: Alarm Systems. A Guide to Design, Management and Procurement. 1999, ISBN 0 8593 1076 0
(http://www.eemua.co.uk)
[2] Tanner, R., Gould J., Turner, R. and Atkinson T. (2005), Keeping the peace (and quiet).
ISA InTech September 2005.
[3] Norwegian Petroleum Directorate YA-711: Principles for alarm system design, 2001
(http://www.ptil.no/regelverk/R2002/ALARM_SYSTEM_DESIGN_E.HTM)
[4] Namur NA102: Alarm Management. 2005
[5] Hollifield, E. Habibi, The Alarm Management Handbook. 2006
[6] Horch, A., Peak performance, ABB Review 1/2007 pp24–29
[7] ISA RP18.2 Management of Alarm Systems for the Process Industries (draft)
Footnotes1) OPC: formerly OLE (Object Linking and Embedding) for Process Control2) SQL: Structured Query Language
Operational profitability
3 Mapping causal relations between process variables. The process variable 15 has a strong causal relation with process variables 1, 2 and 3.This can be used as a proposal for a process engineer to specify an alarm hiding rule.
Intelligent alarming
Normalised trends of selected PCA cluster
Cau
se
Effect
1
2
3
4
5
6
7
8
9
10
11
12
13
14
15
1 2 3 4 5 6 7 8 9 10 11 12 13 14 15
1
2
3
4
5
6
7
8
9
10
11
12
13
14
15

Disturbances and oscillations in production processes usually have a considerable effect on product quality, running costs and profitability because production and throughput may have to back away from their optimum settings to accommodate process variability.
An international research and development team has developed an innovative solution for plant-wide disturbance analysis. After extensive field testing and collection of requirements, a Plant-wide Disturbance Analysis module has been productized and applied successfully at Eastman Kingsport, TN.
24 ABB Review 1/2007
Operational profitability
Peak performanceRoot cause analysis of plant-wide disturbances Alexander Horch, John W. Cox, Nunzio Bonavita

25ABB Review 1/2007
In their drive towards efficiency, modern industrial process plants are
making increased use of recycle streams and heat integration. This integration of mass and energy complicates pro-cess control because variations can propagate through the plant in com-plex ways. Often, a single source of variation manifests itself as a widely distributed disturbance. A propagated disturbance can affect key process variables such as feed, product and recycle flows, column temperature and product composition. Such a dis-turbance can upset just a single unit, for example a distillation column, it can be plant-wide, affecting a com-plete production process or even site-wide if utilities such as the steam supply are involved. When there are many disrupted or oscillating mea-surements, finding the root cause of the disturbance is akin to looking for a needle in a haystack. The motiva-tion behind the product development presented here is the automatic detec-tion of plant-wide disturbances and determination of likely root causes. This allows disturbances to be re-moved or dealt with by maintenance, new control schemes or simply con-troller re-tuning.
In recent years, universities have de-veloped several innovative algorithms based on advanced signal processing, spectral and nonlinear time series analysis for use in industrial process diagnosis. To better apply such knowledge to the problem described
here, ABB initiated a project in coop-eration with the Imperial College / UCL Centre for Process Systems Engi-neering (CPSE).
After preliminary field-tests, a large-scale pilot application of the meth-odology, using a first prototype implementation, was evaluated by ABB. The plant-wide disturbance technology was applied to measure-ment data from a Norwegian oil plat-form. The analysis of disturbances was based on data from more than 2000 measurement tags and more than one month’s worth of data at high resolution.
In recent years, universi-ties have developed sev-eral innovative algorithms based on advanced signal processing, spectral and nonlinear time series anal-ysis for use in industrial process diagnosis. Extensive analysis and discussion revealed significant disturbances that had also been identified by parallel plant investigations by process and process control experts from ABB and the customer. These encouraging results indicated that the intelligent analysis of process data can, to a great extent, help and support the work of
problem identification, localization and diagnosis.
The final step in the product develop-ment process was the integration into ABB’s product portfolio. Due to the nature of the methodology in support-ing process performance analysis, it was chosen to productize the Plant-wide Disturbance Analysis (PDA) functionality as a new module in ABB’s control loop optimization soft-ware OptimizeIT Loop Performance Manager (LPM). The release contain-ing the PDA module is now available from ABB.
Following a brief overview of the methodology, this article will present two successful and surprisingly accu-rate findings from an end-customer evaluation of the tool. Eastman Chem-ical Company, Kingsport, TN (title picture), has been testing the integrat-ed tool with encouraging results.
OptimizeIT – Loop Performance Manager Loop Performance Manager (LPM) is a control loop maintenance tool for control engineers, instrument techni-cians and maintenance personnel. It has been designed to provide a bridge between the technologies developed in academia, and the existing, relevant needs in the industrial world [4]. Its mission is to ensure that control loops, and – consequently – the whole pro-duction process, operates at peak per-formance.
1 LPM screen shot. A single environment for disturbance analysis, root cause detection, control loop monitoring and tuning
2 Typical work flow of PDA analysis within the Loop Performance Manager tool a to e are the five steps of this workflow
Import Preprocessing Data filtering
Cluster Selection
From MS-Excel From auditing files
Bad quality Data compression Remove linear trends
Low/high pass Band pass
OscillationDetection
Non-Linearity
PCA Causality
Oscill, Index
PCA Tree
Transfer Entropy
Time- Delay
Report.xls or HTML
Root-CauseAnalysis
a b c
d
e
Operational profitability
Peak performance

26 ABB Review 1/2007
The package has been structured in a modular way, currently consisting of three software applications: A control loop-tuning component used to improve control loop per-formance
A control loop-auditing component used to monitor loop performance
A Plant-wide Disturbance Analysis (PDA) component. This software simultaneously analyzes multiple loops detecting common behavior and identifying likely root causes.
1 shows a typical screen shot of the LPM tool.
Plant-wide disturbance analysisA good survey of current research can be found in [6]. 2 shows the overall procedure of PDA within the LPM tool [7].
Data importData can be read offline from either Excel files or from data collected in the tool while performing control loop monitoring 2a . Data pre-processing and filteringStandard and simple functionality for data-pre-processing is very useful when different aspects of data, eg different frequency ranges are to be investigated. Also, problematic data, such as bad data, outliers or linear trends are filtered out automatically.
The simple representation of superim-posed data in the form of a high-den-sity plot, is already a very useful pro-cess for engineers. Such presentation modes are not usually available in his-torians or on operator screens 2b 2c .
Problem cluster selectionThe first main step in the analysis is the detection of clusters of time trends that display similar periodically oscil-lating patterns. The oscillation detec-tion is achieved with signal processing methods. In this context the signals are the time trends of the measurements. Oscillation detection has traditionally looked for zero crossings of the mean-centered signal. One weakness of this approach is that noise causes addition-al zero crossings, diminishing the value of the result. The key breakthrough applied here involves detecting oscilla-tions using zero crossings of the sig-nal’s autocovariance function [1]. This provides a significant improvement over previous methods that used time trends directly 2d .
There is no restriction on the number of tags that can be handled. Past in-vestigations used several hundred tags. These could be readily analyzed thanks to the efficient implementation of the underlying algorithms.
High-density plots as shown in 3 show time trends. An alternative way
of viewing such information is by spectral analysis. This method high-lights periodic features better than time trends. Frequency spectra have several advantages when it comes to the detection of distributed distur-bances. However, it is the combined use of time and frequency approaches that is a strength of the described tool. The method employed to select clusters is based on spectral principal component analysis [2].
A powerful way of presenting the spectral clusters is by means of a hierarchical tree, as described in [9]. Spectral clustering also works very reliably for time trends with non-peri-odic features, as long as their spectra are similar. Other, very intuitive ways of representing clusters are also included in the tool.
Finding the likely root cause for disturbance clustersIt is well known, eg [8], that a very common cause of disturbance in chemical processes is a faulty control valve with non-linear characteristics such as dead band or excessive static friction (known as stiction). The limit cycles arising from sticking control valves in a feedback control loop can propagate widely. For this reason, the tool was initially focused on the diag-nosis of non-linear root causes. The methods developed for the diagnosis of sticking control valves can also be applied in locating faults originating in process nonlinearities such as peri-odic foaming in a distillation column or slugging flows in pipelines 2e .
Nonlinear trendsA nonlinear time trend [3] is a signal that cannot be described as the output of a linear system driven by white noise. It is characterized by phase coherence and, if it is oscillatory, by the presence of harmonics. An exam-ple of a very non-linear signal is one with a square wave pattern. A process plant typically acts as a low pass filter, which means that a measurement close to a non-linear source has more non-linearity than a measurement far away from the source. The nonlinear square pattern is smoothed as it prop-agates through the plant. This behav-ior is utilized to identify candidate areas for root causes.
Operational profitability
Peak performance

27ABB Review 1/2007
One way to detect non-lin-earity is by visual inspection of the time trends and the spectra. However, this is a manual procedure that is un-reliable, intricate and prone to error. The novel concept in the current approach is a nonlinearity assessment that is strongest at the source of the nonlinearity. In this way, the root cause oscillation can be distinguished from propa-gated secondary oscillations. The assessment index is large for periodic but non-sinusoi-dal oscillating time trends (that are typical of the output of a control loop with a limit cycle caused by nonlinearity).
The basis for the non-linearity assess-ment is a comparison of the predict-ability of each time trend and a set of constructed time trends that have the same power spectrum but random phases. A non-linear time trend will have a high predictability compared to the constructed time trends, where-as this difference will be small for a linear time trend [3].
The nonlinear square pattern is smoothed as it propagates through the plant. This behavior is utilized to identify candidate areas for root causes.
The power of the described methodol-ogy is underlined by the examples discussed below. A clear direction of operation and/or maintenance inter-vention can easily enable significant reductions in the time lost pursuing the wrong root causes. Furthermore, when applied to large-scale problems, the methodology enables the identifi-cation of problems that might never be identified manually since the root-cause may be located very far from its effect.
A data-driven, computer-aided meth-odology as shown here is a valuable support tool. It will not be able to replace human know-how but it can
greatly reduce the effort in finding and mapping out the extent of plant-wide prob-lems and locating their causes.
Two additional approaches to root-cause analysis are the use of transfer entropy and time-delay estimation meth-ods [5].
Transfer entropyThis statistical method evalu-ates the predictability of a variable from another vari-able based on probability density functions (PDF). The causality measure used to quantify the extent of the in-fluence of a variable X on
another variable Y is derived from transfer entropy T(X|Y). The latter is itself derived from entropy which is a measure of uncertainty of a random variable and sums a weighed loga-rithm of the PDF. Transfer entropy is calculated from the joint PDF of two variables. This provides a measure for the dependencies between those vari-ables. The causality measure t(X,Y) is derived by comparing the influence of X on Y with the influence of Y on X:
t(X,Y) = T(X|Y ) – T(Y|X)
Thus, large values of t(X,Y) indicate a strong causality from X to Y.
Time delay analysisThe second method implemented in the PDA module for causality analysis is based on the Cross-Correlation Function (CCF). This function deter-mines causal relationships between measurements from the presence of time delay between them. The under-lying principle of the method is that when the disturbance propagates through the plant, the disturbance can often be observed at a number of pro-cess variables with a time lag. Knowl-edge of the exact time lag provides clues towards the root cause because it can be argued that the variable clos-er to the root cause will show the dis-turbance earlier than a variable further away. The CCF measures the similarity between signals at different time in-stances and can therefore be used to evaluate time lags between signals.
Key features of plant-wide disturbance analysis
Automatic detection of the presence of
one or more periodic oscillations
Detection of non-periodic disturbances
and plant upsets
Determination of the locations of the
various oscillations / disturbances in the
plant and their most likely root causes
Industrial examples
PDA (Plant-wide Disturbance Analysis)
directed the process experts straight to the
root-cause of plant-wide problems. These
root causes were neither evident from look-
ing at data nor from using process knowl-
edge.
OptimizeIT Loop Performance Manager
Combining bottom-up monitoring (control
loop auditing) and top-down disturbance
analysis (PDA) with world-class controller
tuning functionality offers the most compre-
hensive tool for process control staff on the
market.
3 Oscillatory data from a cluster with 68 minute oscillations. Data is sorted by nonlinearity, correctly indicating LC2 as the root cause
Operational profitability
Peak performance

28 ABB Review 1/2007
The CCF of two signals has a maxi-mum value at a time value that is equal to the dead time.
The difference between these two methods for causality analysis is that the causality matrix based on transfer entropy is more sensitive. It can find a causal relationship even in situations with no measurable time delay, be-cause it detects other effects such as smoothing of the time trend that occur as a disturbance propagates from its source.
A first industrial exampleIn the following, the process section of 4 is considered. This shows a sec-tion in a chemical plant consisting of
5 Oscillatory data distributed over a vaporizer system. The identified root cause is marked red. a – d are vapor columns
1
Steam
a
Liqu
id
2
LC
PC
Vapor Header
Steam
b
Liqu
id
5
5
LC
PC
Steam
c
Liqu
id
7
SP
LC
FC
Steam
d
Liqu
id
9LC
PC7 PI
7PI
9
9
PC
two distillation columns. As can be seen, most measurements cycle with a period of 68 minutes (see also 3 ). Process experts suggested several the-ories explaining this sustained oscilla-tion. Hence several root causes were suggested.
Applying PDA root cause analysis for the cluster related to 68 minutes cycle time suggested that a nonlinear prob-lem around level control loop LC2 was causing the oscillations in all other tags in that specific cluster. This hypothesis was, in fact, experimental-ly verified: The control in LC2 was re-tuned 4–5 times as aggressively as its normal tuning. As a consequence, LC2 cycled at a much higher frequency
and the downstream cycles in all the other variables no longer occurred. This gave the experts confidence that the root cause was within the LC2 loop and most likely a problem in the final control element. This hypothesis was also confirmed using LPM audit-ing analysis on the LC2 control loop data.
Plant-wide disturbance analysis has moved from being a subject of advanced academic research into a successful industrial application in the form of a released product.
A likely explanation for the plant-wide upset is that the oscillation prop-agates through the plant section as the decanter is filled with liquid. As a result, there is more or less flow through the LC2 valve and this affects the LC1 level measurement. LC1 in turn adjusts the feed FC4 (via the master-slave feedback) to column 2. The resulting cycles in FC4 affect several column 2 variables, including the distillate flow FC6.
There was also a secondary cycle in the data set. This oscillation was somewhat faster and the cluster in-volved another five measurements. Root cause analysis gave early indica-tion of stiction behavior in FC2 – this is a correct result.
On the basis of these results, mainte-nance staff can improve the complete plant section peformance by attending to the two indicated valve-related problems in LC2 and FC2.
Second industrial exampleThis example describes the distur-bances found in a vaporizer system 5 .
It can be seen that the pressure in the vapor header is oscillating at a period of 220 seconds. This frequency can clearly be found in all four vaporizers ( 5a 5b 5c and 5d ) that are used for steam and pressure generation. Vapor-izer 5c is used for pressure control in
4 Process schematic for Example 1
TI
PI
FC
PI
Internal Condenser
Col
umn
1
Col
umn
2
Internal Condenser
PDI
Decanter
FC
LC
TC
TI
TI
TI
TC FC
LC
39
32
22
10
1
FC
20
19
16
4
PI
TI
TI
TI
PDI
LCTIFC
LC
TC
1
1
1 1
2
3
4
5
11
3
Steam
2
5 9
2Steam
4
3
7
8
7
32
34
6 6
2
TC
FC
FC
Operational profitability
2
2
Peak performance
TI

29ABB Review 1/2007
the header. A natural first guess by plant staff for a root cause was to in-vestigate the vaporizer 5c .
When applied to large-scale problems, the methodology enables the identification of problems that might never be identified manually.
However, when applying PDA to this problem, a cluster including all related tags was easily identified. Using non-linearity analysis, the level control loop (LC2) in vaporizer 5a was identi-fied 6 .
Experiments performed by process control experts actually verified that this was the – non-intuitive – root
cause. In order to exemplify how LPM can be used for further confirmation, LPM Auditing was applied to this loop. It generated the following diag-nosis which was found true in the plant Factbox .
ConclusionsPlant-wide disturbance analysis has moved from being a subject of ad-vanced academic research into a suc-cessful industrial application in the form of a released product. The in-dustrial cases show that innovative, modern technology offers great help to process experts in their root-cause analysis of important plant problems. These root causes are not always evi-dent to plant personnel and advanced tool support can greatly reduce time spent on localizing these causes.
The unique combination of top-down and bottom-up approaches which
combine the most important tools for process control engineers makes the ABB tool very powerful. Furthermore, encouraging results have been achieved by applying the PDA meth-odology to new fields of application, eg, advanced alarm management and supervision and diagnosis of electrical networks.
Alexander Horch
ABB Corporate Research
Ladenburg, Germany
John W. Cox
Eastman Chemicals Company
Kingsport, USA
Nunzio Bonavita
ABB PS&S S.P.A.
Genova, Italy
6 Level control loop LC2 data in Vaporizer A. a setpoint and process variable (0-100 percent), b manipulated variable (valve opening) (0-100 percent). The data shows a sticking behavior.
PV,
SP
OP
Time [s]
0 1000 2000 3000 4000 5000 6000
80
79
78
77
76
75
0 1000 2000 3000 4000 5000
22
20
18
16
14
12
References
[1] Thornhill, N. F., Huang, B., and Zhang, H., 2003, Detection of multiple oscillations in control loops, Journal of Process Control, 13, 91–100.
[2] Thornhill, N. F., Shah, S. L., Huang, B., and Vishnubhotla, A., 2002, Spectral principal component analysis of dynamic process data, Control Engineering Practice,
10, 833–846
[3] Kantz, H., and Schreiber, T., 1997, Nonlinear time series analysis. Cambridge University Press, Cambridge, UK.
[4] Bonavita, N., Bovero, J.C., and Martini, R., 2004, Control loops: performance and diagnostics, in: 48th ANIPLA Conference, Milano, Italy, September 2004
[5] Bauer, M., Cox, J. W., Caveness, M. H., Downs, J. J., Thornhill, N. F., 2007. „Finding the direction of disturbance propagation in a chemical process using transfer
entropy“, IEEE Transactions on Control Systems Technology, 17(1), 12–21.
[6] Thornhill, N. F., and Horch, A., (2006) “Advances and new directions in plant-wide controller performance assessment”, Proc. Of ADCHEM 2006, Gramado, Brazil,
Appil, 2–5, 2006
[7] Bonavita, N., Caserza-Bovero, J., De Lorenzo, L., Martini, R., 2006, „Control Performance Monitoring: a Data-driven Approach“, Proc. of Monitoraggio delle
Prestazioni dei Processi e dei Sistemi di Controllo, Milan 19 September 2006
[8] Horch, A. (2006), “Benchmarking control loops with oscillations and stiction”. In: Process Control Performance Assessment. (Ordys, A., Uduehi, D and Johnson,
M.A, Eds), Springer, Guildford, UK.
[9] Thornhill, N. F., Melbø, H., and Wiik, J., 2006, Multi-dimensional visualization and clustering of historical process data, Industrial Engineering and Chemistry Research,
45, 5971–5985.
Operational profitability
Factbox LPM Auditing output
- LC2: Overall loop assessment: ------------------------The control loop performance is not acceptable.- LC2: Detailed information: ------------------------The control loop is oscillating.- The control loop is oscillating.- The control valve exhibits stiction that results in
loop oscillations. Put controller in manual to verify.
The oscillation accounts for a significant part of the overall variation. Removing the oscillation will have lead to great improvement.The oscillation amplitude is quite regular. This is untypical for a pure (linear) tuning problem.- The final control element introduces variability to
the output.The control valve suffers from increased static friction (stiction). A malfunctioning valve increases loop variability. Put loop in manual or maintain valve.
Peak performance

How many people would dare board a plane without a pilot on board even though technology has advanced to a point where “flying” a plane from the ground is possible. Can technology be trusted enough to also run nuclear power plants or complex industrial processes without the presence of oper-ators? Of course people make mistakes and often accidents such as nucle-ar meltdowns or airplane crashes are attributed to human error. However, in many cases a lack of relevant information for handling a critical situation has been at fault.
Rather than eliminate humans from the process, the trend nowadays is to fully utilize their capacities and strengths by integrating them more into the overall design. This means designers must harmonize two very different complex models – that of a technical process control system with one representing human behavior – to produce a well-functioning automation system that cannot afford to fail in critical and unpredictable situations. This article gives an overview of how this is done.
30 ABB Review 1/2007
Capital productivity
Design methodsPutting the human in focusCharlotte Skourup, John Pretlove

31ABB Review 1/2007
their way into the industrial market-place.
Knowing the human mindModels of human mental processes and behavior, and user-centered de-sign increase the focus on the opera-tor as an integral part of an advanced automation system. Many such models exist and each represents some aspect of the cognitive processes of the human mind. Two of these are dis-cussed in the following paragraphs.
Models of human mental processes and behavior, and user-centered design increase the focus on the operator as an integral part of an advanced automation system.
Rasmussen [1] has developed a model to help designers combine informa-tion requirements for a system with aspects of human cognition. Also known as the SRK (Skills-Rules-Knowledge) model, it describes three levels of human behavior: skill-based, rule-based and knowledge-based 1 . Skill-based and rule-based behavior
patterns represent situations and tasks that are familiar to an operator. To be more specific, the skill-based level requires almost no conscious human control or cognitive effort to perform an action based on perceived inputs. Human performance at this level is automated and consists of highly inte-grated patterns of behavior acquired through training. The rule-based level occurs when a situation or an event is familiar and the operator uses a selec-tion of acquired rules and procedures to formulate a course of action. Oper-ators base their performance on this type of behavior when they follow specific maintenance procedures, for example. The knowledge-based level of behavior is the most demanding cognitive process and it takes place when the human experiences an en-tirely unknown and unexpected event or situation.
Unlike many other models of human cognitive processes, Rasmussen’s model is based on industrial process operators and how they manage infor-mation and perform tasks. This model is therefore highly relevant for com-plex industrial automation systems. In practice, Rasmussen’s model can be used to decide at which level of be-havior the operator performs specific
Factbox Three Mile Island nuclear accident – an overview
Three Mile Island nuclear generating station
sits on a 3.29 sq. km island in the
Susquehanna River in Dauphin County,
Pennsylvania. In 1979 a sequence of events
led to the partial meltdown of the nuclear
reactor. Initially a failure in the cooling
system caused a relief valve to stick in the
open position. Signals to the operator failed
to indicate that the valve was open. As a
result cooling water continued to pour out
of the reactor causing it to overheat. There
was no indication of the level of coolant in
the reactor. Instead the operators judged
this based on the coolant level in the
pressurizer, and since this was high, they
assumed the core was properly covered.
Even as alarms rang and warning lights
flashed in the control room, operators failed
to realize the seriousness of the situation. In
fact a decision to reduce the flow of coolant
into the reactor only served to exacerbate
the situation. In the investigation that
followed, it was discovered that the
operators did not have all the information
necessary to understand the real situation.
Because of the lack of information, the
operators’ “picture” – or mental model – of
the situation was wrong and all actions
taken were based on this incorrect model.
Even when the predicted outcomes of
specific actions did not match the mental
model, operators disbelieved alarms rather
than question their own understanding of
the situation.
For more detailed information, please refer
to www.nrc.gov/reading-rm/doc-collections/
fact-sheets/3mile-isle.html (Referenced in
November 2006).
In general human nature is uncom-fortable with the idea of giving
away overall responsibility for a com-plex process – a pilotless plane is evi-dence of that. Another example to illustrate this comes from the oil and gas industry where the trend is to move the operation of offshore instal-lations to onshore centers to reduce personnel risks and operational costs. Some teams, however, need to remain offshore not only for safety reasons but also to perform inspection and maintenance tasks. Understandably, there is considerable apprehension towards moving control and responsi-bility hundreds of miles away from the process itself. Because the opera-tor is such an important element in any automation loop – especially when critical and unpredictable events occur – new systems need to be de-signed with an extended focus on the human user. A poorly designed sys-tem can have dreadful consequences of which the Three Mile Island nucle-ar accident is a good example Factbox .
The accident was a catalyst that brought about a new way of thinking in terms of system design. While many technical issues needed to be re-examined, so too did the role of the human operator in certain indus-trial processes. Following the accident investigation, sweeping changes were made to emergency response manage-ment, operator training and, more im-portantly, human factors engineering for plant operations. Many of these changes later filtered through to other industries.
Many institutes have researched the role of the human in industrial pro-cesses. The Institute for Energy Tech-nology (IFE) in Norway, for example, has focused1) its research on: human cognitive processes; design and proto-typing; and task allocation. Similar research in other safety critical indus-tries, such as oil and gas have been following the same trend. Other pro-cess industries with fewer safety re-quirements have been relatively slow at introducing new methods, para-digms and thinking related to safety concerns and the human user. This is, however, beginning to change as new design approaches supporting cogni-tive elements are gradually finding
Capital productivity
Design methods

32 ABB Review 1/2007
tasks and what information should be available at this level. It can also allo-cate tasks between the human and the control system.
Situational awareness – prerequisites for human decision makingEndsley’s [2] situation awareness mod-el describes how people who deal with complex and dynamic systems – such as an industrial process – active-ly look for and interpret specific infor-mation, and how decisions are made based on this information. Endsley’s model comprises three levels 2 : Perception of elements in the envi-ronment within a volume of time and space.
Comprehension of the meaning of these elements.
Projection of the elements’ status into the near future.
The first level describes how the hu-man perceives bits of information in an environment that either deviates from the original situation or repre-sents a state that contributes to the “picture” of the current situation. At the second level, the person acquires a deeper understanding of the current situation while still actively searching for additional and complementary in-formation. Finally, the human opera-tor uses his mental model of the in-dustrial process to simulate potential actions based on perceived informa-tion as well as the present interpreta-tion and understanding of specific in-formation. When a solution has been found which solves the problem the
decision regarding what actions are required naturally takes place.
The challenge of good system design is to fully utilize the strengths of both man and his “machine” (the control system) to achieve what neither can alone.
Endsley’s model helps designers un-derstand how automation and deci-sion support systems collaborate to direct the operator’s attention to spe-cific information essential to compre-hend any given situation. In practice, it can be easily applied and is espe-cially effective where there are long periods of normal or low activity that are suddenly interrupted by the occur-rence of a critical event requiring the operator’s full attention. It does not, however, say anything about the indi-vidual’s mental “picture” or any deci-sion the human operator will take.
Designing for improved human-machine collaborationThe challenge of good system design is to fully utilize the strengths of both man and his “machine” (the control system) to achieve what neither can alone. Where technology-centered design focuses entirely on the tech-nology, user-centered design aims at developing technology to support the specific user and his tasks in context.
The job of integrating the human operator into a well-functioning auto-mation system belongs to the system designers. Even though the system design process – which includes a number of phases, analysis and methods – varies between different industries, the common denominator for all designers is that they must collect relevant information on the human in the loop to design an effec-tive human machine interaction. Such a system acts as a communication channel between the operator and the control system.
Requirement specificationAlmost all designers perform a re-quirement analysis to translate overall system goals and objectives into spe-cific system specifications. Few how-ever focus on the human user as part of the overall system. A complete set of design specifications should con-sider the industrial process itself, the users, the tasks, the environment and the operational requirements. Knowl-edge about the operator and how he performs his tasks ought to drive the design of the automation system.
A user analysis identifies the different users of the automation system. It further groups and characterizes these users based on bibliographic infor-mation, competence, experiences and preferences. This type of analysis helps the designer to get to know the users and to understand how they perform their tasks. Additionally, envi-ronmental requirements relate to ex-
2 Endsleys situation awareness model describes how people in complex and dynamic systems look for and interpret information, and how decisions are made from this information
State of the environment
Situation awareness
Level 3:Projection of future status
Level 2:Comprehension
of current situation
Task and system factors
Knowledge of process dynamics Goals and expectations Experience and training
Individual factors
Interface design Stress and workload Complexity Information systems
performance of actions
Decision
Level 1:Perception ofelements in
current situation
1 Rasmussen model of human behavior – also known as the SRK model – helps designers combine information requirements for a system and aspects of human cognition
Rule-based behavior
IdentificationDecision(of task)
Planning
Recognition AssociationStored
Action rules
Activation
Sensory inputs Actions
Goals
Knowledge-based behavior
Skill-based behavior
Capital productivity
Performance
Design methods

33ABB Review 1/2007
ternal factors such as the layout of work places, lighting conditions and the surrounding environment (ie, ex-plosion risks, dust, humidity, noise, etc.).
Functional analysis and task allocationFunctional analysis identifies the func-tions of the entire automation system including both the human and the control system. The main objective of a functional analysis is to allocate labor – also referred to as task alloca-tion – between the human and the control system. Use cases and scenari-os are examples of techniques needed to gather functional requirements.
It is recognized now more than ever that the human operator is an irreplace-able part of the automa-tion loop, especially when critical and unpredictable events occur.
In many situations, task allocation can be pretty straightforward: nothing matches a computer, for example, when it comes to handling large amounts of data, performing repetitive tasks and following procedures. In addition visualizing and ergonomically presenting complex information in terms of overviews and drill down objects is easier. The human, on the other hand, is good at reasoning, judging, solving problems and making decisions. However, the real world is not black and white and many tasks demand close collaboration between the computer system and the human operator in order to solve a task opti-mally. As well as task allocation, the degree of automation is a highly rele-vant topic. The complexity and degree of automation varies within different industries and sometimes even within a specific process. Also, the way human operators react to problems and situations is dependent on their experiences and skills. However, a conscious decision regarding the level of automation and when the human operator should interact with or over-ride it is essential. This important guideline makes the operator’s work-load “visible” to the designer.
Task analysisThe main aim of a task analysis is to understand the tasks, goals and ex-pectations the user will demand of a new system. It is therefore critical to clarify which tasks an operator should perform to get the job done. The or-der in which the tasks are carried out to fulfill the goal and the tasks them-selves may differ between operators so long as safety is not compromised. A basic task analysis, for example, identifies a number of goals and the related tasks needed to achieve each goal.
A number of variations of task analy-sis methods exist. Two such variations are known as Hierarchical Task Analysis and Cognitive Task Analysis. A Hierarchical Task Analysis simply divides a job into tasks based on a hierarchy whereas a Cognitive Task Analysis focuses on the cognitive pro-cesses needed to perform a task. For example, a field inspection is a rather simple task to define. On the other hand, an unexpected situation novel to the operator demands a higher lev-el of definition. According to Rasmus-sen’s model of human behavior, this task takes place at the knowledge-based level of behavior, which means it may involve tasks such as problem solving and decision making. With this knowledge designers can then determine (a) what information the operator should see and how it is pre-sented, and (b) the decision support and task allocation between the con-trol system and the human operator.
ConclusionsThe trend within almost all industries is towards safer systems (despite in-creasing complexity) and a higher level of automation. The design pro-cess in the past was more technology-centered, but now there is a growing
focus and understanding of the impor-tance of the human in the loop. It is recognized now more than ever that the human operator is an irreplace-able part of the automation loop, especially when critical and unpredict-able events occur. People are however different and unpredictable and respond in slightly different ways to critical situations.
A complete set of design specifications should consider the industrial process itself, the users, the tasks, the environ-ment and the operational requirements.
A number of methods support an ex-tended understanding of the human in the loop and help to define and characterize the typical operator or groups of operators. To ensure a well-designed and safe automation system, the system designer will, now and in the future, need to combine the out-come of these various models and methods.
Charlotte Skourup
John Pretlove
ABB Strategic R&D Group for Oil & Gas
Oslo, Norway
Footnote1) Initially for nuclear power plants.
References
[1] J. Rasmussen, Skill, Rules, and Knowledge; Sig-
nals, Signs, and Symbols, and Other Distinctions
in Human Performance Models. IEEE Transactions
on Systems, Man, and Cybernetics 13 (1983) 3,
257–266.
[2] M. R. Endsley, Towards a Theory of Situation
Awareness in Dynamic Systems. Human Factors
37 (1995) 1, 32–64.
Further reading
T. B. Sheridan, Telerobotics, Automation, and Human
Supervisory Control. The MIT Press, Massachusetts,
1992.
Capital productivity
Design methods

A number of models and methods support an extended understanding of the human in the loop by involving actual users. This was successfully applied through low-fi prototyping and operator involvement in a project to upgrade the control room at Statoil Tjeldbergodden.
Statoil Tjeldbergodden 1 is an in-dustrial complex situated on the
mid-western Norwegian coastline. It comprises four areas: a methanol plant, a gas receiving station, an air separation plant and a gas liquefac-tion facility [1]. As part of a major modification of the plant, it was de-cided to upgrade the existing Infi90 control system human machine inter-face (HMI) to ABB’s System 800xA.
Case Study Prototyping at Statoil TjeldbergoddenTrond Tysseland, Torgeir Enkerud, Kristoffer Husøy
It was determined that the new system should handle 20,000 tags and would consist of approximately 240 process graphics.
The models and methods used in this case study have been introduced in [2] and a brief overview is given in the Factbox 1 . This case study particularly focuses on how low-fi prototyping Factbox 2 was applied to the control
room upgrade project. By using this simple and effective technique, sever-al iterations of the design were com-pleted with minimum effort.
Information navigationThe problem faced by knowledge workers and control room operators in many industries is how to find the right information quickly and effi-ciently. The control system operator interface often consists of anywhere between 20 and a few thousand pro-cess graphics, and the operators must be able to quickly identify and navi-gate to the right one.
The system used at Statoil Tjeldber-godden prior to the upgrade meant operators had to navigate through links in the process graphics 2 . These links were scattered everywhere, often following the process flow. To find the quickest route to the desired graphic meant operators had to be very familiar with the plant layout. Clearly a new HMI was necessary.
Thumbnails for browsingThe first design proposal was inspired by navigation in Microsoft Power-Point, Windows Explorer and some
34 ABB Review 1/2007
Capital productivity

35ABB Review 1/2007
ment, ABB project team and devel-opers. The users liked the concept of a dedicated navigation area, but there were some issues with the thumbnails: There was not a sufficient number of links at a time.
The “visual recognition” effect was not very important because many process graphics look similar.
The level of detail in the thumbnails was judged to be too high, thus cluttering the operator interface.
Tabbed browsingWith this feedback in mind, the team started a new design phase. With in-spiration from the Opera web browser, Microsoft Excel and Microsoft Visual Studio 2005, a concept of using tabs
photo editors where the idea of thumbnails is employed. Basically, a thumbnail is a small visual copy of an object and acts as a direct link to the object. Thumbnail navigation is an intuitive way of navigating because the user can recognize the visual con-tent of the object that is sought, espe-cially if there are many of them, with-out having to remember its name. When applied to process graphics, the idea was to use simplified images of these graphics as thumbnails in a pan-el along one side of the screen dis-play 3 . Overlaying the thumbnails with dynamic information – for exam-ple showing the number of active alarms with highest priority or other aggregated status indicators – was considered to add extra value.
The concept demonstrator was devel-oped in a graphic editor and inserted into Microsoft PowerPoint presenta-tion slides. Several images were creat-ed that contained different process graphics. The corresponding thumb-nails showed which process graphic was selected as well as some alarm information. This allowed the design-ers to demonstrate the concept almost like a working prototype, where click-ing on a thumbnail would move to the next slide or “sublevel” showing a new process graphic and its corre-sponding thumbnail.
The user tests were conducted in an informal manner through a workshop attended by operators, site manage-
Factbox 1 Models and methods applied in industrial automation system design
Many models of humans with respect to how
they perceive and process information exist.
Each of these represents some aspects of
the cognitive process of the human mind,
thus helping designers to better understand
the human operator in his respective role.
Rasmussen’s model of human behavior –
also known as the SRK model – helps
designers combine information requirements
for a system with aspects of human
cognition. It is used to decide (a) at which
level of human behavior (skill-based, rule
based or knowledge-based) the operator
performs specific tasks and (b) what infor-
mation should be available and presented to
the operator. This model can also be used to
give an overview of specific tasks allocated
between the human and the control system.
Endsley’s situation awareness model
describes how humans look for and interpret
information in complex and dynamic
systems, and how decisions are made based
on this information.
The system design process includes a num-
ber of methods related to collecting relevant
information on the human in the loop that
impacts the design of the human machine
interface (HMI):
A Requirement Specification translates
overall goals and objectives of the system
into specific system specifications.
A Task Analysis, of which there are two
types: Hierarchical and Cognitive, aims
to understand the task, goal and
expectations which the user will demand
of a new system.
A Functional Analysis – also referred to
as task allocation – divides the labor be-
tween the human and the control system.
To ensure a well-designed and safe
automation system, the system designer
needs to combine the outcome of the
above-mentioned various models and
methods.
1 The Tjeldbergodden site 2 A screenshot of the old system with display links
Capital productivity
Case Study

36 ABB Review 1/2007
for process graphic navigation was developed. By building on the mental idea of flipping through paper docu-ments in a pile, tabs would be em-ployed to enable the user to quickly switch between several documents within an application. When used for process graphics, the idea is to posi-tion a bar of tabs at the bottom of the user’s screen in combination with a navigation area on the right 4 . The tabs show all process graphics in a process area, while the navigation area is used to navigate between the various areas.
The user tests were again implement-ed using image editing and Microsoft PowerPoint, and several interesting issues were revealed:
The users have a mental model of a logical and structural hierarchy of process graphics in the plant. This hierarchy is based on the different functional areas of the plant, and the displays could be organized into three different types: Process displays – showing a section of the process on an over-view level
Detail displays – presenting more details about a part of the process shown in the process display
Matrix displays – showing the shutdown logic for a section of the process
The users would like to navigate directly to detail and matrix displays from the navigation panel, not via the respective process areas.
The users couldn’t find a way of navigating directly from a detail dis-play to the parenting process dis-play without first having to think about which area they were in.
The use of paper proto-typing combined with knowledge and ideas from experienced users means final designs are usually established with a low level of effort.
The final step in the paper prototyp-ing process was to include the users’ suggestions in finding a solution to these three problems. The first sug-gestion centered on direct access to the detailed tabs panel and matrix
tabs panel for each of the process areas through links in the navigation area. The second suggestion was to include a context-sensitive “up”-but-ton in the tabs panel for the detail displays that navigates directly to the parent of the current display. ConclusionThe use of paper prototyping provid-ed several benefits for the project team. First of all, the concept was quickly developed, and because sim-ple paper prototypes were used, the final design was established with a low level of effort. Experienced users are a great source of ideas and knowl-edge. Bringing them into the project at an early stage lead not only to a feeling of ownership but also to a feeling of having contributed to the final solution.
Trond Tysseland
Torgeir Enkerud
Kristoffer Husøy
ABB AS
Norway
References
[1] http://www.statoil.com/tjeldbergodden (November
2006).
[2] Charlotte Skourup, John Pretlove, “Design
methods – Putting the human in focus”,
ABB Review 1/2007, pp 30–33.
3 Thumbnail navigation 4 Tab navigation
Capital productivity
Factbox 2 Lo-fi prototyping
Low-fidelity (Lo-fi) prototyping is used to
get user feedback as quickly and as effi-
ciently as possible. Normal prototyping
often involves some form of construction
and/or programming, and developers must
often wait until the main product is almost
finished before testing can be carried out
using potential users. Lo-fi prototyping, on
the other hand, uses simple methods, such
as sketching on paper, PowerPoint and im-
age editors, etc, to create straightforward
mock-ups that demonstrate the main func-
tionality – all within a matter of hours. This
method ensures that user feedback comes
at the very beginning of the project rather
than at the end, making major changes
possible.
Case Study

An improved overview of produc-tion, an increase in workplace
efficiency and better ergonomics are principal features of ABB’s complete workplace for control room operators, the System 800xA Extended Operator Workplace.
This workplace builds on ABB’s unique System 800xA software and continuing technical progress. It was developed in conjunction with two Scandinavian companies, and is now being released onto the market. The first installations are completed and several customers within the process industry are awaiting their deliveries and installations. The expectation is that a more effective, safe and profit-able production will ensue 1 .
Operators can see the entire plant in an overall picture, as well as viewing several other selectable images at the same time. When a fault arises they can see it and respond more quickly.
One frequent comment from those customers that have seen and chosen the ABB System 800xA and the Ex-tended Operator Workplace is that they would like the operators in the control room to have the best avail-able production overview. “We want our operators to have a good over-view of the production process and better possibilities to ensure we pro-duce the highest level of quality for our very demanding customers. So we chose ABB’s System 800xA Extended Operator Workplace for our control room”.
An other comment is that the Extend-ed Operator Workplace is effectively combining a large overview display with several regular monitors, all with full interaction.
“The most important thing is that our operators can see the entire plant in an overall picture, as well as viewing several other selectable images at the same time. When a fault arises they
Projections of productivityAn operator’s dream: Ergonomics for the control roomPer Lundmark
It is a universal tenet that providing workers with the right tools augments their ability to produce efficiently. Progress in control room technology is a prime example of this. A good tool is defined not only by the scope of its functionality, but also by the ease with which it can be used. The operator needs rapid and intuitive access to relevant information at all times. A delay in obtaining information or a confusing format for its presentation increase the risk of misjudgment and lost production. ABB has taken on this challenge, taking control room ergonomics and interactivity to new heights, permitting operators to interact with all displays presented to them.
Capital productivity
ABB Review 1/2007 37
Projections of productivity

38 ABB Review 1/2007
through the unique software in the 800xA system that controls the display of images in an ergonomically correct manner and totally automatically. Among other things, this enables numerous combinations of image displays between the monitors and the large-screen.
ABB believes that ergonomics and overview are vitally important in en-abling operators to be able to act quickly and avoid making mistakes. The goal is to minimize the number of unintentional production stops and to maintain a high, safe and consistent level of quality in production.
The development work followed a number of guidelines for a good con-trol room workplace: It must provide a good overview of the process
It must be fully interactive for quick action.
It must be modern and attractive. It must have equipment that replac-es existing, difficult to manage wall panels.
It must be able to integrate video monitors, such as CCTV.
It must be designed in such a way that visitors do not disturb operators.
It must be ergonomically designed with good lighting and a low level of noise.
It must permit consolidation and communication between different control rooms in the flow of pro-duction
The most important thing in a new control room workplace is the option of displaying an overview. It is com-mon in many control rooms in most industries to have large screens that do not offer any means of interaction and often only display images of trends that are not of particularly great use. The operator in such a room struggles with perhaps only two monitors, incomplete information, and ineffectively placed video monitors for the important camera monitoring.
The operator workplace enables numerous combi-nations of image displays between the monitors and the large-screen.
More than 40 percent of all halts in production involve operator errors. In most cases, these can be traced to operators not being able to access vital information sufficiently quickly.
The overview offered by System 800xA Extended Operator Workplace
can see it and respond more quickly. It is also easier to remedy. This en-ables us to minimize the number of halts in production”.
A number of different customers are awaiting delivery of this new presen-tation technology. Process industries, petrochemical industries and com-bined power and heating plants are amongst those who have seen the advantages of having an efficient workplace for their operators.
At the core of the workplace lies ABB’s 800xA automation system with its special sub-function, Operations. The Operations package contains the oper-ator interface and the software that can display information in different ways on screens of various types. It thus opens the possibility for overview pictures of a completely unique type.
More than 40 percent of all halts in production involve operator errors. In most cases, these can be traced to operators not being able to access vital information sufficiently quickly.
With Operations, the foundation was laid for the development of a com-pletely new operator station. ABB inaugurated a working relationship with two Nordic companies, Creative Grafiska Möbler AB, a developer and producer of control room furniture, and 3D-Perception AS, a supplier of projectors for large-screen displays. After several years of development work, System 800xA Extended Opera-tor Workplace is now ready for con-trol rooms around the world.
The operator workplace incorporates an operator desk that is available in two sizes. The desk can be selected to contain one or two operator sta-tions, each with up to four monitors, and one operator station controlling a large screen onto which two or three projectors mounted behind the desk beam information. The work-stations can be configured as desired
1 A more effective, safe and profitable production with System 800xA and the Extended Operator Workplace.
Capital productivity
Projections of productivity

39ABB Review 1/2007
owes its advantage to the flexibly con-figurable display of information on different screens and projectors. Over-view pictures can, for example, be displayed on the entire large-screen, while the monitors show details, dia-grams or other information. Or con-versely, a single image, a diagram for example, can be spread across three monitors as one total picture while the large-screen shows trends in smaller windows. All images are opened correctly and automatically by the software in 800xA Operations, in separate windows and in a clear and readable format.
It is common in many control rooms in most industries to have large screens that do not offer any means of interaction and often only display images of trends that are not of particularly great use.
The large-screen can be used in dif-ferent ways: As a single continuous image In order to display all images in the system as overlapping images
In order to build up group pictures of multiple images
For displays for visitors For “live video”, instead of separate video monitors.
Another important purpose of the workplace is the improvement of the working environment for operators. ABB wishes to change the role of these operators so they can work more effectively and obtain greater satisfaction from the work they do.
The improvements to the working environment include the ability to raise and lower the curved working surface and the desk. Similarly, the large-screen can be raised and low-ered, as well as slightly bent in order to present a clear image from where the operators are sitting. By mounting the large screen directly at the rear of the desk instead of on a wall, as is usually the case, the overview is not disturbed by passers-by. An additional improvement to the working environ-ment is the option of moving the com-puters entirely outside of the control room to deal with the prevalent issues of heat, noise, space, and security. An example of how this can be done leverages new technology developed by the electronics company, Matrox Graph-ics. Matrox introduces a transmitter card on the workstation or server which replaces the standard graphics card and can be fiber-optically cabled to a remote graphics unit on the operator side. The remote graphics unit contains all the necessary I/O including: four monitor ports, six USB ports for peripherals such as keyboard and mouse, and au-dio connections for speakers. Matrox remote graphics units 2 work with all installations of System 800xA.
Working environments are a concern of the international consulting compa-ny ARC Advisory Group, which was commissioned to compare different operator workstation technologies and make recommendations for future developments. As part of its task, it studied the System 800xA Extended Operator Workplace and praised it, describing it as “an ergonomically optimized workstation designed to enhance the operator’s working envi-ronment and effectiveness with fea-tures that reduce fatigue and extend the operator’s range of understand-ing.”
ABB wishes to change the role of operators so they can work more effectively and obtain greater satisfaction from the work they do.
System 800xA Extended Operator Workplace has been shown at a num-ber of trade fairs around the globe, where it has always met with a great deal of interest. Many visitors shared the assessment that “ABB’s workplace is precisely what we want!”
Per Lundmark
ABB Automation Technologies AB
Västerås, Sweden
2 The Matrox remote graphics unit helps reduce heat and noise emis-sions in the control room by providing only the user interface to the operators. The computers are located in a separate room.
Operators are offered optimal support by interactive display technology from ABB
Capital productivity
Projections of productivity

Spatial awareness3D representations improve situational awareness for control room operatorsKristoffer Husoy, Torgeir Enkerud
Progress in both computer power and control algorithms are permitting computers to handle increasingly complex tasks in process control. What then, is the future for control room personnel? The scenario of the computer having the control room to itself is unlikely in the foreseeable future – the human ability to think creatively, exercise judgement and improvise remains unrivalled. However, control room personnel are moving into positions requiring a broader overview. As a result, operators have less detailed knowledge of the plant. Staff effectiveness is increasingly depending on the method in which information is presented to them.
ABB is developing a three-dimensional representation for the oil and gas sector. The operator can see inside the plant and gain an overview of what is happening inside. The 3D view also aids communication with field personnel, as both see the plant in the same way, so reducing the risk of misunderstandings leading to incorrect actions.
40 ABB Review 1/2007
Capital productivity

41ABB Review 1/2007
Today’s industrial processes are controlled by human operators,
who in turn are supported by industri-al control systems – a situation that is unlikely to change in the foreseeable future. In spite of rising levels of auto mation permitting reductions in manpower and hence operational expenses, the unique creative and problem-solving capabilities of humans will remain indispensable at the con-trol desk for many years to come. This means that operators and automation systems must continue to monitor and control such processes in collabora-tion. A clear and efficient communica-tion between the two parties remains a prerequisite for the optimal function-ing of industrial processes.
This is the basis of an ABB research project in Norway, focused on the needs of oil and gas plants. In such installations, the control system needs to display information in a clear and intuitive manner to let the operator do what she does best: interpret informa-tion, solve problems and be creative. When the control system presents its information in a manner that is well suited for human interpretation, the operator can digest more information and grasp what is going on more quickly.
Operators in control The overall safety and operation of a plant relies on human operators being in control and playing a decisive and indispensable role in overall plant operations. Today, processes are mostly controlled from a central loca-
tion – the control room. The operators in the control room are responsible for the day-to-day monitoring of the process. This involves making key decisions such as setting optimization levels for the process, scheduling maintenance and responding to critical alarm situations.
When the control room operators are located away from the plant, they will not be able to main-tain detailed knowledge of physical locations and spatial relations of the plant.
But the operators in the control room do not run the plant by themselves. They rely on personnel in the field. These field operators are the hands and eyes on the plant floor. Their activities include operating, configur-ing and calibrating the equipment, as well as performing maintenance and service operations in conjunction with the dedicated maintenance and ser-vice teams. Furthermore, the process engineers, instrumentation engineers, remote experts and administrative personnel also play a role in the daily operation.
The overall performance of the plant is dependent on all systems and actors performing well together. This collab-oration can take the form of co-locat-
ed collaboration, or remote collabora-tion. In co-located collaboration the process control operators, field opera-tors and managers come together to discuss problems and plan operations. Examples might be shut-downs, start-ups, maintenance schedules and opti-mization issues. In remote collabora-tion, the on-site personnel collaborate with remotely located personnel – either field operators or remote experts. For example, when mainte-nance is performed in the plant, the process control operators and field operators work together to ensure that the operation is as safe as possible. The process control operators make sure that the equipment is properly sealed off and aid the field operators in their maintenance task.
Both of these scenarios require close collaboration between individuals with different domains of expertise and often with different cultural, tech-nical and social backgrounds.
The future is coming Looking ahead, several trends can be identified that will have an impact on the control room operator’s situa-tion and role. The principal among these is the centralization of control rooms, which has recently been pushed by the demands for higher profitability, cost reduction and safe and efficient operation. This trend – often referred to as “Integrated Opera-tions”, “eFields” or “Fields of the Future” in the oil industry – will have great impact on the way industrial plants are controlled in the future.
Capital productivity
Tight integration of the traditional operator interface with the proposed 3D interface is crucial to enhance efficiency and support operator’s situation awareness
Spatial awareness

42 ABB Review 1/2007
When the control room operators are located away from the plant, they will not be able to maintain detailed knowledge of physical locations and spatial relations of the plant. This might lead to field operators becom-ing the only personnel with detailed location-specific knowledge, whereas control operators take over more ad-ministration and optimization related tasks. This trend will also probably lead to one control room operator controlling larger plant areas or even several different plants.
The operator can navigate around the model, investigate details, get an overview and clearly see the physical and spatial relations.
Furthermore, there is a tendency for oil companies to want suppliers to be responsible for equipment and subsys-tems through service agreements to a larger extent than before. The suppli-ers – such as ABB – will not want to place personnel at all sites, but rather monitor and control equipment from a central location. This will require the suppliers to have access to relevant, live, on-line data from the plant, and efficient means to communicate and work together with onsite personnel.
Finally, there is a clear tendency for advances in instrumentation and measurement systems, computing power and network capacity to pro-duce greater amounts of data. Not only will such data be transmitted more frequently, but there will be more sensors transmitting it to the control room. This will lead to even more data being fed into the control
room, with increased risk of informa-tion overload.
The human perspectiveInterpreting these tendencies, the trend towards minimizing the number of operators remains, but it is neither real-istic nor desirable to wholly automate such processes. So, for the foreseeable future, human operators will remain in control and will depend heavily on their ability to communicate with the automatic parts of the control system. When looking at this from the human perspective, a range of interesting im-plications for a control system supplier such as ABB becomes evident:
Support operator’s situation awarenessThe operator must understand the state of the plant at all times. This means the operator needs to get the right information, the appropriate amount of information and most im-portantly, the information needs to be displayed in a manner that the opera-tor can assimilate and can react to.
Ensure optimal allocation of tasks between operator and systemThere should be a conscious decision in selecting the tasks that should be handled by the operator and those that should be automated by the system. One perspective on this choice is that this decision should be based on an understanding of which of these can perform the job best. In this manner the performance of the system, including human and computer, can be opti-mized. This holds that the tasks allocat-ed to the human operator match human abilities, and that the computer handles the tasks it is best suited for Factbox .
Support remote and co-located collaborationAs described above, there are many parties that contribute to successful
plant operation, and it is important to support collaboration between them. This means the collaborators need access to the same information; they need to be able to share information and they need to get an understand-ing of each other’s situation and con-text.
The physical limitations of what a field operator can and cannot do, the physical relationships between different objects and the location of com-ponents are immediately and intuitively understood when viewing a 3D repre-sentation of the plant.
3D visualization to the rescueA research project in ABB Oil & Gas Norway is currently investigating how a 3D interface of the plant and pro-cess can remedy the problems de-scribed above. The idea is to use 3D models of the plant and all equipment in the operator interface. The 3D models are assembled with correct dimensions compared to the real plant layout, and the 3D models are tightly linked to the corresponding control system objects. The operator can navi-gate around the model, investigate details, get an overview and clearly see the physical and spatial relations.
So what benefits does the introduction of the new dimension offer? A 3D inter face is life-like, and hence easy to recognize. It shows relations and dimensions in an intuitive manner, and is well suited to the human mind. Humans are accustomed to perceiving objects, remembering locations and relations and orienting themselves in three dimensions. Even more, we are actually very good at it. It is more efficient to display complex informa-tion in three dimensions compared to traditional presentation techniques.
The advantages in using 3D models of the process and plant for operator interfaces in industrial control are apparent. By augmenting the process
Factbox showing the strengths of humans and computers in decision making, based on Fitt’s list.
Humans are better at Computers are better at
Perceiving patterns Responding quickly to control tasksImprovising and using flexible procedures Repetitive and routine tasksRecalling relevant facts at the appropriate time Reasoning deductivelyReasoning inductively Handling many complex tasks simultaneouslyExercising judgment
Capital productivity
Spatial awareness

43ABB Review 1/2007
control interface with a 3D-interface, many of the problems mentioned above can be overcome. The operator can get a better understanding of the situation, can be relieved of the men-tal stress of trying to understand the situation or remember the location. A 3D representation can simplify col-laboration. The physical limitations of what a field operator can and cannot do, the physical relationships between different objects and the location of components are immediately and intu-itively understood when viewing a 3D representation of the plant. The oper-ator does not need to have been on site or have to remember in which area the component is located. The interface shows it plainly and unam-biguously.
The operator must be able to switch effortlessly between the two repre-sentations to select the one which is most appro-priate at that moment. There are distinct advan-tages in both interfaces that need to be clearly understood and taken advantage of.
Furthermore, if the position of the field operator is known, for example through some tracking method, the advantages are even clearer. There is
no longer any need for the operator to explain what she sees or where she is – such information is displayed precisely by the interface. Explaining one’s exact position is not easily done on the walkie-talkie, especially if the control room operator or remote expert is not familiar with the loca-tion. When a critical situation arises, the seconds saved by this clear under-standing of the situation can be of great value. More importantly, the chance of a misunderstanding is dras-tically reduced. As the control room operator can clearly see which com-ponent the field operator is facing, mistakes such as spelling mistakes or misinterpretations are much easier to detect.
The traditional process graphics can-not be done away with, nor is this an objective. A tight integration between the traditional process graphics and the 3D interface is crucial. The opera-tor must be able to switch effortlessly between the two representations to select the one which is most appropri-ate at that moment. There are distinct advantages in both interfaces that need to be clearly understood and taken advantage of. For example, the traditional two dimensional interface is effective for showing a simplified and structured overview, while the three dimensional interface is better for seeing relations and understanding physical aspects of the process plant. A 3D environment is also better suited for navigating in large information spaces – a challenging task for the control room operators. Navigating
between process graphics is a tedious task today, but the operators depend on being able to find what they are looking for quickly. By better support-ing spatial awareness and providing efficient movement between distant locations, navigation can become nat-ural and lightweight so that users can focus on solving the problem.
So, how distant is this future? ABB has developed a concept prototype that works inside the System 800xA frame-work. This is a necessary step to get valuable feedback from operators, customers, and internal sources. Under standing the true benefit of 3D interfaces can only be achieved through real-life testing and experi-mental investigation. The preliminary results show improved interaction for many of the problems faced by today’s control room operators.
Kristoffer Husoy
ABB Strategic R&D for Oil & Gas
Oslo, Norway
Torgeir Enkerud
ABB Strategic R&D for Oil & Gas
Oslo, Norway
Capital productivity
Interaction with objects can take place in the same manner as in the traditional operator interface. The context menu gives access to all aspects of the component
The 3D model provides an overview of the location of objects, personnel and other spatial considerations
Spatial awareness

Mapping the weakest linkNew tools for visualizing the state of the power system Mats Larsson, Reynaldo Nuqui, Linda-Maria Johansson, Stefan Bengtzing
Recent major blackouts have exposed the vulnerability of power transmission networks. Often such blackouts are caused or aggravated by the overloading of equipment. The resulting tripping shifts the overload to other lines. A rolling blackout can ensue with its negative consequences on the productivity of companies and the safety and comfort of people.
In most cases, the scope of the damage can be limited by operators taking the right decisions at the right time. This in turn requires information to be available in an easily accessible form.
ABB is bringing innovations to the control room. Graphical displays show the load on all lines and help identify the weakest links. Network topology is also matched with geographical and environmental data – operators can identify lines that are at risk of failing due to the weather or vegetation.
44 ABB Review 1/2007
Capital productivity

45ABB Review 1/2007
In most parts of the world, the demand for energy is increasing.
However, the expansion rate of power networks is slowing, mostly due to environmental but also due to eco-nomical concerns. As a result, power grids all over the globe are more heavily loaded and are working hard-er than ever before. This means that margins with respect to equipment failure are shrinking.
Large power outages are usually the result of multiple component failures occurring within a timeframe of min-utes, if not within seconds. Monitoring and control systems installed at utili-ties gather information from sensors within their own grid. They then eval-uate this information to determine whether their network is operating in a state that ensures secure operation and delivers the power to meet demand conditions.
Most power system applications in use today report problems only on an individual component basis, such as line overloads, under/over voltage at specific points. Simultaneously, when things go wrong, power utilities are often dependent on operators taking the correct action to prevent an every-day event turning into a wide-spread blackout. Such an event can start with the outage of a single component, for example, a line or a transformer, and develop into a cascading series of failures, resulting in a severe outage.
A typical transmission grid may have thousands of lines and substations; a vast quantity of measurement data is collected during operation. Since it is impossible for an unassisted operator to grasp the information content of all this data in a timely manner, security assessment and visualization tools that distil the data into useful information are becoming increasingly important.
Large power outages are usually the result of multiple component failures occurring within a timeframe of minutes, if not within seconds.
These needs are underlined by the excerpts from the August 2003 North American Blackout Report [1] present-ed in the Factbox .
One part of the solution that is pre-sented in this article, lies in achieving better situational awareness for power system operators. This can be achieved through tools that process power system measurements using advanced stability assessment and visualization techniques.
Visualization of static power system dataABB has a range of network manage-ment software based around SCADA
(Supervisory Control and Data Acqui-sition) and state-estimation packages. These provide a detailed and accurate picture of the network with a time-resolution of seconds to minutes. This is sufficient for the analysis of all static aspects of power system operation such as reactive power balance and margins, component or transfer path loadability limits and voltage profiles.
1 Visualizing voltage magnitudes through color contours – the red colored section in the center of the system identifies areas with an abnormally low voltage
2 Visualization of line loading through a contour display – the color corresponds to the loading of each line relative
to its capacity
Factbox Excerpts from the August 2003 North American Blackout Report [1]
Observation – “A principal cause of the
August 14 blackout was a lack of
situational awareness, which was in turn
the result of inadequate reliability tools
and backup capabilities.”
Needed Action – “Improved visibility of
the status of the grid beyond an
operator’s own area of control would aid
the operator in making adjustments in its
operations to mitigate potential problems”
Observation – “This resulted in an
inability to detect, assess, respond to,
and recover from IT system-related cyber
failures (failed hardware/software,
malicious code, faulty configurations,
etc.).”
Needed Action – “IT and EMS support
personnel implement technical controls to
detect, respond to, and recover from
system and network problems.”
Capital productivity
Mapping the weakest link

46 ABB Review 1/2007
Experience has shown that humans can absorb and analyze visual infor-mation much more quickly they can absorb numerical information [2]. Con-tour mapping of voltage, load or gen-eration profiles can be used to visual-ize the system-wide operating condi-tions and help operators pinpoint trouble spots in the grid with just a glance at the screen. One example is depicted in 1 , where voltage magni-tudes are shown by color contouring. The red sections in the center of the system identify areas with an abnor-mally low voltage. Following a quick localization, more detailed numerical displays can be opened to further in-vestigate the source and possible solu-tion to an abnormal network situation. In a contour plot, the color indicates the severity of the threat and the loca-tions in the contour maps correspond
to the geographic location of the problem area. Compared to a conven-tional alarm or warning log which typically shows only the location as a text string, it is much easier for an operator to find a solution to the problem. More importantly, when there are deviations from the normal voltage profile in several locations at the same time, the color display can be used to rank the severity of the dif-ferent threats to power system securi-ty and quickly select the best area to focus corrective actions on first.
Once a trouble spot has been located on the contour map, an operator can take preventive action to ensure an abnormal situation does not progress into a system-wide outage. In the example of 1 , the operator can dis-connect load or insert additional
capacitor banks or FACTS (Flexible AC Transmission System) devices to regu-late reactive power and improve the voltage profile.
Contour mapping can also be effec-tively used to pinpoint overloaded components in the network. If such overloads are allowed to persist, most equipment must be fitted with local protection devices that will disconnect it with a time delay of tens of min-utes. Thus, given the right informa-tion, operators can observe overloads in time and take corrective actions such as disconnecting load or recon-figuring the network before lines are automatically disconnected by over-load protection, thereby preventing cascading failures and blackouts. 2 shows an example display where the color contour corresponds to the load-ing of each line relative to its capaci-ty. The red colored section can be used to quickly pinpoint lines that are overloaded.
Visualization of power system dynamicsNew phasor measurement and wide-area monitoring system (WAMS) tech-nology is able to provide data at a rate of 10-20 values per second. This ensures a response of the measuring system that is fast enough for the monitoring, not only of slow phenom-ena such as voltage and load evolu-tion dynamics, but also of faster phe-nomena such as oscillatory, transient and frequency dynamics that are im-
3 Real-time visualization of frequency dynamics in 3-D with the generator speeds and results of oscillatory stability monitoring illustrated by bars animated in real-time.
4 Real-time visualization of electrical network overlaid with GIS shaded relief map and road network map layers
Capital productivity
Mapping the weakest link

47ABB Review 1/2007
portant for the stability of the power system. However, because of the high time-resolution of the measurements, a WAMS will deliver huge amounts of data that needs to be properly pro-cessed for specific applications before being presented to the operator.
The phasor measurement data can also be analyzed automatically in a number of ways. Voltage stability monitoring uses measurements from both ends of a line or corridor that is known to be critical as far as voltage stability is concerned. It creates an equivalent model of the corridor and assesses the voltage stability of the system as often as 10–20 times per second. The output is visualized using the power-voltage characteristic shown in the bottom right portion of 1 , with the current operating point illustrated by the red asterisk and the maximum loadability illustrated by the rightmost point of the blue curve (bottom right). The meter display marked “Loadability” also shows that the current loading is 92 percent of the theoretical maximum.
The monitoring of oscillation damping uses on-line estimation of an equiva-lent dynamic system model based on phasor measurement data. The model can be used to assess the stability of so-called inter-area oscillations that are becoming more and more com-mon as networks are interconnected to span large areas. The damping is illustrated by the meter in the top right of 2 . 3 shows a situation in which there is 1.8 percent damping of the dominant oscillatory mode. A negative damping would imply that the oscillation is unstable and could lead to a power system collapse. Typically, at least 6-7 percent damp-ing is desired. When such a low damping as that shown here is detect-ed, the operator must be alerted so that corrective actions can be taken.
Furthermore, 3 shows a 3-D visualiza-tion of frequency dynamics. The bars shown below the schematic in cool color tones (from violet to green) rep-resent busses or generators where the estimated or measured frequency is below the weighted system average. The bars rendered above the schemat-ic in warm color tones (from green to
red) represent areas where the fre-quency is observed to be above the weighted system average. The figure clearly shows that the two generators at one end of the system oscillate as one group against the group of three generators at the other end. In this case the oscillation is close to being unstable – this is illustrated by the low damping shown on the damping meter at the top right.
Contour mapping can be effectively used to pinpoint overloaded components in the network.
The role of GISGIS (Geographic Information Systems) enhance visualization of power sys-tems by associating spatial data with transmission assets. They support a wide range of visualization options such as contouring and animation, making them attractive platforms for displaying geographically referenced real time power system data such as the voltage and line loading contours discussed above. GIS information is
stored in geographical map layers making it easy to relate transmission network conditions with other rele-vant information such as weather, vegetation growth, and road net-works. Real-time weather data inte-grated in GIS increases the operator’s situational awareness. For example, with the help of such a system, the identification of a weather front mov-ing towards a given area enables op-erators to quickly pinpoint transmis-sion facilities with increased risks of outage. In conjunction with SCADA/EMS1) data, the operator can then initi-ate dispatching orders to protect the system against potential cascading failures. GIS vegetation maps can be combined with real time line loading information to identify lines with in-creased risk of flashovers and faults due to sagging. Such lines can then be considered candidates in the EMS con-tingency analysis. Conversely, if the GIS vegetation map shows negligible growth, operators can push more power through a corridor with line-sag constraints.
GIS data can also enhance operator actions after disturbance conditions. Results from transmission line fault location devices can be translated into
5 The ABB Network Manager function, Dynamic Contour Coloring, monitoring deviations from nominal voltage levels – red areas signal high
and blue areas low voltages
Capital productivity
Mapping the weakest link

48 ABB Review 1/2007
geographical coordinates to identify affected tower spans; this together with GIS data on terrain, vegetation, road networks, and weather condi-tions enables operators to quickly estimate the time required for repairs. The time to repair plays a critical role in deciding whether an operator should issue costly unit start-up/shut-down orders. In major storm events, GIS maps displaying the relative geo-graphical locations of line and tree maintenance crews assist operators in deciding which parts of the power system can be quickly restored to minimize customer outage time.
GIS data can be made available to operators via cross application naviga-tion with SCADA/EMS systems.
4 shows a GIS interface displaying an electrical single line diagram with geographical-based maps and road networks. Assuming that a GIS object representing a substation has changed color and starts flashing, indicating an alarm; the operator can then right-click on the GIS object to bring up a context menu allowing him to navi-gate into the ABB NM WS500 interface for that substation. In the WS500 in-terface, the operator finds that the alarm indicates a breaker fault and acknowledges it and then sends out a maintenance order. The operator then right-clicks on the breaker, navigates back to the GIS interface and quickly
views the road network around the substation. The operator can then or-der a re-dispatching of generation and transmission facilities based on the new operating conditions resulting from the outage.
The geographical information from the GIS data can also be combined with the contour mapping of the electrical state as illustrated in 5 (showing a screenshot from the ABB Network Manager). Here a relief map imported from a GIS is shown togeth-er with a network diagram. The volt-age profile is shown as a contour map.
Geographic information systems enhance visualization of power systems by associating spatial data with trans-mission assets.
From the research labs into the ABB SCADA systemsVisualization of power system dynam-ics is still an important research area in which new visualization techniques will emerge in order to further im-prove situation awareness in power system operation. But techniques are now also finding ways out of the research labs into the ABB SCADA
systems used for geographically dis-tributed processes.
The ABB Network Manager system now supports a function using the dynamic contour coloring technique. This is shown in 5 – the WS500 oper-ator station shows a zoomable world map with a geographic process over-view. The dynamic contour coloring layer is semitransparent and may, as in this figure, be superimposed on a GIS map layer retrieved from a web-based GIS map server. Real-time infor-mation is overlaid over the GIS map and the dynamic contour colored image. Aspect object navigation can be used to navigate to asset and main-tenance management systems, for example.
Mats Larsson
ABB Switzerland Ltd, Corporate Research
Dättwil, Switzerland
Reynaldo Nuqui
ABB Inc, Corporate Research
Raleigh, USA
Linda-Maria Johansson
Stefan Bengtzing
ABB Power Technologies Network Management
Västerås, Sweden
Footnote1) SCADA: Supervisory Control And Data Acquisition
(a large-scale, distributed measurement and control
system) EMS: Energy Management System (a
system of computer-aided tools used to monitor,
control, and optimize system performance)
References
[1] US-Canada Power System Outage Task Force
„Interim Report: Causes of the August 14th
Blackout in the United States and Canada“
November 2003.
[2] Human Factors Aspects Of Power System Voltage
Visualizations, Wiegmann, D. A., A. M. Rich,
T. J. Overbye, and Y. Sun. Proceedings of the
35th Hawaii International Conference on System
Sciences. September 2002.
[3] M. Zima, M. Larsson, P. Korba, C. Rehtanz and
G. Andersson, “Design Aspects for Wide-Area
Monitoring and Control Systems,” Proceedings of
the IEEE, pp. 980–996, vol. 93, no. 5, May 2005.
Capital productivity
Mapping the weakest link
A model of the ABB Network Manager control room

ABB offers one of the world’s largest portfolios of AC drives, serving an expanding horizon of applications. With increasing demands for flexibility, reliability and ease of use, ABB has come up with a number of solutions to make life simpler and cheaper for its customers.
Traditionally, the primary use of drives has been in such applica-
tions as powering pumps, fans and conveyors. And while they will con-tinue to be used in these applications, today’s end-users have a very differ-ent approach to that of a decade ago.
Drives are now fully developed and are therefore more widely accepted as a product. The need to answer the question, “what does it do?” has been replaced by the expectation that the drive will “just do it”. This shift in attitude brings with it the assumption that the drives are simple to buy,
simple to install, simple to start-up, simple to commission and simple to own and run.
At the same time, drives are finding new applications: in exercise ma-chines, pizza ovens, honey centrifuges and car washes. In these applications,
49ABB Review 1/2007
Ease of use
By combining functions and cutting part counts, ABB has reduced the size of its drives while enhancing their reliability. The company has also developed a simplified set-up procedure using a harmonized keypad and software wizards that can be used across the ABB drive family.
More complex programming can be carried out using ABB’s Adaptive Programming utility and parameters can be transferred between drives using ABB’s patented FlashDrop technology.
All these advances are part of an on-going effort at ABB to offer cutting
edge technology in high performance, yet user-friendly systems.
The drive for simplicity Progress in AC drives technology make life easier for operatorsIlpo Ruohonen, Mika Pääkkönen, Mikko S. Koskinen

50 ABB Review 1/2007
Driving down costAn additional benefit of reducing the component count in a drive is that it cuts costs. ABB predicts that, over the next few years, the parts count of its drives will be reduced by approxi-mately 20 percent through the use of integrated electronics to eliminate separate components such as external flash and RAM memories and analog/digital converters. Mechanical parts are also being integrated, for example, by combining frames and enclosures, allowing them to perform multiple functions.
There has been a ten-fold decrease in the size of drives over the past 10 years.
Reducing part count also enhances reliability: fewer parts mean fewer interfaces and fewer mechanical fix-ings, which are often a source of failures.
Improved coolingAdvances in the development of pow-er semiconductors have also helped to improve drives. A reduction in the power losses per unit area of silicon used means that the same silicon area is able to handle more power. This has enabled smaller semiconductors and reduced the need for cooling within the drive. This, in turn, allows the use of smaller heat sinks and re-duced air volumes inside the drive –
the result is smaller and smaller drives. The only limitations are the terminals because these must accom-modate cables that are large enough to carry sufficient current to the drive.
But it is not just the development of power semiconductors that has en-abled miniaturisation of drives. Of prime importance is the technology used for cooling. Considerable R&D effort is being put into developing new cooling techniques, as well as into reducing the need for cooling.
While air cooling is likely to remain the dominant technique, liquid cool-ing is finding increasing use in areas such as wind power, transportation and marine applications, as reflected by the recently launched, liquid-cooled ABB industrial drive.
Increased functionalityThese ever-shrinking drives contain ever-expanding functionality – thanks to developments in software. Today’s software monitors, diagnoses, config-ures and archives information and parameters concerning drives in industrial plants.
Set-ups are performed entirely using software functions, and then down-loaded to the appropriate drives. The set-up information is archived for future retrieval. To obtain the full benefit of this technology, however, operators must still refer to the user manual. ABB is striving to develop intelligent control panels that will
1 The ABB standard drive keypad allow all functions and parameters to be set up with only eight soft keys
2 FlashDrop, a patented new technology that streamlines the drive configuration
process.
the drive is very definitely considered a commodity, and the original equip-ment manufacturers (OEMs), who may not traditionally have used drives, are once again demanding pure simplicity. In fact, a recent sur-vey [1] showed that simple controls and set-ups (70 percent) and conve-nient operator interfaces (53 percent) were rated as “very important” by AC drives users.
The quest for miniaturizationSimplicity and ease of use manifest themselves in many ways. The mere fact that drives can now be used in domestic washing machines is a testi-mony to their extreme compactness. Drives have become smaller, more capable, easier to use and cheaper, by orders of magnitude.
Smaller drives are easier to install. Panel builders are able to fit more drives into a standard cubicle, so the whole panel can be smaller. This al-lows the use of smaller and less costly control rooms. It also becomes easier for OEMs to fit drives into their equip-ment. A classic example of this is in cranes, an application that has always had very limited space for the drive.
The reductions in drive size have resulted from the use of fewer compo-nents, greater packing density, im-provements in semiconductor technol-ogy and improved cooling techniques. In fact, there has been a ten-fold de-crease in the size of drives over the past 10 years.
Ease of use
The drive for simplicity

51ABB Review 1/2007
significantly decrease the need for paper-based manuals. The secret, though, is to find an easy way of accessing this kind of functionality. Enter the keypad 1 .
The ideal keypadABB’s R&D team scrutinized every aspect of how a user interfaces with a drive and developed what it believes is the most user-friendly keypad ever. The keypad for the ABB standard drive features only eight soft keys, through which all parameters, func-tionality and set-ups can be accessed.
Even the actual buttons on the keypad were carefully selected to ensure that just the right level of built-in resis-tance gives the user the feeling of stability and accurate key-press detec-tion.
To develop the keypad, ABB com-piled 11 guiding usability principles that consider all aspects of visibility and readability; the type of text and terminology, and the icons used. Based on this, ABB is now harmoniz-ing the keypads of all of its drives. A common look and feel allows the users to switch between different ABB products easily, without having to go through a time-consuming learning process for each new product.
The true value of the keypadThe advantages are not all aesthetic. There is a real financial incentive for customers to choose this keypad and its intuitive commands. Most equip-
ment investment decisions now carry a proviso for fast installation to ensure that production will start rapidly and smoothly. Paramount is the speed with which a machine can be up and running after the installation of new equipment or after a maintenance shut down. If a machine breaks down, it can cost the operator $ 20,000 per hour, so easy set-up and commission-ing are a priority. Such urgency in-creases the risk of errors in installa-tion and commissioning. These can be overcome by eliminating manual intervention wherever possible; the keypad is central to this aim.
These guiding principles, and the fact that there are only eight keys on the keypad, suggested the need for intui-tive assistance. ABB developed a series of “wizards” aimed at guiding the user through various procedures. There are “maintenance assistants”, “diagnostic assistants” and, one of the most widely used, a “start-up assis-tant”.
The magic of wizardsWith the start-up assistant, ABB pro-vides a tool that guides the user through both start-up and commis-sioning by asking questions in plain text language. There are no complex parameter numbers or codes. The product’s intelligence helps the user through the commissioning process.
For an OEM, who might buy 4,000 AC drives per annum, the time saved by using an easy start-up system such
as ABB’s wizard can be significant. It can cut 15 minutes from the commis-sioning time of each drive, equating to a time saving of 1,000 hours per annum. For an engineer working 2,000 hours per annum, this is half a man-year.
A common look and feel allows the users to switch between different ABB products easily, without having to go through a time-consuming learning process for each new product.
Specialist HMIAnother tool that makes life easier for the OEM is a hand-held human-ma-chine interface (HMI) that allows drive parameters to be installed in seconds. Called FlashDrop and available with selected ABB drives, the device can be used to select and set parameters, and to copy configurations between drives, without even powering up the drive 2 .
FlashDrop is a patented new technol-ogy from ABB that streamlines the drive configuration process, allowing users to download a set of parameters in just two seconds. No specialized knowledge is required to use Flash-Drop and the user interface will be familiar to users of ABB drives.
3 ABB’s Adaptive Programming utility: configuring operations from a predefined set of functionsa b
Ease of use
The drive for simplicity

52 ABB Review 1/2007
While the HMI is clearly important, ABB has also been looking at ways to simplify customer applications using the functionality packed into a drive. One of the drivers is the customer’s interest in total cost of ownership, which includes commissioning, swap-outs and maintenance.
Application-specific solutionsAC drive users can now reduce costs even more by employing application-specific drive solutions. These drives incorporate incremental functionality that supports specific applications such as fan and pump control, mixers, or crane controls. They can reduce the total cost of ownership through shorter start-up times, lower integra-tion costs, and improved machine productivity.
Time savings during commissioning can range from one to several hours The process does not re-quire expert programmers and therefore saves the considerable expense of sending commissioning engineers around the globe to fine tune individ-ual drives.
Take, for example, ABB’s new pump control software module, Intelligent Pump Control (IPC), which eliminates the need for an external PLC (pro-grammable logic controller) and can help to save energy, reduce downtime and prevent pump jamming and pipe-line blocking.
The IPC is a software add-on for ABB industrial drives. It contains all the common functions needed by water and waste utilities, industrial plants and other pump users through six pump control functions.
The software also incorporates ABB’s adaptive programming utility 3 , en-abling users to customize drives for specific applications. This utility con-sists of a set of simple to use blocks that can be programmed to perform
any operation from a predefined set of functions. All common mathemati-cal and logical functions as well as switches, comparators, filters and timers are available. These days, users can have the power of a small PLC inside their drive in the form of ABB’s Adaptive Programming.
A further breakthrough is that pro-gramming can be carried out using the standard control panel. No special hardware or software programming tools are needed. As a result, the pro-gramming takes only a few minutes and can be carried out on-site, during commissioning.
Technology that stands the test of timeEven well established technology does not stand still. It is now 11 years since ABB launched its revolutionary motor control platform, Direct Torque Con-trol (DTC). Now the algorthims have been tweaked in order to move stan-dard AC drive technology into the servo arena. The result is the launch of the ABB machinery drive.
The drive uses standard AC drive technology, but, by tuning DTC to include a motor model designed for servo motors, and by using very fast torque control loops within DTC – along with some other clever design work – the drive can now reach servo drive performance levels. It can con-trol synchronous or asynchronous motors, either open- or closed loop. With the new drive, depending on the application, machinery builders need specify only one drive for a variety of motor types along with an appropriate feedback device.
Three modulesDespite their significance, the advanc-es described so far are only half the story. The ABB machinery drive fea-tures another significant major break-through aimed at meeting head-on the challenges faced by OEMs. This is the use of three plug-in modules that house the heart and brains of the drive. On the hardware side, there is a power module and a control interface module, while the software module provides easy programming of the relay logic or PLC routines that an OEM may require for its own applica-
tions. It is the way in which these modules are used that will reduce commissioning times, eliminate the need for external maintenance engi-neers and minimize unpredicted pro-duction line stoppages.
By providing separate units, both the power module and control interface can be shipped to site and installed ahead of the software memory unit. When the installation is complete, the memory unit, which can be pro-grammed on the OEM’s own premises with specific application code, can be delivered and simply plugged into the control interface on site.
The modular approach also allows the number of product components and variants to be reduced.
Since there is no need for on-site pro-gramming or the connection of any communication cables to PCs, time savings during commissioning can range from one to several hours. The process does not require expert pro-grammers and therefore saves the considerable expense of sending com-missioning engineers around the globe to fine tune individual drives.
The futureAC drives are set to be smaller, more intelligent, easier to install and con-trol, have better communications, and be suitable for many more applica-tions – particularly at the low power end of the range – all at a constantly reducing price. What better future could drive users ask for?
Ilpo Ruohonen
Mika Pääkkönen
Mikko S Koskinen
ABB Oy Drives,
Helsinki, Finland
Reference
[1] Bartos, F., 2004, “AC variable speed drives trend
to efficient, modular designs” Control Engineering
(Europe), 2/1/2004
Ease of use
The drive for simplicity

Ambient intelligenceWired environments keeping the human firmly in the loopNils Leffler
Homes and offices epitomize the inte-gration of the human in the loop. Technology is being used more and more to provide for comfort, entertainment and security needs, and to enhance productivity. During office hours, workers rely on modern computer technology to provide a whole range of services, from e-mail to electronic reservation systems for rooms and equipment. Such services must function efficiently in an integrated network, allowing users in different locations to communicate with one another and access centralized resources. At home, the simple act of recording a favorite television program should not involve hours of pouring over complicated user manuals. Design requirements for intelligent devices are dominated by ease of use, but they also include reliability, energy efficiency and affordability. New technologies are being wired into homes and offices to provide ambient intelligence, with the human clearly in the center.
53ABB Review 1/2007
Ease of use

54 ABB Review 1/2007
Ambient intelligence refers to an emerging technology that “will
increasingly make our everyday envi-ronment sensitive and responsive to our presence” according to a recently published book [1], it will transform homes and offices into “intelligent” environments. “This vision requires technology invisibly embedded in our everyday surroundings, present when-ever we need it that will lead to the seamless integration of lighting, sounds, vision, domestic appliances, and personal healthcare products to
enhance our living experience”. Lights will be switched on and off, and blinds will be moved up in response to a range of stimuli, including human activity. Such automation will provide enhanced comfort and productivity, and will reduce energy consumption. It will also provide better communica-tion and security.
Ambient intelligence refers to an emerging technology that “will increasingly make our everyday environment sensitive and responsive to our presence”.
In keeping with the modern trend for user-friendly intelligent technology, ABB’s company, Busch-Jaeger Elektro GmbH, has launched easily program-mable touch sensitive display units 1 combined with a range of motion sen-sitive switches 2 and alarm units un-der the brand of “Smart&Lean”. These products can be incorporated into net-works to control everything from mu-sic and lighting to blinds and security alarms. The units monitor human ac-tivity using infrared motion detectors, and each has a number of operating modes to satisfy the specific needs of its allocated area. These adjustable modes range from fully automated to fully manual. Heating and cooling functions can be integrated into the system alongside lighting controls, with individual thermostat settings being specified via the central display unit. Key to the success of these de-vices is their ease of use, combined with elegant design 3 and longevity.
Lighting settings need to be controlled for a number of reasons. Aside from creating the right ambience at a din-ner party, building managers may want to reduce electricity consump-tion by installing timed off-switches in corridors and other communal areas. Or they may want to reduce the risk of accidents by providing motion-sen-sitive on-switches in dark stairwells. Whatever the reasons, programming the appropriate settings must be quick and easy, and more than one setting must be available. A reading room and a living room have very different
lighting requirements. But what if the reader wants to read in the living room? The change from one condition to the next should be achieved by the touch of a single button.
The integration of a music system under similar control would further enhance the desired ambience in a room. The incorporation of a service record, listing of maintenance sched-ules and equipment renewal dates, would enhance the efficiency and safety of many buildings.
Safety and securityFor most people, home is a sanctuary in which peace of mind resides. Un-fortunately, this is not universally true and demand for better home security systems is increasing. The integration of additional functions alongside am-bience settings in an intelligent envi-ronment can provide considerable benefits to the home owner. Such fea-tures are now easing their way onto the market. Functions include “door unlocked” and “window left open” warnings and alarms for security motion detectors 4 , along with the more standard alarms and audio fea-tures. A more advanced feature allows lighting and blind settings to be re-corded in a home over a week of nor-mal occupancy. This sequence can then be replayed during periods when the home is unoccupied. The “simu-lated presence” provided by this func-tion gives the absent occupier a feel-ing of comfort, knowing that the house appears to be in use. The application of video surveillance equipment takes security monitoring to a higher level, even allowing remote surveillance of properties.
Energy efficiency in the futureAs demand for electricity continues to grow, periods of peak load are be-coming more difficult to handle. To avoid black outs caused by excessive demand on limited supplies, electrici-ty generators offer cheaper tariffs to encourage off-peak use. By incorpo-rating this information into the inte-grated control systems of homes and offices, significant savings can be made. On a larger scale, control sys-tems of the future will allow functions to be prioritized so that non-essential services can be reduced or suspended
1 Display unit – house overview
2 Movement sensitive switch
3 Display unit – profile
Ease of use
Ambient intelligence

55ABB Review 1/2007
when the risk of network overload is imminent. To implement these fea-tures, each individual appliance must be accessible remotely and low-priori-ty appliances must be distinguishable from more essential equipment such as alarm systems, computers and freezers. This will allow electricity providers to define schedules for each level of equipment, and to shed loads accordingly. The same information bus used for the integration men-tioned above would provide the back-bone necessary for such energy effi-cient use of equipment. Technology from Busch-JaegerThe Busch-Jaeger system is centered on a fully graphical, LCD panel 1 . The touch-sensitive panel is used to display and operate up to 210 switch-ing and control functions via over-views and drill-down screens. The screens define individual rooms or
areas 5 and can be configured to meet the needs of individual end users.
The information bus, on which the system is based, is the ABB i-bus EIB. For programming and commissioning purposes, a multimedia/SD (secure digital) card is the preferred medium, but modifications can also be handled via the EIB bus and a simple comput-er-EIB interface (RS 232 or UBS).
The infrared motion detector in each Busch-Jaeger comfort switch has a range of 170 °C, so little escapes its attention. The switches use two-wire technology combined with an external input to provide convenient integra-tion into any cross-connection. The system is inherently safe and can be installed with minimal disruption to existing services.
The “simulated presence” provided by this function gives the absent occupier a feeling of comfort, knowing that the house appears to be in use.
ConclusionThe intelligent building is gradually becoming a reality, but its success depends on the development of sys-tems that are easy to use. ABB Busch-Jaeger has taken on this challenge and
launched a range of Lean&Smart de-vices that can be networked to control lighting, blinds, screens, room heating and cooling, alarms and intercoms. Embedded sensors measure tempera-ture, light levels, wind speed and human activity, giving rise to audible/visible alarms or mechanical respons-es. The network is based on the ABB’s i-bus EIB that allows the integration of environmental control, entertain-ment and security systems, and more. It is configured via a user-friendly, ergonomically designed touch panel through a series of easy to read screens.
Busch-Jaeger Elektro GmbH, has launched easily programmable touch sensitive display units combined with a range of motion sensitive switches and alarm units under the brand of “Smart&Lean”. The system operates under the guid-ing principle that technology should serve the user – not the other way around. This guarantees that ambient intelligence will enter homes and offices unobtrusively, relieving the human occupants of tedious respon-sibilities, while keeping them firmly in charge of the loop.
Nils Leffler
ABB Review
Dättwil, Switzerland
Reference
[1] E. Aarts, J. Ecarnacao, True Visions,
Springer-Verlag Berlin Heidelberg 2006
5 Display unit – house panel, drilled down to a single room
4 Alarm unit
Ease of use
Ambient intelligence

Room for improvement Identifying limiting factors in process industriesAndreas Kroll, Frank Simon, Gordon Cheever, Tomi Pilbacka, David Stanier
Processing plant operators are under constant pressure to increase profitability. An important first step to securing competitiveness is to understand how an individual plant compares with that run by the most efficient operating authorities. Despite the variation between different plants, this can be done using industrially accepted performance indicators.
ABB Review 1/2007
Ease of use
56

57ABB Review 1/2007
When plant improvement projects are initiated, an important chal-
lenge is to identify opportunities like-ly to yield the highest improvement impact. A possible selection criterion is to choose an area based on the assessor’s personal experience, and carry out an initial survey. Typically this would be followed by a focused techno-economic analysis to estimate the improvement potential. Often, a performance baseline is established in order to measure the effect of the improvement projects.
The principle of this top-down procedure is to search for improvements across disciplines, func-tions and components.
This article presents an alternative ap-proach that broadly screens automa-tion systems and working practices in the process industry for improvement potential1). The screening is function-ally limited to the assessment of: on-line process automation and information systems
instrumentation and analytical devices, motors and drives
motors and drives which will be referred to as „I&C“ in the following
The newly developed, computer sup-ported, systematic procedure enables
the assessor to screen a plant in just a few days. Firstly, a complete technical evaluation of installed systems and equipment as well as working proce-dures is made. Secondly, the econom-ic improvement potential of increased throughput and cost savings is esti-mated by comparison with the perfor-mance of world-class plants.
The principle of this top-down proce-dure is to search for improvements across disciplines, functions and com-ponents. Typical questions include: “Do reduced maintenance costs have a higher impact than the implementa-tion of advanced process control (APC), or would better support of operating-point and product changes have a higher economic impact?”
An interdisciplinary team has devel-oped a process for rapidly screening I&C systems and components and related working procedures by com-bining assessment and benchmarking methods. The new method, which requires a site visit of only two to three days, has been tested in pilot applications in the chemical- and pulp and paper industries.
MethodologyAn overview of the individual steps and the required data processing of the developed methodology is provid-ed in 1 .
Assessment and benchmarking Assessment denotes the act of deter-mining whether items, processes, or services meet specified requirements. In this article, the term assessment refers to the evaluation of plant per-formance using predefined measures. An important, though difficult, task is the identification of the maximum achievable performance value, ie, when exactly 100 percent perfor-mance is achieved.
Ahmad and Benson [2] defined bench-marking as a structured process to compare the performance of a plant with the best similar plants world-wide. The underlying objective is to learn from the best in the class. Some assessments even make comparisons between different industries. In this article, benchmarking refers to the comparison of a plant with other plants in order to rank its perfor-mance. This ranking procedure will identify whether a plant performs better than average and whether it falls within the top 25 percent best performers of the chosen comparison set. Comparisons can be conducted on a global or regional basis, cross-industry or within an industrial sector, or they can be based on other criteria.
An important, though difficult, task is the identifi-cation of the maximum achievable performance value, which does not necessarily equal the theoretical 100 percent performance.
Hierarchy of performance and key performance indicatorsProcess automation is broadly scruti-nized during the technical evaluation. This identifies the most significant issues for further detailed analysis in the follow up engineering study.
The spectrum of assessments ranges from instrumentation, through control systems and APC, to production scheduling and maintenance manage-ment systems. The assessment consid-ers the technology, its utilization,
Ease of use
1 Steps in information collecting and processing
Upfront data
collection
Site visit &interviews
Informationentry into
tool
Indicatorcalculation
Indicatorassessment
Key performance
IndicatorCalculation
(as weightted average)
Result outputof as-is
performance
Determination of potentially improveable automation functions (from sensitivity
matrix)
Determination of potentially improveable practices
Result outputon potential
technical and practice improvement opportunities
Result outputof economicalimprovementopportunities
Estimation of economicalimprovement opportunity
Qualitative criteriafullfillment assessment
DatabasePlant performance
Best Practises
Room for improvement

58 ABB Review 1/2007
working procedures, and operational and maintenance costs.
Approximately 100 criteria, some qualitative, others quantitative, have been identified. Quantitative crite-ria are defined as perfor-mance indicators. Some examples are shown in the Factbox . Qualitative criteria are de-fined for different perfor-mance levels and provide a means by which to carry out consistent, reproducible and comparable assess-ments. All these criteria are aggregated into ten key per-formance indicators (KPIs), highlighting subgroups of areas that may require im-provement.
1. Instrumentation and con-trol (I&C) asset condition
2. I&C life cycle (obsoles-cence)
3. Throughput 4. Quality and yield 5. Flexibility / agility 6. Environment, safety and
compliance 7. Maintenance 8. Operational costs 9. Personnel10. Operator support
Assessing the performance indicatorsOnce the performance indicator val-ues have been computed, they must be assessed. Each is evaluated to determine whether the process perfor-mance is already at a good level or whether there is a significant opportu-nity for improvement.
The scale of each performance indica-tor can be different, but a common scale makes the interpretation and correlation of KPIs easier. For this reason, four performance indicator reference levels were defined: World-class performance (Score = 4) Good performance (Score = 3) Intermediate performance (Score = 2) Significant improvement potential (Score = 1)
The critical success factors that make up each of the ten KPIs are computed as a weighted average, so that the proportional relevance of each component is taken into account. This results in a score on a scale of 1 to 4 and a percentage performance rat-ing. An example calculation in tabular form is given in 2 . The first KPI (I&C asset con-dition) has a percentage score of 33, or a score of 2.0.
Combined perfor-mance indicators can be superim-posed on the matrix elements to indicate which automation applications, components and systems are most relevant to improve operations.
Applying a weighted average score to calculate KPIs can, however, mask individual components that are under-performing. To draw attention to such cases, the component
with the lowest score is displayed as the Min Score. For example, the KPI throughput in 2 , has an intermediate perform-ance score of 2.0 with a min score of 1. This suggests that at least one component of the KPI has signifi-cant improvement potential.
Identifying targets for improvementThe technical assessment recognizes the strengths and weaknesses of a plant and identifies areas with poten-tial for improvement. Depending on which automation-related system, ap-plication or practice is changed, the different performance categories are improved to different extents. For example, analyzers tend to affect yield and product quality. The reliability of systems can be improved by condition monitoring, while energy management systems have a particular influence on energy costs.
In order to determine the boundaries between these four levels, an ABB database with more than 300 perfor-mance assessments, together with results from industry councils and publicly accessible literature, were evaluated. The experiences of ABB experts were also taken into account. This expertise comes from a variety of sources, including ABB’s large port-folio of automation products, many grassroots and modernization projects, and full service contracts for many plants.
To simplify processing, a non-linear scale was introduced to score each performance indicator. This har-monizes the different scales used to assess each performance indicator, mapping the result to a common scale (1 to 4) for all performance indi-cators.
Factbox Quantitative criteria are defined as performance indicators. Examples include:
Ease of use
Room for improvement
I&C Asset Condition
I&C Life Cycle (Obsolescence)
Throughput
Quality and Yield
Flexibility / Agility
Environment, Safety and Compliance
Maintenance / Sustainability
Cost of Operation
People / Sustainability
Operator Support
2 The result example shows the 10 KPIs with the achieved score percent and score points, respectively, and the lowest score (in points) of the supporting performance indicators
Assessment AspectScore
percentScorepoints
Min score
(0–100%) (1–4) (1–4)
33% 2.0 1.5
42% 2.3 1.5
32% 2.0 1.0
59% 2.8 1,5
35% 2.0 1.0
40% 2.2 1.0
51% 2.5 1.0
24% 1.7 1.0
63% 2.9 1.8
46% 2.4 1.0

59ABB Review 1/2007
The sensitivity of (automation) drivers and (performance) results can be summarized as a generic sensitivity matrix 3 that can be read in two directions: The key automation areas for improving selected performance measures can be determined in a focused manner.(Effect area → Systems / compo-nents / applications)
Where automation is missing, or working sub-optimally, the most affected areas can be identified and studied in more detail. (Systems / components / applications → Effect areas)
Combined performance indicators can be superimposed on the matrix ele-ments to indicate which automation applications, components and systems are most relevant to improve opera-tions. This highlights a subset of factors that can be studied in more detail. An example is shown in 3 : The red cells contain large numerical values, indicat-ing that the associated automation issue is highly relevant to the linked im-provement issue. The numbers in the cells represent the relevance or the strength of the association and not the performance itself (as in the case of performance indicators).
Economic improvement potentialTechnical improvements are a means to an end: improved safety, sustain-
ability and profitability of plant opera-tions. Two typical economic objec-tives are increased throughput and r educed costs. The potential for im-provement by increasing throughput can be estimated from an OEE (over-all equipment effectiveness) loss anal-ysis. OEE is expressed as a percentage and is defined as:
OEE = availability × production rate × quality rate
This measure is acknowledged as a best practice performance indicator. It compares current production with maximum possible production. The latter is achieved when a plant runs constantly at maximum capacity with
no reduction in product quality. 4 shows an example of an OEE loss graph for a paper machine.
ABB holds databases with assessment results for different industries, including chemical, metal and mineral, and pulp and paper. The data sets can be classi-fied by region, industry, type of opera-tions, etc. This allows a selected plant to be assessed against a suitable sample.
The data provide demonstrated exam-ples of excellent industrial perfor-mance and an indication of how per-formance can vary 6 . This can be used to assess the potential for eco-nomic improvement and to rank a target plant within the sample set.
Ease of use
Room for improvement
Instrumentation &
Control
Motors &
Drives
Product / Application
Improvement Area / Driver
Process Yield /Efficiency
improvement
Throughput /Capacity /
Production rateimprovement
Process Quality
improvement
Energy & utilitycost reduction
Plant agilityimprovement
Instrumentation – sensors & transmitters 1.6 1.8 1.9 2.1 1.6
Instrumentation – control valves and positioners 1.6 1.8 1.9 2.1 1.6
Motors, Drives, Motor Control Center 1.3 1.3 1.3 2.9 1.3
Analyzers of software property estimators / inferential measurements
2.8 1.8 2.8 1.8 2.0
DCS – kernel i.e. Information and control (system type & size suitable for plant)
2.2 2.0 2.2 2.1 2.0
SCADA & RTUs 1.0 1.5 1.3 1.4 1.6
MES integration with DCS 1.2 2.0 1.3 1.4 2.3
LIMS integration with DCS, QCS and PIMS 2.2 2.0 2.2 1.4 2.3
3 Excerpt of the sensitivity matrix of (automation) drivers and (performance) effects for an example assessment: Red cells (circled) indicate areas with improvement potential

60 ABB Review 1/2007
The potential for cost savings (both fixed and variable) is of particular interest when a plant’s operations are limited by the market rather than by production efficiency. The cost factors to consider include energy consump-tion, maintenance, and personnel. Improvement opportunities can be estimated by comparison with world-class benchmarks.
Software support toolsA software tool was developed for process plant assessment. The appli-cation guides data entry and conducts most of the analysis automatically. Computer support for assessing and benchmarking provides easy access to the integrated know-how and experi-ence of many specialists. Furthermore, it ensures that assessments are carried out in a systematic man-ner. This im-proves consistency and reproducibility of results. The probability of making errors during data processing is re-duced, allowing the assessor to focus on the primary tasks.
Without computer support it would also be difficult to conduct a broad assessment of a plant’s performance within such a short time with a staff of only one or two people.
ProcedureFor increased efficiency, the assess-ment procedures were standardized. The process is summarized from a project per-spective below (see 1 for an outline of the methodology):
1. The scope of the assessment is agreed upon with the customer.
2. The plant receives a data collec-tion form upfront.
3. The assessor conducts a short on-site visit, following a preagreed schedule that includes a plant tour and staff interviews.
4. The collected information is analyzed and benchmarking conducted.
5. The analyses result in the perfor-mance assessment and an overview of improvement opportunities.
6. Optionally, technical and economi-cal improvement opportunities can be investigated in a more detailed study.
7. As an option, a follow up project can be initiated to ensure that the specified improvement opportuni-ties become a reality.
Pilot applications Pilot studies using the methodology and the supporting computer software described in this article have been conducted in several industries: a con-tinuously operated chemical plant, a plant for recycling wastepaper and some paper machines.
The plant operators provided the rele-vant production and financial data, and site visits of two to three days followed. In order to get a compre-hensive view of the plant, interviews were carried out with panel operators, automation engineers, maintenance personnel, production planners, con-
trollers, and the plant manager. With the help of the I&C assessment meth-od and software tool, it was possible to assess the plant, rapidly, systemati-cally and structurally, to obtain a full picture of the automation perfor-mance. Different functional areas were integrated in the assessment and a full view of the plant’s performance was gained, showing its strengths and weaknesses.
Computer support for assessing and bench-marking provides easy access to the integrated know-how and experi-ence of many specialists.
Wastepaper recycling plantResults from the I&C assessment of the paper recycling plant are present-ed in 5 . The assessment highlighted short falls related to the lifecycle of the control system and identified that the current control system would have been unable to cope with the planned expansion of capacity. The low cost score is also linked to the age of the control system, since more than 50 percent of maintenance time is spent on reactive maintenance. A preventive maintenance strategy should reduce this time and allow more time to be spent on improving the performance of the control system.
4 Example of an OEE loss graph for a paper machine
Annual Available Operating Time 8784 Hrs
Xmas 240
204,6 hrs
Rebuilds 1745 HrsCommercial Shutdowns
Annual Available Operating Time 8784 Hrs
Planned Shuts113,2 hrsTechnical Downtime
429,3 hrsTotal Papermaking6,34 hrsOthers22,8 hrsClothing
776,2 HrsProcess Downtime
Gross Operating Time 5851,8 Hrs
Production Rate 90,8%
Quality 90,5%
Availability 88,3%
Planning Factor 75,5%531,53 hrsSpeed Loss
Net Operating Time 5314,8 Hrs
502,4 Hrs
47,0 hrsC.O.M.85,0 hrsDeckle
15,8 hrsQ.C.15,9 hrsStart Up227,9 hrsMachine broke
110,8 hrsBond
Valuable Operating Time 4812,3 Hrs Manufacturing OEE= 72,6%
Business OEE= 54,8%
5 Result of the technical assessment of a recycled fibre plant for waste paper
Overall Assessment (Score 0–100 %)
39%
33%
64%
71%53%
42%
33%
45%
42%
Support Life Cycle
Throughput
Quality
Env. & SafetyMaintenance
Cost
People
Asset Condition
Ease of use
Room for improvement

61ABB Review 1/2007
Footnote1) A similar version of this article was published in German in 2006 [1].
References
[1] Kroll, A., and F. Simon. 2006. Assessment and opportunity screening regarding automation systems and working practices in the process industries (in German).
Automatisierungstechnische Praxis, Vol 48, No. 8, 42–49
[2] Ahmad, M., and R. Benson. 1999. Benchmarking in the process industries. Rugby: IChemE. ISBN 0 85295 411 5
Even though production was already at a high level, signif-icant variations in the pro-duction rate were observed, resulting from different oper-ator practices. By using com-mon setpoint management and corresponding operation-al procedures, it should be possible to stabilize the pro-duction rate at its maximum.
Without computer support it would be difficult to conduct a broad assess-ment of a plant’s performance within such a short time with a staff of only one or two people.
Paper manufacturingIn the case of the paper ma-chine, the PAS assessment pro-vided the results shown in 7 . After extensive modernization of the control system, the cus-tomer consistently obtained good results for the KPIs Asset Condition and Support. Low cost performance was high-lighted by the assessment and attributed to suboptimally coordinated support from the plant’s own maintenance and engineering departments, as well as from suppliers and other third parties. A better clarification of respon-sibilities was suggested to help improve efficiency and lower costs.
Chemical processingAfter assessing and benchmarking the continuously operated chemical plant yield, energy efficiency, and capacity were identified as major areas for im-provement. Measures to improve plant
operations were implemented after conducting a detailed engineering study. More precisely, measures to reduce yield losses by 10 percent were identified. No investments were required to realize this potential, just some adjustments to the control sys-tem and operational procedures. Ener-gy savings of up to 15 percent could be made by modifying the plant’s op-eration. The customer remarked that
relevant issues were rapidly identified using this system-atic approach and more ob-jective results were obtained using external assessors.
Summary and outlookThe method and computer-aided tool described in this article can be used for the rapid assessment and bench-marking of automation sys-tems, their performance and related working procedures. Potential for improvement can be identified and its eco-nomic impact estimated. This new method has helped cus-tomers to identify the most relevant issues in several pilot studies.
Andreas Kroll
Measurement & Control
University of Kassel, Germany
(previously with ABB Corporate
Research, Germany)
Frank Simon
ABB Automation GmbH
Mannheim, Germany
Gordon Cheever
ABB Process Automation
Service Business Development
Wickliffe, USA
Tomi Pilbacka
ABB Full Service
Helsinki, Finland
David Stanier
ABB Engineering Service
Billingham, Great Britain
6 OEE distribution of a sample of chemical plants (left; error bars indicate minimum and maximum; lower and top box boundaries indicate first quartile, median, and third quartile) and of a sample of paper machines (right; error bars indicate minimum and maximum; lower and top box boundaries indicate median, top 25 percent, and top 10 percent)
OEE Chemical plants OEE Paper machines
Batch Continuous Newsprint Copypaper
Tissuepaper
Ease of use
20 p
erce
nt /
div
isio
n
N= 224 158 47 31 23
Room for improvement
7 Result of the technical assessment of a paper machine
4,0
3,5
3,0
2,5
2,0
1,5
1,0
0,5
0,0
3,0
2,6
3,0 2,93,1
1,9
2,4
1,6
2,5
2,8
Overall Assessment (Score 1-4)
a I&C Asset Conditionb I&C Life Cycle (Obsolescence)c Throughputd Quality and Yielde Flexibility / Agility
a b c d e f g h i j
f Environment, Safety and Complianceg Maintenance / Sustainabilityh Cost of Operationi People / Sustainabilityj Operator Support

plugging a laptop into a substation communication network, IEDs can be explored, SA configurations based on the SCD file can be inspected and SA network traffic can be thoroughly ana-lyzed. The tools used for these tasks are described in the following para-graphs.
IEC 61850 Substation BrowserThe IEC 61850 substation browser is a testing tool which allows an engineer to browse an SA system online with IEDs attached. The configuration of an IED can be loaded from an SCL file and the browser then connects to the corresponding servers. It can also de-tect IEDs in an SA network, inspect IEDs for their functions in terms of servers, check for the existence of logical devices and logical nodes (as well as their corresponding attributes), all without having an SCD file at hand. The browser displays process data ie, data attributes with functional constraint status information (ST) or measurands (MX) which are continu-ously updated. The user can addition-ally reserve, enable, configure report control blocks, start general interroga-tion (GI) or check for extensions (or in other words non-registered devices responding to ping, SNMP, MMS). A more extensive presentation of plug-and-play applications build around the concept of the IEC 61860 substa-tion browser can be found in [3].
IEC 61850 Network AnalyzerWith the growing dependency on Eth-ernet communication among IEDs and other devices in a substation, there is a distinct need for tools that can ana-lyze the data traffic (ie, basic Ethernet and related TCP/IP traffic) exchange in an SA network. This data is trans-mitted as a sequence of bits and an engineer must be able to understand the context of any piece of extracted data if he is to discover any irregulari-ties or problems. The IEC 61850 Net-work Analyzer 3 is a testing tool that can capture and analyze substation communication network traffic in combination with the information found in an SCL file . By simply plug-ging in a standard laptop to a substa-tion communication network, prob-lems are quickly detected and IEC 61850 protocol implementations are reliably inspected directly off the Eth-
Power semiconductors Part two: Housing technology and future developmentsStefan Linder
Power semiconductors have, over recent decades, become ubiquitous in a broad range of applications. This was a consequence of the continuous and rapid development of power semiconductor technology, resulting in very powerful, effective, and easy to use devices. In the first part of this article, published in the previous edition of ABB Review1), aspects of chip design and optimization were discussed, as were considerations of the application of different classes of devices, notably of IGBTs and IGCTs.
The continuous optimization of silicon has brought performances closer and closer to the physical and technological limits. The result is that, short of radically new breakthroughs, the potential for further improvement in this aspect of the design is diminishing. Semiconductor device housings, however, still have considerable potential for leveraging performance. This article therefore looks further into this aspect.
Today, virtually all commercial power semiconductors are entirely silicon-based. Looking into the future, this article further discusses the potential of so-called “wide-bandgap” materials, such as silicon carbide, gallium nitride, and diamond.
Whereas, until about a decade ago, power semiconductor
housings were not much more than containers for the devices, they are now more and more becoming the limiting element in power electronic systems. The attention of developers is, therefore, increasingly focusing on aspects of housing design to tackle its limitations.
Housing formsTwo conceptually different housing forms have become established in the high-power range: the insulated hous-ing and the pressure-contact module 1 . The main difference between them is that the electrical circuit in the insulat-ed module is galvanically isolated from the heat sink by a ceramic insulator, whereas in the pressure-contact design, the current flows vertically through the entire module, ie, also through the heat sink.
Both housing forms are fundamentally suitable for IGBTs and IGCTs. In prac-tice, however, IGCTs are currently only offered in pressure-contact hous-ings, whereas IGBTs are manufactured in both variants. The insulated hous-ing currently dominates in systems with low output powers (mostly below one MW), as the circuit can be imple-mented with a lower mechanical out-lay (and hence at lower cost). The pressure-contact housing, on the other hand, is preferred for several reasons for output powers greater than ap-proximately 10 MW. The two most im-portant of these are discussed here:
Ease of use
Footnote1) Stefan Linder, Power semiconductors – Part one:
Basics and applications, ABB Review 4/2006,
pp 34–39.
62 ABB Review 1/2007

63ABB Review 1/2007
Ease of use
Potential for improvements in the housing technology
Increased junction temperaturesThe useful output power P
useful of
power semiconductor devices is scaled in accordance with the law:
Tj,max
is the maximum junction temper-ature, T
ambient is the temperature of the
heat sink (the ambient), and Rth is the
thermal resistance between the semi-conductor junction and the ambient.
Increasing the maximum junction temperature would enable the inverter to be operated at a higher switching frequency, resulting in reduced har-monics and so permitting filters to be smaller in size.It is immediately apparent from this formula that the increase in the maxi-mum junction temperature of high-voltage devices (above 1700 V) from 125 °C (today’s standard) to 150 °C, results in an increase in performance of 25 to 30 percent (assuming an am-bient temperature of approximately 20–40 °C). An alternative to using this performance increase for achieving a higher output power, is to “invest” the better cooling capability in larger loss-es at a given power. The latter would enable the inverter to be operated at a higher switching frequency, resulting in reduced harmonics and so permit-ting filters to be smaller in size.
In practice, a series of important preconditions must complied be with, to permit this potential to be fully utilized:
1) Properties of silicon The power semiconductors must still be able to safely turn off the larger rated current at the higher junction temperature.
In voltage inverters, the freewheel-ing diodes must be able to safely withstand the increased surge cur-rent in case of a fault.
IGBT devices must still have an adequate short-circuit withstand time.
The silicon components must exhib-it stable behavior at 150 °C, ie, they may not permit any temperature-induced accelerating current redistribution.
2) Properties of the housing and interconnection technology
The interconnection technology must have an adequate thermo-mechanical fatigue resistance caused by alternating loads.
The materials used must tolerate the temperatures that arise.
The surge capability of freewheeling diodes usually represents a major ob-stacle in optimizing a semiconductor’s application – in fact, it is often the limiting element, already at 125 °C. An increase in output power, however, usually goes along with an increased demand in terms of surge current. This requires larger diodes, which re-duces the remaining space for switch-ing devices (IGBT or IGCT), and gen-erally also results in an increase in turn-on losses. Hence, without inno-vative approaches, the latitude for an increase in performance through an increase in the semiconductor junction temperature appears restricted. The potential is definitely significantly lower than the purely thermal consid-eration of the formula (1) suggests.
The thermomechanical fatigue resis-tance to alternating loads is the prima-ry limiting factor in the interconnec-tion technology. 2 shows the capabili-ty of modern insulated high-power modules in the case of a maximum junction temperature of 125 °C, and the approximate corresponding curve for the same module construction if T
j,max is increased to 150 °C. The figure
also shows the curve that would be required to provide the system with the life expectancy at 150 °C as it has at 125 °C. It can be seen that demands increase markedly at a higher maxi-mum junction temperature, especially at large temperature excursions. This is because significant changes in the load conditions (eg, full load/zero load cycles) cause a higher tempera-ture excursion (by up to additional 25 °C). The demands do not increase
In systems with very high power outputs, semiconductors must be connected in parallel and/or in series. For the latter, pressure-con-tact housings present a considerable advantage, as the modules can be arranged in a stack, only separated by heat-sinks. One example of this is in HVDC (High voltage DC) power transmission installations, in which up to 200 modules are connected in series.
A pressure-contact housing must be used if the application requires a guaranteed uninterruptible current flow (eg, a current-source inverter, but also all systems that must respond to a semiconductor or con-trol fault by discharging the DC link energy by means of turning on all semiconductors). In a pressure-con-tact housing, the metallic pole piec-es fuse if a semiconductor fails, thereby ensuring a low-impedance current path. In the insulated hous-ing, on the other hand, the current flows through bonding wires, which evaporate upon a high current pulse during a fault, hence leaving an open circuit.
Requirements for housing technologyThe challenge in creating a housing design consists of two main factors: Modern power semiconductors are operated at a continuous power dissipation of 100–200 W/cm2 of silicon. This power density is (per surface area) approximately one magnitude greater than a kitchen stove hotplate operated at maximum power. This poses extreme demands on the housing technology and the materials used.
The coefficient of thermal expansion (CTE) of silicon is approximately five to ten times smaller than that of most metals (Cu, Al) suitable for electrical and thermal coupling. This means that critical components in the housing (bonding wire contacts, solder joints) are subject to consid-erable thermomechanical stress dur-ing load changes. This considerably limits their service life.
As a result of these requirements, there is no alternative to using expen-sive and highly sophisticated materi-als.
Power semiconductors
Tj,max
– T
ambient
Rth
Puseful
∝ (1)

64 ABB Review 1/2007
to such a great extent at a small ΔT, since the temperature of the junction is influenced to a lower degree by small fluctuations in power output. For example, if the power output drops from 100 to 90 percent at an ambient temperature of 30 °C, the junction temperature decreases by 9.5 °C at T
j,max = 125 °C and by 12 °C at
Tj,max
= 150 °C.
Considering the fact that the load cycling capability of modern products only barely meets the requirements in many applications (particularly in trac-tion), it can be inferred that an in-crease in the capability of the mod-ules by at least a factor of five is re-quired to increase the junction tem-perature to 150°C. This may only be possible through the development of new technologies. In particular, large-area solder joints will probably have to be replaced by improved connec-tion technologies. Perhaps the most promising candidate is the so-called low-temperature bonding (LTB) tech-nique, which connects two parts by a spongy silver flake-based sinter layer. In addition to increased resilience to load cycling, low-temperature bonds also exhibit lower thermal resistances.
Reduction in thermal resistanceAs an alternative to increasing the maximum junction temperature, an in-crease in the output power can also
be achieved through a decrease in the thermal resistance R
th (see formula 1).
The typical distribution of the Rth in
an assembly with an insulated high-power IGBT module containing a total IGBT surface area of 45 cm2 is approximately as follows:
IGBT junction to the AlSiC (Aluminum Silicon Carbide) base plate 7 K/kWAlSiC base plate to the heat sink (dry contact) 6 K/kWHeat sink to the ambient 10–35 K/kW*
* This value is strongly dependent on the cooling
method (low for liquid cooling, higher for forced air
convection cooling)
What stands out is that the dry contact of the module to the heat sink has ap-proximately the same thermal resis-tance as the module itself, and that 40 to 70 percent of the entire R
th is locat-
ed between the heat sink and the am-bient. Hence, addressing the module-external R
th promises to yield greater
returns than exclusively concentrating on that within the module. The moti-vation to work on the module-exter-nal R
th is further fueled by the large
performance margins of modern de-vices (as explained in ABB Review 4/2006), and by the fact that new ma-terials are beginning to emerge that are capable of reducing the internal thermal resistance of the modules by
30 to 50 percent. Such materials in-clude advanced MMCs (Metal-Matrix Composites) which have both a favor-able CTE adaptation and an extremely high thermal conductivity. Diamond MMCs, whose thermal conductivities of 400-700 W/mK even surpass cop-per, are an example of this. On ac-count of its high CTE difference from silicon, copper is only used in combi-nation with other materials that have an adapted CTE (eg, molybdenum 1i ).
The surge capability of freewheeling diodes usu-ally represents a major obstacle in optimizing a semiconductor’s applica-tion – in fact, it is often the limiting element, already at 125 °C. An increase in output power, however, usually goes along with an increased demand in terms of surge current.
In addition to improvements in the heat sink, the dry (non bonded) con-tact to the module deserves special attention. Its thermal resistance is not only high, but also notoriously sus-ceptible to variations, since a homo-
In insulated housing modules, the semiconductor f is galvanically isolated from the heat sink c . Electrical contacts within the module are provided by bonding wires. In case of a device failure, these wires tend to evaporate and the module ceases to conduct.
In pressure contact modules, the load current enters through one surface k and leaves through the opposing surface. Low electrical and thermal resitances of the contacts are assured through high mechanical pressure on those surfaces. In the event of a failure, the metallic pole pieces j fuse and current can continue to flow through the module.
1 Common housing forms for high-power semiconductors: An insulated module (left) and a pressure-contact module (right, a typical IGCT is shown here).
Ease of use
Power semiconductors
a Power and control connectionsb Bonding wirec Heat sinkd Ceramic (usually AlN)
e Base plate (usually AlSiC)f Semiconductorg Housing
h Heat sinki CTE compensation (Mo)
j Housing (ceramic)k Copper
a a a
f
c
g
ed
li
ij
h
bk
k
l Semiconductor

65ABB Review 1/2007
Ease of use
geneous contact pressure and a good contact of the surfaces are difficult to ensure. The use of thermal greases and silicone oils only slightly allevi-ates the problems, since the thermal conductivity of these substances is at least a factor 100 lower than those of the metals of the base plate of the module and the heat sink. A very promising approach to the solution of this problem lies in the use of special metallic interlayers with high thermal conductivity, whose properties are designed so that they turn very soft or even fluid under operating conditions. Hence, they form a connection be-tween the heat sink and the module that exhibits an R
th similar that of a
bonded joint. As an alternative to this, it is also conceivable that modules with an integrated heat sink will expe-rience a revival, since the dry contact has been completely eliminated in this concept. Such products have not been able to establish themselves on a wider market so far, for reasons of cost and complexity.
New semiconductor generations
Silicon devicesEspecially in the 90s, a large number of novel component ideas were exam-ined, of which the MCT (MOS-Con-trolled Thyristor), the FCTh (Field-Controlled Thyristor) and the EST (Emitter-Switched Thyristor) are the best known. The common objective of these device concepts consisted in combining thyristor-like properties2) with lower driver power. Since all these components had con-ceptual deficiencies and be-cause the plasma distribution in modern IGBTs has already closely approached the thy-ristor ideal, innovation with regard to new types of struc-tures has markedly decreased in the meantime. Today, the probability of the IGBT and the IGCT being replaced by a fundamentally different sili-con component seems remot-er than ever.
“Wide bandgap“ materialsComponents based on so-called “wide bandgap“ semi-conductor materials represent an alternative direction of
development. The advantage of these materials, the most well-known of which are silicon carbide (SiC), gallium nitride (GaN) and diamond (C), con-sists in their distinctly higher break-down field strength in comparison to silicon. This enables significantly lower component thicknesses and higher dopings of the mid-section3) than in silicon, which, for reasons discussed in part one4), leads to considerably lower losses in the semiconductor.
A fundamental problem of SiC components with conductivity modulation is attributable to the fact that SiC pn-junctions only begin to conduct at approx. 2.8 V (in contrast to silicon, which only requires a voltage of approx. 0.7 V).
Only SiC can presently be considered a serious candidate in the high-power range. SiC is so far the only material that enables vertical components, ie, components, in which the current flows vertically through the semicon-ductor body and not along the sur-face. Only such vertical construction permits an adequately large cross-sec-tion to be provided for the required currents, while maintaining an accept-able component size.
Preferred SiC component conceptsSimilarly to silicon, SiC permits the manufacture of both unipolar and conductivity-modulated (“bipolar“) semiconductors. On account of the larger permitted drift zone doping, however, the economic use of unipo-lar SiC components is viable up to significantly higher blocking voltages than with silicon, specifically up to about 2–4 kV. However, bipolar SiC components are clearly in the focus of interest for use in the high-voltage and high-power range.
In the case of unipolar components, Schottky diodes with nominal cur-rents of up to 20 A and voltages up to 1200 V are already commercially available today. They are mainly used in switching power supplies and in solar cell inverters. Further-more, unipolar SiC switches (MOS-FETs and JFETs) have already been successfully manufactured, albeit only on a laboratory scale. A serious problem consists in the fact that SiC MOSFETs and SiC JFETs with attrac-tive electrical characteristics have so far always been naturally conduc-tive („normally-on“). Components with such characteristics have never been accepted by the market, even so the associated challenges appear to be technically solvable.
In addition to diodes, bipolar com-ponents such as IGBTs, bipolar tran-sistors (BJT) and thyristors for volt-ages up to 10 kV have already been successfully manufactured. In the case of the BJT, it should be noted
that although it is a bipolar component, usually no con-ductivity modulation occurs in the conductive state (un-less it is operated at a very low gain). The BJT must, therefore, be classified as a unipolar component on ac-count of its loss characteris-tics.
A fundamental problem of SiC components with con-ductivity modulation is attrib-utable to the fact that SiC pn-junctions only begin to conduct at approx. 2.8 V (in contrast to silicon, which only requires a voltage of approx. 0.7 V). Since all
Power semiconductors
2 Fatigue life expectancy as a function of thermal excursions of modern insulated high-power IGBT modules with AlSiC base plates (eg, ABB HiPak or Infineon IHM)
Required capability for Tj,max = 150°C (estimated)
Present capability at Tj,max = 125°C
Present capability at Tj,max = 150°C (estimated)
No.
of c
ycle
s un
til fa
ilure
Temperature cycle (ΔT) of the junction [°C]
107
106
105
104
40 50 60 70 80 90 100

66 ABB Review 1/2007
conductivity-modulated components have at least one pn-junction in the current path, they have high conduc-tion losses. This makes them unat-tractive below a breakdown voltage of approx. 4–6 kV. In addition, the cur-rent onset voltage (“built-in voltage”) of SiC pn-junctions has a very nega-tive temperature coefficient. This can lead to a risk of inhomogenous cur-rent distribution in large components.
Material quality of SiCSiC still remains a material which is very difficult to produce in a quality comparable to that of silicon. The frequently discussed “micropipes“ are only one of a series of harmful crystal defects, some of which can have a negative effect on the device’s long-term stability, especially in the case of bipolar components. The industrial production of large-area SiC compo-nents is, therefore, not yet possible. Another negative point lies in the fact that the incentive to improve the quality of SiC is rather low. This is because most SiC is not used for the production of power semiconductors, but as a carrier material for the manu-facture of LEDs (light-emitting di-odes). A different type of SiC is used for LEDs (6H instead of 4H), and a much lower material quality is ade-quate for economic production, on account of the minimal size of the LED.
SiC housing technologyIt is undisputed that SiC components will, even in the long term, remain considerably more expensive than silicon components of the same size. The prospect of commercial success in the high-power range is based on
the fact that the components are able to operate at a significantly higher current density than silicon compo-nents due to their lower losses, and on the higher permitted junction temperature (in excess of 400 °C). Unfortunately, there are two serious obstacles standing in the way of this objective: For the reasons mentioned in the subsection “Increased junction tem-peratures”, it is difficult to establish a housing technology which permits significantly higher junction temper-atures than is usual in silicon. It can therefore be assumed that the losses per unit are of large-area SiC devic-es must remain within the same lim-its like those of silicon components, provided that reliability require-ments remain unchanged.
In addition, there is the problem that SiC devices have shorter switching times (ie, higher di/dt) than silicon. Because of this, the permitted stray inductances in hous-ings are lower than for silicon com-ponents. However, the fact that stray inductances are mainly deter-mined by insulation clearances and conductor cross-sections makes it difficult to achieve the required values in housings for high output powers.
Only SiC can presently be considered a serious candidate in the high-power range.
Unfortunately, the combination of SiC material quality problems, high costs, and technological difficulties both in
the components and in the housing technology, reduces the prospects of SiC breakthrough in the high-power range within the foreseeable future.
SummaryIGBTs and IGCTs have established themselves as the two most successful semiconductor switches in the highest power range in recent years. Both concepts are developing in parallel, and it can be observed that the devel-opment objectives are increasingly converging. At the present stage, both components can be considered ma-ture, ie, quantum leaps seem unlikely, and future progress is likely to take the form of evolution rather than rev-olution. However, this does not apply to housing and interconnection tech-nologies, which may permit to exploit the so far unused potential of silicon. The motivation to innovate in this area is high, as the large scale intro-duction of “wide bandgap” materials to the high-power range is still a long way ahead. At present, SiC appears to be the only one of these materials to have a realistic chance.
Stefan Linder
ABB Switzerland Ltd, Semiconductors
Lenzburg, Switzerland
Footnotes2) See also the sub-section “Optimization of forward-
power losses and turn-off losses by adjustment of
the plasma distribution” on page 36 of part one of
this article (ABB Review 4/2006).3) The so-called drift zone – see figure 4 on page 37
of part one of this article.4) See “Design objectives of the IGBT and the IGCT”
on page 35 of part one of this article.
Ease of use
Assembly of a HiPak power semiconductor module
Power semiconductors
Inside a HiPak module (see also page 64, 1 left)

Research activities
When seeking information in a public library, readers can choose between different ways of finding the right shelf. One way involves consulting the library’s classification index. This can, for trickier enquiries, be a time consuming and confusing activity that misses vital information from related categories. When unsure, it is preferable to ask the librarian. The librarian understands a question formulated in plain language and can point to the desired shelf immediately.
Similarly, when accessing plant information from the control room, an operator may have to drill down through several layers of sub-menus to access fragments of information that only make sense when combined with further fragments from elsewhere in the system. This may take a well-trained operator in a frequently recurring situation just a couple of mouse clicks – but is much more challenging for rarer scenarios. If only the computer, like the librarian, could understand natural language! This is exactly what a joint research project of ABB and MIT is out to achieve.
How much training is required to access key process information at
an industrial plant? How can knowl-edge and experience be easily ex-changed between the skilled staff members that need to work with it? Industrial facilities continually face such questions, as more specialized personnel are needed to operate and maintain production lines at ever more competitive output levels. What if the ever increasing information pro-cessing and storage capacity could be better utilized by making its data accessible more easily? MIT and ABB research labs have jointly demonstrat-ed a technology that will enable users of the future to query an automation system in plain English. This tool can handle large amounts of process and plant information, building upon the flexibility of modern ABB automation system software. Challenges ahead lie in automatic annotation of information and extraction of knowledge from query sessions.
BackgroundA system for industrial automation is typically characterized by several thousand I/O signals, controlling sev-eral hundred real-life objects on the plant floor, eg., valves, tanks, motors, reactors and the like. Operators and other users interact with the system by way of a GUI (graphical user inter-face). A display system manages a hierarchy of up to several hundred screens representing the various sec-tions of the process and/or groups of process objects.
Retrieval of process information can nevertheless be painstaking – object information is stored in multiple re-positories following industry standards such as OPC for data access, history, alarms and events, etc. Naming con-ventions for objects and their values or properties vary from plant to plant. Furthermore, it is often necessary to additionally access maintenance and condition-monitoring data in order to make better operational decisions.
Human in the loopThe central problem lies in finding a way to empower the user to come to grips with this over-abundance of in-formation, while keeping him in the
Plainly speaking Natural language interaction in industrial automation Juan S. Jaliff, Magnus Larsson, Morgan Johansson, Boris Katz, Gary Borchardt
67ABB Review 1/2007
Plainly speaking

68 ABB Review 1/2007
Research activities
The project initially focused on four types of requests. These were requests to(1) display all members of a class (eg, „Show all inputs“)(2) display those members of a class that meet a speci-fied condition (eg, „Get all drives that are interlocked“)(3) display all members of a class, accompanied by relat-ed items of another class (eg, „Get position unit for all control valves“)(4) display those members of a class for which a related
item meets a specified condition (eg, „Which digital inputs have unacknowledged alarms?“)
The START system answers natural language questions by presenting components of text and multi-media information drawn from a set of infor-mation resources hosted locally or on the Internet.
MIT’s START system translates English requests into standardized symbolic expressions that can be easily con-verted into database requests. As an example, the English request, “What manual stations have active inter-locks?” is translated by START into the following expression:
3 The motor found to be in manual by the plain-language query is now put into automatic mode through a
faceplate
loop. Is there a mode of com-munication that can facilitate interaction while keeping decisions in human hands? One response offering multi-ple advantages is the user’s natural language. It requires no training and encourages interaction. A system that can remember a user’s question and answer sessions can later recall them in similar situa-tions, building up a personal knowledge base. This can be of great value for trouble-shooting under stress, particu-larly in seldomly recurring scenarios. Moreover, the user can choose to share this knowledge with other oper-ators, shifts and even other plants. In other words, it is useful for building an informal knowledge management system. Such a system is especially powerful when senior expert staff contribute.
Related researchThe advantages of using natural lan-guage for queries are apparent in systems which can search information on the web.
The START system [1] is a good example. It answers natural language questions by presenting components of text and multi-media information drawn from a set of information resources hosted locally or on the Internet. These resources contain structured, semi-structured and un-structured information. START targets
high precision in its question answer-ing. Its ability to respond to questions derives from its use of natural lan-guage annotations as a mechanism by which questions are matched to can-didate’s answers [2]. START’s potential for use in industrial automation was identified in discussions between researchers at MIT’s CSAIL lab and ABB visiting scientists.
Innovative approach for industrial automationABB researchers identified the main types of information requests and vali-dated them through field interviews at customer plants. XML schemas with classes of process objects were devel-oped in close cooperation with MIT, whose researchers customized the START server to handle these requests 1 . Current development is based on queries in English, but future develop-ments could see other languages being addressed.
2 When starting a process section, the operator wants to check the control mode of the included objects before enabling the automatic start-up sequence
1 Web interface to the START question translation
Plainly speaking

69ABB Review 1/2007
Research activities
<?a, “is a”, “manual station”>
<?b, “is related to”, ?a>
<?b, “is a”, “interlock”>
<?b, “is”, “active”>
The standardization performed by START allows the human user to enter requests in many variants. For exam-ple, START will translate each of the following requests into the symbolic expression listed above: List the active interlocks for manual stations.
What are the interlocks that are active from each manual station?
What are all manual controls with active interlocks?
Let me see all manual controls with interlocks that are active.
Find the interlocks that are active for manual stations.
Get me a list of active interlocks from all manual stations.
At ABB, the company’s 800xA system was used as a test bed for these ideas. Its flexible software architecture enabled a relatively straightforward implementation of query responses. A simple dialogue interface was also added to existing GUI facilities 2 3 . This demonstration system featured live online connectivity with the cus-tomized START server at MIT.
Further challengesUsers have shown a keen technical interest in the demonstration system and have provided much feedback. Estimated benefits in use depend on the type of industry and the target user group. Casual users, eg., mainte-
nance engineers, and operators of flexible processes could benefit the most from being able to pose open queries in plain written language. At the other end of the spectrum, opera-tors of highly standardized plants re-ceiving periodic training probably benefit the least because the facilities for graphically navigating 800xA data structures from the GUI are adequate.
The START system can be of great value for trou-bleshooting under stress, particularly in seldomly recurring scenarios.
The foremost challenge consists in finding a way to produce annotations semi-automatically, with minimal, data-driven manual guidance. In par-ticular, in order to process requests such as those illustrated in 4 and 5 , high-level annotation techniques must be developed that allow application developers to specify entire classes of explanation procedures with a few descriptive annotations.
Depending on the type of decisions that must be based on system re-sponses, the annotations and underly-ing explanation procedures may need to provide responses that are 100 per-cent reliable and complete if the system is to have any value at all. In current automation systems, this is achieved by manual configuration of a limited number of queries. Is there a
use and value for queries that return, eg, 90 percent complete answers, in terms of correct interpretation and processing? If so, this project has already found an application. If not, the challenge remains.
Secondary challenges are the adapta-tion to languages other than English, and of modes such as responding to spoken language rather than writing. None of these challenges are trivial, but technologies are commercially available that can be added to this demonstrator, enabling it to perform such tasks.
Juan S. Jaliff
Magnus Larsson
Morgan Johansson
ABB Corporate Research
Västerås, Sweden
Boris Katz
Gary Borchardt
MIT Computer Science and Artificial Intelligence
Laboratory
Cambridge, Massachusetts, USA
5 The problem is corrected but the operator wants to find out why motor A051M002 was in manual to begin with. With a phone call he knows.
References
[1] http://start.csail.mit.edu/
[2] Boris Katz, Gary Borchardt, Sue Felshin, Natu-
ral Language Annotations for Question Answering.
Proceedings of the 19th International FLAIRS
Conference (FLAIRS 2006), May, 2006.
4 The start-up sequence was aborted. It takes only a simple question to make the system reveal what
went wrong
Plainly speaking

Adjusting the volume of a television set might seem a fairly intuitive task. But when there are several remote controls to choose from, finding the right one may be a trial and error process.
Augmented realityBinding information to the real world Tom Drummond
70 ABB Review 1/2007
Research activities
In industry, similar situations occur. Even well-trained and experienced operators may sometimes have difficulty knowing which switch corresponds to which function. In a rarely occurring but critical situation, valuable time is lost as the operator struggles to find the right switch.
In contrast to using the wrong remote control in the living room, which causes no more damage than wasted time and embarrassment, errors in an industrial environment can have severe and costly consequences. Is there a better way of providing relevant information?
Most modern engineering solu-tions contain a software compo-
nent. There are computers in every-thing from televisions, cars and kitch-en appliances, to large-scale industrial plant systems. A modern credit card has an embedded microprocessor and enough software to run a file system, authenticate the owner’s presence and create digital signatures for financial transactions. This ubiquity of comput-ing in engineering solutions has re-sulted in an increase in software com-plexity.
Just as engineering involves the con-struction of mathematical models of
a problem and its environment, so software engineering requires the creation of software models; a credit card has a software representation of financial transactions (who is pay-ing whom how much?), the owner (name and billing address) and au-thentication (has the user authenticat-ed and what is the procedure for doing so?).
This increase in complexity brings with it a number of problems that arise because the relationship be-tween the software’s model of the world and the real world (or the us-er’s model of it) may not be obvious.
One way in which this manifests itself occurs when software has an internal state that may not be visible or obvi-ous to the user. One example is a software controlled indicator in a car. Instead of the state being represented by the position of the indicator stalk (up = right, down = left, centre = off), such software-controlled systems see the stalk immediately return to its cen-tral position on release by the human. The record of the direction in which the stalk was pushed is stored only by the software. The same is true for how hard the stalk was pushed (soft = blink indicator lights only a few times while changing lanes and then cancel

71ABB Review 1/2007
Research activities
ery and a map, but still to be lost as the binding between mountains as seen in the real world and those seen on the map is not always obvious.
Even well-trained and experienced operators may sometimes have difficulty knowing which switch corresponds to which function. In a rarely occur-ring but critical situation, valuable time is lost as the operator struggles to find the right switch.
The design and operation of large plant control systems also introduces a binding problem. Such systems pres-ent the operators with control views of the plant, which are topological in nature. It is not uncommon for such views to collectively make reference to tens of thousands of tags, each of which corresponds to a component or location within the plant. Many of the alarms generated by the control system require that the control room operator interact with a plant operator by radio in order to make a visual verification concerning some compo-nent of the plant. This means that these two users must manually per-form the binding between the very large database of tags and the real plant components to which they refer.
This human complexity has conse-quences in both training times and in speed of response to rare circum-stances.
Augmented Reality interfacesOne approach to solving the binding problem is to exploit new advances in Augmented Reality. These allow the software engineer to take the graphi-cal user interface (GUI) capabilities of a conventional computer setup which are normally restricted to the comput-er screen, and make them available across the whole world.
This would be easy if the whole world had computerised input and graphical display output, however this is not the case and intermediary hardware is required. In the early days of AR, the most common way to achieve this was to exploit Head Mounted Displays (HMDs). Optical see-through head mounted displays contain a half sil-vered mirror which allow computer generated graphics to be merged with the user’s view of the real world. This allows arbitrary graphical displays to be superimposed on real objects. Provided that the user’s head can be tracked to sufficient precision, and the display can be rapidly updated in response, these graphics can be made to look as though they are stable in the real world and hence belong there rather than to the screen of the HMD.
One of the earliest examples of AR was implemented by the Boeing Com-pany to assist in the production of wiring harnesses for aircraft. Such har-nesses are normally constructed on peg-boards with each wire of the har-ness printed onto the peg-board, thus necessitating one peg-board per air-craft. In the AR setup, the worker wore a HMD which displayed the location of each wire onto a generic peg-board. Such a solution allows a significant saving in storage of peg-boards, but it admits many other ben-efits as well. It is now much easier to upgrade a design since the per-aircraft information is now stored only in the computer, rather than printed onto a board. Further, the dynamic capability of the HMD can be exploited so that the wires can be presented to the operator one or a few at a time.
Similarly, one can imagine that a hiker wearing a HMD could see the name of each mountain (or a grid reference) superimposed above the real view of their summit. Or the author could use
automatically, hard = blink lights until cancelled by pushing softly in the other direction). The problem is that the driver does not necessarily know which of these modes has been engaged as both result in the same immediate behaviour (the indicator lights activate). If the driver incorrect-ly believes that the soft mode has been activated, the vehicle will con-tinue to indicate beyond the time required. On the other hand, if the driver incorrectly believes the hard mode is engaged, the vehicle will indicate in the wrong direction when he or she attempts to cancel.
Another way that increased complexi-ty causes problems can loosely be termed the binding problem.
The binding problemOne classic example of this problem occurs in large rooms with many light switches. A user may wish to turn off a particular bank of lights, such as those near a projection screen, but is faced with a panel of many switches. How can the user know which switch operates which light? (the usual ap-proach is to try them all in turn until the desired outcome is achieved). This problem arises because the binding between the switches and the lights is not obvious, and because such rooms are typically only used intermittently by a given individual, making the binding difficult to memorise.
The author’s living room provides an-other typical example. On the table next to the sofa there is a small moun-tain formed of six remote controls. These control the TV, video, CD, net-worked music, cable and digital TV box. Visitors find it nearly impossible to figure out which remote controls which unit (some members of the household have difficulty too). Again, this is because the binding is not obvious. The situation could be improved somewhat with a universal remote control, but even then an operation such as muting the sound to take a telephone call requires identify-ing the correct device 1 .
Anyone who has hiked in mountain-ous country knows that map reading is a real skill. It is possible to have a very clear view of both the local scen-
1 Which remote control goes with which device? This is a simple example of the binding problem
Augmented reality

72 ABB Review 1/2007
Research activities
a HMD in his living room, together with a pointing device displayed in the HMD to identify the item of enter-tainment hardware that he wishes to interact with by clicking on the real view of it . . .
. . . or are these examples rather a stretch of the imagination? In fact it is rather hard to picture a hiker choos-ing to obstruct his view of nature and the scenery by choosing to wear a bulky HMD. Similarly if somebody were to wear a HMD in the living room, family members would be like-ly to object to the impediment to social interactions.
There are also many other problems with HMDs as a means of delivery of Augmented Reality user interfaces. They can typically only augment a rather nar-
row field of view of the user and they still are rather expensive. For about $ 35,000 it is now possible to purchase a see-through HMD which augments 60 degrees of the user’s field of view.
Such devices need to be calibrated specifically for each user so that real and virtual objects are seen to align. Finally, they inevitably have latency which means that as the user moves their head, the computer graphics lag behind the real motion, typically by at least 100ms. This is enough to cause serious motion sickness, restricting use to a few minutes at a time.
Research sponsored by ABB, is looking at ways of representing and matching models of the world against the live view com-ing from the video camera.
Handheld ARSuch problems with HMDs have led researchers to consider other media for delivery of AR interfaces. The most popular alternative is handheld AR 2 . This works by using a video camera attached to a handheld screen which acts as the viewfinder for the camera. AR is then implemented by trapping the video in-flight between the cam-era and the screen and editing it to insert virtual graphical objects and user interface components.
Handheld devices solve most of the problems with HMDs: they are cheap, nobody is concerned about small latencies, wide fields of view can be obtained by using a wide angle lens, they can be put away in a pocket and taken out as required. They also bring other benefits, for example by allow-ing the user interface designer to inte-grate conventional two-dimensional UI components into an application.
In the author’s living room, anybody could pick up such a handheld device, point it at the entertainment hardware and see a live view of that hardware on the screen. Using a stylus, they could click on the image of the CD player and be presented with a conventional looking GUI for controlling it.
Similarly an operator equipped with this device in a plant could receive graphical navigation information super imposed over a live view of their environment to indicate which physi-cal object corresponds to a particular tag. They could also click on the live view of an object to be presented with a topological view, or mainte-nance information, or sensor trends, or whatever else the application de-signer deems to be valuable to that operator. Further, such a device can be used to widen the communications channel between two operators be-yond the single audio channel used at present to include geographically registered spatial information.
What needs to be done?Currently such devices are in their infancy and significant research effort is going into developing the tracking technologies that are needed to make them work. The most promising pro-totypes combine multiple technolo-gies, for example using inertial sen-sors to supplement computer vision, or adding GPS or ultra wide band (UWB) localisation.
Such approaches have significantly improved the robustness and preci-sion with which these systems oper-ate. The author’s research, sponsored by ABB, is looking at ways of repre-senting and matching models of the world against the live view coming from the video camera so that AR can be provided robustly and reliably on demand in large scale environments, such as complex plant.
The benefits that can come from this are potentially substantial. Augmented Reality provides a way of solving the binding problem by making the real world act as an index into the database of computer system components. This in turn exploits the spatial capabilities of the human users which remains one of their great untapped strengths in conventional software systems.
Tom Drummond
Cambridge University
Cambridge, UK
Factbox About the author
Dr Tom Drummond is a university senior
lecturer in the machine intelligence
laboratory of the department of engineering
at Cambridge University and a Fellow of
St Catharine’s College. He received his PhD
from Curtin University in Western Australia.
His research interests include real-time
computer vision, sensor fusion with an
emphasis on applications to visually guided
robotics and augmented reality user
interface technologies.
2 A handheld AR can simplify navigation
Augmented reality

ABB was formed a century after the foundation of its two parent companies. During these 100 years the electrification of nations changed the industrial world dramatically pioneered by a handful of companies founded in the late 19th century. However, the theoretical foundation of modern electrical technology was laid in the 18th century by scientists such as Franklin, Faraday, Ampere, Volta and Ohm. By 1830 telegraphy was introduced as a low voltage application of this energy form. Low voltage applications were also the basis for company formation during the following 50 years. The world saw lighting become a reality – initially out-doors only – using the arc lamp. With Thomas A Edison’s electrical bulb (1878–79) indoor usage became possible. One of the few low voltage companies of the day that in 1880–1890 added high voltage products to its portfolio was Siemens & Halske. For most others the dynamo and lighting systems remained their core competence and branching out into the risky area of high voltage applications was not attractive. Instead, it was left to new company formations to embark on this high energy venture.
PERPETUAL PIONEERING
73ABB Review 1/2007
Perpetual pioneering Nils Leffler
These companies were often found-ed by engineers and based on
new patents or innovations. Compa-nies in the USA and Germany quickly took the lead in this new industry.
Westinghouse Electric and Manufactur-ing Company was formed in 1884 to build electrical machines. It soon be-came the leading supplier of AC based transmission. The consolidation of several Edison companies combined with the merger with Thomson-Hous-ton formed General Electric in 1892. In Germany, Siemens became success-ful in both the low and high voltage area. Edison’s German operation became known as AEG from 1887 onwards. By pioneering work in the field of three phase alternating current it established itself as a major interna-tional contender.

formed in both directions, hence it could be generated and consumed as low voltage while transmitted as high voltage. Towards the end of the 1880ies, no practically useful AC motor had seen the light and high voltage technology was considered dangerous and difficult. Roughly at the same time in the 1890ies several developers realised that three phase AC was the solution. The very first transmission line for three phase AC was the Lauffen-Frankfurt link in Germany – 175 km long, 30,000 volts – inaugurated August 24, 1891.
ABB Review and its predecessor journals have covered electrification and its practical imple-mentation in industrial applications since the early 20th century.
The flood gates were now opened for rapid expansion of electrically pow-ered industrial applications. The tech-nology allowed the use of centrally located generators, the connection of networks of different voltage levels, and the smooth transformation of electricity to suitable voltage levels. Engineers, meanwhile, had learned
to calculate the performance and material usage of equipment more accurately and precisely. Electrical machines for many different applica-tions were being constructed and safety was improved with breakers and switchgears.
Switzerland with a small home mar-ket, established itself surprisingly early as a leading producer of high voltage equipment through the com-panies Oerlikon, 1882 and Brown Boveri (later BBC), 1891. Actually the two young engineers Charles E. Brown and Walter Boveri worked and met at Oerlikon, where they gained their early experience. They soon decided to establish their new company in Baden, where it rapidly grew into a substantial employer with a broad portfolio of electro-technical products and systems. In Sweden, at this time, several inter-national companies, among them AEG and Siemens, were involved in the electrification of the country. The only local company to make a larger impact was ASEA. This was formed in 1890 in Västeras, but its roots trace back to 1883, when its two parent companies were established. The inventor Jonas Wenström and the industrialist Ludvig Fredlund were the key figures in the formation of the new enterprise. Just as the portfolio of BBC, ASEA’s includ-ed turbine generators and converters; electrical equipment for transmission and distribution such as transformers, breakers and switches; rotating electri-cal machines etc.
ABB Review and its predecessor jour-nals have covered electrification and its practical implementation in indus-trial applications since the early 20th century. A look into the archives dis-covers a fascinating development of key products and solutions, which still today remain crucial for ABB’s market success. This series will commence with a review of the history of the breaker, a key component in many electrical installations.
Nils Leffler
ABB Review
Dättwil, Switzerland
Ludvig Fredlund (1830–1891) and Jonas Wenström (1855–1893), aboveCharles E. Brown (1863–1924) and Walter Boveri (1865–1924), below
The reasons for the formation of larg-er entities lay not only in the interna-tionalization of the business, but also in the scale of the investments re-quired to construct and develop the electrical infrastructure for transmis-sion and distribution of electricity to industry and homes. The ease with which electricity can be transformed into other energy forms such as heat, light and rotational and linear mo-tions, combined with its ability to be transported over some distances with only minor losses, made it the driver of industrialization. Early electrical power applications were focused on transportation (street cars) and indus-trial applications in metallurgy and electro-chemical processes. Early dis-tribution systems were based on direct current which permitted the source and the sink to be separated by a few kilometres at the most because of the rapidly increasing power losses over longer distances. Higher voltage levels reduced the losses but generators and electrical machines were not able to use these voltage levels. The technol-ogy promoted the development of small generating units close to the consumers, which soon proved im-practical and inefficient.
Alternating current can be transmitted at high voltage levels with low losses over long distances. It could be trans-
74 ABB Review 1/2007
PERPETUAL PIONEERING
Perpetual Pioneering

Over the last 100 years, electricity has become the world’s most flexible and reliable form of power. Global demand is increasing and, in many countries, the supply of electricity is directly linked to gross domestic product.
The infrastructure that enables the safe distribution of electrical power is extremely reliable, but the development of ever larger networks and the introduction of new types of power generators are bringing new operational challenges. In this article, ABB Review traces the development of circuit breakers, an indispensable part of the electrical grid, highlighting the contributions made by ABB and its predecessor companies, ASEA and Brown Boveri – both pioneers in electrical power.
The circuit breaker A showcase of industrial product development Fritz Pinnekamp
75ABB Review 1/2007
PERPETUAL PIONEERING
Circuit breakers are critical to the safe operation of an electrical
grid. They are needed in electricity generators, where the full power of an entire power plant (gigawatts of elec-tricity) must to be switched on and off, and on transmission lines in sub-stations to direct the power flow at voltages in excess of 1500 kV. Circuit breakers are also critical components in distribution grids, where very high currents need to be managed at mod-erate voltage levels.
A circuit breaker, irrespective of its position in a grid has two tasks: it is responsible for the daily switching of lines during normal operation, and for the disconnection of the power sup-ply in case of overload or short cir-cuit. Several GVA of power can be tamed by a circuit breaker within frac-tions of a second.
Such is the importance of this single device that tens of billions of dollars have been spent on its development over the last 100 years.1)
The challenge of a circuit breakerElectrical current is transported from power plants to customers through electrically conducting, metal lines, most visible as overhead power lines. The current can be interrupted, simply by cutting the conducting power line: easy to do when there is no current flowing, but extremely difficult when the wire is live. As a live cable is be-ing cut, the current is forced to flow through a progressively smaller cross-section of the wire. This concentration
75
Footnote1) Circuit breaker systems in which free arcs do not
form, ie, power semiconductor devices, perform
extremely well at low power levels, but require
further development for broader application in
power circuit breakers.

76 ABB Review 1/2007
The circuit breaker
lying the minimum oil breaker is shown in 3 . Briefly, when current arcs in oil, the medi-um vaporizes and a bubble forms around the arc. This high-pressure gas, which is almost 80 percent hydrogen, inhibits ionization and moves through the channels sur-rounding the arc. It enhances convection in the oil, which helps to cool the arc residuals around zero current. This arc-induced-convection principle was later used in the “self-
blast” breaker.
Minimum oil breakers work best on high currents that provoke a sharp rise in pressure and strong convec-tion. At lower currents, during normal operation, the self-blast effect cannot develop fully without the help of a moving piston to encourage convec-tion 4 .
In these breakers, when the switch is opened, the current arcs and the pres-sure in the upper chamber rises signif-icantly, causing the piston between the two chambers to move. At a cer-tain point, an aperture in the piston passes the moving contact. This causes a strong axial flow of oil from the lower chamber, which cools the arc.
The obvious advantages of this ap-proach led to a quick adoption of the minimum oil breaker and a phasing out of the conventional oil tank breaker, as the relative sales volumes around 1940 indicate 5 .
Oil is a good electrical insulator and, when the breaker is open, it can insulate grid voltage across the con-tacts. Comparable insulation can be achieved using air, but only if it is compressed to several MPa. The use of such high pressures in compressed-air breakers necessitated a new design of circuit breaker chamber, which was developed alongside that of the oil breakers during the early decades of electrification.
In compressed air breakers, the arc is cooled by convection caused by the large pressure differences between the inner parts of the breaker and the
2 Outdoor single pole oil circuit breaker from 1923, 110 kV, 350 A.
PERPETUAL PIONEERING
of the current leads to heat-ing and eventual evapora-tion of the remaining wire. But even when the wire has been completely severed, current can continue to flow through an electrical arc that forms from ionized gases (plasma) between the opened contacts. The cur-rent can then be interrupted only by a circuit breaker capable of extinguishing this arc. While the speed with which circuit breakers must disconnect heavy metal contacts to effect their purpose has provoked a number of ingenious solutions, this article will concentrate on advances made in the considerable challenge of managing electrical arcs.
Electrical arcs have enormous energy: their temperature can exceed 50,000 °C and pressures up to 100 MPa can be contained within a volume of less than a liter. Over the years, circuit-breakers have incorporated a variety of different media to dissipate this en-ergy, including water, oil, inert gases, and compressed air. The intense heat of the arc can be dispersed either by the application of a gas at high pres-sure, or by gas flow caused by the vaporization of the internal medium, which occurs as a result of arc forma-tion.
Several GVA of power can be tamed by a circuit breaker within fractions of a second.
The body of the circuit breaker also plays a critical role in the effective-ness of the device. It can be used to direct the flow of hot gases, and a range of different approaches have been taken to improve heat dissipa-tion, including the use of semi-de-structible materials. 1 gives an over-view of the various types of circuit breakers used over the last 100 years by ASEA and Brown Boveri, and, more recently, ABB1).
Water- and oil breakers appeared ear-ly on in circuit-breaker development and worked at very low levels of cur-
1 Major types of power ciruit breakers.
1920 1930 1940 1950 1960 1970 1980 1990 2000
Water
Oil
Minimum oil
Compressed air
SF 6
Selfblast SF 6
Vacuum
rent and voltage. 2 shows an example of an early oil-filled circuit breaker. The contacts in these breakers were embedded in a large tank, filled with the chosen medium. Under these con-ditions, arc formation led to ionization of the medium and the formation of hydrogen gas. When the current ap-proached zero (eg, every 10ms in a 50-Hz alternating system), the high pressure of the vaporized medium compressed the gas-filled arc channel. This caused the medium between the opening contacts to lose most of its conductivity, thereby quenching the arc. Unfortunately, because of the large volumes of medium they required, these devices were rather unwieldy and, if an oil breaker failed, allowing pressure to build up, there was a significant risk of explosion and fire 2 . Despite these risks, oil re-mained a popular medium and mini-mum oil breakers, based on these cumbersome early devices, were used until the 1980ies. The principle under-

ambient air outside; a valve opens and compressed air rushes out of the chamber at high speed. A critical design component was ensuring that the arc was correctly positioned to benefit from the intense air flow. Various nozzle designs were tested and, finally, an axial flow, similar to that used in the compression chamber, was chosen.
There were several trade-offs between the compressed air breaker and the minimum oil breaker. The oil breaker, especially the self-blast type, had a simple design and could operate under low mechanical power. As a medium, however, oil was not easy to handle. It posed a fire risk and necessitated more maintenance. Com-pressed air breakers, on the other hand, required powerful compressors and were very noisy when operating. The high pressure could, however, be used to drive the movements of the contacts and compressed air-based systems were much cleaner and easier to maintain than their oil-based coun-terparts.
The market welcomed compressed air breakers and, between 1967 and 1971, sales grew by 20 percent every year. But the development of two breaker principles in parallel polar-ized opinion, even within the produc-ing companies, and competition be-tween the two camps continued with almost religious zeal. In 1955, some engineers claimed that, “The air-blast breaker is better than any other type of breaker for the high voltage level up to 380 kV”, while in 1978, others said, “The minimum oil breaker has
tomers and engineers. Since 1970, increasing investment has been made in the development of these breakers.
Capitalizing on the advantages of SF6
as a medium, ABB engineers went on to combine it with the self-blast prin-ciple, as used in the minimum oil breaker. But the first applications of the self-blast features in an SF
6 break-
er followed another path, as used in vacuum circuit breakers: using a mag-netic field to control the arc. When the contacts are opened, and an arc formed, a magnetic field builds up due to the spiral form of the elec-trodes. This causes the arc to rotate at high speed, forcing it to mix with the cold SF
6 medium, which quickly saps
its energy.
5 Sales volumne of oil breakers from ASEA around the year 1940.
100
90
80
70
60
50
40
30
20
10
0
1938 1939 1940 1941 1942 1943 1944 1945
Source: Asea Journal 1946, p. 17
Oil tank breaker Minimum oil breaker
77ABB Review 1/2007
The circuit breaker
PERPETUAL PIONEERING
4 The operation of the compression chamber upon breaking.
3 Contact opening sequence of minimum oil breaker at short circuit current (1976).
survived the air-blast wave, which now belongs to the past, and will undoubtedly not be stifled by SF
6 [sul-
fur hexafluoride] either”. Market forc-es, however, proved both opinions wrong and the SF
6 solution is now
more popular than either of its prede-cessors.
SF6 is an inert gas with very good in-
sulating properties, even at relatively low pressure (ie, 0.5 MPa). This low pressure is crucial because SF
6 would
liquefy under higher pressures and be unable to interact with the arc. The principle of the SF
6 circuit breaker is
shown in 6 .
Electrical arcs have enormous energy: their temperature can exceed 50,000°C and pressures up to 100 MPa can be contained within a volume of less than a liter.
The moving contact is connected to a nozzle and a cylinder that forms the piston that compresses the SF
6 gas as
the contacts move. When the arc is formed, the cold SF
6 gas, from the
dynamically compressed lower part, can interact with the arc in an axial flow and diffuse its energy.
This device combines a number of beneficial features including low maintenance, clean operation, no external compression, and no exhaust noise. The use of SF
6 as a medium has
proved extremely popular with cus-

A few years later, the cumu-lated expertise in arc cool-ing, gas flow, material abla-tion and gas insulation gave rise to a lean, new SF
6-based
circuit breaker. The device contained few moving parts and the contacts needed to move only a small distance before the circuit was bro-ken. This technology was soon combined with puffer breaker features and finally led to ABB’s current state-of-the-art circuit breakers, which can manage switch ing power of more than 25 GVA in a single chamber. This represents a 100-fold in-crease in performance over the last 80 years 7 .
SF6 is an inert gas with very good insulating properties, even at relatively low pressure (ie, 0.5 MPa).
8 shows a modern Live Tank Breaker (LTB). The energy required for inter-rupting short-circuit current in this breaker is taken partly from the arc itself. This reduces the opera-tional energy requirements to less than half that of a conventional SF
6
puffer-type circuit breaker. Lower energy requirements reduce stress on
the breaker and therefore enhance reliability.
All of the breaker types discussed so far rely on some kind of medium in which the electric arc develops. The vacuum circuit breaker, however, takes a different approach. When live contacts separate in a vacuum, the metal electrodes begin to evaporate and it is this metal vapor that provides a conductive medium for arc forma-tion. Because the electrodes are spiral, a magnetic field is induced in which the arc rotates. The arc is extin-guished when the metal vapor recon-denses on the electrodes and walls of the breaker chamber.
Since the beginning of the 1980ies, ABB has produced well over a million vacuum interrupters. This high-tech product remains in great demand worldwide. ABB’s current product
range comprises vacuum in-terrupters for circuit-breakers from 12 to 40.5 kV, with short-circuit breaking currents up to 63 kA.
Circuit breakers of the future The proper management of the electric arc, unavoidable in all the existing circuit breakers, has been studied and understood over the past 100 years. Of course, prevent-ing arc formation would be preferable to managing it, if a new switching principle using power semi-conductors could be devised.
Power electronic devices are widely used in the electricity industry and high-voltage, direct-current (HVDC) systems – a major product range for ABB – are based on the best performing power semicon-ductors. For this technology to be applied in circuit breakers, the performance of current devices would need to be vastly improved. Current semiconductor technology would allow, at least in prin-ciple, a power circuit breaker to be designed, but it would be a highly complex, extreme-ly costly exercise. A fully elec-
tronic breaker would not be competi-tive in today’s market.
The history of circuit breaker develop-ment shows, however, that the combi-nation of various established technol-ogies in new products has been very successful. ABB is continuing that tra-dition and combining features of con-ventional breakers with power elec-tronic devices. Further leaps in perfor-mance and development are expected in this field.
Friedrich Pinnekamp
Group R&D and Technology
Zürich, Switzerland
8 Live Tank Breaker D for voltage levels up to 170 kV and 40 kA breaking current.
78 ABB Review 1/2007
The circuit breaker
PERPETUAL PIONEERING
7 Breaker capacity per interrupter of ABB circuit breakers.
1920 1925 1930 1935 1940 1945 1950 1955 1960 1965 1970 1975 1980 1985 1990 1995 2000 2005
30
25
20
15
10
5
0
year
Oil
Minimum oil
Compressed air
SF6
Selfblast SF6
6 Operating sequence of SF6 type breaker.
a b c d
f
e
j
g
i
h
a closed position, current flows
through nominal contactb opening sequence, arc is formed
between short circuit contactsc contacts moving, piston generates
high pressure, arc at maximum currentd arc close to current zero affected by
forced gas flow
e contact for nominal currentf contact for short circuit currentg compression chamberh Piston i Hollow contact for exhaust gasj Nozzle for ultrasonic gas flow

79ABB Review 1/2007
Editorial Board
Peter TerwieschChief Technology OfficerGroup R&D and Technology
Clarissa HallerCorporate Communications
Ron PopperSustainability
Friedrich PinnekampGroup R&D and Technology
Nils LefflerChief [email protected]
Publisher’s officeABB Schweiz AGCorporate ResearchABB Review/REVCH-5405 Baden-DättwilSwitzerland
The ABB Review is published four times a year in English, French, German, Spanish, Chinese and Russian.
Partial reprints or reproductions are permit-ted subject to full acknowledgement. Complete reprints require the publisher’s written consent.
The ABB Review is free of charge to those with an interest in ABB’s technology and objectives. For a free subscription please contact your nearest ABB representative or the publisher’s office.
Publisher and copyright ©2007ABB Ltd. Zurich/Switzerland
PrintersVo rarl berger Verl agsan stalt GmbHAT-6850 Dornbirn/Austria
LayoutDAVILLA Werbeagentur GmbHAT-6900 Bregenz/Austria
DisclaimerThe information contained herein reflects the views of the authors and is for informational purposes only. Readers should not act upon the information contained herein without seeking professional advice. We make publications available with the understanding that the authors are not rendering technical or other professional advice or opinions on specific facts or matters and assume no liability whatsoever in connection with their use. The companies of the ABB Group do not make any warranty or guarantee, or promise, expressed or im-plied, concerning the content or accuracy of the views expressed herein.
ISSN: 1013-3119
www.abb.com/abbreview
Preview 2/2007
Towards the end of 2006, several im-portant reports were published by prominent organizations on the topic of a sustainable energy future for the world, including action plans and cost estimates. After the Gleneagles G8 summit meeting held in Scotland in July of 2005, Sir Nicholas Stern was appointed to investigate strategies to contain global warming. His report on the “Economics of Climate Change” issued a stern warning to the world of escalating costs if this issue is not tackled now rather than procrastinated further. The World Business Council for Sustainable Development issued its report in October 2006 under the name of “Powering a Sustainable Future”. ABB co-chaired this work through the active participation of CEO Fred Kindle. The International Energy Agency, IEA, in its most recent report estimates that unexploited energy efficiency potential offers the single largest opportunity for emis-sions reductions.
These reports have two things in common: The demand for electricity will keep increasing and end-user energy efficiency improvement is the only short term remedy to contain rising emission levels. IEA calculates that energy efficiency measures can account for between 31 and 53 per-cent of CO2 emissions reductions by 2050. Technologies to improve the efficiency of energy conversion exist and can be applied cost effectively in all economies and with all end users.
ABB is a major supplier of these technologies. ABB Review will dedi-cate its next issue to present products and solutions available today that can make a difference in how industry and utility use and produce electricity. The long journey towards the goal of “Powering a Sustainable Future” can start today based on these tech-nologies.

Ensuring areliable powergrid is where
we really shine.
Ensuring areliable powergrid is where
we really shine.
© 2005 ABB
Providing breakthroughs in power transmission anddistribution for the 21st century. Visit us at www.abb.com
© 2005 ABB