Returns to Adult Learning in Comparative Perspective
20
52 3. Returns to Adult Learning in Comparative Perspective Moris Triventi and Carlo Barone INTRODUCTION This chapter develops a comparative analysis of wage returns to adult learning. Our analysis is guided by two main research questions. First, we assess whether different forms of adult learning ensure different economic rewards across 22 industrialized countries. Second, we are interested in testing whether the cross-national variability in returns to adult learning is systematically related to the institutional variation captured by the country groupings illustrated in the first chapter of this volume. This chapter focuses on a cross-sectional analysis of wage returns to adult learning among employed persons, whereas the individual country chapters provide a wealth of information on the potential consequences of adult learning for access to employment, job mobility, and other career outcomes. Because we do not have access to longitudinal comparative data on adult learning, we must focus on wages at the time of the interview and on learning experiences undertaken over the 12 months prior to the interview. This means that we cannot trace the potential long-term economic consequences of participation in adult learning. Despite this limitation, our data allow for a large-scale analysis of wage returns to adult learning, thereby ensuring a high degree of standardization and comparability, an accurate measurement of adult learning, and detailed information to control for selection into adult learning. PREVIOUS RESEARCH RESULTS While a considerable number of studies have investigated the determinants of participation in adult learning, there is much less research on its occupational returns, especially in a comparative perspective (O’Connell and Byrne 2009). Furthermore, comparability across country studies is made difficult by the heterogeneity in the definition of adult learning and in the methods used to estimate its effect on occupational outcomes. Most economic research focuses CITATION: Triventi M. & Barone C. (2014). Returns to Adult Learning in Comparative Perspective. Pp. 57-75 in H.-P. Blossfeld, E. Kilpi-Jakonen, D. Vono de Vilhena & S. Buchholz (eds.), Adult Learning in Modern Societies. An International Comparison from a Life- Course Perspective, Cheltenham, UK: Edward Elgar.
Transcript of Returns to Adult Learning in Comparative Perspective

52
3. Returns to Adult Learning inComparative PerspectiveMoris Triventi and Carlo Barone
INTRODUCTION
This chapter develops a comparative analysis of wage returns to adult learning. Our analysis is guided by two main research questions. First, we assess whether different forms of adult learning ensure different economic rewards across 22 industrialized countries. Second, we are interested in testing whether the cross-national variability in returns to adult learning is systematically related to the institutional variation captured by the country groupings illustrated in the first chapter of this volume.
This chapter focuses on a cross-sectional analysis of wage returns to adult learning among employed persons, whereas the individual country chapters provide a wealth of information on the potential consequences of adult learning for access to employment, job mobility, and other career outcomes. Because we do not have access to longitudinal comparative data on adult learning, we must focus on wages at the time of the interview and on learning experiences undertaken over the 12 months prior to the interview. This means that we cannot trace the potential long-term economic consequences of participation in adult learning. Despite this limitation, our data allow for a large-scale analysis of wage returns to adult learning, thereby ensuring a high degree of standardization and comparability, an accurate measurement of adult learning, and detailed information to control for selection into adult learning.
PREVIOUS RESEARCH RESULTS
While a considerable number of studies have investigated the determinants of participation in adult learning, there is much less research on its occupational returns, especially in a comparative perspective (O’Connell and Byrne 2009). Furthermore, comparability across country studies is made difficult by the heterogeneity in the definition of adult learning and in the methods used to estimate its effect on occupational outcomes. Most economic research focuses
CITATION: Triventi M. & Barone C. (2014). Returns to Adult Learning in Comparative Perspective. Pp. 57-75 in H.-P. Blossfeld, E. Kilpi-Jakonen, D. Vono de Vilhena & S. Buchholz (eds.), Adult Learning in Modern Societies. An International Comparison from a Life- Course Perspective, Cheltenham, UK: Edward Elgar.

Returns to Adult Learning 53
only on employer-sponsored on-the-job training, and only a few studies use less-restrictive definitions.1 Moreover, while several studies have used standard OLS regression models, others have made some attempts to control for endogeneity and unobserved heterogeneity using Heckman-type selection models (Lynch 1992), propensity score analyses (Muehler, Beckmann and Schauenberg 2007), instrumental variables (Abadie, Angrist and Imbens 2003), and fixed-effects models on panel data (Barron, Black and Loewenstein 1993; Booth 1993).
Most empirical studies using OLS regression models report that there are positive wage returns to employer-sponsored non-formal training, but when selection effects or ability are controlled for, the returns are frequently found to be smaller or even non-significant (OECD 2004; Bassanini et al. 2005; Dieckhoff, Jungblut and O’Connell 2007). Overall, research that assesses wage returns to non-formal training has reached very heterogeneous results (Dieckhoff, Jungblut and O’Connell 2007). Two recent literature reviews (Hansson 2008; Leuven and Oosterbeek 2008) indicate that after controlling for selection effects, wage returns to training are estimated at between 0 and 4.5 per cent in the United States, between 0 and 2 per cent in Germany, and around 2 per cent in Switzerland, while estimates vary considerably across studies in the United Kingdom (between 1 and 11 per cent). These studies provide interesting results, but they do not compare returns to different forms of adult learning and do not adopt a comparative approach, which is where our work differs.
THEORY AND HYPOTHESES
There are at least four reasons to expect adult learning to be positively rewarded in the labor market, which can be succinctly summarized as follows. First, from a human capital perspective, adult learning provides specific, ready-to-use skills that enhance workers’ productivity, thus leading to higher wages (Becker 1962). Second, following Thurow’s model (1975), education and training may offer opportunities to strengthen more general competencies and soft skills. Third, according to a signaling approach (Spence 1973), participation in adult learning signals employees’ higher motivation and job involvement. Finally, a credentialist approach (Collins 1979) suggests that adult learning can provide certificates needed for promotion into higher-rank positions.
However, these basic mechanisms may operate differentially across different forms of adult learning and thus lead to different occupational outcomes (Loewenstein and Spletzer 1999). At one extreme, non-formal training organized by firms is more likely to be tailored to the specific skill

Comparative contributions54
and credential requirements of the firms, especially when sponsored by employers. Furthermore, employees investing in this form of adult learning show a clear signal of job involvement and attachment to their firms. Hence, we expect that non-formal training organized by firms should positively affect wages.
At the other extreme, when adult learning takes the form of participation in formal education, general competencies and soft skills are likely to be more important than the acquisition of specific, ready-to-use skills. These general competencies may be regarded by employers as less directly relevant for productivity, and they are more easily transferable to other firms, meaning that the signal of attachment to the firm is more ambiguous. Quite unsurprisingly, this form of training is less often sponsored by employers, and we expect that employers should also be less willing to reward it.
To be sure, this hypothesis does not imply that participation in formal education is irrelevant for labor market success. We simply argue that it is less often rewarded among employed persons by their current employers in the short term. At the same time, participation in formal education may afford individuals with more-transferrable skills and more-widely recognized credentials that facilitate career advancement outside the firm. However, these potential positive consequences are more uncertain because they are contingent upon the success of between-firm mobility strategies and are less likely to show up in the short term.
There are, of course, intermediate and mixed forms of adult learning that lie between the two ideal types that we have just outlined. On the one hand, when formal adult education takes place in the vocational sector, it may also supply individuals with skills that are more directly relevant for productivity. On the other hand, when non-formal training takes place outside the firm, it does not need to be organized or sponsored by the firm. In this case, much depends on how the employers perceive the skill content and the quality of the training courses undertaken by their employees.
Moreover, institutional regulations can affect the characteristics of participation in adult learning and its economic implications, meaning that returns to different forms of adult learning can vary across countries. In general terms, we expect that institutional regulations are more likely to be consequential for formal adult education, which should lead to recognized certificates or diplomas. In this case, state regulations can establish the number, type, and content of learning courses that are given formal recognition, and they can also affect their economic value via wage policies and collective bargaining.
In particular, it is well documented that returns to education are low in Nordic countries because of the high degree of institutionalization and regulation of their labor markets. Solidaristic wage policies that aim at

Returns to Adult Learning 55
equal pay for equal work, regardless of the productivity of industries, firms, and workers, are more widely pursued in these countries, with the explicit purpose of reducing variation in wages (Badescu, D’Hombres and Villalba 2011). For similar reasons, it can be expected that formal adult education is also associated with less income variation in these countries. In post-socialist countries, we find the opposite pattern. Previous research has shown that returns to education have rapidly increased in these countries since the fall of the iron curtain, which is due not least to the sudden increase in wage inequality and to the shortages of highly educated workers (ibid.).
On the contrary, because non-formal training is more directly organized by firms and other private organizations, the influence of institutional regulations is more indirect, and structural characteristics of the economy should play a more prominent role. In the case of non-formal activities, the specific characteristics of industries and firms where training is offered drive the economic value of these activities more than the institutional environment. Wage policies may also compress returns to non-formal training, but when training is undertaken as a joint initiative between firms and employees, direct negotiation at the firm level on its wage or career consequences is likely to be far more relevant. Hence, we expect that the institutional variations captured by our country groupings should be more relevant for formal adult education.
RESEARCH DESIGN
Comparable cross-country longitudinal data for both European and non-European countries are currently unavailable; therefore, we are forced to use cross-sectional data. This is unfortunate because it is quite difficult to estimate the causal impact of adult learning on occupational outcomes with cross-sectional data for three reasons. First, potential endogeneity due to omitted-variable bias: adult learning experiences are not randomly assigned to workers since individuals self-select and/or firms select participants. Workers with higher wages might be more likely to participate in adult learning because of unobserved characteristics (e.g., work motivation) that also affect earnings. Since we do not have credible instrumental variables and cannot rely on a panel-data structure, we cannot make any causal claim and can only test whether adult learning is associated with higher earnings conditional on a set of covariates. Second, we must exclude reverse causality, which is quite a reasonable assumption once we consider that wages are measured in the month of the interview and information on training participation refers to the 12 months prior to the interview. Following Leuven and Oosterbeek (2008, p. 428), this implies that, on average, the time that elapses between training experiences and the measurement of wages is roughly 6 months. This time

Comparative contributions56
window is similar to that of most empirical training studies, but it limits the scope of our results, which refer to the short-term effects of adult learning.2 Third and finally, sample selection bias could be an issue because employed individuals are likely to not be a random sample of the whole population. Hence, we do not make inferences on the whole population, and we interpret our results in terms of partial associations among a subgroup of the population (the employed).
DATA, VARIABLES, AND METHODS
Data
We use data from the International Adult Literacy Survey (IALS), a large-scale comparative survey conducted under the auspices of the OECD and coordinated by the Canadian statistical office. The IALS includes representative samples of the non-institutionalized civilian population aged 16–65. It was carried out in 23 industrialized countries between 1994 and 1998 (NCES 1998). Despite the fact that it refers to the 1990s, we rely on the IALS because it is the only data source that provides detailed information on adult learning experiences together with background variables and test scores on general cognitive skills for a large number of countries.
We include in the analysis individuals who were employed at the time of the interview as well as those who were 22–64 years old if they had attained no more than upper secondary education (ISCED levels 3 and 4) and those who were 28–64 years old if they had attained tertiary education (ISCED levels 5 and 6). The sample size is thus reduced to 25 903 individuals living in 22 nations that cover the country groupings illustrated in Chapter 1.3 The liberal countries include English-speaking (CA-En) and French-speaking (CA-Fr) Canada, Great Britain, Ireland, Northern Ireland, New Zealand, and the United States. The group of Central European countries is covered by Flemish-speaking Belgium (BE-Fl), three Swiss cantons (CH-Fr, CH-Ge, CH-It), Germany (DE), the Netherlands (NL), and Italy (IT).4 The Nordic countries comprise Denmark (DK), Finland (FI), Norway (NO), and Sweden (SE). Finally, given the fact that we focus on the 1990s, we consider a fourth cluster of post-socialist countries,5 which includes the Czech Republic (CZ), Hungary (HU), Poland (PL), and Slovenia (SI).
Variables
Our dependent variable is gross personal income from wages, salary, or self-employment and is available in quintiles of the national income distribution.

Returns to Adult Learning 57
To develop our main independent variable, we use information on the three most important adult learning experiences over the 12 months preceding the interview, considering: 1) whether the respondent had any adult learning experience, 2) if this experience was job-related or pursued for personal reasons, and 3) whether it led to a recognized certificate (university degree, college trade-vocational or apprenticeship certificate, elementary- or secondary-school diploma) or not (mainly for professional/career development). Our final variable is a typology of adult learning that classifies respondents in three categories: 1) no adult learning: no training experience, or course attended only for personal interest; 2) formal adult education: at least one experience that led to a recognized certificate; 3) non-formal training: at least one job-related experience without any certificate. If respondents had two or more training experiences of different types, formal adult education prevails over non-formal training.6 Due to sample size constraints, we mainly rely on this parsimonious classification. However, in some additional analyses mentioned below, we further disaggregate non-formal training into internal and external training. The former refers to activities inside one’s work organization, while external training refers to courses attended in schools, in private organizations, at home, etc.7
We introduce a number of control variables into our multivariate models that refer to socio-demographic characteristics and educational attainment, and we also introduce occupation-related variables and a proxy for cognitive skills. The first set includes gender, the highest level of education attained by the parents (primary, secondary, or tertiary education), area of residence (rural vs non-rural area), migration status (born in a foreign country or not), years of education attained upon leaving formal education, age, and age squared.8 Occupation-related variables include total working time in hours, sector of employment (primary, secondary, social/personal services, wholesale, transportation, communication, and financing), occupational class (EGP schema: I-II, IIIa, IIIb, IV, V-VI-VII), and firm size.9 Finally, we use an additive index of general cognitive skills, which combines information on respondents’ literacy scores in three domains: prose, document, and quantitative literacy.10
Methods
The main purpose of our analyses is to assess whether adult learning experiences are related to wages and if so, how returns to adult learning vary across countries. To tackle these issues, we develop a two-stage strategy. In the first stage, we estimate regression models for each individual country; then, in the second stage, we use the estimated coefficients for returns to adult
Comparative contributions58
learning as dependent variables to assess whether they are related to a set of macro-variables.
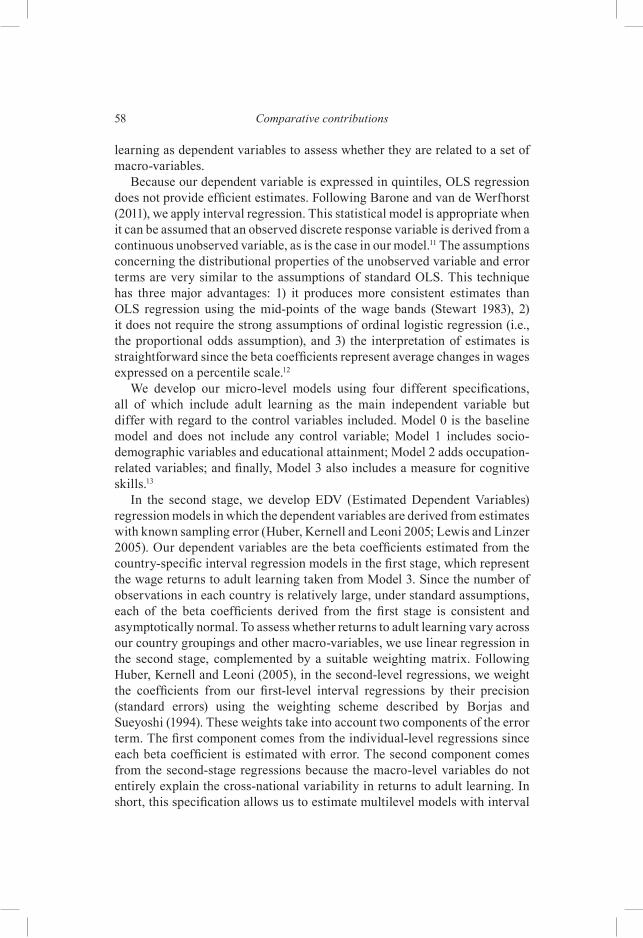
Because our dependent variable is expressed in quintiles, OLS regression does not provide efficient estimates. Following Barone and van de Werfhorst (2011), we apply interval regression. This statistical model is appropriate when it can be assumed that an observed discrete response variable is derived from a continuous unobserved variable, as is the case in our model.11 The assumptions concerning the distributional properties of the unobserved variable and error terms are very similar to the assumptions of standard OLS. This technique has three major advantages: 1) it produces more consistent estimates than OLS regression using the mid-points of the wage bands (Stewart 1983), 2) it does not require the strong assumptions of ordinal logistic regression (i.e., the proportional odds assumption), and 3) the interpretation of estimates is straightforward since the beta coefficients represent average changes in wages expressed on a percentile scale.12
We develop our micro-level models using four different specifications, all of which include adult learning as the main independent variable but differ with regard to the control variables included. Model 0 is the baseline model and does not include any control variable; Model 1 includes socio-demographic variables and educational attainment; Model 2 adds occupation-related variables; and finally, Model 3 also includes a measure for cognitive skills.13
In the second stage, we develop EDV (Estimated Dependent Variables) regression models in which the dependent variables are derived from estimates with known sampling error (Huber, Kernell and Leoni 2005; Lewis and Linzer 2005). Our dependent variables are the beta coefficients estimated from the country-specific interval regression models in the first stage, which represent the wage returns to adult learning taken from Model 3. Since the number of observations in each country is relatively large, under standard assumptions, each of the beta coefficients derived from the first stage is consistent and asymptotically normal. To assess whether returns to adult learning vary across our country groupings and other macro-variables, we use linear regression in the second stage, complemented by a suitable weighting matrix. Following Huber, Kernell and Leoni (2005), in the second-level regressions, we weight the coefficients from our first-level interval regressions by their precision (standard errors) using the weighting scheme described by Borjas and Sueyoshi (1994). These weights take into account two components of the error term. The first component comes from the individual-level regressions since each beta coefficient is estimated with error. The second component comes from the second-stage regressions because the macro-level variables do not entirely explain the cross-national variability in returns to adult learning. In short, this specification allows us to estimate multilevel models with interval

Returns to Adult Learning 59
regression techniques in the first stage while at the same time preserving two separate sources of estimate uncertainty in the second stage.
DESCRIPTIVES
We begin with a brief examination of the distribution of adult learning experiences across countries in the mid 1990s. Table 3.1 shows that there is substantial cross-national variation in the proportion of persons who did not undertake any adult learning. This share is larger in Poland, Hungary, Belgium, and Germany, where more than three-quarters of adult workers did not have any learning activity the year before the interview, while it is smaller in Finland, Sweden, and Norway, where less than half of workers had not
Table 3.1 Distribution of the typology of adult learning experiences in the preceding year
Country Code No Formal Non-formal Total N
Belgium-Flanders BE-Fl 77.9 4.1 17.9 100 826Canada-Eng CA-En 56.0 7.1 36.9 100 1 056Canada-Fr CA-Fr 70.9 8.0 21.0 100 486Czech Republic CZ 68.3 18.3 13.4 100 1 354Denmark DK 41.1 4.5 54.4 100 1 758Finland FI 35.0 6.2 58.9 100 1 458Germany DE 77.8 1.2 21.0 100 734Great Britain GB 45.6 8.5 45.9 100 2 078Hungary HU 79.1 3.6 17.3 100 885Ireland IE 73.3 6.8 19.9 100 845Italy IT 71.2 2.4 26.3 100 1 167Netherlands NL 62.2 7.4 30.4 100 1 485New Zealand NZ 49.4 9.9 40.8 100 1 809Northern Ireland IE-No 56.6 7.7 35.7 100 1 441Norway NO 47.4 3.3 49.4 100 1 751Poland PL 80.9 3.8 15.3 100 1 243Slovenia SI 58.8 5.4 35.9 100 954Sweden SE 41.8 4.0 54.2 100 1 364Switzerland-Ge CH-Ge 58.8 6.1 35.0 100 617Switzerland-It CH-It 59.3 4.5 36.2 100 584Switzerland-Fr CH-Fr 68.5 5.5 26.1 100 657United States US 47.7 8.3 44.0 100 1 351Total 57.0 6.5 36.5 100 25 903
Source: Own calculations based on the IALS.

Comparative contributions60
been involved in any course. As already suggested in the previous chapter, this cross-national variation seems to at least partially reflect institutional differences among the groups of countries. In particular, the highest level of participation is found among the Nordic countries, while the lowest level is found among post-socialist countries. Within these two extremes, we find that the liberal countries are closer to the Nordic countries, whereas Central Europe comes closer to the post-socialist countries. Formal adult education and non-formal training are not equally widespread, and the latter is prevalent in almost all countries. On average in the 22 IALS countries under examination, 6.5 per cent of adult employees had at least one training experience that led to a recognized certificate, with Italy in last place (2.4 per cent) and the Czech Republic at the top (18 per cent). On average, 36.5 per cent of individuals attended at least one non-formal training course in the previous year, but this proportion amounts to 59 per cent in Finland and only to 13.4 per cent in the Czech Republic. Most of the non-formal training experiences were financed by the employer, while formal adult educational experiences were more often self-financed or received some support from the state.
Micro-Analysis
In this section, we examine wage returns to adult learning for adult employees across 22 industrialized countries. The results of our multivariate models are reported in graph form in order to make comparisons across countries and models more straightforward. The figures report point estimates of the beta coefficients and 95 per cent confidence intervals. The estimates represent the average differences in wage returns for individuals who attended various types of adult learning compared with those without any adult learning experience (the omitted reference category). The beta coefficients from interval regression models can be read as percentile differences in wages. The four graphs that constitute each figure report results from the four above-mentioned model specifications, which progressively include more controls. To save space, the estimates related to control variables are not reported, but they are available from the authors upon request. In each graph, countries are listed in descending order of the magnitude of the beta coefficients.
As can be seen in Figure 3.1, there is substantial variability in wage returns to formal adult education when looking at the bivariate relationships (Model 0). While there is a non-significant or even negative association in Nordic countries, we detect a positive, large, and significant bivariate association (around 10–20 percentile points) in post-socialist countries. However, returns to adult learning are mostly reduced and become non-significant once socio-demographic variables and previous educational attainment are introduced as control variables. Nevertheless, the association remains significant and

Returns to Adult Learning 61
positive in some post-socialist (Hungary, Czech Republic) and Anglo-Saxon (Canada, Northern Ireland) countries. Finally, the introduction of additional controls related to the occupations and to the general cognitive skills of respondents (Models 2 and 3) does not change the main pattern of results, with the exception of Hungary, where the estimated effect becomes non-significant. Hence, formal adult education has a limited short-term impact on wages, particularly once we take into account the social selectivity of participation in this form of learning activity, which is mainly related to the social origins and education of individuals.
The overall pattern is rather different for returns to non-formal training. In all countries, the bivariate associations are positive, statistically significant, and much larger than those for formal adult education. The overall pattern of cross-country variation is only partially similar to that observed above. Returns to non-formal activities are smaller in the Nordic countries (around 5–7 per cent), at an intermediate level in Continental Europe, and larger in post-socialist and liberal countries (15–20 per cent). Interestingly, most estimates are only partially reduced when controlling for socio-demographic variables and educational attainment, while they are largely reduced – even
Note: Models 0–3 include different sets of control variables.
Source: Own calculations based on the IALS.
Figure 3.1 Interval regression models: average percentage differences (and 95 per cent confidence intervals) in wages between those with formal adult education experience and those without any experience
DKIT
DEFI
SENO
CH−GeNL
CH−FrNZ
BE−FlUSPLGB
CH−ItIE
CA−EnCA−Fr
HUIE−No
CZSI
−20 −10 0 10 20 30β
Model 0
CH−GeFIIT
DKSEDENO
CH−FrBE−Fl
NLUS
CA−FrPL
CH−ItSI
NZGBIE
CZCA−EnIE−No
HU
−20 −10 0 10 20 30β
Model 1
ITDK
FIDESE
CH−GeNOUSSI
CH−FrNZGB
BE−FlNL
CA−FrCH−It
IEPL
IE−NoCZ
CA−EnHU
−20 −10 0 10 20 30β
Model 2
DEFIIT
DKSE
CH−GeNOUSSI
NZCH−Fr
GBBE−Fl
CA−FrNL
CH−ItIE
IE−NoPL
CA−EnCZHU
−20 −10 0 10 20 30β
Model 3
Formal adult education

Comparative contributions62
if still significant for most countries – when controlling for occupational characteristics (around 5–8 per cent). Finally, controlling for cognitive skills in the last model only slightly affects the estimated returns to non-formal adult learning.
This pattern of results across model specifications is in line with the results of the previous chapter and of previous research (Jenkins et al. 2003; Arulampalam, Bryan and Booth 2004), which have shown that access to on-the-job training is largely affected by occupationally-related characteristics, such as the sector of employment, the occupational level, firm size, and employers’ willingness to fund employees’ participation. On the contrary, participation in formal education among workers is more often an individual choice that is affected more by socio-demographic characteristics, such as gender, age, and the educational level attained. In line with these findings for participation in adult learning, the bivariate estimates for returns to formal adult education are affected more by socio-demographic factors (Model 1), while those for returns to non-formal training are affected more by occupation-related variables (Model 2). The latter are significantly higher than the former across all model specifications.
Note: Models 0–3 include different sets of control variables.
Source: Own calculations based on the IALS.
Figure 3.2 Interval regression models: average percentage differences (and 95 per cent confidence intervals) in wages between those with non-formal adult learning experience and those without any experience
DKSE
NONLDE
CH−GeFI
CH−FrNZPL
CH−ItHU
ITUS
BE−FlIE
GBCZ
CA−EnCA−FrIE−No
SI
0 5 10 15 20 25β
Model 0
DKNOSENL
CH−FrPL
CH−GeSI
USDE
BE−FlIT
HUFI
CZNZ
IECH−It
CA−EnCA−Fr
GBIE−No
0 5 10 15 20 25β
Model 1
DKNOUSNZ
CH−FrDENLSI
CA−FrSEIT
BE−FlCH−Ge
IECZPLGB
CH−ItFI
CA−EnHU
IE−No
0 5 10 15 20 25β
Model 2
DKUSNONZ
CH−FrDENL
CA−FrIESI
GBBE−Fl
CH−GeSEIT
CZFI
PLCH−It
CA−EnHU
IE−No
0 5 10 15 20 25β
Model 3
Non−formal training

Returns to Adult Learning 63
Interestingly, there is a positive relationship between wage returns to formal adult education and non-formal training, with the correlation coefficient amounting to 0.59. Indeed, several countries with high returns to formal adult education also have high returns to non-formal training experiences (Hungary, English-speaking Canada, Northern Ireland, the Italian Swiss canton, Poland, and the Czech Republic). On the contrary, Denmark, Norway, and the United States display relatively small returns to both forms of adult learning compared with the IALS average.
Given the high variability in non-formal training experiences, it could be useful to further distinguish these experiences at least into internal and external ones. Unfortunately, this distinction is unfeasible in the IALS data for Germany and Sweden, but a brief comment on the main pattern of results for the other countries is possible.14 Both forms of non-formal training display a positive bivariate association with wages. Once all available control variables are controlled for, this association remains significant in 9 of 20 countries for internal training and in 12 of 20 countries for external training. At the macro-level, there is only a weak positive relationship between the returns to these two forms of non-formal training. The comparison of the beta coefficients suggests that, on the whole, there is not much difference between the returns to these two forms of non-formal training.
Returns to adult learning could vary by gender, although previous research has found mixed results on this point. The studies by Brunello (2001) and the OECD (2004) on ECHP data found lower wage returns to training for women, whereas some country studies found no difference, or even the opposite pattern (see the review in Hansson 2008). Our own explorative analyses on the IALS data (available upon request) confirm this heterogeneity across countries and types of adult learning, although our results should be interpreted with some caution because of the high estimate uncertainty. Returns to formal adult education look larger for women in most liberal countries, whereas we detect non-significant returns for women and negative returns for men for several countries in Northern and Central Europe. No major differences between the sexes are found among the post-socialist countries. Moreover, returns to non-formal activities are larger for women in all liberal countries and in most of the other countries, with only one exception in which the opposite holds (Belgium) and few exceptions in which estimates are very similar for both sexes (Germany, Finland, Sweden, and Hungary). On the whole, we may tentatively conclude that women benefit more than men from participation in adult learning activities.

Comparative contributions64
Macro-Analysis
In this second part of the analysis, we aim to assess the extent to which cross-country differences in returns to formal adult education and non-formal training are systematically related to the institutional variation captured by our country groupings while controlling for some macro-economic variables. In this analysis, the dependent variables are the estimates for the wage returns to formal adult education and non-formal training presented in the previous section, while the main independent variable is formed by the country groupings illustrated in the “Variables” section.
Of course, cross-national differences in wage returns to adult learning may also reflect structural differences between the national economies (Dieckhoff 2007). Therefore, we include a set of control variables aimed at controlling for these structural features, as well as for the economic cycle. To our knowledge, this is the first attempt to directly assess which macro-variables affect returns to adult learning across countries.
We consider three main macro-economic indicators. The first is the unemployment rate, which may be taken as a proxy for the economic cycle. The second is an additive index of economic development, which is derived from three indicators: 1) the Gross Domestic Product (GDP) per capita, 2) expenditures in Research & Development (R&D) as a percentage of the GDP, and 3) the mean years of education attained in the population. The Cronbach’s alpha for these three indicators is 0.69, suggesting that this index displays a relatively good internal consistency. The third macro-variable is the proportion of small firms (less than 20 employees) in each country. All these macro-variables – with the exception of mean years of education and firm size, which are derived from the IALS – have been extracted from the OECD online database (available at www.stats.oecd.org) and refer to the year before the IALS was conducted in each country.15 All macro-variables have been standardized to have their means equal to zero and their standard deviations equal to one in order to harmonize their measurement scale.
In order to assess whether the groups of countries are characterized by systematically different returns to adult learning, we estimated two EDV regression models at the macro-level for each outcome (wage returns to formal adult education and non-formal training). Results are reported in Figure 3.3.
Net of economic conditions, we find that Central European countries have, on average, similar wage returns to both forms of adult learning as do the liberal countries (reference category). The pattern is different for the other two comparisons. Interestingly, the Nordic countries demonstrate smaller returns to formal adult education compared with the liberal countries. This difference is quite relevant since it amounts to around 5–6 per cent. We do not detect any difference between these two groups in the case of returns to non-

Returns to Adult Learning 65
formal training. Moreover, post-socialist countries have systematically larger returns to formal adult education (5 per cent) compared with the other three groups from the mid-1990s, and they are characterized by similar returns to non-formal activities as the liberal and Central European countries. Finally, the effects of macro-economic variables appear small and with the exception of unemployment rates, they are not statistically significant. On the whole, we find that cross-national differences mainly involve formal adult education, with Nordic and Eastern European countries lying at opposite ends of the spectrum.
Figure 3.4 shows the predicted wage returns according to the country groupings. Both the liberal and Central European countries display non-significant returns to formal adult education, instead having positive and significant returns to non-formal training (around 4 per cent). On the contrary, the Nordic countries are characterized by negative returns to formal adult education and positive returns to non-formal training, much in line with the other countries (when not controlling for trade union density). Finally, post-
Small firms
Unemployment
Econ Devel
Liberal
Central EU
Nordic EU
Post−Socialist
−10 −5 0 5 10 −10 −5 0 5 10
Formal adult education Non−formal training
β β
Source: Own calculations based on the IALS.
Figure 3.3 EDV (estimated dependent variable) regression models to analyse the effect of macro-variables on the cross-country variability in the wage returns to formal and non-formal adult learning: beta coefficients and 95 per cent confidence intervals

Comparative contributions66
socialist countries have similarly positive wage returns to both types of adult learning.
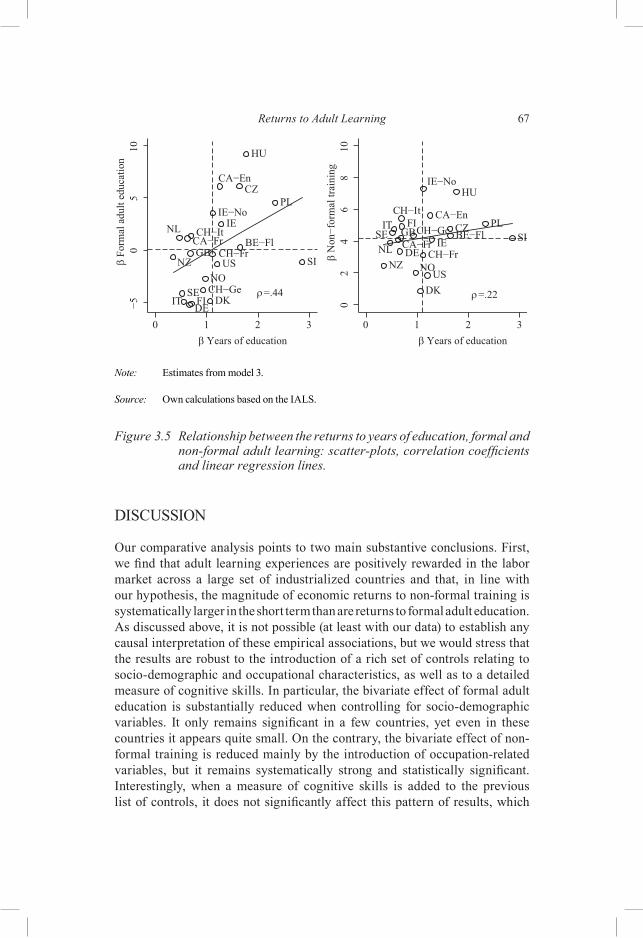
This pattern of results suggests that the institutional mechanisms driving cross-national differences in wage returns to formal adult education may be similar to the mechanisms driving differences in returns to formal standard education. Indeed, returns to years of education correlate more with returns to formal adult education than with returns to non-formal training. Figure 3.5 shows the relevant scatter-plots, correlation coefficients, and regressions. There is a positive and strong correlation (0.44) between wage returns to years of education attained and returns to formal adult education. On the contrary, the correlation between returns to years of schooling and non-formal training is substantially weaker.
−10
−50
510
β
Post−socialistLiberal Central EU Nordic EU
Formal adult education Non−formal training
Source: Own calculations based on the IALS.
Figure 3.4 Predicted wage returns to various forms of adult learning according to the country grouping (%).
Returns to Adult Learning 67
DISCUSSION
Our comparative analysis points to two main substantive conclusions. First, we find that adult learning experiences are positively rewarded in the labor market across a large set of industrialized countries and that, in line with our hypothesis, the magnitude of economic returns to non-formal training is systematically larger in the short term than are returns to formal adult education. As discussed above, it is not possible (at least with our data) to establish any causal interpretation of these empirical associations, but we would stress that the results are robust to the introduction of a rich set of controls relating to socio-demographic and occupational characteristics, as well as to a detailed measure of cognitive skills. In particular, the bivariate effect of formal adult education is substantially reduced when controlling for socio-demographic variables. It only remains significant in a few countries, yet even in these countries it appears quite small. On the contrary, the bivariate effect of non-formal training is reduced mainly by the introduction of occupation-related variables, but it remains systematically strong and statistically significant. Interestingly, when a measure of cognitive skills is added to the previous list of controls, it does not significantly affect this pattern of results, which
BE−Fl
CA−En
CA−FrCH−Fr
CH−Ge
CH−It
CZ
DEDKFI
GB
HU
IEIE−No
IT
NL
NONZ
PL
SE
SIUS
ρ =.44
−50
510
β Fo
rmal
adu
lt ed
ucat
ion
0 1 2 3
BE−Fl
CA−En
CA−FrCH−Fr
CH−Ge
CH−ItCZ
DE
DK
FIGB
HU
IE
IE−No
IT
NL
NONZ
PLSE SI
US
ρ =.22
02
46
810
β N
on−f
orm
al tr
aini
ng0 1 2 3
β Years of educationβ Years of education
Note: Estimates from model 3.
Source: Own calculations based on the IALS.
Figure 3.5 Relationship between the returns to years of education, formal and non-formal adult learning: scatter-plots, correlation coefficients and linear regression lines.

Comparative contributions68
suggests that ability selection into adult learning is already captured by the previous controls (e.g., education and type of occupation).
We wish to acknowledge that the distinction between formal adult education and non-formal training does not do full justice to the wide variety of lifelong learning activities. However, contrary to our expectations, a further distinction between training inside and outside the firm does not prove particularly informative. More than the location of the training itself, it is possible that what matters most for earnings is whether learning activities are undertaken as a joint strategy between employers and employees rather than as an individual initiative of employees.
Our second main conclusion is that, in line with our hypotheses, returns to adult learning vary considerably across industrialized countries and that the institutional differences characterizing the four clusters of countries under examination are relevant, at least in the case of formal adult education. In particular, in the second half of the 1990s, this type of learning activity was less rewarding in the Nordic countries and more rewarding in the post-socialist countries, with the liberal and Central European countries lying in between. We have suggested that the institutional mechanisms driving these differences may be similar to the mechanisms driving differences in returns to education. Indeed, wage returns to formal adult education display marked correlations across countries with wage returns to years of schooling, which were also low for the Nordic countries and high for post-socialist countries. Another possible explanation for these cross-national differences is that formal adult education is more widespread in Nordic countries and less common in post-socialist nations. In other words, the prevalence of adult learning may be inversely correlated with its economic returns. However, we have found that the share of participants in adult learning activities does not account for the differences among the clusters of countries. This work indicates that such differences do exist, but future research is needed to shed more light on the detailed institutional mechanisms that drive them.
NOTES
1. See Asplund (2004) and Hansson (2008) for comprehensive literature reviews.2. We do not have information on the exact starting and ending dates of training episodes, which
means that right-censoring may be an issue, at least for a minority of cases.3. Among the 23 countries included in the IALS survey, we exclude Chile from our analysis.
Some units of analysis at the macro-level include regions within nations (e.g., within Canada, Switzerland), which should not be regarded as independent units, but we ignore this complication.
4. Since Italy is the only Southern European country, we include it in the Central European group because it shares several important institutional characteristics with these countries.

Returns to Adult Learning 69
5. These countries are likely to have been far more similar immediately after the fall of the Iron Curtain than now, which explains why we take a different choice than the previous chapter, that uses more recent data.
6. This decision is driven by the pragmatic concern that the formal adult education category has fewer cases, so we are urged to reduce the uncertainty of its multivariate estimates. This decision does not affect the main patterns of our results.
7. Individuals who reported both internal and external training experiences are assigned to the internal training category because it is likely that this activity is more valued by employers (Loewenstein and Spletzer 1999).
8. Parental occupation is not included because it is not available for all the countries and it has a relatively large number of missing values. Age could also be included among the occupation-related variables if considered as a proxy for job experience or tenure. This would not affect our main findings.
9. Unfortunately, we cannot include as a control variable employment in the public vs private sector, which is likely to affect both participation in adult learning and earnings, because this information is not available in the dataset. The type of contract is also excluded since it is not available for several countries and the share of fixed-term contracts was rather low in many countries in the mid-1990s.
10. Literacy is defined by the IALS team as the ability to “use printed and written information to function in society, to achieve one’s goals and to develop one’s knowledge and potential” (NCES 1998). The IALS administered a total of 114 open-ended literacy tasks, but each respondent answered only a subsample of this set of items. More details on the procedures of data collection, measurement, and scale construction can be found in the NCES (1998).
11. In our case, we attribute the following lower- and upper-bound values to the five original categories: I quintile = 0, 20; II quintile = 21, 40; III quintile = 41, 60; IV quintile = 61, 80; V quintile = 81, 100.
12. This model, as a standard OLS regression, focuses on mean outcomes and does not allow for the examination of whether the effect of training varies across the wage distribution. Nevertheless, Arulampalam, Booth and Bryan (2008) showed that for the majority of countries in their study, the association between training and hourly wages varies little across the conditional wage distribution, whereas there are considerable differences across countries in the average associations between training and wages.
13. It should be clear from this specification that we regard cognitive ability as the cumulative product of inherited talent, family socialization, education, and adult experiences in the work environment (and outside of it).
14. Due to space limitations, we do not report detailed estimates, which are available from the authors upon request.
15. When the appropriate information is missing, the information related to the closest year available is used. Information for sub-regions within countries is usually not available. In some cases, variability across sub-regions is achieved by imputing values for the whole country but in different years in relation to when the survey was administered. In other cases, when this strategy is not feasible, the sub-regions are assigned the same values on the macro-indicators.

Comparative contributions70
REFERENCES
Abadie, A., J. Angrist and G. Imbens (2003), ‘Instrumental variables estimates of the effect of subsidized training on the quantiles of trainee earnings’, Econometrica, 70 (1), 91–117.
Asplund, Rita (2004), ‘The provision and effects of company training: A brief review of the literature’, ETLA Discussion Paper, No. 907, The Research Institute of the Finnish Economy (ETLA).
Arulampalam, W., M. L. Bryan and A. L. Booth (2004), ‘Training in Europe’, Journal of the European Economic Association, 2 (2–3), 246–360.
Arulampalam, W., A. L. Booth and M. L. Bryan (2008), ‘Are there asymmetries in the effects of training on the conditional male wage distribution?’ Journal of Population Economics, 23, 251–72.
Badescu, M., B. D’Hombres and E. Villalba (2011), ‘Returns to education in European Countries. Evidence from the European Community Statistics on Income and Living Conditions (EU-SILC)’, available at: http://publications.jrc.ec.europa.eu/repository/bitstream/111111111/22267/1/reqno_ jrc65411_eur_24850_en_web.pdf%5B1%5D.pdf.
Barone, C. and H. van de Werfhorst (2011), ‘Education, cognitive skills and earnings in comparative perspective’, International Sociology, 26 (4), 483–502.
Barron, J. M., D. A. Black and M. A. Loewenstein (1993), ‘Gender differences in training, capital, and wages’, Journal of Human Resources, 28 (2), 343–64.
Bassanini, Andrea, Alison Booth, Giorgio Brunello, Maria De Paola and Edwin Leuven (2005), ‘Workplace training in Europe’, IZA Discussion Paper, No. 1640, Institute for the Study of Labour, Bonn.
Booth, A. (1993), ‘Private sector training and graduate earnings’, Review of Economics and Statistics, 75 (1), 164–70.
Becker, G. S. (1962), ‘Investment in human capital: a theoretical analysis’, Journal of Political Economy, 70 (1), 9–49.
Borjas, G. J. and G. T. Sueyoshi (1994), ‘A two-stage estimator for probit models with structural group effects’, Journal of Econometrics, 64, 165–82.
Brunello, Giorgio (2001), ‘On the complementarity between education and training in Europe’, IZA Discussion Paper, No. 309, Institute for the Study of Labour, Bonn.
Collins, Randall (1979), The Credential Society, New York: Academic Press.Dieckhoff, M. (2007), ‘Does it work? The effect of continuing training on labour
market outcomes: a comparative study of Germany, Denmark, and the United Kingdom’, European Sociological Review, 23 (3), 295–308.
Dieckhoff, Martina, Jean-Marie Jungblut, and Philip J. O’Connell (2007), ‘Job-related training in Europe. Do institutions matter?’ in Duncan Gallie (ed.), Employment Regimes and the Quality of Work, Oxford: Oxford University Press.
Hansson, Bo (2008), ‘Job-related training and benefits for individuals: a review of
Returns to Adult Learning 71
evidence and explanations’, OECD Education Working Paper, No. 19, OECD, Paris.
Huber, J. D., G. Kernell and E. L. Leoni (2005), ‘Institutional context, cognitive resources and party attachments across democracies’, Political Analysis, 13 (4), 365–86.
Jenkins, A., A. Vignoles, A. Wolf and F. Galindo-Rueda (2003), ‘The determinants and labour market effects of lifelong learning’, Applied Economics, 35 (16), 1711–21.
Lewis, J. B. and D. A. Linzer (2005), ‘Estimating regression models in which the dependent variable is based on estimates’, Political Analysis, 13 (4), 345–64.
Leuven, E. and H. Oosterbeek (2008), ‘An alternative approach to estimate the wage returns to private-sector training’, Journal of Applied Econometrics, 23, 423–34
Loewenstein, M. A. and J. R. Spletzer (1999), ‘General and specific training: Evidence and implications’, The Journal of Human Resources, 34 (4), 710–33.
Lynch, L. (1992), ‘Private sector training and the earnings of young workers’, American Economic Review, 82 (1), 299–312.
Muehler, G., M. Beckmann and B. Schauenberg (2007), ‘The returns to continuous training in Germany: new evidence from propensity score matching estimators’, Review of Managerial Science, 1, 209–35.
NCES (1998), Technical report on the first IALS, Canada: National Center for Education Statistics.
O’Connell, P. and D. Byrne (2012), ‘The determinants and effects of training at work: bringing the workplace back in’, European Sociological Review, 28 (3), 283–300.
OECD (2004), Co-financing lifelong learning: towards a systemic approach, Paris: OECD Publishing.
Spence, A. M. (1973), ‘Job market signalling’, Quarterly Journal of Economics, 87, 355–74.
Stewart, M. (1983), ‘On least squares estimation when the dependent variable is grouped’, Review of Economic Studies, 14, 737–53.
Thurow, Lester C. (1975), Generating Inequality: Mechanisms of Distribution in the U.S. Economy, New York: Basic Books.