Perspective - CiteSeerX
14
Perspective Toward a Molecular Understanding of Crystal Agglomeration Michael Brunsteiner, Alan G. Jones,* ,‡ Federica Pratola, ‡ Sarah L. Price, and Stefaan J. R. Simons ‡ Department of Chemistry, University College London, 20 Gordon Street, London WC1H 0AJ United Kingdom, and Department of Chemical Engineering, University College London, Torrington Place, London, WC1E 7JE United Kingdom Received May 19, 2004 ABSTRACT: A predictive model of the effect of crystal agglomeration on particle form and size distribution requires the quantification of various process parameters that depend on the microscopic properties of specific crystal faces and their interaction with the solvent. In this article, we discuss the various stages in the agglomeration process, using the results of recent experiments on breaking the agglomerative bond and atomic level simulations on the forces involved in crystal aggregation, to highlight the questions that need to be resolved for agglomeration processes to be understood. 1. Introduction During industrial crystallization, nucleation and crys- tal growth are the primary particle formation processes, but within agitated suspensions, secondary processes, including particle breakage, abnormal growth, and agglomeration, can have a determining effect on product quality, 1 in particular, on product form and shape and particle size distribution (PSD). Bimodal PSDs have been observed from well-mixed batch crystallizers 2,3 and from continuous mixed-suspension, mixed-product- removal (MSMPR) crystallizers. 4-6 Such distributions may be caused either by a size-dependent or dispersed aggregation rate, or by agglomerate disruption, or a combination of the two, but the mechanics of formation are not yet fully understood. Here, we take agglomera- tion to mean the intergrowth of aggregates formed by particle collisions, through a cementation process that forms an agglomerative bond. Some of the factors involved in particle agglomeration have been demonstrated in an elegant study of the precipitation and subsequent agglomeration of calcium oxalate dihydrate (CaOx) crystals in an MSMPR mini- nucleator/Couette aggregator sequence. 7,8 Agglomera- tion increased strongly with increasing CaOx supersat- uration, while disruption rates decreased, indicating that a change in ionic conditions at the crystal surface enhanced the probability and strength of particle at- tachment on collision. Agglomeration was only weakly dependent on agitation rate, while rupture of the agglomerates increased presumably due to increasing turbulence. Both crystal aggregation and agglomerate disruption have been inferred empirically to depend on crystal growth rates and, hence, solution supersatura- tion. The inference is that the strength of the crystal agglomerates appears to be a function of supersatura- tion. Thus, crystals appear to both aggregate and form agglomerative bonds at a faster rate at high supersatu- ration, with the resultant agglomerates becoming more difficult to disrupt. 9,10 A critical factor in understanding this behavior is the agglomerate bond strength, both during formation and subsequently, in comparison with the imposed forces due to turbulent motion, which contribute to agglomera- tion and particle breakage. We report here the results of studies to make a fundamental analysis of crystal agglomeration and to assess what is required for a predictive understanding. First, direct measurements are made of the force of attachment of individual crystals within an agglomerate in a supersaturated solution, as a function of supersaturation and the type of crystal faces, using a microforce balance. These results are then compared with bulk data from continu- ous crystallizers at various power inputs, 11 showing that the agglomerate bond strengths are compatible with the fragmentation of agglomerates. Finally, an understand- ing of the dependence of the adhesion forces on the * To whom correspondence should be addressed. E-mail: a.jones@ ucl.ac.uk. Department of Chemistry, University College London. ‡ Department of Chemical Engineering, University College London. CRYSTAL GROWTH & DESIGN 2005 VOL. 5, NO. 1 3 - 16 10.1021/cg049837m CCC: $30.25 © 2005 American Chemical Society Published on Web 09/15/2004
-
Upload
khangminh22 -
Category
Documents
-
view
1 -
download
0
Transcript of Perspective - CiteSeerX
Perspective
Toward a Molecular Understanding of CrystalAgglomeration
Michael Brunsteiner,† Alan G. Jones,*,‡ Federica Pratola,‡ Sarah L. Price,† andStefaan J. R. Simons‡
Department of Chemistry, University College London, 20 Gordon Street,London WC1H 0AJ United Kingdom, and Department of Chemical Engineering,University College London, Torrington Place, London, WC1E 7JE United Kingdom
Received May 19, 2004
ABSTRACT: A predictive model of the effect of crystal agglomeration on particle form and size distribution requiresthe quantification of various process parameters that depend on the microscopic properties of specific crystal facesand their interaction with the solvent. In this article, we discuss the various stages in the agglomeration process,using the results of recent experiments on breaking the agglomerative bond and atomic level simulations on theforces involved in crystal aggregation, to highlight the questions that need to be resolved for agglomeration processesto be understood.
1. Introduction
During industrial crystallization, nucleation and crys-tal growth are the primary particle formation processes,but within agitated suspensions, secondary processes,including particle breakage, abnormal growth, andagglomeration, can have a determining effect on productquality,1 in particular, on product form and shape andparticle size distribution (PSD). Bimodal PSDs havebeen observed from well-mixed batch crystallizers2,3 andfrom continuous mixed-suspension, mixed-product-removal (MSMPR) crystallizers.4-6 Such distributionsmay be caused either by a size-dependent or dispersedaggregation rate, or by agglomerate disruption, or acombination of the two, but the mechanics of formationare not yet fully understood. Here, we take agglomera-tion to mean the intergrowth of aggregates formed byparticle collisions, through a cementation process thatforms an agglomerative bond.
Some of the factors involved in particle agglomerationhave been demonstrated in an elegant study of theprecipitation and subsequent agglomeration of calciumoxalate dihydrate (CaOx) crystals in an MSMPR mini-nucleator/Couette aggregator sequence.7,8 Agglomera-tion increased strongly with increasing CaOx supersat-uration, while disruption rates decreased, indicatingthat a change in ionic conditions at the crystal surface
enhanced the probability and strength of particle at-tachment on collision. Agglomeration was only weaklydependent on agitation rate, while rupture of theagglomerates increased presumably due to increasingturbulence. Both crystal aggregation and agglomeratedisruption have been inferred empirically to depend oncrystal growth rates and, hence, solution supersatura-tion. The inference is that the strength of the crystalagglomerates appears to be a function of supersatura-tion. Thus, crystals appear to both aggregate and formagglomerative bonds at a faster rate at high supersatu-ration, with the resultant agglomerates becoming moredifficult to disrupt.9,10
A critical factor in understanding this behavior is theagglomerate bond strength, both during formation andsubsequently, in comparison with the imposed forcesdue to turbulent motion, which contribute to agglomera-tion and particle breakage. We report here the resultsof studies to make a fundamental analysis of crystalagglomeration and to assess what is required for apredictive understanding. First, direct measurementsare made of the force of attachment of individualcrystals within an agglomerate in a supersaturatedsolution, as a function of supersaturation and the typeof crystal faces, using a microforce balance. Theseresults are then compared with bulk data from continu-ous crystallizers at various power inputs,11 showing thatthe agglomerate bond strengths are compatible with thefragmentation of agglomerates. Finally, an understand-ing of the dependence of the adhesion forces on the
* To whom correspondence should be addressed. E-mail: [email protected].
† Department of Chemistry, University College London.‡ Department of Chemical Engineering, University College London.
CRYSTALGROWTH& DESIGN
2005VOL.5,NO.1
3-16
10.1021/cg049837m CCC: $30.25 © 2005 American Chemical SocietyPublished on Web 09/15/2004
nature of the crystal surfaces and interface betweenaggregating crystals is gained through atomic levelsimulations. This comprises modeling the surface struc-tures, crystal morphology, and the energetics of theinteractions between each specific surface and the soluteand solvent molecules and between other surfaces. Inthis way, the propensity for crystals to aggregate andthen agglomerate, depending on the nature and orienta-tion of the contact surfaces, can be considered.
2. Crystal Agglomeration: From Crystallizers toAtomic Level
Agglomeration occurs when the motion of two or morecrystals in the suspension allows them to aggregate(Step 1, Figure 1a,b) and stay together sufficiently longfor the growth and intergrowth of an agglomerativebond (Step 2, Figure 1c). After aggregation, there issolution between the crystals, which determines theforces holding the crystallites together while an agglom-erative bond of the crystallizing material forms. Theliquid between the aggregated crystals is very differentfrom the bulk solution, and indeed, since it has beenshown that liquids confined to molecularly thin layersmay undergo a liquid-to-solid transition,12 may be ableto sustain a shear stress for macroscopic times. Bysimulating the forces between crystallites separated bya few molecular layers, and examining the nature of theagglomerative bond after breakage, we can make someinferences about the transition from an aggregate to anagglomerate.
Further collisions can lead to the breakage of bothaggregates and agglomerates (Step 3) (the former maybe considered aggregation inefficiency). Various expres-sions have been proposed to model the rates of both thecrystal aggregation and disruption of the agglomerativebond, based on either sound theoretical analysis of theparticle motion or purely empirical considerations.These models are described in this section, with par-ticular emphasis on the assumptions and empiricalparameters required to represent the forces between thecrystallites prior to and after the formation of theagglomerative bond.
2.1 Step 1: Aggregation and Collection Effi-ciency. As early as 1917, Smoluchowski13 showed thatthe rate of aggregation of spherical particles in alaminar shear field can be expressed as
with γ̆ as the shear rate and Lu and Lv as the sizes ofthe aggregating particles. As the aggregation rateincreases with the volume of the particle, it is morelikely that a large particle is involved in an aggregationevent than a small particle. In similar form, aggregationdue to diffusion of particles in eddies in a turbulent flowregime can be expressed as
with U as the velocity gradient of the fluid in turbulentmotion being proportional to ε1/2, where ε is the energydissipation rate14 (see later). In this model, the crystalsare assumed to be spherical and to aggregate on contact.Thus, the applicability of this model will depend on theactual morphology and whether the forces between thecrystals for all possible contacts are strongly attractive.
If we consider this process at the molecular level, itdescribes the approach of two particles on a macroscopiclength scale (Figure 1a). However, once the particles arewithin several nanometers (Figure 1b), the forces be-tween them are determined by the specific nature of thesurfaces of the particles and the nature of the solutionphase between them, as well as the dynamics of theapproach.
A mean field hydrodynamic model15 of aggregation toaccount for aggregation efficiency predicts a size depen-dence of aggregation that passes through a maximumwith increasing mean shear rate, together with acorrelating parameter for the aggregation efficiencybased on the ratio of aggregate strength to applied forcebetween particles. Mersmann and Braun16 and Houn-slow et al.17 provide detailed reviews of work in thisarea. Thus, the aggregation rate, â, can be divided intothree components18:
where âcoll reflects the collision rate of the particles, âL/
is the size dependency and Weff is the proportion ofcollisions that result in an aggregation, which shouldbe determined by the chemical nature of the surfacesand solvents. In this paper, we use molecular dynamicssimulations to demonstrate some of the factors thatinfluence Weff.
2.2 Step 2: Formation of the AgglomerativeBond. Very little has been established about how thecrystal faces, once in contact, actually form an agglom-erative bond, although liquid bridges play an importantrole.19,20 Other evidence comes from the decrease in thedisruption rate of calcium oxalate9 and of calciumcarbonate10 with increasing growth rate. When ag-glomeration takes place during precipitation, agglomer-ates are only recently attached, so the crystallinebridges between the primary particles are not yetcompletely desolvated and cemented and are thereforein a viscous liquid phase. The bonds of some agglom-erative fragments can thus be broken relatively easilyby agitation. Presumably, primary particles would usu-ally (although not necessarily invariably) be the easiestto remove by either fluid shear or collision. On the otherhand, previously aged and dried crystal agglomerates,often used as seeds, are mechanically stronger10 andshould therefore be more difficult to break and so theirattrition occurs at a lower rate.
Figure 1. The stages of crystal agglomeration (A) approachof two crystals on a macroscopic length scale, (B) aggregation,where for separations below several nanometers, the micro-scopic structure of the solvent, solute, and impurities affectthe interaction between the crystals, and (C) a solid agglom-erative bond forms between the particles.
Kagr(Lu,Lv) ) kU[Lu + Lv]3 ) âarl[Lu + Lv]
3 (2)
â ) Weff âcoll âL/ (3)
Kagr(Lu,Lv) ) 16
γ̆[Lu + Lv]3 ) âagr[Lu + Lv]
3 (1)
4 Crystal Growth & Design, Vol. 5, No. 1, 2005 Perspective
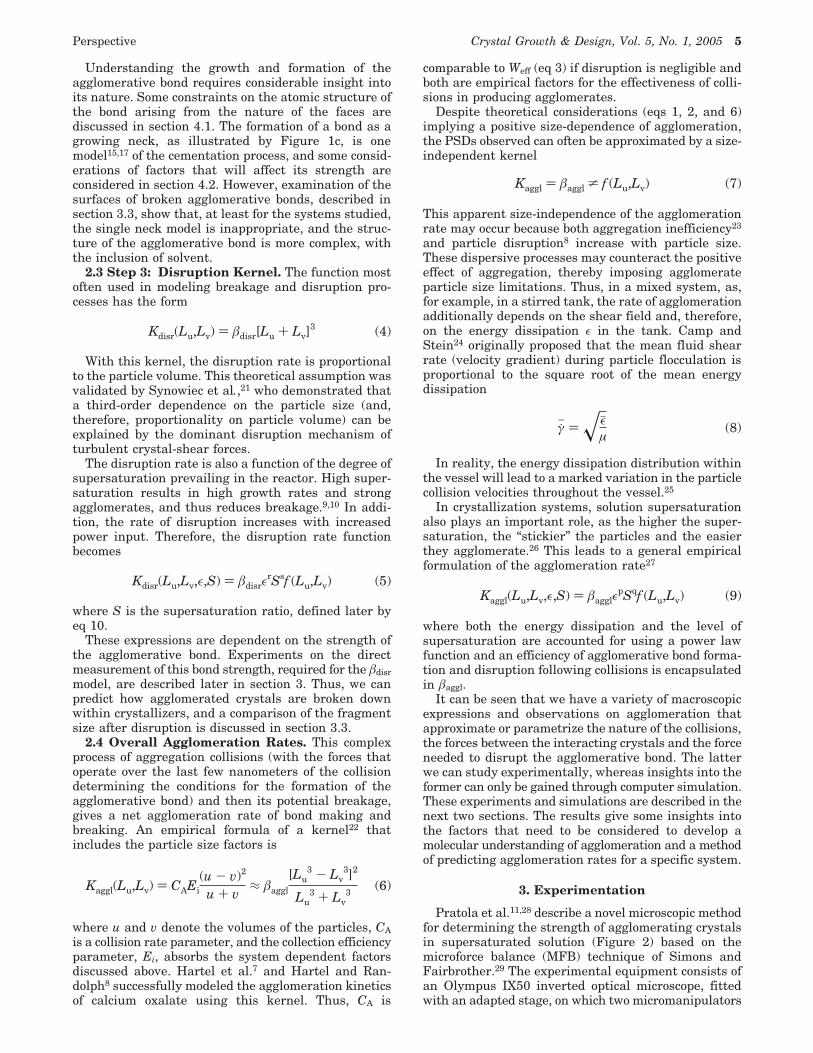
Understanding the growth and formation of theagglomerative bond requires considerable insight intoits nature. Some constraints on the atomic structure ofthe bond arising from the nature of the faces arediscussed in section 4.1. The formation of a bond as agrowing neck, as illustrated by Figure 1c, is onemodel15,17 of the cementation process, and some consid-erations of factors that will affect its strength areconsidered in section 4.2. However, examination of thesurfaces of broken agglomerative bonds, described insection 3.3, show that, at least for the systems studied,the single neck model is inappropriate, and the struc-ture of the agglomerative bond is more complex, withthe inclusion of solvent.
2.3 Step 3: Disruption Kernel. The function mostoften used in modeling breakage and disruption pro-cesses has the form
With this kernel, the disruption rate is proportionalto the particle volume. This theoretical assumption wasvalidated by Synowiec et al.,21 who demonstrated thata third-order dependence on the particle size (and,therefore, proportionality on particle volume) can beexplained by the dominant disruption mechanism ofturbulent crystal-shear forces.
The disruption rate is also a function of the degree ofsupersaturation prevailing in the reactor. High super-saturation results in high growth rates and strongagglomerates, and thus reduces breakage.9,10 In addi-tion, the rate of disruption increases with increasedpower input. Therefore, the disruption rate functionbecomes
where S is the supersaturation ratio, defined later byeq 10.
These expressions are dependent on the strength ofthe agglomerative bond. Experiments on the directmeasurement of this bond strength, required for the âdisrmodel, are described later in section 3. Thus, we canpredict how agglomerated crystals are broken downwithin crystallizers, and a comparison of the fragmentsize after disruption is discussed in section 3.3.
2.4 Overall Agglomeration Rates. This complexprocess of aggregation collisions (with the forces thatoperate over the last few nanometers of the collisiondetermining the conditions for the formation of theagglomerative bond) and then its potential breakage,gives a net agglomeration rate of bond making andbreaking. An empirical formula of a kernel22 thatincludes the particle size factors is
where u and v denote the volumes of the particles, CAis a collision rate parameter, and the collection efficiencyparameter, Ei, absorbs the system dependent factorsdiscussed above. Hartel et al.7 and Hartel and Ran-dolph8 successfully modeled the agglomeration kineticsof calcium oxalate using this kernel. Thus, CA is
comparable to Weff (eq 3) if disruption is negligible andboth are empirical factors for the effectiveness of colli-sions in producing agglomerates.
Despite theoretical considerations (eqs 1, 2, and 6)implying a positive size-dependence of agglomeration,the PSDs observed can often be approximated by a size-independent kernel
This apparent size-independence of the agglomerationrate may occur because both aggregation inefficiency23
and particle disruption8 increase with particle size.These dispersive processes may counteract the positiveeffect of aggregation, thereby imposing agglomerateparticle size limitations. Thus, in a mixed system, as,for example, in a stirred tank, the rate of agglomerationadditionally depends on the shear field and, therefore,on the energy dissipation ε in the tank. Camp andStein24 originally proposed that the mean fluid shearrate (velocity gradient) during particle flocculation isproportional to the square root of the mean energydissipation
In reality, the energy dissipation distribution withinthe vessel will lead to a marked variation in the particlecollision velocities throughout the vessel.25
In crystallization systems, solution supersaturationalso plays an important role, as the higher the super-saturation, the “stickier” the particles and the easierthey agglomerate.26 This leads to a general empiricalformulation of the agglomeration rate27
where both the energy dissipation and the level ofsupersaturation are accounted for using a power lawfunction and an efficiency of agglomerative bond forma-tion and disruption following collisions is encapsulatedin âaggl.
It can be seen that we have a variety of macroscopicexpressions and observations on agglomeration thatapproximate or parametrize the nature of the collisions,the forces between the interacting crystals and the forceneeded to disrupt the agglomerative bond. The latterwe can study experimentally, whereas insights into theformer can only be gained through computer simulation.These experiments and simulations are described in thenext two sections. The results give some insights intothe factors that need to be considered to develop amolecular understanding of agglomeration and a methodof predicting agglomeration rates for a specific system.
3. Experimentation
Pratola et al.11,28 describe a novel microscopic methodfor determining the strength of agglomerating crystalsin supersaturated solution (Figure 2) based on themicroforce balance (MFB) technique of Simons andFairbrother.29 The experimental equipment consists ofan Olympus IX50 inverted optical microscope, fittedwith an adapted stage, on which two micromanipulators
Kdisr(Lu,Lv) ) âdisr[Lu + Lv]3 (4)
Kdisr(Lu,Lv,ε,S) ) âdisrεrSsf (Lu,Lv) (5)
Kaggl(Lu,Lv) ) CAEi(u - v)2
u + v≈ âaggl
[Lu3 - Lv
3]2
Lu3 + Lv
3(6)
Kaggl ) âaggl * f (Lu,Lv) (7)
γ̆h ) xεjµ
(8)
Kaggl(Lu,Lv,ε,S) ) âagglεpSqf (Lu,Lv) (9)
Perspective Crystal Growth & Design, Vol. 5, No. 1, 2005 5
are employed to hold a pair of micropipets. This novelapparatus can measure adhesion forces between micro-scopic particles down to 10 µm in diameter.
The microscope and a video camera are positionedunder the stage, leaving the space above clear foroperation of the manipulators. The special design ofmanipulator B (see Figure 2) allows free rotation of thesupported pipets, which can be oriented perpendicularto the stage, to mount the crystals onto their tips, andthen moved onto the manipulators for measurementsto be carried out. With this tool, it is possible to havetwo crystals with opposing parallel faces. Before mea-surements, the pipets supporting the two selectedcrystals are fixed onto the manipulator parallel to thestage with their tips converging. The supported crystalsare then brought into contact. By using a travellingplatform on the stage G, an optical dish containing apresaturated solution can be raised to submerge thecrystals. The agglomeration occurs under a definedsupersaturation level attained by controlling the tem-perature with the annular thermostatic bath E.
The strength of the agglomerate can be assimilatedto the force needed to disrupt the agglomerate. Duringmeasurements, a long travel piezo adjuster H (MDE227, Elliot Scientific) imparts a controlled movement tothe manipulator C. The force necessary to break theagglomerate is measured by using two linear variabledifferential transducers (LVDT): LVDT I (type GTX1000) detects the movement of the manipulator C, whileLVDT L (Type G5, RDP electronics) detects the flexionof a calibrated flexible blade F (a dynamometer suitablefor solid bridges), mounted on the manipulator B. TheLVDT L allows the measurement of the flexion of theblade (and hence the agglomeration force). A videocamera (JVC 55) connected to the microscope capturesand records images of the crystals before and afterrupture. Crystal contact area and geometry are mea-sured using an image analysis technique.
All electronic devices on the MFB are computercontrolled, with the force and displacement measure-ments saved to hard disk.
3.1 The Crystal-Solvent Systems. Studies wereperformed using potassium aluminum sulfate (potashalum) and succinic acid in aqueous solutions. Thecrystallization of potash alum (K2SO4‚Al2(SO4)3‚24H2O,M ) 948.8, F ) 1760 kg m-3) from aqueous solution hasbeen extensively studied by a large number of workersover the past 20 years.30-32 This substance is oftenselected in investigations on crystallization because (i)
it invariably crystallizes in the form of discrete, near-perfect octahedra (with a surface shape factor of 2.46),(ii) it has well-known kinetics of crystallization, and (iii)it has high solubility that gives a wide metastable rangeavoiding excessive and unwanted nucleation. Further-more, of advantage to this study is the fact that potashalum exhibits three distinctive types of crystal faces(111), (110), and (100), which enables the effects of thenature of the opposing faces at the bond site on theagglomerate bond strength to be investigated.
A smaller set of experiments was performed on anorganic crystal, succinic acid, to investigate the meanvalue of agglomerate strength under a fixed supersatu-ration condition and the effect of supersaturation onagglomerate strength. Experiments were performedusing (020) faces only, since the experimental morphol-ogy of succinic acid crystals are mainly “monodimen-sional”.
The crystal surface topography was assessed bymeans of optical interferometry to detect imperfectionson the free surfaces of each crystal.33 The technique cangive information about the surface microtopography ofa crystal by the application of localized multiple-beamfringes to the surfaces.34
To reveal fringes of interference on a crystal surfacefor the examination of the surface microtopography, theinverted Olympus IX-70 was used as an interferencemicroscope focused on crystals sprinkled onto a glassslide. The appearance of interference fringes indicatesa smooth and flat surface. Hence, those crystals exhibit-ing such fringes have smooth faces lying parallel to theglass microslides and can be glued onto the micropipetsfollowing the procedure described above, to ensuremeasurement of agglomeration forces between crystalswith parallel faces.
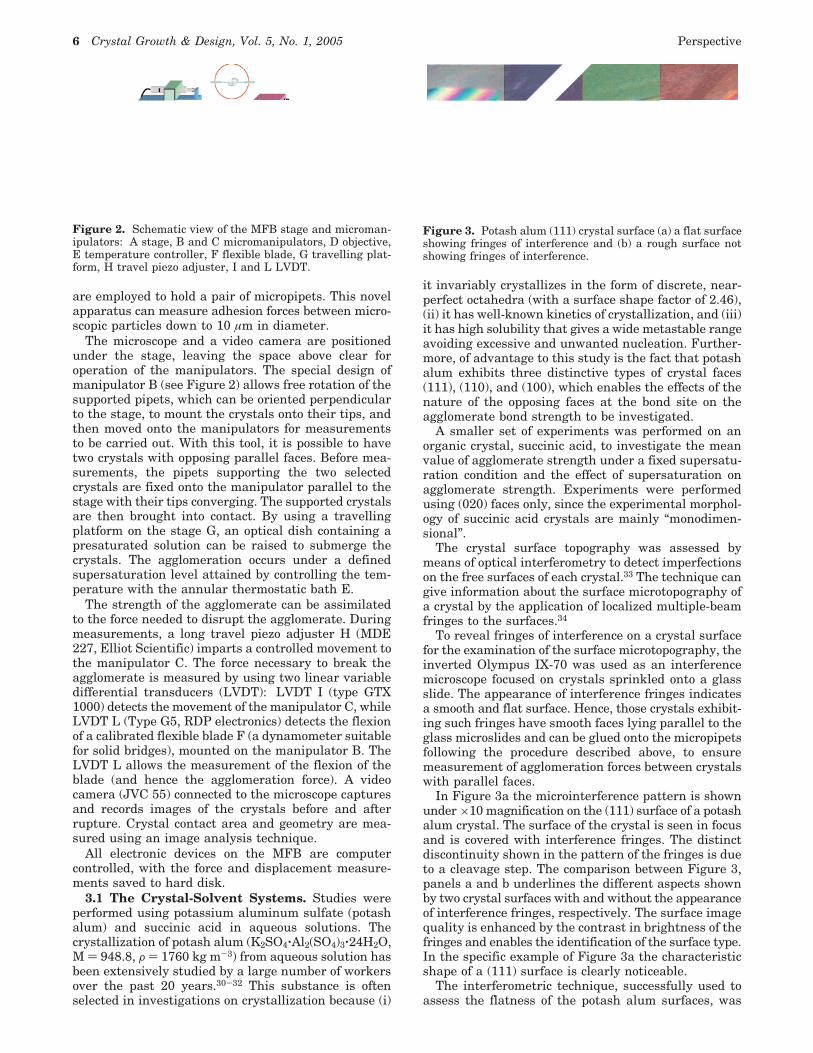
In Figure 3a the microinterference pattern is shownunder ×10 magnification on the (111) surface of a potashalum crystal. The surface of the crystal is seen in focusand is covered with interference fringes. The distinctdiscontinuity shown in the pattern of the fringes is dueto a cleavage step. The comparison between Figure 3,panels a and b underlines the different aspects shownby two crystal surfaces with and without the appearanceof interference fringes, respectively. The surface imagequality is enhanced by the contrast in brightness of thefringes and enables the identification of the surface type.In the specific example of Figure 3a the characteristicshape of a (111) surface is clearly noticeable.
The interferometric technique, successfully used toassess the flatness of the potash alum surfaces, was
Figure 2. Schematic view of the MFB stage and microman-ipulators: A stage, B and C micromanipulators, D objective,E temperature controller, F flexible blade, G travelling plat-form, H travel piezo adjuster, I and L LVDT.
Figure 3. Potash alum (111) crystal surface (a) a flat surfaceshowing fringes of interference and (b) a rough surface notshowing fringes of interference.
6 Crystal Growth & Design, Vol. 5, No. 1, 2005 Perspective
found to be ineffective for succinic acid. As emphasizedin Figure 4, which depicts a succinic acid (020) facetaken under the microscope using the interferometrictechnique, only a few fringes of interference are appar-ent. This suggests that succinic acid crystal faces arenot sufficiently flat and regular to form fringes ofinterference over the extent of the surface. As a conse-quence, the choice of the surface to be used for experi-ments was performed by visual observation under themicroscope.
3.2 Specific Experimental Procedures and Re-sults. 3.2.1 Effect of Supersaturation. Experimentswere performed to investigate the effects of supersatu-ration on agglomerate strength using a solution ofpotash alum saturated at 25 °C.35 The solution wasstored at around 30-35 °C and kept agitated using amagnetic stirrer. The experimental conditions are sum-marized in Table 1a. The experiments were performedusing (111) crystal faces of potash alum only. For eachexperiment, a pair of regular and flat crystals wasselected under the microscope using the interferometricmethod, glued onto the two micropipets, and then fixedon the manipulator with their tips converging, asdescribed in the previous section. A total of 3 mL of theprepared solution was poured into the thermostatic dish.The two crystals were brought into contact and thenimmersed in the solution and left for 45 min to ag-glomerate. After this period of time, the agglomeratewas broken and the displacement of the two LVDTswere recorded.
An analogous set of experiments was performed onthe (020) crystal faces of succinic acid, with the experi-mental conditions summarized in Table 2.
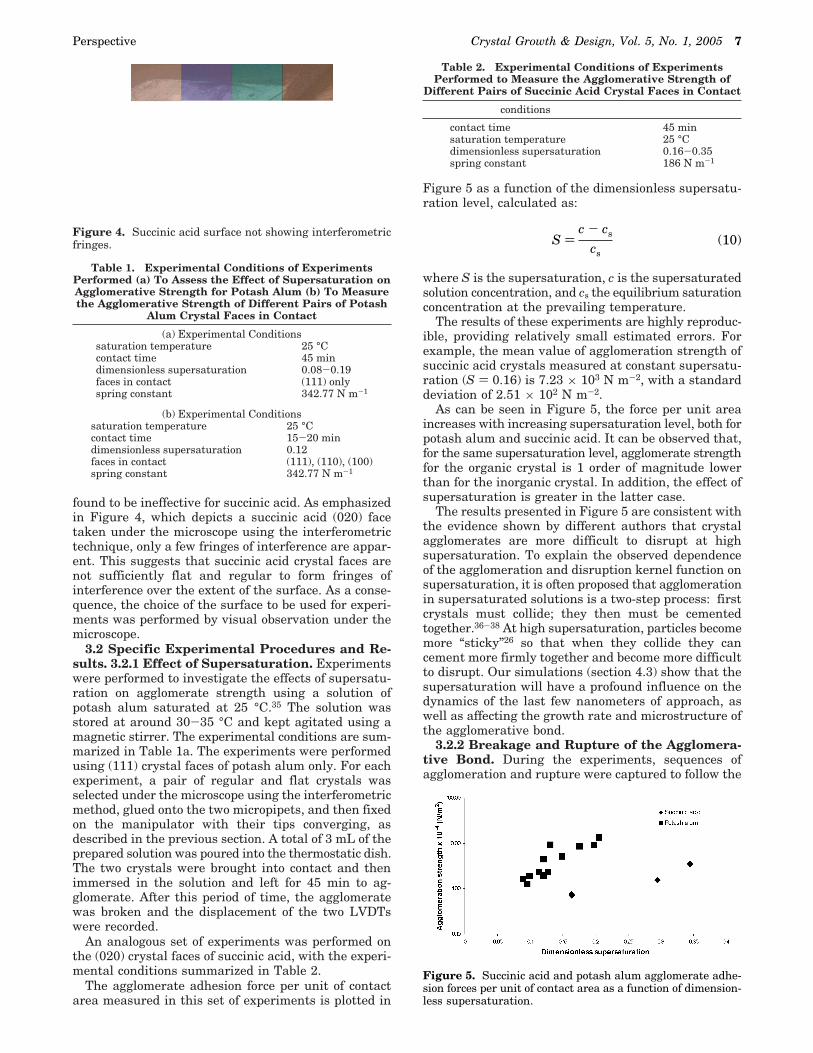
The agglomerate adhesion force per unit of contactarea measured in this set of experiments is plotted in
Figure 5 as a function of the dimensionless supersatu-ration level, calculated as:
where S is the supersaturation, c is the supersaturatedsolution concentration, and cs the equilibrium saturationconcentration at the prevailing temperature.
The results of these experiments are highly reproduc-ible, providing relatively small estimated errors. Forexample, the mean value of agglomeration strength ofsuccinic acid crystals measured at constant supersatu-ration (S ) 0.16) is 7.23 × 10³ N m-2, with a standarddeviation of 2.51 × 10² N m-2.
As can be seen in Figure 5, the force per unit areaincreases with increasing supersaturation level, both forpotash alum and succinic acid. It can be observed that,for the same supersaturation level, agglomerate strengthfor the organic crystal is 1 order of magnitude lowerthan for the inorganic crystal. In addition, the effect ofsupersaturation is greater in the latter case.
The results presented in Figure 5 are consistent withthe evidence shown by different authors that crystalagglomerates are more difficult to disrupt at highsupersaturation. To explain the observed dependenceof the agglomeration and disruption kernel function onsupersaturation, it is often proposed that agglomerationin supersaturated solutions is a two-step process: firstcrystals must collide; they then must be cementedtogether.36-38 At high supersaturation, particles becomemore “sticky”26 so that when they collide they cancement more firmly together and become more difficultto disrupt. Our simulations (section 4.3) show that thesupersaturation will have a profound influence on thedynamics of the last few nanometers of approach, aswell as affecting the growth rate and microstructure ofthe agglomerative bond.
3.2.2 Breakage and Rupture of the Agglomera-tive Bond. During the experiments, sequences ofagglomeration and rupture were captured to follow the
Figure 4. Succinic acid surface not showing interferometricfringes.
Table 1. Experimental Conditions of ExperimentsPerformed (a) To Assess the Effect of Supersaturation onAgglomerative Strength for Potash Alum (b) To Measurethe Agglomerative Strength of Different Pairs of Potash
Alum Crystal Faces in Contact
(a) Experimental Conditionssaturation temperature 25 °Ccontact time 45 mindimensionless supersaturation 0.08-0.19faces in contact (111) onlyspring constant 342.77 N m-1
(b) Experimental Conditionssaturation temperature 25 °Ccontact time 15-20 mindimensionless supersaturation 0.12faces in contact (111), (110), (100)spring constant 342.77 N m-1
Table 2. Experimental Conditions of ExperimentsPerformed to Measure the Agglomerative Strength of
Different Pairs of Succinic Acid Crystal Faces in Contact
conditions
contact time 45 minsaturation temperature 25 °Cdimensionless supersaturation 0.16-0.35spring constant 186 N m-1
Figure 5. Succinic acid and potash alum agglomerate adhe-sion forces per unit of contact area as a function of dimension-less supersaturation.
S )c - cs
cs(10)
Perspective Crystal Growth & Design, Vol. 5, No. 1, 2005 7
evolution of the agglomerate’s growth (Figure 6a,b) andsubsequent rupture (Figure 6c).
Images of the crystal surfaces that came into contactwere captured before and after each experiment (Figure7). From the comparison of the two pictures, it ispossible to elucidate the area of contact between the twocrystals. At the beginning (Figure 7a) the entire surfaceof the crystal appears to be flat, as is apparent fromthe interference fringes. However, after the rupture ofthe agglomerate (Figure 7b), only the surrounding partof the surface is flat, while the central part comprises arough rim of broken agglomerative bond surrounding asmoother concave surface. The area enclosed by therough rim can be considered to be the contact area andcan be measured using image analysis. These can becontrasted with the images of the surface of succinic acidcrystals before agglomeration (Figure 7c) and afterrupture (Figure 7d), where the agglomerative bondseems to have formed in patches between the twocrystals. The contact area comprises an irregular pat-tern of smooth depressed and roughened raised areas,the latter being the broken agglomerative bond.
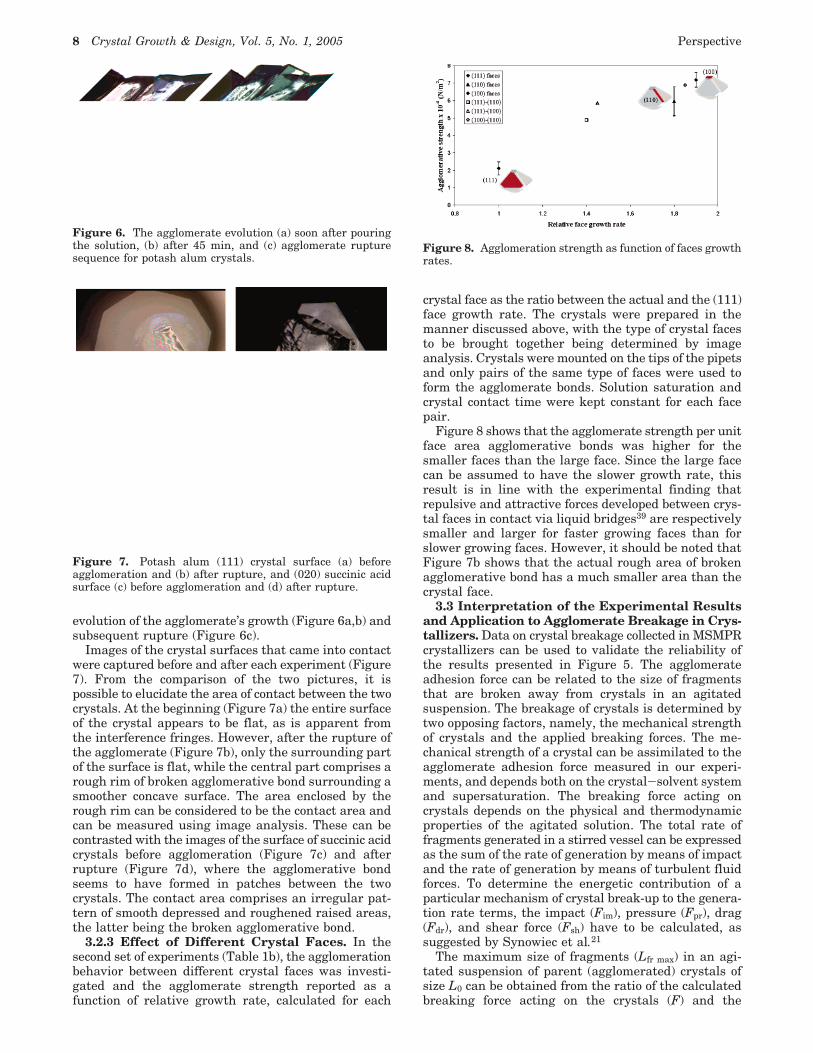
3.2.3 Effect of Different Crystal Faces. In thesecond set of experiments (Table 1b), the agglomerationbehavior between different crystal faces was investi-gated and the agglomerate strength reported as afunction of relative growth rate, calculated for each
crystal face as the ratio between the actual and the (111)face growth rate. The crystals were prepared in themanner discussed above, with the type of crystal facesto be brought together being determined by imageanalysis. Crystals were mounted on the tips of the pipetsand only pairs of the same type of faces were used toform the agglomerate bonds. Solution saturation andcrystal contact time were kept constant for each facepair.
Figure 8 shows that the agglomerate strength per unitface area agglomerative bonds was higher for thesmaller faces than the large face. Since the large facecan be assumed to have the slower growth rate, thisresult is in line with the experimental finding thatrepulsive and attractive forces developed between crys-tal faces in contact via liquid bridges39 are respectivelysmaller and larger for faster growing faces than forslower growing faces. However, it should be noted thatFigure 7b shows that the actual rough area of brokenagglomerative bond has a much smaller area than thecrystal face.
3.3 Interpretation of the Experimental Resultsand Application to Agglomerate Breakage in Crys-tallizers. Data on crystal breakage collected in MSMPRcrystallizers can be used to validate the reliability ofthe results presented in Figure 5. The agglomerateadhesion force can be related to the size of fragmentsthat are broken away from crystals in an agitatedsuspension. The breakage of crystals is determined bytwo opposing factors, namely, the mechanical strengthof crystals and the applied breaking forces. The me-chanical strength of a crystal can be assimilated to theagglomerate adhesion force measured in our experi-ments, and depends both on the crystal-solvent systemand supersaturation. The breaking force acting oncrystals depends on the physical and thermodynamicproperties of the agitated solution. The total rate offragments generated in a stirred vessel can be expressedas the sum of the rate of generation by means of impactand the rate of generation by means of turbulent fluidforces. To determine the energetic contribution of aparticular mechanism of crystal break-up to the genera-tion rate terms, the impact (Fim), pressure (Fpr), drag(Fdr), and shear force (Fsh) have to be calculated, assuggested by Synowiec et al.21
The maximum size of fragments (Lfr max) in an agi-tated suspension of parent (agglomerated) crystals ofsize L0 can be obtained from the ratio of the calculatedbreaking force acting on the crystals (F) and the
Figure 6. The agglomerate evolution (a) soon after pouringthe solution, (b) after 45 min, and (c) agglomerate rupturesequence for potash alum crystals.
Figure 7. Potash alum (111) crystal surface (a) beforeagglomeration and (b) after rupture, and (020) succinic acidsurface (c) before agglomeration and (d) after rupture.
Figure 8. Agglomeration strength as function of faces growthrates.
8 Crystal Growth & Design, Vol. 5, No. 1, 2005 Perspective
measured agglomerate adhesion force per unit contactarea (φa):
where the maximum fragment size is assumed to berelated to the contact area between the fragment andthe parent agglomerate as:
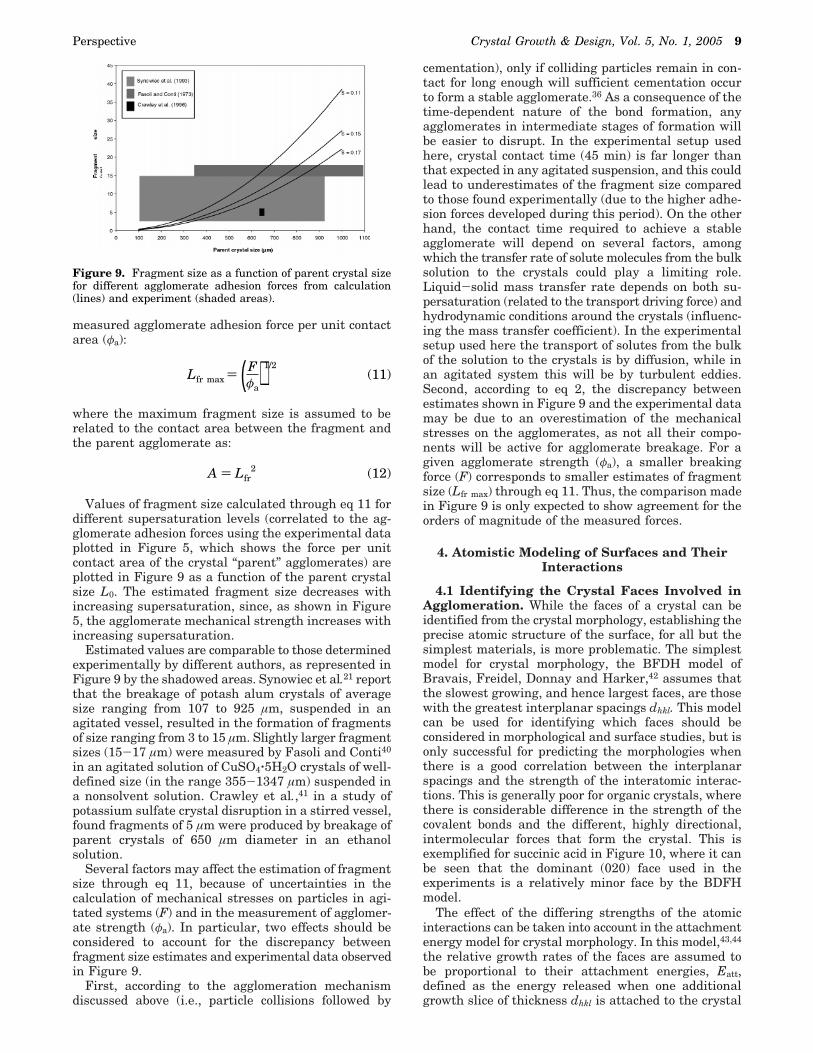
Values of fragment size calculated through eq 11 fordifferent supersaturation levels (correlated to the ag-glomerate adhesion forces using the experimental dataplotted in Figure 5, which shows the force per unitcontact area of the crystal “parent” agglomerates) areplotted in Figure 9 as a function of the parent crystalsize L0. The estimated fragment size decreases withincreasing supersaturation, since, as shown in Figure5, the agglomerate mechanical strength increases withincreasing supersaturation.
Estimated values are comparable to those determinedexperimentally by different authors, as represented inFigure 9 by the shadowed areas. Synowiec et al.21 reportthat the breakage of potash alum crystals of averagesize ranging from 107 to 925 µm, suspended in anagitated vessel, resulted in the formation of fragmentsof size ranging from 3 to 15 µm. Slightly larger fragmentsizes (15-17 µm) were measured by Fasoli and Conti40
in an agitated solution of CuSO4‚5H2O crystals of well-defined size (in the range 355-1347 µm) suspended ina nonsolvent solution. Crawley et al.,41 in a study ofpotassium sulfate crystal disruption in a stirred vessel,found fragments of 5 µm were produced by breakage ofparent crystals of 650 µm diameter in an ethanolsolution.
Several factors may affect the estimation of fragmentsize through eq 11, because of uncertainties in thecalculation of mechanical stresses on particles in agi-tated systems (F) and in the measurement of agglomer-ate strength (φa). In particular, two effects should beconsidered to account for the discrepancy betweenfragment size estimates and experimental data observedin Figure 9.
First, according to the agglomeration mechanismdiscussed above (i.e., particle collisions followed by
cementation), only if colliding particles remain in con-tact for long enough will sufficient cementation occurto form a stable agglomerate.36 As a consequence of thetime-dependent nature of the bond formation, anyagglomerates in intermediate stages of formation willbe easier to disrupt. In the experimental setup usedhere, crystal contact time (45 min) is far longer thanthat expected in any agitated suspension, and this couldlead to underestimates of the fragment size comparedto those found experimentally (due to the higher adhe-sion forces developed during this period). On the otherhand, the contact time required to achieve a stableagglomerate will depend on several factors, amongwhich the transfer rate of solute molecules from the bulksolution to the crystals could play a limiting role.Liquid-solid mass transfer rate depends on both su-persaturation (related to the transport driving force) andhydrodynamic conditions around the crystals (influenc-ing the mass transfer coefficient). In the experimentalsetup used here the transport of solutes from the bulkof the solution to the crystals is by diffusion, while inan agitated system this will be by turbulent eddies.Second, according to eq 2, the discrepancy betweenestimates shown in Figure 9 and the experimental datamay be due to an overestimation of the mechanicalstresses on the agglomerates, as not all their compo-nents will be active for agglomerate breakage. For agiven agglomerate strength (φa), a smaller breakingforce (F) corresponds to smaller estimates of fragmentsize (Lfr max) through eq 11. Thus, the comparison madein Figure 9 is only expected to show agreement for theorders of magnitude of the measured forces.
4. Atomistic Modeling of Surfaces and TheirInteractions
4.1 Identifying the Crystal Faces Involved inAgglomeration. While the faces of a crystal can beidentified from the crystal morphology, establishing theprecise atomic structure of the surface, for all but thesimplest materials, is more problematic. The simplestmodel for crystal morphology, the BFDH model ofBravais, Freidel, Donnay and Harker,42 assumes thatthe slowest growing, and hence largest faces, are thosewith the greatest interplanar spacings dhkl. This modelcan be used for identifying which faces should beconsidered in morphological and surface studies, but isonly successful for predicting the morphologies whenthere is a good correlation between the interplanarspacings and the strength of the interatomic interac-tions. This is generally poor for organic crystals, wherethere is considerable difference in the strength of thecovalent bonds and the different, highly directional,intermolecular forces that form the crystal. This isexemplified for succinic acid in Figure 10, where it canbe seen that the dominant (020) face used in theexperiments is a relatively minor face by the BDFHmodel.
The effect of the differing strengths of the atomicinteractions can be taken into account in the attachmentenergy model for crystal morphology. In this model,43,44
the relative growth rates of the faces are assumed tobe proportional to their attachment energies, Eatt,defined as the energy released when one additionalgrowth slice of thickness dhkl is attached to the crystal
Figure 9. Fragment size as a function of parent crystal sizefor different agglomerate adhesion forces from calculation(lines) and experiment (shaded areas).
Lfr max ) (Fφa
)1/2(11)
A ) Lfr2 (12)
Perspective Crystal Growth & Design, Vol. 5, No. 1, 2005 9
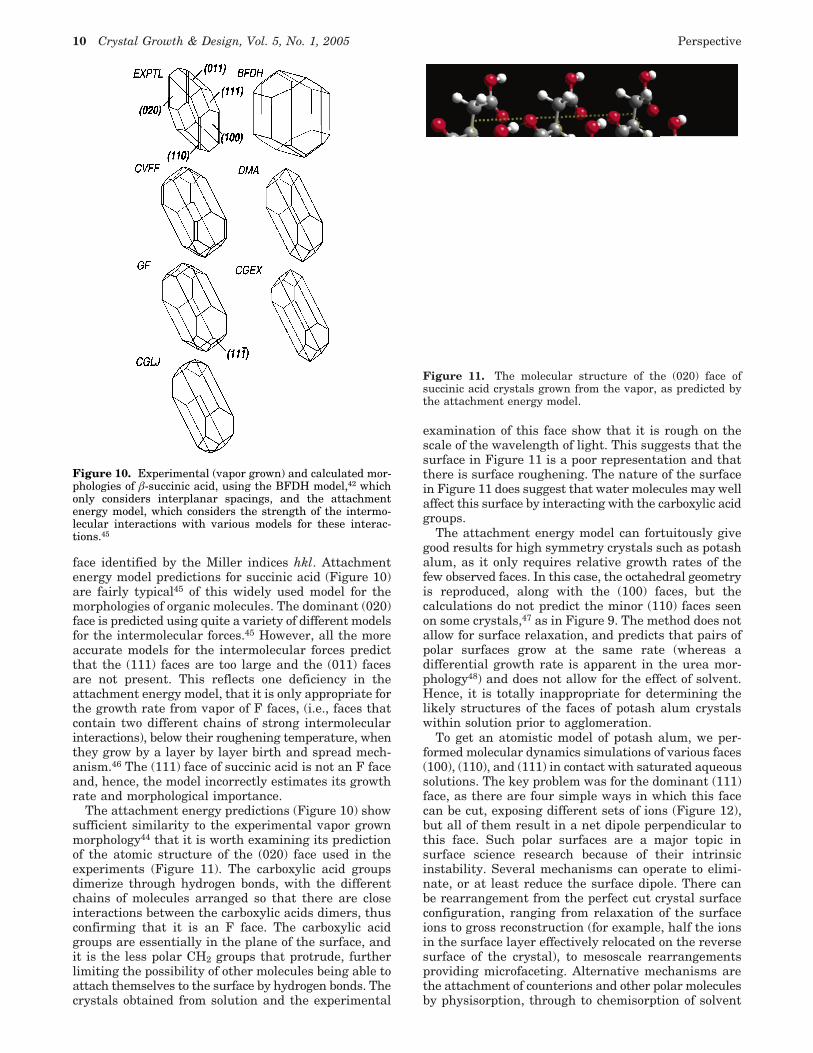
face identified by the Miller indices hkl. Attachmentenergy model predictions for succinic acid (Figure 10)are fairly typical45 of this widely used model for themorphologies of organic molecules. The dominant (020)face is predicted using quite a variety of different modelsfor the intermolecular forces.45 However, all the moreaccurate models for the intermolecular forces predictthat the (111) faces are too large and the (011) facesare not present. This reflects one deficiency in theattachment energy model, that it is only appropriate forthe growth rate from vapor of F faces, (i.e., faces thatcontain two different chains of strong intermolecularinteractions), below their roughening temperature, whenthey grow by a layer by layer birth and spread mech-anism.46 The (111) face of succinic acid is not an F faceand, hence, the model incorrectly estimates its growthrate and morphological importance.
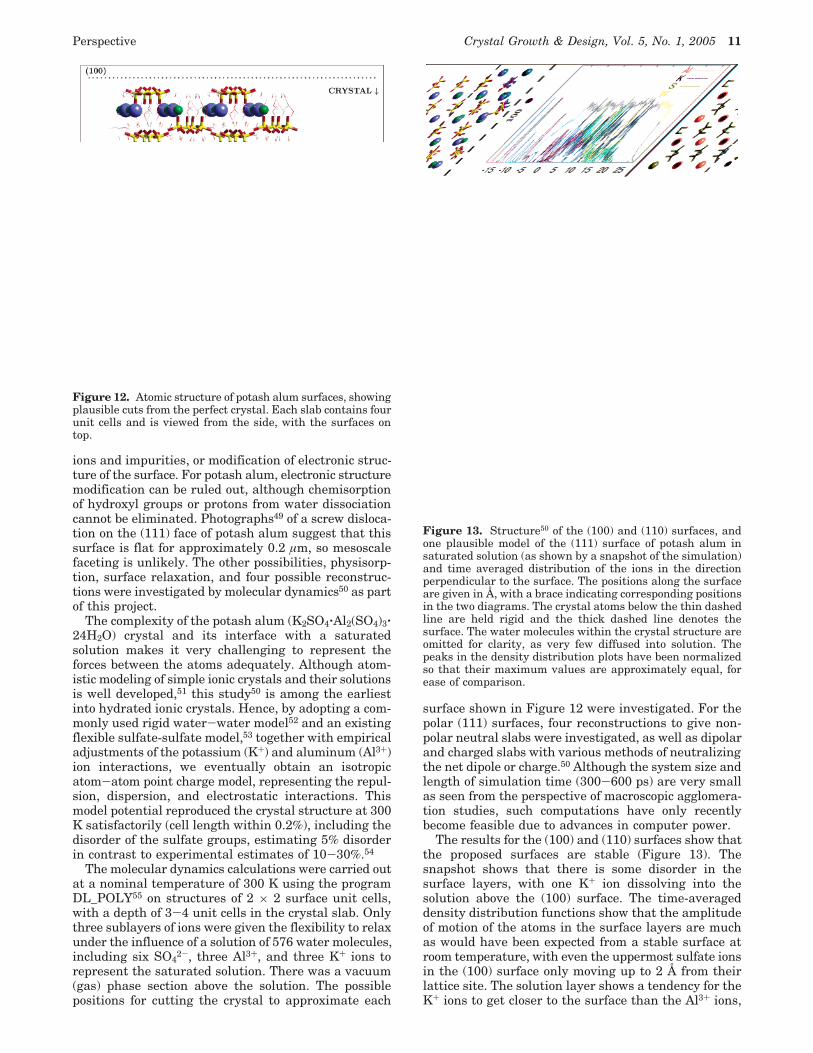
The attachment energy predictions (Figure 10) showsufficient similarity to the experimental vapor grownmorphology44 that it is worth examining its predictionof the atomic structure of the (020) face used in theexperiments (Figure 11). The carboxylic acid groupsdimerize through hydrogen bonds, with the differentchains of molecules arranged so that there are closeinteractions between the carboxylic acids dimers, thusconfirming that it is an F face. The carboxylic acidgroups are essentially in the plane of the surface, andit is the less polar CH2 groups that protrude, furtherlimiting the possibility of other molecules being able toattach themselves to the surface by hydrogen bonds. Thecrystals obtained from solution and the experimental
examination of this face show that it is rough on thescale of the wavelength of light. This suggests that thesurface in Figure 11 is a poor representation and thatthere is surface roughening. The nature of the surfacein Figure 11 does suggest that water molecules may wellaffect this surface by interacting with the carboxylic acidgroups.
The attachment energy model can fortuitously givegood results for high symmetry crystals such as potashalum, as it only requires relative growth rates of thefew observed faces. In this case, the octahedral geometryis reproduced, along with the (100) faces, but thecalculations do not predict the minor (110) faces seenon some crystals,47 as in Figure 9. The method does notallow for surface relaxation, and predicts that pairs ofpolar surfaces grow at the same rate (whereas adifferential growth rate is apparent in the urea mor-phology48) and does not allow for the effect of solvent.Hence, it is totally inappropriate for determining thelikely structures of the faces of potash alum crystalswithin solution prior to agglomeration.
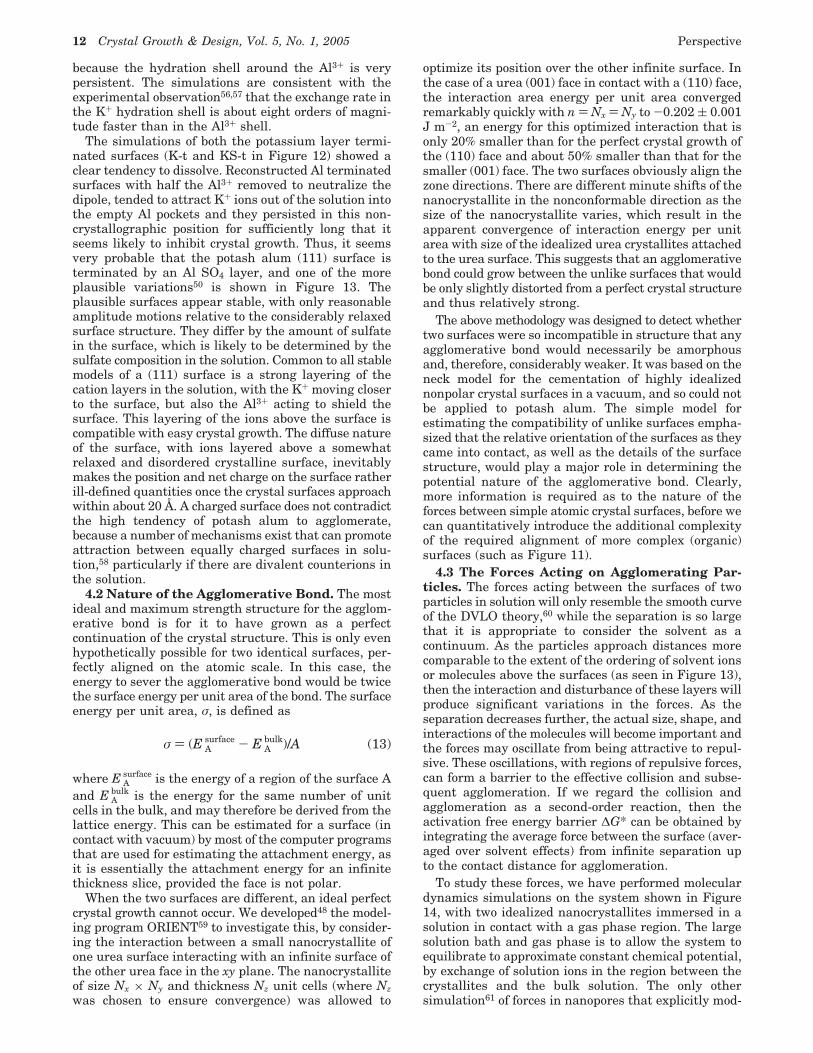
To get an atomistic model of potash alum, we per-formed molecular dynamics simulations of various faces(100), (110), and (111) in contact with saturated aqueoussolutions. The key problem was for the dominant (111)face, as there are four simple ways in which this facecan be cut, exposing different sets of ions (Figure 12),but all of them result in a net dipole perpendicular tothis face. Such polar surfaces are a major topic insurface science research because of their intrinsicinstability. Several mechanisms can operate to elimi-nate, or at least reduce the surface dipole. There canbe rearrangement from the perfect cut crystal surfaceconfiguration, ranging from relaxation of the surfaceions to gross reconstruction (for example, half the ionsin the surface layer effectively relocated on the reversesurface of the crystal), to mesoscale rearrangementsproviding microfaceting. Alternative mechanisms arethe attachment of counterions and other polar moleculesby physisorption, through to chemisorption of solvent
Figure 10. Experimental (vapor grown) and calculated mor-phologies of â-succinic acid, using the BFDH model,42 whichonly considers interplanar spacings, and the attachmentenergy model, which considers the strength of the intermo-lecular interactions with various models for these interac-tions.45
Figure 11. The molecular structure of the (020) face ofsuccinic acid crystals grown from the vapor, as predicted bythe attachment energy model.
10 Crystal Growth & Design, Vol. 5, No. 1, 2005 Perspective
ions and impurities, or modification of electronic struc-ture of the surface. For potash alum, electronic structuremodification can be ruled out, although chemisorptionof hydroxyl groups or protons from water dissociationcannot be eliminated. Photographs49 of a screw disloca-tion on the (111) face of potash alum suggest that thissurface is flat for approximately 0.2 µm, so mesoscalefaceting is unlikely. The other possibilities, physisorp-tion, surface relaxation, and four possible reconstruc-tions were investigated by molecular dynamics50 as partof this project.
The complexity of the potash alum (K2SO4‚Al2(SO4)3‚24H2O) crystal and its interface with a saturatedsolution makes it very challenging to represent theforces between the atoms adequately. Although atom-istic modeling of simple ionic crystals and their solutionsis well developed,51 this study50 is among the earliestinto hydrated ionic crystals. Hence, by adopting a com-monly used rigid water-water model52 and an existingflexible sulfate-sulfate model,53 together with empiricaladjustments of the potassium (K+) and aluminum (Al3+)ion interactions, we eventually obtain an isotropicatom-atom point charge model, representing the repul-sion, dispersion, and electrostatic interactions. Thismodel potential reproduced the crystal structure at 300K satisfactorily (cell length within 0.2%), including thedisorder of the sulfate groups, estimating 5% disorderin contrast to experimental estimates of 10-30%.54
The molecular dynamics calculations were carried outat a nominal temperature of 300 K using the programDL_POLY55 on structures of 2 × 2 surface unit cells,with a depth of 3-4 unit cells in the crystal slab. Onlythree sublayers of ions were given the flexibility to relaxunder the influence of a solution of 576 water molecules,including six SO4
2-, three Al3+, and three K+ ions torepresent the saturated solution. There was a vacuum(gas) phase section above the solution. The possiblepositions for cutting the crystal to approximate each
surface shown in Figure 12 were investigated. For thepolar (111) surfaces, four reconstructions to give non-polar neutral slabs were investigated, as well as dipolarand charged slabs with various methods of neutralizingthe net dipole or charge.50 Although the system size andlength of simulation time (300-600 ps) are very smallas seen from the perspective of macroscopic agglomera-tion studies, such computations have only recentlybecome feasible due to advances in computer power.
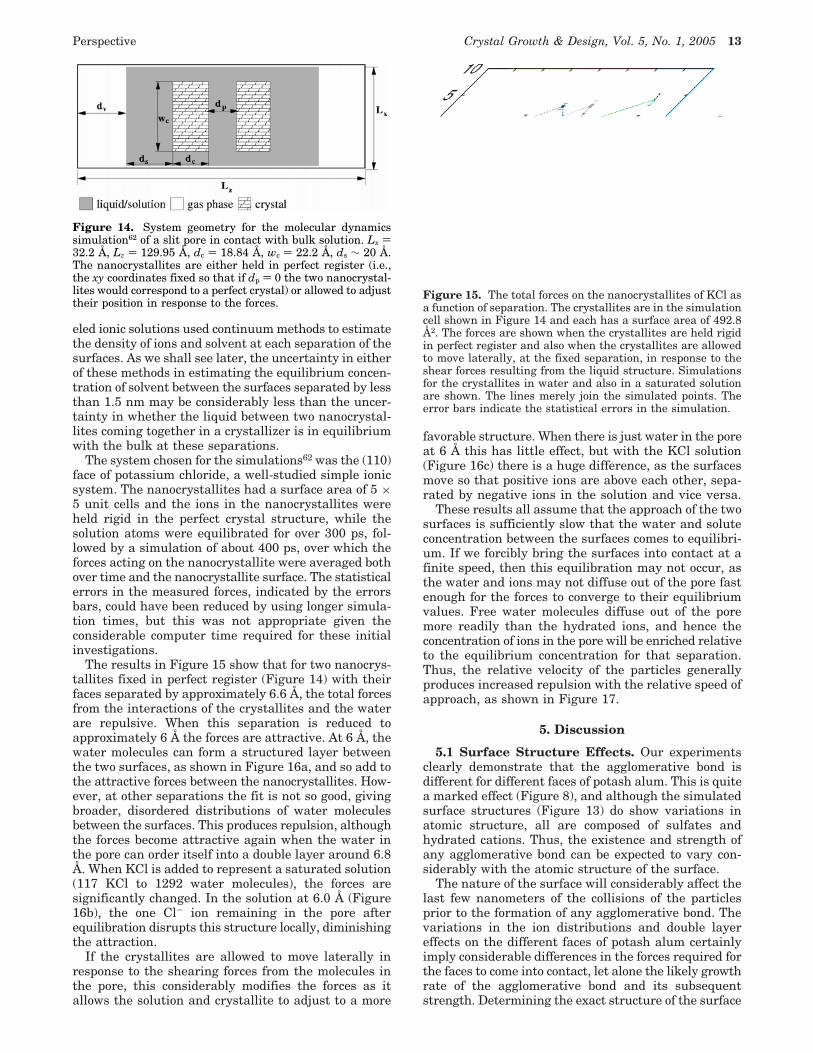
The results for the (100) and (110) surfaces show thatthe proposed surfaces are stable (Figure 13). Thesnapshot shows that there is some disorder in thesurface layers, with one K+ ion dissolving into thesolution above the (100) surface. The time-averageddensity distribution functions show that the amplitudeof motion of the atoms in the surface layers are muchas would have been expected from a stable surface atroom temperature, with even the uppermost sulfate ionsin the (100) surface only moving up to 2 Å from theirlattice site. The solution layer shows a tendency for theK+ ions to get closer to the surface than the Al3+ ions,
Figure 12. Atomic structure of potash alum surfaces, showingplausible cuts from the perfect crystal. Each slab contains fourunit cells and is viewed from the side, with the surfaces ontop.
Figure 13. Structure50 of the (100) and (110) surfaces, andone plausible model of the (111) surface of potash alum insaturated solution (as shown by a snapshot of the simulation)and time averaged distribution of the ions in the directionperpendicular to the surface. The positions along the surfaceare given in Å, with a brace indicating corresponding positionsin the two diagrams. The crystal atoms below the thin dashedline are held rigid and the thick dashed line denotes thesurface. The water molecules within the crystal structure areomitted for clarity, as very few diffused into solution. Thepeaks in the density distribution plots have been normalizedso that their maximum values are approximately equal, forease of comparison.
Perspective Crystal Growth & Design, Vol. 5, No. 1, 2005 11
because the hydration shell around the Al3+ is verypersistent. The simulations are consistent with theexperimental observation56,57 that the exchange rate inthe K+ hydration shell is about eight orders of magni-tude faster than in the Al3+ shell.
The simulations of both the potassium layer termi-nated surfaces (K-t and KS-t in Figure 12) showed aclear tendency to dissolve. Reconstructed Al terminatedsurfaces with half the Al3+ removed to neutralize thedipole, tended to attract K+ ions out of the solution intothe empty Al pockets and they persisted in this non-crystallographic position for sufficiently long that itseems likely to inhibit crystal growth. Thus, it seemsvery probable that the potash alum (111) surface isterminated by an Al SO4 layer, and one of the moreplausible variations50 is shown in Figure 13. Theplausible surfaces appear stable, with only reasonableamplitude motions relative to the considerably relaxedsurface structure. They differ by the amount of sulfatein the surface, which is likely to be determined by thesulfate composition in the solution. Common to all stablemodels of a (111) surface is a strong layering of thecation layers in the solution, with the K+ moving closerto the surface, but also the Al3+ acting to shield thesurface. This layering of the ions above the surface iscompatible with easy crystal growth. The diffuse natureof the surface, with ions layered above a somewhatrelaxed and disordered crystalline surface, inevitablymakes the position and net charge on the surface ratherill-defined quantities once the crystal surfaces approachwithin about 20 Å. A charged surface does not contradictthe high tendency of potash alum to agglomerate,because a number of mechanisms exist that can promoteattraction between equally charged surfaces in solu-tion,58 particularly if there are divalent counterions inthe solution.
4.2 Nature of the Agglomerative Bond. The mostideal and maximum strength structure for the agglom-erative bond is for it to have grown as a perfectcontinuation of the crystal structure. This is only evenhypothetically possible for two identical surfaces, per-fectly aligned on the atomic scale. In this case, theenergy to sever the agglomerative bond would be twicethe surface energy per unit area of the bond. The surfaceenergy per unit area, σ, is defined as
where E Asurface is the energy of a region of the surface A
and E Abulk is the energy for the same number of unit
cells in the bulk, and may therefore be derived from thelattice energy. This can be estimated for a surface (incontact with vacuum) by most of the computer programsthat are used for estimating the attachment energy, asit is essentially the attachment energy for an infinitethickness slice, provided the face is not polar.
When the two surfaces are different, an ideal perfectcrystal growth cannot occur. We developed48 the model-ing program ORIENT59 to investigate this, by consider-ing the interaction between a small nanocrystallite ofone urea surface interacting with an infinite surface ofthe other urea face in the xy plane. The nanocrystalliteof size Nx × Ny and thickness Nz unit cells (where Nzwas chosen to ensure convergence) was allowed to
optimize its position over the other infinite surface. Inthe case of a urea (001) face in contact with a (110) face,the interaction area energy per unit area convergedremarkably quickly with n ) Nx ) Ny to -0.202 ( 0.001J m-2, an energy for this optimized interaction that isonly 20% smaller than for the perfect crystal growth ofthe (110) face and about 50% smaller than that for thesmaller (001) face. The two surfaces obviously align thezone directions. There are different minute shifts of thenanocrystallite in the nonconformable direction as thesize of the nanocrystallite varies, which result in theapparent convergence of interaction energy per unitarea with size of the idealized urea crystallites attachedto the urea surface. This suggests that an agglomerativebond could grow between the unlike surfaces that wouldbe only slightly distorted from a perfect crystal structureand thus relatively strong.
The above methodology was designed to detect whethertwo surfaces were so incompatible in structure that anyagglomerative bond would necessarily be amorphousand, therefore, considerably weaker. It was based on theneck model for the cementation of highly idealizednonpolar crystal surfaces in a vacuum, and so could notbe applied to potash alum. The simple model forestimating the compatibility of unlike surfaces empha-sized that the relative orientation of the surfaces as theycame into contact, as well as the details of the surfacestructure, would play a major role in determining thepotential nature of the agglomerative bond. Clearly,more information is required as to the nature of theforces between simple atomic crystal surfaces, before wecan quantitatively introduce the additional complexityof the required alignment of more complex (organic)surfaces (such as Figure 11).
4.3 The Forces Acting on Agglomerating Par-ticles. The forces acting between the surfaces of twoparticles in solution will only resemble the smooth curveof the DVLO theory,60 while the separation is so largethat it is appropriate to consider the solvent as acontinuum. As the particles approach distances morecomparable to the extent of the ordering of solvent ionsor molecules above the surfaces (as seen in Figure 13),then the interaction and disturbance of these layers willproduce significant variations in the forces. As theseparation decreases further, the actual size, shape, andinteractions of the molecules will become important andthe forces may oscillate from being attractive to repul-sive. These oscillations, with regions of repulsive forces,can form a barrier to the effective collision and subse-quent agglomeration. If we regard the collision andagglomeration as a second-order reaction, then theactivation free energy barrier ∆G* can be obtained byintegrating the average force between the surface (aver-aged over solvent effects) from infinite separation upto the contact distance for agglomeration.
To study these forces, we have performed moleculardynamics simulations on the system shown in Figure14, with two idealized nanocrystallites immersed in asolution in contact with a gas phase region. The largesolution bath and gas phase is to allow the system toequilibrate to approximate constant chemical potential,by exchange of solution ions in the region between thecrystallites and the bulk solution. The only othersimulation61 of forces in nanopores that explicitly mod-
σ ) (E Asurface - E A
bulk)/A (13)
12 Crystal Growth & Design, Vol. 5, No. 1, 2005 Perspective
eled ionic solutions used continuum methods to estimatethe density of ions and solvent at each separation of thesurfaces. As we shall see later, the uncertainty in eitherof these methods in estimating the equilibrium concen-tration of solvent between the surfaces separated by lessthan 1.5 nm may be considerably less than the uncer-tainty in whether the liquid between two nanocrystal-lites coming together in a crystallizer is in equilibriumwith the bulk at these separations.
The system chosen for the simulations62 was the (110)face of potassium chloride, a well-studied simple ionicsystem. The nanocrystallites had a surface area of 5 ×5 unit cells and the ions in the nanocrystallites wereheld rigid in the perfect crystal structure, while thesolution atoms were equilibrated for over 300 ps, fol-lowed by a simulation of about 400 ps, over which theforces acting on the nanocrystallite were averaged bothover time and the nanocrystallite surface. The statisticalerrors in the measured forces, indicated by the errorsbars, could have been reduced by using longer simula-tion times, but this was not appropriate given theconsiderable computer time required for these initialinvestigations.
The results in Figure 15 show that for two nanocrys-tallites fixed in perfect register (Figure 14) with theirfaces separated by approximately 6.6 Å, the total forcesfrom the interactions of the crystallites and the waterare repulsive. When this separation is reduced toapproximately 6 Å the forces are attractive. At 6 Å, thewater molecules can form a structured layer betweenthe two surfaces, as shown in Figure 16a, and so add tothe attractive forces between the nanocrystallites. How-ever, at other separations the fit is not so good, givingbroader, disordered distributions of water moleculesbetween the surfaces. This produces repulsion, althoughthe forces become attractive again when the water inthe pore can order itself into a double layer around 6.8Å. When KCl is added to represent a saturated solution(117 KCl to 1292 water molecules), the forces aresignificantly changed. In the solution at 6.0 Å (Figure16b), the one Cl- ion remaining in the pore afterequilibration disrupts this structure locally, diminishingthe attraction.
If the crystallites are allowed to move laterally inresponse to the shearing forces from the molecules inthe pore, this considerably modifies the forces as itallows the solution and crystallite to adjust to a more
favorable structure. When there is just water in the poreat 6 Å this has little effect, but with the KCl solution(Figure 16c) there is a huge difference, as the surfacesmove so that positive ions are above each other, sepa-rated by negative ions in the solution and vice versa.
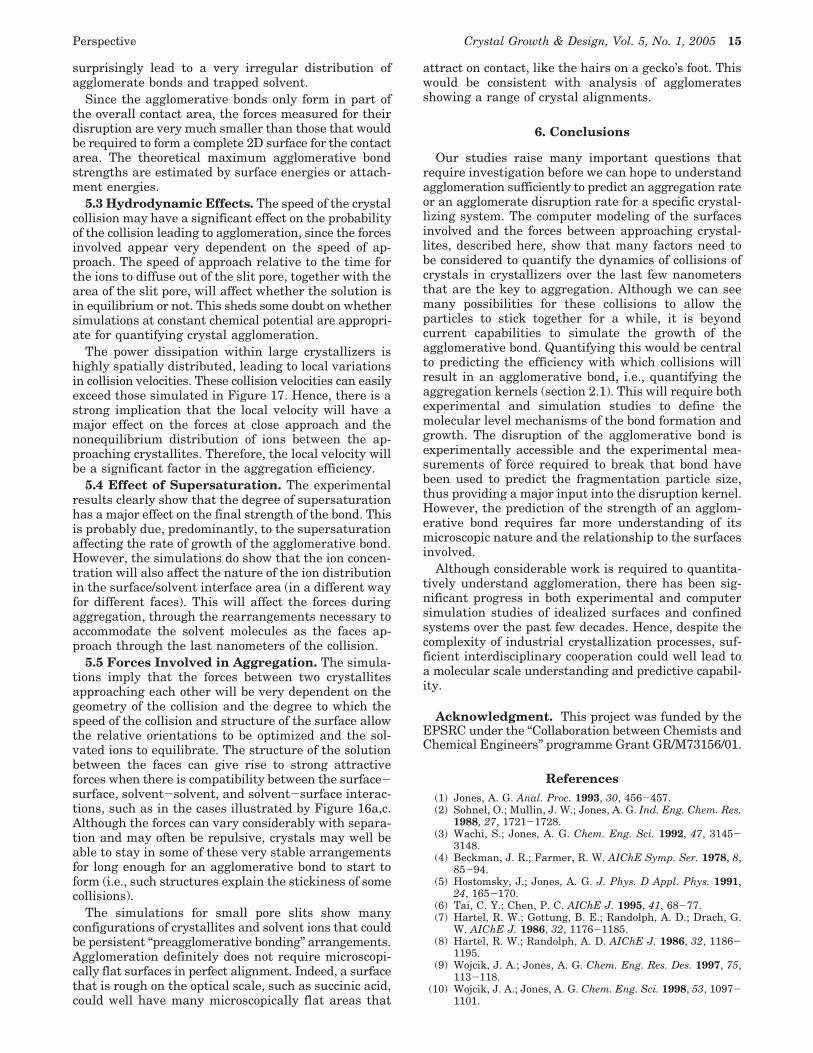
These results all assume that the approach of the twosurfaces is sufficiently slow that the water and soluteconcentration between the surfaces comes to equilibri-um. If we forcibly bring the surfaces into contact at afinite speed, then this equilibration may not occur, asthe water and ions may not diffuse out of the pore fastenough for the forces to converge to their equilibriumvalues. Free water molecules diffuse out of the poremore readily than the hydrated ions, and hence theconcentration of ions in the pore will be enriched relativeto the equilibrium concentration for that separation.Thus, the relative velocity of the particles generallyproduces increased repulsion with the relative speed ofapproach, as shown in Figure 17.
5. Discussion
5.1 Surface Structure Effects. Our experimentsclearly demonstrate that the agglomerative bond isdifferent for different faces of potash alum. This is quitea marked effect (Figure 8), and although the simulatedsurface structures (Figure 13) do show variations inatomic structure, all are composed of sulfates andhydrated cations. Thus, the existence and strength ofany agglomerative bond can be expected to vary con-siderably with the atomic structure of the surface.
The nature of the surface will considerably affect thelast few nanometers of the collisions of the particlesprior to the formation of any agglomerative bond. Thevariations in the ion distributions and double layereffects on the different faces of potash alum certainlyimply considerable differences in the forces required forthe faces to come into contact, let alone the likely growthrate of the agglomerative bond and its subsequentstrength. Determining the exact structure of the surface
Figure 14. System geometry for the molecular dynamicssimulation62 of a slit pore in contact with bulk solution. Lx )32.2 Å, Lz ) 129.95 Å, dc ) 18.84 Å, wc ) 22.2 Å, ds ∼ 20 Å.The nanocrystallites are either held in perfect register (i.e.,the xy coordinates fixed so that if dp ) 0 the two nanocrystal-lites would correspond to a perfect crystal) or allowed to adjusttheir position in response to the forces.
Figure 15. The total forces on the nanocrystallites of KCl asa function of separation. The crystallites are in the simulationcell shown in Figure 14 and each has a surface area of 492.8Å2. The forces are shown when the crystallites are held rigidin perfect register and also when the crystallites are allowedto move laterally, at the fixed separation, in response to theshear forces resulting from the liquid structure. Simulationsfor the crystallites in water and also in a saturated solutionare shown. The lines merely join the simulated points. Theerror bars indicate the statistical errors in the simulation.
Perspective Crystal Growth & Design, Vol. 5, No. 1, 2005 13
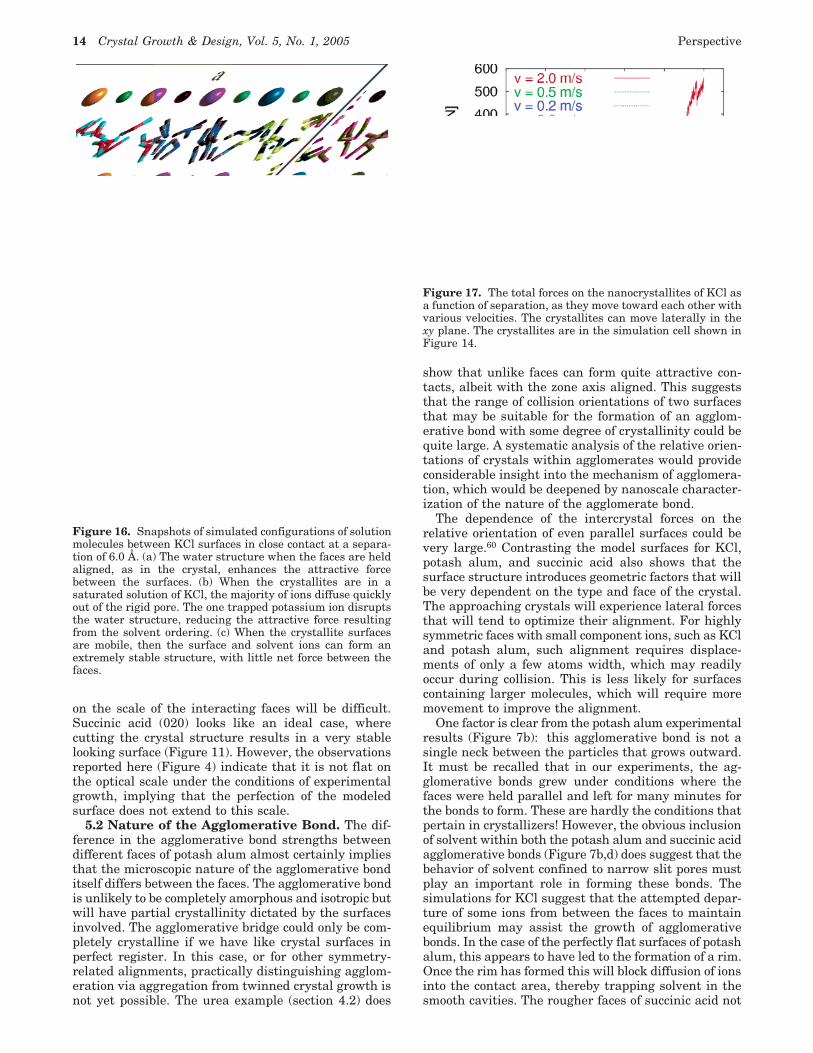
on the scale of the interacting faces will be difficult.Succinic acid (020) looks like an ideal case, wherecutting the crystal structure results in a very stablelooking surface (Figure 11). However, the observationsreported here (Figure 4) indicate that it is not flat onthe optical scale under the conditions of experimentalgrowth, implying that the perfection of the modeledsurface does not extend to this scale.
5.2 Nature of the Agglomerative Bond. The dif-ference in the agglomerative bond strengths betweendifferent faces of potash alum almost certainly impliesthat the microscopic nature of the agglomerative bonditself differs between the faces. The agglomerative bondis unlikely to be completely amorphous and isotropic butwill have partial crystallinity dictated by the surfacesinvolved. The agglomerative bridge could only be com-pletely crystalline if we have like crystal surfaces inperfect register. In this case, or for other symmetry-related alignments, practically distinguishing agglom-eration via aggregation from twinned crystal growth isnot yet possible. The urea example (section 4.2) does
show that unlike faces can form quite attractive con-tacts, albeit with the zone axis aligned. This suggeststhat the range of collision orientations of two surfacesthat may be suitable for the formation of an agglom-erative bond with some degree of crystallinity could bequite large. A systematic analysis of the relative orien-tations of crystals within agglomerates would provideconsiderable insight into the mechanism of agglomera-tion, which would be deepened by nanoscale character-ization of the nature of the agglomerate bond.
The dependence of the intercrystal forces on therelative orientation of even parallel surfaces could bevery large.60 Contrasting the model surfaces for KCl,potash alum, and succinic acid also shows that thesurface structure introduces geometric factors that willbe very dependent on the type and face of the crystal.The approaching crystals will experience lateral forcesthat will tend to optimize their alignment. For highlysymmetric faces with small component ions, such as KCland potash alum, such alignment requires displace-ments of only a few atoms width, which may readilyoccur during collision. This is less likely for surfacescontaining larger molecules, which will require moremovement to improve the alignment.
One factor is clear from the potash alum experimentalresults (Figure 7b): this agglomerative bond is not asingle neck between the particles that grows outward.It must be recalled that in our experiments, the ag-glomerative bonds grew under conditions where thefaces were held parallel and left for many minutes forthe bonds to form. These are hardly the conditions thatpertain in crystallizers! However, the obvious inclusionof solvent within both the potash alum and succinic acidagglomerative bonds (Figure 7b,d) does suggest that thebehavior of solvent confined to narrow slit pores mustplay an important role in forming these bonds. Thesimulations for KCl suggest that the attempted depar-ture of some ions from between the faces to maintainequilibrium may assist the growth of agglomerativebonds. In the case of the perfectly flat surfaces of potashalum, this appears to have led to the formation of a rim.Once the rim has formed this will block diffusion of ionsinto the contact area, thereby trapping solvent in thesmooth cavities. The rougher faces of succinic acid not
Figure 16. Snapshots of simulated configurations of solutionmolecules between KCl surfaces in close contact at a separa-tion of 6.0 Å. (a) The water structure when the faces are heldaligned, as in the crystal, enhances the attractive forcebetween the surfaces. (b) When the crystallites are in asaturated solution of KCl, the majority of ions diffuse quicklyout of the rigid pore. The one trapped potassium ion disruptsthe water structure, reducing the attractive force resultingfrom the solvent ordering. (c) When the crystallite surfacesare mobile, then the surface and solvent ions can form anextremely stable structure, with little net force between thefaces.
Figure 17. The total forces on the nanocrystallites of KCl asa function of separation, as they move toward each other withvarious velocities. The crystallites can move laterally in thexy plane. The crystallites are in the simulation cell shown inFigure 14.
14 Crystal Growth & Design, Vol. 5, No. 1, 2005 Perspective
surprisingly lead to a very irregular distribution ofagglomerate bonds and trapped solvent.
Since the agglomerative bonds only form in part ofthe overall contact area, the forces measured for theirdisruption are very much smaller than those that wouldbe required to form a complete 2D surface for the contactarea. The theoretical maximum agglomerative bondstrengths are estimated by surface energies or attach-ment energies.
5.3 Hydrodynamic Effects. The speed of the crystalcollision may have a significant effect on the probabilityof the collision leading to agglomeration, since the forcesinvolved appear very dependent on the speed of ap-proach. The speed of approach relative to the time forthe ions to diffuse out of the slit pore, together with thearea of the slit pore, will affect whether the solution isin equilibrium or not. This sheds some doubt on whethersimulations at constant chemical potential are appropri-ate for quantifying crystal agglomeration.
The power dissipation within large crystallizers ishighly spatially distributed, leading to local variationsin collision velocities. These collision velocities can easilyexceed those simulated in Figure 17. Hence, there is astrong implication that the local velocity will have amajor effect on the forces at close approach and thenonequilibrium distribution of ions between the ap-proaching crystallites. Therefore, the local velocity willbe a significant factor in the aggregation efficiency.
5.4 Effect of Supersaturation. The experimentalresults clearly show that the degree of supersaturationhas a major effect on the final strength of the bond. Thisis probably due, predominantly, to the supersaturationaffecting the rate of growth of the agglomerative bond.However, the simulations do show that the ion concen-tration will also affect the nature of the ion distributionin the surface/solvent interface area (in a different wayfor different faces). This will affect the forces duringaggregation, through the rearrangements necessary toaccommodate the solvent molecules as the faces ap-proach through the last nanometers of the collision.
5.5 Forces Involved in Aggregation. The simula-tions imply that the forces between two crystallitesapproaching each other will be very dependent on thegeometry of the collision and the degree to which thespeed of the collision and structure of the surface allowthe relative orientations to be optimized and the sol-vated ions to equilibrate. The structure of the solutionbetween the faces can give rise to strong attractiveforces when there is compatibility between the surface-surface, solvent-solvent, and solvent-surface interac-tions, such as in the cases illustrated by Figure 16a,c.Although the forces can vary considerably with separa-tion and may often be repulsive, crystals may well beable to stay in some of these very stable arrangementsfor long enough for an agglomerative bond to start toform (i.e., such structures explain the stickiness of somecollisions).
The simulations for small pore slits show manyconfigurations of crystallites and solvent ions that couldbe persistent “preagglomerative bonding” arrangements.Agglomeration definitely does not require microscopi-cally flat surfaces in perfect alignment. Indeed, a surfacethat is rough on the optical scale, such as succinic acid,could well have many microscopically flat areas that
attract on contact, like the hairs on a gecko’s foot. Thiswould be consistent with analysis of agglomeratesshowing a range of crystal alignments.
6. Conclusions
Our studies raise many important questions thatrequire investigation before we can hope to understandagglomeration sufficiently to predict an aggregation rateor an agglomerate disruption rate for a specific crystal-lizing system. The computer modeling of the surfacesinvolved and the forces between approaching crystal-lites, described here, show that many factors need tobe considered to quantify the dynamics of collisions ofcrystals in crystallizers over the last few nanometersthat are the key to aggregation. Although we can seemany possibilities for these collisions to allow theparticles to stick together for a while, it is beyondcurrent capabilities to simulate the growth of theagglomerative bond. Quantifying this would be centralto predicting the efficiency with which collisions willresult in an agglomerative bond, i.e., quantifying theaggregation kernels (section 2.1). This will require bothexperimental and simulation studies to define themolecular level mechanisms of the bond formation andgrowth. The disruption of the agglomerative bond isexperimentally accessible and the experimental mea-surements of force required to break that bond havebeen used to predict the fragmentation particle size,thus providing a major input into the disruption kernel.However, the prediction of the strength of an agglom-erative bond requires far more understanding of itsmicroscopic nature and the relationship to the surfacesinvolved.
Although considerable work is required to quantita-tively understand agglomeration, there has been sig-nificant progress in both experimental and computersimulation studies of idealized surfaces and confinedsystems over the past few decades. Hence, despite thecomplexity of industrial crystallization processes, suf-ficient interdisciplinary cooperation could well lead toa molecular scale understanding and predictive capabil-ity.
Acknowledgment. This project was funded by theEPSRC under the “Collaboration between Chemists andChemical Engineers” programme Grant GR/M73156/01.
References(1) Jones, A. G. Anal. Proc. 1993, 30, 456-457.(2) Sohnel, O.; Mullin, J. W.; Jones, A. G. Ind. Eng. Chem. Res.
1988, 27, 1721-1728.(3) Wachi, S.; Jones, A. G. Chem. Eng. Sci. 1992, 47, 3145-
3148.(4) Beckman, J. R.; Farmer, R. W. AIChE Symp. Ser. 1978, 8,
85-94.(5) Hostomsky, J.; Jones, A. G. J. Phys. D Appl. Phys. 1991,
24, 165-170.(6) Tai, C. Y.; Chen, P. C. AIChE J. 1995, 41, 68-77.(7) Hartel, R. W.; Gottung, B. E.; Randolph, A. D.; Drach, G.
W. AIChE J. 1986, 32, 1176-1185.(8) Hartel, R. W.; Randolph, A. D. AIChE J. 1986, 32, 1186-
1195.(9) Wojcik, J. A.; Jones, A. G. Chem. Eng. Res. Des. 1997, 75,
113-118.(10) Wojcik, J. A.; Jones, A. G. Chem. Eng. Sci. 1998, 53, 1097-
1101.
Perspective Crystal Growth & Design, Vol. 5, No. 1, 2005 15
(11) Pratola, F.; Simons, S. J. R.; Jones, A. G. Chem. Eng. Res.Des. 2002, 80, 441-448.
(12) Klein, J.; Kumacheva, E. J. Chem. Phys. 1998, 108, 6996-7009.
(13) Smoluchowski, M. V. Z. Phys. Chem. 1917, 19, 129-168.(14) Low, G. C. Agglomeration Effects in Aluminium Trihydrox-
ide Precipitation; Low, G. C., Ed.; University of Queens-land: Australia, 1975.
(15) Mumtaz, H. S.; Hounslow, M. J.; Seaton, N. A.; Paterson,W. R. Chem. Eng. Res. Des. 1997, 75, 152-159.
(16) Mersmann, A.; Braun, B. Agglomeration; 2nd ed.; Mers-mann, A.; Braun, B., Eds.; Dekker: New York, 2001.
(17) Hounslow, M. J.; Mumtaz, H. S.; Collier, A. P.; Barrick, J.P.; Bramley, A. S. Chem. Eng. Sci. 2001, 56, 2543-2552.
(18) Mersmann, A.; Braun, B.; Loffelmann, M. Chem. Eng. Sci.2002, 57, 4267-4275.
(19) Schubert, H. Int. Chem. Eng. 1981, 21, 363-377.(20) Pepin, X.; Simons, S. J. R.; Blanchon, S.; Rossetti, D.;
Couarraze, G. Powder Technol. 2001, 117, 123-138.(21) Synowiec, P.; Jones, A. G.; Shamlou, P. A. Chem. Eng. Sci.
1993, 48, 3485-3495.(22) Thompson, P. D. A Transformation of the Stochastic Equa-
tion for Droplet Coalescence; Thompson, P. D., Ed.: Toronto,Canada, 1968; pp 1115-1126.
(23) Adler, P. M. J. Colloid Interface Sci. 1981, 83, 106-115.(24) Camp, T. R.; Stein, P. C. J. Boston Soc. Civ. Eng. 1943, 30,
219.(25) Jones, A. G Crystallization Process Systems; Butterworth-
Heinemann: Oxford, 2002.(26) Mullin, J. W. Crystallization; 3rd ed.; Butterworth-Hein-
mann: Oxford, 1993.(27) Zauner, R.; Jones, A. G. Chem. Eng. Sci. 2000, 55, 4219-
4232.(28) Simons, S. J. R.; Pratola, F.; Jones, A. G.; Brunsteiner, M.;
Price, S. L. Part. Part. Syst. Charact., in press.(29) Simons, S. J. R.; Fairbrother, R. J. Powder Technol. 2000,
110, 44-58.(30) Mullin, J. W.; Zacek, S. J. Cryst. Growth 1981, 53, 515-
518.(31) Jones, A. G.; Mydlarz, J. Can. J. Chem. Eng. 1990, 68, 250-
259.(32) Nyvlt, J.; Karel, M.; Pisarik, S. Cryst. Res. Technol. 1994,
29, 409-415.(33) Pamplin, B. R. Crystal Growth; Pergamon Press: Elmsford,
NY, 1980.(34) Tolansky, S. An Introduction to Interferometry; Longman
Group Ltd:, 1955.(35) Jancic, S. J. Crystallization Kinetics and Crystal Size
Distribution in Mixed Suspension Mixed Product RemovalCrystallizers; Jancic, S. J., Ed.; University College London,1976.
(36) Ilievski, D.; White, E. T. Chem. Eng. Sci. 1994, 49, 3227-3239.
(37) David, R.; Marchal, P.; Klein, J. P.; Villermaux, J. Chem.Eng. Sci. 1991, 46, 205-213.
(38) Bramley, A. S.; Hounslow, M. J.; Newman, R.; Paterson, W.R.; Pogessi, C. Chem. Eng. Res. Des. 1997, 75, 119-124.
(39) Addai-Mensah, J.; Prestidge, C. A.; Ralston, J. Miner. Eng.1999, 12, 655-669.
(40) Fasoli, U.; Conti, R. Kristall. Technol. 1973, 8, 931-946.(41) Crawley, G. M.; Gruy, F.; Cournil, M. Chem. Eng. Sci. 1996,
51, 4537-4550.(42) Donnay, J. D. H.; Harker, D. Am. Minerol. 1937, 22, 446.(43) Hartman, P.; Bennema, P. J. Cryst. Growth 1954, 8, 49-
52.(44) Berkovitch-Yellin, Z. J. Am. Chem. Soc. 1985, 107, 8239-
8253.(45) Brunsteiner, M.; Price, S. L. Cryst. Growth Des. 2001, 1,
447-453.(46) Hartman, P.; Bennema, P. J. Cryst. Growth 1980, 49, 145-
146.(47) Amara, N.; Ratsimba, B.; Wilhelm, A. M.; Delmas, H.
Ultrason. Sonochem. 2001, 8, 265-270.(48) Engkvist, O.; Price, S. L.; Stone, A. J. Phys. Chem. Chem.
Phys. 2000, 2, 3017-3027.(49) Reyhani, M. M.; Freij, S.; Parkinson, G. M. J. Cryst. Growth
1999, 198-199, 258-263.(50) Brunsteiner, M.; Price, S. L. J. Phys. Chem. B 2004, 108,
12537-12546.(51) Gale, J. D.; Rohl, A. L. Mol. Simulat. 2003, 29, 291-341.(52) Berendsen, H. J. C.; Grigera, J. R.; Straatsma, T. P. J. Phys.
Chem. 1987, 91, 6269-6271.(53) Allan, N. L.; Rohl, A. L.; Gay, D. H.; Catlow, C. R. A.; Davey,
R. J.; Mackrodt, W. C. Faraday Discuss. 1993, 273-280.(54) Sakuntala, T.; Arora, A. K.; Shekar, N. V. C.; Sahu, P. C. J.
Phys.-Condens. Mater. 2000, 12, 4417-4432.(55) Smith, W.; Forester, T. R. J. Mol. Graphics 1996, 14, 136-
141.(56) Rudolph, W. W.; Mason, R.; Pye, C. C. Phys. Chem. Chem.
Phys. 2000, 2, 5030-5040.(57) Chang, T. M.; Dang, L. X. J. Phys. Chem. B 1999, 103,
4714-4720.(58) Hansen, J. P.; Lowen, H. Annu. Rev. Phys. Chem. 2000, 51,
209-242.(59) Stone, A.; Dullweber, A.; Hodges, M. P.; Popelier, P. L. A.;
Wales, D. J. ORIENT; 3.2 ed.; Stone, A., Dullweber, A.,Hodges, M. P., Popelier, P. L. A., Wales, D. J., Ed.;University of Cambridge, 1996.
(60) Israelachvili, J. N. Intermolecular and Surface Forces;Academic Press: London, 1991.
(61) Yang, K. L.; Yiacoumi, S.; Tsouris, C. J. Chem. Phys. 2002,117, 8499-8507.
(62) Brunsteiner, M.; Price, S. L. Langmuir, in preparation.
CG049837M
16 Crystal Growth & Design, Vol. 5, No. 1, 2005 Perspective