Retirement and the Poverty of the Elderly: The Case of Portugal
24
Retirement and the Poverty of the Elderly: The Case of Portugal Paula Albuquerque * ISEG/SOCIUS/CISEP Manuela Arcanjo ISEG/SOCIUS Vítor Esc’aria ISEG/CIRIUS Francisco Nunes ISEG/UECE José Pereirinha ISEG/CISEP Technical University of Lisbon This article discusses whether transition to retirement may be associated with a greater probability of becoming poor. Having recourse to the European Community House- hold Panel (ECHP) for Portugal, the analysis is focused on a sample of individuals who retired in the period 1994-2001. Longitudinal analysis focuses upon income changes upon entering retirement. We relate the dynamics of household income changes for people who retire to personal and household characteristics. A multivari- ate probit model of the probability of low income at the time of retirement, conditional on not having a low income prior to retirement, is then put forward. Keywords: retirement, poverty dynamics, Portugal, old age social protection, in- come mobility JEL Codes: J26, J14, I32 Introduction Income level is the single most important factor impacting welfare, and the risk of loss of income represents the most serious concern of modern welfare states. Several events, among them withdrawal from the labour force, may trigger con- siderable decreases in income. Labour income accounts for the greatest share of household income for the countries of the European Union (EU), and in Portu- gal that percentage is among the highest: 59 per cent in 1996 (Heinrich, 2000). Therefore, given that withdrawal from the labour force requires a substitute for the * Address for correspondence: ISEG/SOCIUS/CISEP, Miguel Lúpi, 20, Room 604, 1249-078 Lisboa, Portugal E-mail: [email protected] 1
Transcript of Retirement and the Poverty of the Elderly: The Case of Portugal

Retirement and the Poverty of the Elderly: The Case ofPortugal
Paula Albuquerque∗
ISEG/SOCIUS/CISEPManuela ArcanjoISEG/SOCIUSVítor Esc’ariaISEG/CIRIUS
Francisco NunesISEG/UECE
José PereirinhaISEG/CISEP
Technical University of Lisbon
This article discusses whether transition to retirement may be associated with a greater
probability of becoming poor. Having recourse to the European Community House-
hold Panel (ECHP) for Portugal, the analysis is focused on a sample of individuals
who retired in the period 1994-2001. Longitudinal analysis focuses upon income
changes upon entering retirement. We relate the dynamics of household income
changes for people who retire to personal and household characteristics. A multivari-
ate probit model of the probability of low income at the time of retirement, conditional
on not having a low income prior to retirement, is then put forward.
Keywords: retirement, poverty dynamics, Portugal, old age social protection, in-come mobilityJEL Codes: J26, J14, I32
Introduction
Income level is the single most important factor impacting welfare, and the riskof loss of income represents the most serious concern of modern welfare states.Several events, among them withdrawal from the labour force, may trigger con-siderable decreases in income. Labour income accounts for the greatest share ofhousehold income for the countries of the European Union (EU), and in Portu-gal that percentage is among the highest: 59 per cent in 1996 (Heinrich, 2000).Therefore, given that withdrawal from the labour force requires a substitute for the
∗Address for correspondence: ISEG/SOCIUS/CISEP, Miguel Lúpi, 20, Room 604, 1249-078Lisboa, Portugal E-mail: [email protected]
1
2 Journal of Income Distribution
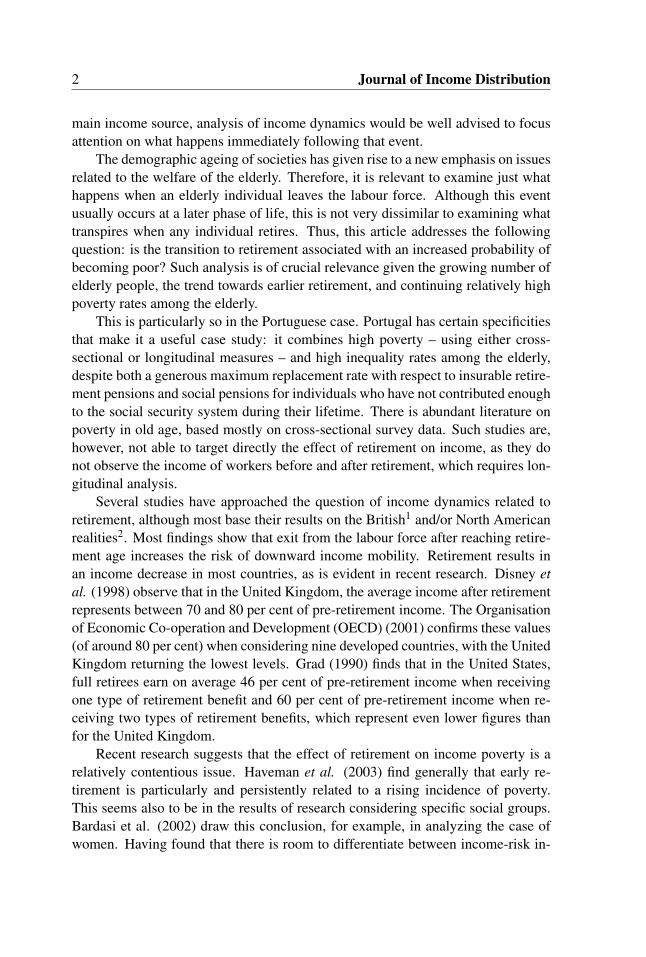
main income source, analysis of income dynamics would be well advised to focusattention on what happens immediately following that event.
The demographic ageing of societies has given rise to a new emphasis on issuesrelated to the welfare of the elderly. Therefore, it is relevant to examine just whathappens when an elderly individual leaves the labour force. Although this eventusually occurs at a later phase of life, this is not very dissimilar to examining whattranspires when any individual retires. Thus, this article addresses the followingquestion: is the transition to retirement associated with an increased probability ofbecoming poor? Such analysis is of crucial relevance given the growing number ofelderly people, the trend towards earlier retirement, and continuing relatively highpoverty rates among the elderly.
This is particularly so in the Portuguese case. Portugal has certain specificitiesthat make it a useful case study: it combines high poverty – using either cross-sectional or longitudinal measures – and high inequality rates among the elderly,despite both a generous maximum replacement rate with respect to insurable retire-ment pensions and social pensions for individuals who have not contributed enoughto the social security system during their lifetime. There is abundant literature onpoverty in old age, based mostly on cross-sectional survey data. Such studies are,however, not able to target directly the effect of retirement on income, as they donot observe the income of workers before and after retirement, which requires lon-gitudinal analysis.
Several studies have approached the question of income dynamics related toretirement, although most base their results on the British1 and/or North Americanrealities2. Most findings show that exit from the labour force after reaching retire-ment age increases the risk of downward income mobility. Retirement results inan income decrease in most countries, as is evident in recent research. Disney etal. (1998) observe that in the United Kingdom, the average income after retirementrepresents between 70 and 80 per cent of pre-retirement income. The Organisationof Economic Co-operation and Development (OECD) (2001) confirms these values(of around 80 per cent) when considering nine developed countries, with the UnitedKingdom returning the lowest levels. Grad (1990) finds that in the United States,full retirees earn on average 46 per cent of pre-retirement income when receivingone type of retirement benefit and 60 per cent of pre-retirement income when re-ceiving two types of retirement benefits, which represent even lower figures thanfor the United Kingdom.
Recent research suggests that the effect of retirement on income poverty is arelatively contentious issue. Haveman et al. (2003) find generally that early re-tirement is particularly and persistently related to a rising incidence of poverty.This seems also to be in the results of research considering specific social groups.Bardasi et al. (2002) draw this conclusion, for example, in analyzing the case ofwomen. Having found that there is room to differentiate between income-risk in-

Retirement and the Poverty of the Elderly: The Case of Portugal 3
tensity in the retirement transition for certain population subgroups, such as Afro-Americans, Hispanics, low-income earners, unmarried individuals, and unhealthyearly retirees, Kingson and Arsenault (2000) stress the diversity of income risksin the transition from active or part-time working status to retirement. The resultsof other studies point, however, in the opposite direction. Using cohort analysis,Williamson and Smeeding published their findings in 2004 regarding Canada andSweden: poverty rates were falling, as the cohort passed beyond 65 years of age.3
When Osberg (2001) focused particularly on the lowest income deciles of the popu-lation, to compare pre-retirement and post-retirement situations, he concluded thatin some countries, like Canada and the United Kingdom, the presence of a floor toold-age security benefits, which is higher than the floor for social assistance for therest of the population, leads to the poorest decile’s actually being better off afterretirement.
The present article joins the body of studies addressing the issue of poverty inold age by using longitudinal data for Portugal; in so doing it resembles the workof Bardasi et al. (2002) for the United Kingdom. The use of longitudinal data fromthe European Community Household Panel (ECHP) for Portugal (survey waves1-8, covering 1994-2001) enables us to trace changes in the economic status ofactual individuals or households that experienced a retirement event, by analysingthe association between transition to retirement and the probability of becomingpoor.
Since the analysis is conducted on the effect of retirement on income poverty,this research is crucially dependent on conceptual and methodological decisionsabout three major issues: the unit of analysis, the identification of retirement, andthe use of income as a proxy for the economic welfare of the population understudy.
The unit of analysis here is the individual who retires. This individual is notnecessarily an old person. The income effect of retirement is, however, certainlygoing to have consequences on how he/she spends old age. Since the most dramaticchange in income is that which leads to poverty, we focus specifically on povertydynamics rather than on general income mobility.
In this article, we base the identification of retirement on the self-reporting ofsurvey respondents who identify themselves as retired individuals. This enables,however, the classification of individuals only as retired or not retired, thereby pre-cluding discussion as to whether retirement is a gradual process or an abrupt tran-sition. This is an important facet, and the appropriate choice is dependent on pre-vailing national characteristics, institutional and sociological. In some countries,like the United States, retirement is considered a long process (see Hungerford2003, Grad 1990). In other countries, like Germany, retirement may be considereda rather definite point in time, since withdrawal from the labour force is usuallyan immediate and complete event, coinciding with the initiation of the receipt of

4 Journal of Income Distribution
retirement income (see Hungerford 2003). In relation to the United Kingdom, Dis-ney et al. (1998) conclude that retirement tends to be a one-time process, whereasBardasi et al. (2002) reach the opposite conclusion, although more so in the caseof women than of men.
The use of income data as a proxy for economic welfare is crucial but faces twomajor limitations:
1. When comparing income before and after retirement, there is the danger ofmisinterpretation if a change in needs is not taken into account for welfareevaluation. After retirement, people need less than their full pre-retirementincome in order to maintain their standard of living. This is due to threereasons: i) income taxes for the retired are frequently lower than for individ-uals pre-retirement, since earnings from work are subject to Social Securitypayroll taxes and these are not paid in retirement; ii) a retired individualno longer needs to save for retirement; and iii) work-related expenses aresubstantially reduced. Munnell and Soto (2005) highlight how studies exam-ining the replacement rate needed to maintain the previous lifestyle proposean amount around 70 to 75 per cent of the pre-retirement earnings.
2. Adequate levels of consumption are possible even when income levels arelow. This may be due to both the availability of free or almost free goods/services, such as free health care, and the existence of wealth levels resultingfrom accumulated savings.
The remainder of this article begins by describing, in the next section, the in-stitutional context of retirement in Portugal. Definitions and methodological issuesare reported in the following section. A further section provides evidence compar-ing low-income incidence among retired people and the rest of the population inPortugal for each of the eight ECHP waves. A next section analyses factors as-sociated with changes in individual economic welfare deriving from the transitionto retirement. The dynamics of retiree household income changes are studied withdiscussion about which personal and household characteristics are associated witha higher risk of low income in the years after retirement. In a subsequent section,a multivariate probit model estimates the probabilities of entering a low incomestatus at the time of retirement, conditional on not having had a low income beforeretirement. A final section concludes the article and discusses some of the policyimplications of our findings.
The Portuguese Pension System
Key Institutional Characteristics
The Portuguese pension system corresponds closely to the Bismarckian model andis characterized as having a first pillar of predominantly public provisions, divided
Retirement and the Poverty of the Elderly: The Case of Portugal 5
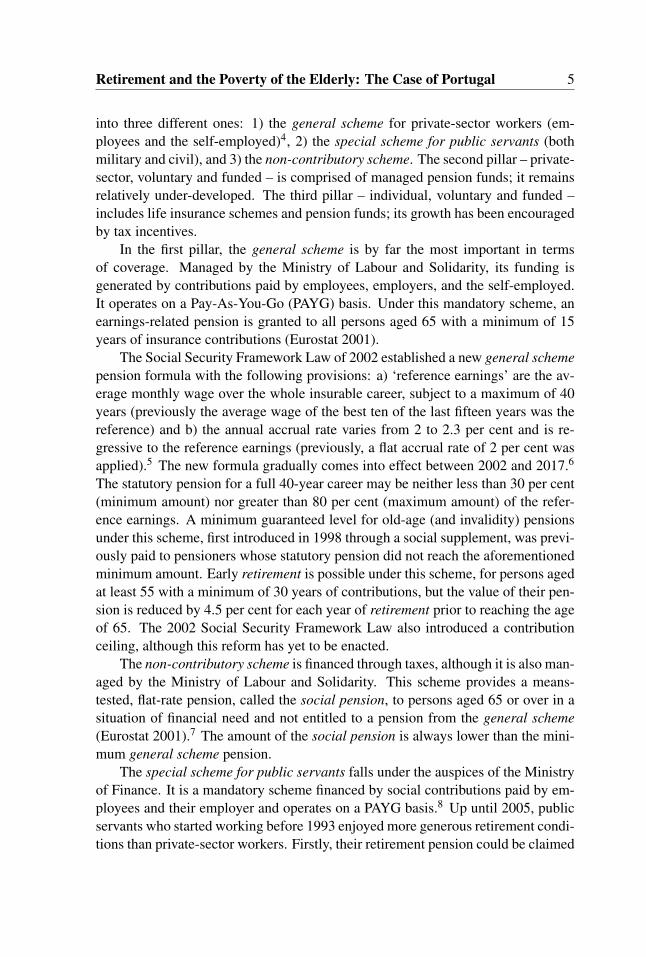
into three different ones: 1) the general scheme for private-sector workers (em-ployees and the self-employed)4, 2) the special scheme for public servants (bothmilitary and civil), and 3) the non-contributory scheme. The second pillar – private-sector, voluntary and funded – is comprised of managed pension funds; it remainsrelatively under-developed. The third pillar – individual, voluntary and funded –includes life insurance schemes and pension funds; its growth has been encouragedby tax incentives.
In the first pillar, the general scheme is by far the most important in termsof coverage. Managed by the Ministry of Labour and Solidarity, its funding isgenerated by contributions paid by employees, employers, and the self-employed.It operates on a Pay-As-You-Go (PAYG) basis. Under this mandatory scheme, anearnings-related pension is granted to all persons aged 65 with a minimum of 15years of insurance contributions (Eurostat 2001).
The Social Security Framework Law of 2002 established a new general schemepension formula with the following provisions: a) ‘reference earnings’ are the av-erage monthly wage over the whole insurable career, subject to a maximum of 40years (previously the average wage of the best ten of the last fifteen years was thereference) and b) the annual accrual rate varies from 2 to 2.3 per cent and is re-gressive to the reference earnings (previously, a flat accrual rate of 2 per cent wasapplied).5 The new formula gradually comes into effect between 2002 and 2017.6
The statutory pension for a full 40-year career may be neither less than 30 per cent(minimum amount) nor greater than 80 per cent (maximum amount) of the refer-ence earnings. A minimum guaranteed level for old-age (and invalidity) pensionsunder this scheme, first introduced in 1998 through a social supplement, was previ-ously paid to pensioners whose statutory pension did not reach the aforementionedminimum amount. Early retirement is possible under this scheme, for persons agedat least 55 with a minimum of 30 years of contributions, but the value of their pen-sion is reduced by 4.5 per cent for each year of retirement prior to reaching the ageof 65. The 2002 Social Security Framework Law also introduced a contributionceiling, although this reform has yet to be enacted.
The non-contributory scheme is financed through taxes, although it is also man-aged by the Ministry of Labour and Solidarity. This scheme provides a means-tested, flat-rate pension, called the social pension, to persons aged 65 or over in asituation of financial need and not entitled to a pension from the general scheme(Eurostat 2001).7 The amount of the social pension is always lower than the mini-mum general scheme pension.
The special scheme for public servants falls under the auspices of the Ministryof Finance. It is a mandatory scheme financed by social contributions paid by em-ployees and their employer and operates on a PAYG basis.8 Up until 2005, publicservants who started working before 1993 enjoyed more generous retirement condi-tions than private-sector workers. Firstly, their retirement pension could be claimed

6 Journal of Income Distribution
before the age of 60 on completion of a minimum 36-year insurable career, and sec-ondly, as the reference earnings were the last monthly wage, public servants witha complete career were entitled to a 100 per cent replacement rate.9 The gradualharmonization of the special scheme for public servants with the general scheme isnow under implementation by: a) raising the retirement age for public servants to65 (by six months a year for the next ten years), b) raising the contribution periodfor public servants to 40 years (by six months a year through to 2016), c) reduc-ing the pension level for public servants in the event of early retirement and d)including all new public employees in the general scheme as of 2006.
Pensioners and Pensions
In line with trends observed in other European countries, the number of contribu-tory pensions has increased significantly. With the number of contributors risingonly 10 per cent during the period 1994-2001, the number of old-age pension-ers increased under both contributory schemes by 34 per cent (from 1,122,000 to1,499,000) and under the general scheme by 79 per cent. As a result, the contrib-utor/pensioner ratio fell from 4:1 to 3:4, while the number of pensioners under thenon-contributory scheme dropped by 28 per cent. In 2001, 65 per cent of all pen-sioners receiving an old-age pension under the special scheme for public servantswere retired males. In the general scheme, this figure falls to 55 per cent. Theproportion of women receiving a pension under the non-contributory scheme was,however, about 70 per cent.
The special scheme for public servants has been much more generous thanits private-sector equivalents. In order to evaluate the difference between the twoschemes, we adopt the average pension for new pensioners relative to the averageprivate-sector earnings as an indicator (see Table 1).
Table 1Average Monthly Pension by Contributory Scheme
(Nominal Terms)
Public Servant Scheme General Scheme
New % of Average New % of AverageYear Pensioners (e) Earningsa Pensioners (e) Earningsa
1994 842 150 198 352001 1225 168 352 48
a) Average monthly earnings in the national private sector.Source: CGA (1994, 2001) and INE (1994, 2001)

Retirement and the Poverty of the Elderly: The Case of Portugal 7
Despite the generosity of the benefit formula under the general scheme, theaverage new monthly pension in 2001 corresponded only to 48 per cent of averagemonthly earnings; for state employees, this ratio rose to 168 per cent under the spe-cial scheme for public servants. There are a couple of reasons for this discrepancy:a) differences in the regulations governing the various schemes outlined above andb) more importantly, the shorter average insured career of persons retiring underthe general scheme. In 1994, the average contribution period was only 21 years,with 73 per cent of male retirees and 88 per cent of retired females having paidcontributions for 20 years or less (DEPP 2002).10
Another way of analysing differences between contributory schemes is to con-sider the number of pensioners included by level of pension (see Table 2). Whereasa pension of 500 euros or less was granted to 92 per cent of pensioners underthe general scheme, this rate fell to 31 per cent for state employees in the specialscheme for public servants.
Table 2Pensioners by Level of Pension in 2001
Level of Pension Public Servant General(e/month) Scheme Scheme≤500 31 92> 500 to 1000 33 6> 1000 36 2
Source: CGA (2001) and INE (2001).
Given the level of risk of poverty among the elderly, a major priority has beenattributed towards raising the minimum amounts guaranteed to pensioners. Underthe contributory schemes, the ratio between the minimum pension and the mini-mum wage has increased significantly: while it stood at 53 per cent in 1994, itranged between 52 and 93 per cent by 2001, in accordance with the respective in-surable career (see Table 3). This was brought about by annual adjustments abovethe rate of inflation. The same principle was also applied to the social pension.
In view of the high incidence in Portugal of short contributory careers andvery low reference earnings, the minimum old-age pension and the social pensionhave proven the most representative of retirement benefits under the Social Securitysystem: in 2001, approximately 80 per cent of all pensioners received an amountequal to, or less than, the minimum of the general scheme pension.11 In the specialscheme for public servants, only 2 per cent of all pensioners received the minimumpension.

8 Journal of Income Distribution
Table 3Minimum and Social Pensions
(Euros, Nominal Terms)
Minimum Wage Minimum Pensiona Social Pension
Year (1) (2) (2)/(1) (3) (3)/(1)
1994 842 131 53% 83 34%2001 1225 174 to 52 to 93% 134 40%
a) A scale for minimum pensions (Public Servant Scheme and General Scheme)has been in place since 1 January 1999, in accordance with the individual’ssocial security career record.Source: CGA (1994, 2001) and INE (1994, 2001).
Data, Definitions, and Methodological Issues
Data
The empirical data source used in this article is the EUROSTAT longitudinal sur-vey, European Community Household Panel (ECHP), covering the eight wavescorresponding to the 1994-2001 period. We use the UDB (User DataBase) versionof this database, which is representative of the whole Portuguese population. Thisdatabase contains systematic information on the household income and the socio-demographic and socio-professional characterizations of the individuals present,including their labour market status, health, education, housing conditions, and awide set of statistics on social indicators of households and personal standards ofliving.
The observation unit considered throughout is the individual, whether in cross-sectional or longitudinal analysis. The household remains, however, the unit ofmeasurement for some variables, such as income, or for characterization of thesocio-economic context of an individual. It must be stated that this may have reper-cussions for analysis, given that the information on an individual’s experience ofpoverty is derived from the data related to the household’s resources.
Definitions
In accordance with the source data, some choices have to be made concerning thedefinitions of variables, as they directly impact upon the analysis carried out: 1)the definition of a retired individual, 2) the determination of the retirement startdate, 3) the choice of resource variables, 4) the appropriate poverty measurementthreshold, and 5) the sample selection.
The first issue to be addressed is the definition of a retired individual. There

Retirement and the Poverty of the Elderly: The Case of Portugal 9
are different means of identifying the status of retirement in microeconomic data,each with advantages and drawbacks. The differences are related to how a survey isconducted and to which criterion is adopted to configure the concept, e.g., whetherof an objective or subjective nature. For instance, considering an objective criterion,we can classify an individual as being retired if he/she receives a pension paid bythe Social Security system as the main source of income. Another example of anobjective criterion is to agree on an exogenous or conventional classification basedon the self-declared number of hours worked. In subjective terms, an individual canbe classified as retired based on the individual’s own assessment of his/her labourmarket status. We assume this latter option. Any one of these possibilities wouldlead to differentiated forms of identifying the target sample population.
Another issue to be addressed is the retirement start date. Retirement may beconsidered a gradual process or, instead, an event constituting an abrupt transition.Many authors consider the individual’s transition to retirement to be a process (inthe sense that as a transition, it usually requires preparation by the individual con-cerned and cannot thus be reduced to a single point in time). Following Bardasiet al. (2002), this article uses a more “workable” definition of retirement, basedon what each adult respondent declares at a given point in time regarding his/herlabour market status. Retirement is then considered to have ‘started’ in the first yeardeclared by the individual that his/her labour market status is retired.
The third question to be addressed regards the choice of resource variables. Wechose to consider income per adult equivalent as our resource variable, with thehousehold remaining the unit of measure. The modified equivalence scale of theOrganisation of Economic Co-operation and Development (OECD)12 was adoptedto allow for income comparability between households registering different scalesand compositions. Current net income per adult equivalent (i.e., the declared dis-posable income in the month prior to the interview) was chosen rather than annualnet income (which refers to the net income of the year prior to the interview). An-nual net income would be the more appropriate income quantity for research ifdecomposition analysis by income source were required.13 The time lag betweenthe reference date for an annual net income and the start date of retirement makes,however, current net income the better choice. Current net income per adult equiv-alent is calculated from the household current net income, the sum of cash incomefrom all sources (direct employment and self-employment labour-market income,private investments and savings income, public-occupation and private pensions,and other net cash benefits from the social security system), after deduction of di-rect income taxes and Social Security contributions.
There remains another issue, despite the emphasis placed on analysis of theincidence of poverty, rooted in a degree of arbitrariness as regards the appropriatepoverty measurement threshold. Therefore, four monetary poverty lines are de-ployed throughout this article. They are the following three contemporary poverty

10 Journal of Income Distribution
thresholds and an “anchored” poverty line: 1) the first quintile of income distri-bution per adult equivalent, 2) the 33rd percentile of income distribution per adultequivalent, 3) 60 per cent of median income distribution per adult equivalent, and4) the “anchored” threshold, or 66 per cent of the median of the income distributionper adult equivalent in Wave 1, 1994.14 The use of other poverty lines – in addi-tion to the third measure noted above, the most commonly used in European Unionstatistics – is justifiable because a) different poverty lines cover different segmentsof the population and b) taking those different groups into consideration is impor-tant, not only for the purpose of verifying the robustness of results but also to checkwhether the results hold across those different groups.
Figure 1Poverty Thresholds
1994 1995 1996 1997 1998 1999 2000 2001
€
450.00
400.00
350.00
300.00
250.00
200.00
150.00
100.00
50.00
0.00
€ Low 20%Low 30%60% Median66% 1994 Median
Figure 1 presents the different poverty thresholds included for analysis. Onesees that not only does each poverty line cover a different population group butalso that each evolved quite differently over the years. The poverty thresholdsincorporating the 33rd percentile and the first quintile exhibit fairly similar be-haviour, demonstrating that the entire base of income distribution experienced asimilar change across the years. The threshold defined in relation to the median,and not to a fixed proportion of the population, changed less, which shows that thedistribution base has moved further than the middle segment. The threshold thatchanged the least is that “anchored” in the 1994 median. This threshold was thesecond highest one in 1994 and the lowest one in 2001, revealing that incomes atthe bottom of the income distribution scale have increased.
Looking at the thresholds, one can see that the broadest definition of povertyis given within the 33rd percentile and that thus correspondingly more people aredeemed to be poor according to this definition. Furthermore, it is revealed that the

Retirement and the Poverty of the Elderly: The Case of Portugal 11
narrowest definition is set in the initial years by the first quintile and in the finalyears by the distribution at 66 per cent of median income per adult equivalent in1994 (adjusted by the consumer price index) These two definitions, each for itscorresponding period, categorise the fewest number of individuals as poor.
Table 4Cross Sectional Comparisons of Low-Income Incidence:
Retired People, Non-Retired Adults, and Workers
Year Male FemaleWorkers Not Retired Retired Workers Not Retired Retired
Poor
estF
ifth
1994 13.10% 16.00% 34.10% 11.00% 18.80% 29.90%1995 13.50% 15.10% 36.20% 10.20% 17.70% 35.80%1996 12.70% 15.50% 32.90% 12.70% 18.40% 33.60%1997 12.40% 14.90% 30.90% 12.20% 19.00% 33.00%1998 12.80% 15.80% 27.80% 12.80% 19.20% 34.20%1999 14.00% 16.90% 30.70% 10.90% 18.30% 33.40%2000 14.00% 17.00% 30.50% 10.20% 16.80% 32.60%2001 12.40% 16.10% 32.70% 9.90% 17.20% 35.40%
Poor
estT
hird
1994 24.50% 27.80% 53.30% 20.30% 30.40% 48.30%1995 25.40% 27.80% 48.70% 20.50% 30.30% 51.00%1996 24.20% 27.90% 47.00% 22.10% 31.20% 49.10%1997 23.90% 27.60% 47.30% 21.90% 31.20% 49.50%1998 24.80% 28.30% 42.50% 22.50% 31.20% 50.80%1999 25.60% 29.20% 45.80% 21.00% 30.80% 48.00%2000 24.60% 27.40% 45.90% 22.90% 30.20% 47.50%2001 23.60% 27.30% 47.50% 22.60% 32.10% 48.20%
60%
Med
ian
1994 14.80% 17.90% 38.80% 12.30% 20.70% 33.80%1995 14.90% 16.40% 36.80% 11.20% 18.90% 37.00%1996 14.40% 17.40% 34.80% 14.00% 20.10% 35.30%1997 13.10% 15.50% 31.20% 12.40% 19.60% 33.20%1998 13.70% 16.80% 29.30% 13.80% 20.30% 35.40%1999 12.50% 15.50% 28.80% 9.90% 16.90% 31.10%2000 13.30% 16.10% 29.60% 9.30% 16.10% 31.10%2001 10.70% 14.30% 27.50% 8.70% 14.80% 31.10%
66%
1994
Med
ian 1994 19.60% 23.30% 48.20% 16.10% 25.60% 42.00%
1995 15.80% 17.70% 38.20% 12.00% 19.90% 39.30%1996 13.60% 16.70% 33.40% 13.30% 19.10% 34.50%1997 11.60% 13.80% 29.90% 11.70% 17.90% 31.70%1998 11.40% 14.10% 25.60% 11.60% 17.30% 32.80%1999 9.80% 12.40% 23.20% 7.80% 13.80% 25.10%2000 6.40% 8.60% 18.00% 4.50% 9.20% 18.10%2001 6.50% 9.30% 18.10% 5.10% 9.80% 17.20%
Source: Authors’ own computations based on ECHP.

12 Journal of Income Distribution
Figure 2Low-Income Incidence – Percentage of Retired People Below Poverty
Threshold, by Birth Cohort
Poorest 5th - Male
0% 10% 20% 30% 40% 50% 60%
1994 1995 1996 1998 1999 2000 2001 1997
Poorest 5th - Female
0% 10% 20% 30% 40% 50% 60%
1994 1995 1996 1997 1998 1999 2000 2001
Poorest 3rd - Male
0% 10%
20%
30%
40%
50%
60%
70%
80%
1994 1995 1996 1997 1998 1999 2000 2001
Poorest 3rd - Female
0% 10%
20%
30%
40%
50%
60%
70%
1994 1995 1996 1997 1998 1999 2000 2001
60% Median - Male
0% 10% 20% 30% 40% 50% 60%
1994 1995 1996 1997 1998 1999 2000 2001
60% Median - Female
0% 5%
10% 15% 20% 25% 30% 35% 40% 45% 50%
1994 1995 1996 1997 1998 1999 2000 2001
66% 1994 Median - Male
0% 10% 20% 30% 40% 50% 60% 70%
1994 1995 1996 1997 1998 1999 2000 2001
66% 1994 Median - Female
0% 10% 20% 30% 40% 50% 60%
1994 1995 1996 1997 1998 1999 2000 2001 <1920 1920-1930 1930-1940 >1940

Retirement and the Poverty of the Elderly: The Case of Portugal 13
Methodological Issues
Some methodological issues need to be addressed, and to do so we have made useof different ECHP panel data or sub-sample sets for this article, depending on theanalytical focus. In the cross-section analysis, the whole sample was used to mea-sure the incidence of poverty among the retired population and to compare this withother specified groups. In the dynamic analysis, with the aim of examining the tran-sition to retirement, only a sub-sample of those who retired within the time windowof the panel was used. In further analyses, to investigate transitions into poverty,this sub-sample was further limited to those who had retired in this period and whowere not identifiably poor in the year prior to retirement. Some analyses requiredthe identification of birth cohorts. Therefore, four distinct cohorts were identified:1) individuals born since 1940, 2) individuals born between 1930 and 1939, 3) in-dividuals born between 1920 and 1929, and 4) the oldest cohort, individuals bornbefore 1920.
Cross-Section Comparisons
This section’s analysis, using cross-section comparisons, is based on the total sam-ple. The number of observed individuals is not the same in every year: it rangesbetween 1,953 and 2,172 per year.
Regardless of the definition of poverty, its incidence for both men and womenwas always larger among retired than non-retired15 persons for the whole period1994-2001 (see Table 4). Among the non-retired, the group with the lowest povertyincidence rate is that of the workers. Nevertheless, among both the retired and non-retired there is also a dimension to poverty, linked to gender: in general, for womenthere is evidence of a larger percentage below the poverty line.
For retired workers, the older cohorts tend to be more subject to poverty thanthe younger ones (see Figure 2 and Table 5).16 The cohort of people born after1940 (i.e., the youngest generation) is consistently the one with the lowest povertyincidence, regardless of the poverty line considered. The older cohorts (1920-29and <1920) sometimes switch positions as the poorest, although the oldest cohortmost frequently occupies that position. The latter situation does not improve duringthe period, unless the 66 per cent of the 1994 median poverty-line criterion is used(see Table 6).
Looking at the demographic composition of households,17 the situation for re-tirees living alone, whether men or women, is the worst (see Table 7). There is,however, some gender bias with women being in a worse relative position.
The higher incidence of poverty among retired individuals in general, as de-scribed above, has different implications, depending of whether it results fromcharacteristics considered related to the individual (e.g., retired or non-retired sta-tus) or to the pension system (e.g., there is low social protection coverage against

14 Journal of Income Distribution
Table 5Cross-Sectional Comparison for Low-Income Incidence for Retired
Individuals by Birth Cohort
YearMale Female
Birth Cohort Birth Cohort
<1920 1920-1930 1930-1940 >1940 <1920 1920-1930 1930-1940 >1940
Poor
estF
ifth
1994 46.10% 32.80% 20.40% 31.10% 38.90% 31.10% 15.30% 20.80%1995 52.50% 36.70% 24.30% 24.30% 45.90% 34.40% 28.90% 23.10%1996 47.30% 37.80% 22.20% 13.80% 43.10% 34.90% 28.50% 13.50%1997 45.30% 38.00% 18.90% 14.10% 41.80% 38.30% 24.50% 8.70%1998 40.70% 32.40% 24.40% 8.80% 42.10% 37.90% 29.30% 16.10%1999 41.10% 41.90% 23.10% 11.10% 41.30% 38.70% 30.50% 8.20%2000 51.60% 39.60% 24.70% 16.10% 34.10% 42.30% 28.70% 14.20%2001 55.70% 41.20% 28.80% 14.50% 42.20% 42.10% 33.60% 15.10%
Poor
estT
hird
1994 62.30% 53.70% 44.60% 40.70% 54.90% 49.00% 38.10% 40.80%1995 64.10% 49.30% 36.50% 39.60% 62.90% 50.60% 41.30% 33.80%1996 59.30% 55.40% 35.90% 21.20% 56.90% 52.60% 43.50% 24.50%1997 61.40% 55.00% 37.20% 22.80% 55.00% 55.60% 42.40% 25.70%1998 59.50% 50.70% 35.70% 17.70% 58.90% 56.60% 44.30% 27.80%1999 69.80% 55.90% 34.10% 27.20% 53.50% 55.70% 41.50% 27.60%2000 63.90% 55.70% 40.50% 31.70% 56.70% 55.50% 44.30% 25.20%2001 63.00% 57.70% 43.10% 31.20% 61.50% 54.30% 46.00% 24.50%
60%
Med
ian
1994 47.60% 40.20% 24.10% 35.30% 40.60% 35.80% 21.20% 23.90%1995 53.40% 37.70% 24.30% 24.50% 46.60% 35.80% 30.90% 23.10%1996 48.50% 40.30% 24.40% 15.30% 44.90% 36.40% 30.60% 15.00%1997 45.30% 38.60% 19.00% 14.10% 41.80% 38.80% 24.70% 8.70%1998 41.50% 33.90% 26.90% 8.80% 42.20% 39.30% 31.20% 16.80%1999 39.40% 38.40% 22.10% 10.80% 40.40% 35.30% 29.10% 6.10%2000 48.40% 38.80% 24.40% 15.30% 34.00% 39.60% 28.10% 13.00%2001 40.20% 37.80% 23.60% 11.50% 34.30% 39.20% 28.50% 12.50%
66%
1994
Med
ian
1994 57.60% 49.70% 36.70% 35.30% 46.70% 44.50% 31.70% 32.80%1995 54.00% 39.30% 25.70% 26.90% 48.90% 38.80% 32.70% 23.50%1996 47.40% 39.10% 22.30% 13.80% 43.40% 36.00% 29.50% 15.00%1997 44.20% 36.30% 18.90% 12.70% 41.20% 36.20% 24.00% 7.70%1998 39.00% 28.50% 23.40% 7.50% 41.60% 35.50% 28.20% 16.00%1999 33.60% 29.20% 19.00% 8.80% 36.20% 27.20% 22.70% 5.20%2000 32.50% 22.80% 15.40% 7.60% 29.00% 22.80% 14.20% 4.90%2001 33.20% 24.00% 14.60% 7.90% 24.60% 21.40% 14.30% 6.30%
Source: Authors’ own computations based on ECHP.
poverty for the elderly). If the latter is the reason, then some policy action is clearlyrequired in order to increase the protection of retired people against poverty risks.
The lower incidence of poverty in younger cohorts is consistent with the in-crease in the weight of pensioners in the contributory schemes with their higherreplacement rates, as compared with the weight of pensioners covered in the non-contributory regime (see the subsection “Pensions and Pensioners”, above). Sincethe proportion of households with one individual living alone largely increases withage (Albuquerque 2009), the fact that retirees living alone are the worst off is again

Retirement and the Poverty of the Elderly: The Case of Portugal 15
Table 6Cross-Sectional Comparisons of Low-Income Incidence for Retired
Individuals by Type of Household
Male Female
Retired Retired Retired RetiredYear Retired - /Couple /Couple Retired - /Couple /Couple
Retired - With With No With Retired - With With No WithAlone Children Children Children Other Alone Children Children Children Other
Poor
estF
ifth
1994 55.50% 25.20% 37.80% 25.50% 23.80% 45.10% 29.00% 32.80% 19.10% 18.70%1995 60.60% 21.00% 41.20% 22.90% 26.60% 57.40% 27.90% 39.80% 12.90% 21.30%1996 56.20% 28.70% 41.20% 20.30% 20.50% 53.20% 23.20% 39.60% 21.10% 18.50%1997 56.60% 46.80% 38.90% 16.20% 18.80% 54.50% 24.60% 38.70% 13.10% 21.70%1998 47.50% 29.30% 33.50% 11.30% 30.10% 55.60% 33.20% 36.40% 11.00% 27.50%1999 51.30% 14.40% 39.00% 17.70% 23.70% 62.80% 14.40% 40.00% 17.60% 16.50%2000 45.40% 8.50% 47.40% 10.20% 25.80% 59.70% 17.00% 46.30% 7.10% 20.50%2001 52.00% 5.20% 48.30% 11.50% 28.50% 59.20% 17.90% 45.80% 6.30% 27.30%
Poor
estT
hird
1994 69.30% 30.80% 60.80% 39.20% 44.00% 62.00% 39.70% 60.30% 35.20% 32.50%1995 65.90% 40.10% 54.10% 37.00% 39.50% 76.50% 30.40% 55.20% 28.60% 36.90%1996 73.40% 41.60% 54.70% 33.30% 36.50% 75.30% 30.20% 53.00% 40.00% 31.30%1997 63.80% 62.50% 54.40% 30.70% 43.90% 76.80% 42.90% 53.60% 29.70% 34.50%1998 55.30% 46.40% 53.30% 24.00% 39.00% 79.20% 43.30% 54.80% 28.00% 38.40%1999 61.20% 40.40% 55.70% 29.60% 40.90% 81.50% 30.60% 55.80% 28.80% 28.10%2000 62.20% 12.50% 60.60% 26.40% 44.40% 75.80% 23.70% 60.50% 24.50% 36.50%2001 66.70% 25.60% 59.90% 24.90% 50.70% 74.30% 28.70% 57.70% 22.80% 37.90%
60%
Med
ian
1994 57.60% 27.70% 44.30% 28.90% 26.50% 47.00% 32.40% 40.10% 21.30% 21.50%1995 60.80% 21.00% 42.20% 23.40% 26.70% 58.60% 28.00% 41.30% 12.90% 23.20%1996 62.70% 29.50% 41.80% 20.80% 26.00% 55.50% 25.50% 40.70% 22.20% 20.50%1997 56.60% 46.80% 38.90% 17.20% 18.90% 54.60% 24.60% 38.70% 14.40% 21.80%1998 47.50% 34.00% 36.90% 11.30% 30.40% 55.80% 33.20% 40.60% 11.10% 27.60%1999 49.20% 12.70% 36.90% 16.00% 21.90% 56.60% 13.20% 38.00% 16.90% 16.30%2000 43.00% 8.50% 46.30% 9.50% 25.80% 58.10% 17.00% 44.90% 6.90% 18.00%2001 47.40% 5.20% 42.00% 7.10% 23.80% 54.50% 13.90% 41.20% 4.90% 22.10%
66%
1994
Med
ian
1994 64.00% 27.70% 56.00% 33.90% 38.20% 52.50% 34.60% 55.70% 28.80% 27.00%1995 61.60% 21.00% 43.80% 24.80% 28.00% 62.10% 28.00% 43.50% 14.90% 25.70%1996 56.50% 28.70% 41.60% 20.40% 22.10% 53.60% 25.30% 40.50% 21.20% 19.90%1997 52.80% 44.70% 38.00% 15.50% 18.10% 51.00% 23.80% 37.60% 12.40% 21.70%1998 45.00% 27.60% 31.70% 7.60% 29.60% 54.30% 33.20% 33.90% 8.30% 27.10%1999 41.40% 12.70% 30.10% 10.30% 19.70% 46.50% 12.90% 29.50% 10.20% 14.30%2000 33.60% 1.00% 29.60% 5.30% 11.70% 40.60% 5.80% 26.90% 3.50% 6.50%2001 34.40% 3.80% 27.40% 4.60% 15.30% 31.50% 11.40% 23.90% 1.20% 9.80%
Source: Authors’ own computations based on ECHP.
consistent with the changes in the relative importance of the contributory and thenon-contributory regimes.
A cross-sectional analysis of poverty, as carried out in the present researchproject, does not, however, enable us to establish whether it is the effect of thepension system itself that is the predominant one. Longitudinal analysis of the in-dividual’s income change as a result of the retirement transition is required. Weneed to evaluate whether this transition increases the likelihood of individuals be-coming poor. The importance of the demographic composition to the probability

16 Journal of Income Distribution
of falling into poverty on retirement is subject to analysis in a section below.
Income Effects in the Transition to Retirement
Analysis of the retirement poverty effect requires the a priori selection of all indi-viduals who retired during our sample period. This longitudinal analysis consists ofthe measurement, for this population, of the incidence of poverty in the year priorto retirement and the year after retirement. In addition, knowledge is required of theproportion of non-poor individuals in the year prior to retirement that became poorin the year after retirement. This information was gathered for the whole populationthat retired during the period and for its household groups, according to relevant at-tributes. These attributes were selected with the aim of studying to what extentcertain individual characteristics account for the pattern of poverty incidence. Theattributes are: gender, taking early retirement,18 economic status (type of activity inthe year prior to retirement), and wealth status (using the need for rent subsidised(council) housing as a proxy).
The sub-sample considered in the dynamic analysis is an equilibrated panelof 956 individuals (473 men and 483 women), aged 50-69 years at the time ofentering the panel database. These were all individuals who had experienced atransition process to retirement within the time frame of the panel, i.e., the subsetof individuals aged 50-69 who, classified as “non-retired” at the time of enteringthe panel, were observed to be making the transition to retirement during the panelperiod.
Retirement is almost by definition associated with important income changes.Table 7 sets out how 20.5% of those not poor in the year prior to retirement becomepoor in the retirement year, as measured against the 33rd percentile low-incomedefinition. In contrast, 16.9% of those who were poor in the year before retirementemerge out of poverty in the retirement year. Even with movements in both di-rections, there is evidence clearly associating retirement with a higher incidence ofpoverty. The percentage of persons living on a low income in the year before theirretirement is less than that the percentage of those living on a low income in thefirst year of their retirement.
Data analysis demonstrates that in general retirement increases the risk of poverty.Even before retirement, however, there are more women than men who are poor.Women are, however, less penalized by retirement than men, with the differencebetween the percentages of poor women and poor men decreasing slightly from theyear before their retirement to the year of their retirement.
‘Wealth status’ (indirectly measured by the need for low-rent (council) hous-ing) is a relevant attribute for the transition to poverty. A large percentage of per-sons who live in social housing are poor, whether before retirement (59%) or afterretirement (63.9%). Nevertheless, the percentage of persons living in social hous-

Retirement and the Poverty of the Elderly: The Case of Portugal 17
Tabl
e7
Low
-Inc
ome
Inci
denc
eA
mon
gPe
rson
sWho
Ret
ire
inth
eYe
arB
efor
eR
etir
emen
t,T
heR
etir
emen
tYea
ran
dIn
flow
into
Low
Inco
me
Perc
enta
geof
Pers
ons
Perc
enta
geof
Pers
ons
Tha
tAre
Not
Poor
inth
eYe
arof
Ret
irem
ent
But
Bec
ome
Poor
inth
eYe
arof
Ret
irem
ent
Perc
enta
geof
Pers
ons
Tha
tAre
Poor
inth
eYe
arof
Ret
irem
entB
utB
ecom
eN
otPo
orin
the
Year
ofR
etir
emen
t
N
Who
Ret
ire:
With
Low
With
Low
Inco
me
inth
eIn
com
ein
the
Year
Bef
ore
Year
ofR
etir
emen
tR
etir
emen
tA
ll44
.50%
48.3
0%20
.50%
16.9
0%95
6
Men
40.6
0%44
.80%
20.3
0%19
.30%
473
Wom
en48
.20%
51.8
0%20
.80%
15.0
0%48
3
Und
erR
etir
emen
tAge
36.1
0%38
.60%
11.7
0%13
.80%
321
Ove
rRet
irem
entA
ge48
.70%
53.2
0%26
.10%
18.1
0%63
5
Ow
ner-
Occ
upie
r44
.70%
48.3
0%19
.50%
16.1
0%72
3So
cial
Hou
sing
59.0
0%63
.90%
38.2
0%20
.80%
150
Oth
er(R
ente
r,et
c)35
.30%
40.0
0%18
.60%
18.4
0%83
Self
-Em
ploy
ed*
55.0
0%61
.10%
36.8
0%19
.00%
211
Em
ploy
ee(>
15ho
urs/
wee
k)*
17.9
0%25
.60%
12.5
0%14
.30%
273
Em
ploy
ee(<
15ho
urs/
wee
k)*
60.0
0%80
.00%
50.0
0%0.
00%
5U
nem
ploy
ed*
50.0
0%52
.30%
25.6
0%20
.90%
86O
ther
(Ina
ctiv
e,U
npai
dW
ork)
*55
.60%
55.9
0%19
.70%
15.2
0%35
4U
nkno
wn
61.5
0%57
.70%
30.0
0%25
.00%
26*
Inth
eye
arpr
iort
ore
tirem
ent
Sour
ce:A
utho
rs’o
wn
com
puta
tions
base
don
EC
HP.

18 Journal of Income Distribution
ing who formerly were not poor but became so in the retirement year is impressive:38.2%.
‘Activity status’ also proves a relevant attribute. Lesser labour-market par-ticipation (e.g., previously working less than 15 hours per week, or being self-employed) corresponds both to a high poverty incidence before retirement and to ahigher rate of entering into poverty upon retirement.
Early retirement is also a factor of relevance to the transition to poverty. A Por-tuguese individual who was formerly an employee working at least 15 hours perweek and who retires before retirement age is somewhat protected against fallinginto poverty in the year of retirement. This may be explained by the number of civilservants having already established a solid foundation of Social Security contribu-tions and thus able to retire before 65 in the period under study.
The above analysis has enabled us to evaluate whether the transition to retire-ment increases/decreases the probability of becoming poor, in addition to identify-ing the groups for which one circumstance or the other is likelier. As this involvedbivariate analysis, in whose results compositional effects may be present, carefulinterpretation is called for. Similarly, the marginal effects of these characteristicscannot be clearly identified.
Multivariate Analysis: Determinants of Becoming Poor
We now focus our analysis on a sub-sample of persons entering into retirementduring the sample period: those not poor in the year prior to retirement19 and atleast 50 years old in 1994.
The analytical purpose is, in overcoming the limitations of the bivariate analy-sis used above, to evaluate which characteristics determine with greater likelihoodof a person’s becoming poor on retirement. The methodology consists of probitmodel estimations of the probability of becoming poor on retirement. These modelsare estimated according to the four previously identified definitions of the povertyline. The number of observations varies according to the poverty line considered;they range from 531 to 664 (see Table 8). The number of transitions is relativelysimilar in all models except in Model 420, in which we have fewer transitions, ex-plained by its stricter definition of poverty.
Two groups of independent variables are considered in this analysis:
1. those accounting for individual characteristics and considered in the previ-ous section (gender, taking early retirement, type of economic activity, andwealth status), plus geographical region of residence21 and household type.
2. other variables categorised by sectors of activity and status of being a stateemployee in the year before retirement, considered in the effort to ascertain

Retirement and the Poverty of the Elderly: The Case of Portugal 19
the differences in social protection regimes indirectly. The inclusion of thesevariables may affect the probability of becoming poor, given that differentoccupational sectors including the civil service have different social protec-tion programs (see the section on “The Portuguese Pension System”, above).
Given that we seek to analyse the incidence of new poverty among retirees,we introduced a variable indicating closeness to poverty in the year before retire-ment, in the expectation of this positively influencing the probability of transition topoverty. The reference individual is an inactive female, who has not retired early.She lives alone in northern Portugal and works in agriculture. She has no civilservant status, and her residential status is ‘tenant’.
The results of the estimate models for the different poverty line definitions arepresented in Table 8, which also includes some diagnostic tests on the overall esti-mate quality. Looking first across different poverty lines one can see that, overall,the results are quite robust. There are no variables that have different effects indifferent models, and even the coefficient sizes are similar. Models 1 and 2 displaysome differences, not in terms of the direction of the effects but in terms of thestatistical significance of some variables. Specifically, industry and civil servantsfor Model 1, and industry, region, and household type for Model 2 do not attainstatistical significance, whereas they are quite significant in the other two models.
Looking in detail at the main determinants of becoming poor when retiring, onecan see that the characteristic of ‘activity status’ emerges as important in explainingentry into poverty with retirement. Having a weak relationship to the labour market,either in being self-employed or involved in unpaid activities, increases the prob-ability of becoming poor, confirming the picture obtained in the section “IncomeEffects in the Transition to Retirement”, above. This differs from what Bardasi etal. (2002) found for the United Kingdom. In their paper, the self-employed are notsignificantly more prone to becoming poor on retirement than are inactive people.In Portugal, working in manufacturing seems to decrease significantly the proba-bility of becoming poor in comparison with working in agriculture. This result alsoholds when the poverty lines are defined in relation to the median.
Living in a poor region is also a relevant factor. Someone who lives in the Alen-tejo, a region of relatively low income, with an older-age demographic, and withoutimportant urban, industrial areas, is significantly more at risk of poverty in retire-ment. These individual attributes reflect the action of labour-market determinantson earnings. Those in more favourable positions experience a reduced probabilityof entering into poverty after retirement. Another robust result is the effect of civilservice employment, which significantly reduces the probability of becoming poor.This reflects the effect of the social protection system in effect for these employees,with its concomitant, stronger protection against the risk of poverty.
On the other hand, taking early retirement, being of a certain gender or be-

20 Journal of Income Distribution
Table 8Probit Model of Mobility Into Poverty for People Who Retire
Model 1 - Model 2 - Model 3 - 60% Model 4 - 66%Bottom 20% Bottom 33% Median 1994 Median
Variable Marginal Effect Marginal Effect Marginal Effect Marginal Effect
GenderMale 0.006 0.001 0.002 -0.006
IncomeIncome Relative toPoverty Threshold
-0.056* -0.124* -0.055* -0.042*
Activity StatusEmployee 0.018 0.020 0.018 0.023Part Time 0.280Self-Employed 0.020** 0.058* 0.032* 0.037*Unpaid Activity 0.069** 0.201* 0.144* 0.133*Unemployed 0.020 0.019 0.020 0.014
IndustryManufacturing -0.012 -0.031 -0.015* -0.019*Services -0.005 -0.002 -0.005 -0.003
Early Retired -0.004 -0.019 -0.005 -0.009
Owner-Occupier -0.006 -0.001 0.010 -0.010Free Occupier -0.011 -0.009
RegionCentre 0.003 -0.025 0.007 0.007Lisbon -0.013 -0.005 -0.007 0.002Alentejo 0.060** 0.043 0.085* 0.032**Algarve -0.004 -0.027 -0.001 -0.006Azores 0.006 -0.019 0.008 0.004
Household TypeRetired Alone With Children -0.001 0.014 0.010 0.020Retired Couple With No Children -0.007 0.013 0.000 -0.001Retired Couple With Children -0.030* -0.027 -0.023** -0.027**Others -0.010 -0.003 0.006 -0.012
Civil Servant -0.011 -0.033** -0.016** -0.029*
Nr Obs 664 531 660 664LR chi2 157.51* 137.55* 75.52* 109.31*Pseudo R2 0.272 0.255 0.297 0.236
* - Significant at the 5% level; ** - Significant at the 10% level.Note: The reference individual is a female, not a civil servant, inactive, not early retired,living alone in the Northregion, working in agriculture, and who is a tenant.
ing a home-owner does not seem to be a relevant determinant of the probabilityof becoming poor. While we note a gender dimension to poverty, visible in thecross-section, we do not find the transition into retirement has different effects on
Retirement and the Poverty of the Elderly: The Case of Portugal 21
the probability of becoming poor for women or men. Similarly, in the section on“Income Effects” above, we even concluded that women are slightly less penalizedby retirement than are men. The type of household also seems to play a role, withretired couples with children being less prone to dropping below the poverty line.22
Conclusions
This article, using an income approach to poverty, has addressed the question ofwhether the transition to retirement is associated with an increase in the probabilityof becoming poor. Since there is some degree of arbitrariness in what is consideredthe appropriate poverty measurement threshold, four monetary poverty lines wereadopted.
After analysing the incidence of poverty among different population groups,i.e., retired and non-retired individuals, it was found that regardless of the defi-nition of poverty, its incidence is always greater among retired than among non-retired persons. Little economic progress was achieved in the position of retiredindividuals in the period under analysis.
There is some evidence of gender inequality, given a larger proportion of retiredand non-retired women than men being identified as living in poverty. This genderdifference does not appear when only workers are considered, which points to thelikelihood that the divergence may arise from gender differences in labour-marketstatus, specifically, the existence of a greater proportion of non-retired women thanmen who are without any paid activity.
For retired workers, older cohorts tend to be more subject to poverty thanyounger ones. The cohort of people born after 1940 is always the one with thelowest incidence of poverty, regardless of the poverty line applied. When analysingdifferences in low-income incidence by household type, the category ‘a retired per-son living alone’ represents those who are the worst off. This is the case for menand women alike. Nevertheless, the gap between the relative position of the house-hold type ‘retired person living alone’ and that of the next poorest household type‘couple with no children’, is especially large for ‘retired women living alone’.
As regards the transition to retirement, based on cross-sectional analysis, itemerges that retirement does increase the risk of poverty. While women are poorerthan men before retirement, on average, they are not more penalized by retirement.The groups tending to be most penalized on retirement are those living in socialhousing (demonstrating a weaker wealth status) and those having previously beenemployed working fewer than 15 hours per week or self-employed (both cases re-flecting weaker labour-market relations). The self-employed are more at risk offalling into poverty on retirement than are the unemployed. A Portuguese indi-vidual who retired before 65 years of age and who before retirement was an em-ployee working at least 15 hours per week is somewhat protected against falling
22 Journal of Income Distribution
into poverty in the year of retirement. This may be explained by the mass of civilservants in the period under analysis who had recorded a solid history of SocialSecurity payments and were able to retire before age of 65.
Finally, several probit models of the probability of becoming poor upon retire-ment were estimated in order to evaluate which characteristics make an individualmore or less prone to poverty in retirement. The findings reveal the most determi-nant characteristics to be: activity status, industry, region, type of household, andcivil servant status. Regarding ‘activity status’, being self-employed or engaged inunpaid activities increases the probability of becoming poor. Working in manufac-turing decreases this likelihood as compared to working in agriculture. Someoneliving in the Alentejo region is more at risk of poverty than a resident anywhereelse in the country. As for household type, retired couples with children are lessprone to becoming poor. Lastly, civil service employment significantly reduces theprobability of becoming poor. In contrast, taking early retirement, being of a cer-tain gender or being a home-owner does not seem to have any great influence onthe probability of becoming poor.
In conclusion, retirement in Portugal is still associated with an increased prob-ability of becoming poor. This is not due to an ungenerous Social Security systembut rather to the fact many individuals simply do not meet the requirements for re-ceipt of Social Security retirement benefits. As our cohort analysis establishes, theoldest cohorts of retired individuals are the poorest. The younger cohorts are betterprotected. This implies that retirement-associated poverty problems are highly sig-nificant in Portugal but will gradually improve with the passing away of the currentoldest cohorts. Meanwhile, it is strongly recommended that coverage of povertyrisks by the social protection system for the elderly be subject to re-evaluation bythe respective authorities.
Notes1See Bardasi et al. 2002; Disney et al. 1998; Johnson et al. 1998; Kingson and Arsenault 2000; Osberg 2001;
Williamson and Smeeding 2004; OECD 2001, and Zaidi 2001.2See Grad 1990, Haveman et al. 2003; Holden et al. 1988; Hurd 1990; Osberg 2001; Williamson and
Smeeding 2004; and OECD 2001.3Age 65 was at the time a statutory retirement age in both Sweden and Canada, although that statutory defini-
tion has since been repealed in Canada.4Bank and telecommunications employees are covered by mandatory occupational schemes, established through
collective agreements, rather than by the general scheme.5In the case of an insurance career of 20 years or less, the accrual rate is 2 per cent per calendar year. For those
individuals with an insurance career of 21 years or more, the accrual rate varies between 2.3 and 2 per cent inrelation to levels of reference earnings varying between 1.1 times and 8 times the minimum wage (Eurostat 2003).
6A transitional period was established (until 2017) during which the most favorable method is applied (i.e.,the former method, the new method, or a combination of the two).
7Monthly income cannot exceed 30 per cent of the minimum wage for a single person or 50 per cent for acouple.
8The Central Government is an exception, making transfers only to cover the annual deficit.9Since 1993, all new public servants have been under the same retirement conditions as private-sector workers.

Retirement and the Poverty of the Elderly: The Case of Portugal 23
10The Portuguese Social Security System (established in 1935) became universal only after 1974. The generalscheme reaches maturity after 2015.
11This rate includes pensioners under the non-contributory scheme and a special scheme for agricultural ac-tivities. This latter scheme was closed in 1986, and its pensioners had an average insurance career of 5 years orless.
12This scale, first proposed by Haagenars et al. (1994), assigns a value of 1 to the household head, 0.5 to eachadditional adult member, and 0.3 to each child.
13Income decomposition is available only for the annual net income variable and not for current income data,which is the income variable used in this article.
14In this case, household income is considered in real terms (base=1994), by deflating nominal incomes inaccordance with the consumer price index; this is in keeping with that advocated by Foster and Shorrocks (1988)and Callan and Nolan (1991).
15The category of the “non-retired” includes “workers” as a subset, as well as the unemployed and certainmembers of the inactive population.
16 The conclusions drawn from cohort analysis do not vary greatly when considering either annual or currentincome.
17According to demographic characteristics, we identify five different types of households to which a retiredperson may belong: 1) the single retired person, 2) the retired person living with children, 3) a couple, one ofwhich is a retired person, with no children, 4) a couple, one of which is a retired person, with children, and 5)other combinations of persons living together of which at least one is retired.
18Early retirement happens when retirement takes place for women, at any age below 60, and for men, before65.
19They are either poor or not poor after retirement.20 In Model 1, there are 105 transitions into poverty, 109, in Models 2 and 3 and 74, in Model 4.21 Considering regional dummies is important, as there are different economic structures, labour relations, and
even different traditions in social security coverage in different Portuguese regions.22 This may be explained partially by the utilization of equivalised income in the analysis.
Bibliography
Albuquerque, P. C. 2009. “The elderly and the extended household in portugal: an age-period-cohort analysis”.Population Research and Policy Review 28, 3: 271–289.
Bardasi, E., S. P. Jenkins, and J. Rigg. 2002. “Retirement and the income of older people: a british perspective”.Ageing and Society 22, 2: 131–159.
Callant, T. and B. Nolan. 1991. “Concepts of poverty and the poverty line”. Journal of Economic Surveys 5, 3:243–261.
CGA. 1994, 2001. “Relatório e contas”. Tech. rep., Caixa Geral de Aposentações, Ministério das Finanças,Lisbon.
DEPP. 2002. “Portugal 1995-2000. perspectivas de evolução social”. Tech. rep., DEPP/MST, Celta.Disney, E., R., Grundy, and P. Johnson. 1998. “The dynamics of retirement: analyses of the retirement surveys”.
Tech. Rep. Research Report no. 72, HMSO, Department of Social Security.Eurostat. 2001. “Social protection in the eu member states and the european economic area. situation on 1st 2001
and evolution”. Tech. rep., European Commission, Brussels.Eurostat. 2003. “Evolution of the social protection of the eu and eea member states”. Portuguese Report MISSOC-
INFO 01/2003, European Commission, Brussels.Foster, J. and A. Shorrocks. 1988. “Poverty orderings”. Econometrica 56, 1: 173–177.Grad, S. 1990. “Income change at retirement”. Social Security Bulletin 53, 1: 2–10.Hagenaars, A., K. de Vos, and M. Zaidi. 1994. “Poverty statistics in the late 1980s: Research based on micro-
data”. Tech. rep., Office for Official Publications of the European Communities, Luxembourg.Haveman, R. S., K. C. Holden, K. Wilson, and B. L. Wolfe. 2003. “Social security, age of retirement, and eco-
nomic welfare: inter-temporal and demographic patterns among retired-worker beneficiaries”. Demography40, 2: 369–394.
Heinrich, G. 2000. “Affluence and poverty in old age: new evidence from the european community householdpanel”. Working Paper Series from IRISS at CEPS/INSTEAD IRISS WP No 2000-08. IRISS WP No 2000-08,Working Paper Series from IRISS at CEPS/INSTEAD.
Hungerford, T. 2003. “Is there an american way of aging?: income dynamics of the elderly in the us and ingermany”. Research on Aging 25, 5: 435–455.

24 Journal of Income Distribution
Hurd, M. 1990. “Research on the elderly: economic status, retirement, and consumption and saving”. Journal ofEconomic Literature 28, 2: 565–637.
INE. 1994, 2001. “Estatísticas da protecção social”. Tech. rep., Instituto Nacional de Estatística, Lisbon.Johnson, P., G. Stears, and S. Webb. 1998. “The dynamics of incomes and occupational pensions after retirement”.
Fiscal Studies 19, 2: 197–215.Munnell, A. and M. Soto. 2005. “What replacement rates do households actually experience in retirement?” Cen-
ter for Retirement Research at Boston College Working Papers WP 2005-10. Center for Retirement Researchat Boston College WP 2005-10.
OECD. 2001. “Maintaining the economic welfare of older people - challenges for retirement income policies”.Policy Brief, URL http://www.oecd.org/dataoecd/39/21/2674669.pdf.
Osberg, L. 2001. The State of Economics in Canada: festschrift in honour of David Slater, chap. Poverty amongsenior citizens: a Canadian success story. Ottawa: Centre for the Study of Living Standards, 151–181.
Williamson, J. T. S. 2004. “Sliding into poverty? cross-national patterns of income source change and incomedecay in old age”. Maxwell School of Citizenship and Public Affairs Working Papers WP 388. Maxwell Schoolof Citizenship and Public Affairs WP 388.
Zaidi, A. 2001. “Snakes and ladders: an analysis of life-course events and income mobility in old age”. Tech.Rep. 08, Sage DP.