Retention of sediment and metals by Narragansett Bay subtidal and marsh environments: an update
20
ELSEVIER The Science of the Total Environment 179 (1996) 27-46 Retention of sediment and metals by Narragansett Bay subtidal and marsh environments: an update Suzanne B. Bricker National Oceanic and Atmospheric Ad~in~tratio~ Q&e of Ocean Resources Conserrwtion and Assessment, SSMC4 Floor 9,130s East West Highway, Siluzr Spring, MD 20910, USA Abstract Unlike many estuaries, Narragansett Bay Rhode Island has a sufficient information base regarding sources and sinksto construct mass balances for sediment,Fe., Mn, Cr, Cu, Ni, Pb, Zn, Ag. Decadal differencesin subtidal data for Pb, Cr and Cu allowed comparison of retention betweenthe 1970s and 1980s. The role of salt marshes in mass balances is considered for the first time. Calculations suggest that Narragansett Bay retains virtually all incoming sediment, the greater portion of incoming Fe (87%), Cu (102-119%) and Pb (39%-203%), and about one third the input of Zn and Mn. The resultsfor Cr (> 300% retention) suggest an unaccounted source, while results for Ag and Ni (1’7%and 12% retention) suggest a loss of thesemetals from the system. The salt marshes are nearly insignificant to retention with the exception of Fe for which they account for one third of total retention. For the metalsPb, Cr, and Cu, comparison of the 1970s and 1980s data suggests reductions in sediment burden reflective of reductionsin sewage discharge of metalsand limitations on the use of Pb in a gasoline. Keywords: Estuarine waters; Sedimentretention; Metal retention; Subtidal environment; Salt marsh; Narragansett Bay, Rhode island 1. Introduction During the past two decades there has been great interest in quantification of the sources, transport and fate of toxics. Because of conflict- ing uses of estuarine waters, as a conduit for waste and as a source of seafood, and because of their location between upland drainage and the sea, much of the research during this time has taken place there. Many contaminant studies have focused on the history of contamination, attempt- ing to look at the variations in contaminant through time, the degree of elevation over natural Elsevier Science BV. SSDI 0048-9697t95)04870-7 levels, particularly at present, and the causes for observed changes in ~n~entrations (Bruland et al., 1974; Goldberg et al., 1977, 1978, 1979, 1981; Santschi et al., 1984; Trefrey et al., 1985; Bricker-Urso et al., 1989; Bricker, 1990, 1993; Valette-Silver, 1992; Alexander et al., 1993). Sedi- ment core studies have been the primary method for historical studies because the sediment layers act as a record of water quality. Sediments are laid down year after year and contaminants that are particle reactive are deposited and retained within the sediments. The sediments act as an integrator such that changes from year to year
-
Upload
independent -
Category
Documents
-
view
1 -
download
0
Transcript of Retention of sediment and metals by Narragansett Bay subtidal and marsh environments: an update
ELSEVIER The Science of the Total Environment 179 (1996) 27-46
Retention of sediment and metals by Narragansett Bay subtidal and marsh environments: an update
Suzanne B. Bricker
National Oceanic and Atmospheric Ad~in~tratio~ Q&e of Ocean Resources Conserrwtion and Assessment, SSMC4 Floor 9,130s East West Highway, Siluzr Spring, MD 20910, USA
Abstract
Unlike many estuaries, Narragansett Bay Rhode Island has a sufficient information base regarding sources and sinks to construct mass balances for sediment, Fe., Mn, Cr, Cu, Ni, Pb, Zn, Ag. Decadal differences in subtidal data for Pb, Cr and Cu allowed comparison of retention between the 1970s and 1980s. The role of salt marshes in mass balances is considered for the first time. Calculations suggest that Narragansett Bay retains virtually all incoming sediment, the greater portion of incoming Fe (87%), Cu (102-119%) and Pb (39%-203%), and about one third the input of Zn and Mn. The results for Cr (> 300% retention) suggest an unaccounted source, while results for Ag and Ni (1’7% and 12% retention) suggest a loss of these metals from the system. The salt marshes are nearly insignificant to retention with the exception of Fe for which they account for one third of total retention. For the metals Pb, Cr, and Cu, comparison of the 1970s and 1980s data suggests reductions in sediment burden reflective of reductions in sewage discharge of metals and limitations on the use of Pb in a gasoline.
Keywords: Estuarine waters; Sediment retention; Metal retention; Subtidal environment; Salt marsh; Narragansett Bay, Rhode island
1. Introduction
During the past two decades there has been great interest in quantification of the sources, transport and fate of toxics. Because of conflict- ing uses of estuarine waters, as a conduit for waste and as a source of seafood, and because of their location between upland drainage and the sea, much of the research during this time has taken place there. Many contaminant studies have focused on the history of contamination, attempt- ing to look at the variations in contaminant through time, the degree of elevation over natural
Elsevier Science BV. SSDI 0048-9697t95)04870-7
levels, particularly at present, and the causes for observed changes in ~n~entrations (Bruland et al., 1974; Goldberg et al., 1977, 1978, 1979, 1981; Santschi et al., 1984; Trefrey et al., 1985; Bricker-Urso et al., 1989; Bricker, 1990, 1993; Valette-Silver, 1992; Alexander et al., 1993). Sedi- ment core studies have been the primary method for historical studies because the sediment layers act as a record of water quality. Sediments are laid down year after year and contaminants that are particle reactive are deposited and retained within the sediments. The sediments act as an integrator such that changes from year to year
28 X3. Bicker / The Science ofthe Totaf Eni~ro~ent 179 11996) 27-46
can be seen without superimposed annual/sea- sonal variations. Depending upon the sediment accretion rate, it is possible that a record for 100-200 years is detectable in a l-2-m core, with age of sediment increasing with depth. Thus sedi- ment cores can be used as a monitoring tool providing there is no physical disturbance or chemical migration.
Although sediment core studies have been able to fink variations in historical inputs with changes in sediment concentrations, there have been only a handful of attempts to construct quantitative mass balances of materials in estuaries. Because of this, there have been few opportunities to examine the role of the estuary as a filter of water on its way from upland to the sea. This is primar- ily a result of the difficulty in estimating sources and sinks of materials. Although in concept this seems straightforward, there has been no compre- hensive sampling or monitoring program designed to enumerate all inputs of metals and no two studies have measured the same elements. The source term must be painstakingly characterized by extracting information from disparate studies which are also of varying data quality and over different time periods. This is true of characteri- zation of the sediment sinks as well. Although we know that the sediments act as a repository for particle reactive materials, there has been no coordination of studies to characterize sediment deposition rates and elemental con~ntrations for those sediments over an entire estuary and thus the efficiency of the estuary as a filter remains unquantified.
Narragansett Bay, Rhode Island is one estuary for which enough information was available to piece together a mass balance (Fig. 1). Cores were sampled from several locations and some elemental analyses were common to all of the cores such that an evaluation of the mass balance of nutrients, metals, carbon and sediments could be constructed (Santschi et al., 1984; Nixon et al., 1986). Inputs from various sources were esti- mated and compared to estimated accumulation in subtidal sediments. Nixon et al. (1986) state that the most reliable part of the balance was the input data and that ‘future efforts should be directed toward a better description of sedimen-
tation rates and sediment characteristics in the Bay’. The mass balances were constructed using analytical results of surface sediments from five cores taken at various locations from the head to the mouth of the estuary and inputs estimated from various sources (Santschi et al., 1984; Nixon et al., 1986). Since that time, metal inputs have been better enumerated (Nixon, 1991) and more i~ormation on sediment a~umulation and metal concentrations has also become available (Corbin, 1989; Bricker, 1990).
This paper draws from the previous work and from the new information. The objective of this paper is to update the sediment and metals bud- gets for Narragansett Bay. Balances here are con- structed using the updated inputs, the original data from five subtidal cores (Goldberg et al., 1977; Hunt and Smith, 1983 as reported in Santschi et al., 1984) and additional sediment data from; seven subtidal cores and five subtidal surface sediment samples (Corbin, 1989), and seven salt marsh cores (Bricker-Ursa et al., 3989; Bricker, 1990, 1993). For all cores, the values used in calculations are averages of concentra- tions of the top O-5 cm and surface sediment samples are averages of the top O-2 cm. (Al- though sediment core data are used, this is not an attempt to re-examine the history of inputs to the bay. For an historical discussion the reader should refer to: Goldberg et al., 1977; Santschi et al., 1984; Bricker-Ursa et al., 1989; Nixon, 1990, 1991; Bricker, 1990, 1993.) The balances constructed here are more complete than the previous esti- mates in that several additional metals are in- cluded, calculations for subtidal retention are based on several more cores and surface samples, and marsh sediment reservoirs have been con- sidered for the first time.
2. Study area and sampling locations
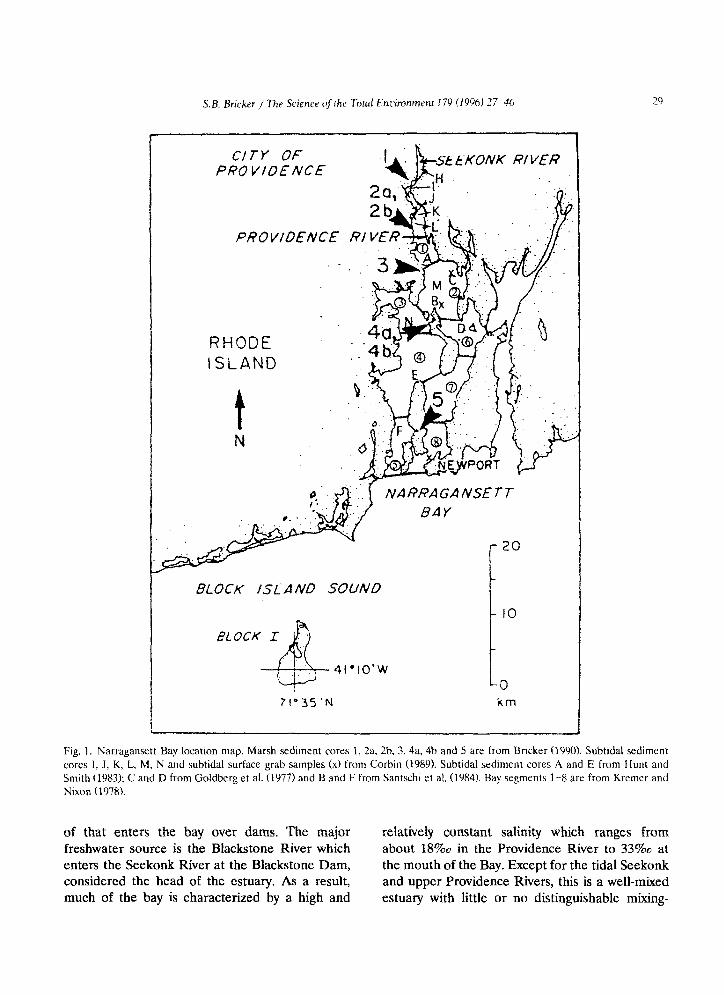
Narragansett Bay is a funnel-shaped estuary of appro~mately 342 km2 with a drainage basin of 4690 km2 in Rhode Island and Massachusetts (Fig. 1). The average depth is about 9 m and the semidiumal tide ranges from 1.1 m at the mouth to 1.4 m at the head. There is only a modest fresh water input (105 m3 s -I; Pilson, 1985) and much
S.B. Bn’cker / Tile Science of the Totaf Entironmertt 179 (19961 Z-46 29
RHODE ISLAND
t N
NARRA GA #SE 7 T BAY
i
71”35’N km
Fig. 1. Narragansett Bay location map. Marsh sediment cores I, 2a, 2b, 3. 4a, 4b and 5 are from Bricker (1990). Subtidal sediment cores I, J, K, L, M, N and subtidal surface grab samples (x) from Corbin (1989). Subtidal sediment cores A and E from Hunt and Smith (1983): C and D from Goldberg et al. (1977) and B and F from Santschi et al. (1984). Bay segments l-8 are from Kremer and Nixon (1978).
of that enters the bay over dams. The major freshwater source is the Blackstone River which enters the Seekonk River at the Blackstone Dam, considered the head of the estuary. As a result, much of the bay is characterized by a high and
relatively constant salinity which ranges fram about 18%0 in the Providence River to 33%0 at the mouth of the Bay. Except for the tidal Seekonk and upper Providence Rivers, this is a well-mixed estuary with little or no distinguishable mixing-
30 S.B. Bricker / The Science of the Total Erzr~ironment 179 (19966) 27-46
zone and weak vertical stratification. In general silt-clay sediments dominate the upper bay and grade to fine sands near the mouth (McMaster, 1960). Suspended sediment concentrations vary from 1 mg I-’ to 5 mg 1-l (Oviatt and Nixon, 1975) except in the Providence and Seekonk Rivers where they may reach nearly 100 mg I-’ (Morton, 1972).
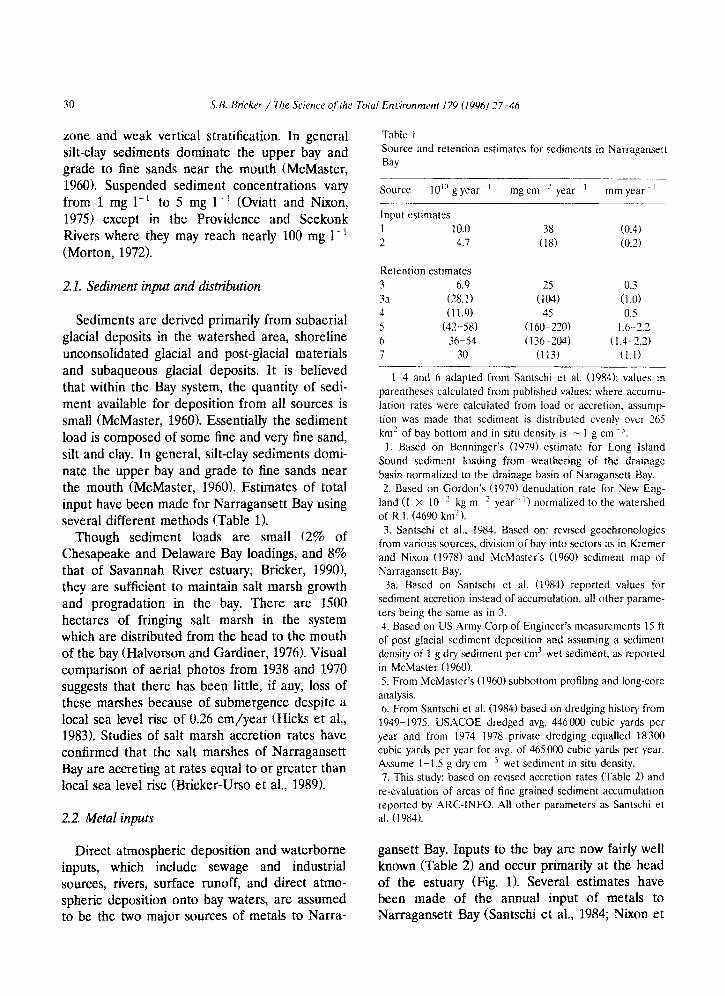
Table 1 Source and retention estimates for sediments in Narragansett Bay
-. SOUIX 10”’ g year- ’ mgcm-’ year ’ mm year- ’
input estimates 1 10.0 35 (0.4) 2 4.7 (18) (0.2)
2.1. ~ed~~e~t input and dis~.b~t~on
Sediments are derived primarily from subaerial glacial deposits in the watershed area, shoreline unconsolidated glacial and post-glacial materials and subaqueous glacial deposits. It is believed that within the Bay system, the quantity of sedi- ment available for deposition from all sources is small (McMaster, 1960). Essentially the sediment load is composed of some fine and very fine sand, silt and clay. In general, silt-clay sediments domi- nate the upper bay and grade to fine sands near the mouth (McMaster, 1960). Estimates of total input have been made for Narragansett Bay using several different methods (Table 1).
Retention estimates 3 6.9 25 0.3 3a (28. I) (104) (1.0) 4 (Il.91 45 0.5 5 (32-58) (160-220) 1.6-2.2 6 36-54 (136-204) (1.4-2.2) 7 30 (1 Ii) (I.11
l-4 and 6 adapted from Santschi et al. (1984): values in parentheses calculated from published values: where accumu- lation rates were calculated from Ioad or accretion, assump- tion was made that sediment is distributed evenly over 265 km” of bay bottom and in situ density is w 1 g cmm3.
1. Based on Benninger’s (1979) estimate for Long Island Sound sediment loading from weathering of the drainage basin normalized to the drainage basin of Naragansett Bay. 2. Based on Gordon’s (1979) denudation rate for New Eng-
land (1 x IO--’ kg mm’ year‘. ‘) normalized to the watershed of R.I. (4690 km”).
Though sediment loads are small (2% of Chesapeake and Delaware Bay loadings, and 8% that of Savannah River estuary; Bricker, 19901, they are sufficient to maintain salt marsh growth and progradation in the bay. There are 1500 hectares of fringing salt marsh in the system which are distributed from the head to the mouth of the bay (Halvorson and Gardiner, 1976). Visual comparison of aerial photos from 1938 and 1970 suggests that there has been little, if any, loss of these marshes because of submergence despite a local sea level rise of 0.26 cm/year (Hicks et al., 1983). Studies of salt marsh accretion rates have confirmed that the salt marshes of Narragansett Bay are accreting at rates equal to or greater than local sea level rise (Bricker-U~o et al., 1989).
3. Santschi et al., 1984. Based on: revised geochronologies from various sources, division of bay into sectors as in Kremer and Nixon (1978) and McMaster’s (1960) sediment map of Narragansett Bay.
3a. Based on Santschi et al. (1984) reported values for sediment accretion instead of accumulation, all other parame- ters being the same as in 3. 4. Based on US Army Corp of Engineer’s measurements 15 ft
of post glacial sediment deposition and assuming a sediment density of I g dry sediment per cm3 wet sediment, as reported in McMaster (1960).
2.2. Metal inputs
5. From McMaster’s (1960) subbottom profiling and long-core analysis. 6. From Santschi et al. (1984) based on dredging history from 1949-1975. USACOE dredged avg. 446ooO cubic yards per year and from 1974-1978 private dredging equalled 18300 cubic yards per year for avg. of 465000 cubic yards per year. Assume l-l.5 g dry cmm3 wet sediment in situ density. 7. This study: based on revised accretion rates (Table 2f and
re-evaluation of areas of fine grained sediment accumulation reported by ARC-INFO. All other parameters as Santschi et al. (1984).
Direct atmospheric deposition and waterborne gansett Bay. Inputs to the bay are now fairly well inputs, which include sewage and industrial known (Table 2) and occur primarily at the head sources, rivers, surface runoff, and direct atmo- of the estuary (Fig. 1). Several estimates have spheric deposition onto bay waters, are assumed been made of the annual input of metals to to be the two major sources of metals to Narra- Narragansett Bay (Santschi et al., 1984; Nixon et
S.B. Bricker / The Science of the Total Environment 179 (1996) 27-46 31
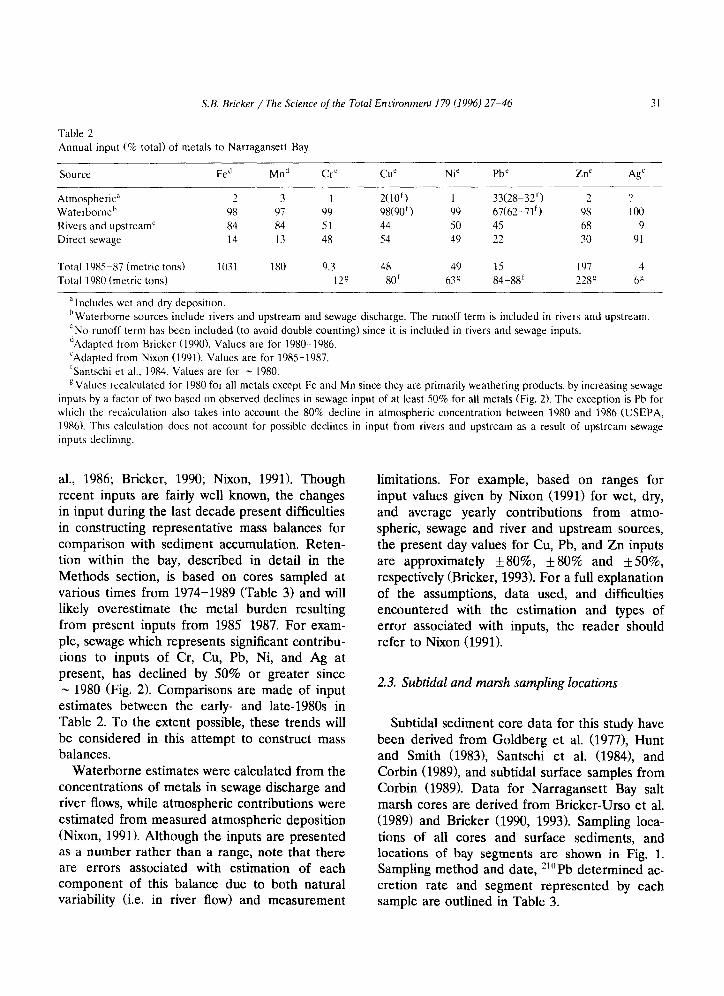
Table 2 Annual input (% total) of metals to Narragansett Bay
source
Atmospheric”
Waterborneh
Rivers and upstreamC Direct sewage
Fe” Mnd CrC
2 3 1
98 91 99
84 84 51 14 13 48
CU’
2(10’)
98(90’) 44
54
Ni’
I
99
50 49
Pb’
33(28-32’)
67(62-71’) 45
22
Zn’ A$
2 ?
98 loo
68 9
30 91
Total 1985587 (metric tons) 1031 Total 1980 (metric tons)
d Includes wet and dry deposition.
180 9.3 48 49 15 197 4
12s 80’ 63” 84-88’ 228” 6”
h Waterborne sources include rivers and upstream and sewage discharge. The runoff term is included in rivers and upstream.
‘No runoff term has been included (to avoid double counting) since it is included in rivers and sewage inputs.
‘Adapted from Bricker (1990). Values are for 1980-1986. ‘Adapted from Nixon (1991). Values are for 1985-1987.
‘Santschi et al., 1984. Values are for - 1980.
“Values recalculated for 1980 for all metals except Fe and Mn since they are primarily weathering products, by increasing sewage inputs by a factor of two based on observed declines in sewage input of at least 50% for all metals (Fig. 2). The exception is Pb for
which the recalculation also takes into account the 80% decline in atmospheric concentration between 1980 and 1986 (USEPA, 1986). This calculation does not account for possible declines in input from rivers and upstream as a result of upstream sewage
inputs declining.
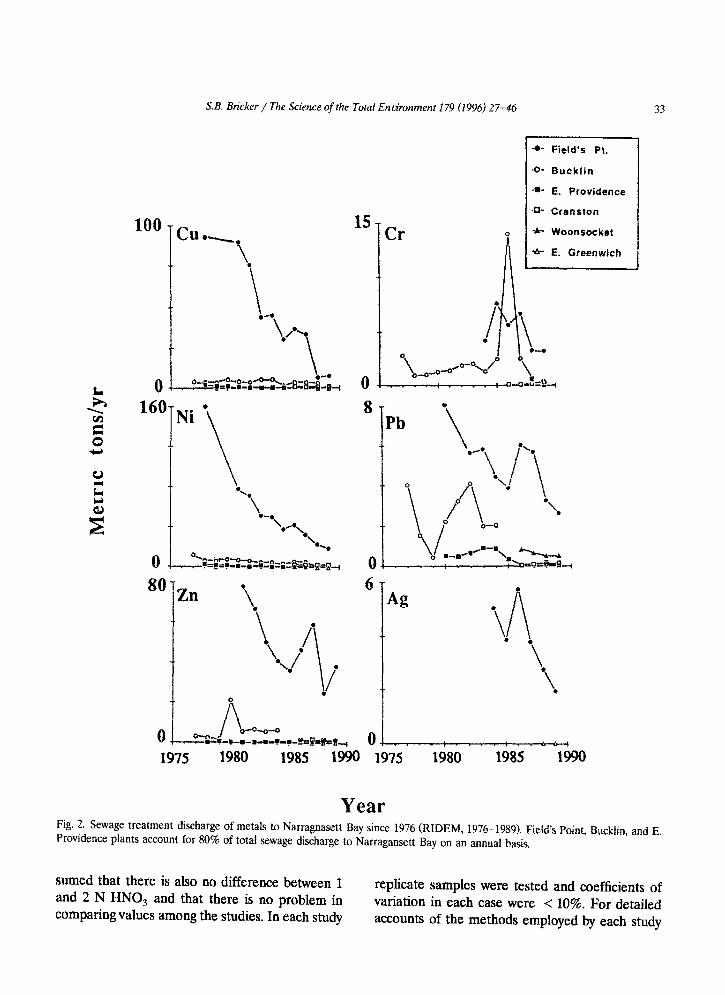
al., 1986; Bricker, 1990; Nixon, 1991). Though recent inputs are fairly well known, the changes in input during the last decade present difficulties in constructing representative mass balances for comparison with sediment accumulation. Reten- tion within the bay, described in detail in the Methods section, is based on cores sampled at various times from 1974-1989 (Table 3) and will likely overestimate the metal burden resulting from present inputs from 1985-1987. For exam- ple, sewage which represents significant contribu- tions to inputs of Cr, Cu, Pb, Ni, and Ag at present, has declined by 50% or greater since - 1980 (Fig. 2). Comparisons are made of input estimates between the early- and late-1980s in Table 2. To the extent possible, these trends will be considered in this attempt to construct mass balances.
Waterborne estimates were calculated from the concentrations of metals in sewage discharge and river flows, while atmospheric contributions were estimated from measured atmospheric deposition (Nixon, 1991). Although the inputs are presented as a number rather than a range, note that there are errors associated with estimation of each component of this balance due to both natural variability (i.e. in river flow) and measurement
limitations. For example, based on ranges for input values given by Nixon (1991) for wet, dry, and average yearly contributions from atmo- spheric, sewage and river and upstream sources, the present day values for Cu, Pb, and Zn inputs are approximately *80%, * 80% and f50%, respectively (Bricker, 1993). For a full explanation of the assumptions, data used, and difficulties encountered with the estimation and types of error associated with inputs, the reader should refer to Nixon (1991).
2.3. Subtidal and marsh sampling locations
Subtidal sediment core data for this study have been derived from Goldberg et al. (1977), Hunt and Smith (19831, Santschi et al. (19841, and Corbin (19891, and subtidal surface samples from Corbin (1989). Data for Narragansett Bay salt marsh cores are derived from Bricker-Ursa et al. (1989) and Bricker (1990, 1993). Sampling loca- tions of all cores and surface sediments, and locations of bay segments are shown in Fig. 1. Sampling method and date, 2”)Pb determined ac- cretion rate and segment represented by each sample are outlined in Table 3.
32 S. B. Bicker / The Science of the Total Eniironment 179 (1996) 27-46
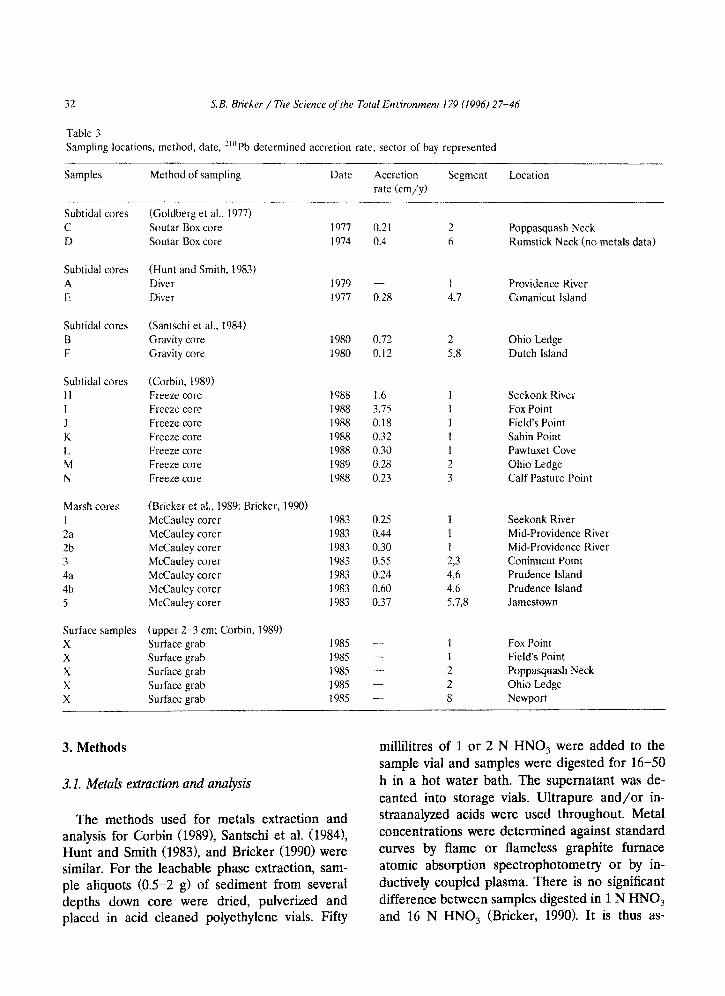
Table 3 Sampling locations, method, date, ““Pb determined accretion rate, sector of bay represented
Samples Method of sampling Date
Subtidal cores (Goldberg et al., 1977) C Soutar Box core D Soutar Box core
Subtidal cores A E
(Hunt and Smith, 1983) Diver Diver
Subtidal cores B F
(Santschi et al., 1984) Gravity core Gravity core
Subtidal cores i-1 I J K L M N
(Corbin, 1989) Freeze core Freeze core Freeze core Freeze core Freeze core Freeze core Freeze core
Marsh cores (Bricker et al., 1989; Bricker, 1990) 1 McCauley corer 2a McCauley corer 2b McCauley corer 3 McCauley corer 4a McCauley corer 4b McCauley corer 5 McCauley corer
Surface samples X X X X X
(upper 2-3 cm; Corbin, 1989) Surface grab Surface grab Surface grab Surface grab Surface grab
Accretion rate (cm/y)
Segment Location
1977 0.21 2 Poppasquash Neck 1974 0.4 6 Rumstick Neck (no metals data)
1979 - 1 Providence River 1977 0.28 4-7 Conanicut Island
1980 0.72 2 Ohio Ledge 1980 0.12 5.8 Dutch Island
1988 1.6 1 Seekonk River 1988 3.75 1 Fox Point 1988 0.18 1 Field’s Point 1988 0.32 1 Sabin Point 1988 0.30 1 Pawtuxet Cove 1989 0.28 2 Ohio Ledge 1988 0.23 3 Calf Pasture Point
1983 0.25 1 Seekonk River 1983 0.44 1 Mid-Providence River I983 0.30 I Mid-Providence River 1983 0.55 2,3 Conimicut Point 1983 0.24 4,6 Prudence Island 1983 0.60 4.6 Prudence Island 1983 0.37 k-f.8 Jamestown
1985 -- 1 Fox Point 1985 - 1 Field’s Point I985 - 2 Poppasqu~h Neck 1985 - 2 Ohio Ledge 1985 - 8 Newport
3. Methods
3.1. MetaB exfructim and analysis
The methods used for metals extraction and analysis for Corbin (1989), Santschi et al. (19841, Hunt and Smith (19831, and Bricker (1990) were similar. For the leachable phase extraction, sam- ple aliquots (0.5-2 g> of sediment from several depths down core were dried, pulverized and placed in acid cleaned polyethylene vials. Fifty
millilitres of 1 or 2 N HNO, were added to the sample vial and samples were digested for 16-50 h in a hot water bath. The supernatant was de- canted into storage vials. Ultrapure and/or in- straanalyzed acids were used throughout. MetaI con~ntrations were determined against standard curves by flame or flameless graphite furnace atomic absorption spectrophotometry or by in- ductive~ coupled plasma. There is no signi~cant difference between samples digested in 1 N HNO, and 16 N HNO, (Bricker, 1990). It is thus as-
S. B. Bricker / The Science of the Total Entimnment 179 (1996) 27-46
Cr
33
O- Bucklin
l - E. Providence
a- Crenston
* Woonsocket
* E. Greenwich
o+.. .:.
1975 1980 1985 1990
Year Fig. 2. sewage treatment discharge of metals to Narragnasett Bay since 1976 (RIDEM, 1976-1989). Field’s Point, &cl&n, and E. Providence plants account for 80% of total sewage discharge to Narragansett Bay on an annual basis.
sumed that there is also no difference between 1 and 2 N HNO, and that there is no problem in
replicate samples were tested and coefficients of
comparing values among the studies. In each study variation in each case were < 10%. For detailed accounts of the methods employed by each study
34 S. B. Bricker / The Science of the Total En rironmmt 179 (I 9%) 27-46
the reader should refer to the original papers (Goldberg et al., 1977; Hunt and Smith, 1983; Santschi et al., 1984; Bricker-Urso et al., 1989; Corbin, 1989; Bricker, 1990).
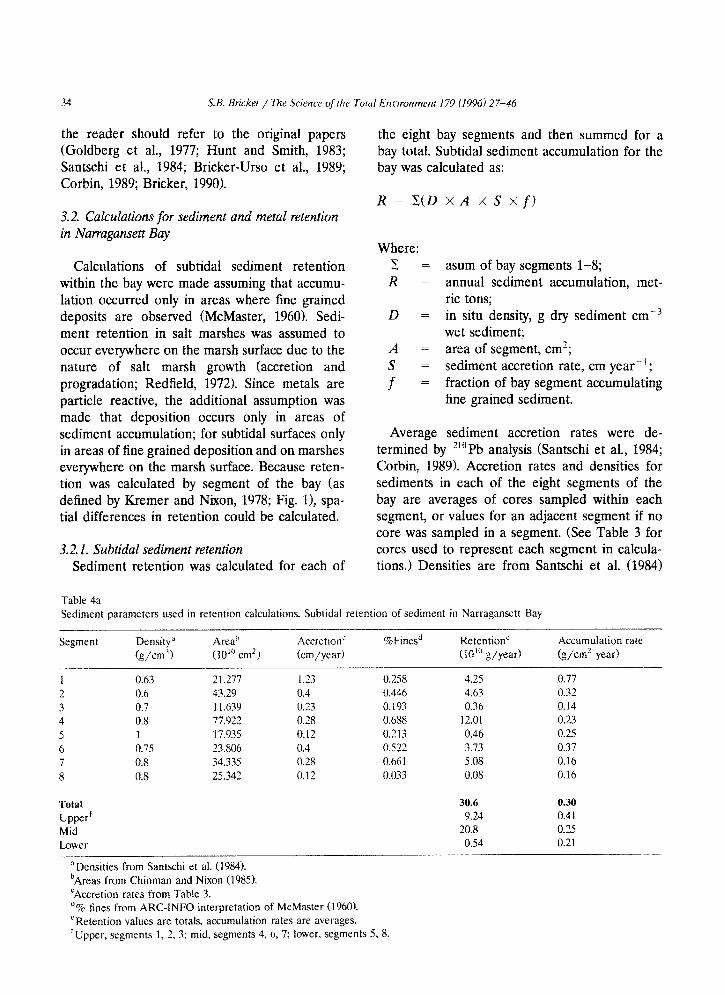
the eight bay segments and then summed for a bay total. Subtidal sediment accumulation for the bay was calculated as:
R = c(D X A X s X f)
Calculations of subtidal sediment retention within the bay were made assuming that accumu- lation occurred only in areas where fine grained deposits are observed (McMaster, 1960). Sedi- ment retention in salt marshes was assumed to occur everywhere on the marsh surface due to the nature of salt marsh growth (accretion and progradation; Redfield, 3972). Since metals are particle reactive, the additional assumption was made that deposition occurs only in areas of sediment accumulation; for subtidal surfaces only in areas of fine grained deposition and on marshes everywhere on the marsh surface. Because reten- tion was calculated by segment of the bay (as defined by Kremer and Nixon, 1978; Fig. 11, spa- tial differences in retention could be calculated.
Where: z: = asum of bay segments 1-8; R = annual sediment accumulation, met-
ric tons; D = in situ density, g dry sediment crnw3
wet sediment; A = area of segment, cm’;
sediment accretion rate, cm year- ’ ; fraction of bay segment accumulating fine grained sediment.
3.2.1. Subtidal sediment retention Sediment retention was calculated for each of
Average sediment accretion rates were de- termined by ““Pb analysis (Santschi et al., 1984; Corbin, 1989). Accretion rates and densities for sediments in each of the eight segments of the bay are averages of cores sampled within each segment, or values for an adjacent segment if no core was sampled in a segment. (See Table 3 for cores used to represent each segment in calcula- tions.) Densities are from Santschi et al. (1984)
Table 4a Sediment parameters used in retention calculations. Subtidal retention of sediment in Narragansett Bay
Segment Density” (g/cm3)
Areat’ t10’” cm21
AccretionC km/year)
%Fines” Retention’ (15”’ g/year)
Accumulation rate (g/cm’ year)
1 0.63 21.277 1.23 0.258 4.25 0.77
2 5.6 43.29 0.4 0.446 4.63 0.32 3 0.7 11.639 0.23 5.193 0.36 0.14 4 0.8 77.922 0.28 0.688 12.01 0.23 5 1 17.935 0.12 0.213 0.46 0.25 6 0.75 23.806 0.4 0.522 3.73 0.37 7 0.8 34.335 0.28 0.661 5.08 0.16 8 0.8 25.342 0.12 0.033 0.08 0.16
Total
Upper’ Mid Lower
30.6 0.30 9.24 0.4f
20.8 5.25 0.54 0.21
‘Densities from Santschi et al. (1984). ‘Areas from Chinman and Nixon (1985). ‘Accretion rates from Table 3. ‘% fines from ARC-INFO interpretation of McMaster (1960). “Retention values are totals. a~umulation rates are averages. r Upper, segments 1 , 2, 3; mid, segments 4, 6, 7; Iower, segments 5, 8.
S.B. Bricker / The Science ofthe Totd E~iir~ff~e~t 179 f19961 Z-46 35
because no recent data were available. Areas for each segment are from Chinman and Nixon (1985) and the values for the fraction of each that is accumulating sediments are from McMaster (1960) as interpreted by ARC-INFO. Parameters used in the calculation are tabulated in Table 4a.
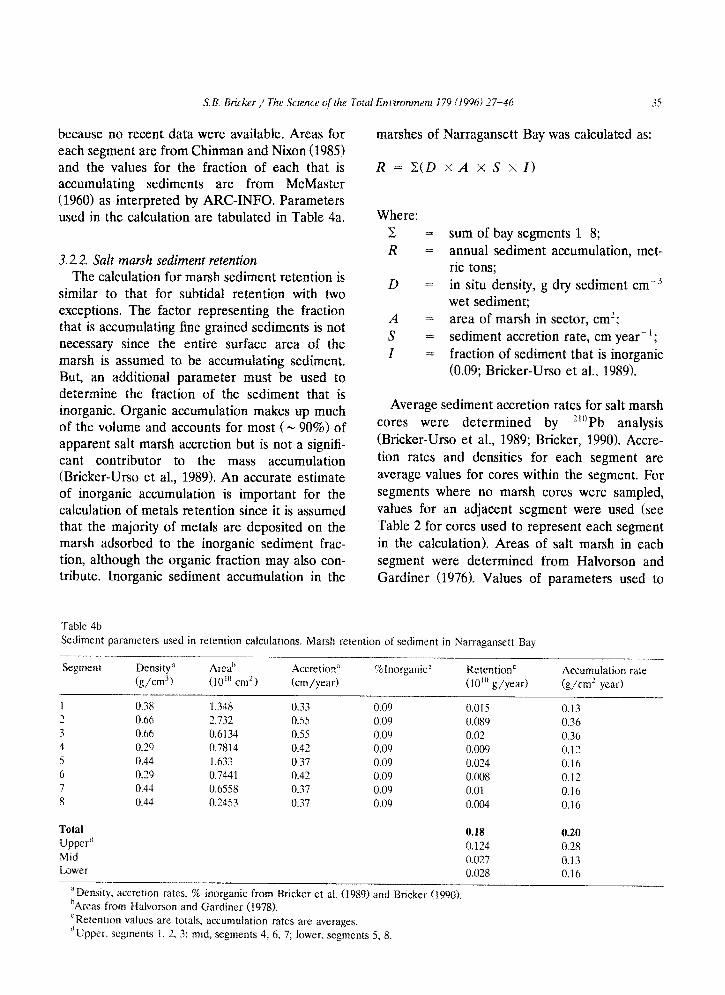
3.2.2. Salt marsh sediment retention The calculation for marsh sediment retention is
similar to that for subtidal retention with two exceptions. The factor representing the fraction that is accumulating fine grained sediments is not necessary since the entire surface area of the marsh is assumed to be accumulating sediment. But, an additional parameter must be used to determine the fraction of the sediment that is inorganic. Organic accumulation makes up much of the volume and accounts for most (* 90%) of apparent salt marsh accretion but is not a signifi- cant contributor to the mass accumulation (Bricker-Urso et al., 1989). An accurate estimate of inorganic accumulation is important for the calculation of metals retention since it is assumed that the majority of metals are deposited on the marsh adsorbed to the inorganic sediment frac- tion, although the organic fraction may also con- tribute. Inorganic sediment accumulation in the
marshes of Narragansett Bay was calculated as:
R = X(D x A x s x I)
Where: 2 i=
R =
D =
A = S =i
I z
sum of bay segments l-8; annual sediment accumulation, rnet- ric tons; in situ density, g dry sediment cmd3 wet sediment; area of marsh in sector, cm’; sediment accretion rate, cm year- ’ ; fraction of sediment that is inorganic (0.09; Bricker-Urso et al., 1989).
Average sediment accretion rates for salt marsh cores were determined by ““Pb analysis (Bricker-Urso et al., 1989; Bricker, 1990). Accre- tion rates and densities for each segment are average values for cores within the segment. For segments where no marsh cores were sampled, values for an adjacent segment were used (see Table 2 for cores used to represent each segment in the calculation). Areas of salt marsh in each segment were determined from Halvorson and Gardiner (1976). Values of parameters used to
Table 4b Sediment parameters used in retention calculations. Marsh retention of sediment in Narragansett Bay
- ------ - Segment Density” Areah Accretion” (ToInorganic” Retention’ Accumulation rate
(g/cm3) (10”’ cm’) (cm/year) (10”’ g/year) (g/cm’ year)
1 0.38 1.348 0.33 0.09 0.015 0.13 2 0.66 2.732 0.55 0.09 0.089 0.36 3 0.66 0.6134 0.55 O.OY 0.02 0.36 4 0.79 0.7814 0.42 0.09 0.009 0.1’ 5 0.44 1.633 0.37 0.09 0.024 0.16 6 0.19 0.7441 0.42 0.09 0.008 0.12 7 0.44 0.6558 0.37 0.09 0.01 0.16 8 0.44 0.2453 0.37 0.09 0.004 0.16
Total 0.18
Upper” 030
0.124 0.28 Mid 0.027 0.13 Lower 0.028 0.16
“Density, accretion rates, % inorganic from Bricker et al. (1989) and Bricker (1990). hAreas from Halvorson and Gardiner (1978). CRetention values are totals, accumulation rates are “Upper. segments 1. 2. 3; mid, segments 4, 6. 7: lower, averages. segments 5, 8.
36 S.B. Brickvr / The Science of the Total Environment 179 (19961 27-46
calculate retention of sediment by salt marshes are tabulated in Table 4b.
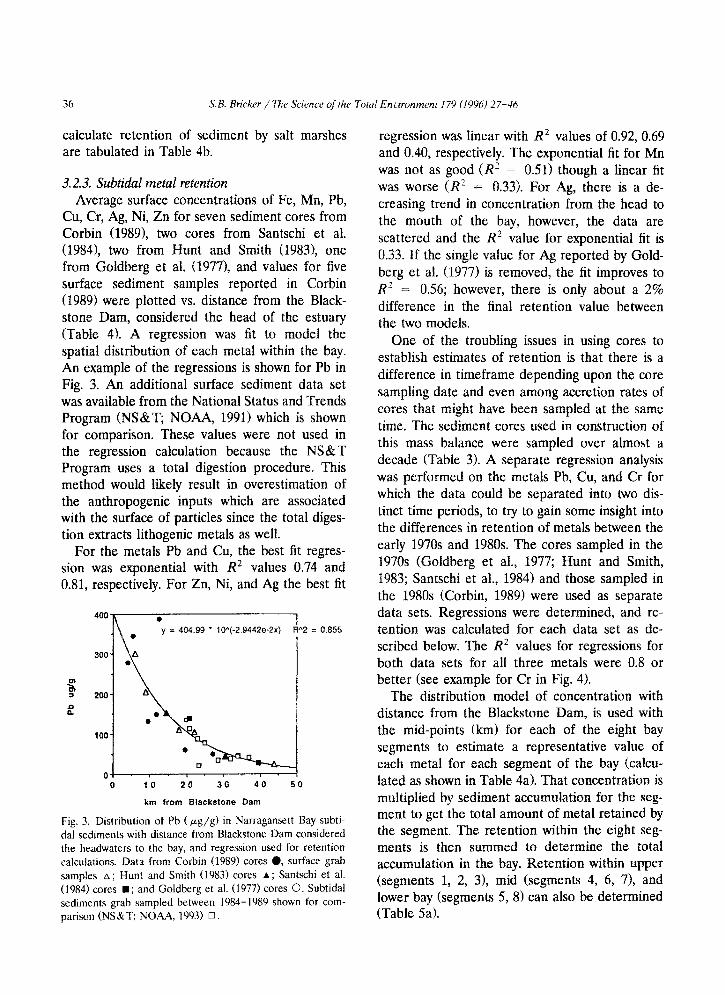
32.3. ~~ti~~~ metal retention Average surface concentrations of Fe, Mn, Pb,
Cu, Cr, Ag, Ni, Zn for seven sediment cores from Corbin (1989), two cores from Santschi et al. (1984), two from Hunt and Smith (19831, one from Goldberg et al. (19771, and values for five surface sediment samples reported in Corbin (1989) were plotted vs. distance from the Black- stone Dam, considered the head of the estuary (Table 41. A regression was fit to model the spatial distribution of each metal within the bay. An example of the regressions is shown for Pb in Fig. 3. An additional surface sediment data set was available from the National Status and Trends Program (NS&T; NOAA, 1991) which is shown for comparison. These values were not used in the regression calculation because the NS&T Program uses a total digestion procedure. This method would likely result in overestimation of the anthropogenic inputs which are associated with the surface of particles since the total diges- tion extracts lithogenic metals as well.
For the metals Pb and Cu, the best fit regres- sion was exponential with R2 values 0.74 and 0.81, respectively. For Zn, Ni, and Ag the best fit
400 l
y = 404.99 * 10”1-2.9442&X) R”2 = 0.855 l
I
km from Blackstone Dam
Fig. 3. Distribution of Pb ( pg/g) in Narragansett Bay subti-
dal sediments with distance from Blackstone Dam considered
the headwaters to the bay, and regression used for retention
calculations. Data from Corbin (1989) cores 0, surface grab
samples A; Hunt and Smith (1983) cores A; San&hi et al.
(1984) cores n ; and Goldberg et al. (1977) cores 0. Subtidal
sediments grab sampled between 1984-1989 shown for com-
parison (NS&T; NOAA, 1993) q .
regression was linear with R” values of 0.92, 0.69 and 0.40, respectively. The exponential fit for Mn was not as good (R’ = 0.51) though a linear fit was worse (R’ = 0.33). For Ag, there is a de- creasing trend in concentration from the head to the mouth of the bay, however, the data are scattered and the R* value for exponential fit is 0.33. If the single value for Ag reported by Gold- berg et al. (1977) is removed, the fit improves to R” = 0.56; however, there is only about a 2% difference in the final retention value between the two models.
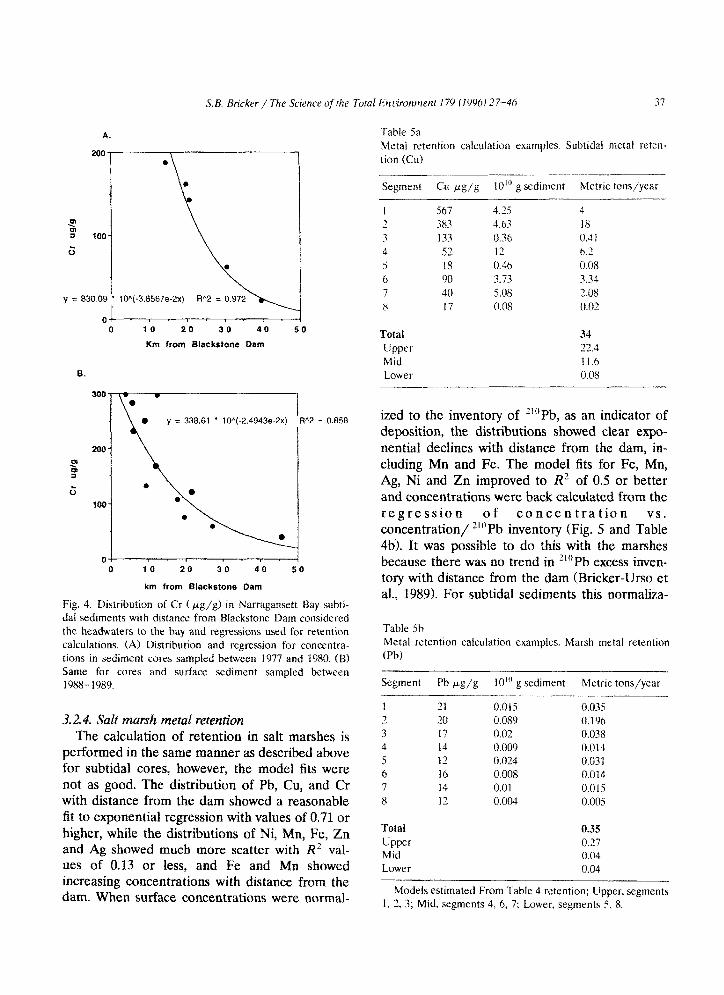
One of the troubling issues in using cores to establish estimates of retention is that there is a difference in timeframe depending upon the core sampling date and even among accretion rates of cores that might have been sampled at the same time. The sediment cores used in construction of this mass balance were sampled over almost a decade (Table 3). A separate regression analysis was performed on the metals Pb, Cu, and Cr for which the data could be separated into two dis- tinct time periods, to try to gain some insight into the differences in retention of metals between the early 1970s and 1980s. The cores sampled in the 1970s (Goldberg et al., 1977; Hunt and Smith, 1983; Santschi et al., 1984) and those sampled in the 1980s (Corbin, 1989) were used as separate data sets. Regressions were determined, and re- tention was calculated for each data set as de- scribed below. The R2 values for regressions for both data sets for all three metals were 0.8 or better (see example for Cr in Fig. 4).
The distribution model of concentration with distance from the Blackstone Dam, is used with the mid-points (km) for each of the eight bay segments to estimate a representative value of each metal for each segment of the bay (calcu- lated as shown in Table 4a). That concentration is multiplied by sediment accumulation for the seg- ment to get the total amount of metal retained by the segment. The retention within the eight seg- ments is then summed to determine the total a~umulation in the bay. Retention within upper (segments 1, 2, 31, mid (segments 4, 6, 7), and lower bay (segments 5, 8) can also be determined (Table 5a).
S.B. Bricker / The Science of the Total Environment 179 (1996) 27-46 31
y = 830.09 * IO”{-3.8567e-2x) I 10 20 30 40 50
Km from Blackslone Dam
o! 0 10 20 30 40 50
km from Blackstone Dam
Fig. 4. Distribution of Cr f&g/g> in Narragansett Bay subti-
da1 sediments with distance from Blackstone Dam considered
the headwaters to the bay and regressions used for retention
calculations. (AI Distribution and regression for concentra-
tions in sediment cores sampled between 1977 and 1980. (B)
Same for cores and surface sediment sampled between
1988-1989.
3.2.4. Salt marsh metal retention The calculation of retention in salt marshes is
performed in the same manner as described above for subtidal cores, however, the model fits were not as good. The distribution of Pb, 0.1, and Cr with distance from the dam showed a reasonable fit to exponential regression with values of 0.71 or higher, while the distributions of Ni, Mn, Fe, Zn and Ag showed much more scatter with R2 val- ues of 0.13 or less, and Fe and Mn showed increasing concentrations with distance from the dam. When surface concentrations were normal-
Table Sa
Metal retention calculation examples. Subtidal metal reten-
tion (Cu) - -
Segment Cu fig/g IO” g sediment Metric tons/year
I 567 4.75 4
7 383 4.63 18
3 133 0.36 0.4 I
4 s2 I2 6.2
5 18 0.46 0.08
6 90 3.73 3.34
7 40 5.08 2.08
8 17 0.08 0.02
Total 34
Upper 21.4
Mid 11.6
Lower 0.08
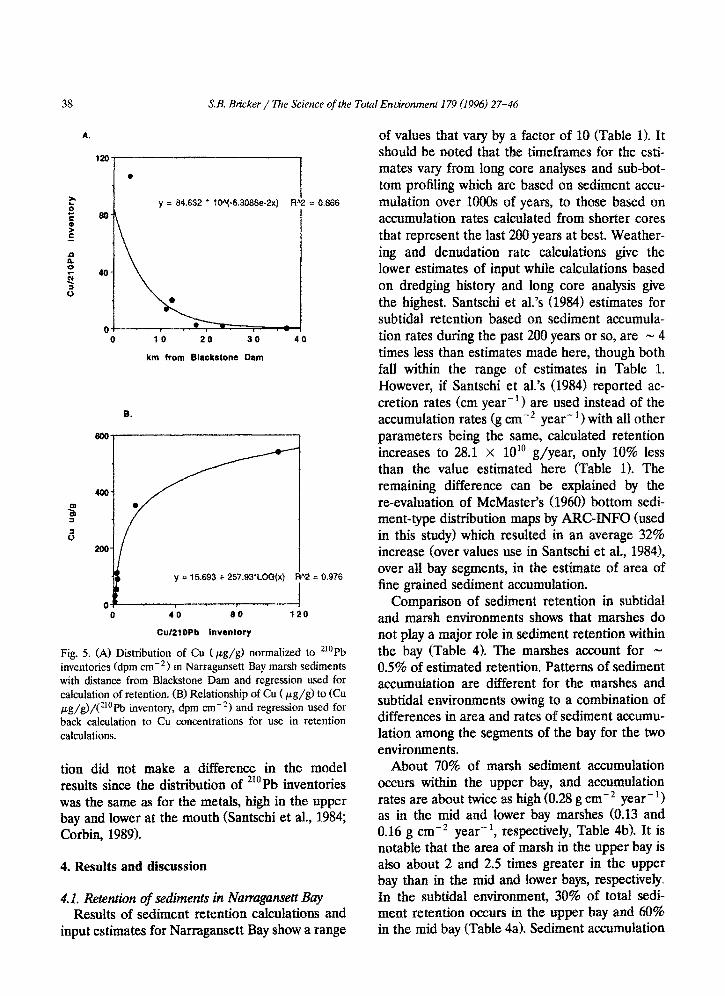
ized to the inventory of ““Pb, as an indicator of deposition, the distributions showed clear expo- nential declines with distance from the dam, in- cluding Mn and Fe. The model fits for Fe, Mn, Ag, Ni and Zn improved to R’ of 0.5 or better and concentrations were back calculated from the regression of concentration vs. concentration/ “‘)Pb inventory (Fig. 5 and Table 4b). It was possible to do this with the marshes because there was no trend in ““Pb excess inven- tory with distance from the dam (Bricker-Urso et al., 1989). For subtidal sediments this normaliza-
Table 5b
Metal retention calculation examples. Marsh metal retention
(Pb)
Segment Pb M/g IO”’ g sediment Metric tons/year _-
-- 1 21 0.015 0.035
2 20 0.089 0.196
3 17 0.02 0.038
4 14 0.009 0.014
5 I? 0.024 0.031
6 16 0.008 0,014
7 I4 0.01 0.015
8 I2 0.004 0.005
Total 0.35
Upper 0.17
Mid 0.04
Lower 0.04
Models estimated From ‘Table 4 retention; Upper, segments
1, 2, 3; Mid, segments 4, 6, 7: Lower, segments 5. 8.
38 S.B. Rricker / The Science of the Total Environment 179 (1996) 27-46
0.866
0 10 20 30 40
km from Blackstone Oam
y = 15.693 + 257.93’LOG(x) “2 = 0.976
0 0 40 80 120
CufPlOPb inventory
Fig. 5. (A) Distribution of Cu (j&g) normalized to “‘Pb inventories (dpm cm -*I in Narragansett Bay marsh sediments with distance from Blackstone Dam and regression used for calculation of retention. (B) Relatjonship of Cu (&g/g> to (Cu ~g/g)/(210Pb inventory, dpm cm-? and regression used for back calculation to Cu concentrations for use in retention calculations.
tion did not make a difference in the model results since the d~~ibution of 21”Pb invento~es was the same as for the metals, high in the upper bay and lower at the mouth (Santschi et al., 1984; Corbin, 1989).
4. Results and discussion
4.1. Relearn of sediments in ~~~~~e~ Bay Results of sediment retention calculations and
input estimates for Narragansett Bay show a range
of values that vary by a factor of 10 (Table 1). It should be noted that the timeframes for the esti- mates vary from long core analyses and sub-bot- tom profiling which are based on sediment accu- mulation over 1000s of years, to those based on accumulation rates calculated from shorter cores that represent the last 200 years at best. Weather- ing and denudation rate calculations give the lower estimates of input while calculations based on dredging history and long core analysis give the highest. Santschi et al.“s (1984) estimates for subtidal retention based on sediment accumula- tion rates during the past 200 years or so, are N 4 times less than estimates made here, though both fall within the range of estimates in Table 1. However, if Santschi et al.‘s (1984) reported ac- cretion rates (cm year-‘) are used instead of the accumulation rates fg cm-’ year-‘) with all other parameters being the same, calculated retention increases to 28.1 x 10” g/year, only 10% less than the value estimated here (Table 0. The remaining difference can be explained by the re-evaluation of McMaster’s (1960) bottom sedi- ment-type dis~bution maps by ARC-INFO (used in this study) which resulted in an average 32% increase (over values use in Santschi et al., 1984), over all bay segments, in the estimate of area of fine grained sediment a~umulation.
Comparison of sediment retention in subtidal and marsh environments shows that marshes do not play a major role in sediment retention within the bay (Table 4). The marshes account for N 0.5% of estimated retention. Patterns of sediment accumulation are different for the marshes and subtidal environment owing to a combination of differences in area and rates of sediment accumu- lation among the segments of the bay for the two environments.
About 70% of marsh sediment accumulation occurs within the upper bay, and accumulation rates are about twice as high (0.28 g cm-’ year- ’ 1 as in the mid and lower bay marshes (0.13 and 0.16 g cm-’ year- ‘, respectively, Table 4b). It is notable that the area of marsh in the upper bay is also about 2 and 2.5 times greater in the upper bay than in the mid and lower bays, respectively. In the subtidal en~ronment, 30% of total sedi- ment retention occurs in the upper bay and 60% in the mid bay (Table 4a). Sediment accumulation
LB. Brichw / The Science of the Total Enkonment I79 (1996127-46 39
rates in the upper bay (0.41 g cmA2 year-‘) are The most important point is that the sediment 1.5 times higher that in mid bay subtidal (0.25 g burden was less in the 1980s than in the 1970s. crnm2 year-‘) areas and are N 2 times higher than in the lower bay (0.21 g cme2 year- ‘>. The
The declines in sediment retention, presumably reflecting declines in metal input, are 18% for Pb,
subtidal area of accumulation in the mid bay is 30% and 34% for Cr and Cu, respectively in the about 3 and 18 times greater than in the upper and lower bay, respectively. Average rates of ac-
~appro~mate) decade time span between the two
cumulation in the subtidal areas (0.30 g cmW2 data sets. These declines correspond to observed
yr- ’ are about one-third higher than in marsh declines in sewage discharge of all 3 metals and
areas (0.20 g cm-* yr- ‘> (Table 4). for Pb, the 1972 legislation limiting the use of lead in gasoline.
4.2. Retention of metals in Narragansett Bay
4.2.1. A note about ~e~rnes The issue of comparative ~me~ames warrants
more consideration prior to discussion of the retention of metals in the bay. The cores from which the data are derived for the construction of the subtidal component of the mass balance were sampled over nearly a decade time period (Table 3). The 0- to S-cm interval in the core sampled in 1974 (Goldberg et al., 1977) represents the ap- proximate time period 1962-1974 based on the estimated accretion rate. The time period repre- sented by the same interval (O-5 cm> in the most recent cores varies, based on sediment accretion rate, from 1960-1988 to 1987-1988 (Corbin, 1989). It is difficult to reconcile the use of such disparate timeframes for comparison to the most recent source estimates (for 1986-19871, and for that reason an analysis was performed on the three metals (Cu, Pb, and Cr) for which there were samples from both the early studies (Gold- berg et al., 1977; Hunt and Smith, 1983; Santschi et al., 1984) and the most recent study (Corbin, 1989). Metal retention was determined for both data sets for the three metals. The earlier data set represents the early 1970s while the more recent values represent the early 1980s. The regressions for the two time periods showed differences for all three metals (regressions for Cr shown in Fig. 4) and the resultant retention in subtidal sedi- ments based on the two data sets were as follows:
This means that the limitations on discharge of metals to coastal waters have been effective. A quantitative comparison to changes in source in- puts over the same time period is not possible due to the d~cul~ in constructing a source inventory for the 1970s. However, it was possible to calculate the decline in sewage discharge of Pb, Cu, and Cr for the largest three sewage treatment plants (responsible for > 80% of sewage discharge to the bay) for specific time- frames. The input of Pb declined by 42% (1981 and 1984), Cu by 68% (1978 and 1985), and Cr by 40% (1978 and 1982). These do not match the declines in the retention reflected in the sediment because they account for only part of the total inputs to the bay (see Table 2 for contribution to total inputs in 1985-87).
Pb (metric tons year-‘)
Cr cu
Early 1970s 33.9 41.9 81.4 Early 1980s 28.0 29.3 53.5
It is notable that the values for retention of Pb and Cu calculated here for the 1970s are two times less for Pb and about equal for Cu to estimates of retention calculated by Santschi et al. (1984) - Pb, 51-90 metric tons year-‘; Cu, 72-100 metric tons year-‘. Those values were calculated based on accumulation over the entire bay bottom without regard to the accumulation of sediment. If recalculated making the assumption that there is metal accumulation only in areas of sediment deposition, the retention values are re- duced to 27 metric tons year- ’ for Pb and to 32 metric tons year- ’ for Cu. This recalculation brings the Pb values into agreement; the distribu- tion model of Pb concentrations in the bay used here match well with the concentrations used by Santschi et al. (1984) for each segment for the calculation. The Cu values do not agree as a result of the model distribution used here giving much higher values (five times greater in segment 1 and three times greater in segment 2) in the
40 S.B. Bricker / The Science of the Total Enuironment I79 (1996) 27-46
upper bay than those used by Santschi et al. (1984).
Unfortunately, for the other metals this com- parison could not be tested because metal analy- ses were not done on both sets of cores (Table 4). However, the comparison of changes in retention of Pb, Cu, and Cr can be used to give some insight to the possible changes in other contami- nant metals (Zn, Ag, Ni) over the same time period since their behavior is expected to be similar. Thus, for metals that were analyzed only in the 1970s data set, the overestimate of reten- tion for comparison to source inputs for the 1980s can be roughly estimated. (The metals Mn and Fe have a primarily natural source that is reflected in the inventory as ‘rivers and upstream sources’ (Table 2) and thus would not be expected to
change significantly as a result of changes in treatment efficiency as the contaminant metals do.)
4.2.2. Retention in subtidal and marsh sediments Although the concentrations of most metals in
surface sediments of upper bay marsh and subti- da1 cores are roughly equal (Table 61, the marsh contribution to total metal retention in the bay is not significant to total retention by bay sediments, with the exception of Fe (Table 7). This is due to the difference between subtidal and marsh areas of sediment deposition and in the rates of deposi- tion. Salt marshes are accumulating sediment and metals in an area that is m 14 times less than the subtidal depositional areas and at rates one-third less on average (Table 4). Retention by marsh
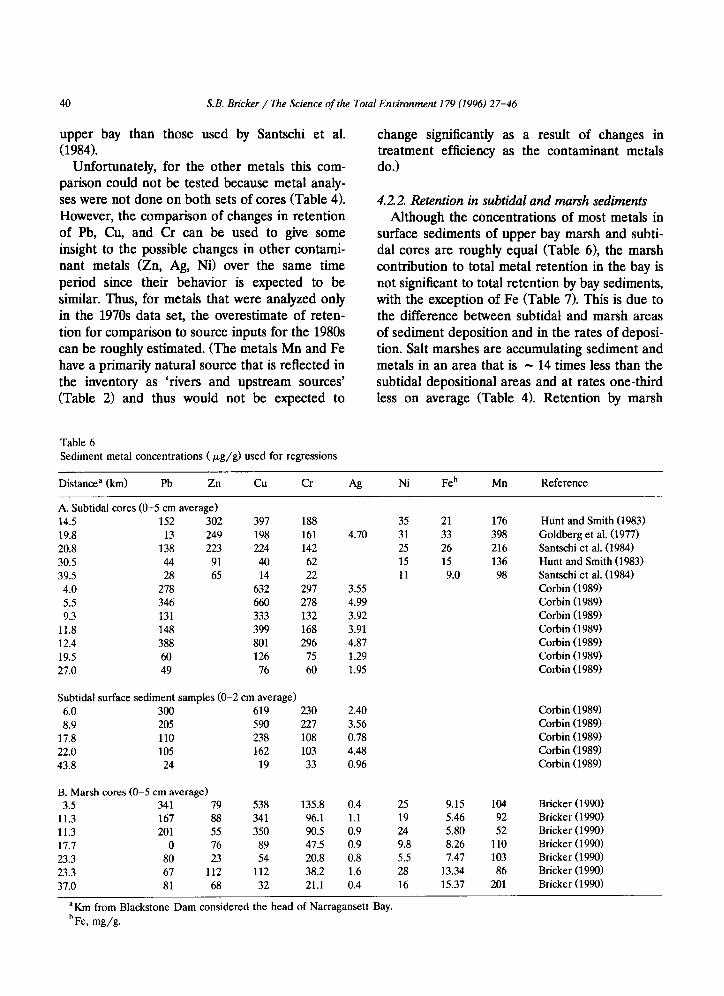
Table 6 Sediment metal concentrations ( pg/g) used for regressions
Distancea (km) Pb Zn CU Cr & Ni Feb Mn Reference
A. Subtidal cores (O-5 cm average) 14.5 152 302 397 188 19.8 13 249 198 161 20.8 138 223 224 142 30.5 44 91 40 62 39.5 28 65 14 22 4.0 278 632 297 5.5 346 660 278 9.3 131 333 132
11.8 148 399 168 12.4 388 801 296 19.5 60 126 75 27.0 49 76 60
Subtidal surface sediment samples (O-2 cm average) 6.0 300 619 230 8.9 205 590 227
17.8 110 238 108 22.0 105 162 103 43.8 24 19 33
B. Marsh cores (O-5 cm average) 3.5 341 79 538 135.8
11.3 167 88 341 96.1 11.3 201 55 350 90.5 17.7 0 76 89 47.5 23.3 80 23 54 20.8 23.3 67 112 112 38.2 37.0 81 68 32 21.1
4.70 35 21 176 31 33 398 25 26 216 15 15 136 11 9.0 98
3.55 4.99 3.92 3.91 4.87 1.29 1.95
Hunt and Smith (1983) Goldberg et al. (1977) Santschi et al. (1984) Hunt and Smith (1983) Santschi et al. (1984) Corbin (1989) Corbin (1989) Corbin (1989) Corbin (1989) Corbin (1989) Corbin (1989) Corbin (1989)
2.40 Corbin (1989) 3.56 Corbin (1989) 0.78 Corbin (1989) 4.48 Corbin (1989) 0.96 Corbin (1989)
0.4 25 9.15 104 Bricker (1990) 1.1 19 5.46 92 Bricker (1990) 0.9 24 5.80 52 Bricker (1990) 0.9 9.8 8.26 110 Bricker (1990) 0.8 5.5 7.47 103 Bricker (1990) 1.6 28 13.34 86 Bricker (1990) 0.4 16 15.37 201 Bricker (1990)
aKm from Blackstone Dam considered the head of Narragansett Bay. bFe, q/g.
S. 3. Brickr / The Science of the Toial Enrironmenf I79 (1996) 27-46 41
sediments varies from 2 to 8% of total retention for all metals with the exception of Fe for which almost 30% of the total is attributed to reten~on by marshes (Table 7). The higher retention of Fe is likely a result of the fixation of Fe into sulfides, particularly pyrite, in the reducing marsh sedi- ments (Lord, 1980; McCaffrey and Thomson, 1980). Although no X-ray analyses were done on these marsh cores, McCaffrey and Thomson (1980) report pyrite framboids in the upper 14 cm of a Connecticut salt marsh core, some as large as 10 pm in diameter. Spatial patterns of metal retention are similar to those of sediment accu- mulation; the majority of metals are retained in the upper and mid bay for both subtidal and marsh environments though the difference between retention in upper and lower bay sedi- ments is greater for the subtidal sediments than it is for the marsh sediments (Table 5).
4.23. Mass balance: inputs UT. retention Sediment mass balance. Retention estimates
vary from 1.4 to 12 times greater than input estimates. Some of this discrepancy can be ex- plained by the methods of estimation. However, some may be explained by the amount of dredg- ing in the bay which, according to Samschi et al. (1984) has removed more sediment from channels
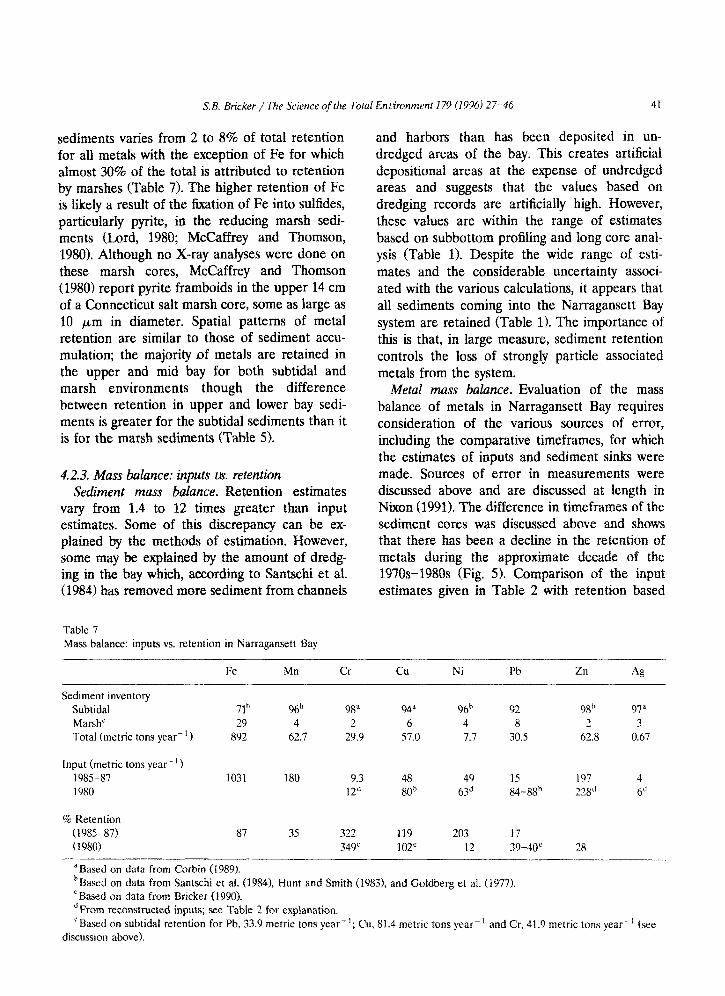
Table 7 Mass balance: inputs vs. retention in Narragansett Bay
and harbors than has been deposited in un- dredged areas of the bay. This creates artificial depositional areas at the expense of undredged areas and suggests that the values based on dredging records are arti~c~ally high. However, these values are within the range of estimates based on subbottom profiling and long core anal- ysis (Table 1). Despite the wide range of esti- mates and the considerable uncertainty associ- ated with the various calculations, it appears that all sediments coming into the Narragansett Bay system are retained (Table 1). The importance of this is that, in large measure, sediment retention controls the loss of strongly particle associated metals from the system.
Metal mass balance. Evaluation of the mass balance of metals in Narragansett Bay requires consideration of the various sources of error, including the comparative timeframes, for which the estimates of inputs and sediment sinks were made. Sources of error in measurements were discussed above and are discussed at length in Nixon (1991). The difference in timeframes of the sediment cores was discussed above and shows that there has been a decline in the retention of metals during the approximate decade of the ~9~Os-1980s (Fig. 5). comparison of the input estimates given in Table 2 with retention based
Fe Mn Cr cu Ni Pb ZII 4%
Sediment inventory Subtidal 77h 96h 98” 94” 96h 92 98h 97” MarshC 29 4 2 6 4 8 2 3 Total (metric tons year- ’ ) 892 62.7 29.9 57.0 1.7 30.5 62.8 0.67
Input (metric tons year- ’ ) 1985-87 1031 180 9.3 48 49 15 197 4 1980 12* 80h 63d 84-88h 2w 6d
% Retention (1985-87) (1980)
87 35 322 119 203 17 349’ 102r 12 39-40” 28
aBased on data from Corbin (1989). hBased on data from Santschi et al. (1984), Hunt and Smith (t983), and Goldberg et al. (19’77). ‘Based on data from Bricker (1990). ‘From reconstructed inputs; see Table 2 for explanation. ‘Based on subtidal retention for Pb, 33.9 metric tons year- r; Cu, 81.4 metric tons year-’ and Cr,41.9 metric tons year- ’ (see
discussion above).
42 S.B. Bricker /The Science of the Total Enrironment 179 (1996) 27-46
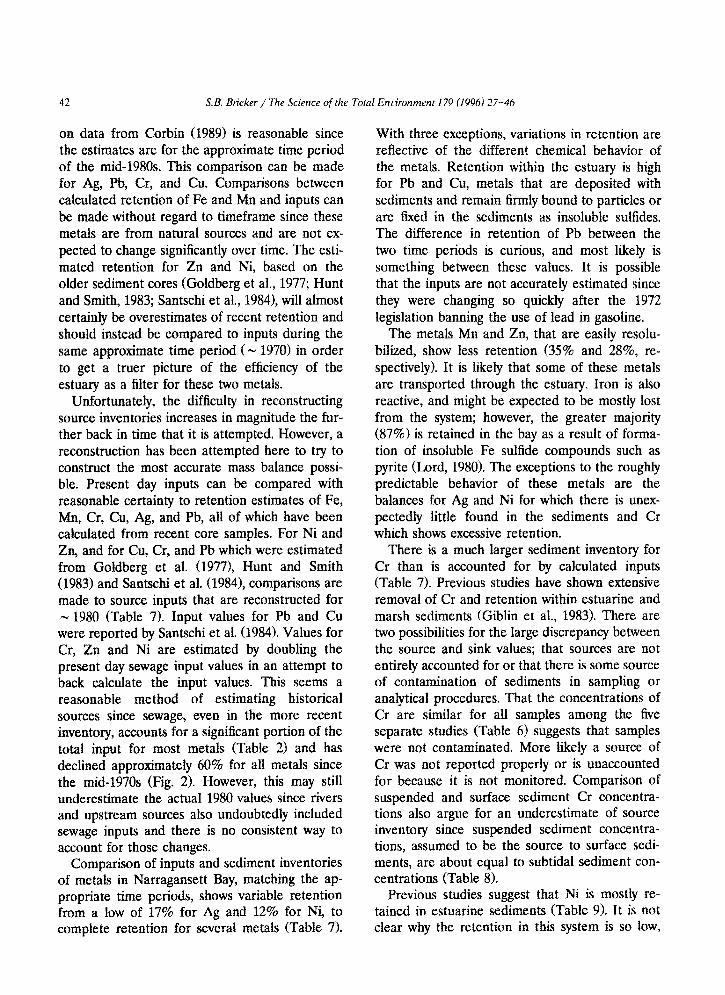
on data from Corbin (1989) is reasonable since the estimates are for the approximate time period of the mid-198~. This comparison can be made for Ag, Pb, Cr, and Cu. ~mparisons between calculated retention of Fe and Mn and inputs can be made without regard to timeframe since these metals are from natural sources and are not ex- pected to change significantly over time. The esti- mated retention for Zn and Ni, based on the older sediment cores (Goldberg et al., 1977; Hunt and Smith, 1983; Santschi et al., 1984), will almost certainly be overestimates of recent retention and should instead be compared to inputs during the same approximate time period (N 1970) in order to get a truer picture of the efficiency of the estuary as a filter for these two metals.
Unfortunately, the difficulty in reconstructing source inventories increases in magnitude the fur- ther back in time that it is attempted. However, a reconstruction has been attempted here to try to construct the most accurate mass balance possi- ble. Present day inputs can be compared with reasonable certainty to retention estimates of Fe, Mn, Cr, Cu, Ag, and Pb, all of which have been calculated from recent core samples. For Ni and Zn, and for Cu, Cr, and Pb which were estimated from Goldberg et al. (19771, Hunt and Smith (1983) and Santschi et al. (19841, comparisons are made to source inputs that are reconstructed for N 1980 (Table 7). Input values for Pb and Cu were reported by Santschi et al. (1984). Values for Cr, Zn and Ni are estimated by doubling the present day sewage input values in an attempt to back calculate the input values. This seems a reasonable method of estimating historical sources since sewage, even in the more recent inventory, accounts for a signi~cant portion of the total input for most metals (Table 2) and has declined approximately 60% for all metals since the mid-1970s (Fig. 2). However, this may still underestimate the actual 1980 values since rivers and upstream sources also undoubtedly included sewage inputs and there is no consistent way to account for those changes.
Comparison of inputs and sediment inventories of metals in Narragansett Bay, matching the ap- propriate time periods, shows variable retention from a low of 17% for Ag and 12% for Ni, to complete retention for several metals (Table 7).
With three exceptions, variations in retention are reflective of the different chemical behavior of the metals. Retention within the estuary is high for Pb and Cu, metals that are deposited with sediments and remain fn-mly bound to particles or are fixed in the sediments as insoluble sulfides. The difference in retention of Pb between the two time periods is curious, and most likely is something between these values. It is possible that the inputs are not accurately estimated since they were changing so quickly after the 1972 legislation banning the use of lead in gasoline.
The metals Mn and Zn, that are easily resolu- bilized, show less retention (35% and 28%, re- s~ctively~. It is likely that some of these metals are transported through the estuary. Iron is also reactive, and might be expected to be mostly lost from the system; however, the greater majority (87%) is retained in the bay as a result of forma- tion of insoluble Fe sulfide compounds such as pyrite (Lord, 1980). The exceptions to the roughly predictable behavior of these metals are the balances for Ag and Ni for which there is unex- pectedly little found in the sediments and Cr which shows excessive retention.
There is a much larger sediment inventor for Cr than is accounted for by calculated inputs (Table 7). Previous studies have shown extensive removal of Cr and retention within estuarine and marsh sediments (Giblin et al., 1983). There are two possibilities for the large discrepancy between the source and sink values; that sources are not entirely accounted for or that there is some source of contamination of sediments in sampling or analytical procedures. That the concentrations of Cr are similar for all samples among the five separate studies (Table 6) suggests that samples were not contaminated. More likely a source of Cr was not reported properly or is unaccounted for because it is not monitored. Comparison of suspended and surface sediment Cr concentra- tions also argue for an underestimate of source inventory since suspended sediment concentra- tions, assumed to be the source to surface sedi- ments, are about equal to subtidal sediment con- centrations (Table 8).
Previous studies suggest that Ni is mostly re- tained in estuarine sediments (Table 9). It is not clear why the retention in this system is so low,
S.B. Bricker / The Science of the Total Ent:ironrnent 179 (1996127-46 43
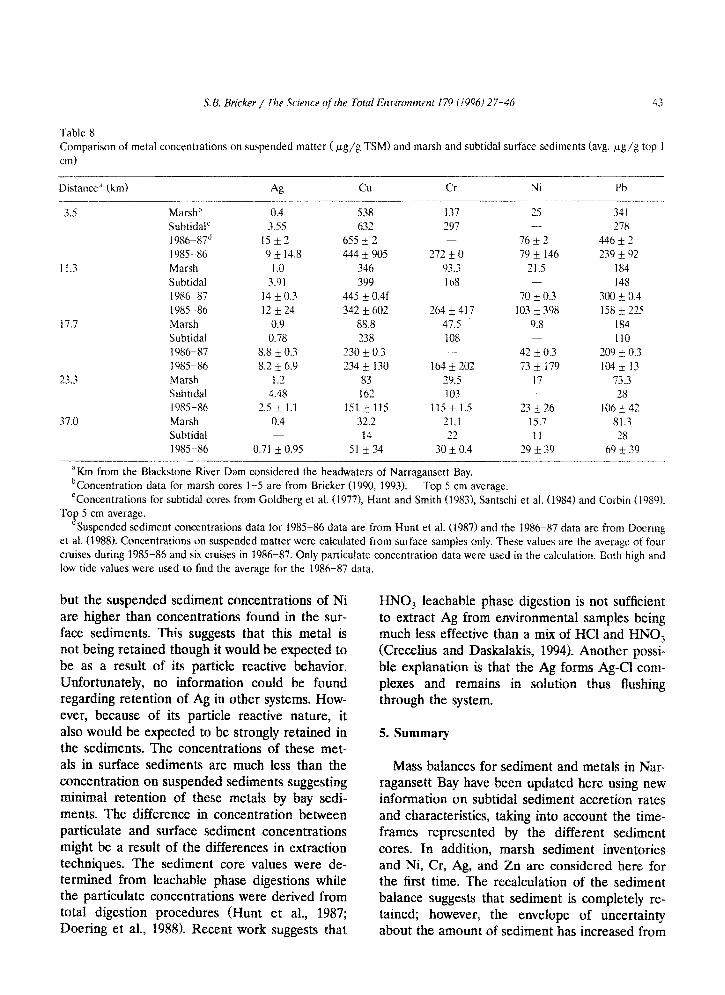
Table 8 Comparison of metal concentrations on suspended matter ( &g TSM) and marsh and subtidal surface sediments (avg. pg/g top 1 cm)
Distance” (km) Ag CU Cr Ni Pb
3.5 Marsh’ 0.4 538 137 ‘5 341 SubtidaP 3.55 632 297 - 278 1986-87” 15 f? 655 It 2 76 I 2 446i2 1985-86 9 i 14.8 444 * 905 272 * 0 79 * 146 239 & 92
11.3 Marsh 1.0 346 93.3 21.5 184 Subtidal 3.91 399 168 148 1986-57 14 * 0.3 445 + 0.4f - 70 + 0.3 300 i 0.4 1985-86 I?.+24 342 rt 602 264+417 103 i- 398 158 & 225
17.7 Marsh 0.9 58.8 41.5 9.8 184 Subtidal 0.78 238 108 110 1986-87 8.8 i 0.3 230 rt 0.3 42 + 0.3 209 i 0.3 t 985-86 8.2 + 6.9 234 j: 130 164+202 73 i 179 104k 13
23.3 Marsh I.2 83 79.5 17 73.3 Subtidal 4.48 162 103 - 28 1985-86 2.5 * 1.1 151 _t 115 115 + 1.5 23 -1.26 106 + 42
37.0 Marsh 0.4 32.2 21.1 15.7 81.3 Subtidal 14 ‘2 11 28 1985-86 0.71 * 0.95 51 rt34 30 k 0.4 29 * 39 69 + 39
.- --.-.-- ‘Km from the Blackstone River Dam considered the headwaters of Narragansett Bay. “Concentration data for marsh cores 1-5 are from Bricker (1990, 1993). Top 5 cm average. cConcentrations for subtidal cores from Goldberg et al. (1977), Hunt and Smith (1983), San&hi et al. (1984) and Corbin (1989).
To2 5 cm average. Suspended sediment concentrations data for 1985-86 data are from Hunt et al. (1987) and the 1986-87 data are from Doering
et al. (1988). Concentrations on suspended matter were calculated from surface samples only. These values are the average of four cruises during 1985-86 and six cruises in 1986-87. Only particulate concentration data were used in the calculation. Both high and low tide values were used to find the average for the 1986-87 data.
but the suspended sediment concentrations of Ni are higher than concentrations found in the sur- face sediments. This suggests that this metal is not being retained though it would be expected to be as a result of its particle reactive behavior. Unfortunately, no information could be found regarding retention of Ag in other systems. How- ever, because of its particle reactive nature, it also would be expected to be strongly retained in the sediments. The concentrations of these met- als in surface sediments are much less than the concentration on suspended sediments suggesting minimal retention of these metals by bay sedi- ments. The difference in concentration between particulate and surface sediment concentrations might be a result of the differences in extraction techniques. The sediment core values were de- termined from leachable phase digestions while the particulate concentrations were derived from total digestion procedures (Hunt et al., 1987; Doering et al., 1988). Recent work suggests that
HNO, leachable phase digestion is not sufficient to extract Ag from environmental samples being much less effective than a mix of HCl and HNO, (Crecelius and Daskalakis, 1994). Another possi- ble e~lanation is that the Ag forms Ag-Cl com- plexes and remains in solution thus flushing through the system.
5. Summary
Mass balances for sediment and metals in Nar- ragansett Bay have been updated here using new info~ation on subtidal sediment accretion rates and characteristics, taking into account the time- frames represented by the different sediment cores. In addition, marsh sediment inventories and Ni, Cr, Ag, and Zn are considered here for the first time. The recalculation of the sediment balance suggests that sediment is completely re- tained; however, the envelope of uncertainty about the amount of sediment has increased from
44 S.B. Bicker / The Science of the Total Endronment 119 (1996) 27-46
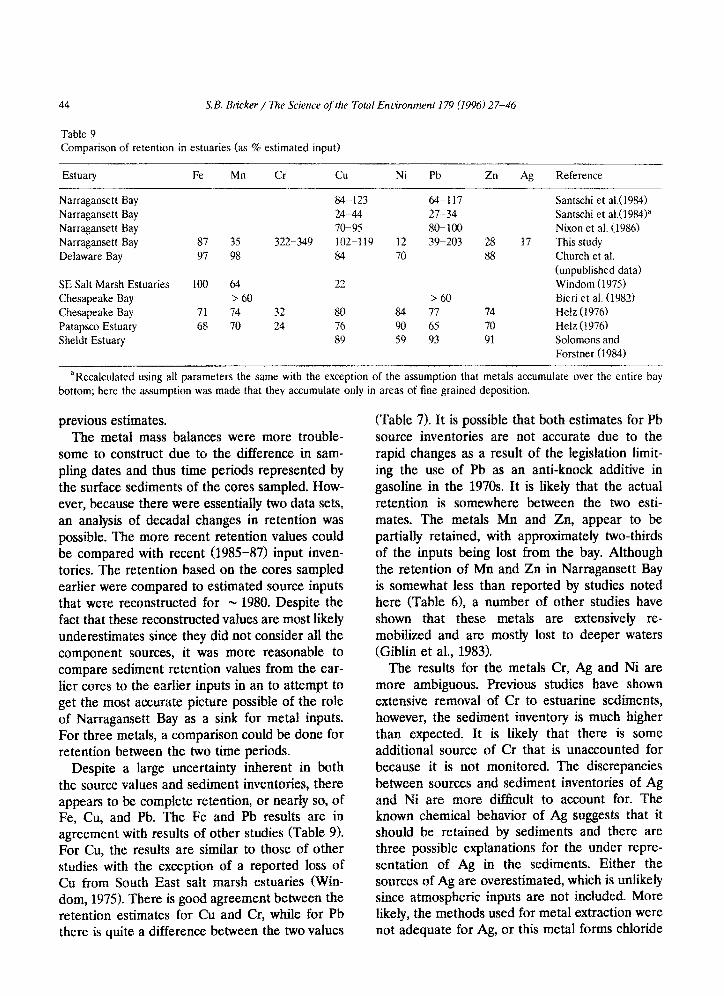
Table 9 Comparison of retention in estuaries (as % estimated input)
Estuary
Narragansett Bay Narragansett Bay Narragansett Bay Narragansett Bay Delaware Bay
SE Salt Marsh Estuaries Chesapeake Bay Chesapeake Bay Patapsco Estuary Sheldt Estuary
Fe Mn Cr
87 35 322-349 97 98
100 64 > 60
71 74 32 68 70 24
cu
84-123 24-44 70-95 102-119 84
22
80 76 89
Ni Pb Zn Ag
64-117 27-34 80-100
12 39-203 28 17 70 88
> 60 84 77 74 90 65 70 59 93 91
Reference
Santschi et aL(1984) Santschi et ak(1984)” Nixon et al. (1986) This study Church et al. (unpublished data) Windom (1975) Bieri et al. (1982) Helz (1976) Helz (1976) Solomons and Forstner (1984)
“Recalculated using all parameters the same with the exception of the assumption that metals accumulate over the entire bay bottom; here the assumption was made that they accumulate only in areas of fine grained deposition.
previous estimates. The metal mass balances were more trouble-
some to construct due to the difference in sam- pling dates and thus time periods represented by the surface sediments of the cores sampled. How- ever, because there were essentially two data sets, an analysis of decadal changes in retention was possible. The more recent retention values could be compared with recent (1985437) input inven- tories. The retention based on the cores sampled earlier were compared to estimated source inputs that were reconstructed for N 1980. Despite the fact that these reconstructed values are most likely underestimates since they did not consider all the component sources, it was more reasonable to compare sediment retention values from the ear- lier cores to the earlier inputs in an to attempt to get the most accurate picture possible of the role of Narragansett Bay as a sink for metal inputs. For three metals, a comparison could be done for retention between the two time periods.
Despite a large uncertainty inherent in both the source values and sediment inventories, there appears to be complete retention, or nearly so, of Fe, Cu, and Pb. The Fe and Pb results are in agreement with results of other studies (Table 9). For Cu, the results are similar to those of other studies with the exception of a reported loss of Cu from South East salt marsh estuaries (Win- dom, 1975). There is good agreement between the retention estimates for Cu and Cr, while for Pb there is quite a difference between the two values
(Table 7). It is possible that both estimates for Pb source inventories are not accurate due to the rapid changes as a result of the legislation limit- ing the use of Pb as an anti-knock additive in gasoline in the 1970s. It is likely that the actual retention is somewhere between the two esti- mates. The metals Mn and Zn, appear to be partially retained, with approximately two-thirds of the inputs being lost from the bay. Although the retention of Mn and Zn in Narragansett Bay is somewhat less than reported by studies noted here (Table 6), a number of other studies have shown that these metals are extensively re- mobilized and are mostly lost to deeper waters (Giblin et al., 1983).
The results for the metals Cr, Ag and Ni are more ambiguous. Previous studies have shown extensive removal of Cr to estuarine sediments, however, the sediment inventory is much higher than expected. It is likely that there is some additional source of Cr that is unaccounted for because it is not monitored. The discrepancies between sources and sediment inventories of Ag and Ni are more difficult to account for. The known chemical behavior of Ag suggests that it should be retained by sediments and there are three possible explanations for the under repre- sentation of Ag in the sediments. Either the sources of Ag are overestimated, which is unlikely since atmospheric inputs are not included. More likely, the methods used for metal extraction were not adequate for Ag, or this metal forms chloride
S. B. Bricker / The Science of the Total En rironment 179 (1996) 27-46 45
complexes which keep the Ag in solution as it is transported through the estuary. For Ni, a ma- jority of inputs would be expected to be retained, given the results of other studies and the known behavior of this metal. It is possible that sources are overestimated but the suspended sediment concentrations suggest that the sediments are not retaining Ag and Ni and that Narragansett Bay is an exception for retention of these metals.
This attempt to include marshes in the sedi- ment and metal mass balances for Narragansett Bay shows that they are not important to reten- tion of sediments, accounting for only * 0.5% of the total. Retention of metals by salt marshes in this system also appears to be insignificant except for Fe for which almost one-third of estimated inputs are retained in the marsh sediments. The difference in retention between the salt marshes and subtidal environments can be attributed to the difference in area and in accumulation rates which are about 14 and one-third times higher in the subtidal environments. In systems with a larger marsh area/subtidal area ratio, the marshes probably play a larger role in the retention of sediment and metals. The mass balance presented here does show, however, that Narragansett Bay acts as an effective filter for sediment and for most metals as they are transported from upland to the sea.
Acknowledgements
This research was partially funded by grants from the National Oceanic and Atmospheric Administration’s Estuarine Sanctuary Program and from the Rhode Island Sea Grant Program. Thanks to Dr Kostas Daskalakis and Dr Owen Bricker for review comments which greatly im- proved the manuscript.
References
Alexander, CR., R.G. Smith, F.D. Calder, S.J. Schropp and H.L. Windom, 1993. The historical record of metal enrich- ment in two Florida estuaries. Estuaries, 16: 627-637.
Benninger, L.K., 1979. ‘i”Pb in Long Island Sound. Geochim. Cosmochim. Acta, 42: 116551174.
Bieri. R., O.P. Bricker, R. Byrne, R. Diaz, G. Helz, J. Hill, R. Huggett, R. Kerhin, M. Nichols, E. Reinharz, L. Schaffner,
D. Wilding and C. Strobe], 1982. Toxic substances, Part III. In: E.G. Macalaster, D.A. Barker and M. Kasper (Eds.), Chesapeake Bay Program Technical Studies: A Synthesis. USEPA, Washington, DC, pp. 263-375.
Bricker, S.B., 1990. The History of Metals Pollution in Narra- gansett Bay as Recorded by Salt Marsh Sediments. Ph.D. Dissertation, University of Rhode Island, Kingston Rhode Island, 355 pp.
Bricker, S.B., 1993. The History of Cu. Pb and Zn inputs to Narragansett Bay, Rhode Island as recorded by salt marsh sediments, Estuaries, 16: 589-607.
Bricker-Ursa, S., SW. Nixon, J.K. Cochran, D.J. Hirschberg and C. Hunt, 1989. Accretion rates and sediment accumu- lation in Rhode Island salt marshes. Estuaries, 12: 300-317.
Bruland, K., K. Bertine, M. Koide and E. Goldberg, 1974. History of metal pollution in southern California coastal zone. Environ. Sci. Technol., 4: 425-432.
Chinman, R.A. and SW. Nixon. 1985. Depth-area-volume Relationships in Narragansett Bay. NOAA/Sea Grant, Marine Technical Report 87. Graduate School Oceanogra- phy, University of Rhode Island, Narragansett, Rhode Is- land, 64 pp.
Corbin, J., 1989. Recent and Historical Accumulation of Trace Metal Contaminants in the Sediment of Narragansett Bay, Rhode Island. MS Thesis. University of Rhode Island. Graduate School of Oceanography, Narraganasett, Rhode Island, 295 pp.
Crecelius, E.A. and K. Daskalakis, 1994. Analysis of silver in mussels and oysters by inductively coupled plasma mass spectrometry (ICPMS). Extended Abstract for: Second ln- temational Conference ‘Transport, Fate and Effects of Silver in the Environment’, University of Wisconsin, Madison, Wl, 11-13 September 1994.
Doering, P.H., L. Weber, W.M. Warren, G. Hoffman, K. Schweitzer, M.E.Q. Pilson, CA. Oviatt, J.D. Cullen and C.W. Brown, 1988. Monitoring of the Providence and Seekonk Rivers for Trace Metals and Associated Parame- ters. Final Report, Marine Ecosystems Research Labora- tory, Graduate School of Oceanography, University of Rhode Island, Narragansett. Rhode Island. Vol. 1, 359 pp. and Vol. 2, 333 pp.
Giblin, A.E., 1986. Comparisons of the processing of elements by ecosystems, II: Metals. In: Godfrey. Kaynor, Pelczarski and Benforado (Eds.1, Ecological Considerations in Wet- lands Treatment of Municipal Wastewater. pp, 158-179.
Gibhn. A.E.. I. Valiela and J.M. Teal, 1983. The fate of metals introduced into a New England salt marsh. Water Air Soil Pollut., 20: 81-98.
Goldberg, ED., E. Gamble, J.J. Griffin and M. Koide. 1977. Pollution history of Narragansett Bay as recorded in its sediments. Estuarine Coast, Shelf Sci., 5: 549-561.
Goldberg, E.D., V.F. Hodge, M. Koide, J. Griffin. O.P. Bricker, G. Matisoff. G.R. Holdren, J.R.R. Braun, 1978. A pollution history of Chesapeake Bay. Geochim. Cosmochim. Acta, 42: 1413-1425,
Goldberg, E.D., J.J. Griffin, V.F. Hodge and M. Koide, 1979. Pollution history of the Savannah River estuary. Environ. Sci. Technol., 13: 588-593.
46 S.B. Bricker / The Science of the Total En~Cvxvnent 179 (1996) 27-46
Goldberg, E.D., V.F. Hodge, J.J. Griffin, M. Koide and R.N.
Edington, 1981. impact of fossil fuel combustion on the
sediments of Lake Michigan. Environ. Sci. Technol., 1.5:
466-471.
Gordon, R.B., 1979. Denudation rate of central New England
determined from estuarine sedimentation. Am. J. Sci., 279:
632-642.
Halvorson, W.L. and W.E. Gardiner, 1976. Atlas of Rhode
Island Salt Marshes. University of Rhode island Marine
Memorandum No, 44. Coastal Resources Center, Univer-
sity of Rhode Island, Kingston, Khode island, 44 pp.
Helz. G.R., 1976. Trace element inventory for the northern
Chesapeake Bay with emphasis on the influence of man.
Geochim. Cosmochim. Acta, 40: 573-580.
Hicks, S.D., H.A. Degaugh, Jr. and J.E. Hickman, Jr., 1983.
Sea Level Variations for the United States 1855-1980. U.S.
Department of Commerce, NOAA, Rockville, MD, 170 pp.
Hunt. C.D. and D.L. Smith, 1983. Remobilization of metals
from polluted marine sediments. Can. J. Fish. Aquat. Sci.,
40(2k 132-142.
Hunt, CD., P.A. Sampou, S.R. Jackson, W.M. Warren, J.D.
Cullen. J. Coyne and M.E.Q. Pilson. 1987. Narragansett
Bay Water Quality Monitoring and Source Strength Mea-
surements. Final Report, Marine Ecosystems Research
Laboratory, Graduate School of Oceanography, University
of Rhode Island, Narragansett, Rhode island, Vol. I, 78
pp.: Vol. 2, 96 pp.; Vol. 3, ii4 pp.; Vol. 4, 166 pp.
Kremer, J.N. and S.W. Nixon, 1978. A Coastal Marine Ecosys-
tem: Simulation and Analysis. Springer, New York, 217 pp.
Lord, C.. 1980. The Chemistry and Cycling of Iron. Man-
ganese and Sulfer in Salt Marsh Sediments. Ph.D. Disserta-
tion. University of Delaware, Newark, DE. 177 pp.
McCaffrey, R.J. and J. Thomson. 1980. A record of the
accumulation of sediment and trace metals in a Connecti-
cut salt marsh. in: B. Saitzman (Ed.), Advances in Geo-
physics. Estuarine Physics and Chemistry: Studies in Long
island Sound, Vol. 22. Academic Press, New York. pp.
165-236.
McMaster, R.L., 1960. Sediments of Narragansett Bay system
and Rhode Island Sound, Rhode Island. J. Sediment.
Petrol.. 30: ‘49-274.
Morton. R.W., 1972. Spatial and temporal distribution of
suspended sediment in Narragansett Bay and Rhode island
Sound. Geoi. Sot. Am. Mem., 133: 131-141.
National Oceanic and Atmospheric Administration, 1993.
Sampling and Analytical Methods of the National Status
and Trends Program National Benthic Surveillance and
Mussel Watch Projects 1984- 1992: Vol. Iii. Comprehen-
sive Descriptions of Elemental Analytical Methods. NOAA
Technical Memorandum NOS ORCA 71. NOAA, National
Ocean Service, Office of Ocean Resources Conservation
and Assessment, Coastal Monitoring and Bioeffects Divi-
sion, Silver Spring, MD.
Nixon. S.W., 1990. A History of Metals inputs to Narragansett
Bay. Final report submitted to the Narragansett Bay Pro-
ject. R.I. Department of Environmental Management, 9
Hayes St., Providence, Rhode island, 69 pp,
Nixon, SW., 1991. Recent Metal inputs to Narragansett Bay.
Final report submitted to the Narragansett Bay Project.
R.I. Department of Environmental Management, 9 Hayes
St., Providence, Rhode island. 57 pp.
Nixon, SW., CD. Hunt and B.N. Nowicki, 1986. The retention
of nutrients (C, N, P), heavy metals (Mn, Cd, Pb, Cu) and
petroleum hydrocarbons in Narragansett Bay. In: P.
Lasserre and J.-M. Martin (Eds.1, Biogeochemical Processes
at the Land-Sea Boundary. Eisevier Oceanography Series,
43. Elsevier, New York, pp. 99-122.
Oviatt, C.A. and SW. Nixon, 1975. Sediment resuspension and
deposition in Narragan~tt Bay. Estuarine Coast. Mar. Sci.,
3: 201-217.
Pilson, M.E.Q., 1985. On the residence time of water in
Narragansett Bay. Estuaries, 8: 2-14.
Redfield. A.C., 1972. Development of a New England salt
marsh. Ecol. Monogr., 42(2): 201-237.
Rhode Island Department of Environmental Management,
1976-I 989. National Pollution Discharge elimination Sys-
tem Monitoring Records. Providence, Rhode island.
Santschi. P.H., S. Nixon, M. Piison and C. Hunt, 1984. Accu-
mulation of sediments, trace metals (Pb, Cui and total
hydrocarbons in Narragansett Bay, Rhode island. Estuar-
ine Coast. Shelf Sci., 19: 427-449.
Soiomons, W. and U. Forstner. 1984. Metals in the Hydrocy-
cle. Springer, Berlin, 349 pp.
Trefrey, J.H., S. Metz, R.P. Trocine and T.A. Nelson, 1985. A
decline in lead transport by the Mississippi River. Science,
230: 439-441.
United States Environmental Protection Agency, i986. 1985
Annual Report on Air Quality in New England. New Eng-
land Regional Laboratory, Lexington, MA, 98 pp.
Valette-Silver, N.J., 1992. The use of sediment cores to recon-
struct historical trends in contamination of estuarine and
coastal sediments. Estuaries, 16: 5777587.
Windom, H.L., 1975. Heavy metal fluxes through salt marsh
estuaries. in: E. Cronin (Ed.), Estuarine Research.
Academic Press, New York, pp. 137-152.