RESTRICTING PESTICIDE USE: THE IMPACT ON PROFITABILITY BY FARM SIZE
11
Restricting Pesticide Use: The Impact on Profitability by Farm Size Gerald Whittaker, Biing-Hwan Lin and Utpal Vasavada* Abstract A sample of 226 cash grain farms in the Lake States-Corn Belt region are analyzed to estimate the impact of restricting pesticide use on profits. These 226 farms are classified into small, medkun, and large farms according to their sale revenues. The results suggest the existence of pest management practices that could substantially reduce pesticide use without incurring economic losses. The reductions in profits associated with gradual reductions in pesticide expenditure appear to increase with fkrm size. Key Words: farm pesticide use, farm size, frontier analysis, profit. Increased pesticide use has contributed to the modernization of agriculture, which is characterked by major changes in production techniques, shifts in input use patterns, and an impressive record of productivity growth, Pesticide use in agriculture, however, has also caused rising concerns about the safety of residues in food and water, as well as other potential health and environmental risks. As a consequence, growth in pesticide use has also been accompanied by increasing regulatory pressures. Between 1964 and 1991, pesticide use in agriculture increased from 320 million pounds of active ingredients (al,) to 817 million pounds of a.i. (Aspelin et al.). Corn and soybeans lead other crqps, by a substantial margin, in terms of total pkticide use (table 1). Herbicides account for the bulk of pesticide use, representing over 80 percent of pesticides applied to major crops. Herbicide use on corn and soybeans grew, respectively, from 26 and 4 million pounds of a,i. in 1964 (Osteen and Szemedra) to 210 and 70 million pounds in 1991. This increase in herbicide use can be attributed to three factors: larger crop acreage, increased shares of corn and soybean acres being treated with herbicides, and higher application rate per treated acre. Corn acreage increased from 66 million planted acres in 1964 to 76 million acres in 1991, and soybean acreage increased from 32 to 70 million acres during the same period of time, The percentage of corn and soybean acres being treated with herbicides increased substantially prior to 1971 and has stabilized since to about 95 percent in recent years (figure 1). Between 1966 and 1991, herbicide application rate increased from 1.23 to 2,94 pounds of a.i. per treated acre of corn, and from 1.03 to 1.23 pounds of a,i, for each treated acre of soybeans.’ Corn acres have also been treated with substantial amounts of insecticides, receiving 28 million pounds of insecticide a.i, in 1991 compared to 16 million pounds in 1964. The percentage of corn acres being treated with insecticides increased drastically from 10 percent in 1964 to 38 percent in 1976, and then declined to 30 percent in 1991. Soybeans receive vety little *Theauthorsare agriculturaleconomistswiththe U.S. Department of Agrictdttue, Economic Research Service. Helpful comments from two anonymous referees are gratefully acknowledged. The views expressed are the authors’ and do not necessarily represent policies or views of the U.S. Department of Agriculture or Economic Research Service. J Agr. and Applied Econ. 27 (2), December, 1995:352-362 Copyright 1995 Southern Agricultural Economics Association
-
Upload
independent -
Category
Documents
-
view
0 -
download
0
Transcript of RESTRICTING PESTICIDE USE: THE IMPACT ON PROFITABILITY BY FARM SIZE
Restricting Pesticide Use: The Impacton Profitability by Farm Size
Gerald Whittaker, Biing-Hwan Lin and Utpal Vasavada*
Abstract
A sampleof 226 cashgrainfarmsin theLake States-CornBelt region are analyzedtoestimatetheimpactof restrictingpesticideuseon profits. These226 farmsareclassified into small,medkun,and large farms accordingto their salerevenues.The resultssuggesttheexistenceof pestmanagementpractices that could substantially reduce pesticide use without incurring economiclosses. The reductionsin profits associatedwith gradualreductionsin pesticideexpenditureappearto increasewith fkrm size.
Key Words: farm pesticide use, farm size, frontier analysis, profit.
Increasedpesticideuse hascontributed tothe modernization of agriculture, which ischaracterked by major changes in productiontechniques, shifts in input use patterns, and animpressiverecordof productivity growth, Pesticideuse in agriculture, however, has also causedrisingconcernsabout the safety of residuesin food andwater, as well as other potential health andenvironmental risks. As a consequence,growth inpesticide use has also been accompanied byincreasingregulatory pressures.
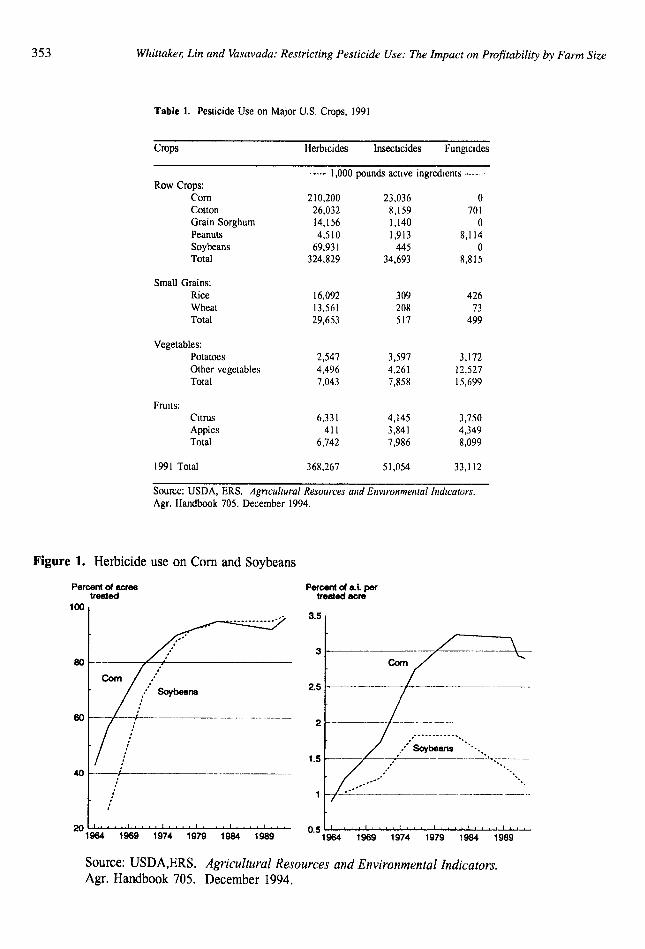
Between 1964 and 1991,pesticideuse inagriculture increasedfrom 320 million pounds ofactive ingredients(al,) to 817million poundsof a.i.(Aspelin et al.). Corn and soybeanslead othercrqps, by a substantial margin, in terms of totalpkticide use (table 1). Herbicidesaccountfor thebulk of pesticideuse, representingover 80 percentof pesticidesapplied to major crops. Herbicideuseon corn and soybeansgrew, respectively, from 26and 4 million pounds of a,i. in 1964 (OsteenandSzemedra)to 210 and 70 million pounds in 1991.This increase in herbicide usecanbeattributedto
three factors: larger crop acreage,increasedsharesof corn and soybean acres being treated withherbicides,and higher application rate per treatedacre.
Corn acreageincreased from 66 millionplanted acresin 1964to 76 million acresin 1991,and soybean acreage increased from 32 to 70million acresduring the sameperiod of time, Thepercentageof corn and soybeanacresbeing treatedwith herbicidesincreasedsubstantiallyprior to 1971and has stabilized since to about 95 percent inrecentyears (figure 1). Between 1966 and 1991,herbicide application rate increasedfrom 1.23 to2,94 pounds of a.i. per treated acre of corn, andfrom 1.03 to 1.23 pounds of a,i, for each treatedacre of soybeans.’ Corn acres have also beentreated with substantial amounts of insecticides,receiving 28 million pounds of insecticide a.i, in1991comparedto 16million poundsin 1964. Thepercentage of corn acres being treated withinsecticidesincreaseddrastically from 10percentin1964to 38 percentin 1976,andthen declinedto 30percent in 1991. Soybeans receive vety little
*Theauthorsareagriculturaleconomistswith theU.S.Departmentof Agrictdttue, EconomicResearchService. Helpfulcommentsfrom two anonymousrefereesare gratefully acknowledged. The views expressedare the authors’ and donot necessarilyrepresentpolicies or views of the U.S. Departmentof Agriculture or EconomicResearchService.
J Agr. and AppliedEcon. 27 (2), December,1995:352-362Copyright 1995 SouthernAgricultural EconomicsAssociation
353 Whittake<Lin and Vasavada:RestrictingPesticideUse:TheImpact on Profitability by Farm Size
Table 1. PesticideUseon Major U.S.Crops,1991
crops Herbicides Inseetlcides Fungtc[dcs
----- 1,000poundsactweingrcdlents------RowCrops:
Com 210,200 23,036 0Cotton 26,032 8,159 70IGrainSorghum 14,156 1,140 0Peanuts 4,510 1,913 8,114Soybeans 69,931 445 0Total 324,829 34,693 8,815
SmallGrains:Rice 16,092 309 426Wheat 13,561 208 73Total 29,653 517 499
Vegetables:Potatoes 2,547 3,597 3,172Othervegetables 4,496 4,261 12,527Total 7,043 7,858 15,699
Frwts:Citrus 6,331 4,145 3,750Apples 411 3,841 4,349Total 6,742 7,986 8,099
1991Total 368,267 51,054 33,112
Souree:USDA,ERS. AgriculturalRe.vourcesalldEt~vtronmenlalIt!dlcators.Agr. Handbook705,December1994,
—. —-Figure 1. Herbicide useon Corn and Soybeans
Percenloi acmetreated
Itm I..-----.......
so
60 - r——--—— -- . ..——-.. ._,______
40 ---: ——. _.— _________,:,,
t,’,’
.~1S64 196S 1974 1979 19S4 1989
PercentOtal. pwtre6tedacre
I-=77’21 —-––f–-----”--- ‘---”
~
...............,,.””Soybeane “’-...
1.5 –— — ——~ .....4. ._-.—...,., ..
.-’ .....-. ..
1 .-. ”———..-—.—— ———.—. —...-. ——-— .-
0.51’’’’’’’’’’’’”1 I 1
1s64 tw9 1974 1979 19s4 1989
Source:USDA,ERS, Agricultural Resourcesand Environmental Indicators.Agr. Handbook705. December1994.
J. Agz and AppliedEcon.,Decembeg1995 354
insecticides,with only 2 percent of planted acresbeing treatedin 1991(USDA 1992).
As a responseto such a high level ofagricultural pesticide(andchemicalfertilizer) useinrecent years, interest in alternative approachestofood and fiber production has increased, Changesin production practiceshave beenadvocatedundersuch nom de plumes as sustainable agriculture,alternative agriculture, and low-input sustainableagriculture. These unconventional productionsystemsseekto increasereliance on non-chemicalpestcontrol to reduce,but in most casesnot totallyeliminate, pesticideusein agriculture. At the sametime, public debates on reducing agriculturalchemical use through regulation or policy changeshave intensified.
Reduction of pesticide use, initiated byregulation or otherwise, will affect farm financialperformance, the mix of outputs produced, andresource allocation, The impact of reducingpesticide use on farm financial performanceis animportant pieceof information in evaluatingmeansand strategies for reducing pesticide use. Theamount by which profits decline when farmersswitch to less chemical-intensive production canalso be viewed as a measureof the incentivethatfarmers might need to adopt environmentallyharmoniousproduction technologies,
The distribution of the financial impactsofreducedpesticideuseby farm sizeis of importanceto policy makers, Many are concernedabout theeffect technologicalandpolicy changeswill haveonfamily farms andrural life. Accordingly, this studyevaluatestheconsequencesof reducingpesticideuseon profitability of small, medium, and large cashgrain farms in the Corn Belt-Lakes Statesproduction region.
Methodology
Numerousstudieshave beenconductedtodetermine the costs and benefits associatedwithpesticideuse. The literaturehasbeenannotatedandreviewed (Osteenet al,; McCarl; Fox et al,). Avariety of analytical methodshave beenapplied toassessthe costsassociatedwith banningor reducingpesticideuse.Theseare:partial budgeting (Delve),economic surplus models (Fergusonet al,), farm-
level linear programming(Cashman,et al.), spatialequdibriumlinearprogramming(Burton andMartin;Taylor and Frohberg), econometric simulation(Knutson et al,; Norton and Bernat; Osteen andKuchler; Taylor et al,), and a computable generalequilibrium model (Rendleman). None of theabove-mentionedmethods is readily equipped toassessthe impacts by farm size of reducingpesticideuse. In fact, this issuehasreceivedlittleattention in the literature.
We employ the dataenvelopmentanalysis(DEA) approach to analyze the impacts ofconstrainingpesticideuse on farming profitability.The DEA approach, as outlined in Ftire et al,(1985), is a non-parametricapproachrequiring noassumptionsabout the functional form of a model.This approachalsolendsitself easily to applicationsbasedon data collected in a complex (multiframe,stratified) survey,which is the type of dataused inthis study. Standardeconometrictechniquescan beusedto analyzedata from a simple random survey.Another major motivation for employing the DEAapproachhere is the ability to assessthe impactsand the distribution of the impacts of imposingconstraints,asdiscussedbelow.
DEA utilizes a linear programming (LP)framework to identify farms that arenot dominatedby others(i.e., efficient farms) in termsof a specificevaluationcriterion. Possiblecriteria includeoutputmaximization, cost minimization, or profitmaximization. Profit maximization is chosenin thisstudy. A linearcombinationof theseefficient farmsestablishesa frontier, which can be usedto predictthe maximum attainableprofit for eachfarm when“bestpractices”are adopted.
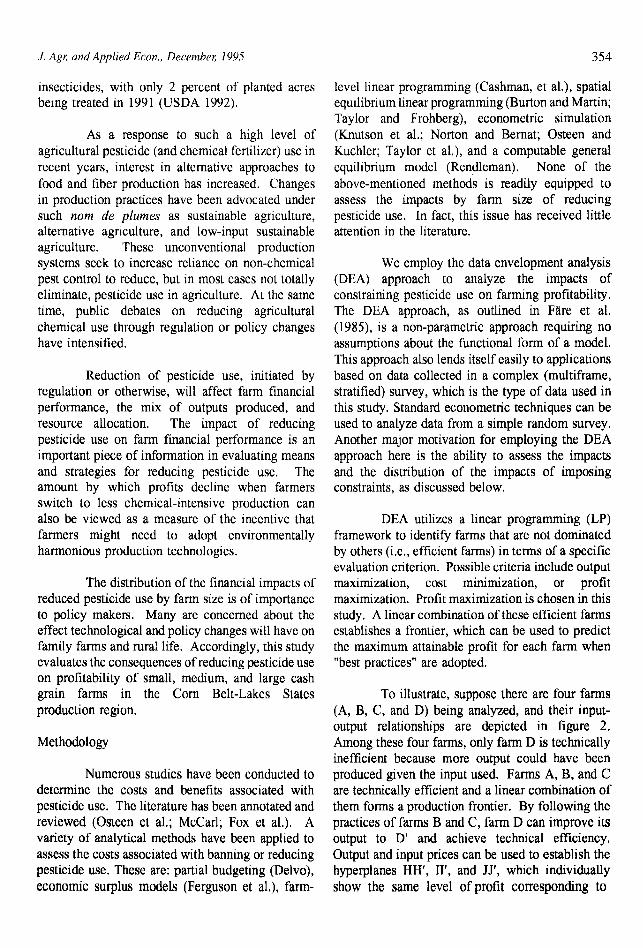
To illustrate, supposethere are four farms(A, B, C, and D) being analyzed,and their input-output relationships are depicted in figure 2.Among thesefour farms,only farm D is technicallyinefficient becausemore output could have beenproducedgiven the input used. FarmsA, B, and Caretechnically efficient anda linear combinationofthem forms a production frontier. By following thepracticesof farms B andC, farm D can improve itsoutput to D’ and achieve technical efficiency.Output andinput pricescanbe usedto establishthehyperplanesHH’, II’, and JJ’, which individuallyshow the same level of profit corresponding to

355 Whittaker Lin and Vasavada:RestrictingPesticideUse:TheImpact on Profitability by Farm Size
different combinationsof output producedandinputused. The hyperplane HH’ is tangent to theproduction frontier at point C, indicating that farmC is not only using the optimal input mix (i.e.,achievingthe allocativeefficiency or locatingon theexpansionpath) butalso producing the maximum-profit level of output (i.e., achieving the scaleefficiency). The profit level indicated by thehyperplaneis thusthemaximumattainableprofit forfarm D, The differencebetweenthe actualandthemaximum attainableprofits canbedecomposedintothree components:technical, allocative, and scaleinefficiencies.
To assessthe impacts of constrainingpesticideuseon profit, the LP model is solvedwithandwithout a pesticideuseconstraint. Without theconstraint, the LP solution establishes thebenchmarkprofit frontier, whereasthe constrainedmodel generatesthe constrainedprofit frontier, Acomparisonof the two frontiers providesa measure
N I
of the profit loss associatedwith the pesticide useconstraint. For example,if the input usefor farm Din figure 2 were to be limited to no more than x’,the constraint would have caused the maximumattainableprofit to decline by the distanceHI.
Recentapplicationsof the aboveapproachto agriculture-related issues include Fiire et al.(1991), Whittaker and Morehart, and Fernandez-Cornejo. A brief synopsisof the LP model used isdescribedhere. Supposetherearek = 1,.,.,Kfarms,eachof which usesM inputs to produceN outputs.Both output prices r = (rl ,...,rn) ● 9?”+ and outputquantitiesu = (Ul,...,).) E $X”+are observed. Totalinput expenditure,x = (xl ,.,.~.) G Ylm+is known,but input prices and quantitiesare not observed(adata limitation of the study). The maximumattainable profit for a particular farm j can beobtained by solving the following linearprogrammingmodel:
nJ(r,x/ ) =(um&) ~’u - ~x
nn “rj = 1,...A
.3 v 1=1
s.t. ~zkuk>u n=l Nn- .9 ,., ,, , (output)k-l
~z ‘x; 5 x\,,, i = 1,,,,,1, (variable costs)k-l
~z’x; s x:, i = 1+1,,,,W, (/lxed costs)k=l
~z’--~, ZE X:.k-1
where rf is total profit of theJth farm, r“ is the nthoutput price, Unis the nth outputquantity,Xu is theith variable input expenditure,andXfiis the ith freedinput expenditure, The vector z measuresinputuse intensity and serves to form a frontier byconnecting linearly “best-practice”farms,
The objectivefunction specifiesprofit (i.e.,return to freed inputs and management)as theevaluationcriterion, The first setof constraints(foroutputs) identify the maximum attainableoutputs.The secondset of constraints(for variable inputs)
determine the minimum possible variable inputs,The third set of constraints require that the linearcombination of “best- practice” farms will use theamount of fwed input not exceeding the amountavailable to the farm in question. The lastconstraint (i.e., summing z to one) allows thetechnology to have increasing, constant, anddecreasingreturns to scale.
The objective fimction is solved for eachfarm with the completedata set on all farms beingusedto formulate the constraints. That is, the LP

J. Agz and AppliedEcon.,DecembeC1995
Figure 2. Frontier analysis
356
output
H
I
J
model is solvedK times, once for eachfarm, whilethe constraints compare the input/output mix foreachfarm with all other farms in the sample. EachLP solution generates the “best practice”input/output mix that yields the maximum profit foreachfarm.
To assessthe impact of imposing anexpenditure constraint on input j, the set ofconstraintsfor variable inputs needto be modifiedas:
~z’x;~x i = 1,...~, (variable costs)“,~k-1
XVj < E, (constrainedvariable cost)
where the expenditureon thejth variable input isboundedby the value E.
Data
The data come from the 1990 soybeanversion of the Farm Costs and ReturnsSurvey(FCRS) conductedby the USDA. The FCRS is amultiframe, strattiled survey, where the sample isdrawn from stratitled list and a~a frames. The1990soybeansurveyobtaineddetailedinformation
G>“D
x’ Input
on the costs and returns of soybeanproduction aswell as similar, less detailed information on theproduction of all other commoditieson the farm,
There were 826 soybeanproducing farmsenumeratedin the survey. After eliminating thosefarms with more than $100 in livestock sales orwith irrigation expenses,226 cashgrain farms wereanalyzed? The subsetof FCRS data represented84,053 cash grain farms in the Lake States-CornBelt production region including Illinois, Indiana,Iowa, Michigan, Minnesota, Missouri, Nebraska,Ohio, and Wisconsin, Over 90 percent of thesefarmers’ income, on average, came from corn,soybean,and wheatproduction.
The 226 farms were classified into small,medium, andlarge farms. Small farms aredefinedasthosewith salesof lessthan $40,000,a thresholdthat commonly distinguishes commercial fromnoncommercial farms, Medium-size farms hadsales of at least $40,000 but below $150,000.Farmswith salesof $150,000or more areclassifiedaslarge farms. The numbersof small, medium,andlarge farms are 72, 78,and 76, respectively. Themediansoybeanandcom outputsare, respectively,1,426and3,528 bushelsfor small farms, 8,025 and22,738bushelsfor medium farms, and 16,050and61,320bushelsfor large farms,

357 WhittakeqLin and Vasavada:RestrictingPesticideUse:TheImpact on Profitability by Farm Size
Table 2. Sample Characteristics(MedianValues)of Faints in rhe 1990FCRSSoybeanSurvey
Farm Size
Variable Sruatl Medium Large
SoybeanAcreage(acres/famr) 39.50 207.50 416.50h
Corn Acreage(acres/farm) 32.50 187.50 648.50Labor Expenses($/acre) 125.84 86.52 54,44Fertilizer Expenses($/acre) 30.40 36.98 33.09SeedExpenses($/acre) 19.48 20.10 20.77PesticideExpenses($/acre) 21.39 29.88 25.60
SoybeanPesticide($/acre) 19.28 20.12 20.51Other Pesticide($/acre) 20.19 43.16 28.00
Fuel Expenses($/acre) 15.62 12.88 14.37MachineryRepairs($/acre) 23.11 17.38 14.74Building Repairs($/acre) 9.78 3.88 1.17’Tool Costs($/acre) 8.31 3.00 333CustomWork Cost($/acre) 11.78 3.94 4.2obBusinessExpenses($/acre) 121.06 137.28 126.45Numberof Farms 72 78 76
‘ Null hypothesesof equalityrejectedat 10%significancelevel.b Null hypothesisof equalityrejectedat 5% significancelevel.
Table 2 summarizesthe characteristicsofthe samplefarms with respectto their usesof fixedand vafiable inputs. Becausethe distributions ofthese characteristics are markedly asymmetrical,their meansare no longer good representationsofthe “center of gravity”. Consequently, medianvalues are used.
Land is consideredas a ftzed input in theDEA analysis, but its allocation among crops istreated as a decision variable,3 The mediansoybeanand corn acres planted are, respectively,39.5 and 32.5 for small farms, 207.5 and 187.5formedium farms,and416.5and648.5for largefarms,Someof the farms planted wheat,but the majorityof the samplefarms did not produceany wheat(themedian wheat acresare zero for all farm sizes).
Variable inputsareclassifiedinto 11items:labor, fertilizers, seed,pesticides,fuel, machineryrepairs,tools, building maintenance,tmnsportation,custom services,and businessexpenses. Variableinput useis measuredin value terms. In estimatingthe maximum attainable profit for each farm,variable input useis aIlowedto changefor all threecrops, On a per acrebasis,labor expensesled othervariableinput expenses,andlaborexpensesdeclinedwith farm size. The decline was statisticallysignificant at a 5 percent level.
Pesticideexpendituresarereportedfor fivecategories: insecticides; herbicides; fungicides;desiccants,defoliants, and growth regulators; andother pesticides. The median per-acre pesticideexpenses for soybean production ranged from$19.28 for small farms, to $20.12 for mediumfarms, and $20,51 for large farms, While thisshows a slight increase with farm size, thedifferenceswere not statistically significant, Cornaccountedfor the bulk of the production of othercrops, and the per-acrepesticide expendituresforother crops were greater than those for soybeans,especially among medium and large farms. Interms of pesticide expendituresfor all crops, themedian per-acre figures were $21,39 for smallfarms, $29.88 for medium farms, and $25.60 forlarge farms, Becausemedian values are reported,pesticide expenditures for all crops cannot bebroken down arithmetically into expenditures forsoybeansandother crops (mainly com and wheat).
Results
Eight levels of constraints on per-acrepesticideexpendituresare analyzed:$6, $10, $14,$18, $22, $26,and $30. The impacts of pesticideexpenditureconstraintson profit aresummarizedintable3. Corn andsoybeanproductionundervariouspesticideexpenditureconstraintsareshownin table

J. Agrand AppliedEcon.,Decembec1995 358
TabIe3. Protitsaod Pesticide Expenditures
Per-Acrelirnita on pesticideexpenditures($)
30 26 22 18 14 10 6
Smatl farmsProfit $/acre’ 163.51 162.75 162.54 157.61 148.16 136.26 117.57Incrementalchange$/acre 0.0 -0.76 -0.21 -4.93 -9.45 -11.90 -18.69Incrementalchange% 0.0 -0.46 -0.13 -3.03 -6.00 -8.03 -13.72
Medium farmsProfit $/acrez 181.66 182.24b 181.62 168.50 153.65 138.92 123.88IrtcrementsJchange$/acre 0.0 0.58 -0.62 -13.12 -14.85 -14.73 -15.04Incrementalchange% 0.0 0.32 -0.34 -7.22 -8.81 -9.59 -9.83
LargefarmsProfit $/acre’ 154.23 153.21 146.50 135.88 126.04 117.71 99.31Incremematchange$/acre 0.0 -1.02 -6.71 -10.62 -9.84 -8.33 -18.40Incrementalchange% 0.0 -0.66 4.38 -7.25 -7.24 -7.@ -15.63
‘Per-acre profits preestimatedmedians.bTtreassociated(unreported)smndarddeviationssuggesttbatper-acreprofits arenotstatisticdly differentfor the threelevelsof pesticideexpenditures:30, 26,and22 dollarsper acre.
Table 4, SoybeanandCornProductionunderDifferentPesticideExpenses
Best-PraetlcePer-Acrelimits on pesticideexpenaea($)
Actual No Limit 22 14 6
SmallFarmsCorn(bushels) 3,528 2,358 2,358 3,468 5,069
(loo) (loo) (147) (215)Soybeans(bushels) 1,426 3,875 3,875 2,829 1,714
(loo) (loo) (73) (44)MediumFarms
Corn(bushels) 22,738 13,444 13,497 21,337 29,205(loo) (loo) (159) (217)
Soybeans(bushels) 8,025 19,562 19,512 13,887 8,472(loo) (loo) (91) (43)
LargeFarmsCorn(bushels) 61,320 77,094 64,401 57,597 46,091
(100) (84) (75) (60)Soybeans(bushels) 16,050 25,583 53,464 22,656 12,399
(loo) (131) (89) (48)
Note: Numbersm theparenthesesrepresentthepercentof theproductionrelatlveto thebest-practice,nopcstlcldeconstraintproduction.
4, Results of DEA analyses are known to besensitive to outliers which outperform other farmsin terms of profit maximization, Solutions for allfarms under all pesticide use restrictions werecarefully examinedand no outliers were detected.
Under no pesticideexpenditureconstraint,the median best-practiceprofit for small farms was$164 per acre. This profit could be achwvedby
allocating more resources toward soybeanproduction and less toward corn production suchthatsoybeanandcom outputsfor small farms were,respectively, 3,875 and 2,358 bushels per farm,comparedto the actualoutputsof 1,426and 3,528bushels(table 4). Similarly, the best practicesformedium farms also called for more soybeanproduction (19,562 bushelsvs. 8,025 bushels)andlesscom production(13,444bushelsvs. 22,738)and

359 WhittakecLin and Vasavada:RestrictingPesticideUse:Theimpact on Profitability by Farm Size
resultedin a medianprofit of $182per acre. Largefarmsproducedmoreof both soybeansandcorn,anevidence of technical inefficiency, in order toachievethe best-practiceprofit of$154 per acre.
Noneof theefficient farmsspentmorethan$30peracre on pesticides. Therefore, a$30 peracre constraint on pesticide expenditure was notbinding, Whenthe constraintwastightenedat $26,only rather small impacts on the maximumattainableprofit were experiencedby all farm sizes.As shown in table 2, the medianper-acrepesticideexpenditures were $26 for large farms, $30 formedium farms, and $21 for small farms. Theresults hence suggestthe availability of practiceswhich could substantially reduce pesticide usewithout incurring significant economiclosses.
Restricting pesticide expenditure to $22from $26 also had negligible impacts on theeconomicperformanceof small andmedium farms,but resulted in a profit reduction of almost $7 peracre(4 percent)amonglargefarms. Reallocationofresources toward soybean production, the best-practice prescription for small and medium farmsundernopesticideconstraint,wasalsosuggestedforlarge farms to minimize the adverse economicimpactsof lowering pesticideexpenditurebelow$26per acre.
Profit reductions began to ampli@,especially among medium and large farms, whenpesticideexpenditureswere restrictedto below $22per acre, A $4 reduction from $22 in per-acrepesticide expenditures caused medium and largefarms’ profits to decline, respectively,by $13 and$11 per acre, implying a marginal revenueof over$2 for eachdollar of pesticideexpenditureover therange of $18-$22 per acre. However, the samereduction in pesticide expenditures had smallereffects on the profitability of small farms. Thesefindings suggestthatpesticidedependenceincreaseswith farm size.
Whenpesticideexpendituresweretightenedfurther below $18 per acre, all farms experiencedsubstantial reductions in profits. Reductions inprofits exceeded$2 per acre for the loss of eachdollar worth of pesticides. Further, the marginalreductions in profits, in terms of percentage,increasewith limitations on pesticide expenditurefor all farm sizes. The prescriptions for resource
reallocationto minimize profit reductions,however,differ by farm size,
The results suggestthat, as pesticide usewas progressivelyreduced,corn provided a betterreturn than soybeans for each dollar worth ofpesticides on small and medium farms.Consequently, ‘corn production on small andmedium farms soaredat the expenseof soybeanproduction. Underthesamerestrictionsonpesticideuse,largefarms,however,wererequiredto cut backboth com and soybean production in order tominimize profit reductions.
Summary
Many interest groups, including theproduction agricultural community, haveregistereda strong interest in switching to alternativeproduction practices and systems using feweragriculturalchemicalsin orderto improve the safetyof food supply and to arrest environmentaldegradation.Whena shift to a low-input productionpractice reduces profit, no incentive exists tovoluntarily adoptthepractice, Insufficient technicaland economic information on alternative practicesalsocontributesto low adoptionrates. Informationabouttheprofitability impactof adoptingalternativepractices is helpful to public decision-makersseeking to encourage adoption by offeringappropriatefinancial incentivesj4
This study examined the impact ofrestricting pesticideuseon profits among a subsetof cash grain farms, who produced soybeansandother crops (mainly corn) in the Corn Belt-LakeStates region in 1990. A linear programmingapproach was utilized to identifi maximumattainable profits for each farm if it adopts bestpractices, The linear programming model wassolved with and without restrictions on pesticideuse. The resulting decline in maximum attainableprofits attributableto the constraint can be viewedas an estimateof the size of subsidiesneededtoinduce farmers to adopt less chemical intensivepractices, Farmerswere also classified into threesizesin termsof their grossrevenuesto analyzethechangein maximum attainableprofits by farm size,Under the current regulatory situation, limitingpesticide expenditureon a per acre basis is not a

J.Agz and AppliedEcon.,December1995
viable policy option dueto enforcementdifficulties,The approachundertakenin this studydoesproduceuseful information,
The results suggestthat limiting pesticideexpenditures to no more than $22 per acre hadalmost no impact on profits among small andmedium farms and had limited impacts on largefarms. The medianper-acrepesticideexpenditureswere $20, $30, and $26 for small, medium, andlarge farms, respectively. There are pestmanagementpractices currently in use which cansubstantiallyreducepesticideusewithout incurringsignificant profit reductions,
As pesticide expenditures were furthertightened below $22 per acre, substantialreductionsin profits werepredicted,especiallyamongmedium
360
and large farms. The results also suggestthat theadverseimpactsof restrictingpesticideexpendituresincreased with farm sizes, As pesticideexpenditureswereprogressivelyrestricted,small andmedium farms neededto allocatedmore resourcestoward com production and less toward soybeanproduction, even though corn usesmore pesticidesthan soybeans. To minimize profit reductionsawxiated with limited pesticideexpenditures,largefarmsneededto reduceinput usedandhenceoutputproducedfor both corn and soybeans.
This study only addressesthe relationshipbetweenprofit and pesticide expenditure. Futurestudiesare neededto examine the factors causingthe uneven-distributedimpactsby farm size and toidentify the pest managementpractices used byefficient farms. The approachtaken by Fernandez-Cornejo worth considering.
References
Aspelin, A.L., A.H, Grube, and R. Torla. PesticideIndustry Salesand Usage: 1990 and 1991MarketEstimates. Economic Analysis Branch, Office of Pesticide Programs, EPA, Fall 1992.
Burton, R.O. and M.A. Martin. “Restrictions onHerbicide Use: An Analysis of the Economic Impacts on
U.S. Agriculture.” North Central J. Agr. Econ,, 9(1987):181-94.
Cashman,C,M,, M.A, Martin, andB.A. McCarl. “Economic Consequencesof Banson Corn (Zea mays)and Soybean(Glycine max) Herbicides Commonly Used on Indiana Farms,” WeedScience,29(1981):323-28.
Fernandez-Cornejo,J. “Nonradial TechnicalEfficiency andChemicalInput Use in Agriculture,” Agr. andRes.Econ. Rev., 23(1994):11-21.
Delve, H.W, Economic Impact of Discontinuing Aldrin Use in Corn Production. Economic ReseamhService,USDA, ERS-557,June 1974.
Fare, R, S. Groskopf, and H. Lee. “A Nonparametric Approach to Expenditure-ConstrainedProfitMaximization.” Amer, J Agr. Econ., 72(1990):574-81.
Filre, R, S.Groskopf, andC.A,K. Lovell. Themeasurementof EJ?ciencyof Production, Boston: Kluwer-Nijhoff, 1985.
Ferguson,W,L,, L,J. Moffitt, and R.M, Davis. “Short-Run Welfare Implications of Restricting FungicideUse in VegetableProduction”, J of Agribusiness,10(1992):41-50.
Fox, G., A. Weersink, G. Sarwar, S. Duff, and B. Deen, “Comparative Economics of AlternativeAgricultural ProductionSystems:A Review.” NortheasternJ. Agr, andRes.Econ., 20(1991):124-142,

361 WhittakegLin and Vasavada:RestrictingPesticideUse:TheImpact on Profitability by Farm Size
Knutson, R.D., C.R. Taylor, J.B. Penson, and E.G. Smith. Economic Impacts of Reduced Chemical LJse,
publishedby Knutson and Associates,College Station,Texas, 1990.
McCarl, B.A. Economics of Integrated Pest Management:An Interpretive Review of [he Literature.Agricultural Experiment Station,Oregon StateUniversity. SpecialReport 636, August 1981.
Norton, G.W, and G.A, Bernat, Jr. “Estimating the Effects of PesticideUse on Burley and Flue-CuredTobacco.” S,J of Agr. Econ., 15(1983):93-99.
Osteen C., E. Bradley, and L, Moffitt. The Economics of Agricultural Pest Control: An AnnotatedBibliography, 1960-80. Economic Research Service, USDA, Bibliographies and Literature ofAgriculture #14, January 1981.
OsteenC, and F, Kuchler. Potential Bans qf Corn and $oybean Pes~icides: Economic implications ,forFarmers and Consumers, ticonomic ResearchService,USDA, AER-546, April 1986.
OsteenC,D, andP.1,Szemedra,Agricultural PesticideUseTrendsandPolicy Issues. Economic ResearchService,USDA, AER-622, September1989,
Rendleman,C,M. “Agrichemical ReductionPolicy: Its Effect on IncomeandIncomeDistribution.” J Agr.Econ, Re~.,43(1991):3-9.
Taylor, C.R, and K.K. Frohberg, “The Welfare Effects of Erosion Controls, Banning Pesticides,andLimiting Fertilizer Application in the Corn Belt.” Amer. J. Agr. Econ., 59(1977):25-36.
Taylor, C.R,, R.D, Lacewell, andH. Talpaz, “Use of ExtraneousInformation with an EconometricModelto EvaluateImpactsof PesticidesWithdrawals.” W J. xtgr. Ecan., 4(1979):1-7.
U.S. Departmentof Agriculture, Economic ResearchService,Agricultural, Resourceand EnvironmentalIndicators. Agr. Handbook705, December1994,
U.S. Departmentof Agriculture, EconomicResearchService,Agricultural Resources:Inputs Situation and(l_.dookReport. AR-24, October 1991,p.19.
U.S. Departmentof Agriculture, National Agricultural StatisticalServiceandEconomicResearchService.Agricultural Chemical Usage,1991Field Crops Summa?y.Ag Ch 1(92), March 1992.
Whittaker, J. andM. Morehart.“Measuringthe Effect of FarmFinancialStructureon CostEfficiency.” Agr.Finance Rev., 51(1991):95-105,
Endnotes
1, According to the eight USDA pesticide surveys conductedover the past three decades,herbicideapplication rateson soybeanspeakedduring the late 1970’sandearly 1980’s. In the late 1980’s,severalnewsoybeanherbicides(e.g.,chlorimuron, imazaquin,andimazcthapyr)wereintroducedto replacealachlor,Thesenew herbicidesareappliedat ratesrangingfrom 0,02to O.I poundsof a,i, per acreascomparedwith2.0 pounds of a.i. for alachlor, causingherbicide apphcationrateson soybeamto decline since the late1980’s.

J. Agr and AppliedEcon.,Decembec1995 362
2, One of the reasonsfor excluding farms with livestock operationsfrom the analysisis that returns mayfluctuate widely betweenyears. Furthermore,thebestpracticesof a non-irrigatedcashgrain farm may notclosely resemblethosepracticedby an irrigated farm or an integratedgram and livestock enterprise.
3. Treating land allocation amongcropsasa decisionvariableor not greatly affectsthe resultsin absoluteterms. This is becauseover 90 percent of the samplefarms receivedgovernmentpaymentsfrom cornproduction, Participationin thecommodity programsrequiresthat land usedto grow a programcrop is tiedto the baseacreageof the farm. This program stipulationwas incorporatedin a separateanalysisin whichthe allocation of land amongcrops is set at the observedratio. Resultsof the analysisare availableuponrequestfrom the authors,
4. In a DEA framework, the pesticideinput constraintcanbe expressedin quantity termsor for only thosepesticides of interest. The survey collected pesticide data only in terms of expendituresfor the fivespecified categories(pesticideuseby active ingredientwas not collected), Consequently,pesticideuse ismeasuredas a single item and expressedin expenditureterms. Herbicide expendituresdominate otherpesticideexpendituresin soybeanandcorn production.