Therapeutical use of probiotic formulations in clinical practice
www.elsevier.com/locate/procbio
Process Biochemistry 41 (2006) 1–10
Response surface optimization of the medium components for
the production of biosurfactants by probiotic bacteria
Lıgia Rodrigues a, Jose Teixeira a,*, Rosario Oliveira a,Henny C. van der Mei b
a Centro de Engenharia Biologica – IBQF, Universidade do Minho, Largo do Paco,
4719 Campus de Gualtar, 4710-057 Braga Codex, Portugalb Department of Biomedical Engineering, University of Groningen Antonius Deusinglaan 1,
9713 AV Groningen, The Netherlands
Accepted 6 January 2005
Abstract
Optimization of the medium for biosurfactants production by probiotic bacteria (Lactococcus lactis 53 and Streptococcus thermophilus A)
was carried out using response surface methodology. Both biosurfactants were proved to be growth-associated, thus the desired response
selected for the optimization was the biomass concentration. The selected factors based onMRSmedium for L. lactis 53 growth were peptone,
meat extract, yeast extract, lactose, ammonium citrate and KH2PO4. For S. thermophilus A based on the M17 medium, the selected factors
were peptone, meat extract, yeast extract, lactose, soya peptone and sodium glycerophosphate. The optimumMRS composition was found to
be 38.6 g/l peptone, 43.0 g/l lactose, 10 g/l meat extract, 5 g/l yeast extract, 1.08 g/l Tween-801, 2 g/l KH2PO4, 2 g/l CH3COONa, 2 g/l
ammonium citrate, 0.2 g/l MgSO4�7H2O and 0.05 g/l MnSO4�4H2O. The optimized medium allowed a mass of produced biosurfactant
(milligram per gram cell dry weight) 1.6 times higher compared to MRS standard medium. The optimummedium composition for growing S.
thermophilus A consists of 5.0 g/l peptone, 5.7 g/l lactose, 5.0 g/l meat extract, 2.5 g/l yeast extract, 5.0 g/l soya peptone, 26.4 g/l sodium
glycerophosphate, 0.5 g/l ascorbic acid and 0.25 g/l MgSO4�7H2O. With the optimization procedure a biosurfactant mass recovery 2.1 times
higher was achieved. The application of response surface methodology resulted in an enhancement in biosurfactants production.
# 2005 Elsevier Ltd. All rights reserved.
Keywords: Biosurfactant; Probiotic bacteria; Response surface methodology; Medium optimization; Experimental factorial design; Product yield
1. Introduction
Interest in biosurfactants has increased considerably in
recent years, as they are potential candidates for many
commercial applications in the petroleum, pharmaceuticals,
biomedical and food processing industries [1]. Dairy
Streptococcus thermophilus strains, for example, can
produce biosurfactants that cause their own desorption
[2]. Lactobacillus and Streptococcus species have been
shown to be able to displace adhering uropathogenic
Enterococcus faecalis from hydrophobic and hydrophilic
substrata in a parallel-plate flow chamber, possibly through
* Corresponding author. Tel.: +351 253 604400; fax: +351 253 678986.
E-mail address: [email protected] (J. Teixeira).
1359-5113/$ – see front matter # 2005 Elsevier Ltd. All rights reserved.
doi:10.1016/j.procbio.2005.01.030
biosurfactant production [3]. Biosurfactants have special
advantages over synthetic surfactants such as their
biodegradability, lower toxicity and greater diversity as
they present a much broader range of surfactant types and
properties than the available synthetic surfactants [4].
Depending upon the nature of the biosurfactant and the
producing microrganisms, the following patterns of bio-
surfactant production by fermentation are possible: (a)
growth-associated production, (b) production under growth
limiting conditions, (c) production by resting/nongrowing
cells, and (d) production associated with the precursor
augmentation. In the case of growth-associated biosurfactant
production, there exists a parallel relationship between the
substrate utilization, growth and biosurfactant production
[5].
L. Rodrigues et al. / Process Biochemistry 41 (2006) 1–102
Cell growth and the accumulation of metabolic products
are strongly influenced by medium compositions such as
carbon sources, nitrogen sources, growth factors, and
inorganic salts. Thus, it is difficult to search for the major
factors and to optimize them for biotechnological processes
as several parameters are involved [6]. Environmental
factors and growth conditions such as pH, temperature,
agitation, and oxygen availability also affect biosurfactant
production through their effects on cellular growth or
activity [1].
The classical method of medium optimization involves
changing one variable at a time, keeping the others at fixed
levels. Being single dimensional, this laborious and time-
consuming method often does not guarantee determination
of optimal conditions. On the other hand carrying out
experiments with every possible factorial combination of
the test variables is impractical because of the large
number of experiments required [7]. In the first screening,
it is recommended to evaluate the result and estimate the
main effects according to a linear model. After this
evaluation, the variables that have the largest influence on
the result are selected for new studies. Thus, a large
number of experimental variables can be investigated
without having to increase the number of experiments to
the extreme [8].
The aim of the present study was to improve the standard
media, using lactose as carbon source instead of glucose, for
growing biosurfactant-producing lactic acid bacteria. The
optimization of cellular growth of the probiotic bacteria
Lactococcus lactis 53 and Streptococcus thermophilus A
was achieved using a 26–2 fractional factorial central
composite design and surface modeling method, after
establishing that their biosurfactants are growth-associated.
The yields of biosurfactant production for both strains were
determined before and after optimization, as well as its
surface-activity. The relation between cellular growth and
surface-activity of the biosurfactant in time (as a measure of
its production) was determined for both strains before and
after the optimization procedure.
2. Materials and methods
2.1. Strains and culture conditions
The bacterial strains L. lactis 53 and S. thermophilus A
were stored at �20 8C in MRS [9] or M17 [10] broth,
respectively. From frozen stock, bacteria were streaked on
MRS or M17 agar plates and incubated at 37 8C. To preparesubcultures, the respective medium was inoculated with a
colony from the plate and incubated overnight under the
same conditions. In the experimental design assays,
optimization of the standard MRS and M17 media was
performed by changing the carbon source from glucose to
lactose, as well as the concentrations of the key factors as
described below.
2.2. Cell growth and biosurfactants production
Cellular growth was measured by optical density of the
culture at 600 nmand biomass concentrations (g dryweight/l)
were determined using a calibration curve. The calibration
curve was calculated for each strain using dilutions of a
biomass suspension with known optical density. A fixed
volumeof thedilutionswasfiltered (0.45 mm)and left todry at
105 8C for 24 h. All the filters were weighed before the
filtration and after the drying. Thus, a relationship between
biomass concentration (g/l) and optical density (600 nm) can
be determined.
For the bacterial strains L. lactis 53 and S. thermophilus
A, 600 ml cultures in MRS and M17 broth, respectively,
were grown overnight (18 h). The growth media used for the
production of these biosurfactants were the standard media
MRS and M17, and the optimized media obtained by
experimental design for higher yields of biosurfactant
production. Cells were harvested by centrifugation
(10,000 � g, 5 min, 10 8C), washed twice in demineralized
water, and resuspended in 100 ml of phosphate-buffered
saline (PBS: 10 mM KH2PO4/K2HPO4 and 150 mM NaCl
with pH adjusted to 7.0). The bacteria were left at room
temperature for 2 h with gentle stirring for cell-bound
biosurfactants release. Subsequently, the bacteria were
removed by centrifugation and the remaining supernatant
liquid was filtered through a 0.22 mm pore-size filter
(Millipore). The supernatant was dialyzed against deminer-
alized water at 4 8C in a Spectrapor membrane tube
(molecular weight cut off 6000–8000, Spectrum Medical
Industries Inc., CA) and freeze-dried.
2.3. Biosurfactants surface-activity determination
Axisymmetric drop shape analysis by profile (ADSA-P)
is a technique for determining liquid surface tensions
based on the shape of an axisymmetric droplet on a solid
substratum. In order to measure the surface-activity of
both cell-bound biosurfactants obtained in the stationary
growth phase (as described previously) by ADSA-P, a
100 ml droplet of a biosurfactant solution was placed on
fluoroethylene-propylene (FEP)-Teflon (Fluorplast, The
Netherlands) in an enclosed chamber to prevent evapora-
tion from the droplet. The shape of the droplet was
monitored for 2 h at room temperature and the surface
tension of the droplet was calculated from its shape as a
function of time [11]. Surface-activity of biosurfactant
produced by bacteria in time was also measured by ADSA-
P. Bacterial suspensions were prepared as follows. The L.
lactis 53 and S. thermophilus A were grown in 200 ml of
MRS and M17 broth, respectively, inoculated with 10 ml
of an overnight pre-culture. After 3, 6, 9 and 24 h, 10 ml of
the culture was harvested by centrifugation (10,000 � g,
5 min, 10 8C) and washed twice in fresh PBS. Bacteria
were counted in a Burker-Turk counting chamber and
diluted in PBS to a final concentration of 5 � 109 cell/ml,
L. Rodrigues et al. / Process Biochemistry 41 (2006) 1–10 3
and used immediately as described above in the ADSA-P
procedure.
2.4. Mass of produced biosurfactants
In order to compare the amount of cell-bound biosurfac-
tants produced by the bacteria grown in standard and
optimized medium, the biosurfactants were released by the
stationary phase cells using the PBS extraction procedure
described below. Briefly, the bacteria were left at room
temperature for 2 h with gentle stirring for cell-bound
biosurfactants release. Subsequently, the bacteria were
removed by centrifugation and the remaining supernatant
liquid was filtered through a 0.22 mm pore-size filter
(Millipore). The supernatant was dialyzed against deminer-
alized water at 4 8C in a Spectrapor membrane tube
(molecular weight cut off 6000–8000, Spectrum Medical
Industries Inc., CA) and freeze-dried. The mass of produced
biosurfactant (milligram per gram cell dry weight) was
determined.
2.5. Experimental designs
Response surface methodology is a collection of
mathematical and statistical techniques that are useful for
the modeling and analysis of problems in which a response
of interest is influenced by several variables and the
objective is to optimize this response [8].
2.5.1. Fractional factorial designs (FFD)
In order to identify which component(s) of the medium
has a significant effect on cellular growth a first optimization
step was developed. In a factorial design the influences of all
experimental variables, factors, and interaction effects on
the response or responses are investigated [8]. Six major
components in MRS (peptone, meat extract, yeast extract,
lactose, ammonium citrate and KH2PO4) and M17 medium
(peptone, meat extract, yeast extract, lactose, soya peptone
and sodium glycerophosphate) to be set as factors in the
factorial designs were selected. According to factorial
designs 26 experiments have to be performed. If the
experimenter can reasonably assume that certain high-order
interactions are negligible, information on the main effects
and low-order interactions may be obtained by running only
a fraction of the complete factorial experiment. The number
of experiments can then be reduced by using only a part of
the factorial designs (fractional factorial design) without
loss of information about the main effects. For a moderately
large number of factors, smaller fractions of the 2k design
are frequently useful [8]. Therefore, for a 26–2 fractional
factorial design with six factors at two levels, only 16
experimental runs are required. A first-order model was then
fitted to the data obtained from the FFD experiments.
Frequently, the initial estimate of the optimum operating
conditions for the system will be far from the actual
optimum. In such circumstances, the objective is to move
rapidly to the general vicinity of the optimum. The method
of steepest ascent is a procedure for moving sequentially
along the path of steepest ascent, that is, in the direction of
the maximum increase in the response. Further studies for
the optimization involved experiments carried out along the
path of steepest ascent, which means, the direction at right
angles to the contour lines representing equal yield, that
shows the relative amounts by which the factors have to vary
in order to attain a maximum increase of responses.
2.5.2. Central composite designs (CCD)
The objective of this second experiment is to develop an
empirical model of the process and to obtain a more precise
estimate of the optimum operating conditions for the factors
involved. This approach to process optimization is called
response surface methodology and the second design is a
central composite design, one of the most important
experimental designs used in process optimization studies
[8]. In order to describe the nature of the response surface in
the optimum region, a central composite design with five
coded levels was performed. For the two factors, this design
was made up a full 22 factorial design with its four cube
points, augmented with five replications of the center points
and the four star points, that is, points having for one factor
an axial distance to the center of �a, whereas the other
factor is at level 0. The axial distance a was chosen to be
1.414 to make this design rotatable. A center point is a point
in which all variables are set at their mid value. Three or four
center experiments should always be included in factorial
designs because the risk of missing non-linear relationships
in the middle of the intervals has to be minimized, and also
because the repetition allows for determination of con-
fidence intervals [8]. To estimate the optimal point, a third-
order polynomial function was fitted to the experimental
results.
2.5.3. Data analysis
Design-Expert 6, Trial version was used for the
regression analysis of the experimental data obtained. The
quality of the fit of the polynomial model equation was
expressed by the coefficient of determination R2, and its
statistical significance checked by a F-test [8]. The
significance of the regression coefficient was tested by a
t-test. The level of significance was given as values of
Prob > F less than 0.1. A differential calculation was then
employed for predicting the optimum point.
3. Results
3.1. Biosurfactant growth-associated production
The relation between cell growth and surface-activity of
the biosurfactant in time was determined for both strains
before the optimization procedure (Figs. 1A and 2A). For
both strains the biosurfactant production is associated with

L. Rodrigues et al. / Process Biochemistry 41 (2006) 1–104
Fig. 1. Fermentation evolution for L. lactis 53: variation of biomass
concentration (g/l) (&) and surface tension (mJ/m2) (~), in time. The
biomass concentration is a measure of the cell growth, while surface tension
is a measure of the biosurfactant activity. (A) L. lactis 53 grown in MRS
medium before experimental design optimization of the media composition.
(B) L. lactis 53 grown in MRS optimized by experimental design.
Fig. 2. Fermentation evolution for S. thermophilus A: variation of biomass
concentration (g/l) (&) and surface tension (mJ/m2) (~), in time. The
biomass concentration is a measure of the cell growth, while surface tension
is a measure of the biosurfactant activity. (A) S. thermophilus A grown in
M17 medium before experimental design optimization of media composi-
tion. (B) S. thermophilus A grown in M17 optimized by experimental
design.
the cellular growth, as an increase in the biomass
concentration leads to a decrease in the surface tension.
In the case of a growth associated biosurfactant production
there is a parallel relationship between the substrate
utilization, growth and biosurfactant production [5]. The
lowest values of surface tension were achieved in the
stationary phase for both bacterial strains.
3.2. Effects of the different MRS or M17 medium
components on cell growth
The factorial design enables the identification of the
mediumcomponents thatplaya significant roleoncellgrowth,
aswell as the rangeswithin themedium components vary. For
each medium six components were set as variables for the
optimization procedure and the concentration for each
component in the medium was appropriately enlarged as the
ranges for the variables. The independent variables, experi-
mental range and levels investigated in this study, for both
media, are given in Table 1. In developing the regression
equation, the test variables were coded according to the
equation:
xi ¼�Xi � X�
i
DXi
�(1)
where xi is the coded value of the ith independent variable, Xi
the uncoded value for the ith independent variable, X�i the
uncoded value of the ith independent variable at the center
point and DXi the step change value.
Results of the experimental design performed to achieve
MRS medium optimization are shown in Table 2. The
biomass concentration varied markedly from 1.811 to
4.250 g/l with the different levels of components in the
medium. The concentration of lactose and peptone strongly
affected the cell growth, with P-values of 0.0766 and 0.0015,
respectively, whereas ammonium citrate and KH2PO4 did
Table 1
Experimental range and levels of the independent variables (Xi and Zi, i = 1,
2, 3, 4, 5, and 6) used in the fractional factorial design (FFD)
Independent variables (g/l) Range and levels
�1 0 1
MRS medium optimization
X1 – peptone 5.0 10.0 15.0
X2 – meat extract 5.0 10.0 15.0
X3 – yeast extract 2.5 5.0 7.5
X4 – lactose 10.0 20.0 30.0
X5 – ammonium citrate 1.0 2.0 3.0
X6 – KH2PO4 1.0 2.0 3.0
M17 medium optimisation
Z1 – peptone 2.5 5.0 7.5
Z2 – meat extract 2.5 5.0 7.5
Z3 – yeast extract 1.25 2.5 3.75
Z4 – lactose 5.0 10.0 15.0
Z5 – soya peptone 2.5 5.0 7.5
Z6 – sodium glycerophosphate 9.5 19.0 28.5
L. Rodrigues et al. / Process Biochemistry 41 (2006) 1–10 5
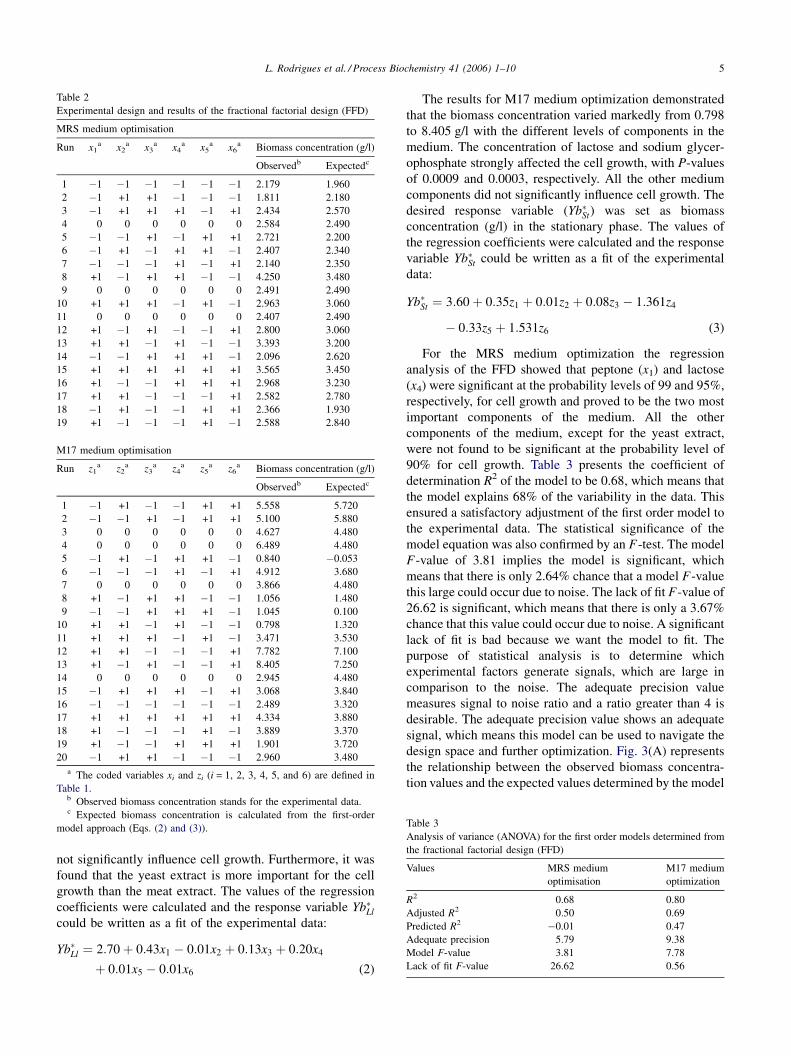
Table 2
Experimental design and results of the fractional factorial design (FFD)
MRS medium optimisation
Run x1a x2
a x3a x4
a x5a x6
a Biomass concentration (g/l)
Observedb Expectedc
1 �1 �1 �1 �1 �1 �1 2.179 1.960
2 �1 +1 +1 �1 �1 �1 1.811 2.180
3 �1 +1 +1 +1 �1 +1 2.434 2.570
4 0 0 0 0 0 0 2.584 2.490
5 �1 �1 +1 �1 +1 +1 2.721 2.200
6 �1 +1 �1 +1 +1 �1 2.407 2.340
7 �1 �1 �1 +1 �1 +1 2.140 2.350
8 +1 �1 +1 +1 �1 �1 4.250 3.480
9 0 0 0 0 0 0 2.491 2.490
10 +1 +1 +1 �1 +1 �1 2.963 3.060
11 0 0 0 0 0 0 2.407 2.490
12 +1 �1 +1 �1 �1 +1 2.800 3.060
13 +1 +1 �1 +1 �1 �1 3.393 3.200
14 �1 �1 +1 +1 +1 �1 2.096 2.620
15 +1 +1 +1 +1 +1 +1 3.565 3.450
16 +1 �1 �1 +1 +1 +1 2.968 3.230
17 +1 +1 �1 �1 �1 +1 2.582 2.780
18 �1 +1 �1 �1 +1 +1 2.366 1.930
19 +1 �1 �1 �1 +1 �1 2.588 2.840
M17 medium optimisation
Run z1a z2
a z3a z4
a z5a z6
a Biomass concentration (g/l)
Observedb Expectedc
1 �1 +1 �1 �1 +1 +1 5.558 5.720
2 �1 �1 +1 �1 +1 +1 5.100 5.880
3 0 0 0 0 0 0 4.627 4.480
4 0 0 0 0 0 0 6.489 4.480
5 �1 +1 �1 +1 +1 �1 0.840 �0.053
6 �1 �1 �1 +1 �1 +1 4.912 3.680
7 0 0 0 0 0 0 3.866 4.480
8 +1 �1 +1 +1 �1 �1 1.056 1.480
9 �1 �1 +1 +1 +1 �1 1.045 0.100
10 +1 +1 �1 +1 �1 �1 0.798 1.320
11 +1 +1 +1 �1 +1 �1 3.471 3.530
12 +1 +1 �1 �1 �1 +1 7.782 7.100
13 +1 �1 +1 �1 �1 +1 8.405 7.250
14 0 0 0 0 0 0 2.945 4.480
15 �1 +1 +1 +1 �1 +1 3.068 3.840
16 �1 �1 �1 �1 �1 �1 2.489 3.320
17 +1 +1 +1 +1 +1 +1 4.334 3.880
18 +1 �1 �1 �1 +1 �1 3.889 3.370
19 +1 �1 �1 +1 +1 +1 1.901 3.720
20 �1 +1 +1 �1 �1 �1 2.960 3.480
a The coded variables xi and zi (i = 1, 2, 3, 4, 5, and 6) are defined in
Table 1.b Observed biomass concentration stands for the experimental data.c Expected biomass concentration is calculated from the first-order
model approach (Eqs. (2) and (3)). Table 3
Analysis of variance (ANOVA) for the first order models determined from
the fractional factorial design (FFD)
Values MRS medium
optimisation
M17 medium
optimization
R2 0.68 0.80
Adjusted R2 0.50 0.69
Predicted R2 �0.01 0.47
Adequate precision 5.79 9.38
Model F-value 3.81 7.78
Lack of fit F-value 26.62 0.56
not significantly influence cell growth. Furthermore, it was
found that the yeast extract is more important for the cell
growth than the meat extract. The values of the regression
coefficients were calculated and the response variable Yb�Llcould be written as a fit of the experimental data:
Yb�Ll ¼ 2:70þ 0:43x1 � 0:01x2 þ 0:13x3 þ 0:20x4
þ 0:01x5 � 0:01x6 (2)
The results for M17 medium optimization demonstrated
that the biomass concentration varied markedly from 0.798
to 8.405 g/l with the different levels of components in the
medium. The concentration of lactose and sodium glycer-
ophosphate strongly affected the cell growth, with P-values
of 0.0009 and 0.0003, respectively. All the other medium
components did not significantly influence cell growth. The
desired response variable (Yb�St) was set as biomass
concentration (g/l) in the stationary phase. The values of
the regression coefficients were calculated and the response
variable Yb�St could be written as a fit of the experimental
data:
Yb�St ¼ 3:60þ 0:35z1 þ 0:01z2 þ 0:08z3 � 1:361z4
� 0:33z5 þ 1:531z6 (3)
For the MRS medium optimization the regression
analysis of the FFD showed that peptone (x1) and lactose
(x4) were significant at the probability levels of 99 and 95%,
respectively, for cell growth and proved to be the two most
important components of the medium. All the other
components of the medium, except for the yeast extract,
were not found to be significant at the probability level of
90% for cell growth. Table 3 presents the coefficient of
determination R2 of the model to be 0.68, which means that
the model explains 68% of the variability in the data. This
ensured a satisfactory adjustment of the first order model to
the experimental data. The statistical significance of the
model equation was also confirmed by an F-test. The model
F-value of 3.81 implies the model is significant, which
means that there is only 2.64% chance that a model F-value
this large could occur due to noise. The lack of fit F-value of
26.62 is significant, which means that there is only a 3.67%
chance that this value could occur due to noise. A significant
lack of fit is bad because we want the model to fit. The
purpose of statistical analysis is to determine which
experimental factors generate signals, which are large in
comparison to the noise. The adequate precision value
measures signal to noise ratio and a ratio greater than 4 is
desirable. The adequate precision value shows an adequate
signal, which means this model can be used to navigate the
design space and further optimization. Fig. 3(A) represents
the relationship between the observed biomass concentra-
tion values and the expected values determined by the model

L. Rodrigues et al. / Process Biochemistry 41 (2006) 1–106
Fig. 3. Plots of Observed vs. expected biomass concentration (g/l) values
for L. lactis 53 (A) and S. thermophilus A (B). The biomass concentration is
the response variable of interest. The expected biomass concentration values
are determined by the model equations determined for fractional factorial
design (FFD).
Eq. (2) for L. lactis 53. It can be observed that most points
are nearby the line adjustment which means that the values
determined experimentally are similar to those determined
by the model. Also for S. thermopilus A it can be observed in
Fig. 3B the same tendency.
For theM17medium optimization the regression analysis
of the FFD showed that lactose (z4) and sodium glyceropho-
sphate (z6) were significant at the probability level of 99%
for cell growth and consequently the two most important
components. All the other components of the medium were
not found to be significant at the probability level of 90% for
cell growth. The ANOVA summarized in Table 3 showed a
coefficient of determination R2 of 0.80, which means that the
model explains 80% of the variability in the data. The model
F-value of 7.78 implies that the model is significant and
there is only 0.14% chance that this value could occur due to
noise. The lack of fit F-value of 0.56 is not significant
relative to true pure error, and there is a 77.9% chance that
this value could occur due to noise. This model was found to
be adequate to navigate the design space and further
optimization.
3.3. The path of steepest ascent
The path of steepest ascent was determined by first-order
model (Eqs. (2) and (3)) and regression analysis for both
bacterial strains. Besides the previously determined sig-
nificant factors (peptone (x1) and lactose (x4) for MRS
medium optimization; lactose (z4) and sodium glyceropho-
sphate (z6) for M17 medium optimization), all the other
components were fixed at the center level of the FFD
because they were not significant at the probability level of
90% for cell growth. According to the signs of their main
effects, the concentrations of the significant factors were
increased or decreased, in order to achieve a positive
consequence in the response variable. In MRS medium
optimization, peptone and lactose were increased serially by
0.5 and 0.25%, respectively, while for M17 medium
optimization lactose was decreased serially by 2.0%, and
sodium glycerophosphate was increased serially by 1.0%.
The higher biomass concentration (2.453 g/l) has been
reached with 30 g/l peptone and 38.6 g/l lactose for MRS
medium optimization. For M17 medium optimization, 3.2 g/
l lactose and 26.6 g/l sodium glycerophosphate allowed a
6.656 g/l biomass concentration.
3.4. Central composite design (CCD)
By determining the path of steepest ascent the vicinity of
the optimum was reached. Thus, for MRS medium
optimization, the levels of the two significant variables,
peptone (x1) and lactose (x4) were further optimized using a
central composite design. The ranges of the variables are 30–
40 g/l for peptone, and 34–43 g/l for lactose. The experi-
mental design and the results are presented in Table 4. The
experimental results of the CCD were fitted with a third-
order polynomial function for estimation of biomass
concentration:
YbLl ¼ 2:55þ 0:46x1 þ 0:15x4 þ 0:15x1x4 � 0:15x21
þ 0:11x24 � 0:26x31 � 0:11x34 (4)
The model adequacy was checked and it was found to be
adequate, the goodness of fit of the model was expressed by
L. Rodrigues et al. / Process Biochemistry 41 (2006) 1–10 7
Table 4
Experimental design and results of the central composite design (CCD)
MRS medium optimization
Run x1a x4
a Biomass concentration (g/l)
Observedb Expectedc
1 0 0 2.463 2.550
2 1.414 0 2.069 2.170
3 0 1.414 2.564 2.670
4 +1 +1 3.016 2.910
5 �1 +1 2.305 2.200
6 0 0 2.469 2.550
7 +1 �1 2.630 2.520
8 0 �1.414 2.778 2.880
9 �1.414 0 2.232 2.340
10 0 0 2.832 2.550
11 0 0 2.499 2.550
12 �1 �1 2.536 2.430
13 0 0 2.501 2.550
M17 medium optimisation
Run z4a z6
a Biomass concentration (g/l)
Observedb Expectedc
1 0 0 6.138 6.10
2 0 0 5.960 6.10
3 1.414 0 5.862 5.64
4 +1 +1 6.201 6.42
5 0 �1.414 6.290 6.07
6 0 0 6.184 6.10
7 0 0 6.132 6.10
8 0 1.414 6.042 5.82
9 �1 +1 5.711 5.93
10 0 0 6.100 6.10
11 �1 �1 5.613 5.84
12 +1 �1 5.305 5.53
13 �1.414 0 6.422 6.20
a The coded variables xi (i = 1 or i = 4) and zj (j = 4 or j = 6) are defined
in Table 1.b Observed biomass concentration stands for the experimental data.c Expected biomass concentration is calculated from the third-order
model approach (Eqs. (4) and (5)).
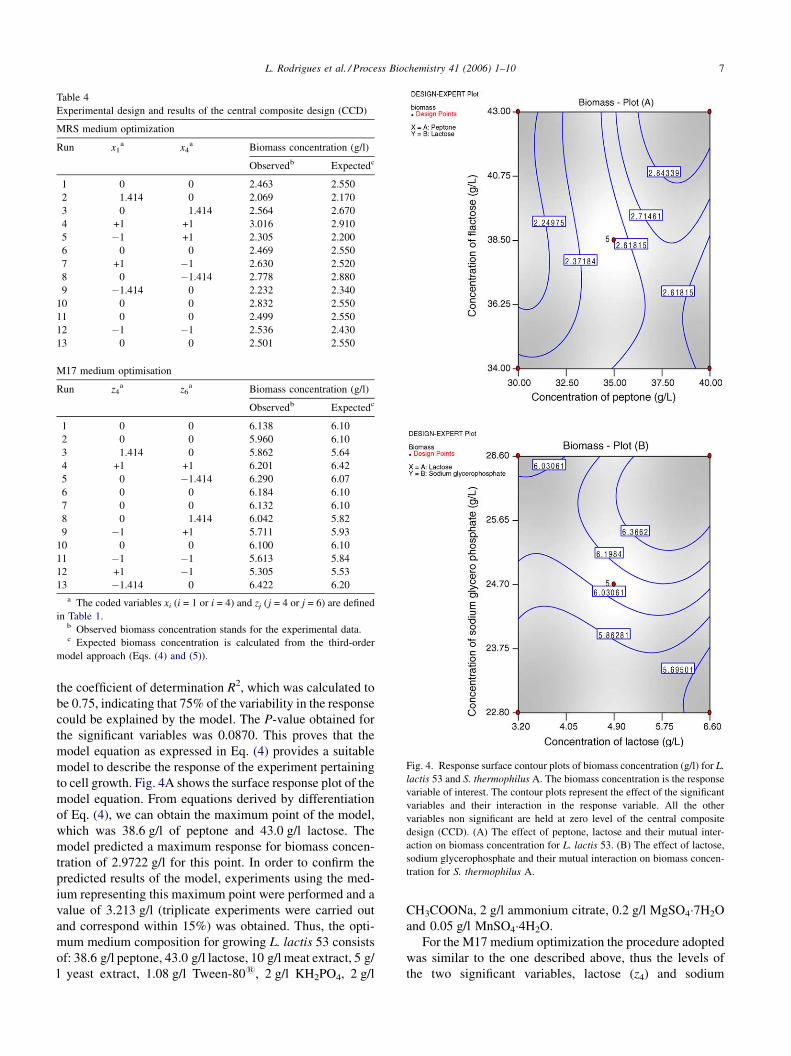
Fig. 4. Response surface contour plots of biomass concentration (g/l) for L.
lactis 53 and S. thermophilus A. The biomass concentration is the response
variable of interest. The contour plots represent the effect of the significant
variables and their interaction in the response variable. All the other
variables non significant are held at zero level of the central composite
design (CCD). (A) The effect of peptone, lactose and their mutual inter-
action on biomass concentration for L. lactis 53. (B) The effect of lactose,
sodium glycerophosphate and their mutual interaction on biomass concen-
tration for S. thermophilus A.
the coefficient of determination R2, which was calculated to
be 0.75, indicating that 75% of the variability in the response
could be explained by the model. The P-value obtained for
the significant variables was 0.0870. This proves that the
model equation as expressed in Eq. (4) provides a suitable
model to describe the response of the experiment pertaining
to cell growth. Fig. 4A shows the surface response plot of the
model equation. From equations derived by differentiation
of Eq. (4), we can obtain the maximum point of the model,
which was 38.6 g/l of peptone and 43.0 g/l lactose. The
model predicted a maximum response for biomass concen-
tration of 2.9722 g/l for this point. In order to confirm the
predicted results of the model, experiments using the med-
ium representing this maximum point were performed and a
value of 3.213 g/l (triplicate experiments were carried out
and correspond within 15%) was obtained. Thus, the opti-
mum medium composition for growing L. lactis 53 consists
of: 38.6 g/l peptone, 43.0 g/l lactose, 10 g/l meat extract, 5 g/
l yeast extract, 1.08 g/l Tween-801, 2 g/l KH2PO4, 2 g/l
CH3COONa, 2 g/l ammonium citrate, 0.2 g/l MgSO4�7H2O
and 0.05 g/l MnSO4�4H2O.
For the M17 medium optimization the procedure adopted
was similar to the one described above, thus the levels of
the two significant variables, lactose (z4) and sodium
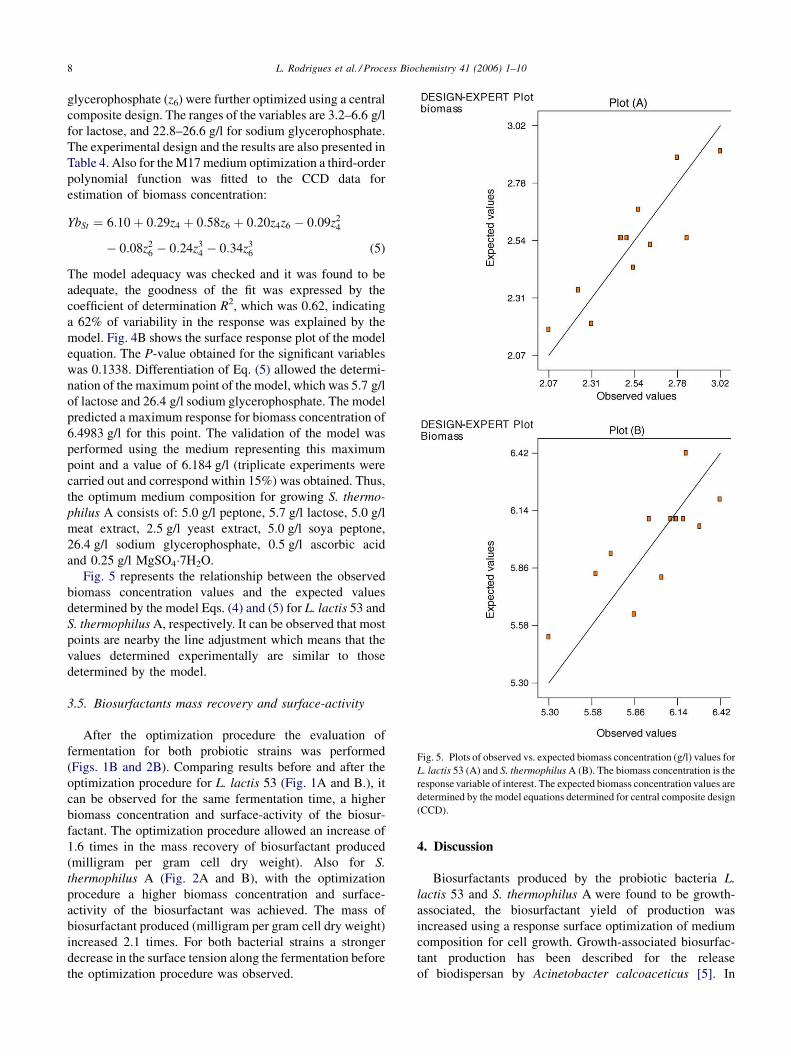
L. Rodrigues et al. / Process Biochemistry 41 (2006) 1–108
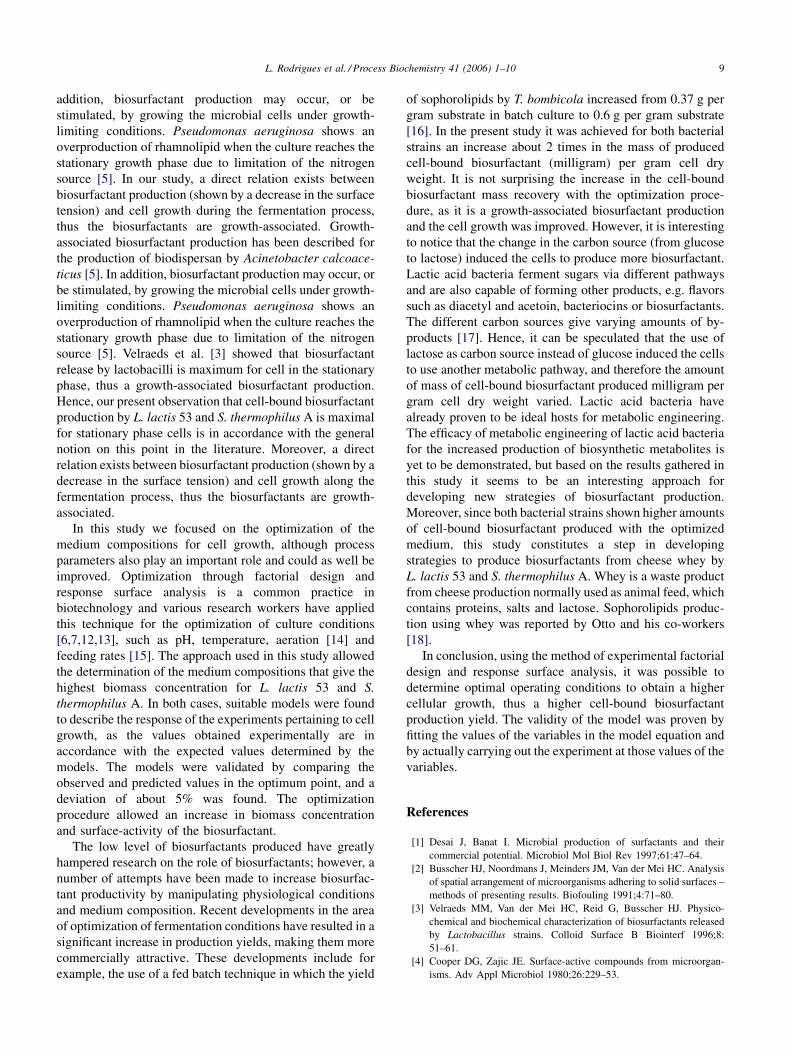
Fig. 5. Plots of observed vs. expected biomass concentration (g/l) values for
L. lactis 53 (A) and S. thermophilus A (B). The biomass concentration is the
response variable of interest. The expected biomass concentration values are
determined by the model equations determined for central composite design
(CCD).
glycerophosphate (z6) were further optimized using a central
composite design. The ranges of the variables are 3.2–6.6 g/l
for lactose, and 22.8–26.6 g/l for sodium glycerophosphate.
The experimental design and the results are also presented in
Table 4. Also for theM17medium optimization a third-order
polynomial function was fitted to the CCD data for
estimation of biomass concentration:
YbSt ¼ 6:10þ 0:29z4 þ 0:58z6 þ 0:20z4z6 � 0:09z24
� 0:08z26 � 0:24z34 � 0:34z36 (5)
The model adequacy was checked and it was found to be
adequate, the goodness of the fit was expressed by the
coefficient of determination R2, which was 0.62, indicating
a 62% of variability in the response was explained by the
model. Fig. 4B shows the surface response plot of the model
equation. The P-value obtained for the significant variables
was 0.1338. Differentiation of Eq. (5) allowed the determi-
nation of the maximum point of the model, which was 5.7 g/l
of lactose and 26.4 g/l sodium glycerophosphate. The model
predicted a maximum response for biomass concentration of
6.4983 g/l for this point. The validation of the model was
performed using the medium representing this maximum
point and a value of 6.184 g/l (triplicate experiments were
carried out and correspond within 15%) was obtained. Thus,
the optimum medium composition for growing S. thermo-
philus A consists of: 5.0 g/l peptone, 5.7 g/l lactose, 5.0 g/l
meat extract, 2.5 g/l yeast extract, 5.0 g/l soya peptone,
26.4 g/l sodium glycerophosphate, 0.5 g/l ascorbic acid
and 0.25 g/l MgSO4�7H2O.
Fig. 5 represents the relationship between the observed
biomass concentration values and the expected values
determined by the model Eqs. (4) and (5) for L. lactis 53 and
S. thermophilus A, respectively. It can be observed that most
points are nearby the line adjustment which means that the
values determined experimentally are similar to those
determined by the model.
3.5. Biosurfactants mass recovery and surface-activity
After the optimization procedure the evaluation of
fermentation for both probiotic strains was performed
(Figs. 1B and 2B). Comparing results before and after the
optimization procedure for L. lactis 53 (Fig. 1A and B.), it
can be observed for the same fermentation time, a higher
biomass concentration and surface-activity of the biosur-
factant. The optimization procedure allowed an increase of
1.6 times in the mass recovery of biosurfactant produced
(milligram per gram cell dry weight). Also for S.
thermophilus A (Fig. 2A and B), with the optimization
procedure a higher biomass concentration and surface-
activity of the biosurfactant was achieved. The mass of
biosurfactant produced (milligram per gram cell dry weight)
increased 2.1 times. For both bacterial strains a stronger
decrease in the surface tension along the fermentation before
the optimization procedure was observed.
4. Discussion
Biosurfactants produced by the probiotic bacteria L.
lactis 53 and S. thermophilus A were found to be growth-
associated, the biosurfactant yield of production was
increased using a response surface optimization of medium
composition for cell growth. Growth-associated biosurfac-
tant production has been described for the release
of biodispersan by Acinetobacter calcoaceticus [5]. In
L. Rodrigues et al. / Process Biochemistry 41 (2006) 1–10 9
addition, biosurfactant production may occur, or be
stimulated, by growing the microbial cells under growth-
limiting conditions. Pseudomonas aeruginosa shows an
overproduction of rhamnolipid when the culture reaches the
stationary growth phase due to limitation of the nitrogen
source [5]. In our study, a direct relation exists between
biosurfactant production (shown by a decrease in the surface
tension) and cell growth during the fermentation process,
thus the biosurfactants are growth-associated. Growth-
associated biosurfactant production has been described for
the production of biodispersan by Acinetobacter calcoace-
ticus [5]. In addition, biosurfactant production may occur, or
be stimulated, by growing the microbial cells under growth-
limiting conditions. Pseudomonas aeruginosa shows an
overproduction of rhamnolipid when the culture reaches the
stationary growth phase due to limitation of the nitrogen
source [5]. Velraeds et al. [3] showed that biosurfactant
release by lactobacilli is maximum for cell in the stationary
phase, thus a growth-associated biosurfactant production.
Hence, our present observation that cell-bound biosurfactant
production by L. lactis 53 and S. thermophilus A is maximal
for stationary phase cells is in accordance with the general
notion on this point in the literature. Moreover, a direct
relation exists between biosurfactant production (shown by a
decrease in the surface tension) and cell growth along the
fermentation process, thus the biosurfactants are growth-
associated.
In this study we focused on the optimization of the
medium compositions for cell growth, although process
parameters also play an important role and could as well be
improved. Optimization through factorial design and
response surface analysis is a common practice in
biotechnology and various research workers have applied
this technique for the optimization of culture conditions
[6,7,12,13], such as pH, temperature, aeration [14] and
feeding rates [15]. The approach used in this study allowed
the determination of the medium compositions that give the
highest biomass concentration for L. lactis 53 and S.
thermophilus A. In both cases, suitable models were found
to describe the response of the experiments pertaining to cell
growth, as the values obtained experimentally are in
accordance with the expected values determined by the
models. The models were validated by comparing the
observed and predicted values in the optimum point, and a
deviation of about 5% was found. The optimization
procedure allowed an increase in biomass concentration
and surface-activity of the biosurfactant.
The low level of biosurfactants produced have greatly
hampered research on the role of biosurfactants; however, a
number of attempts have been made to increase biosurfac-
tant productivity by manipulating physiological conditions
and medium composition. Recent developments in the area
of optimization of fermentation conditions have resulted in a
significant increase in production yields, making them more
commercially attractive. These developments include for
example, the use of a fed batch technique in which the yield
of sophorolipids by T. bombicola increased from 0.37 g per
gram substrate in batch culture to 0.6 g per gram substrate
[16]. In the present study it was achieved for both bacterial
strains an increase about 2 times in the mass of produced
cell-bound biosurfactant (milligram) per gram cell dry
weight. It is not surprising the increase in the cell-bound
biosurfactant mass recovery with the optimization proce-
dure, as it is a growth-associated biosurfactant production
and the cell growth was improved. However, it is interesting
to notice that the change in the carbon source (from glucose
to lactose) induced the cells to produce more biosurfactant.
Lactic acid bacteria ferment sugars via different pathways
and are also capable of forming other products, e.g. flavors
such as diacetyl and acetoin, bacteriocins or biosurfactants.
The different carbon sources give varying amounts of by-
products [17]. Hence, it can be speculated that the use of
lactose as carbon source instead of glucose induced the cells
to use another metabolic pathway, and therefore the amount
of mass of cell-bound biosurfactant produced milligram per
gram cell dry weight varied. Lactic acid bacteria have
already proven to be ideal hosts for metabolic engineering.
The efficacy of metabolic engineering of lactic acid bacteria
for the increased production of biosynthetic metabolites is
yet to be demonstrated, but based on the results gathered in
this study it seems to be an interesting approach for
developing new strategies of biosurfactant production.
Moreover, since both bacterial strains shown higher amounts
of cell-bound biosurfactant produced with the optimized
medium, this study constitutes a step in developing
strategies to produce biosurfactants from cheese whey by
L. lactis 53 and S. thermophilus A. Whey is a waste product
from cheese production normally used as animal feed, which
contains proteins, salts and lactose. Sophorolipids produc-
tion using whey was reported by Otto and his co-workers
[18].
In conclusion, using the method of experimental factorial
design and response surface analysis, it was possible to
determine optimal operating conditions to obtain a higher
cellular growth, thus a higher cell-bound biosurfactant
production yield. The validity of the model was proven by
fitting the values of the variables in the model equation and
by actually carrying out the experiment at those values of the
variables.
References
[1] Desai J, Banat I. Microbial production of surfactants and their
commercial potential. Microbiol Mol Biol Rev 1997;61:47–64.
[2] Busscher HJ, Noordmans J, Meinders JM, Van der Mei HC. Analysis
of spatial arrangement of microorganisms adhering to solid surfaces –
methods of presenting results. Biofouling 1991;4:71–80.
[3] Velraeds MM, Van der Mei HC, Reid G, Busscher HJ. Physico-
chemical and biochemical characterization of biosurfactants released
by Lactobacillus strains. Colloid Surface B Biointerf 1996;8:
51–61.
[4] Cooper DG, Zajic JE. Surface-active compounds from microorgan-
isms. Adv Appl Microbiol 1980;26:229–53.
L. Rodrigues et al. / Process Biochemistry 41 (2006) 1–1010
[5] Desai J, Desai A. Production of biosurfactants. In: Kosaric N, editor.
Biosurfactants: production, properties and applications. New York:
Marcel Dekker; 1993. p. 65–97.
[6] Li C, Bai J, Cai Z, Ouyang F. Optimization of a cultural medium for
bacteriocin production by Lactococcus lactis using a response surface
methodology. J Biotechnol 2002;93:27–34.
[7] Sen R. Response surface optimization of the critical media compo-
nents for the production of surfactin. J Chem Technol Biotechnol
1997;68:263–70.
[8] Montgomery DC. Response surface methods and other approaches
to process optimization. In: Montgomery DC, editor. Design and
analysis of experiments. New York: John Wiley and Sons; 1997 .
p. 427–510.
[9] De Man JC, Rogosa M, Sharpe E. A medium for cultivation of
Lactobacilli. J Appl Bacteriol 1960;23:130–5.
[10] Terzaghi B, Sandine WE. Improved medium for lactic streptococci
and their bacteriophages. Appl Microbiol 1975;29:807–13.
[11] Van der Vegt W, Van der Mei HC, Noordmans J, Busscher HJ.
Assessment of bacterial biosurfactant production through axisym-
metric drop shape analysis by profile. Appl Microbiol Biotechnol
1991;35:766–70.
[12] Vohra A, Satyanarayana T. Statistical optimization of the medium
components by response surface methodology to enhance phytase
production by Pichia anomala. Process Biochem 2002;37:999–1004.
[13] Chen HC. Optimizing the concentrations of carbon, nitrogen and
phosphorous in a citric acid fermentation with response surface
method. Food Biotechnol 1996;10:13–27.
[14] Harris PL, Cuppet SL, Bullerman LB. Optimization of lipase synthesis
by Pseudomonas fluorescens by response surface methodology. J Food
Prot 1990;53:481–3.
[15] Bazaraa WA, Hassan EE. Response surface optimization for the
continuous glucose isomerization process. J Ind Microbiol 1996;17:
100–3.
[16] Lee LH, Kim JH. Distribution of substrate carbon in sophorose lipid
production by Torulopsis bombicola. Biotechnol Lett 1993;15:263–6.
[17] Hofvendahl K, Hahn-Hagerdal B. Factors affecting the fermentative
lactic acid production from renewable resources. Enzyme Microb
Techonol 2000;26:87–107.
[18] Otto RT, Daniel HJ, Pekin G, Muller-Decker K. Production of
sophorolipids from whey II. – Product composition, surface active
properties, cytotoxicity and stability against hydrolases by enzymatic
treatment. Appl Microbiol Biotechnol 1999;52:495–501.
Copyright © 2022 FDOKUMEN