Relationship between Dietary Macronutrients Intake ... - MDPI
Upload
khangminh22Category
view
0download
0
animals
Article
Dietary Probiotic Pediococcus acidilactici MA18/5M Improvesthe Growth, Feed Performance and Antioxidant Status ofPenaeid Shrimp Litopenaeus stylirostris:A Growth-Ration-Size Approach
Mathieu Castex 1,*, Eric Leclercq 1, Pierrette Lemaire 2 and Liêt Chim 2,3
�����������������
Citation: Castex, M.; Leclercq, E.;
Lemaire, P.; Chim, L. Dietary
Probiotic Pediococcus acidilactici
MA18/5M Improves the Growth,
Feed Performance and Antioxidant
Status of Penaeid Shrimp Litopenaeus
stylirostris: A Growth-Ration-Size
Approach. Animals 2021, 11, 3451.
https://doi.org/10.3390/ani11123451
Academic Editors: Cedric J. Simon,
Mauricio G.C. Emerenciano,
Artur Rombenso, Felipe do
Nascimento Vieira and Ravi Fotedar
Received: 18 September 2021
Accepted: 30 November 2021
Published: 3 December 2021
Publisher’s Note: MDPI stays neutral
with regard to jurisdictional claims in
published maps and institutional affil-
iations.
Copyright: © 2021 by the authors.
Licensee MDPI, Basel, Switzerland.
This article is an open access article
distributed under the terms and
conditions of the Creative Commons
Attribution (CC BY) license (https://
creativecommons.org/licenses/by/
4.0/).
1 LALLEMAND SAS, 19 rue des Briquetiers, 31702 Blagnac, France; [email protected] IFREMER, Unité Lagons, Ecosystèmes et Aquaculture Durable en Nouvelle Calédonie (LEAD), B.P. 2059,
98846 Nouméa, New Caledonia, France; [email protected] (P.L.); [email protected] (L.C.)3 IFREMER, Laboratoire BRM/PBA, Rue de l’Ile d’Yeu, 44311 Nantes, France* Correspondence: [email protected]; Tel.: +33-620871370
Simple Summary: Probiotics are increasingly documented to confer health and performance benefitsacross farmed animals. The study assessed the effect of dietary supplementation with the single-strain probiotic Pedicococcus acidilactici MA18/5M on the growth, nutritional indices, and metabolicstatus of the adult western blue shrimp, Litopenaeus stylirostris. The aim was to estimate its potentialat optimizing the performance of the penaeid feed and shrimp farming industry. Supplementationwith P. acidilactici MA18/5M improved the feed conversion efficiency and daily growth rate acrossfixed ration sizes; and decreased both the maintenance and optimal ration size for growth. Thisappeared linked to a better use of dietary carbohydrates as shown by a higher α-amylase activity,free-glucose and glycogen concentration in the digestive gland. Interestingly, P. acidilactici intake wasalso associated with a higher antioxidant status which may be linked to enhanced carbohydratesutilization. Using a fixed ration size approach under controlled laboratory conditions, the studydocumented a clear potential for P. acidilactici MA18/5M to enhance the growth, feed efficiencyand metabolic health of adult penaeid shrimp during on-growing. These findings raise interestingprospects to optimize penaeid feed formulation and the performance of the shrimp-farming industry.
Abstract: Probiotics are increasingly documented to confer health and performance benefits acrossfarmed animals. The aim of this study was to assess the effect of a constant daily intake of the single-strain probiotic Pedicococcus acidilactici MA18/5M (4 × 10⁸ CFU.day−1.kg−1 shrimp) fed over fixed,restricted ration sizes (1% to 6% biomass.day−1) on the nutritional performance and metabolism ofadult penaeid shrimp Litopenaeus stylirostris (initial body-weight, BWi = 10.9 ± 1.8 g). The probioticsignificantly increased the relative daily growth rate (RGR) across all ration size s tested (Mean-RGRof 0.45 ± 0.08 and 0.61 ± 0.07% BWi.day−1 for the control and probiotic groups, respectively) anddecreased the maintenance ration (Rm) and the optimal ration (Ropt) by 18.6% and 11.3%, respec-tively. Accordingly, the probiotic group exhibited a significantly higher gross (K1) and net (K2) feedconversion efficiency with average improvement of 35% and 30%, respectively. Enhanced nutritionalperformances in shrimps that were fed the probiotic P. acidilactici was associated with, in particular,significantly higher α-amylase specific activity (+24.8 ± 5.5% across ration sizes) and a concentrationof free-glucose and glycogen in the digestive gland at fixed ration sizes of 3% and below. Thissuggests that the probiotic effect might reside in a better use of dietary carbohydrates. Interestingly, P.acidilactici intake was also associated with a statistically enhanced total antioxidant status of the diges-tive gland and haemolymph (+24.4 ± 7.8% and +21.9 ± 8.5%, respectively; p < 0.05). As supportedby knowledge in other species, enhanced carbohydrate utilization as a result of P. acidilactici intakemay fuel the pentose-phosphate pathway, generating NADPH or directly enhancing OH-radicalsscavenging by free glucose, in turn resulting in a decreased level of cellular oxidative stress. Inconclusion, the growth-ration method documented a clear contribution of P. acidilactici MA18/5Mon growth and feed efficiency of on-growing L. stylirostris that were fed fixed restricted rations
Animals 2021, 11, 3451. https://doi.org/10.3390/ani11123451 https://www.mdpi.com/journal/animals

Animals 2021, 11, 3451 2 of 21
under ideal laboratory conditions. The effect of the probiotic on α-amylase activity and carbohydratemetabolism and its link to the shrimp’s antioxidant status raises interesting prospects to optimizedietary formulations and helping to sustain the biological and economic efficiency of the penaeidshrimp-farming industry.
Keywords: probiotic; Pediococcus acidilactici; shrimp; growth; carbohydrate; antioxidant status
1. Introduction
Aquaculture widely contributes to the availability of aquatic food for human consumptionand relies on high-quality feed to ensure the health and performance of the animals and thesustainability of its industry. Research into the use of probiotics for aquatic animals has increasedwith the demand for environmentally friendly and sustainable aquaculture [1,2]. Probioticswere originally defined as microbial dietary supplements which bring beneficial effects to thehost [3] and are commonly viewed as prophylactic supplements in human health [4,5]. Severalreviews [2,6–11] detail the various developments made in the application of probiotics in aquaticspecies, including shrimp. In aquaculture, probiotics are usually used as biocontrol agents forpreventing disease and/or increasing resistance to pathogens [12] and several possible actionmechanisms have been suggested. Among these, the competitive exclusion of pathogenicbacteria [13–15] and enhancement of the immune and antioxidant defense systems againstpathogenic micro-organisms [16–21] have been widely invoked. For instance, the probioticstrain Pediococcus acidilactici MA18/5M has been the subject of a number of evaluations withregard to the health of the penaeid shrimp Litopenaeus stylirostris, and its dietary use was shownto be beneficial against vibriosis [17,18,22].
Probiotics are also often used as growth promoting agents in farmed animals [23,24]and as a digestibility enhancer in ruminants [25]. Several studies have recently reportedthat probiotic bacteria are good candidates for improving nutrient digestion and the growthof aquatic organisms [2,11]. Benefits to the host have been reported to include an improvedfeed utilisation and feed value by supplying beneficial dietary compounds (vitamin B12,biotin, carotenoids, amino acids), by detoxifying potentially harmful compounds in feedsand/or by an enzymatic contribution to digestion [2,26,27]. For example, Ref. [28] showedthat abalone (Haliotis midae) that were fed a kelp diet supplemented with Pseudoalteromonassp. strain C4 exhibited an increased growth rate compared to abalone fed standard kelp.They suggested that the probiotic can play an important role in the nutrition of farmedabalone in three ways: (i) pre-digestion of alginate in kelp-based feed, (ii) increasedalginate lyase activity in the abalone digestive tract and (iii) utilisation of strain C4 as aprotein source. Moreover, probiotics are also considered to influence digestive processes byenhancing the population of beneficial micro-organisms [29,30], microbial enzyme activityand the intestinal microbial balance [31]. However, to date, probiotic studies carried outwith shrimps have mainly focused on their increased resistance to disease [12,15,22] andpopulation growth performance [19,32–35].
The aim of the present study was to specify the effect of P. acidilactici on the growthand nutrition of the shrimp L. stylirostris. To this end, we determined the ration sizefor maintenance and optimal growth by means of the growth-ration method initiallyproposed for fish by [36] and largely applied in fish. Its main function is to determine thequantitative daily nutritional and energy requirements for maintenance and optimal growthas well as the impact of environmental factors [36–44]. Surprisingly, this fundamentalGR-method remains seldom applied and quantitative requirements are comparativelyinfrequently determined for penaeid shrimps. Refs. [45–47] based their studies on theGR-relation to determine the effect of feeding frequency and natural productivity of thepond on growth and feed efficiency of Penaeus merguiensis and L. stylirostris. Ref. [48]used the same approach to estimate the daily quantitative protein requirements of juvenileLitopenaeus vannamei. However, most studies have evaluated the effect of qualitative

Animals 2021, 11, 3451 3 of 21
variations of the feed nutritional profile on growth and feed conversion. Indeed, asmentioned by [48], research on the protein requirements of penaeid shrimp has largely beenconcerned with evaluations of optimal dietary protein level and not with the quantitativeprotein requirement, since ad libitum feeding is generally used. The use of the GR-relationand the quantification of the daily requirements obtained from it could provide usefulinformation to maximize penaeid shrimp production [48]. Moreover, this method could beused to evaluate and optimize the use of dietary additives.
Importantly, in many studies on crustaceans, the rearing tank is generally used asthe experimental unit and a simple analysis of variance is applied to the tank’s meandata. However, Ref. [49] highlighted the advantage of using individual measurements andnested designs in aquaculture experiments. In order to analyse such designs without pseu-doreplication [50], a nested analysis of variance has been identified as the correct method touse [51]. Nested ANOVA maintains both between-tank and within-tank variability in theanalysis, and therefore reduces the risk of drawing invalid conclusions as can occur whenusing a simple analysis of variance [52]. New techniques and methods are now availablefor measuring several variables at the individual level for fish, as mentioned by [49]. Theindividual tagging of the animals is one such method [53]; however, its use for individualshrimp growth measurements remains undocumented.
In this study, we combined the GR-method and individual tagging of the test speci-mens in order to precisely measure the key nutritional parameters (maintenance and theoptimal rations, scope for growth, gross and net conversion efficiency) and accuratelyassess the putative effects of the probiotic on the growth and feed efficiency. Furthermore,a biochemical analysis of free glucose, glycogen, digestive enzyme activities and totalantioxidant status (TAS) in the haemolymph and digestive gland was carried out to gainfurther insight into the probiotic effect at physiological level. To the authors knowledge, nosuch approach has been previously applied to assess the effect of probiotic supplementationon nutritional parameters in shrimps.
2. Materials and Methods
The trial was conducted at the Saint Vincent Aquaculture Research Station of IFREMERlocated on the west coast of New Caledonia (Latitude 21◦47′ S, Longitude 165◦45′ E).
2.1. Experimental Diets and Dietary Probiotic
The basal diet was formulated (Table 1; 43.8% protein, 10.0% lipid; 2.0% fiber, 4502kcal.kg−1 gross energy) and processed internally as follows: The ingredients were grindedusing a laboratory grinder with a 1 mm screen and the meal was mixed with oil and water(30%) using a horizontal mixer. The mixture was then extruded using a meat grinderthrough a 3 mm die, the feed strands were dried (60 ◦C, 24 h) in a drying-oven to a residualmoisture of below 10% and then broken-up into pellets from 4 to 5 mm in length.
The commercial probiotic tested in this study (Bactocell PA 10; Lallemand S.A.S,Blagnac, France) consisted of live, freeze-dried Pediococcus acidilactici MA 18/5M (InstitutPasteur, Paris, France) formulated in a powder form to a concentration of 1010 CFU.g−1
of product. The probiotic was top-coated on the pellets using 3% of fish oil as a carrier.Probiotic concentrations in each diet were reviewed after feed production against thetarget concentrations (Table 2) through homogenisation of the feed in peptone water, serialdilution, plating of the selected dilutions on the lactobacilli-specific de Man, Rogosa &Sharpe (MRS) plates and counting the number of Colony Forming Units after incubation(37 ◦C; 48 h). The control diet was also top-coated with 3% fish oil and checked for possiblecontamination by the probiotic strain. All feeds were stored in sealed 5-litre boxes at roomtemperature (~20 ◦C) until use.

Animals 2021, 11, 3451 4 of 21
Table 1. (a) Raw material composition, (b) proximate composition and (c) energy content of the basalexperimental diet.
(a) Ingredients (g/kg)
LT fish meal (a) 300Soybean meal (b) 200Wheat meal (c) 370Wheat gluten 70
Fish oil 20Soy oil 20
Soy lecithin (d) 20Shrimp Vitamin premix (e) 0.5
Shrimp trace mineral premix (f) 1Stay C (g) 0.4
(b) Proximate AnalysisProtein (1) (%, DM basis) 43.8
Fat (2) (%, DM basis) 10Fiber (3) (%, DM basis) 2Ash (4) (%, DM basis) 6.9
(c) Energy Content (kcal.kg−1)Gross energy (5) 4502
Digestible energy (6) 3376
LT, low temperature; DM, dry matter. (a) Chilean low temperature fish meal from anchovy and jack mackerel;(b) Dehulled soybean meal, solvent extracted; (c) Whole wheat gran for animal feed; (d) Ultrales© lecithin (ADMlecithin, Decatur, IL, USA); (e) and (f) SICA Cie (Noumea, New Caledonia, France); (g) Vitamin C (330 mg.kg−1;DSM, Basel, Switzerland) ISO5983 standard; (1) ISO5983 standard; (2) NF V18-117/B standard; (3) NF V03-040standard; (4) NF V18-101 standard; (5) Determined by calorimetric bomb (Parr®, USA, calibrated by benzoic acid).(6) Calculated using the concentration of chromic oxide in feed and feces (Not presented).
Table 2. Expected and measured probiotic concentration (Pediococcus acidilactici) in the probiotic dietprepared at different concentration for each ration size in order to achieve a daily probiotic intake of4 × 108 CFU.kg−1 shrimp. Mean ± SD. Measured count was always within the acceptable range(<0.5 log difference between expected and measured count).
Daily Ration Size (% BMi.day−1)P. acidilactici Count (×107 CFU.g−1 Feed)
Expected Measured
1 4.00 3.8 ± 0.42 2.00 2.5 ± 0.23 1.33 1.5 ± 0.34 1.00 0.87 ± 0.056 0.67 0.65 ± 0.05
BMi, initial tank biomass.
2.2. Animals, Tagging and System
Locally sourced L. stylirostris (20-day post-larvae, PL20) were stocked at a density of20 post-larvae per m2 within a single earthen pond (1000 m2), and reared under standardsemi-intensive practices in New Caledonia for 4-month until they reached the desired sizefor the trial. In brief, shrimp were fed twice daily with a commercial formulated feed; thefeeding rate was adjusted weekly according to the estimated mean body-weight (BW) andthe amount of remaining feed in the feeding trays was assessed two hours after feeding.
Experimental shrimps were caught from an earthen pond using a cast net, transportedin 50 L plastic containers filled with seawater, randomly stocked into the experimentaltanks (6 shrimps/tank) and were permitted to acclimate for 1-week to the experimental con-ditions. Following acclimation, shrimps were individually colour tagged (NMT ElastomerSystem, Norwest Marine Technology, Shaw Island, WA, USA) by sub-cuticle injection inthe last segment of the abdomen, just above the telson. Within each tank, it was possible todistinguish each specimen using 5 distinct tag colours and one specimen was left untagged

Animals 2021, 11, 3451 5 of 21
but handled and sham-injected accordingly. Following tagging and BW measurement,animals were returned to their original tanks, at which point the trial started.
The trial was carried out in 30 self-cleaning circular polyester tanks (0.92 m2 bottomsurface area; 536 L capacity) that were continuously supplied with natural seawater (100%renewal daily) pumped-ashore the adjacent lagoon, sand-filtered and stored in an elevatedearthen reservoir for gravity supply. The water renewal rate was set at 400%.day−1.tank−1
and aeration was provided to each tank. The temperature was measured continuouslyusing an automatic recording probe (Optic StowAway® Temp; Onset, MA, USA). Waterquality parameters over the trial’s duration were DO > 80%; temperature 27.2 ± 1.5 ◦C;salinity = 35.0 ± 0.1 ppt.
2.3. Experimental Design, Feeding and Sampling
The 27-day experiment was conducted using 180 sub-adult L. stylirostris at an initialBW (BWi) of 10.93 ± 1.78 g. The experiment tested two diet conditions (probiotic vs.control) with five fixed ration sizes (1%, 2%, 3%, 4% and 6% BMi.day−1; where BMi isinitial biomass) per diet with three of the tanks randomly assigned to each treatment (30tanks, 6 shrimp.tank−1). The set-feed rations were determined by prior experimentation,which had shown that they were completely consumed under our experimental conditions,with apparent satiation circa 7% BM.day−1. The probiotic treatment targeted, based onprior knowledge [17,22], a daily P. acidilactici 18/5M intake of 4 × 10⁸ CFU.kg−1 shrimpacross ration sizes such that the probiotic incorporation within each diet group was adjustedto the five pre-determined ration size (Table 2). The daily pre-weighed ration per tank wasdelivered in four equally sized meals distributed at 7.00 a.m., 1.00 p.m., 7.00 p.m. and 1.00a.m. using automatic feeders.
Individually tagged specimen were each measured for BW (±0.01 g) after carefullydrying on soft paper at the start (immediately after colour tagging) and at the end of thetrial (on the 28th day at 8.00 a.m., seven hours after the last feeding). At the end of the trial,four shrimps per tank were further sacrificed and immediately sampled for haemolymphand the digestive gland. Only shrimps in intermoult (stage C-D0) were used as digestiveenzyme activity and other physiological parameters change during the moulting stage. Todo so, 200 µL haemolymph was withdrawn from the ventral sinus cavity using a 1 mLsterile syringe, fitted with a 23-gauge needle. Haemolymph samples were immediatelydiluted in a pre-cooled saline-sodium citrate buffer (SCC; 30 mM trisodium citrate, 0.34M sodium chloride, 1 mM EDTA) and snap-frozen in liquid nitrogen prior to storage at−80 ◦C until analysis. Digestive glands were removed, snap-frozen in liquid nitrogen andstored at −80 ◦C until analysis.
2.4. Analytical Protocols2.4.1. Samples Preparation
The diluted haemolymph samples were thawed under refrigeration, vortexed andassayed for glucose and Total Antioxidant Status (TAS). The digestive glands were thawedunder refrigeration, divided into two parts, each of which was weighed. One part washomogenised using an ultra-turrax® in a 10 mM Tris buffer (1 mM DTPA, 1 mM PMSF, pH7.4) for protein, glucose, glycogen, α-amylase and trypsin activity assays and the other partwas homogenised in an SCC buffer for TAS determination. Prior to analysis, the digestivegland homogenates were centrifuged (4000 rpm, 10 min, 4 ◦C) and the supernatant fromtwo shrimps from the same tank were pooled iso-volumetrically.
2.4.2. Biochemical Analysis
Total soluble proteins were determined in accordance with [54] with bovine serumalbumin (BSA) standard. Glucose levels were determined using a commercial kit (GlucoseRTU; bioMérieux, Craponne, France) based on the enzymatic conversion of glucose intoquinoneimine and its colorimetric quantification at 505 nm. The assay was adapted tomicroplate manipulations following the manufacturer’s recommendation. Glycogen was

Animals 2021, 11, 3451 6 of 21
extracted in the presence of sulphuric acid and phenol [55] as follows: Samples werefirst homogenised in trichloro-acetic acid (TCA 5%; 2 min, 16,000 rpm) then centrifuged(5 min, 3000 rpm). This procedure was carried out twice, the supernatants were thenpooled, vortexed and 500 µL of supernatant was pipetted into a tube and mixed withfive volumes of 95% ethanol. The tubes were then left to precipitate in an oven (37 ◦C, 3h) and centrifuged (3000 rpm, 15 min). The glycogen pellet was dissolved through theaddition of boiling water and concentrated sulphuric acid and phenol. The extract wasthen transferred into a microplate reader (four replicate per sample) and read at 490 nm.
The α-amylase activity was assayed by the Bernfeld’s method [56] using 1% solublestarch in phosphate buffer (20 mM; pH 7) as the substrate, 37 ◦C incubation, and an indirectmeasurement of the maltose released by DNS (3,5-dinitrosalicylic acid) colorimetry at 570nm. One unit of enzymatic activity is defined as 1 mg of maltose liberated per min at 37 ◦Cand expressed as total activity (U.mgorgan
−1). Trypsin was assayed by its amidase activityusing benzoyl-Arginine-p-nitroanalide (BAPNA) as the substrate, following the methodof [57,58]. Assays were initiated by the addition of sample supernatant, and the releaseof p-nitroanalide was measured at 410 nm over 15 min. A positive control of 3 mg.mL−1
trypsin (SIGMA) was used. One activity unit was expressed as 1 µmol of p-nitroanilidereleased.min−1.
Total Antioxidant Status (TAS) was determined using a commercial colorimetric kit(Randox TAS Assay; Randox Co., Antrim, UK). The tests quantify the total amount of an-tioxidants in blood by inhibiting the transformation of 2,2-azino-di-[3-ethylbenzthiazolinesulfonate] (ABTS®) into the radical cation (ABTS®•+) in the presence of a peroxidase(metmyoglobin) and H2O2 with an absorbance reading at 600 nm.
2.5. Calculations: Growth and Nutritional Parameters2.5.1. Relative Daily Growth Rate (RGR), K1 and K2
The relative daily growth rate (RGR) was expressed as a percentage of BWi andcalculated as RGRi = 100 × ((BWf − BWi)/(d × BWi)), where BWi and BWf are the initialand final body-weight, respectively, and d is the number of days between measurements.For each modality (treatment and ration size), RGR was first determined at an individuallevel (tagged specimens) and then at tank levels based on individual’s RGR, therebyremoving any mortality from the dataset and providing a more robust estimation of RGR.
The gross feed conversion efficiency (K1) expresses the capacity to convert feed intobody tissues. The net feed conversion efficiency (K2) provides a measure of the capacityto convert the amount of food available for growth, which is equal to the amount of feedconsumed in excess of the maintenance ration (Rm). Both K1 and K2 data were determinedfor each tank according to [39] as K1 = (RGR/R) × 100 and K2 = (RGR/(R − Rm)) × 100;where RGR is the mean relative daily growth rate per tank, R the ration ingested per tankand Rm is the maintenance ration per tank, all expressed in (% BM).
2.5.2. Growth-Ration (GR) and K1-Ration (KR) Curve Models
The experimental design did not allow for quantifying the shrimps’ individual feedconsumption. Thus, we cannot obtain nutritional parameters at the individual level.However, the overall consumption of the ration provides a measurement of the feedconsumption of the shrimps at the tank level. Then, in order to determine the correctparameters to follow, we considered a growth–ration model according to RGR means pertank. For each dietary treatment (control and probiotic diet), the relationship between RGRand ration size was analysed with a non-linear regression and GR curves were plotted.The regressions were calculated to fit the data within the range of the ration sizes (1% to6%). The model describing the response was: (1) GR: y = y0 + a(1 − bx), where y is the tankaverage RGR, x is the ration ingested, and a, b are constants determined by the regression.Furthermore, values of K1 in relation to ration size were plotted (KR curve) by using thepredicted values from the growth–ration model: (2) KR: y/x = (y0 + a(1 − bx))/x.

Animals 2021, 11, 3451 7 of 21
2.5.3. Determination of Maintenance (Rm) and Optimal (Ropt) Rations
From the GR and KR curves, the maintenance (Rm) and optimal (Ropt) rations weredetermined according to [36]. Rm is the feed intake that maintains the animal without anychange in its BW, and Ropt represents the feed intake that produces the greatest increasein BW for the least feed intake, in other words, it determines optimal growth. Daily Rmcalculated from equation (1), when y is null, corresponds to the ration for which the RGR isnull. Ropt is identifiable on the GR curve as the ration for which the tangent crosses theorigin; Ropt was determined as the ration for which the KR curve reaches its maximum,and it is equal to the value of x for which the first order derivative of equation (2) is null(i.e., when dK/dR = 0).
2.5.4. Scope for Growth (SFG)
The scope for growth (SFG) was defined by [59] as “the difference between the energyof the food an animal consumes and all other energy utilisations and losses”. Ref. [60] wasable to demonstrate that the difference between any rations ingested, allowing growth andthe maintenance ration (Rm), gave a simple measurement of SFG. Indeed, only the part ofthe feed allocation that is in excess of the Rm will be available for use in growth. In thisstudy we calculated the SFG as the difference between the digestible energy (DE) fractionof the optimal ration (Ropt × DE) and the digestible energy fraction of the maintenanceration (Rm × DE) according to the following equation: SFG = DE × (Ropt − Rm).
2.6. Statistics
Statistical analyses were conducted using R software [61]. Prior to analysis, all datawere systematically checked for normal distribution and variance homogeneity. The per-centage survival rates were normalized using an arcsine transformation before analysis.Data on survival rates were tested using a one-way analysis of variance followed by aStudent’s multiple comparison t-test to determine differences among ration sizes and treat-ments. The effects of treatments and ration size on the physiological parameters studiedwere assessed by a two-way analysis of variances followed by a pairwise comparisonsusing Fisher’s Protected Least Significant Difference (PLSD). For each parameter, foursamples per tank were assayed. The effect of dietary treatment, ration size and theirinteraction on BWf and RGR were tested using individual shrimp data by a two-waynested analysis of variance in order to take into account a possible significant randomtank effect. Indeed, variations between tanks can represent a random nuisance factor thatcan lead to invalid conclusions if simple ANOVAs are used [52]. With the analysis ofvariance model being mixed, the ration size and dietary treatment effects were tested froma test of hypothesis using the random effect (tank effect) as error term, and individualBWi was also used as a covariate in the model. The effect of dietary treatment, ration sizeand their interaction on K1 and K2 were tested by a two-way analysis of variance with apost hoc Student-Newman-Keuls test, whereby significant differences occurred. Due tolimitations inherent to ANOVAs, the ration-size effect was further assessed within eachseparate diet by non-parametric Kruskall–Wallis and a Mann–Whitney test was used todetermine differences between diet at each ration size. The GR- and KR-curves modelswere determined and plotted for both experimental using Sigmaplot® software (SPSS Inc.).Statistically significant differences between experimental groups were reported at p < 0.05,if not otherwise stated. Data are given as a tank means ± standard deviation of triplicatetanks (n = 3).
3. Results3.1. Survival, Growth and Nutritional Parameters
During the experiment, the shrimp consistently consumed all the feed providedwhatever the ration size, such that the amount of feed distributed was equal to the amountof feed ingested. Zootechnical results at the end of the trial are shown in Table 3. The meanfinal survival rate was 81.6 ± 15.0% without a diet or ration-size effect on this parameter

Animals 2021, 11, 3451 8 of 21
even at a low feeding rate. The mean BWi was 10.93 ± 1.78 g with no significant differencebetween dietary groups (control or probiotic diet). However, significant differences dueto the random allocation of shrimps to ration size and treatment groups were detected(Table 3). Accordingly, BWi was used as a covariate to statistically assess the diet and ration-size effect on BWf. RGR was used for a posteriori analysis to compare growth according totreatment and ration size. No random tank effect was detected when individual RGR datawere used with a mixed ANOVA.
Table 3. Survival, body-size and growth of L. stylirostris per diet group at each ration size. Mean ± SD. For each parameter,different letters within the same raw indicate significant differences between diets within each ration size (Mann–Whitneytest, p < 0.05). Ration-size effects assessed by Kruskal–Wallis test.
Daily Ration Size(% BMi.day−1)
Survival (%) BWi (g) BWf (g) RGR (% BWi.day−1)Control Probiotic Control Probiotic Control Probiotic Control Probiotic
1 83 ± 17 a 83 ± 17 a 11.55 ± 0.10 a 11.02 ± 0.31 b 11.25 ± 0.07 11.06 ± 0.40 −0.08 ± 0.03 a 0.03 ± 0.03 b
2 75 ± 12 a 78 ± 10 a 10.70 ± 1.42 a 11.68 ± 0.44 a 11.64 ± 1.54 13.47 ± 0.22 0.33 ± 0.02 a 0.47 ± 0.06 b
3 78 ± 25 a 83 ± 17 a 11.88 ± 0.59 a 10.70 ± 0.31 b 13.70 ± 0.60 12.15 ± 0.50 0.40 ± 0.05 a 0.56 ± 0.02 b
4 89 ± 19 a 83 ± 29 a 11.15 ± 0.41 a 10.31 ± 0.69 a 12.03 ± 1.55 11.81 ± 0.67 0.45 ± 0.08 a 0.61 ± 0.07 b
6 83 ± 0 a 78 ± 10 a 10.84 ± 1.19 a 9.62 ± 0.43 a 12.07 ± 1.01 11.06 ± 0.98 0.45 ± 0.04 a 0.59 ± 0.09 a
Ration-size effect n.s. n.s. n.s. ** - - *** ***
BMi, initial tank biomass; BWi, initial body-weight; BWf, final body-weight; RGR, relative growth-rate. n.s., non-significant; ** p < 0.01; *** p < 0.001.
Ration size had a significant effect on RGR (Tables 3 and 4; Figure 1a). A posteriori testsindicated a significant increase in RGR between 1, 2 and 3% rations for probiotic treatmentand between 1, 2 and 4% rations for control (Figure 1a). No statistical difference was foundbetween RGRs at 3%, 4% and 6% BM. The probiotic treatment resulted in a significantlyhigher RGR compared to the control at 1, 2, 3% (p < 0.01) and 4% (p < 0.05) but not at6% ration size. Furthermore, a probiotic diet effect on BWf was detected when a mixedANOVA was applied (Table 4) along with a significant random tank effect which was notdetected when a classic ANOVA was applied (Table 3).
Table 4. Statistical significance (p-values) of diet, ration size and their interaction, and of initialbody-weight and tank effects for each growth parameter determined based on type III sum of squaresfrom factorial ANOVA. When nested ANOVA were applied, ration size and treatment effects weresystematically tested from a test of hypothesis using the tank random effect as the error term. (n.s.,not significant; * p < 0.05; ** p < 0.01; *** p < 0.001).
PerformanceIndices Diet Ration Size BWi Diet × Ration Size Tank Effect
BWf (1) (g) *** *** *** n.s. **
RGR (1) (% BWi.day−1) *** *** n.s. n.s. n.s.
K1 (2) *** *** n.a. * n.a.
K2 (2) ** *** n.a. n.s. n.a.
BWf, final body-weight; BWi, initial body-weight; RGR, relative growth-rate; K1, gross feed conversion efficiency;K2, net feed conversion efficiency. (1) Nested two-way analysis of variance with initial body-weight used ascovariate; (2) Two-way analysis of variance; n.a. not applicable.
Animals 2021, 11, 3451 9 of 21
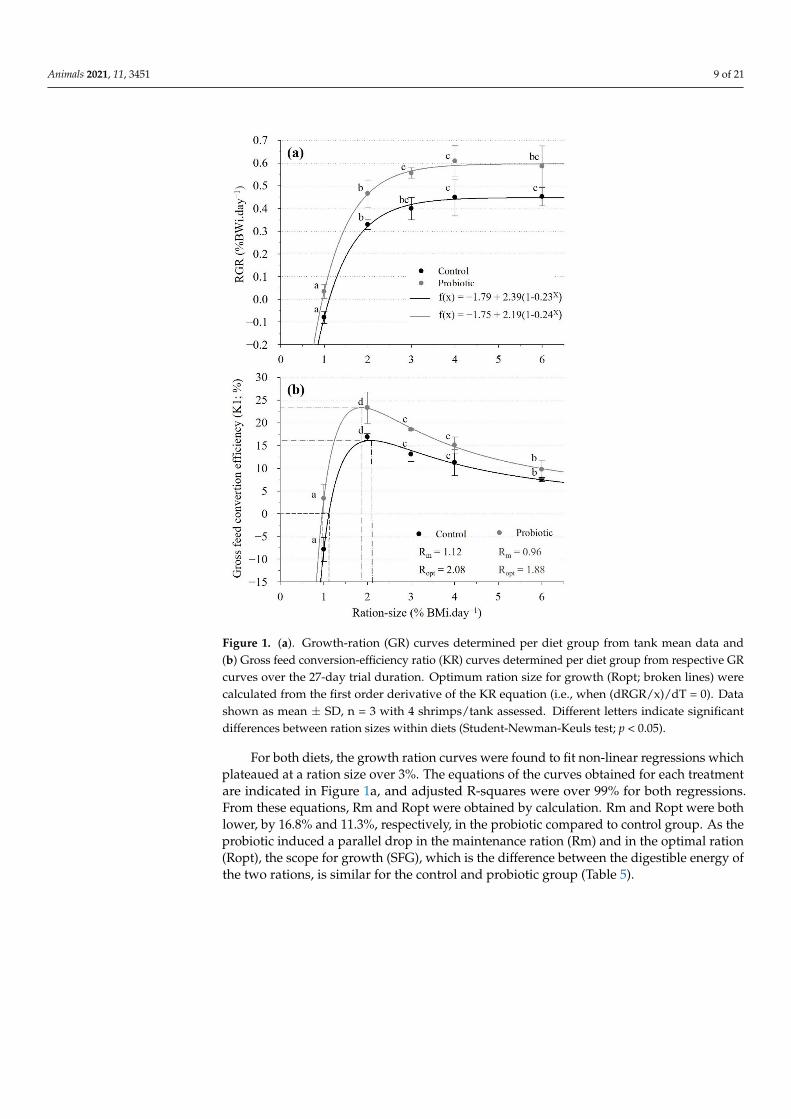
Figure 1. (a). Growth-ration (GR) curves determined per diet group from tank mean data and(b) Gross feed conversion-efficiency ratio (KR) curves determined per diet group from respective GRcurves over the 27-day trial duration. Optimum ration size for growth (Ropt; broken lines) werecalculated from the first order derivative of the KR equation (i.e., when (dRGR/x)/dT = 0). Datashown as mean ± SD, n = 3 with 4 shrimps/tank assessed. Different letters indicate significantdifferences between ration sizes within diets (Student-Newman-Keuls test; p < 0.05).
For both diets, the growth ration curves were found to fit non-linear regressions whichplateaued at a ration size over 3%. The equations of the curves obtained for each treatmentare indicated in Figure 1a, and adjusted R-squares were over 99% for both regressions.From these equations, Rm and Ropt were obtained by calculation. Rm and Ropt were bothlower, by 16.8% and 11.3%, respectively, in the probiotic compared to control group. As theprobiotic induced a parallel drop in the maintenance ration (Rm) and in the optimal ration(Ropt), the scope for growth (SFG), which is the difference between the digestible energy ofthe two rations, is similar for the control and probiotic group (Table 5).

Animals 2021, 11, 3451 10 of 21
Table 5. Gross (K1) and net (K2) feed conversion efficiency by L. stylirostris per test diet at the ration sizes tested. Mean± SD, n = 3. For each parameter, different letters within the same raw indicate significant differences between diets(Mann–Whitney test, p < 0.05). The ration size effects were assessed by a Kruskal–Wallis test (n.s., non-significant; * p < 0.05;** p < 0.01).
Daily Ration Size(% BMi.day−1)
K1 (%) K2 (%)Control Probiotic Control Probiotic
1 −7.87 ± 2.61 a 3.33 ± 3.14 b - 83.33 ± 45.32 16.88 ± 0.75 a 23.33 ± 3.47 b 36.30 ± 1.88 a 49.74 ± 6.68 b
3 13.08 ± 1.61 a 18.53 ± 0.19 b 20.87 ± 2.57 a 27.25 ± 0.27 b
4 11.25 ± 2.85 a 15.09 ± 1.80 a 15.62 ± 3.96 a 19.86 ± 2.37 a
6 7.54 ± 0.45 a 9.73 ± 2.01 a 9.27 ± 0.55 a 11.59 ± 02.40 a
Ration-size effect * ** * *
BMi, initial tank biomass.
Diet and ration size had a significant effect on K1 (Table 4). The KR-curves (Figure 1b),as derived from the GR-curve models, showed that, for both diets, K1 increased significantlyfrom 1 to 2% ration size and progressively decreased thereafter with increasing ration size.The probiotic compared to the control group had a significantly higher K1 at 1, 2 and3% but not at larger ration sizes (Table 6) and differences in K1 between diets decreasedwith increasing ration sizes above Ropt (Figure 1b). K1 reached maximum values of 16.2%and 23.2% at Ropt of 2.08% BM.day−1 and 1.88% BM.day−1 for the control and probiotictreatment, respectively (Figure 1b).
Table 6. Feed, gross energy and digestible energy intake per diet group at the calculated maintenance and optimal feedration size. Estimate of the “scope for growth” and predicted growth-rate of shrimps at optimal ration size.
Feed and GrowthIndices
Maintenance Ration (Rm) Optimal Ration (Ropt)Control Probiotic Control Probiotic
Feed intake (g.kg−1.day−1) 11.3 9.4 21.3 18.9GE intake (a) (kcal.kg−1.day−1) 50.9 42.3 95.9 85.1DE intake (b) (kcal.kg−1.day−1) 38.1 31.7 71.9 63.8
SFG (kcal) 33.8 32.1GR (c) (g.kg−1.day−1) 3.3 4.5
GE, gross energy; DE, digestible energy; SFG, scope for growth; GR, growth rate. (a) based on basal diet GE = 4502 kcal.kg−1 (Table 1); (b)
based on basal diet DE = 3376 kcal.kg−1 (Table 1); (c) predicted optimal growth rate at Ropt.
The K2 values were not calculated for the control group fed at the ration size of 1%, asthe mean relative growth rate was negative. Additionally, K2 was found to significantlydecrease with increasing ration sizes (Tables 4 and 6) and was significantly higher at the2% compared to a 3% ration size in both diets. The probiotic group exhibited significantlyhigher K2 values than the control at feeding rates of 2% and 3% BM.day−1. Finally, asidefor K1, no significant interaction between diet and ration size were detected for any of thevariables tested (Table 4).
3.2. Biochemical Parameters3.2.1. Digestive Enzymes
There were significant diet and ration-size effects without interactions on α-amylasespecific activity in the digestive gland (Table 7). The specific activity of α-amylase decreasedoverall with increasing ration size in both diet groups; and significantly higher activitieswere measured in the probiotic compared to the control groups at ration sizes of 1%, 2%and 3% (Table 7; Figure 2a). There was a significant diet effect and diet × ration sizeinteraction on the specific activity of trypsin in the digestive gland (Table 7). In the controlgroup, trypsin activity decreased with increasing ration size, reaching levels twice lowerwhen fed at 6% compared 1% BM.day−1 (Table 8). In comparison, trypsin activity was not

Animals 2021, 11, 3451 11 of 21
affected by ration size (p > 0.05), instead remaining consistently high in the probiotic group.Variations in the amylase/trypsin ratio were not explained by any of the parameters tested(Table 7). Only one significant difference between treatments was found at 1% ration size,where probiotic fed shrimps showed higher values for this ratio (Table 8).
Figure 2. (a) α-amylase activity, (b) glycogen level and (c) glucose level in digestive gland; (d) glucoselevel in haemolymph of L. stylirostris according to ration size and dietary treatment at the trial’s end-point. Data shown as mean ± SD, n = 3 with 4 shrimps/tank assessed. Asterisk indicate significantdifferences between diets at each ration size (2-way ANOVA, PLSD; * p < 0.05, ** p < 0.01).
Table 7. Statistical significance of diet, ration size and their interaction for each biochemical parametermeasured in the (a) digestive gland and (b) haemolymph (2-way ANOVA; n.s., non-significant; * p <0.05, ** p < 0.01, *** p < 0.001).
Parameter Diet Ration Size Diet × Ration Size
(a) Digestive Glandα-amylase activity (U.mgprot
−1) *** *** n.s.
Trypsine activity (U.mgprot−1) ** n.s. *
α-amylase/trypsine n.s. n.s. n.s.Glucose (mg.gorgan−1) n.s. ** n.s.
Glycogene (mg.gorgan−1) ** * n.s.TAS (µmol.gorgan−1) *** *** n.s.
(b) HemolymphGlucose (mg.mL−1) * * n.s.
TAS (µmol.mL−1) n.s. * n.s.
TAS, total antioxidant status.

Animals 2021, 11, 3451 12 of 21
Table 8. Specific activities of digestive enzymes in the digestive gland of L. stylirostris per test diets at each ration sizetested. Values given as mean ± SD with n = 3. For each parameter, different letters within the same raw indicate significantdifferences between diets by pairwise comparisons using Fisher’s Protected Least Significant Difference (PLSD). Theration-size effects were assessed by a Kruskal–Wallis test (n.s., non-significant; ** p < 0.01; *** p < 0.001).
Daily RationSize (%
BMi.day−1)
α-amylase Activity(U.mgprot−1)
Trypsin Activity(U.mgprot−1) α-amylase/Trypsin
Control Probiotic Control Probiotic Control Probiotic
1 4.03 ± 0.12 a 5.77 ± 0.29 b 0.38 ± 0.04 a 0.33 ± 0.04 a 11.96 ± 1.16 a 18.50 ± 2.26 b
2 4.56 ± 0.27 a 5.52 ± 0.11 b 0.30 ± 0.03 a 0.38 ± 0.05 a 16.00 ± 1.80 a 16.29 ± 0.73 a
3 3.62 ± 0.26 a 4.43 ± 0.20 b 0.31 ± 0.03 a 0.27 ± 0.02 a 11.99 ± 2.47 a 16.91 ± 1.45 a
4 2.63 ± 0.54 a 3.05 ± 0.12 a 0.22 ± 0.04 a 0.23 ± 0.01 a 12.69 ± 1.36 a 13.40 ± 0.66 a
6 3.19 ± 0.31 a 3.90 ± 0.31 a 0.18 ± 0.02 a 0.32 ± 0.06 b 17.80 ± 2.61 a 15.60 ± 4.63 a
Ration sizeeffect *** ** ** n.s. n.s. n.s.
BMi, initial tank biomass.
3.2.2. Glucose and Glycogen Content
There were significant diet and ration-size effects on glycogen content in the digestivegland (Table 7). The probiotic group exhibited significantly higher levels compared tothe control at ration sizes of 1%, 2% and 3% while no difference was detected at higherfeeding rates (Figure 2b). Within diets, glycogen content statistically increased by up to4% and up to 2% in the control and probiotic group, respectively. Free glucose in thedigestive gland was also significantly higher in the probiotic compared to the control groupat ration sizes of 1, 2 and 3% (Figure 2c) with levels remaining unchanged across rationsizes. In comparison, in the control group, free glucose in the digestive gland increasedbetween ration sizes of 1% and 3%, 4%, and 6%; thereby reaching the consistently highlevels measured across the probiotic group at a 4% ration size and above.
In the haemolymph, free glucose slightly, but not significantly, increased up to the ra-tion sizes of 3% and 2% in the control and probiotic groups, respectively (Table 7; Figure 2d)and reached an apparent saturation level close to 1mg.mL−1 in both diet groups. Com-pared to the control, the probiotic group had a significantly higher haemolymph glucoseconcentration at a ration size of 1% and 2%.
3.2.3. Total Antioxidant Status
There were significant diet and ration-size effects on TAS of the digestive gland; anda significant ration-size effect on TAS of the haemolymph (Table 7) without interactions.In the digestive gland, TAS decreased overall with an increased ration size (Figure 3a)reaching significantly lower values at 3%, 4% and 6% compared to 1% and 2% in both diets.On the other-hand, haemolymph TAS remained consistent across ration sizes (Figure 3b).With regard to the diet effect, TAS levels in both the digestive gland and haemolymph weresignificantly higher in the probiotic compared to the control group across all ration sizestested, except at 6%.

Animals 2021, 11, 3451 13 of 21
Figure 3. Total Antioxidant Status (TAS) in (a) the digestive gland and (b) haemolymph of shrimpsfrom each treatment according to each ration size at the trial’s end-point. Mean ± SD, n = 3 with 4shrimps/tank assessed. Asterisk indicate significant differences between diets at each ration size(2-way ANOVA, PLSD; * p < 0.05).
4. Discussion4.1. GR-Curves and Nutritional Parameters in the Control Diet
The two growth-ration (GR) models established in this study for sub-adults L. stylirostrisfed a control or probiotic diet were each based on five fixed ration sizes that were restrictedand systematically fully ingested. This is of particular importance as a precise measure offeed intake is essential to the accuracy of this type of model and is particularly difficult tomeasure in shrimp, owing to their slow-feeding behaviour.
The GR-curves obtained from the mean RGR values per tank (Figure 1a) were usedalong with the KR-curves, expressing the relationship between ration size and gross feedconversion efficiency, K1 (Figure 1b), to determine the daily nutritional requirements ofthe shrimp for maintenance (Rm) and optimal growth (Ropt; [39]). The fundamental GR-and KR-relationships are overall well documented in fish [36–40] but have only rarelybeen investigated in shrimp [45–48]. Ref. [48] used various daily ration sizes to estimatethe daily protein requirements of juvenile L. vannamei. The GR-relation in L. stylirostrisis similar in appearance to those described for some fishes [36,62,63] and can be fitted toa second-order polynomial regression. However, the literature is equivocal with respectto the shape of the feeding relationship of growth in marine fish. Both linear [38,40] andnon-linear (asymptotic; [37,39]) relationships are described, and this may also pertain to therange of ration sizes tested. In this study, digestible Rm of the control diet was equal to 9 gof feed.day−1.kg−1 shrimp (Table 5) which corresponds to a digestible energy (DE) of 38.14kcal.day−1.kg−1 shrimp (159 kJ.day−1.kg−1 shrimp). This value, which is an estimate ofthe maintenance energy requirement, is 30% greater than that of the fasting heat productionor standard metabolism determined by measuring oxygen consumption of fasting shrimpL. stylirostris (116 ± 7.7 kJ. day−1.kg−1 shrimp; BW = 10.6 ± 0.4 g; n = 9, 28 ◦C; [46]). Thisresult is consistent because it is well accepted that the maintenance energy requirementsare between 30 and 60% greater than for basal metabolism [64] and confirms the accuracyof the measurement of Rm from the GR- and KR-models for shrimp. Standard metabolismrequirements are typically estimated directly, by measuring oxygen consumption rates andammonia excretion. This approach is analytically precise but requires the confinement ofthe shrimp in special apparatus which may affect the animal’s response and the results areusually recorded over short time-periods (24 h to 48 h). Under such conditions, metabolicrequirements may be over- or underestimated if handling stress [65,66] and moultingstage [67] are not considered. In the present study, the maintenance energy requirementand Rm were estimated from an experimental period covering several weeks, hence, fullyintegrating various events associated with the shrimp’s biological rhythms and cycle
Animals 2021, 11, 3451 14 of 21
(moulting cycle, feeding, growth, activity and rest) as well as “real-life” fluctuations inenvironmental, social and zootechnical parameters.
The maximum gross conversion efficiency (K1) of sub-adult L. stylirostris fed the con-trol diet was 16.88± 0.75% under our experimental conditions. This value is approximatelyhalf of that measured value in the same experimental conditions with younger L. stylirostris(7.9 ± 0.4 g, n = 150; K1 = 40%; [66]). The lower K1 in this study may reflect the weakercapacity of larger L. stylirostris specimens to transform feed into body tissues compared tosmaller ones [66]. We also observed a gradual decline in K1 at ration sizes greater than Ropt,which may be the result of a quicker digestif transit when feed intake increases. Similarly,the net conversion efficiency (K2) of the control diet was higher at a ratio of 2% BWi.day−1
and then decreased at a ratio of 3% BWi.day−1 and more. Therefore, shrimp seem to requireless feed per unit of weight-gain when the ration size is restricted as previously observedin P. monodon [68]. The maximum K2 obtained in our study (36.3 ± 1.9%) was within therange of values obtained for the larval stage and juveniles of other crustaceans [69–71].
4.2. Effects of the Probiotic on Growth and Nutritional Parameters
Probiotic studies in shrimps more often focus on health, increased disease resistanceand related modes of action while their effect on growth remains overall less addressed.Amongst others, Refs. [32,33,72–76] investigated the effect of Lactobacillus sp., Bacillus sp.photosynthetic bacteria (Rhodobacter sphaeroides) and Gram-negative bacteria (Enterobacterhormaechei) on the growth of M. rosenbergii, Fenneropenaeus indicus and L. vannamei. Intheir experiments, shrimps were fed ad libitum and the effect of the probiotic were deter-mined based on growth rate, feed conversion ratio and digestive enzyme activities suchas protease, lipase and amylase. The authors usually linked the observed benefit of theprobiotic on growth to enhanced digestion and nutrients absorption and to higher activitiesof digestive enzymes. In the present study, (Figure 1), we examined the effect of a constantdaily intake of P. acidilactici on the GR and KR-relationships initially proposed by [36]. TheGR-curves obtained for each dietary treatment were parallel with the probiotic curve above.Dietary probiotic intake at a dose of 4 × 10⁸ CFU.day−1.kg −1 shrimp therefore appearedto promote growth compared to the same non-supplemented diet for a given ration size.Accordingly, based on statistical analysis, RGR was found to plateau at a lower ration sizefor the probiotic (3% BM.day−1) compared to the control (4% BM.day−1), suggesting thatmaximum growth is reached at a smaller ration size when the diet is supplemented withP. acidilactici. Moreover, and interestingly, shrimps fed with the probiotic diets showedreduced Rm and Ropt and increased K1 and K2. At Ropt and despite a smaller Ropt,the probiotic diet resulted in a RGR increase of over 36% compared to the control (4.5g.kg−1.day−1 and 3.3 g.kg−1.day−1, respectively). Accordingly, K1 max was improved by38% and K2 to Ropt by 37% in the probiotic compared to the control diet, which takentogether indicate a better transformation of the feed into shrimp growth. Finally, the presentdata show that at a 1% ration size, shrimps fed the probiotic diet did not lose weight whilecontrol shrimps did (RGR = 0.3 g.kg−1.day−1 and -0.08 g.kg−1.day−1 for the probiotic andcontrol groups, respectively).
Taken together, these results indicate that shrimps supplemented with probioticrequire less feed to reach maintenance and optimal growth and that growth at Ropt is alsosuperior, suggesting enhanced feed utilisation. Two other hypotheses may also explainthese results. Firstly, the probiotic could provide some growth factors or essential nutrientsfavouring growth, as demonstrated with other probiotic strains [28]. Second, the probioticcould result in a decreased metabolic demand as suggested in this study by the lowerfeed requirement for maintenance and by the fact that probiotic-fed shrimps did not losebody-weight at 1% BM.day−1, unlike in the control. This could be evaluated by comparingoxygen consumption rate of shrimps under both dietary regimes. It must be noted thatthe enhanced growth and nutritional performance as a result of the probiotic intake weredocumented under fixed, restricted rations (below satiation), and over a short grow-outperiod under laboratory conditions. Further trials must therefore be performed under

Animals 2021, 11, 3451 15 of 21
commercial conditions and through feed management over a longer timeframe to assessthe potential contribution of the probiotic at farm-level.
4.3. Dietary Carbohydrates (CBH) Utilization and the Effect of Probiotic
Carbohydrates are an important energy source in shrimp diets favouring growth andfat deposition [77]. However, CBH are not efficiently utilized by shrimp which possesslow carbohydrate digestion capacity and a low plasma glucose regulatory ability [78]. Byapplying a range of fixed and restricted rations, the study assessed the effect of a gradedlevel of CBH intake on CBH utilization with or without probiotic supplementation.
Glycogen and free glucose values measured in this study were within the rangepreviously reported for L. vannamei [79]. In the control group, the glycogen content of thedigestive gland tended to increase with increasing ration size until apparent saturationabove 3% BM.day−1 with a similar trend for free glucose level. In comparison, probiotic fedshrimps, overall, showed higher and more consistent glucose and glycogen levels. Ref. [80]reported the saturation of the glycogen level in the digestive gland for L. stylirostris fedover 21% dietary carbohydrates (CBH); which they suggested as the maximum dietaryCBH level and apparent maximum capacity for dietary CBH utilization. However, intheir studies, feed intake was not measured, making quantitative requirements for CBHimpossible to determine. In an L. vannamei study, the same authors [81] reported thesaturation curve of glycogen level in the digestive gland observed for diets with dietaryCBH levels higher than 33%. In the present study, and based on glycogen levels in thedigestive gland, it can be estimated that the control shrimps reached a maximum capacityto use CBH at a feed intake close to 4% BM.day−1, compared to a lower ration size of 2% to3% BM.day−1 when supplemented with the probiotic. It can therefore be hypothesized thatprobiotic supplementation resulted in a more efficient use of available dietary CBH untilsaturation was reached. Once saturation is reached at ration sizes above 3% BM.day−1, theprobiotic was fond to have no further discernible effects on CBH. This is supported by theabsence of a significant probiotic effect on the glycogen and glucose levels of the digestivegland at these higher ration sizes, where a reduced probiotic effect on growth and grossfeed efficiency was also observed.
In shrimps, once feed is ingested, starch is first processed by α-amylase to produceoligosaccharides and then glucose through α-glucosidase. This system gives rise to the slowliberation of glucose into the blood and explains why starch is viewed as an efficient CBHsource in shrimp feeds [82]. Refs. [80,81] showed that in L. stylirostris and in L. vannamei,the hydrolysis of dietary starch by α-amylase could be limited by dietary CBH, and thatα-glucosidase was directly related to but not limited by dietary CBH level. These authorsalso reported a saturation of glycogen and α-amylase specific activity above the same levelof dietary CBH [80]. In this study, the higher glycogen and glucose contents of the digestivegland in probiotic-fed shrimps fed with a lower ration size (1, 2 and 3% BM.day−1) wereassociated with a higher α-amylase specific activity and haemolymph glycemia (1% and2% BM.day−1). This strongly supports the hypothesis of a better utilisation of dietary CBHthrough P. acidilactici supplementation via the stimulation of α-amylase specific activity.Moreover, as for amylase, trypsin activity decreased with an increasing feeding rate whichmay, together, partly explain the lower feed efficiency recorded at larger ration sizes. Finally,the stable amylase/trypsin ratio measured across ration sizes in this study was consistentwith values previously reported in L. vannamei [83] and with these authors’ suggestionthat its alteration would mainly be linked to changes in dietary composition, as previouslyreported [83].
Several authors [33,73] have assumed that probiotics may stimulate the productionof endogenous enzymes and it is possible that the probiotic produces substances, such asvitamins, which will specifically influence some digestive enzyme activities. For instance,vitamin C has been found to increase the activity of amylase [84] in shrimps, and growthfactors presented in some feed ingredients have increased specific activities of amylase,trypsin and total proteases in Marsupenaeus japonicus [85]. Moreover, in an unpublished

Animals 2021, 11, 3451 16 of 21
study, Ref. [86] was able to show that some extracellular protein products secreted byLactobacillus farciminis MA27/6R and Lactobacillus rhamnosus MA27/6B were able to specifi-cally enhance trypsin and α-amylase activity in Artemia. Besides, dietary probiotics mayalso exert their influence on digestive functions indirectly by modulating the compositionof the endogenous intestinal microbiota [87], which has not been addressed here. Thishypothesis is further supported by recent investigations regarding the functional role of theintestinal microbiota of shrimp and the link with the nutritional and phycological status ofthe animal [88,89].
4.4. A Link between Carbohydrate Metabolism and the Antioxidant Status
Ref. [90] previously documented that an increased concentration of liver-glycogencontent, from increased dietary CBH intake, resulted in a decreased activity of the mainantioxidant enzymes superoxide dismutase and catalase. This apparent link betweenCBH metabolism and the activity of antioxidant enzymes was tentatively explained byfree glucose and simple sugars as a direct scavenger of OH-radicals [91,92] as well as apotent stimulant of the pentose phosphate shunt that regenerates NAD+ to NADPH hence,affecting the cellular redox status [93].
In a prior study, we reported decreases in superoxide dismutase and catalase activityin L. stylirostris fed P. acidilactici compared to non-supplemented shrimps [17]. In thepresent and subsequent study, Total Antioxidant Status (TAS) was measured to determinewhether a potential probiotic effect on dietary CBH utilization would be concomitant withan altered antioxidant status. In the digestive gland, TAS decreased for greater ration sizes(3, 4 and 6% BM.day−1) with mean values similar to those previously reported (12.88± 0.63µmol.gorgan
−1) in L. stylirostris fed ad libitum [18]. It has been demonstrated that feed intakeand digestion increase the aerobic metabolism of L. stylirostris [66], while postprandialmetabolism is known to rise with increased feed ingestion in isopod Ligia pallarii [94]. Asthe postprandial metabolism increases with the amount of feed consumed, the productionof ROS is also expected to increase and, therefore, the TAS level to decrease as has beenobserved here. In crustaceans, the mobilization of antioxidant defenses may be particu-larly evident and critical in the lipid-storing digestive gland [95] against the risk of lipidperoxidation at greater ration sizes.
Finally, the dietary probiotic was found to significantly increase TAS level in boththe haemolymph and digestive gland (except for at the highest ration size of 6%), inline with previous reports [18]. The positive effect of P. acidilactici on the antioxidantstatus of the shrimp could be the result of the better use of dietary CBH in probiotic-fedshrimp, as suggested by the work of [90] and as is overall supported by the data presentedin this study. However, the mode of actions of probiotics are overall very diverse anda combination of several action mechanisms is expected to be involved for any given(generalist) probiotic [1]. For instance, the probiotic effect on antioxidant status mightalso be based on the antioxidant properties of the strain, as observed for other lactic acidbacteria used as probiotic [96].
5. Conclusions
In conclusion, the growth-ration method applied in this study was effective at doc-umenting a clear contribution of a dietary probiotic on the growth and feed efficiency ofsub-adults L. stylirostris fed a fixed ration under controlled conditions. The optimal ration(Ropt) was 1.88% BM.day−1 in the probiotic group compared to 2.08% BM.day−1 in thecontrol, while RGR and Ropt were also improved in the probiotic group. The experimentalapproach combined individual tagging to statistically assess the effect of ration size ongrowth, followed by establishing the GR-relation that links ration size to the mean relativegrowth-rate per tank. This combined approach is proposed as a useful way of understand-ing how a feed additive can influence shrimp growth and feed efficiency. The effect ofdietary P. acidilactici MA18/5M on α-amylase activity and CBH utilization and metabolism,and its link to the shrimp antioxidant status should be further studied. This study warrants

Animals 2021, 11, 3451 17 of 21
further research on the contribution of this probiotic under commercial (feed) managementover the grow-out cycle, as it presents the prospect of optimizing dietary formulation, aswell as the biological and economic efficiency of the shrimp-farming industry.
Author Contributions: Conceptualization, M.C. and L.C.; methodology, M.C. and L.C.; software,M.C.; validation, L.C.; formal analysis, M.C.; investigation, M.C., P.L. and L.C.; resources, L.C.;data curation, M.C.; writing—original draft preparation, M.C.; writing—review and editing, E.L.;visualization, E.L.; supervision, L.C.; project administration, L.C.; funding acquisition, M.C. and L.C.All authors have read and agreed to the published version of the manuscript.
Funding: This research received no external funding.
Institutional Review Board Statement: Ethical review and approval were waived for this studyperformed on a marine invertebrate other than cephalopods (shrimp) which do not require Ethicalreview and approval according to EU directive 2010/63/EU (22 September 2010).
Informed Consent Statement: Not applicable.
Data Availability Statement: The data presented in this study are available on request from thecorresponding author.
Acknowledgments: The research was part of M.C. PhD project which was financially supported byLallemand SAS with in-kind contribution from IFREMER. The authors thank the IFREMER technicalstaff of the experimental facilities at St Vincent, New Caledonia for their help.
Conflicts of Interest: The experiment was in part supported by Lallemand SAS with the aim ofinvestigating the effect of a commercial probiotic product and where M.C. and E.L. are employed.
References1. Gatesoupe, F.J. The use of probiotics in aquaculture. Aquaculture 1999, 180, 147–165. [CrossRef]2. Dawood, M.A.O.; Koshio, S.; Abdel-Daim, M.M.; Doan, H.V. Probiotic application for sustainable aquaculture. Rev. Aquac. 2019,
11, 907–924. [CrossRef]3. Fuller, R. Probiotics in man and animals. J. Appl. Bacteriol. 1989, 66, 365–378.4. Mombelli, B.; Gismondi, M.R. The use of probiotics in medical practice. Int. J. Antimicrob. Agents 2000, 16, 531–536. [CrossRef]5. Ouwehand, A.C.; Salminen, S.; Isolauri, E. Probiotics: An overview of beneficial effects. Antonie Van Leeuwenhoek 2002, 82, 279–289.
[CrossRef] [PubMed]6. Vine, N.G.; Leukes, W.D.; Kaiser, H. Probiotics in marine larviculture. FEMS Microbiol. Rev. 2006, 30, 404–427. [CrossRef]7. Kesarcodi-Watson, A.; Kaspar, H.; Lategan, J.; Gibson, L. Probiotics in aquaculture: The need, principles and mechanisms of
action and screening processes. Aquaculture 2008, 274, 1–14. [CrossRef]8. Kumar, V.; Roy, S.; Kumar Meena, D.; Kumar Sarkar, U. Application of probiotics in shrimp aquaculture: Importance, mechanisms
of action, and methods of administration. Rev. Fish. Sci. Aquac. 2016, 24, 342–368. [CrossRef]9. Toledo, A.; Frizzo, L.; Signorini, M.; Bossier, P.; Arenal, A. Impact of probiotics on growth performance and shrimp survival: A
meta-analysis. Aquaculture 2019, 500, 196–205. [CrossRef]10. Kuebutornye, F.K.A.; Abarike, E.D.; Yishan, L. A review on the application of Bacillus as probiotics in aquaculture. Fish Shellfish
Immunol. 2019, 87, 820–828. [CrossRef] [PubMed]11. Butt, U.D.; Lin, N.; Akhter, N.; Siddiqui, T.; Li, S.; Wu, B. Overview of the latest developments in the role of probiotics, prebiotics
and synbiotics in shrimp aquaculture. Fish Shellfish Immunol. 2021, 114, 263–281. [CrossRef]12. Verschuere, L.; Rombaut, G.; Sorgeloos, P.; Verstraete, W. Probiotic bacteria as biological control agents in aquaculture. Microbiol.
Mol. Biol. Rev. 2000, 64, 655–671. [CrossRef] [PubMed]13. Vine, N.; Leukes, W.D.; Kaiser, H.; Daya, S.; Baxter, J.; Hecht, T. Competition for attachment of aquaculture candidate probiotic
and pathogenic bacteria on fish intestinal mucus. J. Fish Dis. 2004, 27, 319–326. [CrossRef]14. Guzmán-Villanueva, L.T.; Escobedo-Fregoso, C.; Barajas-Sandoval, D.R.; Gomez-Gil, B.; Peña-Rodríguez, A.; Martínez-Diaz,
S.F.; Balcazar, J.L.; Quiroz-Guzmán, E. Assessment of microbial dynamics and antioxidant enzyme gene expression followingprobiotic administration in farmed Pacific white shrimp (Litopenaeus vannamei). Aquaculture 2020, 519, 734907. [CrossRef]
15. Knipe, H.; Temperton, B.; Lange, A.; Bass, D.; Tyler, C.R. Probiotics and competitive exclusion of pathogens in shrimp aquaculture.Rev. Aquac. 2020, 13, 324–352. [CrossRef]
16. Scholz, U.; Garcia-Diaz, G.; Ricque, D.; Cruz-Suarez, L.E.; Vargas-Albores, F.; Latchford, J. Enhancement of vibriosis resistance injuvenile Penaeus vannamei by supplementation of diets with different yeast products. Aquaculture 1999, 176, 271–283. [CrossRef]
17. Castex, M.; Lemaire, P.; Wabete, N.; Chim, L. Effect of dietary probiotic Pediococcus acidilactici on antioxidant defences andoxidative stress status of shrimp Litopenaeus stylirostris. Aquaculture 2009, 294, 306–313. [CrossRef]
Animals 2021, 11, 3451 18 of 21
18. Castex, M.; Lemaire, P.; Wabete, N.; Chim, L. Effect of probiotic Pediococcus acidilactici on antioxidant defences and oxidativestress of Litopenaeus stylirostris under Vibrio nigripulchritudo challenge. Fish Shellfish Immunol. 2010, 28, 622–631. [CrossRef]
19. Wang, Y.-C.; Hu, S.-Y.; Chiu, C.-S.; Liu, C.-H. Multiple-strain probiotics appear to be more effective in improving the growthperformance and health status of white shrimp, Litopenaeus vannamei, than single probiotic strains. Fish Shellfish Immunol. 2019,84, 1050–1058. [CrossRef]
20. Kewcharoen, W.; Srisapoom, P. Probiotic effects of Bacillus spp. from Pacific white shrimp (Litopenaeus vannamei) on water qualityand shrimp growth, immune responses, and resistance to Vibrio parahaemolyticus (AHPND strains). Fish Shellfish Immunol. 2019,94, 175–189. [CrossRef]
21. Madhana, S.; Kanimozhi, G.; Panneerselvam, A. Chapter 20—Probiotics in shrimp aquaculture. In Advances in Probiotics;Dhanasekaran, D., Sankaranarayanan, A., Eds.; Academic Press: New York, NY, USA, 2021; pp. 309–325. [CrossRef]
22. Castex, M.; Chim, L.; Pham, D.; Lemaire, P.; Wabete, N.; Nicolas, J.-L.; Schmidely, P.; Mariojouls, C. Probiotic, P. acidilacticiapplication in shrimp Litopenaeus stylirostris culture subject to vibriosis in New Caledonia. Aquaculture 2008, 275, 182–193.[CrossRef]
23. Jin, L.Z.; Ho, Y.W.; Abdullah, N.; Ali, L.A.; Jalaludin, S. Effects of adherent Lactobacillus cultures on growth, weight of organsand intestinal microflora and volatile fatty acids in broilers. Anim. Feed Sci. Technol. 1998, 70, 197–209. [CrossRef]
24. Abe, F.; Ishibashi, N.; Shimamura, S. Effect of administration of bifidobacteria and lactic acid bacteria to newborn calves andpiglets. J. Dairy Sci. 1995, 78, 2838–2846. [CrossRef]
25. Guedes, C.M.; Gonçalves, D.; Rodrigues, M.A.M. Effects of age and mannanoligosaccharides supplementation on production ofvolatile fatty acids in the caecum of rabbits. Anim. Feed Sci. Technol. 2009, 150, 330–336. [CrossRef]
26. Irianto, A.; Austin, B. Probiotics in aquaculture. J. Fish Dis. 2002, 25, 633–642. [CrossRef]27. Gupta, A.; Verma, G.; Gupta, P. Growth performance, feed utilization, digestive enzyme activity, innate immunity and protection
against Vibrio harveyi of freshwater prawn, Macrobrachium rosenbergii fed diets supplemented with Bacillus coagulans. Aquac. Int.2016, 24, 1379–1392. [CrossRef]
28. Doeschate, K.T.; Coyne, V. Improved growth rate in farmed Haliotis midae through probiotic treatment. Aquaculture 2008, 284,174–179. [CrossRef]
29. Bomba, A.; Nemcová, R.; Gancarcíková, S.; Herich, R.; Guba, P.; Mudronová, D. Improvement of the probiotic effect of micro-organisms by their combination with maltodextrins, fructo-oligosaccharides and polyunsaturated fatty acids. Br. J. Nutr. 2002, 88,S95–S99. [CrossRef] [PubMed]
30. Rajeev, R.; Adithya, K.K.; Kiran, G.S.; Selvin, J. Healthy microbiome: A key to successful and sustainable shrimp aquaculture. Rev.Aquac. 2020, 13, 238–258. [CrossRef]
31. Zheng, X.; Duan, Y.; Dong, H.; Zhang, J. The effect of Lactobacillus plantarum administration on the intestinal microbiota ofwhiteleg shrimp Penaeus vannamei. Aquaculture 2020, 526, 735331. [CrossRef]
32. Venkat, H.K.; Sahu, N.P.; Jain, K.K. Effect of feeding Lactobacillus-based probiotics on the gut microflora, growth and survival ofpostlarvae of Macrobrachium rosenbergii (de Man). Aquac. Res. 2004, 35, 501–507. [CrossRef]
33. Ziaei-Nejad, S.; Rezaei, M.H.; Takami, G.A.; Lovett, D.L.; Mirvaghefi, A.; Shakouri, M. The effect of Bacillus spp. bacteria used asprobiotics on digestive enzyme activity, survival and growth in the Indian white shrimp Fenneropenaeus indicus. Aquaculture 2006,252, 516–524. [CrossRef]
34. Bernal, M.G.; Marrero, R.M.; Campa-Córdova, Á.I.; Mazón-Suástegui, J.M. Probiotic effect of Streptomyces strains alone or incombination with Bacillus and Lactobacillus in juveniles of the white shrimp Litopenaeus vannamei. Aquac. Int. 2017, 25, 927–939.[CrossRef]
35. Wang, Y.; Liang, J.; Duan, Y.; Niu, J.; Wang, J.; Huang, Z.; Lin, H. Effects of dietary Rhodiola rosea on growth, body compositionand antioxidant capacity of white shrimp Litopenaeus vannamei under normal conditions and combined stress of low-salinity andnitrite. Aquac. Nutr. 2017, 23, 548–559. [CrossRef]
36. Brett, J.R. Environmental factors and growth. In Fish Physiology; Hoar, W.S., Randall, D.J., Brett, J.R., Eds.; Academic Press: NewYork, NY, USA, 1979; Volume VIII, pp. 595–675.
37. Elliott, J.M. The growth rate of brown trout (Salmo trutta L.) fed on reduced rations. J. Anim. Ecol. 1975, 44, 823–842. [CrossRef]38. Staples, D.J.; Nomura, M. Influence of body size and food ration on the energy budget of rainbow trout Salmo gairdneri Richardson.
J. Fish Biol. 1976, 9, 29–43. [CrossRef]39. Brett, J.R.; Groves, T.D.D. Physiological energetics. In Fish Physiology; Hoar, W.S., Randall, D.J., Brett, J.R., Eds.; Academic Press:
New York, NY, USA, 1979; Volume VIII, pp. 279–352.40. Malloy, K.D.; Targett, T.E. Effects of ration limitation and low temperature on growth, biochemical condition, and survival of
juvenile summer flounder from two Atlantic coast nurseries. Trans. Am. Fish. Soc. 1994, 123, 182–193. [CrossRef]41. Gatlin, D.M.; Poe, W.E.; Wilson, R.P. Protein and energy requirements of fingerling channel catfish for maintenance and maximum
growth. J. Nutr. 1986, 116, 2121–2131. [CrossRef] [PubMed]42. Lupatsch, I.; Kissil, G.W.; Sklan, D. Comparison of energy and protein efficiency among three fish species gilthead sea bream.
(Sparus aurata), European sea bass (Dicentrarchus labrax) and white grouper (Epinephelus aeneus): Energy expenditure for proteinand lipid deposition. Aquaculture 2003, 225, 175–189. [CrossRef]

Animals 2021, 11, 3451 19 of 21
43. Ozório, R.O.A.; Valente, L.M.P.; Correia, S.; Pousão-Ferreira, P.; Damasceno-Oliveira, A.; Escórcio, C.; Oliva-Teles, A. Proteinrequirement for maintenance and maximum growth of two-banded seabream (Diplodus vulgaris) juveniles. Aquac. Nutr. 2008, 15,85–93. [CrossRef]
44. Helland, S.J.; Hatlen, B.; Grisdale-Helland, B. Energy, protein and amino acid requirements for maintenance and efficiency ofutilization for growth of Atlantic salmon post-smolts determined using increasing ration levels. Aquaculture 2010, 305, 150–158.[CrossRef]
45. Sedgwick, R.W. Effect of ration-size and feeding frequency on the growth and food conversion of juvenile Penaeus merguiensis deMan. Aquaculture 1979, 16, 279–298. [CrossRef]
46. Wabete, N.; Chim, L.; Lemaire, P.; Massabuau, J.-C. Growth ration relationship in the shrimp Litopenaeus Stylirostris: Effect offeeding frequency on maintenance energy requirement and scope for growth. In Proceedings of the European AquacultureSociety Meeting, Aquacuture Europe, Florence, Italy, 9–13 May 2006.
47. Chim, L.; Wabete, N.; Lemaire, P.; Della-Patrona, L.; Massabuau, J.C. Growth-ration relationship in the shrimp Litopenaeusstylirostris: Effect of natural food from the pond on maintenance energy requirement and scope for growth. In Proceedings of theEuropean Aquaculture Society Meeting, Aquacuture Europe, Florence, Italy, 9–13 May 2006.
48. Kureshy, N.; Davis, A. Protein requirement for maintenance and maximum weight gain for the Pacific white shrimp Litopenaeusvannamei. Aquaculture 2002, 204, 125–143. [CrossRef]
49. Ruohonen, K. Individual measurements and nested designs in aquaculture experiments: A simulation study. Aquaculture 1998,165, 149–157. [CrossRef]
50. Hurlbert, S.H. Pseudoreplication and the design of ecological field experiments. Ecol. Monogr. 1984, 54, 187–211. [CrossRef]51. Sokal, R.R.; Rohlf, F.J. Biometry: The Principles and Practice of Statistics in Biological Research, 3rd ed.; W. H. Freeman and Co.: New
York, NY, USA, 1995; 887p, ISBN 0716786044.52. Ling, N.; Cotter, D. Statistical power in comparative aquaculture studies. Aquaculture 2003, 224, 159–168. [CrossRef]53. Jobling, M.; Koskela, J. Inter-individual variations in feeding and growth in rainbow trout during restricted feeding and in a
subsequent period of compensatory growth. J. Fish Biol. 1996, 49, 658–667. [CrossRef]54. Lowry, O.; Rosebrough, N.J.; Farr, A.L.; Randall, R.S. Protein measurements with Folin phenol reagent. J. Biol. Chem. 1951, 193,
265–275. [CrossRef]55. Dubois, M.; Gilles, K.A.; Hamilton, J.K.; Rebers, P.A.; Smith, F. Colorimetric method for determination of sugars and related
substances. Anal. Chem. 1956, 28, 350–356. [CrossRef]56. Bernfeld, P. Amylase. In Methods in Enzymology; Colowick, S.P., Kaplan, N.O., Eds.; Academic Press: New York, NY, USA, 1955;
pp. 149–158.57. Erlanger, B.F.; Kokowsky, N.; Cohen, W. The preparation and properties of 2 chromogenic substrates of trypsin. Arch. Biochem.
Biophys. 1961, 95, 271–278. [CrossRef]58. Garcia-Carreno, F.L.; Hernandez-Cortes, M.P.; Haard, N.F. Enzymes with peptidase and proteinase activity from the digestive
systems of a freshwater and a marine decapod. J. Agric. Food Chem. 1994, 42, 1456–1461. [CrossRef]59. Warren, C.E.; Davis, G.E. Laboratory studies on the feeding bioenergetics and growth of fishes. In The Biological Basis of Freshwater
Fish Production, A Symposium; Gerking, S.D., Ed.; Blackwell: Oxford, UK, 1967; pp. 175–214.60. Brett, J.R. Scope for metabolism and growth of sockeye salmon, Oncorhynchus nerka, and some related energetics. J. Fish. Res.
Board Can. 1976, 33, 307–313. [CrossRef]61. R Development Core Team. R: A Language and Environment for Statistical Computing; R Foundation for Statistical Computing:
Vienna, Austria, 2008; ISBN 3-900051-07-0. Available online: http://www.R-project.org (accessed on 23 September 2021).62. Cui, Y.; Wootton, R.J. Effects of ration, temperature and body size on the body composition, energy content and condition of the
minnow, Phoxinus phoxinus (L.). J. Fish Biol. 1988, 32, 749–764. [CrossRef]63. Jobling, M. Fish Bioenergetics. Fish and Fisheries Series 13; Springer Science, Chapman and Hall: London, UK, 1994; 310p.64. National Research Council. Nutrient Requirements of Fish and Shrimp; The National Academies Press: Washington, DC, USA, 2011;
392p. [CrossRef]65. Dall, W.; Smith, D. Oxygen consumption and ammonia-N excretion in fed and starved tiger prawns, Penaeus esculentus Haswell.
Aquaculture 1986, 55, 23–33. [CrossRef]66. Wabete, N. Etude Ecophysiologique du Métabolisme Respiratoire et Nutritionnelle Chez la Crevette Peneide Litopeneaus stylirostris.
Application à la crevetticulture en Nouvelle Calédonie. Ph.D. Thesis, Université Bordeaux 1. Ecole Doctorale Sciences du Vivant,Géosciences et Sciences de l’Environnement, Talence, France, 2005; 173p.
67. Saoud, I.P.; Anderson, G. Using scope-for-growth estimates to compare the suitability of feeds used in shrimp aquaculture. J.World Aquac. Soc. 2004, 35, 523–528. [CrossRef]
68. Glencross, B.D.; Smith, D.M.; Tonks, M.L.; Tabrett, S.M.; Williams, K.C. A reference diet for nutritional studies of the prawn,Penaeus monodon. Aquac. Nutr. 1999, 5, 33–40. [CrossRef]
69. Logan, D.T.; Epifanio, C.E. A laboratory energy balance for the larvae and juvenile of the American lobster Homarus americanus.Mar. Biol. 1978, 47, 381–389. [CrossRef]
70. Lemos, D.; Phan, V.N. Energy partitioning into growth, respiration, excretion and exuvia during larval development of theshrimp Farfantapenaeus paulensis. Aquaculture 2001, 199, 131–143. [CrossRef]

Animals 2021, 11, 3451 20 of 21
71. Sumule, O.; Koshio, S.; Teshima, S.-I.; Ishikawa, M.; Gilmore, J.; Starr, D. Energy budget of Marsupenaeus japonicus postlarvae fedhighly unsaturated fatty acid-enriched and non-enriched Artemia nauplii. Fish. Sci. 2003, 69, 706–715. [CrossRef]
72. Yu, M.C.; Li, Z.L.; Lin, H.Z.; Wen, G.L.; Ma, S. Effects of dietary Bacillus and medicinal herbs on the growth, digestive enzymeactivity, and serum biochemical parameters of the shrimp Litopenaeus vannamei. Aquac. Int. 2008, 16, 471–480. [CrossRef]
73. Wang, Y.B. Effect of probiotics on growth performance and digestive enzyme activity of the shrimp Penaeus vannamei. Aquaculture2007, 269, 259–264. [CrossRef]
74. Zuo, H.H.; Shang, B.-J.; Shao, Y.-C.; Li, W.-Y.; Sun, J.-S. Screening of intestinal probiotics and the effects of feeding probioticson the growth, immune, digestive enzyme activity and intestinal flora of Litopenaeus vannamei. Fish Shellfish Immunol. 2019, 86,160–168. [CrossRef]
75. Fang, H.; Wang, B.; Jiang, K.; Liu, M.; Wang, L. Effects of Lactobacillus pentosus HC-2 on the growth performance, intestinalmorphology, immune-related genes and intestinal microbiota of Penaeus vannamei affected by aflatoxin B1. Aquaculture 2020,525, 735289. [CrossRef]
76. Lee, C.; Kim, S.; Shin, J.; Kim, M.-G.; Gunathilaka, B.E.; Kim, S.H.; Kim, J.E.; Ji, S.-C.; Han, J.E.; Lee, K.-J. Dietary supplementationsof Bacillus probiotic improve digestibility, growth performance, innate immunity, and water ammonia level for Pacific whiteshrimp, Litopenaeus vannamei. Aquac. Int. 2021, 29, 2463–2475. [CrossRef]
77. Zainuddin, H.; Haryati, H.; Aslamyah, S. Effect of dietary carbohydrate levels and feeding frequencies on growth and car-bohydrate digestibility of white shrimp Litopenaeus vannamei under laboratory conditions. J. Aquac. Res. Dev. 2014, 5, 274.[CrossRef]
78. Guo, R.; Liu, Y.; Huang, J.; Tian, L.-X. Effect of dietary cornstarch levels on growth performance, digestibility and microscopicstructure in the white shrimp, Litopenaeus vannamei reared in brackish water. Aquac. Nutr. 2006, 12, 83–88. [CrossRef]
79. Sánchez-Paz, A.; García-Carreño, F.; Hernández-López, J.; Muhlia-Almazán, A.; Yepiz-Plascencia, G. Effect of short-termstarvation on hepatopancreas and plasma energy reserves of the Pacific white shrimp (Litopenaeus vannamei). J. Exp. Mar. Biol.2007, 340, 184–193. [CrossRef]
80. Rosas, C.; Cuzon, G.; Gaxiola, G.; Arena, L.; Lemaire, P.; Soyez, C.; Van Wormhoudt, A. Influence of dietary carbohydrate on themetabolism of juvenile Litopenaeus stylirostris. J. Exp. Mar. Biol. Ecol. 2000, 249, 181–198. [CrossRef]
81. Rosas, C.; Cuzon, G.; Gaxiola, G.; Pascual, C.; Taboada, G.; Arena, L.; van Wormhoudt, A. An energetic and conceptual model ofthe physiological role of dietary carbohydrates and salinity on Litopenaeus vannamei juveniles. J. Exp. Mar. Biol. Ecol. 2002, 268,47–67. [CrossRef]
82. Cousin, M.; Cuzon, G.; Guillaume, J. Aquacop Digestibility of starch in Penaeus vannamei: In vivo and in vitro study on eightsamples of various origin. Aquaculture 1996, 140, 361–372. [CrossRef]
83. Gamboa-Delgado, J.; Molina-Poveda, C.; Cahu, C. Digestive enzyme activity and food ingesta in juvenile shrimp Litopenaeusvannamei (Boone, 1931) as a function of body weight. Aquac. Res. 2003, 34, 1403–1411. [CrossRef]
84. Maugle, P.D.; Deshimaru, O.; Katayama, T.; Simpson, K.L. Effect of short necked clams diet on shrimp growth and digestiveenzyme activities. Bull. Jpn. Soc. Sci. Fish. 1982, 48, 1758–1764. [CrossRef]
85. Van Wormhoudt, A.; Cruz, E.; Guillaume, J.; Favrel, P. Action de l’inhibiteur trypsique de soja sur la croissance et l’activité desenzymes digestives chez Penaeus japonicus (Crustacea, Decapoda): Rôle éventuel des hormones gastro-intestinales. Oceanis 1986,12, 305–319.
86. Cecile, S. Utilisation d’un Bioessai Artemia Pour Caractériser les Molécules Actives d’une Préparation Microbienne Commercialeà Base de Lactobacilles Sur la Physiologie Digestive de Crustacés. Master’s Thesis, Université Pierre et Marie Curie, Paris, France,2006; p. 71.
87. Wei, C.; Wang, X.; Li, C.; Zhou, H.; Liu, C.; Mai, K.; He, G. Effects of dietary Shewanella sp. MR-7 on the growth performance,immunity, and intestinal microbiota of Pacific white shrimp. Aquac. Rep. 2021, 19, 100595. [CrossRef]
88. Garibay-Valdez, E.; Martínez-Porchas, M.; Calderón, K.; Vargas-Albores, F.; Gollas-Galván, T.; Martínez-Córdova, L. Taxonomicand functional changes in the microbiota of the white shrimp (Litopenaeus vannamei) associated with postlarval ontogeneticdevelopment. Aquaculture 2020, 518, 734–842. [CrossRef]
89. Fan, L.; Li, Q.X. Characteristics of intestinal microbiota in the Pacific white shrimp Litopenaeus vannamei differing growthperformances in the marine cultured environment. Aquaculture 2019, 505, 450–461. [CrossRef]
90. Lygren, B.; Hemre, G.-I. Influence of dietary carbohydrate on antioxidant enzyme activities in liver of Atlantic salmon (Salmo salarL.). Aquac. Int. 2001, 9, 421–427. [CrossRef]
91. Sagone, A.L., Jr.; Greenwald, J.; Kraut, E.H.; Bianchine, J.; Singh, D. Glucose: A role as free radical scavenger in biological system.J. Lab. Clin. Med. 1983, 101, 97–103. [PubMed]
92. Morelli, R.; Russo-Volpe, S.; Bruno, N.; Lo Scalzo, R. Fenton-dependent damage to carbohydrates: Free radical scavenging activityof some simple sugars. J. Agric. Food Chem. 2003, 51, 7418–7425. [CrossRef]
93. Fynn-Aikins, K.; Hung, S.S.; Liu, W.; Li, H. Growth, lipogenesis and liver composition of juvenile white sturgeon fed differentlevels of D-glucose. Aquaculture 1992, 105, 61–72. [CrossRef]
94. Carefoot, T.H. Specific dynamic action (SDA) in the supralittoral isopod, Ligia pallasii: Effect of ration and body size on SDA.Comp. Biochem. Phys. A 1990, 95, 317–320. [CrossRef]

Animals 2021, 11, 3451 21 of 21
95. Luvizotto-Santos, R.; Lee, J.T.; Pereira-Branco, Z.; Bianchini, A.; Maia-Nery, L.E. Lipids as energy source during salinityacclimation in the euryhaline crab Chasmagnathus granulate Dana, 1851 (Crustacea–Grapsidae). J. Exp. Zool. 2003, 295, 200–205.[CrossRef] [PubMed]
96. Kullisaar, T.; Songisepp, E.; Mikelsaar, M.; Zilmer, K.; Vihalemm, T.; Zilmer, M. Antioxidative probiotic fermented goats’ milkdecreases oxidative stress-mediated atherogenicity in human subjects. Br. J. Nutr. 2003, 90, 449–456. [CrossRef] [PubMed]
Copyright © 2022 FDOKUMEN