Resource Management and Energy Cooperation in Wireless ...
179
Resource Management and Energy Cooperation in Wireless Cellular Networks By Faran Ahmed CIIT/SP14-PEE-003/WAH PhD Thesis In Electrical Engineering COMSATS University Islamabad Wah Campus, Pakistan Spring, 2018
-
Upload
khangminh22 -
Category
Documents
-
view
3 -
download
0
Transcript of Resource Management and Energy Cooperation in Wireless ...
Resource Management and Energy Cooperation in
Wireless Cellular Networks
By
Faran Ahmed
CIIT/SP14-PEE-003/WAH
PhD Thesis
In
Electrical Engineering
COMSATS University Islamabad Wah Campus, Pakistan
Spring, 2018
ii
COMSATS University Islamabad, Wah Campus
Resource Management and Energy Cooperation in
Wireless Cellular Networks
A Thesis Presented to
COMSATS University Islamabad, Wah Campus
In partial fulfillment
of the requirement for the degree of
PhD (Electrical Engineering)
By
Faran Ahmed
CIIT/SP14-PEE-003/WAH
Spring, 2018

iii
Resource Management and Energy Cooperation in
Wireless Cellular Networks
A Post Graduate Thesis submitted to the Department of Electrical and
Computer Engineering as partial fulfillment of the requirement for the award of
PhD (Electrical Engineering).
Name Registration Number
Faran Ahmed CIIT/SP14-PEE-003/WAH
Supervisor
Dr. Muhammad Naeem
Associate Professor,
Department of Electrical and Computer Engineering
COMSATS University Islamabad
Wah Campus, Pakistan
September, 2018


v
Author’s Declaration
I, Faran Ahmed, CIIT/SP14-PEE-003/WAH, hereby state that my PhD thesis titled
“Resource Management and Energy Cooperation in Wireless Cellular Networks” is
my own work and has not been submitted previously by me for taking any degree
from this University i.e. COMSATS University, Islamabad, or anywhere else in the
country/world.
At any time if my statement is found to be incorrect even after I graduate, the
University has the right to withdraw my PhD degree.
Date: September 13, 2018
Faran Ahmed
CIIT/SP14-PEE-003/WAH

vi
Plagiarism Undertaking
I solemnly declare that research work presented in the thesis titled “Resource
Management and Energy Cooperation in Wireless Cellular Networks” is solely my
research work with no significant contribution from any other person. Small
contribution/help wherever taken has been duly acknowledged and that complete
thesis written by me.
I understand the zero tolerance policy of HEC and COMSATS University Islamabad
toward plagiarism. Therefore, I as an author of the above titled thesis declares that no
portion of my thesis has been plagiarized and any material used as reference is
properly referred/cited.
I undertake if I am found guilty of any formal plagiarism in the above titled thesis
even after award of PhD Degree, the University reserves the right to withdraw/revoke
my PhD degree and that HEC and the university has the right to publish my name on
the HEC/university website on which names of students are placed who submitted
plagiarized thesis.
Date: September 13, 2018
Faran Ahmed
CIIT/SP14-PEE-003/WAH

vii
Certificate
It is certified that Faran Ahmed (Reg. No. CIIT/SP14-PEE-003/WAH) has carried out
all the work related to this thesis under my supervision at the Department of Electrical
and Computer Engineering, COMSATS University Islamabad, Wah Campus and the
work fulfils the requirement for award of PhD degree.
Date: September 13, 2018 Supervisor:
Dr. Muhammad Naeem
Department of Electrical and Computer Engineering
Head of Department:
Dr. Nadia Nawaz Department of Electrical and Computer Engineering

viii
DEDICATION
Dedicated to my beloved family

ix
ACKNOWLEDGEMENTS
I bow my head in gratitude before Almighty Allah, who bestowed upon me this
opportunity and guided me to successfully complete my PhD studies. I also feel
indebted to my family, friends and colleagues who in one way or the other helped me
in achieving this milestone. In this pursuit of knowledge, the prayers and well wishes
of my parents and my kith and kin, especially my better half and my children, were
the anchor for my ship.
One would say that the journey in pursuit of knowledge culminates with a Ph.D
degree. However, one is forced to believe that the learning has just begun and that this
is just another step in the vast field of engineering knowledge. In this regard, I am
highly grateful to my supervisor, Dr. Muhammad Naeem. for his dedication and
support throughout the programme. I am very fortunate to have a person like him
supervise my research, who is most kind, judicious and a learned professor. He
always encouraged me to overcome all hurdles and achieve results. Equally
supportive and helpful was Dr. Muhammad Iqbal, my co-supervisor, as were my
colleagues at CAE, NUST.
I am also thankful to the faculty of Electrical and Computer department of
COMSATS University Islamabad, Wah Campus, especially HoD, for supporting my
effort and making it convenient for me to pursue the programme while commuting
from Risalpur. The journeys were often made in the silence of night which gave me
an opportunity to reflect and contemplate.
Last but not the least, I am thankful to my wife, for her constant support and care, to
my parents and siblings for their prayers and well wishes, and to my children for
bringing me joy and happiness, all of which enabled me to complete this arduous task.
Faran Ahmed
CIIT/SP14-PEE-003/WAH
x
ABSTRACT
Resource Management and Energy Cooperation in Wireless
Cellular Networks
Wireless communication has seen exponential growth in the past few decades due to
advancements in digital communication technologies resulting in emerging wireless
technologies such as LTE-A and WiMAX. Resultantly, wireless communication is
becoming the main choice for voice as well as data communication. However, the
increasing voice, data and internet services are costing heavy on resources. The
consequent resource constraint is driving the technology developers to look for
resource optimization solutions in all domains, particularly energy.
The future radio access networks (RAN) like 5G will comprise denser and diverse
heterogeneous networks (HetNets) of macro, micro, pico and femto BSs. Energy
resource management of such networks is of prime concern besides improving
throughput, latency and quality of service. This involves improving energy efficiency
of all elements such as back haul network, data centers, base stations and mobile
terminals. Amongst these, the base station is the most energy hungry entity,
consuming as much as 60% of the networks energy. Research is, therefore, focusing
component, system and network level energy efficiency improvements by employing
schemes such as 'energy cooperation' between base stations.
The number of BS sites, worldwide, are expected to increase to more than 11 million,
consuming 98 TWh annually, by year 2020. Consequently, it is resulting in increased
GHG emissions since most of the power comes from the fossil fuel based energy
sources. Thus, BSs have become a strong candidate for different energy efficient
techniques as well as incorporation of renewable energy sources (RES) such as solar
panels and wind turbines. Base stations are ideally suited to have renewable sources
installed because all four elements of energy generation, transmission, storage and
consumption are located at one place. RES are not only feasible for stand-alone or
off-grid BS, but also for on-grid BS, especially smart-grid tied.
Equipping base stations with renewable energy sources of solar and wind is feasible
for areas having good sunshine and windy conditions. By considering the fluctuations
xi
in the base station load because temporal and spatial variations in traffic, it is possible
to have energy cooperation between nodes. A base station having deficient green
(harvested) energy is encouraged to borrow it from a neighbor rather than acquire it
from GHG emitting sources such as diesel generator. A novel extension of this
scheme is designed to combine it with sleep mechanism in networks where lean base
stations are put to sleep and their energy and load are distributed in the network. The
strategies of energy resource optimization thus incorporated yield positive results in
energy cost savings for the network.
In this research, initially, a PV array of 7.8 kW and a wind turbine of 7.5 kW peak
power has been modeled for Islamabad region, for a BS consuming 2.35 kWh peak
energy. It is shown that base stations harvesting renewable energy may have surplus
energy that can be shared with other base stations or even sold back to the grid
through net metering. Since the energy consumption of a BS is not fixed and
fluctuates with the traffic load, the energy produced from renewable energy sources
may be more than the energy consumed, especially during off peak hours, opening the
venues for energy cooperation between nodes.
We consider a cellular network of N macro BSs equipped with energy harvesting
systems (solar, wind or both) modeled for site whose weather parameters are known.
The network is powered by the conventional grid (Utility), with a diesel generator
providing backup power at each BS. We consider a finite horizon time slotted system
where the decision to share energy is made for a definite time t (1 ≤ t ≤ T). The key
elements of our system model are; solar/wind energy harvesting base stations, a
battery bank for energy storage at the base station, inter-connectivity between the base
station through grid, smart grid or central controller, for energy transfer, and an
energy management unit at the base station running the algorithms.
We propose a frame work for traffic aware sustainable and environmental friendly
base station operation through energy cooperation (TASEEC) in grid connected green
cellular network, where each base station is encouraged to acquire energy from
renewable source and all base stations are also connected to the utility grid. The
mathematically modeled framework jointly takes care of static and traffic aware load
on the BS. In TASEEC, the optimizer always selects economical power source for
buying purposes. The frame-work is based on the fact that the base station operators
have an agreement on energy cooperation and on cooperation tariff. The main aim is
to jointly minimize the operational cost and greenhouse gas emissions. The cost
xii
includes self-generation cost, cost of energy purchased from other BSs and cost of
energy procured from grid. The non-linear problem is linearized by applying
McCormick approximation and solved through interior point method. The framework
is further extended to a heterogeneous umbrella network with base station on/off
switching incorporated in addition to energy cooperation scheme discussed above.
The results are shown for individual base stations and the energy cost savings -as a
result of proposed energy cooperation strategy - are depicted as a percentage
reduction in network’s energy consumption cost.
Table of Contents
1 Background and Motivation 1
1.1 Introduction . . . . . . . . . . . . . . . . . . . . . . . . . . . . . . . . 2
1.2 Background . . . . . . . . . . . . . . . . . . . . . . . . . . . . . . . . 3
1.2.1 Rising Energy Needs and GHG Emissions . . . . . . . . . . . 5
1.2.2 Renewable Energy Sources for Cellular BSs . . . . . . . . . . . 7
1.2.3 Energy Cooperation in RES Enabled Cellular Networks . . . . 8
1.3 Research Motivation . . . . . . . . . . . . . . . . . . . . . . . . . . . 11
1.4 Research Objective . . . . . . . . . . . . . . . . . . . . . . . . . . . . 12
1.5 Thesis Overview . . . . . . . . . . . . . . . . . . . . . . . . . . . . . . 15
1.5.1 Chapter 2 : Energy Optimization in RES Enabled Cellular Net-
works . . . . . . . . . . . . . . . . . . . . . . . . . . . . . . . 15
1.5.2 Chapter 3 : Modeling Renewable Energy Sources for Base Station 17
1.5.3 Chapter 4 : Sustainable Energy Cooperation in Base Stations 17
1.5.4 Chapter 5 : Energy Cooperation with BS Sleep Mechanism . . 17
1.5.5 Chapter 6 : Conclusion and Future Work . . . . . . . . . . . . 18
1.6 Summary . . . . . . . . . . . . . . . . . . . . . . . . . . . . . . . . . 18
1.7 Publications . . . . . . . . . . . . . . . . . . . . . . . . . . . . . . . . 20
2 Energy Optimization in RES Enabled Cellular Networks 23
2.1 Introduction . . . . . . . . . . . . . . . . . . . . . . . . . . . . . . . . 24
2.2 Evolution in Green Communication . . . . . . . . . . . . . . . . . . . 24
2.3 Literature Review: Resource Optimization in RES Enabled Cellular
Networks . . . . . . . . . . . . . . . . . . . . . . . . . . . . . . . . . . 28
2.3.1 Optimization of Energy Resources . . . . . . . . . . . . . . . . 30
2.3.2 Optimization of Radio Resources . . . . . . . . . . . . . . . . 32
2.3.3 Battery/ Storage Optimization . . . . . . . . . . . . . . . . . 34
2.3.4 Multi-cell Cooperation . . . . . . . . . . . . . . . . . . . . . . 35
2.3.5 Energy Cooperation . . . . . . . . . . . . . . . . . . . . . . . 38
2.3.6 BS Sleep (On/Off) Mechanism . . . . . . . . . . . . . . . . . . 40
2.3.7 Resource Optimization of Cellular Networks in Smart Grid . . 43
2.4 Summary . . . . . . . . . . . . . . . . . . . . . . . . . . . . . . . . . 44
3 Modelling RES for Energy Sharing Microgrid 48
3.1 Introduction . . . . . . . . . . . . . . . . . . . . . . . . . . . . . . . . 49
3.2 Energy Consumption in Cellular Base Stations . . . . . . . . . . . . . 51
3.2.1 Energy Consumption Model of a Base Station . . . . . . . . . 53
xiii
3.2.2 Spatial and Temporal Load Variations . . . . . . . . . . . . . 55
3.2.3 Traffic Pattern Based Energy Consumption . . . . . . . . . . . 56
3.3 Design and Optimization of Hybrid RES . . . . . . . . . . . . . . . . 58
3.3.1 Subsystems of Hybrid Solar/Wind Enabled BS . . . . . . . . . 59
3.3.2 Modelling Energy Sources for Powering a BS . . . . . . . . . . 62
3.4 Green Energy Sharing in Microgrid Without Cooperation . . . . . . . 63
3.4.1 Mathematical Modelling . . . . . . . . . . . . . . . . . . . . . 65
3.5 Solution and Results for Microgrid of Green BSs . . . . . . . . . . . . 66
3.5.1 Power Generation vs Power Consumption . . . . . . . . . . . 67
3.5.2 Power Sharing with Community in Microgrid . . . . . . . . . 71
3.6 Summary . . . . . . . . . . . . . . . . . . . . . . . . . . . . . . . . . 73
Appendices 75
3.A Solar Energy System Model . . . . . . . . . . . . . . . . . . . . . . . 75
3.B Wind Energy System Model . . . . . . . . . . . . . . . . . . . . . . . 77
3.C Battery Bank Modeling . . . . . . . . . . . . . . . . . . . . . . . . . . 80
4 Sustainable Energy Cooperation in Cellular Networks 83
4.1 Introduction . . . . . . . . . . . . . . . . . . . . . . . . . . . . . . . . 84
4.2 System Model . . . . . . . . . . . . . . . . . . . . . . . . . . . . . . . 87
4.2.1 Energy Utilization and Generation at BSs . . . . . . . . . . . 88
4.2.2 Energy Cost Model of RES Enabled Network . . . . . . . . . 89
4.2.3 Energy Exchange and Energy States . . . . . . . . . . . . . . 90
4.2.4 Tariff . . . . . . . . . . . . . . . . . . . . . . . . . . . . . . . . 91
4.3 Energy Cooperation in Green Cellular Network . . . . . . . . . . . . 92
4.3.1 Mathematical Formulation and Solution Approach . . . . . . . 93
4.3.2 Energy Cooperation Results . . . . . . . . . . . . . . . . . . . 101
4.4 Energy Cooperation with GHG Penalty . . . . . . . . . . . . . . . . . 105
4.4.1 Mathematical Formulation and Solution . . . . . . . . . . . . 105
4.4.2 Solution and Results . . . . . . . . . . . . . . . . . . . . . . . 108
4.4.3 Energy Cooperation with GHG Penalty Results . . . . . . . . 109
4.5 Summary . . . . . . . . . . . . . . . . . . . . . . . . . . . . . . . . . 117
5 Traffic Aware Energy Cooperation with BS Sleep Mechanism 118
5.1 Introduction . . . . . . . . . . . . . . . . . . . . . . . . . . . . . . . . 119
5.2 System Model . . . . . . . . . . . . . . . . . . . . . . . . . . . . . . . 122
5.2.1 Energy Saving in Sleep Mode . . . . . . . . . . . . . . . . . . 122
5.2.2 Traffic Load Sharing in Sleep Mode . . . . . . . . . . . . . . . 124
5.2.3 Network Energy Model . . . . . . . . . . . . . . . . . . . . . . 125
5.3 Problem Formulation . . . . . . . . . . . . . . . . . . . . . . . . . . . 127
5.4 Simulation and Results . . . . . . . . . . . . . . . . . . . . . . . . . . 129
5.5 Summary . . . . . . . . . . . . . . . . . . . . . . . . . . . . . . . . . 132
xiv

6 Conclusion and Future Work 138
6.1 Conclusion . . . . . . . . . . . . . . . . . . . . . . . . . . . . . . . . . 139
6.2 Future Work . . . . . . . . . . . . . . . . . . . . . . . . . . . . . . . . 141
6.2.1 Cooperative Relays . . . . . . . . . . . . . . . . . . . . . . . . 142
6.2.2 Energy Cooperation in C-RAN . . . . . . . . . . . . . . . . . 142
Bibliography 144
xv
List of Tables
1.1 Symbols and Notations used in the this thesis. . . . . . . . . . . . . . 22
2.1 Energy cooperation scenarios for cellular BSs enabled with renewable
energy sources. . . . . . . . . . . . . . . . . . . . . . . . . . . . . . . 39
2.2 Dynamic and static power components for different BS types, including
the sleep mode [1]. . . . . . . . . . . . . . . . . . . . . . . . . . . . . 40
3.1 Power consumption breakdown for different types of base stations . . 53
4.1 Energy Cooperation in cellular base stations found in literature . . . 86
4.2 Percentage decrease in cost due to cooperation in base stations . . . . 104
4.3 Energy classification into Green and GHG components. . . . . . . . . 105
4.4 Statistical analysis of proposed framework: Case study for Islamabad,
Pakistan. Base station dynamic load is poisson distributed. . . . . . . 116
xvi
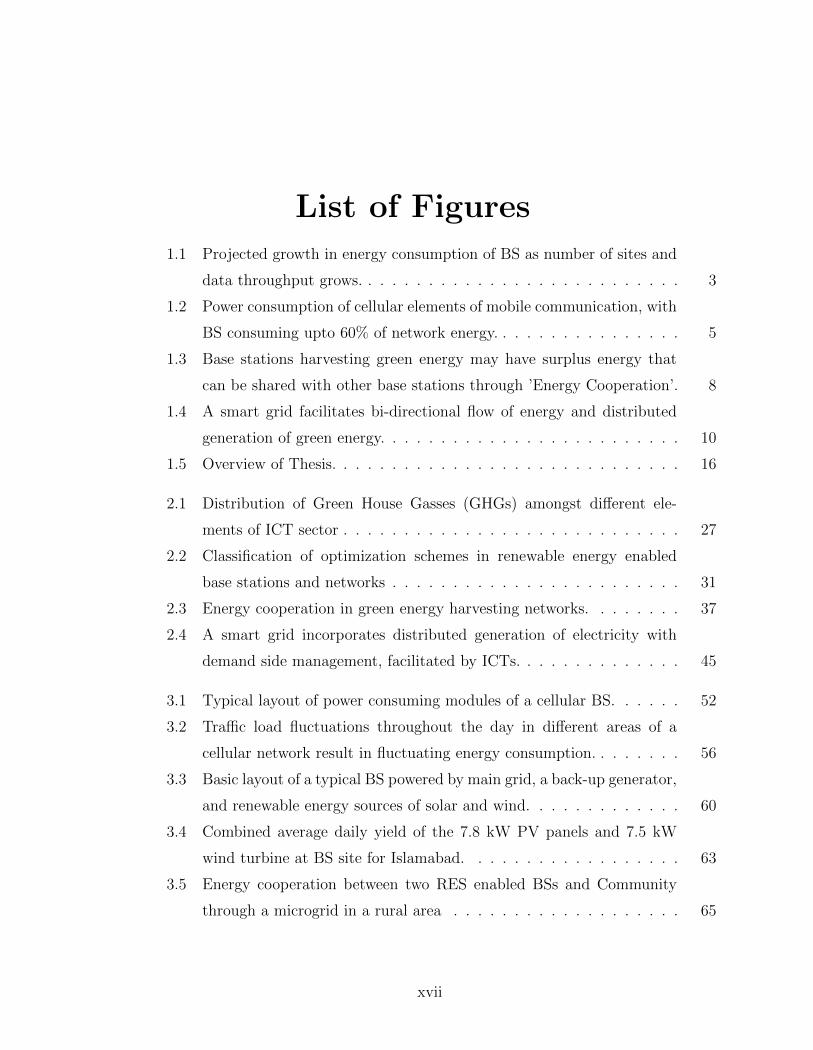
List of Figures
1.1 Projected growth in energy consumption of BS as number of sites and
data throughput grows. . . . . . . . . . . . . . . . . . . . . . . . . . . 3
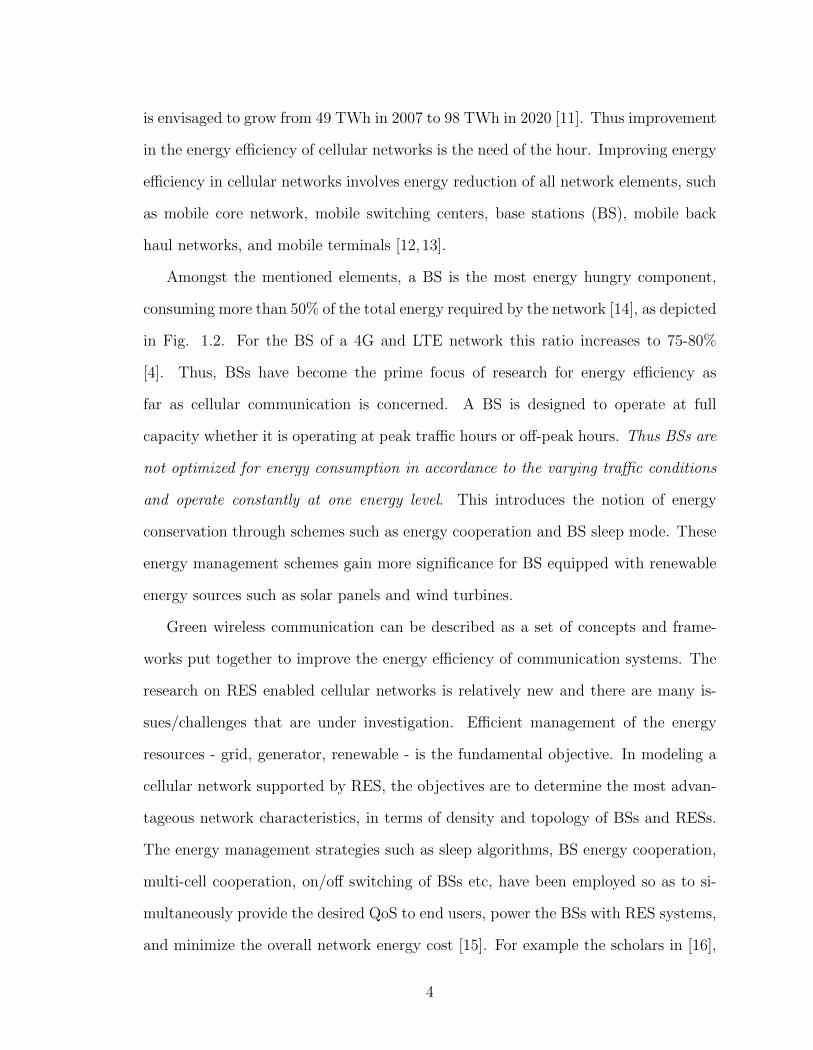
1.2 Power consumption of cellular elements of mobile communication, with
BS consuming upto 60% of network energy. . . . . . . . . . . . . . . . 5
1.3 Base stations harvesting green energy may have surplus energy that
can be shared with other base stations through ’Energy Cooperation’. 8
1.4 A smart grid facilitates bi-directional flow of energy and distributed
generation of green energy. . . . . . . . . . . . . . . . . . . . . . . . . 10
1.5 Overview of Thesis. . . . . . . . . . . . . . . . . . . . . . . . . . . . . 16
2.1 Distribution of Green House Gasses (GHGs) amongst different ele-
ments of ICT sector . . . . . . . . . . . . . . . . . . . . . . . . . . . . 27
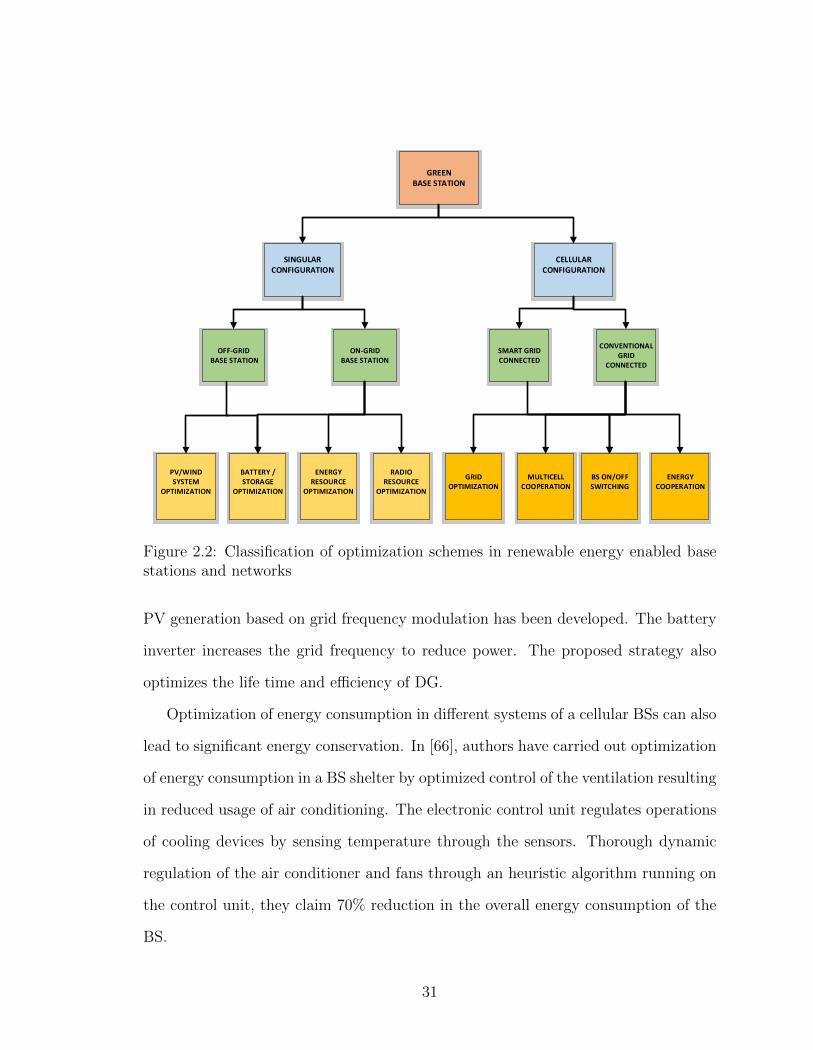
2.2 Classification of optimization schemes in renewable energy enabled
base stations and networks . . . . . . . . . . . . . . . . . . . . . . . . 31
2.3 Energy cooperation in green energy harvesting networks. . . . . . . . 37
2.4 A smart grid incorporates distributed generation of electricity with
demand side management, facilitated by ICTs. . . . . . . . . . . . . . 45
3.1 Typical layout of power consuming modules of a cellular BS. . . . . . 52
3.2 Traffic load fluctuations throughout the day in different areas of a
cellular network result in fluctuating energy consumption. . . . . . . . 56
3.3 Basic layout of a typical BS powered by main grid, a back-up generator,
and renewable energy sources of solar and wind. . . . . . . . . . . . . 60
3.4 Combined average daily yield of the 7.8 kW PV panels and 7.5 kW
wind turbine at BS site for Islamabad. . . . . . . . . . . . . . . . . . 63
3.5 Energy cooperation between two RES enabled BSs and Community
through a microgrid in a rural area . . . . . . . . . . . . . . . . . . . 65
xvii
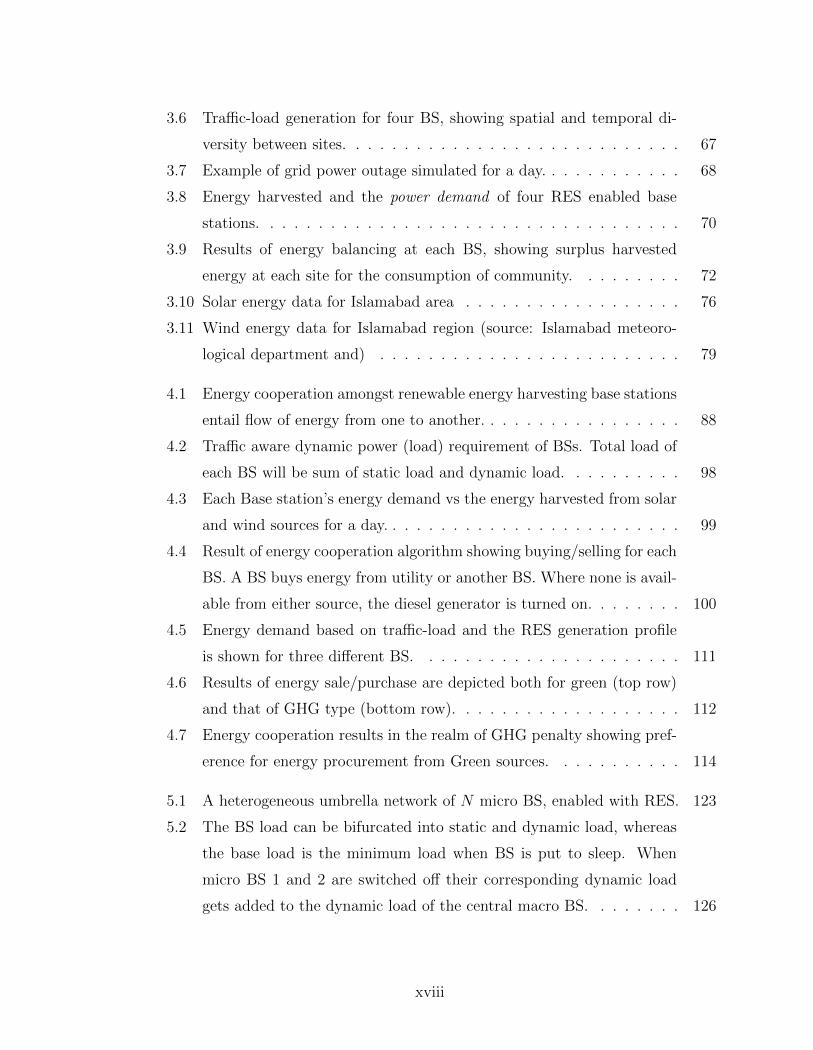
3.6 Traffic-load generation for four BS, showing spatial and temporal di-
versity between sites. . . . . . . . . . . . . . . . . . . . . . . . . . . . 67
3.7 Example of grid power outage simulated for a day. . . . . . . . . . . . 68
3.8 Energy harvested and the power demand of four RES enabled base
stations. . . . . . . . . . . . . . . . . . . . . . . . . . . . . . . . . . . 70
3.9 Results of energy balancing at each BS, showing surplus harvested
energy at each site for the consumption of community. . . . . . . . . 72
3.10 Solar energy data for Islamabad area . . . . . . . . . . . . . . . . . . 76
3.11 Wind energy data for Islamabad region (source: Islamabad meteoro-
logical department and) . . . . . . . . . . . . . . . . . . . . . . . . . 79
4.1 Energy cooperation amongst renewable energy harvesting base stations
entail flow of energy from one to another. . . . . . . . . . . . . . . . . 88
4.2 Traffic aware dynamic power (load) requirement of BSs. Total load of
each BS will be sum of static load and dynamic load. . . . . . . . . . 98
4.3 Each Base station’s energy demand vs the energy harvested from solar
and wind sources for a day. . . . . . . . . . . . . . . . . . . . . . . . . 99
4.4 Result of energy cooperation algorithm showing buying/selling for each
BS. A BS buys energy from utility or another BS. Where none is avail-
able from either source, the diesel generator is turned on. . . . . . . . 100
4.5 Energy demand based on traffic-load and the RES generation profile
is shown for three different BS. . . . . . . . . . . . . . . . . . . . . . 111
4.6 Results of energy sale/purchase are depicted both for green (top row)
and that of GHG type (bottom row). . . . . . . . . . . . . . . . . . . 112
4.7 Energy cooperation results in the realm of GHG penalty showing pref-
erence for energy procurement from Green sources. . . . . . . . . . . 114
5.1 A heterogeneous umbrella network of N micro BS, enabled with RES. 123
5.2 The BS load can be bifurcated into static and dynamic load, whereas
the base load is the minimum load when BS is put to sleep. When
micro BS 1 and 2 are switched off their corresponding dynamic load
gets added to the dynamic load of the central macro BS. . . . . . . . 126
xviii
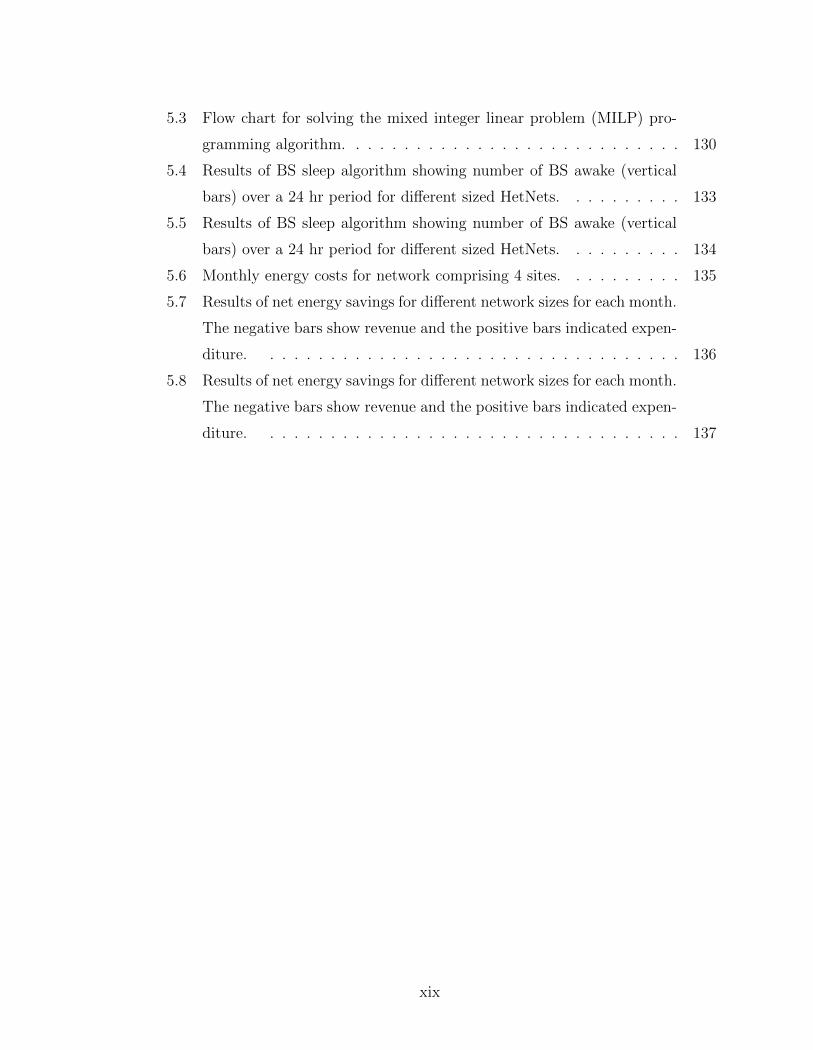
5.3 Flow chart for solving the mixed integer linear problem (MILP) pro-
gramming algorithm. . . . . . . . . . . . . . . . . . . . . . . . . . . . 130
5.4 Results of BS sleep algorithm showing number of BS awake (vertical
bars) over a 24 hr period for different sized HetNets. . . . . . . . . . 133
5.5 Results of BS sleep algorithm showing number of BS awake (vertical
bars) over a 24 hr period for different sized HetNets. . . . . . . . . . 134
5.6 Monthly energy costs for network comprising 4 sites. . . . . . . . . . 135
5.7 Results of net energy savings for different network sizes for each month.
The negative bars show revenue and the positive bars indicated expen-
diture. . . . . . . . . . . . . . . . . . . . . . . . . . . . . . . . . . . 136
5.8 Results of net energy savings for different network sizes for each month.
The negative bars show revenue and the positive bars indicated expen-
diture. . . . . . . . . . . . . . . . . . . . . . . . . . . . . . . . . . . 137
xix

Chapter 1
Background and Motivation
1
1.1 Introduction
Wireless communication has seen exponential growth in the past few decades due to
advancements in digital communication technologies resulting in emerging wireless
technologies such as LTE-A and WiMAX. Resultantly, wireless communication is be-
coming the main choice of consumers for voice as well data communication. However,
the increasing voice, data and internet services are costing heavy on resources. The
consequent resource constraint is, therefore, driving the technology developers to look
for resource optimization solutions in all domains, particularly energy.
Over the past decade concepts such as energy conservation and energy efficiency
have found their way into all technology sectors including information and commu-
nication technology (ICT). The reason is twofold; firstly, the rising operating cost of
powering the energy intensive systems is being felt all over as technology encompasses
every facet of our lives. Secondly, the ICT industry, being the fastest growing sector,
realizes its obligation in reducing harmful CO2 emissions attributed towards it [2].
Amongst the sub-sectors of ICT, the telecomm sector in general and cellular net-
works in particular have shown huge potential for improvements in energy efficiency
and converting systems on clean (renewable) sources of energy. As a result, communi-
cation technologies are not only focused on spectrum management and throughput or
quality of service (QoS) anymore. Rather, a new paradigm has come in, i.e., energy
efficiency with reduced carbon footprint, also called green communication [3].
Green communication has thus become a realistic goal for which new ways and
means are being explored by the industry. [4–8]. Thus, a lot of research has been
undertaken in this regard in recent years as over viewed in literature. Recent research
shows that powering BSs with renewable energy is technically feasible. Although
installation cost of energy from non-renewable energy sources is still lower than RES,
optimized use of the two can yield the best results. Renewable energy sources are
2
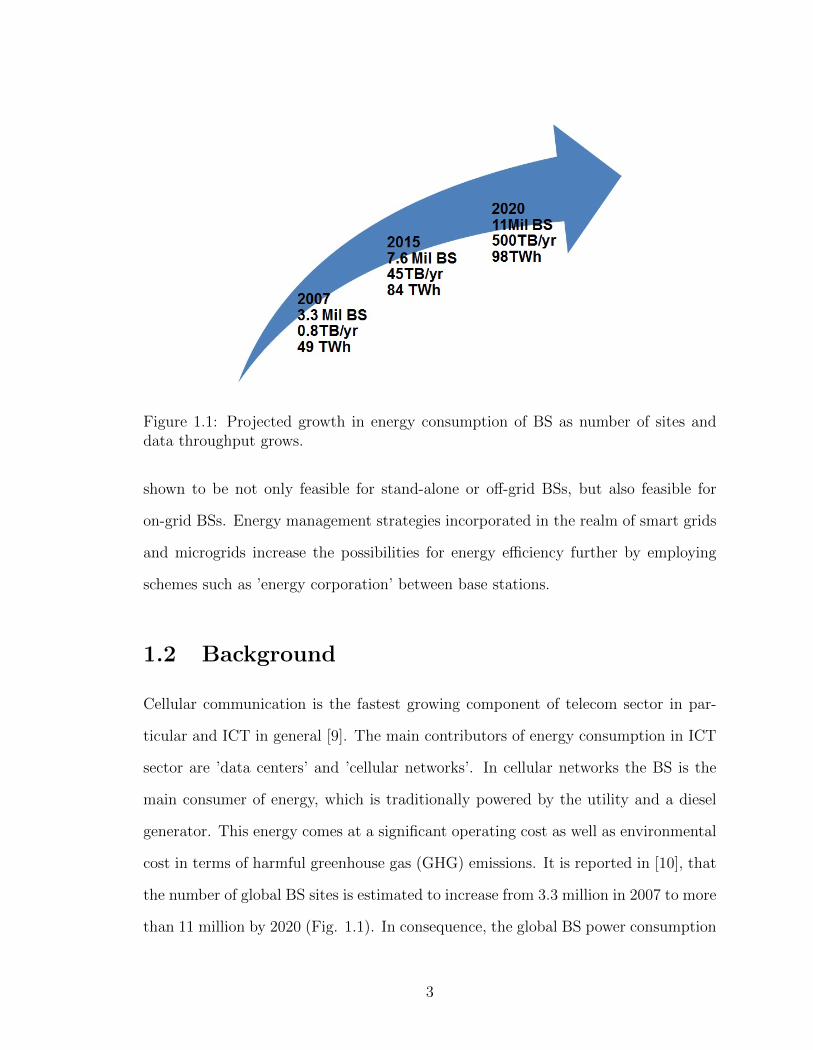
Figure 1.1: Projected growth in energy consumption of BS as number of sites anddata throughput grows.
shown to be not only feasible for stand-alone or off-grid BSs, but also feasible for
on-grid BSs. Energy management strategies incorporated in the realm of smart grids
and microgrids increase the possibilities for energy efficiency further by employing
schemes such as ’energy corporation’ between base stations.
1.2 Background
Cellular communication is the fastest growing component of telecom sector in par-
ticular and ICT in general [9]. The main contributors of energy consumption in ICT
sector are ’data centers’ and ’cellular networks’. In cellular networks the BS is the
main consumer of energy, which is traditionally powered by the utility and a diesel
generator. This energy comes at a significant operating cost as well as environmental
cost in terms of harmful greenhouse gas (GHG) emissions. It is reported in [10], that
the number of global BS sites is estimated to increase from 3.3 million in 2007 to more
than 11 million by 2020 (Fig. 1.1). In consequence, the global BS power consumption
3
is envisaged to grow from 49 TWh in 2007 to 98 TWh in 2020 [11]. Thus improvement
in the energy efficiency of cellular networks is the need of the hour. Improving energy
efficiency in cellular networks involves energy reduction of all network elements, such
as mobile core network, mobile switching centers, base stations (BS), mobile back
haul networks, and mobile terminals [12,13].
Amongst the mentioned elements, a BS is the most energy hungry component,
consuming more than 50% of the total energy required by the network [14], as depicted
in Fig. 1.2. For the BS of a 4G and LTE network this ratio increases to 75-80%
[4]. Thus, BSs have become the prime focus of research for energy efficiency as
far as cellular communication is concerned. A BS is designed to operate at full
capacity whether it is operating at peak traffic hours or off-peak hours. Thus BSs are
not optimized for energy consumption in accordance to the varying traffic conditions
and operate constantly at one energy level. This introduces the notion of energy
conservation through schemes such as energy cooperation and BS sleep mode. These
energy management schemes gain more significance for BS equipped with renewable
energy sources such as solar panels and wind turbines.
Green wireless communication can be described as a set of concepts and frame-
works put together to improve the energy efficiency of communication systems. The
research on RES enabled cellular networks is relatively new and there are many is-
sues/challenges that are under investigation. Efficient management of the energy
resources - grid, generator, renewable - is the fundamental objective. In modeling a
cellular network supported by RES, the objectives are to determine the most advan-
tageous network characteristics, in terms of density and topology of BSs and RESs.
The energy management strategies such as sleep algorithms, BS energy cooperation,
multi-cell cooperation, on/off switching of BSs etc, have been employed so as to si-
multaneously provide the desired QoS to end users, power the BSs with RES systems,
and minimize the overall network energy cost [15]. For example the scholars in [16],
4
Retail
Data Centre
Core Transmission
Mobile Switching
Base Station
Figure 1.2: Power consumption of cellular elements of mobile communication, withBS consuming upto 60% of network energy.
have demonstrated that it is possible to save energy by optimizing the sleep cycles
of a BS. We take a closer look at some of the pertinent optimization strategies in
chapter 2, including scenarios where BSs cooperate with each other and share their
resources.
1.2.1 Rising Energy Needs and GHG Emissions
We have experienced exponential growth in technology over the last century, resulting
in an equal increase in demand for energy, especially electrical energy. Although
the overall growth in electrical power generation remains sensitive to factors such as
country’s income levels, its regional resources, urbanization rates and supply risks [17],
the global energy requirement is estimated to increase by 37% from 2013 to 2035,
which is equal to an average increase of 1.4% per year [18]. This demand is being
met from fossil fuels i.e., coal, oil and natural gas that meet 80% of the worlds
requirement. The other 20% comes from a mix of renewable, hydro and nuclear
5
sources [19]. Coal remains the biggest contributor of electricity generation (40%),
whereas renewables amount to mere 5% (this ratio is fast improving though). As
noted in [20], electricity consumption in 2005 globally stood at 2 TW, which required
an energy consumption worth 5 TW because of the poor efficiency of power plants,
which is about 38% (The new generation of gas-fired plants reaches a substantially
higher efficiency of 55%). in a detailed review of the global energy outlook, the EIA
(Energy Information Administration) of US, IEA (International Energy Agency) and
BP (British Petroleum), have all reported in their reports that the global consumption
of oil and its equivalents is likely to double from its 2009 figure of 9 billion toe (tons
of oil equivalents) to almost 18 billion toe, by the year 2035 [21].
Mankind is paying a heavy price for the manifold increase of energy consumption
in the form of the harmful GHG emissions, resulting in adverse effects on climate [22].
Use of fossil fuels have caused record high levels of CO2 emissions in the atmosphere,
reaching in excess of 410 PPM (parts per million) in pollution. This has resulted in
world wide temperature increase by an average of 2.3oF as compared to the temper-
atures in year 1900, and the trend remains upward [23]. The International panel on
climate change, as well as other world bodies have clearly stated that these adverse
effects can only be mitigated by cutting down on GHG emissions in every sector.
The unprecedented growth of technology in all sectors is causing this rise and ICT
sector is no exception. Although ICT is not contributing in CO2e emissions as much
as some other sectors such as transportation and construction, it is the fastest grow-
ing of all. ICTs are also the key to reducing harmful emissions as advancements
are made in these technologies and has the potential to help all other sectors since
ICTs are embedded in most other technologies. The main contributors of GHG emis-
sions in the information and communication technology sector are telecommunication
infrastructure, PCs & peripherals, and the data centres [9].
6
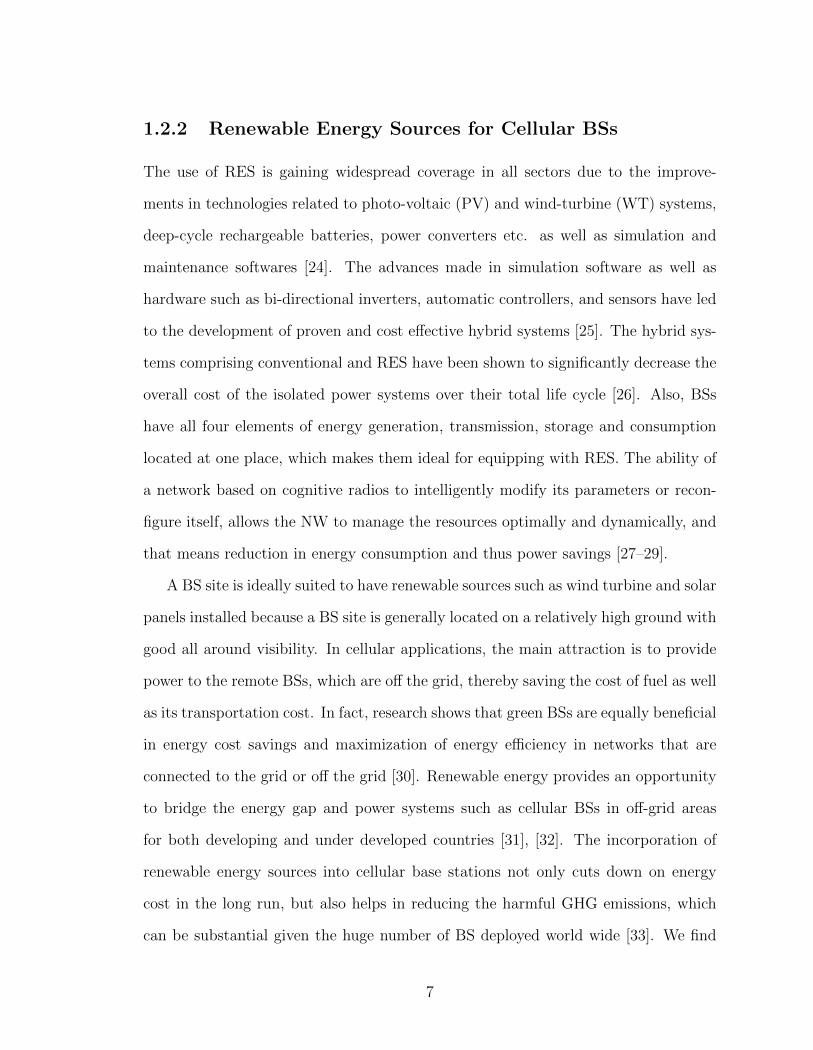
1.2.2 Renewable Energy Sources for Cellular BSs
The use of RES is gaining widespread coverage in all sectors due to the improve-
ments in technologies related to photo-voltaic (PV) and wind-turbine (WT) systems,
deep-cycle rechargeable batteries, power converters etc. as well as simulation and
maintenance softwares [24]. The advances made in simulation software as well as
hardware such as bi-directional inverters, automatic controllers, and sensors have led
to the development of proven and cost effective hybrid systems [25]. The hybrid sys-
tems comprising conventional and RES have been shown to significantly decrease the
overall cost of the isolated power systems over their total life cycle [26]. Also, BSs
have all four elements of energy generation, transmission, storage and consumption
located at one place, which makes them ideal for equipping with RES. The ability of
a network based on cognitive radios to intelligently modify its parameters or recon-
figure itself, allows the NW to manage the resources optimally and dynamically, and
that means reduction in energy consumption and thus power savings [27–29].
A BS site is ideally suited to have renewable sources such as wind turbine and solar
panels installed because a BS site is generally located on a relatively high ground with
good all around visibility. In cellular applications, the main attraction is to provide
power to the remote BSs, which are off the grid, thereby saving the cost of fuel as well
as its transportation cost. In fact, research shows that green BSs are equally beneficial
in energy cost savings and maximization of energy efficiency in networks that are
connected to the grid or off the grid [30]. Renewable energy provides an opportunity
to bridge the energy gap and power systems such as cellular BSs in off-grid areas
for both developing and under developed countries [31], [32]. The incorporation of
renewable energy sources into cellular base stations not only cuts down on energy
cost in the long run, but also helps in reducing the harmful GHG emissions, which
can be substantial given the huge number of BS deployed world wide [33]. We find
7
CONTROL
UTILITY
Figure 1.3: Base stations harvesting green energy may have surplus energy that canbe shared with other base stations through ’Energy Cooperation’.
many studies in literature related to feasibilities on equipping a BS with wind turbines
(WT) and PV panels. The sizing and capacity modeling is carried out using factual
site data as well as simulations carried out using softwares such as HOMER [34]. For
example, the sizing and capacity of a WT or PV array may be carried out using the
availability of natural resources as per the ’most unfavourable month’1 method.
1.2.3 Energy Cooperation in RES Enabled Cellular Networks
Green cellular networks can maximize the use of clean energy harvested from nature
by employing different techniques such as cell zooming, BS on/off switching and en-
ergy cooperation between BSs etc. The basic approach in multi cell cooperation is
to adjust the cells by switching off BSs while associating users with neighbor cells
1The data for the month having least favourable wind/solar conditions is used as basis forcalculations.
8
by extending their coverage area, which requires centralized channel state informa-
tion and traffic load information of every cell. Another is expanding coverage of BSs
powered by RES while constricting the coverage area of BS powered by grid. Co-
ordinated multi point (CoMP) transmission by BSs is another technique in which
BSs cooperatively transmit data to cell edge users, which requires joint processing
and coordinated scheduling strategies by the BSs interconnected on high speed data
links. There are two fundamental aspects associated with on/off switching of BSs,
how to associate users from one BS to another BS without compromising users’ QoS
[35], and, how to perform the on/off mechanism on a BS; centrally or locally?
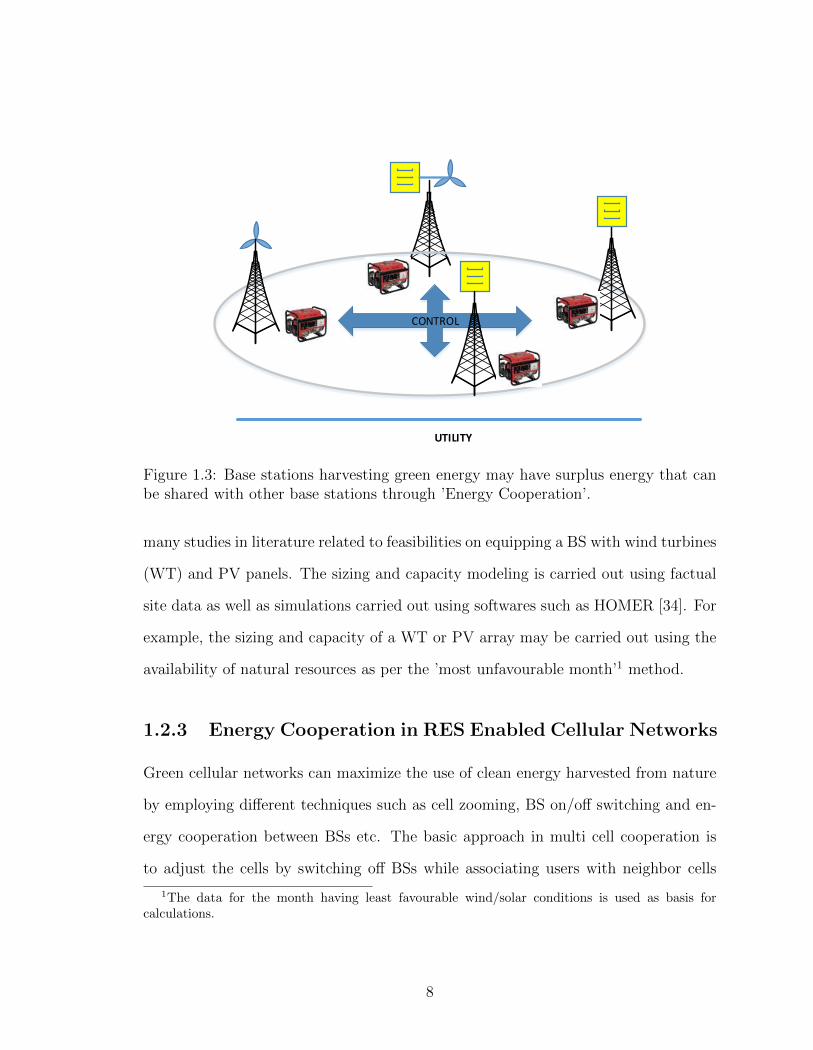
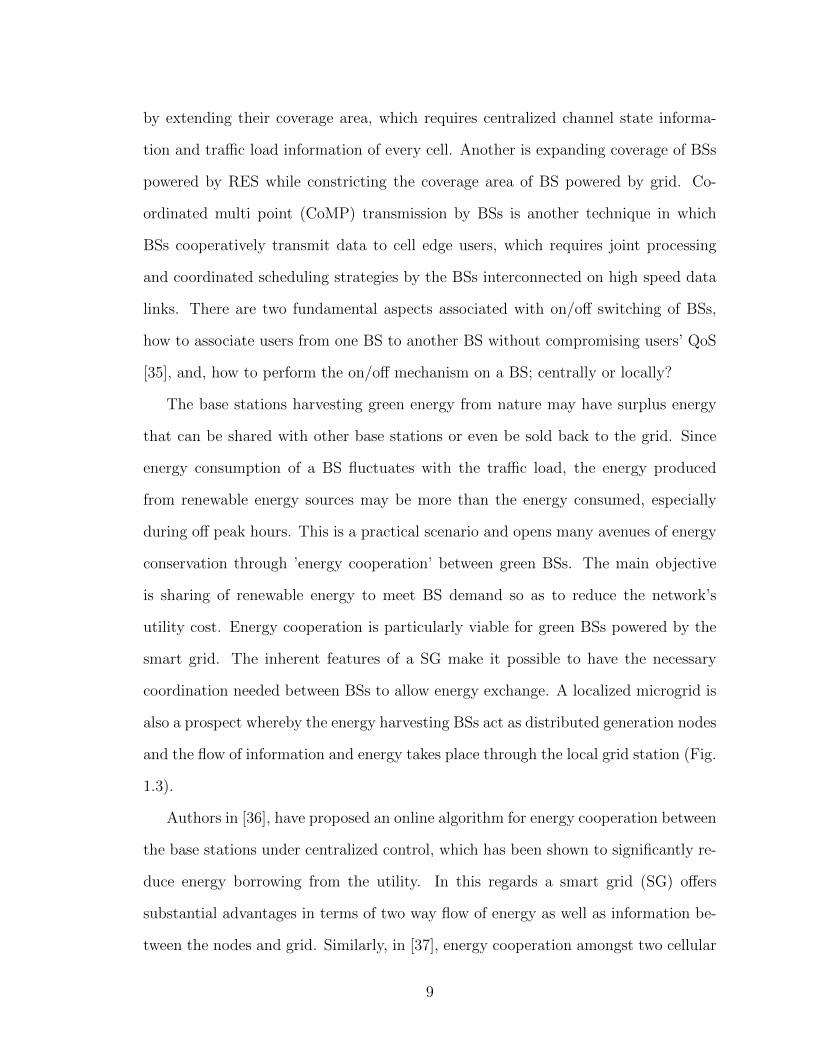
The base stations harvesting green energy from nature may have surplus energy
that can be shared with other base stations or even be sold back to the grid. Since
energy consumption of a BS fluctuates with the traffic load, the energy produced
from renewable energy sources may be more than the energy consumed, especially
during off peak hours. This is a practical scenario and opens many avenues of energy
conservation through ’energy cooperation’ between green BSs. The main objective
is sharing of renewable energy to meet BS demand so as to reduce the network’s
utility cost. Energy cooperation is particularly viable for green BSs powered by the
smart grid. The inherent features of a SG make it possible to have the necessary
coordination needed between BSs to allow energy exchange. A localized microgrid is
also a prospect whereby the energy harvesting BSs act as distributed generation nodes
and the flow of information and energy takes place through the local grid station (Fig.
1.3).
Authors in [36], have proposed an online algorithm for energy cooperation between
the base stations under centralized control, which has been shown to significantly re-
duce energy borrowing from the utility. In this regards a smart grid (SG) offers
substantial advantages in terms of two way flow of energy as well as information be-
tween the nodes and grid. Similarly, in [37], energy cooperation amongst two cellular
9
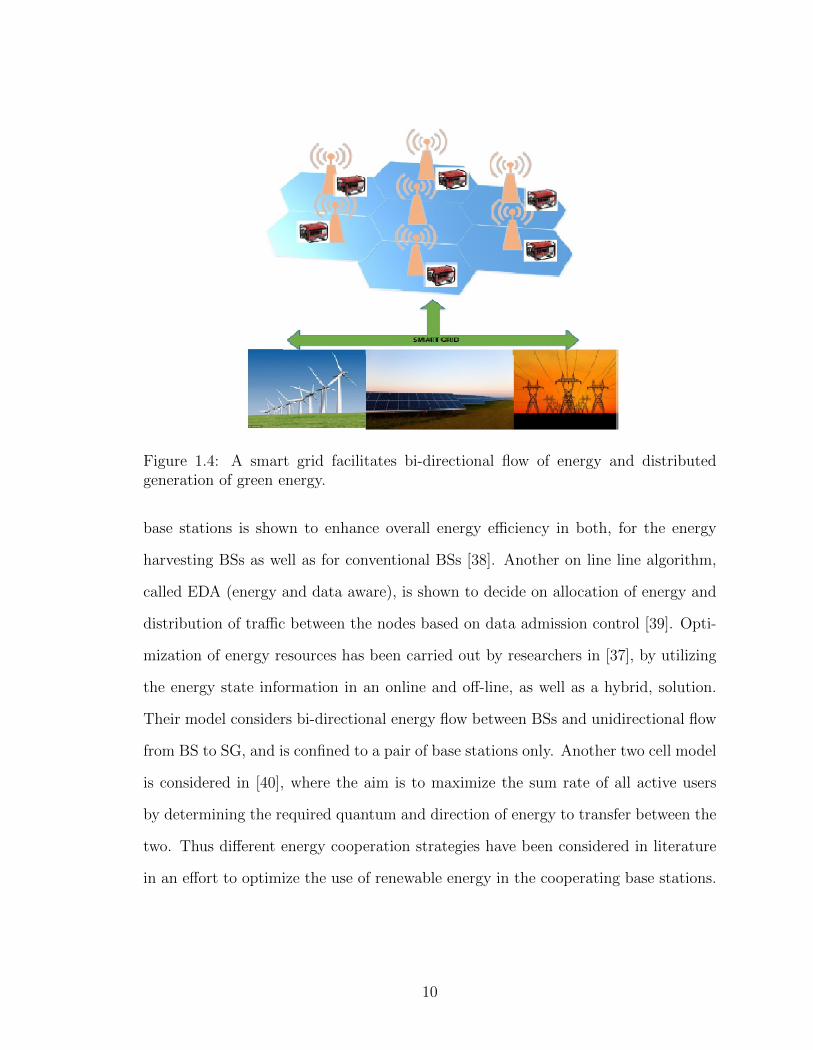
Figure 1.4: A smart grid facilitates bi-directional flow of energy and distributedgeneration of green energy.
base stations is shown to enhance overall energy efficiency in both, for the energy
harvesting BSs as well as for conventional BSs [38]. Another on line line algorithm,
called EDA (energy and data aware), is shown to decide on allocation of energy and
distribution of traffic between the nodes based on data admission control [39]. Opti-
mization of energy resources has been carried out by researchers in [37], by utilizing
the energy state information in an online and off-line, as well as a hybrid, solution.
Their model considers bi-directional energy flow between BSs and unidirectional flow
from BS to SG, and is confined to a pair of base stations only. Another two cell model
is considered in [40], where the aim is to maximize the sum rate of all active users
by determining the required quantum and direction of energy to transfer between the
two. Thus different energy cooperation strategies have been considered in literature
in an effort to optimize the use of renewable energy in the cooperating base stations.
10
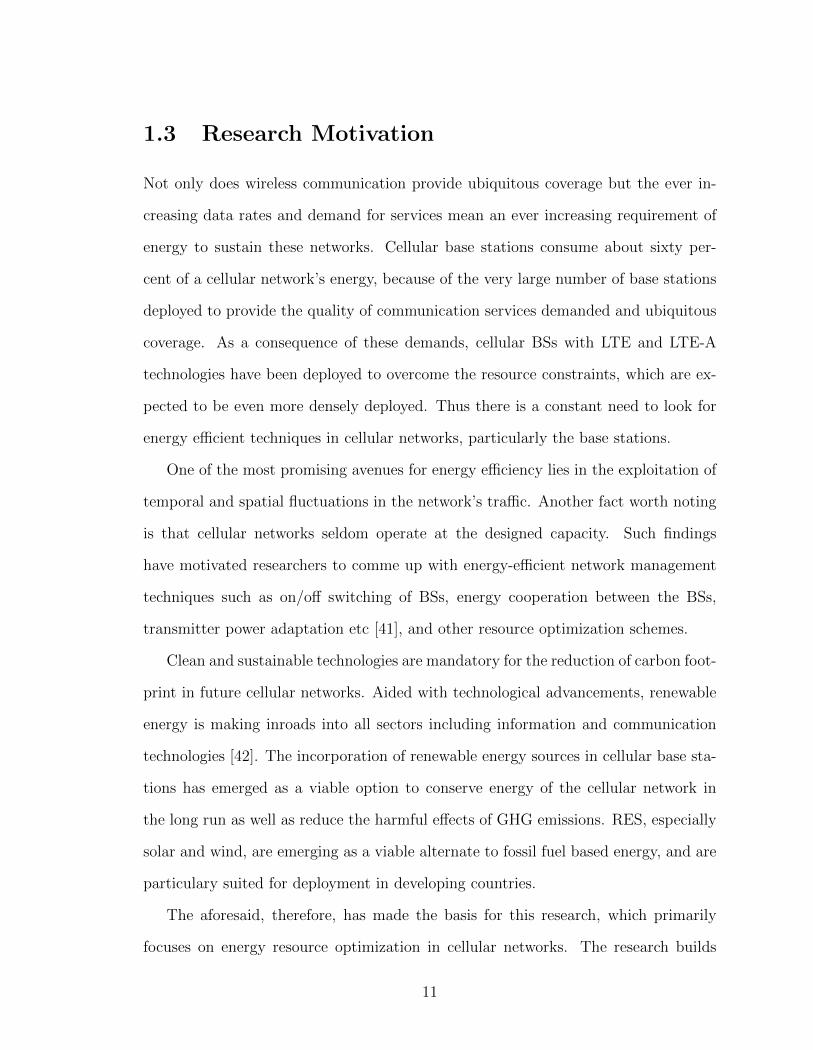
1.3 Research Motivation
Not only does wireless communication provide ubiquitous coverage but the ever in-
creasing data rates and demand for services mean an ever increasing requirement of
energy to sustain these networks. Cellular base stations consume about sixty per-
cent of a cellular network’s energy, because of the very large number of base stations
deployed to provide the quality of communication services demanded and ubiquitous
coverage. As a consequence of these demands, cellular BSs with LTE and LTE-A
technologies have been deployed to overcome the resource constraints, which are ex-
pected to be even more densely deployed. Thus there is a constant need to look for
energy efficient techniques in cellular networks, particularly the base stations.
One of the most promising avenues for energy efficiency lies in the exploitation of
temporal and spatial fluctuations in the network’s traffic. Another fact worth noting
is that cellular networks seldom operate at the designed capacity. Such findings
have motivated researchers to comme up with energy-efficient network management
techniques such as on/off switching of BSs, energy cooperation between the BSs,
transmitter power adaptation etc [41], and other resource optimization schemes.
Clean and sustainable technologies are mandatory for the reduction of carbon foot-
print in future cellular networks. Aided with technological advancements, renewable
energy is making inroads into all sectors including information and communication
technologies [42]. The incorporation of renewable energy sources in cellular base sta-
tions has emerged as a viable option to conserve energy of the cellular network in
the long run as well as reduce the harmful effects of GHG emissions. RES, especially
solar and wind, are emerging as a viable alternate to fossil fuel based energy, and are
particulary suited for deployment in developing countries.
The aforesaid, therefore, has made the basis for this research, which primarily
focuses on energy resource optimization in cellular networks. The research builds
11
on actual modeling of a BS’s traffic based energy consumption and the power ob-
tained from hybrid renewable energy sources. The viability of powering BSs with
solar/wind energy systems is done for specific area. Based on these energy genera-
tion/consumption values, the viability of energy cooperation can be evaluated under a
simple energy sharing mechanism in microgrid to a complex mechanism incorporating
BS on/off switching. A business case for implementing the RES in cellular BSs is a
promising domain to prove the efficacy of these systems. It is, however, an empirical
analysis that can be taken up for further research in this area. There are studies,
also referred in the thesis, that do cost analysis of RES in BSs at various sites, that
prove its financial viability in the long run. This dissertation focuses on the novelty of
resource optimization through energy cooperation and sleep mechanism. A business
case study employing HOMER software will be considered for future research.
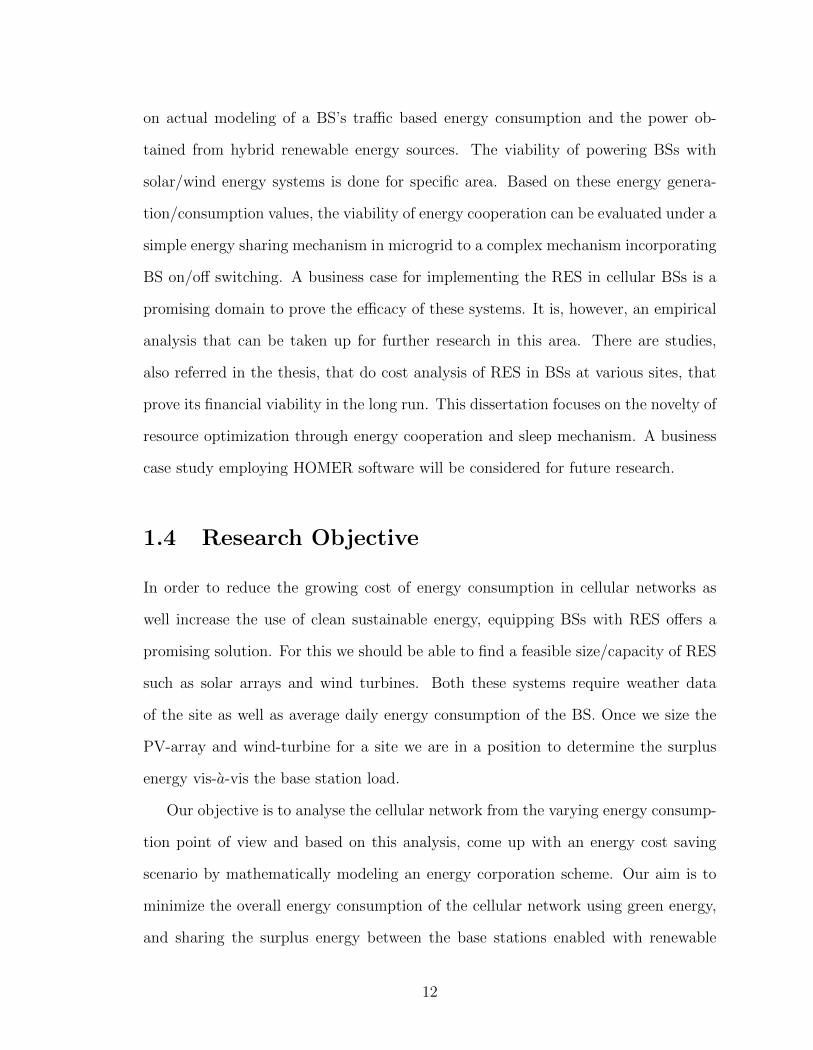
1.4 Research Objective
In order to reduce the growing cost of energy consumption in cellular networks as
well increase the use of clean sustainable energy, equipping BSs with RES offers a
promising solution. For this we should be able to find a feasible size/capacity of RES
such as solar arrays and wind turbines. Both these systems require weather data
of the site as well as average daily energy consumption of the BS. Once we size the
PV-array and wind-turbine for a site we are in a position to determine the surplus
energy vis-a-vis the base station load.
Our objective is to analyse the cellular network from the varying energy consump-
tion point of view and based on this analysis, come up with an energy cost saving
scenario by mathematically modeling an energy corporation scheme. Our aim is to
minimize the overall energy consumption of the cellular network using green energy,
and sharing the surplus energy between the base stations enabled with renewable
12
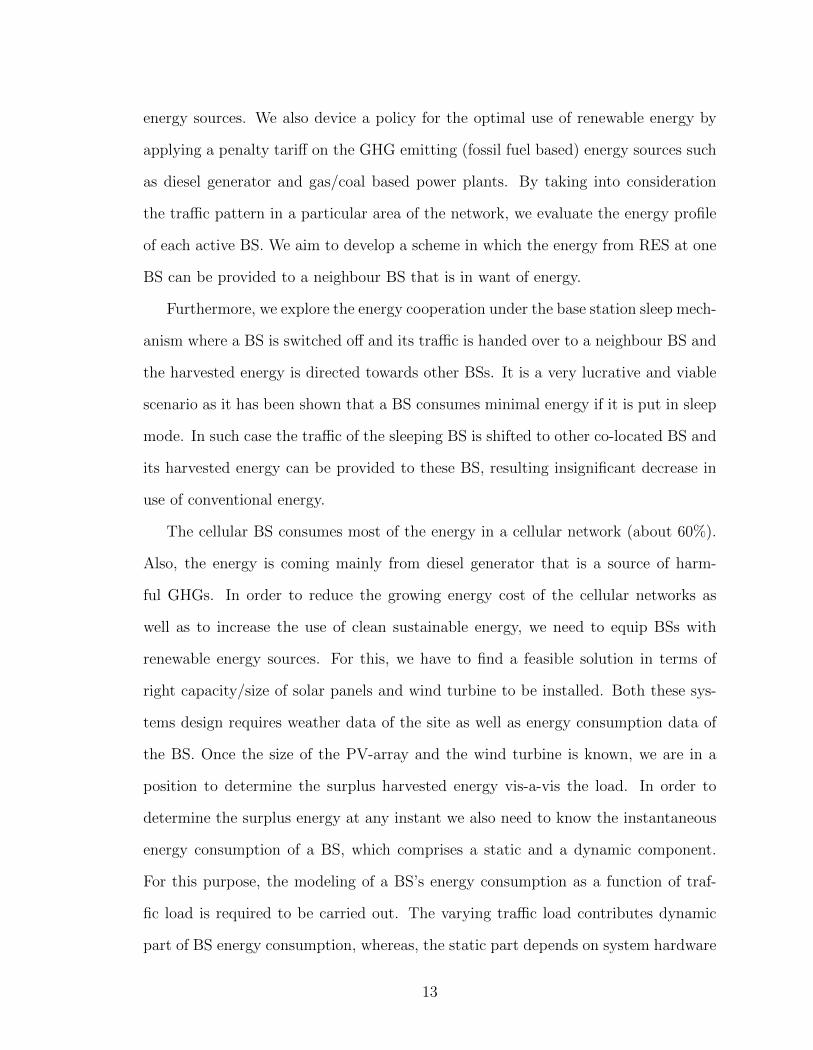
energy sources. We also device a policy for the optimal use of renewable energy by
applying a penalty tariff on the GHG emitting (fossil fuel based) energy sources such
as diesel generator and gas/coal based power plants. By taking into consideration
the traffic pattern in a particular area of the network, we evaluate the energy profile
of each active BS. We aim to develop a scheme in which the energy from RES at one
BS can be provided to a neighbour BS that is in want of energy.
Furthermore, we explore the energy cooperation under the base station sleep mech-
anism where a BS is switched off and its traffic is handed over to a neighbour BS and
the harvested energy is directed towards other BSs. It is a very lucrative and viable
scenario as it has been shown that a BS consumes minimal energy if it is put in sleep
mode. In such case the traffic of the sleeping BS is shifted to other co-located BS and
its harvested energy can be provided to these BS, resulting insignificant decrease in
use of conventional energy.
The cellular BS consumes most of the energy in a cellular network (about 60%).
Also, the energy is coming mainly from diesel generator that is a source of harm-
ful GHGs. In order to reduce the growing energy cost of the cellular networks as
well as to increase the use of clean sustainable energy, we need to equip BSs with
renewable energy sources. For this, we have to find a feasible solution in terms of
right capacity/size of solar panels and wind turbine to be installed. Both these sys-
tems design requires weather data of the site as well as energy consumption data of
the BS. Once the size of the PV-array and the wind turbine is known, we are in a
position to determine the surplus harvested energy vis-a-vis the load. In order to
determine the surplus energy at any instant we also need to know the instantaneous
energy consumption of a BS, which comprises a static and a dynamic component.
For this purpose, the modeling of a BS’s energy consumption as a function of traf-
fic load is required to be carried out. The varying traffic load contributes dynamic
part of BS energy consumption, whereas, the static part depends on system hardware
13
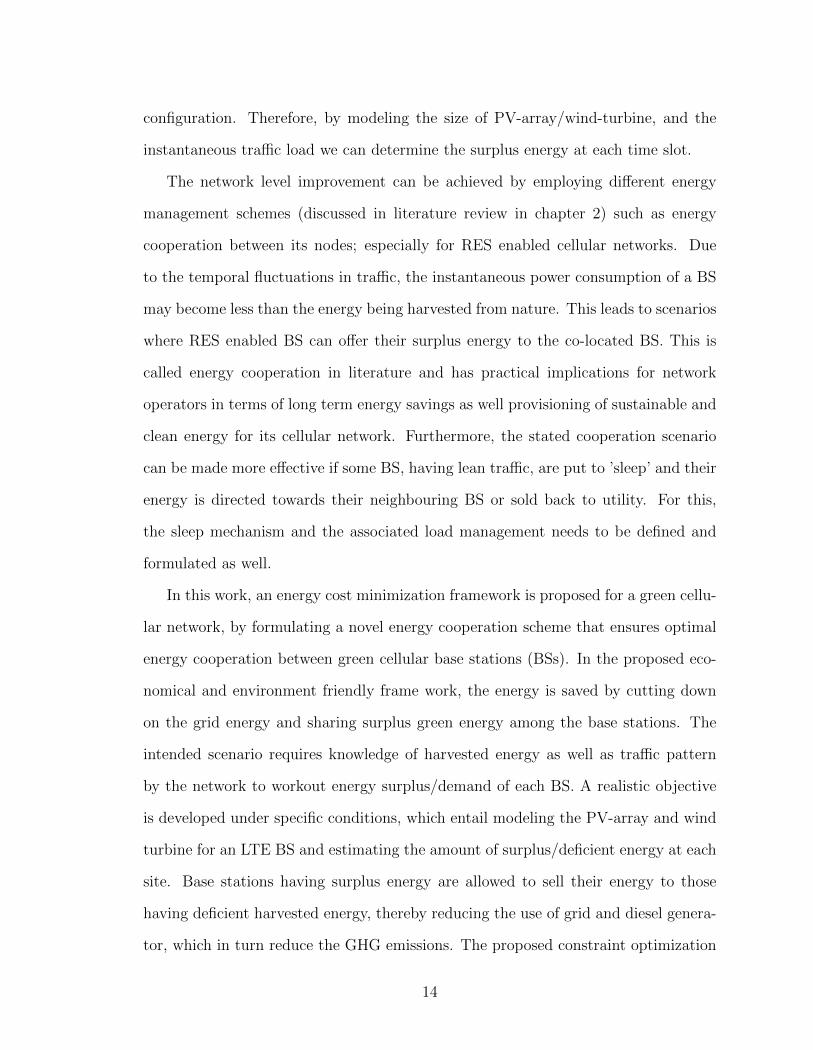
configuration. Therefore, by modeling the size of PV-array/wind-turbine, and the
instantaneous traffic load we can determine the surplus energy at each time slot.
The network level improvement can be achieved by employing different energy
management schemes (discussed in literature review in chapter 2) such as energy
cooperation between its nodes; especially for RES enabled cellular networks. Due
to the temporal fluctuations in traffic, the instantaneous power consumption of a BS
may become less than the energy being harvested from nature. This leads to scenarios
where RES enabled BS can offer their surplus energy to the co-located BS. This is
called energy cooperation in literature and has practical implications for network
operators in terms of long term energy savings as well provisioning of sustainable and
clean energy for its cellular network. Furthermore, the stated cooperation scenario
can be made more effective if some BS, having lean traffic, are put to ’sleep’ and their
energy is directed towards their neighbouring BS or sold back to utility. For this,
the sleep mechanism and the associated load management needs to be defined and
formulated as well.
In this work, an energy cost minimization framework is proposed for a green cellu-
lar network, by formulating a novel energy cooperation scheme that ensures optimal
energy cooperation between green cellular base stations (BSs). In the proposed eco-
nomical and environment friendly frame work, the energy is saved by cutting down
on the grid energy and sharing surplus green energy among the base stations. The
intended scenario requires knowledge of harvested energy as well as traffic pattern
by the network to workout energy surplus/demand of each BS. A realistic objective
is developed under specific conditions, which entail modeling the PV-array and wind
turbine for an LTE BS and estimating the amount of surplus/deficient energy at each
site. Base stations having surplus energy are allowed to sell their energy to those
having deficient harvested energy, thereby reducing the use of grid and diesel genera-
tor, which in turn reduce the GHG emissions. The proposed constraint optimization
14
framework for energy cooperation has bilinear non-convex structure. In order to
convexify the optimization problem we use McCormick envelopes and transform the
bilinear non-convex optimization framework into linear optimization framework. The
numerical results verify the effectiveness of the proposed traffic aware sustainable and
environmental friendly base station operation through energy cooperation (TASEEC).
Keeping in view the futuristic HetNets in evolving 5G network topologies, the energy
cooperation mathematical framework is expanded to an umbrella network of micro
base stations and a central macro BS. The micro BS are put to sleep and their traffic
is directed to the macro BS, whereas the surplus renewable energy is sold to utility.
The main task of the modified algorithm is to determine the quantum of energy and
traffic diverted.
1.5 Thesis Overview
The thesis is divided into six different chapters, each chapter dealing with a distinct
topic of research undertaken. An overview of different aspects of the work is pre-
sented in this chapter i.e., background, research motivation and problem description,
after which more elaborate detail is presented in subsequent chapters, as enumerated
below:-
1.5.1 Chapter 2 : Energy Optimization in RES Enabled Cel-
lular Networks
In chapter 2 a detailed description of the ongoing energy resource management
schemes under research is presented. These include energy management strategies
for both stand-alone and grid connected base stations/cellular networks enabled with
renewable energy sources. These strategies include energy cooperation and BS sleep
strategy, amongst other network energy saving schemes.
15
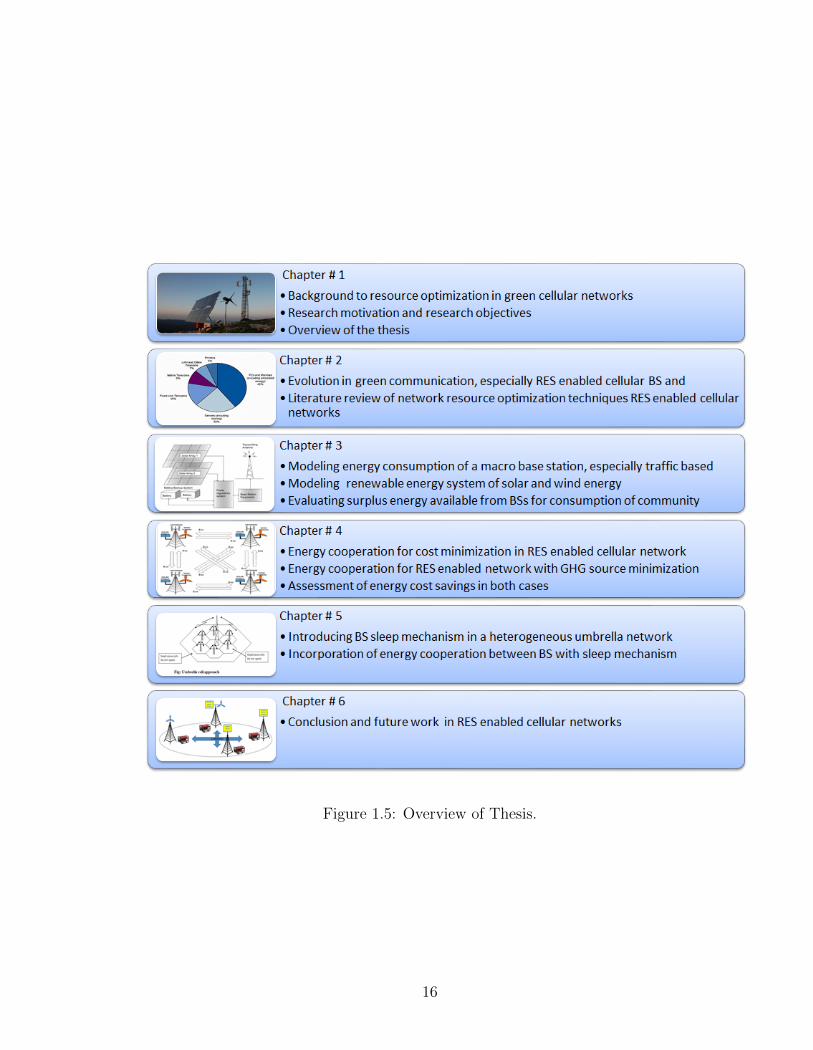
Figure 1.5: Overview of Thesis.
16
1.5.2 Chapter 3 : Modeling Renewable Energy Sources for
Base Station
In this chapter we understand the dynamics of power consumption in a base station
serving the traffic and model the renewable sources of solar and wind to sustain the
load of a BS. We find out the energy consumed by a cellular LTE base station and
observe that some surplus harvested energy is available to us for other use, such as
serving local community through net metering.
1.5.3 Chapter 4 : Sustainable Energy Cooperation in Base
Stations
Based on the work derived in chapter 3 we formulate an energy cooperation scenario
in which the BSs are asses the energy generated and energy being consumed, based on
which they offer the surplus energy to neighboring BSs. The two way flow of energy
takes place under certain constraints that ensure a practical framework for the said
cooperation between the cellular BSs.
1.5.4 Chapter 5 : Energy Cooperation with BS Sleep Mech-
anism
It has been established that BS operate well below their maximum capacity most of
the time. This has led researchers to discuss the notion of sleep mechanism for the
BS in order to conserve resources. The on/off switching technique and algorithm is
developed that address this scenario in particular over and above the energy coopera-
tion scheme developed in the previous chapter. The merger of the two further boosts
the utilization of renewable energy sources incorporated into cellular BSs.
17
1.5.5 Chapter 6 : Conclusion and Future Work
In chapter six, the last chapter, the research work is concluded and consolidated. The
futuristic scenario of LTE/LTE-A cellular BSs, renewable energy sources and smart
grid are analysed, which is the way forward. Other emerging systems such as C-RAN,
cooperative relays and cognitive networks are also discussed in relation to research
carried out here.
1.6 Summary
As mobile communication evolves, focus remained on the performance metrics such
as QoS, throughput and reliability/coverage, with hardly any emphasis on the energy
consumption of the network. However, as the networks became diverse and dense, and
realization about harmful GHG emissions increased, energy efficiency/conservation
became an area of concern. Thus, a new paradigm called ’green communication’
emerged, that aimed to explore the ways and means to reduce energy consumption
through green techniques such as energy cooperation and incorporate the RES to
mitigate the harmful CO2 emissions by harvesting green energy.
A host of component, system and network level research areas have emerged that
explore green communication and related fields. In this dissertation a network level
resource optimization scheme has been developed that not only focuses on energy
efficiency but also on incorporation of renewable energy systems. A realistic scenario
has been considered in this work to implement the aforesaid paradigm. A solar and
wind energy based hybrid system is developed by catering the weather conditions of
Islamabad region and compared with the daily energy consumption of a macro BS. It
is shown that surplus energy is available from such a hybrid system during off peak
hours that can not only be provided to community through a microgrid but can also be
18
made available to other BS through a novel energy cooperation scheme. Furthermore,
the self organizing network (SON) feature being gradually incorporated as a 3GPP
standard, has been exploited in chapter 5 to make use of the sleep mechanism (a
very promising research area) of BS in HetNet of micro and macro BS. Thus, the
green paradigm developed in the study highlights the efficacy of incorporating RES
on cellular BS under different energy cooperation strategies.
19
1.7 Publications
The following contributions have been made to the research community by the author
of this dissertation, thus far.
� Faran Ahmed, Muhammad Naeem, Muhammad Iqbal, Alagan Anpalagan, ”ICT
and renewable energy : a way forward towards the next generation telecom base
station”, Telecommunication Systems, Springer, Volume: 64 Issue: 1 Pages:
4356, 2017
� Faran Ahmed, Muhammad Naeem, Muhammad Iqbal, Waleed Ejaz, Alagan
Anpalagan, ”Resource management in cellular base stations powered by renew-
able energy sources”, Journal of Networks and Computer Applications, Elsevier.
1084-8045, Vol 112 (2018).
� Faran Ahmed, Muhammad Naeem, Muhammad Iqbal, Waleed Ejaz, Alagan An-
palagan, ”Sustainable and Environment Friendly Energy Cooperation in Cel-
lular Networks”, Applied Energy, Elsevier. ID: APEN-D-17-07742. (Under
Review)
� Faran Ahmed, Muhammad Naeem, Muhammad Iqbal, Waleed Ejaz, Alagan
Anpalagan, ”Renewable Energy Assisted Traffic Aware Cellular Base Station
Energy Cooperation”, Energies, MDPI, Volume 11, Issue: 1.
� Faran Ahmed, Muhammad Naeem, Muhammad Iqbal, Alagan Anpalagan, ”Re-
newable Energy Assisted Base Station Collaboration as Microgrid”, IEEE Elec-
trical Power and Energy Conference (EPEC) proceedings, Ontario, Canada,
978-1-5090-1919-9/16, 2016.
� Faran Ahmed, Muhammad Naeem, Muhammad Iqbal, ”Optimal Green Policy
for Energy Sharing by Cellular Base Stations Powered by Renewable Energy
20

Sources”, International Conference on Vehicular, Mobile and Wearable Tech-
nology (ICVMWT), Istanbul, Turkey, Conference proceedings, pp. 16-21, 2017.
21
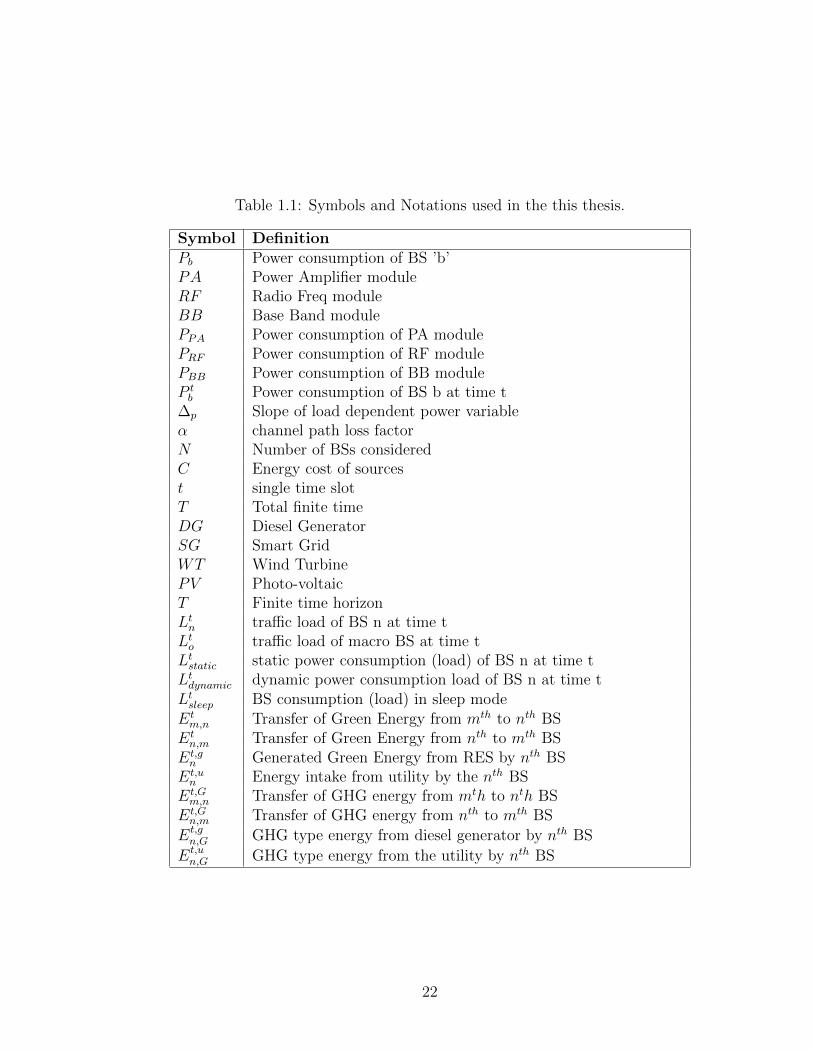
Table 1.1: Symbols and Notations used in the this thesis.
Symbol DefinitionPb Power consumption of BS ’b’PA Power Amplifier moduleRF Radio Freq moduleBB Base Band modulePPA Power consumption of PA modulePRF Power consumption of RF modulePBB Power consumption of BB moduleP tb Power consumption of BS b at time t
∆p Slope of load dependent power variableα channel path loss factorN Number of BSs consideredC Energy cost of sourcest single time slotT Total finite timeDG Diesel GeneratorSG Smart GridWT Wind TurbinePV Photo-voltaicT Finite time horizonLtn traffic load of BS n at time tLto traffic load of macro BS at time tLtstatic static power consumption (load) of BS n at time tLtdynamic dynamic power consumption load of BS n at time tLtsleep BS consumption (load) in sleep modeEtm,n Transfer of Green Energy from mth to nth BS
Etn,m Transfer of Green Energy from nth to mth BS
Et,gn Generated Green Energy from RES by nth BS
Et,un Energy intake from utility by the nth BS
Et,Gm,n Transfer of GHG energy from mth to nth BS
Et,Gn,m Transfer of GHG energy from nth to mth BS
Et,gn,G GHG type energy from diesel generator by nth BS
Et,un,G GHG type energy from the utility by nth BS
22
Chapter 2
Energy Optimization in RES Enabled Cellular
Networks
23
2.1 Introduction
The growing demand for wireless communication especially cellular communication
is putting tremendous burden on the whole infrastructure to redesign and innovate
new strategies for resource optimization. Since energy is one of the main concerns,
it is a prime focus of research as a resource. Also, the compulsion on industry to cut
back on harmful GHG emissions is encouraging sectors to employ renewable energy
sources. The cellular BS is considered as the most energy consuming entity in the
network and consumes up to sixty percent of the network’s energy [11]. Renewable
energy incorporation has been shown to be a viable option for the base station as well
as the whole cellular network [43]. RES can be employed for not only cutting down
on the harmful GHGs but also for decreasing the energy cost of traditional networks
it the long run. Renewable energy is not only feasible for stand alone BSs that are off
grid but equally feasible for BSs deployed in a network powered by the grid. It is also
seen that small cells like femto and micro-cells need lesser energy. Thus, heterogenous
networks comprising small cells are more feasible for the RES to power them. In this
chapter, we take a detailed look at the energy saving strategies being developed for
cellular communication employing the renewable sources, particularly solar and wind.
2.2 Evolution in Green Communication
The phenomenal growth of information and communication technologies, especially
cellular communication, has led to increased energy consumption and resultant GHG
emissions. It is estimated that the global contribution of ICT industry towards CO2
emissions is approximately five percent but expected to grow as global demand for
data and computers rises [9]. Cellular communication is the fastest growing compo-
nent of the ICT sector. Keeping the current trend, the global number of base stations
24
is expected to increase from present figure of 7 million to 11 million by year 2020 [10].
In consequence the annual power consumption of cellular base stations will also grow
from 49 TWh presently to 98 TWh in 2020, with business as usual estimates.
ICTs can help in optimization of systems and processes for energy efficiency and
also help in the innovation processes of industries/organizations by simulating changes
in systems, environments and company strategies [44]. The Information and Commu-
nication Technology sector, is generally sub divided into three sub-sectors, namely (i)
telecommunication and devices, (ii) PCs, printers and peripherals and (iii) the data
centers. Over the past few decades, all three sectors have seen a continuous increase
in usage and consequently in their energy consumption. The combined carbon foot-
print of these sub-sectors was estimated at 0.83 Gt of CO2 emissions in 2007, which
is estimated to increase to 1.43 Gt by 2020 [33]. Fig. 2.1 shows the percentage wise
share of emissions of the three sectors, which is 31% for telecom, 40% for PCs and
peripherals and some 23% by the data centers [9].
On one hand growing energy consumption is causing harmful effects on climate
& on the other, the unavailability of electrical energy in under developed countries is
preventing billions from accessing technological advantages. The cellular base stations
deployed in remote/rural areas resort to expensive diesel generators for meeting their
energy needs. An alternate to these energy sources, a prime source of GHG emissions,
are the renewable sources such as solar and wind energy, which are not only clean but
also sustainable [11,45]. Good BS sites have usually good wind resources because they
have high local elevation and good all around exposure. A number of RES enabled
BS feasibilities have been prepared using factual site data as well as simulated data to
configure the size and capacity of wind turbines and photovoltaic (PV) panels [46,47].
These reports greatly recommend the use of RES enabled BS due to economical
levelized cost and zero emission of greenhouse gases.
A BS is well suited for RES because the electrical power generation, batteries
25
and load are all located at one place. Especially for remote sites that enjoy good
sunshine and windy conditions, RES offers a good alternate to diesel generators, eco-
nomically and environmentally. The advancement in the technology of rechargeable
batteries, maximum power point tracker and inverters make it possible to design ro-
bust hybrid energy systems [25]. In [47], authors analyzed the feasibility of renewable
energy assisted stand alone hybrid GSM base station with diesel generator as backup.
They state that a proper design of an autonomous wind-solar hybrid systems in good
sunny and windy location pays off in two to four years considering the operating and
maintenance cost.
For a stand alone base station the hybrid solar wind hybrid system can provide
the optimal mix of renewable and non-renewable energy sources. The estimation of
hybrid energy systems that harvest energy from renewable sources depend on the
following main factors:-
� The amount of natural energy such as solar irradiation and wind speed available
throughout the year.
� The availability of conventional sources such as diesel generator and grid.
� The energy consumption of the system over a period of time.
� The energy storage capacity or the size of the battery bank.
The futuristic smart grid offers inherent advantage of enabling energy cooper-
ation and distributed generation of energy as demonstrated in [48]. A number of
on-line and off-line energy management schemes for base stations have been proposed
in [36–39,49,50]. In [49], the authors investigate a number of real time energy manage-
ment schemes. These schemes minimize the cost of system with optimal scheduling
of battery charging and optimal integration of renewable energy. In [36], authors in-
vestigate a centralized on-line algorithm for energy cooperation among different base
26
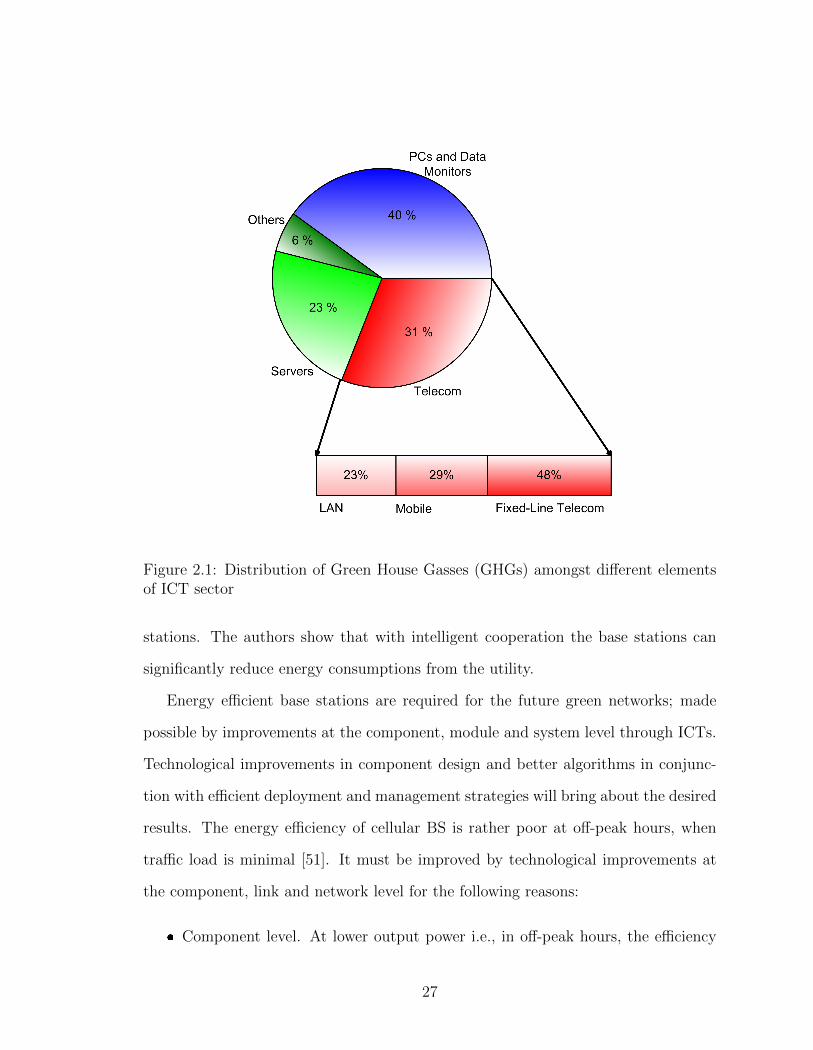
Figure 2.1: Distribution of Green House Gasses (GHGs) amongst different elementsof ICT sector
stations. The authors show that with intelligent cooperation the base stations can
significantly reduce energy consumptions from the utility.
Energy efficient base stations are required for the future green networks; made
possible by improvements at the component, module and system level through ICTs.
Technological improvements in component design and better algorithms in conjunc-
tion with efficient deployment and management strategies will bring about the desired
results. The energy efficiency of cellular BS is rather poor at off-peak hours, when
traffic load is minimal [51]. It must be improved by technological improvements at
the component, link and network level for the following reasons:
� Component level. At lower output power i.e., in off-peak hours, the efficiency
27
of power amplifier (PA) degrades substantially in present designs.
� Link level. Certain signaling such as synchronization and pilot signals need to
be regularly transmitted, forcing the BS to consume energy continuously.
� Network Level. The networks are deployed for full capacity handling and are
not dynamic in topology so as to adjust energy consumption in off-peak hours.
2.3 Literature Review: Resource Optimization in
RES Enabled Cellular Networks
The topic of energy efficiency in cellular networks is vast given the large number of
perspectives available for research. Not only academia but industry as well as govern-
ment and non-government organizations are exploring the realm of energy efficiency
in wireless communications [52]. In green cellular networks, the main objective is
to maximize the use of renewable energy, for which research has focused on energy
consumption strategies, resource management strategies and performance analysis
of demonstration systems [53]. In modeling a cellular network supported by RES,
the objective is to determine the most advantageous network characteristics such as
density of BSs, topology of BSs/RESs, sleep algorithms, BS interconnection, multi-
cell cooperation etc. Powering the BSs with RES systems of manageable size is a
challenging task especially when it aims to minimize the overall network energy cost
without compromising the user QoS [15]. The research on energy efficiency in cel-
lular communication has been carried out from different perspectives, which can be
broadly categorized into five categories:
� Energy efficiency metrics and consumption models: Green spectrum
management for mobile operators is an area that deals with the quantification
28
of energy consumption and formulation of energy models similar to real time
scenarios [54]. The quantification of energy is not only done at system level but
also over life span of technology to come up with accurate metrics for energy
assessment [55].
� Energy efficient hardware and technologies: Another area of interest is
the hardware that can be made more energy efficient by improving design and
technology, e.g., the power amplifier (PA) is a big candidate for improvement
in energy efficiency. It also includes software improvements such as cross-layer
and battery operation optimization.
� Energy efficient architectures: Energy efficiency in wireless networks can
also be achieved through different network architectures, such as cost effective
deployment strategies of heterogeneous networks (HetNets) [56], multi-cell co-
operation, cell zooming or using low-power micro base stations compared to
today’s high-power macro BS schemes etc. [57, 58]. Power consumption can be
reduced using multi-hop transmission in cellular networks [59] or self-organized
energy efficient cellular networks [60].
� Energy efficient resource management: Management of both radio and en-
ergy resources is vast topic of research from the point of energy efficiency [61].
Radio resource management involves efficient spectrum management and user
traffic management. For example, authors in [16] have demonstrated that it is
possible to save energy by optimizing the sleep cycle of a BS. Sum-rate max-
imization and cost minimization are similar objectives [30]. Energy resource
management involves schemes such as energy cooperation and optimization of
different energy sources [62]. Multi-radio access network technologies (Multi-
RAT) management and novel paradigms for delay tolerant services are also
29
some resource management techniques. Authors in [63] present a trade-off be-
tween energy and spectral efficiency in down-link orthogonal frequency-division
multiple access (OFDMA) networks.
� Incorporation of renewable energy sources (RESs): An upcoming paradigm
for energy efficiency is the incorporation of RESs such as solar and wind, par-
ticularly on the BSs. In [64], authors have proposed a scheme to optimize the
utilization of green (solar) energy during the peak traffic hours, i.e., day time,
when solar energy is available.
This reveals that there are many ways of achieving energy efficiency in a cellular
networks/base stations by improving efficiency of the hardware, improving network
protocols, improving system architecture and network deployment tailored to traffic
requirements, and using low-power micro BSs [57]. However, the focus of research in
this dissertation has been energy resource management for renewable energy based
designs and strategies because of the increased interest in simultaneous energy effi-
ciency and reduction in CO2 emissions. Energy resource optimization for a single BS
as well as for the network is classified from different perspectives in Fig.2.2. These
perspectives are discussed in the proceeding sections with some examples, to get a
holistic view of the ongoing research towards green communication, especially for
cellular applications.
2.3.1 Optimization of Energy Resources
A BS having RESs, such as solar panels, in addition to utility and DG (diesel gen-
erator), is optimized in a way such that the energy sources are optimally used and
overall energy cost is minimized. Different energy resource management strategies
for RES enabled BSs have been proposed by researchers. For example, in [65], en-
ergy management strategy for a battery-diesel stand-alone system with distributed
30
SMART GRIDCONNECTED
BS ON/OFF SWITCHING
ENERGY COOPERATION
OFF-GRIDBASE STATION
ON-GRIDBASE STATION
CELLULAR CONFIGURATION
CONVENTIONAL GRID
CONNECTED
GREENBASE STATION
MULTICELL COOPERATION
GRIDOPTIMIZATION
PV/WIND SYSTEM
OPTIMIZATION
RADIO RESOURCE
OPTIMIZATION
ENERGY RESOURCE
OPTIMIZATION
BATTERY / STORAGE
OPTIMIZATION
SINGULAR CONFIGURATION
Figure 2.2: Classification of optimization schemes in renewable energy enabled basestations and networks
PV generation based on grid frequency modulation has been developed. The battery
inverter increases the grid frequency to reduce power. The proposed strategy also
optimizes the life time and efficiency of DG.
Optimization of energy consumption in different systems of a cellular BSs can also
lead to significant energy conservation. In [66], authors have carried out optimization
of energy consumption in a BS shelter by optimized control of the ventilation resulting
in reduced usage of air conditioning. The electronic control unit regulates operations
of cooling devices by sensing temperature through the sensors. Thorough dynamic
regulation of the air conditioner and fans through an heuristic algorithm running on
the control unit, they claim 70% reduction in the overall energy consumption of the
BS.
31
RES enabled BS powered by a smart grid has an advantage over a BS that is
powered by conventional grid, e.g., the BS can balance its energy requirement in such
a way that use of RES is maximized and electricity from smart grid is controlled
as per requirement. This demands priori control over a number of variables such as
price schedules, energy flow from RES, battery charging discharging, traffic intensity
variations etc. This has been shown in [67], where the authors proposed a power
management algorithm to minimize power cost for an RES enabled BS in a smart
grid.
A similar scenario has been tackled in [68], by describing an energy management
scheme for a micro BS, in which renewable energy and SG power is adaptively used
as per user requirement and smart grid tariff. A micro BS has been chosen, because
its traffic based consumption has a significant portion of BS power consumption.
This problem is also formulated as a stochastic power management problem, which
is solved to minimize the energy cost of the BS.
Authors in [69], have tried to address the issue of reducing power consumption
of a BS in a rural area, where grid power is highly unreliable, by optimizing the
cooling of the shelter. The authors have made simulations of the BS load comprising
1) transceiver equipment load, 2) cooling load, and 3) battery charging losses, as well
as the power sources comprising a DG and a PV array. Authors demonstrated that
under separate cooling environments for BS equipment and the batteries, a 3 kW PV
panel can significantly reduce DG running hours (to 3 hrs a day) for a total load of
1.4 kW.
2.3.2 Optimization of Radio Resources
Green (harvested) energy maximization is also shown possible by the intelligent use
of radio resources and traffic management. Strategies developed to this end involve
scheduling of traffic in a green BS, regulating transmission power to maximize green
32
energy usage, employing efficient beam forming techniques, and cell size adaptation
as per RES availability. Adjusting power output results in increase and decrease of
cell size, addressed as cell zooming [70], where the cell size zooms in and out according
to traffic to conserve energy and maximize the use of green energy while maintaining
required QoS. Authors in [71] have proposed an energy-efficient resource allocation in
OFDMA systems with hybrid energy harvesting BS. Temporal and spatial diversity
in traffic also provides opportunities to optimize the radio resources. Uncertainties in
the traffic, energy harvested from renewable sources, as well as the utility pricing, have
led to development of energy efficient scenarios tackled through different heuristics
[67, 71]. Other techniques of radio resource management involve adjusting output
power according to the energy available, called cell breathing, during peak hours of
the traffic [72] and energy efficient system design like cross-layer scheduling amongst
BS modules [73].
Authors in [74], consider the problem of minimizing the average grid power con-
sumption of a Green BS down-link in scheduling N users with average delay con-
straints. The existence of a power optimal policy under delay constraints for multiple
users is proven by scheduling the users and allocating the optimal transmission rate
for the chosen user. The power consumption of different modules such as feeder ca-
bles, base band unit, rectifiers etc. is taken into consideration, however, only power
amplifier (PA) is modeled because it is linked to transmission power. In [30], au-
thors attempt to minimize energy cost while maximizing user sum-rate, by devising
multiuser down-link zero-forcing (ZF) beam-forming and power control policies, for
efficient transmission in a renewable energy enabled BS. The BS is on-grid and also
supported with RES through the associated batteries. Both energy-cost-minimization
and sum-rate-maximization problems are formulated separately. Comparison of off-
line and on-line policies show off-line policies to perform better for both cases.
33
In one energy management scheme for fully green BSs described in [75], the cov-
erage/capacity of the BS is adapted according to the energy stored in batteries, the
forecasted weather data (solar/wind) and the historical power consumption pattern.
The adaptation of the coverage and/or capacity of the BS is performed by controlling
the energy required to provide coverage to mobile users through the pilot channels for
continuous user connectivity, as well as the energy required to service the user traffic
at any given instant.
2.3.3 Battery/ Storage Optimization
Storage operation is a key issue in efficient utilization of energy produced through
renewable sources, especially for large capacity applications. In a green BS, the
harvested energy is stored in a battery bank of limited capacity, which must be used
in such a way that the BS energy requirement is met efficiently. This means the energy
drained from battery is not more than the energy stored. Also, the battery should
not be overcharged to avoid damage. In [69], authors show that a single tenancy BS
is typically backed by a 48V, 600 AH battery rack. The battery is operated at 60%
depth of discharge and takes 4 hours to reach its full capacity when charged at a rate
of capacity/10.
Simulation of battery behavior and estimation of battery’s health is an important
aspect of research as discussed in [76]. Optimization of an off-grid hybrid PV-wind-DG
system with different battery technologies (lead-acid, Li-ion and redox-flow batteries)
has been carried out in [77], with the main objective to operate each battery in a way
that minimizes the ageing for all batteries. Authors in [77] have demonstrated an
off line energy management strategy that decreases energy billing cost significantly
if the BS is equipped with a battery whose capacity and charging/discharging rates
are kept above certain threshold. In [78], performance analysis of an energy storage
system for stand alone BSs has been carried out, which is based on Lithium Polymer
34
(LiPo) cell model whose parameters have been identified through a combination of
least mean square and genetic algorithms.
The battery’s state of charge (SOC) and/or discharge are the key features opti-
mized in a battery bank used to store energy harvested from nature. Thus optimiza-
tion of battery operation is a distinct research area as noted through above examples.
Other features of interest related to storage are the types of batteries/ storage-devices
and battery capacity sizing. The state of storage/battery is a direct measure of the
harvested energy. Based on the battery’s state of charge, algorithms are designed to
optimize the BS’s traffic in terms of throughput, coverage etc. When the battery’s
SOC goes below a predefined threshold, and the BS’s power consumption is signifi-
cant, different energy management strategies may be adopted, such as, Reduce user
QoS by decreasing throughput, increasing the data delay, switch to non-renewable
energy sources till battery is sufficiently charged and Reduce the coverage area of the
BS to save power.
2.3.4 Multi-cell Cooperation
Multi-cell cooperation is a broad mechanism which entails traffic load sharing between
adjacent or close proximity cells to minimize the network power consumption and/or
maximize the use of green energy. Multi-cell cooperation is particularly applicable
for heterogeneous networks employing macro and micro cells or similar cell types.
Authors in [79], discuss pros and cons of large versus small cell size deployment for
energy efficient radio access architectures for green radio. An overview of multi-cell
cooperation has been presented in [80], which broadly classifies it as traffic-intensity-
aware multi cell cooperation and energy-aware multi cell cooperation. In the former,
the network is adapted by switching off cells with lesser traffic and off loading traffic
35
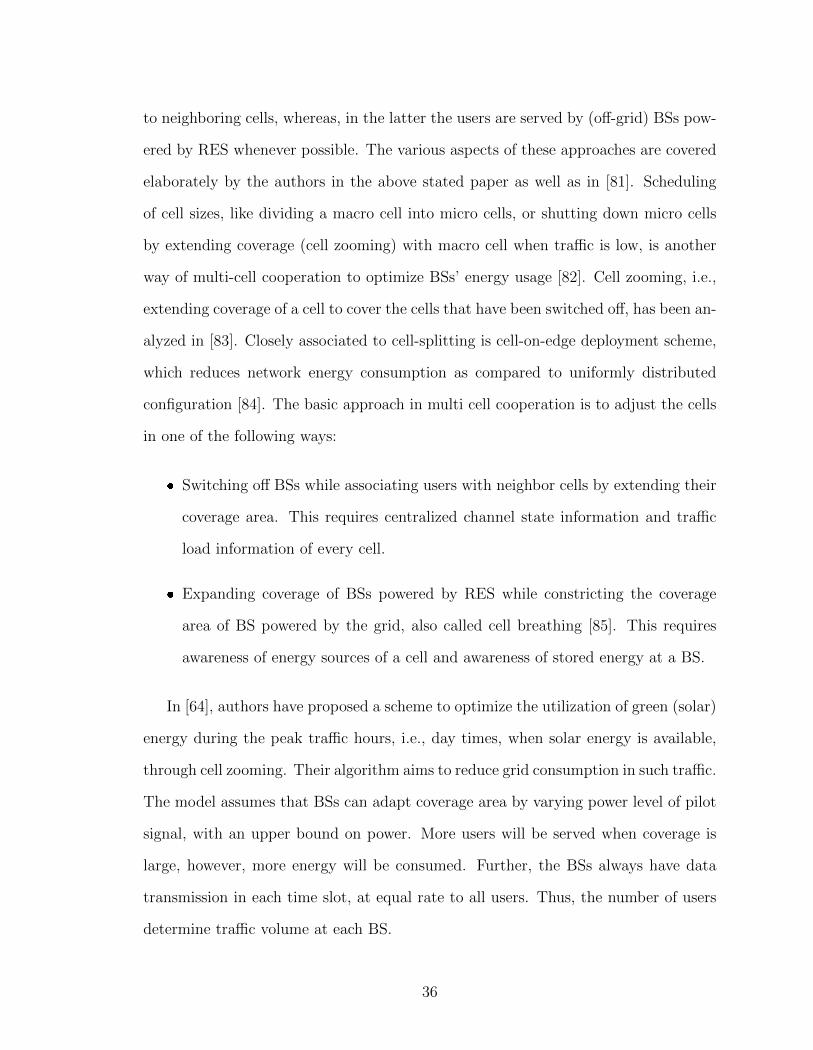
to neighboring cells, whereas, in the latter the users are served by (off-grid) BSs pow-
ered by RES whenever possible. The various aspects of these approaches are covered
elaborately by the authors in the above stated paper as well as in [81]. Scheduling
of cell sizes, like dividing a macro cell into micro cells, or shutting down micro cells
by extending coverage (cell zooming) with macro cell when traffic is low, is another
way of multi-cell cooperation to optimize BSs’ energy usage [82]. Cell zooming, i.e.,
extending coverage of a cell to cover the cells that have been switched off, has been an-
alyzed in [83]. Closely associated to cell-splitting is cell-on-edge deployment scheme,
which reduces network energy consumption as compared to uniformly distributed
configuration [84]. The basic approach in multi cell cooperation is to adjust the cells
in one of the following ways:
� Switching off BSs while associating users with neighbor cells by extending their
coverage area. This requires centralized channel state information and traffic
load information of every cell.
� Expanding coverage of BSs powered by RES while constricting the coverage
area of BS powered by the grid, also called cell breathing [85]. This requires
awareness of energy sources of a cell and awareness of stored energy at a BS.
In [64], authors have proposed a scheme to optimize the utilization of green (solar)
energy during the peak traffic hours, i.e., day times, when solar energy is available,
through cell zooming. Their algorithm aims to reduce grid consumption in such traffic.
The model assumes that BSs can adapt coverage area by varying power level of pilot
signal, with an upper bound on power. More users will be served when coverage is
large, however, more energy will be consumed. Further, the BSs always have data
transmission in each time slot, at equal rate to all users. Thus, the number of users
determine traffic volume at each BS.
36
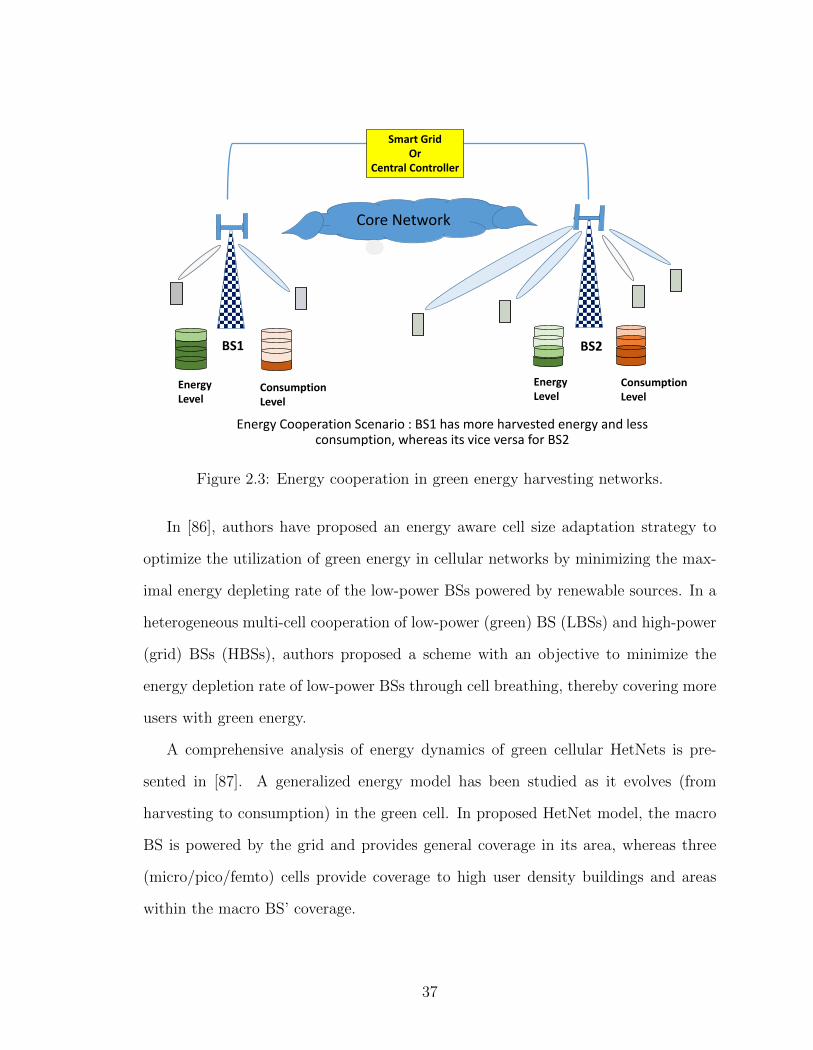
Energy Cooperation Scenario : BS1 has more harvested energy and less consumption, whereas its vice versa for BS2
Smart Grid Or
Central Controller
Core Network
ConsumptionLevel
EnergyLevel
EnergyLevel
ConsumptionLevel
BS1 BS2
Figure 2.3: Energy cooperation in green energy harvesting networks.
In [86], authors have proposed an energy aware cell size adaptation strategy to
optimize the utilization of green energy in cellular networks by minimizing the max-
imal energy depleting rate of the low-power BSs powered by renewable sources. In a
heterogeneous multi-cell cooperation of low-power (green) BS (LBSs) and high-power
(grid) BSs (HBSs), authors proposed a scheme with an objective to minimize the
energy depletion rate of low-power BSs through cell breathing, thereby covering more
users with green energy.
A comprehensive analysis of energy dynamics of green cellular HetNets is pre-
sented in [87]. A generalized energy model has been studied as it evolves (from
harvesting to consumption) in the green cell. In proposed HetNet model, the macro
BS is powered by the grid and provides general coverage in its area, whereas three
(micro/pico/femto) cells provide coverage to high user density buildings and areas
within the macro BS’ coverage.
37
2.3.5 Energy Cooperation
In energy conservation cases discussed above, it is quite evident that an RES enabled
BS that is not fully loaded or is in idle state, may have energy available from its RES,
which can be made available for the neighboring BSs. Such an arrangement is called
energy cooperation and requires both energy and data control amongst network ele-
ments. In such schemes, the nodes may provide the data transmission service, whereas
the power grid is used to transfer the harvested energy between nodes. The BSs also
act as energy storage devices, which cooperate with each other for their energy needs.
Smart grids offer the perfect environment for energy cooperation between the cellular
BS, where BSs not only cooperate in traffic sharing by on/off switching but also in
energy sharing when surplus green energy is available. The common objectives re-
lated to energy cooperation are maximizing the use of renewable energy, minimizing
use of grid energy, load sharing between the cooperating BSs, and minimizing the
GHG emissions. Thus, energy cooperation entails certain desirable features in the
network, which are:
� Energy storage capacity at the BS.
� An energy aware processing capability at the BS.
� A central control/management unit in the network.
� Smart grid or physical connectivity between BSs.
As stated above, the objective of energy cooperation in networks is the optimal
scheduling of energy sources with intelligent utilization of energy generated from RES.
This has been shown in [39], in which an on line data and energy aware algorithm
makes use of data admission control to allocate energy for each node according to
its traffic. A similar results have been achieved in [37], by using the energy state
38
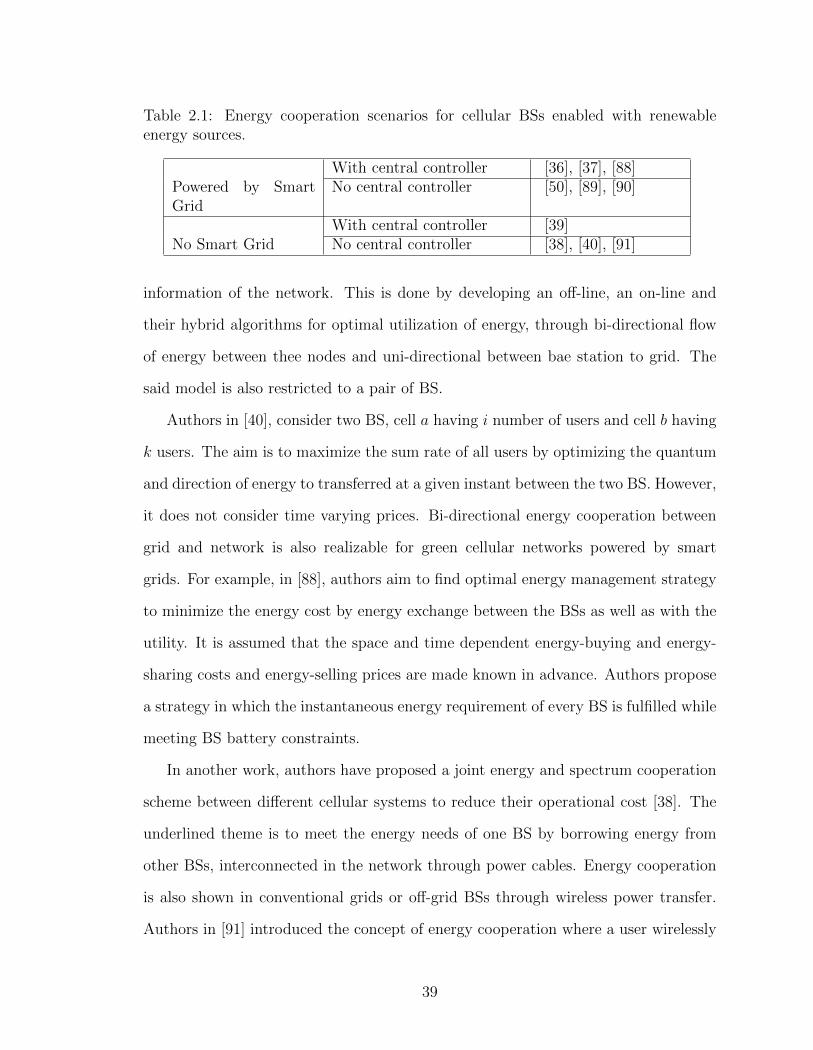
Table 2.1: Energy cooperation scenarios for cellular BSs enabled with renewableenergy sources.
With central controller [36], [37], [88]Powered by SmartGrid
No central controller [50], [89], [90]
With central controller [39]No Smart Grid No central controller [38], [40], [91]
information of the network. This is done by developing an off-line, an on-line and
their hybrid algorithms for optimal utilization of energy, through bi-directional flow
of energy between thee nodes and uni-directional between bae station to grid. The
said model is also restricted to a pair of BS.
Authors in [40], consider two BS, cell a having i number of users and cell b having
k users. The aim is to maximize the sum rate of all users by optimizing the quantum
and direction of energy to transferred at a given instant between the two BS. However,
it does not consider time varying prices. Bi-directional energy cooperation between
grid and network is also realizable for green cellular networks powered by smart
grids. For example, in [88], authors aim to find optimal energy management strategy
to minimize the energy cost by energy exchange between the BSs as well as with the
utility. It is assumed that the space and time dependent energy-buying and energy-
sharing costs and energy-selling prices are made known in advance. Authors propose
a strategy in which the instantaneous energy requirement of every BS is fulfilled while
meeting BS battery constraints.
In another work, authors have proposed a joint energy and spectrum cooperation
scheme between different cellular systems to reduce their operational cost [38]. The
underlined theme is to meet the energy needs of one BS by borrowing energy from
other BSs, interconnected in the network through power cables. Energy cooperation
is also shown in conventional grids or off-grid BSs through wireless power transfer.
Authors in [91] introduced the concept of energy cooperation where a user wirelessly
39
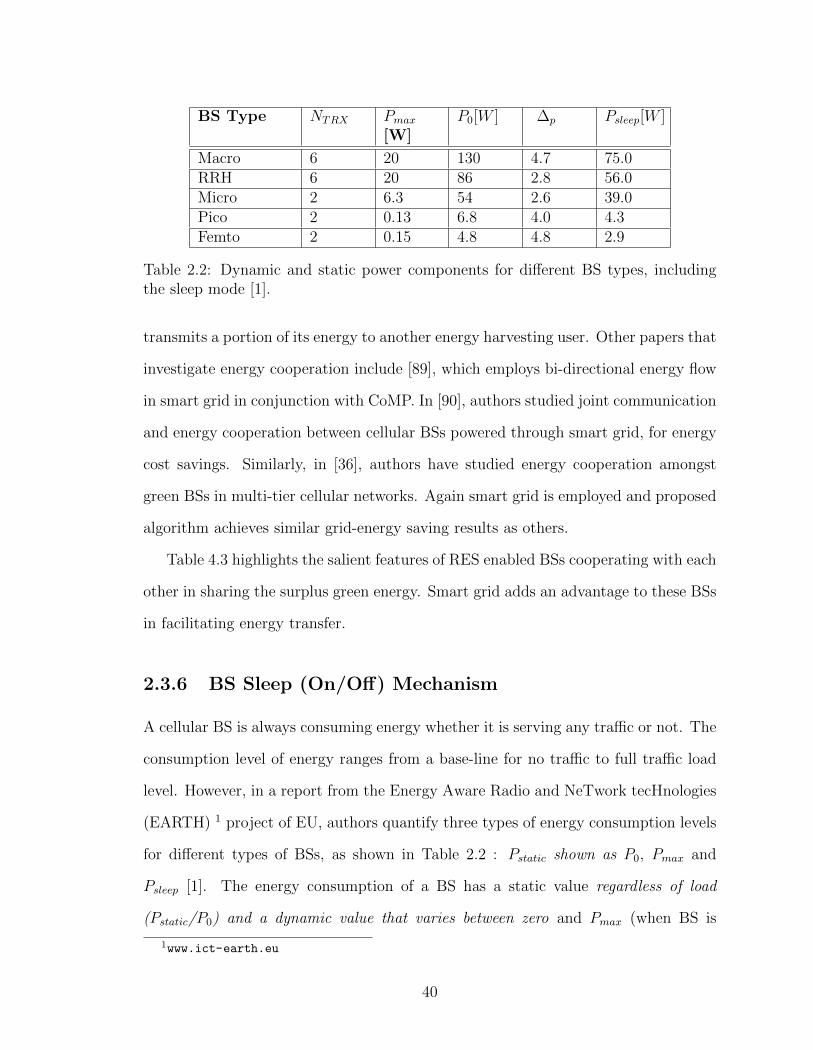
BS Type NTRX Pmax[W]
P0[W ] ∆p Psleep[W ]
Macro 6 20 130 4.7 75.0RRH 6 20 86 2.8 56.0Micro 2 6.3 54 2.6 39.0Pico 2 0.13 6.8 4.0 4.3Femto 2 0.15 4.8 4.8 2.9
Table 2.2: Dynamic and static power components for different BS types, includingthe sleep mode [1].
transmits a portion of its energy to another energy harvesting user. Other papers that
investigate energy cooperation include [89], which employs bi-directional energy flow
in smart grid in conjunction with CoMP. In [90], authors studied joint communication
and energy cooperation between cellular BSs powered through smart grid, for energy
cost savings. Similarly, in [36], authors have studied energy cooperation amongst
green BSs in multi-tier cellular networks. Again smart grid is employed and proposed
algorithm achieves similar grid-energy saving results as others.
Table 4.3 highlights the salient features of RES enabled BSs cooperating with each
other in sharing the surplus green energy. Smart grid adds an advantage to these BSs
in facilitating energy transfer.
2.3.6 BS Sleep (On/Off) Mechanism
A cellular BS is always consuming energy whether it is serving any traffic or not. The
consumption level of energy ranges from a base-line for no traffic to full traffic load
level. However, in a report from the Energy Aware Radio and NeTwork tecHnologies
(EARTH) 1 project of EU, authors quantify three types of energy consumption levels
for different types of BSs, as shown in Table 2.2 : Pstatic shown as P0, Pmax and
Psleep [1]. The energy consumption of a BS has a static value regardless of load
(Pstatic/P0) and a dynamic value that varies between zero and Pmax (when BS is
1www.ict-earth.eu
40
operating at max capacity load). However, Psleep has been additionally defined as
the power consumption when the BS is not transmitting anything and is considered
asleep. NTRX denotes the number of transmitters per node, and ∆p denotes the
slope with which power varies according to increase in traffic load. Consequently,
on/off switching of BSs or putting BSs to sleep to conserve energy, has emerged as a
promising research topic. A detailed example of this mode is presented in chapter 5.
One of the key findings of EARTH project is that a BS is transmitting much below
its capacity most of the time. Also, the call/data traffic at any typical BS demon-
strates significant temporal and spatial fluctuations in user concentration. Fluctua-
tions in network traffic are encountered at different times of the day such as during
the morning office hours, when activity is more as compared to evening hours. In
addition, traffic is more dense in urban areas where people mostly visit and work, as
compared to urban and rural areas. However, the cell is optimized for peak traffic in
a predefined coverage area. That means at off-peak hours, these cells can save energy
by switching off the BS radio resources to exploit the lean traffic. Research shows
that significant energy saving can be made by switching off BS at certain periods [92].
In times when call traffic is low the network operators can employ BS on/off switch-
ing or sleep mechanisms to save power [93]. The users of a BS may be associated
to another BS when certain pre-selected criterion is met, e.g., BS-to-user distance or
data rate. This will result in traffic concentration in fewer BSs, allowing some BSs
to be switched off. There are two fundamental aspects associated with the sleeping
of BSs.
� How and when to associate users from one BS to another BS, without compro-
mising users’ QoS? [35]
� How to perform the on/off switching mechanism of a BS; centrally or locally?
41
A comprehensive analysis of BS on/off switching is presented in [62], which sug-
gests a design principle on the concept of network-impact, introduced in the paper
as a metric for on/off switching decision making. Both user association and on/off
switching mechanism have been addressed in this work. This work shows that the
amount of energy saved is dependent upon the traffic ratio of mean and variance, and
BS deployment. Results shows that the proposed algorithm can save up to 80% of
network energy.
In [16], a network model has been developed for a green LTE cellular network
in which the BSs are enabled with RES and utility is provided by a smart grid,
along with standby generators. The energy cost optimization has been performed
by considering a stochastic network model having variable user traffic and renewable
energy, while maintaining QoS constraint. Furthermore, BS sleep mechanism is also
incorporated whenever traffic state so permits. The aim is to optimize the sleep cycle
of a BS as well as procurement of energy from the smart grid or the generator, i.e.,
procure only when RES at a BS is unable to meet the demand.
The authors in [94] have also shown that energy can be saved by adopting power
aware strategies for on/off switching of BS in LTE, based on transmission power re-
quirements. Instead of distance, their simple model depends on using BS transmission
power requirements as a metric for ranking of BS for switching OFF priority. Authors
proposed two criterion for selecting a BS to be switched off: 1) power-aware strategy
which finds total power consumption of each BS and switching off the one having
highest power consumption. This has been represented as P(b) =∑N
i=1 P(b)i and 2)
Power based ranking strategy called power ratio based strategy, relates the UE (user
equipment) directly with its serving BS (b) and inversely with the power consumption
of its neighboring BSs (b′) that are sharing the load, and is mathematically expressed
as C(b) =∑N
i=1 P(b)i /P
(b′)i .
In [95], authors introduce a dynamic programming algorithm that determines
42
which BSs are to be put sleep, considering the evolving state of cellular traffic and
the harvested energy at each BS, while determining the optimum utilization of RBs for
the active traffic. The network’s QoS is maintained by minimizing the call rejection
probability and the running call’s hand-off probability. Near optimum performance
is achieved by the algorithm and significant energy savings are made by sleep mode
of operations as compared to network energy consumption when it does nothing to
maximize the usage of the harvested energy.
Another scenario that has been investigated by the authors in [96], involves dif-
ferent operators sharing BSs during off-peak hours. It is a known fact that BSs of
multiple users are densely packed in urban city centers to satisfy the high traffic load
in these areas. Often BSs are co-located on a roof top or stand within meters of each
other. Sharing BSs in such locations can make substantial savings in energy if the
operators agree to do so. The authors estimate that this BS cooperation can save
as much as 85% of the total energy consumed during off-peak hours in dense urban
areas, which is considered 35% over and above the savings operators would make if
they acted on their own.
2.3.7 Resource Optimization of Cellular Networks in Smart
Grid
Smart grid is a topic of extensive research in green communication. Smart grids rely
on communication infrastructures for information sharing regarding power tariff, sur-
plus energy etc, and support distributed generation of energy Fig. 2.4. These features
make green cellular BSs, having renewable energy sources, an obvious choice for its
utilization in energy resource optimization. A green cellular network, having utility
provided through a smart grid, can incorporate controlled electrical energy flow from
43
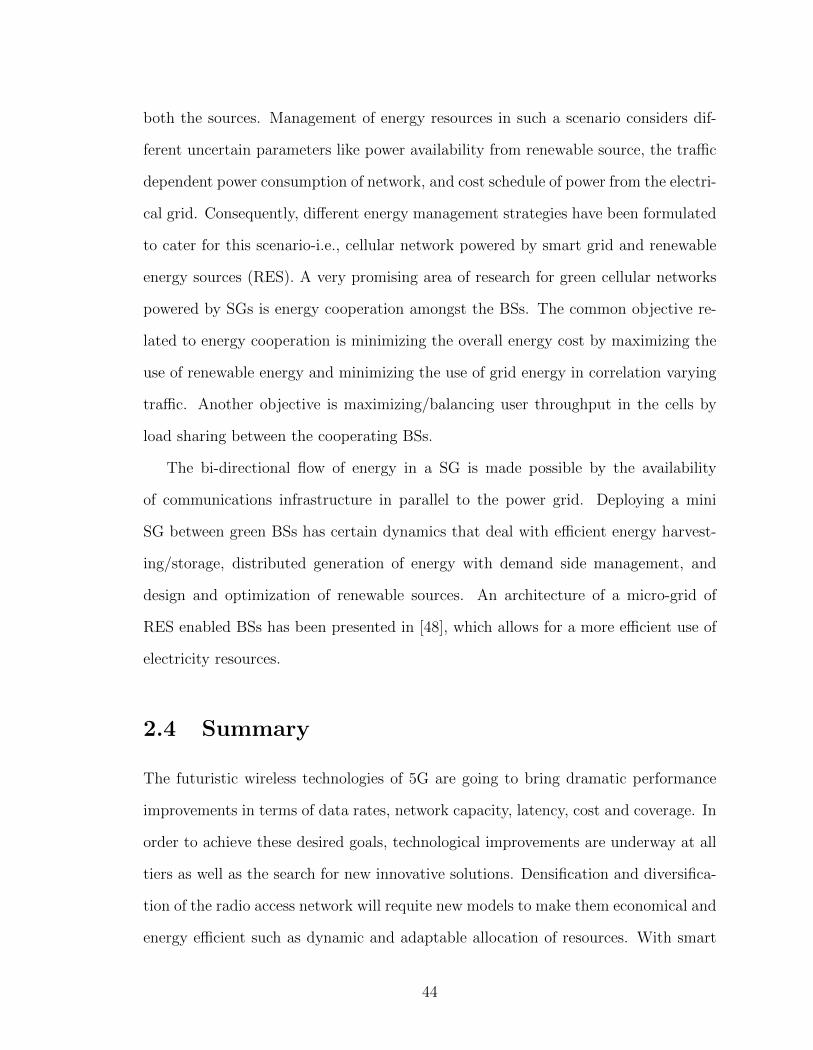
both the sources. Management of energy resources in such a scenario considers dif-
ferent uncertain parameters like power availability from renewable source, the traffic
dependent power consumption of network, and cost schedule of power from the electri-
cal grid. Consequently, different energy management strategies have been formulated
to cater for this scenario-i.e., cellular network powered by smart grid and renewable
energy sources (RES). A very promising area of research for green cellular networks
powered by SGs is energy cooperation amongst the BSs. The common objective re-
lated to energy cooperation is minimizing the overall energy cost by maximizing the
use of renewable energy and minimizing the use of grid energy in correlation varying
traffic. Another objective is maximizing/balancing user throughput in the cells by
load sharing between the cooperating BSs.
The bi-directional flow of energy in a SG is made possible by the availability
of communications infrastructure in parallel to the power grid. Deploying a mini
SG between green BSs has certain dynamics that deal with efficient energy harvest-
ing/storage, distributed generation of energy with demand side management, and
design and optimization of renewable sources. An architecture of a micro-grid of
RES enabled BSs has been presented in [48], which allows for a more efficient use of
electricity resources.
2.4 Summary
The futuristic wireless technologies of 5G are going to bring dramatic performance
improvements in terms of data rates, network capacity, latency, cost and coverage. In
order to achieve these desired goals, technological improvements are underway at all
tiers as well as the search for new innovative solutions. Densification and diversifica-
tion of the radio access network will requite new models to make them economical and
energy efficient such as dynamic and adaptable allocation of resources. With smart
44
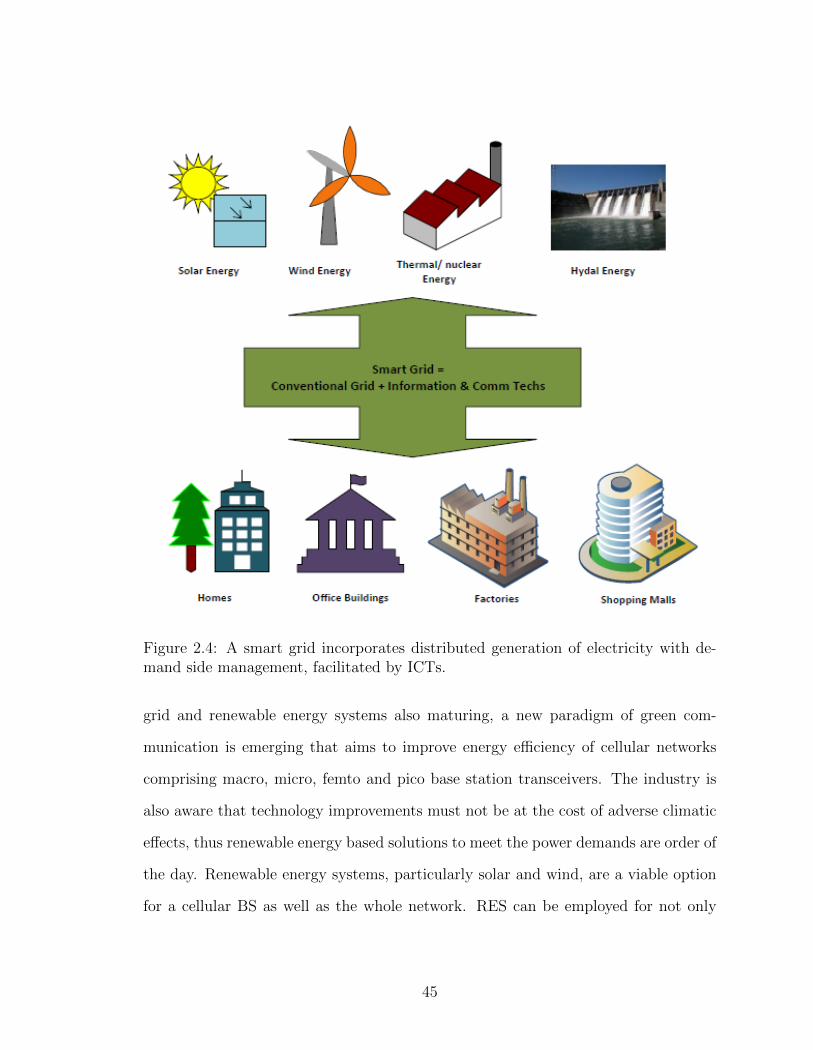
Figure 2.4: A smart grid incorporates distributed generation of electricity with de-mand side management, facilitated by ICTs.
grid and renewable energy systems also maturing, a new paradigm of green com-
munication is emerging that aims to improve energy efficiency of cellular networks
comprising macro, micro, femto and pico base station transceivers. The industry is
also aware that technology improvements must not be at the cost of adverse climatic
effects, thus renewable energy based solutions to meet the power demands are order of
the day. Renewable energy systems, particularly solar and wind, are a viable option
for a cellular BS as well as the whole network. RES can be employed for not only
45
cutting down on the harmful GHGs but also for decreasing the energy cost of tradi-
tional networks. A BS is the most energy hungry element in a cellular network and
consumes upto 60% of the energy consumed by a network of macro BSs. Renewable
energy is not only feasible for stand alone BSs that are off the grid but equally feasible
for BSs deployed in a network supported by the grid energy. It is also seen that small
cells like femto and micro cells need lesser energy. Thus, small cells are more feasible
for the RES to power them. However, for proper integration of RES into the present
networks, proven system designs are required that can readily replace the diesel gen-
erators. Sizing, interfaces, infrastructure etc. need to be defined and standardized
so that RESs can be easily installed and replaced when needed. Smart grids with
distributed generation of green energy can provide clean and cheap power to the cel-
lular networks, thereby, decreasing the energy cost and reducing the harmful GHGs.
Smart grids have special significance for cellular BSs in terms of facilitating energy
exchange between them. Smart grids also provide flexibility in energy price forecast-
ing which allows for scheduling of energy sources to maximize the use of green energy.
Energy cooperation is not only possible between the BSs but also between green
networks and local community where utility supply is non-existent or intermittent.
Intelligent controllers are required that can control the energy flow between different
modules. Researchers have come up with the optimal energy management strategies
to use renewable energy in their systems under various scenarios that make use of
centralized or decentralized controllers. Such controllers will make the BSs smart
energy wise and provide effective demand side management in the emerging smart grid
environment. Incorporating these controllers into existing hardware is a challenge for
the system designers. The essence of research in the are of RESs has been positive and
proven empirically as well as theoretically. What is required is a joint policy statement
by the key industry players to integrate PV-wind energy system solutions at new sites
46
and gradually replace the generator sets at the older ones. Standardization of the
RES is a serious challenge for their practical implementation. Greening of cellular
networks through increased energy efficiency as well as incorporation of renewable
energy is a growing research area. These aspects of RESs have good prospects when
co-joined with other emerging trends in wireless networks, such as cognitive radios,
cooperative relaying and cloud radio access network (C-RAN).
47
Chapter 3
Modelling RES for Energy Sharing Microgrid
48
3.1 Introduction
Electricity is the most widely used form of energy that is required to sustain the
modern living. In some developing and most underdeveloped countries, a significant
portion of population is deprived of a reliable supply of electricity. On the other hand,
these countries do enjoy fairly healthy coverage of wireless cellular communications
through the companies operating different networks. That means a large deployment
of cellular base stations in areas even short of electrical power. For countries that are
deprived of this form of energy, a set of RES enabled base stations can provide some
relief to the local community through energy sharing. Each year, 300 to 400 million
people are added to the subscriber base of mobile users, as a result of some 120,000
base stations being erected world wide to cater for the increasing demand [97].
Ninety nine percent of the BS sites are powered by or have a back up of diesel
generator. Diesel generators have been favoured traditionally due to its low invest-
ment cost, but considering the perpetual requirement of the sites for energy, and the
decreasing cost of wind and solar energy systems, the return of investment (ROI)
equation is changing in favour of RES in the long run [98]. The technology advance-
ments in deep cycle rechargeable batteries, MPPTs (maximum power point trackers),
bi-directional inverters, charge controllers etc. have resulted in the development of
proven systems [25]. In one study carried out to power a GSM BS with solar and wind
hybrid system, with a stand-by diesel generator, it is concluded that an autonomous
BS powered by such a power source, will pay off in two to four years with good windy
and sunny conditions [47].
A BS is well suited for renewable energy sources (RES) because power generation,
storage and load are all located at one place. Especially for remote/off-grid sites that
enjoy good sunshine and wind, RES offer a good alternate to diesel generators, eco-
nomically and environmentally [99]. Other than running cost, storage, transportation
49
and theft of diesel also add to expenses of the operator. But the most compelling
reason, perhaps, is the harmful effect on climate caused by the GHG emissions at-
tributed to diesel generators. System models developed show that for a stand alone
base station the hybrid PV-Wind-generator system can provide the optimal mix of
renewable and non-renewable energy. A green energy harvesting system is a function
of different factors, which are:-
� The amount of natural energy such as solar irradiation and wind speed available
throughout the year.
� The availability of conventional sources such as diesel generator and grid.
� The energy consumption of the system to be powered with RES.
� The energy storage capacity or the size of the battery bank.
A smart-grid/ microgrid offers inherent advantage of enabling distributed genera-
tion and facilitating energy cooperation between energy harvesting nodes as demon-
strated in [48]. Different energy management schemes have been proposed in literature
for both on-line and off-line optimization of energy resources [49,50] in a smart grid.
The distributed generation of electricity at BS sites can be directed towards the local
grid station during off-peak hours when it may be lying surplus at the node. Thus a
microgrid of RES enabled BSs is a lucrative possibility offering a win win situation
to both the network operator as well as the utility.
In this chapter we will formulate a mathematical model to estimate the energy
consumption of a BS as a function of its user traffic. Based on this consumption
figure, which has a static and a dynamic part, we will model a PV-array and a wind
turbine for Islamabad region, to power the BS. An estimate of battery bank to store
the harvested energy will also be made. Based on these models, it will be shown that
the dynamic energy consumption of the BS and the fluctuating harvested energy,
50
yields surplus energy at some time periods of the day, which can be provided to the
local grid for the benefit of the local community.
3.2 Energy Consumption in Cellular Base Stations
A typical base station consists of many sub-systems, which consume energy, as shown
in Fig. 3.1. These sub-systems include baseband (BB) processors, transceiver (TRX)
(comprising power amplifier (PA), RF transmitter and receiver), feeder cable and
antennas, and air conditioner [100]. Their energy consumption ranges from a few
watts to kilo watts depending on the type of BS, with a macro BS consuming most
energy, as depicted in Table 3.1. Power consumption of different modules for some
known BS types is given in the Table 3.1, i.e., power consumption of radio equipment
comprising power amplifier (PA), BB, and RF transmitter/receiver modules, and the
auxiliary equipment comprising main supply, voltage converters, and cooling units
[101]. Whereas, the power consumption of the PA, RF and BB modules is fixed for a
particular type of BS, the consumption of power supply modules and air conditioning
is shown as a factor of the radio equipment’s consumption. It is evident from Table 3.1
that in case of a macro BS the PA alone accounts for 57% of total energy consumption,
which is reduced to 51% for remote radio head (RRH) configuration. Thus, significant
power dissipation takes place in the PA, which is directly associated with the traffic
load at the BS.
From the above discussion we may deduce that the energy consumption by a
BS can be bifurcated into static and dynamic types. The former accounts for basic
consumption, independent of traffic load, and is attributed to the cooling equipment,
power supplies, and RF/BB modules. While the latter is proportional to the traffic
load or data throughput of a BS and is attributed to the energy consumption in PAs.
Thus the total energy being consumed is the sum of the two types of consumptions
51
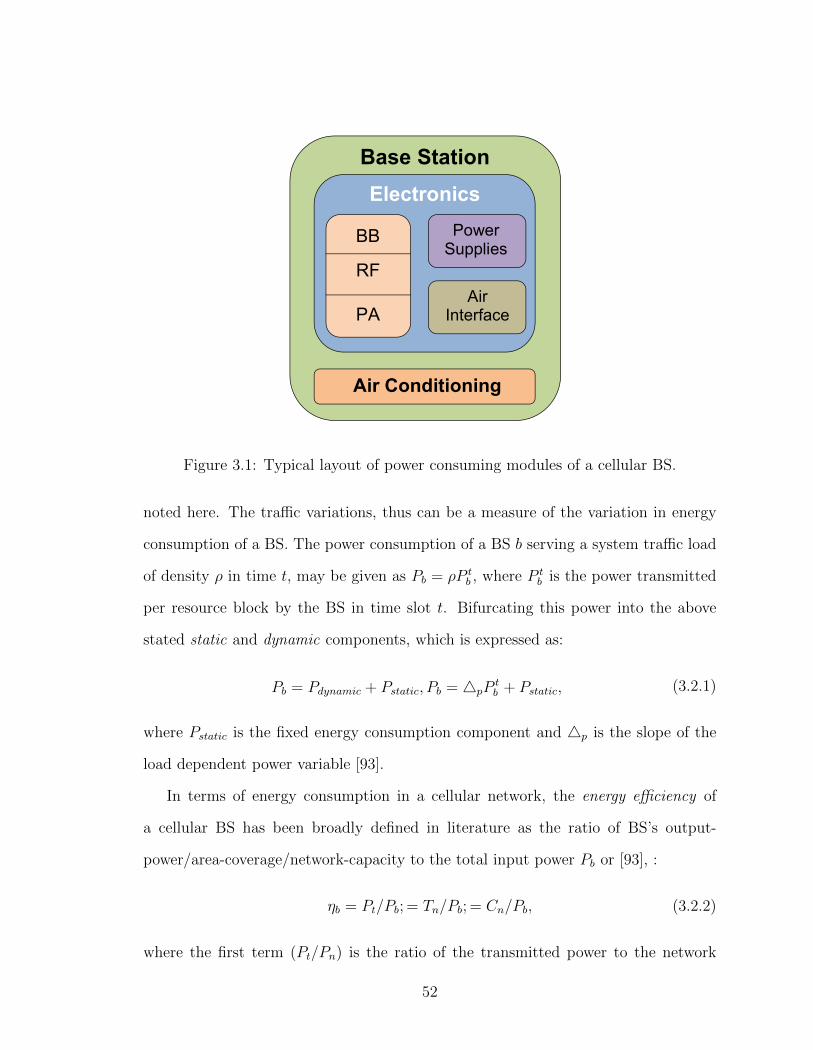
Base Station
Electronics
Air Conditioning
Power Supplies
Air Interface
BB
RF
PA
Figure 3.1: Typical layout of power consuming modules of a cellular BS.
noted here. The traffic variations, thus can be a measure of the variation in energy
consumption of a BS. The power consumption of a BS b serving a system traffic load
of density ρ in time t, may be given as Pb = ρP tb , where P t
b is the power transmitted
per resource block by the BS in time slot t. Bifurcating this power into the above
stated static and dynamic components, which is expressed as:
Pb = Pdynamic + Pstatic, Pb = 4pPtb + Pstatic, (3.2.1)
where Pstatic is the fixed energy consumption component and 4p is the slope of the
load dependent power variable [93].
In terms of energy consumption in a cellular network, the energy efficiency of
a cellular BS has been broadly defined in literature as the ratio of BS’s output-
power/area-coverage/network-capacity to the total input power Pb or [93], :
ηb = Pt/Pb; = Tn/Pb; = Cn/Pb, (3.2.2)
where the first term (Pt/Pn) is the ratio of the transmitted power to the network
52
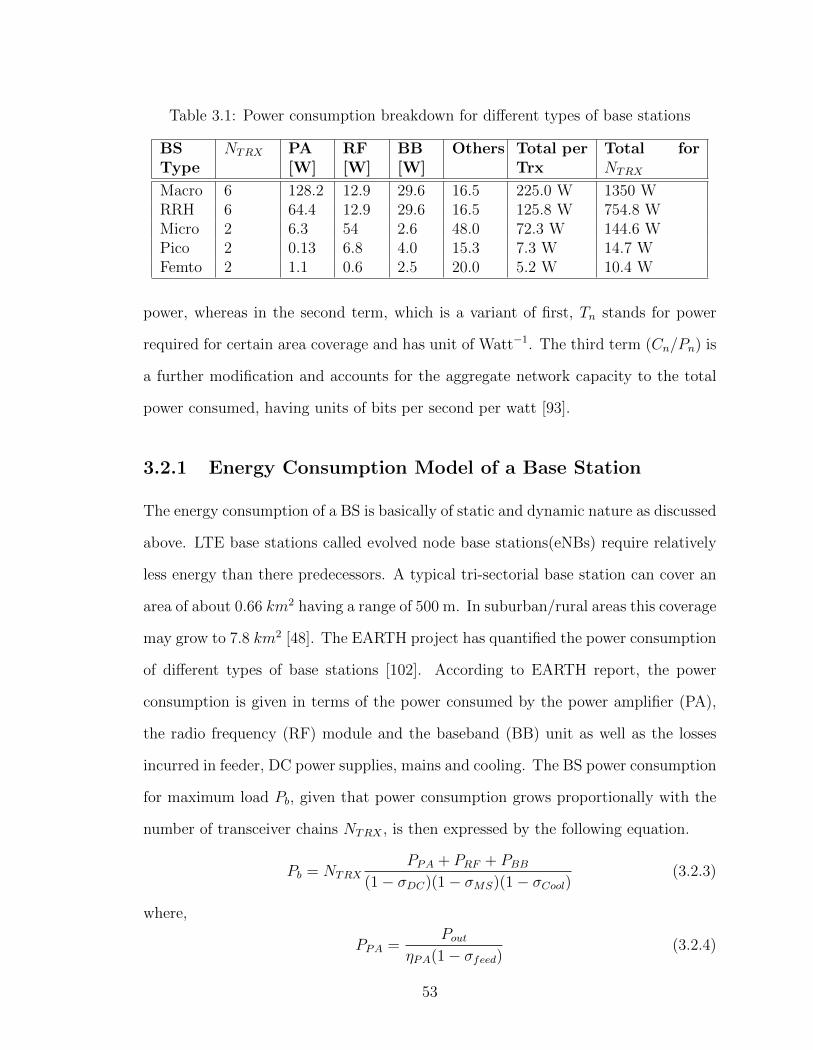
Table 3.1: Power consumption breakdown for different types of base stations
BSType
NTRX PA[W]
RF[W]
BB[W]
Others Total perTrx
Total forNTRX
Macro 6 128.2 12.9 29.6 16.5 225.0 W 1350 WRRH 6 64.4 12.9 29.6 16.5 125.8 W 754.8 WMicro 2 6.3 54 2.6 48.0 72.3 W 144.6 WPico 2 0.13 6.8 4.0 15.3 7.3 W 14.7 WFemto 2 1.1 0.6 2.5 20.0 5.2 W 10.4 W
power, whereas in the second term, which is a variant of first, Tn stands for power
required for certain area coverage and has unit of Watt−1. The third term (Cn/Pn) is
a further modification and accounts for the aggregate network capacity to the total
power consumed, having units of bits per second per watt [93].
3.2.1 Energy Consumption Model of a Base Station
The energy consumption of a BS is basically of static and dynamic nature as discussed
above. LTE base stations called evolved node base stations(eNBs) require relatively
less energy than there predecessors. A typical tri-sectorial base station can cover an
area of about 0.66 km2 having a range of 500 m. In suburban/rural areas this coverage
may grow to 7.8 km2 [48]. The EARTH project has quantified the power consumption
of different types of base stations [102]. According to EARTH report, the power
consumption is given in terms of the power consumed by the power amplifier (PA),
the radio frequency (RF) module and the baseband (BB) unit as well as the losses
incurred in feeder, DC power supplies, mains and cooling. The BS power consumption
for maximum load Pb, given that power consumption grows proportionally with the
number of transceiver chains NTRX , is then expressed by the following equation.
Pb = NTRXPPA + PRF + PBB
(1− σDC)(1− σMS)(1− σCool)(3.2.3)
where,
PPA =Pout
ηPA(1− σfeed)(3.2.4)
53
is the power consumption of the PA, which is equal to the ratio of power out of
the antenna feeder and PA efficiency plus feeder loss. At maximum load the power
consumption of eNB is shown to be 1350 W for three sectorial coverage each having
two transceivers in MIMO configuration. The power consumption figures for various
types of cellular BSs (macro, micro, pico, femto) is shown in Table. 3.1. The power
consumption for each element in a single transceiver configuration is depicted against
each type. The consumption incurred in DC-DC power supply, cooling and mains is
shown as a percentage of overall power consumption. The last column of the table
shows total consumption, which is equal to power consumption of a single transceiver
chain multiplied by the total number of transceivers employed.
The EARTH report also gives useful insight into the dynamic power consump-
tion of a BS, which is discussed in detail in next chapter. That is the relationship
between the BS traffic and power consumption of the base station, which forms the
fundamental basis of energy cooperation. Given the fact that the PA(power amplifier)
consumes between 55-60 % of total power, and that the PA consumption increases
linearly with traffic, the total consumption increases linearly with mobile traffic. The
power consumption can be described in terms of the static P0 and dynamic output
power Pout, which varies with traffic load and number of transceivers deployed. Thus
BS power consumption as fraction of traffic load/transceivers is given as:-
Pb = NTRX × (P0 + ∆pPout), 0 < Pout ≤ Pmax (3.2.5)
where no of transceivers can be six (3x2) maximum, and ∆p is the slope of the
load dependent power consumption given as 4.7 in the said report. For Pmax given
as 20 W per transceiver, we can thus find the maximum value of Pb to be 1344 W at
full traffic load and minimum value of 780 W for no traffic. We add another 1 kW to
these figures for air conditioner (one ton), given the hot climate of this region. The
BS power consumption, therefore, fluctuates between 2.35 kW for max load and 1.78
54
kW at no traffic load in this case. These basic estimates provide the figures for energy
consumption assessment for a cellular base station. At 2.35 kW power consumption,
the daily energy consumption is 56.4 kWh, which is the case for BS operating at
maximum traffic throughout the day.
The power consumption of a BS Pb, estimated above, has a constant (static)
consumption of 1.78 kW, which goes up to 2.35 kW, with the slope noted as δ(t) in
equation (3.2.5). The traffic intensity or the number of users associated with a base
station/network is a function of area-population Pop and the number of network
operators in the area are given as Nop. Then the total subscribers available to the
particular network’s eNBs are Pop/Nop. Ideally every NWO gets equal share, but
realistically the share is unequally distributed, with some having more subscribers
than others. The energy consumption profile varies with user traffic throughout the
day between the following two states of energy consumption:
� High activity state during peak hours of the day, consuming maximum energy.
� Low activity state during off peak hours of the day, having surplus energy.
3.2.2 Spatial and Temporal Load Variations
The traffic intensity associated with any BS may be modeled for some area having
a known population Pop. The number of network operators in the area are given as
Nop. Then the total subscribers available to a particular BS are proportionate to the
population and number of operators in any area – i.e., Pop/Nop. Ideally every network
operator gets equal share, but realistically the share is unequally distributed, with
some having more subscribers than others, which results in spatial load variations
[103].
The power consumption of a BS (Pb), estimated above, comprises two types of
power consumptions. One is the constant consumption independent of the traffic
55
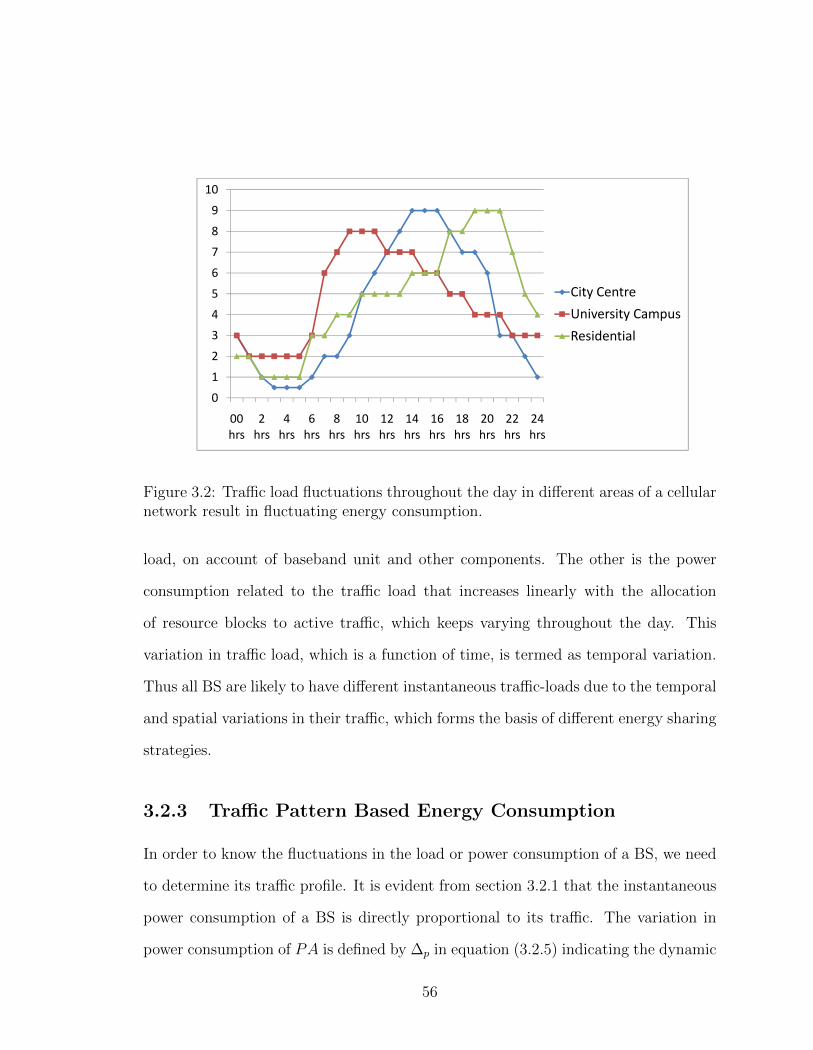
0
1
2
3
4
5
6
7
8
9
10
00 hrs
2 hrs
4 hrs
6 hrs
8 hrs
10 hrs
12 hrs
14 hrs
16 hrs
18 hrs
20 hrs
22 hrs
24 hrs
City Centre
University Campus
Residential
Figure 3.2: Traffic load fluctuations throughout the day in different areas of a cellularnetwork result in fluctuating energy consumption.
load, on account of baseband unit and other components. The other is the power
consumption related to the traffic load that increases linearly with the allocation
of resource blocks to active traffic, which keeps varying throughout the day. This
variation in traffic load, which is a function of time, is termed as temporal variation.
Thus all BS are likely to have different instantaneous traffic-loads due to the temporal
and spatial variations in their traffic, which forms the basis of different energy sharing
strategies.
3.2.3 Traffic Pattern Based Energy Consumption
In order to know the fluctuations in the load or power consumption of a BS, we need
to determine its traffic profile. It is evident from section 3.2.1 that the instantaneous
power consumption of a BS is directly proportional to its traffic. The variation in
power consumption of PA is defined by ∆p in equation (3.2.5) indicating the dynamic
56
part of Pb. Consequently, the energy consumption of a BS keeps varying according to
the 24 hr temporal fluctuations in the user traffic. The traffic pattern is, therefore,
determined by (i) the minimum and maximum values of P tdynamic and (ii) the peak and
lean traffic hours. Using these values, we can generate the pattern curve representing
traffic of a BS as per the expression described in [104], as follows:-
W hb = (
%max − %min2
)
W ob = (
%max + %min2
)
f(b, t) = W hb Cos(2π
t− tpT
) +W ob +W t
p
(3.2.6)
where %max and %min are the maximum and minimum traffic loads of a BS, which
can vary from BS to BS depending on its hardware configuration. For the case of the
BS considered in section 3.2.1, these values may be estimated as %max = 2.35kW and
%min = 1.78kW . W hb is the height of the sinusoidal wave and W o
b is the DC offset. t is
the present time slot and tp is the peak-traffic-hour time slot. T is the total number
of time slots, which can be fixed for a day or a week or any predefined period. W tp
denotes a Poisson random variable.
The cellular BS is designed to handle peak traffic that occurs at a particular time
of the day, depending on area. There is also a corresponding lean time with least
traffic load and in between the traffic load is either decreasing or increasing. Thus
it is appropriate to model traffic load as sinusoidal variation. The BS traffic profile
generated on the basis of empirical data in [105] also shows the same and is very close
to our traffic load pattern. Furthermore, since the Poisson model is the most widely
used model to describe the user traffic arrival in cellular base stations [101, 106],
we apply Poisson probability distribution to the basic pattern generated above to
have varying patterns for different BSs. W pt is Poisson distributed traffic with mean
λ. Consequently, the energy consumption profile varies throughout the day between
the two states of energy consumption i.e., high activity state during peak hours,
consuming maximum energy, and low activity state during off-peak hours, having
57
surplus energy.
As a result, we get traffic pattern for the BSs deployed in a particular region, based
on the variables described above. The twenty four hour traffic profile of different
locations are shown in Fig. 3.2, which have been generated by using equation (3.2.6)
for three different locations i.e., a community centre, a residential complex and a
university campus. Based on the the results for the traffic based load and the size of
renewable energy harvesting systems, estimated next, we may observe surplus energy
during lean traffic period with capacity energy generation from solar and wind. This
surplus energy can be made available to the community as discussed in proceeding
paras.
3.3 Design and Optimization of Hybrid RES
Research has shown that hybrid energy systems can significantly reduce total life
cycle cost of stand alone power supplies in many situations [24]. Similarly in the
case for cellular BSs, the hybrid of both wind/solar and conventional energy gives the
most optimal solution to give energy efficient solutions; as investigated by researchers
in [11, 47, 69, 71, 77, 107]. The fundamental steps involved in equipping a BS with
renewable energy sources can be described as following:
� Feasibility study involves gathering site parameters, particularly average an-
nual solar insolation and wind speed as well as possibility of installation of
systems. Meteorological data generation is required for any feasibility study.
� System modeling/sizing of PV arrays, wind turbines, and battery bank is the
main task, which must be carried out very carefully. Different sizing methods
can be used for solar panels and wind turbines, which must ultimately search
for an optimum combination of two parameters, i.e., system reliability and
58
system cost [108]. For a BS, reliability is of paramount importance, therefore,
the system must be designed carefully with sufficient battery backup. Sizing
of PV-wind hybrid systems may be performed by different methods such as
the monthly average method, the most unfavorable month method, the loss of
power supply probability method, and software simulations.
� System evaluation is carried out using simulation software, which can perform
power reliability analysis and system cost analysis for renewable energy systems.
Several software tools are available for designing of renewable energy hybrid
systems, such as HOMER (hybrid optimization model for electric renewables)
that uses hourly simulations for arriving at optimum target.
� System optimization aims at (1) optimization of system capacity of RES,
i.e., size of PV array and the wind turbine as well as the battery bank and (2)
optimization of energy consumption within system in order to maximize the use
of green harvested energy. Different optimization techniques are employed to
achieve the stated goals [9].
A detailed description of the above stated and other related characteristics for op-
timum configuration of hybrid stand-alone solar/wind power systems is presented
in [24] and [108].
3.3.1 Subsystems of Hybrid Solar/Wind Enabled BS
A hybrid solar/wind based power system comprises PV array, wind turbine, battery
bank, charge controller, inverter, cabling, and other devices (such as fuses etc.). The
basic layout of a BS employing conventional as well as renewable energy sources
is shown in Fig. 3.3. In a green BS, the energy harvested from nature is mostly
either from sun or wind or combination of the two, with a battery bank to store
and regulate the green energy. The heart of the system is a hybrid controller that
59
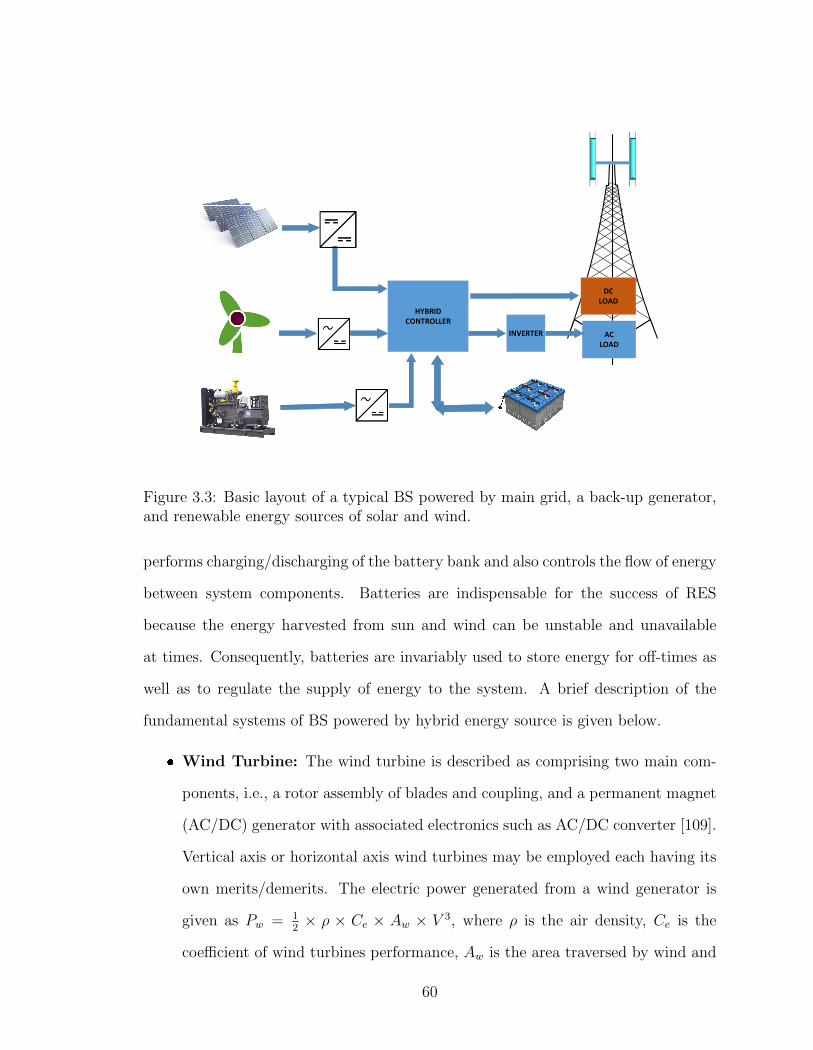
HYBRID
CONTROLLER
AC
LOAD
DC
LOAD
INVERTER
Figure 3.3: Basic layout of a typical BS powered by main grid, a back-up generator,and renewable energy sources of solar and wind.
performs charging/discharging of the battery bank and also controls the flow of energy
between system components. Batteries are indispensable for the success of RES
because the energy harvested from sun and wind can be unstable and unavailable
at times. Consequently, batteries are invariably used to store energy for off-times as
well as to regulate the supply of energy to the system. A brief description of the
fundamental systems of BS powered by hybrid energy source is given below.
� Wind Turbine: The wind turbine is described as comprising two main com-
ponents, i.e., a rotor assembly of blades and coupling, and a permanent magnet
(AC/DC) generator with associated electronics such as AC/DC converter [109].
Vertical axis or horizontal axis wind turbines may be employed each having its
own merits/demerits. The electric power generated from a wind generator is
given as Pw = 12× ρ × Ce × Aw × V 3, where ρ is the air density, Ce is the
coefficient of wind turbines performance, Aw is the area traversed by wind and
60
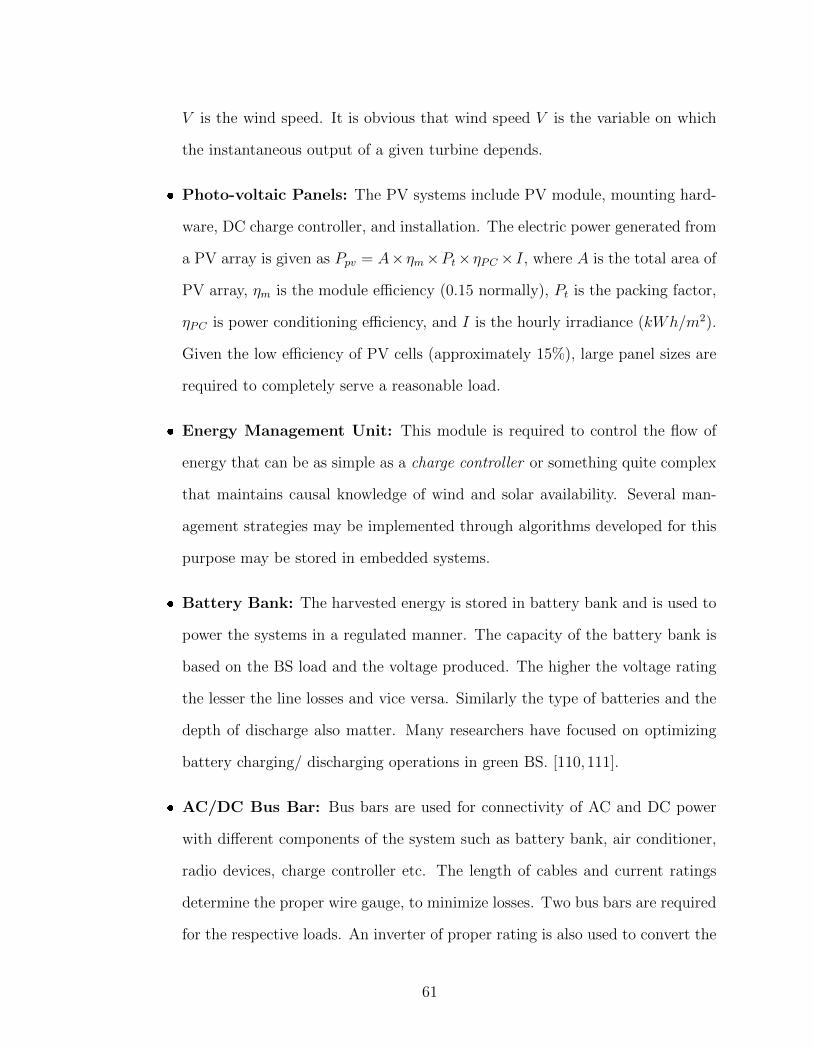
V is the wind speed. It is obvious that wind speed V is the variable on which
the instantaneous output of a given turbine depends.
� Photo-voltaic Panels: The PV systems include PV module, mounting hard-
ware, DC charge controller, and installation. The electric power generated from
a PV array is given as Ppv = A×ηm×Pt×ηPC× I, where A is the total area of
PV array, ηm is the module efficiency (0.15 normally), Pt is the packing factor,
ηPC is power conditioning efficiency, and I is the hourly irradiance (kWh/m2).
Given the low efficiency of PV cells (approximately 15%), large panel sizes are
required to completely serve a reasonable load.
� Energy Management Unit: This module is required to control the flow of
energy that can be as simple as a charge controller or something quite complex
that maintains causal knowledge of wind and solar availability. Several man-
agement strategies may be implemented through algorithms developed for this
purpose may be stored in embedded systems.
� Battery Bank: The harvested energy is stored in battery bank and is used to
power the systems in a regulated manner. The capacity of the battery bank is
based on the BS load and the voltage produced. The higher the voltage rating
the lesser the line losses and vice versa. Similarly the type of batteries and the
depth of discharge also matter. Many researchers have focused on optimizing
battery charging/ discharging operations in green BS. [110,111].
� AC/DC Bus Bar: Bus bars are used for connectivity of AC and DC power
with different components of the system such as battery bank, air conditioner,
radio devices, charge controller etc. The length of cables and current ratings
determine the proper wire gauge, to minimize losses. Two bus bars are required
for the respective loads. An inverter of proper rating is also used to convert the
61
DC power from the battery bank for AC loads, and may come equipped with
charge controllers and net meters.
� Mechanical Assembly: A housing and support structure is required to in-
stall the wind turbine and the PV panels. The design needs to have minimum
maintenance requirements since BS could be located at remote locations. Both
horizontal axis and vertical axis wind turbines have been modeled, for both in-
tegrated or separate installation. Robust non-corrosive structures are employed
that can withstand weather effects for years to come.
3.3.2 Modelling Energy Sources for Powering a BS
Our preference is to use the sustainable green energy as much as possible. In order to
get an estimate of the size of PV-array and wind turbine required to sustain the load,
we have to perform some basic calculations for these systems. These calculations have
been described in Appendix to this chapter and their results are presented here. Not
every parameter such as line losses and battery charging losses are catered for since
we are only interested in general relative figures for BS load and energy generation
system. To power the BS with RES we need to consider the average daily energy
consumption of the BS as per section 3.2. Based on this requirement and the yield
of solar and wind energy at site, we can decide on the size of PV array and wind
turbine (WT). In order to regulate the energy harvested from PV array/wind turbine,
it is stored in batteries for smooth supply, thus a battery bank of sufficient size is
mandatory. In case the harvested energy is not enough to charge the batteries to their
required level, power is provided from a standby generator. On the other hand, if
batteries are fully charged and harvested energy is surplus, we may share this energy
with other consumers.
The individual output of the PV model and wind turbine model are presented in
62
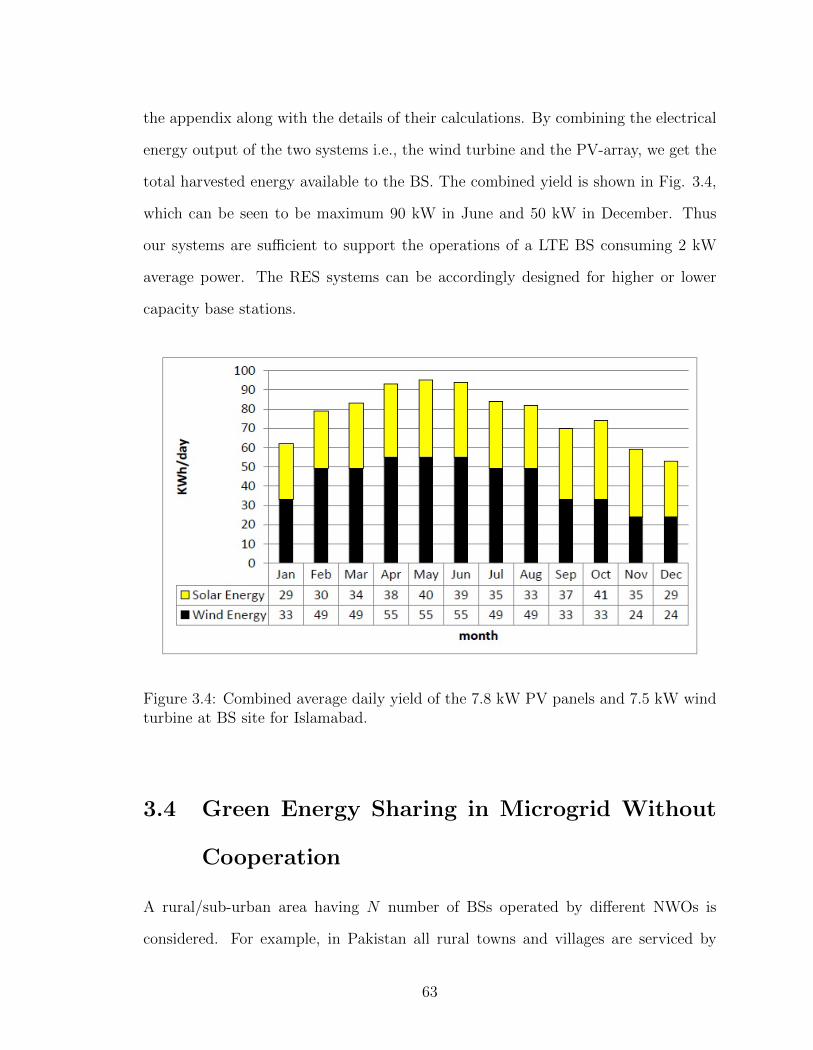
the appendix along with the details of their calculations. By combining the electrical
energy output of the two systems i.e., the wind turbine and the PV-array, we get the
total harvested energy available to the BS. The combined yield is shown in Fig. 3.4,
which can be seen to be maximum 90 kW in June and 50 kW in December. Thus
our systems are sufficient to support the operations of a LTE BS consuming 2 kW
average power. The RES systems can be accordingly designed for higher or lower
capacity base stations.
Figure 3.4: Combined average daily yield of the 7.8 kW PV panels and 7.5 kW windturbine at BS site for Islamabad.
3.4 Green Energy Sharing in Microgrid Without
Cooperation
A rural/sub-urban area having N number of BSs operated by different NWOs is
considered. For example, in Pakistan all rural towns and villages are serviced by
63
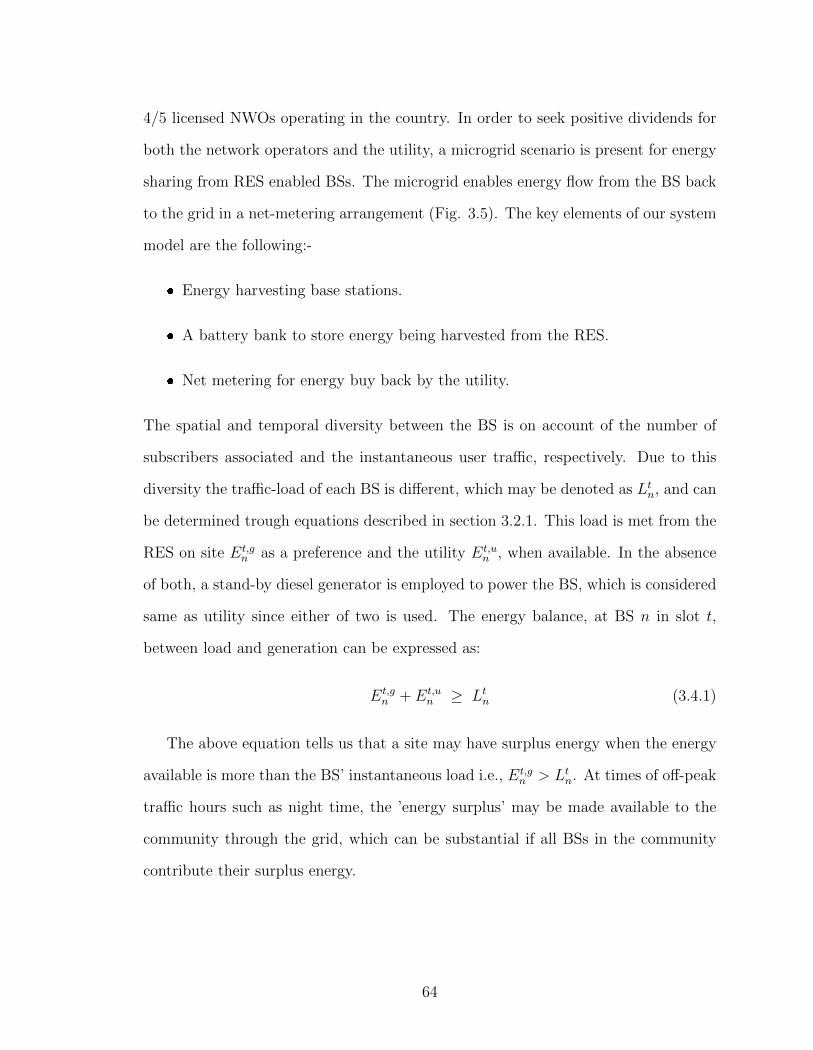
4/5 licensed NWOs operating in the country. In order to seek positive dividends for
both the network operators and the utility, a microgrid scenario is present for energy
sharing from RES enabled BSs. The microgrid enables energy flow from the BS back
to the grid in a net-metering arrangement (Fig. 3.5). The key elements of our system
model are the following:-
� Energy harvesting base stations.
� A battery bank to store energy being harvested from the RES.
� Net metering for energy buy back by the utility.
The spatial and temporal diversity between the BS is on account of the number of
subscribers associated and the instantaneous user traffic, respectively. Due to this
diversity the traffic-load of each BS is different, which may be denoted as Ltn, and can
be determined trough equations described in section 3.2.1. This load is met from the
RES on site Et,gn as a preference and the utility Et,u
n , when available. In the absence
of both, a stand-by diesel generator is employed to power the BS, which is considered
same as utility since either of two is used. The energy balance, at BS n in slot t,
between load and generation can be expressed as:
Et,gn + Et,u
n ≥ Ltn (3.4.1)
The above equation tells us that a site may have surplus energy when the energy
available is more than the BS’ instantaneous load i.e., Et,gn > Ltn. At times of off-peak
traffic hours such as night time, the ’energy surplus’ may be made available to the
community through the grid, which can be substantial if all BSs in the community
contribute their surplus energy.
64
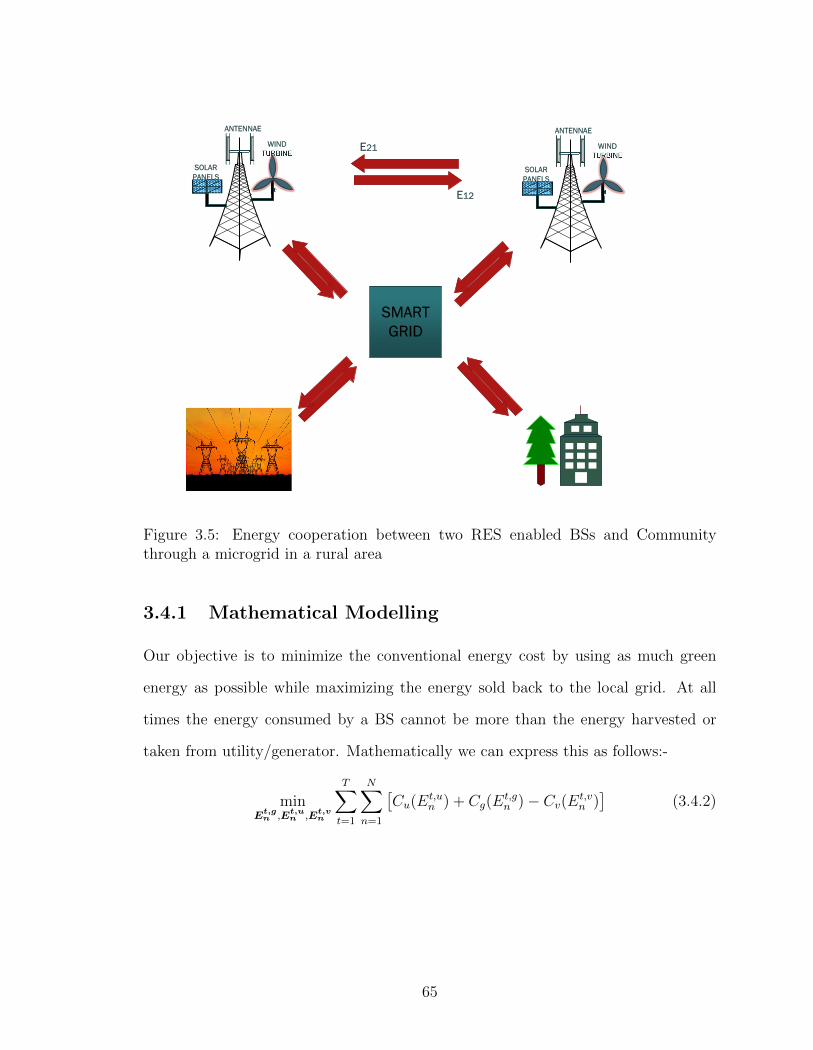
SOLAR
PANELS
WIND
TURBINE
ANTENNAE
SOLAR
PANELS
WIND
TURBINE
ANTENNAE
E12
E21
SMART
GRID
Figure 3.5: Energy cooperation between two RES enabled BSs and Communitythrough a microgrid in a rural area
3.4.1 Mathematical Modelling
Our objective is to minimize the conventional energy cost by using as much green
energy as possible while maximizing the energy sold back to the local grid. At all
times the energy consumed by a BS cannot be more than the energy harvested or
taken from utility/generator. Mathematically we can express this as follows:-
minE
t,gn ,E
t,un ,E
t,vn
T∑t=1
N∑n=1
[Cu(E
t,un ) + Cg(E
t,gn )− Cv(Et,v
n )]
(3.4.2)
65
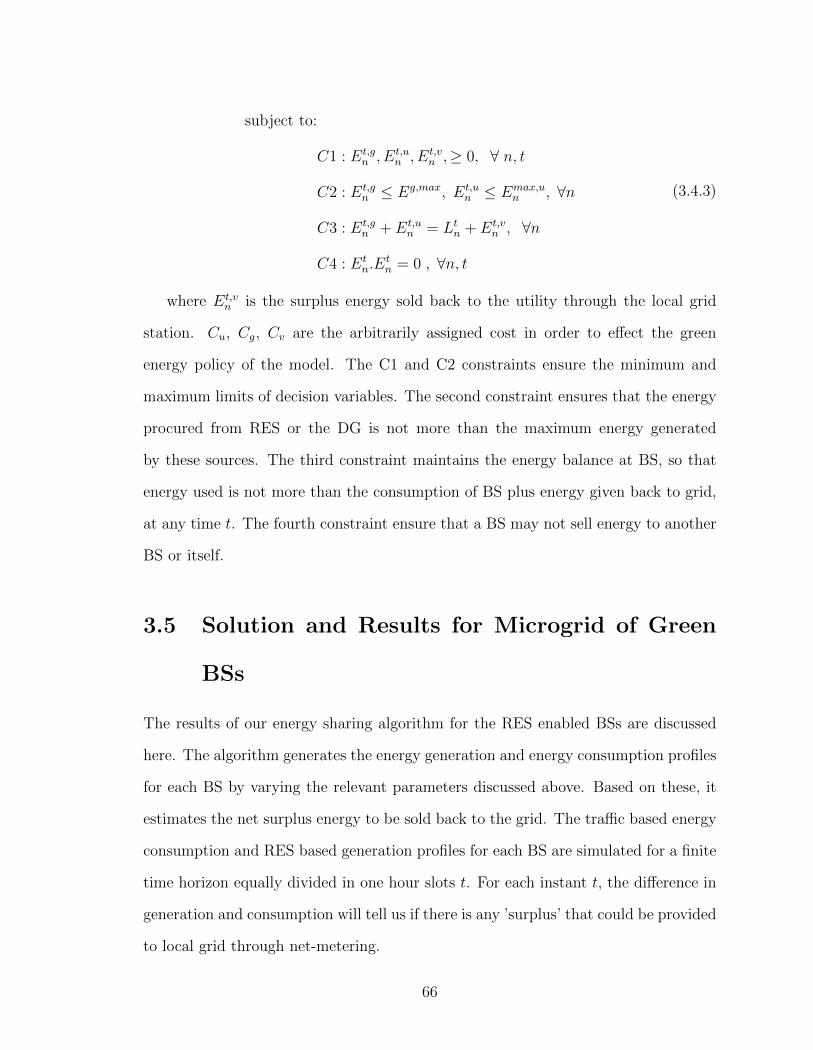
subject to:
C1 : Et,gn , Et,u
n , Et,vn ,≥ 0, ∀ n, t
C2 : Et,gn ≤ Eg,max, Et,u
n ≤ Emax,un , ∀n
C3 : Et,gn + Et,u
n = Ltn + Et,vn , ∀n
C4 : Etn.E
tn = 0 , ∀n, t
(3.4.3)
where Et,vn is the surplus energy sold back to the utility through the local grid
station. Cu, Cg, Cv are the arbitrarily assigned cost in order to effect the green
energy policy of the model. The C1 and C2 constraints ensure the minimum and
maximum limits of decision variables. The second constraint ensures that the energy
procured from RES or the DG is not more than the maximum energy generated
by these sources. The third constraint maintains the energy balance at BS, so that
energy used is not more than the consumption of BS plus energy given back to grid,
at any time t. The fourth constraint ensure that a BS may not sell energy to another
BS or itself.
3.5 Solution and Results for Microgrid of Green
BSs
The results of our energy sharing algorithm for the RES enabled BSs are discussed
here. The algorithm generates the energy generation and energy consumption profiles
for each BS by varying the relevant parameters discussed above. Based on these, it
estimates the net surplus energy to be sold back to the grid. The traffic based energy
consumption and RES based generation profiles for each BS are simulated for a finite
time horizon equally divided in one hour slots t. For each instant t, the difference in
generation and consumption will tell us if there is any ’surplus’ that could be provided
to local grid through net-metering.
66
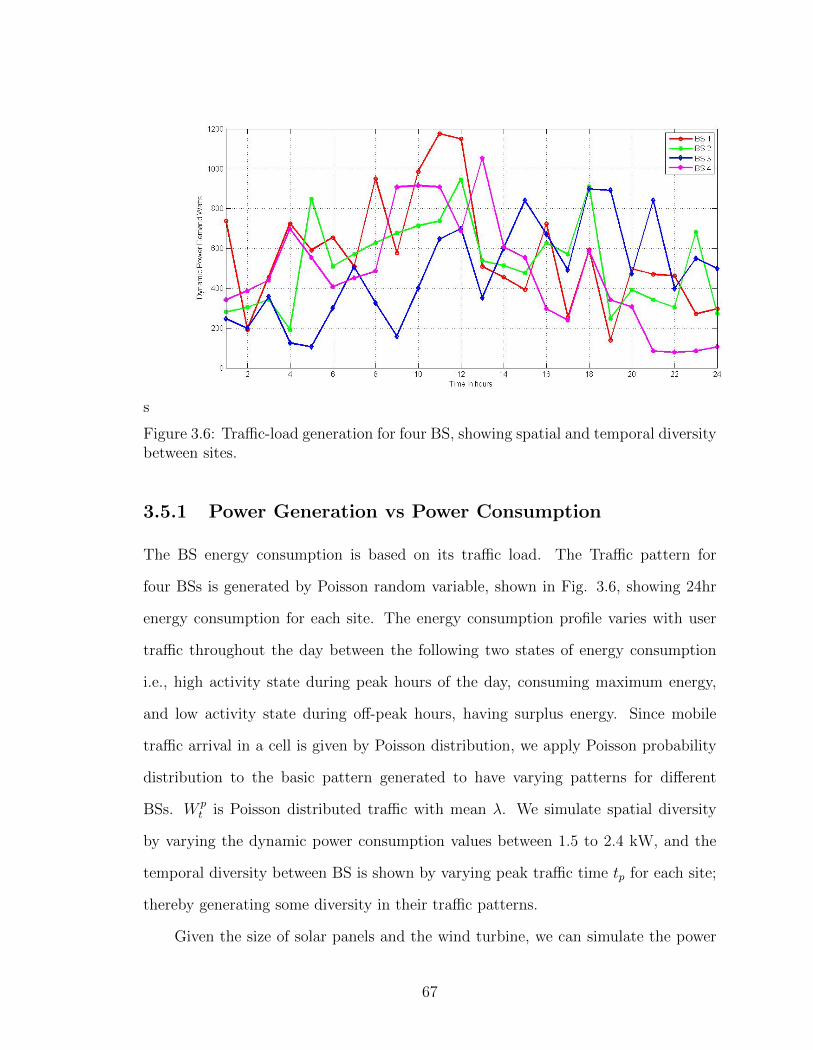
s
Figure 3.6: Traffic-load generation for four BS, showing spatial and temporal diversitybetween sites.
3.5.1 Power Generation vs Power Consumption
The BS energy consumption is based on its traffic load. The Traffic pattern for
four BSs is generated by Poisson random variable, shown in Fig. 3.6, showing 24hr
energy consumption for each site. The energy consumption profile varies with user
traffic throughout the day between the following two states of energy consumption
i.e., high activity state during peak hours of the day, consuming maximum energy,
and low activity state during off-peak hours, having surplus energy. Since mobile
traffic arrival in a cell is given by Poisson distribution, we apply Poisson probability
distribution to the basic pattern generated to have varying patterns for different
BSs. W pt is Poisson distributed traffic with mean λ. We simulate spatial diversity
by varying the dynamic power consumption values between 1.5 to 2.4 kW, and the
temporal diversity between BS is shown by varying peak traffic time tp for each site;
thereby generating some diversity in their traffic patterns.
Given the size of solar panels and the wind turbine, we can simulate the power
67
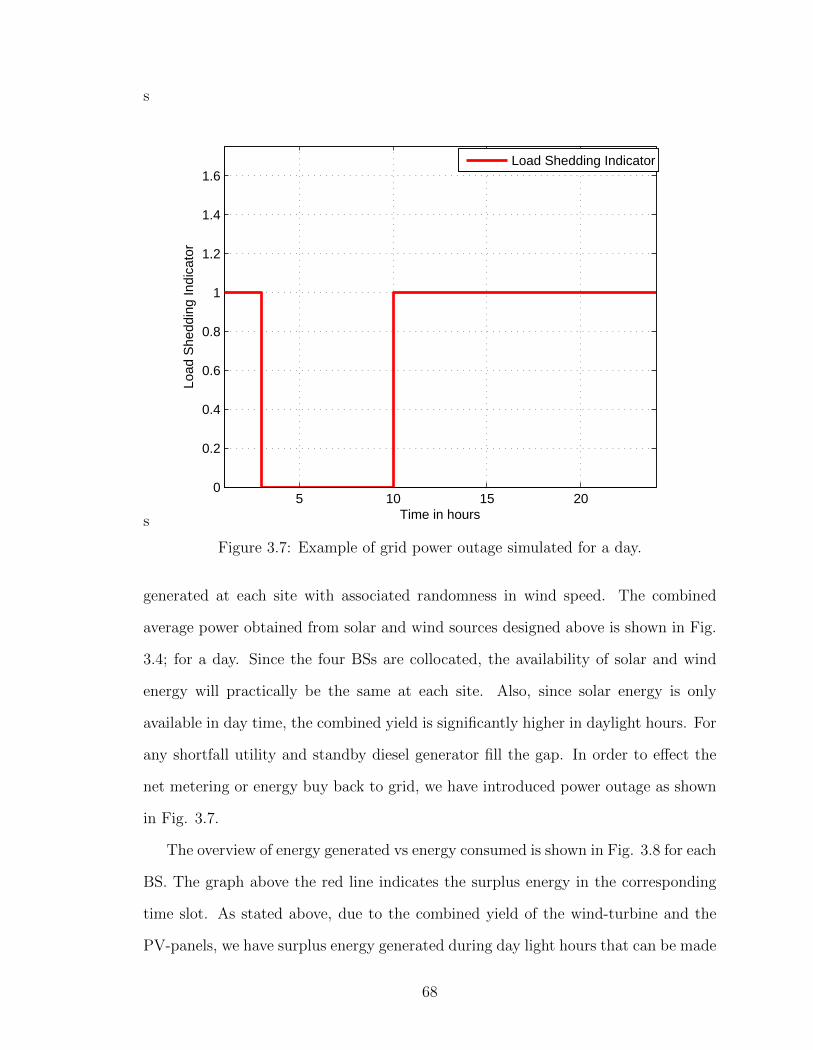
s
5 10 15 200
0.2
0.4
0.6
0.8
1
1.2
1.4
1.6
Time in hours
Load
She
ddin
g In
dica
tor
Load Shedding Indicator
s
Figure 3.7: Example of grid power outage simulated for a day.
generated at each site with associated randomness in wind speed. The combined
average power obtained from solar and wind sources designed above is shown in Fig.
3.4; for a day. Since the four BSs are collocated, the availability of solar and wind
energy will practically be the same at each site. Also, since solar energy is only
available in day time, the combined yield is significantly higher in daylight hours. For
any shortfall utility and standby diesel generator fill the gap. In order to effect the
net metering or energy buy back to grid, we have introduced power outage as shown
in Fig. 3.7.
The overview of energy generated vs energy consumed is shown in Fig. 3.8 for each
BS. The graph above the red line indicates the surplus energy in the corresponding
time slot. As stated above, due to the combined yield of the wind-turbine and the
PV-panels, we have surplus energy generated during day light hours that can be made
68

available to the local grid through net-metering.
69
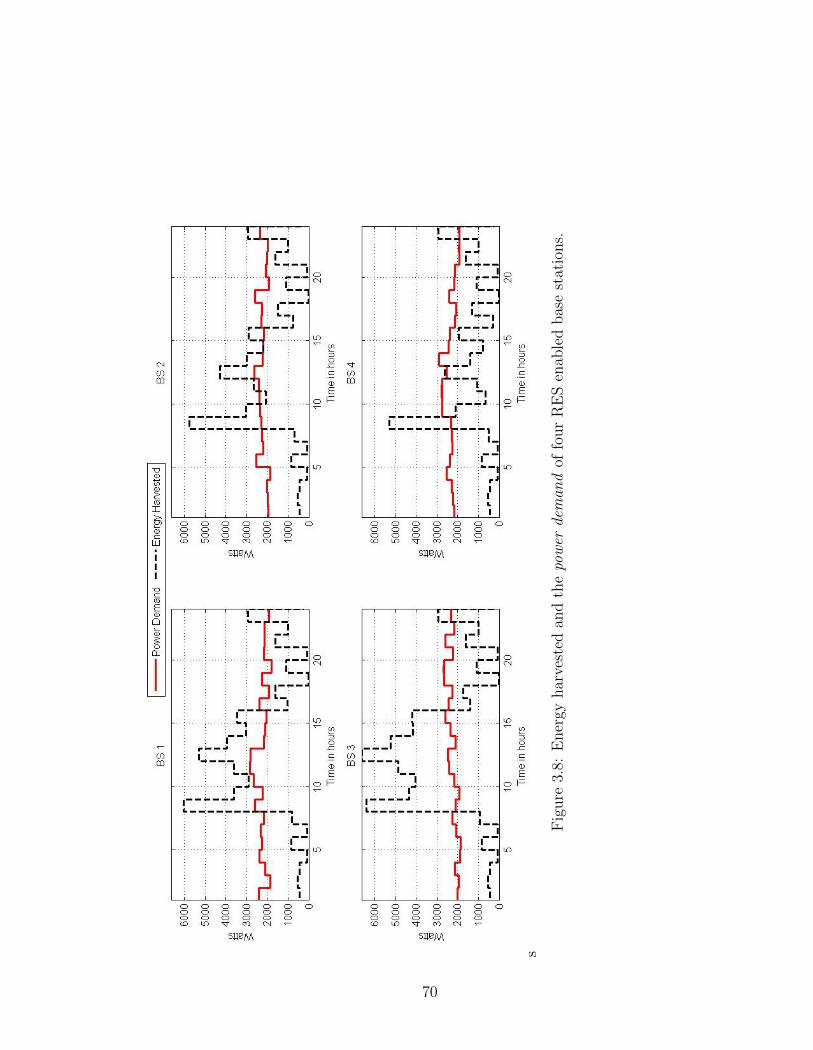
s
Fig
ure
3.8:
En
ergy
har
vest
edan
dth
epo
wer
dem
and
offo
ur
RE
Sen
able
db
ase
stat
ion
s.
70
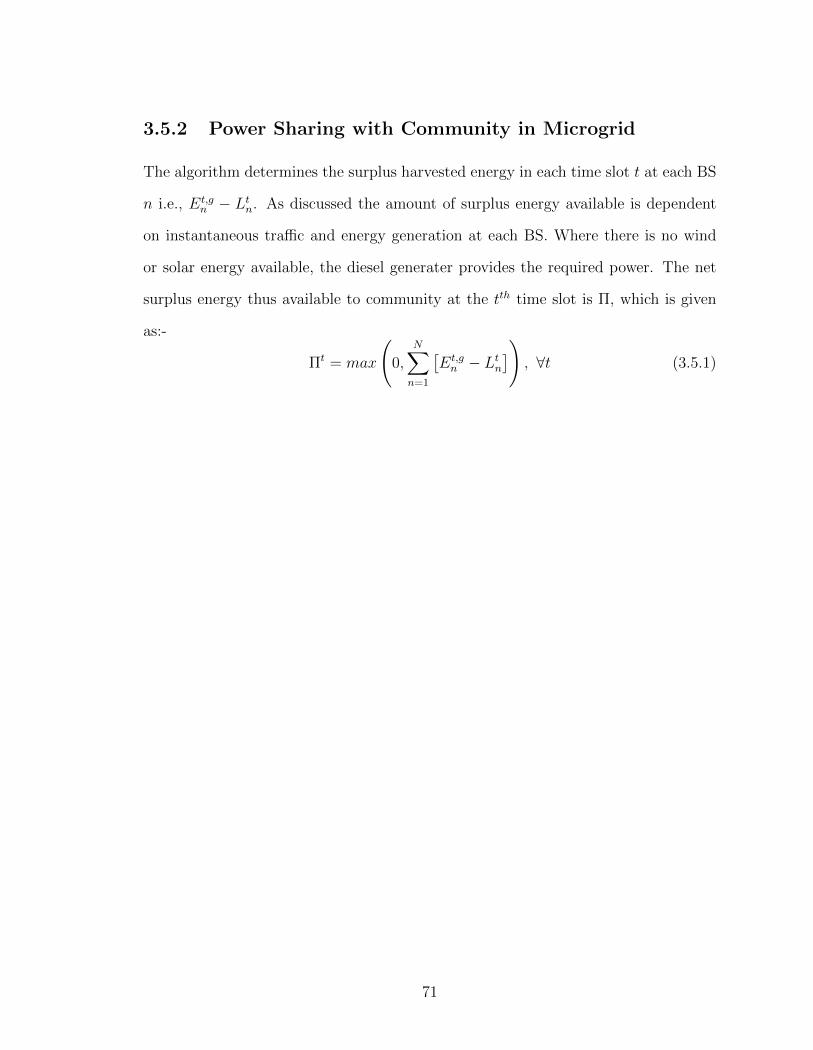
3.5.2 Power Sharing with Community in Microgrid
The algorithm determines the surplus harvested energy in each time slot t at each BS
n i.e., Et,gn − Ltn. As discussed the amount of surplus energy available is dependent
on instantaneous traffic and energy generation at each BS. Where there is no wind
or solar energy available, the diesel generater provides the required power. The net
surplus energy thus available to community at the tth time slot is Π, which is given
as:-
Πt = max
(0,
N∑n=1
[Et,gn − Ltn
]), ∀t (3.5.1)
71
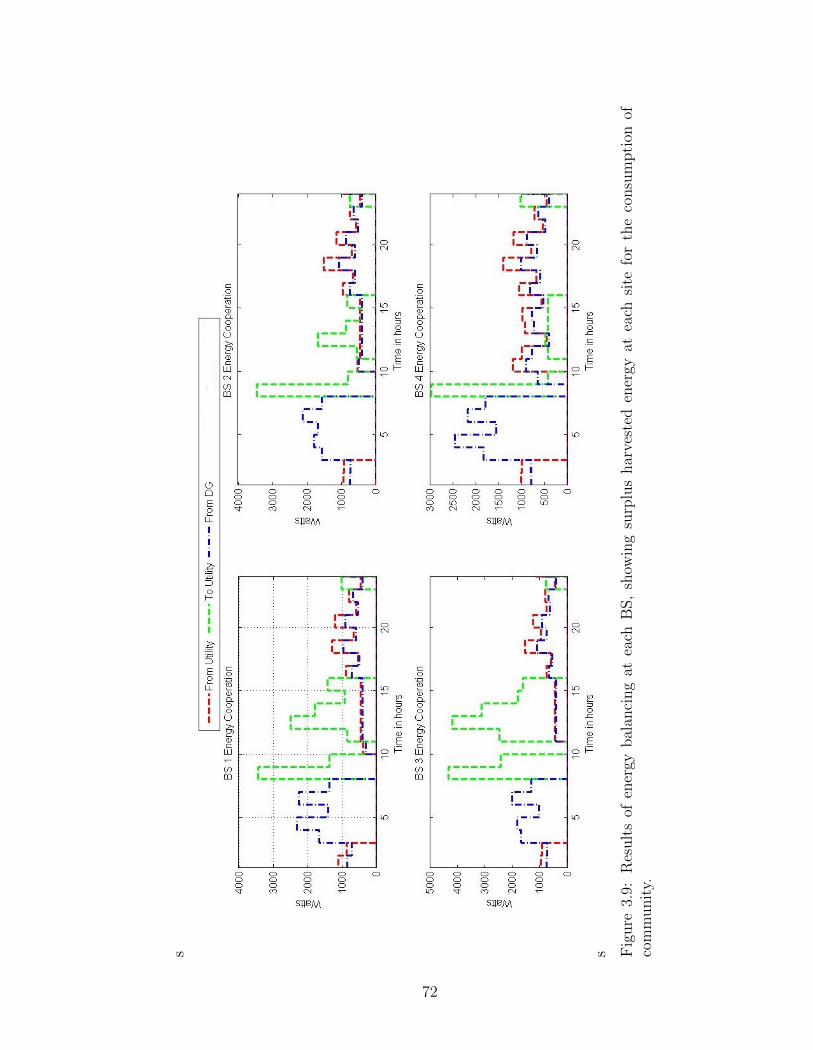
s s Fig
ure
3.9:
Res
ult
sof
ener
gyb
alan
cin
gat
each
BS
,sh
owin
gsu
rplu
sh
arve
sted
ener
gyat
each
site
for
the
con
sum
pti
onof
com
mu
nit
y.
72
The simulation results of the energy sharing algorithm are shown in Fig.3.9. The
share of energy from each BS to the grid station is shown in green, which can be
substantial if all surplus energy from every BS is combined. It can be seen that
maximum energy surplus is available in daylight hours due to availability of both
solar and wind energy, which can be used to serve the local community through the
local grid station in a microgrid scenario. The more the number of RES enabled BS
the more the energy available for community. Also, the net saving is significant if both
wind energy and solar energy is used rather than either of them being deployed solely.
Thus, we may conclude that powering cellular BS with renewable energy sources is
beneficial for both the network operator as well as the utility, especially in areas facing
grid power outages. However, a stand by generator may still be required to make up
for the unavailability of stored renewable energy at any instant.
3.6 Summary
In this chapter a macro BS consuming 2.35 kW of power, including air-conditioning,
was considered for installation of RES of a wind turbine and a PV array. Based on this
load and the solar insolation and wind conditions for Islamabad region, calculations
were made for suitable size of solar panels and a wind turbine. This resulted in a
PV array and a wind turbine with peak capacity of 7.8 kW and 7.5 kW, respectively.
The dynamic and total load as a function of traffic fluctuations were also estimated
for N number of BSs. The yield of the two renewable energy sources was simulated
and it was realized that given the variance in the load as well as energy harvested,
the instantaneous energy state reveals surplus green energy at some instants. It
was assumed that all network operators are willing to cooperate and there is pricing
agreement between utility and operators to buy/sell energy. Also a microgrid is in
place with a central controller for bi-directional energy flow. This model is particularly
73

suited for application at sites that are off-grid and have good windy conditions such
as the coastal area and mountain ranges. Thus we concluded that a BS equipped with
RES of solar and wind can yield surplus energy that may be given to local community
through the local grid station in a microgrid scenario.
74
3.A Solar Energy System Model
Solar irradiation is the solar energy available at a site, indicated in kW/m2, whereas,
solar insolation is the energy available over a period of time. The solar insolation
data for Islamabad is shown in Fig. 3.10(a). The average daily insolation for each
month is given in kWh/m2/day, e.g., it is lowest in December (4.79kWh/m2/day)
and maximum in May (6.63kWh/m2 per day)1. The total electrical energy for a
period (a day in our case) produced by the solar panels of certain size is a function
of the daily solar insolation (I), given in kWh/m2 per day, area of the panels (A)
in m2, photovoltaic (PV) module efficiency or solar yield (ηm) and the performance
ratio or coefficient for losses PR (taken as 0.75). The electrical energy generated in
kWh from PV modules is then given by the following expression.
Epv = A× ηm × PR× I (3.A.1)
where Epv is in kW and the solar yield (ηm) is given as ratio of wattage (in kW)
and area (in m2) of the panel, which is equal to 0.16 = 0.26/1.63 in our model .
Using the above expression, we can find the size of panels to produce 56 kW of
energy required to power the BS, which comes out to be 80m2 approximately for an
insolation value of 5.5kWh/m2. For a single panel of 1.63m2, this translates into
49 panels. This is a very large number and not feasible. We must reduce the PV-
array size and compensate the deficiency with a wind turbine. For an average daily
insolation of worst month of 4.79kWh/m2 per day in December, the electrical energy
yield of a 50m2 panel comes out to be 29 kWh per day approximately. Whereas,
for the month of May this figure increases to 40 kWh per day. The average daily
energy available from the stated panel size is shown for each month for Islamabad
in Fig. 3.10(b), which can be seen to be ranging between 30 to 40 kWh for a day,
1www.solarelectricityhandbook.com/solar-irradiance.html
75
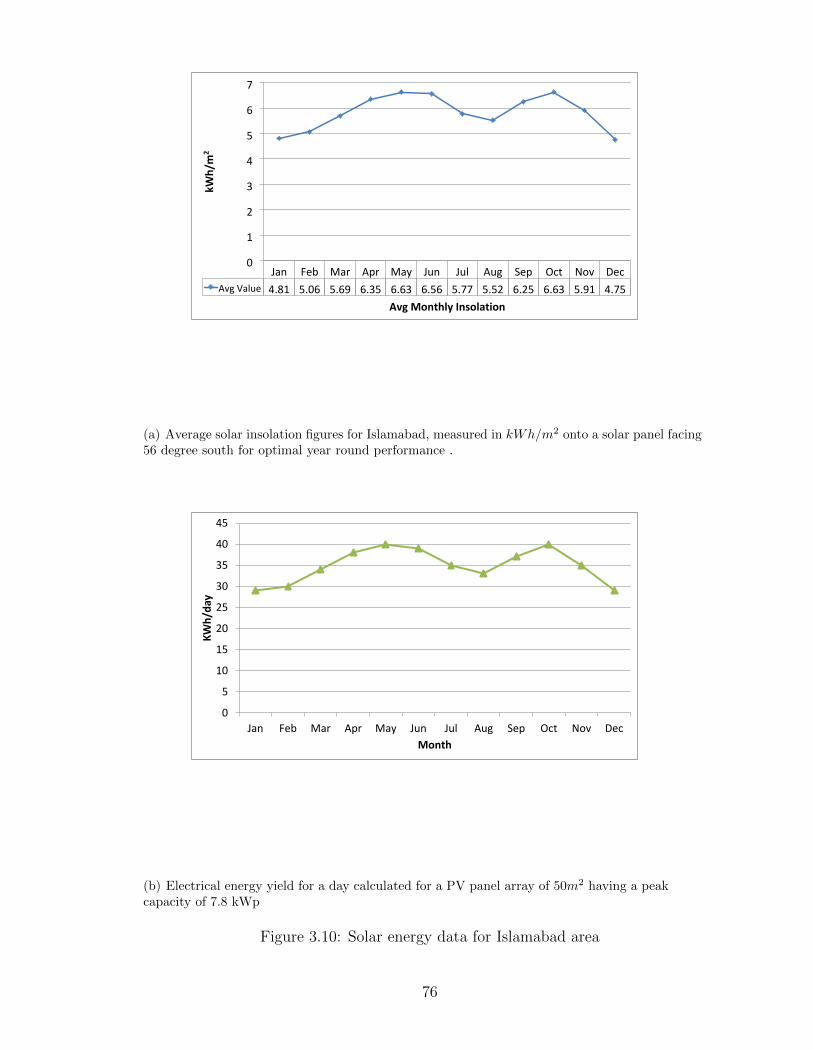
Jan Feb Mar Apr May Jun Jul Aug Sep Oct Nov Dec
Avg Value 4.81 5.06 5.69 6.35 6.63 6.56 5.77 5.52 6.25 6.63 5.91 4.75
0
1
2
3
4
5
6
7
Avg Monthly Insolation
(a) Average solar insolation figures for Islamabad, measured in kWh/m2 onto a solar panel facing56 degree south for optimal year round performance .
0
5
10
15
20
25
30
35
40
45
Jan Feb Mar Apr May Jun Jul Aug Sep Oct Nov Dec
KWh/day
Month
(b) Electrical energy yield for a day calculated for a PV panel array of 50m2 having a peakcapacity of 7.8 kWp
Figure 3.10: Solar energy data for Islamabad area
76
approximately. Thus for 50m2 PV-array, given the size of one panel as 1.63m2 and
260 W power (24V nominal voltage), the total number of panels required are 30
(connected in series parallel), having a total wattage of 7.8 kW peak and 5.85 KW
(7.8× 0.75) nominal.
The minimum solar energy yield is 29 kWh per day in the month of December.
In order to power the above stated load of 56 kWh with solar panels only, we need to
almost double the size of solar panels, so that enough power is generated to charge the
batteries fully and subsequently power the BS. However, instead of making the panels
unreasonably large, we can also make use of a wind turbine. Wind turbine will be a
good edition because it is also a clean source of energy and available at night, unlike
solar. However, wind is more unpredictable than solar energy. Quisque ullamcorper
placerat ipsum. Cras nibh. Morbi vel justo vitae lacus tincidunt ultrices. Lorem
ipsum dolor sit amet, consectetuer adipiscing elit. In hac habitasse platea dictumst.
Integer tempus convallis augue. Etiam facilisis. Nunc elementum fermentum wisi.
Aenean placerat. Ut imperdiet, enim sed gravida sollicitudin, felis odio placerat
quam, ac pulvinar elit purus eget enim. Nunc vitae tortor. Proin tempus nibh sit
amet nisl. Vivamus quis tortor vitae risus porta vehicula.
3.B Wind Energy System Model
On one hand wind energy is available throughout the day in certain areas, unlike
solar energy, while on the other hand, wind can be highly unstable. Different sizes
of horizontal axis wind turbines and vertical axis wind turbine are employed for the
generation of electricity from wind. There are different methods of calculating the
annual energy output (AEO) of a wind turbine, such as (i) swept area method (ii)
manufacturers estimates (iii) and power curve method. A Wind Turbine is described
by its power curve showing output power vs wind speed. Other factors describing a
77
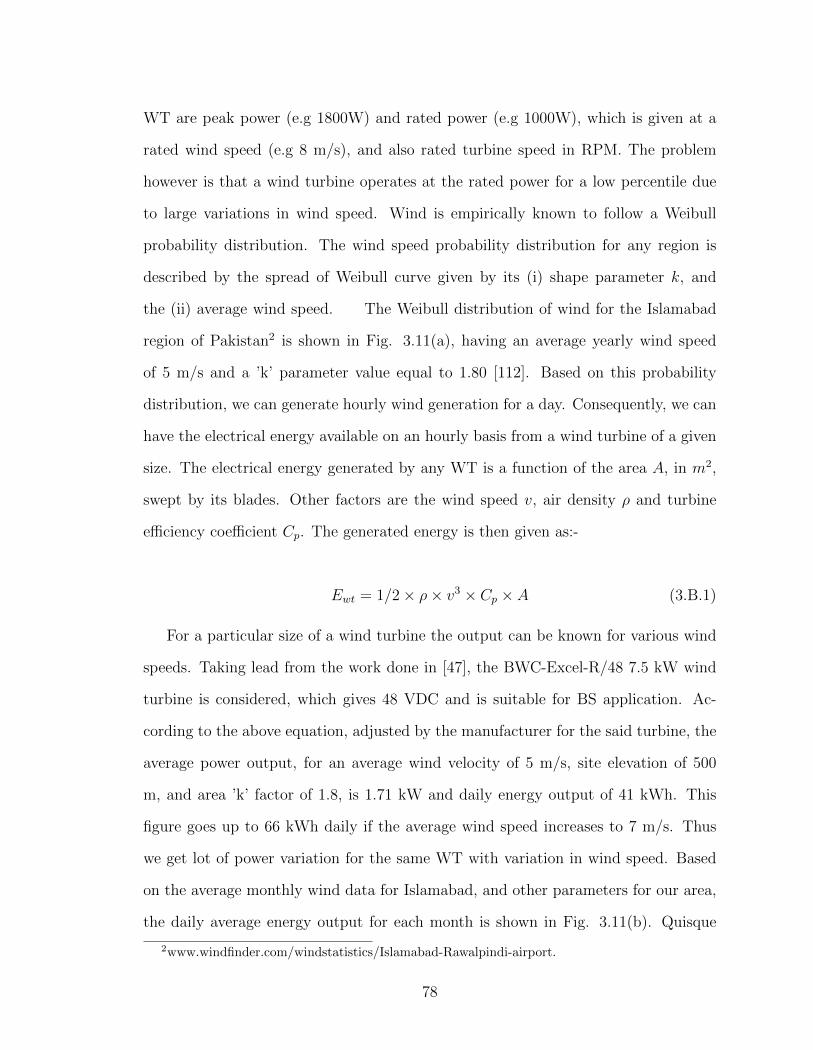
WT are peak power (e.g 1800W) and rated power (e.g 1000W), which is given at a
rated wind speed (e.g 8 m/s), and also rated turbine speed in RPM. The problem
however is that a wind turbine operates at the rated power for a low percentile due
to large variations in wind speed. Wind is empirically known to follow a Weibull
probability distribution. The wind speed probability distribution for any region is
described by the spread of Weibull curve given by its (i) shape parameter k, and
the (ii) average wind speed. The Weibull distribution of wind for the Islamabad
region of Pakistan2 is shown in Fig. 3.11(a), having an average yearly wind speed
of 5 m/s and a ’k’ parameter value equal to 1.80 [112]. Based on this probability
distribution, we can generate hourly wind generation for a day. Consequently, we can
have the electrical energy available on an hourly basis from a wind turbine of a given
size. The electrical energy generated by any WT is a function of the area A, in m2,
swept by its blades. Other factors are the wind speed v, air density ρ and turbine
efficiency coefficient Cp. The generated energy is then given as:-
Ewt = 1/2× ρ× v3 × Cp × A (3.B.1)
For a particular size of a wind turbine the output can be known for various wind
speeds. Taking lead from the work done in [47], the BWC-Excel-R/48 7.5 kW wind
turbine is considered, which gives 48 VDC and is suitable for BS application. Ac-
cording to the above equation, adjusted by the manufacturer for the said turbine, the
average power output, for an average wind velocity of 5 m/s, site elevation of 500
m, and area ’k’ factor of 1.8, is 1.71 kW and daily energy output of 41 kWh. This
figure goes up to 66 kWh daily if the average wind speed increases to 7 m/s. Thus
we get lot of power variation for the same WT with variation in wind speed. Based
on the average monthly wind data for Islamabad, and other parameters for our area,
the daily average energy output for each month is shown in Fig. 3.11(b). Quisque
2www.windfinder.com/windstatistics/Islamabad-Rawalpindi-airport.
78
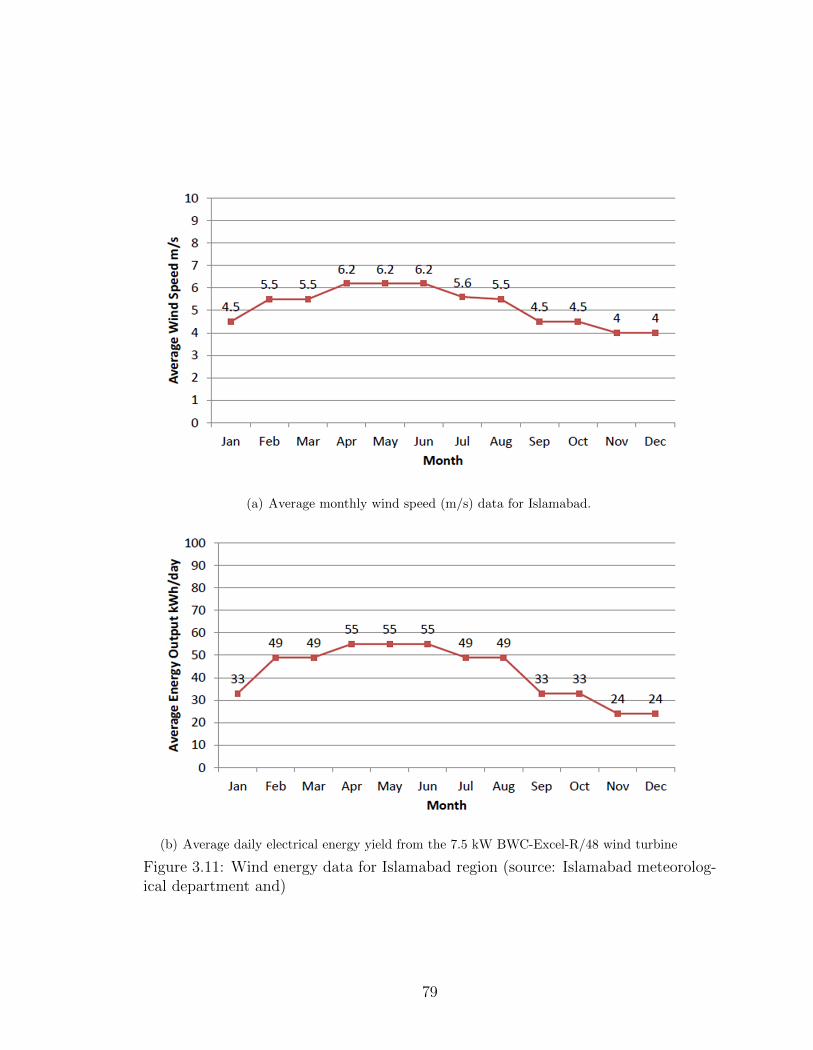
(a) Average monthly wind speed (m/s) data for Islamabad.
(b) Average daily electrical energy yield from the 7.5 kW BWC-Excel-R/48 wind turbine
Figure 3.11: Wind energy data for Islamabad region (source: Islamabad meteorolog-ical department and)
79
ullamcorper placerat ipsum. Cras nibh. Morbi vel justo vitae lacus tincidunt ultrices.
Lorem ipsum dolor sit amet, consectetuer adipiscing elit. In hac habitasse platea dic-
tumst. Integer tempus convallis augue. Etiam facilisis. Nunc elementum fermentum
wisi. Aenean placerat. Ut imperdiet, enim sed gravida sollicitudin, felis odio placerat
quam, ac pulvinar elit purus eget enim. Nunc vitae tortor. Proin tempus nibh sit
amet nisl. Vivamus quis tortor vitae risus porta vehicula.
3.C Battery Bank Modeling
A battery bank is invariably used with communication systems to ensure 100% re-
liability of the system. Ideally, one would like to have a battery bank large enough
to power the BS for considerable time/hours in case of power outage. The size of
the battery bank is a function of two main factors; how much is the load? and, how
long do you want to power it? Thus for a given load (2.35 kilo Watt in our case) the
size will depend on how long we want the backup. Of course, the longer the battery
backup, the larger the size and higher the cost. Other than cost, housing is also an
issue in confined places like a cellular base station. Another important aspect to note
is that it would take longer to charge a larger bank then a smaller one. These factors
determine the impact that size would have on the system and therefore have to be
kept in mind while sizing the battery bank.
Based on the calculations made in section 3.2.1, the maximum energy consumption
figure for the a macro BS is approximately 56 kWh daily [101]. Considering a 48 V DC
system powering the system, the size requirement for the battery bank is 56 kWh/48V
= 1175 Ah. The lifetime of a battery depends upon its charging/discharging cycles
and is different for different types of batteries. An other consideration in prolonging
the battery life is to safeguard it from over charging and over discharging. However,
the batteries are not to be discharged below 50% of their maximum state of charge
80
to preserve their life. If discharged below a certain level, it’s life deteriorates fast.
As a rule of thumb, it is considered that a battery may not be discharged below
50% of its capacity. Therefore, our battery bank should have double the capacity,
112 kWh or 2350 Ah, to power the BS for 24 hrs. Different types of batteries been
developed, however, we consider rechargeable 12 V 180 Ah Deep cycle gel lead-acid
battery, which is widely used and available in developing countries like Pakistan. It
is reasonable to have a standby power for 24-48 hrs. In order to generate this much
backup capacity for the BS, we require a total of quantity eight batteries connected
in series parallel (4x2) configuration i.e., four (04) batteries in series for 48 V output,
and then two such parallel sets. The combined output of such a battery bank would
be 48 V × 360 Ah or 17.28 kWh, which is sufficient to power the BS for three days.
If the RES outage is more, a standby diesel generator would be turned on.
The energy flow w.r.t batteries state of charge (SOC) can be investigated for dif-
ferent cases such as (i) fully charged (ii) below threshold and (iii) in-between threshold
and full capacity. We are not modeling the various states of battery bank here and
assume a simple linear input output relationship between harvested energy and bat-
tery back-up capacity. That means when harvested energy is more than the BS load
it is considered surplus. In good windy and sunny conditions a battery bank would
be amply recharged to provide regulated power to the BS. However, in night time,
with no wind, the battery would start depleting. We have restricted backup to 48
hours, because as the size of the bank increases so does the cost. In our model, a total
of 24 batteries in series-parallel combination are considered (8x3) each of 6 volts and
390 ampere hour to cater for the load of 56 kilowatt hour per day. Depending on the
site - we have an average wind of 5 m/s, which is sufficient to run the wind turbine
– total outage of renewable sources should not prevail for long. So 12 hours backup
is considered. Quisque ullamcorper placerat ipsum. Cras nibh. Morbi vel justo vitae
lacus tincidunt ultrices. Lorem ipsum dolor sit amet, consectetuer adipiscing elit. In
81

hac habitasse platea dictumst. Integer tempus convallis augue. Etiam facilisis. Nunc
elementum fermentum wisi. Aenean placerat. Ut imperdiet, enim sed gravida sollic-
itudin, felis odio placerat quam, ac pulvinar elit purus eget enim. Nunc vitae tortor.
Proin tempus nibh sit amet nisl. Vivamus quis tortor vitae risus porta vehicula.
82
Chapter 4
Sustainable Energy Cooperation in Cellular
Networks
83
4.1 Introduction
Reducing the increasing cost of energy and the associated GHG emissions can be
achieved by adopting energy efficient network topologies/schemes and incorporation
of renewable energy sources. In a cellular network, all elements, such as back haul,
switching centres, base stations and mobile terminals may be subjected to energy effi-
cient designs and strategies [13]. However, as noted earlier, the base station consumes
approximately 60% of the networks energy due to which it is a prime target for said
improvements [14], as well as employment of renewable energy systems as discussed
in last chapter.
Indeed it has been shown in literature that equipping BS with solar panels and
wind turbine is technically and financially viable in the long run [47, 113–115]. This
is especially true for a remote and off-grid sites, which are mostly powered by the
conventional diesel generator. The research models show that regulated supply of
energy can be obtained from these sources through a battery bank. A sizeable battery
bank is required to not only provide back up power but also ensure hundred percent
reliability of energy supply. For example, in one case of a base station equipped with
RES and powered through the smart grid, energy cost minimization is done through
efficient scheduling of renewable energy sources through an energy management unit
(EMU) that also controls the flow of energy from the site (battery bank) to the
grid [50].
In the last chapter we modeled the temporal fluctuation in energy consumption of
an LTE base station. Based on the BS’s energy consumption, and wind/solar resource
available at the site, we subsequently modeled the size of pv-array and wind turbine
required to power the BS with green harvested energy. We also modeled the traffic
pattern of six base stations over a day, divided into 24 time slots. It was shown that,
given the variation both in traffic and the energy harvested from solar and wind, we
84
end up having surplus green energy at some periods of time. This energy can be
sold back to the grid or an arrangement can be made to power the local community
in microgrid scenario. The incorporation of renewable energy cuts down the cost of
conventional energy supply and reduces the harmful GHG emissions.
A network of green BSs also allows for reduction in the overall energy consumption
of cellular networks through different topology management schemes such as ’energy
cooperation’ between the nodes. There are two basic premises for energy cooperation,
either the BSs have different traffic loads or they have different capacities of energy
sources. One such scenario could be a case of energy harvesting BSs sharing their
surplus energy with non-harvesting BSs. Another scenario could be a heterogenous
network with low powered BSs getting green energy from high powered BSs equipped
with PV-array and wind turbine. In all cases energy cooperation is made possible
through an energy transfer mechanism, which can be a smart grid or a dedicated
network for energy transfer with a centralized/decentralized control mechanism.
Energy cooperation amongst cellular BS is an ongoing research topic as seen in
literature, with different aspects of this energy management scheme under study.
The common objective being determining the quantum and direction of energy to
transfer between the base stations. Different energy cooperation strategies have been
considered in literature in an effort to optimize the use of renewable energy in the
cooperating base stations. The inherent features of the smart grid such as demand
side management, intelligent scheduling and smart energy purchasing will potentially
reduce the energy costs [116], as well as facilitate energy cooperation in RES enabled
cellular networks. The bi-directional flow of energy and information in the grid makes
it possible to share energy between the nodes and maximize the use of clean energy
[88,90].
Some recent work pertaining to energy cooperation in cellular networks is sum-
marised in Table 4.1. The salient features of which were discussed in the literature
85
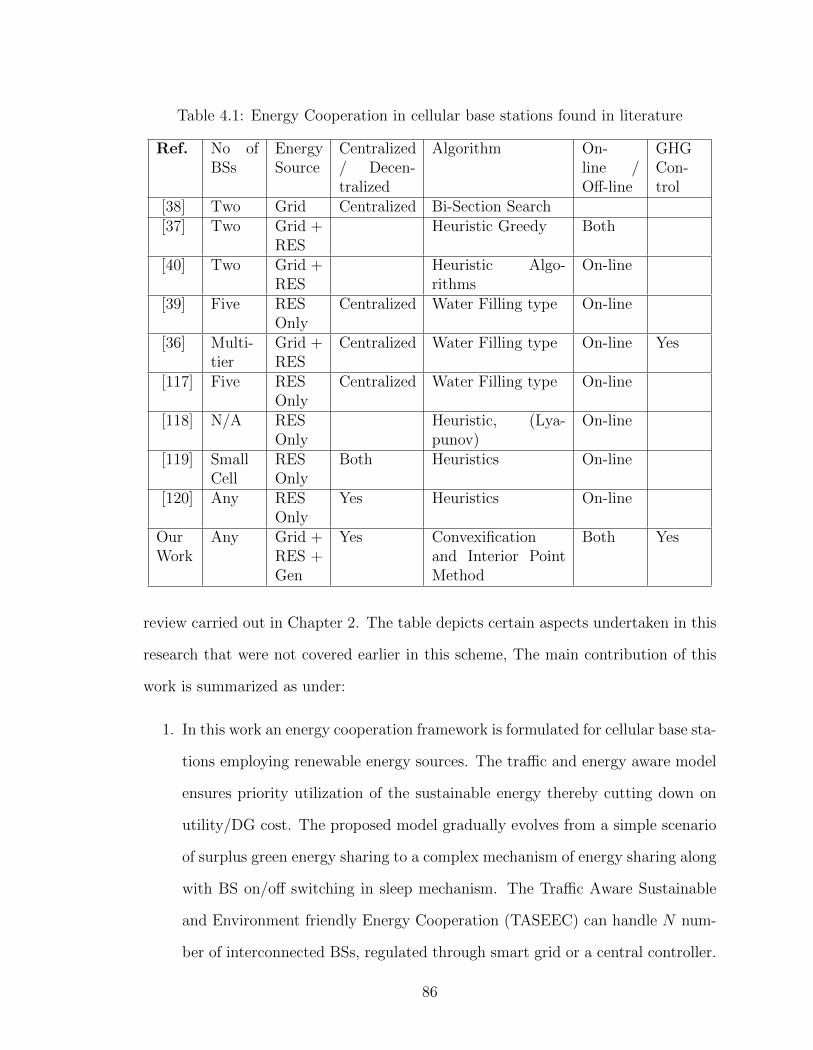
Table 4.1: Energy Cooperation in cellular base stations found in literature
Ref. No ofBSs
EnergySource
Centralized/ Decen-tralized
Algorithm On-line /Off-line
GHGCon-trol
[38] Two Grid Centralized Bi-Section Search[37] Two Grid +
RESHeuristic Greedy Both
[40] Two Grid +RES
Heuristic Algo-rithms
On-line
[39] Five RESOnly
Centralized Water Filling type On-line
[36] Multi-tier
Grid +RES
Centralized Water Filling type On-line Yes
[117] Five RESOnly
Centralized Water Filling type On-line
[118] N/A RESOnly
Heuristic, (Lya-punov)
On-line
[119] SmallCell
RESOnly
Both Heuristics On-line
[120] Any RESOnly
Yes Heuristics On-line
OurWork
Any Grid +RES +Gen
Yes Convexificationand Interior PointMethod
Both Yes
review carried out in Chapter 2. The table depicts certain aspects undertaken in this
research that were not covered earlier in this scheme, The main contribution of this
work is summarized as under:
1. In this work an energy cooperation framework is formulated for cellular base sta-
tions employing renewable energy sources. The traffic and energy aware model
ensures priority utilization of the sustainable energy thereby cutting down on
utility/DG cost. The proposed model gradually evolves from a simple scenario
of surplus green energy sharing to a complex mechanism of energy sharing along
with BS on/off switching in sleep mechanism. The Traffic Aware Sustainable
and Environment friendly Energy Cooperation (TASEEC) can handle N num-
ber of interconnected BSs, regulated through smart grid or a central controller.
86
The framework also handles net-metering and load-shedding in the network. An
arbitrary tariff is assigned to each type of energy, which forces the optimizer to
acquire energy from the most economical source. Thus, through TASEEC, an
environment friendly energy usage is ensured whereby both conventional energy
and GHG emission is reduced.
2. Due to the bilinear form of some constraints, the TASEEC becomes a non-linear
and a non-convex problem. This anomaly is removed by employing McCormick
envelopes to convexify the problem and transform it into a linear optimiza-
tion framework. Therefore, the linear optimization problem is then solved by
applying the interior point method.
3. The dynamic nature of the traffic and the harvested energy is exploited to formu-
late a sustainable energy cooperation policy. Extensive simulation is conducted
to show the positive results of energy cooperation.
4.2 System Model
We consider a cellular network of N macro BSs powered by utility with renewable
energy harvesting systems (solar/wind) installed on site, Fig.4.1. The (dynamic)
energy consumption of the BS is determined in terms of the traffic load of the BS.
The traffic fluctuation in 24 time slots is determined for each BS on the basis of peak
traffic hour and the max/min load value, using calculations shown in section 3.6. We
make all energy calculations in time slotted system, for each slot t (1 ≥ t ≤ T ), T
being the max number of time slots. The key features of our system model are the
following.
� Energy harvesting BSs through solar and wind energy.
� A battery bank for storing the harvested energy.
87
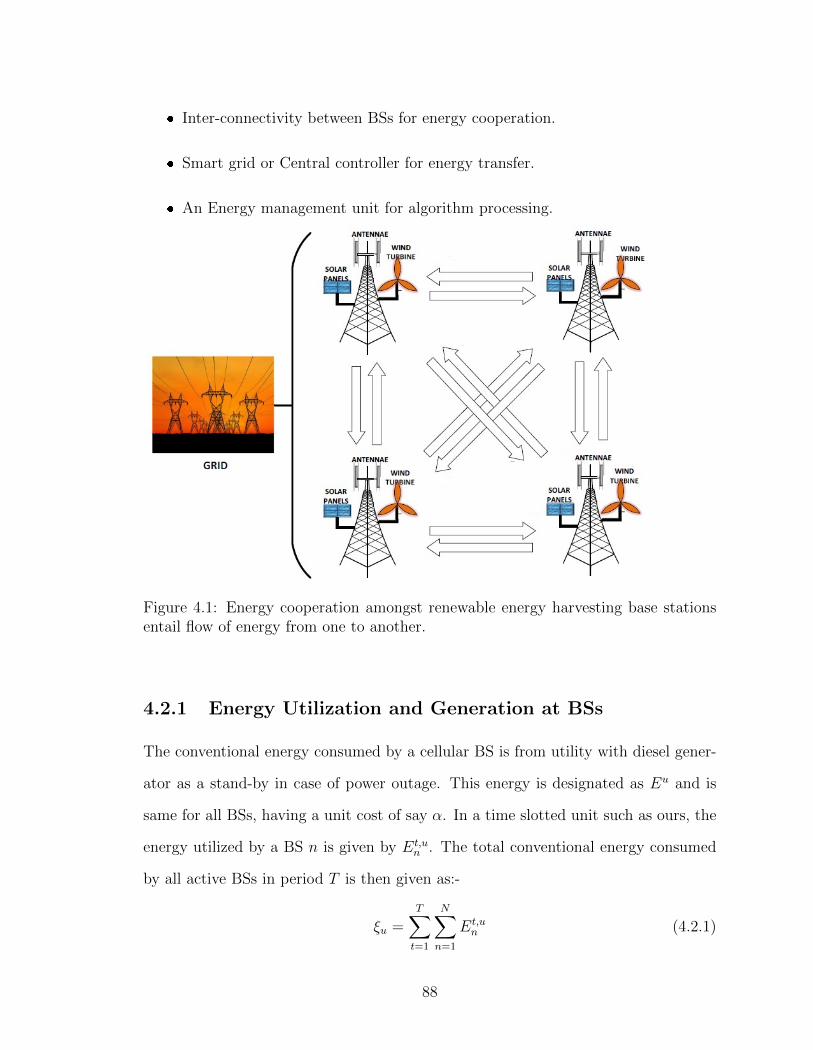
� Inter-connectivity between BSs for energy cooperation.
� Smart grid or Central controller for energy transfer.
� An Energy management unit for algorithm processing.
Figure 4.1: Energy cooperation amongst renewable energy harvesting base stationsentail flow of energy from one to another.
4.2.1 Energy Utilization and Generation at BSs
The conventional energy consumed by a cellular BS is from utility with diesel gener-
ator as a stand-by in case of power outage. This energy is designated as Eu and is
same for all BSs, having a unit cost of say α. In a time slotted unit such as ours, the
energy utilized by a BS n is given by Et,un . The total conventional energy consumed
by all active BSs in period T is then given as:-
ξu =T∑t=1
N∑n=1
Et,un (4.2.1)
88
In the absence of grid supply for any reason, the diesel generator is switched on.
The two supplies, utility and diesel generator are therefore used interchangeably and
not modeled separately. The total cost of the conventional energy is then unit cost
α multiplied with (4.2.1) or αξu. However, the constraint on this usage is that the
total used energy cannot be more than the max available energy.
T∑t=1
N∑n=1
Et,un ≤ Et,u
max (4.2.2)
The solar and wind energy systems modeled in the last chapter were of a larger
capacity than the required power of the BSs. This is because the average yield of
electrical energy from these systems is much less than their peak capacity. However,
it was noted that at times the combined yield of these RES was more than the
instantaneous load of the BS, Ltn, which would render surplus some of the energy
harvested from RES. The green energy harvested by BS n in time slot t is denoted as
Et,gn . Thus we have energy surplus at a BS when Et,g
n is > Ltn, which saves conventional
energy cost of the network. The total renewable energy harvested by the network can
be expressed as follows:-
ξg =T∑t=1
N∑n=1
Et,gn ≤ Et,g
max (4.2.3)
It may be noted that we may have a BS n whose harvested energy Et,gn is more than
its load Ltn, and another BS m where the harvested energy Et,gm is less than the BS
load Ltm. This leads to the possibility of energy cooperation between the two BSs,
described in section 4.2.3, below.
4.2.2 Energy Cost Model of RES Enabled Network
The cellular network powered by conventional energy(utility) furnishes an energy
consumption cost, which is equal to the unit cost of energy times the total energy
consumed. If α is the unit cast of energy procured from utility and ξu is the total
energy consumed, then the total cost of energy for the network is α × ξu. Similarly,
89
the cost of energy consumed from utility is then α×ξu for the network. The combined
green-energy harvested by the network is given as ξg, and the unit cost of this type
of energy is taken as β, giving us the total green-energy cost as β × ξg. In order
to ensure procurement of energy from renewable sources as a first priority, the value
of β is kept lower than α i.e., β << α. We assume that the capital expenditure
and operational expenditures of renewable energy systems have been adjusted in the
pricing formula. The energy cost saving Π of the network is then given as utility cost
minus the harvested energy cost or:-
Π = α× ξu − β × ξg (4.2.4)
Whereas the energy supply from utility is unlimited, the energy from RES is
obviously limited. The objective is then to minimize Π, that is to minimize the use
of utility, which comes from the fossil fuels, and maximize the green energy. The
calculations for energy consumption as well as energy generation profiles are made in
hourly time slots t, as discussed previously.
4.2.3 Energy Exchange and Energy States
The added advantage of RES enabled BS lies in energy cost savings by transferring
surplus energy from one BS to the nearby BS. For BS n having green energy surplus
and BS m having green-energy shortage, we wish to transfer energy from BS n to m.
We denote by Et,gn,m as the energy transferred from BS n to BS m in time t, which is
possible if the green energy harvested at BS n is more than its load, while it is less
than the load for BS m, at any time t. These two conditions can be expressed as
follows.
Et,gn > Ltn, and E
t,gm < Ltm (4.2.5)
Energy exchange, Et,gn,m or Et,g
m,n, between BSs is made possible by the availability
of a central controller in a microgrid or bi-directional flow of energy between nodes
90
made possible through smart grid (Fig.4.1). Else, the network may adjust the over
all energy bill with utility through net metering.
The instantaneous energy consumption of a base station is directly proportional
to the prevailing traffic load. In chapter 3 we modeled the 24 hr traffic variations of
a BS divided into hourly slots throughout the day. The diversity in the traffic load
of various BSs was achieved on account of different peak time Tp for each BS and the
maximum and minimum traffic loads i.e., %max and %min. The former gives temporal
diversity and the latter, the energy consumption diversity. Consequently, the variation
in the traffic profile of each BS forms the basis, which can be the incentive for energy
sharing between BSs. Thus we find the traffic load fluctuating between two states of
energy consumption in a 24 hr period:
� A state of high activity in peak hours of day, consuming maximum energy.
� A state of low activity in off-peak hours, consuming minimum energy.
4.2.4 Tariff
In order to prioritize renewable energy usage over GHG based energy, a tariff is
assigned to each energy type. While assigning tariff to different sources arbitrarily
only one condition is maintained that cost of Utility/DG is higher than that of RES
i.e., Costgenerator > Costutility > CostRES. This difference of cost between non-
renewable and renewable energy sources forms the basis of energy cooperation in
that a BS buys cheaper energy from a neighbour rather than the utility or turn on
the generator. For the network, the aim is to maximize its energy sold cost - sold to
utility and other BS:-
Energy cost to be maximized =N∑
n=1,n6=m
C(Etn,u) + C(Et
n,m)
91
where C(Etn,u) expresses net-metering for selling surplus harvested energy to the
grid. Similarly, minimizing the procurement cost can be depicted by the following
expressions:-
Energy cost to be minimized =T∑t=1
N∑n=1
C(Et,gn ) + C(Et,dg
n ) + C(Etu,n) + C(Et
m,n)
where C(Et,gn ), C(Et,dg
n ), C(Etu,n) and C(Et
m,n) is the cost of energy from RES, gen-
erator, utility and other BS, respectively.
4.3 Energy Cooperation in Green Cellular Net-
work
Energy cooperation entails sharing the load between nodes by providing energy from
one node to the other. The dynamic nature of traffic load Ltn and the harvested
energy Et,gn at a BS, produces different energy states amongst BSs making ’energy
cooperation’ viable. The power consumption of each BS, modeled in Ch 3, fluctuates
between a min and a max value depending on its configuration and traffic profile (e.g.
1.78 kW to 2.35 kW as per calculations in section 3.2.1), whereas, the RESs give
a mix of low or high power output depending on wind speed and solar irradiation.
Considering the energy consumption figures and the power available from the RES,
we see a case of surplus energy available in some slots of the day.
The surplus energy can be made available to a neighbouring BS not harvesting
enough clean energy at that time, or it can be sold back to the local grid station for
community. The energy transferred from BS n to m is denoted as Etn,m, and must be
less than the max available energy at BS n. The energy cooperation must also take
place while maintaining the energy balance, that is, total inflow should be equal to
92
total outflow, expressed as follows:-
Et,gn + Et,u
n +N∑m=1
Etm,n = Ltn +
N∑m=1
Etn,m, ∀n, t (4.3.1)
The instantaneous traffic load of the nth base station is Ltn given by equation (3.2.6)
in chapter 3. The left hand side is then the net energy flowing into the BS and the
right hand side is net energy flowing out for powering the BS or transferring surplus
energy to other BS m.
4.3.1 Mathematical Formulation and Solution Approach
Our objective is to minimize the energy cost of the network operator through energy
cooperation between BSs as well as maximize the use of green energy (Fig. 4.1). The
energy found surplus at any BS is either directed towards another BS that is in want
of energy or sold back to the grid. The generator is only employed if the renewable
harvested energy or that from utility, is not available. The energy cost minimization
optimization problem with energy cooperation is stated as follows:-
Given:
� The total number of BSs in the network.
� The traffic profile of each BS for any period T .
� The energy generation profile of each BS.
� The unit cost of energy from utility and RES.
Determine for each time period t of any finite time horizon T :
� The energy surplus, if any, in time slot t, at a BS.
� The energy deficiency of harvested energy at a BS.
93
� The amount of energy to be transferred from BS n to BS m.
� The net energy savings in network from energy cooperation.
Mathematically, for each BS the objective U(Et,gn , Et,dg
n , Etu,n, E
tn,u, E
tm,n, E
tn,m
)is to
minimize the energy procurement cost while maximizing the energy sold cost, as
depicted in the following expression.
U(Et,g
n ,Et,dgn ,Et
u,n,Etn,u,E
tm,n,E
tn,m
)=
T∑t=1
N∑n=1
[C(Et,g
n ) + C(Et,dgn ) + C(Et
u,n)− C(Etn,u) +
N∑n=1,n6=m
C(Etm,n)− C(Et
n,m)
](4.3.2)
where Et,gn , Et,dg
n , Etu,n, E
tn,u, E
tm,n, E
tn,m are the nth BS’ electricity generated from re-
newable energy sources, from diesel generator, electricity purchased from utility, elec-
tricity sold back to the utility, electricity purchased from the mth BS and electricity
sold to the mth BS, respectively.
The mathematical formulation of the problem can be written as follows:
OP1:
minE
t,gn ,E
t,dgn ,Et
u,n,Etn,u,E
tm,n,E
tn,m
U(Et,g
n ,Et,dgn ,Et
u,n,Etn,u,E
tm,n,E
tn,m
) (4.3.3)
subject to:
C1 : Etm,n, E
tn,m, E
t,gn , Et,u
n ≥ 0, ∀ m,n, t
C2 : Et,un ≤ Eu,max, Et
m,n ≤ Emaxn , ∀n
C3 : Etm,n.E
tn,m = 0 , ∀m,n, t
C4 : Et,gn + Et,u
n +N∑m=1
Etm,n = Ltn +
N∑m=1
Etn,m, ∀n, t
C5 : Etn,n = 0 ∀n, t
94
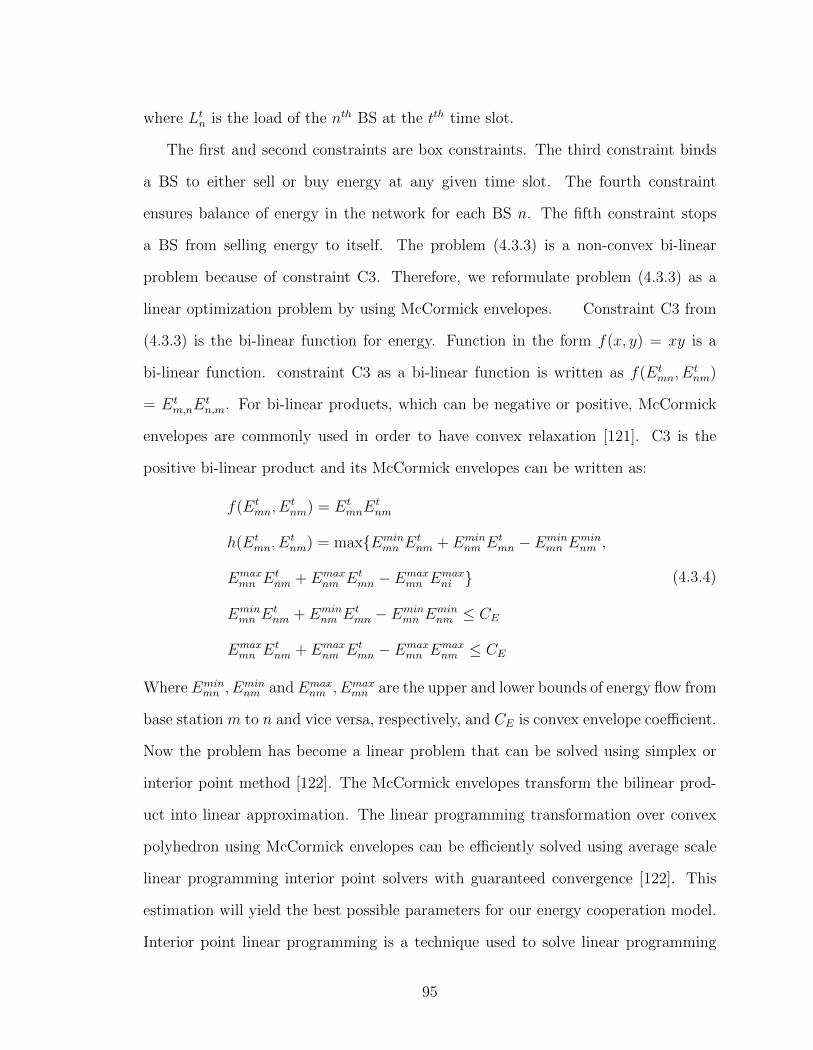
where Ltn is the load of the nth BS at the tth time slot.
The first and second constraints are box constraints. The third constraint binds
a BS to either sell or buy energy at any given time slot. The fourth constraint
ensures balance of energy in the network for each BS n. The fifth constraint stops
a BS from selling energy to itself. The problem (4.3.3) is a non-convex bi-linear
problem because of constraint C3. Therefore, we reformulate problem (4.3.3) as a
linear optimization problem by using McCormick envelopes. Constraint C3 from
(4.3.3) is the bi-linear function for energy. Function in the form f(x, y) = xy is a
bi-linear function. constraint C3 as a bi-linear function is written as f(Etmn, E
tnm)
= Etm,nE
tn,m. For bi-linear products, which can be negative or positive, McCormick
envelopes are commonly used in order to have convex relaxation [121]. C3 is the
positive bi-linear product and its McCormick envelopes can be written as:
f(Etmn, E
tnm) = Et
mnEtnm
h(Etmn, E
tnm) = max{Emin
mn Etnm + Emin
nm Etmn − Emin
mn Eminnm ,
Emaxmn E
tnm + Emax
nm Etmn − Emax
mn Emaxni }
Eminmn E
tnm + Emin
nm Etmn − Emin
mn Eminnm ≤ CE
Emaxmn E
tnm + Emax
nm Etmn − Emax
mn Emaxnm ≤ CE
(4.3.4)
Where Eminmn , E
minnm and Emax
nm , Emaxmn are the upper and lower bounds of energy flow from
base station m to n and vice versa, respectively, and CE is convex envelope coefficient.
Now the problem has become a linear problem that can be solved using simplex or
interior point method [122]. The McCormick envelopes transform the bilinear prod-
uct into linear approximation. The linear programming transformation over convex
polyhedron using McCormick envelopes can be efficiently solved using average scale
linear programming interior point solvers with guaranteed convergence [122]. This
estimation will yield the best possible parameters for our energy cooperation model.
Interior point linear programming is a technique used to solve linear programming
95
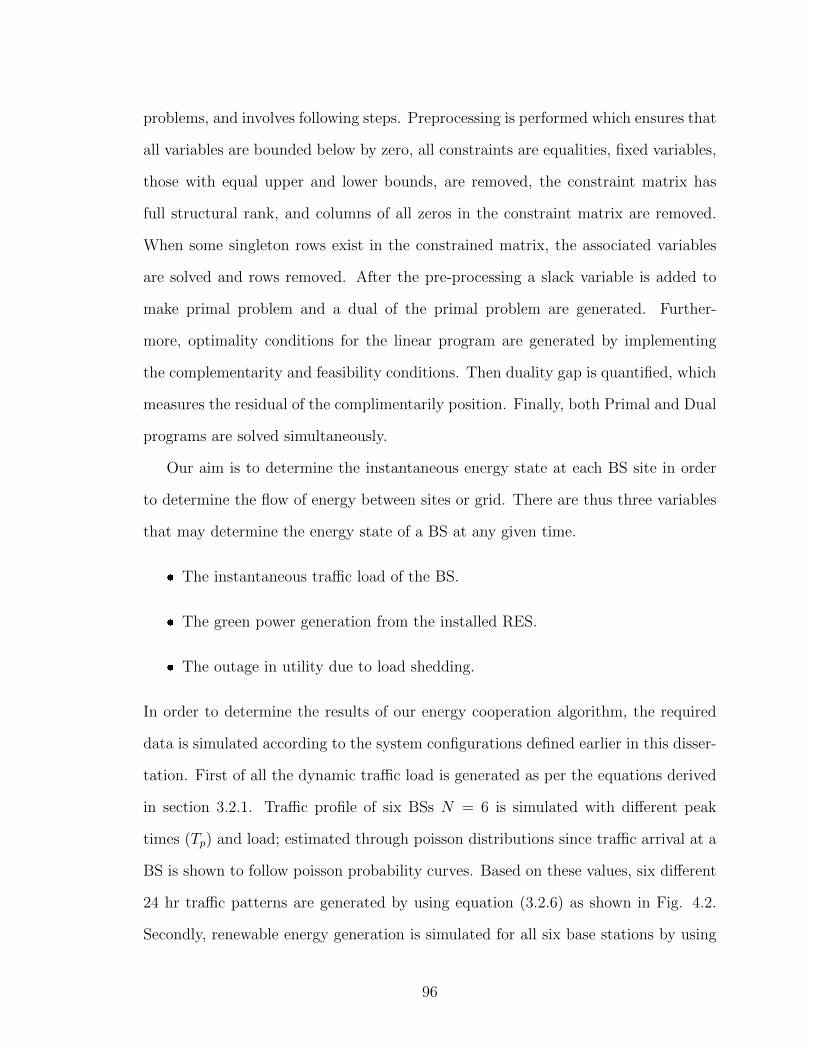
problems, and involves following steps. Preprocessing is performed which ensures that
all variables are bounded below by zero, all constraints are equalities, fixed variables,
those with equal upper and lower bounds, are removed, the constraint matrix has
full structural rank, and columns of all zeros in the constraint matrix are removed.
When some singleton rows exist in the constrained matrix, the associated variables
are solved and rows removed. After the pre-processing a slack variable is added to
make primal problem and a dual of the primal problem are generated. Further-
more, optimality conditions for the linear program are generated by implementing
the complementarity and feasibility conditions. Then duality gap is quantified, which
measures the residual of the complimentarily position. Finally, both Primal and Dual
programs are solved simultaneously.
Our aim is to determine the instantaneous energy state at each BS site in order
to determine the flow of energy between sites or grid. There are thus three variables
that may determine the energy state of a BS at any given time.
� The instantaneous traffic load of the BS.
� The green power generation from the installed RES.
� The outage in utility due to load shedding.
In order to determine the results of our energy cooperation algorithm, the required
data is simulated according to the system configurations defined earlier in this disser-
tation. First of all the dynamic traffic load is generated as per the equations derived
in section 3.2.1. Traffic profile of six BSs N = 6 is simulated with different peak
times (Tp) and load; estimated through poisson distributions since traffic arrival at a
BS is shown to follow poisson probability curves. Based on these values, six different
24 hr traffic patterns are generated by using equation (3.2.6) as shown in Fig. 4.2.
Secondly, renewable energy generation is simulated for all six base stations by using
96
definitions described in previous chapter. Although the solar irradiation and wind
speed are considered same for all sites, algorithm simulates diversity in generation by
varying the size of solar panels and wind turbine. Lastly, we simulate some power
outage (load shedding), which allows the BSs to sell energy to utility through net
metering. Where level is ’0’, it means grid outage or load-shedding and when it is ’1’
it means grid power form utility/grid is available. The combined BS load and energy
profiles of all six BS is shown in Fig. 4.5; the load shown in red colour and generation
in black dashed lines. The twenty four hour time slot covers the whole day which
provides cyclic repetition of parameters. The hourly slot is considered mainly because
it is small enough to capture the variations in traffic as well as energy, in sufficient
detail, and large enough to make the computations easy. Further amplification of
time can be done, e.g., every minute or every five minutes. However, that would
not make any special bearing on result as prime focus of the paper is on energy cost
saving through energy corporation by sharing the surplus energy, which is effectively
shown in the results.
97
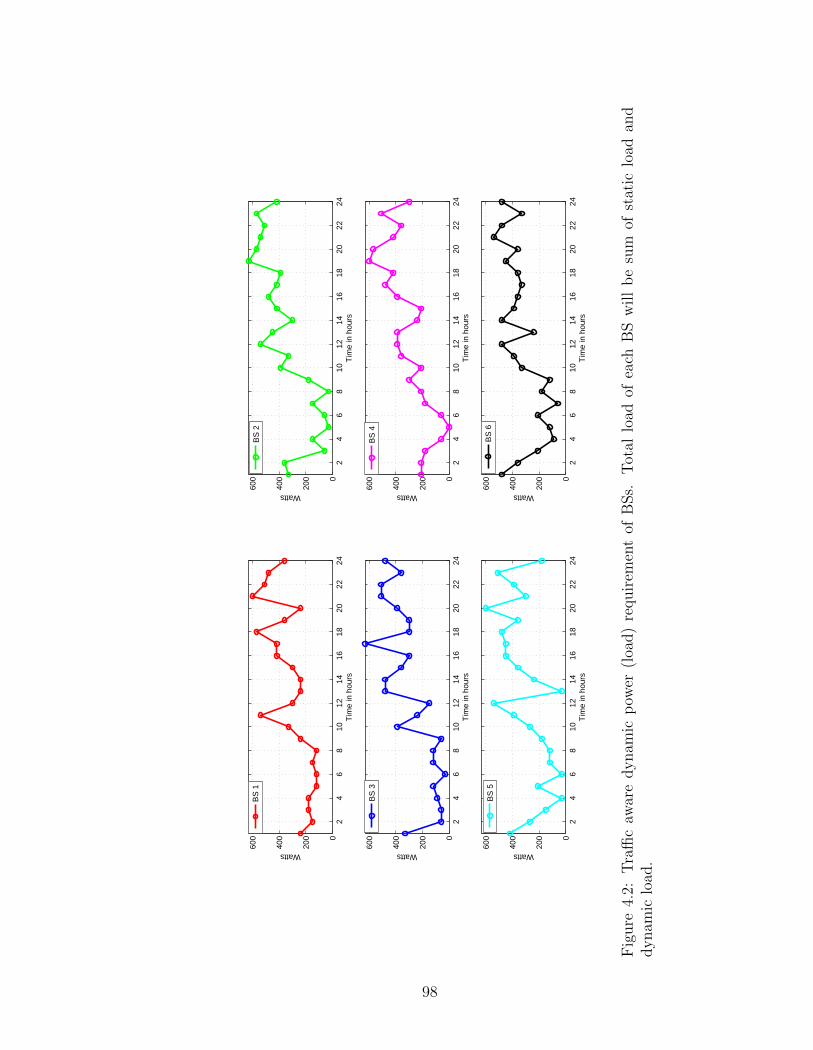
24
68
1012
1416
1820
2224
0
200
400
600
Tim
e in
hou
rs
Watts
B
S 1
24
68
1012
1416
1820
2224
0
200
400
600
Tim
e in
hou
rs
Watts
B
S 2
24
68
1012
1416
1820
2224
0
200
400
600
Tim
e in
hou
rs
Watts
B
S 3
24
68
1012
1416
1820
2224
0
200
400
600
Tim
e in
hou
rs
Watts
B
S 4
24
68
1012
1416
1820
2224
0
200
400
600
Tim
e in
hou
rs
Watts
B
S 5
24
68
1012
1416
1820
2224
0
200
400
600
Tim
e in
hou
rs
Watts
B
S 6
Fig
ure
4.2:
Tra
ffic
awar
ed
yn
amic
pow
er(l
oad)
requ
irem
ent
ofB
Ss.
Tot
allo
adof
each
BS
wil
lb
esu
mof
stat
iclo
adan
dd
yn
amic
load
.
98
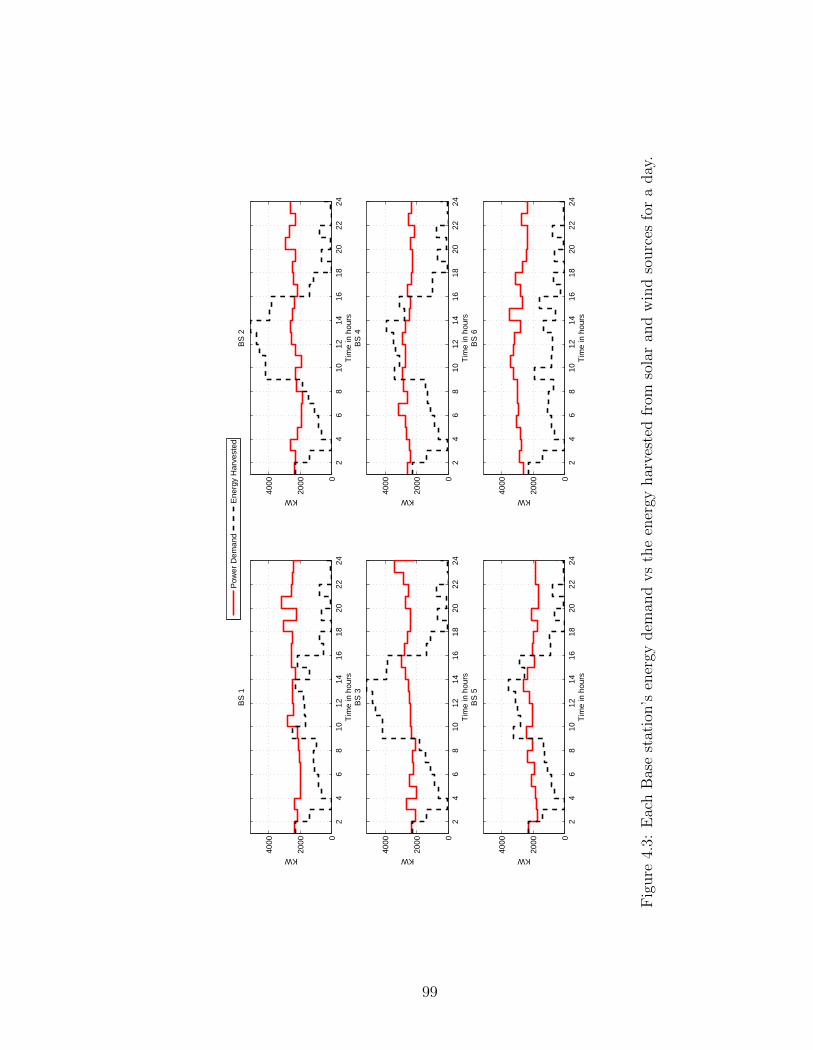
24
68
1012
1416
1820
2224
0
2000
4000
Tim
e in
hou
rs
KW
BS
1
Pow
er D
eman
dE
nerg
y H
arve
sted
24
68
1012
1416
1820
2224
0
2000
4000
Tim
e in
hou
rs
KW
BS
2
24
68
1012
1416
1820
2224
0
2000
4000
Tim
e in
hou
rs
KW
BS
3
24
68
1012
1416
1820
2224
0
2000
4000
Tim
e in
hou
rs
KW
BS
4
24
68
1012
1416
1820
2224
0
2000
4000
Tim
e in
hou
rs
KW
BS
5
24
68
1012
1416
1820
2224
0
2000
4000
Tim
e in
hou
rs
KW
BS
6
Fig
ure
4.3:
Eac
hB
ase
stat
ion
’sen
ergy
dem
and
vs
the
ener
gyh
arve
sted
from
sola
ran
dw
ind
sou
rces
for
ad
ay.
99
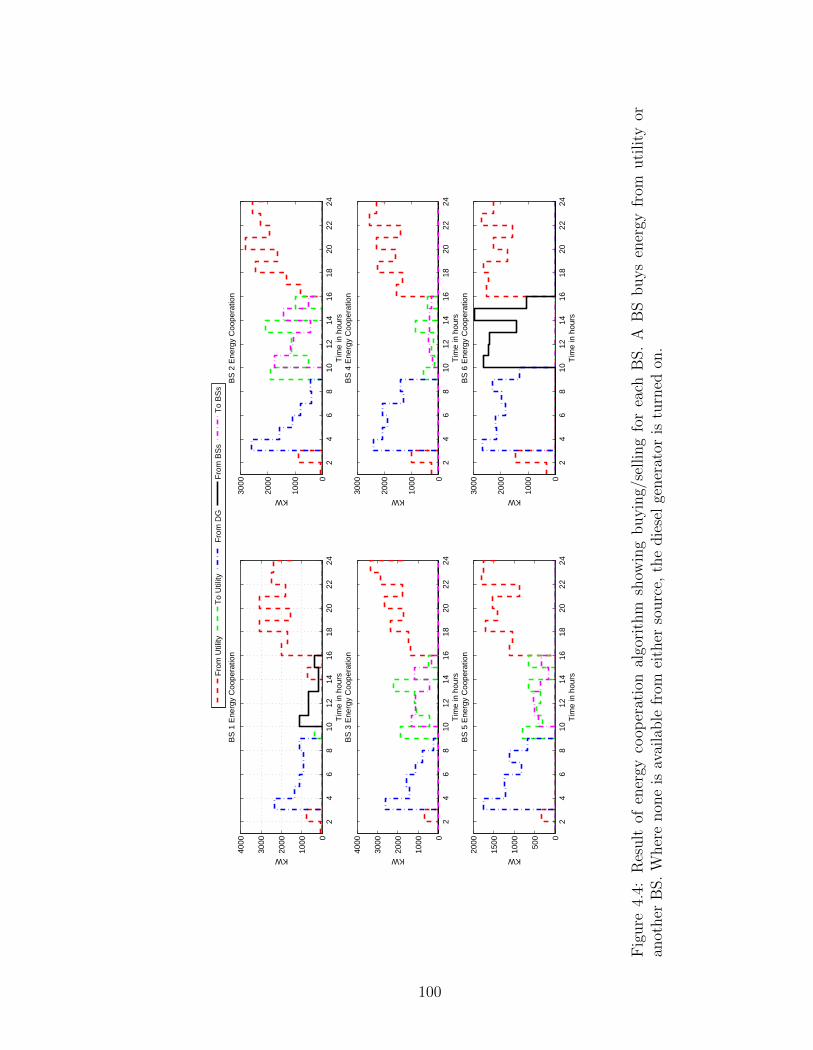
24
68
1012
1416
1820
2224
0
1000
2000
3000
4000
Tim
e in
hou
rs
KW
BS
1 E
nerg
y C
oope
ratio
n
Fro
m U
tility
To
Util
ityF
rom
DG
Fro
m B
Ss
To
BS
s
24
68
1012
1416
1820
2224
0
1000
2000
3000
Tim
e in
hou
rs
KW
BS
2 E
nerg
y C
oope
ratio
n
24
68
1012
1416
1820
2224
0
1000
2000
3000
4000
Tim
e in
hou
rs
KW
BS
3 E
nerg
y C
oope
ratio
n
24
68
1012
1416
1820
2224
0
1000
2000
3000
Tim
e in
hou
rs
KW
BS
4 E
nerg
y C
oope
ratio
n
24
68
1012
1416
1820
2224
0
500
1000
1500
2000
Tim
e in
hou
rs
KW
BS
5 E
nerg
y C
oope
ratio
n
24
68
1012
1416
1820
2224
0
1000
2000
3000
Tim
e in
hou
rs
KW
BS
6 E
nerg
y C
oope
ratio
n
Fig
ure
4.4:
Res
ult
ofen
ergy
coop
erat
ion
algo
rith
msh
owin
gb
uyin
g/se
llin
gfo
rea
chB
S.
AB
Sb
uys
ener
gyfr
omu
tili
tyor
anot
her
BS
.W
her
en
one
isav
aila
ble
from
eith
erso
urc
e,th
ed
iese
lge
ner
ator
istu
rned
on.
100
4.3.2 Energy Cooperation Results
Given the electricity tariff of each source, the load/consumption profile, and the
energy generation profile of a BS, the algorithm finds the quantum and direction of
energy transfer between the nodes and with utility. When a BS is unable to meet
its energy demand from own RES or from a neighbouring BS, the deficiency is met
from utility/diesel generator. The net result of energy cooperation for N = 6 BS is
shown Fig. 4.4. Each BS either sells off energy or purchases it from outer sources in
accordance with its own energy state. The net cost savings are taken where the BS
is able to generate energy from own green sources or from that of a neighbour BS,
minimizing the usage of diesel generator/utility. The results of energy cooperation
show BS2, BS5 and BS6 purchasing green energy from other BSs, whereas BS1, BS3,
and BS4 are selling their surplus harvested energy to other three as well as to the
utility.
To analyze the impact of our energy cooperation mathematical model, we gener-
ated Poisson distributed traffic scenarios for base stations and applied Monte carlo
simulation technique. The temporal and spatial variation in the traffic-load is achieved
by assigning different values to peak-time and max/min load values in equation
(3.2.6). Traffic instances on each base station is generated randomly using poisson
distribution on the BS’ dynamic load. We use Pakistan’s capital Islamabad area’s av-
erage data of wind speed and solar insolation for renewable energy estimation analysis
as shown in Fig. 3.4. The results are simulated for two scenarios, (1) with base sta-
tion energy cooperation as mentioned in (4.3.4) and (2) without base station energy
cooperation as mentioned in (4.3.5). The comparison of the corresponding results
of these two scenarios, one with cooperation and other without cooperation, allows
us to estimate the net energy savings, and thus know the impact of our framework.
When there is no cooperation, all energy over and above the harvested energy is met
101
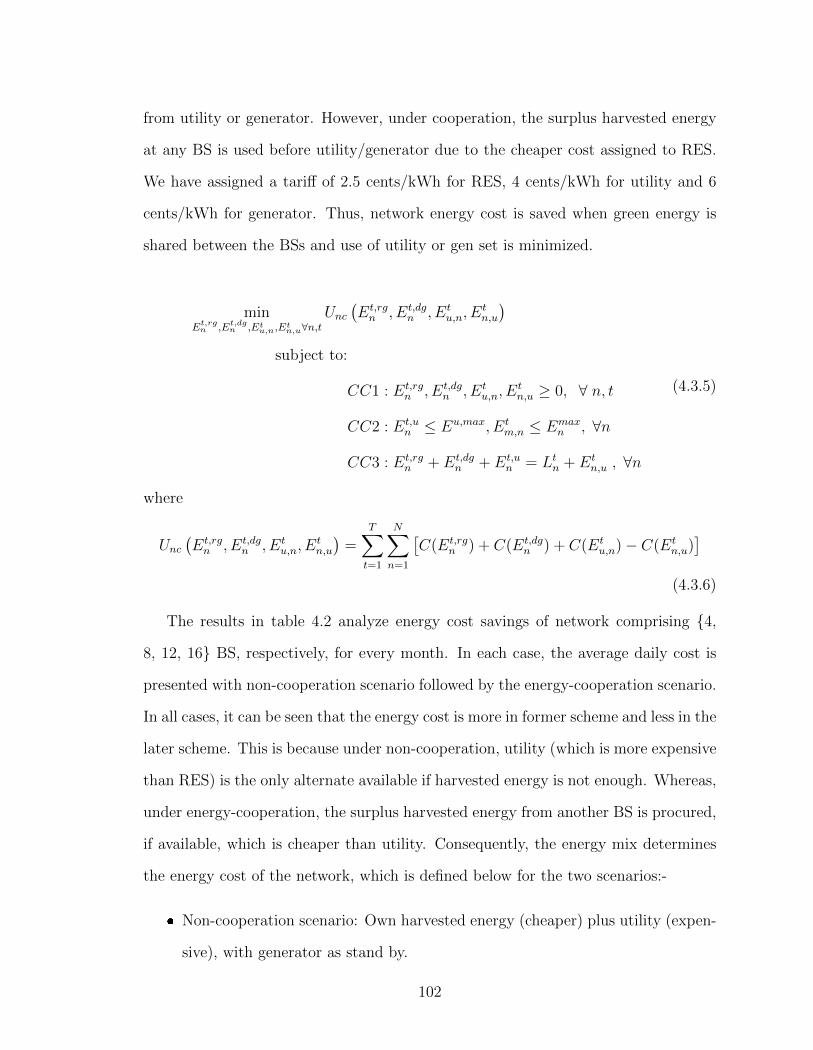
from utility or generator. However, under cooperation, the surplus harvested energy
at any BS is used before utility/generator due to the cheaper cost assigned to RES.
We have assigned a tariff of 2.5 cents/kWh for RES, 4 cents/kWh for utility and 6
cents/kWh for generator. Thus, network energy cost is saved when green energy is
shared between the BSs and use of utility or gen set is minimized.
minEt,rg
n ,Et,dgn ,Et
u,n,Etn,u∀n,t
Unc(Et,rgn , Et,dg
n , Etu,n, E
tn,u
)subject to:
CC1 : Et,rgn , Et,dg
n , Etu,n, E
tn,u ≥ 0, ∀ n, t
CC2 : Et,un ≤ Eu,max, Et
m,n ≤ Emaxn , ∀n
CC3 : Et,rgn + Et,dg
n + Et,un = Ltn + Et
n,u , ∀n
(4.3.5)
where
Unc(Et,rgn , Et,dg
n , Etu,n, E
tn,u
)=
T∑t=1
N∑n=1
[C(Et,rg
n ) + C(Et,dgn ) + C(Et
u,n)− C(Etn,u)]
(4.3.6)
The results in table 4.2 analyze energy cost savings of network comprising {4,
8, 12, 16} BS, respectively, for every month. In each case, the average daily cost is
presented with non-cooperation scenario followed by the energy-cooperation scenario.
In all cases, it can be seen that the energy cost is more in former scheme and less in the
later scheme. This is because under non-cooperation, utility (which is more expensive
than RES) is the only alternate available if harvested energy is not enough. Whereas,
under energy-cooperation, the surplus harvested energy from another BS is procured,
if available, which is cheaper than utility. Consequently, the energy mix determines
the energy cost of the network, which is defined below for the two scenarios:-
� Non-cooperation scenario: Own harvested energy (cheaper) plus utility (expen-
sive), with generator as stand by.
102

� Energy-cooperation scenario: Own harvested energy (cheaper) plus surplus har-
vested energy from neighbor BS (cheaper) plus utility (expensive), with gener-
ator as stand by.
103
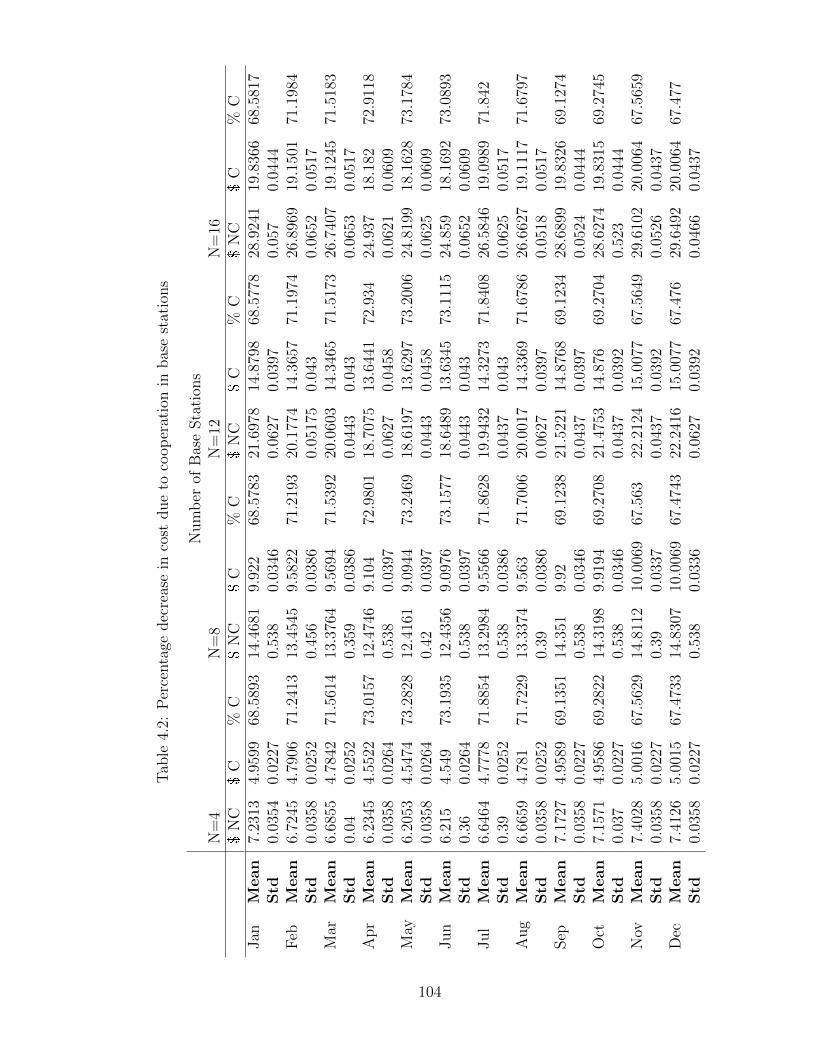
Tab
le4.
2:P
erce
nta
ged
ecre
ase
inco
stdu
eto
coop
erat
ion
inb
ase
stat
ion
s
Nu
mb
erof
Bas
eS
tati
ons
N=
4N
=8
N=
12N
=16
$N
C$
C%
C$
NC
$C
%C
$N
C$
C%
C$
NC
$C
%C
Jan
Mean
7.23
134.
9599
68.5
893
14.4
681
9.92
268
.578
321
.697
814
.879
868
.577
828
.924
119
.836
668
.581
7S
td0.
0354
0.02
270.
538
0.03
460.
0627
0.03
970.
057
0.04
44F
ebM
ean
6.72
454.
7906
71.2
413
13.4
545
9.58
2271
.219
320
.177
414
.365
771
.197
426
.896
919
.150
171
.198
4S
td0.
0358
0.02
520.
456
0.03
860.
0517
50.
043
0.06
520.
0517
Mar
Mean
6.68
554.
7842
71.5
614
13.3
764
9.56
9471
.539
220
.060
314
.346
571
.517
326
.740
719
.124
571
.518
3S
td0.
040.
0252
0.35
90.
0386
0.04
430.
043
0.06
530.
0517
Ap
rM
ean
6.23
454.
5522
73.0
157
12.4
746
9.10
472
.980
118
.707
513
.644
172
.934
24.9
3718
.182
72.9
118
Std
0.03
580.
0264
0.53
80.
0397
0.06
270.
0458
0.06
210.
0609
May
Mean
6.20
534.
5474
73.2
828
12.4
161
9.09
4473
.246
918
.619
713
.629
773
.200
624
.819
918
.162
873
.178
4S
td0.
0358
0.02
640.
420.
0397
0.04
430.
0458
0.06
250.
0609
Ju
nM
ean
6.21
54.
549
73.1
935
12.4
356
9.09
7673
.157
718
.648
913
.634
573
.111
524
.859
18.1
692
73.0
893
Std
0.36
0.02
640.
538
0.03
970.
0443
0.04
30.
0652
0.06
09Ju
lM
ean
6.64
644.
7778
71.8
854
13.2
984
9.55
6671
.862
819
.943
214
.327
371
.840
826
.584
619
.098
971
.842
Std
0.39
0.02
520.
538
0.03
860.
0437
0.04
30.
0625
0.05
17A
ug
Mean
6.66
594.
781
71.7
229
13.3
374
9.56
371
.700
620
.001
714
.336
971
.678
626
.662
719
.111
771
.679
7S
td0.
0358
0.02
520.
390.
0386
0.06
270.
0397
0.05
180.
0517
Sep
Mean
7.17
274.
9589
69.1
351
14.3
519.
9269
.123
821
.522
114
.876
869
.123
428
.689
919
.832
669
.127
4S
td0.
0358
0.02
270.
538
0.03
460.
0437
0.03
970.
0524
0.04
44O
ctM
ean
7.15
714.
9586
69.2
822
14.3
198
9.91
9469
.270
821
.475
314
.876
69.2
704
28.6
274
19.8
315
69.2
745
Std
0.03
70.
0227
0.53
80.
0346
0.04
370.
0392
0.52
30.
0444
Nov
Mean
7.40
285.
0016
67.5
629
14.8
112
10.0
069
67.5
6322
.212
415
.007
767
.564
929
.610
220
.006
467
.565
9S
td0.
0358
0.02
270.
390.
0337
0.04
370.
0392
0.05
260.
0437
Dec
Mean
7.41
265.
0015
67.4
733
14.8
307
10.0
069
67.4
743
22.2
416
15.0
077
67.4
7629
.649
220
.006
467
.477
Std
0.03
580.
0227
0.53
80.
0336
0.06
270.
0392
0.04
660.
0437
104
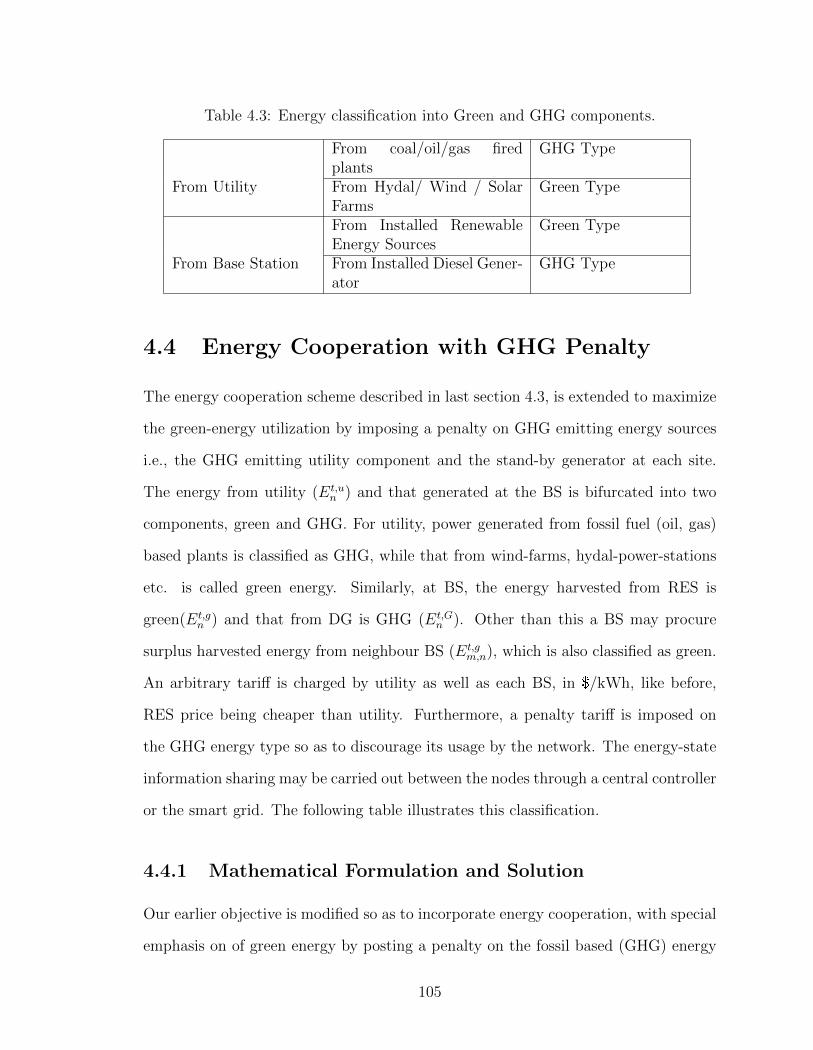
Table 4.3: Energy classification into Green and GHG components.
From coal/oil/gas firedplants
GHG Type
From Utility From Hydal/ Wind / SolarFarms
Green Type
From Installed RenewableEnergy Sources
Green Type
From Base Station From Installed Diesel Gener-ator
GHG Type
4.4 Energy Cooperation with GHG Penalty
The energy cooperation scheme described in last section 4.3, is extended to maximize
the green-energy utilization by imposing a penalty on GHG emitting energy sources
i.e., the GHG emitting utility component and the stand-by generator at each site.
The energy from utility (Et,un ) and that generated at the BS is bifurcated into two
components, green and GHG. For utility, power generated from fossil fuel (oil, gas)
based plants is classified as GHG, while that from wind-farms, hydal-power-stations
etc. is called green energy. Similarly, at BS, the energy harvested from RES is
green(Et,gn ) and that from DG is GHG (Et,G
n ). Other than this a BS may procure
surplus harvested energy from neighbour BS (Et,gm,n), which is also classified as green.
An arbitrary tariff is charged by utility as well as each BS, in $/kWh, like before,
RES price being cheaper than utility. Furthermore, a penalty tariff is imposed on
the GHG energy type so as to discourage its usage by the network. The energy-state
information sharing may be carried out between the nodes through a central controller
or the smart grid. The following table illustrates this classification.
4.4.1 Mathematical Formulation and Solution
Our earlier objective is modified so as to incorporate energy cooperation, with special
emphasis on of green energy by posting a penalty on the fossil based (GHG) energy
105
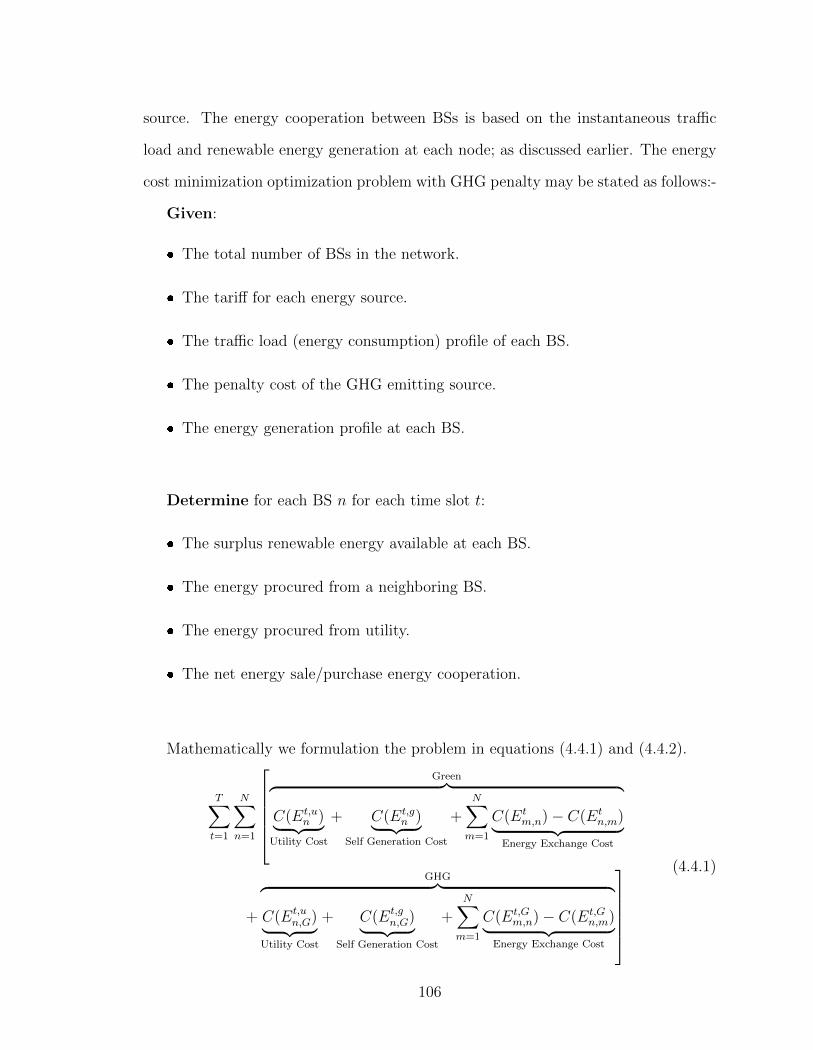
source. The energy cooperation between BSs is based on the instantaneous traffic
load and renewable energy generation at each node; as discussed earlier. The energy
cost minimization optimization problem with GHG penalty may be stated as follows:-
Given:
� The total number of BSs in the network.
� The tariff for each energy source.
� The traffic load (energy consumption) profile of each BS.
� The penalty cost of the GHG emitting source.
� The energy generation profile at each BS.
Determine for each BS n for each time slot t:
� The surplus renewable energy available at each BS.
� The energy procured from a neighboring BS.
� The energy procured from utility.
� The net energy sale/purchase energy cooperation.
Mathematically we formulation the problem in equations (4.4.1) and (4.4.2).
T∑t=1
N∑n=1
Green︷ ︸︸ ︷
C(Et,un )︸ ︷︷ ︸
Utility Cost
+ C(Et,gn )︸ ︷︷ ︸
Self Generation Cost
+N∑m=1
C(Etm,n)− C(Et
n,m)︸ ︷︷ ︸Energy Exchange Cost
+
GHG︷ ︸︸ ︷C(Et,u
n,G)︸ ︷︷ ︸Utility Cost
+ C(Et,gn,G)︸ ︷︷ ︸
Self Generation Cost
+N∑m=1
C(Et,Gm,n)− C(Et,G
n,m)︸ ︷︷ ︸Energy Exchange Cost
(4.4.1)
106
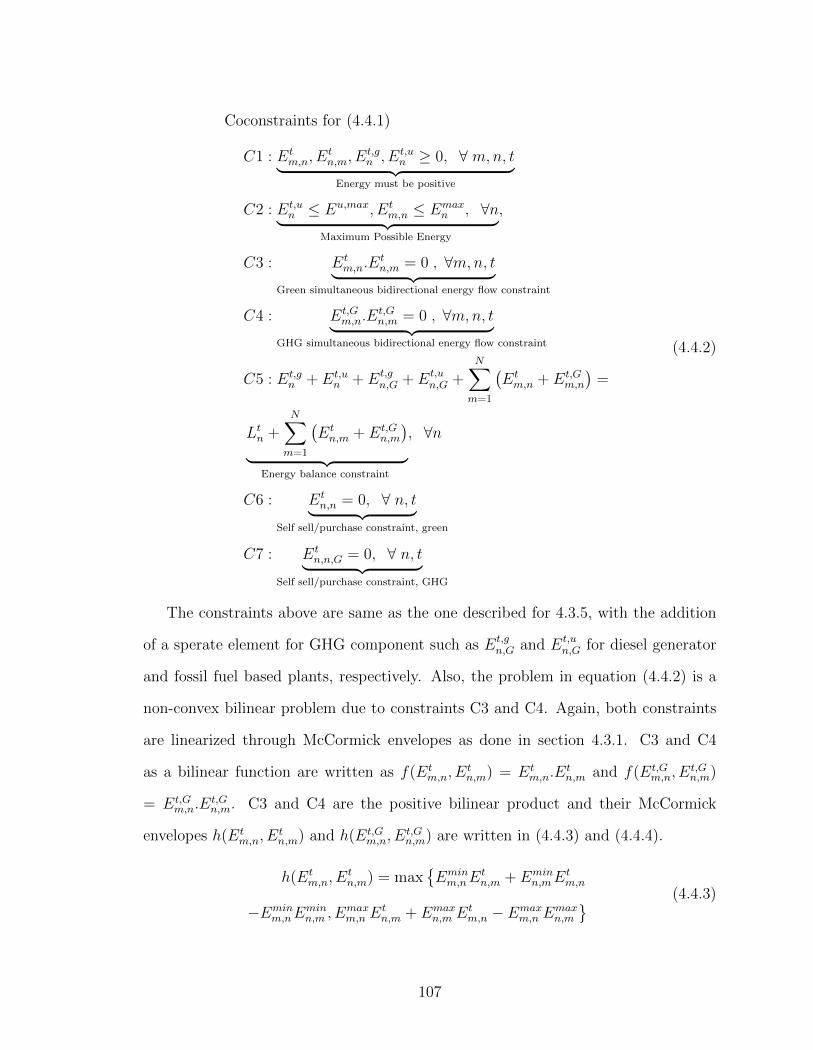
Coconstraints for (4.4.1)
C1 : Etm,n, E
tn,m, E
t,gn , Et,u
n ≥ 0, ∀ m,n, t︸ ︷︷ ︸Energy must be positive
C2 : Et,un ≤ Eu,max, Et
m,n ≤ Emaxn , ∀n︸ ︷︷ ︸
Maximum Possible Energy
,
C3 : Etm,n.E
tn,m = 0 , ∀m,n, t︸ ︷︷ ︸
Green simultaneous bidirectional energy flow constraint
C4 : Et,Gm,n.E
t,Gn,m = 0 , ∀m,n, t︸ ︷︷ ︸
GHG simultaneous bidirectional energy flow constraint
C5 : Et,gn + Et,u
n + Et,gn,G + Et,u
n,G +N∑m=1
(Etm,n + Et,G
m,n
)=
Ltn +N∑m=1
(Etn,m + Et,G
n,m
)︸ ︷︷ ︸
Energy balance constraint
, ∀n
C6 : Etn,n = 0, ∀ n, t︸ ︷︷ ︸
Self sell/purchase constraint, green
C7 : Etn,n,G = 0, ∀ n, t︸ ︷︷ ︸
Self sell/purchase constraint, GHG
(4.4.2)
The constraints above are same as the one described for 4.3.5, with the addition
of a sperate element for GHG component such as Et,gn,G and Et,u
n,G for diesel generator
and fossil fuel based plants, respectively. Also, the problem in equation (4.4.2) is a
non-convex bilinear problem due to constraints C3 and C4. Again, both constraints
are linearized through McCormick envelopes as done in section 4.3.1. C3 and C4
as a bilinear function are written as f(Etm,n, E
tn,m) = Et
m,n.Etn,m and f(Et,G
m,n, Et,Gn,m)
= Et,Gm,n.E
t,Gn,m. C3 and C4 are the positive bilinear product and their McCormick
envelopes h(Etm,n, E
tn,m) and h(Et,G
m,n, Et,Gn,m) are written in (4.4.3) and (4.4.4).
h(Etm,n, E
tn,m) = max
{Eminm,nE
tn,m + Emin
n,mEtm,n
−Eminm,nE
minn,m , E
maxm,n E
tn,m + Emax
n,m Etm,n − Emax
m,n Emaxn,m
} (4.4.3)
107
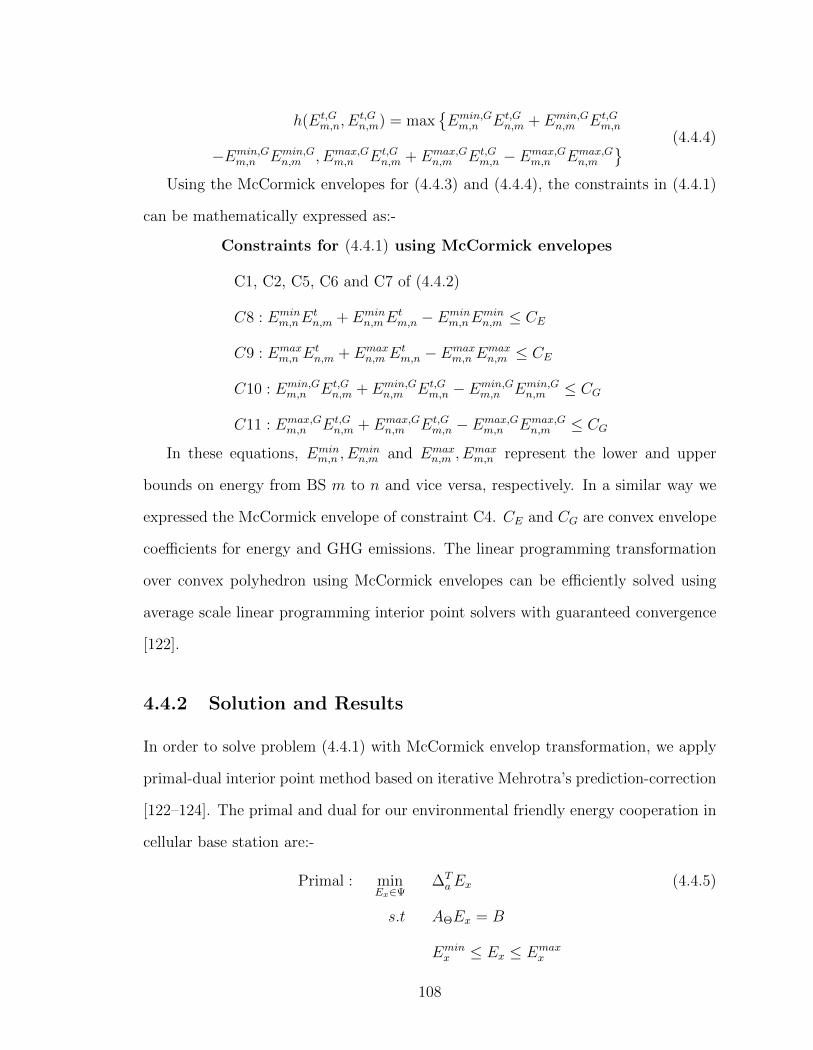
h(Et,Gm,n, E
t,Gn,m) = max
{Emin,Gm,n Et,G
n,m + Emin,Gn,m Et,G
m,n
−Emin,Gm,n Emin,G
n,m , Emax,Gm,n Et,G
n,m + Emax,Gn,m Et,G
m,n − Emax,Gm,n Emax,G
n,m
} (4.4.4)
Using the McCormick envelopes for (4.4.3) and (4.4.4), the constraints in (4.4.1)
can be mathematically expressed as:-
Constraints for (4.4.1) using McCormick envelopes
C1, C2, C5, C6 and C7 of (4.4.2)
C8 : Eminm,nE
tn,m + Emin
n,mEtm,n − Emin
m,nEminn,m ≤ CE
C9 : Emaxm,n E
tn,m + Emax
n,m Etm,n − Emax
m,n Emaxn,m ≤ CE
C10 : Emin,Gm,n Et,G
n,m + Emin,Gn,m Et,G
m,n − Emin,Gm,n Emin,G
n,m ≤ CG
C11 : Emax,Gm,n Et,G
n,m + Emax,Gn,m Et,G
m,n − Emax,Gm,n Emax,G
n,m ≤ CG
In these equations, Eminm,n , E
minn,m and Emax
n,m , Emaxm,n represent the lower and upper
bounds on energy from BS m to n and vice versa, respectively. In a similar way we
expressed the McCormick envelope of constraint C4. CE and CG are convex envelope
coefficients for energy and GHG emissions. The linear programming transformation
over convex polyhedron using McCormick envelopes can be efficiently solved using
average scale linear programming interior point solvers with guaranteed convergence
[122].
4.4.2 Solution and Results
In order to solve problem (4.4.1) with McCormick envelop transformation, we apply
primal-dual interior point method based on iterative Mehrotra’s prediction-correction
[122–124]. The primal and dual for our environmental friendly energy cooperation in
cellular base station are:-
Primal : minEx∈Ψ
∆TaEx (4.4.5)
s.t AΘEx = B
Eminx ≤ Ex ≤ Emax
x
108
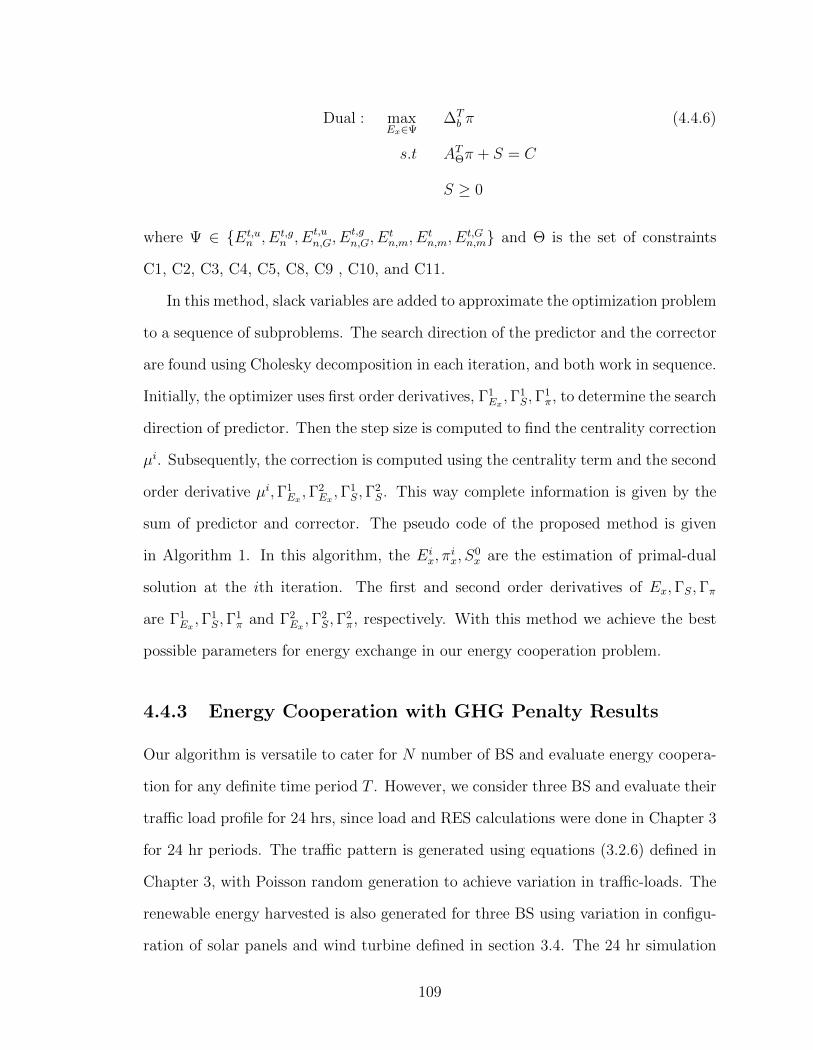
Dual : maxEx∈Ψ
∆Tb π (4.4.6)
s.t ATΘπ + S = C
S ≥ 0
where Ψ ∈ {Et,un , Et,g
n , Et,un,G, E
t,gn,G, E
tn,m, E
tn,m, E
t,Gn,m} and Θ is the set of constraints
C1, C2, C3, C4, C5, C8, C9 , C10, and C11.
In this method, slack variables are added to approximate the optimization problem
to a sequence of subproblems. The search direction of the predictor and the corrector
are found using Cholesky decomposition in each iteration, and both work in sequence.
Initially, the optimizer uses first order derivatives, Γ1Ex,Γ1
S,Γ1π, to determine the search
direction of predictor. Then the step size is computed to find the centrality correction
µi. Subsequently, the correction is computed using the centrality term and the second
order derivative µi,Γ1Ex,Γ2
Ex,Γ1
S,Γ2S. This way complete information is given by the
sum of predictor and corrector. The pseudo code of the proposed method is given
in Algorithm 1. In this algorithm, the Eix, π
ix, S
0x are the estimation of primal-dual
solution at the ith iteration. The first and second order derivatives of Ex,ΓS,Γπ
are Γ1Ex,Γ1
S,Γ1π and Γ2
Ex,Γ2
S,Γ2π, respectively. With this method we achieve the best
possible parameters for energy exchange in our energy cooperation problem.
4.4.3 Energy Cooperation with GHG Penalty Results
Our algorithm is versatile to cater for N number of BS and evaluate energy coopera-
tion for any definite time period T . However, we consider three BS and evaluate their
traffic load profile for 24 hrs, since load and RES calculations were done in Chapter 3
for 24 hr periods. The traffic pattern is generated using equations (3.2.6) defined in
Chapter 3, with Poisson random generation to achieve variation in traffic-loads. The
renewable energy harvested is also generated for three BS using variation in configu-
ration of solar panels and wind turbine defined in section 3.4. The 24 hr simulation
109
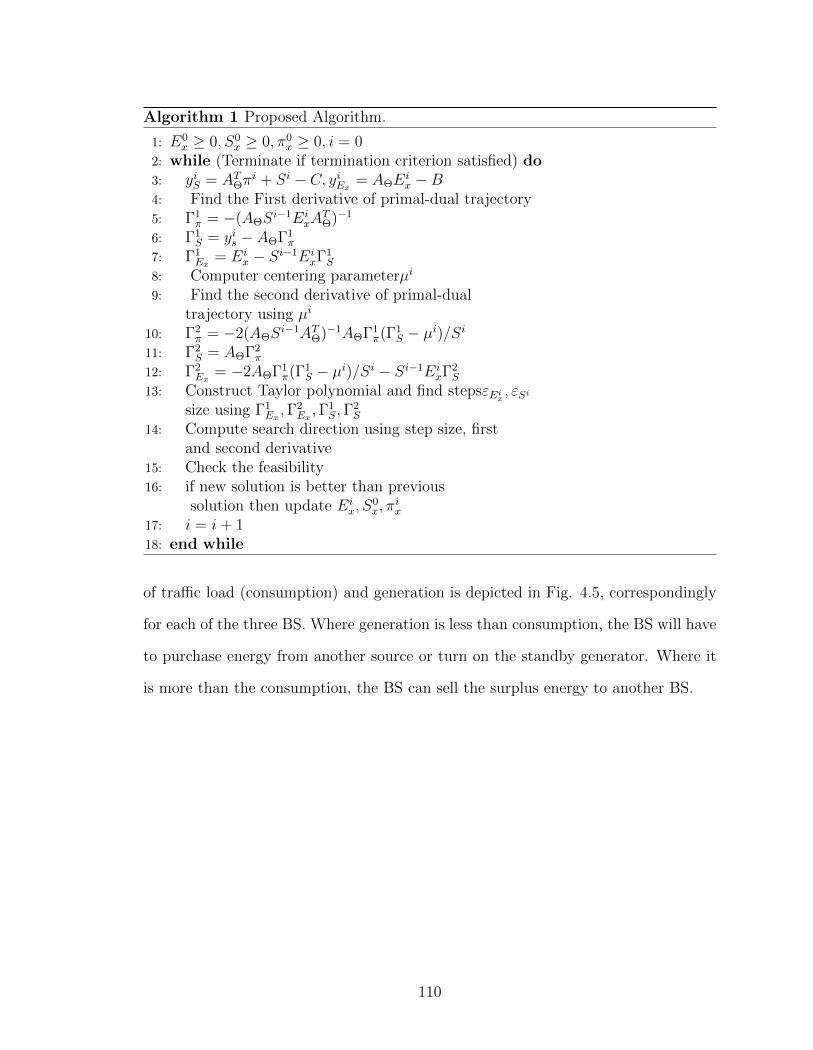
Algorithm 1 Proposed Algorithm.
1: E0x ≥ 0, S0
x ≥ 0, π0x ≥ 0, i = 0
2: while (Terminate if termination criterion satisfied) do3: yiS = ATΘπ
i + Si − C, yiEx= AΘE
ix −B
4: Find the First derivative of primal-dual trajectory5: Γ1
π = −(AΘSi−1Ei
xATΘ)−1
6: Γ1S = yis − AΘΓ1
π
7: Γ1Ex
= Eix − Si−1Ei
xΓ1S
8: Computer centering parameterµi
9: Find the second derivative of primal-dualtrajectory using µi
10: Γ2π = −2(AΘS
i−1ATΘ)−1AΘΓ1π(Γ1
S − µi)/Si11: Γ2
S = AΘΓ2π
12: Γ2Ex
= −2AΘΓ1π(Γ1
S − µi)/Si − Si−1EixΓ
2S
13: Construct Taylor polynomial and find stepsεEix, εSi
size using Γ1Ex,Γ2
Ex,Γ1
S,Γ2S
14: Compute search direction using step size, firstand second derivative
15: Check the feasibility16: if new solution is better than previous
solution then update Eix, S
0x, π
ix
17: i = i+ 118: end while
of traffic load (consumption) and generation is depicted in Fig. 4.5, correspondingly
for each of the three BS. Where generation is less than consumption, the BS will have
to purchase energy from another source or turn on the standby generator. Where it
is more than the consumption, the BS can sell the surplus energy to another BS.
110

510
1520
0
0.51
1.52
2.53
3.5
Tim
e in
hou
rs
KW
BS
1
P
ower
Dem
and
Gen
erat
ion
Lim
it w
/o D
Die
sel G
ener
atio
n Li
mit
510
1520
0
0.51
1.52
2.53
3.5
Tim
e in
hou
rs
KW
BS
2
P
ower
Dem
and
Gen
erat
ion
Lim
it w
/o D
Die
sel G
ener
atio
n Li
mit
510
1520
0
0.51
1.52
2.53
3.5
Tim
e in
hou
rs
KW
BS
3
P
ower
Dem
and
Gen
erat
ion
Lim
it w
/o D
Die
sel G
ener
atio
n Li
mit
510
1520
0
0.51
1.52
2.53
3.5
Tim
e in
hou
rs
KW
BS
1
G
ener
ated
Pow
er w
/o D
Die
sel G
ener
ated
Pow
er
510
1520
0
0.51
1.52
2.53
3.5
Tim
e in
hou
rs
KW
BS
2
G
ener
ated
Pow
er w
/o D
Die
sel G
ener
ated
Pow
er
510
1520
0
0.51
1.52
2.53
3.5
Tim
e in
hou
rs
KW
BS
3
G
ener
ated
Pow
er w
/o D
Die
sel G
ener
ated
Pow
er
Fig
ure
4.5:
En
ergy
dem
and
bas
edon
traffi
c-lo
adan
dth
eR
ES
gen
erat
ion
pro
file
issh
own
for
thre
ed
iffer
ent
BS
.
111
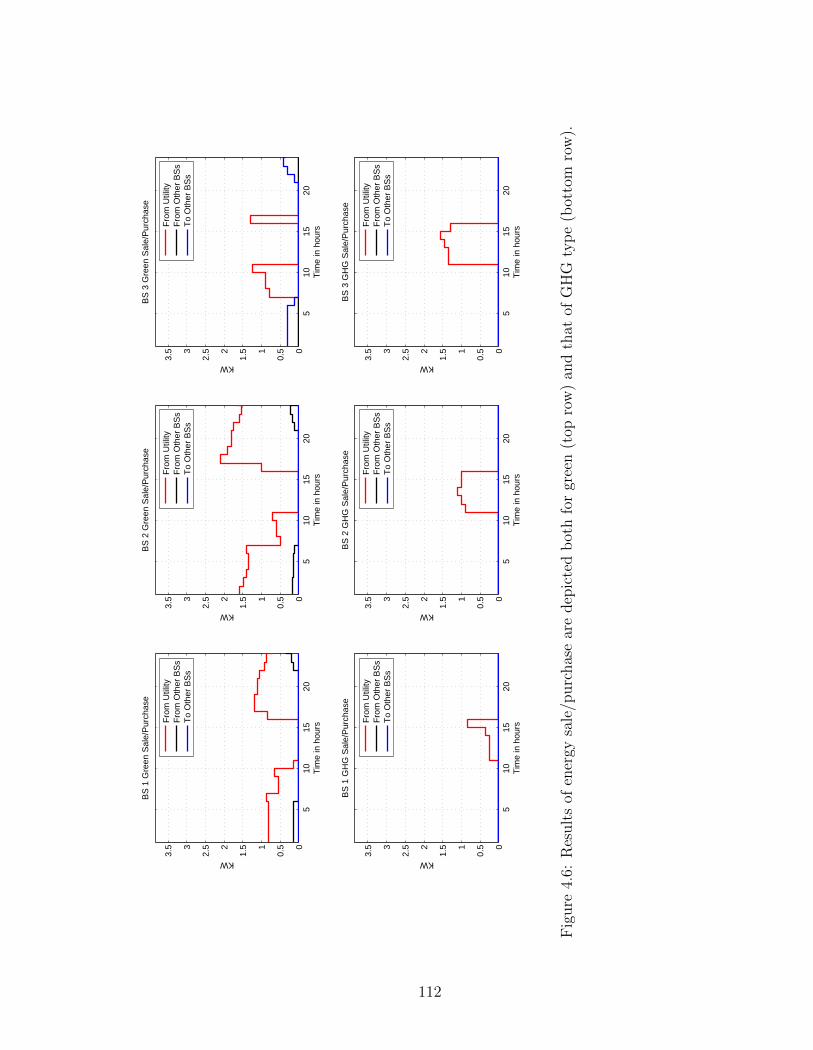
510
1520
0
0.51
1.52
2.53
3.5
Tim
e in
hou
rs
KW
BS
1 G
reen
Sal
e/P
urch
ase
F
rom
Util
ityF
rom
Oth
er B
Ss
To
Oth
er B
Ss
510
1520
0
0.51
1.52
2.53
3.5
Tim
e in
hou
rs
KW
BS
2 G
reen
Sal
e/P
urch
ase
F
rom
Util
ityF
rom
Oth
er B
Ss
To
Oth
er B
Ss
510
1520
0
0.51
1.52
2.53
3.5
Tim
e in
hou
rs
KW
BS
3 G
reen
Sal
e/P
urch
ase
F
rom
Util
ityF
rom
Oth
er B
Ss
To
Oth
er B
Ss
510
1520
0
0.51
1.52
2.53
3.5
Tim
e in
hou
rs
KW
BS
1 G
HG
Sal
e/P
urch
ase
F
rom
Util
ityF
rom
Oth
er B
Ss
To
Oth
er B
Ss
510
1520
0
0.51
1.52
2.53
3.5
Tim
e in
hou
rs
KW
BS
2 G
HG
Sal
e/P
urch
ase
F
rom
Util
ityF
rom
Oth
er B
Ss
To
Oth
er B
Ss
510
1520
0
0.51
1.52
2.53
3.5
Tim
e in
hou
rs
KW
BS
3 G
HG
Sal
e/P
urch
ase
F
rom
Util
ityF
rom
Oth
er B
Ss
To
Oth
er B
Ss
Fig
ure
4.6:
Res
ult
sof
ener
gysa
le/p
urc
has
ear
ed
epic
ted
bot
hfo
rgr
een
(top
row
)an
dth
atof
GH
Gty
pe
(bot
tom
row
).
112
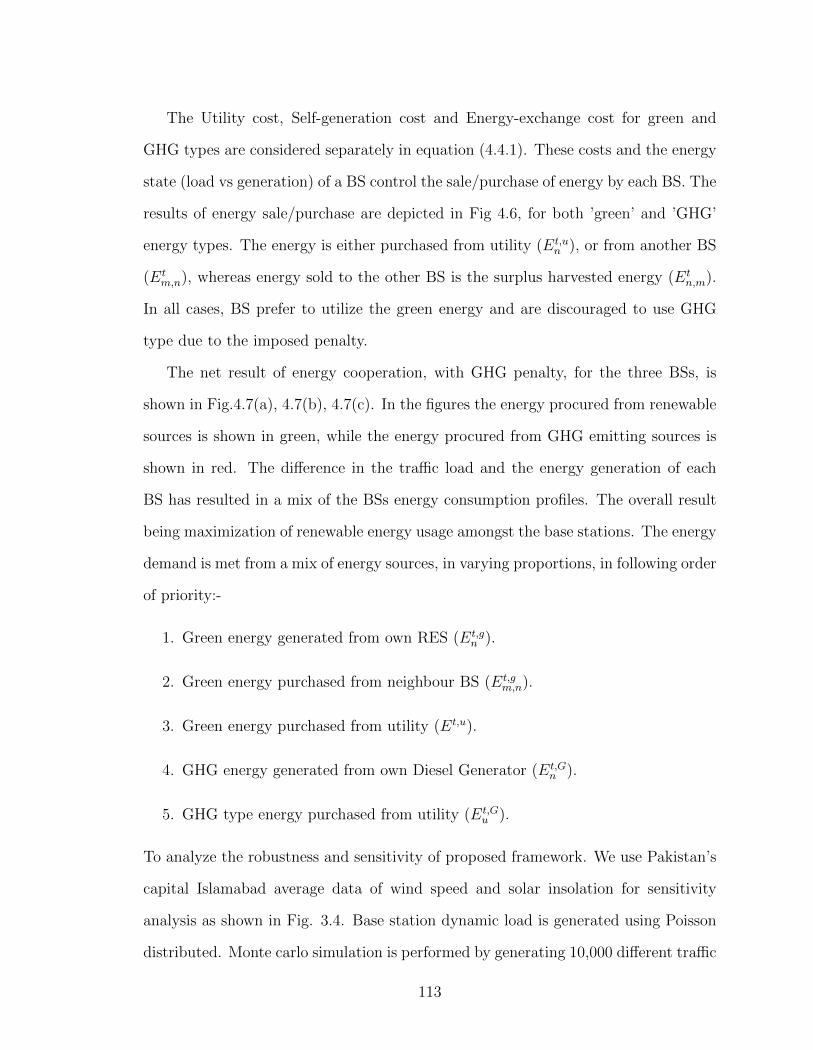
The Utility cost, Self-generation cost and Energy-exchange cost for green and
GHG types are considered separately in equation (4.4.1). These costs and the energy
state (load vs generation) of a BS control the sale/purchase of energy by each BS. The
results of energy sale/purchase are depicted in Fig 4.6, for both ’green’ and ’GHG’
energy types. The energy is either purchased from utility (Et,un ), or from another BS
(Etm,n), whereas energy sold to the other BS is the surplus harvested energy (Et
n,m).
In all cases, BS prefer to utilize the green energy and are discouraged to use GHG
type due to the imposed penalty.
The net result of energy cooperation, with GHG penalty, for the three BSs, is
shown in Fig.4.7(a), 4.7(b), 4.7(c). In the figures the energy procured from renewable
sources is shown in green, while the energy procured from GHG emitting sources is
shown in red. The difference in the traffic load and the energy generation of each
BS has resulted in a mix of the BSs energy consumption profiles. The overall result
being maximization of renewable energy usage amongst the base stations. The energy
demand is met from a mix of energy sources, in varying proportions, in following order
of priority:-
1. Green energy generated from own RES (Et,gn ).
2. Green energy purchased from neighbour BS (Et,gm,n).
3. Green energy purchased from utility (Et,u).
4. GHG energy generated from own Diesel Generator (Et,Gn ).
5. GHG type energy purchased from utility (Et,Gu ).
To analyze the robustness and sensitivity of proposed framework. We use Pakistan’s
capital Islamabad average data of wind speed and solar insolation for sensitivity
analysis as shown in Fig. 3.4. Base station dynamic load is generated using Poisson
distributed. Monte carlo simulation is performed by generating 10,000 different traffic
113
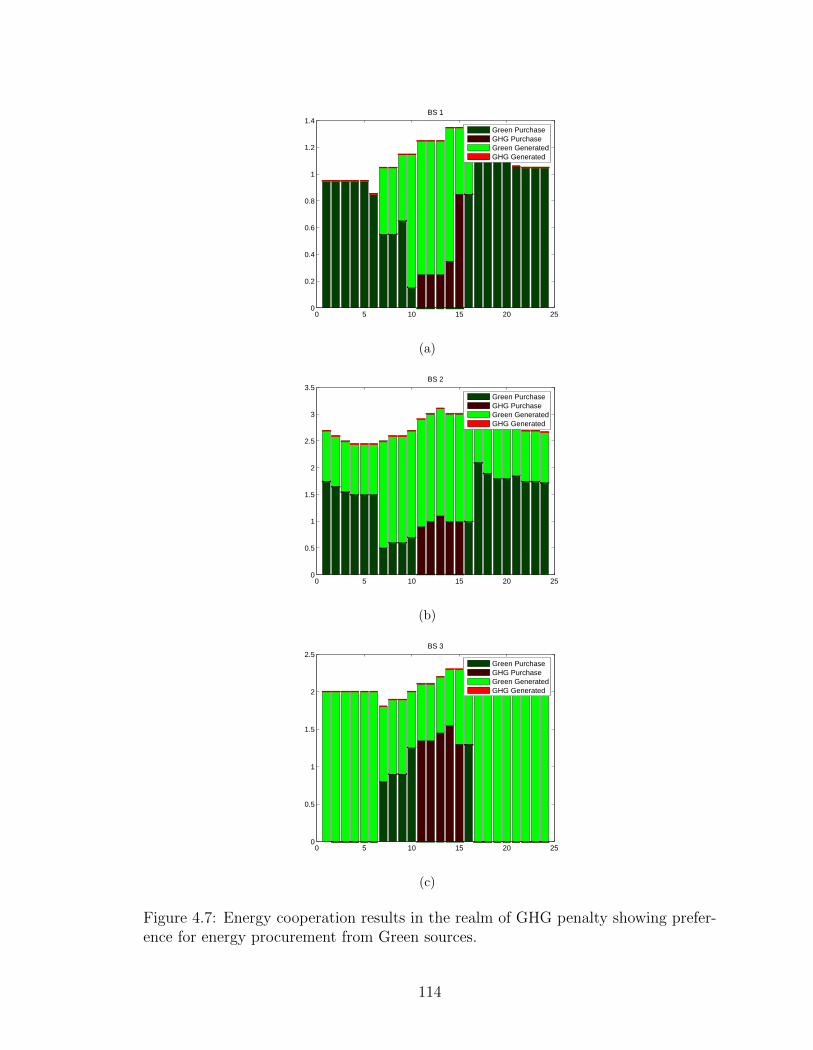
0 5 10 15 20 250
0.2
0.4
0.6
0.8
1
1.2
1.4BS 1
Green PurchaseGHG PurchaseGreen GeneratedGHG Generated
(a)
0 5 10 15 20 250
0.5
1
1.5
2
2.5
3
3.5BS 2
Green PurchaseGHG PurchaseGreen GeneratedGHG Generated
(b)
0 5 10 15 20 250
0.5
1
1.5
2
2.5BS 3
Green PurchaseGHG PurchaseGreen GeneratedGHG Generated
(c)
Figure 4.7: Energy cooperation results in the realm of GHG penalty showing prefer-ence for energy procurement from Green sources.
114
patterns using Poisson distribution for different number of base stations and different
months of the year. Table 4.4 depicts the statistical analysis of the proposed frame-
work in terms of mean, standard deviation, and 95/99% confidence intervals (CI) for
the different months (February, May, September, and November) and different num-
ber of BSs (N = 4, 8, 12, and 16). The results clearly emphasize the effectiveness of
proposed method. It is observed that the mean, standard deviation, and confidence
intervals are increasing with the number of BSs. From Fig. 3.4 it can be noticed that
average solar insolation is high in the month of May and September when compared
to February and November. On the other hand, average monthly wind speed is high-
est in the month of May. Thus, we can see highest mean and confidence interval for
the month of May.
115
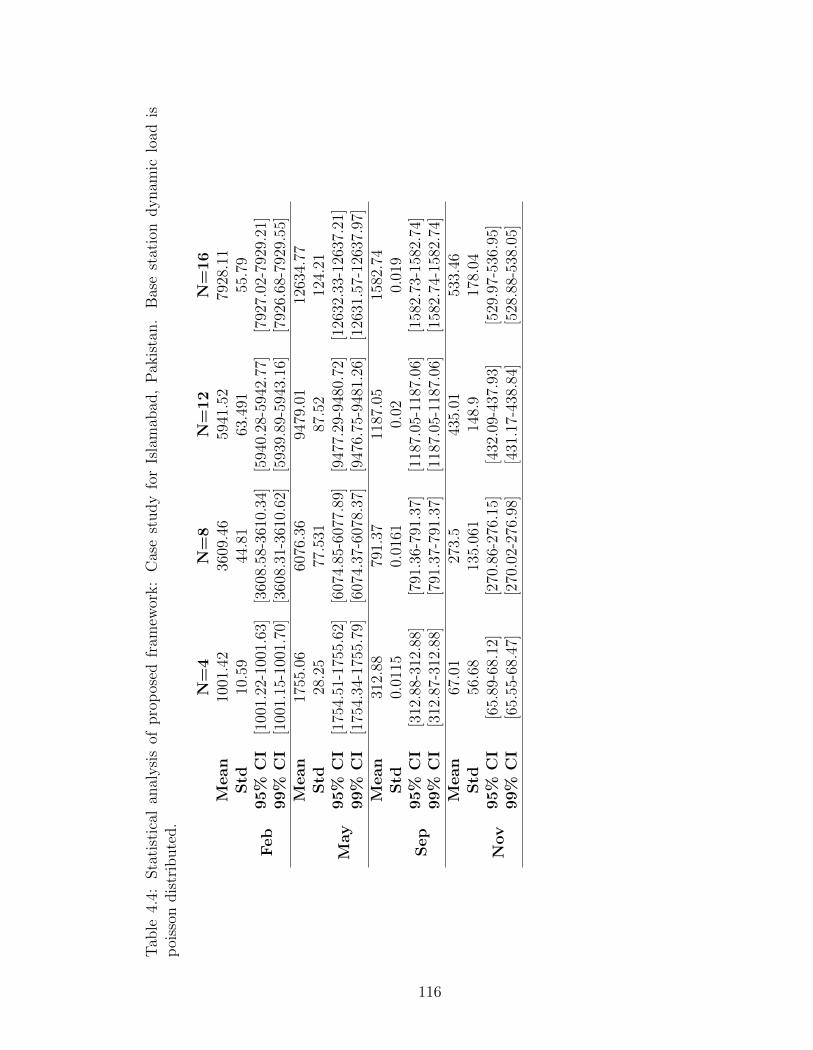
Tab
le4.
4:S
tati
stic
alan
alysi
sof
pro
pos
edfr
amew
ork:
Cas
est
ud
yfo
rIs
lam
abad
,P
akis
tan
.B
ase
stat
ion
dyn
amic
load
isp
oiss
ondis
trib
ute
d.
N=
4N
=8
N=
12
N=
16
Feb
Mean
1001
.42
3609
.46
5941
.52
7928
.11
Std
10.5
944
.81
63.4
9155
.79
95%
CI
[100
1.22
-100
1.63
][3
608.
58-3
610.
34]
[594
0.28
-594
2.77
][7
927.
02-7
929.
21]
99%
CI
[100
1.15
-100
1.70
][3
608.
31-3
610.
62]
[593
9.89
-594
3.16
][7
926.
68-7
929.
55]
May
Mean
1755
.06
6076
.36
9479
.01
1263
4.77
Std
28.2
577
.531
87.5
212
4.21
95%
CI
[175
4.51
-175
5.62
][6
074.
85-6
077.
89]
[947
7.29
-948
0.72
][1
2632
.33-
1263
7.21
]99%
CI
[175
4.34
-175
5.79
][6
074.
37-6
078.
37]
[947
6.75
-948
1.26
][1
2631
.57-
1263
7.97
]
Sep
Mean
312.
8879
1.37
1187
.05
1582
.74
Std
0.01
150.
0161
0.02
0.01
995%
CI
[312
.88-
312.
88]
[791
.36-
791.
37]
[118
7.05
-118
7.06
][1
582.
73-1
582.
74]
99%
CI
[312
.87-
312.
88]
[791
.37-
791.
37]
[118
7.05
-118
7.06
][1
582.
74-1
582.
74]
Nov
Mean
67.0
127
3.5
435.
0153
3.46
Std
56.6
813
5.06
114
8.9
178.
0495%
CI
[65.
89-6
8.12
][2
70.8
6-27
6.15
][4
32.0
9-43
7.93
][5
29.9
7-53
6.95
]99%
CI
[65.
55-6
8.47
][2
70.0
2-27
6.98
][4
31.1
7-43
8.84
][5
28.8
8-53
8.05
]
116
4.5 Summary
Equipping the cellular BSs with RES not only reduces their CO2 footprint but also
make them energy cost efficient in the long run. Using the results of previous chapter
in which we sized the PV array and a wind turbine for a macro BS, we formulated an
energy cooperation scheme for co-located BSs. Two cases of energy cooperation were
formulated. In the first, the surplus green harvested energy was shared between the BS
depending on their instantaneous energy state. In the second case, the GHG sources
were assigned a penalty so that a BS is more inclined to purchase green energy. The
algorithm so designed was simulated for the 24hr load profile of each BS as well the
energy harvested from the two RES. Based on these, the energy cooperation algorithm
ensures optimization of the harvested energy. The green energy maximization policy
so introduced ensured optimum utilization of total harvested energy in the network,
thereby reducing the use of utility and generator to minimal. Introducing energy
cooperation between green BS is especially feasible with the futuristic smart grid
offering bi-directional flow of energy and information.
117
Chapter 5
Traffic Aware Energy Cooperation with BS Sleep
Mechanism
118
5.1 Introduction
The futuristic wireless technologies of 5G are going to bring dramatic performance
improvements in terms of data rates, network capacity, latency, cost and coverage.
In order to achieve these desired goals, technological improvements are underway
at all tiers as well as the search for new innovative solutions. Densification and
diversification of the radio access network will require new models to make them
economical and energy efficient such as dynamic and adaptable allocation of resources.
With smart grid and renewable energy systems also maturing, a new paradigm of
green communication is emerging that aims to improve energy efficiency of cellular
networks comprising macro, micro, femto and pico base station transceivers. The
industry is also aware that technology improvements must not be at the cost of
adverse climatic effects, thus renewable energy based solutions to meet the power
demands are order of the day.
The renewable energy sources enabled cellular BSs can benefit in terms of cli-
mate friendly energy conservation by employing energy optimization schemes such
as ’energy cooperation’. In the last two chapters we modeled the renewable energy
sources for powering a cellular BS and maximized their utilization through energy
cooperation between the network nodes. In off-peak hours these green BS generate
surplus energy that can be sold back to the grid, as demonstrated in chapter 3. More-
over, the energy exchange between the BSs was also shown as a viable management
scheme for energy conservation in general and reducing GHG emitting energy sources
in particular. Smart grid is ideally suited for the exchange of energy between the
cellular elements due to bi-directional flow of information and energy. A central con-
troller in a microgrid is also envisaged a viable option for two way flow of energy and
information.
It is shown through different studies such as the one done in [4], that a BS mostly
119
performs well below its capacity for approximately 80% of the time. A BS is optimized
to handle maximum traffic but such traffic occurs only at a small percentage of
the day. Furthermore, the new standard for self organizing networks (SON) being
gradually introduced by 3GPP (third generation partnership project) is allowing for
more network adaptability according to the environment. This has lead to the notion
of putting some BSs to ’sleep’ during the off-peak hours, and shifting their traffic
to the neighboring BSs. Putting BSs in sleep mode requires on/off switching of BS,
which entails remotely switching off a BS at lean time and then switching it ’on’ when
the traffic increases. The ’sleep’ mechanism thus requires two types of operations to
be controlled. These are:-
� A mechanism to switch-off and switch-on a BS remotely.
� A mechanism to handover the users from off BS to other BS.
Furthermore, for green BS i.e., BS powered by RES such as solar and wind,
the sleep mode discussed above provides added opportunity for energy conservation.
For a green BS that is harvesting energy through its wind turbine/solar panels, the
harvested energy mostly lies surplus in case the BS is in sleep mode. Thus, traf-
fic load cooperation between the ’sleeping’ and active ’macro’ BS of a network is a
very promising solution for overall energy conservation and green energy utilization.
We will explore the said scenario for an ’umbrella’ network of BS and evaluate the
net energy savings by switching off the BS and transferring their traffic load to the
macro BS and their surplus energy to utility. Optimization of the network resources
is carried out by estimating the best number of sites to be switched off, through an
especially designed algorithm.
Lately, LTE networks have been subjected to sleep mode of operations for energy
savings ( [125], [126], [127], [128], [129], [130]). Exploiting the DTX and RTX in 4G
NW, Wang et al. [127] have proposed a novel energy saving scheme for LTE networks
120
in which the number of active sub-frames in a frame are optimally selected, which
results in a reduction in energy of up to 90%, as shown, at low traffic load. In [128],
authors incorporate sleep nodes while optimizing the antenna parameters such as tilt,
beam-width, transmit power etc. under the constraints of SINR, spectral efficiency
and user throughput. Authors in [129] consider both traffic load and the average
distance of its users in deciding which eNBs to switch off in an LTE network. Their
proposed scheme is shown to out perform random switching-off of eNBs, in terms of
overall energy saving. Sleep mode can also be used by utilizing the CoMP feature
in LTE [126]. The net power saving in switching off the BSs and extra power used
in CoMP, can be maximized by selecting an optimized set of points for coordination.
Another optimal energy saving framework through BS sleeping in LTE NW is pre-
sented in [125]. The stochastic analytical framework modifies the theoretical model to
account for the effect of BS sleeping, wile maintaining the outage probability metrics
such as SINR, constant.
In heterogenous networks the user association between small cells access points
(SAPs) used for point coverage, and the broader coverage macro cells, when smaller
(pico/micro) are put to sleep, is a key issue. The models proposed put the light
loaded point coverage eNBs to sleep to conserve energy and associate their users
with central macro cells [ [131], [132], [125], [133], [134]]. In [132], the sleep mode
of SAPs is investigated in relation to the trade-off between energy consumption and
false alarm rate. In another HetNet model the femto cells are switched off when
traffic load ia low, which is then handled by the macro BS [131]. The base station
loads are determined through the continuous time Markov Decision Process, where
states represent loads and switching is added to the state space as a new dimension.
The cost function is defined as an increasing function of energy consumption and a
decreasing of throughput.
121
5.2 System Model
5G networks are envisaged to be dense heterogeneous networks, comprising taller
antenna macro cell sites, combined with local cell sites for point coverage. We consider
an ’umbrella network’ of BSs that has a central macro BS with wide coverage and
within that coverage we have N number of micro BSs with localized coverage as shown
in Fig. 5.1. The BSs are equipped with RES such as wind-turbine and solar-array
to harvest green energy from natural resources. The central macro BS is designated
with symbol M , which is different from micro BSs n (n = 1....N). Here, N = 8 means
that there are eight micro BS plus one macro BS and N = 12 means twelve micro
and one macro; so on and so forth. We assume that any BS n can be switched off, for
multiple time slots t, when traffic is lean. The traffic load (Ltn) of the switched-off BS
is directed towards the Macro BS M , whose load increases as more traffic is handled
by it, which means that while the static power consumption will not be effected, the
dynamic power consumption of the central BS will increase. We shall observe that
this increase in load is considerably less than the power saved by switching off BS n.
Additionally we invoke energy transfer from the switched off BS to utility, resulting
in significant savings in conventional energy usage.
5.2.1 Energy Saving in Sleep Mode
As discussed earlier, the EARTH project report [101], has analyzed the power con-
sumption of a BS in different modes of operation. These modes are listed in Table 2.2
for Macro, RRH, Micro, Pico and Femto base stations. as stated earlier, the power
consumption of a BS is bifurcated into Static and Dynamic types. The static power
consumption per transceiver is designated P0 and is fixed for each BS type. Whereas,
the dynamic power consumption is a function of number of transceivers (NTRX) and
122
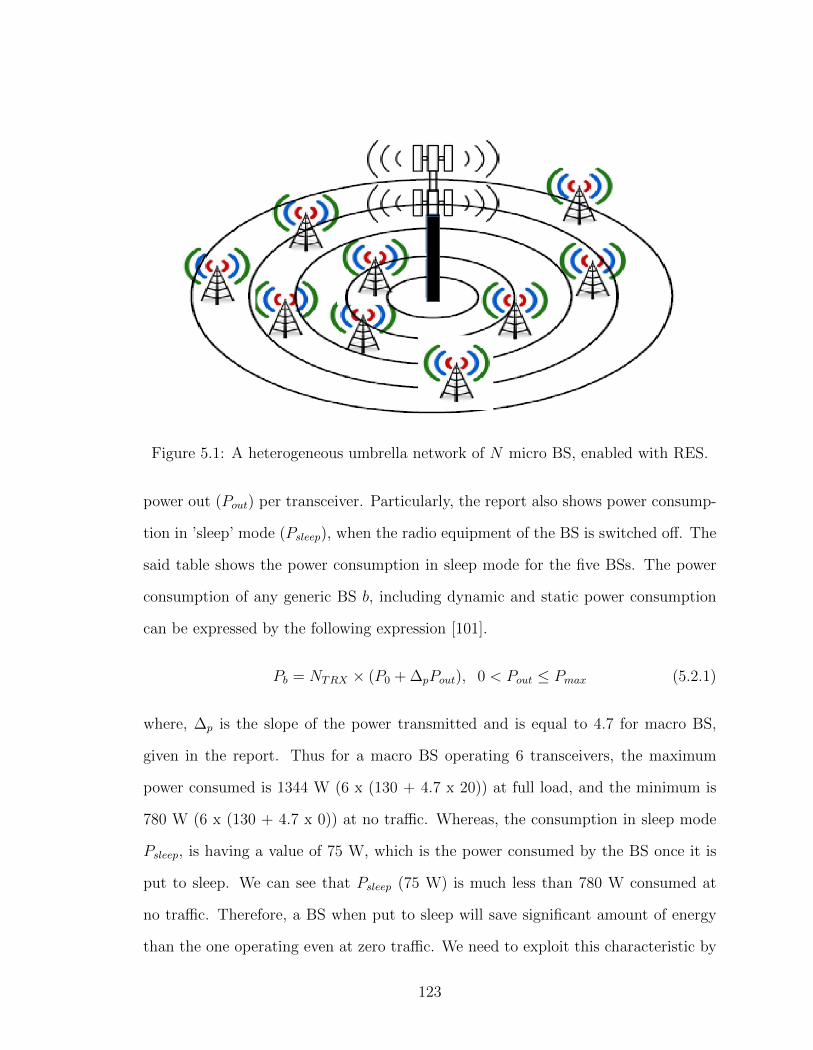
Figure 5.1: A heterogeneous umbrella network of N micro BS, enabled with RES.
power out (Pout) per transceiver. Particularly, the report also shows power consump-
tion in ’sleep’ mode (Psleep), when the radio equipment of the BS is switched off. The
said table shows the power consumption in sleep mode for the five BSs. The power
consumption of any generic BS b, including dynamic and static power consumption
can be expressed by the following expression [101].
Pb = NTRX × (P0 + ∆pPout), 0 < Pout ≤ Pmax (5.2.1)
where, ∆p is the slope of the power transmitted and is equal to 4.7 for macro BS,
given in the report. Thus for a macro BS operating 6 transceivers, the maximum
power consumed is 1344 W (6 x (130 + 4.7 x 20)) at full load, and the minimum is
780 W (6 x (130 + 4.7 x 0)) at no traffic. Whereas, the consumption in sleep mode
Psleep, is having a value of 75 W, which is the power consumed by the BS once it is
put to sleep. We can see that Psleep (75 W) is much less than 780 W consumed at
no traffic. Therefore, a BS when put to sleep will save significant amount of energy
than the one operating even at zero traffic. We need to exploit this characteristic by
123
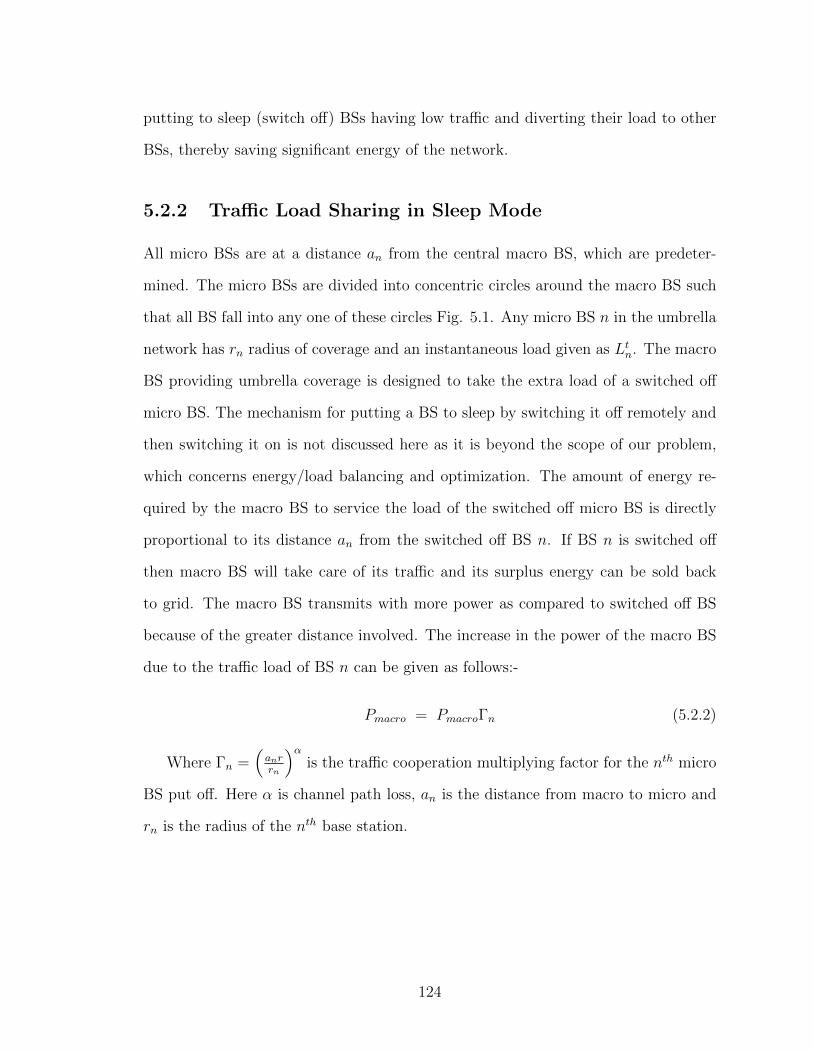
putting to sleep (switch off) BSs having low traffic and diverting their load to other
BSs, thereby saving significant energy of the network.
5.2.2 Traffic Load Sharing in Sleep Mode
All micro BSs are at a distance an from the central macro BS, which are predeter-
mined. The micro BSs are divided into concentric circles around the macro BS such
that all BS fall into any one of these circles Fig. 5.1. Any micro BS n in the umbrella
network has rn radius of coverage and an instantaneous load given as Ltn. The macro
BS providing umbrella coverage is designed to take the extra load of a switched off
micro BS. The mechanism for putting a BS to sleep by switching it off remotely and
then switching it on is not discussed here as it is beyond the scope of our problem,
which concerns energy/load balancing and optimization. The amount of energy re-
quired by the macro BS to service the load of the switched off micro BS is directly
proportional to its distance an from the switched off BS n. If BS n is switched off
then macro BS will take care of its traffic and its surplus energy can be sold back
to grid. The macro BS transmits with more power as compared to switched off BS
because of the greater distance involved. The increase in the power of the macro BS
due to the traffic load of BS n can be given as follows:-
Pmacro = PmacroΓn (5.2.2)
Where Γn =(anrrn
)αis the traffic cooperation multiplying factor for the nth micro
BS put off. Here α is channel path loss, an is the distance from macro to micro and
rn is the radius of the nth base station.
124
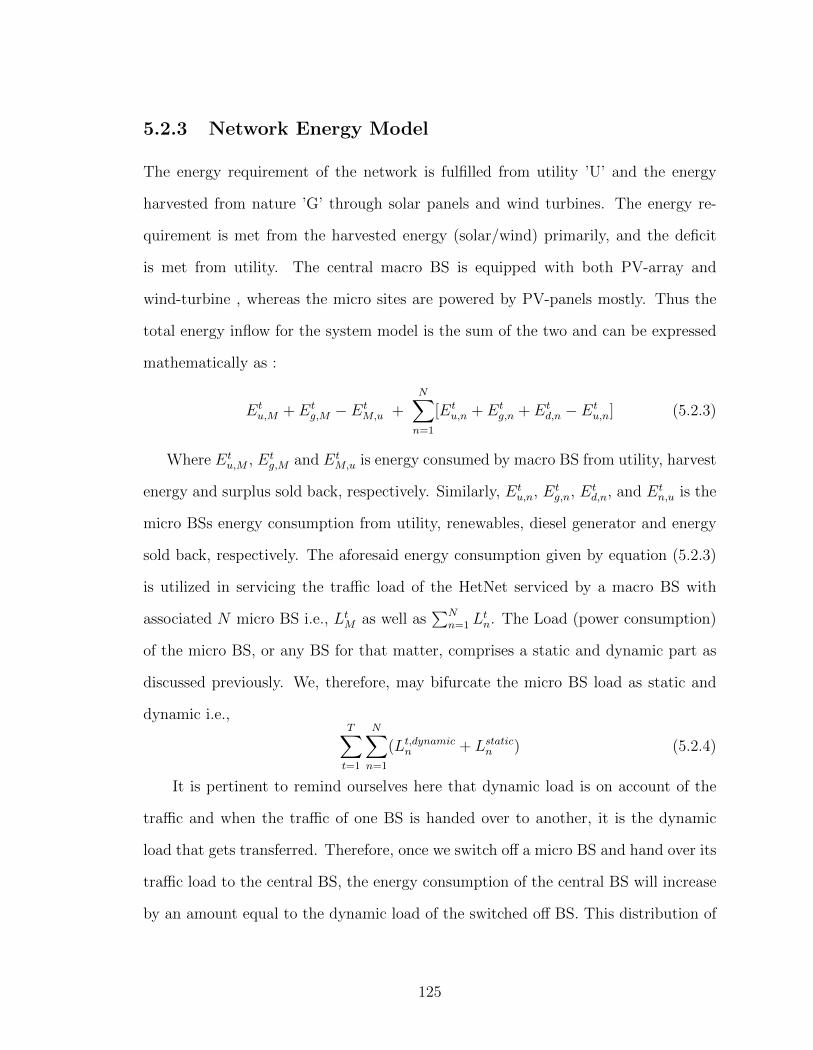
5.2.3 Network Energy Model
The energy requirement of the network is fulfilled from utility ’U’ and the energy
harvested from nature ’G’ through solar panels and wind turbines. The energy re-
quirement is met from the harvested energy (solar/wind) primarily, and the deficit
is met from utility. The central macro BS is equipped with both PV-array and
wind-turbine , whereas the micro sites are powered by PV-panels mostly. Thus the
total energy inflow for the system model is the sum of the two and can be expressed
mathematically as :
Etu,M + Et
g,M − EtM,u +
N∑n=1
[Etu,n + Et
g,n + Etd,n − Et
u,n] (5.2.3)
Where Etu,M , Et
g,M and EtM,u is energy consumed by macro BS from utility, harvest
energy and surplus sold back, respectively. Similarly, Etu,n, Et
g,n, Etd,n, and Et
n,u is the
micro BSs energy consumption from utility, renewables, diesel generator and energy
sold back, respectively. The aforesaid energy consumption given by equation (5.2.3)
is utilized in servicing the traffic load of the HetNet serviced by a macro BS with
associated N micro BS i.e., LtM as well as∑N
n=1 Ltn. The Load (power consumption)
of the micro BS, or any BS for that matter, comprises a static and dynamic part as
discussed previously. We, therefore, may bifurcate the micro BS load as static and
dynamic i.e.,T∑t=1
N∑n=1
(Lt,dynamicn + Lstaticn ) (5.2.4)
It is pertinent to remind ourselves here that dynamic load is on account of the
traffic and when the traffic of one BS is handed over to another, it is the dynamic
load that gets transferred. Therefore, once we switch off a micro BS and hand over its
traffic load to the central BS, the energy consumption of the central BS will increase
by an amount equal to the dynamic load of the switched off BS. This distribution of
125
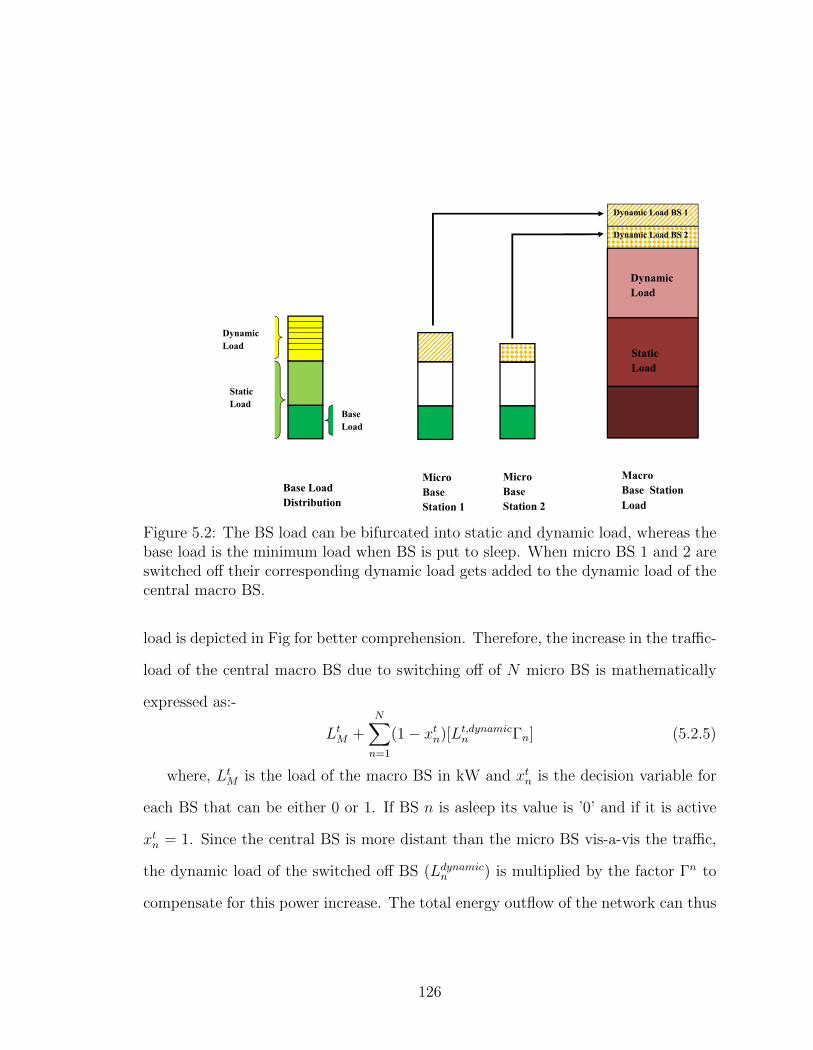
Dynamic Load BS 2
Dynamic
Load
Static
Load Base
Load
Macro
Base Station
Load
Dynamic Load BS 1
Micro
Base
Station 2
Micro
Base
Station 1
Base Load
Distribution
Dynamic
Load
Static
Load
Figure 5.2: The BS load can be bifurcated into static and dynamic load, whereas thebase load is the minimum load when BS is put to sleep. When micro BS 1 and 2 areswitched off their corresponding dynamic load gets added to the dynamic load of thecentral macro BS.
load is depicted in Fig for better comprehension. Therefore, the increase in the traffic-
load of the central macro BS due to switching off of N micro BS is mathematically
expressed as:-
LtM +N∑n=1
(1− xtn)[Lt,dynamicn Γn] (5.2.5)
where, LtM is the load of the macro BS in kW and xtn is the decision variable for
each BS that can be either 0 or 1. If BS n is asleep its value is ’0’ and if it is active
xtn = 1. Since the central BS is more distant than the micro BS vis-a-vis the traffic,
the dynamic load of the switched off BS (Ldynamicn ) is multiplied by the factor Γn to
compensate for this power increase. The total energy outflow of the network can thus
126
be expressed as:-
LtM︸︷︷︸Macro
+N∑n=1
(Lt,dynamicn + Lt,staticn )︸ ︷︷ ︸Micro On
+N∑n=1
(1− xtn)[
Traffic Cooperation︷ ︸︸ ︷Lt,dynamicn Γn +Lsleepn ]︸ ︷︷ ︸Micro Off
(5.2.6)
where LSleepn is the energy consumption in sleep mode for those BS that have been
put to sleep. In order to ensure energy balance in the system, equation (5.2.3) must
be equal to equation (5.2.6). The net energy saving from switching off BS n will be
the difference of ’energy utilized by micro BS (Et,un + Et,g
n )’ and the ’extra energy
consumed by the macro BS’ given by equation (5.2.2). The extra load carried by
the macro BS is significantly less than the energy saved from putting a BS to sleep.
Additional saving is made, which can be substantial, in buy-back of the harvested
energy from the switched-off BS by utility, which is designated as Etn,u, where n, u
means from BS n to utility.
5.3 Problem Formulation
Our objective is to minimize the energy consumption of the umbrella network by
switching off the lean-traffic BSs as well as cut down the energy provided by utility
by transferring the green energy harvested by the switched off BSs. The temporal
fluctuations in the BS traffic serves as the basis for decision on switching off a BS. In
any time slot t, the BS having least traffic load can be switched off. Its traffic load is
shifted to the macro BS and the harvested energy is sold back to the grid. The energy
cost minimization optimization problem for energy cooperation with sleep mode is
stated as follows:-
Given:
� The N number of micro BSs in the network.
127
� The finite period traffic profile of each BS.
� The finite period energy generation profile of each BS.
� The energy cost of utility and RES.
� The distance between the macro BS and micro BSs.
Determine for each time period t of a finite time horizon T :
� The energy surplus, at BS n, to be transferred to utility.
� The micro BS n to be switched off.
� The increase in the energy consumption of macro BS.
� The net energy saving in network from energy cooperation.
minEt
u,M ,Etg,M ,Et
M,u,Etu,n,E
tn,u,E
tg,n,E
td,n,X
tn
T∑t=1
[C(Et
u,M) + C(Etg,M)− C(Et
M,u)N∑n=1
[C(Et
u,n) + C(Etg,n) + CEt
d,n − C(Etu,n)]](5.3.1)
128
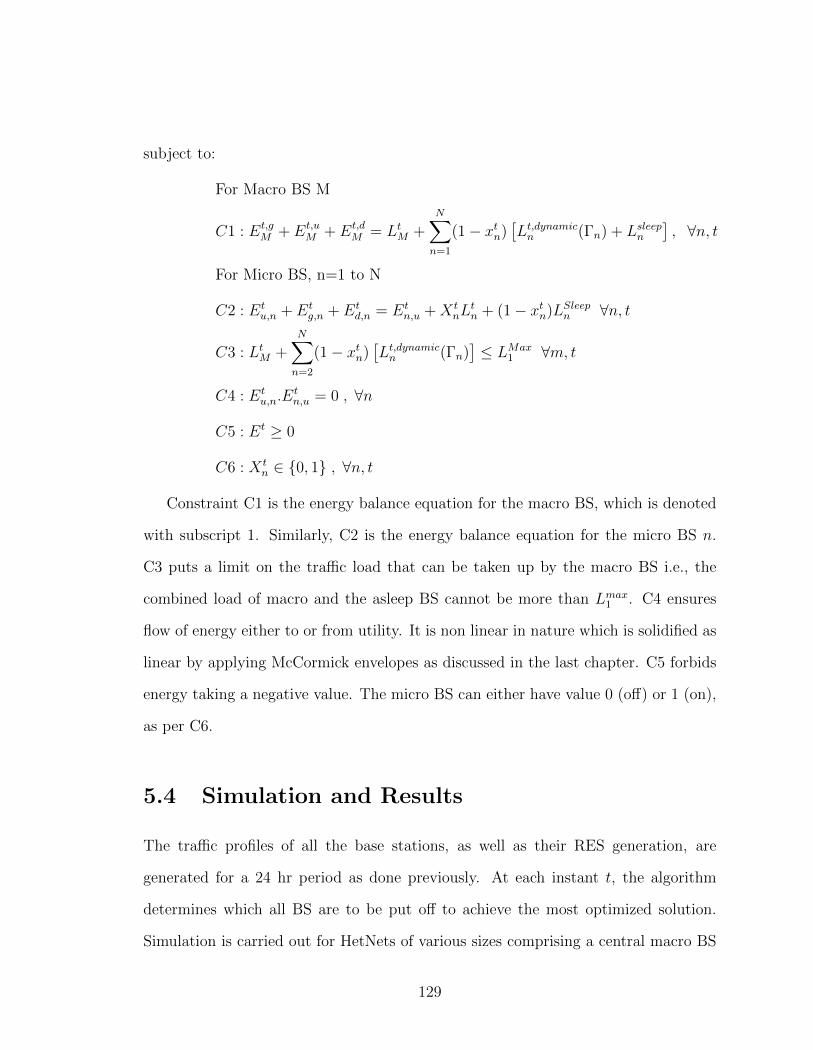
subject to:
For Macro BS M
C1 : Et,gM + Et,u
M + Et,dM = LtM +
N∑n=1
(1− xtn)[Lt,dynamicn (Γn) + Lsleepn
], ∀n, t
For Micro BS, n=1 to N
C2 : Etu,n + Et
g,n + Etd,n = Et
n,u +X tnL
tn + (1− xtn)LSleepn ∀n, t
C3 : LtM +N∑n=2
(1− xtn)[Lt,dynamicn (Γn)
]≤ LMax
1 ∀m, t
C4 : Etu,n.E
tn,u = 0 , ∀n
C5 : Et ≥ 0
C6 : X tn ∈ {0, 1} , ∀n, t
Constraint C1 is the energy balance equation for the macro BS, which is denoted
with subscript 1. Similarly, C2 is the energy balance equation for the micro BS n.
C3 puts a limit on the traffic load that can be taken up by the macro BS i.e., the
combined load of macro and the asleep BS cannot be more than Lmax1 . C4 ensures
flow of energy either to or from utility. It is non linear in nature which is solidified as
linear by applying McCormick envelopes as discussed in the last chapter. C5 forbids
energy taking a negative value. The micro BS can either have value 0 (off) or 1 (on),
as per C6.
5.4 Simulation and Results
The traffic profiles of all the base stations, as well as their RES generation, are
generated for a 24 hr period as done previously. At each instant t, the algorithm
determines which all BS are to be put off to achieve the most optimized solution.
Simulation is carried out for HetNets of various sizes comprising a central macro BS
129
Pre-Processing
Branch and Bound
Pre-processing for Relaxed Conditions
Transfer load of selected Micro to Macro BS Share harvested energy of Off BS to Utility Get Linear programming solution
Initial Conditions X* , E*
Get Solution for Relaxed Problem
Pre-Processing for MILP • Analyze linear inequalities
• Eliminate futile candidates
Apply rounding heuristic to get feasible solution
Prune Xnt
E* < E X* < X
E < E*
Is Termination Criteria satisfied
Start
Stop YES
NO
NO
YES
Figure 5.3: Flow chart for solving the mixed integer linear problem (MILP) program-ming algorithm.
130
and N micro BS. The algorithm performs a thousand monte carlo simulations per
configuration and determines the number of micro BS to be put to sleep as per the
constraints earlier determined. The main constraint being the traffic load capacity
of the macro BS, which determines the number of BS that can be switched off. The
traffic-load of the macro BS increases as more micro BS are put to sleep, whereas,
the conventional energy cost decreases on account of the these asleep BSs and their
harvested energy is sold back to the utility. In Fig. 5.4 and 5.4, the BSs on/off state
is shown for different sized networks having 8,12,16 and 20 micro BSs respectively.
In all cases the BS are put to sleep in lean traffic hours and their number differs not
only from network to network but also throughout the year.
The net energy saving graphs in Fig. 5.6, show the results for four micro BS and
one macro as per our model umbrella configuration. The negative values show revenue
from BS sleep mode and buy back of surplus energy by utility. We have similarly
simulated results for N = 8, 12, 16, 20 BS and are depicted in Figs. 5.7(a), 5.7(b),
5.8(a) and 5.8(b), respectively. The figures show two types (bars) of energy savings
for each month. The white bar shows energy cost (+ive) or revenue (-ive) when
the network is operating normally and there is no sleep mechanism in operation.
In this case the surplus harvested energy, if any, is sold back to the utility by the
network operator. Whereas, the black bar shows the network energy cost/revenue
when BS are put to sleep and their traffic load is transferred to the macro BS, whereas,
the harvested energy, now wholly surplus, is sold back to the grid. In Fig 5.6, for
example, the network is making revenue in most of the months, depicted with negative
values. Since harvested energy is surplus in both cases, both bars are negative showing
revenue in almost all months except Nov and Dec. As the size of the HetNet keeps
increasing from 4 to 20, the energy savings keep reducing. This is because the capacity
of the macro BS to take on additional load is limited, thus in large configurations the
relative energy saving is reduced. However, in all cases, the net energy saving is more
131
in case BS are put to sleep than the case when no sleep mechanism is employed.
5.5 Summary
A novel energy saving scheme has been described for HetNets having RES by exploit-
ing energy and traffic cooperation in the network. An umbrella network consisting
of a central macro BS and surrounding micro BSs was modeled for this scenario. It
is viable to put some BS to sleep during lean traffic hours in order to conserve net-
work energy. Furthermore, if the BS put to sleep is harvesting energy from renewable
sources such as solar and wind, the energy can be sold back to utility to generate
revenue. The energy cooperation scheme developed in chapter 5 is particularly fea-
sible for a heterogenous network of green BS, where some BS are put in the sleep
mode and their traffic-load is shared by the central BS. In asleep BS all the energy
stored/harvested is surplus, which may be transferred to another active BS or sold to
utility. As the size of the network increased, the net savings reduced but nevertheless
remained more than non-cooperation scenario. That is because the traffic load and
therefore the energy consumption of the central BS increases as traffic is assigned to
it up to its maximum capacity. The model is formed under the assumptions that
the user association/dis-association is seamless and that on/off switching is instan-
taneous. The energy cooperation scheme developed in this chapter is particularly
suitable for HetNets of green BSs, where certain selected BS are put in sleep mode
and their traffic-load is shared by the central BS.
132
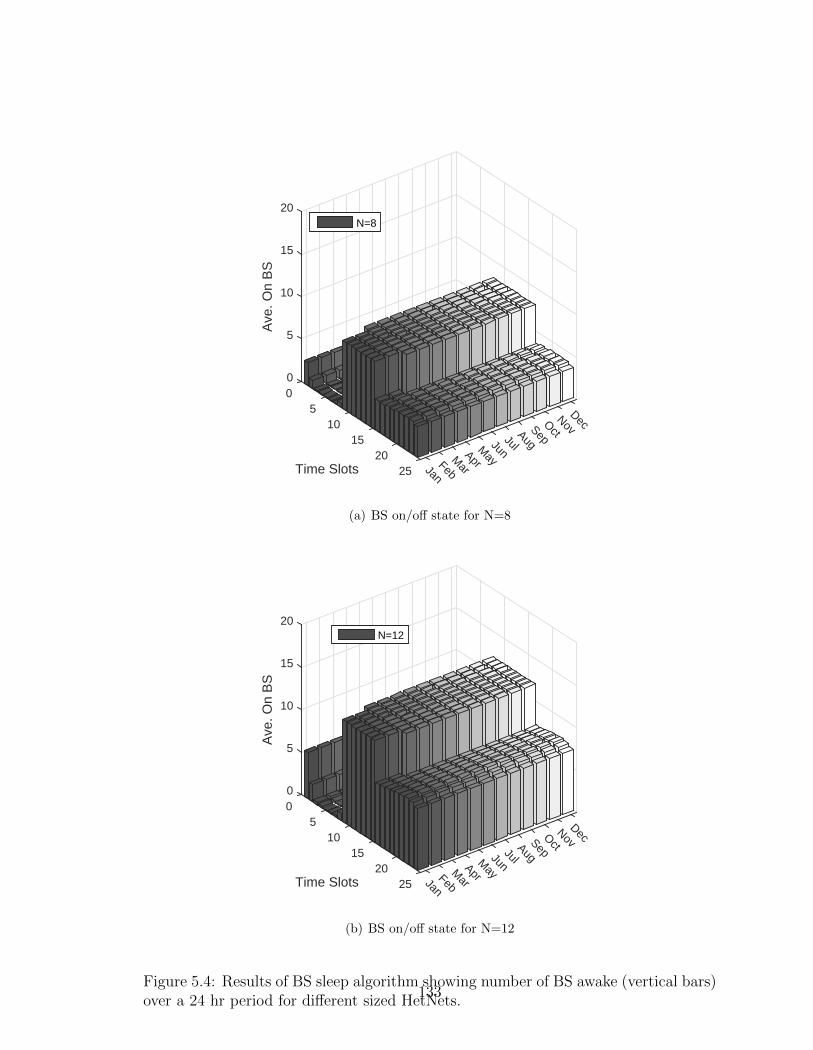
DecNovOctSepAugJulJunMayAprM
arFebJan2520
15
Time Slots
105
0
5
10
20
15
0
Ave
. On
BS
N=8
(a) BS on/off state for N=8
DecNovOctSepAugJulJunMayAprM
arFebJan2520
15
Time Slots
105
0
5
10
20
15
0
Ave
. On
BS
N=12
(b) BS on/off state for N=12
Figure 5.4: Results of BS sleep algorithm showing number of BS awake (vertical bars)over a 24 hr period for different sized HetNets.
133
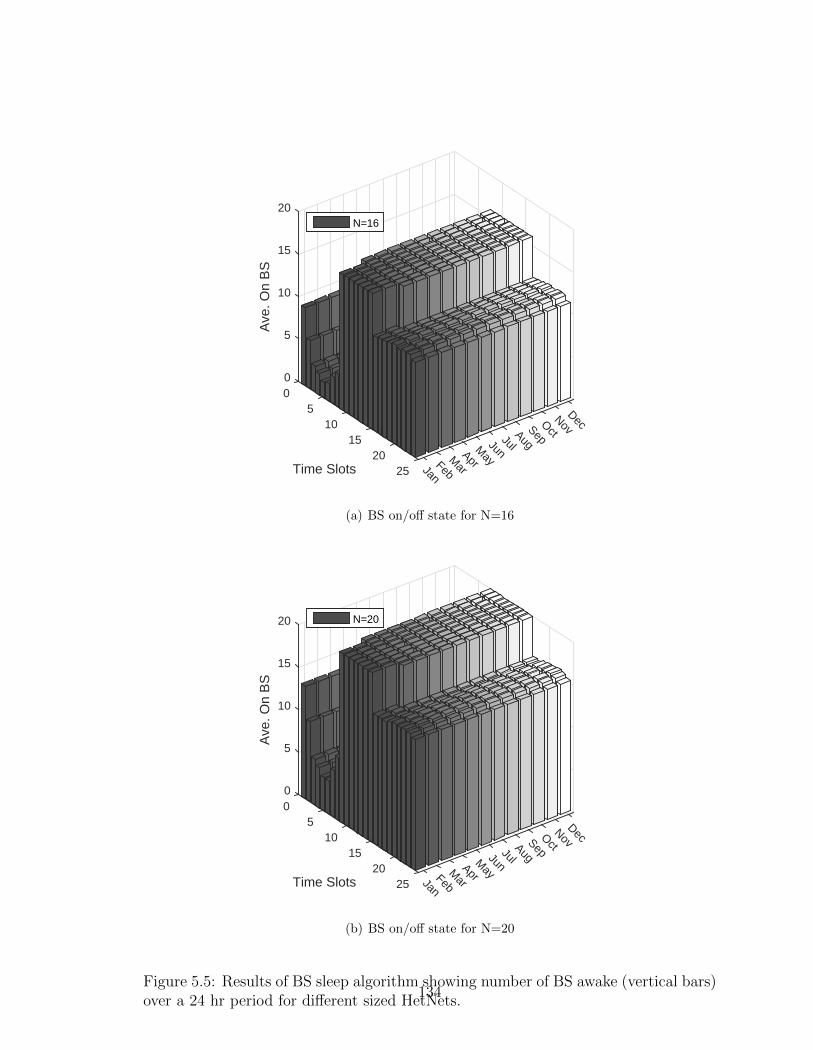
DecNovOctSepAugJulJunMayAprM
arFebJan2520
15
Time Slots
105
0
5
10
20
15
0
Ave
. On
BS
N=16
(a) BS on/off state for N=16
DecNovOctSepAugJulJunMayAprM
arFebJan2520
15
Time Slots
105
0
5
10
20
15
0
Ave
. On
BS
N=20
(b) BS on/off state for N=20
Figure 5.5: Results of BS sleep algorithm showing number of BS awake (vertical bars)over a 24 hr period for different sized HetNets.
134
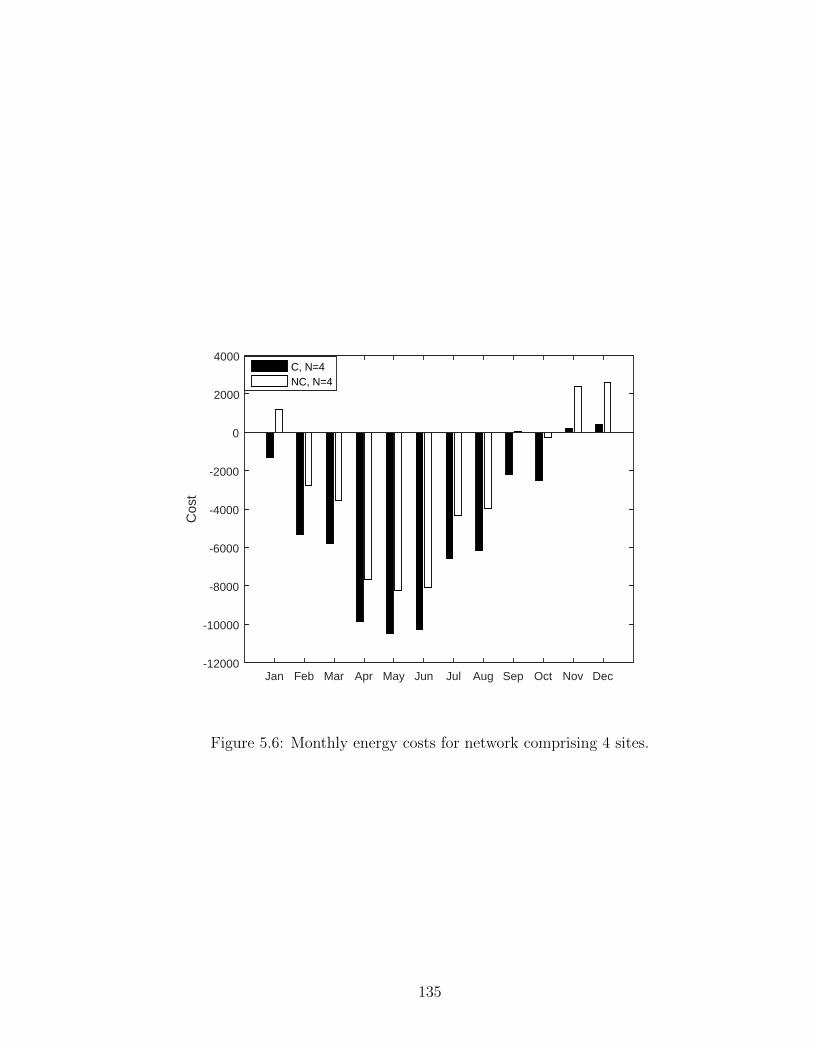
Jan Feb Mar Apr May Jun Jul Aug Sep Oct Nov Dec
Cos
t
-12000
-10000
-8000
-6000
-4000
-2000
0
2000
4000C, N=4NC, N=4
Figure 5.6: Monthly energy costs for network comprising 4 sites.
135
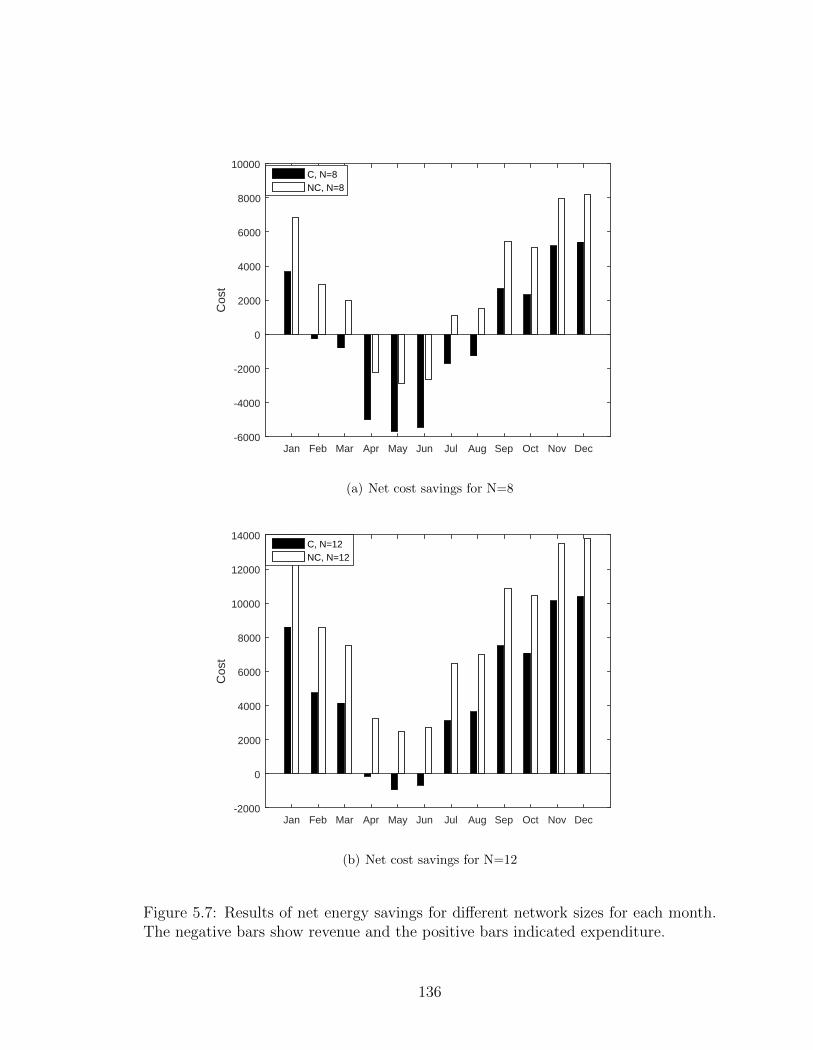
Jan Feb Mar Apr May Jun Jul Aug Sep Oct Nov Dec
Cos
t
-6000
-4000
-2000
0
2000
4000
6000
8000
10000C, N=8NC, N=8
(a) Net cost savings for N=8
Jan Feb Mar Apr May Jun Jul Aug Sep Oct Nov Dec
Cos
t
-2000
0
2000
4000
6000
8000
10000
12000
14000C, N=12NC, N=12
(b) Net cost savings for N=12
Figure 5.7: Results of net energy savings for different network sizes for each month.The negative bars show revenue and the positive bars indicated expenditure.
136
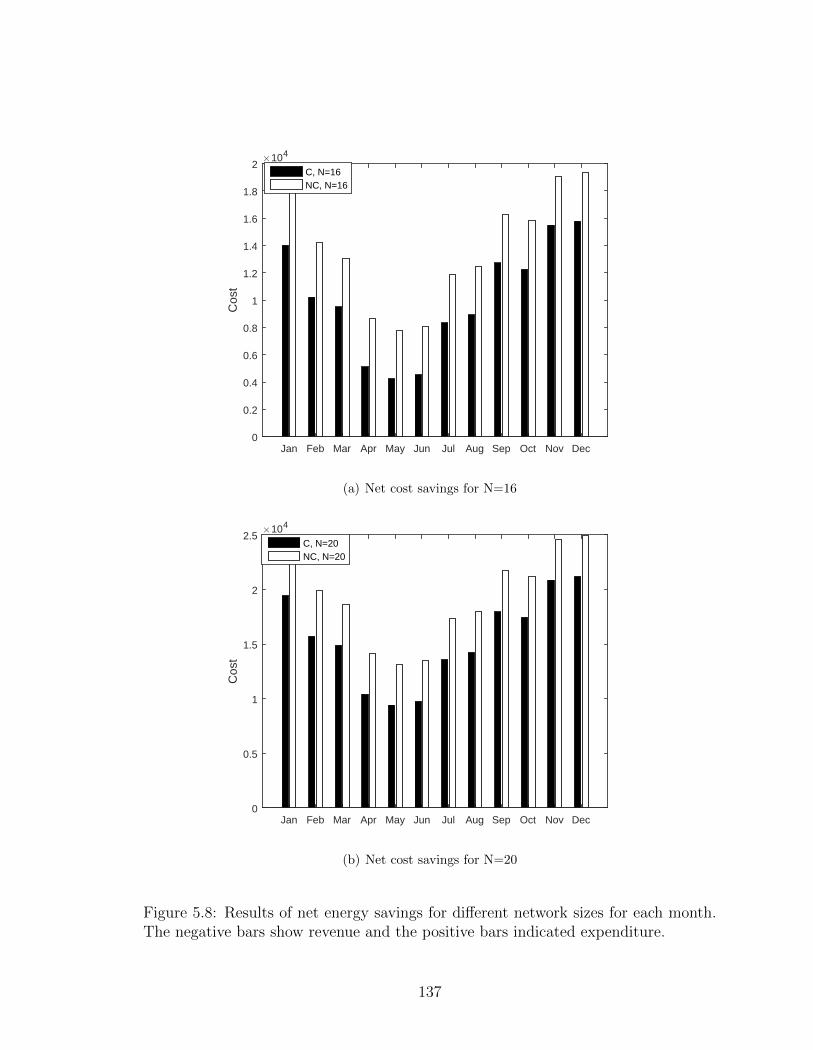
Jan Feb Mar Apr May Jun Jul Aug Sep Oct Nov Dec
Cos
t
×104
0
0.2
0.4
0.6
0.8
1
1.2
1.4
1.6
1.8
2C, N=16NC, N=16
(a) Net cost savings for N=16
Jan Feb Mar Apr May Jun Jul Aug Sep Oct Nov Dec
Cos
t
×104
0
0.5
1
1.5
2
2.5C, N=20NC, N=20
(b) Net cost savings for N=20
Figure 5.8: Results of net energy savings for different network sizes for each month.The negative bars show revenue and the positive bars indicated expenditure.
137
Chapter 6
Conclusion and Future Work
138
6.1 Conclusion
The rising energy consumption and the consequent increase in GHG emissions are
forcing world wide adaptation of non-fossil fuel based energy sources. Renewable
energy systems such as wind turbines and PV arrays are a viable option for a cellular
BS as well as the whole network. RES can be employed for not only cutting down on
the harmful GHGs but also for decreasing the energy cost of traditional networks when
used intelligently. A BS is the most energy hungry element in a cellular network and
consumes up to 60% of the energy consumed by a network of macro BSs. Renewable
energy is not only feasible for stand alone BSs that are off the grid but equally feasible
for BSs deployed in a network supported by the grid energy. It is also seen that small
cells like femto and micro cells need lesser energy and thus are more feasible for the
incorporation RES. However, for their proper integration into the present networks,
proven system designs are required that can effectively replace the diesel generators.
Sizing, interfaces, infrastructure etc. need to be defined and standardized so that
they can be easily installed and replaced when needed.
Power generated at a BS through renewable energy sources can be particularly
useful if utilized in a network of co-located BS. It is often seen that different ser-
vice providers are co-located at remote sites or along national highways due certain
geographical advantages. For such BS equipped with RES, other than conventional
ones such as diesel generator, they can efficiently be interconnected in a local net-
work to augment each other in power use. The cellular network traffic at each node
varies both temporally and spatially, offering different load situation for each service
provider. Thus, a node with less load may have redundant power available that it can
lend to its neighbors. The load sharing can be controlled through a central control
station, which receives both load-information and power from each BS and directs the
139
surplus power of one node towards the other. Such energy sharing in an off-grid sce-
nario can relieve each service provider from expensive diesel generated power to some
extent. This type of energy sharing is already a topic of much research, particularly in
smart grid scenarios. Energy cooperation mechanism has been discussed in this paper
which has much scope for study and implementation, especially in smart grid envi-
ronment. Other schemes like on/off switching and multi-cell cooperation also benefit
with the employment of renewable energy. In stand-alone BSs, co-located at a remote
site, it especially holds lucrative potential vis-a-vis alternate energy co-sharing. With
physical interconnection and necessary software/hardware upgrade, this research has
rich potential undertaking and should prove enticing for future researchers.
The advance LTE networks with incorporated RES and powered by smart grid of-
fer many new avenues of energy efficiency strategies and schemes. The new paradigm
of RES enabled cellular networks in SG involve different technologies that are mak-
ing green communication possible. The three distinct spheres of technology are then
renewable energy systems, smart grid and wireless networks (radio and network). As
the new paradigm find its way into field, many of these technologies will merge or
adapt to the new scenario. Smart grids with distributed generation of green energy
can help distribute clean and cheap power to the cellular networks thereby decreasing
the energy cost and reducing the harmful GHGs. Smart grids have special significance
for cellular BSs in terms of facilitating energy exchange between the nodes. Smart
grids also provide flexibility in energy price forecasting which allows for scheduling of
energy sources to maximize the use of green energy. Energy cooperation is not only
possible between the BSs but also between green NWs and local community in areas
where utility supply is non-existent or intermittent.
We have demonstrated an optimal energy management strategy to use renew-
able energy in cellular systems under varying scenarios that make use of centralized
140
or decentralized controllers. Intelligent controllers that control the energy flow be-
tween different modules can be incorporated with algorithms developed here. Such
controllers will make the BSs smart energy wise and provide effective demand side
management in the emerging smart grid environment. Incorporating these controllers
into existing hardware is a challenge for the system designers. Energy cooperation is
a viable strategy for optimization of RES as demonstrated in this research. A net-
work/group of RES enabled BS has shown to reduce the conventional energy usage
in the network. For this, three progressive scenarios were developed:-
1. A microgrid of RES enabled base stations sharing their surplus harvested energy
with local grid by exploiting the temporal and spatial variations amongst the
nodes.
2. A cellular network of green BS, cooperating with each other to use the surplus
green energy at a BS instead of using utility or employing the DG. A special
case was developed where a penalty was imposed on GHG emitting sources such
as coal fired plants.
3. An umbrella network of heterogenous BS employing sleep mechanism to con-
serve energy and sharing the surplus energy of the ’Off’ BS with utility under
a traffic cooperation scheme.
6.2 Future Work
The essence of such research, presented here, has been positive and proven empirically
as well as theoretically. What is required is a joint policy by the key industry players
to integrate PV-Wind energy system solutions at the newer sites and gradually replace
the generator sets at the older ones. Standardization of the RES is a serious challenge
for their practical implementation. Greening of cellular networks through increased
141
energy efficiency as well as incorporation of renewable energy is a growing research
area. These two aspects have good prospects when co-joined with other emerging
trends in wireless networks, such as cooperative relaying and cloud RAN or C-RAN.
6.2.1 Cooperative Relays
In conventional networks it is difficult to extend the range/ coverage to the distant
users due to impeding network characteristics such as path loss, signal fading etc.
Increasing transmission power is not always feasible due to negative effects such as
co-channel interference and increased power consumption. Cooperative relays allow
extension of coverage of coverage by creating a virtual MIMO system [135]. Relaying
is achieved either by installing fixed relays within the network or by making use of
other users as relays, as and when required [136]. The relays are more complex than
mere repeaters as they support complex algorithms and advanced functions. Whether
fixed or mobile, cooperative relaying techniques involve scheduling, routing and data
storing algorithms, amongst others, which require much research before they can be
integrated into networks [137]. The fixed relays can be investigated from the point
of view of incorporating renewable energy sources, which will allow them to function
independent of grid and at remote locations.
6.2.2 Energy Cooperation in C-RAN
Cloud RAN is an evolving concept that aims to maximize the network’s capacity to
use its resources. The RAN deployments for 5G networks will pose serious challenges
and host a combination of technologies. 5G Networks will have large number of
nodes with non-uniform sites. Sharing of resources between nodes and carriers will
be required. C-RAN envisages such sharing of resources to optimize the network.
This sharing mechanism thus developed will also give opportunity to share energy
142
between the nodes. An RES enabled 5G network can make use of information sharing
in cloud to share the surplus harvested energy between nodes. The C-RAN thus
offers advantages in terms of shared protocols and on-line data taht can allow energy
cooperation schemes such as the one developed here.
In this work, we have formulated and evolved an optimization strategy based
on energy cooperation, to increase the green energy usage and reduce the energy
costs of BS that were traditionally relying on grid and diesel generator. While RES
can supplement the energy requirements of a single BS, it can also be employed in
network configuration for the benefit of all BSs under different power sharing and
energy reduction schemes. The main purpose of energy cooperation in a SG of green
cellular NWs is sharing of green energy and cutting down on grid power. Energy
cooperation requires both energy and data flow amongst the NW elements, which is
possible through a SG. The application of this scheme in conjunction with network
sleep mechanism was a novel strategy employed for the first time in this research.
Energy cooperation in green cellular NWs is an active research topic, especially in
the realm of SG powered NWs. However, the unstable nature of renewable sources
like wind and solar energy call for efficient energy storage and diffusion solutions.
The variables associated with renewable sources and their integration issues into
mainstream cellular applications, in terms of cost and infrastructure, demands models
based on feasibility studies and optimization techniques explored thus far, so that an
RES enabled BS becomes a common sight.
143
Bibliography[1] G. Auer, I. Godor, L. Hevizi, M. A. Imran, J. Malmodin, P. Fazekas, G. Biczok,
H. Holtkamp, D. Zeller, O. Blume et al., “Enablers for energy efficient wire-
less networks,” in Vehicular Technology Conference Fall (VTC 2010-Fall), 2010
IEEE 72nd. IEEE, 2010, pp. 1–5.
[2] I. Gross, “Mitigating ict-related carbon emissions: Using renewable energy to
power base stations in africa’s mobile telecommunications sector,” Centre for
Development Informatics (CDI), University of Manchester: Manchester, UK,
2012.
[3] H. Al Haj Hassan, L. Nuaymi, and A. Pelov, “Renewable energy in cellular
networks: a survey,” in Online Conference on Green Communications (Green-
Com), 2013 IEEE. IEEE, 2013, pp. 1–7.
[4] H. A. H. Hassan, L. Nuaymi, and A. Pelov, “Classification of renewable energy
scenarios and objectives for cellular networks,” in Personal Indoor and Mobile
Radio Communications (PIMRC), 2013 IEEE 24th International Symposium
on. IEEE, 2013, pp. 2967–2972.
[5] L. Suarez, L. Nuaymi, and J.-M. Bonnin, “An overview and classification of
research approaches in green wireless networks,” Eurasip journal on wireless
communications and networking, vol. 2012, no. 1, pp. 1–18, 2012.
[6] D. Feng, C. Jiang, G. Lim, L. J. Cimini, G. Feng, and G. Y. Li, “A survey of
energy-efficient wireless communications,” Communications Surveys & Tutori-
als, IEEE, vol. 15, no. 1, pp. 167–178, 2013.
144
[7] Z. Hasan, H. Boostanimehr, and V. K. Bhargava, “Green cellular networks:
A survey, some research issues and challenges,” Communications Surveys &
Tutorials, IEEE, vol. 13, no. 4, pp. 524–540, 2011.
[8] R. Mahapatra, Y. Nijsure, G. Kaddoum, N. U. Hassan, and C. Yuen, “Energy
efficiency tradeoff mechanism towards wireless green communication: A survey,”
IEEE Communications Surveys & Tutorials, vol. 18, no. 1, pp. 686–705, 2015.
[9] M. Iqbal, M. Azam, M. Naeem, A. Khwaja, and A. Anpalagan, “Optimization
classification, algorithms and tools for renewable energy: A review,” Renewable
and Sustainable Energy Reviews, vol. 39, pp. 640–654, 2014.
[10] A. Fehske, G. Fettweis, J. Malmodin, and G. Biczok, “The global footprint of
mobile communications: The ecological and economic perspective,” Communi-
cations Magazine, IEEE, vol. 49, no. 8, pp. 55–62, 2011.
[11] S. Bian, X. Wang, and M. Congiatu, “An off-grid base station powered by sun
wind, and water,” in Telecommunications Energy Conference’Smart Power and
Efficiency’(INTELEC), Proceedings of 2013 35th International. VDE, 2013,
pp. 1–5.
[12] J. Wu, “Green wireless communications: from concept to reality [industry per-
spectives],” Wireless Communications, IEEE, vol. 19, no. 4, pp. 4–5, 2012.
[13] M. Etoh, T. Ohya, and Y. Nakayama, “Energy consumption issues on mobile
network systems,” in Applications and the Internet, 2008. SAINT 2008. Inter-
national Symposium on. IEEE, 2008, pp. 365–368.
[14] T. Chen, Y. Yang, H. Zhang, H. Kim, and K. Horneman, “Network energy sav-
ing technologies for green wireless access networks,” Wireless Communications,
IEEE, vol. 18, no. 5, pp. 30–38, 2011.
[15] M. A. Marsan, G. Bucalo, A. Di Caro, M. Meo, and Y. Zhang, “Towards zero
grid electricity networking: Powering bss with renewable energy sources,” in
Communications Workshops (ICC), 2013 IEEE International Conference on.
IEEE, 2013, pp. 596–601.
145
[16] H. Ghazzai, E. Yaacoub, M.-S. Alouini, and A. Abu-Dayya, “Performance of
green lte networks powered by the smart grid with time varying user density,”
in Vehicular Technology Conference (VTC Fall), 2013 IEEE 78th. IEEE, 2013,
pp. 1–6.
[17] F. Karanfil and Y. Li, “Electricity consumption and economic growth: exploring
panel-specific differences,” Energy Policy, vol. 82, pp. 264–277, 2015.
[18] Energy outlook 2035. [Online]. Available: http://www.bp.com/en/global/
corporate/about-bp/energy-economics
[19] R. Quadrelli and S. Peterson, “The energy–climate challenge: recent trends
in co 2 emissions from fuel combustion,” Energy Policy, vol. 35, no. 11, pp.
5938–5952, 2007.
[20] L. A. Greening, D. L. Greene, and C. Difiglio, “Energy efficiency and consump-
tion—the rebound effect—a survey,” Energy policy, vol. 28, no. 6, pp. 389–401,
2000.
[21] H. Lund, “Renewable energy strategies for sustainable development,” Energy,
vol. 32, no. 6, pp. 912–919, 2007.
[22] A. V. Ospina and R. Heeks, “Unveiling the links between icts & climate change
in developing countries: A scoping study,” International Development Research
Centre, vol. 2, pp. 2009–2010, 2010.
[23] M. Steinacher and F. Joos, “Earth system responses to cumulative carbon emis-
sions,” Earth, vol. 12, pp. 9839–9877, 2015.
[24] P. Nema, R. Nema, and S. Rangnekar, “A current and future state of art devel-
opment of hybrid energy system using wind and pv-solar: A review,” Renewable
and Sustainable Energy Reviews, vol. 13, no. 8, pp. 2096–2103, 2009.
[25] N. A. Ahmed and M. Miyatake, “A stand-alone hybrid generation system com-
bining solar photovoltaic and wind turbine with simple maximum power point
146
tracking control,” in Power Electronics and Motion Control Conference, 2006.
IPEMC 2006. CES/IEEE 5th International, vol. 1. IEEE, 2006, pp. 1–7.
[26] R. Karki and R. Billinton, “Reliability/cost implications of pv and wind en-
ergy utilization in small isolated power systems,” Energy Conversion, IEEE
Transactions on, vol. 16, no. 4, pp. 368–373, 2001.
[27] D. Grace, J. Chen, T. Jiang, and P. D. Mitchell, “Using cognitive radio to
deliver ‘green’communications,” in Cognitive Radio Oriented Wireless Networks
and Communications, 2009. CROWNCOM’09. 4th International Conference
on. IEEE, 2009, pp. 1–6.
[28] G. Gur and F. Alagoz, “Green wireless communications via cognitive dimension:
an overview,” Network, IEEE, vol. 25, no. 2, pp. 50–56, 2011.
[29] A. He, S. Srikanteswara, J. H. Reed, X. Chen, W. H. Tranter, K. K. Bae,
and M. Sajadieh, “Minimizing energy consumption using cognitive radio,” in
Performance, Computing and Communications Conference, 2008. IPCCC 2008.
IEEE International. IEEE, 2008, pp. 372–377.
[30] Y.-S. Wang, Y.-W. P. Hong, and W.-T. Chen, “Sum-rate maximization and
energy-cost minimization for renewable energy empowered base-stations using
zero-forcing beamforming,” in Signal and Information Processing Association
Annual Summit and Conference (APSIPA), 2013 Asia-Pacific. IEEE, 2013,
pp. 1–9.
[31] K. Kusakana and H. J. Vermaak, “Hybrid renewable power systems for mobile
telephony base stations in developing countries,” Renewable Energy, vol. 51,
pp. 419–425, 2013.
[32] G. Coppez, S. Chowdhury, and S. Chowdhury, “South african renewable energy
hybrid power system storage needs, challenges and opportunities,” in Power
and Energy Society General Meeting, 2011 IEEE. IEEE, 2011, pp. 1–9.
[33] G. eSustainability Initiative et al., SMART 2020: Enabling the low carbon econ-
omy in the information age. Climate Group, 2008.
147
[34] M. Deshmukh and S. Deshmukh, “Modeling of hybrid renewable energy sys-
tems,” Renewable and Sustainable Energy Reviews, vol. 12, no. 1, pp. 235–249,
2008.
[35] K. Son, H. Kim, Y. Yi, and B. Krishnamachari, “Base station operation and user
association mechanisms for energy-delay tradeoffs in green cellular networks,”
Selected Areas in Communications, IEEE Journal on, vol. 29, no. 8, pp. 1525–
1536, 2011.
[36] N. Reyhanian, V. Shah-Mansouri, B. Maham, and C. Yuen, “Renewable energy
distribution in cooperative cellular networks with energy harvesting,” in Per-
sonal, Indoor, and Mobile Radio Communications (PIMRC), 2015 IEEE 26th
Annual International Symposium on. IEEE, 2015, pp. 1617–1621.
[37] Y.-K. Chia, S. Sun, and R. Zhang, “Energy cooperation in cellular networks
with renewable powered base stations,” in Wireless Communications and Net-
working Conference (WCNC), 2013 IEEE. IEEE, 2013, pp. 2542–2547.
[38] Y. Guo, J. Xu, L. Duan, and R. Zhang, “Joint energy and spectrum cooperation
for cellular communication systems,” arXiv preprint arXiv:1312.1756, 2013.
[39] C. Hu, X. Zhang, S. Zhou, and Z. Niu, “Utility optimal scheduling in en-
ergy cooperation networks powered by renewable energy,” in Communications
(APCC), 2013 19th Asia-Pacific Conference on. IEEE, 2013, pp. 403–408.
[40] Z. Guo, T. J. Lim, and M. Motani, “Department of electrical and computer
engineering, national university of singapore, singapore,” in Global Conference
on Signal and Information Processing (GlobalSIP), 2013 IEEE. IEEE, 2013,
pp. 349–352.
[41] O. Blume, H. Eckhardt, S. Klein, E. Kuehn, and W. M. Wajda, “Energy savings
in mobile networks based on adaptation to traffic statistics,” Bell Labs Technical
Journal, vol. 15, no. 2, pp. 77–94, 2010.
148
[42] F. Ahmed, M. Naeem, and M. Iqbal, “Ict and renewable energy: a way for-
ward to the next generation telecom base stations,” Telecommunication Sys-
tems, vol. 64, no. 1, pp. 43–56, 2017.
[43] Y. Chen, S. Zhang, S. Xu, and G. Y. Li, “Fundamental trade-offs on green
wireless networks,” Communications Magazine, IEEE, vol. 49, no. 6, pp. 30–
37, 2011.
[44] W. Vereecken, W. Van Heddeghem, D. Colle, M. Pickavet, and P. Demeester,
“Overall ict footprint and green communication technologies,” in Communica-
tions, Control and Signal Processing (ISCCSP), 2010 4th International Sympo-
sium on. IEEE, 2010, pp. 1–6.
[45] A. M. Aris and B. Shabani, “Sustainable power supply solutions for off-grid
base stations,” Energies, vol. 8, no. 10, pp. 10 904–10 941, 2015.
[46] S. Hashimoto, T. Yachi, and T. Tani, “A new stand-alone hybrid power system
with wind generator and photovoltaic modules for a radio base station,” in
Telecommunications Energy Conference, 2004. INTELEC 2004. 26th Annual
International. IEEE, 2004, pp. 254–259.
[47] P. Nema, S. Rangnekar, and R. Nema, “Pre-feasibility study of pv-solar/wind
hybrid energy system for gsm type mobile telephony base station in central
india,” in Computer and Automation Engineering (ICCAE), 2010 The 2nd In-
ternational Conference on, vol. 5. IEEE, 2010, pp. 152–156.
[48] A. Kwasinski, “Architecture for green mobile network powered from renewable
energy in microgrid configuration,” in Wireless Communications and Network-
ing Conference (WCNC), 2013 IEEE. IEEE, 2013, pp. 1273–1278.
[49] J. Leithon, T. J. Lim, and S. Sun, “Online energy management strategies for
base stations powered by the smart grid,” in Smart Grid Communications
(SmartGridComm), 2013 IEEE International Conference on. IEEE, 2013,
pp. 199–204.
149
[50] J. Leithon, S. Sun, and T. J. Lim, “Energy management strategies for base
stations powered by the smart grid,” in Global Communications Conference
(GLOBECOM), 2013 IEEE. IEEE, 2013, pp. 2635–2640.
[51] L. M. Correia, D. Zeller, O. Blume, D. Ferling, Y. Jading, I. Godor, G. Auer,
and L. Van Der Perre, “Challenges and enabling technologies for energy aware
mobile radio networks,” Communications Magazine, IEEE, vol. 48, no. 11, pp.
66–72, 2010.
[52] A. P. Bianzino, C. Chaudet, D. Rossi, and J.-L. Rougier, “A survey of green
networking research,” Communications Surveys & Tutorials, IEEE, vol. 14,
no. 1, pp. 3–20, 2012.
[53] I. Humar, X. Ge, L. Xiang, M. Jo, M. Chen, and J. Zhang, “Rethinking energy
efficiency models of cellular networks with embodied energy,” Network, IEEE,
vol. 25, no. 2, pp. 40–49, 2011.
[54] O. Holland, V. Friderikos, and A. H. Aghvami, “Green spectrum management
for mobile operators,” in GLOBECOM Workshops (GC Wkshps), 2010 IEEE.
IEEE, 2010, pp. 1458–1463.
[55] T. Chen, H. Kim, and Y. Yang, “Energy efficiency metrics for green wireless
communications,” in Wireless Communications and Signal Processing (WCSP),
2010 International Conference on. IEEE, 2010, pp. 1–6.
[56] K. Johansson, “Cost effective deployment strategies for heterogenous wireless
networks,” 2007.
[57] S. Tombaz, A. Vastberg, and J. Zander, “Energy-and cost-efficient ultra-high-
capacity wireless access,” Wireless Communications, IEEE, vol. 18, no. 5, pp.
18–24, 2011.
[58] A. J. Fehske, F. Richter, and G. P. Fettweis, “Energy efficiency improvements
through micro sites in cellular mobile radio networks,” in GLOBECOM Work-
shops, 2009 IEEE. IEEE, 2009, pp. 1–5.
150
[59] J.-y. Song, H. J. Lee, and D.-H. Cho, “Power consumption reduction by multi-
hop transmission in cellular networks,” in Vehicular Technology Conference,
2004. VTC2004-Fall. 2004 IEEE 60th, vol. 5. IEEE, 2004, pp. 3120–3124.
[60] K. Samdanis, D. Kutscher, and M. Brunner, “Self-organized energy efficient
cellular networks,” in Personal Indoor and Mobile Radio Communications
(PIMRC), 2010 IEEE 21st International Symposium on. IEEE, 2010, pp.
1665–1670.
[61] L. Budzisz, F. Ganji, G. Rizzo, M. A. Marsan, M. Meo, Y. Zhang, G. Koutitas,
L. Tassiulas, S. Lambert, B. Lannoo et al., “Dynamic resource provisioning for
energy efficiency in wireless access networks: A survey and an outlook,” IEEE
Communications Surveys & Tutorials, vol. 16, no. 4, pp. 2259–2285, 2014.
[62] E. Oh, K. Son, and B. Krishnamachari, “Dynamic base station switching-on/off
strategies for green cellular networks,” Wireless Communications, IEEE Trans-
actions on, vol. 12, no. 5, pp. 2126–2136, 2013.
[63] C. Xiong, G. Y. Li, S. Zhang, Y. Chen, and S. Xu, “Energy-and spectral-
efficiency tradeoff in downlink ofdma networks,” Wireless Communications,
IEEE Transactions on, vol. 10, no. 11, pp. 3874–3886, 2011.
[64] T. Han and N. Ansari, “On optimizing green energy utilization for cellular net-
works with hybrid energy supplies,” Wireless Communications, IEEE Transac-
tions on, vol. 12, no. 8, pp. 3872–3882, 2013.
[65] A. Urtasun, P. Sanchis, D. Barricarte, and L. Marroyo, “Energy management
strategy for a battery-diesel stand-alone system with distributed pv generation
based on grid frequency modulation,” Renewable Energy, vol. 66, pp. 325–336,
2014.
[66] G. Fabbri, A. Cardoso, C. Boccaletti, and A. Girimonte, “Control and opti-
misation of power consumption in radio base stations,” in Telecommunications
Energy Conference (INTELEC), 2011 IEEE 33rd International. IEEE, 2011,
pp. 1–6.
151
[67] R. Kaewpuang, D. Niyato, and P. Wang, “Decomposition of stochastic power
management for wireless base station in smart grid,” Wireless Communications
Letters, IEEE, vol. 1, no. 2, pp. 97–100, 2012.
[68] D. Niyato, X. Lu, and P. Wang, “Adaptive power management for wireless
base stations in a smart grid environment,” Wireless Communications, IEEE,
vol. 19, no. 6, pp. 44–51, 2012.
[69] S. Narayanamurthy, S. Ramdaspalli, A. Jhunjhunwala, and B. Ramamurthi,
“Rural base station powering,” in Communications (NCC), 2012 National Con-
ference on. IEEE, 2012, pp. 1–5.
[70] Y. Chen, S. Zhang, and S. Xu, “Characterizing energy efficiency and deployment
efficiency relations for green architecture design,” in Communications Work-
shops (ICC), 2010 IEEE International Conference on. IEEE, 2010, pp. 1–5.
[71] D. W. K. Ng, E. S. Lo, and R. Schober, “Energy-efficient resource allocation in
ofdma systems with hybrid energy harvesting base station,” Wireless Commu-
nications, IEEE Transactions on, vol. 12, no. 7, pp. 3412–3427, 2013.
[72] T. Pamuklu and C. Ersoy, “Optimization of renewable green base station de-
ployment,” in Green Computing and Communications (GreenCom), 2013 IEEE
and Internet of Things (iThings/CPSCom), IEEE International Conference on
and IEEE Cyber, Physical and Social Computing. IEEE, 2013, pp. 59–63.
[73] Y. Yang, B. Yang, and X. Guan, “Pricing-based cross-layer scheduling and
energy management over ofdm downlink networks,” in Control and Automation
(ICCA), 2013 10th IEEE International Conference on. IEEE, 2013, pp. 1538–
1543.
[74] A. Lalitha, S. Mondal, S. Kumar, and V. Sharma, “Power-optimal scheduling
for a green base station with delay constraints,” in Communications (NCC),
2013 National Conference on. IEEE, 2013, pp. 1–5.
152
[75] D. Valerdi, Q. Zhu, K. Exadaktylos, S. Xia, M. Arranz, R. Liu, and D. Xu,
“Intelligent energy managed service for green base stations,” in GLOBECOM
Workshops (GC Wkshps), 2010 IEEE. IEEE, 2010, pp. 1453–1457.
[76] K. Tutuncuoglu and A. Yener, “Optimum transmission policies for battery lim-
ited energy harvesting nodes,” Wireless Communications, IEEE Transactions
on, vol. 11, no. 3, pp. 1180–1189, 2012.
[77] G. Merei, M. Leuthold, and D. U. Sauer, “Optimization of an off-grid
hybrid pv-wind-diesel system with different battery technologies-sensitivity
analysis,” in Telecommunications Energy Conference’Smart Power and Effi-
ciency’(INTELEC), Proceedings of 2013 35th International. VDE, 2013, pp.
1–6.
[78] G. Fabbri, M. Paschero, A. Cardoso, C. Boccaletti, and F. Mascioli, “A genetic
algorithm based battery model for stand alone radio base stations powering,”
in Telecommunications Energy Conference (INTELEC), 2011 IEEE 33rd Inter-
national. IEEE, 2011, pp. 1–8.
[79] B. Badic, T. O’Farrrell, P. Loskot, and J. He, “Energy efficient radio access
architectures for green radio: large versus small cell size deployment,” in Ve-
hicular Technology Conference Fall (VTC 2009-Fall), 2009 IEEE 70th. IEEE,
2009, pp. 1–5.
[80] T. Han and N. Ansari, “On greening cellular networks via multicell coopera-
tion,” Wireless Communications, IEEE, vol. 20, no. 1, pp. 82–89, 2013.
[81] J. B. Rao and A. O. Fapojuwo, “A survey of energy efficient resource manage-
ment techniques for multicell cellular networks,” IEEE Communications Sur-
veys & Tutorials, vol. 16, no. 1, pp. 154–180, 2014.
[82] T. A. Le, S. Nasseri, A. Zarrebini-Esfahani, M. R. Nakhai, and A. Mills, “Power-
efficient downlink transmission in multicell networks with limited wireless back-
haul,” Wireless Communications, IEEE, vol. 18, no. 5, pp. 82–88, 2011.
153
[83] Z. Niu, Y. Wu, J. Gong, and Z. Yang, “Cell zooming for cost-efficient green
cellular networks,” Communications Magazine, IEEE, vol. 48, no. 11, pp. 74–
79, 2010.
[84] M. Z. Shakir, K. A. Qaraqe, H. Tabassum, M.-S. Alouini, E. Serpedin, and
M. A. Imran, “Green heterogeneous small-cell networks: toward reducing the co
2 emissions of mobile communications industry using uplink power adaptation,”
Communications Magazine, IEEE, vol. 51, no. 6, pp. 52–61, 2013.
[85] S. Bhaumik, G. Narlikar, S. Chattopadhyay, and S. Kanugovi, “Breathe to stay
cool: adjusting cell sizes to reduce energy consumption,” in Proceedings of the
first ACM SIGCOMM workshop on Green networking. ACM, 2010, pp. 41–46.
[86] T. Han and N. Ansari, “Ice: Intelligent cell breathing to optimize the utilization
of green energy,” Communications Letters, IEEE, vol. 16, no. 6, pp. 866–869,
2012.
[87] Y. Xu, H. Li, Z. Feng, P. Zhang, and S. Ci, “Energy sustainability modeling and
liquid cell management in green cellular networks,” in Communications (ICC),
2013 IEEE International Conference on. IEEE, 2013, pp. 4414–4419.
[88] J. Leithon, T. J. Lim, and S. Sun, “Energy exchange among base stations in
a cellular network through the smart grid,” in Communications (ICC), 2014
IEEE International Conference on. IEEE, 2014, pp. 4036–4041.
[89] J. Xu and R. Zhang, “Cooperative energy trading in comp systems powered by
smart grids,” IEEE Transactions on Vehicular Technology, vol. 65, no. 4, pp.
2142–2153, 2016.
[90] J. Xu, L. Duan, and R. Zhang, “Cost-aware green cellular networks with energy
and communication cooperation,” Communications Magazine, IEEE, vol. 53,
no. 5, pp. 257–263, 2015.
[91] B. Gurakan, O. Ozel, J. Yang, and S. Ulukus, “Energy cooperation in energy
harvesting communications,” Communications, IEEE Transactions on, vol. 61,
no. 12, pp. 4884–4898, 2013.
154
[92] J. Wu, Y. Zhang, M. Zukerman, and E. K.-N. Yung, “Energy-efficient base-
stations sleep-mode techniques in green cellular networks: A survey,” IEEE
Communications Surveys & Tutorials, vol. 17, no. 2, pp. 803–826, 2015.
[93] M. Ismail and W. Zhuang, “Network cooperation for energy saving in green
radio communications,” Wireless Communications, IEEE, vol. 18, no. 5, pp.
76–81, 2011.
[94] T. Elshabrawy and R. Mourad, “Power-aware on/off switching strategies of
enodeb for green lte networks,” in New Technologies, Mobility and Security
(NTMS), 2014 6th International Conference on. IEEE, 2014, pp. 1–4.
[95] J. Gong, J. S. Thompson, S. Zhou, and Z. Niu, “Base station sleeping and
resource allocation in renewable energy powered cellular networks,” Communi-
cations, IEEE Transactions on, vol. 62, no. 11, pp. 3801–3813, 2014.
[96] G. Y. Li, Z. Xu, C. Xiong, C. Yang, S. Zhang, Y. Chen, and S. Xu, “Energy-
efficient wireless communications: tutorial, survey, and open issues,” Wireless
Communications, IEEE, vol. 18, no. 6, pp. 28–35, 2011.
[97] H. Sistek, “Green-tech base stations cut diesel usage by 80 percent,” CNET
News Green Tech, 2008.
[98] M. H. Masud, N. Malik2a, and M. K. Shukran2b, “Evaluating the effectiveness
of energy efficient and ecoleveling ict infrastructures for environmental sustain-
ability,” Energy, vol. 4, no. 6, 2012.
[99] N. Agrawal and K. N. Agarwal, “Current trends in green ict,” JoAAG, vol. 7,
no. 1, pp. 71–85, 2012.
[100] A. Ambrosy, O. Blume, H. Klessig, and W. Wajda, “Energy saving potential
of integrated hardware and resource management solutions for wireless base
stations,” in Personal Indoor and Mobile Radio Communications (PIMRC),
2011 IEEE 22nd International Symposium on. IEEE, 2011, pp. 2418–2423.
155
[101] G. Auer, V. Giannini, C. Desset, I. Godor, P. Skillermark, M. Olsson, M. A.
Imran, D. Sabella, M. J. Gonzalez, O. Blume et al., “How much energy is needed
to run a wireless network?” Wireless Communications, IEEE, vol. 18, no. 5,
pp. 40–49, 2011.
[102] G. Auer, O. Blume, V. Giannini, I. G. ETH, M. A. Imran, Y. J. EAB, E. Ka-
tranaras, M. O. EAB, D. S. TI, P. S. EAB et al., “Infso-ict-247733 earth.”
[103] F. Ahmed, M. Naeem, M. Iqbal, and A. Anpalagan, “Renewable energy as-
sisted base station collaboration as micro grid,” in Electrical Power and Energy
Conference (EPEC), 2016 IEEE. IEEE, 2016, pp. 1–6.
[104] M. A. Yigitel, O. D. Incel, and C. Ersoy, “Qos vs. energy: A traffic-aware
topology management scheme for green heterogeneous networks,” Computer
Networks, vol. 78, pp. 130–139, 2015.
[105] D. Willkomm, S. Machiraju, J. Bolot, and A. Wolisz, “Primary users in cellular
networks: A large-scale measurement study,” in New frontiers in dynamic spec-
trum access networks, 2008. DySPAN 2008. 3rd IEEE symposium on. IEEE,
2008, pp. 1–11.
[106] B. Chandrasekaran, “Survey of network traffic models.”
[107] W. Yu and X. Qian, “Design of 3kw wind and solar hybrid independent power
supply system for 3g base station,” in Knowledge Acquisition and Modeling,
2009. KAM’09. Second International Symposium on, vol. 3. IEEE, 2009, pp.
289–292.
[108] W. Zhou, C. Lou, Z. Li, L. Lu, and H. Yang, “Current status of research on
optimum sizing of stand-alone hybrid solar–wind power generation systems,”
Applied Energy, vol. 87, no. 2, pp. 380–389, 2010.
[109] A. Ericsson, “Sustainable energy use in mobile communications,” white paper,
EAB-07: 02l80l Uen Rev C, 2007.
156
[110] E. Reihani, S. Sepasi, L. R. Roose, and M. Matsuura, “Energy management
at the distribution grid using a battery energy storage system (bess),” Inter-
national Journal of Electrical Power & Energy Systems, vol. 77, pp. 337–344,
2016.
[111] A. Aktas, K. Erhan, S. Ozdemir, and E. Ozdemir, “Experimental investigation
of a new smart energy management algorithm for a hybrid energy storage system
in smart grid applications,” Electric Power Systems Research, vol. 144, pp. 185–
196, 2017.
[112] I. Mirza and M. Khalil, “Renewable energy in pakistan: opportunities and
challenges,” Science Vision, vol. 16, pp. 13–20, 2011.
[113] V. Chamola and B. Sikdar, “A multistate markov model for dimensioning solar
powered cellular base stations,” Sustainable Energy, IEEE Transactions on,
vol. 6, no. 4, pp. 1650–1652, 2015.
[114] C. Grangeat, G. Grandamy, and F. Wauquiez, “A solution to dynamically de-
crease power consumption of wireless base stations and power them with alter-
native energies,” in Telecommunications Energy Conference (INTELEC), 32nd
International. IEEE, 2010, pp. 1–4.
[115] T.-J. Yang, Y.-J. Zhang, S. Tang, and J. Zhang, “How to assess and manage
energy performance of numerous telecommunication base stations: Evidence in
china,” Applied Energy, vol. 164, pp. 436–445, 2016.
[116] X. Fang, S. Misra, G. Xue, and D. Yang, “Smart grid—the new and improved
power grid: A survey,” Communications Surveys & Tutorials, IEEE, vol. 14,
no. 4, pp. 944–980, 2012.
[117] J. L. Melo, T. J. Lim, and S. Sun, “Online demand response strategies for non-
deferrable loads with renewable energy,” IEEE Transactions on Smart Grid,
2017.
157
[118] B. Xu, Y. Chen, J. R. Carrion, J. Loo, and A. Vinel, “Energy-aware power
control in energy cooperation aided millimeter wave cellular networks with re-
newable energy resources,” IEEE Access, 2016.
[119] N. Reyhanian, B. Maham, V. Shah-Mansouri, W. Tusher, and C. Yuen, “Game-
theoretic approaches for energy cooperation in energy harvesting small cell net-
works,” IEEE Transactions on Vehicular Technology, 2017.
[120] P.-H. Huang, S.-S. Sun, and W. Liao, “Greencomp: Energy-aware cooperation
for green cellular networks,” IEEE Transactions on Mobile Computing, vol. 16,
no. 1, pp. 143–157, 2017.
[121] A. Mitsos, B. Chachuat, and P. I. Barton, “Mccormick-based relaxations of
algorithms,” SIAM Journal on Optimization, vol. 20, no. 2, pp. 573–601, 2009.
[122] S. Boyd and L. Vandenberghe, Convex optimization. Cambridge university
press, 2004.
[123] D. G. Luenberger and Y. Ye, Linear and Nonlinear Programming. Springer,
2016.
[124] S. Mehrotra, “On the implementation of a primal-dual interior point method,”
SIAM Journal on optimization, vol. 2, no. 4, pp. 575–601, 1992.
[125] D. Tsilimantos, J.-M. Gorce, and E. Altman, “Stochastic analysis of energy
savings with sleep mode in ofdma wireless networks,” in INFOCOM, 2013 Pro-
ceedings IEEE. IEEE, 2013, pp. 1097–1105.
[126] G. Cili, H. Yanikomeroglu, and F. R. Yu, “Cell switch off technique com-
bined with coordinated multi-point (comp) transmission for energy efficiency
in beyond-lte cellular networks,” in Communications (ICC), 2012 IEEE Inter-
national Conference on. IEEE, 2012, pp. 5931–5935.
[127] R. Wang, J. S. Thompson, and H. Haas, “A novel time-domain sleep mode de-
sign for energy-efficient lte,” in Communications, Control and Signal Processing
(ISCCSP), 2010 4th International Symposium on. IEEE, 2010, pp. 1–4.
158
[128] P. Ghosh, S. S. Das, S. Naravaram, and P. Chandhar, “Energy saving in ofdma
cellular systems using base-station sleep mode: 3gpp-lte a case study,” in Com-
munications (NCC), 2012 National Conference on. IEEE, 2012, pp. 1–5.
[129] A. Bousia, A. Antonopoulos, L. Alonso, and C. Verikoukis, “” green” distance-
aware base station sleeping algorithm in lte-advanced,” in Communications
(ICC), 2012 IEEE International Conference on. IEEE, 2012, pp. 1347–1351.
[130] A. Zakrzewska, D. Lopez-Perez, S. Kucera, and H. Claussen, “Dual connectivity
in lte hetnets with split control-and user-plane,” in Globecom Workshops (GC
Wkshps), 2013 IEEE. IEEE, 2013, pp. 391–396.
[131] L. Saker, S.-E. Elayoubi, R. Combes, and T. Chahed, “Optimal control of wake
up mechanisms of femtocells in heterogeneous networks,” IEEE Journal on
Selected Areas in Communications, vol. 30, no. 3, pp. 664–672, 2012.
[132] M. Wildemeersch, T. Q. Quek, C. H. Slump, and A. Rabbachin, “Cognitive
small cell networks: Energy efficiency and trade-offs,” IEEE Transactions on
Communications, vol. 61, no. 9, pp. 4016–4029, 2013.
[133] S. Cai, L. Xiao, H. Yang, J. Wang, and S. Zhou, “A cross-layer optimization of
the joint macro-and picocell deployment with sleep mode for green communi-
cations,” in Wireless and Optical Communication Conference (WOCC), 2013
22nd. IEEE, 2013, pp. 225–230.
[134] P. Dini, M. Miozzo, N. Bui, and N. Baldo, “A model to analyze the energy sav-
ings of base station sleep mode in lte hetnets,” in Green computing and commu-
nications (GreenCom), 2013 IEEE and internet of things (iThings/CPSCom),
IEEE international conference on and IEEE cyber, physical and social comput-
ing. IEEE, 2013, pp. 1375–1380.
[135] J. N. Laneman and G. W. Wornell, “Energy-efficient antenna sharing and relay-
ing for wireless networks,” in Wireless Communications and Networking Con-
fernce, 2000. WCNC. 2000 IEEE, vol. 1. IEEE, 2000, pp. 7–12.
159

[136] M. Nokleby and B. Aazhang, “User cooperation for energy-efficient cellular com-
munications,” in Communications (ICC), 2010 IEEE International Conference
on. IEEE, 2010, pp. 1–5.
[137] P. Rost and G. Fettweis, “Green communications in cellular networks with fixed
relay nodes,” Cooperative Cellular Wireless Networks, p. 300, 2011.
160