Corrections and Additions to the Book 'Morphology of Seed ...

Ecology, 94(11), 2013, pp. 2505–2517� 2013 by the Ecological Society of America
Resource limitation in a competitive context determines complexplant responses to experimental resource additions
CAROLINE E. FARRIOR,1,5 DAVID TILMAN,2 RAY DYBZINSKI,1 PETER B. REICH,3,4 SIMON A. LEVIN,1
AND STEPHEN W. PACALA1
1Department of Ecology and Evolutionary Biology, Princeton University, Princeton, New Jersey 08544 USA2Department of Ecology, Evolution, and Behavior, University of Minnesota, St. Paul, Minnesota 55108 USA
3Department of Forest Resources, University of Minnesota St. Paul, Minnesota 55108 USA4Hawkesbury Institute for the Environment, University of Western Sydney Penrith, New South Wales 2751 Australia
Abstract. Almost all models of plant resource limitation are grounded in either one orboth of two simple conceptual models: Liebig’s Minimum Hypothesis (LMH), the idea thatplants are limited by the resource in shortest supply, and the Multiple Limitation Hypothesis(MLH), the idea that plants should adjust to their environment so that all essential resourcesare equally limiting. Despite the differences in their predictions, experiments have so far failedto discriminate between them. In a simple factorial nitrogen and water addition experiment ina Minnesota grassland, we observed shifts in allocation that, as in previous studies, are not allexplained by a single theory. We found that leaf biomass responded positively to nitrogenadditions but did not respond to water additions. We found that fine-root biomass increasedin response to water additions, but only at low nitrogen levels, and that fine-root biomassdecreased in response to nitrogen additions, but only at high water levels.
To understand these responses we built a physiologically based model of plant competitionfor water, nitrogen, and space to predict plant allocation to fine roots and leaves. Critically, weinclude in our model the inherent variability of soil moisture and treat light, water, andnitrogen as resources with distinct mechanistic roles. Experimental results showed that plantswere nitrogen and water limited. The model explains the experimental results, underconditions of co-limitation, as follows. Foliage increases with nitrogen additions but not wateradditions because leaf construction is constrained by nitrogen uptake. When water is added,plants spend a larger fraction of the growing season limited by light (and effectively nitrogen)than by water. Thus, water additions cause fine-root biomass to increase because of theincreased importance of nitrogen limitation. The response of fine-root biomass to wateradditions decreases with nitrogen additions because these additions reduce nitrogen limitation.In general, our results are explained by sequential resource limitation. The rate of carbonassimilation may be limited by a single resource at any one moment, but the identity of thelimiting resource(s) changes throughout the growing season.
Key words: Liebig’s law of the minimum; multiple resource limitation hypothesis; nitrogen; plantcompetition; resource limitation; water.
INTRODUCTION
Scarcity of resources limits the productivity of plants,
which creates incentives for competition and shapes the
composition of, and interactions within, a community.
As climate changes, the relative availabilities of different
resources in communities may shift and play a critical
role in determining how plant communities respond to
climate change (Sinclair 1992, Oren et al. 2001, Luo et
al. 2004, Reich et al. 2006). Understanding how resource
availabilities influence plant communities is thus more
important than ever.
Almost all models of plant-essential resource limita-
tion are grounded in either one or both of two simple
conceptual models: Liebig’s law of the minimum and
optimal foraging for essential resources (e.g., Chapin
1980, Tilman 1982, Bloom et al. 1985, Gleeson and
Tilman 1992, Harpole et al. 2011). Liebig’s law of the
minimum (Liebig’s Minimum Hypothesis, LMH) is the
idea that because it is unlikely that an environment will
supply resources in the exact proportions that plants
require, a plant will always be limited by a single
resource (van der Ploeg et al. 1999). This idea was
developed to understand agricultural systems, but was
quickly adopted by community ecologists, and is still
used today (e.g., Danger et al. 2008, Agren et al. 2012).
However, several ecologists have pointed out that if a
plant is limited by a single resource, it is by definition,
at that moment, overinvesting in the uptake of all other
essential resources. Strategic plants should adjust
Manuscript received 10 September 2012; revised 15 April2013; accepted 7 May 2013. Corresponding Editor: A. M.de Roos.
5 E-mail: [email protected]
2505

uptake to maintain limitation by all essential resources
(Multiple Limitation Hypothesis, MLH [Tilman 1982,
Bloom et al. 1985, Chapin et al. 1987]). These two
theories make contradictory predictions for plant
communities: LMH predicts that all communities
should be limited by a single resource and only respond
to changes in that resource whereas MLH predicts that
plants should respond to any essential resource
addition by decreasing their investment in uptake of
that resource, making limitation by multiple resources
the norm. Although this seems like the perfect
opportunity for an experiment to settle a theoretical
dispute, decades of resource-addition experiments leave
us with support for both theories and few generaliza-
tions about the conditions that determine when one or
the other is applicable (e.g., Aerts et al. 1991, Gedroc et
al. 1996, Kaspari et al. 2008).
Several factors may help to explain the difficulty in
finding a general theory of plant limitation (Rubio et al.
2003, Danger et al. 2008, Harpole et al. 2011). The
availability of two or more resources may be physically
tied together (e.g., water increasing microbial rates of
nitrogen mineralization [Schimel et al. 1996]). Invest-
ment in a single structure may increase the uptake of
several different resources (i.e., leaves capture light and
take in CO2). Essential resources, which determine
limitation, may be used for nonessential functions (i.e.,
a specific resource may be critical for one process but
substitutable in other functions). Communities may
include individuals with differing resource requirements
but with access to the same resource pools.
Perhaps a less-appreciated role of resource limitation
is that it creates incentives for plants to over-invest in
resource capture. Here, by ‘‘over-invest,’’ we mean a
phenomenon in which plants invest in resource capture
at levels that would be suboptimal for the productivity
of a plant in isolation but pay off for the plant in
competition with others, e.g., investment in height
growth for light capture and investment in fine roots
for belowground resources (Givnish 1982, Iwasa et al.
1984, King 1990, Falster and Westoby 2003, Craine
2006, Dybzinski et al. 2011, Farrior et al. 2013,
McNickle and Dybzinski 2013). The negative effect of
competition on whole-community productivity has been
elegantly demonstrated in several experiments where
competition was manipulated (e.g., Maina et al. 2002,
Montgomery et al. 2010, Semchenko et al. 2010).
However, the role of competitive over-investments has
been largely overlooked in resource limitation theory
and adds a level of complication to both LMH and
MLH perspectives.
How and whether any or all of these complications
influence resource limitation depends on specific details
of the resource: availability, method of plant uptake,
and dependence of plant fitness on uptake. In an effort
to incorporate these details, we focus on two essential
resources: water, and nitrogen. Both water and nitrogen
are essential resources that commonly limit plant
growth, evidenced by the use of irrigation and nitrogen
rich fertilizer in agricultural fields all over the globe
(Postel et al. 1996, Vitousek et al. 1997).
In most plant communities, water availability fluctu-
ates over timescales that are shorter than a plant’s ability
to shift its allocation strategy. Within a single hot
summer day, a plant can move from water saturation in
the morning to severe water limitation in the middle of
the day and return to water saturation before it shuts off
photosynthesis in the evening (Slatyer 1967; cited in
Larcher [2003]). With a simple model of variable water
availability, Farrior et al. (2013) found that trees in
competition for water and light depend critically on the
timing, and not just the amount, of water availability.
The model predicts that the amount of time that plants
are water saturated and how much water they have on
average during water limitation, both indices of water
availability, have opposite effects on the dominant
allocation strategy. The competitive plants have alloca-
tion strategies that balance the benefits of competition
for water during water limitation with competition for
light during water saturation.
Because of the variability of water availability, it is
likely that the resources that limit plants shift identity
throughout the growing season, adding another compli-
cation to the LMH and MLH debate. Indeed, over the
course of the entire growing season, limitation by light,
water, and nitrogen may be the norm for several
reasons. First, plants shade themselves with their own
leaves, making their lowest leaves light limited. Second,
water likely moves from saturating levels immediately
after rain to limiting levels during long periods between
storms (or even during hot periods within a day). Third,
nitrogen often limits the number of leaves that plants
can physically build.
In this paper, we seek to understand the interactions
of light, water, and nitrogen limitation in plant
communities and their effects on plant allocation
strategies. We first present the results of a factorial
resource addition experiment in a water and nitrogen-
limited environment. Like other such experiments
(e.g., Aerts et al. 1991, Gedroc et al. 1996, Kaspari et
al. 2008), we find pieces of evidence that contradict
basic predictions from both LMH and MLH. We
present a model, which includes aspects of LMH and
MLH, but also includes water variability and the
influence of interstrategy competition among plants.
These findings lead to new predictions that are
consistent with the data and provide a novel concep-
tual understanding of limitation by light, water, and
nitrogen in plants.
NITROGEN AND WATER ADDITION EXPERIMENT
We planted 36 9 3 9 m plots on disked soil on a
Minnesota sandplain in 1994 with 32 grassland native or
naturalized perennial species including: nine forbs, eight
legumes, seven C3 grasses, and eight C4 grasses. A full
CAROLINE E. FARRIOR ET AL.2506 Ecology, Vol. 94, No. 11
species list for the experiment is available online (see
Other Cedar Creek Data: E248).6
From 2007 to 2010, these plots were treated with all
combinations of three nitrogen (0, 7, and 14 g
NH4NO3�m�2�yr�1 applied at the beginning of the
growing season) and two water treatments (ambient
and elevated). Elevated water treatments were adminis-
tered manually with sprinklers in an attempt to evenly
add 2 cm per week to soil, a doubling of average
growing season rainfall for the area.
Two 10 cm wide by 6 m long samples of aboveground
biomass were clipped from each plot during the first
week of September 2010, near peak biomass. Sampling
time was chosen to be at the point of maximal
productivity for an accurate representation of leaf and
fine-root biomass in the plots. All biomass from 1 cm
above the soil was collected. Biomass from the first strip
was left unsorted and dried together, whereas biomass
from the second strip was separated while fresh into leaf,
reproductive, and structural biomass. Material from
each of these categories was dried to constant mass and
weighed. All biomass with photosynthetic potential was
counted as leaf biomass. Reproductive biomass consist-
ed of inflorescences together with any structural biomass
that did not also support leaves. All other non-
photosynthetic aboveground biomass was counted as
structural biomass. See Appendix A for examples. It
should be noted that this one-time sampling was meant
to capture plant investment in leaf and fine-root
biomass. Measurements of reproductive biomass will
be significant underestimates of the total investment in
reproductive biomass throughout the year because many
species flower earlier or later in the season.
Samples of belowground biomass were harvested
from the strips taken in the aboveground harvest.
Within the first sampled strip, we collected six 5 cm
diameter by 30 cm deep soil cores from evenly spaced
locations within the strip of clipped aboveground
biomass. These samples were washed of soil on a 1
mm screen, dried to constant biomass, and weighed.
Within the second sampled strip, 12 5 cm diameter by 30
cm deep soil cores were taken. These roots were washed
on the screen as well, but were sorted to fine (,1 mm
diameter), coarse roots (.1 mm diameter), and root
crowns (biomass at or below the soil surface where the
roots join the stem) before being dried and weighed. All
fine roots were processed after drying to remove any
remaining soil and then dried again.
Analyses of total biomass, aboveground biomass, and
belowground biomass include all 1.2 m2 of aboveground
biomass and all 18 soil cores. Analyses of the component
parts of the biomass come from the single 0.6-m2 strip
and 12 soil cores. Statistics were performed with R
(version 2.9.2; R Development Core Team 2009) and
JMP (v10; SAS Institute 2012). Nitrogen and water
treatments were treated as factors in the analysis.
Significance levels are indicated as * P , 0.05, ** P ,
0.01, *** P , 0.001, throughout.
EXPERIMENTAL RESULTS
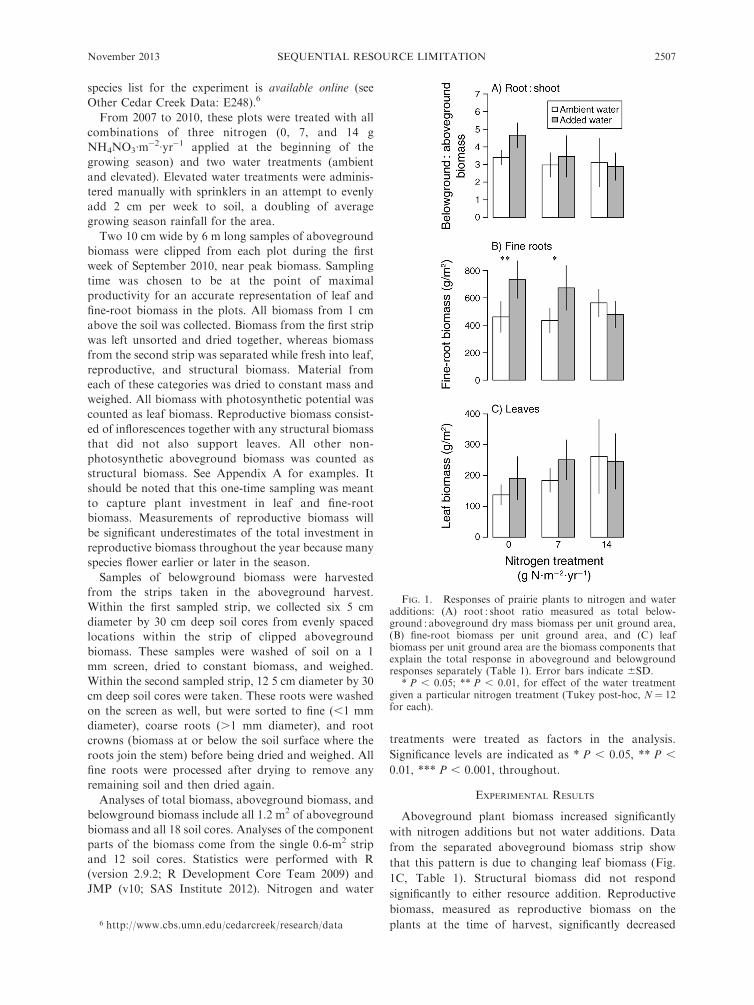
Aboveground plant biomass increased significantly
with nitrogen additions but not water additions. Data
from the separated aboveground biomass strip show
that this pattern is due to changing leaf biomass (Fig.
1C, Table 1). Structural biomass did not respond
significantly to either resource addition. Reproductive
biomass, measured as reproductive biomass on the
plants at the time of harvest, significantly decreased
FIG. 1. Responses of prairie plants to nitrogen and wateradditions: (A) root : shoot ratio measured as total below-ground : aboveground dry mass biomass per unit ground area,(B) fine-root biomass per unit ground area, and (C) leafbiomass per unit ground area are the biomass components thatexplain the total response in aboveground and belowgroundresponses separately (Table 1). Error bars indicate 6SD.
* P , 0.05; ** P , 0.01, for effect of the water treatmentgiven a particular nitrogen treatment (Tukey post-hoc, N ¼ 12for each).
6 http://www.cbs.umn.edu/cedarcreek/research/data
November 2013 2507SEQUENTIAL RESOURCE LIMITATION

with water additions and did not respond to nitrogen
additions.
Belowground plant biomass responded to both water
and nitrogen additions. Separated belowground biomass
again shows that the total pattern is driven by changes in
the resource gathering tissues, fine roots. Coarse-rootand root-crown biomass did not respond significantly to
the resource additions. Total belowground and fine-root
biomass increased significantly with water additions. A
significant interaction of the water and nitrogen
additions reveal two, more subtle, patterns: (1) fine-root
biomass increased with water additions, but only at low
nitrogen levels (effect of water addition under ambient, 7
g N�m�2�yr�1, and 14 g N�m�2�yr�1, respectively [Tukey
post-hoc test, N ¼ 12 for each] is þ272**, þ239*, and�84.48 g/m2 [plus sign indicates an increase and minus
sign indicates a decrease]) and (2) fine-root biomass
decreased with nitrogen additions but only at high water
levels (effect of 14 g N�m�2�yr�1 under ambient and
added water levels, respectively [Tukey post-hoc, N¼ 12
for each] isþ103 and �255** g/m2).
Like several other simple resource-addition experi-
ments (e.g., Aerts et al. 1991, Gedroc et al. 1996,
Kaspari et al. 2008), we obtained a constellation of
confusing results. Neither LMH nor MLH is sufficient
to explain all of the significant results. Plants responded
to both water and nitrogen additions, showing the plants
were not limited by a single nutrient, a result not
predicted by LMH. Plants responded to the addition of
a belowground resource, water, by increasing their
investment belowground, a result that contradicts
MLH. Moreover, the interaction between the effects of
water and nitrogen additions on fine-root biomass
suggests that plants become water saturated at high
levels of nitrogen. This pattern is consistent with
substitutable resources (a possibility for water and
nitrogen [Wright et al. 2003]), but is contradicted by
the opposing responses to water and nitrogen at the
lower addition levels.
We now develop a model that draws heavily on LMH
and MLH, but adds variability in water availability, and
most importantly, competitive optimization of alloca-
tion.
A MODEL OF PLANT COMPETITION FOR WATER,
NITROGEN, AND SPACE
Model overview
Here we describe a model of competition for water,
nitrogen and space among plants with different alloca-
tion strategies. The model borrows heavily from forest
models of competition for light and nitrogen (Dybzinski
et al. 2011) and light and water (Farrior et al. 2013) with
modifications for prairie plants.
In brief, we determine the competitive-dominant
strategy of allocation of photosynthates among three
pools: leaves, fine roots, and reproductive biomass. We
imagine these plants as individuals, each occupying the
same amount of space and spending a negligible amount
of their lifetime as growing juveniles. Adult plants use
their photosynthates for the respiration and mainte-
nance of leaves and fine roots, and spend the rest on
reproduction. We assume that aboveground plants do
not shade one another whereas belowground their roots
share access to common resource pools of water and
nitrogen. For this system, it has been shown that
belowground competition plays a much stronger role
than aboveground competition in plant productivity
(Wilson and Tilman 1991). However, these strict
assumptions about plant territoriality are relaxed in
Appendix B, which demonstrates that they are not
critical to the qualitative predictions of the model.
TABLE 1. Prairie biomass component responses to nitrogen and water additions.
Effect size
Component Nitrogen Water Nitrogen 3 water Model R2
Aboveground 44.55* þ16.41 �21.62 0.25
Reproductive �1.21 �5.81* þ1.55 0.17Leaf þ41.97* þ17.41 �25.36 0.30*Structural þ12.76 �1.81 �4.60 0.12
Belowground �22.56 þ143.37*** �155.89** 0.54***
Root-crown þ7.49 þ0.70 �33.69 0.05Coarse-root þ1.47 �6.39 �15.58 0.11Fine-root �36.18 þ71.17** �113.41** 0.51***
Below : aboveground �0.42* þ0.26 �0.37 0.34*
Total þ22.00 þ159.78*** �177.51** 0.50***
Notes: Each row represents a single two-way analysis of variance. Water and nitrogen treatmentsare treated as factors (for each row, N¼ 36, df¼ 2, 1, and 2 for nitrogen, water, nitrogen 3 waterinteraction, respectively). A plus sign indicates a positive effect, a minus sign indicates a negativeeffect. Main effects, interaction effects, and the model R2 estimated from a generalized linear modelfor each are provided. Note that effect sizes for each component biomass do not add up perfectly tothose for the aggregate measures (aboveground, belowground, and total) because aboveground,belowground, and total biomass includes data from a second clip strip that was not sorted into thecomponent parts.
* P , 0.05; ** P , 0.01; *** P , 0.001.
CAROLINE E. FARRIOR ET AL.2508 Ecology, Vol. 94, No. 11

What is critical is our assumption that light, water,
and nitrogen are distinct resources that have different
functions within the plant. Light is intercepted by leaves
and used in photosynthesis. Leaves are self-shading;
each successive leaf layer absorbs less light and, when
light falls below the threshold required to saturate the
photosynthetic machinery, does less photosynthesis than
the layer above it. Water is transpired by the plant in
exchange for the uptake of carbon dioxide. If there is not
sufficient water to match the demand of the leaves,
photosynthesis and transpiration are downregulated by
stomatal closure until water supply matches demand.
Nitrogen is used to build leaves and in the rest of the
plant in processes that support the leaves. If nitrogen is
in limiting supply, the amount of leaf biomass is
constrained.
Not only do we model the basic differences in plant
use of light, water, and nitrogen, but we also model the
basic differences in plant competition above and
belowground. Water and nitrogen are both taken up
by fine roots belowground where they share access to
resources with the rest of the individuals in the
community. In addition, plants compete for space.
When an individual dies, it is replaced with a randomly
selected seed from the pool of seeds produced by all
individuals in the community. Individuals that invest
more in reproduction than other individuals will have
more seeds in the pool and a higher chance of taking
over this spot.
The payoff of investments in leaves, fine roots, and
fecundity for an individual is determined by the other
strategies present in the community. When a below-
ground resource is limiting, we assume that the plants
are capable of taking all of it up. Therefore if one plant
invests more in fine roots than another plant, it will get
more water and nitrogen than the other plant. Similarly
we assume that the empty sites left by individuals are
always colonized by seeds, and thus the only way a plant
can increase its chance of winning a vacant site is by
increasing its fecundity relative to that of its competi-
tors. To find the competitive dominant allocation
strategy (i.e., the strategy we expect to dominate either
through individual plasticity or species replacement), we
derive the allocation strategy that when in monoculture
cannot be invaded by any other. This is the evolution-
arily stable strategy (ESS).
We limit our description and analysis to situations in
which plants are light, water, and nitrogen limited
(although all other combinations of limitation have been
analyzed; C. E. Farrior, unpublished analyses). This
turns out to be a common scenario in the model’s
parameter space and is the case most likely to help us
understand the results of our experiment, which shows
plant responses to both water and nitrogen. We assume
photosynthesis is limited for part of the year by light and
the rest of the year by water. We assume nitrogen limits
the production of leaf biomass and thus effectively limits
photosynthesis while plants are light limited.
The rest of this section provides the mathematical
formulation of these processes with further biological
justification and detail. Variables are also defined in
Table 2 and units are given there.
Individual plant physiology
Because individuals of perennial grassland species can
live for several decades (Adler et al. 2006), we assume
the time it takes an individual to reach maturity and
begin reproduction is much shorter than its expected
lifetime. This makes the proportion of ground filled by
immature individuals at any one time close to zero. Here
we approximate it as precisely zero.
Each mature plant occupies the same amount of
space. They do not grow (in the sense of occupying more
space or of having a greater maximum biomass in each
successive year), but invest photosynthates in the
maintenance of leaves (l ) and fine roots (r) and in
reproduction ( f ). That is, adult mass increases with l or
r but all adults occupy the same amount of area.
However, note that this model is equivalent to any in
which individuals may be described by a characteristic
investment in leaves and fine roots per unit area, and in
which the plant fitness is proportional to the carbon left
over after paying for the respiration and maintenance of
leaves and fine roots.
At any one instant, the rate of carbon assimilation in
a plant with a given amount of leaf biomass l is either
limited by light or by water. If carbon assimilation is
light limited, plants operate photosynthesis at a rate
determined by the light that their leaves can capture
(AL). Within a plant, each leaf layer has less light than
the layer above it due to self-shading. The total number
of layers is given by l/g, where g is the leaf mass per
unit leaf area, assumed to be constant. The light level
falls off exponentially through the plant at a rate k with
the number of leaf layers (L0 exp[�k(l/g)], where L0 is
the light at the top of the plant). We use a simplified
model of photosynthesis where photosynthesis is
proportional to light level (by af ), up to a maximum
rate V. We assume that plants have enough leaf layers
such that not all are operating at the maximum rate (l .
(g/k)ln[afL0/V ]):
ALðlÞ ¼V
k1þ ln
afL0
V
� �� afL0
Ve�kðl=gÞ
� �: ð1Þ
If carbon assimilation is water limited, plants operate
photosynthesis at a lower level (AW), limited by their
water uptake. Water uptake is fine-root biomass r
multiplied by the conductance of fine roots to water uWand the water available in the soil W:
AWðr;WÞ ¼ x r uW W ð2Þ
where x is the intrinsic water-use efficiency. See
Appendix C for an illustration of Eqs. 1 and 2.
To capture the variability in water availability, we
assume plants spend a portion of the growing season
saturated with water and the rest of the time limited by
November 2013 2509SEQUENTIAL RESOURCE LIMITATION

water. For convenience, we sum these such that plants
spend q fraction of the growing season water saturated
and 1� q fraction of the growing season water limited.
The total carbon assimilation over the growing season
(A) is then the time-weighted average of light-limited
and water-limited carbon assimilation rates:
Aðr; l;WÞ ¼ qALðlÞ þ ð1� qÞAWðr;WÞ: ð3Þ
Each year, this carbon is used to pay for the costs of
respiration and maintenance of the roots cr and leaves clas well as the cost of the plant’s investment in
reproduction cf. We assume these costs are proportional
to the biomass of each component. Note that cr and clencompass the costs of respiration for as well as the
costs of turning over all (as in leaves) or a portion (as in
fine roots) of the plant biomass for a single year.
Only allocation patterns that balance the carbon
assimilation over a growing season (A) with these costs
are physically possible. Thus,
Aðr; l;WÞ[ cr r þ cl lþ cf f ð4Þ
where f is the seed production of the plant. This
conservation of carbon within the plant constrains the
set of feasible allocation strategies to two dimensions.
Here we assume that nitrogen is limiting, placing a
second constraint on the feasible allocation strategies.
Following Dybzinski et al. (2011) we assume that half of
the nitrogen used by the plant each year is used to build
leaves of fixed stoichiometry and that the remainder is
used in other tissues with flexible stoichiometry. Because
nitrogen uptake in natural systems is primarily limited
by diffusion and mass flow, rather than uptake kinetics
(Chapin 1980, Raynaud and Leadley 2004, Craine et al.
2005), we assume that relative differences in fine-root
mass affect uptake but that root stoichiometry does not
affect uptake (uN is constant). In short, if nitrogen is in
limiting supply, the leaf biomass of the plant is
constrained by nitrogen uptake:
lðr;NÞ ¼ uN r N
qð5Þ
where nitrogen uptake is fine-root biomass (r) multiplied
by the conductance of fine roots to nitrogen (uN) and by
the nitrogen availability in the soil (N ). The variable q is
the amount of nitrogen needed by the plant per unit of
leaf biomass per year.
Given resource availability, the constraints of carbon
conservation and nitrogen limitation reduce the poten-
tial allocation strategy space to a single dimension. For
convenience, we choose to follow the investment in fine-
root biomass (r) when defining allocation strategy. From
resource availability and r, one can calculate the leaf
biomass l and investment in reproduction f of the plant.
We describe the rest of the model in two steps: first we
describe the environment created by a monoculture of
individuals with allocation strategy defined by fine-root
biomass r (hence, strategy r). This environment includes
all influences of the community of individuals on the
resource availability to an individual: water availability
W, nitrogen availability N, and competition for sites,
measured by seed production f . Second, we describe the
invasion potential of an individual with a different
TABLE 2. Description of model variables.
Variable Definition Units
s size of the community m2
r fine-root biomass g C/m2
l(r0, N(r)) leaf biomass of individuals with strategy r0, in monoculture of strategy r g C/m2
f (r0, N(r), W(r)) rate of seed production strategy r0 in a monoculture of strategy r seeds�m�2�yr�1g leaf mass per unit leaf area g C/m2
N0 nitrogen mineralization rate g N�m�2�yr�1N nitrogen availability g N/m2
uN conductance of nitrogen from root to leaf m2�g C�1�yr�1L0 photosynthetically active radiation MJ PAR�m�2�yr�1k exponential rate of light extinction by leaf layersaf leaf-level photosynthetic dependence on light level g C/MJ PARV maximum photosynthetic rate g C�m�2�yr�1q fraction of the growing season spent in water saturationW0 precipitation during water limitation m/yrW water availability m3 water/m2 surfaceuW conductance of water from root to leaf m2�g C�1�yr�1x intrinsic water-use efficiency g C/mA rate of carbon assimilation g C/yrAL light-limited carbon assimilation g C�m�2�yr�1AW water-limited carbon assimilation g C�m�2�yr�1cl carbon cost of leaf respiration and maintenance g C�g C�1�yr�1cr carbon cost of fine-root respiration and maintenance g C�g C�1�yr�1cf carbon cost of seed production g C/seedq plant nitrogen maintenance per year per leaf biomass g N�g C�1�yr�1F(r0, r) fitness of strategy r0 in the environment set by a monoculture of strategy r
Note: PAR is photosynthetically active radiation.
CAROLINE E. FARRIOR ET AL.2510 Ecology, Vol. 94, No. 11
allocation strategy, r0, in this environment. With this
framework, we then find the allocation strategy that,
when in monoculture, cannot be invaded by any other.
The strategy r*, if it exists, is the evolutionarily stable
strategy (ESS) and predicted to be the dominant strategy
in the community.
Note, different allocation strategies (r’s) are most
easily thought of as different species. In reality however,
an individual plant may have the plasticity to adopt the
new ESS strategy following an environmental change.
Thus differences among strategies are most generally
thought of as different phenotypes that plants may
achieve through species replacement or individual
plasticity.
The environment created by a monoculture
of a single strategy, r
To find the strategy that cannot be invaded, we must
first examine how an allocation strategy affects the
environment experienced by other individuals: nitrogen
availability, water availability, and competition for sites.
Nitrogen availability (N) is the result of inputs from
the environment and the uptake of plants. Nitrogen
comes in at constant nitrogen-mineralization rate (N0),
assumed to be independent of the allocation strategies of
the plants in the community. Plants take up nitrogen at a
constant rate (uN) proportional to their investment in
fine roots (r). For nitrogen-limited plants, fine roots are
relatively efficient at nitrogen uptake and leakage of
nitrogen from the system is small. Here we assume
leakage is zero.
Because there is considerable overlap in inter-individ-
ual fine roots (Frank et al. 2010) and because mineral
nitrogen is relatively mobile, we assume the fluxes in and
out of the available nitrogen pool are well mixed within
the community of size s. If the environment is filled with
individuals with r fine-root biomass, the change in
nitrogen availability over time is then
dN
dtðrÞ ¼ s N0 � s uN r NðrÞ
s: ð6Þ
Nitrogen availability N reaches an equilibrium when
NðrÞ ¼ N0
uN r: ð7Þ
Water availability is also the result of inputs from the
environment and the uptake of plants. We use a
simplified model of rainfall. Rainfall comes in as a
constant drizzle that switches between two levels: one
that is high enough for water saturation, and one that is
low enough for water limitation. When plants are water
saturated, their photosynthesis does not depend on
water availability and there is no competition for water.
During water limitation, water comes in at a constant
rate of drizzle (W0), and plants take up water at a
constant rate proportional to their investment in fine
roots (uW). If the environment is filled with individuals
with r fine-root biomass, the change in water availability
over time is then
dW
dtðrÞ ¼ s W0 � s uW r WðrÞ
s: ð8Þ
Water availability during water limitation (W )
reaches an equilibrium when
W ¼ W0
uW r: ð9Þ
Site availability is determined by the fecundity of
individuals with allocation strategy r, the number of
seeds an invader will have to compete with in a lottery to
occupy new sites. To find this, we solve Eq. 4 evaluated
at N(r) and W(r) of Eqs. 7 and 9 for f :
f ðr;NðrÞ;WðrÞÞ
¼ 1
cf
qV
k1þ ln
af L0
V
� �� af L0
Ve�kðN0=gqÞ
���
þ ð1� qÞx W0 � cl
N0
q� crr
�: ð10Þ
Expected fitness of an individual with strategy, r0
If an individual with the invading strategy has greater
seed production than an individual of the resident strategy,
r, it will slowly win ever more open sites, potentially taking
over as resident. The competitive-dominant strategy
(single-strategy ESS), if it exists, is one that creates an
environment that no other strategy can invade.
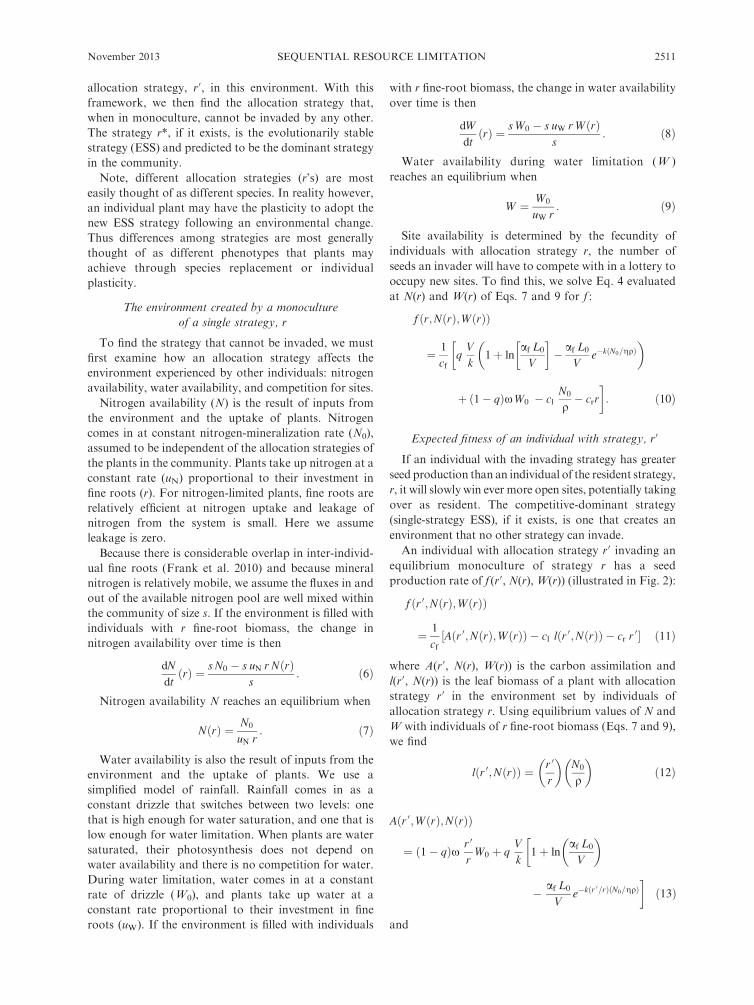
An individual with allocation strategy r0 invading an
equilibrium monoculture of strategy r has a seed
production rate of f (r0, N(r), W(r)) (illustrated in Fig. 2):
f ðr 0;NðrÞ;WðrÞÞ
¼ 1
cf
Aðr 0;NðrÞ;WðrÞÞ � cl lðr 0;NðrÞÞ � cr r 0½ � ð11Þ
where A(r0, N(r), W(r)) is the carbon assimilation and
l(r0, N(r)) is the leaf biomass of a plant with allocation
strategy r0 in the environment set by individuals of
allocation strategy r. Using equilibrium values of N and
W with individuals of r fine-root biomass (Eqs. 7 and 9),
we find
lðr 0;NðrÞÞ ¼ r 0
r
� �N0
q
� �ð12Þ
Aðr 0;WðrÞ;NðrÞÞ
¼ ð1� qÞx r 0
rW0 þ q
V
k1þ ln
af L0
V
� ��
� af L0
Ve�kðr 0=rÞðN0=gqÞ
�ð13Þ
and
November 2013 2511SEQUENTIAL RESOURCE LIMITATION
f ðr 0;NðrÞ;WðrÞÞ
¼ 1
cf
�ð1� qÞx r 0
rW0 þ q
V
k1þ ln
af L0
V
� ��
� af L0
Ve�kðr 0=rÞðN0=gqÞ
�
� cl
r 0
r
� �N0
q
� �� r 0
�: ð14Þ
Because population growth rate is proportional to an
individual’s relative seed set, the fitness of the invading
strategy is
Fðr 0; rÞ} f ðr 0;NðrÞ;WðrÞÞf ðr;NðrÞ;WðrÞÞ : ð15Þ
Using Maynard Smith and Price’s (1973) and
Maynard Smith’s (1982) definition of an ESS (the
competitive-dominant strategy that cannot be invaded
once established), we define an ESS as a strategy r*,
which satisfies the following conditions:
8 r 0 6¼ r� : Fðr 0; r�Þ, Fðr�; r�Þ
or
Fðr 0; r�Þ ¼ Fðr�; r�Þ and Fðr�; r 0Þ. Fðr 0; r 0Þ: ð16Þ
We also verify that the ESS is convergence stable,
meaning a community could arrive at them by successive
invasions of individuals with small trait differences
(Geritz et al. 1998; see Appendix D).
MODEL PREDICTIONS
For a light-, water-, and nitrogen-limited plant, the
competitive-dominant (ESS) allocation strategy is
r� ¼ ð1� qÞxW0
cr
þ q
af L0
N0
q ge�kðN0=qgÞ
cr
� cl
cr
� �N0
q
� �ð17Þ
which in monoculture has leaf biomass
l� ¼ N0
q: ð18Þ
Because we assume that (1) nitrogen is in limiting
supply, (2) precipitation is sufficiently variable so that
water is sometimes limiting and sometimes not, and (3)
nitrogen is sufficiently common for the leaf biomass of
plants to cause at least some self-shading, we find that
the productivity, fine-root investment, and fecundity of
the competitive (ESS) plants depends on all three
resources: light, water, and nitrogen.
ESS fine-root biomass (r*) is the sum of three
components (Eq. 17). The third component accounts
for the carbon constraint on fine-root biomass caused by
building leaves. It is the biomass of roots that could have
been made and maintained if the plant did not have to
pay to build and maintain its leaves (the carbon it takes
to build and maintain l*, cl[N0/q], divided by the carbon
cost of building and maintaining fine-root biomass, cr).
Note that this term is independent of the time plants
spend in water limitation (1� q) or water saturation (q).
The first two components of r* (Eq. 17) describe the
influence of competition for water and nitrogen on r*
and are weighted by the portion of time plants spend
effectively limited by each. If plants spend a large
portion of the growing season in water limitation (q is
close to zero), competition for water, described by the
first component, has a large influence on r*. This
component increases with W0, the rate of water input
during water-limitation and is independent of both the
nitrogen mineralization rate (N0) and light (L0). If
instead plants spend a large portion of the growing
season in light limitation, effectively limited by their
foliage and nitrogen uptake (q is close to one),
competition for nitrogen, described by the second
component has a large influence on r*. This component
increases linearly with light level (L0), increases and then
decreases with nitrogen-mineralization rate (N0), and
does not depend on the water input rate during water
limitation (W0). Overall, water additions influence r* in
two ways: first as a weight that determines the strength
of competition for water vs. nitrogen, shifting the
influence between the first and second components of
Eq. 17 (q, represented as a black ‘‘weight’’ in Fig. 3), and
second as an influence on competition for water itself,
where higher W0 increases fine-root investment (repre-
sented by the height of the blue boxes in Fig. 3).
Although ours is a simple model of prairie plants,
predictions for ESS fine-root and leaf investments are
similar to those predicted from a forest dynamics model
with individual-based height-structured competition. In
particular, the dependence of the first component of Eq.
17 on W0 and the second component on N0 are the same
as those presented in the cases of nitrogen saturation in
forests (Farrior et al. 2013) and water saturation in
forests (Dybzinski et al. 2011). We review the depen-
dence of each on the belowground resource here.
When rainfall during water limitation (W0) increases,
the competitive-dominant fine-root strategy increases
linearly. Plants compete for water within a commons
belowground, where the decrease in water availability
due to uptake of an individual is shared by the group.
Because individual fitness is the currency of selection,
competitive plants invest in water uptake until the water
availability is so low so that the costs of water uptake
equal the benefits. If the currency of selection were
instead plot-level productivity, plants would have a
much lower investment in fine roots. As we have
assumed no leakage of water during water-limitation,
plants would only invest the infinitesimal amount
needed to take up the water. Thus, competitive
allocation reduces productivity, creating a tragedy of
the commons (Hardin 1968). When the size of potential
CAROLINE E. FARRIOR ET AL.2512 Ecology, Vol. 94, No. 11
benefits increase (as W0 increases), the competitive
investment in uptake (r*) increases so that the costs of
uptake again equal the benefits to an individual (see
Farrior et al. [2013] for further explanation).
Nitrogen, N0, is also a resource taken up from within
a commons. When N0 increases at very low N0 levels,
competitive plants are predicted to increase their
investment in fine roots, just as they do when W0
increased. Nitrogen, however, is different from water
because it is used by the plant to build leaves, the
productivity of which depends on the leaf area already
on the plant. After light availability falls below the
threshold needed to operate at the maximum photosyn-
thetic rate, each additional leaf has lower productivity
than those already on the plant because of self-shading.
Thus, each additional unit of nitrogen taken up by a
plant yields an ever decreasing benefit, and the benefits
of additional N0 decrease as N0 increases. So, in
competition for nitrogen, plants initially respond posi-
tively to increasing N0, but as N0 increases beyond very
low N0 levels, r* decreases rapidly with continued N0
additions. Several theories have predicted the decrease in
fine roots with added nitrogen, but have focused on the
carbon tradeoff between investment in fine roots and
investment in leaves (e.g., Chapin 1980, Tilman 1988).
The decreasing marginal returns of nitrogen uptake
provide an additional mechanism that may explain
decreases in fine-root biomass with N0 additions.
Taking together the effects of nitrogen (N0) and water
(q and W0) on the competitive-dominant fine-root
strategy (r*), we find two specific predictions for
interactions between water and nitrogen. First, the
influence of nitrogen on fine roots should be weaker
when water availability is low. That is, when water is
scarce, the time in water-saturation (q) is low and the
negative influence of N0 on r* has less of an effect on the
resultant fine-root biomass (compare columns of Fig. 3).
Second, the influence of water (q and W0) on fine-root
biomass decreases with increased nitrogen availability
(N0). The effect of water additions on q and W0 should
be the same across nitrogen levels, but the fine-root
biomass needed in competition for nitrogen should
decrease. At low nitrogen levels, r* is higher than at high
nitrogen levels. Adding water increases the weight of
competition for nitrogen on r*, thus exposing the effect
of nitrogen on r*. Thus the effect of water additions
should become less positive or more negative on fine-
root biomass as nitrogen increases (compare rows of
Fig. 3).
DISCUSSION
In our experiment, we found results, which, like
several other resource addition experiments (e.g., Aerts
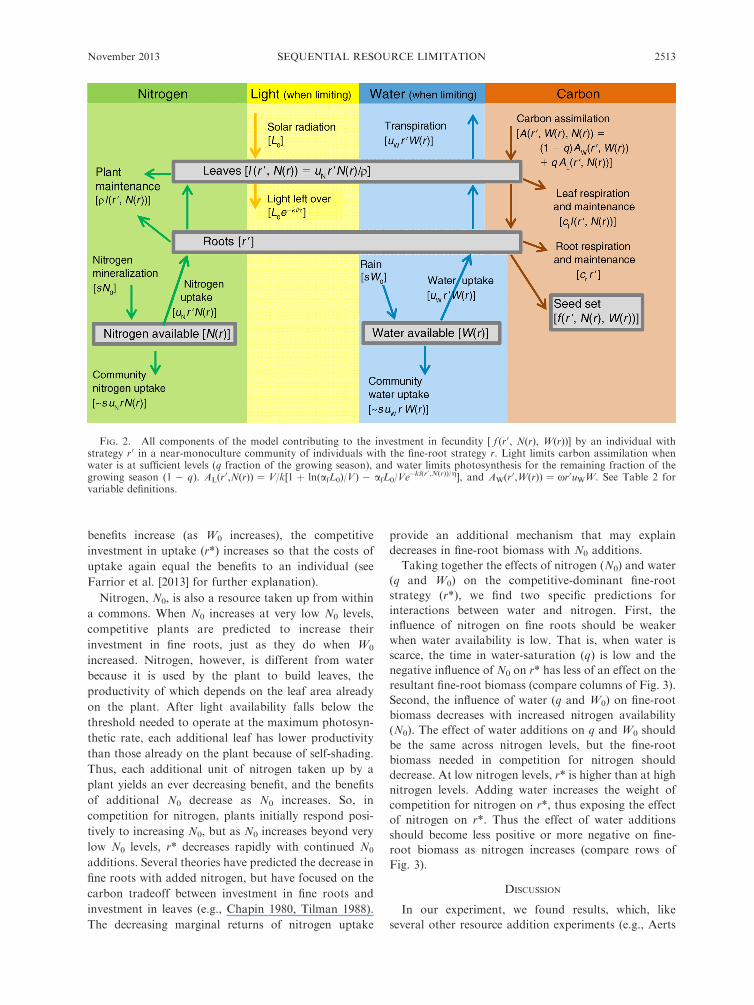
FIG. 2. All components of the model contributing to the investment in fecundity [ f (r0, N(r), W(r))] by an individual withstrategy r0 in a near-monoculture community of individuals with the fine-root strategy r. Light limits carbon assimilation whenwater is at sufficient levels (q fraction of the growing season), and water limits photosynthesis for the remaining fraction of thegrowing season (1 � q). AL(r
0,N(r)) ¼ V/k[1 þ ln(afL0)/V) � afL0/Ve�kl(r0 ,N(r))/g], and AW(r0,W(r)) ¼ xr0uWW. See Table 2 for
variable definitions.
November 2013 2513SEQUENTIAL RESOURCE LIMITATION
et al. 1991, Gedroc et al. 1996, Kaspari et al. 2008), were
not predicted by either Liebig’s law of the minimum
(LMH) or the optimal foraging/multiple limitation
hypothesis (MLH). Plants responded to both nitrogen
and water additions separately and together, violating
Liebig’s law of the minimum. Second, plants responded
to water additions by increasing investment in fine roots,
contradicting MLH.
These responses and almost all of the other significant
empirical results were predicted by our model of plant
competition for water, nitrogen, and space. Above-
ground, leaf biomass responded positively to nitrogen
additions but not to water additions, as predicted for
nitrogen-limited plants. Belowground, the model pre-
dicts and the data show a significant interaction between
water and nitrogen. Specifically, the positive response of
fine roots to water additions weakened with nitrogen
additions.
Our model predicts that the competitive fine-root
strategy is a weighted average of the influences of
competition for water and nitrogen. The weight is the
fraction of time plants are limited by either resource, i.e.,
the fraction of time in water limitation and water
saturation (and carbon assimilation is effectively nitro-
gen limited). When water is added, the competitive fine-
root strategy is more heavily influenced by fine-root
competition for nitrogen. This is evidenced experimen-
tally by greater reduction of fine-root biomass in
response to nitrogen additions with water additions
(Fig. 3).
Looking at the interaction another way, we observed
an increase in fine-root biomass in response to water
additions, but only at low nitrogen levels. This increase
in belowground biomass in response to the addition of a
belowground resource can be explained by two different
mechanisms. First, the increase may be the result of the
predicted increase in the biomass with greater water
availability during water limitation (the positive effect of
W0 on r*). And/or the increase may be due to the greater
weight of competition for nitrogen on fine-root biomass
(increasing q), which is relatively high at low nitrogen
levels. In both cases, the subsequent decrease in response
with increasing nitrogen levels must be due to the
decreasing nitrogen-limited fine-root ESS with greater
nitrogen availability. These results are consistent with
our theoretical prediction that plant responses to water
during water limitation and to nitrogen are opposite:
fine-root biomass should increase with water additions
(assuming water is limiting at the time of additions) and
decrease with nitrogen additions in all but the very
lowest nitrogen levels (assuming nitrogen is limiting).
The mechanism responsible for this difference in
predictions is the difference in the marginal returns of
nitrogen and water uptake within a competitive context.
Marginal returns are the net benefits of an additional,
arbitrarily small unit of resource. The marginal returns
of nitrogen uptake decrease with total nitrogen uptake,
whereas marginal returns of water uptake remain
constant with total water uptake. Nitrogen is used to
build the engines of photosynthesis, the leaves. Because
of self shading, the productivity of a leaf decreases as
more leaves are placed above it, but the leaf costs remain
the same (shade leaf plasticity moderates this phenom-
enon, but does not remove it). In contrast, water is a fuel
of photosynthesis; when water is limiting, whole-canopy
photosynthesis is simply proportional to water uptake.
A mechanism not included in our model is the
potential positive biogeochemical interaction between
water availability and nitrogen mineralization (Borken
and Matzner 2009). There is a suggestion of this effect in
the response of leaf biomass in the experiment. Leaf
biomass increases with both water and nitrogen
additions, although the response to nitrogen is much
stronger than that of water (effect size of 42 g/m2 vs. 17
g/m2; Table 1). However, the interaction between water
and nitrogen is negative, but not significant (P ¼ 0.257,
Table 1). Belowground, fine-root biomass responds to
water and nitrogen in opposite directions. If the
biogeochemical interaction of water and nitrogen were
driving the response, fine-root biomass should respond
in the same direction to either resource. Thus, the
observed leaf and fine-root biomass responses to water
and nitrogen occurs in spite of any biogeochemical effect
of water availability on nitrogen mineralization, not
because of it.
Reproductive biomass decreased with water additions
in the experiment. This is the only significant experi-
mental response not predicted by our model. Recall that
our sampling scheme was designed to capture standing
biomass of leaves and fine roots accurately. The
reproductive biomass we measured may not have
accurately captured investment in reproductive biomass
as we measured only the biomass attached to live plants
(flowers, seeds, and their supports) during sampling in
early September. Biomass produced and dropped earlier
in the season is missing from our estimates. It is possible
that water additions allowed plants to be reproductive
earlier in the season and decreasing the reproductive
biomass found on the plants in September. It is also
possible that as long-lived perennial plants, reproduc-
tion output in any given year is not as tightly linked to
resource availability as we assume for annual plants.
Our model is a simplified model of plant physiology
that ignores several details of leaf physiology that could
be important and are found in detailed models of leaf
physiology (e.g., Collatz et al. 1991, Lloyd and Farquhar
1996, Evans and Poorter 2001, Farquhar et al. 2001).
These include photorespiration, temperature dependen-
cies of photosynthesis and respiration, the effect of
vapor pressure deficit on stomates, variation in nitrogen
allocation among leaves as a function of the level of
shade, and variation among species in water-use
efficiency. Any of these could affect our results
quantitatively. However, their omission allowed us to
derive qualitative results that we suspect are robust to
the added details, including the way light, water and
CAROLINE E. FARRIOR ET AL.2514 Ecology, Vol. 94, No. 11

nitrogen co-limit plants and lead to significant water-
nitrogen interactions in experiments, the explanation of
the decrease in root investment with nitrogen additions
and the explanation for increased root investment with
water additions.
The explanations from our model should not be and
do not seem to be restricted to our particular
experiment. The model’s predictions are consistent with
the results of other published factorial water and
nitrogen addition experiments. For example, in a
Canadian prairie, Lamb et al. (2007) finds a significant
increase in belowground biomass with water additions
that appears to decrease with nitrogen additions, as our
model predicts. Our ability to test the model with other
published studies however, is limited by the lack of
belowground measurements in most factorial water and
nitrogen addition experiments.
In our model, at any one moment, photosynthesis is
limited by the resource in shortest supply, a concept
central to Liebig’s law of the minimum. Furthermore,
plants act to maximize their carbon gain by investing in
structures that take up those resources that are most
limiting, a concept central to the multiple limitation
hypothesis. We add to these concepts carbon maximi-
zation within a competitive context and the specific
biological functions of water and nitrogen in plants: the
dependence of plant fitness on N and water uptake, and
the environmental variability of the supply of each
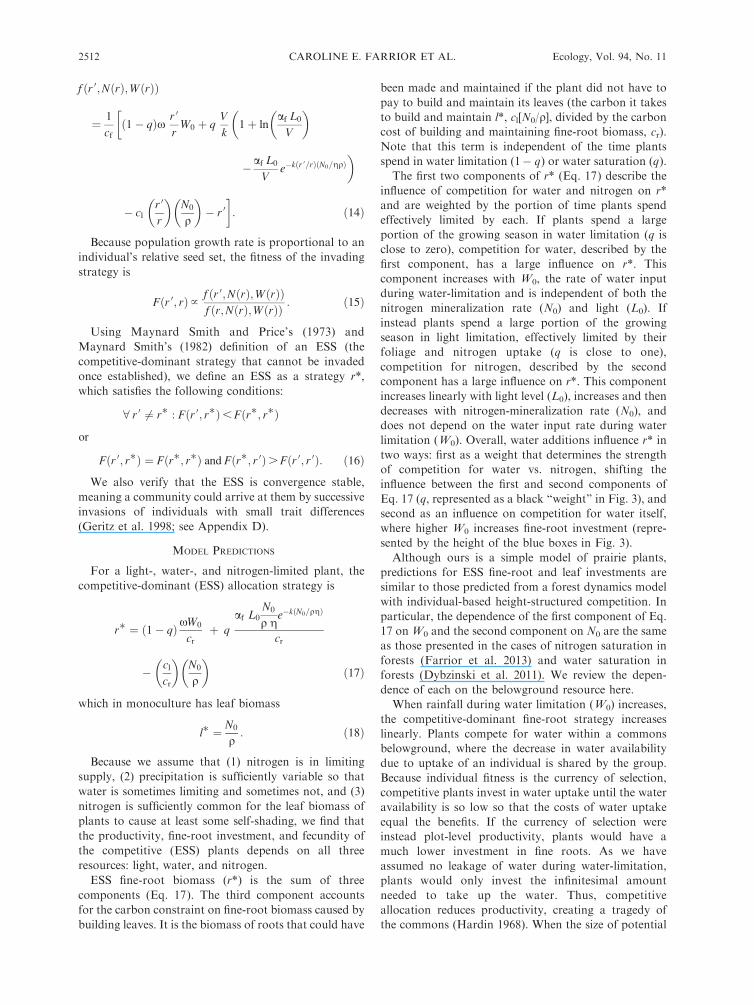
FIG. 3. The model predicts the influence of experimental water additions (increasing both time spent in water saturation q andprecipitation during water limitation W ) on evolutionarily stable strategy (ESS) fine-root biomass (r*) should become less positiveor more negative as nitrogen availability increases (increasing nitrogen mineralization rate N0; see Eq. 17). Leaf biomass (l*) shoulddepend only on nitrogen (increasing with N0 for realistic N levels; see Eq. 18). Here we depict these predictions for a range ofparameter values. Please note that these parameters were not explicitly measured in the field experiment. The sizes of the blue andgreen boxes represent the value of ESS leaf and fine-root biomass if plants were always water limited (q¼0, blue) and if plants werealways water saturated (q¼ 1, green). The ESS fine-root biomass, r* is a weighted combination of the blue and green boxes and isrepresented by the size of the black box:
r� ¼ ð1� qÞx W0
cr
þ q
afL0
N0
gqe�kðN0=gqÞ
cr
� cl
cr
� �N0
q
� �0BB@
1CCA:
The interaction between water and nitrogen on fine-root biomass is demonstrated by comparing rows or columns. Comparing rowsshows that, at low N0, water addition increases fine-root biomass by both the increase in the size of the blue box (increasing W0
increases competition for water) and the weight of the green box (increasing q, the influence of competition for nitrogen). The effectof water addition is diminished at high N0 because the size of the green box is smaller (competition for nitrogen decreases).Comparing columns shows that, at low water levels, the green boxes have little influence on r* (low q), and N0 additions have littleeffect. At high water levels, the influence of the green boxes on r* is revealed (high q).
November 2013 2515SEQUENTIAL RESOURCE LIMITATION
resource relative to a plant storage ability. As a result,
we found that plants were limited by a single resource at
any one instant, but were limited by both over the
season, a blend of limitation distinct from LMH and
MLH.
This form of co-limitation should be pervasive in
plant communities. In any place where there are
rainstorms and sufficiently dry periods throughout
the growing season, plants will switch between water
limitation and water saturation. If nitrogen availability
is high enough that plants can make several leaf layers,
there is likely to be light limitation during water
saturation. These components should lead to signifi-
cant interactions between water and nitrogen and/or
light availability in other systems and other models,
whenever increasing water availability enhances the
influence of the other productivity limiting resources.
Evidence of interactions between water and nitrogen
additions may thus be evidence of co-limitation over
the course of a growing season caused by fluctuations
in the identities of the limiting resources, rather than
the result of a delicate balancing act that maintains co-
limitation at each instant during the season. This
sequential co-limitation is driven by competitive
optimization of resource capture in the face of
fluctuations in resource availability.
ACKNOWLEDGMENTS
We thank Troy Mielke, Kally Worm, and Cedar Creekinterns, especially those from the summer of 2010, for their helpsampling the experiments. We thank Carla Staver, SarahBatterman, Henry Horn, Matthew Lutz, Alexandra Wright,Lindsay Turnbull, and an anonymous reviewer for helpfulcomments on the manuscript, and Lars Hedin for thesuggestion to consider the effect of water on nitrogenavailability. This material is based upon work supported undera National Science Foundation Graduate Research Fellowship(DGE-0646086), the Carbon Mitigation Initiative (CMI),USDA Forest Service, and the National Science FoundationLong Term Ecological Research (NSF/LTER-0620652).
LITERATURE CITED
Adler, P. B., J. HilleRisLambers, P. C. Kyriakidis, Q. Guan,and J. M. Levine. 2006. Climate variability has a stabilizingeffect on the coexistence of prairie grasses. Proceedings of theNational Academy of Sciences USA 103:12793–12798.
Aerts, R., R. G. A. Boot, and P. J. M. van der Aart. 1991. Therelation between above- and belowground biomass allocationpatterns and competitive ability. Oecologia 87:551–559.
Agren, G. I., J. A. M. Wetterstedt, and M. F. K. Billberger.2012. Nutrient limitation on terrestrial plant growth—modeling the interaction between nitrogen and phosphorus.New Phytologist 194:953–960.
Bloom, A. J., F. S. Chapin, III, and H. A. Mooney. 1985.Resource limitation in plants—an economic analogy. AnnualReview of Ecology and Systematics 16:363–392.
Borken, W., and E. Matzner. 2009. Reappraisal of drying andwetting effects on C and N mineralization and fluxes in soils.Global Change Biology 15:808–824.
Chapin, F. S., III, 1980. The mineral nutrition of wild plants.Annual Review of Ecology and Systematics 11:233–260.
Chapin, F. S., III, A. J. Bloom, C. B. Field, and R. H. Waring.1987. Plant responses to multiple environmental factors:physiological ecology provides tools for studying how
interacting environmental resources control plant growth.BioScience 37:49–57.
Collatz, G. J., J. T. Ball, C. Grivet, and J. A. Berry. 1991.Physiological and environmental regulation of stomatalconductance, photosynthesis and transpiration: a model thatincludes a laminar boundary layer. Agricultural and ForestMeteorology 54:107–136.
Craine, J. M. 2006. Competition for nutrients and optimal rootallocation. Plant and Soil 285:171–185.
Craine, J. M., J. Fargione, and S. Sugita. 2005. Supply pre-emption, not concentration reduction, is the mechanism ofcompetition for nutrients. New Phytologist 166:933–940.
Danger, M., T. Daufresne, F. Lucas, S. Pissard, and G.Lacroix. 2008. Does Liebig’s law of the minimum scale upfrom species to communities? Oikos 117:1741–1751.
Dybzinski, R., C. Farrior, A. Wolf, P. B. Reich, and S. W.Pacala. 2011. Evolutionarily stable strategy carbon allocationto foliage, wood, and fine roots in trees competing for lightand nitrogen: an analytically tractable, individual-basedmodel and quantitative comparisons to data. AmericanNaturalist 177:153–166.
Evans, J. R., and H. Poorter. 2001. Photosynthetic acclimationof plants to growth irradiance: the relative importance ofspecific leaf area and nitrogen partitioning in maximizingcarbon gain. Plant, Cell and Environment 24:755–767.
Falster, D., and M. Westoby. 2003. Plant height andevolutionary games. Trends in Ecology and Evolution 18:337–343.
Farquhar, G. D., S. von Caemmerer, and J. A. Berry. 2001.Models of photosynthesis. Plant Physiology 125:42–45.
Farrior, C. E., R. Dybzinski, S. A. Levin, and S. W. Pacala.2013. Competition for water and light in closed-canopyforests: a tractable model of carbon allocation withimplications for carbon sinks. American Naturalist 181:314–330.
Frank, D. A., A. W. Pontes, E. M. Maine, J. Caruana, R.Raina, S. Raina, and J. D. Fridley. 2010. Grassland rootcommunities: species distributions and how they are linked toaboveground abundance. Ecology 91:3201–3209.
Gedroc, J. J., K. D. M. McConnaughay, and J. S. Coleman.1996. Plasticity in root/shoot partitioning: optimal, ontoge-netic, or both? Functional Ecology 10:44–50.
Geritz, S. A. H., E. Kisdi, G. Meszena, and J. A. J. Metz. 1998.Evolutionarily singular strategies and the adaptive growthand branching of the evolutionary tree. EvolutionaryEcology 12:35–57.
Givnish, T. J. 1982. On the adaptive significance of leaf heightin forest herbs. American Naturalist 120:353–381.
Gleeson, S. K., and D. Tilman. 1992. Plant allocation and themultiple limitation hypothesis. American Naturalist 139:1322–1343.
Hardin, G. 1968. The tragedy of the commons. Science 162:1243–1248.
Harpole, W. S., et al. 2011. Nutrient co-limitation of primaryproducer communities. Ecology Letters 14:852–862.
Iwasa, Y., D. Cohen, and J. A. Leon. 1984. Tree height andcrown shape, as results of competitive games. Journal ofTheoretical Biology 112:279–297.
Kaspari, M., M. N. Garcia, K. E. Harms, M. Santana, S. J.Wright, and J. B. Yavitt. 2008. Multiple nutrients limitlitterfall and decomposition in a tropical forest. EcologyLetters 11:35–43.
King, D. A. 1990. The adaptive significance of tree height.American Naturalist 135:809–828.
Lamb, E. G., B. H. Shore, and J. F. Cahill. 2007. Water andnitrogen addition differentially impact plant competition in anative rough fescue grassland. Plant Ecology 192:21–33.
Larcher, W. 2003. Physiological plant ecology: ecophysiologyand stress physiology of functional groups. Springer, NewYork, New York, USA.
CAROLINE E. FARRIOR ET AL.2516 Ecology, Vol. 94, No. 11
Lloyd, J., and G. D. Farquhar. 1996. The CO2 dependence ofphotosynthesis, plant growth responses to elevated atmo-spheric CO2 concentrations and their interaction with soilnutrient status. I. General principles and forest ecosystems.Functional Ecology 10:4–32.
Luo, Y., et al. 2004. Progressive nitrogen limitation ofecosystem responses to rising atmospheric carbon dioxide.BioScience 54:731–739.
Maina, G. G., J. S. Brown, and M. Gersani. 2002. Intra-plantversus inter-plant root competition in beans: avoidance,resource matching or tragedy of the commons. Plant Ecology160:235–247.
Maynard Smith, J. 1982. Evolution and the theory of games.Cambridge University Press, Cambridge, UK.
Maynard Smith, J., and G. R. Price. 1973. The logic of animalconflict. Nature 246:15–18.
McNickle, G. G., and R. Dybzinski. 2013. Game theory andplant ecology. Ecology Letters 16:545–555.
Montgomery, R. A., P. B. Reich, and B. J. Palik. 2010.Untangling positive and negative biotic interactions: viewsfrom above and below ground in a forest ecosystem. Ecology91:3641–55.
Oren, R., et al. 2001. Soil fertility limits carbon sequestration byforest ecosystems in a CO2-enriched atmosphere. Nature 411:469–472.
Postel, S. P., G. C. Daily, and P. R. Ehrlich. 1996. Humanappropriation of renewable fresh water. Science 271:785–788.
R Development Core Team. 2009. R 2.9.2. R Project forStatistical Computing, Vienna, Austria. www.r-project.org
Raynaud, X., and P. W. Leadley. 2004. Soil characteristics playa key role in modeling nutrient competition in plantcommunities. Ecology 85:2200–2214.
Reich, P. B., S. E. Hobbie, T. Lee, D. S. Ellsworth, J. B. West,D. Tilman, J. M. H. Knops, S. Naeem, and J. Trost. 2006.Nitrogen limitation constrains sustainability of ecosystemresponse to CO2. Nature 440:922–925.
Rubio, G., J. Zhu, and J. P. Lynch. 2003. A critical test of thetwo prevailing theories of plant response to nutrientavailability. American Journal of Botany 90:143–152.
SAS Institute. 2012. JMP version 10. SAS Institute, Cary,North Carolina, USA.
Schimel, D. S., B. H. Braswell, R. McKeown, D. S. Ojima,W. J. Parton, and W. Pulliam. 1996. Climate and nitrogencontrols on the geography and timescales of terrestrialbiogeochemical cycling. Global Biogeochemical Cycles 10:677–692.
Semchenko, M., K. Zobel, and M. J. Hutchings. 2010. Tocompete or not to compete: an experimental study ofinteractions between plant species with contrasting rootbehaviour. Evolutionary Ecology 24:1433–1445.
Sinclair, T. R. 1992. Mineral nutrition and plant growthresponse to climate change. Journal of Experimental Botany43:1141–1146.
Slatyer, R. O. 1967. Plant–water relationships. Academic Press,London, UK.
Tilman, D. 1982. Resource competition and communitystructure. Princeton University Press, Princeton, New Jersey,USA.
Tilman, D. 1988. Plant strategies and the dynamics andstructure of plant communities. Princeton University Press,Princeton, New Jersey, USA.
van der Ploeg, R. R., W. Bohm, and M. B. Kirkham. 1999. Onthe origin of the theory of mineral nutrition of plants and thelaw of the minimum. Soil Science Society of America Journal63:1055–1062.
Vitousek, P. M., J. D. Aber, R. W. Howarth, G. E. Likens,P. A. Matson, D. W. Schindler, W. H. Schlesinger, and D. G.Tilman. 1997. Human alteration of the global nitrogen cycle:Sources and consequences. Ecological Applications 7:737–750.
Wilson, S. D., and D. Tilman. 1991. Component of plantcompetition along an experimental gradient of nitrogenavailability. Ecology 72:1050–1065.
Wright, I. J., P. B. Reich, and M. Westoby. 2003. Least-costinput mixtures of water and nitrogen for photosynthesis.American Naturalist 161:98–111.
SUPPLEMENTAL MATERIAL
Appendix A
Experiment sampling methods: separation of aboveground biomass (Ecological Archives E094-230-A1).
Appendix B
Relaxation of territoriality and well-mixed assumptions (Ecological Archives E094-230-A2).
Appendix C
Photosynthetic rate dependence on leaf and fine-root biomass (Ecological Archives E094-230-A3).
Appendix D
Pairwise invasion plot (Ecological Archives E094-230-A4).
November 2013 2517SEQUENTIAL RESOURCE LIMITATION
Copyright © 2022 FDOKUMEN