Resistance of Transversally Stiffened Hybrid Steel Plate ... - UPC
235
Resistance of Transversally Stiffened Hybrid Steel Plate Girders to Concentrated Loads Doctoral Thesis by: Rolando Chacón Flores Supervised by: Enrique Mirambell Arrizabalaga Esther Real Saladrigas Barcelona, April 2009 Universitat Politècnica de Catalunya Departament d´Enginyeria de la Construcció
-
Upload
khangminh22 -
Category
Documents
-
view
1 -
download
0
Transcript of Resistance of Transversally Stiffened Hybrid Steel Plate ... - UPC

Resistance of Transversally Stiffened Hybrid Steel Plate Girders to Concentrated Loads Doctoral Thesis by: Rolando Chacón Flores
Supervised by: Enrique Mirambell Arrizabalaga Esther Real Saladrigas Barcelona, April 2009 Universitat Politècnica de Catalunya Departament d´Enginyeria de la Construcció


A Chicarero y Calle 15


i Preface
Agradecimientos
El aterrizaje en este departamento y el despegue hacia la realización de todas las cosas positivas que me han llenado estos años en el mundo de la investigación se deben de manera simultánea a los Doctores, y amigos, Enrique Mirambell y Esther Real. Agradezco y agradeceré por siempre el hecho de haberme concedido el voto de confianza que me permitió cursar este viaje. He intentado dar lo mejor de mí para llenar las expectativas propias de estas apuestas personales. Espero que lo que hemos podido realizar hasta este momento solo sea el principio de muchas cosas positivas. Quiero dejar claro que desde que recibí la aceptación y admisión al Programa de Doctorado, mi vida cambió. Quique, muchas gracias por enseñarme lo que quiere decir la palabra rigor en un sentido amplio, Esther mil gracias por creer en mí de esta manera. A ambos, digo que la innumerable cantidad de consejos día a día han moldeado de manera sustancial mi aprendizaje en la academia. Gracias a esta apuesta, pude aplicar para la obtención de la beca FPI del Ministerio de Educación y Ciencia, que se enmarca dentro del Proyecto Nacional de Investigación BIA2004-0673, el cual se titula “Comportamiento Estructural de Vigas Armadas Híbridas de Aceros de Alto Límite Elástico”. Sin dicho apoyo financiero e institucional, el presente trabajo no hubiese podido llevarse a cabo. Asimismo, agradezco a la empresa TADARSA por la manufactura y suministro de las vigas metálicas híbridas utilizadas así como a ARCELOR, por el suministro del material de ensayo. Las imperfecciones iniciales fueron medidas por la empresa ABROX, a quien hago extensivo el agradecimiento. Seguidamente, quisiera agradecer a los Doctores Antonio Marí y Climent Molins por su ayuda en aquellos momentos del inicio de mi Doctorado. La posibilidad de colaborar en el convenio GISA-UPC me permitió salvar mis primeros obstáculos económicos al llegar a la ciudad de Barcelona. Asimismo, agradezco el sinfín de comentarios y recomendaciones que permitieron mejorar continuamente los trabajos realizados durante ese primer año. Agradezco igualmente la posibilidad que se me ha brindado de colaborar en diferentes convenios realizados desde el Departamento de Ingeniería de la Construcción. Ha sido para mí un aprendizaje continuo y espero que lo que he podido aportar también haya sido útil y satisfactorio. Agradezco al equipo de la empresa Mecanotubo. Agradezco al equipo de Sener, especialmente al Doctor Alfredo Arnedo. Asimismo, agradezco a la gente de Arch-Beacon y al equipo de TEC-4, en especial al Doctor Diego Cobo. Finalmente, al Doctor Jesús Bairán por sus sugerencias y comentarios en los trabajos de modelizado que realizamos en conjunto. I would like to express my gratitude to the Plate Buckling Group TW-8.3 for invitating Dr. Mirambell and I into different activities in which part of this work was presented. In particular, I express my gratitude to Dr. Kuhlmann from University of Stuttgart and Dr. Beg from University of Ljubljana. Muy en especial, quisiera agradecer las horas de paciencia, y de impaciencia, a la gente de Laboratori de Tecnología d’Estructures LTE con quién pude compartir una

ii Preface
experiencia de casi un año en laboratorio. Tomas, Miguel, Jordi, Camilo y Carlos. Jordi, en particular muchas gracias por tu inmensa ayuda. Sin ti no se hubiese podido aplicar esa carga concentrada de manera correcta. Por otro lado, quisiera agradecer a la gente del centro de cálculo, quienes supieron aguantar mis infinitas y pesadas insistencias acerca de los servidores y programas de los ordenadores de la escuela. En particular, Josep Maria Jordana. Moltes gracies noi!! Espero deixar de moment totes aquelles cues. Tanmateix, he de reconèixer tota la ajuda que he rebut en el Departament. En especial a la Montse, Mercè, Maricarme, Anna, Cristina, Aurea i Carme, Moltes gracies noies!. Agradezco al colectivo de la ETSCCPB, camineros y Erasmus que siguieron de cerca gran parte de los ensayos y/o simulaciones: el Pepu i el Xavi, Nick, Margaux et Marie, Nina, Marina, Jêrome y Marc. Me habéis liado con tantos idiomas simultáneos mientras aplicábamos cargas concentradas! Reconozco sinceramente que lo disfruté mucho. Agradezco a los amigos doctorandos (algunos ya doctores) del DEC, con quienes pude compartir el viaje doctoral de manera simultánea. En particular, a Imma Estrada, moltes gracies per tota la ajuda en els meus primers moments a l’escola! Y en especial a todos los hormigoneros y pétreos doctorandos, quienes me aceptaron como compañero dúctil de comidas. También, agradezco a Juan Carlos Rosas por sus muestras de genialidad en programar y optimizar el trabajo de día a día. Agradezco igualmente a todos los profesores del DEC y de la ETSCCPB por el continuo apoyo recibido en el día a día doctoral. He vivido momentos muy gratificantes y formativos con todos vosotros. Agradezco a tres profesores que siguieron de cerca parte de la investigación en sus diferentes estancias y visitas al DEC. In particular to William Davids from the University of Maine, Carlos Graciano de la Universidad Simón Bolívar en Venezuela and Leroy Gardner, from The Imperial College of London. I am gratefully acknowledged to your sharp and accurate suggestions and comments. In addition, I express my gratitude to Dr. Jonas Gozzi from LTU in Sweden as well as to Dr. Laurence Davaine from SETRA in France for all the shared technical information. De igual manera, agradezco al Dr. y amigo Carlos Quintero de la Universidad de los Andes por sus muestras de ánimo y curiosidad sobre mi desempeño doctoral. Asimismo, agradezco muy especialmente a la memoria del Dr. Pether Inglessis, una fuente eterna de inspiración estructural. A mis colegas de la ULA con quien comparto este trabajo y asimismo a la gente de CPIET,C.A., quienes me dieron el impulso necesario para llegar a Barcelona en el año 2003. Agradezco muy especialmente a mi familia, quienes además del inmenso apoyo, han sido una fuente eterna de inspiración. Esto es un gran agradecimiento claro está, pero también una linda dedicación de trabajo. De même, je suis très reconnaisant au soutien emotionell de toute la famille Daga, qui a toujours eté concernée et enthousiaste vis-a-vis mon travail. Thankfully, I acknowledge all the enthusiastic support and curiosity from the Taube family towards this work. Finalmente, quisiera agradecer muy, pero muy especialmente a la persona que me ha acompañado incondicionalmente durante todo este tiempo. Cada comentario de vida, trabajo, amor y familia me ha dado fuerza para seguir adelante. Jag älskar dig.

iii Preface
SUMMARY
A girder is deemed as being hybrid when it is fabricated with different steel strengths for the flange and web panels. This type of girder is popular as the girder yields a greater flexural capacity at a lower cost and weight compared to a homogeneous girder. Extensive experimental, theoretical and numerical research on hybrid design can be found in the literature. Flexural capacity, shear resistance, instability and fatigue resistance of hybrid prototypes have been widely investigated in the last decades. Hybrid design has proven economically sound when used in continuous bridges. Consequently, a myriad of bridges have been designed world-wide using a hybrid girder structural solution. A vast amount of these bridges have been erected by using the incremental launching method. The incremental launching method is particularly suited for the construction of continuous multi-span steel plate girder bridges. It consists of assembling and casting sections of the bridge superstructure in a stationary formwork behind an abutment in order to push a completed section forward with jacks along the bridge axis. This construction process implies that the reactions of the piers become moving concentrated loads acting in short lengths of the webs assembling the plate girders. During launching, the reactions of the piers are expected to be quite large, particularly when the cantilever reaches its maximum value. A concentrated force acting perpendicular to the flange of a steel girder is commonly referred to as patch loading. This type of loading usually induces a local failure of the web plate in the vicinity of the loaded flange. If the web panel is stocky, the failure mode is primarily dominated by yielding whereas whether the panel is slender, instability-related modes may occur. Patch loading phenomena has been widely analysed since the early sixties. Several failure mechanisms and critical buckling loads have been proposed throughout the last decades for the case of stiffened and unstiffened panels. Despite the vast amount of research devoted to both topics, the research work that matches both subjects is scant. Consequently, a research work has been developed for the sake of bridging this gap. This thesis deals simultaneously with the patch loading and hybrid design fields. The core of the work is an experimental programme on eight hybrid steel plate girders together with a vast amount of simulations performed on a properly validated numerical model. The work is focused on the assessment of the actual resistance predicted by EN1993-1-5 provisions. The most remarkable results of the research work are pointed out. On the one hand, it is shown that the influence of the fyf/fyw ratio (namely, the hybrid grade) is negligible for girders with largely spaced transverse stiffeners and stiff flanges. On the other, it is shown that this influence can be significant if the transverse stiffeners are closely spaced and/or alternatively, the flanges are relatively flexible. At the end of the work, suggestions for considering these findings on design codes are provided.
iv Preface
RESUMEN Una viga armada se considera híbrida cuando se utilizan diferentes límites elásticos de acero en las chapas de alas y alma que la conforman. Un diseño estructural de una viga armada híbrida puede resultar más eficiente que el de una viga homogénea, tanto desde un punto de vista resistente como desde un punto de vista económico y sostenible. Las vigas armadas híbridas han sido estudiadas a nivel teórico, experimental y numérico bajo solicitaciones de flexión, de abolladura por cortante, de interacción flexión-cortante y de fatiga. Los estudios realizados han demostrado que dicho diseño puede ser especialmente atractivo en la construcción de puentes metálicos de tipo bijácena-mixtos. Como resultado, dicha solución ha sido ampliamente utilizada a nivel mundial en el diseño de puentes metálicos tanto ferroviarios como de carretera. Uno de los posibles procesos constructivos de dichos puentes es el lanzamiento. El lanzamiento por empujes sucesivos es un proceso constructivo que presenta grandes ventajas desde el punto de vista económico como logístico. Este proceso consiste en empujar mediante gatos hidráulicos, la estructura entre un estribo y otro. Las ganancias generadas en términos económicos y logísticos de este proceso llevan asociado un incremento sustancial en el nivel de solicitaciones en la estructura que puede llegar a niveles muy superiores a los que habitualmente soportan los puentes construidos de manera convencional. Durante el proceso de lanzamiento, todas las secciones transversales tanto rigidizadas como no rigidizadas pasan por las pilas del puente, por lo que se pueden ver solicitadas con una carga concentrada de una gran entidad en la dirección vertical. Esta carga concentrada puede agotar la pieza, bien sea por plastificación total de la misma o bien, por la aparición de fenómenos de inestabilidad. La resistencia de vigas armadas homogéneas sometidas a cargas concentradas ha sido estudiada de manera extensa en las últimas décadas del siglo pasado. A pesar de la profusa investigación que se ha publicado en ambos campos de manera separada, se ha encontrado que la misma, cuando analizada de manera conjunta en ambos tópicos es bastante escasa. Por ello, se ha juzgado pertinente el desarrollo de un trabajo de investigación que pudiera poner en solfa los diferentes avances encontrados en ambas líneas de investigación. En la presente Tesis Doctoral se presenta una investigación sobre la resistencia de vigas armadas híbridas sometidas a cargas concentradas. El trabajo se basa en los resultados obtenidos en una campaña experimental de ocho prototipos y cientos de simulaciones numéricas realizadas en un modelo contrastado adecuadamente con la experimentación. El objetivo principal del estudio ha sido el de valorar los mecanismos resistentes de las vigas híbridas frente a cargas concentradas. Se presenta un análisis comparativo entre los resultados obtenidos y los derivados de la formulación recogida en EN1993-1-5. Los resultados han mostrado que el tratamiento de la resistencia es sensiblemente diferente en vigas en función del espaciamiento de su rigidización transversal. Al final del trabajo, se proponen algunas sugerencias que permitirían incluir los resultados obtenidos en las actuales expresiones de diseño de EN1993-1-5 para el caso particular de vigas híbridas sometidas a cargas concentradas.

v Preface
NOTATIONS AND SYMBOLS Notations and symbols used in this thesis are listed in alphabetical order in the following: a Width of web panel between transverse stiffeners b Body forces Afn Flange plus cover plate areas α Significance level α Distance between yield lines in the web αF Distance between yield lines in the web b1 Distance of the longitudinal stiffener from the loaded flange bst Stiffener width bf Flange width β Distance to plastic hinges within the flange βi Distance i to plastic hinges within the flange δow Initial out-of-flatness of the web δog Initial sweep of the girder Df Tensile or compressive stress of the flange Dpl,f Tensile or compressive yield stress of the flange δω Flange and web vertical compatible deformation E Young’s modulus εyw Yield strain of the web material εyf Yield strain of the flange material εln
p Logarithmic plastic strain εp Plastic strain ε Strain field γ Flange rotation γT Transition rigidity fs Amplifying factor that accounts for longitudinal stiffening fyw Yield strength of the web material fyf Yield strength of the flange material Fexp Ultimate load obtained experimentally Fu,o Ultimate load of unstiffened girders Fcr Elastic critical buckling load Fcrw Web bend-buckling resistance fn Hardening stress Fy Yield resistance FEN1993-1-5 Design resistance FRd FEd Design acting force according to EN1993-1-5 FRd Design resistance according to EN1993-1-5 Fu,stiffened Ultimate patch load for longitudinally stiffened webs Fu,stiffened Ultimate patch load for longitudinally stiffened webs Fu,unstiffened Ultimate patch load for unstiffened webs Fu,o Ultimate patch load for unstiffened webs F1 Concentrated load at which the failure mechanism changes (for the case of closely spaced transverse stiffeners) F2 Ultimate patch load for girders with closely spaced transverse stiffeners fext External forces (actions) G Shear modulus hw Web depth

vi Preface
hcr Critical length in terms of the web height for buckling calculations I1 First invariant If Flange moment of inertia J2 Second invariant J3 Third invariant k Hardening variable kF Buckling coefficient for patch loading kb Buckling coefficient kτ Buckling coefficient for shear buckling ksl Buckling coefficient contribution of the longitudinal stiffener Slenderness
F Slenderness in patch loading verification ly Effective loaded length Leff Reduced length for resistance to transverse forces MEd Design acting moment according to EN1993-1-5 MRd Design bending moment according to EN1993-1-5 Mu Acting moment Mr Bending resistance Myf Plastic resistance of the flange plate. Myw Plastic resistance of the web plate. Mpt Plastic resistance of the fictitious T-shaped plate. Mpf Plastic resistance of the flange plate. N Shape function tf Flange thickness tw Web thickness TR() Trace of a tensor tst Stiffener thickness θ Yield line rotation θi Yield rotation of line i Sy Distance between plastic hinges in the flange µ Poisson’s ratio φ Curvature φh Hybrid factor Pc Crippiling load ρ0 Density σi Stress in the i-direction σ Stress field Ss Bearing length tw,red Reduced web thickness τ0 Pure shear stress χF Reduction factor for patch loading γM1 Partial factor for members susceptible to instability u displacement field Vx Coefficient of variation VR Shear resistance w Maximum amplitude of the web out-of-flatness Weff Effective section modulus according to EN 1993-1-5 Wext External work Wint Internal work

vii Preface
TABLE OF CONTENTS PREFACE I SUMMARY III RESUMEN IV NOTATION AND SYMBOLS V TABLE OF CONTENTS VII
1. INTRODUCTION 1
1.1 Background 1
1.2 Scope and limitations 2
1.3 Original features 2
1.4 Outline and content 3
2. REVIEW OF THE EARLIER WORK 4
2.1 Introduction 4
2.2 Hybrid steel plate girders 4
2.1.1 Research programmes related to hybrid steel plate girders 6
2.1.2 Design provisions 13
2.3 Patch Loading in Plate Girders 15
2.3.1 Resistance of members subjected to compressive loads 15
2.3.2 Resistance of members subjected to concentrated loads 16
2.3.3 Experimental works. Retrospective 19
2.3.4 Critical buckling load 23
2.3.5 Empirical approaches of ultimate load capacity 24
2.3.6 Mechanical models 27
2.3.7 χ- forms 36
2.3.8 Interaction with bending moments 40
2.2.9 Design Provisions 41
2.4 Discussion 44
viii Preface
3. EXPERIMENTAL PROGRAMME 46
3.1 Introduction 46
3.2 Geometry 46
3.3 Material 47
3.4 Testing procedure 48
3.4.1 Instrumentation 49
3.5 Initial imperfections 52
3.6 Test results 54
3.6.1 Largely spaced transverse stiffeners (a/hw>2,0) 58
3.6.2 Closely spaced transverse stiffeners (a/hw<2,0) 62
3.6.3 Tests results vs. EN1993-1-5 66
3.7 Discussion 67
4. NUMERICAL MODEL 69
4.1 The Finite Element Method 69
4.1.1 Classical formulation of elastic solids 70
4.2 Material 72
4.2.1 Yield criterion, the von Mises criterion 73
4.2.2 Material hardening 75
4.2.3 Idealisation of the material 76
4.3 Geometry 77
4.3.1 Large displacement formulation in shells 81
4.4 Type of analyses 82
4.4.1 Nonlinear analysis 82
4.4.2 Eigenvalue prediction 84
4.5 Discussion 86
5. VALIDATION OF THE NUMERICAL MODEL 87
5.1 Introduction 87
5.2 EN1993-1-5. FE-analyses 88
5.3 Experimental vs. numerical results. Performed comparisons 89

ix Preface
5.4 Mesh design 90
5.5 Numerical modelling according to EN1993-1-5. Annex C 93
5.5.1 Initial geometrical imperfections 93
5.5.2 Initial structural imperfections 96
5.6 Influence of initial conditions. Results obtained 97
5.6.1 Influence of the shape of the initial imperfection 97
5.6.2 Influence of the structural imperfections 101
5.6.3 Influence of the magnitude of the maximum amplitude 103
5.7 Discussion 103
6. NUMERICAL DATABASE 107
6.1 Introduction 107
6.2 Parameters 107
6.2.1 Variation 108
6.3 Numerical results. Patch loading phenomena 109
6.3.1 Stocky girders 112
6.3.2 Slender girders 116
6.3.3 Very slender girders 118
6.3.4 Discussion of the results 119
6. 4 Numerical results. Hybrid steel plate girders 120
6.4.1 Largely spaced transverse stiffeners (ly<<a) 120
6.4.2 Closely spaced transverse stiffeners (ly>a) 123
6.5 Numerical results vs. EN1993-1-5 126
6.6 Discussion 132
7. RESISTANCE OF HYBRID STEEL PLATE GIRDERS TO CONCENTRATED LOADS 133
7.1 Introduction 133
7.2 Largely spaced transverse stiffeners 134
7.2.1 Influence of fyf/fyw 137
7.2.2 Influence of the relative flange stiffness 143
7.2.3 Influence of bf/tw 147
7.3 Closely spaced transverse stiffeners 150
7.3.1 Influence of transverse stiffeners 163

x Preface
7.3.2 Influence of the top flange resistance 168
7.3.3 New proposal 172
7.3.4 Influence of fyf/fyw 178
7.3.5 Summary 188
7.4 Discussion 189
8. DESIGN PROCEDURE ACCORDING TO APPROACH 190
8.1 New proposal 190
9. CONCLUSIONS AND SUGGESTION FOR FURTHER WORK 194
9.1 Discussion 194
9.2 Suggestions for further work 196
REFERENCES 198 ANNEXES 207
1 Chapter 1.Introduction
1. Introduction 1.1 Background
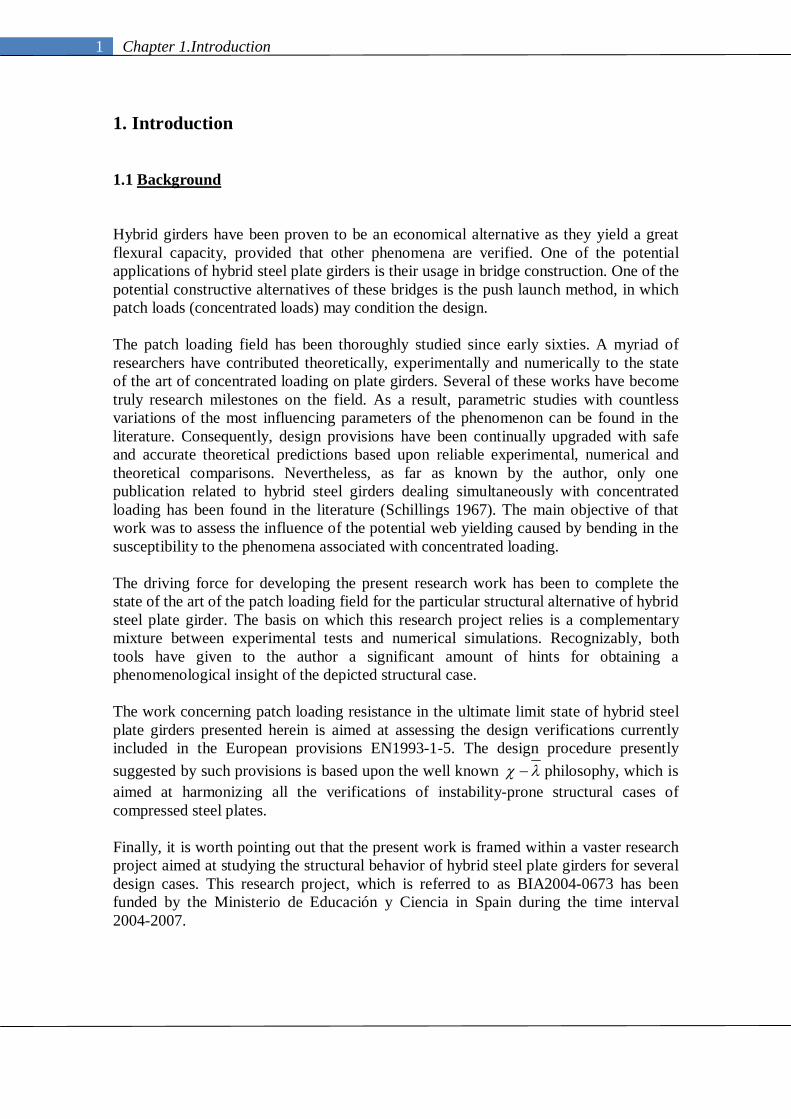
Hybrid girders have been proven to be an economical alternative as they yield a great flexural capacity, provided that other phenomena are verified. One of the potential applications of hybrid steel plate girders is their usage in bridge construction. One of the potential constructive alternatives of these bridges is the push launch method, in which patch loads (concentrated loads) may condition the design. The patch loading field has been thoroughly studied since early sixties. A myriad of researchers have contributed theoretically, experimentally and numerically to the state of the art of concentrated loading on plate girders. Several of these works have become truly research milestones on the field. As a result, parametric studies with countless variations of the most influencing parameters of the phenomenon can be found in the literature. Consequently, design provisions have been continually upgraded with safe and accurate theoretical predictions based upon reliable experimental, numerical and theoretical comparisons. Nevertheless, as far as known by the author, only one publication related to hybrid steel girders dealing simultaneously with concentrated loading has been found in the literature (Schillings 1967). The main objective of that work was to assess the influence of the potential web yielding caused by bending in the susceptibility to the phenomena associated with concentrated loading. The driving force for developing the present research work has been to complete the state of the art of the patch loading field for the particular structural alternative of hybrid steel plate girder. The basis on which this research project relies is a complementary mixture between experimental tests and numerical simulations. Recognizably, both tools have given to the author a significant amount of hints for obtaining a phenomenological insight of the depicted structural case. The work concerning patch loading resistance in the ultimate limit state of hybrid steel plate girders presented herein is aimed at assessing the design verifications currently included in the European provisions EN1993-1-5. The design procedure presently suggested by such provisions is based upon the well known philosophy, which is aimed at harmonizing all the verifications of instability-prone structural cases of compressed steel plates. Finally, it is worth pointing out that the present work is framed within a vaster research project aimed at studying the structural behavior of hybrid steel plate girders for several design cases. This research project, which is referred to as BIA2004-0673 has been funded by the Ministerio de Educación y Ciencia in Spain during the time interval 2004-2007.

2 Chapter 1.Introduction
1.2 Scope and limitations The scope of the work presented herein is:
To summarise the existing experimental tests on hybrid steel plate girders subjected to patch loading.
To perform an experimental programme on hybrid steel plate girders subjected to patch loading.
To assess the designer-assumed initial conditions suggested in EN1993-1-5 for the numerical modelling of plate girders when verifying the resistance to the particular case of concentrated loads.
To perform a parametric numerical study aimed at fulfilling the lack of data on hybrid girders subjected to concentrated loading.
To investigate whether the mechanism model developed for the yield resistance of plate girders subjected to concentrated loads proposed in EN1993-1-5 is relevant or not for the particular case of hybrid girders.
To formulate a design alternative for obtaining more accurately the resistance to patch loading of hybrid steel plate girders.
The following limitations were imposed to the work:
The patch loading resistance is investigated for steel I-plated girders only. The patch loading resistance is investigated for steel girders without longitudinal
stiffening. The study was limited to the patch loading resistance, i.e. opposite- and end-
patch loading phenomena were not dealt with. No specific attempts have been performed for the sake of studying the
deflections and/or other issues related to serviceability limit states of the girders. The study was limited to steel grades up to S460. Likewise, the hybrid factor
φh=fyf/fyw, was limited to 2,0, as suggested in EN1993-1-5. 1.3 Original features To the best of the author’s knowledge, the original topics of the present work are:
The results from eight tests on hybrid steel plate girders subjected to patch loading.
The results from around 350 numerical simulations on hybrid steel plate girders subjected to patch loading.
The analyses of the patch loading resistance of hybrid steel plate girders for the cases in which:
o The girders present largely spaced transverse stiffeners. o The girders present closed spaced transverse stiffeners.
For the aforementioned analyses, two original design procedures are proposed
throughout the present dissertation.

3 Chapter 1.Introduction
1.4 Outline and content
Chapter 2 presents a general view of the research dealing with the hybrid structural alternative and the particular load case of patch loading. First, a review of the hybrid girder usage is presented followed by a brief presentation of the currently implemented design guidelines. Second, a close examination of the patch loading phenomena is presented for stiffened plate girders. Finally, a match between both sections is performed and the current state-of-the-art of hybrid girders when subjected to patch loading is discussed. Chapter 3 presents a general description of the experimental programme performed in the Laboratori de Tecnologia d’Estructures (LTE). General features of the tested elements as well as general features of the testing procedures and instrumentation are described. For the sake of conciseness, solely remarkable results obtained in the whole experimental programme are presented and discussed. Chapter 4 is an attempt to bring together some concepts behind the various strands of work on structural modelling with which this research has been involved. This involvement has been on both the engineering and research sides with an emphasis of the production of accurate solutions for this particular practical problem. It has been recognised that the European design rules EN1993-1-5 allows the usage of FE-analyses as reliable tools in the verification of limit states of plated structures under certain designer-assumed initial conditions. Chapter 5 presents an assessment of the influence of these conditions on the ultimate load capacity of steel plate girders when subjected to patch loading. The basis of the research is a thorough comparison between experimental and numerical results. In Chapter 6, a numerical database of hybrid specimens subjected to patch loading is developed and presented. The prototypes are assembled following realistic proportions typically found in European steel and composite bridges. Results of ultimate load capacity obtained from 192 hybrid steel plate girders subjected to patch loading are obtained. Furthermore, results concerning their structural response are described (stresses, strains and deflections) and finally, statistical comparisons are included. Chapter 7 contains phenomenological insight of the resistance of hybrid steel plate girders when subjected to patch loading. The conclusions derived from this chapter are twofold. First, the influence of the fyf/fyw ratio (namely, the hybrid grade) is described for girders with largely spaced transverse stiffeners and second, for girders in which the transverse stiffeners are closely spaced. Chapter 8 includes a new calibration of the
resistance function with the
proposed modifications of the resistance depicted in previous chapters for the pool of hybrid girders subjected to concentrated loads described throughout this work. Recognizably, it has been decided to maintain the core of the dissertation in a simple but meaningful fashion. Consequently, additional data are annexed at the end of the work. Experimental and numerical results are appended as well as detailed information about the testing procedures and test data collected during the experimental programme.

4 Chapter 2. Review of the earlier work
2. Review of the earlier work
“No matter how many layers you penetrated, there was always still to come” Mikael Niemi, Popular Music
2.1 Introduction One of the potential applications of hybrid steel plate girders is their usage in bridge construction. Likewise, one of the potential constructive alternatives of these bridges is the push launch method, in which patch loads may condition the design. This constructive alternative has become increasingly popular in steel bridges construction (Fig. 2.1(a) and (b)). Hybrid girders have been proven to be an economical alternative as they yield a great flexural capacity, provided that other phenomena are verified. The aim of this chapter is to present a general view of the research dealing with these two subjects; the hybrid design alternative when subjected to the particular load case of patch loading. Firstly, a historical review about the hybrid girder usage is presented followed by a brief presentation of the currently implemented design guidelines. Secondly, a close examination of the patch loading phenomena is presented for stiffened plate girders. Finally, a match between both sections is performed and the current state-of-the-art of hybrid girders when subjected to patch loading is discussed. 2.2 Hybrid steel plate girders Plate girders are used when it is necessary for a structural element to support high loads, above which a normal rolled section would either not be structurally viable or would become uneconomical. Plate girders carry the load by means of flanges and webs made from plates that are welded together. Plate girders are generally assembled as I-shaped. The plates are stiffened against buckling by welding stiffeners transversally and/or longitudinally usually at a regular spacing along the sides of the plates. Typical applications include transfer beams in buildings and small- to medium-span bridges (Fig. 2.1 (a)). Likewise, vehicle and mobile crane girders are often assembled using welded plates as described. Plate girders have been the subject of profuse research world-wide in the last century.
Figure 2.1. Girders in medium-span launched bridges.
(a)Caracas-La Guaira Viaduct. Venezuela. (b) Sant Boi Viaduct. Spain

5 Chapter 2. Review of the earlier work
The construction industry is continuously updating its “structural palette”. New structural types are steadily included as suitable choices for the construction of new challenges. Recently, the introduction of new high strength steels is giving new options for the design of steel and composite structures. The main motivation for developing new high strength steels -hereafter referred to as HSS- is the need for a high strength-to-weight ratio which allows leading to achieve cost- and environmental-effective structures. Unfortunately, the construction industry is lagging behind other fields upon the use of HSS. Mainly, this lag is due to the lack of rigorous codes that penalise the use of new HSS. In Europe, until recent years Eurocode 3 has limited its scope to S460. Fortunately, a recently finished part 1-12 (EN1993-1-12) extends its scope to steels up to S700 and accordingly, these rules may be applicable.
Ever since that, HSS have been gaining ground as an economical and suitable alternative for its usage in plate girders (Johansson et al. 2005). There are new thermo-mechanical methods for processing thicker and longer plates than the former quenched-tempered methods. The thermo-mechanical methods have been considered extremely expensive so far; nonetheless, new technologies have recently led to reduce the economical gap existing between such processes.
Estimating prices within the steel industry has always been a quite intricate question. Random variables such as material prices and labour costs must be taken into account. Conclusive statements about economical issues within the steel construction field are far from accurate. Although, it is well recognised that even if the price of structural steel increases with its strength, if the structure is efficiently designed, the high strength alternative happens to be more economically sound than the conventional one.
One common practice to achieve economical alternatives for the design using HSS is the hybrid girder usage (Veljkovic et al. 2004). A girder is deemed as being hybrid when it is fabricated with different steel strengths for the flange and web panels. Strictly speaking, all girders assembled with different plates are potentially hybrid. Steel manufacturers usually guarantee a minimum strength of the plates but random values can be measured above this lower bound. If a girder, however, is deemed explicitly hybrid, the different strengths come as a result of a deliberate policy rather than accidentally. This type of girder is popular as the girder yields a greater flexural capacity at a lower cost compared to a homogeneous girder. The first proposal of hybrid design as a suitable weight and material-cost effective solution dates back to early forties (Wilson 1944) but it was not until early sixties, when Haaijer (1961) re-introduced this concept on his work about HSS. Formerly, the featured performance of those HSS was admittedly less attractive than nowadays. Ever since, hybrid design has proven economically sound when used in continuous bridges. A myriad of bridges have been designed world-wide using a hybrid girder structural solution. Mostly, these structures can be found in the United States. Several examples can be also found in Europe and Japan. Fig. 2.2 displays two bridges in which the cross-section is partially formed by an arrangement of hybrid steel plate girders.

6 Chapter 2. Review of the earlier work
(a) (b)
Figure 2.2 Bridges designed with hybrid steel plate girders. (a) South Carolina, U.S.A. (Fenkel et al. 2006); (b) Rångedala, Sweden (ComBri 2007)
Unfortunately, a fully achievement of the strength capacity on plate girders is not always feasible due to other concerns. The dead and live loads that act upon a structure during erection and/or service may result in excessive deformations. In fact, if the design of the plate girders is governed for instance, by deflections control, the hybrid alternative might not lead to any actual structural benefit. In any case, it may be concluded that if hybrid girders achieve more efficiently the same level of performance than homogeneous girders, their economical and environmental potential is assured. A plethora of research has been intended to analyse theoretically, experimentally and numerically the behaviour of hybrid steel plate girders. In the forthcoming section, a considerable number of research works are chronologically presented. 2.2.1 Research programmes related to hybrid steel plate girders. Hybrid girders were primarily used and studied in North America. The first published work was presented by Wilson (1944). The investigation focused on a beam with carbon steel in the web and an old type of steel for the flanges, namely, the silicon steel. Oddly enough, the most intensive experimental and theoretical development was concentrated to a short period of time between the sixties and mid-seventies. The interest in hybrid girder usage dwindled during the eighties and nineties, this fact seemingly due to economical reasons existing at that time, e.g., high material prices. With the advent of the new century, though, hybrid girders have been newly launched. The recent economical conditions have been encouraging the hybrid design as the structures are less material-cost sensitive. The first extensive theoretical and experimental work describing the behaviour of hybrid steel plate girders was presented by Frost et al. (1964). These authors analysed the behaviour of hybrid girders under pure bending and combined shear and bending both theoretically and experimentally. It is worth mentioning that the first design rules concerning hybrid girders of ASCE-AASHTO (1968) were based upon that work.

7 Chapter 2. Review of the earlier work
In order to analyse pure bending, a development of a fully plastic condition in a hypothetical four-stepped moment versus curvature path was presented (Fig 2.4). A meaningful definition of ultimate strength for bending, based on the concept of the moment causing first yielding of the flanges, was proposed. At the point the flanges started to yield (Step 2, Φ=Φ’’), the web would have reached its maximum strength. Subsequently, the whole cross-section was expected to gradually yield until reaching a fully plastic condition. The theoretical approach presented by the authors was correctly compared with a conducted experimental programme. The tested girders were adequately braced for the sake of avoiding any instability. The relative error between both results was judged as being tolerable and the model was considered accurate. Furthermore, Frost and his co-worker found that the maximum shear strength could be considered as the strength causing the web to become fully plastic independently from longitudinal stresses, i.e., for design purposes, it was satisfactory for hybrid girders to be independently verified for bending and shear loads. The drawn conclusions were based upon moment versus shear interaction plots.
Figure 2.4 Distribution of strain, stress and yielding. Theoretical moment vs. curvature. Frost et al (1964).
Subsequently, Schillings (1967) presented the first and only found publication related to hybrid steel girders dealing with concentrated loading. The main objective of this work was to assess the influence of the potential web yielding caused by bending in the susceptibility to the phenomena associated with concentrated loading. As one can observe in Fig. 2.4, the web is yield-prone before any evidence of flange yielding. In order to assess this susceptibility, Schillings performed two tests on the same hybrid

8 Chapter 2. Review of the earlier work
specimen. Firstly, a transverse compressive load was applied on the compression flange and secondly, the transverse load was applied on the tension flange. The tests showed that concentrated loads can be applied in either tension or compression flanges even when the longitudinal stress in the flange is close to its yield strength. Ultimate load was defined as the load in which linearity of the load-displacement plot was no longer observable. It can be, however, inferred from the experimental observations described by Schillings that those girders were able to undergo higher load capacities than those defined by the authors. The crippling load Pc was defined by Schillings, according to eq. 2.1, as the bearing length, times the web-thickness, times the yield strength of the web.
wywsc tfSP ·· (2.1) Ever since, refinements have been properly implemented in codes and nowadays the crippling load substantially differs from the one stated in that publication. Further on section 2.3, several definitions of resistance to concentrated loads are presented.
Figure 2.5 Stresses in hybrid beams under transverse loads. Schillings (1967)
Sequentially, Schillings (1968) introduced a theoretical approach on one potential application of hybrid girders by adding a concrete slab (composite hybrid girder). In this work, approximate design formulae were proposed. Furthermore, technical comparisons between both composite homogeneous and hybrid girders were presented. In the same year, Carskaddan (1968) presented a work related to instability of unstiffened hybrid girders. This investigation was specifically conducted for the sake of determining the maximum web-slenderness ratio that could be used for an unstiffened hybrid girder without having any instability problem. Firstly, a theoretical approach was developed by means of an energy analysis and secondly, an experimental programme was carried out. The theoretical study indicated that, for high bending stresses, web yielding dramatically reduces the web stiffness and accordingly, the resistance to shear buckling. Contrarily, the experimental programme showed considerable greater ultimate loads than those predicted theoretically.

9 Chapter 2. Review of the earlier work
In 1971, a working commission reported several studies related to the design of plate and box girders for ultimate strength in an IABSE colloquium. Within this report, Maeda (1971) presented an experimental programme on four full-scaled longitudinally stiffened hybrid plate girders subjected to bending loads. The main variable of study was the web slenderness. Some conclusions about the failure modes and the post-buckling strength of the longitudinally stiffened hybrid and non-hybrid girders were pinpointed. Subsequently, a leap-forward approach concerning stability of hybrid girders was presented by Nethercot (1976). That work was focused on studying the elastic and inelastic buckling of hybrid steel plate girders. The author used general numerical techniques for the sake of assessing the drawn objectives. The results obtained within the research showed that early yielding of the web had relatively little effect upon the lateral stability of the girder. Residual stresses, however, remained a variable with a significant effect on this particular situation. Thereafter, during a long span between the eighties and nineties, scarce works related to hybrid steel plate girders were published. Seemingly, economy ruled the structural choice in detriment of the hybrid alternative. Nevertheless, in some countries like Sweden, the hybrid alternative has been continuously investigated. In the frame of several investigations performed at the SBI, a Swedish think-tank in steel research, a quite extensive rule-of-thumb manual was presented by Åhlenius (1994). A remarkable sum-up of several experimental programmes carried out especially in the United States can be found in this work. The handbook is focused in the calculation of bending moment resistance, shear resistance and their pertinent interactions. Verifications concerning fatigue design can be also found within this handbook. Recently, Barker et al. (2000) explored the potential benefits of HSS girder bridges by studying six different alternatives of design. Within this work, an alternative considering hybrid girders was also assessed. Admittedly, the hybrid design showed the potential benefits of using HSS in bridges. Not only weight savings but also considerable cost savings were pinpointed within this work. Table 2.1 summarises some drawn conclusions worth pointing out. Three different bridge girders were compared in terms of weight and total cost. Firstly, a homogeneous 50W steel girder (fy=345 N/mm2), secondly, a homogeneous 70W HPS girder (fy=485 N/mm2) and finally, a hybrid design using 70W steel for the flanges and 50W steel for the web (fyf/fyw=1,40). All the alternatives being studied were judged to be comparable. Primarily, total steel weight of the girders as well as total costs including the material, erection and transport were compared.
50W 310,5 Base 505132,00 Base70W 270,6 -12,85 550036,00 8,89
Hybrid design 276,7 -10,89 449591,00 -11,00
Cost savings(%)
Design alternative
Steel weight(tonnes)
Total cost ($)
Weight savings (%)
Table 2.1 Comparison between three design alternatives using steel girders.
Barker et al. (2000)
10 Chapter 2. Review of the earlier work
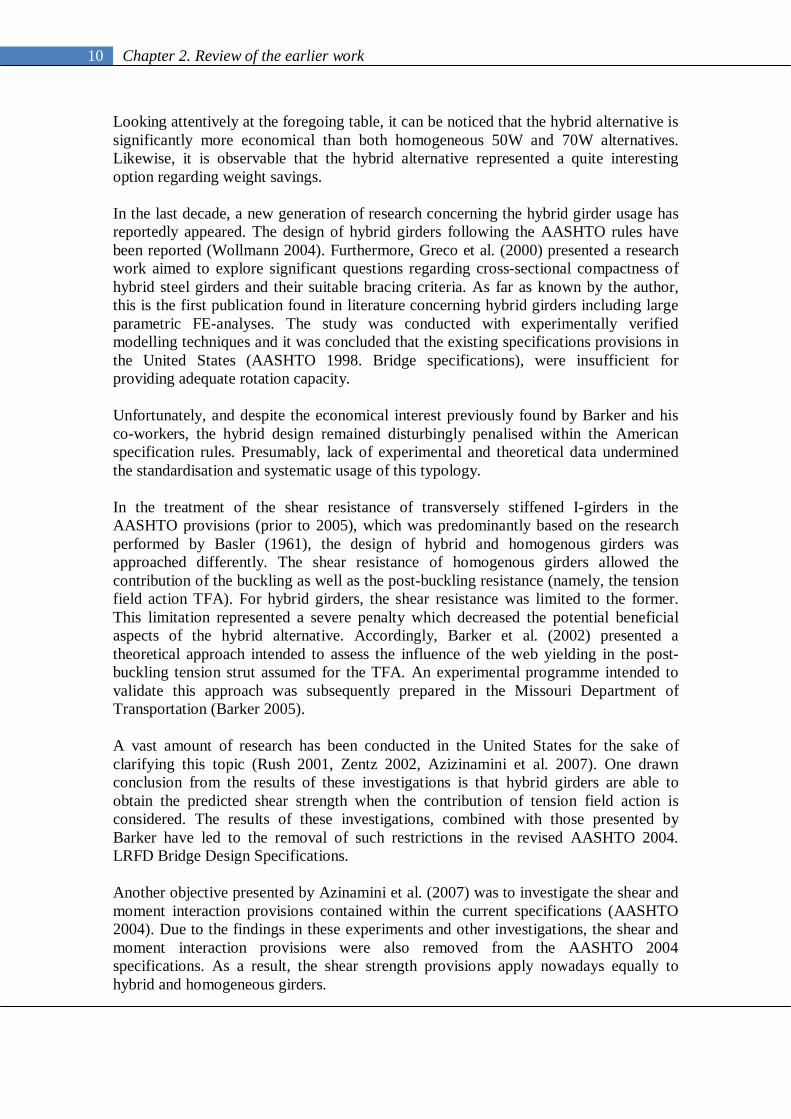
Looking attentively at the foregoing table, it can be noticed that the hybrid alternative is significantly more economical than both homogeneous 50W and 70W alternatives. Likewise, it is observable that the hybrid alternative represented a quite interesting option regarding weight savings. In the last decade, a new generation of research concerning the hybrid girder usage has reportedly appeared. The design of hybrid girders following the AASHTO rules have been reported (Wollmann 2004). Furthermore, Greco et al. (2000) presented a research work aimed to explore significant questions regarding cross-sectional compactness of hybrid steel girders and their suitable bracing criteria. As far as known by the author, this is the first publication found in literature concerning hybrid girders including large parametric FE-analyses. The study was conducted with experimentally verified modelling techniques and it was concluded that the existing specifications provisions in the United States (AASHTO 1998. Bridge specifications), were insufficient for providing adequate rotation capacity. Unfortunately, and despite the economical interest previously found by Barker and his co-workers, the hybrid design remained disturbingly penalised within the American specification rules. Presumably, lack of experimental and theoretical data undermined the standardisation and systematic usage of this typology. In the treatment of the shear resistance of transversely stiffened I-girders in the AASHTO provisions (prior to 2005), which was predominantly based on the research performed by Basler (1961), the design of hybrid and homogenous girders was approached differently. The shear resistance of homogenous girders allowed the contribution of the buckling as well as the post-buckling resistance (namely, the tension field action TFA). For hybrid girders, the shear resistance was limited to the former. This limitation represented a severe penalty which decreased the potential beneficial aspects of the hybrid alternative. Accordingly, Barker et al. (2002) presented a theoretical approach intended to assess the influence of the web yielding in the post-buckling tension strut assumed for the TFA. An experimental programme intended to validate this approach was subsequently prepared in the Missouri Department of Transportation (Barker 2005). A vast amount of research has been conducted in the United States for the sake of clarifying this topic (Rush 2001, Zentz 2002, Azizinamini et al. 2007). One drawn conclusion from the results of these investigations is that hybrid girders are able to obtain the predicted shear strength when the contribution of tension field action is considered. The results of these investigations, combined with those presented by Barker have led to the removal of such restrictions in the revised AASHTO 2004. LRFD Bridge Design Specifications. Another objective presented by Azinamini et al. (2007) was to investigate the shear and moment interaction provisions contained within the current specifications (AASHTO 2004). Due to the findings in these experiments and other investigations, the shear and moment interaction provisions were also removed from the AASHTO 2004 specifications. As a result, the shear strength provisions apply nowadays equally to hybrid and homogeneous girders.

11 Chapter 2. Review of the earlier work
Recently, Barth et al. (2007) presented numerical studies intended to investigate the applicability of the current AASHTO Specifications for hybrid HSS 100W I-Girders (this corresponds to fyf=690 N/mm2). The investigation was carried out through extensive FE-analyses, using a matrix of hypothetical I-girders typical of those routinely employed in bridge design. In this research, the authors recommended to remove the conservative limitations currently imposed in the American specifications for the maximum allowable nominal yield stress (see 2.2.2; Design provisions). Likewise, the study showed that hybrid girders are able to produce considerable weight savings over homogenous girders (see Fig. 2.6).
0
50
100
150
200
250
0 10 20 30 40 50
Wei
ght o
f gir
der (
Tonn
es)
Span-to-Depth Ratio
Hybrid HSS 690W Design
HSS 480W Design
Fig 2.6 Comparison of hybrid HSS 690W (fyf=690 N/mm2 fyw=480 N/mm2) design with
480W (480 N/mm2) designs. Barth et al. (2007)
In Europe, hybrid girders have been investigated at Luleå University of Technology as a part of a larger project concerning a plastic design of slender bridge girders (Veljkovic and Johansson (2004), Johansson and Collin (2005)). This project was co-partnered by the CTICM (Bitar et al (2003), Bitar (2003)). The question was whether or not the current codes concerning homogeneous plate girders could be directly extrapolated to hybrid girders. For this purpose, a very extensive summary of existing experimental data for welded I hybrid girders was used. Typical verifications usually performed in plate girders such as the determination of cross-section class, bending resistance, shear resistance, transverse forces and fatigue were assessed. Likewise, serviceability requirements were studied within the project. For the sake of achieving a suitable design, recommendations were suggested for both resistance and serviceability reasons in hybrid girder usage. Conclusions derived from those works stated that the design of hybrid steel girders may be performed with the rules for homogeneous plated structures found on EN1993-1-5 with some minor modifications and limitations (see 2.2.2, Design provisions). Recently, in the frame of a research programme of the Research Fund for Coal and Steel, namely, the ComBri project (2007), several comparisons and appraisals of the

12 Chapter 2. Review of the earlier work
common praxis in European bridges were included. The usage of HSS and hybrid design was, among other things, studied. Table 2.2 shows the current treatment some European countries present towards HSS and the design of hybrid girders (the table shows whether this alternative is allowable or not).
Road bridges Rail bridgesBelgium S355- S460 S355 allowed but not usedFrance S460 S355 No
Germany S355- S460 S355 YesSpain S460 S355 No
Sweden S690 S420 Yes
Highest steel grade Hybrid girders allowance
Country
Table 2.2 Summary of European requirements for bridges. COMBRI project (2007)
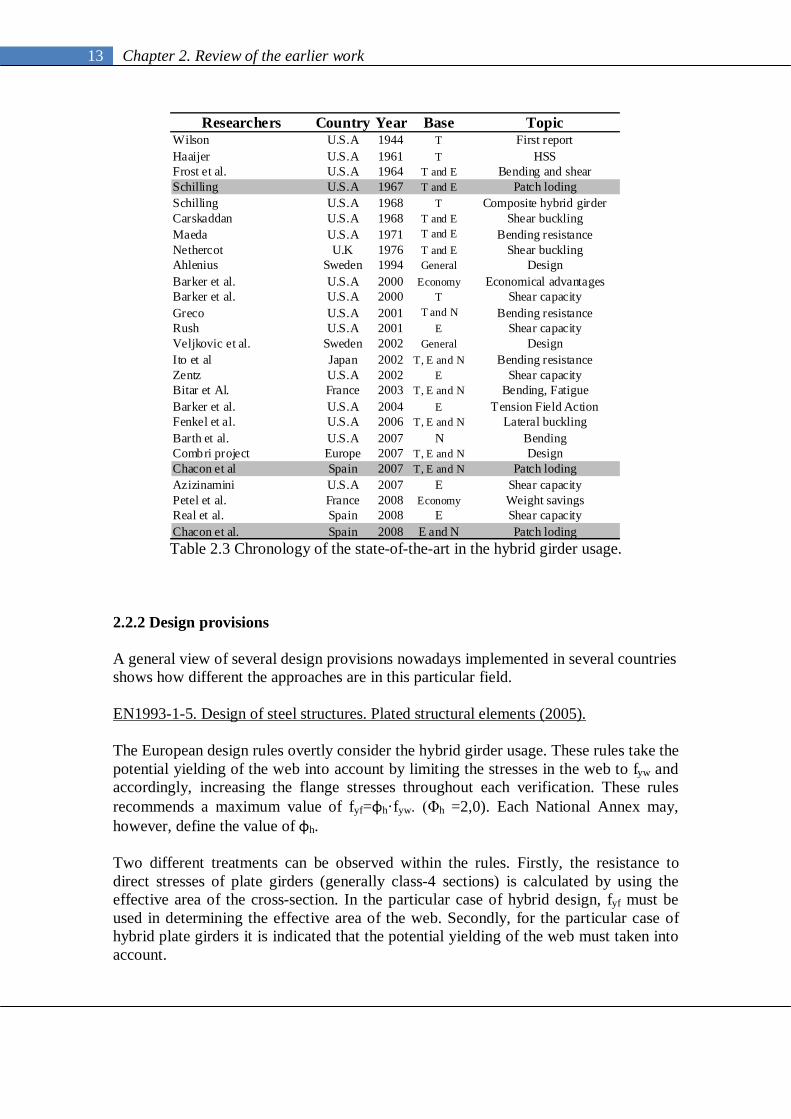
In Japan, hybrid girder usage has also been considered as a suitable choice for slender plate bridge girders and some reports have been found in literature, especially those concerning the rotation capacity of hybrid beams (Ito et al. 2005) Very recently, some authors (Fenkel et al. 2006) have conducted in-situ optical measurements, experimental tests and analytical investigations on full- and half-scale hybrid specimens. Other authors (Petel et al. 2008) have shown the potential advantages regarding weight savings that provide the hybrid girder usage when applying the EN1993-1-5 provisions. Moreover, shear buckling resistance has also been studied within the frame of a recently finished research project performed in the Construction Engineering Department of the Universitat Politècnica de Catalunya (Real et al. 2008). Several tests on hybrid steel plate girders subjected to shear were performed. The results were used for assessing the predicted ultimate load capacity of such girders according to several design codes. Likewise, within the frame of the same project, the field of patch loading on hybrid steel plate girders have been also tackled. First, test reports on hybrid girders subjected to patch loading have been reported (Chacon et al. 2007) and second, these tests have been used as benchmarks for validating subsequent numerical studies (Chacon et al. 2008). The latter have been useful for validating the potential usage of FE-analyses according to EN1993-1-5-Annex C, for the particular case of plate girders subjected to concentrated loading. Table 2.3 summarises chronologically the presented history of the hybrid girder usage. The nature of each conducted research is indicated, namely, the theoretical (T), experimental (E) and numerical (N) studies. The studies that are focused on studying the resistance of hybrid girders to concentrated loading are highlighted within the table.
13 Chapter 2. Review of the earlier work
Researchers Country Year Base TopicWilson U.S.A 1944 T First reportHaaijer U.S.A 1961 T HSSFrost et al. U.S.A 1964 T and E Bending and shearSchilling U.S.A 1967 T and E Patch lodingSchilling U.S.A 1968 T Composite hybrid girderCarskaddan U.S.A 1968 T and E Shear bucklingMaeda U.S.A 1971 T and E Bending resistanceNethercot U.K 1976 T and E Shear bucklingAhlenius Sweden 1994 General DesignBarker et al. U.S.A 2000 Economy Economical advantagesBarker et al. U.S.A 2000 T Shear capacityGreco U.S.A 2001 T and N Bending resistanceRush U.S.A 2001 E Shear capacityVeljkovic et al. Sweden 2002 General DesignIto et al Japan 2002 T, E and N Bending resistanceZentz U.S.A 2002 E Shear capacityBitar et Al. France 2003 T, E and N Bending, FatigueBarker et al. U.S.A 2004 E Tension Field ActionFenkel et al. U.S.A 2006 T, E and N Lateral bucklingBarth et al. U.S.A 2007 N BendingCombri project Europe 2007 T, E and N DesignChacon et al Spain 2007 T, E and N Patch lodingAzizinamini U.S.A 2007 E Shear capacityPetel et al. France 2008 Economy Weight savingsReal et al. Spain 2008 E Shear capacityChacon et al. Spain 2008 E and N Patch loding Table 2.3 Chronology of the state-of-the-art in the hybrid girder usage.
2.2.2 Design provisions A general view of several design provisions nowadays implemented in several countries shows how different the approaches are in this particular field. EN1993-1-5. Design of steel structures. Plated structural elements (2005). The European design rules overtly consider the hybrid girder usage. These rules take the potential yielding of the web into account by limiting the stresses in the web to fyw and accordingly, increasing the flange stresses throughout each verification. These rules recommends a maximum value of fyf=φh·fyw. (Φh =2,0). Each National Annex may, however, define the value of φh. Two different treatments can be observed within the rules. Firstly, the resistance to direct stresses of plate girders (generally class-4 sections) is calculated by using the effective area of the cross-section. In the particular case of hybrid design, fyf must be used in determining the effective area of the web. Secondly, for the particular case of hybrid plate girders it is indicated that the potential yielding of the web must taken into account.
14 Chapter 2. Review of the earlier work
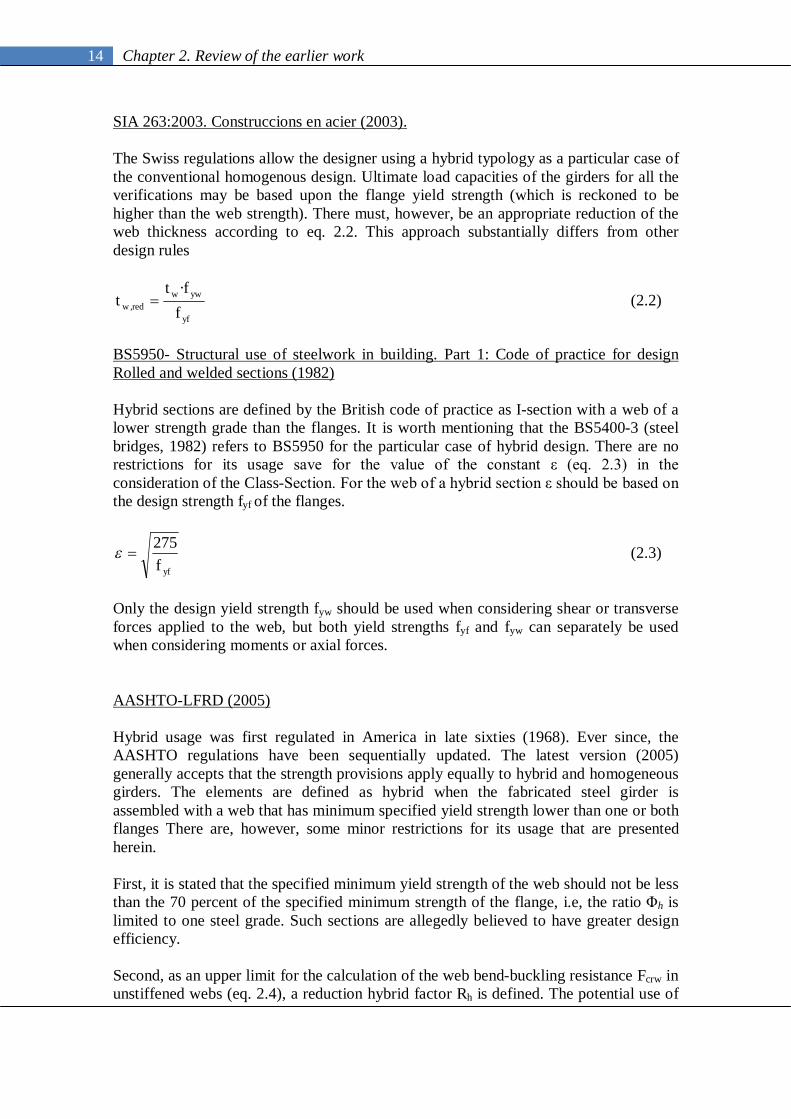
SIA 263:2003. Construccions en acier (2003). The Swiss regulations allow the designer using a hybrid typology as a particular case of the conventional homogenous design. Ultimate load capacities of the girders for all the verifications may be based upon the flange yield strength (which is reckoned to be higher than the web strength). There must, however, be an appropriate reduction of the web thickness according to eq. 2.2. This approach substantially differs from other design rules
yf
ywwredw f
ftt
·, (2.2)
BS5950- Structural use of steelwork in building. Part 1: Code of practice for design Rolled and welded sections (1982) Hybrid sections are defined by the British code of practice as I-section with a web of a lower strength grade than the flanges. It is worth mentioning that the BS5400-3 (steel bridges, 1982) refers to BS5950 for the particular case of hybrid design. There are no restrictions for its usage save for the value of the constant ε (eq. 2.3) in the consideration of the Class-Section. For the web of a hybrid section ε should be based on the design strength fyf of the flanges.
yff275
(2.3)
Only the design yield strength fyw should be used when considering shear or transverse forces applied to the web, but both yield strengths fyf and fyw can separately be used when considering moments or axial forces. AASHTO-LFRD (2005) Hybrid usage was first regulated in America in late sixties (1968). Ever since, the AASHTO regulations have been sequentially updated. The latest version (2005) generally accepts that the strength provisions apply equally to hybrid and homogeneous girders. The elements are defined as hybrid when the fabricated steel girder is assembled with a web that has minimum specified yield strength lower than one or both flanges There are, however, some minor restrictions for its usage that are presented herein. First, it is stated that the specified minimum yield strength of the web should not be less than the 70 percent of the specified minimum strength of the flange, i.e, the ratio Φh is limited to one steel grade. Such sections are allegedly believed to have greater design efficiency. Second, as an upper limit for the calculation of the web bend-buckling resistance Fcrw in unstiffened webs (eq. 2.4), a reduction hybrid factor Rh is defined. The potential use of

15 Chapter 2. Review of the earlier work
Fcrw greater than the specified value of fyw in hybrid sections is justified since the flange tends to restrain the longitudinal strain associated with bend-buckling for nominal compression-flange stresses up to Rh·Fyc. The parameter is defined in eq. 2.5 and it is necessary in lieu of an alternative rational analysis.
70f
FR
th
kE90F yw
ych2
w
w
bcrw ,
···,
(2.4)
212312R
3
h
·
(2.5)
fn
ww
Ath ·
(2.6)
The term is defined as the smallest value between 1,0 and fyw/fyf. In eq. 2.6, Afn is defined as the sum of the flange area and the area of any cover plates on the side of the neutral axis corresponding to hw/2 . 2.3 Patch Loading in Plate Girders. 2.3.1 Resistance of members subjected to compressive loads The resistance of members subjected to compressive loads has been a main subject of study in steel structures. Structural design is normally concerned with the determination of stresses based upon the assumption that stable equilibrium exists. However, if the level of stress surpasses a certain value, the plate may start to buckle and instability may govern the design. Scientists of the first part of twentieth century erected a frame for instability that continues to command general assent. There is an extensive amount of literature dealing with the resistance of compressed steel members and it is beyond the scope of this thesis to review this literature to any larger extent. Even though the thought is too well known to be worth writing out, it is considered important to mention the first works dealing with plate stability. Dating back to nineteenth century, the work of Bryan (1891) could arguably be defined as the first publication related to the solution of a plate with two opposites sides carrying compressive loads. The same problem was later solved by Timoshenko in his life-long studies (summarised thoroughly in Timoshenko (1961)). This latter work gained reputation as one of the most comprehensive approaches of plates stability ever published. Further, with this paved way, von Kármán (1932) and Winter (1940) intensified the work with determining the plate buckling and the ultimate load resistance of a perfectly flat compressed plate by deriving the equations of the phenomena and by introducing the concept of effectively compressed width.
16 Chapter 2. Review of the earlier work
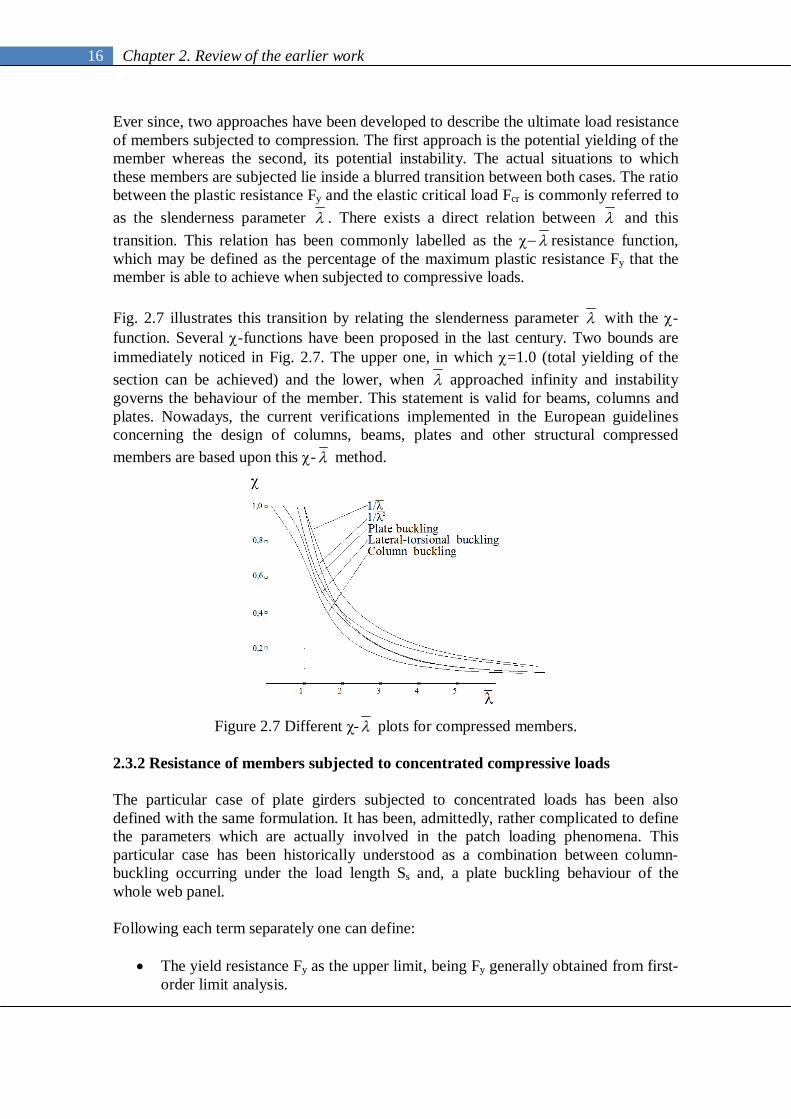
Ever since, two approaches have been developed to describe the ultimate load resistance of members subjected to compression. The first approach is the potential yielding of the member whereas the second, its potential instability. The actual situations to which these members are subjected lie inside a blurred transition between both cases. The ratio between the plastic resistance Fy and the elastic critical load Fcr is commonly referred to as the slenderness parameter . There exists a direct relation between and this transition. This relation has been commonly labelled as the resistance function, which may be defined as the percentage of the maximum plastic resistance Fy that the member is able to achieve when subjected to compressive loads. Fig. 2.7 illustrates this transition by relating the slenderness parameter with the -function. Several -functions have been proposed in the last century. Two bounds are immediately noticed in Fig. 2.7. The upper one, in which =1.0 (total yielding of the section can be achieved) and the lower, when approached infinity and instability governs the behaviour of the member. This statement is valid for beams, columns and plates. Nowadays, the current verifications implemented in the European guidelines concerning the design of columns, beams, plates and other structural compressed members are based upon this - method.
Figure 2.7 Different χ- plots for compressed members.
2.3.2 Resistance of members subjected to concentrated compressive loads The particular case of plate girders subjected to concentrated loads has been also defined with the same formulation. It has been, admittedly, rather complicated to define the parameters which are actually involved in the patch loading phenomena. This particular case has been historically understood as a combination between column-buckling occurring under the load length Ss and, a plate buckling behaviour of the whole web panel. Following each term separately one can define:
The yield resistance Fy as the upper limit, being Fy generally obtained from first-order limit analysis.
17 Chapter 2. Review of the earlier work
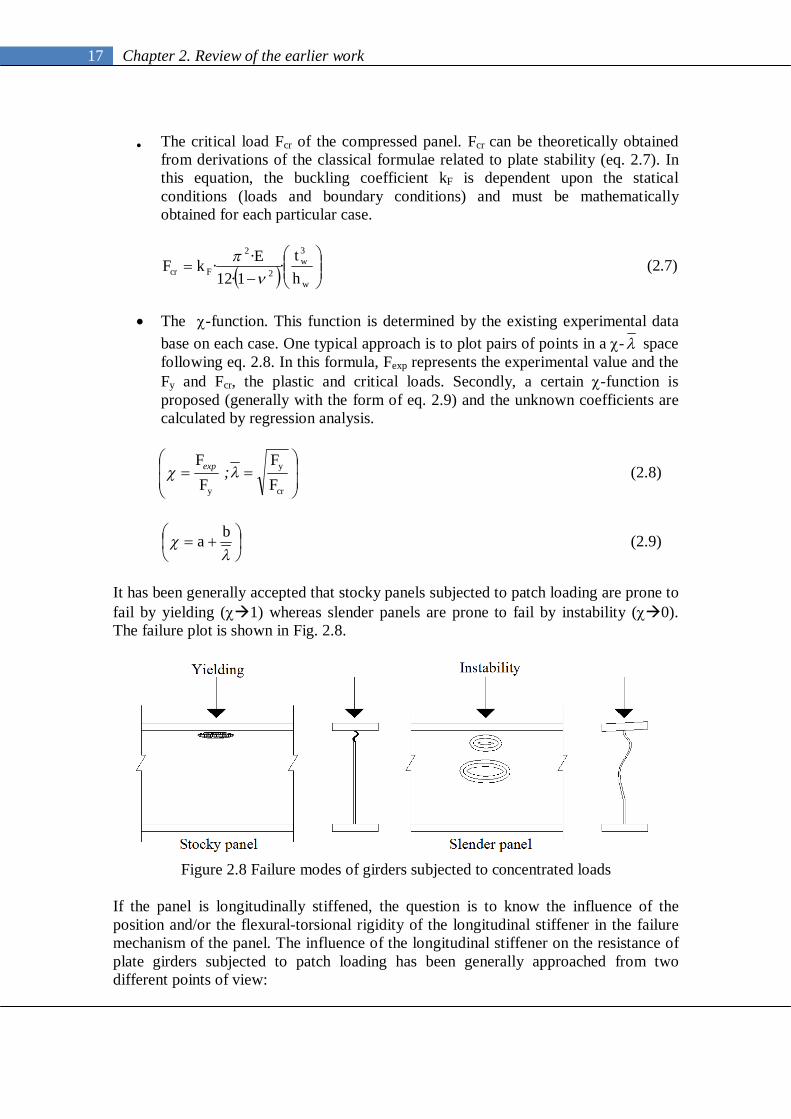
The critical load Fcr of the compressed panel. Fcr can be theoretically obtained
from derivations of the classical formulae related to plate stability (eq. 2.7). In this equation, the buckling coefficient kF is dependent upon the statical conditions (loads and boundary conditions) and must be mathematically obtained for each particular case.
w
3w
2
2
Fcr ht
112EkF ·
···
(2.7)
The -function. This function is determined by the existing experimental data base on each case. One typical approach is to plot pairs of points in a - space following eq. 2.8. In this formula, Fexp represents the experimental value and the Fy and Fcr, the plastic and critical loads. Secondly, a certain -function is proposed (generally with the form of eq. 2.9) and the unknown coefficients are calculated by regression analysis.
cr
y
y FF
FF
;exp (2.8)
ba (2.9)
It has been generally accepted that stocky panels subjected to patch loading are prone to fail by yielding (1) whereas slender panels are prone to fail by instability (0). The failure plot is shown in Fig. 2.8.
Figure 2.8 Failure modes of girders subjected to concentrated loads
If the panel is longitudinally stiffened, the question is to know the influence of the position and/or the flexural-torsional rigidity of the longitudinal stiffener in the failure mechanism of the panel. The influence of the longitudinal stiffener on the resistance of plate girders subjected to patch loading has been generally approached from two different points of view:

18 Chapter 2. Review of the earlier work
The panel is treated as unstiffened and subsequently, a fs factor is defined. This
factor increases the resistance of the unstiffened panel in a percentage which is a function of the longitudinal stiffener itself and its position within the panel (eq. 2.10)
dunstiffeneusstiffenedu FfF ,, · (2.10)
The panel is treated as stiffened and as such, its geometrical conditions can be
changed in the definition of Fcr. This approach also leads to a certain increment of Fu as a function of the stiffener and its position.
Extensive experimental, numerical and theoretical investigations concerning compressive concentrated loads on both stiffened and unstiffened panels have been published. Relatively recent works summarise profusely these investigations. The first summary works were presented by Lagerqvist (1994, 1995, 1996). Transversally stiffened girders are thoroughly studied when subjected to different sorts of concentrated loading. Subsequently, Graciano (2002) and Davaine (2005), presented their Doctoral Thesis concerning longitudinally stiffened plate girders. The concepts developed in the first two works were intended to harmonise the guidelines concerning plate girders subjected to patch loading to the described χ- form. Excellent reviews of the prior work can be found as well as remarkable summaries of experimental programmes dealing with both transversally and longitudinally stiffened panels. As a matter of fact, it was early established that the most important parameters for predicting the ultimate load capacity of girders subjected to concentrated loads are the web thickness tw and its yield strength fyw. The first publication related to the problem in concern dates back to late forties (Hendry 1949). Stress distributions in the local vicinity of the applied patch load were studied experimentally and photo-elastically by testing a few small scale tests. Afterwards, in the sixties, results from seven individual tests on girders subjected to patch loading were reported at Chalmers University, Sweden (Granholm 1960). Reportedly, the yield strength of the web was 275 N/mm2 and that of the flange 343 N/mm2. That is to say, perhaps without a deliberate policy, the first tested plate girders subjected to patch loading were hybrid. The conclusions drawn by Granholm in this first research pointed eq. 2.11 as being accurately valid. Oddly enough, the formula disregarded any interaction and was independent from hw, fyw and fyf.
2wu t850F ·, (2.11)
Ever since, a myriad of researchers have contributed theoretically, experimentally and numerically to the patch loading field. A considerable amount of publications as well as state-of-the-art reports dealing with this particular subject can be found on literature. It is a rather intricate task to summarise comprehensively and chronologically all the works reported world-wide. Consequently, rather than giving undue emphasis to the whole field, this section only focuses on the contributions in which, accidentally or not, the different steel grades fyf and fyw of the plates are taken into account.

19 Chapter 2. Review of the earlier work
2.3.3 Experimental works. Retrospective Hundreds of girders subjected to patch loading have been reported throughout the last century. In their doctoral theses, Lagerqvist (1994), Graciano (2002) and Davaine (2005) presented exhaustive summaries of the patch loaded girders tested either in Universities or steel research think-tanks around the world. These tests, added to new contributions presented so far (Seitz et al. 2004, Gozzi 2007, Clarin 2007), give an experimental frame of 400-odd plate girders subjected to patch loading. It is beyond the scope of this work to present the whole extent of this database. A sample of hybrid girders is extracted from the whole population though. In order to define the scope of the word hybrid in this section, the girders are considered as such whether the ratio fyf/fyw is greater than 1,25 (which is approximately equivalent to one steel grade of difference, e.g., 460/355). It is important to point out that if a small tolerance were strictly adopted, almost all the girders with different plate thickness in web and flanges would be classified as hybrid. Table 2.4 shows the pool of unstiffened hybrid steel plate girders subjected to patch loading found in the literature. A total amount of 72 girders tested by several authors can be included within this category. Table 2.5 shows the longitudinally stiffened girders. 32 specimens have been encountered among the whole population. For the latter, the vast majority of tests were performed by the same research group. Details of stiffened and unstiffened specimens are appended in Annex A.
Researcher Year Number of tests fyf/fyw a/hw hw/tw Ss/hw Ss/aBamm et al. 1983 3 1,40-1,49 3,30 69,75 0,06-0,13 0,02-0,04Granholm 1960 7 1,25 13,80 126-263 0,00-0,20 0,00-0,06Schillings 1967 2 2,50 7,00-13,00 36 0,27 0,019-0,037
Bossert et al 1967 6 1,27-1,29 0,80-1,60 294 0,80-1,60 1,00Bergfelt 1979 14 1,31-2,65 0,60-3,40 227-241 0,00-0,14 0,00-0,25Bergfelt 1983 18 1,25-1,38 1,38-8,00 150-400 0,05-0,40 0,013-0,13
Roberts et al. 1981-1988 22 1,25-1,59 0,80-2,40 81-500 0,06-0,20 0,07-0,08 Table 2.4 Transversally stiffened hybrid steel plate girders
Resercher Year Number of tests fyf/fyw b1/hw b1/a a/hw hw/tw Ss/hw Ss/aJanus et al 1980-1988 28 1,44-2,22 0,09-0,50 0,05-0,50 1,00-2,00 2,08-252 0,01-0,02 0,01
Markovic et al. 1992 4 1,27 0,15-0,85 0,15-0,85 1,00 166,66 0,01 0,01 Table 2.5 Longitudinally stiffened hybrid steel plate girders Noticeably, a non negligible amount of hybrid steel plate girders have been already tested. Presumably, in some cases, it is an accidental fact. The only experimental programme intended to evaluate the response of a hybrid girder subjected to patch loading is the one presented by Schillings (1967). Reportedly, these tests were performed on fairly stocky panels (hw/tw=36). Furthermore, in this particular case, the fyf/fyw ratio was admittedly extreme. Fig. 2.9 shows a histogram of frequencies developed on several categories of the fyf/fyw ratio. Categories ranging from 1,25 to 2,35 are sketched within the plot for both transversally and longitudinally stiffened webs. It is noticeable that for transversally
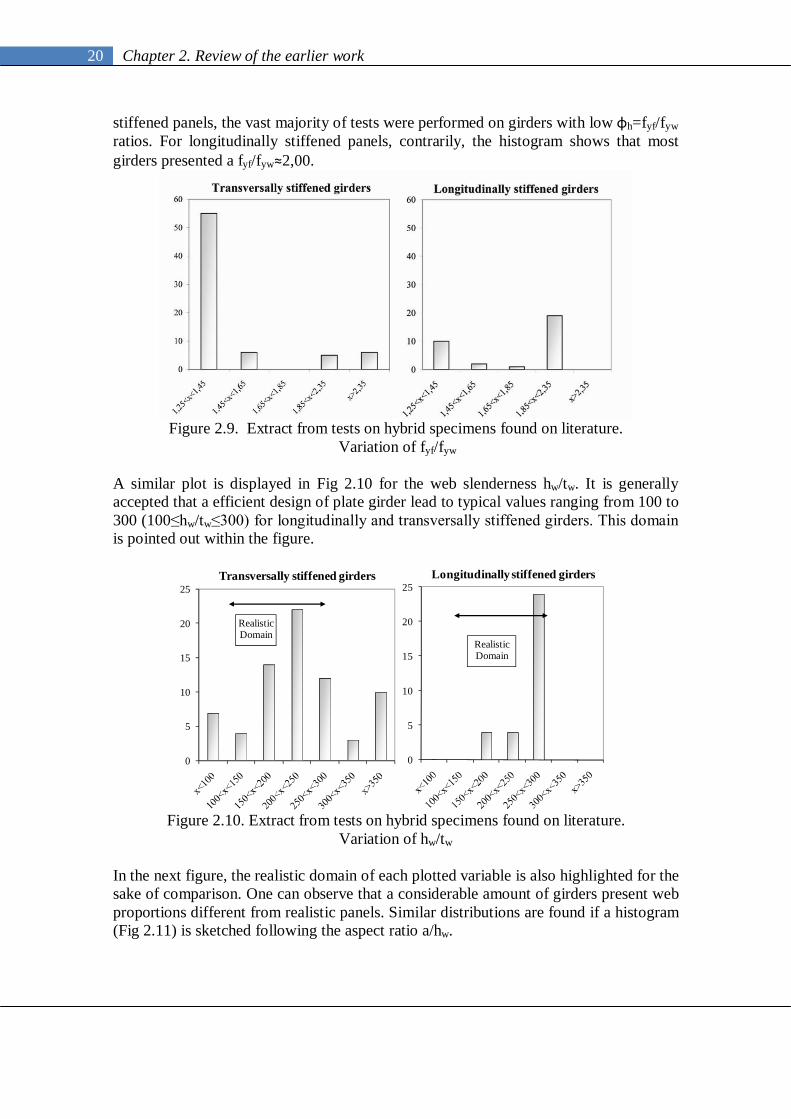
20 Chapter 2. Review of the earlier work
stiffened panels, the vast majority of tests were performed on girders with low φh=fyf/fyw ratios. For longitudinally stiffened panels, contrarily, the histogram shows that most girders presented a fyf/fyw≈2,00.
Figure 2.9. Extract from tests on hybrid specimens found on literature.
Variation of fyf/fyw
A similar plot is displayed in Fig 2.10 for the web slenderness hw/tw. It is generally accepted that a efficient design of plate girder lead to typical values ranging from 100 to 300 (100≤hw/tw≤300) for longitudinally and transversally stiffened girders. This domain is pointed out within the figure.
0
5
10
15
20
25Transversally stiffened girders
RealisticDomain
0
5
10
15
20
25Longitudinally stiffened girders
RealisticDomain
Figure 2.10. Extract from tests on hybrid specimens found on literature.
Variation of hw/tw In the next figure, the realistic domain of each plotted variable is also highlighted for the sake of comparison. One can observe that a considerable amount of girders present web proportions different from realistic panels. Similar distributions are found if a histogram (Fig 2.11) is sketched following the aspect ratio a/hw.

21 Chapter 2. Review of the earlier work
0
5
10
15
20
25Transversally stiffened girders
RealisticDomain
0
5
10
15
20
25Longitudinally stiffened girders
RealisticDomain
Figure 2.11. Extract from tests on hybrid specimens found on literature.
Variation of a/hw
The variation of the existing ratio between the load length Ss and the panel dimensions a and hw is presented in Fig. 2.12. For all cases, it is noticeable that the vast majority of tests were performed by applying relatively short patch loads. It has been found that common launching shoes currently used in bridge construction are longer than the used in laboratory.
Figure 2.12. Extract from tests on hybrid specimens found on literature.
Variation of Ss/hw and Ss/a
22 Chapter 2. Review of the earlier work
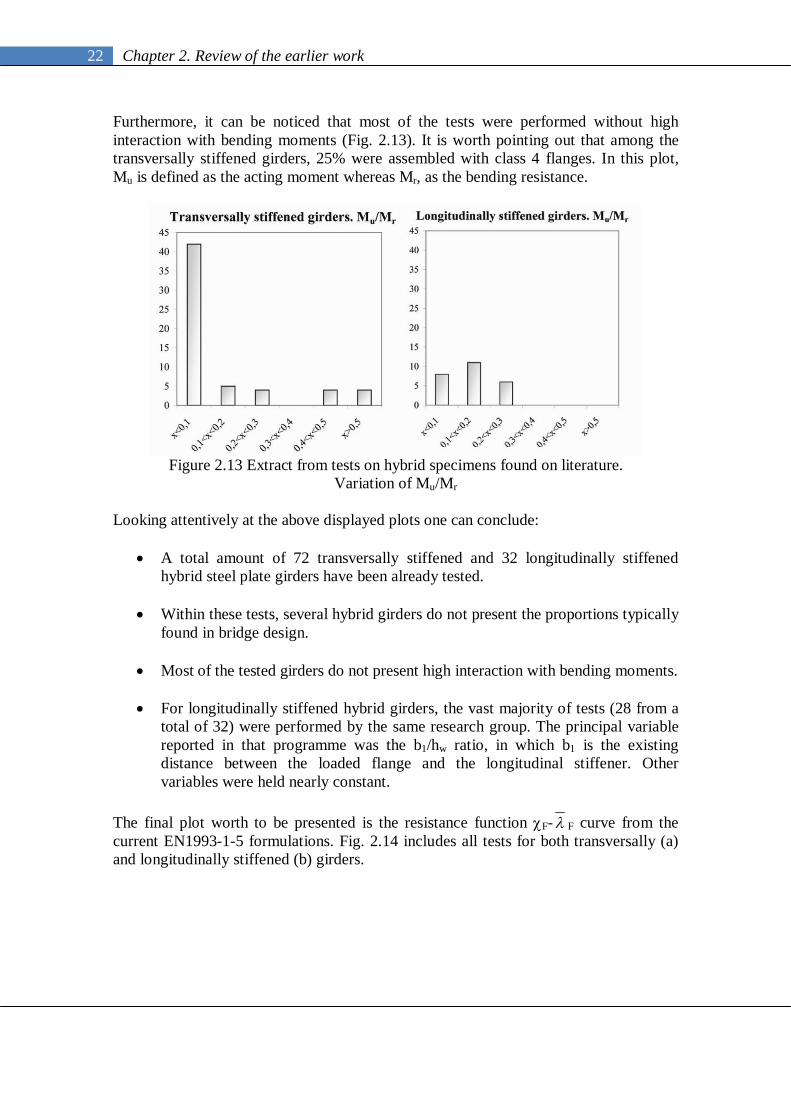
Furthermore, it can be noticed that most of the tests were performed without high interaction with bending moments (Fig. 2.13). It is worth pointing out that among the transversally stiffened girders, 25% were assembled with class 4 flanges. In this plot, Mu is defined as the acting moment whereas Mr, as the bending resistance.
Figure 2.13 Extract from tests on hybrid specimens found on literature.
Variation of Mu/Mr
Looking attentively at the above displayed plots one can conclude:
A total amount of 72 transversally stiffened and 32 longitudinally stiffened hybrid steel plate girders have been already tested.
Within these tests, several hybrid girders do not present the proportions typically found in bridge design.
Most of the tested girders do not present high interaction with bending moments.
For longitudinally stiffened hybrid girders, the vast majority of tests (28 from a total of 32) were performed by the same research group. The principal variable reported in that programme was the b1/hw ratio, in which b1 is the existing distance between the loaded flange and the longitudinal stiffener. Other variables were held nearly constant.
The final plot worth to be presented is the resistance function F- F curve from the current EN1993-1-5 formulations. Fig. 2.14 includes all tests for both transversally (a) and longitudinally stiffened (b) girders.

23 Chapter 2. Review of the earlier work
0,00
0,20
0,40
0,60
0,80
1,00
1,20
0,00 1,00 2,00 3,00 4,00 5,00 6,00
Res
istan
ce fu
nctio
n F
Slenderness F
EN1993-1-5Bamm et al.Granholm et al.SchillingsBergfelt et al.Roberts et al.Bossert et al.
0,00
0,20
0,40
0,60
0,80
1,00
1,20
0,00 1,00 2,00 3,00 4,00 5,00 6,00
Res
istan
ce fu
nctio
n F
Slenderness F
EN1993-1-5Janus et al.Markovic et al.
Figure 2.14 The resistance F- F curve.
(a) Transversally stiffened girders. (b) Longitudinally stiffened girders The foregoing figure shows the following remarks:
For transversally stiffened hybrid girders, the vast majority of dots are located above the theoretical EN1993-1-5 curve, which is structurally safe and expected from the design point of view.
Two points (from tests performed by Schillings) are located inside the resistance curve. As aforementioned, the ultimate load was conservatively defined by this author.
For longitudinally stiffened hybrid girders, the vast majority of specimens are
also located above the resistance curve.
Among the tested prototypes, three specimens lie slightly below the resistance curve.
2.3.4 Critical buckling load The classic elastic theory of instability states that the critical bucking load for an unstiffened or stiffened plate may be obtained from eq. 2.12. This is the general verification for a uniformly compressed plate, however, the coefficient kF particularises the formula for different geometrical and/or statical boundary conditions.
w
3w
2
2
Fcr ht
112EkF
(2.12)
In all buckling problems, the solution is aimed to establishing an accurate value of this coefficient kF for each particular situation. Uniformly distributed loads, pure shearing stresses or concentrated loads applied in the plate edge lead to different values of this coefficient. The kF coefficient varies considerably if simply supported conditions are considered instead of totally clamped conditions. Accordingly, concentrated forces on plate girders are particular situations that have been specifically studied.

24 Chapter 2. Review of the earlier work
The solution of equation 2.12 requires a previous knowledge of the stress distribution all over the plate. Accordingly, a two-dimensional elasticity problem arises. The research dealing with obtaining the correct value of kF is not treated within this work since it is considered that the numerical solution of kF on hybrid girders is not particularly different that the solution for homogeneous girders. The author suggests the works presented by Lagerqvist (1994) and Graciano (2002) for a thorough survey of this field. 2.3.5 Empirical approaches of ultimate load capacity. The first investigation leading to empirical approaches for obtaining the ultimate load capacity of plate girders subjected to patch loading was presented by Granholm (1960). Ever since, a great number of different formulae have been proposed for the prediction of the ultimate load capacity of girders subjected to patch loading. In most cases, these equations have been derived by means of linear regressions from empirically obtained values. The most outstanding formulae have been chronologically proposed by a myriad of authors and are generally known. Several contributions by Granholm (1960), Bergfelt et al (1979;1983), Kutmanova et al (1992), Drdacky (1991), Elgaaly (1990), among others are reported within the literature. Reportedly, the vast majority of these empirical formulae did not include the potential contribution of the flange strength (fyf was overtly disregarded). In this work, solely the investigations in which the ratio fyf/fyw played a significant role are described. Generally, these formulae show the form of eq. 2.13:
xyffswywwu ftSahftfF ,,,,,,, (2.13) Several empirical investigations were presented by the group led by Professor Skaloud in Prague. These authors performed a vast amount of tests on longitudinally stiffened webs. In early ages, the tests observations led to interesting conclusions related to the most outstanding parameters governing the phenomenon, i.e.:
The optimal position and the cross-section of the longitudinal stiffener. The aspect ratio a/hw of the panel. The geometrical features bf and tf of the loaded flange The optimal rigidity of the stiffener.
After proposing several equations in sequential reports, a quite general verification for the resistance of a longitudinally stiffened girder was proposed (eq. 2.14). The resistance of the unstiffened panel was defined by eq. 2.15, as a function of several variables. It can be noticed that the increment of the ultimate load capacity of longitudinally stiffened webs is defined as a function of b1/hw. If all the coefficients different from fyf and fyw are held constant and algebraic operations are performed, Fu,o becomes eq. 2.16. It is noticeable that this empirically obtained formula is a monotonically increasing function if fyf/fyw is taken as the independent variable.

25 Chapter 2. Review of the earlier work
w
1uou h
b0909580FF ·ln,,· (2.14)
1530
yf4w
f
w
syw
2wou 240
ftI
tS
00401ft612F,
, ···,···,
(2.15)
3060
yw
yf3061yw
3060yfywou f
ffCffCF
,
,,, ·····
(2.16)
Moreover, Dubas et al. (1990) proposed a quite advanced fashion for determining the ultimate load capacity of plate girders subjected to patch loading. A vast amount of tests performed on stiffened and unstiffened panels were used for this calibration. Eq. 2.17 defines this ultimate load capacity as an addition of two terms.
2u
1uu FFF (2.17)
The first term of the formula Fu
1 is obtained from a von Kármán approach (eq. 2.18). The authors considered that the web slenderness did not actually play a considerable role in the phenomenon and thus, hw/tw was limited to 60 (minimum allowable web slenderness) throughout the derivation of the formula (this statement was based upon observations from their own tests)
w
fsyw
2w
1u t
t2SfEt110F
·····, (2.18)
For the calculation of Fu
2, the authors proposed a mechanism solution model based on a triangular truss as shown in Fig. 2.15. In this figure, shear stresses are denoted by τi whereas tensile and/or compressive stresses on the upper flange are denoted by Di.
Figure 2.15 Mechanical model proposed by Dubas et al (1990).
The structural basis of this model is a vertical compressed member rigidly connected to the flange as well as two diagonal elements subjected to tensile forces. Following the model, the girder was expected to fail when shear stresses in the horizontal plane τh acting in the length formed by the intersection between the diagonals and the upper

26 Chapter 2. Review of the earlier work
flange surpass the value 3yff . A column-buckling approach was used for the derivation of the formulae proposed. The assumed buckling length of the column was 0,7·l. Based on equilibrium and on geometrical relations Fu
2 can be obtained. The Euler load is defined as:
2cr
3ws
2euler h12tSEF //··· (2.19)
The vertical component of diagonal tensile forces is defined as:
3fth2F yfwcrv /··· (2.20) Equating both equations and operating conveniently, Dubas et al obtained a simplified formula for Fu
2* only dependent on the flange yield strength, the web thickness, and Ss (eq. 2.21).
31
s5w
2yf
2u StfEF ···* (2.21)
Further, a correction covering a wider range of girders was presented (eq. 2.22). The correction was mainly focused on taking the area of the web into account.
3fs
5w
2yf2
w
ff2u t2StfE
t100tb
F ·······
(2.22)
Moreover, in his doctoral thesis, Graciano (2002) approached the patch loading phenomenon on longitudinally stiffened webs from two different points of view:
Defining the fs factor for increasing the resistance of unstiffened webs. Defining different geometrical conditions of the panel and thus, changing the
definition of Fcr by means of coefficient kF ( methodology).
The first approach was similar to the one proposed by other researchers. Relevant parameters governing the phenomenon were identified and among others, the fyf/fyw ratio was deemed as being fairly significant (eq. 2.23). Graciano displayed several trend lines in different plots relating these parameters with the ultimate load capacity obtained experimentally and the ultimate load capacity obtained for unstiffened webs (this latter following the equations derived by Lagerqvist (1994))
yw
yf
w
1
w
fsousou f
fhb
ttfFfFF ,,·· ,,exp (2.23)
After several trials, a suitable form for the parameter fs was given by:

27 Chapter 2. Review of the earlier work
wf
ywyf
w
1s tt
ffhb
27705560f ·ln,, (2.24)
This parameter (eq. 2.24) was claimed, on the average, to lead to a fairly good correlation between tests results and theoretical correlations. It can, though, be noticed that if other relevant parameters are held constant the fs factor becomes a monotonically decreasing function for fyf/fyw. Recently, Fonseca et al (2007) proposed a quite advanced method for solving physical problems associated to experimental data, the so-called Neuro Fuzzy Systems (NFS). NFS are essentially flexible black-box systems which can learn to predict and adapt to real world observations (in this particular case, patch loading experimental tests found in literature). Essentially, the research was performed by treating adequately the experimental data with specialised software. The software capabilities included a comprehensive investigation of the most relevant variables, allowing a fast database manipulation, and a graphical evaluation of each trained network. No definite conclusion regarding ultimate load capacity of the girder was included but interestingly, a quite detailed summary of the relation between variables governing the problem was exposed. Finally, Cevik (2007) proposed a new formulation for longitudinally stiffened webs subjected to patch loading by using genetic programming (GP). The main aim in that study was to obtain the explicit formulation of patch loading resistance of longitudinally stiffened webs as a function of geometrical and mechanical properties given as follows:
stst1syfffywwwu btbsfbtfhatfF ,,,,,,,,,, (2.25) Cevik developed a GP-based formulation by using experimental results from the literature. Within the work, the author assigned to an arbitrary function several constants and also, all the parameters described in eq. 2.25. 2.3.6 Mechanical models Several mechanical models have been suggested for the sake of predicting collapse loads of plate girders subjected to patch loading. Generally, the models are based upon the first theorem of limit analysis, namely, the theorem of plastic collapse. The plastic hinge hypothesis, which forms the basis of the calculation of plastic collapse loads, are often characterised by the relationship between plastic moments and kinematic compatibility. The plastic collapse load can be calculated once the mechanism is known. For simple structures there is only one possible collapse mechanism, but in most cases this is not so. The basic assumption is made that whenever the plastic moment Mp is attained in a cross-section, a plastic hinge forms which can undergo rotation of any magnitude, provided that the bending moment remains constant.

28 Chapter 2. Review of the earlier work
The proposed mechanism solutions in the particular case of girders subjected to patch loading vary from one to another in several basic assumptions. One of the most remarkable contributors to the development of patch loading is the Swedish researcher Bergfelt. His life-long publications had shaped the thought about patch loading throughout the years. Bergfelt and his co-authors claimed that patch loading ultimate load is reached either the web cripples by combined compression and folding directly under the load or when the web buckles in an overall mode. When summarising his research concerning patch loading, Bergfelt (1979) suggested a three-hinge-flange failure mechanism. At low load levels, the flange lies on an elastic support consisting of the web. If the load is gradually increased, a plastic hinge appears right below the applied load. At this point, stresses in the web increase at a higher rate as thus, the yielding region extends. Finally, two hogging zones are observed as well as outer plastic hinges prior to collapse. The mechanical model, as well as the cross-section of the flange considered in the derivation of the equations are schematically presented in Fig 2.16.
Figure 2.16. Mechanical model suggested by Bergfelt (1979)
From the model one can infer:
wywu tf2F0V ··· (2.26) If force equilibrium is established in the segment AB it is obtained:
2tff
4tb
2M20M wywyf
2ff
yf
·······
(2.27)
From 2.26 and 2.27, the ultimate load capacity of the girder Fu can be derived. It is noteworthy that this approach may not be cinematically admissible. The work presented by Bergfelt was formerly used as a base in Swedish recommendations for bridge design.
ywyfwffu fftbt2F ···· (2.28) The second model worth outlining was presented by Roberts and Rockey. In several chronological papers, Roberts et al. (1979, 1981) presented a mechanical model derived by the theorem of plastic collapse. As mentioned by the authors, extensive conducted experimental programmes had shown that collapse of slender plate girders occurs in a

29 Chapter 2. Review of the earlier work
fashion where plastic hinges form in the flange accompanied by semi-circular yield lines in the web. This mechanism is shown in Fig 2.17. It is observed in the figure that flanges move vertically downwards a small distance δω due to the applied load.
Figure 2.17 Mechanical model proposed by Roberts and Rockey (1979).
Three parameters characterise the collapse mechanism proposed by Roberts:
The vertical displacement δω The rotation γ of the loaded flange (assuming γ =δω/β for small
displacements). The rotation of the web θ. Trigonometrically, it can be found that
θ=δω/2αcosθ. Following the theorem of plastic collapse, the external work of the system can be defined by:
·uext FW (2.29) The internal work, moreover, is related to four different terms:
The contribution of the four plastic hinges within the loaded flange:
··
··intyf
yfflange M4
M4W (2.30)
The contribution of the three yield lines within the web in the length Ss. Notice
that the upper and bottom lines rotate an angle θ whereas the middle line rotates an angle 2θ:
···,int yws
Ssweb MS4W (2.31)
The contribution of the three yield lines within the web in the length β:
···,int ywweb M4W (2.32)

30 Chapter 2. Review of the earlier work
Finally, the contribution of the three yield lines rotating within the web in the
length η, which defines a length of web plate beneath the load which is assumed to yield due to the presence of transverse membrane stresses and therefore, offers no resistance to bending. Thus, this contribution is negative:
···int ywM4W (2.33)
Equating external and internal work gives:
·cos··
·cos··
·cos··· ywywsywyf
u
M2MS2M4M4F (2.34)
If Fu is minimised with respect to β, which is considered one of the unknowns, the result is given by:
yw
yf2
MM
·cos·
(2.35)
At this point, Roberts et al. included full compatibility of deformation in the web-to-flange juncture at collapse load. For this purpose, the vertical deflection of web and flanges at the web-to-flange juncture is equalled. Furthermore, a linear variation of bending moments in the flange is assumed (Fig. 2.18).
Figure 2.18 Linear variation of Myf
xM2
MxM yfyf ·
·
(2.36)
Thus, the integration of the differential equation 2.37 leads to the flange vertical displacement yf.
f
2f
f3fff
2
2f
IE6M
y
12tb
E
xMIExM
dxdy
···
··
·
(2.37)
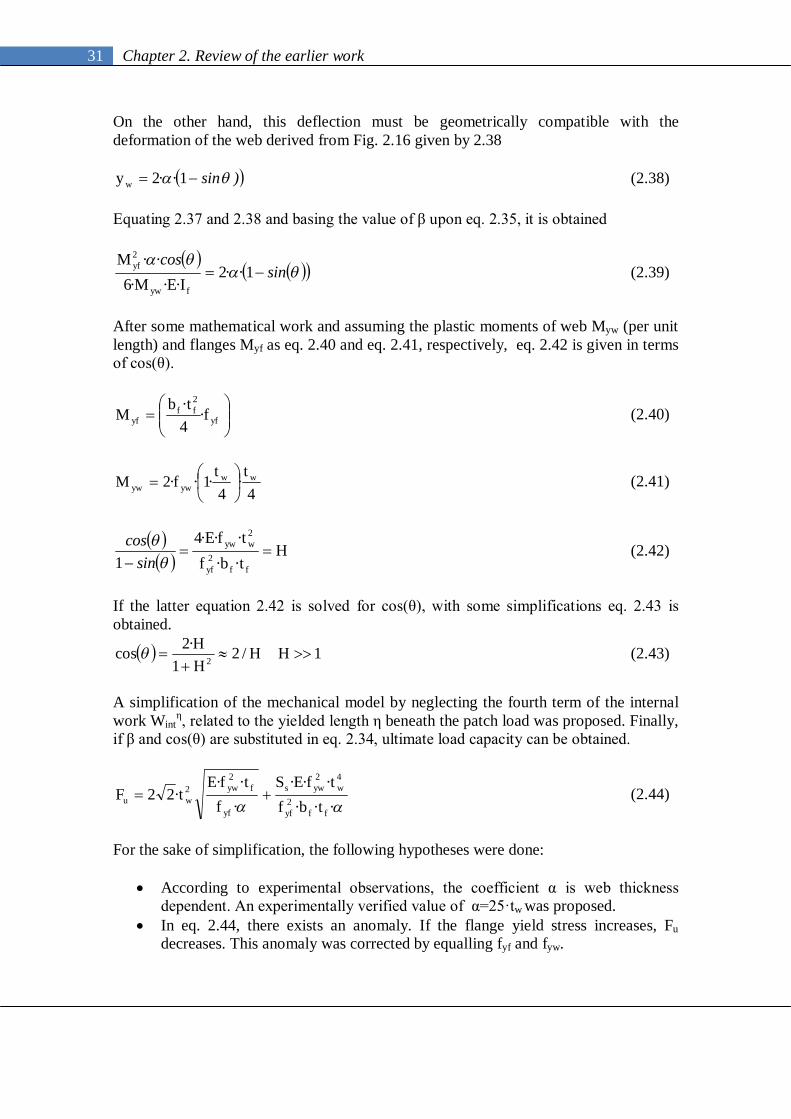
31 Chapter 2. Review of the earlier work
On the other hand, this deflection must be geometrically compatible with the deformation of the web derived from Fig. 2.16 given by 2.38
)sin·· 12y w (2.38) Equating 2.37 and 2.38 and basing the value of β upon eq. 2.35, it is obtained
sin·····
·cos· 12
IEM6M
fyw
2yf (2.39)
After some mathematical work and assuming the plastic moments of web Myw (per unit length) and flanges Myf as eq. 2.40 and eq. 2.41, respectively, eq. 2.42 is given in terms of cos(θ).
yf
2ff
yf f4tb
M ·· (2.40)
4t
4t
1f2M wwywyw ····
(2.41)
H
tbftfE4
1 ff2yf
2wyw
·····
sincos
(2.42)
If the latter equation 2.42 is solved for cos(θ), with some simplifications eq. 2.43 is obtained.
1HH/2H1H·2cos 2
(2.43)
A simplification of the mechanical model by neglecting the fourth term of the internal work Wint
η, related to the yielded length η beneath the patch load was proposed. Finally, if β and cos(θ) are substituted in eq. 2.34, ultimate load capacity can be obtained.
······
···
·ff
2yf
4w
2yws
yf
f2yw2
wu tbftfES
ftfE
t22F (2.44)
For the sake of simplification, the following hypotheses were done:
According to experimental observations, the coefficient α is web thickness dependent. An experimentally verified value of α=25·tw was proposed.
In eq. 2.44, there exists an anomaly. If the flange yield stress increases, Fu decreases. This anomaly was corrected by equalling fyf and fyw.

32 Chapter 2. Review of the earlier work
Finally, Roberts came up to eq. 2.45 as the ultimate load capacity of a plate girder subjected to patch loading
23
f
w
w
s2
1
w
fyw
2wu t
thS3
1tt
Eft50F ··, (2.45)
The formula was verified with the existing experimental database. The results were judged to be satisfactory and thus, the fourth term Wint
η was kept out of the formulation. The validity of 2.46 was bounded by the following ranges.
3tt
20hS
w
f
w
s , (2.46)
In subsequent publications, an additional factor intended to correct eq. 2.45 by adding the effect of longitudinal direct stresses was suggested.
2
yw
x
f1
(2.47)
being σx the actual longitudinal compressive stress in the flange at the mid-plane. Following a similar procedure, Shimizu et al. (1989) presented a variation of the mechanical model presented by Roberts. Collapse modes observed by Shimizu and his co-workers differed from those observed by Roberts in the number of yield lines considered. The new collapse model included only two parallel yield lines (Fig. 2.19). The difference was found to be explained by the patch load lengths adopted by Roberts, which, was approximately limited to Ss/hw ≤2. Shimizu and his co-workers adopted practical launching shoe dimensions of 0,3-0,5 hw.
Figure 2.19 Mechanical model suggested by Shimizu et al (1989).
The procedure to estimate the ultimate load capacity of a patch loaded web was similar than the one previously developed. Finally, these authors proposed a formula (eq. 2.48) claimed to lead to more accurate results.

33 Chapter 2. Review of the earlier work
cos·····
21syw
2
yfu
22SM2M4F (2.48)
in which Myf and Myw are the fully plastic moments. As a drawback, the equation was based on some experimentally obtained magnitudes, such as the yielded lengths and the values of α and γ (position of the yield line in the flanges) Moreover, Lagerqvist (1994) proposed in his doctoral thesis a mechanical model by simplifying the equations derived from other researchers. Currently, the EN1993-1-5 formulation is based upon these studies and some simplifications proposed by the author (Lagerqvist et al. 1995). The model is primarily based upon the one presented by Roberts with a more easy-to-derive formulation. In this particular case no yield lines are considered for the web. The model (Fig. 2.20) is characterised by a vertical deflection and a total yield length of ly = (Ss + Sy).
Figure 2.20 Mechanical model proposed by Lagerqvist (1994).
The plastic resistance Fy is read as eq. 2.49:
yfswywy St2StfF ··· (2.49) The procedure of obtaining Sy is based on the virtual work principle. In this particular case, the calculation of the plastic moment Mpt in outer hinges is performed considering a fictitious T-shaped cross-section (and thus, the web contribution is included). The depth of this assumed section is referred to as 10tw+tf. The calculation of the plastic moment Mpf is performed considering only the flange proportions. This assumption was performed on the basis that the web at the outer hinges location (Mpt) is longitudinally and transversally compressed whereas the web at Mpf is only compressed in the transversal direction. External and internal works are given by eq. 2.50 and eq. 2.51:
·yext FW (2.50)
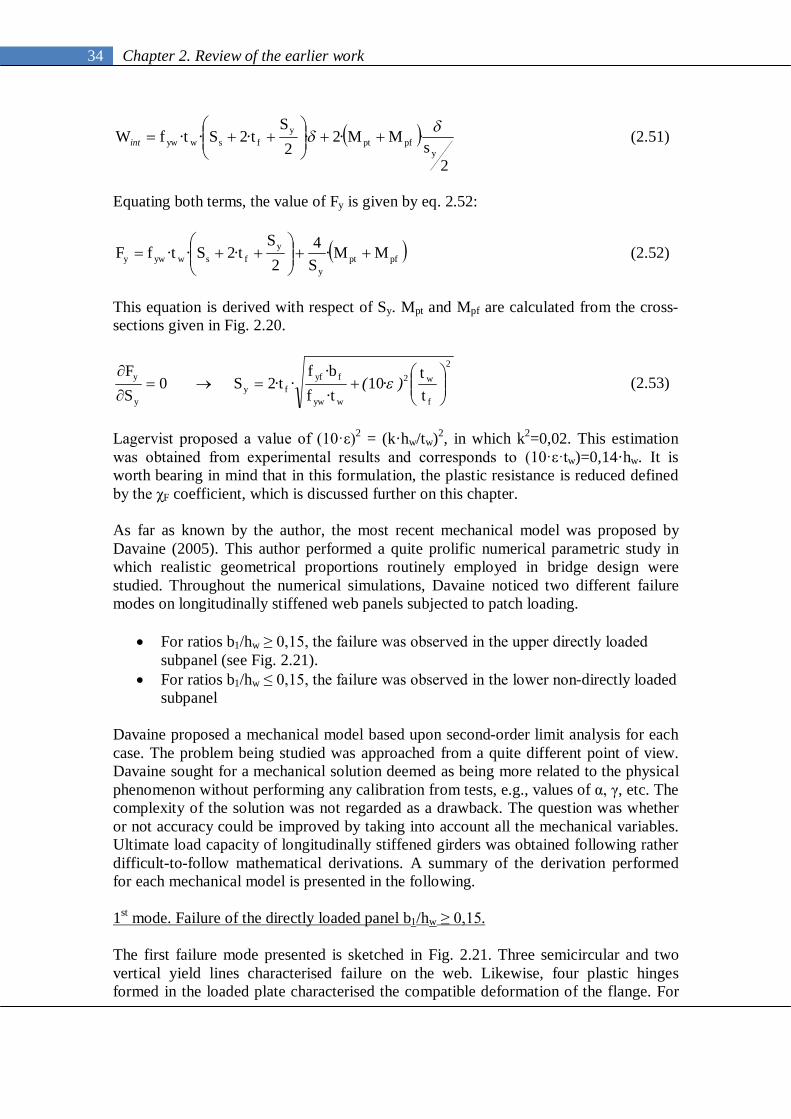
34 Chapter 2. Review of the earlier work
2
sMM2
2S
t2StfWy
pfpty
fswyw
······int
(2.51)
Equating both terms, the value of Fy is given by eq. 2.52:
pfpty
yfswywy MM
S4
2S
t2StfF
···· (2.52)
This equation is derived with respect of Sy. Mpt and Mpf are calculated from the cross-sections given in Fig. 2.20.
2
f
w2
wyw
fyffy
y
y
tt
10tfbf
t2S0SF
)·(
··
·· (2.53)
Lagervist proposed a value of (10·ε)2 = (k·hw/tw)2, in which k2=0,02. This estimation was obtained from experimental results and corresponds to (10·ε·tw)=0,14·hw. It is worth bearing in mind that in this formulation, the plastic resistance is reduced defined by the χF coefficient, which is discussed further on this chapter. As far as known by the author, the most recent mechanical model was proposed by Davaine (2005). This author performed a quite prolific numerical parametric study in which realistic geometrical proportions routinely employed in bridge design were studied. Throughout the numerical simulations, Davaine noticed two different failure modes on longitudinally stiffened web panels subjected to patch loading.
For ratios b1/hw ≥ 0,15, the failure was observed in the upper directly loaded subpanel (see Fig. 2.21).
For ratios b1/hw ≤ 0,15, the failure was observed in the lower non-directly loaded subpanel
Davaine proposed a mechanical model based upon second-order limit analysis for each case. The problem being studied was approached from a quite different point of view. Davaine sought for a mechanical solution deemed as being more related to the physical phenomenon without performing any calibration from tests, e.g., values of α, γ, etc. The complexity of the solution was not regarded as a drawback. The question was whether or not accuracy could be improved by taking into account all the mechanical variables. Ultimate load capacity of longitudinally stiffened girders was obtained following rather difficult-to-follow mathematical derivations. A summary of the derivation performed for each mechanical model is presented in the following. 1st mode. Failure of the directly loaded panel b1/hw ≥ 0,15. The first failure mode presented is sketched in Fig. 2.21. Three semicircular and two vertical yield lines characterised failure on the web. Likewise, four plastic hinges formed in the loaded plate characterised the compatible deformation of the flange. For

35 Chapter 2. Review of the earlier work
this range of b1/hw ratio, it was assumed that the entire length b1 is involved in the resistance. As a result, the coefficient α was directly taken as being b1/2. Moreover, different values for rotation θi for each segment of the yield lines were considered (this fact increased considerably the mathematical derivations). Likewise, each angle θi was related to a length li of each segment.
Figure 2.21 Mechanical model proposed by Davaine (2005). 1st failure mode.
The limit collapse load Fu of the subpanel subjected to patch loading was defined as eq. 2.54. This equation includes the contribution of four plastic hinges as well as the contribution of the yield lines rotating a certain angle θi.
o
4
1iiiywyf
ou lMM4
y1F ····· (2.54)
Several steps are necessary to solve this equation:
Calculation of the set of angles θi, related to the rotation the yield lines within the web as well as the segment lengths li=f(β,Ss,wo,yo).
Application of the principle of virtual work Wext=Wint, in which the internal work is calculated from the contributions of web and flange.
Cinematic compatibility between yo and wo by means of geometrical relations is applied.
Calculation of β. Calculation of wo. Calculation of η. Introduction of wi, an initial out-of-plane displacement. Introduction of all the magnitudes into eq. 2.54
Davaine happened to assume several hypotheses leading to slightly simpler formulae of each term. A quite sophisticated flow chart with the algorithm of resolution was also proposed within the work. 2nd mode. Failure of the lower non-loaded panel b1/hw ≤ 0,15. Davaine observed in the numerical simulations that for ratios b1/hw ≤ 0,15, the directly loaded panel remained almost undeformed at ultimate load. In the post-peak range, however, a yield line appeared within the subpanel. Moreover, the numerical
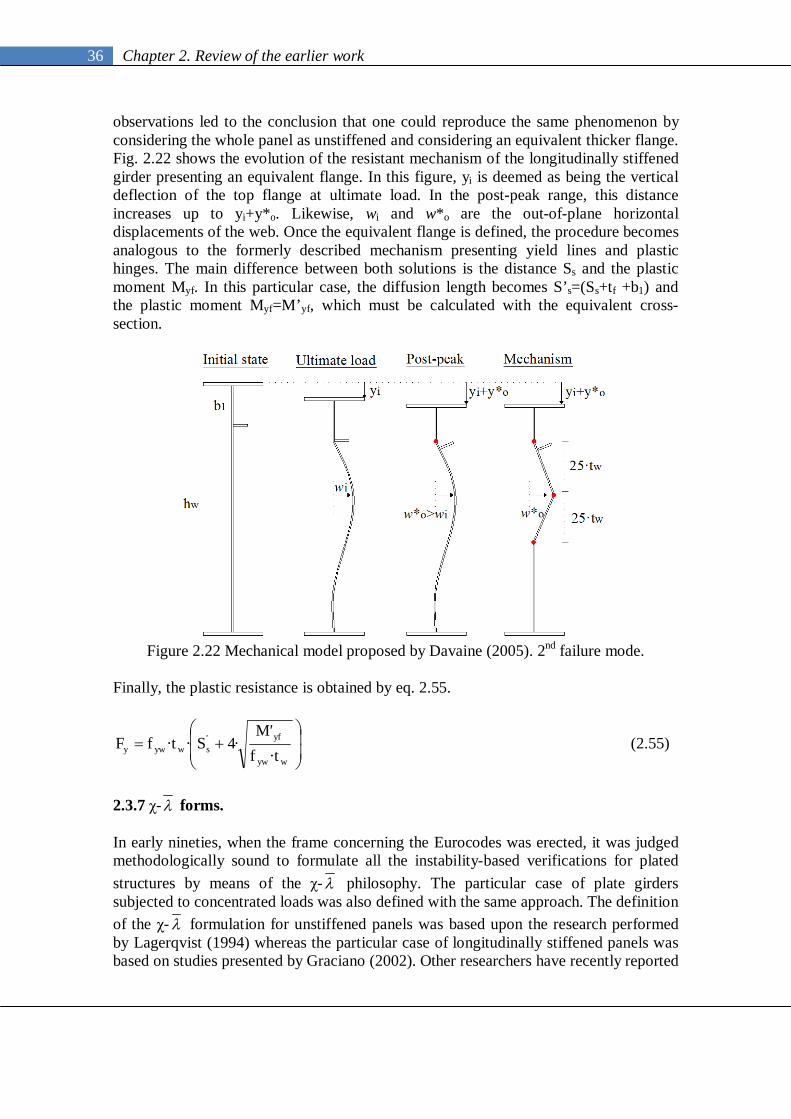
36 Chapter 2. Review of the earlier work
observations led to the conclusion that one could reproduce the same phenomenon by considering the whole panel as unstiffened and considering an equivalent thicker flange. Fig. 2.22 shows the evolution of the resistant mechanism of the longitudinally stiffened girder presenting an equivalent flange. In this figure, yi is deemed as being the vertical deflection of the top flange at ultimate load. In the post-peak range, this distance increases up to yi+y*o. Likewise, wi and w*o are the out-of-plane horizontal displacements of the web. Once the equivalent flange is defined, the procedure becomes analogous to the formerly described mechanism presenting yield lines and plastic hinges. The main difference between both solutions is the distance Ss and the plastic moment Myf. In this particular case, the diffusion length becomes S’s=(Ss+tf +b1) and the plastic moment Myf=M’yf, which must be calculated with the equivalent cross-section.
Figure 2.22 Mechanical model proposed by Davaine (2005). 2nd failure mode.
Finally, the plastic resistance is obtained by eq. 2.55.
wyw
yfswywy tf
M4StfF
·'
··· ' (2.55)
2.3.7 χ- forms. In early nineties, when the frame concerning the Eurocodes was erected, it was judged methodologically sound to formulate all the instability-based verifications for plated structures by means of the χ- philosophy. The particular case of plate girders subjected to concentrated loads was also defined with the same approach. The definition of the χ- formulation for unstiffened panels was based upon the research performed by Lagerqvist (1994) whereas the particular case of longitudinally stiffened panels was based on studies presented by Graciano (2002). Other researchers have recently reported
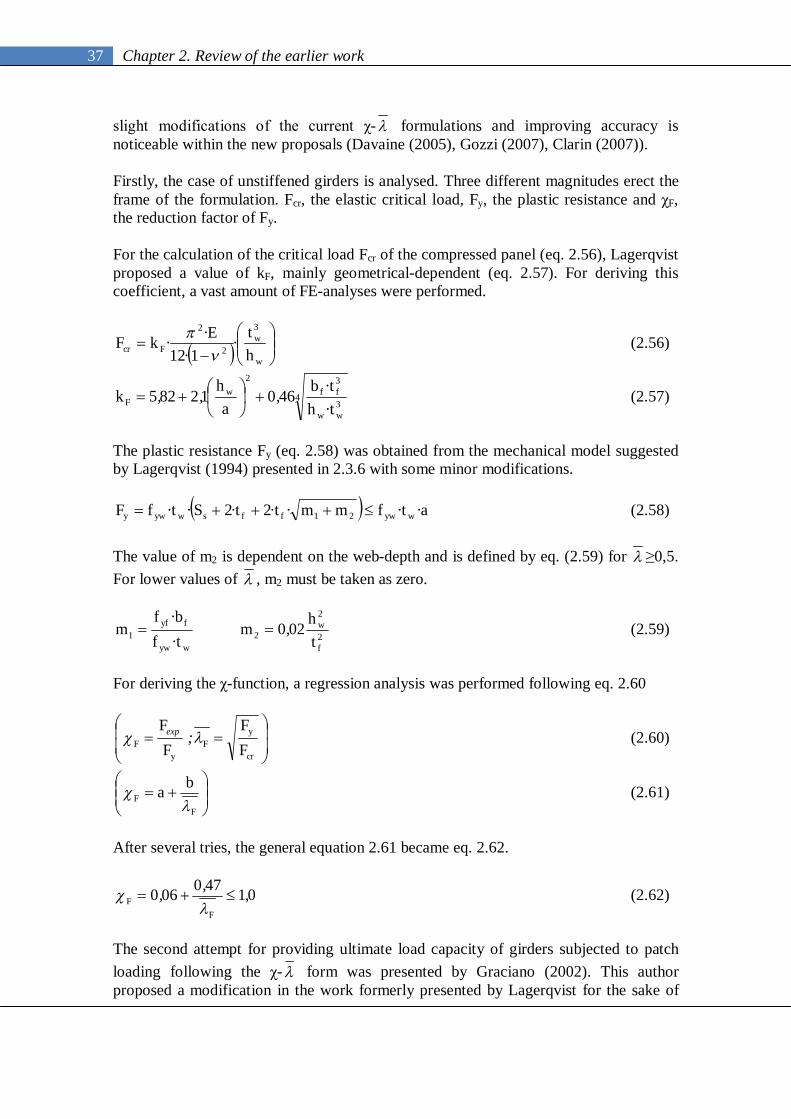
37 Chapter 2. Review of the earlier work
slight modifications of the current χ- formulations and improving accuracy is noticeable within the new proposals (Davaine (2005), Gozzi (2007), Clarin (2007)). Firstly, the case of unstiffened girders is analysed. Three different magnitudes erect the frame of the formulation. Fcr, the elastic critical load, Fy, the plastic resistance and χF, the reduction factor of Fy. For the calculation of the critical load Fcr of the compressed panel (eq. 2.56), Lagerqvist proposed a value of kF, mainly geometrical-dependent (eq. 2.57). For deriving this coefficient, a vast amount of FE-analyses were performed.
w
3w
2
2
Fcr ht
112EkF ·
···
(2.56)
43ww
3ff
2w
F thtb460
ah
12825k··,,,
(2.57)
The plastic resistance Fy (eq. 2.58) was obtained from the mechanical model suggested by Lagerqvist (1994) presented in 2.3.6 with some minor modifications.
atfmmt2t2StfF wyw21ffswywy ······· (2.58) The value of m2 is dependent on the web-depth and is defined by eq. (2.59) for ≥0,5. For lower values of , m2 must be taken as zero.
2f
2w
2wyw
fyf1 t
h020m
tfbf
m ,··
(2.59)
For deriving the χ-function, a regression analysis was performed following eq. 2.60
cr
yF
yF F
FFF
;exp (2.60)
FF
ba
(2.61)
After several tries, the general equation 2.61 became eq. 2.62.
01470060F
F ,,,
(2.62)
The second attempt for providing ultimate load capacity of girders subjected to patch loading following the χ- form was presented by Graciano (2002). This author proposed a modification in the work formerly presented by Lagerqvist for the sake of

38 Chapter 2. Review of the earlier work
including the effect of the longitudinal stiffening. The value of kF was modified according to eq. 2.63.
sl43ww
3ff
2w
F kthtb460
ah
12825k
···,,, (2.63)
An additional term ksl is defined as the contribution of the longitudinal stiffener.
tostosl CCk ·· (2.64)
Co is a coefficient geometrical-dependent (eq. 2.65). It is a direct function of the b1/a ratio and the relative flexural rigidity Φs/γs of the longitudinal stiffener. The formula is valid in the range 0,05≤b1/a≤0,30.
150210
ab445
150ab516
C
s
s1
s
s1
o
,,,
,,
(2.65)
Stiffeners having an open cross section generally fulfil the first condition whereas closed stiffeners (triangular or trapezoidal) the second condition. The formula is limited by γt, commonly referred to as transition rigidity of the stiffener and defined by the following eq. 2.66.
150ha045
150ab
300211ha14
s
s
31
w
s
s1
92
wt
,·,
,,·,·
,
,
(2.66)
Table 2.6 shows the statistical verifications of each model. For transversally stiffened girders, Lagerqvist compared the given formulation with 190 tests whereas for longitudinally stiffened webs, Graciano performed the same comparison by using 130 tests available in literature.
Lagerqvist (1994) Graciano (2002)
Statistics
Number of tests 190 130Mean value 1,280 1,280
Standard deviation 0,168 0,200Coefficient of variation 0,131 0,150Upper 5-percent fractile 1,56 n.g.Lower 5-percent fractile 1,00 n.g.
Research Transversally stiffened panels
Longitudinally stiffened panels
147,00 6,0 F
F
Table 2.6. Statistics for Fu,experimental/Fu,theoretical for patch load tests.
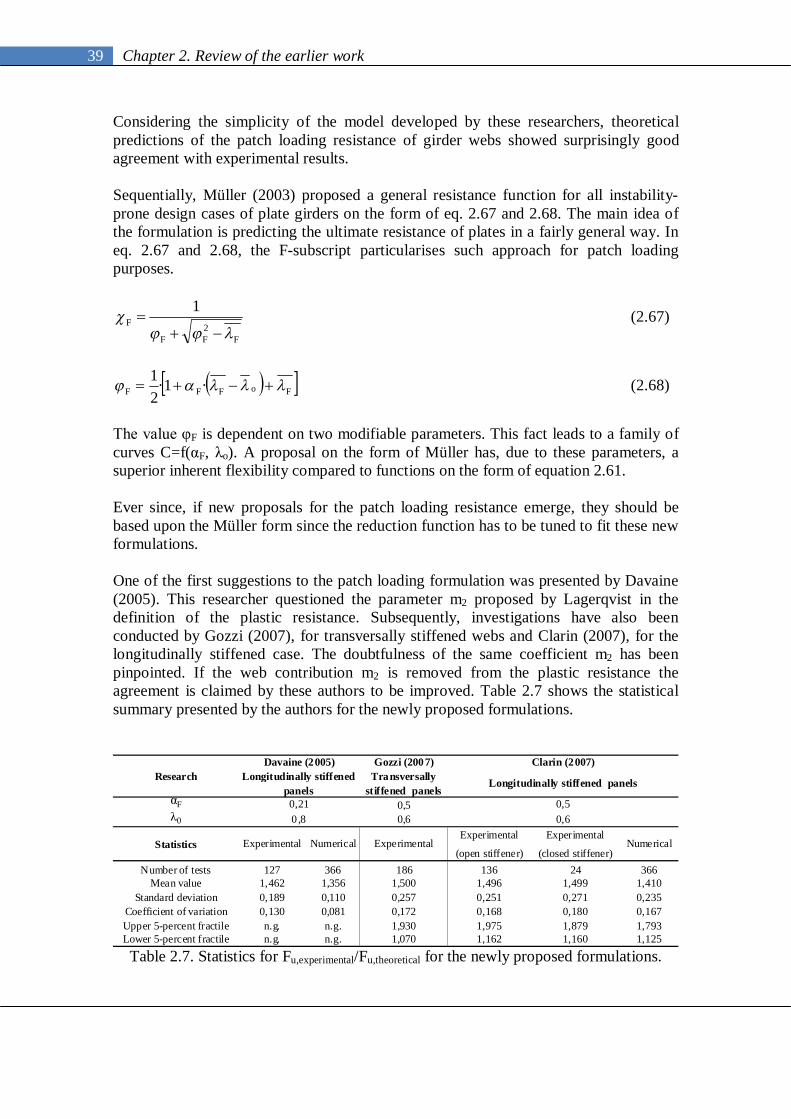
39 Chapter 2. Review of the earlier work
Considering the simplicity of the model developed by these researchers, theoretical predictions of the patch loading resistance of girder webs showed surprisingly good agreement with experimental results. Sequentially, Müller (2003) proposed a general resistance function for all instability-prone design cases of plate girders on the form of eq. 2.67 and 2.68. The main idea of the formulation is predicting the ultimate resistance of plates in a fairly general way. In eq. 2.67 and 2.68, the F-subscript particularises such approach for patch loading purposes.
F2FF
F1
(2.67)
FoFFF 121 ·· (2.68)
The value φF is dependent on two modifiable parameters. This fact leads to a family of curves C=f(αF, λo). A proposal on the form of Müller has, due to these parameters, a superior inherent flexibility compared to functions on the form of equation 2.61. Ever since, if new proposals for the patch loading resistance emerge, they should be based upon the Müller form since the reduction function has to be tuned to fit these new formulations. One of the first suggestions to the patch loading formulation was presented by Davaine (2005). This researcher questioned the parameter m2 proposed by Lagerqvist in the definition of the plastic resistance. Subsequently, investigations have also been conducted by Gozzi (2007), for transversally stiffened webs and Clarin (2007), for the longitudinally stiffened case. The doubtfulness of the same coefficient m2 has been pinpointed. If the web contribution m2 is removed from the plastic resistance the agreement is claimed by these authors to be improved. Table 2.7 shows the statistical summary presented by the authors for the newly proposed formulations.
Gozzi (2007)
αF 0,5λ0 0,6
Statistics Experimental Numerical ExperimentalExperimental
(open stiffener)
Experimental
(closed stiffener)Numerical
Number of tests 127 366 186 136 24 366Mean value 1,462 1,356 1,500 1,496 1,499 1,410
Standard deviation 0,189 0,110 0,257 0,251 0,271 0,235Coefficient of variation 0,130 0,081 0,172 0,168 0,180 0,167Upper 5-percent fractile n.g. n.g. 1,930 1,975 1,879 1,793Lower 5-percent fractile n.g. n.g. 1,070 1,162 1,160 1,125
Research
0,210,8
0,50,6
Davaine (2005) Clarin (2007)Longitudinally stiffened
panelsTransversally
stiffened panelsLongitudinally stiffened panels
Table 2.7. Statistics for Fu,experimental/Fu,theoretical for the newly proposed formulations.

40 Chapter 2. Review of the earlier work
2.3.8 Interaction with bending moments Plate girders are generally subjected simultaneously to concentrated loads and bending moments during launching. Researchers have also pointed out the relevance of this issue by proposing design formulae which take this interaction into account. It is worth bearing in mind that hybrid girders exhibit a very efficient design for flexural loads and thus, the cross-section may be lighter when compared to a homogenous girder. This fact, however, may influence the structural response when interactions with other loads are taken into account. Bergfelt (1971) proposed that the interaction between patch loading and bending moment should be taken care of by means of equation 2.69
01MM
FF
Rd
Ed
8
Rd
Ed ,
(2.69)
Roberts (1982) proposed eq. 2.70, which leads to a circular segment.
01MM
FF
2
Rd
Ed
2
Rd
Ed ,
(2.70)
Elgaaly (1983) proposed a slight variation of the previous approach by updating the power of each term (eq. 2.71).
01MM
FF
3
Rd
Ed
3
Rd
Ed ,
(2.71)
Ungermann (1990) suggested an interaction formula given by eq. 2.72
41MM
FF
Rd
Ed
Rd
Ed ,
(2.72)
Finally, Lagerqvist (1994) proposed a tri-linear diagram based upon eq. 2.73 provided that the values of FEd/FRd≤1 and MEd/MRD≤1
41MM
80FF
Rd
Ed
Rd
Ed ,·,
(2.73)
These equations are typically plotted in a standardised form FEd/FRd-MEd/MRd space as shown in Fig 2.23.

41 Chapter 2. Review of the earlier work
0,00
0,20
0,40
0,60
0,80
1,00
1,20
0 0,2 0,4 0,6 0,8 1 1,2
F Ed/F
Rd
MEd/MRd
Bergfelt
Roberts
Elgaaly
Ungermann
Lagerqvist
Figure 2.23. Interaction Concentrated load- Bending moment in a standardised form.
The foregoing figure leads to point out the following remarks:
The formula suggested by Roberts clearly gives the lower bound of the plot.
The upper limit is more difficult to determine according to this plot since some lines cross each other for values MEd/MRd>0.6
2.3.9 Design Provisions SIA 263:2003 (2003)
The Swiss design provisions SIA 263:2003 Constructions métalliques, defines the patch loading resistance FRd as the smallest values between FRd1 and FRd2. The value of FRd1 is deemed as being the plastic resistance whereas FRd2 takes account of the instability problems.
1M
ywwfs1Rd
ftt10sF
··· (2.74)
4321wy
fy
2w
1M2Rd tf
tEft501F
······, (2.75)
For the calculation of FRd2, the β coefficients take other parameters into account. β1, for the flange slenderness, β2, for the web slenderness, β3, patch load length Ss and β4, accounting for the effect of the direct stresses in the web plate (eq. 2.76 to 2.79).
251t10
b4
f
f1 ,
· (2.76)
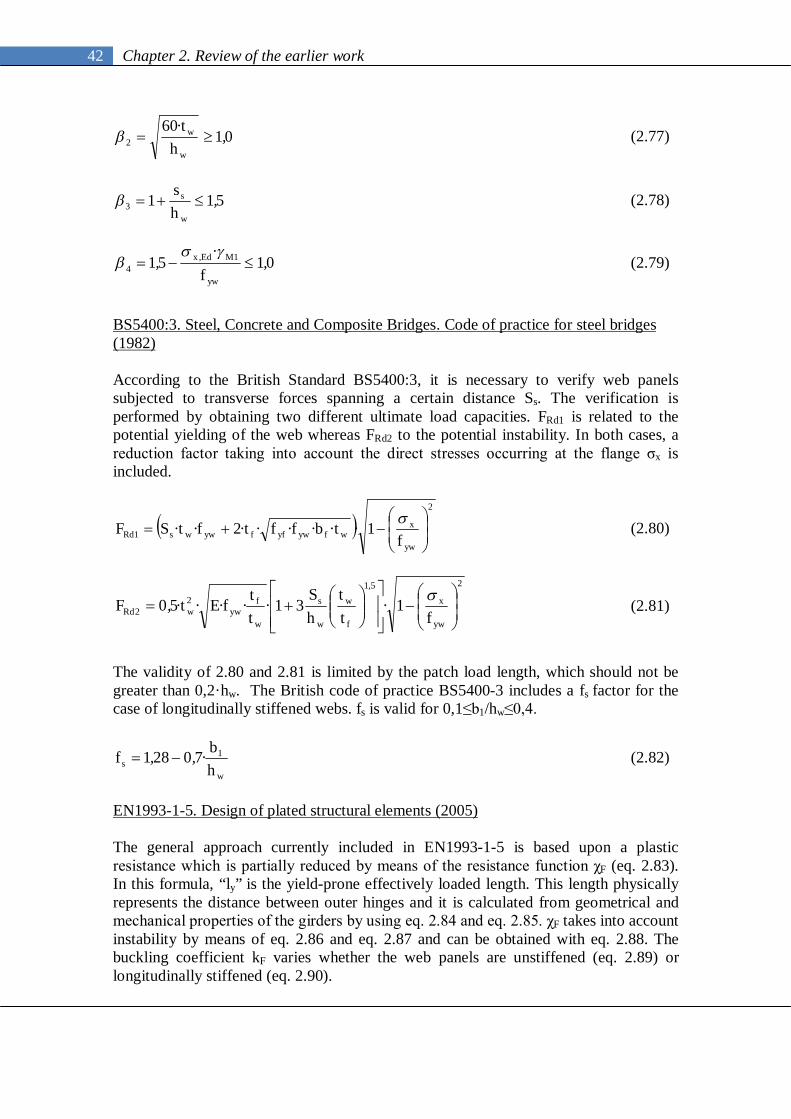
42 Chapter 2. Review of the earlier work
01h
t60
w
w2 ,
· (2.77)
51hs
1w
s3 , (2.78)
01f
51yw
1MEdx4 ,
·, ,
(2.79)
BS5400:3. Steel, Concrete and Composite Bridges. Code of practice for steel bridges (1982) According to the British Standard BS5400:3, it is necessary to verify web panels subjected to transverse forces spanning a certain distance Ss. The verification is performed by obtaining two different ultimate load capacities. FRd1 is related to the potential yielding of the web whereas FRd2 to the potential instability. In both cases, a reduction factor taking into account the direct stresses occurring at the flange σx is included.
2
yw
xwfywyffywws1Rd f
1tbfft2ftSF
········ (2.80)
2
yw
x51
f
w
w
s
w
fyw
2w2Rd f
1tt
hS
31ttfEt50F
······,,
(2.81)
The validity of 2.80 and 2.81 is limited by the patch load length, which should not be greater than 0,2·hw. The British code of practice BS5400-3 includes a fs factor for the case of longitudinally stiffened webs. fs is valid for 0,1≤b1/hw≤0,4.
w
1s h
b70281f ·,, (2.82)
EN1993-1-5. Design of plated structural elements (2005) The general approach currently included in EN1993-1-5 is based upon a plastic resistance which is partially reduced by means of the resistance function χF (eq. 2.83). In this formula, “ly” is the yield-prone effectively loaded length. This length physically represents the distance between outer hinges and it is calculated from geometrical and mechanical properties of the girders by using eq. 2.84 and eq. 2.85. χF takes into account instability by means of eq. 2.86 and eq. 2.87 and can be obtained with eq. 2.88. The buckling coefficient kF varies whether the web panels are unstiffened (eq. 2.89) or longitudinally stiffened (eq. 2.90).

43 Chapter 2. Review of the earlier work
1M
wyywFRd
tlfF
·
(2.83)
2
wyw
fyffsy m
tfbf
1t2Sl··
·· (2.84)
0motherwise50ifth
020m 2F
2
f
w2
,·, (2.85)
cr
wyywF F
tlf ·· (2.86)
w
3w
Fcr htEk90F ···, (2.87)
0150
FF ,,
(2.88)
2w
F ah
26k
·
(2.89)
st1
2w
F 210ab
445a
h26k
,,·
(2.90)
AASHTO-AISC-LFRD (2005)
The American bridge codes AASHTO include different verifications for panels subjected to concentrated loading (the term “patch loading” is not of common use in the U.S.A.). Ultimate load capacity must be the minimum value of FRd1, FRd2, FRd3.
FRd1 is referred to as the plastic resistance given by eq. 2.91.
ywwfs1Rd ftt5sF ···· (2.91)
FRd2 is associated to instability, given in eq. 2.92.
w
fyw50
f
w
fw
s2w2Rd t
tfEtt
t2hs
31t800F··
···
··,·,
(2.92)
Finally, FRd3 (eq. 2.93 and 2.94) applies when relative lateral displacement between flanges is permitted (unrestrained flanges) and potentially, global web buckling may occur.

44 Chapter 2. Review of the earlier work
32b
lt
h
ifb
lt
h
401h
ttCF
f
w
w3
f
w
w
2w
f3wr
3Rd ,,··
(2.93)
71b
lt
hif
bl
th
40h
ttCF
f
w
3
f
w
w
2w
f3wr
3Rd ,,··
(2.94)
being Cr=960000 ksi (66,2x10⁵ N/mm2) and l, the unbraced length. 2.4 Discussion Two separate sections compound this chapter, the first one concerning the structural alternative of plate girders using a hybrid alternative and the second, the patch loading field. After conducting the research of the previous studies found in the literature, the works related to hybrid steel plate girders subjected to patch loading were found to be very scarce. Such survey of the literature led to point out the following remarks.
There is a considerable amount of hybrid steel plate girders that have been already tested. A sample of 100 hybrid girders has been extracted from the whole population of 800-odd plate girders tested experimentally to patch loading.
Reportedly, among the tests, several hybrid girders do not present realistic proportions typically found in bridge design.
A survey of the empirical solutions historically presented in literature showed that the fyf/fyw ratio has been rather disregarded as a relevant parameter in the definition of ultimate load capacity.
The most outstanding mechanical models concerning patch loading were analysed. One can observe that some simplifications have been performed in the development of the mechanism solution formulae. In some cases, these assumptions deal with the existing ratio between yield strengths for flanges and web (fyf/fyw), which may highly influence the hybrid design.
The χ- approach has also been studied within the section. Presently, the patch loading resistance is based upon a resistance function of the form χ- . Nowadays, whether new proposals for the patch loading resistance emerge, they should be based upon newly proposed forms. The resistance function must be tuned to fit these new formulations by two flexible parameters αF and λo.
After conducting this state of the art, some topics appear to be worth looking at.

45 Chapter 2. Review of the earlier work
Firstly, it is judged to be necessary to complete the existing database concerning
hybrid girders subjected to patch loading. Experimental and numerical techniques offer reliable tools for these purposes.
Secondly, it is considered necessary to contribute to the particular case of patch loading in hybrid girders by assessing whether the current verifications in the guidelines provide accurate predictions of the load or contrarily, minor modifications are necessary for the hybrid design in the χ- formulations.
In the following chapters, both points are thoroughly studied and described.

46 Chapter 3. Experimental programme
3. Experimental programme “The point is that Western science is based on doubt, experiment, and measurement, and the truth is regarded as unfolding and provisional…
Morris Berman, Dark ages America 3.1 Introduction There is a great deal of interest in testing steel structures. Largely, this fact comes as a result of a recent increment in the number of new structural types. In this research work, hybrid girders are studied for the specific case of patch loading. It has been shown that there exists scarce works dealing deliberately and simultaneously with both fields. In order to contribute to the general knowledge of these two fields, an experimental programme was carried out at the LTE of the School of Civil Engineering of Barcelona, UPC. A total of 8 tests on hybrid steel plate girders subjected to concentrated loads were performed. The tests girders were designed as half-scale due to laboratory capacities. The programme was arbitrarily separated into two series of four girders each. The main difference between both series was the yield strengths of all plates assembling the girders. Within each series, the only varying parameter was the distance between transverse stiffeners a. General features of the tested elements as well as general features of the testing procedures and instrumentation are described. For the sake of conciseness, solely remarkable results obtained in the whole experimental programme are presented and discussed. Other results are further appended in Annex B at the end of the work. Loads, displacements and strains at key points were measured during the development of the tests by using two different sets of instrumentation slightly different from one another. In the foregoing, a detailed description of the tests is presented. 3.2 Geometry The experimental programme consists of two series of hybrid steel plate girders. Hereafter, the first one is referred to as 1VPL and the second, to as 2VPL. Each series consists of four specimens. There are no geometrical differences from one series to another. The main difference between both series lies in the mechanical properties of the plates. The girders were centrically loaded in the middle panel, hereafter referred to as directly loaded panel. The width of this panel is deemed as being the distance between transverse stiffeners a whereas the width of the adjacent panels is deemed as being distance b (Fig. 3.1).

47 Chapter 3. Experimental programme
The length of the span in all girders was 2500 mm and the clear web height was 500 mm; the former was measured between bearings. Each girder was assembled with three different steel plates. The first plate of 4 mm thickness for the webs, the second of 20 mm thickness for the flanges and the third, of 20 mm for the stiffeners. Table 3.1 provides useful information about the test geometries. The girders were designed as symmetrical and simply supported as shown in Fig. 3.1. The load was applied through a rigid 150x200 mm2 steel plate acting in the top flange as observed in Fig. 3.1.
Figure 3.1 Geometry of the specimens
The geometry of each tested girders is summarised in table 3.1
Series Specimen L (mm) a (mm) b (mm) hw (mm) Ss/a a/hw
1VPL2500 2700 2500 0 500 0,06 5,001VPL1500 2700 1500 500 500 0,10 3,001VPL750 2700 750 875 500 0,20 1,501VPL450 2700 450 1025 500 0,33 0,90
2VPL2500 2700 2500 0 500 0,06 5,002VPL1500 2700 1500 500 500 0,10 3,002VPL750 2700 750 875 500 0,20 1,502VPL450 2700 450 1025 500 0,33 0,90
Second
First
Table 3.1 Geometry of the tested hybrid steel plate girders.
3.3 Material
Tensile coupon tests were conducted for the purpose of determining the basic stress-strain uni-axial behaviour of the material of each plate. The coupons were cut from low-stressed corner regions of the specimens after testing. These coupon tests were performed in accordance to Spanish Standards (UNE 1992). For the fabrication of the girders, six different plates were used; three plates for each series. Table 3.2 summarises the mechanical properties obtained from each plate of the welded girders. Further information concerning the coupon tests is appended in Annex B.1.
Series Plate width (mm) thickness (mm) yield stress (N/mm2) ultimate stress (N/mm2) fu/fy
Web 14,87 4,10 325 443 1,36Flange 30,32 20,65 454 595 1,31
Stiffener 30,05 19,90 310 464 1,50Web 15,29 3,90 210 309 1,47
Flange 30,08 20,78 449 591 1,32Stiffener 30,32 19,71 249 387 1,55
2VPL
1VPL
Table 3.2 Results from tensile coupon-tests in all plates.
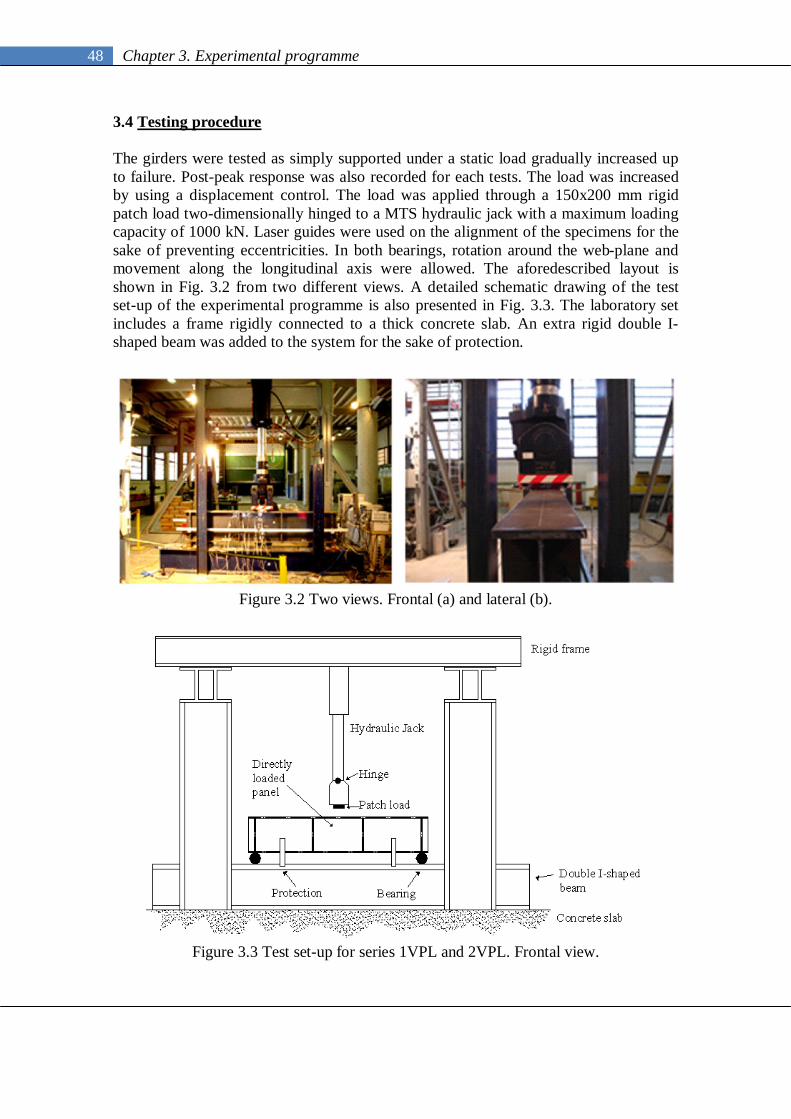
48 Chapter 3. Experimental programme
3.4 Testing procedure The girders were tested as simply supported under a static load gradually increased up to failure. Post-peak response was also recorded for each tests. The load was increased by using a displacement control. The load was applied through a 150x200 mm rigid patch load two-dimensionally hinged to a MTS hydraulic jack with a maximum loading capacity of 1000 kN. Laser guides were used on the alignment of the specimens for the sake of preventing eccentricities. In both bearings, rotation around the web-plane and movement along the longitudinal axis were allowed. The aforedescribed layout is shown in Fig. 3.2 from two different views. A detailed schematic drawing of the test set-up of the experimental programme is also presented in Fig. 3.3. The laboratory set includes a frame rigidly connected to a thick concrete slab. An extra rigid double I-shaped beam was added to the system for the sake of protection.
Figure 3.2 Two views. Frontal (a) and lateral (b).
Figure 3.3 Test set-up for series 1VPL and 2VPL. Frontal view.
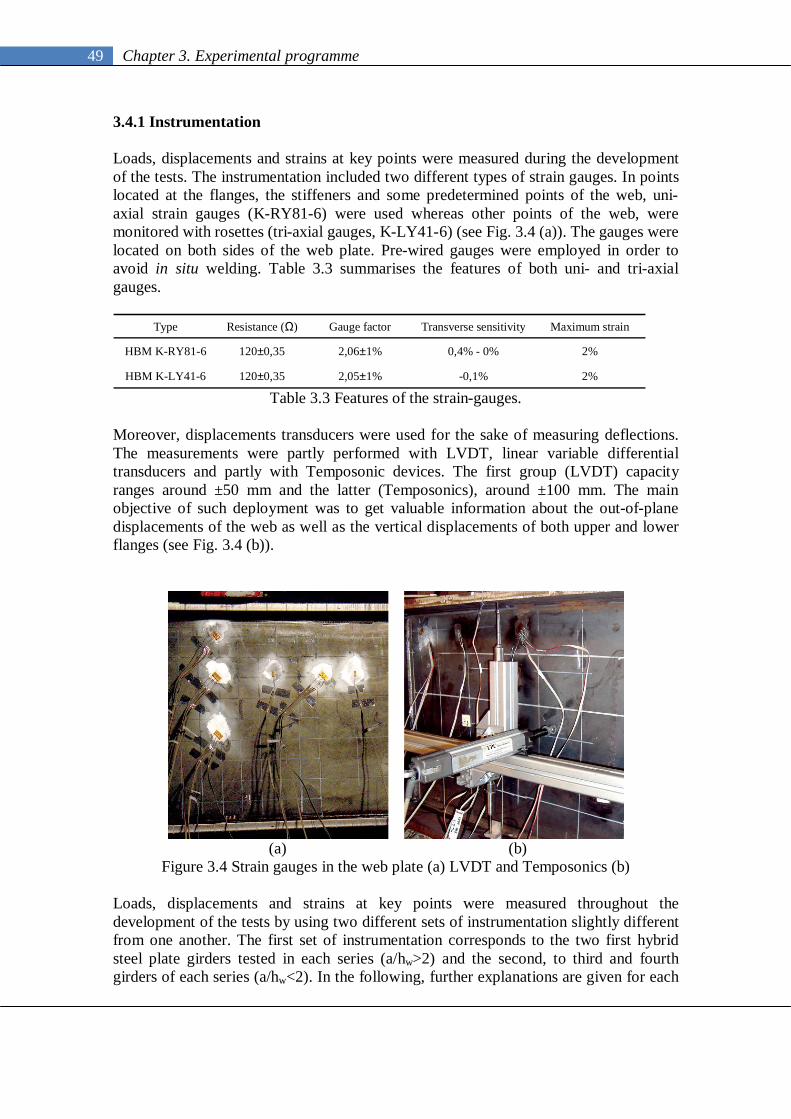
49 Chapter 3. Experimental programme
3.4.1 Instrumentation Loads, displacements and strains at key points were measured during the development of the tests. The instrumentation included two different types of strain gauges. In points located at the flanges, the stiffeners and some predetermined points of the web, uni-axial strain gauges (K-RY81-6) were used whereas other points of the web, were monitored with rosettes (tri-axial gauges, K-LY41-6) (see Fig. 3.4 (a)). The gauges were located on both sides of the web plate. Pre-wired gauges were employed in order to avoid in situ welding. Table 3.3 summarises the features of both uni- and tri-axial gauges.
Type Resistance (Ω) Gauge factor Transverse sensitivity Maximum strain
HBM K-RY81-6 120±0,35 2,06±1% 0,4% - 0% 2%
HBM K-LY41-6 120±0,35 2,05±1% -0,1% 2% Table 3.3 Features of the strain-gauges.
Moreover, displacements transducers were used for the sake of measuring deflections. The measurements were partly performed with LVDT, linear variable differential transducers and partly with Temposonic devices. The first group (LVDT) capacity ranges around ±50 mm and the latter (Temposonics), around ±100 mm. The main objective of such deployment was to get valuable information about the out-of-plane displacements of the web as well as the vertical displacements of both upper and lower flanges (see Fig. 3.4 (b)).
(a) (b)
Figure 3.4 Strain gauges in the web plate (a) LVDT and Temposonics (b) Loads, displacements and strains at key points were measured throughout the development of the tests by using two different sets of instrumentation slightly different from one another. The first set of instrumentation corresponds to the two first hybrid steel plate girders tested in each series (a/hw>2) and the second, to third and fourth girders of each series (a/hw<2). In the following, further explanations are given for each

50 Chapter 3. Experimental programme
case. In addition, Annex B.2 includes valuable information of the precise location of all devices during the tests. Girders with a/hw>2 Fig. 3.5 shows the directly loaded panel from a frontal view. The gauges were identically fastened on both sides of the web panel. Basically, strain gauges were fastened on two orthogonal axes of the web. Three rosettes were placed on the vertical axis. An arrangement of two uniaxial gauges and one additional rosette was placed on the horizontal axis approximately located at 0,25·hw from the upper flange. No strain measuring points were located in the stiffeners.
Figure 3.5 Frontal view of the web in the directly loaded panel
Tested girders with a/hw>2. Strain gauges. Fig. 3.6 shows a top view of the girder. Strain gauges aiming to capture the development of longitudinal direct strains were fastened on the top surface of the upper flange.
Figure 3.6 Top view of the upper flange in the directly loaded panel
Tested girders with a/hw>2. Strain gauges.
On the other hand, displacement transducers were located at key points of the web and flanges. The device deployment is sketched in Fig. 3.7. The out-of-plane displacement of the web was measured by using Temposonic devices (H) whereas vertical deflections were measured by using LVD transducers located at both top and bottom flange (V). An additional control measurement of the potential vertical displacement of the bearings was taken.

51 Chapter 3. Experimental programme
Figure 3.7 Frontal view of the web in the directly loaded panel
Tested girders with a/hw>2. Displacement transducers.
Girders with a/hw<2 The instrumentation deployments were slightly modified in these cases. The distance a was judged to be short enough for expecting non-negligible stress levels in the transverse stiffeners and, in the adjacent panels. In this case, the horizontal axis of gauges was located at 0,05·hw. An extra rosette was located on the same axis but in the adjacent panel. Uniaxial gauges were fastened on the transverse stiffeners for the sake of evaluating the strain evolution (see Fig. 3.8). Slight modifications on the flange arrangement can be observed in Fig. 3.9. An additional gauge was fastened below the patch load on one surface of the top flange. In this case, the deployment corresponding to Temposonics and transducer devices was identical to the one previously depicted.
Figure 3.8 Frontal and isometric views of the web in the directly loaded panel
Tested girders with a/hw<2. Strain gauges.
Figure 3.9 Top view of the upper flange in the directly loaded panel
Tested girders with a/hw<2. Strain gauges.

52 Chapter 3. Experimental programme
The information related to the applied load was obtained from the hydraulic jack system. The data related to oil pressure measurements from the system were digitally converted as a surface load. A MGC-Plus data acquisition system was used with a 1-Hz reading frequency. As a result, the history load of the test was recorded and then stored in a data worksheet. 3.5 Initial imperfections Usually, steel girders are assumed to be straight plated. There are, however, geometrical imperfections and residual stresses. For some cases, these singularities may play an important role in the response of the girders when subjected to arbitrary loads. Nowadays, geometrical imperfections can be measured by means of optical devices. Unfortunately, residual stresses remain a variable that has to be inferred from external information. Residual stress measurements are often associated, at least in a reliable way, to destructive tests. Before the tests, initial shapes of the web and flange panels in four of the tested hybrid girders were obtained by means of a 3D co-ordinate measuring device (these girders belong to the first series). The 3D data format, namely, the point cloud format, leads to a series of co-ordinates {xi,yi,zi} of each point. The data allow the reproduction of the original shape for both the web and flanges of all hybrid steel plate girders. The measurement principle is to obtain the position of infrared LEDs by means of cameras through triangulations using a portable device as shown in Fig. 3.10.
Figure 3.10. Measurement of initial imperfections.
3D data from all web and flange panels were obtained following a hundred millimetres square grid previously drawn. Two singularities were observed after plotting the results. First, random shapes of the initial imperfections of the webs were noticed. Second, the initial imperfection of the flanges was judged to be negligible. A considerable twisting of such plates relative to a vertical reference was noticed though. A series of plots of the cross-section at mid-span of the girders are displayed in Fig. 3.11 (a) for girders with a/hw>2 and (b) for girders with a/hw<2.

53 Chapter 3. Experimental programme
050
100150200250300350400450500
0 1 2 3 4 5
Web
hei
ght (
mm
)
Measured out-of-plane imperfection(mm)
1VPL2500Cross-section at mid-span
050
100150200250300350400450500
0 1 2 3 4 5
Web
hei
ght (
mm
)
Measured out-of-plane imperfection(mm)
1VPL1500Cross-section at mid-span
(a) a/hw>2
Figure 3.11 Measurements of the imperfections at mid-span cross-section
050
100150200250300350400450500
-4 -2 0 2 4
Web
hei
ght (
mm
)
Measured out-of-plane imperfection(mm)
1VPL750Cross-section at mid-span
050
100150200250300350400450500
-4 -2 0 2 4
Web
hei
ght (
mm
)
Measured out-of-plane imperfection(mm)
1VPL450Cross-section at mid-span
(b) a/hw<2
Figure 3.11 Measurements of the imperfections at mid-span cross-section Two features are noticed in the foregoing figure.
In 1VPL2500 and 1VPL1500 (a/hw>2); a C-shaped initial imperfection at mid-span is observed. The magnitude of the maximum out-of-flatness is approximately 4 millimetres (which is comparable to the web thickness).
In 1VPL750 and 1VPL450, the out-of-flatness follows an initially S-shaped plate. For these girders, the magnitude of the initial imperfection is approximately 2,5 mm.
Fig. 3.12 shows contours on each web plate. For this purpose, a perfectly vertical reference was adopted for all plates.
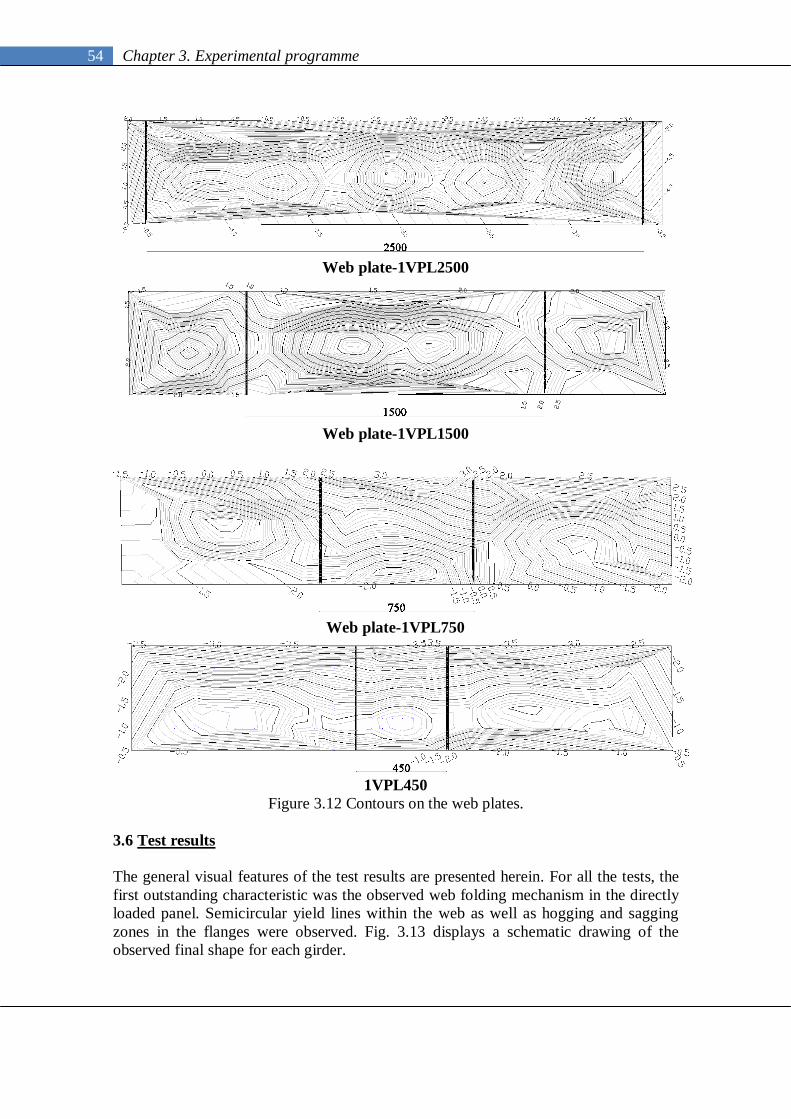
54 Chapter 3. Experimental programme
Web plate-1VPL2500
Web plate-1VPL1500
Web plate-1VPL750
1VPL450
Figure 3.12 Contours on the web plates. 3.6 Test results The general visual features of the test results are presented herein. For all the tests, the first outstanding characteristic was the observed web folding mechanism in the directly loaded panel. Semicircular yield lines within the web as well as hogging and sagging zones in the flanges were observed. Fig. 3.13 displays a schematic drawing of the observed final shape for each girder.

55 Chapter 3. Experimental programme
Figure 3.13 Failure modes observed in the experimental programme.
Several incidences worth to be outlined were observed during the development of the tests.
In specimen 1VPL1500, an unexpected situation occurred. From the onset of the test, an excessive twisting of the upper flange was observed. Seemingly, the load was not vertically introduced (perhaps due to initial imperfection of the top flange). This fact could be explained partly by a misalignment of the specimen but also by an initial twisting of the upper flange during the welding. The results obtained from this test were judged invalid as it did not represent accurately a centrically applied load on the web. Instead, it represented a load that could be separated into vertical and horizontal components. As one might expect, in this particular case, the ultimate load capacity was lower than predicted.
In girder 2VPL450, a shear buckling related wave was observed in the adjacent panel at the end of the test. Unfortunately, no measurement points were located at that panel since this fact was not expected. At least visually, buckling occurred in the post-peak range after achieving the ultimate load capacity due to patch loading. The results obtained from this test were considered as being valid though.
The post-peak response in all girders was similar. The load decreased gradually while the buckling wave located locally below the patch load increased its size. Significant ductility was observed for all cases.
Moreover, a peculiar situation occurred for girders with a=450mm (1VPL450 and 2VPL450). The load was firstly applied on the top flange with a rigid patch.

56 Chapter 3. Experimental programme
Perfect contact between the rigid patch and the flange was observed. At some point, due to hogging and sagging zones deformation, the top flange diverted this perfect contact towards two outer lines. Marks of the edges of the patch load were recognised indicating that the load was applied as two concentrated loads at these outer lines. These lines were observed to be very near the hogging zone. Fig. 3.14 illustrates the observed phenomenon.
Figure 3.14 Application of the load at the end of the tests for girders with a=450 mm.
Table 3.4 gives the experimental results of ultimate load resistance together with the vertical deflection of the top flange at this load.
Girder a (mm) a/hw fyf/fyw Fu (kN) Vertical deflection (mm)1VPL2500 2500 5,0 1,34 217,23 2,611VPL1500 1500 3,0 1,34 195,68 5,581VPL750 750 1,5 1,34 251,80 13,081VPL450 450 0,9 1,34 426,00 10,202VPL2500 2500 5,0 2,19 134,25 4,942VPL1500 1500 3,0 2,19 126,24 6,522VPL750 750 1,5 2,19 190,94 18,562VPL450 450 0,9 2,19 337,00 9,80
Table 3.4 Ultimate load of the tested girders. In this table, a trend can be noticed, the shorter the distance between transverse stiffeners, the greater the ultimate load capacity on the plate girders subjected to patch loading. Two exceptions should be pointed out though. First, specimen 1VPL1500 led to a lower ultimate load capacity than 1VPL2500, which is contrary to this trend. This fact can be explained since during the test, an excessive twisting of the flange (corresponding to a structural situation different from patch loading) was noticed. Second, in specimen 2VPL1500 the measured ultimate load capacity was lower than predicted as well. In this particular case, however, the test was performed without any singularity, at least visually. Moreover, the failure mechanisms observed during the tests are pictured in Fig. 3.15.

57 Chapter 3. Experimental programme
Figure 3.15 Girders at the end of the tests.
Fig. 3.16 displays graphically the ultimate load capacity of the girders as a function of distance a. The results obtained in 1VPL450 and 2VPL450 show that for short distances between transverse stiffeners, the slope of the plot changes considerably. Expectedly, for girders with a/hw>2, ultimate load capacity should decrease linearly with distance a. It is worth mentioning that results from girders 1VPL1500 and 2VPL1500 are not included within the plot.

58 Chapter 3. Experimental programme
0
50
100
150
200
250
300
350
400
450
0 500 1000 1500 2000 2500 3000
Fu (
kN)
Distance a (mm)
First seriesSecond series
Figure 3.16. Experimental results. Ultimate load resistance of the girders vs. distance a
In the forthcoming, load-displacement plots and load-strain plots are sequentially presented and discussed. For the sake of conciseness, only the most remarkable observed features are presented in this section. Additional results are appended in Annex B.3 as well as in Roca (2007). 3.6.1 Largely spaced transverse stiffening a/hw>2. Load-deflection plots are presented for two girders with a=2500 mm. (a/hw=5,0). The first plot (Fig. 3.17 (a)) corresponds to the vertical displacement measured from the top flange of the girders whereas the second plot (Fig. 3.17 (b)) corresponds to the out-of-plane displacement of the web.
0
50
100
150
200
250
0 5 10 15 20
Loa
d (k
N)
Vertical deflection (mm)
1VPL25002VPL2500
0
50
100
150
200
250
0 10 20 30
Loa
d (k
N)
out-of-plane deflection (mm)
1VPL25002VPL2500
Figure 3.17 (a) Load vs. vertical deflection (b) Load vs. out-of-plane displacement
Several remarks can be pointed out from the foregoing plots:

59 Chapter 3. Experimental programme
1VPL2500 shows a linear elastic branch up to high load levels. Once the capacity is exhausted, the load decreases gradually.
The response that characterises the specimen 2VPL2500 shows a premature loss of linearity from the onset of the test. This loss is very significant at approximately 60 kN (0,46·Fu).
The ultimate load capacity Fu of 1VPL2500 is higher than of 2VPL2500 since fyw1VPL> fyw2VPL.
Moreover, out-of-plane displacements are plotted for different load-levels at two points of the mid-span section in Fig. 3.18. In 1VPL2500, the initial shape imperfection at the mid-span cross-section is included. In 2VPL2500, only relative values of the out-of-plane displacement are presented since no initial imperfections were measured in this case.
0
50
100
150
200
250
300
350
400
450
500
0 5 10 15 20
Web
hei
ght (
mm
)
Out-of-plane deflection (mm)
1VPL2500
Initial shape-Impefection25% Fu50% Fu75% Fu100% Fu
0
50
100
150
200
250
300
350
400
450
500
0 5 10 15 20 25
Web
hei
ght (
mm
)
Out-of-plane deflection (mm)
2VPL2500
25% Fu50% Fu75% Fu100% Fu
Figure 3.18 Evolution of out-of-the-plane displacements during the tests, a=2500mm. Likewise, load vs. vertical strains are plotted in Fig. 3.19 from the information obtained at three points at each side of the web in 1VPL2500.
0
50
100
150
200
250
-0,015 -0,01 -0,005 0 0,005 0,01
Loa
d (k
N)
Strain
A
BA B
(a)
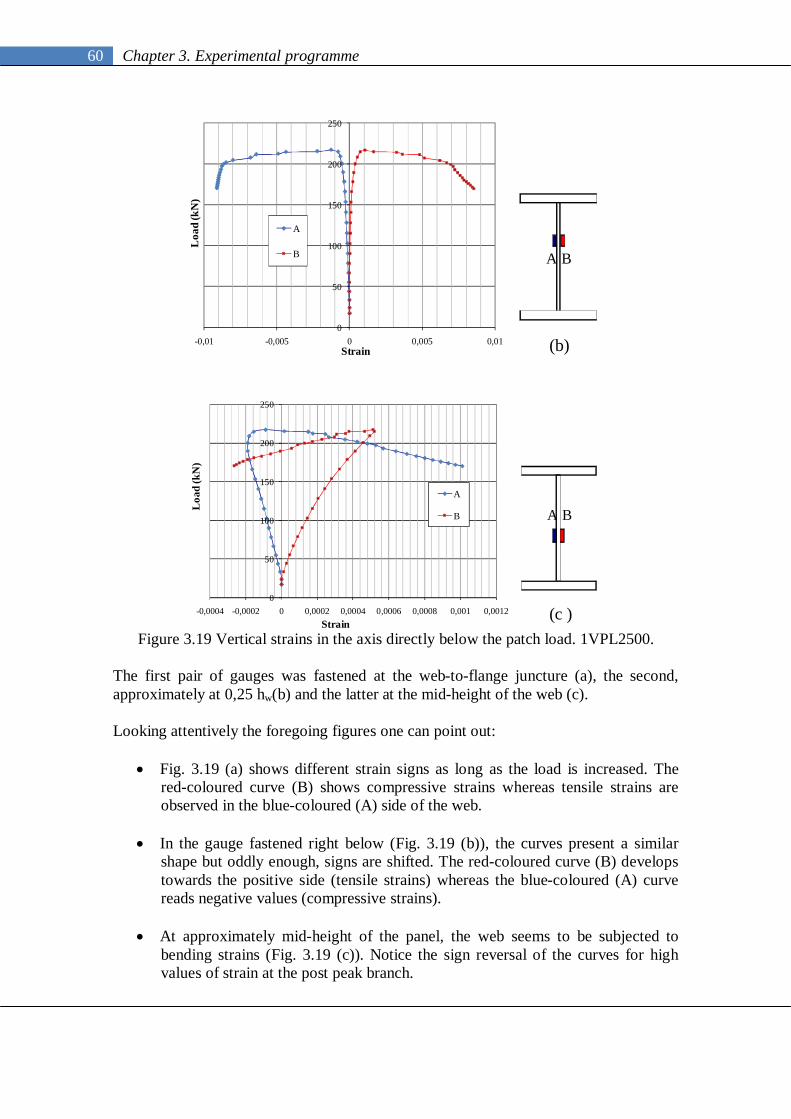
60 Chapter 3. Experimental programme
0
50
100
150
200
250
-0,01 -0,005 0 0,005 0,01
Loa
d (k
N)
Strain
A
B A B
(b)
0
50
100
150
200
250
-0,0004 -0,0002 0 0,0002 0,0004 0,0006 0,0008 0,001 0,0012
Loa
d (k
N)
Strain
A
B A B
(c ) Figure 3.19 Vertical strains in the axis directly below the patch load. 1VPL2500.
The first pair of gauges was fastened at the web-to-flange juncture (a), the second, approximately at 0,25 hw(b) and the latter at the mid-height of the web (c). Looking attentively the foregoing figures one can point out:
Fig. 3.19 (a) shows different strain signs as long as the load is increased. The red-coloured curve (B) shows compressive strains whereas tensile strains are observed in the blue-coloured (A) side of the web.
In the gauge fastened right below (Fig. 3.19 (b)), the curves present a similar shape but oddly enough, signs are shifted. The red-coloured curve (B) develops towards the positive side (tensile strains) whereas the blue-coloured (A) curve reads negative values (compressive strains).
At approximately mid-height of the panel, the web seems to be subjected to
bending strains (Fig. 3.19 (c)). Notice the sign reversal of the curves for high values of strain at the post peak branch.
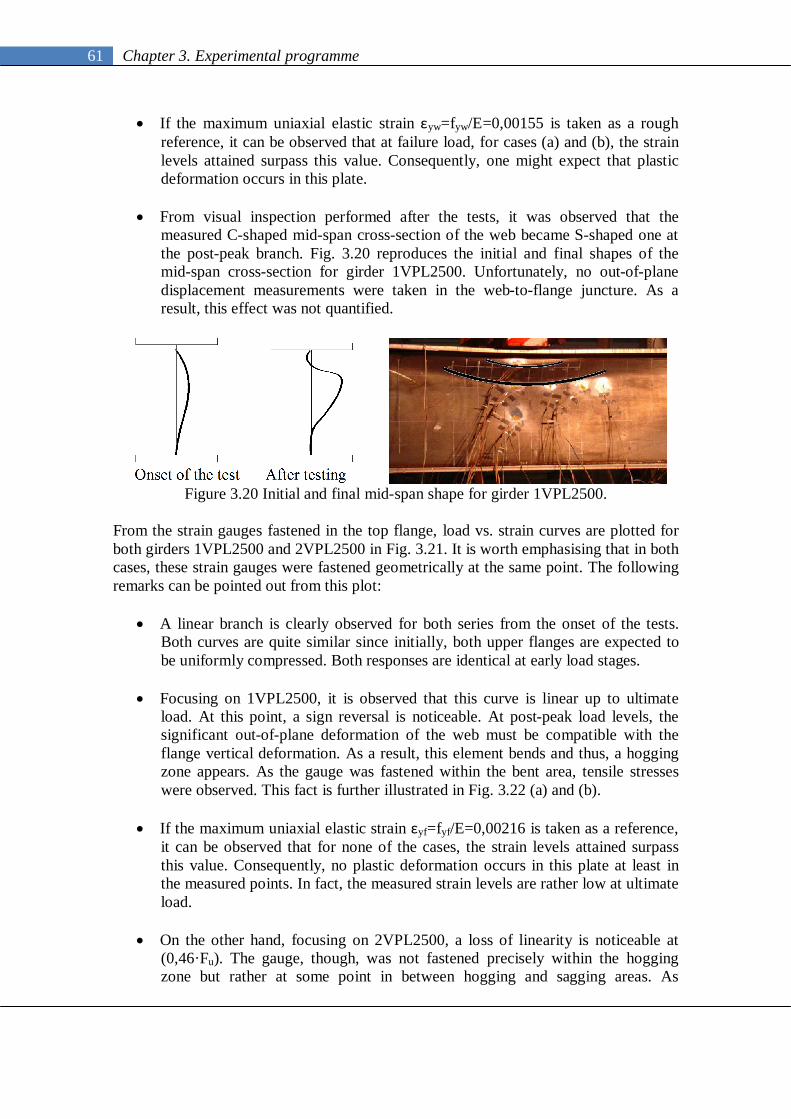
61 Chapter 3. Experimental programme
If the maximum uniaxial elastic strain εyw=fyw/E=0,00155 is taken as a rough reference, it can be observed that at failure load, for cases (a) and (b), the strain levels attained surpass this value. Consequently, one might expect that plastic deformation occurs in this plate.
From visual inspection performed after the tests, it was observed that the
measured C-shaped mid-span cross-section of the web became S-shaped one at the post-peak branch. Fig. 3.20 reproduces the initial and final shapes of the mid-span cross-section for girder 1VPL2500. Unfortunately, no out-of-plane displacement measurements were taken in the web-to-flange juncture. As a result, this effect was not quantified.
Figure 3.20 Initial and final mid-span shape for girder 1VPL2500.
From the strain gauges fastened in the top flange, load vs. strain curves are plotted for both girders 1VPL2500 and 2VPL2500 in Fig. 3.21. It is worth emphasising that in both cases, these strain gauges were fastened geometrically at the same point. The following remarks can be pointed out from this plot:
A linear branch is clearly observed for both series from the onset of the tests. Both curves are quite similar since initially, both upper flanges are expected to be uniformly compressed. Both responses are identical at early load stages.
Focusing on 1VPL2500, it is observed that this curve is linear up to ultimate load. At this point, a sign reversal is noticeable. At post-peak load levels, the significant out-of-plane deformation of the web must be compatible with the flange vertical deformation. As a result, this element bends and thus, a hogging zone appears. As the gauge was fastened within the bent area, tensile stresses were observed. This fact is further illustrated in Fig. 3.22 (a) and (b).
If the maximum uniaxial elastic strain εyf=fyf/E=0,00216 is taken as a reference,
it can be observed that for none of the cases, the strain levels attained surpass this value. Consequently, no plastic deformation occurs in this plate at least in the measured points. In fact, the measured strain levels are rather low at ultimate load.
On the other hand, focusing on 2VPL2500, a loss of linearity is noticeable at (0,46·Fu). The gauge, though, was not fastened precisely within the hogging zone but rather at some point in between hogging and sagging areas. As

62 Chapter 3. Experimental programme
explained, since the material properties of the girders are different, the location of these zones is not necessarily identical.
0
50
100
150
200
250
-0,0002 -0,0001 0,0000 0,0001 0,0002 0,0003 0,0004 0,0005
Loa
d (k
N)
Strain
1VPL25002VPL2500
Figure 3.21 Load vs. strain. Upper flange.
Figure 3.22 (a) Uniformly compressed flange.
(b) local bending-like behaviour in upper flange. 3.6.2 Closely spaced transverse stiffeners a/hw≤2,0 Figure 3.23 displays load vs. vertical deflection of the top flange for girders 1VPL750 and 2VPL750. The shape of these curves significantly differs from the previously plotted curves for high a/hw ratios.
0
50
100
150
200
250
300
0 5 10 15 20 25 30
Loa
d (k
N)
Vertical deflection (mm)
1VPL7502VPL750
Figure 3.23 Load vs. vertical deflection of the upper flange for girders with a=750 mm
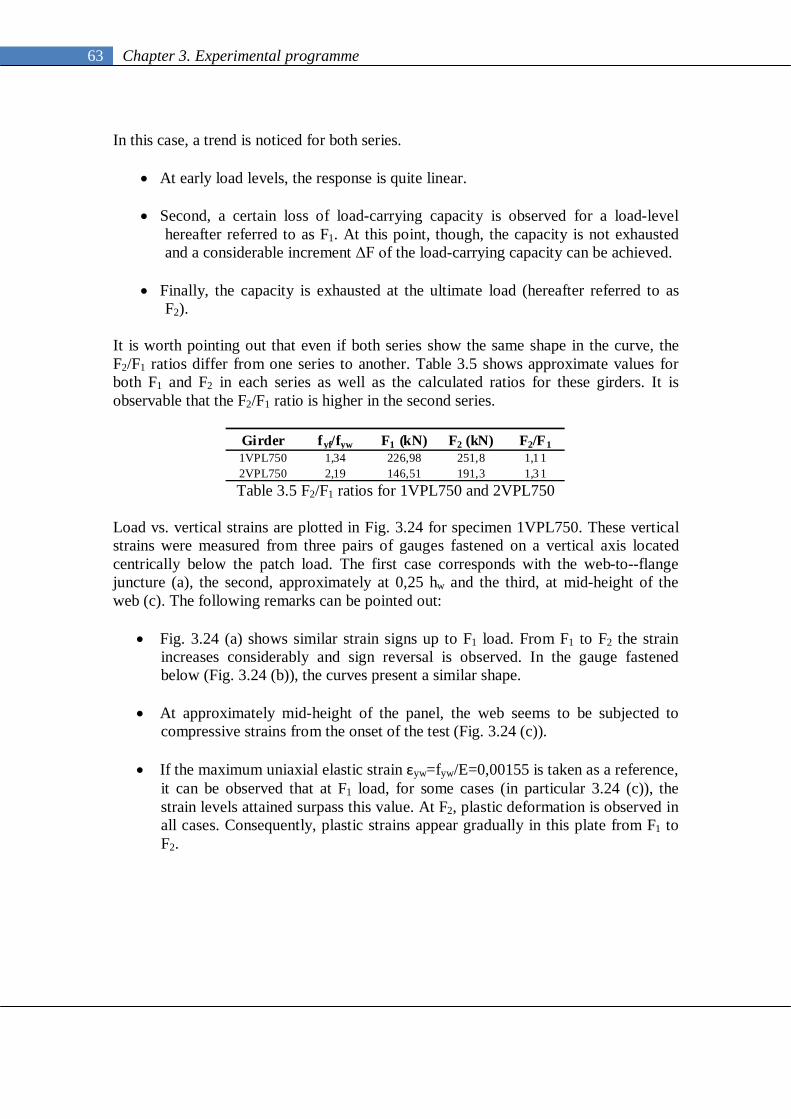
63 Chapter 3. Experimental programme
In this case, a trend is noticed for both series.
At early load levels, the response is quite linear.
Second, a certain loss of load-carrying capacity is observed for a load-level hereafter referred to as F1. At this point, though, the capacity is not exhausted and a considerable increment ΔF of the load-carrying capacity can be achieved.
Finally, the capacity is exhausted at the ultimate load (hereafter referred to as
F2). It is worth pointing out that even if both series show the same shape in the curve, the F2/F1 ratios differ from one series to another. Table 3.5 shows approximate values for both F1 and F2 in each series as well as the calculated ratios for these girders. It is observable that the F2/F1 ratio is higher in the second series.
Girder fyf/fyw F1 (kN) F2 (kN) F2/F11VPL750 1,34 226,98 251,8 1,1 12VPL750 2,19 146,51 191,3 1,3 1 Table 3.5 F2/F1 ratios for 1VPL750 and 2VPL750
Load vs. vertical strains are plotted in Fig. 3.24 for specimen 1VPL750. These vertical strains were measured from three pairs of gauges fastened on a vertical axis located centrically below the patch load. The first case corresponds with the web-to--flange juncture (a), the second, approximately at 0,25 hw and the third, at mid-height of the web (c). The following remarks can be pointed out:
Fig. 3.24 (a) shows similar strain signs up to F1 load. From F1 to F2 the strain increases considerably and sign reversal is observed. In the gauge fastened below (Fig. 3.24 (b)), the curves present a similar shape.
At approximately mid-height of the panel, the web seems to be subjected to compressive strains from the onset of the test (Fig. 3.24 (c)).
If the maximum uniaxial elastic strain εyw=fyw/E=0,00155 is taken as a reference, it can be observed that at F1 load, for some cases (in particular 3.24 (c)), the strain levels attained surpass this value. At F2, plastic deformation is observed in all cases. Consequently, plastic strains appear gradually in this plate from F1 to F2.

64 Chapter 3. Experimental programme
0
50
100
150
200
250
300
-0,003 -0,002 -0,001 0 0,001 0,002 0,003 0,004
Loa
d (k
N)
Strain
A
B
0
50
100
150
200
250
300
-0,002 -0,001 0 0,001 0,002 0,003 0,004
Loa
d (k
N)
Strain
A
B
0
50
100
150
200
250
300
-0,006 -0,004 -0,002 0 0,002 0,004
Load
(kN
)
Strain
A
B
Figure 3.24.Vertical strains in the vertical axis directly below the patch load. 1VPL750. Fig. 3.25 shows the uniaxial strain measurements obtained from gauges fastened on the upper flange. A lateral detailed view of the transverse stiffener-web-flange conjunction is also sketched in Fig. 3.26. The relative location of two sensors is indicated in this
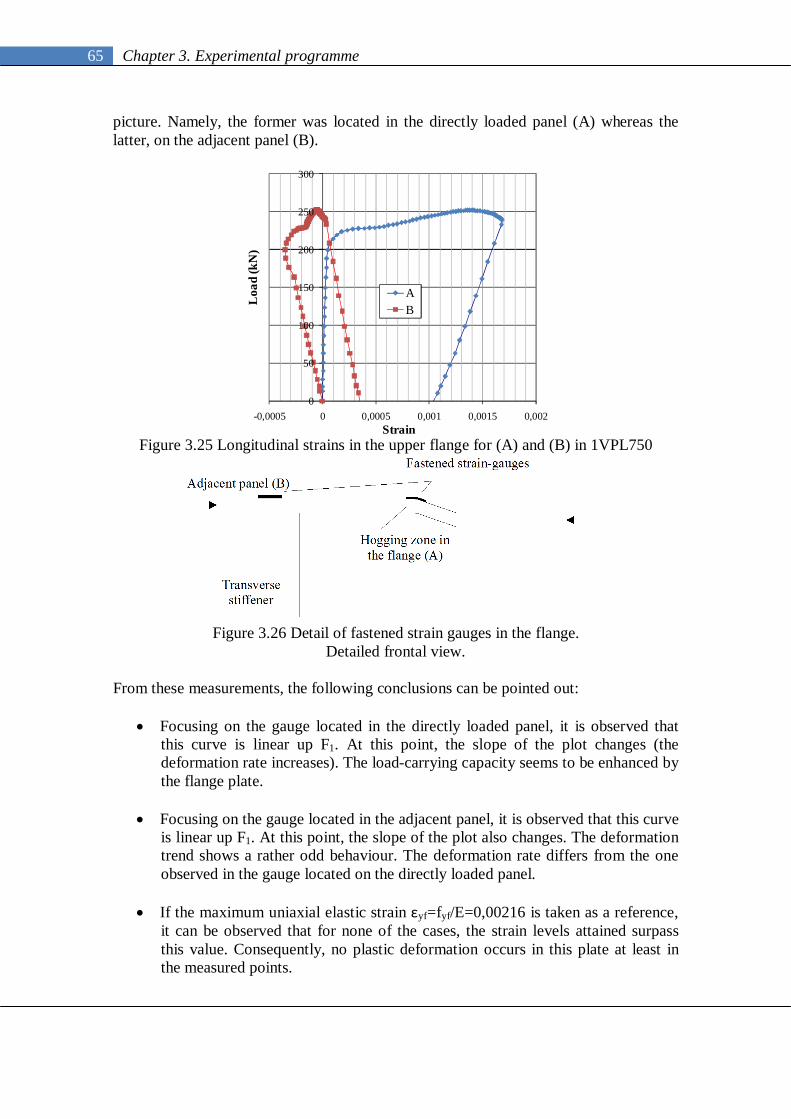
65 Chapter 3. Experimental programme
picture. Namely, the former was located in the directly loaded panel (A) whereas the latter, on the adjacent panel (B).
0
50
100
150
200
250
300
-0,0005 0 0,0005 0,001 0,0015 0,002
Loa
d (k
N)
Strain
AB
Figure 3.25 Longitudinal strains in the upper flange for (A) and (B) in 1VPL750
Figure 3.26 Detail of fastened strain gauges in the flange.
Detailed frontal view. From these measurements, the following conclusions can be pointed out:
Focusing on the gauge located in the directly loaded panel, it is observed that this curve is linear up F1. At this point, the slope of the plot changes (the deformation rate increases). The load-carrying capacity seems to be enhanced by the flange plate.
Focusing on the gauge located in the adjacent panel, it is observed that this curve is linear up F1. At this point, the slope of the plot also changes. The deformation trend shows a rather odd behaviour. The deformation rate differs from the one observed in the gauge located on the directly loaded panel.
If the maximum uniaxial elastic strain εyf=fyf/E=0,00216 is taken as a reference, it can be observed that for none of the cases, the strain levels attained surpass this value. Consequently, no plastic deformation occurs in this plate at least in the measured points.

66 Chapter 3. Experimental programme
Finally, a load vs. vertical strain from a uniaxial gauge fastened in the vertical stiffener is presented for both series of girders (Fig. 3.27).
0
50
100
150
200
250
300
0 0,0005 0,001 0,0015 0,002
Loa
d (k
N)
Strain
1VPL7502VPL750
Figure 3.27 Load vs. vertical strain at transverse stiffeners.
From these measurements, the following conclusions can be pointed out:
The curves are linear up to F1 for both series.
The transverse stiffeners present a quite different response from the load level F1 onwards.
If the maximum uniaxial elastic strain εys=fys/E=0,00148 is taken as a reference,
it can be observed that for none of the cases, the strain levels attained surpass this value. Consequently, no plastic deformation occurs in this plate at least in the measured points.
3.6.3 Tests results vs. EN1993-1-5 At this point, it is worth keeping in mind the current formulation of EN1993-1-5. As explained in previous chapters, the calculated effective loaded length ly cannot be greater than distance a in eq. 3.1
1M
wywF
1M
wyywF
1M
weffywRd
taftlftLfF
····
(3.1)
Fig. 3.32 shows the current EN1993-1-5 value of FRd when plotted as a function of the distance a for idealised girders. The geometry of such girders is identical to the basic geometry of tested prototypes. In addition, experimentally obtained ultimate load capacities are included for both series.

67 Chapter 3. Experimental programme
Firstly, for girders with a>ly, ultimate load capacity expectedly decreases with distance a. Both experimental and theoretical values present the same trend.
On the opposite side, i.e., a<ly, a discontinuity is observed for ly=a, which is the limit value in eq. 3.1. As long as distance a is decreased, ultimate load capacity decreases. This trend is completely different to the one experimentally observed. If results obtained from the experimental programme are compared to those derived from design codes, one can observe the divergence between both results for short distances between transverse stiffeners. It is noticeable that whereas the experimental results show a change of slope towards one sense, the design formulation shows a trend towards the opposite sense. The design formulation is seemingly conservative for panels with closely spaced transverse stiffening.
0
50
100
150
200
250
300
350
400
450
0 500 1000 1500 2000 2500 3000
Loa
d (k
N)
Distance a (mm)
EN1993-1-5 -First seriesEN1993-1-5- Second seriesTests- First seriesTests- Second series
Figure 3.32. Ultimate load resistance of the girders
Experimentally and theoretically obtained values vs. distance a 3.7 Discussion This chapter is an attempt to bring together the various strands of experimental testing with which this research has been involved. This involvement has been on the preparation, performing and presentation of remarkable results of the programme. The partial objective of obtaining experimental data of the performed is presented within this chapter. The geometry of the tested specimens has been chosen as a compromise between laboratory capacities and desired proportions. Primarily, two variables were taken into account. First, the plates yield strengths, for assessing the hybrid condition and second, the distance between transverse stiffeners a. A set of variation between both magnitudes led to the experimental programme design. The preparation of the tests was quite laborious. For the sake of instrumentation, two arrangements were conceived, one slightly different from another. Girders with high a/hw ratios were instrumented differently from girders with low a/hw ratios (in which several gauges were fastened on

68 Chapter 3. Experimental programme
the transverse stiffeners). The initial imperfections of all girders of the first series were measured. Thus, 3D data from all web and flanges panels were obtained following a hundred millimetres square grid. The 8 hybrid steel plate girders were tested up to failure. The first outstanding result was the failure mode in the directly loaded panel observed in seven prototypes. A four-hinge resistant mechanism was visually noticeable after testing. It was, however, observed that the response of the girders depended upon the aspect ratio of the directly loaded panel. Girders with a/hw>2 showed a load-deflection plot with no post-buckling reserve. Moreover, the strain measurements showed the following remarks:
The web plates presented considerable plastic deformations at collapse loads.
No plastic deformation was observed from the measurements performed on the flange plates.
Likewise, it is observed that the EN1993-15 formulation follows the
experimentally obtained trend when comparing experimental and theoretical ultimate load capacities.
Girders with a/hw<2 showed a load-deflection with a considerable post-buckling reserve. The observed response showed a first linear branch up to F1 and subsequently, an increment ΔF up to F2. Moreover, the strain measurements showed the following remarks:
The web plates presented considerable plastic deformations at F1 and collapse loads F2.
No plastic deformation was observed from the measurements performed on the flange plates at F1. The response of such elements varied considerably from the value of F1 onwards.
No plastic deformation was observed from the measurements performed on the
stiffener plates. The response of such elements varied considerably from the value of F1 onwards.
Likewise, it was observed that the EN1993-15 formulation does not follow the
experimentally obtained trend when comparing experimental and theoretical ultimate load capacities. In subsequent chapters, numerical simulations are performed and further studies are addressed.

69 Chapter 4. Numerical model
4. Numerical model
“The origin of the word abacus can be traced to the Arabic abq -meaning “dust” or “fine sand”- which became abax for “sand tray” in Greek, and abaqus in Latin”
Jan Gulberg. Mathematics from the birth of numbers 4.1 Introduction. The Finite Element Method This chapter is an attempt to bring together some concepts behind the various strands of work on structural modelling with which this research has been involved. This involvement has been on both the engineering and research sides with an emphasis of the production of accurate solutions for a particular practical problem. Advanced pre- and post-processing techniques are explored for the sake of developing realistic structural models. The structural modelling has been useful for conducting large parametric studies but also for thoroughly understanding the phenomena associated with the resistance mechanism of hybrid girders when subjected to patch loading. The numerical model implemented in the multi-purpose code ABAQUS which includes geometrical and material nonlinearities has been systematically used as a simulation tool. The core of this commercial software package for engineering calculations is the FE-method. Most of practical problems arising in engineering applications must be solved in an approximate way by some numerical methods since closed-form exact solutions exist only for a narrow category of problems. Nowadays, the most universal technique applicable to structural problems (or in a broad sense, physical problems) is the FE-method. This method remains the core of most of the software packages for engineering computations. It is beyond the scope of this work to present a detailed description of this subject to any larger extent. For a broad and systematic treatment of the subject, classical textbooks which have been highly helpful in this research are recommended (Zienkiewicz and Taylor 2003, Bathe 1982, Oñate 1992). The advent of numerical methods as tools in the simulation of physical problems encourages the research community to avoid formerly expensive experimental programmes. The best available theoretical knowledge is nowadays in contact with new user-friendly modelling techniques but also the available data-storage capacity allows disregarding the size of these studies in most cases. In structural problems, the FE-method usage requires a careful formulation of a mathematical model which enables to take simultaneously into account the external factors involved, such as the geometry, the material, the loads and the prescribed conditions. There is, unavoidably, a concern about the scope and shortcomings of the models that presumably represent the system. The usual methodology starts with a definition of the nature of the problem. Broadly speaking, structures could be considered either as continuous, with an infinite number of degrees of freedom (DOF) or as discrete, with a finite number of DOF. The FE-

70 Chapter 4. Numerical model
method consists in transforming all the continuous structures into discrete systems. Even if this transformation implies a result of large amounts of equations, usually nonlinear, the advent of modern computers and programming retains suitable possibilities of its application. Once the model is defined, the structure should then be “meshed”. This mesh is a graphical division of the whole structure in small elements, the well-known finite elements. These elements must be properly connected in their boundaries by nodes. The elements may be chosen as one, two or three-dimensional. This choice is different for each particular study, e.g., a simply supported beam could either be modelled in one, two or three dimensions as sketched in Fig 4.1. The decision relies upon which kind of information is further needed. Elastic static analyses can be modelled one-dimensionally whereas inelastic local buckling problems in beams should be modelled either two or three-dimensionally. Eventually, time and computation-costs are increased with the complexity of the problem.
Figure 4.1 Geometrical idealisation of a simply supported I-shaped beam.
4.1.1 Classical formulation of elastic solids In elasticity, the displacement-field of the nodal points becomes the unknown of the problem (Navier formulation). A set of linear or non-linear algebraic equations must be assembled by including the contribution of each element to the system as a whole. Under the classical assumptions of small displacements, infinitesimal strains and linear relationship between stresses and strains, the three fundamental sets of equations describing a linear elastic structural problem can be written as follows: tt S ,x, uxε Kinematic equations (strain-displacement) (4.1)
ε1εxσ ·2··, Trt Constitutive equations (stress-strain) (4.2)
0, tt o x,bx·σ Static equations (internal equilibrium) (4.3)

71 Chapter 4. Numerical model
These equations must be properly supplemented by appropriate boundary conditions for satisfying the equilibrium. In the standard version of the FE-method, the displacement components are approximated as linear combinations of suitably chosen interpolation functions; namely the shape functions, each one associated with a node and commonly arranged into a matrix N. If arbitrary nodal displacements of the whole structure are collected into a vector d (namely, the virtual displacements), this approximation reads:
dim
N
1iii ....2,1id·xd·xxu
nod
NNN
(4.4)
If the derivatives of 4.4 are substituted in 4.1 and thus, substituting the strain approximation in 4.2, equation 4.5 gives
dxxtt ··,,
NxDxσ (4.5)
The approximation of displacements, strains and stresses satisfy both kinematic and constitutive equations exactly. The differential equations of equilibrium (4.3) cannot, however, be satisfied exactly at every point in a strong sense. Therefore, they are replaced by the virtual work equality presented in an integral form which is commonly referred to as weak form of the equilibrium equations. Eq. 4.6 gives the integral form of the equilibrium equation.
0··· V
TT
SV
T dVudSudV b·t·σ (4.6)
V is defined as the volume of the solid, t as the column matrix corresponding to the forces acting in the surface S (boundary conditions) and b, the body forces prescribed in the volume V. This principle is usually assumed as fundamental. Accordingly, no demonstration is required. A philosophical approach concerning this assumption can be found in Zienkiewicz and Taylor (2003) where a detailed explanation of weak and strong forms of the static equations (integral and differential forms) is presented. Substituting 4.1, 4.2 and 4.4 into the virtual work equality, the discretised weak form of equilibrium equations is obtained:
0dV···dS··tdV·····
V
T
S )x(T
)x(TT
V )x(T dNbdNdNDNd (4.7)
dTδd ·Ke δd·fext

72 Chapter 4. Numerical model
Vectors d and δd are not functions of the spatial coordinates and as such, can be brought in front of the integrals. If Ke is defined as the global stiffness matrix and fext is defined as the equivalent external force vector in eq. 4.8.
extV
T
S xT fdVNbdSNt ··· )( (4.8)
Eq. 4.7 can be rewritten as:
dfKdd extTe
T ··· (4.9) This equation must be satisfied for any arbitrary vector of virtual displacements δd. Then, the unknown displacements d can be obtained from matrix Ke, the shape functions N and the external actions fext. In the particular problem dealt with in this research work, the procedure for the resolution of the set of equations 4.1 to 4.9 is considerably nonlinear. There is a certain need of using incremental-iterative processes. Material properties must be gradually updated in each step as a result of the constitutive elastic perfectly-plastic equations assumed. Moreover, a large-displacement theory of the element (geometrical nonlinearity) must be formulated. Furthermore, for each increment, a continuous updating of the nodal coordinates in the calculation of the equilibrium static equations must be included (second-order effects). In the forthcoming sections, a general view of these sources of nonlinearities is presented. Subsequently, the analyses strategies employed within this work for solving the derived equations are described. 4.2 Material The relationship between the strains and the stresses of the structure is based upon the constitutive model. An adequate choice of it is of an extreme importance in the simulation of any structural problem. The constitutive model should be able to reproduce realistically the phenomenological observations of the mechanical response of the material along the equilibrium path. A wide spectrum of constitutive models has been proposed by researchers and some of them are presently implemented in commercial FE-based packages. The choice ranges from simple elastic to highly nonlinear constitutive equations. The derivation presented through the development of equations 4.1 to 4.9 can be extended to the more general case in which the material is not linearly elastic. It would be simple to formally substitute the global stiffness matrix Ke by a nonlinear constitutive matrix Knle. With some exceptions, though, the stress cannot be expressed as a uniquely defined function of only the current strain-state. Instead, the stress must be described either by a function depending on the previous strain history or, which is more convenient for numerical applications, by functions depending on the current values of the strains. A proper definition of constitutive models in computational

73 Chapter 4. Numerical model
mechanics requires some internal characteristics of the material such as the plastic strains εp, the hardening law, the flow rule, and the loading-unloading conditions. In general, at least in the field of civil engineering, it is common to assume the steel to be isotropic and elastic perfectly plastic with an associated flow rule, this assumption leading in most cases to accurate results. Theoretically, after the yield stress is achieved, e.g., under uni-axial loading, the stress transmitted by the yielding material may potentially increase or decrease. An increase of the yield stress is referred to as hardening and its decrease is called softening. During hardening, the elastic domain undergoes a certain evolution in both uni-axial and multi-axial stress states. In plane stress, which is the case of study, the elastic domain of a virgin material is bounded by the initial yield surface. In plane stress, questions arise regarding the definition of yielding. The decision as to whether the material is yielding or not is independent of the coordinate system in which the calculations are performed. In isotropic materials such as steel, no orientation effects are noticed. In such cases, the yield condition depends upon the volumetric I1 and deviator invariants of the stress tensor J2 y J3. Roughly, in terms of these invariants, the yield condition can be written as: 0,J,JIf 321 (4.10)
4.2.1 Yield criterion, the von Mises criterion. It has been experimentally noticed that in metals the yielding does not depend on the volumetric part of the stress tensor (invariant I1). Microscopically, the inelastic deformation usually takes place by plastic slipping along crystallographic planes. A criterion postulated by von Mises is usually applied to estimate the yielding point. The criterion is based upon the determination of the distortion energy and depends only on the deviator invariant J2, since there exists a proportional relation between this invariant and the distortional strain energy. This simple and useful criterion of yielding reads: 0JJf o22 (4.11)
in which τo is a material parameter, commonly defined as the pure shear stress. This parameter is related to the uni-axial yield stress of the material by 03yf In terms of principal stresses, J2 can be written as follows:
213
232
2212 6
1J (4.12)
Under plane stress, (σ3=0), and after some mathematical transformations of expressions 4.11 and 4.12, the von Mises yield condition can be written as:

74 Chapter 4. Numerical model
2y
2221
21 f (4.13)
Geometrically, the von Mises yield surface is surrounded by an ellipsis. This surface defines the elastic region of a material loaded under different states of stress. Fig. 4.2 displays the yield surface in a σ1-σ2 plane, commonly referred to as the Haigh-Westergaard space.
Figure 4.2 The von Mises criterion in the σ1-σ2 plane.
When the stress state (σi,σj) lies inside the elastic domain the deformation process is purely elastic and the plastic strain does not change. If the stress state reaches the surface, plastic flow is initiated. During plastic flow, the stress state must remain in the yield surface satisfying the yield condition whereas plastic strains can gradually increase. The evaluation of the strain field is not mathematically feasible solely with the condition presented in eq. 4.11. Accordingly, a rule governing the evolution of plastic flow must be postulated. It is convenient to associate this rule with the von Mises criterion by preserving its validity. The validity is preserved by using the criterion of normality Graphically, this rule is illustrated in Fig. 4.3, in which the vector is sketched as normal to the ellipsis surface.
Figure 4.3 Illustration of flow rule and its normality.
Since the yield surface is a graphic representation of f(σ)=0, this normal direction to the yield surface is determined by the gradient of the f-function. Thus, the associated flow rule can be written as incremental form according to 4.14. The symbol λ denotes a scalar magnitude known as a plastic multiplier.

75 Chapter 4. Numerical model
ddfdd p · (4.14)
4.2.2 Material hardening If the material is considered to be elastic perfectly-plastic, during plastic flow, stress must remain in the yield surface. It could eventually move along the surface, but never go beyond. In fact, the microstructure of the material has been proven unstable as plastic flow continues. As a result, the macroscopic properties change. In order to describe this potential evolution, new parameters that characterise the effect of hardening must be postulated. The problem is usually approached in the simplest form, which is commonly referred to as the isotropic hardening model. Other criteria as kinematic, mixed, or general hardenings have also been proposed (Bazant and Jirasek, 2002). A meaningful description of the isotropic hardening laws of the material is sketched in a graphical representation of the uni-axial stress-strain relationship (Fig. 4.4 (a)) and its yielding surface in the Haigh-Westergaard space (Fig. 4.4 (b)). Uni-axially, the yield stress increases following a certain slope (the plastic modulus) and this fact is reflected in the von Mises ellipsis, which is deformed following a homothetic proportion. The isotropic hardening model links the plastic modulus with the ellipsis deformation.
Figure 4.4 (a) Uniaxial stress-strain diagram. (b) Yield surface in σ1-σ2 space.
The yield function originally defined by equation 4.11, can be reformulated by equation 4.15. 0fF n (4.15)
Equation 4.15 remains insufficient for the proper evaluation of both strain and stress fields. The model must include not only the newly reached value of fn but also a certain evolution of plastic flow, namely, the hardening law, (i.e., the stress-strain relationship after yielding). Uni-axially, this evolution during plastic flow is explicit. But in a general multi-axial stress-state, where the plastic strain is a second-order tensor, the derivation is more complicated. A scalar magnitude that properly reflects the rate of changes in the material independently of the direction must be included within the formulation.

76 Chapter 4. Numerical model
Two alternatives have been proposed in literature, the strain-hardening, and the work-hardening. As ABAQUS is based on the latter, the general explanation presented herein is focused on it. The work hardening hypothesis states that the yield stress depends on the plastic work:
dtWt
o pp ·
)(:)( (4.16)
t is the time-like variable controlling any monotonically increased loading process. As a result, in isotropic hardening, two additional variables are found, the current yield stress fn, and the hardening variable k. In order to include the effect of hardening in the elasto-plastic tensor, the former equation 4.15 is shifted into: khFkf , (4.17)
4.2.3 Idealisation of the material In this work, two different idealisations of the steel have been used:
Realistic constitutive equations when reproducing experimental tests (these equations were obtained from tensile coupon tests).
Elastic perfectly-plastic constitutive equation when performing systematic parametric studies.
In the former, the theories described in 4.2.1 and 4.2.2 give the basis of the numerical tools used throughout the simulations. In the latter, only 4.2.1 (yielding criterion) has been necessary since no strain-hardening has been included within the analyses. Fig. 4.5 shows the idealisation of the elastic perfectly plastic steels. For the web and flange materials, sufficient ductility has been assumed by defining a minimum relationship εmax ≥15 εy. The elastic properties considered for all steels within this dissertation are presented as follows: The Young modulus E has been set to 210000 N/mm2 and te Poisson ratio ν to 0,3. The shear modulus can be expressed in terms of E and ν.
12EG
· (4.18)

77 Chapter 4. Numerical model
Figure 4.5 Stress-strain uni-axial behaviour assumed within this work.
Moreover, for the definition of the plastic zone, ABAQUS requires the use of the true-stress vs. logarithmic plastic-strain rule. The relationship between engineering stress-strain relationship and those required are defined as:
nomnomtrue 1 · (4.19)
E
1 truenom
pl lnln (4.20)
Data of the material are given by means of (σtrue, ln(εpl)) points of the law. ABAQUS interpolates linearly the values between those given. The data are assumed to be constant outside the given range. This fact implies that a certain stop criterion must be adopted for avoiding pointless computations. The fail criterion states if total strain ε achieves the value of 16·εy (ε = ε y+15 ε y) in any integration point, the analysis is stopped. 4.3 Geometry Plate girders are structures that must be at least, mathematically approached as two-dimensional. Initially straight plates are welded and assembled together with stiffeners in a manner that two of their dimensions are considerably larger than their thickness. They become relatively slender structures in which different phenomena such as instability and yielding are often intertwined.

78 Chapter 4. Numerical model
Figure 4.6 Typical meshes in a longitudinally and transversally stiffened plate girder. The modelling is generally conducted using two-dimensional elements referred to as shells. Generally, the body is modelled by defining the geometry at a reference surface and the thickness through the section property definition. Conventionally, shell elements have both displacement and rotational degrees of freedom in each node. Shell elements can be subjected both to bending and to “in-plane” membrane force resultants acting on the middle surface. The resultant of “in-plane” loading and bending can be decomposed as shown in Fig 4.7. The mechanism of plate action is also illustrated for a strip of unit-width. If displacements are considered sufficiently small, the effect of both bending and in-plane resultants can be superimposed in the derivation of the kinematic equations. The first assumption in theory of plates is that sections normal to the middle plane remain plane during deformation. In Fig. 4.7, AA and A*A* are linear segments after deformation. The second assumption states that the stresses in the z-axis are small and hence direct strains in that direction can be neglected. The total strain can be obtained by displacements of the middle surface uo and wo as well as a rotation θx of the normal surface. The local displacements and the strain in the x and z axes are available as eq. 4.21 and eq. 4.22. xwzxwxzxuzxu oxo ,·, (4.21)
xw
zu
0
xz
xu
xz
z
xox
(4.22)

79 Chapter 4. Numerical model
Figure 4.7 “In-plane” and bending resultants for a flat plate.
For some structural applications, however, a “change-in-geometry” effect may be significant and the two problems of “in-plane” and “lateral” deformations can no longer be dealt with separately but coupled (see 4.3.1). Moreover, the robustness provided for the thickness may also change the physical conditions that must be taken into account in the formulation of the analysis. That is to say, thick plates must be treated differently than thin plates. The thin plate theory is based on the assumptions postulated by Kirchhoff (1850). A variation of these assumptions was later postulated by Reissner (1945) and Mindlin (1951). Its usage was extended to thick plates, commonly referred to as Reissner-Mindlin approach. The main difference between both approaches is their treatment of transverse shear deformation. As a result, the element formulation must be chosen adequately for each specific type of analysis in accordance with the nature of the problem. Analysts are often faced with the question of which element is to be used to reliably satisfy their needs. Usually, the answer is not always unique.

80 Chapter 4. Numerical model
The ABAQUS shell element library includes several elements for three-dimensional geometries. In this library, there is an extensive choice of thick and thin elements. Thin shell elements provide solutions for problems that are adequately described by classical shell theory (Kirchhoff). Thick shell elements provide solutions for structures that are best modelled by shear flexible theory (Reissner-Mindlin). Furthermore, general-purpose elements can provide solutions for both structural problems. Generally, either thick or thin elements are provided with integration points on each surface. Element type S4 is a quadrilateral four-noded, general-purpose, fully integrated, finite-membrane-strain shell element available in the ABAQUS library. The membrane response of the element is treated with an assumed strain formulation that gives accurate solutions for both in-plane and bending problems. The element has four integration points and six degrees of freedom per node. This particular element is not sensitive to element distortion and avoids pathological numerical problems such as parasitic-locking and hour-glassing. Furthermore, its thickness may change as a function of in-plane deformation. S4 element allows transverse shear deformation. For this purpose, it uses thick shell theory as the shell thickness increases and become discrete thin shell elements as the thickness decreases. The response throughout the thickness can be obtained by numerical integration below these integration points. Hence, the material response can either vary from point to point through the thickness, or, on each surface. Fig. 4.8 displays top and frontal views of a typical shell element. If desired, integration through the thickness can be performed numerically following the Simpson rule, or alternatively, the Gauss quadrature. In this particular study, 5-point Simpson-based elements are judged to give a sound accuracy. Section point 1 is associated with this bottom surface, labelled SNEG whereas the top surface is associated with point 5 and is labelled SPOS.
Figure 4.8 Numbering and labelling of S4 element.
The sign conventions determined in ABAQUS yields to the following orientations and node numbering of the nodes. The default local 1-direction is the projection of the global x-axis onto the surface. If the global x-axis is within 0.1° of being normal to the surface, the local 1-direction is the projection of the global z-axis onto the surface. The local 2-direction is then at right angles to the local 1-direction, so that the local 1-direction, local 2-direction, and the positive normal to the surface form a right-handed
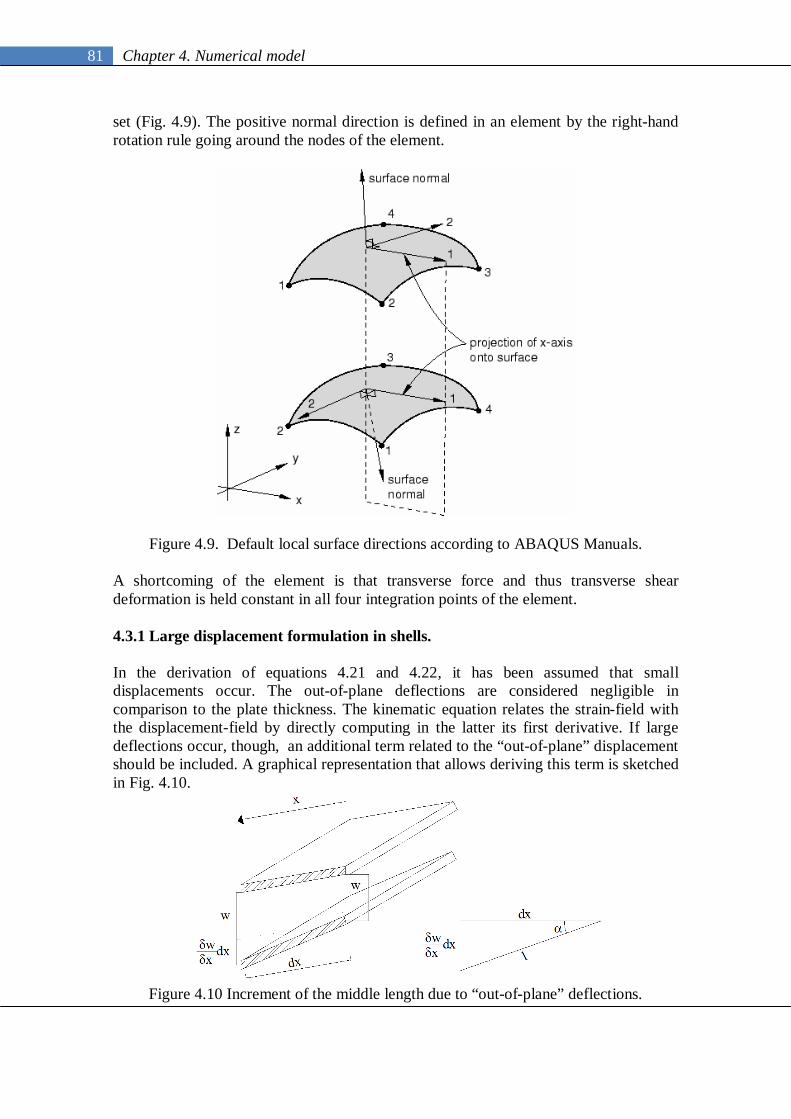
81 Chapter 4. Numerical model
set (Fig. 4.9). The positive normal direction is defined in an element by the right-hand rotation rule going around the nodes of the element.
Figure 4.9. Default local surface directions according to ABAQUS Manuals.
A shortcoming of the element is that transverse force and thus transverse shear deformation is held constant in all four integration points of the element. 4.3.1 Large displacement formulation in shells. In the derivation of equations 4.21 and 4.22, it has been assumed that small displacements occur. The out-of-plane deflections are considered negligible in comparison to the plate thickness. The kinematic equation relates the strain-field with the displacement-field by directly computing in the latter its first derivative. If large deflections occur, though, an additional term related to the “out-of-plane” displacement should be included. A graphical representation that allows deriving this term is sketched in Fig. 4.10.
Figure 4.10 Increment of the middle length due to “out-of-plane” deflections.

82 Chapter 4. Numerical model
Trigonometrically, if small rotations are considered (cos(α)≈1), it can be stated that the projection of the deformed length l of the middle surface onto the x-axis is given by the eq. 4.23
···'22
xw
211dx
xw1dx (4.23)
Accordingly, the additional strain due to “out-of-plane” deflections in x-axis can be approximated by truncating the developed series on second-order terms. Finally, the kinematic equation can be generalised to other strain-components and arrayed in eq. 4.24. The first term belongs to the classical linear kinematic equation and the second, to the second-order terms due to the “out-of-plane” displacements.
TT
yw
xw
yw
xw
yxw
yw
xw
xv
yu
yv
xu
000··21·
21
·2
222
2
2
2
2
(4.24)
4.4 Type of analyses 4.4.1 Nonlinear analysis As aforementioned, the derivation of the equations 4.1 to 4.9 is nonlinear. The first cause of this fact lies in the kinematic equation whereas the second, in the material nonlinearity. Whether it is needed to obtain the response of the structure, a nonlinear analysis is compulsory. The objective of nonlinear analysis is to trace the response of the structural model subjected to a particular loading history. This is usually done using an incremental-iterative procedure. The structural response is computed after each increment by taking the previous step as the initial state. It allows updating for each step the cumulative strain and the nodal coordinates in order to take into account both material and geometrical nonlinearities. It is very important to distinguish between the criterion that fixes the size of each step and the iterative procedure that solves the equilibrium equations. For most cases, ABAQUS uses the Newton-Raphson method (Fig. 4.11) as an iterative procedure technique for solving the nonlinear equilibrium equations. The motivation for this choice is primarily the convergence rate obtained by using this method compared to the convergence rates exhibited by alternate ones (usually modified-Newton or quasi-Newton methods).

83 Chapter 4. Numerical model
Figure 4.11 Standard Newton-Raphson method .
Moreover, a criterion that fixes the size of each step must also be defined. In fact, this solution strategy is independent of the choice of the iterative procedure. Examples of step-size control techniques include the load control, the displacement control or the various versions of the arc-length (Riks (1979); Mathies and Strang (1979); Crisfield (1981)). The most natural way of specifying an incremental step is by prescribing the external loads that act on the structure at the end of the step. The load is assumed to be known in advance and is gradually applied in a number of increments in which several iterations are often needed. Once the load-carrying capacity is exhausted, the iteration process oscillates or diverges and equilibrium cannot be restored. In many engineering analyses it is sufficient to determine the collapse load and this divergence is considered as an indicator of failure. Nevertheless, two problems arise. Firstly, the load-carrying capacity may eventually be increased beyond the peak in certain structural problems and secondly, it is well known that divergence may be due to other reasons different from failure. Solution techniques that follow the load-displacement diagram beyond the peak have been developed in order to fulfil this gap. The response on the post-peak branch of the diagram can be accordingly provided. The direct displacement control is a cost-effective technique commonly used. In this case, the load point is considered as an additional support with prescribed displacement known in advance and the force acting on the structure is measured as the reaction generated at this support. A shortcoming of the direct displacement control is that it can only be applied whether the structure is loaded at one point, which is not always the case. Furthermore, if snap-back phenomena occur (see Fig. 3.15 (b)) the response is not realistically reproduced.

84 Chapter 4. Numerical model
Figure 4.12 Load-displacement diagrams. (a) load control (b) displacement control. Unlike the aforesaid methods, advanced step-size control techniques abandon the assumption that values of external loads or displacements after each step are prescribed in advance. Instead, the basic idea of such incremental control techniques is that the step size is specified by a constraint equation that involves the unknown displacements as well as the reference load. One of the most outstanding techniques is the arc-length approach. This criterion states a constant arc-length in a load-displacement plot which automatically emphasises the contribution of the variable (e.g. load or displacement) that changes faster. Despite its apparent simplicity, it is worth bearing in mind that force and displacement have completely different units. Accordingly, the geometrical measure of the arc does not represent any physical sense. Usually, a suitable metric is obtained by introducing a scaling factor “c” that converts the load parameter into a quantity with the physical dimension of displacement. The arc-length of a step is then defined as:
2T cddl (4.25) By adjusting the value of “c”, the relative contribution of loads and displacements can be tuned. Several arc-length methods have been proposed and applied to such problems, among which, the most successful seems to be the modified Riks method (Riks 1979) which is implemented in ABAQUS. It remains a suitable tool for analyses beyond the peak. The iterative algorithm remains the Newton-Raphson method . 4.4.2 Eigenvalue prediction In practically all numerical simulations within this work, a stability analysis has been required. The results obtained with such analyses have given guidance on the critical buckling loads of the plates (eigenvectors) and additionally, of the eigenmodes related to these loads. The linear analysis of stability is associated with the computation of a bifurcation load and its corresponding buckling mode. In previous sections, the linear matrix equation governing the response of the structures has been given by:

85 Chapter 4. Numerical model
·TTeext uKf (4.26)
This equation is commonly presented as incremental in the given form:
uKf ext · (4.27) In this equation, u is the column matrix of small generalised displacement increments from the initial state, f is the column matrix of the associated small generalised force increments and K is a matrix of incremental stiffness coefficients. If an arbitrarily achieved base configuration is in equilibrium and small displacements are applied, consistent applications of the small-displacement gradient assumption to the kinematics and to the constitutive equation lead to the solution of a linear problem.
uKfext · (4.28) Each distinct value of λ corresponds to a linear perturbation of the base state. Among these perturbed states, special values of λ allow the existence of nontrivial incremental displacement fields with arbitrary magnitudes as valid solutions to the problem. There is, however, a particular situation that could eventually arise. If the determinant of matrix K approaches zero, displacements u increase to infinity and any f, no matter how small, causes infinitely large displacements (according to linear theory). This fact represents instability in the static sense and the vanishing of the determinant is the condition of critical load. Such nontrivial incremental displacement fields are referred to as buckling modes and this physical problem is addressed as eigenvalue buckling analysis. The necessary condition of critical state of the system is zero value of the stability determinant |det K=0|. The singularity of matrix K is evaluated with the analysis of the so-called standard eigenvalue problem: 0uKK o ·· (4.29) being Ko the stiffness matrix corresponding to the initial state, Kσ the incremental stiffness matrix due to the incremental loading, λ the eigenvalues and u, the nodal displacements corresponding to a particular buckling mode shape (eigenvectors). ABAQUS contains a capability for estimating elastic buckling by eigenvalue extraction. Eigenvalue buckling analysis is performed with ABAQUS by first storing the stiffness matrix at the state corresponding to the base state loading of the structure, then applying a small perturbation. The initial stress matrix resulting from the load is calculated, and then an eigenvalue calculation is performed to determine a multiplier to the load at which the structure reaches instability. As a result, eigenmodes can be shaped in the initially straight plates. In fact, each eigenvalue represents the amount of total energy of the system. ABAQUS presents the results ranging from lower energy to greater energy with the corresponding buckling shape associated.

86 Chapter 4. Numerical model
4.5 Discussion The complexity of reproducing the physical phenomena commonly found on engineering structures requires the formulation of models, i.e such theoretical “objects” which enable the designers to investigate and solve significant problems caused by external factors. This chapter presents an overview of the general formulation involved in common FE-analyses. These models require several assumptions. In general, it can arguably be state that the more realistic the assumptions, the more accurate the solution. The assumptions deal with:
The geometrical representation of the problem. The material idealisation. The resolution of the governing equations of the problem
The considerable nonlinearity of the formulated problem in which this work has been involved requires incremental-iterative procedures suitable to solve simultaneously the arisen set of differential equations that govern the mechanical problem. It is very important to distinguish between the criterion that fixes the size of each step (incremental criterion) and the procedure that solves the equilibrium equations (iterative criterion). In subsequent chapters, the numerical model and its capabilities are compared against experimental results. In such a way, the validity of these assumptions is demonstrated.

87 Chapter 5. Validation of the numerical model
5. Validation of the numerical model “Aristarchus of Samos, mathematician and astronomer,(…), made an attempt to compare the distances from Earth to the Sun and to the Moon. Although his reasoning was perfectly sound, the instrument he used to determine the angle of sight between the Sun and the half Moon failed him by faulty calibration. He found the distance to the Sun to be about 18 to 20 times that to the Moon, instead of the correct figure of approximately 390 times.”
Jan Gulberg. Mathematics from the birth of numbers
5.1 Introduction The multi-purpose code ABAQUS has been systematically used as a simulation tool in this research. Simulation is an indispensable problem solving methodology for the solution of many real-world problems. Descriptions, analyses and what-if questions about the real system can be easily performed. Nevertheless, when developing large works based on numerical methods, there is always a need for checking the results against an exact solution and/or experimentally obtained values. ABAQUS has been widely contrasted and bench-marked with infinity of examples. This chapter is not an attempt to show the reliability of this code. Instead, this chapter is intended to show an understanding and shortcomings of the modelling of this particular problem. The characteristics of the numerical model depicted so far read:
Geometrically, the girders are idealised with S4 shell elements. Materially, the steel is idealised as elastic-plastic, with a von Mises yield
criterion and isotropic hardening when required. The iterative procedure for solving the assembled equation is the Newton
Raphson method. The chosen incremental procedure is based upon the arc-length method.
The stability analysis are performed following an eigenvalue extraction.
The reproduction of the patch loading phenomena is based upon additional assumptions such as mesh design, geometrical and structural imperfections of the girders. These assumptions are generally “designer-assumed”. Consequently, concerns about the reliability of such assumptions arise, particularly when large systematic parametric studies are developed. The idealisation of the girders within this work has been based upon the recommendations provided by EN1993-1-5-Annex C, which gives guidance about numerical modelling of plated structures. In this chapter, the experimental features observed in chapter 3 were compared with the results obtained with the numerical model employed within this work. Basically, these comparisons were performed by using the experimentally obtained equilibrium path of the girders. On such a basis, the phenomena associated with the resistance of hybrid steel girders subjected to patch

88 Chapter 5. Validation of the numerical model
loading was predicted and described and thus, these assumptions were no longer regarded as uncertain. This methodology has already been used when studying other structural cases such as shear (Pavlovčič et al. 2007). 5.2 EN1993-1-5. Annex C. FE-analyses Presently, European design rules include the possibility of using FE-analyses as reliable tools in the calculation of plated structures. The modelling may be either based upon a refined analysis by including geometrical imperfections (eigenmode-based, for instance) and structural imperfections (residual stresses) or, based upon equivalent geometric imperfections which should include both effects. In fact, there is a decision to be taken in this definition and hence, engineering judge is needed to some degree. Firstly, the refined analysis is discussed. This analysis can be based upon critical eigenmodes of the structure conveniently scaled a maximum amplitude w. EN1993-1-5-Annex C rules recommend a value for w at least of 80% of the maximum allowed fabrication tolerances (80%·FT). EN1993-1-5-Annex C suggests this percentage generically for all cases in design of plated structures. Presently, fabrication tolerances limit this out-of-flatness to the lowest value between two magnitudes:
tw, thickness of the web hw/100, being hw the clear web depth between flanges
In addition, it is stated in EN1993-1-5-Annex C that the chosen imperfection shape should lead to the lowest resistance for each case. In the particular case of patch loading, the initial out-of-flatness of the web in the directly loaded panel should be the most significant initial imperfection. Finally, the refined analysis requires the numerical modelling of structural imperfections by means of a typical residual stress pattern. It is worth mentioning that no specific details concerning which pattern should be used for each case are given (further details of this topic are given in 5.5.2). The second possibility is defined by the equivalent geometric imperfections, which may be based upon the following considerations:
An initial out-of-flatness of the web panels δow (Fig. 5.1 (a)). In accordance with
EN1993-1-5-Annex C, the maximum initial out-of flatness of the web panel is the minimum value between (a/200;hw/200).
An initial sweep of the girder within bearings δog (Fig. 5.1 (b)). This represents a
lateral deviation in the longitudinal direction. The minimum value to be introduced following EN1993-1-1 is L/100 for girders using buckling curve d.
An initial twisting θ of the top flange and/or longitudinal stiffening (Fig. 5.1 (c)).
The magnitude of this twisting must be at least 1/50 radians.

89 Chapter 5. Validation of the numerical model
These equivalent imperfections may be substituted by appropriate forces acting on the member. In this work, the equivalent imperfections are treated as geometrical and thus, are not substituted by any force.
Figure 5.1 Introduction of equivalent geometric imperfections 5.3 Experimental versus numerical results. Performed comparisons The equilibrium path of a plate girder subjected to patch loading is composed of a sequence of stable equilibrium configurations. This path is often characterised by load-deflection plots. The shapes of these plots have been experimentally traced for some specimens and described in chapter 3. From the tested samples, it was observed that some girders with a/hw>2 presented load-deflection plots as idealised in Fig. 5.2 (a) whereas girders with a/hw<2 presented a quite different response including a post-peak reserve (Fig. 5.2 (b)).
Figure 5.2 Response of plate girders when subjected to patch loading.
(a) high a/hw ratios (b) low a/hw ratios

90 Chapter 5. Validation of the numerical model
The information that can be extracted from these plots is of an extreme importance. This equilibrium path presents several characteristics that deserve emphasis such as:
Linear branches Critical bifurcation points Loss of stiffness Ultimate loads Post-peak capacities
This path can be traced by an incremental solution strategy with ABAQUS if an appropriate model is considered. The accuracy of the model must be verified with experimentally obtained values. Three girders from chapter 3 were used for the sake of comparison, namely, 1VPL2500, 1VPL750 and 1VPL450. Details of such prototypes and their structural responses are widely described in chapter 3 and Annex B. During the modelling of plated structures, certain initial conditions must be assumed by the designer. The influence of these features such as mesh sensitivity, geometrical and structural idealisations must be evaluated. In this work, a thorough evaluation of these conditions was performed by following a sequential methodology. The first step was to perform an appraisal of the required mesh size by means of two different assessments.
Firstly, the appraisal consisted in comparing results of theoretical and numerical obtained critical buckling loads of a simply supported plate. This simply supported plate model has been widely used in the patch loading field for comparisons purposes. For this comparison, several mesh sizes were studied.
Secondly, a numerical reproduction of one experimental test (1VPL2500) was performed. Essentially, the ultimate load capacity Fu of the girder was used as a comparative magnitude. Both numerically- and experimentally-obtained values of Fu were compared for numerical models presenting different mesh sizing.
For the second step, a reproduction of three tests presented in chapter 3 was conducted. Complete equilibrium paths of 1VPL2500, 1VPL750 and 1VPL450 were reproduced for a set of variations of several initial conditions. As a result, the influence of the designer-assumed initial conditions on the modelling (geometrical and structural) was assessed. For this purpose, the EN1993-1-5 Annex C was taken as a basis regarding the structural modelling of plate girders. 5.4 Mesh design As aforementioned, the mesh design was performed by using two types of comparisons. The first comparison was related to the elastic buckling coefficient. This comparison is related to the critical bifurcation points. The methodology of these analyses is fairly straightforward. A critical buckling load related to the first eigenmode is obtained and then, the elastic buckling coefficient is derived from eq. 5.1.

91 Chapter 5. Validation of the numerical model
3w
w2
2
crF th
E112Fk ·
···
(5.1)
A series of five eigenvalue predictions were performed in ABAQUS in a simply supported plate model displayed in Fig. 5.3. This model has been reportedly studied both theoretically and numerically for other researchers (Rockey et al. (1970), Lagerqvist (1994), Shahabian (1999), Ren et al. (2005)). The model consists in a simply supported plate with a constant ratio a/hw=1,0 which is locally loaded on the top edge in a distance Ss.
Figure 5.3 Model of simply supported rectangular plate
The ratio Ss/hw was varied ranging from 0,1 to 0,5. Different buckling coefficients corresponding to different mesh sizes were obtained for each case. The analyses were performed for different mesh sizes ranging from coarse meshes (500x500mm, i.e., 4 quadrilateral S4 elements) to fairly fine meshes (approx 10x10mm, i.e., 8100 quadrilateral S4 elements). The out-of-plane displacements (3-axis) in all edges were prevented. Likewise, the vertical displacements (2-axis) were restrained at vertical edges. Horizontal displacements (1-axis) of the corner nodes were restrained for the sake of preventing rigid body motion of the whole plate. The elasticity modulus was taken as E=210000 N/mm2 and the Poisson coefficient as ν=0,3. Table 5.1 shows the obtained coefficients kF for the studied cases.
500 100 50 100,10 3,30 3,27 3,26 3,26 5,80 3,24 3,15 3,110,20 3,45 --- 3,34 3,36 5,96 3,46 3,33 3,280,30 3,60 --- 3,49 3,51 6,17 3,52 3,35 3,300,40 3,70 3,68 3,67 3,71 6,43 3,64 3,51 3,470,50 3,95 3,90 3,92 3,97 6,76 3,88 3,72 3,68
Ss/hw
kF
(Rockey et al.1970)
kF
(Shahabian 1999)
kF
(Lagerqvist 1994)
kF
(Ren et al. 2005)
Mesh size in mm. (approx)kF (ABAQUS)
Table 5.1 Elastic buckling coefficients of the studied cases (a/hw=1,0).
In general, a good agreement is observed between the results for fine meshes. It is observed though that linear perturbations give erroneous results for highly coarse meshes. Fig. 5.4 shows the obtained values of kF (for Ss/hw=0,2) when plotted against the needed CPU-time for the calculation (logarithmically scaled). If refinements are performed in the mesh, the solution converges quickly. At some point, however, further

92 Chapter 5. Validation of the numerical model
refinements are no longer needed. As a result, as long as the mesh is refined CPU time as well as file sizes increase.
0,00
1,00
2,00
3,00
4,00
5,00
6,00
7,00
0 1 10 100 1000
k F
CPU time (sec)
Ss/hw=0,2
500x500
50x50
100x100
10x10
Figure 5.4. kF vs. CPU time. Ss/hw=0,2 (x-axis logarithmically scaled)
The second comparison was performed by using the results obtained experimentally. The obtained ultimate load capacity of specimen 1VPL2500 was employed for the sake of comparison (Fu1VPL2500=217,23 kN). Fig. 5.5 plots the results obtained against to the needed CPU time for each case. The results obtained numerically are standardised to Fu1VPL2500. For coarse meshes, a severe overestimation of Fu is noticeable. For dense meshes, the solution tends to an asymptotic value Fu,num/ Fu1VPL2500=1,0, which represents a very good agreement between both results. Higher refinements lead to the same solution but the CPU time becomes practically unaffordable.
0,00
0,50
1,00
1,50
2,00
2,50
3,00
1 10 100 1000 10000
F u,n
um/ F
u,ex
p
CPU Time (sec)
1VPL2500
500 x500
250x250
100x100
50 x50
25x25
10x10
Figure 5.5 Fu,num/ Fu1VPL2500 vs. CPU time (x-axis logarithmically scaled)

93 Chapter 5. Validation of the numerical model
As a result, in order to make computationally tractable the parametric studies within this dissertation, the mesh size was fixed at 25 mm. 5.5 Numerical modelling according to EN1993-1-5-Annex C The pre-processors ABAQUS-CAE and GID (GID 2006), which are capable of reproducing intricate geometries, were used to assemble suitable meshes for developing the geometrical models. Several nonlinear analyses were performed on the steel plate girders using quad-dominant S4 shell elements for web, flanges and stiffeners. Both geometric and material nonlinear effects were considered. The adopted constitutive equation was the one observed in tensile coupon tests. The nonlinear solution strategy used is the Modified Riks (Riks 1978) algorithm implemented in ABAQUS. 5.5.1 Initial geometrical imperfections Three different initial “imperfect” geometries were modelled in ABAQUS. Precise shape initial imperfection The precise shape of the girders was introduced from 3D experimental data previously obtained. The data included global co-ordinates of points previously located on grids in the webs and flanges of the girders. The points were referenced to a global coordinate system. From these results, a graphical reproduction of the girders was sketched with a Computer-Aid-Design (CAD) tool (see Fig. 5.6 (a)). The next step (Fig. 5.6 (b)) was the development of surfaces containing these points. For this purpose, three assumptions were necessary.
First, surface bound points (specifically NURBS surfaces) were developed aiming to numerically smooth the vertices of all lines of the webs. NURBS surfaces were developed with GID and then exported as an IGES part to ABAQUS-CAE.
Second, perfect vertical straight surfaces were assumed for the transverse stiffeners of the girders.
Third, the tf/tw ratio of the tested girders (tf/tw=5,0) was judged to be sufficiently high for considering null relative deformation amid points of the flanges. Consequently, these elements were assumed as straight.
Once the plates were exported into ABAQUS-CAE, this pre-processor was used for assembling all plates as a whole (Fig. 5.6 (c)). An advancing-front algorithm using quad-dominant elements was used for meshing the assemblies. The shell-element based mesh fitted to the precise shape imperfection of the girders was then used for each nonlinear analysis including both material and geometric effects. In this particular case, the mesh was designed as free (a very dense mesh was necessary to model these prototypes, with 5mm S4 elements as well as triangular S3 elements when needed).

94 Chapter 5. Validation of the numerical model
Fig. 5.6. Introduction of the precise shape of the girders
Eigenmode-based geometries Imperfections consisting of multiple superimposed buckling modes are usually introduced in plate girder simulations. This procedure is quite advantageous since there is no need of modelling intricate geometries. The method requires the model definitions for the eigenvalue prediction analysis and the nonlinear procedure to be identical. The meshes can be designed as structured, following the mesh design performed on 5.4. The method consists on perturbing the initial straight geometry by a given eigenmode or different superimposed eigenmodes scaled so that the largest perturbation is a known value w. Table 5.2 shows useful information about critical loads and shapes of the tested girders in study after performing an eigenvalue extraction in girders 1VPL2500, 1VPL750 and 1VPL450. For each case, top and frontal views of the perturbed specimens are displayed in the table. Furthermore, numerical values of the elastic critical loads obtained in each extraction are included.
M4-353,46 kN (AS) M4-436,13 kN (SB) M4-449,29 kN (SB)
M2-239,16 kN (S) M2-271,40 kN (S) M2-436,28 kN (SB)
M3-340,86 kN (AS) M3-432,48 kN (AS) M3-436,31 kN (SB)
1VPL2500 1VPL750 1VPL450
M1-161,84 kN (S) M1-180,72 kN (S) M1-325,04 kN (S)
Table 5.2. Critical loads (kN) and critical shapes Mi.
Symmetric (S), antysymmetric (AS) and shear buckling modes (SB).

95 Chapter 5. Validation of the numerical model
Focusing on specimen 1VPL2500, it is observed that eigenmode M1 showed an initially C-shaped web vertically below the patch load whereas eigenmode M2 showed an initially S-shaped web. These eigenmodes are deemed as being symmetric (S). It is also observed that for eigenmodes M3 and M4, the cross-section vertically below the patch load presented null deformation. These eigenmodes are referred to as antisymmetric (AS) and would hardly lead to the lowest resistance as required in EN1993-1-5-Annex C. Eigenvalue extraction performed on 1VPL750 showed slightly different results. Two symmetric and one antisymmetric eigenmodes are observed (M1-M2 and M3, respectively) whereas the fourth shape is an eigenmode related to shear buckling in the adjacent panels (SB). It is noteworthy that eigenmode M1 led to an initially C-shaped web in the loaded cross-section whereas eigenmode M2 led to an initially S-shaped web. On 1VPL450, only one symmetric C-shaped wave in the loaded panel was found in the first eigenmode. The following eigenmodes (M2, M3, M4) were related to shear buckling in adjacent panels. Predictably, these latter geometries do not lead to the lowest resistance as required by EN1993-1-5-Annex C. Equivalent geometric imperfections EN1993-1-5-Annex C allows modelling plated structures from equivalent geometric imperfections. This procedure may be advantageous when the structures to be modelled are idealised with one-dimensional finite elements. Global bow imperfections can be easily represented by mathematical functions (e.g. sinusoidal laws). When local buckling is prone to occur, however, three dimensional shell-based idealizations are needed (which is the case of study). EN1993-1-5-Annex C suggests a combination of equivalent imperfections involving local and global imperfections of the panels. This combination should lead to the lowest resistance for each structural case. Recognazibly, some of them lead to significant geometrical incompatibilities when idealized in shell structures. The decision of which type of imperfection is needed is therefore an intricate task. For this particular study, three types of geometric imperfections were considered to be included in the FE-analyses following EN1993-1-5-Annex C. The designer-assumed decision of which type was included in the modelling is explained herein for each case.
An initial out-of-flatness of the web panels δow (Fig. 5.1 (a)). This imperfection was considered as the shape leading to the lowest resistance for the case of patch loading.
An initial sweep of the girder within bearings δog (Fig. 5.1 (b)). This type of
imperfection was included conservatively for the sake of bolding the effect of the out-of-flatness imperfection.

96 Chapter 5. Validation of the numerical model
An initial twisting θ of the top flange (Fig. 5.1 (c)). This type of imperfection was observed within the tested specimens. Due to these observations, it was decided to include it within the analysis as well.
The girders were assembled in ABAQUS-CAE as a whole and then an advancing-front algorithm using quad-dominant elements was used for meshing the assemblies. In this case, the mesh was designed as free. Even though these imperfections shapes are thought to be a reasonable approximation of the actual imperfections that occur in typical welded girders, it is necessary to assume certain geometrical incompatibilities. First, an initial constant twist of the flanges leads to an odd geometrical inconsistency. The transverse stiffeners happen to be trapezoidally-shaped (Fig. 5.1 (c)). Second, the webs happen to be C-shaped in all cases. The actual shapes of the girders obtained experimentally were found as being either C-shaped or S-shaped. Third, the orientation of transverse stiffeners located along the swept length of the girders ought to follow (or not) a certain assumed pattern in the modelling. This pattern (or its absence) is arbitrary and designer-assumed. 5.5.2 Initial structural imperfections In accordance to EN1993-1-5-Annex C, structural imperfections should be defined in terms of residual stresses by a typical stress pattern from the fabrication process. No specific details of such pattern are given within the provisions. Residual stress pattern is a parameter that defies generalisations (Barth et al. 1998); each particular case might present different features. In this study, a typical idealized residual stress pattern for plate girders was assumed.
Fig. 5.7 Residual stresses. (a) Typical pattern. (b) Assumed pattern in the analysis
Longitudinal residual stresses were incorporated into the girder models using the stress pattern idealization depicted in Fig. 5.7 (a). The pattern follows the European Convention for Constructional Steelwork Recommendations (ECCS 1990), which reflect the two primary causes of longitudinal residual stress in welded I-girders: flame

97 Chapter 5. Validation of the numerical model
cutting of the plates and longitudinal welding in the web-to-flange juncture. Essentially, the residual stresses are equal to the yield stress of the plate within a small width at the heat affected zones; this is primarily a tensile stress. Then, a smaller self-equilibrating compressive stress is generated within the other regions of the plates. The modelling of such idealized pattern might be rather tough in systematic parametric studies. Fortunately, ECCS provides simplified equations for estimating the widths that are effectively stressed. These equations take into account flame-cutting, welding at junctures, geometrical properties of the added weld metal as well as the efficiency in the welding process. If these equations are faithfully followed, one result is that the predicted residual stresses are highly dependent upon the cross-section size. Within this study, the stress pattern is assumed to present a near-constant tensile stress within a rather wide zone of the borders of the flanges (0,18·fyf), a higher value of tensile stress in the web-to-flange juncture (0,33·fyf in the flange and 0,63·fyw in the web) and an additional compressive stress aimed to equilibrate the whole section (0,20·fyf in the flange and 0,15·fyw in the web). These values (Fig. 5.7 (b)) have been considered structurally sound in other studies (Barth et al. 2006) and were systematically included as typical patterns in all girders of the present work. Other studies which included residual stresses in the patch loading verifications (Gozzi (2007), Clarin (2007) used the simplified pattern suggested by the Swedish design code for steel structures (BSK 1999). The residual stress profile is simpler than the one depicted above and lead to accurate results as well. Considering that the initial stress state may not be in exact equilibrium, an initial step was included to allow ABAQUS to check for equilibrium and iterate, if necessary, to achieve it. 5. 6 Influence of initial conditions. Results obtained. The influence of the initial conditions on the general response of steel plate girders when subjected to patch loading was tackled within three separated sections.
Firstly, an appraisal of the influence of the shape of the initial geometry is presented.
Secondly, simulations were separately performed on models with and without including structural imperfections. Thus, the influence of the latter condition was assessed.
Thirdly, the influence of the maximum amplitude of the geometric shape was assessed by means of a large parametric study varying significant parameters, among others, the web slenderness. In this particular case, a refined analysis including both geometrical and structural imperfections was deployed on each model of the study.
5.6.1 Influence of the shape of the initial imperfection. The first appraisal is extracted from results concerning ultimate load capacity of the experimentally and numerically tested girders. In these cases, both precise shape and eigenmode-based geometries were modelled, as aforementioned, with a residual stress

98 Chapter 5. Validation of the numerical model
pattern. The eigenmode-based geometry was scaled, as suggested by EN1993-1-5, with an amplitude w=80% of the fabrication tolerance (FT). The results are graphically presented in Fig. 5.8 as a function of the distance between transverse stiffeners a. Generally, the numerical results are in good agreement with the experimentally obtained values. Nevertheless, the geometries which are based upon some eigenmodes lead to undesired overestimations, i.e., these modes do not reproduce the required lowest resistance. As a matter of fact, it is observed in Table 5.2 that these modes do not show any deformation in the directly loaded panel (or seem related to other instability modes different from patch loading).
0
50
100
150
200
250
300
350
400
450
500
0 500 1000 1500 2000 2500
Ulti
mat
e loa
d ca
paci
ty F
u(k
N)
Distance a (mm)
Experimental resultsNum-Precise shapeNum-Equivalent ImperfectionNum-1st EigenmodeNum-2nd EigenmodeNum-3rd Eigenmode
Figure 5.8. Ultimate load capacity of the girder for different initial conditions.
Table 5.3 numerically displays the ratio between experimental and FE-results for each case. Precise shape, equivalent imperfection and the symmetric eigenmodes lead to results on ultimate load capacity thought to be satisfactory. Perfect match between both results is observed for the 1st eigenvalue. It is finally confirmed that values corresponding to antisymmetric and shear-buckling like modes do not lead to the lowest predicted resistance as required.
Girder Precise shape
Equivalent imperfection
1st Eigenmode
2nd Eigenmode
3rd Eigenmode
1VPL2500 0 ,98 0,96 1,00 0,97 1,441VPL750 1 ,03 1,01 1,00 0,95 1,401VPL450 0 ,94 0,89 1,00 1,10 1,10
Fu, num / Fu, Experimental
Table 5.3. Experimental vs. numerical results. Influence of the initial shape imperfections.

99 Chapter 5. Validation of the numerical model
Moreover, the general response of the girders is studied by using load-deflection plots. The first analysed prototype was 1VPL2500 (a=2500mm). Fig. 5.9 shows differently obtained responses when varying the initial shape. The response seems to be appropriately captured in all cases save for 3rd eigenmode (which confirms previous results). Linear branches as well as peak zones are similar. The precise shape, the 1st and the 2nd eigenmodes accurately reproduce the post peak branch of the plots. The equivalent imperfection shows a slightly different response than other cases. It is observed that the response obtained numerically for this case underestimates the capacity of the girders. Possibly, the way in which the assumed combination is modelled penalise considerably the structural performance of the prototype.
0
50
100
150
200
250
0 5 10 15 20 25
Loa
d (k
N)
Vertical displacement (mm)
Experimental
Numerical. Precise shape
0
50
100
150
200
250
0 5 10 15 20 25
Loa
d (k
N)
Vertical displacement (mm)
Experimental
Numerical. Equivalent imperfections
0
50
100
150
200
250
0 5 10 15 20 25
Loa
d (k
N)
Vertical displacement (mm)
Eigenmodes
Experimental
Numerical 1st-Eigenmode
Numerical 2nd-Eigenmode
0
50
100
150
200
250
300
350
0 5 10 15 20 25
Loa
d (k
N)
Vertical displacement (mm)
Experimental
Numerical. 3rd Eigenmode
Figure 5.9. Load-deflection curves (1VPL2500).
Influence of the initial shape imperfection. Secondly, specimen 1VPL750 was studied (a=750 mm). Fig. 5.10 shows similar plots. Noticeably, linear branches are appropriately reproduced in all cases. Post-buckling behaviour, however, is less satisfactory. Only refined analyses performed by introducing either the 1st or the 2nd eigenvalues as initial imperfection lead to the same response observed experimentally. Precise shape gives quite accurate results but numerical difficulties were encountered throughout the analysis of such specimen. Other reproductions such as equivalent geometric imperfections give satisfactory results regarding ultimate load capacity but do not appropriately capture the observed post-buckling branch. 3rd eigenmode yields to overestimated results and should not be taken
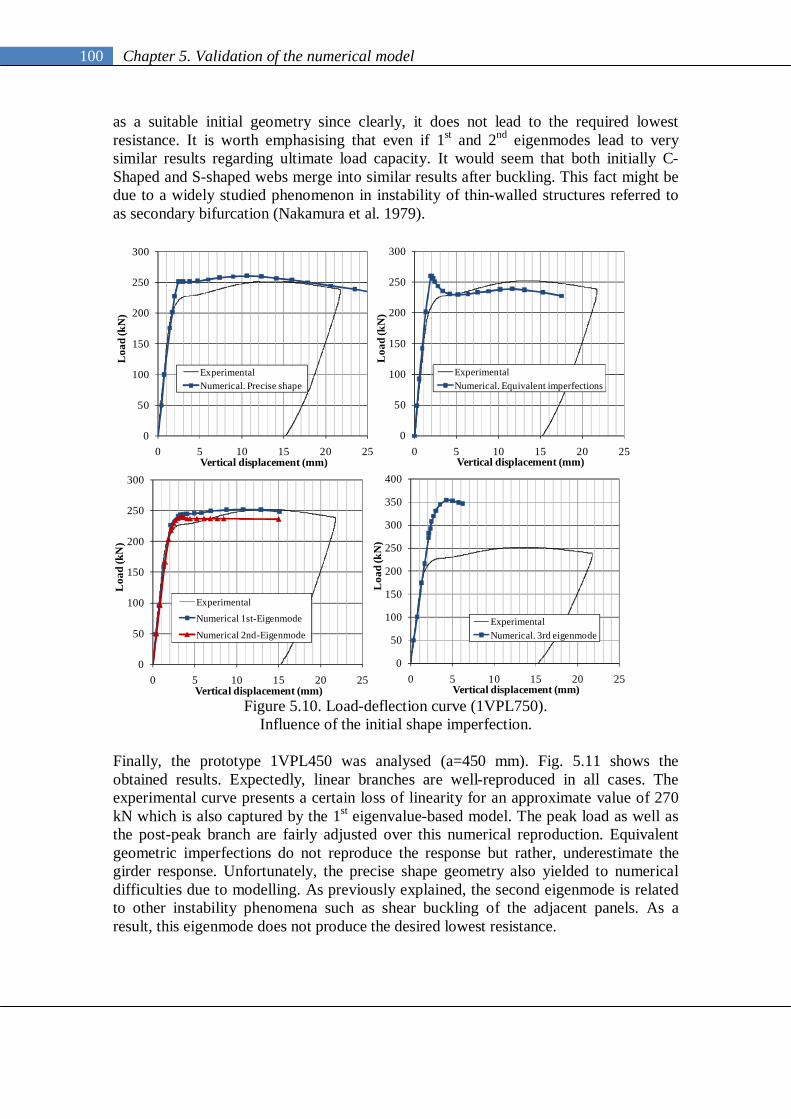
100 Chapter 5. Validation of the numerical model
as a suitable initial geometry since clearly, it does not lead to the required lowest resistance. It is worth emphasising that even if 1st and 2nd eigenmodes lead to very similar results regarding ultimate load capacity. It would seem that both initially C-Shaped and S-shaped webs merge into similar results after buckling. This fact might be due to a widely studied phenomenon in instability of thin-walled structures referred to as secondary bifurcation (Nakamura et al. 1979).
0
50
100
150
200
250
300
0 5 10 15 20 25
Loa
d (k
N)
Vertical displacement (mm)
ExperimentalNumerical. Precise shape
0
50
100
150
200
250
300
0 5 10 15 20 25
Loa
d (k
N)
Vertical displacement (mm)
ExperimentalNumerical. Equivalent imperfections
0
50
100
150
200
250
300
0 5 10 15 20 25
Loa
d (k
N)
Vertical displacement (mm)
Experimental
Numerical 1st-Eigenmode
Numerical 2nd-Eigenmode
0
50
100
150
200
250
300
350
400
0 5 10 15 20 25
Loa
d (k
N)
Vertical displacement (mm)
ExperimentalNumerical. 3rd eigenmode
Figure 5.10. Load-deflection curve (1VPL750).
Influence of the initial shape imperfection. Finally, the prototype 1VPL450 was analysed (a=450 mm). Fig. 5.11 shows the obtained results. Expectedly, linear branches are well-reproduced in all cases. The experimental curve presents a certain loss of linearity for an approximate value of 270 kN which is also captured by the 1st eigenvalue-based model. The peak load as well as the post-peak branch are fairly adjusted over this numerical reproduction. Equivalent geometric imperfections do not reproduce the response but rather, underestimate the girder response. Unfortunately, the precise shape geometry also yielded to numerical difficulties due to modelling. As previously explained, the second eigenmode is related to other instability phenomena such as shear buckling of the adjacent panels. As a result, this eigenmode does not produce the desired lowest resistance.
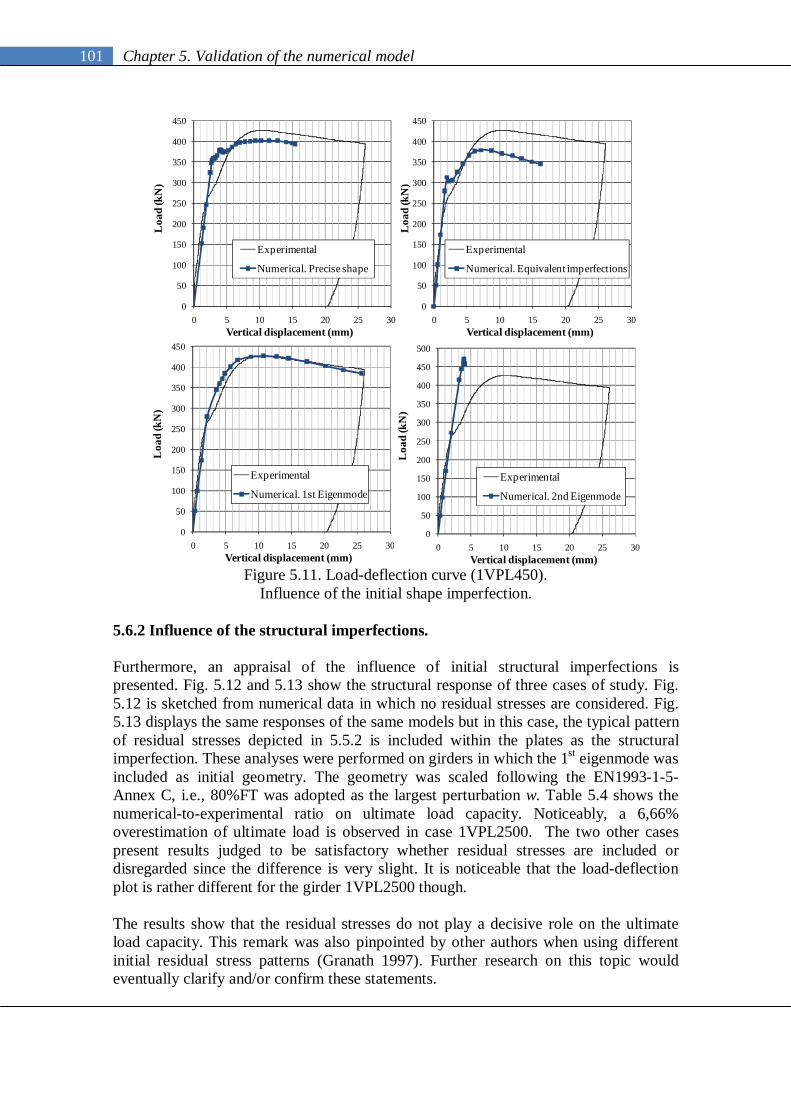
101 Chapter 5. Validation of the numerical model
0
50
100
150
200
250
300
350
400
450
0 5 10 15 20 25 30
Loa
d (k
N)
Vertical displacement (mm)
Experimental
Numerical. Precise shape
0
50
100
150
200
250
300
350
400
450
0 5 10 15 20 25 30
Loa
d (k
N)
Vertical displacement (mm)
Experimental
Numerical. Equivalent imperfections
0
50
100
150
200
250
300
350
400
450
0 5 10 15 20 25 30
Loa
d (k
N)
Vertical displacement (mm)
Experimental
Numerical. 1st Eigenmode
0
50
100
150
200
250
300
350
400
450
500
0 5 10 15 20 25 30
Loa
d (k
N)
Vertical displacement (mm)
Experimental
Numerical. 2nd Eigenmode
Figure 5.11. Load-deflection curve (1VPL450).
Influence of the initial shape imperfection. 5.6.2 Influence of the structural imperfections. Furthermore, an appraisal of the influence of initial structural imperfections is presented. Fig. 5.12 and 5.13 show the structural response of three cases of study. Fig. 5.12 is sketched from numerical data in which no residual stresses are considered. Fig. 5.13 displays the same responses of the same models but in this case, the typical pattern of residual stresses depicted in 5.5.2 is included within the plates as the structural imperfection. These analyses were performed on girders in which the 1st eigenmode was included as initial geometry. The geometry was scaled following the EN1993-1-5-Annex C, i.e., 80%FT was adopted as the largest perturbation w. Table 5.4 shows the numerical-to-experimental ratio on ultimate load capacity. Noticeably, a 6,66% overestimation of ultimate load is observed in case 1VPL2500. The two other cases present results judged to be satisfactory whether residual stresses are included or disregarded since the difference is very slight. It is noticeable that the load-deflection plot is rather different for the girder 1VPL2500 though. The results show that the residual stresses do not play a decisive role on the ultimate load capacity. This remark was also pinpointed by other authors when using different initial residual stress patterns (Granath 1997). Further research on this topic would eventually clarify and/or confirm these statements.

102 Chapter 5. Validation of the numerical model
0
50
100
150
200
250
300
350
400
450
0 5 10 15 20 25 30
Loa
d (k
N)
Vertical displacement (mm)
1VPL450
1VPL750
1VPL2500
Figure 5.12. Load-deflection curves. Influence of the initial structural imperfections.
Residual stresses not taken into consideration. 1st Eigenmode w=80%FT
0
50
100
150
200
250
300
350
400
450
0 5 10 15 20 25 30
Loa
d (k
N)
Vertical displacement (mm)
1VPL450
1VPL750
1VPL2500
Figure 5.13. Load-deflection curves. Influence of the initial structural imperfections.
Residual stresses taken into consideration. 1st Eigenmode w=80%FT
(a) not taken into consideration (b) taken into consideration[(Fu,num/Fu,exp) -1,0]·100 [(Fu,num/Fu,exp) -1,0]·100
1VPL2500 6,66 0,001VPL750 -0,22 0,401VPL450 0,29 -0,20
GirderResidual stresses
Table 5.4. Influence of initial structural imperfections.
Three cases of study. Experimental vs. numerical results.

103 Chapter 5. Validation of the numerical model
5.6.3 Influence of the magnitude of the maximum amplitude. The second designer-assumed feature in the analyses is the maximum amplitude of the web out-of-flatness (w). Numerical simulations presented in this study so far are focused on a reproduction of a half-scale experimental programme. One could argue that the maximum out-of-flatness of the webs in plate girders due to welding may be dependent on the tf/tw ratio and/or the slenderness of the web panel (hw/tw). An appraisal of this influence without considering these additional conditions was judged to be unfair. Consequently, the web thickness was also included as an additional parameter. For this purpose, a wide deterministic parametric study was developed. Numerical simulations were performed on girders in which the maximum amplitude of the buckling shape varies approximately from 0% to 200% of the maximum allowable out-of-flatness according to fabrication tolerances. The mechanical properties of the girders involved in this parametric study were identical to the properties of the tested girders. Geometrically, the length and clear web depth were held constant and equal to the experimental prototypes. The web slenderness was varied ranging from 71 to 166,66. The variation was performed via web thickness (ranging from 3mm to 6 mm). The study case 1 includes the stockiest web panel whereas the study case 4 includes the most slender one. Case 3 coincides with the geometry of the tested girders (highlighted in table 5.5). In this study, all the calculations were performed on an initial shape based upon the 1st eigenmode previously obtained in the perturbation analysis. Initial structural imperfections were included by the simplified pattern of residual stresses depicted in 5.5.2.
[0,20,40….200]
Case
1
2
3
4
w --> f (%FT)
[0,20,40….200]
[0,20,40….200]
[0,20,40….200]
100
125
166,66
5-1,25-0,9
5-1,25-0,9
5-1,25-0,9
web slenderness
(hw/tw)
aspect ratio
(a/hw)
71 5-1,25-0,9
tw (mm)
6
5
4
3
tf / tw
3,33
4
5
6,67
Table 5.5. Parametric study. Influence of the maximum amplitude A total amount of 120 simulations were performed. Noticeably, the web thickness tw together with w were the principal parameters within the set of variation. Ultimate load capacity of the girders was obtained for each case. Four plots are sketched in Fig. 5.14. In the vertical axis, the ratio Fu/Fu,80%, is displayed (ultimate load Fu of the girders standardised to the Fu,%80, in which 80% of the fabrication tolerances is used as EN1993-1-5 suggests). In the horizontal axis, the maximum amplitude of the shape imperfection is sketched as a percentage of the allowed fabrication tolerances. Eq. (5.2) indicates the mathematical relationship governing these plots.
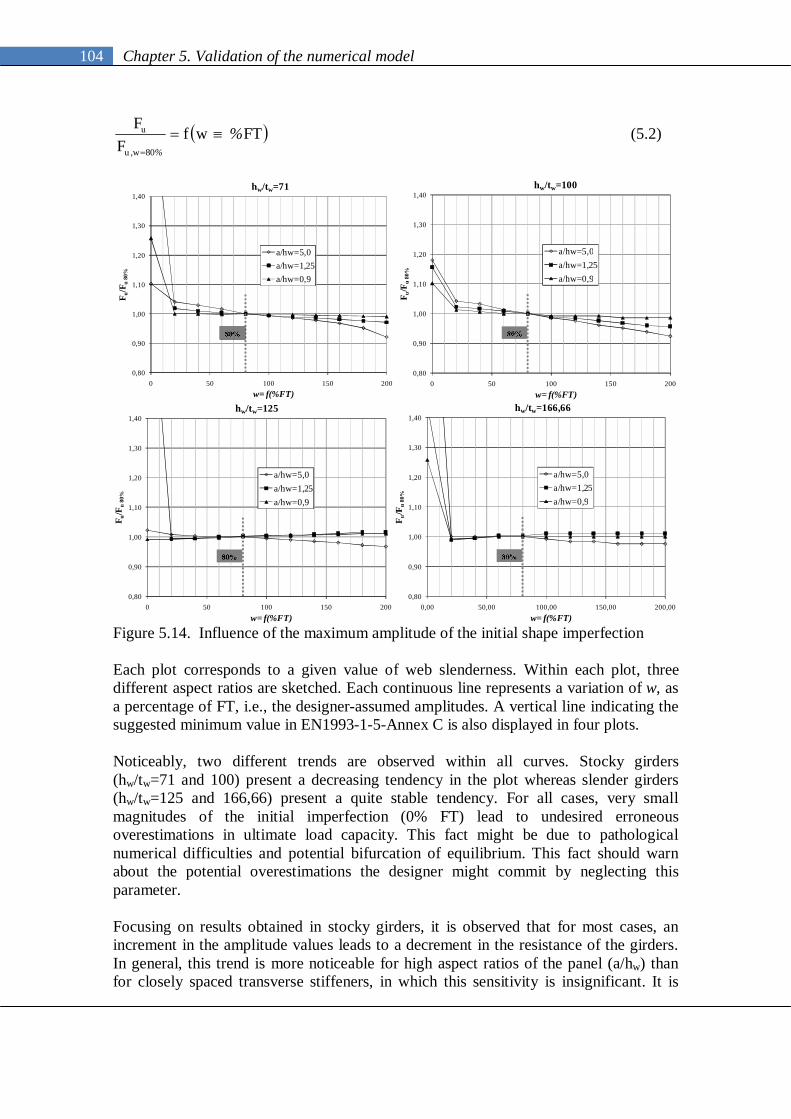
104 Chapter 5. Validation of the numerical model
FTwfF
F
80wu
u %%,
(5.2)
0,80
0,90
1,00
1,10
1,20
1,30
1,40
0 50 100 150 200
F u/F
u 80
%
w= f(%FT)
hw/tw=71
a/hw=5,0a/hw=1,25a/hw=0,9
0,80
0,90
1,00
1,10
1,20
1,30
1,40
0 50 100 150 200
F u/F
u 80
%
w= f(%FT)
hw/tw=100
a/hw=5,0a/hw=1,25a/hw=0,9
0,80
0,90
1,00
1,10
1,20
1,30
1,40
0 50 100 150 200
F u/F
u 80
%
w= f(%FT)
hw/tw=125
a/hw=5,0a/hw=1,25a/hw=0,9
0,80
0,90
1,00
1,10
1,20
1,30
1,40
0,00 50,00 100,00 150,00 200,00
F u/F
u 80
%
w= f(%FT)
hw/tw=166,66
a/hw=5,0a/hw=1,25a/hw=0,9
Figure 5.14. Influence of the maximum amplitude of the initial shape imperfection Each plot corresponds to a given value of web slenderness. Within each plot, three different aspect ratios are sketched. Each continuous line represents a variation of w, as a percentage of FT, i.e., the designer-assumed amplitudes. A vertical line indicating the suggested minimum value in EN1993-1-5-Annex C is also displayed in four plots. Noticeably, two different trends are observed within all curves. Stocky girders (hw/tw=71 and 100) present a decreasing tendency in the plot whereas slender girders (hw/tw=125 and 166,66) present a quite stable tendency. For all cases, very small magnitudes of the initial imperfection (0% FT) lead to undesired erroneous overestimations in ultimate load capacity. This fact might be due to pathological numerical difficulties and potential bifurcation of equilibrium. This fact should warn about the potential overestimations the designer might commit by neglecting this parameter. Focusing on results obtained in stocky girders, it is observed that for most cases, an increment in the amplitude values leads to a decrement in the resistance of the girders. In general, this trend is more noticeable for high aspect ratios of the panel (a/hw) than for closely spaced transverse stiffeners, in which this sensitivity is insignificant. It is
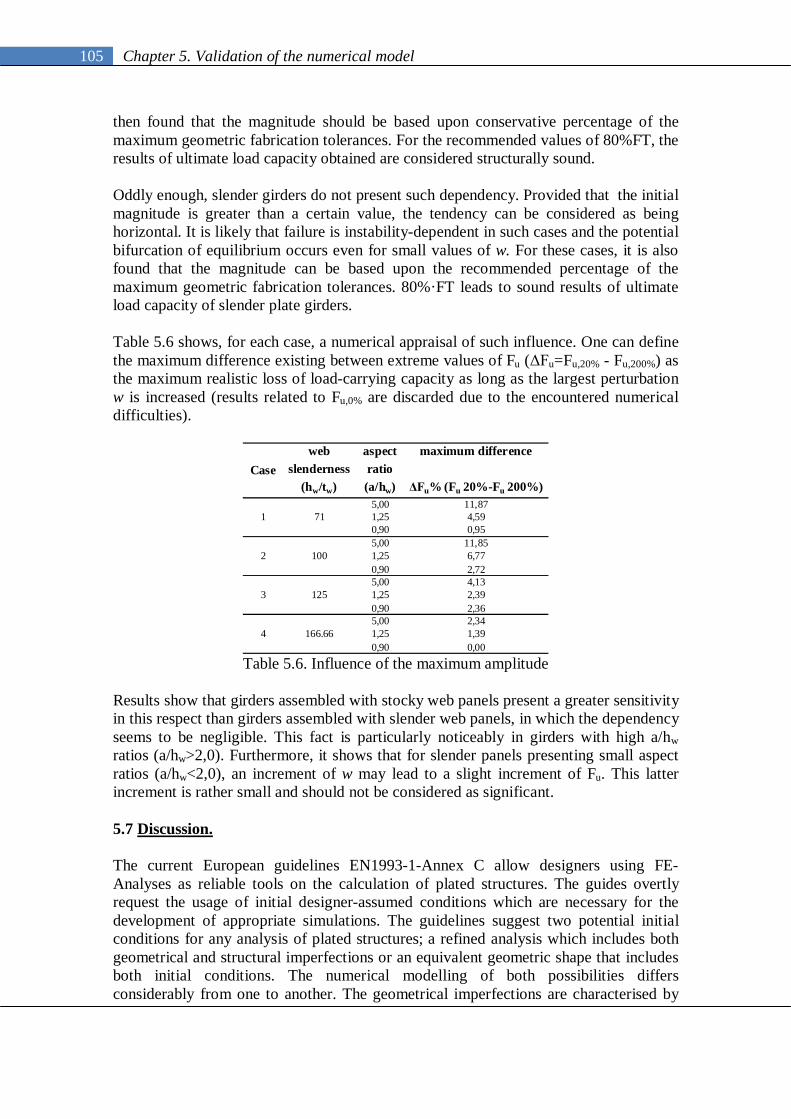
105 Chapter 5. Validation of the numerical model
then found that the magnitude should be based upon conservative percentage of the maximum geometric fabrication tolerances. For the recommended values of 80%FT, the results of ultimate load capacity obtained are considered structurally sound. Oddly enough, slender girders do not present such dependency. Provided that the initial magnitude is greater than a certain value, the tendency can be considered as being horizontal. It is likely that failure is instability-dependent in such cases and the potential bifurcation of equilibrium occurs even for small values of w. For these cases, it is also found that the magnitude can be based upon the recommended percentage of the maximum geometric fabrication tolerances. 80%·FT leads to sound results of ultimate load capacity of slender plate girders. Table 5.6 shows, for each case, a numerical appraisal of such influence. One can define the maximum difference existing between extreme values of Fu (ΔFu=Fu,20% - Fu,200%) as the maximum realistic loss of load-carrying capacity as long as the largest perturbation w is increased (results related to Fu,0% are discarded due to the encountered numerical difficulties).
5,00 11,871,25 4,590,90 0,955,00 11,851,25 6,770,90 2,725,00 4,131,25 2,390,90 2,365,00 2,341,25 1,390,90 0,00
4 166.66
1 71
2 100
3 125
Caseweb
slenderness (hw/tw)
aspect ratio (a/hw)
maximum difference
ΔFu% (Fu 20%-Fu 200%)
Table 5.6. Influence of the maximum amplitude
Results show that girders assembled with stocky web panels present a greater sensitivity in this respect than girders assembled with slender web panels, in which the dependency seems to be negligible. This fact is particularly noticeably in girders with high a/hw ratios (a/hw>2,0). Furthermore, it shows that for slender panels presenting small aspect ratios (a/hw<2,0), an increment of w may lead to a slight increment of Fu. This latter increment is rather small and should not be considered as significant. 5.7 Discussion. The current European guidelines EN1993-1-Annex C allow designers using FE-Analyses as reliable tools on the calculation of plated structures. The guides overtly request the usage of initial designer-assumed conditions which are necessary for the development of appropriate simulations. The guidelines suggest two potential initial conditions for any analysis of plated structures; a refined analysis which includes both geometrical and structural imperfections or an equivalent geometric shape that includes both initial conditions. The numerical modelling of both possibilities differs considerably from one to another. The geometrical imperfections are characterised by

106 Chapter 5. Validation of the numerical model
the introduction of an initially non-straight shape properly scaled whereas the structural imperfections by a typical residual stress pattern. First, it has been shown that the initial shape of the girder does not play a primary role on the ultimate load capacity of the girders as far as realistic symmetric shapes are introduced directly below the patch load. It is worth pointing out that the experimentally-obtained response of the girders was perfectly reproduced when 1st eigenmode-based geometries were used as initial geometrical conditions. The introduction of equivalent geometric imperfections led to satisfactory and conservative results concerning ultimate load capacity. The modelling, however, was judged rather intricate and several decisions involving engineering judgement were needed. This fact came as a result of the modelling of a combination of different types of imperfection. The modelling according to equivalent imperfections might be less complicated if only one “leading type” is defined as the one producing the lowest resistance. This procedure may be conservatively used if more refined analysis is not feasible. In this work, due to simplicity and accuracy, the usage of eigenmode-based geometries is recommended. All subsequent numerical studies presented within this work are based upon the eigenmode-based geometries. Second, the structural imperfections are introduced in the girders by means of a typical residual stress pattern found in literature. It has been noticed that if these patterns are included in the analysis, the results are more refined. The difference between considering or discarding these imperfections does not play a decisive role on the response of the girders. Other studies have also pointed out similar remarks. It is highly recommended to address further research concerning this particular topic by means of vaster parametric studies including a set of variation of different patterns. Third, the influence of the maximum amplitude magnitude w suggested in EN1993-1-5-Annex C has been assessed. The maximum allowable fabrication tolerances were used as a comparative magnitude. It has been shown that whether these amplitudes are kept within reasonable limits related to fabrication tolerances, the influence of the magnitude is negligible. It has been also observed that in stocky girders, an increment in the amplitude values leads to a decrement in the resistance of the girders whereas in slender girder this tendency is not noticeable. In all cases, for the specific recommended values of 80% of the allowed fabrication tolerances, results of ultimate load capacity obtained were considered structurally sound. These drawn conclusions give guidance of the potential influence of the designer-assumed conditions on ultimate limit states verifications for the particular case of steel plate girders subjected to patch loading. In subsequent chapters, all the numerical simulations are developed following the EN1993-1-5 recommendations. The refined analysis is used in such simulations with the features presented herein.
The shape of the initial geometry is based upon the 1st eigenmode. The largest amplitude w of the shape is scaled to a value equalling 80% of the
fabrication tolerances. The structural imperfections are included in the form of the residual stress
patterns.
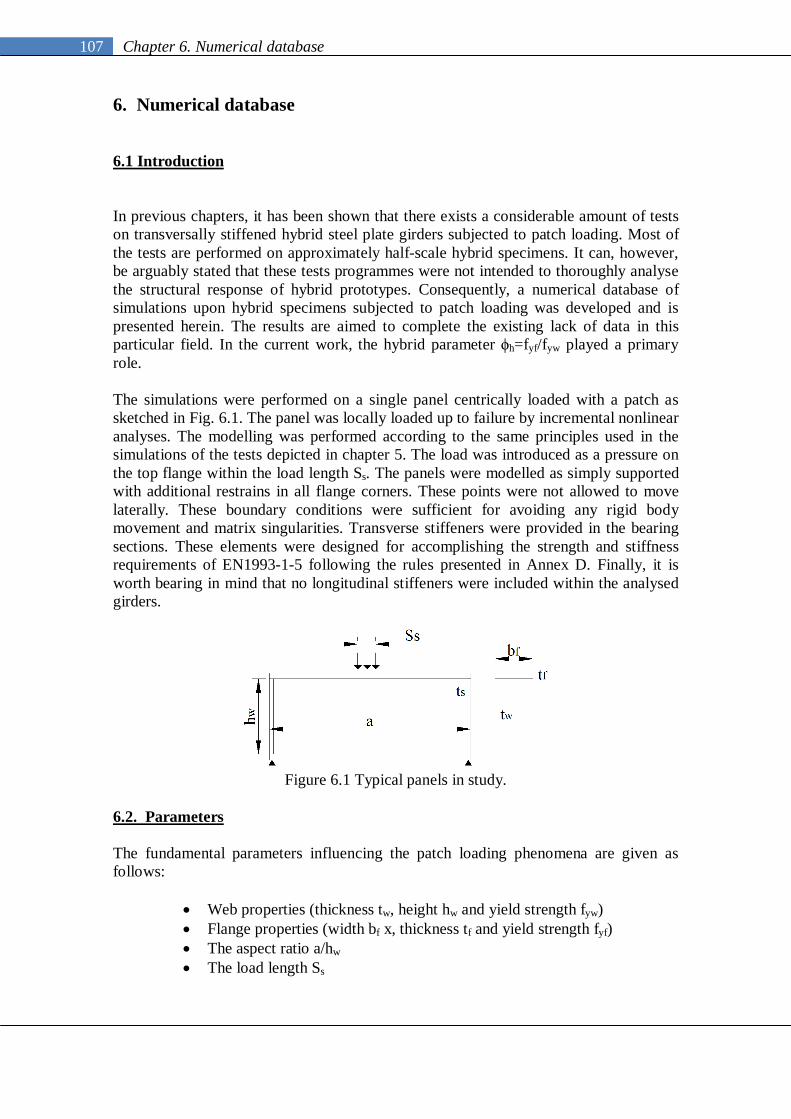
107 Chapter 6. Numerical database
6. Numerical database 6.1 Introduction
In previous chapters, it has been shown that there exists a considerable amount of tests on transversally stiffened hybrid steel plate girders subjected to patch loading. Most of the tests are performed on approximately half-scale hybrid specimens. It can, however, be arguably stated that these tests programmes were not intended to thoroughly analyse the structural response of hybrid prototypes. Consequently, a numerical database of simulations upon hybrid specimens subjected to patch loading was developed and is presented herein. The results are aimed to complete the existing lack of data in this particular field. In the current work, the hybrid parameter ϕh=fyf/fyw played a primary role. The simulations were performed on a single panel centrically loaded with a patch as sketched in Fig. 6.1. The panel was locally loaded up to failure by incremental nonlinear analyses. The modelling was performed according to the same principles used in the simulations of the tests depicted in chapter 5. The load was introduced as a pressure on the top flange within the load length Ss. The panels were modelled as simply supported with additional restrains in all flange corners. These points were not allowed to move laterally. These boundary conditions were sufficient for avoiding any rigid body movement and matrix singularities. Transverse stiffeners were provided in the bearing sections. These elements were designed for accomplishing the strength and stiffness requirements of EN1993-1-5 following the rules presented in Annex D. Finally, it is worth bearing in mind that no longitudinal stiffeners were included within the analysed girders.
Figure 6.1 Typical panels in study.
6.2. Parameters The fundamental parameters influencing the patch loading phenomena are given as follows:
Web properties (thickness tw, height hw and yield strength fyw) Flange properties (width bf x, thickness tf and yield strength fyf) The aspect ratio a/hw The load length Ss

108 Chapter 6. Numerical database
6.2.1 Variation The numerical database was constructed by varying the aforementioned parameters. This variation was chosen from realistic proportions typically found in European steel bridges. Four different groups formed the framework of the sample. Each group consisted of a web panel presenting a given value of hw. Within each group, three different lengths a were studied. This variation led to three different aspect ratios. Likewise, two different values of tw studied for each case leading to varying systematically the web slenderness within each group. The hybrid parameter ϕh was included within the numerical database by varying the fyf/fyw ratio in all specimens. The web yield strength was held constant whereas the flange yield strength was systematically increased from fyf/fyw=235/235=1,0 (homogenous girder) to fyf/fyf=460/235=1,95. Table 6.1 summarises the set of variations, which resulted in an amount of 192 specimens.
0 I II III
Web yield strength fyw (N/mm2) 235 235 235 235
235 235 235 235275 275 275 275355 355 355 355460 460 460 460
hw (mm) 1000 2000 3000 40001000 2000 3000 40002000 4000 6000 80003000 6000 9000 12000
8 12 15 1512 20 25 30
250 500 750 1000500 1000 1500 2000
Flange dimensions (mm) 800x60 900 x 80 1000 x 80 1200 x 100Stiffener thickness (mm) 40 60 60 80Girders per group 48 48 48 48
Numerical database variations Group
Flange yield strength fyf (N/mm2)
a (mm)
tw (mm)
192Total number of numerical simulations
Ss (mm)
Table 6.1 Girder properties of the numerical simulations
Table 6.2 shows the proportions of the girders numerically simulated. As described in chapters 3, the structural response of plate girders subjected to patch loading may vary whether the transverse stiffeners are closely or largely spaced. Noticeably, the set of variations displayed in table 6.2 includes three aspect ratios ranging from 1 to 3 for the sake of assessing this particular topic. Moreover, the web slenderness is varied from stocky (hw/tw=83,33) to very slender web panels (hw/tw=266,67). These proportions are thought to as being realistic limits of the web robustness in typical European steel bridges. The flange proportions satisfy at least class 3 sections according to EN1993-1-1 since the compressed flange may undergo to non-negligible stress levels after the web buckles.

109 Chapter 6. Numerical database
0 I II III1,00 1,00 1,00 1,001,17 1,17 1,17 1,171,51 1,51 1,51 1,511,96 1,96 1,96 1,96
hw (mm) 1000 2000 3000 40001 1 1 12 2 2 23 3 3 3
125 166,67 200 266,6783,33 100 120 133,330,25 0,25 0,25 0,250,5 0,5 0,5 0,5
Flange-Section class 1-2 1-2 1-2 1-2
Numerical database variations Group
fyf/fyw
a / hw
hw/tw
Ss/hw
Table 6.2 Girder proportions of the numerical simulations
Annex C includes significant information related to the girder properties as well as the results of critical and ultimate load obtained for each simulation. The results obtained by applying the current EN1993-1-5 formulations are also included within the results displayed on the tables. In the forthcoming sections, the results are pictorially presented in a distilled form (for more details of each simulation, see Annex C). 6.3 Numerical results. Patch loading phenomena. The collapse load of girders subjected to concentrated loads has been characterised by a mechanism including plastic hinges within the flanges and yield lines within the web panel. The mechanism is thought of as occurring for collapse loads in both the flange and the web. Some authors have observed three yield lines within the web and four hinges within the top flange (Roberts 1979, Davaine 2005) while others, have proposed mechanisms with two yield lines (Shimizu et al. 1989), three plastic hinges (Bergfelt 1983) and four plastic hinges within the top flange (Lagerqvist 1994). The mechanism proposed by Roberts (sketched in Fig. 6.2) has been widely studied. Most of design provisions are, or have been, based upon this mechanism or, at least, upon a sort of variation. The theoretical model is characterised by three parameters:
The yielded length (2β + Ss) in the web, which also defines the location of the potential outer plastic hinges of the flanges.
The length α , which defines the location of the yield lines along the web depth.
The rotation of the yield lines θ.

110 Chapter 6. Numerical database
Figure 6.2 Mechanical model for predicting the collapse loads. Roberts (1979)
Moreover, it has been experimentally observed that a typical response of an unstiffened girder (ly<<a) centrically loaded with a concentrated force follows a load-displacement plot according to Fig. 6.3. As the load is increased, the structure undergoes a linear response. If the load seizes a certain level, the linearity is lost, after which, the girder is incapable of supporting any further load increment. At this point, a failure mechanism occurs. Both the stiffness and the carrying load capacity of the structure are gradually decreased while the deformation increases substantially.
Figure 6.3 Response of an unstiffened plate girder to concentrated loading.
On the other hand, it has been experimentally observed that the response of plate girders subjected to patch loading may vary whether the transverse stiffeners are closely spaced or not. If these closely spaced stiffeners provide a sufficient rigidity to the web panel, it may eventually carry increments of load (ΔF) beyond Fu. The structural response depicted in Fig. 6.3 is modified with the aid of both the transverse ribs and the flange. If the stiffeners are moderately close (ly≈a), the girders exhibits a path as shown in Fig. 6.4 whereas if the stiffeners are very close (ly>a) the response is substantially modified. In both cases, the load can be increased up to values of F2 after awhile the capacity of the girder is exhausted. The defined value of F2 would represent the ultimate load capacity of the girders belonging to such cases. Fig. 6.4 shows the response of the girders presenting such geometrical configurations.

111 Chapter 6. Numerical database
Figure 6.4 Response of a densely stiffened plate girder subjected to patch loading.
The question is whether or not these responses match accurately with the theoretical mechanical models depicted. The focus of this section is to infer the failure mechanisms of the girders from the numerical simulations. For this purpose, a first series of observations is performed and presented. Primarily, the observations are focused on the encountered failure mechanisms for girders with web slenderness ranging from stocky (hw/tw=83,33) to slender panels (hw/tw=266,66) and for largely (a/hw=3,00, ly<<a) to closely spaced transverse stiffeners (a/hw=1,00, ly≈a). It is worth pointing out that only homogeneous girders (fyf/fyw=235/235=1,00) are studied within this section. Eight girders have been chosen for the first result analysis. Four girders belong to group 0 (VT-0-3-12-25-1, VT-0-3-12-50-1, VT-0-1-12-25-1 and VT-0-1-12-50-1). Two girders belong to group I (VT-1-2-12-5-1 and VT-1-6-12-5-1) and finally, two girders were picked from group III (VT-3-4-15-10-1 and VT-3-12-15-10-1). It is worth emphasising that girders from group II and III presented similar trends in the results. Only results from group III are presented in order to avoid repetitions. For this first analysis, the specimens were chosen following two criteria: the web slenderness range (from stocky to very slender girders) and the aspect ratio (from largely to closely spaced transverse stiffeners). Table 6.3 summarises the most remarkable information about the studied specimens (further details are appended in Annex C). The EN1993-1-5 theoretical verification is also included within the table. Notice that values of ly, or alternatively, ly,corrected=a are included. This analysis is presented in three separated sections as follows:
hw tw Ss a ly ly,corr FRd EN1993-1 -5 Fu, num
(mm) (mm) (mm) (mm) (mm) (mm) (kN) (kN)0 VT-0-1-12-25-1,0 1000 12 250 1000 1389,80 1000,00 1357 20740 VT-0-1-12-50-1,0 1000 12 500 1000 1639,80 1000,00 1357 23520 VT-0-3-12-25-1,0 1000 12 250 3000 1389,80 1389,80 1411 16790 VT-0-3-12-50-1,0 1000 12 500 3000 1639,80 1639,80 1533 1749I VT-1-2-12-5-1,0 2000 12 500 2000 2156,66 2000,00 1357 2886I VT-1-6-12-5-1,0 2000 12 500 6000 2156,66 2156,66 1243 1947
III VT-3-4-15-10-1,0 4000 15 1000 4000 3316,60 3316,60 1931 3332III VT-3-12-15-10-1,0 4000 15 1000 12000 3316,60 3316,60 1703 2820
Group Specimen
Table 6.3 Girder proportions of the presented numerical results

112 Chapter 6. Numerical database
6.3.1 Stocky girders (hw/tw=83,33). A sample of stocky specimens (hw/tw=83,33) encountered among the whole population is analysed. In this case, the sample is taken from group 0. All specimens within this group are assembled with a web plate of height hw=1000mm. Firstly, the load-displacement structural response is sketched for four specimens in Fig. 6.5. Two girders (VT-0-3-12-25-1 and VT-0-3-12-50-1) present largely spaced transverse stiffeners (a/hw=3,00; ly<<a) whereas in two others, the distance between transverse stiffeners is considered short (a/hw=1,00; ly>a, see Table 6.3 for further details). In each plot, the Ss/hw ratios are included.
0
200
400
600
800
1000
1200
1400
1600
1800
2000
0 5 10 15 20
Loa
d (k
N)
Vertical displacement (mm)
Group 0a/hw=3,00; hw/tw=83,33
VT-0-3-12-25-1. Fu=1679 kNVT-0-3-12-50-1. Fu=1749 kN
0
500
1000
1500
2000
2500
0 2 4 6 8 10 12
Loa
d (k
N)
Vertical displacement (mm)
Group 0a/hw=1,00; hw/tw=83,33
VT-0-1-12-25-1. F2=2074 kNVT-0-1-12-50-1. F2=2352 kN
F1
F2
Figure 6.5 Stocky girders. Load vs. Displacement plots.
(a) a/hw=3,00; ly<<a. (b) a/hw=1,00; ly>a The plot gives significant information about the structural response of the girders.
In both cases, the ultimate load capacity increases with Ss.
For the case of a/hw=3,00 (Fig. 6.5 (a)), the response follows the pattern depicted in Fig. 6.3. The girder capacity is exhausted at the value of Fu.
For the case of a/hw=1,00 (Fig. 6.5 (b)), the response follows the pattern depicted
in Fig. 6.4. After achieving the F1 load, the girder undergoes a post-peak behaviour leading to F2. A greater increment ΔF is observed in the girder with higher Ss/hw ratio. In both cases, according to EN1993-1-5, the calculated effectively loaded length ly must be shifted by ly,corrected=a
Secondly, Fig. 6.6 shows stresses (pictorially) at Fu in specimen VT-0-3-12-25-1. This prototype presents an aspect ratio a/hw=3,00. Front and isometric views show the von Mises stresses in this girder at Fu. In this plot, red areas indicate stress levels in the panel equal to fyw=235 N/mm2. Gray areas denote plastic deformation in the plates. Furthermore, a cross-section of the deformed girder at mid-span is included.
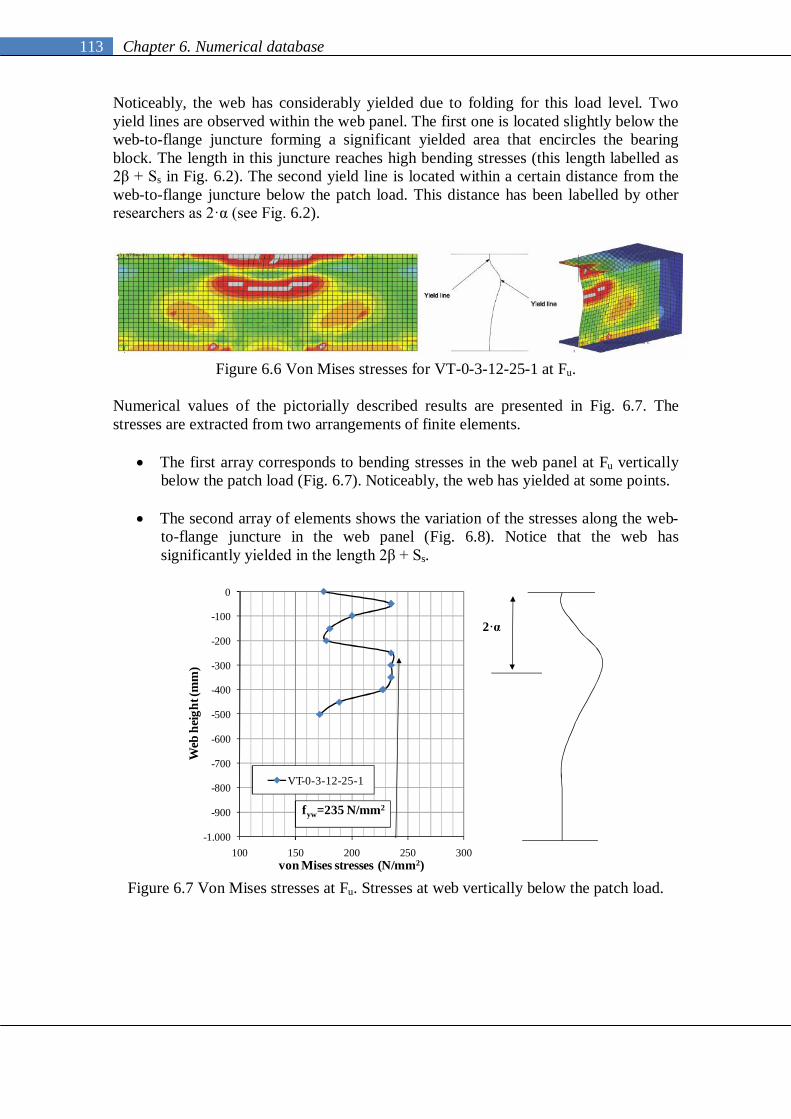
113 Chapter 6. Numerical database
Noticeably, the web has considerably yielded due to folding for this load level. Two yield lines are observed within the web panel. The first one is located slightly below the web-to-flange juncture forming a significant yielded area that encircles the bearing block. The length in this juncture reaches high bending stresses (this length labelled as 2β + Ss in Fig. 6.2). The second yield line is located within a certain distance from the web-to-flange juncture below the patch load. This distance has been labelled by other researchers as 2·α (see Fig. 6.2).
Figure 6.6 Von Mises stresses for VT-0-3-12-25-1 at Fu.
Numerical values of the pictorially described results are presented in Fig. 6.7. The stresses are extracted from two arrangements of finite elements.
The first array corresponds to bending stresses in the web panel at Fu vertically below the patch load (Fig. 6.7). Noticeably, the web has yielded at some points.
The second array of elements shows the variation of the stresses along the web-to-flange juncture in the web panel (Fig. 6.8). Notice that the web has significantly yielded in the length 2β + Ss.
-1.000
-900
-800
-700
-600
-500
-400
-300
-200
-100
0
100 150 200 250 300
Web
hei
ght (
mm
)
von Mises stresses (N/mm2)
VT-0-3-12-25-1
2·α
fyw=235 N/mm2
Figure 6.7 Von Mises stresses at Fu. Stresses at web vertically below the patch load.

114 Chapter 6. Numerical database
0
50
100
150
200
250
300
0 500 1000 1500 2000 2500 3000
von
Mise
s str
esse
s (N
/mm
2 )
Length (mm)
VT-0-3-12-25-1
Ss+2
235 N/mm2
Figure 6.8 Von Mises stresses at Fu. Web-to-flange juncture.
Even if the web panel has considerably yielded in certain areas at Fu, no evidence of yielding is noticeable within the flanges. At this load level, these members remain elastic (beyond the increment corresponding the ultimate load, the top flange gradually yields tough). Fig. 6.9 shows the maximum principal plastic strain component from an isometric point of view. Red-coloured elements indicate elastic areas whereas any colour different from red, flags the elements that have undergone a plastic behaviour. These results confirm the numerical observations performed by Granath (1997).
Figure 6.9 Maximum principal plastic strain components at Fu. VT-0-3-12-25-1.
Following the same procedure, VT-0-1-12-25-1 is analysed (in this girder, ly>a). Fig. 6.10 shows the von Mises stresses at F1 and F2. Front and isometric views are pictured for F1= 1793 kN and F2=2074 kN. Red and gray areas indicate information related to yielding and plastic deformation. At F1, the mechanism seems similar than the one depicted above. Upper and bottom yield lines due to web folding are noticeable. The upper line is located in the web-to-flange juncture whereas the bottom line is located vertically below the juncture a certain distance 2·α. No evidence of yielding is observed within the flanges. At F2, a considerable percentage of the web has reached a stress level fyw=235 N/mm2. The yielded length along the web goes far beyond the former distance 2·α. At this load level, the flange has also reached the yield stress fyf=235N/mm2.

115 Chapter 6. Numerical database
Figure 6.10 Von Mises stresses. VT-0-1-12-25-1 at F1 and F2.
Fig. 6.11 shows two different plots. First, Fig. 6.11 (a) shows numerically the von Mises stresses extracted from the web plate (specifically, from the web-to-flange juncture). The web has considerably yielded at F1. Second, Fig. 6.11 (b) shows the von Mises stresses extracted from a horizontal array of finite elements located on the flange plate. For this case, the flange plate has yielded very locally at F1. At F2, the yielded length increases considerably.
100
120
140
160
180
200
220
240
0 200 400 600 800 1000
von
Mise
s str
ess
(N/m
m2 )
Length (mm)
F1=1793 kNF2=2074 kN
50
70
90
110
130
150
170
190
210
230
250
0 200 400 600 800 1000
von
Mise
s str
ess
(N/m
m2 )
Length (mm)
F1=1793 kNF2=2074 kN
Figure 6.11 Von Mises stresses for VT-0-1-12-25-1 at F1 and F2.
(a) Web-to-flange juncture. (b) Flange plate Subsequently, the girder response changes at F1. Certainly, the linearity is lost due to a coupled phenomenon (yielding with instability). Noticeably, the three different elements assembling the girder (web, top flange and stiffener plates) exhibit a different behaviour from the value of F1 onwards. For the sake of illustration, a stress vs. load plot is presented in Fig. 6.12 for these three different plates of specimen VT-0-1-12-25-1. First, web plate stresses are studied in the web-to-flange juncture below the patch load. Second, the top flange is studied precisely below the load. Third, the transverse stiffener is studied in the juncture with the flange. In Fig. 6.12, it is observed that web element response is nonlinear from early increments of load. At F1, the web has already undergone a significant stiffness change. For the case of the flange element, the response is quite linear up to F1 after which the stress variation is put to a higher gear. A similar behaviour is observed for the case of the stiffener element, the curve slope changes at F1. All changes of the plate responses occur simultaneously at F1.
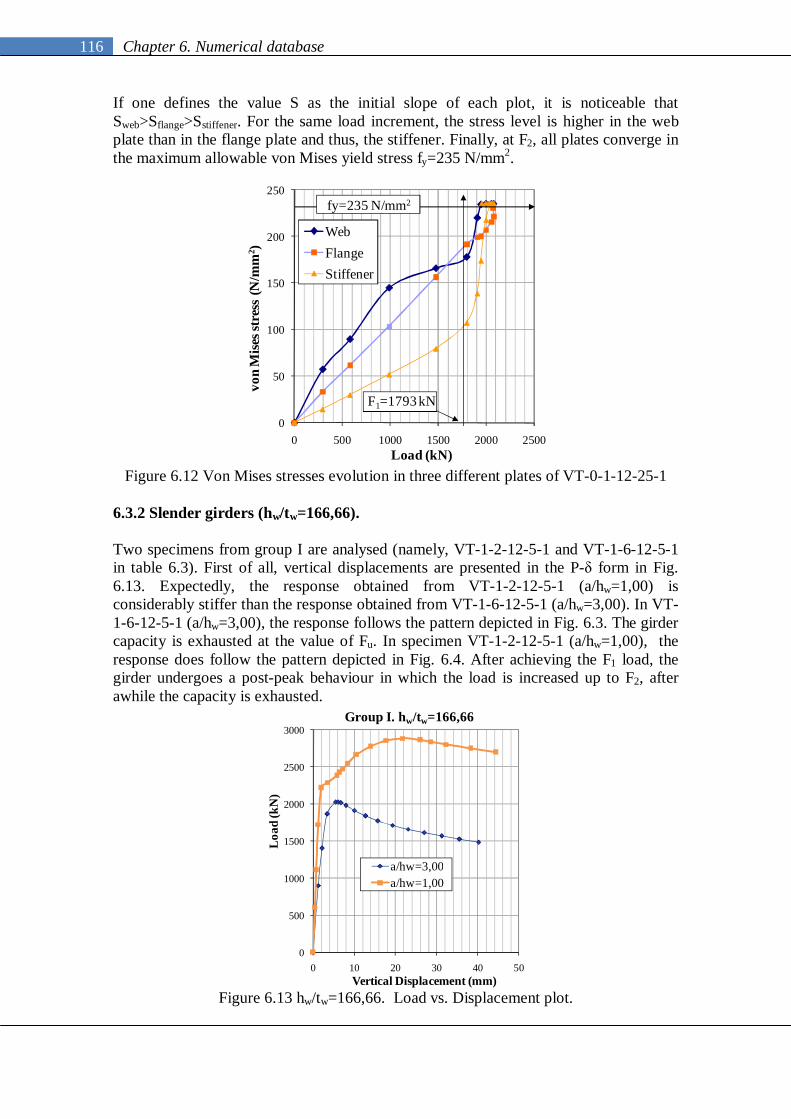
116 Chapter 6. Numerical database
If one defines the value S as the initial slope of each plot, it is noticeable that Sweb>Sflange>Sstiffener. For the same load increment, the stress level is higher in the web plate than in the flange plate and thus, the stiffener. Finally, at F2, all plates converge in the maximum allowable von Mises yield stress fy=235 N/mm2.
0
50
100
150
200
250
0 500 1000 1500 2000 2500
von
Mise
s str
ess
(N/m
m2 )
Load (kN)
WebFlangeStiffener
F1=1793 kN
fy=235 N/mm2
Figure 6.12 Von Mises stresses evolution in three different plates of VT-0-1-12-25-1
6.3.2 Slender girders (hw/tw=166,66). Two specimens from group I are analysed (namely, VT-1-2-12-5-1 and VT-1-6-12-5-1 in table 6.3). First of all, vertical displacements are presented in the P-δ form in Fig. 6.13. Expectedly, the response obtained from VT-1-2-12-5-1 (a/hw=1,00) is considerably stiffer than the response obtained from VT-1-6-12-5-1 (a/hw=3,00). In VT-1-6-12-5-1 (a/hw=3,00), the response follows the pattern depicted in Fig. 6.3. The girder capacity is exhausted at the value of Fu. In specimen VT-1-2-12-5-1 (a/hw=1,00), the response does follow the pattern depicted in Fig. 6.4. After achieving the F1 load, the girder undergoes a post-peak behaviour in which the load is increased up to F2, after awhile the capacity is exhausted.
0
500
1000
1500
2000
2500
3000
0 10 20 30 40 50
Loa
d (k
N)
Vertical Displacement (mm)
Group I. hw/tw=166,66
a/hw=3,00a/hw=1,00
Figure 6.13 hw/tw=166,66. Load vs. Displacement plot.

117 Chapter 6. Numerical database
Second, Fig. 6.14 shows the von Mises stresses at Fu in specimens VT-1-6-12-5-1 (a/hw=3,00) both pictorially and numerically. In this case, identically to other cases, red areas indicate stress levels in the panel equal to fyw=235 N/mm2 whereas gray areas indicate plastic deformation. The upper plot presents the von Mises stresses along the web-to-flange juncture. Notice that for this load level, the web has considerably yielded due to folding.
Figure 6.14 Von Mises stresses for VT-1-6-12-5-1 (a/hw=3,00) at Fu .
Focusing on VT-1-2-12-5-1 (a/hw=1,00), Fig. 6.15 shows the von Mises stresses at F1 (a) and F2 (b). The pattern observed is similar to the one depicted above for stocky girders. At F1, the web has considerably yielded due to folding but the top flange remains elastic. Further on, at F2, the upper half of the web is fully plastic. Moreover, the flange has considerably yielded.
Figure 6.15 Von Mises stresses for VT-1-2-12-5-1 (a/hw=1,00)
(a) F1. (b) Post-peak branch F2.
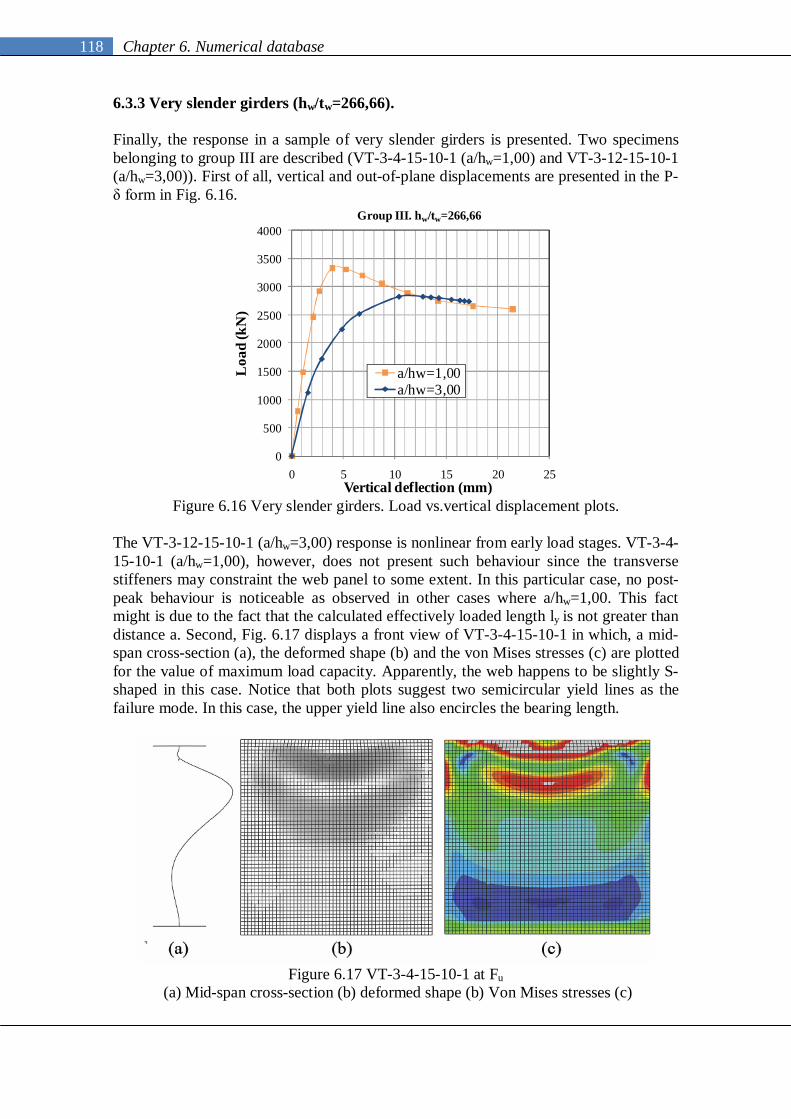
118 Chapter 6. Numerical database
6.3.3 Very slender girders (hw/tw=266,66). Finally, the response in a sample of very slender girders is presented. Two specimens belonging to group III are described (VT-3-4-15-10-1 (a/hw=1,00) and VT-3-12-15-10-1 (a/hw=3,00)). First of all, vertical and out-of-plane displacements are presented in the P-δ form in Fig. 6.16.
0
500
1000
1500
2000
2500
3000
3500
4000
0 5 10 15 20 25
Loa
d (k
N)
Vertical deflection (mm)
Group III. hw/tw=266,66
a/hw=1,00a/hw=3,00
Figure 6.16 Very slender girders. Load vs.vertical displacement plots.
The VT-3-12-15-10-1 (a/hw=3,00) response is nonlinear from early load stages. VT-3-4-15-10-1 (a/hw=1,00), however, does not present such behaviour since the transverse stiffeners may constraint the web panel to some extent. In this particular case, no post-peak behaviour is noticeable as observed in other cases where a/hw=1,00. This fact might is due to the fact that the calculated effectively loaded length ly is not greater than distance a. Second, Fig. 6.17 displays a front view of VT-3-4-15-10-1 in which, a mid-span cross-section (a), the deformed shape (b) and the von Mises stresses (c) are plotted for the value of maximum load capacity. Apparently, the web happens to be slightly S-shaped in this case. Notice that both plots suggest two semicircular yield lines as the failure mode. In this case, the upper yield line also encircles the bearing length.
Figure 6.17 VT-3-4-15-10-1 at Fu
(a) Mid-span cross-section (b) deformed shape (b) Von Mises stresses (c)

119 Chapter 6. Numerical database
Finally, Fig. 6.18 displays a front view of VT-3-12-15-10-1 (a/hw=3,00) in which, the von Mises stresses are pictured for both top flange (a) and web panel (b). The deformed shape is also plotted for the value of maximum load capacity (c). In this case, the web also seems to be slightly S-shaped. Furthermore both plots suggest two semicircular yield lines as the failure mode.
Figure 6.18 VT-3-4-15-10-1 at Fu.
(a) Von Mises stresses. Top flange. (b) Web panel (c) deformed shape (c).
6.3.4 Discussion of the results.
At first glance, the numerical results shows interesting conclusions that should be pinpointed. The depicted numerical observations lead to the following observations:
Primarily, the encountered failure mechanism for all cases is the web folding. Two yield lines can be observed within the web panel at maximum load capacity Fu (this failure mechanism, was already observed by Granath (1997) when using numerical simulations). In this case, however, at Fu the flanges remains elastic and no plastic hinges are noticeable. It is clear that even if a compatible vertical deformation is needed within the flanges at this load level for developing the web folds, this deformation does not seem to lead to yielding stress levels of the top flange.
The yield line in the web-to-flange juncture encircles the bearing length. The
bottom yield line is located a distance 2· from the web-to-flange juncture (according to Roberts (1979), the value of 2· depends upon the web thickness. Roberts proposed a simplification that reads =30·tw)
As the web is vertically deformed and considerably folded beyond Fu, the flanges experience a non-negligible bending deformation that leads to a plastic deformation in the hogging and sagging zones. This fact leads to the formation of the hinges. For most cases, this fact is only noticeable when high levels of deformation are attained.

120 Chapter 6. Numerical database
In the particular case of closely spaced transverse stiffeners (ly≥a), a peculiar situation arises. If the stiffeners are close and rigid enough, the web yield lines can be anchored on the vertical ribs. A post-peak behaviour is observed and the load undergoes from the maximum value of F1 to F2. The numerical results confirm the experimental observation described in chapter 3. This fact remains unclear and must be thoroughly studied. At this point, only single panels with rigid transverse stiffeners have been studied. Chapter 7 includes further numerical simulations from which additional conclusions can be drawn up.
6.4 Numerical results. Hybrid steel plate girders. From now onwards, the focus of the analysis is aimed at studying the influence of the flange strength upon the resistance of plate girders subjected to patch loading. The numerical study includes a vast amount of girders in which the hybrid parameter fyf/fyw plays a primary role. This section is entirely focused on the assessment of the influence of fyf/fyw ratio upon the aforementioned resistance by using the numerical results. Likewise, the EN1993-1-5 formulation is also compared with the obtained numerical results. This section is presented following the same procedure than section 6.3. The response of the girders is studied through load-displacement plots in the P-δ form. Stress analysis and deformed shapes are also pictorially and numerically presented. The section is arbitrarily divided for largely (ly<<a) and closely spaced transverse stiffeners (ly>a). The treatment of the numerical input, however, is slightly different. For the sake of conciseness, girders will be treated by groups, instead of using their own labels. 6.4.1 Largely spaced transverse stiffeners (ly<<a). These geometric proportions include the vast majority of realistic panels subjected to patch loading. Accordingly, most of numerically simulated cases are included within this category (see Annex C for further details). The structural response is studied from a sample of typical load-displacement plots extracted for each group (0 to III). Fig 6.19 displays four plots. At each plot, four curves corresponding to different fyf/fyw ratio are sketched. Notice that the web slenderness is different from one to another. All plots are drawn from values of applied load and vertical displacement of a node located at the mid-span cross-section of the top flange. For the sake of conciseness, only one Ss/hw ratio (0,25) is studied since similar responses were observed for other prototypes. The web slenderness was chosen ranging from hw/tw=83,33 (stocky panel) to hw/tw=266,66 (very slender panel). It is worth bearing in mind table 6.1 and 6.2, in which all girder proportions are presented.
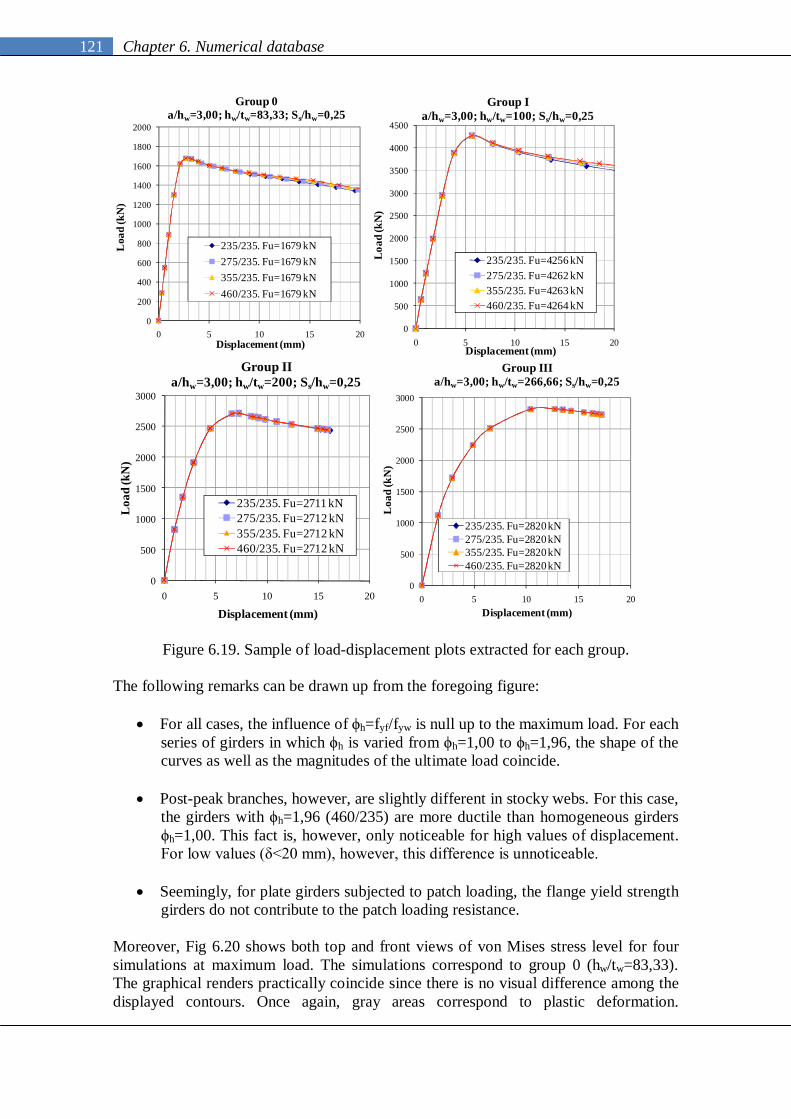
121 Chapter 6. Numerical database
0
200
400
600
800
1000
1200
1400
1600
1800
2000
0 5 10 15 20
Loa
d (k
N)
Displacement (mm)
Group 0a/hw=3,00; hw/tw=83,33; Ss/hw=0,25
235/235. Fu=1679 kN275/235. Fu=1679 kN355/235. Fu=1679 kN460/235. Fu=1679 kN
0
500
1000
1500
2000
2500
3000
3500
4000
4500
0 5 10 15 20
Loa
d (k
N)
Displacement (mm)
Group Ia/hw=3,00; hw/tw=100; Ss/hw=0,25
235/235. Fu=4256 kN275/235. Fu=4262 kN355/235. Fu=4263 kN460/235. Fu=4264 kN
0
500
1000
1500
2000
2500
3000
0 5 10 15 20
Loa
d (k
N)
Displacement (mm)
Group IIa/hw=3,00; hw/tw=200; Ss/hw=0,25
235/235. Fu=2711 kN275/235. Fu=2712 kN355/235. Fu=2712 kN460/235. Fu=2712 kN
0
500
1000
1500
2000
2500
3000
0 5 10 15 20
Loa
d (k
N)
Displacement (mm)
Group IIIa/hw=3,00; hw/tw=266,66; Ss/hw=0,25
235/235. Fu=2820 kN275/235. Fu=2820 kN355/235. Fu=2820 kN460/235. Fu=2820 kN
Figure 6.19. Sample of load-displacement plots extracted for each group. The following remarks can be drawn up from the foregoing figure:
For all cases, the influence of ϕh=fyf/fyw is null up to the maximum load. For each series of girders in which ϕh is varied from ϕh=1,00 to ϕh=1,96, the shape of the curves as well as the magnitudes of the ultimate load coincide.
Post-peak branches, however, are slightly different in stocky webs. For this case, the girders with ϕh=1,96 (460/235) are more ductile than homogeneous girders ϕh=1,00. This fact is, however, only noticeable for high values of displacement. For low values (δ<20 mm), however, this difference is unnoticeable.
Seemingly, for plate girders subjected to patch loading, the flange yield strength
girders do not contribute to the patch loading resistance. Moreover, Fig 6.20 shows both top and front views of von Mises stress level for four simulations at maximum load. The simulations correspond to group 0 (hw/tw=83,33). The graphical renders practically coincide since there is no visual difference among the displayed contours. Once again, gray areas correspond to plastic deformation.

122 Chapter 6. Numerical database
Noticeably, all web panels present two yield lines. The flange, however, remains within the elastic range for all cases with a stress level lower than 235 N/mm2.
Fig. 6.20. The von Mises contours for 4 numerical simulations at maximum load.
This fact can be numerically confirmed by reproducing load vs. stress-at-the-top-flange plots for each group. Fig 6.21 displays the stress evolution of the top flange at the mid-span section. The plots for girders of all groups coincide up to ultimate. The post-peak branch, however, differs slightly for stocky girders. The studied girders from group II and III (i.e. slender girders) show identical plots for all fyf/fyw ratios even beyond the ultimate load. At this point, it is worth bearing in mind eq. 6.1 (the effectively loaded length as a function of geometrical parameters but also, of the fyf/fyw ratio (the first term within the square root is commonly labelled as m1 whereas the second as m2).
2
f
w
yww
yfffsy t
h020
ftfb
1t2Sl ·,··
· (6.1)
It is noticeable that ly is an increasing function of fyf/fyw in the current formulation that defines the patch loading resistance. The influence of the fyf/fyw ratio upon the ultimate load capacity of plated girders subjected to patch loading is, consequently, seriously questioned by the numerical results obtained in this study.

123 Chapter 6. Numerical database
0
200
400
600
800
1000
1200
1400
1600
1800
2000
0 100 200 300 400 500
Loa
d (k
N)
von Mises stress (N/mm2)
Group 0a/hw=3,00; hw/tw=83,33; Ss/hw=0,25
235/235. Fu=1679 kN275/235. Fu=1679 kN355/235. Fu=1679 kN460/235. Fu=1679 kN
0
500
1000
1500
2000
2500
3000
3500
4000
4500
0 100 200 300 400 500
Loa
d (k
N)
von Mises Stress (N/mm2)
Group Ia/hw=3,00; hw/tw=100; Ss/hw=0,25
235/235. Fu=4256 kN275/235. Fu=4261 kN355/235. Fu=4263 kN460/235. Fu=4264 kN
0
500
1000
1500
2000
2500
3000
0 100 200 300 400 500
Loa
d (k
N)
von Mises stress (N/mm2)
Group IIa/hw=3,00; hw/tw=200; Ss/hw=0,25
235/235. Fu=2711 kN275/235. Fu=2712 kN355/235. Fu=2712 kN460/235. Fu=2712 kN
0
500
1000
1500
2000
2500
3000
0 100 200 300 400 500
Loa
d (k
N)
von Mises stresses (N/ mm2)
Group IIIa/hw=3,00; hw/tw=266,66; Ss/hw=0,25
235/235. Fu=2820 kN275/235. Fu=2820 kN355/235. Fu=2820 kN460/235. Fu=2820 kN
Figure 6.21 Sample of load-stress plots extracted for each group.
6.4.2. Closely spaced transverse stiffeners (ly>a). At this point, the transverse stiffeners are deemed as being closely spaced when the yield-prone distance ly is greater than the distance between transverse stiffeners a. This geometrical situation is infrequent in bridge design. Nevertheless, the potential effect the stiffeners have onto the resistance to patch loading is still both unclear and dismissed. It has been shown in section 6.3 that within the numerical population of girders in study, some cases belong to this category (see Annex C for more details of each specimen and a thorough comparison of ly and a). A sample of two girders is extracted from these cases. A comparison of load-displacement plots is performed for aforementioned groups. Fig. 6.22 shows typical load-displacement curves (the displacement is obtained from the top flange at mid-span section). Notice that the web slenderness of each case differs significantly. The same structural response is observed in both cases though. A first loss of rigidity at F1 is noticed (following the notation presented throughout the dissertation).

124 Chapter 6. Numerical database
From the value of F1 onwards, the load is significantly increased up to F2, where the girder capacity is exhausted. The post-F1 capacity is enhanced as long as the fyf/fyw ratio is increased. The flange yield strength makes a considerable difference for each case.
0
500
1000
1500
2000
2500
3000
0 5 10 15 20 25 30
Loa
d (k
N)
Displacement (mm)
Group 0a/hw=1,00, hw/tw=83,33, Ss/hw=0,25
235/235. F2=2074 kN275/235. F2=2188 kN355/235. F2=2412 kN460/235. F2=2734 kN
0
500
1000
1500
2000
2500
3000
3500
4000
0 10 20 30 40 50L
oad
(kN
)Displacement (mm)
Group Ia/hw=1,00, hw/tw=166,66, Ss/hw=0,25
235/235. F2=2886 kN275/235. F2=3048 kN355/235. F2=3274 kN460/235. F2=3533 kN
Figure 6.22 Sample of load-displacement plots extracted for two groups.
Certainly, the post-peak increment is due to some extent to the contribution of both the flange and the transverse stiffener. It is judged necessary to evoke the stress evolution in both plates as long as the load is increased. For the sake of illustration, the von Mises stresses contours are sketched in Fig. 6.23 for the load levels of F1 and F2 in four girders belonging to group I (a/hw=1,00, hw/tw=166,66, Ss/hw=0,25, see Fig. 6.22). Top and front views are showed within the plot for each fyf/fyw ratio in these specimens. Within the displayed gray, plastic deformation is attained. At F1, the flange remains within the elastic range whereas at F2, the flange has significantly yielded.
Figure 6.23 The von Mises stress contours for 4 numerical simulations at F1 and F2 load. Four specimens belonging to group 0 are also studied but in this case, by means of a load vs. stress plot (Fig. 6.24). The von Mises stress evolution is plotted against the

125 Chapter 6. Numerical database
incremental load (the yield strength of the flange is varied within each case). It is worth emphasising that the plot is stopped once the concerned area starts yielding (the structure is not necessarily exhausted at this point). All curves present similar trends. A quite linear elastic branch is observed at early load stages whereas a loss of rigidity is noticeable for the same approximate value of F1. For the 235/235 specimen, flange yielding occurs at this point. For the other cases, as expected, the flange undergoes to higher stress values. The maximum load for each specimen occurs fairly beyond the yielding load of each area.
0
200
400
600
800
1000
1200
1400
1600
1800
2000
0 100 200 300 400 500
Loa
d (k
N)
Von Mises Stress (N/mm2)
Group 0. a/hw=1,00, hw/tw=83,33, Ss/hw=0,25Top flange. Mid-span section
235/235275/235355/235460/235
Yielding
Figure 6.24 Evolution of the von Mises stresses at the top flange up to yielding.
The evolution of the von Mises stresses in the stiffener-to-flange juncture is also presented (Fig. 6.25). Two similar branches are noticed within the plot for all fyf/fyw ratios. A linear branch at early load stages and a loss of rigidity at a certain point are clearly noticed. At this juncture, the stiffener yields but the load eventually increases until the structure is fully exhausted. Other specimens show similar responses.
0
200
400
600
800
1000
1200
1400
1600
1800
0 50 100 150 200 250
Loa
d (k
N)
Von Mises Stress (N/mm2)
Group 0. a/hw=1,00, hw/tw=83,33, Ss/hw=0,25Flange-to-stiffener juncture
235/235275/235355/235460/235
235
yielding
Figure 6.25 Evolution of the von Mises stresses at the stiffener-to-flange juncture.

126 Chapter 6. Numerical database
6.5 Numerical results vs. EN1993-1-5 The EN1993-1-5 formulation includes the basis in which structural designers rely when plated structural elements are to be designed. It is considered extremely important to compare the obtained numerical results with those theoretically predicted by the present design rules. It is worth bearing in mind that the EN1993-1-5 formulation is based upon four main parameters:
An elastic critical load Fcr. A plastic resistance Fy.
The slenderness cr
yF
FF
The resistance function FF f In particular, the plastic resistance (and thus, the ultimate load capacity) may be influenced by the fyf/fyw ratio. The elastic critical load is not regarded as an assessable parameter since null influence of the fyf/fyw ratio on Fcr is expected. Moreover, for the sake of results comparison, the partial factor is treated as γM1=1,0. First of all, the ultimate load capacity is compared in Fig. 6.26 in which the ratio Fu,num / Fu, EN1993-1-5 is plotted against the slenderness. A first conclusion can be drawn from this plot, the EN1993-1-5 lies on the safe side for all simulations. It is, in fact, considerably conservative for some cases, in particular, the dots sketched for group 0. These dots coincide with the aforementioned girders presenting closely spaced transverse stiffeners. The underestimation of the ultimate load capacity s up to 4,5 times the numerical value.
0,00
0,50
1,00
1,50
2,00
2,50
3,00
3,50
4,00
4,50
5,00
0 1 2 3 4 5
F u, n
um /
F u, E
N19
93-1
-5
Slenderness f
Ultimate load capacity. Fu,num vs. Fu,EN1993-1-5
Group 0
Group I
Group II
Group III
Figure 6.26 Fu,num / Fu, EN1993-1-5

127 Chapter 6. Numerical database
A similar plot is displayed in Fig. 6.27 (a) but in this case, as a function of the a/hw ratio. In this plot, the trend can be easily pictured. The formulation is particularly conservative for the dots corresponding to group 0 (a/hw=1,00). Results obtained with girders with a/hw≥2,00 seem to be structurally sound. Finally, a similar plot is sketched as a function of the web slenderness (Fig.6.27 (b)). It can be noticed that the underestimation of the ultimate load capacity for the dots corresponding to group 0 varies from one web slenderness to another. Likewise, a certain trend of increasing overestimation is observed when hw/tw is increased. Notice that each group present two different values of web slenderness. If each one of the matching arrays of dots is compared, the one corresponding to the most slender specimens leads to a higher underestimation of the ultimate load capacity. This trend occurs for all cases.
0,00
0,50
1,00
1,50
2,00
2,50
3,00
3,50
4,00
4,50
5,00
0 1 2 3 4
F u, n
um /
F u, E
N19
93-1
-5
a/hw
Ultimate load capacity. Fu,num / Fu,EN1993-1-5
Group 0Group IGroup IIGroup III
0,00
0,50
1,00
1,50
2,00
2,50
3,00
3,50
4,00
4,50
5,00
50 75 100 125 150 175 200 225 250 275 300
F u, n
um /
F u, E
N19
93-1
-5
hw / tw
Ultimate load capacity. Fu,num / Fu,EN1993-1-5
Group 0
Group I
Group II
Group III
Figure 6.27 Fu,num / Fu, EN1993-1-5
(a) Aspect ratio a/hw. (b) Web slenderness hw/tw.
A plot worth to be presented is the resistance function curve. The actual F
F50
,
formula is theoretically plotted within Fig. 6.28. A total amount of 192 numerical pairs
of points of the form
F
y
numu
FF
;, are included for the sake of comparing theoretical
with numerical values. Fy is the theoretically predicted plastic resistance. The vast majority of dots are located above the theoretical EN1993-1-5 curve, which is structurally safe and expected from the design point of view. It is pinpointed though, that some points (particularly of group 0) surpass the value of χF=1,0, which is not consistent with the actual definition of χF. It can be explained since Fy does not represent the actual plastic resistance of these girders. In chapter 7, a thorough discussion of this topic is addressed.

128 Chapter 6. Numerical database
0
0,2
0,4
0,6
0,8
1
1,2
1,4
1,6
0 1 2 3 4 5 6
F
Slenderness f
Resistance curve. EN1993-1-5 formulation
EN1993-1-5Group 0Group IGroup IIGroup III
Figure 6.28 Comparison of the resistance function χF.
Moreover, for the sake of assessing the hybrid condition within the EN1993-1-5 formulation, ultimate loads obtained for hybrid specimens are presented. These values are standardised to the ultimate load obtained with an equivalent homogeneous prototype, i.e, Fu,hybrid / Fu,homogeneous. This ratio is plotted against the variation of the flange steel grade. Fig. 6.29 shows the evolution of this ratio as long as the fyf/fyw is increased for both numerical and design results. The results obtained are quite outlandish and should be studied separately for girders presenting largely or closely spaced transverse stiffeners. For the former, the EN1993-1-5 formulation predicts a considerable increment of ultimate load capacity of the girders whether the yield strength of the flange is increased. Different maximum increments are observed for each case (Group 0≈15%; Group III≈10%). The numerical model, however, does not predict the same results nor the same trend. The ultimate load capacity is maintained as the fyf/fyf ratio is increased. There seems to be null contribution of the yield strength of the flange for certain cases of girders presenting largely spaced transverse stiffeners. The present formulation included in EN1993-1-5 leads to this anomaly and must be evaluated. In chapter 7, an approach for correcting this anomaly is suggested. If the analyses are focused on girders with closely spaced stiffeners, the results are also outlandish.
In this particular case, as long as the fyf/fyw ratio is increased, the ultimate load capacity predicted by ABAQUS is increased (see Fig. 6.30). The maximum increment in group 0 happens to be higher than 40%.
The EN1993-1-5 prediction remains, in this case, constant as the fyf/fyw is increased. It is worth bearing in mind that this fact is due to the mentioned inconsistency of the EN1993-1-5 formulation.
Presently, when calculated length ly (eq.6.1) is found to be greater than a, the resistance formula must be altered. In this new equation, the ultimate load capacity is obtained regardless of the flange and stiffeners properties.

129 Chapter 6. Numerical database
0,90
0,95
1,00
1,05
1,10
1,15
1,20
0,80 1,30 1,80 2,30
F R,d
hyb
rid
/ F R
,d H
omog
eneo
us
fyf/fyw
a/hw=3,00; Ss/hw=0,25Group 0
Num. hw/tw=120EN1993-1-5-hw/tw=120Num. hw/tw=83,33EN1993-1-5-hw/tw=83,33
0,90
0,95
1,00
1,05
1,10
1,15
1,20
0,80 1,30 1,80 2,30
F R,d
hyb
rid
/ F R
,dH
omog
eneo
us
fyf/fyw
w s wGroup I
Num. hw/tw=166,66EN1993-1-5-hw/tw=166,66Num. hw/tw=100EN1993-1-5-hw/tw=100
0,90
0,95
1,00
1,05
1,10
1,15
1,20
0,80 1,30 1,80 2,30
F R,d
hyb
rid
/ F R
,d H
omog
eneo
us
fyf/fyw
Group II
Num. hw/tw=200EN1993-1-5-hw/tw=200Num-hw/tw=120EN1993-1-5-hw/tw=120
0,90
0,95
1,00
1,05
1,10
1,15
1,20
0,80 1,30 1,80 2,30
F R,d
hyb
rid
/ F R
,d H
omog
eneo
us
fyf/fyw
Group III
Num. hw/tw=266,66EN1993-1-5-hw/tw=266,66Num-hw/tw=133,33EN1993-1-5-hw/tw=133,33
Figure 6.29 Fu,hybrid / Fu,homogeneous vs. fyf/fyw ratio. a/hw=3,00. Ss/hw=0,25
0,80
0,90
1,00
1,10
1,20
1,30
1,40
1,50
1,60
0,80 1,30 1,80 2,30
F R,d
hyb
rid
/ F R
,d H
omog
eneo
us
fyf/fyw
Group 0
Num. hw/tw=120EN1993-1-5-hw/tw=120Num-hw/tw=83,33EN1993-1-5-hw/tw=83,33
0,80
0,90
1,00
1,10
1,20
1,30
1,40
1,50
1,60
0,80 1,30 1,80 2,30
F R,d
hyb
rid
/ F R
,d H
omog
eneo
us
fyf/fyw
Grupo I
Num. hw/tw=166,66EN1993-1-5-hw/tw=166,66Num-hw/tw=100EN1993-1-5-hw/tw=100
Figure 6.30 Fu,num / Fu,homogeneous vs. fyf/fyw ratio. a/hw=1,00. Ss/hw=0,25 The aforementioned structural comparisons are reinforced with a first statistical appraisal of the theoretical prediction. The results include a total amount of 192 pairs of points of the form (Fu,num; Fu, EN1993-1-5). This first appraisal can be readily performed by means of two basic concepts.

130 Chapter 6. Numerical database
Firstly, the ratio Fu,num / Fu, EN1993-1-5 = X can be understood as a random variable showing how safe the model is. If this variable takes values below 1,0 the model happens to be on the unsafe side. If this variable takes values around 1,30, the model can be understood as 130% safe. The coefficient of variation Vx measures the scatter of this random variable. The coefficient of variation represents the ratio of the standard deviation to the mean, and it is a useful statistic for comparing the degree of variation from one data series to another, even if the means are drastically different from each other. The coefficient is typically defined for a sample of data as eq. 6.2 and it can be stated that if the coefficient approaches 0, the random variable is lowly scattered (this statement can be considered as reliable when the mean value does not approach 0).
XS
V xx (6.2)
The mean can be obtained from eq. 6.3 and the standard deviation by eq. 6.4.
nF
F
x
n
1i 511993ENui
numui ,
,
(6.3)
2ix xx1n
1S
· (6.4)
The second concept worth to point out is the potential dependency between both calculated magnitudes ratio Fu,num and Fu, EN1993-1-5. If the theoretical prediction follows satisfactorily the trend showed by the experiment (in this particular case, a “numerical” simulation), both magnitudes are deemed as being mutually correlated. For the sake of assessing this correlation, the usage of the Pearson coefficient is quite customary in statistics. This coefficient indicates the strength and direction of a linear relationship between two random variables. The Pearson coefficient is also known as the "sample correlation coefficient". It is particularly important if both magnitudes are normally distributed.
If there exists a series of n measurements of Fu,num and Fu,EN1993-1-5 written respectively as Yi and Zi where i = 1, 2, ..., n, then the Pearson product-moment correlation coefficient, namely ρ, can be used to estimate the correlation of Y and Z (eq. 6.5). The standard deviation of each variable is defined similarly than in eq. 6.4.
ZY
in
iiii
SSn
ZYnZY
··1
···1
(6.5)
The correlation approaches the value of ρ=1,0 in the case of an increasing linear relationship. In the case of a decreasing linear relationship, the value approaches ρ=-1,0. The values in between in all other cases indicate the degree of linear dependence between the variables. The closer the coefficient is to either ρ=−1,0 or ρ=1,0, the stronger the correlation between the variables. Table 6.4 shows the statistics obtained for the aforementioned parameters. These statistics are calculated separately for different a/hw ratios within each group of girders. The statistics are applied to the whole
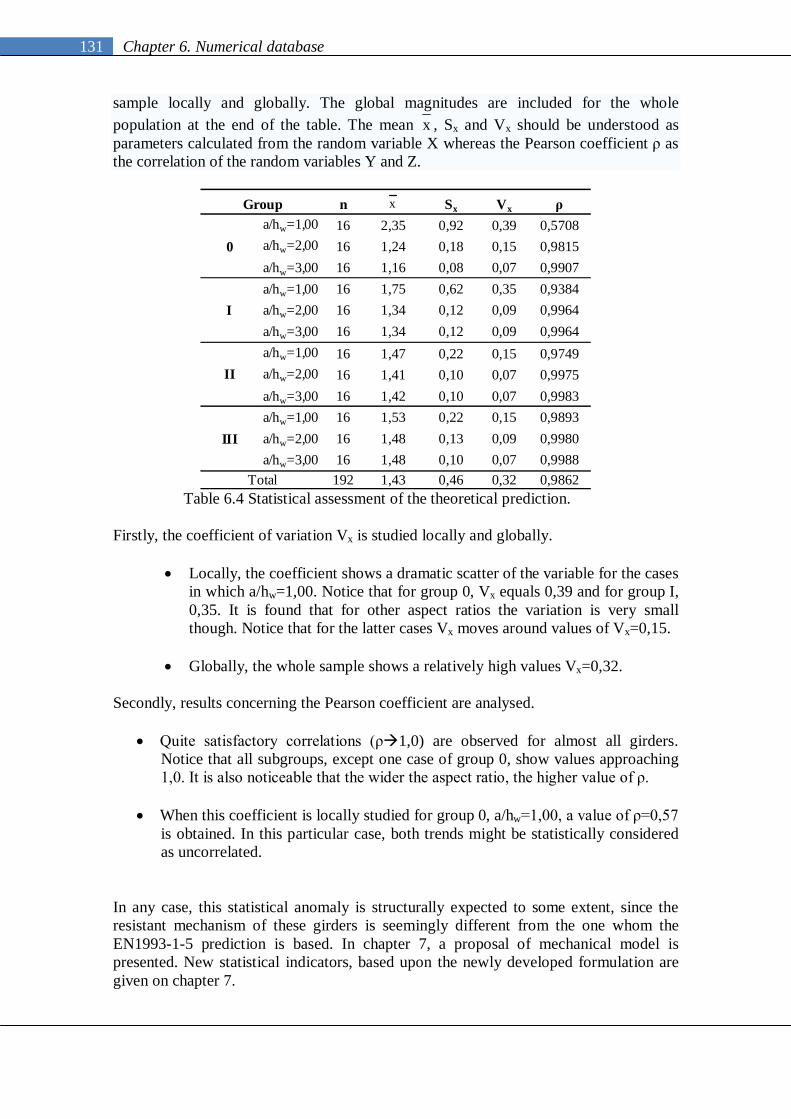
131 Chapter 6. Numerical database
sample locally and globally. The global magnitudes are included for the whole population at the end of the table. The mean x , Sx and Vx should be understood as parameters calculated from the random variable X whereas the Pearson coefficient ρ as the correlation of the random variables Y and Z.
n Sx Vx ρa/hw=1,00 16 2,35 0,92 0,39 0,5708a/hw=2,00 16 1,24 0,18 0,15 0,9815a/hw=3,00 16 1,16 0,08 0,07 0,9907a/hw=1,00 16 1,75 0,62 0,35 0,9384a/hw=2,00 16 1,34 0,12 0,09 0,9964a/hw=3,00 16 1,34 0,12 0,09 0,9964a/hw=1,00 16 1,47 0,22 0,15 0,9749a/hw=2,00 16 1,41 0,10 0,07 0,9975a/hw=3,00 16 1,42 0,10 0,07 0,9983a/hw=1,00 16 1,53 0,22 0,15 0,9893a/hw=2,00 16 1,48 0,13 0,09 0,9980a/hw=3,00 16 1,48 0,10 0,07 0,9988
192 1,43 0,46 0,32 0,9862
Group
Total
0
I
II
III
x
Table 6.4 Statistical assessment of the theoretical prediction.
Firstly, the coefficient of variation Vx is studied locally and globally.
Locally, the coefficient shows a dramatic scatter of the variable for the cases
in which a/hw=1,00. Notice that for group 0, Vx equals 0,39 and for group I, 0,35. It is found that for other aspect ratios the variation is very small though. Notice that for the latter cases Vx moves around values of Vx=0,15.
Globally, the whole sample shows a relatively high values Vx=0,32.
Secondly, results concerning the Pearson coefficient are analysed.
Quite satisfactory correlations (ρ1,0) are observed for almost all girders. Notice that all subgroups, except one case of group 0, show values approaching 1,0. It is also noticeable that the wider the aspect ratio, the higher value of ρ.
When this coefficient is locally studied for group 0, a/hw=1,00, a value of ρ=0,57 is obtained. In this particular case, both trends might be statistically considered as uncorrelated.
In any case, this statistical anomaly is structurally expected to some extent, since the resistant mechanism of these girders is seemingly different from the one whom the EN1993-1-5 prediction is based. In chapter 7, a proposal of mechanical model is presented. New statistical indicators, based upon the newly developed formulation are given on chapter 7.

132 Chapter 6. Numerical database
6.6. Discussion In this chapter, a numerical database of hybrid specimens subjected to patch loading is presented. The prototypes are assembled following realistic proportions typically found in European steel and composite bridges. The numerical database includes specimens presenting both largely and closely spaced transverse stiffeners. Results of ultimate load capacity obtained from 192 hybrid steel plate girders subjected to patch loading are presented. Furthermore, results concerning their structural response (stresses, deflections, strains) and statistical comparisons are also included within the chapter. These results are studied separately for the aforementioned cases of transverse stiffening. First advances show outlandish results concerning the hybrid parameter fyf/fyw. It has been numerically predicted that for girders with ly<<a, there is null influence of this ratio upon the ultimate load capacity of patch loaded girders. The current formulation of EN1993-1-5 takes this ratio into account in such a way that, the greater the ratio fyf/fyw is, the higher the ultimate load capacity of the girders. The results show a rather opposite trend when the effectively loaded length ly is greater than the distance between transverse stiffeners a (ly>a). The numerical model predicts a post-peak capacity which is highly influenced by both the flanges and the transverse stiffening of the panel. Several load-displacement and load-stress plots show how the evolution of the response varies as long as the fyf/fyw ratio is increased. Certainly, there is a strong dependency between this ratio and the ultimate load capacity of the girders. It is difficult to state conclusive remarks of this influence at this point of the study. It has been shown though, that the current formulation of EN1993-1-5 underestimates the numerically (and experimentally) observed post-peak capacity of the girders. It has been observed that this fact comes mainly as a result of the restriction concerning the maximum allowed value of the effectively loaded length ly ( ly≤a). For the sake of evaluation, statistics estimators are employed. The coefficient of variation V of Fu,num/Fu,EN1993-1-5=X (Vx) is studied locally and globally within the numerical results. Locally, the coefficient shows a dramatic scatter of the variable for the cases in which a/hw=1,00. It is found that for other aspect ratios this variation is very small though. The correlation between the results obtained with the numerical model (Fu,num=Y) and those calculated from the EN1993-1-5 formulation (Fu, EN1993-1-5=Z) is assessed by using the Pearson coefficient. Quite satisfactory correlations (ρ1,0) are observed for almost all girders. Whether this coefficient is locally studied at group 0, a/hw=1,00, the results are less satisfactory. This statistical indication was structurally expected since the resistant mechanism of these girders is seemingly different from the formulation presently implemented in EN1993-1-5.

133 Chapter 7. Resistance of hybrid steel plate girders subjected to concentrated loads
7 Resistance of hybrid steel plate girders subjected to concentrated
loads
“From all this it is clear that beams and trusses of various sorts and kinds play an immensely important part in sustaining the burdens of the world. What is rather less clear is just how they do it.”
J. Gordon. Structures or why things don’t fall down 7.1 Introduction The collapse behaviour of patch loaded plate girders has been widely studied through experimental, theoretical and numerical analyses. As a result, these studies have enriched design rules with safe predictions of the resistance of plate girders subjected to concentrated forces. For the sake of predicting the ultimate load capacity, researchers have proposed several mechanical models which accurately reproduce the limit state of the plates at ultimate load. Generally, these models are based upon limit analysis and define potential plastic hinges occurring in the flanges as well as potential yield lines occurring within the web panel. The majority of the proposed models agree with a vast number of experimental results obtained from various sources. The experimental database includes both transversally and longitudinally stiffened girders. In chapter 2, the need of completing the existing database with hybrid specimens has been discussed. Subsequently, one major contribution of this work has been presented in chapter 6, in which a total amount of 192 steel plate girders have been numerically simulated (three-fourths of the database correspond to hybrid specimens). Pairs of values of ultimate and critical loads are herein available for each simulation. Load-deflection plots have also been systematically used for the sake of featuring the structural response of the girders. The experimental and numerical results obtained have shown two different structural responses in hybrid steel plate girders subjected to patch loading. The girders presenting a sufficiently large distance between transversal stiffeners (first category) and the girders with a sufficiently short distance (second category). The distance between transversal stiffeners is labelled short when the calculated effectively loaded length ly is greater than a. Fig 7.1 displays the sample of simulated girders. The results are presented in such a way that the ly/a ratio is plotted against the web slenderness hw/tw.
0,00
0,50
1,00
1,50
2,00
2,50
3,00
0 50 100 150 200 250 300
l y/a
hw/tw
Group 0Group 1Group 2Group 3
ly <<a 148 specimens1st category
ly>a 44 specimens2nd category
Fig. 7.1 Sample of numerical simulations. ly/a vs. hw/tw.

134 Chapter 7. Resistance of hybrid steel plate girders subjected to concentrated loads
The vast majority of the simulated prototypes belong to the first category (148 specimens). Typically, European steel bridges present an aspect ratio a/hw equal or greater than 2,0; which can be considered high enough for expecting the transversal stiffeners as being largely spaced. Presently, it is more likely for a designer to increase the web stockiness than providing densely smeared stiffening. Section 7.2 focuses on the resistance of hybrid steel plate girders subjected to patch loading when no contribution of the transversal stiffeners is expected. The aim of this section is to assess the potential influence of the fyf/fyw ratio in the resistance of the girders. There are, however, certain design cases in which closely spaced stiffening is likely. Among the simulated prototypes, a non-negligible amount (44 specimens, about 25% of the entire database) of girders present closely spaced transverse ribs. For such situations, it has been found that the resistant mechanism is considerably influenced by both the transverse stiffener itself but also, the yield strength of the flange. The current EN1993-1-5 prediction leads to a high underestimation of the results by dismissing the contribution of the transverse stiffeners. To provide more generality, a new resistant mechanism for transversally stiffened plate girders (either hybrid or not) subjected to patch loading is proposed in 7.3. 7.2 Largely spaced transverse stiffeners The current formulation of EN1993-1-5 defines the patch loading resistance by eq. 7.1
1M
wywF
1M
ywywF511993ENuRd
atfltfFF
······
, (7.1)
The effectively loaded length ly has been quite a topic of study among researchers of the patch loading phenomena. Namely, Roberts (1979) defined ly by means of eq. 7.2. This definition comes as a result of applying the virtual work principle to a four hinge mechanism developed on the web-to-flange junctures of patch loaded girders (only the flanges are assumed to contribute to the moment resistance within the plastic hinges).
yww
yfffsy ft
fbt2Sl
··
· (7.2)
The same author proposed a slight modification (Roberts and Newmark, 1997) of this equation resulting in 7.3. The model was tuned to take into account the load spread through the flange.
yww
yfffsy ft
fb1t2Sl
··
· (7.3)
Moreover, the four-hinge model presented by Lagerqvist and Johansson in 1995 (currently used in the definition of the plastic resistance in EN1993-1-5) includes a part of the web in the moment resistance of the outer plastic hinges. As a result, ly happens to present an additional term (the terms included within the square root were labelled by these authors as m1 and m2 (eq. 7.5)).

135 Chapter 7. Resistance of hybrid steel plate girders subjected to concentrated loads
2
f
w
yww
yfffsy t
h020
ftfb
1t2Sl ·,··
· (7.4)
2
f
w2
yww
yff1 t
h020m
ftfb
m
·,
··
(7.5)
The latter term m2 was questioned by Davaine (2005) in her Doctoral thesis for the particular case of slender girders. The author observed numerically the effectively loaded length ly. This length was understood as the distance between the observed plastic hinges within the flanges at advanced load levels (certainly beyond the ultimate load capacity). These observations were compared to the design provisions given by EN1993-1-5. The author claimed that if m2 was suppressed from the current formulation, the accuracy of the formulation would be increased. Subsequently, following the same procedure, Gozzi (2007) carried out investigations focused on the relevance of m2. This relevance was studied by means of numerical observations of the effectively loaded length ly on girders with a web slenderness ranging from 150 to 500 (from slender to very slender web plates). Numerical values of ly were inferred from the performed simulations. Preliminary conclusions demonstrated that m2 could be suppressed for the case of slender girders. Accordingly, the effectively loaded length has been claimed back to eq. 7.6.
yww
yfffsy ft
fb1t2Sl
··
· (7.6)
Table 7.1 summarises the different shapes of the effectively loaded length according to the aforementioned authors. In all cases, the term m1 is included whereas m2 is alternatively considered or dismissed.
Researcher Equation Terms
(1) studies performed upon slender girders
Davaine (2005) Gozzi (2007)
m1
m1
m1; m2
m1(¹)
Roberts (1979)
Roberts and Newmark
(1997)
Lagerqvist (1994)
2
·02.0··
1·2f
w
yww
yfffsy t
hftfb
tSl
yww
yfffsy ft
fbtSl
··
·2
yww
yfffsy ft
fbtSl
··
1·2
yww
yfffsy ft
fbtSl
··
1·2
Table 7.1 Effectively loaded length ly according to several authors.

136 Chapter 7. Resistance of hybrid steel plate girders subjected to concentrated loads
Moreover, the numerical database of hybrid steel plate girders subjected to patch loading presented in chapter 6 has shown an additional outlandish peculiarity worth to be assessed. For girders with largely spaced transversal stiffeners, the contribution of the ratio fyf/fyw upon the patch loading resistance seems negligible at least for girders presenting stiff flanges. The current formulation of EN1993-1-5 takes this ratio into account in such a way that, the greater the ratio fyf/fyw, the higher the ultimate load capacity of the girders. Presently, the term m1 is a monotonically increasing function of fyf/fyw. The results obtained suggest that m1 should be modified to some extent since numerical observations do not show the same trend. Noticeably, m1 consists of two magnitudes: the fyf/fyw ratio, which takes the mechanical properties of the plates into account, and the bf/tw ratio, which accounts for the flange-web geometry. The results obtained in chapter 6 shows that for collapse loads, the failure mechanism is characterized by two yield lines in the web as long as this plate folds. The top flange experiences a vertical deformation for collapse loads but doubtfully, this fact leads to yielding of the flange plates at those load levels. If web folding continues beyond the peak load, the hinges are finally formed within the flanges. Consequently, the post peak behaviour is certainly influenced by the flange yield strength. Presently, the geometrical and mechanical terms found in the calculation of ly come as a result of applying the virtual work principle on a hinge-based mechanical model. The plastic hinges are thought of as forming within the flanges. The web contribution is considered by including a percentage of the web depth in the cross-section of the inner plastic hinges. Some studies have been focused on the determination of more realistic mechanical models that depict the actual resistance of plates subjected to patch loading by including more degrees of kinematical compatibilities. Their main intentions have been to develop theoretical approaches that agree more accurately with experimental data (Shimizu (1989) Davaine (2005)). As a drawback, the depicting equations of ly become considerably more complicated than those based upon simpler approaches. Furthermore, the accuracy of these proposed models is not greatly enhanced when compared to simpler models. The scope of the present work, rather than attempting to reshape the whole formulation, is aimed at correcting the observed anomalies of the current formulations without proposing new yield line-based mechanisms. The numerical database developed on chapter 6 includes homogeneous and hybrid steel plate girders with relatively stiff flanges. The flange rigidity is defined within this work as the ratio between the web slenderness (hw/tw) and the flange slenderness (bf/tf). Generally, it is desirable that cross-sections of typical plate girders present a class 4 web with class 2 or 3 flanges (ComBri 2007). As a result, (hw/tw) / (bf/tf) happens to be greater than 10. Section 7.2.1 focuses entirely in the influence of fyf/fyw on the resistance of plate girders with stiff flanges when subjected to patch loading. It is well-known though, that the hybrid usage of girders allows the designers to provide thinner flanges than homogenous girders for the same level of performance. As a consequence, the flange plates may happen to be more slender than the in the case of a homogeneous girders. Therefore, the conclusions presented in 7.2.1 are verified in

137 Chapter 7. Resistance of hybrid steel plate girders subjected to concentrated loads
section 7.2.2 for the case of hybrid girders with relatively flexible flange plates. A second parametric numerical study is developed for the sake of verification. Finally, further checks of the proposal are performed by using a third parametric numerical study in which the influence of the flange width is assessed. Section 7.2.3 summarises this latter appraisal. 7.2.1 Influence of fyf/fyw on girders with stiff flanges. The influence of fyf/fyw on the resistance of plate girders subjected to patch loading is analysed by using the results obtained in the numerical database presented in chapter 6. In addition, further comparisons are performed on the experimental database depicted in chapter 2 including 72 hybrid steel plate girders found in the literature. Figure 7.2 displays two summary graphs (histograms) showing a count of the data- points falling in various ranges of (hw/tw) / (bf/tf). In these histograms all girders are included (first and second category totalling 192 specimens). Noticeably, the vast majority of the depicted experimentally and numerically tested girders present relatively stiff flanges ((hw/tw) / (bf/tf) ≥10).
0
5
10
15
20
25
30
Freq
uenc
ies
(hw/tw) / (bf/tf)
Experimental results from the literature
0
20
40
60
80
100
120
Freq
uenc
ies
(hw/tw) / (bf/tf)
Numerical results (chapter 6)
Figure 7.2. Frequencies. (hw/tw) / (bf/tf).
The first analysis is performed upon results obtained from 148 prototypes of the numerical database (ly<<a, first category). For the sake of evaluation, these specimens are divided in four groups of 37 girders presented in chapter 6 (each one corresponding to a value of fyf/fyw). Each group represents approximately one fourth of the whole sample. Once again, the ratio Fu,num / Fu, EN1993-1-5 = X is used. Fig 7.3 shows the variable X as a function of fyf/fyw. In this case, m1 as well as ly is maintained are taken from eq. 7.4 and 7.5. It is noticeable that as long as fyf/fyw is increased, the scatter is gradually moved vertically (the arrow in the plot shows such trend).
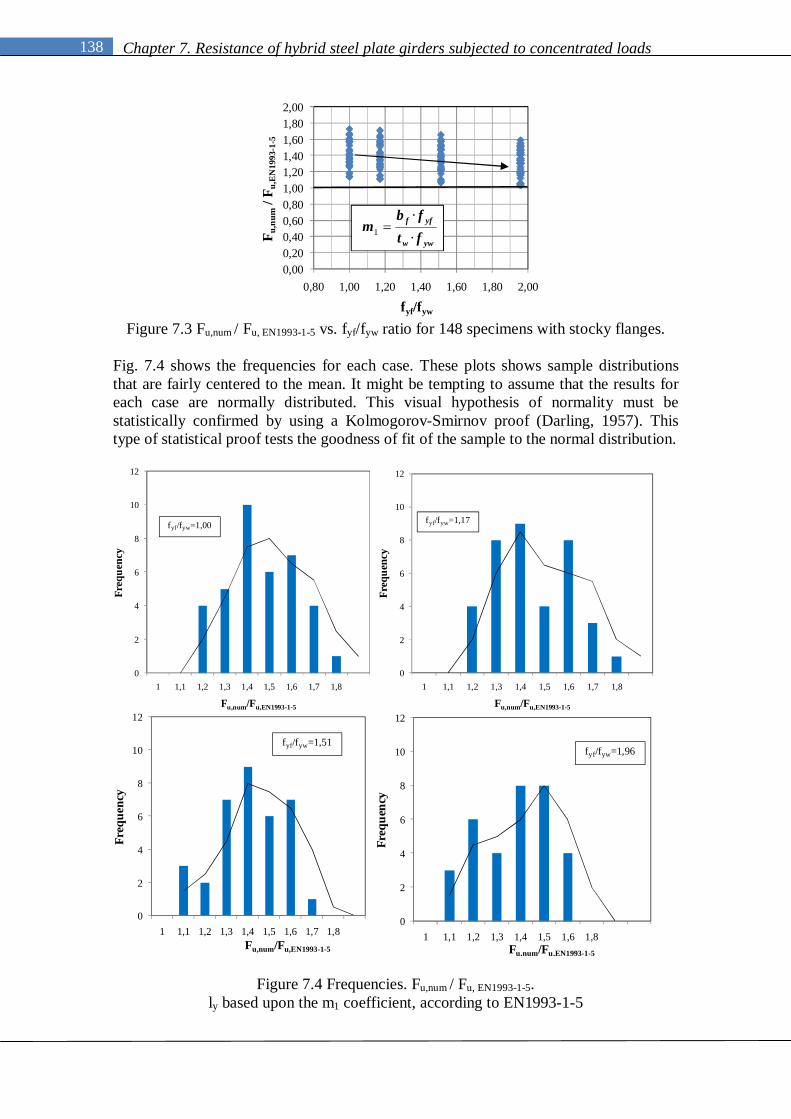
138 Chapter 7. Resistance of hybrid steel plate girders subjected to concentrated loads
0,000,200,400,600,801,001,201,401,601,802,00
0,80 1,00 1,20 1,40 1,60 1,80 2,00F u
,num
/ Fu,
EN
1993
-1-5
fyf/fyw
yww
yff
ftfb
m··
1
Figure 7.3 Fu,num / Fu, EN1993-1-5 vs. fyf/fyw ratio for 148 specimens with stocky flanges.
Fig. 7.4 shows the frequencies for each case. These plots shows sample distributions that are fairly centered to the mean. It might be tempting to assume that the results for each case are normally distributed. This visual hypothesis of normality must be statistically confirmed by using a Kolmogorov-Smirnov proof (Darling, 1957). This type of statistical proof tests the goodness of fit of the sample to the normal distribution.
0
2
4
6
8
10
12
1 1,1 1,2 1,3 1,4 1,5 1,6 1,7 1,8
Freq
uenc
y
Fu,num/Fu,EN1993-1-5
fyf/fyw=1,00
0
2
4
6
8
10
12
1 1,1 1,2 1,3 1,4 1,5 1,6 1,7 1,8
Freq
uenc
y
Fu,num/Fu,EN1993-1-5
fyf/fyw=1,17
0
2
4
6
8
10
12
1 1,1 1,2 1,3 1,4 1,5 1,6 1,7 1,8
Freq
uenc
y
Fu,num/Fu,EN1993-1-5
fyf/fyw=1,51
0
2
4
6
8
10
12
1 1,1 1,2 1,3 1,4 1,5 1,6 1,8
Freq
uenc
y
Fu,num/Fu,EN1993-1-5
fyf/fyw=1,96
Figure 7.4 Frequencies. Fu,num / Fu, EN1993-1-5. ly based upon the m1 coefficient, according to EN1993-1-5

139 Chapter 7. Resistance of hybrid steel plate girders subjected to concentrated loads
For this purpose, a proper transformation of X
is needed since theoretically, normal distributions are defined on (-∞,∞) rather than in [0,∞), which is the theoretical counter-domain of X. Consequently, the newly calculated magnitude Y=ln(X) is used when performing the proof. Goodness of fit tests are used when the null hypothesis Ho states that the sample belongs to a given distribution whereas the alternative hypothesis H1 is the case that the sample does not. Whether one of these hypotheses is assumed, there is an inherent error probability that arises. The significance level indicates the error probability one may obtain if the null hypothesis is considered as false when in fact this assumption is true. Table 7.2 shows the goodness of fit of the sample to the normal distribution when the test is performed on each sample. According to the results obtained, all samples can be assumed as normally distributed (the error probability of considering the null hypothesis as false is obviously very high).
n fyf/fyw Significance level α 37 1,00 0,79 37 1,17 0,89 37 1,51 0,92 37 1,96 0,91
Table 7.2 Goodness of fit to normal distribution.
Remarkable statistical information extracted from each sample is presented in table 7.3. This information gives hints about the trends observed within the plots. X (the sample mean), Sx, (the sample standard deviation) and Vx (the sample variation) are employed as suitable statistics. In addition, maxima and minima are indicated for each sample (these values come as a result of calculating the estimators of Y=ln(X) and then applying the inverse transformation).
n fyf/fyw Sx Vx Maximum Minimum37 1,00 1,42 0,157 0,111 1,73 1,1437 1,17 1,39 0,155 0,111 1,70 1,1137 1,51 1,36 0,156 0,115 1,65 1,0737 1,96 1,32 0,149 0,113 1,59 1,03
X
Table 7.3 Statistical values extracted from the population of 148 prototypes.
ly based upon the m1 coefficient, according to EN1993-1-5
From table 7.3, one can point out significant results:
The mean value X decreases with fyf/fyw. The sample standard deviation Sx and the sample variation Vx remain
nearly constant in all cases. Maxima and minima values of the sample decrease gradually with fyf/fyw.
According to the results obtained, one can observe a certain dependency of the statistics upon the fyf/fyw ratio (fundamentally, the mean and the extremes). These statistics, which are essentially estimators of the safety margin, decrease monotonically. This fact may be structurally detrimental and undesirable. The question is whether or not this decreasing trend is due to the fyf/fyw ratio affecting the values or, contrarily, to

140 Chapter 7. Resistance of hybrid steel plate girders subjected to concentrated loads
randomness. For the sake of verification, a hypothesis testing problem is presented by using an ANOVA (analysis of variance) test. This type of test is useful when comparing different samples in which a single factor (namely, fyf/fyw) may be affecting the results. The topic deals with the equality of means, the various means µi of a random quantity corresponding to different treatments. The Ho (null hypothesis) states that all means are actually equal and the sample differences are only due to randomness. The H1 (alternative hypothesis) states that the means are actually different and the given parameter is matter-of-factly affecting the results. Consequently, in this particular case, if Ho is rejected, the conclusion that X is a decreasing function with fyf/fyw is verified. Ho: µi = µj | σi =σj for i,j=1 to 4 H1: µi ≠ µj | σi =σj for i,j=1 to 4 When performing ANOVA procedures, two hypotheses are needed to be previously tested.
The populations are normally distributed (verified above). The variances σi and σj of all observations should be equal. Equal variance
across samples is called homogeneity of variance.
The ANOVA test was performed on the SPSS statistical analysis package. First, according to the test results, the homogeneity of variance was verified (for this purpose, SPSS uses a Lèvene procedure). Second, the ANOVA test led to the following results, the null hypothesis Ho of no difference in sample means is rejected at α=0,06 significance level (the error probability of considering the null hypothesis as false is relatively low). As a result, the sample means may be considered as different according to the alternative hypothesis H1. Consequently, the decreasing trend of the sample means is due to one single factor (namely, fyf/fyw) affecting the values. The first attempt for correcting this anomaly is to take the fyf/fyw ratio equal to 1,0 in the current expression from EN1993-1-5. This attempt leads to eq. 7.7 in which m1 is shifted by m1
*.
w
f1
2
f
w
w
ffsy t
bm
th
020tb
1t2Sl
*·,· (7.7)
Fig. 7.5 shows a plot in which the populations are plotted against the fyf/fyw ratio. The distributions in this case remains similar for each group but a substantial change is observed regarding the influence of fyf/fyw.
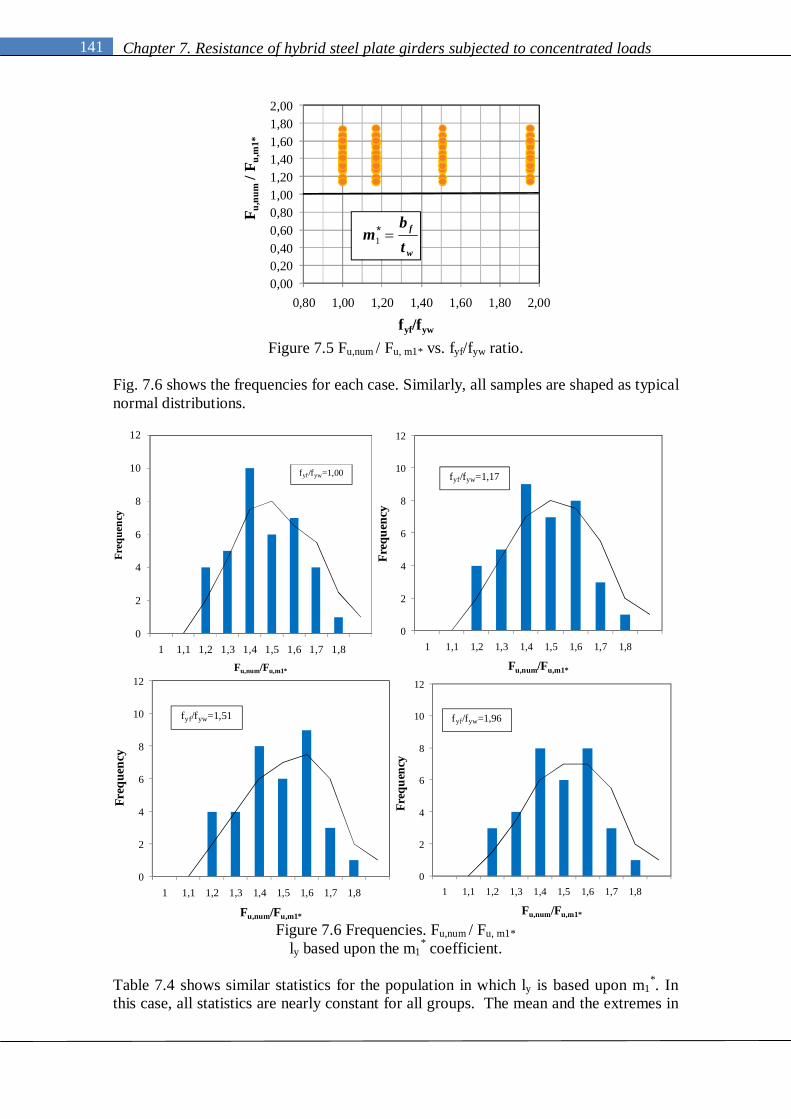
141 Chapter 7. Resistance of hybrid steel plate girders subjected to concentrated loads
0,000,200,400,600,801,001,201,401,601,802,00
0,80 1,00 1,20 1,40 1,60 1,80 2,00
F u,n
um/ F
u,m
1*
fyf/fyw
w
f
tb
m 1*
Figure 7.5 Fu,num / Fu, m1* vs. fyf/fyw ratio.
Fig. 7.6 shows the frequencies for each case. Similarly, all samples are shaped as typical normal distributions.
0
2
4
6
8
10
12
1 1,1 1,2 1,3 1,4 1,5 1,6 1,7 1,8
Freq
uenc
y
Fu,num/Fu,m1*
fyf/fyw=1,00
0
2
4
6
8
10
12
1 1,1 1,2 1,3 1,4 1,5 1,6 1,7 1,8
Freq
uenc
y
Fu,num/Fu,m1*
fyf/fyw=1,17
0
2
4
6
8
10
12
1 1,1 1,2 1,3 1,4 1,5 1,6 1,7 1,8
Freq
uenc
y
Fu,num/Fu,m1*
fyf/fyw=1,51
0
2
4
6
8
10
12
1 1,1 1,2 1,3 1,4 1,5 1,6 1,7 1,8
Freq
uenc
y
Fu,num/Fu,m1*
fyf/fyw=1,96
Figure 7.6 Frequencies. Fu,num / Fu, m1*
ly based upon the m1* coefficient.
Table 7.4 shows similar statistics for the population in which ly is based upon m1
*. In this case, all statistics are nearly constant for all groups. The mean and the extremes in
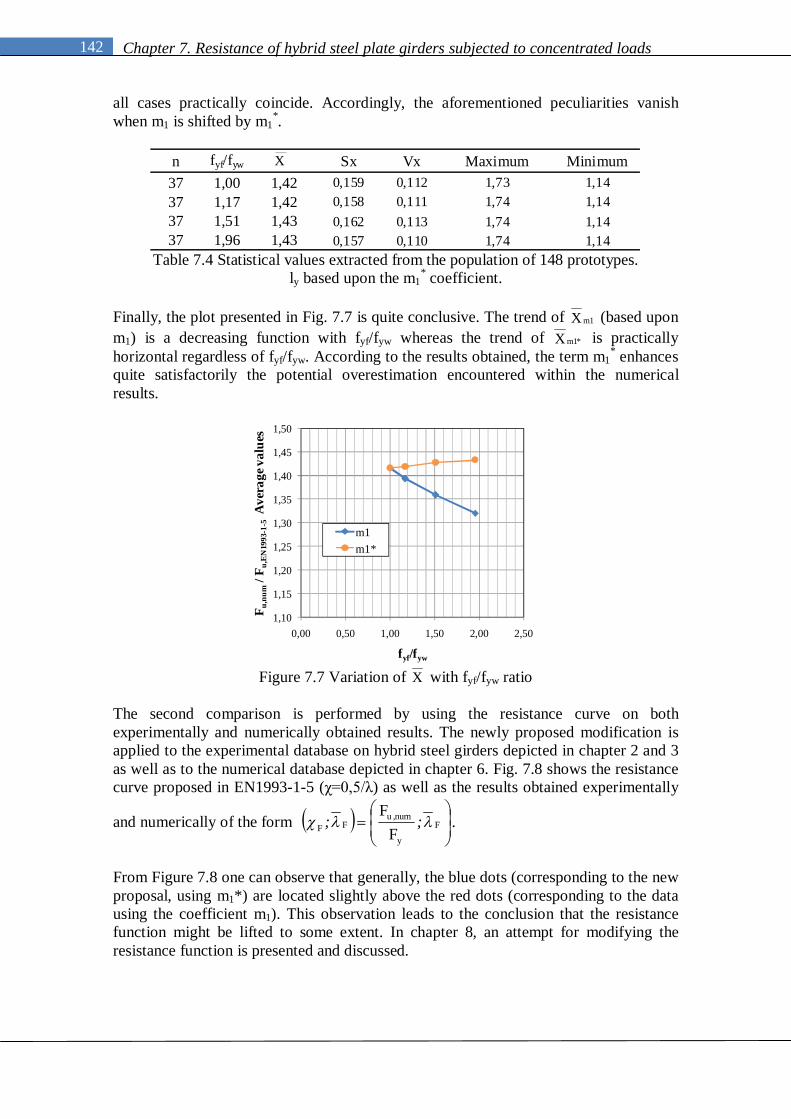
142 Chapter 7. Resistance of hybrid steel plate girders subjected to concentrated loads
all cases practically coincide. Accordingly, the aforementioned peculiarities vanish when m1 is shifted by m1
*.
n fyf/fyw Sx Vx Maximum Minimum37 1,00 1,42 0,159 0,112 1,73 1,1437 1,17 1,42 0,158 0,111 1,74 1,1437 1,51 1,43 0,162 0,113 1,74 1,1437 1,96 1,43 0,157 0,110 1,74 1,14
X
Table 7.4 Statistical values extracted from the population of 148 prototypes.
ly based upon the m1* coefficient.
Finally, the plot presented in Fig. 7.7 is quite conclusive. The trend of 1mX (based upon m1) is a decreasing function with fyf/fyw whereas the trend of *1mX is practically horizontal regardless of fyf/fyw. According to the results obtained, the term m1
* enhances quite satisfactorily the potential overestimation encountered within the numerical results.
1,10
1,15
1,20
1,25
1,30
1,35
1,40
1,45
1,50
0,00 0,50 1,00 1,50 2,00 2,50
F u,n
um/ F
u,E
N19
93-1
-5 A
vera
ge v
alue
s
fyf/fyw
m1m1*
Figure 7.7 Variation of X with fyf/fyw ratio
The second comparison is performed by using the resistance curve on both experimentally and numerically obtained results. The newly proposed modification is applied to the experimental database on hybrid steel girders depicted in chapter 2 and 3 as well as to the numerical database depicted in chapter 6. Fig. 7.8 shows the resistance curve proposed in EN1993-1-5 (χ=0,5/λ) as well as the results obtained experimentally
and numerically of the form
F
y
numuFF F
F ;; , .
From Figure 7.8 one can observe that generally, the blue dots (corresponding to the new proposal, using m1*) are located slightly above the red dots (corresponding to the data using the coefficient m1). This observation leads to the conclusion that the resistance function might be lifted to some extent. In chapter 8, an attempt for modifying the resistance function is presented and discussed.

143 Chapter 7. Resistance of hybrid steel plate girders subjected to concentrated loads
0,00
0,20
0,40
0,60
0,80
1,00
1,20
0 1 2 3 4 5 6
F
Slenderness f
The resistance curve. Numerical database
ly m1ly m1*
0,00
0,20
0,40
0,60
0,80
1,00
1,20
0 1 2 3 4 5 6
F
Slenderness F
The resistance function. Experimental database
ly m1
ly m1*
Figure 7.8 The resistance curve. Experimental and numerical results.
7.2.2 Influence of the relative flange stiffness (hw/tw) / (bf/tf). It is recognised that the beneficial aspects of the hybrid design are related to weight savings of the structure. Namely, flange plates of I-girders designed with high strength steel may be thinner than plates designed with conventional steel when achieving the same capacity. Fig. 7.9 shows the law governing the reduction of the flange thickness of a plate for the same flexural capacity for a typical I-girder according to EN1993-1-5 provisions. It is observed that as long as the flange thickness is decreased, the yield strength must be increased for attaining the same level of performance. In this case, increasing the yield strength from fyf=355 N/mm2 to fyf=460 N/mm2 allows for the reduction of the flange thickness from approximately tf =80mm to tf =60mm.
200
300
400
500
600
700
800
20 40 60 80 100
f yf
(N
/mm
2 )
tf (mm)
hw=2500 mm. tw=20 mm
Figure 7.9 fyf vs. tf for a given level of flexural performance.
As a result, it is tempting to state that generally, hybrid girders present more slender flange plates than homogeneous girders. Consequently, it is considered necessary to assess the potential influence of the flange rigidity on the results obtained in 7.2.1. For the sake of evaluating the influence of the flange stiffness on this study, a second parametric database is developed. A total amount of 36 plate girders following similar characteristics to those depicted in chapter 6 are numerically simulated. The modelling of all girders follows identical initial designer-assumed conditions to those presented in
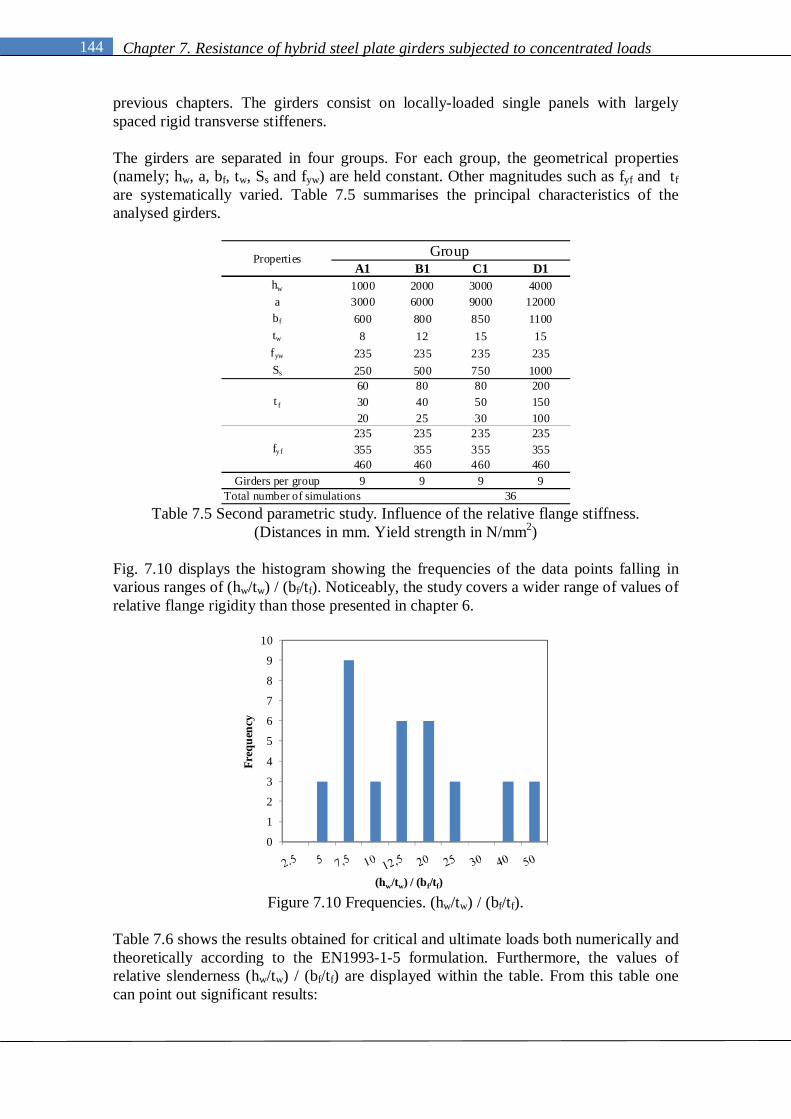
144 Chapter 7. Resistance of hybrid steel plate girders subjected to concentrated loads
previous chapters. The girders consist on locally-loaded single panels with largely spaced rigid transverse stiffeners. The girders are separated in four groups. For each group, the geometrical properties (namely; hw, a, bf, tw, Ss and fyw) are held constant. Other magnitudes such as fyf and tf are systematically varied. Table 7.5 summarises the principal characteristics of the analysed girders.
A1 B1 C1 D1hw 1000 2000 3000 4000a 3000 6000 9000 12000bf 600 800 850 1100tw 8 12 15 15fyw 235 235 235 235Ss 250 500 750 1000
60 80 80 20030 40 50 15020 25 30 100
235 235 235 235355 355 355 355460 460 460 460
Girders per group 9 9 9 9
Group
t f
Properties
Total number of simulations 36
fyf
Table 7.5 Second parametric study. Influence of the relative flange stiffness.
(Distances in mm. Yield strength in N/mm2)
Fig. 7.10 displays the histogram showing the frequencies of the data points falling in various ranges of (hw/tw) / (bf/tf). Noticeably, the study covers a wider range of values of relative flange rigidity than those presented in chapter 6.
0
1
2
3
4
5
6
7
8
9
10
Freq
uenc
y
(hw/tw) / (bf/tf) Figure 7.10 Frequencies. (hw/tw) / (bf/tf).
Table 7.6 shows the results obtained for critical and ultimate loads both numerically and theoretically according to the EN1993-1-5 formulation. Furthermore, the values of relative slenderness (hw/tw) / (bf/tf) are displayed within the table. From this table one can point out significant results:

145 Chapter 7. Resistance of hybrid steel plate girders subjected to concentrated loads
The values of relative slenderness (hw/tw) / (bf/tf) ranges from approximately 4 to 48.
The buckling load according to EN1993-1-5 (Fcr,EN1993-1-5) remains constant within each group (since Fcr,EN1993-1-5 is independent of tf and fyf in the formulation).
The numerical model predicts a significant increment of Fcr,num as tf is increased.
Fcr,num is calculated by means of an eigenvalue analysis.
The ultimate load according to EN1993-1-5 (Fu,EN1993-1-5) is sensitive to fyf/fyw (since m1 is used, see eq. 7.4 and 7.5).
The ultimate load according to the numerical model (Fu,num) is sensitive to fyf/fyw for some cases in which the flanges are relatively flexible whereas this load is independent of fyf/fyw for stiff flanges.
Group Girder bf tf tw hw hw /tw fyf fyw (hw/tw) / (bf/tf) Fcr,EN1993-1-5 Fcr,num Fu,EN1993 -1-5 Fu,num
a1-20-nl1 600 20 8 1000 125 235 235 4,17 602,11 583,64 456,76 640,52a1-20-nl2 600 20 8 1000 125 355 235 4,17 602,11 583,64 476,15 713,62a1-20-nl3 600 20 8 1000 125 460 235 4,17 602,11 583,64 490,79 696,42a1-30-nl1 600 30 8 1000 125 235 235 6,25 602,11 663,80 505,12 739,15a1-30-nl2 600 30 8 1000 125 355 235 6,25 602,11 663,80 534,22 731,21a1-30-nl3 600 30 8 1000 125 460 235 6,25 602,11 663,80 555,41 730,10a1-60-nl1 600 60 8 1000 125 235 235 12,50 602,11 729,42 639,92 854,25a1-60-nl2 600 60 8 1000 125 355 235 12,50 602,11 729,42 689,15 854,25a1-60-nl3 600 60 8 1000 125 460 235 12,50 602,11 729,42 723,80 854,25b1-25-nl1 800 25 12 2000 166,67 235 235 5,21 1016,06 803,12 945,36 1235,08b1-25-nl2 800 25 12 2000 166,67 355 235 5,21 1016,06 803,12 967,28 1475,82b1-25-nl3 800 25 12 2000 166,67 460 235 5,21 1016,06 803,12 984,80 1550,62b1-40-nl1 800 40 12 2000 166,67 235 235 8,33 1016,06 1040,64 1017,08 1634,12b1-40-nl2 800 40 12 2000 166,67 355 235 8,33 1016,06 1040,64 1057,82 1595,04b1-40-nl3 800 40 12 2000 166,67 460 235 8,33 1016,06 1040,64 1088,75 1586,21b1-80-nl1 800 80 12 2000 166,67 235 235 16,67 1016,06 1170,16 1221,70 1815,03b1-80-nl2 800 80 12 2000 166,67 355 235 16,67 1016,06 1170,16 1300,86 1815,03b1-80-nl3 800 80 12 2000 166,67 460 235 16,67 1016,06 1170,16 1357,69 1815,03c1-30-nl1 850 30 15 3000 200 235 235 7,06 1323,00 929,48 1437,04 1876,97c1-30-nl2 850 30 15 3000 200 355 235 7,06 1323,00 929,48 1458,28 2284,35c1-30-nl3 850 30 15 3000 200 460 235 7,06 1323,00 929,48 1475,76 2261,01c1-50-nl1 850 50 15 3000 200 235 235 11,76 1323,00 1319,37 1521,02 2509,35c1-50-nl2 850 50 15 3000 200 355 235 11,76 1323,00 1319,37 1566,74 2479,29c1-50-nl3 850 50 15 3000 200 460 235 11,76 1323,00 1319,37 1602,46 2470,34c1-80-nl1 850 80 15 3000 200 235 235 18,82 1323,00 1496,85 1666,94 2638,77c1-80-nl2 850 80 15 3000 200 355 235 18,82 1323,00 1496,85 1746,52 2638,77c1-80-nl3 850 80 15 3000 200 460 235 18,82 1323,00 1496,85 1805,73 2638,77
d1-100-nl1 1100 100 15 4000 266,67 235 235 24,24 992,25 1149,65 1686,47 2828,88d1-100-nl2 1100 100 15 4000 266,67 355 235 24,24 992,25 1149,65 1771,72 2828,88d1-100-nl3 1100 100 15 4000 266,67 460 235 24,24 992,25 1149,65 1834,78 2828,88d1-150-nl1 1100 150 15 4000 266,67 235 235 36,36 992,25 1186,67 1895,09 3125,89d1-150-nl2 1100 150 15 4000 266,67 355 235 36,36 992,25 1186,67 2017,34 3125,89d1-150-nl3 1100 150 15 4000 266,67 460 235 36,36 992,25 1186,67 2105,16 3125,89d1-200-nl1 1100 200 15 4000 266,67 235 235 48,48 992,25 1218,24 2092,50 3372,35d1-200-nl2 1100 200 15 4000 266,67 355 235 48,48 992,25 1218,24 2244,14 3372,35d1-200-nl3 1100 200 15 4000 266,67 460 235 48,48 992,25 1218,24 2351,59 3372,35
A1
B1
C1
D1
Table 7.6 Second parametric study.
(Distances in mm. Results obtained in kN. Yield strength in N/mm2) For the sake of assessing the latter observation, it is worth displaying the results graphically. Fig 7.11 shows the ratio Fu,hybrid /Fu, homogeneous versus the relative rigidity (hw/tw) / (bf/tf). The ratio Fu,hyb /Fu, hom=1,0 is observed in all girders with stiff flanges

146 Chapter 7. Resistance of hybrid steel plate girders subjected to concentrated loads
(no influence of fyf/fyw on the ultimate load capacity) whereas Fu,hyb /Fu, hom varies when the girders present flexible members.
0,80
0,85
0,90
0,95
1,00
1,05
1,10
1,15
1,20
1,25
1,30
0 5 10 15 20 25 30 35 40 45 50 55
F u, h
ybrid
/ Fu,
hom
ogen
eous
(hw/tw) / (bf/tf)
fyf/fyw=355/235fyf/fyw=460/235
Figure 7.11 Influence of (hw/tw) / (bf/tf) on Fu,hyb /Fu, hom.
For flexible flanges, numerical observations show some outlandish results worth pointing out:
For some cases, Fu,hyb /Fu, hom is greater in girders with fyf/fyw=355/235 than in girders with fyf/fyw=460/235.
In other cases, Fu,hyb /Fu, hom≤1,0. Ultimate load capacity of the girders decreases with fyf.
In addition, the limit rigidity from which the flanges can be considered as stiff might be inferred from the plot. A vertical line at approximately (hw/tw) / (bf/tf)≈12,5 defines the change in the trend. From this point onwards the ultimate load capacity of steel plate girders subjected to patch loading is independent of the flange strength (provided that fyf≥fyw). Fig. 7.12 shows an isometric detailed view of the top loaded flange of the girder a1-20-nl3 at ultimate load. The plot shows a view cut performed on the mid-span section. The failure mode seems rather different than the typical yield-lined, four- hinged model of patch loading depicted throughout this work. In fact, the collapse mechanism seems related to transverse bending of the loaded flange. The plate behaves like a cantilever and significant yielding (gray areas) is noticeable. Other studies found in literature have already shown a certain dependency of Fu on the fyf/fyw ratio (Mabuma 2008). All the girders analysed by this author presented values of relative rigidity (hw/tw) / (bf/tw) around 10, belonging to the range of flange relative stiffness in which the failure mechanism might differ from patch loading. It is beyond the scope of this work to present further investigations on failure modes different from the patch loading type. Due to this fact, the proposed equation 7.8 is presented with a lower bound. The effectively loaded length ly in the verification of collapse loads of hybrid steel plate girders subjected to patch loading is presented as a suitable alternative.

147 Chapter 7. Resistance of hybrid steel plate girders subjected to concentrated loads
512tbthforth
020tb
1t2Sl ffww
2
f
w
w
ffsy ,/·,·
(7.8)
Figure 7.12 Transverse bending in top flange for flexible flange plates.
7.2.3 Influence of bf/tw. The term m1
* still considers the contribution of the flange width from a geometrical point of view. A supplementary appraisal of the influence of bf/tw (m1
*) upon the resistance of the girders subjected to concentrated loads is presented. Only stiff flanges [(hw/tw) / (bf/tf)≥12,5] are considered within this assessment. Fig. 7.13 shows the typical assumption of load spread through the flange thickness. The length Ss is increased up to the effectively loaded length ly somewhat. It is clear that the flange geometry has a significant effect onto the spread of the concentrated load through the web plate.
Figure 7.13 Load spread through the flange from Ss to ly.
For the sake of evaluating the m1
* term, a third parametric study is developed. A total amount of 16 plate girders following similar characteristics to those previously depicted are numerically simulated. The modelling of all girders follows identical conditions to those presented in previous chapters.

148 Chapter 7. Resistance of hybrid steel plate girders subjected to concentrated loads
The girders are separated in four groups. For each group, the mechanical properties (namely, the fyf/fyw ratio) as well as the geometrical properties (except for the flange width bf) are held constant. Similarities with other groups belonging to the numerical database presented are noticeable. Table 7.7 summarises the principal characteristics of the analysed girders.
A2 B2 C2 D2hw 1000 2000 3000 4000a 3000 6000 9000 12000t f 60 80 80 100tw 8 12 15 15
fyf/fyw 235/235 235/235 235/235 235/235Ss 250 500 750 1000
600 800 850 1100700 850 950 1200750 900 1050 1300800 950 1150 1400
Girders per group 4 4 4 4
Group
bf
Properties
Total number of simulations 16 Table 7.7. Third parametric study. Variation of the stiffness bf/tw. Assessment of m1
*. (Distances in mm. Yield strength in N/mm2)
Table 7.8 shows the results obtained for critical and ultimate loads both numerically and theoretically according to eq. 7.4. Furthermore, the values of web slenderness hw/tw and the relative stiffness bf/tw are displayed within the table. Group Girder hw bf tw bf/tw hw/tw Fcr,num Fcr,EN1993-1-5 Fu,num Fu,EN1993-1-5
C7-a-600 1000 600 8 75,00 125 728,79 591,36 849,17 634,18C7-a-700 1000 700 8 87,50 125 738,71 591,36 866,50 651,59C7-a-750 1000 750 8 93,75 125 743,85 591,36 876,82 659,70C7-a-800 1000 800 8 100,00 125 749,12 591,36 884,51 667,46C7-b-800 2000 800 12 66,67 166,67 1169,44 997,92 1813,44 1210,74C7-b-850 2000 850 12 70,83 166,67 1189,49 997,92 1840,89 1221,44C7-b-900 2000 900 12 75,00 166,67 1192,86 997,92 1847,12 1231,78C7-b-950 2000 950 12 79,17 166,67 1196,34 997,92 1854,38 1241,80C7-c-850 3000 850 15 56,67 200 1497,11 1299,38 2640,53 1651,99C7-c-950 3000 950 15 63,33 200 1514,02 1299,38 2671,18 1671,57
C7-c-1050 3000 1050 15 70,00 200 1518,91 1299,38 2693,64 1690,23C7-c-1150 3000 1150 15 76,67 200 1521,18 1299,38 2729,61 1708,07C7-d-1100 4000 1100 15 73,33 266,67 1150,49 974,53 2795,23 1671,34C7-d-1200 4000 1200 15 80,00 266,67 1153,86 974,53 2849,14 1687,70C7-d-1300 4000 1300 15 86,67 266,67 1159,00 974,53 2875,88 1703,42C7-d-1400 4000 1400 15 93,33 266,67 1169,85 974,53 2897,41 1718,57
A2
B2
C2
D2
Table 7.8. Theoretical and numerical values of Fcr and Fu
Variation of the web slenderness hw/tw and the relative stiffness bf/tw. (Distances in mm. Results obtained in kN. Yield strength in N/mm2)
From table 7.8 one can point out significant results:
The bf/tw ratio ranges from approximately from 56,67 to 100 whereas the web slenderness from 125 to 266,67.

149 Chapter 7. Resistance of hybrid steel plate girders subjected to concentrated loads
The numerical results show that both the elastic critical load Fcr,num and the
ultimate load capacity Fu,num are increasing functions of the bf/tw coefficient.
According to the EN1993-1-5 formulation, Fu,EN1993-1-5 is also an increasing function but Fcr,EN1993-1-5 is held constant (since this critical load is only dependent on the web panel proportions).
Fig. 7.14 shows a plot in which, for each group, the ultimate load capacity is plotted against bf/tw both numerically (a) and theoretically (EN1993-1-5 (b)). The values of ultimate load capacity are normalised to the first value of Fu,a obtained for each group (highlighted within Table 7.8).
1,00
1,01
1,02
1,03
1,04
1,05
1,06
1,07
1,08
50 60 70 80 90 100 110
F u,n
um, i
/ Fu,
num
, a
bf/tw
Numerical Results
Group A2
Group B2
Group C2
Group D2
1
1,01
1,02
1,03
1,04
1,05
1,06
1,07
1,08
50 60 70 80 90 100 110
F u,E
N19
93-1
-5,
i/ F
u,E
N19
93-1
-5,
a
bf/tw
EN1993-1-5 predictions
Group A2
Group B2
Group C2
Group D2
Figure 7.14 Increase of ultimate load capacity with bf/tw.
(a) Numerical results. (b) EN1993-1-5 formulation.
Both trends are similar in shape and results. The ultimate load capacity is increased in the same proportion (from 3% to 5%) according to the numerical results as well as with the EN1993-1-5 formulation. In Fig. 7.14 (b), it is observed that C2 and D2 trends cross each other. This is due to the fact that girders belonging to group D2 presents different height hw. Fig. 7.15 shows a similar plot but in this case, the increase of load capacity is plotted against the bf/hw ratio. In this case, the similarities among all trends are clearer than above.
1,00
1,01
1,02
1,03
1,04
1,05
1,06
1,07
1,08
0,00 0,20 0,40 0,60 0,80 1,00
F u,n
um, i
/ Fu,
num
, a
bf/hw
Numerical Results
Group A2Group B2Group C2Group D2
1
1,01
1,02
1,03
1,04
1,05
1,06
1,07
1,08
0,00 0,20 0,40 0,60 0,80 1,00
F u,E
N19
93-1
-5,
i/ F
u,E
N19
93-1
-5,
a
bf/hw
EN1993-1-5 predictions
Group A2
Group B2
Group C2
Group D2
Figure 7.15 Increase of ultimate load capacity with bf/hw.
(a) Numerical results. (b) EN1993-1-5 formulation.

150 Chapter 7. Resistance of hybrid steel plate girders subjected to concentrated loads
The coefficient m1, which is originally dependent on bf/tw as well as fyf/fyw can be modified in the proposed fashion and according to the results obtained, the newly proposed term m1
*=(bf/tw) still reflect quite satisfactorily the effect of the geometrical proportions of the top flange. 7.3 Closely spaced transversal stiffeners, ly>a The formulation of EN1993-1-5 presented so far defines the patch loading resistance with an upper bound. The calculated effectively loaded length ly cannot exceed the distance a. If this is the case, ly must be shifted (Eq. 7.1). This limitation has been included in EN1993-1-5 in order to constrain the concerns related to the shear capacity of the adjacent panels. As far as known by the author, no specific attempts for studying thoroughly this limitation have been presented in the literature. As a result of this limitation, ultimate load capacity Fu,EN1993-1-5 (for the sake of conciseness, this load is labelled indistinctly hereafter as FRd) happens to be dependent on distance a in such a way that, the shorter this distance, the lower the value of FRd. Fig. 7.16 displays a graph in which FRd (standardised to FRd (a|a∞)) is plotted against the a/ly ratio following Eq. 7.1 for idealised geometries of several plate girders when the current EN1993-1-5 provisions are applied. Expectedly, if one tracks FRd from right to left in the plot (from long to short values of a), the result is an increasing function (similarly for each studied web slenderness hw/tw). The trend is shifted whether a/ly equals 1,00, which is the limit case. Common sense, however, suggests that stiffening philosophy of web panels should read: the shorter the distance between transverse stiffeners, the greater the ultimate load capacity should be.
0,95
1
1,05
1,1
1,15
1,2
0,00 0,50 1,00 1,50 2,00 2,50
F Rd (a
) / F
Rd
(a→
∞)
a/ly
hw/tw=83hw/tw=100hw/tw=125hw/tw=166hw/tw=250
Fig. 7.16. FRd / FRd (a|a∞) vs. a/ly ratios according to EN1993-1-5.
Even though the structural typology of densely stiffened plate girders is rather infrequent in bridge design, it has been noticed that this anomaly may arise under certain realistic girder proportions. Fig. 7.17 displays the ratio a/ly as a function of the aspect ratio of the loaded panel a/hw for different values of hw of idealised plate girders according to EN1993-1-5 rules.
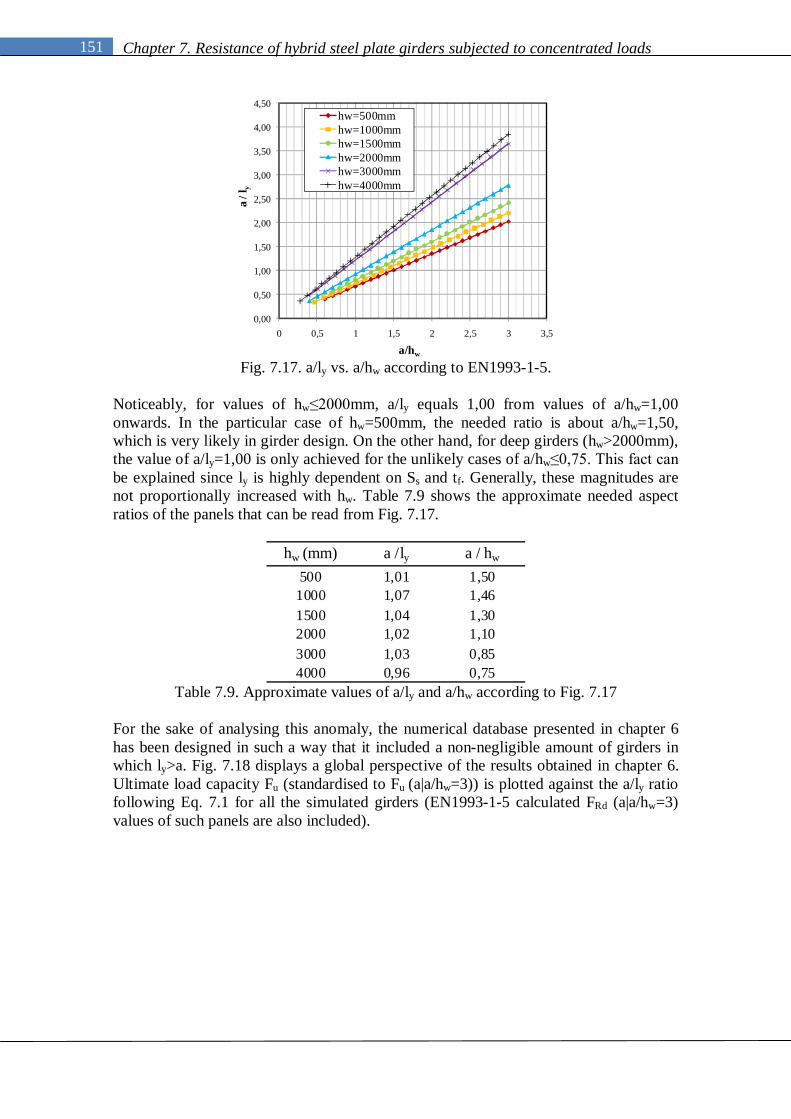
151 Chapter 7. Resistance of hybrid steel plate girders subjected to concentrated loads
0,00
0,50
1,00
1,50
2,00
2,50
3,00
3,50
4,00
4,50
0 0,5 1 1,5 2 2,5 3 3,5
a / l
y
a/hw
hw=500mmhw=1000mmhw=1500mmhw=2000mmhw=3000mmhw=4000mm
Fig. 7.17. a/ly vs. a/hw according to EN1993-1-5.
Noticeably, for values of hw≤2000mm, a/ly equals 1,00 from values of a/hw=1,00 onwards. In the particular case of hw=500mm, the needed ratio is about a/hw=1,50, which is very likely in girder design. On the other hand, for deep girders (hw>2000mm), the value of a/ly=1,00 is only achieved for the unlikely cases of a/hw≤0,75. This fact can be explained since ly is highly dependent on Ss and tf. Generally, these magnitudes are not proportionally increased with hw. Table 7.9 shows the approximate needed aspect ratios of the panels that can be read from Fig. 7.17.
hw (mm) a /ly a / hw
500 1,01 1,501000 1,07 1,461500 1,04 1,302000 1,02 1,103000 1,03 0,854000 0,96 0,75
Table 7.9. Approximate values of a/ly and a/hw according to Fig. 7.17 For the sake of analysing this anomaly, the numerical database presented in chapter 6 has been designed in such a way that it included a non-negligible amount of girders in which ly>a. Fig. 7.18 displays a global perspective of the results obtained in chapter 6. Ultimate load capacity Fu (standardised to Fu (a|a/hw=3)) is plotted against the a/ly ratio following Eq. 7.1 for all the simulated girders (EN1993-1-5 calculated FRd (a|a/hw=3) values of such panels are also included).

152 Chapter 7. Resistance of hybrid steel plate girders subjected to concentrated loads
0
0,5
1
1,5
2
2,5
3
3,5
0 0,5 1 1,5 2 2,5 3 3,5 4 4,5
F u(a
) / F
u(a
| a/
h w=3
)
a/ly
Numerical ResultsEN1993-1-5
Fig. 7.18. Fu / Fu (a|a/hw=3) vs. a/ly ratios. Numerical and EN1993-1-5 results
The conclusions that can be drawn from Fig. 7.18 are twofold:
For a>ly; both numerical and EN1993-1-5 present the same trend.
For a<ly; both numerical and EN1993-1-5 present rather opposite trends. Clearly, a/ly=1,00 is the turning point. The results obtained when using the EN1993-1-5 formulation are particularly conservative from a/ly=1,00 leftwards. The results obtained with the numerical model (and expected by common sense) are, therefore, confirmed. The shorter the distance between transverse stiffeners, the greater the ultimate load capacity. Moreover, the numerical results presented in chapter 3 and 6 have shown a clear response of girders with such geometrical proportions when subjected to concentrated loads. Fig. 7.19 (a) shows the results obtained from a local perspective by means of load-displacement plots (the vertical displacement δ is typically measured in the top flange). These graphs show an elastic branch up to F1. Once the value F1 is achieved, the slope of the curve changes. At this point the web is said to fold. The folded web panel is partially yielded at F1 but the top flange remains elastic. Subsequently, the capacity of the girder is increased up to a value F2. At this value, four plastic hinges are developed in the top flange while the web deforms and yields considerably. The ideal outer hinges are formed in the stiffener-to-flange junctures whereas the inner hinges are formed in the edges of the concentrated loading (Fig. 7.19 (b)). If sufficient ductility is assumed, one may state that the ultimate load capacity of a single web panel subjected to patch loading is increased by means of a new resistant mechanism developed with the aid of the top flanges and the transverse stiffeners. A post-F1 capacity (hereafter labeled as ΔFf) is developed and might be worth quantifying.
f12 FFF (7.8)

153 Chapter 7. Resistance of hybrid steel plate girders subjected to concentrated loads
Fig. 7.19. Structural response of girders subjected to patch loading when ly>a
(a) P-δ plot. (b) Observed mechanism for collapse loads
At first glance, it may be tempting to assume that the new resistant mechanism is dependent on the stiffeners and top flange resistances and rigidities (ts, fys, tf, fyf). The formulation of a new resistant mechanism is not a trivial task and must be based upon further numerical studies. The numerical database has pinpointed rigorously the potential underestimation but unfortunately, does not provide sufficient information for inferring new theoretical models. Likewise, the analysed girders consist in locally-loaded single panels of plated I-girders. The potential failure due to shear on the adjacent panels have been dismissed so far. Consequently an additional parametric study was developed in order to analyse the post-F1 capacity of the girders. In such study, the girders consisted in three-paneled simply supported specimens. In this additional fourth parametric study, 89 plate girders with closely spaced transverse stiffeners were numerically simulated. The scope of this study was limited to homogeneous plate girders according to the following assumptions:
The web height ranged between 500mm and 2000mm The simulations were deployed on three-paneled, simply supported girders with equally spaced transverse stiffeners. The aspect ratio a/hw=1,0 was held constant in all specimens.
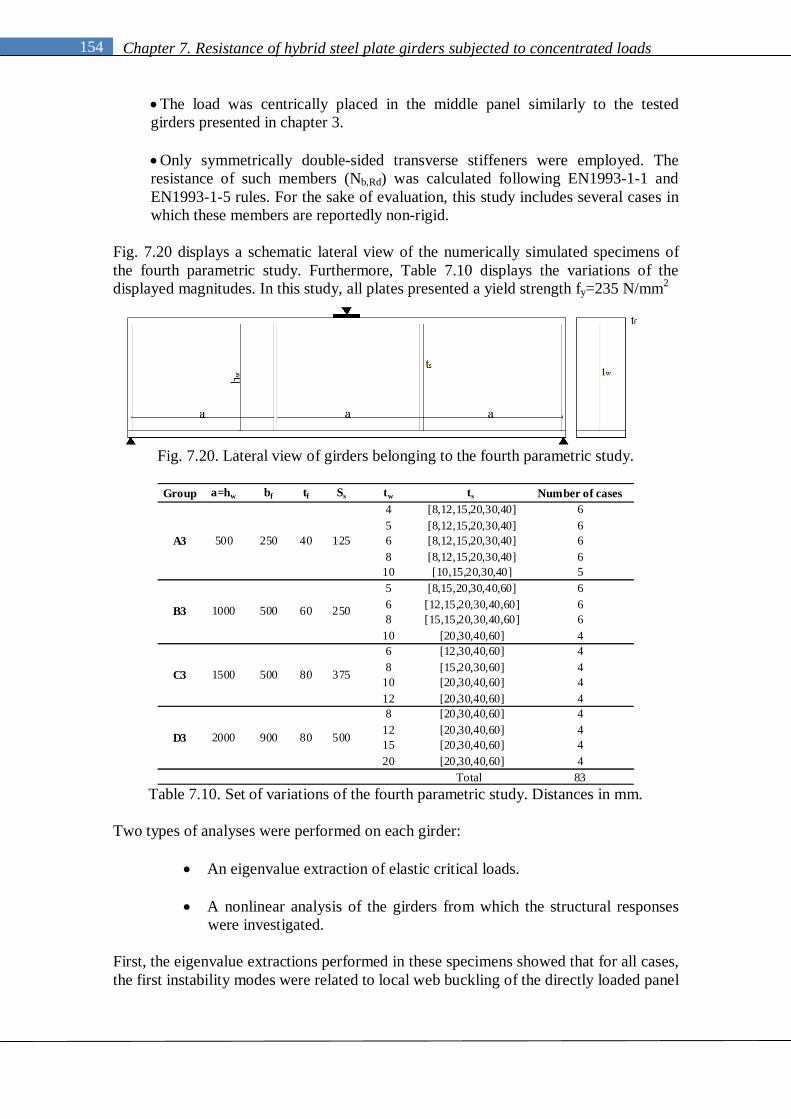
154 Chapter 7. Resistance of hybrid steel plate girders subjected to concentrated loads
The load was centrically placed in the middle panel similarly to the tested girders presented in chapter 3.
Only symmetrically double-sided transverse stiffeners were employed. The resistance of such members (Nb,Rd) was calculated following EN1993-1-1 and EN1993-1-5 rules. For the sake of evaluation, this study includes several cases in which these members are reportedly non-rigid.
Fig. 7.20 displays a schematic lateral view of the numerically simulated specimens of the fourth parametric study. Furthermore, Table 7.10 displays the variations of the displayed magnitudes. In this study, all plates presented a yield strength fy=235 N/mm2
Fig. 7.20. Lateral view of girders belonging to the fourth parametric study.
Group a=hw bf tf Ss tw ts Number of cases
4 [8,12,15,20,30,40] 65 [8,12,15,20,30,40] 66 [8,12,15,20,30,40] 68 [8,12,15,20,30,40] 6
10 [10,15,20,30,40] 55 [8,15,20,30,40,60] 66 [12,15,20,30,40,60] 68 [15,15,20,30,40,60] 6
10 [20,30,40,60] 46 [12,30,40,60] 48 [15,20,30,60] 4
10 [20,30,40,60] 412 [20,30,40,60] 48 [20,30,40,60] 4
12 [20,30,40,60] 415 [20,30,40,60] 420 [20,30,40,60] 4
Total 83
40
60
80
80
125
250
375
500
A3
B3
C3
D3
250
500
500
900
500
1000
1500
2000
Table 7.10. Set of variations of the fourth parametric study. Distances in mm.
Two types of analyses were performed on each girder:
An eigenvalue extraction of elastic critical loads.
A nonlinear analysis of the girders from which the structural responses were investigated.
First, the eigenvalue extractions performed in these specimens showed that for all cases, the first instability modes were related to local web buckling of the directly loaded panel

155 Chapter 7. Resistance of hybrid steel plate girders subjected to concentrated loads
(Fig. 7.21 (a)) whereas the second, to shear buckling in the adjacent panels (Fig. 7.21 (b)).
Fig. 7.21. Lateral view of girders obtained in a eigenvalue analysis.
(a) First instability mode (b) Second instability mode. For some cases, these modes were closely related though. This fact warned about the potential interaction of both modes in the collapse mechanism of such girders when subjected to patch loading. In order to evaluate both instability modes, the patch loading-shear buckling interaction of such girders was quantified by using the numerical relationship between the applied patch load F, and the elastic critical shear buckling force Vcr of the adjacent panel. As the analyzed girders are simply supported and the load is centrically applied, the relationship that applies in this case reads:
crwwEwwcrcr V2FthkthV2F ······ (7.9) In this formula, the elastic critical plate buckling stress σE is defined as eq. 7.10. For plates with rigid transverse stiffeners, the shear buckling coefficient kτ can be obtained by using eq. 7.11 (no intermediate non-rigid transverse stiffeners are allowed for in the latter)
2
w
w2
2
E ht
112E
··
·
(7.10)
2w
ah
004345k
,, (7.11)
Fig. 7.22 shows the three different possible relationships between the defined load F1 and 2·Vcr. Both magnitudes are web-slenderness dependent. It is observed that 2·Vcr may alternatively be located below or above the defined F1 load. Eventually, 2·Vcr might be even greater than the attained value of ultimate load capacity F2 for some structural design cases (in particular, very stocky girders). The question is whether or not a strong shear-patch loading interaction arises for each of the depicted structural cases.
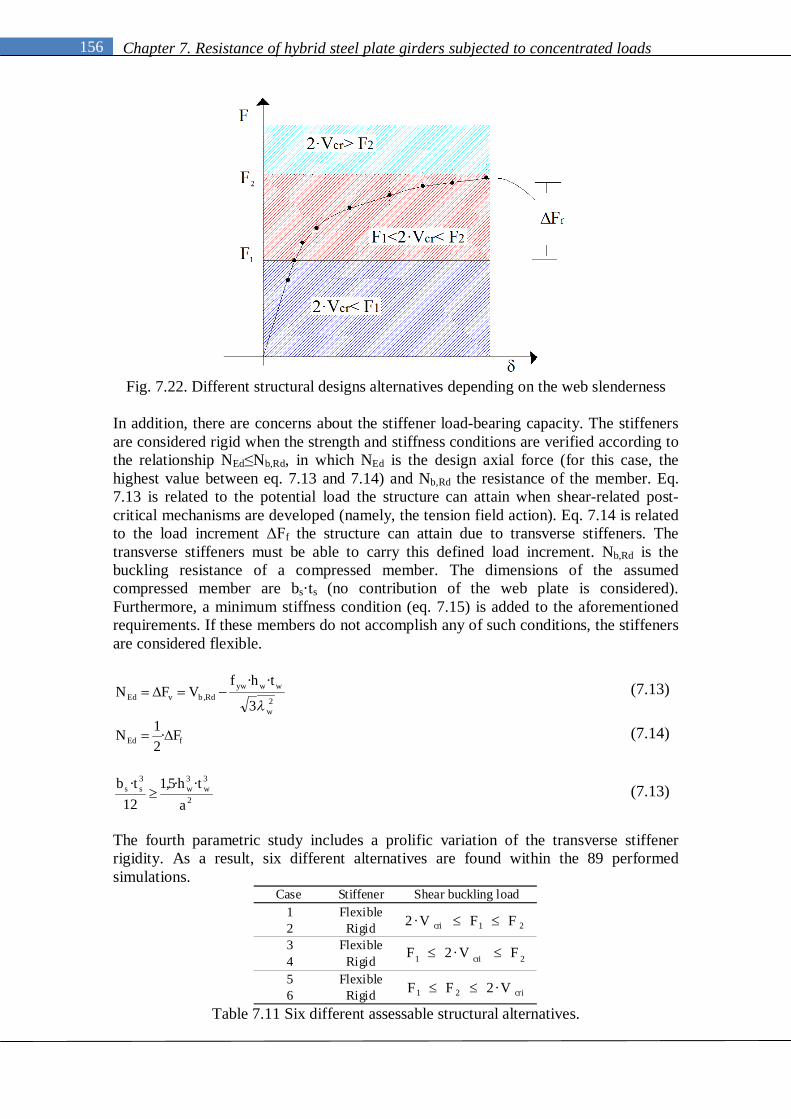
156 Chapter 7. Resistance of hybrid steel plate girders subjected to concentrated loads
Fig. 7.22. Different structural designs alternatives depending on the web slenderness In addition, there are concerns about the stiffener load-bearing capacity. The stiffeners are considered rigid when the strength and stiffness conditions are verified according to the relationship NEd≤Nb,Rd, in which NEd is the design axial force (for this case, the highest value between eq. 7.13 and 7.14) and Nb,Rd the resistance of the member. Eq. 7.13 is related to the potential load the structure can attain when shear-related post-critical mechanisms are developed (namely, the tension field action). Eq. 7.14 is related to the load increment ΔFf the structure can attain due to transverse stiffeners. The transverse stiffeners must be able to carry this defined load increment. Nb,Rd is the buckling resistance of a compressed member. The dimensions of the assumed compressed member are bs·ts (no contribution of the web plate is considered). Furthermore, a minimum stiffness condition (eq. 7.15) is added to the aforementioned requirements. If these members do not accomplish any of such conditions, the stiffeners are considered flexible.
2w
wwywRdbvEd
3
thfVFN
··, (7.13)
fEd F21N · (7.14)
2
3w
3w
3ss
ath51
12tb ··,· (7.13)
The fourth parametric study includes a prolific variation of the transverse stiffener rigidity. As a result, six different alternatives are found within the 89 performed simulations.
Case Stiffener1 Flexible2 Rigid3 Flexible4 Rigid5 Flexible6 Rigid
Shear buckling load
21cri FFV2 ·
2cri1 FV2F ·
cri21 V2FF ·
Table 7.11 Six different assessable structural alternatives.

157 Chapter 7. Resistance of hybrid steel plate girders subjected to concentrated loads
Tables 7.12 to 7.15 display the numerical results obtained for all girders of each group after performing nonlinear analyses: Results related to F1 (loss of linearity, web folding and yielding) and F2 (ultimate load capacity, formation of four plastic hinges within the top flange). In addition, in these tables, the following theoretical values are added for the sake of comparison.
FRd the patch loading resistance according to EN1993-1-5.
Vcr the elastic critical buckling load according to eq. 7.9.
Vb,Rd the shear resistance according to EN1993-1-5.
ΔFf obtained from the numerical results (F2-F1).
ΔFv obtained from the theoretical results (eq. 7.13).
Nb,Rd the buckling resistance of the transverse stiffeners. A conservative condition of no contribution of the web plates in such resistance is assumed. The minimum required thickness of the transverse stiffeners is highlighted within the tables for each case.
For each case of web slenderness, the limit case from which the stiffener rigidity
is considered sufficient is highlighted within the tables.
The structural design case (1 to 6) to which each simulation belongs is also indicated.
Group tw hw/tw min ts ts ts/tf FRd F1 F2 2*Vcr 2*Vb,Rd Ff Fv Nb,Rd Case8 0,20 150,80 275,90 507,68 226,91 700,36 231,77 167,30 76,19 1
12 0,30 150,80 277,93 529,04 226,91 700,36 251,10 167,30 231,94 1
15 0,38 150,80 279,03 547,47 226,91 788,21 268,45 167,30 407,45 220 0,50 150,80 280,75 581,27 226,91 788,21 300,52 167,30 760,13 2
30 0,75 150,80 284,17 620,48 226,91 788,21 336,31 167,30 1462,13 240 1,00 150,80 286,76 629,66 226,91 788,21 342,91 167,30 2117,50 28 0,20 235,62 295,18 647,00 443,18 953,56 351,82 100,21 76,19 3
12 0,30 235,62 296,35 653,92 443,18 953,56 357,57 100,21 231,94 315 0,38 235,62 296,71 659,34 443,18 1086,41 362,62 100,21 407,45 320 0,50 235,62 297,25 667,63 443,18 1086,41 370,37 100,21 760,13 430 0,75 235,62 298,44 679,50 443,18 1086,41 381,07 100,21 1462,13 440 1,00 235,62 299,57 687,18 443,18 1086,41 387,61 100,21 2117,50 48 0,20 339,30 474,06 702,14 765,82 1229,54 228,08 0,00 33,48 5
12 0,30 339,30 479,46 716,15 765,82 1229,54 236,69 0,00 231,94 515 0,38 339,30 480,86 720,22 765,82 1531,64 239,36 0,00 407,45 520 0,50 339,30 483,62 728,58 765,82 1531,64 244,96 0,00 760,13 630 0,75 339,30 489,65 743,87 765,82 1531,64 254,22 0,00 1462,13 640 1,00 339,30 495,57 752,47 765,82 1531,64 256,90 0,00 2117,50 68 0,20 603,20 724,53 843,21 1815,28 1890,20 118,68 0,00 76,19 5
12 0,30 603,20 716,65 852,33 1815,28 1896,84 135,67 0,00 231,94 515 0,38 603,20 718,15 858,39 1815,28 1896,84 140,24 0,00 407,45 520 0,50 603,20 722,46 866,08 1815,28 1896,84 143,61 0,00 760,13 530 0,75 603,20 747,31 879,18 1815,28 1896,84 131,86 0,00 1462,13 640 1,00 603,20 760,37 891,30 1815,28 1896,84 130,94 0,00 2117,50 610 0,25 942,50 957,23 1009,73 3545,46 2293,77 52,50 0,00 141,95 515 0,38 942,50 960,07 1018,05 3545,46 2293,77 57,97 0,00 407,45 520 0,50 942,50 964,44 1025,72 3545,46 2293,77 61,28 0,00 760,13 530 0,75 942,50 978,90 1043,32 3545,46 2293,77 64,43 0,00 1462,13 540 1,00 942,50 994,51 1056,46 3545,46 2293,77 61,95 0,00 2117,50 6
13
16
19
26
3310
A3
125
100
83,33
62,5
50
4
5
6
8
Table 7.12. Results obtained. Group A3. hw=500mm (Distances in mm, Loads in kN)

158 Chapter 7. Resistance of hybrid steel plate girders subjected to concentrated loads
Group tw hw/tw min ts ts ts/tf FRd F1 F2 2*Vcr 2*Vb,Rd Ff Fv Nb,Rd Case8 0,13 235,62 461,55 1050,23 443,18 1455,72 588,68 575,00 41,18 1
15 0,25 235,62 466,46 1134,51 443,18 1455,72 668,05 575,00 253,80 120 0,33 235,62 468,99 1184,58 443,18 1592,99 715,59 575,00 567,81 230 0,50 235,62 472,57 1267,73 443,18 1592,99 795,16 575,00 1629,80 240 0,67 235,62 475,76 1292,06 443,18 1592,99 816,30 575,00 3040,53 260 1,00 235,62 481,35 1316,35 443,18 1592,99 835,00 575,00 5848,52 212 0,20 339,30 520,40 1323,10 765,82 1808,77 802,70 620,48 133,93 315 0,25 339,30 522,12 1332,92 765,82 1808,77 810,80 620,48 253,80 320 0,33 339,30 523,59 1347,16 765,82 2006,45 823,57 620,48 567,81 430 0,50 339,30 525,58 1366,09 765,82 2006,45 840,51 620,48 1629,80 440 0,67 339,30 527,72 1377,18 765,82 2006,45 849,46 620,48 3040,53 460 1,00 339,30 532,26 1395,05 765,82 2006,45 862,79 620,48 5848,52 415 0,25 603,20 916,55 1518,18 1815,28 2593,75 601,63 565,34 253,80 520 0,33 603,20 918,61 1530,99 1815,28 2945,18 612,38 565,34 567,81 530 0,50 603,20 922,16 1544,05 1815,28 2945,18 621,89 565,34 1629,80 640 0,67 603,20 926,92 1561,12 1815,28 2945,18 634,20 565,34 3040,53 660 1,00 603,20 937,29 1572,89 1815,28 2945,18 635,60 565,34 5848,52 620 0,33 942,50 1360,77 1722,58 3545,46 4046,00 361,81 251,03 567,81 530 0,50 942,50 1392,21 1746,24 3545,46 4046,00 354,03 251,03 1629,80 540 0,67 942,50 1408,14 1766,63 3545,46 4046,00 358,49 251,03 3040,53 660 1,00 942,50 1394,13 1781,54 3545,46 4046,00 387,41 251,03 5848,52 6
B3
5 200
6 166,7
8 125
10
16
20
26
33100
Table 7.13. Results obtained. Group B3, hw=1000mm (Distances in mm, Loads in kN)
Group tw hw/tw min ts ts ts/tf FRd F1 F2 2*Vcr 2*Vb,Rd Ff Fv Nb,Rd Case
12 0,15 339,30 600,73 974,19 510,55 2440,24 373,47 964,96 61,77 130 0,38 339,30 605,50 978,28 510,55 2440,24 372,77 964,96 851,72 1
40 0,50 339,30 608,82 984,38 510,55 2440,24 375,56 964,96 1827,64 260 0,75 339,30 611,65 988,78 510,55 2440,24 377,13 964,96 4560,80 215 0,19 603,20 1075,76 1721,46 1210,19 3434,01 645,70 1112,17 118,47 320 0,25 603,20 1076,92 1729,68 1210,19 3434,01 652,76 1112,17 271,99 330 0,38 603,20 1080,28 1737,04 1210,19 3434,01 656,77 1112,17 851,72 340 0,50 603,20 1083,28 1739,54 1210,19 3434,01 656,27 1112,17 1827,64 420 0,25 942,50 1400,31 1931,56 2363,64 4573,76 531,25 1105,57 271,99 530 0,38 942,50 1404,73 1950,11 2363,64 4573,76 545,38 1105,57 851,72 540 0,50 942,50 1407,09 1962,97 2363,64 4573,76 555,89 1105,57 1827,64 660 0,75 942,50 1416,22 1985,93 2363,64 4573,76 569,71 1105,57 4560,80 620 0,25 1357,20 1915,75 2183,30 4084,37 5874,25 267,55 895,82 271,99 530 0,38 1357,20 1914,11 2189,26 4084,37 5874,25 275,15 895,82 851,72 540 0,50 1357,20 1917,38 2210,91 4084,37 5874,25 293,53 895,82 1827,64 560 0,75 1357,20 1928,00 2244,03 4084,37 5874,25 316,03 895,82 4560,80 6
10 150
12
23
30
37
4583,33
C3
6 250
8 187,5
Table 7.14. Results obtained. Group C3, hw=1500mm (Distances in mm, Loads in kN)
Group tw hw/tw min ts ts ts/tf FRd F1 F2 2*Vc r 2*Vb,R d Ff Fv Nb,R d Case
20 0,25 603,20 1046,57 2183,75 907,64 4077,46 1137,18 1584,91 284,32 130 0,38 603,20 1079,52 2198,89 907,64 4077,46 1119,37 1584,91 913,68 1
40 0,50 603,20 1076,79 2205,00 907,64 4077,46 1128,21 1584,91 2044,13 260 0,75 603,20 1081,91 2222,67 907,64 4077,46 1140,76 1584,91 3716,29 220 0,25 1357,20 2144,42 2653,93 3063,28 6663,69 509,50 1800,20 284,32 530 0,38 1357,20 2153,35 2670,70 3063,28 6663,69 517,35 1800,20 913,68 540 0,50 1357,20 2147,96 2678,77 3063,28 6663,69 530,81 1800,20 2044,13 660 0,75 1357,20 2173,87 2719,79 3063,28 6663,69 545,91 1800,20 3716,29 620 0,25 2120,62 2967,38 3106,59 5982,97 9020,78 139,21 1518,91 284,32 530 0,38 2120,62 2967,39 3127,30 5982,97 9020,78 159,91 1518,91 913,68 540 0,50 2120,62 2967,05 3148,23 5982,97 9020,78 181,18 1518,91 2044,13 660 0,75 2120,62 2977,93 3188,96 5982,97 9020,78 211,03 1518,91 3716,29 620 0,25 3648,58 4363,58 4415,86 14181,86 13832,74 52,27 0,00 284,32 530 0,38 3648,58 4328,60 4411,47 14181,86 13832,74 82,87 0,00 913,68 540 0,50 3648,58 4322,07 4404,58 14181,86 13832,74 82,52 0,00 2044,13 560 0,75 3648,58 4321,67 4379,77 14181,86 13832,74 58,10 0,00 3716,29 6
133
20 100
27
40
51
60
D3
8 250
12 166,7
15
Table 7.15. Results obtained. Group D3, hw=2000mm (Distances in mm, Loads in kN)

159 Chapter 7. Resistance of hybrid steel plate girders subjected to concentrated loads
From the results obtained the following conclusions can be drawn up:
All girders present a significant increment ΔFf.
According to visual inspection of all specimens, the girders present web folding at F1.
According to visual inspection of all specimens, the girders present plastic
deformation within the top flange at the stiffener-to-flange juncture at F2. Furthermore, a thorough analysis of the numerical results gives hints about the structural response of the girders for cases 1 to 6. The numerical observations are presented separately for each case in the following: Case 1. Flexible stiffeners
21cri FFV2 · The theoretical shear buckling capacity is smaller than the observed value F1. In addition, the transverse stiffeners are flexible members. Fig. 7.23 (a) shows the von Mises stresses obtained numerically at F2. Noticeably, web folding in the directly loaded panel, plastic deformation (gray-coloured in all plots) within the flanges and web, buckling of the flexible transverse stiffeners and shear buckling in the adjacent panels occur. For the latter, a frame mechanism related to the tension field action is observed at F2. As a whole, it might be stated that the failure mode shows blurred combination of failure modes with a strong interaction between them.
Case 2 Rigid stiffeners
21cri FFV2 · The theoretical shear buckling capacity is smaller than the observed value F1. The transverse stiffeners are, in this case, rigid members according to the minimum requirements depicted by equations 7.13 to 7.15. Fig. 7.23 (b) shows the von Mises stresses obtained numerically at F2. In this case, web folding in the directly loaded panel as well as plastic deformation within the flanges and web are observable. Moreover, other numerical results show that shear buckling in the adjacent panels also occurs (additional plots would be needed for clarifying this topic, however, for the sake of conciseness, they are not included herein). In addition, considerable yielding of such panels is observed at F2. Noticeably, the stiffeners rigidity influences the stress distribution from one panel to another.
Fig. 7.23. Lateral view of girders belonging to case 1 and 2 at F2.
(a) Flexible stiffeners (b) Rigid stiffeners.

160 Chapter 7. Resistance of hybrid steel plate girders subjected to concentrated loads
Fig. 7.24 shows the typical structural response observed in girders belonging to cases 1 and 2 by means of a P- plot (being the vertical displacement of the top flange at mid-span section). In these particular girders, a first loss of linearity is observed simultaneously in both specimens (see table 7.12). This value is greater than the theoretical shear buckling load. From this point onwards, the girders belonging to case 1 experience a post-F1 branch different from the girder belonging to case 2. In both cases, F1 is increased but the case-2 girder attains a higher value of F2. In the former prototype, the load-deflection plot exhibits several losses of linearity up to F2. The capacity is exhausted once high values of deformation are attained. In the latter prototype, a second lost of linearity is observed for approximate values of F=520kN (marked with an arrow in Fig. 7.24). As mentioned above, interaction of patch loading and shear buckling occurs to some extent.
0
100
200
300
400
500
600
700
0 5 10 15 20
Loa
d (k
N)
Displacement (mm)
hw=500mm, tw=4mm
ts=8mm-Case 1
ts=40mm-Case 2F1
2·Vcr
Fig. 7.24. Structural response of girders subjected to patch loading for cases 1 and 2
Case 3 Flexible stiffeners
2cri1 FV2F · The theoretical shear buckling capacity is between the observed values F1 and F2. In addition, the transverse stiffeners are non-rigid members. Fig. 7.25 (a) shows the von Mises stresses obtained numerically at F2. In this case, web folding in the directly loaded panel and plastic deformation of the flanges is observed. Considerable yielding of the adjacent panels is observed at F2. Case 4 Rigid stiffeners
2cri1 FV2F · The theoretical shear buckling capacity is between the observed values F1 and F2. In addition, the transverse stiffeners are rigid members. Fig. 7.25 (b) shows the von Mises stresses obtained numerically at F2. The failure mode is similar to case 3. Yielding within the web of the adjacent panels however, is reduced significantly by the aid of the rigid transverse stiffeners.
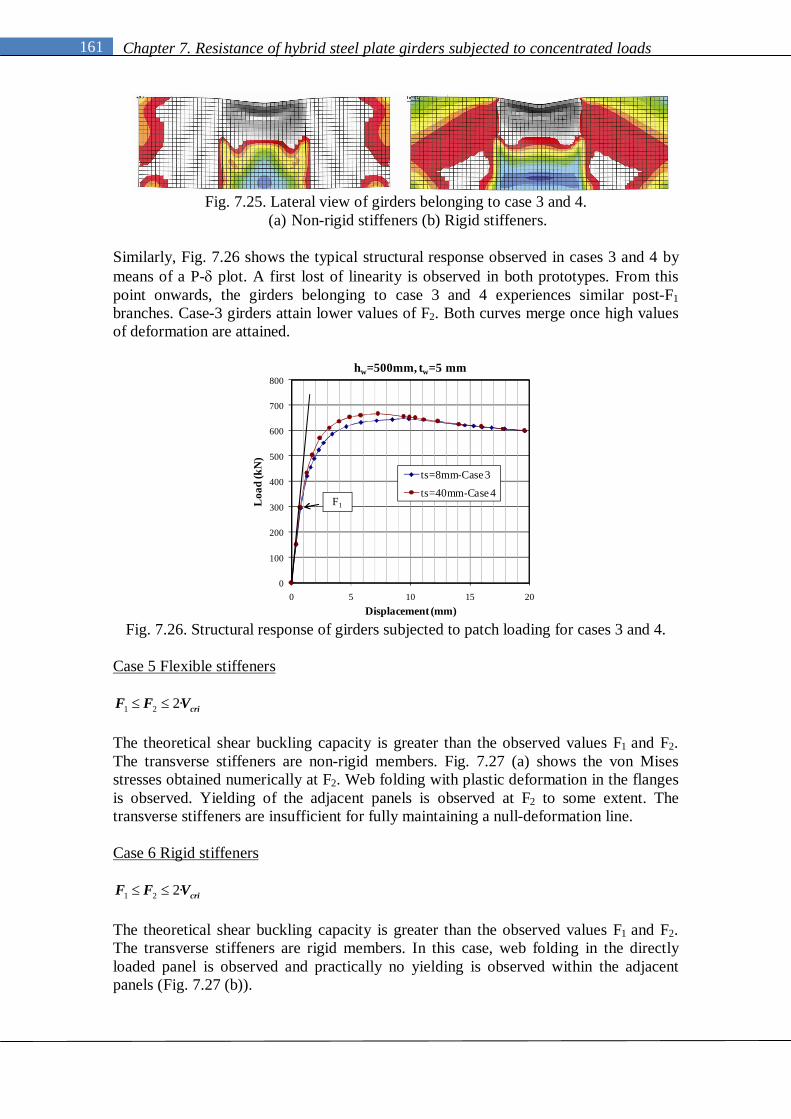
161 Chapter 7. Resistance of hybrid steel plate girders subjected to concentrated loads
Fig. 7.25. Lateral view of girders belonging to case 3 and 4.
(a) Non-rigid stiffeners (b) Rigid stiffeners. Similarly, Fig. 7.26 shows the typical structural response observed in cases 3 and 4 by means of a P- plot. A first lost of linearity is observed in both prototypes. From this point onwards, the girders belonging to case 3 and 4 experiences similar post-F1 branches. Case-3 girders attain lower values of F2. Both curves merge once high values of deformation are attained.
0
100
200
300
400
500
600
700
800
0 5 10 15 20
Loa
d (k
N)
Displacement (mm)
hw=500mm, tw=5 mm
ts=8mm-Case 3
ts=40mm-Case 4F1
Fig. 7.26. Structural response of girders subjected to patch loading for cases 3 and 4.
Case 5 Flexible stiffeners
criVFF ·221 The theoretical shear buckling capacity is greater than the observed values F1 and F2. The transverse stiffeners are non-rigid members. Fig. 7.27 (a) shows the von Mises stresses obtained numerically at F2. Web folding with plastic deformation in the flanges is observed. Yielding of the adjacent panels is observed at F2 to some extent. The transverse stiffeners are insufficient for fully maintaining a null-deformation line. Case 6 Rigid stiffeners
criVFF ·221 The theoretical shear buckling capacity is greater than the observed values F1 and F2. The transverse stiffeners are rigid members. In this case, web folding in the directly loaded panel is observed and practically no yielding is observed within the adjacent panels (Fig. 7.27 (b)).
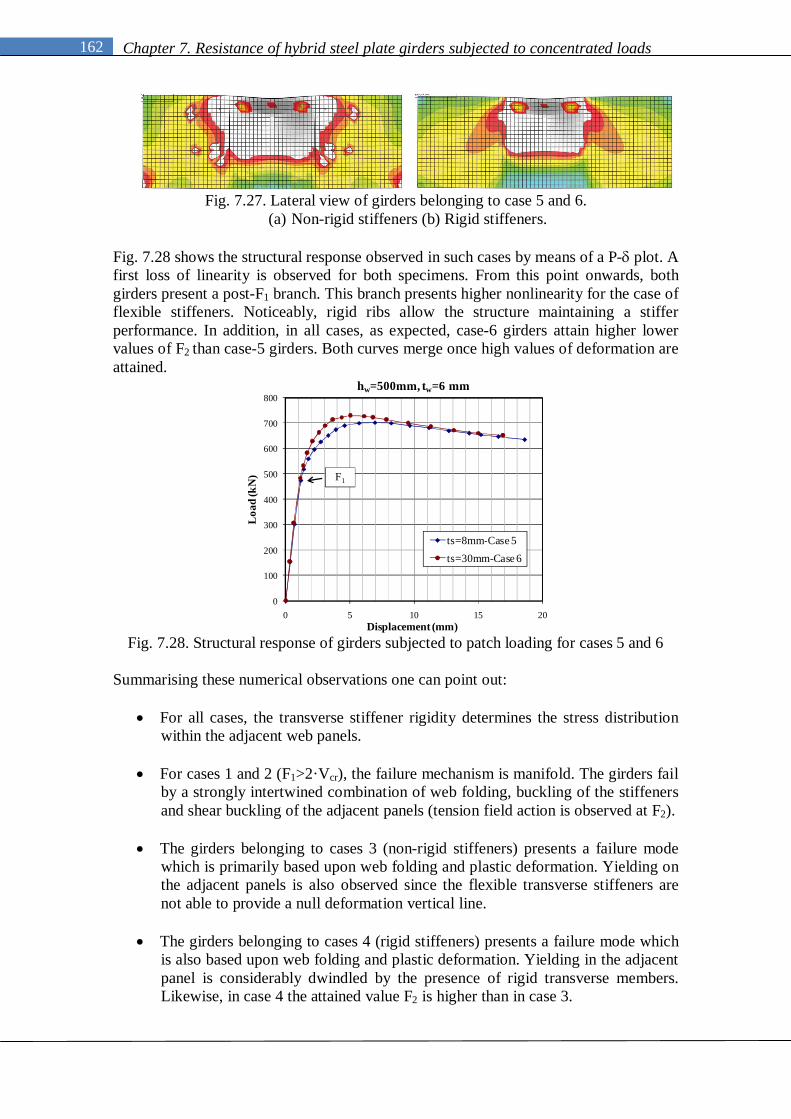
162 Chapter 7. Resistance of hybrid steel plate girders subjected to concentrated loads
Fig. 7.27. Lateral view of girders belonging to case 5 and 6.
(a) Non-rigid stiffeners (b) Rigid stiffeners. Fig. 7.28 shows the structural response observed in such cases by means of a P- plot. A first loss of linearity is observed for both specimens. From this point onwards, both girders present a post-F1 branch. This branch presents higher nonlinearity for the case of flexible stiffeners. Noticeably, rigid ribs allow the structure maintaining a stiffer performance. In addition, in all cases, as expected, case-6 girders attain higher lower values of F2 than case-5 girders. Both curves merge once high values of deformation are attained.
0
100
200
300
400
500
600
700
800
0 5 10 15 20
Loa
d (k
N)
Displacement (mm)
hw=500mm, tw=6 mm
ts=8mm-Case 5ts=30mm-Case 6
F1
Fig. 7.28. Structural response of girders subjected to patch loading for cases 5 and 6
Summarising these numerical observations one can point out:
For all cases, the transverse stiffener rigidity determines the stress distribution within the adjacent web panels.
For cases 1 and 2 (F1>2·Vcr), the failure mechanism is manifold. The girders fail
by a strongly intertwined combination of web folding, buckling of the stiffeners and shear buckling of the adjacent panels (tension field action is observed at F2).
The girders belonging to cases 3 (non-rigid stiffeners) presents a failure mode
which is primarily based upon web folding and plastic deformation. Yielding on the adjacent panels is also observed since the flexible transverse stiffeners are not able to provide a null deformation vertical line.
The girders belonging to cases 4 (rigid stiffeners) presents a failure mode which
is also based upon web folding and plastic deformation. Yielding in the adjacent panel is considerably dwindled by the presence of rigid transverse members. Likewise, in case 4 the attained value F2 is higher than in case 3.

163 Chapter 7. Resistance of hybrid steel plate girders subjected to concentrated loads
The girders belonging to case 5 and 6 present similar responses than the girders belonging to cases 3 and 4. The failure mode is clearly related to web folding at F1 and plastic deformation in four hinges formed within the top flange at F2. The transverse stiffener rigidity determines the stress distribution on the directly loaded panel and the adjacent ones. Similarly, the attained values of F2 are higher in case 6 than in case 5.
In the forthcoming subsections, a systematic exploit of the results obtained is also addressed. Case 1 and 2 are not treated herein due to the potential shear-patch loading interaction. For this purpose, the influence of two parameters is studied separately.
The influence of the transverse stiffeners on the ultimate load capacity F2. The top flange remaining moment resistance.
7.3.1 Influence of transverse stiffeners This sub-section shows the influence of the transverse stiffener rigidity on the defined ultimate load capacity F2. This study is, as aforementioned, limited to double-sided symmetric stiffeners. For this purpose, the results presented in tables 7.12 to 7.15 have been systematically used. It is worth pointing out that a preliminary glimpse of these tables shows outlandish peculiarities concerning the optimal design of the transverse stiffeners according to EN1993-1-5 (eq 7.13 to 7.15).
The design loads NEd of such members (eq. 7.13 and eq. 7.14) decrease with the web thickness.
The stiffness requirements of such members (min ts in tables 7.12 to 7.15) increase with the web thickness.
Furthermore, looking attentively at the results in tables 7.12 to 7.15 as well as in Figures 7.23, 7.25 and 7.27, it is first observed that there is practically no influence of the stiffener rigidity on the F1 load (loss of linearity), which, as demonstrated, is primarily governed by the web. Subsequently, Fig. 7.29 shows the obtained ultimate load capacity of the girders F2 as a function of the relative stiffness ts/tf (since bf=bs in all specimens). For all cases, F2 increases with ts/tf. The relative increment of ultimate load capacity, however, is not very significant. In fact, the trends observed are fairly horizontal. Seemingly, the transverse stiffeners cross-section does not play a role upon the ultimate load capacity F2 of the girders to a decisive way (this statement is valid for cases 3 to 6 since cases 1 and 2 proved a shear-patch loading interaction clearly influenced by the transverse stiffeners).

164 Chapter 7. Resistance of hybrid steel plate girders subjected to concentrated loads
500
600
700
800
900
1000
1100
0,00 0,20 0,40 0,60 0,80 1,00 1,20
Ulti
mat
e lo
ad ca
paci
ty F
2(k
N)
ts/tf
Group A3. hw=500mm
tw=5mmtw=6mmtw=8mmtw=10mm
800
1000
1200
1400
1600
1800
2000
0,00 0,20 0,40 0,60 0,80 1,00 1,20
Ulti
mat
e lo
ad ca
pcity
F2
(kN
)
ts/tf
Group B3. hw=1000mm
tw=6mmtw=8mmtw=10mm
1200
1400
1600
1800
2000
2200
2400
0,00 0,10 0,20 0,30 0,40 0,50 0,60 0,70 0,80
Ulti
mat
e lo
ad ca
paci
ty F
2(k
N)
ts/tf
Group C3. hw=1500mm
tw=8mmtw=10mmtw=12mm
2200
2700
3200
3700
4200
4700
0,00 0,10 0,20 0,30 0,40 0,50 0,60 0,70 0,80
Ulti
mat
e lo
ad ca
paci
ty F
2(k
N)
ts/tf
Group D3. hw=2000mm
tw=12mmtw=15mmtw=20mm
Fig. 7.29. Ultimate load capacity F2 vs. ts/tf.
Table 7.16 displays numerical values that confirm these visual hypotheses. The following calculated values are included within the table (only for cases 3 to 6, as mentioned above):
F2,max and F2,min as the maximum and minimum obtained values for each different girder within the set of variations of ts/tf presented in tables 7.10 to 7.15 and Fig. 7.29 (excepting girders which belongs to cases 1 and 2).
F2, mean as the average calculated value of F2 between F2, max and F2, min.
%(F2 max-min) as the calculated increment of ultimate load capacity in terms of percentage between extreme values according to eq 7.16. This value is a relative quantity.
100F
FFF
2
222 ·%
min
minmaxminmax
(7.16)
δ (F2 max-min) as the calculated difference of ultimate load capacity between extreme values. This value is an absolute quantity.

165 Chapter 7. Resistance of hybrid steel plate girders subjected to concentrated loads
Group hw=a tw F2, max F2, min F2, mean % (F2 max-min) (F2 max-min)5 687,18 647,00 665,76 6,2 40,26 752,47 702,14 727,24 7,2 50,38 891,30 843,21 865,08 5,7 48,1
10 1056,46 1009,73 1030,66 4,6 46,76 1395,05 1323,10 1356,92 5,4 72,08 1572,89 1518,18 1545,45 3,6 54,7
10 1781,54 1722,58 1754,25 3,4 59,08 1739,54 1721,46 1731,93 1,1 18,1
10 1985,93 1931,56 1957,64 2,8 54,412 2244,03 2183,30 2206,88 2,8 60,712 2719,79 2653,93 2680,80 2,5 65,915 3188,96 3106,59 3142,77 2,7 82,420 4415,86 4379,77 4402,92 0,8 36,1
D3 2000
A3 500
B3 1000
C3 1500
Table 7.16. Influence of the transverse stiffener rigidity upon F2.
(Distances in mm, Loads in kN) From the foregoing table, it is worth pointing out the following conclusions:
% (F2 max-min) ranges from a minimum value of 0,8% to a maximum value of 7,2%. These relative results show that the influence of ts/tf on F2 is very low in terms of percentage.
For all cases, δ (F2 max-min)<< F2, mean. These absolute results confirm that the influence of ts/tf on F2 is practically negligible on F2 (again, for cases 3 to 6).
For summary purposes, the observed failure mechanisms depicted in Figs. 7.23, 7.25 and 7.27 are illustrative. The overall conclusions that can be drawn up from all results are twofold:
If F1≥2Vcr and the transverse stiffeners are flexible (namely, case 1, 2 and 3), buckling of these members as well as shear buckling of the adjacent panels is observed to some extent. In addition, it is noticeable that these members exert a considerable influence upon the stress distribution on the adjacent panels of the girders. In such cases, instability and other structural problems may arise. The entire top flange moment capacity of such specimens cannot be achieved. It is beyond the scope of this work to develop further research on the potential effect of the adjacent panels when high shear interactions are observed
If F1<2Vcr and the members are rigid enough, the failure mechanisms as well as the ultimate load capacity F2 are not particularly influenced by the ts/tf ratio. Furthermore, the required stiffness proposed by EN1993-1-5 is considered sufficient for these members to achieve a full post-F1 capacity. This stiffness has been verified for the conservative case of no contribution of the web panel in the stiffener moment of inertia. Noticeably, though, the obtained values of Ff and
Fv, however, decrease in all cases with the web thickness. That is to say, the stockier the web panel, the smaller the value of NEd. In addition, it has been observed that the minimum stiffness requirements of such members increase with the web thickness. Accordingly, the stiffener design does not seem very optimal. As far as known by the author, several works on optimal design of transverse stiffeners are being developed at the time of the present work. In this

166 Chapter 7. Resistance of hybrid steel plate girders subjected to concentrated loads
doctoral thesis, the EN1993-1-5 assumptions are thought of as valid since they represent a conservative approach for the design of transverse stiffeners. No attempts for studying the optimal design of such members are addressed. Further research on this topic may improve the design of such members by using more efficiently their structural capacity.
Consequently, only the cases with the minimum stiffness required in EN1993-1-5 and with no shear-patch loading interaction are treated hereafter (namely, cases 4 and 6). These cases are summarized in table 7.17.
Group tw ts ts/tf FRd F1 F2 2*Vcri 2*Vb,Rd �F f �Fv Nb,Rd Case5 20 0,50 235,62 297,25 667,63 443,18 1086,41 370,37 100,21 760,13 46 20 0,50 339,30 483,62 728,58 765,82 1531,64 244,96 0,00 760,13 68 30 0,75 603,20 747,31 879,18 1815,28 1896,84 131,86 0,00 1462,13 6
10 40 1,00 942,50 994,51 1056,46 3545,46 2293,77 61,95 0,00 2117,50 66 20 0,33 339,30 523,59 1347,16 765,82 2006,45 823,57 620,48 567,81 48 30 0,50 603,20 922,16 1544,05 1815,28 2945,18 621,89 565,34 1629,80 6
10 40 0,67 942,50 1408,14 1766,63 3545,46 4046,00 358,49 251,03 3040,53 68 40 0,50 603,20 1083,28 1739,54 1210,19 3434,01 656,27 1112,17 1827,64 4
10 40 0,50 942,50 1407,09 1962,97 2363,64 4573,76 555,89 1105,57 1827,64 612 60 0,75 1357,20 1928,00 2244,03 4084,37 5874,25 316,03 895,82 4560,80 612 40 0,50 1357,20 2147,96 2678,77 3063,28 6663,69 530,81 1800,20 2044,13 615 40 0,50 2120,62 2967,05 3148,23 5982,97 9020,78 181,18 1518,91 2044,13 620 60 0,75 3648,58 4321,67 4379,77 14181,86 13832,74 58,10 0,00 3716,29 6
D3
C3
B3
A3
Table 7.17. Summary of cases studied herafter.
(Distances in mm, Loads in kN)
For these highlighted cases, Figures 7.30 to 7.33 show the structural response in a form of P- plots. The stiffeners cross-sections in such cases are sufficient according to EN1993-1-5 provisions.
0
200
400
600
800
1000
1200
0 5 10 15 20
Loa
d (k
N)
Displacement (mm)
hw=500 mm
tw=5mm
tw=6mm
tw=8mm
tw=10mm
Fig. 7.30. Structural response of girders subjected to patch loading. Group A3

167 Chapter 7. Resistance of hybrid steel plate girders subjected to concentrated loads
0
200
400
600
800
1000
1200
1400
1600
1800
2000
0 5 10 15 20
Load
(kN
)
Displacement (mm)
hw=1000mm
tw=6mm
tw=8mm
tw=10mm
Fig. 7.31. Structural response of girders subjected to patch loading. Group B3
0
500
1000
1500
2000
2500
0 5 10 15 20
Loa
d (k
N)
Displacement (mm)
hw=1500mm
tw=8mm
tw=10mm
tw=12mm
Fig. 7.32. Structural response of girders subjected to patch loading. Group C3
0
500
1000
1500
2000
2500
3000
3500
4000
4500
5000
0 5 10 15 20 25 30
Load
(kN
)
Displacement (mm)
hw=2000mm
tw=12mm
tw=15mm
tw=20mm
Fig. 7.33. Structural response of girders subjected to patch loading. Group D3

168 Chapter 7. Resistance of hybrid steel plate girders subjected to concentrated loads
7.3.2 Influence of the top flange resistance. The numerical observations have shown the following response of the girders. The specimens are loaded up to F1. At this point, the web folds whereas the top flange remains elastic. At this load, the flanges are longitudinally stressed (σf) to some extent. The web membrane stress (yield lines) anchorage into the stiffeners-to-flange junctures (if the transverse members are sufficiently rigid). From F1 to F2, the stress levels in the top flange are increased from σf up to fyf, after awhile F2 is achieved and the capacity is exhausted. Fig. 7.35 shows a schematic view of this observed mechanism.
Fig. 7.35. Schematic failure mechanism for girders subjected to patch loading.
Case of closely spaced transversal stiffeners.
Likewise, Fig. 7.35 displays the visual numerical observations (in this case, von Mises stresses) obtained for one specimen belonging to group A3.
Fig. 7.35. von Mises stresses at F1 and F2. Group A3, hw=5mm

169 Chapter 7. Resistance of hybrid steel plate girders subjected to concentrated loads
Certainly, the influence of the top flange moment resistance is considerable and must-quantify. For the sake of evaluation, longitudinal stress evolutions were studied in specimens presented in table 7.17 in the form of load vs. σf-stress. These stresses were inferred from the numerical results on two separated zones displayed in Fig. 7.36:
The potential outer hinge located in the flange-to-stiffener junctures within a distance equal to the flange thickness tf.
The potential inner hinge located in the edge of the bearing length. The stresses were studied within a distance equal to the flange thickness tf symmetrically located from the edge.
Fig. 7.36. Location of plastic hinges at F2.
Figures 7.37 to 7.40 show the evolution of these longitudinal stresses in the form of load vs. σf plots.
0
200
400
600
800
1000
1200
0 50 100 150 200 250
Loa
d (k
N)
Longitudinal stress f (N/mm2)
hw=500mm. Outer hinge
tw=5mmtw=6mmtw=8mmtw=10mm
0
200
400
600
800
1000
1200
0 50 100 150 200 250
Loa
d (k
N)
Longitudinal stress f (N/mm2)
hw=500mm. Inner hinge
tw=5mmtw=6mmtw=8mmtw=10mm
Fig. 7.37. Load vs. σf . Group A3

170 Chapter 7. Resistance of hybrid steel plate girders subjected to concentrated loads
0
200
400
600
800
1000
1200
1400
1600
1800
0 50 100 150 200 250
Loa
d (k
N)
Longitudinal stress f (N/mm2)
hw=1000 mm. Outer hinge
tw=6mmtw=8mmtw=10mm
0
200
400
600
800
1000
1200
1400
1600
1800
0 50 100 150 200 250
Loa
d (k
N)
Longitudinal stress f (N/mm2)
hw=1000 mm. Inner hinge
tw=6mmtw=8mmtw=10mm
Fig. 7.38. Load vs. σf . Group B3
0
500
1000
1500
2000
2500
0 50 100 150 200 250
Loa
d (k
N)
Longitudinal stress f (N/mm2)
hw=1500mm. Outer hinge
tw=8mmtw=10mmtw=12mm
0
500
1000
1500
2000
2500
0 50 100 150 200 250
Loa
d (k
N)
Longitudinal stress f (N/mm2)
hw=1500mm. Inner hinge
tw=8mmtw=10mmtw=12mm
Fig. 7.39. Load vs. σf . Group C3
0
500
1000
1500
2000
2500
3000
3500
4000
4500
5000
0 50 100 150 200 250
Loa
d (k
N)
Longitudinal stress f (N/mm2)
hw=2000mm. Outer hinge
tw=12mmtw=15mmtw=20mm
0
500
1000
1500
2000
2500
3000
3500
4000
4500
5000
0 50 100 150 200 250 300
Loa
d (k
N)
Longitudinal stress f (N/mm2)
hw=2000mm. Inner hinge
tw=12mmtw=15mmtw=20mm
Fig. 7.40. Load vs. σf . Group D3
From these numerical observations, one can point out the following conclusions:
All girders present a considerable change of slope. The loss of linearity matches precisely with the defined load F1. From this point onwards, the stress level increases considerably for further load increments.

171 Chapter 7. Resistance of hybrid steel plate girders subjected to concentrated loads
At F1, for a given girder, σf in either outer or inner hinges is web-slenderness dependent. The trend can be read as follows, the stockier the panel, the higher the value of σf.
For all cases, the stress levels within the inner hinges are higher than those obtained within the outer hinges at F1.
Moreover, eq. 7.17 defines this actual stress level of the flanges σf (at location j) by aid of coefficient χfj , which can be understood as the ratio between the actual stress σf at F1 and the flange yield strength.
yf
fjfj f
(7.17)
Fig 7.41 displays the obtained ratio χfj for outer (χfo) and inner (χfi) hinges as a function of the web slenderness.
0,00
0,20
0,40
0,60
0,80
1,00
1,20
0 20 40 60 80 100 120
Xf
hw/tw
hw=500mm
Outer hingeInner hinge
0,00
0,20
0,40
0,60
0,80
1,00
1,20
0 50 100 150 200
Xf
hw/tw
hw=1000mm
Outer hingeInner hinge
0,00
0,20
0,40
0,60
0,80
1,00
1,20
0 50 100 150 200
Xf
hw/tw
hw=1500mm
Outer hingeInner hinge
0,00
0,20
0,40
0,60
0,80
1,00
1,20
0 50 100 150 200
Xf
hw/tw
hw=2000mm
Outer hingeInner hinge
Fig. 7.41. χf vs hw/tw at F1 load.
From these numerical observations, one can point out the following conclusions:
The calculated stress level χf at F1 decreases with the web slenderness.
In all cases, the calculated stress level in the inner hinge (χfi) is higher than the calculated stress in the outer hinge (χfo).

172 Chapter 7. Resistance of hybrid steel plate girders subjected to concentrated loads
For some stocky panels, the actual value of σf at F1 at inner hinges is fyf (χfi=1,0). That is to say, early yielding within the top flange is observed at F1. The developing of four plastic hinges in such cases and thus, of a post-F1 capacity, is seriously questioned. For one of these cases (namely, the girder from group D3, hw=2000mm, tw=20mm, see table 7.18), ly is not greater than the distance between transverse stiffeners a. Accordingly, this case should not be treated as belonging to the second category of closely spaced transverse stiffeners.
In addition, results observed in table 7.17 show that ΔFf decreases with the web thickness tw, which is completely logic since the actual value of σf at F1 also increases with tw. The numerical observations show that ΔFf depends primarily on this moment resistance reserve of the flanges (stress level χf). A mechanism solution aimed to reproduce this response is presented in the following. 7.3.3 New proposal. The present formulation provided in EN1993-1-5 for the case of plate girders subjected to patch loading in which ly>a does not consider the contribution of the moment resistance reserve of the loaded flange. Table 7.18 shows theoretical and numerical results obtained in 13 girders belonging to the fourth parametric study. Furthermore, the ratio F2/FRd=X is included within the table. The obtained scatter of X is subsequently plotted in Fig. 7.42, as a function of the web slenderness. Group bf tf tw hw a hw/tw ly ly,corrected FRd F2,num F2,num / FRd=X
250 40 5 500 500 100 788,10 500 235,62 667,63 2,83250 40 6 500 500 83,333 740,41 500 339,30 728,58 2,15250 40 8 500 500 62,5 674,04 500 603,20 879,18 1,46250 40 10 500 500 50 629,26 500 942,50 1056,46 1,12500 60 6 1000 1000 166,67 1501,37 1000 339,30 1347,16 3,97500 60 8 1000 1000 125 1359,95 1000 603,20 1544,05 2,56500 60 10 1000 1000 100 1264,43 1000 942,50 1766,63 1,87500 80 8 1500 1500 187,5 1869,17 1500 603,20 1739,54 2,88500 80 10 1500 1500 150 1743,30 1500 942,50 1962,97 2,08500 80 12 1500 1500 125 1651,54 1500 1357,20 2244,03 1,65900 80 12 2000 2000 166,67 2156,66 2000 1357,20 2678,77 1,97900 80 15 2000 2000 133,33 2022,35 2000 2120,62 3148,23 1,48900 80 20 2000 2000 100 1873,26 1873,26 3648,58 4379,77 1,20
A3
B3
C3
D3
Table 7.18. Summary of the studied cases.
(Distances in mm. Loads in kN)
0,00
0,50
1,00
1,50
2,00
2,50
3,00
3,50
4,00
4,50
0 50 100 150 200
F 2,n
um/ F
Rd
hw/tw Fig. 7.42. F2 / FRd vs. hw/tw.
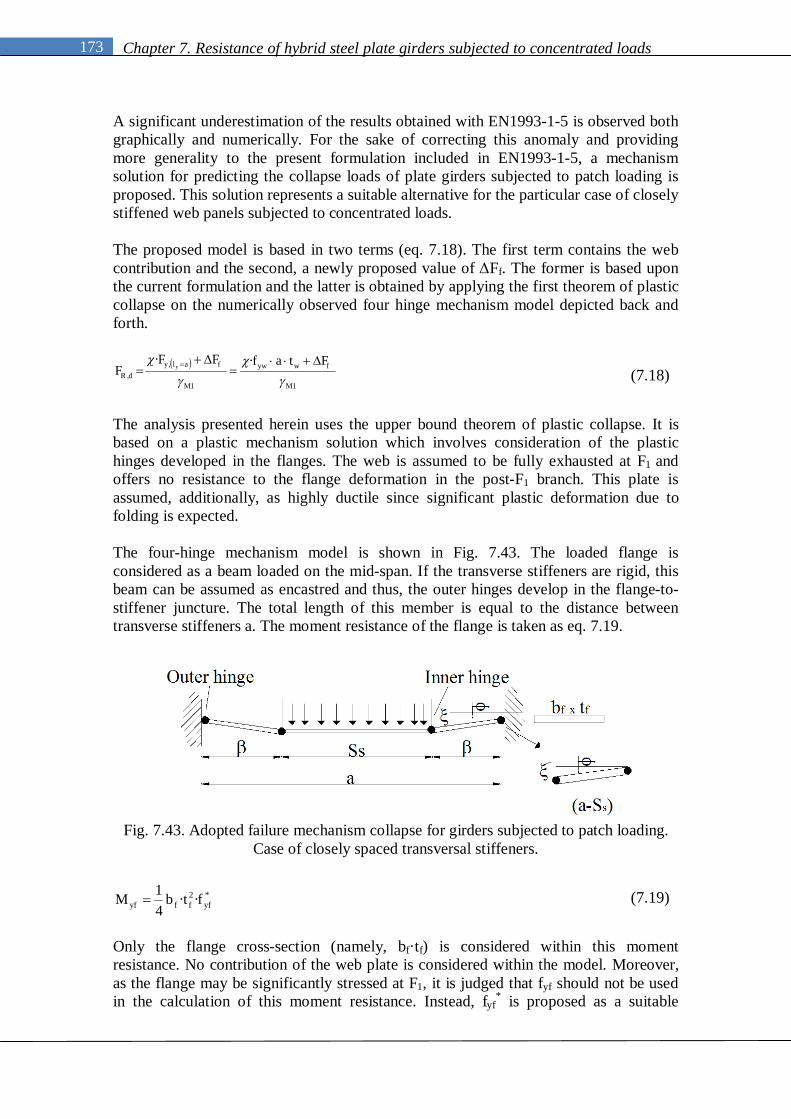
173 Chapter 7. Resistance of hybrid steel plate girders subjected to concentrated loads
A significant underestimation of the results obtained with EN1993-1-5 is observed both graphically and numerically. For the sake of correcting this anomaly and providing more generality to the present formulation included in EN1993-1-5, a mechanism solution for predicting the collapse loads of plate girders subjected to patch loading is proposed. This solution represents a suitable alternative for the particular case of closely stiffened web panels subjected to concentrated loads. The proposed model is based in two terms (eq. 7.18). The first term contains the web contribution and the second, a newly proposed value of ΔFf. The former is based upon the current formulation and the latter is obtained by applying the first theorem of plastic collapse on the numerically observed four hinge mechanism model depicted back and forth.
1M
fwyw
1M
falydR
FtafFFF y
·· ,
, (7.18)
The analysis presented herein uses the upper bound theorem of plastic collapse. It is based on a plastic mechanism solution which involves consideration of the plastic hinges developed in the flanges. The web is assumed to be fully exhausted at F1 and offers no resistance to the flange deformation in the post-F1 branch. This plate is assumed, additionally, as highly ductile since significant plastic deformation due to folding is expected. The four-hinge mechanism model is shown in Fig. 7.43. The loaded flange is considered as a beam loaded on the mid-span. If the transverse stiffeners are rigid, this beam can be assumed as encastred and thus, the outer hinges develop in the flange-to-stiffener juncture. The total length of this member is equal to the distance between transverse stiffeners a. The moment resistance of the flange is taken as eq. 7.19.
Fig. 7.43. Adopted failure mechanism collapse for girders subjected to patch loading.
Case of closely spaced transversal stiffeners.
*·· yf2ffyf ftb
41M (7.19)
Only the flange cross-section (namely, bf·tf) is considered within this moment resistance. No contribution of the web plate is considered within the model. Moreover, as the flange may be significantly stressed at F1, it is judged that fyf should not be used in the calculation of this moment resistance. Instead, fyf
* is proposed as a suitable

174 Chapter 7. Resistance of hybrid steel plate girders subjected to concentrated loads
alternative. This value is defined as the available yield strength reserve of the flange (eq. 7.20). The above defined magnitudes χfi and χfo represent the ratio of actual longitudinal stress level σfj for each cross-section at F1.
yf
jfjyffiiyfyffooyf f
f1ff1f
·· *,
*, (7.20)
Eq. 7.21 shows the value of ΔFf in terms of the geometrical proportions and fyf
* as well as the virtual displacements (displacement and rotation ). These magnitudes are assumed infinitesimal and thus, /= . Equating external and internal work gives:
*
,*
,,,
,, ··
····
····· iyfs
2ff
oyfs
2ffiyfoyf
fiyfoyff fSatb
fSatbM2M2
FM2M2F
(7.21)
Finally, after some easy-to-derive mathematical simplifications and using eq. 7.20, ΔFf can be presented in the simplified form of eq. (7.22)
fifos
yf2ff
f 2Saftb
F
···
(7.22) If χfi and χfo are taken from the numerical results shown in Fig 7.41, eq. 7.22 can be applied on the studied girders. Table 7.19 displays a summary of the magnitudes involved within the model as well as the proposed ultimate load capacity FRd
* Group tw Xfo Xfi FRd F1 F2 (F2-F1) ΔFf FRd*=FRd+ΔFf F2/FRd
* F1+ΔFf F2/(F1+ΔFf)5 0,16 0,42 235,62 297,25 667,63 370,37 356,28 591,90 1,13 653,53 0,986 0,27 0,70 339,30 483,62 728,58 244,96 256,68 595,98 1,22 740,29 1,028 0,52 0,97 603,20 747,31 879,18 131,86 127,53 730,73 1,20 874,85 1,00
10 0,80 1,00 942,50 994,51 1056,46 61,95 49,37 991,87 1,07 1043,88 0,996 0,14 0,35 339,30 523,59 1347,16 823,57 847,13 1186,43 1,14 1370,72 1,028 0,30 0,61 603,20 922,16 1544,05 621,89 612,85 1216,05 1,27 1535,02 0,99
10 0,54 0,88 942,50 1408,14 1766,63 358,49 325,86 1268,36 1,39 1734,00 0,988 0,24 0,62 603,20 1083,28 1739,54 656,27 765,50 1368,70 1,27 1848,78 1,06
10 0,27 0,77 942,50 1407,09 1962,97 555,89 642,36 1584,85 1,24 2049,44 1,0412 0,32 0,92 1357,20 1928,00 2244,03 316,03 508,26 1865,45 1,20 2436,26 1,0912 0,46 0,88 1357,20 2147,96 2678,77 530,81 598,77 1955,96 1,37 2746,73 1,0315 0,47 1,00 2120,62 2967,05 3148,23 181,18 478,34 2598,96 1,21 3445,39 1,0920 0,49 1,00 3648,58 4321,67 4379,77 58,10 462,21 4110,79 1,07 4783,88 1,09
A3
B3
C3
D3
Table 7.19. Summary of the results obtained with the new proposal
(Distances in mm. Loads in kN) From the results presented in table 7.19, one can point out the following conclusions:
The numerically obtained values F2-F1 decrease with the web thickness (this statement being previously shown).
The proposed values of ΔFf decrease with the web thickness as well. This facts is explained since χfi and χfo increase with this magnitude. The proposed model reflects this fact quite satisfactorily.
Generally, ΔFf proposed values are similar enough to those obtained numerically
(these values are shown as F2-F1 within the table).

175 Chapter 7. Resistance of hybrid steel plate girders subjected to concentrated loads
Two girders from group D3 and one girder from group C3 show unsatisfactory results. It is worth pointing out that these models present a considerable yielding in the top flange at inner hinges at F1 load. The predicted value ΔFf includes the moment resistance reserve from the outer hinges but apparently, the actual contribution of the flange is practically null according to the results. This fact warns about the potential usage of the proposed model for the cases in which either χfi or χfo tends to 1,00 (early yielding of the flange occurs).
Generally, the F1+ΔFf proposed values are satisfactorily similar to those
obtained numerically F2.
Moreover, the FRd*=FRd+ΔFf proposed design values lead to a satisfactory
prediction of the actual ultimate load capacity. This prediction includes a safety margin, which is dependent on the current ratio F1/FRd.
One attempt of modifying the new proposal for the sake of correcting the observed overestimations is to limit the value of ΔFf according to eq. 7.23. Theoretically, this limitation can be understood as no contribution of the flange resistance if early yielding of this member is noticed at F1. This situation may arise for girders with stocky panels.
01if0F fjf , (7.23) Group tw Xfo Xfi FRd F1 F2 (F2-F1) ΔFf FRd*=FRd+ΔFf F2/FRd
* F1+ΔFf F2/(F1+ΔFf)5 0,16 0,42 235,62 297,25 667,63 370,37 356,28 591,90 1,13 653,53 0,986 0,27 0,70 339,30 483,62 728,58 244,96 256,68 595,98 1,22 740,29 1,028 0,52 0,97 603,20 747,31 879,18 131,86 127,53 730,73 1,20 874,85 1,00
10 0,80 1,00 942,50 994,51 1056,46 61,95 0,00 942,50 1,12 994,51 0,946 0,14 0,35 339,30 523,59 1347,16 823,57 847,13 1186,43 1,14 1370,72 1,028 0,30 0,61 603,20 922,16 1544,05 621,89 612,85 1216,05 1,27 1535,02 0,99
10 0,54 0,88 942,50 1408,14 1766,63 358,49 325,86 1268,36 1,39 1734,00 0,988 0,24 0,62 603,20 1083,28 1739,54 656,27 765,50 1368,70 1,27 1848,78 1,06
10 0,27 0,77 942,50 1407,09 1962,97 555,89 642,36 1584,85 1,24 2049,44 1,0412 0,32 0,92 1357,20 1928,00 2244,03 316,03 508,26 1865,45 1,20 2436,26 1,0912 0,46 0,88 1357,20 2147,96 2678,77 530,81 598,77 1955,96 1,37 2746,73 1,0315 0,47 1,00 2120,62 2967,05 3148,23 181,18 0,00 2120,62 1,48 2967,05 0,9420 0,49 1,00 3648,58 4321,67 4379,77 58,10 0,00 3648,58 1,20 4321,67 0,99
C3
D3
A3
B3
Table 7.20. Summary of the results obtained with the new modified proposal
(Distances in mm. Loads in kN) Fig. 7.44 shows the ratios between the ultimate load capacity of the girders obtained by the numerical model (F2) and the following magnitudes:
The current formulation of EN1993-1-5 (FRd) The predicted sum F1 + ΔFf. The former term is numerically obtained and the
latter, predicted from eq. 7.22.

176 Chapter 7. Resistance of hybrid steel plate girders subjected to concentrated loads
0,00
0,50
1,00
1,50
2,00
2,50
3,00
3,50
4,00
4,50
0 50 100 150 200
F 2/ F
pred
icte
d
hw/tw
F2/(FRd)
F2/(F1+DFf)
Fig. 7.44. F2 / Fpredicted vs. hw/tw.
Readably, the current FRd highly underestimates the actual capacity of the girders whereas the sum (F1 + ΔFf) is satisfactorily close to the ultimate load capacity of the girders obtained by the numerical model F2. Moreover, the mean values of the scatter presented in Fig. 7.44 read:
Rd
2
FF =2,10
f1
2
FFF =1,01
The average of the first magnitude is admittedly high whereas in the second, the mean value is thought of as being fundamentally sound. In fact, very good agreement with the numerical results is observed. The sum F1 + ΔFf, though, is not a design load for its own sake since F1 is a numerically inferred magnitude. F1 is significantly related to the current design verification FRd though. It has been foreshown that this resistance is primarily governed by the web. Similarly, Fig. 7.45 shows the ratios between the ultimate load capacity of the girders obtained by the numerical model F2 and:
The current formulation of EN1993-1-5 (FRd) The sum FRd
* = FRd + ΔFf. In this case, the former term is the currently included in EN1993-1-5 and the latter, is the term obtained from eq. 7.22.

177 Chapter 7. Resistance of hybrid steel plate girders subjected to concentrated loads
0,00
0,50
1,00
1,50
2,00
2,50
3,00
3,50
4,00
4,50
0 50 100 150 200
F 2/ F
pred
icte
d
hw/tw
F2/FRdF2/FRd*
Fig. 7.45. F2 / Fpredicted vs. hw/tw.
In this case, the mean value of the scatter from FRd
* is:
fRd
2
FFF = 1,42
This magnitude might be understood as the mean safety margin currently existing for the ratio (F1 / FRd). Presently, the prediction FRd is sufficiently conservative when compared to numerically or experimentally obtained values of F1. Clearly and expectably, F1 is for all cases greater than FRd. Noticeably, this approximate method of analysis leads to a satisfactory prediction of collapse loads. The method might be adaptable for design purposes inasmuch as the actual stress levels of the flanges are accurately known in advance. It has been, nonetheless, observed that the safety margin (F1/FRd) is also web-slenderness dependent. Fig. 7.46 shows the obtained (F1/FRd) values as a function of hw/tw. The best linear fit is also indicated in the plot. These findings are fundamental for the conclusions presented in the following section.
y = 0,004x + 0,939
0,8
1
1,2
1,4
1,6
1,8
2
0 50 100 150 200 250
F 1 /
F Rd
hw/tw Fig. 7.46. F1 / FRd vs. hw/tw.

178 Chapter 7. Resistance of hybrid steel plate girders subjected to concentrated loads
Flange resistance reserve. χfi and χfo The flange remaining strength reserve (fyf
*) has been, so far, inferred from the numerically obtained stress values at F1. From the designer perspective, it is desired that these values could be taken from the global structural analysis when the structure is loaded in a concentrated fashion. Unfortunately, as the defined magnitudes χfi and χfo represent the ratio of actual longitudinal stress level σfj for each cross-section at F1, the designer would not, therefore, necessarily know the actual value of such concentrated load. As a result, the suitable alternative for the designer is using the current value FRd (ly=a), as a concentrated load applied in the panel when studying the structure globally. A global elastic analysis of the structure including all dead loads would eventually lead to an accurate prediction of the longitudinal stress level σfj for each cross-section. This prediction may, however, be inherently dependent on the reliability of such elastic analysis. There is a drawback though. As shown in Fig. 7.46, F1 is greater than FRd for all cases. If one infers the longitudinal stress at FRd, the values will always lead to unsafe predictions of the realistic stress level of σfj. The flanges would happen to be less stressed than they actually are and as a consequence, ΔFf would happen to be greater than it should. For the sake of correcting this anomaly, an extra coefficient is proposed in eq. 7.24 for χfj (previously defined in eq. 7.20), this coefficient is based on a simplification of the linear regression (best linear fit) depicted in Fig. 7.46 on the existing relationship between F1/FRd and hw/tw. This coefficient approaches 1,0 as the web slenderness approaches 0 (stocky prototypes). Likewise, the coefficient may increase the stress level for very slender girders, in which it is proven that the safety margin is considerably high.
w
w
yf
Fjfj t
h005001
fRd ·,,·,
(7.24)
7.3.4 Influence of the fyf/fyw ratio Since the most significant parameter of the proposed model is the remaining top flange strength fyf
*, the hybrid girder design must be studied thoroughly. In order to assess the influence of the fyf/fyw ratio on the resistance of plate girders subjected to patch loading a fifth parametric numerical study is presented in table 7.21. This final parametric study is based upon the cases presented in table 7.17 corresponding to the highlighted girders belonging to groups A3, B3, C3 and D3. Two additional girders, namely, fyf/fyw=355/235 and fyf/fyw=460/235 are added for each one of these prototypes. In the following table, apart from geometric and mechanical proportions of the specimens, the following calculated magnitudes are indicated:
The effectively loaded length ly (eq. 7.4 and if the case, the corrected one). The design resistance FRd from EN1993-1-5.
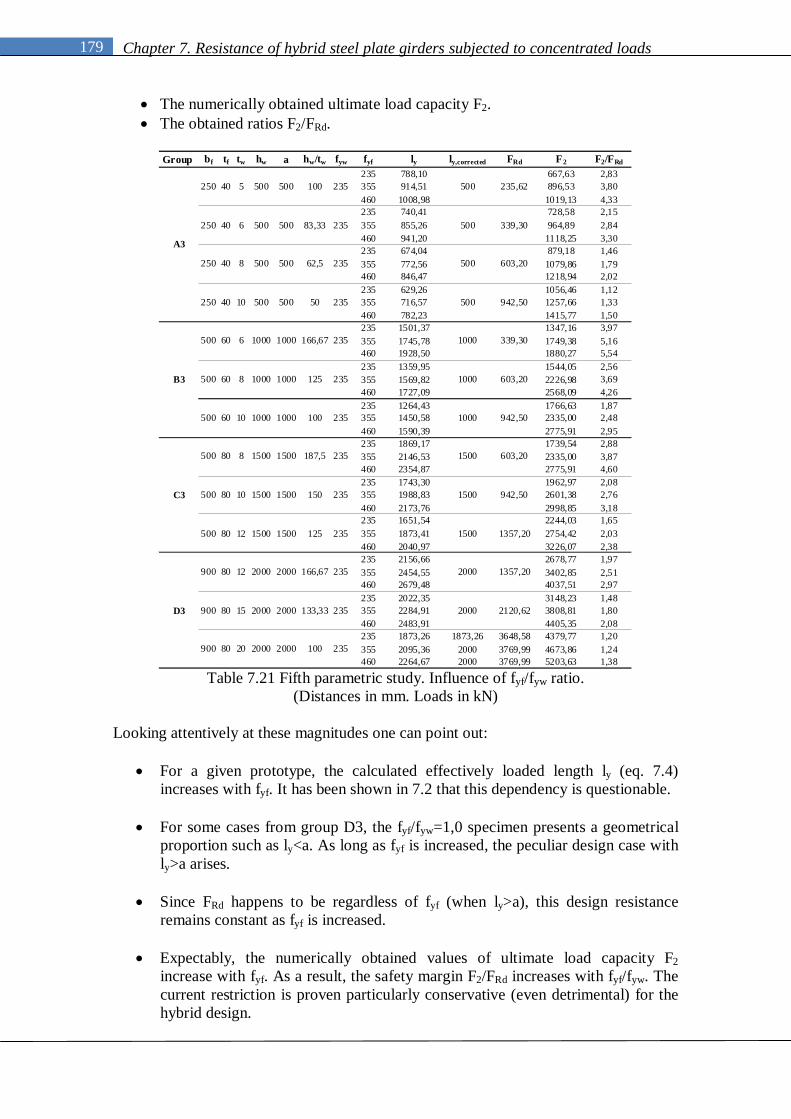
179 Chapter 7. Resistance of hybrid steel plate girders subjected to concentrated loads
The numerically obtained ultimate load capacity F2. The obtained ratios F2/FRd.
Group bf tf tw hw a hw/tw fyw fyf ly ly,corrected FRd F2 F2/FRd
235 788,10 667,63 2,83355 914,51 896,53 3,80460 1008,98 1019,13 4,33235 740,41 728,58 2,15355 855,26 964,89 2,84460 941,20 1118,25 3,30235 674,04 879,18 1,46355 772,56 1079,86 1,79460 846,47 1218,94 2,02235 629,26 1056,46 1,12355 716,57 1257,66 1,33460 782,23 1415,77 1,50235 1501,37 1347,16 3,97355 1745,78 1749,38 5,16460 1928,50 1880,27 5,54235 1359,95 1544,05 2,56355 1569,82 2226,98 3,69460 1727,09 2568,09 4,26235 1264,43 1766,63 1,87355 1450,58 2335,00 2,48460 1590,39 2775,91 2,95235 1869,17 1739,54 2,88355 2146,53 2335,00 3,87460 2354,87 2775,91 4,60235 1743,30 1962,97 2,08355 1988,83 2601,38 2,76460 2173,76 2998,85 3,18235 1651,54 2244,03 1,65355 1873,41 2754,42 2,03460 2040,97 3226,07 2,38235 2156,66 2678,77 1,97355 2454,55 3402,85 2,51460 2679,48 4037,51 2,97235 2022,35 3148,23 1,48355 2284,91 3808,81 1,80460 2483,91 4405,35 2,08235 1873,26 1873,26 3648,58 4379,77 1,20355 2095,36 2000 3769,99 4673,86 1,24460 2264,67 2000 3769,99 5203,63 1,38
2000
2000
235
235
235
1357,20
2120,62
2000
2000
2000 2000
2000
166,67
133,33
100
235
235
235
D3
900 80
900 80
900 80
1500
1500
1500
603,20
942,50
1357,20
1500
1500
1500 125
150
187,58
10
12 1500
1500
1500
235
235
235
C3
500
500
500 80
80
80
1000
1000
1000
339,30
603,20
942,50
1000
1000
1000
166,67
125
100
6
8
10 1000
1000
1000
B3
500
500
500 60
60
60
500
500
500
500 942,50
603,20
339,30
235,62100
83,33
62,5
50
235
235
235
235
500
500
500
500
500
500
500
500250 40
40
40
40 5
6
8
10
20
15
12 2000
A3
250
250
250
Table 7.21 Fifth parametric study. Influence of fyf/fyw ratio.
(Distances in mm. Loads in kN)
Looking attentively at these magnitudes one can point out:
For a given prototype, the calculated effectively loaded length ly (eq. 7.4) increases with fyf. It has been shown in 7.2 that this dependency is questionable.
For some cases from group D3, the fyf/fyw=1,0 specimen presents a geometrical proportion such as ly<a. As long as fyf is increased, the peculiar design case with ly>a arises.
Since FRd happens to be regardless of fyf (when ly>a), this design resistance
remains constant as fyf is increased.
Expectably, the numerically obtained values of ultimate load capacity F2 increase with fyf. As a result, the safety margin F2/FRd increases with fyf/fyw. The current restriction is proven particularly conservative (even detrimental) for the hybrid design.
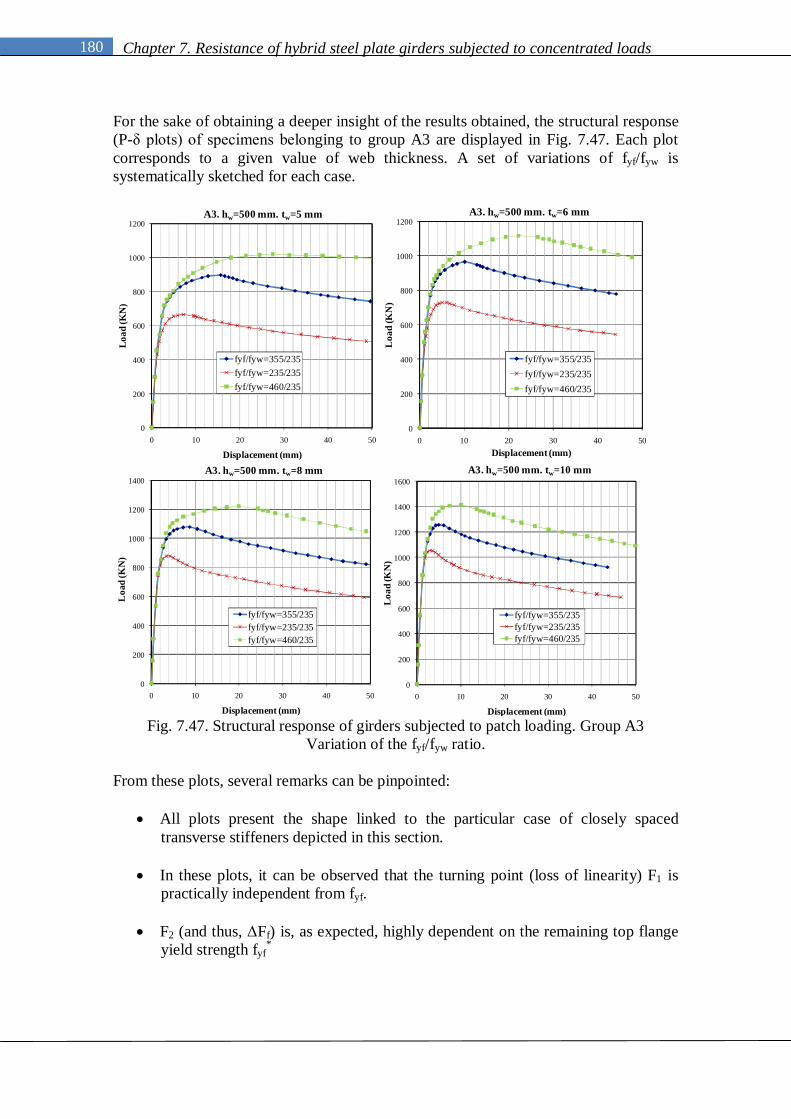
180 Chapter 7. Resistance of hybrid steel plate girders subjected to concentrated loads
For the sake of obtaining a deeper insight of the results obtained, the structural response (P-δ plots) of specimens belonging to group A3 are displayed in Fig. 7.47. Each plot corresponds to a given value of web thickness. A set of variations of fyf/fyw is systematically sketched for each case.
0
200
400
600
800
1000
1200
0 10 20 30 40 50
Loa
d (K
N)
Displacement (mm)
A3. hw=500 mm. tw=5 mm
fyf/fyw=355/235fyf/fyw=235/235fyf/fyw=460/235
0
200
400
600
800
1000
1200
0 10 20 30 40 50
Loa
d (K
N)
Displacement (mm)
A3. hw=500 mm. tw=6 mm
fyf/fyw=355/235fyf/fyw=235/235fyf/fyw=460/235
0
200
400
600
800
1000
1200
1400
0 10 20 30 40 50
Loa
d (K
N)
Displacement (mm)
A3. hw=500 mm. tw=8 mm
fyf/fyw=355/235fyf/fyw=235/235fyf/fyw=460/235
0
200
400
600
800
1000
1200
1400
1600
0 10 20 30 40 50
Loa
d (K
N)
Displacement (mm)
A3. hw=500 mm. tw=10 mm
fyf/fyw=355/235fyf/fyw=235/235fyf/fyw=460/235
Fig. 7.47. Structural response of girders subjected to patch loading. Group A3
Variation of the fyf/fyw ratio.
From these plots, several remarks can be pinpointed:
All plots present the shape linked to the particular case of closely spaced transverse stiffeners depicted in this section.
In these plots, it can be observed that the turning point (loss of linearity) F1 is practically independent from fyf.
F2 (and thus, ΔFf) is, as expected, highly dependent on the remaining top flange
yield strength fyf*

181 Chapter 7. Resistance of hybrid steel plate girders subjected to concentrated loads
In slender girders (A3, tw=5mm), the shape of P-δ plot differs slightly from one fyf/fyw ratio to another. Whether F2 is increased considerably, concerns about instability and shear failure of the adjacent panels may arise.
In stocky girders, the shape of P-δ plot is practically identical from one fyf/fyw
ratio to another. Instability and shear failure of the adjacent panels seem unlikely in these cases.
Fig 7.48 to 7.50 show similar structural responses observed in girders from groups B3 to D3. The plots include two specimens per group. Web slenderness varies from one prototype to another.
0
500
1000
1500
2000
2500
3000
0 10 20 30 40 50 60
Loa
d (K
N)
Displacement (mm)
B3. hw=1000 mm. tw=8 mm
fyf/fyw=355/235fyf/fyw=235/235fyf/fyw=460/235
0
500
1000
1500
2000
2500
3000
0 10 20 30 40 50 60
Loa
d (K
N)
Displacement (mm)
B3. hw=1000 mm. tw=10 mm
fyf/fyw=355/235fyf/fyw=235/235fyf/fyw=460/235
Fig. 7.48. Structural response of girders subjected to patch loading. Group B3
Variation of the fyf/fyw ratio.
0
500
1000
1500
2000
2500
3000
0 20 40 60 80
Load
(KN
)
Displacement (mm)
C3. hw=1500 mm. tw=8 mm
fyf/fyw=355/235fyf/fyw=235/235fyf/fyw=460/235
0
500
1000
1500
2000
2500
3000
3500
0 10 20 30 40 50 60
Load
(KN
)
Displacement (mm)
C3. hw=1500 mm. tw=12 mm
fyf/fyw=355/235fyf/fyw=235/235fyf/fyw=460/235
Fig. 7.49. Structural response of girders subjected to patch loading. Group C3
Variation of the fyf/fyw ratio.

182 Chapter 7. Resistance of hybrid steel plate girders subjected to concentrated loads
0
500
1000
1500
2000
2500
3000
3500
4000
4500
0 10 20 30 40 50 60 70
Loa
d (K
N)
Displacement (mm)
D3. hw=2000 mm. tw=12 mm
fyf/fyw=355/235fyf/fyw=235/235fyf/fyw=460/235
0
500
1000
1500
2000
2500
3000
3500
4000
4500
5000
0 10 20 30 40 50 60 70
Loa
d (K
N)
Displacement (mm)
D3. hw=2000 mm. tw=15 mm
fyf/fyw=355/235fyf/fyw=235/235fyf/fyw=460/235
Fig. 7.50. Structural response of girders subjected to patch loading. Group D3
Variation of the fyf/fyw ratio. Furthermore, table 7.22 shows detailed results concerning the most significant parameters studied so far for all the studied girders. Group tw fyf/fyw Xfo Xfi FRd F1 F2 (F2-F1) ΔFf FRd*=FRd+ΔFf F2/FRd
* F1+ΔFf F2/(F1+ΔFf)1,00 0,16 0,42 667,63 370,37 356,28 591,90 1,13 653,53 0,981,51 0,10 0,28 896,53 599,28 612,28 847,90 1,06 909,53 1,011,96 0,08 0,22 1019,13 721,88 836,28 1071,90 0,95 1133,53 1,111,00 0,27 0,70 728,58 244,96 256,68 595,98 1,22 740,29 1,021,51 0,18 0,46 964,89 481,27 512,68 851,98 1,13 996,29 1,031,96 0,14 0,36 1118,25 634,63 736,68 1075,98 1,04 1220,29 1,091,00 0,52 0,97 879,18 131,86 127,53 730,73 1,20 874,85 1,001,51 0,35 0,64 1079,86 332,54 383,53 986,73 1,09 1130,85 1,051,96 0,27 0,49 1218,94 471,63 607,53 1210,73 1,01 1354,85 1,111,00 0,80 1,00 1056,46 61,95 49,37 991,87 1,07 1043,88 0,991,51 0,53 0,66 1257,66 263,15 305,37 1247,87 1,01 1299,88 1,031,96 0,41 0,51 1415,77 421,25 529,37 1471,87 0,96 1523,88 1,081,00 0,14 0,35 1380,27 856,68 847,13 1186,43 1,16 1370,72 0,991,51 0,10 0,23 1749,38 1225,79 1423,13 1762,43 0,99 1946,72 1,111,96 0,07 0,18 1880,27 1356,68 1927,13 2266,43 0,83 2450,72 1,301,00 0,30 0,61 1544,05 621,89 612,85 1216,05 1,27 1535,02 0,991,51 0,20 0,41 2226,98 1304,82 1188,85 1792,05 1,24 2111,02 0,951,96 0,15 0,31 2568,09 1645,93 1692,85 2296,05 1,12 2615,02 1,021,00 0,54 0,88 1766,63 358,49 325,86 1268,36 1,39 1734,00 0,981,51 0,36 0,58 2335,00 926,86 901,86 1844,36 1,27 2310,00 0,991,96 0,28 0,45 2775,91 1367,77 1405,86 2348,36 1,18 2814,00 1,011,00 0,24 0,62 1737,04 653,77 765,50 1368,70 1,27 1848,78 1,061,51 0,16 0,41 2335,00 1251,72 1448,16 2051,36 1,14 2531,44 1,081,96 0,12 0,32 2775,91 1692,63 2045,50 2648,70 1,05 3128,78 1,131,00 0,27 0,77 1962,97 555,89 642,36 1584,85 1,24 2049,44 1,041,51 0,18 0,51 2601,38 1194,29 1325,02 2267,52 1,15 2732,11 1,051,96 0,14 0,39 2998,85 1591,76 1922,36 2864,85 1,05 3329,44 1,111,00 0,92 0,92 2244,03 316,03 108,60 1465,80 1,53 2036,60 0,911,51 0,61 0,61 2754,42 826,42 791,27 2148,46 1,28 2719,27 0,991,96 0,47 0,47 3226,07 1298,07 1388,60 2745,80 1,17 3316,60 1,031,00 0,46 0,88 2678,77 530,81 598,77 1955,96 1,37 2746,73 1,031,51 0,30 0,58 3402,85 1254,88 1520,37 2877,56 1,18 3668,33 1,081,96 0,24 0,45 4037,51 1889,55 2326,77 3683,96 1,10 4474,73 1,111,00 0,47 1,00 3148,23 181,18 478,34 2598,96 1,21 3445,39 1,091,51 0,31 0,66 3808,81 841,77 1399,94 3520,56 1,08 4366,99 1,151,96 0,24 0,51 4405,35 1438,31 2206,34 4326,96 1,02 5173,39 1,171,00 0,49 1,00 4379,77 58,10 0,00 4110,79 1,07 4783,88 1,091,51 0,32 0,66 4673,86 352,19 1383,81 5032,39 0,93 5705,48 1,221,96 0,25 0,51 5203,63 881,96 2190,21 5838,79 0,89 6511,88 1,25
2147,96
2120,62
3648,58 4321,67
2967,05
235,62 297,25
603,20 1083,28
942,50 1407,09
942,50 994,51
603,20 747,31
339,30 483,62
20,00
339,30
603,20
942,50 1408,14
922,16
523,59
1357,20 1928,00
1357,20
10
8
10
12
12,00
15,00
5
6
8
10
6
8
D3
A3
B3
C3
Table 7.22 Fifth parametric study. Results obtained.
From the foregoing table, the following remarks are noteworthy:
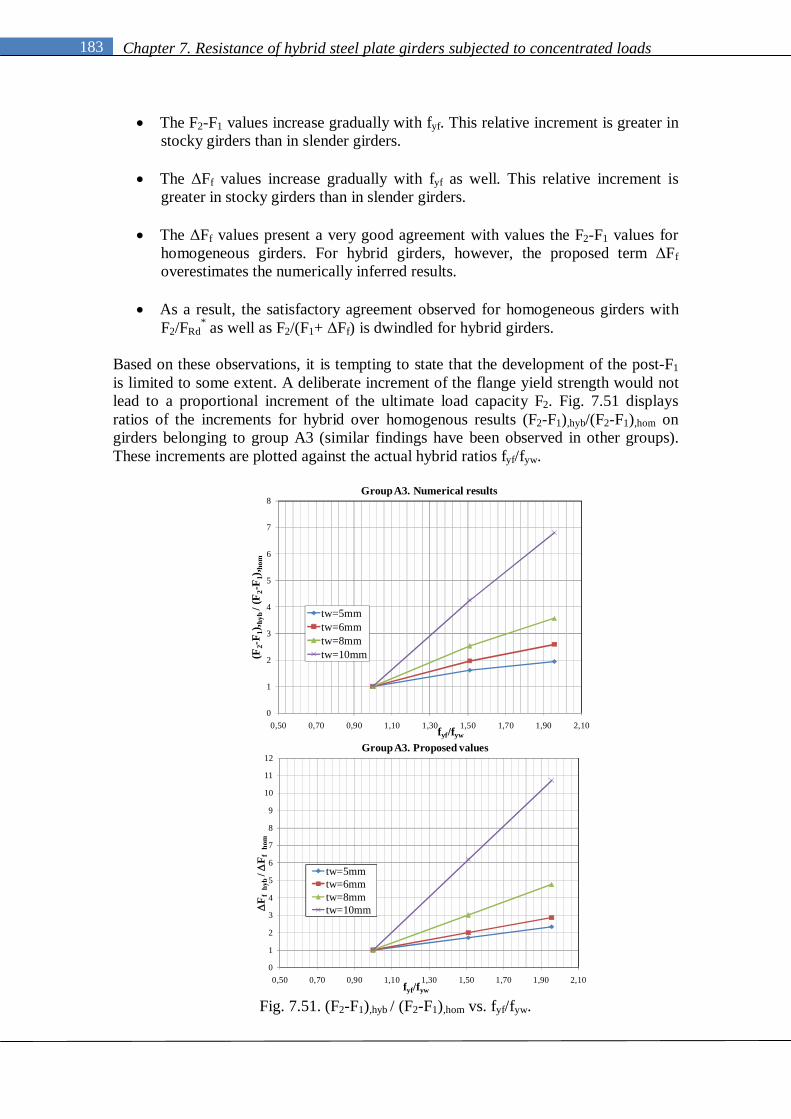
183 Chapter 7. Resistance of hybrid steel plate girders subjected to concentrated loads
The F2-F1 values increase gradually with fyf. This relative increment is greater in
stocky girders than in slender girders.
The ΔFf values increase gradually with fyf as well. This relative increment is greater in stocky girders than in slender girders.
The ΔFf values present a very good agreement with values the F2-F1 values for
homogeneous girders. For hybrid girders, however, the proposed term ΔFf overestimates the numerically inferred results.
As a result, the satisfactory agreement observed for homogeneous girders with
F2/FRd* as well as F2/(F1+ ΔFf) is dwindled for hybrid girders.
Based on these observations, it is tempting to state that the development of the post-F1 is limited to some extent. A deliberate increment of the flange yield strength would not lead to a proportional increment of the ultimate load capacity F2. Fig. 7.51 displays ratios of the increments for hybrid over homogenous results (F2-F1),hyb/(F2-F1),hom on girders belonging to group A3 (similar findings have been observed in other groups). These increments are plotted against the actual hybrid ratios fyf/fyw.
0
1
2
3
4
5
6
7
8
0,50 0,70 0,90 1,10 1,30 1,50 1,70 1,90 2,10
(F2-
F 1), h
yb/ (
F 2-F
1), ho
m
fyf/fyw
Group A3. Numerical results
tw=5mmtw=6mmtw=8mmtw=10mm
0
1
2
3
4
5
6
7
8
9
10
11
12
0,50 0,70 0,90 1,10 1,30 1,50 1,70 1,90 2,10
F f
hyb
/ F f
hom
fyf/fyw
Group A3. Proposed values
tw=5mmtw=6mmtw=8mmtw=10mm
Fig. 7.51. (F2-F1),hyb / (F2-F1),hom vs. fyf/fyw.

184 Chapter 7. Resistance of hybrid steel plate girders subjected to concentrated loads
Both numerical and proposed values present quite similar linear shapes, especially for stocky girders. According to the numerical results, for slender girders (tw=5mm) the trend of (F2-F1),hyb/(F2-F1),hom vs fyf/fyw is not fully linear though. The fundamental difference between both numerical and predicted ratios is the actual value of (F2-F1),hyb/(F2-F1),hom. For stocky girders (tw=10mm) the predicted value of (F2-F1),hyb/(F2-F1),hom for fyf/fyw=1,96 is greater than 10. The numerically obtained values are not greater than 7 though. Similar overestimations are observed in all girders displayed in table 7.22. This anomaly may arise since the structural response of the girders from F1 onwards is not uniquely dependent on the top flange moment resistance. Concerns about shear and transverse stiffeners buckling may arise if (F2 –F1) is deliberately increased. One should not expect such ideal behavior since there are other members of the whole structure that may start collapsing. At this point, it is important to bear in mind Fig. 7.22, in which the different design alternatives of design are depicted. Regarding hybrid design, these alternatives must be taken into account due to the following facts.
A given girder with fyf/fyw=1,0 might belong to case 5 or 6, i.e, cri21 V2FF ·
If the strength of the top flange is increased, e.g, to fyf/fyw=1,96 the same girder might subsequently lie on case 3 or 4 since F2 is also increased, i.e.,
2cri1 FV2F ·
If this increment of F2 is considerable, the minimum requirement of stiffener rigidity may be altered to some extent (eq. 7.15). As a result, if a fully development of the post-F1 capacity of the girders is desired in such cases, it might be needed to increase the stiffener rigidity. In such a way, the former case-5 or case-6 girders would belong to case 4, which is desired for achieving the full capacity of the flange.
Consequently, the structural designer might be faced to an optimization problem
in which a compromise between stiffening, mechanical properties and geometrical proportions of the girders is needed.
Notwithstanding, the F2/FRd
* values lead to quite satisfactory results (Fig. 7.52 shows the final F2/FRd and F2/FRd
* ratios).

185 Chapter 7. Resistance of hybrid steel plate girders subjected to concentrated loads
0,00
1,00
2,00
3,00
4,00
5,00
6,00
0 50 100 150 200
F 2 /
Fpr
edic
ted
hw/tw
F2/FRdF2/FRd*
Fig. 7.52. F2 / Fpredicted vs. hw/tw.
Nevertheless, a final reduction coefficient is thought of as being needed for the particular case of hybrid steel plate girders with closely spaced stiffeners when subjected to concentrated loading. This coefficient may limit the overestimations observed in Fig. 7.51. Fig. 7.53 (a) shows the decreasing trend of F2/(FRd+ ΔFf) with fyf/fyw. This trend (marked with an arrow in this figure) seems quite linear. Moreover, Fig. 7.53 (b) (c) and (d) show the frequencies for each case when falling into different classes of F2/(FRd+ ΔFf). Seemingly, the distributions are quite centered to the mean. If the mean values obtained for each case are extracted (table 7.23) and plotted separately (Fig. 7.54) one can observe a neat decreasing linear trend. Homogeneous girders present a sound mean value of this safety margin equaling F2/(FRd+ΔFf)=1,24 whereas the same calculation approaches F2 / FRd
*1,0 for the limit case fyf/fyw=2,0
fyf/fyw F2/(FRd+ΔFf)1,00 1,241,51 1,121,96 1,03
Table 7.23 Mean values of F2/(FRd+ΔFf) for different ratios fyf/fyw

186 Chapter 7. Resistance of hybrid steel plate girders subjected to concentrated loads
0,60
0,70
0,80
0,90
1,00
1,10
1,20
1,30
1,40
1,50
1,60
0,00 0,50 1,00 1,50 2,00 2,50
F 2/
( FR
d+
F f)
fyf/fyw(a) 0
1
2
3
4
5
6
7
1,00 1,10 1,20 1,30 1,40 1,50 1,60
Freq
uenc
y
(b) F2 / (FRd+Ff)
fyf/fyw=1,00
0
1
2
3
4
5
6
7
0,80 0,90 1,00 1,10 1,20 1,30 1,40
Freq
uenc
y
(c) F2 / (FRd+Ff)
fyf/fyw=1,51
0
1
2
3
4
5
6
7
0,80 0,90 1,00 1,10 1,20 1,30 1,40
Freq
uenc
y
(d) F2 / (FRd+Ff)
fyf/fyw=1,96
Fig. 7.53. (a) F2/ (FRd+ΔFf) vs. fyf/fyw. (b) (c) and (d) Frequencies
0,60
0,70
0,80
0,90
1,00
1,10
1,20
1,30
1,40
0,50 1,00 1,50 2,00 2,50
Mea
n va
lues
F2
/ (F R
d+
F f)
fyf/fyw Fig. 7.54. F2/(FRd+ΔFf) vs. fyf/fyw.
The reduction coefficient κ should include these upper and lower bounds to be consistent with these numerical observations. For the sake of considering such behavior on the proposed model and extending its scope to the case of hybrid steel plate girders eq. 7.25 is proposed. This reduction coefficient is based upon a linear decreasing relationship dependent on fyf/fyw. It is worth pointing out that this study is limited to the upper bound suggested in EN1993-1-5, namely, fyf/fyw≤2.

187 Chapter 7. Resistance of hybrid steel plate girders subjected to concentrated loads
yw
yf
ff
250251 ·,,· (7.25)
If this coefficient is applied in the results displayed in table 7.23, the proposed model leads to safer predictions than those obtained without applying this factor. Fig. 7.55 sketches the scatter of the definite proposal and Fig. 7.56 displays the plot safety margin F2/(FRd+ ΔFf,corrected)=FRd
*corrected as a function of fyf/fyw. This latter proposal is regardless
whether the girder is hybrid or not.
0,00
1,00
2,00
3,00
4,00
5,00
6,00
0 50 100 150 200
F 2 /
F pre
dict
ed
hw/tw
F2/FRdF2/FRd* corrected
Fig. 7.55. F2/(FRd+ΔFf,corrected) vs. hw/tw.
0,60
0,70
0,80
0,90
1,00
1,10
1,20
1,30
1,40
0,50 1,00 1,50 2,00 2,50
Mea
n va
lues
F2
/ (F R
d+
F f)
fyf/fyw Fig. 7.56. Mean values F2/(FRd+ΔFf,corrected) vs. fyf/fyw.
fyf/fyw F2/(FRd+ΔFf,corrected)1,00 1,241,51 1,221,96 1,25
Table 7.24 Mean values of F2/(FRd+ΔFf,corrected) for different ratios fyf/fyw Noticeably, the results happen to be fairly satisfactory. The safety margin is independent whether the girder is hybrid or not. Finally, the severe underestimation obtained if the

188 Chapter 7. Resistance of hybrid steel plate girders subjected to concentrated loads
current limitation of EN1993-1-5 is applied can be get over by applying the proposed procedure. 7.3.5 Summary The proposed model for enhancing the EN1993-1-5 depicted limitation for the particular case of girders with closely spaced transverse stiffeners is based upon eq. 7.26
1M
fwywF
1M
falyFRd
FtafFFF y
·· ,
(7.26)
In this equation, the extra term ΔFf is related to the post-F1 reserve (eq. 7.27). This term is obtained by applying the first theorem of plastic collapse in a mechanical model in which four plastic hinges are formed in the top flange.
····
fifos
yf2ff
f 2Saftb
F
(7.27)
In the foregoing equation, χfo and χfo represent the top flange strength reserve at FRd in the location of outer (flange-to-stiffener juncture) and inner (edge of the applied load) hinges. σj,FRd represents the longitudinal stress obtained from the global analysis when the FRd is applied. The κ coefficient represents the reduction factor which accounts for the proper usage of hybrid girders.
w
w
yf
Fjfj t
h005001
fRd ·,,·,
(7.28)
yw
yf
ff
250251 ·,,· (7.29)
The proposed post-F1 capacity term must be limited if no flange strength reserve is available in the outer hinge.
01if0F 0ff , (7.30) The proposed model is valid in girders in which:
1cri FV2 · (7.31) in which F1 can be obtained with eq. 7.32.
w
wRd1 t
h005001FF ·,,· (7.32)

189 Chapter 7. Resistance of hybrid steel plate girders subjected to concentrated loads
7.4 Discussion The experimental and numerical results presented so far have shown two different structural responses in hybrid steel plate girders subjected to patch loading. The girders presenting a sufficiently large distance between transversal stiffeners lead to a rather different behaviour than the girders with a sufficiently short distance. The distance between transversal stiffeners is labelled short when the calculated effectively loaded length ly is greater than a. For each of the depicted cases, the resistance of hybrid steel plate girders subjected to patch loading has been thoroughly studied. For the former case, the results showed outlandish peculiarities concerning the hybrid parameter φh=fyf/fyw. Numerically, it was predicted that for girders with stiff flanges and ly≤a there is null influence of this ratio upon the ultimate load capacity of patch loaded girders. The current formulation of EN1993-1-5 takes this ratio into account in such a way that, the greater the ratio fyf/fyw is, the higher the ultimate load capacity of the girders. For the sake of correcting this anomaly, a modification on the current EN1993-1-5 formulation that enhances the results quite satisfactorily has been proposed. Readably, the m1 coefficient should be shifted by the m1
* coefficient as depicted in section 7.2. The proposal has been tested both structurally and statistically. The results lead to a satisfactory improvement of the formulation. Moreover, this modification has been tested for the case in which the girders present flexible flanges. The failure mode observed in girders with such geometrical proportions is rather different than the typical web folding one. At failure loads, instead, transverse bending of the top flange as well as web folding to some extent is noticeable. The upgraded coefficient m1
* has been numerically tested as well, the numerical observations have shown that the results obtained are also structurally sound. Moreover, for the latter case, the results show a rather opposite trend when ly>a. The numerical model predicts a post-peak capacity which is highly influenced by both the flanges and the transversal stiffening of the panel. It has been shown though, that the current formulation of EN1993-1-5 underestimates the numerically (and experimentally) observed post-peak capacity of the girders. In order to enhance the current formulation by getting over this limitation, a new mechanical model for the particular case of densely stiffened girders which accounts for the presence of both the transverse stiffener and the top flange has been presented. The proposed formulation provides a quite compact alternative for designers. This proposal is mainly based upon geometrical and mechanical proportions of the girders. Likewise, the formula includes limitations concerning other failure different from patch loading (namely, shear failure of the adjacent panels and buckling of the transverse stiffeners). In addition, it has been demonstrated that the formulation is applicable in the case of hybrid girders. A reduction coefficient is required for obtaining similar results than in homogeneous girders though. As a consequence of these new proposals, some other modifications are required for completing the EN1993-1-5 procedure. In next chapter, an attempt for calibrating the χ-λ approach for the resistance of hybrid steel plate girders is presented.

190 Chapter 8. Design procedure according to EN1993-1-5
8 Design procedure according to the χ-λ approach. 8.1 New proposal The new proposal for the yield resistance of hybrid steel plate girders subjected to patch loading depicted in 7.2 includes a substantial change in ly, the effectively loaded length, as shown in eq. 8.1. As a consequence, additional modifications should be done in particular, to the presently included resistance function (eq. 8.2). This function has been calibrated for the former yield resistance and thus, should be tuned to be fitted to any newly proposal.
2
f
w
w
ffsy t
h020
tb
1t2Sl ,· (8.1)
FF
50
, (8.2)
The resistance function presented in eq. 8.2 was proposed by Lagerqvist (1994). Presently, it has been suggested that any change in the yield resistance of plated structures should be based upon the proposal presented by Müller (2003), which has the form of the equation included in EN1993-1-5-Annex B. This new proposal is advantageous since it harmonises the resistance function shape for all verifications of compressed members. Equations 8.3 and 8.4 show the general form of this proposal.
In eq. 8.4, 0F and 0F are tuneable magnitudes that must be calibrated with experimental data. The former represents an imperfection factor and the latter, the plateau length. According to a consensus of experts within the frame of the ComBri project (2007), this equation might be cut at χF=1,20 (Gozzi 2007) for the particular case of patch loading. In this work, however, it has been observed that χF>1,00 is achieved only for the cases in which the failure mechanism differs from the one depicting the patch loading phenomena. As a result, the reduction factor is cut at the value of χF=1,00 herein.
0101
F2FF
F ,,
(8.3)
F0FF0FF 121 · (8.4)
In order to evaluate this new proposal within this work, 72 tests on hybrid steel plate girders subjected to patch loading collected in Annex A were employed. In addition to this pool of available tests, the experimental results performed in the LTE-UPC were added to the calibration. Likewise, the numerical results obtained from the first parametric study (148 specimens in which ly<a) were included.

191 Chapter 8. Design procedure according to EN1993-1-5
The following tests, with label corresponding to the numbering presented in Annex A were excluded due to various reasons:
Test 1 and Test 2 (Schillings, 1967) were excluded from the calibration since the ultimate load capacity defined by the author was uncertain.
Test A1-7, A1-12, B1-7, B1-12 (Roberts 1981-1988) were excluded since it was considered questionable how the connection between the web and the flange is possible with such a thin web.
All tests performed by Bossert et al (1983) were discarded since the loaded
length Ss was found to be equal to distance a.
As a result, a pool of 208 remaining experimental and numerical tests were used to calibrate the resistance function. Fig. 8.1 shows the ratio χF=Fu/Fy as a function of
F with the current EN1993-1-5 resistance function (eq. 8.2). Fy is based on the newly proposed ly (eq. 8.1).
0
0,2
0,4
0,6
0,8
1
1,2
0 1 2 3 4 5 6
F
Slenderness F
EN1993-1-5
Tests literature
Tests author
Numerical results
Fig. 8.1 χF=Fu/Fy vs. F .
The statistics for the Fu/FRd ratios using 208 tests are shown in table 8.1
Statistics Fu /FRd
Mean 1,46Standard deviation 0,20
Coefficient of variation 0,14 Table 8.1 Statistics for the Fu/FRd ratio
As a further step, those 208 tests were used to calibrate the tuneable coefficients 0F and
0F in the newly proposed eq. 8.3. In this step, the mean was defined as the target

192 Chapter 8. Design procedure according to EN1993-1-5
value. Fig. 8.2 shows the variation of the mean with the plateau length 0F . Noticeably,
there is a decreasing relationship between both variables. It is also noticeable that the
mean value increases with 0F .
1,10
1,15
1,20
1,25
1,30
1,35
1,40
1,45
1,50
0 0,1 0,2 0,3 0,4 0,5 0,6 0,7 0,8
Mea
n X
F0
Fig. 8.2 Mean value X vs. 0F for different values 0F
There are concerns about other statistics such as the minimum value of Fu/FRd. Fig. 8.3 shows the variation of these minima with both the plateau length 0F and 0F . Decreasing trends between both variables are also noticeable. Furthermore, it is observed that minimum values of X decrease with 0F
0,00
0,20
0,40
0,60
0,80
1,00
1,20
0 0,1 0,2 0,3 0,4 0,5 0,6 0,7 0,8
Min
imum
val
ue X
F0
Fig. 8.3 Minimum value minX vs. 0F for different values 0F
In this work, the latter term (the plateau length) was fixed so as to maintaining the current EN1993-1-5 value. After several trials, and as a compromise between mean and minimum values, a good fit was obtained with:
500750
0F
0F
,,

193 Chapter 8. Design procedure according to EN1993-1-5
Fig. 8.4 shows the ratio Fu/Fy as a function of the slenderness with the current EN1993-1-5 resistance function (eq. 8.2) as well as the new proposal. Noticeably, the proposal is slightly closer to the scatter than the current EN1993-1-5 formulation. It is also observed that whether the resistance function is, the statistics describing the sample give less variation and lower mean compared to the existing procedure included in EN1993-1-5. These statistics for the new Fu/FRd ratios (208 tests) are shown in table 8.2
0
0,2
0,4
0,6
0,8
1
1,2
0 1 2 3 4 5 6
F
Slenderness F
New proposal
EN1993-1-5
Tests literature
Tests author
Numerical results
Fig. 8.4 χF=Fu/Fy vs. F .
Statistics Fu /FRd
Mean 1,41Standard deviation 0,18
Coefficient of variation 0,13 Table 8.2 Statistics for the Fu/FRd ratios. New proposal
Finally, the frequencies of Fu/FRd are displayed in Fig. 8.5. Noticeably, both samples seem fairly centred to the mean.
0
10
20
30
40
50
60
Freq
uenc
y
Fu/FRd
Current EN1993-1-5 resistance function
0
10
20
30
40
50
60
Freq
uenc
y
Fu/FRd
Newly proposed resistance function
Fig. 8.5 Frequency of Fu/FRd for various classes

194 Chapter 9. Conclusions and suggestions for further work
9. Conclusions and suggestions for further work 9.1 Discussion This section summarises the important findings and presents the overall conclusions of this work. More detailed concluding comments may be found at the end of each of the individual chapters. Chapter 2 described the literature survey of the twofold strands in which this research work has been involved. After conducting the research of the previous studies found in the literature, the work related to hybrid steel plate girders subjected to patch loading was found to be very scarce. It was judged to be necessary to complete the existing database concerning hybrid girders subjected to patch loading. Chapter 3 described the laboratory testing programme conducted as part of the overall study. A total of eight hybrid steel plate girders were tested up to failure. The tests were carefully conducted and the most remarkable results are reported within this work. These tests represent a major contribution to the pool of available experimental results on hybrid steel plate girders subjected to patch loading. Throughout the development of these tests, it was observed that the response of the girders depended upon the aspect ratio of the directly loaded panel. Girders with a/hw>2 showed a load-deflection plot with no post-buckling reserve whereas girders with a/hw<2 showed a load-deflection with a considerable post-buckling reserve. The observed response showed a first linear branch up to F1 and subsequently, an increment ΔF up to F2. Chapter 4 and 5 described thoroughly all the aspects concerning the numerical modelling of the girders. The current European guidelines EN1993-1-Annex C allow designers using FE-Analyses as reliable tools on the calculation of plated structures. The guides overtly request the usage of initial designer-assumed conditions which are necessary for the development of appropriate simulations. The influence of such conditions was carefully assessed by comparing the numerical results to those obtained experimentally. Numerical prediction of the key performance measures from tests was achieved with a high degree of accuracy. The drawn conclusions give guidance of the reliability of these designer-assumed conditions on ultimate limit states verifications for the particular case of steel plate girders subjected to patch loading. The simulations presented in subsequent chapters were developed following faithfully the EN1993-1-5 recommendations. In chapter 6, a numerical database of hybrid specimens subjected to patch loading was presented. Results of ultimate load capacity obtained from 192 hybrid steel plate girders subjected to patch loading were carefully reported. These results were studied separately for the aforementioned cases of transversal stiffening. In chapter 7, the previously obtained phenomenological vision was exploited for developing new design procedures. This chapter represents the major contribution of the present work. The most remarkable results of the research work are pointed out in this chapter. On one hand, it was shown that the influence of the fyf/fyw ratio (namely, the hybrid grade) is negligible for girders with largely spaced transverse stiffeners and stiff flanges.

195 Chapter 9. Conclusions and suggestions for further work
Equation 9.1 was presented as a suitable alternative for the calculation of the effectively loaded length ly in the verification of collapse loads of hybrid steel plate girders subjected to patch loading.
512tbthforth
020tb
1t2Sl ffww
2
f
w
w
ffsy ,/·,·
(9.1)
On the other hand, it was demonstrated that the influence of the fyf/fyw ratio can be significant if the transverse stiffeners are closely spaced. The proposed model for enhancing the EN1993-1-5 depicted limitation for the particular case of girders with closely spaced transverse stiffeners is based upon the following equations.
1M
fwywF
1M
falyFRd
FtafFFF y
·· ,
(9.2) In eq. 9.2, the extra term ΔFf is related to the post-F1 reserve (eq. 9.3). This term is obtained by applying the first theorem of plastic collapse in a mechanical model in which four plastic hinges are formed in the top flange.
····
fifos
yf2ff
f 2Saftb
F
(9.3) In eq. 9.3, χfo and χfi represent the top flange strength reserve at FRd in the location of outer (flange-to-stiffener juncture) and inner (edge of the applied load) hinges. The κ coefficient represents the reduction factor which accounts for the proper usage of hybrid girders.
w
w
yf
Fjfj t
h005001
fRd ·,,·,
(9.4)
yw
yf
ff
250251 ·,,· (9.5)
The proposed post-F1 capacity term must be limited if no flange strength reserve is available in the outer hinge.
01if0F fjf , (9.6) Finally, it is important to bear in mind that the proposed model is valid in girders in which:
w
wRd1cr t
h005001FFV2 ·,,·· (9.7)

196 Chapter 9. Conclusions and suggestions for further work
In chapter 8, a design procedure for the verification of hybrid steel plate girders subjected to concentrated loads was presented. A succinct modification of the χ-λ procedure currently implemented in EN1993-1-5 was proposed. In particular, this modification was done according to the suggestions presented by other authors for any change in the formulation. The proposed design procedure gives slightly lesser variation and lower mean when compared to the existing procedure in EN1993-1-5 for the particular case of hybrid steel plate girders subjected to patch loading. Finally, several annexes are appended at the end of the work. These annexes include:
Experimental database on hybrid girders subjected to patch loading found in the literature.
Specific details concerning the experimental programme performed in the LTE-UPC.
Specific details concerning all numerical specimens performed within this work.
9.2 Suggestions for further work A considerable amount of questions have been systematically arising throughout the development of this work. Manifold research possibilities might be generated from each one of the depicted chapters. In the following, some of the most outstanding and appealing research strands are summarized:
It might be interesting to conduct an experimental programme on several hybrid steel plate girders in which the web plate presents identical mechanical properties for all prototypes. The flange mechanical properties may, therefore, be systematically varied. This experimental programme could give experimental confirmation about the numerically observed structural responses of hybrid steel plate girders subjected to patch loading.
Likewise, there is a need of verifying the potential flexural-patch loading interaction in hybrid steel plate girders subjected to patch loading.
The resistance of hybrid steel plate girders with longitudinal stiffeners subjected to patch loading should be studied. The suggestions for modifying the design procedure of EN1993-1-5 should be assessed for such cases.
There is a need of verifying the potential shear-patch loading interaction in very slender girders with closely spaced transverse stiffeners. This case has been pinpointed in chapter 7 as a potential structural design alternative. No insightful attempts of studying such cases have been addressed.
The newly proposed design model for the particular case of plate girders with
closely spaced transverse stiffeners should be verified for the case in which the transverse ribs are non-symmetric and or for non-flat members.

197 Chapter 9. Conclusions and suggestions for further work
In chapter 5, the appraisal of the designer-assumed initial conditions solely included one residual stress pattern according to ECCS suggestions. A more profuse parametric study with varying residual stress patterns from other sources could clarify and/or confirm the drawn conclusions.
Likewise, following the same procedure depicted in chapter 5, it might be interesting to perform research works for assessing these initial conditions for the cases of girders subjected to shear and/or flexural loads.
Finally, it is suggested to harmonise the design procedure for homogenous and hybrid steel plate girders simultaneously. The resistance function proposed in chapter 8 could be calibrated by using the whole pool of experimental and numerical tests available in the literature (either homogeneous or hybrid). In addition, the calibration of the partial factor γM1 can be performed by using this database.
198 References
References AASHTO. LRFD Bridge Specifications, American Association of State Highway and Transportation Officials, Inc., Washington, D.C. 2005 ABAQUS, 6.5 Version. Manuals, 2005 Abaqus Inc, USA Aribert J., Moheissen M. Justification théorique d’une formulation nouvelle de la résistance en double compression locale d’un profilé en présence du voilement. Construction métallique, CTICM, n.4, pp. 25 – 48, 1991 (in french) Azizinamini A., Hash J., Yakel A., Farimani R. Shear capacity of hybrid plate girders. Journal of bridge engineering. Vol. 12, Issue 5, pp. 535-543. Sep-Oct 2007 Bamm D., Lindner J., Voss R.P. Traglastversuhe an ausgesteiften Trägerauflagern, Stahlbau, Vol 52, No 10, pp. 296-300 1983 (in german) Barker M., Hurst A., White D., Tension Field Action in Hybrid Steel Girders Engineering Journal, AISC, Vol. 39, Issue 1.pp. 52-62. 2002 Barker M.G. Shear Tests of High Performance Steel Hybrid Girders. Final Report to the Missouri Department of Transportation 2005 Barker M.G., Schrage S.D., High performance Steel Bridge Design and Cost Comparisons. Transportation Research Record, N.1740, pp 33-39. 2000 Barth K., White D. Finite element evaluation of pier moment-rotation characteristics in continuous-span steel I-girders. Engineering Structures. 20 (8) pp. 761-778. 1998 Barth K., Yang L., Righman J., Simplified moment redistribution of hybrid 485W bridge girders in negative bending. Journal of bridge engineering. Vol. 12, Issue 4, pp. 456-466. Jul-Aug 2007 Barth K., Righman J., Freeman L., Assessment of AASHTO LFRD Specifications for Hybrid HPS 690W Steel I-Girders. Journal of bridge engineering. Vol. 12, Issue 3, pp. 380-388 May-Jun 2007 BSK 99. Boverkets handbook om stalkonstruktioner, Boverket. 1999 (in Swedish) Bathe KJ. Finite Element Procedures in Engineering Analysis. USA, Englewood Cliffs: Prentice-Hall. ISBN 0-13-317305-4. 1982 Bazant Z., Jirasek M., Inelastic Analysis of structures. Wiley. 2002 Bazant Z., Cedolin L., Stability of Steel Structures. Oxford Engineering Series. 1991 Bergfelt A. Patch loading on a slender web – Influence of horizontal and vertical web stiffeners on the load carrying capacity. Chalmers University of Technology, Division of Steel and Timber Structures. Publication S79:1, Göteborg 1979

199 References
Bergfelt A. Girder web stiffening for patch loading. Chalmers University of Technology, Division of Steel and Timber Structures, Publication S83:1, Göteborg 1983 Bitar D., Résistance a la flexion des poutres hybrides à section en I. Construction Métallique, vol. 40, no2, pp. 77-92 2003 (in french) Bitar D., Lukiç M., Trumph H. and Galea Y. Composite bridge design for small and medium spans. Institute of Steel Construction. ECSC Steel RTD programme. Final report. 2001 Bryan, G., On the stability of a plane plate under thrusts in its own plane with applications to the buckling of the sides of a ship. Proceedings of the London Mathematical Society, Vol. 22, pp. 55-67. 1891 BS 5950. Structural use of steelwork in building. Part 1: Code of practice for design Rolled and welded sections. British Standard Institution, 1982 BS 5400:3. Steel, concrete and composite bridges. Part 3: Code of practice for design of steel. British Standard Institution, 1982 Bossert T, Ostapenko A. Buckling and ultimate loads for palte girder web plates under edge loading, Report 319.1 Fritz Eng. Lab., Dept of Civil Engineering, Lehigh University. USA. June, 1967 Carskaddan P. Shear buckling of unstiffened hybrid beams. Journal of the structural division. ASCE; Vol. 94. Issue ST8, pp. 1965–1990. 1968 Cevik A. A new formulation for longitudinally stiffened webs subjected to patch loading, Journal of Constructional Steel Research, Vol. 63. Issue 10, pp. 1328-1340. 2007 Chacon R., Mirambell E., Real E. Algunas consideraciones sobre la resistencia de las vigas armadas híbridas sometidas a cargas concentradas. Hormigón y Acero.. 3rd trimestre, pp. 43-57. 2007 (in spanish) Chacon R., Mirambell E., Real E. Influence of initial imperfections on the resistance of hybrid steel plate girders subjected to concentrated loads. Proceedings of 6th International Conference Steel and Aluminium Structures ICSAS’07. Oxford, U.K, pp. 736-743 July 2007 Chacon R., Mirambell E., Real E. Resistance of transversally stiffened hybrid steel plate girders subjected to concentrated loads.. Proceedings SDSS. International Colloquium on Stability and Ductility of Steel Structures, Lisbon 2006 Chacon R., Mirambell E., Real E. Influence of designer-assumed initial conditions of the numerical modelling of steel plate girders subjected to patch loading. Thin Walled Structures. 2009. Vol. 47. Issue 4. pp 391-402 doi:10.1016/j.tws.2008.09.001. 2009

200 References
Chacon R., Guzman F., Mirambell E., Real E, Oñate E. Wireless Sensor Networks for Strain Monitoring during Steel Bridges Launching. Structural Health Monitoring, 8; 195. 2009. DOI: 10.1177/1475921708100779 Chacon R., Mirambell E., Real E. A mechanism solution for predicting the collapse loads of girders subjected to patch loading. Proceedings of 5th European Conference on Steel and Composite Structures, Graz, Austria, pp. 159-164. September 3-5, 2008. ISBN 92-0147-00-90 Clarin, M.. High Strength Steel - Local Buckling and Residual Stresses, Lic.Thesis 2004:54, Division of Structural Engineering - Steel Structures, Luleå University of Technology, Sweden. (ISRN: LTU-LIC--04/54--SE). 2007 Composite bridge design for short and medium spans, Final Report ECSC Steel RTD Programmeme Contract no. 7210-PR/113, ECSC steel publications. EUR20583 EN. 2003 ComBri. Competitive Steel and Composite Bridges by Improved Steel Plated Structures, Final Report, RFCS Contract No. RFS-CR-03018. 2007 Crisfield M. An arc-length method including line searches and accelerations, Computer methods in Applied Mechanics and Engineering Vol. 19, pp. 1269-1289. 1983 Darling, D.A. The Kolmogorov-Smirnov, Crámer-von Mises tests. Annals Mathematics Statistics. Vol. 28, pp. 823. 1957 Davaine L., Raoul J. and Aribert J. Patch load resistance of longitudinally stiffened bridge girders. Proceedings of the International symposium on steel bridges -Steelbridge 2004, Millau, France, June 23-25, 2004 Davaine L., Aribert J. Launching of steel girder bridge - Patch load resistance of longitudinally stiffened webs, Proceedings of 4thEuropean Conference on Steel and Composite Structures, Maastricht, The Netherlands, June 8-10, 2005 Davaine L. Formulations de la résistance au lancement d’une âme métallique de pont raide longitudinalement. Doctoral Thesis D05-05, INSA de Rennes, France. 2005 (in french) Dowling P., Harding J., Bjorhovde R. Constructional Steel Design, an international guide. Elsevier Applied Science, 1992 Drdadcky M. On two particular problems of plate girder webs under partial edge loads. Journal of Constructional Steel Research, Vol 20, pp. 183 – 190, 1991 Dubas P., Gehri E. Behaviour and Design of Steel Plated Structures. European Convention for Steel Construction, Technical Committee 8 – Working group 8-3, Plated Structures n.44, 1986 Dubas P., Tschamper H. Stabilité des âmes soumises à une charge concentrée et à une flexion globale. Construction Métallique n.2, CTICM, pp. 25 – 39, 1990 (in french)

201 References
Duerr D. Beam web strength under pairs of concentrated compression loads. Practice periodical on structural design and construction, February 2003. ECCS, Ultimate Limit State Calculations of Sway Frames with Rigid Joints (lst edn), ECCS - Committee 8 - Stability, Technical Working Group 8.2 - System, European Convention for Constructional Steelwork, N. 33, pp 20. 1984 ECCS. European recommendations for the design of longitudinally stiffened webs and of stiffened compression flanges. Technical committee 8 – technical working group 8-3 – First edition, N.60, 1990 Elgaaly M. Behaviour of webs under eccentric compressive edge loads. IUTAM Symposium . Contact loading and local effects in thin-walled plated and shell structures. Proceedings edited by Springer-Verlag, Prague September 1990 Elgaaly M. Web design under Compressive Edge loads. Engineering Journal. 1983 20 (4) 153-171 Elgaaly M., Salkar R. Web crippling under local compressive edge loading. Report, Department of Civil Engineering, University of Maine, Orono, U.S.A. 1990 EN1993-1-1. Eurocode 3. Design of steel structures –Part 1-1: General rules and rules for buildings. CEN 2006 EN1993-1-5. Eurocode 3. Design of steel structures – Part 1-5: Plated structural elements CEN. 2006 EN1993-1-12. Design of Steel Structures–Part 1-12: Additional Rules for the Extension of EN1993 up to steel grades S700. CEN. 2007 Felkel J., Rizos D. and Ziehl P, Structural performance and design of HPS70W bridge girders. Journal of Constructional Steel Research. Volume 63. Issue 7 pp. 909-921. 2007 Frost R., Schilling C., Behaviour of hybrid beams subjected to static loads. Journal of the Structural Division ASCE, Vol.90, ST3, pages 55–86. 1964 Fonseca E., de Andrade S., da Vellasco P., Vellasco M., A parametric analysis of the patch loading behaviour using a neuro-fuzzy system. Journal of Constructional Steel Research.Vol.63(2).pp:194-210.2007 GiD (v. 7) Pre and post processor. CIMNE. Barcelona, Spain. 2006 Gozzi J. Patch loading resistance of plated girders. Doctoral thesis 2007:30. Luleå University of Technology, Sweden. ISRN: LTU-DT-07/30--SE. 2007 Graciano C. Patch Loading : Resistance of longitudinally stiffened steel girder webs Doctoral thesis 2002:18, Lulea University of Technology, Sweden. ISRN: LTU-DT-02/18-SE. 2002

202 References
Graciano C., Casanova, E. Ultimate strength pf longitudinally stiffened I-girder webs subjected to combined patch loading and bending, Journal of Constructional Steel Research, Vol. 61. pp. 93-111. 2005 Granath P. Behaviour of slender plate girders subjected to patch loading. Journal of Constructional Steel Research, 42, p. 1 – 19, 1997 Granholm C. A. Provning av balkar med extremt tunt liv, Raport 202, Inst. För Byggnadsteknik, Göteborg, 1960 Greco N., Earls C., Structural Ductility in Hybrid High Performance Steel Beams. Journal of Structural Engineering, ASCE, Vol.129, N.12, 2000 Haaijer G., Economy of High Strength Steel Structural Members. Journal of the Structural Division, ASCE, (87-ST8), December, 1961 Hendry A.W. The stress distribution in a simply supported beam o I-section carrying a central concentrated load. Proceedings, Society for Experimental Stress Analysis, Vol. 7, No 2, pp 91-102. 1949 Ito M., Nozaka K., Shirosaki T. Experimental Study on Moment-Plastic Rotation Capacity of Hybrid Beams. Journal of Bridge Engineering, ASCE, Vol.10, N.4. 2005 Janus K., Kutmanova I., Skaloud M. Experimental investigation into the ultimate load behaviour of longitudinally stiffened steel webs under partial edge loading.Acta Technica CSAV, n. 2, p. 158 – 195, 1988 Johansson B., Collin P., Eurocode for High Strength Steel and Applications in Construction. Proceedings of Super-High Strength Steels. Associazione Italiana di Metallurgia. Rome, 2th-4th November 2005 Kirchhoff G., Über das Gleichgewicht und die Bewegung elastischen Scheibe. Crelles Journal 40, pp. 51–88. 1850 Kutmanova I., Skaloud M. Ultimate Limit State of Slender Steel Webs Subject to (i) Constant and (ii) Repeated Partial Edge Loading. Journal of Construction Steel Research, 21, p. 147 – 162, 1992 Lagervist O. Patch Loading. Resistance of steel girders subjected to concentrated forces. Doctoral thesis 1994:159D. Division of Steel Structures, Lulea University of Technology. Sweden, ISSN 0348-8373. 1994 Lagerqvist O., Johansson B. Resistance of plate edges to concentrated forces. Journal of Constructional Steel Research, Vol.32, pp. 69 – 105, 1995 Lagerqvist O., Johansson B. Resistance of I-girders to concentrated loads. Journal of Constructional Steel Research, Vol. 39, pp. 87 – 119, 1996

203 References
Lagerqvist O., Johansson B. Résistance des .mes des poutres de ponts pendant le lancement. Construction métallique n.2, pp. 224. 1996 Lindgren B.W. Statistical theory. The Macmillan company. Second Edition.1968 Maeda Y. Additional Study on Static Strength of Hybrid Plate girders in Bending. Colloquim of Design of plate and box girders for ultimate strength, London, International Association for Bridge and Structural Engineering, 1971 Mabuma J. Patch loading resistance- Influence of flange parameters and non-uniform load distributions. Diploma Thesis. Universität Stuttgart Institut für Konstruktion und Entwurf Stahl-, Holz- und Verbundbau. 2008 Martínez J., Graciano C., Casanova E. Imperfection sensitivity of plate girder webs under patch loading. 3rd International Conference on Structural Engineering, Mechanics and Computation (SEMC). September 2007. Cape Town, South Africa, 1 - 8 Markovic N. Hajdin N. A contribution to the analysis of the behaviour of plate girders subjected to patch loading. Journal of Constructional Steel Research. Vol. 21, pp. 163 – 173, 1992 Mathies H. Strang G. The solution of nonlinear finite elements equations, International journal for Numerical Methods in Engineering Vol. 14, pp. 1613-1626. 1979 Millanes F, Pascual J., Ortega M., Viaducto "Arroyo las Piedras": primer viaducto mixto de las Líneas de Alta Velocidad Españolas Hormigón y acero, ISSN 0439-5689, Nº 243, pags. 5-38 2007 (in spanish) Mindlin R. Influence of rotatory inertia and shear in flexural motion of isotropic, elastic plates. ASME Journal of Applied Mechanics Vol. 18, pp. 1031–1036. 1951 Müller C. Zum Nachweis ebener Tragwerke aus Stahl gegen seitliches Ausweichen. Schriftenreihe Stahlbau, RWTH – Prof. Sedlacek, Heft 47 Shaker Verlag, 2003 (in german) Nakamura T., Uetani K., The secondary buckling and post-secondary-buckling behaviours of rectangular plates. International Journal of Mechanical Sciences; Vol. 21 issue 5, pp. 265-286. 1979 Nethercot D. Buckling of welded hybrid steel I-beams. Journal of the structural division. ASCE. Vol.102 (ST3), pp.461–74. 1976 Oñate E., Calculo de Estructuras por el Método de Elementos Finitos. Primera edición. Ediciones CIMNE. 1992 (in Spanish) Pavlovčič L., Detzel A., Kuhlmann U., Beg D., Shear resistance of longitudinally stiffened panels-Part I: Tests and numerical analysis of imperfections. Journal of Constructional Steel Research. Vol. 63, pp. 337 – 350, 2007

204 References
Petel A., Picard L., Imberty F., Raoul J. Design of a composite road bridge with high strength steels and ultra-high performance fiber reinforced concrete. Proceedings of 5th European Conference on Steel and Composite Structures, Graz, Austria, pp. 159-164. September 3-5, 2008. ISBN 92-0147-00-90 Real E., Chacon R., Mirambell E., Shear response of hybrid steel plate girders. Proceedings of 5th European Conference on Steel and Composite Structures, Graz, Austria, pp. 159-164. September 3-5, 2008. ISBN 92-0147-00-90 Reissner E. The effect of transverse shear deformation on the bending of elastic plates, ASME Journal of Applied Mechanics Vol. 12, pp. 66–77. 1945 Ren T, Tong G. Elastic buckling of web plates in I-girders under patch and wheel loading. Engineering Structures Vol. 27, pp. 1528–1536 2005 Riks, E., An incremental approach to the solution of snapping and buckling problems. International Journal of Solids Structures. Vol. 15 Issue 7, pp. 529-551. 1979 Ripa T., Pascual J., Design improvements for patch loading resistance in bridges during launching. Steelbridge. Millau, June 23-25. 2004 Roberts T., Rockey K. A mechanism solution for predicting the collapse loads of slender plate girders when subjected to in-plane patch loading. Proceedings of the Institution of Civil Engineers, Part 2, 67, pp. 155 – 175, 1979 Roberts T. Slender plate girders subjected to edge loading. Proceedings of the Institution of Civil Engineers, Part 2, 71, pp. 805 – 819, 1981 Roberts, T. Patch loading on plate girders. Chapter 3. Plated structures, Stability and Strength. Edited by R. Nayarayanan. Applied Science Publishers, London and New York, p. 77 – 102, 1983 Roberts T., Markovic N. Stocky plate girders subjected to edge loading. Proceedings of the Institution of Civil Engineers, Part 2, 75, p. 539 – 550, 1983. Roca J., Campaña experimental para el análisis de vigas armadas híbridas sometidas a cargas concentradas. Tesina de especialidad. Departament d’Enginyeria de la Construcció. ETSCCPB. UPC. 2007 (in spanish) Rockey K., Bagchi D. Buckling of plate girder webs under partial edge loadings. International Journal of Mechanics Science; Vol 12, pp 61–76. 1970 Rush C., Experimental tension field action behaviour in HPS plate girders. MS thesis, Univ. of Missouri-Columbia, U.S.A 2001 Schilling C., Bending behaviour of composite hybrid beams. Journal of the Structural Division, ASCE, Vol.94 (ST8),1968 Schilling C., Web Crippling Test on Hybrid Beams. Journal of the Structural Division, ASCE, Vol.93, 1967

205 References
Seitz M., Kuhlmann U., Longitudinally Stiffened Girder Webs Subjected To Patch Loading. Steelbridge. Millau, June 23-25. 2004 Shahabian F, Roberts T.M., Buckling of slender web plates subjected to combinations of in-plane loading. Journal of Constructional Steel Research. 51, pp 99–121.1999 Shimizu S., Yabana H., Yoshida S., A new collapse model for patch loaded web plates. Journal of Constructional Steel Research, 13, p. 61 – 73, 1989 SN505 263 Norme Suisse – construction en acier SIA, 2003 Timoshenko S.P., Theory of elastic stability. Second edition, McGraw-Hill Book Company. ISBN 0-07-085821-7, 1961 UNE-EN 10002-1. Materiales metálicos. Ensayo de tracción. Parte 1: Método de ensayo a temperatura ambiente. AENOR. 1992 Ungermann D. Bemessungsverfahren fur vollwand- un kastenträger unter besonderer berucksichtigung des stegverhaltens, Heft 17, Stalhbau, RWTH Aachen. 1990 (in german) Veljkovic M., Johansson B., Design of hybrid steel girders. Journal of Constructional Steel Research. (64) pp. 535-547. 2004 von Kármán Th., Sechler E.E., Donnell L.H., The strength of thin plates in compression. Trans. ASME 54. Applied mechanics, APM-54-5,53-57. 1932 von Mises R., Mechanik des festen Körpers im plastischen deformablen Zustand. Nachrichten der Kgl. Gesellschaft der Wissenschaften Göttingen. Math-Phys Klasse, pp. 582–592. 1913 (in german) Waszczyszyn Z, Cichon C, Radwanska M., Stability of structures by finite element methods. Studies in Applied Mechanics. Elsevier 1994 Wilson W., Physical Properties That Effect Behaviour of Structural Members. Transactions ASCE, (109) 1944 Winter G., Stress distribution in an equivalent width of flanges of wide, Thin-walled steel beams. NACA 738. Technical Note. Washington 1940 Wojnowski D., Domel A.,Wilkinson J.,Kenner M., Analysis of a hybrid plate girder bridge during erection: collapse of Tennessee Highway 69 bridge. Progress in Structural and Engineering Materials. Issue 4: pages 87–95 2002 Wollmann G., Steel Girder Design per AASHTO LRFD Specifications. Part 1. Journal of bridge engineering. Vol. 9. Issue 4, pp. 364-374 ASCE. July/August 2004 Wollmann G., Steel Girder Design per AASHTO LRFD Specifications. Part 2. Journal of bridge engineering. Vol. 9. Issue 4, pp. 375-381 ASCE. July/August 2004

206 References
Zentz A., Experimental moment-shear interaction and TFA behaviour in hybrid plate girders. MS thesis, Univ. of Missouri-Columbia, U.S.A. 2002 Zienkiewicz O., Taylor R. The Finite Element Method. Vol.1 The Basis. Butterworth- Heinemann. Fifth Edition. 2003 Zienkiewicz O., Taylor R. The Finite Element Method. Vol.2 Solids Mechanics. Butterworth- Heinemann. Fifth Edition. 2003 Åhlenius E., Hybridbalkar I stål. Swedish Institute of Steel Construction, Pub.147, 1994. (in Swedish)

207 Annexes
Annexes Annex A. Review of the earlier work Tests collected from literature Annex B. Experimental programme B.1 Results obtained from coupon tests
B.2 Data from the instrumentation of the tests B.3 Additional results from the experimental programme
Annex C. Numerical database C.1 Geometry and results obtained. Numerical database
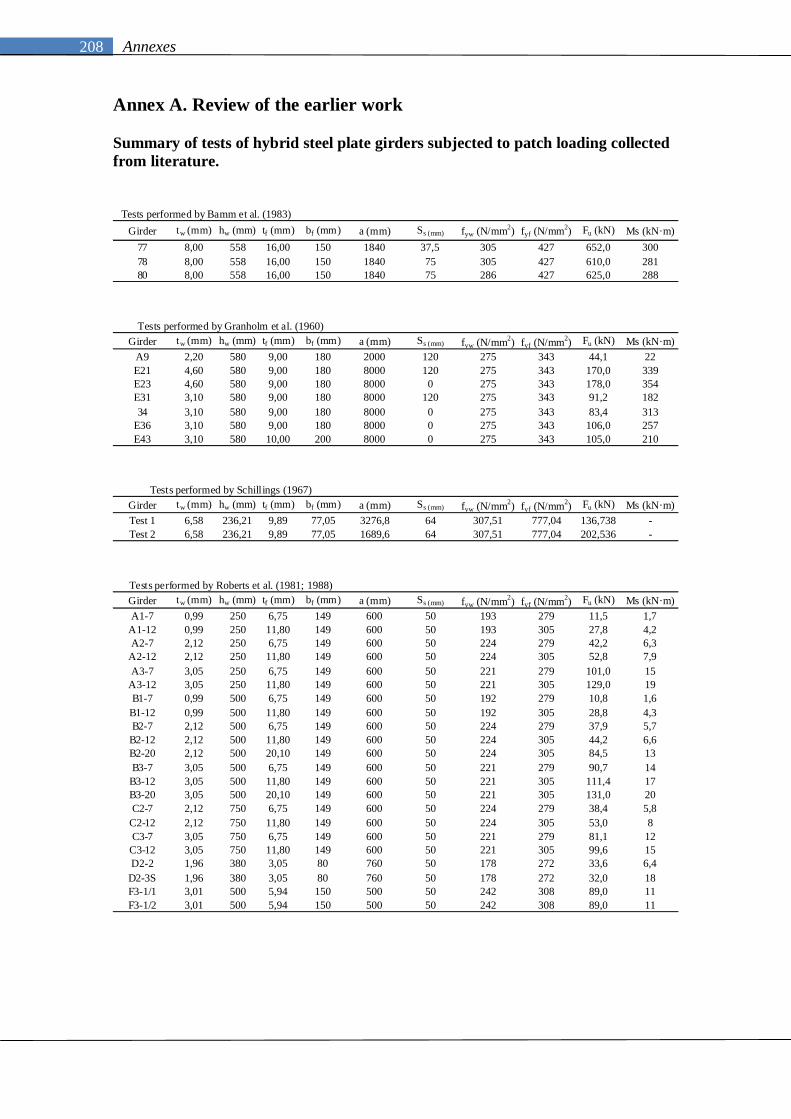
208 Annexes
Annex A. Review of the earlier work Summary of tests of hybrid steel plate girders subjected to patch loading collected from literature.
Girder tw (mm) hw (mm) tf (mm) bf (mm) a (mm) Ss (mm) fyw (N/mm2) fyf (N/mm2) Fu (kN) Ms (kN·m)77 8,00 558 16,00 150 1840 37,5 305 427 652,0 30078 8,00 558 16,00 150 1840 75 305 427 610,0 28180 8,00 558 16,00 150 1840 75 286 427 625,0 288
Tests performed by Bamm et al. (1983)
Girder tw (mm) hw (mm) tf (mm) bf (mm) a (mm) Ss (mm) fyw (N/mm2) fyf (N/mm2) Fu (kN) Ms (kN·m)A9 2,20 580 9,00 180 2000 120 275 343 44,1 22E21 4,60 580 9,00 180 8000 120 275 343 170,0 339E23 4,60 580 9,00 180 8000 0 275 343 178,0 354E31 3,10 580 9,00 180 8000 120 275 343 91,2 18234 3,10 580 9,00 180 8000 0 275 343 83,4 313
E36 3,10 580 9,00 180 8000 0 275 343 106,0 257E43 3,10 580 10,00 200 8000 0 275 343 105,0 210
Tests performed by Granholm et al. (1960)
Girder tw (mm) hw (mm) tf (mm) bf (mm) a (mm) Ss (mm) fyw (N/mm2) fyf (N/mm2) Fu (kN) Ms (kN·m)Test 1 6,58 236,21 9,89 77,05 3276,8 64 307,51 777,04 136,738 -Test 2 6,58 236,21 9,89 77,05 1689,6 64 307,51 777,04 202,536 -
Tests performed by Schillings (1967)
Girder tw (mm) hw (mm) tf (mm) bf (mm) a (mm) Ss (mm) fyw (N/mm2) fyf (N/mm2) Fu (kN) Ms (kN·m)A1-7 0,99 250 6,75 149 600 50 193 279 11,5 1,7
A1-12 0,99 250 11,80 149 600 50 193 305 27,8 4,2A2-7 2,12 250 6,75 149 600 50 224 279 42,2 6,3
A2-12 2,12 250 11,80 149 600 50 224 305 52,8 7,9A3-7 3,05 250 6,75 149 600 50 221 279 101,0 15
A3-12 3,05 250 11,80 149 600 50 221 305 129,0 19B1-7 0,99 500 6,75 149 600 50 192 279 10,8 1,6
B1-12 0,99 500 11,80 149 600 50 192 305 28,8 4,3B2-7 2,12 500 6,75 149 600 50 224 279 37,9 5,7
B2-12 2,12 500 11,80 149 600 50 224 305 44,2 6,6B2-20 2,12 500 20,10 149 600 50 224 305 84,5 13B3-7 3,05 500 6,75 149 600 50 221 279 90,7 14
B3-12 3,05 500 11,80 149 600 50 221 305 111,4 17B3-20 3,05 500 20,10 149 600 50 221 305 131,0 20C2-7 2,12 750 6,75 149 600 50 224 279 38,4 5,8
C2-12 2,12 750 11,80 149 600 50 224 305 53,0 8C3-7 3,05 750 6,75 149 600 50 221 279 81,1 12
C3-12 3,05 750 11,80 149 600 50 221 305 99,6 15D2-2 1,96 380 3,05 80 760 50 178 272 33,6 6,4
D2-3S 1,96 380 3,05 80 760 50 178 272 32,0 18F3-1/1 3,01 500 5,94 150 500 50 242 308 89,0 11F3-1/2 3,01 500 5,94 150 500 50 242 308 89,0 11
Tests performed by Roberts et al. (1981; 1988)
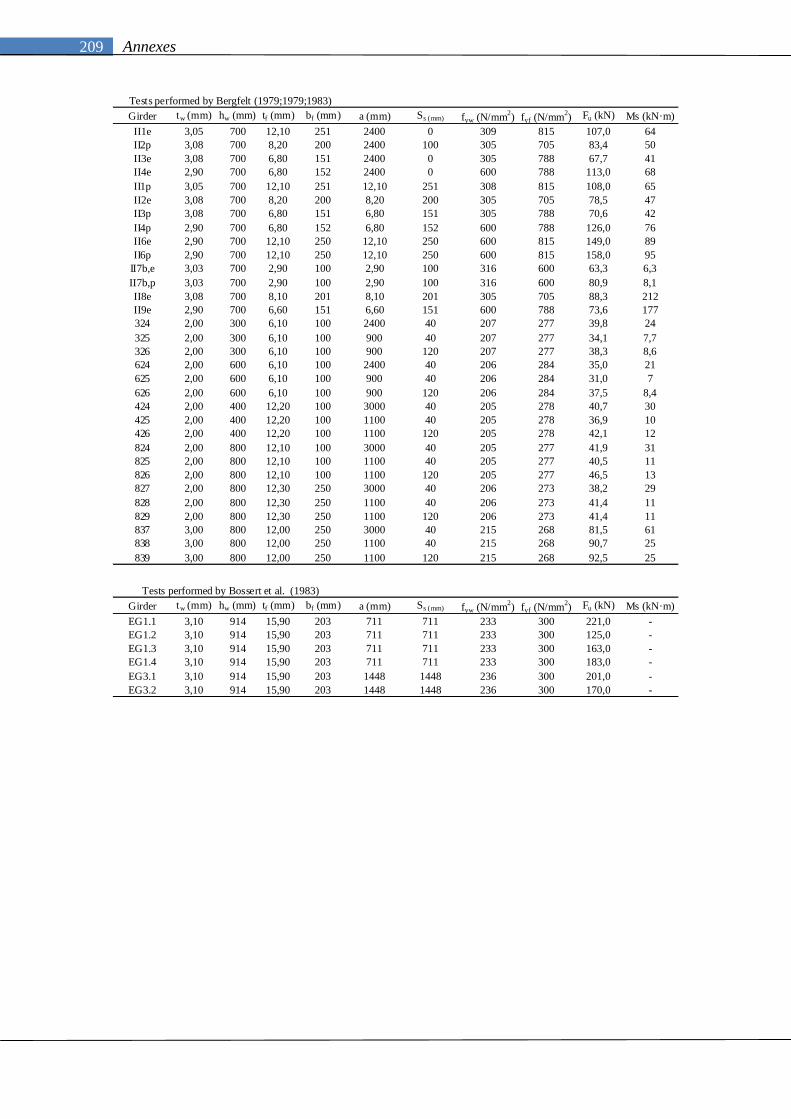
209 Annexes
Girder tw (mm) hw (mm) tf (mm) bf (mm) a (mm) Ss (mm) fyw (N/mm2) fyf (N/mm2) Fu (kN) Ms (kN·m)II1e 3,05 700 12,10 251 2400 0 309 815 107,0 64II2p 3,08 700 8,20 200 2400 100 305 705 83,4 50II3e 3,08 700 6,80 151 2400 0 305 788 67,7 41II4e 2,90 700 6,80 152 2400 0 600 788 113,0 68II1p 3,05 700 12,10 251 12,10 251 308 815 108,0 65II2e 3,08 700 8,20 200 8,20 200 305 705 78,5 47II3p 3,08 700 6,80 151 6,80 151 305 788 70,6 42II4p 2,90 700 6,80 152 6,80 152 600 788 126,0 76II6e 2,90 700 12,10 250 12,10 250 600 815 149,0 89II6p 2,90 700 12,10 250 12,10 250 600 815 158,0 95
II7b,e 3,03 700 2,90 100 2,90 100 316 600 63,3 6,3II7b,p 3,03 700 2,90 100 2,90 100 316 600 80,9 8,1II8e 3,08 700 8,10 201 8,10 201 305 705 88,3 212II9e 2,90 700 6,60 151 6,60 151 600 788 73,6 177324 2,00 300 6,10 100 2400 40 207 277 39,8 24325 2,00 300 6,10 100 900 40 207 277 34,1 7,7326 2,00 300 6,10 100 900 120 207 277 38,3 8,6624 2,00 600 6,10 100 2400 40 206 284 35,0 21625 2,00 600 6,10 100 900 40 206 284 31,0 7626 2,00 600 6,10 100 900 120 206 284 37,5 8,4424 2,00 400 12,20 100 3000 40 205 278 40,7 30425 2,00 400 12,20 100 1100 40 205 278 36,9 10426 2,00 400 12,20 100 1100 120 205 278 42,1 12824 2,00 800 12,10 100 3000 40 205 277 41,9 31825 2,00 800 12,10 100 1100 40 205 277 40,5 11826 2,00 800 12,10 100 1100 120 205 277 46,5 13827 2,00 800 12,30 250 3000 40 206 273 38,2 29828 2,00 800 12,30 250 1100 40 206 273 41,4 11829 2,00 800 12,30 250 1100 120 206 273 41,4 11837 3,00 800 12,00 250 3000 40 215 268 81,5 61838 3,00 800 12,00 250 1100 40 215 268 90,7 25839 3,00 800 12,00 250 1100 120 215 268 92,5 25
Tests performed by Bergfelt (1979;1979;1983)
Girder tw (mm) hw (mm) tf (mm) bf (mm) a (mm) Ss (mm) fyw (N/mm2) fyf (N/mm2) Fu (kN) Ms (kN·m)EG1.1 3,10 914 15,90 203 711 711 233 300 221,0 -EG1.2 3,10 914 15,90 203 711 711 233 300 125,0 -EG1.3 3,10 914 15,90 203 711 711 233 300 163,0 -EG1.4 3,10 914 15,90 203 711 711 233 300 183,0 -EG3.1 3,10 914 15,90 203 1448 1448 236 300 201,0 -EG3.2 3,10 914 15,90 203 1448 1448 236 300 170,0 -
Tests performed by Bossert et al. (1983)

210 Annexes
Annex B. Experimental programme Annex B.1 Results obtained from coupon tests
0
100
200
300
400
500
600
700
0 0,01 0,02 0,03 0,04
Stre
ss (N
/mm
2 )
Strain
First series. 1VPL
Flange plateWeb plateStiffener plate
0
100
200
300
400
500
600
700
0 0,005 0,01 0,015 0,02 0,025
Stre
ss (N
/mm
2 )
Strain
Second series. 2VPL
Flange plateWeb plateStiffener plate
Fig. B1. Stress-strain relationship obtained from coupon tests according to
UNE-EN 10002-1. Annex B.2 Data from the instrumentation of the tests
Fig. B.2.1 Instrumentation. Frontal and top views of tested girders a/hw>2
Fig. B.2.2 Instrumentation. Frontal and top views of tested girders a/hw<2
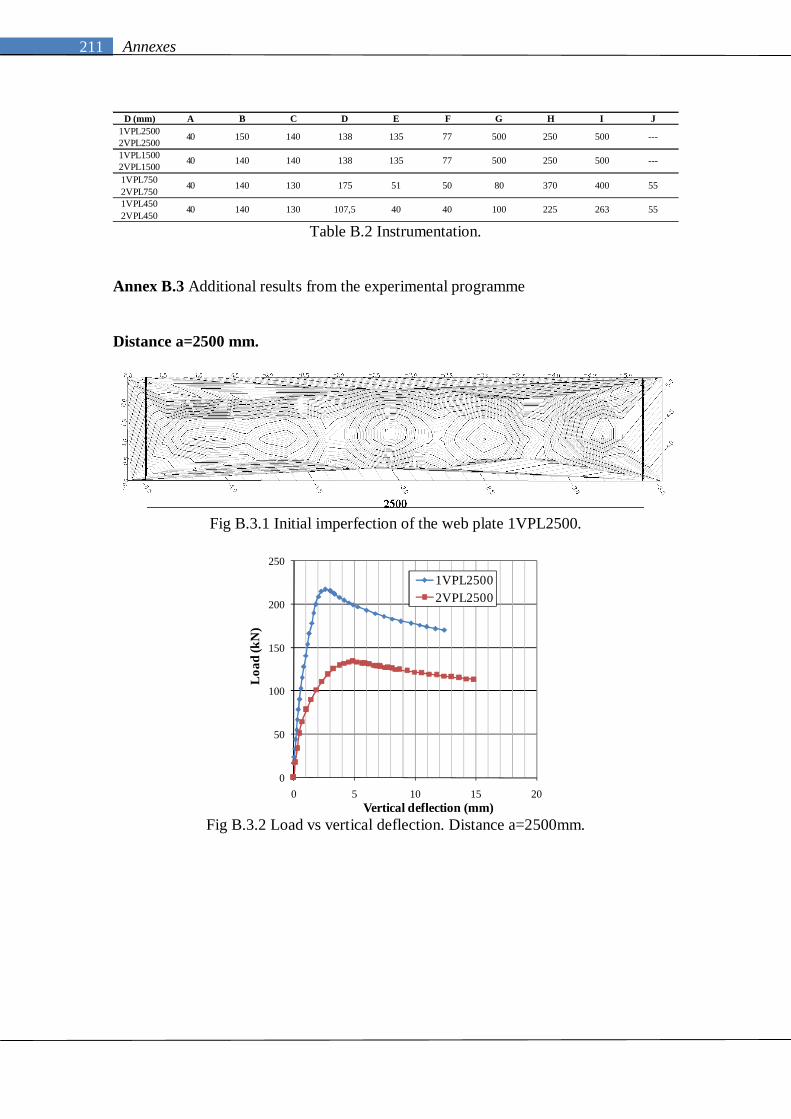
211 Annexes
D (mm) A B C D E F G H I J
1VPL25002VPL25001VPL15002VPL15001VPL7502VPL7501VPL4502VPL450
250 500 ---
40 140 140 138 135 77 500 250
40 150 140 138 135 77 500
40
500 ---
40 140 130 175 51 50 80
40 140 130 107,5 40 100 225 263 55
370 400 55
Table B.2 Instrumentation.
Annex B.3 Additional results from the experimental programme Distance a=2500 mm.
Fig B.3.1 Initial imperfection of the web plate 1VPL2500.
0
50
100
150
200
250
0 5 10 15 20
Loa
d (k
N)
Vertical deflection (mm)
1VPL25002VPL2500
Fig B.3.2 Load vs vertical deflection. Distance a=2500mm.

212 Annexes
0
50
100
150
200
250
0 10 20 30
Loa
d (k
N)
out-of-plane deflection (mm)
1VPL25002VPL2500
Fig B.3.3 Load vs out-of-plane deflection. Distance a=2500mm.
0
50
100
150
200
250
-0,0002 -0,0001 0,0000 0,0001 0,0002 0,0003 0,0004 0,0005
Loa
d (k
N)
Strain
1VPL25002VPL2500
Fig B.3.4 Load vs longitudinal strain at point I. Distance a=2500mm.
Distance a=1500 mm.
Fig B.3.5 Initial imperfection of the web plate 1VPL1500.

213 Annexes
0
20
40
60
80
100
120
140
160
180
200
0 5 10 15 20 25 30
Loa
d (k
N)
Vertical deflection (mm)
1VPL15002VPL1500
Fig B.3.6 Load vs vertical deflection. Distance a=1500mm.
0
20
40
60
80
100
120
140
160
180
200
0 5 10 15 20 25 30 35 40
Loa
d (k
N)
Out-of-plane deflection (mm)
1VPL15002VPL1500
Fig B.3.7 Load vs out-of-plane deflection. Distance a=1500mm.
0
20
40
60
80
100
120
140
160
180
200
-0,0002 0 0,0002 0,0004 0,0006 0,0008
Loa
d (k
N)
Longitudinal strain in I (mm)
1VPL15002VPL1500
Fig B.3.8 Load vs longitudinal strain at point I. Distance a=1500mm.
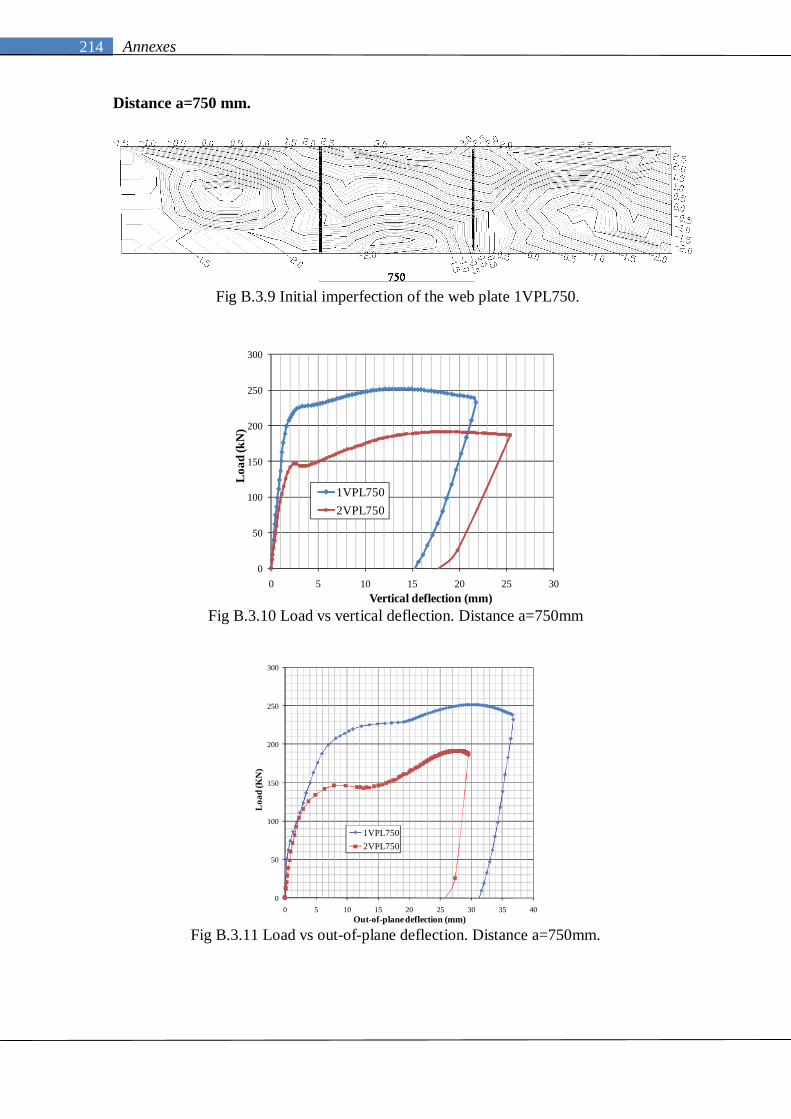
214 Annexes
Distance a=750 mm.
Fig B.3.9 Initial imperfection of the web plate 1VPL750.
0
50
100
150
200
250
300
0 5 10 15 20 25 30
Loa
d (k
N)
Vertical deflection (mm)
1VPL7502VPL750
Fig B.3.10 Load vs vertical deflection. Distance a=750mm
0
50
100
150
200
250
300
0 5 10 15 20 25 30 35 40
Loa
d (K
N)
Out-of-plane deflection (mm)
1VPL7502VPL750
Fig B.3.11 Load vs out-of-plane deflection. Distance a=750mm.

215 Annexes
0
50
100
150
200
250
300
-0,002 0 0,002 0,004 0,006 0,008 0,01 0,012 0,014 0,016
Loa
d (k
N)
Longitudinal strain
1VPL7502VPL750
Fig B.3.12 Load vs longitudinal strain at point G. Distance a=750mm
Distance a=450 mm.
Fig B.3.13 Initial imperfection of the web plate 1VPL750.
0
50
100
150
200
250
300
350
400
450
0 5 10 15 20 25 30
Loa
d (k
N)
Vertical deflection (mm)
1VPL4502VPL450
Fig B.3.14 Load vs vertical deflection. Distance a=450mm.

216 Annexes
0
50
100
150
200
250
300
350
400
450
0 10 20 30 40 50
Loa
d (k
N)
out-of-plane deflection (mm)
1VPL4502VPL450
Fig B.3.15 Load vs out-of-plane deflection. Distance a=450mm.
0
50
100
150
200
250
300
350
400
0 0,002 0,004 0,006 0,008 0,01 0,012
Loa
d (k
N)
Vertical strain in J
1VPL4502VPL450
Fig B.3.16 Load vs vertical strain at point J. Distance a=450mm.
Annex C. Numerical database

217 Annexes
Group Number Specimen hw (mm) a (mm) bf (mm) tf (mm) tw (mm) fyw (N/mm2) fyf (N/mm2) Ss (mm) FRd EN1993-1-5 (kN) Fcri, num (kN) Fu, num (mm)1 VT-0-1-8-25-1,0 1000 1000 800 60 8 235 235 250 603,20 1333,80 1592,882 VT-0-1-8-25-1,2 1000 1000 800 60 8 235 275 250 603,20 1333,80 1729,453 VT-0-1-8-25-1,6 1000 1000 800 60 8 235 355 250 603,20 1333,80 1995,284 VT-0-1-8-25-2 1000 1000 800 60 8 235 460 250 603,20 1333,80 2354,295 VT-0-1-8-50-1,0 1000 1000 800 60 8 235 235 500 603,20 1461,12 1818,606 VT-0-1-8-50-1,2 1000 1000 800 60 8 235 275 500 603,20 1461,12 1971,137 VT-0-1-8-50-1,6 1000 1000 800 60 8 235 355 500 603,20 1461,12 2275,668 VT-0-1-8-50-2 1000 1000 800 60 8 235 460 500 603,20 1461,12 2693,009 VT-0-1-12-25-1,0 1000 1000 800 60 12 235 235 250 1357,20 4208,76 2074,13
10 VT-0-1-12-25-1,2 1000 1000 800 60 12 235 275 250 1357,20 4208,76 2188,0911 VT-0-1-12-25-1,6 1000 1000 800 60 12 235 355 250 1357,20 4208,76 2412,0112 VT-0-1-12-25-2 1000 1000 800 60 12 235 460 250 1357,20 4208,76 2733,6813 VT-0-1-12-50-1,0 1000 1000 800 60 12 235 235 500 1357,20 4615,20 2352,1814 VT-0-1-12-50-1,2 1000 1000 800 60 12 235 275 500 1357,20 4615,20 2471,7315 VT-0-1-12-50-1,6 1000 1000 800 60 12 235 355 500 1357,20 4615,20 2737,1116 VT-0-1-12-50-2 1000 1000 800 60 12 235 460 500 1357,20 4615,20 3105,3617 VT-0-2-8-25-1,0 1000 2000 800 60 8 235 235 250 688,37 757,56 945,1118 VT-0-2-8-25-1,2 1000 2000 800 60 8 235 275 250 708,62 757,56 979,4119 VT-0-2-8-25-1,6 1000 2000 800 60 8 235 355 250 743,87 757,56 1059,6820 VT-0-2-8-25-2 1000 2000 800 60 8 235 460 250 768,93 757,56 1138,2021 VT-0-2-8-50-1,0 1000 2000 800 60 8 235 235 500 740,11 788,40 982,3922 VT-0-2-8-50-1,2 1000 2000 800 60 8 235 275 500 758,98 788,40 1017,9223 VT-0-2-8-50-1,6 1000 2000 800 60 8 235 355 500 768,93 788,40 1107,3424 VT-0-2-8-50-2 1000 2000 800 60 8 235 460 500 768,93 788,40 1245,1725 VT-0-2-12-25-1,0 1000 2000 800 60 12 235 235 250 1442,22 2493,36 1700,7826 VT-0-2-12-25-1,2 1000 2000 800 60 12 235 275 250 1481,73 2493,36 1700,7727 VT-0-2-12-25-1,6 1000 2000 800 60 12 235 355 250 1550,83 2493,36 1700,9428 VT-0-2-12-25-2 1000 2000 800 60 12 235 460 250 1627,43 2493,36 1700,9429 VT-0-2-12-50-1,0 1000 2000 800 60 12 235 235 500 1566,57 2600,88 1778,2130 VT-0-2-12-50-1,2 1000 2000 800 60 12 235 275 500 1603,02 2600,88 1778,3031 VT-0-2-12-50-1,6 1000 2000 800 60 12 235 355 500 1667,10 2600,88 1778,3532 VT-0-2-12-50-2 1000 2000 800 60 12 235 460 500 1730,09 2600,88 1778,3533 VT-0-3-8-25-1,0 1000 3000 800 60 8 235 235 250 673,50 759,30 887,6834 VT-0-3-8-25-1,2 1000 3000 800 60 8 235 275 250 693,31 759,30 887,6835 VT-0-3-8-25-1,6 1000 3000 800 60 8 235 355 250 727,80 759,30 887,6836 VT-0-3-8-25-2 1000 3000 800 60 8 235 460 250 765,85 759,30 887,6837 VT-0-3-8-50-1,0 1000 3000 800 60 8 235 235 500 724,12 790,80 911,2138 VT-0-3-8-50-1,2 1000 3000 800 60 8 235 275 500 742,58 790,80 911,2139 VT-0-3-8-50-1,6 1000 3000 800 60 8 235 355 500 774,88 790,80 911,2140 VT-0-3-8-50-2 1000 3000 800 60 8 235 460 500 810,72 790,80 911,2141 VT-0-3-12-25-1,0 1000 3000 800 60 12 235 235 250 1411,06 2489,28 1678,8642 VT-0-3-12-25-1,2 1000 3000 800 60 12 235 275 250 1449,72 2489,28 1678,8943 VT-0-3-12-25-1,6 1000 3000 800 60 12 235 355 250 1517,33 2489,28 1679,0544 VT-0-3-12-25-2 1000 3000 800 60 12 235 460 250 1592,28 2489,28 1679,0545 VT-0-3-12-50-1,0 1000 3000 800 60 12 235 235 500 1532,73 2592,60 1749,0046 VT-0-3-12-50-1,2 1000 3000 800 60 12 235 275 500 1568,39 2592,60 1749,1747 VT-0-3-12-50-1,6 1000 3000 800 60 12 235 355 500 1631,09 2592,60 1749,2248 VT-0-3-12-50-2 1000 3000 800 60 12 235 460 500 1701,03 2592,60 1749,22
0

218 Annexes
Group Number Specimen hw (mm) a (mm) bf (mm) tf (mm) tw (mm) fyw (N/mm2) fyf (N/mm2) Ss (mm) FRd EN1993-1-5 (kN) Fcri, num (kN) Fu, num (mm)1 VT-1-2-12-5-1,0 2000 2000 900 80 12 235 235 500 1357,20 1917,32 2387,012 VT-1-2-12-5-1,2 2000 2000 900 80 12 235 275 500 1357,20 1917,32 2432,723 VT-1-2-12-5-1,6 2000 2000 900 80 12 235 355 500 1357,20 1917,32 2667,504 VT-1-2-12-5-2,0 2000 2000 900 80 12 235 460 500 1357,20 1917,32 3003,015 VT-1-2-12-10-1,0 2000 2000 900 80 12 235 235 1000 1357,20 2160,99 2885,836 VT-1-2-12-10-1,2 2000 2000 900 80 12 235 275 1000 1357,20 2160,99 3047,647 VT-1-2-12-10-1,6 2000 2000 900 80 12 235 355 1000 1357,20 2160,99 3273,898 VT-1-2-12-10-2,0 2000 2000 900 80 12 235 460 1000 1357,20 2160,99 3532,909 VT-1-2-20-5-1,0 2000 2000 900 80 20 235 235 500 3648,58 8320,19 4541,02
10 VT-1-2-20-5-1,2 2000 2000 900 80 20 235 275 500 3724,04 8320,19 4542,5511 VT-1-2-20-5-1,6 2000 2000 900 80 20 235 355 500 3769,99 8320,19 4539,2512 VT-1-2-20-5-2,0 2000 2000 900 80 20 235 460 500 3769,99 8320,19 4535,2613 VT-1-2-20-10-1,0 2000 2000 900 80 20 235 235 1000 3769,99 9343,80 5198,6514 VT-1-2-20-10-1,2 2000 2000 900 80 20 235 275 1000 3769,99 9343,80 5043,7715 VT-1-2-20-10-1,6 2000 2000 900 80 20 235 355 1000 3769,99 9343,80 5040,1516 VT-1-2-20-10-2,0 2000 2000 900 80 20 235 460 1000 3769,99 9343,80 5007,9617 VT-1-4-12-5-1,0 2000 4000 900 80 12 235 235 500 1270,37 1271,70 1998,2918 VT-1-4-12-5-1,2 2000 4000 900 80 12 235 275 500 1301,06 1271,70 1998,4219 VT-1-4-12-5-1,6 2000 4000 900 80 12 235 355 500 1355,27 1271,70 1998,6620 VT-1-4-12-5-2,0 2000 4000 900 80 12 235 460 500 1416,00 1271,70 1998,9721 VT-1-4-12-10-1,0 2000 4000 900 80 12 235 235 1000 1409,96 1344,60 2062,4722 VT-1-4-12-10-1,2 2000 4000 900 80 12 235 275 1000 1437,68 1344,60 2062,6123 VT-1-4-12-10-1,6 2000 4000 900 80 12 235 355 1000 1486,91 1344,60 2062,9324 VT-1-4-12-10-2,0 2000 4000 900 80 12 235 460 1000 1542,47 1344,60 2063,3025 VT-1-4-20-5-1,0 2000 4000 900 80 20 235 235 500 3288,79 5653,26 4309,2226 VT-1-4-20-5-1,2 2000 4000 900 80 20 235 275 500 3356,80 5653,26 4311,2427 VT-1-4-20-5-1,6 2000 4000 900 80 20 235 355 500 3478,29 5653,26 4311,5628 VT-1-4-20-5-2,0 2000 4000 900 80 20 235 460 500 3616,09 5653,26 4328,4229 VT-1-4-20-10-1,0 2000 4000 900 80 20 235 235 1000 3701,77 5989,68 4693,0030 VT-1-4-20-10-1,2 2000 4000 900 80 20 235 275 1000 3762,33 5989,68 4693,0031 VT-1-4-20-10-1,6 2000 4000 900 80 20 235 355 1000 3871,11 5989,68 4694,0932 VT-1-4-20-10-2,0 2000 4000 900 80 20 235 460 1000 3995,38 5989,68 4695,0233 VT-1-6-12-5-1,0 2000 6000 900 80 12 235 235 500 1242,93 1271,15 1947,0034 VT-1-6-12-5-1,2 2000 6000 900 80 12 235 275 500 1272,96 1271,15 1947,0835 VT-1-6-12-5-1,6 2000 6000 900 80 12 235 355 500 1325,99 1271,15 1947,0436 VT-1-6-12-5-2,0 2000 6000 900 80 12 235 460 500 1385,42 1271,15 1947,0037 VT-1-6-12-10-1,0 2000 6000 900 80 12 235 235 1000 1379,51 2559,25 2027,3038 VT-1-6-12-10-1,2 2000 6000 900 80 12 235 275 1000 1406,62 2559,25 2027,2839 VT-1-6-12-10-1,6 2000 6000 900 80 12 235 355 1000 1454,79 2559,25 2027,2440 VT-1-6-12-10-2,0 2000 6000 900 80 12 235 460 1000 1509,15 2559,25 2027,1841 VT-1-6-20-5-1,0 2000 6000 900 80 20 235 235 500 3217,75 5523,93 4256,3842 VT-1-6-20-5-1,2 2000 6000 900 80 20 235 275 500 3284,29 5523,93 4261,7343 VT-1-6-20-5-1,6 2000 6000 900 80 20 235 355 500 3403,16 5523,93 4262,8344 VT-1-6-20-5-2,0 2000 6000 900 80 20 235 460 500 3537,98 5523,93 4264,0745 VT-1-6-20-10-1,0 2000 6000 900 80 20 235 235 1000 3621,81 5845,50 4636,5946 VT-1-6-20-10-1,2 2000 6000 900 80 20 235 275 1000 3681,06 5845,50 4636,8447 VT-1-6-20-10-1,6 2000 6000 900 80 20 235 355 1000 3787,49 5845,50 4637,8548 VT-1-6-20-10-2,0 2000 6000 900 80 20 235 460 1000 3909,08 5845,50 4638,42
1
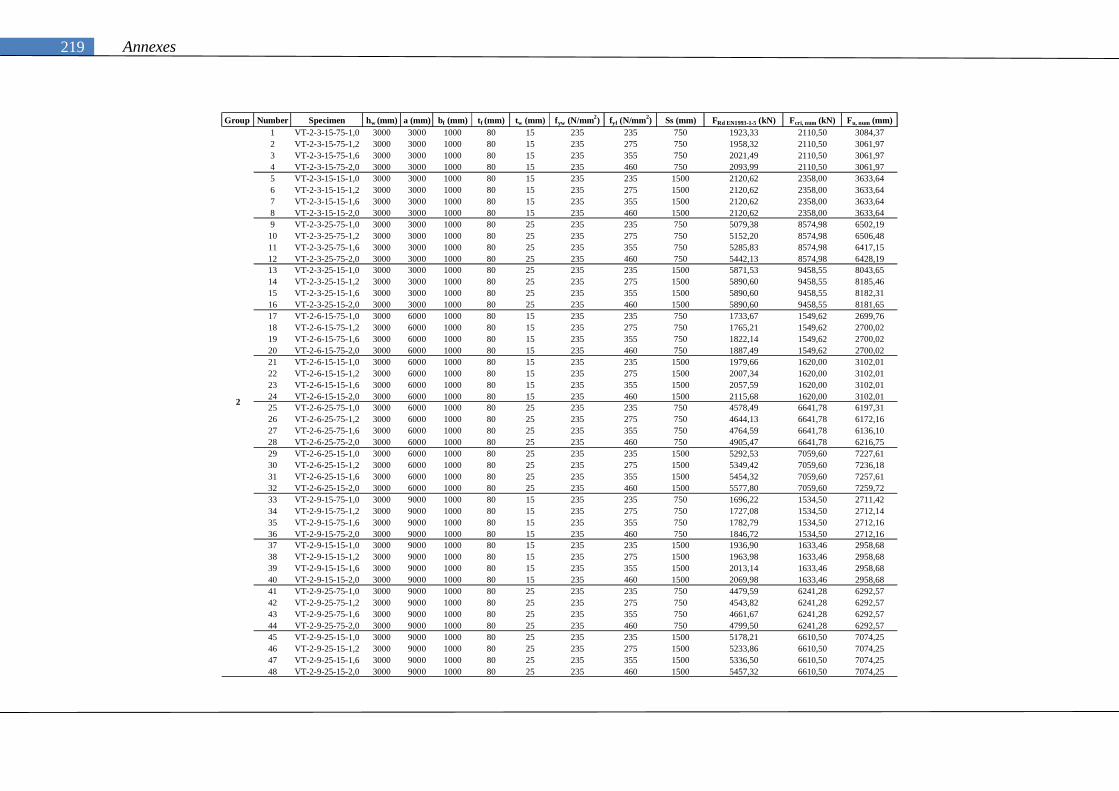
219 Annexes
Group Number Specimen hw (mm) a (mm) bf (mm) tf (mm) tw (mm) fyw (N/mm2) fyf (N/mm2) Ss (mm) FRd EN1993-1-5 (kN) Fcri, num (kN) Fu, num (mm)1 VT-2-3-15-75-1,0 3000 3000 1000 80 15 235 235 750 1923,33 2110,50 3084,372 VT-2-3-15-75-1,2 3000 3000 1000 80 15 235 275 750 1958,32 2110,50 3061,973 VT-2-3-15-75-1,6 3000 3000 1000 80 15 235 355 750 2021,49 2110,50 3061,974 VT-2-3-15-75-2,0 3000 3000 1000 80 15 235 460 750 2093,99 2110,50 3061,975 VT-2-3-15-15-1,0 3000 3000 1000 80 15 235 235 1500 2120,62 2358,00 3633,646 VT-2-3-15-15-1,2 3000 3000 1000 80 15 235 275 1500 2120,62 2358,00 3633,647 VT-2-3-15-15-1,6 3000 3000 1000 80 15 235 355 1500 2120,62 2358,00 3633,648 VT-2-3-15-15-2,0 3000 3000 1000 80 15 235 460 1500 2120,62 2358,00 3633,649 VT-2-3-25-75-1,0 3000 3000 1000 80 25 235 235 750 5079,38 8574,98 6502,19
10 VT-2-3-25-75-1,2 3000 3000 1000 80 25 235 275 750 5152,20 8574,98 6506,4811 VT-2-3-25-75-1,6 3000 3000 1000 80 25 235 355 750 5285,83 8574,98 6417,1512 VT-2-3-25-75-2,0 3000 3000 1000 80 25 235 460 750 5442,13 8574,98 6428,1913 VT-2-3-25-15-1,0 3000 3000 1000 80 25 235 235 1500 5871,53 9458,55 8043,6514 VT-2-3-25-15-1,2 3000 3000 1000 80 25 235 275 1500 5890,60 9458,55 8185,4615 VT-2-3-25-15-1,6 3000 3000 1000 80 25 235 355 1500 5890,60 9458,55 8182,3116 VT-2-3-25-15-2,0 3000 3000 1000 80 25 235 460 1500 5890,60 9458,55 8181,6517 VT-2-6-15-75-1,0 3000 6000 1000 80 15 235 235 750 1733,67 1549,62 2699,7618 VT-2-6-15-75-1,2 3000 6000 1000 80 15 235 275 750 1765,21 1549,62 2700,0219 VT-2-6-15-75-1,6 3000 6000 1000 80 15 235 355 750 1822,14 1549,62 2700,0220 VT-2-6-15-75-2,0 3000 6000 1000 80 15 235 460 750 1887,49 1549,62 2700,0221 VT-2-6-15-15-1,0 3000 6000 1000 80 15 235 235 1500 1979,66 1620,00 3102,0122 VT-2-6-15-15-1,2 3000 6000 1000 80 15 235 275 1500 2007,34 1620,00 3102,0123 VT-2-6-15-15-1,6 3000 6000 1000 80 15 235 355 1500 2057,59 1620,00 3102,0124 VT-2-6-15-15-2,0 3000 6000 1000 80 15 235 460 1500 2115,68 1620,00 3102,0125 VT-2-6-25-75-1,0 3000 6000 1000 80 25 235 235 750 4578,49 6641,78 6197,3126 VT-2-6-25-75-1,2 3000 6000 1000 80 25 235 275 750 4644,13 6641,78 6172,1627 VT-2-6-25-75-1,6 3000 6000 1000 80 25 235 355 750 4764,59 6641,78 6136,1028 VT-2-6-25-75-2,0 3000 6000 1000 80 25 235 460 750 4905,47 6641,78 6216,7529 VT-2-6-25-15-1,0 3000 6000 1000 80 25 235 235 1500 5292,53 7059,60 7227,6130 VT-2-6-25-15-1,2 3000 6000 1000 80 25 235 275 1500 5349,42 7059,60 7236,1831 VT-2-6-25-15-1,6 3000 6000 1000 80 25 235 355 1500 5454,32 7059,60 7257,6132 VT-2-6-25-15-2,0 3000 6000 1000 80 25 235 460 1500 5577,80 7059,60 7259,7233 VT-2-9-15-75-1,0 3000 9000 1000 80 15 235 235 750 1696,22 1534,50 2711,4234 VT-2-9-15-75-1,2 3000 9000 1000 80 15 235 275 750 1727,08 1534,50 2712,1435 VT-2-9-15-75-1,6 3000 9000 1000 80 15 235 355 750 1782,79 1534,50 2712,1636 VT-2-9-15-75-2,0 3000 9000 1000 80 15 235 460 750 1846,72 1534,50 2712,1637 VT-2-9-15-15-1,0 3000 9000 1000 80 15 235 235 1500 1936,90 1633,46 2958,6838 VT-2-9-15-15-1,2 3000 9000 1000 80 15 235 275 1500 1963,98 1633,46 2958,6839 VT-2-9-15-15-1,6 3000 9000 1000 80 15 235 355 1500 2013,14 1633,46 2958,6840 VT-2-9-15-15-2,0 3000 9000 1000 80 15 235 460 1500 2069,98 1633,46 2958,6841 VT-2-9-25-75-1,0 3000 9000 1000 80 25 235 235 750 4479,59 6241,28 6292,5742 VT-2-9-25-75-1,2 3000 9000 1000 80 25 235 275 750 4543,82 6241,28 6292,5743 VT-2-9-25-75-1,6 3000 9000 1000 80 25 235 355 750 4661,67 6241,28 6292,5744 VT-2-9-25-75-2,0 3000 9000 1000 80 25 235 460 750 4799,50 6241,28 6292,5745 VT-2-9-25-15-1,0 3000 9000 1000 80 25 235 235 1500 5178,21 6610,50 7074,2546 VT-2-9-25-15-1,2 3000 9000 1000 80 25 235 275 1500 5233,86 6610,50 7074,2547 VT-2-9-25-15-1,6 3000 9000 1000 80 25 235 355 1500 5336,50 6610,50 7074,2548 VT-2-9-25-15-2,0 3000 9000 1000 80 25 235 460 1500 5457,32 6610,50 7074,25
2
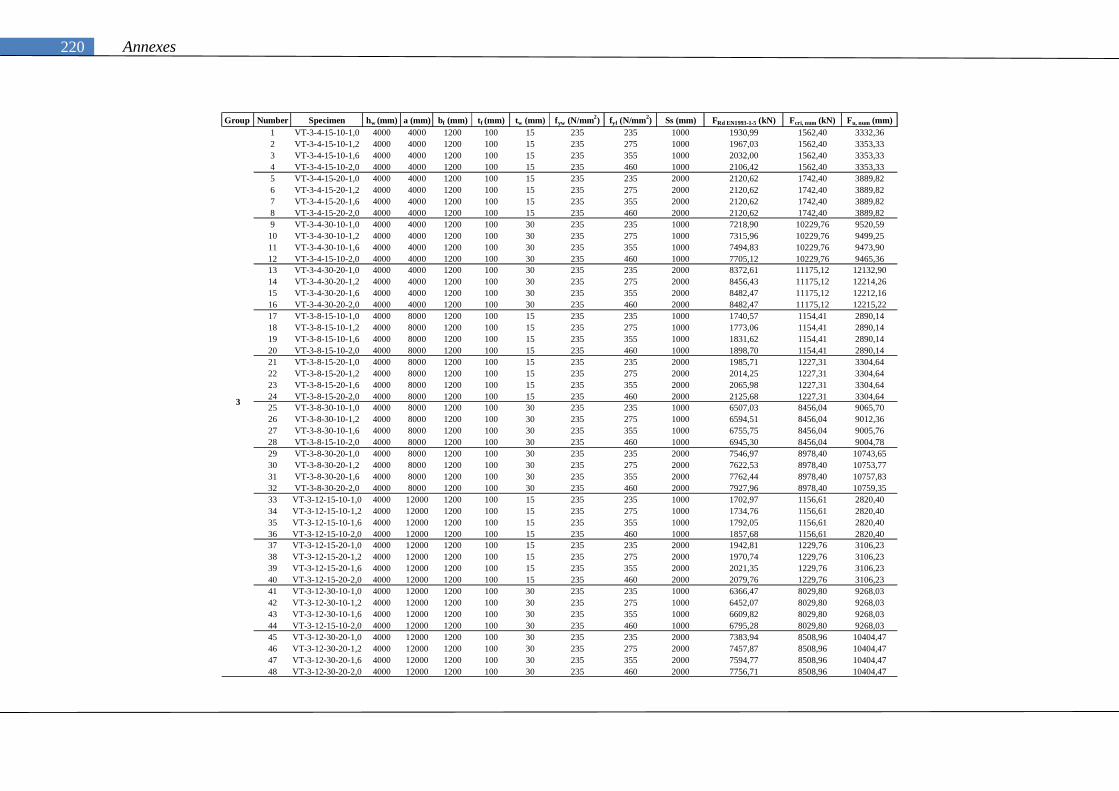
220 Annexes
Group Number Specimen hw (mm) a (mm) bf (mm) tf (mm) tw (mm) fyw (N/mm2) fyf (N/mm2) Ss (mm) FRd EN1993-1-5 (kN) Fcri, num (kN) Fu, num (mm)1 VT-3-4-15-10-1,0 4000 4000 1200 100 15 235 235 1000 1930,99 1562,40 3332,362 VT-3-4-15-10-1,2 4000 4000 1200 100 15 235 275 1000 1967,03 1562,40 3353,333 VT-3-4-15-10-1,6 4000 4000 1200 100 15 235 355 1000 2032,00 1562,40 3353,334 VT-3-4-15-10-2,0 4000 4000 1200 100 15 235 460 1000 2106,42 1562,40 3353,335 VT-3-4-15-20-1,0 4000 4000 1200 100 15 235 235 2000 2120,62 1742,40 3889,826 VT-3-4-15-20-1,2 4000 4000 1200 100 15 235 275 2000 2120,62 1742,40 3889,827 VT-3-4-15-20-1,6 4000 4000 1200 100 15 235 355 2000 2120,62 1742,40 3889,828 VT-3-4-15-20-2,0 4000 4000 1200 100 15 235 460 2000 2120,62 1742,40 3889,829 VT-3-4-30-10-1,0 4000 4000 1200 100 30 235 235 1000 7218,90 10229,76 9520,59
10 VT-3-4-30-10-1,2 4000 4000 1200 100 30 235 275 1000 7315,96 10229,76 9499,2511 VT-3-4-30-10-1,6 4000 4000 1200 100 30 235 355 1000 7494,83 10229,76 9473,9012 VT-3-4-15-10-2,0 4000 4000 1200 100 30 235 460 1000 7705,12 10229,76 9465,3613 VT-3-4-30-20-1,0 4000 4000 1200 100 30 235 235 2000 8372,61 11175,12 12132,9014 VT-3-4-30-20-1,2 4000 4000 1200 100 30 235 275 2000 8456,43 11175,12 12214,2615 VT-3-4-30-20-1,6 4000 4000 1200 100 30 235 355 2000 8482,47 11175,12 12212,1616 VT-3-4-30-20-2,0 4000 4000 1200 100 30 235 460 2000 8482,47 11175,12 12215,2217 VT-3-8-15-10-1,0 4000 8000 1200 100 15 235 235 1000 1740,57 1154,41 2890,1418 VT-3-8-15-10-1,2 4000 8000 1200 100 15 235 275 1000 1773,06 1154,41 2890,1419 VT-3-8-15-10-1,6 4000 8000 1200 100 15 235 355 1000 1831,62 1154,41 2890,1420 VT-3-8-15-10-2,0 4000 8000 1200 100 15 235 460 1000 1898,70 1154,41 2890,1421 VT-3-8-15-20-1,0 4000 8000 1200 100 15 235 235 2000 1985,71 1227,31 3304,6422 VT-3-8-15-20-1,2 4000 8000 1200 100 15 235 275 2000 2014,25 1227,31 3304,6423 VT-3-8-15-20-1,6 4000 8000 1200 100 15 235 355 2000 2065,98 1227,31 3304,6424 VT-3-8-15-20-2,0 4000 8000 1200 100 15 235 460 2000 2125,68 1227,31 3304,6425 VT-3-8-30-10-1,0 4000 8000 1200 100 30 235 235 1000 6507,03 8456,04 9065,7026 VT-3-8-30-10-1,2 4000 8000 1200 100 30 235 275 1000 6594,51 8456,04 9012,3627 VT-3-8-30-10-1,6 4000 8000 1200 100 30 235 355 1000 6755,75 8456,04 9005,7628 VT-3-8-15-10-2,0 4000 8000 1200 100 30 235 460 1000 6945,30 8456,04 9004,7829 VT-3-8-30-20-1,0 4000 8000 1200 100 30 235 235 2000 7546,97 8978,40 10743,6530 VT-3-8-30-20-1,2 4000 8000 1200 100 30 235 275 2000 7622,53 8978,40 10753,7731 VT-3-8-30-20-1,6 4000 8000 1200 100 30 235 355 2000 7762,44 8978,40 10757,8332 VT-3-8-30-20-2,0 4000 8000 1200 100 30 235 460 2000 7927,96 8978,40 10759,3533 VT-3-12-15-10-1,0 4000 12000 1200 100 15 235 235 1000 1702,97 1156,61 2820,4034 VT-3-12-15-10-1,2 4000 12000 1200 100 15 235 275 1000 1734,76 1156,61 2820,4035 VT-3-12-15-10-1,6 4000 12000 1200 100 15 235 355 1000 1792,05 1156,61 2820,4036 VT-3-12-15-10-2,0 4000 12000 1200 100 15 235 460 1000 1857,68 1156,61 2820,4037 VT-3-12-15-20-1,0 4000 12000 1200 100 15 235 235 2000 1942,81 1229,76 3106,2338 VT-3-12-15-20-1,2 4000 12000 1200 100 15 235 275 2000 1970,74 1229,76 3106,2339 VT-3-12-15-20-1,6 4000 12000 1200 100 15 235 355 2000 2021,35 1229,76 3106,2340 VT-3-12-15-20-2,0 4000 12000 1200 100 15 235 460 2000 2079,76 1229,76 3106,2341 VT-3-12-30-10-1,0 4000 12000 1200 100 30 235 235 1000 6366,47 8029,80 9268,0342 VT-3-12-30-10-1,2 4000 12000 1200 100 30 235 275 1000 6452,07 8029,80 9268,0343 VT-3-12-30-10-1,6 4000 12000 1200 100 30 235 355 1000 6609,82 8029,80 9268,0344 VT-3-12-15-10-2,0 4000 12000 1200 100 30 235 460 1000 6795,28 8029,80 9268,0345 VT-3-12-30-20-1,0 4000 12000 1200 100 30 235 235 2000 7383,94 8508,96 10404,4746 VT-3-12-30-20-1,2 4000 12000 1200 100 30 235 275 2000 7457,87 8508,96 10404,4747 VT-3-12-30-20-1,6 4000 12000 1200 100 30 235 355 2000 7594,77 8508,96 10404,4748 VT-3-12-30-20-2,0 4000 12000 1200 100 30 235 460 2000 7756,71 8508,96 10404,47
3

221 Annexes