Fish Genetics Research in Member Countries and Institutions ...
Upload
aiimspatnaCategory
view
7download
0
University of Nebraska - LincolnDigitalCommons@University of Nebraska - Lincoln
Library Philosophy and Practice (e-journal) Libraries at University of Nebraska-Lincoln
Research Output of some Selected Indian MedicalResearch Institutions (2007-2011)Ramesh Pandita
Shivendra Singh Mr.
Ramesh C. Gaur Dr.
Follow this and additional works at: http://digitalcommons.unl.edu/libphilpracPart of the Library and Information Science Commons, and the Medicine and Health Sciences
Commons
Research Output of some Selected Indian Medical Research
Institutions (2007-2011)
Ramesh Pandita
Assistant Librarian, BGSB University, Rajouri, R/O 274-C, Durga Nagar Sect. No I
P/O Roop Nagar, Jammu – 180013, E-mail: [email protected]
Shivendra Singh
Assistant Librarian, UCN, BFUHS, Farikdot-151203, Punjab
Ph. -+91-1639-250433, E-mail: [email protected]
Ramesh C. Gaur
Department: University Library
University/Institution: Jawaharlal Nehru University
New Delhi-110067 E-mail: [email protected]
ABSTRACT
Research is the backbone of any subject field, not just required to be undertaken for its
survival and sustenance but also for the furtherance of subject scope. Most of the research
activities undertaken at any level are aimed towards the welfare and betterment of living
being and humans being the first consideration. Medical research has always been the
supreme fantasy of humans as it has got direct bearing upon human health and longevity
of life. In the present study attempt has been made to have an analysis of medical
literature produced in four most primer medical and research institutions of India. To
undertake the study, data was retrieved from Web of Science, Thomson Reuters on
November 08, 2012 and the analysis is being undertaken on those publications only
identified on this particular databank. The study is undertaken with the view to assess the
general publication trend of medical sciences in India by undertaking four primer medical
institutions under study. Study of the related literature has also been undertaken so as to
develop better understanding of the concept and thereby help in the furtherance of its
scope.
KEY WORDS: Medical Research, Research Output, Bibliometrics, India, AIIMS,
JIPMER, PGIMER, SGPGIMS
INTRODUCTION
Excellence in medical sciences has always been the bone of contention in developed
world. The developed countries across the world if are seen as progressive, developed
and advanced, medical excellence in that very particular country had always been one of
the parameters. Even today more the country is well off at the medical facility front more
the country is rated as developed. Even we should not forget that length of human life in
a particular country is always taken into consideration to determine the medical sector of
that country. Among so many things either directly or indirectly related with humans on
health front is actually based on the amount of medical research undertaken in a
particular country. More robust the health sector of a country more progressive the nation
is.
With the similar view, Indian health sector has improved considerably during the last two
decades; even Indian health sector is being seen as second to none across the globe. The
biggest advantage which makes people to look at the Indian medical facility is of its
being cheap and world class. People all across the South Asia, if have to opt for
advanced medical facility, their preferred destination is India for aforesaid reasons and if
we have to owe it to something it is medical research carried out in primer medical
institutions across the country.
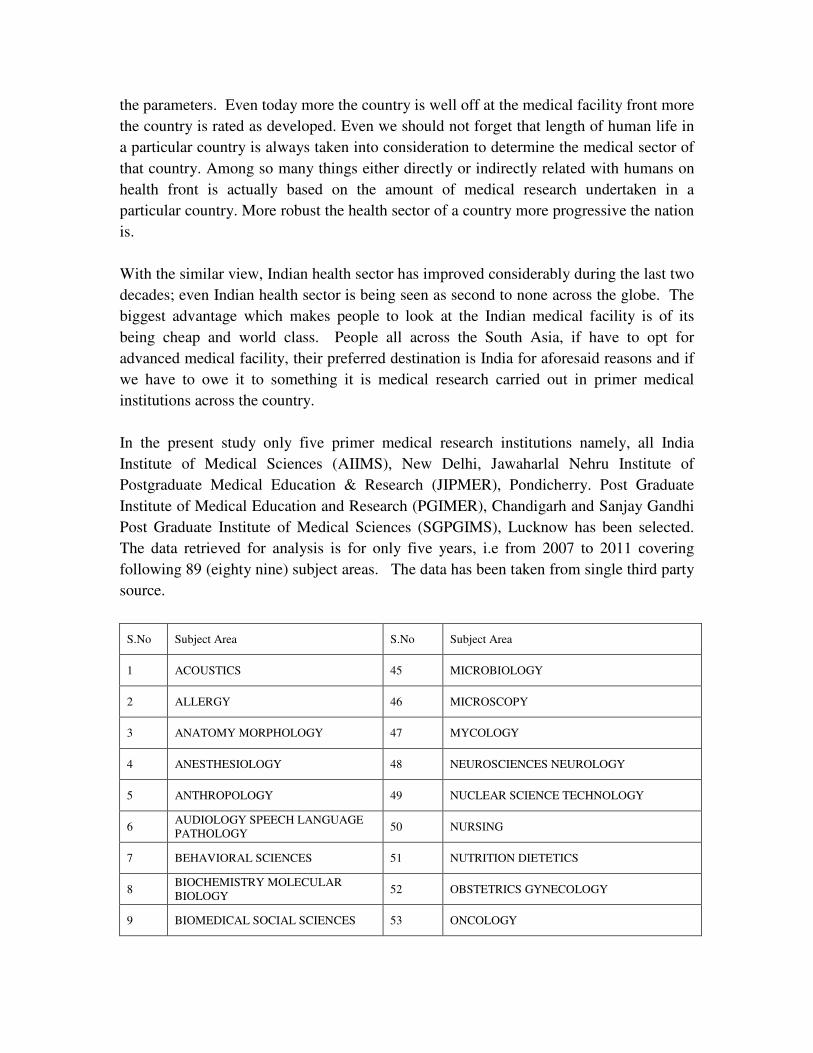
In the present study only five primer medical research institutions namely, all India
Institute of Medical Sciences (AIIMS), New Delhi, Jawaharlal Nehru Institute of
Postgraduate Medical Education & Research (JIPMER), Pondicherry. Post Graduate
Institute of Medical Education and Research (PGIMER), Chandigarh and Sanjay Gandhi
Post Graduate Institute of Medical Sciences (SGPGIMS), Lucknow has been selected.
The data retrieved for analysis is for only five years, i.e from 2007 to 2011 covering
following 89 (eighty nine) subject areas. The data has been taken from single third party
source.
S.No Subject Area S.No Subject Area
1 ACOUSTICS 45 MICROBIOLOGY
2 ALLERGY 46 MICROSCOPY
3 ANATOMY MORPHOLOGY 47 MYCOLOGY
4 ANESTHESIOLOGY 48 NEUROSCIENCES NEUROLOGY
5 ANTHROPOLOGY 49 NUCLEAR SCIENCE TECHNOLOGY
6 AUDIOLOGY SPEECH LANGUAGE
PATHOLOGY 50 NURSING
7 BEHAVIORAL SCIENCES 51 NUTRITION DIETETICS
8 BIOCHEMISTRY MOLECULAR
BIOLOGY 52 OBSTETRICS GYNECOLOGY
9 BIOMEDICAL SOCIAL SCIENCES 53 ONCOLOGY
10 BIOPHYSICS 54 OPERATIONS RESEARCH MANAGEMENT
SCIENCE
11 BIOTECHNOLOGY APPLIED
MICROBIOLOGY 55 OPHTHALMOLOGY
12 CARDIOVASCULAR SYSTEM
CARDIOLOGY 56 OPTICS
13 CELL BIOLOGY 57 ORTHOPEDICS
14 CHEMISTRY 58 OTORHINOLARYNGOLOGY
15 COMPUTER SCIENCE 59 PARASITOLOGY
16 CRYSTALLOGRAPHY 60 PATHOLOGY
17 DENTISTRY ORAL SURGERY
MEDICINE 61 PEDIATRICS
18 DERMATOLOGY 62 PHARMACOLOGY PHARMACY
19 DEVELOPMENTAL BIOLOGY 63 PHYSICS
20 EDUCATION EDUCATIONAL
RESEARCH 64 PHYSIOLOGY
21 ELECTROCHEMISTRY 65 PLANT SCIENCES
22 EMERGENCY MEDICINE 66 POLYMER SCIENCE
23 ENDOCRINOLOGY METABOLISM 67 PSYCHIATRY
24 ENGINEERING 68 PSYCHOLOGY
25 ENVIRONMENTAL SCIENCES
ECOLOGY 69
PUBLIC ENVIRONMENTAL
OCCUPATIONAL HEALTH
26 EVOLUTIONARY BIOLOGY 70 RADIOLOGY NUCLEAR MEDICINE
MEDICAL IMAGING
27 FOOD SCIENCE TECHNOLOGY 71 REHABILITATION
28 GASTROENTEROLOGY
HEPATOLOGY 72 REPRODUCTIVE BIOLOGY
29 GENERAL INTERNAL MEDICINE 73 RESEARCH EXPERIMENTAL MEDICINE
30 GENETICS HEREDITY 74 RESPIRATORY SYSTEM
31 GERIATRICS GERONTOLOGY 75 RHEUMATOLOGY
32 GOVERNMENT LAW 76 SCIENCE TECHNOLOGY OTHER TOPICS
33 HEALTH CARE SCIENCES
SERVICES 77 SOCIAL SCIENCES OTHER TOPICS
34 HEMATOLOGY 78 SPECTROSCOPY
35 IMMUNOLOGY 79 SPORT SCIENCES
36 INFECTIOUS DISEASES 80 SUBSTANCE ABUSE
37 INSTRUMENTS
INSTRUMENTATION 81 SURGERY
38 INTEGRATIVE COMPLEMENTARY
MEDICINE 82 TOXICOLOGY
39 LEGAL MEDICINE 83 TRANSPLANTATION
40 LIFE SCIENCES BIOMEDICINE
OTHER TOPICS 84 TRANSPORTATION
41 MATERIALS SCIENCE 85 TROPICAL MEDICINE
42 MATHEMATICAL
COMPUTATIONAL BIOLOGY 86 UROLOGY NEPHROLOGY
43 MATHEMATICS 87 VETERINARY SCIENCES
44 MEDICAL LABORATORY
TECHNOLOGY 88 VIROLOGY
89 ZOOLOGY
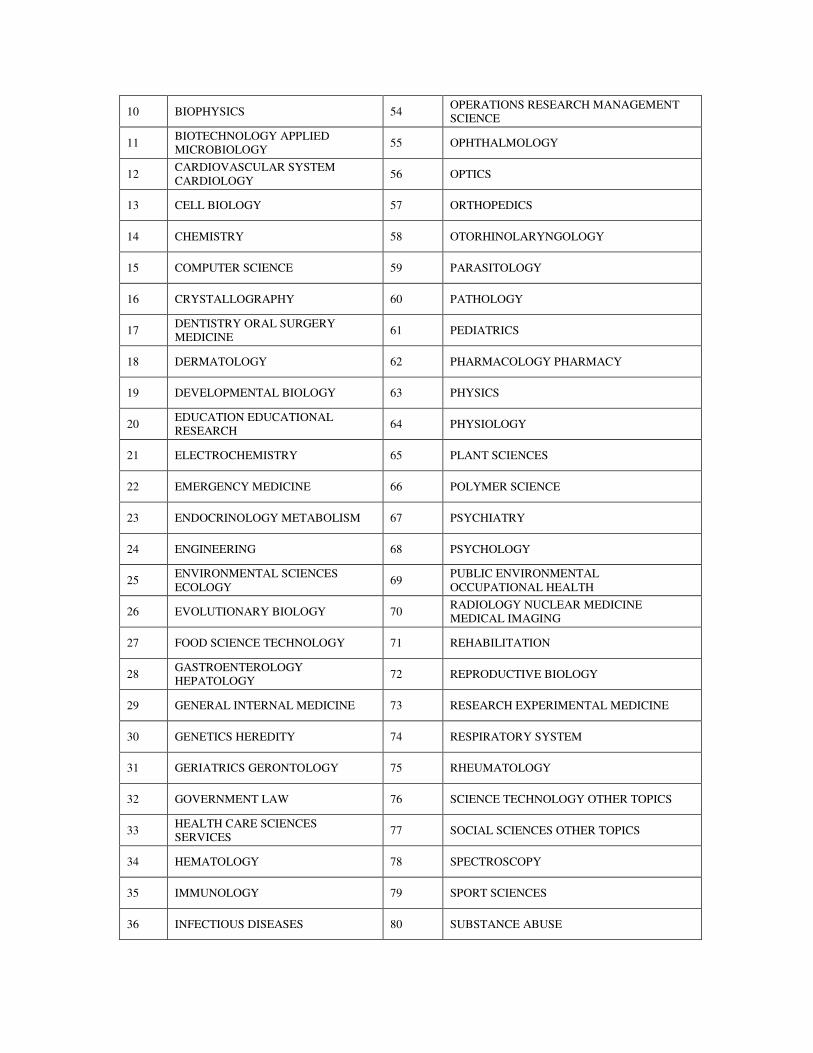
The study revolves round the aforementioned subject areas as these were found the areas
common among all the four institutes. The bibilometric analysis of the data retrieved has
been formulated in accordance to objectives set for the study. This study is totally
confined to the data accessed from the Web of Science, Thomson Reuters and no
inferences have been drawn so as to maintain total objectivity of the study. The major
limitation of the study is that data retrieved is not in consonance with the research
institutions under study and is merely a collection from the third party as such possibility
of various such publications not covered by this particular database is very much there.
This as a matter of fact does not mean that this is the total number of publications,
published by any of the institutions under study during a particular year and there may be
various other publications which may not have been covered by this databank. While as
to serve the purpose of the present study vis-à-vis to assess the overall trend of research
growth in medical institutes, the data retrieved will surely serve the purpose.
RELATED LITERATURE
A good number of studies have already been undertaken in the field of research
evaluation, commonly known as bibilometric studies. Biblometrics studies have always
been undertaken to assess the growth of research publications in a particular discipline by
means of bibliometric indicator, a simple substitute of publication count(Martin 1996).
Bibliometric studies undertaken have got greater bearing in ascertaining the overall
research output or growth in the research activity undertaken at global or regional level.
In order to study the subject areas minutely most of the time researchers undertake such
studies at institutional level so as to assess the growth and trend of research output in that
very particular institution. When taken together these small but vital studies, helps one to
draw the assessment and better understanding of research output in a particular discipline,
both at national and global level.
In order to get better insight of research productivity in the field of medicine, bibliometric
or other sociometric studies have been undertaken from time to time all across the globe.
A study on Primary Health Care in Australia observed that compared to 1990-1999
general practice publications increased from 1.0 to 3.0 publications per 1000 from during
2000-2007(Askew et al. 2008). Cloft, H.J., et al in its survey of Medline publications for
the period 1992-1999 observed that only in few or minority of cases pilot reports are
followed by more definitive publications(Cloft et al. 2001). The researchers observed that
only 27% pilot studies were followed up by more definitive publication within seven
years of initial publication. In a study carried out by Lowcay, B., et al. in 2004 for the
period 1990-1999 on General Practice Evaluation Program (GPEP) on 99 funded projects
and observed that 201 peer reviewed articles were published in 64 Australian and
international journals with on average 2.3 articles per completed or in progress project
with the suggestion that Australian general practice research should still improve(Lowcay
et al. 2004). A similar study carried out in U.K to measure the out of medical research by
Wakeford, R, and R. Adams in 1984 for the period 1973-81 by using computerized
database Excerpta Medical and observed a mixed response on both increase and decrease
of medical research output even among primer research institutions in the field of
medicine(Wakeford and Adams 1984).
A study carried out on research output from India during 2001-2008 by Dandona, L., et
al. in 2009 undertaking study on PubMed publications and observed that research output
from India in PubMed doubled from 4494 to 9066 publication from 2002 to 2007
covering various subject areas with some improper distribution and suffering at some
quality parameters(Dandona et al. 2009). Another study carried out by Dandona, L., et al.
in 2004 tried to draw comparison between Australia and India towards the amount of
research output published during a particular period in both the countries in PubMed. In
2002 from India 4876 papers were published on health which included 48.4% on basic
health sciences, 47.1% on clinical health and 4.4% on public health sciences which on
comparison with Australian research output was very low, even in those areas where
Indian population is more vulnerable to diseases(Dandona et al. 2004). Gagnon, R.E, et
al. conducted study on Canadian contribution to medical research entries MEDLARS
during the period 1989 to 1998 and the researchers observed that Canadian contribution
to world medical literature was three times more than that of average world contribution
which as result put the country on global map of its schools being more productive,
making contributions to medical sciences(Gagnon et al. 2000).
The bibliometric study undertaken by Kumbar et al, during 1996-2006 by evaluating and
analyzing the Scopus database observed that on research publications in the field of
science and technology at the University of Mysore on average grew at the rate of 23%
per annum. The study was undertaken on 1518 research publications(Kumbar et al.
2008). Similarly Garg and Rag undertook the study spanning through the period of 1965
-82 in the field of science where physics research was analyzed, published in both SCI
and non SCI journals(Garg and Rag 1988). This study was equally a bibliometric study
to assess the growth in research productivity in various areas of physics with the
observation that manpower and research output are interdependent and interrelated to
each other.
Koganuramath, et al, in their study undertaken in the Tata Institute of Social Sciences
analyzed 663 research publications, published during the period 1990-
2000(Koganuramah et al. 2002). The study was primarily aimed to give a grasping over
the bibliometric growth of research publications where scientists were more conscious of
publishing their research results in more reputed journals. The importance of the
bibliomertic studies is also important from the view that it helps to sustain the research
growth. What is more important about bibilomertic studies is they help as a benchmark
already set with defined objectives to give more research produce this year from the
corresponding year. Moed, et al. were of the view that these studies act as monitoring
devices and as a result help in setting the objectives for institutions and in framing future
policies of an institution(Moed et al. 1985).
Another study based on the extracts of Scopus undertaken by Vasishta for the period
1996 to 2009 analyzed 177 research publications for PEC University of Technology;
Chandigarh observed that there is steady growth in the research output of the university
from year after year(Vasishta 2011). In a similar study undertaken by Singh et al.
evaluated the data of Science citation Index, wherein the study was undertaken on 901
research publication spread over the period 1993-2001 observed that most of research
work was undertaken in the field of Mathematics, Biology, and Clinical Medicine(Singh
et al. 2005).
The important aspect of the most of the research works undertaken in the field of sciences
is the collaborative authorship what we commonly known as joint authorship, observed
Sharma in his study while analyzing 2603 research publications, published between
1991-2007 of Central Potato Research Institute(Sharma 2009).
On the whole we can see people have undertaken bibliometric studies for different
reasons but most of the studies end up with that these studies are important from various
angles, be it about the assessment of the strengths and weaknesses of a research
institution or in setting benchmarks for other institutions. Setting objectives, defining
future strategy or policy of an institution and the requirements to fulfill those objectives
are great deal helped by the net research output of the institution which again heavily
relies on bibliometric studies undertaken by institutions from time to time.
OBJECTIVES OF THE STUDY
The present study has been undertaken with the following objectives
� To find and understand the research productivity of Indian Medical Research
Institutions.
� To assess the growth of medical literature during the last five years.
� Subject areas covered mostly in Indian Medical Research
� Major contributors to Medical Research in India
� To analyze frequency distribution of medical literature in India.
SOURCE & METHODOLOGY
To carry out the present study, services of Web of Science, Thomson Reuters were used.
The statistical database uploaded and readily available at the website of said databank
was retrieved on November 08, 2012. The database covered 89 medical subject areas of
research and practice spanning through four different medical and research institutions of
India. From the scope point of view it is to maintain that study is confined to four
institutions under study, however the aim of the steady is to show the overall bibilometric
trend of research publications in the field of medical sciences in India. It is to mention
that in this study we have undertaken only those publications which could be retrieved
from the aforesaid databank and this does not necessarily mean that this is the actual
produce of publications in these institutions during the period of study. There is every
possibility that there may also be some additional publications which may not have been
covered in the said database, which in turn can also be termed as one of the prime
limitations of the study. The data retrieved from the databank was put to excel format
for better analysis and understanding to achieve the set objectives.
DATA ANALYSIS
For executing common operation like, addition, subtraction, drawing percentage etc. data
analysis of the present study has been undertaken mostly by putting data to excel format
and in all cases the percentage has been drawn up to the two decimal places only.
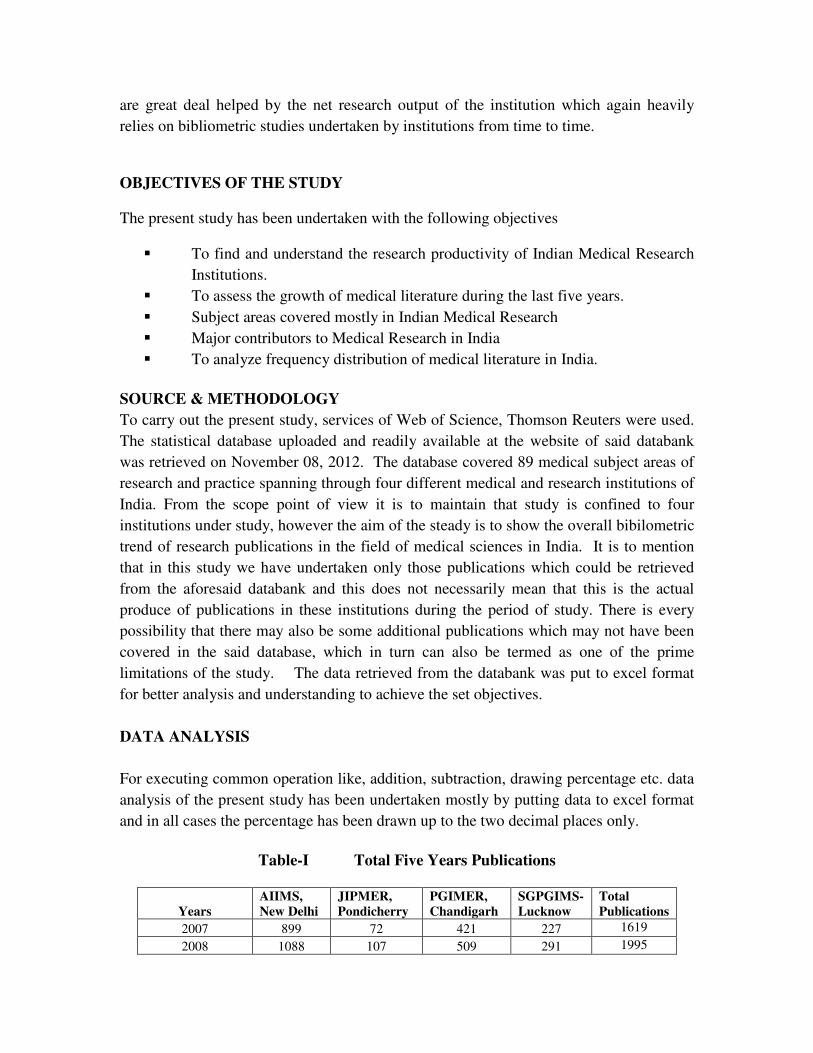
Table-I Total Five Years Publications
Years
AIIMS,
New Delhi
JIPMER,
Pondicherry
PGIMER,
Chandigarh
SGPGIMS-
Lucknow
Total
Publications
2007 899 72 421 227 1619
2008 1088 107 509 291 1995

2009 1058 99 489 223 1869
2010 1127 98 547 213 1985
2011 1012 96 515 205 1828
Total Publications 5184 472 2481 1159 9296
Figure 1
In the above tabulation the attempt was made to segregate the year wise publication
distribution of among four aforementioned institutions of medical science and research
during the last five years viz. from year 2007 to 2011. In the tabulation and represented
by bars in its graphical presentation we can see AIIMS, New Delhi leads the overall
talley with its gross publications of 5184, published in almost all 89 subject areas during
the period. PGIMER, Chandigarh ranks 2nd
with its total publication contribution of
2481, followed by SGPGIMS, Lucknow with 1159 publications and lastly JIPMER,
Pondicherry 472 publications the lowest among four. Even if we see figures during the
individual years AIIMS, New Delhi emerges top contributor throughout the period,
followed by PGIMER, Chandigarh, SGPGIMS Luknow and JIPMER, Pondicherry, all
had been steady in their contribution during the years of analysis, though we can observe
slight increase and decrease in publication form year to year in each institution.
Table-II Year wise of research output with %age increase
Years 2007 2008 2009 2010 2011
Overall growth with
%age increase
1619
(0.00)
3614
(123.22)
5483
(51.71)
7468
(36.20)
9296
(24.47)
(Figures in the parenthesis indicate percentage)
899
10881058
1127
1012
72107 99 98 96
421
509 489547
515
227
291
223 213 205
0
200
400
600
800
1000
1200
2007 2008 2009 2010 2011
AIIMS, New Delhi
JIPMER, Pondicherry
PGIMER, Chandigarh
SGPGIMS- Lucknow
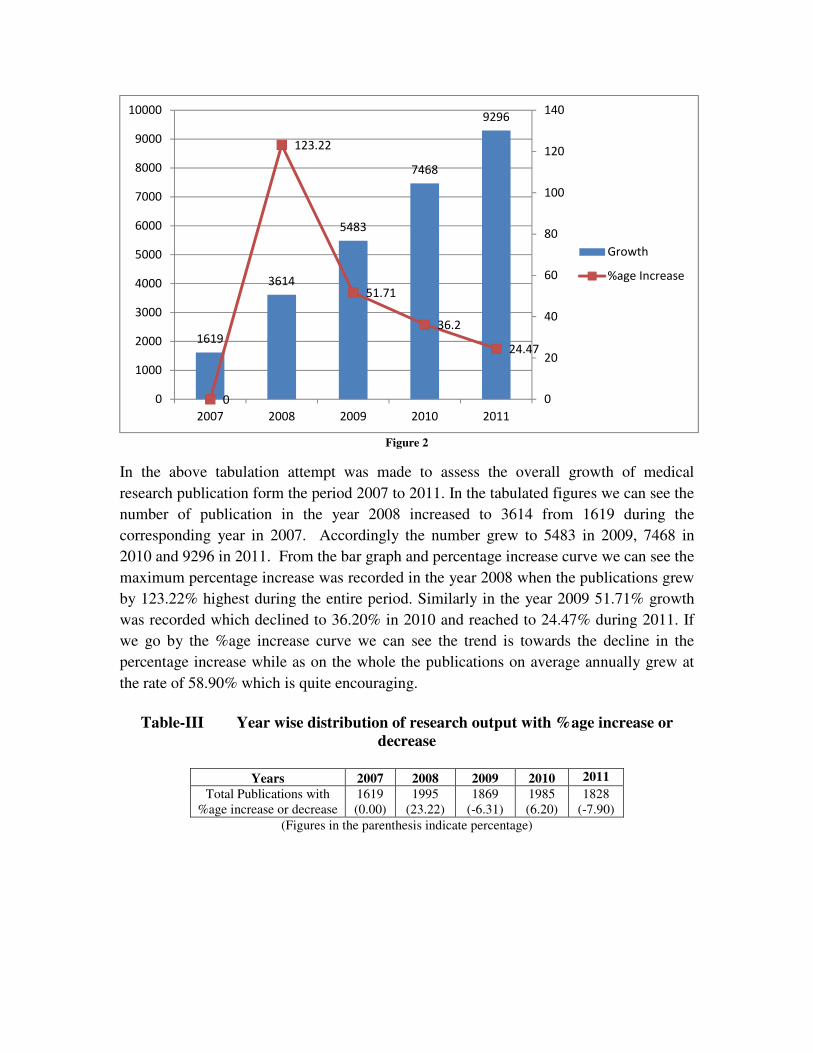
Figure 2
In the above tabulation attempt was made to assess the overall growth of medical
research publication form the period 2007 to 2011. In the tabulated figures we can see the
number of publication in the year 2008 increased to 3614 from 1619 during the
corresponding year in 2007. Accordingly the number grew to 5483 in 2009, 7468 in
2010 and 9296 in 2011. From the bar graph and percentage increase curve we can see the
maximum percentage increase was recorded in the year 2008 when the publications grew
by 123.22% highest during the entire period. Similarly in the year 2009 51.71% growth
was recorded which declined to 36.20% in 2010 and reached to 24.47% during 2011. If
we go by the %age increase curve we can see the trend is towards the decline in the
percentage increase while as on the whole the publications on average annually grew at
the rate of 58.90% which is quite encouraging.
Table-III Year wise distribution of research output with %age increase or
decrease
Years 2007 2008 2009 2010 2011
Total Publications with
%age increase or decrease
1619
(0.00)
1995
(23.22)
1869
(-6.31)
1985
(6.20)
1828
(-7.90)
(Figures in the parenthesis indicate percentage)
1619
3614
5483
7468
9296
0
123.22
51.71
36.2
24.47
0
20
40
60
80
100
120
140
0
1000
2000
3000
4000
5000
6000
7000
8000
9000
10000
2007 2008 2009 2010 2011
Growth
%age Increase
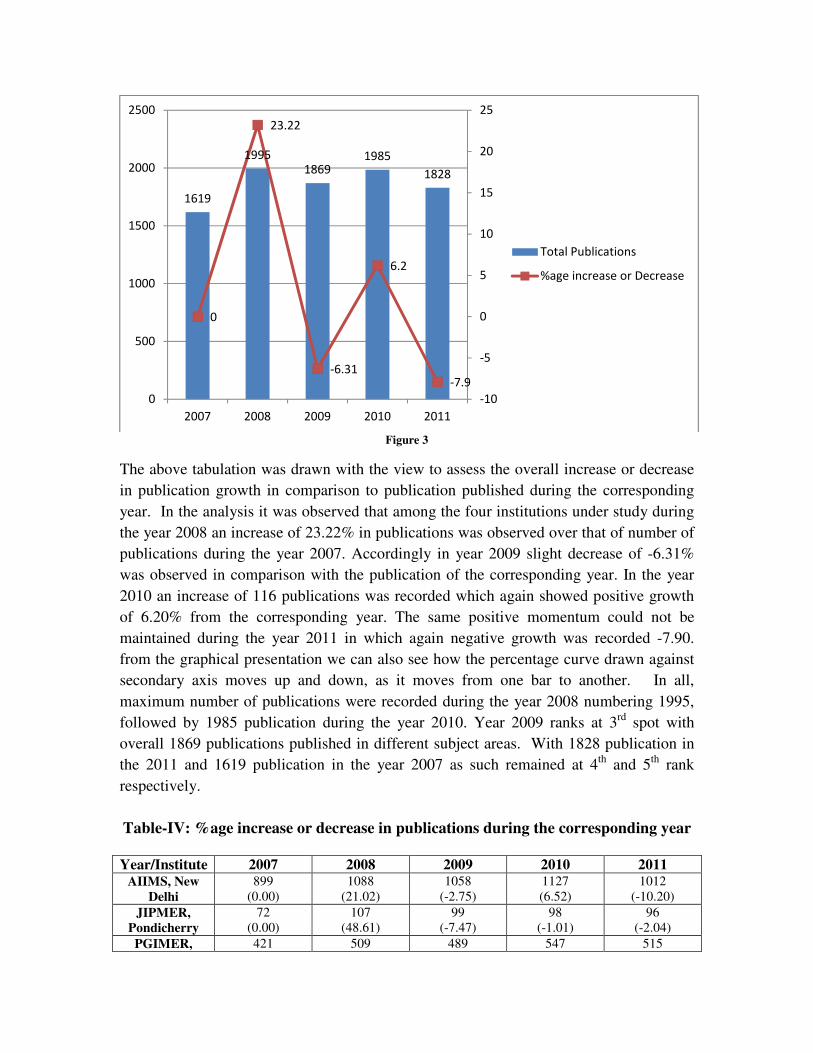
Figure 3
The above tabulation was drawn with the view to assess the overall increase or decrease
in publication growth in comparison to publication published during the corresponding
year. In the analysis it was observed that among the four institutions under study during
the year 2008 an increase of 23.22% in publications was observed over that of number of
publications during the year 2007. Accordingly in year 2009 slight decrease of -6.31%
was observed in comparison with the publication of the corresponding year. In the year
2010 an increase of 116 publications was recorded which again showed positive growth
of 6.20% from the corresponding year. The same positive momentum could not be
maintained during the year 2011 in which again negative growth was recorded -7.90.
from the graphical presentation we can also see how the percentage curve drawn against
secondary axis moves up and down, as it moves from one bar to another. In all,
maximum number of publications were recorded during the year 2008 numbering 1995,
followed by 1985 publication during the year 2010. Year 2009 ranks at 3rd
spot with
overall 1869 publications published in different subject areas. With 1828 publication in
the 2011 and 1619 publication in the year 2007 as such remained at 4th
and 5th
rank
respectively.
Table-IV: %age increase or decrease in publications during the corresponding year
Year/Institute 2007 2008 2009 2010 2011
AIIMS, New
Delhi 899
(0.00)
1088
(21.02) 1058
(-2.75) 1127
(6.52) 1012
(-10.20) JIPMER,
Pondicherry
72
(0.00)
107
(48.61) 99
(-7.47) 98
(-1.01) 96
(-2.04) PGIMER, 421 509 489 547 515
1619
1995
18691985
1828
0
23.22
-6.31
6.2
-7.9
-10
-5
0
5
10
15
20
25
0
500
1000
1500
2000
2500
2007 2008 2009 2010 2011
Total Publications
%age increase or Decrease
Chandigarh (0.00) (20.90) (-3.92) (11.86) (-5.85) SGPGIMS-
Lucknow
227
(0.00)
291
(28.19) 223
(-23.36) 213
(-4.48) 205
(-3.75) (Figures in the parenthesis indicate percentage)
Figure 4
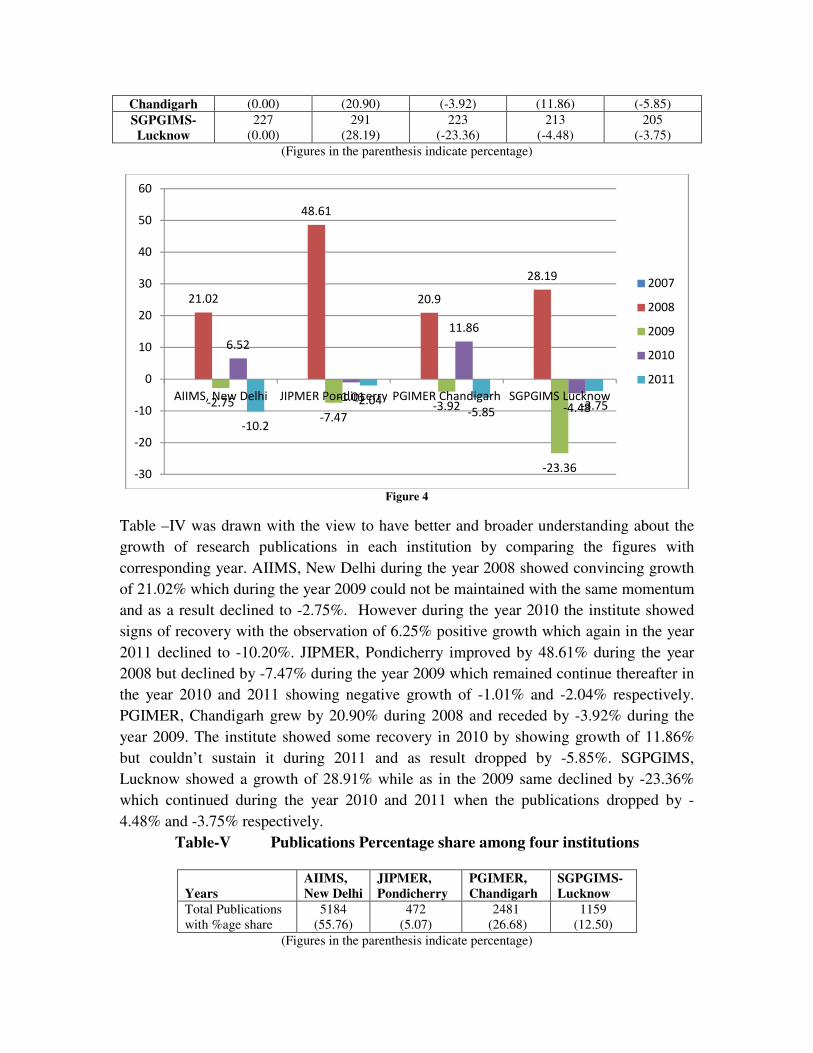
Table –IV was drawn with the view to have better and broader understanding about the
growth of research publications in each institution by comparing the figures with
corresponding year. AIIMS, New Delhi during the year 2008 showed convincing growth
of 21.02% which during the year 2009 could not be maintained with the same momentum
and as a result declined to -2.75%. However during the year 2010 the institute showed
signs of recovery with the observation of 6.25% positive growth which again in the year
2011 declined to -10.20%. JIPMER, Pondicherry improved by 48.61% during the year
2008 but declined by -7.47% during the year 2009 which remained continue thereafter in
the year 2010 and 2011 showing negative growth of -1.01% and -2.04% respectively.
PGIMER, Chandigarh grew by 20.90% during 2008 and receded by -3.92% during the
year 2009. The institute showed some recovery in 2010 by showing growth of 11.86%
but couldn’t sustain it during 2011 and as result dropped by -5.85%. SGPGIMS,
Lucknow showed a growth of 28.91% while as in the 2009 same declined by -23.36%
which continued during the year 2010 and 2011 when the publications dropped by -
4.48% and -3.75% respectively.
Table-V Publications Percentage share among four institutions
Years
AIIMS,
New Delhi
JIPMER,
Pondicherry
PGIMER,
Chandigarh
SGPGIMS-
Lucknow
Total Publications
with %age share
5184
(55.76)
472
(5.07)
2481
(26.68)
1159
(12.50)
(Figures in the parenthesis indicate percentage)
21.02
48.61
20.9
28.19
-2.75
-7.47-3.92
-23.36
6.52
-1.01
11.86
-4.48
-10.2
-2.04-5.85
-3.75
-30
-20
-10
0
10
20
30
40
50
60
AIIMS, New Delhi JIPMER Pondincerry PGIMER Chandigarh SGPGIMS Lucknow
2007
2008
2009
2010
2011
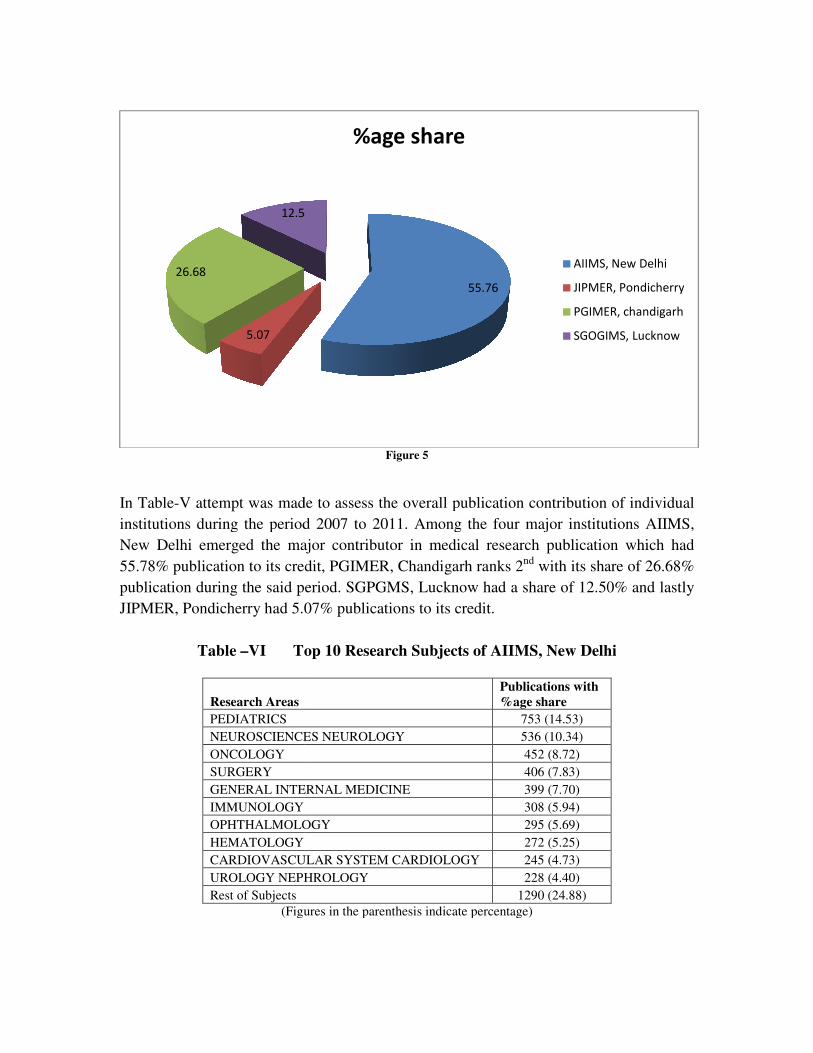
In Table-V attempt was made to assess the overall publication contribution of individual
institutions during the period 2007 to 2011. Among the four major institutions AIIMS,
New Delhi emerged the major contributor in medical research publication which had
55.78% publication to its credit, PGIMER, Chandigarh ranks 2
publication during the said period. SGPGMS, Lucknow had a share of 12.50% and lastly
JIPMER, Pondicherry had 5.07% publications to its credit.
Table –VI Top 10 Research Subjects of AIIMS,
Research Areas
PEDIATRICS
NEUROSCIENCES NEUROLOGY
ONCOLOGY
SURGERY
GENERAL INTERNAL MEDICINE
IMMUNOLOGY
OPHTHALMOLOGY
HEMATOLOGY
CARDIOVASCULAR SYSTEM CARDIOLOGY
UROLOGY NEPHROLOGY
Rest of Subjects
(Figures in the parenthesis indicate percentage)
5.07
26.68
12.5
Figure 5
made to assess the overall publication contribution of individual
institutions during the period 2007 to 2011. Among the four major institutions AIIMS,
New Delhi emerged the major contributor in medical research publication which had
its credit, PGIMER, Chandigarh ranks 2nd
with its share of 26.68%
publication during the said period. SGPGMS, Lucknow had a share of 12.50% and lastly
JIPMER, Pondicherry had 5.07% publications to its credit.
Top 10 Research Subjects of AIIMS, New Delhi
Publications with
%age share
753 (14.53)
NEUROSCIENCES NEUROLOGY 536 (10.34)
452 (8.72)
406 (7.83)
GENERAL INTERNAL MEDICINE 399 (7.70)
308 (5.94)
OPHTHALMOLOGY 295 (5.69)
272 (5.25)
CARDIOVASCULAR SYSTEM CARDIOLOGY 245 (4.73)
UROLOGY NEPHROLOGY 228 (4.40)
1290 (24.88)
(Figures in the parenthesis indicate percentage)
55.76
12.5
%age share
AIIMS, New Delhi
JIPMER, Pondicherry
PGIMER, chandigarh
SGOGIMS, Lucknow
made to assess the overall publication contribution of individual
institutions during the period 2007 to 2011. Among the four major institutions AIIMS,
New Delhi emerged the major contributor in medical research publication which had
with its share of 26.68%
publication during the said period. SGPGMS, Lucknow had a share of 12.50% and lastly
New Delhi
AIIMS, New Delhi
JIPMER, Pondicherry
PGIMER, chandigarh
SGOGIMS, Lucknow

Figure 6
In the above tabulation leading ten research areas of medicine in the AIIMS, New Delhi
were identified based on the maximum number of publication contributed to a particular
area. From the analysis it Pediatrics emerged top most research area of AIIMS which as
many 753 publications credited to, constituting 14.53% of research publication of AIIMS
to this particular discipline. Neuroscience and Neurology is the 2nd
top most discipline in
which 536 publications where published by this institute during the five years span
spreading from 2007 to 2011, constituting 10.34% share. Oncology ranks at third place
with 452 publications, constituting 8.72% share. Accordingly the trend goes down the
line where in Urology and Nephrology ranks at 10th
spot with 228 publications to its
credit making it 4.40% share. From the tabulation we can see rest of the areas have got
1290 publications, accounting to 24.88% share which is also commendable. On the whole
AIIMS, New Delhi has produced fair amount of literature in all the disciplines, obviously
mostly depending upon the thrust areas the institution covers.
Table –VII Top 10 Research Subjects of PGIMER, Chandigarh
Research Areas Publications with %age share
PEDIATRICS 310 (12.49)
GENERAL INTERNAL MEDICINE 241 (9.71)
GASTROENTEROLOGY HEPATOLOGY 208 (8.38)
SURGERY 195 (7.86)
NEUROSCIENCES NEUROLOGY 185 (7.46)
PATHOLOGY 142 (5.72)
DERMATOLOGY 137 (5.52)
ONCOLOGY 120 (4.84)
0
14.52
10.338.71 7.83 7.69
5.94 5.69 5.24 4.72 4.39
24.88
0
5
10
15
20
25
30
0
200
400
600
800
1000
1200
1400
Publications
%age share
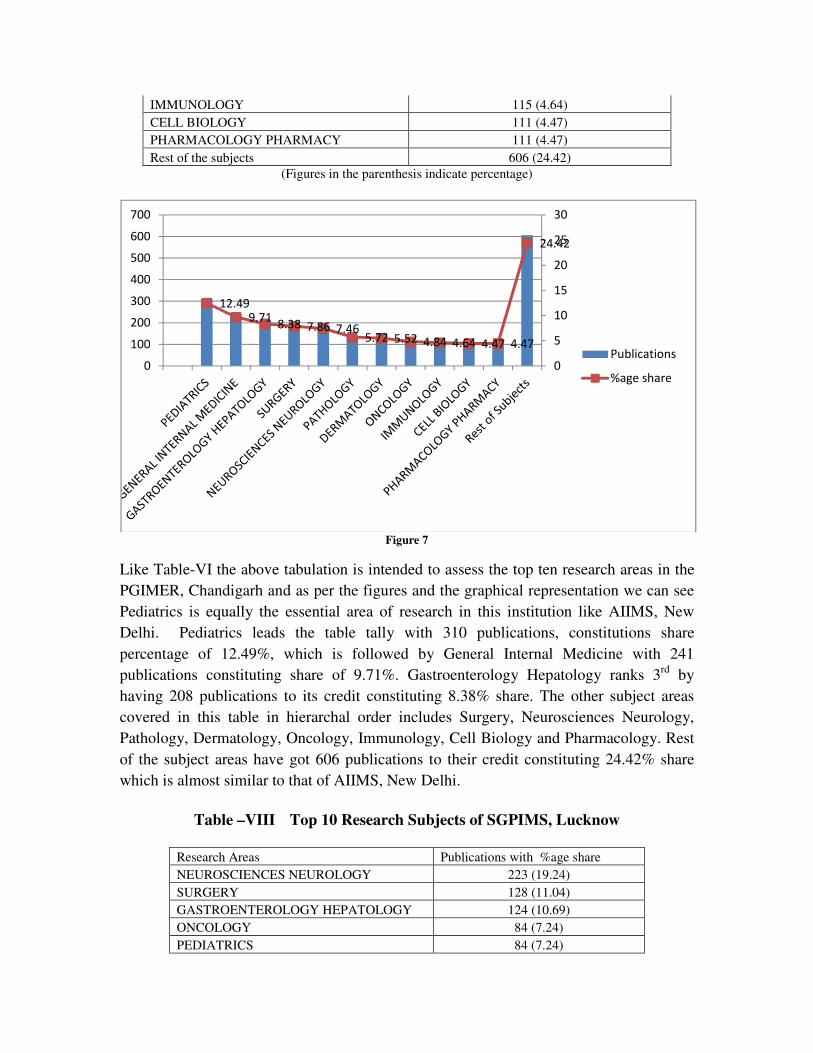
IMMUNOLOGY 115 (4.64)
CELL BIOLOGY 111 (4.47)
PHARMACOLOGY PHARMACY 111 (4.47)
Rest of the subjects 606 (24.42)
(Figures in the parenthesis indicate percentage)
Figure 7
Like Table-VI the above tabulation is intended to assess the top ten research areas in the
PGIMER, Chandigarh and as per the figures and the graphical representation we can see
Pediatrics is equally the essential area of research in this institution like AIIMS, New
Delhi. Pediatrics leads the table tally with 310 publications, constitutions share
percentage of 12.49%, which is followed by General Internal Medicine with 241
publications constituting share of 9.71%. Gastroenterology Hepatology ranks 3rd
by
having 208 publications to its credit constituting 8.38% share. The other subject areas
covered in this table in hierarchal order includes Surgery, Neurosciences Neurology,
Pathology, Dermatology, Oncology, Immunology, Cell Biology and Pharmacology. Rest
of the subject areas have got 606 publications to their credit constituting 24.42% share
which is almost similar to that of AIIMS, New Delhi.
Table –VIII Top 10 Research Subjects of SGPIMS, Lucknow
Research Areas Publications with %age share
NEUROSCIENCES NEUROLOGY 223 (19.24)
SURGERY 128 (11.04)
GASTROENTEROLOGY HEPATOLOGY 124 (10.69)
ONCOLOGY 84 (7.24)
PEDIATRICS 84 (7.24)
12.499.71
8.38 7.86 7.465.72 5.52 4.84 4.64 4.47 4.47
24.42
0
5
10
15
20
25
30
0
100
200
300
400
500
600
700
Publications
%age share
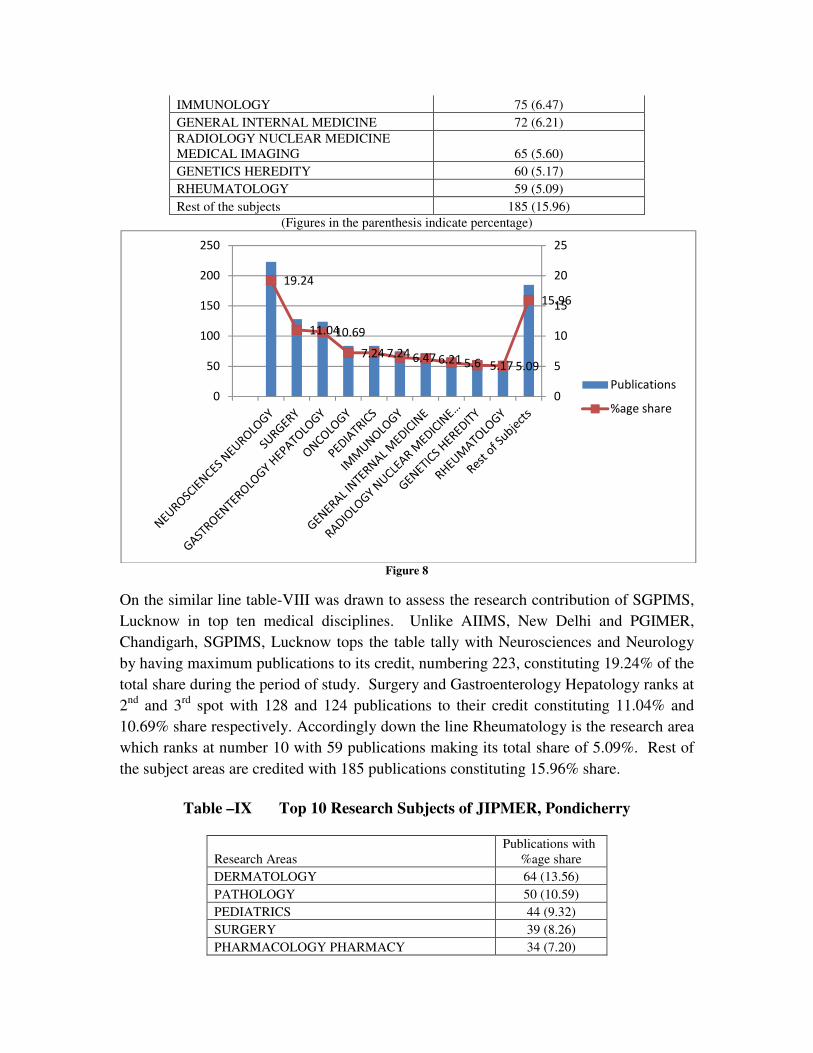
IMMUNOLOGY 75 (6.47)
GENERAL INTERNAL MEDICINE 72 (6.21)
RADIOLOGY NUCLEAR MEDICINE
MEDICAL IMAGING 65 (5.60)
GENETICS HEREDITY 60 (5.17)
RHEUMATOLOGY 59 (5.09)
Rest of the subjects 185 (15.96)
(Figures in the parenthesis indicate percentage)
Figure 8
On the similar line table-VIII was drawn to assess the research contribution of SGPIMS,
Lucknow in top ten medical disciplines. Unlike AIIMS, New Delhi and PGIMER,
Chandigarh, SGPIMS, Lucknow tops the table tally with Neurosciences and Neurology
by having maximum publications to its credit, numbering 223, constituting 19.24% of the
total share during the period of study. Surgery and Gastroenterology Hepatology ranks at
2nd
and 3rd
spot with 128 and 124 publications to their credit constituting 11.04% and
10.69% share respectively. Accordingly down the line Rheumatology is the research area
which ranks at number 10 with 59 publications making its total share of 5.09%. Rest of
the subject areas are credited with 185 publications constituting 15.96% share.
Table –IX Top 10 Research Subjects of JIPMER, Pondicherry
Research Areas
Publications with
%age share
DERMATOLOGY 64 (13.56)
PATHOLOGY 50 (10.59)
PEDIATRICS 44 (9.32)
SURGERY 39 (8.26)
PHARMACOLOGY PHARMACY 34 (7.20)
19.24
11.0410.69
7.24 7.24 6.47 6.21 5.6 5.17 5.09
15.96
0
5
10
15
20
25
0
50
100
150
200
250
Publications
%age share
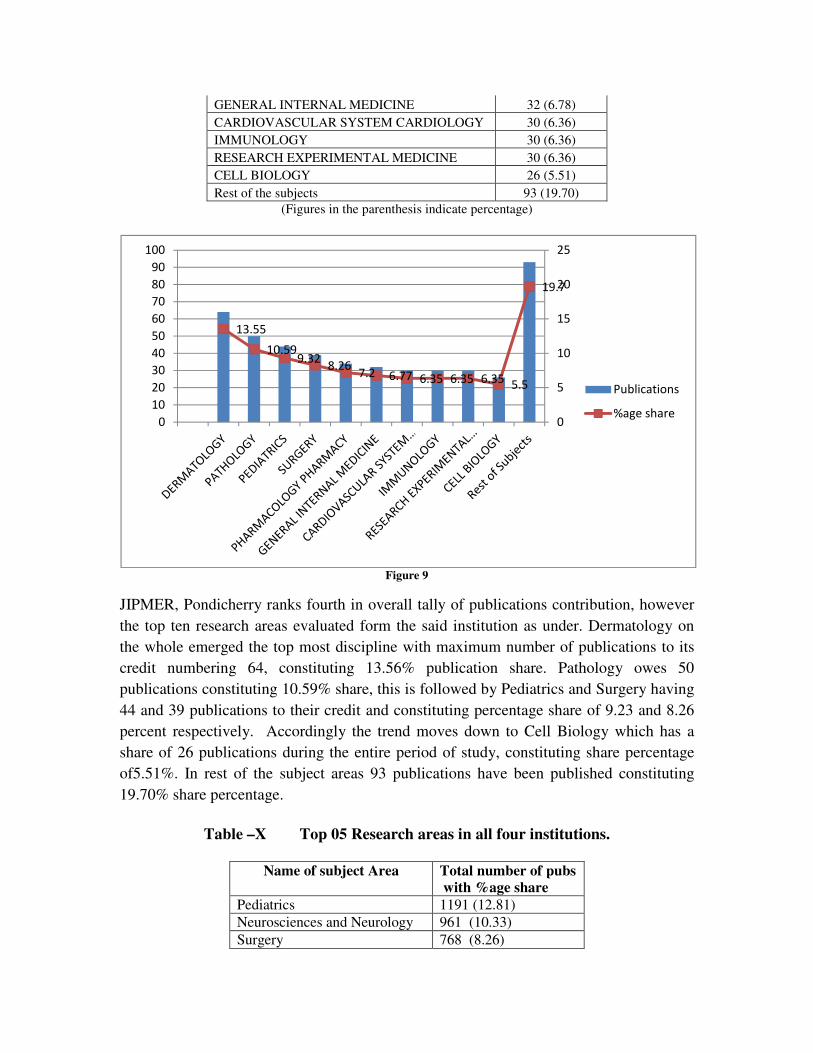
GENERAL INTERNAL MEDICINE 32 (6.78)
CARDIOVASCULAR SYSTEM CARDIOLOGY 30 (6.36)
IMMUNOLOGY 30 (6.36)
RESEARCH EXPERIMENTAL MEDICINE 30 (6.36)
CELL BIOLOGY 26 (5.51)
Rest of the subjects 93 (19.70)
(Figures in the parenthesis indicate percentage)
Figure 9
JIPMER, Pondicherry ranks fourth in overall tally of publications contribution, however
the top ten research areas evaluated form the said institution as under. Dermatology on
the whole emerged the top most discipline with maximum number of publications to its
credit numbering 64, constituting 13.56% publication share. Pathology owes 50
publications constituting 10.59% share, this is followed by Pediatrics and Surgery having
44 and 39 publications to their credit and constituting percentage share of 9.23 and 8.26
percent respectively. Accordingly the trend moves down to Cell Biology which has a
share of 26 publications during the entire period of study, constituting share percentage
of5.51%. In rest of the subject areas 93 publications have been published constituting
19.70% share percentage.
Table –X Top 05 Research areas in all four institutions.
Name of subject Area Total number of pubs
with %age share Pediatrics 1191 (12.81) Neurosciences and Neurology 961 (10.33) Surgery 768 (8.26)
13.55
10.599.32
8.267.2 6.77 6.35 6.35 6.35
5.5
19.7
0
5
10
15
20
25
0
10
20
30
40
50
60
70
80
90
100
Publications
%age share
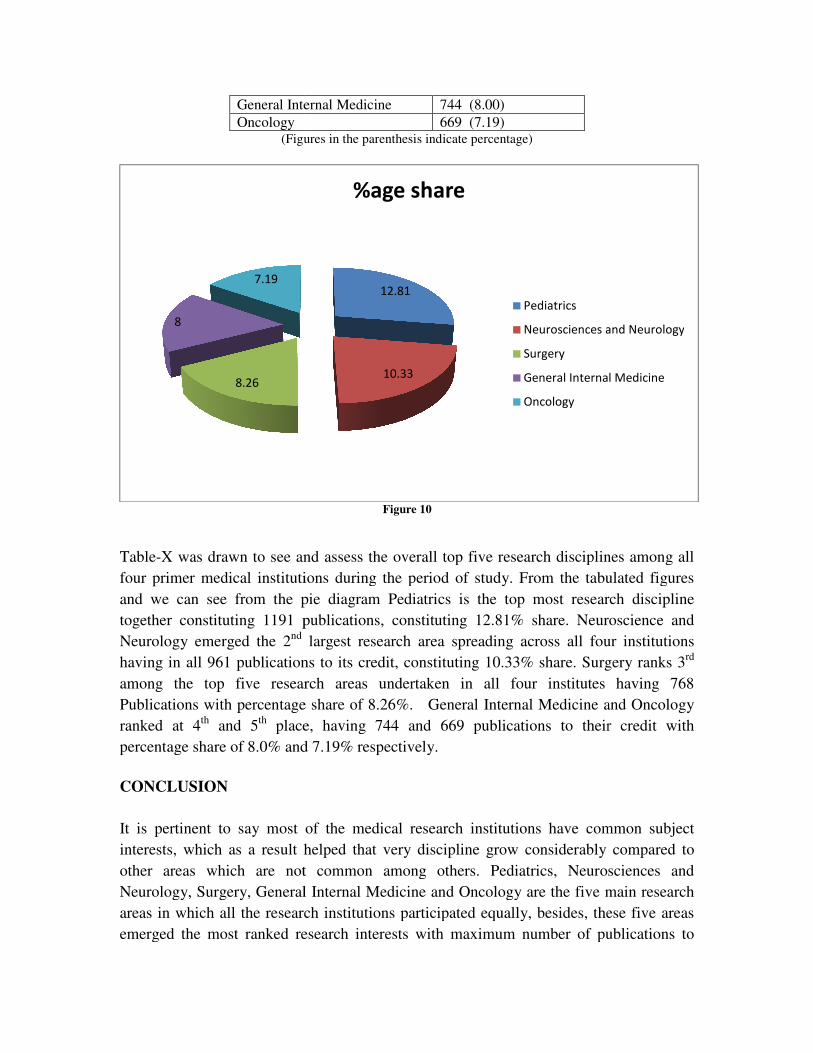
General Internal Medicine
Oncology (Figures in the parenthesis indicate percentage)
Table-X was drawn to see and assess the overall top five research disciplines among all
four primer medical institutions during the period of study. From the tabulated figures
and we can see from the pie diagram Pediatrics is the top most research discipline
together constituting 1191 publications, constituting 12.81% share. Neuroscience and
Neurology emerged the 2nd
having in all 961 publications to its credit, constituting 10.33% share. Surgery ranks 3
among the top five research areas undertaken in all four institutes having 768
Publications with percentage share of 8.26%. General Internal Medicine and Oncology
ranked at 4th
and 5th
place, having 744 and 669 publications to their credit with
percentage share of 8.0% and 7.19% respectively.
CONCLUSION
It is pertinent to say most of the medical
interests, which as a result helped that very discipline grow considerably compared to
other areas which are not common among others.
Neurology, Surgery, General Internal Medicine and
areas in which all the research institutions participated equally, besides, these five areas
emerged the most ranked research interests with maximum number of publications to
8.26
8
7.19
Internal Medicine 744 (8.00) 669 (7.19)
(Figures in the parenthesis indicate percentage)
Figure 10
X was drawn to see and assess the overall top five research disciplines among all
institutions during the period of study. From the tabulated figures
and we can see from the pie diagram Pediatrics is the top most research discipline
together constituting 1191 publications, constituting 12.81% share. Neuroscience and
largest research area spreading across all four institutions
having in all 961 publications to its credit, constituting 10.33% share. Surgery ranks 3
among the top five research areas undertaken in all four institutes having 768
ercentage share of 8.26%. General Internal Medicine and Oncology
place, having 744 and 669 publications to their credit with
percentage share of 8.0% and 7.19% respectively.
say most of the medical research institutions have common subject
interests, which as a result helped that very discipline grow considerably compared to
other areas which are not common among others. Pediatrics, Neurosciences and
Neurology, Surgery, General Internal Medicine and Oncology are the five main research
areas in which all the research institutions participated equally, besides, these five areas
emerged the most ranked research interests with maximum number of publications to
12.81
10.33
%age share
Pediatrics
Neurosciences and Neurology
Surgery
General Internal Medicine
Oncology
X was drawn to see and assess the overall top five research disciplines among all
institutions during the period of study. From the tabulated figures
and we can see from the pie diagram Pediatrics is the top most research discipline
together constituting 1191 publications, constituting 12.81% share. Neuroscience and
largest research area spreading across all four institutions
having in all 961 publications to its credit, constituting 10.33% share. Surgery ranks 3rd
among the top five research areas undertaken in all four institutes having 768
ercentage share of 8.26%. General Internal Medicine and Oncology
place, having 744 and 669 publications to their credit with
institutions have common subject
interests, which as a result helped that very discipline grow considerably compared to
Pediatrics, Neurosciences and
Oncology are the five main research
areas in which all the research institutions participated equally, besides, these five areas
emerged the most ranked research interests with maximum number of publications to
Neurosciences and Neurology
General Internal Medicine
their credit. On the whole there is steady increase in the research publications in medical
sciences having average annual growth of 58.90% which is noteworthy. The research
output can be also seen from the point that AIIMS, New Delhi being one of the oldest
medical and research institutions makes it to contribute and publish maximum research
results. Other institutions can also been seen as contributing significantly mostly
depending upon their coming into being.
From the analyzed data we can see that there is not always positive growth in the amount
of research publications when weighed with publications of the corresponding year. Even
AIIMS, New Delhi showed mixed trend with slight increase and decrease in the
publications as we moved from year to year. Other institutions do showed decline in the
research publications as we progressed from year to year analysis, which is a bit sign of
worry. Over all during the year 2009 and 2011 negative growth was recorded in the
research publication among all four institutions when taken together.
On the whole we can see the progressive side of the medical research output, and hope
this trend is similar to other medical institutions across the country. Though we have
some limitations in analyzing the bibilomertic study to its perfection, still we definitely
have been left with better and boarder understanding about the trend in research
productivity in medical institutions across the country. We do leave here scope for other
researchers whereby they can carry forward this study by taking similar analysis with the
research publications of other medical institutions across the country.
REFERENCES
1. Askew, D. A., Schluter, P. J. and Gunn, J. M. (2008) 'Research productivity in
Australian general practice: what has changed since the 1990s?', Med J Aust,
189(2), 103-4.
2. Cloft, H. J., Shengelaia, G. G., Marx, W. F. and Kallmes, D. F. (2001)
'Preliminary reports and the rates of publication of follow-up reports in peer-
reviewed, indexed journals', Acad Med, 76(6), 638-41.
3. Dandona, L., Raban, M. Z., Guggilla, R. K., Bhatnagar, A. and Dandona, R.
(2009) 'Trends of public health research output from India during 2001-2008',
BMC Med, 7, 59.
4. Dandona, L., Sivan, Y. S., Jyothi, M. N., Bhaskar, V. S. and Dandona, R. (2004)
'The lack of public health research output from India', BMC Public Health, 4, 55.
5. Gagnon, R. E., Macnab, A. J. and Gagnon, F. A. (2000) 'A quantitative ranking of
Canada's research output of original human studies for the decade 1989 to 1998',
CMAJ, 162(1), 37-40.
6. Garg, K. C. and Rag, M. K. D. (1988) 'Bibliometric analysis of scientific
productivity: a case study of an Indian physics laboratory', Scientometrics, 13(5),
261-270.
7. Koganuramah, M., Angadi, M. and Kademani, B. (2002) 'Bibliometric dimension
of innovation communication productivity of Tata Institute of Social Sciences',
Malaysian Journal of Library and Information Science, 7(1), 69-76.
8. Kumbar, M., Gupta, B. M. and Dhawan, S. M. (2008) 'Growth and impact of
research output of University of Mysore, 1996-2006: A case study', Annals of
Library & Information Studies, 55(3), 3-3.
9. Lowcay, B., McIntyre, E., Hale, M. and Ward, A. M. (2004) 'Peer reviewed
publication rates. An indication of research output', Aust Fam Physician, 33(4),
284-6.
10. Martin, B. R. (1996) 'The use of multiple indicators in the assessment of basic
research', Scientometrics, 36(3), 343-362.
11. Moed, H. F., Burger, W., Frankfort, J. and Van Raan, A. F. J. (1985) 'The use of
bibliometric data for the measurement of university research performance',
Research Policy, 14(3), 131-149.
12. Sharma, R. M. (2009) 'Research publication trend among scientists of Central
Potato Research Institute: A bibliometric study', Annals of library and
information studies, 56(1), 29-34.
13. Singh, Y., Gupta, B. M. and Kumar, S. (2005) 'Research Contributions and
Impact of Research of Indian Institute of Technology, Roorkee, 1993 to 2001',
Annals of Library & Information Studies, 52(1), 8-14.
14. Vasishta, S. (2011) 'Assessment of Academic Research Output during 1996-2009:
A Case Study of PEC University of Technology, Chandigarh', DESIDOC Journal
of Library & Information Technology, 31(2), 136-142.
15. Wakeford, R. and Adams, R. (1984) 'For debate . . . medical research output
1973-81: a romp around the United Kingdom research centres', Br Med J (Clin
Res Ed), 288(6413), 297-9.
Copyright © 2022 FDOKUMEN