Editor: Pages: Abstract: URLs: Author(s) - CSU Research Output
Upload
khangminh22Category
view
0download
0
Who leads the Company?
An analysis of the Typology of the Company,
the Constellation of the Top Management Team
and the Characteristics of Managers
to determine the Dominant Coalition.
Yves Michel Serge Clerc
Bachelor of Business Administration (GSBA Zürich, Switzerland)
Master of Business Administration (Steinbeis University Berlin, Germany)
Thesis submitted in partial fulfilment of the requirements for the degree of
Doctor of Business Administration
School of Management & Marketing, Charles Sturt University, NSW Australia
December 2017


Table of Contents
Tables ...................................................................................................................... i
Figures .................................................................................................................... iv
Screenshots ................................................................................................................... v
Graphs ................................................................................................................... vii
Certificate of Authorship.............................................................................................. ix
Acknowledgements ....................................................................................................... x
Dedication ................................................................................................................... xi
Abstract .................................................................................................................. xiii
1 Chapter one: Introduction ......................................................................................... 1
1.1 Conceptual framework .................................................................................. 1
1.2 Background to the research ........................................................................... 3
1.3 Research problem and hypotheses ................................................................. 5
1.3.1 Research problem .............................................................................. 5
1.3.2 Hypotheses ........................................................................................ 5
1.4 Justification for the research ........................................................................ 10
1.4.1 Example: Application of this Dissertation (Presumption) ................. 12
1.5 Methodology ............................................................................................... 12
1.6 Outline of this thesis ................................................................................... 13
1.7 Definitions for this thesis ............................................................................ 14
1.8 Delimitations of scope and key assumptions ............................................... 15
1.9 Conclusion .................................................................................................. 16
2 Chapter two: Literature Review .............................................................................. 17
2.1 Introduction ................................................................................................ 17
2.1.1 The Literature Review Framework................................................... 19
2.2 Research Topic ........................................................................................... 20
2.2.1 Perspectives of the Research Topics ................................................ 20 2.2.2 Visualization of the four Perspectives .............................................. 21
2.2.3 The first Perspective: The Typology of the Company....................... 21 2.2.4 The second Perspective: The Top Management Team ...................... 22
2.2.5 The third Perspective: Managers’ Characteristics ............................. 22 2.2.6 The fourth Perspective: Span of Control .......................................... 22
2.3 Draft of Parent Disciplines and Problem Areas in this Dissertation.............. 23
2.4 Perspective: Typology of the Company ....................................................... 24
2.4.1 Miles & Snow Typology .................................................................. 26 2.4.2 Mintzberg’s Model of the Five Structural Configurations ................ 28
2.4.3 Porter’s Generic Competitive Strategies ........................................... 30

2.4.4 The Sixteen Detailed Business Model Archetypes ............................ 32
2.4.5 The Combined Approach: Porter / Miles & Snow ............................ 33 2.4.6 Recent Research Discourse .............................................................. 33
2.4.7 The interpretation of the Miles and Snow Typology in this thesis ..... 36
2.5 Perspective: Top Management Team ........................................................... 38
2.5.1 The influence of a TMT’s Constellation on Value Creation .............. 39
2.5.2 Summary of TMT-Constellation Aspects ......................................... 52 2.5.3 Age as a Parameter in TMT-Constellation........................................ 53
2.5.4 Education as a Parameter in TMT-Constellation .............................. 53 2.5.5 Tenure as a Parameter in TMT-Constellation ................................... 54
2.6 Perspective: Managers’ Characteristics ....................................................... 54
2.6.1 Managers’ Characteristics ................................................................ 54 2.6.2 Overview of Managers’ Characteristics ............................................ 55
2.6.3 Findings ........................................................................................... 58 2.6.4 Conclusion ....................................................................................... 60
2.7 Perspective: Span of Control ....................................................................... 61
2.7.1 Introduction ..................................................................................... 61 2.7.2 History of the concept of ‘Span of Control’ ...................................... 62
2.7.3 How Span of Control is defined in the Management Literature ........ 64 2.7.4 Literature Review on the ‘Optimum Span of Control’ ...................... 66
2.7.5 Recent discourse .............................................................................. 73 2.7.6 Collection of all Findings ................................................................. 78
2.7.7 Summary ......................................................................................... 79
2.8 A CEO’s Power .......................................................................................... 81
2.8.1 Types of Social Power ..................................................................... 82
2.8.2 Recent Discourse ............................................................................. 83 2.8.3 Conclusion ....................................................................................... 86
2.9 Summary of the Literature Review Chapter ................................................. 87
3 Chapter three: Methodology ................................................................................... 89
3.1 Introduction ................................................................................................ 89
3.1.1 Paradigm and Methodology ............................................................. 89
3.1.2 Justification for the Methodology used in the Research .................... 91 3.1.3 Role of the Researcher during this Dissertation ................................ 92
3.1.4 Reliability and Validity .................................................................... 92 3.1.5 The Unit of Analysis, the Instruments of Measurement and Sources 93
3.1.6 Instruments and Procedures used to collect Data .............................. 95 3.1.7 Administration of Procedures ........................................................... 95
3.1.8 Limitations of the Methodology ....................................................... 96 3.1.9 Software used for the Analysis ......................................................... 96
3.2 Data Collection for each Research Perspective ............................................ 97
3.3 Typology of a Company .............................................................................. 97
3.3.1 Methodology of Collecting Data ...................................................... 98 3.3.2 Introduction to Awkward Constellations .......................................... 99
3.3.3 Conditions: .................................................................................... 100
3.4 Constellation of the Top Management Team ............................................. 101
3.4.1 Age as a Parameter in TMT-Constellation...................................... 101
3.4.2 Education as a Parameter in the TMT-Constellation ....................... 101 3.4.3 Tenure as a Parameter in TMT-Constellation ................................. 102
3.4.4 Methodology of Collecting Data .................................................... 102

3.4.5 Conditions: .................................................................................... 103
3.5 Methodology to evaluate Managers’ Characteristics .................................. 105
3.5.1 Public Opinion Poll ....................................................................... 107 3.5.2 Methodology for the Data collection .............................................. 108
3.5.3 Conditions for the Perspective Characteristics................................ 109 3.5.4 Summary of all Perspectives .......................................................... 109
3.6 Methodology of the Perspective: Span of Control ..................................... 110
3.7 Ethical Considerations .............................................................................. 112
3.7.1 Consent Process ............................................................................. 112 3.7.2 Administrative Details ................................................................... 114
3.7.3 Profile of Participants .................................................................... 114 3.7.4 LOTE Subjects .............................................................................. 115
3.8 Conclusion to Chapter 3: Methodology ..................................................... 115
4 Chapter four: Data Collection ............................................................................... 117
4.1 Introduction .............................................................................................. 117
4.1.1 Online Survey ................................................................................ 118
4.1.2 Description of the Online Application ............................................ 118 4.1.3 Sample Survey-Report ................................................................... 124
4.2 Collection of Data ..................................................................................... 128
4.2.1 Synopsis of 114 Submissions ......................................................... 128 4.2.2 Partial Review of Survey-Reports .................................................. 137
4.2.3 Top Management Teams with 2 Managers plus CEO ..................... 137 4.2.4 Top Management Teams with 3, 4 and 5 Managers plus CEO........ 140
4.2.5 Teams of six and above Managers ................................................. 147
4.3 Summary .................................................................................................. 147
5 Chapter five: Conclusions and implications .......................................................... 151
5.1 Introduction .............................................................................................. 151
5.2 Conclusions from each research question and hypotheses.......................... 151
5.3 Conclusions about the research problem .................................................... 163
5.4 Implications .............................................................................................. 164
5.5 Limitations................................................................................................ 165
5.6 Further research ........................................................................................ 166
5.7 Conclusion ................................................................................................ 167
6 References ............................................................................................................ 169
7 Appendices........................................................................................................... 185
7.1 Survey Reports ......................................................................................... 185
7.2 Approval of the Business Human Research Ethics Committee .................. 243


i
Tables
Table 2.1 Different approaches for a literature review 17
Table 2.2 Stages of this thesis and the framework of a literature review from
Arksey and O’Malley (2007) 19
Table 2.3 Based on Miles & Snow (1978) ‘Dimensions of the adaptive cycle and
strategic type characteristics’ (Table 1 of Conant et al., 1990, p.367) 28
Table 2.4 The key parts of an organization, based on Mintzberg (1980), source
Lunenburg (2012, p.4) 30
Table 2.5 Porter, M. E. Competitive advantage: Creating and sustaining superior
performance, Simon and Schuster, New York, (2008, p.40‒41) 31
Table 2.6 The sixteen detailed business model archetypes from ‘Do some
business models perform better than others? A study of the 1000 largest
US firms’, Weill et al. (2006, p.31) 32
Table 2.7 ‘Combined typology of business-level competitive strategies’, Mullins
and Walker (2013), retrieved from:
www.mktgsensei.com/MBA522/Chap009.ppt 33
Table 2.8 10 parameter-questions leading to Typology. Based on Conant et al.,
(1990, p.367), author’s interpretation 36
Table 2.9 The combined Typology. Derived from Conant et al., (1990, p.367),
author’s interpretation 36
Table 2.10 Re-phrased parameter-questions to identify the Typology and therefore
the Dominant Coalition 37
Table 2.11 Framework for understanding diversity in work teams. Jackson et al.
(1995, p.212‒213) 45
Table 2.12 Smith et al.’s (1989, p.65) citation of Miles & Snow strategy continuum,
reduced to the administrative problem variables. 48
Table 2.13 Summary of parameters considered in regard to TMT’s constellation
for strategic decision-making 53

ii
Table 2.14 Summary of the findings of the literature research on Managers’
Characteristics 58
Table 2.15 Selected Managers’ Characteristics, horizontal relationship 58
Table 2.16 Selected Managers’ Characteristics, vertical relationship 59
Table 2.17 Nine limitations of Span of Control according to Hanna and Gentel
(1971, p.115) 65
Table 2.18 Company/department size versus complexity of work 66
Table 2.19 Size/complexity-grid with all findings of this literature review: on the
ideal Span of Control (numbers link to the researched literature) 79
Table 2.20 Abstracted ideal Span of Control findings with +/- tolerance indication 80
Table 2.21 Pattern in the abstracted ideal Span of Control findings 81
Table 2.22 Summary of the selected variables for the four perspectives analysed
in this thesis 87
Table 3.1 The basic characteristics of qualitative and quantitative research from
Park and Park (2016, p.2) 90
Table 3.2 Paradigm and methodology of this thesis 91
Table 3.3 Selected measurement factors of each perspective and the instruments
used in this thesis 94
Table 3.4 Re-phrased parameter-questions to isolate the Dominant Coalition
based on Miles and Snow (1978) (repeated Table 2.10) 97
Table 3.5 Constellation of Dominant Coalition based on the Miles & Snow
Typology (1978), by the author 99
Table 3.6 Ideal Span of Control findings with average and +/- delta, by the author
(repeated Table 2.20) 110
Table 3.7 Pattern in the abstracted ideal Span of Control findings, by the author
(repeated Table 2.21) 111
Table 3.8 Administrative details of this thesis 114

iii
Table 4.1 Weighting of Typology by number of participating companies 128
Table 4.2 Frequency of departments in the survey and the potential Dominant
Coalition they belong to, according to Miles & Snow (1978) 129
Table 4.3 Managers’ Characteristics by frequency and departments 129
Table 4.4 Balanced weighting of Managers’ Characteristics 130
Table 4.5 Complexity of departments with the core area indicated in yellow 130
Table 4.6 Educational level of the managers by departments in nominations 131
Table 4.7 Educational level of the managers by department as a percentage 132
Table 4.8 Occurrence of first ranking department vs perspective, split
by team size 133
Table 4.9 Departments by team size and rank according to the computer
calculation 134
Table 4.10 Departments by team size and rank according to participants
assumption 135
Table 4.11 Matching of the survey’s calculation and assumption’s result 135
Table 4.12 Number of departments having an influencer separated by the sizes of
the Top Management Teams 136
Table 5.1 Constellation of Dominant Coalition based on the Miles & Snow
Typology (1978), by the author (repeated Table 3.5) 154
Table 5.2 Confusion matrix showing calculated ranking vs assumed ranking 155
Table 5.3 Confusion matrix split by ranks into accuracy tables 156
Table 5.4 Comparison of the impact of the perspectives Typology, Team
Constellation and Manager’s Characteristics on
the final result 157
Table 5.5 Educational level of dominant Top Management Team members 161
Table 5.6 Number of departments having an influencer separated by Top
Management Team sizes 163

iv
Figures
Figure 1.1 Model of the sections of a thesis (Perry, 1998, p.65) 13
Figure 2.1 Relationship between literature review, parent disciplines, research
problem and hypotheses (Perry, 1994, p.16) 18
Figure 2.2 Parent disciplines and problem areas in this thesis 23
Figure 2.3 The five basic parts of the organization, Mintzberg (1980, p.324) 29
Figure 2.4 The key parts of an organization, abstract version of the Mintzberg
Model, source Lunenburg (2012, p.2) 29
Figure 2.5 A diagram created by Denis Fadeev (2014) of Michael Porter's three
generic strategies based on a figure from Porter M. E., Competitive
strategy: Techniques for analyzing industries and competitors, New
York: Free Press, 1980, p.39. Https://commons.wikimedia.org/
wiki/File: Michael_Porter%27s_Three_Generic_Strategies.svg 31
Figure 2.6 A common illustration of the value chain (Porter, 1985, p.36) 38
Figure 2.7 The role of strategic choice in a theory of organization,
Child (1972, p.18) 50
Figure 2.8 The relationship between one supervisor to another supervisor or
between one supervisor to a subordinate 54
Figure 2.9 Relevant Managers’ Characteristics, in horizontal and
vertical relationships 60
Figure 2.10 The limited span concept (Van Fleet and Bedeian, 1977, p.357) 63
Figure 2.11 The optimum span concept (Van Fleet and Bedeian, 1977, p.360) 64
Figure 3.1 The three major research paradigms (Johnson, Onwuegbuzie and
Turner, 2007, p.124) 90
Figure 3.2 Convergence of multiple sources of evidence, from Yin
(2017, p.117) 94
Figure 3.3 Previous Findings –Managers’ Characteristics
(repeated Figure 2.9) 106

v
Screenshots
Screenshot 2.1 Online opinion poll; Managers’ Characteristics,
author’s work from the study DBA712 55
Screenshot 3.1 Screenshot of the first online opinion poll (DBA712) to evaluate
Managers’ Characteristics 107
Screenshot 3.2 Screenshot of online opinion poll – online results (repetition of
Screenshot 2.1) 107
Screenshot 3.3 Consent form and information sheet of the online survey in a
pop up window 113
Screenshot 4.1 URL of the online survey 118
Screenshot 4.2 Instructions to start the online survey 119
Screenshot 4.3 Typology perspective I 119
Screenshot 4.4 Typology perspective II 120
Screenshot 4.5 Size of the company 120
Screenshot 4.6 Size of the Top Management Team 121
Screenshot 4.7 CEO’s age and tenure 122
Screenshot 4.8 Details about each member of the Top Management Team 122
Screenshot 4.9 Details about each Managers’ Characteristics 123
Screenshot 4.10 Ranking of the influence of the Top Management Team
members by assumptions 123
Screenshot 4.11 Sample survey-report organizational chart with percentage
values and indications of potential influencers 124
Screenshot 4.12 Sample survey-report comparing ranking by calculation
(computer) and assumption (participant) 125
Screenshot 4.13 Sample survey-report perspective Typology 126
Screenshot 4.14 Sample survey-report perspective Constellation 126

vi
Screenshot 4.15 Sample survey-report perspective Managers’ Characteristics 127
Screenshot 4.16 Survey-Report 2.7 137
Screenshot 4.17 Survey-Report 2.13 138
Screenshot 4.18 Survey-Report 2.15 139
Screenshot 4.19 Survey-Report 2.25 140
Screenshot 4.20 Survey Report 3.5 141
Screenshot 4.21 Survey-Report 3.9 142
Screenshot 4.22 Survey-Report 4.4 144
Screenshot 4.23 Survey-Report 4.16 145
Screenshot 4.24 Survey-Report 5.11 146

vii
Graphs
Graph 2.1 CEO Span of Control (1986-2008). Source: Guadalupe, M., Li, H., &
Wulf, J. (2011). Who Lives in the C-Suite? In Wulf, J. (2012). The
flattened firm: Not as advertised. California Management Review.
Fall, Volume 55, Issue 1, p.10. 76
Graph 3.1 A visual representation of the Empirical (68-95-99.7) Rule based on the
normal distribution divided in 0.5 steps of Standard Deviation. Retrieved
from Math Planet, Algebra 2, Quadratic Functions and Inequalities -
https://www.mathplanet.com/education/algebra-2/quadratic-functions-
and-inequalities/standard-deviation-and-normal-distribution 104

viii

ix
Certificate of Authorship
I hereby declare that this submission is my own work and to the best of my knowledge
and belief, understand that it contains no material previously published or written by
another person, nor material which to a substantial extent has been accepted for the
award of any other degree or diploma at Charles Sturt University or any other
educational institution, except where due acknowledgement is made in the thesis [or
dissertation, as appropriate]. Any contribution made to the research by colleagues with
whom I have worked at Charles Sturt University or elsewhere during my candidature is
fully acknowledged. I agree that this thesis be accessible for the purpose of study and
research in accordance with normal conditions established by the Executive Director,
Library Services, Charles Sturt University or nominee, for the care, loan and
reproduction of thesis, subject to confidentiality provisions as approved by the
University.
Yves Michel Serge Clerc 17th
December 2017

x
Acknowledgements
The realization of this thesis has been a lonely way throughout a significant period of
my life. Intrinsic conviction and stamina have led to this result.
per aspera ad astra
There are three people which have supported me in the finalization of this thesis and
deserve my utmost gratitude:
First and most importantly my principal supervisor Dr. Kerry Tilbrook who has
patiently accompanied this long journey with profound academic support.
Ms Honey Yam, BSc (Drake) Mathematics, from Malaysia, for translating the
researched variables into algorithms and equations as well as being supportive with the
multivariate data analyses.
Mr Yaroslav Bykov, Ph.D. (Russian Academy of Sciences) from Russia, for
programming the same algorithms and equations into an online software application
which was used for the survey.

xi
Dedication
With deep love to my wife Jrene Clerc;
by the time this work is published she has shared 20 years of her life with me.
During the realization of this doctoral dissertation she has been living and working
with me in Switzerland, Russia and Malaysia and has given birth to our children
Maurice (*2014), Nicolas (*2015) and Nathalie (*2016). Only nine months after our
daughter was born, Jrene won the Johor Bahru Triathlon (Malaysia). In every respect,
she is truly an inspiration for stamina.

xii

xiii
Abstract
The aim of this thesis is to measure the relative share of the Top Management Team
Members’ influence on strategic decisions. Three perspectives are explored: Typology,
Team Constellation and Manager’s Characteristics and an additional dimension is added
with an in-depth analysis of the Span of Control of each Top Management Team
Manager to identify potential influencers. A model was developed which was tested
through an online survey, which showed good agreement with the theory.
Many of the factors influencing the decision-making process of the upper echelon are
difficult to specify numerically and are also hard to determine. This dissertation takes a
numerical approach to the disciplinary relationships among decision-makers within the
Top Management Team where the CEO is equipped with the power of a blocking
minority.
A predominantly quantitative methodology is applied in this thesis. Although during the
pre-empirical stage, subjective and non-measurable data is collected using an
interpretative approach, for the perspectives of Team Constellation and Manager’s
Characteristics. The research on the perspective of Span of Control is evaluated by
measurable factors and is quantitative in nature. The perspective of Typology
concentrates on the model to be applied. The empirical stage – the online survey – aims
to collect numerical data for statistical analysis. Consequently, an online survey was
developed with the objective to determine the key factors that are identified in the
literature and this resulted in 114 valid data sets, from a number of different companies.
Consideration is given to the fact that Typology originates from the organisational
structure of the business and is only influenced by the managers themselves, through
effective change management. Whereas Team Constellation is constantly changing with
increasing age and tenure of the team members; and Manager’s Characteristics can be
directly influenced by each Manager. Further research might analyse these factors by
taking an even broader approach without the use of Typology and instead considering
just the Constellation and Characteristics.
Keywords: Dominant Coalition, Top Management Team, Organizational Structure,
Typology, Team Constellation, Managers’ Characteristics, Span of Control

xiv
1
1 Chapter one: Introduction
1.1 Conceptual framework
This thesis aims to develop a systematic approach which enables an evaluation or
comparison of the Top Management Team members according to their influence on
strategic decisions by analysing and comparing organizational structures. For example,
Barrick, Bradley, Kristof-Brown and Colbert (2007, p.545) argue that “distinguishing
between team interdependence and team processes is vital to understanding how TMT
functioning relates to team and organizational outcomes” or “[i]dentifying which factors
affect firms’ performance is a critical issue in strategic management research” (Escribá-
Esteve, Sánchez-Peinado and Sánchez-Peinado, 2009, p.581). Within the same category
of statements Hambrick and Quigley’s comment is pertinent “[h]aving an accurate grasp
of whether – or how much, when and where – top executives matter is centrally
important for advancing theory and research” (2014, p.473).
In selecting a company containing complex tasks, various departments and employees;
the number of people having influence in leading the company is most probably also
larger than one. What could be described as 1 + n, where ‘1’ represents the chief
executive officer (CEO), and ‘n’ is the number of members in the Top Management
Team. Business objectives and human characteristics are variable and it can be assumed
that not everyone in the ‘n-group’ is equal. For everyone in the ‘n-group’ is as unique as
a fingerprint. This diversity should be an advantage or an added value described by
Daellenbach, McCarthy and Schoenecker as ‘Heterogeneity or diversity of the Top
Management Team (TMT)’ when mentioning that:
[w]hile heterogeneity in the TMT may increase the level of conflict within the
team, the variety of values, biases and perceptions that result from functional
background diversity should lead to a more comprehensive consideration of the
investment alternatives (1999, p.202).
Some members of this group may vary in their role in influencing the leading process,
based on criteria such as their position, participation, expertise, etc. or in “functional
background and functional experience” as defined by Daellenbach et al. (1999, p.201)
and repeated by Escribà-Esteve et al. when describing the factors such as “average age,
level of education, amount of experience, number of members or number of family
members in the TMT [that] may condition the firm’s behaviour” (2009, p.584). Talke,
Salomon and Kock describe executives’ cognitive backgrounds and values as they are

2
“a function of observable characteristics such as education or work experience” but
argue at the same time “however empirical findings on a direct relationship between
Top Management Teams diversity and firm performance are equivocal” (2011, p.821).
Whereas, Hambrick and Quigley conclude: “[i]ndeed, an understanding of executive
effects can be thought of as fundamentally important for much of organizational
science” (2014, p.473).
The aim of this thesis is to enable a pro-rated weighting of the influence of different
members in a decision-making team. The results reveal that a certain combination of
members of a group can execute more dominance in their decision-making process than
another. For example, Hambrick and Mason (1984, p.199) state that managers from
“output functions – marketing, sales and product R&D – emphasize growth and the
search for new domain opportunities” and in contrast, managers from “throughput
functions (production, process engineering, accounting)” are hypothesized to emphasize
increased efficiency and backward integration as cited in Daellenbach et al. (1999,
p.201). This will become important for this research when evaluating the value chain of
an organization. The results of this research prove that depending on the business
typology different departments do have differing levels of influence on strategic
decisions.
Hamilton, (1921), Graicunas (1933), Gulick et al. (1937) and Urwick (1956) were
among the most influential authors in the early twentieth century to write about the
principle of Span of Control and the corresponding relationships between the staff
members. The paper ‘Relationship in Organization’ which is a foundational study for
that topic, was written originally by Graicunas (1933), edited by Gulick et al. in 1937
and retyped by Nickols in 2011. From the viewpoint of this thesis, Gulick et al., have
forfeited an opportunity when they concluded that “it is not possible to assign
comparable weights to these different varieties of relationship” (Gulick et al., 1937,
p.185). This capitulation in any attempt to allocate pro-rated values to relationships was
a surprise for the author of this thesis and resulted in the initial stimulus to undertake the
research reflected in this work.
Research and in-depth analysis are conducted to discover answers to a total of seven
hypotheses covering the topic of the Dominant Coalition in Top Management Teams in
order to enrich professional research in two main fields. These are described below.

3
Referring to the aim to refute the impossibility of weighting relationships in
organizational structures it was discovered that there are specific criteria which enable a
comparison of the relationships among the members of the top management team. With
that outcome a value for the influence of each management member on strategic
decisions can be calculated.
Depending on the complexity of the tasks to solve and on the skills and experience of
staff members to solve the task, there are limits in a supervisor’s capacity to handle
organisational complexity. The British General Sir Hamilton (1853–1947) wrote in
detail about Span of Control as early as in 1921, which is elaborated in the subchapter
‘2.72 History of the concept Span of Control’. The ratio between supervisor and staff is
usually defined as the span of management, Span of Control or supervisory ratio and
work group size (Meyer, 2008, p.104).
Defining the Span of Control of a department will disclose the possibility to determine
influencers by analysing organisational structures. This is contributing to the body of
knowledge because it was found throughout the research that an overload in work or
responsibility of a manager can lead to something which is termed in this thesis ‘the
momentum of losing control’. When this happens there could be other team members
who gain influence due to the necessity of the overloaded manager having to share
responsibility.
Combining the schemata to define the power of top management team members with
the identification of their influencer results in the possibility of answering the research
question: ‘Who leads the Company?’ It is possible today to answer this question
because as Pettigrew asserts when referring to Hambrick and Mason’s ‘upper echelon’
published in 1984 that “since then a noteworthy pattern of work has emerged linking the
demographic characteristics of top management teams to a variety of organizational
outcomes such as performance” (Pettigrew, 1992, p.164).
1.2 Background to the research
What is the purpose of such a weighting system? Firstly, it provides an idea of the team
members who are necessary to lead a group of people under various circumstances.
Since a large company is not led by its thousands of employees, but by a small group of
responsible people. McManus states in ‘Losing our Span of Control’ that “the number
of people per leader should be no more than five” and suggests that “a span of control of
50:1 is ridiculous” (2007, p.22). Therefore, it makes sense to know who those people

4
are or ideally where their place in the company should be, to make sure that this group
of leading supervisors can work efficiently. A systematic approach to define those
group members and their influence in the decision-making process, could therefore also
reveal missing positions and assist in describing the profile of the incumbents who are
necessary to ensure the best performance of the company depending on its
circumstances or environment. Or as Hambrick and Mason (1984, p.200) describe it,
homogeneity can be supportive for efficient solutions, whereas heterogeneity gives
better performances for new or innovative solutions. This also means that companies
which are required to find new solutions due to their unfavourable situation can opt to
sacrifice homogeneity in their TMT to a certain degree.
But how can informal leaders and bottom-up as opposed to top-down decisions be
measured? Many factors which are influencing the decision-making process of the
upper echelon are difficult to specify numerically and are often hard to determine or as
Pettigrew puts it “research in this tradition is avowedly sociological” (1992, p.165).
Therefore it can happen that employees might ask themselves sometimes why certain
decisions were made by their company and other suggestions were unsuccessful. If they
knew a way to find and address relevant influencers (those whose names do not
necessarily appear on the senior managers’ organisational chart) employees could
contribute much better to the successful implementation of ideas. The chance that an
idea is successfully realised can be enhanced by the opportunity to communicate with
the right people in advance. “Management requires tolerance of the idea that the
meaning of yesterday’s action will be discovered in the experiences and interpretations
of today” is a valid observation by March (1991, p.100).
The systematic approach utilised in this research is useful for external people who want
to introduce their ideas into a company’s decision-making process. This follows the
perspective of Galeotti and Goyal (2009, p.510) who suggest that: “incorporating social
network information in the design of marketing and influence strategies can both reduce
waste in resources and generate greater sales” or simply as Kerr says: “[i]nfluencers are
the people who can influence the decision-makers” (2011, p.69). In Hypothesis No. 3
treated later in this study it describes for example how Sales Teams, Marketing or
Human Resources Departments or also firms located in the field of Mergers and
Acquisitions could assimilate this approach in their work.
The approach of this thesis assists in measuring who belongs to the dominant coalition
in the Top Management Teams of profit-oriented companies based on the analysis of

5
organisational structures. This systematic approach could assist in (re)organising
companies, and analyse the reasons for the success or failure of internal decisions and
also help third parties to define an effective strategy for negotiating with a company.
1.3 Research problem and hypotheses
1.3.1 Research problem
The approach of this thesis will assist in recognizing the influence of the different
members working in a decision team. The results show how a certain combination of
members of a group may be more effective in their decision-making process than
another, and also that depending on the Typology of the company, different departments
have varying influences on strategic decisions. The importance of choice was described
by March in an arresting way: “[it] is the process that gives meaning to life, and
meaning is the core of life” (1991, p.111).
1.3.2 Hypotheses
The following section describes the hypotheses, the research background and their
contribution to the immediate field of research.
Hypothesis 1: The impossibility to allocate numerical values to relationships of
decision-makers in organizational structures as Gulick et al. have written in 1937 can
be refuted.
Research background: The research knowledge developed after 1937 makes it
possible to select specific criteria to facilitate the comparison of the members of the Top
Management Team and then to charge these criteria with different weightings. Four
perspectives are analysed to consider and validate this:
1. The Typology of a company. In respect to the nature of the business it is defined
which departments will directly or indirectly belong to the Dominant Coalition.
2. The Constellation of the Top Management Team members could give more
insights. Through the analysis of the team constellation in selected Top
Management Teams it should be possible to define those people who hold a
stronger position in the team and therefore exert more influence on the CEO
than others.
3. Managers’ Characteristics It is assumed that it is necessary to know which
characteristics are of importance in a horizontal relationship (between manager

6
and manager) on the organizational chart and which characteristics are of
importance in a vertical relationship (leader to subordinate).
4. Span of Control. Regarding the size of the organization and also the complexity
of tasks it is explored how many subordinates are effectively managed by one
person. If that value is exceeded, the responsible manager is losing control and
then the next logical step would be that another person in the team beside the
leader gains importance in supporting/influencing the leader – because this
manager can no longer handle the task of leading in isolation.
The above perspectives describe in descending order the following factors:
the environment of the company
the Top Management Team and
the individual Manager
and finally the Span of Control of each manager.
Collecting data on these four perspectives results in enough information to rank the
members of the Top Management Team by their influence on the decision-making
process and to indicate if there is a high probability for a hidden force, or an influencer,
in any or several of the departments.
Hypothesis 2: Members of the top management team with an identical hierarchical
level have differing amounts of influence on strategic decisions.
Research Background: This research theorises that the official leader of a group has
the power to say ‘no’ to a proposal because s/he has the final responsibility for that
decision. Hambrick and Quigley (2014) describe the influence of the CEO on Return on
Assets with 35.5% where they differentiate “low- (28.3), medium- (35.0), and high-
discretion (42.4) industry subsamples” (p.484). In this research the power of a CEO is
described as the blocking minority, which is 34% because each decision is assumed to
be a vote for which a two-thirds majority is necessary to succeed. Pettigrew succinctly
states that “power lies with those at the strategic apex of the organization” (1992,
p.163). From a mathematical point of view, however, if any other value such as for
example 25% is defined as the CEO’s part of decision power it would not lead to
another outcome. The only relevant question is how the reciprocal value of the CEO’s
power, the blocking minority, is divided among the other team-members. The easiest
answer is that in our case the remaining 66% of the decision power is equally divided
among the number of team members in the top management team. But it seems

7
self-evident that depending on different factors the amount of influence may differ
among the members of the top management. Nevertheless, there are some uniform
patterns because as Talke et al. suggest “TMT candidates often exhibit similar
characteristics: most of them are male, older and have a business background” (2011,
p.829). March’s comment on hierarchies reinforces this observation more strongly in
that they “fit a mostly male world view of human order … organized around relations of
domination and subordination” (1991, p.108). If Hypothesis No 1, that influence is
measurable, can be verified, then it should also be possible to allocate this influence
among the Top Management Team members through finding differences amongst them.
Hypothesis 3: An algorithm can be used to evaluate the members of the Dominant
Coalition.
Research Background: Despite the question of whether the interdependence of Top
Management Team members in regards to the company and team can be measured it is
important to understand to what degree this process can be done without human
interference and just by feeding a system with a minimal set of data. If this is achievable
such an evaluation can be done without having personal knowledge of either the
company or the Top Management Team members. The potential value of such a
possibility is apparent for many different applications such as:
For organizational design in an attempt to reduce dysfunctional aspects
The strategic approach of a sales team towards a potential customer could be
adjusted when knowing who is most influential in the targeted company
Marketing could use this tool to stimulate the right channels
Merger and Acquisition companies may find such a tool interesting because it
could detect hidden influencers
Human Resources companies, departments or even individuals who are
approaching new employers could use such a tool for a better prediction of
whether cooperation is likely to result.
These are just to name a few possibilities. The question is how with a little information
(relevant set) and grade of accuracy (in percentage) a prediction of the constellation of
the Dominant Coalition is given just based on the perspectives of Typology,
Constellation and Manager’s Characteristics.

8
Exploration 3a: Which of the analysed perspectives, Typology, Team Constellation or
Managers’ Characteristics, has most influence on the constitution of the Dominant
Coalition?
Research Background: After selecting three perspectives as important to the
constitution of the Dominant Constellation it is evaluated if one of these perspectives is
determining the result more than the others. It could be that three perspectives are
evaluated but actually the outcome is established with just one or two of them. Are there
factors in one of the perspectives of such importance that there is just no way to
compensate this factor by substituting any other or a combination of these? One
difference among the perspectives of Typology, Constellation and Characteristics which
needs to be remembered is that the perspective of Typology is pre-determined by the
design and structure of the company and is not influenced by the individual manager.
Depending on the Typology of a company a dominant coalition is already determined
(Miles & Snow, 1978), however, most likely a company is not classified into one
Typology only but rather is a mixture of several Typologies so that the Dominant
Coalition might oscillate among various departments.
Exploration 3b: If the Dominant Coalition is predetermined through the Typology what
influence does Team Constellation have on the final setting?
Research Background: Another aspect related to the three perspectives which is
analysed is whether the right person in a suitable company might fail if the constellation
of the Top Management Team is unsuitable for them. Certainly, a positive team
constellation is beneficial to the individual manager but the question is how much
weight (importance) is implied in the Team Constellation. Understanding this could be
beneficial for the career planning of job movers; one person may be the successful
candidate having found a compatible company but later becomes a disruptive element
within the Team Constellation and therefore is not suitable.
Exploration 3c: If the Dominant Coalition is predetermined through Typology what is
the influence of Managers’ Characteristics on the final setting?
Research Background: Allied with the perspective of Team Constellation’s influence,
and the possibility of one department being in the Dominant Coalition, we explore to
what extent the Characteristics of each Top Management Team manager is influencing
the constellation of the Dominant Coalition. Typology representing the nature or
organisational structure of the company is the superordinate perspective as it is or at
9
least should be in most cases a stable perspective. The Constellation of the Top
Management Team is a comparably dynamic (fast or slowly) changing perspective
depending on the time line and the associated changes of Top Management Team
members. Both of those perspectives cannot or can only partially be influenced by the
individual Manager whereas the perspective Characteristics focuses on the individuality
of each Manager. A person may analyse a Top Management Team and evaluate its
weaknesses with the aim of taking advantage of such weakness. For example, if
someone can capitalize on a certain personal strength which by coincidence is a
weakness of the remaining Top Management Team members then this person
potentially could secure a place in the Dominant Coalition.
Hypothesis 4: The head of Finance is predominantly the hidden deputy (number two) in
the Top Management Team
Research Background: It is unsurprising that the Chief Financial Officer has an
important role especially when companies declare themselves as a profit oriented entity.
This research also investigates to what extent the head of Finance is the shadow of the
CEO and also what are the circumstances that could reward another member of the Top
Management Team (other than the head of Finance) with such an influential deputy
position. The perspective of Typology usually finds Finance most often in the Dominant
Coalition. Nevertheless, there is room for the assumption that depending on the nature
of the business, other Top Management Team Members are also important or even the
most important directly after the CEO. Although Finance is important for a small
laboratory developing a treatment against cancer it is obvious that the role of the head of
R&D of the same company is of utmost importance because the results of this
department will have a direct impact on the laboratory’s future existence.
Hypothesis 5: Dominance in a Management Team is related to Education and the
Complexity of Tasks of the dominant team members.
Research Background: This research analyses data from 100 companies which
captures information from an estimated 400 individual managers including data in
respect of their education and the complexity of their role within the context of the
whole company. This information is useful if the complexity of work (difficulty of the
tasks and numbers of supervised staff) and educational status of the manager serves as
an entitlement for membership of the Dominant Coalition within the company.

10
Exploration 5a: So who leads the company? Where are the influencers hidden?
Research Background: The hypothesis is that if the number of subordinates exceeds
the Span of Control of a manager then there is a requirement for a hidden number two to
emerge in that team or department. Because the manager is overloaded with tasks, this
number two or deputy will take over partially and make proposals to the manger. The
manager will or chooses to trust these proposals from the influencers due to time
constrains and then by osmosis gradually includes them in his or her contributions to the
overall top management team. This means that the contribution to the top management
team comes not only from the managers themselves but also indirectly from their
influencers. This may result in the situation of bottom up leadership where a hidden (or
not hidden) influencer is steering the company to a certain extent.
1.4 Justification for the research
This dissertation will allocate numeric values to disciplinary relationships among
decision makers in the Top Management Team by analysing the Company’s Typology,
the Team Constellation and Manager’s Characteristics simultaneously. For example,
Escribà-Esteve et al. encouraged the author to undertake this research when they
lamented that “few studies have provided a framework that jointly analyses the
managerial characteristics, the mediating processes and attitudes by which managers
shape the direction of their firms” (2009, p.582). Also Hambrick and Quigley (2014,
p.474) asked “how much influence do CEOs in general have on organizational
performance?” when referring to Lieberson and O’Connor (1972) as well as Mackey
(2008).
Any individual or group whether internal or external to a particular company could ask
themselves why certain proposals were accepted and others were unsuccessful. Who
belongs to the team which is taking the decision and who is influencing this team might
be unclear. “The question of the relative power of managerial elites and others is a
crucial empirical issue” according to Pettigrew (1992, p.163). The name of a potential
influencer does not even have to appear on the organisational chart. The chance that a
proposal is successfully accepted is enhanced by the opportunity to understand the Top
Management Team members and how they form coalitions in working together. As
recommended by Sabatier and Weible “in order to have any prospect of success, they
[policy participants] must seek allies, share resources, and develop complementary
strategies” (2007, p.196). What is new in this approach is the opportunity of isolating

11
the internal influencers through the analysis of organizational structures. Firstly, a
relevant set of questions is defined where answers are weighted according to an
algorithm and will result in a ranking of the evaluated Top Management Team members
according to their dominance. Secondly, the possibility of managers having lost their
Span of Control is analysed because this may lead to the support of subordinates who
finally could function as influencers.
To demonstrate the importance of the proposed model a situation from the author’s own
work environment is described which is representative of similar situations in other
companies within the private sector. The author of this research is employed by a
German manufacturer of hydraulic accessories, a globally leading supplier for industries
such as Oil & Gas, Heavy Machinery, Railway Systems or Mining. The Shipbuilding
industries offered a large market to sell the products of this hydraulic accessory
producer. Yet it was difficult to tackle that potential market. Due to the fact that quite
often the sales representatives liaised with the wrong people. Whenever a contact with
the shipyards was established bargaining commenced for every single small order
between the purchasing or engineering departments. After considerable time, it was
realized that it was necessary to liaise with the design departments of the ship owners
who produce the drawings of the whole ship. These departments or in some cases
separate companies, are more worried about topics such as the safety, long-time
corrosion prevention or the overall weight reduction than the shipbuilder itself and have
a different agenda of priorities compared with the procurement department. It was
discovered that although the design department would not buy our products or install
them they could specify those products in their drawings which makes the selection of
them mandatory for all following parties involved. Jungmeister (2006, p.2) captures the
same principle when stating:
[a]s early compliance with the regulation often is a key differentiating factor,
this means, that companies that are quicker to get official approval for their
products, have an important and usually lasting competitive advantage and
therefore have a sustainable source of profit.
This awareness has saved the hydraulic accessory producer a significant amount of
money due to reduced travel and visiting costs and has increased financial turnover. If
there was a tool like the one which is developed with this dissertation – this awareness
could have been gained earlier. This tool can assist in reorganizing companies when
analysing the reasons for the success or failure of an internal decision system that might

12
expose an unbalanced accumulation of power in the Top Management Team. “The
decision processes we observe seem to be infused with strategic actions and politics at
every level and every point” (March, 1991, p.104). Due to these considerations the
author is convinced that it is worthwhile to undertake this research in order to develop a
tool which assists companies to understand the dominant coalition of Top Management
Teams and their influencers.
1.4.1 Example: Application of this Dissertation (Presumption)
In the following example an imaginary case demonstrates how the outcome of this
research is applied. It is unnecessary for the reader to understand every part of the
calculation at this stage because it is explained later in this thesis.
1.5 Methodology
For this thesis a predominantly quantitative methodology is applied, although during the
pre-empirical stage subjective and non-measurable data is collected in an interpretative
approach for the perspectives of Team Constellation and Managers’ Characteristics. The
Given Assumption: A small company in the health care business develops and distributes complex hearing aid
devices. The CEO has, through his position, a blocking minority for decisions defined with 34% (in value of the
whole decision process). The other 66% of the decision power is to be shared among the Top Management Team.
In this fictional case study there are four departments with 6 employees in each department; R&D, Production,
Finance and Sales.
The Calculation: Through the analysis of the Typology of the company, the Constellation of the Top
Management Team and the Characteristics of each Manager the following findings are calculated:
R&D is three times more dominant than sales and six times more important than finance and production
(6/2/1/1)
In a small department with complex tasks, the maximum span of control is 5
The Outcome
The manager of R&D will possess an allocated decision power of 39.6%
As the maximum span of control is 5 the manager of the R&D department achieved the ‘momentum of losing
control’ and therefore at least 1 influencer is assumed in this department.
The Conclusion: The target of this dissertation is to understand who is leading the company and to understand
the dominance of Top Management Team members. With the small case study above it is demonstrated that in
this case the R&D department accrues the biggest amount of power (dominance) in regards to strategic decisions;
even more than the CEO. Additionally, it was found, that there must be at least one influencer in the R&D
department. This knowledge could be crucial to understand the decision process of that specific company. If it is
the goal to sell a production machine to this company, a sales presentation should therefore not only be held for
the CEO and the head of the Production but also the head of R&D and maybe even a search for the influencer of
the R&D department is necessary to be successful.

13
research concerning the perspective Span of Control is evaluated by measurable factors
and is of a quantitative nature. The perspective Typology was found neither with
quantitative nor qualitative research because this perspective involved the selection of
the model which is applied and already included some of the factors that we were
investigating. The empirical stage – the online survey – is based on a quantitative
process with the aim to collect numerical data for statistical analysis.
1.6 Outline of this thesis
The structure of this study follows the model for a thesis described by Perry (1998) who
outlined the structure of a thesis as comprising five main chapters. These are an
Introduction, Model and Hypotheses, Methodology of data collection, Analysis of the
collected data and Contribution to the body of Knowledge. According to Perry “this five
section structure can be justified” because “it starts with the description of the problem
at the beginning and finishes with the solution for the same problem in the final
chapter” (1998, p.66).
The pre-empirical stage includes the description of the research, the definition of the
problem area and the research questions discussed in this introductory chapter.
The second chapter informs the reader about the research undertaken through literature
reviews and the systematic approach as to how the parent disciplines were narrowed
down to the corresponding research areas consisting of Typology, Team Constellation,
Managers’ Characteristics and Span of Control.
Then the third chapter discusses the methodology chosen, the process of data collection
and outlines the approach of the analysis to finally resolve the research questions. The
first section commences by defining which variables will be considered and then
discusses the methodology used for the data collection for that perspective. During this
Body of Knowledge
Candidate’s research
Chapter 1 Introduction
Chapter 2 Model and Hypotheses
Chapter 3 Methodology of data collection
Chapter 4 Analysis of
collected data
Chapter 5 Contribution to
body of Knowledge
Figure 1.1: Model of the sections of a thesis (Perry, 1998, p.65)

14
empirical stage a positivist approach in collecting and comparing all the findings
is taken.
Data collection is obtained in the fourth chapter. Initially, the developed online survey
and its related data collection process are described before the collected data is
presented. In this chapter, however, the findings are not analysed in detail but rather just
enumerated and potential trends are briefly highlighted.
In the final chapter there is an in-depth discussion of the results and thematic patterns of
the findings where deductive logic (deductive from the findings) is applied to answer
and resolve each of the hypotheses. The findings assist in improving the online survey
and also to suggest future research directions.
1.7 Definitions for this thesis
Echelon: Describes the level of management
Team Constellation: In this thesis the Team Constellation is measured with Age,
Tenure and Education because these factors were evaluated through the research
literature to significantly impact on the functionality of the team.
Top Management Team: Generally, this includes the CEO plus the first layer of
Managers the HOD’s (Head of Departments). In this research, however, the focus is on
the Top Management Team (TMT) that is the first layer of managers only. Atypically,
this excludes the CEO, due to the circumstances that a numerical value for each of the
team members is allocated whereas the CEO has (in this thesis) a fixed value and
therefore is irrelevant.
Managers’ Characteristics: The literature review paired with an online opinion poll
with 525 valid participations resulted in a core of 21 personal Characteristics which
were reduced to the most relevant set of 6 Characteristics. These are Reliability,
Archetype (role model), Communication, Competence, Social Competence and
Network so as to compare Managers’ Characteristics. Throughout the thesis this term is
also mentioned as Characteristics.
Span of Control: This is the principle where depending on the size of a company
paired with the complexity of the corresponding team a limitation is given to where one
team leader can retain an overview. This limitation is termed the momentum of losing

15
control which for this research is of great importance because this is the moment when
the leader’s dependency on some of the team members will increase.
Typology: This term was defined by Miles & Snow in 1978 and describes four essential
natures of business entities: Prospector, Defender, Analyser and Reactor.
1.8 Delimitations of scope and key assumptions
The thesis aims to determine the constellation of the Dominant Coalition in the Top
Management Team as well as potential influencers among the subordinates in profit-
oriented companies. This limits the research to profit-orientated companies to exclude
variables that could occur due to the nature of different businesses. Furthermore, the
discussed target group is limited to the Top Management Team (TMT) echelon with the
exception of potential influencers among subordinates. The remaining staff as well as
board members are not included in this research. It is also clear, that this dissertation
will not result in one fixed formula which can be applied to any potential Team
Constellation or for all situations. Rather this thesis results in one possible approach
exploring how evaluations are narrowed down from collecting a specific set of data to
describe the relationships among the Top Management Team members. This process
may reveal room for improvements which is documented along with the results in the
final chapter.
This dissertation aims to find a method to answer the initial research question ‘Who
leads a company?’ and to provide a proposed way to measure interdependencies among
Top Management Team members. It is assumed that the literature review with topics
such as Typology, Team Constellation, Managers’ Characteristics and Span of Control
results in enough criteria to describe at least the following points:
The nature of a business in regards to its Typology which may not solely be
dominated by one of the Typologies of Defender, Prospector, Analyser or
Reactor but is more likely a less distinctive or hybrid mixture of them
Team Constellation in regards to Age, Tenure with the company and Education
as the most important factors to express one’s proportion of dominance in a
management team
Selection of the most important Managers’ Characteristics relevant in horizontal
professional relationships (Manager towards Manager) and in vertical
professional relationships (Manager towards Subordinates)

16
Ideal Span of Control regarding the Team/Company size and complexity of
work to define the momentum of losing control and becoming dependant on
influencers
Undertaking this research is also justified by the perspectives of other researchers such
as Talke, Salomo and Kock (2011, p.820) who for example complain that “whether
TMT diversity has a direct impact on firm performance or whether this relationship is in
fact mediated by a firm’s innovation strategy and subsequent innovation outcomes
remains largely unanswered”. Pettigrew (1992, p.163) also emphasises the necessity “to
draw together aspects of the sociological, organizational and managerial literature,
which in the past have not talked to one another”.
In the following chapter a major literature review (consisting of several smaller reviews)
is undertaken to isolate key factors in all four perspectives which this research uses as a
foundation to construct an algorithm to measure the allocation of dominance in Top
Management Teams.
1.9 Conclusion
In this initial chapter, the conceptual framework is described and an explanation of what
was the initial trigger in commencing this research is provided. The interest of the
author in organisational structures and understanding the evolution of the Dominant
Coalition was confronted with the prejudice in historical research assuming that the
relationship among managers cannot be measured. Questioning this preconception
became the first of seven hypotheses. The research in its entirety is elaborated with a
pre-dominantly quantitative methodology within the standard five chapter outline. This
chapter concludes with an explanation of the terminologies used frequently in this thesis
and the delimitations of the scope and key assumptions.
The second chapter covers the literature review or rather the four small literature
reviews outlining the different perspectives used in this thesis to capture the main topic.
It concludes with a discussion of the CEO’s share of dominance when it comes to
decision making in the Top Management Team.

17
2 Chapter two: Literature Review
2.1 Introduction
“A Literature review is a story about a journey”, introduces Robert Brown’s ‘How to
prepare a literature review’ (2002, p.57). After having worked for a long time on this
literature review, the author identifies with Dr Brown’s analogy. The development went
several times through a process of interest, satiation and disaffirmation. Why is hard to
say. Maybe the best explanation is “The Problem of too few sources and the problem of
many sources” as Knopf aptly describes it (2006, p.130). For this thesis a major
problem was the process of gathering the data and composing and combining parts of
different puzzles into one larger picture. This differed from the logical stages of how to
conduct a literature review according to authors such as Arksey and O’Malley (2007),
Cronin, Ryan and Coughlan (2008) or Randolph, (2009) as described in the table below.
How to Conduct a
Literature Review
Methodological
Framework
Undertaking a literature
review, a step-by-step
approach
1. Problem formulation
2. Data collection
3. Data evaluation
4. Analysis and
interpretation
5. Public presentation
1. Identifying the research
question
2. Identifying relevant
studies
3. Study selection
4. Charting the data
5. Collating, summarizing
and reporting the
results
1. Selecting a review topic
2. Searching the literature
3. Gathering, reading and
analysing the literature
4. Writing the review
5. References
Randolph
(2009, p.4)
Arksey and O’Malley
(2007, p.22)
Cronin, Ryan and Coughlan
(2008, p.39)
Table 2.1: Different approaches for a literature review
By comparing the three variants on how to undertake literature reviews, the author
considers step number four ‘charting the data’ as described by Arksey and O’Malley
(2007) an important stage which is less emphasized in the other two frameworks. This
was exactly what was ignored at the beginning of this literature review; after defining
the research topics whatever literature was available was gathered in the aim to
synthesise this together. It is as if one would try to push several pieces of furniture
through a door at the same time. For as Gall, Borg and Gall warned: “[y]ou cannot
simply read all these documents, take casual notes, and then write a literature

18
review…you might need to develop a coding scheme, apply it to the documents, revise
it based on this experience, and re-apply it” (1996, p.159).
An illustration of the relationship between the literature review, parent disciplines,
research problems and hypotheses is given by Perry (1994, p.16) in the figure below.
This shows the importance of understanding that the literature review does not only
cover the research problem area itself. A literature review overlays the research problem
area into parent (or neighboring) disciplines.
Figure 2.1: Relationship between literature review, parent disciplines, research problem and hypotheses (Perry, 1994,
p.16)
Furthermore, it is important to distinguish if the research question itself has an
exploratory or an explanatory character. As this definition implies, exploratory is
sourced from the word exploring and explanatory from explaining or as Perry defined it:
“…if the [PhD] research is exploratory…then the literature will unearth research
questions (like ‘what’) that will be answered in the research”, and on the other hand if
the research is explanatory “then the literature review will unearth testable hypotheses
that can be answered with a ‘yes’ or ‘no’”, Perry (1994, p.20).
There are different reasons to undertake a literature review; to introduce a short journal
article/research report or to prepare an integrative literature research piece on a topic of
significance. According to Bragget, Jarratt and Bamberry (2008, p.19) we can
distinguish the following types of literature analysis:
historical research (data collection to determine and interpret its validity)
survey research (conducting a survey by using a questionnaire)
experimental/empirical research (controlling variables in experiments)
Literature Review Including Parent Discipline Research Problem Area
Boundaries of Research Problem
Parts of the Research Problem studied in previous Research
Research Questions or Hypotheses not answered in Previous Research

19
qualitative research (usually the interpretation of a particular group of
individuals)
evaluative research (determination of how well something is being performed).
The literature reviews for this thesis have an exploratory character offering a mixture of
historical research where data was collected to determine the validity of the research
topics, and also an evaluative aspect to find out how well the research topics are sourced
from the contemporary literature. Because the majority of research topics of this thesis
were introduced during the last century each of the four short literature reviews is
discussing historical papers which are explaining the foundations of each topic or are
written based on the original documents published during an earlier period. To balance
this, each of the four literature reviews employs a selection of recent research to assess
any new developments or determine if the principles of each topic remain unchanged.
2.1.1 The Literature Review Framework
After the results from the earlier study the author follows the procedure as discussed in
Table 2.2 and shown in the framework below which leads through the review like an
imaginary red thread. This framework will assist in maintaining the focus of the
literature review. Each research topic is re-named later as a ‘perspective’ and is
introduced and then elaborated through the analysis of historical and recent articles and
finally summarized when the findings are tabulated. The goal of each short literature
review is to find the key-arguments of one perspective (for example Managers’
Characteristics) in order to weight them according to their significance and popularity in
academic research.
Table 2.2: Stages of this thesis and the framework of a literature review from Arksey and O’Malley (2007)
Introduction of Research Topic
Main Results of Prior Findings
Finding gaps through Literature Review
Conclusions and summary
Methodological Framework Literature
Review
1. Identifying the Research Question
2. Identifying Relevant Studies
3. Study Selection 4. Charting the Data 5. Collating,
summarizing and
reporting the Results
Arksey and O’Malley (2007, p.22)
20
After a review of available literature which encompassed a broader perspective of the
research area including the parent disciplines, relevant papers to the specific research
problem areas were selected and collated in order to frame the research questions and
hypotheses. This was done with the intention;
a) to detect gaps in the existing literature
b) of being led to new findings
c) of obtaining answers on questions from the author’s former research
d) to formulate and verify hypotheses.
In this thesis four short literature reviews are conducted. These are covering the
Typology of the Company, Team Constellation of Top Management Teams, Managers’
Characteristics and Span of Control. At the conclusion of each of the literature reviews
the main results and findings are summarized in tables. Then the findings are discussed
and the remaining open questions are explored to detect gaps which could provide
insight into the answers this thesis is investigating.
2.2 Research Topic
2.2.1 Perspectives of the Research Topics
In this section the framework is described through which the influence of Top
Management Team members on strategic decisions will be evaluated. The complexity
contained in the title of this thesis makes it unlikely to provide a valid answer by
analysing the topic from just one perspective. In the research conducted before
commencing this study it was concluded that a systematic approach of four perspectives
would result in one possible way to examine the research topic by incorporating a 360°
view which should help to make any outcome as accurate as possible, repeatable and
reproducible. In analysing the dominance of Top Management Team members it was
decided to approach this phenomena from the perspectives of the:
Typology of the Company
Team Constellation of the Top Management Team
Managers’ Characteristics
Span of Control.
Certainly, it is worth mentioning that instead of perspectives the research topics could
be called different viewpoints, sub-systems, or levels; however, it was decided to call
them perspectives because it seemed the most appropriate description. At the end of this
chapter a scheme of a square depicting one of the literature / research topics on each
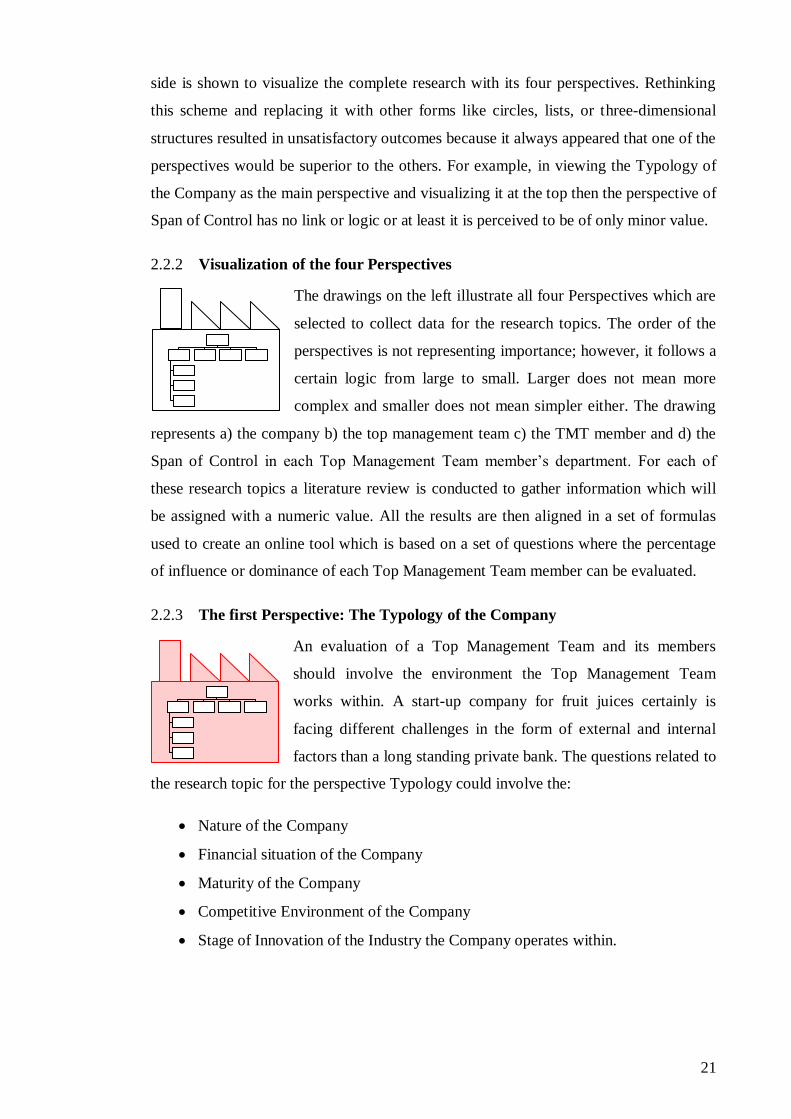
21
side is shown to visualize the complete research with its four perspectives. Rethinking
this scheme and replacing it with other forms like circles, lists, or three-dimensional
structures resulted in unsatisfactory outcomes because it always appeared that one of the
perspectives would be superior to the others. For example, in viewing the Typology of
the Company as the main perspective and visualizing it at the top then the perspective of
Span of Control has no link or logic or at least it is perceived to be of only minor value.
2.2.2 Visualization of the four Perspectives
The drawings on the left illustrate all four Perspectives which are
selected to collect data for the research topics. The order of the
perspectives is not representing importance; however, it follows a
certain logic from large to small. Larger does not mean more
complex and smaller does not mean simpler either. The drawing
represents a) the company b) the top management team c) the TMT member and d) the
Span of Control in each Top Management Team member’s department. For each of
these research topics a literature review is conducted to gather information which will
be assigned with a numeric value. All the results are then aligned in a set of formulas
used to create an online tool which is based on a set of questions where the percentage
of influence or dominance of each Top Management Team member can be evaluated.
2.2.3 The first Perspective: The Typology of the Company
An evaluation of a Top Management Team and its members
should involve the environment the Top Management Team
works within. A start-up company for fruit juices certainly is
facing different challenges in the form of external and internal
factors than a long standing private bank. The questions related to
the research topic for the perspective Typology could involve the:
Nature of the Company
Financial situation of the Company
Maturity of the Company
Competitive Environment of the Company
Stage of Innovation of the Industry the Company operates within.

22
2.2.4 The second Perspective: The Top Management Team
Every Top Management Team comprises two main roles: the role
of the CEO and the role of Top Management Team members.
Although the CEO is a member of the Top Management Team
through their given mandate to say ‘No’ to any proposal s/he is
different from the other team members. The main focus of the
literature review about the perspective of the Top Management Team is to identify those
factors which are important to define how the remaining power (besides the CEO’s) is
allocated among the other Top Management Team members.
2.2.5 The third Perspective: Managers’ Characteristics
It was found that there are some characteristics more important in
horizontal relationships (the same hierarchical level; Manager to
Manager) and some characteristics that are more important in
vertical relationships (supervisor towards subordinates). Some of
the characteristics are found to be relevant in both directions. The
categorization of horizontal and vertical descriptors illustrates how the relationship from
the point of view of a manager is described on an organizational chart. The selection of
the relevant characteristics will enable a comparison and determine the ranking
accordingly.
2.2.6 The fourth Perspective: Span of Control
This perspective is only indirectly influencing the amount of
influence a Top Management Team member may have in a
decision-making process. The Span of Control, however, has an
importance in the momentum of losing control. This momentum
is achieved when the complexity of work and team size is
unbalanced. In such cases a manager will inevitably lose control and either appoints
officially one or several deputies or indeed one or several deputies will evolve
unofficially because the Managers cannot handle their tasks anymore. This phenomena
is important because the manager is accumulating a high share in the influencing power
on strategic decisions but on the other hand has delegated some power to deputies. This
combination would lead to the fact that deputies might be responsible for proposals
introduced to the Top Management Team.

23
2.3 Draft of Parent Disciplines and Problem Areas in this Dissertation
Typology, Top Management Team value creation, Team Roles and Span of Control are
selected in the context of this thesis to be evaluated as the parent disciplines. The figure
below has to be read from each side towards the centre. The parental discipline of Span
of Control discusses the concept of how much individuals can be controlled under
certain conditions by one supervisor and in the second layer what happens if that Span
of Control is exceeded. In Value Creation the focus is on the differentiation of primary
and secondary departments and then the focus is on the Team Constellation. The
analysis of the Typology of a company leads us to the definition of the dominant
coalition that runs a company. Team Roles are discussed in the broader context of
Managers’ Characteristics and the selection of the most relevant ones in relationship
towards another manager (horizontal relationship on an organizational chart) or towards
a subordinate (vertical relationship on an organizational chart).
Figure 2.2: Parent disciplines and problem areas in this thesis

24
2.4 Perspective: Typology of the Company
The questions related to the research topic for the perspective
Typology of the Company concern the nature, competitiveness,
development or strategy of a company to list a few factors
describing the business environment a Top Management Team
works within. Child suggests that:
[i]t is not possible to abstract from the environment when considering the
strategic choices available to organizational actors. This is partly because the
environment presents threats and opportunities for the organization which
establish the parameters of choice. It is also because the ways in which
organizational actors understand the environment affect the extent to which they
believe they enjoy autonomy of choice between alternatives. (1997, p.53)
The combination of these environmental factors could result in too many answers or
variables which then make it necessary to combine and categorize information.
“Typologies are a key way of organizing complex webs of causal relationships”
according to Delbridge and Fiss (2013, p.329) and Snow and Ketchen (2014, p.231)
prescribe the use of typologies for “description and prediction”.
The literature review about the nature of the company is initiated with Delbridge and
Fiss because these two authors are elaborating and simultaneously critically evaluating
the importance of Typologies in their article ‘Editors’ comments: Styles of theorizing
and the social organization of knowledge’ (2013). Delbridge and Fiss have analyzed the
number of publications of the Academy of Management Review over the timespan from
1976 and 2012 regarding papers related to Typology. The authors found that there is a
clear decline in publications and have questioned that phenomena:
[b]y their very nature typological theories tend to be holistic and therefore do not
lend themselves as easily to a focus on individual direct net effects. As
interdependent webs of relationships, typologies more frequently involve
complex causal relationships involving interaction, substitution, and
bidirectional causality. (Delbridge and Fiss, 2013, p.330)
The authors, however, agree that correlational methods can be used for typological
theories but underline “that the methodological training and habits, as well as norms and
expectations that come with correlational analysis, may subtly bias us against
25
typological theorizing” (p.330). Another reason for a decline in research related to
typologies could be that “there are fewer new phenomena that could be addressed by
means of a typology” and this would lead to the assumption that “typologies have
somewhat outlived their usefulness since there is nothing new to classify” (Delbridge
and Fiss, 2013, p.329).
A rebuttal to this assumption was written one year later in 2014, when Snow and
Ketchen published their paper on ‘Typology-driven theorizing: A response to Delbridge
and Fiss’ in the same journal where these authors confirm that “sciences would benefit
from a renewed emphasis on typology-driven theorizing” (2014, p.231). Snow and
Ketchen give several reasons to Delbridge and Fiss why fewer new models may be
developed by stating that:
[a] typology is valuable when its ideal types are comprehensive and mutually
exclusive, the types can be validly and reliably measured, and the theoretical
foundation underlying the typology is clearly articulated. (2014, p.231)
Similarly, Snow and Ketchen (2014, p.232) question if a Typology still has validity
after more than three decades and explain a possible reason with the existence of a
theoretical framework (in this case the adaptive cycle) which accompanies the Miles
and Snow (1978) Typology. In answering Delbridge and Fiss’ question as to why there
are fewer new papers written about typologies, Snow and Ketchen analyse authors of
various works (Snow and Hambrick, 1980; Conant, Mokwa and Varadarajan, 1990; and
Desarbo, Di Benedetto, Song and Sinha, 2005) amongst others who have developed
quantitative measurement methods based on the Miles and Snow Typology. These
studies are giving researchers today “an array of measurement techniques at their
disposal when using the Miles-Snow Typology” (Snow and Ketchen, 2014, p.232).
This thesis concludes that there are three basic models widely accepted in academic
literature describing the typology of companies; Miles, Snow, Meyer and Coleman’s
‘Organizational strategy, structure, and process’ from 1978, Mintzberg’s model from
1980 outlined in ‘The structure in 5’S: A synthesis of the research on organization
design’ and Porter’s Competitive strategy: Techniques for analysing industries and
competitors also from 1980. Less popular, but more recent models, are found in Weill,
Malone, D’Urso, Hermann and Woerner’s paper ‘Do some business models perform
better than others?’ (2006) and an approach of Mullins & Walker (2013) titled
‘Combined typology of business-level competitive strategies’ combining Porter’s and

26
Miles et al.’s models. In the following literature review of Typology (the first
perspective) the focus is on explaining the principles of all the models described above
to select the most suitable one for the thesis and to assess how the selected model assists
in classifying companies analysed in this context.
2.4.1 Miles & Snow Typology
The Miles & Snow Typology (1978) is the oldest one in this comparison. It has not lost
its premier position, however, as the tool for company classifications pertaining to their
organizational strategy. Although, only Miles and Snow are usually mentioned, which
could give the false impression that those two authors are the sole developers of this
classification tool; the original article ‘Organizational strategy, structure, and process’
was co-written by Miles, Snow, Meyer and Coleman (1978). Miles et al. (1978)
summarize that:
[p]roponents of the strategic-choice perspective argue that organizational
behavior is only partially preordained by environmental conditions and that the
choices which top managers make are the critical determinants of organizational
structure and process (p.548).
The model of Miles et al. (1978) is building on previous models from Chandler (1962),
Child (1972), Cyert and March (1963), Drucker (1954/1974), Thompson (1967) and
Weick (1969/1977). Dahlan, Auzair and Ibrahim (2007, p.84) conclude that “typology
focuses on the rate of change in products or markets”. Miles et al. (1978) categorize the
complexity of problems and their consequential choices into three categories:
The entrepreneurial problem
The engineering problem
The administrative problem.
They suggest that in “mature organizations, management must solve each of these
problems simultaneously, but for explanatory purposes, these adaptive problems can be
discussed as if they occurred sequentially” (Miles et al., 1978, p.549).
Miles et al. emphasize the position of the strategic orientation of the organizations
because “each type has its own unique strategy for relating to its chosen market(s) and
each has a particular configuration of technology, structure, and process that is
consistent with its market strategy” (1978, p.550). These typologies are the; Defenders,
Analysers, Prospectors and Reactors.

27
There are a large number of representations of the Miles & Snow Typology which are
available in the research literature. The one which was chosen to use further is derived
from Conant, Mokwa and Varadarajan (1990). The reason for this selection is that
Conant et al. have in comparison to the others included the dominant coalition initially
described by Miles and Snow. This is important for this research because the
classification of the organization to analyze is to pair the typology with the aim to know
how this impacts on the Top Management Teams’ dominant coalition.
The qualifying arguments identifying which typology a company belongs to can be
evaluated among other criteria through their company strategy, the environment a
company operates within and their organizational characteristics. A Prospector may be
described as a creative and innovative organization in a dynamic environment following
a progressive strategy to find new opportunities. A Defender is set up with a more
centralized organization focused on tight control and efficient overhead planning,
surrounded by a stable environment protecting their current market. The Analyser
represents more of a mix in respect to its organization with an efficient but creative
point; their environment could change slightly as the main focus is on their existing
market with only moderate innovation. Finally, the Reactor will have no structured
organization and will just adjust to whatever needs appear which is also reflected in
their strategy (Conant et al. 1990, pp.381–383).
One of the questions elaborated further in Chapter 3 of this thesis is the quantification of
such findings. Even if it is defined for example that a chosen company belongs to the
Typology Defender where it is clear that finance and production will achieve a
dominant coalition it will be part of the methodology discussed in this thesis to quantify
such advantages. It is unlikely that an organizational typology is the sole parameter
giving any department a strategic advantage in comparison to others. The approach of
the author is that there are different parameters accumulating in the strengths of Top
Management Team members. As mentioned above Snow and Hambrick (1980), Conant,
Mokwa and Varadarajan (1990) and Desarbo, Di Benedetto, Song and Sinha (2005)
amongst others were named by Snow and Ketchen (2014, p.232) as researchers who
have developed quantitative measurement methods based on the Miles and Snow
Typology which are providing researchers today with “an array of measurement
techniques at their disposal when using the Miles-Snow Typology”. From those articles
the table by Conant, Mokwa and Varadarajan (1990) proved very helpful as it compiles
all parameters together in one summary.

28
Table 2.3: Based on Miles & Snow (1978), Dimensions of the adaptive cycle and strategic type characteristics
(Table 1 by Conant et al., 1990, p.367)
2.4.2 Mintzberg’s Model of the Five Structural Configurations
Two years after Miles & Snow and also in the same year as Michael Porter, Henry
Mintzberg published his ‘Structure in 5’s: A synthesis of the research on organization
design’ (1980). According to Mintzberg an organizational strategy is seen as a logical
output depending on five structural configurations. These are the:
Simple Structure
Machine Bureaucracy
Professional Bureaucracy
Divisionalized Form
Adhocracy.
This model is based on five core typologies of an organisation which is illustrated in
different versions as shown in Figure 2.3, the original from Mintzberg, and as an
example Figure 2.4, a ‘refined’ version by Lunenburg.

29
Figure 2.3: The five basic parts of the organization, Figure 2.4: The key parts of an organization,
Mintzberg (1980, p.324) abstract version of the Mintzberg Model, source
Lunenburg (2012, p.2)
The five core typologies of Mintzberg (1980) are influenced by the single or combined
influence of a) five mechanisms as to how those core parts are coordinated by
supervision or standardization levels b) the design of organizational structures (whereas
Mintzberg enumerates nine parameters as the most commonly found) and finally c) the
contingency factors which are adding another four parameters. The influence of a
tension on each core part individually or on several core parts simultaneously would
then result in a specific orientation of the company’s strategy. For example tension on
the strategic apex would result in more centralisation.
Lunenberg (2012, p.4) summarizes the Mintzberg model in a table which was helpful in
deciding whether the model is useful for this thesis (Table 2). The answer is ‘most
likely no’ because the Mintzberg-model is from the author’s point of view more of a
holistic approach with too many unmeasurable parameters. Or as Doty, Glick and Huber
stated: “because the typology and underlying theory have received little or no
systematic empirical examination, in large-scale comparative studies, there is little
support for the theory” (1993, p.1197). Mintzberg’s model is based on several levels of
influencing factors and the assumption that any changing variable may originate from
inside the organization or could be an external influence and these factors will have an
impact on the different core typologies which could become hard to measure. The
approach used in this thesis requires a system which is more rigid, knowing that flexible
parameters will be sacrificed in order to make the collected data measurable.
Although it is helpful to have an indication of the ‘Key Parts of Organization’ the
Mintzberg-model does elaborate all parts of an organization (the different echelons)
which means utilizing both the horizontal and vertical differentiations. Whereas, the

30
focus of this thesis is purely on the echelon of the Top Management team or to label it
in the terminology of the Mintzberg model; the horizontal differentiation of the
‘Strategic Apex’.
Table 2.4: The key parts of an organization, based on Mintzberg (1980), source Lunenburg (2012, p.4)
2.4.3 Porter’s Generic Competitive Strategies
The difference between Porter’s (1980) model, which is certainly among the most
popular ones, is that it is less of a classification model like the one from Mintzberg
(1980), Miles & Snow (1978), Weill et al. (2006) or Mullins and Walker (2013). Each
of those models considers all possible kinds of strategies and also the less optimum
performing strategies such as for example the Miles & Snow strategic type of the
Reactor. Porter’s Generic competitive strategies are restricted to delineating the attempt
of the ‘strategic approaches to outperforming other firms in an industry’ (2008, p.35).
Consequently, as Peng, Tan & Tong claim the “[s]trategic group has become an
attractive middle ground between firm- and industry-level analyses in strategic
management research” (2004, p.1105). Porter also admits the existence of organizations
not falling into any of his three generic strategic approaches: “the firm failing to develop
its strategy in at least one of the three directions – a firm that is ‘stuck in the middle’ –
is in an extremely poor strategic situation”. Furthermore, that:
[t]he firm stuck in the middle is almost guaranteed low profitability. It either
loses the high-volume customers who demand low prices or must bid away its
profits to get this business away from low-cost firms. (2008, p.41–42)
Porter’s (2008) model is mapping two axes; the strategic advantage and the strategic
target. In a four field matrix the targets specified are ‘industrywide’ or a ‘particular
segment only’ versus the strategic advantages of ‘uniqueness’ or ‘low cost’. In the
original diagram from 1980 ‘stuck in the middle’ is not part of the graph; however, later
illustrations of this model included it.

31
Figure 2.5: A diagram created by Denis Fadeev (2014) of Michael Porter's three generic strategies based on a figure
from Porter M. E., Competitive strategy: Techniques for analyzing industries and competitors (New York: Free Press,
1980), page 39. Https://commons.wikimedia.org/wiki/File:Michael_Porter%27s_Three_Generic_Strategies.svg
In the table below the model is described showing the three Generic Strategies in
respect to their commonly required skills and resources as well as the main
organizational requirements. Although we could interpret the meanings and try to
stretch the interpretation until it fits, however, overall in the context of this research it
was concluded that Porter’s model will not suit the needs and approach for this thesis in
developing a tool to classify a Top Management Team by departments due to the
model’s too general classification. This perception is shared with Smith, Guthrie and
Chen who criticized Porter’s model as being “described in relatively general terms”
(1989, p.63). In comparison Miles & Snow offer a classification using 10 parameters
whereas Mintzberg’s model is almost too complex with three dimensions containing
five, nine and four parameters respectively.
Table 2.5 : Porter, M. E. (2008).
Competitive advantage:
Creating and sustaining superior
performance, Simon and
Schuster, New York, pp.40–41).

32
2.4.4 The Sixteen Detailed Business Model Archetypes
In ‘Do some business models perform better than others? A study of the 1000 largest
US firms’, by Weill, Malone, D’Urso, Herman and Woerner (2006) the authors have
studied the business model archetypes and set them in a grid with the type of asset
which is involved in different types of businesses or as they describe it “what a
company does and how the business makes money doing these things” (p.2). The result
is a table of 16 different business models from which in the authors’ point of view
Table 2.6: The sixteen detailed business model archetypes from ‘Do some business models perform better than
others? A study of the 1000 largest US firms’, Weill et al. (2006, p.31)
organizations can be classified. In their study, the top 1000 companies of the United
States’ economy in the year 2000 were analysed in order to compare their performances.
Weill et al. (2006) conclude that “business models are a better predictor of financial
performance than industry classifications and that some business models do, indeed,
perform better than others” (p.1) or similarly “a company’s business model[s] are
substantially better predictors of its operating income than its industry classification and
other control variables alone” (p.21).
Although this classification model from Weill et al. is interesting, and a new approach
in 2006, after most other models were established decades before; it was decided not to
select this classification table to be the parameter for this thesis. The classification itself
is very clear and straight forward, however, the aim behind it is focused on the financial
performance and it omits additional parameters which would obtain further conclusions
about a potential dominant coalition of the Top Management Team. For example, a
‘Distributor of Physical goods’ is just not specific enough for this research.

33
2.4.5 The Combined Approach: Porter / Miles & Snow
Mullins and Walker’s (2013, p.5) ‘Combined typology of business-level competitive
strategies’, is an interesting approach in melding Miles & Snow’s Typology together
with Porter’s Three Generic Strategies. This approach, however, is comparatively young
in relation to the other models and is not be found widely in the research literature
which suggests a lack of proven applicability.
The Mullins and Walker model is shown in the context of this chapter for the sake of
covering this topic as comprehensively as possible because it is definitely an interesting
approach, however, a further analysis of this model will not be undertaken.
Table 2.7: Combined typology of business-level competitive strategies, Mullins and Walker (2013, Chapter 9, p.5),
retrieved from: www.mktgsensei.com/MBA522/Chap009.ppt
2.4.6 Recent Research Discourse
The discussion of how to categorize the strategies of companies in an application of any
of the Typologies discussed before has not lost its importance today. The model of
Miles & Snow (1978) is widely accepted and contemporary research is based on this
typology’s definition. A few examples of recent research using the Miles & Snow
typology as an integral part of it are discussed here.
Hussin, King and Cragg (2002) analysed typologies in ‘IT alignment and firm
performance in small manufacturing firms’ using a comparable process to that
undertaken for this thesis. For Hussin et al.’s study an e-mail questionnaire was sent out

34
to participants similar to an online survey which was the option chosen for this thesis.
Hussin et al. (2002) have based their categorization of seven company strategy types
based on different previous studies and they requested the 50 randomly contacted
managers of small firms to indicate their company strategy on Likert-scales, the same
procedure that was undertaken for this thesis. Ghezal (2015) used Confirmatory Factor
Analysis (CFA) to investigate the reliability of the seven business strategies used by
Hussin et al (2002) and although Ghezal (2015, p.86) concludes that “this confirmatory
factor analysis confirmed the multidimensionality of the small business strategy
instrument developed by Cragg et al. (2002)” Ghezal encourages other researchers to
replicate his research which should be focused on additional considerations such as
“sample size and deeper interpretations of absolute values” (2015, p.86).
Taran and Boer (2015) were aiming to develop a business model ‘innovation typology’
in their paper. Taran and Boer suspect that “innovation based solely on new products
and aimed at local markets is no longer sufficient to sustain competitiveness and
survival” (2015, p.301). For this reason the authors searched for the business model
typology which in terms of innovation is most successful or more successful than its
competitors and they analyzed case studies of flourishing innovative companies.
Chung, Jung, Baek and Lee researched ‘The impacts of strategic orientation and HRM
systems on firm performance’ (2008). The authors were looking for a correlation
between human resource strategies and improved company performance and they
conduct regression analysis in order to compare Miles & Snow (1978) typologies and
found their hypothesis confirmed in that “prospectors adopt more high involvement
HRM systems as compared to analysers and defenders” (Chung et al., 2008, p.87).
In ‘Cloning an industry: Strategy typologies of Shanghai biotechnology companies’
Malone, Hales, Chan, Love and Rayner (2008) analysed 19 biotechnology companies
and categorized them according to the Miles & Snow Typology (1978) and Porter’s
Generic Strategy Type (1980) with the finding that the majority of the investigated
companies (Shanghai based and active in biotechnology) are applying Porter’s cost
leadership strategy (Malone et al., 2008, p.38) and are either Analyser or Reactor types
(Malone et al., 2008, p.40).
Castro Pinto, Altinsoy and Santos António (2014) use the Miles & Snow (1978)
typology to explore the performance of military organizations; especially the alignment
of the divisions of strategic and operational military. The authors conclude that in terms

35
of their sample group “there is no significant overall performance difference among the
Prospector, Analyser and Defender groups” (2008, p.14) but “all the fit factors related
with Miles and Snow (1978) adaptive cycle dimensions (entrepreneurial, engineering,
administrative and environmental) have a significant impact on the organizational
performance” (2008, p.18).
Zinn, Spector, Weimer and Mukamel (2008) explored the Miles & Snow (1978)
typology to compare the response of nursing homes to quality measurement
publications in relation to the nursing homes’ strategic orientation. The survey was
undertaken with a comparatively large sample size by addressing 10% of nursing homes
nationwide of which 48% have participated (724 nursing homes responded). Among
their outcomes they found that “Prospectors are almost twice as likely and Analysers 67
percent more likely to change priorities of existing quality programs when compared
with Defenders” (Zinn et al., 2008, p.610).
Song, Di Bendetto and Mason compare “the relationship between M-S strategic type
and four firm capabilities (technology, information technology, market-linking, and
marketing capabilities)” (2007, p.28). The authors see the strength of prospectors in
Technology and IT capabilities whereas defenders were found to be the weakest in
those two fields. Defenders on the other hand are assumed to be strongest in market-
linking and marketing capabilities with prospectors vice versa being the weakest in this
discipline. The authors found that “the best way to measure capabilities was to ask the
informant to rate their firms on the various capabilities, relative to their “top three”
competitors in the industry” (Song et al., 2008, p.22). The hypothesis was supported
with defenders being strongest in market-linking and marketing capabilities as well as
prospectors having “significantly” greater capabilities in IT but it only “partially
supported” that the prospectors have better capabilities in technology (p.24). To find
verification, in this thesis the participants are also asked to assign their own ranking,
however, this will be in relation to the most influential top management team members.

36
2.4.7 The interpretation of the Miles and Snow Typology in this thesis
The Miles & Snow Typology is
selected for this thesis to
create a tool to measure who belongs
to the dominant coalition in Top
Management Teams. This Typology-
model is among the most established
and it also suits the aim of this
thesis in regard to its establishment
of 11 parameters under the four
typologies; Defender, Prospectors,
Analysers and Reactors. Although
typology itself is not a primary
concern, however, the fact that each
typology has a given dominant
coalition makes the model of
Miles & Snow the perfect match
with this thesis. Thus in this research
10 of the parameters are used to find
out which typology an organization
most likely belongs to which is then
automatically described in the 11th
parameter (red frame) which
departments are most likely to
appear in the dominant coalition. Of
course it is very likely that an
organization does not 100% fall
into one typology. It is also
possible that an organization might
have the majority of weight
in one Typology but to some
extent also experiences aspects of
the other typologies. For example
Entrepreneurial and Engineering
Table 2.8: 10 parameter-questions leading to Typology. Based on Conant et al., (1990, p.367), authors’ interpretation
Table 2.9: The combined Typology. Derived from Conant et al.,
(1990, p.367), author’s interpretation

37
problems could be allocated under the Prospector typology whereas the administrational
problems are more suitable in the Reactor typology. This will be helpful to weigh and
compare the influence of departments. In order to make the parameters understandable
for participants in the study the parameters are rephrased slightly without changing their
meaning. The participant will be asked the Questions from the table below – with four
answers given on the right to choose from. An interesting finding was done by Smith et
al. on the correlation between company size and Typology, “[a]nalysers are primarily
large firms and Reactors are small firms” whereas Defenders and Prospectors “are
generally smaller than Analysers and larger than Reactors” (1989, p.75).
Defenders Prospectors Analysers Reactors Parameters/Questions
1. The Market
environment of
our company is:
We focus on a narrow
market segment
We continuously
expand our market
focus
We continuously adjust
our market focus
Our market focus
can change
2. Our company
achieves Success
because…
…we are prominent in
our market
…we are permanently
pushing for new
solutions
…we adjust to market
needs
…we exploit
chances
3. Our company
conducts
Observations…
…of our market and
our organization
…wherever possible,
aggressive search
…we observe our
competition
…depending on
actual need
4. Growth is
experienced
because of…
…we focus on a
narrow market
segment with
advanced technology
…permanently
accessing new markets
/ new developments
…focused penetration
and careful product
selection
…our flexibility
5. Technology in
our company
needs to…
…be cost-efficient …flexible …synchronised …adjusted to our
actual needs
6. Our company
invests in
Technology…
…of our core market …of different and new
developments
…which is compatible to
our infrastructure
…when necessary
7. Technology in
our company
works because of:
…standardization and
maintenance
…of the people behind
it
…planning and
synergies
…we are open for
experiments
8. Planning is for
our company
…a fundamental …related to problems
and opportunities
…comprehensive and
permanently improved
…crisis oriented
9. The Structure of
our company is…
…functional/line
authority
…product and/or
market centered
…staff dominated /
matrix
…tight formal
authority
10. Control in our
company is…
…centralized and
backed up by finance
…depending on
market performance
…calculated based on
risks
…handling
problems
Dominant
Coalition
Finance, Production Marketing, Sales,
Research &
Development
Planning Staff / Support
Activities acc. to Porter
Trouble-Shooter
(depending on the
issue)
The weighting of the typology of the organization together with the Team Constellation
of the Top Management Team and the Characteristics of the individual member of the
Top Management Team combined together results in a comparison among all members
of the Top Management Team in order to evaluate their importance in the Dominant
Coalition. The weighting approach used is discussed in Chapter 3: Research
Methodology.
Table 2.10: Re-phrased parameter-questions to identify the Typology and therefore the Dominant Coalition

38
2.5 Perspective: Top Management Team
The following short literature review was conducted with the aim
to segregate the relevant attributes of managers which seems of
importance in describing one’s connections in the Top
Management Team. In order to analyse “the importance of
competitive behaviours to overall firm strategy and performance,
an understanding of the determinants, or influencers of those behaviours is essential”
according to Hambrick, Cho, & Chen (1996, p.659)
The concept of the value chain or a chain of activities (Porter, 1985, p.36ff) is an
illustration to describe each single process in a company or system. The value chain
is often visualised as in the figure below. In this case the value chain
Figure 2.6: A common illustration of the value chain (Porter, 1985, p.36)
diagram is helpful to describe the structure of the company. Describing all the positions
in the value chain which are coordinated by members of the Top Management team
allows us to consider which position is adding value, and accordingly to enable the
ranking of the positions/managers in descending order. This is necessary to understand
who is responsible for the most valuable process steps. It is clear that valuable in this
context is not a solely monetary value. Depending on the nature of a business the
creation of ideas or strategies may be valuable as well. A company could either
integrate or outsource some positions of their value chain depending on the decision
whether a competence is a core competence or not. Prahalad and Hamel (1990, pp.79–
91) provide three definitions: “[a] core competence allows potential access to a
multitude of markets, a core competence contributes to a considerable customer benefit
regarding the final product, and a core competence should be hard to copy by the
competition”. Normann and Ramírez argue that Porter’s value chain (see the previous
figure) is a ‘traditional’ way of looking at it and that “every company occupies a
Firm Infrastructure
Human Resource Management
Technology Development
Procuration
Logis
tics
Op
erati
on
s
Mark
etin
g
S
ale
s
Logis
tics
Ser
vic
es
Pro
fit
Pri
mary
Act
ivit
ies S
up
port
Act
ivit
ies

39
position on a value chain” as this understanding is still focused on an “assembly line”
whereas the authors are convinced that “global competition, changing markets, and new
technologies are opening up qualitatively new ways of creating value” (1993, p.65).
2.5.1 The influence of a TMT’s Constellation on Value Creation
Andrew Kakabadse highlights the importance of reducing tensions in the Top
Management Team Constellation in this comment:
[i]t is important to create an environment, where the pronouncing of views the
asking of questions, the entering into deep debate and emerging with the
declaring of intent, is a vital process to experience in order to shift towards a
cohesive team who could effectively lead the organization. (2000, p.11–12)
This section provides an overview of the findings of different authors in respect of what
kind of parameters in the Top Management Team constellation are resulting in some
kind of influence on the value creation. These may be positive or negative factors. All
the parameters found are enumerated and if possible weighted according to the
frequency or popularity of their occurrence. In a second step a selection of the most
important factors and also research on how these impact decisions related to the value
chain is done.
Agnihotri (2014) is describing educational level, total organizational tenure and
functional heterogeneity collectively as “the top management traits” (p.250).
Agnihotris’ analysis of ‘The role of the upper echelon in the value chain management’
is referenced again in this chapter but it can already be stated that throughout the
research of the available literature those three factors seem among the crucial ones and
were repeatedly confirmed when sourcing related papers. In ‘The influence of top
management team heterogeneity on firms’ competitive moves’, Hambrick, Cho and
Chen (1996) define top management teams as “the aggregate informational and
decisional entity through which competitive moves are made.” Hambrick et al. (1996,
p.659) found top management teams to show a “great propensity for action” if they
were diverse “in terms of functional backgrounds, education and company tenure”
compared with more homogeneous top management teams who were considered as
comparatively “slower”. This research paper compares the relationship of team
heterogeneity of the top management team in regard to acting and responding. Whereas
Hambrick et al. (1996, p.661) cite the studies of Bantel and Jackson documenting that
“young, short-tenure, highly educated teams... [are] relatively innovative”. In contrast

40
Hambrick et al. (1996, p.662) also suggest that the authors Finkelstein and Hambrick
(1990), Grimm and Smith (1991), Wiersema and Bantel (1992) have found that
“organizational tenure of top management team members was found to be strongly
associated with strategic persistence”.
Hambrick et al. reviewed the work of Wagner, Pfeffer, and O’Reilly (1984) and Jackson
et al. (1991) who both found that if the firm tenure of an individual top management
team member is too different from the top management team members’ average firm
tenure then: “[t]he more likely he or she was to depart” (Hambrick et al. 1996, p.663).
This means that a heterogeneous firm tenure might increase innovation but also implies
the risk of more frequent changes of top management team members for those team
members who are too diverse in terms of firm tenure. Therefore, a converse argument
may be that an ideal firm tenure dispensation for an innovative team would be if all or
most team members were different from the average firm tenure. The author of this
thesis regrets that Hambrick et al. (1996) do not discuss the influence of top
management team members’ education and functional background to the extent which
was expected from reading their introduction. A hint is found in regard to functional
background; however, as a more diverse top management team is more likely to have a
“broader potential repertoire for generating actions” although the number of internal
conflicts may arise because of this diversity. Hambrick et al. propose that “top
management team heterogeneity is positively related to the firm’s action propensity”
(1996, p.665).
Support for diversity in top management teams is apparent in Jackson, May & Witney’s
report ‘Understanding the dynamics of diversity in decision-making teams’ (1995,
p.218) where the authors state that “diversity within a decision-making team is
recognized as important primarily because it is associated with the resources available
during the decision-making process”. Usually, diversity in Top Management Teams in
the research literature is related to an increased number of actions which improve the
company’s result or as Ferrier and Lee (2002, p.162) describe it: “overall, this stream of
research suggests that aggressive competitive behaviour – more actions, innovative and
radical actions, quick response, complex and differentiated action repertoires – is related
to better organizational performance”. Both Hambrick et al. (1996) and Jackson et al.
(1995) are presenting a variety of studies which substantiate that broadening team
diversity (educational background, gender, age) may lead to communication errors and
reduced team cohesiveness. Since this thesis is interested in a snap-shot method of the

41
allocation of decision-making power in a top management team, the potential negative
mid- and long-term aftermath of team diversity are neglected. An interesting point in
regards to age and tenure is raised by Jackson et al. who are convinced that employees
can compensate for age and firm tenure with education and “consequently, within each
level of the organizational hierarchy, age diversity is replacing the homogeneity
associated with traditional age-based stratification” (1995, p.206).
Knight et al. (1999) in ‘Top management team diversity, group process and strategic
census’ selected the variables of interpersonal conflict, agreement seeking, strategic
consensus, location, functional diversity, age diversity, educational diversity and
employment tenure diversity to study the influence of demographic diversity on
strategic consensus. It was unusual to see ‘location’ as a variable in Knight et al.’s paper
but an explanation is given by the authors with the comment that “in order to test for
systematic differences between the two subsamples, location was included as a control
variable” (1999, p.454). Furthermore, as the relation concerned parameters that are
discussed in the literature review about relevant Managers’ Characteristics for the
moment the control variable ‘location’ will be skipped and also interpersonal conflict,
agreement seeking and strategic consensus which leaves function, age, education and
tenure. In their conclusion Knight et al. explain that they were assuming that all
diversity variables have a negative impact on strategic consensus, however, they found
that “employment tenure diversity had a positive effect on strategic consensus” (1999,
p.459) and although “diverse values and perspectives may bring challenges… [but it]
…is also likely to have positive effects such as increasing the environmental scanning
capacity or [to] increase the potential actions”.
Richard and Shelor (2011) provide a focused paper linking age and top management
team’s performance. In their introduction to the term cultural diversity, the authors cite
Cox and Blake (1991), when distinguishing between visible attributes such as “race,
gender and age” from non-visible visible attributes such as “marital status, educational
level and work experience” (2011, p.958). Richard and Shelor (2011, p.959) reviewed
various work of other authors (Hambrick, 1994; Hambrick et al. 1996; Jackson, 1992)
and found age to serve as a “proxy for perspectives, belief systems and network and
affiliations” while also referring to social identity theory when affirming that belonging
to an (age) group “creates a psychological state that confers social identity or a
collective representation of self-identity and behaviour”.

42
According to Eagly and Wood (1991) there is “little scientific evidence for sex
differences in any social behaviour except for aggression” and that if differences occur
“they are very small in magnitude” (p.2). After this assertion, Eagly and Wood (1991)
recap the widely accepted stereotypes of men being more task-oriented and women
being stronger on interpersonal disciplines (p.7). Reynolds, Fisher and Nelson (1996,
p.87) argue that female leaders have a preference for being led by feelings which is not
necessarily negative because they acknowledge that “executives with this style of
(feeling-) decision-making will be recognized and promoted to positions where they can
make a significant strategic contribution regardless of gender” (1996, p.87).
In more recent work by Eagly and Carli such as ‘The female leadership advantage: An
evaluation of the evidence’ (2003) the authors reject previous research which expressed
little difference in gender roles in Top Management Teams with a collection of evidence
that suggests the qualities of the female leadership actually results in the winning
margin. For example, when introducing newer research they comment that “[a]rticles in
newspapers and business magazines reveal a cultural realignment in the United States
that proclaims a new era for female leaders” (Eagly and Carli, 2003, p.808). This is a
result of a transformational process where “modern characterizations of effective
leadership have become more consonant with the female gender role” (p.810). The
authors see evidence in the transformation of different parameters because of a) women
having changed in general, b) leadership roles having changed, c) organizational
practices have changed and d) culture is changing, resulting in the numbers of women in
managerial positions are rising (Eagly and Carli, 2003, pp.826–827).
By 2005, Eagly is extending those findings further in ‘Achieving relational authenticity
in leadership: Does gender matter?’ She states that the dominance of men is a manmade
phenomenon and that “[w]hen leadership is defined in masculine terms, the leaders who
emerge are disproportionately men, regardless of the sex composition of the community
of followers” (Eagly, 2005, p.463). The author, however, also acknowledges that:
[r]esearch has shown that men and women differ ideologically to some extent,
especially in terms of the twin themes of women’s greater social compassion and
men’s more non-traditional morality and greater tolerance of ethical lapses.
(Eagly, 2005, p.467)
Or as Sinclair (2008) declares “critical and feminist theorists show that most leadership
research, including studies of transformational leadership, continue to present

43
prescription – heroic or post-heroic – as if they were gender neutral” (p.32) but
“[l]eaders who are highly emotionally literate become able to demand new levels of
emotional labour from employees” (pp.32–33).
More pertinent to this study is the question of whether gender diversity has any
influence in regards to the Top Management Team constellation. Ruiz-Jimenez,
Fuentes-Fuentes and Ruiz-Arroyo explore this topic in ‘Knowledge combination
capability and innovation: The effects of gender diversity on Top Management Teams
in technology-based firms’ (2016). The authors assume that companies have better
innovation performance if they have the capability to combine knowledge and that this
is augmented by gender diversity in the Top Management Team (pp.505–506). A
sample size of 205 firms was analysed and all results were supportive of the claim that
“for higher levels of gender diversity, innovation performance increases as the level of
knowledge combination capability increases” (Ruiz-Jimenez et al., 2016, p.510). This
leads these authors to conclude that:
[i]ncorporating a greater number of woman at the levels of top management in
technology sectors is not only a question of moral justice or social equity, but
also contributes positively to the quality of the decisions made by the Top
Management to stimulate the development of organizational capabilities. (Ruiz-
Jimenez et al., 2016, p.513)
Opstrup and Villadsen (2015) have researched the influence of gender diversity in Top
Management Teams in regards to financial performance. The authors provide three
factors suggesting why gender diversity in Top Management Teams is positive and
these are promoting a) a better understanding of the organization’s environment, b)
increased creativity and innovative output and c) more effective problem solving
(Opstrup and Villadsen, 2015, p.292). Unfortunately, in this case their hypothesis that
more gender diverse Top Management Teams will result in better financial performance
was not supported through their analysis (p.297).
‘The more, the merrier? Women in Top-Management teams and entrepreneurship in
established firms’ by Lyngsie and Foss (2017) is a paper exploring gender diversity in
Top Management Team pertaining to entrepreneurial performance. They argue that
“while increasing female representation in the TMT may make the firm more
entrepreneurial, this effect depends on how female top managers are perceived by lower
level employees” (p.488). Lyngsie and Foss (2017 p.492) evaluated “the existence of a

44
direct positive association of female top managers and entrepreneurial outcomes”.
Finally, Kakabadse et al. (2015, p.268) conclude the discussion about gender diversity
with a clear statement that “corporate governance theories support board diversity on
the basis that a diverse board operates to reduce agency costs, facilitates access to
untapped resources and networks, and improves performance”.
Richard and Shelor (2011) in a meta-analysis compare different approaches as to
whether the span of age in a Top Management Team has a negative, positive or no
effect at all on company performance. The authors also differentiate if the heterogeneity
of age could have a different impact on lower or higher levels of management. The
proposition that age heterogeneity might have a negative impact on group performances
received “marginal” support (p.965) whereas the proposition that age heterogeneity may
have a positive impact on group performances depending on the level of the
management received “significant” (p.967) support through the authors’ analysis where
the result is described as an inverted U-shape. Meaning that at the lowest level of
management the heterogeneity of age is less relevant than on a medium level of
management whereas it turns into a “marginal” negative when it comes to the highest
level of management.
In ‘Understanding the dynamics of diversity in decision-making teams’ Jackson, May &
Withney (1995) undertook research exploring how the diversity of decision-making
teams is influencing their dynamics. Jackson et al. see the mix of genders in the
workforce as “maximally diverse” and resulting in a decline in the gender based
segregation over the time. Although the percentage of women in the boardroom is not as
high as men this proportion is “substantial” (p.205). In regards to age the authors
unsurprisingly conclude that the average age is increasing and therefore the
“distribution of ages (variance) represented in the workforce is also changing” (p.206).
Jackson et al. (1995, p.212–213) have created an overview about the taxonomy of
diversity in teams by grouping the aspects of diversity where a confirmation of the
previous findings throughout the literature is evident. These aspects are grouped as task-
related (i.e. tenure and educational level) and relational-related aspects (gender,
ethnicity or culture).

45
Table 2.11: Framework for understanding diversity in work teams (Jackson et al., 1995, p.212‒213).
Regarding tenure which was discussed previously, Jackson et al. (1995, p.214) portray
tenure in the context of decision agendas that might be influenced by politically
motivated agendas with increased tenure of the decision-makers and conversely that
shorter tenure or higher turnover rates will provide more diversity in a team and could
improve the innovation performance. Homogeneity in a team is strengthening
operations whereas heterogeneity is more helpful to break with existing models and
allow new options to be considered.
There is no ideal position on the proportion of homogeneity or heterogeneity in a team
since the positive or negative attributes related to it are finally related to the tasks to be
solved by the same team. Consequently, it is most likely that a finance department
requires more streamlined actions than a research and development department where it
is a more routine part of the work to find new ways of achieving things. Also Jackson et
al. (1995, p.230) state that there is “clear support for a relationship between diversity
and creativity”, however, it should be considered that “if team members are so

46
heterogeneous that there is no basis for similarity, then they may be unable to work
together” (p.231). The positives and negatives of a heterogenic composition in the role
of a top management team depend largely on the circumstances of the company at the
time of the analysis. Factors like the financial status of the company, expansion or
consolidation phase could be pivotal. “Diversity [heterogeneity] within a decision-
making team is recognized as important primarily because it is associated with the
resources available during the decision-making process” (Jackson et al. 1995, p.218)
and in contrast to this “positive affect [homogeneity] is likely to be particularly
beneficial for improving performance” (p.244).
The hypothesis of this thesis that the influence of Top Management Team members
towards a dominant coalition can be calculated by looking at parameters describing that
specific manager in horizontal and vertical relationship to his or her environment is
gaining support from Hambrick and Mason’s statement that “the theory states that
organizational outcomes – strategic choices and performance levels – are partially
predicted by managerial background characteristics” and “organizational outcome –
both strategies and effectiveness – are viewed as [a] reflection of values and cognitive
bases of powerful actors in the organization. It is expected that, to some extent, such
linkages can be detected empirically” (1984, p.193).
Value dissimilarity in top management teams is also discussed by Lankau, Ward,
Amason, Ng, Sonnenfeld and Agle (2007) and the authors see satisfaction, commitment,
and effectiveness as important factors between team members (p.13). Furthermore,
Lankau et al., (2007, p.23) mention age and education level as important factors. Also,
they can claim, that perceived and actual disagreements between a member of the top
management team and the CEO, influence the employee’s attitudes and satisfaction
(Lankau et al., 2007, p.28).
Hambrick and Mason (1984, p.196) admit that their research is limited to “observable
managerial characteristics” for which they chose as examples age, tenure in the
organisation, functional background, education, socioeconomic roots, and financial
position. Socioeconomic roots or socioeconomic status (SES) defines the collective
measurement of social and economic factors of one person in relation to others, which
from another point of view can be seen as the accumulation of the characteristics of age,
tenure in the organisation, functional background, education and financial position. It
should be seen as a summary of those factors and not as an additional one. The term is
used in this research to describe one TMT member in relation to another. Regarding age

47
Hambrick and Mason (1984, p.199) propose that: “[f]irms with young managers will be
more inclined to pursue risky strategies than will firms with older managers. Specific
forms of risk include unrelated diversification, product innovation and financial
leverage”.
In this thesis it was analysed earlier that tenure could be described as an inverted U-
shape whereas a short and a too long tenure would not be positively associated with the
efficiency of a decision-making team or as Agnihotri (2014, p.250) concludes “as the
tenure of a TMT increases, actions taken by that team become more homogenous in
nature”. Kakabadse, Kakabadse and Khan (2014, p.642) discuss the importance of
company secretaries because the authors are convinced that the company secretaries
outstay the management: “[n]on-executive directors have been the focus of much
attention post-financial crisis, but their positions can be transient”. Hambrick and
Mason also differentiate the financial climate that the company finds itself. For
organizations which are exploring new terrain or are forced to change their strategy,
longer tenure of managers is not positively associated. For education, the authors
summarize in their research that the type of education is less relevant than the amount of
education, however, more education is only required with more complex tasks (1984,
pp.200–201). Agnihotri concludes that an “average educational level” is contributing
positively to a company’s value chain action intensity and value chain action
heterogeneity” (2014, pp.243).
Finally, Hambrick and Mason (1984) also consider the impact on performance of team
diversity depending on the financial possibilities of the company. It can be summarized
that homogeneity seems to be supportive for efficient solutions whereas heterogeneity
gives better performances for new or innovative solutions which also means that
companies which are forced by a crisis to find new solutions will need to sacrifice
homogeneity in their TMT to a certain degree (Hambrick and Mason, 1984, pp.200).
Agnihotri has found evidence for this when concluding that “value chain action
heterogeneity is positively impacted by the top management team’s functional
heterogeneity” (2014, p.250).
Smith, Guthrie and Chen (1989) in their field study of the Typologies from Miles &
Snow (1978) summarize Top Management Team similarities in respect to
Entrepreneurial, Engineering and Administrative problems. For this research, only the
administrative part was extracted. Besides quantifying ‘age’ and ‘tenure’ as a parameter,
Smith et al. also use the variable of educational background in the corresponding

48
typologies of Defender, Analyser and Prospector. The typology of Reactor was omitted,
most likely as this typology is constituted as having no planned structure. An additional
aspect which Smith et al. (1989) have added and which we have not found throughout
other research discussed in this chapter is the variable of whether top management
people are recruited from inside or from outside of the company. This is most likely,
however, a logical implication of Prospector-Organizations having on average younger
Top Management Team Members with shorter tenure.
Table 2.12: Smith et al.’s (1989, p.65) citation of Miles & Snow strategy continuum, reduced to the administrative
problem variables.
In regards to identifying who is most or least replaceable in industrial value chains a
recent article in the Harvard Business Review written by Jacobides and MacDuffie
portrays the system integrators; those companies that are combining the products of
many other companies and distributing them finally to the consumer, as being those
which are least likely to be replaced (2013, p.94). The authors describe four things of
importance in order to ensure irreplaceability. These are: “controlling the assets least
likely to be commoditized; being the guarantor of quality to the end customer; staying
in close touch with changing customer needs; and balancing the imperatives of growth
and strategic control of the value chain” (Jacobides and MacDuffie, 2013, p.95). Due to
the unlimited number of different business objectives, however, there is no general rule
applicable to determine who is irreplaceable because this is dependent on the
environment, stage of development and as mentioned above the business objectives a
company finds itself at the time of such a statement. Given the assumption that those
variables are accessible then a ranking could be done.
In a fictitious case where a company’s survival is dependent on an expected
breakthrough development from the R&D department in the next twelve months, it is
most likely that this situation is strengthening the position of the responsible head of
department. The important factors outlined by Jacobides and MacDuffie (2013, p.95)
such as being in charge of the quality control and facing the customer are giving the

49
impression that throughput departments and their responsible leaders might be more
likely to be replaced than output departments. Support for this belief is found for
example in ‘The role of the upper echelon in the value chain management’ a meta-study
based on a secondary data collection by Agnihotri (2014) which analyses the impact of
the TMT’s members and constellation in regards to value chain action intensity and
value chain activity heterogeneity. Agnihotri focuses on the educational level, the tenure
with the company and the heterogeneity of TMT’s in regards to the value chain. The
assumption made in this thesis that throughput departments are of less importance than
output departments finds support when Agnihotri (2014, p.242) concludes that:
[f]or example in the airline industry, competitive moves that were considered
included price cuts, promotions, service improvements and acquisitions and co-
promotion (referring to Chen and MacMillan, 1992) but human resource
management practices, like changes in compensation policies or outsourcing of
aircraft management maintenance, repair and operations services were not
considered in any of the studies.
Baig and Akhtar (2011) dedicated part of their Value Configuration Analysis Approach
to differentiate the primary activities versus the support activities in Porter’s Value
Chain Model from 1985. Whereas Porter called logistics, operations, marketing & sales
and service primary activities and infrastructure such as human resources, information
technology and procurement the support activities. Baig and Akhtar (2011, p.253) view
the primary activities as mediators which “rely on a mediating technology to handle and
coordinate in standardized ways operations involving multiple clients who are
distributed in time and space”. Hambrick and Mason (1984) classify the primary and
support activities as output and throughput departments when positioning of importance
(in terms of value creation) is related to or dependent on the industry and developmental
stage of a company. The relationship of the functional background of a TMT member is
always related to growth and profitability. Yet the difference is that throughput
functions are better in commodity-like stable industries and output functions are more
positively related to turbulent, differentiable industries (Hambrick and Mason, 1984,
p.199). The primary and support activities of a company are not only important but also
the environmental and actual situation a company is in during the time of the analysis.
Consequently, finance may be a supportive department in an expanding company, yet
the same department might gain an importance in times where the financial resources
are limited. Child suggests that:

50
[the] choice of markets to be served can considerably affect the performance of
an enterprise because the return available from different markets and industries
varies considerably and because some markets are expanding while others are
not – a poor choice here leads to market inefficiency. (1972, p.12)
It is difficult to undertake research about the traits and characteristics of managers in
the upper echelon without studying the highly regarded and pioneering studies of John
Child (1972) who was amongst those who introduced the term ‘strategic choice’.
‘Strategic choice’ describes the situation where the increasing complexity of the
environment or the permanent change of conditions influences the number of possible
decisions from which the manager must select a preferred option. These external
influencing factors are categorized as environmental variability, encompassing the
frequency of change and environmental complexity, as well as the heterogeneity and the
concept of environmental illiberality to describe the “degree of threat that faces
organizational decision-makers in the achievement of their goals from external
competition, hostility or even indifference” (Child, 1972, p.4). Internal influencing
factors such as ‘technology’ and ‘size’ are nominated. The factor of technology covers
the development of technology or the invention of accessible technology or the
knowledge about existing technology. Size as an influencing factor is seen from
different perspectives whereas the larger size of operations could give access to more
opportunities, however, this also increases the number of organizational problems
connected with more administration necessary to manage size (Child, 1972, pp.1–7).
Internal factors of technology and size are often interconnected because according to
Child “there is in fact a considerable debate as to the type of constraints which size and
technology may each and both imply for organizational structure” (1972, p.7).
Figure 2.7: The role of strategic choice in a theory of organization (Child, 1972, p.18).

51
This study concludes from the influencing factors that there are two main categories.
Those directed externally from the company implying “that organizational decision-
makers do take positive steps to define and manipulate their own corners of the
environment” and those influencing factors directed inwards used and/or abused by
those who have created a territorial area within a certain workspace. “[T]hose in control
of an organization may in practice be able to exercise a degree of authority… over other
organizations or individuals which are nominally independent” says Child (1972, p.9).
Finally, taking all those influencing factors together the most important issue among the
relationship between individuals and organizations is “the degree of influence which the
controllers of one organization can exert over their counterparts in other organizations,
and vice versa” (Child, 1972, p.10). Furthermore, Child compares the individual
performance of decision-makers with the performance of their organization. Child is
convinced that if the performance of the organization reaches the required level a
decision holder might adjust their decision-making pattern to accommodate their
performance according to personal preferences, even to the extent that this might imply
additional costs for the organization (1972, p.11). In a second paper published in 1997,
Child reviews the model of strategic choice under a more contemporary lens and
concludes that:
[w]ithout an attempt to draw upon, and even to reconcile, the insights offered by
its various perspectives, organization studies will run a serious risk of becoming
little more than an arena of ‘clashing cymbals’ (or indeed symbols) making little
real theoretical advance and having nothing useful to say for practice either.
(1997, p.44)
He further suggests that “a contemporary contribution of strategic choice analysis
derives from its potential to integrate some of the different perspectives in organization
studies” (1997, p.44).
Also Child confirms that age and educational level are among the factors to be
considered when analyzing the constellation of a Top Management Team:
[a]ge and education, although they locate people within social categories which
can generate common identities and beliefs, are likely to affect action
determinism not only through the medium of ideology but also through
competence. (1997, p.51)

52
Child (1997, p.59) also sees common identities in the Top Management Team
Member’s social network which extends his earlier work on strategic choice where
organization and environment were previously viewed as two separate clusters. Child
refers to the Miles & Snow Typology which was written in 1978, well after his own
initial article on strategic choice (1972) and admits that the Miles & Snow
“categorization was an important refinement of the strategic choice concept”. In the
same article Child is even citing Miles & Snow (1978) in regard to his own strategic
choice approach that “the effectiveness of the organizational adaption hinges on the
dominant coalition’s perceptions of environmental conditions and the decisions it makes
concerning how the organization will cope with these conditions” (1997, p.59). Another
salient point is where Child argues that it is important to distinguish in the strategic
choice analysis if one wants to view the market as the influencing unit or just the
organization itself. From Child’s perspective it requires “an understanding of how
actors engage with both internally sedimented structures (‘routines’) and external
institutionalized structures in the process of furthering organizational evolution” (1997,
pp.66–67).
The review of Child’s papers about strategic choice concludes this short literature
review. This chapter’s role is to find evidence to decide which parameters are
considered by analyzing the Top Management Teams’ constellation of attributes in
regard to strategic decision-making. Chapter 3 provides a summary of these findings
and investigates how the selected factors are developed.
2.5.2 Summary of TMT-Constellation Aspects
The table below illustrates the parameters considered by different authors in respect to
key factors of the Top Management Team members in regard to their performance in
strategic decision-making. Overall it can be shown that the overwhelming majority of
authors use Age, Education and Tenure as the key parameters. Not as frequently cited,
but also quite often mentioned, is the importance of Functional Background. Also for
this study the Typology of the Organization is important because it already defines
under which classification the department would belong to the dominant coalition. It is
understood, that there may also be cases where employees have a different functional
background than their departmental attachment. The exploration of gender diversity in
Top Management Teams has not resulted in an advantage for either gender because the
stereotypes discussed within the gender related debate have also crystalized the pros and

53
Table 2.13: Summary of parameters considered in regard to TMT’s constellation for strategic decision-making
cons of both stereotypes and overall only gender diversity is related positively to firms’
performance. Consequently, this thesis does not pursue this issue further. MOVE Down
2.5.3 Age as a Parameter in TMT-Constellation
The literature review has shown that age has an impact on the functionality of top
management teams under different pre-conditions. What all findings have in common is
that age is not having a positive affect if it is completely different from all other group
members which is similar to the heterogeneity / homogeneity discussion. It results in a
positive impact on firms’ performance to have a group where all staff are in the same
age group but it is also acceptable to have a group which is homogenous in regards to an
equally diversified age constellation. Whatever could be considered as a norm in that
specific group – should not be challenged with something which is completely out of
that norm. In Chapter 3: Research Methodology, this parameter will be measured by
standard deviation, applied to the group which is to be analyzed, and then calculating
how the Top Management Team members are in or out of the norm of their specific
team.
2.5.4 Education as a Parameter in TMT-Constellation
Education can compensate for age and/or experience for younger staff, however, there
was no indication that education is compensated when considering this in reverse. The
reviewed authors seem to have a common consensus that the type of education is of less
importance than the amount of education. This parameter is steadily increasing in
importance from NO education until MORE education.
Author Age Education Tenure Various
Hambrick et al., 1996 Age Education Tenure Functional Background
Finkelstein and Hambrick, 1990 Tenure
Wagner, Pfeffer and O’Reilly, 1984 Tenure
Jackson et al., 1991 Age Education Tenure Gender
Knight et al., 1999 Age Education Tenure Interpersonal Conflict, Agreement seeking, Strategic
Consensus, Location, Functional Background
Richard and Shelor, 2011 Age Education Gender, Experience, Race, Marital Status
Jackson and Withney, 1995 Age Education Tenure Gender
Hambrick and Mason, 1984 Age Education Tenure Functional Background, Socioeconomic Roots, Financial
Position
Smith, Guthrie and Chen, 1989 Age Education Tenure
Agnihotri 2014 Education Tenure Functional Background
Hambrick, Cho and Chen, 1996 Education Tenure Functional Background
Child, 1997 Age Education Socioeconomic Roots
Lankau, 2007 Age Education

54
2.5.5 Tenure as a Parameter in TMT-Constellation
Tenure will also be described using standard deviation so as to allocate values to each
top management team member. Due to tenure being considered as an inverted U-shape
where a certain amount of tenure in the company is increasing the job holder’s
importance but after exceeding the peak point the tenure is then reducing in its
importance. Certainly, this parameter also has to be set in proportion to the other Top
Management Team Members.
2.6 Perspective: Managers’ Characteristics
Merely estimating which characteristics of one’s personality may
assist people in increasing their influence on decision-making
processes would be purely subjective. Everyone consulted would
give a different answer. One person could consider factors like
networking, contribution to profit or knowledge as very
important. Someone else might view other characteristics as important. That is why a
separate literature research was undertaken in this thesis concerning the key personality
and attributes or characteristics of managers. On the following pages the key
characteristics between a supervisor to another supervisor (horizontal) or between
supervisors to a subordinate are explored (vertical).
Figure 2.8: The relationship between one supervisor to another supervisor or between one supervisor to a subordinate
2.6.1 Managers’ Characteristics
In regards to Managers’ Characteristics the initial research undertaken for this thesis
was the screening of a database of interviews with senior executives who are in leading
positions in reputable companies in Switzerland. The interviews were collected from the
newspaper Neue Zürcher Zeitung, which is one of the foremost quality broadsheets
servicing the German-speaking part of Europe.
The second research for this thesis was undertaken to evaluate the key Characteristics of
Managers using an online opinion poll conducted during the study prior to this thesis. In
cooperation with an IT-Specialist, a web site was set-up on which visitors were invited

55
to rate the importance of the key factors which were found in the first research activity
described above. This was both in the horizontal and vertical directions demonstrating
the direction of relationships from the point of view of the individual manager
appearing on an organizational chart. The directions were illustrated by two small icons,
symbolising a manager (wearing a suit) and a subordinate (wearing a safety helmet). For
each direction of the relationship, the relevant set of key factors was listed and next to
each feature an evaluation scale was shown. Through Likert-scales, each participant was
able to allocate points and vote according to their preference.
In the picture above the result of the online survey is shown. The upper part shows the
key Characteristics for a manager in the relationship between supervisor and
subordinate and the lower portion shows the key Characteristics for a manager in the
relationship between supervisor and supervisor. With the following short literature
review, the author of this thesis is aiming for verification of the findings from this
earlier research.
2.6.2 Overview of Managers’ Characteristics
Commencing with Mayer and Gavin, (2005, p.878), trust, performance and the ability to
focus attention are key factors which should be characteristics of a successful manager.
Furthermore, the paper states that trust is a result of ability, benevolence and integrity.
Screenshot 2.1: On-line opinion poll; key characteristics of managers, author’s work from the study DBA712

56
Mayer and Gavin, (2005, p.878) conclude that “[...] a lack of trust in management may
undermine attempts to direct employees’ attention”.
Barrick et al. (2007) researched the influence on companies’ performance if members of
the top management team (TMT) pursued common goals. Referring to Pulitzer Prize-
winning author James McGregor, who wrote that “[t]he function of leadership is to
engage followers, not merely to activate them”, Barrick et al. state that leaders were
rated by followers as more effective when communicating organisational goals. In the
results of their study, Barrick et al. (2007, p.89) conclude that contrary to popular
assumptions, a similar prioritisation of goals is not related to individual performance.
‘Feeling at the Top’ is a study by Reynolds Fisher and Nelson (1996). The article
focuses on female leadership qualities. They argue that “females are more likely to
prefer the feeling decision-making style associated with affiliative leadership than the
thinking style preferred by males and associated with authoritarian leadership”
(Reynolds Fisher and Nelson, 1996, p.77) and conclude their research with the result
that strategic value is enhanced when feeling decision-making styles are adopted by
executive teams (1996, p.87). Unfortunately, this study also perpetuates the dichotomies
between thinking and feeling, logic and intuition.
Medcof (2008, p.412) begins his paper on Chief Technology Officers’ power, with the
description of personal characteristics such as strong personal relationships, networks
inside and outside the company and ownership positions in the firm. Medcof (2008,
p.415) claims that these can be more important than traditional definitions. He describes
monitoring, updating and planning as the most time-consuming activities for the
members of the top management team.
In 1997, Katzenbach wrote a paper about ‘The Myth of the Top Management Team’.
The title indicates the author’s critique of the term ‘team’ because he views top
management not as a group of people working together on the basis of free will but
rather because of organisational necessity. For example, Katzenbach states that the
“team at the top is a badly misused term that obscures both what teams can accomplish
and what makes them work” (1997, p.84). He explains that because members of the top
management normally have to lead the team below them, team leaders therefore have
different characteristics compared to team members. Real teamwork becomes difficult
when a team, in this case a top management team, only consists of team leaders
(Katzenbach, 1997, pp.84–87). Katzenbach highlights several characteristics of people

57
with leadership qualities and describes them as important and / or counterproductive in
the relationship between managers. These include performance, skills, commitment,
accountability, overachiever and a sense of urgency.
In ‘The New Deal at the Top’ Doz and Kosonen (2007) are convinced that members of
the top management team “have a very clear idea of their roles and responsibilities and
of how they relate to one another” (p.98). The authors conclude that collective
responsibility, interdependent strategy and value creation, coupled with transparent
measurement, overlapping experience and responsibility and also value-oriented control
should be the characteristics of modern top management team members (Doz and
Kosonen, 2007, p.101). Doz and Kosonen, however, confirm that “authoritative CEOs
find the new deal particularly difficult” (2007, p.100) due to their inflexibility.
‘Environment, Strategy and Power within Top Management Teams’ is the title of a
study conducted by Hambrick in 1981. In this study, Hambrick (1981, pp.253–254)
mentions that “intra-organisational power” results from the combination of formal
authority, coping behaviour and personal characteristics which strengthens the
assumption that formal authority is not the sole factor of the decision-making process.
From a strategic point of view, the author distinguishes between prospectors and
defenders (Hambrick (1981, p.256). This means, that some of the executives intend to
guard their field of responsibilities (defenders) and others are permanently aiming to
expand their influence (prospectors).
Barrick et al. (2007, p.547) investigated top management team interdependence. The
team mechanism comprises communication and cohesion between the team members,
and the authors argue that “... the more that team members need to coordinate their work
to achieve collective tasks, goals, and rewards, the more team performance should be
influenced by team communication and cohesion” (Barrick et al, 2007, p.546). As
already concluded by Katzenbach (1997), Barrick et al, (2007, p.555) also suggest that
an organisation does not always need a “real team at the top” but that communication
and cohesion between employees generate increased value.
The last paper examined has the humorous title ‘Surviving Your New CEO’, written by
Coyne and Coyne in 2007. These authors give advice on the key characteristics
supporting productive relationships between managers and managers. They believe the
most important characteristics described in their study are: trust, vision, honesty,
performance and commitment (Coyne and Coyne, 2007, pp.66 – 68).

58
2.6.3 Findings
For the research on Managers’ Characteristics this thesis builds upon the results from:
a) the analysis of 50 interviews from a database
b) an online opinion poll with 525 valid individual votes
c) the summarized key characteristics of managers according to the literature review
which are shown in the table below:
Author Selected Managers’ Characteristics
Barrick, Bradley, Kristof-Brown and
Colbert
2007
Communication and cohesion between team members
Coyne and Coyne
2007 Trust, vision, honesty, performance and commitment
Doz and Kosonen
2007 Responsibility, transparency, experience, control
Hambrick
1981 Formal authority, coping behaviour and personal characteristics
Katzenbach
1997
Performance, skills, commitment, accountability, overachiever, sense
of urgency
Lankau et al.
2007 Satisfaction, commitment, effectiveness, age, education level
Mayer and Gavin
2005
Trust, performance and the ability to focus attention. Trust is a result
of ability, benevolence and integrity
Medcof
2008
Strong personal relationship, networking, ownership, monitoring,
updating, planning
Reynolds Fisher and Nelson 1996 Feeling decision-making
Affiliative Leadership
Table 2.14 Summary of the findings of the literature research on Managers’ Characteristics
To provide a better overview, the keywords were clustered into groups and subgroups.
Reliability Archetype (Role Model) Competence Network
Trust (2)
Ability
Benevolence
Integrity
Accountability
Transparency
Honesty
Commitment (2)
Engagement
Overachiever
Satisfaction
Responsibility
Skills
Age
Education level
Experience
Sense of urgency
Authority
Coping behaviour
‘Feeling’ decisions
Affiliative leader
Relationship
Network
Cohesion
Communication Authority Foresight Hard Facts
Communication (2) Monitoring
Control
Visionary
Performance (3)
Ownership
Table 2.15 Selected Managers’ Characteristics, horizontal relationship

59
In a comparison of the same groups and subgroups (with the number of mentions for
each Characteristic in brackets) these results were found through the analysis of the
published interviews:
Reliability Archetype (Role Model) Communication Conveyor
Reliability (15) Openness (9) Honesty (9) Fairness (6) Transparency (4)
Trust (4) Respect (3) Objectivity (2) Clarity
Archetype (Role Model) (8) Commitment (5) Authenticity (4) Worker (3) Integrity (3)
Responsibility (2) Engagement Fighter Loyalty
Communicator (12) Listener (6)
Conveyor (14) Supporter (2) Motivator Feedback
Foresight Authority Competence Social Competence
Foresight (12) Targets (2) Innovation Priorities
Authority (8) Decider (2)
Competence (7) Social competence (6)
Humour Humility Cooperation Generosity
Humour (3) Humility(3) Cooperation (2) Team player
Generosity
Table 2.16 Selected Managers’ Characteristics, vertical relationship
The keywords were ranked through an online survey with 525 valid individual
respondents to allocate a numerical value representing its importance. The participants
were eligible to give a value from 1 (least important) to 10 (most important) and the
participants could give a value for the keywords for the relationship between Manager –
Manager (horizontal) and Manager – Subordinate (vertical). Regarding the purely
horizontal factors (manager – manager), networking, holding shares in the company and
contribution to profit were the outcomes. Those resulting from the survey were the
relevant factors. To hold shares, however, is not seen as much influence on the
relationship among managers. Networking and contribution to profit were higher in
percentage indicating their importance. This might differ depending on the size of the
company. For example, in a small or medium sized company a Top Management Team
member may also be the company owner. In such a case it is most likely that a
shareholder could use their power to overrule other Top Management Team members.
Whereas, in larger companies the percentage of shares held by executives could be a
minor percentage or maybe a part of their salary remuneration.

60
2.6.4 Conclusion
Combining all the findings to derive Managers’ Characteristics within horizontal and
vertical relations, there are six major factors (although they could be divided into more
different sub groups) that are relevant in both horizontal and vertical directions. The
factors mainly required in horizontal relationships among managers are networking,
shares in the company and contribution to turnover. On the other hand social
competence, the ability to convey ideas, humour, humility, cooperation and generosity
are skills that are mainly beneficial for the vertical relationships between managers and
their subordinates. These are the findings of the previous research and the result of more
than 700 participants of whom 525 are used for this thesis as shown below:
Figure 2.9: Managers’ Characteristics, in horizontal and vertical relationships
Important factors in both directions
Reliability Archetype (Role Model) Communication Competence Authority
Foresight
Horizontal factors
Network Shares in the company Contribution to turnover
Vertical factors
Social competence Conveyor Humour Humility Cooperation Generosity

61
2.7 Perspective: Span of Control
2.7.1 Introduction
The last perspective of Span of Control is not directly related to
the evaluation of dominance of each Top Management Team
member but is more of an evaluation of whether any of the Top
Management Team members are likely to be influenced by
someone in their team when measured on the assumption that
they must have reached the momentum of losing control after exceeding a certain
number of direct reports. The aim of the following short literature review is to gather
knowledge about what are the criteria necessary to define the maximum Span of
Control. This is because this study requires a formula to base the development of the
research tool to be designed.
Span of control as defined at the beginning of this thesis is the limitation of the amount
of subordinates a manager can control at one time. If a group which is under the control
of one manager exceeds a certain team size, one or more members of the group
members will be officially or unofficially involved in the group leadership to support
the manager. This may be a formal deputy or a person who comes into this role for
whatever reason. There could also be more than one person involved in assisting the
manager. It is clear that a manager, who leads a group that exceeds a group size which
makes it unfavourable to lead it alone, also has to handle a certain amount of difficulties
which makes it hard to be respected by everybody and to control everything alone.
Based on the consideration that if one person in a management team is accumulating a
reasonable amount of power and this person is supported by one or more official or
unofficial influencers it is reasonable to assume that those influencers indirectly control
the manager through their role in the top management team. This is why it is important
to know what are the factors limiting the Span of Control.
This section starts with a description of the history of Span of Control and how the
managerial literature defines this concept. Following this, different approaches of how
to define the maximum Span of Control are explored. Similar to the earlier literature
reviews the findings are summarized in a grid with several fields representing the size of
a group or company in relation to the maximum Span of Control. The definition of the
fields results from the literature review as the same parameters were found to recur. The
fields of the grid will assist in separating the findings visually.

62
2.7.2 History of the concept of ‘Span of Control’
Generally, the term ‘Span of Control’ refers to the number of subordinates a supervisor
oversees or can effectively control or as Meyer commented “Span of Management is
typically measured as a ratio” (2008, p.104). But the assumed optimal span differs.
Napoleon, for example, mentioned a span of five people, Clausewitz spoke of ten and
the British General Sir Ian Hamilton proposed a span of three to six people (Van Fleet
and Bedeian, 1977, p.357). As can be seen by several sources, the term ‘Span of
Control’ has its origin in the military. The British general Sir Hamilton (1853–1947)
was one of the first who wrote in detail about the term within a military context in his
book The Soul and Body of an Army (1921). Hamilton stated that: “[a]s to whether the
groups are three, four, five or six it is useful to bear in mind; the smaller the
responsibility of the group member, the larger may be the number of [the] group – and
vice versa” (as cited in Gulick and Urwick, 1937, p.183). In addition, Gulick and
Urwick cited Hamilton (1921, p.183) regarding the ideal sizes of groups. For example,
an ideal size of a group at a higher hierarchical level is described as three group
members (for example the management team) and an ideal group size on a lower
hierarchical level is considered to have around six group members as cited by Urwick
(1956, p.39). Also Entwisle and Walton (1961, p.522) mention Hamilton (1921) but
they also claim that the concept of Span of Control might be much older. Most probably
the idea did not come from theoretical models but rather from the “intuitive belief” to
increase the effectiveness when forming tight groups (Entwisle and Walton, 1961,
p.522). According to Van Fleet and Bedeian (1977, p.357), Span of Control is therefore
an historical concept which was used by the Romans, Egyptians or Greeks, and then
later mainly in a military context.
Besides Hamilton (1921), Gulick and Urwick (1937), Entwisle and Walton (1961) and
also Graicunas (1933) took an important role in providing guidelines for the theory of
the Span of Control model. In his ‘Relationship in Organization’ (1933), a paper on the
science of administration which later was edited by several other writers such as Gulick
et al. in (1937), Graicunas wrote that “one of the surest sources of delay and confusion
is to allow any superior to be directly responsible for the control of too many
subordinates” (as cited in Nickols, 2011, p.2). Urwick, who was a friend of Graicunas,
remembers a day in Paris when Graicunas asked him to discuss a “mathematical proof”
that the numbers of subordinates reporting to a supervisor should be limited (Urwick,
1956, p.40). After analysing the work of Graicunas and Urwick, Nickols (2011, p.2)

63
provides six pragmatic reasons for increasing the Span of Control in organisations.
These are that:
people want to report to the supervisor
they aim to build empires
cost reduction as well as the minimising of management overheads
the desire to shorten command chains
to flatten the hierarchy
the existence of companies which work successfully with a higher Span of Control than the
proposed five or six.
It is apparent here that some of these reasons are unethical or even specious such as
building up empires because they occur at the expense of the company’s welfare.
Some years later Urwick wrote a paper about Span of Control and saw the complexity,
duties and problems of top executives as having increased “commensurately” (Urwick.
1956, p.39). This is probably the reason why Urwick concludes that it is one of the main
tasks of an executive to reduce his or her “overload of less important daily duties” to
gain more time for strategic tasks and facilitate better relationships with his or her staff
and the organisation which ultimately makes the executive a high performing “business
leader” (Urwick, 1956, p.39).
The figure below by Van Fleet and Bedeian, (1977, p.357), illustrates the relationship
between effectiveness of supervision and Span of Control. Therefore, it can be stated
that when the number of supervised staff increases the effectiveness of the individual
supervision decreases. The following illustration shows the limits where no more
effectiveness is evident.
Figure 2.10: The limited span concept (Van Fleet and Bedeian, 1977, p.357)
Van Fleet and Bedeian (1977) concluded that the limit of Span of Control greatly
depends on the supervisor and that this limit most probably differs from the optimum
Increasing effectiveness
per person supervised
Decreasing effectiveness per person supervised
Constant effectiveness
per person supervised
Span of Management
Eff
ecti
ven
ess
of
Su
per
vis
ion

64
effectiveness. Van Fleet and Bedeian (1977, p.360) visualized the optimum span of
management. The figure below shows, that the effectiveness is not the highest where
one might naively assume by having a ratio from 1:1 for supervisor to subordinate
because it would be a waste of resources rather than the ideal constellation which is the
crossing point of the two lines representing “available managing power” and
“supervision needed”. After that point the effectiveness is decreasing until a point which
is defined as the limit.
Figure 2.11: The optimum span concept (Van Fleet and Bedeian, 1977, p.360)
2.7.3 How Span of Control is defined in the Management Literature
According to Van Fleet and Bedeian (1977, p.356), Span of Control is “one of the most
discussed single concepts in classical, neo-classical or modern management theory”.
Schroeder, Lombardo and Strollo (2000) rationalize this and argue that Span of Control
in reality is “determined more by budgetary considerations than by management theory”
(p.35). Yassine, Goldberg and Yu see the concept of Span of Control as rather simplistic
when summarizing their review of Koontz and O’Donnell (1959), Bell (1967),
Williamson (1967) and Perrow (1986) when stating: “[t]he span of control is a simple
managerial construct which identifies or regulates the amount of direct supervision that
exists between a superior and his direct subordinates within an organization” (Yassine,
Goldberg and Yu, 2005, p.1). On the other hand there are authors who believe that Span
of Control is one of the “crucial” factors concerning the effectiveness of a company
(Van Fleet and Bedeian, 1977, p.356).
For this study, it is important to understand that in any group that exceeds a certain size
(maximum Span of Control) the group leader is at risk of losing control or of becoming
dependent on other group members. Abramson et al. (1958, p.17) states that power
cannot be measured through the amount of people controlled by a leader. In addition, it
can be said that the power of a group leader is limited by the size of the group, and
depends on what the group does. Consequently, this research looks at different

65
perspectives in order to describe the minimum, ideal and optimum Span of Control
depending on the size of the group and what the group does to a) build an overview b)
search for interconnections and c) visualize the results.
McManus (2007, p.22) criticises today’s trend to eliminate the middle management, so
that the upper management receives an even bigger Span of Control, which in return
significantly reduces the effectiveness of supervision. McManus (2007, p.22) asks: “if
we reduce the number of supervisors per employee, aren’t we also moving toward the
need for more self-direction?” His opinion parallels the conclusion drawn by Gittel
(2001, p.471), in a study of Continental airline, where he states that performance
improves with a small Span of Control through “positive effects on group processes”. In
this respect Hanna and Gentel (1971, p.115) went a step further when arguing that Span
of Control should not exceed the number of people “that can feasibly and effectively be
coordinated and directed” which in turn depends upon nine circumstances:
the nature of the task the area involved the time involved
the nature of the instructions the abilities of the
subordinates the material used
the amount of authority
delegated the abilities of the supervisor
the harmony of the
subordinates
Table 2.17: Nine limitations of Span of Control according to Hanna and Gentel (1971, p.115)
This is confirmed by the work of Wilson and McLaren (1977) where the authors argue
that there is no perfect rule for a standard Span of Control and that it depends on the
level of authority. For example, “the height and width of each pyramid will be
determined by conditions ... such as time ... competence ... reliability ... and the ability
of the head to delegate authority” (Wilson and McLaren, 1977, p.68). Souryal (1977,
p.161) views efficiency as the main outcome which has to be increased through Span of
Control. Usually, a larger Span of Control results in a lack of supervision which again
reduces efficiency. Yassine, Goldberg and Yu (2005, p.1) comment that “organizational
theorizing has become either overly complex, computational and mathematical”.
Therefore, the trend is towards ‘simple’ quantitative modelling (Yassine et al, 2005,
p.1). This chapter concludes the literature compilation with Michel (2007, p.40) who
states that the executive becomes “the limiting factor” when the company is growing
and therefore an executive “should use a scorecard to observe where there is a
slowdown in [the]company’s control”.
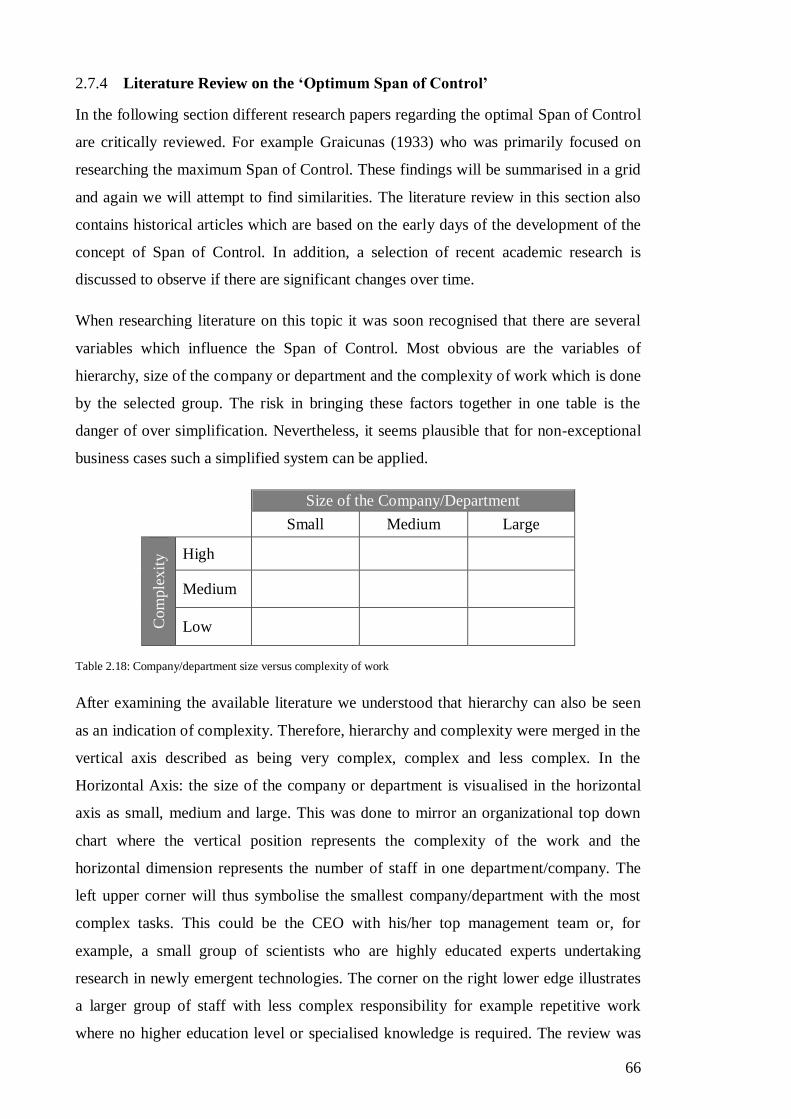
66
2.7.4 Literature Review on the ‘Optimum Span of Control’
In the following section different research papers regarding the optimal Span of Control
are critically reviewed. For example Graicunas (1933) who was primarily focused on
researching the maximum Span of Control. These findings will be summarised in a grid
and again we will attempt to find similarities. The literature review in this section also
contains historical articles which are based on the early days of the development of the
concept of Span of Control. In addition, a selection of recent academic research is
discussed to observe if there are significant changes over time.
When researching literature on this topic it was soon recognised that there are several
variables which influence the Span of Control. Most obvious are the variables of
hierarchy, size of the company or department and the complexity of work which is done
by the selected group. The risk in bringing these factors together in one table is the
danger of over simplification. Nevertheless, it seems plausible that for non-exceptional
business cases such a simplified system can be applied.
Size of the Company/Department
Small Medium Large
Com
ple
xit
y High
Medium
Low
Table 2.18: Company/department size versus complexity of work
After examining the available literature we understood that hierarchy can also be seen
as an indication of complexity. Therefore, hierarchy and complexity were merged in the
vertical axis described as being very complex, complex and less complex. In the
Horizontal Axis: the size of the company or department is visualised in the horizontal
axis as small, medium and large. This was done to mirror an organizational top down
chart where the vertical position represents the complexity of the work and the
horizontal dimension represents the number of staff in one department/company. The
left upper corner will thus symbolise the smallest company/department with the most
complex tasks. This could be the CEO with his/her top management team or, for
example, a small group of scientists who are highly educated experts undertaking
research in newly emergent technologies. The corner on the right lower edge illustrates
a larger group of staff with less complex responsibility for example repetitive work
where no higher education level or specialised knowledge is required. The review was

67
undertaken wherever possible in the sequence of the date of publication, as it has been
recognized that the values given by the authors reviewed for a maximum Span of
Control became more precise over the years and also have increased numerically.
Similarly, to the previous literature reviews, this review begins with the analysis of
papers and articles dating around the time when research about Span of Control was at
its peak. Elevated numbers (1, 2, 3
) in this chapter are used to index authors in a table at
the end of this short literature review.
In The Manager’s Span of Control by Urwick (1956, p.39) there is an early citation of
Hamilton who stated, that the “average human brain finds its effective scope in handling
from three to six other brains”1 and “if he delegates to three heads he will be kept fairly
busy whilst six heads of branches will give most bosses a ten hours day” (as cited by
Urwick, 1956, p.39)1. Later Urwick (1956) confirms the structure of the newly created
matrix in this research by citing Hamilton again, saying “the smaller the responsibility
of the group members, the larger may be the number of the group and vice versa” (as
cited by Urwick, 1956, p.40). Urwick (1956) also makes a cross reference to a paper he
had written roughly twenty years before where he reduces part of the work of Graicunas
to a concise statement: “No superior can supervise directly the work of more than five
or, at most, six subordinates whose work interlocks” (Urwick, 1956, p.8), referring to
Urwick’s (1938) Scientific Principles and Organization)2. Reading Urwick’s study
(1956, p.42) it is apparent that “social and administrative distance” as well as a great
number of subordinates create a certain “looseness of supervision”. Furthermore,
Urwick (1956) gives examples from the army where a Chief Officer had eleven officers
under his immediate control and a total force of 2,500 people which illustrates how the
Span of Control can increase in large organisations.3 Urwick (1956) also analyses the
organisation of Sears, a large U.S. corporation, by discussing different levels of
complexity. In this business case where a standardised pattern is used Urwick does not
see any reason why 20 stores “should not be controlled effectively by a single chief”4
(Urwick, 1956, p.45). He even mentions a director who controlled 30 business units –
he was not involved in the daily business any longer but only had to supervise that
developments went “according to plan” (Urwick, p.1956, 45)5. Another example by
Urwick (1956) reports a divisional commander who was coordinating the work of 18
people directly which was beyond his personal maximum Span of Control. To return to
his personal optimum Span of Control, the commander limited the right of people
contacting him directly to six instead of the initial 18 people (Urwick, 1956, p.46)6.

68
Entwisle and Walton (1961) undertook a broad survey of organisations with different
sizes according to the number of people involved and they distinguished three
companies/departments (small, medium and big) which supports the layout of this
thesis’ framework for Span of Control. In the survey executives explain how many
people report directly to them and also, at one level lower, how many people are
involved at this level. By distinguishing the results of the smaller and the medium-sized
organisations, Entwisle and Walton (1961, p.524)7
state that the medium Span of
Control should be as large as four to seven for smaller organisations and five to seven
for medium-sized organisations. Entwisle and Walton (1961) emphasise that they only
examined “the positions of chief executives or other positions only to the extent that
they are related to the chief executive position”. Entwisle and Walton (1961) compared
their work with Dale8
(1952), who advocated “a median span between eight and nine for
large companies, and a median span between six and seven for medium companies” and
argues that the Span of Control is identical when looking at businesses or universities
(Dale, 1952, cited in Entwisle and Walton, 1961, p.528). Also discussed by Entwisle
and Walton (1961, p.529) is the term ‘span of attention’ which is pertinent to the
discussion in this thesis, especially in connection with networking factors between
managers. ‘Span of attention’ counts the direct contacts between members of a group
and also compares the number of contacts between people.
Meyer (1968, p.945) introduces the factor of expertise into our discussion. Experts gain
their knowledge outside organisations or corporations and thus have knowledge which
is difficult to supervise for managers. This leads to the assumption that groups of
experts could ask for less supervision – which would influence the Span of Control. In
each level of hierarchy “goals are further divided into sub goals, until at the non-
supervisory level work is divided so that each employee can be expected to complete
alone the tasks assigned to him” (March and Simon,1958, as cited by Meyer, 1968,
p.945). This confirms the approach of this thesis to merge together hierarchy and
complexity in the vertical axis of the matrix. An interesting input is given by Meyer
when he states that “the greatest number of expert employees tends to occur in divisions
that combine complex financial functions” (1968, p.947). This assists in understanding
the influence of external consultants as they obtain their expertise by analysing different
organizations and situations. Meyer (1968, p.948) notices that departments have fewer
experts if a department has less than 20% of subordinates holding a college degree.
According to Meyer’s analysis (1968, p.948), small groups in small companies have an

69
optimal Span of Control of about 2.88–3.34 in groups with many experts and of about
4.67–5.56 in groups with fewer experts9. Larger groups in large companies have an
optimal Span of Control of about 6.25–8.05 in groups with many experts and of 10.7–
11.27 in groups with few experts10
. Furthermore, Meyer (1968) emphasises specialised
departments which are placed in the matrix as small groups. He ranks them according to
complexity with 6.08, 6.89 and 8.38 as the average Span of Control11
(Meyer 1968,
p.948). According to Meyer (1968, p.949)12
, the average Span of Control of a first-line
supervisor lies between 6.25 and 11.27 in large departments. As most of the literature
reviewed describes the possible Span of Control only with one digit after the comma, in
this thesis Meyer’s findings will be placed in the matrix rounded to the next tenth to
ensure ease of understanding.
Ouchi and Dowling (1974, p.358) add the time spent on each subordinate by the
supervisor as an important variable and remind us that not only the figure of Span of
Control should be considered when analysing organisational structures. Furthermore,
Ouchi and Dowling confirm that “as the subordinate’s task becomes more complex, he
requires more contact and thus causes his superior’s span to narrow” (1974, p.358).
According to Ouchi and Dowling it is a simple equation which shows the relationship of
span and supervision. To supervise four people who work ten hours a week is equal to
supervising one person who works 40 hours a week. The author considers this
calculation to be a little too simplistic even if the principle can be supported, however,
not to consider the complexity of the work makes every comparison useless in the
author’s opinion. Yet, the argument of Ouchi and Dowling (1974, p.361) advances
further when they add that workload in administration may change according to the
subordinates supervised. Ouchi’s and Dowling’s (1974) survey was undertaken with
124 retail department stores that could be considered as medium-sized organisations.
From the results of the survey an average span of 12.9 for executives who supervise
managers and 23.3 as a Span of Control for executives who supervise salespeople can
be concluded (Ouchi and Dowling, 1974, p.361) 13
.
‘A History of the Span of Management’ from Van Fleet and Bedeian (1977) is another
article which was analysed in the context of this literature review. In a grid of
chronological statements, the authors Van Fleet and Bedeian (1977, p.358) list different
authors; some of them give valuable information for this research: Fayol (1916)
recommends no more than six subordinates in small teams and for 20–30 subordinates
“when the work is simple”14
, which is similar to the findings of Jones (1925)15
who

70
mentions five and 25 under the same circumstances. White (1926)16
sees seven as the
maximum span for an administrative executive, and Dennison (1931)17
thinks that for
people who have to deal with more than “simple or uniform mechanical work” between
six and 12 is the right Span of Control. For the executive level, Alford (1940)18
sees
“preferably [a] limitation” of five or six subordinates which Brech (1946)19
agrees to
with the additional proviso “if their activities interlock”19
. Balderston, Karabasz and
Brecht (1949)20
state that four to five at the upper level of authority, ten at a lower level
of authority and up to 50 in “the case of the supervision of common labourers” are
appropriate, whereas Davis (1954)21
considers a range from three to nine on an
executive level and ten to 30 on an operative level suitable. Van Fleet and
Bedeian (1977, p.358) have chronically collected all of the previous mentioned authors
into one table.
Where Van Fleet and Bedeian (1977, p.361)22
refer to General Electric, a Span of
Control of 50+ is mentioned. Woodward (1959)23
concludes that the median number of
persons reporting to the top executive should vary from four to ten and of those
reporting to first-line supervisors from fifteen to twenty-three as cited in Van Fleet and
Bedeian (1977, p.361). Hair (1959) 24
finds three types of averages of Span of Control;
five for chief executives, 13 for first-line supervisors and 20 for the lowest level in the
management hierarchy (which we allocate in the ‘lowest level of difficulty’) as cited by
Van Fleet and Bedeian (1977, p.361). Viola and Najjar (1970, 1971)25
undertook
research into the life insurance industry – which is categorised in this thesis as
representing a large company – and found an average of 6.75 subordinates (as cited in
Van Fleet and Bedeian, 1977, p.362). In their conclusion Van Fleet and Bedeian
emphasise that the theory of Span of Control has experienced an evolution in two steps.
In the beginning the limitations of Span of Control were mainly researched and later the
focus was more concentrated on approximating the optimum Span of Control (Van
Fleet and Bedeian 1977, p.365).
In ‘Span of control on nursing inpatient units’, Pabst (1993) compares two medical
centres which are classified as large organisations. Pabst studies the distribution of
managers and caregiving staff, which will be categorized in the medium difficult section
of the grid because although it is repetitive work, however, it also involves care giving
for people. The average ratio of supervisor to subordinate is 27.5 in one medical centre
and 22.9 in the other (Pabst 1993, p.89)26
. Also originating from the nursing sector,
Altaffer (1998, p.36), examined the Span of Control of first-line managers, who are

71
positioned between staff members and higher level managers in the organisational chart.
Altaffer (1998, p.37) distinguishes between first-line managers with nursing and non-
nursing tasks – which are categorized as medium and low complexity in large
companies in our matrix. The optimum Span of Control for nursing first-line managers
is 24.45–38.47 and for non-nursing first-line managers it is 25.78–27.93 subordinates
per manager (Altaffer., 1998, p.37)27
.
Funkhouser (2002, p.1) conducted a performance audit to assess the organisational
structures of city departments. He researched only departments which are organised
according to the free market economy and therefore excluded police and fire
departments “which use hierarchical, military-like structures”. Funkhouser (2002, p.8)28
discovered that the smallest city department has a Span of Control of 3.2 and that the
largest Span of Control with 12.8 is found in a medium-sized department. Funkhouser
(2002, p.15) also observes that there is a trend towards increasing the Span of Control
through “eliminating middle management” with the target to save costs. This makes
sense from a monetary and short-term point of view but because the attention of a
supervisor to their team is reduced by increasing the Span of Control, subordinates
would find themselves increasingly in an unobserved situation which would most
probably influence their satisfaction and quality of work or even compromise their
safety. Haslam et al., argue that some of the causes of fatal accidents at work are poor
maintenance, defective materials and poor supervision (2005, p.402).
In their research paper ‘Span of control matters’, Cathcart et al., (2004) discuss the
influence of Span of Control on employees’ engagement. Cathcart et al., (2004) provide
cases from the nursing field which were discussed earlier in the research by Pabst
(1993) and Altaffer (1998). These mainly fit into medium-sized organisations with
medium and low hierarchical levels for which Cathcart et al. (2004) suggest eight to
twelve subordinates or 20–30 in cases where “an area was defined as having ‘simple’
operations” (Cathcart et al., 2004, p.396)29
.
Cathcart et al.’s paper again questions the issue of ‘how big is too big’ and the authors’
state that “employee engagement scores declined fairly consistently as work group size
increased” (Cathcart et al., 2004, p.398). The results of their research finally answered
the question of when a group size exceeds a successful level. In their conclusion they
identify that the performance of work groups is diminishing in team sizes of 15 and 40
(Cathcart et al., 2004, p.398). Furthermore, the authors strengthen their research results

72
with the argument that “the relationship between employee engagement and span of
control was real ... across all conditions and was independent of all other demographic
variables” (Cathcart et al., 2004, p.398).
Yassine, Goldberg and Yu (2005) also discussed Span of Control in their research
‘Simple models of hierarchical organizations’. At the beginning of their study, the
authors emphasise that “simple models of hierarchy can help to understand or compress
empirical results” and that “communication time ratio between and within hierarchies
and communication topology ratio are important factors in determining span of control”
(Yassine et al., 2005, p.1). Additionally, Yassine et al., (2005, p.2) suggest that “the
optimal Span of Control depends on the nature, scale, topic of work and tasks
processed”, which again supports our grid and also the conclusion of Yassine et al.,
(2005, p.2) that simpler models may be less accurate than expensive and complicated
computing models but are easier to “construct and analyse”. Mackenzie (1974) like
Graicunas (1933) also searched for a calculation of the maximum Span of Control
instead of the more modern aim to find the optimum Span of Control (as cited in
Yassine et al., 2005, p.4). Mackenzie (1974) has undertaken more sophisticated research
in visualising relationships between subordinates and supervisors because he assumed
“that any person in a hierarchical organization spends time either working on his/her
own task or interacting with others” (as cited in Yassine et al., 2005, p.4). In their
research Yassine et al. found that “the total communication time is composed of two
components ... the time between teams ... and the time within teams” (Yassine et al.,
2005, p.7), which has another influence on our grid, as the time is increasing according
to the complexity of work/tasks. Through such statements, this research is gaining
support that more difficult tasks require smaller teams.
A comprehensive paper about ‘Losing our span of control’ was written by McManus
(2007). In this work McManus enumerates three levels of Span of Control: at a higher
level he recommends a span of 3, for a medium level a span of 15 and for the lowest
level a span of up to 50. McManus (2007, p.22)30
argues that a Span of Control of 50 is
“ridiculous”. To enlarge the Span of Control “might be trendy” and it “looks a lot better
on the short-term-budget bottom line” but it also correlates directly to a decline of
“work force skill level” according to McManus (2007, p.22). Furthermore, McManus
(2007) criticises the reduction of middle level managers because he cannot see who else
would do their work (p.22). There are small or medium sized companies in which the
available amount of management capacity is low. Yet, there are of course also

73
companies, which are spoiled by success and have an oversupply of managers. Many of
whom were hired in successful years to reduce the workload of the hardworking
managers. In such companies there are certainly also hierarchical levels of supervisors
that are unnecessary if it comes to accurate calculations in times where margins are
becoming smaller and organisational structures need to be reconsidered.
In the ‘Span of management: Concept analysis’ by Meyer (2008) a list of conceptual
approaches is described which includes a lot of the papers which were also reviewed
such as Altaffer (1998), Cathcart et al. (2004), Gulick et al. (1937), Ouchi and Dowling
(1974), Pabst (1993) and Van Fleet & Bedeian (1977). It could be critiqued, however,
that well known and important papers such as those from Graicunas (1933, 1937),
Urwick (1937, 1956), Entwisle and Walton (1961) or Mackenzie (1974) are missing. In
addition, although Meyer (2008) has analysed a broader collection of research papers
(51) there is not much new information compared with what is already summarized
throughout the more classical literature review. This could be considered as a sign that
the information and results regarding the theory of Span of Control have somehow
reached their natural limitations.
Unfortunately, the paper by Meyer (2008) does not give numerical indications about
Span of Control. As the paper compares different concepts it would have been helpful
for this thesis if the results of the research would deliver something measurable. On the
other hand, Meyer’s work is beneficial in framing the problem and does help to support
the findings of this thesis. One citation which refers to Cathcart et al. (2004) is the
identical one which was selected in the analysis of the same paper for this research
which states that “employee engagement declines if group sizes exceed 15 and/or 40
group members (as cited in Meyer, 2008, p.108)”.
2.7.5 Recent discourse
The following section discusses how more recent academic research is building on
knowledge concerning the model of Span of Control. As indicated at the beginning of
the literature review about Span of Control the work of Graicunas has contributed
significantly to the topic overall and is discussed in conjunction with the analysis of
‘The span of control and the formulas of V.A. Graicunas’ written by Nickols (2011).
This is one of the latest research papers focussing on Graicunas’ work in connection
with Span of Control. After an introduction to Graicunas’ curriculum vitae, the author
discusses the term ‘maximum span of control’ and connects Graicunas’ research with
74
more up-to-date discussions about the topic of the ‘optimum span of control’. Also
Nickols (2011) discusses the modern pressure to enlarge the Span of Control and
speculates about the consequences when he asks “how many is too many?” (Nickols,
2011, p.3). Nickols concludes by reviewing the papers of Graicunas who suggested
“that the maximum number of subordinates should be five and probably four in most
cases” (as cited in Nickols, 2011, p.3) and that this is more dependent on the
environment and factors like “the scope and scale of the work”. Nickols then goes a step
further and provides an example: “a group of six factory workers reporting to a
supervisor presents a less complex problem than six division presidents reporting to the
CEO of a large company” (Nickols, 2011, p.3). Then Nickols examines Graicunas’
work more closely and argues that “as the number of subordinates increase the
complexity of the relationships increases exponentially” (2011, p.4). Nickols (2011,
pp.3–5) explains how Graicunas merged the:
direct single relationship between superior and individual subordinates
cross relationships between individual subordinates and
direct group relationships between superior and combinations of subordinates.
In ‘Exploring the performance effects of visible attribute diversity: the moderating role
of Span of Control and organizational life cycle’ by Richard, Ford and Ismail (2007),
the authors examine racial and gender diversity with Span of Control and explore these
factors also in relation to the organizational life cycle. The hypothesis regarding Span of
Control is that a narrow Span of Control with diverse racial or gender backgrounds will
increase the team’s performance. This sample group was taken from the banking
industry and organizational structure was measured with the proportion of managers to
staff. The outcome of the research is that the racial background received only marginal
support whereas the gender diversity of the team showed some significance related to
firm’s performance under a narrow Span of Control, however, the authors explain that
the topic is complex and has to be set within the context of the individual company. For
example when stating “[w]hile organizations in earlier stages benefit from more
diversity, firms in later stages experienced economic performance losses with more
diversity” (Richard et al., 2007, p.2101).
Mena (2012) makes a huge claim in describing the span of management as simply the
“most discussed single concept in classical, neo-classical or modern management
theory” (p.181). In his research the author attempts to create a model which helps to
75
identify the right group sizes sourced from the organizational structure on a case by case
basis for make-to-order enterprises. The findings reveal some correlations from group
sizes “when the number of jobs and groups were less than or equal to 30 and 10
respectively, the run time was reasonable. When the number of jobs increased beyond
40, the run time increased exponentially” (Mena, 2012, p.190)31
. In relation to optimal
group size and effort this is claimed to be 5 staff (p.191)31
.
In The determination of span of control, Hopej and Martan (2006) compare the methods
of Stieglitz (1962) and Graicunas (1933) in an attempt to find a specific indication for
Span of Control. The authors see some limitations, however, in both methods. The
Graicunas method involves the measurement of relationships with an exponential
character “which means that even a small change in the number of relationships
between superior and subordinates influences in a fierce way the degree of the load on
the superior” (Hopej and Martan, 2006, p.60). They suggest that in the Stieglitz method
“one may claim that it does not take into account the greater number of factors, such as
time pressure or organisational culture” or that “the way of assigning values to
individual factors is also debatable” (p.61). Hopej and Martan, (2006) conclude with an
insight which they admit is to some extent separate from most of the literature, claiming
that “span of control is an endless process” (p.61) which requires regular review.
A critical review of the trend to reduce hierarchical levels is offered in Wulf’s, ‘The
flattened firm: Not as advertised’ (2012) where the author lists several factors
such as enhanced competition, deregulation and higher efficiency in
combination with the belief “that firms were eliminating layers in their internal
structures and pushing decisions down to lower-level managers” (Wulf, 2012,
p.7). She explains the changes in firm hierarchies over the last decades where
hierarchical layers were taken out and the span of control was increased and
queries “however was this delayering or restructuring?” (Wulf, 2012, p.9). There
is also a direct correlation between the increased Span of Control, the reduced
number of layers and the increased financial compensation for the managers in
charge (Wulf, 2012, pp.10-13). The author concludes that “flattening is not just
about structural change. It affects the role of the CEO, how decisions are made
and managerial incentives” (Wulf, 2012, p.18).
In a graph sourced from an earlier work by Wulf the increase of the CEO Span of
Control is shown to have doubled during the last two decades.

76
Graph 2.1: CEO Span of Control (1986-2008). Source: Guadalupe, M., Li, H., & Wulf, J. (2011). Who lives in the C-
Suite? In Wulf, J. (2012). The flattened firm: Not as advertised. California Management Review. Fall, Volume 55,
Issue 1, p.10.
In another interesting paper where Wulf was co-author ‘How many direct reports?’
(Neilson and Wulf, 2012) the same increase in Span of Control as per the previous
paper by Wulf is emphasised:
[t]he leap in the chief executive’s purview is all the more remarkable when you
consider that companies today are vastly more complex, globally dispersed, and
strictly scrutinized than those of previous generations. (p.113)
Here the authors discuss five relevant fields encompassing not only the CEO’s purvue
but also being valid for up to two hierarchical levels lower. First of all senior-executives
should consider their own position in regards to their tenure because the authors see the
Span of Control shrinking in the future for in an ideal case “the span of control is
typically highest at the start” (Neilson and Wulf, 2012, p.115). Furthermore, one should
consider its involvement in cross-organizational tasks for “the more highly related the
business activities, the more time a leader is likely to spend on integration issues,
working with colleagues at the next level down in committees or one-on-one” (p.117).
Thirdly, a manager should observe their own time allocation for non span-of-control
related activities:
[f]irst, be aware of how you’re spending your days and how that meshes with the
needs of the business; awareness is the starting point of any adjustment that may
help you in the longer run. (Neilson and Wulf, 2012, p.117)
The fourth consideration for a manager is to reflect on the scope of their role. Whereas
“dividing the roles may allow you to take on more functional responsibility” and should
be compared with the advantages of having not appointed a deputy “you’ll have more
on your hands” according to Neilson and Wulf (2012, p.118). Finally, the fifth point is

77
regarding the team’s composition. Also the authors note that during the last 20 years
80% of the CEO positions added to the Fortune 500 are for CEOs who are functional
specialists which is possibly creating the opportunity for CEOs “to have more time to
devote to business strategy” (Neilson and Wulf, 2012, p.119).
This thesis will not discuss in detail the case study of El-Khalil and El-Kassar (2016)
describing different departments in the car manufacturing industry. It is worth
mentioning, however, that after the 2009 financial crisis in the United States the authors
found a sharp increase in the Span of Control in different departments among the three
largest car manufacturers examined in this case study. They stated that “the increase in
the span of control from pre 2009 to post 2009 was not a standard increase. Some
facilities increased by 67% (lowest increase) and others by 271% (highest increase)”
(El-Khalil and El-Kassar, 2016, p.1730), which is demonstrating the dynamic
connection of Span of Control to the external environment and market flucuations.
Graves (2013) refers to the Span of Control and is convinced that “no perfect ratio
likely exists” when explaining that a narrow Span of Control gives a CEO the advantage
to dedicate more time with his/her subordinates in contrast to a flat hierarchy where
subordinates could enjoy more independent activity (p.118). In order to determine the
optimum Span of Control, Graves recommends considering four factors: 1st
Organizational Size, 2nd
Skill Level, 3rd
Organizational Culture and 4th
Manager
Responsibilities (2013, p.118).
A short article presented by Zoltners, Sinha and Lorimer (2014) in the Harvard
Business Review asks in its title ‘Does your company have enough sales managers?’ An
average for the United States sales force of a span of 10–12 sales people is mentioned
which is relevant to this research and it is brought into the context of complexity of
work where “sales teams work with customers to deliver technically complex, custom
solutions; sales managers each supervise an average of 6–8 strategic account managers”.
It goes further in describing the part-time merchandisers who “perform activities such as
stocking shelves, setting up displays and conducting inventories” (Zoltners et al., 2014,
p.2)32
to reach a Span of Control up to 50. After recapping what kind of tasks sales
people usually undertake the authors finish with the reminder that costs should not
define the Span of Control but rather the efficiency of the management:
[a] company needs enough sales managers to ensure that all key people,
customers, and business management tasks get executed well. At the same time,
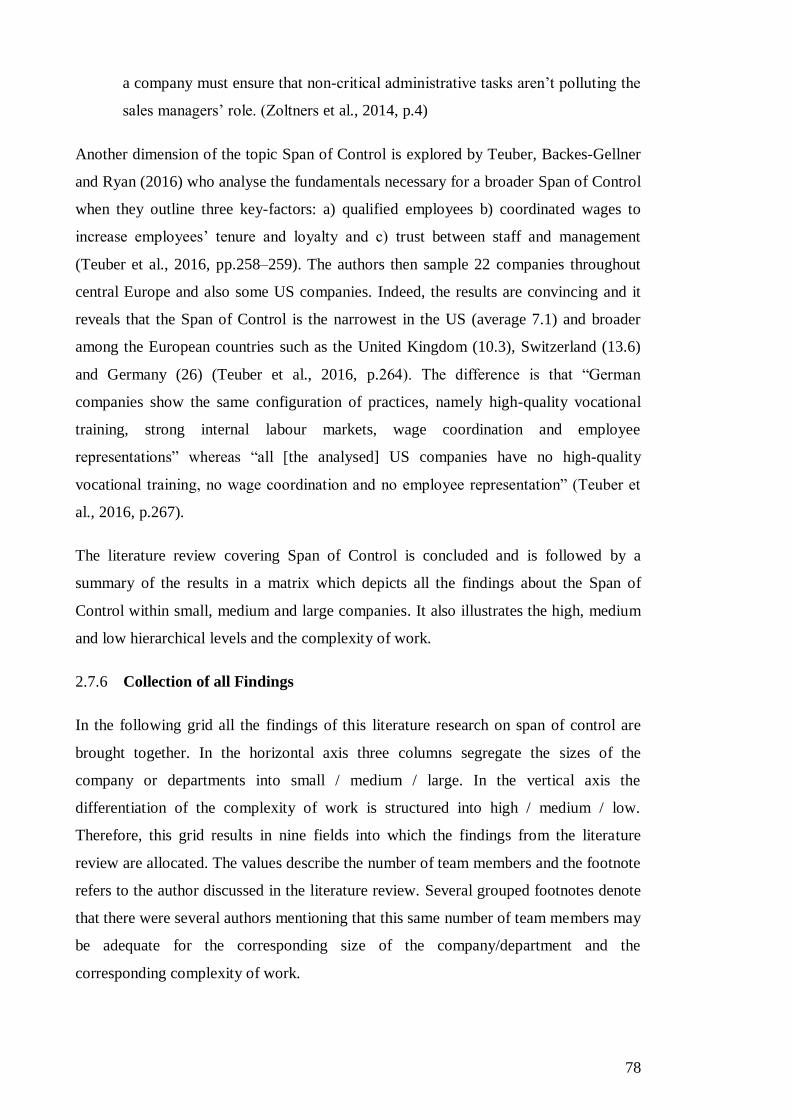
78
a company must ensure that non-critical administrative tasks aren’t polluting the
sales managers’ role. (Zoltners et al., 2014, p.4)
Another dimension of the topic Span of Control is explored by Teuber, Backes-Gellner
and Ryan (2016) who analyse the fundamentals necessary for a broader Span of Control
when they outline three key-factors: a) qualified employees b) coordinated wages to
increase employees’ tenure and loyalty and c) trust between staff and management
(Teuber et al., 2016, pp.258–259). The authors then sample 22 companies throughout
central Europe and also some US companies. Indeed, the results are convincing and it
reveals that the Span of Control is the narrowest in the US (average 7.1) and broader
among the European countries such as the United Kingdom (10.3), Switzerland (13.6)
and Germany (26) (Teuber et al., 2016, p.264). The difference is that “German
companies show the same configuration of practices, namely high-quality vocational
training, strong internal labour markets, wage coordination and employee
representations” whereas “all [the analysed] US companies have no high-quality
vocational training, no wage coordination and no employee representation” (Teuber et
al., 2016, p.267).
The literature review covering Span of Control is concluded and is followed by a
summary of the results in a matrix which depicts all the findings about the Span of
Control within small, medium and large companies. It also illustrates the high, medium
and low hierarchical levels and the complexity of work.
2.7.6 Collection of all Findings
In the following grid all the findings of this literature research on span of control are
brought together. In the horizontal axis three columns segregate the sizes of the
company or departments into small / medium / large. In the vertical axis the
differentiation of the complexity of work is structured into high / medium / low.
Therefore, this grid results in nine fields into which the findings from the literature
review are allocated. The values describe the number of team members and the footnote
refers to the author discussed in the literature review. Several grouped footnotes denote
that there were several authors mentioning that this same number of team members may
be adequate for the corresponding size of the company/department and the
corresponding complexity of work.

79
For example: in the field in the upper left corner (yellow background) the first number
is indicated as: 5-62, 18, 19, 31
where it means that Urwick (1938)2, Alford (1940)
18, Brech
(1946)19
and Mena (2012) 31
see preferably a limitation of five to six subordinates on a
complex level of work in a small entity or department.
Size of the Company/Department
Small Medium Large C
om
ple
xit
y/H
iera
rch
y
High
5-62, 18, 19, 31,
4-77,
2.9 – 3.49,
6.111, 614, 515,
4-520, 3.228,
330
5-77, 6-78,
6.2 – 810,
3 – 921,
4 – 1023,
524
5-832
113, 8-98,
6.3 – 11.312,
6.7525
Medium
3-61,
4.7 – 5.69,
6.911, 715
6-186,
10.7 – 11.310,
12.313, 10-1232
6 – 1217, 1020,31,
1324, 12.828,
8-1229, 1530
204, 15-2323,
22.9 – 27.526,
25.8 – 27.927
Low
8.411, 23.313,
10 – 3021,
2024,
20 – 3029,
305,31,
20 – 3014, 2515,
5020, 22,
24.5 – 38.527,
5030,32 Table 2.19: Size/complexity-grid with all findings of this literature review on the ‘ideal Span of Control’ (the
numbers link to the researched literature)
2.7.7 Summary
For a better overview of the findings and to improve readability the average Span of
Control is calculated for every field in the matrix. Furthermore, an indication of a
possible range based on all the literature reviewed indicates the approximate range of
tolerance to be applied for departments belonging in this field. Because of this the
results are just indications possibly having an unpredictable deviation from unknown
variables, depending on the culture, complexity of the task and disposable time to solve
the task. The definition of the possible range is calculated so that it includes 50% of the
range of all references from the different papers in a specific field of the matrix. For
example, if we have the following ‘cited’ values: 1, 2, 3, 4, 5, 6 as the recommended
number of subordinates in one field, the average would be 3.5 and the range is 5 where
50% equals 2.5, which means, that the indication in the sample field would be
Ø3.5 ±1.25. This means, that the recommended number of subordinates for those
intersections of company/department size and complexity level would be 3.5, whereas
±1.25 subordinates would be still in the range. Indications are given with two digits

80
after the comma because in later work using this matrix there could be part-time as well
as full time positions being considered. The star at the deviation number in the field of
small group/low complexity is set because there was only one reference which fitted
into this field – but, as it can be recognised, there are certain visual patterns in the
diagonal axis (discussed in more detail below the table) and one can find the closest
number to 8.4 for the field small Company/low complexity and 8.73 for the field large
Company/high complexity. Based on that consideration the same deviation for both
fields was applied.
Size of the Company/Department
Small Medium Large
Com
ple
xit
y/H
iera
rchy
High Ø 4.86
± 1.03
Ø 6.38
±1.75
Ø 8.73
±1.25
Medium Ø 5.38
± 1.00
Ø 11.32
± 3.00
Ø 23.16
± 3.26
Low Ø8.4
± 1.25*
Ø 22.22
± 5.00
Ø 35.33
± 6.38
Table 2.20: Abstracted ideal Span of Control findings with +/- tolerance indication
This is the matrix where this thesis consolidates the further discussion about Span of
Control. Viewing the matrix and ignoring the mathematical details of the figures for a
moment, after looking at them from some distance, one realises that the figures
resemble each other in a diagonal direction. With the aim to simplify them by rounding
up or down, a pattern is becoming visible. For the matrix of nine fields, separating
complexity and company size, one could assume only four recommended Span of
Control recommendations 5, 10, 20 and 35 in order to simplify it. To verify this
phenomena further study through the literature available has resulted in finding a related
statement from Cathcart et al. (2004, p.398) who is answering the question about
maximum Span of Control when he concludes “there were 2 points at which
engagement scores dropped most noticeably: as work group sizes grew larger than 15,
and then again as work group sizes grew larger than 40”, which the author of this thesis
then has illustrated with two black arrows. Considering all the readings, a third arrow
has been added at the level of six for the maximum Span of Control as found in Urwick
(1956, p.39); Graicunas (1938, p.8); Entwisle and Walton (1961, p.524); Meyer (1968,
p.948); Van Fleet and Bedeian (1977, p.358, citing Fayol (1916); Alford (1940); Brech

81
(1946) and also Viola and Najjar (1970, 1971, as cited in Van Fleet and Bedeian, 1977,
p.362). Next to the first matrix the final matrix below shows now a combination of
optimum Span of Control (in colours) and maximum Span of Control (arrows) in
relation to company size and complexity level to show a pattern in diagonal axis.
Size of the Company/Department
Small Medium Large C
om
ple
xit
y/H
iera
rchy
High 5 5 10
Medium 5 10 20
Low 10 20 35
Table 2.21: Pattern in the abstracted ideal Span of Control findings
2.8 A CEO’s Power
The following brief summary does not represent any of the perspectives explained
earlier. Nevertheless, the aim is to give a brief introduction to the topic of the CEO’s
power to elaborate the considerations for the allocation of dominance in the Top
Management Team which were undertaken for this thesis.
In terms of organisational charts, this thesis shall draw a model of power of the top
management team when it comes to decision-making. In the past the CEO or Managing
Director was seen as the primary and single source of power to decide the company’s
direction, however, today “the emphasis changed from the one person clearly
highlighting the pathways forward, to a group based view of leadership” and in this
group consensus “understanding and being responsive to context became the
predominant concern” (Kakabadse, 2000, pp.14–15). The top management team is
assumed to contain two major fields of power which differ according to their
hierarchical level; the power of the CEO and the power of the top management team.
In general, for this thesis it is considered that every single decision is conducted similar
to a vote by the people involved in this specific decision process. Full acceptance would
mean 100%. Expecting the total decision power to be 100% and searching for the
6 15 40

82
influence of each participant of the deciding group (which is absolutely unclear and not
possible without further information) the power of the CEO and the power of the rest of
the Top Management Team can be differentiated because this is the only given variable
at present. Finding an answer to this question, which is the aim of this thesis, will assist
in replicating a real decision-making situation among a few people by allocating each
member of the decision team a numerical value representing their power of influence on
the final decision. For example, if a CEO’s power is equal to 50%, the other 50% of the
decision power can be allocated amongst the other members of the Top Management
Team. How to define who is holding how much of the decision-making power is the
main topic of this thesis.
To introduce the subject of the CEO’s power a short introduction of the definition of
power is provided and then a brief literature sample is undertaken to understand if there
is any rule or commonality regarding a CEO’s power in a decision-making process.
2.8.1 Types of Social Power
French and Raven (1959) developed the well-known classification of five main types of
social power, plus two additional types. The two additional forms are firstly
informational power which concerns the possession of information others do not have.
This form of power is closely related to the power by expertise, but weakens as soon as
the information is shared (French and Raven, 1959). On the other hand there is
connectional power, concerning the influence actors possess due to their network or
contacts, which is reflected in the support they receive from others (French and Raven,
1959). The basic five forms of power are:
reward power: power exerted by a supervisor in rewarding a subordinate,
regardless of the form of the reward (monetary, hierarchical, social, etc.)
legitimate power: power given through a position or an authority which makes a
subordinate believe that the supervisor has a legitimate right to perform certain
actions
coercive power: power delegated from the government to the police in a
democratic country. In the corporate environment it is the power to penalize the
subordinate by taking away something like status, position, job, etc.
referent power: this form of power refers to the identification and respect which
is connected with a supervisor. In this case subordinates identify with the

83
personality of the supervisors and feel satisfaction by accepting and/or imitating
them.
expert power: special or additional knowledge gives people a privileged and
special status which finally results in a powerful position and the dependency of
those who do not share this knowledge
(based on French & Raven, 1959, pp.156–163).
Docherty (2004) adds an interesting component which is social time, to the above-
mentioned power factors. Social time is not just a matter of elapsed time – social time is
the trajectory of a human life; it is valuable to us because of what we can do or want to
do while time passes (Docherty, 2004, p.863). This could provide managers with
interesting input, as they could attempt to motivate subordinates to try to achieve as
much as possible in their social time. Conversely, subordinates always weigh effort
against output. For example, a staff member can ask them self whether it is worthwhile
to follow the instructions of a supervisor or should a change (e.g. of the workplace) be
considered?
Becker argued that “People rationally evaluate the benefits and costs of activities, such
as education, training, expenditures on health, migration, and formation of habits that
radically alter the way they are” (1992, p.51). Motivation is discussed widely in the
current management literature but derives mainly from the work of motivational
theorists such as Douglas McGregor (1906–1964), Abraham Maslow (1908–1970),
David C. McClelland (1917–1998), Frederick Herzberg (1923–2000), John Adair
(*1934) and Victor H. Vroom (*1932). This thesis is based on the generalised
assumption that people are free to decide for themselves at any time if they would like
to follow their leaders or not. This freedom sometimes results in employees resigning
and leaving their positions.
2.8.2 Recent Discourse
According to Morgan (2006) the question how managers lead, is answered frequently
by exploring the: “authority, power and the superior – subordinate relationship” (1997,
p.154). Shin (2008, p.9) sees the power of a CEO evolving in three processes: through
board co-optation, resource dependence and informational advantage. Consequently,
“power is inherently a relational concept; power is meaningful only when it refers to the
actual or ability to control the behaviour of others” (Emerson 1962, as cited in Shin
2008, p.9). Alvarez and Svejenova, authors of Sharing Executive Power: Roles and

84
Relationships at the Top (2007) believe that “the life of top managers is now so
complex that they cannot cope with the demands” as cited in Hanson (2008, p.54).
Despite this observation, Kakabadse is not surprised that the sharing of CEO positions
often fails: “It's impossible to share the same vision of where you want to take the
business”, as cited in Hanson (2008, p.54). Also Kakabadse and Kakabadse see a
potential area of conflict regarding the CEO’s power, between the roles of the
chairperson and the CEO: “it is not clear who is in charge of the corporation - for many
people, the role of corporate leader has become synonymous with the CEO” (2007,
p.60). ‘Sense making’ and ‘deep friendship’ are the two key elements according to
Kakabadse, Kakabadse and Knyght (2010) in the constellation between the Chairman
and the CEO. “If either component is lacking, the study respondents narrated bonding
deficits, but specified the relationship as workable as long as both parties acknowledge
‘the need to work at it’” (p.293). Against this backdrop complexity is always apparent
because “[c]onflict and power plays inevitably arise whenever interests collide and
therefore, we may regard them as an inevitable part of organizational life” (Neumann
and Hirschorn, 1999, p.685).
In ‘The Perils of Power’ Kwak (2002) suggests that the power related to the CEO,
depends on whether s/he is the owner of the company. Founder-owned companies tend
to have fewer outside directors, but Kwak (2002, p.13) argues that “giving [a] founder-
CEO too much power can be a recipe for disaster”, because the CEO might be
“overconfident of [his/her] own power” which Kwak calls the “Icarus Paradox” (Kwak,
2002, p.13). To lessen the power of a CEO, Kwak proposes to set up a “strong and
independent” board because “truly visionary leaders understand the value of sometimes
binding their hands” (Kwak, 2002, p.13).
“The company that wins today is the one that makes the best decisions and is able to act
on them quickly”, says Michel (2007, p.33) who, citing Bass (1990) and Cannella and
Monroe (1997), thinks that decision-making processes are executed through “various
professionals” and these factors also influence a company`s performance. Porter, Lorsch
and Nohria start their paper ‘Seven surprises for new CEOs’ (2004) with the statement
that a CEO is “bearing full responsibility for a company’s success or failure, but … [is]
unable to control most of what will determine it” (Porter et al., 2004, p.62), because
running the business is just “a small part” of a CEO’s work (Porter et al., 2004, p.64).
Also Porter et al. (2004, p.65) state that it is not possible for a CEO to personally
control everything and that finally “control shifts from direct to indirect” which means

85
in this context, that a “CEO often ends up knowing less about the operational details of
their companies than they did in their previous positions” and that is why s/he will run
the company through “the right senior management team to share the burden”.
Shen (2003) discusses a number of different views focussed on understanding the
CEOs’ power. These include those of Daily and Dalton (1994) where power plays a
central role in corporate governance. Pfeffer (1981) succinctly suggests that power
refers to the capacity of social actors to exert their will and to achieve their goal, and
finally Pfeffer and Salanick (1978, cited in Shen 2003, p.468) state that the CEO’s
power is reflected in their ability to hold on to the job.
Generally, Shen (2003, p.468) observes that the power of a CEO increases over time.
Shen (2003), however, does not analyse the dependence between a CEO’s power and
members of the top management team. There are only slight hints of this when Shen
cites Westphal and Zajac (1995) in saying that “the CEO may try to strengthen his or
her power by selecting directors who are sympathetic to management or passive in
governance” (Shen, 2003, p.469) and also when he cites Pfeffer (1981) “the CEO may
try to promote executives who are loyal and force out those who challenge his or her
authority” (Shen, 2003, p.469).
Conversely, to Shen (2003), Combs, Ketchen, Perryman and Donahue (2007, p.1302)
believe that CEO power decreases over time due to “political obstacles arising from an
increasing number of enemies and rivals as one rises in the firm”. According to their
study on ‘The moderating effect of CEO power on the board composition-firm
performance relationship’, Combs et al. (2007, p.1302) believe that periods of political
stability within a top management team are only transitory. They suggest that other
executives are highly motivated to detect and react to the shortcomings of the CEO
because each of them may have the potential to become CEO (as cited in Combs et al.,
2007, p.1302). Also the discussion of power, is repeated by Combs et al. (2007), for
example when they cite Pearce (1995) who alludes to the political instability that results
in CEOs gaining sources of “formal and reward power” to enhance “their ability to
maintain a dominant coalition and reduce the probability of a power contest” (Pearce,
1995, cited in Combs et al., 2007, p.1303). Beyond that, Combs et al. (2007) discuss
different situations of a CEO’s power but unfortunately do not venture deeper into our
research topic of how the top management team shares the amount of power necessary
to enforce strategic decisions. Some explanations regarding the CEO’s power are
numerical and appear to be what this thesis is searching for, but after precise analysis it

86
is concluded that this is merely a discussion about measuring the impact of events on a
company depending on a CEO’s power (Combs, 2007, p.1309).
2.8.3 Conclusion
Based on the analysis of the research undertaken the main conclusion is that the CEO
has a very powerful position when it comes to decision-making. What Porter et al.
(2004, p.65) even describe as the ‘most’ powerful position in an organisation. But the
CEO’s power might be different depending on the decision which s/he has to take
together with their top management team. The CEO does not always enjoy the same
power of influencing a decision. This thesis is based on the assumption that the CEO
has the exclusive right to refuse and to say ‘no’ or what is described by Porter et al. as
the use of the CEO’s power to “reject” proposals (Porter, et al., 2004, p.65). Since a
CEO has the power to reject a proposal, it means that in “negative” cases the CEO has
100% of the decision power bundled in their vote. In the case of a positive decision, the
CEO is depending on their team and therefore is just one part of the positive decision
which is again confirmed by Porter et al. (2004, p.65) when they suggest that a CEO by
implementing their plans (being committed to a decision) “reduces his real power”. In
the context of this thesis this reduction of power is expressed in a blocking minority
which represents 34% to express the share of a CEO in a constructive process of finding
solutions. Consequently, 34% is seen in the context of this thesis as the ideal value to
describe a CEO’s power as 34% does contribute significantly to a positive scenario but
at the same time is enough to block or reject any proposal in a negative scenario.
Consequently, the percentage of the influence of the CEO is described in three possible
values (when describing it in percentages):
100% influence in the case that the CEO would be the only one in the
management of a Company
51% if the CEO has only one more person in his/her team and they accept each
other to be acting as a team but with the CEO as the supervisor
and finally 34% if the CEO has two or more members in her team accepting
each other acting as a team but where the CEO has the power to say ‘no’ which
is interpreted in this thesis with a blocking minority (which is technically 1/3+1n
whereas n means anything: 33.4 as well as 33.333334 but in order to keep it with
the numbers without decimals it will be expressed as 34%.

87
2.9 Summary of the Literature Review Chapter
With the aim to unpack the necessary variables to construct an equation which will
enable a ranking of Top Management Team members according to their influence when
it comes to strategic decision taking, four perspectives have been researched in
individual short literature reviews with the following findings:
Perspective Variables
Typology of a Company
- Defenders
- Analysers
- Prospectors
- Reactor
Top Management Team Constellation
- Age
- Tenure
- Education
Managers’ Characteristics
Horizontal Factors:
Network, Shares in the company, Contribution to Turnover
Bi-Directional Factors
Reliability, Archetype (Role Model), Communication, Competence,
Authority, Foresight
Vertical Factors
Social Competence, Conveyor, Humour, Humility, Cooperation,
Generosity
Span of Control
Table 2.22: Summary of the selected variables for the four perspectives analysed in this thesis
Those variables are set into an algorithm and allocated weightings to profile the Top
Management Team members in regard to their participation in the dominant coalition.
The four Typologies cannot be influenced by the manager directly but depending into
which Typology a company’s strategy is more oriented it will influence the power of
the departments benefitting from each Typology. The Team Constellation changes its

88
parameter of age and tenure with time; which means that the conditions may change for
each individual manager when personal age and tenure fit into the Top Management
Teams’ configuration or also may diverge from it. Managers’ Characteristics is certainly
the perspective where each manager can potentially have most influence by adjusting
their personal habits and behaviours to confirm to the strategic direction of the firm. The
matrix of Span of Control categorizes companies and departments in terms of
complexity and size, whereas the number in each field indicates the momentum of
losing control.
In Chapter 3: Research Methodology the selection, explanation and justification of the
research methodology is discussed. This chapter, describes the role of the researcher,
the instruments and procedures used to collect data including their respective
limitations. The process of data collection for each perspective will be outlined. For the
perspective of Typology the definition of which departments belong to the Dominant
Coalition is discussed although there are situations of awkward constellations and these
are explained further and shown how they are handled. Team Constellation explores
why the factor of education was easier to quantify than age and tenure. After this, the
selection of 21 Managers’ Characteristics is revised to compile a relevant set. In
addition, it is outlined how the participants were selected along with the consent process
obtained from each participant, as well as the corresponding ethics approval which was
a requirement for this research.

89
3 Chapter three: Methodology
3.1 Introduction
In this chapter the methodology used for this thesis is explained in detail following
Chad Perry’s model outlined in ‘A structured approach to presenting theses’ (2012)
which is applied in the research. This introduction is followed by subchapters
explaining the justification for the methodology chosen, the units, the sources,
procedures, limitations, software used and ethical issues related to the research. Then
this chapter explores the research methodology used for each of the four perspectives
analysed (Typology, Team Constellation, Managers’ Characteristics and Span of
Control) and reveals how all the results are consolidated into one ranking to express the
dominance of each member of the Top Management Team.
3.1.1 Paradigm and Methodology
Thomas Samuel Kuhn, a scientific theorist, popularised the term ‘paradigm’ with his
publication of ʻThe Structure of Scientific Revolution’, but according to Wray (2011)
Kuhn did not invent the term. Wray (2011, p.380) states that Kuhn claims in the preface
of ‘The Structure of Scientific Revolutionsʼ to have discovered the concept of a
paradigm, but as Wray has researched “Daniel Cedarbaum (1983) has traced the first
use of the term ‘Paradigm’ in discussions of science to the late 1700s” (Wray, 2011,
p.382).
Guba and Lincoln (1994), define a paradigm as:
[a] set of basic beliefs (or metaphysics) that deals with ultimate or first
principles. It represents a worldview that defines, for its holder, the nature of the
‘world’, the individual's place in it, and the range of possible relationships to that
world and its parts, as, for example, cosmologies and theologies do (p.107)
The four categories of research paradigms defined by Guba and Lincoln (1994) describe
the pattern regarding ontology (the meaning of being or reality), epistemology (how and
why do we know something) and methodology (how will we find out something).
Regarding the research methodology there is a fundamental question about the selection
of the design for a research undertaking when defining the aim of the research and the
strategy of how to achieve this. The thesis writer has to ask himself if the aim of the
research is to discover or to justify (Park and Park, 2016, p.1) when deciding between

90
qualitative or quantitative research methodologies. Park and Park (2016) illustrate the
basic characteristics of qualitative and quantitative research in this helpful table for
researchers to identify into which category the research fits.
Table 3.1: The basic characteristics of qualitative and quantitative research from Park and Park (2016, p.2)
According to Park and Park qualitative research is used to “explore the descriptive
accounts and similarities and differences of various social events” whereas the
“objectives of the quantitative method in social science are to predict and control social
phenomena” (2016, p.4). Given that from the beginning this is not always a clear or
easy decision, understandingly the author was uncertain as to which methodology
would be most appropriate for this research. Because of this difficulty, Park and Park
highlight that “some researchers have suggested the integration of both qualitative and
quantitative research methods” (2016, p.3). According to Johnson, Onwuegbuzie and
Turner (2007, p.123) “mixed research can be viewed as incorporating several
overlapping groups of mixed methods researchers or types of mixed methods research”.
In the figure below from Johnson et al. (2007) the transition from pure qualitative to
pure mixed to pure quantitative is shown with the intermediate steps of qualitative
mixed and quantitative mixed.
Figure 3.1: The three major research paradigms (Johnson, Onwuegbuzie and Turner, 2007, p.124)
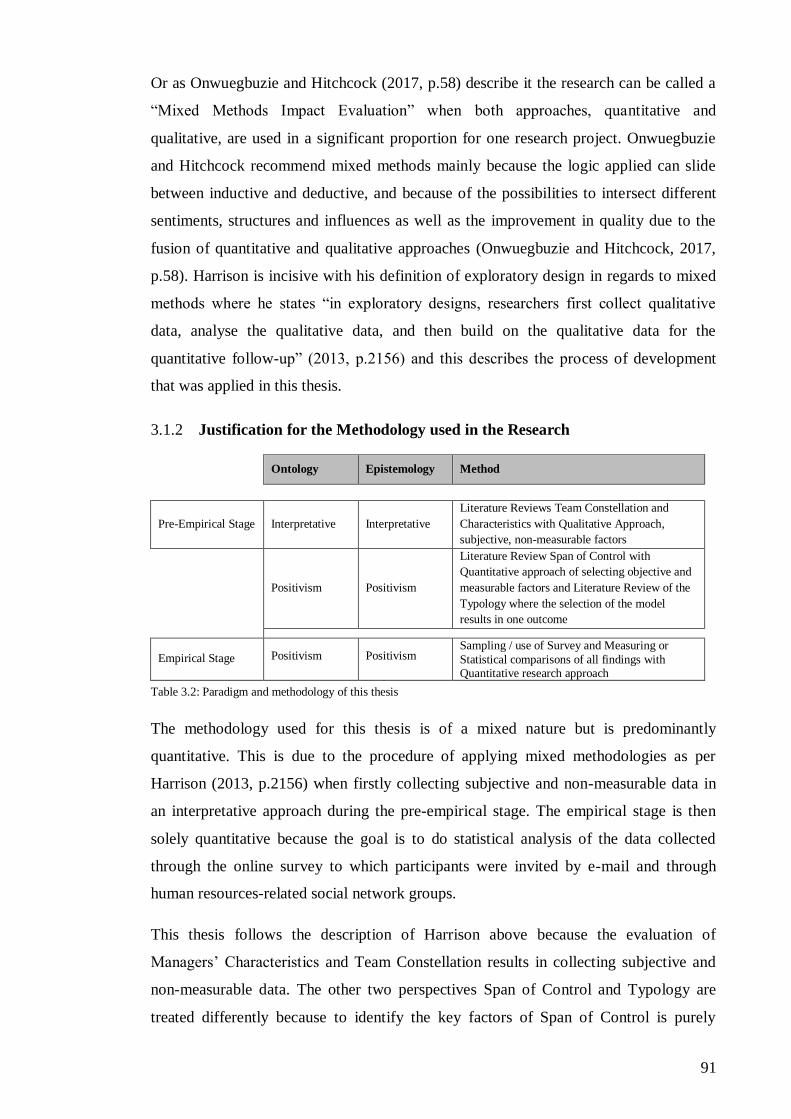
91
Or as Onwuegbuzie and Hitchcock (2017, p.58) describe it the research can be called a
“Mixed Methods Impact Evaluation” when both approaches, quantitative and
qualitative, are used in a significant proportion for one research project. Onwuegbuzie
and Hitchcock recommend mixed methods mainly because the logic applied can slide
between inductive and deductive, and because of the possibilities to intersect different
sentiments, structures and influences as well as the improvement in quality due to the
fusion of quantitative and qualitative approaches (Onwuegbuzie and Hitchcock, 2017,
p.58). Harrison is incisive with his definition of exploratory design in regards to mixed
methods where he states “in exploratory designs, researchers first collect qualitative
data, analyse the qualitative data, and then build on the qualitative data for the
quantitative follow-up” (2013, p.2156) and this describes the process of development
that was applied in this thesis.
3.1.2 Justification for the Methodology used in the Research
Ontology Epistemology Method
Pre-Empirical Stage Interpretative Interpretative
Literature Reviews Team Constellation and
Characteristics with Qualitative Approach,
subjective, non-measurable factors
Positivism Positivism
Literature Review Span of Control with
Quantitative approach of selecting objective and
measurable factors and Literature Review of the
Typology where the selection of the model
results in one outcome
Empirical Stage Positivism Positivism Sampling / use of Survey and Measuring or
Statistical comparisons of all findings with Quantitative research approach
Table 3.2: Paradigm and methodology of this thesis
The methodology used for this thesis is of a mixed nature but is predominantly
quantitative. This is due to the procedure of applying mixed methodologies as per
Harrison (2013, p.2156) when firstly collecting subjective and non-measurable data in
an interpretative approach during the pre-empirical stage. The empirical stage is then
solely quantitative because the goal is to do statistical analysis of the data collected
through the online survey to which participants were invited by e-mail and through
human resources-related social network groups.
This thesis follows the description of Harrison above because the evaluation of
Managers’ Characteristics and Team Constellation results in collecting subjective and
non-measurable data. The other two perspectives Span of Control and Typology are
treated differently because to identify the key factors of Span of Control is purely

92
quantitative based research with measurable, objective values obtained from the
literature review. The perspective of Typology did not require much data collection
because the literature review conducted for the Typology mainly provided a foundation
for a decision on which model to apply. The decision to use the typology of Miles &
Snow (1978) pre-determines the selection of dominant coalition, at least in a case where
a firm would fit into only one Typology.
Overall this thesis belongs in the category of pre-dominant quantitative methodologies
which is evident by the overall aim of this thesis to express each Top Management
Team members’ share of the Dominant Coalition which yields a requirement for a
measurable quantitative outcome where all data collected and evaluated is in statistical
form.
3.1.3 Role of the Researcher during this Dissertation
The outcome of a research project is a result of factors, such as interpretation, meaning,
individual points of views, and understanding and experiences and because of this it is
necessary to define where researchers state their position in this process. Four roles,
which are traditionally held by a researcher are those of complete participation,
participant as observer, observer as participant or complete observation as per the
definition of Junker (1960, p.223). The method applied to find the ‘truth’ also depends
on the paradigm which is used in the research. For quantitative research, Hinds,
Scandrett-Hibden and McAulay (1990) note that all research must undergo critical
appraisal, especially regarding objectivity, reliability and validity (p.431). In this thesis,
the author will act as a pure observer when gathering data from existing and already
published data.
3.1.4 Reliability and Validity
Emden and Sandelowski (1998) state that “in order for an experiment to be without
error, it must be replicable (that is, be reliable), measure those things that it purports to
measure (that is, be internally valid), and enables generalizability (that is, be externally
valid)” (p.207). On the other hand Wolcott (1990) provides a more cynical definition of
validation when he suggests “whatever validity is, I apparently ‘have’ or ‘get’ or
‘satisfy’ or ‘demonstrate’ or ‘establish’ it …” (p.121). Morse et al. (2002) also describe
this by stating that “verification is the process of checking, confirming, making sure and
being certain” p.9). The reliability and validity of this thesis is in the pre-empirical stage
based on data from publications collected in the field of research which is then verified

93
by the comparison of supporting or dissenting publications and then argued based on
their commonality. The empirical stage finds its verification in the statistical direct
comparison between the assumptions of the participants on the online survey with the
prediction of the developed algorithm based on the previous research.
3.1.5 The Unit of Analysis, the Instruments of Measurement and Sources
An outcome of this research is the percentage value indicating the dominance of Top
Management Team members in the dominant coalition. The final result is an
accumulation of shares which each Top Management Team member can accumulate in
each sub-category of the three perspectives (Typology, Team Constellation and
Managers’ Characteristics). The fourth sub-category or perspective Span of Control is
not contributing to the percentage of dominance. Span of Control is measured separately
to monitor the momentum of losing control.
The table below details for each perspective, the measurement factors collected in the
pre-empirical stage through literature reviews, and the measurement instruments applied
and developed in the online survey. For each perspective data was collected in different
ways. For example, Typology had 10 dimensions laid out as multiple choice questions
with 4 answers according to the nature of Typology. Team Constellation collected
manual input data about age and tenure for each Top Management Team member
(which was complemented with additional collected information about the same
parameters for the CEO) and then it offered a multiple choice selection for the section
on education.
Information about the Managers’ Characteristics was collected with Likert-scales
following the recommendation from Neumann (2014) to ask the participants if they
approved or did not approve so as to give at least 2 categories (p.231). The survey
requests the participants to rate the capability of a Manager from 0 (non-existent or
neutral) and then with index scores from 1 (lowest) to 10 (best) in any of the 6
Characteristics. It was decided to use index scores to avoid potential cultural confusions
by different perceptions in regard to wording (such as weak or strong) depending on the
participants’ backgrounds because “zero implies neutrality” and “index scores give a
more precise quantitative measure of a person’s opinion” according to Neumann (2014,
p.234). In Span of Control on the other hand the number of staff per department is set in
context to the complexity of work (low, medium, high) and the size of the company
(small, medium, large).

94
Overall aim Perspective Measurement factors Measurement instrument
Percentile
Ranking of Top
Management
Team members
participation in
the Dominant
Coalition
Typology
Identification of preferred Typology
in regards to a firm being an
Analyser, Defender, Prospector or
Reactor
Typology has 10 dimensions which
result in dominant coalitions in
favour of different departments;
each dominant coalition results in a
percentage allocation for each
department; the total value of all 10
dimensions is counted
Team
Constellation
Fit of a Manager in a team’s
homogeneity or heterogeneity in
terms of Age, Tenure and
Education
Age and Tenure are measured with
Standard Deviation whereas
Education is related to gaining
points for more Education
Managers’
Characteristics
Comparison of each Top Managers’
Profile in terms of: Reliability,
Role-Model (Archetype)*,
Communication and Competence,
Network and Social Competence
The total score received through
Likert-scales of each member of the
Top Management Team is weighted
against the total score of all
managers
Table 3.3: Selected measurement factors of each perspective and the instruments used in this thesis
*The Characteristic Role-Model was named Archetype during the time of the usage of the survey for this thesis but later renamed Role-Model to avoid confusion with C.G. Jung’s Archetype’s
Yin (2017) details six valid sources of evidence: Documentation, Archival Records,
Interviews, Direct Observations, Participant-Observation and Physical Artifacts (p.102).
Although “any of the preceding sources of evidence can and have been the sole basis for
entire studies”, however, the author recommends the use of multiple sources as the
“finding or conclusion is likely to be more convincing and accurate if it is based on
several different sources” (Yin, 2017, pp.114–116).
Figure 3.2: Convergence of multiple sources of evidence, from Yin (2017, p.117)
For this study the selection of the sources of evidence follows the principle of collecting
data through the research of documents and archival records during the pre-empirical

95
stage and applying a survey with a sample group for the data collection during the
empirical stage to quantify the reliability.
The target group for which the survey of this thesis focuses on is any employee attached
to a profit oriented company. The sample group was selected by the equal probability
sampling method (EPSEM) by a simple random sample from professional business
networks in Xing and LinkedIn used by the author. The criterion of the participants’
selection was limited to employed individuals aged between 20 and 65 years old,
working in profit oriented companies. There were no restrictions on gender or ethnicity
or any orientation of belief. The pool of sampling elements contained 461 derived from
Switzerland, Germany, France, United Kingdom, Russia, United States, Thailand,
Malaysia and Vietnam comprising of 76% males and 24% females. Data was collected
from 114 participants whereas for the first 9 submissions the analysis of standard
deviation for the perspective Team Constellation omitted collecting the data of the CEO
which was amended and then applied for the remaining 105 participants. All
submissions are printed in the appendix of this thesis.
3.1.6 Instruments and Procedures used to collect Data
The background of how each perspective has been measured is explained in detail after
this general overview of the methodologies applied for this thesis.
3.1.7 Administration of Procedures
Data was collected for the period of one month between 11th of January 2017 and 3
rd of
February 2017. An invitation to participate in the testing of an online calculation tool
was sent out to 461 individuals of whom 114 (24.7%) followed the invitation (response
rate). Then 342 (74.2%) ignored the invitation and 5 (1.1%) declined to answer either
due to confidentiality reasons or based on the opinion that the organisational structure of
the company exceeded the capability of levels to be captured by the developed tool. The
response rate of 24.7% achieved within this research is lower than an average value of
33% for online surveys which Nulty (2008, p.302) is indicating in his meta survey of
eight reported online surveys. Nulty (2008, p.302) concludes that “in general, online
surveys are much less likely to achieve response rates as high as surveys administered
on paper”. A plausible reason for obtaining a lower response rate in respect to this thesis
survey could be the language barrier where the social environment/background of the
author and therefore most of the potential participants are from German speaking

96
Switzerland and the survey was solely available in English because it was created in the
context of this thesis for a University in Australia.
3.1.8 Limitations of the Methodology
As mentioned above the online calculation tool is only available in English which is not
the native language of about 60% of the participants, however, this may only have led to
difficulties of understanding. Throughout most of the survey there is no requirement to
write (with the exception of numbers for age and tenure).
The size of the Top Management Team which was analysed is limited from 2–9
members as fewer members would not qualify to form a Dominant Coalition and more
members minimize the measurable difference among the members so that any
calculation applied becomes redundant with the chosen methodology.
Entries of Age are limited from 20 to 65 years and the tenure from 1 to 45 years in order
to reflect working generations only.
The list of Departments is limited to those enumerated in Porter’s (1980) illustration of
the Value Chain. For the selection in the survey, however, Finance is mentioned
additionally (although it is not explicitly mentioned in the Value Chain) because it is
hidden amongst ‘infrastructure’ and this was assumed to lead to confusion.
3.1.9 Software used for the Analysis
The development of a customised online tool to enable addressing random participants
involved the author working together with two different specialists. As a first step the
findings of the literature research had to be set in equations for each perspective
(Typology, Team Constellation, Managers’ Characteristics and Span of Control) and
then as a summary into a fifth equation. This was done in cooperation with Ms Honey
Yam, a mathematician from Kuala Lumpur, and generated in Excel for a fast review and
testing of the set of algorithms. In a second step, Dr. Yaroslav Bykov with his company
AvantLab from St. Petersburg, was engaged to undertake the programming. For the
development on side of the server AvantLab has chosen LAMP stack which is a
combination of Linux, Apache, MySQL and PHP. Mostly it is PHP scripting language
and MySQL database which are comparable easy and well known tools. For the client-
side the choice was only one: HTML and JavaScript. It is implemented in XHTML 1.0
Strict, which is a subset of HTML and supported by most browsers, including those for
mobile phones.
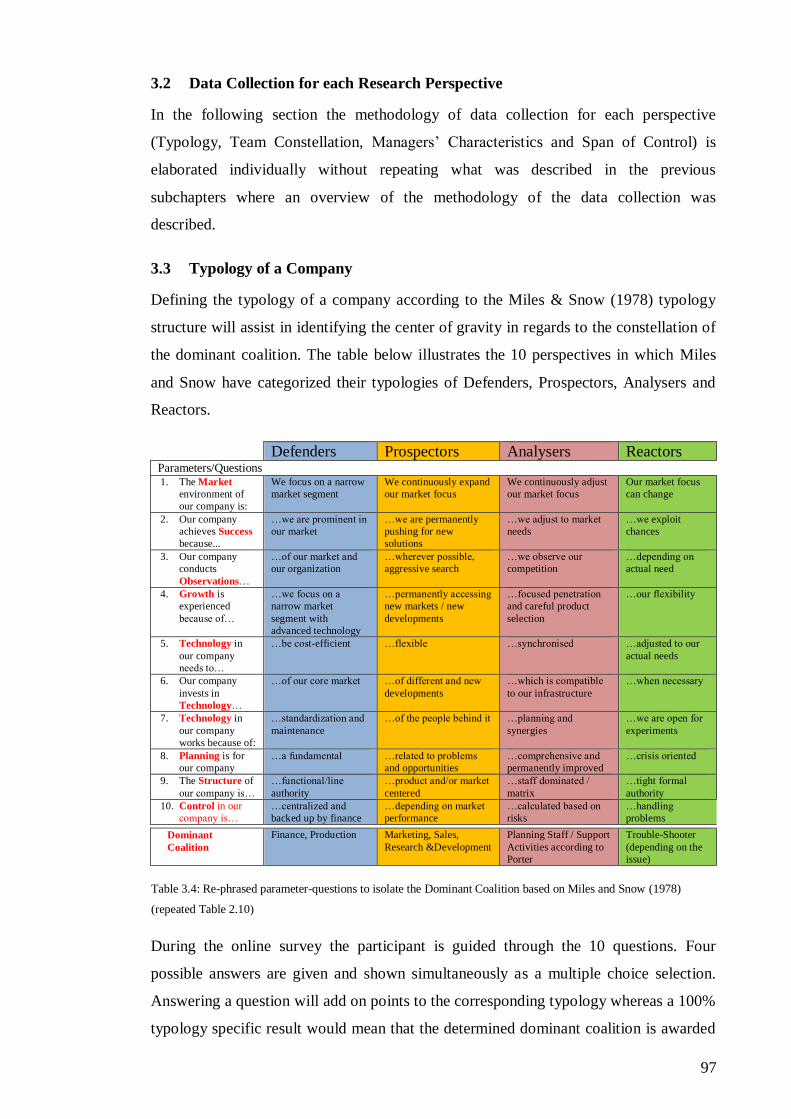
97
3.2 Data Collection for each Research Perspective
In the following section the methodology of data collection for each perspective
(Typology, Team Constellation, Managers’ Characteristics and Span of Control) is
elaborated individually without repeating what was described in the previous
subchapters where an overview of the methodology of the data collection was
described.
3.3 Typology of a Company
Defining the typology of a company according to the Miles & Snow (1978) typology
structure will assist in identifying the center of gravity in regards to the constellation of
the dominant coalition. The table below illustrates the 10 perspectives in which Miles
and Snow have categorized their typologies of Defenders, Prospectors, Analysers and
Reactors.
Defenders Prospectors Analysers Reactors Parameters/Questions 1. The Market
environment of
our company is:
We focus on a narrow
market segment
We continuously expand
our market focus
We continuously adjust
our market focus
Our market focus
can change
2. Our company
achieves Success
because...
…we are prominent in
our market
…we are permanently
pushing for new
solutions
…we adjust to market
needs
…we exploit
chances
3. Our company
conducts
Observations…
…of our market and
our organization
…wherever possible,
aggressive search
…we observe our
competition
…depending on
actual need
4. Growth is
experienced
because of…
…we focus on a
narrow market
segment with
advanced technology
…permanently accessing
new markets / new
developments
…focused penetration
and careful product
selection
…our flexibility
5. Technology in
our company
needs to…
…be cost-efficient …flexible …synchronised …adjusted to our
actual needs
6. Our company
invests in
Technology…
…of our core market …of different and new
developments
…which is compatible
to our infrastructure
…when necessary
7. Technology in
our company
works because of:
…standardization and
maintenance
…of the people behind it …planning and
synergies
…we are open for
experiments
8. Planning is for
our company
…a fundamental …related to problems
and opportunities
…comprehensive and
permanently improved
…crisis oriented
9. The Structure of
our company is…
…functional/line
authority
…product and/or market
centered
…staff dominated /
matrix
…tight formal
authority
10. Control in our
company is…
…centralized and
backed up by finance
…depending on market
performance
…calculated based on
risks
…handling
problems
Dominant
Coalition
Finance, Production Marketing, Sales,
Research &Development
Planning Staff / Support
Activities according to
Porter
Trouble-Shooter
(depending on the
issue)
Table 3.4: Re-phrased parameter-questions to isolate the Dominant Coalition based on Miles and Snow (1978)
(repeated Table 2.10)
During the online survey the participant is guided through the 10 questions. Four
possible answers are given and shown simultaneously as a multiple choice selection.
Answering a question will add on points to the corresponding typology whereas a 100%
typology specific result would mean that the determined dominant coalition is awarded

98
51% of the maximum ‘points’ which can be collected in this part of the survey. It is
more complicated when there is not a 100% match in one specific typology – and it is
more probable that this will be the case most of the time.
Now the question is how to create an algorithm to allocate the pointing systems among
the typologies depending on how often a participant has selected it. The variety of
combinations could be calculated through a grid of 4 questions in 10 categories,
whereas the participant is required to answer each question and not more than one
answer per category is allowed. The total number of permutations is 104 (10’000). A
preference for one or the other typology will show a preference towards certain
departments. It is interesting if for example the answers are distributed among
Defenders and Analysers as in such a case the department of Finance would feature
twice among the beneficiaries and accordingly its share on the dominant coalition
would increase significantly. Attention is given to answers which fall into the category
of the Reactors because it cannot be identified which department is carrying the role
defined by Miles & Snow (1978) as a trouble shooter. Consequently, points resulting
out of a selection for this Typology will be allocated equally to all departments available.
3.3.1 Methodology of Collecting Data
The creation of a pointing system for Typology was not done in one attempt as there
were several obstacles. Firstly, it was necessary to make the main differentiation about
Dominant groups and Secondary groups. According to the Miles & Snow Typology it is
a given which Typology will result in which constellation of a dominant coalition. For
the Typology of Defender a Dominant Coalition results with Finance and Production (2
Departments). For the Typology of Prospector a Dominant Coalition is resulting among
Marketing, Sales and R&D (3 Departments). The Typology of Analyser is putting
Finance, HR, Infrastructure and R&D together into a Dominant Coalition (4
Departments) and in the Typology of Reactor all existing Departments are falling into
the group of the dominant coalition according to Porter’s Value Chain (1980). As
previously mentioned, Finance was added because this department is hidden in Porter’s
Infrastructure and could be missed by participants. The table below is depicting all the
possible Dominant Coalitions depending on which Typology is chosen by the
participant at each of the 10 strategic directions of the company analysed.
What is apparent from viewing the table, before starting with any calculation, is that
Finance is represented in three out of four Typologies. This implies that the department

99
of Finance is counted more often to the Dominant Coalition than any other department.
This result is surprising because Finance is only a secondary activity according to
Porter’s Value Chain.
Defender Prospector Analyser Reactor
Finance X X X
Production X X
Marketing X X
Sales X X
R & D X X X
HR X X
Infrastructure X X
Logistics X
Service X
Table 3.5: Constellation of Dominant Coalition based on the Miles & Snow Typology (1978), by the author
In general the allocation of percentages for the Dominant and Secondary groups is that
the Dominant Group gains 51% whereas the Secondary group gets 49%. Unfortunately,
this does not work out in all constellations.
3.3.2 Introduction to Awkward Constellations
Relying on the basic assumption that the Group of Dominant Departments always
possesses 51% of power versus 49% for the Secondary Departments will not eventuate
as demonstrated in the examples below in cases where there are more Dominant
Departments than Secondary Departments. This is because the shared percentage would
become less for a Dominant in comparison to a Secondary Department. In such
situations, the Dominant Departments would not be dominant anymore:
1 Dominant Department (51%) vs 1 Secondary Department (49%)
2 Dominant Departments (25.5% each) vs 1 Secondary Department (49%)
3 Dominant Departments (17% each) vs 2 Secondary Departments (25.5% each)
Therefore, in a constellation of more Dominant Departments than Secondary
Departments a Dominant Department would have a smaller percentage than a
Secondary Department! Since a Coalition per se consists of more than one (1) and Miles
& Snow have defined in their Typologies that the Defender, Prospector and Analyser
have two (2), three (3) and four (4) departments in its Dominant Coalitions for each
Typology this leads to awkward constellations whenever there are companies having
fewer Secondary Departments in such a specific case. The exception is for companies in
the Typology of Reactors as in this case all Departments are in the Dominant Coalition.

100
The problem will appear in the following situations (Dominant vs Secondary) 2:1, 3:1,
3:2, 4:1, 4:2, 4:3. One way to counteract this issue is to view it from the smallest
possible constellation where a smaller group is dominant over a larger group by the
percentage allocated. Two (2) is given as this is the minimum required to build a
coalition. Three (3) is therefore the next bigger value. Thus 2:3 is taken as the smallest
ideal example where therefore the proportional factor is 1.5 in order to be equal and
1.5+1n to be dominant. Therefore, 1n is representing just about anything. A majority is
at the end not only 51% but also 50.1 or 50.001 or 50.0001% … it is just 50% +
anything, which is defined in this thesis as 1n. So in awkward constellations we chose to
describe the value for the Dominant Department to be the value of the Secondary
Department multiplied by 1.5 + adding 1n, a microscopic value which at the end gives
the amplitude. So the smallest possible constellation was taken as a pattern to be applied
to all other situations where the same unfavourable constellation will appear.
3.3.3 Conditions:
1. Ten Typology questions are asked and the answer for each question will determine
which department is in the Dominant Coalition.
2. In the cases where the number of Departments in the Dominant Group (d) is lower
than the number of Departments in the Secondary Group (s), the percentage of
influence assigned to each Department of the Dominant Group is 0.51/d, whereas the
percentage of influence assigned to each Department of the Secondary Group is (1-
0.51)/s.
3. In cases where the number of Departments in the Dominant Group (d) is higher than
the number of Departments in the Secondary Group (s) for example 3d:2s the
percentage of influence assigned to each Department of the Dominant Group is
[1.00/(d+s)]+0.01 whereas the percentage of influence assigned to each Department
of the Secondary Group is the proportional remaining value/s.
4. If there is only one Department named in the Dominant Group (in cases where there
are not all departments available according to the Miles & Snow Typology) then this
department receives 51% by default.
In the conditions set above with all possible variations the percentage of influence of a
Department or the whole Group in the Dominant Coalition is always higher than the
percentage of influence of a Department or the Group in the Secondary Coalition.

101
At the end of the section on Typology the accumulated percentages through all ten
questions for each Manager (Department) are weighted in comparison to all other
Managers (Departments).
3.4 Constellation of the Top Management Team
The findings of the literature review have resulted in three main parameters defining
how well members of the Top Management Team fit into that team. These are the Age,
Education, and Tenure with the company. The three parameters are to some extent
independent, however, it is clear that a certain age is required to gain education. The
same follows for the qualifications and expertise necessary for being a Member of the
Top Management Team. Finally, this might be different from company to company or
be industry related, and only gains its importance when compared to other members of
the same team.
3.4.1 Age as a Parameter in TMT-Constellation
Age can be seen as a positive factor under different pre-conditions. What all findings
have in common is that age is not having a positive affect if it is completely different
from all others in a group. It is preferable, to have a group where all are in the same age
group but it is also fine to have a group which is homogenous in regards to an equally
diversified age constellation. Whatever could be considered as a norm in that specific
group – should not be challenged with something which is completely outside of that
norm. Standard deviation is applied to the group which is analyzed to calculate if all
team members are in or out of the norm. If all other members of the Top Management
are 50 years old then most likely it is a disadvantage being the only person who is 40
years old in that team. If in another group, however, all members are equally diversified
in the age group between 40 and 50 then to be any age in that range does not matter.
There is very little ambiguity in how points are allocated to Top Management Team
Members for the parameter age-constellation. The question is just whether someone fits
IN the age pattern of a group or NOT; meaning one or zero as a result.
3.4.2 Education as a Parameter in the TMT-Constellation
Education potentially can compensate for age and or experience for younger staff,
however, throughout the literature review no indication was found that education could
be compensated when considering this the other way around. A manager could qualify
in a higher age group with the help of additional knowledge but it does not matter how
educated one is, s/he will not get younger. In some cases, if for example the complete

102
Top Management Group is constituted with younger members, this might be a
disadvantage. The authors who were reviewed seem to have common agreement that the
kind or type of education is less important than the amount of education. This parameter
is steadily increasing in importance from NO education until MORE education. In the
online survey form each member of the Top Management Team has to be classified by
the participants according to their levels of education from No Tertiary Education,
Bachelor’s, Master’s until Doctorate. The points which each member of the Top
Management Team can earn are dependent on their education only, but not in
proportion to the other Top Management Team Members unlike Age and Tenure. This
is because according to the literature review being over- or under qualified is not a
direct problem once one is in the job, however, it may be a hindrance in being
considered for a position in the first place.
3.4.3 Tenure as a Parameter in TMT-Constellation
Tenure is considered as an inverted U-shape where a certain amount of tenure to the
company is increasing the job holder’s importance but if exceeding the peak point then
tenure is losing its importance. Likewise with age, this parameter also has to be set in
proportion to the other Top Management Team Members with standard deviation used
for this sub perspective because it is a requirement to fit the group, whatever the group
segregation may appear. Clearly, the nature of the company does play a role in this. For
an organization which is permanently exploring new markets an ideal tenure is certainly
defined differently from the ideal tenure of members of an organization that is trying to
retain the same values over time. Where the nature of the company is defined by its
Typology the analogies in regards to the composition of the Top Management Team are
then organically given. Therefore, in the attempt to collect primary data, tenure can be
monitored exclusively for one Top Management Team at a time and the results might
not be comparable with any other company’s Top Management Team. In further studies
where a lot of data would be available it is most likely that one can identify similarities
in comparable fields such as on an industry wide basis for example.
3.4.4 Methodology of Collecting Data
This chapter delineates the main factors qualifying a manager’s personal fit into the Top
Management Team which is measured in this thesis through Age, Education and
Tenure. All three parameters are considered to be equally important and therefore a
similar maximum amount of points is given for each.

103
3.4.5 Conditions:
1. The online survey is created to capture a total of a maximum of 10 Top Management
Team Members
2. The CEO possess by default 34% of the decision-making power because s/he is the
only one who can say ‘no’ to anything and for this s/he needs to hold the blocking
minority which is given as 1/3+1n (33.4 or 33.34 or 33.334 etc.). To avoid decimals
in this research the CEO’s power is expressed as 34%.
3. Tenure is measured in this thesis in a value curve like an inverted U shape. The
contribution of a Top Management Team Member to the company is increasing if
one stays a certain time with the company, however, it is then again decreasing if that
person stays too long. The benchmark for what is considered a short, right or long
term tenure can only be given when the collected data for all Top Management Team
Members is from the same company. The highest peak of contribution lies in the
average for that set of top management team members. By using standard deviation
the sample data set is analysed so that 68% of all samples are falling within 1
standard deviation, 95% will fall within the range of 2 standard deviations and 99.7%
are covered in the range of 3 standard deviations of the mean.
After the first few tests using standard deviation to measure and judge Tenure, the
findings were that the outcome was not really meaningful. The reason for this is that
the usual age to enter into professional life would be somewhere in a person’s
twenties whereas a standard age to become retired is then in a person’s sixties which
gives only forty years of professional life. Typically, people do not commence their
professional life in the Top Management Team, however, membership of this
enclave can last until retirement. In this simple example of a team consisting of two
members where the younger member is 30 years old and the older one 60, the
average would be 45 and therefore the standard deviation is 15. So by a normal use
of standard deviation both members would fall into +/- 1 standard deviation and
anyone who could be imagined working in the same group would fall into a +/- 2
standard deviation (as this covers the age of 15 up to 75). If an example with a
smaller bandwidth such as a range of 35 to 55 years is considered then the average
would be 45 with a standard deviation of +/-10 years. Also in the second example,
the majority of Top Management Team members would fall into the same group and
any differentiation becomes obsolete. For this reason smaller steps were considered

104
necessary to recognize differences in age and tenure patterns. So for Age and Tenure
a minimum of 1 and maximum of 4 points have been defined and separated in steps
of 0.5 standard deviations:
4 points = within +/- 0.5 standard deviation from average
3 points = within +/- 1 standard deviation from average
2 points = within +/- 1.5 standard deviation from average
1 point = more than +/- 1.5 standard deviation from average
4. Age is also measured similarly to Tenure with standard deviation and rated in steps
of 0.5 standard deviations. There is no right or wrong in regards to a person’s age;
the only thing that matters is if it fits to the group or not. One’s age might fit to a
group if there is no pattern of age in this group or conversely if there is a pattern of
age. In other words, the homogeneity or heterogeneity of the age-pattern of an
existing group is defining if an additional person fits into that group. Of course not to
fit in that group is not the mistake of the additional person but rather a disadvantage
for that person because their age may fit well into another team.
In conclusion, for Age and Tenure standard deviation was applied in bandwidths of
half standard deviations to receive more details. The goal is to differentiate how far
from the average age-and tenure-pattern the individual manager is.
5. Education Level: It can be said that the level of education has a significant relevance
to a member of the Top Management Team. Yet the type of one’s education does not
matter according to academic literature when it comes to the performance analysis of
Top Management Teams. Hambrick and Mason, (1984, pp.200–201) or Jackson et
Graph 3.1: A visual representation of the empirical (68-95-99.7) rule based on the normal distribution divided in
0.5 steps of Standard Deviation. Retrieved from Math Planet, Algebra 2, Quadratic Functions and Inequalities -
https://www.mathplanet.com/education/algebra-2/quadratic-functions-and-inequalities/standard-deviation-and-
normal-distribution

105
al. (1995, p.206) are convinced that age and firm tenure can be compensated by
education, however, the focus is on the level of the education (Jackson, 1995, p.212).
For as Talke, Salomo, Kock, (2011, p.826) describe it “[e]ducational background is
the maximum educational level of each TMT member within the categories high
school degree, bachelor’s degree, master’s degree, and doctoral degree”. Important
issues are the amount of education, which is serving as a filter to select the right
candidates and secondarily the comparison in regards to the amount of education of
the other Top Management Team Members. If all possess a bachelor’s degree then
the similarity is already given. A question which is not answered in this thesis would
be if for example someone has done two different bachelor’s degrees, would that
have a comparable value with someone who completed one master degree? This
scenario is not evaluated in this survey. This perspective was standardized to have
for Age, Tenure and Education always as a minimum 1 point, maximum 4 point
because the literature review has not resulted in any preference.
4 points = Doctoral degree or equivalent
3 points = Master’s degree or equivalent
2 points = Bachelor’s degree or equivalent
1 point = No Tertiary degree or equivalent
In the section Team Constellation in the online survey the maximum points which
can be collected or awarded to one member of the Top Management Team is 12
points (age 4, tenure 4, education 4) and the minimum to be received is 3 points
(each with 1).
3.5 Methodology to evaluate Managers’ Characteristics
To find the ideal Characteristics of a Manager, Yin’s Convergence of Evidence (2017)
was applied in creating evidence through the research from different sources. Firstly,
archival records from over 50 interviews with members of top management teams were
studied in order to segregate key Characteristics which were then compared with the
findings of a classical literature review and thirdly quantified in a public opinion poll.
The figure below (which is repeated) illustrates the outcome of this initial research
about the Managers’ Characteristics where this was separated into a horizontal
(relationship between two or more people on the same hierarchical level) and in a
vertical (relationship between a supervisor to his or her subordinates) direction.

106
Figure 3.3: Previous Findings – Managers’ Characteristics (repeated Figure 2.9)
There are six major factors which are relevant in both directions, horizontal and vertical.
Factors like networking, shares in the company and contribution to turnover are mainly
important between managers (horizontal). Shares in the company and contribution to
turnover are not Characteristics per se as they are not influenced by personality. Shares
can be bought or inherited for example and certainly do have an influence in the
company’s strategic direction, however, holding shares and its relationship to legitimate
power is more associated with the Constellation of the Board Members. Contribution to
Turnover is another Characteristic which should be related to someone’s field of action
rather than personality. The head of Sales and Marketing most likely has more influence
on the turnover than the head of the R&D department, although the developments from
R&D will lead to turnover once new developments/products are launched. This will be
discussed in Typology in regards to the strategic orientation of a company. Social
competence, conveyor (of ideas), humour, humility, cooperation and generosity are
skills mainly important between managers and subordinates (vertical relationships) and
are related more to a manager’s personality.
Important Factors in both Directions
Reliability
Role-Model (Archetype) Communication Competence Authority Foresight
Horizontal Factors
Network Shares in the company Contribution to turnover
Vertical Factors
Social competence Conveyor Humour Humility Cooperation Generosity

107
3.5.1 Public Opinion Poll
In order to allocate to each characteristic a numeric value to emphasise its particular
importance, a public opinion poll on the Internet was conducted prior to this research
where participants were requested to rate the importance of the Managers’
Characteristics, both in horizontal and vertical directions. The directions were illustrated
by two small icons, symbolising a manager (wearing a suit) and a subordinate (wearing
a safety helmet). For each direction of relationship, the relevant set of Characteristics
was listed and next to each a Likert-scale was shown.
After the rating, a second screen appeared where the outcome of the poll was visualized.
So each participant immediately received an overview of the general results and was
able to compare the public opinion to his/her own.
Screenshot 3.2: Screenshot of online opinion poll – online results (repetition of Screenshot 2.1)
From 678 votes those responses were eliminated which were incomplete or duplicates.
After this initial cull 525 votes remained.
Screenshot 3.1: Screenshot of the first
online opinion poll (DBA712) to evaluate
Managers’ Characteristics

108
3.5.2 Methodology for the Data collection
The data collection for this thesis about the perspective Managers’ Characteristics was
influenced by three main considerations:
Would the participant of the survey lose motivation if they were requested to
evaluate each Top Management Team member for all 21 Characteristics?
Does achieving a good result in one Characteristic compensate for a poor
performance in another Characteristic?
Are the Characteristics comparable in terms of importance?
In the research prior to this thesis it was analysed if the different Characteristics have
anything in common and it was concluded that this is not the case. No commonalities or
dependences among any Characteristic were identified. Because participants of the
online survey are requested to rate each Top Management Team member it seemed
problematic to ask a participant to rate all Managers by 21 separate Characteristics.
Another point would be that having so many Characteristics to choose from would
make the impact of one Characteristic irrelevant. Because of these considerations, as a
first step, the two Characteristics ‘shares in the company’ and ‘contribution to turnover’
have been sorted out as per the explanation above. Furthermore, those six
Characteristics which were named twice, (and also in the horizontal and vertical
relationships), have been sorted out as it was considered difficult to determine in an
online survey whether a member of a Top Management Team is more reliable towards
colleagues on the same hierarchical level than towards colleagues on a lower hierarchy
level for example. Finally, those Characteristics were chosen which obtained a mode of
10 and a median higher than eight out of ten.
With these few steps a selection of all Characteristics was received which first of all
have scored highest in the opinion poll. Four were named to be important in both
horizontal and vertical relationships (Reliability, Role-Model, Communication and
Competence) plus another Characteristic which is only named in the vertical (Network)
and one which is only named in the horizontal (Social Competence). With these
modifications the author believes that a balanced selection was chosen out of the 21
Characteristics making it more user-friendly for participants.
As the preliminary research prior to this thesis has shown that none of the
Characteristics has anything in common with another one, it was then necessary to
ensure that the calculation model for this thesis included the proviso that performing

109
well in one Characteristic would not compensate for underperforming in another
Characteristic. To achieve this it was decided to weight each Characteristic in
proportion to how the participants from the first public poll have voted for those
Characteristics. It was counted how many people have rated these Characteristics with a
10, 9 or an 8 and so on. Adding up all the results gave an overall score for each
Characteristic.
In the end the value of a Characteristic was set in proportion to the overall value of all
Characteristics; to rate someone in Reliability (for example) with a value of 8 does not
have the same impact as rating someone on Competence also with 8. Furthermore, a cap
on the value of each Characteristic median was set to ensure, someone could not
achieve more points than the ideal. Also people should not be punished for scoring
better in a specific Characteristic. It is not relevant having too much of a certain
Characteristic (for example if Reliability is chosen by the public poll to have an
importance of 7, then a manager is not considered over-reliable if rated with an 8).
3.5.3 Conditions for the Perspective Characteristics
Assuming that the total score for all six Characters is 400 and Reliability scored 100,
Role-Model 50, Competence 75 then their weight is:
Reliability = 100/400 = 025%
Role-Model = 50/400 = 013%
Competence = 75/400 = 019%
…and so forth until the Total = 100%
Then if assuming manager A scored in Reliability 10 points, in Role-Model 8 points and
Competence 6 points then the score would be (10 points x 25%) + (8 points x 13%) + (6
points x 19%). Similarly, to the method applied for Typology and also in the selection
of Characteristics, the weight of the total score of one member is weighted against the
total score of all managers to quantify their share in that section.
3.5.4 Summary of all Perspectives
The result is that the proportion of each member of the management team counts
together as 100%. For all perspectives these 100 percentages are reflecting the influence
on decision-making power in that specific perspective, ignoring the proportion for the
CEO. Once the CEO’s value is deducted (34%) the remainder is then weighted as 1/3
since there are three perspectives: Typology, Team Constellation and Managers’

110
Characteristics. So the combined total of all three perspectives is (100 - 34) = 66% or
22% per each perspective.
3.6 Methodology of the Perspective: Span of Control
The last perspective of this research, Span of Control, should be understood separately
from the previous three perspectives of Typology, Team Constellation and Managers’
Characteristics. The perspective of Span of Control is only added after the evaluation of
each manager’s dominance to evaluate if there is a solid reason to assume if there are
one or more additional influencers in any of the departments of the Top Management
Team Members.
The approach used for this research builds on the principle of Span of Control, where
depending on the size of a company, paired with the complexity of the corresponding
team, limitations exist on whether a team leader can retain an overview. Once this
limitation is reached, there are reasonable grounds to assume that a second force, an
influencer, is officially or unofficially installed to support the team leader. Given the
common situation that Managers are overloaded with their assigned tasks, this ‘second’
voice may be the source for the reports or proposals given to the CEO. If the CEO is
following the advice of his/her most influential Top Management Team Member then at
the end an ‘official decision of the CEO’ is possibly being steered by a regular staff
member.
Size of the Company/Department
Small Medium Large
Com
ple
xit
y/H
iera
rchy
High Ø 4.86
± 1.03
Ø 6.38
±1.75
Ø 8.73
±1.25
Medium Ø 5.38
± 1.00
Ø 11.32
± 3.00
Ø 23.16
± 3.26
Low Ø8.4
± 1.25*
Ø 22.22
± 5.00
Ø 35.33
± 6.38
Table 3.6: Ideal Span of Control findings with average and +/- delta, by the author (repeated Table 2.20)
The results are illustrated in a grid of nine fields where from left to right the three
classifications of size, and in the vertical direction the three classifications of the
complexity of work are shown. Both tables show the same results, however, in the first
table the exact average figures with the +/- Delta are shown, and the second table
illustrates the results in rounded numbers to show the similarity in the diagonal axis.

111
Size of the Company/Department
Small Medium Large
Com
ple
xit
y/H
iera
rchy
High 5 5 10
Medium 5 10 20
Low 10 20 35
Table 3.7: Pattern in the abstracted ideal Span of Control findings, by the author (repeated Table 2.21)
As an example, in a small company a head of department dealing with a high
complexity of tasks will ideally have not more than a Span of Control of 5 people (Ø
4.86 ± 1.03). Should the data analysis of the online survey result in a situation in which
the Span of Control is more than 6 for the department described above, then it is
assumed that the head of this department is losing control and delegating some of their
work to an influencer.
The survey is aligning three parameters to evaluate if the corresponding head of
department has lost control over their staff. These factors are: a) the size of the
company, where this information is relative to the industry the company is in and b) the
complexity of work, which on the other hand is set in relation to the other departments
and the number of staff in the department itself. These two parameters will define the
field in the table above whereas the third question then quantifies if the maximum Span
of Control is exceeded. Wherever this is the case, it will be indicated with (+influencer)
that the head of this department is unlikely to manage the whole department by herself
and therefore has to delegate some leadership tasks or bases her leadership on the
influence of some team members.
It is fundamental to understand that this perspective to identify a potential influencer of
a department is only relevant for departments which achieve more than 16% in the
overall dominance. Only these departments are (in theory) strong enough to form a
dominant coalition with the CEO (34%).
6 15 40

112
In a situation where a CEO is deciding on a recommendation from her strongest
department and that department is headed by someone who has exceeded his Span of
Control, it would mean that the decision taken by the CEO is based ultimately on the
influencer of that specific department.
3.7 Ethical Considerations
In the National Ethics Application Form (NEAF) it was described that this research is
“an approach to allocate numeric values to the professional network relationships
among decision-makers in the same organizational structure”. The aim is to determine,
measure and compare the internal influencers among the Top Management Team
members who might have final responsibility for strategic decisions in profit-oriented
companies. The main part of this thesis – especially in preparation for the data
collection – will be informed through several short literature reviews. Detailed literature
reviews were carried out in the fields of Typology, Team Constellation, Managers’
Characteristics and Span of Control.
In order to collect data from participants and also to justify if the theoretical approaches
can withstand verification in a real environment a survey will be made accessible
online. The Ethics approval was necessary because of the involvement of participants in
this research. It has to be understood, however, that the survey will not be conducted in
a form where the principle investigator requests a participant to communicate details of
their own experience. The participant will be invited as an evaluator of the developed
system. The aim is to reach 100 submissions in total as a mix of all hierarchical levels:
CEO, Top Management Team and Staff. It may be that not every hierarchical level will
be reached equally. The selection process of the candidates will be done in a way that
there is no restriction in regards to the age, gender or ethnicity as long as the participant
is part of the workforce. Results will be treated anonymously where the participants
decide to submit anonymously; however, the IP address as well as time and date is
captured in order to have an anchor of differentiation for internal purposes.
A scan of the approval of the Business Human Research Ethics Committee under which
the survey of this research with participants is covered is printed in the appendices.
3.7.1 Consent Process
There will be no data collection without obtaining the consent from every participant.
Informed consent is obtained from the participants before going through the survey
which results from the compilation of the outcome of our research to evaluate the

113
percentage of influence per Top Management Member regarding strategic decisions.
The candidate will see on their computer screen a window explaining that no data will
be recorded for the sake of identifying the candidate. There will be a second notice at
the end of the application where the participant can decide whether the transmitted data
shall be anonymously transmitted or not. The participant has to confirm before and after
the application with a mouse click that s/he agrees to that procedure prior to proceeding
and/or then finishing the evaluation.
The participants cannot be identified from the obtained data except if the participant has
decided that it is not necessary to keep the collected information anonymously or if
someone undertakes the effort to track back an IP number.
Screenshot 3.3: Consent form and information sheet of the online survey in a pop up window
There is no incentive or payment given to any participant. The participant will see at the
end of the survey an organizational chart which includes a percentage/weighting the
corresponding influence next to each position of the Top Management Team. In
addition there will be a number or sign which indicates potential influencers that are
working in this department. Furthermore, there are several tables enumerating all the
values keyed in by the participants linked with our formulas. Next to each table there is
a brief explanation about the meaning of that specific section as well as an icon linked
to a more detailed document providing an explanatory background.

114
3.7.2 Administrative Details
Name: Mr Yves Clerc
Address: 10 Jalan Bukit Pantai, Condo ZEHN A-22-3 59100 Kuala Lumpur, Malaysia
Organisation: Charles Sturt University School of Management and Marketing
Position: Student
Email: [email protected]
Summary of qualifications and relevant expertise BBA, MBA
Site for which this principal researcher / investigator is responsible.
School of Management and Marketing Faculty of Business, Charles Sturt University
What training or experience does the student have in the relevant research methodology?
Coursework Assignments DBA 711.1 / 711.2 / 711.3 DBA 712.1 / 712.2 / 712.3 DBA 713 DBA 714.1 / 714.2 / 714.3
Supervision Dr. Kerry Tilbrook, BA (Hons) MA (Hons) and PhD Dr. Paul Ammann, M. Sc. / EMBA-HSG / Dr. oec HSG
Acknowledgements
Ms Honey Yam, BSc (Drake) Mathematics, from Malaysia, for translating the researched variables into algorithms and equations as well as being supportive with the multivariate data analyses.
Mr Yaroslav Bykov, Ph.D. (Russian Academy of Sciences) from Russia, for programming the same algorithms and equations into an online software application which was used for the online survey on www.The2ndCeo.com.
Name of Grant / Sponsor
Amount of funding
Yves Clerc
Roughly 1’000 AUD
Name of HREC Charles Sturt University Ethics Human Research Committee
HREC Protocol Number 200/2014/04
Expected benefits for the wider community are:
1) An approach to calculate the allocation of decision power among Top Management Team Members 2) An approach to encircle the potential influencers by analysing organizational structures and team roles.
Table 3.8 Administrative details of this thesis
3.7.3 Profile of Participants
In the context of this survey the author has addressed through social media the
professional workforce which is in general 18 to 65 years old. Cultural and ethnic
background as well as gender or any personal or political orientation has been ignored.
The geographical clusters would be Southeast Asia Region due to the researcher’s
actual place of working as well as Switzerland, the place of origin of the researcher.
Because the link to our online application was also advertised on discussion forums,
which were mainly related to management or Human Resources issues, it is possible
115
that people from other regions have participated. Initially, it was intended to approach at
least 10 volunteers for each echelon: CEO, Top Management Team, and Staff. Because
of the option of participating anonymously, however, it is no longer possible for the
researcher to identify the individual participants and even if identification was possible
since the link for the online application was advertised on open forums it is no longer
possible to know all participants in order to categorize them.
3.7.4 LOTE Subjects
LOTE Subjects: It is possible that anyone who has access to a computer might have
coincidentally participated in this survey. There is no physical or psychological harm to
anyone who clicks through it. In the worst case the result might just make no sense.
From the researcher’s point of view, these results will not have an influence on the total
results, as the coincidental participation of any population as defined as LOTE Subjects
is possible but is unlikely or has no consequence due to the fact that the addressed
participant should be actively involved in a profit oriented organization.
3.7.5 Unequal Relationship
There is a chance that some of the participants are working in the same organization as
the author, due to the fact that the holding structure includes more than 40 companies.
Those participants working in the same group of companies, however, have been
addressed to test run the application in regards to their previous working place so that
there should be no overlapping with the environment of the author. Although the
organization would be known and all involved people are working there, since the
whole application is based on giving points without writing anything it is the sole
discretion of a participant to submit the data anonymously. Furthermore, participants are
free to decide if they want to participate in general and free to decide if the outcome
shall be saved or not until the complete end when the results are already visible on the
participants’ screen.
3.8 Conclusion to Chapter 3: Methodology
In the introduction this chapter has defined and explored the justification for the
methodology employed in this research, the role of the researcher during this
dissertation as well as the clarification of details about the procedures, the instruments
and also the limitations of this research. Then the author has described how the
collection of data will be conducted for all of the key parameters of the four
perspectives evaluated in the Literature Review (Chapter 2) which are; Typology,

116
Constellation of the Top Management, Managers’ Characteristics and Span of Control.
In the final section, the ethics approval for the survey including its consent process are
described and details about the on-line survey group of participants are provided.
Chapter 4 on the Data Collection then follows and details the setup and functionality of
the online survey which gathers the primary data for the thesis. Firstly, it enumerates all
the questions that the participant will be using during the survey after giving consent.
Whereas for some questions (such as Typology, department, education, size and
complexity of each department, age and tenure) a selection is given, the questions about
the Characteristics have to be answered on Likert-scales and only the name (real or
fictitious) are keyed in by the participants. Chapter 4 describes each step in detail
supporting it with screenshots from the actual online survey. In the second part a range
of selected submissions are discussed for each team size to highlight the findings and
observations that occurred through the data collection. The most interesting samples
were collected among the team sizes of three to five Top Management Team members
(excluding the CEO) because the findings from six team members and upwards were
insignificant.
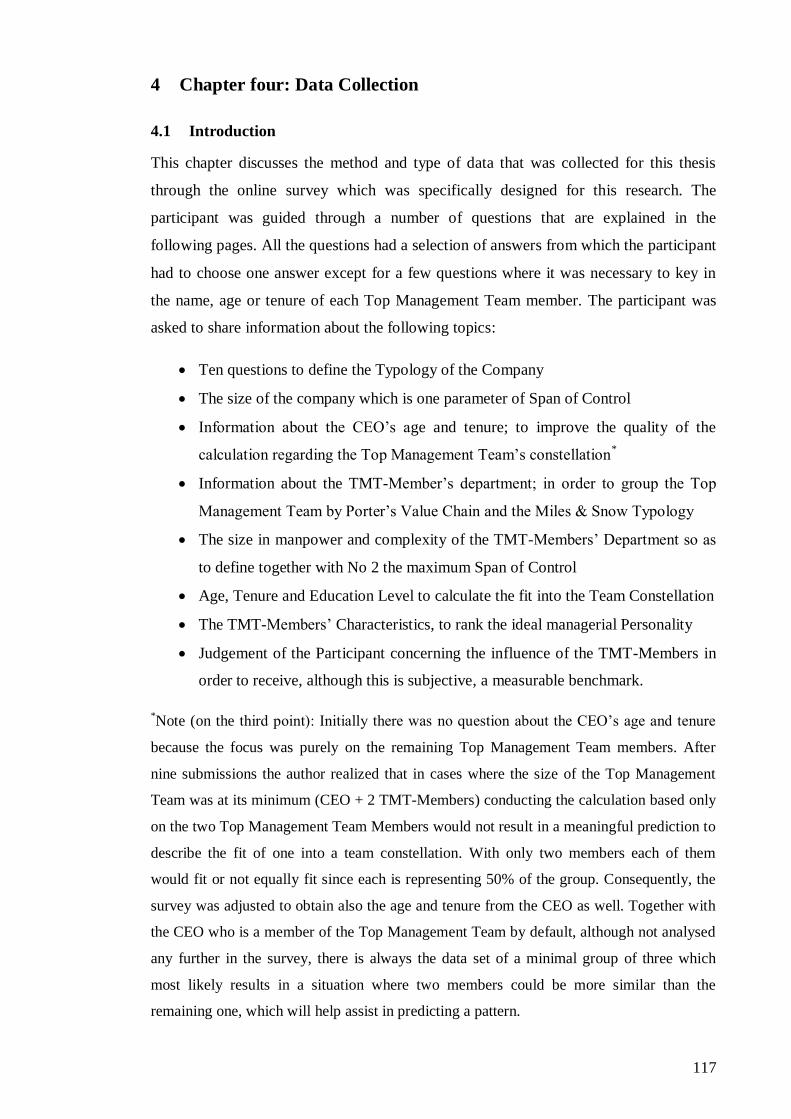
117
4 Chapter four: Data Collection
4.1 Introduction
This chapter discusses the method and type of data that was collected for this thesis
through the online survey which was specifically designed for this research. The
participant was guided through a number of questions that are explained in the
following pages. All the questions had a selection of answers from which the participant
had to choose one answer except for a few questions where it was necessary to key in
the name, age or tenure of each Top Management Team member. The participant was
asked to share information about the following topics:
Ten questions to define the Typology of the Company
The size of the company which is one parameter of Span of Control
Information about the CEO’s age and tenure; to improve the quality of the
calculation regarding the Top Management Team’s constellation*
Information about the TMT-Member’s department; in order to group the Top
Management Team by Porter’s Value Chain and the Miles & Snow Typology
The size in manpower and complexity of the TMT-Members’ Department so as
to define together with No 2 the maximum Span of Control
Age, Tenure and Education Level to calculate the fit into the Team Constellation
The TMT-Members’ Characteristics, to rank the ideal managerial Personality
Judgement of the Participant concerning the influence of the TMT-Members in
order to receive, although this is subjective, a measurable benchmark.
*Note (on the third point): Initially there was no question about the CEO’s age and tenure
because the focus was purely on the remaining Top Management Team members. After
nine submissions the author realized that in cases where the size of the Top Management
Team was at its minimum (CEO + 2 TMT-Members) conducting the calculation based only
on the two Top Management Team Members would not result in a meaningful prediction to
describe the fit of one into a team constellation. With only two members each of them
would fit or not equally fit since each is representing 50% of the group. Consequently, the
survey was adjusted to obtain also the age and tenure from the CEO as well. Together with
the CEO who is a member of the Top Management Team by default, although not analysed
any further in the survey, there is always the data set of a minimal group of three which
most likely results in a situation where two members could be more similar than the
remaining one, which will help assist in predicting a pattern.
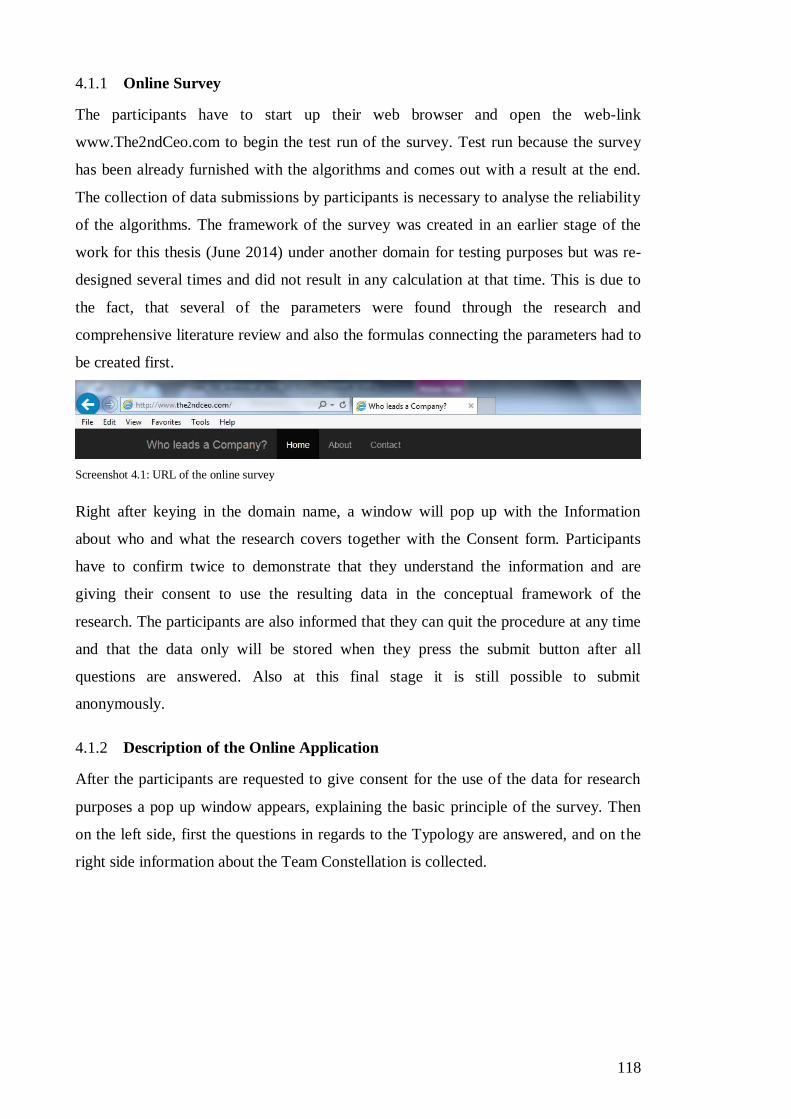
118
4.1.1 Online Survey
The participants have to start up their web browser and open the web-link
www.The2ndCeo.com to begin the test run of the survey. Test run because the survey
has been already furnished with the algorithms and comes out with a result at the end.
The collection of data submissions by participants is necessary to analyse the reliability
of the algorithms. The framework of the survey was created in an earlier stage of the
work for this thesis (June 2014) under another domain for testing purposes but was re-
designed several times and did not result in any calculation at that time. This is due to
the fact, that several of the parameters were found through the research and
comprehensive literature review and also the formulas connecting the parameters had to
be created first.
Screenshot 4.1: URL of the online survey
Right after keying in the domain name, a window will pop up with the Information
about who and what the research covers together with the Consent form. Participants
have to confirm twice to demonstrate that they understand the information and are
giving their consent to use the resulting data in the conceptual framework of the
research. The participants are also informed that they can quit the procedure at any time
and that the data only will be stored when they press the submit button after all
questions are answered. Also at this final stage it is still possible to submit
anonymously.
4.1.2 Description of the Online Application
After the participants are requested to give consent for the use of the data for research
purposes a pop up window appears, explaining the basic principle of the survey. Then
on the left side, first the questions in regards to the Typology are answered, and on the
right side information about the Team Constellation is collected.
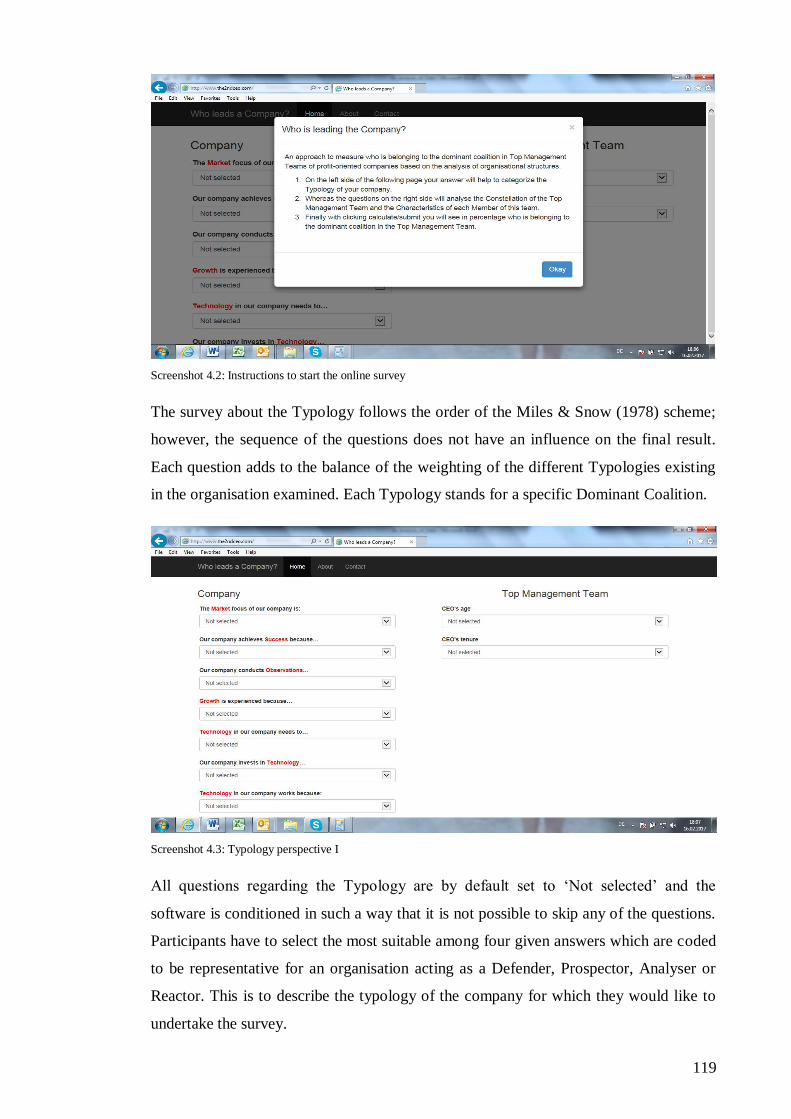
119
Screenshot 4.2: Instructions to start the online survey
The survey about the Typology follows the order of the Miles & Snow (1978) scheme;
however, the sequence of the questions does not have an influence on the final result.
Each question adds to the balance of the weighting of the different Typologies existing
in the organisation examined. Each Typology stands for a specific Dominant Coalition.
Screenshot 4.3: Typology perspective I
All questions regarding the Typology are by default set to ‘Not selected’ and the
software is conditioned in such a way that it is not possible to skip any of the questions.
Participants have to select the most suitable among four given answers which are coded
to be representative for an organisation acting as a Defender, Prospector, Analyser or
Reactor. This is to describe the typology of the company for which they would like to
undertake the survey.

120
Screenshot 4.4 Typology perspective II
Since there are ten questions in total; the answer for each of the questions does not have
the amplitude to change the overall result. The computation is done in such a way that
for each question the dominant coalition is calculated where the dominant departments
always will receive a higher percentage than the subordinate departments. As explained
in the previous chapter, there may be cases where there are fewer departments in the
secondary group than in the dominant group. Then the answers of all ten questions are
adding up to a total score per department. At this stage of the application the score is
expressed in a percentage as part of 100% among the Top Management Team members.
Only at the end, the percentages of all parts of the survey are consolidated and then
calculated without the share of the CEO, which is described in this dissertation as 34%
so as to possess a blocking minority.
Screenshot 4.5: Size of the company

121
The survey continues with the collection of the parameters about the company size. The
answer to this question is subjective and relative dependent on the participant’s point of
view. That is why it is explained in this question that the size is indicated in relation to
the industry the company is in which should provide a benchmark for the participant.
The size of the company is amongst the questions which are not related to the
percentage calculation of Typology, Team Constellation or Managers’ Characteristics
because this answer is used later to give one dimension of the calculation if a Manager
has exceeded their Span of Control.
Screenshot 4.6: Size of the Top Management Team
Also the participant is asked about the age and tenure of the CEO. Although the CEO is
not evaluated in the research for this thesis, the collected data is helpful to ensure that
the Constellation of the Top Management Team can be calculated even in cases where
there are only two Top Management Team members or for larger teams because it helps
to produce smoother results. After this, the participants are requested to evaluate each
member of the top management team in regard to:
the title of the Department (for which the selection of the seven departments
defined by Porter’s Value Chain is given) and this helps to allocate managers by
the Typology of the company into the Dominant Coalition,
the complexity of work in this department as well as the number of staff in this
department (which are together the other two dimensions to evaluate the Span of
Control of each of the departments) and
questions in regard to the age, tenure and education of each manager (which are
defining the fit into the Team Constellation of a Manager into the Top
Management Team).

122
Screenshot 4.7: CEO’s age and tenure
The questions about each member of the Top Management Team are then divided into
six Characteristics which were selected earlier in this thesis to describe the ideal profile
of a manager. When those Characteristics were identified it was discussed that some
Characteristics of managers are required in both directions; horizontal (manager to
manager) as well as vertical (manager to subordinates) which are in this thesis
Reliability, Archetype (Role Model), Communication and Competence.
Screenshot 4.8: Details about each member of the Top Management Team
Additionally, there are two more Characteristics; Social Competence for the relationship
of manager to subordinate and Network for the relationship of manager to manager. All
six Characteristics had to be keyed in for each member of the top management team
except for the CEO because the CEO’s power and influence is calculated separately.
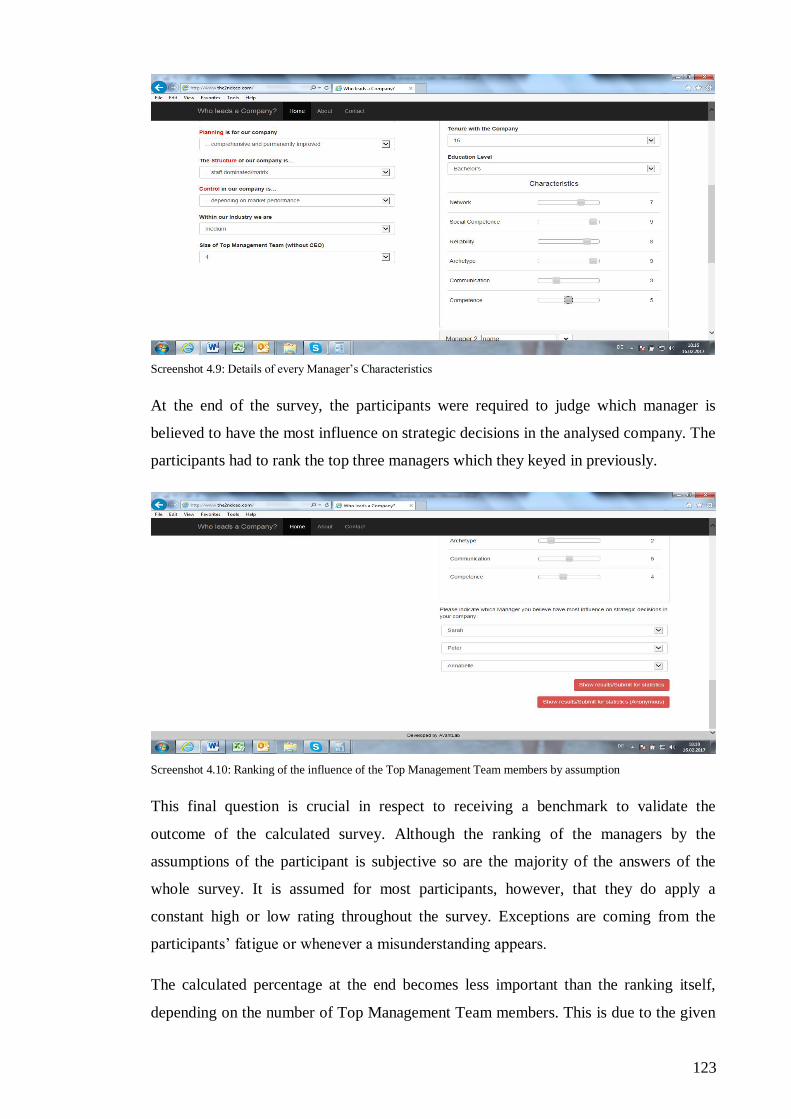
123
Screenshot 4.9: Details of every Manager’s Characteristics
At the end of the survey, the participants were required to judge which manager is
believed to have the most influence on strategic decisions in the analysed company. The
participants had to rank the top three managers which they keyed in previously.
Screenshot 4.10: Ranking of the influence of the Top Management Team members by assumption
This final question is crucial in respect to receiving a benchmark to validate the
outcome of the calculated survey. Although the ranking of the managers by the
assumptions of the participant is subjective so are the majority of the answers of the
whole survey. It is assumed for most participants, however, that they do apply a
constant high or low rating throughout the survey. Exceptions are coming from the
participants’ fatigue or whenever a misunderstanding appears.
The calculated percentage at the end becomes less important than the ranking itself,
depending on the number of Top Management Team members. This is due to the given

124
limitation occurring when one is fragmenting a capped value among an increasing
number of people. In this thesis a maximum of 66% of the decision power is allocated
among the Top Management Team. As the CEO has a blocking minority of 34% any
value larger than 16% allocated to one member of the Top Management Team would
cumulate in a majority when teaming up with the CEO. Although it is hypothetically
possible that one manager is outstanding in their performance and all others are
performing poorly, it is more likely to have a balanced team where no one person would
collect the vast majority of the points. This would mean that results showing potential
candidates receiving around 16% share on dominance are most likely in teams of up to
five managers (plus CEO). In larger teams the application should still detect more
powerful managers but may not result anymore in a dominating figure. The core value
of the developed application is finally the ability to distinguish people by factors which
are non-metric in order to express something in a value. This is the central outcome of
this thesis and where future research could be expanded.
4.1.3 Sample Survey-Report
When the participants have finished the data entry, the choice is given between
submitting the data showing the participants’ details or doing so anonymously.
Regardless of which option is chosen the participants are rewarded for their work with
an instant evaluation of the submitted data. The report below is constructed to
demonstrate a potential outcome.
Screenshot 4.11: Sample survey-report organizational chart with percentage values and indication of potential influencers
The Survey-Report starts with a visualization of an organizational chart. In the example
above a team with four managers; finance, production, marketing and sales is analysed.
Beside the name of the manager and the indication of the department they are heading,

125
there is also the result of the calculated dominance in the percentage shown. In this
example, Sarah, the head of Production achieved the highest value (21%), Annabelle
heading up Marketing, ends up second (18%) where both could form a dominant
coalition with the CEO (34%). Peter, the head of Finance, reaches 15% and Marlene the
head of Sales attains only 10%. Attached to the organisational chart is one more field
below Sarah, Production, which contains the word ‘Influencer’. This reveals that Sarah
has due to the headcount supervised by her in relation to the complexity of work in her
department and also the size of the company, exceeded the maximum Span of Control.
Therefore it is appropriate to assume in her department that there is at least one
subordinate officially or unofficially influencing Sarah. Since Sarah is representing the
strongest department, this influencer indirectly may lead the company.
After that the report shows a ranking of the manager’s dominance assumed by the
participant compared with the ranking calculated by the online tool. Throughout the
whole report, next to each topic, there is a short explanation describing in brief what the
data is about or what the reader should be expecting. There is also an icon at the bottom
of each text linked to a more detailed explanation of the research.
Screenshot 4.12: Sample survey-report comparing ranking by calculation (computer) and assumption (participant)
The table Typology is showing all aspects (market, technology etc.) and the implication
of the selected answer on the dominant coalition according to Miles & Snow (1978).
Based on Typology the example company is mostly dominated by financial issues
which has given Peter a clear advantage over the other managers.

126
Screenshot 4.13: Sample survey-report perspective Typology
When analysing the Constellation table, however, it becomes clearer why Peter has lost
his pole position. Compared to the rest of the managers, Peter loses some points because
his age in proportion to the rest of the team is a bit far from the ideal, not because he is
the oldest, but because his positioning is a deviation from the group. The lowest score
was reached by Marianne who is the youngest one and even further away in the
deviation. Marianne’s tenure fits more to the group than Peter’s tenure because he has
stayed too long with the company which could negatively influence his openness to
dynamic change. Sarah who was behind in the Typology chart is gaining points with the
best fit into the Top Management team by having the right age, a good tenure and the
highest education. After Typology and Constellation, Annabelle and Sarah are still head
to head having collected 55.8% and 60.2% respectively.
Screenshot 4.14: Sample survey-report perspective Constellation

127
The virtual competition in the example is only decided after reviewing the last
perspective; Managers’ Characteristics. Sarah is dominating clearly because of earning
high scores across the six Characteristics whereas Peter and Annabelle are positioned
more in the middle and Marlene is receiving the lowest points as shown in the
screenshot below.
The sample report which was described on the previous pages was designed to
demonstrate that each of the perspectives (Typology, Team Constellation
or Managers’ Characteristics) is not enough to predetermine a domination favouring one
Screenshot 4.15: Sample survey-report perspective Managers’ Characteristics
department. Although the Typology of the example company was clearly in favour of
the Finance department, the Constellation and Characteristics perspectives have
influenced the total result in such a way that the constellation of the dominant coalition
has changed and Production and Marketing have taken over the lead.
Throughout the following pages, the valid submissions of the online survey are analysed
in the same format as just demonstrated, to summarize in the next chapter if it was
possible through this research to verify the hypotheses of this thesis or parts thereof.
The review is separated into an overall review in statistical form in which all
submissions in their entirety are reflected. This leads to the second section where
selected submissions are discussed to illuminate specific outcomes.

128
4.2 Collection of Data
4.2.1 Synopsis of 114 Submissions
To motivate more than 100 professionals from different ethnic and demographic
backgrounds was the goal when participants were sourced to test run the developed
application on the web domain www.The2ndCeo.com which was set up specifically for
this thesis. In a period of roughly one month, 114 submitted data forms were filled out
by professionals from 37 large, 46 medium and 31 small organizations. Unfortunately, 9
out of the 114 submissions were not filled out completely so that in some of the
evaluations only 105 are mentioned as the total participating companies. This chapter
begins with the synopsis of the collected data where not all count towards the results in
regards to evaluating the most dominant manager; however, they do contribute to the
body of knowledge in order to answer the hypotheses.
Starting with the average age of the CEOs’ which from all the submissions was 48years
and 11months, with spans between 22 and 62 years old (the most common ages
mentioned are 8x50, 7x40, 7x52, 7x57 and 6x45 out of a total of 114). There is a very
broad band of CEOs’ tenure ranging from 1 up to 40 years which is probably less
meaningful than the average tenure which is 11.5 years gained from the submissions
collected.
In the selection of Typology where the participant chooses from among the four
possible Typologies to describe the overall company there were only 14 out of 114
companies which did not select at least once each possible Typology (Defender,
Analyser, Prospector or Reactor). This is leading to the interpretation that there is
almost never something like a uniform Typology among organizations because the vast
majority of the companies are organised as a hybrid form of Typologies. The table
below shows how many companies have selected any specific Typology more than
once. For example, there is only one company which has selected nine times the same
Typology; almost a homogeneous selection. Whereas for example, 22 companies have a
dominant Typology that was selected five times.
No of Companies 104 84 65 22 21 7 3 1
…selected x time the same Typology (maximum possible is 10)
2 3 4 5 6 7 8 9
Table 4.1: Weighting of Typology by number of participating companies
Overall Defender was the most often selected Typology as it was selected 412 times
followed by Prospector 309 times, Analyser 220 times and Reactor 185 times.

129
In total the data from 428 Managers working for 114 companies was collected. Without
the CEO, the management team counted 28x2, 31x3, 19x4, 24x5, 5x6, 5x7, 2x9
managers which results in an average of 3.75 Managers in the Top Management Teams
(not counting the CEO). The table below is showing the number of times each of the
departments was selected. Sales and Finance are ranking on top of the list whereas
Logistics and Infrastructure are forming the bottom of the table. In terms of the
algorithm in the online application two things have to be mentioned. These are that
Procurement is treated in terms of the calculation similarly to Finance whenever the
Typology ‘Analyser’ is chosen because the supportive activities according to Porter’s
Value Chain (1980) are grouped together.
Department …times
mentioned
Defender Prospector Analyser Reactor
Sales 89 X X
Finance 81 X X X
Production 55 X X
Service 50 X
Marketing 37 X X
HR 36 X X
R & D 32 X X X
Logistics 20 X
Infrastructure 14 X X
Table 4.2: Frequency of departments in the survey and the potential Dominant Coalition they belong to, according to
Miles & Snow (1978)
The largest amount of data was collected in regards to the Top Manager Team
Members. For each member of the Top Management Team six Characteristics have
been evaluated through Likert-Scales. The first table below shows the number of data
sets collected and the average values which were given from the participants.
Table 4.3 Characteristics by frequency and departments
In a second step the values in dependence of each Characteristic over all the
departments are sorted out to ensure that a comparison could be undertaken. Each of the
Characteristics was analysed for the highest and the smallest values and then the

130
complete span of values was divided into deciles. After that, each department was
grouped into the decile by Characteristics or if a value was in between the deciles the
result was rounded up to allocate scores between 1and 10. With this system for each of
the Characteristics the weakest and the strongest department could be visualized. For
example, in terms of the Characteristic ‘Network’ the head of department from Sales
will obtain the best rating with a 10 whereas the head of department from Finance will
gain the lowest rating with 1.
Table 4.4: Balanced weighting of Managers’ Characteristics
The question about the Complexity of Departments did result overall in a medium to
high perception of complexity that the departments have to manage.
Table 4.5: Complexity of departments with the core area indication in yellow
The table above shows for example that Marketing, Human Resources and Procurement
are departments which are perceived to be challenged by an average level of complexity
whereas the Research & Development department was judged from almost all
participants to handle tasks of high complexity. The results of the above table are not
Department …times mentioned High Complexity Medium Complexity Low Complexity
Sales 89 42% 49% 9%
Finance 81 46% 41% 13%
Production 55 49% 44% 7%
Service 50 66% 28% 6%
Marketing 37 35% 54% 11%
HR 36 22% 50% 28%
R & D 32 94% 6%
Logistics 20 40% 45% 15%
Procurement 14 29% 50% 21%
Infrastructure 14 50% 21% 29%
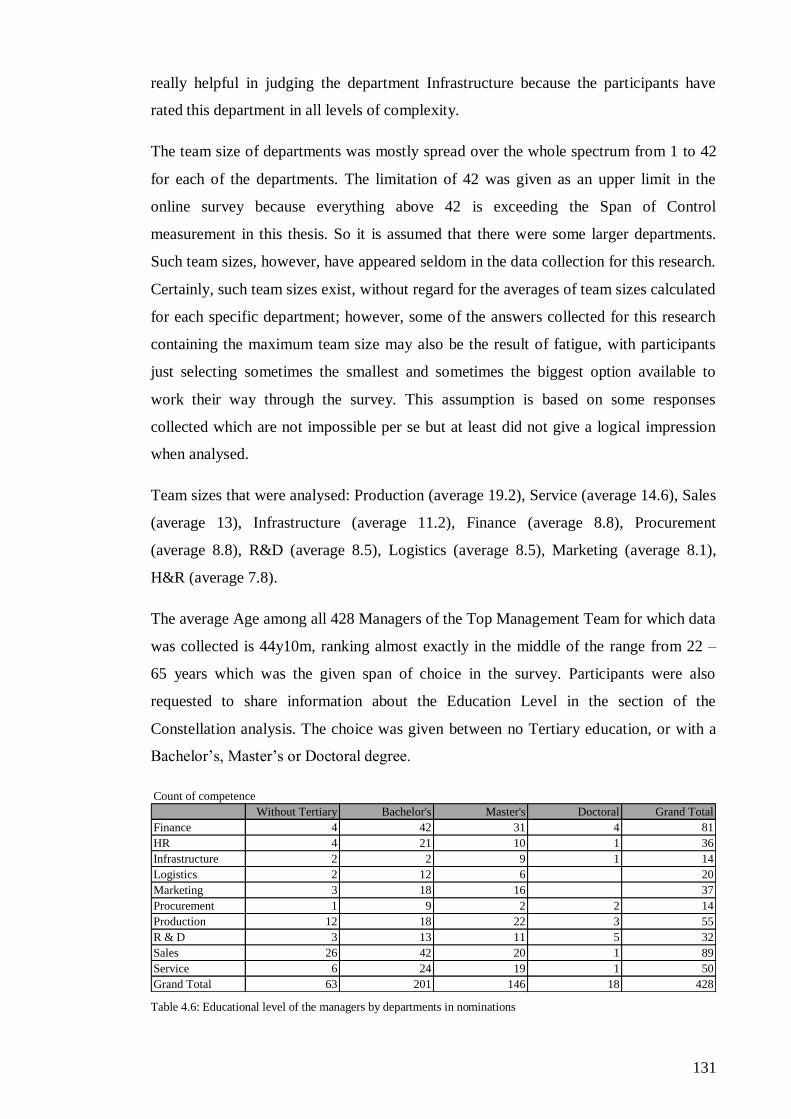
131
really helpful in judging the department Infrastructure because the participants have
rated this department in all levels of complexity.
The team size of departments was mostly spread over the whole spectrum from 1 to 42
for each of the departments. The limitation of 42 was given as an upper limit in the
online survey because everything above 42 is exceeding the Span of Control
measurement in this thesis. So it is assumed that there were some larger departments.
Such team sizes, however, have appeared seldom in the data collection for this research.
Certainly, such team sizes exist, without regard for the averages of team sizes calculated
for each specific department; however, some of the answers collected for this research
containing the maximum team size may also be the result of fatigue, with participants
just selecting sometimes the smallest and sometimes the biggest option available to
work their way through the survey. This assumption is based on some responses
collected which are not impossible per se but at least did not give a logical impression
when analysed.
Team sizes that were analysed: Production (average 19.2), Service (average 14.6), Sales
(average 13), Infrastructure (average 11.2), Finance (average 8.8), Procurement
(average 8.8), R&D (average 8.5), Logistics (average 8.5), Marketing (average 8.1),
H&R (average 7.8).
The average Age among all 428 Managers of the Top Management Team for which data
was collected is 44y10m, ranking almost exactly in the middle of the range from 22 –
65 years which was the given span of choice in the survey. Participants were also
requested to share information about the Education Level in the section of the
Constellation analysis. The choice was given between no Tertiary education, or with a
Bachelor’s, Master’s or Doctoral degree.
Table 4.6: Educational level of the managers by departments in nominations
Count of competence
Without Tertiary Bachelor's Master's Doctoral Grand Total
Finance 4 42 31 4 81
HR 4 21 10 1 36
Infrastructure 2 2 9 1 14
Logistics 2 12 6 20
Marketing 3 18 16 37
Procurement 1 9 2 2 14
Production 12 18 22 3 55
R & D 3 13 11 5 32
Sales 26 42 20 1 89
Service 6 24 19 1 50
Grand Total 63 201 146 18 428
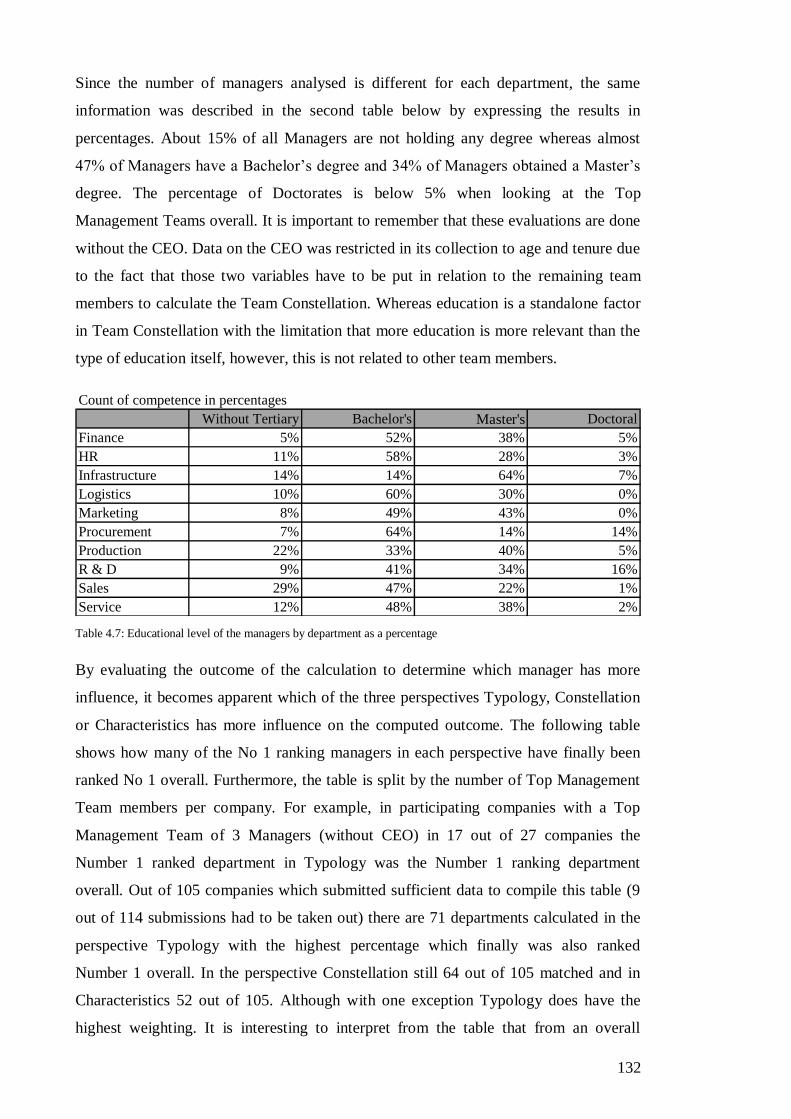
132
Since the number of managers analysed is different for each department, the same
information was described in the second table below by expressing the results in
percentages. About 15% of all Managers are not holding any degree whereas almost
47% of Managers have a Bachelor’s degree and 34% of Managers obtained a Master’s
degree. The percentage of Doctorates is below 5% when looking at the Top
Management Teams overall. It is important to remember that these evaluations are done
without the CEO. Data on the CEO was restricted in its collection to age and tenure due
to the fact that those two variables have to be put in relation to the remaining team
members to calculate the Team Constellation. Whereas education is a standalone factor
in Team Constellation with the limitation that more education is more relevant than the
type of education itself, however, this is not related to other team members.
Table 4.7: Educational level of the managers by department as a percentage
By evaluating the outcome of the calculation to determine which manager has more
influence, it becomes apparent which of the three perspectives Typology, Constellation
or Characteristics has more influence on the computed outcome. The following table
shows how many of the No 1 ranking managers in each perspective have finally been
ranked No 1 overall. Furthermore, the table is split by the number of Top Management
Team members per company. For example, in participating companies with a Top
Management Team of 3 Managers (without CEO) in 17 out of 27 companies the
Number 1 ranked department in Typology was the Number 1 ranking department
overall. Out of 105 companies which submitted sufficient data to compile this table (9
out of 114 submissions had to be taken out) there are 71 departments calculated in the
perspective Typology with the highest percentage which finally was also ranked
Number 1 overall. In the perspective Constellation still 64 out of 105 matched and in
Characteristics 52 out of 105. Although with one exception Typology does have the
highest weighting. It is interesting to interpret from the table that from an overall
Count of competence in percentages
Without Tertiary Bachelor's Master's Doctoral
Finance 5% 52% 38% 5%
HR 11% 58% 28% 3%
Infrastructure 14% 14% 64% 7%
Logistics 10% 60% 30% 0%
Marketing 8% 49% 43% 0%
Procurement 7% 64% 14% 14%
Production 22% 33% 40% 5%
R & D 9% 41% 34% 16%
Sales 29% 47% 22% 1%
Service 12% 48% 38% 2%
Master's

133
judgement the importance of Constellation and Managers’ Characteristics is
proportionally higher in smaller teams whereas the importance of these perspectives is
lessened with increasing team size.
Table 4.8: Occurrence of first ranking department vs perspective, split by team size
The next two tables are showing the rankings of the head of Departments by calculation
of the online application (first table) and then by assumption of the participant (second
table). Both tables are set up the same way to allow an in-depth comparison. Vertically
there are four main sections showing the accumulated results when the department was
ranked first, second and third, whereas for each rank there is an additional, separate
section afterwards. In the horizontal axis the tables are split in the team sizes of the Top
Management.
Overall it is apparent that the intuitive feelings of the participants have yielded a very
high consensus with the calculated algorithm of this thesis. Finance / Sales / Production
were calculated as ranked most often among the top three with
67 – 67 – 40 compared to the assumption table with 67 – 75 – 36. Whereas the
calculation as predicted on the first rank Finance / Sales / Marketing with
36 – 29 – 13 nominations versus the assumption of 26 – 33 – 14. In both, calculation
and assumption, Production is third among the most often named departments but does
not appear among the top three on the 1st Rank section. Analysing the
2nd
Rank section finds Finance / Sales / Production nominated in total
19 – 25 – 19 times versus the assumed nominations of 25 – 24 – 17. In both the first
ranking departments as well as the second ranking departments the number of
nominations are dropping significantly. The pattern seems to change in the 3rd
rank
where the calculation sees Service / Production / Sales to be strongest whereas the
assumption chart is still dominated by Sales and Finance. The differences in the results,
however, are becoming less obvious and vaguer.
Overall 1st department vs 1st in perspective Number of Managers in the TMT without CEO
2 Mngr 3 Mngr 4 Mngr 5 Mngr 6 Mngr 7 Mngr 8 Mngr 9 Mngr Total
Typology 17 17 10 17 4 4 0 2 71
Constellation 22 17 10 10 1 4 0 0 64
Characteristics 20 13 8 8 2 1 0 0 52
Total number of companies 27 27 18 22 4 5 0 2 105

134
Table 4.9: Departments by team size and rank according to the computer calculation
Based on the frequency with which a department is named compared to their ranking a
similar result which could be termed ‘the winner takes it all’ was the outcome and the
performance of the remaining departments is dropping abruptly. From the 428
departments keyed in throughout the entire survey, there are most entries for 83 Sales,
76 Finance and 51 Production (followed by 45 Service, 36 Marketing and 35 HR).
Whereas Sales on average ((calculation + assumption) / 2) gets Ranked 1st by 85%, but
Finance with fewer nominations achieved a 88% chance of being Ranked 1st.
Production on the other hand, although the third most often named department, is only
achieving a 35% chance of Ranking 2nd
which is about the same for Marketing,
obtaining a 37% chance of being Ranked 1st. The highest result in a proportional chance
for Service is only at 3rd
Rank with 27% and finally for HR the opportunity to Rank 2nd
or 3rd
is only 20% and 19% respectively.
CALCULATION of Ranking Number of Managers in the TMT without CEO
2 Mngr 3 Mngr 4 Mngr 5 Mngr 6 Mngr 7 Mngr 8 Mngr 9 Mngr Total
Frequency a department ranked 1st, 2nd or 3rd
Finance 13 16 14 16 4 3 0 1 67
Production 8 12 5 13 1 1 0 0 40
Marketing 10 5 3 8 1 0 0 0 27
R & D 4 4 3 2 2 2 0 0 17
Sales 12 22 15 12 2 4 0 0 67
HR 2 6 6 4 2 1 0 2 23
Service 5 10 6 3 0 2 0 2 28
Infrastructure 0 0 1 2 0 0 0 0 3
Logistics 0 3 0 3 0 1 0 0 7
Procurement 0 3 1 3 0 1 0 1 9
Frequency a department ranked 1st
Finance 4 7 8 11 3 3 0 0 36
Production 3 1 0 3 0 0 0 0 7
Marketing 6 4 1 2 0 0 0 0 13
R & D 3 0 1 1 1 1 0 0 7
Sales 8 10 6 4 0 1 0 0 29
HR 1 2 1 0 0 0 0 1 5
Service 2 1 0 0 0 0 0 0 3
Infrastructure 0 0 1 0 0 0 0 0 1
Logistics 0 1 0 0 0 0 0 0 1
Procurement 0 1 0 1 0 0 0 1 3
Frequency a department ranked 2nd
Finance 9 4 5 1 0 0 0 0 19
Production 5 6 1 6 0 1 0 0 19
Marketing 4 0 1 3 1 0 0 0 9
R & D 1 0 2 0 1 1 0 0 5
Sales 4 6 7 5 1 2 0 0 25
HR 1 4 0 1 1 0 0 1 8
Service 3 5 1 0 0 0 0 1 10
Infrastructure 0 0 0 1 0 0 0 0 1
Logistics 0 0 0 3 0 1 0 0 4
Procurement 0 2 1 2 0 0 0 0 5
Frequency a department ranked 3rd
Finance 0 5 1 4 1 0 0 1 12
Production 0 5 4 4 1 0 0 0 14
Marketing 0 1 1 3 0 0 0 0 5
R & D 0 4 0 1 0 0 0 0 5
Sales 0 6 2 3 1 1 0 0 13
HR 0 0 5 3 1 1 0 0 10
Service 0 4 5 3 0 2 0 1 15
Infrastructure 0 0 0 1 0 0 0 0 1
Logistics 0 2 0 0 0 0 0 0 2
Procurement 0 0 0 0 0 1 0 0 1
Total number of companies 27 27 18 22 4 5 0 2

135
Table 4.10: Departments by team size and rank according to participants’ assumptions
Comparing the accuracy in which the online application has matched the assumption of
the below table demonstrates impressively that in all company sizes the developed
system achieved a higher accuracy than by allocating the percentages by chance. As an
example in a company of three Managers in the Top Management Team there would be
a chance of 33.3% to identify the leader by random guessing, however, the
system reached an accuracy of 55.5% on the first rank and 51.8% on the second
rank. Bearing in mind that the system is based on the same algorithm and is compared
with the unpredictable feelings of 114 individuals who have keyed in the data.
Table 4.11: Matching of the survey’s calculation and assumption’s results
ASSUMPTION of Ranking Number of Managers in the TMT without CEO
2 Mngr 3 Mngr 4 Mngr 5 Mngr 6 Mngr 7 Mngr 8 Mngr 9 Mngr Total
Frequency a department ranked 1st, 2nd or 3rd
Finance 12 16 14 15 4 5 0 1 67
Production 8 12 4 10 0 1 0 1 36
Marketing 10 5 4 6 0 1 0 0 26
R & D 4 4 3 5 2 1 0 0 19
Sales 13 22 15 16 4 4 0 1 75
HR 2 6 3 1 0 0 0 0 12
Service 5 10 5 4 0 2 0 3 29
Infrastructure 0 0 2 3 1 0 0 0 6
Logistics 0 3 3 4 1 1 0 0 12
Procurement 0 3 1 2 0 0 0 0 6
Frequency a department ranked 1st
Finance 5 7 3 7 2 2 0 0 26
Production 3 1 1 5 0 0 0 0 10
Marketing 6 2 3 3 0 0 0 0 14
R & D 1 1 1 0 0 0 0 0 3
Sales 9 9 5 6 1 2 0 1 33
HR 0 2 1 0 0 0 0 0 3
Service 3 4 3 0 0 1 0 1 12
Infrastructure 0 0 1 0 0 0 0 0 1
Logistics 0 0 0 0 1 0 0 0 1
Procurement 0 1 0 1 0 0 0 0 2
Frequency a department ranked 2nd
Finance 7 3 6 5 1 3 0 0 25
Production 5 7 1 3 0 0 0 1 17
Marketing 4 2 1 1 0 0 0 0 8
R & D 3 1 1 2 1 1 0 0 9
Sales 4 7 6 5 2 0 0 0 24
HR 2 2 1 1 0 0 0 0 6
Service 2 3 0 2 0 0 0 1 8
Infrastructure 0 0 1 1 0 0 0 0 2
Logistics 0 1 0 1 0 1 0 0 3
Procurement 0 1 1 1 0 0 0 0 3
Frequency a department ranked 3rd
Finance 0 6 5 3 1 0 0 1 16
Production 0 4 2 2 0 1 0 0 9
Marketing 0 1 0 2 0 1 0 0 4
R & D 0 2 1 3 1 0 0 0 7
Sales 0 6 4 5 1 2 0 0 18
HR 0 2 1 0 0 0 0 0 3
Service 0 3 2 2 0 1 0 1 9
Infrastructure 0 0 0 2 1 0 0 0 3
Logistics 0 2 3 3 0 0 0 0 8
Procurement 0 1 0 0 0 0 0 0 1
Total number of companies 27 27 18 22 4 5 0 2
Accuracy of calculation vs assumption Number of Managers in the TMT without CEO
2 Mngr 3 Mngr 4 Mngr 5 Mngr 6 Mngr 7 Mngr 8 Mngr 9 Mngr Total
1st rank match calculation vs assumption 16 15 6 6 2 1 0 0 46
2nd rank match calculation vs assumption 15 14 6 6 1 2 0 1 45
Total number of companies 27 27 18 22 4 5 0 2 105

136
Examining the 1st and 2
nd Ranks together the performance of the developed algorithm
can be summarized as promising. Taking for example, the case of 22 companies with a
team size of five, means there are 110 managers of which one would have to hit two
matches being blindfolded resulting in a chance result of 1.8% whereas the system has
shown an accuracy of 10.9% in the same case. Those matching accuracies ignore
‘nearby’ results and the chances of the unreliability of the participants where some of
the participants were too tired or unmotivated to answer the final question (which is the
basis for the above comparison) or have keyed in a wrong result. The ranking by
assumption is reflecting, as far as when filled in honestly, a cumulative objective
impression or an assumption that this could be what the designer of the survey is
expecting. Whereas the system is computing the results based on a set of value grids
without having preferences for any result as shown in the example at the beginning of
this chapter where the ranking has kept on changing after each perspective.
Finally, in the discussion is the revelation of the existence of Influencers, split by team
size and department and based on the phenomena of exceeding the Span of Control. The
bottom line of the table below shows the percentage of departments overall which have
lost the Span of Control and therefore are most likely to have at least one second
important person per department who may act as an influencer. Overall more than one
third (36%) of all head of Departments are depending on internal support. Looking at it
separated by departments the results are drifting apart. The lowest risk of losing control
is a factor for the heads of Departments of Human Resources with only 17% when there
is as much as 58% of all heads of Production for that condition. Second lowest is
Finance with 24% followed by Procurement (a department located due to its scope of
work nearby Finance) with 25%. Service and Logistics on the other side are ranked
second and third from the top with 49% and 45% respectively.
Table 4.12: Number of departments having an influencer separated by the sizes of the Top Management Teams
Share of influencers by department and by TMT size
TMT size w/o CEO 2 3 4 5 6 7 8 9
Total
Influencers
Total
Deptmtnts
share of
influencer by
department
Finance 1 3 2 9 2 1 0 0 18 76 23.7%
Production 5 8 5 9 2 1 0 0 30 51 58.8%
Marketing 3 1 2 4 0 0 0 0 10 36 27.8%
R & D 2 0 1 2 2 1 0 0 8 24 33.3%
Sales 3 8 4 11 3 2 0 0 31 83 37.3%
HR 1 1 0 4 0 0 0 0 6 35 17.1%
Service 2 4 3 4 0 1 0 8 22 45 48.9%
Infrastructure 0 0 2 3 0 0 0 0 5 12 41.7%
Logistics 0 0 1 5 2 1 0 0 9 20 45.0%
Procurement 0 1 0 2 0 0 0 0 3 12 25.0%
Total Influencers 17 26 20 53 11 7 0 8 142
Total deptmts in this team size 54 81 72 110 24 35 0 18 394
share of influencer by TMT size 31.5% 32.1% 27.8% 48.2% 45.8% 20.0% 44.4% 36.0%

137
4.2.2 Partial Review of Survey-Reports
In the next few pages a selection of some of the 114 submitted forms is discussed which
were found to be special or different from the others. As some of the submitted forms
are anonymous and some not, it was decided to name them by
‘Team_Size_Point_No_of_Submission’ for example in the report 2.7 it means the Top
Management Team consists of two managers (without the CEO) and was the 7th
submission in its category.
4.2.3 Top Management Teams with 2 Managers plus CEO
Screenshot 4.16: Survey-Report 2.7
Survey-Report number 2.7 was chosen to show here how sensitive the created software
is. The submitted example could not be simpler with the smallest team size of only three
(including the CEO) and the starting position for the two managers is as close as it can
occur. Based on Typology there would be no advantage for either, Marketing or Finance
when they are just 0.2% apart. Even when it comes to Constellation; age, tenure and
education are the same and do not result in an advantage of one over the other.
Managers’ Characteristics finally ends up with the same total number of points
collected. The amplitude for the software to allocate 1% more to Marketing than to
Finance is that the Manager responsible for Marketing, who is gaining fewer points in
Reliability and Archetype and pointing similarly in Social Competence and Competence
Name: field was not filled by user Submitted: 04:52:40 16-01-2017
E-mail: field was not filled by user IP: 103.47.135.45
Ranking by calculation using your answers provided during survey
Rank Manager Influencer Department %
1 Rudy - Marketing 33.09
2 Andes - Finance 32.91
CEO
34%
Rudy Andes
Ranking by your assumption Marketing Finance
Rank Manager 33.09% 32.91%
1 Rudy
2 Andes
Typology
Market Success Observartion Growth Technology Tech II Tech III Planning Structure Control
Rudy 1 1 0 0 0 0 1 1 1 0 4.99 49.9
Andes 0 1 1 1 1 1 0 0 0 1 5.01 50.1
Constellation
Age Tenure (y) Education Age Tenure (Years)Education Level TOTAL
Rudy 25 2 Without Tertiary Marketing 3 2 1 6 50
Andes 27 4 Without Tertiary Finance 3 2 1 6 50
Characteristics
Manager Reliability Archetype Comm. Social Comp. Competence Network TOTAL Characteristics %
Rudy 4 5 8 5 8 6 6 50.5
Andes 7 7 5 5 8 3 6 49.5
Dominant TagManager TOTAL Typology %
Developed by AvantLab, www.avantlab.com
Constellation Input ScoresManager Department Const. %

138
but is allocated higher on the criteria Communication which is weighted more than the
others. Intuitively it could be assumed that Marketing might be stronger in
Communication than Finance, this fact was proven in the overall statistics in the
previous chapter, and so it is considered positive that the computer selected the same
Manager to be more influential as the participant has already indicated.
Screenshot 4.17: Survey-Report 2.13
Survey-Report 2.13 is another sample of a small top management team and it is selected
to illustrate an example where Finance is in an insignificant position due to the
Typology of the company (which is not automatically given through the fact of having
only two departments observed). Except for Growth where Sales and Finance are
earning points, all other Typology factors chosen are only rewarding one of them each
so the result could be quite extreme. What is evident in this example is that the Manager
of Finance has a disadvantage in the team constellation which is quite significant with
5% in such a small team size. Although the Manager of Finance is holding a degree
compared with the Sales Manager, however, the latter fits just perfectly into the Top
Management Team in terms of age and tenure. Yet the Finance Manager is outmatching
the Sales Manager in five out of six Characteristics. The accumulated points although
more segregated than in the previous example are enough for the system to rank the
Managers in the right order.
Name: Mohammad Aidil Alladin Submitted: 04:39:36 18-01-2017
E-mail: [email protected] IP: 113.210.125.96
Ranking by calculation using your answers provided during survey
Rank Manager Influencer Department %
1 Suhairul - Finance 33.42
2 Rosnani - Sales 32.58
CEO
34%
Suhairul Rosnani
Ranking by your assumption Finance Sales
Rank Manager 33.42% 32.58%
1 Suhairul
2 Rosnani
Typology
Market Success Observartion Growth Technology Tech II Tech III Planning Structure Control
Suhairul 0 1 1 1 1 1 1 0 1 1 5.05 50.5
Rosnani 1 0 0 1 0 0 0 1 0 0 4.95 49.5
Constellation
Age Tenure (y) Education Age Tenure (Years)Education Level TOTAL
Suhairul 37 7 Bachelor's Finance 2 4 2 8 47.1
Rosnani 40 7 Without Tertiary Sales 4 4 1 9 52.9
Characteristics
Manager Reliability Archetype Comm. Social Comp. Competence Network TOTAL Characteristics %
Suhairul 8 7 7 8 7 7 7 54.3
Rosnani 8 6 5 6 6 6 6 45.7
Dominant TagManager TOTAL Typology %
Developed by AvantLab, www.avantlab.com
Constellation Input ScoresManager Department Const. %

139
In contrast to Survey-Reports 2.7 and 2.13 where the perspective Managers’
Characteristics gave the final amplitude in the total scoring it can be demonstrated that
this is not a pattern overall. Survey-Report 2.15 demonstrates that someone who is
scoring lower in Characteristics and has a non-significant advantage through the
perspective Typology, (where the participant has selected three times a Typology which
is not rewarding either one) can win the contest in the perspective Constellation if age
and tenure turns out favourably.
Screenshot 4.18: Survey-Report 2.15
This is evident in Constellation where the heads of the departments of Sales and Service
both have tenure with the company for 10 years and each are holding a bachelor’s
degree. One would not assume that the five year age difference would impact in such an
overall balanced picture. Checking the database, however, reveals that the CEO’s age is
41 and is closer to the Sales Manager than to the Service Manager. Therefore, the main
(only) amplitude was given by the Age, which in this case is advantageous for one of
the managers but of course also could lead to a disadvantage. Although ranking lower in
the Characteristics only the computed data of Constellation has made the final
difference – and this has matched the ranking assumed by the participant.
The same counts occur for the last sample out of the category with only two Managers,
Survey-Report 2.25. Where the Service Manager had a disadvantage from the
perspectives of Typology and Characteristics but scored significantly better than the
Marketing Manager in the Constellation. By the logic of the applied algorithm which
Name: user voted anonymously Submitted: 08:29:42 16-01-2017
E-mail: user voted anonymously IP: 115.134.150.216
Ranking by calculation using your answers provided during survey
Rank Manager Influencer Department %
1 Jolene - Sales 33.71
2 MK - Service 32.29
CEO
34%
Jolene MK
Ranking by your assumption Sales Service
Rank Manager 33.71% 32.29%
1 Jolene
2 MK
Typology
Market Success Observartion Growth Technology Tech II Tech III Planning Structure Control
Jolene 0 1 0 1 1 1 1 0 1 1 5.04 50.4
MK 0 0 0 0 1 1 1 0 0 0 4.96 49.6
Constellation
Age Tenure (y) Education Age Tenure (Years)Education Level TOTAL
Jolene 40 10 Bachelor's Sales 3 4 2 9 52.9
MK 35 10 Bachelor's Service 2 4 2 8 47.1
Characteristics
Manager Reliability Archetype Comm. Social Comp. Competence Network TOTAL Characteristics %
Jolene 8 6 7 10 6 10 8 49.9
MK 10 7 7 8 7 8 8 50.1
Dominant TagManager TOTAL Typology %
Developed by AvantLab, www.avantlab.com
Constellation Input ScoresManager Department Const. %

140
accumulates percentages there is no other possible outcome to rank the Service Manager
higher, but surprisingly, although the type of business of the company and even the
Characteristics of the Service Manager should result in a lower ranking s/he has made it
to the top.
In the reviewed example depicted below the age and tenure are making the difference.
The sample is also selected here due to the situation that the leading Manager obviously
has exceeded their Span of Control (the complexity of the task was selected to be high
with a team size of 7 in a small company). This example is exactly such a case where
the most dominant member of the Top Management Team is depending on a lower
ranking staff member which could result in a bottom up leading of the entire company.
Screenshot 4.19: Survey-Report 2.25
4.2.4 Top Management Teams with 3, 4 and 5 Managers plus CEO
The average size of Top Management Teams (without CEOs) in the undertaken survey
is 3.75 with a 65% polarisation among teams with three, four and five Top Management
Team Members (without CEOs). Whereas the perspective Constellation was unable to
compute any preference throughout all the samples which were collected for the teams
of only two managers (as each of the Top Management Team members would be
similarly off the average ideal) an ideal Constellation can be identified easily now when
analysing larger team sizes, even starting with only three managers. Furthermore, from
the computation of the developed algorithm the allocation of points in Constellation is
Name: user voted anonymously Submitted: 05:50:20 18-01-2017
E-mail: user voted anonymously IP: 211.25.13.146
Ranking by calculation using your answers provided during survey
Rank Manager Influencer Department %
1 ju +Influencer Service 34.9
2 je - Marketing 31.1
CEO
34%
ju je
Ranking by your assumption Service Marketing
Rank Manager 34.90% 31.10%
1 ju
2 je
Typology
Market Success Observartion Growth Technology Tech II Tech III Planning Structure Control
ju 0 0 0 0 0 1 0 0 0 0 4.97 49.7
je 0 1 0 1 0 1 0 0 1 0 5.03 50.3
Constellation
Age Tenure (y) Education Age Tenure (Years)Education Level TOTAL
ju 58 25 Bachelor's Service 3 4 2 9 60
je 46 10 Bachelor's Marketing 2 2 2 6 40
Characteristics
Manager Reliability Archetype Comm. Social Comp. Competence Network TOTAL Characteristics %
ju 4 5 4 4 8 5 5 48.9
je 4 6 5 5 6 5 5 51.1
Dominant TagManager TOTAL Typology %
Developed by AvantLab, www.avantlab.com
Constellation Input ScoresManager Department Const. %

141
becoming smoother due to the fact that standard deviation is limited in force of
expression for smaller teams but draws a smoother bell curve when taking parameters
from a larger sample group.
Screenshot 4.20: Survey-Report 3.5
Survey-Report 3.5 shows a perfect match of the calculated ranking versus the
participant’s assumption of the same ranking where all three Managers are in the same
order. The Survey-Report is even more interesting in respect of a not obvious outcome
since each of the Managers is dominating in one of the perspectives. For Typology,
Manager 1 (Finance) would take over the lead, whereas in Constellation the odds are
preferable for Manager 3 (Marketing) and in terms of Characteristics, Manager 2
(Production) seems the one with the most ideal profile. As an external consultant,
without knowing the Managers and the company personally, it would not be possible
any longer to make a prediction of the influence among the Members of the Top
Management Team. Marketing, the department which is the strongest member of the
Management Team in the final ranking is surprisingly the lowest scoring when it comes
to Typology where one would assume the basis of preference for different departments
is found. Finance on the other hand which is according to Typology predicted to be the
strongest one loses its advantage with low scores in an average Constellation and with a
poor profile in Managers’ Characteristics.
Name: Mario Miranda Submitted: 11:28:46 13-01-2017
E-mail: [email protected] IP: 200.150.166.208
Ranking by calculation using your answers provided during survey
Rank Manager Influencer Department %
1 Manager 3 - Marketing 24.95
2 Manager 2 +Influencer Production 22.22
3 Manager 1 - Finance 18.83
CEO
34%
Manager 3 Manager 2 Manager 1
Ranking by your assumption Marketing Production Finance
Rank Manager 24.95% 22.22% 18.83%
1 Manager 3
2 Manager 2
3 Manager 1
Typology
Market Success Observartion Growth Technology Tech II Tech III Planning Structure Control
Manager 1 1 1 0 1 1 1 0 1 1 1 3.54 35.4
Manager 2 0 1 0 1 1 1 0 0 1 1 3.01 30.1
Manager 3 0 1 1 1 0 1 1 0 0 0 3.45 34.5
Constellation
Age Tenure (y) Education Age Tenure (y) Education TOTAL
Manager 1 41 11 Bachelor's Finance 2 3 2 7 30.4
Manager 2 55 4 Masters Production 2 2 3 7 30.4
Manager 3 50 12 Bachelor's Marketing 4 3 2 9 39.1
Characteristics
Manager Reliability Archetype CommunicationSocial competenceCompetence Network TOTAL Characteristics %
Manager 1 5 4 4 2 7 2 4 19.8
Manager 2 9 7 8 8 9 8 8 40.5
Manager 3 9 5 8 9 8 9 8 39.8
Dominant TagManager TOTAL Typology %
Developed by AvantLab, www.avantlab.com
Constellation Input ScoresManager Department Const. %

142
Screenshot 4.21: Survey-Report 3.9
The Survey-Report 3.9 above is selected to demonstrate under what circumstances the
developed algorithm is still able to detect the most dominant manager in a report where
the participant became either distracted or bored during the process of the data
collection. This participant has given all three managers in each Characteristic the
maximum score of 10, where it can be assumed that it is unlikely for any person to have
a perfect personality and even more unlikely for this to be the case for each member of
the Top Management Team. The mathematical result highlighted in this case is that due
to the above circumstances, there will be no advantage or disadvantage for any team
members in Characteristics so that the other perspectives of Constellation and Typology
are solely responsible for the final result. In this sample, Typology is very favourable to
Finance, where 8 out of 10 criteria are rewarding Finance, so that even ranking last in
Constellation (which has resulted due to being the youngest Manager in the team) does
not disrupt the overall results from ranking Finance in first place which is congruent
with the participant’s assumption. The second calculated rank then goes, against the
assumption of the participant, to Manager 3 due to the fact that s/he is the only one
holding a doctoral degree paired with the right age.
On a separate note we would like to discuss the finding that in the category of 3
Managers + CEO the developed algorithm has yielded 37% accuracy to predict all ranks
Name: user voted anonymously Submitted: 17:28:51 17-01-2017
E-mail: user voted anonymously IP: 164.14.60.91
Ranking by calculation using your answers provided during survey
Rank Manager Influencer Department %
1 Person 1 - Finance 24.19
2 Person 3 - Service 21.36
3 Person 2 +Influencer Service 20.45
CEO
34%
Person 1 Person 3 Person 2
Ranking by your assumption Finance Service Service
Rank Manager 24.19% 21.36% 20.45%
1 Person 1
2 Person 2
3 Person 3
Typology
Market Success Observartion Growth Technology Tech II Tech III Planning Structure Control
Person 1 1 1 1 1 1 0 1 1 0 1 4.75 47.5
Person 2 0 0 0 0 0 0 0 0 0 0 2.63 26.3
Person 3 0 0 0 0 0 0 0 0 0 0 2.63 26.3
Constellation
Age Tenure (y) Education Age Tenure (y) Education TOTAL
Person 1 49 8 Masters Finance 2 2 3 7 29.2
Person 2 58 20 Masters Service 2 3 3 8 33.3
Person 3 56 22 Doctoral Service 3 2 4 9 37.5
Characteristics
Manager Reliability Archetype CommunicationSocial competenceCompetence Network TOTAL Characteristics %
Person 1 10 10 10 10 10 10 10 33.3
Person 2 10 10 10 10 10 10 10 33.3
Person 3 10 10 10 10 10 10 10 33.3
Dominant TagManager TOTAL Typology %
Developed by AvantLab, www.avantlab.com
Constellation Input ScoresManager Department Const. %

143
1, 2 and 3 correctly which happened in a total of 10 out of 27 Survey-Reports (3.05,
3.08, 3.11, 3.13, 3.14, 3.16, 3.18, 3.21, 3.24, 3.25 all printed in the Appendix). There are
four (15%) of the Survey-Reports, however, with a completely opposite result and no
matches in comparison with the assumption made by the participants (3.03, 3.06, 3.12,
3.19 available in the Appendix). There is always the possibility of a participant not
understanding the task or just having filled out nonsense. It was noticeable in the review
that 3 out of those 4 Survey-Reports without any matches were following the sizes of
the departments in terms of staff when ranking them. Similarly, there were 3 out of
those 4 Survey-Reports where the last position was allocated to the oldest Manager who
of all of them had the smallest team to supervise.
The following sample collection of four Managers plus CEO is interesting because the
allocated value of the 66% dominant power (100 in total minus 34% allocated for the
blocking minority of the CEO) is just marginally enough to build a majority with only
one Manager in combination with the CEO (34 + 16.5 = 50.5) in a case where the total
value is distributed equally. This was not the case in teams with only two Managers in
which case each of them in a balanced situation would receive 33% or with three
managers where each Top Management Team Member would receive 22% and could
easily team up with the CEO. From combinations of 5 managers onwards it is necessary
for one manager to evolve significantly more influence than the others (66 / 5 = 13) in
order to describe her influence as really dominant.
Chapter 5 explores to what extent the percentage figures can be taken as a valid
representation of a manager’s influence and opportunity to guide the business in
cooperation with the CEO or if the percentage figure is primarily a help to rank and/or
compare Managers. One finding in the selection of 4 Managers + CEO is that there are
10 out of 18 (56%) cases where Finance and Sales are ranking first and second or vice
versa whereas the same set of departments (Finance + Sales) only have been ranking 6
out of 27 cases (22%) on the first two places in teams of 3 Managers + CEO, or in 6 out
of 22 cases (27%) in teams of 5 Managers + CEO. In teams of 6 Managers + CEO, the
same consideration comes to a frequency of 25% and in teams of 7 Managers + CEO to
40%, however, it has to be noted that the last two mentioned categories are only
represented with four and five Survey-Reports each. It seems that Finance and Sales
Managers can assume a positive environment supporting a strong position when
working in constellations of Top Management Teams of 4 Managers + CEO.

144
Screenshot 4.22: Survey-Report 4.4
Continuing the findings in regard to the dominance of Finance and Sales in teams of 4
Managers + CEO it became obvious that Typology selections have reached more
extreme levels in some Survey-Reports than in others. This is apparent in Survey-
Report 4.4 above where Finance receives 41% of the score (2.4 times more than the
weakest two team members). Although the same Finance manager in this report is
scoring second lowest both in the perspectives of Managers’ Characteristics and
Constellation, which could explain why the participant has set Finance as rank three
only, however, this has resulted in the first rank overall in the computed result. Because
of this biased result the Survey-Reports have been separately reviewed with an
additional filter and it was found that 10 out of 18 Survey-Reports where Finance and
Sales have ranked first and second or vice versa, Finance has been ranked seven times
highest in Typology but only twice as the highest in Characteristics. Whereas Sales has
ranked six times highest in Characteristics but only twice as the highest in Typology (in
the perspective of Constellation both have ranked three times as the highest). This
Survey-Report was submitted anonymously so it was unfortunately impossible to
investigate any further why the participant has rated the Manager of Service highest
although this manager has not ranked highest in any perspective and is even lowest in
Typology and Constellation.
As an example of a very balanced Management Team it is worthwhile showing Survey-
Report 4.16. None of the perspectives of Typology, Constellation or Managers’
Name: user voted anonymously Submitted: 11:43:30 15-01-2017
E-mail: user voted anonymously IP: 203.106.162.247
Ranking by calculation using your answers provided during survey
Rank Manager Influencer Department %
1 Loo SH - Finance 18.79
2 Michael +Influencer Sales 18.73
3 Christina - HR 15.16
4 KS Liew +Influencer Service 13.33
CEO
34%
Loo SH Michael Christina KS Liew
Ranking by your assumption Finance Sales HR Service
Rank Manager 18.79% 18.73% 15.16% 13.33%
1 KS Liew
2 Michael
3 Loo SH
Typology
Market Success Observartion Growth Technology Tech II Tech III Planning Structure Control
KS Liew 0 0 0 0 0 0 0 0 0 0 1.71 17.1
Michael 0 0 0 0 0 0 0 1 0 1 2.4 24
Christina 0 0 0 0 0 1 0 0 0 0 1.73 17.3
Loo SH 1 1 1 1 1 1 1 0 1 0 4.16 41.6
Constellation
Age Tenure (y) Education Age Tenure (y) Education TOTAL
KS Liew 47 15 Bachelor's Service 1 2 2 5 16.7
Michael 40 10 Bachelor's Sales 4 4 2 10 33.3
Christina 41 13 Bachelor's HR 4 3 2 9 30
Loo SH 38 6 Bachelor's Finance 2 2 2 6 20
Characteristics
Manager Reliability Archetype CommunicationSocial competenceCompetence Network TOTAL Characteristics %
KS Liew 8 8 8 7 9 6 8 26.8
Michael 7 8 8 8 8 9 8 27.8
Christina 6 6 7 6 7 5 6 21.6
Loo SH 6 7 8 6 8 6 7 23.8
Dominant TagManager TOTAL Typology %
Developed by AvantLab, www.avantlab.com
Constellation Input ScoresManager Department Const. %

145
Characteristics in this sample favours any department nor does it seem that the
participant has made any shortcut (through boredom or misunderstanding) which would
result in an unreliable outcome. The biggest peak out of the norm is the age of the
Finance Manager, however, this is balanced against his/her good ratings in
Characteristics. The results of the four managers are very close together with less than
1.1% difference from the highest to the lowest value with three of them being in a range
of less than 0.2% variance. Without anticipating the last chapter of this thesis it is
unlikely that anyone in this top management team is exercising a dominating role or
viewing it from the antipode each of the managers has an equal opportunity to table his
or her request to the Top Management Team with a valid chance it being accepted. The
only additional variable is the +influencer remark for the Marketing Manager who
obtains this due to the selection of high complexity with a team size of 10 staff to
supervise which means that besides the four managers and the CEO there is most likely
at least one more influential person hidden in the Marketing team.
Screenshot 4.23: Survey-Report 4.16
Those Survey-Reports with 5 Managers + CEO and above seem to invite departments
other than Finance and Sales to be among the Dominant Coalition which could derive
from the increased complexity of the business models possible for such Top
Management Team sizes. Finance outperforms all other departments by far in reaching
Name: isabell erlenmaier Submitted: 22:39:06 01-02-2017
E-mail: [email protected] IP: 83.150.10.100
Ranking by calculation using your answers provided during survey
Rank Manager Influencer Department %
1 david - Sales 16.84
2 Hans Pete - Production 16.73
3 rico +Influencer Marketing 16.66
4 werner - Finance 15.77
CEO
34%
david Hans Pete rico werner
Ranking by your assumption Sales Production Marketing Finance
Rank Manager 16.84% 16.73% 16.66% 15.77%
1 rico
2 david
3 werner
Typology
Market Success Observartion Growth Technology Tech II Tech III Planning Structure Control
rico 0 0 0 0 1 1 0 1 1 1 2.41 24.1
david 0 0 0 0 1 1 0 1 1 1 2.41 24.1
werner 1 1 1 1 1 0 1 0 0 0 2.76 27.6
Hans Pete 1 0 1 1 1 0 1 0 0 0 2.41 24.1
Constellation
Age Tenure (y) Education Age Tenure (y) Education TOTAL
rico 47 15 Masters Marketing 3 4 3 10 28.6
david 51 20 Masters Sales 4 3 3 10 28.6
werner 65 22 Masters Finance 1 2 3 6 17.1
Hans Pete 51 9 Masters Production 4 2 3 9 25.7
Characteristics
Manager Reliability Archetype CommunicationSocial competenceCompetence Network TOTAL Characteristics %
rico 6 5 3 5 7 6 5 23
david 5 5 6 4 7 6 5 23.8
werner 8 6 5 5 9 4 6 27
Hans Pete 6 5 7 5 6 7 6 26.2
Dominant TagManager TOTAL Typology %
Developed by AvantLab, www.avantlab.com
Constellation Input ScoresManager Department Const. %

146
11 out of 22 times (50%) the 1st rank. In larger configurations of team size where Sales
obtains four times the first placing, just one more than Production, however, other
departments like Marketing, R&D and Procurement can step into the spotlight. As
mentioned earlier, the percentage value per manager does become flatter with increasing
numbers of Managers, however, there are still a significant number of 10 out of 22
Survey-Reports (45%) in the team size of 5 Managers + CEO, where one manager is
dominating in a way which could be described as ‘the winner takes it all’ (examples are:
5.2, 5.3, 5.8, 5.9, 5.11, 5.14, 5.18, 5.19, 5.20 and 5.21). To demonstrate this disparity,
Survey-Report 5.11 is highlighted although it is not the one with the biggest gap
between the highest and lowest ranking manager; but it has the most extreme lacuna
between the dominant leader and the average of the others. Surprisingly, the
constellation is clearly against the Sales Manager due to his/her age and education,
however, the Typology and Characteristics score is segregating him/her towards
the others into a separate caste. The sales manager has accumulated more than 17%
of power which allows a dominant coalition with the CEO and is rare in a team size
of 5 + CEO.
Screenshot 4.24: Survey-Report 5.11
Name: user voted anonymously Submitted: 09:03:23 26-01-2017
E-mail: user voted anonymously IP: 175.139.244.61
Ranking by calculation using your answers provided during survey
Rank Manager Influencer Department %
1 BL - Sales 17.55
2 JN - Logistics 13.38
3 VP - HR 12.47
4 MM - Procurement 12.11
5 Tee - Finance 10.5
CEO
34%
BL JN VP MM Tee
Ranking by your assumption Sales Logistics HR Procurement Finance
Rank Manager 17.55% 13.38% 12.47% 12.11% 10.50%
1 Tee
2 JN
3 BL
Typology
Market Success Observartion Growth Technology Tech II Tech III Planning Structure Control
Tee 0 0 1 0 1 0 1 0 0 1 1.61 16.1
BL 1 1 0 1 1 1 0 1 1 0 3.79 37.9
VP 0 0 0 0 1 0 1 0 0 1 1.52 15.2
JN 0 0 0 0 1 0 0 0 0 0 1.47 14.7
MM 0 0 1 0 1 0 1 0 0 1 1.61 16.1
Constellation
Age Tenure (y) Education Age Tenure (y) Education TOTAL
Tee 55 37 Bachelor's Finance 1 2 2 5 13.9
BL 34 10 Without Tertiary Sales 2 3 1 6 16.7
VP 46 9 Bachelor's HR 4 3 2 9 25
JN 40 30 Bachelor's Logistics 4 3 2 9 25
MM 36 2 Bachelor's Procurement 3 2 2 7 19.4
Characteristics
Manager Reliability Archetype CommunicationSocial competenceCompetence Network TOTAL Characteristics %
Tee 9 5 5 5 8 3 6 17.7
BL 9 5 9 9 9 9 8 25.2
VP 6 6 5 5 5 6 5 16.5
JN 8 3 7 8 8 8 7 21.1
MM 6 8 6 7 5 7 6 19.5
Dominant TagManager TOTAL Typology %
Developed by AvantLab, www.avantlab.com
Constellation Input ScoresManager Department Const. %

147
4.2.5 Teams of six and above Managers
Firstly, there were not many larger Top Management Teams submitted overall. Just four
Survey-Reports with six Managers, five Survey-Reports with seven Managers and two
Survey-Reports with nine Managers were collected. Whereas, the sets with nine
Managers (although interesting) are questionable due to one of them having included
some managers from the second line. The other Survey-Report is showing one HR and
eight Service Departments which is not impossible but is not representative of a widely
spread type of business model. It is also apparent that Finance expands its dominant
position in six out of nine (66%) Survey-Reports (ignoring the two questionable sets
with nine Managers). The Sales Department is reaching the top position just once but it
is interesting to see R&D appearing twice. It is apparent that not only companies
classified as large have big management teams, which is a logical assumption, but seven
out of nine (78%) declare themselves as being medium sized. Regarding larger entities
it is worth mentioning that two Managers who were asked to participate in this research
informed us that their company structure was too large and or too complex in order to
be captured accurately in the developed software. One company was Siemens and the
other Swiss Post.
From a diagrammatical point of view there was nothing exceptional discovered in the
team sizes of six and upwards which is why any further discussion on large sized
Management Teams is waived. The interested reader is referred to the Appendix where
all submitted Survey-Reports are available.
4.3 Summary
This chapter has depicted the functionality and design of the online survey through
which 114 valid data sets were collected. With the exception of the perspective
Constellation, where the calculation of the age and tenure was computed without the
same information for the CEO for the first 9 data sets, the remaining 105 submissions
were complete, valid and useful for statistical analysis.
The average tenure of the CEO’s of the participating companies is 11.5years. The
majority of the companies analysed selected themselves to represent the Typology of a
Defender. The average size of all 114 Top Management Teams was 3.75 mangers plus
the CEO. The most named departments were Sales and Finance followed by Production.
Not surprisingly, it was Production with the largest average team size of 19.2, whereas
the smallest teams were found in HR departments with 7.8. Data was collected from

148
428 Top Management Team members who were 44years and 10 months old on average.
In terms of qualifications, 15% of them have no degree, and almost every second
manager has a bachelor’s degree (47%) whereas 34% gained a master’s and 5% possess
a doctoral degree. The Finance department, at least in the context of this research, is the
most educated department with 95% of all Finance managers holding a degree.
In the evaluation of which department would be most influential in regards to
contributing to strategic decisions it was also Finance which ranked in 88% of the cases
in the 1st Rank, followed by Sales, which ranked first in 85% of the cases proportional
to the existence of those departments. The departments HR and Services were ranked as
least influential in regards to the decision-making process.
The evaluation of the fourth perspective, Span of Control, revealed that 36% of all 428
evaluated Top Management Team members are categorized as having lost control over
their departments and therefore as most likely to being more receptive to the input of
influencers. In conclusion, of all the perspectives analysed to understand the allocation
of the Top Management Team members it was shown that the Typology of the company
is a precursor to the power allocation among its Top Management Team members.
Whereas the perspectives Managers’ Characteristics and Team Constellation where
more important among smaller teams. Those two perspectives, however, are losing
importance with the increasing size of the Top Management Teams.
This chapter has profiled in this last section selected submissions in each team size from
two up to six Top Management Team members (excluding the CEO) to elaborate some
of the observations in more detail. There were a few submissions with seven, eight and
nine Top Management Team members but the value of information gained from those
submissions is negligible.
The final chapter will discuss the findings and their interpretation of the seven
hypotheses put forward at the beginning of this thesis. Some of these answers are based
on statistical values received through the survey. Consequently, the question of whether
the Top Management Team members can be profiled through the developed algorithm
is answered by using a confusion matrix through which the accuracy of the results was
measured. To evaluate which of the perspectives (Typology, Team Constellation,
Characteristics) is having most influence on the final ranking a regression analysis was
applied. A summary of all collected data is presented and its meaning in regards to the
initial question of ‘who is leading the company?’ is resolved. This question also

149
incorporates the answer as to how and where to find the hidden influencers in an
organisational chart. The final chapter concludes with a declaration of the limitations of
the research and explores why the ranking described in the previous chapter could prove
more meaningful than the allocation of a numeric value. It also outlines the potential for
future research in examining the Dominant Coalition within an organisation.

150

151
5 Chapter five: Conclusions and implications
5.1 Introduction
In this fifth and final chapter answers are provided to the questions raised at the
beginning of this thesis. During the search for potential parameters through literature
reviews in chapter two it was possible to develop an online survey to profile managers
according to their presumed dominance in the Top Management Team. This was
described in Chapter 3 where more than 100 professionals were encouraged to
participate in the online survey presented in the collected data in Chapter 4. This final
chapter will answer all seven Hypotheses before it concludes with a discussion about
the implications of the findings, limitations and potential further research related to the
research topic.
5.2 Conclusions from each research question and hypotheses
Hypothesis 1: The impossibility to allocate numerical values to relationships of
decision-makers in organizational structures as Gulick et al. have written in 1937 can
be refuted.
Accepted: This thesis has demonstrated that with the knowledge developed after 1937
in business research today that it is possible to select specific criteria and charge these
criteria with different weights in order to profile the members of the Top Management
Team and then to rank them accordingly. In this thesis, research was undertaken to
analyse the influence of different perspectives in terms of a system (the company) and
sub-system (the Top Management Team) and a single key element of the sub-system
(the manager). To facilitate this a line was drawn from the perspective of the Typology,
describing a business in its entirety, down to the perspective Constellation, describing
the highest echelon of staff in the Top Management Team, and lastly the perspective of
Managers’ Characteristics which profiles the individual member of the Top
Management Team. The fourth perspective Span of Control is not directly connected to
the other three but gives an indication of potential influence from people not evaluated
in the main three perspectives. The research has provided a detailed overview of the
academic work which was published over time for all of the perspectives:
Span of Control is probably the oldest of the perspectives in this thesis and has
been discussed in the past but then again in academic literature research from the
early 20th
century with Hamilton (1921) applying the term in the military context

152
and also Graicunas (1933), Gulick et al. (1937), Urwick (1956), Entwisle and
Walton (1961) and Van Fleet and Bedeian, (1977) have contributed to the
concept in its fundamentals. Later research was more focused on Span of
Control’s limitations and relevance as for example work by Schroeder,
Lombardo and Strollo (2000), Gittel (2001), Yassine, Goldberg and Yu (2005),
McManus (2007) and Nickols (2011),.
Characteristics is also a perennial topic with its modern format deriving from
C.G. Jung’s Psychological Types (1921/1923) and The Archetypes and The
Collective Unconscious (1934–1954) which was the basis for the Myers-Briggs
Type Indicator (1944/1956). Today MBTI is still one of the fundamental
instruments for team building and management development and its usage is
increasing according to Gardner & Martinko (1996, p.46). There are concerns,
however, about MBTI’s psychometric properties (1996, p.77) which
demonstrates again, that this topic is being continuously researched.
Whereas Team Constellation is a perspective which academic research only
developed after Characteristics gave a blueprint for the analysis of personality
and interaction among the different team members. The Constellation
perspective is important today and is repeatedly discussed for example in
relation to the effectiveness of homogenous versus heterogeneous team
constellations, gender related topics or its contribution to company performance
(as for example by Hambrick, Cho & Chen, 1996; Child, 1997; Knight et al.,
1999; Lankau, 2007; Richard & Shelor, 2011; or Agnihotri, 2014).
The fourth perspective on the nature of business or Typology is derived from the
Miles and Snow model which is the youngest of the perspectives analysed in this
thesis and our discussion here is based on one or a combination of the three basic
models of Miles & Snow, Mintzberg or Porter. All of these were developed
within a seven year time frame and even today they are unchanged in their
basics. The Miles & Snow Typology (1978) offered a classification through 10
parameters which also determined the Dominant Coalition that was very
important for the development of our research. Mintzberg’s model of the five
structural configurations (1980) is based on an assumption of five core parts of
an organisation and provides the design of organizational structures and
potential contingency factors. Porter’s model of generic competitive strategies
(1985) is restricted to a focus on companies attempting to perform better than
their competition.

153
When Gulick et al. (1937) discuss a group’s teams and configuration they explore the
numbers of relationships among every group member and this is described as
encouraging direct single relationships, cross relationships and direct group
relationships. The complete statement about how to compare such relationships is given
here:
[s]ince it is not possible to assign comparable weights to these different varieties
of relationship, it is probably safest to accept the most inclusive assumption as
the standard by which to judge the relative complexity of supervision imposed
by varying numbers of subordinates. (Gulick et al. 1937, p.185)
The authors at that time were convinced that the complexity of work for each supervisor
could not be weighted and therefore the number of subordinates and the emerging
quantity of relationships was used as a scale for comparison.
The tools for comparing the perspectives of the entire company, the Top Management
Team and the individual Manager seem obvious today but were not available to the
authors in 1937. Span of Control and Characteristics were relatively new to academic
research, whereas the Team Constellation has only expanded after more awareness was
gained about Characteristics early and in the mid-twentieth century. The concept of
Typology which may be the most important key for weighting the departments, was
developed around forty years after Gulick et al.’s article. In 2017 with this research it is
documented and proven that it is possible to compare and weight the relationships of
managers in horizontal positions, towards other managers, and in vertical relationships
towards subordinates. Finally, the above statement by Gulick et al. (1937) can be
revised in respect of the knowledge from a different century where the complexity of
supervision is influenced by more important factors than purely the number of
subordinates.
Hypothesis 2: Members of the top management team with an identical hierarchical
level have differing amounts of influence on strategic decisions.
Accepted: Although the organizational chart shows all members of the Top
Management Team on the same echelon each of the perspectives analysed in this thesis
do confirm that every Manager enjoys a different amount of influence. Starting with the
perspective Typology, where depending on 10 criteria the company’s nature is
described as Defender, Prospector, Analyser or Reactor. Each of these Typologies has a

154
predetermined constellation of a Dominant Coalition; which results in these
Departments having more influence than the remaining ones.
Defender Prospector Analyser Reactor
Finance X X X
Production X X
Marketing X X
Sales X X
R & D X X X
HR X X
Infrastructure X X
Logistics X
Service X
Some other parameters are directly or indirectly influenced by the Manager themselves.
For example, the findings of the literature review have resulted in three main parameters
defining the Constellation of a Top Management Team; Age, Education and Tenure
with the company. These three parameters are to some extent independent, however, it
is clear that a certain age is required to gain for example education. But the same could
be said about the qualifications and experience necessary to contribute as a Member of
the Top Management Team. Finally, this may differ from company to company
depending also on specific industries but actually only gains its importance when
compared with other members of the same team. For example, nobody is too old or too
young, if it matches the rest of the team’s pattern and is homogeneous (however it also
can be a heterogeneous match if there is no pattern apparent in age among all team
members). There is only no match if there is a pattern but the candidate does not comply
with it.
Through the literature review and the first extensive online opinion poll with 525 valid
submissions, 21 of the most important Managers’ Characteristics were evaluated. As it
would have rough-handled time constraints for the participants of the online survey to
key in 21 Characteristics of each of the Top Management Team members; the 21
Characteristics which scored highest in the opinion poll were reduced to the six most
important ones. Four of them have been named to be important for horizontal and
vertical relationships (Reliability, Archetype, Communication and Competence) plus
one Characteristic which is only named for vertical relationships (Social Competence)
and one which is only selected for horizontal relationships (Network). Those six
Characteristics were used as the relevant set for a profiling of each of the Top
Management Team members to compare them with each other.
Table 5.1: Constellation of Dominant Coalition based on the Miles & Snow Typology (1978), by the author (repeated Table 3.5)

155
These three perspectives analysed either alone or together will result in an advantage or
disadvantage for the different departments which confers an inequality of dominance in
the Top Management Team. Therefore, members of the Top Management Team will
wield differing amounts of dominance although they belong to the same echelon.
Hypothesis 3: An algorithm can be used to evaluate the members of the Dominant
Coalition.
Accepted: Despite the question of whether interdependence of Top Management Team
members in regards to Company and Team can be measured it is important to
understand to which degree this process is achieved without human interference and
attained just by feeding a system with a minimal set of data. If this is possible such an
evaluation can be done without having personal knowledge of either the company or the
Top Management Team members.
The aim of the online survey was to evaluate the dominance of Top Management Team
members based on the evaluation of collected data on the perspectives of Typology,
Team Constellation and Characteristics. In order to evaluate the accuracy of the survey
approach we have chosen a Confusion Matrix (Kohavi and Provost, 1998) to measure
the accuracy of actual (assumed by the participant) versus predicted rankings (the
computation of the online survey). For the application of the confusion matrix it has to
be assumed that the answers of the participants are the actual (true) ones since there is
no possibility to prove whether wrong information is given. The data matrix below is
used to calculate with a confusion matrix the accuracy of the applied algorithm of the
online survey. For example, in the first field, top left with the entry ‘43’ how many
managers the survey predicted (calculated) to rank first in comparison with how many
of those managers the participants have assumed (actual) to be in the first place.
Whereas, the field next to it with the entry ‘30’ shows how many of the managers were
calculated to rank second but have been assumed to be on the first rank by the
participants.
Table 5.2: Confusion matrix showing calculated ranking vs assumed ranking
1 2 3 4 TOTAL
1 43 30 20 13 106
2 39 41 7 16 103
3 9 20 29 21 79
4 14 14 22 56 106
TOTAL 105 105 78 106 394
Actual RankCalculated

156
From the confusion matrix the information was sourced for the accuracy-tables below
(confusion matrices) for the rankings 1st to 3
rd whereas 4
th is representing all others and
the last one is the summary or average of all accuracy tables. The indication ‘+’ stands
for correct/positive whereas ‘-’ means incorrect/negative. As an example for the 1st
accuracy table below; 43 managers have been calculated 1st and assumed 1
st whereas we
calculated 62 to be 1st which were not assumed to be 1
st. The remaining 226 managers
who were neither calculated nor assumed to be 1st are indicated at the bottom right of
the 1st accuracy table. The accuracy is derived from the addition of true positive + true
negative and then set in relation to the total number of managers (there were 114
submission with a total of 428 managers, however, due to some submissions being not
complete this evaluation is based on 105 submissions with 394 managers in total).
Table 5.3: Confusion matrix split by ranks into accuracy tables
Whereas, the prediction of the survey has achieved an average accuracy of more than
71% the system has shown as stable with 68.3% and 68% for the first two ranks and
even a higher percentage for the third or the remaining ranks with 74.9% and 74.6%
respectively. As the accuracy tables are showing the accuracy of the prediction of the
exact ranking combined with the accuracy of which manager would not be on that rank
it can be said in the argumentum e contrario that only 28.6% of the participants’
assumptions could not be matched from which some assumptions could have been
Accuracy
Rank 1 Calc + Calc -
Actual + 43 63
68.3% Actual - 62 226
Rank 2 Calc + Calc -
Actual + 41 62
68.0% Actual - 64 227
Rank 3 Calc + Calc -
Actual + 29 50
74.9% Actual - 49 266
Rank 4 Calc + Calc -
Actual + 56 50
74.6% Actual - 50 238
Avg Calc + Calc -
Actual + 42 56
71.4% Actual - 56 239

157
wrong by a false answer or wrong by misinterpretation. In conclusion, the computation
of the confusion matrices confirm that with the selected factors and the resulting
algorithm, key managers qualifying for a potential Dominant Coalition can be predicted
with accuracy of 68% and above. Future research could improve the rate of accuracy
even further and it is clear that different ways of aiming for the same goal could be
considered as well.
Proposition 3a: Which of the analysed perspectives, Typology, Team Constellation or
Managers’ Characteristics, has most influence on the constitution of the Dominant
Coalition?
Research outcome: Having selected three perspectives as important in regards to the
constitution of the Dominant Constellation it is evaluated if one of those perspectives is
contributing more towards the result than the others.
Table 5.4: Comparison of the impact of the perspectives Typology, Team Constellation and Managers’
Characteristics on the final result
To investigate the performance of each perspective, Typology, Team Constellation and
Managers’ Characteristics we have conducted a Least-Squares Estimation Regression
(Gauss-Markov theorem) where the adjusted R-squared represents the percentage our
perspectives have on the outcome and 75% are coming from whatever we have not
considered for our online survey (inheritance of power as an example). The Regression
Residuals:
Min 1Q Median 3Q Max
-2.62786 -0.6962 0.06263 0.83474 2.55699
Coefficients:
Estimate Std. Error t value Pr(>|t|)
(Intercept) 4.52692 0.34886 12.976 < 2e-16 ***
ConTOT -0.01265 0.03071 -0.412 0.68054
ChaTOT -0.09551 0.02934 -3.255 0.00123 **
TypeTOT -0.49121 0.04281 -11.475 < 2e-16 ***
---
Signif. codes: 0 ‘***’ 0.001 ‘**’ 0.01 ‘*’ 0.05 ‘.’ 0.1 ‘ ’ 1
Residual standard error: 0.9999 on 390 degrees of freedom
Multiple R-squared: 0.2532, Adjusted R-squared: 0.2475
F-statistic: 44.08 on 3 and 390 DF, p-value: < 2.2e-16
Residual Std. Error 22.1%
Residual Standard Error

158
is based on the rankings to be independent from the variety of scorings for Typology,
Team Constellations and Characteristics.
In the table of the Coefficients TypoTOT stands for Typology Total in the field
‘PR(>|t|)’ which represents the P value, therefore Typology has most influence on the
Constellation of the Dominant Coalition (which was defined in this case to be among
the top 3 ranked Managers). As already mentioned in Chapter 1, it has to be
remembered that the perspective Typology is literally pre-set from the nature of the
company and is not influenced by the individual manager. Typology is not ranking Top
Management Team members; it is splitting the team into two groups where one
constitutes the Dominant Coalition. This explains why this perspective has the most
influence in the online survey.
Proposition 3b: If the Dominant Coalition is predetermined through the Typology what
influence does Team Constellation have on the final setting?
Research outcome: As a sub-question to the importance of the three perspectives
analysed it is interesting to know if the right person in a compatible company might fail
if the constellation of the Top Management Team is unsuitable for them. It is impossible
to answer this based on this thesis. What can be said is that according to the outcome of
the Regression analysis the perspective Team Constellation does not have much
influence in recognizing members of the Dominant Coalition. As indicated in
Hypothesis 4 Team Constellation helps together with Managers’ Characteristics to rank
the Top Management Team members only. One interesting aspect which was
discovered was the aspect that Team Constellation calculated with Standard Deviation
is permanently transforming. If Age and Tenure are evaluated with a bell curve the
results are moving like a wave year by year and though the limitations of professional
life (assuming 20 to 65 years and accordingly also the Tenure is limited) or by natural
changes such as resignation or dismissal at some point the Team Constellation will
change and might be reset with new conditions for existing managers. At some point a
long tenure could be an advantage whereas a few years later the remaining Manger/s
with long tenure may not fit into a team which was undergoing some renewal.
Proposition 3c: If the Dominant Coalition is predetermined through Typology what is
the influence of Managers’ Characteristics on the final setting?
Research outcome: Typology and Team Constellation cannot be influenced by an
individual Manager, whereas the Characteristic profile can be developed by everyone.

159
From the Regression Analysis it can be seen that P is significantly higher than in Team
Constellation but lower in Typology. Whereas, Typology is pre-setting the Dominant
Coalition members therefore Managers’ Characteristics is steered to a certain extent by
each Manager to influence their participation in the Dominant Coalition. Looking at the
Questions 4, 4a and 4b one could argue the reverse way that if a Manager wants to
become a member of the Dominant Coalition, they should first identify the nature of
business of a potential employer to ensure the Typology suits them and then study the
Top Management Team to find the right time slot, or a more suitable Top Management
Team of a comparable business to join under more favourable circumstances.
Hypothesis 4: The head of Finance is predominantly the hidden deputy (number two) in
the Top Management Team
Accepted: It is reasonable to assume that the Chief Financial Officer has an important
role especially when companies declare themselves as profit oriented entities. This
research also investigated to what extend the head of Finance is the shadow of the CEO.
The perspective Typology sees Finance and R&D in comparison to all other
departments, in three out of the four Typologies within the Dominant Coalition.
Although as an example, Finance is important for a small laboratory developing a
treatment against cancer; however, it seems sensible to assume that the role of the head
of R&D of the same company is of utmost importance because their results directly
impact on the laboratory’s future existence. Subsequently, 76 companies reported
having a Finance department, whereas only 32 companies stated they had an R&D
department. The sales department was the most often mentioned with 83. Among the
top three ranks our online application has calculated Finance and Sales 67 times and
Production 40 times as the three most ranked departments. Whereas, the participants
also listed the departments of Finance, Sales and Production most often with 67-75-36
votes respectively. The rankings after the surveys took place appear as follows:
1st Rank
By online calculation: Finance / Sales / Marketing with 36 – 29 – 13
Assumption of the participants Finance / Sales / Marketing with 26 – 33 – 14
2nd
Rank
By online calculation: Finance / Sales / Production 19 – 25 – 19
Assumption of the participants Finance / Sales / Production 25 – 24 – 17

160
By both calculation and assumption, Production is third amongst the most named
departments but does not show up among the top three on the 1st Rank section. When
looking at the results for the 2nd
Rank section one will find Finance / Sales / Production.
From the first to the second rank, the first ranked departments as well as the second
ranked departments the counts are dropping significantly. The pattern seems to change
on the 3rd
rank where the calculation sees Service / Production / Sales to be strongest
whereas the assumption chart is still dominated by Sales and Finance.
Considering the frequency with which a department is named compared to their ranking
a similar result is obtained which could be termed ‘the winner takes it all’ and the
remaining results are dropping rapidly. From the 428 departments keyed in throughout
the entire survey there were most entries for 83 Sales, 76 Finance and 51 Production
followed by 45 Service, 36 Marketing and 35 HR. Whereas, Sales on average
((calculation + assumption) / 2) is Ranked 1st by 85%, however, Finance with less
counts is achieving 88% chances of being Ranked 1st. Production on the other hand,
although being the third most often named department is only obtaining a 35% chance
of Ranking 2nd
which is about the same for Marketing, having a 37% chance of being
Ranked 1st. The highest result in a proportional chance for Service is only at 3
rd Rank
with 27% and for HR finally the chances to Rank 2nd
or 3rd
are only at 20% and 19%
respectively.
So the question as to whether Finance is the grey eminence in a company can be
confirmed with a chance of 88%, however, it is equal to Sales with 85%. Yet this only
counts if those departments exist. From 114 participants, 22% did not report a Sales
department and 29% did not have a Finance department in their organisation.
Hypothesis 5: Dominance in a Management Team is related to Education and the
Complexity of Tasks of the dominant team members.
Accepted with conditions: In this research 114 companies were evaluated resulting in
the data for 428 individual managers from which data was collected in respect of their
education and the complexity of their role in the whole company. For the statistics
below the data from 394 Managers were sufficient for a comparison. In the first part of
the table below it is listed for each department how many times education appeared. For
example, there was one Manager in the Sales department holding a Doctoral degree.
Then points were allocated for each Educational level (1 for Without Tertiary, 2 for
Bachelor’s, 3 for Master’s and 4 for Doctoral) which were multiplied by the number of

161
Managers in this department (for example 83 in Sales). By multiplying this, a sum was
obtained which again was divided by the number of Sales Managers to receive an
average educational indication which was then ranked among all departments. Sales
managers, in this research, obtained the lowest level of education (on Average) and
R&D was the highest. The second part of the table below illustrates how many of the
Managers per department are amongst the top 3 ranked Managers, split by Education.
For example, 74 (second part) out of the 83 (first part) of Sales Managers have secured
their place among the most dominant Managers overall. This is expressed as a
percentage with the title ‘% Ranked Top 3’.
Table 5.5: Education level of dominant Top Management Team members
In the last section of the above table an overview of the Education distribution per
Department is given. For the hypothesis it was observed in the table with the title ‘%
Ranked Top 3’ that higher Education does not necessarily mean a higher percentage of
opportunity to be among the top three Managers. In the total column on the complete
right in the part of the table (Title: % Ranked Top 3) holders of a Doctoral degree have
an overall 80% chance to rank among the Top 3 most influential Managers, holders of a
Master’s degree 74% and Bachelor’s 70% which so far would be a logical gradation. It
seems counterintuitive that 79% of all Managers without a tertiary degree ranked in the
Top 3, the second highest result. One explanation for this phenomena is found in the
tenure aspect where Managers without a tertiary degree stay on average longest within
Education Sales Finance Prod Service Mktng HR R & D Logistics Infra Procure Total
Doctoral 1 2 3 1 1 4 1 2 15
Master's 20 31 20 16 15 10 9 6 7 2 136
Bachelor's 39 39 17 21 18 20 10 13 2 7 186
Without Tertiary 23 4 11 6 3 4 1 2 2 1 57
Grand Total 83 76 51 44 36 35 24 21 12 12 394
Total 165 183 117 100 84 78 64 46 31 29 897
Avg 1.99 2.41 2.29 2.27 2.33 2.23 2.67 2.19 2.58 2.42 2.28
Complexity 1 7 5 4 6 3 10 2 9 8
Count of Managers by Ranking
Education Sales Finance Prod Service Mktng HR R & D Logistics Infra Procure Total
Top 3
Doctoral 1 2 3 1 3 1 1 12
Master's 19 26 13 9 12 3 7 5 4 2 100
Bachelor's 32 35 12 15 13 7 8 7 2 131
Without Tertiary 22 4 8 4 1 2 1 1 1 1 45
Grand Total 74 67 36 29 26 12 19 13 6 6 288
% Ranked Top 3
Education Sales Finance Prod Service Mktng HR R & D Logistics Infra Procure Total
Doctoral 100% 100% 100% 100% 0% 75% 100% 50% 80%
Master's 95% 84% 65% 56% 80% 30% 78% 83% 57% 100% 74%
Bachelor's 82% 90% 71% 71% 72% 35% 80% 54% 0% 29% 70%
Without Tertiary 96% 100% 73% 67% 33% 50% 100% 50% 50% 100% 79%
Grand Total 89% 88% 71% 66% 72% 34% 79% 62% 50% 50% 73%
% Education by Department
Education Sales Finance Prod Service Mktng HR R & D Logistics Infra Procure Total
Doctoral 1% 3% 6% 2% 3% 17% 8% 17% 4%
Master's 24% 41% 39% 36% 42% 29% 38% 29% 58% 17% 35%
Bachelor's 47% 51% 33% 48% 50% 57% 42% 62% 17% 58% 47%
Without Tertiary 28% 5% 22% 14% 8% 11% 4% 10% 17% 8% 14%
Grand Total 83 76 51 44 36 35 24 21 12 12

162
the same organisation (14.9 years) compared to managers with Doctoral qualifications
(13.9 years), Master’s (10.3 years) and Bachelor’s (10.7 years). This could imply that if
someone does not have a degree they can demonstrate organisational stamina to
compensate for a lack of qualifications. Therefore, Education can be a fast-track to
break into a Top Management Team but it is not the only way. Throughout the research
undertaken it was found that except in HR, R&D and Procurement, 100% of the
Managers holding a Doctoral degree were ranked among the top 3 most influential
Managers, however, the small number of Doctoral degree holders (15) is not making
this statement very representative.
Proposition 5a: So who leads the company? Where are the influencers hidden?
Research outcome: The hypothesis is that if the number of subordinates exceeds the
Span of Control of a manager, there is a requirement for a hidden number two in that
team or department. Because the manager is overloaded with tasks, this number two
will take over partially and make proposals to the manger. In this situation the manager
will or has to trust these proposals and include them into his or her contribution to the
overall top management team. This means that the contribution to the top management
team is not only coming from the manager them self but also indirectly from their
influencers which is making them by default the real leaders.
The table below is showing the existence of Influencers among the participant-portfolio
of 105 submissions. The matrix is arranged by type of department in the vertical
arrangement and size of the Top Management Team in the horizontal direction. The
numbers in the cells are indicating how many momentums of losing control were
counted whereas the percentage indication at the bottom is showing the proportion of
influencers in that category of team size. Percentage indication on the right side
describes the proportion of cases where influencer/s are existing split by departments in
respect to the overall existence of this specific department.
Overall more than one third (36%) of all head of departments are depending on internal
support. Separated by departments, however, the results are drifting apart. The lowest
risk of losing control is at 17% for Human Resources, Finance 24% and Procurement (a
department linked closely to Finance) with 25%. Exposed to the highest risk of losing
control are the heads of Production with 58%, with Service and Logistics ranking
second and third from the top with 49% and 45% respectively. It must be stated that the
high number of influencers for the Service department is strongly influenced by one

163
single submission from the online survey – excluding that result would give Service a
37% risk of losing control. Surprisingly, the results are not only a reflection of a
department with large team sizes that is suffering from this problem. For example, R&D
was shown as handling the most complex tasks which would make the head of this
Department at risk of losing control with a very low number of staff. A head of R&D,
however, is only at a 33% risk of losing control which is pretty much in the middle of
all the departments’ risk.
Table 5.6: Number of departments having an influencer separated by Top Management Team sizes
5.3 Conclusions about the research problem
This thesis although limited by its time and financial funding has resulted in a feasible
approach to the research questions evaluating ‘who is leading the company’ through the
analysis of organisational structures. Based on the perspectives of Typology, Team
Constellation, Managers’ Characteristics and Span of Control it was possible to analyse
sample cases which were submitted by more than 114 participants and through this
collect a reasonable quantity of 428 data sets of different managers. It is apparent that
there are different ways to conduct a similar research project or to select other
parameters to focus on but in the aim of classifying a Top Management Team within a
reasonable set of questions it can be concluded that our approach has resulted in
measurable results unveiling new facts and adding to the body of knowledge. Whereas,
the perspective Typology has delivered half of the answer to who is leading the
company by preselecting the Dominant Coalition; the perspectives of Team
Constellation and Managers’ Characteristics helped in ranking the Top Management
Team members and also demonstrated that Managers’ Characteristics has performed as
a better indicator than Team Constellation. The sub criteria of Span of Control assisted
in indicating which head of Department might have reached the momentum of losing
Influencers per department, separated by TMT size
164
control which then increases the chance that there are one or more influencers in this
department.
Who is leading the company is dependent on the nature (Typology) of the company and
also on the Constellation and Managers’ Characteristics. The chances are at 88% and
85% respectively that the head of Finance or Sales are the most dominant members of
the Top Management Teams in companies that have one or both of those departments.
The chances of having a potentially hidden influencer in the departments lies highest in
Production, Service and Logistics at around 58%, 49% and 45% respectively.
Therefore, perceptions of dominant Top Management Team members may in reality not
be quite as dominant as assumed when compared with others because it is the
combination of all perspectives which may strengthen or weaken the position of
someone. Finally, it does matter under what circumstances which of the different Top
Management Team members combine together to facilitate championing a proposal. It
is the coalition of Top Management Team members which makes them convincing.
Assuming that Finance or Sales is the most influential in an enterprise leaves us with the
question of whether there is a combination of the remaining heads of Department who
could build up a strong position or if there are key departments besides Finance and
Sales who could form a coalition with either one of them. Another consideration is that
although superficially one would assume that Finance and Sales exist in each company
actually from 114 participants, 22% have not reported having a Sales department and
29% lacked a Finance department. This can leave a lot of room for different Dominant
Coalitions in Top Management Teams.
5.4 Implications
As indicated in the first Chapter, there is potential for the private (and public) sector to
benefit from the application of this research. Further development of this empirical
approach would allow different interest groups to focus their activities, reducing costs
and time. Also, Sales teams could ensure the right Top Management Team members or
even the influencers of a targeted client would join their presentations. Marketing teams
could evaluate not only individual companies, but also analyse market segments in
order to channel their flow of information in the right context. Mergers and Acquisition
firms could ensure they bring the relevant stakeholders into their negotiations or Human
Resources departments, or even individuals who are connecting with new colleagues or
teams, could use such a tool for a better prediction if the new Team Constellation is
most likely to be productive to select a few possibilities. Without excluding the chances
165
that there are other ways to analyse all the above situations, this research has narrowed
down the different perspectives to a minimal set of questions which ensures fast results
with a high level of accuracy.
Considering the theory and research it is apparent that assumptions made in the first half
of the twentieth century were overwritten with further research conducted in the same or
related fields. As cited earlier Gulick et al. have argued that the complexity of work of
each supervisor could not be weighted and therefore the number of subordinates and the
emerging quantity of relationships could be used as a scale for comparison when saying
that “it is probably safest to accept the most inclusive assumption as the standard by
which to judge the relative complexity of supervision imposed by varying numbers of
subordinates.” (1937, p.185). Yet this research has collected data from Typology, Team
Constellation and Managers’ Characteristics to undertake what was defined as
unquantifiable. The analysis of the number of subordinates was important in terms of
defining the momentum of losing control when it comes to Span of Control. This has
not been documented in such a comprehensive form before it was mapped for this thesis
and brings together the whole topic of Span of Control in a nine-field-matrix applicable
for further research. Also the findings in Team Constellation with just three and
Managers’ Characteristics with six parameters are comprehensive to focus on the most
important ones considering that more parameters impinge on the time and effort of
collecting data in proportion to a more diluted result. It is clear, however, that specific
other studies may be case sensitive.
5.5 Limitations
It was decided at the beginning of the research to separate the CEO with 34% from the
TMT and this was done to symbolize a blocking minority with which a CEO is enforced
to steer a company’s direction to be able to say ‘no’ to a proposal. Although this still
seems sensible after having undertaken this research it became obvious that the
remaining 66% of decision power allocated among the remaining TMT members results
in some limitations in terms of allocating a meaningful figure to each of them. In total
the data from 428 Managers working for 114 companies was collected. The
management team counted 28x2, 31x3, 19x4, 24x5, 5x6, 5x7, 2x9 managers which
results in an average of 3.75 Managers in the TMT (without counting the CEO).
Whereas, the 64% distributed equally to three, four or five managers (nearest logical
team sizes) would result in 21%, 16% and 13% allocation for each manager if equally
dominant which means any comparison is becoming flatter and less meaningful with
increasing TMT size. Consequently, in larger teams the application can still detect more

166
influential managers but the percentage indication is becoming less meaningful. In such
cases, the ranking is probably becoming more important, and not the fact if a Manager
could team up with the CEO for a majority dominance based on the percentage
calculation.
Another limitation which is worthwhile mentioning is that the developed approach is
solely created in such a way to compare each of the individual Top Management Team
members but there was no research undertaken to measure the personal relationships
among them (i.e. having sympathies or not for each other). This approach is ranking all
members of the TMT and also assumes the eventuality that depending on the nature of a
business proposal each of the Managers could team up with like-minded colleagues to
achieve a dominant position. There may be cases, where the mathematical combination
would make sense, but non-measured personal sympathies will hinder any cooperation
by them. This would be the responsibility of the observer to judge real or opportunistic
collaborations when comparing possible clusters in the Top Management Team. The
developed approach is ignoring underlying and overt animosities and each relationship
between the Top Management Team members is hypothetically set to be equal.
5.6 Further research
During the research and in terms of the algorithm of the online survey to equip the Top
Management Team members with a value representing their dominance in the team
each of the perspectives of Typology, Team Constellation and Managers’
Characteristics were allocated with the same importance. At the conclusion of this thesis
in retrospect from a meta point of view it can be seen that Typology is predetermining a
disadvantage for those departments which are not among the Dominant Coalition as per
Miles & Snow (1978). There is also the consideration that Typology is formed by the
nature of the business and only can be influenced by the managers themselves through
active organisational change management. Whereas, Team Constellation is a permanent
changing value in regards to the increasing age and tenure of the team members and
Managers’ Characteristics can be directly influenced by each Manager.
Although the system is designed this way and there were observations of such special
cases, where Managers dominating from each perspective are able to influence the final
results to their advantage, it is seen that Typology is somehow building one half and
Constellation and Characteristic the other half of the shape of a team. Further research
could analyse the impacts if looking at the whole concept either without Typology and
judging just Constellation and Characteristics to rank team members or the other way

167
around where based on the Typology only those Top Management Team members are
further evaluated who are falling into the Dominant Coalition team. The second
approach would mean that less data is collected and that the percentage allocation
among the remaining Managers should be more meaningful. In this context it is also
worthwhile to consider if one of the perspectives is disturbing the accuracy of the
overall result or if another perspective which was not considered would improve it.
The reliability of this approach is based on the comparison between the online survey
calculations versus the actual assumptions of the participants. No research was
undertaken as to the reliability of the participants. It is most likely that the indication for
Typology, Constellation and Characteristics are easier to judge than the overall ranking
of the Top Management Team members amongst each other.
5.7 Conclusion
As cited on the first page of this thesis: “[i]dentifying which factors affect firms’
performance is a critical issue in strategic management research” according to Escribá-
Esteve, Sánchez-Peinado and Sánchez-Peinado (2009, p.581). The significant number
of research papers that were written during the last few decades concentrating on the
Constellation of Top Management Teams and the impact of Top Management Teams on
company’s performance seem to confirm this statement (for example research by
Hambrick and Mason, 1984; Wagner, Pfeffer and O’Reilly, 1984; Finkelstein and
Hambrick, 1990; Jackson and Withney, 1995; Hambrick et al., 1996; Hambrick, Cho
and Chen, 1996; Child, 1997; Richard and Shelor, 2011; Lankau, 2007; or Agnihotri,
2014). This thesis has analyzed potential factors influencing the Dominant Coalition of
Top Management Teams with the aim to rank managers by their share of dominance
considering the perspectives of Typology, Team Constellation and Managers’
Characteristics equally.
Through the literature reviews the most widely discussed factors of each perspective
were isolated followed by the experiment to connect them all in an equation which was
tested in an online survey and verified to have a high level of accuracy. The CEO as
such has been excluded as a fixed value from this equation. The result is an opportunity
to explore the topics of TMT Constellation and the impact of Top Management Teams
on company’s performance from a different angle. This research is a comprehensive
study of the Dominant Coalition offering a method to profile TMT members and it
encourages other researchers to build upon it or explore further research in this field.

168

6 References
Abramson, E., Cutler, H. A., Kautz, R. W., & Mendelson, M. (1958). Social power
and commitment: A theoretical statement. American Sociological Review, Volume 23,
Issue 1, 15–22. DOI: 10.2307/2088619
Agnihotri, A. (2014). The role of the upper echelon in the value chain management.
Competitiveness Review, Volume 24, Number 3, 240–255. Https://doi.org/10.1108/CR-
05-2013-0049
Altaffer, A. (1998). First-line managers, measuring their span of control. Nursing
Management, July, Volume 29, Issue 7, 36–39.
Alvarez, J. L., & Svejenova, S. (2007). Sharing Executive Power: Roles and
Relationships at the Top. Industrial Relations Journal, Volume 38, Issue 3, 274–276.
DOI:10.1111/j.1468-2338.2007.00447_3.x
Arksey, H., & O’Malley, L. (2007). Scoping studies: Towards a methodological
framework. International Journal of Social Research Methodology, Volume 8,
Number1, 19–32. DOI: 10.1080/1364557032000119616
Baig, V. A., & Akhtar, J. (2011). Supply chain management: Value configuration
analysis approach. Vision, Volume 15, Issue 3, 251–266.
Https://doi.org/10.1177/097226291101500305
Bantel, K., & Jackson, S. (1989). Top management and innovations in banking: Does
the composition of the top team make a difference? Strategic Management Journal,
Volume 10, Issue 1, 107–124. Http://www.jstor.org/stable/2486585
Barrick, M. R., Bradley, B. H., Kristof-Brown, A. L., & Colbert, A. E. (2007). The
moderating role of top management team interdependence: Implications for real teams
and working groups. Academy of Management Journal, Volume 50, Number. 3, 544 –
557. DOI: 10.5465/AMJ.2007.25525781
Becker, G. S. (1992). The Economic Way of Looking at Life. Nobel Lecture, 9, 38–58.
Bell, G. (1967). Determinants of span of control. American Journal of Sociology,
Volume 73, Number 1, 100–109. Http://www.jstor.org/stable/2776131
Bragget, E., Jarratt, D., & Bamberry, G. (2008). Literature Review [DBA713 Study
Guide], 19.

Brown, R. (2002). How to prepare a literature review. Key skills for
writing and publishing research. 57-64. Retrieved from http://citeseerx.ist.psu.edu/
viewdoc/download?doi=10.1.1.474.6878&rep=rep1&type=pdf
Cathcart, D., Jeska, S., Karnas, J., Miller, S. E., Penchacek, J., & Rheault, L. (2004).
Span of control matters. Journal of Nursing Administration, Volume 34, Issue 9, 395–
399.
Castro Pinto, J., Altinsoy, N. & Santos António, N. (2014). The organizational
alignment-strategy, structure and process: An empirical study regarding the impact on
the performances of military organizations. Euro Asia Journal of Management, Volume
24, Issue 1-2, 3–22.
Chen, M. J., & MacMillan, I. C. (1992). Nonresponse and delayed response
to competitive moves: The roles of competitor dependence and action
irreversibility. Academy of Management Journal, Vol. 35, No. 3, 539–570.
Http://www.jstor.org/stable/256486
Child, J. (1972). Organizational structure, environment and performance: The role of
strategic choice. Sociology, Volume 6, Issue 1, 1–22.
Https://doi.org/10.1177/003803857200600101
Child, J. (1997). Strategic choice in the analysis of action, structure, organizations and
environment: Retrospect and prospect. Organization Studies, Volume 18, Issue 1, 73–
76. Https://doi.org/10.1177/017084069701800104
Chung, D. S., Jung, H. W., Baek, S. J., & Lee, H. O. (2008). The impacts of strategic
orientation and HRM systems on firm performance. International Journal of Business
Strategy, Volume 8, Issue 2, 82–88.
Combs, J. G., Ketchen, D. J., Perryman, A. A., & Donahue M. S. (2007). The
moderating effect of CEO power on the board composition–firm performance
relationship. Journal of Management Studies, Volume, 44, Issue 8, 1299–1323.
DOI:10.1111/j.1467-6486.2007.00708.x
Conant, J. S., Mokwa, M. P., & Varadarajan, P. R. (1990). Strategic types, distinctive
marketing competencies and organisational performance: A multiple measures-based
study. Strategic Management Journal, Volume 11, Issue 5, 365–383.
DOI:10.1002/smj.4250110504

Coyne, K. P., & Coyne, E. J. (2007). Surviving your new CEO. Harvard Business
Review, Issue May, 62–69.
Cragg, P., King, M., & Hussin, H. (2002). IT alignment and firm performance in small
manufacturing firms. The Journal of Strategic Information Systems, Volume 11, Issue 2,
109–132. Https://doi.org/10.1016/S0963-8687(02)00007-0
Cronin, P., Ryan, F., & Coughlan, M. (2008). Undertaking a literature review: A step-
by-step approach. British Journal of Nursing, Volume 17, Issue 1, 38–43.
Https://doi.org/10.12968/bjon.2008.17.1.28059
Daellenbach, U.S., McCarthy, A.M., & Schoenecker, T.S. (1999). Commitment to
innovation: The impact of top management team characteristics. R&D Management,
Volume 29, Issue 3, 199–208. DOI: 10.1111/1467-9310.00130
Dahlan, M., Auzair, S. M., & Ibrahim, W. M. W. (2007). Tight budgetary control,
business strategy, external environment and firm performance. Malaysian Accounting
Review, Volume 6, Number 2, 81–96.
Daily, C., & Dalton, D. (1994). Bankruptcy and corporate governance: The impact of
board composition and structure. The Academy of Management Journal, Volume 37,
Number 6, 1603–1617. Http://www.jstor.org/stable/256801
Dale, E. (1952). Planning and developing the company organization structure. New
York, NY: American Management Association.
Delbridge, R., & Fiss, P. C. (2013). Editors’ comments: Styles of theorizing and the
social organization of knowledge. Academy of Management Review, Volume 38,
Number 3, 325–331. DOI: 10.5465/amr.2013.0085
Desarbo, W. S., Di Benedetto, C. A., Song, M., & Sinha, I. (2005). Revisiting the Miles
and Snow strategic framework: Uncovering interrelationships between strategic types,
capabilities, environmental uncertainty, and firm performance. Strategic Management
Journal, Volume 26, Number 1, 47–74. Http://www.jstor.org/stable/20142205
Docherty, J. (2004). Power in the social/political realm. Marquette Law Review, Special
Issue, Volume 87, Issue 4, 862–866.

Doty, D. H., Glick, W., & Huber, G. (1993). Fit, equifinality, and organizational
effectiveness: A test of two configurational theories. Academy of Management Journal,
Volume 36, Number 6, 1196–1250. DOI: 10.2307/256810
Doz, Y. L., & Kosonen, M. (2007). The new deal at the top. Harvard Business Review,
Issue June, 98–104.
Eagly, A. H., & Wood, W. (1991). Explaining sex differences in social behavior: A
meta-analytic perspective. Personality and Social Psychology Bulletin, Volume 17,
Issue 3, 306–315. DOI: 10.1177/0146167291173011
Eagly, A. H., & Carli, L. L. (2003). The female leadership advantage: An evaluation of
the evidence. Leadership Quarterly. December, Volume 14, Issue 6, 807–834. DOI:
10.1016/j.leaqua.2003.09.004
Eagly, A. H. (2005). Achieving relational authenticity in leadership: Does gender
matter? Leadership Quarterly. June, Volume 16, Issue 3, 459–474. DOI:
10.1016/j.leaqua.2005.03.007
El-Khalil, R., & El-Kassar, A.-N. (2016). Managing span of control efficiency and
effectiveness: A case study. Benchmarking: An International Journal, Volume 23, Issue
7, 1717–1735. DOI: 10.1108/BIJ-04-2014-0037
Emden, C., & Sandelowski, M. (1998). The good, the bad and the relative, part one:
Conceptions of goodness in qualitative research. International Journal of Nursing
Practice, Number 4, 206–212. DOI: 10.1046/j.1440-172X.1998.00105.x
Emerson, R. (1962). Power-dependence relations. American Sociological Review,
Volume 27, Number 1, 31–41. Http://www.jstor.org/stable/2089716
Entwisle, D. R., & Walton J. (1961). Observations on the span of control.
Administrative Science Quarterly, Volume 5, Number 4, 522–533. DOI:
10.2307/2390619
Escribà-Esteve, A., Sànchez-Peinado, L., & Sénchez-Peinado, E. (2009). The influence
of top management teams in the strategic orientation and performance of small and
medium-sized enterprises. British Journal of Management, Volume 20, 581–597. DOI:
10.1111/j.1467-8551.2088.00606.x

Ferrier, W. J., & Lee H. (2002). Strategic aggressiveness, variation, and surprise: How
the sequential pattern of competitive rivalry influences stock market returns. Journal of
Managerial Issues, Volume XIV, No. 2, Summer, 162–180. Stable URL:
http://www.jstor.org/stable/40604382
Finkelstein, S., & Hambrick, D. C. (1990). Top-Management-Team tenure and
organizational outcomes: The moderating role of managerial discretion. Administrative
Science Quarterly, Volume 35, Number 3, 484–503. DOI: 10.2307/2393314
French, J. R. P., Jr., & Raven, B. (1959). The bases of social power. In D. Cartwright
(Ed.), Studies in social power (pp. 150‒167). Oxford, England: University of Michigan.
Funkhouser, M. (2002). Performance audit - span of control. City Auditor’s Office, City
of Kansas City, Missouri, 1–23.
Galeotti, A., & Goyal, S. (2009). Influencing the influencers: A theory of strategic
diffusion. RAND Journal of Economics, Volume 40, Number 3, 509–532. DOI:
10.1111/j.1756-2171.2009.00075.x
Gall, M.D., Borg, W.R., & Gall, J.P. (1996). Education research: An introduction,
6th
ed., White Plains, England: Longman.
Gardner, W. L., & Martinko, M. J. (1996). Using the Myers-Briggs Type Indicator to
study managers: A literature review and research agenda. Journal of Management.
Volume 22, Issue 1, 45–83. Https://doi.org/10.1177/014920639602200103
Ghezal, S. (2015). Assessing the validity of a small business strategy instrument using
confirmatory factor analysis. International Journal of the Academic Business World,
Volume 9, Issue 1, 79–87.
Gittel, J. (2001). Supervisory span, relational coordination and flight departure
performance: A reassessment of post bureaucracy theory. Organization Science,
Number 12, 468–483. Https://doi.org/10.1287/orsc.12.4.468.10636
Graves, P. (2013). What kinds of factors should determine how many direct reports a
manager supervises? HR Magazine. July, Volume 58, Issue 7, 19–19.
Graicunas, V. A. (1933). Relationship in organization. Bulletin of the International
Management Institute, Volume 7, March, 39‒42.

Grimm, C. M., & Smith K. G. (1991). Management and organizational change: A note
on the railroad industry. Strategic Management Journal, Volume 12, Number. 7, 557–
562. Http://www.jstor.org/stable/2486527
Guba, E. G. & Lincoln, Y. S. (1994). Competing paradigms in qualitative research. In
N. K. Denzin & Y.S. Lincoln (Eds.), Handbook of qualitative research, Thousand Oaks,
CA: Sage, 105–117.
Gulick, L. H., Urwick, L. F., Mooney, J. D., Fayol, H., Dennison, H. S., Henderson, L.
J., Whitehead, T. N., Mayo, E., Follett, M. B., Lee J., & Graicunas, V. A. (1937).
Relationship in Organization. Papers on the Science of Administration. Institute of
Public Administration, Columbia University, New York, 182–187.
Hambrick, D. C. (1981). Environment, strategy and power within top management
teams. Administrative Science Quarterly, Volume 26, 253–276. DOI: 10.2307/2392472
Hambrick, D. C., & Chen, M-J. (1995). Speed, stealth, and selective attack: How small
firms differ from large firms in competitive behaviour. Academy of Management
Journal, Volume 38, Number 2, 453–482. Stable URL:
http://www.jstor.org/stable/256688
Hambrick, D. C., Cho, T. S. & Chen, M-J. (1996). The influence of top management
team heterogeneity on firms’ competitive moves. Administrative Science Quarterly,
December, Volume 41, Number 4, 659–684. DOI: 10.2307/2393871
Hambrick, D. C., & Mason, P. (1984). Upper echelons: The organization as a reflection
of its top managers. Academy of Management Review, Volume 9, Number 2, 193–206.
Stable URL: http://www.jstor.org/stable/258434
Hambrick, D. C., & Quigley T. J. (2014). Toward more accurate contextualization of
the CEO effect on firm performance. Strategic Management Journal, Volume 35, Issue
4, 473–491. DOI: 10.1002/smj.2108
Hamilton, I. (Sir) (1921). The Soul and Body of an Army. London: E. Arnold.
Hanson, S. (2008). Dual control. Health Business Elite, Volume 62, Issue 3, 54–55.
Hanna, D. G., & Gentel, W. D. (1971). A guide to primary police management
concepts. Springfield, Illinois, USA: Charles C. Thomas.

Harrison, R. L. (2013). Using mixed methods designs in the Journal of Business
Research, 1990–2010. Journal of Business Research, Volume 66, Issue 11, 2153–2162.
DOI: 10.1016/j.jbusres.2012.01.006
Hinds, P. S., Scandrett-Hibden, S., & McAulay, L. S. (1990). Further assessment of a
method to estimate reliability and validity of qualitative research findings. Journal of
Advanced Nursing, Issue 15, 430–435. DOI: 10.1111/j.1365-2648.1990.tb01836.x
Hopej, M., & Martan, J. (2006). The determination of span of control. Operations
Research & Decisions, Issue 2, 55–62.
Hussin, H., King, M., & Cragg, P. (2002). IT alignment in small firms.
European Journal of Information Systems, Volume 11, Issue 2, 108–127.
DOI: 10.1057/palgrave/ejis/3000422
Jacobides, M. G., & MacDuffie, J. P. (2013). How to drive value your way. Harvard
Business Review, Issue July-August, 92–100.
Jackson, S. E. (1992). Consequences of group composition for the interpersonal
dynamics of strategic issue processing. Advances in Strategic Management, Volume 8,
January, 345–382.
Jackson, S. E., Brett, J. F., Sessa, V. I., Cooper, D. M., Julin, J. A., & Peyronnin, K.
(1991). Some differences make a difference: Individual dissimilarity and group
heterogeneity as correlates of recruitment, promotions, and turnover. Journal of Applied
Psychology, Volume 76, Issue 5, 675–689.
Jackson, S. E., May, K. E., & Whitney K. (1995). Understanding the dynamics of
diversity in decision-making teams. In R. A. Guzzo & E. Salas and Associates, Team
effectiveness and decision making in organizations. San Francisco: Jossey-Bass,
Chapter 7, 204–261.
Jarratt, D. G. and Fayed, R. (2001), The impact of market and organisational challenges
on marketing strategy decision-making, Journal of Business Research, Volume 51,
Number. 1, 61–72. Https://doi.org/10.1016/S0148-2963(99)00040-5
Johnson, R., Onwuegbuzie, A., & Turner, L. (2007). Toward a definition of mixed
methods research. Journal of Mixed Methods Research, Volume 1, Issue 2, 112–133.
Https://doi.org/10.1177/1558689806298224

Jungmeister, A. (2006). Profit Pools – Atoms of Strategy Development. Technical
Papers, UASB, Berne, 1–8.
Junker, B. H. (1960). Field work: An introduction to the social sciences. Chicago, USA:
University of Chicago Press.
Kakabadse, A. (2000). From individual to team to cadre: Tracking leadership for
the third millennium. Strategic Change, Volume 9, Issue 1, 5–16. DOI:
10.1002/(SICI)1099-1697(200001/02)9:1<5::AID-JSC482>3.0.CO;2-Z
Kakabadse, A., Kakabadse, N., Lee-Davies, L., & Johnson, N. (2011). Deliberative
inquiry: Integrated ways of working in children services. Systemic Practice & Action
Research. February, Volume 24, Issue 1, 67–84. Https://doi.org/10.1007/s11213-010-
9177-1
Kakabadse, A., & Kakabadse, N. (2007). The return of the Chairman.
Business Strategy Review, Volume 18, Issue 4, 60–65. https://dx.doi.org/10.1111/j.1467-
8616.2007.00501.x
Kakabadse, A. P., Kakabadse, N. K., & Knyght, R. (2010). The chemistry factor in
the Chairman/CEO relationship. European Management Journal, Volume 28, Issue 4,
285–296. DOI: 10.1016/j.emj.2010.05.001
Kakabadse, A. P., Kakabadse, N. K. and Khan, N. (2014). Knowledge is power.
Governance Directions, Volume 66, Number 10, November, 642–644.
Kakabadse, N. K., Figueira, C., Nicolopoulou, K., Hong Yang, J., Kakabadse, A. P.,
and Özbilgin, M. F. (2015). Gender diversity and board performance: Women's
experiences and perspectives. Human Resource Management, March, Volume 54,
Issue 2, 265–281. DOI: 10.1002/hrm.21694
Katzenbach, J. R. (1997). The myth of the top management team. Harvard Business
Review, Issue 75, Issue November – December, 83–91.
Kerr, E. (2011). Engaging the decision-makers and the influencers. Teacher Librarian,
Volume 38, Issue 3, February, 69–71.
Knight, D., Pearce, C. L., Smith, K. G., Olian, J. D., Sims, H. P., Smith, K. A., & Flood,
P. (1999). Top management team diversity, group process, and strategic consensus.

Strategic Management Journal, Volume 20, 445–465. DOI: 10.1002/(SICI)1097-
0266(199905)20:5<445::AID-SMJ27>3.0.CO;2-V
Knopf, J. W. (2006). Doing a literature review. Political Science & Politics, Volume 39,
Issue 1, 127–132. Stable URL: http://www.jstor.org/stable/20451692
Kohavi, R. & Provost, F. (1998). Glossary of Terms. Machine Learning, Volume 30,
271–274.
Kwak, M. (2002). The perils of power. MIT Sloan Management Review, Spring, Volume
43, Issue 3, 13.
Lankau, M. J., Ward, A., Amason, A., Ng T., Sonnenfeld, J. A., & Agle, B. R. (2007).
Examining the impact of organizational value – Dissimilarity in top management
teams. Journal of Managerial Issues, Volume XIX, Number. 1, Spring, 11–34.
Stable URL: http://www.jstor.org/stable/40601191
Lieberson, S., O’Connor, J. F. (1972). Leadership and organizational performance: A
study of large corporations. American Sociological Review, Volume 37, Number 2, 117–
130. Stable URL: http://www.jstor.org/stable/2094020
Lunenburg, F. C. (2012). Organizational structure: Mintzberg’s framework.
International Journal of Scholarly, Academic, Intellectual Diversity, Volume 14,
Number 1, 1–8.
Lyngsie, J., & Foss, N. J. (2017). The more, the merrier? Women in top-management
teams and entrepreneurship in established firms. Strategic Management Journal, March,
Volume 38, Issue 3, 487–505. DOI: 10.1002/smj.2510
Mackenzie, K. D. (1974). Measuring a person’s capacity for interaction in a problem
solving group. Organizational Behavior and Human Performance, Volume 12, Issue 2,
149–169. Doi.org/10.1016/0030-5073(74)90044-0
Mackey, A. (2008). The effect of CEOs on firm performance. Strategic Management
Journal, Volume 29, Number. 12, 1357–1367. Http://www.jstor.org/stable/40060233
Malone, K., Hales, B., Chan, J., Love, M., & Rayner, J. (2008). Cloning an industry:
Strategy typologies of Shanghai biotechnology companies. Journal of Commercial
Biotechnology. Volume 14, Issue 1, 31–42. DOI: 10.1057/palgrave.jcb.3050077

March, J. G. (1991). How decisions happen in organizations. Human-Computer
Interaction, Volume 6, 95–117. DOI: 10.1207/s15327051hci0602_1
March, J. G., & Simon, H. A. (1958). Organizations. New York: John Wiley and Sons.
Mayer, R. C., & Gavin, M. B. (2005). Trust in management and performance:
Who minds the shop while the employees watch the boss? Academy of
Management Journal, October 2005, Volume 48, Issue 5, 874–888. Stable URL:
http://www.jstor.org/stable/20159703
McManus, K. (2007). Losing our span of control. Industrial Engineer, Volume 39, Issue
9, 22.
Medcof, J. W. (2008). The organizational influence of the Chief Technology Officer.
R&D Management. 2008, Volume 38, Issue 4, 406–420. DOI: 10.1111/j.1467-
9310.2008.00526.x.
Mena, J. A. (2012). The optimal organization structure design problem in make-to-order
enterprises. International Journal of Industrial Engineering, Volume 19, Issue 4, 181–
192.
Meyer, M.W. (1968). Expertness and the span of control. American Sociological
Review, Volume 33, Number 6, December, 944–951.
Http://www.jstor.org/stable/2092685
Meyer, R.M. (2008). Span of management: Concept analysis. Journal of Advanced
Nursing, Number 63, 104–112. Doi:10.1111/j.1365-2648.2008.04635.x
Michel, L. (2007). Understanding decision making in organizations to focus its
practices where it matters. Measuring Business Excellence, Volume 11, Number 1, 33–
45. Https://doi.org/10.1108/13683040710740916
Miles, R. E., Snow, C. C., Meyer, A. D., & Coleman, Jr. H. J. (1978). Organizational
strategy, structure and process. Academy of Management Review, Volume 3, Number 3,
546–562. Stable URL: http://www.jstor.org/stable/257544
Mintzberg, H. (1980). Structure in 5’S: A synthesis of the research on organization
design. Management Science, Volume 26, Number 3, 322–341. DOI:
10.1287/mnsc.26.3.322
Morgan, G. (2006). Images of Organisations. Updated edition, London: Sage.

Morse, J. M., Barrett, M., Mayan, M., Olson, K., & Spiers, J. (2002).
Verification strategies for establishing reliability and validity in qualitative research.
International Journal of Qualitative Methods 1 (2), Article 2, 1–22.
Https://doi.org/10.1177/160940690200100202
Mullins, J. W., & Walker, Jr. O. C. (2013). A strategic decision-making approach.
In Marketing Management, 8th Edition, McGraw Hill/Irwin, retrieved May 15, 2017
from: www.mktgsensei.com/MBA522/Chap009.ppt
Neilson, G. L. and Wulf, J. (2012). How many direct reports? Harvard Business
Review, Volume 90, Issue 4, 112–119.
Neumann, J., & Hirschhorn, L. (1999). The challenge of integrating psychodynamic
and organisational theory. Human Relations, Volume 52, Issue 6, 683–695.
Https://doi.org/10.1177/001872679905200601
Nickols, F. (2011). The span of control and the formulas of V.A. Graicunas. Distance
Consulting, February, 1–6.
Normann, R., & Ramirez, R. (1993). From value chain to value constellation: Designing
interactive strategy. Harvard Business Review, Issue July-August, 65–77.
Nulty, D. D. (2008). The adequacy of response rates to online and paper surveys: What
can be done? Assessment & Evaluation in Higher Education, Volume 33, Number 3,
301–314. DOI: 10.1080/02602930701293231
Onen, D. (2016). Appropriate conceptualization: The foundation of any solid
quantitative research. The Electronic Journal of Business Research Methods, Volume
14, Issue 1, 28–38.
Onwuegbuzie, A. J., & Hitchcock, J. H. (2017). A meta-framework for conducting
mixed methods impact evaluations: Implications for altering practice and the
teaching of evaluation. In Studies in Educational Evaluation, Volume 53, 55–68.
Https://doi.org/10.1016/j.stueduc.2017.02.001
Opstrup, N., & Villadsen, A. R. (2015). The right mix? Gender diversity in top
management teams and financial performance. Public Administration Review, March,
Volume 75, Issue 2, 291–301. DOI: 10.1111/puar.12310
Ouchi, W., & Dowling, J. (1974). Defining span of control. Administrative Sciences
Quarterly, Volume 19, Issue 3, 357– 365. DOI: 10.2307/2391977

Pabst, M.K. (1993). Span of control in nursing inpatient units. Nursing Economics,
March - April, Volume 11, Issue 2, 87–90.
Park, J., & Park, M. (2016). Qualitative versus Quantitative research methods:
Discovery or justification. Journal of Marketing Thought, Volume 3, Issue 1, 1–7.
DOI:10.15577/jmt.2016.03.01.1.
Peng, M. W., Tan, J., & Tong T. W. (2004). Ownership types and strategic groups in
an emerging economy. Journal of Management Studies, Volume 41, Issue 7, November,
1105–1129. DOI:10.1111/j.1467-6486.2004.00468.x
Perrow, C. (1986). Economic theories of organization. Theory and Society, Volume 15,
Issue 1-2, 11–45. Http://www.jstor.org/stable/657174
Perry, C. (1998). A structured approach for presenting theses. Australasian Marketing
Journal, Volume 6, Number. 1, 63–85. DOI: 10.1016/S1441-3582(98)70240-X
Pettigrew, A. M. (1992). On studying managerial elites. Strategic Management Journal,
Volume 13, 163–182. DOI: 10.1002/smj.4250130911
Pfeffer, J. (1981). Power in organizations. Boston: Pitman.
Pfeffer, J., & Salancik, G. R. (1978). The external control of organizations: A resource
dependence perspective. New York: Harper & Row.
Porter, M. (2008). Generic competitive strategies. In Competitive Advantage: Creating
and Sustaining Superior Performance, Simon and Schuster, New York, 7th Edition,
Chapter 2, 34–46.
Porter, M.E., Lorsch, J.W., & Nohria, N. (2004). Seven surprises for new CEO’s.
Harvard Business Review, October, Volume 82, Issue 10, 62–72.
Prahalad, C. K., & Hamel, G. (1990). The core competence of the corporation.
Harvard Business Review, May-June, 79–91.
Randolph, J. (2009). A guide to writing the dissertation literature review. Practical
Assessment, Research & Evaluation, Volume 14, Number 13, 1–13. Retrieved
November 1, 2017 from: http://pareonline.net/getvn.asp?v=14&n=13
Reynolds Fisher, S., & Nelson, D. L. (1996). “Feeling” at the top: An underutilized
resource in top management teams. Journal of Social Behavior & Personality, Special
Issue, Volume 11, Issue 5, 77–90.

Richard, O. C., & Shelor, R. M. (2011). Linking top management team age
heterogeneity to firm performance: Juxtaposing two mid-range theories. International
Journal of Human Resource Management, Volume 13, September, 958–974.
Http://dx.doi.org/10.1080/09585190210134309
Richard, O. C., Ford, D., & Ismail, K. (2007). Exploring the performance effects of
visible attribute diversity: The moderating role of span of control and organizational life
cycle. International Journal of Human Resource Management. December, Volume 17,
Issue 12, 2091–2109. DOI: 10.1080/09585190601000246.
Ruiz-Jiménez, J., Fuentes-Fuentes, M., & Ruiz-Arroyo, M. (2016). Knowledge
combination capability and innovation: The effects of gender diversity on Top
Management Teams in technology-based firms. Journal of Business Ethics. May,
Volume 135, Issue 3, 503–515. DOI: 10.1007/s10551-014-2462-7.
Sabatier, P. A., & Weible C. M. (2007). The advocacy coalition framework: Innovations
and clarifications. In P. Sabatier, ed., Theories of the Policy Process. Boulder, CO:
Westview Press, 189–215.
Schroeder, D. J., Lombardo, F., & Strollo, J. (2000). Management and Supervision of
Law Enforcement Personnel. Binghamton, New York, NY: J.B.L. Publications.
Shen, W. (2003). The dynamics of the CEO-Board relationship: An evolutionary
perspective. Academy of Management Review, Volume 28, Number 3, 466–476.
DOI: 10.2307/30040733
Shin, T. (2008). Pay disparities within firms: The role of chief executive officers.
Working Papers, Department of Sociology, University of California, Berkeley, 1–10.
Sinclair, A. (2008). What’s wrong with ideas about leadership? Leadership for the
disillusioned: Moving beyond the myths and heroes to leading that liberates. Chapter 2,
17–33. Crows Nest, Sydney: Allen & Unwin.
Smith, K. G., Guthrie, J. P., & Ming-Jer C. (1989). Strategy, size,
performance. Organization Studies, Volume 10, Issue 1, 63–81.
Https://doi.org/10.1177/017084068901000104
Snow, C. C., & Hambrick, D. C. (1980). Measuring organizational strategies: Some
theoretical and methodological problems. Academy of Management Review, Volume 5,
Number 4, 527–538. Http://www.jstor.org/stable/257458

Snow, C. C., & Ketchen, Jr., D. J. (2014). Typology-driven theorizing: A response
to Delbridge and Fiss. Academy of Management Review, Volume 39, Number 2, 231–
233. DOI: 10.5465/amr.2013.0388
Song, M., Di Benedetto, C. A., & Mason, R. W. (2007). Capabilities and financial
performance: The moderating effect of strategic type. Journal of the Academy of
Marketing Science, Volume 35, Issue 1, 18–34. Https://doi.org/10.1007/s11747-006-
0005-1
Souryal, S. S. (1977). Police administration and management. Police Administration,
St. Paul, Minnesota, United States: West Publishing, 160–163.
Stieglitz, H. (1962). Optimizing span of control. Management Record, Volume 24,
Number 9, 25–29.
Talke, K., Salomo, S., & Kock, A. (2011). Top management team diversity and strategic
innovation orientation: The relationship and consequences for innovativeness and
performance. Product Development & Management Association, Volume 28, Issue 6,
819–932. DOI: 10.1111/j.1540-5885.2011.00851.x
Taran, Y., Boer, H., & Lindgren, P. (2015). A business model innovation typology.
Decision Sciences, Volume 46, Issue 2, 301–331. DOI: 10.1111/deci.12128.
Teuber, S., Backes-Gellner, U., & Ryan, P. (2016). How companies adjust their span of
control to national institutions. Die Betriebswirtschaft, Volume 76, Issue 4, 255–273.
Urwick, L. F. (1938). Scientific principles and organization. New York: American
Management Association, Institute of Management series, Number 19, 1–16.
Urwick, L. F. (1956). The manager’s span of control. Harvard Business Review, May –
June, 39–47.
Van Fleet, D. D., & Bedeian, A. G. (1977). A history of the span of management.
The Academy of Management Review, Volume 2, Number 3, 356–372. Stable URL:
http://www.jstor.org/stable/257693
Wagner, G. W., Pfeffer, J., & O'Reilly, C. A. III (1984). Organizational demography
and turnover in top-management groups. Administrative Science Quarterly, Volume 29,
Number 1, 74–92. DOI: 10.2307/2393081

Weill, P., Malone, T. W., D’Urso, V. T., Herman, G., & Woerner, S. (2006). Do some
business models perform better than others? A study of the 1000 largest US firms. MIT
Center for Coordination Science, Working Paper Number 226, 1–34.
Westphal, J., & Zajac, E. (1995). Who shall govern? CEO/Board power, demographic
similarity, and new director selection. Administrative Science Quarterly, Volume 40,
Number 1, 60–83. Doi:10.2307/2393700
Williamson, O. (1967). Hierarchical control and optimum firm size. Journal of Political
Economy, Volume 75, Number. 2, 123–138. Http://www.jstor.org/stable/1829822
Wiersema, M. F., & Bantel, K. A. (1992). Top management team demography and
corporate strategic change. Academy of Management Journal, Volume 35, Number. 1,
91–121. Http://www.jstor.org/stable/256474
Wilson, O. W., & McLaren, C. R., (1977). Police administration. 4th edition, New York,
NY: McGraw-Hill Book Company, 68–70.
Wolcott, H. F. (1990). On seeking - and rejecting - validity in qualitative research. In E.
W. Eisner & A. Peshkin (Eds.), Qualitative inquiry in education: The continuing
debate, New York, NY: Teachers College Press, 121–152.
Wray, B.K. (2011). Kuhn and the discovery of paradigms. Philosophy of the Social
Sciences, September, Volume 41, 380–397. Https://doi.org/10.1177/0048393109359778
Wulf, J. (2012). The flattened firm: Not as advertised. California Management Review.
Fall, Volume 55, Issue 1, 5–23. Https://doi.org/10.1525/cmr.2012.55.1.5
Yassine A., Goldberg D., & Yu T. (2005). Simple models of hierarchical organizations.
University of Illinois at Urbana-Champaign, IlliGAL Report No. 2005015, 1–16.
Yin, R. K. (2017). Case study research: Design and methods. Applied Social Research
Methods Series, 6th
Edition, Thousand Oaks: Sage Publications.
Zinn, J. S., Spector, W. D., Weimer, D. L., & Mukamel, D. B. (2008). Strategic
orientation and nursing home response to public reporting of quality
measures: An Application of the Miles and Snow Typology. Health Services Research.
April 2008, Volume 43, Issue 2, 598–615. DOI: 10.1111/j.1475-6773.2007.00781.x
Zoltners, A. A., Sinha, P. K., & Lorimer, S. E. (2014). Does your company have enough
sales managers? Harvard Business Review, April, Issue 1, 2–4.


7 Appendices
7.1 Survey Reports
Name: Annie Eng Submitted: 03:37:11 11-01-2017
E-mail: [email protected] IP: 175.139.208.103
Ranking by calculation using your answers provided during survey
Rank Manager Influencer Department %
1 Florence Sales 34.05
2 Helen Finance 31.95
CEO
34%
Florence Helen
Ranking by your assumption Sales Finance
Rank Manager 34.05% 31.95%
1 Florence
2 Florence
Typology
Market Success Observartion Growth Technology Tech II Tech III Planning Structure Control
Helen 1 1 1 1 1 1 1 1 1 1 5.1 51
Florence 0 0 0 0 0 0 0 0 0 0 4.9 49
Constellation
Age Tenure (y) Education Age Tenure (y) Education TOTAL
Helen 53 26 Bachelor's Finance 3 3 2 8 50
Florence 38 7 Bachelor's Sales 3 3 2 8 50
Characteristics
Manager Reliability Archetype Comm. Social Comp. Competence Network TOTAL Character %
Helen 5 5 5 5 6 5 5 44.2
Florence 7 6 7 5 7 7 6 55.8
Survey-Report 2.1
Dominant TagManager TOTAL Typology %
Developed by AvantLab, www.avantlab.com
Constellation Input ScoresManager Department Const. %
Name: Huwiler Submitted: 13:20:06 13-01-2017
E-mail: [email protected] IP: 57.98.63.66
Ranking by calculation using your answers provided during survey
Rank Manager Influencer Department %
1 Mangler +Influencer R & D 33.54
2 Werner +Influencer Marketing 32.46
CEO
34%
Mangler Werner
Ranking by your assumption R & D Marketing
Rank Manager 33.54% 32.46%
1 Werner
2 Mangler
Typology
Market Success Observartion Growth Technology Tech II Tech III Planning Structure Control
Werner 0 0 0 1 0 0 0 0 0 0 4.97 49.7
Mangler 1 1 0 1 0 0 0 0 1 0 5.03 50.3
Constellation
Age Tenure (y) Education Age Tenure (Years)Education Level TOTAL
Werner 38 15 Masters Marketing 3 3 3 9 50
Mangler 56 20 Masters R & D 3 3 3 9 50
Characteristics
Manager Reliability Archetype Comm. Social Comp. Competence Network TOTAL Characteristics %
Werner 5 5 3 1 7 7 5 47.9
Mangler 6 5 5 1 7 6 5 52.1
Survey-Report 2.2
Dominant TagManager TOTAL Typology %
Developed by AvantLab, www.avantlab.com
Constellation Input ScoresManager Department Const. %
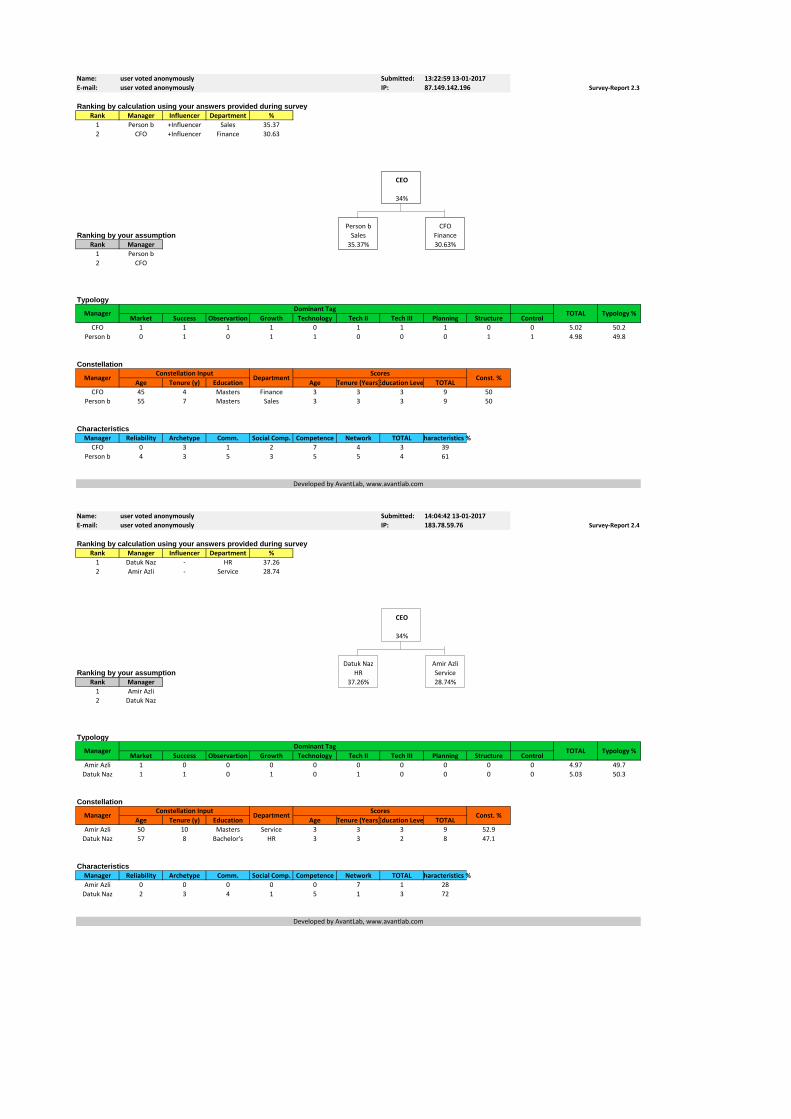
Name: user voted anonymously Submitted: 13:22:59 13-01-2017
E-mail: user voted anonymously IP: 87.149.142.196
Ranking by calculation using your answers provided during survey
Rank Manager Influencer Department %
1 Person b +Influencer Sales 35.37
2 CFO +Influencer Finance 30.63
CEO
34%
Person b CFO
Ranking by your assumption Sales Finance
Rank Manager 35.37% 30.63%
1 Person b
2 CFO
Typology
Market Success Observartion Growth Technology Tech II Tech III Planning Structure Control
CFO 1 1 1 1 0 1 1 1 0 0 5.02 50.2
Person b 0 1 0 1 1 0 0 0 1 1 4.98 49.8
Constellation
Age Tenure (y) Education Age Tenure (Years)Education Level TOTAL
CFO 45 4 Masters Finance 3 3 3 9 50
Person b 55 7 Masters Sales 3 3 3 9 50
Characteristics
Manager Reliability Archetype Comm. Social Comp. Competence Network TOTAL Characteristics %
CFO 0 3 1 2 7 4 3 39
Person b 4 3 5 3 5 5 4 61
Survey-Report 2.3
Dominant TagManager TOTAL Typology %
Developed by AvantLab, www.avantlab.com
Constellation Input ScoresManager Department Const. %
Name: user voted anonymously Submitted: 14:04:42 13-01-2017
E-mail: user voted anonymously IP: 183.78.59.76
Ranking by calculation using your answers provided during survey
Rank Manager Influencer Department %
1 Datuk Naz - HR 37.26
2 Amir Azli - Service 28.74
CEO
34%
Datuk Naz Amir Azli
Ranking by your assumption HR Service
Rank Manager 37.26% 28.74%
1 Amir Azli
2 Datuk Naz
Typology
Market Success Observartion Growth Technology Tech II Tech III Planning Structure Control
Amir Azli 1 0 0 0 0 0 0 0 0 0 4.97 49.7
Datuk Naz 1 1 0 1 0 1 0 0 0 0 5.03 50.3
Constellation
Age Tenure (y) Education Age Tenure (Years)Education Level TOTAL
Amir Azli 50 10 Masters Service 3 3 3 9 52.9
Datuk Naz 57 8 Bachelor's HR 3 3 2 8 47.1
Characteristics
Manager Reliability Archetype Comm. Social Comp. Competence Network TOTAL Characteristics %
Amir Azli 0 0 0 0 0 7 1 28
Datuk Naz 2 3 4 1 5 1 3 72
Survey-Report 2.4
Dominant TagManager TOTAL Typology %
Developed by AvantLab, www.avantlab.com
Constellation Input ScoresManager Department Const. %
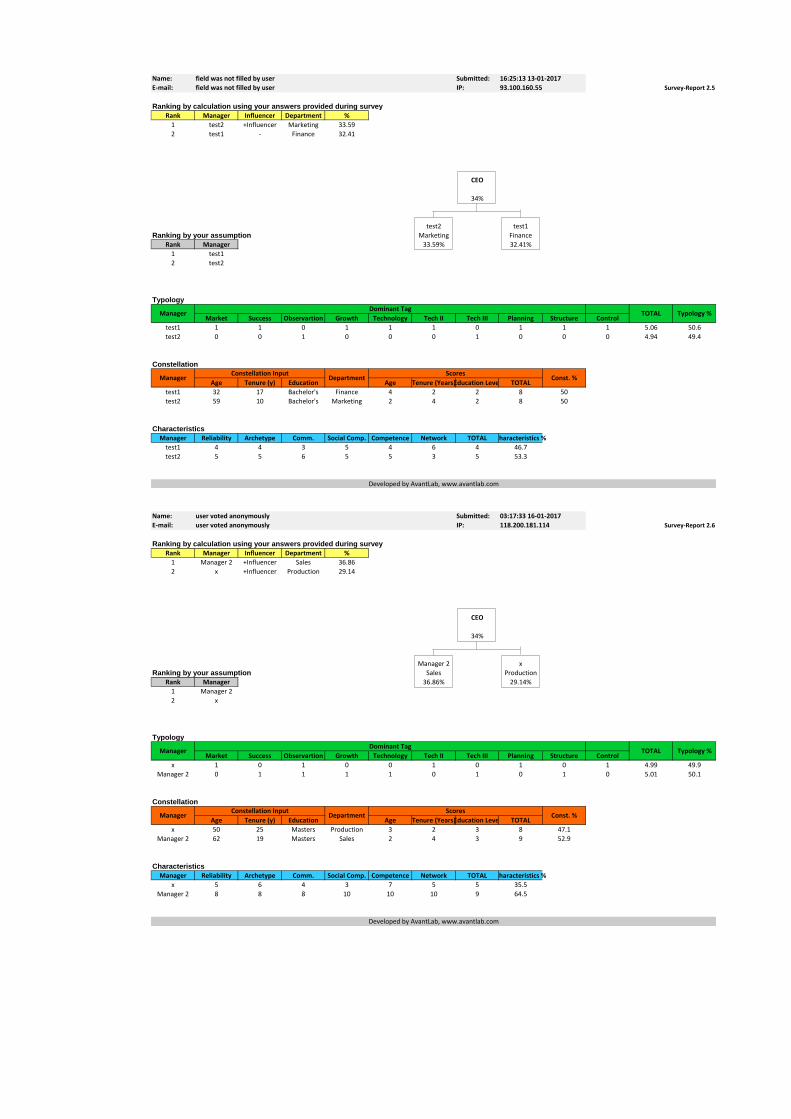
Name: field was not filled by user Submitted: 16:25:13 13-01-2017
E-mail: field was not filled by user IP: 93.100.160.55
Ranking by calculation using your answers provided during survey
Rank Manager Influencer Department %
1 test2 +Influencer Marketing 33.59
2 test1 - Finance 32.41
CEO
34%
test2 test1
Ranking by your assumption Marketing Finance
Rank Manager 33.59% 32.41%
1 test1
2 test2
Typology
Market Success Observartion Growth Technology Tech II Tech III Planning Structure Control
test1 1 1 0 1 1 1 0 1 1 1 5.06 50.6
test2 0 0 1 0 0 0 1 0 0 0 4.94 49.4
Constellation
Age Tenure (y) Education Age Tenure (Years)Education Level TOTAL
test1 32 17 Bachelor's Finance 4 2 2 8 50
test2 59 10 Bachelor's Marketing 2 4 2 8 50
Characteristics
Manager Reliability Archetype Comm. Social Comp. Competence Network TOTAL Characteristics %
test1 4 4 3 5 4 6 4 46.7
test2 5 5 6 5 5 3 5 53.3
Survey-Report 2.5
Dominant TagManager TOTAL Typology %
Developed by AvantLab, www.avantlab.com
Constellation Input ScoresManager Department Const. %
Name: user voted anonymously Submitted: 03:17:33 16-01-2017
E-mail: user voted anonymously IP: 118.200.181.114
Ranking by calculation using your answers provided during survey
Rank Manager Influencer Department %
1 Manager 2 +Influencer Sales 36.86
2 x +Influencer Production 29.14
CEO
34%
Manager 2 x
Ranking by your assumption Sales Production
Rank Manager 36.86% 29.14%
1 Manager 2
2 x
Typology
Market Success Observartion Growth Technology Tech II Tech III Planning Structure Control
x 1 0 1 0 0 1 0 1 0 1 4.99 49.9
Manager 2 0 1 1 1 1 0 1 0 1 0 5.01 50.1
Constellation
Age Tenure (y) Education Age Tenure (Years)Education Level TOTAL
x 50 25 Masters Production 3 2 3 8 47.1
Manager 2 62 19 Masters Sales 2 4 3 9 52.9
Characteristics
Manager Reliability Archetype Comm. Social Comp. Competence Network TOTAL Characteristics %
x 5 6 4 3 7 5 5 35.5
Manager 2 8 8 8 10 10 10 9 64.5
Survey-Report 2.6
Dominant TagManager TOTAL Typology %
Developed by AvantLab, www.avantlab.com
Constellation Input ScoresManager Department Const. %

Name: field was not filled by user Submitted: 04:52:40 16-01-2017
E-mail: field was not filled by user IP: 103.47.135.45
Ranking by calculation using your answers provided during survey
Rank Manager Influencer Department %
1 Rudy - Marketing 33.09
2 Andes - Finance 32.91
CEO
34%
Rudy Andes
Ranking by your assumption Marketing Finance
Rank Manager 33.09% 32.91%
1 Rudy
2 Andes
Typology
Market Success Observartion Growth Technology Tech II Tech III Planning Structure Control
Rudy 1 1 0 0 0 0 1 1 1 0 4.99 49.9
Andes 0 1 1 1 1 1 0 0 0 1 5.01 50.1
Constellation
Age Tenure (y) Education Age Tenure (Years)Education Level TOTAL
Rudy 25 2 Without Tertiary Marketing 3 2 1 6 50
Andes 27 4 Without Tertiary Finance 3 2 1 6 50
Characteristics
Manager Reliability Archetype Comm. Social Comp. Competence Network TOTAL Characteristics %
Rudy 4 5 8 5 8 6 6 50.5
Andes 7 7 5 5 8 3 6 49.5
Survey-Report 2.7
Dominant TagManager TOTAL Typology %
Developed by AvantLab, www.avantlab.com
Constellation Input ScoresManager Department Const. %
Name: user voted anonymously Submitted: 05:27:15 16-01-2017
E-mail: user voted anonymously IP: 175.139.208.103
Ranking by calculation using your answers provided during survey
Rank Manager Influencer Department %
1 Eric Kogu - Marketing 33.58
2 Melvin Ta - Marketing 32.42
CEO
34%
Eric Kogu Melvin Ta
Ranking by your assumption Marketing Marketing
Rank Manager 33.58% 32.42%
1 Eric Kogu
2 Melvin Ta
Typology
Market Success Observartion Growth Technology Tech II Tech III Planning Structure Control
Melvin Ta 1 0 0 0 0 0 0 1 1 1 5 50
Eric Kogu 1 0 0 0 0 0 0 1 1 1 5 50
Constellation
Age Tenure (y) Education Age Tenure (Years)Education Level TOTAL
Melvin Ta 40 5 Bachelor's Marketing 4 3 2 9 47.4
Eric Kogu 40 5 Masters Marketing 4 3 3 10 52.6
Characteristics
Manager Reliability Archetype Comm. Social Comp. Competence Network TOTAL Characteristics %
Melvin Ta 10 10 10 10 10 10 10 50
Eric Kogu 10 10 10 10 10 10 10 50
Survey-Report 2.8
Dominant TagManager TOTAL Typology %
Developed by AvantLab, www.avantlab.com
Constellation Input ScoresManager Department Const. %

Name: Muff Submitted: 14:03:48 17-01-2017
E-mail: [email protected] IP: 195.75.72.179
Ranking by calculation using your answers provided during survey
Rank Manager Influencer Department %
1 Matsubara - Sales 41.33
2 Aoki - Sales 24.67
CEO
34%
Matsubara Aoki
Ranking by your assumption Sales Sales
Rank Manager 41.33% 24.67%
1 Aoki
2 Matsubara
Typology
Market Success Observartion Growth Technology Tech II Tech III Planning Structure Control
Matsubara 1 0 0 0 1 1 1 1 1 0 5 50
Aoki 1 0 0 0 1 1 1 1 1 0 5 50
Constellation
Age Tenure (y) Education Age Tenure (Years)Education Level TOTAL
Matsubara 45 20 Without Tertiary Sales 4 4 1 9 56.3
Aoki 40 20 Without Tertiary Sales 2 4 1 7 43.8
Characteristics
Manager Reliability Archetype Comm. Social Comp. Competence Network TOTAL Characteristics %
Matsubara 2 4 2 7 4 4 4 81.6
Aoki 2 0 1 0 1 1 1 18.4
Survey-Report 2.9
Dominant TagManager TOTAL Typology %
Developed by AvantLab, www.avantlab.com
Constellation Input ScoresManager Department Const. %
Name: user voted anonymously Submitted: 16:04:53 17-01-2017
E-mail: user voted anonymously IP: 151.248.188.220
Ranking by calculation using your answers provided during survey
Rank Manager Influencer Department %
1 Joe +Influencer Service 34.66
2 Martin - Service 31.34
CEO
34%
Joe Martin
Ranking by your assumption Service Service
Rank Manager 34.66% 31.34%
1 Joe
2 Martin
Typology
Market Success Observartion Growth Technology Tech II Tech III Planning Structure Control
Joe 0 1 0 0 0 0 0 0 0 0 5 50
Martin 0 1 0 0 0 0 0 0 0 0 5 50
Constellation
Age Tenure (y) Education Age Tenure (Years)Education Level TOTAL
Joe 46 4 Masters Service 3 3 3 9 56.3
Martin 53 5 Masters Service 2 2 3 7 43.8
Characteristics
Manager Reliability Archetype Comm. Social Comp. Competence Network TOTAL Characteristics %
Joe 10 2 5 2 3 10 5 51.3
Martin 9 4 2 7 5 3 5 48.7
Survey-Report 2.10
Dominant TagManager TOTAL Typology %
Developed by AvantLab, www.avantlab.com
Constellation Input ScoresManager Department Const. %

Name: field was not filled by user Submitted: 17:48:22 17-01-2017
E-mail: field was not filled by user IP: 178.196.147.235
Ranking by calculation using your answers provided during survey
Rank Manager Influencer Department %
1 Manager 2 - Finance 33.9
2 Manager 1 - R & D 32.1
CEO
34%
Manager 2 Manager 1
Ranking by your assumption Finance R & D
Rank Manager 33.90% 32.10%
1 Manager 1
2 Manager 2
Typology
Market Success Observartion Growth Technology Tech II Tech III Planning Structure Control
Manager 1 1 1 1 0 1 0 1 1 0 0 5 50
Manager 2 0 1 1 1 0 1 0 0 1 1 5 50
Constellation
Age Tenure (y) Education Age Tenure (Years)Education Level TOTAL
Manager 1 41 10 Bachelor's R & D 3 2 2 7 46.7
Manager 2 50 4 Masters Finance 2 3 3 8 53.3
Characteristics
Manager Reliability Archetype Comm. Social Comp. Competence Network TOTAL Characteristics %
Manager 1 10 10 5 1 9 1 6 49.3
Manager 2 6 5 7 7 8 4 6 50.7
Survey-Report 2.11
Dominant TagManager TOTAL Typology %
Developed by AvantLab, www.avantlab.com
Constellation Input ScoresManager Department Const. %
Name: Andi Lapon Submitted: 03:53:41 18-01-2017
E-mail: [email protected] IP: 118.189.2.162
Ranking by calculation using your answers provided during survey
Rank Manager Influencer Department %
1 GC - R & D 33.04
2 RVH - Finance 32.96
CEO
34%
GC RVH
Ranking by your assumption R & D Finance
Rank Manager 33.04% 32.96%
1 RVH
2 GC
Typology
Market Success Observartion Growth Technology Tech II Tech III Planning Structure Control
RVH 0 0 1 1 1 1 1 1 1 1 5.04 50.4
GC 1 1 0 1 1 0 0 0 0 0 4.96 49.6
Constellation
Age Tenure (y) Education Age Tenure (Years)Education Level TOTAL
RVH 41 5 Masters Finance 2 3 3 8 53.3
GC 45 3 Masters R & D 2 2 3 7 46.7
Characteristics
Manager Reliability Archetype Comm. Social Comp. Competence Network TOTAL Characteristics %
RVH 8 0 8 4 7 8 6 46.1
GC 8 0 8 8 9 8 7 53.9
Survey-Report 2.12
Dominant TagManager TOTAL Typology %
Developed by AvantLab, www.avantlab.com
Constellation Input ScoresManager Department Const. %

Name: Mohammad Aidil Alladin Submitted: 04:39:36 18-01-2017
E-mail: [email protected] IP: 113.210.125.96
Ranking by calculation using your answers provided during survey
Rank Manager Influencer Department %
1 Suhairul - Finance 33.42
2 Rosnani - Sales 32.58
CEO
34%
Suhairul Rosnani
Ranking by your assumption Finance Sales
Rank Manager 33.42% 32.58%
1 Suhairul
2 Rosnani
Typology
Market Success Observartion Growth Technology Tech II Tech III Planning Structure Control
Suhairul 0 1 1 1 1 1 1 0 1 1 5.05 50.5
Rosnani 1 0 0 1 0 0 0 1 0 0 4.95 49.5
Constellation
Age Tenure (y) Education Age Tenure (Years)Education Level TOTAL
Suhairul 37 7 Bachelor's Finance 2 4 2 8 47.1
Rosnani 40 7 Without Tertiary Sales 4 4 1 9 52.9
Characteristics
Manager Reliability Archetype Comm. Social Comp. Competence Network TOTAL Characteristics %
Suhairul 8 7 7 8 7 7 7 54.3
Rosnani 8 6 5 6 6 6 6 45.7
Survey-Report 2.13
Dominant TagManager TOTAL Typology %
Developed by AvantLab, www.avantlab.com
Constellation Input ScoresManager Department Const. %
Name: user voted anonymously Submitted: 07:21:04 13-01-2017
E-mail: user voted anonymously IP: 218.111.0.38
Ranking by calculation using your answers provided during survey
Rank Manager Influencer Department %
1 LKW +Influencer Production 33.8
2 TCM +Influencer Marketing 32.2
CEO
34%
LKW TCM
Ranking by your assumption Production Marketing
Rank Manager 33.80% 32.20%
1 TCM
2 LKW
Typology
Market Success Observartion Growth Technology Tech II Tech III Planning Structure Control
TCM 0 0 0 1 1 1 0 1 0 0 4.98 49.8
LKW 0 1 1 0 1 1 1 0 1 0 5.02 50.2
Constellation
Age Tenure (y) Education Age Tenure (Years)Education Level TOTAL
TCM 55 25 Bachelor's Marketing 3 3 2 8 50
LKW 42 19 Bachelor's Production 3 3 2 8 50
Characteristics
Manager Reliability Archetype Comm. Social Comp. Competence Network TOTAL Characteristics %
TCM 7 2 5 6 7 9 6 46.6
LKW 8 5 6 7 9 6 7 53.4
Survey-Report 2.14
Dominant TagManager TOTAL Typology %
Developed by AvantLab, www.avantlab.com
Constellation Input ScoresManager Department Const. %

Name: user voted anonymously Submitted: 08:29:42 16-01-2017
E-mail: user voted anonymously IP: 115.134.150.216
Ranking by calculation using your answers provided during survey
Rank Manager Influencer Department %
1 Jolene - Sales 33.71
2 MK - Service 32.29
CEO
34%
Jolene MK
Ranking by your assumption Sales Service
Rank Manager 33.71% 32.29%
1 Jolene
2 MK
Typology
Market Success Observartion Growth Technology Tech II Tech III Planning Structure Control
Jolene 0 1 0 1 1 1 1 0 1 1 5.04 50.4
MK 0 0 0 0 1 1 1 0 0 0 4.96 49.6
Constellation
Age Tenure (y) Education Age Tenure (Years)Education Level TOTAL
Jolene 40 10 Bachelor's Sales 3 4 2 9 52.9
MK 35 10 Bachelor's Service 2 4 2 8 47.1
Characteristics
Manager Reliability Archetype Comm. Social Comp. Competence Network TOTAL Characteristics %
Jolene 8 6 7 10 6 10 8 49.9
MK 10 7 7 8 7 8 8 50.1
Survey-Report 2.15
Dominant TagManager TOTAL Typology %
Developed by AvantLab, www.avantlab.com
Constellation Input ScoresManager Department Const. %
Name: Michael Heinzer Submitted: 17:14:32 16-01-2017
E-mail: [email protected] IP: 84.253.60.194
Ranking by calculation using your answers provided during survey
Rank Manager Influencer Department %
1 Roman - Finance 35.46
2 Michael +Influencer Production 30.54
CEO
34%
Roman Michael
Ranking by your assumption Finance Production
Rank Manager 35.46% 30.54%
1 Michael
2 Roman
Typology
Market Success Observartion Growth Technology Tech II Tech III Planning Structure Control
Michael 0 0 1 0 1 0 0 0 1 1 4.97 49.7
Roman 1 1 1 1 1 0 0 0 1 1 5.03 50.3
Constellation
Age Tenure (y) Education Age Tenure (Years)Education Level TOTAL
Michael 42 13 Without Tertiary Production 2 2 1 5 35.7
Roman 51 21 Without Tertiary Finance 4 4 1 9 64.3
Characteristics
Manager Reliability Archetype Comm. Social Comp. Competence Network TOTAL Characteristics %
Michael 10 8 4 7 9 7 7 53.4
Roman 5 4 7 9 8 6 7 46.6
Survey-Report 2.16
Dominant TagManager TOTAL Typology %
Developed by AvantLab, www.avantlab.com
Constellation Input ScoresManager Department Const. %

Name: Urs Wohlgemuth Submitted: 17:39:51 26-01-2017
E-mail: [email protected] IP: 87.245.102.60
Ranking by calculation using your answers provided during survey
Rank Manager Influencer Department %
1 Christian - Production 36.92
2 Marcel - Finance 29.08
CEO
34%
Christian Marcel
Ranking by your assumption Production Finance
Rank Manager 36.92% 29.08%
1 Marcel
2 Christian
Typology
Market Success Observartion Growth Technology Tech II Tech III Planning Structure Control
Marcel 1 1 1 1 0 0 0 1 1 1 5.01 50.1
Christian 1 1 0 1 0 0 0 1 1 1 4.99 49.9
Constellation
Age Tenure (y) Education Age Tenure (Years)Education Level TOTAL
Marcel 62 26 Bachelor's Finance 2 2 2 6 42.9
Christian 38 9 Bachelor's Production 2 4 2 8 57.1
Characteristics
Manager Reliability Archetype Comm. Social Comp. Competence Network TOTAL Characteristics %
Marcel 2 4 5 3 8 2 4 39.2
Christian 5 6 5 7 9 5 6 60.8
Survey-Report 2.17
Dominant TagManager TOTAL Typology %
Developed by AvantLab, www.avantlab.com
Constellation Input ScoresManager Department Const. %
Name: Syeikh Submitted: 03:04:15 27-01-2017
E-mail: field was not filled by user IP: 175.139.244.61
Ranking by calculation using your answers provided during survey
Rank Manager Influencer Department %
1 Manager 1 - Sales 40.36
2 Manager 2 - Production 25.64
CEO
34%
Manager 1 Manager 2
Ranking by your assumption Sales Production
Rank Manager 40.36% 25.64%
1 Manager 1
2 Manager 2
Typology
Market Success Observartion Growth Technology Tech II Tech III Planning Structure Control
Manager 1 1 0 0 0 0 0 1 1 0 1 5.01 50.1
Manager 2 0 1 0 0 1 1 0 0 0 0 4.99 49.9
Constellation
Age Tenure (y) Education Age Tenure (Years)Education Level TOTAL
Manager 1 63 18 Bachelor's Sales 3 4 2 9 60
Manager 2 36 3 Bachelor's Production 2 2 2 6 40
Characteristics
Manager Reliability Archetype Comm. Social Comp. Competence Network TOTAL Characteristics %
Manager 1 5 3 5 5 7 6 5 73.4
Manager 2 2 4 2 2 0 1 2 26.6
Survey-Report 2.18
Dominant TagManager TOTAL Typology %
Developed by AvantLab, www.avantlab.com
Constellation Input ScoresManager Department Const. %

Name: user voted anonymously Submitted: 03:04:48 27-01-2017
E-mail: user voted anonymously IP: 175.139.244.61
Ranking by calculation using your answers provided during survey
Rank Manager Influencer Department %
1 Manager 1 - Sales 40.36
2 Manager 2 - Production 25.64
CEO
34%
Manager 1 Manager 2
Ranking by your assumption Sales Production
Rank Manager 40.36% 25.64%
1 Manager 1
2 Manager 2
Typology
Market Success Observartion Growth Technology Tech II Tech III Planning Structure Control
Manager 1 1 0 0 0 0 0 1 1 0 1 5.01 50.1
Manager 2 0 1 0 0 1 1 0 0 0 0 4.99 49.9
Constellation
Age Tenure (y) Education Age Tenure (Years)Education Level TOTAL
Manager 1 63 18 Bachelor's Sales 3 4 2 9 60
Manager 2 36 3 Bachelor's Production 2 2 2 6 40
Characteristics
Manager Reliability Archetype Comm. Social Comp. Competence Network TOTAL Characteristics %
Manager 1 5 3 5 5 7 6 5 73.4
Manager 2 2 4 2 2 0 1 2 26.6
Survey-Report 2.19
Dominant TagManager TOTAL Typology %
Developed by AvantLab, www.avantlab.com
Constellation Input ScoresManager Department Const. %
Name: field was not filled by user Submitted: 22:50:42 29-01-2017
E-mail: [email protected] IP: 176.108.195.59
Ranking by calculation using your answers provided during survey
Rank Manager Influencer Department %
1 Manager 2 +Influencer Sales 34.97
2 Manager 1 +Influencer Production 31.03
CEO
34%
Manager 2 Manager 1
Ranking by your assumption Sales Production
Rank Manager 34.97% 31.03%
1 Manager 1
2 Manager 2
Typology
Market Success Observartion Growth Technology Tech II Tech III Planning Structure Control
Manager 1 0 1 1 0 1 0 1 0 1 1 5.01 50.1
Manager 2 1 1 0 1 0 0 1 1 0 0 4.99 49.9
Constellation
Age Tenure (y) Education Age Tenure (Years)Education Level TOTAL
Manager 1 47 11 Without Tertiary Production 2 2 1 5 45.5
Manager 2 60 14 Without Tertiary Sales 2 3 1 6 54.5
Characteristics
Manager Reliability Archetype Comm. Social Comp. Competence Network TOTAL Characteristics %
Manager 1 6 0 5 5 9 0 4 45.5
Manager 2 7 10 3 2 4 5 5 54.5
Survey-Report 2.20
Dominant TagManager TOTAL Typology %
Developed by AvantLab, www.avantlab.com
Constellation Input ScoresManager Department Const. %

Name: user voted anonymously Submitted: 07:55:27 30-01-2017
E-mail: user voted anonymously IP: 212.101.8.162
Ranking by calculation using your answers provided during survey
Rank Manager Influencer Department %
1 Binzegger +Influencer Production 34.28
2 Gulich - Finance 31.72
CEO
34%
Binzegger Gulich
Ranking by your assumption Production Finance
Rank Manager 34.28% 31.72%
1 Binzegger
2 Gulich
Typology
Market Success Observartion Growth Technology Tech II Tech III Planning Structure Control
Binzegger 1 1 0 1 0 1 0 0 0 1 4.99 49.9
Gulich 1 1 1 1 0 1 0 0 0 1 5.01 50.1
Constellation
Age Tenure (y) Education Age Tenure (Years)Education Level TOTAL
Binzegger 42 16 Masters Production 4 2 3 9 56.3
Gulich 51 3 Masters Finance 2 2 3 7 43.8
Characteristics
Manager Reliability Archetype Comm. Social Comp. Competence Network TOTAL Characteristics %
Binzegger 2 2 6 6 6 6 5 49.7
Gulich 6 5 4 4 8 1 5 50.3
Survey-Report 2.21
Dominant TagManager TOTAL Typology %
Developed by AvantLab, www.avantlab.com
Constellation Input ScoresManager Department Const. %
Name: field was not filled by user Submitted: 19:31:13 30-01-2017
E-mail: field was not filled by user IP: 212.4.94.65
Ranking by calculation using your answers provided during survey
Rank Manager Influencer Department %
1 Figols - Marketing 39.4
2 Aoki - Sales 26.6
CEO
34%
Figols Aoki
Ranking by your assumption Marketing Sales
Rank Manager 39.40% 26.60%
1 Aoki
2 Figols
Typology
Market Success Observartion Growth Technology Tech II Tech III Planning Structure Control
Aoki 1 0 1 1 0 0 1 1 1 1 5 50
Figols 1 0 1 1 0 0 1 1 1 1 5 50
Constellation
Age Tenure (y) Education Age Tenure (Years)Education Level TOTAL
Aoki 36 15 Without Tertiary Sales 3 4 1 8 53.3
Figols 38 9 Bachelor's Marketing 3 2 2 7 46.7
Characteristics
Manager Reliability Archetype Comm. Social Comp. Competence Network TOTAL Characteristics %
Aoki 2 2 1 1 1 1 1 17.6
Figols 5 3 8 6 8 8 6 82.4
Survey-Report 2.22
Dominant TagManager TOTAL Typology %
Developed by AvantLab, www.avantlab.com
Constellation Input ScoresManager Department Const. %

Name: field was not filled by user Submitted: 13:12:02 31-01-2017
E-mail: field was not filled by user IP: 82.136.98.113
Ranking by calculation using your answers provided during survey
Rank Manager Influencer Department %
1 Manager 1 - Finance 34.83
2 Manager 2 +Influencer HR 31.17
CEO
34%
Manager 1 Manager 2
Ranking by your assumption Finance HR
Rank Manager 34.83% 31.17%
1 Manager 1
2 Manager 2
Typology
Market Success Observartion Growth Technology Tech II Tech III Planning Structure Control
Manager 1 1 1 1 1 1 1 1 1 0 1 5.05 50.5
Manager 2 0 0 1 0 1 1 0 1 0 0 4.95 49.5
Constellation
Age Tenure (y) Education Age Tenure (Years)Education Level TOTAL
Manager 1 40 10 Masters Finance 4 4 3 11 61.1
Manager 2 38 5 Masters HR 2 2 3 7 38.9
Characteristics
Manager Reliability Archetype Comm. Social Comp. Competence Network TOTAL Characteristics %
Manager 1 8 5 4 5 7 7 6 46.7
Manager 2 8 5 8 9 6 4 7 53.3
Survey-Report 2.23
Dominant TagManager TOTAL Typology %
Developed by AvantLab, www.avantlab.com
Constellation Input ScoresManager Department Const. %
Name: user voted anonymously Submitted: 16:51:13 01-02-2017
E-mail: user voted anonymously IP: 85.3.83.195
Ranking by calculation using your answers provided during survey
Rank Manager Influencer Department %
1 Manager 2 - Marketing 37.97
2 Manager 1 - Finance 28.03
CEO
34%
Manager 2 Manager 1
Ranking by your assumption Marketing Finance
Rank Manager 37.97% 28.03%
1 Manager 2
2 Manager 1
Typology
Market Success Observartion Growth Technology Tech II Tech III Planning Structure Control
Manager 1 1 1 1 1 1 1 0 1 1 1 5.04 50.4
Manager 2 0 1 1 1 0 1 1 0 0 0 4.96 49.6
Constellation
Age Tenure (y) Education Age Tenure (Years)Education Level TOTAL
Manager 1 46 3 Bachelor's Finance 2 2 2 6 37.5
Manager 2 44 2 Bachelor's Marketing 4 4 2 10 62.5
Characteristics
Manager Reliability Archetype Comm. Social Comp. Competence Network TOTAL Characteristics %
Manager 1 10 2 4 6 10 2 6 39.5
Manager 2 7 6 10 10 10 10 9 60.5
Survey-Report 2.24
Dominant TagManager TOTAL Typology %
Developed by AvantLab, www.avantlab.com
Constellation Input ScoresManager Department Const. %

Name: user voted anonymously Submitted: 05:50:20 18-01-2017
E-mail: user voted anonymously IP: 211.25.13.146
Ranking by calculation using your answers provided during survey
Rank Manager Influencer Department %
1 ju +Influencer Service 34.9
2 je - Marketing 31.1
CEO
34%
ju je
Ranking by your assumption Service Marketing
Rank Manager 34.90% 31.10%
1 ju
2 je
Typology
Market Success Observartion Growth Technology Tech II Tech III Planning Structure Control
ju 0 0 0 0 0 1 0 0 0 0 4.97 49.7
je 0 1 0 1 0 1 0 0 1 0 5.03 50.3
Constellation
Age Tenure (y) Education Age Tenure (Years)Education Level TOTAL
ju 58 25 Bachelor's Service 3 4 2 9 60
je 46 10 Bachelor's Marketing 2 2 2 6 40
Characteristics
Manager Reliability Archetype Comm. Social Comp. Competence Network TOTAL Characteristics %
ju 4 5 4 4 8 5 5 48.9
je 4 6 5 5 6 5 5 51.1
Survey-Report 2.25
Dominant TagManager TOTAL Typology %
Developed by AvantLab, www.avantlab.com
Constellation Input ScoresManager Department Const. %
Name: field was not filled by user Submitted: 07:28:43 27-01-2017
E-mail: field was not filled by user IP: 113.163.107.255
Ranking by calculation using your answers provided during survey
Rank Manager Influencer Department %
1 Thuan +Influencer R & D 33.77
2 Vinh - Sales 32.23
CEO
34%
Thuan Vinh
Ranking by your assumption R & D Sales
Rank Manager 33.77% 32.23%
1 Vinh
2 Thuan
Typology
Market Success Observartion Growth Technology Tech II Tech III Planning Structure Control
Thuan 0 1 1 0 1 0 1 1 1 1 5.02 50.2
Vinh 0 0 1 0 1 0 1 0 1 1 4.98 49.8
Constellation
Age Tenure (y) Education Age Tenure (Years)Education Level TOTAL
Thuan 46 13 Bachelor's R & D 3 2 2 7 53.8
Vinh 41 3 Bachelor's Sales 2 2 2 6 46.2
Characteristics
Manager Reliability Archetype Comm. Social Comp. Competence Network TOTAL Characteristics %
Thuan 6 5 8 8 7 8 7 49.4
Vinh 6 6 8 8 7 8 7 50.6
Survey-Report 2.26
Dominant TagManager TOTAL Typology %
Developed by AvantLab, www.avantlab.com
Constellation Input ScoresManager Department Const. %

Name: Nguyen Thi Thu Huong Submitted: 10:22:44 27-01-2017
E-mail: [email protected] IP: 171.253.17.253
Ranking by calculation using your answers provided during survey
Rank Manager Influencer Department %
1 Mr. Tung - Marketing 33.81
2 Ms. Hieu - Finance 32.19
CEO
34%
Mr. Tung Ms. Hieu
Ranking by your assumption Marketing Finance
Rank Manager 33.81% 32.19%
1 Mr. Tung
2 Ms. Hieu
Typology
Market Success Observartion Growth Technology Tech II Tech III Planning Structure Control
Mr. Tung 1 1 1 0 1 1 0 1 1 1 5.04 50.4
Ms. Hieu 0 0 1 1 1 0 1 0 0 0 4.96 49.6
Constellation
Age Tenure (y) Education Age Tenure (Years)Education Level TOTAL
Mr. Tung 35 3 Masters Marketing 4 4 3 11 55
Ms. Hieu 30 3 Masters Finance 2 4 3 9 45
Characteristics
Manager Reliability Archetype Comm. Social Comp. Competence Network TOTAL Characteristics %
Mr. Tung 9 6 10 10 8 8 9 48.3
Ms. Hieu 9 8 10 10 9 9 9 51.7
Survey-Report 2.27
Dominant TagManager TOTAL Typology %
Developed by AvantLab, www.avantlab.com
Constellation Input ScoresManager Department Const. %
Name: Yves Submitted: 04:11:43 13-01-2017
E-mail: [email protected] IP: 175.139.208.103
Ranking by calculation using your answers provided during survey
Rank Manager Influencer Department %
1 Yves - Sales 25.86
2 Michael +Influencer Production 22.73
3 Alain - Finance 17.42
CEO
34%
Yves Michael Alain
Ranking by your assumption Sales Production Finance
Rank Manager 25.86% 22.73% 17.42%
1 Alain
2 Yves
3 Michael
Typology
Market Success Observartion Growth Technology Tech II Tech III Planning Structure Control
Yves 0 1 1 1 1 1 1 1 1 1 3.84 38.4
Michael 1 1 1 1 1 1 0 0 0 1 3.08 30.8
Alain 1 1 1 1 1 1 0 0 0 1 3.08 30.8
Constellation
Age Tenure (y) Education Age Tenure (y) Education TOTAL
Yves 28 5 Bachelor's Sales 3 4 2 9 34.6
Michael 28 5 Without Tertiary Production 3 4 1 8 30.8
Alain 34 5 Masters Finance 2 4 3 9 34.6
Characteristics
Manager Reliability Archetype CommunicationSocial competenceCompetence Network TOTAL Characteristics %
Yves 3 5 8 9 8 5 6 44.5
Michael 8 4 4 4 10 6 6 41.8
Alain 1 1 2 2 4 2 2 13.8
Survey-Report 3.1
Dominant TagManager TOTAL Typology %
Developed by AvantLab, www.avantlab.com
Constellation Input ScoresManager Department Const. %

Name: user voted anonymously Submitted: 04:52:25 13-01-2017
E-mail: user voted anonymously IP: 116.12.139.18
Ranking by calculation using your answers provided during survey
Rank Manager Influencer Department %
1 Iris C - HR 22.25
2 Naresh K - HR 22.12
3 CK Lai - Service 21.62
CEO
34%
Iris C Naresh K CK Lai
Ranking by your assumption HR HR Service
Rank Manager 22.25% 22.12% 21.62%
1 CK Lai
2 Naresh K
3 Iris C
Typology
Market Success Observartion Growth Technology Tech II Tech III Planning Structure Control
CK Lai 0 1 1 0 0 1 0 0 0 0 3.31 33.1
Naresh K 0 1 1 0 0 1 0 0 1 0 3.34 33.4
Iris C 0 1 1 0 0 1 0 0 1 0 3.34 33.4
Constellation
Age Tenure (y) Education Age Tenure (y) Education TOTAL
CK Lai 40 5 Bachelor's Service 2 3 2 7 31.8
Naresh K 45 5 Bachelor's HR 3 3 2 8 36.4
Iris C 45 4 Bachelor's HR 3 2 2 7 31.8
Characteristics
Manager Reliability Archetype CommunicationSocial competenceCompetence Network TOTAL Characteristics %
CK Lai 9 7 8 7 9 6 8 33.3
Naresh K 7 7 6 7 8 8 7 30.8
Iris C 8 7 7 10 8 10 8 35.9
Survey-Report 3.2
Dominant TagManager TOTAL Typology %
Developed by AvantLab, www.avantlab.com
Constellation Input ScoresManager Department Const. %
Name: user voted anonymously Submitted: 04:53:41 13-01-2017
E-mail: user voted anonymously IP: 153.58.16.104
Ranking by calculation using your answers provided during survey
Rank Manager Influencer Department %
1 Bill - Procurement 22.67
2 Tom - Finance 21.71
3 Jo - R & D 21.62
CEO
34%
Bill Tom Jo
Ranking by your assumption Procurement Finance R & D
Rank Manager 22.67% 21.71% 21.62%
1 Jo
2 Bill
3 Tom
Typology
Market Success Observartion Growth Technology Tech II Tech III Planning Structure Control
Jo 0 1 1 1 1 1 0 0 0 1 3.25 32.5
Bill 1 1 1 1 1 1 1 1 1 1 3.37 33.7
Tom 1 1 1 1 1 1 1 1 1 1 3.37 33.7
Constellation
Age Tenure (y) Education Age Tenure (y) Education TOTAL
Jo 32 5 Without Tertiary R & D 4 3 1 8 34.8
Bill 22 4 Bachelor's Procurement 2 4 2 8 34.8
Tom 35 1 Bachelor's Finance 3 2 2 7 30.4
Characteristics
Manager Reliability Archetype CommunicationSocial competenceCompetence Network TOTAL Characteristics %
Jo 9 9 8 9 9 10 9 31
Bill 10 10 10 10 10 10 10 34.5
Tom 10 10 10 10 10 10 10 34.5
Survey-Report 3.3
Dominant TagManager TOTAL Typology %
Developed by AvantLab, www.avantlab.com
Constellation Input ScoresManager Department Const. %

Name: Alex Lim Submitted: 05:58:43 13-01-2017
E-mail: [email protected] IP: 175.138.55.106
Ranking by calculation using your answers provided during survey
Rank Manager Influencer Department %
1 Kim - HR 23.12
2 Melinda +Influencer Service 23.04
3 KY +Influencer Finance 19.84
CEO
34%
Kim Melinda KY
Ranking by your assumption HR Service Finance
Rank Manager 23.12% 23.04% 19.84%
1 KY
2 Melinda
3 Kim
Typology
Market Success Observartion Growth Technology Tech II Tech III Planning Structure Control
KY 0 1 1 1 1 1 0 0 1 1 4.05 40.5
Melinda 0 1 0 0 0 1 0 0 0 0 2.96 29.6
Kim 0 1 0 1 0 1 0 0 0 0 2.99 29.9
Constellation
Age Tenure (y) Education Age Tenure (y) Education TOTAL
KY 30 10 Bachelor's Finance 2 2 2 6 27.3
Melinda 50 15 Bachelor's Service 4 3 2 9 40.9
Kim 60 15 Bachelor's HR 2 3 2 7 31.8
Characteristics
Manager Reliability Archetype CommunicationSocial competenceCompetence Network TOTAL Characteristics %
KY 1 1 3 5 2 6 3 22.4
Melinda 9 1 7 2 5 2 5 34.2
Kim 5 1 10 10 5 2 6 43.4
Survey-Report 3.4
Dominant TagManager TOTAL Typology %
Developed by AvantLab, www.avantlab.com
Constellation Input ScoresManager Department Const. %
Name: Mario Miranda Submitted: 11:28:46 13-01-2017
E-mail: [email protected] IP: 200.150.166.208
Ranking by calculation using your answers provided during survey
Rank Manager Influencer Department %
1 Manager 3 - Marketing 24.95
2 Manager 2 +Influencer Production 22.22
3 Manager 1 - Finance 18.83
CEO
34%
Manager 3 Manager 2 Manager 1
Ranking by your assumption Marketing Production Finance
Rank Manager 24.95% 22.22% 18.83%
1 Manager 3
2 Manager 2
3 Manager 1
Typology
Market Success Observartion Growth Technology Tech II Tech III Planning Structure Control
Manager 1 1 1 0 1 1 1 0 1 1 1 3.54 35.4
Manager 2 0 1 0 1 1 1 0 0 1 1 3.01 30.1
Manager 3 0 1 1 1 0 1 1 0 0 0 3.45 34.5
Constellation
Age Tenure (y) Education Age Tenure (y) Education TOTAL
Manager 1 41 11 Bachelor's Finance 2 3 2 7 30.4
Manager 2 55 4 Masters Production 2 2 3 7 30.4
Manager 3 50 12 Bachelor's Marketing 4 3 2 9 39.1
Characteristics
Manager Reliability Archetype CommunicationSocial competenceCompetence Network TOTAL Characteristics %
Manager 1 5 4 4 2 7 2 4 19.8
Manager 2 9 7 8 8 9 8 8 40.5
Manager 3 9 5 8 9 8 9 8 39.8
Survey-Report 3.5
Dominant TagManager TOTAL Typology %
Developed by AvantLab, www.avantlab.com
Constellation Input ScoresManager Department Const. %

Name: johnny Poh Submitted: 07:25:46 16-01-2017
E-mail: [email protected] IP: 1.32.40.113
Ranking by calculation using your answers provided during survey
Rank Manager Influencer Department %
1 Mike Lim - Marketing 22.89
2 John Wong - Service 22.47
3 Alex Ooi - Sales 20.64
CEO
34%
Mike Lim John Wong Alex Ooi
Ranking by your assumption Marketing Service Sales
Rank Manager 22.89% 22.47% 20.64%
1 Alex Ooi
2 Mike Lim
3 John Wong
Typology
Market Success Observartion Growth Technology Tech II Tech III Planning Structure Control
Alex Ooi 0 0 1 1 1 1 0 0 0 0 3.35 33.5
Mike Lim 0 0 1 1 1 1 0 0 0 0 3.35 33.5
John Wong 0 0 0 1 1 0 0 0 0 0 3.29 32.9
Constellation
Age Tenure (y) Education Age Tenure (y) Education TOTAL
Alex Ooi 30 5 Without Tertiary Sales 2 3 1 6 27.3
Mike Lim 36 3 Bachelor's Marketing 4 1 2 7 31.8
John Wong 35 4 Without Tertiary Service 4 4 1 9 40.9
Characteristics
Manager Reliability Archetype CommunicationSocial competenceCompetence Network TOTAL Characteristics %
Alex Ooi 5 5 7 7 5 6 6 33
Mike Lim 7 6 8 7 7 6 7 38.7
John Wong 7 5 5 3 6 4 5 28.3
Survey-Report 3.6
Dominant TagManager TOTAL Typology %
Developed by AvantLab, www.avantlab.com
Constellation Input ScoresManager Department Const. %
Name: NGUYEN TRUNG QUAN Submitted: 08:56:51 16-01-2017
E-mail: [email protected] IP: 113.161.35.120
Ranking by calculation using your answers provided during survey
Rank Manager Influencer Department %
1 Manager 1 +Influencer Sales 25.44
2 Manager 3 +Influencer Procurement 20.6
3 Manager 2 +Influencer Production 19.96
CEO
34%
Manager 1 Manager 3 Manager 2
Ranking by your assumption Sales Procurement Production
Rank Manager 25.44% 20.60% 19.96%
1 Manager 1
2 Manager 2
3 Manager 3
Typology
Market Success Observartion Growth Technology Tech II Tech III Planning Structure Control
Manager 1 1 1 0 1 1 1 1 1 1 0 4.46 44.6
Manager 2 0 0 1 0 1 0 0 0 0 0 2.64 26.4
Manager 3 0 0 1 0 1 0 0 0 0 1 2.9 29
Constellation
Age Tenure (y) Education Age Tenure (y) Education TOTAL
Manager 1 35 3 Masters Sales 3 4 3 10 35.7
Manager 2 48 3 Masters Production 1 4 3 8 28.6
Manager 3 35 3 Masters Procurement 3 4 3 10 35.7
Characteristics
Manager Reliability Archetype CommunicationSocial competenceCompetence Network TOTAL Characteristics %
Manager 1 7 5 7 8 7 9 7 35.3
Manager 2 9 7 7 8 7 5 7 35.8
Manager 3 7 5 6 5 6 6 6 28.9
Survey-Report 3.7
Dominant TagManager TOTAL Typology %
Developed by AvantLab, www.avantlab.com
Constellation Input ScoresManager Department Const. %

Name: Michael Degiampietro Submitted: 14:27:34 16-01-2017
E-mail: [email protected] IP: 80.187.110.243
Ranking by calculation using your answers provided during survey
Rank Manager Influencer Department %
1 Manager 1 - Service 23.09
2 Manager 2 - Service 21.89
3 Manager 3 - Marketing 21.02
CEO
34%
Manager 1 Manager 2 Manager 3
Ranking by your assumption Service Service Marketing
Rank Manager 23.09% 21.89% 21.02%
1 Manager 1
2 Manager 2
3 Manager 3
Typology
Market Success Observartion Growth Technology Tech II Tech III Planning Structure Control
Manager 1 0 0 0 1 0 0 0 0 0 0 2.89 28.9
Manager 2 0 0 0 1 0 0 0 0 0 0 2.89 28.9
Manager 3 1 1 0 1 1 1 0 0 1 0 4.22 42.2
Constellation
Age Tenure (y) Education Age Tenure (y) Education TOTAL
Manager 1 50 15 Masters Service 3 3 3 9 42.9
Manager 2 50 15 Bachelor's Service 3 3 2 8 38.1
Manager 3 35 2 Bachelor's Marketing 1 1 2 4 19
Characteristics
Manager Reliability Archetype CommunicationSocial competenceCompetence Network TOTAL Characteristics %
Manager 1 7 7 7 8 10 10 8 33.2
Manager 2 7 5 10 10 7 8 8 32.5
Manager 3 10 6 8 8 8 10 8 34.3
Survey-Report 3.8
Dominant TagManager TOTAL Typology %
Developed by AvantLab, www.avantlab.com
Constellation Input ScoresManager Department Const. %
Name: user voted anonymously Submitted: 17:28:51 17-01-2017
E-mail: user voted anonymously IP: 164.14.60.91
Ranking by calculation using your answers provided during survey
Rank Manager Influencer Department %
1 Person 1 - Finance 24.19
2 Person 3 - Service 21.36
3 Person 2 +Influencer Service 20.45
CEO
34%
Person 1 Person 3 Person 2
Ranking by your assumption Finance Service Service
Rank Manager 24.19% 21.36% 20.45%
1 Person 1
2 Person 2
3 Person 3
Typology
Market Success Observartion Growth Technology Tech II Tech III Planning Structure Control
Person 1 1 1 1 1 1 0 1 1 0 1 4.75 47.5
Person 2 0 0 0 0 0 0 0 0 0 0 2.63 26.3
Person 3 0 0 0 0 0 0 0 0 0 0 2.63 26.3
Constellation
Age Tenure (y) Education Age Tenure (y) Education TOTAL
Person 1 49 8 Masters Finance 2 2 3 7 29.2
Person 2 58 20 Masters Service 2 3 3 8 33.3
Person 3 56 22 Doctoral Service 3 2 4 9 37.5
Characteristics
Manager Reliability Archetype CommunicationSocial competenceCompetence Network TOTAL Characteristics %
Person 1 10 10 10 10 10 10 10 33.3
Person 2 10 10 10 10 10 10 10 33.3
Person 3 10 10 10 10 10 10 10 33.3
Survey-Report 3.9
Dominant TagManager TOTAL Typology %
Developed by AvantLab, www.avantlab.com
Constellation Input ScoresManager Department Const. %

Name: Hinrich Submitted: 20:51:44 17-01-2017
E-mail: [email protected] IP: 194.39.218.10
Ranking by calculation using your answers provided during survey
Rank Manager Influencer Department %
1 Jörg - Finance 23.77
2 Sven - Production 23.09
3 Dörthe - R & D 19.14
CEO
34%
Jörg Sven Dörthe
Ranking by your assumption Finance Production R & D
Rank Manager 23.77% 23.09% 19.14%
1 Jörg
2 Dörthe
3 Sven
Typology
Market Success Observartion Growth Technology Tech II Tech III Planning Structure Control
Dörthe 0 0 0 0 0 0 1 0 0 0 3.33 33.3
Sven 1 1 1 1 1 1 0 1 1 1 3.34 33.4
Jörg 1 1 1 1 1 1 0 1 1 1 3.34 33.4
Constellation
Age Tenure (y) Education Age Tenure (y) Education TOTAL
Dörthe 60 5 Masters R & D 2 1 3 6 24
Sven 50 2 Doctoral Production 3 2 4 9 36
Jörg 50 3 Masters Finance 3 4 3 10 40
Characteristics
Manager Reliability Archetype CommunicationSocial competenceCompetence Network TOTAL Characteristics %
Dörthe 7 5 2 7 2 5 5 29.7
Sven 6 5 5 6 6 6 6 35.6
Jörg 6 5 5 6 6 5 6 34.7
Survey-Report 3.10
Dominant TagManager TOTAL Typology %
Developed by AvantLab, www.avantlab.com
Constellation Input ScoresManager Department Const. %
Name: user voted anonymously Submitted: 02:56:17 18-01-2017
E-mail: user voted anonymously IP: 113.210.179.41
Ranking by calculation using your answers provided during survey
Rank Manager Influencer Department %
1 CFO - Finance 22.82
2 Head of M +Influencer Production 21.97
3 Head of E - R & D 21.21
CEO
34%
CFO Head of M Head of E
Ranking by your assumption Finance Production R & D
Rank Manager 22.82% 21.97% 21.21%
1 CFO
2 Head of M
3 Head of E
Typology
Market Success Observartion Growth Technology Tech II Tech III Planning Structure Control
CFO 0 1 1 0 1 1 0 0 1 1 3.03 30.3
Head of M 0 1 1 0 1 1 0 0 0 1 3 30
Head of E 1 0 0 1 1 0 1 1 1 0 3.97 39.7
Constellation
Age Tenure (y) Education Age Tenure (y) Education TOTAL
CFO 43 5 Bachelor's Finance 3 3 2 8 34.8
Head of M 40 2 Bachelor's Production 4 3 2 9 39.1
Head of E 35 2 Bachelor's R & D 1 3 2 6 26.1
Characteristics
Manager Reliability Archetype CommunicationSocial competenceCompetence Network TOTAL Characteristics %
CFO 8 6 8 8 9 5 7 38.6
Head of M 7 5 5 7 7 4 6 30.7
Head of E 8 6 4 6 7 4 6 30.6
Survey-Report 3.11
Dominant TagManager TOTAL Typology %
Developed by AvantLab, www.avantlab.com
Constellation Input ScoresManager Department Const. %

Name: Shammi Submitted: 03:18:07 18-01-2017
E-mail: Krishnan IP: 175.144.54.70
Ranking by calculation using your answers provided during survey
Rank Manager Influencer Department %
1 Mr. C - Logistics 23.03
2 Mr. B - Sales 21.79
3 Mr. A +Influencer Service 21.19
CEO
34%
Mr. C Mr. B Mr. A
Ranking by your assumption Logistics Sales Service
Rank Manager 23.03% 21.79% 21.19%
1 Mr. A
2 Mr. C
3 Mr. B
Typology
Market Success Observartion Growth Technology Tech II Tech III Planning Structure Control
Mr. A 0 0 0 0 0 0 0 0 0 0 2.89 28.9
Mr. B 1 1 0 1 0 1 0 0 0 1 4.22 42.2
Mr. C 0 0 0 0 0 0 0 0 0 0 2.89 28.9
Constellation
Age Tenure (y) Education Age Tenure (y) Education TOTAL
Mr. A 40 18 Bachelor's Service 3 2 2 7 33.3
Mr. B 54 12 Without Tertiary Sales 1 4 1 6 28.6
Mr. C 42 1 Masters Logistics 3 2 3 8 38.1
Characteristics
Manager Reliability Archetype CommunicationSocial competenceCompetence Network TOTAL Characteristics %
Mr. A 8 6 8 8 9 5 7 34
Mr. B 6 5 6 6 8 6 6 28.3
Mr. C 8 7 9 8 9 8 8 37.7
Survey-Report 3.12
Dominant TagManager TOTAL Typology %
Developed by AvantLab, www.avantlab.com
Constellation Input ScoresManager Department Const. %
Name: Sunil Submitted: 15:47:46 18-01-2017
E-mail: field was not filled by user IP: 49.207.188.247
Ranking by calculation using your answers provided during survey
Rank Manager Influencer Department %
1 Manager 1 - Finance 25.4
2 Manager 2 - Sales 21.71
3 Manager 3 - R & D 18.89
CEO
34%
Manager 1 Manager 2 Manager 3
Ranking by your assumption Finance Sales R & D
Rank Manager 25.40% 21.71% 18.89%
1 Manager 1
2 Manager 2
3 Manager 3
Typology
Market Success Observartion Growth Technology Tech II Tech III Planning Structure Control
Manager 1 1 1 1 1 1 1 1 1 0 0 4.37 43.7
Manager 2 0 0 0 0 0 0 0 0 1 1 2.78 27.8
Manager 3 0 0 0 0 1 0 1 0 1 1 2.84 28.4
Constellation
Age Tenure (y) Education Age Tenure (y) Education TOTAL
Manager 1 35 1 Masters Finance 4 3 3 10 40
Manager 2 36 1 Masters Sales 3 3 3 9 36
Manager 3 31 2 Bachelor's R & D 1 3 2 6 24
Characteristics
Manager Reliability Archetype CommunicationSocial competenceCompetence Network TOTAL Characteristics %
Manager 1 5 5 5 5 5 5 5 31.7
Manager 2 5 5 10 0 9 4 5 34.9
Manager 3 9 5 4 5 8 0 5 33.4
Survey-Report 3.13
Dominant TagManager TOTAL Typology %
Developed by AvantLab, www.avantlab.com
Constellation Input ScoresManager Department Const. %

Name: user voted anonymously Submitted: 08:53:32 26-01-2017
E-mail: user voted anonymously IP: 62.2.210.50
Ranking by calculation using your answers provided during survey
Rank Manager Influencer Department %
1 Fred +Influencer Sales 23.5
2 Jim +Influencer Production 22.3
3 Joe +Influencer Finance 20.2
CEO
34%
Fred Jim Joe
Ranking by your assumption Sales Production Finance
Rank Manager 23.50% 22.30% 20.20%
1 Fred
2 Jim
3 Joe
Typology
Market Success Observartion Growth Technology Tech II Tech III Planning Structure Control
Joe 0 0 1 0 1 1 0 0 0 0 2.74 27.4
Jim 0 0 1 0 1 1 0 0 0 0 2.74 27.4
Fred 1 1 0 1 0 1 1 1 1 1 4.53 45.3
Constellation
Age Tenure (y) Education Age Tenure (y) Education TOTAL
Joe 64 10 Masters Finance 2 3 3 8 34.8
Jim 53 11 Masters Production 2 4 3 9 39.1
Fred 54 22 Bachelor's Sales 3 1 2 6 26.1
Characteristics
Manager Reliability Archetype CommunicationSocial competenceCompetence Network TOTAL Characteristics %
Joe 7 5 4 5 8 7 6 29.7
Jim 8 5 6 7 7 9 7 34.9
Fred 6 7 7 6 8 9 7 35.4
Survey-Report 3.14
Dominant TagManager TOTAL Typology %
Developed by AvantLab, www.avantlab.com
Constellation Input ScoresManager Department Const. %
Name: field was not filled by user Submitted: 10:04:36 26-01-2017
E-mail: field was not filled by user IP: 62.12.137.67
Ranking by calculation using your answers provided during survey
Rank Manager Influencer Department %
1 Manager 3 +Influencer Production 24.04
2 Manager 1 - HR 23.28
3 Manager 2 - Production 18.69
CEO
34%
Manager 3 Manager 1 Manager 2
Ranking by your assumption Production HR Production
Rank Manager 24.04% 23.28% 18.69%
1 Manager 1
2 Manager 3
3 Manager 2
Typology
Market Success Observartion Growth Technology Tech II Tech III Planning Structure Control
Manager 1 0 0 0 0 0 0 0 0 0 1 3.39 33.9
Manager 2 1 1 0 0 1 1 1 1 0 0 3.31 33.1
Manager 3 1 1 0 0 1 1 1 1 0 0 3.31 33.1
Constellation
Age Tenure (y) Education Age Tenure (y) Education TOTAL
Manager 1 34 5 Bachelor's HR 3 4 2 9 39.1
Manager 2 32 10 Without Tertiary Production 3 1 1 5 21.7
Manager 3 40 3 Masters Production 4 2 3 9 39.1
Characteristics
Manager Reliability Archetype CommunicationSocial competenceCompetence Network TOTAL Characteristics %
Manager 1 7 8 8 8 9 4 7 32.8
Manager 2 6 7 6 7 8 7 7 30.1
Manager 3 7 9 10 8 9 7 8 37.1
Survey-Report 3.15
Dominant TagManager TOTAL Typology %
Developed by AvantLab, www.avantlab.com
Constellation Input ScoresManager Department Const. %

Name: Knut HAENJES Submitted: 16:05:53 26-01-2017
E-mail: [email protected] IP: 109.43.2.72
Ranking by calculation using your answers provided during survey
Rank Manager Influencer Department %
1 Cathro - Finance 26.29
2 Emanu +Influencer Sales 21.76
3 Nils +Influencer Sales 17.95
CEO
34%
Cathro Emanu Nils
Ranking by your assumption Finance Sales Sales
Rank Manager 26.29% 21.76% 17.95%
1 Cathro
2 Emanu
3 Nils
Typology
Market Success Observartion Growth Technology Tech II Tech III Planning Structure Control
Emanu 0 0 0 0 1 0 1 0 0 0 2.64 26.4
Nils 0 0 0 0 1 0 1 0 0 0 2.64 26.4
Cathro 1 1 1 1 1 1 0 1 1 1 4.73 47.3
Constellation
Age Tenure (y) Education Age Tenure (y) Education TOTAL
Emanu 45 10 Without Tertiary Sales 3 4 1 8 38.1
Nils 31 3 Without Tertiary Sales 1 2 1 4 19
Cathro 43 8 Without Tertiary Finance 4 4 1 9 42.9
Characteristics
Manager Reliability Archetype CommunicationSocial competenceCompetence Network TOTAL Characteristics %
Emanu 8 8 8 7 6 3 7 34.4
Nils 8 6 9 8 8 3 7 36.2
Cathro 10 6 2 3 9 5 6 29.4
Survey-Report 3.16
Dominant TagManager TOTAL Typology %
Developed by AvantLab, www.avantlab.com
Constellation Input ScoresManager Department Const. %
Name: user voted anonymously Submitted: 16:22:28 26-01-2017
E-mail: user voted anonymously IP: 171.99.152.236
Ranking by calculation using your answers provided during survey
Rank Manager Influencer Department %
1 Manager 1 - Sales 23.94
2 Manager 3 +Influencer Service 22.41
3 Manager 2 - Logistics 19.65
CEO
34%
Manager 1 Manager 3 Manager 2
Ranking by your assumption Sales Service Logistics
Rank Manager 23.94% 22.41% 19.65%
1 Manager 3
2 Manager 1
3 Manager 2
Typology
Market Success Observartion Growth Technology Tech II Tech III Planning Structure Control
Manager 1 1 1 1 0 1 0 0 1 1 1 4.39 43.9
Manager 2 0 0 1 0 0 0 0 0 0 0 2.8 28
Manager 3 0 0 1 0 0 0 0 0 0 0 2.8 28
Constellation
Age Tenure (y) Education Age Tenure (y) Education TOTAL
Manager 1 46 1 Masters Sales 4 4 3 11 40.7
Manager 2 38 1 Bachelor's Logistics 2 4 2 8 29.6
Manager 3 52 1 Bachelor's Service 2 4 2 8 29.6
Characteristics
Manager Reliability Archetype CommunicationSocial competenceCompetence Network TOTAL Characteristics %
Manager 1 3 4 5 4 4 4 4 24.1
Manager 2 6 5 6 6 5 3 5 31.7
Manager 3 7 7 7 8 7 8 7 44.2
Survey-Report 3.17
Dominant TagManager TOTAL Typology %
Developed by AvantLab, www.avantlab.com
Constellation Input ScoresManager Department Const. %

Name: user voted anonymously Submitted: 11:35:53 19-01-2017
E-mail: user voted anonymously IP: 85.189.53.122
Ranking by calculation using your answers provided during survey
Rank Manager Influencer Department %
1 NH - Sales 22.85
2 wpv - Sales 21.67
3 SL - Sales 21.48
CEO
34%
NH wpv SL
Ranking by your assumption Sales Sales Sales
Rank Manager 22.85% 21.67% 21.48%
1 NH
2 wpv
3 SL
Typology
Market Success Observartion Growth Technology Tech II Tech III Planning Structure Control
NH 0 0 0 1 1 1 0 1 1 0 3.33 33.3
wpv 0 0 0 1 1 1 0 1 1 0 3.33 33.3
SL 0 0 0 1 1 1 0 1 1 0 3.33 33.3
Constellation
Age Tenure (y) Education Age Tenure (y) Education TOTAL
NH 25 3 Bachelor's Sales 3 3 2 8 32
wpv 26 5 Bachelor's Sales 4 3 2 9 36
SL 25 3 Bachelor's Sales 3 3 2 8 32
Characteristics
Manager Reliability Archetype CommunicationSocial competenceCompetence Network TOTAL Characteristics %
NH 9 8 8 7 10 7 8 38.5
wpv 5 6 8 6 7 5 6 29.2
SL 7 6 7 7 7 7 7 32.3
Survey-Report 3.18
Dominant TagManager TOTAL Typology %
Developed by AvantLab, www.avantlab.com
Constellation Input ScoresManager Department Const. %
Name: user voted anonymously Submitted: 12:11:30 24-01-2017
E-mail: user voted anonymously IP: 212.4.83.101
Ranking by calculation using your answers provided during survey
Rank Manager Influencer Department %
1 Vogel - Sales 23.74
2 Röscher - Finance 23.29
3 Rüttimann +Influencer Production 18.97
CEO
34%
Vogel Röscher Rüttimann
Ranking by your assumption Sales Finance Production
Rank Manager 23.74% 23.29% 18.97%
1 Rüttimann
2 Vogel
3 Röscher
Typology
Market Success Observartion Growth Technology Tech II Tech III Planning Structure Control
Rüttimann 1 0 0 1 1 1 1 0 0 1 3.02 30.2
Vogel 0 0 0 1 0 1 0 1 1 0 3.43 34.3
Röscher 1 1 1 1 1 1 1 0 0 1 3.55 35.5
Constellation
Age Tenure (y) Education Age Tenure (y) Education TOTAL
Rüttimann 51 20 Without Tertiary Production 3 1 1 5 22.7
Vogel 46 10 Bachelor's Sales 4 3 2 9 40.9
Röscher 53 8 Bachelor's Finance 3 3 2 8 36.4
Characteristics
Manager Reliability Archetype CommunicationSocial competenceCompetence Network TOTAL Characteristics %
Rüttimann 10 7 3 6 5 10 7 33.3
Vogel 10 5 5 5 5 10 7 32.7
Röscher 10 6 8 5 7 5 7 34
Survey-Report 3.19
Dominant TagManager TOTAL Typology %
Developed by AvantLab, www.avantlab.com
Constellation Input ScoresManager Department Const. %
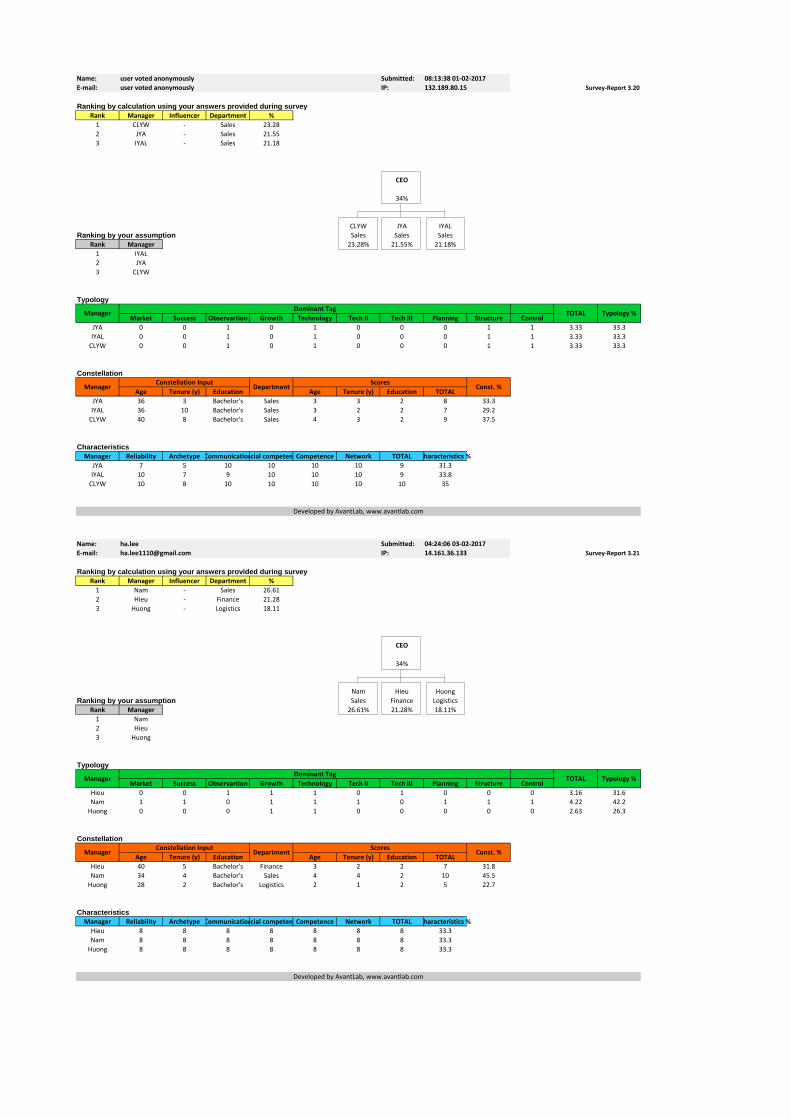
Name: user voted anonymously Submitted: 08:13:38 01-02-2017
E-mail: user voted anonymously IP: 132.189.80.15
Ranking by calculation using your answers provided during survey
Rank Manager Influencer Department %
1 CLYW - Sales 23.28
2 JYA - Sales 21.55
3 IYAL - Sales 21.18
CEO
34%
CLYW JYA IYAL
Ranking by your assumption Sales Sales Sales
Rank Manager 23.28% 21.55% 21.18%
1 IYAL
2 JYA
3 CLYW
Typology
Market Success Observartion Growth Technology Tech II Tech III Planning Structure Control
JYA 0 0 1 0 1 0 0 0 1 1 3.33 33.3
IYAL 0 0 1 0 1 0 0 0 1 1 3.33 33.3
CLYW 0 0 1 0 1 0 0 0 1 1 3.33 33.3
Constellation
Age Tenure (y) Education Age Tenure (y) Education TOTAL
JYA 36 3 Bachelor's Sales 3 3 2 8 33.3
IYAL 36 10 Bachelor's Sales 3 2 2 7 29.2
CLYW 40 8 Bachelor's Sales 4 3 2 9 37.5
Characteristics
Manager Reliability Archetype CommunicationSocial competenceCompetence Network TOTAL Characteristics %
JYA 7 5 10 10 10 10 9 31.3
IYAL 10 7 9 10 10 10 9 33.8
CLYW 10 8 10 10 10 10 10 35
Survey-Report 3.20
Dominant TagManager TOTAL Typology %
Developed by AvantLab, www.avantlab.com
Constellation Input ScoresManager Department Const. %
Name: ha.lee Submitted: 04:24:06 03-02-2017
E-mail: [email protected] IP: 14.161.36.133
Ranking by calculation using your answers provided during survey
Rank Manager Influencer Department %
1 Nam - Sales 26.61
2 Hieu - Finance 21.28
3 Huong - Logistics 18.11
CEO
34%
Nam Hieu Huong
Ranking by your assumption Sales Finance Logistics
Rank Manager 26.61% 21.28% 18.11%
1 Nam
2 Hieu
3 Huong
Typology
Market Success Observartion Growth Technology Tech II Tech III Planning Structure Control
Hieu 0 0 1 1 1 0 1 0 0 0 3.16 31.6
Nam 1 1 0 1 1 1 0 1 1 1 4.22 42.2
Huong 0 0 0 1 1 0 0 0 0 0 2.63 26.3
Constellation
Age Tenure (y) Education Age Tenure (y) Education TOTAL
Hieu 40 5 Bachelor's Finance 3 2 2 7 31.8
Nam 34 4 Bachelor's Sales 4 4 2 10 45.5
Huong 28 2 Bachelor's Logistics 2 1 2 5 22.7
Characteristics
Manager Reliability Archetype CommunicationSocial competenceCompetence Network TOTAL Characteristics %
Hieu 8 8 8 8 8 8 8 33.3
Nam 8 8 8 8 8 8 8 33.3
Huong 8 8 8 8 8 8 8 33.3
Survey-Report 3.21
Dominant TagManager TOTAL Typology %
Developed by AvantLab, www.avantlab.com
Constellation Input ScoresManager Department Const. %

Name: user voted anonymously Submitted: 10:53:33 03-02-2017
E-mail: user voted anonymously IP: 212.4.83.101
Ranking by calculation using your answers provided during survey
Rank Manager Influencer Department %
1 Tom - Sales 22.71
2 Philip - Finance 21.92
3 David - Production 21.37
CEO
34%
Tom Philip David
Ranking by your assumption Sales Finance Production
Rank Manager 22.71% 21.92% 21.37%
1 Tom
2 David
3 Philip
Typology
Market Success Observartion Growth Technology Tech II Tech III Planning Structure Control
Tom 1 0 1 1 1 1 1 0 1 1 3.86 38.6
David 0 0 1 0 1 1 1 0 0 0 2.8 28
Philip 0 1 1 0 1 1 1 1 0 0 3.33 33.3
Constellation
Age Tenure (y) Education Age Tenure (y) Education TOTAL
Tom 30 3 Bachelor's Sales 3 3 2 8 32
David 35 5 Bachelor's Production 4 3 2 9 36
Philip 29 3 Bachelor's Finance 3 3 2 8 32
Characteristics
Manager Reliability Archetype CommunicationSocial competenceCompetence Network TOTAL Characteristics %
Tom 8 6 10 5 8 8 8 32.6
David 8 5 7 8 10 8 8 33.1
Philip 9 8 8 9 8 5 8 34.3
Survey-Report 3.22
Dominant TagManager TOTAL Typology %
Developed by AvantLab, www.avantlab.com
Constellation Input ScoresManager Department Const. %
Name: field was not filled by user Submitted: 14:55:19 03-02-2017
E-mail: field was not filled by user IP: 213.188.40.105
Ranking by calculation using your answers provided during survey
Rank Manager Influencer Department %
1 Kettelhut +Influencer Finance 24.98
2 Naier +Influencer Sales 21.66
3 Brocker - Production 19.36
CEO
34%
Kettelhut Naier Brocker
Ranking by your assumption Finance Sales Production
Rank Manager 24.98% 21.66% 19.36%
1 Naier
2 Kettelhut
3 Brocker
Typology
Market Success Observartion Growth Technology Tech II Tech III Planning Structure Control
Kettelhut 1 1 1 1 1 0 1 1 1 1 3.48 34.8
Naier 0 0 0 0 1 1 1 0 0 0 3.3 33
Brocker 1 1 1 1 1 0 1 1 0 1 3.22 32.2
Constellation
Age Tenure (y) Education Age Tenure (y) Education TOTAL
Kettelhut 47 3 Masters Finance 2 3 3 8 40
Naier 48 5 Without Tertiary Sales 3 3 1 7 35
Brocker 61 36 Bachelor's Production 2 1 2 5 25
Characteristics
Manager Reliability Archetype CommunicationSocial competenceCompetence Network TOTAL Characteristics %
Kettelhut 7 7 8 9 9 7 8 38.7
Naier 5 6 8 5 8 5 6 30.5
Brocker 6 7 3 7 8 7 6 30.8
Survey-Report 3.23
Dominant TagManager TOTAL Typology %
Developed by AvantLab, www.avantlab.com
Constellation Input ScoresManager Department Const. %

Name: user voted anonymously Submitted: 21:38:19 25-01-2017
E-mail: user voted anonymously IP: 82.136.123.27
Ranking by calculation using your answers provided during survey
Rank Manager Influencer Department %
1 T. Abegg +Influencer Sales 23.68
2 N. Iseli - HR 23.01
3 P.Zangger +Influencer Sales 19.31
CEO
34%
T. Abegg N. Iseli P.Zangger
Ranking by your assumption Sales HR Sales
Rank Manager 23.68% 23.01% 19.31%
1 T. Abegg
2 N. Iseli
3 P.Zangger
Typology
Market Success Observartion Growth Technology Tech II Tech III Planning Structure Control
P.Zangger 0 0 1 1 1 1 1 0 0 0 3.26 32.6
N. Iseli 0 1 1 1 1 1 0 0 0 0 3.49 34.9
T. Abegg 0 0 1 1 1 1 1 0 0 0 3.26 32.6
Constellation
Age Tenure (y) Education Age Tenure (y) Education TOTAL
P.Zangger 40 18 Without Tertiary Sales 4 1 1 6 28.6
N. Iseli 36 6 Without Tertiary HR 2 4 1 7 33.3
T. Abegg 40 4 Without Tertiary Sales 4 3 1 8 38.1
Characteristics
Manager Reliability Archetype CommunicationSocial competenceCompetence Network TOTAL Characteristics %
P.Zangger 8 7 6 6 6 5 6 26.7
N. Iseli 9 8 9 9 10 7 9 36.3
T. Abegg 9 9 10 8 9 8 9 37
Survey-Report 3.24
Dominant TagManager TOTAL Typology %
Developed by AvantLab, www.avantlab.com
Constellation Input ScoresManager Department Const. %
Name: field was not filled by user Submitted: 08:16:06 26-01-2017
E-mail: field was not filled by user IP: 178.194.55.169
Ranking by calculation using your answers provided during survey
Rank Manager Influencer Department %
1 CMO +Influencer Marketing 26.22
2 Prod. +Influencer Production 21.59
3 CFO - Finance 18.19
CEO
34%
CMO Prod. CFO
Ranking by your assumption Marketing Production Finance
Rank Manager 26.22% 21.59% 18.19%
1 CMO
2 Prod.
3 CFO
Typology
Market Success Observartion Growth Technology Tech II Tech III Planning Structure Control
CFO 1 1 1 1 1 1 0 1 1 0 3.56 35.6
CMO 0 0 0 1 0 0 1 0 0 1 3.41 34.1
Prod. 1 1 1 1 1 0 0 0 1 0 3.03 30.3
Constellation
Age Tenure (y) Education Age Tenure (y) Education TOTAL
CFO 64 40 Bachelor's Finance 1 1 2 4 19
CMO 39 8 Masters Marketing 3 3 3 9 42.9
Prod. 35 4 Bachelor's Production 3 3 2 8 38.1
Characteristics
Manager Reliability Archetype CommunicationSocial competenceCompetence Network TOTAL Characteristics %
CFO 6 5 3 7 8 1 5 28.1
CMO 9 8 9 6 7 6 8 42.2
Prod. 4 5 7 5 7 4 5 29.7
Survey-Report 3.25
Dominant TagManager TOTAL Typology %
Developed by AvantLab, www.avantlab.com
Constellation Input ScoresManager Department Const. %

Name: user voted anonymously Submitted: 17:59:51 28-01-2017
E-mail: user voted anonymously IP: 217.162.158.73
Ranking by calculation using your answers provided during survey
Rank Manager Influencer Department %
1 Manager 3 - Marketing 23.15
2 Manager 1 +Influencer HR 22.11
3 Manager 2 +Influencer Sales 20.74
CEO
34%
Manager 3 Manager 1 Manager 2
Ranking by your assumption Marketing HR Sales
Rank Manager 23.15% 22.11% 20.74%
1 Manager 1
2 Manager 3
3 Manager 2
Typology
Market Success Observartion Growth Technology Tech II Tech III Planning Structure Control
Manager 1 1 0 1 1 0 1 0 0 0 1 3.47 34.7
Manager 2 1 1 0 1 0 1 0 0 1 1 3.27 32.7
Manager 3 1 1 0 1 0 1 0 0 1 1 3.27 32.7
Constellation
Age Tenure (y) Education Age Tenure (y) Education TOTAL
Manager 1 60 30 Without Tertiary HR 3 3 1 7 31.8
Manager 2 33 10 Bachelor's Sales 2 3 2 7 31.8
Manager 3 40 4 Masters Marketing 3 2 3 8 36.4
Characteristics
Manager Reliability Archetype CommunicationSocial competenceCompetence Network TOTAL Characteristics %
Manager 1 10 7 8 10 10 7 9 34
Manager 2 8 7 9 5 7 10 8 29.8
Manager 3 8 9 9 10 10 10 9 36.2
Survey-Report 3.26
Dominant TagManager TOTAL Typology %
Developed by AvantLab, www.avantlab.com
Constellation Input ScoresManager Department Const. %
Name: user voted anonymously Submitted: 21:56:50 28-01-2017
E-mail: user voted anonymously IP: 95.210.198.91
Ranking by calculation using your answers provided during survey
Rank Manager Influencer Department %
1 hoc - Finance 23.49
2 mep - Procurement 23.07
3 meg - Service 19.43
CEO
34%
hoc mep meg
Ranking by your assumption Finance Procurement Service
Rank Manager 23.49% 23.07% 19.43%
1 mep
2 hoc
3 meg
Typology
Market Success Observartion Growth Technology Tech II Tech III Planning Structure Control
mep 0 1 1 1 1 1 1 0 0 0 3.37 33.7
hoc 0 1 1 1 1 1 1 0 0 0 3.37 33.7
meg 0 0 1 0 1 0 0 0 0 0 3.25 32.5
Constellation
Age Tenure (y) Education Age Tenure (y) Education TOTAL
mep 37 10 Without TertiaryProcurement 3 4 1 8 42.1
hoc 38 4 Bachelor's Finance 3 3 2 8 42.1
meg 65 33 Without Tertiary Service 1 1 1 3 15.8
Characteristics
Manager Reliability Archetype CommunicationSocial competenceCompetence Network TOTAL Characteristics %
mep 8 1 3 3 7 6 5 29
hoc 8 2 5 6 6 2 5 31
meg 8 10 3 5 5 8 6 40
Survey-Report 3.27
Dominant TagManager TOTAL Typology %
Developed by AvantLab, www.avantlab.com
Constellation Input ScoresManager Department Const. %

Name: Yves Submitted: 02:34:10 11-01-2017
E-mail: [email protected] IP: 175.139.208.103
Ranking by calculation using your answers provided during survey
Rank Manager Influencer Department %
1 Pee Finance 21.02
2 Brandon Sales 18.5
3 Shamsul HR 14
4 Melvin Logistics 12.47
CEO
34%
Pee Brandon Shamsul Melvin
Ranking by your assumption Finance Sales HR Logistics
Rank Manager 21.02% 18.50% 14.00% 12.47%
1 Pee
2 Shamsul
3 Brandon
Typology
Market Success Observartion Growth Technology Tech II Tech III Planning Structure Control
Shamsul 0 0 1 1 1 0 0 0 0 0 1.91 19.1
Pee 1 0 1 1 1 1 1 1 0 0 3.3 33
Brandon 0 1 1 0 0 0 0 0 1 1 2.91 29.1
Melvin 0 0 1 0 0 0 0 0 0 0 1.87 18.7
Constellation
Age Tenure (y) Education Age Tenure (y) Education TOTAL
Shamsul 46 5 Bachelor's HR 2 1 2 5 16.1
Pee 41 1 Masters Finance 4 3 3 10 32.3
Brandon 37 2 Without Tertiary Sales 2 4 1 7 22.6
Melvin 41 1 Bachelor's Logistics 4 3 2 9 29
Characteristics
Manager Reliability Archetype CommunicationSocial competenceCompetence Network TOTAL Characteristics %
Shamsul 10 1 5 10 5 8 7 28.4
Pee 10 9 7 4 10 2 7 30.3
Brandon 8 8 8 8 6 7 8 32.4
Melvin 1 1 0 3 7 1 2 8.9
Survey-Report 4.1
Developed by AvantLab, www.avantlab.com
Constellation Input ScoresManager Department Const. %
Dominant TagManager TOTAL Typology %
Name: user voted anonymously Submitted: 04:52:19 13-01-2017
E-mail: user voted anonymously IP: 171.96.110.254
Ranking by calculation using your answers provided during survey
Rank Manager Influencer Department %
1 FN - Finance 19.38
2 S - Sales 16.71
3 SV - Service 14.96
4 LG - Logistics 14.95
CEO
34%
FN S SV LG
Ranking by your assumption Finance Sales Service Logistics
Rank Manager 19.38% 16.71% 14.96% 14.95%
1 S
2 FN
3 LG
Typology
Market Success Observartion Growth Technology Tech II Tech III Planning Structure Control
FN 0 1 1 0 1 0 1 1 1 1 3.8 38
S 1 0 0 1 1 1 0 0 0 0 2.76 27.6
LG 0 0 0 0 1 0 0 0 0 0 1.72 17.2
SV 0 0 0 0 1 0 0 0 0 0 1.72 17.2
Constellation
Age Tenure (y) Education Age Tenure (y) Education TOTAL
FN 30 1 Bachelor's Finance 4 3 2 9 26.5
S 30 2 Bachelor's Sales 4 1 2 7 20.6
LG 30 1 Bachelor's Logistics 4 3 2 9 26.5
SV 30 1 Bachelor's Service 4 3 2 9 26.5
Characteristics
Manager Reliability Archetype CommunicationSocial competenceCompetence Network TOTAL Characteristics %
FN 9 6 10 8 8 7 8 23.6
S 9 9 10 10 9 10 10 27.8
LG 8 8 8 9 8 9 8 24.3
SV 8 8 9 8 9 8 8 24.3
Survey-Report 4.2
Dominant TagManager TOTAL Typology %
Developed by AvantLab, www.avantlab.com
Constellation Input ScoresManager Department Const. %

Name: user voted anonymously Submitted: 05:11:51 13-01-2017
E-mail: user voted anonymously IP: 175.139.208.103
Ranking by calculation using your answers provided during survey
Rank Manager Influencer Department %
1 Pearl - Finance 18.55
2 Ashikeen - Sales 17.08
3 Shaiful - HR 16.27
4 Bruno - Sales 14.09
CEO
34%
Pearl Ashikeen Shaiful Bruno
Ranking by your assumption Finance Sales HR Sales
Rank Manager 18.55% 17.08% 16.27% 14.09%
1 Pearl
2 Ashikeen
3 Bruno
Typology
Market Success Observartion Growth Technology Tech II Tech III Planning Structure Control
Ashikeen 1 0 0 1 0 1 1 1 1 1 2.45 24.5
Bruno 1 0 0 1 0 1 1 1 1 1 2.45 24.5
Shaiful 0 1 1 0 0 0 0 0 0 1 2.37 23.7
Pearl 0 1 1 0 1 0 0 0 0 1 2.72 27.2
Constellation
Age Tenure (y) Education Age Tenure (y) Education TOTAL
Ashikeen 35 6 Bachelor's Sales 2 3 2 7 23.3
Bruno 36 1 Bachelor's Sales 3 3 2 8 26.7
Shaiful 46 6 Bachelor's HR 3 3 2 8 26.7
Pearl 48 1 Bachelor's Finance 2 3 2 7 23.3
Characteristics
Manager Reliability Archetype CommunicationSocial competenceCompetence Network TOTAL Characteristics %
Ashikeen 10 3 5 5 8 8 7 29.8
Bruno 2 2 4 2 2 5 3 12.9
Shaiful 1 5 9 6 1 9 5 23.6
Pearl 9 8 7 7 9 4 7 33.8
Survey-Report 4.3
Dominant TagManager TOTAL Typology %
Developed by AvantLab, www.avantlab.com
Constellation Input ScoresManager Department Const. %
Name: user voted anonymously Submitted: 11:43:30 15-01-2017
E-mail: user voted anonymously IP: 203.106.162.247
Ranking by calculation using your answers provided during survey
Rank Manager Influencer Department %
1 Loo SH - Finance 18.79
2 Michael +Influencer Sales 18.73
3 Christina - HR 15.16
4 KS Liew +Influencer Service 13.33
CEO
34%
Loo SH Michael Christina KS Liew
Ranking by your assumption Finance Sales HR Service
Rank Manager 18.79% 18.73% 15.16% 13.33%
1 KS Liew
2 Michael
3 Loo SH
Typology
Market Success Observartion Growth Technology Tech II Tech III Planning Structure Control
KS Liew 0 0 0 0 0 0 0 0 0 0 1.71 17.1
Michael 0 0 0 0 0 0 0 1 0 1 2.4 24
Christina 0 0 0 0 0 1 0 0 0 0 1.73 17.3
Loo SH 1 1 1 1 1 1 1 0 1 0 4.16 41.6
Constellation
Age Tenure (y) Education Age Tenure (y) Education TOTAL
KS Liew 47 15 Bachelor's Service 1 2 2 5 16.7
Michael 40 10 Bachelor's Sales 4 4 2 10 33.3
Christina 41 13 Bachelor's HR 4 3 2 9 30
Loo SH 38 6 Bachelor's Finance 2 2 2 6 20
Characteristics
Manager Reliability Archetype CommunicationSocial competenceCompetence Network TOTAL Characteristics %
KS Liew 8 8 8 7 9 6 8 26.8
Michael 7 8 8 8 8 9 8 27.8
Christina 6 6 7 6 7 5 6 21.6
Loo SH 6 7 8 6 8 6 7 23.8
Survey-Report 4.4
Dominant TagManager TOTAL Typology %
Developed by AvantLab, www.avantlab.com
Constellation Input ScoresManager Department Const. %

Name: user voted anonymously Submitted: 02:30:02 17-01-2017
E-mail: user voted anonymously IP: 210.195.15.162
Ranking by calculation using your answers provided during survey
Rank Manager Influencer Department %
1 Manager 1 - Sales 18.71
2 Manager 2 - Finance 18.35
3 Manager 4 +Influencer Production 14.6
4 Manager 3 +Influencer Production 14.34
CEO
34%
Manager 1 Manager 2 Manager 4 Manager 3
Ranking by your assumption Sales Finance Production Production
Rank Manager 18.71% 18.35% 14.60% 14.34%
1 Manager 1
2 Manager 2
3 Manager 3
Typology
Market Success Observartion Growth Technology Tech II Tech III Planning Structure Control
Manager 1 1 0 0 0 1 1 1 1 1 0 3.31 33.1
Manager 2 0 1 1 1 1 1 0 0 0 1 2.69 26.9
Manager 3 0 0 1 0 1 1 0 0 0 1 2 20
Manager 4 0 0 1 0 1 1 0 0 0 1 2 20
Constellation
Age Tenure (y) Education Age Tenure (y) Education TOTAL
Manager 1 56 10 Masters Sales 2 1 3 6 20.7
Manager 2 54 30 Bachelor's Finance 4 3 2 9 31
Manager 3 50 30 Without Tertiary Production 2 3 1 6 20.7
Manager 4 52 30 Without Tertiary Production 4 3 1 8 27.6
Characteristics
Manager Reliability Archetype CommunicationSocial competenceCompetence Network TOTAL Characteristics %
Manager 1 7 0 8 7 9 7 6 31.3
Manager 2 6 0 7 4 7 7 5 25.4
Manager 3 6 0 5 5 7 7 5 24.5
Manager 4 5 0 3 4 7 4 4 18.8
Survey-Report 4.5
Dominant TagManager TOTAL Typology %
Developed by AvantLab, www.avantlab.com
Constellation Input ScoresManager Department Const. %
Name: Azreen Bashah Submitted: 07:36:30 13-01-2017
E-mail: [email protected] IP: 175.139.208.103
Ranking by calculation using your answers provided during survey
Rank Manager Influencer Department %
1 Michael +Influencer Sales 18.04
2 Siew - Finance 17.66
3 KS Liew +Influencer Service 15.34
4 Christina - HR 14.96
CEO
34%
Michael Siew KS Liew Christina
Ranking by your assumption Sales Finance Service HR
Rank Manager 18.04% 17.66% 15.34% 14.96%
1 KS Liew
2 Michael
3 Siew
Typology
Market Success Observartion Growth Technology Tech II Tech III Planning Structure Control
KS Liew 0 0 1 0 1 0 0 0 0 0 1.88 18.8
Christina 0 0 1 0 1 0 1 0 0 0 1.9 19
Michael 1 0 1 0 1 0 0 1 0 1 2.92 29.2
Siew 0 1 1 1 1 1 1 0 1 0 3.29 32.9
Constellation
Age Tenure (y) Education Age Tenure (y) Education TOTAL
KS Liew 47 15 Bachelor's Service 2 3 2 7 22.6
Christina 45 15 Bachelor's HR 4 3 2 9 29
Michael 40 10 Bachelor's Sales 2 3 2 7 22.6
Siew 43 8 Bachelor's Finance 4 2 2 8 25.8
Characteristics
Manager Reliability Archetype CommunicationSocial competenceCompetence Network TOTAL Characteristics %
KS Liew 7 7 7 7 8 7 7 28.3
Christina 5 5 6 5 5 4 5 19.9
Michael 7 8 7 8 9 7 8 30.2
Siew 5 5 5 5 8 5 5 21.6
Survey-Report 4.6
Dominant TagManager TOTAL Typology %
Developed by AvantLab, www.avantlab.com
Constellation Input ScoresManager Department Const. %

Name: user voted anonymously Submitted: 11:59:23 19-01-2017
E-mail: user voted anonymously IP: 195.75.72.179
Ranking by calculation using your answers provided during survey
Rank Manager Influencer Department %
1 Manager 3 - R & D 18.56
2 Manager 1 - Marketing 17.22
3 Manager 2 - Sales 15.76
4 Manager 4 +Influencer Production 14.47
CEO
34%
Manager 3 Manager 1 Manager 2 Manager 4
Ranking by your assumption R & D Marketing Sales Production
Rank Manager 18.56% 17.22% 15.76% 14.47%
1 Manager 1
2 Manager 4
3 Manager 2
Typology
Market Success Observartion Growth Technology Tech II Tech III Planning Structure Control
Manager 1 1 0 0 0 1 1 1 0 0 1 2.1 21
Manager 2 1 0 0 0 1 1 1 0 0 1 2.1 21
Manager 3 1 0 1 0 1 1 1 0 0 1 2.44 24.4
Manager 4 0 1 0 1 1 0 0 1 1 1 3.36 33.6
Constellation
Age Tenure (y) Education Age Tenure (y) Education TOTAL
Manager 1 47 20 Masters Marketing 4 3 3 10 30.3
Manager 2 49 20 Masters Sales 3 3 3 9 27.3
Manager 3 46 20 Masters R & D 4 3 3 10 30.3
Manager 4 38 10 Bachelor's Production 1 1 2 4 12.1
Characteristics
Manager Reliability Archetype CommunicationSocial competenceCompetence Network TOTAL Characteristics %
Manager 1 4 5 6 6 8 6 6 27
Manager 2 3 4 4 4 6 10 5 23.4
Manager 3 3 6 6 6 9 9 6 29.6
Manager 4 3 3 4 5 6 5 4 20
Survey-Report 4.7
Dominant TagManager TOTAL Typology %
Developed by AvantLab, www.avantlab.com
Constellation Input ScoresManager Department Const. %
Name: Teerapatch Tachasirodom Submitted: 08:11:35 20-01-2017
E-mail: [email protected] IP: 58.8.181.177
Ranking by calculation using your answers provided during survey
Rank Manager Influencer Department %
1 Yodchai S +Influencer Sales 18.63
2 Nuanwan B +Influencer Finance 18.22
3 Piya Y. +Influencer Service 16.1
4 Sanjai B. +Influencer Logistics 13.05
CEO
34%
Yodchai S Nuanwan B Piya Y. Sanjai B.
Ranking by your assumption Sales Finance Service Logistics
Rank Manager 18.63% 18.22% 16.10% 13.05%
1 Piya Y.
2 Yodchai S
3 Sanjai B.
Typology
Market Success Observartion Growth Technology Tech II Tech III Planning Structure Control
Nuanwan B 1 1 1 1 0 1 0 1 1 1 3.63 36.3
Piya Y. 0 0 0 1 0 0 0 1 0 1 1.89 18.9
Yodchai S 0 0 0 1 1 0 1 1 0 1 2.59 25.9
Sanjai B. 0 0 0 1 0 0 0 1 0 1 1.89 18.9
Constellation
Age Tenure (y) Education Age Tenure (y) Education TOTAL
Nuanwan B 53 4 Masters Finance 3 1 3 7 23.3
Piya Y. 54 10 Bachelor's Service 3 3 2 8 26.7
Yodchai S 54 10 Masters Sales 3 3 3 9 30
Sanjai B. 65 10 Bachelor's Logistics 1 3 2 6 20
Characteristics
Manager Reliability Archetype CommunicationSocial competenceCompetence Network TOTAL Characteristics %
Nuanwan B 7 7 7 7 6 7 7 23.2
Piya Y. 9 8 7 8 7 10 8 27.6
Yodchai S 10 10 8 7 9 7 9 28.8
Sanjai B. 7 5 5 7 5 7 6 20.4
Survey-Report 4.8
Dominant TagManager TOTAL Typology %
Developed by AvantLab, www.avantlab.com
Constellation Input ScoresManager Department Const. %
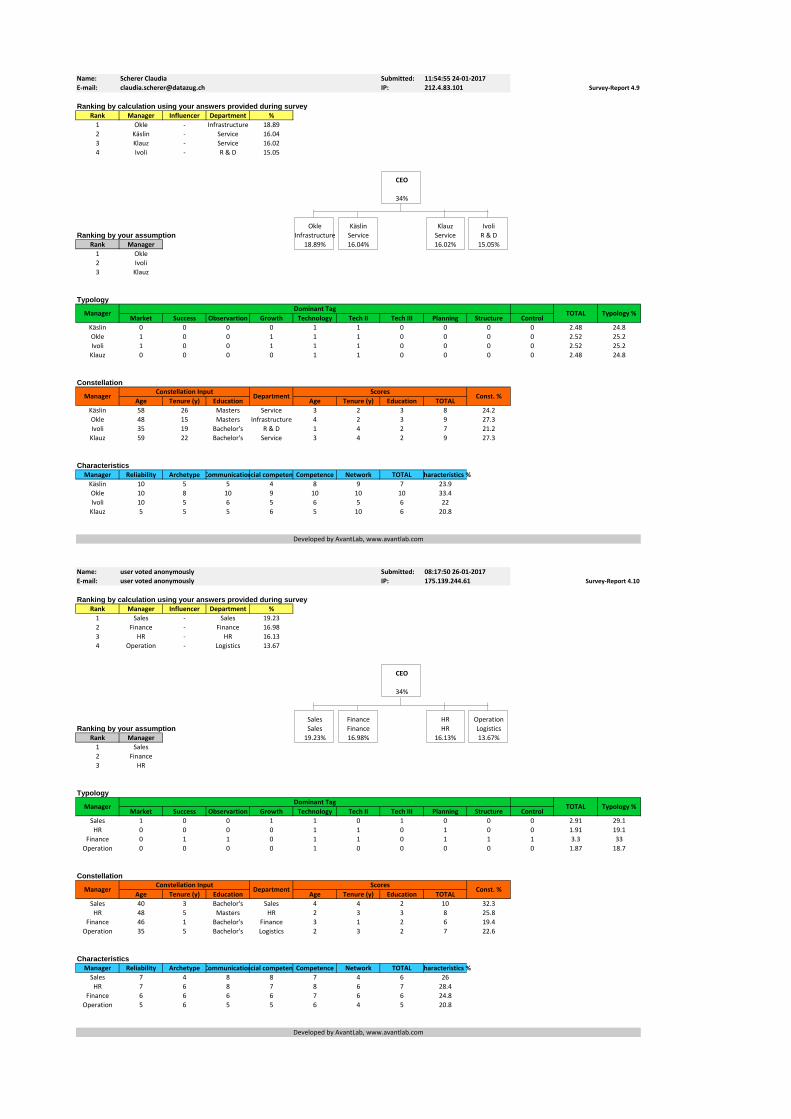
Name: Scherer Claudia Submitted: 11:54:55 24-01-2017
E-mail: [email protected] IP: 212.4.83.101
Ranking by calculation using your answers provided during survey
Rank Manager Influencer Department %
1 Okle - Infrastructure 18.89
2 Käslin - Service 16.04
3 Klauz - Service 16.02
4 Ivoli - R & D 15.05
CEO
34%
Okle Käslin Klauz Ivoli
Ranking by your assumption Infrastructure Service Service R & D
Rank Manager 18.89% 16.04% 16.02% 15.05%
1 Okle
2 Ivoli
3 Klauz
Typology
Market Success Observartion Growth Technology Tech II Tech III Planning Structure Control
Käslin 0 0 0 0 1 1 0 0 0 0 2.48 24.8
Okle 1 0 0 1 1 1 0 0 0 0 2.52 25.2
Ivoli 1 0 0 1 1 1 0 0 0 0 2.52 25.2
Klauz 0 0 0 0 1 1 0 0 0 0 2.48 24.8
Constellation
Age Tenure (y) Education Age Tenure (y) Education TOTAL
Käslin 58 26 Masters Service 3 2 3 8 24.2
Okle 48 15 Masters Infrastructure 4 2 3 9 27.3
Ivoli 35 19 Bachelor's R & D 1 4 2 7 21.2
Klauz 59 22 Bachelor's Service 3 4 2 9 27.3
Characteristics
Manager Reliability Archetype CommunicationSocial competenceCompetence Network TOTAL Characteristics %
Käslin 10 5 5 4 8 9 7 23.9
Okle 10 8 10 9 10 10 10 33.4
Ivoli 10 5 6 5 6 5 6 22
Klauz 5 5 5 6 5 10 6 20.8
Survey-Report 4.9
Dominant TagManager TOTAL Typology %
Developed by AvantLab, www.avantlab.com
Constellation Input ScoresManager Department Const. %
Name: user voted anonymously Submitted: 08:17:50 26-01-2017
E-mail: user voted anonymously IP: 175.139.244.61
Ranking by calculation using your answers provided during survey
Rank Manager Influencer Department %
1 Sales - Sales 19.23
2 Finance - Finance 16.98
3 HR - HR 16.13
4 Operation - Logistics 13.67
CEO
34%
Sales Finance HR Operation
Ranking by your assumption Sales Finance HR Logistics
Rank Manager 19.23% 16.98% 16.13% 13.67%
1 Sales
2 Finance
3 HR
Typology
Market Success Observartion Growth Technology Tech II Tech III Planning Structure Control
Sales 1 0 0 1 1 0 1 0 0 0 2.91 29.1
HR 0 0 0 0 1 1 0 1 0 0 1.91 19.1
Finance 0 1 1 0 1 1 0 1 1 1 3.3 33
Operation 0 0 0 0 1 0 0 0 0 0 1.87 18.7
Constellation
Age Tenure (y) Education Age Tenure (y) Education TOTAL
Sales 40 3 Bachelor's Sales 4 4 2 10 32.3
HR 48 5 Masters HR 2 3 3 8 25.8
Finance 46 1 Bachelor's Finance 3 1 2 6 19.4
Operation 35 5 Bachelor's Logistics 2 3 2 7 22.6
Characteristics
Manager Reliability Archetype CommunicationSocial competenceCompetence Network TOTAL Characteristics %
Sales 7 4 8 8 7 4 6 26
HR 7 6 8 7 8 6 7 28.4
Finance 6 6 6 6 7 6 6 24.8
Operation 5 6 5 5 6 4 5 20.8
Survey-Report 4.10
Dominant TagManager TOTAL Typology %
Developed by AvantLab, www.avantlab.com
Constellation Input ScoresManager Department Const. %

Name: user voted anonymously Submitted: 08:28:12 26-01-2017
E-mail: user voted anonymously IP: 124.120.238.101
Ranking by calculation using your answers provided during survey
Rank Manager Influencer Department %
1 Manager 2 - Sales 17.79
2 Manager 4 - Procurement 16.96
3 Manager 1 - Finance 15.99
4 Manager 3 - Service 15.26
CEO
34%
Manager 2 Manager 4 Manager 1 Manager 3
Ranking by your assumption Sales Procurement Finance Service
Rank Manager 17.79% 16.96% 15.99% 15.26%
1 Manager 1
2 Manager 4
3 Manager 3
Typology
Market Success Observartion Growth Technology Tech II Tech III Planning Structure Control
Manager 1 1 1 0 1 1 0 1 1 1 1 2.41 24.1
Manager 2 0 0 1 0 0 1 0 0 0 0 2.94 29.4
Manager 3 0 0 0 0 0 0 0 0 0 0 2.25 22.5
Manager 4 1 1 0 1 1 0 1 1 1 1 2.41 24.1
Constellation
Age Tenure (y) Education Age Tenure (y) Education TOTAL
Manager 1 55 17 Bachelor's Finance 2 4 2 8 23.5
Manager 2 45 17 Bachelor's Sales 3 4 2 9 26.5
Manager 3 44 17 Bachelor's Service 2 4 2 8 23.5
Manager 4 52 17 Bachelor's Procurement 3 4 2 9 26.5
Characteristics
Manager Reliability Archetype CommunicationSocial competenceCompetence Network TOTAL Characteristics %
Manager 1 10 7 7 6 9 6 8 25.1
Manager 2 7 7 8 8 7 8 8 25
Manager 3 9 7 6 6 8 6 7 23.4
Manager 4 8 8 8 7 8 9 8 26.5
Survey-Report 4.11
Dominant TagManager TOTAL Typology %
Developed by AvantLab, www.avantlab.com
Constellation Input ScoresManager Department Const. %
Name: user voted anonymously Submitted: 08:28:34 26-01-2017
E-mail: user voted anonymously IP: 175.139.244.61
Ranking by calculation using your answers provided during survey
Rank Manager Influencer Department %
1 FC - Finance 17.41
2 SM - Sales 16.69
3 HR - HR 16.57
4 OM - Service 15.33
CEO
34%
FC SM HR OM
Ranking by your assumption Finance Sales HR Service
Rank Manager 17.41% 16.69% 16.57% 15.33%
1 HR
2 FC
3 SM
Typology
Market Success Observartion Growth Technology Tech II Tech III Planning Structure Control
FC 1 0 1 1 1 1 1 1 1 0 2.63 26.3
HR 1 0 1 1 1 1 1 1 0 0 2.28 22.8
OM 0 0 1 1 1 0 0 0 0 0 2.2 22
SM 0 1 1 1 1 0 0 0 0 1 2.89 28.9
Constellation
Age Tenure (y) Education Age Tenure (y) Education TOTAL
FC 50 2 Bachelor's Finance 3 1 2 6 20.7
HR 50 5 Masters HR 3 3 3 9 31
OM 51 5 Bachelor's Service 1 3 2 6 20.7
SM 50 5 Bachelor's Sales 3 3 2 8 27.6
Characteristics
Manager Reliability Archetype CommunicationSocial competenceCompetence Network TOTAL Characteristics %
FC 10 5 8 7 10 10 8 32.2
HR 8 5 5 5 5 5 6 21.5
OM 8 5 8 10 5 5 7 27
SM 5 5 5 5 5 5 5 19.3
Survey-Report 4.12
Dominant TagManager TOTAL Typology %
Developed by AvantLab, www.avantlab.com
Constellation Input ScoresManager Department Const. %

Name: user voted anonymously Submitted: 14:18:19 26-01-2017
E-mail: user voted anonymously IP: 178.192.238.184
Ranking by calculation using your answers provided during survey
Rank Manager Influencer Department %
1 cfo - Finance 18.15
2 verkauf - Sales 17.42
3 verkauf - Sales 16.11
4 logistik - Logistics 14.32
CEO
34%
cfo verkauf verkauf logistik
Ranking by your assumption Finance Sales Sales Logistics
Rank Manager 18.15% 17.42% 16.11% 14.32%
1 verkauf
2 verkauf
3 logistik
Typology
Market Success Observartion Growth Technology Tech II Tech III Planning Structure Control
cfo 1 1 1 1 0 1 0 0 1 1 3.77 37.7
logistik 0 0 1 0 0 1 0 0 0 0 2.04 20.4
verkauf 0 0 1 0 1 1 1 1 0 0 2.1 21
verkauf 0 0 1 0 1 1 1 1 0 0 2.1 21
Constellation
Age Tenure (y) Education Age Tenure (y) Education TOTAL
cfo 35 4 Bachelor's Finance 2 3 2 7 24.1
logistik 48 19 Without Tertiary Logistics 4 1 1 6 20.7
verkauf 41 3 Masters Sales 3 3 3 9 31
verkauf 58 10 Without Tertiary Sales 2 4 1 7 24.1
Characteristics
Manager Reliability Archetype CommunicationSocial competenceCompetence Network TOTAL Characteristics %
cfo 9 9 6 5 7 0 6 20.6
logistik 5 9 9 6 4 10 7 24
verkauf 9 6 8 10 5 10 8 27.2
verkauf 10 5 7 9 9 10 8 28.1
Survey-Report 4.13
Dominant TagManager TOTAL Typology %
Developed by AvantLab, www.avantlab.com
Constellation Input ScoresManager Department Const. %
Name: Matthias Gantner Submitted: 08:29:54 31-01-2017
E-mail: [email protected] IP: 194.41.216.154
Ranking by calculation using your answers provided during survey
Rank Manager Influencer Department %
1 Gantner - Finance 18.41
2 Curdin - R & D 16.31
3 Studer +Influencer Production 15.91
4 Strahm +Influencer Infrastructure 15.38
CEO
34%
Gantner Curdin Studer Strahm
Ranking by your assumption Finance R & D Production Infrastructure
Rank Manager 18.41% 16.31% 15.91% 15.38%
1 Studer
2 Gantner
3 Curdin
Typology
Market Success Observartion Growth Technology Tech II Tech III Planning Structure Control
Strahm 1 1 1 1 1 1 0 1 0 0 2.41 24.1
Studer 1 0 1 1 1 1 0 0 1 1 2.37 23.7
Curdin 1 1 1 1 1 1 1 1 0 0 2.76 27.6
Gantner 1 1 1 1 1 1 0 1 1 1 2.45 24.5
Constellation
Age Tenure (y) Education Age Tenure (y) Education TOTAL
Strahm 47 2 Bachelor's Infrastructure 3 3 2 8 24.2
Studer 47 15 Bachelor's Production 3 1 2 6 18.2
Curdin 45 8 Masters R & D 1 4 3 8 24.2
Gantner 46 3 Doctoral Finance 4 3 4 11 33.3
Characteristics
Manager Reliability Archetype CommunicationSocial competenceCompetence Network TOTAL Characteristics %
Strahm 6 4 4 5 9 5 5 21.5
Studer 9 6 7 8 9 7 8 30.4
Curdin 7 5 4 5 8 5 6 22.3
Gantner 9 5 6 5 9 5 7 25.8
Survey-Report 4.14
Dominant TagManager TOTAL Typology %
Developed by AvantLab, www.avantlab.com
Constellation Input ScoresManager Department Const. %

Name: Milan Pumpalovic Submitted: 11:22:02 31-01-2017
E-mail: field was not filled by user IP: 136.238.2.50
Ranking by calculation using your answers provided during survey
Rank Manager Influencer Department %
1 Mr. G - HR 18.17
2 Mr. T +Influencer Sales 17.57
3 Mr. S - Production 15.55
4 Mr. H +Influencer Finance 14.71
CEO
34%
Mr. G Mr. T Mr. S Mr. H
Ranking by your assumption HR Sales Production Finance
Rank Manager 18.17% 17.57% 15.55% 14.71%
1 Mr. T
2 Mr. H
3 Mr. S
Typology
Market Success Observartion Growth Technology Tech II Tech III Planning Structure Control
Mr. T 1 0 0 0 0 0 0 0 1 0 2.94 29.4
Mr. S 0 0 1 0 1 1 1 1 0 1 2.37 23.7
Mr. H 0 1 1 1 1 1 1 1 0 1 2.41 24.1
Mr. G 0 1 0 1 0 0 0 0 0 0 2.29 22.9
Constellation
Age Tenure (y) Education Age Tenure (y) Education TOTAL
Mr. T 56 15 Masters Sales 2 4 3 9 26.5
Mr. S 52 20 Masters Production 4 1 3 8 23.5
Mr. H 42 13 Masters Finance 1 2 3 6 17.6
Mr. G 51 16 Masters HR 4 4 3 11 32.4
Characteristics
Manager Reliability Archetype CommunicationSocial competenceCompetence Network TOTAL Characteristics %
Mr. T 9 9 7 5 8 7 7 24
Mr. S 8 9 7 6 9 5 7 23.5
Mr. H 9 6 8 7 10 7 8 25.2
Mr. G 8 7 10 9 9 8 9 27.4
Survey-Report 4.15
Dominant TagManager TOTAL Typology %
Developed by AvantLab, www.avantlab.com
Constellation Input ScoresManager Department Const. %
Name: isabell erlenmaier Submitted: 22:39:06 01-02-2017
E-mail: [email protected] IP: 83.150.10.100
Ranking by calculation using your answers provided during survey
Rank Manager Influencer Department %
1 david - Sales 16.84
2 Hans Pete - Production 16.73
3 rico +Influencer Marketing 16.66
4 werner - Finance 15.77
CEO
34%
david Hans Pete rico werner
Ranking by your assumption Sales Production Marketing Finance
Rank Manager 16.84% 16.73% 16.66% 15.77%
1 rico
2 david
3 werner
Typology
Market Success Observartion Growth Technology Tech II Tech III Planning Structure Control
rico 0 0 0 0 1 1 0 1 1 1 2.41 24.1
david 0 0 0 0 1 1 0 1 1 1 2.41 24.1
werner 1 1 1 1 1 0 1 0 0 0 2.76 27.6
Hans Pete 1 0 1 1 1 0 1 0 0 0 2.41 24.1
Constellation
Age Tenure (y) Education Age Tenure (y) Education TOTAL
rico 47 15 Masters Marketing 3 4 3 10 28.6
david 51 20 Masters Sales 4 3 3 10 28.6
werner 65 22 Masters Finance 1 2 3 6 17.1
Hans Pete 51 9 Masters Production 4 2 3 9 25.7
Characteristics
Manager Reliability Archetype CommunicationSocial competenceCompetence Network TOTAL Characteristics %
rico 6 5 3 5 7 6 5 23
david 5 5 6 4 7 6 5 23.8
werner 8 6 5 5 9 4 6 27
Hans Pete 6 5 7 5 6 7 6 26.2
Survey-Report 4.16
Dominant TagManager TOTAL Typology %
Developed by AvantLab, www.avantlab.com
Constellation Input ScoresManager Department Const. %

Name: field was not filled by user Submitted: 10:23:58 09-02-2017
E-mail: field was not filled by user IP: 85.7.104.201
Ranking by calculation using your answers provided during survey
Rank Manager Influencer Department %
1 Kohler +Influencer Marketing 20.13
2 Gerber - Finance 16.85
3 Lang +Influencer Production 15.12
4 Burger +Influencer Infrastructure 13.9
CEO
34%
Kohler Gerber Lang Burger
Ranking by your assumption Marketing Finance Production Infrastructure
Rank Manager 20.13% 16.85% 15.12% 13.90%
1 Kohler
2 Burger
3 Gerber
Typology
Market Success Observartion Growth Technology Tech II Tech III Planning Structure Control
Kohler 1 1 0 0 0 1 0 1 0 1 3.75 37.5
Burger 0 0 0 1 0 0 0 0 0 0 2.04 20.4
Gerber 0 0 1 1 1 0 1 0 1 0 2.12 21.2
Lang 0 0 1 0 1 0 1 0 1 0 2.1 21
Constellation
Age Tenure (y) Education Age Tenure (y) Education TOTAL
Kohler 43 4 Bachelor's Marketing 4 4 2 10 28.6
Burger 52 12 Masters Infrastructure 2 1 3 6 17.1
Gerber 45 3 Masters Finance 4 4 3 11 31.4
Lang 38 1 Masters Production 2 3 3 8 22.9
Characteristics
Manager Reliability Archetype CommunicationSocial competenceCompetence Network TOTAL Characteristics %
Kohler 10 8 8 10 8 10 9 25.4
Burger 10 9 6 10 10 10 9 25.7
Gerber 10 8 6 10 10 7 9 24
Lang 10 8 7 10 8 10 9 24.9
Survey-Report 4.17
Dominant TagManager TOTAL Typology %
Developed by AvantLab, www.avantlab.com
Constellation Input ScoresManager Department Const. %
Name: Michael Flückiger Submitted: 18:13:39 28-01-2017
E-mail: field was not filled by user IP: 46.127.52.7
Ranking by calculation using your answers provided during survey
Rank Manager Influencer Department %
1 Christoph - Finance 17.74
2 Tino +Influencer R & D 17.71
3 Sabine - Service 15.82
4 Michael - Marketing 14.74
CEO
34%
Christoph Tino Sabine Michael
Ranking by your assumption Finance R & D Service Marketing
Rank Manager 17.74% 17.71% 15.82% 14.74%
1 Tino
2 Michael
3 Christoph
Typology
Market Success Observartion Growth Technology Tech II Tech III Planning Structure Control
Tino 1 1 1 0 0 1 1 1 0 0 2.19 21.9
Christoph 1 1 1 1 1 1 1 0 1 1 3.56 35.6
Michael 0 0 1 0 0 1 0 1 0 0 2.13 21.3
Sabine 0 0 1 0 0 1 0 0 0 0 2.11 21.1
Constellation
Age Tenure (y) Education Age Tenure (y) Education TOTAL
Tino 49 3 Doctoral R & D 4 4 4 12 34.3
Christoph 53 7 Masters Finance 3 1 3 7 20
Michael 43 1 Masters Marketing 1 3 3 7 20
Sabine 53 1 Masters Service 3 3 3 9 25.7
Characteristics
Manager Reliability Archetype CommunicationSocial competenceCompetence Network TOTAL Characteristics %
Tino 9 8 7 7 10 10 8 24.3
Christoph 10 8 8 9 9 8 9 25
Michael 9 8 10 10 9 7 9 25.6
Sabine 10 8 8 9 9 8 9 25
Survey-Report 4.18
Dominant TagManager TOTAL Typology %
Developed by AvantLab, www.avantlab.com
Constellation Input ScoresManager Department Const. %

Name: field was not filled by user Submitted: 04:46:36 13-01-2017
E-mail: field was not filled by user IP: 171.96.110.254
Ranking by calculation using your answers provided during survey
Rank Manager Influencer Department %
1 C - Marketing 13.84
2 E - Logistics 13.71
3 D - HR 13.35
4 B +Influencer Sales 12.63
5 A - Finance 12.47
CEO
34%
C E D B A
Ranking by your assumption Marketing Logistics HR Sales Finance
Rank Manager 13.84% 13.71% 13.35% 12.63% 12.47%
1 A
2 B
3 C
Typology
Market Success Observartion Growth Technology Tech II Tech III Planning Structure Control
A 0 1 1 0 1 0 1 0 0 1 1.98 19.8
B 1 0 0 1 1 1 0 1 1 1 2.17 21.7
C 1 0 0 1 1 1 0 1 1 1 2.17 21.7
D 0 1 1 0 1 0 1 0 0 1 1.98 19.8
E 0 0 0 0 1 0 0 0 0 1 1.71 17.1
Constellation
Age Tenure (y) Education Age Tenure (y) Education TOTAL
A 35 10 Bachelor's Finance 3 3 2 8 20
B 45 9 Bachelor's Sales 1 3 2 6 15
C 35 4 Masters Marketing 3 2 3 8 20
D 41 3 Masters HR 3 2 3 8 20
E 38 10 Masters Logistics 4 3 3 10 25
Characteristics
Manager Reliability Archetype CommunicationSocial competenceCompetence Network TOTAL Characteristics %
A 5 5 5 5 5 5 5 16.9
B 6 6 6 6 6 7 6 20.8
C 6 6 6 6 8 6 6 21.3
D 6 6 6 7 6 6 6 20.8
E 6 6 6 6 6 6 6 20.3
Survey-Report 5.1
Dominant TagManager TOTAL Typology %
Constellation Input ScoresManager Department Const. %
Name: user voted anonymously Submitted: 07:11:51 13-01-2017
E-mail: user voted anonymously IP: 10.22.214.57
Ranking by calculation using your answers provided during survey
Rank Manager Influencer Department %
1 CPO +Influencer Procurement 15.22
2 CTO +Influencer Infrastructure 14.6
3 CDO +Influencer Production 12.73
4 CFO +Influencer Finance 11.8
5 CSDO +Influencer Infrastructure 11.65
CEO
34%
CPO CTO CDO CFO CSDO
Ranking by your assumption Procurement Infrastructure Production Finance Infrastructure
Rank Manager 15.22% 14.60% 12.73% 11.80% 11.65%
1 CDO
2 CPO
3 CTO
Typology
Market Success Observartion Growth Technology Tech II Tech III Planning Structure Control
CDO 0 0 0 1 1 1 0 0 0 1 1.83 18.3
CFO 1 1 1 1 1 1 0 1 1 1 2.08 20.8
CSDO 1 1 1 0 1 0 0 1 1 0 2.01 20.1
CTO 1 1 1 0 1 0 0 1 1 0 2.01 20.1
CPO 1 1 1 1 1 1 0 1 1 1 2.08 20.8
Constellation
Age Tenure (y) Education Age Tenure (y) Education TOTAL
CDO 50 20 Masters Production 3 2 3 8 18.2
CFO 35 2 Masters Finance 1 2 3 6 13.6
CSDO 50 2 Masters Infrastructure 3 2 3 8 18.2
CTO 45 15 Doctoral Infrastructure 4 3 4 11 25
CPO 45 10 Masters Procurement 4 4 3 11 25
Characteristics
Manager Reliability Archetype CommunicationSocial competenceCompetence Network TOTAL Characteristics %
CDO 8 7 5 5 10 10 7 21.4
CFO 8 7 5 5 10 5 7 19.2
CSDO 3 7 4 5 10 2 5 14.7
CTO 5 7 6 7 10 10 7 21.3
CPO 8 7 10 8 10 5 8 23.4
Survey-Report 5.2
Dominant TagManager TOTAL Typology %
Constellation Input ScoresManager Department Const. %

Name: honey Submitted: 10:20:03 13-01-2017
E-mail: field was not filled by user IP: 211.25.13.130
Ranking by calculation using your answers provided during survey
Rank Manager Influencer Department %
1 Tiger +Influencer Sales 15.94
2 Sid +Influencer Production 14.45
3 Fan - Finance 12.23
4 DipDip +Influencer HR 11.9
5 Ops +Influencer Logistics 11.49
CEO
34%
Tiger Sid Fan DipDip Ops
Ranking by your assumption Sales Production Finance HR Logistics
Rank Manager 15.94% 14.45% 12.23% 11.90% 11.49%
1 Sid
2 Tiger
3 Fan
Typology
Market Success Observartion Growth Technology Tech II Tech III Planning Structure Control
Sid 0 0 0 0 0 1 0 1 1 0 1.58 15.8
Tiger 1 0 0 1 0 1 1 1 1 1 3.13 31.3
DipDip 0 1 1 0 1 1 0 1 1 0 1.86 18.6
Ops 0 0 0 0 0 1 0 1 1 0 1.58 15.8
Fan 0 1 1 0 1 1 0 1 1 0 1.86 18.6
Constellation
Age Tenure (y) Education Age Tenure (y) Education TOTAL
Sid 45 1 Masters Production 3 2 3 8 21.1
Tiger 48 1 Masters Sales 3 2 3 8 21.1
DipDip 46 3 Bachelor's HR 3 3 2 8 21.1
Ops 25 3 Bachelor's Logistics 1 3 2 6 15.8
Fan 33 3 Bachelor's Finance 3 3 2 8 21.1
Characteristics
Manager Reliability Archetype CommunicationSocial competenceCompetence Network TOTAL Characteristics %
Sid 10 10 10 10 10 10 10 28.8
Tiger 6 4 8 7 9 8 7 20.1
DipDip 4 5 6 6 5 4 5 14.5
Ops 7 8 7 7 7 7 7 20.6
Fan 6 7 7 4 5 4 6 16
Survey-Report 5.3
Dominant TagManager TOTAL Typology %
Constellation Input ScoresManager Department Const. %
Name: user voted anonymously Submitted: 16:01:02 16-01-2017
E-mail: user voted anonymously IP: 60.52.1.96
Ranking by calculation using your answers provided during survey
Rank Manager Influencer Department %
1 Winston - Finance 14.6
2 Melvin - Sales 14.18
3 Andrea - Marketing 13.36
4 Margerat - HR 12.32
5 Kevin +Influencer Sales 11.55
CEO
34%
Winston Melvin Andrea Margerat Kevin
Ranking by your assumption Finance Sales Marketing HR Sales
Rank Manager 14.60% 14.18% 13.36% 12.32% 11.55%
1 Winston
2 Margerat
3 Kevin
Typology
Market Success Observartion Growth Technology Tech II Tech III Planning Structure Control
Winston 1 1 1 1 1 1 0 0 0 1 2.74 27.4
Kevin 0 0 1 0 1 0 1 1 1 0 1.77 17.7
Margerat 0 1 1 1 1 1 0 0 0 0 1.97 19.7
Melvin 0 0 1 0 1 0 1 1 1 0 1.77 17.7
Andrea 0 0 1 0 1 0 1 1 1 0 1.77 17.7
Constellation
Age Tenure (y) Education Age Tenure (y) Education TOTAL
Winston 46 3 Bachelor's Finance 2 4 2 8 21.1
Kevin 42 1 Bachelor's Sales 2 3 2 7 18.4
Margerat 45 44 Bachelor's HR 3 1 2 6 15.8
Melvin 45 2 Bachelor's Sales 3 4 2 9 23.7
Andrea 43 1 Bachelor's Marketing 3 3 2 8 21.1
Characteristics
Manager Reliability Archetype CommunicationSocial competenceCompetence Network TOTAL Characteristics %
Winston 7 3 3 3 7 3 4 17.9
Kevin 4 3 2 6 5 4 4 16.4
Margerat 5 3 5 5 5 7 5 20.5
Melvin 3 6 7 5 7 6 6 23.1
Andrea 4 4 6 7 5 6 5 22
Survey-Report 5.4
Dominant TagManager TOTAL Typology %
Constellation Input ScoresManager Department Const. %

Name: field was not filled by user Submitted: 11:27:27 18-01-2017
E-mail: field was not filled by user IP: 115.42.189.186
Ranking by calculation using your answers provided during survey
Rank Manager Influencer Department %
1 Manager 1 +Influencer Finance 14.64
2 Manager 2 +Influencer Production 13.65
3 Manager 5 +Influencer Infrastructure 13.25
4 Manager 3 +Influencer R & D 12.67
5 Manager 4 +Influencer HR 11.78
CEO
34%
Manager 1 Manager 2 Manager 5 Manager 3 Manager 4
Ranking by your assumption Finance Production Infrastructure R & D HR
Rank Manager 14.64% 13.65% 13.25% 12.67% 11.78%
1 Manager 2
2 Manager 1
3 Manager 3
Typology
Market Success Observartion Growth Technology Tech II Tech III Planning Structure Control
Manager 1 1 1 1 1 1 1 1 1 1 1 2.23 22.3
Manager 2 0 1 1 0 1 0 0 0 1 0 1.93 19.3
Manager 3 1 1 0 1 0 1 1 1 0 1 1.95 19.5
Manager 4 1 1 0 1 0 1 1 1 0 1 1.95 19.5
Manager 5 1 1 0 1 0 1 1 1 0 1 1.95 19.5
Constellation
Age Tenure (y) Education Age Tenure (y) Education TOTAL
Manager 1 50 10 Masters Finance 4 4 3 11 26.2
Manager 2 50 15 Masters Production 4 3 3 10 23.8
Manager 3 52 20 Masters R & D 2 2 3 7 16.7
Manager 4 45 1 Bachelor's HR 1 2 2 5 11.9
Manager 5 48 5 Bachelor's Infrastructure 4 3 2 9 21.4
Characteristics
Manager Reliability Archetype CommunicationSocial competenceCompetence Network TOTAL Characteristics %
Manager 1 8 6 6 8 10 8 8 18.1
Manager 2 7 6 9 8 9 9 8 19
Manager 3 10 8 8 10 8 10 9 21.4
Manager 4 8 8 10 10 10 10 9 22.2
Manager 5 8 8 7 8 9 9 8 19.3
Survey-Report 5.5
Dominant TagManager TOTAL Typology %
Constellation Input ScoresManager Department Const. %
Name: MOHD AZMI BIN MAHZAN @ MOHD ZIN Submitted: 16:07:41 18-01-2017
E-mail: [email protected] IP: 103.1.71.26
Ranking by calculation using your answers provided during survey
Rank Manager Influencer Department %
1 Manager 2 +Influencer Production 13.51
2 Manager 1 +Influencer Marketing 13.45
3 Manager 5 +Influencer R & D 13.39
4 Manager 3 +Influencer Finance 13.28
5 Manager 4 +Influencer Logistics 12.37
CEO
34%
Manager 2 Manager 1 Manager 5 Manager 3 Manager 4
Ranking by your assumption Production Marketing R & D Finance Logistics
Rank Manager 13.51% 13.45% 13.39% 13.28% 12.37%
1 Manager 3
2 Manager 2
3 Manager 1
Typology
Market Success Observartion Growth Technology Tech II Tech III Planning Structure Control
Manager 1 1 0 0 1 0 0 0 1 1 1 2.09 20.9
Manager 2 0 1 1 0 0 1 1 0 0 0 2 20
Manager 3 0 1 1 0 1 1 1 0 0 0 2.09 20.9
Manager 4 0 0 0 0 0 0 0 0 0 0 1.63 16.3
Manager 5 1 0 0 1 1 0 0 1 1 1 2.18 21.8
Constellation
Age Tenure (y) Education Age Tenure (y) Education TOTAL
Manager 1 33 33 Bachelor's Marketing 4 4 2 10 20
Manager 2 33 33 Bachelor's Production 4 4 2 10 20
Manager 3 33 33 Bachelor's Finance 4 4 2 10 20
Manager 4 33 33 Bachelor's Logistics 4 4 2 10 20
Manager 5 33 33 Bachelor's R & D 4 4 2 10 20
Characteristics
Manager Reliability Archetype CommunicationSocial competenceCompetence Network TOTAL Characteristics %
Manager 1 8 8 8 9 9 8 8 20.2
Manager 2 8 9 9 9 9 9 9 21.4
Manager 3 8 8 8 8 8 8 8 19.4
Manager 4 8 8 9 8 8 8 8 19.9
Manager 5 8 7 8 8 8 8 8 19.1
Survey-Report 5.6
Dominant TagManager TOTAL Typology %
Constellation Input ScoresManager Department Const. %

Name: user voted anonymously Submitted: 12:24:28 24-01-2017
E-mail: user voted anonymously IP: 212.4.83.101
Ranking by calculation using your answers provided during survey
Rank Manager Influencer Department %
1 Bleisch - Sales 14.8
2 Stalder - Production 14.08
3 Meier - Finance 12.48
4 Fretz - Marketing 12.35
5 Mathis - Infrastructure 12.29
CEO
34%
Bleisch Stalder Meier Fretz Mathis
Ranking by your assumption Sales Production Finance Marketing Infrastructure
Rank Manager 14.80% 14.08% 12.48% 12.35% 12.29%
1 Meier
2 Bleisch
3 Stalder
Typology
Market Success Observartion Growth Technology Tech II Tech III Planning Structure Control
Meier 0 0 0 0 1 0 1 1 0 1 1.95 19.5
Bleisch 1 1 1 1 1 1 0 0 1 0 2.22 22.2
Fretz 1 1 1 1 1 1 0 0 1 0 2.22 22.2
Stalder 0 0 0 0 1 0 0 1 0 1 1.85 18.5
Mathis 0 0 0 0 1 0 1 0 0 0 1.76 17.6
Constellation
Age Tenure (y) Education Age Tenure (y) Education TOTAL
Meier 55 22 Masters Finance 2 1 3 6 14
Bleisch 46 12 Bachelor's Sales 4 4 2 10 23.3
Fretz 33 5 Masters Marketing 1 2 3 6 14
Stalder 48 9 Masters Production 4 4 3 11 25.6
Mathis 42 7 Masters Infrastructure 4 3 3 10 23.3
Characteristics
Manager Reliability Archetype CommunicationSocial competenceCompetence Network TOTAL Characteristics %
Meier 10 6 10 10 10 10 9 23.3
Bleisch 10 5 10 10 7 10 9 21.8
Fretz 10 5 10 5 8 10 8 20
Stalder 5 5 10 10 10 8 8 19.9
Mathis 6 5 7 6 5 7 6 15
Survey-Report 5.7
Dominant TagManager TOTAL Typology %
Constellation Input ScoresManager Department Const. %
Name: zulfadhli Submitted: 08:12:05 26-01-2017
E-mail: [email protected] IP: 175.139.244.61
Ranking by calculation using your answers provided during survey
Rank Manager Influencer Department %
1 roslee - Production 16.6
2 rizal - HR 13.01
3 chan +Influencer Marketing 12.54
4 lim +Influencer Logistics 12.21
5 rosli - Infrastructure 11.63
CEO
34%
roslee rizal chan lim rosli
Ranking by your assumption Production HR Marketing Logistics Infrastructure
Rank Manager 16.60% 13.01% 12.54% 12.21% 11.63%
1 chan
2 rosli
3 lim
Typology
Market Success Observartion Growth Technology Tech II Tech III Planning Structure Control
rosli 0 1 1 1 1 1 0 0 0 0 1.72 17.2
chan 1 1 0 1 1 0 0 0 0 0 1.93 19.3
rizal 0 1 1 1 1 1 0 0 0 0 1.72 17.2
lim 0 1 0 1 1 0 0 0 0 0 1.54 15.4
roslee 0 1 0 1 1 0 1 1 1 1 3.09 30.9
Constellation
Age Tenure (y) Education Age Tenure (y) Education TOTAL
rosli 37 15 Masters Infrastructure 1 3 3 7 17.1
chan 40 17 Masters Marketing 3 2 3 8 19.5
rizal 40 10 Masters HR 3 4 3 10 24.4
lim 40 3 Masters Logistics 3 2 3 8 19.5
roslee 40 4 Masters Production 3 2 3 8 19.5
Characteristics
Manager Reliability Archetype CommunicationSocial competenceCompetence Network TOTAL Characteristics %
rosli 10 3 8 7 5 6 7 18.6
chan 6 5 10 5 6 7 7 18.2
rizal 7 6 4 7 7 7 6 17.5
lim 10 5 5 10 6 8 7 20.6
roslee 9 9 8 10 10 8 9 25.1
Survey-Report 5.8
Dominant TagManager TOTAL Typology %
Constellation Input ScoresManager Department Const. %

Name: VALLIRAJAH RAJAMONEY Submitted: 08:30:31 26-01-2017
E-mail: [email protected] IP: 175.139.244.61
Ranking by calculation using your answers provided during survey
Rank Manager Influencer Department %
1 SUKRI - Finance 16.03
2 RAUNNY - Sales 14.99
3 RITA - HR 13.27
4 LOGAN - Service 10.86
5 SALLEH +Influencer Logistics 10.84
CEO
34%
SUKRI RAUNNY RITA LOGAN SALLEH
Ranking by your assumption Finance Sales HR Service Logistics
Rank Manager 16.03% 14.99% 13.27% 10.86% 10.84%
1 RAUNNY
2 SUKRI
3 SALLEH
Typology
Market Success Observartion Growth Technology Tech II Tech III Planning Structure Control
SALLEH 1 1 0 0 1 1 0 0 0 0 1.58 15.8
RITA 1 1 0 0 1 1 1 0 0 0 1.67 16.7
LOGAN 1 1 0 0 1 1 0 0 0 0 1.58 15.8
SUKRI 1 1 0 1 1 1 1 1 1 0 2.83 28.3
RAUNNY 1 1 1 0 1 1 0 0 0 1 2.35 23.5
Constellation
Age Tenure (y) Education Age Tenure (y) Education TOTAL
SALLEH 53 15 Bachelor's Logistics 2 3 2 7 17.5
RITA 45 7 Bachelor's HR 4 3 2 9 22.5
LOGAN 38 4 Bachelor's Service 1 2 2 5 12.5
SUKRI 47 12 Masters Finance 4 4 3 11 27.5
RAUNNY 50 16 Masters Sales 3 2 3 8 20
Characteristics
Manager Reliability Archetype CommunicationSocial competenceCompetence Network TOTAL Characteristics %
SALLEH 5 5 5 5 5 7 5 16
RITA 7 7 7 7 7 7 7 21.2
LOGAN 6 6 7 8 7 8 7 21.1
SUKRI 6 6 6 4 6 6 6 17.1
RAUNNY 8 8 8 8 8 9 8 24.6
Survey-Report 5.9
Dominant TagManager TOTAL Typology %
Constellation Input ScoresManager Department Const. %
Name: Benny Lee Submitted: 08:48:01 26-01-2017
E-mail: [email protected] IP: 175.139.244.61
Ranking by calculation using your answers provided during survey
Rank Manager Influencer Department %
1 MOK +Influencer Marketing 15.35
2 Shirley - Procurement 14.45
3 Khor - Sales 14.39
4 GEOK LAN - Finance 11.54
5 Mahmood - HR 10.27
CEO
34%
MOK Shirley Khor GEOK LAN Mahmood
Ranking by your assumption Marketing Procurement Sales Finance HR
Rank Manager 15.35% 14.45% 14.39% 11.54% 10.27%
1 MOK
2 GEOK LAN
3 Khor
Typology
Market Success Observartion Growth Technology Tech II Tech III Planning Structure Control
Khor 0 0 0 0 0 0 0 1 1 1 2 20
Mahmood 1 0 1 1 0 0 1 0 0 0 1.82 18.2
GEOK LAN 1 1 1 1 1 1 1 0 0 0 2.1 21
Shirley 1 1 1 1 1 1 1 0 0 0 2.1 21
MOK 0 0 0 0 0 0 0 1 1 1 2 20
Constellation
Age Tenure (y) Education Age Tenure (y) Education TOTAL
Khor 55 30 Without Tertiary Sales 3 3 1 7 19.4
Mahmood 40 2 Bachelor's HR 3 1 2 6 16.7
GEOK LAN 37 15 Bachelor's Finance 2 4 2 8 22.2
Shirley 40 20 Bachelor's Procurement 3 4 2 9 25
MOK 60 37 Bachelor's Marketing 2 2 2 6 16.7
Characteristics
Manager Reliability Archetype CommunicationSocial competenceCompetence Network TOTAL Characteristics %
Khor 4 6 6 8 6 9 6 26
Mahmood 0 0 4 4 4 6 3 11.8
GEOK LAN 0 2 5 0 7 0 2 9.3
Shirley 5 5 5 6 5 3 5 19.8
MOK 8 5 10 8 9 9 8 33.2
Survey-Report 5.10
Dominant TagManager TOTAL Typology %
Constellation Input ScoresManager Department Const. %

Name: user voted anonymously Submitted: 09:03:23 26-01-2017
E-mail: user voted anonymously IP: 175.139.244.61
Ranking by calculation using your answers provided during survey
Rank Manager Influencer Department %
1 BL - Sales 17.55
2 JN - Logistics 13.38
3 VP - HR 12.47
4 MM - Procurement 12.11
5 Tee - Finance 10.5
CEO
34%
BL JN VP MM Tee
Ranking by your assumption Sales Logistics HR Procurement Finance
Rank Manager 17.55% 13.38% 12.47% 12.11% 10.50%
1 Tee
2 JN
3 BL
Typology
Market Success Observartion Growth Technology Tech II Tech III Planning Structure Control
Tee 0 0 1 0 1 0 1 0 0 1 1.61 16.1
BL 1 1 0 1 1 1 0 1 1 0 3.79 37.9
VP 0 0 0 0 1 0 1 0 0 1 1.52 15.2
JN 0 0 0 0 1 0 0 0 0 0 1.47 14.7
MM 0 0 1 0 1 0 1 0 0 1 1.61 16.1
Constellation
Age Tenure (y) Education Age Tenure (y) Education TOTAL
Tee 55 37 Bachelor's Finance 1 2 2 5 13.9
BL 34 10 Without Tertiary Sales 2 3 1 6 16.7
VP 46 9 Bachelor's HR 4 3 2 9 25
JN 40 30 Bachelor's Logistics 4 3 2 9 25
MM 36 2 Bachelor's Procurement 3 2 2 7 19.4
Characteristics
Manager Reliability Archetype CommunicationSocial competenceCompetence Network TOTAL Characteristics %
Tee 9 5 5 5 8 3 6 17.7
BL 9 5 9 9 9 9 8 25.2
VP 6 6 5 5 5 6 5 16.5
JN 8 3 7 8 8 8 7 21.1
MM 6 8 6 7 5 7 6 19.5
Survey-Report 5.11
Dominant TagManager TOTAL Typology %
Constellation Input ScoresManager Department Const. %
Name: user voted anonymously Submitted: 16:41:45 26-01-2017
E-mail: user voted anonymously IP: 1.46.65.204
Ranking by calculation using your answers provided during survey
Rank Manager Influencer Department %
1 Manager 3 +Influencer Finance 14.91
2 Manager 5 - Logistics 13.09
3 Preecha +Influencer Sales 12.99
4 Manager 4 +Influencer Service 12.68
5 Pinyawee - Marketing 12.33
CEO
34%
Manager 3 Manager 5 Preecha Manager 4 Pinyawee
Ranking by your assumption Finance Logistics Sales Service Marketing
Rank Manager 14.91% 13.09% 12.99% 12.68% 12.33%
1 Preecha
2 Manager 4
3 Manager 5
Typology
Market Success Observartion Growth Technology Tech II Tech III Planning Structure Control
Preecha 1 0 1 0 0 1 1 1 1 1 2.1 21
Pinyawee 1 0 1 0 0 1 1 1 1 1 2.1 21
Manager 3 0 1 0 1 1 0 1 0 0 0 2.71 27.1
Manager 4 0 0 0 0 0 0 1 0 0 0 1.55 15.5
Manager 5 0 0 0 0 0 0 1 0 0 0 1.55 15.5
Constellation
Age Tenure (y) Education Age Tenure (y) Education TOTAL
Preecha 45 13 Bachelor's Sales 4 1 2 7 18.4
Pinyawee 35 3 Bachelor's Marketing 1 3 2 6 15.8
Manager 3 45 2 Bachelor's Finance 4 2 2 8 21.1
Manager 4 46 10 Bachelor's Service 3 3 2 8 21.1
Manager 5 47 5 Bachelor's Logistics 3 4 2 9 23.7
Characteristics
Manager Reliability Archetype CommunicationSocial competenceCompetence Network TOTAL Characteristics %
Preecha 9 10 9 9 9 9 9 19.6
Pinyawee 10 9 8 9 9 9 9 19.3
Manager 3 9 8 9 9 10 10 9 19.6
Manager 4 10 10 10 10 9 10 10 21.1
Manager 5 9 10 10 9 9 10 9 20.3
Survey-Report 5.12
Dominant TagManager TOTAL Typology %
Constellation Input ScoresManager Department Const. %

Name: user voted anonymously Submitted: 16:35:34 17-01-2017
E-mail: user voted anonymously IP: 63.138.62.76
Ranking by calculation using your answers provided during survey
Rank Manager Influencer Department %
1 L - Finance 14.98
2 R +Influencer Sales 13.49
3 G +Influencer Service 13.29
4 D - R & D 12.22
5 T +Influencer Production 12.03
CEO
34%
L R G D T
Ranking by your assumption Finance Sales Service R & D Production
Rank Manager 14.98% 13.49% 13.29% 12.22% 12.03%
1 R
2 D
3 G
Typology
Market Success Observartion Growth Technology Tech II Tech III Planning Structure Control
D 1 1 1 1 1 1 1 1 0 0 2.26 22.6
R 1 1 1 1 1 0 0 0 0 0 1.98 19.8
T 0 0 1 0 1 0 0 0 1 1 1.89 18.9
G 0 0 1 0 1 0 0 0 0 0 1.71 17.1
L 0 0 1 0 1 1 1 1 1 1 2.17 21.7
Constellation
Age Tenure (y) Education Age Tenure (y) Education TOTAL
D 48 20 Bachelor's R & D 1 1 2 4 10.8
R 58 10 Without Tertiary Sales 4 3 1 8 21.6
T 52 9 Bachelor's Production 3 3 2 8 21.6
G 60 13 Without Tertiary Service 3 4 1 8 21.6
L 60 12 Bachelor's Finance 3 4 2 9 24.3
Characteristics
Manager Reliability Archetype CommunicationSocial competenceCompetence Network TOTAL Characteristics %
D 8 5 9 5 7 5 7 22.2
R 5 3 5 6 9 8 6 19.9
T 4 5 7 2 5 2 4 14.2
G 9 6 9 4 5 5 6 21.7
L 9 7 7 5 9 2 7 22.1
Survey-Report 5.13
Dominant TagManager TOTAL Typology %
Constellation Input ScoresManager Department Const. %
Name: user voted anonymously Submitted: 13:51:20 22-01-2017
E-mail: user voted anonymously IP: 124.188.212.20
Ranking by calculation using your answers provided during survey
Rank Manager Influencer Department %
1 Manager 1 +Influencer Finance 16.72
2 Manager 2 +Influencer Sales 14.24
3 Manager 5 +Influencer Service 12.96
4 Manager 3 +Influencer HR 12.6
5 Manager 4 +Influencer Logistics 9.48
CEO
34%
Manager 1 Manager 2 Manager 5 Manager 3 Manager 4
Ranking by your assumption Finance Sales Service HR Logistics
Rank Manager 16.72% 14.24% 12.96% 12.60% 9.48%
1 Manager 1
2 Manager 5
3 Manager 2
Typology
Market Success Observartion Growth Technology Tech II Tech III Planning Structure Control
Manager 1 1 0 1 1 1 0 1 1 1 1 3 30
Manager 2 0 1 0 1 0 1 0 0 0 0 2.24 22.4
Manager 3 1 0 0 1 1 0 1 0 0 1 1.83 18.3
Manager 4 0 0 0 1 0 0 0 0 0 0 1.47 14.7
Manager 5 0 0 0 1 0 0 0 0 0 0 1.47 14.7
Constellation
Age Tenure (y) Education Age Tenure (y) Education TOTAL
Manager 1 48 1 Bachelor's Finance 4 3 2 9 23.7
Manager 2 42 3 Bachelor's Sales 3 3 2 8 21.1
Manager 3 37 2 Bachelor's HR 2 3 2 7 18.4
Manager 4 62 38 Bachelor's Logistics 1 1 2 4 10.5
Manager 5 52 18 Bachelor's Service 4 4 2 10 26.3
Characteristics
Manager Reliability Archetype CommunicationSocial competenceCompetence Network TOTAL Characteristics %
Manager 1 10 6 8 7 10 5 8 22.4
Manager 2 8 8 6 9 6 7 7 21.3
Manager 3 10 8 8 5 7 4 7 20.5
Manager 4 8 7 5 6 5 6 6 17.9
Manager 5 8 7 7 4 6 5 6 18
Survey-Report 5.14
Dominant TagManager TOTAL Typology %
Constellation Input ScoresManager Department Const. %

Name: Alexander Melikyan Submitted: 07:16:55 27-01-2017
E-mail: [email protected] IP: 89.84.210.156
Ranking by calculation using your answers provided during survey
Rank Manager Influencer Department %
1 FI - Finance 15.11
2 MP +Influencer Procurement 14.15
3 JK +Influencer Production 13.77
4 HS - Marketing 11.57
5 MR +Influencer Sales 11.4
CEO
34%
FI MP JK HS MR
Ranking by your assumption Finance Procurement Production Marketing Sales
Rank Manager 15.11% 14.15% 13.77% 11.57% 11.40%
1 MP
2 MR
3 FI
Typology
Market Success Observartion Growth Technology Tech II Tech III Planning Structure Control
MP 0 1 1 1 1 1 0 0 1 1 1.98 19.8
HS 1 0 1 1 1 0 1 1 0 0 2.08 20.8
MR 1 0 1 1 1 0 1 1 0 0 2.08 20.8
JK 0 0 1 1 1 1 0 0 1 1 1.88 18.8
FI 0 1 1 1 1 1 0 0 1 1 1.98 19.8
Constellation
Age Tenure (y) Education Age Tenure (y) Education TOTAL
MP 58 8 Doctoral Procurement 2 2 4 8 19.5
HS 44 8 Masters Marketing 2 2 3 7 17.1
MR 54 35 Without Tertiary Sales 3 1 1 5 12.2
JK 50 20 Masters Production 4 4 3 11 26.8
FI 45 19 Masters Finance 3 4 3 10 24.4
Characteristics
Manager Reliability Archetype CommunicationSocial competenceCompetence Network TOTAL Characteristics %
MP 8 9 7 10 7 10 8 25
HS 1 2 10 10 1 5 5 14.7
MR 10 6 2 2 10 9 6 18.8
JK 7 4 3 10 7 3 6 16.9
FI 10 6 7 7 10 10 8 24.5
Survey-Report 5.15
Dominant TagManager TOTAL Typology %
Constellation Input ScoresManager Department Const. %
Name: Marc Nideröst Submitted: 09:04:51 27-01-2017
E-mail: [email protected] IP: 213.180.186.69
Ranking by calculation using your answers provided during survey
Rank Manager Influencer Department %
1 JLE - Production 14.76
2 PSC - Production 13.46
3 WHU - Production 13.28
4 FMA +Influencer Production 13.01
5 ADU - Production 11.49
CEO
34%
JLE PSC WHU FMA ADU
Ranking by your assumption Production Production Production Production Production
Rank Manager 14.76% 13.46% 13.28% 13.01% 11.49%
1 FMA
2 PSC
3 WHU
Typology
Market Success Observartion Growth Technology Tech II Tech III Planning Structure Control
ADU 0 1 1 1 1 0 1 0 0 0 2 20
WHU 0 1 1 1 1 0 1 0 0 0 2 20
PSC 0 1 1 1 1 0 1 0 0 0 2 20
JLE 0 1 1 1 1 0 1 0 0 0 2 20
FMA 0 1 1 1 1 0 1 0 0 0 2 20
Constellation
Age Tenure (y) Education Age Tenure (y) Education TOTAL
ADU 45 10 Masters Production 3 2 3 8 18.6
WHU 60 35 Doctoral Production 3 2 4 9 20.9
PSC 41 20 Without Tertiary Production 2 4 1 7 16.3
JLE 45 20 Masters Production 3 4 3 10 23.3
FMA 65 30 Doctoral Production 2 3 4 9 20.9
Characteristics
Manager Reliability Archetype CommunicationSocial competenceCompetence Network TOTAL Characteristics %
ADU 6 5 3 2 7 3 4 13.6
WHU 9 5 4 4 7 8 6 19.4
PSC 9 8 7 8 9 6 8 24.9
JLE 8 8 7 8 9 5 8 23.8
FMA 7 5 4 4 5 10 6 18.2
Survey-Report 5.16
Dominant TagManager TOTAL Typology %
Constellation Input ScoresManager Department Const. %

Name: user voted anonymously Submitted: 07:39:06 30-01-2017
E-mail: user voted anonymously IP: 178.174.83.242
Ranking by calculation using your answers provided during survey
Rank Manager Influencer Department %
1 Manager 2 - R & D 14.08
2 Manager 5 - Marketing 13.51
3 Manager 1 - Finance 13.21
4 Manager 4 - Production 13.09
5 Manager 3 - Sales 12.12
CEO
34%
Manager 2 Manager 5 Manager 1 Manager 4 Manager 3
Ranking by your assumption R & D Marketing Finance Production Sales
Rank Manager 14.08% 13.51% 13.21% 13.09% 12.12%
1 Manager 3
2 Manager 2
3 Manager 1
Typology
Market Success Observartion Growth Technology Tech II Tech III Planning Structure Control
Manager 1 1 1 1 1 1 0 0 1 0 0 2.22 22.2
Manager 2 0 1 0 0 1 1 1 1 1 1 2.04 20.4
Manager 3 0 0 0 0 1 1 1 0 1 1 1.86 18.6
Manager 4 1 0 1 1 1 0 0 0 0 0 2.03 20.3
Manager 5 0 0 0 0 1 1 1 0 1 1 1.86 18.6
Constellation
Age Tenure (y) Education Age Tenure (y) Education TOTAL
Manager 1 40 1 Bachelor's Finance 2 3 2 7 17.1
Manager 2 44 7 Bachelor's R & D 4 4 2 10 24.4
Manager 3 55 22 Doctoral Sales 1 1 4 6 14.6
Manager 4 45 1 Bachelor's Production 4 3 2 9 22
Manager 5 47 1 Bachelor's Marketing 4 3 2 9 22
Characteristics
Manager Reliability Archetype CommunicationSocial competenceCompetence Network TOTAL Characteristics %
Manager 1 8 8 8 7 8 8 8 20.8
Manager 2 8 7 8 7 8 5 7 19.2
Manager 3 6 9 8 8 9 10 8 21.9
Manager 4 6 7 6 7 7 6 6 17.2
Manager 5 8 7 9 7 8 8 8 20.9
Survey-Report 5.17
Dominant TagManager TOTAL Typology %
Constellation Input ScoresManager Department Const. %
Name: field was not filled by user Submitted: 21:30:59 31-01-2017
E-mail: field was not filled by user IP: 194.230.188.92
Ranking by calculation using your answers provided during survey
Rank Manager Influencer Department %
1 Manager 5 +Influencer Finance 16.01
2 Manager 1 +Influencer Production 14.4
3 Manager 3 - Sales 12.76
4 Manager 4 - R & D 12.63
5 Manager 2 - HR 10.19
CEO
34%
Manager 5 Manager 1 Manager 3 Manager 4 Manager 2
Ranking by your assumption Finance Production Sales R & D HR
Rank Manager 16.01% 14.40% 12.76% 12.63% 10.19%
1 Manager 1
2 Manager 5
3 Manager 4
Typology
Market Success Observartion Growth Technology Tech II Tech III Planning Structure Control
Manager 1 0 1 1 1 1 1 1 0 1 1 2.39 23.9
Manager 2 0 0 0 0 0 0 0 1 0 0 1.68 16.8
Manager 3 1 0 0 0 0 0 0 0 0 0 1.75 17.5
Manager 4 1 0 0 0 0 0 0 1 0 0 1.77 17.7
Manager 5 0 1 1 1 1 1 1 1 1 1 2.41 24.1
Constellation
Age Tenure (y) Education Age Tenure (y) Education TOTAL
Manager 1 51 23 Masters Production 3 3 3 9 20.9
Manager 2 39 7 Bachelor's HR 1 1 2 4 9.3
Manager 3 48 21 Bachelor's Sales 4 4 2 10 23.3
Manager 4 53 24 Masters R & D 2 3 3 8 18.6
Manager 5 46 17 Doctoral Finance 4 4 4 12 27.9
Characteristics
Manager Reliability Archetype CommunicationSocial competenceCompetence Network TOTAL Characteristics %
Manager 1 7 9 9 7 8 9 8 20.7
Manager 2 7 9 7 9 8 8 8 20.2
Manager 3 7 8 6 6 6 8 7 17.3
Manager 4 8 9 8 8 8 9 8 21.1
Manager 5 9 8 8 7 9 8 8 20.7
Survey-Report 5.18
Dominant TagManager TOTAL Typology %
Constellation Input ScoresManager Department Const. %

Name: field was not filled by user Submitted: 05:39:41 04-02-2017
E-mail: field was not filled by user IP: 118.139.142.72
Ranking by calculation using your answers provided during survey
Rank Manager Influencer Department %
1 Hong - Finance 15.44
2 Craig - Production 13.26
3 Kong +Influencer Finance 12.79
4 Paul - Infrastructure 12.37
5 Wong - Procurement 12.14
CEO
34%
Hong Craig Kong Paul Wong
Ranking by your assumption Finance Production Finance Infrastructure Procurement
Rank Manager 15.44% 13.26% 12.79% 12.37% 12.14%
1 Hong
2 Craig
3 Paul
Typology
Market Success Observartion Growth Technology Tech II Tech III Planning Structure Control
Paul 1 1 1 1 0 0 0 0 0 0 1.9 19
Hong 1 1 1 1 1 0 0 1 1 0 2.05 20.5
Craig 0 1 1 0 1 0 0 1 1 0 1.95 19.5
Kong 1 1 1 1 1 0 0 1 1 0 2.05 20.5
Wong 1 1 1 1 1 0 0 1 1 0 2.05 20.5
Constellation
Age Tenure (y) Education Age Tenure (y) Education TOTAL
Paul 48 20 Without TertiaryInfrastructure 3 2 1 6 16.2
Hong 45 20 Bachelor's Finance 4 2 2 8 21.6
Craig 41 5 Bachelor's Production 3 3 2 8 21.6
Kong 50 4 Masters Finance 2 2 3 7 18.9
Wong 38 9 Bachelor's Procurement 2 4 2 8 21.6
Characteristics
Manager Reliability Archetype CommunicationSocial competenceCompetence Network TOTAL Characteristics %
Paul 5 3 9 10 3 5 6 21
Hong 10 8 4 10 10 6 8 28
Craig 9 9 2 2 10 1 5 19.2
Kong 10 8 2 2 8 2 5 18.7
Wong 6 3 2 5 3 3 4 13.1
Survey-Report 5.19
Dominant TagManager TOTAL Typology %
Constellation Input ScoresManager Department Const. %
Name: Stephan Wilk Submitted: 11:53:57 27-01-2017
E-mail: field was not filled by user IP: 178.38.165.114
Ranking by calculation using your answers provided during survey
Rank Manager Influencer Department %
1 Manager 3 +Influencer Finance 15.99
2 Manager 5 +Influencer Sales 13.21
3 Manager 1 +Influencer Marketing 12.87
4 Manager 4 +Influencer Sales 12.07
5 Manager 2 +Influencer Sales 11.85
CEO
34%
Manager 3 Manager 5 Manager 1 Manager 4 Manager 2
Ranking by your assumption Finance Sales Marketing Sales Sales
Rank Manager 15.99% 13.21% 12.87% 12.07% 11.85%
1 Manager 1
2 Manager 2
3 Manager 4
Typology
Market Success Observartion Growth Technology Tech II Tech III Planning Structure Control
Manager 1 1 0 0 1 1 0 1 0 1 0 1.66 16.6
Manager 2 1 0 0 1 1 0 1 0 1 0 1.66 16.6
Manager 3 0 1 1 0 0 1 0 1 0 1 3.35 33.5
Manager 4 1 0 0 1 1 0 1 0 1 0 1.66 16.6
Manager 5 1 0 0 1 1 0 1 0 1 0 1.66 16.6
Constellation
Age Tenure (y) Education Age Tenure (y) Education TOTAL
Manager 1 51 7 Masters Marketing 4 2 3 9 22.5
Manager 2 59 8 Without Tertiary Sales 2 3 1 6 15
Manager 3 48 15 Masters Finance 2 4 3 9 22.5
Manager 4 57 30 Bachelor's Sales 3 1 2 6 15
Manager 5 50 18 Masters Sales 3 4 3 10 25
Characteristics
Manager Reliability Archetype CommunicationSocial competenceCompetence Network TOTAL Characteristics %
Manager 1 7 8 5 8 8 4 7 19.4
Manager 2 7 8 8 8 5 10 8 22.2
Manager 3 9 4 5 5 9 2 6 16.7
Manager 4 8 6 8 9 7 10 8 23.3
Manager 5 7 6 7 5 6 7 6 18.4
Survey-Report 5.20
Dominant TagManager TOTAL Typology %
Constellation Input ScoresManager Department Const. %

Name: user voted anonymously Submitted: 14:39:39 27-01-2017
E-mail: user voted anonymously IP: 84.226.43.223
Ranking by calculation using your answers provided during survey
Rank Manager Influencer Department %
1 CEO +Influencer Sales 16.02
2 CFO +Influencer Finance 13.36
3 CTO +Influencer Service 12.41
4 CTO - Logistics 12.33
5 HR +Influencer HR 11.87
CEO
34%
CEO CFO CTO CTO HR
Ranking by your assumption Sales Finance Service Logistics HR
Rank Manager 16.02% 13.36% 12.41% 12.33% 11.87%
1 CEO
2 CFO
3 CTO
Typology
Market Success Observartion Growth Technology Tech II Tech III Planning Structure Control
CEO 1 0 1 1 1 1 1 1 1 1 3.16 31.6
CTO 1 0 1 1 1 0 1 0 0 0 1.61 16.1
CTO 1 0 1 1 1 0 1 0 0 0 1.61 16.1
CFO 1 1 1 1 1 0 1 0 0 0 2 20
HR 1 0 1 1 1 0 1 0 0 0 1.61 16.1
Constellation
Age Tenure (y) Education Age Tenure (y) Education TOTAL
CEO 38 6 Masters Sales 3 3 3 9 22.5
CTO 45 10 Masters Service 3 2 3 8 20
CTO 49 8 Masters Logistics 1 4 3 8 20
CFO 42 5 Bachelor's Finance 4 2 2 8 20
HR 37 10 Masters HR 2 2 3 7 17.5
Characteristics
Manager Reliability Archetype CommunicationSocial competenceCompetence Network TOTAL Characteristics %
CEO 9 7 7 8 7 10 8 18.7
CTO 10 8 8 8 10 8 9 20.3
CTO 9 9 8 9 8 8 9 19.9
CFO 8 9 10 9 9 8 9 20.7
HR 9 8 9 9 9 8 9 20.4
Survey-Report 5.21
Dominant TagManager TOTAL Typology %
Constellation Input ScoresManager Department Const. %
Name: user voted anonymously Submitted: 11:52:02 28-01-2017
E-mail: user voted anonymously IP: 213.196.139.54
Ranking by calculation using your answers provided during survey
Rank Manager Influencer Department %
1 philipp - Finance 14.14
2 mario - Marketing 14.01
3 jürg +Influencer Production 13.84
4 corinna - R & D 13.73
5 Bruno - Sales 10.28
CEO
34%
philipp mario jürg corinna Bruno
Ranking by your assumption Finance Marketing Production R & D Sales
Rank Manager 14.14% 14.01% 13.84% 13.73% 10.28%
1 Bruno
2 mario
3 corinna
Typology
Market Success Observartion Growth Technology Tech II Tech III Planning Structure Control
Bruno 1 1 0 1 0 1 0 0 1 0 1.87 18.7
mario 1 1 0 1 0 1 0 0 1 0 1.87 18.7
philipp 0 0 1 0 1 0 1 1 0 1 2.2 22
jürg 0 0 1 0 1 0 0 1 0 1 2.11 21.1
corinna 1 1 0 1 0 1 1 0 1 0 1.96 19.6
Constellation
Age Tenure (y) Education Age Tenure (y) Education TOTAL
Bruno 55 15 Without Tertiary Sales 1 1 1 3 7.5
mario 51 6 Masters Marketing 3 3 3 9 22.5
philipp 43 6 Masters Finance 3 3 3 9 22.5
jürg 45 10 Without Tertiary Production 4 4 1 9 22.5
corinna 40 8 Doctoral R & D 2 4 4 10 25
Characteristics
Manager Reliability Archetype CommunicationSocial competenceCompetence Network TOTAL Characteristics %
Bruno 8 5 8 8 6 10 8 20.6
mario 9 5 9 9 9 8 8 22.5
philipp 9 5 6 9 9 5 7 19.8
jürg 9 5 6 8 9 5 7 19.3
corinna 8 5 5 7 9 5 7 17.8
Survey-Report 5.22
Dominant TagManager TOTAL Typology %
Constellation Input ScoresManager Department Const. %

Name: user voted anonymously Submitted: 02:40:35 17-01-2017
E-mail: user voted anonymously IP: 175.139.210.202
Ranking by calculation using your answers provided during survey
Rank Manager Influencer Department %
1 Manager 1 - Finance 12.49
2 Manager 5 - Marketing 11.62
3 Manager 3 - Sales 10.63
4 Manager 6 - R & D 10.51
5 Manager 2 - Sales 10.41
6 Manager 4 - HR 10.34
CEO
34%
Manager 1 Manager 5 Manager 3 Manager 6 Manager 2 Manager 4
Ranking by your assumption Finance Marketing Sales R & D Sales HR
Rank Manager 12.49% 11.62% 10.63% 10.51% 10.41% 10.34%
1 Manager 1
2 Manager 3
3 Manager 6
Typology
Market Success Observartion Growth Technology Tech II Tech III Planning Structure Control
Manager 1 0 0 1 0 1 0 1 1 1 1 2.64 26.4
Manager 2 1 1 0 1 0 1 1 0 0 0 1.48 14.8
Manager 3 1 1 0 1 0 1 1 0 0 0 1.48 14.8
Manager 4 0 0 0 0 1 0 1 1 0 0 1.4 14
Manager 5 1 1 0 1 0 1 1 0 0 0 1.48 14.8
Manager 6 1 1 0 1 1 1 1 1 0 0 1.52 15.2
Constellation
Age Tenure (y) Education Age Tenure (y) Education TOTAL
Manager 1 40 2 Bachelor's Finance 2 2 2 6 13.6
Manager 2 35 2 Bachelor's Sales 3 2 2 7 15.9
Manager 3 34 6 Bachelor's Sales 2 3 2 7 15.9
Manager 4 40 6 Masters HR 2 3 3 8 18.2
Manager 5 37 3 Bachelor's Marketing 4 3 2 9 20.5
Manager 6 34 6 Bachelor's R & D 2 3 2 7 15.9
Characteristics
Manager Reliability Archetype CommunicationSocial competenceCompetence Network TOTAL Characteristics %
Manager 1 9 6 6 6 9 7 7 16.8
Manager 2 7 7 9 8 6 5 7 16.6
Manager 3 9 9 8 5 9 5 8 17.6
Manager 4 5 4 7 8 5 9 6 14.8
Manager 5 8 7 8 6 9 7 7 17.5
Manager 6 9 6 5 6 9 8 7 16.7
Survey-Report 6.1
Dominant TagManager TOTAL Typology %
Developed by AvantLab, www.avantlab.com
Constellation Input ScoresManager Department Const. %

Name: user voted anonymously Submitted: 06:41:51 18-01-2017
E-mail: user voted anonymously IP: 76.126.227.60
Ranking by calculation using your answers provided during survey
Rank Manager Influencer Department %
1 Manager 1 - Finance 15.35
2 Manager 2 - Sales 11.89
3 Manager 4 - HR 11.45
4 Manager 5 +Influencer Logistics 9.66
5 Manager 3 - Infrastructure 9.17
6 Manager 6 - Service 8.48
CEO
34%
Manager 1 Manager 2 Manager 4 Manager 5 Manager 3 Manager 6
Ranking by your assumption Finance Sales HR Logistics Infrastructure Service
Rank Manager 15.35% 11.89% 11.45% 9.66% 9.17% 8.48%
1 Manager 2
2 Manager 1
3 Manager 3
Typology
Market Success Observartion Growth Technology Tech II Tech III Planning Structure Control
Manager 1 1 0 1 1 0 1 1 1 1 1 3.27 32.7
Manager 2 0 1 0 1 1 0 0 0 0 0 1.99 19.9
Manager 3 0 0 0 1 0 0 1 0 0 1 1.21 12.1
Manager 4 0 0 0 1 0 0 1 0 0 1 1.21 12.1
Manager 5 0 0 0 1 0 0 0 0 0 0 1.17 11.7
Manager 6 0 0 0 1 0 0 0 0 0 0 1.17 11.7
Constellation
Age Tenure (y) Education Age Tenure (y) Education TOTAL
Manager 1 43 7 Masters Finance 4 4 3 11 22.4
Manager 2 44 11 Bachelor's Sales 4 2 2 8 16.3
Manager 3 38 11 Masters Infrastructure 2 2 3 7 14.3
Manager 4 42 8 Doctoral HR 3 4 4 11 22.4
Manager 5 49 1 Bachelor's Logistics 3 2 2 7 14.3
Manager 6 57 2 Bachelor's Service 1 2 2 5 10.2
Characteristics
Manager Reliability Archetype CommunicationSocial competenceCompetence Network TOTAL Characteristics %
Manager 1 7 5 5 5 9 7 6 14.7
Manager 2 7 5 7 8 9 10 8 17.8
Manager 3 5 8 6 5 8 8 7 15.3
Manager 4 8 7 7 7 9 7 7 17.5
Manager 5 9 7 7 7 9 7 8 18
Manager 6 6 8 8 6 8 7 7 16.7
Survey-Report 6.2
Dominant TagManager TOTAL Typology %
Developed by AvantLab, www.avantlab.com
Constellation Input ScoresManager Department Const. %

Name: field was not filled by user Submitted: 10:10:41 27-01-2017
E-mail: field was not filled by user IP: 85.7.102.200
Ranking by calculation using your answers provided during survey
Rank Manager Influencer Department %
1 Manager 1 +Influencer Finance 13.47
2 Manager 3 +Influencer R & D 11.94
3 Manager 2 +Influencer Production 11.51
4 Manager 5 - Marketing 10.78
5 Manager 4 +Influencer Sales 9.94
6 Manager 6 +Influencer Sales 8.36
CEO
34%
Manager 1 Manager 3 Manager 2 Manager 5 Manager 4 Manager 6
Ranking by your assumption Finance R & D Production Marketing Sales Sales
Rank Manager 13.47% 11.94% 11.51% 10.78% 9.94% 8.36%
1 Manager 1
2 Manager 3
3 Manager 4
Typology
Market Success Observartion Growth Technology Tech II Tech III Planning Structure Control
Manager 1 1 1 1 1 1 0 1 1 1 1 2.44 24.4
Manager 2 1 0 1 1 1 0 1 1 1 0 2.18 21.8
Manager 3 0 1 0 0 0 1 0 0 0 1 1.54 15.4
Manager 4 0 0 0 0 0 1 0 0 0 0 1.28 12.8
Manager 5 0 0 0 0 0 1 0 0 0 0 1.28 12.8
Manager 6 0 0 0 0 0 1 0 0 0 0 1.28 12.8
Constellation
Age Tenure (y) Education Age Tenure (y) Education TOTAL
Manager 1 45 2 Masters Finance 3 3 3 9 18
Manager 2 55 2 Masters Production 2 3 3 8 16
Manager 3 54 15 Doctoral R & D 3 3 4 10 20
Manager 4 42 8 Masters Sales 2 4 3 9 18
Manager 5 43 6 Masters Marketing 2 4 3 9 18
Manager 6 55 26 Bachelor's Sales 2 1 2 5 10
Characteristics
Manager Reliability Archetype CommunicationSocial competenceCompetence Network TOTAL Characteristics %
Manager 1 10 10 10 10 10 10 10 18.8
Manager 2 8 8 5 8 8 10 8 14.6
Manager 3 10 10 10 10 10 10 10 18.8
Manager 4 7 5 7 10 7 10 8 14.4
Manager 5 10 8 10 10 10 10 10 18.2
Manager 6 7 6 6 10 10 10 8 15.2
Survey-Report 6.3
Dominant TagManager TOTAL Typology %
Developed by AvantLab, www.avantlab.com
Constellation Input ScoresManager Department Const. %

Name: Frank Wagner Submitted: 00:43:19 29-01-2017
E-mail: [email protected] IP: 49.48.146.150
Ranking by calculation using your answers provided during survey
Rank Manager Influencer Department %
1 R1 +Influencer R & D 13.38
2 H1 - HR 11.14
3 F1 +Influencer Finance 11.01
4 L1 +Influencer Logistics 10.8
5 S1 +Influencer Sales 10.75
6 P1 +Influencer Production 8.92
CEO
34%
R1 H1 F1 L1 S1 P1
Ranking by your assumption R & D HR Finance Logistics Sales Production
Rank Manager 13.38% 11.14% 11.01% 10.80% 10.75% 8.92%
1 L1
2 S1
3 F1
Typology
Market Success Observartion Growth Technology Tech II Tech III Planning Structure Control
F1 0 0 1 1 1 0 0 1 0 1 1.63 16.3
P1 0 0 1 1 1 0 0 0 0 1 1.61 16.1
L1 0 0 0 1 1 0 0 0 0 0 1.35 13.5
S1 1 1 0 1 1 1 1 0 1 0 2.01 20.1
R1 1 1 0 1 1 1 1 1 1 0 2.03 20.3
H1 0 0 0 1 1 0 0 1 0 0 1.37 13.7
Constellation
Age Tenure (y) Education Age Tenure (y) Education TOTAL
F1 48 10 Bachelor's Finance 2 4 2 8 16
P1 50 20 Bachelor's Production 3 1 2 6 12
L1 58 10 Masters Logistics 1 4 3 8 16
S1 56 5 Masters Sales 2 2 3 7 14
R1 48 11 Doctoral R & D 2 4 4 10 20
H1 52 12 Masters HR 4 4 3 11 22
Characteristics
Manager Reliability Archetype CommunicationSocial competenceCompetence Network TOTAL Characteristics %
F1 8 6 7 8 8 7 7 17.7
P1 5 5 5 5 7 4 5 12.4
L1 8 8 8 8 9 8 8 19.6
S1 6 7 5 6 8 5 6 14.8
R1 8 8 9 9 9 8 9 20.5
H1 6 5 8 6 7 5 6 15
Survey-Report 6.4
Dominant TagManager TOTAL Typology %
Developed by AvantLab, www.avantlab.com
Constellation Input ScoresManager Department Const. %

Name: user voted anonymously Submitted: 00:44:26 14-01-2017
E-mail: user voted anonymously IP: 50.29.200.50
Ranking by calculation using your answers provided during survey
Rank Manager Influencer Department %
1 Manager 1 +Influencer Finance 11.28
2 Manager 4 - Sales 10.23
3 Manager 5 - Service 9.39
4 Manager 7 +Influencer Logistics 9.38
5 Manager 3 +Influencer Sales 9.01
6 Manager 2 - Production 8.46
7 Manager 6 - Marketing 8.26 CEO
34%
Manager 1 Manager 4 Manager 5 Manager 7 Manager 3 Manager 2 Manager 6
Ranking by your assumption Finance Sales Service Logistics Sales Production Marketing
Rank Manager 11.28% 10.23% 9.39% 9.38% 9.01% 8.46% 8.26%
1 Manager 3
2 Manager 1
3 Manager 5
Typology
Market Success Observartion Growth Technology Tech II Tech III Planning Structure Control
Manager 1 1 0 1 1 1 1 1 1 1 1 2.73 27.3
Manager 2 1 0 1 0 1 1 1 0 0 1 1.45 14.5
Manager 3 1 1 0 0 1 1 1 0 0 0 1.18 11.8
Manager 4 1 1 0 0 1 1 1 0 0 0 1.18 11.8
Manager 5 1 0 0 0 1 1 1 0 0 0 1.13 11.3
Manager 6 1 1 0 0 1 1 1 0 0 0 1.18 11.8
Manager 7 1 0 0 0 1 1 1 0 0 0 1.13 11.3
Constellation
Age Tenure (y) Education Age Tenure (y) Education TOTAL
Manager 1 36 2 Masters Finance 1 1 3 5 9.4
Manager 2 59 40 Without Tertiary Production 3 2 1 6 11.3
Manager 3 61 12 Without Tertiary Sales 3 3 1 7 13.2
Manager 4 55 20 Bachelor's Sales 4 4 2 10 18.9
Manager 5 58 21 Without Tertiary Service 4 4 1 9 17
Manager 6 58 37 Without Tertiary Marketing 4 2 1 7 13.2
Manager 7 54 20 Without Tertiary Logistics 4 4 1 9 17
Characteristics
Manager Reliability Archetype CommunicationSocial competenceCompetence Network TOTAL Characteristics %
Manager 1 9 10 6 6 10 8 8 14.5
Manager 2 9 6 7 7 7 6 7 12.7
Manager 3 9 9 9 10 8 8 9 15.9
Manager 4 8 9 9 9 9 9 9 15.8
Manager 5 9 8 7 8 8 8 8 14.3
Manager 6 5 6 7 9 7 8 7 12.5
Manager 7 9 8 7 7 9 8 8 14.3
Survey-Report 7.1
Dominant TagManager TOTAL Typology %
Developed by AvantLab, www.avantlab.com
Constellation Input ScoresManager Department Const. %

Name: user voted anonymously Submitted: 02:13:29 17-01-2017
E-mail: user voted anonymously IP: 210.5.149.103
Ranking by calculation using your answers provided during survey
Rank Manager Influencer Department %
1 A - Sales 11.66
2 F - Logistics 10.82
3 E - Procurement 10.04
4 V - Production 9.76
5 J - HR 8.88
6 r - Marketing 8.5
7 C - Finance 6.35 CEO
34%
A F E V J r C
Ranking by your assumption Sales Logistics Procurement Production HR Marketing Finance
Rank Manager 11.66% 10.82% 10.04% 9.76% 8.88% 8.50% 6.35%
1 C
2 F
3 A
Typology
Market Success Observartion Growth Technology Tech II Tech III Planning Structure Control
C 1 1 1 1 1 1 1 1 1 1 1.65 16.5
J 0 1 0 0 1 1 1 0 0 0 1.36 13.6
E 1 1 1 1 1 1 1 1 1 1 1.65 16.5
A 0 0 0 0 1 1 0 0 0 0 1.27 12.7
F 0 0 0 0 1 1 0 0 0 0 1.27 12.7
V 1 0 1 1 1 1 0 1 1 1 1.55 15.5
r 0 0 0 0 1 1 0 0 0 0 1.27 12.7
Constellation
Age Tenure (y) Education Age Tenure (y) Education TOTAL
C 55 10 Bachelor's Finance 1 4 2 7 11.9
J 33 14 Without Tertiary HR 2 3 1 6 10.2
E 45 2 Doctoral Procurement 3 1 4 8 13.6
A 40 10 Masters Sales 4 4 3 11 18.6
F 38 9 Masters Logistics 4 4 3 11 18.6
V 42 15 Bachelor's Production 4 3 2 9 15.3
r 36 16 Bachelor's Marketing 3 2 2 7 11.9
Characteristics
Manager Reliability Archetype CommunicationSocial competenceCompetence Network TOTAL Characteristics %
C 0 0 0 0 0 1 0 0.5
J 6 5 2 7 6 2 5 16.6
E 3 7 5 2 5 5 4 15.6
A 7 7 5 5 8 5 6 21.7
F 6 5 4 7 6 2 5 17.9
V 4 4 3 5 4 3 4 13.6
r 2 6 4 6 3 3 4 14.1
Survey-Report 7.2
Dominant TagManager TOTAL Typology %
Developed by AvantLab, www.avantlab.com
Constellation Input ScoresManager Department Const. %

Name: user voted anonymously Submitted: 07:50:59 17-01-2017
E-mail: user voted anonymously IP: 175.145.134.124
Ranking by calculation using your answers provided during survey
Rank Manager Influencer Department %
1 KW - R & D 11.97
2 EL - Production 10.06
3 CD - Service 9.58
4 L - HR 9.28
5 AW - Finance 8.54
6 HC - Service 8.51
7 PW +Influencer Service 8.05 CEO
34%
KW EL CD L AW HC PW
Ranking by your assumption R & D Production Service HR Finance Service Service
Rank Manager 11.97% 10.06% 9.58% 9.28% 8.54% 8.51% 8.05%
1 PW
2 AW
3 EL
Typology
Market Success Observartion Growth Technology Tech II Tech III Planning Structure Control
PW 1 0 0 1 0 1 0 0 0 1 1.15 11.5
AW 1 1 1 1 1 1 0 0 1 1 1.67 16.7
KW 1 1 0 1 0 1 1 1 0 1 2.06 20.6
EL 1 0 1 1 1 1 0 0 1 1 1.62 16.2
CD 1 0 0 1 0 1 0 0 0 1 1.15 11.5
HC 1 0 0 1 0 1 0 0 0 1 1.15 11.5
L 1 1 0 1 0 1 0 0 0 1 1.2 12
Constellation
Age Tenure (y) Education Age Tenure (y) Education TOTAL
PW 51 20 Bachelor's Service 2 1 2 5 9.4
AW 50 10 Without Tertiary Finance 3 1 1 5 9.4
KW 48 15 Bachelor's R & D 4 4 2 10 18.9
EL 40 15 Masters Production 1 4 3 8 15.1
CD 45 15 Bachelor's Service 4 4 2 10 18.9
HC 42 15 Without Tertiary Service 2 4 1 7 13.2
L 50 12 Bachelor's HR 3 3 2 8 15.1
Characteristics
Manager Reliability Archetype CommunicationSocial competenceCompetence Network TOTAL Characteristics %
PW 7 4 6 7 9 9 7 15.6
AW 6 5 5 5 6 7 6 12.7
KW 6 6 7 7 7 7 7 15
EL 7 6 7 7 6 5 6 14.4
CD 6 5 6 6 6 6 6 13.2
HC 6 5 8 6 5 7 6 14
L 7 7 7 7 7 5 7 15.1
Survey-Report 7.3
Dominant TagManager TOTAL Typology %
Developed by AvantLab, www.avantlab.com
Constellation Input ScoresManager Department Const. %

Name: Andi Lapon Submitted: 09:43:12 18-01-2017
E-mail: [email protected] IP: 192.228.131.199
Ranking by calculation using your answers provided during survey
Rank Manager Influencer Department %
1 RVH - Finance 10.58
2 GC - R & D 10.21
3 PN - Sales 9.69
4 SKM +Influencer Production 9.66
5 ALH - Procurement 9.25
6 JKD - HR 8.5
7 JNG - Sales 8.09 CEO
34%
RVH GC PN SKM ALH JKD JNG
Ranking by your assumption Finance R & D Sales Production Procurement HR Sales
Rank Manager 10.58% 10.21% 9.69% 9.66% 9.25% 8.50% 8.09%
1 RVH
2 GC
3 PN
Typology
Market Success Observartion Growth Technology Tech II Tech III Planning Structure Control
RVH 0 0 1 1 1 1 1 1 1 1 1.54 15.4
GC 1 1 0 1 1 1 0 1 0 0 1.44 14.4
JKD 0 0 0 1 1 1 0 1 0 0 1.35 13.5
SKM 0 0 1 0 0 0 1 0 1 1 1.44 14.4
ALH 0 0 1 1 1 1 1 1 1 1 1.54 15.4
PN 1 1 0 0 0 0 0 0 0 0 1.35 13.5
JNG 1 1 0 0 0 0 0 0 0 0 1.35 13.5
Constellation
Age Tenure (y) Education Age Tenure (y) Education TOTAL
RVH 41 5 Masters Finance 4 4 3 11 18.3
GC 45 2 Masters R & D 4 3 3 10 16.7
JKD 56 4 Bachelor's HR 1 4 2 7 11.7
SKM 39 4 Bachelor's Production 4 4 2 10 16.7
ALH 36 2 Bachelor's Procurement 3 3 2 8 13.3
PN 43 5 Without Tertiary Sales 4 4 1 9 15
JNG 35 12 Bachelor's Sales 2 1 2 5 8.3
Characteristics
Manager Reliability Archetype CommunicationSocial competenceCompetence Network TOTAL Characteristics %
RVH 8 5 8 8 8 8 8 14.4
GC 8 6 8 9 8 9 8 15.3
JKD 8 7 7 8 7 5 7 13.5
SKM 9 8 6 5 7 5 7 12.8
ALH 8 7 6 6 9 6 7 13.4
PN 7 8 8 9 8 9 8 15.6
JNG 8 8 7 8 8 8 8 15
Survey-Report 7.4
Dominant TagManager TOTAL Typology %
Developed by AvantLab, www.avantlab.com
Constellation Input ScoresManager Department Const. %

Name: Andreas Volkart Submitted: 17:12:21 26-01-2017
E-mail: field was not filled by user IP: 178.197.226.141
Ranking by calculation using your answers provided during survey
Rank Manager Influencer Department %
1 Philip - Finance 12.28
2 Fabienne +Influencer Sales 9.97
3 Beat - HR 9.22
4 Lukas - Infrastructure 8.96
5 Stefan - Marketing 8.56
6 Thomas +Influencer R & D 8.52
7 Andreas - Service 8.49 CEO
34%
Philip Fabienne Beat Lukas Stefan Thomas Andreas
Ranking by your assumption Finance Sales HR Infrastructure Marketing R & D Service
Rank Manager 12.28% 9.97% 9.22% 8.96% 8.56% 8.52% 8.49%
1 Fabienne
2 Philip
3 Stefan
Typology
Market Success Observartion Growth Technology Tech II Tech III Planning Structure Control
Philip 0 1 1 1 1 0 1 1 1 1 2.86 28.6
Stefan 1 1 0 1 1 1 1 0 0 0 1.24 12.4
Fabienne 1 1 0 1 1 1 1 0 0 0 1.24 12.4
Andreas 0 1 0 1 1 0 1 0 0 0 1.14 11.4
Lukas 0 1 0 1 1 0 1 0 0 0 1.14 11.4
Beat 0 1 0 1 1 0 1 0 0 0 1.14 11.4
Thomas 1 1 0 1 1 1 1 0 0 0 1.24 12.4
Constellation
Age Tenure (y) Education Age Tenure (y) Education TOTAL
Philip 40 2 Masters Finance 4 2 3 9 15.8
Stefan 35 3 Bachelor's Marketing 1 4 2 7 12.3
Fabienne 48 3 Masters Sales 1 4 3 8 14
Andreas 39 2 Bachelor's Service 3 2 2 7 12.3
Lukas 41 4 Masters Infrastructure 4 2 3 9 15.8
Beat 44 3 Bachelor's HR 3 4 2 9 15.8
Thomas 45 4 Masters R & D 3 2 3 8 14
Characteristics
Manager Reliability Archetype CommunicationSocial competenceCompetence Network TOTAL Characteristics %
Philip 7 2 1 5 2 6 4 11.5
Stefan 2 5 6 6 4 6 5 14.3
Fabienne 6 2 8 7 6 9 6 18.9
Andreas 6 5 3 6 7 3 5 14.9
Lukas 5 4 2 3 7 7 5 13.5
Beat 2 5 6 6 3 8 5 14.7
Thomas 5 4 3 3 8 2 4 12.3
Survey-Report 7.5
Dominant TagManager TOTAL Typology %
Developed by AvantLab, www.avantlab.com
Constellation Input ScoresManager Department Const. %

Name: field was not filled by user Submitted: 10:59:21 13-01-2017
E-mail: field was not filled by user IP: 210.195.43.42
Ranking by calculation using your answers provided during survey
Rank Manager Influencer Department %
1 Mimi - HR 9.14
2 Li Lin +Influencer Service 7.43
3 Aizura +Influencer Service 7.43
4 Chan +Influencer Service 7.37
5 Craig +Influencer Service 7.22
6 Nazli +Influencer Service 7.16
7 Quek +Influencer Service 7.11 CEO
8 Murali +Influencer Service 6.79
9 Mark +Influencer Service 6.37 34%
Mimi Li Lin Aizura Chan Craig Nazli Quek Murali Mark
Ranking by your assumption HR Service Service Service Service Service Service Service Service
Rank Manager 9.14% 7.43% 7.43% 7.37% 7.22% 7.16% 7.11% 6.79% 6.37%
1 Craig
2 Li Lin
3 Murali
Typology
Market Success Observartion Growth Technology Tech II Tech III Planning Structure Control
Craig 1 0 0 0 1 1 0 0 0 0 1.01 10.1
Li Lin 1 0 0 0 1 1 0 0 0 0 1.01 10.1
Mimi 1 1 0 1 1 1 0 0 0 0 1.91 19.1
Mark 1 0 0 0 1 1 0 0 0 0 1.01 10.1
Nazli 1 0 0 0 1 1 0 0 0 0 1.01 10.1
Quek 1 0 0 0 1 1 0 0 0 0 1.01 10.1
Aizura 1 0 0 0 1 1 0 0 0 0 1.01 10.1
Murali 1 0 0 0 1 1 0 0 0 0 1.01 10.1
Chan 1 0 0 0 1 1 0 0 0 0 1.01 10.1
Constellation
Age Tenure (y) Education Age Tenure (y) Education TOTAL
Craig 50 2 Masters Service 3 2 3 8 9.6
Li Lin 44 20 Masters Service 3 4 3 10 12
Mimi 45 5 Masters HR 4 2 3 9 10.8
Mark 57 2 Masters Service 1 2 3 6 7.2
Nazli 44 25 Masters Service 3 3 3 9 10.8
Quek 45 25 Masters Service 4 3 3 10 12
Aizura 45 25 Masters Service 4 3 3 10 12
Murali 46 25 Masters Service 4 3 3 10 12
Chan 45 14 Masters Service 4 4 3 11 13.3
Characteristics
Manager Reliability Archetype Comm. Social Comp. Competence Network TOTAL Characteristics %
Craig 9 9 9 9 9 9 9 13
Li Lin 8 8 8 8 8 8 8 11.6
Mimi 8 8 8 8 8 8 8 11.6
Mark 8 8 8 8 8 8 8 11.6
Nazli 8 8 8 8 8 8 8 11.6
Quek 7 7 7 7 7 7 7 10.1
Aizura 8 8 8 8 8 8 8 11.6
Murali 6 6 6 6 6 6 6 8.7
Chan 7 7 7 7 7 7 7 10.1
Survey-Report 9.1
Dominant TagManager TOTAL Typology %
Developed by AvantLab, www.avantlab.com
Constellation Input ScoresManager Department Const. %

Name: user voted anonymously Submitted: 17:08:36 13-01-2017
E-mail: user voted anonymously IP: 31.185.251.21
Ranking by calculation using your answers provided during survey
Rank Manager Influencer Department %
1 Down - Procurement 8
2 Sally - HR 7.92
3 Over - Finance 7.68
4 Dide - Production 7.42
5 Reich - Marketing 7.35
6 Mass - Sales 7.21
7 McCaverty - Infrastructure 6.95 CEO
8 Thomas - Service 6.8
9 Dover - Sales 6.67 34%
Down Sally Over Dide Reich Mass McCaverty Thomas Dover
Ranking by your assumption Procurement HR Finance Production Marketing Sales Infrastructure Service Sales
Rank Manager 8.00% 7.92% 7.68% 7.42% 7.35% 7.21% 6.95% 6.80% 6.67%
1 Dover
2 Dide
3 Over
Typology
Market Success Observartion Growth Technology Tech II Tech III Planning Structure Control
Down 1 0 1 1 0 1 1 1 1 1 1.29 12.9
Dover 0 1 0 1 1 0 0 0 0 0 1.09 10.9
McCaverty 1 0 0 1 0 1 1 1 0 0 1.03 10.3
Over 1 0 1 1 0 1 1 1 1 1 1.29 12.9
Mass 0 1 0 1 1 0 0 0 0 0 1.09 10.9
Dide 0 0 1 1 0 0 0 0 1 1 1.18 11.8
Sally 1 0 0 1 0 1 1 1 0 0 1.03 10.3
Reich 0 1 0 1 1 0 0 0 0 0 1.09 10.9
Thomas 0 0 0 1 0 0 0 0 0 0 0.91 9.1
Constellation
Age Tenure (y) Education Age Tenure (y) Education TOTAL
Down 45 23 Bachelor's Procurement 3 3 2 8 13.1
Dover 58 10 w/o Tertiary Sales 1 3 1 5 8.2
McCaverty 55 21 w/o Tertiary Infrastructure 2 4 1 7 11.5
Over 38 16 Bachelor's Finance 1 4 2 7 11.5
Mass 51 35 w/o Tertiary Sales 4 1 1 6 9.8
Dide 43 6 w/o Tertiary Production 3 2 1 6 9.8
Sally 50 15 w/o Tertiary HR 4 4 1 9 14.8
Reich 48 7 w/o Tertiary Marketing 4 2 1 7 11.5
Thomas 45 28 w/o Tertiary Service 3 2 1 6 9.8
Characteristics
Manager Reliability Archetype Comm. Social Comp. Competence Network TOTAL Characteristics %
Down 9 10 9 7 10 4 8 10.3
Dover 10 9 8 8 10 9 9 11.2
McCaverty 9 10 7 6 10 5 8 9.8
Over 10 10 7 8 10 5 8 10.5
Mass 10 10 9 9 10 10 10 12.1
Dide 10 10 10 9 10 9 10 12.1
Sally 10 10 9 9 10 4 9 11
Reich 9 9 9 8 10 8 9 11.1
Thomas 10 10 10 10 10 7 10 12
Survey-Report 9.2
Dominant TagManager TOTAL Typology %
Developed by AvantLab, www.avantlab.com
Constellation Input ScoresManager Department Const. %

7.2 Approval of the Business Human Research Ethics Committee

Copyright © 2022 FDOKUMEN