RESEARCH, DESIGN AND DEVELOPMENT OF A BANANA ...
93
RESEARCH, DESIGN AND DEVELOPMENT OF A BANANA DEHYDRATION PROCESS A Thesis submitted to the University of New South Wales as full requirement for the degree of Master of Engineering (Design) by A.A. ROBINSON School of Chemical Engineering November 1980
-
Upload
khangminh22 -
Category
Documents
-
view
0 -
download
0
Transcript of RESEARCH, DESIGN AND DEVELOPMENT OF A BANANA ...

RESEARCH, DESIGN AND DEVELOPMENTOF
A BANANA DEHYDRATION PROCESS
A Thesis submitted to the University of New South Wales as full requirement for the degree of Master of Engineering (Design)
by
A.A. ROBINSON
School of Chemical Engineering
November 1980

UNIVERSITY OF N.S.W.
71387 11 SEP. 81
LIBRARY

DECLARATION
The candidate hereby declares the work reported in this thesis has not been submitted for a degree or similar award to any other University or Institution.
A. A. RobinsonOctober 1980

ACKNOWLEDGEMENTS
I am extremely grateful and acknowledge the infinite help and encouragement continually offered by my father James Robinson and my immediate family. I would also like to acknowledge the stimulus and guidance provided by Professor Robins throughout the project.

S U M M A R Y
The operation of a banana plantation to produce dried bananas was investigated. Although an increase in operational costs was discovered an accompanied increase in productivity would more than offset this increase in cost. A small market survey revealed that dried bananas, as sold in health food shops in major cities, were in short supply and in fact were imported to a large degree from the Philippines and Thailand. The wholesale price of dried bananas rendered the dried banana market an economic alternative to producing bananas for the tranditional fresh banana market.
A design for a process to produce dried bananas was instigated. The process requirements were broken down to identifiable unit operations and mass and energy balances were performed around each unit. A fully integrated, solid state, electronic control system was utilised to continually monitor and control the external process variables as well as maximise the use of solar energy to dehydrate the bananas. A degree of flexibility was necessarily designed into the process control due to the paucity of published data on the dehydration of whole ripe bananas.
Commissioning of the process revealed few problems and investigations were carried out to determine optimum operating conditions. Further experiments were carried out to establish a banana drying curve and to elucidate the mechanisms that govern the dehydration process of whole bananas. It was clearly established that the dehydration of whole ripe bananas was governed by initially the rate of heat transfer to the banana and finally by the mass transfer of moisture through the banana pulp. There also existed a transition period where the transfer rate interacted. Further studies are required to mathematically investigate these rates, however the rates were maximised to maximise production. The process is now operating full-time, seven days per week producing dried bananas.

RESEARCH, DESIGN AND DEVELOPMENT OF
A BANANA DEHYDRATION PROCESS
TABLE OF CONTENTS
Page
1.00 INTRODUCTION1.10 Product 11.20 Production Cost/Benefit Comparison 21.30 Profitability 101.40 Market 12
2.00 DESIGN2.10 Unit Operations 16
2.11 Ripening 172.12 Peeling 232.13 Dehydration 302.14 Packaging 41
2.20 Process Control2.21 Temperature 422.22 Air flow 442.23 Humidity 442.24 Instrumentation 45
3.00 EXPERIMENTATION3.10 Dehydration Experimentation 51
3.11 Air flow 523.12 Temperature 553.13 Humidity observation 583.14 Dehydration mechanism 603.15 Solar flat-plate collector 65
4.00 REFERENCES 68APPENDICES 72

LIST OF PHOTOGRAPHS
PagePhotograph 1 - Operation of loading rail, -1 19
2 - Operation loading rail, - 2 20
3 - Bunch 'staggering' 21
4 - Peeling operation 24
5 - Peeling machine -1 25
6 - Peeling machine -2 26
7 - Trays and trolleys 28
8 - Loading the chambers 29
9 - Dehydration chambers 38
10 - Solar collector 39
11 - View of factory 40

1
1.00 INTRODUCTION
Due to the recurring depressed nature of the market for fresh bananas and the dismal likelihood of market control in the future, an alternative banana product saleable to an independent market is desired.
There are several banana products presently trading internationally, these are; banana figs, flakes, powder, puree, jam, canned, quick frozen, flour, chips and distilled essences. (*) (2) of these theleast complex to process and the oldest trading of the banana products (known in the twelfth century in China (3)) is the banana fig. They are popular in France, Germany, Japan and the United Kingdom, with trade in excess of 2,500 tonnes per annum (4) (5) (6).
At present there is no significant commerical production of banana figs in Australia although several advantages over the fresh banana market production exists. This thesis then, is the result of investigations into the benefits of producing dried bananas instead of fresh bananas, and the subsequent design, construction and commissioning of such a banana dehydration plant for J & MJ ROBINSON'S BANANA PLANTATION COFF'S HARBOUR.
$
1.10 PRODUCT
Banana figs are the resultant product, when peeled, ripe bananas are dehydrated at elevated temperatures (7) (s) (9). The moisture contentof the banana is reduced from approximately 75% (lo) (li) to less than 20% (12) (1 3) (14) . This gives the product a shelf life of at least sixmonths (i^. The dehydration process is such that the vitamin content of the banana (1^ , is not depleted and is in fact raised with the subsequent reduction of moisture content.
The more stable product (17) (is) allows consistent supply with no product deterioration in transit to the market, in storage or on the shelf.

2
1.20 PRODUCTION COST/BENEFIT COMPARISON
Cost of operating a banana plantation for the fresh banana market or for the dehydration process would be identical, only the actual preparation and/or processing costs would differ.
The preparation for the fresh banana market can be qualitatively represented as:
BANANA
PLANTATION
10% WASTE RETURNS*(STALKS)
PACKAGING"DEHANDING"
Removing banana hand from stalk
HANDS OF FUNGICIDEPrevent
HANDS OF Separating hands to
BANANASr fungus growth in transit
BANANAS ^ singles and packing into bushels by Ward
FIGURE 1
Similarly processing for dehydration could be represented as;
35% WASTE RETURNS** (PEELS)
LOSS ON DRYING
10% WASTE RETURNS * (*** WET BASIS)
MOIST PEELED BANANA;
DRYPEELEDBANANASINGLE
BANANAS PACKAGING
BANANAPLANTATION
COOLING AND RIPENING
CHAMBERS FOR DEHYDRATION (Solar and Electrical)
PEELING ONTOCONVEYINGSYSTEM
FIGURE 2
Mass balance; 75% moisture content 15% moisture content.Trials show that peels make up approximately 32->-35% of ripened banana weight (APPENDIX 1)
Bunch stalks make up approximately 8 to 12% of total bunch weight (Estimate) . d*'

3
The processing costs for dried banana production and the related costs for fresh banana production can be divided into:
1.21) Utilities1.22) Transportation1.23) Packaging1.24) Labour1.25) Productivity Benefit1.26) Waste.
1.21 UTILITIES
Power requirement for the dehydration process is greater than that for the fresh banana market. From Figure 1 and 2 the basic power requirements are:
1) Refrigeration plant - less than 5 kW2) Peeling machinery - less than .5 kW3) Air circulation to dehydration chamber - less than 10 kW4) Heating elements - 300-400 kWh/wk
Refrigeration
Banana ripening in an exothermic process (19) and will be developed further in section 2, however for the purposes here a total power requirement of 5 kW will be assumed. Using agricultural tariffs for electricity at 4.25 cents/kWh and assuming 12 hrs/day operation, operating cost is $17.64/wk.
Peeling
Peeling machinery of . 5kW ( photograph 4 p24) operating at 4hours per day, operates at $00.59 per week.

4
Air circulation
Fan operation for 24 hrs.day/7 day/week at 10kW is $70.56 per
week.
Heating elements
Assuming half the energy required for dehydration is electrical
and assuming 40% efficiency (for rough calculation purposes only), then the required electrical energy input can be calculated based on average
production figures for J & MJ ROBINSON'S plantation Coffs Harbour.
Fresh peeled bananas
75% H.,0 - 75kg25% Soluble solids - 25kg
100kg
Dehydrated banana 15% H20 - 4.41kg85% S.S. - 25.00kg
29.41kg
i.e., for every 100 kilograms of green bananas, 70.59 kilograms of H.,0 have to be evaporated.
5 year production figures for J & MJ ROBINSON'S plantation predict an annual output of 3,500 cases of 20kg of green bananas.
i.e. 3,500 x 20kg x .65 45500kgs of peeled banana (35% peel)
i.e. 45500 875kgs/wk.
hence 875100 x 70.59kgs of H2O to evaporate/week.
617.66kgs of H?0/wk.
From Mayhew and Rogers, heat of evaporation is 2258 KJ/kg,
(neglecting sensible heat requirements)
i.e. 617.66 x 2258 = 1,394,681.9 KJ/wk.and since lkWh = 3600KJ
then 1,394,681KJ wk
lkWh 3600kJ
.0225 $ /kWh
$8.72/wk. *r A-~$ar8/W*

5
Total production cost Utilities
Refrigeration $17.64
Peeling $ .59
Air circulation $70.56
Dehydration energy $2/ .80
$1/0.53
This represents the approximate increase in running cost for
dehydrated banana production at 260kgs of dried product per week
(equivalent to 67 x 20kg cartons of green bananas per week).
1.22 TRANSPORTATION
A significant cost factor in the Fresh Banana Industry is
freighting costs to the large metropolitan markets. The banana
plant requires areas of high rainfall (approximately 1520mm per year)
but well drained soil, in Australia,suitable areas such as this do
not coincide with large metropolitan cities, hence the remoteness of
banana plantations and the inherent high freight costs.
At present (January 1980) freight costs are $1.75 per 20kg case
from Coffs Harbour to Melbourne, (present destination of fresh fruit
from J & MJ ROBINSON'S plantation).
Hence at 67 cases per week freight costs are $117.25/week for
green bananas.
Freight charges for a dried banana carton at lOkgs are $.88,
i.e. for equivalent production of 26 x lOkgs per week, freight costs
are $22.88. The cost reduction is of course directly proportional to
the weight reduction and hence dried banana freight costs eliminate
the freight charge for transporting the banana skin and the moisture
in the banana to the market.

6
1.23 PACKAGING
Due to the large bulk weight of bananas, packaging is also a significant cost. Present cost, (January 1979 Coffs Harbour) for a non returned, wooden case, capable of holding 20kg of green bananas,(used to freight +60% of green bananas to respective markets at present*) is $1.20. Hence weekly costs are $80.40 (67 case/week).
Packaging costs for dried bananas in cartons containing lOkgs of dried bananas is 24C/carton, hence @26 cartons/week (equivalent to 67 cases green bananas) is $6.24.
1.24 LABOUR COMPARISON
The labour requirements for each process can be broken down into:
Fresh Banana Dried BananaMarket Market
1. Delivering/loading the bunches into the packing station.
1. Delivering/loading thebunches into the cooling/ripeningrooms.
2. Dehanding into clusters. 2. Collecting single ripe bananas.
3. Fungicide treatment(spray or dipping clusters) in bath.
3. Peeling onto Conveying System- automated peeling- manual placement onto tray/trolleysystem to dehydrated chambers.
4. Break down of clustersto single bananas and packing into 20kg wooden
4. Removal from dehydration chambers and packing into 10kg cartons.
cases.
5. Freighting to market. 5. Freighting to market.
Figure from B.G.F. (Banana Growers Federation)

7
The labour costs involved are very similar, although the peeling process could involve up to an estimated 20% more labour.
1.25 PRODUCTIVITY BENEFIT
Productivity is markedly enhanced when operating a banana plantation supplying for the dehydration process. Firstly ripe bananas are the raw material for the dehydration process and hence all mixed ripe bananas previously too ripe for transport to the city markets and consequently discarded, are now processable for dehydration.
This loss due to "mixed ripe condition", varies considerably with season, plantation aspect, growing conditions and personal ability to judge the correct stage of maturity for the fresh market. Throughout a year's production it could easily vary between 10 to 25% of total production.
Secondly the ripe bananas for the dehydration process are peeled and hence blemished fruit previously discarded, also becomes processable. Blemished fruit usually results from various diseases such as "Red Spider" and "Corky Scale" or damaged and bruised fruit. The resultant increase in production again would vary significantly from plantation to plantation, but a percentage between 10 and 20 is a realistic estimate.
Finally banana productivity is significantly affected by wind, "blow over" and bunch "fall out". These losses occur when the fruit becomes very heavy in the latter part of its development and the supporting "banana stool1’ cannot carry the weight. Under these conditions either the "stool" falls over or the bunch breaks off at the neck and falls to the ground. In either case productivity is lost, except in the banana dehydration process where the fallen bunch can be ripened, peeled and processed as normal. Again this loss in productivity would vary significantly but a resultant increase in productivity for the banana dehydration process is estimated between 15-25%.

8
Total productivity losses
1. Mixed Ripe 10-25%2. Blemished Fruit 10-20%3. "Blow Over" and "Fall Out" 15-25%Total gain in productivity available to dehydration 35-70%
1.26 WASTE
No offensive pollution is produced by either the dehydration process or the preparation of bananas for the fresh fruit market.
The wastes broadly are:
1. Banana stalks or stems.
2. Bananas unsuitable for either processingor marketing.
3. Banana peels from the dehydration process.
4. Liquid wastes (mainly H20) from work areacleaning.
A large increase in wastes from the dehydration process comes from the peels of bananas. This is a significant amount as shown in table 3 and is of some nutritional value, particularly when related to the high costs of commercial fertilisers ($200/tonne).

9
TABLE 3
PRODUCTIVITY1489kgs of banana bunches per week.
Fresh Banana Production Waste1340kgs of fruit 149kgs
(Stems)
PACKAGING
i.e. 67 x20kg cases of green bananas per week.
149kgs
Dried Banana Production Waste1340kgs of fruit 149kgs
(Stems)871kgs of peeled fruit 46#kgs
(Peels)25lkgs of dried fruit 610kgs
(H20)i.e, approximately25 x 10kg cartons of driedbananas per week.
(Note waste H20 to atmosphere)______618kgs
The following table summarises the production cost/benefit comparisons,
TABLE 4
Item Fresh Banana Production Dried Banana ProductionProjected
Utilities Normal Increase cost approx. $97.51Transportation
Present average cost $117.25 Projected cost $22.88
Packaging Present averagecost $ 80.40 Projected cost $ 6.24
Labour Present average 2+3men
Projected no cost increase (expected tobe met by existing labour)
$197.65 $126.63

10
From the above a small savings in actual costs per week of $71 ($3,693/yr) can be realised although this figure is small compared with the increase in overall productivity gained in the dehydration process. Hence the major production benefit is the expected increase in fruit productivity of at least 35%.
1.30 PROFITABILITY
Returns for bananas can vary from $4.00 per 25kg case to $19 per 25kg case throughout the year. This fluctuation is a direct result of seasonal variation in the production of bananas. Average returns for fresh bananas were calculated for the last five years and are shown in graph 1* below.
This graph shows an expected average of $9.00/case in 1979 and also indicates qualitatively the degree of confidence in this figure.
Current wholesale prices of imported dried bananas ** vary from $4 to $5 per kilogram.
Figure gathered in market survey P7.Figures from J & M.J. ROBINSONS weekly returns for last 5 years (see appendix 3).

11
A graph of returns for green bananas versus returns for dehydrated bananas can be plotted if;
x = price of fresh bananas/20kg case, y = kgs of fruit to be sold.R = reduction ratio for the dehydration process. P = price of a carton of banana figs (10kg).
then y10R * P
i. e. x 2. P R or P = xR
2
From this equation graph 2 can be constructed.
P ri ce P$/10kg Carton
X $/20kg CaseGRAPH 2
This graph shows the equivalent returns of fresh bananas and dehydrated bananas for various reduction ratios. The reduction ratio is the weight of green bananas divided by its equivalent weight after dehydration and is approximately 5.1.
Hence for a given return of $3/kg for dehydrated bananas (less than imported products), fresh bananas would have to return $12/case to 'break even' with the return for dehydrated bananas.

12
Similarly this graph shows the sensitivity of the 'break even' price to variations of the reduction ratio. Simple mass balances indicate a reduction ratio of 4.96, this assumes a 35% peel loss and 75% -*■20% moisture loss, therefore R = 4.96,however with a 35% peel reduction and 75% ->15% moisture loss, R = 5.2.
Hence large variations in R do not greatly affect the 'break even" price.
From Graph 1 it is evident that the returns for fresh bananas will not approach the $ 12/case required to meet the expected returns from dehydrated bananas.
At this point it should be emphasised that only yearly figures are shown and although peak winter (low banana production period) prices can reach $20, low summer prices of $4 and less reduce the average price to that shown.
1.40 MARKET
To gain some estimate of the market size and depth, several Health Food stores in highly populated areas were approached.Questions relating to popularity, quantities, origin, wholesale price and selling rates were posed.
Fifteen Health Food stores in Sydney, four Health Food stores on the Gold Coast and six in Brisbane were approached. It was found that the market was grossly under supplied or in many stores not supplied at all. Usually a sporadic supply of imported product from the Philippines or Taiwan was all that was available. A limited amount of locally produced dried bananas were enthusiastically received and preferred to the imported product which were generally thinner and darker in colour.
The local product was produced by I. Harney, a banana grower in Coffs Harbour. He has developed a simple drying cabinet that dries approximately one tonne of fruit in 72 hours (7). He dries all the fruit from his banana plantation and agreed that the present market for dried bananas is under supplied.

- 13
Given an increasing trend in public awareness of natural, healthy life styles (as evident in the increasing number of health food stores) then the market for dried bananas appears both undersupplied and expanding.

14
2.00 DESIGN
It was proposed to design and construct a dehydration plant
sufficient in size to process all the banana harvest from J & M.J.
ROBINSON'S twelve acre Banana Plantation in Coffs Harbour.
The plant site selected was in the actual banana plantation to
minimise transporting of whole banana bunches for processing. However
due to the varying slope surrounding the site (a feature necessarily
common to all banana plantations) a direction of true north could not
be achieved for the maximum benefit of solar energy collection.
However a bearing of 350° was obtained.
The most significant design constraint imposed was the limited
financial backing available, (Bank loan plus small working capital
with overdrafts) overall cost was limited to less than $30,000. This
constraint controlled the general size of the plant and basic con
struction materials. It also emphasised the importance of the
optimisation of the use of solar energy for drying and the maximisation
of automation to minimise labour operating costs.
The lack of published data for the dehydration of bananas,
introduced a required degree of flexibility throughout the process
and particularly influenced the design of the control system for the
dehydration chambers.
Sizing of the plant was based on yearly production figures for
J & M.J. ROBINSON banana plantation and for the years 1970-1979 and a
projected yearly output of seventy tonnes was calculated as shown in
graph 3.
CASESOFBANANAS
4000
3000
2000
1000
1970 71
GRAPH 3

15
Unfortunately banana production is a highly seasonal industry and graph 4 (based on monthly production figure averaged from the last 5 years) shows that approximately 65% of banana production occurs in the November to April period.
GRAPH 4
In fact the highest monthly production in the last five years was 11.9 tonnes in November 1976. In addition to this an increase in banana production due to increased suitability of fruit for processing was also taken into account and an increase of 35% allowed for.Hence a plant capable of processing 16 tonnes/month of fresh fruit was designed.

FULLY MATURE B
UNCHES
16
2.10 UNIT OPERATIONS
The process was divided into four unit operations;1. Ripening, 2. Peeling, 3. Dehydration, 4. Packaging, as shown in figure 3.
i* a
COOLING STALKS(10%)
PEELS (35%)
RIPENING PEELING TRAYS/TROLLEY'i'
PRODUCT
SMALL
CONTROLLED AIR BLEED 70% Moisture
DEHYDRATIONCHAMBER
HEATEDAIR
SOLAR COLLECTOR
A JT A it JL
SOLAR ENERGY
FIGURE 3

17
2.11 RIPENING
To obtain the best quality ripe bananas with high sugar content, (thus minimising starch content, (20) ) the harvesting of the banana bunches is delayed until the ripening process has already commenced while the bunch is in the plantation. It is only the final ripening to reach maximum sugar content that is carried out in a temperature controlled environment maintained at 18-20°C, (21). This isbecause the ripening process is an exothermic process evolving up to 1800 kJ/tonne/hour at peak ripeness (1,700 Btu/tonne/hour) , (22) and also the banana becomes very soft and vulnerable to damage from rough handling if transported to the processing plant after this stage.
Apart from heat, bananas also evolve ethylene gas, carbon dioxide and water vapour during the ripening process, (23) . Ethylene is also a catalyst to ripening and hence good circulation in the ripening chamber is desired to achieve improved ripening rates of newly introduced bananas.
Optimum ripening conditions are maintained in the chamber by removing evolved heat and maintaining an even temperature of 20°C plus the circulation of evolved gases throughout the chamber.
To do this and to minimise the handling of bunches a rail system was constructed in the chamber as shown in figure 4 and illustration 1. This system facilitated the loading of the chamber with fresh bananas by hanging the bunches from pulleys and conveying the bunches along the required rails until the chamber is full.
In such a manner and by staggering the loading of the rails as shown in figure 4, ten bunches per three metres of rail can be accomodated. A chamber of six metres by six metres with ten rails as per figure 4 was constructed, this holds approximately
6M x 10 bunches x 10 rails = 200 bunches rail 3M
@ 20kgs per bunch (average size of bunch on J & M.J.ROBINSON'S plantation)= 4 tonnes
The ripening process varies from 3 to 6 days hence capacity of this operation is in excess of required 4 tonnes/week and allows for an even loading of the chambers and uniform ripening of the bunches.

18
ELEVATION SECTIONAL ELEVATION AA
PLAN
Loading Rail
FIGURE 4
Drawing of the cooling/ripening room in the factory, showing the network of rail in the plan view and method of bunch "staggering", in the sectional elevation AA.

19
PHOTOGRAPH 1
Mr J. Robinson using the loading rail before opening the
cooling/ripening room.

20
PHOTOGRAPH 2
Quick loading of the cooling/ripening room to minimise
ingress of warm air.

21
PHOTOGRAPH 3
Staggered loading of the support rails in the cooling/ripeningroom to maximise capacity.

22
Heat removal
Bananas produce up to 1800 kJ/tonne/hr (1,700 Btu/tonnes/hr)
when ripening, (12, *0 and inferior quality fruit will result if the
ripening temperature is not maintained betveen 18-20°C, (25).
It was proposed to purchase a packaced cooling plant to
remove this heat plus the heat leakage intc the ripening chamber
from the mid-day peak temperatures that occur in Coffs Harbour.
The construction materials were timber frarre, fibro clad with
exploded glass fibre insulation in the interstices.
Required heat removal from the chamber was calculated as:
(i) Heat from the ripening bananas was 3,600 kJ/hr, since
it was assumed that approximately half of the fruit in
the chamber was at peak ripening condition i.e. 2 tonnes.
(ii) Heat leakage into the chamber at mid-day temperatures at
Coffs Harbour was 3,277kJ/hr.
This was calculated from:
K A (T2 ~ Ti)
= A (T2 - Ti)
Axi + Ax2 + Ax 3Ki K2 K 3
(26)
Where:
q
A
T2
Ti
Ax i = Ax 3
Ax2
Ki = K3
k2
heat flow in kJ/hr
area available for heat flow (see fig. 4 for dimensions)
— 89.2m2
average maximum daily temp, summer (assumption)
o 0 n
required temp, in ripening chambers = o o o
thickness of fibro cladding (V') 6.35x10 3m
thickness of insulation (3") 7.62x10 2m
thermal conductivity for fibro, (27) = 7.44x10² Kw/m°C
thermal conductivity for insulation 7.91x10⁵ Kw/m°C
(ACI "Pink Batts" specification) .

23
Hence total heat removal was 6,877 kJ/hr. (6,518 Btu/hr)
at mid-day.
Normal engineering practice is to size a refrigeration plant
to run approximately 16 hrs/day or in the case of cyclic demands
66% of peak demand i.e. 4,586 kJ/hr. The nearest packaged unit to
this rating was a unit capable of removing 5,275 kJ/hr (5,000 Btu/hr)
which was purchased.
2.12 PEELING
To minimise operating labour costs a prototype banana
peeling machine was purchased from Mr L. Black of Ipswich Queensland<r t
(a retired engineer - turned inventor).
Photograph 4 shows Mr J. Robinson feeding a fresh ripe
banana into the prototype peeler. A chute under the machine directs
the peeled banana onto a tray (not shown in this photograph) where
they are arranged in closely packed rows while the peels are directed
to the rear of the machine and drop into a hopper. The trays are a
plastic close mesh, supported by 75mm square steel mesh.
The most economical approach for drying was adopted i.e.
arrangement of fruit on trays which are slid onto trolleys that can
be wheeled into the drying cabinets.
This allows quick efficient loading of the drying cabinets
without excessive ingress of cool air.
The size of the trays and trolleys was governed by the
maximum size convenient to handle - this was considered to be 1M by
hM for the trays and a maximum height of 1.7m (5ft 6") for the
trolleys. The spacing between the trays was largely governed by
convenience for loading but greatly affects the area available for
air flow above the bananas. A spacing of 75mm (3") was settled
on, - this results in 17 trays per trolley (see figure 5). Since
each tray holds approximately 8kgs of fruit a row of six trolleys
would contain 6 x 17 x 8 = 816 kgs of moist fruit.

24
PHOTOGRAPH 4
Feeding ripe bananas into the peeling machine. The chute directs the peeled banana to a tray located on the top of peel bin. The tray covers half the peel bin thus allowing the peels to fall into the bin.

25
PHOTOGRAPH 5
Peeling machine to be fitted with safety guard and motorisolating switch.

26
PHOTOGRAPH 6
Peeling machine showing brass "spiked" wheels that remove
the peel from the banana.

27
DRYING TROLLEY
NYLON MESH OVERLAY
/
,///// / / // , / X / / /w
STEEL MESH TRAY

28
PHOTOGRAPH 7
Trays conveniently slide onto trolleys.

29
PHOTOGRAPH 8
Loading a trolley into a dehydration chamber.

30
To process a total of at least 4 ton.nes of moist unpeeled fruit or 2.6 tonnes of peeled fruit a cycle time of:
24hrs x 7days x 816kgs x wk_____day wk cycle 2,600kg
= 52.7 hrs/cycle is required.
2.13 DEHYDRATION
Dehydrating bananas from approximately 75% moisture content to less than 23% moisture content renders the bananas stable to microbial spoilage, (28, 29). The dehydration in its simplest form, involves the elimination of water and volatile solvents at elevated temperatures. It is a function of the rate of mass transfer of these molecules through the banana substrate and the subsequent rate of evaporation at the surface of the banana into the overlaying air stream.
The mass transfer rate of the molecules is directly related to temperature of the substrate which is limited by the thermal breakdown of the polysaccharide, pectin, (30,31). Pectan at elevated temperatures forms pectinic acid and combines with starch and albumen which apart from having a disagreeable flavour acts as a barrier to mass transfer through the banana substrate. This temperatire limit is variously reported from 72°C~>-80oC , ( 3 2 , 3 3 , 34 ).
The evaporation rate from the banana surface into the air stream is a function of the temperature of tie system, the relative humidity of the incoming air stream and its velocity across the evaporating surface , ( 35 ,36 ) . The temperature of the system is limited by the thermal degradation limits of the banaia constituents, however the humidity of the incoming air stream and i'.s velocity can be manipulated.

31
Ve Locity
To minimise the thickness of the stagnant boundary Layer adjacent to the banana surface and hence maximise mass transfer across it, air stream velocities causing turbulent flow were employed. To ensure flow in the turbulent regime occured, Reynolds Number (Re) for the system was calculated for various flow capacities.
u
Where:d = hydraulic mean diameter P = density of air at 70°C (assume dry) v = velocityu = viscosity of air (assume dry)
Assuming the average thickness of a banana during the drying process is 25mm (1 inch) then the approximate space for the air stream is 50mm (2 inches) . Hence the hydraulic mean diameter ( 3 7) is :
4 x cross sectional area wetted perimeter
4 x 1M x .05M (.05x2) + 2xlM
= 9.52 x 10 2M (3.75 inches)
Where:
p = 1,009 kg/m3 ('9 3 50K), (33)u = 2.075 x 10 4 5 kg/ms (0 350K), (33)v _ volumetric throughput (Vol)_____________
cross sectional area available for flow
Cross Sectional area = 1M x .05M x 17
= .85M2

32
Re > 4,000 for turbulent flow in rough pipes, (39).
Therefore 4,000 - 9.52 x 10~2M x 1.009 ^ x x ^ 1(H
Therefore Volumetric capacity = . 734NT/S (1,554 CFMfn)
To allow for losses and flexibility a fan capable of circulating 1.4M3/Sec (3,000 CFM ) was selected. This will ensure turbulent regime flow characteristics for maximum heat transfer to the banana surface.
Humidity
Published data on drying time for bananas varies from 18-72 hrs,(49,41) hence flexibility of humidity control was a prime factor in humidity control design.
Initially it was proposed to operate at very low humidities (10% R.H.) to maximise evaporation rates. A mass balance was performed on the system to determine evaporation rates as a function of flow rate and the required bleed out of moist air.
The system can be considered as:
SOLAR COLLECTOR
DEHYDRATION CHAMBERS
Fe = EVAPORATION RATE
CIRCULATING FAN
FIGURE 6

33
Where:
Fj_ = dry air flow through solar collector etc. in kgs/min.
Xj_ = humidity of air entering chambers in kgs of J^O/kg dry air.
xQ = humidity of air leaving the chambers in kgs of B^O/kg of dry air.
FB = dry air flow in bleed off in kgs/min.
Fa = dry air flow into system in kgs/min.
xa = humidity of ambient air.
Fe = evaporation rate.
Unknowns = Fi, xa, xQ, FB, Fa, Fe
Knowns = xa = Relative humidity of ambient air.
Basis
Assume xi = 10% R.H. @ 70°C
= .027kgs H20/kg dry air (42)
xQ = 35% R.H. @ 53°C (assume adiabatic path)
= .035kgs H20/kg dry air for dehydration (43)
Known xa = 60% R.H. of ambient air @ 25°C
= .OlOkgs of H20/kg dry air.
H2O balance across chambers
Fi - xi + Fe = Fi xo
fe = Fi (x0 - xi)
= .008 Fi kgs/min.
Since 52.7 hrs/cycle is required to dehydrate 816kgs of moist
fruit i.e. 780kgs of moisture in 52.7 hrs or .247kg/mins of moisture.
Figure 7 was calculated assuming 10% R.H. air @ 70°C entering
the chambers and after following an adiabatic path leaves the chambers
at 35% R.H. @ 53°C since,Fe = .008 Fi
then it is obvious that the relative humidity assumption only
affects the slope of the line in figure 7 which can be compensated
by increasing the recirculated air flow rate to thus achieve any
desired theoretical evaporation rate.

34
>. INITIAL OPERATING POINT
>- TURBULENT FLOW
MINIMUM REQUIRED EVAPORATION PER CYCLE
120 140 160 180 200F± kg dry air/min ->
FIGURE 7
Required bleed off rate can now be determined for the required
evaporation rates by performing a total mass balance.
Total mass balance
Input + Reaction = Output + Accumulation
Fa + Fa xa + Fe = Fb + Fb xq + 0
Fe = Fb(1 + x0) - Fa(l + xa)
= 1.035 Fb - 1.010 Fa
Total air balance
Fg + 0 = Fa + 0
hence Fe = .025 Fg
= .008 Fi
hence FB = . 32 Fj_
i.e. FB is 32% of Fj_ flow to achieve the desired maximum
evaporation rate at the above relative humidity and adiabatic path.

35
Solar collector
Solar energy will be utilised in the dehydration of the bananas from 75% moisture content to 20% moisture content.
It was proposed to circulate air through the dehydration chambers, bleed out a fraction of the moist air and simultaneously bleed in a fraction of dry ambient air. The air will then be directed to the solar collector to be heated to set point and/or through the electrical heating elements if additional heat is required.
To prevent the ingress of cool ambient air into the system the solar collector is operated at a slight positive pressure hence the dehydration chambers will be slightly negative in pressure. A pressure drop of not greater than 50mm H2O (2" WG) across the chambers will be allowed since this will require 420N (94 lbSf) to open a chamber door.
The solar collector was incorporated into the structure of the roof. A flat-plate collector, consisted of the roof claddingpainted matt black as the absorptive surface. A 75mm gap betwen the roof cladding and the roof bearers was created by using oversized rafters. This space was isolated by heavy duty polypropylene lining cleated to the rafters and bearers. The air from the chambers is blown along this path and absorbs the heat from the roof cladding. Clear rigid sheet acrylic is fixed above the roof cladding and insulation below the air space as shown in Figure 8.
Average solar incidence as shown in graph 5 is
17.2 ± 4.6 MJ/M2/days.

MJ/M
^/DA
Y
36
1977
GRAPH 5 - SOLAR INCIDENCEYearly average = 17.2 ± 4.6 MJ/M2/DAYSummer average = 21.0 ± 2.6 MJ/M2/DAYWinter average = 13.4 ± 2.3 MJ/M2/DAY
Average Summer maximum temperature = 27°C Average Winter maximum temperature = 19°C
NOTE: All figures provided by the Department of Primary Industry,Lismore research centre, N.S.W.

37
/. . . • •
Sectional view showing fan and ducting arrangement
SOLAR ENERGYBlack heatabsorbingsurface
50mmRoof
I AIR \ FLOW75mm
INSULATION
Heavy dutyplastic seal
Roof bearers
Detail section of collector/roof construction.
FIGURE 8

38
PHOTOGRAPH 9
The dehydration chambers with the solar by-pass ductingdirectly above. To the right is the by-pass actuator.

39
PHOTOGRAPH 10
A view across the solar flat-plate collector showing theabsorptive black surface and the acrylic sheeting.

40
PHOTOGRAPH 11
South western view showing bleed in/out vents on external walland full view of solar collector.

41
Energy available from the solar collector assuming a 50% efficiency (35) for the summer season is 1000 MJ/day and 625 MJ/day in winter.
Energy required to dehydrate one batch or 1 tonne of (i.e.1 load of the dehydration chambers) moist peeled bananas from 75%
\moisture content to 20% moisture content, (i.e. 687kgs of moisture) is 1,700 MJ (36) .
To provide energy for winter processing and to allow 24 hr. operations, electrical heating elements were installed in the ducting to the dehydration chambers.
These elements were sized assuming a dehydration rate between 24 ->-60hrs hence at least 20 Kw are required.
2.14 PACKAGING
When the dehydration process is complete, experimental "feel" of the banana will be the initial guide for the appropriate dryness, the nylon shade mesh with the dried bananas will be removed from the trays, thus freeing the tray and trolley for further processing.
The dried bananas are then removed from the shade mesh and packed into cardboard cartons with plastic bag liner, sealed and placed in intermediate storage for freighting.
Initial packaging is 10kg bulk only and freighted to health food distributors in the major capital cities as required. As production and expertise in processing develops, then a smaller packaging operation will be set up to permit direct sales to retail outlets.

42
2.20 PROCESS CONTROL
To ensure a consistent high quality product and to maintain optimum productivity of the process, dehydrating conditions are accurately monitored and controlled.
The three external variables of temperature, humidity and air flow are the principle variables that can be used to control the dehydrating conditions for the product.
As depicted in figure 9 there are two heat energy sources - solar energy and electrical energy. The control system is designed to optimise the use of solar energy.
2.21 TEMPERATURE
Temperature probes T2 and Ti, as shown in figure 6, control the by-pass damper D. The signals from T2 and Ti are compared and if Ti is equal to or less than T2, then D is proportionally opened to by-pass air.
In this manner the solar collector is brought onto line whenever there is a net temperature increase across the collector, and is not directly controlled by set point adjustments to the temperature controlling system for the chambers. This system centres on a ductaveraging temperature probe, T3, which sends a signal to a two-term controller, that actuates electrical heating probes q through time, proportioning two stage relays.
If, due to cloudy or early morning/late evening conditions the set point is not reached, then q is energised until set point is reached. If at this set point energy is lost through the flat-plate collector the damper D progressively closes until the flow through the collector is such that a temperature increase is registered, or full by-pass is reached.
Similarly if the collector exceeds set point for the chambers, then a high temperature signal from, T3 through the temperature controller, progressively closes damper D until set point is reached.

43
SOLAR ENERGY
FLAT PLATE COLLECTOR
BY-PASS DUCTING
DEHYDRATING CHAMBERS
DAMPER
FIGURE 9
Ti - Output temperature sensor for the flat-plate collector.
T2 - Input temperature sensor for the flat-plate collector.
T3 - Duct averaging temperature probe.
Hi - Duct averaging humidity probe,
q - Electrical heating elements.
DAMPER A
DAMPER B
DAMPER C
DAMPER D
- bleed in control
- bleed out control
- velocity control
- solar by-pass control
- free swinging air flow direction damperDAMPER E

44
This temperature control system thus ensures the maximum use of the flat-plate collector and the heating probes are only used to make set point under adverse solar conditions.
Alternatively the two-stage relays can be manually operated and the flat-plate collector used exclusively as the heat source.
2.22 AIR FLOW
Air velocity through the dehydration chambers is controlled by damper C. It was proposed to initially control the chamber air velocity manually. Due to the independent control of air velocities in the solar system the automatic control of this parameter is not immediately warranted given the critical velocity for maximum mass and heat transfer in the chambers is exceeded.
2.23 HUMIDITY
Humidity is controlled by simultaneously bleeding in fresh air and expelling the hot moist air. The capacity of bleed system as shown in figure 9 is approximately 0-50% of the air flow and is actuated through dampers A and B.
Damper A allows air to bleed into the intake of the fan (slightly negative air pressure) and damper B diverts air to atmosphere. These dampers are controlled by a proportional humidity controller that receives a signal from Hi, a humidity duct averaging sensor. If the humidity exceeds set point then the controller simultaneously opens damper A and B causing a net reduction in humidity until set point is reached or until maximum bleed off is reached.

45
2.24 INSTRUMENTATION
Several firms dealing in control instrumentation were approached for quotes utilising both pneumatic and electronic systems. An electronic system from Barcol Pty. Ltd. Aust. using Barber Colman instruments was finally selected. Attributes of this system include price, the modular nature of the system, all solid/state components, simple replacement of electronic cards and due to the prototype nature of the control system, no charge for commissioning.
The requirements for process control were satisfied using three independent control loops. A temperature controlling loop, a humidity controlling loop and a loop controlling the amount of air directed into the flat-plate collector. Each loop, as shown in figure 10, is characterised by closed loop, negative feed back control system designed for simplicity and stability.
The wiring diagrams corresponding to the three control loops are shown in figures 11 and 12. The only additional requirement for the Barber Colman system was the provision of a 120V power source (American based system), driving the power unit ASR 301 which provides a 20 volt DC current and a 5 volt square wave AC, both requirements for the relative humidity sensor HSP 6181.
The control units were located in a control board as shown in figure 13 (each unit identified in figure 14), enabling centralised monitoring and control of all process variables.
Commissioning of the control system consisted basically of spanning the controllers to give mid point control for each variable against the position of each actuator. No problems eventuated in either wiring, commissioning or subsequent operation of the control system and hence proved to be a rather successful system with all units operating to specification.

46
CONTROL LOOPS
UNLOAD
TemperatureHeatingStaging2 Term
PROCESSController Relay
Elements
TemperatureProbe T
TEMPERATURE CONTROL LOOP
U 'j LOAD
Ref -ho- 2 Term-------- r*’ Controlle r
Actuator and Positioner for Dampers - A & B
0~Relative Humidity---------- j*
Relative Humidity Probe H \
HUMIDITY CONTROL LOOP
U/LOAD
PROCESS
Probe T,Temperati re
Amplifier
Probe TTemperatu
Actuator
tioner forand Posi-
Damper
AIR FLOW TO FLAT-PLATE COLLECTOR CONTROL LOOP
FIGURE 10

47
Kj ^ ^
«-n *3

*-
ft b
-
Q)CO■u•Htoo\InO-u*
1
V^/iK
y;>3
'g<
V.«
S
^ ^
>•H
<Q \6
»Q
O
'§ S 3
**
\->
>sCDO4JCl
tj
&■'M
/W'-
V|
V/
O5»
Si
•^i
a*S
soo
U
»o
0
<\|
V/1<
t^0
COSt
Uj
c
‘‘Vto<t
<T>=
0
to•uMSotM\OCNJ
'}!«*
^ vo QC cn t)
a+jv?
roo
&Dh
to
©O
cc:©
a.<3
3T vr\
vs 'sjs^>-v.
,\
CNrHsDUH(M
/ V

49
PHOTOGRAPH 12
Control Board
® a j

50
CONTROL BOARD IDENTIFICATION
1 - Temperature controller
2 - Temperature transmitter
3 - Humidity Controller
4 - Stagging relays
5 - Temperature set point
6 - Power supply
7 - Comparator/Amplifier
8 - Maximum humidity warning light
9 - Humidity indicator
10 - Temperature indicator
11 - Control board fuse
12 - Power to control boardwarning light
13 - Heating elements contactor
14 - Main switch heating elements
15 - Main fuses heating elemens
16 - Main switch - refrigerationunit, light, power & fan motor
17 - Main fuses - fan motor
18 - Power outlet fuse
19 - Main fuses - refrigerationunit and light.
FIGURE 14

51
3.00 EXPERIMENTATION
The experiments carried out pursued two separate but parallel courses. The initial experiments were designed to investigate and optimise the operating conditions for the process, while subsequent experiments were performed to investigate the nature of the dehydration mechanism of whole ripe bananas.
The experiments centred around the dehydration unit operation due to the basic trouble free operation, as specified, of the ripening, peeling, tray/trolley and packaging unit operations. The ripening operation required a steady loading of the ripening/cooling room to minimise peaks in the supply of ripe bananas. The ripe bananas produced were of a good uniform ripeness with little or no bruising, fully mature and pleasing taste, (suspected slightly higher sugar content then normally found in gas ripened bananas). No difficulty was encountered in the peeling operation or the transfer to the trays and trolleys.
3.10 DEHYDRATION EXPERIMENTS
It was proposed to manipulate the control variables; air flow, temperature and humidity to optimise process conditions and production. To optimise production, minimum drying times were sought, given that a acceptable quality could be maintained. Acceptable quality was defined as equal to or superior to currently available, retail product in the following qualitative terms;
a) degree of darkness or appearance of the dried banana,b) minimum stickiness,c) palatable - not too hard or too soft.d) no chemicals, preservatives, colouring or flavouring added.
Experiments were then carried out to determine the effect of each of the control variables on the above criteria of quality.

52
3.11 AIR FLOW
As previously discussed in the design section, it was proposed that turbulent air flow is required for maximum heat transfer to the banana and maximum mass transfer from the banana surface.
The controlling parameters for air flow in the dehydration chambers were the speed of the circulating fan and the available space above the bananas on each tray, free for air flow.
The spacing between each tray was set, as previously determined in the design section, at 75mm. The height of the layer of bananas on each tray varied from 30-45mm for fresh bananas and 10-20mm for dried bananas. It was calculated that the height of the passage available for free air flow varied from,
75 - = 37.5mm for fresh bananas,
to 75 - ^= 60mm when dried.
Hence the hydraulic mean diameter varied from;4 x cross sectional area wetted perimeter
_ 4 x 1M x .0375M________(.0375 x 2)M + (1 x 2) M
= 7.229 x 10²M (2.85 inches)
4 x 1M x .06M________(.06 x 2)M + (1 x 2)M
= 1.132 x 101 M (4.46 inches)
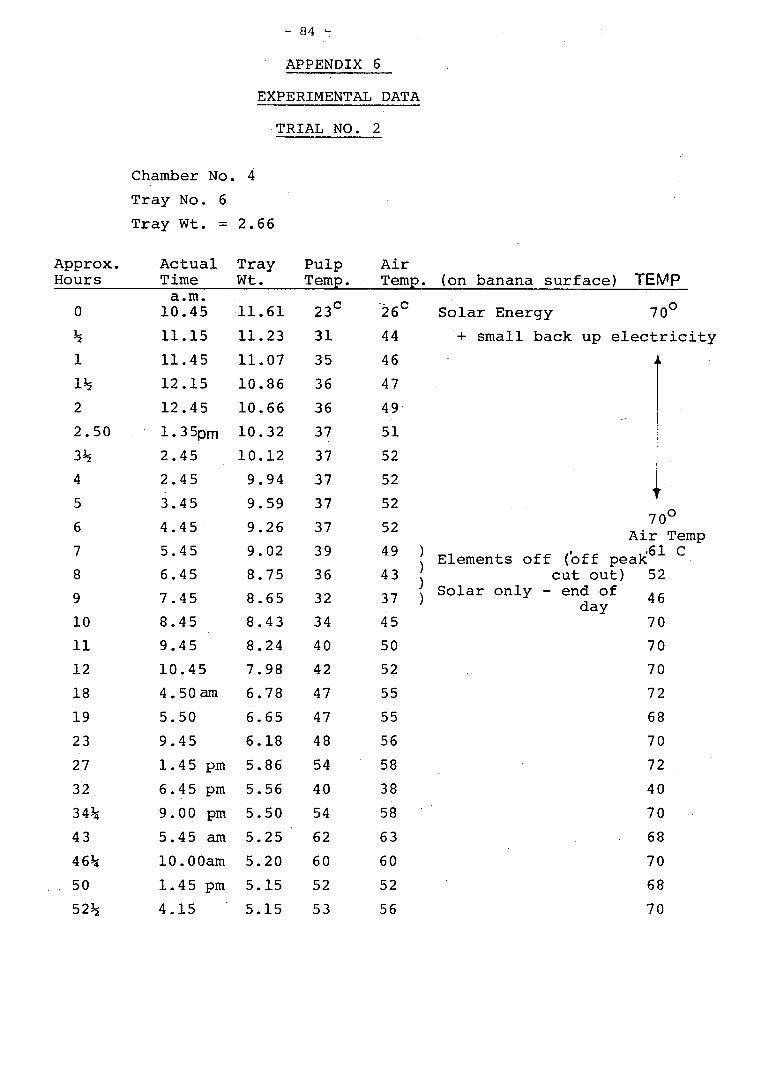
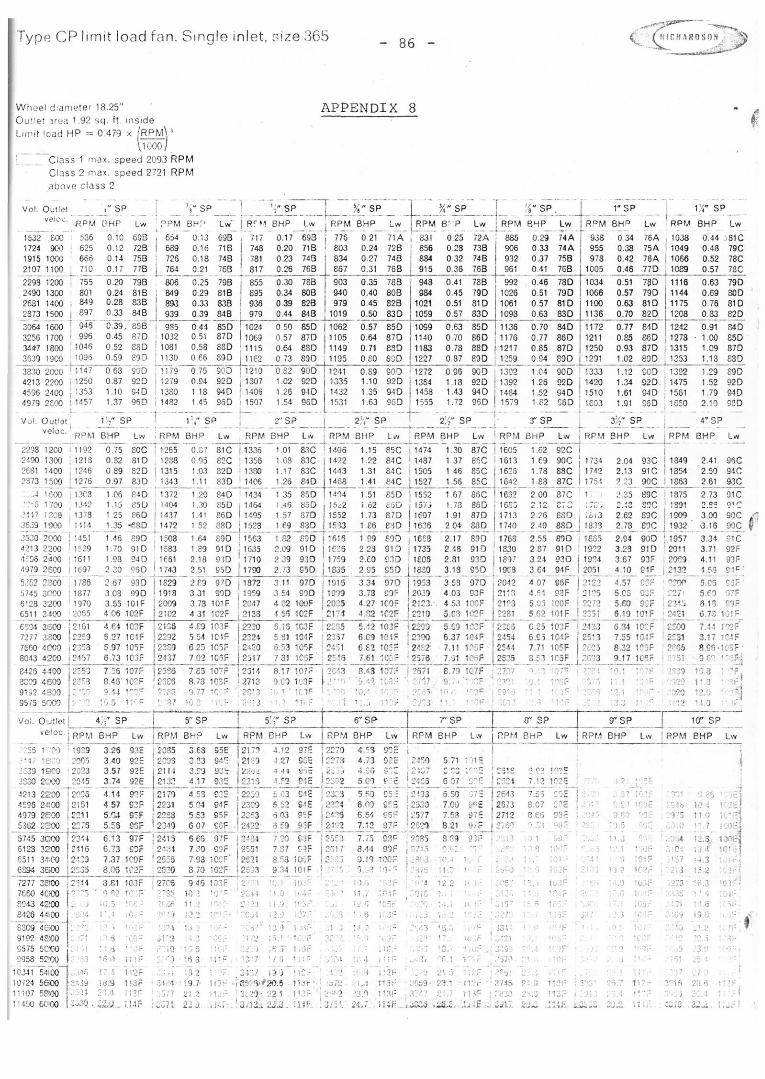
The speed of the circulating fan was set by selection of pulley sizes for the fan and its motor (rated at 1400 rpm) to rotate at 1800 revolutions per minute (rpm) and checked using a stroboscope to be approximately 1,795 rpm. Using the manufacturers specifications for fan performance (appendix 8 ) the volumetric capacity at 1800 rpm

53
varies from approximately 2.362M3 sec 1 (5,000 cfm) at 50mm of staticpressure, water gauge (W.G.) to less than 1.086M3 sec-1 (2,300 cfm) at 100mm of static pressure, W.G. (when full of fruit using a water manometer.) Subsequent measurements at the fan inlet, fan outlet and dehydration chamber inlet were:
Chamber inlet = -13mm, W.G. (-4" W.G.)Fan inlet = -38mm, W.G. (-14" W.G.)Fan outlet = +45mm, W.G. (+lV' W.G.)
Hence static pressure across the fan was 82mm W.G. (34" W.G.)3 “1and volumetric capacity of the fan was approximately 1.417M sec
(3,000 cfm).
The velocity of air flow across the chambers was then calculated using the volumetric capacity of the fan at the above operating pressures, and the initial and final size of the available space for air passage above the bananas;
i.e. available area = .0375M x 1M x 17 (Number of trays) .6375M2
(using initial size)
Therefore velocity 1.417M3 sec 1 .6375M2
= 2.22M sec"‘ (436.9 ft min-1 ) (using initial size)
available area .06M x 1M x 171.02M2
Therefore velocity 1.417M3 sec 11.02M2
= 1.389 (273.4 ft min *) (using final size)
These velocities have been calculated from data without consideration for air flow loss from the system in the discharge side of fan and ingresses into the system on the inlet to the fan. Air flow from the system on the discharge side of the fan would not greatly effect the velocity of air flow in the dehydration chamber.

54
However air flow leakage into the chambers due to the operating pressure drop across the chambers from minus 13mm W.G. to minus 38mm W.G. at the fan would have a significant affect on air velocity through the dehydration chambers.
Subsequent measurement of velocities in the chambers across the bananas was found to be between .9M sec (180 ft min ) and 1.5M sec (300 ft min 1 ) . This was a difficult variable to measure, it involved the use of an aerometer with its pitot tube placed in the air space above the bananas. The pitot tube was then connected to the meter, placed in the next chamber and readings taken, hence downstream effects would be considerable. However readings of the correct order were found and it was assumed that velocities of approximately 1.2M sec-1 ± .3M sec 1 (240 ft min 1 ± 60 ft min 1 ) would exist under operating conditions.
Using these values the Reynolds Number (Re) can be calculated for the air flow across the bananas
Re dpvu where P
vddu
— 31.009 kgM (from design section)1.2M sec 1 7.229 x 10~2M 1.132 x 10_1M2.075 x 10 5kg M_1 sec-1 (from design section)
Re i = 7.229 x 10 2M x 1.009 kgM 3x 1.2M sec 2.075 x 10”^ kgM-1 sec 1
= 4,218
Re 2 1.132 x 10 1M x 1.009 kgM 3 x 1.2M sec 2.075 x 10⁻⁵kgM-1 sec"1 ‘
= 6,605
i.e. Re2 > Rei > 4,000
Hence the air flow in the dehydration chambers is in the turbulent flow regime.
The doors to all chambers were adequately sealed using synthetic rubber on sealing surfaces. The pressure drop of approximately 25mm W.G. between the chambers and atmosphere pressure resulted in a force of

55
208N (56.8 lbf) required to open a chamber door during processing of fruit. This was not found to be restrictive in the operation of loading or unloading the chambers with fruit.
A second aspect of air flow in the dehydration chambers is its relative distribution across each tray, down each trolley and chamber to chamber. To determine the uniformity of the air distribution throughout the dehydration chambers a set of drying experiments were carried out.
These experiments involved measuring the percent moisture lost on drying on a wet basis, for each tray in each drying chamber. The spread of results, as shown in graphs 6-11, gives an indication of the uniformity of drying. However due to lack of facilities at Coffs Harbour, no quantitative determination of final moisture contents could be determined for each sample. Alternatively a sample of product was forwarded to CSIRO Ltd. (North Ryde Sydney) for moisture determination and results of between 13.8-15.2% moisture were reported. This variability in final moisture content resulted basically from the empirical nature of the method for determining when the bananas have been dried enough, i.e. degree of stickiness and the "feel" of the banana, (not too soft and not too hard).
3.12 TEMPERATURE
As previously discussed maximum thermal limit for the process is approximately 85°C, hence trials for drying were carried out at 60°C, 70°C and 80°C
Trials at 80°c showed definite signs of thermal degradation, darkening in appearance although drying times of less than 50 hours were found. This darkening in appearance rendered this level of temperature operation unsatisfactory on the grounds of unacceptable product quality.
Trials at 60°C were excessively long, 70-80 hours, to dry to an acceptable quality of stickiness, feel and appearance.
Trials at 70°C proved to be the most successful giving a dried banana of good appearance (see figure 15), feel and stickiness. All further trials and factory operation was at this temperature. Future development is required in this area to determine the exact operational limit, although it appears to be in excess of 75°C.

56
Percent Loss on Drying
(wet basis)
CHAMBER No. 1
Cycle time 55 hours
12 3 45 678 9 30 11
Percent Loss on Drying (wet basis)
CHAMBER No. 2
Cycle time 53 hours
1 234 56 78 9 10 11GRAPH 7
i
100n CHAMBER No. 3
90-
Percent Lossr, ■ 80'on Drying
(wet basis)70*
Cycle time 50 hours
60-
50 —*—♦—1—♦—*—• •—-—•—-*—* '1 2 3 4 5 6 7 8 9 10 11 13 15 17
GRAPH 8

57
Percent Loss on Drying (wet basis)
Percent Loss on Drying (wet basis)
Percent Loss on Drying (wet basis)
CHAMBER No. 4
Cycle time 63 hours
50 —■---- •—----- *—•—----- 1—'—1-1—1—1---- -- ---- ----- *—1—11 2 3 4 5 6 7 8 9 10 11 13 15 17GRAPH 10
CHAMBER No. 6
Cycle time 52 hours
GRAPH 11

58
3.13 humidity observations
Initial proposals were to operate from 10% relative humidity at 70°C, for the air flow at the inlet to the dehydration chambers, to a maximum of 35% relative humidity at 53°C, for the air flow at the outlet from the chambers, (assuming an adiabatic path is followed for the dehydration process). This would result in a bleed out ratio of up to 32%.
After commencement of a drying cycle it was noted that the relative humidity was initially 50%-60% and decreased steadily to less than 10% when set point temperature was reached. During this stage, with the humidity controller set point adjusted to 10% relative humidity, the bleed dampers progressively closed from fully open initially, to fully closed when the relative humidity reached 10% (as specified). The air flow from the dehydration chambers was measured at @ 61°C ±2°C and approximately 21% ±2% relative humidity.
This mode of operation has resulted from the low evaporation rate during the dehydration process and partly non adiabatic transfer of moisture to the air stream. The overall evaporation rate for the dehydration process can be calculated from the data found in trial 1 for the air flow and uniform drying experiments (appendix 7).
Drying times: 55 hrs, 53 hrs, 50 hrs, 63 hrs, 57 hrs, 52 hrs,Average drying time = 55 hrsInitial mass = 800 kgsAverage % loss on drying = 70.7%
Therefore H2O evaporated = 800 x .707= 565.6 kgs
i.e. 10.284 kgs/hr(.1714 kgs/min)
The non adiabatic aspect of the dehydration process accounts for the air stream from the dehydration chamber at approximately 21% relative humidity (measured using wet and dry bulb thermometers) and 61°C. A adiabatic path would have resulted in air at approximately 15% relative humidity and 65°C (using Pyschrometic charts in ref. 36).

59
The expected average percent bleed out can be calculated from the average evaporation rate, final humidities from the dehydration chambers and air flows found in section 3.11.
Air flow at fan = 1.417M3 sec 1 (section 3.11)= 85M3min-1
density at 61°C = 1.058 kg m-3 .............. 37Therefore mass flow = 89.9 kg min-1
Assume humidity into chamber = .027 kgs of H20/kg dry air (i.e. 10% relative humidity)
humidity increase by evaporation = .1714 kgs/min= .0019 kgs of H20/kg dry air
Therefore humidity out of the dehydration chambers= (.027 + .0019( kgs of H20/kg dry air = .0289 kgs of H20/kg dry air.
i.e. 15% relative humidity at 65°C
Since Fe = Fg (1 + xQ) - Fa (1 + xa) from section 2.13 P34and Fg = FaThen Fe = FB (x0 - xa)i.e. .1714 = Fb (.0289 - .010)Therefore FB = 9.085 kgs/minTherefore percent bleed out =
= 10%
This anomaly it is proposed arises from the inaccuracy of the measurement of the humidity of the air stream entering the chambers. Economically priced humidity measuring devices operating at 70°C and detecting less than 20% relative humidity are not commercially available. The humidity sensor used by Barcol Pty. Ltd was on trial, since it was not designed for this application and hence its output was subject to inaccuracies. After further trials to determine the variability of these inaccuracies it will be relocated in the downstream side of the dehydration chambers, where conditions are in the vicinity of 20%-30% relative humidity and 60°C. This will be a less stable

60
control system since relative humidity varies very significantly with temperature, which at this point is uncontrolled and is dependent on the loading in the dehydration chambers and the evaporation rate at that moment. However the expected bleed out/air flow ratio is of the order of 5%-10% since an error of 5% relative humidity of the air flow into the chambers results in a bleed out/air flow ratio of 6%.
3.14 DEHYDRATION MECHANISM
It was the object of this section to establish a drying curve for the dehydration of whole ripe bananas. From a study of this curveit will be possible to determine the applicability of the classical
\
mechanism of solids drying (*+5, *+6), to the dehydration of bananas.The clasical mechanism for solids drying is based on evaporating moisture from a saturated surface, (where the heat transfer from the air stream to the surface is limiting) progressing to evaporating moisture from a partially saturated surface,(where the mass transfer rate through the substrate is limiting.)
To collect the data required to construct a drying curve for whole ripe bananas, periodical weighing of a known initial weight of fresh bananas was carried out. This involved removing a tray of bananas from a particular chamber at the required intervals and weighing it, also a thermometer was placed on the tray and another inserted in the banana pulp, these were read at the same time. The change in temperature level of banana pulp will indicate if a constant evaporation rate, limited by heat transfer is occurring and when this rate ceases to be limited by the heat transfer rate.
Graph 12 was constructed from this data. From the pulp temperature profile a definite constant temperature period exists between points A and B.
This indicates a constant rate of evaporation since the surface temperature of the banana is also reasonably steady. At this stage the evaporation is from a saturated surface and the rate is limited by the heat transfer rate, hence the steady temperature profiles.

10 60°C surface temperature
61'OmLT)oLOroomin-cmoIT)
i—I
O i—I
WEIGHT (kgs)
TIME (hrs)

62
Point C highlights the disadvantage of "off peak" electricity supply. During this period (5.30pm to 8.30pm every evening) there is no electricity supply to the heating elements and hence temperature in the chambers falls until the electricity supply is restored. Evaporation still proceeds and draws the required energy from the heat in the pulp, hence pulp temperature falls.
Point D to point E shows a steady increase in pulp temperature, this indicates a departure from a saturated surface condition and an increasing dominance of the mass transfer rate through the banana pulp. As heat is progressively transfered through the pulp the temperature rises and surface looses saturation.
Point F again shows the effect of, "off peak" power supply.
Point G, the banana has now reached an acceptable level of dehydration.
The weight versus time curve does not clearly demonstrate these changes of evaporation rate and so a further graph was drawn from the percent moisture content versus time. Percent moisture was calculated by assuming 15% moisture when fully dried and back calculating on a dry basis, this results in graph 13.
Point B to C on this graph shows the constant evaporation rate (straight line) period.
Point C to D shows a tendency to curve away from the straight line and hence indicates the decreasing effect of the heat transfer rate and marks the start of the mass transfer limiting rate period.
Point D is the effect of "off peak" power supply, although evaporation still occurs during this stage.
Point D to point E is the fallfrvj rate period that is governed by the mass transfer of moisture through the pulp.

2 5 OH \ % MOISTURE v s TIME
63rouiLONrLD•“CO
ooCNoLDi-1
—r o
oi—i
oID
% MOISTURE CONTENTDRY BASIS
TIME (hrs)

RATE OF MOISTURE LOSS
64d(me)/dt
MOISTURE CONTENT

65
From this graph the actual rate of moisture lost (dmc) dt ' can be
calculated for each section of the graph, (similarly it can be calculated from the data points) as shown in graph 14.
In this graph the constant rate period (A-B), is evident and similarly the constant falling rate period (C-D), however the transition period (B-C) is not so amenable. Here the effects of, "off peak" supply tend to scatter the results by the transient effect on pulp temperature and surface evaporation rates. However the interdependencies of the mass transfer rate and the heat transfer rate, during this period would leak one to expect an increased "dropping off", of the rate of moisture lost from the bananas, until the mass transfer rate is the sole limiting rate for moisture loss. From this point the graph approaches a straight line, thus indicating a constant falling rate period.
3 *15 SOLAR FLAT-PLATE COLLECTOR
The control of the air flow to the solar collector operated very satisfactorily. Temperatures in excess of set point were readily obtained during the peak day time temperatures. Unfortunately due to the lack of facilities and detection equipment at Coffs Harbour to measure and record temperatures, flow rates and solar incident levels over long periods, reliable operational efficiencies could not be calculated. However observations of maximum temperatures and length of periods of operation under automatic control were made and an estimated level of energy contribution to system was calculated.
During peak daylight temperatures (January) dehydration chamber temperatures in excess of 85°C at maximum air flows were observed.Under these conditions the control was placed on manual to enable measurements to be taken.
Temperature into the collector 4= 55-60°CTemperature out of the collector = 85°C
Specific heat of airAir mass flow = 90 kg/min (section 3.14)
= 1.0 KJ kg-1K

66
Since Ah = mCpAT ....................... (4 2)
i.e. Ah = 90 kg x 10KJ x 25Kkg K
= 2250 KJ/min
To determine the approximate heat absorbed during a day, the
temperature of the air stream from the solar collector was observed
from when it initially opened, indicating a rise in temperature
across the collector. A linear increase was assumed until a plateau
is reached where a maximum (or near maximum) is maintained for a
period and then a linear decrease in temperature until the by-passes
closes, this is shown in Graph 15.
This is a simplified approach to act as a broad indication of
the energy contribution of the solar, flat-plate collector to the
energy requirements for the dehydration of whole ripe bananas.
800 900 1000 1100 1200'1300 1400 1500 1600 1700 1800
GRAPH 15
Since Ah = mCpAT
for period, "A" use average At=10K
Therefore Ah = 90 kg x 1KJ x 10k x 3hrs x 60 minmin kgK hr
164,000 KJ

67
for period B
Ah = 90 kg x 1KJ x 20K x 6h hrs x 60 min
For period C
Ah = 90 kg x 1KJ x 10K x 2 hrs x 60 min min kgK hr
= 108,000 KJ
Therefore Aht = 974 MJ
Since the summer average = 1700 MJ
The actual efficiency would be less than this since only the summer average solar incidence was available.
min kgK hr702,000 KJ
and indication of efficiency
= 57%
A quantitative study is required in this area to determine actual operational efficiencies and energy contribution levels.

68
4.00
1.
2.
3.
4 .
5.
6.
7.
8.
9.
10.
11.
REFERENCES
Kay D.E."The Processing of Banana Products", Tech. Inf. Paper No. 8
South Pacific Commission November 1967, p4
Robinson I. (M.H.R. for Cowper, N.S.W.)"Investigations of Banana By-Products", 1968 Parlimentary Mission Overseas. Published - "Coffs Harbour Advocate",
-, p4 25th September 1968
ibid, p2
ibid, 3 September 25th, 1968
Bolduan R.C.Regional Director - Dept, of Trade & Resources - Private
Communication 26th August 1980
Op. Cit. Kay D.E."The Processing of Banana Products", pi
ibid, p2
Op. Cit. I. Robinson, p3
McBean D. and Shipton J."Dehydration of Bananas", Research Report No. 21 Division ov Food Preservation & Transport, CSIRO
August 1950
Garcia R. , Menchu J.F. and Rolz C."Tropical Fruit Dry, a Comparative Study". Proc IV Int.
Congress Food Sci. and Technol. (1974) Vol 14, p37
Wei-Wen Mao"Banana Fruit Technology",
Ph.D. Thesis, Cornell University 1974, p4

69
12. Brekke J.E., Allen L."Dehydrated Bananas",
Food Technology (USA), Vol 21, No. 10, plOl
13. Op. Cit. D.E. Kay, p3
14. Bowery R.G., Buckle K.A., Harney I., Pavenayotin P."Use of Solar Energy for Banana Drying".
Food Technology in Australia, Vol 32(6) June 1980 P290
15. Op. Cit. J.E. Brekke and L. Allen, p4
16. Op. Cit. R. Garcic, J.F. Menchir and C. Roly, p35-38
17. ibid, p38
18. Op. Cit. J.E. Brekke and L. Allen p4
19. Division of Food Research, circular 8,CSIRO, Australian 1972, p4
20. Op. Cit. Wei-Wen Mao, p66
21. Op. Cit. Division of Food Research Circular 8, p3
22. ibid, p4
23. ibid, p6
24. ibid, p4
25. ibid, p2
26. Holman J.P."Heat Transfer", 3rd, McGraw-Hill Kogakusha Ltd.
Yokyo, 1972, p21
27. ibid, p431

70
28. Op. Cit. R.G. Bowrey et. al., p290
29. McBean D.CSIRO Food Research Laboratory - Private Communication
May 1980
30. Op. Cit. D.E. Kay, p3
31. Op. Cit. Wei-Wen Mao, p5-p7
32. ibid, p63
33. Op. Cit. D.E. Kay, p4
34. Op. Cit. J.E. Brekke and L. Allen, pi
35. Article - "Principles of Dehydration", Dept, of Primary Industry19 70
36. Op. Cit. D.E. Kay, p3
37. Coulson J.M. and Richardson J.F."Chemical Engineering, Volume One", 2nd Ed.,
Pergamor Press, London, p67
38. Mayhew Y.R. and Rogers G.F.C."Thermodynamic and Transport Properties of Fluids", 2nd Ed.
Oxford, Basil Blackwell 1972, pl6
39. ibid, pl6
40. Op. Cit. Coulson J.M. et. al., p46
41. Op. Cit. D.E. Kay, p3
42. Op. Cit. Bowery R.G. et. al., p290
43. Op. Cit. Coulson J.M. et. al., p398

71
44. ibid, p398
45. Op. Cit. Mayhew Y.R. et. al., p2
46. Coulson J.M. and Richardson J.F."Chemical Engineering, Volume 2", 2nd Ed.
Pergamon Press, London, P620-626
47. Penny J.H."Chemical Engineer's Handbook", 4th Ed.
Me Graw- Hill, New York, 1963 pl5-32-pl5-44

APPENDICES
Peels 32-35% of ripe banana weight
Average returns $/case green bananas
Production figures yeariy/monthly
Solar incidence
Drying figures for chambers 1-6
Drying figures and temperatures for rates
Calculated variables
Fan performance table

73
APPENDIX 1
Trial to determine the mass of the peel portion of a whole ripe banana. Thirty whole bananas in three lots of ten bananas were weighed on a kitchen scale, peeled and reweighed. The results appear below:
Weight whole Weight peeled % Lost on peeling
505.5 gms 342.7 32.2
546.1 gms 356.6 34.7
530.1 gms 349.7 24.0
average 33.6% ± 1.3%

74
APPENDIX 2
Average return for case:
1978 - $7.491977 - $8.771976 - $4.261975 - $6.111974 - $3.90
These figures were derived from the gross return from the market for each year divided by the total number of cases freighted to the market in that year for J. & M.J. ROBINSON.

75
APPENDIX 3
PRODUCTION FIGURES - 5 YEARS
1978 1977 1976 1975 1974 AverageJanuary 266 542 225 174 93 260February 355 501 392 373 432 410March 254 379 421 291 380 345April 345 270 331 231 490 333May 321 216 428 156 136 251June 205 198 349 245 178 235July 147 100 156 198 139 148August 158 114 360 104 159 179September 132 125 260 126 172 163October 207 318 223 169 148 213November 269 387 578 320 390 389December 252 281 511 370 290 340
Yearly production figures for 1970 - 2981 cases1971 - 3105 cases1972 - 2544 cases1973 - 2396 cases
Max capacity in Any 6 months = 41.5 tonnes.
Max capacity for any month = 578 cases i.e. 11.56 tonne = 2.89 tonne/week
allowing 50% improvement = 5.78 tonne/week

76
SOLAR
Units
APPENDIX 4
INCIDENCE - SHORT WAVE
- MJ M ZDay
1978January *21.2February *23.2March *16.4April 15.5May 11.7June 11.2July 12.3August 12.8September 17.1October *19.8November *23.2December *22.4
YEARLY AVERAGE 17.23 ±4.6
* SUMMER =21.0 ±2.6 (HIGH BANANA PRODUCTIVITY)
WINTER = 13.4 ±2.3
TEMPERATURESMaximum
Summer Winter 15 Year Average 27°C 19°C A. T.F.R.S.
Minimum 19°C 10°C
Data supplied by Department of Primary Industry - Lismore, N.S.W

77
APPENDIX 5
Chamber No. 1 Cycle Time: 55 hrs.
y No. Tray Wt. Empty
Tray Wt. Full
Wt. of Bananas
Dry Wt.~T rc\ u -»• Bahamas
% Loss on Drying (wet basis)
1 2.25 10.00 7.75 4.80 672 2.40 10.18 7.78 4.74 673 2.27 10.40 8.13 5.00 664 2.25 9.55 7.30 4.65 675 2.26 9.90 7.04 4.82 676 2.22 10.50 8.78 4.67 707 2.24 9.80 7.56 4.45 718 2.30 9.85 7.55 4.40 729 2.50 10.30 7.80 4.70 7210 2.85 10.50 7.65 5.02 7211 2.42 10.50 8.08 4.75 7112 2.80 10.70 7.90 5.10 7113 2.50 10.50 8.00 4.82 7114 2.50 10.12 7.60 4.75 7115 2.15 9.80 7.65 4.46 7016 2.55 10.20 7.65 4.72 7217 2.95 10.60 7.65 5.15 71
131.995 Ave 70

78
APPENDIX 5
Chamber No. 2 Cycle Time: 53 hrs.
y No. Tray Wt. Empty
Tray Wt. Full
Wt. of Bananas
Dry Wt.Tray -*•&onor\ as
% Loss on Drying (wet basis)
1 2.42 10.46 8.04 4.78 712 2.75 10.41 7.66 4.96 713 2.52 10.74 8.22 4.95 704 2.41 10.59 8.18 4.87 695 2.25 10.45 8.20 4.64 716 2.27 9.98 7.71 4.46 727 2.54 10.79 8.25 4.95 718 2.22 11.04 8.82 4.75 719 2.39 10.80 8.41 4.75 7210 2.52 10.92 8.40 4.83 7311 2.63 11.14 8.51 4.95 7312 2.64 11.30 8.66 5.02 7313 2.54 10.96 8.42 4.88 7214 2.54 10.84 8.30 4.80 7315 2.41 10.79 8.38 4.78 7216 2.52 10.39 7.87 4.75 7217 2.61 10.16 7.55 4.80 71
139.59 Ave = 72

12
34567891011121314
79
APPENDIX 5
Chamber No. 3
Cycle Time: 50 hrs.
Tray Wt. Empty
Tray Wt. Full
Wt. of Bananas
Dry Wt. % Loss on Drying (wet basis)
2.42 9.35 6.93 4.56 692.52 9.33 6.81 4.64 692.62 9.31 6.69 4.70 692.26 9.38 7.12 4.45 692.82 9.82 7.00 5.05 682.43 9.72 7.29 4.70 692.44 9.46 7.02 4.62 692.64 9.72 7.08 4.90 682.19 9.57 7.38 4.60 672.53 10.00 7.47 4.85 692.45 9.71 7.26 4.74 692.45 10.10 7.65 4.90 702.52 10.49 7.97 4.86 712.36 10.05 7.69 4.55 72
101.36 Ave = 69

80
APPENDIX 5
Chamber No. 4 Cycle Time: 63 hrs.
Tray No. Tray Wt. Empty
Tray 1 Full
1 2.40 10.692 2.42 10.863 2.82 10.644 2.40 10.845 2.39 11.106 2.25 10.747 2.41 10.718 2.26 10.749 2.24 10.4810 2.40 10.5411 2.52 10.6112 2.37 10.4713 2.74 11.5914 2.24 11.0015 2.50 11.2516 2.85 11.4217 2.50 11.45
Wt. of Bananas
Dry Wt.Trocj -+
Roncmas
% Loss on Drying (wet basis)
8.29 4.78 718.44 4.74 737.82 5.00 728.44 4.81 718.71 4.87 728.49 4.70 718.30 4.92 708.48 4.80 708.24 4.64 718.14 4.74 718.09 4.90 718.10 4.65 728.85 5.10 738.76 4.55 748.75 5.00 718.57 5.20 738.95 5.05 72
143.42 Ave = 72

81
APPENDIX 5
Chamber No. 5 Cycle Time : 57 hrs.
y No. Tray Wt. Empty
Tray Wt. Full
Wt. of Bananas
Dry Wt. % Loss on Drying (wet basis)
1 2.24 9.05 6.81 4.40 682 2.50 9.28 6.78 4.66 683 2.39 9. 80 7.41 4.62 704 2.25 10.20 7.95 4.62 705 2.45 10.40 7.95 4.60 736 2.72 10.25 7.53 4.87 727 2.42 10.00 7.58 4.68 708 2.25 11.50 9.25 5.15 699 2.80 11.25 8.45 5.30 7010 2.30 11.45 9.15 4.95 7111 2.60 11.05 8.45 4.94 7212 2.95 11.03 8.08 5.32 7113 2.55 11.15 8.60 5.00 7214 2.55 10.85 8.30 4.95 7115 2.90 10.50 7.60 4.80 7516 2.52 10.50 7.98 4.76 7217 2.27 10.80 8.53 4.75 71
136.4 Ave 71

82
APPENDIX 5
Chamber No. 6Cycle Time : 52 hrs
Tray No. Tray Wt. Empty
Tray 1 Full
1 2.85 11.612 2.40 10.863 2.25 10.504 2.25 10.555 2.41 10.306 2.52 11.107 2.42 11.428 2.40 11.759 2.77 11.6310 2.30 11.3611 2.60 11.8012 2.94 11.7513 2.50 11.3014 2.40 11.0215 2.42 10.8516 2.54 11.1517 2.28 10.83
Wt. of Bananas
Dry Wt.TrQtj6>ar>arvc»^
% Loss on Drying (wet basis)
8.76 5.45 708.46 4.89 718.25 4.56 728.30 4.73 707.89 4.85 708.58 4.96 729.00 5.25 699.35 5.16 718.86 5.61 689.06 4.97 719.20 5.41 708.81 5.49 718.80 5.10 718.62 4.89 718.45 5.03 708.61 5.24 698.55 4.76 71
147.55 Ave = 70

83
RESULTS TRIAL NO. 1
Wt. of Wet Fruit
Trays Average % Lost on Drying
Chamber No. 1 132.00 17 70
Chamber No. 2 139.59 17 72
Chamber No. 3 101.36 14 69
Chamber Mo. 4 143.42 17 72
Chamber No. 5 136.40 17 71
Chamber No. 6 147.55 17 70
800.32 99 70.7
84
APPENDIX 6 EXPERIMENTAL DATA TRIAL NO. 2
Chamber No. 4 Tray No. 6 Tray Wt. = 2.66
Approx. Actual Tray Pulp AirHours_____ Time____Wt.____Temp. Temp, (on banana surface) TEMP
a.m0 10.45 11.61 2 3 26% 11.15 11.23 31 44l 11.45 11.07 35 461% 12.15 10.86 36 472 12.45 10.66 36 492.50 1.3 5pm 10.32 37 513% 2.45 10.12 37 524 2.45 9.94 37 525 3.45 9.59 37 526 4.45 9.26 37 527 5.45 9.02 39 498 6.45 8.75 36 439 7.45 8.65 32 3710 8.45 8.43 34 4511 9.45 8.24 40 5012 10.45 7.98 42 5218 4.5 0 am 6.78 47 5519 5.50 6.65 47 5523 9.45 6.18 48 5627 1.45 pm 5.86 54 5832 6.45 pm 5.56 40 3834% 9.00 pm 5.50 54 5843 5.45 am 5.25 62 6346% 10.00am 5.20 60 6050 1.45 pm 5.15 52 5252% 4.15 5.15 53 56
Solar Energy 70°+ small back up electricity
II70°
Air Temp! Elements off (’off peak’^ C > cut out) 52v Solar only - end of ^
day70707072687072407068706870

85
APPENDIX 7
EXPERIMENTAL DATA
DRYING CHARACTERISTICS OF BANANAS
Based on the effects of external variables Temperature, Humidity, Velocity
WET BASIS DRY BASIS
lime (hr) Wt(kg) % M.C. dwdt
d (me) dt % M.C. d (me)
dt
0 8.95 77.7 0 3231 8.41 76.3 .54 1.40 297 26lh 8.20 75.7 .42 1.20 287 202 8.00 75.1 .40 1.2 278 18
2.85 7.66 74.0 .40 1.3 262 184 7.28 72.6 .33 1.2 24 4 185 6.93 71.3 .35 1.3 227 176 6.60 69.8 .33 1.5 212 157 6.36 68.7 . 24 1.1 200 128 6.09 67.3 .27 1.4 188 129 5.99 66.7 .10 .6 183 ^ jAssume10 5.77 65.5 .22 1.2 173 10 ) 9.2511 5.58 64.3 .19 1.2 164 at
10 hrs12 5.32 62.6 .26 1.7 151 13 )18 4.14 51.9 .20 1.8 96 919 3.99 50.1 .15 1.8 89 723 3.52 43.4 .12 1.7 66 7.727 3.20 37.8 .08 1.4 51 3.7532 2.90 31.3 .06 1.3 37 2.834^ 2.84 29.9 .02 .6 32 243 2.59 23.1 .03 .8 22 1.1846 2.54 21.6 .016 .5 20 .6750 2.49 20 .013 .4 18 .552*5 2.49 20 .000 0 18 0
Type CP limit load fan. Single inlet, size 365 _ 35 _ C (^haroso*
Wheel diameter 18.25" APPENDIX 8Outlet Area 1.92 sq. ft inside
Limit load HP = 0 479 X jRPMV
Class 1 max. speed 2093 RPM
Class 2 max. speed 2721 RPM
above class 2
"Vol. Outlet SP V SP1
r sp _ %" SF Z” SF[-; RPM
885
Vi" SP . r spi—
RPM
\/H SPveioc. -RPM RHP Lw ' PPM BHP Lw' j ROM BHP Lw - RPM BHP Lw RPM B' P Lw BHP Lw RPM BH0 Lw BHP Lw
1532 800 I 536 0.10 69B 654 0.13 69B 717 0.17 693 j 776 0 21 71A 831 0.25 72 A 0.29 74 A ^ 938 0 34 76A 1038 0.44 81C1724 900 * 625 0.12 72B I 689 0.16 71B 748 0.20 71B 1 803 0.24 72B 856 0.28 738 906 0 33 74 A 955 0.38 75 A 1049 0.48 79 C1915 1000 666 0.14 75B 726 0.18 74B 781 0 23 743 | 834 0.27 74 B 884 0.32 74 B 932 0.37 75B 978 0.42 76A 1066 0.52 78C2107 1100 i 710 0.17 77B j 764 0.21 76B 817 0.26 768 867 0.31 76 B 915 0 36 76B 961 0.41 76B 1005 0.46 77D 1089 0.57 78 C
2293 1200 | 755 0.20 79B 806 0.25 79B 855 0.30 78B 903 0.35 783 948 0.41 78B 992 0.46 78D 1034 0.51 780 1116 0.63 7902490 1300 801 0.24 81B 849 0.29 81B 895 0.34 80S 940 0.40 80 B 984 0.45 79 D 1026 0.51 79 D 1066 0.57 79D 1144 0.69 80D2631 1400 j 849 0.28 83B 893 0.33 83B I 936 039 82 B 979 0 45 82B 1021 0.51 81D 1061 0.57 81 D 1100 0.63 81D 1175 0.76 8102873 1500 J 897
0.33 84B 939 0.39 84B i 979 0 44 84B 1019 0.50 83 D 1059 0.57 83D 1093 0.63 83D 1136 0.70 82D 1208 0.33 82D
3064 1600 | 945 0.39 . 85B 985 0 44 85D j~1024 0 50 85D 1062 0.57 85D 1099 0.63 85D 1136 0.70 84D 1172 0.77 84 D 1242 0.91 8403256 1700 I 996 0.45 870 1032 0.51 870 I 1069 0 57 87D 1105
11490.64 87D 1140 0.70 86 D 1176 0.77 86 D 1211 0.85 86D 1273 ■ 1.00 85D
344-7 1 800 1046 0 52 88 D 1081 0.58 88D : 1115 0.64 88 D 0.71 88 D 1183 0.73 88D 1217 0.85 870 1250 0.93 870 1315 1.09 8703639 19C0 ! 1096 0.59 SOD 1130 0 66 89 D j 1162 0 73 SOD 1195 0.80 89D 1227 0.87 89 D 1259 0.94 89 D 1291 1.02 890 1253 1.13 S3D
3830 2000 !~1147 0.63 90 D 1179 0.75 900 1210 0.82 90D 1241 0.89 900 1272 0.96 900 1302 1.04 90D 1333 1.12 CCD 1392 1.29 8904213 2200 j 1250 0.87 92 D 1279 0.94 92 D 1307 1.02 92 D 1335 1.10 92D 1364 1.18 92 D 1392 1 26 92 D 1420 1.34 920 1475 1.52 9204596 2400 j 1353 1.10 94 D 1380 1 18 94D 1406 1.26 94 D 1432 1.35 94D 1458 1.43 94 D 1484 1.52 94 D 1510 1.61 940 1561 1.79 S4D49 79 2 600 i 1457 1.37 96 D 1482 1 45 96 D 1507 1.54 96 D 1531 1.63 96 D 1555 1.72 96D 1579 1.82 96 D 1603 1.91 96D 1650 2.10 SSD
Vol. Outlet \1V," SP 1\" SP | 2' SP 2.V SP 2/j" SP TSP ^ 3%" SP 4’ SP
veioc. RPM BHP Lw RPM BHP Lw RPM BHP Lw RPM BHP Lw RPM BHP Lw RPM BHP Lw RPM BHP Lw RPM BHP Lw
2298 1200 I 1192 0.75 80C 1265 0.87 81C 1336 1.01 83 C 1406 1.15 85C 1474 1.30 87C 1605 1.62 92C2490 1300 ; 1213 0 82 81 D 1288 0 95 82 C 1356 1 08 83C 1422 1.22 84 C 1487 1.37 86C 1613 1 69 90C 1734 2.04 93C 1849 2.41 96C2681 1400 j 1246 0.89 82 D 1315 1 03 82D 1380 1.17 R3C 1443 1.31 84C 1505 1 46 85C 1625 1.78 88C 1742 2.13 91C 1854 2.50 94C2373 1500 j 1276 0.97 83D 1343 1.11 83D 14C6 1.26 84 D 1468 1.41 84 C 1527 1.56 85C 1642 1.83 87C 1754 2.23 90C 1863 2 61 9-3C
.4 1600 j 1303 1.06 84D 1372 1.20 84D 1434 1.35 85D 1494 1.51 85D 1552 1.67 86C 1652 2.00 87C 1, ’ i 2 35 89 C 1875 2.73 91CI2S6 1 700 1342 1.15 85D 1404 1.30 85 D 1464 1 46 85D 15^2 1.62 660 1579 1.73 86 D 1685 2.12 C7C i7C* 2.42 SOC 1391 O oq 9’C
3147 1800 1378 125 86D 1437 1.41 86 D 1495 1.57 87 D 1552 1.73 87D 1607 1.91 87D 1713 2.26 880 i 613 2.62 S9C 1909 3 00 SOC3639 1*900 1414 1.35 -esD 1472 1.52 88D 1528 1.69 830 1533 1 86 83 D 1636 2 04 83D 1740 2.40 88D j 1833 2.78 83 C 1932 3.16 90C
3330 2*000 I 1451 1.46 89 D 1508 1.64 890 1563 1.82 890 I 1615 1 99 89D 1658 2.17 89D 1763 2.55 890 1865 2.94 900 1957 3.34 91C4213 2200 1529 1.70 91D 1583 1.89 91D 1635 2.09 91D 1636 2 23 910 1735 2 43 910 1830 2 87 91D 1922 3.23 91D 2011 3.71 92 F4r08 2400 1611 1.93 94 D 1661 2 18 93D 1710 2 39 930 1759 2.C0 930 1805 2 81 93 D 1897 3.24 930 1984 3.67 93? 2009 4.11 93 F4979 2600 1697 2 30 95D 1743 2 51 S5D 1790 2.73 S50 j 1835 2.95 950 | 1830 3.18 95D 1963 3 64 94 F 2051 4.10 91F | 2132 4.58 91?
5362 2SCO 1786 2 67 930 1829 2.89 97D 1872 3.11 970 1915 3.34 97 D I 1953 3 53 970 204? 4 07 96F j 2122 4.57 C3F atTOP 5.C5 SSF5745 3000 1877 3.03 99 D 1918 3.31 90D 1959 3 54 SCO 1999 3.73 99F I 2039 4 03 93 F 2113 4X1 93 F [ 2185 5.C5 99? 227' 5X0 07?6128 3200 1970 3.55 101 F 2009 3.73 101 F 2047 4 02 100F 2025 4.27 1C0F j 2123. 4 53 100F 216*3 5.05 1C0F 1 2272 5.60 39F 234.3 8 10 S9F6511 3 400 2065 4 06 102F 2102 4 31 1C2F 2133 4 56 1C-2F 2171 4.82 1C2F j 2210 5.C3 1C2F 2281 5.62 101F ! 2351 6.10 101F 2421 6.73 101?
6S94 3300 2161 4.64 103F 21SS 4.69 103F 2230 5.13 1G3F 2235 5.12 103F i 2299 5X9 103F 2365 0.25 103F I 24:33 6.84 102F 2500 7.44 192F7277 3300 2259 5.27 1C1F 2292 5 54 1C1F 2324 £ 81 104F 2357 6.C9 104? ! 2300 6.37 104F 2454 6.95 1C4F j 2513 7.55 104? ! 2531 3.17 104?7660 4000 2353 5.97 105F 23S9 6.25 105F 2420 6.53 105F 2451 6.82 103? 1 2452 7.11 105? 2544 7.71 105F | 2805 8.32 103F 2065 8.96- 103?8043 4200 12457 6.73 1C3F 2437 7.02 1C5F 2517 7 31 1C5F 2548 7.61 100? 1 2573 7.91 106F 2635 8.53 105F | 2003 9.17 1C6F ! 8751 9 8°
8426 4400 2553 7 56 107F 2586 7.83 107F 2314 8.17 107F I 2013 8.43 107= | 2571 8.79 107 F 2727 n.ri 3 *37= * 272 i 10.1 107F 50 39 10.3 1 IF.8CC9 4600 2353 8.43' 100 F '2586 8.73 103F (2713 9.C9 103F 2i”0 iiM 103? ' rAi a.;> '■'T- 2321 10.1 108? 9 5 n.t 'M20 11.3 : Xt-J9192 4 800 9.44 10OF 2783 977 1(7 r 28’3 ;o » ‘ 1C1F ! : '-n 10.1 1C ?55>- 10.8 ‘■"OF i 6916 11.1 1;jF 2953 12.1 v;~ ■ .020 12.0 - *9575 50X10 f 0.5 11 OF C '87 !0.3 2-713 •: 1 2 IMF ?: *1 11 OF CD ^3 * * . 1 !0F- 8013 12. *5 110F , ? :3.3 V 'r : ; 112 14.0
Vol. Outlet 4,Vf SP 5" SP 5]T SP 6" SP 7" SP G" SP cr sp 10" SPveioc. | RPM BHP Lw j RPM BHP Lw RPM BHP Lw RPM BHP Lw RPM BHP Lw j PPM BHP Lw RPM BHP Lw | PPM BHP Lw
:255 1"M 1939 3 26 93 E 2035 3 63 95E 2179 4.12 97E 2279 4X3 99 E i3147 1800 2005 3.40 92E 2093 3 33 94E 2153 4 27 S3E 1 2273 4.73 92c 2450 5.71 171= ! i3339 1 900 2023 3.57 92 E l 2114 3.89 92 E 22 Vi 4 44 VIC 20 39 4.30 952 j 2 5 23 Y"S ! 2S18 5 93 1n?E3230 2 000 2045 3.74 92E | 2132 4 17 93 E 2218 4.52 P1E (2302 5.09 f'c j 2155 6 07 OPE 2324 7.12 102? ! 1.7’ {*5?4213 2200 2033 4.14 92 F j 2179 4 53 92= 2239 5.03 d? j 2X3 5.50 95= , 2193 6.50 57 2 2643 7.55 COE 1 ■j ' 102? 38.1 9.85 •'j4596 24100 2151 4 57 93F 2231 5.04 94 F 2309 5.52 S-lE 2324 6X0 95 S | 2580 7.00 96E 2673 8.07 COE j 9.21 1C0E 2946 10 4 12c!4979 2800 2211 5.04 S5F j 2283 5.53 SSF j 2363 6 03 95F j 2433 6.54 95 F 2577 7.53 97? 2712 3.65 98 c ; 2845 3.80- 93E , 2975 11.9 U’d5362 2 200 2278 5.53 SSF I 2349 6 07 9SF 2422 6.59 93F I 2492 7.12 97 F ! 2529 8.21 9/F 2760 9.33 :*<!? ' 2gr. . 13.5 c/2 COiO 11.7 ,7)34
5745 3000 2344 6.13 97 F j 2415 6 65 97 F 2434 7.29 93F J 2553 7.75 G3F j 2685 8.89 93 r j ?rJ 13 10.1 S9? ‘ 11.3 r/:-z ! .2034 12.3,10* :]6123 3200 2416 6.73 S3F i 2484 7 30 29F
1CCF‘2551 7.87 f IF 2517 3.44 99 F | 274.5 9X2' T," 13 8 100P *',,23 • :v.a 13 4
6511 34100 2433 7.37 1C0F ! 2536 7.93 2521 8.58 100F | 2X83 9.19 100? j..S03- 19>= !?3,5
10.4 io*T ; . Td 1 i .7 101F 1 .9 101? <157 ■4.3 Xilt-jYAr]6394 36)00 2255 8.06 102F j 2330 3 70 102F 2633 934 101 f ! 3775 ; 9,33 !1.3 10!? . i 29vO M; 5 1C2F Vi 3 102? i ':?;3 13.2
7277 38!00 2544 8.81 1C>3F J 2706 9 46 103F : zm KM 10oF 2 ' 10/> X.3F -i < *4 12.2 1i J;- 3057 13,0 1U3? ;!6H U.O 1uo? 7273 16.3 *0! '17660 4 000 2725 9*2 10 '? ”S5 10 3 <0 ’? 2344 f 1.0 164? 2* ? 11.7 16 IF r.-r.c 1.. i 1 . 0125 14.5 Ci r 15.0 In *.? :*.M5 17.42043 42100 2 v‘!) >0.5 !06.- 2866 11.2 i f- 2323 i 1.9. 1L‘5r :• 12 6 ’C5F •NjAQ • 1'r.i H i? ! o!5T ; f ^ 105? ; 17.1 ;05F .13! 13.8 • ix* -8426 44.00 •5 *4 r.4 iG7c ?! •> 12.2 10? 8C51 12.9 I07r co:s 13.6 lf.3? ■ii'j
*..: x?hl.4 of 15.7 115? 537 ,3.3 103? 5 ’.09 19.8
83C9 46100 2382 12 > 19SF \ ’*4 13 2 : of > 13 9 1 rt? 31 3 14.? 3 %o :>-7F . 5341 J • .p :n.r ' 1 ■;, t ;)T* [0 /1- 8740 -1.2 1, 7? ,9192 48100 071 6 i09r or 2 14.3 -csi- ’ i m J5.1 160? 3272, i. J r 729 17.7 Hi :f ! 0421 MV . 1Qor :'*7 0 ICO? “7 *2 >2..i 7 OF9575 50*00 Cl 51 14.a HOF 8710 i r - !<7J !10? 52 . J ■e.x 1. OF • C’7 UCr /--'.‘'j 13-7 1',uF 3-199 Y'A cor ' - > i) 2 1'Xr y j5 23.11 i9958 52*00 3 >53 16.0 i!!F 3 ") 16 3 111.F 334? ■ / 8 111? ■ >••.74 U' 4 IMF . 34 37 Tj.1 T'»r . 3570 10F 35 X* j 4.- : 7761 >1
10341 54-00 C,v?5 17.i 112F .?.;-i 13 2 1 ' 7F 2487 i 3 ) !12.: ' .172 ifi.d 112F ’ 7 ML' 21 5 K2F J 365! 23.3 Fir , 1:5.1 i!t; "*•>? 21 010724 56C0 2439 18.9 H3F 34X4 19.7 113F
113:*- ■85' 3*720.5 113?’ • 3)72 t13F X59 - 23 1 no? • * 3745 2X9 112F : 3331 2677 117.- 3*'16 28 9 17?.
11107 58100 5534 20.4 1I.3F 1 3577 21.2 3 YtJ- 221 H 3F j 33 X 113? j 3747 113? [3830 26.3 13? ( :■ j : 3 ». ',1.4 M3? ; 30.4 :f11490 COOO 3u30 . 32J1- IMF 1 3371 229. : i-.r .! 11.4F..! 3/a/t: 24.7 IMF jCCii .12 .. 3317 23-7 .114? iliC- 2'J 2. iti£. iocs.. 2,22.