The effect of maturity stages of banana on the formation of acrylamide in banana fritters
6
The effect of maturity stages of banana on the formation of acrylamide in banana fritters G. Daniali a , S. Jinap a, b, * , N.L. Hanifah a, c , P. Hajeb a a Food Safety Research Centre (FOSREC), Faculty of Food Science and Technology, Universiti Putra Malaysia, 43400 UPM Serdang, Selangor, Malaysia b Institute of Tropical Agriculture, Universiti Putra Malaysia, 43400 UPM Serdang, Selangor, Malaysia c Department of Food Science and Technology, Bogor Agricultural University, Bogor, Indonesia article info Article history: Received 4 October 2012 Received in revised form 31 December 2012 Accepted 8 January 2013 Keywords: Acrylamide Reducing sugars Banana abstract The effect of maturity stages of two varieties of banana (Musaparadisiaca variety Awak and Abu) on the formation of acrylamide was obtained in banana fritters, the most mature banana had significantly (p < 0.05) higher concentrations of reducing sugars; however, the concentrations of free amino acids at different maturity stages were relatively similar (p > 0.05). The study indicated that reducing sugars had a significant (p < 0.05) and strong correlation (R 2 ¼ 0.92 for Abu, R 2 ¼ 0.82 for Awak) with the formation of acrylamide compared to asparagine. The formation of acrylamide in both banana varieties was enhanced with an increase in both reducing sugars (glucose and fructose). This research demonstrated that the formation of acrylamide was strongly dependent on the concentration of, both glucose and fructose. Ó 2013 Elsevier Ltd. All rights reserved. 1. Introduction Acrylamide is formed in carbohydrate and protein rich foods during heat processing such as frying, baking and roasting at high temperatures; even microwave heating provides a suitable me- dium for the occurrence of acrylamide and probably affects the formation and kinetics of acrylamide distinctively due to its extraordinary heating style (Tareke, Rydberg, Karlsson, Eriksson, & Tornqvist, 2002). The most important factors for the formation of acrylamide are the occurrence of precursors, such as reducing sugars (glucose (Glc) and fructose (Fru)), an amino acid, such as asparagine, and the magnitude of the combined temperature and time (Brathen & Knutsen, 2005). Several reactions concerning the formation of acrylamide in cooked foods have been considered. These reactions are common thermally allowed reactions in food (Yaylayan, Wnorowski, & Locas, 2003). The reducing sugars and asparagine are believed to be the major reactants in food, and that are responsible for the of acrylamide formation (Stadler et al., 2003; Zyzak et al., 2003). The potential of generating acrylamide from suitable precursors has mainly been attributed to the concentration of asparagine, when its concentration is lower than reducing sugars (Stadler et al., 2002; Zyzak et al., 2003), however, there is an indication in the literature that the type of sugars may significantly affect the final concen- tration of acrylamide produced through the Maillard reaction (Pollien, Lindinger, Yeretzian, & Blank, 2003; Stadler et al., 2002; Stadler et al., 2004; Zyzak et al., 2003). Asparagine has been iden- tified as a possible source of acrylamide because decarboxylation and deamination of this amino acid, in principle can produce acrylamide. The other mechanism was also found in other study which revealed that some oxidised lipids are able to convert asparagine into acrylamide to a high extent (Zamora & Hidalgo, 2008). The presence rather than the concentration of asparagine, i.e. the amount/concentration of acrylamide formed would depend on whether asparagine or glucose/fructose is limiting. Although there are differences between the major mechanisms for the formation of acrylamide in plant-derived foods, all involve the reaction of asparagine with glucose/fructose present in these foods. According to Surdyk, Rosean, Andersson, and Aman (2004) append asparagine caused increase concentration of acrylamide in crusts of wheat bread while added fructose did not affect the content of acrylamide. Even though the limiting factor in acrylamide formation in potato products is expected to be the concentration of reducing sugar (glucose/fructose) due to the higher amount of asparagine in po- tatoes (one-third of the total free-amino acid pool) (Nigel et al., 2012), Elmore et al. (2005) found a linear relationship between * Corresponding author. Food Safety Research Centre (FOSREC), Faculty of Food Science and Technology, Universiti Putra Malaysia, 43400 UPM Serdang, Selangor, Malaysia. Tel.: þ60 38946 8393; fax: þ60 389423552. E-mail addresses: [email protected], [email protected] (S. Jinap). Contents lists available at SciVerse ScienceDirect Food Control journal homepage: www.elsevier.com/locate/foodcont 0956-7135/$ e see front matter Ó 2013 Elsevier Ltd. All rights reserved. http://dx.doi.org/10.1016/j.foodcont.2013.01.006 Food Control 32 (2013) 386e391
-
Upload
independent -
Category
Documents
-
view
3 -
download
0
Transcript of The effect of maturity stages of banana on the formation of acrylamide in banana fritters

at SciVerse ScienceDirect
Food Control 32 (2013) 386e391
Contents lists available
Food Control
journal homepage: www.elsevier .com/locate/ foodcont
The effect of maturity stages of banana on the formation of acrylamidein banana fritters
G. Daniali a, S. Jinap a,b,*, N.L. Hanifah a,c, P. Hajeb a
a Food Safety Research Centre (FOSREC), Faculty of Food Science and Technology, Universiti Putra Malaysia, 43400 UPM Serdang, Selangor, Malaysiab Institute of Tropical Agriculture, Universiti Putra Malaysia, 43400 UPM Serdang, Selangor, MalaysiacDepartment of Food Science and Technology, Bogor Agricultural University, Bogor, Indonesia
a r t i c l e i n f o
Article history:Received 4 October 2012Received in revised form31 December 2012Accepted 8 January 2013
Keywords:AcrylamideReducing sugarsBanana
* Corresponding author. Food Safety Research CenScience and Technology, Universiti Putra Malaysia, 43Malaysia. Tel.: þ60 38946 8393; fax: þ60 389423552
E-mail addresses: [email protected], sjinap@
0956-7135/$ e see front matter � 2013 Elsevier Ltd.http://dx.doi.org/10.1016/j.foodcont.2013.01.006
a b s t r a c t
The effect of maturity stages of two varieties of banana (Musaparadisiaca variety Awak and Abu) on theformation of acrylamide was obtained in banana fritters, the most mature banana had significantly(p < 0.05) higher concentrations of reducing sugars; however, the concentrations of free amino acids atdifferent maturity stages were relatively similar (p > 0.05). The study indicated that reducing sugars hada significant (p < 0.05) and strong correlation (R2 ¼ 0.92 for Abu, R2 ¼ 0.82 for Awak) with the formationof acrylamide compared to asparagine. The formation of acrylamide in both banana varieties wasenhanced with an increase in both reducing sugars (glucose and fructose). This research demonstratedthat the formation of acrylamide was strongly dependent on the concentration of, both glucose andfructose.
� 2013 Elsevier Ltd. All rights reserved.
1. Introduction
Acrylamide is formed in carbohydrate and protein rich foodsduring heat processing such as frying, baking and roasting at hightemperatures; even microwave heating provides a suitable me-dium for the occurrence of acrylamide and probably affects theformation and kinetics of acrylamide distinctively due to itsextraordinary heating style (Tareke, Rydberg, Karlsson, Eriksson, &Tornqvist, 2002). The most important factors for the formation ofacrylamide are the occurrence of precursors, such as reducingsugars (glucose (Glc) and fructose (Fru)), an amino acid, such asasparagine, and the magnitude of the combined temperature andtime (Brathen & Knutsen, 2005). Several reactions concerning theformation of acrylamide in cooked foods have been considered.These reactions are common thermally allowed reactions in food(Yaylayan, Wnorowski, & Locas, 2003).
The reducing sugars and asparagine are believed to be the majorreactants in food, and that are responsible for the of acrylamideformation (Stadler et al., 2003; Zyzak et al., 2003). The potentialof generating acrylamide from suitable precursors has mainlybeen attributed to the concentration of asparagine, when its
tre (FOSREC), Faculty of Food400 UPM Serdang, Selangor,.gmail.com (S. Jinap).
All rights reserved.
concentration is lower than reducing sugars (Stadler et al., 2002;Zyzak et al., 2003), however, there is an indication in the literaturethat the type of sugars may significantly affect the final concen-tration of acrylamide produced through the Maillard reaction(Pollien, Lindinger, Yeretzian, & Blank, 2003; Stadler et al., 2002;Stadler et al., 2004; Zyzak et al., 2003). Asparagine has been iden-tified as a possible source of acrylamide because decarboxylationand deamination of this amino acid, in principle can produceacrylamide. The other mechanism was also found in other studywhich revealed that some oxidised lipids are able to convertasparagine into acrylamide to a high extent (Zamora & Hidalgo,2008).
The presence rather than the concentration of asparagine, i.e.the amount/concentration of acrylamide formed would depend onwhether asparagine or glucose/fructose is limiting. Although thereare differences between themajor mechanisms for the formation ofacrylamide in plant-derived foods, all involve the reaction ofasparagine with glucose/fructose present in these foods. Accordingto Surdyk, Rosean, Andersson, and Aman (2004) append asparaginecaused increase concentration of acrylamide in crusts of wheatbreadwhile added fructose did not affect the content of acrylamide.Even though the limiting factor in acrylamide formation in potatoproducts is expected to be the concentration of reducing sugar(glucose/fructose) due to the higher amount of asparagine in po-tatoes (one-third of the total free-amino acid pool) (Nigel et al.,2012), Elmore et al. (2005) found a linear relationship between

G. Daniali et al. / Food Control 32 (2013) 386e391 387
acrylamide formation and the residual levels of asparagine andreducing sugars for potato, wheat, and rye. Other researchersreported concentration of free asparagine as the major determinantof acrylamide-forming potential inwheat and rye flour (Curtis et al.,2010; Granvogl, Wieser, Koehler, Von Tucher, & Schieberle, 2007).The objective of this research was to determine the effect of thematurity stages of banana on the formation of acrylamide in bananafritters. Banana of different degrees of ripeness was presumed tocontain different compositions and concentrations of sugars, whichcould act as precursors for acrylamide formation. The banana frit-ter, which has the highest acrylamide concentration of tested foodsaccording to a previous study, was chosen to be investigated for theacrylamide formation in this study (Daniali, Jinap, Zaidul, &Hanifah, 2010).
2. Materials and methods
2.1. Materials
Ammonium acetate, phenyl isothiocyanate (PITC), cuprum sul-phate, selenium dioxide methyl red, methylene blue, zinc pellet,glass ball, hydrochloric acid, boric acid, sulphric acid and sodiumhydroxide were purchased from Merck (Darmstadt, Germany) andwere of analytical grade. Triethylamine (TEA) and ethyl acetatewere purchased from Fluka (Buchs, Switzerland), whereas sucrose,De(�)efructose, De(þ)eglucose and the amino acid standardswere purchased from Sigma Chemical Co. (St Louis, MO, USA).Bromine was obtained from Merck (Darmstadt, Germany). Tepunggoring pisang (banana fritter flour) containing rice flour and con-ditioner (Adabi consumer industries Serdang, Kuala lumpur,Selangor, Malaysia), salt (pure dry vacuum salt, 99.9%, ES food in-dustries, Kajang, Malaysia), and palm olein (Buruh, Lam Soon,Selangor, Malaysia) were purchased from a local market.
2.2. Samples
The two varieties of banana used in the study, Abu and Awak arecommonly used to produce banana fritter. Two mature branches(stage 1; green stage) of each variety was purchased from an openmarket in Serdang, Malaysia, and stored at room temperature for 2weeks to allow for ripening. The maturity of both banana varieties(stage 1e4) was determined based on peel colour using a color-imeter (Minolta CR-10, Konica Minolta, Tokyo, Japan); the color-imeter readings for each stage of maturity are shown in Table 1.Banana of four different maturity stages for both varieties were alsoanalysed for amino acid, reducing sugar, sucrose and acrylamideconcentrations (with 3 replications).
2.3. Sample preparation
Six bananas were picked randomly from three different parts ofeach branch of the Awak and Abu for each maturity stage (2 fromthe top, 2 from the middle and 2 from the end of the branch). Threebananas were peeled and crushed with a crusher (Braun, Frankfurt,Germany) for 3 min before the samples were used for the
Table 1Peel colour of 4 stages of maturity of two varieties of commercial banana (Awak and Ab
Banana variety Stage 1 green Stage 2 yellow green
L C h L C h
Awak 55.0 37.4 119.2 55.4 35.9 117.4Abu 55.5 38.3 119.3 55.9 37.4 117.3
L ¼ lightness ranged from 0 for black to 100 for white, C ¼ Chroma indicate a hue of r(a2 þ b2)½ and h ¼ hue is calculated from the arctangent of b/a.
determination of reducing sugars and amino acids. The other 3banana samples were used for frying, to produce banana fritters asfood samples for acrylamide determination. The experiment wasreplicated twice.
The preparation of the banana fritter samples was as follows.First, the bananawas peeled and soaked in a dough (30 min, 21 �C),which consisted of banana fritter flour (42.8%), salt (0.2%) anddistillated water (57%). The banana and dough were mixed for2min. The samples were deep fried in palm olein using an electricalfryer (Philips HD 6153, Beijing, China) at 170 �C. The temperaturewas monitored by the use of a thermometer 51 series II coupledwith a temperature probe (Fluke Corporation, Everett, USA) for10 min. After cooling, the acrylamide concentration was deter-mined. The same dough was used for all bananas with differentmaturity degrees.
2.4. Instrumentation
A high performance liquid chromatography system (HPLC)(JASCO 2080 Tokyo, Japan) equipped with a fluorescence detector(MDe2010 plus FPe2020), pump (PUe2080) degasser (DGe2080e54) and wavelength (254 nm) was used for amino acid analysis. ALichrocart analytical column (250 � 4.6 mm i.d. and 5 mm particlesize) from Merck (Darmstadt, Germany) was used. The flow ratewas 1 mL/min.
The HPLC used for sugar analysis was consisted of a gradientunit (Model LGe1580e04), a pump (PUe1580) and a refractiveindex detector (RIe1350, JASCO Corp. Tokyo, Japan). Manual in-jections were carried out using a Rheodyne injector (Model 7125Tokyo, Japan) with a 20 mL sample loop. The analytical column usedwas NH2 mBondapak (Waters Corporation, Massachusetts, USA)with a 125Ǻ pore size, 300� 3.9mm i.d and 10 mmparticle size. Theflow rate was 1 mL/min.
Gas chromatographyemass spectrometry (GCeMS) used foracrylamide analysis was HP 5890 gas chromatograph, connected toanHP 5973mass spectrometer andHP7683 auto sampler (HewlettePackard, Avondale, PA, Pennsylvania, USA). The GC column used wasan Innowax capillary column (30 m � 0.25 mm i.d., 0.25 mm filmthickness; Agilent Technologies, Palo Alto, CA, USA). The MS condi-tions were a follows: ionization by EI mode at 70 eV with ion sourcetemperature as high as 230 �C, ion analysis by TOF (time of flight)analyser with scan range at 20e500 m/z, and using SIM (selectedion monitoring) mode for monitoring ions at m/z 149 for 2ebromopropenamide, andm/z 154 for 2ebromo (13C3) propenamide.
2.5. Determination of sugars by HPLC
The HPLC method used to determine the sugars in Awak andAbu varieties at the four maturity stages were performed accordingto the method of Hunt, Jackson, Mortlock, and Kirtc (1977) andAOAC (2000). The sugar standards used were glucose, fructose andsucrose in the concentration range of 0.5, 1, 1.5, 2 and 2.5% (w/v).The extraction of samples performed prior to injection into HPLCwas carried out according to Wills, Balmer, and Greenfield (1980)and AOAC (2000).
u) (n ¼ 3).
Stage 3 yellow Stage 4 yellow with black spots
L C h L C h
66.3 45.5 90.2 69.3 56.3 90.170.8 48.2 90.7 73.5 56.0 90.9
ed/purple, bluish/green and also indicate yellow and blue, Chroma is calculated as

G. Daniali et al. / Food Control 32 (2013) 386e391388
Sample preparation for sugar analysis was as follows: ten gramsof the crushed banana was heated with 150 mL of methanol ona steam bath for 30 min. The mixture was filtered using WhatmanNo. 1 filter paper (Kent, UK) into a round bottom flask. The residuewas re-extracted twice in 100 mL portions of methanol, and thenfiltered. The filtrate was evaporated to less than 10 mL under vac-uum at 50 �C in a rotary evaporator (Rotavapor Re210, Buchi Labrortechnik AG, Flawil, Switzerland). The volume was increased to10 mL in a volumetric flask. The solution was then filtered througha SEPePAK cartridge and a 0.45 mm membrane filter. Ten microlitres of this solution were injected to HPLC equipped with refrac-tive index detector. The mobile phase used in this HPLC was ace-tonitrile and distilled water (80:20, v/v).
2.6. Determination of amino acids by HPLC
The samples used for amino acid analysis were the same asthose used for sugar analysis. The determination of amino acids byHPLC was carried out according to Khan, Kuo, Kebede, and Lambein(1994) and AOAC (2002). One gram of the crushed banana wasweighted, transferred into a tube, combined with 15 mL of 6 N HCland stirred by autovortex mixer (Stuart scientific, Manchester, En-gland) for 2 min. The tube was heated in an oven at 60 �C for 24 hand then combined with 10 mL of an internal standard and a suf-ficient volume of deionized water to reach a final volume of 50 mL.The upper layer was filtered into a tube and was stored at �20 �Cuntil use in HPLC analysis.
Ten-microlitre aliquots of extract or 10 mL of the amino acidstandards mixture for preparing standard was dried under vacuum(37 �C, 20 mmHg). A 20 mL aliquot of the first coupling reagent[methanol, water, triethylamine (TEA) (2:2:1; v/v)] was added, andthe mixture was swirled after mixing, the sample was dried undervacuum (Rhino Pump, Ningbo, China) for 10 min and then reactedwith 30 mL of phenyl isothiocyanate (PITC) reagent (methanol,PITC, TEA, water (7:1:1:1; v/v)) at room temperature for 20 minbefore drying under a vacuum to remove the PITC. The derivatizedsamples were then redissolved in 500 mL of buffer A, which is usedas mobile phase for HPLC and filtered through a Millipore mem-brane (0.22 mm). A 20 mL sample of this mixture was injected in toan HPLC system. Buffer A (0.1 M ammonium acetate, pH 6.5) andbuffer B (0.1 M ammonium acetate containing acetonitrile andmethanol, 44:46:10, v/v, pH 6.5) were used as a mobile phase(80:20).
Table 2Concentration of free amino acids (mg/g of fresh wt) in commercial banana (Awak) after hby phenyl isothiocyanate (n ¼ 3).
Amino acids Stage 1 green Stage 2 yellow
Asparagine (Asn) 0.92 � 0.54a* 1.22 � 0.41a
Glutamine (Gln) 0.80 � 0.28b 0.78 � 0.064b
Serine (Ser) 0.42 � 0.07a 0.34 � 0.016a
Glycine (Gly) 0.26 � 0.12b 0.34 � 0.02b
Histidine (His) 0.15 � 0.01b 0.15 � 0.05b
Arginine (Arg) 1.10 � 1.55b NDThreonine (Thr) 2.00 � 0.40a 1.02 � 0.01b
Alanine (Ala) 0.60 � 0.04a 0.57 � 0.02a
Proline (Pro) 0.20 � 0.17b 0.32 � 0.01b
Tyrosine (Tyr) 0.03 � 0.04a 0.08 � 0.01a
Valine (Val) 0.27 � 0.16a 0.42 � 0.01a
Isoleucine (Ile) 0.07 � 0.10a 0.26 � 0.01b
Leucine (Leu) 2.4 � 1.58a 1.41 � 0.06a
Phenylalanine (Phe) 0.34 � 0.48a 0.52 � 0.06a
Lysine (Lys) 0.43 � 0.02a 0.41 � 0.01a
*Similar letter in each row shows insignificant difference (p > 0.05).
3. Statistical analysis
Analysis of variance (ANOVA)was used to analyse the significantdifference between acrylamide, reducing sugar and amino acidsconcentrations. The descriptive statistics and ANOVA were per-formed using Minitab (Release 14 for Windows, Pennsylvania,USA). Tukey’s test was used for the statistical analysis; a p-value ofless than 0.05 was considered to indicate statistical significance.The strength of the association between acrylamide, reducing sugarand amino acids concentrations in the samples wasmeasured usingPearson’s correlation coefficient.
4. Results and discussion
The amino acids compositions of Awak and Abu banana varietiesare presented in Table 2 and Table 3, respectively. The amino acidscomposition of Abu and Awak bananas were different at differentmaturity stages. Asparagine did not show any significant differencein concentration (p > 0.05) between different maturity stages anddifferent banana varieties. Asparagine was present in Abu variety ata range of 1.37e2.16 mg/g (fresh wt.), and in Awak range of 0.92e1.37 mg/g (fresh wt.). This results showed that the presence ofasparagine and reducing sugar are determining factors for acryl-amide formation, but correlation between acrylamide formationand asparagine concentration is extremely weak.
As shown in Tables 2 and 3, both varieties showed no significantdifference (p > 0.05) in asparagine concentrations at differentmaturity stages; however, for glutamine concentrations, thereweresignificant differences (p< 0.05) between stages 1 and 2 with 3 and4 in Awak variety. The concentrations of asparagine and glutaminein the Abu variety were significantly higher (p< 0.05) than those inthe Awak variety.
Table 4 shows the concentrations of fructose, glucose and su-crose in the two banana varieties at different maturity stages. Thecalibration curves obtained were all in the acceptable linearityrange (R2 > 0.990). Each calibration curve was used to calculateeach corresponding sugar concentration. The sugars in the sampleswere quantified by comparing the peak areas of samples with thoseof the standards. Fructose and glucose are reducing sugars, whichare important for Maillard reaction. Although sucrose is nota reducing sugar, it is a possible reaction partner, considering itspotential hydrolysis into an equimolar mixture of glucose andfructose upon heating.
ydrolysis at 4 stages of maturity after acid hydrolysis and pre-column derivatization
green Stage 3 yellow Stage 4 yellow withblack spots
1.37 � 0.07a 1.04 � 0.19a
1.29 � 0.27a 1.05 � 0.15a
0.68 � 0.01a 0.68 � 0.08a
0.50 � 0.05a 0.50 � 0.04a
0.36 � 0.04a 0.49 � 0.32a
0.41 � 0.06a 0.42 � 0.05a
0.74 � 0.21b 0.64 � 0.07b
0.57 � 0.01a 0.55 � 0.08a
0.43 � 0.04a 0.40 � 0.01a
0.13 � 0.01b 0.16 � 0.02b
0.32 � 0.02b 0.37 � 0.10b
ND 0.26 � 0.01b
4.79 � 0.79b 4.51 � 0.44b
0.33 � 0.01b 0.28 � 0.03a
0.43 � 0.02a 0.40 � 0.03a
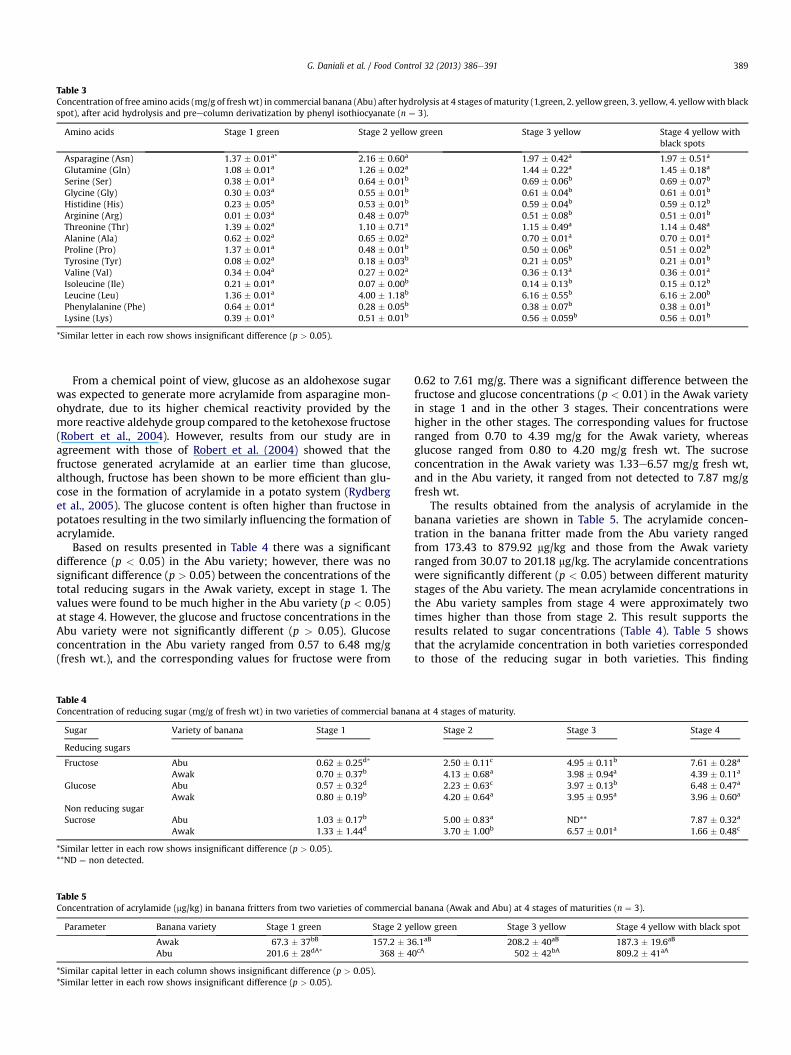
Table 3Concentration of free amino acids (mg/g of freshwt) in commercial banana (Abu) after hydrolysis at 4 stages of maturity (1.green, 2. yellowgreen, 3. yellow, 4. yellowwith blackspot), after acid hydrolysis and preecolumn derivatization by phenyl isothiocyanate (n ¼ 3).
Amino acids Stage 1 green Stage 2 yellow green Stage 3 yellow Stage 4 yellow withblack spots
Asparagine (Asn) 1.37 � 0.01a* 2.16 � 0.60a 1.97 � 0.42a 1.97 � 0.51a
Glutamine (Gln) 1.08 � 0.01a 1.26 � 0.02a 1.44 � 0.22a 1.45 � 0.18a
Serine (Ser) 0.38 � 0.01a 0.64 � 0.01b 0.69 � 0.06b 0.69 � 0.07b
Glycine (Gly) 0.30 � 0.03a 0.55 � 0.01b 0.61 � 0.04b 0.61 � 0.01b
Histidine (His) 0.23 � 0.05a 0.53 � 0.01b 0.59 � 0.04b 0.59 � 0.12b
Arginine (Arg) 0.01 � 0.03a 0.48 � 0.07b 0.51 � 0.08b 0.51 � 0.01b
Threonine (Thr) 1.39 � 0.02a 1.10 � 0.71a 1.15 � 0.49a 1.14 � 0.48a
Alanine (Ala) 0.62 � 0.02a 0.65 � 0.02a 0.70 � 0.01a 0.70 � 0.01a
Proline (Pro) 1.37 � 0.01a 0.48 � 0.01b 0.50 � 0.06b 0.51 � 0.02b
Tyrosine (Tyr) 0.08 � 0.02a 0.18 � 0.03b 0.21 � 0.05b 0.21 � 0.01b
Valine (Val) 0.34 � 0.04a 0.27 � 0.02a 0.36 � 0.13a 0.36 � 0.01a
Isoleucine (Ile) 0.21 � 0.01a 0.07 � 0.00b 0.14 � 0.13b 0.15 � 0.12b
Leucine (Leu) 1.36 � 0.01a 4.00 � 1.18b 6.16 � 0.55b 6.16 � 2.00b
Phenylalanine (Phe) 0.64 � 0.01a 0.28 � 0.05b 0.38 � 0.07b 0.38 � 0.01b
Lysine (Lys) 0.39 � 0.01a 0.51 � 0.01b 0.56 � 0.059b 0.56 � 0.01b
*Similar letter in each row shows insignificant difference (p > 0.05).
G. Daniali et al. / Food Control 32 (2013) 386e391 389
From a chemical point of view, glucose as an aldohexose sugarwas expected to generate more acrylamide from asparagine mon-ohydrate, due to its higher chemical reactivity provided by themore reactive aldehyde group compared to the ketohexose fructose(Robert et al., 2004). However, results from our study are inagreement with those of Robert et al. (2004) showed that thefructose generated acrylamide at an earlier time than glucose,although, fructose has been shown to be more efficient than glu-cose in the formation of acrylamide in a potato system (Rydberget al., 2005). The glucose content is often higher than fructose inpotatoes resulting in the two similarly influencing the formation ofacrylamide.
Based on results presented in Table 4 there was a significantdifference (p < 0.05) in the Abu variety; however, there was nosignificant difference (p > 0.05) between the concentrations of thetotal reducing sugars in the Awak variety, except in stage 1. Thevalues were found to be much higher in the Abu variety (p < 0.05)at stage 4. However, the glucose and fructose concentrations in theAbu variety were not significantly different (p > 0.05). Glucoseconcentration in the Abu variety ranged from 0.57 to 6.48 mg/g(fresh wt.), and the corresponding values for fructose were from
Table 4Concentration of reducing sugar (mg/g of fresh wt) in two varieties of commercial banan
Sugar Variety of banana Stage 1
Reducing sugars
Fructose Abu 0.62 � 0.25d*
Awak 0.70 � 0.37b
Glucose Abu 0.57 � 0.32d
Awak 0.80 � 0.19b
Non reducing sugarSucrose Abu 1.03 � 0.17b
Awak 1.33 � 1.44d
*Similar letter in each row shows insignificant difference (p > 0.05).**ND ¼ non detected.
Table 5Concentration of acrylamide (mg/kg) in banana fritters from two varieties of commercial
Parameter Banana variety Stage 1 green Stage 2 ye
Awak 67.3 � 37bB 157.2 � 3Abu 201.6 � 28dA* 368 � 4
*Similar capital letter in each column shows insignificant difference (p > 0.05).*Similar letter in each row shows insignificant difference (p > 0.05).
0.62 to 7.61 mg/g. There was a significant difference between thefructose and glucose concentrations (p < 0.01) in the Awak varietyin stage 1 and in the other 3 stages. Their concentrations werehigher in the other stages. The corresponding values for fructoseranged from 0.70 to 4.39 mg/g for the Awak variety, whereasglucose ranged from 0.80 to 4.20 mg/g fresh wt. The sucroseconcentration in the Awak variety was 1.33e6.57 mg/g fresh wt,and in the Abu variety, it ranged from not detected to 7.87 mg/gfresh wt.
The results obtained from the analysis of acrylamide in thebanana varieties are shown in Table 5. The acrylamide concen-tration in the banana fritter made from the Abu variety rangedfrom 173.43 to 879.92 mg/kg and those from the Awak varietyranged from 30.07 to 201.18 mg/kg. The acrylamide concentrationswere significantly different (p < 0.05) between different maturitystages of the Abu variety. The mean acrylamide concentrations inthe Abu variety samples from stage 4 were approximately twotimes higher than those from stage 2. This result supports theresults related to sugar concentrations (Table 4). Table 5 showsthat the acrylamide concentration in both varieties correspondedto those of the reducing sugar in both varieties. This finding
a at 4 stages of maturity.
Stage 2 Stage 3 Stage 4
2.50 � 0.11c 4.95 � 0.11b 7.61 � 0.28a
4.13 � 0.68a 3.98 � 0.94a 4.39 � 0.11a
2.23 � 0.63c 3.97 � 0.13b 6.48 � 0.47a
4.20 � 0.64a 3.95 � 0.95a 3.96 � 0.60a
5.00 � 0.83a ND** 7.87 � 0.32a
3.70 � 1.00b 6.57 � 0.01a 1.66 � 0.48c
banana (Awak and Abu) at 4 stages of maturities (n ¼ 3).
llow green Stage 3 yellow Stage 4 yellow with black spot
6.1aB 208.2 � 40aB 187.3 � 19.6aB
0cA 502 � 42bA 809.2 � 41aA
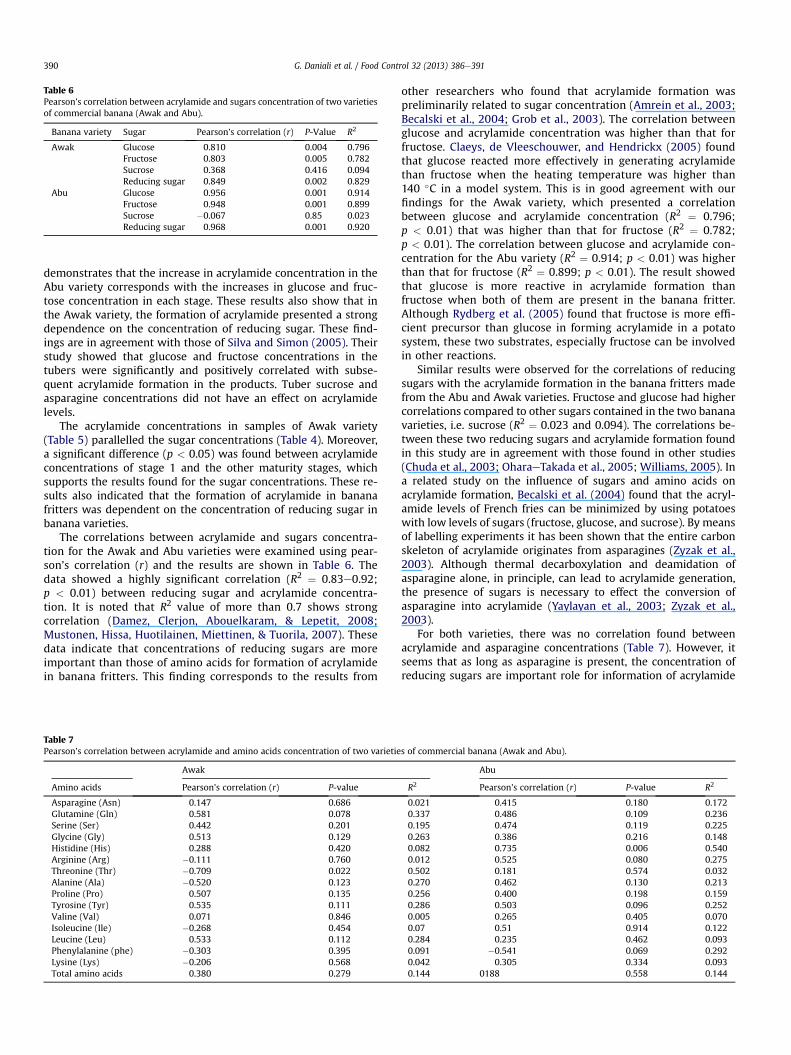
Table 6Pearson’s correlation between acrylamide and sugars concentration of two varietiesof commercial banana (Awak and Abu).
Banana variety Sugar Pearson’s correlation (r) P-Value R2
Awak Glucose 0.810 0.004 0.796Fructose 0.803 0.005 0.782Sucrose 0.368 0.416 0.094Reducing sugar 0.849 0.002 0.829
Abu Glucose 0.956 0.001 0.914Fructose 0.948 0.001 0.899Sucrose �0.067 0.85 0.023Reducing sugar 0.968 0.001 0.920
G. Daniali et al. / Food Control 32 (2013) 386e391390
demonstrates that the increase in acrylamide concentration in theAbu variety corresponds with the increases in glucose and fruc-tose concentration in each stage. These results also show that inthe Awak variety, the formation of acrylamide presented a strongdependence on the concentration of reducing sugar. These find-ings are in agreement with those of Silva and Simon (2005). Theirstudy showed that glucose and fructose concentrations in thetubers were significantly and positively correlated with subse-quent acrylamide formation in the products. Tuber sucrose andasparagine concentrations did not have an effect on acrylamidelevels.
The acrylamide concentrations in samples of Awak variety(Table 5) parallelled the sugar concentrations (Table 4). Moreover,a significant difference (p < 0.05) was found between acrylamideconcentrations of stage 1 and the other maturity stages, whichsupports the results found for the sugar concentrations. These re-sults also indicated that the formation of acrylamide in bananafritters was dependent on the concentration of reducing sugar inbanana varieties.
The correlations between acrylamide and sugars concentra-tion for the Awak and Abu varieties were examined using pear-son’s correlation (r) and the results are shown in Table 6. Thedata showed a highly significant correlation (R2 ¼ 0.83e0.92;p < 0.01) between reducing sugar and acrylamide concentra-tion. It is noted that R2 value of more than 0.7 shows strongcorrelation (Damez, Clerjon, Abouelkaram, & Lepetit, 2008;Mustonen, Hissa, Huotilainen, Miettinen, & Tuorila, 2007). Thesedata indicate that concentrations of reducing sugars are moreimportant than those of amino acids for formation of acrylamidein banana fritters. This finding corresponds to the results from
Table 7Pearson’s correlation between acrylamide and amino acids concentration of two varietie
Awak
Amino acids Pearson’s correlation (r) P-value
Asparagine (Asn) 0.147 0.686Glutamine (Gln) 0.581 0.078Serine (Ser) 0.442 0.201Glycine (Gly) 0.513 0.129Histidine (His) 0.288 0.420Arginine (Arg) �0.111 0.760Threonine (Thr) �0.709 0.022Alanine (Ala) �0.520 0.123Proline (Pro) 0.507 0.135Tyrosine (Tyr) 0.535 0.111Valine (Val) 0.071 0.846Isoleucine (Ile) �0.268 0.454Leucine (Leu) 0.533 0.112Phenylalanine (phe) �0.303 0.395Lysine (Lys) �0.206 0.568Total amino acids 0.380 0.279
other researchers who found that acrylamide formation waspreliminarily related to sugar concentration (Amrein et al., 2003;Becalski et al., 2004; Grob et al., 2003). The correlation betweenglucose and acrylamide concentration was higher than that forfructose. Claeys, de Vleeschouwer, and Hendrickx (2005) foundthat glucose reacted more effectively in generating acrylamidethan fructose when the heating temperature was higher than140 �C in a model system. This is in good agreement with ourfindings for the Awak variety, which presented a correlationbetween glucose and acrylamide concentration (R2 ¼ 0.796;p < 0.01) that was higher than that for fructose (R2 ¼ 0.782;p < 0.01). The correlation between glucose and acrylamide con-centration for the Abu variety (R2 ¼ 0.914; p < 0.01) was higherthan that for fructose (R2 ¼ 0.899; p < 0.01). The result showedthat glucose is more reactive in acrylamide formation thanfructose when both of them are present in the banana fritter.Although Rydberg et al. (2005) found that fructose is more effi-cient precursor than glucose in forming acrylamide in a potatosystem, these two substrates, especially fructose can be involvedin other reactions.
Similar results were observed for the correlations of reducingsugars with the acrylamide formation in the banana fritters madefrom the Abu and Awak varieties. Fructose and glucose had highercorrelations compared to other sugars contained in the two bananavarieties, i.e. sucrose (R2 ¼ 0.023 and 0.094). The correlations be-tween these two reducing sugars and acrylamide formation foundin this study are in agreement with those found in other studies(Chuda et al., 2003; OharaeTakada et al., 2005; Williams, 2005). Ina related study on the influence of sugars and amino acids onacrylamide formation, Becalski et al. (2004) found that the acryl-amide levels of French fries can be minimized by using potatoeswith low levels of sugars (fructose, glucose, and sucrose). By meansof labelling experiments it has been shown that the entire carbonskeleton of acrylamide originates from asparagines (Zyzak et al.,2003). Although thermal decarboxylation and deamidation ofasparagine alone, in principle, can lead to acrylamide generation,the presence of sugars is necessary to effect the conversion ofasparagine into acrylamide (Yaylayan et al., 2003; Zyzak et al.,2003).
For both varieties, there was no correlation found betweenacrylamide and asparagine concentrations (Table 7). However, itseems that as long as asparagine is present, the concentration ofreducing sugars are important role for information of acrylamide
s of commercial banana (Awak and Abu).
Abu
R2 Pearson’s correlation (r) P-value R2
0.021 0.415 0.180 0.1720.337 0.486 0.109 0.2360.195 0.474 0.119 0.2250.263 0.386 0.216 0.1480.082 0.735 0.006 0.5400.012 0.525 0.080 0.2750.502 0.181 0.574 0.0320.270 0.462 0.130 0.2130.256 0.400 0.198 0.1590.286 0.503 0.096 0.2520.005 0.265 0.405 0.0700.07 0.51 0.914 0.1220.284 0.235 0.462 0.0930.091 �0.541 0.069 0.2920.042 0.305 0.334 0.0930.144 0188 0.558 0.144

G. Daniali et al. / Food Control 32 (2013) 386e391 391
(Amrein et al., 2003; Mottram, Wedzicha, & Dodson, 2002; Stadleret al., 2002; Williams, 2005; Yaylayan et al., 2003).
5. Conclusions
The concentration of acrylamide in banana fritter of both bananavarieties was enhanced by the increase in the concentration of thereducing sugars, glucose and fructose with the increase of thematurity stages of banana. This finding demonstrated that theacrylamide concentration is strongly dependent on the concen-tration of reducing sugars and the reducing sugars are the limitingfactor for the formation of acrylamide in banana fritters.
Acknowledgement
The authors are grateful for the facilities and grant provided byUniversiti Putra Malaysia, and the assistants rendered by lab per-sonnel at the Food Safety Research Center (FOSREC) and the Facultyof Food Science and Technology, Universiti Putra Malaysia.
References
Amrein, T. M., Bachmann, S., Noti, A., Biedermann, M., Barbosa, M. F., BiedermanneBrem, S., et al. (2003). Potential of acrylamide formation, sugars, and freeasparagine in potatoes: a comparison of cultivars and farming systems. Journalof Agricultural and Food Chemistry, 51, 5556e5560.
AOAC. (2000). Official method of analysis of AOAC.INTERNATIONAL (17th ed.). Gai-thersburg, MD, USA: AOAC. INTERNATIONAL, Official Method 982.14.
AOAC. (2002). Official method of analysis of AOAC.INTERNATIONAL (17th ed.). Gai-thersburg, MD, USA: AOAC. INTERNATIONAL, Official Method 982.30.
Becalski, A., Lau, B. P. Y., Lewis, D., Seaman, S. W., Hayward, S., Sahagian, M., et al.(2004). Acrylamide in French fries: influence of free amino acids and sugars.Journal of Agricultural and Food Chemistry, 52, 3801e3807.
Brathen, E., & Knutsen, S. H. (2005). Effect of temperature and time on the for-mation of acrylamide in starchebased and cereal model systems, flat breadsand bread. Food Chemistry, 92, 693e700.
Chuda, Y., Ono, H., Yada, H., OharaeTakada, A., MatsuuraeEndo, C., & Mori, M.(2003). Effects of physiological changes in potato tubers (Solanum tuberosum L.)after low temperature storage on the level of acrylamide formed in potatochips. Bioscience Biotechnology and Biochemistry, 67, 1188e1190.
Claeys, W. L., de Vleeschouwer, K., & Hendrickx, M. E. (2005). Kinetics of acrylamideformation and elimination during heating of an asparagineesugar model sys-tem. Journal of Agricultural and Food Chemistry, 53, 9999e10005.
Curtis, T. Y., Muttucumaru, N., Shewry, P. R., Parry, M. A. J., Powers, S. J., Elmore, J. S.,et al. (2010). Effects of genotype and environment on free amino acid levels inwheat grain: implications for acrylamide formation during processing. Journalof Agricultural and Food Chemistry, 57, 1013e1021.
Damez, J. L., Clerjon, S., Abouelkaram, S., & Lepetit, J. (2008). Electrical impedanceprobing of the muscle food anisotropy for meat ageing control. Food Control, 19,931e939.
Daniali, G., Jinap, S., Zaidul, S. I., & Hanifah, N. L. (2010). Determination of acryl-amide in Malaysian banana based snacks. International Food Research Journal,17, 433e439.
Elmore, S. J., Georgios, E., Andrew, K., Dodson, T., Donald, S., Motram, D., et al.(2005). Measurement of acrylamide and its precursors in potato, wheat, and ryemodel systems. Agricultural and Food Chemistry, 53, 1286e1293.
Granvogl, M., Wieser, H., Koehler, P., Von Tucher, S., & Schieberle, P. (2007). Influ-ence of sulfur fertilization on the amounts of free amino acids in wheat. Cor-relation with baking properties as well as with 3-aminopropionamide and
acrylamide generation during baking. Journal of Agricultural and Food Chemistry,55, 4271e4277.
Grob, K., Biedermann, M., Biedermann, B. S., Noti, A., Imhof, D., Amrein, T., et al.(2003). French fries with less than 100 mg/kg acrylamide. A collaboration be-tween cooks and analysts. European Food Research and Technology, 217, 185e194.
Hunt, R. S., Jackson, P. A., Mortlock, R. E., & Kirtc, R. S. (1977). Quantitative deter-mination of sugars in foodstuffs by high performance liquid chromatography.Analyst, 102, 917e920.
Khan, J. K., Kuo, Y. H., Kebede, N., & Lambein, F. (1994). Determination of non-protein amino acids and toxins in lathyrus by high performance liquid chro-matography with precolumn phenyl isothiocyanate derivatization. Journal ofChromatography, A687, 113e119.
Mottram, D. S., Wedzicha, B. L., & Dodson, A. T. (2002). Acrylamide is formed in theMaillard reaction. Nature, 419, 448e449.
Mustonen, S., Hissa, I., Huotilainen, A., Miettinen, S. M., & Tuorila, H. (2007). He-donic responses as predictors of food choice: flexibility and selfeprediction.Appetite, 49, 159e168.
Nigel, G. H., Curtis, Y. T., Muttucumaru, N., Postles, J., Elmore, S., & Mottram, D. S.(2012). The acrylamide problem: a plant and agronomic science issue. Journal ofExperimental Botany, 1093, 1e11.
OharaeTakada, A., MatsuuraeEndo, C., Chuda, Y., Ono, H., Yada, H., Yoshida, M., et al.(2005). Change in content of sugars and free amino acids in potato tubers undershort-term storage at low temperature and the effect on acrylamide after fry-ing. Bioscience, Biotechnology Biochemistry, 69, 1232e1238.
Pollien, P., Lindinger, C., Yeretzian, C., & Blank, I. (2003). Proton-transfer reactionmass spectrometry is a suitable tool for on-line monitoring of acrylamide infood and Maillard systems. Journal of Analytical Chemistry, 75, 5488e5494.
Robert, F., Vuataz, G., Pollien, P., Saucy, F., Alonso, M., Bauwens, I., et al. (2004).Acrylamide formation from asparagine under low-moisture Maillard reactionconditions. Journal of Agricultural and Food Chemistry, 52, 6837e6842.
Rydberg, P., Eriksson, S., Tareke, E., Karlsson, P., Ehrenberg, L., & Törnqvist, M.(2005). Factors that influence the acrylamide content of heated foods. In (1sted.).. Chemistry and safety of acrylamide in food, 561 (pp. 317e328) New York(NY): Springer Science þ Business Media Inc.
Silva, E. M., & Simon, P. W. (2005). Genetic, physiological, and environmental factorsaffecting acrylamide concentration in fried potato products. In M. Friedman, &D. Mottram (Eds.), Chemistry and safety of acrylamide in food (1st ed). (pp. 371e386). New York (NY): Springer Science Business Media, Inc.
Stadler, R. H., Blank, I., Varga, N., Robert, F., Hau, J., Guy, P. A., et al. (2002). Acryl-amide from Maillard reaction products. Nature, 419, 449e450.
Stadler, R. H., Robert, F., Riediker, S., Varga, N., Davidek, T., Devaud, S., et al. (2004).In-depth mechanistic study on the formation of acrylamide and other vinyl-ogous compounds by the Maillard reaction. Journal of Agricultural and FoodChemistry, 52, 5550e5558.
Stadler, R. H., Verzegnassi, L., Varga, N., Grigorov, M., Studer, A., Riediker, S., et al.(2003). Formation of vinylogous compounds in model Maillard reaction sys-tems. Chemical Research in Toxicology, 16, 1242e1250.
Surdyk, N. U., Rosean, J., Andersson, R., & Aman, P. (2004). Effects of asparagine,fructose, and baking conditions on acrylamide content in yeast-leavened wheatbread. Journal of Agricultural and Food Chemistry, 52, 2047e2051.
Tareke, E., Rydberg, P., Karlsson, P., Eriksson, S., & Tornqvist, M. (2002). Analysis ofacrylamide, a carcinogen formed in heated foodstuffs. Journal of Agricultural andFood Chemistry, 50, 4998e5006.
Wills, R. B. H., Balmer, N., & Greenfield, H. (1980). Composition of Australian foods,2.methods of analysis. Journal of Food Technology, 32, 198e204.
Williams, J. S. E. (2005). Influence of variety and processing conditions on acryl-amide levels in fried potato crisps. Food Chemistry, 90, 875e881.
Yaylayan, V. A., Wnorowski, A., & Locas, C. P. (2003). Why asparagines needs car-bohydrates to generate acrylamide. Journal of Agricultural and Food Chemistry,51, 1753e1757.
Zamora, R., & Hidalgo, F. J. (2008). Contribution of lipid oxidation products toacrylamide formation in model systems. Journal of Agricultural and FoodChemistry, 56, 6075e6080.
Zyzak, D. V., Sanders, R. A., Stojanovic, M., Tallmadge, D. H., Eberhart, B. L.,Ewald, D. K., et al. (2003). Acrylamide formation mechanism in heated foods.Journal of Agricultural and Food Chemistry, 51, 4782e4787.