New Frontiers in Acrylamide Study in Foods - MDPI
158
New Frontiers in Acrylamide Study in Foods Formation, Analysis and Exposure Assessment Printed Edition of the Special Issue Published in Foods www.mdpi.com/journal/foods Marta Mesías, Cristina Delgado-Andrade and Francisco J. Morales Edited by
-
Upload
khangminh22 -
Category
Documents
-
view
1 -
download
0
Transcript of New Frontiers in Acrylamide Study in Foods - MDPI

New
Frontiers in Acrylamide Study in Foods • M
arta Mesías, Cristina Delgado-Andrade and Francisco J. M
orales
New Frontiers in Acrylamide Study in FoodsFormation, Analysis and Exposure Assessment
Printed Edition of the Special Issue Published in Foods
www.mdpi.com/journal/foods
Marta Mesías, Cristina Delgado-Andrade and Francisco J. Morales
Edited by

New Frontiers in Acrylamide Study in Foods: Formation, Analysis and Exposure Assessment


New Frontiers in Acrylamide Studyin Foods: Formation, Analysis andExposure Assessment
Editors
Marta Mesıas
Cristina Delgado-Andrade
Francisco J. Morales
MDPI • Basel • Beijing • Wuhan • Barcelona • Belgrade • Manchester • Tokyo • Cluj • Tianjin
Editors
Marta MesıasSpanish National Research Council (CSIC)Spain
Cristina Delgado-Andrade
Spain
Francisco J. Morales
Spanish National Research Council (CSIC)
Spanish National Research Council (CSIC)Spain
Editorial Office
MDPI
St. Alban-Anlage 66
4052 Basel, Switzerland
This is a reprint of articles from the Special Issue published online in the open access journal Foods
(ISSN 2304-8158) (available at: https://www.mdpi.com/journal/foods/special issues/Acrylamide
Foods Formation Analysis Exposure).
For citation purposes, cite each article independently as indicated on the article page online and as
indicated below:
LastName, A.A.; LastName, B.B.; LastName, C.C. Article Title. Journal Name Year, Volume Number,
Page Range.
ISBN 978-3-0365-0030-0 (Hbk)
ISBN 978-3-0365-0031-7 (PDF)
Cover image courtesy of Marta Mesıas, Cristina Delgado-Andrade andFrancisco J. Morales
c© 2020 by the authors. Articles in this book are Open Access and distributed under the Creative
Commons Attribution (CC BY) license, which allows users to download, copy and build upon
published articles, as long as the author and publisher are properly credited, which ensures maximum
dissemination and a wider impact of our publications.
The book as a whole is distributed by MDPI under the terms and conditions of the Creative Commons
license CC BY-NC-ND.

Contents
About the Editors . . . . . . . . . . . . . . . . . . . . . . . . . . . . . . . . . . . . . . . . . . . . . . vii
Cristina Delgado-Andrade, Marta Mesıas and Francisco J. Morales
Introduction to the Special Issue: New Frontiers in Acrylamide Study in Foods—Formation,Analysis and Exposure AssessmentReprinted from: Foods 2020, 9, 1506, doi:10.3390/foods9101506 . . . . . . . . . . . . . . . . . . . . 1
Mingfei Pan, Kaixin Liu, Jingying Yang, Liping Hong, Xiaoqian Xie and Shuo Wang
Review of Research into the Determination of Acrylamide in FoodsReprinted from: Foods 2020, 9, 524, doi:10.3390/foods9040524 . . . . . . . . . . . . . . . . . . . . 5
Cristiana L. Fernandes, Daniel O. Carvalho and Luis F. Guido
Determination of Acrylamide in Biscuits by High-Resolution Orbitrap Mass Spectrometry:A Novel ApplicationReprinted from: Foods 2019, 8, 597, doi:10.3390/foods8120597 . . . . . . . . . . . . . . . . . . . . . 25
Na Sun, Yi Wang, Sanjay K. Gupta and Carl J. Rosen
Potato Tuber Chemical Properties in Storage as Affected by Cultivar and Nitrogen Rate:Implications for Acrylamide FormationReprinted from: Foods 2020, 9, 352, doi:10.3390/foods9030352 . . . . . . . . . . . . . . . . . . . . . 37
Marta Mesias, Cristina Delgado-Andrade, Faver Gomez-Narvaez, Jose Contreras-Calderon
and Francisco J. Morales
Formation of Acrylamide and Other Heat-Induced Compounds during Panela ProductionReprinted from: Foods 2020, 9, 531, doi:10.3390/foods9040531 . . . . . . . . . . . . . . . . . . . . . 53
Jong-Sun Lee, Ji-Won Han, Munyhung Jung, Kwang-Won Lee and Myung-Sub Chung
Effects of Thawing and Frying Methods on the Formation of Acrylamide and PolycyclicAromatic Hydrocarbons in Chicken MeatReprinted from: Foods 2020, 9, 573, doi:10.3390/foods9050573 . . . . . . . . . . . . . . . . . . . . 67
Daniel Martın-Vertedor, Antonio Fernandez, Marta Mesıas, Manuel Martınez, Marıa Dıaz
and Elisabet Martın-Tornero
Industrial Strategies to Reduce Acrylamide Formation in Californian-Style Green Ripe OlivesReprinted from: Foods 2020, 9, 1202, doi:10.3390/foods9091202 . . . . . . . . . . . . . . . . . . . . 81
Marta Mesias, Aouatif Nouali, Cristina Delgado-Andrade and Francisco J Morales
How Far Is the Spanish Snack Sector from Meeting the Acrylamide Regulation 2017/2158?Reprinted from: Foods 2020, 9, 247, doi:10.3390/foods9020247 . . . . . . . . . . . . . . . . . . . . . 97
Marta Mesias, Cristina Delgado-Andrade and Francisco J. Morales
Are Household Potato Frying Habits Suitable for Preventing Acrylamide Exposure?Reprinted from: Foods 2020, 9, 799, doi:10.3390/foods9060799 . . . . . . . . . . . . . . . . . . . . . 109
Amaia Iriondo-DeHond, Ana Sofıa Elizondo, Maite Iriondo-DeHond, Maria Belen Rıos,
Romina Mufari, Jose A. Mendiola, Elena Ibanez and Maria Dolores del Castillo
Assessment of Healthy and Harmful Maillard Reaction Products in a Novel Coffee CascaraBeverage: Melanoidins and AcrylamideReprinted from: Foods 2020, 9, 620, doi:10.3390/foods9050620 . . . . . . . . . . . . . . . . . . . . . 129
v


About the Editors
Marta Mesıas graduated in Pharmacy from the University of Seville (Spain) and graduated in
Food Science and Technology from the University of Granada (Spain). She is part of the research
team studying chemical modifications in processed foods at the Institute of Food Science, Technology
and Nutrition (ICTAN). Particularly, her investigations focus on the Maillard reaction, evaluating
the technological, nutritional, and toxicological consequences of the appearance of Maillard reaction
products during food processing. She combines her research with dissemination, promoting the
transfer of knowledge to society and consumer education in terms of food safety.
Cristina Delgado-Andrade is a tenured scientist from the Spanish National Research Council
working at the field of Food Science and Health–Diet interactions since 1997. Her major interests
are in the exposition to different food processing contaminants and the study of their connection
with the progress and development of associated diseases. Thanks to a multidisciplinary training
acquired in Spanish and European laboratories, she is currently involved in various scientific
projects in collaboration with notable international researchers and institutions. She has also carried
out advisory works for the food industry as well as tailored projects according to business necessities.
Francisco J. Morales graduated in Biochemistry and Molecular Biology and with a PhD in
Food Chemistry from the Autonomous University of Madrid (Spain). He has been a permanent
scientific research staff member at the Spanish National Council for Scientific Research (CSIC) since
1998. He is currently a member of the scientific committee of the Spanish Agency for Food Safety
at the European Committee for Standardization (CEN), and at the Commission of the Global Area
LIFE at CSIC. He is Director of the research team on chemical modifications in processed foods at
the Institute of Food Science, Technology and Nutrition (ICTAN). He served as Researcher at the
University of Wageningen (NL) for 2 years and, later, Deputy Scientific Director at the Institute of
Science and Technology of Food and Nutrition (ICTAN) from 2011 to 2017. His research covers the
study of the beneficial/adverse properties of processed foods from a risk/benefit perspective. He
coordinates a multidisciplinary team with complementary skill in food chemistry, food technology,
nutrition, human health, and social sciences. Particularly, his investigations focus on the Maillard
reaction, covering the technological, nutritional, and toxicological repercussion of Maillard reaction
products. He has participated and led a large number of regional, national, and European research
projects in addition to contracts for development and innovation with the agro-food private sector.
He has transferred a patent under international exploitation, and also acts as supervisor of visiting
researchers, predoctoral, students, and technicians. He has published more than 150 scientific articles
in peer-reviewed international journals (corresponding to a h-index of 41), and 18 book chapters in
the field of quality and food safety.
vii


foods
Editorial
Introduction to the Special Issue: New Frontiers inAcrylamide Study in Foods—Formation, Analysis andExposure Assessment
Cristina Delgado-Andrade, Marta Mesías * and Francisco J. Morales
Institute of Food Science, Technology and Nutrition (ICTAN), Spanish National Research Council (CSIC),E-28040 Madrid, Spain; [email protected] (C.D.-A.); [email protected] (F.J.M.)* Correspondence: [email protected]; Tel.: +34-91-5492300
Received: 28 September 2020; Accepted: 16 October 2020; Published: 21 October 2020
Abstract: Acrylamide is a chemical contaminant that naturally originates during the thermalprocessing of many foods. Since 2002, worldwide institutions with competencies in food safetyhave promoted activities aimed at updating knowledge for a revaluation of the risk assessmentof this process contaminant. The European Food Safety Authority (EFSA) ruled in 2015 that thepresence of acrylamide in foods increases the risk of developing cancer in any age group of thepopulation. Commission Regulation (EU) 2017/2158 establishes recommended mitigation measuresfor the food industry and reference levels to reduce the presence of acrylamide in foods and,consequently, its harmful effects on the population. This Special Issue explores recent advances onacrylamide in foods, including a novel insight on its chemistry of formation and elimination, effectivemitigation strategies, conventional and innovative monitoring techniques, risk/benefit approachesand exposure assessment, in order to enhance our understanding for this process contaminant and itsdietary exposure.
Keywords: acrylamide; chemical process contaminants; Maillard reactions; food safety; risk/benefits;mitigations; exposure
Chemical process contaminants are substances formed when foods undergo chemical changesduring processing, including heat treatment, fermentation, smoking, drying and refining. Althoughnecessary for making food edible and digestible, heat treatment can have undesired consequencesleading to the formation of heat-induced contaminants such as acrylamide. It is well-establishedthat acrylamide is formed when foods containing free asparagine and reducing sugars are cookedat temperatures above 120 ◦C in low moisture conditions. It is mainly formed in baked or friedcarbohydrate-rich foods, as the relevant raw materials contain its precursors. These include cereals,potatoes and coffee beans. In 1994, acrylamide was classified by the International Agency for Researchon Cancer as being probably carcinogenic to humans (group 2A), and in 2015, the European FoodSafety Authority (EFSA) confirmed that the presence of acrylamide in foods is a public health concern,requiring continued efforts to reduce its exposure.
This special edition assembled nine quality papers, one review and eight research papers, focusingon several acrylamide-related issues, from raw materials to consumer exposure.
Different approaches for acrylamide determination in foods have been critically reviewed by Panet al. [1], including conventional instrumental analysis methods and the new rapid immunoassayand sensor detection procedures. Advantages and disadvantages of different analysis technologiesare compared in order to provide new ideas for the development of more efficient and practicalanalysis methods and detection equipment. Fernandes et al. [2] set up a high-resolution orbitrap massspectrometry method for acrylamide measurement, with good repeatability, limit of detection andquantification, as well as enhanced detection sensitivity.
Foods 2020, 9, 1506; doi:10.3390/foods9101506 www.mdpi.com/journal/foods1

Foods 2020, 9, 1506
Some of the papers included have focused on the importance of precursor levels in the rawmatter and the processing conditions on acrylamide formation. In this sense, Sun and colleagues [3]investigated the effects of nitrogen rate and storage time on potato glucose concentrations in differentcultivars, analyzing the relationships between acrylamide, glucose, and asparagine for new cultivars.Mesias et al. [4] evaluated browning, antioxidant capacity and the formation of acrylamide and otherheat-induced compound at different stages during the production of block panela (non-centrifugalcane sugar), establishing the juice concentration step as the critical point to settle mitigation strategies.Lee and co-workers [5] assessed the effects of thawing and frying methods on the formation ofacrylamide and polycyclic aromatic hydrocarbons (PAHs) in chicken meat. They conclude that airfrying could reduce the formation of acrylamide and PAHs in this food matrix at in comparison withdeep-fat frying. In the case of cereal-derived products, Fernandes et al. [2] compared the acrylamidelevels of biscuits with several production parameters, such as time/cooking temperature, placement onthe cooking conveyor belt, color, and moisture. They state that the composition of the raw materials isthe most important factor in the acrylamide content; therefore, establishing the level of precursor ofingredients strongly would contribute to the establishment of effective mitigation strategies. Industrialstrategies to reduce acrylamide formation in Californian-style green ripe olives were studied byMartín-Veltedor et al. [6], with interesting results for the table olive industry to identify critical pointsin the production of this type of olives, thus helping to control acrylamide formation in this foodstuff.
It is well-known that potato- and cereal-derived products as well as coffee are important acrylamidesources in the Western diet. The food industry is especially interested in prospective studies dealingwith the presence of acrylamide in these elaborations and its evolution in recent years. The studyby Mesias et al. [7] evaluated acrylamide levels in seventy potato crisp samples commercialized inSpain with the purpose of updating knowledge about the global situation in this snack sector andevaluate the effectiveness of mitigation strategies applied, especially since the publication of the2017/2158 Regulation. Results demonstrated that average acrylamide content in 2019 was 55.3% lowercompared to 2004, 10.3% lower compared to 2008 and very similar to results from 2014, evidencing theeffectiveness of mitigation measures implemented by Spanish potato crisp manufacturers. However,27% of samples exhibited concentrations above the benchmark level established in the Regulation, whichsuggests that efforts to reduce acrylamide formation in this sector must continue. The same researchteam also developed a survey in 730 Spanish households to identify culinary practices which mightinfluence acrylamide formation during the domestic preparation of French fries and their compliancewith the acrylamide mitigation strategies described in the same document [8]. They conclude thatalthough habits of the Spanish population are in line with recommendations to mitigate acrylamideduring French fry preparation, educational initiatives disseminated among consumers would reducethe formation of this contaminant and, consequently, exposure to it in a domestic setting. Finally,an assessment of healthy and harmful Maillard reaction products (melanoidins and acrylamide) in asun-dried coffee cascara beverage was developed by Iriondo-DeHond et al. [9], analyzing its safetyand health-promoting properties. The novel beverage is proposed as a potential sustainable alternativefor instant coffee, with low caffeine and acrylamide levels and a healthy composition of nutrientsand antioxidants.
We hope that this Special Issue will be interesting for researchers engaged in the acrylamide issuein foods, including a novel insight on its chemistry of formation and elimination, effective mitigationstrategies, classical and novel monitoring techniques, risk/benefit approaches, and exposure assessment,in order to enhance our understanding for this process contaminant and its dietary exposure.
Conflicts of Interest: The authors declare no conflict of interest.
References
1. Pan, M.; Liu, K.; Yang, J.; Hong, L.; Xie, X.; Wang, S. Review of Research into the Determination of Acrylamidein Foods. Foods 2020, 9, 524. [CrossRef] [PubMed]
2

Foods 2020, 9, 1506
2. Fernandes, C.; Carvalho, D.; Guido, L. Determination of Acrylamide in Biscuits by High-Resolution OrbitrapMass Spectrometry: A Novel Application. Foods 2019, 8, 597. [CrossRef] [PubMed]
3. Sun, N.; Wang, Y.; Gupta, S.K.; Rosen, C.J. Potato Tuber Chemical Properties in Storage as Affected byCultivar and Nitrogen Rate: Implications for Acrylamide Formation. Foods 2020, 9, 352. [CrossRef]
4. Mesias, M.; Delgado-Andrade, C.; Gómez-Narváez, F.; Contreras-Calderón, J.; Morales, F. Formation ofAcrylamide and other Heat-Induced Compounds during Panela Production. Foods 2020, 9, 531. [CrossRef]
5. Lee, J.; Han, J.; Jung, M.; Lee, K.; Chung, M. Effects of Thawing and Frying Methods on the Formation ofAcrylamide and Polycyclic Aromatic Hydrocarbons in Chicken Meat. Foods 2020, 9, 573.
6. Martín-Vertedor, D.; Fernández, A.; Mesías, M.; Martínez, M.; Díaz, M.; Martín-Tornero, E. IndustrialStrategies to Reduce Acrylamide Formation in Californian-Style Green Ripe Olives. Foods 2020,9, 1202. [CrossRef]
7. Mesias, M.; Nouali, A.; Delgado-Andrade, C.; Morales, F. How Far is the Spanish Snack Sector from Meetingthe Acrylamide Regulation 2017/2158? Foods 2020, 9, 247. [CrossRef] [PubMed]
8. Mesias, M.; Delgado-Andrade, C.; Morales, F. Are Household Potato Frying Habits Suitable for PreventingAcrylamide Exposure? Foods 2020, 9, 799. [CrossRef]
9. Iriondo-DeHond, A.; Elizondo, A.; Iriondo-DeHond, M.; Ríos, M.; Mufari, R.; Mendiola, J.; Ibañez, E.; delCastillo, M. Assessment of Healthy and Harmful Maillard Reaction Products in a Novel Coffee CascaraBeverage: Melanoidins and Acrylamide. Foods 2020, 9, 620. [CrossRef]
Publisher’s Note: MDPI stays neutral with regard to jurisdictional claims in published maps and institutionalaffiliations.
© 2020 by the authors. Licensee MDPI, Basel, Switzerland. This article is an open accessarticle distributed under the terms and conditions of the Creative Commons Attribution(CC BY) license (http://creativecommons.org/licenses/by/4.0/).
3


foods
Review
Review of Research into the Determination ofAcrylamide in Foods
Mingfei Pan 1,2, Kaixin Liu 1,2, Jingying Yang 1,2, Liping Hong 1,2, Xiaoqian Xie 1,2 and
Shuo Wang 1,2,*
1 State Key Laboratory of Food Nutrition and Safety, Tianjin University of Science & Technology,Tianjin 300457, China; [email protected] (M.P.); [email protected] (K.L.);[email protected] (J.Y.); [email protected] (L.H.); [email protected] (X.X.)
2 Key Laboratory of Food Nutrition and Safety, Ministry of Education of China,Tianjin University of Science and Technology, Tianjin 300457, China
* Correspondence: [email protected]; Tel.: +86-022-60912493
Received: 30 March 2020; Accepted: 20 April 2020; Published: 22 April 2020
Abstract: Acrylamide (AA) is produced by high-temperature processing of high carbohydratefoods, such as frying and baking, and has been proved to be carcinogenic. Because of its potentialcarcinogenicity, it is very important to detect the content of AA in foods. In this paper, the conventionalinstrumental analysis methods of AA in food and the new rapid immunoassay and sensor detectionare reviewed, and the advantages and disadvantages of various analysis technologies are compared,in order to provide new ideas for the development of more efficient and practical analysis methodsand detection equipment.
Keywords: acrylamide; detection; rapid methods; food safety
1. Introduction
Acrylamide (AA) is a small molecule organic compound that exists in solid form at normaltemperature and pressure. It is sensitive to the light and can be initiated to polymerize to formpolyacrylamide under ultraviolet conditions [1,2]. Therefore, AA is a commonly-used polymerizationmonomer in industry. In 1994, AA was classified as a “probable carcinogen” by the International CancerAgency (IARC) and in April 2002, researchers demonstrated that plant foods rich in carbohydrates andlow in protein are prone to produce large amounts of AA during high-temperature (>120 ◦C) processingsuch as frying and baking [3,4]. This result has caused widespread concern about this compoundworldwide. The thermal processing of food is an indispensable process in modern food processing.Under heat treatment such as frying and baking, foods rich in starch and other carbohydrates have color,flavor, and other characteristics added through the Maillard reaction, which is the main way to formAA [5–7]. Recently, AA generation has been associated with high sterilization temperatures, mainlyinvolving the formation of AA in fat-rich foods such as ripe black table olives [8,9]. The content of AAin high-carbohydrate foods with different thermal processing methods is different, and within a certaintemperature range, the content of AA increases with the processing time and temperature [10–13].According to the report of Commission Regulation (EU) 2017/2158 which established mitigationmeasures and benchmark levels for the reduction of the presence of acrylamide in food, the average AAcontent in food (processed cereal products, coffee substitutes, etc.) is in the range of 40–4000 μg kg−1 [14].Since foods proposed to monitor the presence of AA in the Commission Regulation (EU) 2019/1888(potato products, bakery products, cereal products, and others such as dried fruits, olives in brine) arean important part of human food, it is particularly important to deepen the research and quantitativeanalysis of the process control of AA content in foods [15–17].
Foods 2020, 9, 524; doi:10.3390/foods9040524 www.mdpi.com/journal/foods5

Foods 2020, 9, 524
In recent years, the mechanism of AA production and its mutagenesis and carcinogenesis in thehuman body have been gradually revealed [18–21] and related strategies for AA detection in variousfoods have been successively developed. These strategies are not only used for the analysis of AAcontent in foods, but also provide a reliable judgement of AA risk level [22]. It has been reportedthat the tolerable daily intake (TDI) of neurotoxic and carcinogenic AA is 40 and 2.6 μg kg−1 day−1,respectively [23]. On the other hand, the matrix of heat-processed foods rich in carbohydrates is usuallycomplicated. In addition, AA has a small molecular weight (Mr = 71.08 g mol−1), high reactivity,and other characteristics, which makes it difficult to perform accurate quantitative analysis of AA.Therefore, it is of great significance to develop accurate, sensitive, and anti-interference methods forthe analysis and detection of AA content in foods.
This paper reviews the conventional instrumental methods for AA detection in foods andnew types of analytical methods such as rapid immunoassays, supramolecular recognition, andnano-biosensors, and comprehensively evaluates the advantages and the shortcomings of variousanalytical techniques, aiming to provide new ideas for the development of more-efficient and practicalanalytical methods and testing devices, so as to provide technical support for the detection and riskassessment of AA in foods.
2. Instrumental Analysis Strategies for AA Content in Foods
Up to now, instrumental analysis based on the principles of chromatography and mass spectrometryincluding high performance liquid chromatography (HPLC) [24–26], gas chromatography (GC) [27–29],liquid chromatography tandem mass spectrometry (LC-MS/MS) [30–32], and gas chromatography-massspectrometry (GC-MS) [33] have still been the main methods to detect AA content in foods. With highaccuracy and sensitivity, as well as good stability and reproducibility, these kinds of methods arethe most reliable for analysis and detection of AA. Therefore, although these kinds of methods needexpensive equipment and are high in detection cost, they are still the main methods for detectingAA content in food. Luo et al. have developed a non-aqueous reaction system based on the GC-MSmethod for rapid and sensitive detection of AA in food matrices [34]. Under mild reaction conditions(40 ◦C), concentrated AA can complete the reaction with flavanol in 1 min, which simplifies thederivatization reaction process and improves the stability of the detection results. Under optimalconditions, this developed GC-MS method has a linear response range of 0.005–4 μg mL−1 withcorrelation coefficient (R2) at 0.99993 in food matrices. The limit of detection (LOD, S/N = 3) andthe relative standard deviation (RSD, n = 6) are achieved at 0.7 μg kg−1 and 2.3–6.1%, respectively,showing good accuracy, sensitivity, and repeatability, which can meet the needs of detection of AA infood matrix. However, due to the high polarity, low volatility, and low molecular weight of AA, thederivatization process is often needed to enhance the stability of AA, and further improve the detectionsensitivity of GC and its combination technology. LC-MS/MS, however, has no derivatization process,greatly reducing the detection time and meeting the requirements for a green environment [35,36].Calbiani and his co-workers established a fast and accurate method for the determination of AAin cooked food samples by reversed-phase LC-MS coupled with electrospray [37]. An acidifiedwater extraction step without purification was used in this method, simplifying sample-processingprocedures. Remarkable results (LOD: <15 μg kg−1; LOQ: <25 μg kg−1) were obtained for intradayrepeatability (RSD < 1.5%) and between-day precision (RSD < 5%), demonstrating that this method issuitable for the determination of AA in cooked food products. Galuch et al. extracted AA from coffeesamples by the method of dispersion liquid–liquid microextraction, combined with ultra-performanceLC-MS/MS and standard addition method, obtaining good detection sensitivity (LOD: 0.9 μg L−1;limit of quantitation (LOQ): 3.0 μg L−1) and precision (internal and inter-assay precision: 6–9%) [38].Tolgyesi developed a hydrophilic interaction liquid chromatography tandem mass spectrometric(HILIC-MS/MS) to determine AA in gingerbread samples with high sugar content [39]. The proposedmethod had acceptable accuracy (101–105%) and precision (2.9–7.6%) with a LOQ of 20 μg kg−1.At the same time, the method was also applied to other food samples (bread, roasted coffee, instant
6

Foods 2020, 9, 524
coffee, cappuccino powder, and fried potatoes), and the tested AA content was lower than theEU-set level. Additionally, because of the good separation effect, LC-MS/MS can also be applied insimultaneous detection of AA and other harmful substances in one sample, which has good applicationvalue [40,41]. Wu et al. used isotope-dilution ultra-performance LC-MS/MS for simultaneous detectionof 4-methylimidazole and AA in 17 commercial biscuit products [42], revealing the wide presence of4-methylimidazole and AA in biscuit products. This method was validated with respect to linearity,LOQ, precision, trueness, and measurement uncertainty and offers a reliable and sensitive tool for4-MI and AA measurements in biscuit products.
In addition, because foods are complex matrices, analytical methods using large precisioninstruments often require a relatively tedious process for sample purification. Therefore, developingeffective and reliable materials for sample pretreatment and purification is meaningful to improvesensitivity and accuracy of AA detection, and has very important application value [43,44]. Arabi andhis co-workers have prepared dummy molecularly-imprinted silica nanoparticles (DMISNPs) withhigh selectivity for AA based on the techniques of sol-gel, one-step synthesis and central compositedesign [45]. In the polymerization process, 3-aminopropyltrimethoxysilane (APTMS) was usedas the functional monomer, propionamide as the dummy template, and tetraethyl orthosilicate(TEOS) as the crosslinking agent. The obtained DMISNPs were further used as sorbent to extractAA from food samples using a matrix solid-phase dispersion method (MSPD), and then combinedwith HPLC-MS to detect AA in biscuits and bread samples. The results showed that DMISNPshave high porosity, good uniformity and high selectivity and affinity for AA. More importantly,this molecularly-imprinted polymer (MIP) composite was easy to completely remove the dummytemplates to obtain highly-recognized cavities, which are beneficial to eliminate template problems andimprove mass transfer and extraction efficiency (Figure 1A). The MSPD method also greatly reduces theconsumption of toxic organic solvents. Magnetic solid-phase extraction (MSPE) consumes less organicsolvent and has higher contact-surface efficiency and repeatability. In addition, the magnetic adsorbentdoes not require the processes of filtration, centrifugation, and precipitation, and can be directlycollected magnetically, which greatly simplifies the pretreatment steps and has received great attentionin complex sample pretreatment techniques in recent years [46–48]. Nodeh successfully developed ahybrid of magnetite (Fe3O4) and sol-gel of TEOS and methyltrimethoxysilane (MTMOS) to modify thegraphene. The obtained material was further applied as magnetic solid purified adsorbent for rapidpurification and extraction of AA in various foods, combined with GC-MS analysis (Figure 1B) [49].Compared with previous studies based on MSPE, this study used the matrix-matching method forcalibration, which has better linearity (R2 = 0.9990), lower LOD (0.061–2.89 μg kg−1), and higherrecovery (82.7–105.2%). The prepared Fe3O4@graphene-TEOS -MTMOS extractant can be reused atleast seven times with a recovery rate higher than 85%. Bagheri et al. also used propionamide as adummy template to fix a thin layer of chitosan-imprinting network on Fe3O4@PEG core in aqueousmedium, and obtained a dummy MIP (DMIP) (Figure 1C), which was applied to detect AA in biscuitsamples in combination with HPLC [50]. This DMIP had a uniform nano-core-shell structure andgood magnetic properties, which were conducive to simple and rapid separation. This novel core-shellrecognition material further overcame the shortcomings of poor selectivity of MSPE, and the synthesiswas simple, easy to separate, in line with the green synthesis strategy, and very suitable for thepretreatment and purification of complex samples.
7

Foods 2020, 9, 524
(A) (B)
(C)
Figure 1. (A) Surface topography of dummy molecularly-imprinted silica nanoparticles (DMISNPs)(a: SEM and b: TEM) and the DMISNPs-matrix solid-phase dispersion method (MSPD) extractionprocedure [45]. Copyright: Food Chemistry, 2016. (B) Schematic procedure of magnetic solid-phaseextraction (MSPE) using Fe3O4@graphene-TEOS-MTMOS [49]. Copyright Food Chemistry, 2018; (C)Schematic procedure of MSPE using dummy molecularly-imprinted polymer (DMIP) with Fe3O4@PEGas core [50]. Copyright: Talanta, 2019.
On the other hand, solid-phase microextraction (SPME) is a kind of non-solvent selective extractionmethod, which abandons the shortcomings of the traditional SPE process that needs column packingand solvent for desorption, and only needs a simple syringe to complete the whole pretreatment andinjection processes. Therefore, SPME has the characteristics of low cost, simple device and operation,fast, efficient, and high sensitivity. As a unique sample pretreatment and enrichment method, SPMEhas also been paid attention to in the detection of AA [51,52]. A direct, fast strategy based onheadspace SPME has been developed for AA extraction from coffee beans [53]. The commercial SPMEfiber-coated polydimethylsiloxane (PDMS) was employed to carry out the silylation reaction of AAwith N,O-bis(trimethylsilyl) trifluoroacetamide and further quantified AA analysis in combination withGC-MS methods. The LOQ of AA for this method is 3 μg kg−1 with good reproducibility (RSD: 2.6%),which was in accordance with the EU’s recommendations for monitoring AA content in foods [54].The liquid-phase microextraction (LPME) method realizes the integration of sampling, separation,purification, concentration, and injection, which is simple and fast in AA detection [55,56]. Elahi et al.have developed a dispersive liquid microextraction combined with GC-MS method to detect AA incookie samples [57]. This study has effectively removed the complex matrix components in samplepretreatment and significantly extracted trace amounts of target analytes in a short time. Lower valuesof LOD (0.6 μg kg−1) and LOQ (1.9 μg kg−1) and acceptable recovery range (89–95%) with RSD of 9.2%demonstrated the merits of the method in the detection of AA at low and high content in biscuits.
8

Foods 2020, 9, 524
Stable isotope tracing technology is one technique that uses the enriched stable isotope-labeledcompounds as tracers and analyzes isotopic compositions to monitor or detect certain biochemicalprocesses [58,59]. At present, the main internal standard compounds used in the detection of AA byMS include d3-AA, 13C3-AA, N, N-dimethylacrylamide, propionic acid, and methacrylamide [60].By adding 13C3-AA internal standard solution to the test sample, through a series of extraction,purification, and derivatization of bromine reagents, the GC-MS method can reach an LOD of 10 μgkg−1 of AA in rice [61]. Lim et al. employed the deuterated d3-AA as an internal standard for theanalysis of AA content in food samples, and the established LC-MS/MS method achieved a lowerLOD (0.04 μg kg−1) and LOQ (0.14 μg kg−1) [62]. The RSD values in the AA concentration range of20–100 μg kg−1 was less than 8%, demonstrating good sensitivity and reproducibility of the developedmethod. This strategy did not require further extraction and purification processes, but still requireda certain amount of toxic organic reagents. Ferrer-Aguirre et al. employed deuterated d5-AA as aninternal standard, in combination with HPLC coupled to triple quadrupole-tandem MS, to initiallydetermine AA content in different starchy foods (such as potato chips and potatoes) [63]. This effectiveanalysis strategy used the water as an extraction solvent, which minimized the detection cost andreduced the sample processing. The values of LOD and LOQ were 4 and 12 μg kg−1 (potato chips)and 2 and 5 μg kg−1 (roasted asparagus), respectively. This method has the advantages of simpleprocess, low cost, and no toxicity, and is suitable for preliminary identification of AA in differentstarchy foods. Carbon-labeled internal standards were also used for the detection of AA contentin foods. Yoshioka Toshiaki et al. developed a supercritical fluid chromatography tandem massspectrometry (SFC-MS/MS) technique using 13C3-AA as an internal standard for rapid quantitativeanalysis of AA in various beverage, cereal, and confectionery samples [64]. Compared with methodsusing hydrogen-labeled internal standards, this proposed method has extremely high accuracy andsensitivity, simplifies the detection steps, and can quickly quantify low-concentration analytes, whichhas a very important practical value.
3. New Strategies for AA Analysis
Food belongs to fast consumer goods, which require fast detection speeds and high throughput,which puts forward new requirements for food analysis and detection. Although the traditionalinstrumental analysis of AA in foods has obvious advantages in detection stability and accuracy,it needs a relatively cumbersome sample pretreatment process, which makes it far behind in real-time,online and large-number sample analysis. With the rise and in-depth development of technologiessuch as immunity, sensing, and chips, some simple, fast, low cost, and convenient analytical strategieshave been proposed and applied to the detection of AA content in foods.
3.1. Capillary Electrophoresis
Capillary electrophoresis (CE) has the characteristics of fast analysis speed and high separationefficiency, and requires a small amount of sample, making it an effective tool for the analysis of tracecomponents in foods [65,66]. CE is based on different charge ratios of the target substance to achieveefficient separation. Therefore, the target substance is required to have a certain charge (positive ornegative). The non-charged AA can achieve the detection purpose by adding an ionic surfactant to thedetection system to form a charged micelle on its surface. Abd El-Hady et al. developed an analytefocusing by ionic liquid micelle collapse (AFILMC) capillary electrophoresis method combined withionic liquid ultrasonic-assisted extraction to simultaneously measure AA, asparagine, and glucose infoods [67]. In this process, 1-butyl-3-methylimidazolium bromide (BMIM+ Br−) was used as a surfactant,and the washing procedure of HCl and water was appropriately optimized to sufficiently reduce theadsorption of BMIM+ Br−. The separation and extraction efficiency exceeded 97.0%. The AFILMCmeasurements achieved adequate reproducibility and accuracy with RSD 1.14–3.42% (n = 15) andrecovery 98.0–110.0% within the concentration range of 0.05–10.0 μmol L−1. The LODs achieved to0.71 μg kg−1 for AA, 1.06 μg kg−1 for asparagine, and 27.02 μg kg−1 for glucose, respectively, with
9

Foods 2020, 9, 524
linearity ranged between 2.2 and 1800 μg kg−1. This method has the characteristics of environmentalprotection, low cost, high efficiency, and high selectivity. Pre-column derivatization is another methodused in CE to charge AA.
Yang et al. proposed an efficient method for AA derivatization based on thiol-olefin reaction usingcysteine as a derivatization reagent, and combined with capacitively-coupled contactless conductivitydetection (C4D) for CE analysis of AA (Figure 2A) [68]. This method can analyze labeled AA within2.0 min, and the RSD of migration time and peak area are less than 0.84% and 5.6%, showing goodaccuracy and selectivity. At the same time, the C4D signal of the AA derivative has a good linearrelationship with the AA concentration in the range of 7–200 μmol L−1 (R2 = 0.9991), LOD and LOQ(0.16 μmol L−1 and 0.52 μmol L−1). Due to the advantages of simple sample pretreatment, highderivatization efficiency, short analysis time, and high selectivity and sensitivity, this CE-C4D isexpected to achieve further miniaturization for field analysis.
(A) (B)
Figure 2. (A) Schematic illustration for thiol-ene click derivatization of acrylamide (AA) usingcysteine and the CE-C4D system [68]. Copyright: Journal of Agricultural and Food Chemistry, 2019.(B) Five-steps of microchip electrophoresis technology (MCE) strategy. A: preloading, B: loading, C:prolonged field-amplified sample stacking, D: reversed-field stacking, and E: separation [69]. Copyright:Food Chemistry, 2016.
A portable microchip requires a small amount of detection samples, especially when combinedwith electrophoresis technology, which shortens the separation channel, thus achieving faster separationand more sensitive detection [70,71]. Because the content of AA in foods is very low, it is not suitable formicrochip electrophoresis technology (MCE). It must be combined with on-line enrichment technologyto improve the sensitivity. This on-line enrichment and detection method effectively overcomes theinterference of food complex matrix and improves the detection speed [72,73]. Wu et al. proposed anMCE based on a combination of high-field amplification and anti-field superposition of online multiplepre-enrichment technology for efficient analysis of AA in foods (Figure 2B) [69]. The best separationhas been achieved under the condition of 100 mmol L−1 borate solution at pH 9.3 as the running buffer.The sensitivity of this method (LOD: 1 μg L−1) is 41–700 times higher than the previously-reportedCE of on-line preconcentration technology, which has been successfully applied to detect AA contentin potato chips and French fries with reliable results and satisfactory recoveries. Compared withtraditional methods for AA detection, this effective method has the advantages of short analysis time,low sample and reagent consumption, and low instrumental cost.
3.2. Immunoassay Method
Immunoassay is one new, rapid, and high-throughput analysis strategy based on the specificcombination of antigen (Ag) and antibody (Ab). After nearly 20 years of development, the immunoassayhas gradually developed into enzyme-linked immunoassay (ELISA) [74,75], chemiluminescent
10

Foods 2020, 9, 524
immunoassay [76,77], fluorescent immunoassay [78,79] and so on, which have been widely usedin food analysis, especially in the field of rapid detection. The Ab with specific binding abilityis the basis of immunoassay. Due to the fact that AA is a small molecular compound, lacking inantigenic determinant and immunogenicity, AA is usually cross-linked with the carrier proteins,bovine serum albumin (BSA), ovalbumin (OVA), etc., with immune response, to prepare incompleteantigens, and the polyclonal Abs with specific recognition ability are further obtained by immunizinganimals. Singh et al. prepared polyclonal Abs which were raised against a hapten derived from AAand 3-mercaptobenzoic acid (3-MBA) and established an indirect competitive ELISA (ic-ELISA) toquickly quantify AA in complex foods matrix and water [80]. This ic-ELISA had high affinity andspecificity for AA-3-MBA derivatives and did not cross-react with the main precursors (asparagine,aspartic acid, AA, or 3-MBA) that form AA in foods. The LODs achieved for AA-3-MBA in foodmatrices and water were 5.0 μg kg−1, and 0.1 μg L−1, respectively, which verified that the developedic-ELISA has extremely high sensitivity and good AA recovery, and is suitable for AA detectionin multiple matrices. Wu and his co-workers used the 4-mercaptophenylacetic-acid-derived AA(AA-4-MPA) to prepare polyclonal Abs and developed a pre-analytical derivatization method foric-ELISA analysis of AA (Figure 3A) [81]. By comparison with the results from the HPLC-MS/MSmethod, this ic-ELISA has better accuracy and reliability (IC50: 2.86 μg kg−1, LOD: 0.036 μg kg−1,linear range: 0.25–24.15 μg kg−1), lower detection cost, and is suitable for routine rapid screeningof AA in food samples. Monoclonal antibodies (MAbs) are homologous Abs produced by a B-cellclone that recognize an antigenic determinant, have high titer, strong homogeneity and specificity,and low cross reactivity. Zhu et al. used the 4-mercaptobenzoic acid-derived AA (AA-4-MBA) tocouple to carrier proteins (BSA and OVA) (Figure 3B) [82]. The resulting conjugates of AA-4-MBA–BSAand AA-4-MBA–OVA were used as the immunogen and coating antigen. The obtained MAb is notspecific for AA or 4-MBA but has high affinity for AA-4-MBA (IC50: 32 μg L−1; LOD 8.87 μg L−1).The quantitative working range is 8.87–12.92 μg L−1 (IC20 to IC80) and the cross-reactivity with otheranalogs is less than 10%, meaning that the developed ic-ELISA method has extremely high specificityand can effectively detect AA in high-temperature-cooking foods.
(A) (B)
Figure 3. (A) The indirect competitive ELISA (ic-ELISA) procedure for AA analysis in foods [81].Copyright: Journal of Agricultural and Food Chemistry, 2014. (B) Scheme for 4-mercaptobenzoicacid-derived AA (AA-4-MBA) hapten synthesis and UV scans of curves of AA-4-MBA, protein, andAg [82]. Copyright: Food and Agricultural Immunology, 2016.
Compared with the ELISA, the immunochromatographic strip (ICS) is a relatively matureintegrated detection product, which is simpler to operate and can be completed without professionaloperators, meeting the real-time and fast-detection requirements of AA. Assaat et al. have produced,purified, and characterized a polyclonal Ab against AA for ICS testing of AA [83]. Polyclonal anti-AAAb was prepared by injecting N-acryloxysuccinimide conjugated BSA hapten into New Zealand white
11

Foods 2020, 9, 524
rabbits and further purified with protein A and conjugated with Au nanoparticles (AuNPs). Accordingto the obtained results, the ICS prepared in this study quantitatively showed that the intensity of thered line increased with the increase of AA concentration, and was sensitive to standard AA solution at1 g L−1 concentration, which is expected to be applied for the rapid detection of AA in foods.
Immunoassay based on biological Abs has the advantage of fast detection speed and highthroughput. However, the process of obtaining biological Abs with high specific binding ability iscomplicated and costly; it is easy to be affected by environmental conditions in the detection process,resulting in false positive results, which to some extent limit the development of biological immunoassay.Molecular imprinting technology (MIT) can chemically synthesize high-specific and stable polymersbased on the principle of Ab formation. The obtained MIPs also called “artificial antibodies”, areused in the development of biomimetic ELISA method, which has very broad application prospects.A direct competitive biomimetic ELISA rapid analysis method for AA analysis was developed by Sunet al. using a hydrophilic-imprinted membrane as a biomimetic Ab [84]. In the preparing process ofthe imprinted membrane, -COOH of methacrylic acid reacted with -NH2 of AA, and an imprintedcavity and a specific binding site of -OH group were generated in a predetermined direction, so thatthe imprinted membrane had high binding and selectivity to AA. The developed biomimetic ELISAmethod had high sensitivity (IC50: 8.0 ± 0.4 mg L−1) and low LOD (IC15: 85.0 ± 4.2 μg L−1), and foran AA-blank potato sample, the recovery rate ranged from 90.0% to 111.5%. The biomimetic ELISAmethod is simple in pretreatment and does not require Ab coating and BSA/PBS blocking procedures,which greatly reduces the operation time. Additionally, the developed blotting membrane can bereused 20 times without loss of sensitivity, which greatly reduces the cost of analysis.
3.3. Sensor Analysis Technique
Sensors can on-line monitor the binding reaction between the tested substance and the recognitionelement, and convert the generated binding signal into a signal that can be processed quantitatively,such as electricity, light, or mass, to achieve the purpose of analysis and detection [85,86]. The AAmolecule contains a -NH2 structure, which can be hydrolyzed to NH4
+ and then detected by theselective electrode [87]. Because this method is based on the catalytic hydrolysis of -NH2, it has astrong cross-reaction to compounds containing -NH2 groups such as formamide and acetamide [88].A new two-step waveform containing a process of separation of reverse-phase LC coupled toa pulsed amperometric detection was reported by Casella’s group for the quantification of lowconcentrations of AA in foodstuffs such as coffee and potato fries. Compared to the classical type ofwaveform, the proposed two-step waveform showed favorable analytical performance in terms ofLOD (1.4 μg kg−1), precision, and improved long-term reproducibility.
3.3.1. Electrochemical Sensing Analysis Based on Biomolecules
As an emerging analysis strategy, biosensors have made in-depth developments in the fieldsof environment, medicine, and food. In food safety, various types of biosensors are designedfor the analysis of food components and harmful substances [89–92]. Hemoglobin (Hb) is aredox-active protein that involves four polypeptide chains, each of which has an electroactivegroup of Fe3+/heme. The electrical activity of Hb is related to the reversible conversion of Hb-Fe3+
to Hb-Fe2+ [93,94]. At the same time, the valine α-NH2 in Hb can be combined with AA to form acomplex, which causes the amount of Hb-Fe2+ to decrease, resulting in the change in the electrontransfer on the surface of the sensing electrode. Based on this principle, the Hb can be modifiedon the surface of the transducer for AA detection [95]. Compared with other proteins with similarmechanisms of action (myoglobin, cytochrome c, etc.), Hb is more appropriate in the constructionof a AA biosensor, due to its commercial accessibility at low cost, its relatively higher stability,and its configuration (N-(2-carbamoyl-ethyl)-L-valine), which is similar to that of the glycidamide(N-(2-carbamoyl-2-hydroxyethyl) -RS-valine), which facilitates the formation of Hb–AA adduct [96,97].However, Hb has a complex spatial structure, and its electroactive center exists inside a polypeptide
12

Foods 2020, 9, 524
chain, which easily causes the electrode surface to be passivated and slows down the electron transferrate. In recent years, in view of these shortcomings and problems, some meaningful solutions havebeen proposed.
Yadav et al. prepared one kind of Hb nanoparticle (HbNP) by the desolvation method,and covalently immoblized HbNPs on a polycrystalline Au electrode to construct a current-type AAbiosensor (Figure 4) [98]. At the experimental conditions of 20 ◦C, 0.26 V, and pH 5.0, the HbNP’smodified Au electrode showed the best current response within 2 s. In the water extract of foods atspiked AA concentration of 5 and 10 mmol L−1, a remarkable recovery of more than 95% was achieved,and the intra- and inter-assay coefficients of variation were lower than 5%. The wide-working range(0.1–100 nmol L−1) and the lower LOD (0.1 nmol L−1) signified this HbNP’s modified Au electrode couldoffer an effective measurement of AA in various processed foods. In this research, the use of HbNPsinstead of natural Hb molecules solved the problem that Hb easily causes the electron transfer rate onthe electrode surface to slow down, increases the specific surface area, and enables highly-sensitivemicro detection of AA. In addition, the constructed sensor was not affected by the structural analogsof AA (such as acrylic acid and propionic acid) during the working process, signifying its goodselective recognition ability. Asnaashari and his co-workers designed an effective double-strandedDNA (dsDNA)/Hb-modified screen-printed Au electrode for the detection of AA (Figure 5A) [99].The square wave voltammetry (SWV) was used to monitor the current response of the designedbiosensor to AA and AA-valine adduct, as well as the changes in the reduction/oxidation processof Hb-Fe3+/Hb-Fe2+. This fabricated sensor obtained a linear working range of AA (2.0 × 10⁻⁶ to5.0 × 10−2 mol L−1) and a lower LOD (1.58 × 10⁻⁷ mol L−1) and had good reproducibility and highstability, which is suitable for direct determination of AA in foods.
(A) (B)
Figure 4. (A) a: Electrochemical reactions involved in the functioning of the hemoglobin nanoparticle(HbNP)-AA biosensor and b: adduct formation of HbNPs and AA. (B) Schematic representation ofchemical reaction of the fabrication of HbNPs onto an Au electrode [98]. Copyright: InternationalJournal of Biological Macromlecules, 2018.
13

Foods 2020, 9, 524
(A) (B)
Figure 5. (A) Hb–AA adduct formation and schematic description of the preparation ofdsDNA/Hb-modified screen-printed Au electrode for AA [99]. Copyright: Food Chemistry, 2019. (B)The reactions catalyzed by glutathione S-transferase (GST). A: coupling of GSH with AA and B: colorreaction used for enzymatic activity measurements [100]. Copyright: Rsc Advances, 2018.
Studies have shown that most of the AA ingested in the body is metabolized in the liver, exceptfor a small part (<10%) which is excreted in the prototype with urine [101–104]. Under the action ofenzymes, AA can combine with glutathione (GSH) to form thioglycolic acid compound, which is furtherconverted into glycidomide (GA). In the case of low AA dose, about 50% of AA will be convertedto GA, while in the case of high dose AA, most of AA will react with GSH and about 13% will beconverted to GA. Therefore, GSH can also be modified on the electrode surface for the sensing responseof AA in foods. Bucur et al. have proposed a method based on the amperometric monitoring of thecoupling reaction between reduced glutathione (GSH) and AA catalyzed by glutathione S-transferase(GST) to produce an electrochemically-inactive compound (Figure 5B) [100]. Cobalt phthalocyaninewas modified on a screen-printed electrode to monitor the decrease in GSH concentration at +300 mV,further aimed to detect the target AA. At the optimal GSH concentration (100 μmol L−1), the linearrange for AA analysis was 7–50 μmol L−1 and LOD achieved to 5 μmol L−1. This proposed methodwas simple, did not require auxiliary substrates such as 1-chloro-2,4-dinitrobenzene (CDNB), and didnot need to suppress adverse competitive kinetics. The whole detection process was not affected byinterfering compounds usually found in foods and could be applied for real sample analysis.
Experimental factors such as the electron transfer rate on the electrochemical sensing interface,and the immobilization capacity and biological activity of the identification element have profoundlyaffected the performance of the sensors. The introduction of nanomaterials not only increases theelectron transfer rate, but also increases the fixed amount and activity of biometric recognition elements,which can significantly improve the stability and sensitivity of sensors. Wulandar et al. developeda platinum (Pt) and Hb-modified boron-doped diamond electrode (Pt-BDD) for the construction ofAA biosensors (Figure 6A) [105]. The surface of Pt-BDD modified with PtNPs had excellent stability.Meanwhile, Hb-Pt-modified BDD (Hb-Pt-BDD) showed a linear CV response in acetate buffered saline(0.2 mol L−1, pH 4.8) with AA concentration range of 0.01–1 nmol L−1. The LOD and LOQ achievedto 0.0085 nmol L−1 and 0.026 nmol L−1, respectively. These results demonstrated that the preparedHb-Pt-BDD electrode has high stability, good sensitivity, and is reusable because it removes Hb adductswithout removing Pt on the surface of BDD. Compared with PtNPs, Au nanomaterials also haveexcellent catalytic activity, efficient electron transfer performance, and good optical characteristics,and have been widely used in the sensing fields. Figure 6B shows the development of an ultrasensitiveimmunosensor using chitosan/SnO2-SiC hollow-sphere nanochains/AuNPs as signal amplification fordetecting AA in water and food samples [106]. SnO2-SiC hollow-sphere nanochains with high surfacearea and AuNPs with good electrical conductivity were prepared on the surface of glassy carbon
14

Foods 2020, 9, 524
electrodes pre-coated with chitosan for subsequent fixed coating of antigens. Under this workingmode, the constructed immunosensor has a lower LOD of 45.9 ± 2.7 ng kg−1 and wider working rangeof 187 ± 12.3 ng kg−1 to 104 ± 8.2 mg kg−1 at the optimized conditions. The recovery of AA in thespiked samples was in the range of 86.0–115.0%. The immunosensor exhibited a sensitive response toAA, and acceptable repeatability and stability.
(A) (B)
Figure 6. (A) Schematic representation of the Pt modification of a boron-doped diamond electrode(BDD) [105]. Copyright: Sensors and Materials, 2019. (B) Schematic illustration of the AA immunosensorfabrication [106]. Copyright: Analytica Chimica Acta, 2019.
Carbon-based nanomaterials (carbon nanotubes, nanocarbon spheres, graphene, carbon nanofibers,etc.) have unique conductive and good mechanical properties, such as unique nanometer size, highsurface area, high electron transfer rate, high stability and the ability to be modified on the surface thatcan maintain the stability and activity of biorecognition molecules [107,108]. Liu et al. have combinedthe composite of AuNPs-multi-walled carbon nanotubes (MWCNTs )-chitosan (AuNPs-MWCNTs-CS)with sol-gel MIT to construct a molecularly-imprinted electrochemical sensor for AA detection [109].The composite of AuNPs and MWCNTs was introduced to improve the polymer conductivity andexpand the surface area of electrode. At the working potential of 0–0.4 V, this developed electrochemicalsensor exhibits a linear current response to AA in the concentration range of 0.05–5 mg L−1 with LODof 0.028 mg L−1 (S/N = 3). With the characteristics of good repeatability, stable and reliable storage,good selectivity, high sensitivity, and low cost, this molecularly-imprinted electrochemical sensor has avery broad application prospect.
Carbon nanomaterials and their composites are also used in Hb-based AA electrochemicalbiosensors to enhance the surface electron transfer rate of electrodes. Batra et al. have developed anHb electrochemical biosensor based on the composite of carboxylated MWCNTs/CuNPs/polyaniline(PANI) (c-MWCNTs/CuNPs/PANI), which can detect AA with high sensitivity (Figure 7A) [110].Under the optimized experimental conditions, the fabricated sensor has low LOD (0.2 nmol L−1), highsensitivity (72.5 μA nmol L−1 cm−2), fast response time (<2 s), and wide linear range (5 nmol L−1 to75 mmol L−1). When stored at 4 ◦C, the electrode can be used 120 times in 100 days with acceptablerepeatability and stability. Varmiraa et al. also constructed an effective electrochemical biosensor basedon Hb-dimethyldioctadecyl ammonium bromide (DDAB)/Pt-Au-palladium three metallic alloy NPschitosan-1-/ethyl-3-methylimidazolium bis(trifluoromethylsulfonyl)imide/MWCNTs-IL/glassy carbonelectrode (Hb-DDAB/PtAuPd NPs/Ch-IL/MWCNTs-IL/GCE) for selective and sensitive determinationof AA in food samples (Figure 7B) [111]. The developed sensor can determine AA in two linearconcentration ranges of 0.03–39.0 nmol L−1 and 39.0–150.0 nmol L−1 using SWV with LOD of 0.01 nmolL−1 and can selectively detect the target AA even in the presence of high concentrations of commoninterferences, confirming its highly selectivity. From the experimental results, it has been confirmed that
15

Foods 2020, 9, 524
the proposed sensor has a short response time (<8 s), good sensitivity, long-term stability, repeatabilityand reproducibility, and is capable of successfully measured AA in potato chips.
(A) (B)
Figure 7. (A) Schematic representation of the fabrication of Hb/c-MWCNTs/CuNPs/PANI/PG [110].Copyright: Analytical Biochemistry, 2013. (B) Schematic representation of the biosensor based onHb-DDAB/PtAuPd NPs/Ch-IL/MWCNTs-IL/GCE [111]. Copyright: Talanta, 2018.
In summary, electrochemical sensing methods for AA detection have certain selectivity, highsensitivity, good reproducibility, and cannot be interfered with by other ingredients in foods. This givesthem a unique advantage in the analysis of AA content in foods.
3.3.2. Fluorescence Sensing Analysis Method
Fluorescence sensors express signals generated by molecular recognition in the form of fluorescence(changes in fluorescence intensity and wavelength) to achieve information transmission [112,113].Due to the merits of high sensitivity, good selectivity, and convenient use, fluorescence sensing analysishas been widely used and has made great progress in recent years [114–116]. Quantum dots (QDs) haveunique photophysical properties such as high fluorescence quantum yield, size-controlled fluorescence,and photobleaching resistance, and have been widely used in the field of fluorescence sensing [117,118].Since the AA molecule does not have fluorescent properties, it needs to be detected using otherfluorescent substances. This kind of chemical reaction-based fluorescence sensing detection modeneeds further research in terms of enhancing the detection sensitivity and selectivity. Especially whenintroducing new nanomaterials with unique properties into the fluorescence detection system, it ispossible to develop more efficient and accurate analysis strategies [119–121]. Hu et al. have proposeda fluorescence sensing method for online detection of AA in potato chips, which was based on theincrease of the distance between QDs caused by AA polymerization (Figure 8A) [122]. The UV lightirradiation caused the C=C bond polymerization of N-acryloxysuccinimide-modified QDs, whichshortened the distance between the QDs, leading to a decrease in fluorescence intensity. When AAis present in the tested sample, AA would participate in the above polymerization reaction, causingan increase of fluorescence intensity. The linear range and LOD of the established method reached3.5 × 10−5–3.5 g L−1 (R2 = 0.94) and 3.5 × 10⁻⁵ g L−1, respectively. Although the sensitivity andspecificity of this method cannot be compared with those of standard instrumental analysis, it greatlyreduces the cost and time of detection and is suitable for the rapid detection of AA online in foodprocessing. The ZnS QDs doped with Mn2+ were added onto graphene oxide as a fluorescent source toprepare an AA-MIP, which was successfully used as an environmentally-friendly fluorescent probefor AA detection [123]. When AA was adsorbed by AA-MIP, the fluorescence of ZnS QDs-dopedwas quenched, and the quenching effect was much stronger than that of non-imprinted polymers.The excitation and emission spectra of AA-MIP peaked at 325 nm and 601 nm, respectively. Under theoptimal experimental conditions, the fluorescence of ZnS QDs in AA-MIP decreased within a linear
16

Foods 2020, 9, 524
range of 0.5–60 μmol L−1 AA concentration, and the LOD reached 0.17 μmol L−1. In the spikedwater, acceptable recovery in a range of 100.2–104.5% with remarkable RSD of 1.9–3.9% was obtained,signifying the great accuracy and sensitivity of the developed methods.
(A) (B)
Figure 8. Schematic representation of fluorescent methods for AA detection. (A) CdSe/ZnS quantumdots (QDs) [122]. Copyright: Biosensors & Bioelectronics, 2014. (B) AuNPs and FAM-dsDNA [124].Copyright: Sensors and Actuators B-Chemical, 2018.
Because of their excellent optical and catalytic properties, easy synthesis, high chemical stabilityand selectivity, and high absorption coefficient, colloidal AuNPs are widely used as fluorescencequenchers in fluorescence sensors [125]. Figure 8B shows a simple, fast, and accurate fluorescencesensor using AuNPs and FAM-labeled dsDNA (FAM-dsDNA) for AA detection [124]. The detectionprinciple was that the AA target present in the environment forms an adduct with single-strandedDNA, and the freely-existing FAM-labeled complementary strand DNA was adsorbed on the surfaceof AuNPs, causing the AuNPs quench. This proposed fluorescence sensor could be quickly assembledand complete the detection process in a short time, and have high sensitivity and selectivity, and widelinear response range of AA (1 × 10⁻⁷–0.05 mol L−1) and LOD of 1 × 10⁻⁸ mol L−1.
4. Conclusions
In recent years, various strategies based on different principles have been successively developedfor the analysis of AA content in different food matrices. In contrast, the traditional instrumentalanalysis strategies based on chromatographic separation and mass spectrometry are still the firstchoice for AA analysis, due to the advantages of high accuracy and good reproducibility. In follow-upresearch, the development of efficient, stable, cheap, and convenient pretreatment purificationmaterials for food matrices will continue to be one of the research hotspots. ELISA analysis kitsand immunoassay test strips with the characteristics of high throughput and low cost have broadapplication prospects in rapid screening of large numbers of samples, but they need to be improved interms of detection stability and environmental adaptability. Electrochemical and fluorescence sensingtechnologies need further research in the construction of sensing interfaces and the improvement ofstability. The excellent electrical and optical properties of various nanomaterials provide new ideas fordeveloping nano-sensing methods with high sensitivity, high throughput, and good reproducibility.
Author Contributions: M.P. provided the idea and financial support of the research and completed Section 4;K.L. coordinated and organized the writing of the entire manuscript and completed the Section 1, Section 2,Section 3.1, and part of Section 3.3 (M.P. and X.L. contributed to this article equally); J.Y. completed Section 3.2.and checked the language and format of the manuscript; L.H. and X.X. completed part of Section 3.3 and analyzedand compared the results of the experiment; S.W. provided the framework of the paper and finally checked thequality of the article. All authors have read and agreed to the published version of the manuscript.
Funding: This research was funded by the National Key R&D Program of China (No. 2017YFC1600402), NationalNatural Science Foundation of China (No. 31972147), Tianjin Technical Expert Project (No. 19JCTPJC52700),
17

Foods 2020, 9, 524
Project of Tianjin Science and Technology Plan (No. 18ZYPTJC00020), and the Open Project Program of StateKey Laboratory of Food Nutrition and Safety, Tianjin University of Science and Technology (SKLFNS-KF-201907).The APC was funded by Project of Tianjin Science and Technology Plan (No. 18ZYPTJC00020).
Conflicts of Interest: The authors declare no conflict of interest.
References
1. Friedman, M. Chemistry, biochemistry, and safety of acrylamide. A review. J. Agric. Food Chem. 2003, 51,4504–4526. [CrossRef] [PubMed]
2. Altunay, N.; Gürkan, R.; Orhan, U. A preconcentration method for indirect determination of acrylamidefrom chips, crackers and cereal-based baby foods using flame atomic absorption spectrometry. Talanta 2016,161, 143–150. [CrossRef]
3. IARC. IARC Monographs on the Evaluation of Carcinogenic Risks to Humans; IARC: Lyon, France, 1994; Volume60, pp. 389–433.
4. Tareke, E.; Rydberg, P.; Karlsson, P.; Eriksson, S.; Törnqvist, M. Analysis of acrylamide, a carcinogen formedin heated foodstuffs. J. Agric. Food Chem. 2002, 50, 4998–5006. [CrossRef] [PubMed]
5. Mottram, D.S.; Wedzicha, B.L.; Dodson, A.T. Acrylamide is formed in the maillard reaction. Nature 2002, 419,448–449. [CrossRef] [PubMed]
6. Stadler, R.H.; Varga, N.; Robert, F.; Hau, J.; Guy, P.A.; Robert, M.C.; Riediker, S. Acrylamide from Maillardreaction products. Nature 2002, 419, 449–450. [CrossRef]
7. Claeys, W.L.; De Vleeschouwer, K.; Hendrickx, M.E. Kinetics of acrylamide formation and elimination duringheating of an asparagine-sugar model system. J. Agric. Food Chem. 2005, 53, 9999–10005. [CrossRef]
8. Ehling, S.; Hengel, M.; Shibamoto, T. Formation of acrylamide from lipids. In Chemistry and Safety ofAcrylamide in Food; Friedman, M., Mottram, D., Eds.; Advances in Experimental Medicine and Biology;Springer: Boston, MA, USA, 2005; Volume 561, pp. 223–233.
9. Perez-Nevado, F.; Cabrera-Banegil, M.; Repilado, E.; Martillanes, S.; Martin-Vertedor, D. Effect of differentbaking treatments on the acrylamide formation and phenolic compounds in Californian-style black olives.Food Control 2018, 94, 22–29. [CrossRef]
10. Ehling, S.; Shibamoto, T. Correlation of acrylamide generation in thermally processed model systems ofasparagine and glucose with color formation, amounts of pyrazines formed, and antioxidative properties ofextracts. J. Agric. Food Chem. 2005, 53, 4813–4819. [CrossRef]
11. Casado, F.J.; Montano, A. Influence of processing conditions on acrylamide content in black ripe olives.J. Agric. Food Chem. 2008, 56, 2021–2027. [CrossRef]
12. Charoenprasert, S.; Mitchell, A. Influence of California-style black ripe olive processing on the formation ofacrylamide. J. Agric. Food Chem. 2014, 62, 8716–8721. [CrossRef]
13. Esposito, F.; Fasano, E.; De Vivo, A.; Velotto, S.; Sarghini, F.; Cirillo, T. Processing effects on acrylamidecontent in roasted coffee production. Food Chem. 2020, 319, 126550. [CrossRef]
14. Commission Recommendation (EU) 2017/2158. Commission Regulation (EU) 2017/2158 of 20 November2017 establishing mitigation measures and benchmark levels for the reduction of the presence of acrylamidein food. Off. J. Eur. Union 2017, L304, 24–44.
15. Oracz, J.; Nebesny, E.; Zyzelewicz, D. New trends in quantification of acrylamide in food products. Talanta2011, 86, 23–34. [CrossRef] [PubMed]
16. Hu, Q.Q.; Xu, X.H.; Fu, Y.C.; Li, Y.B. Rapid methods for detecting acrylamide in thermally processed foods:A review. Food Control 2015, 56, 135–146. [CrossRef]
17. Commission Recommendation (EU) 2019/1888. Commision Recommendation (EU) 2019/1888 of 7 November2019 on the Monitoring of the Presence of Acrylamide in Certain Foods; European Union: Brussels, Belgium, 2019;Volume L291, pp. 31–33, (document 32019H1888).
18. Gokmen, V.; Palazoglu, T.K. Acrylamide Formation in Foods during Thermal Processing with a Focus onFrying. Food Bioprocess Technol. 2008, 1, 35–42. [CrossRef]
19. El-Assouli, S.M. Acrylamide in selected foods and genotoxicity of their Extracts. J. Egypt Public Health Assoc.2009, 84, 371–392. [PubMed]
20. Erkekoglu, P.; Baydar, T. Toxicity of acrylamide and evaluation of its exposure in baby foods. Nutr. Res. Rev.2010, 23, 323–333. [CrossRef] [PubMed]
18

Foods 2020, 9, 524
21. Kumar, J.; Das, S.; Teoh, S.L. Dietary acrylamide and the risks of developing cancer: Facts to ponder.Front. Nutr. 2018, 5, 14. [CrossRef]
22. Koszucka, A.; Nowak, A.; Nowak, I.; Motyl, I. Acrylamide in human diet, its metabolism, toxicity, inactivationand the associated European Union legal regulations in food industry. Crit. Rev. Food Sci. 2019. [CrossRef]
23. Tardiff, R.G.; Gargas, M.L.; Kirman, C.R.; Carson, M.L.; Sweeney, L.M. Estimation of safe dietary intakelevels of acrylamide for humans. Food Chem. Toxicol. 2010, 48, 658–667. [CrossRef]
24. Singh, P.; Singh, P.; Raja, R.B. Determination of acrylamide concentration in processed food products usingnormal phase high-performance liquid chromatography (HPLC). Afr. J. Biotechnol. 2010, 9, 8085–8091.
25. Geng, Z.M.; Wang, P.; Liu, A.M. Determination of acrylamide in starch-based foods by HPLC with pre-columnultraviolet derivatization. J. Chromatogr. Sci. 2011, 49, 818–824. [CrossRef]
26. Xu, L.H.; Zhang, L.M.; Qiao, X.G.; Xu, Z.X.; Song, J.M. Determination of trace acrylamide in potato chip andbread crust based on SPE and HPLC. Chromatographia 2012, 75, 269–274.
27. Sun, S.Y.; Fang, Y.; Xia, Y.M. A facile detection of acrylamide in starchy food by using a solid extraction-GCstrategy. Food Control 2012, 26, 220–222. [CrossRef]
28. Yao, W.J. Direct determination of acrylamide in food by gas chromatography with nitrogen chemiluminescencedetection. J. Sep. Sci. 2015, 38, 2272–2277.
29. Saraji, M.; Javadian, S. Single-drop microextraction combined with gas chromatography-electron capturedetection for the determination of acrylamide in food samples. Food Chem. 2019, 274, 55–60. [CrossRef]
30. Zhang, Y.; Ren, Y.; Jiao, J.; Li, D.; Zhang, Y. Ultra high-performance liquid chromatography-tandem massspectrometry for the simultaneous analysis of asparagine, sugars, and acrylamide in Maillard reactions.Anal. Chem. 2011, 83, 3297–3304. [CrossRef]
31. De Paola, E.L.; Montevecchi, G.; Masino, F.; Garbini, D.; Barbanera, M.; Antonelli, A. Determination ofacrylamide in dried fruits and edible seeds using QuEChERS extraction and LC separation with MS detection.Food Chem. 2017, 217, 191–195. [CrossRef]
32. Fernández, A.; Talaverano, M.I.; Pérez-Nevado, F.; Boselli, E.; Cordeiro, A.M.; Martillanes, S.; Foligni, R.;Martín-Vertedor, D. Evaluation of phenolics and acrylamide and their bioavailability in high hydrostaticpressure treated and fried table olives. J. Food Process Pres. 2020. [CrossRef]
33. Cagliero, C.; Ho, T.D.; Zhang, C.; Bicchi, C.; Anderson, J.L. Determination of acrylamide in brewed coffee andcoffee powder using polymeric ionic liquid-based sorbent coatings in solid-phase microextraction coupled togas chromatography-mass spectrometry. J. Chromatogr. A 2016, 1449, 2–7. [CrossRef] [PubMed]
34. Luo, L.; Ren, Y.; Liu, J.; Wen, X.D. Investigation of a rapid and sensitive non-aqueous reaction system for thedetermination of acrylamide in processed foods by gas chromatography-mass spectrometry. Anal. Methods2016, 8, 5970–5977. [CrossRef]
35. Jozinovic, A.; Sarkanj, B.; Ackar, D.; Balentic, J.P.; Subaric, D.; Cvetkovic, T.; Ranilovic, J.; Guberac, S.; Babic, J.Simultaneous determination of acrylamide and hydroxymethylfurfural in extruded products by LC-MS/MSmethod. Molecules 2019, 24, 1971. [CrossRef] [PubMed]
36. Fernandes, C.L.; Carvalho, D.O.; Guido, L.F. Determination of acrylamide in biscuits by high-resolutionorbitrap mass spectrometry: A novel application. Foods 2019, 8, 597. [CrossRef] [PubMed]
37. Calbiani, F.; Careri, M.; Elviri, L.; Mangia, A.; Zagnoni, I. Development and single-laboratory validation of areversed-phase liquid chromatography-electrospray-tandem mass spectrometry method for identificationand determination of acrylamide in foods. J. AOAC Int. 2004, 87, 107–115. [CrossRef] [PubMed]
38. Galuch, M.B.; Magon, T.F.S.; Silveira, R.; Nicacio, A.E.; Pizzo, J.S.; Bonafe, E.G.; Maldaner, L.; Santos, O.O.;Visentainer, J.V. Determination of acrylamide in brewed coffee by dispersive liquid-liquid microextraction(DLLME) and ultra-performance liquid chromatography tandem mass spectrometry (UPLC-MS/MS). FoodChem. 2019, 282, 120–126. [CrossRef] [PubMed]
39. Tolgyesi, A.; Sharma, V.K. Determination of acrylamide in gingerbread and other food samples byHILIC-MS/MS: A dilute-and-shoot method. J. Chromatogr. B 2020, 1136, 121933. [CrossRef] [PubMed]
40. Xiong, J.; Qian, S.; Xie, Y.H.; Xie, Z.W.; Li, H.X. Simultaneous determination of acrylamide, aniline andbenzidine in water sample by high performance liquid chromatography-tandem mass spectrometry. Chin. J.Anal. Chem. 2014, 42, 93–98.
41. Lee, K.J.; Lee, G.H.; Kim, H.S.; Oh, M.S.; Chu, S.; Hwang, I.J.; Lee, J.Y.; Choi, A.; Kim, C.I.;Park, H.M. Determination of heterocyclic amines and acrylamide in agricultural products with liquidchromatography-tandem mass spectrometry. Toxicol. Res. 2015, 31, 255–264. [CrossRef] [PubMed]
19

Foods 2020, 9, 524
42. Wu, C.J.; Wang, L.; Guo, X.B.; Li, H.; Yu, S.J. Simultaneous detection of 4(5)-methylimidazole and acrylamidein biscuit products by isotope-dilution UPLC-MS/MS. Food Control 2019, 105, 64–70. [CrossRef]
43. Pugajeva, I.; Jaunbergs, J.; Bartkevics, V. Development of a sensitive method for the determination ofacrylamide in coffee using high-performance liquid chromatography coupled to a hybrid quadrupoleorbitrap mass spectrometer. Food Addit. Contam. A 2015, 32, 170–179. [CrossRef]
44. Omar, M.M.A.; Elbashir, A.A.; Schmitz, O.J. Determination of acrylamide in Sudanese food by highperformance liquid chromatography coupled with LTQ Orbitrap mass spectrometry. Food Chem. 2015, 176,342–349. [CrossRef] [PubMed]
45. Arabi, M.; Ghaedi, M.; Ostovan, A. Development of dummy molecularly imprinted based on functionalizedsilica nanoparticles for determination of acrylamide in processed food by matrix solid phase dispersion.Food Chem. 2016, 210, 78–84. [CrossRef]
46. Chang, T.T.; Yan, X.Y.; Liu, S.M.; Liu, Y.X. Magnetic dummy template silica sol-gel molecularly imprintedpolymer nanospheres as magnetic solid-phase extraction material for the selective and sensitive determinationof bisphenol A in plastic bottled beverages. Food Anal. Method 2017, 10, 3980–3990. [CrossRef]
47. Nasir, A.N.M.; Yahaya, N.; Zain, N.N.M.; Lim, V.; Kamaruzaman, S.; Saad, B.; Nishiyama, N.; Yoshida, N.;Hirota, Y. Thiol-functionalized magnetic carbon nanotubes for magnetic micro-solid phase extraction ofsulfonamide antibiotics from milks and commercial chicken meat products. Food Chem. 2019, 276, 458–466.[CrossRef] [PubMed]
48. Liu, J.M.; Lv, S.W.; Yuan, X.Y.; Liu, H.L.; Wang, S. Facile construction of magnetic core-shell covalent organicframeworks as efficient solid-phase extraction adsorbents for highly sensitive determination of sulfonamideresidues against complex food sample matrices. RSC Adv. 2019, 9, 14247–14253. [CrossRef]
49. Nodeh, H.R.; Ibrahim, W.A.W.; Kamboh, M.A.; Sanagi, M.M. Magnetic graphene sol-gel hybrid as clean-upadsorbent for acrylamide analysis in food samples prior to GC-MS. Food Chem. 2018, 239, 208–216. [CrossRef][PubMed]
50. Bagheri, A.R.; Arabi, M.; Ghaedi, M.; Ostovan, A.; Wang, X.Y.; Li, J.H.; Chen, L.X. Dummy molecularlyimprinted polymers based on a green synthesis strategy for magnetic solid-phase extraction of acrylamide infood samples. Talanta 2019, 195, 390–400. [CrossRef] [PubMed]
51. Pourmand, E.; Ghaemi, E.; Alizadeh, N. Determination of acrylamide in potato-based foods usingheadspace solid-phase microextraction based on nanostructured polypyrrole fiber coupled with ion mobilityspectrometry: A heat treatment study. Anal. Method 2017, 9, 5127–5134. [CrossRef]
52. Nematollahi, A.; Kamankesh, M.; Hosseini, H.; Ghasemi, J.; Hosseini-Esfahani, F.; Mohammadi, A.Investigation and determination of acrylamide in the main group of cereal products using advancedmicroextraction method coupled with gas chromatography-mass spectrometry. J. Cereal. Sci. 2019, 87,157–164. [CrossRef]
53. Wawrzyniak, R.; Jasiewicz, B. Straightforward and rapid determination of acrylamide in coffee beans bymeans of HS-SPME/GC-MS. Food Chem. 2019, 301, 125264. [CrossRef]
54. Commission Recommendation (EU). 2013/647 of 8 November 2013 on investigations into the levels ofacrylamide in food. Off. J. Eur. Union 2013, L301, 15–17.
55. Zokaei, M.; Abedi, A.S.; Kamankesh, M.; Shojaee-Aliababadi, S.; Mohammadi, A. Ultrasonic-assistedextraction and dispersive liquid-liquid microextraction combined with gas chromatography-massspectrometry as an efficient and sensitive method for determining of acrylamide in potato chips samples.Food Chem. 2017, 234, 55–61. [CrossRef] [PubMed]
56. Faraji, M.; Hamdamali, M.; Aryanasab, F.; Shabanian, M. 2-Naphthalenthiol derivatization followed bydispersive liquid-liquid microextraction as an efficient and sensitive method for determination of acrylamidein bread and biscuit samples using high-performance liquid chromatography. J. Chromatogr. A 2018, 1558,14–20. [CrossRef] [PubMed]
57. Elahi, M.; Kamankesh, M.; Mohammadi, A.; Jazaeri, S. Acrylamide in cookie samples: Analysisusing an efficient co-derivatization coupled with sensitive microextraction method followed by gaschromatography-mass spectrometry. Food Anal. Method 2019, 12, 1439–1447. [CrossRef]
58. Lim, H.H.; Shin, H.S. Ultra trace level determinations of acrylamide in surface and drinking water by GC-MSafter derivatization with xanthydrol. J. Sep. Sci. 2013, 36, 3059–3066. [CrossRef] [PubMed]
20

Foods 2020, 9, 524
59. Backe, W.J.; Yingling, V.; Johnson, T. The determination of acrylamide in environmental and drinking watersby large-volume injection-hydrophilic-interaction liquid chromatography and tandem mass spectrometry.J. Chromatogr. A 2014, 1334, 72–78. [CrossRef] [PubMed]
60. Wang, H.; Lee, A.W.; Shuang, S.; Choi, M.M. SPE/HPLC/UV studies on acrylamide in deep-fried flour-basedindigenous Chinese foods. Microchem. J. 2008, 89, 90–97. [CrossRef]
61. GB/T 5009. 204–2014. Determination of Acrylamide in Food; Standard Press: Beijing, China, 2015.62. Lim, H.H.; Shin, H.S. A new derivatization approach with d-cysteine for the sensitive and simple analysis
of acrylamide in foods by liquid chromatography-tandem mass spectrometry. J. Chromatogr. A 2014, 1361,117–124. [CrossRef]
63. Ferrer-Aguirre, A.; Romero-Gonzalez, R.; Vidal, J.L.M.; Frenich, A.G. Simple and fast determination ofacrylamide and metabolites in potato chips and grilled asparagus by liquid chromatography coupled tomass spectrometry. Food Anal. Method 2016, 9, 1237–1245. [CrossRef]
64. Yoshioka, T.; Izumi, Y.; Nagatomi, Y.; Miyamoto, Y.; Suzuki, K.; Bamba, T. A highly sensitive determinationmethod for acrylamide in beverages, grains, and confectioneries by supercritical fluid chromatographytandem mass spectrometry. Food Chem. 2019, 294, 486–492. [CrossRef]
65. Baskan, S.; Erim, F.B. NACE for the analysis of acrylamide in food. Electrophoresis 2007, 28, 4108–4113.[CrossRef] [PubMed]
66. Voeten, R.L.C.; Ventouri, I.K.; Haselberg, R.; Somsen, G.W. Capillary electrophoresis: Trends and recentadvances. Anal. Chem. 2018, 90, 1464–1481. [CrossRef]
67. Abd El-Hady, D.; Albishri, H.M. Simultaneous determination of acrylamide, asparagine and glucose in foodusing short chain methyl imidazolium ionic liquid based ultrasonic assisted extraction coupled with analytefocusing by ionic liquid micelle collapse capillary electrophoresis. Food Chem. 2015, 188, 551–558. [CrossRef][PubMed]
68. Yang, S.P.; Li, Y.T.; Li, F.; Yang, Z.Y.; Quan, F.F.; Zhou, L.; Pu, Q.S. Thiol-ene click derivatization for thedetermination of acrylamide in potato products by capillary electrophoresis with capacitively coupledcontactless conductivity detection. J. Agric. Food Chem. 2019, 67, 8053–8060. [CrossRef]
69. Wu, M.L.; Chen, W.J.; Wang, G.; He, P.G.; Wang, Q.J. Analysis of acrylamide in food products by microchipelectrophoresis with on-line multiple-preconcentration techniques. Food Chem. 2016, 209, 154–161. [CrossRef]
70. Kitagawa, F.; Kawai, T.; Sueyoshi, K.; Otsuka, K. Recent progress of on-line sample preconcentrationtechniques in microchip electrophoresis. Anal. Sci. 2012, 28, 85–93. [CrossRef]
71. Arvanitoyannis, I.S.; Dionisopoulou, N. Acrylamide: Formation, occurrence in food products, detectionmethods, and legislation. Crit. Rev. Food Sci. 2014, 54, 708–733. [CrossRef]
72. Sueyoshi, K.; Kitagawa, F.; Otsuka, K. Effect of a low-conductivity zone on field-amplified sample stackingin microchip micellar electrokinetic chromatography. Anal. Sci. 2013, 29, 133–138. [CrossRef]
73. Breadmore, M.C.; Tubaon, R.M.; Shallan, A.I.; Phung, S.C.; Keyon, A.S.A.; Gstoettenmayr, D.; Prapatpong, P.Recent advances in enhancing the sensitivity of electrophoresis and electrochromatography in capillariesand microchips (2012–2014). Electrophoresis 2015, 36, 36–61. [CrossRef]
74. Cui, Y.L.; Zhao, J.; Zhou, J.; Tan, G.Y.; Zhao, Q.Y.; Zhang, Y.H.; Wang, B.M.; Jiao, B.N. Developmentof a sensitive monoclonal antibody-based indirect competitive enzyme-linked immunosorbent assay foranalysing nobiletin in citrus and herb samples. Food Chem. 2019, 293, 144–150. [CrossRef]
75. Chen, Y.J.; Zhang, S.P.; Hong, Z.S.; Lin, Y.Y.; Dai, H. A mimotope peptide-based dual-signal readoutcompetitive enzyme-linked immunoassay for non-toxic detection of zearalenone. J. Mater. Chem. B 2019, 7,6972–6980. [CrossRef] [PubMed]
76. Zhou, X.C.; Shi, J.; Zhang, J.; Zhao, K.; Deng, A.P.; Li, J.G. Multiple signal amplification chemiluminescenceimmunoassay for chloramphenicol using functionalized SiO2 nanoparticles as probes and resin beads ascarriers. Spectrochim. Acta. A 2019, 222, 117177. [CrossRef] [PubMed]
77. Li, J.; Zhao, X.; Chen, L.J.; Qian, H.L.; Wang, W.L.; Yang, C.; Yan, X.P. p-Bromophenol-enhanced bienzymaticchemiluminescence competitive immunoassay for ultrasensitive determination of aflatoxin B-1. Anal. Chem.2019, 91, 13191–13197. [CrossRef] [PubMed]
78. Chen, E.J.; Xu, Y.; Ma, B.; Cui, H.F.; Sun, C.X.; Zhang, M.Z. Carboxyl-functionalized, europiumnanoparticle-based fluorescent immunochromatographic assay for sensitive detection of citrinin in monascusfermented food. Toxins 2019, 11, 605. [CrossRef]
21

Foods 2020, 9, 524
79. Xiong, Y.; Zhang, K.K.; Gao, B.; Wu, Y.Q.; Huang, X.L.; Lai, W.H.; Xiong, Y.H.; Liu, Y. Fluorescenceimmunoassay through histone-ds-poly(AT)-templated copper nanoparticles as signal transductors for thesensitive detection of salmonella choleraesuis in milk. J. Dairy Sci. 2019, 102, 6047–6055. [CrossRef]
80. Singh, G.; Brady, B.; Koerner, T.; Becalski, A.; Zhao, T.; Feng, S.; Godefroy, S.B.; Huet, A.C.; Delahaut, P.Development of a highly sensitive competitive indirect enzyme-linked immunosorbent assay for detectionof acrylamide in foods and water. Food Anal. Method 2014, 7, 1298–1304. [CrossRef]
81. Wu, J.; Shen, Y.D.; Lei, H.T.; Sun, Y.M.; Yang, J.Y.; Xiao, Z.L.; Wang, H.; Xu, Z.L. Hapten synthesis anddevelopment of a competitive indirect enzyme-linked immunosorbent assay for acrylamide in food samples.J. Agr. Food Chem. 2014, 62, 7078–7084. [CrossRef]
82. Zhu, Y.T.; Song, S.S.; Liu, L.Q.; Kuang, H.; Xu, C.L. An indirect competitive enzyme-linked immunosorbentassay for acrylamide detection based on a monoclonal antibody. Food Agric. Immunol. 2016, 27, 796–805.[CrossRef]
83. Assaat, L.D.; Saepudin, E.; Soejoedono, R.D.; Adji, R.S.; Poetri, O.N.; Ivandini, T.A. Production of a polyclonalantibody against acrylamide for immunochromatographic detection of acrylamide using strip tests. J. Anim.Vet. Adv. 2019, 6, 366–375. [CrossRef]
84. Sun, Q.; Xu, L.H.; Ma, Y.; Qiao, X.G.; Xu, Z.X. Study on a biomimetic enzyme-linked immunosorbent assaymethod for rapid determination of trace acrylamide in French fries and cracker samples. J. Sci. Food Agric.2014, 94, 102–108. [CrossRef]
85. Sarkar, D.; Xie, X.J.; Anselmo, A.C.; Mitragotri, S.; Banerjee, K. MoS2 Field-effect transistor for next-generationlabel-free biosensors. ACS Nano. 2014, 8, 3992–4003. [CrossRef]
86. Hu, Q.Q.; Wang, R.H.; Wang, H.; Slavik, M.F.; Li, Y.B. Selection of acrylamide-specific aptamers by a quartzcrystal microbalance combined SELEX method and their application in rapid and specific detection ofacrylamide. Sens. Actuators B Chem. 2018, 273, 220–227. [CrossRef]
87. Bhadani, S.N.; Prasad, Y.K.; Kundu, S. Electrochemical and chemical polymerization of acrylamide. J. Polym.Sci. Pol. Chem. 1980, 18, 1459–1469. [CrossRef]
88. Casella, I.G.; Pierri, M.; Contursi, M. Determination of acrylamide and acrylic acid by isocratic liquidchromatography with pulsed electrochemical detection. J. Chromatogr. A 2006, 1107, 198–203. [CrossRef]
89. Trojanowicz, M.; Hitchman, M.L. Determination of pesticides using electrochemical biosensors. Trac-TrendsAnal. Chem. 2015, 14, 1311–1328. [CrossRef]
90. Wu, D.; Du, D.; Lin, Y. Recent progress on nanomaterial-based biosensors for veterinary drug residues inanimal-derived food. Trends Anal. Chem. 2016, 83, 95–101. [CrossRef]
91. Pandey, C.M.; Malhotra, B.D. Nanomaterials for Biosensors; Biosensors: Basel, Switzerland, 2018; pp. 1–74.92. Rasooly, A.; Herold, K.E. Biosensors for the analysis of food-and waterborne pathogens and their toxins.
J. Aoac. Int. 2019, 89, 873–883. [CrossRef]93. Shiddiky, M.J.A.; Torriero, A.A.J. Application of ionic liquids in electrochemical sensing systems. Biosens.
Bioelectron. 2011, 26, 1775–1787. [CrossRef]94. Batra, B.; Lata, S.; Pundir, C.S. Construction of an improved amperometric acrylamide biosensor based on
hemoglobin immobilized onto carboxylated multi-walled carbon nanotubes/iron oxide nanoparticles/chitosancomposite film. Bioproc. Biosyst. Eng. 2013, 36, 1591–1599. [CrossRef]
95. Garabagiu, S.; Mihailescu, G. Simple hemoglobin-gold nanoparticles modified electrode for the amperometricdetection of acrylamide. J. Electroanal. Chem. 2011, 659, 196–200. [CrossRef]
96. Sayyad, A.S.; Balakrishnan, K.; Ci, L.; Kabbani, A.T.; Vajtai, R.; Ajayan, P.M. Synthesis of iron nanoparticlesfrom hemoglobin and myoglobin. Nanotechnology 2012, 23, 1–5. [CrossRef]
97. Wu, H.; Wang, X.; Qiao, M. Enhancing sensitivity of hemoglobin-based electrochemical biosensor by usingprotein conformational intermediate. Sens. Actuators B-Chem. 2015, 22, 1694–1699. [CrossRef]
98. Yadav, N.; Chhillar, A.K.; Pundir, C.S. Preparation, characterization and application of haemoglobinnanoparticles for detection of acrylamide in processed foods. Int. J. Biol. Macromol. 2018, 107, 1000–1013.[CrossRef]
99. Asnaashari, M.; Kenari, R.E.; Farahmandfar, R.; Abnous, K.; Taghdisi, S.M. An electrochemical biosensorbased on hemoglobin-oligonucleotides-modified electrode for detection of acrylamide in potato fries.Food Chem. 2019, 271, 54–61. [CrossRef]
100. Bucur, M.P.; Bucur, B.; Radu, G.L. Simple, selective and fast detection of acrylamide based on glutathioneS-transferase. RSC Adv. 2018, 8, 23931–23936. [CrossRef]
22

Foods 2020, 9, 524
101. Sumner, S.C.; MacNeela, J.P.; Fennell, T.R. Characterization and quantitation of urinary metabolites of[1,2,3-13C]acrylamide in rats and mice using 13C nuclear magnetic resonance spectroscopy. Chem. Res. Toxicol.1992, 5, 81–89. [CrossRef]
102. Hartmann, E.C.; Bolt, H.M.; Drexler, H.; Angerer, J. N-Acetyl-S-(1-carbamoyl-2-hydroxy-ethyl)-l-cysteine(iso-GAMA) a further product of human metabolism of acrylamide: Comparison with the simultaneouslyexcreted other mercaptuic acids. Arch. Toxicol. 2009, 83, 731–734. [CrossRef] [PubMed]
103. Hartmann, E.C.; Latzin, J.M.; Schindler, B.K.; Koch, H.M.; Angerer, J. Excretion of 2,3-dihydroxy-propionamide (OH-PA), the hydrolysis product of glycidamide, in human urine after single oral doseof deuterium-labeled acrylamide. Arch. Toxicol. 2011, 85, 601–606. [CrossRef]
104. Luo, Y.S.; Long, T.Y.; Shen, L.C.; Huang, S.L.; Chiang, S.Y.; Wu, K.Y. Synthesis, characterization and analysisof the acrylamide- and glycidamide-glutathione conjugates. Chem. Biol. Interact. 2015, 237, 38–46. [CrossRef]
105. Wulandari, R.; Ivandini, T.A.; Irkham; Saepudin, E.; Einaga, Y. Modification of boron-doped diamondelectrodes with platinum to increase the stability and sensitivity of haemoglobin-based acrylamide sensors.Sens. Mater. 2019, 31, 1105–1117.
106. Wu, M.F.; Wang, Y.; Li, S.; Dong, X.X.; Yang, J.Y.; Shen, Y.D.; Wang, H.; Sun, Y.M.; Lei, H.T.; Xu, Z.L.Ultrasensitive immunosensor for acrylamide based on chitosan/SnO2-SiC hollow sphere nanochains/goldnanomaterial as signal amplification. Anal. Chim. Acta 2019, 1049, 188–195. [CrossRef] [PubMed]
107. Rivas, G.A.; Rubianes, M.D.; Rodriguez, M.C.; Ferreyra, N.E.; Luque, G.L.; Pedano, M.L.; Miscoria, S.A.;Parrado, C. Carbon nanotubes for electrochemical biosensing. Talanta 2007, 74, 291–307. [CrossRef]
108. Deshmukh, M.A.; Jeon, J.Y.; Ha, T.J. Carbon nanotubes: An effective platform for biomedical electronics.Biosens. Bioelectron. 2020, 150, 111919. [CrossRef] [PubMed]
109. Liu, X.; Mao, L.G.; Wang, Y.L.; Shi, X.B.; Liu, Y.; Yang, Y.; He, Z. Electrochemical sensor based onimprinted sol-gel polymer on Au NPs-MWCNTs-CS modified electrode for the determination of acrylamide.Food Anal. Method. 2016, 9, 114–121. [CrossRef]
110. Batra, B.; Lata, S.; Sharma, M.; Pundir, C.S. An acrylamide biosensor based on immobilization of hemoglobinonto multiwalled carbon nanotube/copper nanoparticles/polyaniline hybrid film. Anal. Biochem. 2013, 433,210–217. [CrossRef]
111. Varmira, K.; Abdi, O.; Gholivand, M.B.; Goicoechea, H.C.; Jalalvand, A.R. Intellectual modifying a bareglassy carbon electrode to fabricate a novel and ultrasensitive electrochemical biosensor: Application todetermination of acrylamide in food samples. Talanta 2018, 176, 509–517. [CrossRef]
112. Wolfbeis, O.S. Materials for fluorescence-based optical chemical sensors. J. Mater. Chem. 2005, 15, 2657–2669.[CrossRef]
113. Dandin, M.; Abshire, P.; Smela, E. Optical filtering technologies for integrated fluorescence sensors. Lab Chip2007, 7, 955–977. [CrossRef]
114. Dhenadhayalan, N.; Lee, H.L.; Yadav, K.; Lin, K.C.; Lin, Y.T.; Chang, A.H.H. Silicon quantum dots basedfluorescence turn-on metal ion sensors in live cells. ACS Appl. Mater. Inter. 2016, 8, 3953–23962. [CrossRef]
115. Li, X.; Li, Z.; Yang, Y.W. Tetraphenylethylene-interweaving conjugated macrocycle polymer materials astwo-photon fluorescence sensors for metal ions and organic molecules. Adv. Mater. 2018, 30, 1800177.[CrossRef]
116. Al-Zahrani, F.A.M.; El-Shishtawy, R.M.; Asiri, A.M.; Al-Soliemy, A.M.; Abu Mellah, K.; Ahmed, N.S.E.;Jedidi, A. A new phenothiazine-based selective visual and fluorescent sensor for cyanide. BMC Chem. 2020,14, 2. [CrossRef]
117. Kong, Y.L.; Cheng, Q.; He, Y.; Ge, Y.L.; Zhou, J.G.; Song, G.W. A dual-modal fluorometric and colorimetricnanoprobe based on graphitic carbon nitrite quantum dots and Fe(II)-bathophenanthroline complex fordetection of nitrite in sausage and water. Food Chem. 2020, 312, 126089. [CrossRef]
118. Huang, B.H.; Shen, S.S.; Wei, N.; Guo, X.F.; Wang, H. Fluorescence biosensor based on silicon quantumdots and 5,5’-dithiobis-(2-nitrobenzoic acid) for thiols in living cells. Spectrochim. Acta A 2020, 229, 117972.[CrossRef]
119. Zhou, Y.; Ma, Z.F. A novel fluorescence enhanced route to detect copper(II) by click chemistry-catalyzedconnection of Au@SiO2 and carbon dots. Sens. Actuators B-Chem. 2016, 233, 426–430. [CrossRef]
120. Mani, N.P.; Ganiga, M.; Cyriac, J. MoS2 nanohybrid as a fluorescence sensor for highly selective detection ofdopamine. Analyst 2018, 143, 1691–1698. [CrossRef]
23

Foods 2020, 9, 524
121. Peng, D.; Zhang, L.; Liang, R.P.; Qiu, J.D. Rapid detection of mercury ions based on nitrogen doped graphenequantum dots accelerating formation of manganese porphyrin. ACS Sens. 2018, 3, 1040–1047. [CrossRef]
122. Hu, Q.Q.; Xu, X.H.; Li, Z.M.; Zhang, Y.; Wang, J.P.; Fu, Y.C.; Li, Y.B. Detection of acrylamide in potato chipsusing a fluorescent sensing method based on acrylamide polymerization-induced distance increase betweenquantum dots. Biosens. Bioelectron. 2014, 54, 64–71. [CrossRef]
123. Liu, Y.; Hu, X.; Bai, L.; Jiang, Y.H.; Qiu, J.; Meng, M.J.; Liu, Z.C.; Ni, L. A molecularly imprinted polymerplaced on the surface of graphene oxide and doped with Mn(II)-doped ZnS quantum dots for selectivefluorometric determination of acrylamide. Microchim. Acta 2018, 185, UNSP 48. [CrossRef]
124. Asnaashari, M.; Kenari, R.E.; Farahmandfar, R.; Taghdisi, S.M.; Abnous, K. Fluorescence quenchingbiosensor for acrylamide detection in food products based on double-stranded DNA and gold nanoparticles.Sens. Actuators B-Chem. 2018, 265, 339–345. [CrossRef]
125. Amit, N.; Anupam, B.; Shweta, P. Gold nanoparticle induced enhancement of molecular fluorescence forZn2+ detection in aqueous niosome solution. In Proceedings of the 13th International Conference on FibreOptics & Photonics, Kanpur, India, 4–8 December 2016; Optical Society of America: Washington, DC, USA,2016; Paper W2D.1.
© 2020 by the authors. Licensee MDPI, Basel, Switzerland. This article is an open accessarticle distributed under the terms and conditions of the Creative Commons Attribution(CC BY) license (http://creativecommons.org/licenses/by/4.0/).
24
foods
Article
Determination of Acrylamide in Biscuits byHigh-Resolution Orbitrap Mass Spectrometry:A Novel Application
Cristiana L. Fernandes, Daniel O. Carvalho and Luis F. Guido *
REQUIMTE—Departamento de Química e Bioquímica, Faculdade de Ciências, Universidade do Porto, Rua doCampo Alegre 687, 4169-007 Porto, Portugal; [email protected] (C.L.F.); [email protected] (D.O.C.)* Correspondence: [email protected]; Tel.: +351-220-402-644
Received: 14 October 2019; Accepted: 18 November 2019; Published: 20 November 2019
Abstract: Acrylamide (AA), a molecule which potentially increases the risk of developing cancer,is easily formed in food rich in carbohydrates, such as biscuits, wafers, and breakfast cereals, attemperatures above 120 ◦C. Thus, the need to detect and quantify the AA content in processedfoodstuffs is eminent, in order to delineate the limits and mitigation strategies. This work reportsthe development and validation of a high-resolution mass spectrometry-based methodology foridentification and quantification of AA in specific food matrices of biscuits, by using LC-MS withelectrospray ionization and Orbitrap as the mass analyser. The developed analytical method showedgood repeatability (RSDr 11.1%) and 3.55 and 11.8 μg kg−1 as limit of detection (LOD) and limit ofquantification (LOQ), respectively. The choice of multiplexed targeted-SIM mode (t-SIM) for AAand AA-d3 isolated ions provided enhanced detection sensitivity, as demonstrated in this work.Statistical processing of data was performed in order to compare the AA levels with several productionparameters, such as time/cooking temperature, placement on the cooking conveyor belt, color, andmoisture for different biscuits. The composition of the raw materials was statistically the mostcorrelated factor with the AA content when all samples are considered. The statistical treatmentpresented herein enables an important prediction of factors influencing AA formation in biscuitscontributing to putting in place effective mitigation strategies.
Keywords: acrylamide; biscuits; mitigation measures; benchmark levels; contaminant
1. Introduction
Once Tareke et al. [1] have reported acrylamide (AA) as a carcinogen formed in heated foodstuffsin the food industry, Member States of the European Union and the European Commission havemade considerable efforts to investigate AA formation pathways in order to reduce the levels of thiscompound in processed foods. In addition to being present in foods, AA has also been found inthe environment (due to industrial discharges), cosmetics, drinking water, as well as tobacco smoke.Human exposure to AA may be by ingestion, inhalation, or contact with the skin [2]. Dietary exposureis the most concerning, since acrylamide is present in a wide range of everyday foods. Between 10%and 50% of AA of the diet of pregnant women passes through the placenta and breast milk also containsthis compound [3]. In the US, most exposure to AA comes from potato chips, breads, cereals, crackers,and other snacks [4]. In Europe, toasted bread, coffee, and potatoes are the main food sources of AA [5].
Human exposure to AA may have toxicological effects (neurotoxicity, genotoxicity, carcinogenicity,and reproductive toxicity), and AA has been classified as carcinogenic by the International Agency forResearch on Cancer [6] in the 2A group (probably carcinogenic in humans). AA has an α, β-unsaturatedcarbonyl group with electrophilic reactivity, which can react with nucleophilic groups of biologicalmolecules, thus contributing to toxic effects. The reaction of AA with proteins is extensive and the
Foods 2019, 8, 597; doi:10.3390/foods8120597 www.mdpi.com/journal/foods25

Foods 2019, 8, 597
products of this reaction are used as biomarkers of its presence [5]. It is metabolized together withglutathione (GSH) and also by epoxidation, resulting in glycidamide (GA). The formation of GA ismediated preferentially by cytochrome P450, and is on the basis of neuro and genotoxicity of AA.Covalent DNA adducts of GA were observed in vitro and in animal experiments and were used asbiomarkers [2,5].
Only the legal limit of AA for water has been established, with the value of 0.1 μg L−1 [7]. Thelevels of AA in foodstuffs of the Member States of the European Union were monitored between2007 and 2012. Based on the results, the European Commission outlined indicative values for AA indifferent foodstuffs [8]. According to Regulation 2017/2158, these values are not safety values but ratherindicative values, so that further research is promoted in foods with higher AA levels and consequentreduction throughout the agronomical factors, the food recipe, processing, and final preparation [5].
The level of free asparagine in cereals has been claimed to be the major influence on the formationof AA [9], since the largest pathway of AA formation involves this amino acid. The choice of cerealvarieties with lower levels of free asparagine is recommended, but challenging given the influence ofenvironmental conditions on their production [10].
Corn and rice products tend to have lower AA contents than wheat, barley, oats, or rye. Productswith whole flours have higher levels of AA [10]. The choice of different varieties of cereals alsodetermines the development of AA: Five varieties of rye with different fertilizations were used tostudy the effect of nitrogen and sulfur on AA formation. A positive correlation was found betweenasparagine concentration in grains and the highest levels of nitrogen used and the final concentrationof AA [11,12].
The influence of cereal types on bread was investigated by Przygodzka et al. [13], concluding thatrye loaves form more AA in cooking, followed by spelled loaves and loaves of refined flour—“whitebread.” In the same study, the extraction rates of the flour were compared with AA formation: 100%whole flours obtained higher concentrations of AA, followed by flours with extractions of 70%,indicating that “whole flours” have more AA precursors.
Several AA mitigation measures have been established that involve the use of the enzymeasparaginase, which converts asparagine to aspartic acid, although control of adverse effects onorganoleptic properties is necessary [14].
The requirement for ultra-trace level detection of AA has led to the development of severalanalytical methods, most of which involve chromatographic separation techniques, both liquid andgas chromatography. Determination of AA in food by GC-MS methods can be carried out with orwithout derivatization. The advantage of derivatization processes is increased volatility and improvedselectivity. The bromination [1,15–20], xanthydrol [21–25], and silylation [26,27] have been widelyused for determining of AA in foodstuffs.
In recent years, the use of ultra-performance liquid chromatography (UPLC) has become morepopular because of its high sensitivity and selectivity, without the need for derivatization. Liquidchromatography coupled to mass spectrometry have become the method of choice for the determinationof AA in food products, by using different mass analysers. Conventional triple quadrupole (QqQ)have been for long the technique of choice by selecting the characteristic transitions m/z 72→55, and72→27. Ion trap [28–30] and TOF [28,31–33] have also been useful for quantitative analyses of AA.
Considering that the capabilities of high-resolution mass spectrometry (HRMS) basedmethodologies for quantitative LC/MS analysis of AA in foodstuffs have been scarcely explored [34–36]the present work aims at validating a HRMS methodology for detection and quantification of AAin biscuits. The implemented procedure has been applied for investigating the impact of severalproduction parameters on the AA content in biscuits.
26

Foods 2019, 8, 597
2. Materials and Methods
2.1. Chemicals
Acrylamide (≥ 95% for HPLC) and acrylamide-d3 standard solution (1000 mg L−1 in acetonitrile)were purchased from Sigma-Aldrich (Steinheim, Germany). Methanol (for UHPLC), ethanol (99.5%),and dichloromethane (for HPLC) were from Panreac (Barcelona, Spain). High-purity water from aMillipore Simplicity 185 water purification system (Millipore Iberian S. A., Madrid, Spain) was usedfor all chemical analyses and glassware washing. The solvents employed for HPLC were filteredthrough a Nylon filter of 0.45 μm pore size (Whatman, Clifton, NJ, USA) and degasified for 10 min inan ultrasound bath.
2.2. Standard Solutions
Concentrated stock solutions of acrylamide (1 mg mL−1) and acrylamide-d3 (0.5 mg mL−1),used as internal standard, were prepared by dissolving the compounds in ethanol. Diluted standardsolutions were further prepared by adding the appropriate volume of each stock solution to water.
2.3. Biscuit Samples
This work has been carried out in close collaboration with a leading company at the nationallevel and with an international dimension, whose confidentiality will be maintained for obviousreasons. Four biscuit types were supplied (hereinafter referred to A, B, C, and D), collected from threedifferent sample points in the baking oven, as depicted in Figure 1. Biscuits A, B, and C are made fromwheat flour type 65 whereas Biscuit D is made from wheat bran. In addition, Biscuit C has cocoa inits composition.
Figure 1. Sample collection points from the baking oven.
2.4. Sample Preparation
Between three and five biscuits were pooled and grinded in a solid sample grinder (Moulinex,France) and put through an Endecott’s test sieve (London, England). Approximately 1 g of each groundhomogenous sample were transferred into a 50 mL polypropylene graduated conical tube with cap.250 ng of internal standard (acrylamide-d3) and then 15 mL of ultrapure water were added to eachtube, which was placed in the ultrasonic bath for 15 min. 2 mL of dichloromethane was added to eachtube, left on the rotary shaker for further 20 min. The tubes were centrifuged at 5000 rpm for 15 min.1500 μL of supernatant from each tube was withdrawn for extraction and purification by solid phaseextraction (SPE).
For the SPE clean-up, the Oasis HLB SPE cartridge (6 mL, 200 mg, 30 μm particle size from Waters)was conditioned under vacuum with methanol (3.5 mL), and equilibrated with water (3.5 mL). Then,1.5 mL of the withdrawn supernatant were loaded on the Oasis HLB SPE cartridge and allowed to passcompletely through the sorbent material. The cartridge was rinsed with 500 μL of ultrapure water andsamples were eluted with 1.5 mL of water.
27

Foods 2019, 8, 597
For the second step of the clean-up, the Bond Elut AccuCAT SPE cartridge (3 mL, 200 mg, 50 μmparticle size from Agilent Technologies) was conditioned under vacuum with methanol (2.5 mL), andequilibrated with water (2.5 mL). Then, the cartridge was loaded with the solution from the previousstep and 1 mL was discarded. The remaining volume was collected directly to an injection vial.
2.5. LC-ESI-Orbitrap
The samples were separated on Accela HPLC (Thermo Fischer Scientific, Bremen, Germany)Electrospray Orbitrap, using a C18 Phenomenex Germini (Phenomenex, USA), particle size of threemicrons and size 4.6 mm ID × 150 mm. The samples were eluted through a gradient of 90% solvent A(0.1% HCOOH in water) and 10% solvent B (methanol) for 2 min at a flow rate of 0.4 mL/min, thereafterfor 18 min over 100% solvent B and 10 min in a 10% solvent B gradient.
The analysis was performed on a hybrid mass spectrometer LTQ XL OrbitrapTM (Thermo FischerScientific, Bremen, Germany), controlled by LTQ Tune Plus Xcalibur 2.5.5 and 2.1.0. The followingionisation (positive mode) parameters were applied: Electrospray voltage 3.2 kV, capillary temperature300 ◦C, sheath gas (N2), 40 arbitrary units (arb), auxiliary gas (N2) 10 (arb), and S-Lens RF level at 25(arb). The automatic gain control was used to fill the C-trap and gain accuracy in mass measurements(ultimate mass accuracy mode, 1 × 10⁵ ions), the SIM maximum IT was set to 50 ms, the number ofmicro-scans to be performed was set at three. Mass spectra were recorded in multiplexed targeted-SIMmode (t-SIM) with a mass resolving power of 60,000 full width at half maximum (FWHM) with aquadrupole isolation window of 1.0 Da for isolated ions (72.0444 Da for acrylamide and 75.0632 Da foracrylamide-d3). Chromatograms for a biscuit sample, indicating the acrylamide (AA) and deuteratedacrylamide (acrylamide-d3) retention times, are shown in Figure S1.
2.6. Analysis of Colour
The biscuits’ colour (Biscuit D) was analyzed with the Minolta CR-410 colorimeter. The parametersused were Luminosity (L), Red (a), and Yellow (b). The biscuits were analyzed in their form ofconsumption (without being ground), so that the color could be considered a method of control infuture industrial tests and quality parameters.
2.7. Moisture Content Determination
The biscuits’ moisture level (Biscuit D) was assessed on the same day of the AA extraction. About5 g of ground biscuit were dried for 3 h at 100 ◦C. After drying and cooling, the dry mass of the biscuitwas measured and the moisture content was calculated.
2.8. Statistical Analysis
To measure the strength of relationship between the measured variables, Pearson’s correlationcoefficient (r) and Spearman’s correlation coefficient (ρ) were calculated. While the Pearson correlationcoefficient reflects the strength of linear relationships, the Spearman rank correlation reflects thestrength of monotonic relationship [37].
The statistical package StatBox 7.5 (Grimmer Logiciel, Paris, France) was used for allstatistical calculations.
3. Results and Discussion
3.1. Method Performance
Limits of detection and quantification (LOD and LOQ) were estimated by using the signal-to-noisemethod, as specified in the European Pharmacopoeia [38]. The peak-to-peak noise around the AA (m/z72.0444) retention time was measured, and subsequently, the concentration of the AA that yielded asignal equal to a certain value of noise to signal ratio was estimated, by comparing measured signalsfrom samples with known low concentrations of the AA with those of blank samples. This method
28

Foods 2019, 8, 597
allows a decrease of the signal (peak height) to be observed to the extent that the concentration isreduced through a series of dilutions, establishing the minimum concentration at which the analytecan be reliably quantified. The signal-to-noise (S/N) ratios accepted as estimates of the LOD and LOQwere 3:1 and 10:1, respectively [39]. The values found in this study, based on three measurements ofBiscuit A, are 3.55 μg kg−1 for LOD and 11.8 μg kg−1 for LOQ, as shown in Table 1.
Table 1. Repeatability, limit of detection (LOD), and limit of quantification (LOQ) of the proposedmethodology, based on several measurements of Biscuit A.
AssayAcrylamide
(AA) Content(μg kg−1)
AverageAA Content
(μg kg−1)
SDRSDr
%LOD
(μg kg−1)LOQ
(μg kg−1)
1 254.12 277.33 343.94 309.85 269.8 297.9 33.1 11.1 3.55 11.86 345.07 290.98 292.0
Commission regulation of 20 November 2017 states that the method of analysis used for theanalysis of AA must comply with the following criteria: LOQ less than or equal to two fifths ofthe benchmark level (for benchmark level <125 μg kg−1) and less than or equal to 50 μg kg−1 (forbenchmark level ≥125 μg kg−1); LOD less than or equal to three tenths of LOQ [40]. According to thesame regulation, the benchmark level for the presence of AA in biscuits and wafers is 350 μg kg−1.This means that LOD and LOQ is required to be less than or equal to 15 and 50 μg kg−1, respectively.The method herein presented clearly meets these requirements. Moreover, in a proficiency test recentlyorganized by the EURL-PAH, for the determination of the AA content in potato chips, the methodperformance LOD and LOQ were reported [41]. Twenty-six laboratories guarantee the determinationof AA with an average LOD of 22.5 μg kg−1 and LOQ 55.8 μg kg−1 by liquid chromatography (LC)coupled with mass spectrometry (MS; MS/MS). Nine laboratories participating in this proficiency testreported 15.2 and 36.3 μg kg−1 as average LOD and LOQ, respectively, based on GC-MS methods.By using the analytical method herein reported, it is possible to increase the detectability and thusachieve lower limit of quantification, which can be particularly useful in the case of low-abundanceAA matrices. The selection of the acquisition mode in the Orbitrap has a direct impact on the detectionsensitivity. In a recent paper, Kaufmann demonstrated that the sensitivity of eight selected analytes isstrongly increased by the use of SIM (selected ion monitoring) relatively to the FS (full scan) mode(1.5-fold increase for analytes in pure standard solutions and 2-fold increase for analytes spiked in aheavy matrix) [42]. A detailed study of the acquisition method for determination of eight synthetichormones in animal urine concluded that reducing the scan range for Full MS (using the quadrupole)and targeted modes give higher S/N ratios and thereby better detection limits for analytes in complexmatrices [43]. In fact, the targeted-SIM (t-SIM) is not more selective than full MS, but it does provideenhanced detection sensitivity. As only a small fraction of the continuously entering ion beam issampled by the C-trap, the number of ions transmitted is greatly reduced and a much longer segmentof the ion beam can be collected. Accordingly, significantly higher sensitivity can be achieved, mainlyfor small molecules applications, such as the present case of AA.
The precision of the method was evaluated by measuring the repeatability (intra-day variability).The relative standard deviation was calculated for repeatability (RSDr) by performing eight repeatedanalyses for samples of the same biscuit. The results showed that the RSDr (11.1%) was less than 12%for a sample with an average AA content of 297.9 μg kg−1 (Table 1). The use of isotopically labeledinternal standard (acrylamide-d3) is herein especially useful, as sample loss may occur during sample
29
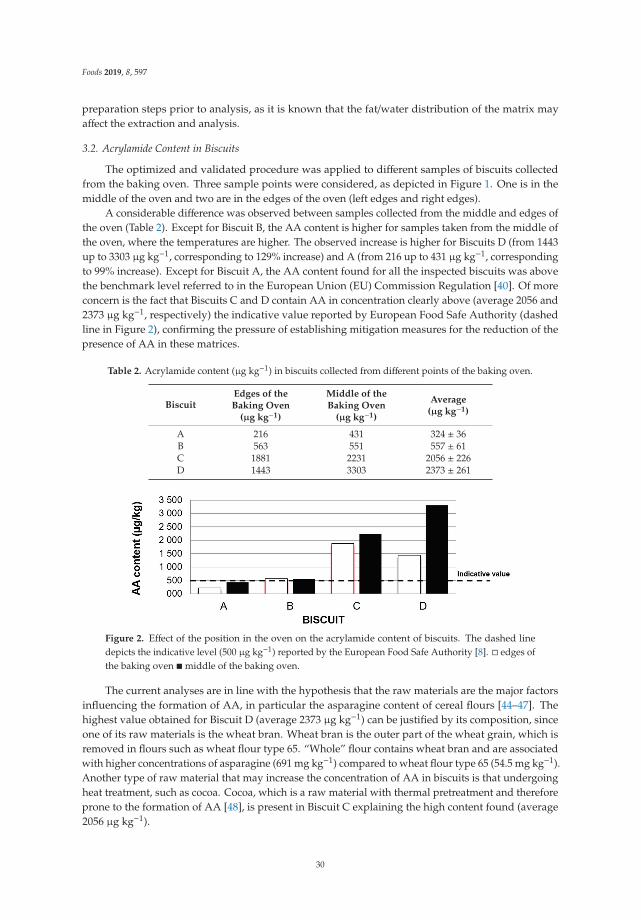
Foods 2019, 8, 597
preparation steps prior to analysis, as it is known that the fat/water distribution of the matrix mayaffect the extraction and analysis.
3.2. Acrylamide Content in Biscuits
The optimized and validated procedure was applied to different samples of biscuits collectedfrom the baking oven. Three sample points were considered, as depicted in Figure 1. One is in themiddle of the oven and two are in the edges of the oven (left edges and right edges).
A considerable difference was observed between samples collected from the middle and edges ofthe oven (Table 2). Except for Biscuit B, the AA content is higher for samples taken from the middle ofthe oven, where the temperatures are higher. The observed increase is higher for Biscuits D (from 1443up to 3303 μg kg−1, corresponding to 129% increase) and A (from 216 up to 431 μg kg−1, correspondingto 99% increase). Except for Biscuit A, the AA content found for all the inspected biscuits was abovethe benchmark level referred to in the European Union (EU) Commission Regulation [40]. Of moreconcern is the fact that Biscuits C and D contain AA in concentration clearly above (average 2056 and2373 μg kg−1, respectively) the indicative value reported by European Food Safe Authority (dashedline in Figure 2), confirming the pressure of establishing mitigation measures for the reduction of thepresence of AA in these matrices.
Table 2. Acrylamide content (μg kg−1) in biscuits collected from different points of the baking oven.
BiscuitEdges of theBaking Oven
(μg kg−1)
Middle of theBaking Oven
(μg kg−1)
Average(μg kg−1)
A 216 431 324 ± 36B 563 551 557 ± 61C 1881 2231 2056 ± 226D 1443 3303 2373 ± 261
Figure 2. Effect of the position in the oven on the acrylamide content of biscuits. The dashed linedepicts the indicative level (500 μg kg−1) reported by the European Food Safe Authority [8]. � edges ofthe baking oven �middle of the baking oven.
The current analyses are in line with the hypothesis that the raw materials are the major factorsinfluencing the formation of AA, in particular the asparagine content of cereal flours [44–47]. Thehighest value obtained for Biscuit D (average 2373 μg kg−1) can be justified by its composition, sinceone of its raw materials is the wheat bran. Wheat bran is the outer part of the wheat grain, which isremoved in flours such as wheat flour type 65. “Whole” flour contains wheat bran and are associatedwith higher concentrations of asparagine (691 mg kg−1) compared to wheat flour type 65 (54.5 mg kg−1).Another type of raw material that may increase the concentration of AA in biscuits is that undergoingheat treatment, such as cocoa. Cocoa, which is a raw material with thermal pretreatment and thereforeprone to the formation of AA [48], is present in Biscuit C explaining the high content found (average2056 μg kg−1).
30
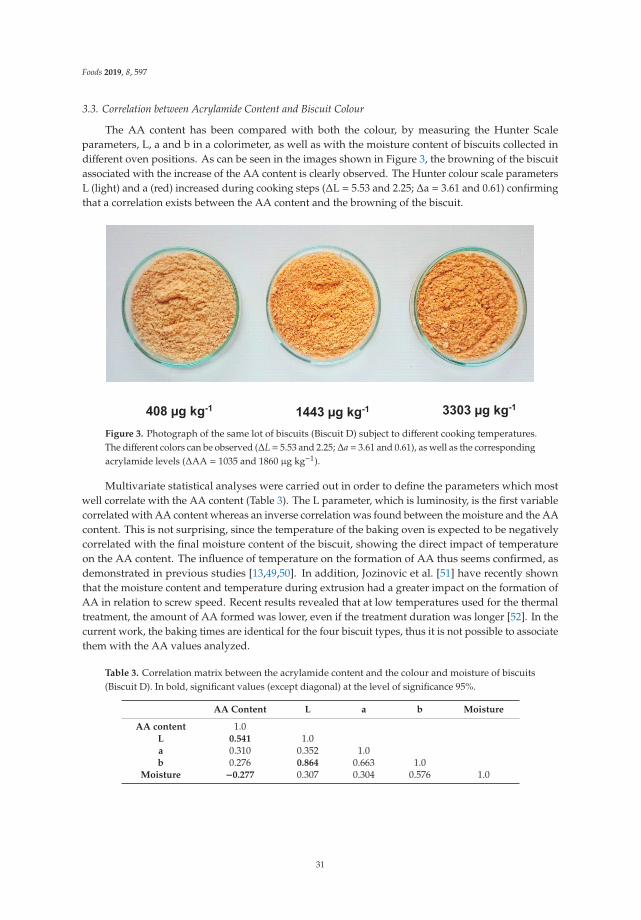
Foods 2019, 8, 597
3.3. Correlation between Acrylamide Content and Biscuit Colour
The AA content has been compared with both the colour, by measuring the Hunter Scaleparameters, L, a and b in a colorimeter, as well as with the moisture content of biscuits collected indifferent oven positions. As can be seen in the images shown in Figure 3, the browning of the biscuitassociated with the increase of the AA content is clearly observed. The Hunter colour scale parametersL (light) and a (red) increased during cooking steps (ΔL = 5.53 and 2.25; Δa = 3.61 and 0.61) confirmingthat a correlation exists between the AA content and the browning of the biscuit.
Figure 3. Photograph of the same lot of biscuits (Biscuit D) subject to different cooking temperatures.The different colors can be observed (ΔL= 5.53 and 2.25; Δa= 3.61 and 0.61), as well as the correspondingacrylamide levels (ΔAA = 1035 and 1860 μg kg−1).
Multivariate statistical analyses were carried out in order to define the parameters which mostwell correlate with the AA content (Table 3). The L parameter, which is luminosity, is the first variablecorrelated with AA content whereas an inverse correlation was found between the moisture and the AAcontent. This is not surprising, since the temperature of the baking oven is expected to be negativelycorrelated with the final moisture content of the biscuit, showing the direct impact of temperatureon the AA content. The influence of temperature on the formation of AA thus seems confirmed, asdemonstrated in previous studies [13,49,50]. In addition, Jozinovic et al. [51] have recently shownthat the moisture content and temperature during extrusion had a greater impact on the formation ofAA in relation to screw speed. Recent results revealed that at low temperatures used for the thermaltreatment, the amount of AA formed was lower, even if the treatment duration was longer [52]. In thecurrent work, the baking times are identical for the four biscuit types, thus it is not possible to associatethem with the AA values analyzed.
Table 3. Correlation matrix between the acrylamide content and the colour and moisture of biscuits(Biscuit D). In bold, significant values (except diagonal) at the level of significance 95%.
AA Content L a b Moisture
AA content 1.0L 0.541 1.0a 0.310 0.352 1.0b 0.276 0.864 0.663 1.0
Moisture −0.277 0.307 0.304 0.576 1.0
31

Foods 2019, 8, 597
4. Conclusions
A sensitive and efficient HRMS methodology, based on LC-MS with electrospray ionization andOrbitrap as mass analyser, allowing quantification of AA for specific food matrices of biscuits waspresented. Combining the multiplexed targeted-SIM mode for AA and isotopically labeled internalstandard (acrylamide-d3), the proposed HRMS method enables reliable and accurate analyses of AAwith very little influence by the matrix components. Under these conditions 3.55 μg kg−1 for LOD and11.8 μg kg−1 for LOQ are attainable.
During baking an increase in AA concentration was observed, as well as for samples taken fromthe middle of the oven, where the temperatures are higher. Statistical processing of data shows thatthe composition of the raw materials of the biscuits was statistically the most correlated factor with theAA content. Statistical treatment shows the direct impact of temperature on the AA content as well.
This study also reported that two types of biscuits (out of four) contain AA in concentrationclearly above the indicative value reported by European Food Safe Authority, confirming the pressureof establishing mitigation measures for the reduction of the presence of AA in these matrices.
Supplementary Materials: The following are available online at http://www.mdpi.com/2304-8158/8/12/597/s1,Figure S1: Chromatograms for a biscuit sample, indicating the acrylamide (AA) and deuterated acrylamide(AA-d3) retention times.
Author Contributions: Conceptualization, L.F.G.; Methodology, C.L.F. and D.O.C.; Data curation, C.L.F. andL.F.G.; Writing—original draft preparation, L.F.G.; Writing—review and editing, all authors; Supervision, L.F.G.
Funding: This research received financial support from the European Union (FEDER funds POCI/01/0145/FEDER/007265) and from FCT/MEC through national funds and co-financed by FEDER (UID/QUI/50006/2013-NORTE-01-0145-FEDER-00011) under the Partnership Agreement PT2020. DOC receives a postdoc grant throughthe project Operação NORTE-01-0145-FEDER-000011. Mass spectrometric analyses were conducted at CEMUP(Materials Centre of the University of Porto, Portugal) supported by the project NORTE-07-0162-FEDER-00048.
Acknowledgments: The authors are thankful to Silvia Maia (CEMUP) for her technical assistance in the massspectrometric analyses.
Conflicts of Interest: All authors disclose any potential sources of conflict of interest.
References
1. Tareke, E.; Rydberg, P.; Karlsson, P.; Eriksson, S.; Tornqvist, M. Analysis of acrylamide, a carcinogen formedin heated foodstuffs. J. Agric. Food Chem. 2002, 50, 4998–5006. [CrossRef]
2. Bergmark, E. Hemoglobin Adducts of Acrylamide and Acrylonitrile in Laboratory Workers, Smokers andNonsmokers. Chem. Res. Toxicol. 1997, 10, 78–84. [CrossRef]
3. Sorgel, F.; Weissenbacher, R.; Kinzig-Schippers, M.; Hofmann, A.; Illauer, M.; Skott, A.; Landersdorfer, C.Acrylamide: Increased concentrations in homemade food and first evidence of its variable absorption fromfood, variable metabolism and placental and breast milk transfer in humans. Chemotherapy 2002, 48, 267–274.[CrossRef]
4. Friedman, M. Chemistry, biochemistry, and safety of acrylamide. A review. J. Agric. Food Chem. 2003, 51,4504–4526. [CrossRef]
5. EFSA Panel on Contaminants in the Food Chain. Scientific Opinion on acrylamide in food. EFSA J. 2015, 13,4104. [CrossRef]
6. WHO. IARC Monographs on the Evaluation of Carcinogenic Risks to Humans; W. Press: Beijing, China, 1994.7. European Commission. Council Directive 98/83/EC of 3 November 1998 on the quality of water intended for
human consumption. Off. J. Eur. Communities 1998, 41, 32–54.8. European Union. Commission Recommendation of 8 November 2013 on investigations into the levels of
acrylamide in food. Off. J. Eur. Union 2013, 56, 17.9. Yaylayan, V.A.; Wnorowski, A.; Perez Locas, C. Why Asparagine Needs Carbohydrates To Generate
Acrylamide. J. Agric. Food Chem. 2003, 51, 1753–1757. [CrossRef]10. FDA. Guidance for Industry: Acrylamide in Foods; Food and Drug Administration: Rockville, MD, USA, 2016.
32

Foods 2019, 8, 597
11. Halford, N.G.; Curtis, T.Y. Reducing the Acrylamide-Forming Potential of Wheat, Rye and Potato: A Review.In Browned Flavors: Analysis, Formation, and Physiology; American Chemical Society: Washington, DC, USA,2016; Volume 1237, pp. 35–53.
12. Postles, J.; Powers, S.J.; Elmore, J.S.; Mottram, D.S.; Halford, N.G. Effects of variety and nutrient availabilityon the acrylamide-forming potential of rye grain. J. Cereal Sci. 2013, 57, 463–470. [CrossRef]
13. Przygodzka, M.; Piskula, M.K.; Kukurová, K.; Ciesarová, Z.; Bednarikova, A.; Zielinski, H. Factors influencingacrylamide formation in rye, wheat and spelt breads. J. Cereal Sci. 2015, 65, 96–102. [CrossRef]
14. Xu, Y.; Cui, B.; Ran, R.; Liu, Y.; Chen, H.; Kai, G.; Shi, J. Risk assessment, formation, and mitigation of dietaryacrylamide: Current status and future prospects. Food Chem. Toxicol. 2014, 69, 1–12. [CrossRef] [PubMed]
15. Pittet, A.; Perisset, A.; Oberson, J.M. Trace level determination of acrylamide in cereal-based foods by gaschromatography-mass spectrometry. J. Chromatogr. 2004, 1035, 123–130. [CrossRef] [PubMed]
16. Mizukami, Y.; Kohata, K.; Yamaguchi, Y.; Hayashi, N.; Sawai, Y.; Chuda, Y.; Ono, H.; Yada, H.; Yoshida, M.Analysis of acrylamide in green tea by gas chromatography-mass spectrometry. J. Agric. Food Chem. 2006, 54,7370–7377. [CrossRef] [PubMed]
17. Soares, C.M.D.; Fernandes, J.O. MSPD Method to Determine Acrylamide in Food. Food Anal. Methods 2008,2, 197. [CrossRef]
18. Cengiz, M.F.; Boyacı Gündüz, C.P. An eco-friendly, quick and cost-effective method for the quantification ofacrylamide in cereal-based baby foods. J. Sci. Food Agric. 2014, 94, 2534–2540. [CrossRef]
19. Delevic, V.; Zejnilovic, R.; Jancic Stojanovic, B.; Djordjevic, B.; Tokic, Z.; Zrnic-Ciric, M.; Stankovic, I.Quantification of acrylamide in foods selected by using gas chromatography tandem mass spectrometry.Hem. Ind. 2015, 70, 209–215. [CrossRef]
20. Sobhi, H.R.; Ghambarian, M.; Behbahani, M.; Esrafili, A. Application of modified hollow fiber liquidphase microextraction in conjunction with chromatography-electron capture detection for quantification ofacrylamide in waste water samples at ultra-trace levels. J. Chromatogr. 2017, 1487, 30–35. [CrossRef]
21. Yamazaki, K.; Isagawa, S.; Kibune, N.; Urushiyama, T. A method for the determination of acrylamide in abroad variety of processed foods by GC-MS using xanthydrol derivatization. Food Addit. Contam. 2011, 29,705–715. [CrossRef]
22. Molina-Garcia, L.; Santos, C.S.P.; Melo, A.; Fernandes, J.O.; Cunha, S.C.; Casal, S. Acrylamide in Chips andFrench Fries: A Novel and Simple Method Using Xanthydrol for Its GC-MS Determination. Food Anal.Methods 2015, 8, 1436–1445. [CrossRef]
23. Luo, L.; Ren, Y.; Liu, J.; Wen, X. Investigation of a rapid and sensitive non-aqueous reaction system for thedetermination of acrylamide in processed foods by gas chromatography-mass spectrometry. Anal. Methods2016, 8, 5970–5977. [CrossRef]
24. Norouzi, P.; Larijani, B.; Bidhendi, M.E.; Eshraghi, M.; Ebrahimi, M. A Sensitive Biosensor for AcrylamideDetection based on Polyaniline and Au Nanoparticles using FFT Admittance Voltammetry. Anal. Bioanal.Electrochem. 2018, 10, 18–32.
25. Zokaei, M.; Abedi, A.S.; Kamankesh, M.; Shojaee-Aliababadi, S.; Mohammadi, A. Ultrasonic-assistedextraction and dispersive liquid-liquid microextraction combined with gas chromatography-massspectrometry as an efficient and sensitive method for determining of acrylamide in potato chips samples.Food Chem. 2017, 234, 55–61. [CrossRef] [PubMed]
26. Lagalante, A.F.; Felter, M.A. Silylation of acrylamide for analysis by solid-phase microextraction/gaschromatography/ion-trap mass spectrometry. J. Agric. Food Chem. 2004, 52, 3744–3748. [CrossRef] [PubMed]
27. Surma, M.; Sadowska-Rociek, A.; Cieslik, E. Development of a sample preparation method for acrylamidedetermination in cocoa via silylation. Anal. Methods 2016, 8, 5874–5880. [CrossRef]
28. Bermudo, E.; Moyano, E.; Puignou, L.; Galceran, M.T. Liquid chromatography coupled to tandem massspectrometry for the analysis of acrylamide in typical Spanish products. Talanta 2008, 76, 389–394. [CrossRef]
29. Claus, A.; Weisz, G.M.; Kammerer, D.R.; Carle, R.; Schieber, A. A method for the determination of acrylamidein bakery products using ion trap LC-ESI-MS/MS. Mol. Nutr. Food Res. 2005, 49, 918–925. [CrossRef]
30. Tsutsumiuchi, K.; Hibino, M.; Kambe, M.; Oishi, K.; Okada, M.; Miwa, J.; Taniguchi, H. Application ofion-trap LC/MS/MS for determination of acrylamide in processed foods. Shokuhin Eiseigaku Zasshi 2004, 45,95–99. [CrossRef]
33

Foods 2019, 8, 597
31. Cajka, T.; Hajšlová, J. Gas Chromatography-Time-of-Flight Mass Spectrometry in Food Analysis. LC GC Eur.2007, 20, 25.
32. Huang, Y.S.; Hsieh, T.J.; Lu, C.Y. Simple analytical strategy for MALDI-TOF-MS and nanoUPLC-MS/MS:Quantitating curcumin in food condiments and dietary supplements and screening of acrylamide-inducedROS protein indicators reduced by curcumin. Food Chem. 2015, 174, 571–576. [CrossRef]
33. Qi, Y.; Zhang, H.; Wu, G.; Zhang, H.; Gu, L.; Wang, L.; Qian, H.; Qi, X. Mitigation effects of proanthocyanidinswith different structures on acrylamide formation in chemical and fried potato crisp models. Food Chem.2018, 250, 98–104. [CrossRef]
34. Omar, M.M.; Elbashir, A.A.; Schmitz, O.J. Determination of acrylamide in Sudanese food by high performanceliquid chromatography coupled with LTQ Orbitrap mass spectrometry. Food Chem. 2015, 176, 342–349.[CrossRef] [PubMed]
35. Troise, A.D.; Fiore, A.; Fogliano, V. Quantitation of Acrylamide in Foods by High-Resolution MassSpectrometry. J. Agric. Food Chem. 2014, 62, 74–79. [CrossRef] [PubMed]
36. Pugajeva, I.; Jaunbergs, J.; Bartkevics, V. Development of a sensitive method for the determination ofacrylamide in coffee using high-performance liquid chromatography coupled to a hybrid quadrupoleOrbitrap mass spectrometer. Food Addit. Contam. 2015, 32, 170–179. [CrossRef] [PubMed]
37. Howell, D.C. Fundamental Statistics for the Behavioural Sciences, 4th ed.; Duxbury Resource Center: PacificGrove, CA, USA, 1999.
38. European Union. European Union. European Directorate for the Quality of Medicines. In EuropeanPharmacopoeia; Council of Europe: Strasbourg, France, 2007.
39. ICH, Q.R. Validation of Analytical Procedures: Text and Methodology. In Proceedings of the InternationalConference on Harmonization, Geneva, Switzerland, 8–13 November 2005.
40. European Commission. Commission Regulation (EU) 2017/2158 Establishing mitigation measures andbenchmark levels for the reduction of the presence of acrylamide in food. Off. J. Eur. Union 2017, 304, 24–44.
41. Bratinova, S.; Karasek, L. Determination of the acrylamide content in potato chips. Report on proficiency testorganised by the EURL-PAH. In JRC Technical Reports; European Union: Luxembourg, 2017. [CrossRef]
42. Kaufmann, A. Analytical performance of the various acquisition modes in Orbitrap MS and MS/MS. J. MassSpectrom 2018, 53, 725–738. [CrossRef]
43. Kumar, P.; Rubies, A.; Centrich, F.; Granados, M.; Cortes-Francisco, N.; Caixach, J.; Companyo, R. Targetedanalysis with benchtop quadrupole-orbitrap hybrid mass spectrometer: Application to determination ofsynthetic hormones in animal urine. Anal. Chim. Acta 2013, 780, 65–73. [CrossRef]
44. Pedreschi, F.; Kaack, K.; Granby, K. The effect of asparaginase on acrylamide formation in French fries. FoodChem. 2008, 109, 386–392. [CrossRef]
45. Pedreschi, F.; Mariotti, S.; Granby, K.; Risum, J. Acrylamide reduction in potato chips by using commercialasparaginase in combination with conventional blanching. LWT-Food Sci. Technol. 2011, 44, 1473–1476.[CrossRef]
46. Mustatea, G.; Popa, M.; Mioara, N. Influence of Flour Extraction Degree on Acrylamide Formation in Biscuits.Rom. Biotechnol. Lett. 2016, 21, 11328–11336.
47. Mustatea, G.; Popa, M.; Mioara, N.; Israel, F. Asparagine and sweeteners—How they influence acrylamideformation in wheat flour biscuits? J. Biotechnol. 2015, 208, S81. [CrossRef]
48. Delatour, T.; Périsset, A.; Goldmann, T.; Riediker, S.; Stadler, R.H. Improved Sample Preparation to DetermineAcrylamide in Difficult Matrixes Such as Chocolate Powder, Cocoa, and Coffee by Liquid ChromatographyTandem Mass Spectroscopy. J. Agric. Food Chem. 2004, 52, 4625–4631. [CrossRef] [PubMed]
49. Van Der Fels-Klerx, H.J. Acrylamide and 5-hydroxymethylfurfural formation during baking of biscuits:NaCl and temperature–time profile effects and kinetics. Food Res. Int. 2014, 57, 210–217. [CrossRef]
50. Nguyen, H.T.; van der Fels-Klerx, H.J.I.; van Boekel, M. Acrylamide and 5-hydroxymethylfurfural formationduring biscuit baking. Part II: Effect of the ratio of reducing sugars and asparagine. Food Chem. 2017, 230,14–23. [CrossRef] [PubMed]
34

Foods 2019, 8, 597
51. Jozinovic, A.; Šarkanj, B.; Ackar, Đ.; Panak Balentic, J.; Šubaric, D.; Cvetkovic, T.; Ranilovic, J.; Guberac, S.;Babic, J. Simultaneous Determination of Acrylamide and Hydroxymethylfurfural in Extruded Products byLC-MS/MS Method. Molecules 2019, 24, 1971. [CrossRef] [PubMed]
52. Constantin, O.E.; Kukurova, K.; Dasko, L.; Stanciuc, N.; Ciesarova, Z.; Croitoru, C.; Rapeanu, G. ModellingContaminant Formation during Thermal Processing of Sea Buckthorn Puree. Molecules 2019, 24, 1571.[CrossRef]
© 2019 by the authors. Licensee MDPI, Basel, Switzerland. This article is an open accessarticle distributed under the terms and conditions of the Creative Commons Attribution(CC BY) license (http://creativecommons.org/licenses/by/4.0/).
35


foods
Article
Potato Tuber Chemical Properties in Storage asAffected by Cultivar and Nitrogen Rate: Implicationsfor Acrylamide Formation
Na Sun 1,†, Yi Wang 2, Sanjay K. Gupta 1 and Carl J. Rosen 1,*
1 Department of Soil, Water, and Climate, University of Minnesota, St. Paul, MN 55108, USA;[email protected] (N.S.); [email protected] (S.K.G.)
2 Department of Horticulture, University of Wisconsin, Madison, WI 53706, USA; [email protected]* Correspondence: [email protected]; Tel.: +1-612-625-8114† Na Sun, current address: Beijing Academy of Agriculture and Forestry Science, Institute of Plant Nutrition
and Resources, Beijing 100097, China.
Received: 17 February 2020; Accepted: 10 March 2020; Published: 18 March 2020
Abstract: Recently released potato cultivars Dakota Russet and Easton were bred for low reducingsugars, and low acrylamide-forming potential in French fries. The objectives of this study were todetermine: (1) the effects of nitrogen rate and storage time on tuber glucose concentrations in differentcultivars; (2) the relationships between acrylamide, glucose, and asparagine for the new cultivarsand Russet Burbank. The study was conducted at Becker, Minnesota over a period of two years on aloamy sand soil under irrigated conditions. All cultivars were subjected to five N rates from 135 to404 kg ha−1 in a randomized complete block design. Following harvest, tubers were stored at 7.8 ◦Cand sampled at 0, 16, and 32 weeks. Dakota Russet and Easton had significantly lower concentrationsof stem- and bud-end glucose, asparagine, and acrylamide than those of Russet Burbank in both years.The effect of storage time on glucose concentration was significant but differed with cultivar and year.N rate effects on stem- and bud-end glucose concentrations were cultivar and storage time dependent.After 16 weeks of storage, both asparagine and acrylamide concentrations linearly increased withincreasing N rate. Glucose concentration was positively correlated with acrylamide concentration(r2 = 0.61). Asparagine concentration was also positively correlated with acrylamide concentration(r2 = 0.45) when the asparagine:glucose ratio was <1.306. The correlation between fry color andstem-end glucose concentration was significant over three cultivars in both years, but stronger in agrowing season with minimal environmental stress. Taken together, these results suggest that whileacrylamide formation during potato processing is a complex process affected by agronomic practices,environmental conditions during the growing season, and storage conditions, cultivar selection maybe the most reliable method to minimize acrylamide in fried products.
Keywords: reducing sugars; glucose; asparagine; acrylamide; potato; cultivar; storage time
1. Introduction
Acrylamide, a neurotoxin and probable carcinogen for humans, was first reported in fried potato(Solanum tuberosum L.) products in 2002 [1]. The concentration of acrylamide in processed productsis strongly affected by processing conditions (for instance frying temperature and duration) andthe concentrations of acrylamide precursors, reducing sugars, and asparagine [2,3]. Other factorssuch as cultivar, soil nutrition, environmental conditions during plant growth, harvesting time,storage conditions and genetic modification can affect the concentrations of reducing sugars andasparagine, and consequently acrylamide-forming potential [4–13]. Following the evaluation ofnumerous approaches to mitigate acrylamide in fried potato products, progress has been made in
Foods 2020, 9, 352; doi:10.3390/foods9030352 www.mdpi.com/journal/foods37

Foods 2020, 9, 352
lowering its concentration. Power et al. [14] reported the mean acrylamide level decreased from763 μg kg−1 in 2002 to 358 μg kg−1 in potato chips from 20 European countries; Wang et al. [15] showedthat many new elite U.S. fry processing cultivars exist with substantially lower acrylamide-formingpotential than the standard check Russet Burbank. However, despite the current mitigation efforts,acrylamide remains a public concern due to the potential cancer risk [16].
Nitrogen (N) management is a common agronomic practice that can influence acrylamideprecursors, reducing sugars, glucose and fructose, and asparagine in potato tubers, and consequentlyacrylamide-forming potential. The effects of N rate on reducing sugars in potato tubers can be highlyvariable. For example, reducing sugar concentrations have been reported to both increase or decreasewith increasing N supply in one study, while in another study N rate had no effect on reducingsugars [5,10]. A few studies also reported a decrease in reducing sugars at the stem end or in the wholetuber with increasing N rate [6,17–19]. Compared to the complex responses of reducing sugars to Nrate, asparagine concentrations have been shown to generally increase with increasing N rate [19–21].Low tuber reducing sugars concentrations were detected along with high asparagine concentrations inthese studies [20,21].
Tuber glucose concentrations can vary significantly during storage and often interact with cultivarand growing conditions [22–25]. Muttucumaru et al. [24] reported reducing sugars’ concentrationsincreased from 2 to 6 months of storage at 8 ◦C for tubers harvested from one location but decreased fortubers harvested from the other location under the same storage conditions for the cultivars PentlandDell and Umatilla Russet. In another study, tuber glucose concentrations increased during the 9-monthstorage in one year but were not affected by storage time in the following year at a storage temperatureof 7.2 ◦C for Alpine Russet [25]. The results of these studies suggest that environmental conditionsduring the growing season can alter or even reverse the storage time effect on reducing sugars underappropriate storage temperature conditions for certain cultivars.
Unlike the variable responses of reducing sugars to storage time, asparagine concentration isgenerally considered stable during storage [26–28]. Olsson et al. [29] investigated the asparagine contentfluctuation during the long-term storage at both 3 and 10 ◦C for eight potato cultivars. Minimal effectsof storage time and storage temperature on asparagine concentration were reported in the study andgenetic and year effects were substantial for some cultivars. Matsuura-Endo et al. [30] reported minorvariation of tuber asparagine concentrations during 18 weeks of storage at 2–18 ◦C.
The relationship between reducing sugars, asparagine, and acrylamide is complicated and appearsto be affected by the relative concentrations of the precursors [31]. Reducing sugar concentrations aregenerally considered the limiting factor for acrylamide formation due to their lower concentrationthan asparagine in fry-processing potato tubers [26]. This relationship often results in a significantlypositive correlation between reducing sugar and acrylamide concentrations [15,23,27,32,33]. However,positive correlations between asparagine and acrylamide concentrations have also been reported [30,34].Shepherd et al. [35] suggested that both reducing sugars and asparagine should be considered tohelp explain the variation in acrylamide concentrations. Muttucumaru et al. [36] speculated thathigher amounts of reducing sugars relative to asparagine in some cultivars were the reason for a moresignificant role of asparagine in acrylamide formation. They found that asparagine affected acrylamideformation when its concentration was 2.257× lower than that of reducing sugars in 20 potato cultivarsgrown in two locations after 2 and 6 months of storage [24].
This study investigates the effects of N fertilization rate on asparagine and glucose concentrationsin recently released potato cultivars during storage and implications for acrylamide formation duringprocessing over two growing seasons. The specific objectives of this study were to: (1) determinethe effects of N rate and storage time on stem- and bud-end glucose concentrations of Easton andDakota Russet cultivars, relative to the standard cultivar Russet Burbank over two growing seasons;and (2) elucidate relationships between acrylamide, glucose, and asparagine, for the test cultivars after16 weeks of storage at 7.8 ◦C.
38

Foods 2020, 9, 352
2. Materials and Methods
The study was conducted at the Sand Plain Research Farm in Becker, Minnesota on a Hubbardloamy sand soil (sandy, mixed, frigid Entic Hapludolls) in 2014 and 2015. A randomized completeblock experimental design was adopted with a factorial treatment arrangement of N rate and cultivarreplicated four times. Three French fry cultivars—Russet Burbank, Dakota Russet, and Easton—weresubjected to five N fertilizer treatments, 135, 202, 269, 336, and 404 kg ha−1. For each treatment,101 kg ha−1 N fertilizer was applied pre-planting as polymer coated urea (44–0–0; EnvironmentallySmart Nitrogen, Agrium, Inc.) and 34 kg ha−1 N fertilizer was applied at planting as diammoniumphosphate (18–46–0). The remainder, 0, 67, 134, 201, and 269 kg N ha−1, for each treatment was appliedat emergence as polymer coated urea.
Each plot consisted of seven 7.6 m rows with 25 plants in each row. The spacing between rowswas 0.9 m and seed tubers were spaced 0.3 m apart within each row. Sample tubers were harvestedfrom rows 4 and 5. Whole “B” seed (56–84 g) of Russet Burbank and cut “A” seed (56–84 g) of DakotaRusset and Easton were hand planted in furrows on 6 May, 2014 and 21 April, 2015. Soil propertiesand further cultural practices used in this study can be found in [37].
2.1. Sample Collection and Analysis
Tuber harvest dates were scheduled on 2 October 2014 and 28 September 2015 according toweather conditions. After harvest, approximately 23 kg of tubers (single tuber weight between170 and 283 g) from each plot were shipped to the USDA-ARS (United States Department ofAgriculture-Agricultural Research Service) Potato Research Worksite in East Grand Forks, Minnesota.Tubers were preconditioned at 10 ◦C for two weeks and then stored at 7.8 ◦C for 32 weeks.Glucose concentrations in both the stem and bud end of tubers were determined by a YSI-2700Select Biochemistry Analyzer (Yellow Springs Instrument Co. Inc. Yellow Springs, Ohio, USA) after 0,16, and 32 weeks of storage. Glucose extraction from tubers was as follow: stem-end samples (50 gper sample) were collected from the 3.8 cm of tuber tissues surrounding the stem scar, while bud-endsamples (50 g per sample) were collected from the remainder of the tuber. The stem- and bud-endsamples were ground separately in an Acme Juicerator (Acme Equipment, Spring Hill, FL, USA),and brought up to a final volume of 100 mL with 50 mM phosphate buffer (pH 7.2) in a beaker. Sampleswere then stored at 4 ◦C for 20–30 min and gently stirred without disturbing the precipitate (includingstarch) in the bottom of the beaker. For each sample, 15 mL of juice was transferred into a labeledscintillation vial and frozen for glucose analysis.
Tuber samples for asparagine analysis were collected after vine kill both years. Six tubers greaterthan 85 g from each plot were randomly chosen for the determination of asparagine concentration.Fresh tuber tissue was collected about 0.5 cm from the stem and bud ends of the tubers using a 7.8 mmHumboldt Brass Cork borer, and then stored at −20 ◦C for later asparagine extraction. Asparagine wasdetermined by liquid chromatography with tandem mass spectrometry. Details on sample preparationand determination of asparagine analysis in this study can be found in Sun et al. [37]. All massspectrometry analyses were conducted by the Center for Mass Spectrometry and Proteomics at theUniversity of Minnesota.
To investigate the relationships between acrylamide formation and its precursors, we selectedthe storage midpoint of 16 weeks, with the assumption that asparagine concentrations analyzed atharvest were similar to those over the entire storage period [29,30]. After 16 weeks of storage, tuberswere fried at the worksite in East Grand Forks. Five tubers from each plot were washed, cut (crosssection dimension: 22 × 6.5 mm), blanched at 74 ◦C for 6 min, and then par fried in canola oil at185 ◦C for 2.75 min. Even though a frying temperature of 168 ◦C has been recommended to loweracrylamide formation in processed potato products, our objective was to access the contribution ofthe precursors, asparagine and glucose, on acrylamide formation in new potato cultivars under acommercial setting. Therefore, we adopted a French fry production procedure currently used bythe industry. In commercial French fry production, blanching is performed to remove precursors in
39

Foods 2020, 9, 352
the uncooked cut potatoes, which will then reduce acrylamide formation during the frying process.After freezing at −26 ◦C, all fries were finish fried for 1 min at 191 ◦C. Fry color at stem and budends was determined at the East Grand Forks worksite with a Photovolt Reflectance Meter (PhotovoltInstruments Inc., Minneapolis, MN, USA) about 3 min after finish frying. The fried samples wereshipped frozen to the University of Minnesota for acrylamide extraction. For each plot, three frieswere ground for 30 s in a coffee grinder, and 0.8–1.0 g of ground powder was taken for each sample foracrylamide extraction and determination as described by Sun et al. [25]. Acrylamide was determinedin whole fries and, therefore, the average concentrations of stem- and bud-end glucose and asparaginewere used to explore the relationships between these precursors and acrylamide formation.
2.2. Statistical Analysis
Analysis of variance (ANOVA) for glucose in the stem and bud end as a function of N rate,cultivar, storage time, and year was conducted using PROC ANOVA (Analysis of Variance Procedure)with repeated measures for storage time in SAS 9.4 statistical software package (Statistical AnalysisSystem, SAS Institute Inc., Cary, NC, USA). A square root transformation was used when necessary toaccount for the heterogeneity of variance. The average of stem-end and bud-end glucose or asparagineconcentrations was considered as the concentration of the whole-tuber glucose or asparagine, whichwas then analyzed with PROC ANOVA as a function of N rate, cultivar, and year. Acrylamideconcentrations in fried potatoes were also analyzed using PROC ANOVA. Means of interest werecompared using the least significant difference (LSD) test at the 5% probability level. PROC GLM(General Linear Models Procedure) and CONTRAST statements were used to determine linear orquadratic effects of N rate on glucose, asparagine, and acrylamide concentrations. All figures andtables were depicted using Excel (Microsoft, Seattle, WA). A p-value < 0.05 was considered significant.The relationship between acrylamide and the molar ratio of asparagine to glucose was investigatedusing a piecewise linear regression (also known as a broken-stick regression) model:
acrylamide = a1 + b1 × asparagine/glucose for asparagine/glucose ≤ c (1)
acrylamide = a2 + b2 × asparagine/glucose for asparagine/glucose > c (2)
where a1 and a2 are the intercept, b1 and b2 are the slope of the two linear lines, and c is the breakpointin the model [24,38]. PROC NLIN (Nonlinear Regression Models Procedure) statement was used toestimate the parameters a1, a2, b1, b2, and c in SAS.
3. Results and Discussion
3.1. Glucose Concentrations
Stem-end glucose concentrations in 2014 and 2015 were significantly influenced by the interactionof cultivar by storage time by year (Table 1). A decrease in glucose concentration at the stem endwas observed for all three cultivars during the 32-week storage in 2014 (Figure 1). The decrease ofstem-end glucose concentration was significant at harvest for Easton, and 16 weeks after storage forRusset Burbank and Dakota Russet in 2014. In 2015, the fluctuation of stem-end glucose during the32-week storage varied by cultivar (Figure 1). For Dakota Russet, the stem-end glucose concentrationwas stable for the first 16 weeks and significantly increased since then. However, Russet Burbank andEaston had stem-end glucose concentrations not affected by storage time in 2015. Stem-end glucoseconcentrations of Dakota Russet and Easton were significantly lower than that of Russet Burbankduring the 32-week storage both years.
40

Foods 2020, 9, 352
Table 1. The analysis of variance for glucose concentration during 32 weeks of storage in 2014 and 2015.
Source of VarianceGlucose During 32 Weeks of Storage
Stem End Bud End
Main Effect
Cultivar (C) <0.0001 <0.0001N Rate (N) 0.0718 0.4334
Year (Y) 0.1461 0.0018Storage Time (S) <0.0001 0.0765
Interactions
N ×Y 0.3955 0.0142N × S 0.3319 0.7266S × Y <0.0001 0.0052C × Y <0.0001 0.0049C × N 0.0033 0.8609C × S <0.0001 0.2078
N × S × Y 0.5359 0.2544C × N × Y 0.4159 0.1309C × N × S 0.0562 0.6043C × S × Y 0.0295 0.2783
C × N × S × Y 0.4247 0.6849
Figure 1. Three-way interaction of cultivar by storage time by year effect on stem-end glucoseconcentrations in 2014 and 2015 (Means were separated at the 5% level, with the same letter above thebar indicating no significant difference.). FW: Fresh weight.
The effect of N rate on stem-end glucose concentration was storage-time and cultivar dependent(Table 1 and Figure 2). Stem-end glucose concentration in Russet Burbank tended to decrease withincreasing N supply through the entire storage. However, the N rate effect was significant at 32weeks of storage only. Stem-end glucose concentrations of Easton and Dakota Russet responded to Nsupply at harvest only, quadratically decreased for Dakota Russet and linearly increased for Easton.Overall, the N rate effect on stem-end glucose concentration of Easton and Dakota Russet was not asdramatic as it was for Russet Burbank.
Bud-end glucose concentration of all three cultivars was significantly affected by storage time,cultivar, and N rate, but the effect differed by year (Table 1 and Figure 3). Bud-end glucose concentrationaveraged over cultivar and N rate decreased and then leveled off at 16 weeks of storage in 2014,but it was not affected by storage time in 2015 (Figure 3a). New cultivars Dakota Russet andEaston had significantly lower bud-end glucose concentrations than Russet Burbank in both years.However, bud-end glucose concentrations of the new cultivars significantly increased in 2015, and thedifferences between these two cultivars were greater with Dakota Russet than Easton in 2015 (Figure 3b).Bud-end glucose concentrations were not affected by N supply in 2014, but linearly decreased withincreasing N rate in 2015 for all three cultivars averaged during the entire storage (Figure 3c). The results
41

Foods 2020, 9, 352
indicate that the effect of environmental conditions during the growing season on bud-end glucoseconcentration continues in storage and can be affected by N rate and cultivar.
Figure 2. Three-way interaction of cultivar by N rate by storage time on stem-end glucose in 2014and 2015.
Figure 3. Interactions of storage by year (a), cultivar by year (b), and N rate by year (c) effects onbud-end glucose (Means were separated at the 5% level, with the same letter above the bar indicatingno significant difference.).
42

Foods 2020, 9, 352
Cold temperatures before vine kill may have induced reducing sugar accumulation in both stemand bud end for all three cultivars at harvest in 2014, while no cold stress occurred in 2015 [37].Even though tubers were preconditioned at 10 ◦C for two weeks after harvest, higher glucoseconcentrations were still detected at the stem end for Russet Burbank in 2014 (4.54 mg g−1) than in2015 (2.79 mg g−1), suggesting that two weeks was not long enough for preconditioning of this cultivar.Dakota Russet and Easton also had elevated stem-end glucose at harvest in 2014 relative to 2015 (20%higher for Dakota Russet and 9% higher for Easton), but the difference was not as large as in RussetBurbank (63%), suggesting a stress resistant characteristic of the new cultivars.
Glucose concentrations decreased in the stem and bud end of all three cultivars during storagein 2014, which may be due to the proper storage temperature (7.8 ◦C) for the tuber reconditioning inthis study. This is consistent with the conclusion of Silva and Simon [39], who reported a decreaseof glucose concentration from 2.64% to 0.58% dry weight (DW) (averaged over seven cultivars) aftertuber reconditioning at 15 ◦C for 2 weeks during storage.
Knowles et al. [22] stored Ranger Russet, Umatilla Russet, and Russet Burbank at low temperatures(4.5 and 6.7 ◦C) and reported an increase in reducing sugar accumulation during the first 31 days.However, a decrease in reducing sugar concentrations was observed over the next 220 days when thestorage temperature increased from 4.5 to 6.7 ◦C and 6.7 to 9 ◦C for all three cultivars. The results abovesuggest that sugar accumulation from cold stress is reversible with proper reconditioning temperatures.
The effect of N rate on glucose accumulation differed in stem and bud end, and often interactedwith cultivar, storage time, or year. Contradictory results of N rate effects on glucose concentrationshave been reported in the previous studies [10,17,40–43]. Westermann et al. [17] reported an increasein reducing sugars at the bud end, and a decrease at the stem end with increasing N supply from0 to 336 kg ha−1 for Russet Burbank, which is consistent with the results for the stem end in thisstudy. However, a minimal N rate effect on reducing sugar concentration for Russet Burbank wasreported by Zebarth et al. [41]. Knowles et al. [43] reported a decreasing tendency of reducing sugarswith increasing N supply at the stem and bud end for Alpine Russet, while reducing sugars of thecultivar Sage Russet barely responded to N supply at harvest. Gause [44] reported reducing sugarconcentrations in Easton were not significantly affected by N rate when stored at 10 ◦C, which agreedin part with the results in this study. The effects of N rate on glucose concentrations in the stem andbud end of Dakota Russet have not been previously reported.
3.2. Concentrations of Acrylamide and Acrylamide Precursors
The cultivar by year interaction was significant for whole-tuber glucose concentration at 16 weeksof storage (Table 2). Due to high stem-end and low bud-end glucose concentrations in potato tuber,the whole-tuber glucose response to cultivar and year interaction was the same as that of stem-endglucose in Figure 1 (data not shown).
The main effects of cultivar, year, and N rate significantly affected whole-tuber asparagineconcentrations (Table 2, Figure 4). Asparagine concentrations in Dakota Russet and Easton wereconsistently lower than those in Russet Burbank. Asparagine concentration increased with increasingN supply over three cultivars in two years. Averaged over cultivar and N rate, whole-tuber asparagineconcentrations were lower in 2015 than in 2014, indicating the pronounced growing-condition effect.Warm weather early and late in the growing season in 2015 was favorable for tuber bulking and Nuptake, but not for asparagine accumulation, suggesting that high tuber N did not proportionallyconvert to tuber asparagine.
43

Foods 2020, 9, 352
Table 2. The analysis of variance for the concentrations of glucose, asparagine, and acrylamide in 2014and 2015.
SourceWhole-Tuber
Glucose (16 Weeks) Asparagine (After Vine Kill) Acrylamide (16 Weeks)
Main Effect
Cultivar (C) <0.0001 <0.0001 <0.0001N Rate (N) 0.3042 0.0002 <0.0001
Year (Y) 0.3065 <0.0001 0.0052
Interactions
C × N 0.1617 0.7709 0.4667C × Y <0.0001 0.3661 0.0049N × Y 0.4420 0.4715 0.8615
C × N × Y 0.7170 0.9011 0.4493
Figure 4. Main effects of cultivar (a), year (b), and N rate (c) on whole-tuber asparagine concentrationsat 16-week storage (Means were separated at the 5% level, with the same letter above the bar indicatingno significant difference.).
The effect of cultivar by year interaction was significant on acrylamide concentration after16 weeks of storage (Table 2 and Figure 5). Russet Burbank had the same level of acrylamideconcentrations in two years (388 μg kg−1 in 2014 and 378 μg kg−1 in 2015). New cultivars DakotaRusset and Easton had significantly lower acrylamide concentrations than Russet Burbank in bothyears. However, the acrylamide concentration was significantly higher in Dakota Russet (169 μg kg−1)than in Easton (127 μg kg−1) in 2014, but on an equivalent level in 2015 (209 and 203 μg kg−1 for DakotaRusset and Easton, respectively). The lower acrylamide concentrations in French fries produced fromDakota Russet and Easton relative to Russet Burbank are consistent with reports from the North Dakotaand Maine potato breeding programs [45,46].
44

Foods 2020, 9, 352
Figure 5. Cultivar by year interaction effect on acrylamide concentration at 16-week storage (Meanswere separated at the 5% level, with the same letter above the bar indicating no significant difference.).
Averaged over cultivar and year, acrylamide concentrations increased linearly with increasing Nrate (Figure 6), which is consistent with the conclusion from previous studies on Russet Burbank byMuttucumaru et al. [10] and Easton by Gause [44]. However, in another study, acrylamide concentrationsin Russet Burbank were not affected by N supply in one year, and quadratically changed in the followingyear [25]. These results suggest acrylamide response to N rate probably depends on environmentalconditions during the growing season and cultivar. For example, acrylamide concentrations decreasedin Saturna and Hermes, and increased in Lady Rosetta and Markies with increasing N supply in theUnited Kingdom [10] but were not affected by N supply in Switzerland for the same four cultivars [5].The effect of N rate on acrylamide concentrations for Dakota Russet has not been previously reported.
Figure 6. N rate effect on acrylamide concentration after 16 weeks of storage.
3.3. Relationships between Acrylamide, Glucose, and Asparagine
The tuber glucose concentration was significantly correlated with the concentration of acrylamidein French fries over three cultivars in two years with r2 = 0.61 (Figure 7a).
The relationship between tuber asparagine and acrylamide was also significant, but not as strong(r2 = 0.15, p < 0.01, Figure 7b). Previous studies have reported similar conclusions of a strong correlationbetween reducing sugars and acrylamide with R2 values ranging from 0.73 to 0.95 [15,23,27,32,36],and a weak relationship between asparagine and acrylamide with R2 values ranging from 0.03 to0.27 [23,27,36].
45
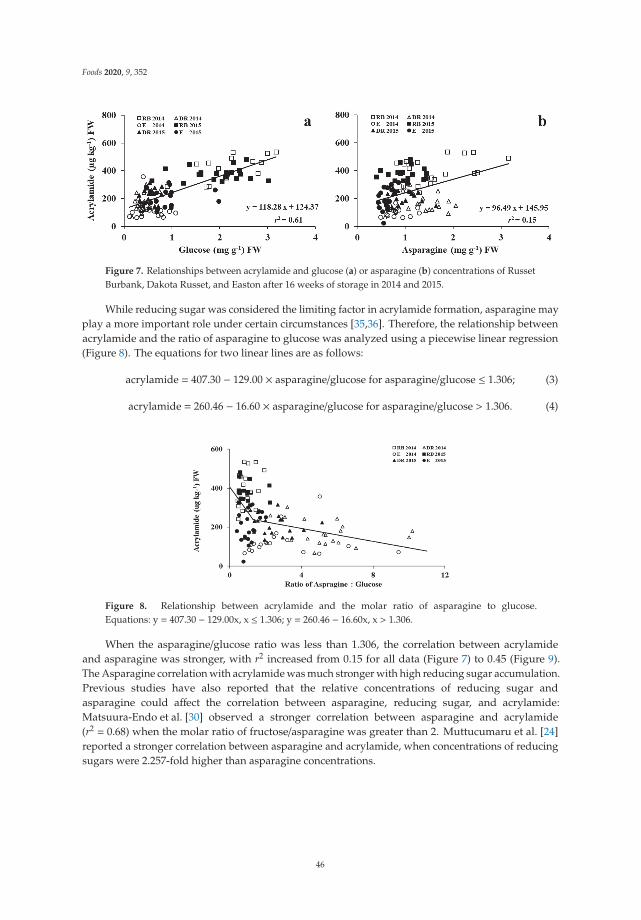
Foods 2020, 9, 352
Figure 7. Relationships between acrylamide and glucose (a) or asparagine (b) concentrations of RussetBurbank, Dakota Russet, and Easton after 16 weeks of storage in 2014 and 2015.
While reducing sugar was considered the limiting factor in acrylamide formation, asparagine mayplay a more important role under certain circumstances [35,36]. Therefore, the relationship betweenacrylamide and the ratio of asparagine to glucose was analyzed using a piecewise linear regression(Figure 8). The equations for two linear lines are as follows:
acrylamide = 407.30 − 129.00 × asparagine/glucose for asparagine/glucose ≤ 1.306; (3)
acrylamide = 260.46 − 16.60 × asparagine/glucose for asparagine/glucose > 1.306. (4)
Figure 8. Relationship between acrylamide and the molar ratio of asparagine to glucose.Equations: y = 407.30 − 129.00x, x ≤ 1.306; y = 260.46 − 16.60x, x > 1.306.
When the asparagine/glucose ratio was less than 1.306, the correlation between acrylamideand asparagine was stronger, with r2 increased from 0.15 for all data (Figure 7) to 0.45 (Figure 9).The Asparagine correlation with acrylamide was much stronger with high reducing sugar accumulation.Previous studies have also reported that the relative concentrations of reducing sugar andasparagine could affect the correlation between asparagine, reducing sugar, and acrylamide:Matsuura-Endo et al. [30] observed a stronger correlation between asparagine and acrylamide(r2 = 0.68) when the molar ratio of fructose/asparagine was greater than 2. Muttucumaru et al. [24]reported a stronger correlation between asparagine and acrylamide, when concentrations of reducingsugars were 2.257-fold higher than asparagine concentrations.
46

Foods 2020, 9, 352
Figure 9. Relationships between acrylamide and asparagine (a) for Russet Burbank in two years andEaston in 2015, and (b) when asparagine/glucose ≤ 1.306.
In Figure 9a, most values of asparagine/glucose for Russet Burbank in two years and Easton in2015 fell into the range of less than 1.306 as shown in Figure 9b, demonstrating a strong correlationbetween acrylamide and asparagine (r2 = 0.41). The ratio of asparagine/glucose was greater than 1.306for Dakota Russet in both years and for Easton in 2014 (data not shown). No effects of N rate onasparagine/glucose ratio were observed at 16 weeks of storage. This result suggests that cultivar andenvironmental conditions during the growing season were more important than N rate in affectingthe relative concentrations of reducing sugars and asparagine, and consequently their relationshipswith acrylamide.
3.4. Relationships between Fry Color, Glucose, and Acrylamide at 16 Weeks of Storage
In the stem end, glucose concentration was significantly correlated with fry color with r2 = 0.40and 0.75 in 2014 and 2015, respectively (Figure 10). However, it is not the case for the bud end. Thecorrelation between bud-end glucose and fry color was not significant in 2014 and was weak in 2015(r2 = 0.20). High stem-end sugar concentration generally caused dark color French fries (Figure 10a,c).Tubers containing the same amount of stem-end glucose had lower photovolt readings in 2015 than in2014. Thus, although this correlation was significant for the stem end in both years, the equation inone year cannot be used to predict fry color or glucose concentration in another year. This is consistentwith a previous study conducted with fry and chip cultivars [25].
The relationship between acrylamide and fry color was also investigated in this study. Bud-endglucose concentration was neglected due to the minimal contribution of bud-end glucose to fry color.Acrylamide and stem-end fry color was significantly correlated with an r2 = 0.57 and p < 0.05 over threecultivars and two years (Figure 11), indicating that fry color can be used as a predictor of acrylamide infried potatoes. Fry color is considered acceptable when more than 80% of French fries have photovoltreadings greater than 23 [47,48]. Therefore, all tested cultivars produced French fries with acceptablecolor in this study.
47

Foods 2020, 9, 352
Figure 10. Relationships between tuber glucose and fry color at stem (a,c) and bud end (b,d) of Frenchfries from tubers stored for 16 weeks at 7.8 ◦C in 2014 and 2015.
Figure 11. Relationship between stem-end fry color and acrylamide concentration of French fries fromtubers stored for 16 weeks at 7.8 ◦C in 2014 and 2015.
4. Conclusions
New cultivars Dakota Russet and Easton contained significantly lower concentrations ofacrylamide precursors (glucose at both ends and asparagine), and consequently acrylamideconcentrations as well. These results suggest that cultivar selection may be the most importantconsideration for minimizing acrylamide during potato processing. Environmental conditions duringthe growing season appeared to affect tuber glucose and asparagine concentrations in storage for allthree cultivars. For example, glucose concentrations decreased during storage at both ends for all threecultivars in 2014 but increased or stayed the same depending on cultivar in 2015. Lower asparagineconcentration in 2015 than in 2014 was observed in all three cultivars. Differences may have beendue to colder conditions during harvest in 2014 than in 2015; although other stresses during the 2014growing season cannot be ruled out.
While glucose is generally the limiting factor in acrylamide formation, asparagine could also playan important role under high reducing sugar accumulation. With asparagine/glucose ratio <1.306,asparagine was significantly correlated with the acrylamide concentration with r2 = 0.45. Cultivar and
48

Foods 2020, 9, 352
environmental conditions during the growing season seemed to affect the ratio of asparagine/glucoseat 16 weeks of storage, while N rate showed no impact. Russet Burbank, Dakota Russet, and Eastonproduced French fries with acceptable fry color under the conditions of this study. Fry color can beused as a straightforward indicator of acrylamide and glucose concentrations in the stem end for testcultivars in this study, but the exact relationship between fry color and stem-end glucose concentrationwas found to differ by year.
Author Contributions: Conceptualization: C.J.R., S.K.G. and Y.W.; Funding acquisition, C.J.R.; Methodology:C.J.R., N.S., Y.W. and S.K.G; Data curation and formal analysis: N.S.; Original draft preparation, N.S.;Writing, review and editing: N.S., C.J.R., S.K.G, and Y.W. All authors have read and agreed to the publishedversion of the manuscript.
Funding: This research was supported by a USDA-NIFA (United States Department of Agriculture-NationalInstitute of Food and Agriculture) grant (prime award 2011-51181-30629) entitled “Improved breeding and varietyevaluation methods to reduce acrylamide content and increase quality in processed potato products”.
Acknowledgments: The authors would like to thank Matt McNearney, Rosa Lozano, and Ron Faber for assistancewith field plot maintenance; Bruce Witthuhun for assistance with asparagine and acrylamide analysis; and MartinGlynn and Darrin Haagenson for assistance with sugar analysis.
Conflicts of Interest: The authors declare no conflict of interest.
References
1. Mottram, D.S.; Wedzicha, B.L.; Dodson, A.T. Food chemistry: Acrylamide is formed in the Maillard reaction.Nature 2002, 419, 448–449. [CrossRef]
2. Cummins, E.; Butlet, F.; Brunton, N.; Gormley, R. Factors affecting acrylamide formation in processedpotato products—A simulation approach. In Proceedings of the 13th World Congress of Food Science andTechnology, Nantes, France, 17–21 September 2006.
3. Visvanathan, R.; Krishnakumar, T. Acrylamide in Food Products: A Review. J. Food Process. Technol. 2014, 5,344. [CrossRef]
4. Kooman, P.L.; Haverkort, A.J. Modelling development and growth of the potato crop influenced bytemperature and daylength: LINTUL-POTATO. In Proceedings of the Potato Ecology and Modelling of Cropsunder Conditions Limiting Growth, Wageningen, The Netherlands, 17–19 May 1994; Volume 3, pp. 41–59.
5. Amrein, T.M.; Bachmann, S.; Noti, A.; Biedermann, M.; Barbosa, M.F.; Biedermann-Brem, S.; Grob, K.;Keiser, A.; Realini, P.; Escher, F.; et al. Potential of acrylamide formation, sugars, and free asparaginein potatoes: A comparison of cultivars and farming systems. J. Agric. Food Chem. 2003, 51, 5556–5560.[CrossRef] [PubMed]
6. Kumar, D.; Singh, B.P.; Kumar, P. An overview of the factors affecting sugar content of potatoes. Ann. Appl. Biol.2004, 145, 247–256. [CrossRef]
7. Rommens, C.M.; Yan, H.; Sword, K.; Richael, C.; Ye, J. Low-acrylamide French fries and potato chips.Plant Biotechnol. J. 2008, 6, 843–853. [CrossRef] [PubMed]
8. Ye, J.; Shakya, R.; Shrestha, P.; Rommens, C.M. Tuber-specific silencing of the acid invertase gene substantiallylowers the acrylamide-forming potential of potato. J. Agric. Food Chem. 2010, 58, 12162–12167. [CrossRef]
9. Bethke, P.C.; Bussan, A.J. Acrylamide in processed potato products. Am. J. Potato Res. 2013, 90, 403–424.[CrossRef]
10. Muttucumaru, N.; Powers, S.J.; Elmore, J.S.; Mottram, D.S.; Halford, N.G. Effects of nitrogen and sulfurfertilization on free amino acids, sugars, and acrylamide-forming potential in potato. J. Agric. Food Chem.2013, 61, 6734–6742. [CrossRef] [PubMed]
11. Muttucumaru, N.; Powers, S.J.; Elmore, J.S.; Mottram, D.S.; Halford, N.G. Effects of water availability on freeamino acids, sugars, and acrylamide-forming potential in potato. J. Agric. Food Chem. 2015, 63, 2566–2575.[CrossRef]
12. Paul, V.; Ezekiel, R.; Pandey, R. Acrylamide in processed potato products: Progress made and present status.Acta Physiol. Plant. 2016, 38, 276. [CrossRef]
13. Rosen, C.; Sun, N.; Olsen, N.; Thornton, M.; Pavek, M.; Knowles, L.; Knowles, N.R. Impact of agronomic andstorage practices on acrylamide in processed potatoes. Am. J. Potato Res. 2018, 95, 319–327. [CrossRef]
49

Foods 2020, 9, 352
14. Powers, S.J.; Mottram, D.S.; Curtis, A.; Halford, N.G. Acrylamide concentrations in potato crisps in Europefrom 2002 to 2011. Food Addit. Contam. A 2013, 30, 1493–1500. [CrossRef] [PubMed]
15. Wang, Y.; Bethke, P.C.; Bussan, A.J.; Glynn, M.T.; Holm, D.G.; Navarro, F.M.; Novy, R.G.; Palta, J.P.; Pavek, M.J.;Porter, G.A.; et al. Acrylamide-forming potential and agronomic properties of elite us potato germplasmfrom the national fry processing trial. Crop Sci. 2016, 56, 30–39. [CrossRef]
16. European Food Safety Authority. Acrylamide in Food is a Public Health Concern. Available online:http://www.efsa.europa.eu/en/press/news/150604 (accessed on 10 January 2020).
17. Westermann, D.T.; James, D.W.; Tindall, T.A.; Hurst, R.L. Nitrogen and potassium fertilization of potatoes:Sugars and starch. Am. Potato J. 1994, 71, 433–453. [CrossRef]
18. De Wilde, T.B.; De Meulenaer, B.; Mestdagh, F.; Govaert, Y.; Vandeburie, S.; Ooghe, W.; Fraselle, S.;Demeulemeester, K.; Van Peteghem, C.; Calus, A.; et al. Influence of fertilization on acrylamide formationduring frying of potatoes harvested in 2003. J. Agric. Food Chem. 2006, 54, 404–408. [CrossRef]
19. Argyropoulos, D.; Psallida, C.; Varzakas, T. The effect of nitrogen fertilisation and metabolic regulatorsSNRK1, GCN2 on the formation of acrylamide in two potato varieties (Spunta and Lady Rosetta) fried incorn oil. Curr. Res. Nutr. Food Sci. 2016, 4, 69–73. [CrossRef]
20. Kolbe, H. Kartoffeldüngung Unter Differenzierten ökologischen Bedingungen. Ph.D. Thesis,Georg-August-Universität, Götingen, Germany, 1990.
21. Morales, F.; Capuano, E.; Fogliano, V. Mitigation strategies to reduce acrylamide formation in fried potatoproducts. Ann. NY Acad. Sci. 2008, 1126, 89–100. [CrossRef]
22. Knowles, N.R.; Driskill, E.P.; Knowles, L.O. Sweetening responses of potato tubers of different maturity toconventional and non-conventional storage temperature regimes. Postharvest Biol. Technol. 2009, 52, 49–61.[CrossRef]
23. Elmore, J.S.; Briddon, A.; Dodson, A.T.; Muttucumaru, N.; Halford, N.G.; Mottram, D.S. Acrylamide inpotato crisps prepared from 20 UK-grown varieties: Effects of variety and tuber storage time. Food Chem.2015, 182, 1–8. [CrossRef]
24. Muttucumaru, N.; Powers, S.J.; Elmore, J.S.; Dodson, A.; Briddon, A.; Mottram, D.S.; Halford, N.G.Acrylamide-forming potential of potatoes grown at different locations, and the ratio of free asparagine toreducing sugars at which free asparagine becomes a limiting factor for acrylamide formation. Food Chem.2017, 220, 76–86. [CrossRef]
25. Sun, N.; Rosen, C.; Thompson, A. Acrylamide formation in processed potates as affected by cultivar, nitrogenfertilization and storage time. Am. J. Potato Res. 2018, 95, 473–486. [CrossRef]
26. De Wilde, T.; De Meulenaer, B.; Mestdagh, F.; Govaert, Y.; Vandeburie, S.; Ooghe, W.; Fraselle, S.;Demeulemeester, K.; van Peteghem, C.; Calus, A.; et al. Influence of storage practices on acrylamideformation during potato frying. J. Agric. Food Chem. 2005, 53, 6550–6557. [CrossRef] [PubMed]
27. Ohara-Takada, A.; Matsuura-Endo, C.; Chuda, Y.; Ono, H.; Yada, H.; Yoshida, M.; Kobayashi, A.; Tsuda, S.;Takigawa, S.; Noda, T.; et al. Change in content of sugars and free amino acids in potato tubers undershort-term storage at low temperature and the effect on acrylamide level after frying. Biosci. Biotechnol.Biochem. 2005, 69, 1232–1238. [CrossRef] [PubMed]
28. Pavek, M.J.; Knowles, N.R. WSU Potato Cultivar Yield and Postharvest Quality Evaluations for 2015.Washington State University Special Report, 114. Available online: http://potatoes.wsu.edu/wp-content/uploads/2016/01/Potato-Cultivar-Yield-and-Postharvest-Quality-Evaluations-Research-Edition-2015.pdf.(accessed on 10 January 2020).
29. Olsson, K.; Svensson, R.; Roslund, C.A. Tuber components affecting acrylamide formation and colour infried potato: Variation by variety, year, storage temperature and storage time. J. Sci. Food Agric. 2004, 84,447–458. [CrossRef]
30. Matsuura-Endo, C.; Ohara-Takada, A.; Chuda, Y.; Ono, H.; Yada, H.; Yoshida, M.; Kobayashi, A.; Tsuda, S.;Takigawa, S.; Noda, T.; et al. Effects of storage temperature on the contents of sugars and free amino acidsin tubers from different potato cultivars and acrylamide in chips. Biosci. Biotechnol. Biochem. 2006, 70,1173–1180. [CrossRef] [PubMed]
31. Halford, N.G.; Curtis, T.Y.; Muttucumaru, N.; Postles, J.; Elmore, J.S.; Mottram, D.S. The acrylamide problem:A plant and agronomic science issue. J. Exp. Bot. 2012, 63, 2841–2851. [CrossRef]
50
Foods 2020, 9, 352
32. Amrein, T.M.; Schönbächler, B.; Rohner, F.; Lukac, H.; Schneider, H.; Keiser, A.; Escher, F.; Amadò, R.Potential for acrylamide formation in potatoes: Data from the 2003 harvest. Eur. Food Res. Technol. 2004, 219,572–578. [CrossRef]
33. Halford, N.G.; Muttucumaru, N.; Powers, S.J.; Gillatt, P.N.; Hartley, L.; Elmore, J.S.; Mottram, D.S.Concentrations of free amino acids and sugars in nine potato varieties: Effects of storage and relationshipwith acrylamide formation. J. Agric. Food Chem. 2012, 60, 12044–12055. [CrossRef]
34. Zhu, F.; Cai, Y.Z.; Ke, J.; Corke, H. Compositions of phenolic compounds, amino acids and reducing sugars incommercial potato varieties and their effects on acrylamide formation. J. Sci. Food Agric. 2010, 90, 2254–2262.[CrossRef]
35. Shepherd, L.V.T.; Bradshaw, J.E.; Dale, M.F.B.; McNicol, J.W.; Pont, S.D.A.; Mottram, D.S.; Davies, H.V.Variation in acrylamide producing potential in potato: Segregation of the trait in a breeding population.Food Chem. 2010, 123, 568–573. [CrossRef]
36. Muttucumaru, N.; Powers, S.J.; Elmore, J.S.; Briddon, A.; Mottram, D.S.; Halford, N.G. Evidence for thecomplex relationship between free amino acid and sugar concentrations and acrylamide-forming potentialin potato. Ann. Appl. Biol. 2014, 164, 286–300. [CrossRef] [PubMed]
37. Sun, N.; Wang, Y.; Gupta, S.K.; Rosen, C.J. Nitrogen fertility and cultivar effects on potato agronomicproperties and acrylamide-forming potential. Agron. J. 2019, 3, 408–418. [CrossRef]
38. Ryan, S.E. A Tutorial on the Piecewise Regression Approach Applied to Bedload Transport Data. USDA ForestService—General Technical Report RMRS-GTR-189. Available online: https://www.fs.usda.gov/rds/archive/Product/RDS-2007-0004/ (accessed on 10 January 2020).
39. Silva, E.M.; Simon, P.W. Genetic, physiological, and environmental factors affecting acrylamide concentrationin fried potato products. In Chemistry and Safety of Acrylamide in Food; Friedman, M., Mottram, D., Eds.;Springer: Boston, MA, USA, 2005; Volume 561, pp. 371–386.
40. Long, C.M.; Snapp, S.S.; Douches, D.S.; Chase, R.W. Tuber yield, storability, and quality of Michigan cultivarsin response to nitrogen management and seed piece spacing. Am. J. Potato Res. 2004, 81, 347–357. [CrossRef]
41. Zebarth, B.J.; Leclerc, Y.; Moreau, G.; Botha, E. Rate and timing of nitrogen fertilization of Russet Burbankpotato: Yield and processing quality. Can. J. Plant Sci. 2004, 84, 855–863. [CrossRef]
42. Gerendás, J.; Heuser, F.; Sattelmacher, B. Influence of nitrogen and potassium supply on contents of acrylamideprecursors in potato tubers and on acrylamide accumulation in French fries. J. Plant Nutr. 2007, 30, 1499–1516.[CrossRef]
43. Knowles, N.R.; Pavek, M.J.; Knowles, L.O. Developmental profiles, nitrogen use and postharvest qualityof alpine and sage russet potatoes in the columbia basin. In Proceedings of the Annual Washingtonand Oregon Potato Conference, Kennwick, WA, USA, 27–30 January 2015; pp. 37–50. Available online:http://www.nwpotatoresearch.com/IPMStuff/PDFs/Proceedings2015.pdf. (accessed on 10 January 2020).
44. Gause, K. Effect of Nitrogen and Potassium on Potato Yield, Quality and Acrylamide-Forming Potential.Master’s Thesis, University Maine, Orono, ME, USA, 2014.
45. North Dakota State University Research Foundation. Available online: http://www.ndsuresearchfoundation.org/dakota_russet (accessed on 10 January 2020).
46. Porter, G.; Alyokhin, A.; Lambert, D.; Halseth, D.; Yencho, G.; Jemison, J.; Freeman, J.; Perry, K.; Perkins, L.B.;Zotarelli, L.; et al. Potato Breeding and Variety Development for Improved Quality and Pest Resistance in the EasternUnited States; Grant reports; University of Maine office of research and sponsored programs: Orono, ME, USA.Available online: http://digitalcommons.library.umaine.edu/orsp_reports/31/. (accessed on 10 January 2020).
47. Shock, C.C.; Stieber, T.D.; Zalewski, J.C.; Eldredge, E.P.; Lewis, M.D. Potato tuber stem-end fry colordetermination. Am. J. Potato Res. 1994, 71, 77–88. [CrossRef]
48. Driskill, E.P.; Knowles, L.O.; Knowles, N.R. Temperature-induced changes in potato processing qualityduring storage are modulated by tuber maturity. Am. J. Potato Res. 2007, 84, 367–383. [CrossRef]
© 2020 by the authors. Licensee MDPI, Basel, Switzerland. This article is an open accessarticle distributed under the terms and conditions of the Creative Commons Attribution(CC BY) license (http://creativecommons.org/licenses/by/4.0/).
51


foods
Article
Formation of Acrylamide and Other Heat-InducedCompounds during Panela Production
Marta Mesias 1, Cristina Delgado-Andrade 1,*, Faver Gómez-Narváez 2, José Contreras-Calderón 2
and Francisco J. Morales 1
1 Instituto de Ciencia y Tecnología de Alimentos y Nutrición (ICTAN-CSIC), C/José Antonio Novais, 10,E-28040 Madrid, Spain; [email protected] (M.M.); [email protected] (F.J.M.)
2 Bioali Research Group, Food Department, Faculty of Pharmaceutical and Food Sciences,University of Antioquia, Calle 67 No. 53–108, Ciudad Universitaria, Medellín 050010, Colombia;[email protected] (F.G.-N.); [email protected] (J.C.-C.)
* Correspondence: [email protected]; Tel.: +34-915492300
Received: 6 March 2020; Accepted: 17 April 2020; Published: 22 April 2020
Abstract: Non-centrifugal cane sugar (panela) is an unrefined sugar obtained through intensedehydration of sugarcane juice. Browning, antioxidant capacity (measured by ABTS (2,2’-azino-bis(3-ethylbenzothiazoline-6-sulfonic acid) assay and total phenolic content) and the formation ofacrylamide and other heat-induced compounds such as hydroxymethylfurfural (HMF) and furfural,were evaluated at different stages during the production of block panela. Values ranged betweenbelow the limit of quantitation (LOQ)–890 μg/kg, < LOQ–2.37 mg/kg, < LOQ–4.5 mg/kg, 0.51–3.6 Abs420 nm/g, 0.89–4.18 mg gallic acid equivalents (GAE)/g and 5.08–29.70μmol TE/g, for acrylamide, HMF,furfural, browning, total phenolic content and ABTS (all data in fresh weight), respectively. Acrylamidesignificantly increased as soluble solid content increased throughout the process. The critical stagesfor the formation of acrylamide, HMF and furfural were the concentration of the clarified juice inthe concentration stage to get the panela honey and the final stage. Similar trends were observedfor the other parameters. This research concludes that acrylamide, HMF and furfural form at a highrate during panela processing at the stage of juice concentration by intense evaporation. Therefore,the juice concentration stage is revealed as the critical step in the process to settle mitigation strategies.
Keywords: panela; processing; acrylamide; furanic compounds; antioxidants; non-enzymaticbrowning
1. Introduction
Production of panela, also known as unrefined non-centrifugal sugar or non-centrifugal canesugar, is one of the most traditional agro-industries in tropical countries. Panela is obtained by grindingthe sugar cane, clarifying, evaporating the juice and concentrating it until honey is obtained (morethan 90◦ Brix). This is then beaten, molded and cooled to achieve solidification [1]. Panela productionexhibits yields between 6.4% and 14.9% [2].
Panela is produced by small farmers around the world. India is by far the world’s largest producerof panela, accounting for 56.15% of global production in 2011. Colombia, the world’s second largestproducer, contributed 14.1% of total panela globally in 2011. While India and Colombia dominateglobal production, other countries from Asia, Africa or Latin America are also producers of thisfoodstuff [3]. The use of panela in industrially produced foods is as a sweetener to replace refinedsugars, but also as an ingredient for the manufacture of foodstuffs such as puddings, baked goods,marmalades, protein/energy/weight control bars, desserts, confectionary and chocolate products [4].
Unlike white sugar, panela contains minerals, vitamins, phenolic compounds, amino acids andproteins. The presence of bioactive, health-promoting compounds increases the beneficial effects
Foods 2020, 9, 531; doi:10.3390/foods9040531 www.mdpi.com/journal/foods53

Foods 2020, 9, 531
of panela on human health, including effects that are anticarcinogenic, antitoxic, cytoprotective,anti-inflammatory and antiatherogenic [5].
Due to high sugar (≈14 g/100 g) and nitrogen compound (≈0.40 g/100 g) levels in sugarcane [6],the Maillard reaction and caramelization are the main chemical reactions to take place during panelaproduction. The Maillard reaction is promoted at >50 ◦C and pH 4–7 and occurs in low moistureconditions. The initial step involves the formation of a Schiff base from the reaction of the aminogroup on an amino acid with the carbonyl group of a reducing sugar, which can rearrange to forman Amadori compound whose degradation yields intermediate compounds such as acrylamideand furanic compounds. Caramelization is favored at temperatures of >120 ◦C and pH 3–9 andinvolves another nonenzymatic browning step through the degradation of reducing sugars withoutthe condensation step [7]. Acrylamide formation in panela is possible due to the presence of freeamino acids and reducing sugars, intense thermal treatment, and the low moisture found in the finalproduct [1,6]. Acrylamide has been described to present neurotoxic, genotoxic, carcinogenic andreproductive toxic effects [8,9]. On the other hand, furanic compounds such as hydroxymethylfurfural(HMF) and furfural have been extensively applied as heat-induced chemical indexes for monitoring thethermal damage of food. These furan derivatives, which can be generated during panela productionthrough both caramelization and Maillard reactions [7,10], have been confirmed to confer genotoxic,mutagenic, carcinogenic, DNA-damaging, organotoxic and enzyme inhibitory effects. It has beenreported that HMF is an indirect mutagen because it is converted to an active metabolite, the sulfuricacid ester 5-sulfo-oxymethylfurfural (SMF), with mutagenicity [11], whereas furfural has showntoxicological effects leading to hepatotoxicity [12].
Scientific research is scarce in relation to the occurrence and pathways involved in the formation ofheat-induced process contaminants, particularly acrylamide and furfurals, during panela production.In addition, data have mostly been derived from methodologies that apply analytical techniques whichlack sensitivity and fail to refer to normalized procedures [1]. Due to the toxicological effects on humanhealth related to these compounds, evaluation of their formation in foods is necessary to look formitigation strategies aimed to reduce the exposure to the contaminants. Thus, the aim of this workwas to study the impact of different stages during the panela production chain on the formation ofacrylamide and other heat-induced process contaminants by applying robust and validated analyticalmethods. The results will provide greater insight into the identification of critical points in the process.It is the first time that such assays have been carried out together and, therefore, the outcomes of thisinvestigation could be key for establishing mitigation strategies which can be used by panela producersand food safety bodies.
2. Material and Methods
2.1. Chemicals and Reagents
Potassium hexacyanoferrate (II) trihydrate (98%, Carrez-I) and zinc acetate dehydrate (>99%,Carrez-II) were obtained from Sigma (St. Louis, MO, USA). 13C3-labelled acrylamide (99% isotopicpurity) was obtained from Cambridge Isotope Laboratories (Andover, MA, USA. Formic acid (98%),D(+) glucose, D(-) fructose, D(-) sorbitol, ethanol, methanol (99.5%) and hexane were obtainedfrom Panreac (Barcelona, Spain). Deionized water was obtained from a Milli-Q Integral 5 waterpurification system (Millipore, Billerica, MA, USA). All other chemicals, solvents and reagents were ofanalytical grade.
2.2. Samples
Samples were supplied by a large panela producer located in the province of Antioquia (Colombia).Samples were collected at four different stages, which represent critical points during the manufactureof block panela (Figure 1). Samples were as follows: raw cane juice obtained after the cane is ground(Sample 1); clarified juice obtained by heating (<100 ◦C) sample 1 (Sample 2); concentrated juice
54

Foods 2020, 9, 531
produced at 60–65◦ Brix following evaporation (>110 ◦C) (Sample 3); block panela obtained followingconcentration (>120 ◦C) (Sample 4). Evaporation of the juice is performed in batches of 1000 L,whilst being heated at 110–120 ◦C for approximately 40 min. Panela honey concentration is performedat 120 ◦C for approximately 20 min in batches of 40 L. Samples 1, 2 and 3—which correspond to thejuices—were lyophilized and stored at −20 ◦C whilst awaiting analysis. Block panela (sample 4) wasstored at room temperature.
Figure 1. Scheme of the panela production process.
2.3. Basic Analyses
Moisture was estimated gravimetrically to constant weight following well-established proceduresfor panela juices [13] and block panela [14]. The pH of panela was determined by mixing the sample(1 g) with 100 mL of water and vortexing for 3 min. The mixture was kept at room temperature for1 h and centrifuged to separate impurities. The pH was measured using a CG-837 pH meter (Schott,Mainz, Germany). The pH of juices was directly measured in fresh samples immediately followingcollection. Soluble solids content (◦Brix; in original juices immediately after their collection) weremeasured with a digital refractometer OptiDuo (Bellingham + Stanley, Kent, UK). Soluble solid contentin panela was calculated from the moisture content.
2.4. Determination of Reducing Sugars
The content of reducing sugars (glucose + fructose) was determined in lyophilized juices andin the panela sample via high performance liquid chromatography using a refractive index detector(HPLC-RID). The procedure was based on a slightly modified version of the method described byAyvaz [15]. Three hundred mg of sample was weighed and mixed with 9 mL of 80% (v/v) ethanoland 1 mL of sorbitol (10 mg/mL), as an internal standard. Following vortex agitation, the mixture wasincubated at 50 ◦C and 900 rpm for 1 h, and centrifuged at 4 ◦C and 5000 rpm for 20 min. The supernatantwas transferred into a new tube and ethanol was evaporated using TurboVap equipment (Biotage,Uppsala, Sweden). The aqueous extract was purified via solid-phase extraction using an SCX cartridge(Supelco, Sigma Aldrich, St. Louis, MO, USA) and filtered (0.22 μm pore-size membrane) prior toHPLC analysis. Twenty μL of extract was injected into the HPLC System LC-20 AD, using a RID-10A(Shimadzu, Scientific Instruments, INC, Columbia, MD, USA). Analytical separation was achievedwith a Rezex RCM-Monosaccharide Ca2+ column (300 × 7.8 mm, 8 μm; Phenomenex, Torrance, CA,USA) at 80 ◦C in isocratic elution, with a mobile phase of deionized water and a flow rate of 0.6 mL/min.Sugars were quantified using standard solutions spiked with sorbitol. Results were expressed asg/100 g of fresh weight (FW) and dry matter (DM). The analysis was performed in duplicate.
2.5. Determination of Asparagine
Asparagine was determined in the lyophilized juices and panela sample via gas chromatography-flame ionization detection (GC-FID), according to Farkas and Toulouee [16] but with some minormodifications as described by Mesias et al. [17]. A GC-FID (Agilent GC 7820A FID) equipped withan automatic injector was used for quantitation. An amino acid dedicated column (Zebron ZBAAA
55

Foods 2020, 9, 531
capillary; 10 × 0.25 mm) was used to separate amino acids. Starting oven temperature was set at 110 ◦Cand increased 32 ◦C per minute until 320 ◦C was reached. An aliquot of the derivatized sample (1 μL)was injected in split mode (15:1) at 250 ◦C. The FID detector was set to 320 ◦C and the carrier heliumgas flow rate was maintained at 1.5 mL/min whilst in process. External calibration was carried outusing asparagine standard and results were corrected according to norvaline recovery, this being usedas an internal standard. Free asparagine content was expressed as mg/100 g of FW and DM. Analysiswas performed in duplicate.
2.6. LC-ESI-MS-MS Determination of Acrylamide
Sample extraction followed a slightly modified version of the method described by Mesias andMorales [18]. Lyophilized juice and panela samples (0.5 g) were weighed and mixed with 9.4 mLof water in polypropylene centrifugal tubes. The mixture was spiked with 100 μL of a 5 μg/mL[13C3]-acrylamide methanolic solution, which served as an internal standard, and later homogenized(Ultra Turrax, IKA, Mod-T10 basic, Bohn, Germany) for 10 min. Afterwards, samples were treated with250 μL of Carrez I (15 g potassium ferrocyanide/100 mL water) and Carrez II (30 g zinc acetate/100 mLwater) solutions, and centrifuged (9000 g for 10 min) at 4 ◦C. Samples were clarified using Oasis-HLBcartridges (Supelco, Saint Louis, MO, USA) and extracts were analyzed according to Mesías andMorales [18]. Acrylamide recovery occurred between 90% and 106%. Relative standard deviations(RSD) for precision, repeatability and reproducibility of the analyses were calculated as 2.8%, 1.2%and 2.5%, respectively. The procedure fulfilled method performance requirements established bythe EU acrylamide Regulation 2017/2158. The limit of quantitation was set at 20 μg/kg. Acrylamideresults were expressed as μg/kg of FW and DM, and comparisons were made between different stages.Samples were analyzed in duplicate.
2.7. Determination of HMF and Furfural
HMF and furfural content was determined in lyophilized juices and panela samples usingHigh-Performance Liquid Chromatography with Diode-Array Detection (HPLC-DAD), as describedby Mesías et al. [19]. The limits of quantification were set at 0.6 and 0.3 mg/kg for HMF and furfural,respectively. Results were expressed as mg/kg of FW and DM. Samples were analyzed in duplicate.
2.8. Determination of Browning
Supernatant fractions (200 μL) obtained during preparation of HMF and furfural sampleswere placed in 96-well plates. Browning at 420 nm was measured at room temperature usinga BioTekSynergyTM HT-multimode microplate spectrophotometer (BioTek Instruments, Winooski, VT,USA). Samples were analyzed in duplicate and results were expressed as absorbance units (AU)/g ofFW and DM.
2.9. Sample Extraction for Measurement of Antioxidant Activity (ABTS (2,2’-azino-bis(3-ethylbenzothiazoli-ne-6-sulfonic acid) Assay and Total Phenolic Content)
Sample extraction was performed following the procedure described by Pérez-Jiménez andSaura-Calixto [20]. Briefly, 0.1 g of lyophilized juice and panela sample was placed in a tube, and 6 mLof acidic methanol/water (50:50 v/v, pH 2) was added. The tube was thoroughly shaken at roomtemperature for 20 min and centrifuged at 2500 g for 10 min in order to recover the supernatant.Four milliliters of the same acidic methanol/water solution were added to the residue, with shakingand centrifugation steps then being repeated. The second methanolic extract was combined with thefirst one. When necessary, proper dilutions with distilled water were performed to measure in theABTS assay and the total phenolic content. Extraction was performed in duplicate.
56

Foods 2020, 9, 531
2.9.1. Total Phenolic Content (TPC)
Total phenolic content was determined according to a slightly modified version of theFolin–Ciocalteu method described by Marfil et al. [21]. Briefly, 80 μL of sample, blank or gallicacid standard, 1520 μL of distilled water and 300 μL of 20% Na2CO3 (w/v) were mixed with 100 μL ofcommercial Folin–Ciocalteu’s reagent and incubated for 1h at room temperature. Absorbance wasmeasured at 750 nm using a Biotek Synergy HT multi-mode microplate reader (BioTek® Instruments Inc.,USA). Results were expressed as mg gallic acid equivalent (GAE)/g of FW and DM. All measurementswere performed in triplicate.
2.9.2. ABTS Assay
The ABTS assay was developed as described by Rufián-Henares and Delgado-Andrade [22],with slight modifications. The ABTS+• was produced by reacting 7 mM ABTS stock solution with2.45 mM potassium persulfate and allowing the mixture to stand in the dark at room temperature for12–16 h before use. The ABTS+• working solution (stable for 2 days) was diluted with an ethanol:water (50:50) solution until an absorbance of 0.70 ± 0.02 at 730 nm was achieved. For analyses, 40 μLof sample, blank or Trolox standard and 200 μL of 5 mM pH 8.4 phosphate buffer were added to60 μL of diluted ABTS+• solution. The absorbance reading was taken at 10 min using the previouslydescribed microplate reader. Aqueous Trolox solutions were used for calibration (15–125 μM). Resultswere expressed as μmol Trolox equivalents (TE)/g of FW and DM. All measurements were performedin triplicate.
2.10. Statistical Analysis
One-way ANOVA was used to investigate differences between final block panela and sugar canejuice, in the content of processing contaminants and other physicochemical variables at three differentprocessing stages. Significant differences were established using the LSD test, with a confidence of95%. All statistical analyses were performed using Statgraphics Centurion® Version XVI (The Plains,VA, USA).
3. Results and Discussion
Samples collected at different stages during panela processing were analyzed for pH value,moisture and soluble solids content (Table 1). According to the good processing practices for highquality block panela [6], the pH of the mature sugar cane must increase from 5.0–5.3 to 5.2–5.4 aftercrushing (raw juice cane). Then, during the clarification stage, the pH of the juice will remain between5.8 and 6.5 by the addition of pH regulators that will avoid sucrose inversion [6]. Similarly, thesoluble solids in the raw juice must be ≥20◦ Brix, and between 18 and 20◦ Brix in the juice followingclarification. After the heating and evaporation stage, the pH of the panela honey must be at least5.8, with the soluble solids around 65–70◦ Brix. At the final stage, the panela normally exhibits pHvalues between 5.6 and 6.3, and a soluble solid content between 88◦ and 92◦ Brix. In the present study,results of pH and soluble solid content are in line with that described above for block panela. Sample 1(raw juice) showed a pH value of 5.4, which increased to 6.0 following pH regulation. In the same way,soluble solid content increased from 21.2 in sample 1, to 92.4◦ Brix in the block panela. As expected,the moisture content decreased from 78.8 to 7.6% as panela elaboration progressed.
57

Foods 2020, 9, 531
Table 1. Moisture, soluble solids, pH and acrylamide precursors (reducing sugars and asparagine) insamples obtained during panela processing (fresh weight—FW).
Sample 1 Sample 2 Sample 3 Sample 4
Moisture (%) 78.8 c 81.5 32.5 7.60Soluble solids (◦ Brix) 21.2 18.5 67.5 92.4
pH 5.40 5.50 5.70 6.00Reducing sugars (g/100 g) 3.20 b (3.18–3.22) 2.65 a (2.53–2.78) 4.01 c (3.89–4.12) 6.02 d (6.02–6.03)
Asparagine (mg/100 g) 16.2 a (15.5–17.0) 12.7 a (12.4–12.9) 80.5 c (68.7–92.3) 39.7 b (38.4–41.0)
Results are expressed as mean (range) (n = 2). Different superscripts in the same row indicate significant differences(p < 0.05).
3.1. Acrylamide
The acrylamide content ranged from < limit of quantitation (LOQ) to 890 μg/kg sample (FW)(Table 2). Throughout the panela manufacturing progress, the formation of acrylamide increasedfrom sample 1 to sample 4 (panela). This increase in acrylamide formation is in line with the useof higher temperatures and the relative concentration of solids in the samples. At the end of theconcentration step (Figure 1), sample 3 (67.5◦ Brix) exhibited an acrylamide content of 298 μg/kg,with this climbing sharply to reach 890 μg/kg (Table 2) in the final product (92.4◦ Brix). In line withVargas Lasso et al. [1], negligible amounts of acrylamide (<LOQ) were detected in raw cane juice andin the juice following clarification. Vargas Lasso et al. [1] reported higher values in concentrated juice(800 μg/kg) and final block panela (2200 μg/kg) than those observed in our study. The differenceswith these authors could be related to the different origins of sugar cane, amounts of acrylamideprecursors and processing conditions. However, application of a non-specific and non-selectiveanalytical technique for acrylamide should also be considered as this could lead to overestimationsinstead of detections based on tandem mass spectrometry. The fate of acrylamide in the samplescorroborates the conclusion that temperature and moisture content are the key physical parameters toinfluence acrylamide formation during panela production, whilst maintaining levels of precursors insugar cane.
Table 2. Acrylamide, hydroxymethylfurfural (HMF) and furfural content, browning (420 nm),ABTS (2,2’-azino-bis(3-ethylbenzothiazoline-6-sulfonic acid) and total phenolic content (TPC) insamples obtained during panela processing (FW).
Sample 1 Sample 2 Sample 3 Sample 4
Acrylamide (μg/kg) <LOQ <LOQ 298 ± 31 a 890 ± 15 b
HMF (mg/kg) <LOQ <LOQ <LOQ 2.37 ± 0.16Furfural (mg/kg) <LOQ <LOQ <LOQ 4.50 ± 0.75Browning (AU/g) 0.51 a (0.50–0.53) 0.41 a (0.40–0.41) 1.70 b (1.69–1.70) 3.60 c (3.53–3.67)
ABTS (μmol TE/g) 5.08 ± 0.13 b 3.47 ± 0.15 a 20.68 ± 0.78 c 29.70 ± 0.41 d
TPC (mg GAE/g) 0.89 ± 0.02 b 0.66 ± 0.01 a 3.12 ± 0.04 c 4.18 ± 0.08 d
Results are expressed as mean (range) (n = 2) and as mean ± SD (n = 3). Different superscripts in the same rowindicate significant differences (p < 0.05).
Data available in the literature are scarce regarding acrylamide content in panela. Hoenicke andGatermann [23] found values of around 140 μg/kg in raw sugar. These data are much lower than thatdetected in the present study. This may be attributed to reasons such as a more drastic thermal process,high content of precursors in raw juice and inadequate pH regulation, which favors sucrose hydrolysisfollowed by the Maillard reaction. The acrylamide level measured in the block panela sample was closeto the highest values reported by Gómez-Narváez et al. [24] in eight panela blocks, with an averagefigure of 540 μg/kg.
Figure 2 shows the trends in acrylamide, asparagine and reducing sugars (results expressed as DM)at critical stages of the process. No significant changes (p > 0.05) were observed in sample 1 and sample
58

Foods 2020, 9, 531
2 regarding acrylamide and its precursors. However, the acrylamide content increased, whilst thecontent of its precursors decreased during the concentration stage. It is unexpected that asparaginecontent increased in sample 3 (expressed in DM), however, standard deviations between measurementswere much higher when compared to the other samples. Residual proteolysis activity followingthe breakage of vegetable cells is also plausible during crushing and clarification stages at moderatetemperatures, prior to inactivation induced by temperatures higher than 100 ◦C and the resultingincrease in asparagine. The concentration stage during panela production is characterized by intenseheat treatment during which clarified juice is boiled at temperatures higher than 120 ◦C. Followingthis, a marked drop in asparagine was displayed, together with a high increase in the acrylamideconcentration in block panela. With regard to the reducing sugars content, a trend towards a decreaseis shown, with a steeper decline observed between sample 2 and sample 3. The stable levels seen inreducing sugars between sample 3 and sample 4 (panela) would suggest that acrylamide formationduring this stage occurs through several reaction mechanisms. These mechanisms occur in lowhumidity conditions and involve decarboxylation of the Schiff base, leading to Maillard intermediatesthat directly or indirectly release acrylamide [25]. The reducing sugar content patterns in panela aresimilar to those reported by other authors. Jaffé [26] described levels of between 3.69 and 10.5 g/100 g,whereas Lee et al. [27] indicated ranges of 2.10–3.30 g/100 g for glucose and 1.76–2.56 g/100 g forfructose. These high reducing sugar levels suggest that asparagine could be the limiting factor ofacrylamide formation in panela samples.
Figure 2. Cont.
59

Foods 2020, 9, 531
Figure 2. Development of acrylamide (A), asparagine (B) and reducing sugars (C) at different stagesof panela production. All data expressed in dry matter (DM). Different letters indicate significantdifferences (p < 0.05).
3.2. HMF, Furfural and Browning
The HMF and furfural contents ranged from <LOQ to 2.37 mg/kg of FW and from <LOQ to4.50 mg/kg of FW (Table 2) in sample 1 and sample 4 (panela), respectively (Figure 3A,B). When expressedaccording to dry matter, values ranged from<LOQ to 2.57 mg/kg for HMF and from<LOQ to 4.87 mg/kgfor furfural. Both HMF and furfural are chemical markers of progress in the heat process [22]. However,the values are low considering the high sugar content (sucrose) seen in sugarcane and the hightemperatures applied during the process. These values are similar to those reported in milk proteins(not detected (ND)–7.42 mg HMF/kg) [28,29] and infant formulas (not detected–14.2 mg HMF/kg andnot detected–0.62 mg Furfural/kg), which do not have such a high sugar content or undergo suchdrastic thermal processes. HMF and furfural content in panela was quite low in comparison withother food matrices such as coffee (23.3–4112 mg HMF/kg) [30], dried fruit (25–2900 mg HMF/kg)and balsamic vinegar (316.4–35251.3 mg HMF/kg) [31]. Gómez-Narváez et al. [24] found averageHMF and furfural values in panela blocks of 5.9 and 3.0 mg/kg, respectively, which is similar to thosefound in the present study. Since furfural is generated from pentoses and not from hexoses, it maybe hypothesized that furfural is formed from the interconversion of HMF. This occurs as a result ofstrong heating conditions [32], which is supported by the fact that furfural was only found in the finalproduct (block panela).
Measurement of absorbance at 420 nm in the soluble fraction of panela is a parameter that is usedto monitor the extent of browning reactions [33]. Several compounds account for the absorbance seenat 420 nm. These include natural compounds present in the juice such as phytochemicals, and thoseformed during processing such as products of caramelization, the Maillard reaction or the oxidationof phenolic compounds. Browning ranged from 0.51 to 3.60 AU/g of FW (Table 2) for sample 1 andsample 4, respectively. Browning in panela is similar to that reported by Gómez-Narváez et al. [24] inblock panela (mean 2.2 units/g). In a similar way to HMF and furfural, significant differences wereobserved (p < 0.05) when different stages of the process in DM were considered (Figure 3). In the case ofbrowning, the greatest increase occurred in panela (1.6 times the value detected in sample 1) (Figure 3C).This was an expected result given the progress of the thermal treatment applied during different stagesof block panela production. In accordance with the findings relating to other parameters analyzed inthe present study, no outcomes were seen in relation to the progress of browning during the processingof raw sugar cane juice.
60
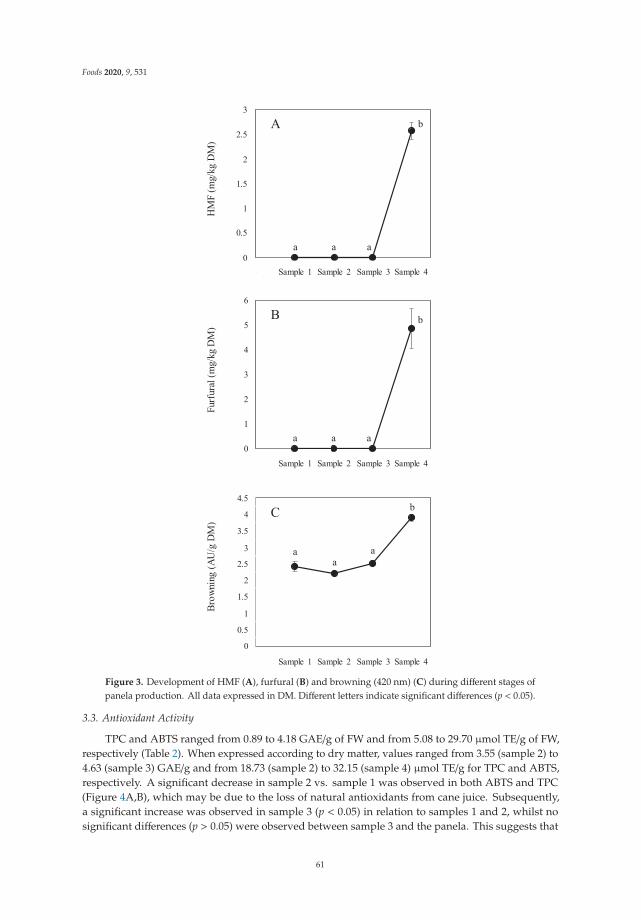
Foods 2020, 9, 531
Figure 3. Development of HMF (A), furfural (B) and browning (420 nm) (C) during different stages ofpanela production. All data expressed in DM. Different letters indicate significant differences (p < 0.05).
3.3. Antioxidant Activity
TPC and ABTS ranged from 0.89 to 4.18 GAE/g of FW and from 5.08 to 29.70 μmol TE/g of FW,respectively (Table 2). When expressed according to dry matter, values ranged from 3.55 (sample 2) to4.63 (sample 3) GAE/g and from 18.73 (sample 2) to 32.15 (sample 4) μmol TE/g for TPC and ABTS,respectively. A significant decrease in sample 2 vs. sample 1 was observed in both ABTS and TPC(Figure 4A,B), which may be due to the loss of natural antioxidants from cane juice. Subsequently,a significant increase was observed in sample 3 (p < 0.05) in relation to samples 1 and 2, whilst nosignificant differences (p > 0.05) were observed between sample 3 and the panela. This suggests that
61

Foods 2020, 9, 531
antioxidant compounds derived from the heat treatment are generated mainly during the concentrationstage and remain constant in the final product (block panela). There are no reports in the literatureregarding the evolution of antioxidant activity measured as the TPC and ABTS during panela production.The values found in the present study are within the range reported by Gómez-Narváez et al. [24]for block and granulated panela samples (1.1–6.2 mg of GAE/g and 12.7–50.5 μmol TE/g). However,lower values of the TPC (0.26 mg GAE/g) have been reported by Payet et al. [34], whereas muchhigher values (165–321 mg GAE/g) have been described by Lee et al. [27]. These differences maybe due to different varieties of cane being used, alongside different panela processes, antioxidantextraction methods and measurement protocols. According to Payet et al. [34], antioxidant phenolicsand flavonoids from the sugarcane stalk are retained in brown sugar during the non-centrifugationprocedure. On the other hand, the high temperatures applied during the evaporation process promotenon-enzymatic browning reactions, the formation of dark-colored substances with antioxidant activityand greater accessibility of phenolic compounds trapped in complex structures [35]. In this respect,significant correlations were observed between the ABTS results in relation to acrylamide (r2 = 0.8517,p = 0.0073) and browning (r2 = 0.7230, p = 0.0427). Figure 4 shows the evolution of antioxidant capacitymeasured as ABTS (4A) and the TPC (4B) during panela production (results expressed according todry matter). A similar pattern is observed in both parameters, with a large increase being evidentbetween sample 2 and sample 3, which is confirmed by a significant correlation between these samples(r2 = 0.9341, p = 0.0007). This fact suggests the essential contribution of polyphenolic compounds toincrease ABTS values.
Figure 4. Evolution of antioxidant activity measured as ABTS (2,2’-azino-bis(3-ethylbenzothiazoline-6-sulfonic acid (A) and TPC (Total Phenolic Content) (B) during different stages of panela production.All data expressed in DM. Different letters indicate significant differences (p < 0.05).
62

Foods 2020, 9, 531
4. Conclusions
The formation of acrylamide, HMF and furfural, the evolution of the antioxidant capacity andbrowning during different stages of panela production were evaluated by applying robust and validatedanalytical methods for the first time in the present study. Acrylamide occurs mainly at the stage ofhoney concentration and at the final stage of block panela manufacturing. Antioxidant compoundscontributing to antioxidant capacity are mainly generated at the stage of honey concentration,whilst HMF, furfural and soluble compounds contributing to browning are primarily formed duringthe final stage of the process. The high temperatures applied during the evaporation process promotenon-enzymatic browning reactions and the formation of dark-colored substances with antioxidantactivity. Acrylamide formation during the final stage (block panela) takes place without interferencefrom reducing sugars, possibly due to the presence of Maillard reaction intermediate compounds,which have been formed in previous stages of the process. These results provide greater insight intothe identification of critical points in the process and suggest that mitigation strategies could be focusedon the last stage of panela production, which would help panela producers and food safety bodies tocontrol the formation of processing contaminants in this foodstuff.
Author Contributions: Conceptualization, F.J.M.; Methodology, M.M., C.D.-A., J.C.-C. and F.G.-N.; Software,M.M. and F.G.-N.; Validation, C.D.-A., J.C.-C. and F.J.M.; Formal Analysis, J.C.-C. and F.G.-N.; Investigation, M.M.,C.D.-A. and F.J.M.; Resources, F.J.M.; Data Curation, M.M., C.D.-A., J.C.-C., F.G.-N. and F.J.M.; Writing—OriginalDraft Preparation, J.C.-C., F.G.-N.; Writing—Review and Editing, M.M., C.D.-A. and F.J.M.; Supervision, M.M.,C.D.-A. and F.J.M.; Funding Acquisition, F.J.M. All authors have read and agreed to the published version ofthe manuscript.
Funding: This research was co-funded by the Spanish National Research Council (CSIC) (Spain) under projectiCOOP (COOPB20288) and the Community of Madrid and European funding from FSE and FEDER programs(project S2018/BAA-4393, AVANSECAL-II-CM).
Acknowledgments: The authors would like to thank the University of Antioquia (UdeA).
Conflicts of Interest: The authors declare no conflict of interest.
References
1. Vargas Lasso, J.J.; Talero Pérez, Y.V.; Trujillo Suárez, F.A.; Caballero, L.R. Determinación de acrilamida en elprocesamiento de la panela por cromatografía líquida Acrylamide Determintion in the Sugar Cane JuiceProcess by the Liquid Chromatography Technique. Rev. Cienc. en Desarro. 2014, 5, 99–105.
2. Osorio-Cadavid, G. Manual Técnico: Buenas Prácticas Agrícolas -BPA- y Buenas Pácticas de Manufactura -BPM-en la Produccion de Caña y Panela; FAO: Medellín, Colombia, 2007.
3. Food and Agriculture Organization Commodity Balances—Crops Primary Equivalent. Available online:http://www.fao.org/faostat/en/#data/BC/metadata (accessed on 21 March 2020).
4. De María, G. Panela: The natural nutritionalsweetener. Agro Food Ind. Hi-Tech 2013, 24, 44–48.5. Jaffé, W. Health Effects of Non-Centrifugal Sugar (NCS): A Review. Sugar Tech. 2012, 14, 87–94. [CrossRef]6. Durán-Castro, N. Reingeniería Panelera, 1st ed.; Buhos Editores: Tunja, Colombia, 2010; Available online: https:
//www.editorialprodumedios.com/agricola/269-reingenieria-panelera.html (accessed on 15 February 2020).7. Kroh, L.W. Caramelisation in food and beverages. Food Chem. 1994, 51, 373–379. [CrossRef]8. Park, J.; Kamendulis, L.; Friedman, M.; Klaunig, L. Acrylamide-Induced Cellular Transformation. Toxicol. Sci.
2002, 65, 177–183. [CrossRef]9. Rice, J.M. The carcinogenicity of acrylamide. Mutat. Res. Genet. Toxicol. Environ. Mutagen. 2005, 580, 3–20.
[CrossRef]10. Friedman, M. Food browning and its prevention: An overview. J. Agric. Food Chem. 1996, 44, 631–653.
[CrossRef]11. Shapla, U.M.; Solayman, M.; Alam, N.; Khalil, M.I.; Gan, S.H. 5-Hydroxymethylfurfural (HMF) levels in
honey and other food products: Effects on bees and human health. Chem. Cent. J. 2018, 12, 1–18. [CrossRef]
63

Foods 2020, 9, 531
12. EFSA (European Food Safety Authority). Opinion of the scientific panel on food additives, flavourings,processing aids and materials in contact with food (AFC) on a request from the commission related toflavouring group evaluation 13: Furfuryl and furan derivatives with and without additional. EFSA J.2005, 215, 1–73.
13. AOAC. Official Method of Analysis of AOAC Intl, 17th ed.; Association of Official Analytical Chemists:Gaithersburg, MD, USA, 2003.
14. Ministerio de Salud Panela Manual de Análisis. Available online: https://www.minsalud.gov.co/sites/rid/Lists/BibliotecaDigital/RIDE/IA/INS/ManualparaelanálisisdePanela.pdf (accessed on 22 March 2020).
15. Ayvaz, H. Rapid Assessment of Acrylamide and Its Precursors in Potato Tubers and Snacks by InfraredSpectroscopy. Ph.D. Thesis, The Ohio State University, Columbus, OH, USA, 2014.
16. Farkas, T.; Toulouee, J. Asparagine analysis in food products. LC GC Eur. 2003, 21, 14–16.17. Mesias, M.; Delgado-Andrade, C.; Holgado, C.; Morales, F.J. Acrylamide content in French fries prepared in
households: A pilot study in Spanish homes. Food Chem. 2018, 260, 44–52. [CrossRef] [PubMed]18. Mesías, M.; Morales, F.J. Acrylamide in commercial potato crisps from Spanish market: Trends from 2004 to
2014 and assessment of the dietary exposure. Food Chem. Toxicol. 2015, 81, 104–110. [CrossRef] [PubMed]19. Mesías, M.; Holgado, F.; Márquez-Ruíz, G.; Morales, F.J. Effect of sodium replacement in cookies on the
formation of process contaminants and lipid oxidation. LWT Food Sci. Technol. 2015, 62, 633–639. [CrossRef]20. Pérez-Jiménez, J.; Saura-Calixto, F. Literature Data May Underestimate the Actual Antioxidant Capacity of
Cereals. J. Agric. Food Chem. 2005, 53, 5036–5040. [CrossRef] [PubMed]21. Marfil, R.; Giménez, R.; Martínez, O.; Bouzas, P.R.; Rufián-Henares, J.A.; Mesías, M.; Cabrera-Vique, C.
Determination of polyphenols, tocopherols, and antioxidant capacity in virgin argan oil (Argania spinosa,Skeels). Eur. J. Lipid Sci. Technol. 2011, 113, 886–893. [CrossRef]
22. Rufián-Henares, J.A.; Delgado-Andrade, C. Effect of digestive process on Maillard reaction indexes andantioxidant properties of breakfast cereals. Food Res. Int. 2009, 42, 394–400. [CrossRef]
23. Hoenicke, K.; Gatermann, R. Studies on the Stability of acrylamide in food during storage. J. AOAC Int.2005, 88, 268–273. [CrossRef]
24. Gómez-Narváez, F.; Mesías, M.; Delgado-Andrade, C.; Contreras-Calderón, J.; Ubillús, F.; Cruz, G.;Morales, F.J. Occurrence of acrylamide and other heat-induced compounds in panela: Relationship withphysicochemical and antioxidant parameters. Food Chem. 2019, 301, 125256. [CrossRef]
25. Knerr, T.; Lerche, H.; Pischetsrieder, M.; Severin, T. Formation of a novel colored product during the maillardreaction of d-glucose. J. Agric. Food Chem. 2001, 49, 1966–1970. [CrossRef]
26. Jaffé, W.R. Nutritional and functional components of non centrifugal cane sugar: A compilation of the datafrom the analytical literature. J. Food Compos. Anal. 2015, 43, 194–202. [CrossRef]
27. Lee, J.S.; Ramalingam, S.; Jo, I.G.; Kwon, Y.S.; Bahuguna, A.; Oh, Y.S.; Kim, M. Comparative study of thephysicochemical, nutritional, and antioxidant properties of some commercial refined and non-centrifugalsugars. Food Res. Int. 2018, 109, 614–625. [CrossRef] [PubMed]
28. Contreras-Calderón, J.; Guerra-Hernández, E.; García-Villanova, B. Indicators of non-enzymatic browning inthe evaluation of heat damage of ingredient proteins used in manufactured infant formulas. Eur. Food Res.Technol. 2008, 227, 117–124. [CrossRef]
29. Gómez-Narváez, F.; Medina-Pineda, Y.; Contreras-Calderón, J. Evaluation of the heat damage of whey andwhey proteins using multivariate analysis. Food Res. Int. 2017, 102, 768–775. [CrossRef] [PubMed]
30. Contreras-Calderón, J.; Mejía-Díaz, D.; Martínez-Castaño, M.; Bedoya-Ramírez, D.; López-Rojas, N.;Gómez-Narváez, F.; Vega-Castro, O. Evaluation of antioxidant capacity in coffees marketed in Colombia:Relationship with the extent of non-enzymatic browning. Food Chem. 2016, 209, 162–170. [CrossRef]
31. Theobald, A.; Müller, A.; Anklam, E. Determination of 5-hydrox-ymethylfurfural in vinegar samples byHPLC. J. Agric. Food Chem. 1998, 46, 1850–1854. [CrossRef]
32. Wen, C.; Shi, X.; Wang, Z.; Gao, W.; Jiang, L.; Xiao, Q.; Deng, F. Effects of metal ions on formation ofacrylamide and 5-hydroxymethylfurfural in asparagine-glucose model system. Int. J. Food Sci. Technol.2016, 51, 279–285. [CrossRef]
33. Delgado-Andrade, C.; Morales, F.J.; Seiquer, I.; Navarro, M.P. Maillard reaction products profile and intakefrom Spanish typical dishes. Food Res. Int. 2016, 43, 1304–1311. [CrossRef]
64

Foods 2020, 9, 531
34. Payet, B.; Sing, A.S.C.; Smadja, J. Assessment of antioxidant activity of cane brown sugars by ABTS and DPPHradical scavenging assays: Determination of their polyphenolic and volatile constituents. J. Agric. Food Chem.2005, 53, 10074–10079. [CrossRef]
35. Asikin, Y.; Hirose, N.; Tamaki, H.; Ito, S.; Oku, H.; Wada, K. Effects of different drying-solidification processeson physical properties, volatile fraction, and antioxidant activity of non-centrifugal cane brown sugar.LWT Food Sci. Technol. 2016, 66, 340–347. [CrossRef]
© 2020 by the authors. Licensee MDPI, Basel, Switzerland. This article is an open accessarticle distributed under the terms and conditions of the Creative Commons Attribution(CC BY) license (http://creativecommons.org/licenses/by/4.0/).
65


foods
Article
Effects of Thawing and Frying Methods on theFormation of Acrylamide and Polycyclic AromaticHydrocarbons in Chicken Meat
Jong-Sun Lee 1, Ji-Won Han 1, Munyhung Jung 2, Kwang-Won Lee 3 and Myung-Sub Chung 1,*
1 Department of Food Science and Technology, Chung-Ang University, 4726 Seodongdae-Ro, Daedeok-Myeon,Anseong-Si 17546, Korea; [email protected] (J.-S.L.); [email protected] (J.-W.H.)
2 Department of Food and Biotechnology, Graduate School, Woosuk University, Samnye-eup,Wanju-gun 55338, Korea; [email protected]
3 Department of Biotechnology, College of Life Sciences and Biotechnology, Korea University, Anam-Dong,Sungbuk-Gu, Seoul 02841, Korea; [email protected]
* Correspondence: [email protected]; Tel.: +82-31-670-3272
Received: 30 March 2020; Accepted: 23 April 2020; Published: 4 May 2020
Abstract: Air frying is commonly used as a substitute for deep-fat frying. However, few studies haveexamined the effect of air frying on the formation of potential carcinogens in foodstuffs. This studyaimed to investigate the formation of acrylamide and four types of polycyclic aromatic hydrocarbons(PAHs) in air-fried and deep-fat-fried chicken breasts, thighs, and wings thawed using differentmethods, i.e., by using a microwave or a refrigerator, or by water immersion. The acrylamideand PAHs were analyzed by high-performance liquid chromatography–tandem mass spectrometry(HPLC-MS/MS) and gas chromatography–mass spectrometry (GC-MS), respectively. Deep-fat-friedchicken meat had higher acrylamide (n.d.–6.19μg/kg) and total PAH (2.64–3.17μg/kg) air-fried chickenmeat (n.d.–3.49 μg/kg and 1.96–2.71 μg/kg). However, the thawing method did not significantlyaffect the formation of either acrylamide or PAHs. No significant differences in the acrylamidecontents were observed among the chicken meat parts, however, the highest PAH contents werefound in chicken wings. Thus, the results demonstrated that air frying could reduce the formation ofacrylamide and PAHs in chicken meat in comparison with deep-fat frying.
Keywords: chicken; air frying; deep-fat frying; acrylamide; polycyclic aromatic hydrocarbons
1. Introduction
Although meat consumption has increased steadily in recent years, the consumption of low-fat,low-calorie, and high-protein chicken has grown significantly [1]. The number of chicken franchisestores in Korea has increased from 9000 in 2002 to 24,602 in 2018 [2]. Additionally, the domesticconsumption of chicken has continued to grow from 7.5 kg per person per year in 2005 to 14.2 kgper person per year in 2018 [3]. The consumption of chicken in the USA has also increased from39.2 kg per person per year in 2005 to 42.6 kg per person per year in 2018 [4]. In the European Union,the production of chicken has increased from 8169 billion tons per year in 2005 to 12,260 billion tonsper year in 2018 [5]. Furthermore, the most frequently consumed meat cooked at high temperatures isfried chicken [6].
Generally, frying involves more rapid heat transfer in comparison with other cooking methods.The lowest temperature employed for frying is 140 ◦C, although fried food is typically cookedat temperatures between 175 ◦C and 195 ◦C [7]. High temperatures promote dehydration of thecrust, oil intake, and the chemical reactions of various food constituents such as the denaturation ofproteins and the caramelization of carbohydrates [8–10]. Moreover, the compounds produced via the
Foods 2020, 9, 573; doi:10.3390/foods9050573 www.mdpi.com/journal/foods67

Foods 2020, 9, 573
Maillard reaction during frying enhance the aroma, color, crust, and texture of the food but reduce itsnutritional quality [11,12].
Many epidemiological studies have indicated that a high consumption of processed meats mayincrease the risk of cancer (e.g., breast, prostate, colorectal, ureter, and pancreatic) in humans becausethe high cooking temperatures employed in their production can result in high levels of carcinogeniccompounds, such as acrylamide and polycyclic aromatic hydrocarbons (PAHs) [13–15]. Acrylamide,which is classified as a probable carcinogen to humans (Group 2A) by the International Agency forResearch on Cancer (IARC) [16], is also produced during the frying of chicken [14]. Additionally,based on previous studies regarding the carcinogenicity, epidemiology, and mutagenicity of the PAHbenzo[a]pyrene (B(a)P), it was categorized by the IARC as a Group 1 carcinogen, indicating that itis carcinogenic to humans [17]. Furthermore, PAHs are known to be endocrine disorder substances,which have long residual terms and exhibit high toxicities as carcinogens [18]. Formerly, the EuropeanCommission (EC) regulations required the use of B(a)P as a marker for the content of carcinogenicPAHs in foods [19]. However, as B(a)P was not always found in foods containing PAHs, in 2008,a group of four PAHs (PAH4) and a group of eight PAHs (PAH8) were proposed as better indicatorsbased on data relating to occurrence and toxicity [20]. However, PAH8 measurements provided noadditional advantage over PAH4 measurements. Based on comments from the European Food SafetyAuthority, in 2011, the EC expanded the scope of their regulations to include other food types and toadd restrictions on PAH4 levels [21].
As the formation of carcinogenic compounds, such as acrylamide and PAHs, in chicken meatposes a significant risk to human health, studies are required to determine alternative cookingmethods that produce healthier products without compromising the texture, flavor, taste attributes,and appearance [22–24]. For example, some previous studies have investigated limiting the formationof carcinogenic compounds through the use of precooking methods, such as microwave prethawing,predrying, and low-pressure frying [25–27]. An additional means to reduce the formation ofcarcinogenic compounds is the use of a different cooking method. For example, air frying is commonlyused as a substitute for deep-fat frying. This method produces fried food using only a small quantity offat through oil droplets spread in a hot air stream. Direct contact between the dispersion of oil dropletsin hot air and the product inside a closed chamber provides constant heat transfer rates between the airand the food being fried. Thus, this technology permits a reduction of ~90% in the fat content of friedproducts [24]. Moreover, a 77% reduction in the acrylamide content of air-fried French fries has alsobeen reported (30 μg/kg for air frying and 132 μg/kg for deep-fat frying [28]). Importantly, the air-friedfood was crispy on the outside and moist on the inside, and the sensory properties of the final productwere similar to those obtained after deep-fat frying. Furthermore, the smell of the food during cookingwas less intense in comparison with other frying methods. For this reason, air fryer purchases haverisen from 2% in 2014 to 38% in 2018 [29].
However, despite the number of studies conducted to evaluate the effect of hazardous compoundformation in fried foods, few studies have examined the effect of air frying on the formation ofacrylamide and PAHs in foodstuffs. Thus, we herein investigate the formation of acrylamide andfour types of PAHs in chicken breasts, thighs, and wings fried by air frying and deep-fat frying afterthawing using a microwave or a refrigerator, or by water immersion. Higher acrylamide and PAHcontents were found in deep-fat-fried chicken meat than in air-fried chicken meat, but the thawingmethod did not significantly affect the formation of either acrylamide or PAHs. Thus, air frying is apromising method for reducing the formation of potentially hazardous compounds in chicken.
2. Materials and Methods
2.1. Raw Materials
Frozen skinless chicken breasts as well as thighs and wings with skin (Harim Co. Ltd., Iksan-si,South Korea) were purchased from a local food market (Jeonju, South Korea). Soybean oil (CJ
68

Foods 2020, 9, 573
CheilJedang, Seoul, South Korea) was purchased from a local food market and used for frying thechicken samples.
2.2. Chemicals
Acrylamide (>99%) and 13C3-acrylamide (>99%) were supplied by Cambridge Isotope Laboratories(Andover, MA, USA). Formic acid (>99%) was purchased from Sigma-Aldrich (St. Louis, MO, USA)and methanol was supplied by J.T. Baker (Phillipsburg, NJ, USA).
Strata-X (200 mg, 6 mL) and Bond Elut AccuCAT (200 mg, 3 mL) solid-phase extraction (SPE)cartridges were purchased from Phenomenex (Torrance, CA, USA) and Agilent Technologies (SantaClara, CA, USA), respectively. Polyvinylidene fluoride (PVDF) syringe filters were purchased fromFutecs Co. (Daejeon, South Korea).
Benzo(a)anthracene (B(a)A), benzo(b)fluoranthene (B(b)F), chrysene (CRY), and B(a)P standardsas well as benzo(a)pyrene-d12 (B(a)P-d12) and chrysene-d12 (CRY-d12) internal standards (I.S.)were purchased from Supelco (Bellefonte, PA, USA). Organic solvents, including n-hexane, ethanol,and dichloromethane, were purchased from Burdick & Jackson (Muskegon, MI, USA). Potassiumhydroxide (>85%) for alkali saponification was purchased from Showa Denko (Tokyo, Japan). Sodiumsulfate anhydrous (>99%) for dehydration from Yakuri Pure Chemicals (Kyoto, Japan) and filter paperfrom Whatman (Maidstone, UK) were used for the dehydration process. Sep-Pak cartridges AgilentTechnologies (Santa Clara, CA, USA) were used for SPE. Polytetrafluoroethylene (PTFE) membranesyringe filters from Whatman (Maidstone, UK) and 1 mL syringes from KOREAVACCINE (Ansan-Si,South Korea) were used for the filtration process.
All chemicals used for the determination of acrylamide and the PAHs were of analytical orhigh-performance liquid chromatography (HPLC) analytical grade.
2.3. Thawing Procedures
Chicken thigh, wing, and breast samples of approximately 100 g were employed for the thawingexperiments. The frozen chicken samples were subjected to three different home-based thawingpractices prior to frying. In accordance with the sanitation standard operating manual [30], the chickenwas packed in a low-density polyethylene plastic bag (Cleanwrap, South Korea) for thawing byimmersion in water and for refrigeration. Microwave thawing was conducted in a polypropylenemicrowave-specific container (LocknLock, South Korea). Specifically, the thawing practices used inthis study were as follows: (i) Thawing in a microwave (KR-M201BWB; Winia Daewoo, South Korea)at 310 W for 3 min; (ii) thawing in a refrigerator (GC-114HCMP; LG Electronics, South Korea) at4 ◦C for 24 h; and (iii) thawing by immersion in distilled water at 20 ◦C for 1 h (changing thewater after 30 min). These thawing practices are suggested by the United States Department ofAgriculture (USDA) as safe defrosting methods [31]. Frying was performed immediately after thawingto prevent contamination [30].
2.4. Frying Procedures
Deep-fat frying was performed in a domestic electric fryer (model DK-201; Delki, South Korea) withan adjustable temperature up to 190 ◦C, a 6 L capacity, and a nominal power of 2000 W. The temperaturewas controlled using a digital thermometer. Hot air frying was conducted using an HD9220 Air Fryer(Royal Philips Electronics N.V., Amsterdam, The Netherlands) with an adjustable temperature upto 200 ◦C, a 2.2 L capacity, and a nominal power of 1425 W. Approximately 100 g of each sample ofthe thawed chicken thighs, wings, and breasts were fried at the same time when the temperatures ofboth fryers reached 180 ◦C. Deep-fat frying was performed for 10 min using an oil volume of 3.6 L,and the oil was changed thrice for triplicate experiments. Air frying was performed for 35 min, and thesamples were flipped once after 20 min without oil spray.
69

Foods 2020, 9, 573
2.5. Sample Preparation
All fried chicken parts were cooled to room temperature (approximately 20 ◦C) after frying andthe chicken bone was removed. The deboned skinless chicken breasts and the thighs and wings withskin were homogenized using a Ninja blender (Hai Xin Technology Co. Ltd., Shenzhen, China) for2 min, and the homogenized samples were stored at 4 ◦C prior to analysis.
2.6. Determination of Acrylamide Content
The analytical method employed for acrylamide determination was based on The Ministry ofFood and Drug Safety method with minor modifications [32]. Specifically, each homogenized chickensample (1 g) was added to water (9 mL) and 13C3 acrylamide (1 mL, 200 ng/mL) in a 50 mL tube.The tube was shaken at 250 rpm for 20 min, centrifuged (COMBI-514R; Hanil Scientific Inc., Gimpo-si,South Korea) at 3500 rpm for 5 min, and filtered through a 0.45 μm PVDF syringe filter. A Strata-X SPEcolumn was conditioned with methanol (3.5 mL) followed by water (3.5 mL). An aliquot of the sample(1.5 mL) was introduced onto the cartridge followed by water (0.5 mL), and the eluent was discarded.Then, further water (1.5 mL) was passed through the column and the eluent was collected. A BondElut AccuCAT SPE column was conditioned using methanol (2.5 mL) followed by water (2.5 mL).Finally, after passing an aliquot (0.5 mL) of the eluate collected from the Strata-X SPE column throughthe preconditioned Bond Elut AccuCAT SPE column, an aliquot (1 mL) of the eluate from the Strata-Xcolumn was introduced onto the Bond Elut AccuCAT SPE column and was collected in 2 mL vials.
High-performance liquid chromatography–tandem mass spectrometry (HPLC-MS/MS) wasperformed using a Shimadzu 30A HPLC system coupled to a Shimadzu MS8040 MS/MS system(Shimadzu, Kyoto, Japan). The HPLC-MS/MS analytical conditions are outlined in Table 1. The multiplereaction monitoring (MRM) transitions for the quantitation of acrylamide and 13C3 acrylamide (internalstandard) were m/z 72 > 55 and m/z 75 > 58, respectively.
Table 1. Analytical conditions employed for high-performance liquid chromatography–tandem massspectrometry (HPLC-MS/MS) analysis of acrylamide contents in chicken samples.
Item Conditions
HPLC instrument Shimadzu 30AColumn Kinetex polar C18 (150 mm × 2.1 mm i.d., 2.6 μm particle size, Phenomenex)
Flow rate 0.3 mL/minOven temperature 26 ◦CInjection volume 20 μL
Mobile phases 0.5% methanol in distilled water and 0.1% acetic acidMS/MS instrument Shimadzu MS8040
Ionization mode Electrospray ionization, 5000 V, positive mode,Detection mode MRM mode
Desolvation gas, collision gas N2
MRM: multiple reaction monitoring.
A calibration curve for acrylamide was prepared in the range of 0.5–200 μg/L. The correlationcoefficient was 0.999. Based on the calibration curve parameters, the limit of detection (LOD) and thelimit of quantification (LOQ) were calculated as 0.186 μg/kg and 0.562 μg/kg, respectively.
2.7. Determination of PAH Content
The PAH content was determined using the method of Lee et al. [33] with modifications.Specifically, each homogenized chicken sample (1 g) was placed in a flat-bottomed 300 mL flask,and then spiked with an internal standard mixture (1 mL, 100 μg/kg of CRY-d12 and B(a)P-d12).The combined n-hexane phase was washed with distilled water (3 × 50 mL), dried over Na2SO4,and concentrated using a rotary evaporator (N-1110, EYELA, Seoul, South Korea) at 37 ◦C to givea final volume of 2 mL. The samples were then eluted using a Sep-Pak silica cartridge, which was
70

Foods 2020, 9, 573
activated with hexane (20 mL). The resulting solution was concentrated to dryness under N2 gas at40 ◦C, and the residue was redissolved in dichloromethane (1 mL). This solution was passed through a0.45 μm PTFE membrane filter and transferred into a 2 mL amber screw cap vial. Finally, the PAHcontents were analyzed using gas chromatography–mass spectrometry (GC-MS) following a slightlymodified standard procedure. GC-MS analyses were performed using an Agilent Technologies 7890Agas chromatograph coupled to an Agilent Technologies 5977B mass spectrometer (Agilent Technologies,Santa Clara, CA, USA). The GC-MS conditions used to analyze the PAH contents are outlined in Table 2.The selected ions employed for the four PAHs and the standards in selected ion monitoring (SIM)mode were as follows: B(a)A (m/z 228, 226, 229), B(b)F (m/z 252, 250, 253), CRY (m/z 228, 226, 229), B(a)P(m/z 252, 250, 253), B(a)P-d12 (m/z 264, 263, 265), and CRY-d12 (m/z 240, 236, 241). The values in boldindicate the quantification ions.
Table 2. Gas chromatography–mass spectrometry (GC-MS) conditions for analysis of the four polycyclicaromatic hydrocarbons (PAHs) in chicken samples.
Item Conditions
GC instrument Agilent Technologies 7890A
Column HP-5MS UI(30 m × 250 μm i.d., 0.25 μm film thickness)
Column oven temperature 80 ◦C (1 min)→ 4 ◦C/min, 220 ◦C→ 20 ◦C/min, 280 ◦C (10 min)
Post run 310 ◦C, 10 minFlow rate 1.5 mL/min, helium
Injection mode Splitless modeInjection volume 1 μL
Injection temperature 320 ◦CMS instrument Agilent Technologies 5977B
Fragmentation mode Electron impact at 70 eVDetection mode SIM mode
SIM: selected ion monitoring.
2.8. Statistical Analysis
The experimental data were evaluated using the analysis of variance (ANOVA). Using the SPSSsoftware program (IBM Inc., Chicago, IL, USA), significant differences (p < 0.05) among the meanswere determined from triplicate analysis using Duncan’s multiple range test. The differences betweenthe means of the two frying methods were estimated using the t-test for independent samples. Valueswere considered significant at p < 0.05.
3. Results and Discussion
3.1. Acrylamide Contents of Air-Fried and Deep-Fat-Fried Chicken Meat Parts
Figure 1 depicts the retention times of the acrylamide standard and internal standard in theHPLC-MS/MS chromatograms of a typical chicken meat sample. The acrylamide contents of theair-fried and deep-fat-fried chicken breast, thigh, and wing samples after thawing in a microwave, in arefrigerator, and by immersion in water are presented in Table 3. The effects of the frying method onacrylamide formation were examined using the same thawing method and the same chicken meat part.
The acrylamide levels of the deep-fat-fried chicken meats ranged from n.d. (not detected) to6.19 μg/kg, whereas those of the air-fried chicken meats ranged from n.d. to 3.49 μg/kg. Overall,the deep-fat-fried samples contained significantly higher acrylamide levels than the air-fried samples,with the exception of the thigh and wing parts thawed in a refrigerator. For this study, deep-fat fryingwas performed using soybean oil for 10 min, whereas air frying was conducted without an oil sprayfor 25 min. Despite the longer frying time, lower acrylamide levels were observed in the air-friedchicken meat samples. It has been proposed that acrylamide is formed from acrolein, which originates
71
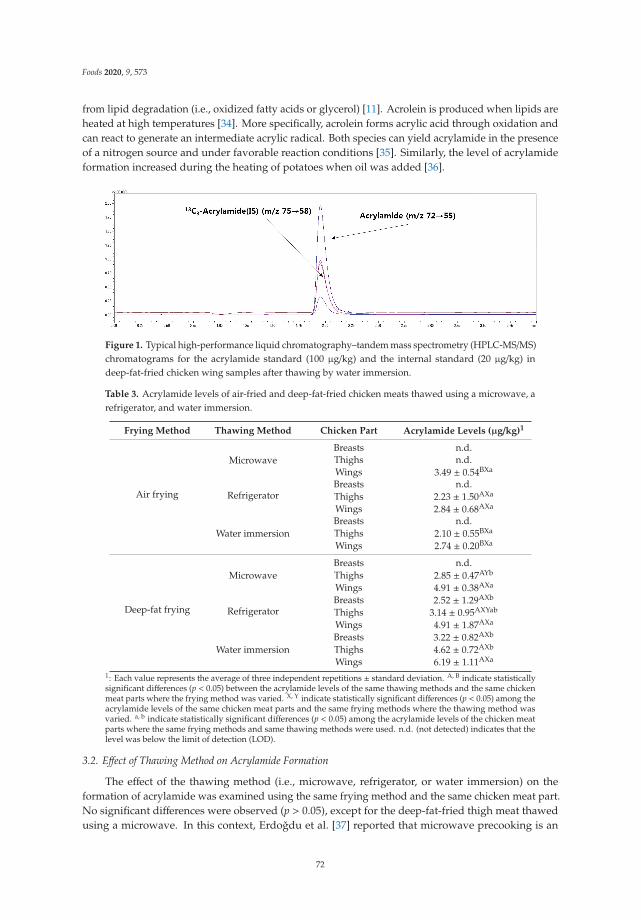
Foods 2020, 9, 573
from lipid degradation (i.e., oxidized fatty acids or glycerol) [11]. Acrolein is produced when lipids areheated at high temperatures [34]. More specifically, acrolein forms acrylic acid through oxidation andcan react to generate an intermediate acrylic radical. Both species can yield acrylamide in the presenceof a nitrogen source and under favorable reaction conditions [35]. Similarly, the level of acrylamideformation increased during the heating of potatoes when oil was added [36].
Figure 1. Typical high-performance liquid chromatography–tandem mass spectrometry (HPLC-MS/MS)chromatograms for the acrylamide standard (100 μg/kg) and the internal standard (20 μg/kg) indeep-fat-fried chicken wing samples after thawing by water immersion.
Table 3. Acrylamide levels of air-fried and deep-fat-fried chicken meats thawed using a microwave, arefrigerator, and water immersion.
Frying Method Thawing Method Chicken Part Acrylamide Levels (μg/kg)1
Air frying
MicrowaveBreasts n.d.Thighs n.d.Wings 3.49 ± 0.54BXa
RefrigeratorBreasts n.d.Thighs 2.23 ± 1.50AXa
Wings 2.84 ± 0.68AXa
Water immersionBreasts n.d.Thighs 2.10 ± 0.55BXa
Wings 2.74 ± 0.20BXa
Deep-fat frying
MicrowaveBreasts n.d.Thighs 2.85 ± 0.47AYb
Wings 4.91 ± 0.38AXa
RefrigeratorBreasts 2.52 ± 1.29AXb
Thighs 3.14 ± 0.95AXYab
Wings 4.91 ± 1.87AXa
Water immersionBreasts 3.22 ± 0.82AXb
Thighs 4.62 ± 0.72AXb
Wings 6.19 ± 1.11AXa
1: Each value represents the average of three independent repetitions ± standard deviation. A, B indicate statisticallysignificant differences (p < 0.05) between the acrylamide levels of the same thawing methods and the same chickenmeat parts where the frying method was varied. X, Y indicate statistically significant differences (p < 0.05) among theacrylamide levels of the same chicken meat parts and the same frying methods where the thawing method wasvaried. a, b indicate statistically significant differences (p < 0.05) among the acrylamide levels of the chicken meatparts where the same frying methods and same thawing methods were used. n.d. (not detected) indicates that thelevel was below the limit of detection (LOD).
3.2. Effect of Thawing Method on Acrylamide Formation
The effect of the thawing method (i.e., microwave, refrigerator, or water immersion) on theformation of acrylamide was examined using the same frying method and the same chicken meat part.No significant differences were observed (p > 0.05), except for the deep-fat-fried thigh meat thawedusing a microwave. In this context, Erdogdu et al. [37] reported that microwave precooking is an
72

Foods 2020, 9, 573
efficient way to decrease acrylamide formation in French fries by down-regulating the frying time andtemperature. Additionally, Demirok and Kolsarıcı [14] used microwave pretreatment to reduce thelevels of acrylamide from 95.15 to 94.13 μg/kg for coated chicken thighs and from 90.47 to 84.38 μg/kgfor coated chicken wings.
3.3. Acrylamide Formation in Different Chicken Meat Parts
The formation of acrylamide in the chicken breasts, thighs, and wings thawed and fried using thesame methods was examined. In general, independent of the frying method employed, the chickenwings contained the highest acrylamide contents, followed by the chicken thighs and the breast meat.No significant differences (p > 0.05) were observed among the air-fried chicken meat parts, whereasthe deep-fat-fried chicken wings contained significantly higher acrylamide contents than the breastand thigh samples (p < 0.05). These results may be due to the different fat contents in the chicken meatparts. The EC established a recommended permitted value of 1000 μg/kg for residual acrylamide inpotato crisps [38]; however, in our study, this value was not exceeded for any sample. Specifically,the acrylamide levels of the fried chicken samples produced herein were in the range of n.d.–3.22 μg/kgfor the breast samples, n.d.–4.62 μg/kg for the thigh samples, and 2.74–6.19 μg/kg for the wing samples,which are extremely low levels. These results may be due to the use of fresh soybean oil in eachfrying experiment.
3.4. PAH Contents in Air-Fried and Deep-Fat-Fried Chicken Meat Samples
Figure 2 illustrates the GC-MS total ion chromatograms of a standard mixture of the fourPAHs (PAH4, 10 μg/kg) and the internal standards (10 μg/kg). The PAH levels of the air-fried anddeep-fat-fried chicken breast, thigh, and wing samples after thawing in a microwave, in a refrigerator,or by immersion in water are presented in Table 4. The results obtained for the two frying methodswere compared for the same meat parts and thawing methods.
The sums of the four PAH levels for the deep-fat-fried chicken meat samples ranged from2.60 to 3.17 μg/kg, whereas for the air-fried samples, these values ranged from 1.96 to 2.71 μg/kg.The deep-fat-fried chicken meats exhibited significantly higher (p < 0.05) total PAH levels than theair-fried chicken meats. Methyl linoleate is known to produce the highest levels of PAHs, followed bymethyl oleate and methyl stearate, and it has been concluded that a greater extent of PAH formationoccurs as the degree of unsaturation of the added lipids increases [39]. This behavior was attributedto unsaturated fatty acids being more prone to oxidation during heating [40]. It has previously beendiscussed that unsaturated fatty acids form cyclic monomers or dimers through polymerization [41].According to Kostik et al. [42], the unsaturated fatty acid composition of soybean oil consists of oleicacid (28.5%, w/w), linoleic acid (49.5%), and linolenic acid (8%). Additionally, soybean oil should besusceptible to PAH formation because linoleic acid and linolenic acid are likely precursors of such lipidbreakdown products [39]. Therefore, our results indicated that the unsaturated fatty acids present inthe frying oil promoted PAH production.
73

Foods 2020, 9, 573
B[a]A CRY
B[b]F B[a]P
CRY-d12(I.S.)
B(a)P-d12
Figure 2. Gas chromatography–mass spectrometry (GC-MS) total ion chromatograms of a mixtureof the four polycyclic aromatic hydrocarbons (PAHs) (10 μg/kg) and the B(a)P-d12 and CRY-d12internal standards (10 μg/kg). Benzo(a)anthracene, B(a)A; benzo(b)fluoranthene, B(b)F; chrysene, CRY;benzo(a)pyrene, B(a)P; benzo(a)pyrene-d12, B(a)P-d12; and chrysene-d12, CRY-d12.
74

Foods 2020, 9, 573
Ta
ble
4.
Leve
ls1
(μg/
kg)o
fthe
four
PAH
sin
the
air-
frie
dan
dde
ep-f
at-f
ried
chic
ken
brea
st,t
high
,and
win
gsa
mpl
esth
awed
ina
mic
row
ave,
ina
refr
iger
ator
,or
byw
ater
imm
ersi
on.
Fry
ing
Me
tho
dT
ha
win
gM
eth
od
Ch
ick
en
Pa
rtB
(a)A
B(b
)FC
RY
B(a
)PP
AH
42
Air
fryi
ng
Mic
row
ave
Brea
sts
0.27±0
.03BX
b0.
28±0
.05A
Xa
0.94±0
.12BX
b0.
52±0
.03A
Xa
2.00±0
.20BX
b
Thig
hs0.
31±0
.02A
Xb
0.24±0
.05A
Xa
1.06±0
.01BY
b0.
54±0
.00BX
a2.
15±0
.07BX
Yb
Win
gs0.
43±0
.04A
Xa
0.30±0
.05BX
a1.
43±0
.10A
Xa
0.55±0
.05A
Xa
2.71±0
.18BX
a
Ref
rige
rato
rBr
east
s0.
26±0
.04A
Xa
0.19±0
.02BY
b0.
95±0
.05A
Xb
0.56±0
.08A
Xa
1.96±0
.16BX
b
Thig
hs0.
33±0
.03A
Xa
0.20±0
.02BX
b1.
01±0
.05BY
b0.
55±0
.02BX
a2.
08±0
.07BY
b
Win
gs0.
32±0
.04A
Ya0.
35±0
.05A
Xa
1.30±0
.08A
Xa
0.54±0
.09A
Xa
2.51±0
.18BX
a
Wat
erim
mer
sion
Brea
sts
0.29±0
.02BX
ab0.
25±0
.04A
XYa
1.04±0
.08BX
a0.
51±0
.00BX
a2.
08±0
.10BX
a
Thig
hs0.
24±0
.04BY
b0.
22±0
.03A
Xa
1.22±0
.09A
Xa
0.59±0
.05BX
a2.
26±0
.09BX
a
Win
gs0.
32±0
.02BY
a0.
30±0
.06A
Xa
1.10±0
.11BY
a0.
59±0
.09A
Xa
2.31±0
.24BX
a
Dee
p-fa
tfry
ing
Mic
row
ave
Brea
sts
0.42±0
.05A
Xa
0.33±0
.07A
XYa
b1.
30±0
.09A
Xb
0.59±0
.07A
Ya2.
64±0
.14A
Xb
Thig
hs0.
39±0
.07A
Xa
0.31±0
.06A
Xb
1.44±0
.14A
Xab
0.76±0
.04A
XYa
2.90±0
.2A
Xab
Win
gs0.
46±0
.06A
Xa
0.42±0
.04A
Xa
1.52±0
.06A
Xa
0.76±0
.13A
Xa
3.17±0
.15A
Xa
Ref
rige
rato
rBr
east
s0.
35±0
.06A
Xa
0.40±0
.07A
Xa
1.21±0
.24A
Xa
0.64±0
.02A
Ya2.
60±0
.21A
Xa
Thig
hs0.
40±0
.03A
Xa
0.35±0
.03A
Xa
1.40±0
.09A
Xa
0.64±0
.02A
Ya2.
79±0
.09A
Xa
Win
gs0.
40±0
.03A
Xa
0.45±0
.06A
Xa
1.40±0
.09A
Xa
0.59±0
.01A
Xb
2.84±0
.09A
Ya
Wat
erim
mer
sion
Brea
sts
0.43±0
.05A
Xa
0.27±0
.02A
Yb
1.33±0
.05A
Xa
0.79±0
.03A
Xa
2.81±0
.13A
Xa
Thig
hs0.
40±0
.03A
Xa
0.27±0
.04A
Xb
1.33±0
.01A
Xa
0.78±0
.10A
Xa
2.78±0
.08A
Xa
Win
gs0.
46±0
.03A
Xa
0.36±0
.03A
Xa
1.38±0
.07A
Xa
0.73±0
.09A
Xa
2.93±0
.14A
XYa
1 :Eac
hva
lue
repr
esen
tsth
eav
erag
eof
thre
ein
depe
nden
trep
etiti
ons±s
tand
ard
devi
atio
n.2 :P
AH
4is
the
sum
ofth
ebe
nzo(
a)an
thra
cene
(B(a
)A),
benz
o(b)
fluor
anth
ene
(B(b
)F),
chry
sene
(CR
Y),
and
benz
o(a)
pyre
ne(B
(a)P
)con
tent
s.A
,Bin
dica
test
atis
tical
lysi
gnifi
cant
diff
eren
ces
(p<
0.05
)bet
wee
nth
ePA
Hle
vels
ofth
esa
me
thaw
ing
met
hods
and
the
sam
ech
icke
nm
eat
part
sw
here
the
fryi
ngm
etho
dw
asva
ried
.X,Y
indi
cate
stat
istic
ally
sign
ifica
ntdiff
eren
ces
(p<
0.05
)am
ong
the
PAH
leve
lsof
the
sam
ech
icke
nm
eatp
arts
and
the
sam
efr
ying
met
hods
whe
reth
eth
awin
gm
etho
dw
asva
ried
.a,b
ind
icat
est
atis
tica
llysi
gnifi
cant
diff
eren
ces
(p<
0.05
)am
ong
the
PAH
leve
lsof
the
chic
ken
mea
tpar
tsw
here
the
sam
efr
ying
met
hod
san
dsa
me
thaw
ing
met
hods
wer
eus
ed.
75

Foods 2020, 9, 573
3.5. Effect of Thawing Method on PAH Formation
The effect of the thawing method (i.e., microwave, refrigerator, or water immersion) on theformation of PAHs was investigated using the same frying method and same chicken meat parts. It wasfound that the thawing method had no significant effect (p > 0.05) on PAH formation in air-fried chickenmeats, with the exception of the thigh meat thawed in a refrigerator. In the case of the deep-fat-friedsamples, the total PAH levels in the chicken wings thawed in a refrigerator were significantly lower(p < 0.05) than those of the chicken wings thawed using either a microwave or water immersion.
Previous research confirmed that thawing in a refrigerator resulted in a lower drip loss of 0.62%among chicken breast samples [43]. Additionally, the presence of water is an important factor in PAHformation because it prevents incomplete combustion by providing oxygen during heating [44,45].Therefore, it is likely that the lower quantities of PAHs formed in the chicken samples thawed using arefrigerator were due to reduced moisture loss.
3.6. PAH Formation in Different Chicken Meat Parts
The formation of PAHs was examined in the chicken breast, thigh, and wing samples that werethawed and fried using the same methods. Specifically, the air-fried chicken wings exhibited the highestPAH contents, followed by the chicken thigh and breast samples. The total PAH levels were in the rangeof 1.96–2.08 μg/kg for the chicken breasts, 2.08–2.26 μg/kg for the chicken thighs, and 2.31–2.71 μg/kgfor the chicken wings. Similar trends were observed for the deep-fat-fried chicken samples. However,no significant differences (p > 0.05) were observed among the deep-fat-fried chicken meat samples,with the exception of the chicken breast thawed in the microwave. Lee et al. [33] reported average PAHcontents of 0.60–0.76 μg/kg for chicken breasts, 0.94–1.14 μg/kg for chicken thighs, and 0.70–1.17 μg/kgfor chicken wings. According to Koh and Yu [46], the lipid contents of chicken wings (14.9%) arehigher than those of thighs (2.8%) and breasts (1.2%). Additionally, the most prevalent fatty acid isoleic acid (42.57%), followed by palmitic acid (27.5%) and linoleic acid (15.96%) in chicken meats.Additionally, it has been reported that the fat content of a sample is an important factor in determiningthe extent of PAH formation in grilled meat [47]. More specifically, PAH formation can occur uponthe pyrolysis of organic matter, and the greatest concentrations of PAHs have been shown to arisefrom the pyrolysis of fat [48], which accounts for the higher levels of PAH formation observed inthe chicken wing samples. The regulatory maximum level for B(a)P in smoked meat products is2 μg/kg, whereas the maximum PAH4 level is 12 μg/kg [21]. In the present study, none of the chickensamples exceeded these maximum values; the B(a)P contents were 0.51–0.79 μg/kg for the chickenbreast samples, 0.54–0.78 μg/kg for the chicken thigh samples, and 0.54–0.76 μg/kg for the chickenwing samples. Interestingly, these values were significantly lower than the level of 9.2 μg/kg in duckmeat reported by Chen and Lin [49]. However, the B(a)P and PAH4 levels (max 0.79 and 3.17 μg/kg,respectively) were similar to previously reported levels for beef (0.59 and 4.32 μg/kg, respectively) [50].Furthermore, the maximum B(a)P level fell within the range of n.d.–1.2 μg/kg previously reported fordeep-fat-fried chicken breasts [51].
4. Conclusions
We herein reported our investigation into the effects of different frying methods (air frying anddeep-fat frying) and thawing methods (microwave, refrigerator, and water immersion) of chicken meatparts (breasts, thighs, and wings) on the formation of acrylamide and PAHs. The air-fried samplesexhibited lower acrylamide and total PAH contents than the deep-fat-fried samples due to the lower oilcontent used during the frying process. No significant differences were observed among the thawingmethods and the chicken parts in terms of the acrylamide content. However, higher PAH contents weredetected in the chicken wing samples in comparison with the chicken thigh and chicken breast samples,likely due to the higher fat content of the chicken wings. Additionally, the amounts of carcinogeniccompounds detected in this study were lower than those reported in previous studies because no
76

Foods 2020, 9, 573
batter was employed, and the frying oil was relatively fresh. Overall, air frying reduced the formationof acrylamide and PAHs in comparison with deep-fat frying. Therefore, these results may be useful indetermining the optimal frying method for chicken in terms of minimizing the formation of potentiallyhazardous substances.
Author Contributions: Conceptualization, J.-W.H.; methodology, M.-S.C., M.J., and K.-W.L.; investigation, J.-S.L.and J.-W.H.; writing—Original draft preparation, M.-S.C., J.-S.L., and J.-W.H.; writing—Review and editing,M.-S.C., M.J., and K.-W.L. All authors have read and agreed to the published version of the manuscript.
Funding: This research was supported by a grant (18162 MFDS 053) from Ministry of Food and Drug Safetyin 2019.
Acknowledgments: This research was supported by the Chung-Ang University Graduate Research Scholarshipin 2018.
Conflicts of Interest: The authors declare no conflict of interest.
References
1. Animal Husbandry and Nutrition. Available online: https://www.intechopen.com/books/animal-husbandry-and-nutrition/quality-of-chicken-meat (accessed on 15 April 2020).
2. Korean Fair Trade Commission. 2019. Available online: http://www.ftc.go.kr/www/selectReportUserView.do?key=10&rpttype=1&report_data_no=8091 (accessed on 23 November 2019).
3. Ministry of Agriculture Food and Rural Affairs. Available online: http://kass.mafra.go.kr/kass/phone/kass.htm (accessed on 25 November 2019).
4. The National Chicken Council. Per Capita Consumption of Poultry and Livestock, 1960 to Forecast 2020,in Pounds. Available online: https://www.nationalchickencouncil.org/about-the-industry/statistics/per-capita-consumption-of-poultry-and-livestock-1965-to-estimated-2012-in-pounds/ (accessed on 14 April 2020).
5. USDA/FAS PSD Online. Available online: https://fas.usda.gov/psdonline/psdQuery.aspx (accessed on 15April 2020).
6. Lee, J.-K.; Yoon, K.-S. A study of adult’s consumption of cooked food with high heat. J. Korean Soc. Food Sci.Nutr. 2011, 40, 290–307. [CrossRef]
7. Aladedunye, F.A.; Przybylski, R. Degradation and nutritional quality changes of oil during frying. J. Am. OilChem. Soc. 2009, 86, 149–156. [CrossRef]
8. Foegeding, E.A.; Davis, J.P. Food protein functionality: A comprehensive approach. Food Hydrocoll. 2011, 25,1853–1864. [CrossRef]
9. Gertz, C. Fundamentals of the frying process. Eur. J. Lipid Sci. Technol. 2014, 116, 669–674. [CrossRef]10. Sengar, G.; Sharma, H.K. Food caramels: A review. J. Food Sci. Technol. 2014, 51, 1686–1696. [CrossRef]
[PubMed]11. Ibrahim, R.M.; Nawar, I.; Yousef, M.I.; El-Sayed, M.I.; Hassanein, A. Protective Role of Natural Antioxidants
Against the Formation and Harmful Effects of Acrylamide in Food. Trends Appl. Sci. Res. 2019, 14, 41–55.[CrossRef]
12. Zhang, Q.; Saleh, A.S.; Chen, J.; Shen, Q. Chemical alterations taken place during deep-fat frying based oncertain reaction products: A review. Chem. Phys. Lipids 2012, 165, 662–681. [CrossRef]
13. Rose, M.; Holland, J.; Dowding, A.; Petch, S.R.; White, S.; Fernandes, A.; Mortimer, D. Investigation into theformation of PAHs in foods prepared in the home to determine the effects of frying, grilling, barbecuing,toasting and roasting. Food Chem. Toxicol. 2015, 78, 1–9. [CrossRef]
14. Demirok, E.; Kolsarıcı, N. Effect of green tea extract and microwave pre-cooking on the formation ofacrylamide in fried chicken drumsticks and chicken wings. Food Res. Int. 2014, 63, 290–298. [CrossRef]
15. Carrabs, G.; Marrone, R.; Mercogliano, R.; Carosielli, L.; Vollano, L.; Anastasio, A. Polycyclic aromatichydrocarbons residues in Gentile di maiale, a smoked meat product typical of some mountain areas in Latinaprovince (Central Italy). Ital. J. Food Saf. 2014, 3, 102–104. [CrossRef]
16. International Agency for Research on Cancer (IARC). Some industrial chemicals. In IARC Monographs on theEvaluation of Carcinogenesis Risks to Humans; IARC: Lyon, France, 1994; Volume 60, pp. 435–453.
77
Foods 2020, 9, 573
17. International Agency for Research on Cancer (IARC). Polynuclear aromatic compounds, part 1, chemical,environmental, and experimental data. In IARC Monographs on the Evaluation of Carcinogenesis Risks to Humans;IARC: Lyon, France, 1983; Volume 32, pp. 33–451.
18. Teruel, M.D.R.; Gordon, M.; Linares, M.B.; Garrido, M.D.; Ahromrit, A.; Niranjan, K. A comparative study ofthe characteristics of french fries produced by deep fat frying and air frying. J. Food Sci. 2015, 80, E349–E358.[CrossRef] [PubMed]
19. European Commission (EC). European Commission Regulation (EC) No 1881/2006 of 19 December 2006Setting Maximum Levels for Certain Contaminants in Foodstuffs (Text with EEA relevance). OJEU 2006, 364,5–24.
20. European Food Safety Authority. EFSA Scientific Opinion of the Panel on Contaminants in the food chain ona request from the European Commission on polycyclic aromatic hydrocarbons in food. EFSA J. 2008, 724,1–114.
21. Commission Regulation (EU). Available online: https://op.europa.eu/en/publication-detail/-/publication/6a58ffa2-7404-4acf-b1df-298f611f813d/language-en (accessed on 15 April 2020).
22. Basuny, A.M.; Arafat, S.M.; Ahmed, A.A. Vacuum frying: An alternative to obtain high quality potato chipsand fried oil. Banats J. Biotechnol. 2012, 3, 22–30.
23. Andrés-Bello, A.; García-Segovia, P.; Martínez-Monzó, J. Vacuum frying: An alternative to obtain high-qualitydried products. Food Eng. Rev. 2011, 3, 63–78. [CrossRef]
24. Andrés, A.; Arguelles, Á.; Castelló, M.L.; Heredia, A. Mass transfer and volume changes in French friesduring air frying. Food Bioproc. Technol. 2013, 6, 1917–1924. [CrossRef]
25. Tuta, S.; Palazoglu, T.K.; Gökmen, V. Effect of microwave pre-thawing of frozen potato strips on acrylamidelevel and quality of French fries. J. Food Eng. 2010, 97, 261–266. [CrossRef]
26. Dueik, V.; Moreno, M.C.; Bouchon, P. Microstructural approach to understand oil absorption during vacuumand atmospheric frying. J. Food Eng. 2012, 111, 528–536. [CrossRef]
27. Cruz, G.; Cruz-Tirado, J.; Delgado, K.; Guzman, Y.; Castro, F.; Rojas, M.L.; Linares, G. Impact of pre-dryingand frying time on physical properties and sensorial acceptability of fried potato chips. Food Sci. Technol.2018, 55, 138–144. [CrossRef]
28. Sansano, M.; Juan-Borrás, M.; Escriche, I.; Andrés, A.; Heredia, A. Effect of pretreatments and air-frying, anovel technology, on acrylamide generation in fried potatoes. J. Food Sci. 2015, 80, T1120–T1128. [CrossRef]
29. Chosunbiz. Available online: https://biz.chosun.com/site/data/html_dir/2019/02/21/2019022100937.html(accessed on 25 November 2019).
30. The Ministry of Food and Drug Safety. Available online: http://www.prism.go.kr/homepage/origin/retrieveOriginDetail.do;jsessionid=259A3D50EBB62ADE8CC47A32B02495C6.node02?cond_research_name=&cond_research_start_date=&cond_research_end_date=&cond_organ_id=1471000&research_id=1470000-200700053&pageIndex=24&leftMenuLevel=120 (accessed on 20 November 2019).
31. United States Department of Agriculture. The Big Thaw—Safe Defrosting Methods for Consumers.Available online: https://www.fsis.usda.gov/wps/portal/fsis/topics/food-safety-education/get-answers/food-safety-fact-sheets/safe-food-handling/the-big-thaw-safe-defrosting-methods-for-consumers/ct_index/!ut/p/a1/jZFRT8IwFIV_zR5LO4dk-LYsMYCySYgy9kLKdtc22VrSXpz66y3zCQNK-9R7zpd77yktaUFLzd-V4KiM5u3pXU52bMUm4TRli3waPrJ59rbKn9KUxet7b9j-YciiG_krJ2H_8YsbGtzZZboUtDxwlETpxtBCABKuXQ_W0aIxpiaON4CfpOEVEicB0AunGhlUyXXdKi1ogRLIXgmCkvcDRGporHHoVdIBSlM7z1hSGe2O3dCgwp3SNXzQDS3P52Whv_MsWo9niyxi-fi34UKgP4briflIRGv2w-9tE72PYr-7hQYs2NHR-rJEPLiHgAWs7_uRMEa0MKpMF7BLiPTL0eLcSQ_da_H1nMyYeuk2sUu-AT1hIAs!/#1 (accessed on 25 November 2019).
32. The Ministry of Food and Drug Safety. Available online: http://www.law.go.kr/LSW/admRulInfoP.do?admRulSeq=2000000012210 (accessed on 20 November 2019).
33. Lee, Y.-N.; Lee, S.; Kim, J.-S.; Patra, J.K.; Shin, H.-S. Chemical analysis techniques and investigation ofpolycyclic aromatic hydrocarbons in fruit, vegetables and meats and their products. Food Chem. 2019, 277,156–161. [CrossRef] [PubMed]
34. Umano, K.; Shibamoto, T. Analysis of acrolein from heated cooking oils and beef fat. J. Agric. Food Chem.1987, 35, 909–912. [CrossRef]
35. Yasahura, A.; Tanaka, Y.; Hengel, M.; Shibamoto, T. Gas chromatographic investigation of acrylamideformation in browning model system. J. Agric. Food Chem. 2003, 51, 3999–4003. [CrossRef] [PubMed]
78

Foods 2020, 9, 573
36. Tareke, E. Identification and Origin of Potential Background Carcinogens: Endogenous Isoprene andOxiranes, Dietary Acrylamide. Ph.D. Thesis, Stockholm University, Stockholm, Sweden, 2003.
37. Belgin Erdogdu, S.; Palazoglu, T.K.; Gökmen, V.; Senyuva, H.Z.; Ekiz, H.I. Reduction of acrylamide formationin French fries by microwave pre-cooking of potato strips. J. Sci. Food Agric. 2007, 87, 133–137. [CrossRef]
38. Commission Recommendation (EC). Investigations into the levels of acrylamide in food. OJEU 2013,50, L301/15.
39. Chen, B.H.; Chen, Y.C. Formation of polycyclic aromatic hydrocarbons in the smoke from heated modellipids and food lipids. J. Agric. Food Chem. 2001, 49, 5238–5243. [CrossRef]
40. Cossignani, L.; Giua, L.; Simonetti, M.S.; Blasi, F. Volatile compounds as indicators of conjugated andunconjugated linoleic acid thermal oxidation. Eur. J. Lipid Sci. Technol. 2014, 116, 407–412. [CrossRef]
41. Ezechi, E.H.; Affam, A.C.; Muda, K. Handbook of Research on Resource Management for Pollution and WasteTreatment, 1st ed.; IGI Global: Hershey, PA, USA, 2019; p. 29.
42. Kostik, V.; Memeti, S.; Bauer, B. Fatty acid composition of edible oils and fats. J. Hyg. Eng. Des. 2013, 4,112–116.
43. Benli, H. Consumer attitudes toward storing and thawing chicken and effects of the common thawingpractices on some quality characteristics of frozen chicken. Asian-Australas. J. Anim. Sci. 2016, 29, 100–108.[CrossRef]
44. Olatunji, O.S.; Fatoki, O.S.; Opeolu, B.O.; Ximba, B.J. Determination of polycyclic aromatic hydrocarbons[PAHs] in processed meat products using gas chromatography–Flame ionization detector. Food Chem. 2014,156, 296–300. [CrossRef]
45. Min, S.; Patra, J.K.; Shin, H.-S. Factors influencing inhibition of eight polycyclic aromatic hydrocarbons inheated meat model system. Food Chem. 2018, 239, 993–1000. [CrossRef] [PubMed]
46. Koh, H.-Y.; Yu, I.-J. Nutritional analysis of chicken parts. J. Korean Soc. Food Sci. Nutr. 2015, 44, 1028–1034.[CrossRef]
47. Fretheim, K. Polycyclic aromatic hydrocarbons in grilled meat products—A review. Food Chem. 1983, 10,129–139. [CrossRef]
48. Bartle, K.D. Analysis and occurrence of PAHs in food. In Food Contaminants: Sources and Surveillance, 1st ed.;Creaser, C., Purchase, R., Eds.; Royal Society of Chemistry: Cambridge, UK, 1991; pp. 41–60.
49. Chen, B.; Lin, Y. Formation of polycyclic aromatic hydrocarbons during processing of duck meat. J. Agric.Food Chem. 1997, 45, 1394–1403. [CrossRef]
50. Bogdanovic, T.; Pleadin, J.; Petricevic, S.; Listeš, E.; Sokolic, D.; Markovic, K.; Ozogul, F.; Šimat, V.The occurrence of polycyclic aromatic hydrocarbons in fish and meat products of Croatia and dietaryexposure. J. Food Compost. Anal. 2019, 75, 49–60. [CrossRef]
51. Aaslyng, M.D.; Duedahl-Olesen, L.; Jensen, K.; Meinert, L. Content of heterocyclic amines and polycyclicaromatic hydrocarbons in pork, beef and chicken barbecued at home by Danish consumers. Meat. Sci. 2013,93, 85–91. [CrossRef]
© 2020 by the authors. Licensee MDPI, Basel, Switzerland. This article is an open accessarticle distributed under the terms and conditions of the Creative Commons Attribution(CC BY) license (http://creativecommons.org/licenses/by/4.0/).
79


foods
Article
Industrial Strategies to Reduce Acrylamide Formationin Californian-Style Green Ripe Olives
Daniel Martín-Vertedor 1,2,*, Antonio Fernández 1, Marta Mesías 3, Manuel Martínez 2,4,
María Díaz 5 and Elisabet Martín-Tornero 4
1 Technological Institute of Food and Agriculture (CICYTEX-INTAEX), Junta of Extremadura,Avda. Adolfo Suárez s/n, 06007 Badajoz, Spain; [email protected]
2 Research Institute of Agricultural Resources (INURA), Campus Universitario, Avda. de la Investigación s/n,06071 Badajoz, Spain; [email protected]
3 Institute of Food Science, Technology and Nutrition (ICTAN-CSIC), Jose Antonio Novais 10,28040 Madrid, Spain; [email protected]
4 Environmental Engineering Agronomic and Forestry Department, University of Extremadura,Avda. Adolfo Suárez s/n, 06007 Badajoz, Spain; [email protected]
5 Official College of Pharmacists, C/Ramón Albarrán 15, 06002 Badajoz, Spain; [email protected]* Correspondence: [email protected]; Tel./Fax: +34-924-012-664
Received: 4 August 2020; Accepted: 28 August 2020; Published: 31 August 2020
Abstract: Acrylamide, a compound identified as a probable carcinogen, is generated during thesterilization phase employed during the processing of Californian-style green ripe olives. It is possibleto reduce the content of this toxic compound by applying different strategies during the processingof green ripe olives. The influence of different processing conditions on acrylamide content wasstudied in three olives varieties (“Manzanilla de Sevilla”, “Hojiblanca”, and “Manzanilla Cacereña”).Olives harvested during the yellow–green stage presented higher acrylamide concentrations thangreen olives. A significant reduction in acrylamide content was observed when olives were washedwith water at 25 ◦C for 45 min (25% reduction) and for 2 h (45% reduction) prior to lye treatment.Stone olives had 21–26% higher acrylamide levels than pitted olives and 42–50% higher levels thansliced olives in the three studied varieties. When calcium chloride (CaCl2) was added to the brineand brine sodium chloride (NaCl) increased from 2% to 4%, olives presented higher concentrations ofthis contaminant. The addition of additives did not affect acrylamide levels when olives were cannedwithout brine. Results from this study are very useful for the table olive industry to identify criticalpoints in the production of Californian-style green ripe olives, thus, helping to control acrylamideformation in this foodstuff.
Keywords: acrylamide reduction; table olives; sterilization; additives
1. Introduction
Table olives are one of the main pickled products prepared throughout the world. Three mainprocessing technologies are used worldwide to produce table olives: Spanish style, Californian-styleand natural olives. The “Spanish-style” technique includes debittering the olives by soaking them indiluted lye solutions, washing them to remove excess lye and partial fermentation in brine. In the“Californian-style” method, olives are immersed in lye solutions, with or without air bubbling to causedarkening via oxidation, and then packaged and sterilized using retorts. The “natural olive” techniqueinvolves soaking olives in brine where they are subjected to spontaneous fermentation [1,2]. In general,the aim of all of these processing methods is to remove the natural bitterness of this fruit caused by theglucoside oleuropein, improve the sensory characteristics of olives, and ensure that they are safe forconsumption [3].
Foods 2020, 9, 1202; doi:10.3390/foods9091202 www.mdpi.com/journal/foods81

Foods 2020, 9, 1202
The Californian-style, including Californian-style black ripe olives and Californian-style green ripeolives, is one of the most commonly used procedures, and olives treated according to this technique arethe most commercialized. Both types of olives are obtained through very similar processes, howeverCalifornia-style green ripe olives are produced fresh without being stored in brine and are not submittedto air oxidation in tanks, thus avoiding the loss of their green color. The process starts with olivesharvested at the green–yellow stage and, as mentioned before, being subjected to successive treatmentswith diluted NaOH (lye) to remove the natural bitterness. Then, olives are washed several times withwater to remove most of the residual lye and lower the pH to 7–8. In the case of green olives, ferrousgluconate is not added for darkening. Finally, olives are canned in mild salt brine and heat sterilized attemperatures >110 ◦C [4–6].
It has been demonstrated that acrylamide is generated during the sterilization phase inCalifornia-style green ripe olives. Acrylamide is a toxic compound classified as a probable humancarcinogen by the International Agency for Research on Cancer [7]. It is mainly produced as a result ofthe reaction between the asparagine amino acid and reducing sugars through the Maillard reaction,although different mechanisms appear to be involved in the formation of acrylamide in table olives [5,8].In 2015, the European Food Safety Authority (EFSA) confirmed that the presence of acrylamide in foodsis a public health concern [9]. EFSA considers Californian-style table olives as a potential source ofacrylamide since these foods contain similar or even higher levels to those found in other food productssuch as French fries, cereals, or coffee. However, acrylamide concentrations in table olives can varywidely between different commercial canned black ripe olives [10], with values from 243 to 1349 ng·g−1
being recorded. Recently, olives in brine have been included among the foods that the EuropeanCommission recommends for monitoring due to the presence of acrylamide [11]. Mechanisms involvedin the formation of this contaminant in this foodstuff should, therefore, be investigated.
Casado and Montaño [6] showed only trace or negligible amounts of acrylamide in olives prior tothe sterilization process, however, concentrations increased up to 1578 ng·g−1 following sterilization.Thus, acrylamide has been associated with high-temperature treatments in Californian-styleolives [5,6,10,12,13]. Furthermore, the application of different intensities of thermal sterilizationtreatments produces modifications in the sensory profile of Californian-style olives, mainly becauseit contributes a different cooked defect intensity [14]. In addition to temperature, other processingconditions such as storage time, washing of the fruit after oxidation, darkening methods, olive harvest,or the presence of additives can affect the acrylamide concentration [5,6,15]. Specifically, Charoenprasertand Mitchell [5] reported that acrylamide decreased when stored for longer than 30 days. Reduced lyetreatment and washing with water also resulted in a higher acrylamide concentration [6], whilstolives processed when exposed to air had higher acrylamide levels than olives processed without airoxidation. This fact explains the higher acrylamide content of Californian-style black ripe olives whencompared with Californian-style green ripe olives [16]. The cultivar also has a large influence on thevariability of acrylamide levels in this food, with “Manzanilla de Sevilla” being the olive variety withthe highest concentrations of this contaminant [6,13,16].
Additives in the brine solution (amino acids, water-soluble vitamins, or sodium sulfite, amongstothers) have been described to influence acrylamide formation during the processing of ripe olives.Consequently, some have been tested as inhibitors of acrylamide formation. Casado et al. [17] foundthat the addition of cysteine (50 mM) caused a 50% reduction in acrylamide content. Lysine, arginine,and glycine also showed a significant decrease, with percentages dropping by a range of between 24%and 27%. López-López et al. [15] reported that proline and sarcosine are the most potent acrylamideinhibitors, whilst glycine, ornithine, taurine, and γ-aminobutyric acid are also effective. Both authorsindicated that sodium bisulfite was the major inhibitor of acrylamide formation, with a low impact onsensory quality. However, this additive is currently not permitted by the European regulation for tableolives. On the other hand, the absence of calcium chloride in the brine solution appeared to decreasethe levels of acrylamide in olives following sterilization [5]. Based on these results, Charoenprasertand Mitchell [5] suggested that modifications to traditional processing methods such as keeping olives
82

Foods 2020, 9, 1202
in the brine solution for longer periods, decreasing oxygen exposure time, or reducing sterilizationtemperatures can reduce acrylamide levels in table olives.
Another strategy that has been proved to control acrylamide formation is adding phenoliccompounds to the can, such as olive leaf extract mixed with hydroxytyrosol. These constitute foodadditives and are introduced after the elaboration process and prior to the sterilization phase [10,13,18].Casado et al. [17] reduced acrylamide in Californian-style olives by adding different natural vegetableswith high antioxidant properties. Specifically, blanched garlic reduced acrylamide content by 23%.In contrast, the same authors found that adding to the brine two phenolic compounds, hydroxytyrosoland 3,4-dihydroxyphenyl glycol, which are naturally present in olives does not significantly affectacrylamide levels.
In conclusion, there are several steps during olive manufacturing that can affect acrylamideformation. As far as we know, most research on acrylamide in table olives has been focused onCalifornian-style black ripe olives and few studies have been conducted on green ripe olives. For thisreason, the aim of the present work was to study the effect of processing conditions on acrylamideformation in Californian-style green ripe olives. Aspects considered included the harvest moment,washing prior to the sterilization process, the use of additives, and the form of presentation (stoned,pitted, sliced, or without brine). To our knowledge, this is the first study to focus on this kind of food.Although the acrylamide content of Californian-style green ripe olives is lower than that of blackripe olives, results from the present study could be very useful for controlling acrylamide productionduring the industrial processes producing green ripe olives.
2. Materials and Methods
2.1. Samples
Olives (Olea europaea L.) of the “Manzanilla de Sevilla”, “Hojiblanca”, and “Manzanilla Cacereña”varieties (as known as “Sevillana”, “Hojiblanca”, and “Cacereña”, respectively) were obtained from acultivar that collaborates with the “La Orden-CICYTEX” Research Center (Badajoz, Spain). Olive groveswere located in the “Vegas Bajas del Guadiana” region. Olives were handpicked in perfect sanitaryconditions during the 2018/19 crop season.
The climate of the region can be described as Mediterranean and sees an average annual rainfallof 404 mm. The olive orchard contained 25-year-old olive trees (6 × 6 m2). The soil at the experimentalorchard was a sandy loam (depth 2 m). About 3500 cm3 water/ha was applied (between the 15 May andthe 18 November) via linear drip irrigation. Weeds were controlled with post-emergence herbicidesand by applying no-tillage conditions.
The three olive varieties were harvested at the green maturation stage (maturity index (MI = 0)according to skin color and flesh evaluations proposed by Uceda and Frías [19]. Olive samplingwas carried out in the morning, taking samples randomly from different parts of the central area ofthe olive tree. After harvesting, olives were immediately introduced into tanks with NaOH (Dirna,Valencia, Spain) at 0.3% (154 kg table olives/225 L NaOH, approximately) and transported to the factory.Following this, olives were processed according to Californian-style green ripe olive techniques [5,16]in a factory located in the Northwest of Spain. Olives were then subjected to lye treatment, immersingthe samples in a 2.5% (w/v) sodium hydroxide solution. This process took place at a room temperatureof 25 ◦C and lasted until NaOH penetrated the pit of the olive. This solution was then removed, and theolives were placed into fresh water. The pH of the olives was neutralized using lactic acid and carbondioxide gas until the pH value of the final table olives and brine solutions was 4.0. Following this, tableolives (150 g) were packed in cans with different presentation formats (stoned olives, pitted olives,and sliced olives). A brine solution containing sodium chloride (NaCl, Valdequímica, Barcelona, Spain)(2% w/v) was added to the cans. Olive cans did not contain calcium chloride (CaCl2). Finally, olive canswere sterilized in an autoclave at 121 ± 3 ◦C for 30 min. This treatment is equivalent to the cumulativelethality or “F0 value” of 15 min. Thus, we make sure that this is the treatment duration required
83
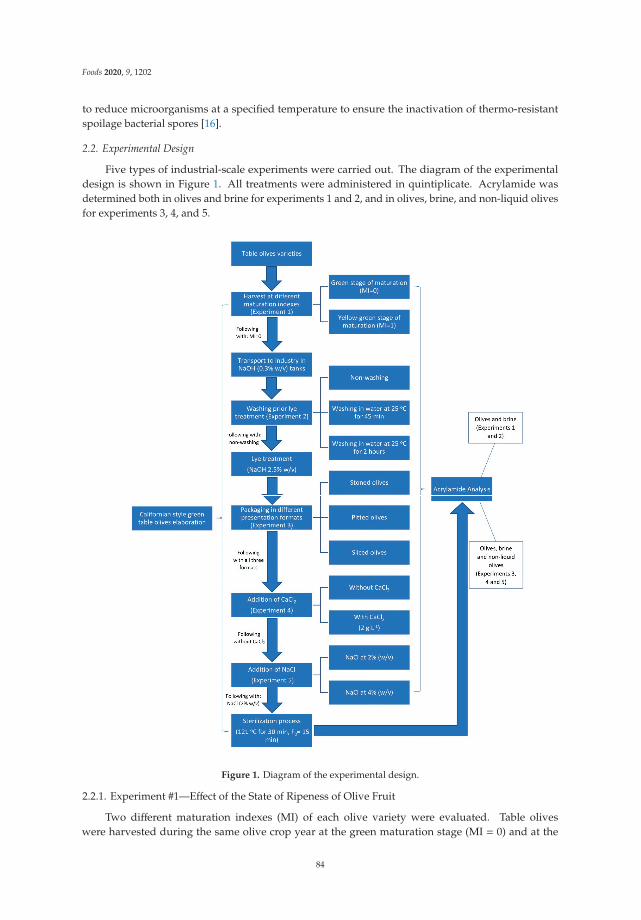
Foods 2020, 9, 1202
to reduce microorganisms at a specified temperature to ensure the inactivation of thermo-resistantspoilage bacterial spores [16].
2.2. Experimental Design
Five types of industrial-scale experiments were carried out. The diagram of the experimentaldesign is shown in Figure 1. All treatments were administered in quintiplicate. Acrylamide wasdetermined both in olives and brine for experiments 1 and 2, and in olives, brine, and non-liquid olivesfor experiments 3, 4, and 5.
Figure 1. Diagram of the experimental design.
2.2.1. Experiment #1—Effect of the State of Ripeness of Olive Fruit
Two different maturation indexes (MI) of each olive variety were evaluated. Table oliveswere harvested during the same olive crop year at the green maturation stage (MI = 0) and at the
84
Foods 2020, 9, 1202
yellow–green maturation stage (MI = 1). All samples were subjected to the same Californian-styletreatment previously described.
2.2.2. Experiment #2—Effect of Washing Prior to Lye Treatment
Different washing treatments were applied to three varieties of table olives (MI = 0) prior to lyetreatment: (i) non-washing, (ii) washing in water at 25 ◦C for 45 min (short washing), and (iii) washingin water at 25 ◦C for 2 h (long washing). In all cases, wash waters were removed, and table olives weresprayed for 5 min for superficial washing.
2.2.3. Experiment #3—Effect of the Presentation Format of Olives
Prior to packing, three presentation formats of the non-washed table olives obtained fromexperiment #2 were prepared: (i) stoned olives; (ii) pitted olives; and (iii) sliced olives. A modelPSL-51 olive pitting and slicing machine (OFM Food Machinery, Seville, Spain) was used to obtain thedifferent formats.
A batch of olives was put in brine (2% NaCl) while a second batch was canned without brine(non-liquid olives), with the latter being an innovation product. In this way, olives, brine, and non-liquidolives were evaluated in the three different formats (stone, pitted, and sliced olives).
2.2.4. Experiment #4—Effect of CaCl2 Addition to the Brine Solution
After preparing the different presentation formats (stone, pitted, and sliced olives, with andwithout brine), the influence of adding CaCl2 (Tetra Chemicals Europe, Helsingborg, Sweden) to thebrine solution was studied. The following conditions were evaluated: (i) addition of CaCl2 (2 g·L−1)and (ii) no addition of CaCl2.
2.2.5. Experiment #5—Effect of Different Concentrations of NaCl
Samples with the different presentation format (stone, pitted, and sliced olives) obtained fromexperiment #3 were introduced in different brine solutions: (i) with NaCl at 2% and (ii) with NaCl at4%. CaCl2 was not added to the samples.
2.3. Acrylamide Analysis in Olives and Brine Solutions
Samples of olives from the different experiments were crushed with a T-18 Basis Ultra-Turrax®
Homogenizer device (IKA, Germany) in order to obtain a homogeneous olive paste. This was thenstored at −80 ◦C whilst awaiting acrylamide analysis. Acrylamide was determined as described byPérez-Nevado et al. [10]. Briefly, 2 g of table olives were stirred in 10 mL of distilled water, centrifugedat 1677 g at 4 ◦C for 10 min and filtered through a 0.22 μm nylon syringe filter (FILTER-LAB, Barcelona,Spain). Brine solution was only filtered. Filtered supernatants and brines were cleaned up using PCX(200 mg/3 mL) and PRP (60 mg/3 mL) column cartridges (Telos, Kinesis, Australia).
Sample extracts and calibration standards were analyzed on an Agilent Model 1200 Infinity LChigh-performance liquid chromatograph (Agilent Technologies, Palo Alto, CA, USA) coupled with anAgilent Technologies triple quadrupole mass spectrometer, as outlined in the method proposed byFernández et al. [20].
2.4. Statistical Analysis
SPSS 18.0 software was used for statistical analysis (SPSS Inc. Chicago, IL, USA). Data wereexpressed as mean values followed by the standard deviation (SD). One-way analysis of variance(ANOVA) followed by Tukey’s multiple range test was used. The significance level was set at p < 0.05.
85
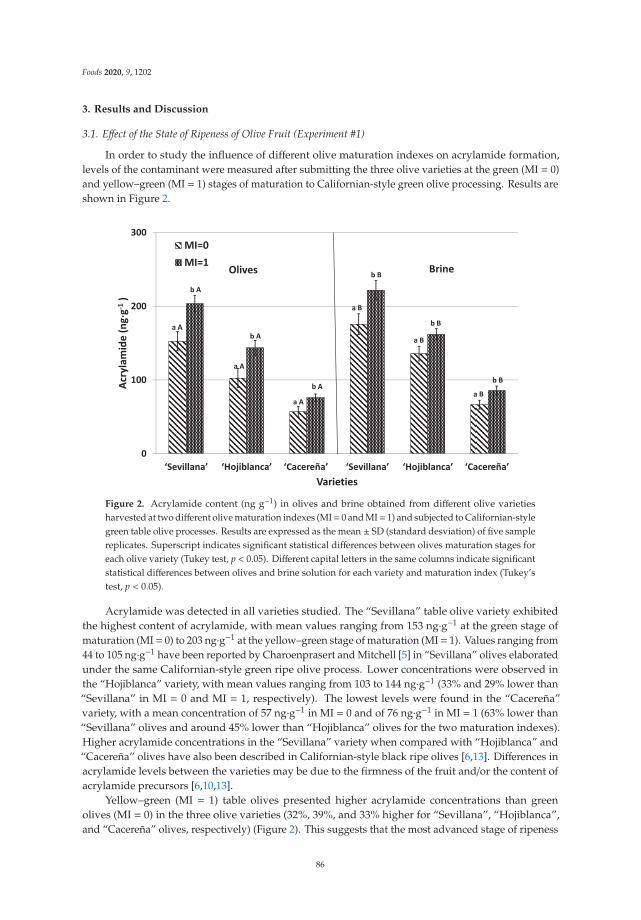
Foods 2020, 9, 1202
3. Results and Discussion
3.1. Effect of the State of Ripeness of Olive Fruit (Experiment #1)
In order to study the influence of different olive maturation indexes on acrylamide formation,levels of the contaminant were measured after submitting the three olive varieties at the green (MI = 0)and yellow–green (MI = 1) stages of maturation to Californian-style green olive processing. Results areshown in Figure 2.
Figure 2. Acrylamide content (ng g−1) in olives and brine obtained from different olive varietiesharvested at two different olive maturation indexes (MI= 0 and MI= 1) and subjected to Californian-stylegreen table olive processes. Results are expressed as the mean ± SD (standard desviation) of five samplereplicates. Superscript indicates significant statistical differences between olives maturation stages foreach olive variety (Tukey test, p < 0.05). Different capital letters in the same columns indicate significantstatistical differences between olives and brine solution for each variety and maturation index (Tukey’stest, p < 0.05).
Acrylamide was detected in all varieties studied. The “Sevillana” table olive variety exhibitedthe highest content of acrylamide, with mean values ranging from 153 ng·g−1 at the green stage ofmaturation (MI= 0) to 203 ng·g−1 at the yellow–green stage of maturation (MI= 1). Values ranging from44 to 105 ng·g−1 have been reported by Charoenprasert and Mitchell [5] in “Sevillana” olives elaboratedunder the same Californian-style green ripe olive process. Lower concentrations were observed inthe “Hojiblanca” variety, with mean values ranging from 103 to 144 ng·g−1 (33% and 29% lower than“Sevillana” in MI = 0 and MI = 1, respectively). The lowest levels were found in the “Cacereña”variety, with a mean concentration of 57 ng·g−1 in MI = 0 and of 76 ng·g−1 in MI = 1 (63% lower than“Sevillana” olives and around 45% lower than “Hojiblanca” olives for the two maturation indexes).Higher acrylamide concentrations in the “Sevillana” variety when compared with “Hojiblanca” and“Cacereña” olives have also been described in Californian-style black ripe olives [6,13]. Differences inacrylamide levels between the varieties may be due to the firmness of the fruit and/or the content ofacrylamide precursors [6,10,13].
Yellow–green (MI = 1) table olives presented higher acrylamide concentrations than greenolives (MI = 0) in the three olive varieties (32%, 39%, and 33% higher for “Sevillana”, “Hojiblanca”,and “Cacereña” olives, respectively) (Figure 2). This suggests that the most advanced stage of ripeness
86
Foods 2020, 9, 1202
promotes the formation of this contaminant. This can be explained by the changes that occur inthe composition and appearance of olives during the olive ripening process. Initially, the olive hasan intense green color and becomes more yellowish during the maturation process. During thisprocess, photosynthesis performed by the olive tree generates sugars and other compounds in the olivefruit, in this way increasing acrylamide precursors and, consequently, promoting greater acrylamideformation during sterilization treatment [10,16,21]. In addition, olives in the green–yellow stage containa lower amount of phenolic compound than they do in the green stage of maturation, decreasing theprotection given by these compounds against acrylamide formation [13].
Acrylamide levels in brine were significantly higher than that in olives for both indexes of maturationin the three studied varieties (Figure 2). This fact could be expected due to the diffusion of compoundsfrom one matrix to another when olives are in brine. On the one hand, precursors of acrylamide in the fresholives could diffuse into surrounding medium during brine storage [5] and, on the other hand, acrylamidegenerated after sterilization could also enter the brine. Acrylamide is a hydrosoluble and hydrophilicmolecule and, therefore, when in aqueous mediums the chemical balance is expected to be displaced fromthe fruit to the brine. Similar results were found by Pérez-Nevado et al. [10] in Californian-style blackripe olives. These findings corroborate the information included in the recent publication of EuropeanCommission Recommendations [11]. This established that the high content of acrylamide in brined-storedfood could be linked to the possible presence of acrylamide in brine.
According to our knowledge, this is the first study relating acrylamide formation and the ripenessstate of olives. Considering the results, it is recommended that companies producing Californian-styleolives acquire the raw fruits as early as possible when still in the earlier maturation state. In otherwords, the color of the olives should be as close as possible to green. In addition, due to the acrylamidepresence in brine, consumers should remove brine before eating olives. It may also be advisable to addwater to the olives for a few minutes to wash them and eliminate acrylamide from the brine. In thisway, acrylamide exposure from table olives could be reduced.
3.2. Effect of Washing Prior to Lye Treatment (Experiment #2)
The acrylamide content of olives subjected to different washing processes prior to lye treatment isshown in Table 1. Significant differences were observed between the three conditions (non-washing,washing in water at 25 ◦C for 45 min (short washing), and washing in water at 25 ◦C for 2 h (longwashing)). The lowest levels of acrylamide were observed in olives washed for a long time, followedby short-washed olives and, finally, non-washed olives. When compared with non-washed olives, 2 hwashes reduced the formation of the contaminant by around 45% in the three varieties, with 45 minwashes causing a reduction of around 25%. According to these results, it could be suggested thatthe cleaning step prior to lye treatment in lipid-rich foods removes acrylamide precursors from theolive fruit, subsequently decreasing contaminant formation. A similar mitigation strategy has beenproposed for potatoes, in that it is recommended to wash or even soak fresh tubers before frying inorder to reduce acrylamide precursors in the preparation of French fries or chips [11].
When olives were washed, brine also presented lower acrylamide concentrations (25%, 32%, and 22%lower in “Sevillana”, “Hojiblanca”, and “Cacereña” olives, respectively, when olives were washed during45 min and 41%, 51%, and 36% lower for the same varieties when olives were washed for 2 h, whencompared with levels in non-washed olives). This could be due to a lower diffusion of precursors fromthe fruits to the brine and lower diffusion of acrylamide from the sterilized olives to the brine.
Casado and Montaño [6] showed that olive fruits with a lower acrylamide concentration werethose that underwent a washing process twice as long as that of comparison olives. These researchersindicated that long washing (24 h) following lye treatment reduced acrylamide content by approximately50% in “Sevillana” olives (from 1340 to 680 ng·g−1;) and around 80% in the “Hojiblanca” variety (from1130 to 200 ng·g−1). These percentages are much higher than those obtained in the present study,probably due to the shorter washing time employed in our experiment but also due to the step inthe process during which washing was carried out. These authors washed olives during the NaOH
87

Foods 2020, 9, 1202
treatment, which favors greater diffusion and elimination of precursors. It is known that treatmentswith NaOH modify olive texture, making them less hard and more porous [10,22]. This promotesgreater diffusion of compounds from the olives to the brine.
Table 1. Acrylamide content (ng·g−1) of olives and brine after submitting olives to washing (non-washing,washing in water at 25 ◦C for 45 min (short washing), and washing in water at 25 ◦C for 2 h (long washing)after the sterilization process. Results are expressed as mean ± SD of five sample replicates. Superscript inthe same row indicates statistically significant differences between washing processes (Tukey test, p < 0.05).Different capital letters in the same columns indicate statistically significant differences between olivesand brine in each treatment (Tukey test, p < 0.05).
Acrylamide (ng·g−1)
Samples Non-Washing Short Washing Long Washing
“Sevillana” Olives 210 ± 8 c A 161 ± 5 b A 124 ± 7 a A
“Sevillana” Brine 233 ± 9 c B 175 ± 8 b B 137 ± 4 a B
“Hojiblanca” Olives 151 ± 10 c A 108 ± 7 b A 84 ± 7 a A
“Hojiblanca” Brine 184 ± 8 c B 125 ± 7 b B 90 ± 7 a B
“Cacereña” Olives 79 ± 6 c A 58 ± 8 b A 44 ± 8 a A
“Cacereña” Brine 84 ± 7 c B 65 ± 7 b B 54 ± 4 a B
In conclusion, industries should include a washing step prior to the elaboration process in orderto reduce acrylamide precursors and, consequently, to decrease contaminant formation. According tothe results of the present experiment, washing in water at 25 ◦C for 2 h could be an adequatemitigation strategy.
3.3. Effect of the Presentation Format of Olives on Acrylamide Content (Experiment #3)
The influence of the different table olive presentation formats (stone, pitted, and sliced olives)prior to packing, with and without brine, on acrylamide content in the three varieties is shown inFigure 3. For olives canned in brine, stone olives presented the highest concentrations in the threestudied olive varieties, with levels 21–26% greater than pitted olives and 42–50% higher than slicedolives. Stone olives have a compact format enabling a smaller contact surface between the fruit and theliquid. This reduces the diffusion of both acrylamide and acrylamide precursors between the matrices,thus leading to the highest levels. In contrast, sliced olives have a greater contact surface with the brinesolution throughout the different steps of the industrial elaboration process. This promotes a greaterdiffusion of acrylamide and acrylamide precursors from the olives to the brine. This fact explains whysliced presentations showed the lowest concentrations of this toxic substance. Our results agree withthose of Casado and Montaño [6], verifying that oxidized sliced black olives pertained to the formatwith the lowest final acrylamide concentration following the sterilization process. As expected, pittedolives exhibited moderate values for acrylamide levels (Figure 3).
Similarly to previously conducted experiments, brine presented significantly higher concentrationsthan olives canned in brine and the trend according to the different format presentations was similar tothose observed in the fruits: stone > pitted > sliced.
This trend was also noticed in olives canned without brine (non-liquid olives). Again, stoneolives displayed the highest acrylamide concentration (20% higher than pitted olives and 45% higherthan sliced olives). When compared with olives canned with brine, levels of the contaminant weresignificantly higher in samples canned without brine (non-liquid olives), with recorded values beingas much as three times larger. No previous information has been found regarding the formation ofacrylamide in olives canned without brine during the sterilization process. However, it could bededuced that the absence of a liquid medium in the can implies that there is no diffusion, of eitherthe precursors or of acrylamide, to the aqueous medium and, therefore, all the acrylamide generatedremains in the olives. In addition, when olives are canned with brine, the heat applied during
88

Foods 2020, 9, 1202
sterilization is transmitted by convection and the thermal process occurs in a less aggressive way [10].The absence of liquid could cause overheating in olives, leading to increased formation of acrylamide.For that reason, the consumption of olives with this presentation format, with more than 250 ng g−1 ofacrylamide, should be controlled, especially among children and elderly consumers, in order to reducea high acrylamide exposure and, consequently, to prevent possible health risks [5,18].
(a) Olives of the “Sevillana” variety elaborated such as Californian-style green ripe olive with
different presentation formats.
(b) Olives of the “Hojiblanca” variety elaborated such as Californian-style green ripe olive with
different presentation formats.
Figure 3. Cont.
89

Foods 2020, 9, 1202
(c) Olives of the “Cacereña” variety elaborated such as Californian-style green ripe olive with
different presentation formats.
Figure 3. Acrylamide content (ng g−1) of olives (maturity index (MI = 0)) and brine with differentpresentation formats (stone, pitted, and sliced olives), canned with and without brine (non-liquidolives) after the sterilization process. Results are expressed as means ± SD of the five sample replicates.Superscript indicates significant statistical differences between presentation formats in each sample(Tukey test, p < 0.05). Different capital letters in the same columns indicate significant statisticaldifferences between raw materials (olives, brine, and non-liquid olives) in each individual presentationformat (Tukey´s test, p < 0.05).
3.4. Effect of CaCl2 Addition to the Brine Solution (Experiment #4)
CaCl2 is a firming agent, which is frequently added to the covering brine of packed table olives toimprove olive firmness [23]. The influence of the addition or absence of CaCl2 in the brine solution onacrylamide formation in the different presentation formats of table olives and after being submitted tothe sterilization process is shown in Figure 4.
Olives canned with added CaCl2 showed acrylamide levels approximately 20% higher thansamples without CaCl2. These higher levels coincide with the lower acrylamide concentrations of thebrine in samples treated with CaCl2. These results agree with those reported by Casado et al. [17] in anolive model system with olive juice obtained from “Hojiblanca” olives. They also coincide with thosedescribed by Charoenprasert and Mitchell [5] in Californian-style black ripe olives. These authorsindicated that, in general, calcium ions help to maintain structural firmness and stability of the cell walland the cellular turgor of the fruits that form cross links between pectin molecules. This strengthensplant cells and prevents their collapse. It is deduced that calcium reduces the transcription of acrylamideand acrylamide precursors between olives and brine despite these compounds being hydrophilic.The retention of acrylamide precursors inside the fruit promotes a higher formation of the contaminant,whilst the retention of generated acrylamide in sterilized olives increases its concentration in thefinal product.
The effect of adding calcium to samples canned without brine was not significant and similarconcentrations were observed between olives treated and not treated with this additive. This was thecase regardless of presentation format and olive variety. In this case, both acrylamide and acrylamideprecursors could not migrate from olives to brine in cases where brine was not present. In summary,
90

Foods 2020, 9, 1202
the presence of CaCl2 does not affect acrylamide formation but can reduce the diffusion of acrylamideand acrylamide precursors from olives to brine when olives are canned in an aqueous environment.The addition of this additive to brine should be avoided in order to reduce the acrylamide content ofolives after the sterilization process. However, industries must take into account that the firmness ofthe olives could be modified, and consumer’s acceptance may be affected. For olives without brine,the use of CaCl2 can be continued.
(a) Olives of the “Sevillana” variety elaborated such as Californian-style green ripe olive with
different presentation formats and with or without the addition of CaCl2 to the brine.
(b) Olives of the “Hojiblanca” variety elaborated such as Californian-style green ripe olive with
different presentation formats and with or without the addition of CaCl2 to the brine.
Figure 4. Cont.
91

Foods 2020, 9, 1202
(c) Olives of the “Cacereña” variety elaborated such as Californian-style green ripe olive with
different presentation formats and with or without the addition of CaCl2 to the brine.
Figure 4. Acrylamide content (ng g−1) of olives and brine obtained from different olive presentationformats (stones, pitted, sliced), with or without the addition of CaCl2 to brine after the sterilizationprocess. Results are expressed as means± SD of five sample replicates. Superscript indicates statisticallysignificant differences relating to CaCl2 addition (Tukey test, p < 0.05). Different capital letters in thesame columns indicate statistically significant differences between different olive presentation formats(Tukey test, p < 0.05). ns: no significant differences.
3.5. Effect of Different NaCl Concentrations (Experiment #5)
The influence of different NaCl concentrations in brine on acrylamide content in the differentpresentation formats of olives and varieties is shown in Table 2. NaCl is added during the processing ofthe table olive in order to give a salty taste to the final product. In this experiment, two different NaClconcentrations (2% and 4%) were added to the different olive samples and acrylamide content wasanalyzed in both the olives and the brine. Acrylamide concentration in olives in the three presentationformats was higher when 4% of NaCl was added to the brine. In contrast, acrylamide decreased inbrine with a higher concentration of NaCl. Results are similar to those found in experiment #4 withthe application of CaCl2 but to a lesser extent. Although the objective of adding NaCl is different,resulting behavior suggests that this additive also indirectly strengthens the olive cellular membranesand, therefore, prevents the diffusion of acrylamide precursors from the olives to the brine. This givesrise to an increase in acrylamide content. In agreement with this finding, Fadda et al. [24] reportedthat olives canned in brine with higher NaCl percentages showed higher breaking force and hardnessvalues than olives processed with lower NaCl contents.
Regarding the presentation format, when the percentage of NaCl increases, acrylamide formationincreases to a lesser extent in stone olives, with greater increases seen in pitted and sliced samples.The greater contact surface in pitted and sliced olives probably allows NaCl to make the cell structuresof olives harder, reducing the diffusion of acrylamide precursors from olives to brine and, consequently,increasing acrylamide formation in these formats when compared with stone olives.
Finally, the addition of salt led to no significant differences when olives were not canned withbrine. This is an expected result because, as mentioned before, the absence of a liquid medium inthe can prevents the diffusion of precursors and acrylamide to the aqueous medium and, as a result,
92

Foods 2020, 9, 1202
all generated acrylamide remains in the olives. No bibliographic references have been found to confirmor disprove the results obtained in this experiment.
Table 2. Acrylamide content (ng·g−1) of olives and brine after NaCl addition to brine at differentconcentrations (2% and 4%) after the sterilization process. Results are expressed as mean ± SD ofthe five sample replicates. Superscript in the same row indicates statistically significant differencesbetween NaCl treatments (Tukey test, p < 0.05). Different capital letters in the same columns indicatestatistically significant differences between olive presentation formats in each variety (olives, brine,and non-liquid olives) and NaCl treatment.
Varieties SamplesAcrylamide (ng·g−1)
2 % NaCl 4 % NaCl
“Sevillana” OlivesStone 146 ± 9 a C 166 ± 9 b C
Pitted 122 ± 10 a B 155 ± 9 b B
Sliced 97 ± 7 a A 117 ± 7 b A
“Sevillana” BrineStone 161 ± 7 b C 147 ± 11 a C
Pitted 138 ± 11 b B 110 ± 9 a B
Sliced 114 ± 8 b A 96 ± 8 a A
“Sevillana” Non-liquid olivesStone 426 ± 20 ns C 431 ± 13 ns C
Pitted 343 ± 22 ns B 359 ± 20 ns B
Sliced 231 ± 22 ns A 223 ± 20 ns A
“Hojiblanca” OlivesStone 111 ± 9 a C 137 ± 9 b C
Pitted 91 ± 10 a B 115 ± 9 b B
Sliced 73 ± 7 a A 97 ± 7 b A
“Hojiblanca” BrineStone 120 ± 7 b C 107 ± 9 a C
Pitted 101 ± 8 b B 90 ± 9 a B
Sliced 85 ± 8 b A 73 ± 8 a A
“Hojiblanca” Non-liquid olivesStone 320 ± 20 ns C 331 ± 13 ns C
Pitted 257 ± 22 ns B 269 ± 20 ns B
Sliced 173 ± 21 ns A 163 ± 20 ns A
“Cacereña” OlivesStone 64 ± 5 a C 87 ± 6 b C
Pitted 52 ± 5 a B 75 ± 6 b B
Sliced 42 ± 6 a A 67 ± 6 b A
“Cacereña” BrineStone 69 ± 7 b C 60 ± 7 a B
Pitted 59 ± 7 b B 40 ± 6 a AB
Sliced 49 ± 5 b A 41 ± 7 a A
“Cacereña” Non-liquid olivesStone 183 ± 20 ns C 171 ± 13 ns C
Pitted 147 ± 22 ns B 159 ± 20 ns B
Sliced 99 ± 22 ns A 103 ± 20 ns A
4. Conclusions
Californian-style olives are subjected to extreme temperatures during the sterilization process,promoting the formation of acrylamide. Significant amounts of acrylamide have been found ingreen ripe olives, although in lower concentrations than that in black ripe olives. The present studyexamined different mitigation strategies with the aim of reducing acrylamide formation in this foodstuff.According to the results obtained, it could be concluded that raw olives should be harvested at thegreen stage rather than allowing olives to reach later stages of maturity (green–yellow stage). This maymitigate sugar increases and the consequent formation of acrylamide after the sterilization process.Washing with water at 25 ◦C for at least 45 min but ideally for 2 h prior to lye treatment reduces thelevels of acrylamide precursors in olives and, therefore, acrylamide formation during subsequentthermal treatment. Another point to control is the presentation format of olives. In this sense, stone
93

Foods 2020, 9, 1202
olives have significantly more acrylamide content than sliced and pitted olives, since their smallercontact surface reduces the diffusion of acrylamide precursors from olives to the brine, which wouldenable greater acrylamide formation. Moreover, the addition of some additives, such as CaCl2 andNaCl, commonly used in the elaboration of table olives to provide firmness and a salty taste to thefruit, should be controlled since their use increments acrylamide content in olives. These additivesprevent diffusion of acrylamide precursors to the brine, thus increasing formation of the contaminant.This last consideration is not relevant when olives are canned without brine. Finally, due to the highpresence of acrylamide in brine, it is recommended to wash olives prior to consumption. Results fromthis study are very useful for the table olive industry as they will enable it to identify critical points inthe production of Californian-style green ripe olives and, in this way, control acrylamide formation inthis foodstuff.
Author Contributions: Formal analysis, D.M.-V. and A.F.; investigation, D.M.-V.; supervision, D.M.-V.,writing—original draft, D.M.-V., A.F., and E.M.-T.; writing—review and editing, D.M.-V., A.F., M.M. (Marta Mesías),M.M. (Manuel Martínez), M.D., and E.M.-T.; funding acquisition, D.M.-V. and M.M. (Manuel Martínez). All authorshave read and agreed to the published version of the manuscript.
Funding: The research leading to these results received financial support from Junta de Extremadura (projectIB18125) cofinanced by the European Regional Development Fund. Furthermore, this work has been alsosupported by research groups of Junta de Extremadura (GR18162).
Acknowledgments: The authors thank the Elemental and Molecular Analysis Service belonging to the ResearchSupport Service of the University of Extremadura for development of the acrylamide determination method,and María Dolores López Soto and Elena Rodríguez Paniagua for their help in carried out this study. D.M.-V. isgrateful to J.A. Pereira and A.M. Peres at the Centro de Investigação de Montanha (CIMO) (Polytechnic Institute ofBragança, Portugal) for the support in this research. We also thank the Research Institute of Agricultural Resources(INURA) for their help in the development of this work.
Conflicts of Interest: The authors state that they have no conflict of interest.
References
1. Hurtado, A.; Reguant, C.; Bordons, N.; Rozés, N. Lactic acid bacteria from fermented table olives.Food Microbiol. 2012, 31, 1–8. [CrossRef] [PubMed]
2. Campus, M.; Degirmencioglu, N.; Comunian, R. Technologies and Trends to improve table olive quality andsafety. Front. Microbiol. 2018, 9, 617. [CrossRef]
3. IOOC (International Olive Oil Council). Trade Standard Applying to Table Olives; International Olive OilCouncil COI/T20/Doc No 1; IOOC: Madrid, Spain, 2004.
4. Garrido Fernández, A.; Fernández Díez, M.J.; Adams, M.J. Table Olives: Production and Processing, 1st ed.;Chapman & Hall: London, UK, 1997.
5. Charoenprasert, S.; Mitchell, A. Influence of Californian-style black ripe olive processing on the formation ofacrylamide. J. Agric. Food Chem. 2014, 62, 8716–8721. [CrossRef]
6. Casado, F.J.; Montaño, A. Influence of processing conditions on acrylamide content in black ripe olives.J. Agric. Food Chem. 2008, 56, 2021–2027. [CrossRef] [PubMed]
7. IARC (International Agency for Research on Cancer). Some industrial chemicals. In IARC Monographs on theEvaluation for Carcinogenic Risk of Chemicals to Humans; IARC: Lyon, France, 1994; Volume 60, pp. 435–453.
8. Casado, F.J.; Montaño, A.; Spitzner, D.; Carle, R. Investigations into acrylamide precursors in sterilized tableolives: Evidence of a peptic fraction being responsible for acrylamide formation. Food Chem. 2013, 141,1158–1165. [CrossRef] [PubMed]
9. EFSA (European Food Safety Authority). Scientific opinion on acrylamide in food. EFSA J. 2015, 13, 4104.Available online: https://efsa.onlinelibrary.wiley.com/doi/pdf/10.2903/j.efsa.2015.4104 (accessed on 10 June 2020).
10. Pérez-Nevado, F.; Cabrera-Bañegil, M.; Repilado, E.; Martillanes, S.; Martín-Vertedor, D. Effect of differentbaking treatments on the acrylamide formation and phenolic compounds in Californian-style black olives.Food Control. 2018, 94, 22–29. [CrossRef]
11. EC (European Commission). Commission Regulation (EU) 2017/2158 of 20 November 2017 establishingmitigation measures and benchmark levels for the reduction of the presence of acrylamide in food. OJEU2017, 304, 24–44.
94
Foods 2020, 9, 1202
12. Tang, S.; Avena-Bustillos, R.J.; Lear, M.; Sedej, I.; Holstege, D.M.; Friedman, M.; McHugh, T.H.; Wang, S.C.Evaluation of thermal processing variables for reducing acrylamide in canned black ripe olives. J. Food Eng.2016, 191, 124–130. [CrossRef]
13. Martín-Vertedor, D.; Fernández, A.; Hernández, A.; Arias-Calderón, R.; Delgado-Adámez, J.; Pérez-Nevado, F.Acrylamide reduction after phenols addition to Californian-style black olives. Food Control 2020, 108, 106888.[CrossRef]
14. Martín-Vertedor, D.; Rodrigues, N.; Marx, I.; Veloso, A.; Peres, A.M.; Pereira, J.A. Impact of thermalsterilization on the physicochemical-sensory characteristics of Californian-style black olives and its assessmentusing an electronic tongue. Food Control 2020, 117, 107369. [CrossRef]
15. López-López, A.; Beato, V.M.; Sánchez, A.H.; García-García, P.; Montaño, A. Effects of selected amino acidsand water-soluble vitamins on acrylamide formation in a ripe olive model system. J. Food Eng. 2014, 120,9–16. [CrossRef]
16. Montaño, A.; Casado, F.J.; Carle, R. Acrylamide in Table Olives. In Acrylamide in Food. Analysis, Content andPotential Health Effects; Gökmen, V., Ed.; Academic Press: London, UK, 2016; pp. 229–251.
17. Casado, F.J.; Sánchez, A.H.; Montaño, A. Reduction of acrylamide content of ripe olives by selected additives.Food Chem. 2010, 119, 161–166. [CrossRef]
18. Lodolini, E.M.; Cabrera-Bañegil, M.; Fernández, A.; Delgado-Adámez, J.; Ramírez, R.; Martín-Vertedor, D.Monitoring of acrylamide and phenolic compounds in table olive after high hydrostatic pressure and cookingtreatments. Food Chem. 2019, 286, 250–259. [CrossRef] [PubMed]
19. Uceda, M.; Frías, L. Harvest dates. Evolution of the fruit oil content, oil composition and oil quality.In Proceedings of the II Seminario Oleícola Internacional, Córdoba, Spain, 6 October 1975; pp. 125–128.
20. Fernández, A.; Talaverano, M.I.; Pérez-Nevado, F.; Boselli, E.; Cordeiro, A.M.; Martillanes, S.; Foligni, R.;Martín-Vertedor, D. Evaluation of phenolics and acrylamide and their bioavailability in high hydrostaticpressure treated and fried table olives. J. Food Process. Pres. 2020, 44, e14384. [CrossRef]
21. Gonçalves, A.; Silva, E.; Brito, C.; Martins, S.; Pinto, L.; Dinis, T.L.; Luzio, A.; Martins-Gomes, C.;Fernandes-Silva, A.; Ribeiro, C.; et al. Olive tree physiology and chemical composition of fruits aremodulated by different deficit irrigation strategies. J. Sci. Food Agric. 2020, 100, 682–694. [CrossRef][PubMed]
22. Cabrera-Bañegil, M.; Pérez-Nevado, F.; Montaño, A.; Pleite, R.; Martín-Vertedor, D. The effect of olive fruitmaturation in Spanish style fermentation with a controlled temperature. LWT Food Sci. Technol. 2018, 91,40–47. [CrossRef]
23. Tsantili, E.; Christopoulos, M.V.; Pontikis, C.A.; Kaltsikes, P.; Kallianou, C.; Komaitis, M. Texture and otherquality attributes in olives and leaf characteristics after preharvest calcium chloride sprays. Hort. Sci. 2008,43, 1852–1856. [CrossRef]
24. Fadda, C.; Del Caro, A.; Sanguinetti, A.M.; Piga, A. Texture and antioxidant evolution of naturally greentable olives as affected by different sodium chloride brine concentrations. Int. J. Fat Oils 2014, 65, e002.
© 2020 by the authors. Licensee MDPI, Basel, Switzerland. This article is an open accessarticle distributed under the terms and conditions of the Creative Commons Attribution(CC BY) license (http://creativecommons.org/licenses/by/4.0/).
95


foods
Article
How Far Is the Spanish Snack Sector from Meetingthe Acrylamide Regulation 2017/2158?
Marta Mesias *, Aouatif Nouali, Cristina Delgado-Andrade and Francisco J Morales
Institute of Food Science, Technology and Nutrition (ICTAN-CSIC), 28040 Madrid, Spain;[email protected] (A.N.); [email protected] (C.D.-A.); [email protected] (F.J.M.)* Correspondence: [email protected]; Tel.: +34-91-549-2300; Fax: +34-91-549-3627
Received: 3 February 2020; Accepted: 21 February 2020; Published: 24 February 2020
Abstract: In 2017, the European Commission published Regulation 2017/2158 establishing mitigationmeasures and benchmark levels to reduce acrylamide in foods. Acrylamide was determined inseventy potato crisp samples commercialized in Spain. The aim was to update knowledge about theglobal situation in the snack sector and evaluate the effectiveness of mitigation strategies applied,especially since the publication of the Regulation. Results were compared with data previouslypublished in 2004, 2008, and 2014, assessing the evolution over recent years. Average acrylamidecontent in 2019 (664 μg/kg, range 89–1930 μg/kg) was 55.3% lower compared to 2004, 10.3% lowercompared to 2008 and practically similar to results from 2014. Results support the effectiveness ofmitigation measures implemented by Spanish potato crisp manufacturers. However, 27% of samplesexhibited concentrations above the benchmark level established in the Regulation (750 μg/kg), whichsuggests that efforts to reduce acrylamide formation in this sector must be continued. Besides thevariability seen between samples, acrylamide significantly correlated with the color parameter a*,which enables discrimination of whether potato crisps contain above or below benchmark content.The calculated margin of exposure for carcinogenicity was below the safety limit, which should beconsidered from a public health point of view.
Keywords: acrylamide; potato crisps; dietary intake; exposure; consumers
1. Introduction
Acrylamide is a chemical process contaminant formed when foods containing free asparagineand reducing sugars are cooked at temperatures above 120 ◦C in low moisture conditions [1]. Itis identified by the International Agency for Research on Cancer as being probably carcinogenic tohumans (group 2A) [2]. In 2015, the Expert Panel on Contaminants in the Food Chain (CONTAM) ofthe European Authority on Food Safety (EFSA) concluded that the presence of acrylamide in foodspotentially increases the risk of developing cancer for consumers in all age groups [1]. Among theeleven food categories evaluated, potato fried products are generally the main contributor to totaldietary acrylamide exposure [1].
There are several initiatives aiming to mitigate acrylamide formation in processed foods and itsconsequent acrylamide exposure and health concern. In the food processing sector, FoodDrinkEuropedeveloped the so-called “Acrylamide Toolbox”. This collects and updates the most effectivetechnological strategies and recommendations in the food processing chain to mitigate the formationof acrylamide [3]. The Food and Drug Administration (FDA) also published guidance for acrylamidemitigation in the food industry to bring acrylamide levels down [4]. In parallel, the EuropeanCommission issued indicative values for the presence of acrylamide in foods in 2011 and 2013, basedon EFSA monitoring data from 2007–2008 [5,6]. Subsequently, on 20 November 2017, the EuropeanRegulation (EU) 2017/2158 was published, establishing mitigation measures and benchmark levels
Foods 2020, 9, 247; doi:10.3390/foods9020247 www.mdpi.com/journal/foods97

Foods 2020, 9, 247
for reducing the presence of acrylamide in food [7]. Although benchmark levels are not regulatorylimits or safety thresholds, they serve to provide reference values for the industry. In the case thata product exceeds these values, the manufacturer should address the problem and apply relevantmitigation strategies in order to decrease acrylamide levels in the food. Focusing on potato-basedproducts, including French fries and potato crisps, recommendations to mitigate the formation ofthis contaminant include selecting suitable potato varieties, controlling potato storage and transport,monitoring recipe, and process conditions, and providing information to end users about adequatecooking practices. For potato crisps, the first indicative value for acrylamide was set at 1000 μg/kg [5,6],though subsequent revisions have reduced this benchmark level to 750 μg/kg [7].
Control of any step in the manufacturing process of fried potatoes is especially important toreduce exposure to acrylamide. Variations in total dietary exposure to this contaminant of up to 80%can be expected in fried potatoes, depending on the conditions of potato frying [1]. As a result of thecommitment of the potato snack sector to follow indications stipulated in the “Acrylamide Toolbox”,various studies have reported the successful application of acrylamide mitigation strategies in potatosnacks over recent years. Powers et al. [8] described a statistically significant downward trend in meanacrylamide levels in potato crisps in Europe from 763 μg/kg in 2002 to 358 μg/kg in 2011 (a decrease of53%). The same authors published an updated evaluation in 2016, describing mean concentration to be412 μg/kg [9]. While these data represent a 46% reduction since 2002, a leveling off has been observedsince 2011 [9]. In a previous study, our research group observed a decrease in acrylamide levels inpotato crisps in the Spanish market from 1484 μg/kg in 2004 to 629 μg/kg in 2014, representing anoverall reduction of 57.6% [10]. Despite this decline, 17.5% of the samples in 2014 registered valueshigher than the indicative value recommended by the European Commission for potato crisps, at thetime of publication. Parallel to this, our research team, together with some others, has established theexistence of a direct correlation between the CIELab color parameter a* and acrylamide content in thisfoodstuff, proposing a* as a useful predictor of the acrylamide formation in fried potatoes [11–15].
In the present investigation, the acrylamide content of potato crisps marketed in Spain wasre-evaluated one year after introduction of the Regulation with a view to investigate the current stateof the snack food sector and degree of compliance with the Regulation. Results were consideredalongside results produced during the period 2004 to 2014. Additionally, suitability of the CIElabparameter a* for predicting acrylamide levels in potato crisps was explored.
2. Material and Methods
2.1. Chemicals and Materials
Acrylamide standard (99%), potassium hexacyanoferrate (II) trihydrate (98%, Carrez-I), and zincacetate dehydrate (>99%, Carrez-II) were obtained from Sigma (St. Louis, MO, USA). 13C3-labelledacrylamide (99% isotopic purity) was obtained from Cambridge Isotope Laboratories (Andover,MA, USA). Formic acid (98%), methanol (99.5%) and hexane were from Panreac (Barcelona, Spain).Deionized water was obtained from a Milli-Q Integral 5 water purification system (Millipore, Billerica,MA, USA). All other chemicals, solvents and reagents were of analytical grade. Reversed-phaseOasis-HLB cartridges (30 mg, 1 mL) were from Waters (Mildford, MA, USA). Syringe filter units (0.45μm and 0.20 μm, cellulose) were purchased from Análisis Vínicos (Tomelloso, Ciudad Real, Spain).
2.2. Samples
Seventy commercial potato crisps from 33 different producers were purchased in several Spanishsupermarkets in February 2019. Of the producers, 11 supplied the present study with more than onebrand, whilst the remaining 22 supplied a single brand only. Samples containing different flavoringsand/or added spices were excluded from sampling in order to avoid bias during data interpretation.Potato crisps were classified according to producer, type of frying oil (sunflower oil, olive oil, andother/undefined oil), type of cut (smooth, wavy), oily appearance (oily, semi-oily, non-oily), and type
98

Foods 2020, 9, 247
of container (light protected, partly-light protected, non-light protected). Potato crisps (100–280 g,according to the size of the bag) were mixed and ground to ensure homogeneous distribution ofpotential hotspots. A portion (ca. 80 g) was distributed into two containers and stored under vacuumand light protected conditions at 4 ◦C, until analysis.
2.3. Determination of CIELAB Color
Color measurements were made at room temperature using a HunterLab Spectrophotometer150 CM-3500D colorimeter (Hunter Associates laboratory, Stamford, CT, USA). Three independentmeasurements of a* (redness), b* (yellowness), and L* (lightness) parameters were carried out ondifferent areas of the ground potato crisps in order to consider the non-homogeneous distributionof color within the same batch of the product. E index was calculated according to the followingequation: E = (L2 + a2 + b2)1/2. Equipment was calibrated with a standard calibration white plateCR-A43 (L*/93.80, a*/0.3156, b*/0.3319).
2.4. LC-ESI-MS-MS Determination of Acrylamide
Acrylamide was determined in potato crisp samples as described by Mesias and Morales [10]and based on the ISO:EN:16618:2015 method. The recovery rate of acrylamide spiked to the sampleswas between 90 and 106%. Relative standard deviations (RSD) for precision, repeatability, andreproducibility of analyses were calculated as 2.8%, 1.2% and 2.5%, respectively. The limit ofthe quantitation was set at 20 μg/kg, complying with performance criteria set by EU Regulation2017/2158 [7]. Accuracy of the results was demonstrated for potato crisps and pre-cooked French friesin four proficiency tests launched by the Food Analysis Performance Assessment Scheme (FAPAS)program, yielding a z-score of –0.2 (Test 3071, Feb–March 2017), −0.3 (Test 3080, Feb–March 2018), 0.0(Test 3085, Sep–Oct 2018), and 0.3 (Test 3089, Feb-2019). Results of acrylamide were expressed as μg/kgof sample. Analysis was done in duplicate.
2.5. Dietary Exposure Assessment
Categories of dietary exposure to acrylamide from potato crisps were estimated by combiningdata for total per capita consumption of potato crisps (1.34 kg/person/year) established by the SpanishMinistry of Agriculture, Food and Environment [16], and acrylamide content of the samples. Anaverage body weight (bw) of 70 kg was used to estimate total daily intake of acrylamide from potatocrisps for the total population and expressed as μg/kg bw/day.
The margin of exposure (MOE) approach was applied to carry out risk assessment for acrylamideprovided by potato crisps. MOE was calculated as the BMDL value divided by the respective totalacrylamide intake, considering 430 μg/kg bw/day as the BMDL10 value for neurotoxicity (peripheralnerve axonal degeneration in male rats) and 170 μg/kg bw/day for carcinogenicity (harderian glandadenocarcinomas in mice). This is dictated in the EFSA opinion report on acrylamide [1].
2.6. Statistical Analysis
Statistical analyses were performed using SPSS version 23.0 (SPSS Inc., Chicago, IL, USA). Datawere expressed as mean ± standard deviation (SD). Student t-test and analysis of variance (ANOVAone-way) followed by the Fisher’s test were used to identify the overall significance of differencesbetween variables. Homogeneity of variances was determined using the Levene test. Relationshipsbetween the different variables were evaluated by computing Spearman’s linear correlation coefficients.The significance of all statistical parameters was evaluated at the level of p < 0.05.
99

Foods 2020, 9, 247
3. Results and Discussion
3.1. Nutritional Composition of Potato Crisps
Table S1 depicts the average nutritional composition of potato crisps as declared by themanufacturer. Energy values (439–589 kcal/100 g) were close for all samples, with higher differencesbeing observed in relation to other parameters. Total fat content ranged between 13.2 and 40.7 g/100 g,with saturated fat being between 1.4 and 6.1 g/100 g. Carbohydrates exhibited a mean value of 50.1g/100 g (38.0–72.1 g/100 g) and sugar content was 0.6 g/100 g (0.1–4.7 g/100 g). Fiber showed valuesfrom 0.5 to 7.7 g/100 g, and protein values ranged from 1.0 to 7.8 (maximum) g/100 g. The maximumsalt level was 1.7 g/100 g, although 3.0% of samples claimed to be ‘no added-salt’.
3.2. Acrylamide Levels in Potato Crisps
Seventy (non-flavored) classical potato crisps commercialized in Spain coming from 33 differentsnack producers were collected during February 2019 and analyzed for acrylamide. All samplesshowed an acrylamide content greater than the LOQ, ranging from 89 to 1930 μg/kg (Table 1). Mean,median, and 95th percentile were 664 μg/kg, 569 μg/kg, and 1576 μg/kg, respectively. These valueswere higher than those reported by the EFSA for the category of potato crisps made from freshpotatoes (mean value: 392 μg/kg, 95th percentile: 949 μg/kg, n = 31467) in European countries [1].However, results were in line with information provided by other authors in recent years. Hai et al. [17]found levels ranging from 25 to 1620 μg/kg in potato chips from Hanoi (Vietnam), whilst Kafouris etal. [18] described an average value of 642 μg/kg in potato crisps from Cyprus (10–2193 μg/kg). Higherconcentrations have been reported in potato crisps from Italy (173–3444 μg/kg, average value: 1162μg/kg) [19] and lower value (mean value 475 μg/kg) have been described for potato crisps collectedfrom several Portuguese local markets [20].
Table 1. Statistical analysis of the acrylamide levels (μg/kg) of different potato crisp categories.
Category Mean ± SD Median Minimum Maximum 95th n
Total 664 ± 387 569 89 1930 1576 70Type of oil
Sunflower 689 ± 387a 627 199 1930 1271 41Olive oil 624 ± 333a 560 89 1381 1280 20Other or undefined oil 642 ± 524a 459 243 1815 1563 9
Type of cutSmooth 642 ± 369a 561 89 1889 1286 59Wavy 786 ± 473a 577 315 1930 1548 11
AppearanceOily 614 ± 287a 541 241 1275 1212 35Semi-oily 886 ± 592b 656 221 1930 1102 12Non-oily 626 ± 368ab 561 89 1815 1838 23
Light protectionLight protected 695 ± 410a 599 199 1930 1650 47Partly-light protected 587 ± 332a 539 89 1381 750 18Non-light protected 653 ± 385a 541 259 1271 1349 5
Different letters in the same column mean significant differences within the same category (p < 0.05). SD: standarddeviation. 95th: 95 percentile.
Figure 1 shows acrylamide distribution in the seventy measured samples of potato crisps. Dataexhibited high variability in acrylamide content between samples, in accordance with previouslypublished results [10]. Four outliers were identified in the global distribution. As explained by Mesiasand Morales [10], the 90th percentile is identified as the signal value of the dataset. Samples foundwith values higher than this should be especially evaluated in order to mitigate acrylamide formation.
100
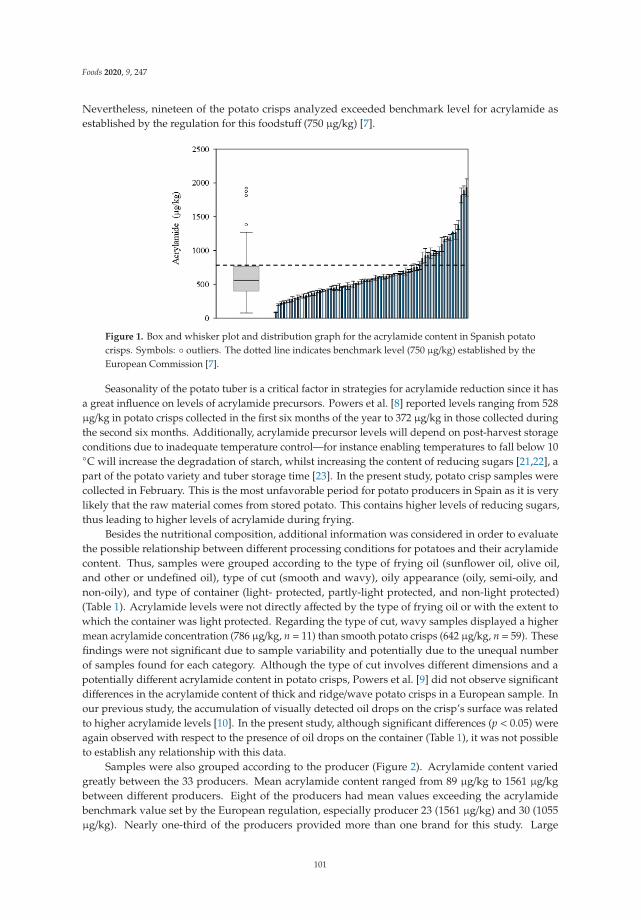
Foods 2020, 9, 247
Nevertheless, nineteen of the potato crisps analyzed exceeded benchmark level for acrylamide asestablished by the regulation for this foodstuff (750 μg/kg) [7].
Figure 1. Box and whisker plot and distribution graph for the acrylamide content in Spanish potatocrisps. Symbols: ◦ outliers. The dotted line indicates benchmark level (750 μg/kg) established by theEuropean Commission [7].
Seasonality of the potato tuber is a critical factor in strategies for acrylamide reduction since it hasa great influence on levels of acrylamide precursors. Powers et al. [8] reported levels ranging from 528μg/kg in potato crisps collected in the first six months of the year to 372 μg/kg in those collected duringthe second six months. Additionally, acrylamide precursor levels will depend on post-harvest storageconditions due to inadequate temperature control—for instance enabling temperatures to fall below 10◦C will increase the degradation of starch, whilst increasing the content of reducing sugars [21,22], apart of the potato variety and tuber storage time [23]. In the present study, potato crisp samples werecollected in February. This is the most unfavorable period for potato producers in Spain as it is verylikely that the raw material comes from stored potato. This contains higher levels of reducing sugars,thus leading to higher levels of acrylamide during frying.
Besides the nutritional composition, additional information was considered in order to evaluatethe possible relationship between different processing conditions for potatoes and their acrylamidecontent. Thus, samples were grouped according to the type of frying oil (sunflower oil, olive oil,and other or undefined oil), type of cut (smooth and wavy), oily appearance (oily, semi-oily, andnon-oily), and type of container (light- protected, partly-light protected, and non-light protected)(Table 1). Acrylamide levels were not directly affected by the type of frying oil or with the extent towhich the container was light protected. Regarding the type of cut, wavy samples displayed a highermean acrylamide concentration (786 μg/kg, n = 11) than smooth potato crisps (642 μg/kg, n = 59). Thesefindings were not significant due to sample variability and potentially due to the unequal numberof samples found for each category. Although the type of cut involves different dimensions and apotentially different acrylamide content in potato crisps, Powers et al. [9] did not observe significantdifferences in the acrylamide content of thick and ridge/wave potato crisps in a European sample. Inour previous study, the accumulation of visually detected oil drops on the crisp’s surface was relatedto higher acrylamide levels [10]. In the present study, although significant differences (p < 0.05) wereagain observed with respect to the presence of oil drops on the container (Table 1), it was not possibleto establish any relationship with this data.
Samples were also grouped according to the producer (Figure 2). Acrylamide content variedgreatly between the 33 producers. Mean acrylamide content ranged from 89 μg/kg to 1561 μg/kgbetween different producers. Eight of the producers had mean values exceeding the acrylamidebenchmark value set by the European regulation, especially producer 23 (1561 μg/kg) and 30 (1055μg/kg). Nearly one-third of the producers provided more than one brand for this study. Large
101

Foods 2020, 9, 247
acrylamide variations were also observed within the same producer; for instance, samples fromproducer 30 ranged from 295 μg/kg to 1815 μg/kg. High variability in acrylamide content of potatocrisps suggests differences in the raw material (potato variety and post-harvest storage) and processingconditions applied. Although this information is not available, it is assumed that potato crisp producersmarketing a unique brand are small companies with a nearby geographical distribution of their product,in contrast to large companies marketing several brands throughout the country. From a managerialpoint of view, large snacking companies would have more resources to implement mitigation strategies;for instance, they are more likely to be able to select the most appropriate potato tuber. However, onlyfour of the 22 small potato crisp producers exceeded the benchmark value for acrylamide.
Figure 2. Acrylamide content in potato crisp samples from the Spanish market, grouped according totheir producers (n = 33). Among them: producers with a single brand (n = 22) and producers withmore than one brand (n = 11). Circles represent individual values; horizontal lines represent meanvalues and vertical lines represent the range for each producer.
3.3. Acrylamide–Color Relationship in Potato Crisps
One of the critical factors to establish the end-point of frying is the color of potato chips [24].Samples in the present study were characterized according to the CIELab color scale. Mean ± standarddeviation, minimum, and maximum values for a*, b*, L*, and E are presented in Table 2. Again, a hugevariability was observed between the samples, with values ranging from –0.62 to 5.53 for a*, from 16.08to 29.22 for b*, from 50.04 to 68.01 for L*, and from 53.74 to 72.24 for E. A significant correlation wasfound between acrylamide and L* (r2 = −0.2889, p = 0.0153) and E (r2 = −0.2511, p = 0.0360), indicatingthat browning and lower luminosity in potato chips led to greater formation of this contaminant. Thecorrelation with b* was not found to be significant; however, a strong relationship was displayed witha* (r2 = 0.6736, p < 0.0001) (Figure 3A). Two essential factors would explain that the curve does not gothrough zero. On the one hand, the color parameter a* in the fried potato has not been corrected bythe color in the raw potato. On the other hand, the contribution to the color of the frying oil shouldbe also considered since nearly 30% of the final product is oil that affects the color. However, evenconsidering this limitation, the relationship is strongly significant. Previous studies have alreadyreported a direct correlation between a* and acrylamide in this foodstuff; thus, a* has been proposedas a useful predictor of acrylamide formation in fried potatoes [11–15]. Besides the high variabilityaccording to sample type, producers, and acrylamide level, our results pointed out that the a* parameteris capable of discriminating (p < 0.0001) between samples that contain above and below benchmarklevel of acrylamide (750 μg/kg) (Figure 3B).
102

Foods 2020, 9, 247
Table 2. CIELab parameters for potato crisps.
CIELab Parameter Mean ± SD Minimum Maximum
a* 2.64 ± 0.13 −0.62 5.53b* 24.75 ± 0.24 16.08 29.22L* 56.97 ± 0.27 50.04 68.01E 62.21 ± 0.38 53.74 72.24
SD: standard deviation
Figure 3. Relationship between color and acrylamide content (μg/kg) in potato crisps marketed inSpain. Linear regression between acrylamide content and the color parameter a* (r2 = 0.6736, p <0.0001) (A) and box-and-whisker plot of color parameter a* according to the acrylamide levels usingthe benchmark level as the threshold (750 μg/kg) (B).
3.4. Evaluation of Acrylamide Exposure from Spanish Commercialized Potato Crisps
Exposure to acrylamide from potato crisps in the Spanish population was estimated consideringtotal data per capita consumption of this foodstuff as indicated by the Spanish Ministry of Agriculture,Food and Environment (1.34 kg/person/year) [16], and acrylamide content in present samples.Considering the minimum and maximum acrylamide content in the overall sample, exposure tothis contaminant was seen to range between 0.33 and 7.09 μg/person/day, with a mean value of 2.44μg/person/day. Assuming an average body weight (bw) of 70 kg, mean daily intake of acrylamide
103
Foods 2020, 9, 247
from potato crisps for the total population was estimated to be 0.035 μg/kg bw/day, ranging from 0.005to 0.101 μg/kg bw/day. Median values matched with previous estimations made in 2015, in whichaverage contribution of potato crisps to dietary acrylamide exposure in Spain was also calculated to be0.035 μg/kg (range: 0.006–0.12 μg/kg bw/day) [10].
Acrylamide exposure estimated in the present assay was similar to that observed for othercountries in studies with different population sectors (Table 3). The average value was similar to themedian reported in adults from Italy [19], higher than mean exposure in adults from Belgium [25]and much lower than in the general population from Denmark [26]. Adolescents generally presentgreater exposure [18,19,25], except those from Poland [27], with median values being close to the meandescribed in the present study. In contrast, elderly and very elderly populations have shown loweracrylamide exposure due to lower consumption of potato crisps [19].
Table 3. Dietary acrylamide exposure and contribution of fried potatoes in different studies, countries,and population groups.
CountryTotal Intake
(μg/kg bw/day)
PotatoChips/Crisps (%)
Partial Contribution(μg/kg bw/day)
Age (years) ReferenceMedian2 or
Mean3 95th
Italy n.a.1 n.a.1 0.0702 0.387 Toddlers [19]
0.1122 0.238 Otherchildren
0.0752 0.201 Adolescents0.0302 0.097 Adults0.0042 0.029 Elderly0.0012 0.019 Very elderly
Poland 0.09 50 0.0452 0.500 Teenagergirls [27]
0.13 34 0.0442 0.570 Teenagerboys
Denmark 0.31 464 0.1433 0.382 Generalpopulation [26]
Cyprus 0.8 14 0.1123 0.252 Adolescents [18]Belgium 0.72 5.9 0.0423 0.143 Children [15]
0.48 18.8 0.0903 0.297 Adolescents0.33 5.8 0.0193 0.063 Adults
1 n.a.: not available. 2 Median value. 3 Mean value. 4 Fried potatoes including French fries
Risk characterization for acrylamide in potato crisps was conducted taking MOE values of 125 and10,000 as values indicating no concern for neurotoxicity and carcinogenicity in people, respectively [1].As mentioned above, MOE was calculated as the BMDL value divided by respective total acrylamideintake; 430 μg/kg bw/day was considered as the BMDL10 value for neurotoxicity, and 170 μg/kg bw/dayas the value for carcinogenicity, as dictated in EFSA opinion on acrylamide [1]. In this respect, meanMOE value of 12,348 was obtained for neurotoxicity (range: 92,122–4248 for minimum and maximumexposure). Even the maximum value was above the safety limit of 125, which indicates no healthconcern. In contrast, when comparing with the BMDL10 for carcinogenicity, a mean value of 4882 wascalculated (range: 36,420–1679 for minimum and maximum exposure). In this case, MOE was belowthe safety limit of 10,000, suggesting that it should be considered from a public health point of view.This remarkable outcome is in line with data reported in several studies [1,19,27].
3.5. Evolution of Acrylamide Levels in Spanish Commercialized Potato Crisps in Recent Years
Acrylamide content in commercialized potato chips analyzed in this study was compared withresults previously obtained by the same research group in 2014 [10], 2008 [28], and 2004 [29]. Mesiasand Morales [10] showed a clear downward trend in acrylamide content of potato crisps marketedin Spain over the last 10 years. Mean values decreased from 1484 μg/kg in 2004 to 629 μg/kg in 2014,
104

Foods 2020, 9, 247
representing an overall reduction of 57.6%. Analyzing the whole period monitored between 2004and 2019, the overall reduction was 55.2%. Statistical analysis revealed a significant reduction in theperiod 2004–2008 (Figure 4); however, this has since been followed by a period of leveling off, with nosignificant differences between mean acrylamide levels for 2008 (740 μg/kg), 2014 (629 μg/kg), and2019 (664 μg/kg) being seen. Similar observations were displayed in the 90th and 95th percentiles.Downward trends were also seen in these values from 2004 to 2019 (Figure 4). 90th percentile values,considered as signal values, decreased from 2270 μg/kg in 2004 to 1377 μg/kg in 2008, and 1136 μg/kg in2014, slightly increasing back up to 1187 μg/kg in 2019. Similarly, 95th percentile values decreased from3805 μg/kg in 2004 to 1981 μg/kg in 2008, and 1233 μg/kg in 2014, increasing again to 1576 μg/kg in 2019.These findings are in agreement with results reported by Powers et al. [9]. These authors evaluatedthe trend in acrylamide concentration in potato crisps in Europe from 2002 to 2016, describing a 46%reduction overall throughout the period. Mean values decreased from 763 μg/kg in 2002 to 412 μg/kgin 2016. However, as in the present study, there were significant reductions between 2002 and 2011,but, since then, a leveling off has been observed, with means being even slightly greater in recent years.Thus, the year when the lowest content of acrylamide was achieved was 2011. In our case, lowestconcentrations were observed in 2014.
Figure 4. Temporal patterns for acrylamide content (μg/kg) in Spanish potato crisps sampled from2004 to 2019. represents 90th percentile, represents 95th percentile.
Similarly, Claeys et al. [25] also reported a significant decrease in mean acrylamide levels inpotato crisps from the Belgian market, when comparing the periods 2002–2007 and 2008–2013 (averagereduction 38%). In this case, concentrations, 95th percentile values, and maximum levels decreasedfrom 609 μg/kg (mean), 1500 μg/kg (95th), and 3200 μg/kg (maximum) in the period 2002–2007 to 375μg/kg (mean), 725 μg/kg (95th) and 1300 μg/kg (maximum), respectively, in the period 2008–2013.
As mentioned before, 17.5% of samples taken in 2015 registered higher values than thoserecommended by the European Commission that year (1000 μg/kg), whilst, in the present study, 27%of analyzed potato crisps exceeded the updated benchmark value (750 μg/kg). Results illustrate theneed to reduce levels of acrylamide in potato crisps since concentrations have not yet been adapted tothe new recommendations. In recent years, acrylamide reduction measures in potato-based productsin the acrylamide toolbox have been proposed and updated [3], as has industry guidance regardingacrylamide in foods reported by the Food and Drug Administration [4]. In addition, risk managementmeasures for acrylamide were included and revised in the European Regulation [7].
105

Foods 2020, 9, 247
4. Conclusions
Although it has been demonstrated that mitigation strategies have been successfully appliedto Spanish industrial potato crisps in recent years, the greatest reduction in acrylamide levels wasachieved during years close to the identification of acrylamide in foods as a health concern. Followingthis, declining trends have ceased and nearly one-third of samples fail to meet benchmark valueestablished by the current European Regulation. Thus, potato crisp manufacturers must continueefforts to reduce acrylamide formation in this foodstuff in order to reach levels as low as reasonablyachievable, whilst also considering the potentially pending downward revision of the benchmark level.This new study corroborates the suitability of the color parameter a* for helping producers to controlthe quality of potato crisps introduced into the market, so that they meet quality standards indicatedby the European Regulation concerning acrylamide levels.
Supplementary Materials: The following are available online at http://www.mdpi.com/2304-8158/9/2/247/s1,Table S1. Average nutritional composition of the whole dataset of potato crisps as provided by the manufacturer.Data are expressed as mean ± standard deviation (SD) per 100 g of sample
Author Contributions: Conceptualization, M.M., C.D.-A., and F.J.M.; Methodology, A.N.; Software, M.M.;Validation, M.M., C.D.-A., and F.J.M.; Formal Analysis, A.N.; Investigation, M.M., C.D.-A., and F.J.M.; Resources,F.J.M.; Data Curation, M.M., C.D.-A., and F.J.M.; Writing—Original Draft Preparation, M.M.; Writing—Review andEditing, M.M., C.D.-A., and F.J.M.; Supervision, M.M., C.D.-A., and F.J.M.; Funding Acquisition, M.M., C.D.-A.,and F.J.M. All authors have read and agreed to the published version of the manuscript.
Funding: This research was partly funded by the Ministry of Science, Innovation and Universities (Spain): projectACRINTAKE (RTI2018-094402-B-I00, MCIU/AEI/FEDER, UE), Comunidad of Madrid, and European fundingfrom FSE and FEDER programs: Project S2018/BAA-4393, AVANSECAL-II-CM. The authors thank InmaculadaAlvarez and Beatriz Díaz for their technical assistance.
Acknowledgments: This work was partially supported by the Ministry of Science, Innovation, andUniversities (Spain) under the project ACRINTAKE (RTI2018-094402-B-I00, MCIU/AEI/FEDER, UE) andby the Community of Madrid, and European funding from FSE and FEDER programs under the projectS2018/BAA-4393, AVANSECAL-II-CM.
Conflicts of Interest: The authors declare that they have no conflict of interest.
References
1. EFSA (European Food Safety Authority). Scientific opinion on acrylamide in food. EFSA J. 2015, 13,4104. Available online: https://efsa.onlinelibrary.wiley.com/doi/pdf/10.2903/j.efsa.2015.4104 (accessed on 12December 2019).
2. IARC (International Agency for Research on Cancer). Some industrial chemicals. In IARC Monographs on theEvaluation for Carcinogenic Risk of Chemicals to Humans; IARC: Lyon, France, 1994; Volume 60, pp. 435–453.
3. FDE (FoodDrinkEurope). 2019. Available online: https://www.fooddrinkeurope.eu/uploads/publications_documents/FoodDrinkEurope_Acrylamide_Toolbox_2019.pdf (accessed on 12 December 2019).
4. FDA (Food and Drug Administration). Guidance for Industry Acrylamide in Foods. 2016. Available online:https://www.fda.gov/media/87150/download (accessed on 5 December 2019).
5. Commission Recommendation. Investigations into the levels of acrylamide in food. OJEU 2011. Availableonline: http://ec.europa.eu/food/food/chemicalsafety/contaminants/recommendation_10012011_acrylamide_food_en.pdf. (accessed on 1 December 2019).
6. Commission Recommendation. Investigations into the levels of acrylamide in food. OJEU 2013, L301/15.7. EC (European Commission). Commission Regulation (EU) 2017/2158 of 20 November 2017 establishing
mitigation measures and benchmark levels for the reduction of the presence of acrylamide in food. OJEU2017, L304, 24–44.
8. Powers, S.J.; Mottram, D.S.; Curtis, A.; Halford, N.G. Acrylamide concentrations in potato crisps in Europefrom 2002 to 2011. Food Addit. Contam. Part A 2013, 30, 1493–1500. [CrossRef]
9. Powers, S.J.; Mottram, D.S.; Curtis, A.; Halford, N.G. Acrylamide levels in potato crisps in Europe from 2002to 2016. Food Addit. Contam. Part A 2017, 34, 2085–2100. [CrossRef]
106

Foods 2020, 9, 247
10. Mesias, M.; Morales, F.J. Acrylamide in commercial potato crisps from Spanish market: Trends from 2004 to2014 and assessment of the dietary exposure. Food Chem. Toxicol. 2015, 81, 104–110. [CrossRef]
11. Gökmen, V.; Senyuva, H.Z.; Dülek, B.; Çetin, A.E. Computer vision-based image analysis for the estimationof acrylamide concentrations of potato chips and french fries. Food Chem. 2007, 101, 791–798. [CrossRef]
12. Behrens, T.K.; Liebert, M.L.; Peterson, H.J.; Smith, H.J.; Sutliffe, J.T.; Day, A.; Mack, J. Changes in School FoodPreparation Methods Result in Healthier Cafeteria Lunches in Elementary Schools. Am. J. Prev. Med. 2018,54, S139–S144. [CrossRef]
13. Mesias, M.; Delgado-Andrade, C.; Holgado, F.; Morales, F.J. Acrylamide content in French fries prepared inhouseholds: A pilot study in Spanish homes. Food Chem. 2018, 260, 44–52. [CrossRef]
14. Mesias, M.; Delgado-Andrade, C.; Holgado, F.; Morales, F.J. Acrylamide content in French fries prepared infood service establishments. LWT Food Sci. Technol. 2019, 100, 83–91. [CrossRef]
15. Mesias, M.; Delgado-Andrade, C.; Holgado, F.; Morales, F.J. Acrylamide in French fries prepared at primaryschool canteens. Food Funct. 2020, (in press). [CrossRef] [PubMed]
16. MAPA (Ministry of Agriculture, Fisheries and Foods). Datos de consumo alimentario. Informe del consumealimentario en España. 2018. Available online: https://www.mapa.gob.es/es/alimentacion/temas/consumo-y-comercializacion-y-distribucion-alimentaria/20190807_informedeconsumo2018pdf_tcm30-512256.pdf(accessed on 10 December 2019).
17. Hai, Y.D.; Tran-Lam, T.T.; Nguyen, T.Q.; Vu, N.D.; Ma, K.H.; Le, G.T. Acrylamide in daily food in themetropolitan área of Hanoi, Vietnam. Food Addit. Contam. Part B 2019, 12, 159–166. [CrossRef] [PubMed]
18. Kafouris, D.; Stavroulakis, G.; Christofidou, M.; Iakovou, X.; Christou, E.; Paikousis, L.; Christodoulidou, M.;Ioannou-Kakouri, E.; Yiannopoulos, E. Determination of acrylamide in food using a UPLC–MS/MS method:Results of the official control and dietary exposure assessment in Cyprus. Food Addit. Contam. Part A 2018,35, 1928–1939. [CrossRef] [PubMed]
19. Esposito, F.; Nardone, A.; Fasano, E.; Triassi, M.; Cirillo, T. Determination of acrylamide levels in potatocrisps and other snacks and exposure risk assessment through a Margin of Exposure approach. Food Chem.Toxicol. 2017, 108, 249–256. [CrossRef]
20. Molina-Garcia, L.; Santos, C.S.P.; Melo, A.; Fernandes, J.O.; Cunha, S.C.; Casal, S. Acrylamide in chips andFrench fries: A novel and simple method using xanthydrol for its GC-MS determination. Food Anal. Methods2015, 8, 1436–1445. [CrossRef]
21. De Wilde, T.; De Meulenaer, B.; Mestdagh, F.; Govaert, Y.; Vandeburie, S.; Ooghe, W.; Fraselle, S.;Demeulemeester, K.; Van Peteghem, C.; Calus, A.; et al. Influence of Storage Practices on AcrylamideFormation during Potato Frying. J. Agric. Food Chem. 2005, 53, 6550–6557. [CrossRef]
22. Muttucumaru, N.; Powers, S.J.; Elmore, J.S.; Briddon, A.; Mottram, D.S.; Halford, N.G. Evidence for thecomplex relationship between free amino acid and sugar concentrations and acrylamide-forming potentialin potato. Ann. Appl. Biol. 2014, 164, 286–300. [CrossRef]
23. Elmore, J.S.; Briddon, A.; Dodson, A.T.; Muttucumaru, N.; Halford, N.G.; Mottram, D.S. Acrylamide inpotato crisps prepared from 20 UK-grown varieties: Effects of variety and tuber storage time. Food Chem.2015, 182, 1–8. [CrossRef]
24. Pedreschi, F.; Mery, D.; Marique, T. Quality evaluation and control of potato chips and French fries. InComputer Vision Technology for Food Quality Evaluation; Sun, D., Ed.; Academic Press: Cambridge, MA, USA,2008; pp. 545–566.
25. Claeys, W.; De Meulenaer, B.; Huyghebaert, A.; Scippo, M.L.; Hoet, P.; Matthys, C. Reassessment of theacrylamide risk: Belgium as a case-study. Food Control 2016, 59, 628–635. [CrossRef]
26. Jakobsen, L.S.; Granby, K.; Knudsen, V.K.; Nauta, M.; Pires, S.M.; Poulsen, M. Burden of disease of dietaryexposure to Acrylamide in Denmark. Food Chem. Toxicol. 2016, 90, 151–159. [CrossRef]
27. Wyka, J.; Tajner-Czopek, A.; Broniecka, A.; Piotrowska, E.; Bronkowska, M.; Biernat, J. Estimation of dietaryexposure to Acrylamide of Polish teenagers from an urban environment. Food Chem. Toxicol. 2015, 75,151–155. [CrossRef]
107

Foods 2020, 9, 247
28. Arribas-Lorenzo, G.; Morales, F.J. Dietary exposure to acrylamide from potato crisps to the Spanish population.Food Addit. Contam. 2009, 26, 289–297. [CrossRef] [PubMed]
29. Rufián-Henares, J.A.; Morales, F.J. Determination of acrylamide in potato chips by a reversed-phase LC-MSmethod based on the stable isotope dilution assay. Food Chem. 2006, 97, 555–562. [CrossRef]
© 2020 by the authors. Licensee MDPI, Basel, Switzerland. This article is an open accessarticle distributed under the terms and conditions of the Creative Commons Attribution(CC BY) license (http://creativecommons.org/licenses/by/4.0/).
108
foods
Article
Are Household Potato Frying Habits Suitable forPreventing Acrylamide Exposure?
Marta Mesias *, Cristina Delgado-Andrade and Francisco J. Morales
Institute of Food Science, Technology and Nutrition, ICTAN-CSIC, José Antonio Novais 10, 28040 Madrid, Spain;[email protected] (C.D.-A.); [email protected] (F.J.M.)* Correspondence: [email protected]
Received: 22 May 2020; Accepted: 12 June 2020; Published: 17 June 2020
Abstract: A survey was conducted of 730 Spanish households to identify culinary practices whichmight influence acrylamide formation during the domestic preparation of french fries and theircompliance with the acrylamide mitigation strategies described in the 2017/2158 Regulation. Spanishhousehold practices conformed with the majority of recommendations for the selection, storingand handling of potatoes, with the exception of soaking potato strips. Olive oil was the preferredfrying oil (78.7%) and frying pans were the most common kitchen utensils used for frying (79.0%),leading to a higher oil replacement rate than with a deep-fryer. Although frying temperature wasusually controlled (81.0%), participants were unaware of the maximum temperature recommendedfor preventing acrylamide formation. For french fries, color was the main criteria when decidingthe end-point of frying (85.3%). Although a golden color was preferred by respondents (87.3%),color guidelines are recommended in order to unify the definition of “golden.” The results concludethat habits of the Spanish population are in line with recommendations to mitigate acrylamideduring french fry preparation. Furthermore, these habits do not include practices that risk increasingacrylamide formation. Nevertheless, educational initiatives tailored towards consumers wouldreduce the formation of this contaminant and, consequently, exposure to it in a domestic setting.
Keywords: consumers; domestic habits; french fries; frying habits; households; oil; acrylamide
1. Introduction
Chemical process contaminants are substances formed when foods undergo chemical changesduring processing, including heat treatment, fermentation, smoking, drying and refining [1]. Althoughnecessary for making food edible and digestible, heat treatment can have undesired consequencesleading to the formation of heat-induced contaminants such as acrylamide [2]. Acrylamide is a chemicalprocess contaminant formed when foods containing free asparagine and reducing sugars are cookedat temperatures above 120 ◦C in low moisture conditions [3]. It is mainly formed in baked or friedcarbohydrate-rich foods as the relevant raw materials contain its precursors. These include cereals,potatoes and coffee beans. In 1994, acrylamide was classified by the International Agency for Researchon Cancer as being probably carcinogenic to humans (group 2A) [4]. In 2015, the European FoodSafety Authority (EFSA) confirmed that the presence of acrylamide in foods is a public health concern,requiring continued efforts to reduce its exposure [3].
Fried potato products are the main contributor to total dietary acrylamide exposure, especiallyamongst young people [3]. The recent 2017/2158 Regulation [5] on benchmark levels for reducing thepresence of acrylamide in foods and the acrylamide toolbox compiled by Food Drink Europe [6] includespecific mitigation strategies for decreasing the presence of acrylamide in foodstuffs. The category offried potato products is divided between two subcategories. The first category describes potato-basedsnacks, whilst the second describes french fries and other cut potato products. When fried potato
Foods 2020, 9, 799; doi:10.3390/foods9060799 www.mdpi.com/journal/foods109

Foods 2020, 9, 799
products are made from fresh potatoes, mitigation measures are focused on the following factors:selection of suitable potato varieties, acceptance criteria based on quality, potato storage and transport,recipe and process design. In addition, information for end users can be supplied in packaging ifpotatoes are intended to be fried at home. These recommendations are aimed at controlling theprecursor levels in fresh tubers (mainly reducing sugar content), frying temperature and the colorof the final product. Further, they are fundamentally focused on the industrial sector [5,6]. As aresult of following these measures, acrylamide levels in potato chips have decreased in recent years,demonstrating that mitigation strategies are being successfully applied to industrial potato crisps [7–9].However, these strategies cannot be directly extended to private domestic settings as the main variablesaccounting for the cooking process vary between households and even between individuals [10].Consumers may significantly influence their dietary acrylamide exposure through their purchasechoices and the selection of culinary methods for cooking food, amongst other factors [11,12]. The EFSAhas reported that home-cooking behaviors for potato frying lead to variations of up to 80% total dietaryacrylamide exposure.
Several initiatives have been driven by different national food safety authorities with the aim ofhelping consumers understand how they can minimize acrylamide exposure when cooking at home.Examples of this include the “go for gold” campaign by the Food Standards Agency (FSA) [11] andthe “golden but not toasted” campaign by the Spanish Food Safety Agency [13]. Both campaignsintended to educate audiences on how to identify the golden color that is characteristic of a healthierfry and lower acrylamide content in fried potatoes. Despite these campaigns, the population may notbe applying mitigation measures during the preparation of french fries at home. They may even beunaware that acrylamide is an issue and that its formation can be reduced during frying. In June 2019,the EFSA published the last special Eurobarometer on risk perceptions, which included the resultsof a survey of 27,655 respondents from different social and demographic groups around Europe [14].The survey showed that when considering commonly known food safety related topics, Europeancitizens were most concerned about antibiotic residues; hormones or steroids in meat (44%); pesticideresidues in food (39%); environmental contaminants in fish, meat or dairy products (37%) and additivessuch as colorants and preservatives or flavors used in food or beverages (36%). Process contaminantsin foods, including acrylamide, were not listed amongst these topics.
Within this framework, the aim of the present work was to explore domestic practices for thepreparation of french fries in Spanish households using a survey of domestic culinary habits andconsumer preferences. The degree of compliance with mitigation strategies for reducing acrylamideformation in french fries was then evaluated, whilst also identifying unwanted practices that couldbe modified through re-education to favor healthier frying habits amongst the Spanish population.To our knowledge, this is the first survey conducted in a Spanish population with a focus on french frypreparation habits.
2. Materials and Methods
2.1. Study Design
The experimental design was based on similar studies in the literature [15–17]. The questionnairewas supervised by researchers from the Food Innovation research team at the Polytechnic Universityof Valencia (Valencia, Spain). Firstly, the survey was piloted with 20 individuals via one-on-oneinterviews. This was done to identify specific focal points for questionnaire development and tomake the necessary adjustments based on respondent feedback. Following this, the questionnaire wasdrafted and validated with 35 subjects. The survey included thirty-two questions divided into sevendifferent topics. These were:
i. Socio-demographic characteristics: gender, age group, nationality, type of household, number ofindividuals at home and number of individuals under 18 years old at home.
ii. Culinary habits: cooking experience.
110

Foods 2020, 9, 799
iii. French fry consumption: characteristics of potatoes intended for frying (fresh or frozen, par-fried),frequency of french fry consumption and the way in which they are consumed.
iv. Fresh potato characteristics: place of purchase and type of fresh tubers (in-season or stored,washed or unwashed, bulk or bagged, labelled as “special for frying,” etc.), geographical origin,botanical variety and place of storage at home.
v. Practices at the pre-frying stage: peeling, washing, soaking, adding salt and cutting preferences.vi. Practices at the frying stage: kitchen utensil, frying oil characteristics, frying temperature,
subjective ratio between the amount of food with respect to the dimensions of the frying utensil,defrosting prior to par-frying potatoes or frying from frozen and frying cycles.
vii. Post-frying practices: criterion for establishing the frying end-point, color and texture preferences;method for removing oil from fried food; criteria for stopping oil use in other frying cycles;cleaning procedures for oil reuse and oil storage.
Questions were structured according to check boxes with unique or multiple possible responses.The questionnaire included a brief introduction about the aim of the study and participants gave theirconsent to use their data in the research (Supplementary Material: Survey on household habits inrelation to frying potatoes).
2.2. Data Collection
The present study was conducted with 730 respondents, using both online (n = 421) andpaper-based (n = 309) questionnaires. A web-based survey was launched via an internet platformthrough Google form links (Melbourne, Australia), and paper-based questionnaires were directlydistributed to respondents. Questionnaire data were included when more than 75% of the survey wascompleted and no more than two questions per topic were missing. Both datasets were merged foranalysis since the approach through which information was compiled was not a limiting source ofvariability for analysis. The selection of participants was limited to adults who consume or preparefrench fries at home. The main channels for questionnaire distribution were schools, consumerassociations, universities, food associations, research centers, culinary centers, etc. Participants agreedto the anonymous use of their data for the study.
2.3. Data Processing
Outputs from the online and paper-based questionnaires were merged and compiled in an excelspreadsheet format. Data processing was performed using SPSS version 23.0 (SPSS Inc., Chicago, IL,USA). Categorical data were expressed as frequencies and percentages.
3. Results and Discussion
3.1. Characteristics of the Participants
The present study aimed to evaluate the adhesion of potato frying habits in Spanish householdsto recommendations for mitigating acrylamide formation provided by the European 2017/2158Regulation [5]. It has to be pointed out that the purpose was not to give advice on acrylamide andfrying practices or to assess the population’s knowledge of these issues but to evaluate the domestichabits for the preparation of french fries and to compare them with the recommendations. Figure 1depicts the critical action points for reducing acrylamide formation during the preparation of friedpotatoes from fresh tubers according to three stages (pre-frying, frying, post-frying). An ad-hocsurvey of culinary practices for the preparation of fried potatoes in households was conducted withSpanish adults. To obtain a representative and diverse number of respondents and minimize responsebias, the survey included both online and paper-based questionnaires [18]. The web-based formatallows for a broader dissemination, being less time demanding and less expensive, whilst paper-based
111
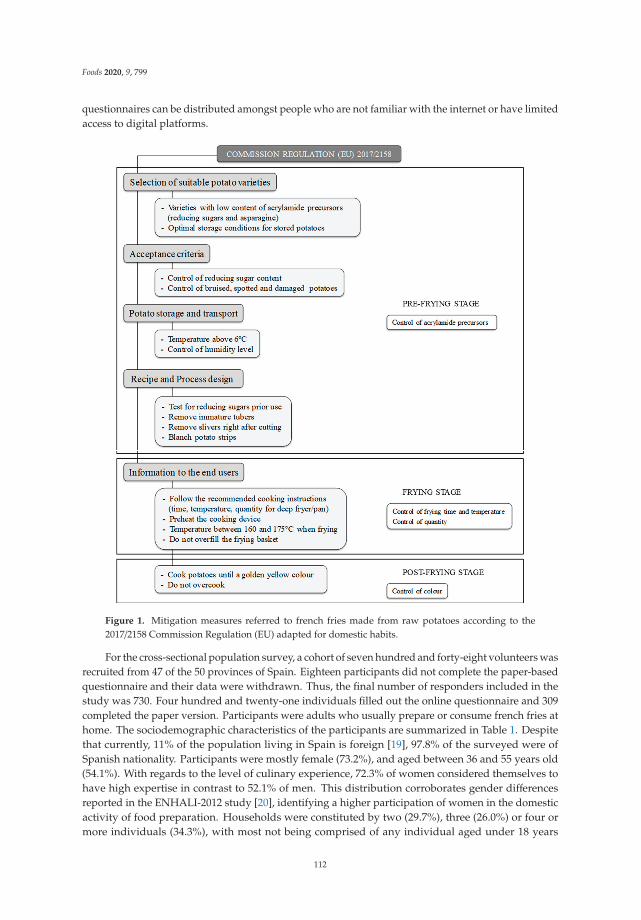
Foods 2020, 9, 799
questionnaires can be distributed amongst people who are not familiar with the internet or have limitedaccess to digital platforms.
Figure 1. Mitigation measures referred to french fries made from raw potatoes according to the2017/2158 Commission Regulation (EU) adapted for domestic habits.
For the cross-sectional population survey, a cohort of seven hundred and forty-eight volunteers wasrecruited from 47 of the 50 provinces of Spain. Eighteen participants did not complete the paper-basedquestionnaire and their data were withdrawn. Thus, the final number of responders included in thestudy was 730. Four hundred and twenty-one individuals filled out the online questionnaire and 309completed the paper version. Participants were adults who usually prepare or consume french fries athome. The sociodemographic characteristics of the participants are summarized in Table 1. Despitethat currently, 11% of the population living in Spain is foreign [19], 97.8% of the surveyed were ofSpanish nationality. Participants were mostly female (73.2%), and aged between 36 and 55 years old(54.1%). With regards to the level of culinary experience, 72.3% of women considered themselves tohave high expertise in contrast to 52.1% of men. This distribution corroborates gender differencesreported in the ENHALI-2012 study [20], identifying a higher participation of women in the domesticactivity of food preparation. Households were constituted by two (29.7%), three (26.0%) or four ormore individuals (34.3%), with most not being comprised of any individual aged under 18 years
112

Foods 2020, 9, 799
(59.5%). The majority of participants live with a partner (70.7%), with 45.1% living with children andrelatives, and 25.6% being couples without children. The household profile is consistent with thetypology described for the Spanish population, with smaller and one-person households made up of ayoung person or an independent adult predominating [21].
Table 1. Sociodemographic characteristics of participants (n = 730).
Characteristic n (%)
Gender
Male 190 (26.0)
Female 534 (73.2)
Missing 6 (0.8)
Age group
18–35 209 (28.6)
36–55 395 (54.1)
56–65 86 (11.8)
>65 38 (5.2)
Missing 2 (0.3)
Nationality
Spanish 714 (97.8)
Other than Spanish 8 (1.1)
Missing 8 (1.1)
Individuals < 18 at home
Yes 290 (39.7)
No 434 (59.5)
Missing 6 (0.8)
Individuals/home
1 63 (8.6)
2 217 (29.7)
3 190 (26.0)
4 210 (28.8)
5 33 (4.5)
>5 7 (1.0)
Missing 10 (1.4)
Type of household
Single 61 (8.4)
Single with children 30 (4.1)
Shared apartment 27 (3.7)
Couple without children 187 (25.6)
Couple with children 313 (42.9)
Couple, children and relatives 16 (2.2)
With parents 26 (3.6)
With parents and siblings 47 (6.4)
Other 12 (1.6)
Missing 11 (1.5)
Number of cases (n).
113

Foods 2020, 9, 799
3.2. French Fry Consumption
Most respondents (85.3%) usually buy fresh tubers to prepare french fries at home. In total,21 (2.9%) reported preparing only frozen par-fried potatoes, with 84 (11.5%) using both foods indistinctly(Table 2). This finding agrees with the data described in the food consumption report in Spain 2018.This indicated that fresh tubers and frozen par-fried potatoes represent 72.7% and 3.4%, respectively,of all potatoes bought by the Spanish population [21]. A total of 43.5% of respondents affirmedconsuming french fries several times a month (monthly), whilst 35.9% reported a consumption ofseveral times a week (weekly). A lower percentage eats these products only on exceptional occasions(19.7%) and only two individuals indicated a daily consumption (0.3%). With regards to consumptionpreferences, french fries make up the side dish for other foods (97.1%) such as meat (79.7%); fish (23.8%);vegetables (8.9%) and other foods including fried eggs, sausages, croquettes, etc. (47.6%).
Potato chips or french fries are a cause of concern due to their high fat and energy content.This is associated with a higher incidence of diseases such as obesity, high blood pressure and/orhypercholesterolemia [22]. For this reason, although frying is an ancestral and popular culinarytechnique and a typical way of cooking in the Mediterranean diet [23], nutritional recommendationslimit this culinary practice to prevent its associated health complications. The relationship was evaluatedbetween french fry consumption and both age of and household type. The most significant differencewas observed in people older than 65 years of age who usually consume potatoes several times a week(weekly), with the frequency of consumption in other age groups predominantly being several times amonth (monthly) (Figure 2A). Households with a higher potato consumption were typically formed bycouples with children, followed by couples without children. These groups predominantly reporteda monthly or weekly consumption (Figure 2B). Similarly, in Spain, a higher potato consumptioncorresponds to households made up of middle-aged and older children, single-parent households andhouseholds made up of adult couples without children [21].
3.3. Fresh Potato Characteristics
The survey showed that fresh tubers are mainly bought in supermarkets (48.1%) and neighborhoodgrocery stores (44.1%), followed by hypermarkets (29.3%) and markets (16.2%) (Table 2). This agreeswith purchase habits described for the global Spanish population [21]. Respondents are generallyinterested in knowing the geographical origin and/or botanical variety of the potato, although 38.1%are not interested in this aspect. Some of the common varieties used in Spain to prepare frenchfries are Monalisa, Caesar, Milva and Agria [12]. Potatoes are normally bought in bulk rather thanbagged (36.1 vs. 28.1), and are washed (43.3%) and fresh harvested (in-season) (49.1%). However,some respondents expressed not being concerned about the type of potato purchased in relation to itspresentation (6.0%) and seasonality (24.1%).
Five hundred and seventeen individuals (70.8%) indicated that they do not buy “special fryingpotatoes,” with a further 98 (13.4%) not being aware of this type of classification. According tocommercial quality norms for potatoes for consumption in the Spanish market, commercial potatoesmust be identified according to product type (variety, uncalibrated/calibrated, in-season/stored),origin (country and, optionally, regional or local production area or national denomination) andcommercial characteristics (category, net weight, batch, caliber/size, recommended culinary use, etc.).For bagged potatoes, the name, trade name or designation of the packer and/or shipper or seller shouldalso be identified [24]. Regarding the place of storage, 79.6% store potatoes indoors, whilst 4.0% keeptheir potatoes both indoors and outdoors (Figure 3A) The UK Food Standards Agency (FSA) drew upa report which aimed to provide information on actual domestic cooking and french fry preparationpractices in the UK. The report indicated that the majority of individuals in the UK usually store theirpotatoes outside of the fridge, such as in a kitchen cupboard, garage or utility room, prior to preparingand cooking them [11]. This is similar to the Spanish habits observed in the present study.
114
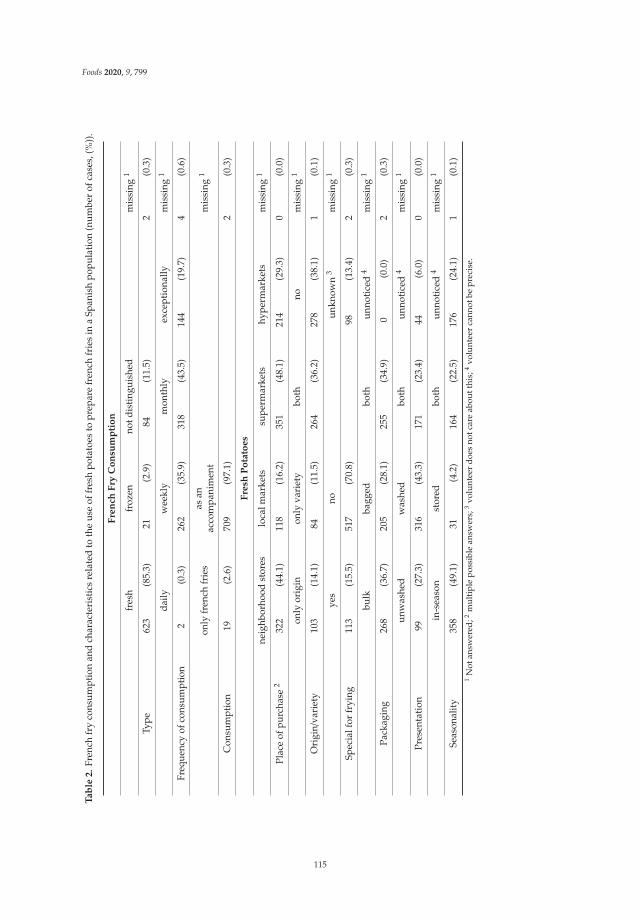
Foods 2020, 9, 799
Ta
ble
2.
Fren
chfr
yco
nsum
ptio
nan
dch
arac
teri
stic
sre
late
dto
the
use
offr
esh
pota
toes
topr
epar
efr
ench
frie
sin
aSp
anis
hpo
pula
tion
(num
ber
ofca
ses,
(%))
.
Fre
nch
Fry
Co
nsu
mp
tio
n
fres
hfr
ozen
notd
isti
ngui
shed
mis
sing
1
Type
623
(85.
3)21
(2.9
)84
(11.
5)2
(0.3
)
daily
wee
kly
mon
thly
exce
ptio
nally
mis
sing
1
Freq
uenc
yof
cons
umpt
ion
2(0
.3)
262
(35.
9)31
8(4
3.5)
144
(19.
7)4
(0.6
)
only
fren
chfr
ies
asan
acco
mpa
nim
ent
mis
sing
1
Con
sum
ptio
n19
(2.6
)70
9(9
7.1)
2(0
.3)
Fre
shP
ota
toe
s
neig
hbor
hood
stor
eslo
calm
arke
tssu
perm
arke
tshy
perm
arke
tsm
issi
ng1
Plac
eof
purc
hase
232
2(4
4.1)
118
(16.
2)35
1(4
8.1)
214
(29.
3)0
(0.0
)
only
orig
inon
lyva
riet
ybo
thno
mis
sing
1
Ori
gin/
vari
ety
103
(14.
1)84
(11.
5)26
4(3
6.2)
278
(38.
1)1
(0.1
)
yes
noun
know
n3
mis
sing
1
Spec
ialf
orfr
ying
113
(15.
5)51
7(7
0.8)
98(1
3.4)
2(0
.3)
bulk
bagg
edbo
thun
noti
ced
4m
issi
ng1
Pack
agin
g26
8(3
6.7)
205
(28.
1)25
5(3
4.9)
0(0
.0)
2(0
.3)
unw
ashe
dw
ashe
dbo
thun
noti
ced
4m
issi
ng1
Pres
enta
tion
99(2
7.3)
316
(43.
3)17
1(2
3.4)
44(6
.0)
0(0
.0)
in-s
easo
nst
ored
both
unno
tice
d4
mis
sing
1
Seas
onal
ity
358
(49.
1)31
(4.2
)16
4(2
2.5)
176
(24.
1)1
(0.1
)1
Not
answ
ered
;2m
ulti
ple
poss
ible
answ
ers;
3vo
lunt
eer
does
notc
are
abou
tthi
s;4
volu
ntee
rca
nnot
bepr
ecis
e.
115
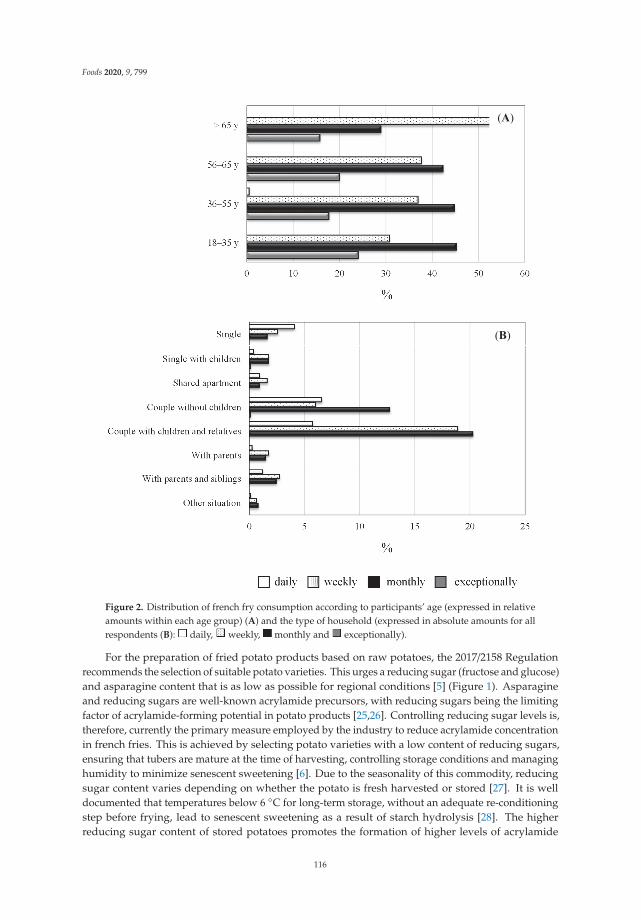
Foods 2020, 9, 799
Figure 2. Distribution of french fry consumption according to participants’ age (expressed in relativeamounts within each age group) (A) and the type of household (expressed in absolute amounts for allrespondents (B): daily, weekly, monthly and exceptionally).
For the preparation of fried potato products based on raw potatoes, the 2017/2158 Regulationrecommends the selection of suitable potato varieties. This urges a reducing sugar (fructose and glucose)and asparagine content that is as low as possible for regional conditions [5] (Figure 1). Asparagineand reducing sugars are well-known acrylamide precursors, with reducing sugars being the limitingfactor of acrylamide-forming potential in potato products [25,26]. Controlling reducing sugar levels is,therefore, currently the primary measure employed by the industry to reduce acrylamide concentrationin french fries. This is achieved by selecting potato varieties with a low content of reducing sugars,ensuring that tubers are mature at the time of harvesting, controlling storage conditions and managinghumidity to minimize senescent sweetening [6]. Due to the seasonality of this commodity, reducingsugar content varies depending on whether the potato is fresh harvested or stored [27]. It is welldocumented that temperatures below 6 ◦C for long-term storage, without an adequate re-conditioningstep before frying, lead to senescent sweetening as a result of starch hydrolysis [28]. The higherreducing sugar content of stored potatoes promotes the formation of higher levels of acrylamide
116

Foods 2020, 9, 799
during the frying process [6]. However, all of these practices must be controlled at both farming andindustrial stages in order to provide consumers with optimum potato tubers for helping to mitigateacrylamide formation in the domestic environment. The most important consumer’s decision whenpurchasing potatoes for the preparation of french fries is to select those that are fresh harvested,whenever possible, and store them indoors, since temperatures inside the home will not promote thementioned sweetening. On the other hand, although potatoes labelled as “special for frying” couldbe expected to be the most suitable potatoes for frying, previous research has demonstrated that thiscommercial label is not always adequate when guiding consumers in the preparation of french frieswith low acrylamide content [12].
Figure 3. Handling habits of fresh tubers: place of storage (A), washing-related habits (cut or uncutpotatoes) (B), soaking-related habits (washed or unwashed potatoes) (C), washing and soaking-relatedhabits (stored and seasonal potatoes) (D).
It might be concluded that the Spanish population tends to adhere to acrylamide mitigationstrategies relating to storage conditions (Figure 4). However, more information should be provided forconsumers to improve their selection of raw materials. This is especially the case for those who donot take the type of potato purchased on the market into consideration, as the acquisition of storedpotatoes probably promotes higher acrylamide formation and, thus, a higher reducing sugar content.In addition, use of the “special for frying” label should be supervised by the relevant food authority inorder to ensure products exhibit low levels of precursors, in addition to the suitable raw materialsintended for frying.
117

Foods 2020, 9, 799
Figure 4. Adherence of the Spanish population to EU recommendations for the mitigation of acrylamideformation in potatoes fried from raw potatoes in a domestic setting [5].
3.4. Practices Related to the Pre-Frying Stage
Before frying, most participants peel the potatoes (97.5%) (Table 3) and wash them after peeling(86.8%). Only 43 respondents (5.9%) usually wash tubers before peeling. Amongst the volunteers whowash potatoes (n = 634), 66 cut them after washing, whilst the remaining participants do so beforehand(Figure 3B). Most volunteers (n = 531) do not soak the potatoes; however, 508 do wash the potato tubersafter peeling. In contrast, 126 individuals both wash and soak the potatoes (Figure 3C), with less than15 min being the most commonly applied soaking time (126 respondents) (Table 3). Both washingand soaking habits are indistinctly applied with stored and in-season tubers (Figure 3D). In order todecrease the sugar content of fresh tubers, especially in the case of stored potatoes, practices such aswashing, soaking and/or blanching should be applied [29,30]. The European Commission recommendswashing and soaking for 30 min to 2 h in cold water, soaking for a few minutes in warm water orblanching [5] (Figure 1). Although respondents mostly wash potatoes before frying, soaking practicesshould be included as common habits during french fry preparation in Spain. These practices should beespecially promoted when using stored potatoes, as they lead to improved compliance with pre-fryingpotato handling and practice recommendations (Figure 4). It should be noted that consumers maywash potatoes for reasons other than to mitigate acrylamide formation. Reasons may include heritagehabits, hygiene purposes or simply to prevent browning whilst other elements of the meal are prepared.This observation was also made in the FSA report [11].
118

Foods 2020, 9, 799
Ta
ble
3.
Hab
its
for
fryi
ngpo
tato
esin
aSp
anis
hpo
pula
tion
(num
ber
ofca
ses,
(%))
.
Pre
-Fry
ing
Sta
ge
yes
nom
issi
ng1
Peel
ed71
2(9
7.5)
2(0
.3)
16(2
.2)
yes
nom
issi
ng1
Was
hed
634
(86.
8)82
(11.
3)14
(1.9
)
yes
nom
issi
ng1
Soak
ed18
5(2
5.4)
531
(72.
7)14
(1.9
)
<15
min
15–3
0m
in>
30m
in
Ifso
akin
g,du
rati
on12
6(1
7.3)
43(5
.9)
16(2
.2)
befo
refr
ying
duri
ngfr
ying
afte
rfr
ying
nom
issi
ng1
Salt
263
(36.
1)39
(5.3
)34
7(4
7.5)
79(1
0.8)
2(0
.3)
stri
pscu
bes
chip
sir
regu
lar
slic
es
Type
ofcu
t264
2(8
7.9)
142
(19.
5)57
(7.8
)85
(11.
6)15
8(2
1.6)
Fry
ing
Sta
ge
fryi
ngpa
nel
ectr
icfr
yer
both
othe
rm
issi
ng1
Kit
chen
appl
ianc
e57
7(7
9.0)
67(9
.2)
63(8
.6)
23(3
.2)
0(0
.0)
oliv
esu
nflow
erbo
thot
her
mis
sing
1
Type
ofoi
l57
4(7
8.7)
128
(17.
5)20
(2.7
)7
(1.0
)1
(0.1
)
tast
epr
ice
heal
thpe
rfor
man
ceap
plia
nce
Cri
teri
afo
roi
lsel
ecti
on37
5(5
1.3)
116
(15.
9)46
8(6
4.1)
132
(18.
1)25
(3.4
)
yes
noun
know
n3
mis
sing
1
Spec
ialf
orfr
ying
51(7
.0)
535
(73.
3)14
4(1
9.7)
0(0
.0)
<ha
lfha
lf>
half
full
mis
sing
1
Pota
to/a
pplia
nce
surf
ace
59(8
.1)
187
(25.
6)24
7(3
3.8)
235
(32.
2)2
(0.3
)
119

Foods 2020, 9, 799
Ta
ble
3.
Con
t.
yes
nono
tcon
sum
edm
issi
ng1
Def
rost
sfr
ozen
pota
toes
46
(0.8
)10
0(1
3.7)
621
(85.
1)3
(0.4
)
one
two
mis
sing
1
Fryi
ngcy
cles
696
(95.
3)22
(3.0
)12
(1.7
)
Po
st-F
ryin
gS
tag
e
soft
crun
chy-
soft
crun
chy
mis
sing
1
Text
ure
103
(14.
1)60
3(8
2.6)
24(3
.3)
0(0
.0)
pape
rra
ckbo
thno
nem
issi
ng1
Rem
oval
ofoi
l42
4(5
8.1)
114
(15.
6)15
4(2
1.1)
36(4
.9)
2(0
.3)
stra
iner
pape
rde
cant
atio
nno
clea
ning
mis
sing
1
Cle
anin
g43
9(6
0.1)
39(5
.3)
77(1
0.6)
164
(22.
5)11
(1.5
)
used
appl
ianc
ecl
osed
cont
aine
rop
enco
ntai
ner
nore
usin
gm
issi
ng1
Stor
age
133
(18.
2)38
4(5
2.6)
102
(14.
0)10
3(1
4.1)
8(1
.1)
1no
tans
wer
ed;2
mul
tipl
epo
ssib
lean
swer
s;3
volu
ntee
rdo
esno
tcar
eab
outt
his;
4on
lyfo
rfr
ozen
par-
frie
dpo
tato
es.
120

Foods 2020, 9, 799
Other aspects to mention in relation to the pre-frying stage include the addition of salt and the typeof potato cut. Salt is mainly added after frying (47.5%) and potatoes are mainly cut into strips (87.9%),followed by slices (21.6%) and cubes (19.5%). In response to this question, participants could providemultiple answers. For this reason, the sum of partial percentages is higher than 100%. Althoughneither the relevant regulation nor the acrylamide toolbox mention any indication about addingsalt before frying, the addition of calcium salts is recommended for the preparation of dough-basedpotatoes in order to reduce the pH level [5,6]. The presence of NaCl in the food matrix has beendescribed as decreasing the acrylamide content following heat treatment [31]. Thus, as long as theamount of added salt is not high and adheres to health recommendations for salt consumption [32],the population should be encouraged to add salt before frying. With regards to cutting preferences,given that acrylamide is formed on the surface of fried food, controlling thickness is an important factorfor preventing its formation. For french fries, it is better to cut in strips than in slices and, in addition,creating thicker strips of potato may reduce acrylamide in french fries [6]. In this sense, several authorshave observed an inverse trend between acrylamide levels and french fry thickness [33,34]. The FSAstudy [11] highlighted, in an English sample, that homemade potato items tended not to be finelychopped, avoiding the risk of additional acrylamide exposure through greater surface area to volumeratios. Similarly, Spanish habits with respect to the type of cut selected for french fries appear to beappropriate, although thickness should be more thoroughly examined.
3.5. Practices Related to the Frying Stage
Practically all respondents (95.3%) carry out a single frying cycle (Table 3). More than threequarters generally use a frying pan to fry potatoes (79.0%), with 9.2% remarking that the electricfryer was the preferred utensil and 8.6% indicating that they used both types of cookware indistinctly(Table 3). These results contrast those reported by Romero et al. [15], who reported that SpanishUniversity students mainly used electric fryers to prepare french fries (71.3%). Olive oil is the mostwidely used oil for frying potatoes (indicated by 78.7% of volunteers), with a much smaller percentageselecting sunflower oil as the preferred oil (17.5%). This reflects other profiles reported in previouslyconducted studies in Spain [35,36]. Respondents’ oil choices are conditioned by their related healthproperties (468 subjects), taste (375 subjects), oil stability (132 subjects), price (116 subjects) and,to a lesser extent, the appliance used for frying (20 subjects). The majority of participants (73.3%)do not consume oil labelled as “special for frying,” with 144 even being unaware of the existenceof these oils. The use of olive oil for frying is associated with healthy habits as it improves thesaturated/monounsaturated/polyunsaturated fatty acid profile of food and enriches its fat-solublevitamin and antioxidant compound content [37]. However, with regards to acrylamide formation,no significant differences have been observed following the preparation of french fries in differentedible oils [33]. Recommendations of the acrylamide toolbox and relevant regulation do not makeany type of reference to the type of oil to be used for frying, though they do specify the maximumtemperatures advised for the oil (Figure 1). Temperature is one of the main factors to determineacrylamide formation in processed foods and, consequently, its control is absolutely essential [33].Frying temperatures are recommended to be below 175 ◦C, and as low as possible at all times whilstconsidering food safety requirements. In addition, it is recommended to preheat the cooking utensilin order to reduce frying time [5,6]. All volunteers preheat the oil and indicated different criteriafor checking that oil temperature is ready for frying: adding a potato and observing its behavior(47.5%), smoke emission (smoke point) (18.9%) and controlling the thermostat of the electric fryer(7.9%). At the same time, 24.5% reported not having precise control, adding the food to the frying panafter the oil has warmed up for a period of time (without control) (Figure 5A). The majority of Spanishparticipants (80.8%) stated that they control the frying temperature by adjusting the thermostat (in thecase of using an electric fryer) or the power of the gas flame, glass ceramic or induction plate (in thecase of a frying pan) (Figure 5B). From the remaining sample, 68 people always select the maximumtemperature, whilst 59 do not control this aspect. Although the majority of individuals reported
121

Foods 2020, 9, 799
exercising control of the frying temperature, a temperature below 175 ºC cannot be ensured (Figure 4).Thus, recommendations on the optimal frying temperature for potatoes in order to prevent acrylamideformation should be addressed with the population. Frying temperature may be substantially lowerowing to the strong cooling that results from heating the potatoes and water evaporation, furtherdepending on the amount of potato added to the volume of frying oil [38]. Information about thefood/frying oil ratio was not obtained in the present survey; however, respondents made inferencesbased on the surface area of the appliance used. In this sense, the amount of food intended for fryingtypically amounted to more than half of the dimension of the frying surface (frying pan or fryingbasket) (33.8%) (Table 3). Thus, not only should recommendations be made for temperature control,but potato/oil ratio should be also considered.
Figure 5. Selection of frying starting point (A) and temperature control during french fry preparation (B).
Only 14.5% of participants (n = 106) reported consuming frozen par-fried potatoes. Of these,100 subjects do not defrost the product before frying, following the indications provided on the label ofthese products. This result could be considered a good practice as the relevant regulation suggests thatcooking instructions should be followed for frozen potato products [5].
3.6. Practices Related to the Post-Frying Stage
The literature describes a correlation between color and acrylamide formation in frenchfries [12,39–41]. Thus, the decision of food handlers regarding the final color will influence acrylamideexposure from french fries. It is recommendable to cook until a golden (yellow) color is achieved andto avoid overcooking [5,6] (Figure 1). Several educational initiatives have been undertaken to orientateconsumers so that they associate the extent of browning in french fries with mitigation strategiesfor acrylamide at home. Examples include the “go for gold” campaign launched by the UK FoodStandards Agency [11] and the slogan “golden but not toasted” by the Spanish Food Safety Agency [13].Participants in the present study showed an appropriate compliance with recommendations whenselecting the color of french fries as the main criteria for choosing the frying end-point (85.3%), with onlya minority of respondents stopping the procedure by tasting a sample (11.9%) or when the friedpotato stops bubbling in the oil (1.2%) (Figure 6A). Despite golden being the preferred color (87.3%)(Figure 6B), the distribution of color guides providing guidance on the optimal combination of colorand low acrylamide levels should not be discarded since previous research by our team has identifiedthe necessity of a clear definition of “golden” amongst consumers [41]. In agreement with theseobservations, visual checking of color and appearance was the dominant way to decide whether aproduct was “ready” as desired within a sample of English consumers [11].
122

Foods 2020, 9, 799
Figure 6. Criteria to decide the frying end-point (A) and color preferences in relation to french fries (B).
Another aspect collected in the survey refers to the texture of french fries, with crunchy on theoutside and soft on the inside being the preferred characteristic (82.6%) (Table 3). Further, approachesto removing oil from the fried product were considered, with this mainly performed through theapplication of absorbent paper (58.1%) or paper and rack (21.1%). With regards to the use of fryingoil, it is known that oils deteriorate during frying. This leads to changes in the fatty acid compositionand retention of other oil-degradation products in fried foods [42]. This fact becomes even morerelevant with repeated use. It is, therefore, important to control the number of times that frying oil isreused. In the present survey, amongst frying pan users, 25.8% utilize fresh oil whereas 63.1% reuse oil2–4 times. A minority of individuals stated reusing oil 4–8 times (8.8%) or more than 8 times (2.3%)(Figure 7). The amount of oil used in the frying pan tended to be small, with alterations appearingquickly. Oil should therefore be changed more frequently. In contrast, electric fryers use a greatervolume of oil, leading to more diluted alteration products and, therefore, allowing more foodstuffs tobe fried [37]. Only 130 respondents of the present survey used this appliance; four of these indicatedthat they always use fresh oil, with a higher proportion reusing the oil: 4–8 times (41.5%), more than8 times (37.7%) and 2–4 times (17.7%).
Factors considered by participants to determine changes to the frying oil are shown in Figure 7B.As shown, the main factors are organoleptic in nature, such as the darkening of the oil (32.0%) andpresence of sediments (20.1%). Taste (3.8%) and viscosity (4.2%) were reported to a lower extent.In contrast, 27.8% consider the number of frying cycles used to be the main criterion when determiningan oil change. In this sense, Romero et al. [15] reported that Spanish University students usuallychanged the oil in the electric fryer after a number of frying processes: <5 times (9%), 5–10 times (21%),11–20 times (25%) and >20 times (8%). Similarly, Gatti et al. [16] indicated that Argentinian adultstended to reuse oil used for domestic practices once (28%), twice (40%), three times (4%) or until someextent of alteration was observed (28%), although they did not specify the type of appliance used.Spanish volunteers mainly clean the oil by filtering it with a strainer (60.1%) and storing it in a closedcontainer (52.6%), open container (14.0%) or in the same frying container (13.2%) (Table 3). Similarhabits have been described for adults from Argentina. In this case, the main technique was to usepaper to remove excess oil from the food (84%); filter the oil before storage (52%) and store it in thesame container (60%), in a glass container (20%) or in a plastic container (20%) [16]. Oil cleaning is alsomentioned in acrylamide mitigation strategies during potato frying since removing fines and crumbsis recommended for maintaining frying oil quality [5]. Since frequent use of the same oil for fryingpotatoes was reported as a household habit of respondents, more emphasis on the importance of oilrenewal and its cleaning should be made in communications within the Spanish population.
123

Foods 2020, 9, 799
(B)
Figure 7. Frequency of use of frying oil (A) and reason for changing (B).
4. Conclusions
In the present study, a survey of domestic practices for cooking and preparing french fries wasconducted within the Spanish population. The aim was not to give advice on acrylamide or fryingpractices but to provide information on domestic habits in relation to french fry preparation, identifywhich consumer practices may influence acrylamide formation and evaluate compliance with theacrylamide mitigation strategies described by the European Regulation. Results indicated that theSpanish population mainly prepares french fries from fresh tubers acquired in supermarkets (48.1%),preferably in-season potatoes (49.1%), purchased in bulk (36.1%), washed (43.3%) and stored indoors(79.6%). These habits, together with frequent washing of potatoes before frying, are adequate forcontrolling acrylamide precursor levels (mainly reducing sugar content). However, consumers shouldbe more mindful when selecting the raw material. This is especially the case for those who donot consider the type of potato purchased at market. Improved practices would also include morefrequently soaking potatoes to reduce the sugar content of the fresh tubers, particularly during periodswhen stored potatoes are the only ones available on the market.
Following the typical Mediterranean culinary practices, olive oil was the most commonly usedfrying oil, followed by sunflower oil, whilst frying pans were the most common utensils used for thefrying process, leading individuals to more frequently replace cooking oil. Although most respondentsreported controlling frying temperature, advice relating to the maximum temperature recommendedfor preventing acrylamide formation in french fries should be addressed. On the other hand, examining
124

Foods 2020, 9, 799
the color of french fries as the main criteria for deciding the frying end-point was often reported,which coincides with one of the main tips for controlling acrylamide levels and, consequently, exposureto it. In this regard, although a golden color was preferred by respondents, color guidelines should bedistributed in order to clarify the definition of “golden.” The population should also be instructedabout the introduction of practices in relation to adding salt prior to frying, the type of cut, amount ofpotatoes in the appliance and cleaning oil after frying in order to understand all possible strategies foracrylamide mitigation at home.
From these results, it might be deduced that culinary domestic habits of the Spanish population arein line with recommendations for mitigating acrylamide during the preparation of french fries.Furthermore, they do not include any practices that increase the risk of acrylamide exposure.Nevertheless, some actions could be mentioned in order to control its presence in this food:(1) educational initiatives including information provision targeting improved domestic behaviorsfor the promotion of healthy frying habits should be promoted; (2) information should be speciallyfocused on the importance of the selection of suitable fresh tubers; (3) on the washing and soaking ofpotatoes before frying; and (4) on the control of frying temperatures below 175 ◦C, avoiding excessivebrowning of food. All these measures will effectively prevent acrylamide formation and, consequently,will reduce its exposure.
Supplementary Materials: The following are available online at http://www.mdpi.com/2304-8158/9/6/799/s1,Supplementary material: Survey on household habits in relation to frying potatoes.
Author Contributions: Conceptualization, M.M., C.D.-A. and F.J.M.; methodology, M.M.; software, M.M.;validation, M.M., C.D.-A. and F.J.M.; formal analysis, M.M.; investigation, M.M., C.D.-A. and F.J.M.; resources,F.J.M.; data curation, M.M., C.D.-A. and F.J.M.; writing—original draft preparation, M.M.; writing—review andediting, M.M., C.D.-A. and F.J.M.; supervision, M.M., C.D.-A. and F.J.M.; funding acquisition, M.M., C.D.-A. andF.J.M. All authors have read and agreed to the published version of the manuscript.
Funding: This research was partly funded by the Ministry of Economy and Competitiveness (Spain)under the projects SAFEFRYING (AGL2015-46234-R; MINECO) and ACRINTAKE (RTI2018-094402-B-I00,MCIU/AEI/FEDER, UE).
Acknowledgments: The authors thank J. Martinez-Monzó and P. García for their work in validating the questionnaire.
Conflicts of Interest: The authors declare no conflict of interest.
References
1. Bonwich, G.; Birch, C.S. European regulation of process contaminants in food. In Mitigation Contaminationfrom Food Processing; Birch, C.S., Bonwick, G.A., Eds.; RSC: Cambridge, UK, 2019; pp. 1–16.
2. Van Boekel, M.; Fogliano, V.; Pellegrini, N.; Stanton, C.; Scholz, G.; Lalljie, S.; Somoza, V.; Knorr, D.; Jasti, P.R.;Eisenbrand, G. A review on the beneficial aspects of food processing. Mol. Nutr. Food Res. 2010, 54,1215–1247. [CrossRef]
3. EFSA (European Food Safety Authority). Scientific opinion on acrylamide in food. EFSA J. 2015, 13, 4104.4. IARC (International Agency for Research on Cancer). Some industrial chemicals. In IARC Monographs on the
Evaluation for Carcinogenic Risk of Chemicals to Humans; IARC: Lyon, France, 1994; Volume 60, pp. 435–453.5. EC (European Commission). Commission Regulation (EU) 2017/2158 of 20 November 2017 establishing
mitigation measures and benchmark levels for the reduction of the presence of acrylamide in food. OJEU 2017,304, 24–44.
6. FDE (FoodDrinkEurope). 2019. Available online: https://www.fooddrinkeurope.eu/uploads/publications_documents/FoodDrinkEurope_Acrylamide_Toolbox_2019.pdf (accessed on 12 April 2020).
7. Claeys, W.; De Meulenaer, B.; Huyghebaert, A.; Scippo, M.L.; Hoet, P.; Matthys, C. Reassessment of theacrylamide risk: Belgium as a case-study. Food Control 2016, 59, 628–635. [CrossRef]
8. Powers, S.J.; Mottram, D.S.; Curtis, A.; Halford, N.G. Acrylamide levels in potato crisps in Europe from 2002to 2016. Food Addit. Contam. Part A 2017, 34, 2085–2100. [CrossRef]
9. Mesias, M.; Nouali, A.; Delgado-Andrade, C.; Morales, F.J. How far is the Spanish snack sector from meetingthe acrylamide regulation 2017/2158? Foods 2020, 9, 247. [CrossRef]
125

Foods 2020, 9, 799
10. Langiano, E.; Ferrara, M.; Lanni, L.; Viscardi, V.; Abbatecola, A.M.; De Vito, E. Food safety at home:Knowledge and practices of consumers. Z. Gesundh. 2012, 20, 47–57. [CrossRef]
11. FSA (Food Standards Agency). Acrylamide in the home: Home-Cooking Practices and Acrylamide Formation.2017. Available online: https://www.food.gov.uk/research/research-projects/acrylamide-in-the-home-the-effects-of-home-cooking-on-acrylamide-generation (accessed on 14 April 2020).
12. Mesías, M.; Holgado, F.; Márquez-Ruiz, G.; Morales, F.J. Impact of the characteristics of fresh potatoes availablein-retail on exposure to acrylamide: Case study for French fries. Food Control 2017, 73, 1407–1414. [CrossRef]
13. AECOSAN (Spanish Agency for Consumer Affairs, Food Safety and Nutrition). 2015. Available online: http://www.aecosan.msssi.gob.es/AECOSAN/web/seguridad_alimentaria/subdetalle/acrilamida.htm (accessed on14 April 2020).
14. EFSA (European Food Safety Authority). Special Eurobarometer Wave EB91.3. 2019. Available online:http://www.efsa.europa.eu/sites/default/files/corporate_publications/files/Eurobarometer2019_Food-safety-in-the-EU_Full-report.pdf (accessed on 12 April 2020).
15. Romero, A.; Cuesta, C.; Sánchez-Muniz, F.J. Utilización de freidora doméstica entre universitarios madrileños.Aceptación de alimentos congelados fritos en aceite de oliva virgen extra, girasol y girasol alto oleico.Grasas Aceites 2001, 52, 38–44.
16. Gatti, M.B.; Cabreriso, M.S.; Chain, P.; Coniglio, A.; Manin, M.; Ciappini, M.C. Evaluación de la frecuenciade consumo de alimentos fritos y de las técnicas de frituras domésticas en adultos rosarinos. Invenio 2015,19, 155–165.
17. Wood, K.; Carragher, J.; Davis, R. Australian consumer’s insights into potatoes-nutritional knowledge,perceptions and beliefs. Appetite 2017, 114, 169–174. [CrossRef] [PubMed]
18. Van den Berg, M.H.; Overbeek, A.; van der Pal, H.J.; Versluys, B.; Bresters, D.; van Leeuwen, F.E.; Lambalk, C.B.;Kaspers, G.J.L.; van Dulmen-den Broeder, E. Using web-based and paper-based questionnaires for collectingdata on fertility issues among female childhood cancer survivors: Differences in response characteristics.J. Med. Internet Res. 2011, 13, e76. [CrossRef]
19. Instituto Nacional de Estadistica. Cifras de Población Residente en España. Datos Provisionales a 1 deEnero de 2020. Available online: https://www.ine.es/dyngs/INEbase/es/operacion.htm?c=Estadistica_C&cid=1254736176951&menu=ultiDatos&idp=1254735572981 (accessed on 10 June 2020).
20. Díaz-Méndez, C.; García-Espejo, I.; Gutiérrez-Palacios, R.; Novo-Vázquez, A. Hábitos alimentarios de losespañoles; Ministerio de Agricultura, Alimentación y Medio Ambiente: Madrid, Spain, 2013. Available online:http://www.besana.es/sites/default/files/estudio_habitos_alimentarios_de_los_espanoles.pdf (accessed on10 April 2020).
21. MAPA (Ministry of Agriculture, Fisheries and Foods). Datos de Consumo Alimentario. Informe delConsume Alimentario en España. 2018. Available online: https://www.mapa.gob.es/images/es/20190807_informedeconsumo2018pdf_tcm30-512256.pdf (accessed on 10 April 2020).
22. Mellema, M. Mechanism and reduction of fat uptake in deep-fatfried foods. Trends Food Sci. Technol. 2003,14, 364. [CrossRef]
23. Bastida, S.; Sánchez-Muniz, F.J. Frying: A cultural way of cooking in the Mediterranean diet. In TheMediterranean Diet. An Evidence-Based Approach; Preedy, V.R., Watson, R.S., Eds.; Academic Press: London,UK, 2015; pp. 217–236.
24. Boletin Oficial del Estado (BOE). Real Decreto 31/2009, de 16 de enero, por el que se aprueba la norma decalidad comercial para las patatas de consumo en el mercado nacional y se modifica el anexo I del RealDecreto 2192/1984, de 28 de noviembre, por el que se aprueba el Reglamento de aplicación de las normas decalidad para las frutas y hortalizas frescas comercializadas en el mercado interior. BOE 2009, 21, 8175–8182.
25. Becalski, A.; Lau, B.P.Y.; Lewis, D.; Seaman, S.W.; Hayward, S.; Sahagian, M.; Ramesh, M.; Leclerc, Y.Acrylamide in French fries: Influence of free amino acids and sugars. J. Agric. Food Chem. 2004, 52, 3801–3806.[CrossRef] [PubMed]
26. Williams, J.S.E. Influence of variety and processing conditions on acrylamide levels in fried potato crisps.Food Chem. 2005, 90, 875–881. [CrossRef]
27. Muttucumaru, N.; Powers, S.J.; Elmore, J.S.; Briddon, A.; Mottram, D.S.; Halford, N.G. Evidence for thecomplex relationship between free amino acid and sugar concentrations and acrylamide-forming potentialin potato. Ann. Appl. Biol. 2014, 164, 286–300. [CrossRef] [PubMed]
126
Foods 2020, 9, 799
28. De Wilde, T.; De Meulenaer, B.; Mestdagh, F.; Govaert, Y.; Vandeburie, S.; Ooghe, W.; Fraselle, S.;Demeulemeester, K.; Van Peteghem, C.; Calus, A.; et al. Influence of storage practices on acrylamideformation during potato frying. J. Agric. Food Chem. 2005, 53, 6550–6557. [CrossRef] [PubMed]
29. Burch, R.S.; Trzesicka, A.; Clarke, M.; Elmore, J.S.; Briddon, A.; Matthews, W.; Webber, N. The effects oflow-temperature potato storage and washing and soaking pre-treatments on the acrylamide content ofFrench fries. J. Sci. Food Agric. 2008, 88, 989–995. [CrossRef]
30. Abboudi, M.; Al-Bachir, M.; Koudsi, Y.; Jouhara, H. Combined effects of gamma irradiation and blanchingprocess on acrylamide content in fried potato strips. Int. J. Food Prop. 2016, 19, 1447–1454. [CrossRef]
31. Kolek, E.; Simko, P.; Simon, P. Effect of NaCl on the decrease of acrylamide content in a heat-treated modelfood matrix. J. Food Nutr. Res. 2006, 45, 17–20.
32. He, F.J.; Tan, M.; Ma, Y.; MacGregor, G.A. Salt reduction to prevent hypertension and cardiovascular disease.J. Am. Coll. Cardiol. 2020, 75, 632–647. [CrossRef]
33. Matthäus, B.; Haase, N.; Vosmann, K. Factors affecting the concentration of acrylamide during deep-fatfrying of potatoes. Eur. J. Lipid Technol. 2004, 106, 793–801. [CrossRef]
34. Mesias, M.; Delgado-Andrade, C.; Holgado, F.; Morales, F.J. Acrylamide content in French fries prepared inhouseholds: A pilot study in Spanish homes. Food Chem. 2018, 260, 44–52. [CrossRef]
35. Sayon-Orea, C.; Bes-Rastrollo, M.; Basterra-Gortari, F.J.; Beunza, J.J.; Guallar-Castillon, P.; de la Fuente-Arrillaga, C.;Martinez-Gonzalez, M.A. Consumption of fried foods and weight gain in a mediterranean cohort: The sunproject. Nutr. Metab. Cardiovas. 2013, 23, 144–150. [CrossRef]
36. Guallar-Castillón, P.; Rodríguez-Artalejo, F.; Lopez-Garcia, E.; León-Muñoz, L.M.; Amiano, P.; Ardanaz, E.;Arriola, L.; Barricarte, A.; Buckland, G.; Chirlaque, M.D.; et al. Consumption of fried foods and risk ofcoronary heart disease: Spanish cohort of the European prospective investigation into cancer and nutritionstudy. Br. Med. J. 2012, 344, e363. [CrossRef] [PubMed]
37. Sánchez Muniz, F.J. Aceite de oliva, clave de vida en la Cuenca Mediterránea. Real Acad. Nac. F. 2007,73, 653–692.
38. Fiselier, K.; Bazzocco, D.; Gama-Baumgartner, F.; Grob, K. Influence of the frying temperature on acrylamideformation in French fries. Eur. Food Res. Technol. 2006, 222, 414–419. [CrossRef]
39. Pedreschi, F.; Kaack, K.; Granby, K. Acrylamide content and color development in fried potato strips. Food Res.Int. 2006, 39, 40–46. [CrossRef]
40. Gökmen, V.; Senyuva, H.Z.; Dülek, B.; Çetin, A.E. Computer vision-based image analysis for the estimationof acrylamide concentrations of potato chips and French fries. Food Chem. 2007, 101, 791–798. [CrossRef]
41. Mesias, M.; Delgado-Andrade, C.; Holgado, F.; Morales, F.J. Impact of the consumer cooking practices onacrylamide formation during the preparation of French fries in Spanish households. Food Addit. Contam.Part A 2020, 37, 254–266. [CrossRef] [PubMed]
42. Nayak, P.K.; Dash, U.; Rayaguru, K.; Krishnan, K.R. Physio-chemical changes during repeated frying ofcooked oil: A review. J. Food Biochem. 2016, 40, 371–390. [CrossRef]
© 2020 by the authors. Licensee MDPI, Basel, Switzerland. This article is an open accessarticle distributed under the terms and conditions of the Creative Commons Attribution(CC BY) license (http://creativecommons.org/licenses/by/4.0/).
127


foods
Article
Assessment of Healthy and Harmful MaillardReaction Products in a Novel Coffee Cascara Beverage:Melanoidins and Acrylamide
Amaia Iriondo-DeHond 1, Ana Sofía Elizondo 1, Maite Iriondo-DeHond 2, Maria Belén Ríos 1,
Romina Mufari 1,3, Jose A. Mendiola 1, Elena Ibañez 1 and Maria Dolores del Castillo 1,*
1 Instituto de Investigación en Ciencias de la Alimentación (CIAL) (CSIC-UAM), Calle Nicolás Cabrera, 9,28049 Madrid, Spain; [email protected] (A.I.-D.); [email protected] (A.S.E.);[email protected] (M.B.R.); [email protected] (R.M.);[email protected] (J.A.M.); [email protected] (E.I.)
2 Instituto Madrileño de Investigación y Desarrollo Rural, Agrario y Alimentario (IMIDRA), N-II km 38,28800 Alcalá de Henares, Spain; [email protected]
3 Instituto de Ciencia y Tecnologia de los Alimentos (ICTA), Av. Velez Sarsfield 1611, Cordoba 5016, Argentina* Correspondence: [email protected]; Tel.: +34-91-0017900 (ext. 953)
Received: 31 March 2020; Accepted: 7 May 2020; Published: 12 May 2020
Abstract: Our research aimed to evaluate the formation of Maillard reaction products in sun-driedcoffee cascara and their impact on the safety and health promoting properties of a novel beveragecalled “Instant Cascara” (IC) derived from this coffee by-product. Maillard reaction products insun-dried coffee cascara have never been reported. “Instant Cascara” (IC) extract was obtained byaqueous extraction and freeze-drying. Proteins, amino acids, lipids, fatty acid profile, sugars, fiber,minerals, and vitamins were analyzed for its nutritional characterization. Acrylamide and caffeinewere used as chemical indicators of safety. Colored compounds, also called melanoidins, their stabilityunder 40 ◦C and in light, and their in vitro antioxidant capacity were also studied. A safe instantbeverage with antioxidant properties was obtained to which the following nutritional claims can beassigned: “low fat”, “low sugar” “high fiber” and “source of potassium, magnesium and vitamin C”.For the first time, cascara beverage color was attributed to the presence of antioxidant melanoidins(>10 kDa). IC is a potential sustainable alternative for instant coffee, with low caffeine and acrylamidelevels and a healthy composition of nutrients and antioxidants.
Keywords: acrylamide; coffee cascara; food safety; instant beverage; Maillard reaction; melanoidins
1. Introduction
Maillard Reaction Products (MRPs) are the result of a chemical reaction between amino acids andreducing sugars when foods are being processed at high temperatures [1]. This reaction enhances flavorand color, and MRP have been associated with both positive and negative health effects [2]. In thecase of coffee, the main MRPs produced during coffee roasting are melanoidins. The main sources ofdietary melanoidins in Western diets are coffee and bakery products [3,4]. The average melanoidincontent in medium roasted coffee is 7.2 g per 100 g. On the other hand, the amount of melanoidins inbread crusts ranges from 14 g to 30 g per 100 g of bread crust [3]. Different health-promoting propertiessuch as antioxidant, antimicrobial, anti-inflammatory and antihypertensive activity have been assessedin these molecules [5]. Besides melanoidins, another MRP found in coffee beverages is acrylamide.This compound is considered a contaminant and classified by the International Agency of Research onCancer (IARC) as a potential carcinogenic (class 2A) [6]. The European Food Safety Authority (EFSA)has stated that coffee and its substitutes can contribute up to 40% of the dietary exposure to acrylamide
Foods 2020, 9, 620; doi:10.3390/foods9050620 www.mdpi.com/journal/foods129
Foods 2020, 9, 620
for the adult population. The European Commission (EC) established several recommendations formonitoring acrylamide levels in food, recommending 450 μg/kg for roasted coffee and 900 μg/kg forinstant coffee [7]. Besides coffee, the main sources of human dietary exposure to acrylamide are friedpotatoes (~272–570 μg/kg), bakery products (~75–1044 μg/kg) and breakfast cereals (~149 μg/kg) [7,8].
Given the great demand for coffee worldwide, an important number of by-products are generatedduring its processing [9]. Coffee cascara represents the main by-product of the coffee industry andits revalorization has gained interest over the last decade. After de-pulping, this by-product isnormally dehydrated in the sun for 21 days to reduce its moisture to 10%. Cascara contains thesubstrates, such as amino acids, proteins and carbohydrates, needed for the Maillard reaction (MR) [10].During the dehydration process of cascara, the MR may occur and healthy (melanoidins) and harmful(acrylamide) MRP may be generated [11,12]. The occurrence of the MR during the dehydration of figs,dates and raisins under similar conditions to those employed in cascara processing has been previouslydescribed [11].
Recent studies consider cascara as a potential source of phenolic compounds with antioxidantproperties and the potential to improve human health [13,14]. For this reason, the use of this by-productto elaborate a novel antioxidant beverage supposes several advantages: promoting the sustainability ofthe coffee industry, avoiding the waste of new by-products by using the insoluble residue that resultsfrom the extraction to obtain cascara flour [10], and creating an added value, sustainable and healthydrink [15]. Since cascara is considered a novel food according to the European Commission [16],more safety and toxicity studies are needed for its further approval [17].
An aqueous extraction of coffee cascara was proposed to obtain a soluble powder also calledhereby as ‘Instant Cascara’ (IC). This research seeks to obtain a product that offers a healthier nutritionalprofile than the powdered soft drinks commercially available, which stand out mainly for the excessivepresence of sugar [18]. A very recently published critical review showed that the consumption ofsoft drinks has increased dramatically over the past years, being mostly consumed by children andteenagers [19]. Excessive intake of soft drinks with high sugar and acid leads to dental caries anderosion, overweight, obesity and increased risk of type 2 diabetes [19]. Although consumers are awareof the impact of the consumption of these beverages on human health, it is still necessary to educatethe population about the harmful effects of these drinks and also to develop healthier alternatives.Therefore, the aim of this research was to develop a novel safe antioxidant “Instant Cascara” beverage(IC), contributing to the sustainability of the coffee sector and offering healthier products to the generalpopulation satisfying their nutritional demands. To achieve the goal, the formation of Maillard reactionproducts in sun-dried coffee cascara and their impact on the safety and health promoting propertiesof a novel beverage called “Instant Cascara” (IC) derived from this coffee by-product was assessed.Maillard reaction products in sun-dried coffee cascara have never been reported before.
2. Materials and Methods
2.1. Food Samples
2.1.1. Raw Cascara
SUPRACAFÉ S.A. (Móstoles, Madrid, Spain) provided coffee cascara (CA) from Arabica speciesand Tabi variety from Colombia. Coffee cascara was obtained in the processing of the coffee berry,dried for 21 days in the sun, and subjected to a sanitation process involving the use of a carbon dioxideatmosphere (Martin Bauer, MABA-PEX process).
2.1.2. Homemade Instant Cascara
Powdered aqueous extract from coffee cascara (IC) was obtained as described in the patentWO2013004873A1 [20], which consisted of an aqueous extraction of 50 g/L at 100 ◦C for 10 min.Sample was filtered (250 μm) and freeze-dried. IC extraction yield was 20%.
130

Foods 2020, 9, 620
Two beverages were formulated from IC at 4 mg/mL and 10 mg/mL. Concentrations were chosenbased on commercial instant coffee drinks. Elaboration consisted of diluting each IC dose with waterat room temperature.
2.1.3. Commercial Cascara Infusion (Tabifruit)
IC drinks (4 and 10 mg/mL) were compared with a commercial infusion of coffee cascara (Tabifruit,Supracafé S.A., Madrid, Spain). This was elaborated according to the procedure indicated for theproduct, leaving the infusion bag (3 g) in 250 mL of water at 100 ◦C for 4 min, creating a finalconcentration of cascara of 12 mg/mL.
2.2. Nutritional Characterization
2.2.1. Protein and Amino Acid Profile
Protein content in cascara (CA) and instant cascara (IC) was obtained through Kjeldahlmineralization carried out by the Bioanalytical Techniques Unit at the Instituto de Investigaciónen Ciencias de la Alimentación (CIAL, UAM-CSIC, Madrid, Spain) and quantification was performedby colorimetric analysis of nitrogen (AOAC-32.1.22,920.87). A conversion factor of 5.6 was usedto calculate protein content. Analysis was carried out in duplicate and results were expressed aspercentage of dry matter.
Free and total amino acid quantification was carried out by the Servicio de Química de Proteínasof the Centro de Investigaciones Biológicas (CIB, CSIC, Madrid, Spain). For total amino acidquantification, samples were hydrolyzed in an acid medium for later analysis by high performanceliquid chromatography (HPLC) with post-column derivatization, using nihydrin. Analyses werecarried out in duplicate and results were expressed as mg/g.
Both determinations were performed as previously described [21].
2.2.2. Lipids and Fatty Acid Profile
Lipid quantification in CA and IC was performed by Soxhlet extraction as described in AOACOfficial Method 945.16. using petroleum ether. Results were obtained by weighing the dry productcontaining the lipid fraction and were expressed as % dry matter.
Fatty acid profile was determined by gas chromatography according to ISO 12966-2:2017;using a flame ionization detector (Agilent 7820A GC system, Agilent Technologies, Inc., Santa Clara,CA, USA) [22]. Analysis was carried out by the Analysis Services Unit facilities of the Institute ofFood Science, Technology and Nutrition (ICTAN, CSIC, Madrid, Spain). Analysis was carried out induplicate and results were expressed as grams per 100 g of sample.
Both determinations were performed as previously described [23].
2.2.3. Dietary Fiber
Insoluble (IDF), soluble (SDF) and total (TDF) dietary fiber were determined in CA and IC usingthe Megazyme Total Dietary Fiber Kit (Megazyme, Wicklow, Ireland), an enzymatic-gravimetricassay based on the AOAC-991.43 and AACC-32.07.01 method. Analysis was carried out in duplicate.Results were expressed as weight percentage (%).
2.2.4. Sugars, Minerals and Vitamin C
Determination of sugars, minerals and ascorbic acid in CA and IC was carried out by theAnalysis Services Unit facilities of the Institute of Food Science, Technology and Nutrition (ICTAN,CSIC, Madrid, Spain). All determinations were performed in duplicate as previously described [24].Results were expressed as g/100 g for simple sugars and mg/100 g for minerals and ascorbic acid.
131

Foods 2020, 9, 620
2.2.5. Total Carbohydrates
Carbohydrate content in liquid IC beverages (4 mg/mL and 10 mg/mL) was determined asdescribed by Masuko et al. (2005), using the phenol-sulfuric method [25]. The experiment was initiatedwith the preparation of the reagents, phenol at 5% (Sigma-Aldrich, St. Louis, MO, USA) and sulfuricacid at 98% (Sigma-Aldrich, St. Louis, MO, USA). Glucose (Sigma-Aldrich, St. Louis, MO, USA)calibration curves was prepared (0.1–0.5 mg/mL), and in 2 mL glass vials, 100 μL of sample or standard,300 μL of sulfuric acid and 90 μL of phenol or H20 for the sample blanks were added. Vials wereincubated at 90 ◦C for 5 min, followed by a water bath at room temperature for 5 min. Then, 100 μL ofeach sample was transferred to a 96-well plate and absorbance was measured at 490 nm in a UV-Visiblespectrophotometer (BioTek Instruments, Winooski, VT, USA).
2.2.6. Glucose
Free glucose content was determined in liquid IC beverages (4 mg/mL and 10 mg/mL) usingthe Glucose TR Kit (SpinReact, Girona, Spain) following manufacturer’s instructions. Results wereexpressed as mg glucose/mL of beverage.
2.3. Maillard Reaction Products (MRP)
2.3.1. Acrylamide
For certifying the safety of the novel instant beverage, acrylamide content was analyzed in the ICpowder and in liquid samples. A sample preparation procedure according to the standard UNE-EN16618:2015 [26] with some modifications was used. A total of 1 g of sample was weighed into acentrifuge tube (20 mL of water in the case of IC powder were added) and was spiked with 100 ng/g of13C3-labelled acrylamide (Sigma-Aldrich, St. Louis, MO, USA), to determine the percentage recoveryof the method at this stage. Then, it was quantitatively transferred for the SPE clean-up in C18 (Isolute,500 mg/ 6 mL, Biotage, Uppsala, Sweden) cartridge preconditioned using a multi-stage vacuum system(Agilent Technologies; Palo Alto, CA, USA). The eluate was collected and submitted to another step ofclean up with the ENV+ (Isolute, 500 mg/ 6 mL, Biotage, Uppsala, Sweden) preconditioned cartridge.The cartridge was rinsed with two fractions of 2 mL of water, followed by the elution of acrylamidewith 2 mL of methanol 60% in water. The final extract was concentrated by removing the extractionsolvent in an oven at 35 ◦C to an approximate volume of 500 μL and stored in vials for the quantitationby LC-MS/MS.
The LC-MS/MS analysis was performed according to methodology described by Mastovska andLehotay [27], using an Agilent 1290 Infinity II system, interfaced to an Agilent 6470 triple quadrupolemass spectrometer (Agilent Technologies; Palo Alto, CA, USA). Sample injection volume was 10 μL,and an Agilent Infinity Lab Poroshell 120 EC-C18 column (100 × 4.6 mm; 2.7 μm particle size) kept at30 ◦C was employed for the LC separation. The mobile phase was 99.5:0.5 (v/v) water-MeOH, with 0.1%formic acid, at a flow rate of 400 μL/min for 8 min for elution of acrylamide (retention time 4.02 min)and then 0.1% formic acid in MeCN-MeOH (50:50, v/v) for the post-analysis wash (at 400 μL/min for6 min) followed by equilibration to initial conditions. The MS determination was performed in ESIpositive mode. Monitoring transitions m/z 72 > 55, 72 > 54, 72 > 44, and 72 > 27 were recorded foracrylamide, whereas the transitions m/z 75 > 58 were used for the 13C3-labelled acrylamide. Resultswere expressed as μg/kg of sample.
2.3.2. Melanoidins
The content of melanoidins in liquid IC beverages was analyzed spectrophotometrically.Light-absorption measurement of samples at 420 nm was performed using a microplate reader(BioTek Epoch 2 Microplate Spectrophotometer, Winooski, VT, USA). Caramel (E-150d) was used as amelanoidin standard. Analytical determination was carried out in triplicate. Results were expressed inequivalent milligrams of caramel melanoidins/gram of sample.
132

Foods 2020, 9, 620
2.3.3. Antioxidants
Preliminary Information on Antioxidant Composition by Spectral Analysis
UV-Visible spectrum of in liquid IC beverages (4 mg/mL and 10 mg/mL) was obtainedusing a microplate reader (BioTek Epoch 2 Microplate Spectrophotometer, Winooski, VT, USA).Absorption spectra of samples were recorded from 200 to 700 nm.
Phenolic Compounds
For phenolic compounds analysis in liquid IC beverages (4 mg/mL and 10 mg/mL), Folin-Ciocalteumethod was adapted to a micro-method format [28]. Folin-Ciocalteu reagent (Sigma-Aldrich,St. Louis, MO, USA) and chlorogenic acid (CGA) (Sigma-Aldrich, St. Louis, MO, USA) standardsolution (0.1–0.9 mg/mL) were prepared. Reaction was initiated by adding 10 μL of sample or standardand 150 μL of the Folin solution to a 96-well plate. Blanks from samples and reagent were also analyzed.After 3 min of incubation at 37 ◦C, 50 μL of sodium carbonate (Sigma-Aldrich, St. Louis, MO, USA)were added. Samples were incubated for 2 h and absorbance was measured at 735 nm. Results wereexpressed as mg/mL of CGA and measurements were performed in triplicate.
Total Anthocyanins
Total anthocyanins content was measured in liquid IC beverages (4 mg/mL and 10 mg/mL)according to Wrolstad and Giusti (2001) [29]. In a 96-well plate, 40 μL of sample and 160 μL ofpotassium chloride (0.025 M, Sigma-Aldrich, St. Louis, MO, USA) and sodium acetate buffer (0.4 M,Sigma-Aldrich, St. Louis, MO, USA) were added and incubated for 15 min at 37 ◦C. Absorbance wasmeasured at 520 nm and 700 nm. Cyanidine-3-glucoside (C3G) was used as reference for calibrationcurve (0.0–0.2 mg/mL) and measurements were performed in triplicate.
Overall Antioxidant Capacity
ABTS
ABTS (2,2′-azino-bis(3-ethylbenzothiazoline-6-sulfonic acid)) bleaching method was determinedin liquid IC beverages (4 mg/mL and 10 mg/mL) as detailed by Tsao et al. (2003) and rectified byOki et al. (2006) for its use in a microplate [30,31]. ABTS•+ stock solution was prepared by mixing theABTS•+ radical and potassium persulfate (Sigma-Aldrich, St. Louis, MO, USA). Solution was thenleft to stand for 16h at room temperature. Afterwards, ABTS•+ working solution was prepared bydiluting the stock solution 1:75 (v/v) in 5 mM of sodium phosphate buffer at pH 7.4 and adjusted toan absorbance of 0.7 ± 0.02 at 734 nm. Chlorogenic acid (CGA) calibration curve (25–200 μM) wasused for antioxidant capacity analysis. Measurements were performed in triplicate and results wereexpressed as mg/mL of CGA.
FRAP
Antioxidant capacity by FRAP (Ferric Reducing Antioxidant Power Assay) was determined inliquid IC beverages (4 mg/mL and 10 mg/mL) as described by Benzie and Strain (1996) and modifiedby Tsao et al. (2003) for use in a microplate [30,32]. Experiment was initiated with the preparation ofTPTZ 10 mM in 40 mM HCl, ferric chloride hexahydrate (FeCl3-6H20) 20 mM, and the FRAP reagent(Sigma-Aldrich, St. Louis, MO, USA): a mixture of 0.3 M of acetate buffer, 2.5 mL of TPTZ solutionand 2.5 mL of FeCl3-6H2O solution. Reaction took place by adding 10 μL of sample and 290 μL ofFRAP reagent into a 96-well plate for 10 min at 593 nm. Sample and reagent blanks were also measured.CGA was used for the calibration curve (0.025–0.2 mg/mL) and results were expressed as mg/mL of CGA.
133

Foods 2020, 9, 620
Contribution of Melanoidins to the Overall Antioxidant Properties of IC
To determine which compounds contribute to the antioxidant properties of the beverages,each sample was ultra-filtrated using Macrosep Advance Centrifugal Devices (Pall Corporation,Ann Arbor, MI, USA) of a molecular cut membrane of 10 kDa. Samples were centrifuged(Hettich Universal 320R Centrifuge, Andreas Hettich GmbH & Co.KG, Tuttlingen, Germany) at3000 g for 90 min to separate the high molecular weight (HMW) and low molecular weight (LMW)fractions. HMW fractions were washed three times using same centrifugation conditions. Antioxidantcapacity of HMW and LMW fractions of IC beverages (4 and 10 mg/mL) and Tabifruit was analyzed byABTS and FRAP methods (see methods described above).
2.4. Shelf Life Study Under Accelerated Storage Conditions of Liquid IC
Beverage stability was evaluated under different light exposure and temperatureconditions. In 10 mL glass vials, samples were tested for 72 h under three different conditions: 40 ◦Cand light (Temp + light), room temperature and light (light) and room temperature and no lightexposure (darkness) [33]. Light exposure was carried out with artificial light from a fluorescent lampof 500 lux of illuminance. Prior to the study, pH of each sample was measured using the pH meter MP230 (Mettler Toledo, Barcelona, Spain) previously calibrated.
Total phenolic content and ABTS were determined in beverages after the shelf life study asindicated in Section 2.3.3.
Color
Color measurement was performed with a Reflectance Integrating Sphere SPECORD 210 Plus(Analytik Jena, Jena, Germany). Samples were analyzed in 2 mL plastic vials and results were obtainedthrough the WinAspect Plus program (Jena, Germany), using the CIE color space L* a* b* as numericalvalues representing luminosity and color parameters. Samples were analyzed in triplicate. Colors weregenerated from L* a* b* values using colorizer.org as a high precision color generator [34].
2.5. Statistical Analysis
All results were expressed as the mean ± standard deviation (SD). Analysis of variance(ANOVA) and Tukey as a post-hoc test were carried out to determine differences between means.Differences were considered to be statistically significant at p < 0.05. Pearson’s correlation coefficientwas calculated using the Excel Analysis ToolPak (Microsoft, Redmond, WA, USA). XL-Stat version2020.1.3 (Addinsoft, New York, NY, USA) was used to analyze JAR data. Analysis of variance wereconducted on IBM SPSS Statistics 24 (IBM, Armonk, NY, USA).
3. Results and Discussion
3.1. Nutritional Characterization of CA
Table 1 shows protein and amino acid content (free and total) of the raw material used in thisinvestigation, coffee cascara (CA). Protein content found in CA was 9.55%, which is in accordance tothat previously described [10,35–38].
134

Foods 2020, 9, 620
Table 1. Total protein (%) and free and total amino acid content (mg/g) of raw dry coffee cascara (CA)and powdered Instant Cascara beverage (IC).
CA IC
Total Protein (%) 9.55 ± 0.11 b 6.25 ± 0.27 a
Amino Acids (mg/g) Free Total Free Total
Aminobutyric acid (GABA) N.D. N.A. 0.3 ± 0.00 N.A.Glutamic acid (Glu) N.D. 2.13 ± 0.04 a 0.40 ± 0.01 2.11 ± 0.17 a
Alanine (Ala) N.D. 2.06 ± 0.11 a 2.27 ± 0.01 2.44 ± 0.05 a
Arginine (Arg) N.D. 0.48 ± 0.03 a 1.39 ± 0.02 1.05 ± 0.04 b
Asparagine (Asp) N.D. 2.84 ± 0.14 a 1.91 ± 0.05 7.79 ± 0.37 b
Cysteine (Cis) N.D. 0.18 ± 0.00 a 0.17 ± 0.01 0.22 ± 0.02 a
Phenylalanine (Phe) N.D. 0.98 ± 0.10 a 0.17 ± 0.01 0.31 ± 0.01 a
Glycine (Gly) N.D. 2.71 ± 0.17 a 0.30 ± 0.27 1.19 ± 0.04 a
Histidine (His) N.D. 0.52 ± 0.10 b 0.08 ± 0.01 0.16 ± 0.01 a
Isoleucine (Ile) N.D. 0.63 ± 0.05 b 0.05 ± 0.00 0.18 ± 0.04 a
Leucine (Leu) N.D. 1.17 ± 0.03 b 0.05 ± 0.01 0.27 ± 0.04 a
Lysine (Lys) N.D. 0.38 ± 0.01 a 0.03 ± 0.01 0.21 ± 0.01 a
Methionine (Met) N.D. 0.25 ± 0.02 a N.D. 0.07 ± 0.04 a
Proline (Pro) N.D. 1.60 ± 0.01 a 6.77 ± 0.02 4.82 ± 0.12 b
Serine (Ser) N.D. 1.91 ± 0.02 a 5.71 ± 0.01 2.08 ± 0.05 a
Tyrosine (Tyr) N.D. 0.63 ± 0.05 a N.D. 0.68 ± 0.01 a
Tryptophan (Trp) N.D. N.A. N.D. N.A.Threonine (Thr) N.D. 0.96 ± 0.03 b 0.05 ± 0.01 0.35 ± 0.02 a
Valine (Val) N.D. 1.27 ± 0.02 a 0.30 ± 0.01 0.60 ± 0.07 a
Totals (mg/g) N.D. 25.05 ± 0.16 a 20.43 ± 0.37 29.78 ± 1.97 b
EAA (% total) N.D. 32.07 ± 0.07 b 10.19 ± 0.01 13.04 ± 0.25 a
BCAA (Val + Leu + Ile) (% total) N.D. 14.83 ± 0.10 b 1.92 ± 0.01 4.28 ± 0.14 a
AAA (Phe + Tyr + Trp) (% total) N.D. 7.77 ± 0.15 b 0.8 ± 0.01 4.03 ± 0.00 a
EAA, essential amino acids; BCAA, branched-chain amino acids; AAA, aromatic amino acids. N.D., not detected;N.A., not analyzed. Results are expressed as mean ± SD. Different superscript letters indicate significant differencesfor total protein and total amino acids (Student’s T, p < 0.05).
With regard to amino acid content, no free amino acids were detected in CA. Amino acidspresent in the raw material derived from the proteins that compose it. Of the total amino acids inCA, 32% corresponded to essential amino acids. Asparagine, glycine and glutamic acid presented thehighest values for total amino acids in CA. The main amino acids found in CA corresponded to thosereported by Elías in 1979 [39] and also recently described by our research group [10]. Tryptophan wasnot detected in total amino acids, as the acidic conditions needed for quantification resulted inits hydrolysis.
The lipid content and the fatty acid profile of CA are shown in Table 2. Total fat content foundin CA was 2%, which is in line to that reported by other authors (2.3–2.5%) [38,40,41]. In thisstudy, palmitic acid (C16:0) was the main fatty acid in CA (36.02 g/100 g), followed by linoleic acid(C18:2n6c, 21.80 g/100 g), α-linoleic acid (C18:3n3, 17.37 g/100 g) and oleic acid (C18:1n9c, 6.72 g/100 g).The polyunsaturated fatty acids (PUFA) and saturated fatty acids (SFA) ratio was 0.85, i.e., higher than0.45, which is considered as healthy by the World Health Organization [42].
The main sugars found in CA were glucose (13.45 g/100 g) and fructose (21.70 g/100 g).Mannose (0.06 g/100 g) was also detected in CA. Xylose and sucrose were not detected in thisby-product. Values for simple sugars are in line with that reported by Urbaneja et al. (1996) [43].
With regard to fiber content in CA, this by-product presented 47.44% of total dietary fiber (TDF).This dietary fiber is composed of fibers of different nature, being 31.32% insoluble (IDF) and 16.12%soluble (SDF). These values are in line with those reported for CA in other studies and by companiesthat are using this by-product as a food ingredient [10,44].
135
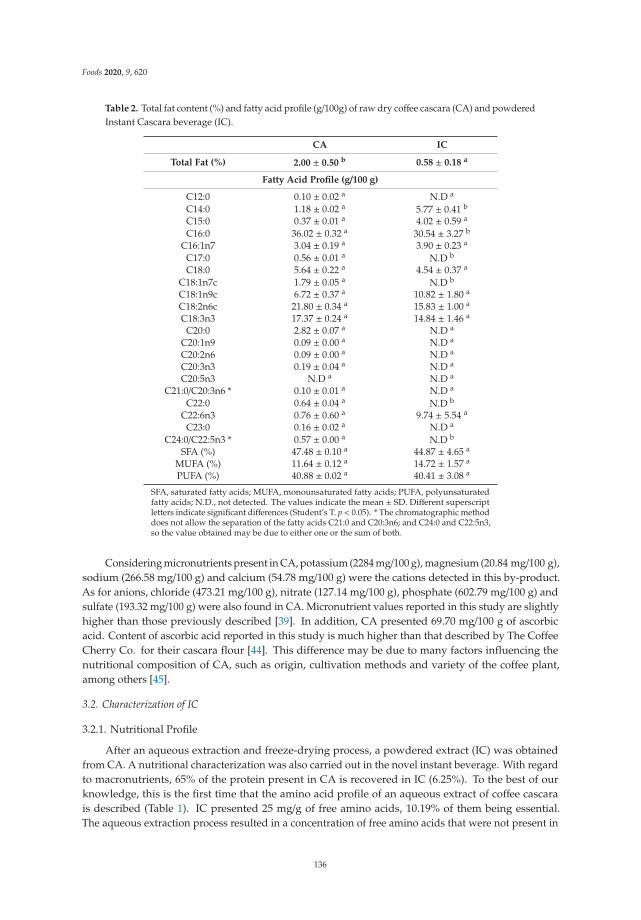
Foods 2020, 9, 620
Table 2. Total fat content (%) and fatty acid profile (g/100g) of raw dry coffee cascara (CA) and powderedInstant Cascara beverage (IC).
CA IC
Total Fat (%) 2.00 ± 0.50 b 0.58 ± 0.18 a
Fatty Acid Profile (g/100 g)
C12:0 0.10 ± 0.02 a N.D a
C14:0 1.18 ± 0.02 a 5.77 ± 0.41 b
C15:0 0.37 ± 0.01 a 4.02 ± 0.59 a
C16:0 36.02 ± 0.32 a 30.54 ± 3.27 b
C16:1n7 3.04 ± 0.19 a 3.90 ± 0.23 a
C17:0 0.56 ± 0.01 a N.D b
C18:0 5.64 ± 0.22 a 4.54 ± 0.37 a
C18:1n7c 1.79 ± 0.05 a N.D b
C18:1n9c 6.72 ± 0.37 a 10.82 ± 1.80 a
C18:2n6c 21.80 ± 0.34 a 15.83 ± 1.00 a
C18:3n3 17.37 ± 0.24 a 14.84 ± 1.46 a
C20:0 2.82 ± 0.07 a N.D a
C20:1n9 0.09 ± 0.00 a N.D a
C20:2n6 0.09 ± 0.00 a N.D a
C20:3n3 0.19 ± 0.04 a N.D a
C20:5n3 N.D a N.D a
C21:0/C20:3n6 * 0.10 ± 0.01 a N.D a
C22:0 0.64 ± 0.04 a N.D b
C22:6n3 0.76 ± 0.60 a 9.74 ± 5.54 a
C23:0 0.16 ± 0.02 a N.D a
C24:0/C22:5n3 * 0.57 ± 0.00 a N.D b
SFA (%) 47.48 ± 0.10 a 44.87 ± 4.65 a
MUFA (%) 11.64 ± 0.12 a 14.72 ± 1.57 a
PUFA (%) 40.88 ± 0.02 a 40.41 ± 3.08 a
SFA, saturated fatty acids; MUFA, monounsaturated fatty acids; PUFA, polyunsaturatedfatty acids; N.D., not detected. The values indicate the mean ± SD. Different superscriptletters indicate significant differences (Student’s T. p < 0.05). * The chromatographic methoddoes not allow the separation of the fatty acids C21:0 and C20:3n6; and C24:0 and C22:5n3,so the value obtained may be due to either one or the sum of both.
Considering micronutrients present in CA, potassium (2284 mg/100 g), magnesium (20.84 mg/100 g),sodium (266.58 mg/100 g) and calcium (54.78 mg/100 g) were the cations detected in this by-product.As for anions, chloride (473.21 mg/100 g), nitrate (127.14 mg/100 g), phosphate (602.79 mg/100 g) andsulfate (193.32 mg/100 g) were also found in CA. Micronutrient values reported in this study are slightlyhigher than those previously described [39]. In addition, CA presented 69.70 mg/100 g of ascorbicacid. Content of ascorbic acid reported in this study is much higher than that described by The CoffeeCherry Co. for their cascara flour [44]. This difference may be due to many factors influencing thenutritional composition of CA, such as origin, cultivation methods and variety of the coffee plant,among others [45].
3.2. Characterization of IC
3.2.1. Nutritional Profile
After an aqueous extraction and freeze-drying process, a powdered extract (IC) was obtainedfrom CA. A nutritional characterization was also carried out in the novel instant beverage. With regardto macronutrients, 65% of the protein present in CA is recovered in IC (6.25%). To the best of ourknowledge, this is the first time that the amino acid profile of an aqueous extract of coffee cascarais described (Table 1). IC presented 25 mg/g of free amino acids, 10.19% of them being essential.The aqueous extraction process resulted in a concentration of free amino acids that were not present in
136

Foods 2020, 9, 620
CA. From a nutritional point of view, free amino acids would be more bio-accessible in IC compared toCA. Proline (6.77 mg/g), serine (5.71 mg/g) and alanine (2.27 mg/g) were the major free amino acidsfound in IC. In addition, free aminobutyric acid (GABA) was also detected in IC (0.3 mg/g). GABA isknown for its health-promoting properties, such as an anti-hypotensive effect [46]. Together with otherfruits, such as melon and apricot, IC could contribute to lower blood pressure. Considering resultsobtained in free and total amino acids, IC might be a potential sustainable source of these molecules.A recent clinical trial has observed that continuous intake of the amino acid supplements significantlyincrease muscle amount and improve skin texture in young adult women [47].
With regard to total amino acids, asparagine was the main amino acid in IC (7.79 mg/g), followed byproline (4.82 mg/g) and alanine (2.44 mg/g). Although the claimed health-promoting properties ofamino acids are not yet established in terms of a cause–effect relationship after the evaluation of theEFSA Panel, the potential claimed health-promoting properties related to amino acids are growthor maintenance of muscle mass, maintenance of normal muscle function, faster recovery of musclefunction/strength/glycogen stores after exercise, faster recovery from muscle fatigue after exercise andskeletal muscle tissue repair [48].
Total fat percentage is significantly higher (p < 0.05) in CA (2%) than in IC (0.58%). According tothe statement by the European Commission Regulation No 1924/2006, IC would be “low in fat” sincethe product contains no more than 1.5 g of fat per 100 mL [49]. This instant beverage would even beclose to the “fat-free” nutrition claim, which is attributed to products that have no more than 0.5 g offat per 100 mL. Fatty acid composition of IC mainly includes palmitic acid (C16:0), followed by linoleicacid (C18:2n6) and α-linoleic acid (C18:3n3), similar to that found in CA (Table 2).
The main simple sugars found in IC were fructose (16.19 g/100g) and glucose (6.02 g/100 g),being lower in IC compared to CA. Xylose (6.02 g/100 g), sucrose (0.08 g/100 g) and mannose(0.03 g/100 g) were also detected in IC.
Dietary fiber present in IC was 18.32%, all soluble dietary fiber. As expected, the aqueousextraction process concentrated the SDF present in CA. There are several health promoting propertiesattributed to SDF, which include reduction in cholesterol level and blood pressure, prevention ofgastrointestinal diseases, protection against onset of several cancers, such as colorectal, prostate andbreast cancer, and increased mineral bioavailability, among others [50,51]. This novel powderedbeverage can reach the nutrition claim of “high in fiber” since the product contains at least 6 g of fiberper 100 g [49]. The health claims attributed to the “high in fiber” nutrition claim are “fiber increasesfecal bulk, contributes to normal bowel function and to an acceleration of intestinal transit” [52].
After aqueous extraction, powdered IC was enriched in micronutrients since values of anionsand cations in IC were higher compared to CA. Cations in IC were potassium (6701 mg/100 g),magnesium (121.56 mg/100 g), sodium (354.19 mg/100 g) and calcium (109.88 mg/100 g). As foranions, chloride (618.32 mg/100 g), nitrate (489.48 mg/100 g), phosphate (1314 mg/100 g) and sulfate(533.61 mg/100 g) were detected in IC.
The European Commission (EU) regulation N◦ 1925/2006, indicates that to establish an ingredientas a source of any micronutrient, it must represent at least 15% of the daily recommendation [53].Recommended daily allowances for potassium and magnesium are 3600 and 300 mg, respectively.Therefore, IC may be considered a “source of potassium and magnesium” since values of potassiumand magnesium present in IC represent 15% of the recommended allowance per 100 g of product.The Official Journal of the European Union (No 432/2012) makes the following statement for foodsconsidered as a source of potassium: “Potassium contributes to the normal functioning of the nervoussystem, muscles, and the maintenance of normal blood pressure” [52]. On the other hand, a productthat is a “source of magnesium” is related to the following health claims: “Magnesium contributesto a reduction of tiredness and fatigue, to electrolyte balance, to normal energy-yielding metabolism,to normal functioning of the nervous system, to normal muscle function, to normal protein synthesis,to normal physiological function, to the maintenance of normal bones and teeth and a role in theprocess of cell division” [52].
137

Foods 2020, 9, 620
With regard to the content of ascorbic acid, IC presented 438.95 mg/100 g. IC can also be consideredas a source of vitamin C, considering that the daily recommendation is 60 mg/day. Thus, the followinghealth claims can be attributed to IC: “Vitamin C contributes to the normal functioning of the immunesystem during intense physical exercise, normal energy metabolism, normal functioning of the nervoussystem, normal psychological function, protection of cells against oxidative damage, reduction offatigue and fatigue, regeneration of the reduced form of vitamin E, improvement of iron absorption,and normal collagen formation for the normal functioning of blood vessels, bones, cartilage, gums,skin, and teeth” [52].
Once powdered IC was characterized, two liquid beverages were prepared at 4 and 10 mg/mL.Results of liquid beverages were compared to the commercial cascara infusion Tabifruit. Table 3shows the composition in nutrients and antioxidants of the three drinks. All samples showedsignificant differences (p < 0.05) in carbohydrate content. Tabifruit presented the lowest values oftotal carbohydrates (22 g/100 mL) followed by IC at 4 mg/mL (27 g/100 mL) and IC at 10 mg/mL(47 g/100 mL). This carbohydrate fraction may be composed of the soluble dietary fiber previouslymentioned and other polysaccharides. For instance, previous studies showed that coffee cascaracontains up to 35% of pectin [54].
Table 3. Nutrients (total carbohydrates (g/100 mL), glucose content (g/100 mL)) and non-nutrientantioxidants of the three beverages IC (4 mg/mL), IC (10 mg/mL) and Tabifruit.
IC (4 mg/mL) IC (10 mg/mL) Tabifruit
Nutrients
Total carbohydrates (g/100 mL) 27.50 ± 0.07 b 47.48 ± 0.20 c 22.22 ± 0.06 a
Glucose (g/100 mL) 0.04 ± 0.01 b 0.05 ± 0.01 c 0.02 ± 0.01 a
Antioxidants
Total phenolic content (mg eq. CGA/mL) 0.25 ± 0.0 a 0.89 ± 0.0 c 0.37 ± 0.0 b
Anthocyanins N.D. N.D. N.D.ABTS (mg eq. CGA/mL) 16.82 ± 0.9 b 27.58 ± 2.3 c 15.05 ± 0.6 a
FRAP (mg eq. CGA/mL) 0.15 ± 0.0 a 0.43 ± 0.0 c 0.34 ± 0.0 b
CGA, chlorogenic acid. Each value represents the mean ± SD. Different letters indicate significant differences(p < 0.05) between samples in the same row. Different superscript letters indicate significant differences betweensamples (Tukey Test, p < 0.05).
Regarding glucose content, the same behavior as for total carbohydrates was observed;Tabifruit showed the lowest values (0.02 g/100 mL) and IC at 10 mg/mL the highest (0.05 g/100 mL).As expected, a dose-response effect in total carbohydrates and glucose content was observed in ICat 4 and 10 mg/mL. For both IC beverages, glucose values remained under those established for thenutrition claim “low in sugar” and could even be classed as “sugar-free”. According to the EuropeanCommission Regulation (No. 1047/2012), for a food to be considered “low sugar”, it must contain nomore than 2.5 g of sugar per 100 mL; and for it to be declared “sugar-free”, the product must not containmore than 0.5 g of sugar per 100 mL [49]. Therefore, considering free glucose content both IC beveragescould make the “low sugar” nutrition claim. For the “sugar-free” claim, further quantification ofother predominant simple sugars would be necessary. IC is a healthy alternative compared to otherinstant powdered soft drinks in the Food Data Central Database of the United States Department ofAgriculture (USDA), whose sugar content ranges from 29 to 93 g/100 g per product [55].
3.2.2. Impact of MRP on Safety and Health Promoting Properties of IC
Safety
MRP compromise the nutritional value, safety and health promoting properties of IC. Since ICcontains amino acids (Table 1) and reducing sugars, which are substrates of the Maillard reaction,acrylamide was analyzed to confirm the food safety of the novel beverages. Acrylamide content was
138

Foods 2020, 9, 620
below the detection limit for the three beverages. In contrast, it was found in powdered IC at 223 μg/kg.Acrylamide content found in IC is much lower than the limit stablished by the European Commissionfor coffee and instant coffee, 450 and 900 μg/kg, respectively [7]. Considering acrylamide content,this novel instant beverage would be a safe alternative to instant coffee. However, since acrylamidecompromises the food safety of the beverage, shorter drying periods, different drying techniquesor using fresh coffee cascara are measures that must be considered to decrease the amount of thiscompound in IC.
Since asparagine was the main amino acid in IC and this amino acid is known to be responsiblefor the development of acrylamide, another potential acrylamide mitigation strategy would be treatingIC with L-asparaginase [56]. This enzyme is considered to be useful for acrylamide mitigation and tohave negligible effects on the general formation of Maillard products. L-Asparaginase can selectivelyreduce the level of free L-Asn by hydrolyzing it to L-Asp and ammonia, thus specifically removing oneof the essential acrylamide precursors [57]. However, in this particular case the preferred acrylamidemitigation strategy would be non-thermal drying procedures of cascara.
Drying of the raw material is a critical step in the conversion of coffee cascara into a safefood ingredient for human consumption. Novel drying methods will ensure the chemical andmicrobiological safety of cascara. Reducing moisture under 13% is necessary to avoid fungal growthand the consequent production of mycotoxins [58]. In this context, previous research has confirmedthe absence of mycotoxins, such as aflatoxin B1, enniantin B and ochratoxin A in a cascara aqueousextract [59].
Another limitation on the use of a coffee by-product as a food ingredient is connected to its caffeinecontent. Results published so far suggest that caffeine content in an aqueous cascara extract (1.39%)does not need to be considered a safety concern [59]. The caffeine content of IC at 10 mg/mL in 250 mLwould be around 34 mg, which is below the EFSA safety level for daily caffeine consumption of 400 mgfor the general population, 3 mg/kg b.w. per day for children and adolescents and 200 mg for lactatingwomen [60]. Therefore, almost no limitations on the use of IC for human consumption need to beconsidered, since pregnant women would have to drink over 1.47 L of IC beverage to exceed the safetylevel for the fetus.
Antioxidant Properties
Overall Antioxidant Capacity and Identification of Antioxidant Compounds
Liquid IC beverages are also a source of antioxidants (Table 3). In both antioxidant capacitydeterminations (ABTS and FRAP), IC at 10 mg/mL presented a significantly higher (p< 0.05) antioxidantcapacity (27.58 mg eq. CGA/mL for ABTS and 0.43 mg eq. CGA/mL for FRAP) compared to theother two beverages. Results obtained for the antioxidant capacity corresponded to the total phenoliccontent (TPC) found in samples, IC being at 10 mg/mL the beverage presenting the highest valuesfor TPC (0.89 mg eq. CGA/100 mL). Pearson’s correlation coefficient was calculated to check forthe existence of linear relationships between TPC, ABTS and FRAP of the beverages. A very strong(r = 0.97) or strong (r = 0.79) positive association was found between TPC and ABTS and FRAP,respectively. TPC, but not anthocyanins that were not detected in samples, seem to contribute to theoverall antioxidant capacity of IC. Previous studies have reported that coffee cascara is a source ofphenolic compounds, such as CGA and protocatechuic acid, which represent more than 80% of thepolyphenols analyzed by Heeger et al. (2017) [40].
The presence of anthocyanins in coffee cascara has been previously reported [14,61,62].However, anthocyanins were not detected in any of the samples using the pH-dependent colorimetricassay (Table 3) and therefore results seem to indicate that they are not the main responsible compoundsfor the antioxidant properties of IC. A comparative study of fresh and sun-dried grapes indicated atotal loss of flavonoids, and in less quantity, of hydroxycinnamic acids (estimated at 62% for sun-driedgrapes). This study concluded that the most labile polyphenols were procyanidins and flavan-3-ols,since they were completely degraded in all sun-dried raisin samples [63]. Therefore, anthocyanins might
139

Foods 2020, 9, 620
have been degraded during the 21 days of sun drying of the coffee cascara used in the present study,which, in fact, is the most cheap and common method to dry it. However, quantification analysis, such asNMR [64] and HPLC [65], are needed to confirm the absence of anthocyanins in the studied sample.In addition, the three beverages showed a similar UV-Visible absorption spectrum (Figure S1A).A maximum absorption was detected at 280 nm, indicative of the presence of caffeine, proteinsand phenolic compounds, and at 325 nm, which would correspond to CGA and caffeic acid [66].This analysis would also support the absence of anthocyanins that absorb at 520 nm [29] (Figure S1B),since none of the beverages seemed to absorb at this wavelength (Figure S1A).
With regard to Maillard reaction products, melanoidins were detected in the three beveragesat 1.48 mg eq. caramel/mL, 0.54 mg eq. caramel/mL, 1.2 mg eq. caramel/mL, for IC (10 mg/mL),IC (4 mg/mL and Tabifruit, respectively. To the best of our knowledge, this is the first time thepresence of melanoidins and the occurrence of the Maillard reaction are described in coffee cascara.Melanoidins may have been formed during sun drying of the raw material for 21 days, as occursduring the dehydration of figs, dates and raisins under similar conditions to those employed in cascaraprocessing [11]. In addition, beverages absorbed over the full wavelength range of 200–700 nm,which is characteristic of melanoidins [5]. CGA and melanoidins, usually have a maximum absorptionclose to 360 nm, which might indicate the linkage of CGA molecules to the structure of melanoidins bynon-covalent interactions [5,67,68].
Contribution of MRP to the Antioxidant Properties of IC
In order to identify which compounds were responsible for the antioxidant capacity of IC, the threebeverages were ultra-filtrated by a 10 kDa cut-offmembrane. Table 4 shows the overall antioxidantcapacity of the high (HMW) and low (LMW) molecular weight fractions of the three beveragesmeasured by ABTS and FRAP. Antioxidant capacity analyzed by ABTS and FRAP of the LMW fractionof the three beverages did not differ significantly (p > 0.05) among samples. The HMW fractionsof the three beverages was significantly (p < 0.05) more antioxidant compared to the LMW fraction.The HMW fraction of IC at 10 mg/mL presented the highest values of antioxidant capacity analyzedby ABTS (82.85 mq eq. CGA/mL) and FRAP 1.08 mg eq. CGA/mL). For both antioxidant capacitydeterminations, the HMW fraction of Tabifruit presented the lowest values. Results seem to indicatethat HMW compounds (>10 kDa), such as melanoidins seem to be the main contributors of the overallantioxidant capacity of IC.
Table 4. Antioxidant capacity analyzed by ABTS (mg eq. CGA/mL) and FRAP (mg eq. CGA/mL) ofthe high molecular weight (HMW, >10 kDa) and low molecular weight (LMW, <10 kDa) fractions ofbeverages IC (4 mg/mL), IC (10 mg/mL) and Tabifruit separated by ultrafiltration.
IC (4 mg/mL) IC (10 mg/mL) Tabifruit
HMW LMW HMW LMW HMW LMW
ABTS 61.25 ± 0.49 b 0.92 ± 0.01 a 82.85 ± 0.19 d 0.92 ± 0.00 a 66.68 ± 0.48 c 0.93 ± 0.00 a
FRAP 0.61 ± 0.08 b 0.12 ± 0.00 a 1.08 ± 0.02 d 0.25 ± 0.01 a 0.90 ± 0.09 c 0.14 ± 0.00 a
Values indicate the mean± standard deviation and different superscript letters denote significant differences betweeneach row (Tukey Test. p < 0.05).
Melanoidins are high molecular weight, brown-colored and nitrogen-containing compoundsgenerated in the late stages of the Maillard reaction [4]. Rufián-Henares and Pastoriza statedthat melanoidins are great contributors to the overall antioxidant intake in the Spanish diet.In addition, these melanoidins come mainly from coffee, followed by biscuits, beer and chocolate [3,69].Many health-promoting properties are attributed to melanoidins, such as antioxidant, antimicrobial,anti-inflammatory, antihypertensive or prebiotic activity [4]. Melanoidins have also been isolatedfrom other coffee by-products, such as silverskin, and have shown antioxidant properties in vitroand a dietary fiber effect in vivo [67]. Melanoidins extracted from spent coffee grounds, the last
140

Foods 2020, 9, 620
coffee by-product generated during the beverage elaboration, have also shown antioxidant capacityin vitro [70]. IC may be another sustainable source of melanoidins that would contribute to theantioxidant intake of the global population.
3.3. Shelf Life Study Under Accelerated Storage Conditions of Liquid IC
For the stability study, the three liquid beverages were exposed to different conditions of light andtemperature for 72 h. Figure 1 shows the differences in color, pH, total antioxidant capacity (TAC) andtotal phenolic content (TPC) in each beverage exposed to different conditions of light and temperature.As for color, significant differences (p < 0.05) were found in L a* b* parameters when the three beverageswere exposed to 40 ◦C and light for 72 h (Table S1). Color alteration after temperature al light exposurecan be easily visualized in Figure 1A. Tabifruit was the only sample that presented a significant change(p < 0.05) to light treatment, which might suggest that CA has a higher susceptibility to light exposure(Table S1). In general, there is a significant decrease (p < 0.05) in the red tonality (a*) of all beveragesafter temperature and light exposure (Table S1).
Figure 1. Photosensitivity and heat resistance of IC at 4 mg/mL, IC at 10 mg/mL and Tabifruit. (A) Colordifferences (colorizer.org as a tool for color generation [34]); (B) pH; (C) Total antioxidant capacity(TAC) determined by ABTS; (D) Total phenolic content (TPC). Bars represent the mean values and theerror bars denote the standard deviation. Different letters on bars indicate significant differences ineach beverage sample (Tukey Test, p < 0.05).
For IC at 4 and 10 mg/mL, parameters L and a* correspond linearly to IC concentration (Table S1).Torres et al. (2019) studied the color parameters in coffee cascara before and after drying process.They observed a darker coloration in parameter a* (red color) in the dry samples, concluding thatit may be related to the browning processes as effects of the temperature used in the drying of thecascara [71]. Altogether, melanoidins generated during the drying process of coffee cascara seem tobe responsible for the color of IC and Tabifruit. This is in accordance to the UV-Visible spectra of the
141

Foods 2020, 9, 620
beverages (Figure S1A), which absorb throughout the whole spectrum in a similar way to the caramelstandard used to determine melanoidin content (Figure S1B) [72].
Regarding pH results, pH values of all beverages significantly decreased (p < 0.05) after thestability study compared to the fresh preparation of the beverages (Figure 1B). These results seem toindicate that temperature and light are determining factors for changes in pH. Nicoli et al. explainthat a drop in pH may occur as a consequence of reactions that might be related to non-enzymaticbrowning, the Maillard reaction, between carbohydrates and amino acids that occurs also duringstorage [73,74]. The pH is a determining factor for flavor, color, and shelf life of flavored beverages,and it is estimated that the optimal pH to prevent the growth of bacteria and accentuate flavor notes isbetween 3 and 4 [75]. Other authors state that drinks with acidic pH show good color stability underrefrigerated storage conditions to maintain their phenolic content at 90% for a period of 4 monthsapproximately [76]. Therefore, the low pH of IC is suitable for the preservation of the bioactivecompounds present in the beverage.
Figure 1C shows results for TAC of the beverages after the stability study. A significant decrease(p < 0.05) in antioxidant capacity was observed in all samples compared to the fresh preparation.Considering the TPC (Figure 1D), temperature and light and only light exposure produced a significantdecrease in TPC in IC at 4 and 10 mg/mL, respectively. Keeping the liquid preparation in darknessseemed to be the condition that best preserved the phenolic compounds present in IC and Tabifruit.
Considering the composition in nutrients and antioxidants, together with the stability analysis,powdered IC could be considered as the best option for its future commercialization. The process ofobtaining IC is green, simple and could be easily carried out using the same facilities used to produceinstant coffee. A stability study can predict and optimize the most suitable package conditions toconserve the beverage [33]. Taking into account results from the stability study, IC could be packagedas an instant beverage format to dissolve in either warm or cold water at 10 mg/mL, a similar dosageas the one used for commercially available instant coffee products. Powdered IC would have longershelf life and less distribution costs, but less expensive concentration and drying techniques, such asvacuum drying at low temperatures (50 ◦C) and for short periods [77], are needed to implement thisprocedure in coffee producing countries.
4. Conclusions
A safe instant beverage with antioxidant properties has been obtained to which the followingnutrition claims can be assigned: “low fat”, “low sugar”, “high in fiber” and “source of potassium,magnesium and vitamin C”. For the first time, cascara beverage color was attributed to the presence ofmelanoidins. The shelf life study seemed to indicate that IC beverages in solution are more susceptibleto color changes by light and temperature (40 ◦C) exposure. A package is therefore suggested thatprotects the product from light and is stored in a cool, dry place. Although very low levels ofacrylamide were reported, melanoidins with potential health-promoting properties have also beenformed. These melanoidins’ high molecular weight compounds (>10 kDa) seem to contribute mostly tothe overall antioxidant capacity of IC. The novel powdered instant beverage developed in the presentstudy, IC, is a potential sustainable alternative for instant coffee, with low caffeine and acrylamidelevels and a healthy composition in nutrients and antioxidants that would allow the whole recovery ofthe by-product in two novel ingredients (IC and a dietary fiber fraction).
Supplementary Materials: The following are available online at http://www.mdpi.com/2304-8158/9/5/620/s1,Figure S1: (A) UV-Visible absorption spectrum of the three beverages, measured in a wavelength range of 200to 700 nm. (B) UV-Visible spectrum of caramel E-150d (Car) and cyanidine-3-glucoside (C-3) at pH 1 and 4.5;Table S1: Measurement of color (L, a*, b*) of the three beverages IC (4 mg/mL), IC (10 mg/mL) and Tabifruit afterstability test for 72 h. Studied conditions were: Fresh, 40 ◦C and light (Temp + light), room temperature and light(light) and room temperature and no light exposure (darkness).
142

Foods 2020, 9, 620
Author Contributions: Conceptualization and investigation, M.D.d.C.; Methodology, J.A.M., E.I. and M.D.d.C.;Data Curation, A.I.-D., A.S.E., M.B.R., M.I.-D., and R.M.; Formal Analysis, A.I.-D., and M.D.d.C.; Writing—OriginalDraft Preparation, A.S.E., A.I.-D. and M.D.d.C.; Writing—Review & Editing, A.I.-D., M.I.-D., J.A.M., E.I., R.M. andM.D.d.C.; Supervision, A.I.-D. and M.D.d.C.; Project Administration, M.D.d.C.; Funding Acquisition, J.A.M andM.D.d.C. All authors have read and agreed to the published version of the manuscript.
Funding: The project “Generar oportunidades de desarrollo sostenible para 990 familias de La Paz(Honduras) mediante el aprovechamiento de subproductos del café” funded by AECID (2018/ACDE/000666),“Nuevos conocimientos para la sostenibilidad del sector cafetero” funded by CSIC (201970E117) and “Generaciónde nuevos ingredientes y alimentos beneficiosos dirigidos a condiciones de riesgo y al bienestar global de personascon cáncer colorrectal (TERÁTROFO)” funded by CDTI (IDI-20190960), funded this work.
Acknowledgments: The authors thank the Analysis Service Unit facilities of ICTAN and the Servicio de Químicade Proteínas of CIB for the analysis of fatty acids and the amino acid profile. We are grateful to COPADE,COMSA and COMBRIFOL staff for their great contribution to the project. The authors also thank Supracafé forproviding Tabifruit and coffee cascara for IC elaboration.
Conflicts of Interest: The authors declare no conflict of interest.
References
1. Cagliero, C.; Ho, T.D.; Zhang, C.; Bicchi, C.; Anderson, J.L. Determination of acrylamide in brewed coffee andcoffee powder using polymeric ionic liquid-based sorbent coatings in solid-phase microextraction coupled togas chromatography-mass spectrometry. J. Chromatogr. A 2016, 1449, 2–7. [CrossRef]
2. Tamanna, N.; Mahmood, N. Food Processing and Maillard Reaction Products: Effect on Human Health andNutrition. Int. J. Food Sci. 2015, 2015, 526762. [CrossRef] [PubMed]
3. Fogliano, V.; Morales, F.J. Estimation of dietary intake of melanoidins from coffee and bread. Food Funct.2011, 2, 117–123. [CrossRef] [PubMed]
4. Mesías, M.; Delgado-Andrade, C. Melanoidins as a potential functional food ingredient. Curr. Opin. Food Sci.2017, 14, 37–42. [CrossRef]
5. Iriondo-dehond, A.; Ramírez, B.; Escobar, F.V. Antioxidant properties of high molecular weight compoundsfrom coffee roasting and brewing byproducts. Bioact. Compd. Health Dis. 2019, 2, 48–63. [CrossRef]
6. Soares, C.M.D.; Alves, R.C.; Oliveira, M.B.P.P. Acrylamide in coffee. In Processing and Impact on ActiveComponents in Food; Elsevier: Amsterdam, The Netherlands, 2015; pp. 575–582. ISBN 9780124047099.
7. European Food Safety Authority Scientific Opinion on acrylamide in food. EFSA J. 2015, 13, 4104.8. Pedreschi, F.; Mariotti, M.S.; Granby, K. Current issues in dietary acrylamide: Formation, mitigation and risk
assessment. J. Sci. Food Agric. 2014, 94, 9–20. [CrossRef]9. Esquivel, P.; Jiménez, V.M. Functional properties of coffee and coffee by-products. Food Res. Int. 2012, 46, 488–495.
[CrossRef]10. Rios, M.B.; Iriondo-deHond, A.; Iriondo-deHond, M.; Herrera, T.; Velasco, D.; Gomez-Alonso, S.; Callejo, M.J.;
del Castillo, M.D. Effect of coffee cascara dietary fiber on the physicochemical, nutritional and sensoryproperties of a gluten-free bread formulation. Molecules 2020, 25, 1358. [CrossRef]
11. Sanz, M.L.; del Castillo, M.D.; Corzo, N.; Olano, A. Formation of amadori compounds in dehydrated fruits.J. Agric. Food Chem. 2001, 49, 5228–5231. [CrossRef]
12. European Commission COMMISSION REGULATION (EU) 2017/2158 of 20 November 2017 establishingmitigation measures and benchmark levels for the reduction of the presence of acrylamide in food. Off. J.Eur. Union 2017, 204, 24–44.
13. Martínez-Saez, N.; Del Castillo, M.D. Development of Sustainable Novel Foods and Beverages Based onCoffee By-Products for Chronic Diseases. Encycl. Food Secur. Sustain. 2018, 307–315. [CrossRef]
14. Alves, R.C.; Rodrigues, F.; Nunes, M.A.A.; Vinha, A.F.; Oliveira, M.B.P.P. State of the art in coffee processingby-products. In Handbook of Coffee Processing By-Products: Sustainable Applications; Galanakis, C., Ed.;Academic Press-Elsevier: Burlington, MA, USA, 2017; pp. 1–26. ISBN 978-0-12-811290-8.
15. Murthy, P.S.; Madhava Naidu, M. Sustainable management of coffee industry by-products and valueaddition—A review. Resour. Conserv. Recycl. 2012, 66, 45–58. [CrossRef]
16. The European Parliament and The Council of the European Union Regulation (EU) 2015/2283 on novel foods.Off. J. Eur. Union 2015, 327, 1–22.
17. EFSA Panel on Dietetic Products Guidance on the preparation and presentation of an application forauthorisation of a novel food in the context of Regulation (EU) 2015/2283. EFSA J. 2016, 14, 11.
143
Foods 2020, 9, 620
18. Alaska Health Fair, I. How Much Sugar Is There in a Glass of a Powdered Mix Drink? Available online:https://alaskahealthfair.org/much-sugar-glass-powdered-mix-drink/ (accessed on 23 March 2020).
19. Tahmassebi, J.F.; BaniHani, A. Impact of soft drinks to health and economy: A critical review. Eur. Arch.Paediatr. Dent. 2020, 21, 109–117. [CrossRef]
20. del Castillo, M.D.; Ibañez, M.E.; Amigo, M.; Herrero, M.; Plaza del Moral, M.; Ullate, M. Applicationof Products of Coffee Silverskin in Anti-Ageing Cosmetics and Functional Food. WO 2013/004873 2013.Available online: https://digital.csic.es/handle/10261/92745 (accessed on 30 March 2020).
21. Martinez-Saez, N.; Tamargo García, A.; Domínguez Pérez, I.; Rebollo-Hernanz, M.; Mesías, M.; Morales, F.J.;Martín-Cabrejas, M.A.; del Castillo, M.D. Use of spent coffee grounds as food ingredient in bakery products.Food Chem. 2017, 216, 114–122. [CrossRef] [PubMed]
22. Sukhija, P.S.; Palmquist, D.L. Rapid method for determination of total fatty acid content and composition offeedstuffs and feces. J. Agric. Food Chem. 1988, 36, 1202–1206. [CrossRef]
23. Iriondo-DeHond, A.; Cornejo, F.S.; Fernandez-Gomez, B.; Vera, G.; Guisantes-Batan, E.; Alonso, S.G.;Andres, M.I.S.; Sanchez-Fortun, S.; Lopez-Gomez, L.; Uranga, J.A.; et al. Bioaccesibility, metabolism, andexcretion of lipids composing spent coffee grounds. Nutrients 2019, 11, 1411. [CrossRef] [PubMed]
24. Iriondo-DeHond, A.; Rios, M.B.; Herrera, T.; Rodriguez-Bertos, A.; Nuñez, F.; San Andres, M.I.;Sanchez-Fortun, S.; del Castillo, M.D. Coffee silverskin extract: Nutritional value, safety and effect onkey biological functions. Nutrients 2019, 11, 2693. [CrossRef] [PubMed]
25. Masuko, T.; Minami, A.; Iwasaki, N.; Majima, T.; Nishimura, S.-I.; Lee, Y.C. Carbohydrate analysis by aphenol-sulfuric acid method in microplate format. Anal. Biochem. 2005, 339, 69–72. [CrossRef] [PubMed]
26. Comite Europeen de Normalisation Food Analysis—Determination of Acrylamide in Food by Liquid ChromatographyTandem Mass Spectrometry (LC-ESI-MS/MS); Comite Europeen de Normalisation: Brussels, Belgium, 2015;EN 166182015.
27. Mastovska, K.; Lehotay, S.J. Rapid Sample Preparation Method for LC−MS/MS or GC−MS Analysis ofAcrylamide in Various Food Matrices. J. Agric. Food Chem. 2006, 54, 7001–7008. [CrossRef]
28. Contini, M.; Baccelloni, S.; Massantini, R.; Anelli, G. Extraction of natural antioxidants from hazelnut (Corylusavellana L.) shell and skin wastes by long maceration at room temperature. Food Chem. 2008, 110, 659–669.[CrossRef]
29. Wrolstad, R.E.; Giusti, M.M. Characterization and Measurement of Anthocyanins by UV-Visible Spectroscopy.Curr. Protoc. Food Anal. Chem. 2001, F1.2.1–F1.2.13. [CrossRef]
30. Tsao, R.; Yang, R.; Young, C.; Zhu, H. Polyphenolic profiles in eight apple cultivars using high-performanceliquid chromatography (HPLC). J. Agric. Food Chem. 2003, 51, 6347–6353. [CrossRef]
31. Oki, T.; Nagai, S.; Yoshinaga, M.; Nishiba, Y.; Suda, I. Contribution of b-Carotene to Radical ScavengingCapacity Varies among Orange-fleshed Sweet Potato Cultivars. Food Sci. Technol. Res 2006, 12, 156–160.[CrossRef]
32. Benzie, I.F.F.; Strain, J.J. The ferric reducing ability of plasma (frap) as a measure of ‘“ antioxidant power ”’:The FRAP assay. Anal. Biochem. 1996, 76, 70–76. [CrossRef]
33. Manzocco, L.; Kravina, G.; Calligaris, S.; Nicoli, M.C. Shelf life modeling of photosensitive food: The case ofcolored beverages. J. Agric. Food Chem. 2008, 56, 5158–5164. [CrossRef]
34. Sebastian Loncar Colorizer—Color Picker and Converter. Available online: http://colorizer.org/ (accessed on20 March 2020).
35. Adrianzén, G. Determinación De La Capacidad Antioxidante y Polifenoles Totales de la Cáscara Y MucílagoDe La Especie Coffea Arábica L. Y Sus Posibles Usos. Bachelor’s Thesis, Universidad Nacional José FaustinoSánchez Carrión, Huacho, Peru, 2018.
36. Alvarez, W. Evaluación De Rangos Del Espectro Caracterización Fisicoquímica De Cáscara De Café ParaAlimentación Animal. Master’s Thesis, Universidad Nacional Toribio Rodríguez Mendoza de Amazonas,Chachapoyas, Peru, 2018.
37. Tobón Arroyave, N.; Cerón Cárdenas, A.F.; Garcés Giraldo, L.F. Análisis y modelamiento de la granulometríaen la cáscara del café (Coffea arabica L.) variedad Castillo. Producción+ Limpia 2015, 10, 80–91. [CrossRef]
38. Pandey, A.; Soccol, C.R.; Nigam, P.; Brand, D.; Mohan, R.; Roussos, S. Biotechnological potential of coffeepulp and coffee husk for bioprocesses. Biochem. Eng. J. 2000, 6, 153–162. [CrossRef]
39. Elías, L.G. Chemical composition of coffee-berry by-products. Coffee Pulp Compos. Technol. Util. 1979, 11–16.
144
Foods 2020, 9, 620
40. Heeger, A.; Kosinska-Cagnazzo, A.; Cantergiani, E.; Andlauer, W. Bioactives of coffee cherry pulp and itsutilisation for production of Cascara beverage. Food Chem. 2016, 221, 969–975. [CrossRef] [PubMed]
41. Janissen, B.; Huynh, T. Chemical composition and value-adding applications of coffee industry by-products:A review. Resour. Conserv. Recycl. 2018, 128, 110–117. [CrossRef]
42. World Health Organization. Joint WHO-FAO expert consultation on diet, nutrition, and the prevention ofchronic diseases, 2002, Geneva, Switzerland. WHO Tech. Rep. Ser. 2003, 916, 149.
43. Urbaneja, G.; Ferrer, J.; Paez, G.; Arenas, L.; Colina, G. Acid hydrolysis and carbohydrates characterization ofcoffee pulp. Renew. Energy 1996, 9, 1041–1044. [CrossRef]
44. Belliveau, D. The Coffee Cherry Co. Available online: https://coffeecherryco.com/ (accessed on 24 March 2020).45. Bernacchia, R.; Preti, R.; Vinci, G. Organic and conventional foods: Differences in nutrients. Ital. J. Food Sci.
2016, 28, 565–578.46. Ito, H.; Ueno, H.; Kikuzaki, H. Nutrition and dietetic practice free amino acid compositions for fruits. J. Nutr.
Diet. Pr. 2017, 1, 1–5.47. Takaoka, M.; Okumura, S.; Seki, T.; Ohtani, M. Effect of amino-acid intake on physical conditions and skin
state: A randomized, double-blind, placebo-controlled, crossover trial. J. Clin. Biochem. Nutr. 2019, 65, 52–58.[CrossRef]
48. Turck, D.; Castenmiller, J.; De Henauw, S.; Hirsch-Ernst, K.I.; Kearney, J.; Knutsen, H.K.; Maciuk, A.;Mangelsdorf, I.; McArdle, H.J.; Naska, A.; et al. Guidance on the scientific requirements for health claimsrelated to muscle function and physical performance: (Revision 1). EFSA J. 2018, 16.
49. Regulation EC 1924 European Community (EC) No 1924/2006 of the European Parliament and of the Councilof 20 December 2006 on nutrition and health claims made on foods. Off. J. Eur. Union 2006, 9–25.
50. Chawla, R.; Patil, G.R. Soluble dietary fiber. Compr. Rev. Food Sci. Food Saf. 2010, 9, 178–196. [CrossRef]51. Koh, A.; De Vadder, F.; Kovatcheva-Datchary, P.; Bäckhed, F. From dietary fiber to host physiology: Short-chain
fatty acids as key bacterial metabolites. Cell 2016, 165, 1332–1345. [CrossRef] [PubMed]52. The european commission commission regulation (EU) No 432/2012. Off. J. Eur. Union 2012, 13.53. European council council directive of 24 September 1990 on nutrition labelling for foodstuffs (90/496/ EEC).
Off. J. Eur. Union 1990, 18–63.54. Hasanah, U.; Setyowati, M.; Efendi, R.; Safitri, E.; Idroes, R.; Heng, L.Y.; Sani, N.D. Isolation of Pectin from
coffee pulp Arabica Gayo for the development of matrices membrane. IOP Conf. Ser. Mater. Sci. Eng.2019, 523, 12–14. [CrossRef]
55. USDA (United States Department of Agriculture USA) FoodData Central. Available online: https://fdc.nal.usda.gov/fdc-app.html#/?query=hemp (accessed on 25 March 2020).
56. Porto, A.C.V.; Freitas-Silva, O.; de Souza, E.F.; Gottschalk, L.M.F. Effect of asparaginase enzyme in thereduction of asparagine in green coffee. Beverages 2019, 5, 32. [CrossRef]
57. Onishi, Y.; Prihanto, A.A.; Yano, S.; Takagi, K.; Umekawa, M.; Wakayama, M. Effective treatment forsuppression of acrylamide formation in fried potato chips using L-asparaginase from Bacillus subtilis.3 Biotech 2015, 5, 783–789. [CrossRef]
58. Atanda, S. A Fungi and mycotoxins in stored foods. Afr. J. Microbiol. Res. 2011, 5, 4373–4382. [CrossRef]59. Iriondo-DeHond, A.; Aparicio García, N.; Velazquez Escobar, F.; San Andres, M.I.; Sanchez-Fortun, S.;
Blanch, G.P.; Fernandez-Gomez, B.; Guisantes Batan, E.; del Castillo, M.D. Validation of coffee by-productsas novel food ingredients. Innov. Food Sci. Emerg. Technol. 2019, 51, 194–204. [CrossRef]
60. European Food Safety Authority (EFSA) Scientific Opinion on the safety of caffeine. EFSA J. 2015, 13, 1–21.61. del Castillo, M.D.; Iriondo-DeHond, A.; Martinez-Saez, N.; Fernandez-Gomez, B.; Iriondo-DeHond, M.;
Zhou, J.-R. Chapter 6—Applications of recovered compounds in food products. In Handbook of CoffeeProcessing By-Products; Academic Press-Elsevier: London, UK, 2017; pp. 171–194. ISBN 9780128112908.
62. Murthy, P.S.; Naidu, M.M. Recovery of phenolic antioxidants and functional compounds from coffee industryby-products. Food Bioprocess Technol. 2012, 5, 897–903. [CrossRef]
63. Karadeniz, F.; Durst, R.W.; Wrolstad, R.E. Polyphenolic composition of raisins. J. Agric. Food Chem.2000, 48, 5343–5350. [CrossRef]
64. Murthy, P.S.; Manjunatha, M.R.; Sulochannama, G.; Naidu, M.M. Characterization and bioactivity of coffeeanthocyanins. Eur. J. Biol. Sci. 2012, 4, 13–19.
65. Prata, E.R.; Oliveira, L.S. Fresh coffee husks as potential sources of anthocyanins. LWT Food Sci. Technol.2007, 40, 1555–1560. [CrossRef]
145

Foods 2020, 9, 620
66. Belay, A.; Gholap, A. Characterization and determination of chlorogenic acids (CGA) in coffee beans byUV-Vis spectroscopy. Afr. J. Pure Appl. Chem. 2009, 3, 234–240.
67. Tores de la Cruz, S.; Iriondo-DeHond, A.; Herrera, T.; Lopez-Tofiño, Y.; Galvez-Robleño, C.; Prodanov, M.;Velazquez-Escobar, F.; Abalo, R.; del Castillo, M.D. An assessment of the bioactivity of coffee silverskinmelanoidins. Foods 2019, 8, 68. [CrossRef]
68. Delgado-Andrade, C.; Rufián-Henares, J.A.; Morales, F.J. Assessing the antioxidant activity of melanoidinsfrom coffee brews by different antioxidant methods. J. Agric. Food Chem. 2005, 53, 7832–7836. [CrossRef]
69. Pastoriza, S.; Rufián-Henares, J.A. Contribution of melanoidins to the antioxidant capacity of the Spanishdiet. Food Chem. 2014, 164, 438–445. [CrossRef]
70. Bravo, J.; Juániz, I.; Monente, C.; Caemmerer, B.; Kroh, L.W.; De Peña, M.P.; Cid, C. Evaluation of spent coffeeobtained from the most common coffeemakers as a source of hydrophilic bioactive compounds. J. Agric.Food Chem. 2012, 60, 12565–12573. [CrossRef]
71. Torres-Valenzuela, L.S.; Martínez, K.G.; Serna-Jimenez, J.A.; Hernández, M.C. Secado de pulpa de café:Condiciones de proceso, modelación matemática y efecto sobre propiedades fisicoquímicas. Inf. Tecnológica2019, 30, 189–200. [CrossRef]
72. Royle, L.; Radcliffe, C.M. Analysis of caramels by capillary electrophoresis and ultrafiltration. J. Sci. Food Agric.1999, 79, 1709–1714. [CrossRef]
73. Nicoli, M.C.; Calligaris, S.; Manzocco, L. Shelf-life testing of coffee and related products: Uncertainties,pitfalls, and perspectives. Food Eng. Rev. 2009, 1, 159–168. [CrossRef]
74. Manzocco, L.; Lagazio, C. Coffee brew shelf life modelling by integration of acceptability and quality data.Food Qual. Prefer. 2009, 20, 24–29. [CrossRef]
75. Malvais, R. Estudio De Vida De Anaquel En Bebidas Saborizadas. Bachelor’s Thesis, Universidad Autonómadel Estado de México, Cuernavaca, Mexico, 2017.
76. Marete, E.N.; Jacquier, J.C.; O’Riordan, D. Feverfew as a source of bioactives for functional foods: Storagestability in model beverages. J. Funct. Foods 2011, 3, 38–43. [CrossRef]
77. Michalska, A.; Wojdyło, A.; Brzezowska, J.; Majerska, J.; Ciska, E. The influence of inulin on the retention ofpolyphenolic compounds during the drying of blackcurrant juice. Molecules 2019, 24, 4167. [CrossRef]
© 2020 by the authors. Licensee MDPI, Basel, Switzerland. This article is an open accessarticle distributed under the terms and conditions of the Creative Commons Attribution(CC BY) license (http://creativecommons.org/licenses/by/4.0/).
146

MDPISt. Alban-Anlage 66
4052 BaselSwitzerland
Tel. +41 61 683 77 34Fax +41 61 302 89 18
www.mdpi.com
Foods Editorial OfficeE-mail: [email protected]
www.mdpi.com/journal/foods


MDPI St. Alban-Anlage 66 4052 Basel Switzerland
Tel: +41 61 683 77 34 Fax: +41 61 302 89 18
www.mdpi.com ISBN 978-3-0365-0031-7