Amany-Aly-Acrylamide-Awareness-and-Related-Domestic ...
198
ACRYLAMIDE AWARNESS AND RELATED DOMESTIC FOOD PRACTICES AMONG THE RESIDENTS OF THE REPUBLIC OF IRELAND Amany Aly Submitted to the Technological University Dublin in partial fulfilment of the requirements of degree of Master of Science (Food Safety Management) Supervisor: Dr. Julie Dunne SCHOOL OF FOOD SCIENCE AND ENVIRONMNTAL HELATH COLLEGE OF SCIENCES & HEALTH TECHNOLOGICAL UNIVERSITY DUBLIN September 2019
-
Upload
khangminh22 -
Category
Documents
-
view
1 -
download
0
Transcript of Amany-Aly-Acrylamide-Awareness-and-Related-Domestic ...

ACRYLAMIDE AWARNESS AND RELATED
DOMESTIC FOOD PRACTICES AMONG THE
RESIDENTS OF THE REPUBLIC OF IRELAND
Amany Aly
Submitted to the Technological University Dublin in partial fulfilment of the requirements
of degree of Master of Science (Food Safety Management)
Supervisor: Dr. Julie Dunne
SCHOOL OF FOOD SCIENCE AND ENVIRONMNTAL HELATH
COLLEGE OF SCIENCES & HEALTH
TECHNOLOGICAL UNIVERSITY DUBLIN
September 2019

i
ABSTRACT
A lack of knowledge in relation to the risks of high levels of exposure to acrylamide
contamination in home-made meals among consumers has led to questionable food preferences
and preparation practices.
A questionnaire (N=555, over 18, Irish inhabitants, March to June 2019) was used to determine
the specific domestic food practices and food preferences in relation to potatoes, bread and
coffee, as well as ascertaining individual levels of acrylamide knowledge among Ireland’s
inhabitants .
Of those questioned, 39% had heard about a harmful component formed during heat treatment
of carbohydrate-rich food, while only 14.8% recognised the term ‘acrylamide’. Awareness
relating to the carcinogenic effects of acrylamide was 94.5% among those who had heard about
this as a harmful compound, whilst 85.4% of this group were aware of the role of high cooking
temperatures as the main contributor in acrylamide generation.
In relation to the major foodstuff contributors in acrylamide formation, it was shown that
potatoes were involved in 75% of respondents; bread, biscuits and crackers in 52%, cereals in
48% and coffee in 38%.
On the subject of home-food practices, it was shown that potato-storage behaviours, pealing,
washing practices, cut-sizes and common cooking methods for the preparation of potato chips
do not significantly increase acrylamide exposure. In contrast, there were concerns in relation
to the process of soaking fresh potatoes before cooking, the parboiling process, the method for
estimating the cooking end-point and adhering to the cooking instructions on food packages.

ii
Desire for a medium-golden to brown appearance on the surface of roasted potatoes, chips and
toasted bread was the underlying reason for this concern.
The consumption rate among the main foodstuff contributors in acrylamide generation was also
recorded. Consensus for the use of acrylamide information labelling in food packages reached
73.8%, while 80% were in favour of adding precautionary information about potential
formation of acrylamide if cooking instructions are not adhered to. The present study
highlighted the need for increased efforts at different levels to teach and improve knowledge
about good cooking practices, as well as changing food habits, to minimise exposure to
acrylamide from home-prepared meals.

iii
DECLARATION
I hereby certify that this material, which I now submit in part fulfilment of the requirement for the award of MSc in Food Safety Management, is entirely my own work and has not been taken from the work of others save and to the extent such work has been cited and acknowledged within the text of my work.
This thesis was prepared according to the guidelines for dissertation production in the M.Sc. Food Safety Management and has not been submitted in whole or in part for an award in any other Institute or University.
The work reported on in this thesis conforms to the principles and requirements of the Institute's guidelines for ethics in research.
The Institute has permission to keep, to lend or to copy this thesis in whole or in part, on condition that any such use of the material of the thesis be duly acknowledged.
Signed ______________________________
Candidate
Date ____________

iv
ACKNOWLEDGEMENTS
Special appreciation to God Almighty who has enabled me to undertake and complete this
thesis. Secondly, I would like to thank my supervisor, Dr. Julie Dunne, for providing invaluable
support and direction throughout my study. Without her patience and belief, it would not
have been possible to complete my dissertation. I would also like to thank Mr. Fintan Moran
and Dr. Amit Jaiswal for providing me with the opportunity to share and gain endless
knowledge and experience. I am also grateful to Miss. Marilyn Nyquist from Southside
Partnership DLR for her support as well as her efforts in the distribution of my questionnaire
relating to the study.
Finally, I wish to extend further gratitude to my sister Dr. Marwa Aly, and her lovely family.
Thank you for your love, encouragement and support. I am truly blessed to have you in my
life.
Amany Aly
Sept.2019

v
ABBREVIATIONS
AA Acrylamide
ATSDR : The Agency for Toxic Substances and Disease Registry
BEUC: The European Consumer Organisation
CONTAM : The Panel on Contaminants in the Food Chain
DG SANTA: The Directorate-General for Health and Food Safety
ECF : European Coffee Federation
EFSA : European Food Safety Authority
EPA : Environmental Protection Agency
EU : European Union
EUPPA : European Potato Processors' Association
FAO : Food and Agriculture Organization
FDA: The Food and Drug Administration
FOBs: Food Operative Business
FSAI : Food Safety Authority of Ireland
HEATOX: Heat-Generated Food Toxicants, Identification, Characterization, and Risk
Minimization Project.
IARC : International Agency for Research on Cancer
IUNA: Irish Universities Nutrition Alliance
JECFA : Joint FAO/WHO Expert Committee on Food Additives
MB : Medium bound
SCF: Scientific Committee on Food
WHO : World Health Organization

1
Table of Contents
ABSTRACT .................................................................................................................................... i
DECLARATION ............................................................................................................................ iii
ACKNOWLEDGEMENTS .............................................................................................................. iv
Abbreviations .............................................................................................................................. v
Table of Contents ........................................................................................................................ 1
List of Tables ............................................................................................................................... 4
List of Figures .............................................................................................................................. 5
Chapter 1 . LITERATURE REVIEW ................................................................................................ 7
1.1. Introduction .......................................................................................................................... 7
1.2. Background .......................................................................................................................... 8
1.2.1. Historical Aspect ....................................................................................................... 8
1.2.2. Acrylamide Chemical Structure, Formation and Properties ......................................... 9
1.2.3. Acrylamide Health Risk Assessment ........................................................................ 16
1.2.4. Regulatory and International Efforts......................................................................... 18
1.3. The Main Foodstuffs contribute to AA Exposure Intake ...................................................... 20
1.3.1. Potatoes ................................................................................................................... 20
1.3.1.1. Precursors of AA in Potatoes ............................................................................. 21
1.3.1.2. Storage Conditions ............................................................................................ 23
Temperature .............................................................................................................. 23
Storage Time ............................................................................................................. 23
1.3.1.3. Potato Consumption Rate in Ireland .................................................................. 24
1.3.2. Bread ....................................................................................................................... 25
1.3.2.1. Factors Influencing Acrylamide Formation in Bread .......................................... 26
1.3.2.1.1. Precursors................................................................................................... 26
1.3.2.1.2. The pH of the Dough .................................................................................. 27
1.3.2.1.3. Baking Conditions ...................................................................................... 27
1.3.2.1.4. Types of Bread ........................................................................................... 27
1.3.2.2. Toasting Effects ................................................................................................ 30
1.3.2.3. Bread Storing Influence in AA level .................................................................. 31
1.3.2.4. Bread Consumption in Ireland ........................................................................... 31
1.3.3. Coffee ...................................................................................................................... 32
1.3.3.1. The Factors Influence Acrylamide Formation in Coffee ..................................... 32
1.3.3.2. Storage Effects .................................................................................................. 35
1.4.3.3. Coffee Consumption ......................................................................................... 36
2
1.4. Home Food Preparation and Cooking Practices .................................................................. 37
1.4.1. Storage Practices ...................................................................................................... 39
1.4.2. Cutting Size ............................................................................................................. 39
1.4.3. Pre-cooking treatment .............................................................................................. 40
Blanching ...................................................................................................................... 40
Soaking ......................................................................................................................... 41
pH value ........................................................................................................................ 43
1.4.4. Cooking ................................................................................................................... 43
1.4.4.1. Cooking Temperature and Time ........................................................................ 43
1.4.4.2. Influences of Cooking Method on Acrylamide Formation .................................. 45
1.4.4.3. Evaluating or Judging When Food is 'Done' ....................................................... 47
Following the manufacturer's instructions .................................................................. 47
1.4.4.4. Colour Indication .............................................................................................. 47
1.5. Previous Acrylamide Awareness Studies ............................................................................. 50
1.6. Research Gap Analysis ....................................................................................................... 53
1.7. Research Questions ............................................................................................................ 54
1.8. Aim and Objective ............................................................................................................. 54
Chapter 2 . METHODOLOGY ..................................................................................................... 57
2.1. Research Strategy ............................................................................................................... 57
2.2. Research Methodology ....................................................................................................... 58
2.3. Justification of the Research Methodology ......................................................................... 58
2.4. Research Design Process .................................................................................................... 59
2.4.1. Questionnaire design ................................................................................................ 59
2.4.2. Target participants ................................................................................................... 66
2.4.3. Data collection ......................................................................................................... 66
2.4.4. Data Analysis .......................................................................................................... 66
Chapter 3 . RESULTS & DISCUSSION.......................................................................................... 70
3.1 Participants’ Profile ............................................................................................................ 70
3.2 The Respondents, Awareness about Acrylamide ................................................................. 72
3.3. Home Food Practices .......................................................................................................... 82
3.3.1. Potato Storage Practices ........................................................................................... 82
3.3.2. Peeling and washing potatoes practices .................................................................... 87
3.3.4. Cutting potato sizes for roasting ............................................................................... 89
3.3.5. Soaking Potatoes...................................................................................................... 90
3.3.6. Parboiling Potatoes .................................................................................................. 96
3
3.3.7. Potato cooking ......................................................................................................... 98
3.3.7.1 Cooking Time Estimation for Pre-cooked Potato Products .................................. 98
3.3.7.2. Oven Temperature........................................................................................... 100
3.3.7.3. Fried Potatoes Cooking Methods ..................................................................... 102
3.4. Cooking End-Point Preferences ......................................................................................... 103
3.4.1. Potatoes ................................................................................................................. 103
3.4.2. Toasted Bread ........................................................................................................ 107
3.5. Frequency of Consumption of the Selected Products and Respondents, Preferences ........ 112
3.5.1 Potatoes Consumption ............................................................................................ 112
3.5.2 Bread Consumption ................................................................................................ 113
3.5.3 Coffee Consumption ............................................................................................... 116
3.6. Consumers Perceptions and Attitudes to Acrylamide Labelling ......................................... 123
Chapter 4 . CONCLUSION and DISCUSSIONS ........................................................................... 127
4.1 Conclusion ........................................................................................................................ 127
4.2 Recommendations ............................................................................................................. 129
4.3 Study Limitations ................................................................................................................ 67
4.4 Future Work ...................................................................................................................... 130
Chapter 5 . References ........................................................................................................... 133
Chapter 6 . JOURNAL ARTICAL ................................................................................................ 147
APPENDICES ........................................................................................................................... 169
Appendix A: The study questionnaire .............................................................................. 169
Appendix B: Author Guidelines for the Food Control Journal .......................................... 183

4
List of Tables
Table 1-1 Physical and Chemical Properties of Acrylamide .............................................................. 10
Table 1-2 EU benchmark levels for the presence of acrylamide in potato products, bread & coffee
referred to EU Regulation 2017/2158. .............................................................................................. 19
Table 1-3 Asparagine level measures among different flour types ..................................................... 28
Table 3-1 The demographic characteristics of the resident participants’ sample. ............................... 72
Table 3-2 The Acrylamide Term Awareness Responses Frequency. .................................................. 73
Table 3-3 Relationship between Responses to Q3 and Q31 ............................................................... 74
Table 3-4 The percentages of the responses for every foodstuff ........................................................ 76
Table 3-5 Frequency of responses to the main foodstuffs contributing in .......................................... 77
Table 3-6 The reasons for choosing specific foodstuffs that may contribute in Acrylamide exposure. 78
Table 3-7 The negative health effects of acrylamide, according to respondents’ answers ................... 80
Table 3-8 The channels of acrylamide information among the participants ....................................... 81
Table 3-9 The frequent locations of raw potato storage (participants and corresponding %). ............. 83
Table 3-10 The participants’ reasons for storing potatoes according to the chosen place. .................. 84
Table 3-11 Reasons behind potato storage in terms of places, choices and frequency. ....................... 84
Table 3-12 Raw potatoes storage period (participants and corresponding %)..................................... 85
Table 3-13 Peeling Potatoes Responses Frequency. .......................................................................... 88
Table 3-14 Washing peeled potatoes responses frequency. ............................................................... 89
Table 3-15 Potato Cuts Preferences Responses ................................................................................. 90
Table 3-16 Frequency of soaking potatoes before cooking ................................................................ 91
Table 3-17 Reasons behind soaking fresh potatoes ........................................................................... 93
Table 3-18 Frequency of average time for soaking responses ............................................................ 94
Table 3-19 Frequency of main soaking reasons code and soaking raw potatoes average time ........... 94
Table 3-20 Frequency of blanching potatoes before cooking ............................................................. 96
Table 3-21 Categories of the reasons behind blanching potatoes ....................................................... 97
Table 3-22 Percentage of the Food Doneness Assessment Methods .................................................. 99
Table 3-23 Frequency of oven temperature degree choices for roasting fresh potatoes. ................... 101
Table 3-24 The common methods for frying potatoes ..................................................................... 102
Table 3-25 Colour-degree preferences for roasted potato cooking .................................................. 104
Table 3-26 The chips colour-degree preferences ............................................................................ 105
Table 3-27 The frequency of reasons behind chips and roasted potatoes preferences. ...................... 107
Table 3-28 The frequency of toasted bread degree .......................................................................... 108
Table 3-29 Bread-toasting preferences among brown/wholemeal bread responses .......................... 109
Table 3-30 The reasons behind toasting degree preferences ............................................................ 111
Table 3-31 Frequency of reasons for specific toasting degree Vs toasting preferences ..................... 111
Table 3-32 The bread-type preferences ........................................................................................... 115
Table 3-33 Coffee consumption rate among genders ....................................................................... 118
Table 3-34 Frequency of common coffee-type preferences among the total participants .................. 120
Table 3-35 Frequency of who do not drink coffee, according to gender and age .............................. 121
Table 3-36 Coffee consumption rate according to gender, age and the type of coffee ...................... 121
Table 3-37 The relation between gender type and coffee consumption type .................................... 122
Table 3-38 the responses to the questions related to acrylamide information in food packages ........ 124

5
List of Figures
Figure 1-1 Chemical structure of acrylamide (AA) ............................................................................. 10
Figure 1-2 The main mechanism for acrylamide formation in food ................................................... 12
Figure 1-3 The Contribution to acrylamide intake from selected food groups for the Irish adult
population. ...................................................................................................................................... 14
Figure 1-4 Contribution of the major food groups in acrylamide intake for Irish adult. ..................... 14
Figure 2-1 The questionnaire’s questions pathways according to participants’ responses................... 63
Figure 2-2 Roasted potatoes home-made validated samples (Source, Brook Lyndhurst, 2014, p.42). 64
Figure 2-3 Potato Chips Good Fry Practices. ..................................................................................... 65
Figure 2-4 Toasted bread degree and acrylamide contents. .............................................................. 65
Figure 3-1 Responses relating to perceived conditions for acrylamide formation. .............................. 79
Figure 3-2 The storage time among fridge-storage responders. ......................................................... 86
Figure 3-3 The storage time among room-temperature storage responders. ....................................... 86
Figure 3-4 Potato-peeling practice attitudes. .................................................................................... 88
Figure 3-5 The reasons behind no-soaking (never & rarely) potatoes. ............................................... 92
Figure 3-6 The reasons behind soaking (always & usually) potatoes ................................................. 92
Figure 3-7 The Food Doneness Assessment Methods ....................................................................... 98
Figure 3-8 The Percentage of toasted degree preferences in wholemeal /brown bread. .................... 109
Figure 3-9 Frequency of roasted and potato-chip consumption ....................................................... 112
Figure 3-10 The rate of bread consumption daily ............................................................................ 114
Figure 3-11 Rate of Drinking Coffee Daily .................................................................................... 117
Figure 3-12 Percentage of coffee-type preferences among coffee consumers .................................. 120
6
LITERATURE REVIEW
7
Chapter 1 . LITERATURE REVIEW
1.1. Introduction
Concern has grown ever since it was discovered that acrylamide is being formed in food during
thermal treatment and preparation of starchy foods. The EU has led the worldwide effort geared
towards protecting consumer health as well as improving food safety awareness. A considerable
amount has already been achieved in a relatively short space of time. For example, on April 11,
2018, Regulation (EU) 2017/2158 came into act, which has been applied to control and manage
the acrylamide (AA) level in most food products. The overall aim of this regulation is to
minimise the health risks caused by AA, which is associated with food production in all
manufacturing stages (European Commission, 2017). Governmental authorities have been
given the responsibility of monitoring the compliance of different manufacturers, restaurants
and food chains with the legal benchmark levels of AA in foodstuffs by establishing the suitable
mitigation measures and food safety management system to reduce AA in their food products
There is now evidence that suggests the AA levels in food products are, for the most part,
compliant with the benchmarks (Mesias et al., 2019). This illustrates that new regulations are
being followed, but also that the respective national authorities have been competently
monitoring food suppliers and using the power of law to positive effect.
However, it is an ongoing task. To maintain adequate consumer protection, the domestic nation
has a major role to play if continued success is to be maintained. Ultimately, regulations will
only be successful if they are rigidly enforced. Since the role of domestic food practices rests
with each individual nation, food preferences and consumption habits have a major impact on
the total dietary level of exposure to AA (Mesias et al., 2018). This occurs through food choices,
food preparation, individual preferences, and cooking and overall domestic food perceptions.
Therefore, the scientific opinion of the European Food Safety Authority (EFSA) is that AA

8
investigation among the population and related home-food practices is crucial. The EFSA
believes this can provide the key in achieving a safe-level exposure to AA (EFSA, 2015).
At present, to the best of the author’s knowledge, there has not been an attempt to explore
acrylamide awareness and domestic food practices among the population of Ireland. There are
reports which have covered the estimated daily exposure to AA in Ireland. However, there are
no studies available that cover specific home practices and food preferences in regard to AA in
Ireland.
In terms of the purposes served by the references to the literature, this section covers the
following four main outlines. Firstly, the background part, which looks at historical aspects, the
chemical profile of AA, the associated health risks and the EU’s efforts to manage the risk of
exposure to AA. The second part deals with the main foodstuffs that contribute to high AA
level exposure, in particular potatoes, bread and coffee. The third part reviews the impact of
different home-food practices on AA levels. The fourth part presents the previous studies in
regard to the home practices and preferences, as well as examining the outcome of global AA
awareness studies. The section will then close out with a look at previous research gap, as well
as current research questions and the study’s objectives.
1.2. Background
1.2.1. Historical Aspect
In 2000, an experiment was carried out on rats by feeding them fried animal feed. The results
showed an increase in haemoglobin (Hb) adduct levels of AA by 10 times in comparison to
controlled rats (Tareke et al., 2000). This result encouraged the same research group to
experiment with cooking foodstuffs. By 2002, they discovered that high level of AA formed in
starch-rich foods between 50-4000 µg/kg, when food was exposed to high heat treatment,

9
compared with 5-50 µg/kg in protein-rich foods (Tareke et al., 2002). Following these findings,
the Swedish National Food Administration and Stockholm University announced in April 2002
that AA can be formed in many carbohydrate-rich foods during baking and frying under high
temperature. As a consequence, worldwide concern to AA in foods rose, particularly because
acrylamide had previously been classified as (Group 2A) probably carcinogenic to humans by
the International Agency for Research on Cancer (IARC, 1994). Further studies conducted all
over the world made similar findings about AA formation, mainly in carbohydrate-rich food
prepared under high temperature and low moisture. Furthermore, findings confirmed that the
formation pathway of AA in foods occurs during the Maillard process. This is the reaction of
free asparagine and reducing sugars under high temperature and low moisture (Nursten, 2005;
Stadler et al., 2002; Mottram, Wedzicha and Dodson, 2002). Meanwhile, the Joint FAO/WHO
Consultation on Health Implications of Acrylamide in Food rose concerns about other possible
significant risk factors from some cooked foodstuffs, in addition to neurotoxic effects (WHO,
2002). Thus, the Joint FAO/WHO Expert Committee on Food Additives (JECFA) conducted a
massive data collection and data analysis on the occurrence of AA from several countries,
mainly in Europe and North America. The outcomes from data analysis revealed that the main
food groups contributing to high levels of AA are potato-based products, cereal-based products
and coffee (JECFA, 2006).
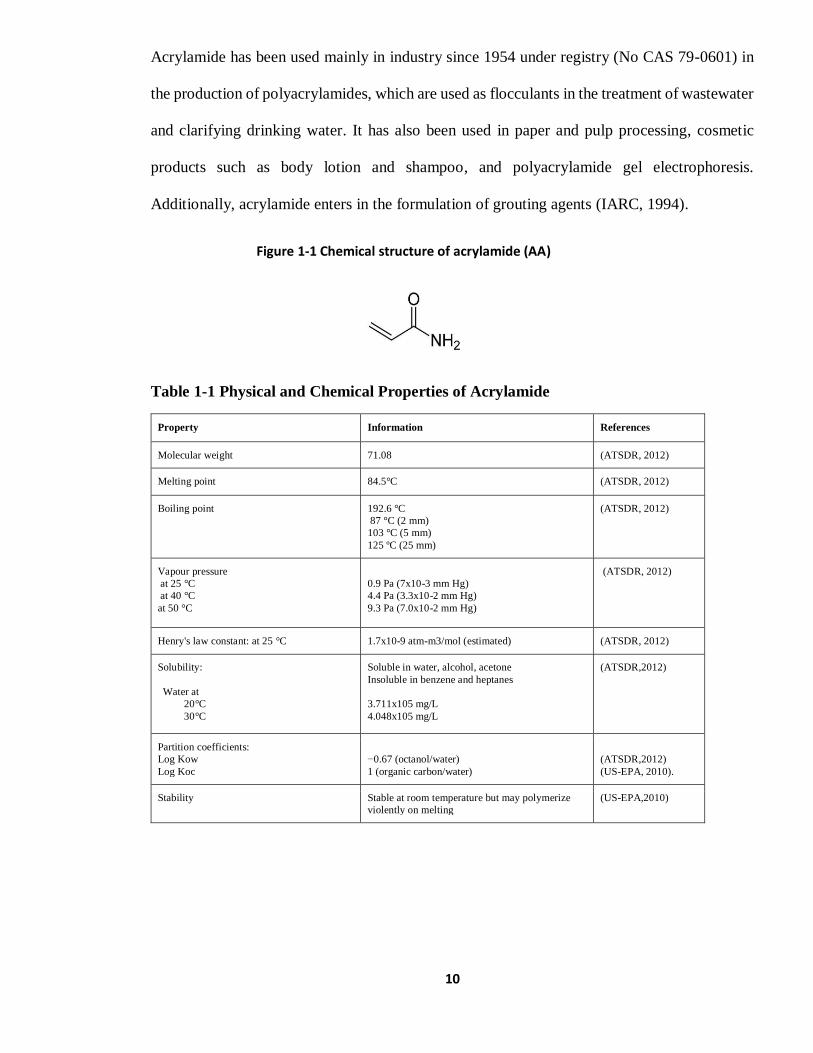
1.2.2. Acrylamide Chemical Structure, Formation and Properties
Acrylamide (C3H5NO) () is a white or colourless, odourless crystalline solid organic compound
with low molecular weight and high water solubility (ATSDR, 2012).
Table 1-1 summarises the chemical and physical characteristics of AA.
10
Acrylamide has been used mainly in industry since 1954 under registry (No CAS 79-0601) in
the production of polyacrylamides, which are used as flocculants in the treatment of wastewater
and clarifying drinking water. It has also been used in paper and pulp processing, cosmetic
products such as body lotion and shampoo, and polyacrylamide gel electrophoresis.
Additionally, acrylamide enters in the formulation of grouting agents (IARC, 1994).
Figure 1-1 Chemical structure of acrylamide (AA)
Table 1-1 Physical and Chemical Properties of Acrylamide
Property Information References
Molecular weight 71.08 (ATSDR, 2012)
Melting point 84.5°C (ATSDR, 2012)
Boiling point 192.6 °C
87 °C (2 mm)
103 °C (5 mm)
125 ºC (25 mm)
(ATSDR, 2012)
Vapour pressure
at 25 °C
at 40 °C
at 50 °C
0.9 Pa (7x10⁻³ mm Hg)
4.4 Pa (3.3x10⁻² mm Hg)
9.3 Pa (7.0x10⁻² mm Hg)
(ATSDR, 2012)
Henry's law constant: at 25 °C 1.7x10⁻⁹ atm-m3/mol (estimated) (ATSDR, 2012)
Solubility:
Water at
20°C
30°C
Soluble in water, alcohol, acetone
Insoluble in benzene and heptanes
3.711x10⁵ mg/L
4.048x10⁵ mg/L
(ATSDR,2012)
Partition coefficients:
Log Kow
Log Koc
−0.67 (octanol/water)
1 (organic carbon/water)
(ATSDR,2012)
(US-EPA, 2010).
Stability Stable at room temperature but may polymerize
violently on melting
(US-EPA,2010)

11
Pathways of Acrylamide Formation
Early research into the mechanism of AA generation in food suggested that the main pathway
for AA formation is the Maillard reaction between free amino acids, particularly asparagine and
reducing sugars (glucose, fructose and others) in carbohydrate-rich foods (Halford et al., 2012),
when exposed to temperatures higher than 120°C and under low humidity (Halford et al., 2011;
Mottram, 2007; Nursten, 2005; Mottram, Wedzicha and Dodson, 2002; Stadler et al., 2002).
However, under certain conditions AA may form at a temperature less than 100°C, such as
during the processing of prunes and pears (Becalski et al., 2011).
There are several other suggested pathways (as shown in Figure 01-2) within the Maillard
reaction, while alternative pathways and precursors have also been stated as contributing to the
formation of AA in food. These include acrylic acid, as a precursor formed via acrolein and
ammonia by oxidative degradation of lipids (Gertz and Klostermann, 2002; Yasuhara et al.,
2003; Vattem and Shetty, 2003). Additionally, the formation of pyrolytic acrylamide from
wheat gluten, with protein-bound alanine (Claus et al., 2006), or peptides with proteins as
precursors (Casado et al., 2013).
Maillard reaction is a non-enzymatic browning reaction that occurs during the cooking of food.
This reaction is responsible for generating the aroma, flavour and colour of the cooked food
(Nursten, 2005). The mechanism for AA formation in food through the Maillard reaction
(Figure 01-2) involves a reaction between a carbonyl compound (C=O) and asparagine under
high temperature, resulting in N-glycosyl asparagine formation, which in turn undergoes
hydrolysis, producing a Schiff base (Blank et al., 2005; Stadler et al., 2002). Following on from
that, an unstable intermediate compound forms from decarboxylation of the Schiff base. Either
this compound can hydrolyse to 3- aminopropionamide, which on elimination of ammonia
yields acrylamide, or the alternative pathway involves elimination of an imine from

12
decarboxylated Schiff base which leads to acrylamide formation (Zyzak et al., 2003). The role
of 3-aminopropionamide (3-APA) in acrylamide formation has been described by Granvogl
and Schieberle (2006) and Granvogl et al. (2004).
Figure 01-2 The main mechanism for acrylamide formation in food (adapted from
(Zhang and Chen, 2015, p.16)
The amount of AA which forms in food depends on a combination of factors. These are the
specific precursors ratio, the rate of reaction and the available time to proceed. Therefore, AA

13
formation is under kinetic control (HEATOX, 2007b; Claeys, De Vleeschouwer and
Hendrickx, 2005).
Sources of Exposure to Acrylamide
There is a consensus regarding the major food contributors in the total AA exposure. These
foods are potato chips and crisps (fried, roasted, baked), potato products, bread and bakery
products, cereals and grain products including coffee (EFSA, 2015; JECFA, 2006; WHO, 2002;
Scientific Committee on Food (SCF), 2002; Tareke et al., 2002). For example, potato chips
contribute 10% to 60% of AA intake, potato crisps 10% to 22% , bread/toast 13% to 34%, and
pastry & biscuits 10% to 15% (JECFA, 2011).
EFSA (2015) reported the average medium bound (MB) AA level in main food commodities
among EU markets as follows: dry coffee substitutes 1499µg/kg, solid coffee 522µg/kg, potato
fried products 308μg/kg, potato crisps 389μg/kg and soft bread 42µg/kg. These products
contributed to the highest levels of AA exposure among food commodities in the EU.
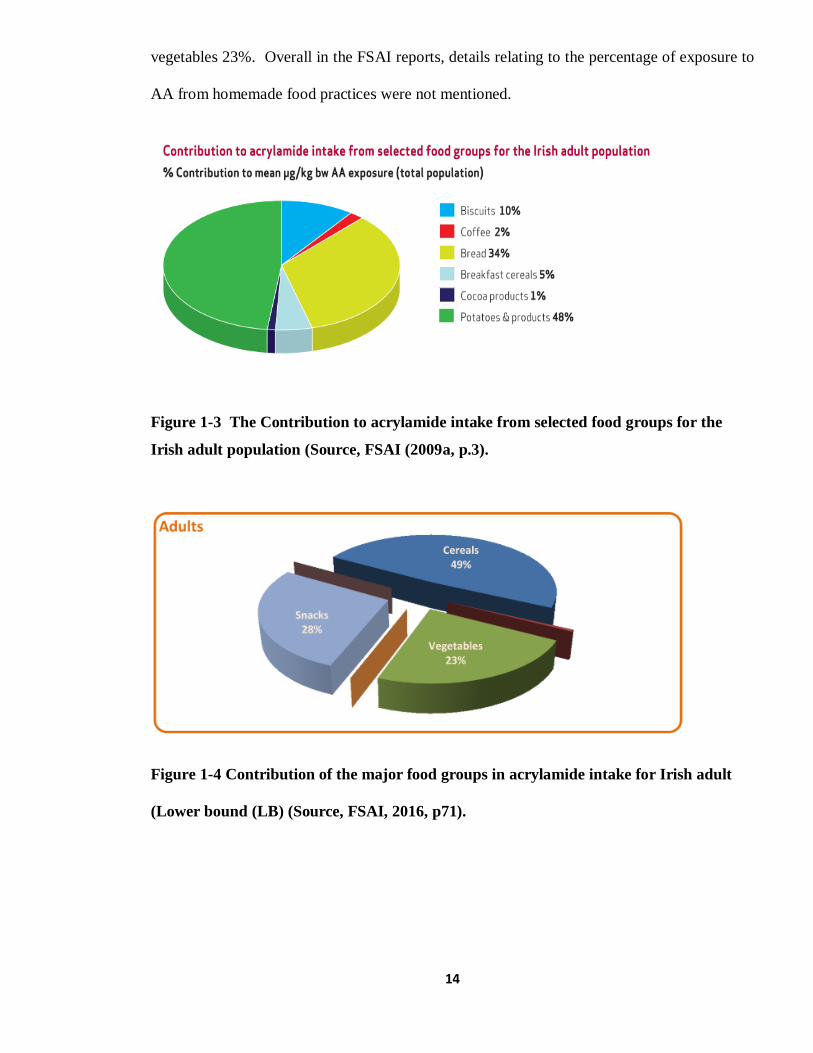
FSAI (2009a) recorded that overall consumption of potatoes and potato products has the largest
contribution percentage in total mean μg/kg bodyweight (bw) dietary intake of AA among the
population of Ireland. This is followed by bread and biscuit consumption, and then coffee. The
report illustrated that among the adult population, potatoes and potato-based products
contributed to 48% in AA intake. Bread accounted for 34% and white coffee represented 2%
of the total contribution to mean dietary AA intake (Figure 1-3). This was in contrast to the last
FSAI report in 2016, which presented the data in the form of the major food groups rather than
in terms of the individual foods, like in the 2009 report (Figure 1-4). The data from the 2009
FSAI report specifically detailed the contribution of individual food items, while the 2016
report was more general, stating that cereal groups accounted for 49%, savoury snacks 28% and
14
vegetables 23%. Overall in the FSAI reports, details relating to the percentage of exposure to
AA from homemade food practices were not mentioned.
Figure 1-3 The Contribution to acrylamide intake from selected food groups for the
Irish adult population (Source, FSAI (2009a, p.3).
Figure 1-4 Contribution of the major food groups in acrylamide intake for Irish adult
(Lower bound (LB) (Source, FSAI, 2016, p71).

15
Estimates of Acrylamide Exposure
As a result of different exposure levels to AA being recorded in even the same foods, it is clear
that these levels depend heavily on how foods are prepared, cooked (methods), cooking
conditions (temperature, time, moisture), as well as food preferences and different consumption
habits. This was concluded in Brook Lyndhurst’s report to the Food Standards Agency (2014)
and by the European Union-funded project entitled “Heat-Generated Food Toxicants
(HEATOX)” (HEATOX, 2007b). Therefore, estimating the actual dietary acrylamide intake is
particularly difficult.
The international mean AA dietary exposures for acrylamide was estimated by the Joint
FAO/WHO Expert Committee on Food Additives (JECFA) as 1μg/kg bw per day, and 4 μg/kg
bw per day for a high percentile consumer (JECFA, 2006). Comparing this in 2010, the mean
range was between 1.1 and 4.8μg/kg bw per day, assuming an individual body weight was 60kg.
In spite of this estimated result, the JECFA recommended to keep 1μg/kg bw per day and
4μg/kg bw per day estimates for safety evaluation purposes (JECFA, 2011).
At the level of European nations, the EFSA Panel on Contaminants in the Food Chain
(CONTAM) estimated the chronic mean AA exposures for adolescents, adults, elderly and
over-age as 0.4 to 1.9µg/kg bw per day and the 95th percentile was 0.6 to 2 µg/kg bw per day.
Among EU children, it was 0.5 and 1.9 µg/kg bw per day and the 95th percentile was between
1.4 and 3.4 µg/kg bw per day (EFSA, 2015).
An EFSA report in 2015 referred to developing specific scenarios for calculating the influence
of home-food cooking habits and consumers preferences on the total dietary exposure to AA.
The estimations revealed that in the scenario of frying potatoes at home, the increases in
exposure to AA reached 80%, and 14% in coffee preferences. Preferences for toasted bread
showed decreases by 8% when compared to the baseline estimation. However, Mesias et

16
al.(2018) proved there was underestimation on the dietary exposure to AA among the European
population. This is due to the fact that the EFSA report did not contain actual data regarding
the acrylamide occurrence in domestic prepared meals in the home. Where the researchers
examined the actual home practices was in regard to fried potatoes, and this found that the level
of AA in homemade chips was more than double the level which was recorded by EFSA (2015).
This, high level of exposure from home-made chips has been pointed out early by researchers
in Teagasc, who referred to the level of acrylamide in home-made French fries was estimated
in risk assessment model with a mean simulated value of 1073µg/kg (Brunton et al., 2006) and
this value was almost three times higher than EFSA home-made potatoes estimation.
In Ireland
The average intake of acrylamide from food had been estimated to be between 0.16 and 0.38
μg/kg bw/day, while the above-average (97.5th percentile) daily intake was estimated to be
between 0.51 and 1.03μg/kg bw/day among the adult population in Ireland (FSAI, 2016). In
contrast, in 2009, the mean dietary exposure to acrylamide was about 0.6µg/per kg bw/day for
the Irish adult population, and the above-average (97.5th percentile) daily intake was
approximately 1.75µg/kg bw/day (FSAI, 2009a).
1.2.3. Acrylamide Health Risk Assessment
In 1991, the Scientific Committee on Food (SCF) in the European Commission considered
presentation of acrylamide in form of a monomer in food contact materials as a genotoxic
carcinogen substance (The Codex Alimentarius Commission, 2004). Later, in 2002 the
17
Scientific Committee on Food (SCF) confirmed the same conclusion after re-evaluation (SCF,
2002).
Also, by 1994, the International Agency for Research on Cancer (IARC) classified acrylamide
as “probably carcinogenic to humans” (Group 2A) as acrylamide undergoes biotransformation
into the metabolite glycidamide which has genotoxic activity (IARC, 1994). Furthermore, the
US Environmental Protection Agency (EPA) classified acrylamide and glycidamide as a
“probable human carcinogen” category B2 (US-EPA, 2000). AA has been listed by the
European Parliament and Council as a carcinogen and mutagen (category 1B). It is also listed
as a reproductive toxicant (category 2, fertility) compound in Regulation (EC) No 1272/2008
of the European Parliament and of the Council, of December 16, 2008, on Classification,
Labelling and Packaging of Substances and Mixtures.
In 2015, the Scientific Panel on Contaminants in the Food Chain (CONTAM) of the European
Food Safety Authority established an opinion on acrylamide in food based on early research
and animal studies. The Panel’s conclusion was confirmation of the previous evaluations, which
considered the presence of AA in food as potentially increasing the risk of development
carcinogenic effects among consumers in all age groups. However, based on the estimated
levels of dietary exposure, the Panel consider the probability of other harmful effects of AA on
foetal development, nervous system and male fertility were not such a heightened concern. The
levels of dietary exposure to acrylamide across all age groups in Europe raise a concern
regarding its carcinogenic effects (EFSA, 2015). That view was reaffirmed by FSAI ( 2016).

18
Recent acrylamide health-risk studies
A recent acrylamide exposure risk-assessment study showed that males are at higher
carcinogenic and neurotoxic risk than females. This is because, subsequent to the chronic
dietary exposures to AA, the mean mass of food consumed among males was higher than that
of females. Moreover, the study stated that the adult group (40 years and above) face the highest
risk of developing cancer compared to other population groups (children and teenagers (5-19)
and young adults (20-39) (Siaw, et al., 2018).
In 2019, a new discovery of unique mutational signatures imprinted by acrylamide through
glycidamide was made. In the discovery, glycidamide mutational signature is found in 35% of
tumour genomes corresponding to 19 human tumour types (Zhivagui et al., 2019).
Rivadeneyra-Domínguez et al. (2018) reported that systemic introducing of AA to Wistar rats
causes damage to renal and hepatic function, producing dose-dependent alterations of blood
chemistry and cytometry parameters.
1.2.4. Regulatory and International Efforts
Since 2002, extensive projects have been established by the Food and Agriculture Organization
(FAO), World Health Organization (WHO) and European Commission to explore AA
formation mechanisms, levels of exposure, suitable analytical procedures and mitigation
strategies in food stuffs. Following on from this, the European Commission, in collaboration
with the Confederation of the Food and Drink Industry, established FoodDrinkEurope
Acrylamide Toolbox in 2005. This forms platform guidelines for food processing industries in
regard to covering the particular requirements to lower AA levels in food processed products.
With a total of 15 editions published, the last version of the Acrylamide Toolbox was published
19
in 2019 (FoodDrinkEurope, 2019). It aims to be a useful guide in the target of correctly
implementing Commission Regulation (EU) 2017/2158. This relates to establishing mitigation
measures and benchmark levels for reducing the presence of acrylamide in food.
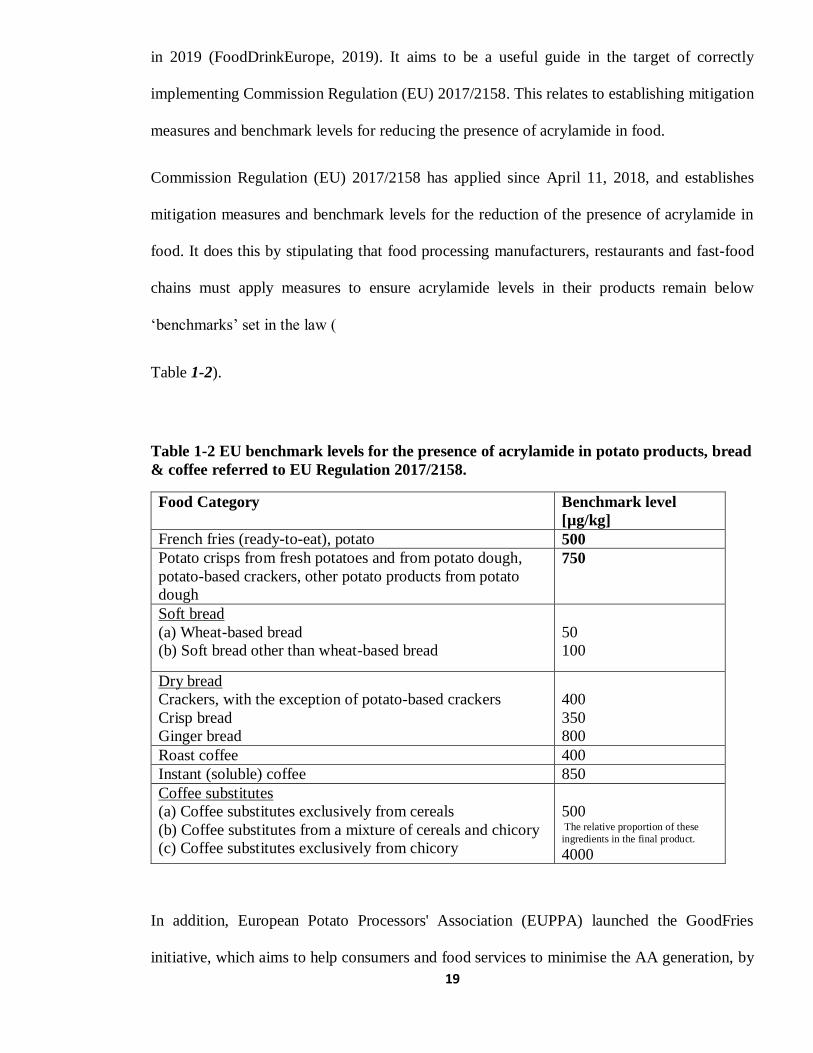
Commission Regulation (EU) 2017/2158 has applied since April 11, 2018, and establishes
mitigation measures and benchmark levels for the reduction of the presence of acrylamide in
food. It does this by stipulating that food processing manufacturers, restaurants and fast-food
chains must apply measures to ensure acrylamide levels in their products remain below
‘benchmarks’ set in the law (
Table 1-2).
Table 1-2 EU benchmark levels for the presence of acrylamide in potato products, bread
& coffee referred to EU Regulation 2017/2158.
Food Category Benchmark level
[µg/kg]
French fries (ready-to-eat), potato 500
Potato crisps from fresh potatoes and from potato dough,
potato-based crackers, other potato products from potato
dough
750
Soft bread
(a) Wheat-based bread
(b) Soft bread other than wheat-based bread
50
100
Dry bread
Crackers, with the exception of potato-based crackers
Crisp bread
Ginger bread
400
350
800
Roast coffee 400
Instant (soluble) coffee 850
Coffee substitutes
(a) Coffee substitutes exclusively from cereals
(b) Coffee substitutes from a mixture of cereals and chicory
(c) Coffee substitutes exclusively from chicory
500 The relative proportion of these
ingredients in the final product.
4000
In addition, European Potato Processors' Association (EUPPA) launched the GoodFries
initiative, which aims to help consumers and food services to minimise the AA generation, by

20
good food preparation practices through recommendations, pictures and a demonstrative video
on the best practices to cook fried potatoes (EUPPA, 2019). Moreover, a guide reference about
acrylamide management in catering and food service sectors was published by UKHospitality
(2018). As well as FDA established guide tool for controlling acrylamide in industry (FDA,
2016)
1.3. The Main Foodstuffs contribute to AA Exposure Intake
WHO (2002) referred to for reliable AA exposure evaluation, the importance of ensuring that
the data has been collected from the food items that have lower AA contents, but show high
levels of consumption, as well as the main food groups that contribute most to AA exposure.
1.3.1. Potatoes
There are several factors that affect acrylamide levels in potato products, such as the
concentration of precursors (reducing sugars and free asparagine) in raw potatoes, which in
turn is dependent on potato varieties and storage condition. Cooking conditions
(temperature/time) and the moisture content (Elmore et al., 2005) are also factors that impact
upon acrylamide levels in potato products..

21
1.3.1.1. Precursors of AA in Potatoes
There is a natural variation in the level of free reducing sugars in different potato varieties, from
season to season and from year to year (Sun, Rosen and Thompson, 2018; Viklund et al., 2008;
HEATOX, 2007a; Silva and Simon, 2005). This is also the case within the same varieties under
different growing conditions (season, temperature, type and amount of fertilisers and soil) (De
Wilde et al., 2006,a,b). Reducing sugar concentration in potato tubers and, consequently, AA
level are significantly dependent on potato varieties (Sun, Rosen & Thompson, 2018; Shojaee-
Aliabadi et al., 2013; Vivanti, Finotti and Friedman, 2006; Amrein et al., 2003).
The presence of reducing sugars in potato tubers appears to be the main determinant for
acrylamide formation rather than asparagine (Sun, Rosen and Thompson, 2018; Kalita and
Jayanty, 2017; Wicklund et al., 2006; Brunton et al., 2006; De Wilde et al., 2005; Williams,
2005; Chuda et al., 2003; Amrein et al., 2003). Fructose and glucose, in particular, play the
greater impact in AA formation, while sucrose and asparagine concentrations in tubers did not
show any correlation to acrylamide levels (Sun, Rosen and Thompson, 2018; Mestdagh et al.,
2008; Wicklund et al., 2006; Silva and Simon, 2005; Amrein et al., 2004). This supported what
Shojaee-Aliabadi et al. (2013) studied on one potato variety (Savalan) that contains high level
of asparagine and low level of sugars. However, the findings indicated a low level of AA in the
fried potatoes. Muttucumaru et al. (2017) assumed free asparagine could impact upon AA
formation level, particularly when it was presented in relatively low concentration compared
with the concentration of reducing sugars. Halford et al. (2012a), meanwhile, monitored a
significant correlation between AA formation and asparagine and free amino acid in French
fried potato varieties. Matsuura-Endo et al. (2006) summarised the contribution degree of both
22
reducing sugars and asparagine in AA formation according to the fructose/asparagine molar
ratio, which means if the ratio was less than two, the sugars will correlate well with the AA
formation. On the other hand, when the ratio was more than two (at low temperature) asparagine
will be the limiting factor for AA formation.
Conversely, Skog et al. (2008) reported an absence of any correlation between precursor content
in typical home-cooking potatoes and acrylamide content. They assumed there was a reason to
hinder the availability of the precursor to generate AA at the surface of potato cuts. That is in
line with the findings of Sansano et al. ( 2015), who talks about the lack of correlation between
AA contents in fried potatoes and the amount of reduced sugars in the raw potatoes. Researchers
explained this by the presence of complex mechanism responses on AA inhibition, such as the
interference of additives in the Maillard reaction and the kinetics and conditions of frying beside
the role of the precursors (Sansano et al., 2015).
1.4.1.2. Storage Practices Affecting Acrylamide Precursors or Acrylamide in Potatoes
The storage conditions of raw potatoes can significantly influence acrylamide formation in
cooked potatoes through directly affecting the level of reducing sugars (Matsuura-Endo et al.,
2006; Chuda et al., 2003). The storage temperature and storage period represent the pivot
factors.
23
1.3.1.2. Storage Conditions
Temperature
Early research discovered that keeping potato tubers at a cold condition of 4°C or lower leads
to sweetening of potatoes. This is where the level of reducing sugars (glucose and fructose)
increases due to breakdown of potato starch to reducing sugars (Sowokinos, 1990). Low
temperature enhance inactivation of phosphofructokinase, which results in the accumulation of
hexose phosphates, and that increases sucrose generation (Hammond, Burrell and Kruger,
1990).
It has been explained in literature that AA formation levels were higher when the potatoes had
been stored at 4°C or lower, rather than 8°C or over prior to cooking (Viklund et al., 2008;
Matsuura-Endo et al., 2006; De Wilde et al., 2005; Silva and Simon, 2005; Amrein et al.,
2004b). Chuda et al. (2003) recorded that, at 2°C storage temperature, AA level in potato chips
rose tenfold than if potatoes were stored at 20°C for two weeks. Therefore, potatoes should be
stored at temperatures above 8 ºC (Palermo et al., 2016).
Storage Time
Several studies investigated the impact of storage time and temperature in the level of AA in
end-products and they tend to concur, there is a positive correlation between storage time of
potato tubers and AA formation in final products, and explained that as subsequent to the rising
in reducing sugars (fructose and glucose) content of tubers during storage period (Silva and
Simon, 2005; Matthäus, Haase and Vosmann, 2004). Storing various cultivars of potatoes at
8°C for two to six months has shown a total increase in reducing sugar contents of potatoes,
which reached a 2.74-fold increase after six months in comparison to two months in some
24
cultivars, such as Lady Rosella (Elmore et al., 2015). In contrast, HEATOX (2007a) recorded
that the sugar level in Lady Olympia potato varieties showed a reduction after six months of
storage at 8°C.
1.3.1.3. Potato Consumption Rate in Ireland
According to the Teagasc (2018) official website, potato consumption in Ireland reached an
average of 125kg per Irish household per year. Furthermore, a recent Bord Bia report stated
that more than 97% of Ireland's population are purchasing potatoes and they consumed potatoes
on average over three times per week (Neary, 2019). ShelfLife (2015) reported that 29% of
people in Ireland eat potatoes daily, while 60% consume potatoes two to three times weekly.
Mintel (2019b) carried out a survey to discover the types of potatoes commonly consumed
among participants from Ireland, where the survey showed fresh potatoes bags are the popular
where represented 83% of respondents, while frozen processed potatoes formed 26% and loose
potatoes choices25%.
Also, a recent research investigated the level of using processes potatoes in the foodservice
sector in Leinster, where the results revealed that, the tendency to purchase and eat fresh
potatoes in Ireland is showing growth in comparison to processed potatoes (Gray, 2018).
While, Teagasc researchers group simulated risk assessment module among Irish population in
regard to the impact of home-made chips in the level of exposure to acrylamide, the results for
a simulated mean value per a portion of chips were 0.94µg/kg bw for males and 0.69µg/kg
females (Brunton et al., 2006). This result represented only a portion of fried potatoes,
meanwhile, WHO estimated the daily intake limit set at 1µg/kg bw/day. Thus, the contribution
of home French fried on daily exposure to acrylamide among Irish communities was considered
higher than WHO limits.

25
1.3.2. Bread
Bread is considered a source of acrylamide intake by people all over the world, despite the low
level of AA recorded in bread. The reason it is considered a source of acrylamide intake is
related to a high consumption rate of bread (EFSA, 2011). Mesías and Morales (2015) reported
that acrylamide from bakery products could be a major contributor to the daily acrylamide
intake of between 20% and 60%. In a recent study which monitored AA levels among 56 Iranian
traditional flat breads (whole-wheat flour) and 30 industrial breads, it was concluded that the
average daily intake of acrylamide in Iran, based on consumption of traditional bread, was
estimated at 145 ng/kg bw/day (Eslamizad et al., 2019).
In Ireland, the average annual per capita bread consumption stands at 67.9kg in 2019 (Statista,
2019). Thus, the contribution to acrylamide intake from bread consumption among the Irish
adult population has been recorded at 34% (FSAI, 2009a).
EFSA (2015) reported that the acrylamide MB (average medium bound) levels in the ‘soft
bread’ category was at 42µg/kg, while in the ‘crisp bread’ category it was 171 µg/kg.
Additionally, AA levels in wheat bread were lower than in rye bread.

26
1.3.2.1. Factors Influencing Acrylamide Formation in Bread
Acrylamide level in bread depends on specific factors, such as the initial concentrations of
asparagine, rather than concentration of reducing sugars (Surdyk et al., 2004). This differs
according to the type of flour (Wang et al., 2017), the pH of the dough, the water activity and
the baking condition in regard to the time and temperature of the heating process (Mustafa,
2008; Gökmen et al., 2007). Surdyk et al. (2004) presented a significant interaction correlation
between baking temperature, baking time in wheat bread and AA content.
1.3.2.1.1. Precursors
Asparagine is the main contributor in the formation of AA in baked products, rather than the
role of reducing sugars, as confirmed by (Mustafa, 2008; Claus et al., 2006; Mustafa et al.,
2005). There is a positive correlation between the level of free asparagine in cereal products
and the amount of acrylamide in bread (Capuano et al., 2009; Fredriksson et al., 2004). That
means the main key in AA level is the concentration of free asparagine in flour. By contrast,
Esfahani et al. (2017) referred to how there wasn’t a significant relationship detected between
the acrylamide precursors, either the reducing sugars or free amino acid contents in dough
samples, and the level of AA in bread end-products.
Shen, Chen and Li (2019), meanwhile, confirmed that both asparagine and reduced sugars,
particularly fructose, have highly impacted upon the level of AA in white pan bread.

27
1.3.2.1.2. The pH of the Dough
The effect of low pH in sourdough has a role in AA reduction in bread (Nachi et al., 2018;
Esfahani et al., 2017; Wang et al., 2017; Bartkiene et al., 2013; Fredriksson et al., 2004).
1.3.2.1.3. Baking Conditions
Jouquand et al. (2018) tested the effect of temperature/time in melanoidins compounds
formation and the relation with AA level in French baguettes. The result pointed out that under
baking parameters (225°C for 22 minutes) a high crust colour with a crispy base and an intense
flavour could be achieved without increasing the generation of acrylamide, where the level
remained below 18 μg/kg. The authors suggested a slow dough fermentation could contribute
to limit the formation of acrylamide in French baguettes.
Moreover, there was a correlation between the water content in bread and AA level (Esfahani
et al., 2017). That explains why the dry breads have higher levels of AA compared with soft
bread from the same type of flour.
1.3.2.1.4. Types of Bread
The amount of free asparagine in flour varied significantly, which is influenced by plant
varieties and cultivars (Stockmann et al., 2018; Rapp et al., 2018; Wang et al., 2017; Claus et
al., 2006). Stockmann et al. (2018) illustrated that cultivars differed in free asparagine by up to
67% in wheat, 55% in spelt, and 33% in rye, as well as noting a relation between asparagine in
specific species of grain and the growing time per year. Consequently, the contents of
asparagine in flour will reflect on the total AA in end-products. This means the total daily
exposure to AA from bread consumption will differ between consumers according to the type
of bread they consume, even if it is the same amount of bread at the same degree of toasting.
The contents of asparagine among different types of flour have been measured in many studies

28
and then compared to the AA level in end-products. Table 1-3 summarises the average
measured asparagine concentration in different flour types.
Table 1-3 Asparagine level measures among different flour types
Flour Types Level of Asparagine/
flour (mg/100gm)
Reference Note
Wheat flour 1.74-19.05
14-17
25.5-36.5
14.325-39.275
14.5
10
0.64-4.46 (mmol/kg)
14
(Claus et al., 2006)
(Fredriksson et al., 2004)
(Wang et al., 2017)
(Rapp et al., 2018)
(Shen, Chen & Li, 2019)
(Stockmann et al., 2018)
(Curtis et al., 2010)
(Granby et al., 2008)
sifted flour
sifted flour
Rye flour 41.37-44.1
53-68
43
3.63-15.14 (mmol/kg)
110
76
(Claus et al., 2006)
(Fredriksson et al, 2004)
(Stockmann et al., 2018)
(Curtis et al., 2010)
(Fredriksson et al., 2004)
(Granby et al., 2008)
sifted flour
whale grain
whale grain
Spelt flour 6.46-12.17
8
(Claus et al., 2006)
(Stockmann et al., 2018)
Whole grain
flour
48-51 (Fredriksson et al., 2004)
Wheat bran 261-318 (Fredriksson et al, 2004)
Crawford et al. (2019) evaluated the AA in experimental and commercial flatbreads with
different flour types. The researchers found that commercial flatbread as naan (whole wheat)

29
contained about (32.8µg/kg), in contrast with crackers, which show significantly high levels of
AA ranging from 455 to 504µg/kg. Furthermore, this study recorded that the gluten-free Matzo-
style bread hit 1880-2070 µg/kg AA.
Gündüz and Cengiz (2015) found that the highest level of AA was recorded among whole-
wheat bread when compared to other types of bread (white wheat bread, stone oven wheat
bread, wheat bran bread, rye bread). The authors stated that the high level of AA in whole-
wheat bread attributed to the significant amount of asparagine contents due to the presence of
wheat germ and bran contents in flour. That is similar to Fredriksson et al. (2004), who
mentioned the level of asparagine in raw ingredients. Additionally, Mustafa (2008) and
Fredriksson et al. (2004) recorded double the amount of asparagine in whole rye flour than in
wholegrain wheat. Likewise, Stockmann et al. (2018), Claus et al. (2006) and Elmore et al.
(2005) detected free asparagine levels that were two to three times higher in rye flour compared
to wheat flour.
The highest content of glucose, fructose and asparagine was found in cultivars of rye compared
to other cereals cultivars (Žilić et al., 2017). Therefore, the suspected AA formation in breads
from rye flour is considered to be higher than from wheat breads (Stockmann et al., 2018;
Capuano et al., 2009; Granby et al., 2008; Claus et al., 2006; and Elmore et al., 2005). Despite
evidence that the asparagine in rye flour was nearly three times higher than in wheat flour in a
study by Curtis et al. (2010), the AA formation in heated flour at 180°C for 20 minutes in rye
flour was much lower than in wheat flour. The authors explained that this was largely due to
high concentration of proline in rye flour, which competes with asparagine in reaction with
carbonyl compounds (Curtis et al,, 2010).

30
Lower levels of AA were observed in wheat soft and crisp bread (38 and 126µg/kg,
respectively) compared to rye soft and crisp bread (57 and 245 µg/kg, respectively) (EFSA,
2015).
A difference in the level of AA formation had been recorded between white toast and brown
toast during toasting under the same conditions. Even though the AA level before toasting was
the same in both toast types, brown bread ultimately showed higher AA levels than white bread
(Ahn et al., 2002). In line with that, HEATOX (2007a) pointed out that acrylamide generation
in the different bread types by toasting were primary related to the concentration before
toasting, thus the project’s results showed that acrylamide contents in toasted brown bread was
much more than in toasted white bread. In the same way, Brook Lyndhurst (2014) reported that
in home-made toasted samples, the levels of AA in brown and wholemeal bread were greater
than in white toasted bread samples.
1.3.2.2. Toasting Effects
Although untoasted bread contributes to 2µg dietary AA intake, AA exposure from toasted
bread increases significantly (Granby et al., 2008).
Eerola et al. (2007) conducted a test to investigate the impact of different degrees of toasting
on AA formation in bread (wheat, oats and rye). The results showed that the difference between
slightly toasted bread (40seconds) and strongly toasted bread (180 seconds) nearly doubled the
AA level (Eerola et al., 2007), and the level of AA in medium toasting was recorded higher
than the untoasted bread by 1.5 to five times (HEATOX, 2007a).
Also, Granby et al. (2008) reported the effect of toasting on increase AA level and comparing
between toasted rye and wheat bread slices and untoasted slices. The results showed that rye
31
bread contained a high level (7-23µg/kg) of AA, while wheat bread contained less than 5µg/kg.
Asparagine content of flour is higher in rye than in wheat flour. Therefore, the toasted slices
represented 27-205 µg/kg AA in rye slices, compared with 11-161µg/kg AA in toasted wheat
slices.
1.3.2.3. Bread Storing Influence in AA level
The effect of storing cooked foods such as breads has been tested with common results, which
almost was stability of the AA contents (Tareke et al., 2002). It is more specifically stable at -
80 to 6°C according to Mustafa (2008). In contrast, Mustafa (2008) demonstrated a reduction
in AA level at 20 to 40 °C after storing rye crisp bread for up to 224 days.
1.3.2.4. Bread Consumption in Ireland
A report examining the pattern of white and wholemeal bread consumption among the Irish
population was conducted by the Irish Universities Nutrition Alliance (IUNA) in 2016. It
revealed that the mean daily intake of white bread among adult consumers was 51.2g, which
equals nearly 1.3 slices per day (one slice’s average weight was taken as 38g). It also concluded
that 57% of adults were consumers of white bread (61% males, 53% females). Additionally,
males over 65 consume the highest amount, about 2.2 slices, compared to the lowest amount,
which is 1.5 slices per day among 18 to 35-year-old males. The quantity of white bread
consumption among different female age groups was nearly constant at about 1.2 slices per day
(IUNA, 2016).
32
In regard to wholemeal bread-group (wholemeal bread & brown/wholemeal soda-type breads)
consumption among the adult nation, IUNA’s report recorded that over 72% of Irish adults
consumed wholemeal bread daily, with a mean daily intake of 32.8g (approximately 0.9 slices).
Wholemeal bread consumption among females formed 74%, while in males it formed 69%.
Males consume more portions than females, with a mean of approximately 2.1 slices and 1.6
slices respectively. In 2001, the consumption rate of white bread and rolls among the Irish
population was 94%. In the same year, consumption of wholemeal and brown breads and rolls
was 73%, with the mean daily intake being 83g per day for males and 61g per day for females
(IUNA, 2001).
In regard to the types of bread most purchased in Ireland in April 2019, the packaged sliced
bread showed 78%, baguette 53%, flat bread (wrap, pita, naan) 46%, wheaten /brown soda
bread 43%, while about 2% of the respondents did not consume bread (Mintel, 2019a).
1.3.3. Coffee
1.3.3.1. The Factors Influence Acrylamide Formation in Coffee
The roasting condition of coffee beans (time and temperature), species of coffee and amount of
precursors in raw beans are considered the most important factors in the control of the
acrylamide level in coffee (Bagdonaite, Derler and Murkovic, 2008; Lantz et al., 2006). Many
studies investigated the formation of AA at the different roasting stages and concluded that
asparagine is the limiting compound in reactions leading to AA formation in coffee.
Furthermore, there was a significant inverse correlation between the content of sucrose in green
coffee bean and the concentration of AA or there was no relation with glucose (Lantz et al.,

33
2006). Akgün and Arıcı (2019) confirmed that the reducing sugars were not the limiting factor
for AA formation in coffee.
Moreover, 3-Aminopropionamide (3-APA) compound had recorded in coffee with the
possibility to be a potential precursor for acrylamide formation (Intermediate in the reaction
pathway) (Morales and Mesias, 2015; Bagdonaite, Derler and Murkovic, 2008; Granvogl and
Schieberle, 2007).
Among roasting experiments, studies confirmed there are inverse correlations between coffee
roasting degree (light, medium or dark) and acrylamide content. During shorter roasting times,
or at an early time in the roasting process and under low temperatures, the incidence of higher
acrylamide formation occurred. In higher-degree roasting temperatures or long-time roasting,
results on darker roasted coffee had low AA concentrations more often (Lachenmeier et al.,
2018; Mojska and Gielecińska, 2013; Alves et al., 2009; Bagdonaite, Derler and Murkovic,
2008; Summa et al., 2007; HEATOX, 2007b; Lantz et al., 2006; Gökmen and Şenyuva, 2006;
Bagdonaite and Murkovic, 2018) .
The levels of AA in coffee is also influenced by the types and species of beans. For instance,
Arabica coffee contains less AA compared to Robusta coffee (Alves et al., 2009; Bagdonaite,
Derler and Murkovic, 2008; Bagdonaite and Murkovic, 2018). In contrast, Mojska and
Gielecińska (2013) argued that the type of coffee species did not show a role in the level of AA
formation in coffee. Their results showed the difference in mean AA level between Robusta
coffee and Arabica coffee was just 18ug/kg, compared to the roasting process, which has a
significant impact on AA levels. Andrzejewski et al. (2004) explained the differences in AA
levels in retailer coffees (drink) related to many factors such as coffee type, brand, consumer
preferences and freshness of coffee

34
In regard to the relation between coffee types and AA levels, it was found that the highest levels
usually accompanied dry coffee substitutes, then dry instant coffee and lastly dry roasted coffee
(Akgün and Arıcı, 2019; EFSA, 2015; Mojska and Gielecińska, 2013). In consideration to
coffee substitutes, chicory-based coffee showed higher AA levels than in cereals-based coffee,
with MB (middle bound) mean 2942µg/kg and 510µg/kg respectively (EFSA, 2015). Terebinth
coffee (Turkish coffee substitute) showed 240.3μg/kg AA (Akgün & Arıcı, 2019).
Likewise, Khan et al. (2017) reported that in regard to the type of coffee, Arabic coffee (Qahwa)
showed low level (73-108μg/kg) of AA compared to roasted coffee, which was 152-682μg/kg.
Additionally, Turkish coffee types had been recently recorded with 131.1-283.0μg/kg AA
(Akgün & Arıcı, 2019). Similar findings were observed in other studies (Ölmez et al., 2008;
Tawfik and El-Ziney, 2008; HEATOX, 2007a).
EFSA (2015) claims that the level of AA in coffee beverages are considered low consequent to
dilution factor. JECFA (2011) estimated AA levels in ready-to-drink coffee to be from 0.9 to
22.7μg per cup (300ml). Moreover, Andrzejewski et al. (2004) calculated the acrylamide
consumed per cup (300ml) among different types of coffee from different brands and locations.
For example, instant coffee (2.5 g per cup) recorded between 0.42 and 1.34µg acrylamide;
ground/brewed coffee was between 0.74-3.63µg acrylamide per cup (300ml); brewed black
coffee was 1.77-3.24 µg. Mojska and Gielecińska (2013) calculated that one cup (160ml) of
roasted coffee delivered about 0.45ug AA, and 3.21ug per cup of institute coffee.
Grob (2007) estimated the average amount of AA per cup of coffee (8gm dry coffee) was 2.3ug,
which equates to 286 ug/kg AA in dry coffee. The author argued that, though a cup of coffee
contains low AA content, frequent consumption of coffee will strongly contribute to mean daily
exposure to AA. In other work recorded, dry coffee (200ml) contained 4-5.8µg of AA. An
instant coffee drink in concentration of 1gm coffee/cup (200ml) recorded less than 2µg AA

35
(Eerola et al., 2007). Recently, Lachenmeier et al. (2018) calculated the average and 95th
percentile exposure for AA per cup of roasted coffee (14gm dry coffee) were 0.05/0.10 µg/kg
bw/day respectively. In regard to dry roasted coffee, it contains 249/543 µg/kg AA.
Espresso coffee shows higher AA concentration when it is compared to other regular coffee
drinks, but it contributes less in AA intake due to the small volume per cup (Alves et al., 2009).
1.3.3.2. Storage Effects
Storage time seems to be play a major factor in decreasing the existing level of AA in coffee
products, where longer storage periods of 3-6 months had been degraded AA in roasted coffee
by about 31% compared with the fresh sample, different from that soluble coffee and coffee
substitutes, which showed stable AA levels during storage stage (Hoenicke and Gatermann,
2005). In other studies, similar effects related to storing time were observed in reducing the
amount of AA in roasted coffee (Lantz et al., 2006; Andrzejewski et al., 2004). In contrast,
Delatour et al. (2004) recorded that storing for 12 months had reduced AA in soluble coffee by
66.8%, while Michalak et al. (2016) recorded that reduction reached 33% in instant coffee that
was stored at room temperature (25◦C) for 12 months. Delatour et al. (2004) noticed a reduction
in AA contents among all coffee categories (roasted, instant and alternative coffee such as
chicory) after 5-12 months storage.
Hoenicke and Gatermann (2005) concluded that the causes behind degradation of AA in coffee
by storing is related to the reaction between SH group-compounds in coffee and AA.

36
1.4.3.3. Coffee Consumption
Some food items that are relatively low in AA content, such as coffee or bread, will still
contribute significantly to AA dietary intake when consumed in large quantities (Becalski et
al., 2011; Grob, 2007). Coffee consumption is a major dietary component among many
population groups and considered as one of the main sources for dietary exposure to acrylamide.
This is because in many countries all over the world it is usually consumed in large quantities.
For example, the coffee contribution to the total acrylamide exposure formed 20% among the
Danish population (Granby and Fagt, 2004), 27.7% in French consumers (Sirot et al., 2012),
28-29% in Norway (Dybing and Sanner, 2003), while the contribution reached 39% among
Swedish adults (Friedman and Levin, 2008). In Ireland, the contribution of coffee consumption
in the total dietary exposure to AA was estimated to be 2% (FSAI, 2009a).
Among EU coffee consumers, the median average coffee consumption (g/day) was estimated
in mean and 95th percentile within adult, elderly and very elderly age groups. The results for
mean were 14, 21, 17gm dry equivalent coffee per day respectively. For 95th percentile
respectively, consumption was 37, 45, 40gm dry equivalent coffee per day (EFSA, 2015).
According to the European Coffee Federation (ECF), EU consumption was 51.9million bags
(60kg) of coffee in 2017. That is equal to consumption of over four kilos of roasted coffee per-
capital in EU per year. In 2017, the ‘Western Europe’ region imported 3.42million tons of green
coffee. Furthermore, Ireland showed growth in green coffee importation by 51% since 2015
(European Coffee Federation (ECF), 2018).
In 2016, research conducted by Empathy Research Company revealed that about 56% of Irish
adults are drinking coffee at least once a day, while 34% drink more than one cup daily. The
survey added that, although there is a significant increase in coffee pod/capsule consumption
37
(46%), ground/filter coffee (35%) and coffee from coffee shops (30%), instant coffee is still the
most common type of coffee consumed amongst the Irish adult population (Checkout, 2018).
In line with this, instant coffee was also recorded as the most common type of coffee consumed
at home and work in Ireland among 45-54year-olds, which was representative of 57% of the
participants. Ground coffee was consumed by 32% in this category and coffee pods were
consumed by 21% (Mintel, 2018b). Bord Bia (2011) presented information stating that
cappuccinos are the most frequently drank coffee type outside of home in Ireland, representing
53%.
In regard to ground coffee preferences among Irish consumers, it has been found that there is a
positive correlation between ground coffee being a drink of choice in high social levels (Mintel,
2018a).
Saeed et al. (2019) and O’Keefe, DiNicolantonio and Lavie (2018) conducted a comprehensive
overview about the health benefits and risks of consumption of coffee, with the study finding
that consumption of up to 3-4 cups per day has health benefits effects to the most consumers.
These health benefits consist of, for example, reduction in the incidence of some chronic liver
diseases, as well as aiding mental health problems, some of which are associated with people
believed to be suicide risks.
1.4. Home Food Preparation and Cooking Practices
A recent Bord Bia survey demonstrated that almost half of Irish consumers prepare food from
scratch at least once a day, with oven-baked and roasted being the most popular methods of

38
food preparation in the home. Over 75% of females in Ireland are responsible for preparation
of meals at home. Taste and quality of home-prepared food ranked as the most important factors
among Irish consumers. The consumers placed slightly less emphasis on the freshness and
safety of the food (Bord Bia, 2017).
Grob (2007) claims that about 50% of AA intake is generated from homemade meals or
restaurant meals. Claeys et al. (2010) investigated the AA intake among the Belgian population,
concluding that the consumer is equally as responsible as industry for reducing AA formation
in food. This can be done by applying good cooking practices such as avoiding dark colouration
during cooking (frying, baking or roasting) of carbohydrate-rich foods.
Although domestic food practices play a significant role in consumers’ exposure to AA, studies
relating to the generation of AA during home food preparation and actual cooking practices
have only been addressed in infrequent studies. These include Jackson and Al-Taher (2005),
HEATOX (2007a,b), Brook Lyndhurst (2014), Mesias et al. (2018) and Mesias, Delgado-
Andrade and Morales (2018).
A field pilot study in 2018 investigated the contribution of home practices to the increase of the
level of AA in chips (French fries) in Spanish houses. The study revealed that formation of AA
in home-prepared chips from fresh potatoes samples were about 45.2%. Samples exceeded the
EU benchmark level for French fries (500ug/kg) by two to four times and hit all the average
AA exposures intake sceneries, as considered by EFSA. For instance, 6.9% of the collected
home-prepared chips recorded 2000ug/kg AA contents, while the average of the other samples
was 644 µg/kg in home-made fried chips (Mesias et al., 2018).

39
1.4.1. Storage Practices
In 2014, a field project in the UK was conducted to investigate the impact of home practices in
the formation of AA. Most of the participants in this project stated that they stored raw potatoes
outside the fridge for an average period of less than two weeks. They explained that the reasons
behind their storage choices were shortage of space in the fridge or that they inherited this action
from parents. Those who stored potatoes in the fridge (a low percentage did this) did it to keep
the potatoes fresh (Brook Lyndhurst, 2014)
1.4.2. Cutting Size
Generally, a larger surface-to-volume ratio resulted in a much higher content of AA in cooked
potatoes. In other words, smaller and/or thinner pieces result in a higher level of AA content
after heat treatment. AA formed mainly on the outer surface of the food, which contacts directly
with the high heat treatment during cooking or toasting. Therefore, the size and the cut-shape
of cooked products, i.e. the surface-to-volume ratio (SVR) will significantly influence the final
level of AA (Kalita and Jayanty, 2017; Matthäus, Haase and Vosmann, 2004; Taubert et al.,
2004).
Matthäus, Haase & Vosmann (2004) showed that large-cut potato strips (14x14mm) resulted in
significantly lower AA content than thin-cut potato strips (8x8 mm). In line with this, Mesias
et al. (2018) demonstrated a reverse correlation between the potato cuts thickness and
acrylamide contents in home-prepared fried potatoes. The explanation for this was that a large
surface area improves evaporation of water, leading to a reduction in humidity of the surface
cuts during frying or baking that enhance AA formation in the outer surfaces (Matthäus, Haase
and Vosmann, 2004). In contrast, Michalak, Gujska and Klepacka (2011) did not find a clear
relation between shape and size of fried potatoes and the level of AA formation.

40
Contrary findings were recorded when Taubert et al. (2004) discovered a systematic correlation
between lower SVR and increasing AA levels. This occurs in tandem with increases in
temperature and cooking time. An opposite correlation was also recorded in regard to medium-
to-large SVR, which reached the highest AA level at 160-180°C. Any further increase in
temperature or cooking time will lead to a degradation in AA level.
1.4.3. Pre-cooking treatment
Blanching or soaking of potatoes before frying has been shown to significantly reduce the
acrylamide content in fried potatoes.
Blanching
The main aims behind blanching or soaking potatoes, from a food-safety perspective, are to
decrease the concentration of reducing sugars and asparagine in potato cuts, as well as reducing
the time required to cook under high heat treatment (frying, roasting),this is reflected in the
reduction of AA content in the final product, in contrast to potatoes that haven’t been blanched
(Viklund et al., 2010; Matthäus, Haase and Vosmann, 2004). Elimination of AA precursors
from the surface through blanching or soaking depends on immersion time or the temperature
of the blanching. Zhang et al. (2018) illustrated that blanching time had a more significant
impact than blanching temperature in reducing the concentration of AA precursors and,
subsequently, AA formation in fried potato chips. Zhang et al. (2018) recommended an ideal
blanching condition, which was 68.7 to 75°C for 8.8 to 9.7 minutes, with optimal reduction in
precursor concentration reaching 49.8% for asparagine, 64.2% for reducing sugars and 61.3%
for AA. In a similar study, Shojaee-Aliabadi et al. (2013) demonstrated that ideal blanching
conditions were a temperature of 75˚C for nine minutes, which led to a 74% reduction in AA
formation in fried potatoes.

41
Mestdagh et al. (2008b) reported that a decrease of about 65% in the level of AA in chips had
been achieved through a blanching process with water at 70°C for 10 to 15 minutes. A similar
percentage of AA reduction had been recorded by Matthäus, Haase & Vosmann (2004) at 82°C
for 2.5 minutes for blanching of potato crisps, or soaking at 50°C for 15 minutes.
Therefore, Viklund et al. (2010) recommended potato blanching as an efficient way to reduce
AA content in potato crisps, and referred to a blanching process of three minutes in water at
80°C which would reduce AA content of fried potatoes by 51% to 73%, while reducing the
precursor contents by 17% to 66%. The authors stated that the reduction rate of AA and
precursors related to blanching, which restricted movement of precursors to the surface and
decreased chances for AA formation on the outer surface.
The effect of blanching with a shorter roasting time demonstrated a reduction in AA levels
between 46% and 60% in roasted potato wedges (Skog et al., 2008).
It was noted that blanching potato sticks in water at 50°C for 80 minutes had shown a greater
reduction in AA content compared to blanching at 70°C for 10 and 45 minutes, or at 90°C for
three and 10 minutes (Pedreschi, Kaack and Granby, 2006).
In a UK survey, the level of blanching practice in the home was recorded. However, the data
revealed that soaking before frying was uncommon, with just one case. Parboiling was more
common. Among the respondents’ reasons for parboiling were that it shortens the roasting time
and helps to achieve a desired texture (Brook Lyndhurst, 2014).
Soaking
Soaking potato strips in water for two hours showed a reduction of 33%, 21% and 27% in
acrylamide formation when potatoes were fried at 150, 170 and 190°C respectively (Pedreschi,
Kaack & Granby, 2006). Therefore, HEATOX (2007a) advised consumers to wash and soak

42
potatoes in cold water for at least 30 minutes, or blanch them in hot water for a few minutes.
Also, FSAI (2009a) recommended the soaking or blanching of potatoes as well as draining well
before cooking.
On the other hand, Williams (2005) argued that two hours’ soaking of potato chips in water
under room temperatures did not show an effect in reduction of AA content. He added that
soaking does not have a role in leaching of precursors in water during the soaking process.
Additionally, the author suggested that parboiling reduces the level of AA due to the reduction
in frying time, rather than losses of precursors in water (Williams, 2005).
In a different experiment, soaking potato chips in salt solution (NaCl) of 0.002 gm/liter for five
minutes resulted in a reduction of AA levels by an average of 90% (it depended on the applied
frying temperature), while it reached 97% reduction at 120°C frying temperature (Pedreschi et
al., 2007a). Soaking potatoes in NaCl provided the similar surface colour degree as the control
sample, while also lowering the AA content (Gökmen and Şenyuva, 2007).
In an early study comparing the impact of both NaCl and calcium chloride (CaCl2) in AA
reduction, CaCl2 was more effective in limiting AA formation. The reduction in AA formation
reached 95% by soaking potato strips in CaCl2 0.1 M solution for one hour at room temperature,
while it maintained the desired appearance in colour (Gökmen & Şenyuva, 2007).
The practice of soaking potatoes was evaluated in British domestic kitchens by researchers and
they concluded that washing potatoes after peeling was uncommon among participants. This is
because they relied on peeling or blanching to provide a hygienic purpose. Participants did not
really consider soaking potatoes as a step in the potato preparation process. Furthermore, many
viewed it as a waste of time when they could be carrying out other cooking tasks (Brook
Lyndhurst, 2014).

43
pH value
It has been observed that the formation of acrylamide decreases with a lower pH of the food
mixture (Kalita and Jayanty, 2013; Levine and Ryan, 2009; Jung, Choi and Ju, 2003). Yuan et
al. (2007) and Rydberg et al. (2003) also confirmed that higher acrylamide formation occurred
near a pH of 8.0. Jung, Choi and Ju (2003) tested the effect of citric acid on reduction of AA
formation in chips by soaking potato cuts in 1% and 2% citric acid solutions for one hour before
frying. This showed a reduction in the AA content of fried chips of about 73.1% to 79.7%, and
explained that reduction as a result of the lower pH of the potatoes. Pedreschi, Kaack and
Granby (2006) reported that reduction reached 53% by immersing potato strips in 1% citric
acid solution for one hour before frying. A similar observation led to an 80% reduction of AA
contents by using 0.5% citric acid solution for one hour (HEATOX, 2007b).
1.4.4. Cooking
The effect of cooking foods on AA formation depends on the method of cooking which has
been used, such as boiling, baking, frying or microwaving. The other factors are the cooking
temperature, length of time cooking and other food additives. Generally, reducing undesirable
reactions during cooking can be achieved through the use of relatively low cooking
temperatures and shorter cooking times.
1.4.4.1. Cooking Temperature and Time
Cooking temperature and time were identified as relevant factors on AA generation in food.
Increasing frying temperature has been shown to lead to a significant increase in acrylamide
formation.

44
Several studies have confirmed a link between AA formation and cooking temperatures and
time in various food products (Norén, 2019; Daniali et al., 2018; Shojaee-Aliabadi et al., 2013;
Michalak, Gujska and Klepacka, 2011; Majcher and Jeleń, 2007; Pedreschi, Kaack and Granby,
2006; Fiselier et al., 2006; Williams, 2005; Matthäus, Haase and Vosmann, 2004; Rydberg et
al., 2003).
Matthäus, Haase and Vosmann (2004) detected a simultaneous relation in temperature
reduction with increasing the cooking time and reduction of acrylamide concentration in final
food. They described that as a linear relation between AA level and cooking time, but it was
not linear between AA formation and temperature, and the recommended condition for frying
potatoes was 175°C for 2.5 minutes. Granda, Moreira and Tichy (2004) illustrated a 51%
reduction in AA content in potato chips was achieved by dropping frying temperature about 15
degrees, from 180°C to 165°C, during a traditional frying method. Pedreschi et al. (2005) tested
the impact of different frying temperatures on AA formation levels in fried chips. The final
results showed a significant elevation of the AA level, reaching an average 54-fold when the
frying temperature increased from 120°C to 180°C.
It was recorded that there is a relationship between frying time and acrylamide content among
traditional frying methods under all temperatures (Granda, Moreira and Tichy, 2004), or in the
oven under low temperatures for a long time (Norén, 2019).
In regard to the role of frying oil in acrylamide formation, controversial observations were
recorded in various studies.The majority of studies showed there was not any link in the AA
formation (Mestdagh, De Meulenaer and Van Peteghem, 2007; Williams, 2005; Matthäus,
Haase and Vosmann, 2004). On the other hand, papers discussed the probability of some oils
being involved in AA formation (Zhang et al., 2015; Capuano et al., 2010; Napolitano et al.,
2008; Becalski et al., 2003; Gertz and Klostermann, 2002). The explanation for the presence of

45
a link between oil and AA formation is related to the unsaturated fatty acid contents in oil.
These fatty acids displayed the probability to form acrylamide by other paths through
degradation of acrolein as an alternative to the Maillard reaction (Marchettini et al., 2013;
Becalski et al., 2003).
1.4.4.2. Influences of Cooking Method on Acrylamide Formation
The method of cooking is an important factor involved in AA formation. For instance, in a
home-cooking practices study it was revealed that grilling of potato wedges generated higher
levels of AA on average 1520 ug/kg, while potato wedges that were shallow fried in oil
generated 525 ug/kg. Deep fried in oil produced 375 ug/kg, with the lowest level of AA being
observed in oven-baked potato wedges 245 ug/kg (Ahn et al., 2002).
Another study concluded that the vacuum frying method is a healthy alternative way for frying
chips compared to the traditional way of frying chips. It revealed that reduction in AA formation
reached 94%. However, this comparative analysis between both methods of frying were under
different temperatures, with traditional frying at 150, 165 and 180°C, while for vacuum frying
it was conducted at 118, 125 and 140°C (Granda, Moreira and Tichy, 2004).
Based on the Food and Drug Administration’s (FDA) comparative research about the
contribution of frying, roasting and baking potatoes on AA formation, it was concluded that
baking whole potatoes is the lowest producer of AA in potatoes. This was in contrast to frying,
which is the highest producer of AA, followed by roasting. Boiling whole potatoes did not show
AA formation (FDA, 2017).

46
Another comparative study examined boiling, frying and microwaving methods on the
formation of AA in cooking chips. The results showed that microwaving contributed to a
significant increase in the level of AA compared to other conventional methods of cooking
under the same conditions. The authors referred to a positive relation between microwave power
and the level of AA generated (Yuan et al., 2007). The same conclusion about the significant
level of AA correlating with the microwave power, cooking time and temperature has been
confirmed by Elfaitouri et al. (2018). These findings are similar to those of other studies, which
were conducted to evaluate the effect of different cooking methods such as roasting, pan-frying,
deep-frying and microwaving on the generation of AA in pre-cooked croquettes and fried
potatoes. It showed the highest level of AA among microwave treatment and the lowest level
among pan-frying processes (Michalak et al., 2017; Michalak, Gujska and Klepacka, 2011).
Palazog̀lu, Savran and Gökmen (2010) pointed out that the cooking method has the major
impact on the AA level rather than the temperature of cooking applied. In terms of the impact
of baking and frying methods on the formation of AA in potato chips, results revealed that
baking chips at 170°C produced AA over double higher than what was formed upon frying at
the same temperature. However, frying at 180°C and 190°C formed higher levels of AA (39
ng/g and 95 ng/g respectively) in chips than what was generated by baking at the same
temperature (19.3 ng/g and 29.7 ng/g respectively).
Sansano et al. (2015) examined the effect of the air-frying method in reduction of AA formation
in potatoes against the traditional deep-frying method. Both were carried out at 180°C on
potatoes that were not pre-treated. The researchers found a 90% reduction in AA level among
the air-fryer method in comparison with the conventional frying method. In an additional
experiment, the effect of pre-treatment on the level of AA reduction in air-frying was 77%
compared to potatoes that were not pre-treated with the same air-frying method.

47
Regarding the boiling or steaming method, no effect has been recorded in the level of
acrylamide in potatoes (Hogervorst et al., 2010; Dybing et al., 2005; Ahn et al., 2002; Tareke
et al., 2002).
1.4.4.3. Evaluating or Judging When Food is 'Done'
Following the manufacturer's instructions
Under Regulation (EU) 2017/2158 it is stated “the FOBs shall indicate recommended cooking
methods specifying time, temperature, quantity for oven/deep fryer/pan on packaging”
(European Commission, 2017, p.31), for good cooking practices and protecting consumers’,
health. Following on from this, FoodDrinkEurope published the updated version of Acrylamide
Toolbox 2019, which stated the following advice to chefs and consumers: “Follow exactly the
product-specific cooking instructions on the packaging” (FoodDrinkEurope, 2019, p.68).
Behaviour to food-package instructions were studied in a field research project in the UK, with
the observations revealing that the reality was people did not pay attention to the manufacturer's
instructions. It found that people had their own systems for evaluating if food is properly
cooked, such as time guide, visual assessment or combinations of both (Brook Lyndhurst,
2014).
1.4.4.4. Colour Indication
Since the Maillard reaction is responsible for colour changes (browning) in foods and,
furthermore, acrylamide generation, measuring the degree of colour in foods can be used as a
method to indicate the level of AA present. Thus, AA level can be compared to specific
chromatic indicators “a*”, “b*” and luminance indicator “L*”, with a* value representing

48
redness (green to red scale), L* value representing lightness and b* representing yellowness
(blue to yellow scale) (Yam and Papadakis, 2004).
A noticeable correlation between browning levels in food surfaces and AA concentrations in
different food products have been tested over many studies, as shown in cooked potatoes
(Mesias et al., 2018; Serpen and Gökmen, 2009; Mestdagh et al., 2008a; Gökmen et al., 2007;
Majcher and Jeleń, 2007; Pedreschi et al., 2007b; Pedreschi, Kaack and Granby, 2006;
Pedreschi et al., 2005), coffee, wheat flour (Gökmen and Şenyuva, 2006) and bread (Mustafa
et al., 2005; Surdyk et al., 2004).
Measurement of the food colour degree and AA content at different temperatures and roasting
times in chips showed that there is a substantial correlation between L*, a*, b* and acrylamide
concentration as a function of time. While L*and a* correlated positively with acrylamide
content as a function of temperature, b* did not show any correlation in regard to the
temperature (Majcher and Jeleń, 2007).
Gökmen and Şenyuva (2006) reported a relationship between the chromatic parameter a*
changes and AA levels in green coffee, wheat flour and potato chips during heat treatment.
Therefore, the redness parameter a* has been suggested to be used as an indicator to evaluate
AA levels in thermally processed products. This was in keeping with the results of Pedreschi ,
Kaack & Granby (2006), and Jackson & Al-Taher (2005), with regard to the presence of high
correlations between the colour indicator parameters L* and a* with acrylamide content in
French fries and toasted bread. The same observation about a linear correlation between AA
and a* value was observed , but a low relation was recorded between AA and L* value in potato
chips (Zhang et al., 2018). Therefore, Mesias et al. (2018) concluded that the parameter a*
could be used to sort the fried potatoes according to AA levels .

49
Sun, Rosen and Thompson (2018) linked dark colouration in fried potatoes with the tubers
glucose concentration. There was a strong correlation recorded between glucose concentrations
for chip cultivars with fry colour, whereas there was a medium correlation in the case of French
fry cultivars. Also, the paper confirmed that a positive correlation existed between glucose
concentration and AA level in fried potatoes.
In relation to bread, a highly significant correlation between the colour degree and AA
formation in wheat bread crust was recorded in early studies by Surdyk et al. (2004). On the
contrary, Taubert et al. (2004) suggested that the degree of browning was not a reliable indicator
for AA content in large-surface cooked foods.
Claus et al. (2006) argued that there was not clear correlation between the surface colour in
bread and AA contents. Thus, Mustafa et al. (2005) explained that surface colour parameters
a* and b* were significantly affected by both time and temperature of baking, without direct
correlation to the AA level in bread. However, the authors stated that time and temperature of
baking correlated to acrylamide formation. Additionally, a significant correlation between AA
formation and browning intensity and baking time has been recorded in gingerbread baked at
180°C to 200°C for 10 to 20 minutes (Amrein et al., 2004). The authors argued that lower
temperature with a prolonged baking time did not lower AA content. On the contrary, the level
of AA was higher in low temperatures with long baking times in gingerbread. Therefore, the
suggestion was a short time (10 minutes) at 200°C, which formed half the amount of AA
produced under 160°C for 20 minutes (Amrein et al., 2004).
In the toasting process, Jackson and Al-Taher (2005) pointed out the positive correlation
between AA contents in home-toasted bread and the dark colour of the toasted bread surface.

50
AA had been recorded (43.7 to 610.7ug/kg) in dark toasting compared to light toasting (8.27 to
217.5ug/kg) or medium toasting (10.9 to 213.7ug/kg). Thus, the authors found a positive
correlation between the surface colour (a* and L* values) and AA level, while also suggesting
that the degree of surface browning could be used as a tool indicator of AA formation in cooked
foods (Jackson and Al-Taher, 2005). Similarly, Nachi et al. (2018) found the L* and b*
parameters of crusts correlated positively with the level of AA in bread samples.
Ahn et al. (2002) argued that browning degree during toasting and AA level is a causal relation
rather than a direct correlation. In other words, under the same toasting conditions, the colour
degree of white toast differs from brown toast.
1.5. Previous Acrylamide Awareness Studies
This section presents a review on recent literature about studies that have been conducted to
investigate acrylamide awareness among different nations and various demographics. In
Poland, a study has been conducted among medical school students about AA awareness and
eating habits. It revealed that only 7% of the participants had heard about AA before. Moreover,
those who had heard about AA were not aware of details relating to AA formation in food
(Kowalska et al., 2017). A similarly low percentage 5.1% had heard about AA risk in a survey
among Chinese university students, while 65.3% of the students were not familiar with
acrylamide (Meng et al., 2012).
The lowest percentage of awareness of AA formation and the associated health risks was
recorded among West African countries, with less than 2% awareness of the possible adverse
health impact of AA. About 28.4% were aware of acrylamide formation in cooked foods
(Akinosun, Ojinnaka and Aouzelleg, 2018).

51
The level of awareness about AA and its potential risks reached 22% in a recent survey focusing
on France, UK and USA, carried out by DSM Research Company. The percentage reached 54%
in Germany for the same survey, with 2000 individuals overall. Of the 22% who had heard
about AA, 50% were aware of its formation, while 19% of the participants believed that AA is
not harmful at all (DSM, 2018).
In 2014 a field study project for Food Standards Agency in the UK examined the effects of
home-cooking practices on acrylamide formation. It concluded that there was a low level of
awareness of acrylamide exposure among British participants. That project focused on the
different home practices for instant potato storage, preparation of potatoes, cooking preferences
and bread-toasting practices. Furthermore, the study referred to the presence of a relation
between consumer preferences and AA exposure, and a correlation between desired food colour
and AA levels in examined foods (Brook Lyndhurst, 2014).
In the Republic of Ireland, there is not any paper that has investigated the level of knowledge
about acrylamide awareness and domestic food practices. However, McCarthy et al. (2007)
conducted a quantitative study among 1025 residents on the island of Ireland to examine
knowledge levels about food safety practices and food safety. The authors discovered that most
of the population know what they should be doing in their kitchen from a food safety
perspective, but they are not often applying what they know. The authors also considered it less
than ideal that food-handling practices are considered safe among some people. Moreover,
Moreb, Priyadarshini and Jaiswal (2017) investigated the level of food safety knowledge among
the residents of Ireland and they concluded that, in total, the participants showed an average
level of 67% of food safety practices knowledge.
Most Irish adults (83%) positioned themselves as very healthy, mainly among 35 to 44-year-
olds. Nearly 50% of Irish adults say that they are often confused about what they should eat to
52
stay healthy, while most of the Irish population (88%) agree that living a healthy life depends
mainly on proper eating habits (Bord Bia, 2017).
In June 2019, EFSA published the Eurobarometer report on food safety in the EU. With relation
to Ireland, the report showed that 76% of the population of Ireland say that food safety is a
concern for them, while one-third of the participants consider it as a main issue. It stated that
around half of the Irish respondents consider food safety as important during the purchasing of
food items.
Furthermore, a strong majority of Irish participants (77%) rely on the opinions of national
authorities to get their food-risk information, while just over half (55%) believe there are
regulations in place to protect food safety. Just under a quarter of the respondents (22%)
consider sold food to be safe (EFSA, 2019).
The EFSA report also stated that the major outlets for receiving food-risk information in Ireland
are TV (59%) and internet searching (47%), while paper media, radio and social media are
nearly the same, between 37 to 39%. Person-to-person information (family and friends) was
recorded as being 32%.
In addition, the EFSA barometric report measured the tendency of the Irish participants to
change their habits in light of food-safety risks information. The report's results show that about
40% of them believe they will constantly change their consumption habits, while 34% will
temporarily modify their behaviours and 14% cannot change their food habits (EFSA, 2019).

53
1.6. Research Gap Analysis
In 2002, the FAO/WHO consultation on the health implications of acrylamide in food stated
that, for obtaining a reliable AA intake estimation, the data about how food is cooked and
processed in domestic level as well as industrial level should be collected (WHO, 2002).
Thirteen years after WHO spoke of a need for data about domestic food practices, EFSA stated
that home-cooking habits and preferences could have a heavy impact on dietary AA exposure,
and mentioned a gap still existed relating to the data on the actual food consumption habits
within the exposure assessment. Furthermore, the available consumption data has been
generally collected at the level of raw ingredients stage, without detailed information on how
raw food stuffs had been prepared or cooked before consumption at the home level. Therefore,
EFSA mentioned in their risk assessment of exposure of AA in food that there was uncertainty
in regard to potato preparation, coffee choice and consumers’ preferences regarding the degree
of potato frying and bread toasting due to shortage of this specific data (EFSA, 2015).
Recently, Mesias et al. confirmed the importance of collecting home foods practices data for
accurate evaluation of AA intake. Mesias et al. (2018, p.51) stated that “it is necessary to
consider the frying practices in a domestic setting as a key factor to assess the real dietary
acrylamide exposure of the European population”. This was said after conducting research
among Spanish home preparation practices in regard to the cooking of chips (French fries). It
confirmed that AA formation during domestic preparation of French fries hit nearly double the
average value estimated by EFSA (2015) and four times the benchmark level of AA (Mesias et
al., 2018).
This clearly highlights the crucial role that is played by domestic food practices in dietary AA
intake. To focus on the Irish context and, in particular, there being no study (to my knowledge),
54
a knowledge gap has developed where the extent to which consumers are exposed to acrylamide
is unknown. Similarly, cooking practices and behaviours are not widely known, even though
these are the aspects that influence their level of exposure. Collection of data is needed. This
data needs to focus on home practices and awareness among Irish residents for reliable
evaluation. This deficiency of inherently Irish empirical data contributed to inspire the basis of
this study.
1.7. Research Questions
This study looks to answer the following questions:
● What is the existing knowledge about acrylamide formation and its risk among Irish
residents?
● How do the residents in Ireland engage in home-food practices (preparation, storage,
cooking) and what are their food preferences that may contribute to the level of exposure
to acrylamide?
● Is there any suspected high exposure to AA through home-made food practices or food
preferences?
1.8. Aim and Objective
The aim of this study is to explore the level of awareness regarding acrylamide in home-
prepared foods and, in particular, domestic cooking/preparation practices consumers are
engaging in that have the potential to influence acrylamide generation. An additional aim of
this research is to provide an indication of the extent that consumers may be exposed to AA
risks from home-made food and food preferences.

55
The overall aim is to overview to what extent could domestic contribute in exposure to
acrylamide, in particular, home-made food preparation practices and food preferences among
the adult residents in Ireland. Additionally, to assess the impact of this knowledge on the actual
cooking practices and food preferences. Moreover, to identify the potential food practices for
follow-on investigations or education initiatives.
The study objective was achieved by surveying residents in different regions, including all
ranges of ages over 18, from different genders and nationalities. People with different education
levels will also be covered, as well as different personal statuses. Furthermore, the survey
collected data based on multiple aspects in acrylamide formation in domestic foods to include
food preparation, storage, cooking preferences and the consumption rate of the selected food
items. Additionally, information relating to general acrylamide formation and health risks was
collected.
56
METHODOLOGY

57
Chapter 2 . METHODOLOGY
According to the literature review gap analysis and previous studies conducted in other
countries in regard to the contribution of home practices in AA formation and AA awareness
levels, there has not been data collected or investigatory research conducted in Ireland. This is
an important subject which can have a great impact on the general health of the nation.
Therefore, this study is based on covering the gap regarding acrylamide awareness, domestic
food practices and food preferences.
2.1. Research Methodology
There are times when quantitative and qualitative data are practically inseparable (Atieno,
2009). A mixed strategy has been employed in this study, which included a combination of
quantitative and qualitative questions in order to achieve a clear insight through employing both
methods in research. Therefore, the data collection strategy is based on closed-end multiple and
single-choice questions, as well as open-ended questions.
Qualitative questions were used to accurately interpret and assess the personal responses to
closed-end questions, as well as avoiding any associated bias with multiple-choice questions
(Malhotra, 2004).
58
2.2. Research Method
The study was conducted using a questionnaire which was developed in order to assess
acrylamide awareness and home-food practices among residents of Ireland. The questionnaire
was completed by random people aged between 18 to 64 and living in Ireland. The survey was
carried out either by electronic questionnaire or hard copy from March to June 2019.
2.3. Justification of the Research Method
The questionnaire provides access to a significant number of participants during a relatively
short timeframe while it was also cost-affordable. Further online activity allowed for wide
distribution of surveys without bias.
The quantitative method is considered the best way to collect a large number of respondents,
test broader patterns and provided broad scope for generalising the findings (Panke, 2018).
However, qualitative research questions provide more chances to collect important clues about
a wide range of answers, instead of being confined to a limited and often self-fulfilling
perspective. Additionally, qualitative research questions allow participants to express their
answers with authenticity and, consequently, the collected data becomes more accurate and can
lead to more reliable conclusions. Also, the responses to open questions provided in-depth
information, especially about issues not present in the questionnaire, which reflects the participants’
knowledge.
Therefore, the mixed-method approach keeps the advantages of both approaches, while helping
to overcome the disadvantages of using one strategy alone (Panke, 2018).

59
Participants were afforded anonymity and confidentiality, as per the ethics guidelines. In
addition to this, they had freedom to skip questions or withdraw from the survey at any stage if
they did not feel comfortable answering. This all combined to support the assumption of
truthfulness of the responders’ answers.
2.4. Research Design Process
2.4.1. Questionnaire design
The questionnaire was designed to capture information about the aspects of food preference
and home-food preparations that can influence acrylamide levels. Moreover, evaluate the level
of awareness about acrylamide formation aspects. A copy of the questionnaire is presented in
appendix A.
The questionnaire development was guided by questions used in published literature to assess
knowledge and eating habits of a population in the field of acrylamide, as well as home-cooking
practices and acrylamide formation (Mesias et al., 2018; Kowalska et al., 2017; Brook
Lyndhurst, 2014). Appropriate modifications were made to the questions to fit the objective of
the study. For validation of the questionnaire, a pilot test was conducted via 16 food-safety
management professionals to assess the clarity of the questions and associated pictures,
suitability of wording and the average time needed for its completion. The required amendments
and enhancements were made according to the feedback, then re-evaluation occurred before
final distribution online or manual paper questionnaire.
According to Bryman (2016), when a measure is reliable it can be valid, because a valid
measure reflects the concept it is supposed to be measuring. Therefore, in order to test the home-
food practices and their contributions in AA exposure and the general awareness, the reliable
indicators were employed to investigate the practices and awareness in regard to AA generation

60
in home-made foods. Thus, the questionnaire focused on collecting data, which covers the
home-food practices and preferences among those specific food items (potatoes, bread and
coffee).
Based on the previous literature review, it was emphasised that the major food stuffs that
correlate with formation of acrylamide are potatoes (such as French fries and potato crisps),
bread and coffee (EFSA, 2015; WHO, 2011; Claeys et al., 2010). Moreover, the relation
between cooking methods used during preparation of potatoes and the levels of AA in meals
was confirmed. Also, the role of bread toasting degree and concentration of AA in bread.
Additionally, the contribution of coffee preferences and consumption rate in AA exposure level.
Overall, the questionnaire consisted of 43 questions. The multiple-choice questions formed four
questions (Q6, Q12, Q25, Q33), while there were 33 single answer-choice questions and six
open-ended questions. The questionnaire was designed on SurveyMonkey platform and
organised in a logical automatic order (as shown in Figure 2-1) which depended on the
participants’ responses to questions, without distinguishing separated sections in order to avoid
any influence during the experiment and to prevent bias. Furthermore, the closed-end questions
contained options stating “other” or “I do not know” to avoid limiting responses to a
predetermined list of options.
The first two questions of the questionnaire aimed to screen participants and fulfil criteria (age
and country of living).
Questions relating to acrylamide knowledge and awareness were displayed directly to
distinguish the knowledgeable participants from others for further investigative questions in
different automatic questionnaire pathways. The direct questions that tested acrylamide
information knowledge were Q3, Q4, Q5, Q6, Q32 and Q33. Indirect awareness questions
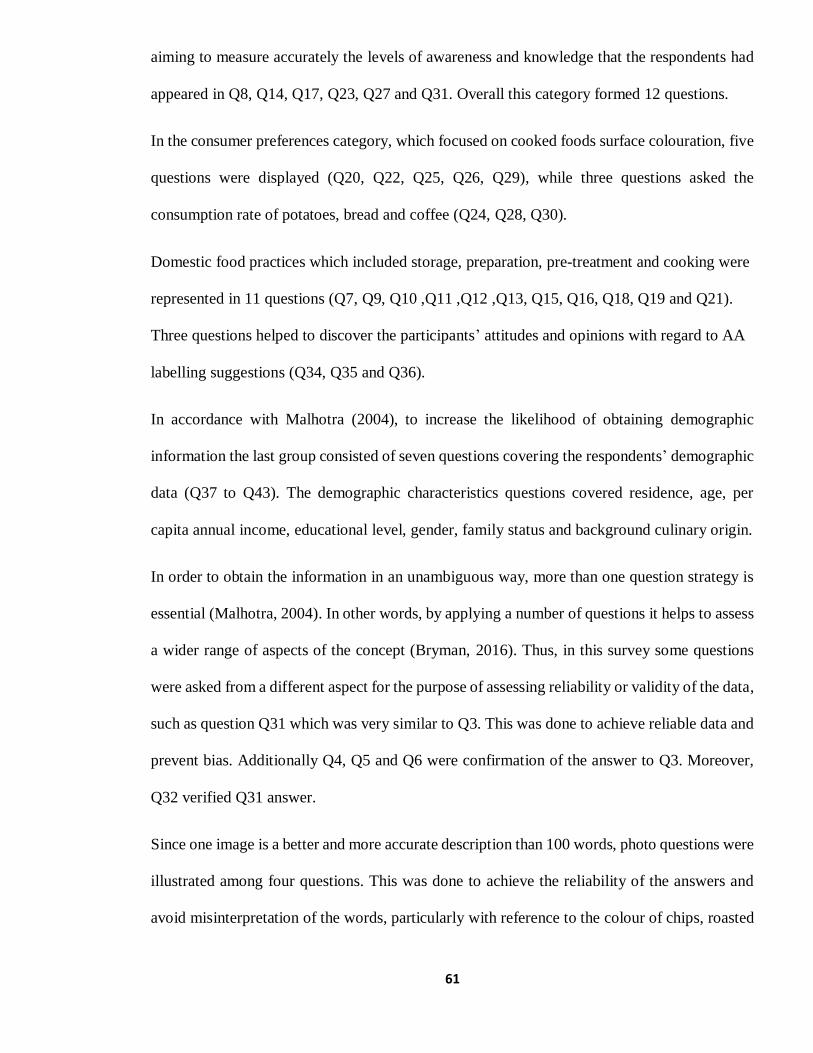
61
aiming to measure accurately the levels of awareness and knowledge that the respondents had
appeared in Q8, Q14, Q17, Q23, Q27 and Q31. Overall this category formed 12 questions.
In the consumer preferences category, which focused on cooked foods surface colouration, five
questions were displayed (Q20, Q22, Q25, Q26, Q29), while three questions asked the
consumption rate of potatoes, bread and coffee (Q24, Q28, Q30).
Domestic food practices which included storage, preparation, pre-treatment and cooking were
represented in 11 questions (Q7, Q9, Q10 ,Q11 ,Q12 ,Q13, Q15, Q16, Q18, Q19 and Q21).
Three questions helped to discover the participants’ attitudes and opinions with regard to AA
labelling suggestions (Q34, Q35 and Q36).
In accordance with Malhotra (2004), to increase the likelihood of obtaining demographic
information the last group consisted of seven questions covering the respondents’ demographic
data (Q37 to Q43). The demographic characteristics questions covered residence, age, per
capita annual income, educational level, gender, family status and background culinary origin.
In order to obtain the information in an unambiguous way, more than one question strategy is
essential (Malhotra, 2004). In other words, by applying a number of questions it helps to assess
a wider range of aspects of the concept (Bryman, 2016). Thus, in this survey some questions
were asked from a different aspect for the purpose of assessing reliability or validity of the data,
such as question Q31 which was very similar to Q3. This was done to achieve reliable data and
prevent bias. Additionally Q4, Q5 and Q6 were confirmation of the answer to Q3. Moreover,
Q32 verified Q31 answer.
Since one image is a better and more accurate description than 100 words, photo questions were
illustrated among four questions. This was done to achieve the reliability of the answers and
avoid misinterpretation of the words, particularly with reference to the colour of chips, roasted

62
potatoes and toasting degree of bread (Q20, Q21 and Q23) or size of potatoes (Q12). Question
12 used images to illustrate cut sizes of potatoes used.
In regard to the degree of cooking preferences for roasted potatoes (Q20), validated images
(Figure 2-2) have been used (adapted from Brook Lyndhurst, 2014, p.42). The, photo of chips
(Q21) was adapted from EUPPA (2019) GoodFries initiative web page (Figure 2-3), which is
used in a flyer as a tool for learning good frying practices. Q23 contained a validated photo
(Figure 2-4) demonstrating the degrees of surface browning in toasted bread. This image had
been presented by Jackson (slide no.16) in a Food Safety Symposium in Brazil in 2008
(Jackson, 2008).

63
Figure 2-1 The questionnaire’s questions pathways according to participants’ responses.

64
Figure 2-2 Roasted potatoes home-made validated samples (Source, Brook Lyndhurst,
2014, p.42).
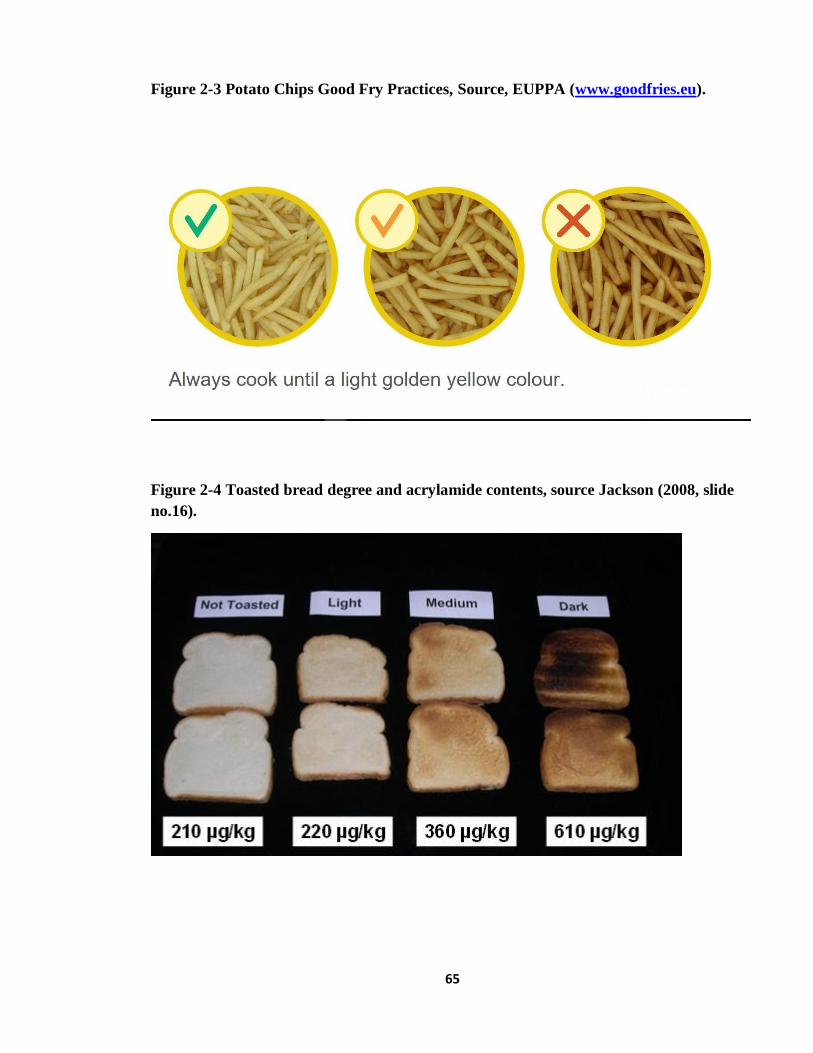
65
Figure 2-3 Potato Chips Good Fry Practices, Source, EUPPA (www.goodfries.eu).
Figure 2-4 Toasted bread degree and acrylamide contents, source Jackson (2008, slide
no.16).

66
2.4.2. Target participants
The criteria for selecting the suitable participants were the people who reside in the Republic
of Ireland and who were 18 or older.
To reduce a potential non-coverage bias, a sampling frame covering age, gender, income,
culinary origin and educational level was used.
2.4.3. Data collection
The present study was conducted using both a web-based survey and paper-based questionnaire.
The web-based survey was established via SurveyMonkey platform. The participants have been
reached in a non-systematic way in different forums, common public areas, community-based
centres and community training centres. Also, the survey link had been advertised in different
public places and universities in Ireland via direct emails, social media platforms or via paper
advertisement which were distributed to cover multiple areas in the Republic of Ireland. The
hard copies were distributed and later collected. An automatic approach via online link was
used for completing the survey and submitting the answers directly. The survey was conducted
between March to the end of June, 2019.
2.4.4. Data Analysis
The data from paper responses was entered manually in the same survey platform as the output
data, which was received in the same Excel data sheets for further analysis and interpretations.
For the data analysis, the software package of SPSS version 25 by IBM Corporation was used
to statistically analyse some variables relations. Pearson’s Chi-squared Test were performed to

67
examine if there was a significant association between variables, where it was considered
significant if p < 0.05. Whereas, the alternative test was Fisher's Exact Test. Which was used
particularly when more than 20% of cells have expected frequencies < 5 samples (Kim, 2017;
Marshall and Boggis, 2016).
Meanwhile, answers to the open-ended questions were firstly manually categorised by
conducting a thematic analysis and creating classification for the responses in SurveyMonkey
platform. After tagging the answers, re-evaluation and sorting took place. Then the coded data
results were exported to Microsoft Office Excel sheets, where the data was expressed in
frequencies, percentages and graphs.
According to Bryman (2016) the thematic analysis is applied through extracting core meanings
that could be distinguished in and between the text words responses.
2.5 Study Limitations
The sources about domestic food preparations as well as acrylamide awareness studies
are limited for using to compare or contrast. Furthermore, some papers are in different
languages, such as Polish and Chinese.
The limiting of questionnaire time to be within 15 minutes, as more questions increase
the required time for answering, subsequently leading to the probability of participation
rejection or partial participation. Thus, some aspects in the research require more
investigation, such as types of potato variants used and the knowledge about this
difference and following their specific use. Also, the temperature for frying and types
of used oil. However, those types of questions would be better contributed to a field
study rather than a questionnaire alone.

68
Due to the respondents’ tendency to answer open questions in different 'dimensions',
when the answers were coded and reduced to manageable categories, the outcome was
many categories. This hindered conducting further analysis as the number of responses
per-category was small, which restricted applying further analysis.
Single coding the open-answer questions mainly depended on personal perceptions.
Therefore it could be considered uncertain evaluated data. However, in this study all the
open-end questions were dependent questions. Therefore, in coding it was more
specified and clearer because that associated to previous specific answers.
Self-reported practices are doubtful as they possibly do not reflect actual behavior.
Thus, containment of some self-reported practices in the current study may be
considered a limitation. Therefore, all practical questions are followed by open-end
questions to confirm and validate the previous one, aiming for avoiding bias.
The other limitations were shortage in the available time and resources to expand the
research topic to include field work, in particular home-made practices related to
acrylamide generation. This would need a sponsor as this topic issue is known to have
a huge impact at national level. Thus, it would be worthwhile if future field research can
be undertaken.
Relatively small size sample , however it covered the all demographical characteristics.

69
RESULTS AND DISCUSSION

70
Chapter 3 . RESULTS & DISCUSSION
The Chapter Outlines
The chapter topics are organised to represent the results and the findings of discussions as
follows:
Part 1: Participants’ Profile.
Part 2: Acrylamide Knowledge.
Part 3: Home-food Practices.
Part 4: Frequency of Consumption of Selected Foodstuffs and Respondents’ Preferences.
Part 5: Cooking End-point Preferences in Regard to Roasted and Fried Potatoes and Toasted
Bread.
Part 6: Consumers’ Perceptions and Attitudes to Acrylamide Labelling.
3.1 Participants’ Profile
The total number of participants was 642. There were 68 disqualified respondents, with
disqualification criteria such as 'do not live in Ireland' (60) and 'under 18 years old' (8). In
addition to incomplete responses (19), the final number of qualified participations was 555.
Table 3-1 presents the collected demographic characteristics of the participants’ sample, as
shown among the age groups there was similar representation in the lower age groups, with 18-
24-years-old, 25-34 and 35-44 forming approximately 75% of the represented age groups. In

71
terms of gender, females formed more than 80% of the respondents, which is expected since
Bord Bia (2017) recorded that about 75% of Irish women are responsible for meal preparation.
Among the living area, 86.5% were from the cities. Regarding education levels, 84.3% of
participants have university qualifications. There were moderate differences in per capita
annual income between groups, with 40.2% earning between €30,000-€60,000, 30.4% earning
under €30,000) while 28.8% had an income of more than €60,000. The marital status
distribution showed that 39.7% were parents with children, 33.6% were single and 21% were
couples without children. The last census survey in Ireland by the Central Statistics Office
(CSO) illustrates that parents with children represent about 52.8% of the total numbers of
families and 13.5% of the country’s total population. Single status represents 32.7% of the total
population, while 29.2% of the total number of families are couples without children (CSO,
2016). Lastly, concerning the culinary practices status profile, the majority were of Irish origin
(46.5%). No-Irish nationals who are resident in Ireland account for about 12.2% of the total
population, according to the CSO (2018).
In comparison to the last census, there was a difference in the participant sample percentages.
Overall, the present sample covered all of the demographic groups. There is about 17.5%
missed demographic data (voluntarily skipped by the participants) which is considered as the
limitation to have all the demographical data. However, this limitation does not affect the
present study as it is out of the scope of the present study. Which mainly focused on the actual
home-foods practices and consumers’ practices, and its influences in the level of exposure to
acrylamide.

72
Table 3-1 The demographic characteristics of the resident participants’ sample.
Characters Category Respondents (n.) Percentage (%)
Age 18-24 107 23.4%
25-34 120 26.2%
35-44 121 26.4%
45-54 67 14.6%
55-64 39 8.5%
65+ 4 0.9%
Gender Male 90 19.7%
Female 367 80.1%
Other 1 0.2%
Place of Residence City 396 86.5%
Countryside 62 13.5%
Education Level University and Above 386 84.3%
Leaving Cert. 59 12.9%
Junior Cert. 11 2.4%
No qualification 2 0.4%
Per capita Annual
Income (Euro)
Under 30,000 139 30.4%
30,000-60,000 184 40.2%
Above 60,000 133 28.8%
I do not like to answer 2 0.4%
Family Status Single 154 33.6%
Single with children 19 4.2%
Couple without children 96 21.0%
Couple with children 182 39.7%
Other 7 1.5%
Culinary Practices
Origin
European-Irish 213 46.5%
European- non-Irish 85 18.6%
North American 10 2.2%
South American 14 3.1%
Asian 49 10.7%
African 34 7.4%
Australian 1 0.2%
Middle Eastern 52 11.4%
Total responses / question 458
Total Skipping / question 97
.
3.2 The Respondents, Awareness about Acrylamide
There were seven questions used to assess the acrylamide awareness topic, as shown in
Table 3-2. The first of these questions (Q3) in this section determined the pathway through the
survey for the respondents according to their responses. Across the total 555 respondents, there

73
were 473 respondents 85.2% who had not heard about acrylamide. Therefore, they were brought
automatically to the second section of this questionnaire (to Q7).
On the other hand, the positive responses to Q3, those who heard about acrylamide (as a term)
amounted to 82 respondents (14.8%). Whereas, when this question was asked using the
terminology (in Q31) “hearing about a harmful compound that forms when some carbohydrate
foods are overheated”, the results rose to 183 from the 465 respondents and represented 39.4%
from the total respondents.
Table 3-2 The Acrylamide Term Awareness Responses Frequency.
Q3. Have you previously heard about acrylamide in food?
Total Respondents
(N)
Category Respondents
(N)
Percentage
(%)
555
Yes 82 14.8%
No 473 85.2%
Q31.Have you previously heard about the formation of a harmful compound
when some carbohydrate foods (eg. bread, potatoes) are overheated to a brown
colour appearance?
465
Missed responses 90
Yes 183 39.4%
No 282 60.7%
It is noted in Table 3-3 that there are 125 respondents who gave a negative reply to Q3, while
they answered positively to Q31. On the other hand, 11 participants reacted positively to Q3
and responded negatively in Q31. There was significant evidence of a relationship between the
Q3 and Q31, which was confirmed among the Pearson Chi-Square test (value 67.84,df =1 and
p=0.000).

74
Table 3-3 Relationship between Responses to Q3 and Q31
Chi-Square Tests
Value df
Asymptotic
Significance (2-sided)
Exact Sig. (2-
sided)
Exact Sig.
(1-sided)
Pearson Chi-Square 67.840a 1 .000
Continuity Correctionb 65.659 1 .000
Likelihood Ratio 68.992 1 .000
Fisher's Exact Test .000 .000
Linear-by-Linear
Association
67.695 1 .000
N of Valid Cases 465
a. 0 cells (.0%) have an expected count of less than 5. The minimum expected count is 27.15.
b. Computed only for a 2x2 table
In the present study, the frequency of hearing the term “Acrylamide” was double compared to
the results from Poland, which recorded that 7% of the participants had heard about acrylamide
(Kowalska et al., 2017). Additionally, the results from China, among Chinese university
students, revealed that 5.1% of participating students heard about acrylamide risk. Access to
more information regarding this study was limited due to a Chinese language barrier (Meng,

75
Zhao and Qian, 2012). Moreover, acrylamide awareness levels in Ireland are similar to the level
of awareness in the UK, USA and France, which recorded that 22% had previously heard about
acrylamide (DSM, 2018). The above countries recorded less than the result from Germany,
where 54% had heard about acrylamide in food.
The positive respondents to Q3 entered the other pathway (Q4), a multi-choice question that
would further evaluate their knowledge. Therefore, as shown in Table 3-4, from the 82
respondents approximately three-quarters (75.6%) chose potatoes as a potential food source
contributing to high acrylamide exposure. Also, bread, biscuits and crackers were chosen by
more than half of the positive respondents (52.4%), while 37.8% selected coffee as a main
contributor in acrylamide consumption source.
In Table 3-5, those who had heard about acrylamide showed average information of 59.2% in
regard to the main acrylamide contributor food items such as potatoes, bread, coffee, bread and
biscuits.
Meat was chosen by almost a third of the respondents as one of the main food contributors in
acrylamide exposure. This is contrary to Tareke et al. (2002), who reported that in general,
protein-rich foods such as fish, meat and poultry under heat-treatment showed lower amounts
of acrylamide than carbohydrate-rich foods.
The data about choosing meat as a main source for acrylamide generation in this study is
presumed to have developed due to a mis-differentiation between acrylamide and heterocyclic
amines (HCAs) and polycyclic aromatic hydrocarbons (PAHs) compounds. HCAs and PAHs
can commonly be generated in some cooked meats under high temperature, such as grilling and
pan cooking (Cross and Sinha, 2004; Skog et al., 1998).

76
Therefore, this area of information needs more investigation about the awareness level in regard
to heat-induced toxicants in food such as HMF and Furan rather than acrylamide. As shown by
Akinosun, Ojinnaka and Aouzelleg (2018), the awareness of N-nitrosamines, furans and PAH
present in food and their risks, among participants from Ghana, Nigeria and UK, was almost
less than 3%.
Table 3-4 The percentages of the responses for every foodstuff
Q4. Which of the following foods have the potential to
contribute to high acrylamide exposure? (Tick as many as are
relevant).
Category Respondents (N) Percentage (%)
Green vegetables 9 11.0%
Fruit 4 4.9%
Milk 8 9.8%
Meat 27 32.9%
Fish 16 19.5%
Bread 43 52.4%
Eggs 12 14.6%
Potatoes 62 75.6%
Poultry 15 18.3%
Coffee 31 37.8%
Biscuits & Crackers 43 52.4%
Cereals 40 47.6%
Beer 8 9.8%
Total Respondents (N) 82
Skipped to other pathway 473

77
Table 3-5 Frequency of responses to the main foodstuffs contributing in
acrylamide generation.
To gain further insight into the knowledge of the respondents, an open question (Q5) tested the
reasons behind their selections in regard to potential sources that contribute to high acrylamide
exposure and aiming to test the reliability of the answers. The responses were sorted manually
and coded for further analysis.
Table 3-6 shows that about one-third of respondents who selected the food which contributed
in acrylamide formation did not know the reasons. On the other hand, 56 participants gave
reasons. The reason for acrylamide forming was attributed to the starchy nature of the foods in
37.5%. High temperature as a cause was represented by 19.6%, while just knowledge was
selected by 26.8% as the reason behind their responses. In addition, other reasons such as
cooking methods, cooking time and presence of asparagine in foodstuffs were also mentioned
by only two participants.
Overall, the results confirmed that about 31% of those who heard about acrylamide did not
know the reasons behind their choices for those food options. Conversely, the results in regard
to the reasons for choosing specific foodstuffs as main sources in acrylamide exposure revealed

78
that about 41% referred to carbohydrate, grain and asparagine contents in those food items as
being behind their choice, while cooking conditions were the reasons in about 44.6% of choices.
Table 3-6 The reasons for choosing specific foodstuffs that may contribute in
Acrylamide exposure.
Q5. Why do you think so?
Total Respondents (N) Category Respondents (N) Percentage (%)
82
I do not know 26 31.7%
Presented a reason 56 68.3%
Presented reason
56
Starchy /Carb foods 21 37.5%
Asparagine 2 3.6%
Burn cooking 3 5.4%
Cooking Methods 5 8.9%
Cooking Time 2 3.6%
Food Process 4 7.1%
High Temp. 11 19.6%
Knowledge 15 26.8%
Other 3 5.4%
For further, in-depth understanding and evaluation of the awareness, another confirmative
question was asked about the conditions which may be responsible for the formation of
acrylamide in foods. The overall 82 answers, as illustrated in Figure 3-1, it is shown that
cooking at high temperatures represented 85.4% (70 N). This percentage reflects the high level
of awareness about the main causes for acrylamide formation in food which also, consequently,
confirmed the reliability of positive responses in regard to hearing about acrylamide. Differing
from that, 5.2% participants from the UK knew about the link between high-temperature and
chemical hazards generation in food (Akinosun, Ojinnaka and Aouzelleg, 2018).

79
Figure 3-1 Responses relating to perceived conditions for acrylamide formation.
Q32 tested the knowledge about the adverse health impact associated with chronic exposure to
acrylamide or overheated carbohydrate foods. This question followed Q31 which informed the
participants about the acrylamide term.
The results showed that there was nearly a full consensus (94.5%) that there were
carcinogenic risks associated with consumption of acrylamide. This was shown in an open-
ended question (Q32) among the 177 respondents who heard about harmful compounds
associated with overheating of carbohydrate-based foods. Moreover, Table 3-7 displayed that
about 38.4% out of 177 were aware of the health risks of this substance.
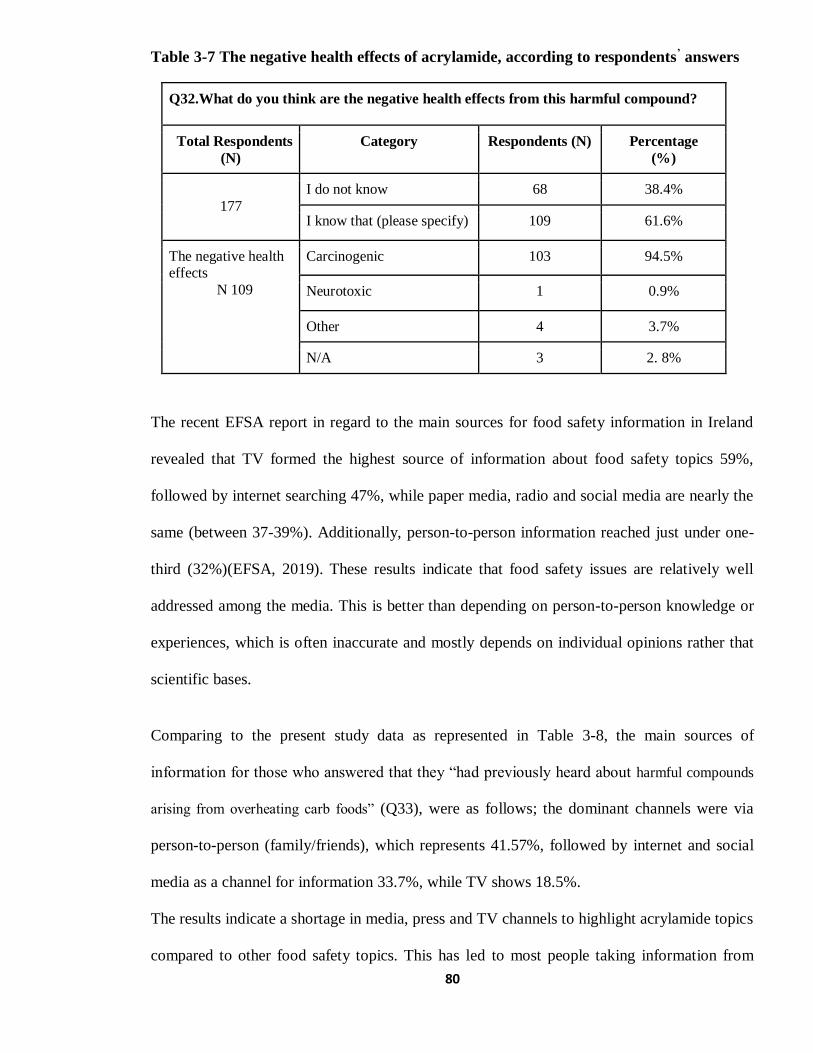
80
Table 3-7 The negative health effects of acrylamide, according to respondents’ answers
Q32.What do you think are the negative health effects from this harmful compound?
Total Respondents
(N)
Category Respondents (N) Percentage
(%)
177
I do not know 68 38.4%
I know that (please specify) 109 61.6%
The negative health effects
N 109
Carcinogenic 103 94.5%
Neurotoxic 1 0.9%
Other 4 3.7%
N/A 3 2. 8%
The recent EFSA report in regard to the main sources for food safety information in Ireland
revealed that TV formed the highest source of information about food safety topics 59%,
followed by internet searching 47%, while paper media, radio and social media are nearly the
same (between 37-39%). Additionally, person-to-person information reached just under one-
third (32%)(EFSA, 2019). These results indicate that food safety issues are relatively well
addressed among the media. This is better than depending on person-to-person knowledge or
experiences, which is often inaccurate and mostly depends on individual opinions rather that
scientific bases.
Comparing to the present study data as represented in Table 3-8, the main sources of
information for those who answered that they “had previously heard about harmful compounds
arising from overheating carb foods” (Q33), were as follows; the dominant channels were via
person-to-person (family/friends), which represents 41.57%, followed by internet and social
media as a channel for information 33.7%, while TV shows 18.5%.
The results indicate a shortage in media, press and TV channels to highlight acrylamide topics
compared to other food safety topics. This has led to most people taking information from

81
families’ daily activates (habits) or searching for information online, as shown from the answers
distribution. This way of gaining information will open the door for exposure to
misunderstanding and personal opinions rather than scientific information, leading to unclear
and incorrect perceptions about the potential risk. This conclusion is supported when compared
with the EFSA (2019) report. Additionally, this conclusion is supported by the participants’
responses, as they claimed to know about acrylamide but further questions pointed out that there
were limitations in their claim. This is best illustrated by those who referred to person-to-person
as the source of information.
Receiving information from the internet was also recorded as the main source for acrylamide
information among a Polish-chosen population (Kowalska et al., 2017).
Table 3-8 The channels of acrylamide information among the participants
Q33. From what source did you get your information about this
harmful compound? (Tick as many as are relevant)
Category Respondents (N) Percentage (%)
TV 33 18.5%
Internet/ social media 60 33.7%
Journal/Magazine 41 23.0%
From person (Family/friends) 74 41.6%
School/College 45 25.3%
Food Safety Authority of Ireland. 14 7.9%
Other 13 7.3%
Total Respondents (N) 178
Skipped 377
82
3.3. Home Food Practices
3.3.1. Potato Storage Practices
As shown in the literature review, storage conditions play a role in the acrylamide formation
level in potato-based foods, through controlling reducing sugars generation.
Under this part, three questions (Q7, Q8, Q9) investigated the domestic practices in relation to
the storage of potatoes.
The present results show that the majority of participants store their fresh potatoes outside the
fridge, such as in a closet, pantry, cupboard, garage, or in an open area such as shelves and
baskets. Therefore, over a total of 555 participants there was 459 (82.7%) who store fresh
potatoes in a room temperature environment. The percentage of those who store potatoes
outside the fridge, in a closet or closed space at room temperature, was 78%. In the smaller
bracket, 26 respondents 4.7% preferred to keep fresh potatoes in an open-air space such as
shelves (Table 3-9).
Only 70 respondents store fresh potatoes in the fridge, while five store them in a freezer. It was
noticed that from 70 responders, who store fresh potatoes in the fridge, there were eight
participants who mentioned previously that they had heard about acrylamide. Moreover, six
respondents chose potatoes as one of the major food contributors in acrylamide formation.
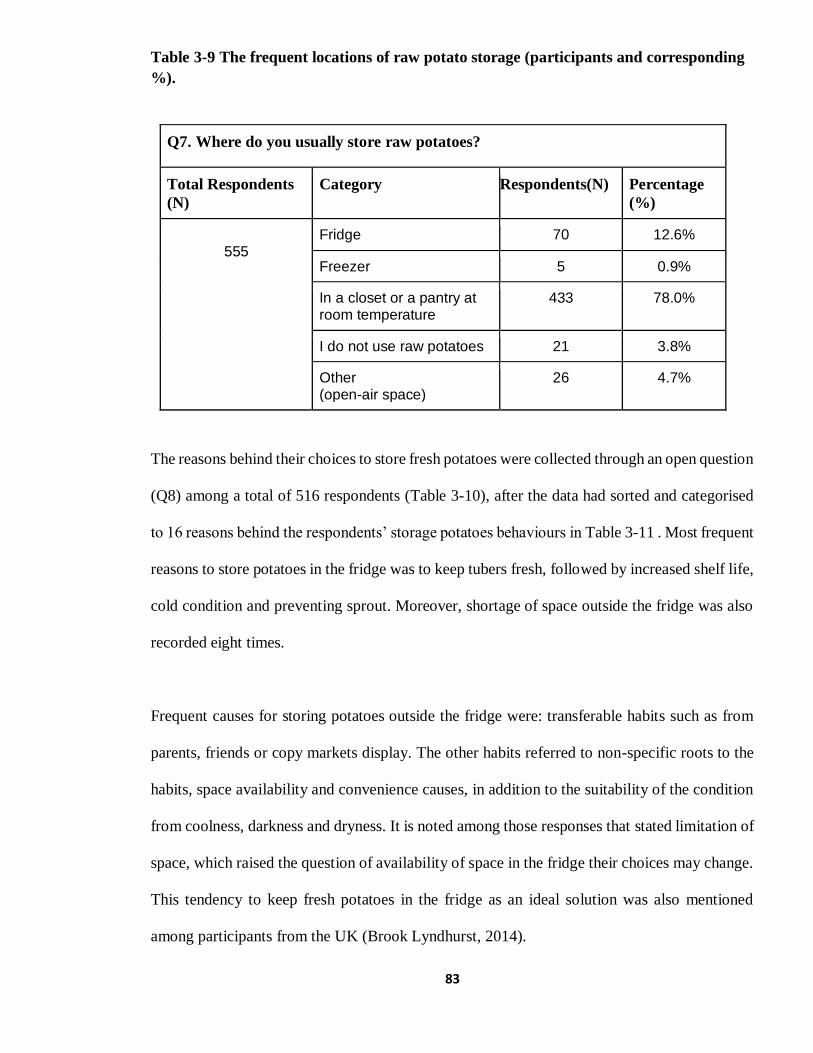
83
Table 3-9 The frequent locations of raw potato storage (participants and corresponding
%).
Q7. Where do you usually store raw potatoes?
Total Respondents
(N)
Category Respondents(N) Percentage
(%)
555
Fridge 70 12.6%
Freezer 5 0.9%
In a closet or a pantry at room temperature
433 78.0%
I do not use raw potatoes 21 3.8%
Other (open-air space)
26 4.7%
The reasons behind their choices to store fresh potatoes were collected through an open question
(Q8) among a total of 516 respondents (Table 3-10), after the data had sorted and categorised
to 16 reasons behind the respondents’ storage potatoes behaviours in Table 3-11 . Most frequent
reasons to store potatoes in the fridge was to keep tubers fresh, followed by increased shelf life,
cold condition and preventing sprout. Moreover, shortage of space outside the fridge was also
recorded eight times.
Frequent causes for storing potatoes outside the fridge were: transferable habits such as from
parents, friends or copy markets display. The other habits referred to non-specific roots to the
habits, space availability and convenience causes, in addition to the suitability of the condition
from coolness, darkness and dryness. It is noted among those responses that stated limitation of
space, which raised the question of availability of space in the fridge their choices may change.
This tendency to keep fresh potatoes in the fridge as an ideal solution was also mentioned
among participants from the UK (Brook Lyndhurst, 2014).
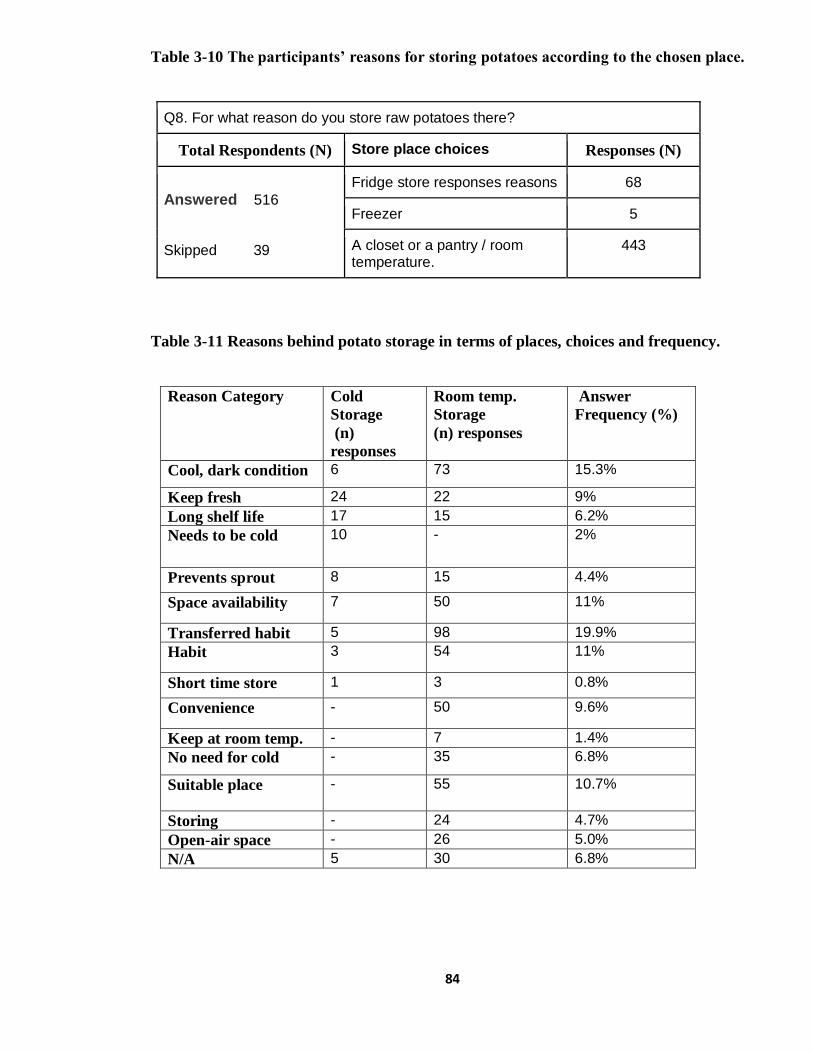
84
Table 3-10 The participants’ reasons for storing potatoes according to the chosen place.
Q8. For what reason do you store raw potatoes there?
Total Respondents (N) Store place choices Responses (N)
Answered 516 Skipped 39
Fridge store responses reasons 68
Freezer 5
A closet or a pantry / room temperature.
443
Table 3-11 Reasons behind potato storage in terms of places, choices and frequency.
Reason Category Cold
Storage
(n)
responses
Room temp.
Storage
(n) responses
Answer
Frequency (%)
Cool, dark condition 6 73 15.3%
Keep fresh 24 22 9%
Long shelf life 17 15 6.2%
Needs to be cold 10 - 2%
Prevents sprout 8 15 4.4%
Space availability 7 50 11%
Transferred habit 5 98 19.9%
Habit 3 54 11%
Short time store 1 3 0.8%
Convenience - 50 9.6%
Keep at room temp. - 7 1.4%
No need for cold - 35 6.8%
Suitable place - 55 10.7%
Storing - 24 4.7%
Open-air space - 26 5.0%
N/A 5 30 6.8%

85
Overall, the majority of the participants store fresh potatoes at room temperature above 8°C.
This indicates the level of free sugars in potatoes does not increase significantly and generation
of high acrylamide levels in cooked potatoes are unlikely (Viklund et al., 2008; Matsuura-Endo
et al., 2006; De Wilde et al., 2005; Silva and Simon, 2005; Amrein et al., 2004b). The potato-
storing behaviour, findings appear consistent with prior research results among UK consumers,
in regard to keeping potato tubers at room temperature rather than in the fridge (Brook
Lyndhurst, 2014). Comparing to the potato storage behaviour among Spanish potato home-
cooking volunteers, it showed that nearly 71% store fresh potatoes in room conditions while
19% store outdoor, where the storage duration reached 14 days and 54 days respectively,
moreover there was not any mention of using the fridge for keeping tubers (Mesias et al., 2018).
As the storage temperature influences the levels of acrylamide in potatoes, so too does the
storing duration. The collected data showed that about 70% store potatoes over a week. Over
half usually store potatoes for between seven to14 days and about 17% store for longer than
two weeks (Table 3-12).
Table 3-12 Raw potatoes storage period (participants and corresponding %).
Q9. For how long would you say you usually store raw potatoes from date of purchase?
Total Respondents (N) Category Responses (N) Percentage (%)
Answered 515
Skipped 40
0-3 days 21 4.1%
4-6 days 106 20.6%
7-9 days 135 26.2%
For 2 weeks 134 26.0%
More than 2 weeks 88 17.1%
I cannot remember 31 6.0%
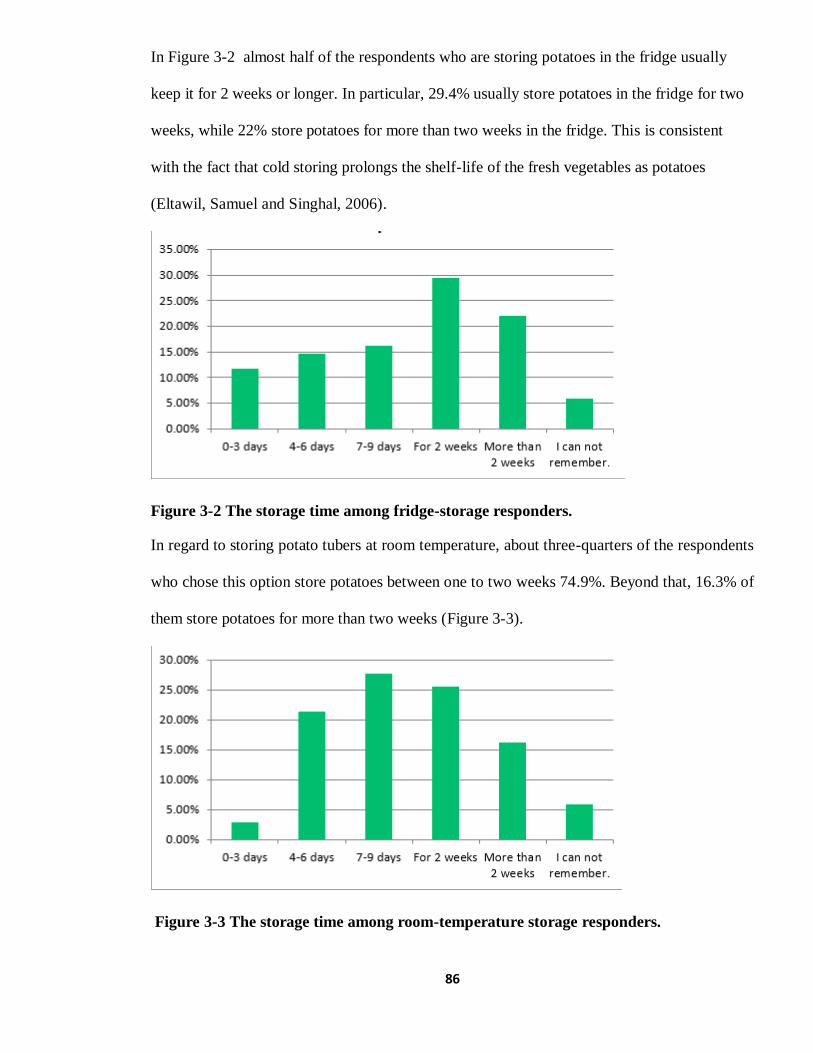
86
In Figure 3-2 almost half of the respondents who are storing potatoes in the fridge usually
keep it for 2 weeks or longer. In particular, 29.4% usually store potatoes in the fridge for two
weeks, while 22% store potatoes for more than two weeks in the fridge. This is consistent
with the fact that cold storing prolongs the shelf-life of the fresh vegetables as potatoes
(Eltawil, Samuel and Singhal, 2006).
Figure 3-2 The storage time among fridge-storage responders.
In regard to storing potato tubers at room temperature, about three-quarters of the respondents
who chose this option store potatoes between one to two weeks 74.9%. Beyond that, 16.3% of
them store potatoes for more than two weeks (Figure 3-3).
Figure 3-3 The storage time among room-temperature storage responders.

87
It seems that potatoes are stored mostly over a week, as shown from the results. The percentage
of respondents keeping tubers in a cold temperature represented less than 15%, however the
tendency to keep fresh tubers in a low temperature for a long time in the fridge for two weeks
or more represented almost 50%. Among room temperature respondents, the storing period
decreased slightly and represented 52% storing mostly between seven to 14 days.
The storage behaviours in the current study referred to there being a tendency to store potatoes
for more than two weeks, this result almost agrees with the storage behaviours among Spanish
sample (Mesias et al., 2018). The storage tendency time differed with previous notices among
the Uk participants. Which referred to all the participants kept fresh potatoes less than two
weeks (Brook Lyndhurst, 2014).
3.3.2. Peeling and washing potatoes practices
The results show in Table 3-13 that, among 516 total responses, the majority (over 80%) peel
potatoes. In particular, 201 participants always peel potatoes, in addition to 220 who usually
peel, while about 18% do not peel potatoes (Figure 3-4). Moreover, washing potatoes practices
after peeling was also recorded as a high percentage which reached 85% (Table 3-14). To
conclude, peeling and washing potatoes practices among the participants was high. The
percentage in regard to washing potatoes results among the participants matched with the results
of washing practices, which was recorded among Spanish participants in a pilot study (Mesias
et al., 2018).
By contrast, in a British field study about domestic food practices, it was recorded that most of
the participants often did not wash peeled potatoes, as they rely on peeling and parboiling.
Furthermore, the researchers described peeling practice behaviours as being reliant on what
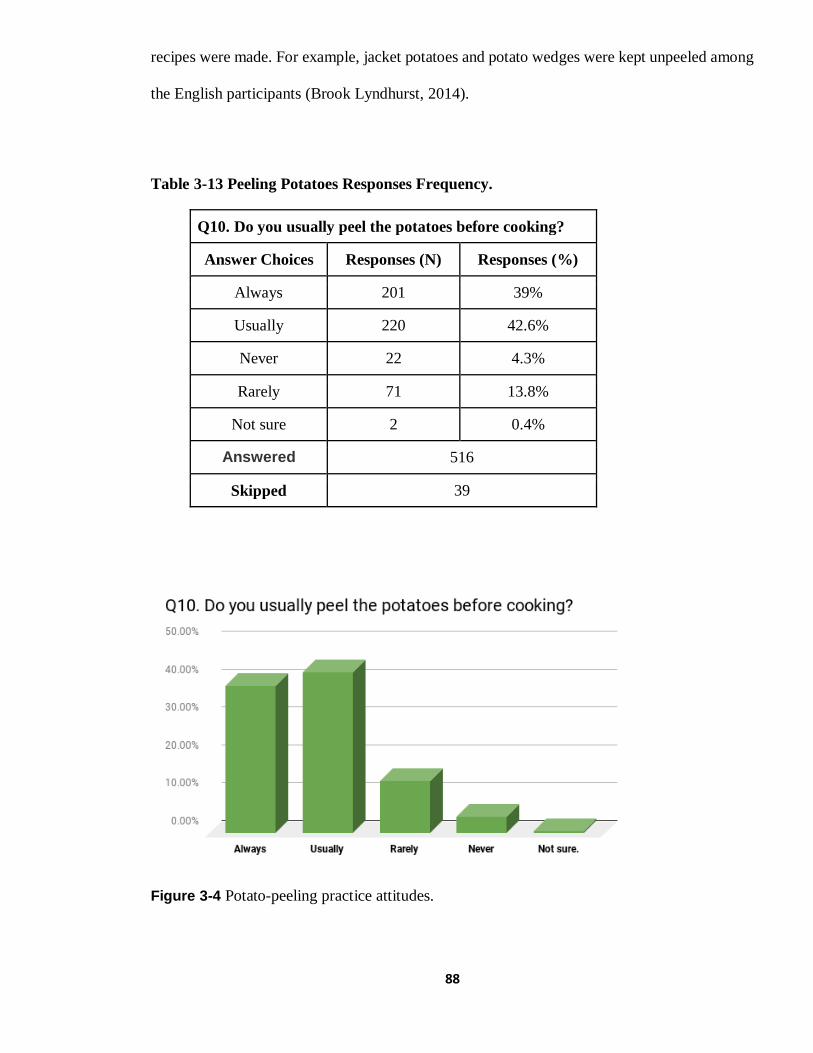
88
recipes were made. For example, jacket potatoes and potato wedges were kept unpeeled among
the English participants (Brook Lyndhurst, 2014).
Table 3-13 Peeling Potatoes Responses Frequency.
Q10. Do you usually peel the potatoes before cooking?
Answer Choices Responses (N) Responses (%)
Always 201 39%
Usually 220 42.6%
Never 22 4.3%
Rarely 71 13.8%
Not sure 2 0.4%
Answered 516
Skipped 39
Figure 3-4 Potato-peeling practice attitudes.

89
Table 3-14 Washing peeled potatoes responses frequency.
Q11. Do you usually wash the potatoes after peeling?
Answer Choices Responses (N) Responses (%)
Always 310 65.1%
Never 34 7.1%
Usually 98 20.6%
Rarely 30 6.3%
Not sure 4 0.8%
Answered 476
Skipped 79
3.3.4. Cutting potato sizes for roasting
Over 495 total respondents, the medium cubes potatoes size was the most common size at
41.8%, then halved potatoes at 30.9%, while wedges, circles and chips size were nearly the
same with an average 22.7%. Thin-chopped potato cuts were less than 6% (
Table 3-15). When the average dimensions of medium potato cubes are 12.7mm x 12.7mm x
12.7mm (Auguste Escoffier School of Culinary Arts, 2014), that refers to the potatoes chopped.
Sizing practices do not tend to be fine cuts. Thus, the expected risk from fine size cuts to
generate more acrylamide is relatively low in the present study. Whereas, the tendency to cut
potato chips to large size was noticed by Brook Lyndhurst (2014).

90
Table 3-15 Potato Cuts Preferences Responses
Q12 which size do you usually cut potatoes for roasting? (Tick as many as are
relevant)
Answer Choices Responses (N) Responses% Cases (%)
Whole size 126 12.5% 25.5%
Halves 153 15.1% 30.9%
Quarters 140 13.8% 28.3%
Wedges 111 11.0% 22.4%
Thin size 29 2.9% 5.9%
Medium size cubes 207 10.9% 41.8%
Medium size circles 110 20.5% 22.2%
Chips size 117 11.6% 23.6%
Crisps size 8 0.8% 1.6%
Smaller than above 5 0.5% 1.0%
Never roasting 8 0.6% 1.6%
Total participants 495
Skipping 60
3.3.5. Soaking Potatoes
In regard to soaking potato practices, there were three questions that covered the applicability,
duration and perceptions behind soaking activity (Q13, Q14 and Q15). Table 3-16 represents
that, from a total 494 participants using fresh potatoes from scratch, there were 39.9% who
practiced soaking potatoes before cooking. On the other hand, there are 56% who did not soak
fresh-peeled or chopped tubers.
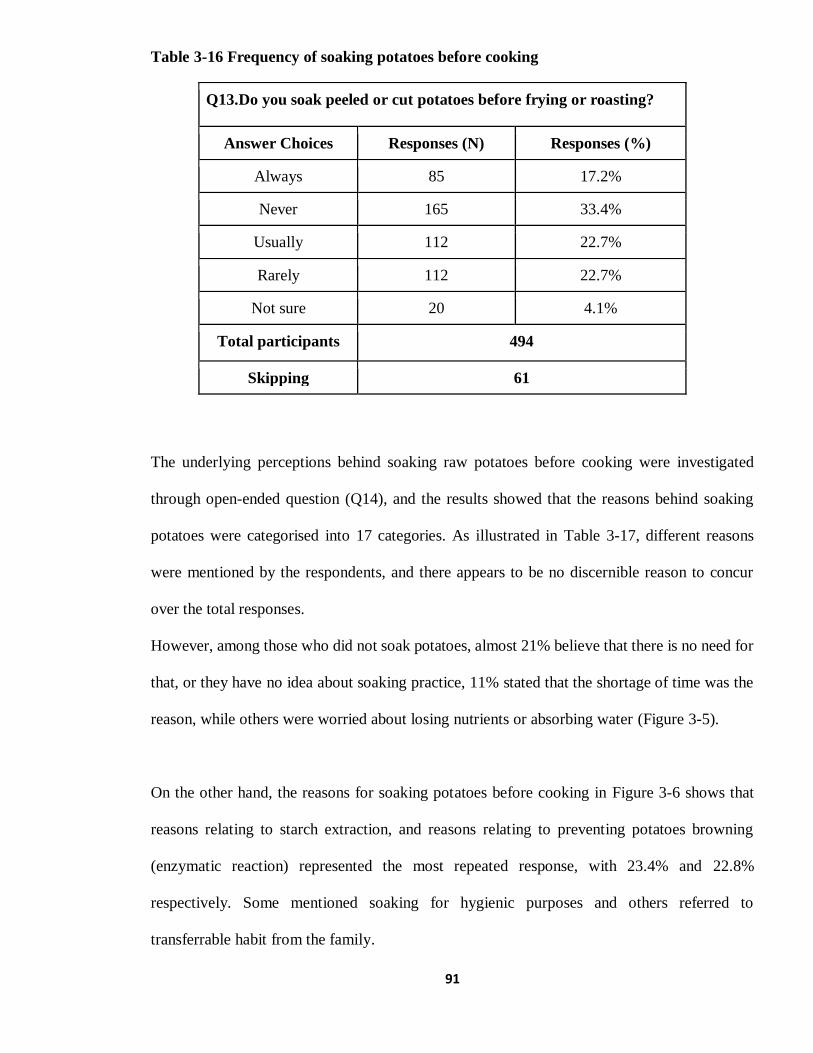
91
Table 3-16 Frequency of soaking potatoes before cooking
Q13.Do you soak peeled or cut potatoes before frying or roasting?
Answer Choices Responses (N) Responses (%)
Always 85 17.2%
Never 165 33.4%
Usually 112 22.7%
Rarely 112 22.7%
Not sure 20 4.1%
Total participants 494
Skipping 61
The underlying perceptions behind soaking raw potatoes before cooking were investigated
through open-ended question (Q14), and the results showed that the reasons behind soaking
potatoes were categorised into 17 categories. As illustrated in Table 3-17, different reasons
were mentioned by the respondents, and there appears to be no discernible reason to concur
over the total responses.
However, among those who did not soak potatoes, almost 21% believe that there is no need for
that, or they have no idea about soaking practice, 11% stated that the shortage of time was the
reason, while others were worried about losing nutrients or absorbing water (Figure 3-5).
On the other hand, the reasons for soaking potatoes before cooking in Figure 3-6 shows that
reasons relating to starch extraction, and reasons relating to preventing potatoes browning
(enzymatic reaction) represented the most repeated response, with 23.4% and 22.8%
respectively. Some mentioned soaking for hygienic purposes and others referred to
transferrable habit from the family.

92
Figure 3-5 The reasons behind no-soaking (never & rarely) potatoes.
Figure 3-6 The reasons behind soaking (always & usually) potatoes
0.0% 10.0%20.0%30.0%40.0%50.0%60.0%70.0%80.0%90.0%100.0%
Avoid absorbing water
Crisp/ tasty
In advance preparation
N/A
No need for soaking
Parboil
Prior washing occurred
Seasoning
Time consuming/not enough time
No-Soaking Reasons
Never Rarely
0.0% 5.0% 10.0% 15.0% 20.0% 25.0% 30.0% 35.0% 40.0% 45.0% 50.0%
Cleaning
Crisp/ tastyIn advance preparation
N/A
No Idea about Soaking
No need for soaking
Other
Prevent browning
Starch Removal
SeasoningSoftening
Time consuming/not enough time
Transferable habit/ habit
Reasons for Soaking Potatoes
Always Usually
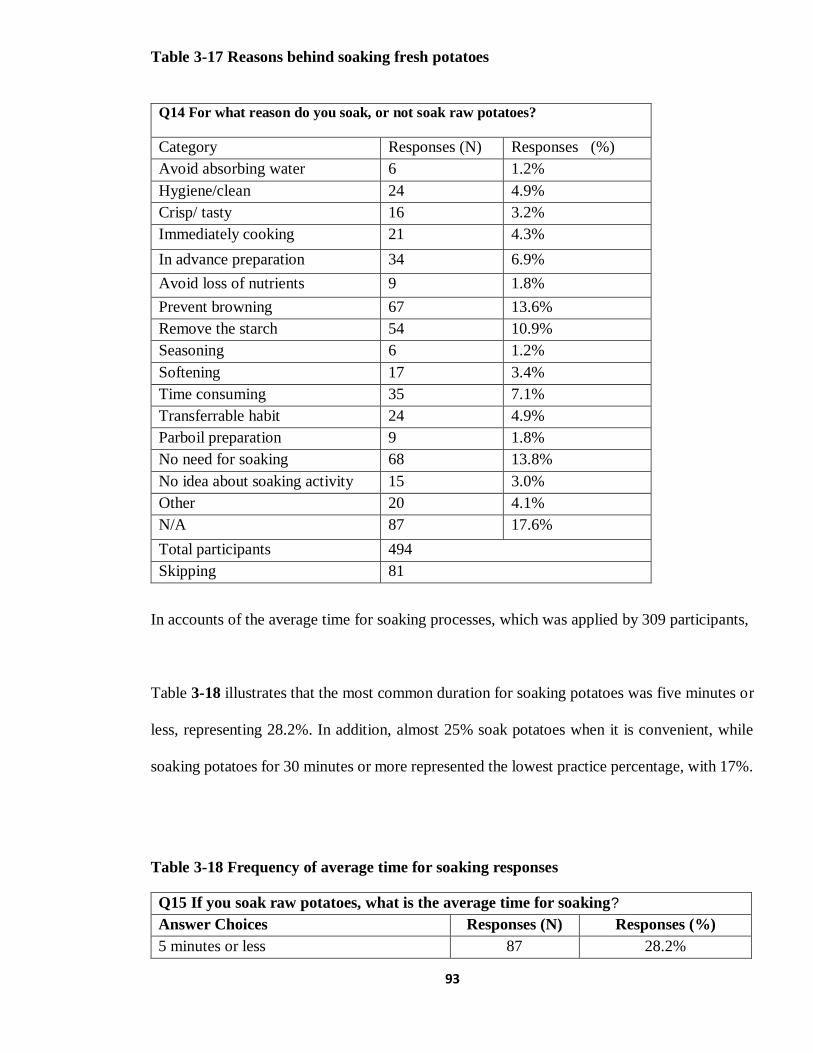
93
Table 3-17 Reasons behind soaking fresh potatoes
Q14 For what reason do you soak, or not soak raw potatoes?
Category Responses (N) Responses (%)
Avoid absorbing water 6 1.2%
Hygiene/clean 24 4.9%
Crisp/ tasty 16 3.2%
Immediately cooking 21 4.3%
In advance preparation 34 6.9%
Avoid loss of nutrients 9 1.8%
Prevent browning 67 13.6%
Remove the starch 54 10.9%
Seasoning 6 1.2%
Softening 17 3.4%
Time consuming 35 7.1%
Transferrable habit 24 4.9%
Parboil preparation 9 1.8%
No need for soaking 68 13.8%
No idea about soaking activity 15 3.0%
Other 20 4.1%
N/A 87 17.6%
Total participants 494
Skipping 81
In accounts of the average time for soaking processes, which was applied by 309 participants,
Table 3-18 illustrates that the most common duration for soaking potatoes was five minutes or
less, representing 28.2%. In addition, almost 25% soak potatoes when it is convenient, while
soaking potatoes for 30 minutes or more represented the lowest practice percentage, with 17%.
Table 3-18 Frequency of average time for soaking responses
Q15 If you soak raw potatoes, what is the average time for soaking?
Answer Choices Responses (N) Responses (%)
5 minutes or less 87 28.2%
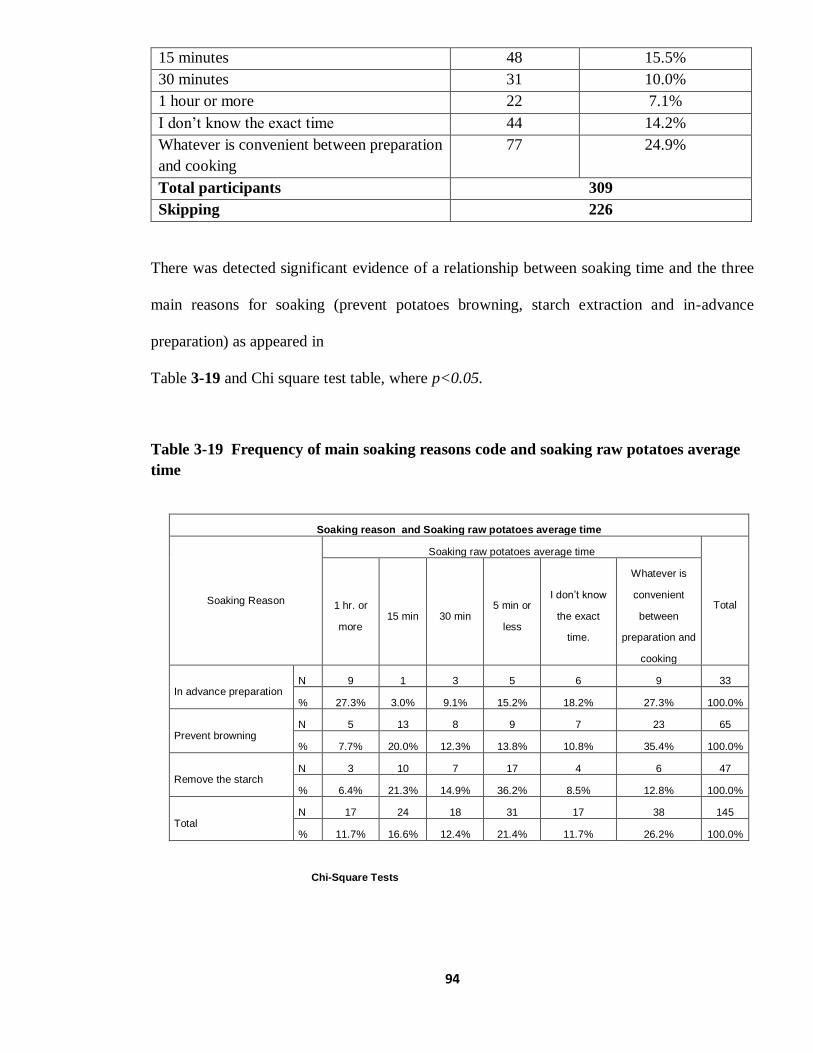
94
15 minutes 48 15.5%
30 minutes 31 10.0%
1 hour or more 22 7.1%
I don’t know the exact time 44 14.2%
Whatever is convenient between preparation
and cooking
77 24.9%
Total participants 309
Skipping 226
There was detected significant evidence of a relationship between soaking time and the three
main reasons for soaking (prevent potatoes browning, starch extraction and in-advance
preparation) as appeared in
Table 3-19 and Chi square test table, where p<0.05.
Table 3-19 Frequency of main soaking reasons code and soaking raw potatoes average
time
Soaking reason and Soaking raw potatoes average time
Soaking Reason
Soaking raw potatoes average time
Total 1 hr. or
more 15 min 30 min
5 min or
less
I don’t know
the exact
time.
Whatever is
convenient
between
preparation and
cooking
In advance preparation N 9 1 3 5 6 9 33
% 27.3% 3.0% 9.1% 15.2% 18.2% 27.3% 100.0%
Prevent browning N 5 13 8 9 7 23 65
% 7.7% 20.0% 12.3% 13.8% 10.8% 35.4% 100.0%
Remove the starch N 3 10 7 17 4 6 47
% 6.4% 21.3% 14.9% 36.2% 8.5% 12.8% 100.0%
Total N 17 24 18 31 17 38 145
% 11.7% 16.6% 12.4% 21.4% 11.7% 26.2% 100.0%
Chi-Square Tests

95
Value df Asymptotic
Significance (2-sided)
Pearson Chi-Square 28.238a 10 .002
Likelihood Ratio 28.451 10 .002
Linear-by-Linear Association .009 1 .925
N of Valid Cases 145
a. 3 cells (16.7%) have expected count less than 5. The minimum expected
count is 3.87.
Overall, the data about soaking potatoes practices among the respondents states that almost
40% of those who prepare potatoes from scratch practice soaking as part of a potato preparation
process. This results is considered double percentage compared to the soaking practices results
among Spanish consumers, which was recorded with 19.2% (Mesias et al., 2018).
However, the overall applicable times for soaking practice were relatively short or non-specific
duration. Whereas HEATOX (2007b) recommended the soaking time to be at least for 30
minutes or more. Likewise, the result from a previous British field study, which recorded that
the participants did not consider soaking potatoes before cooking as a part of the preparation
procedures. But they did it whenever it was convenient or when potatoes were peeled in advance
time just for saving time to do other cooking tasks. In other words, to prevent the developing
of browning during preparation of other tasks (Brook Lyndhurst, 2014).
Moreover, the present findings show that there are perceptions about the reasons behind soaking
potatoes, such as removal of starch from potatoes, which formed 10.9% as a reason for soaking
potatoes, which is reported in literature reviews as a powerful way to reduce acrylamide
generation (Pedreschi, Kaack and Granby, 2006). Conversely, “no-need for soaking” reason
was also presented among those who totally denied the necessity of soaking practice, while
some attributed that to shortage of available time for preparation and cooking.

96
Therefore, although there is awareness about the soaking process, the common practice times
were not enough to fulfil the purpose to extract the large portion of acrylamide precursors.
3.3.6. Parboiling Potatoes
Aiming to reduce generation of higher amount of acrylamide when dealing with fresh potatoes,
many projects and bodies recommended applying of parboil, soak, and blanch for fresh
potatoes before cooking to eliminate starch contents from potatoes, subsequently limiting
acrylamide level in end-cooked meal (UKHospitality, 2018; FSAI, 2009a; HEATOX, 2007a).
From a total of 493 who shared in a question about parboil fresh potatoes before cooking, there
were 51 respondents who confirmed that they always blanch potatoes before further use
(roasting or frying) in addition to 112 other usually practice it, with overall together formed
almost 33%. The majority do not blanch potatoes before cooking and they represent 58.4%
(Table 3-20). In contrast to the current results, Brook Lyndhurst (2014) noted that all home-
made fresh potatoes had been parboiled before roasting by the British participants, aiming to
save roasting time and gaining desirable texture.
Table 3-20 Frequency of blanching potatoes before cooking
Q16 Do you parboil the potatoes before cooking?
Answer Choices Responses (N) Responses (%)
Always 51 10.3%
Usually 112 22.7%
Rarely 138 28.0%
Never 150 30.4%
Not sure 42 8.5%
TOTAL 493

97
For insight, respondents reasons for parboiling potatoes before further cooking was
investigated. The data had been collected from 275 respondents through open-ended question
(Q17), and the responses were sorted and coded in 11 categories, as shown in Table 3-21.
The most recorded reason was reducing the cooking time 41.5%, also to achieve the desired
tenderness and fluffiest taste represented 15.6%. Those main reasons are in line with the reasons
that were mentioned previously by Brook Lyndhurst (2014).
The results in regard to blanching fresh potatoes in water before cooking in total does not seem
a common practice at home. However, it is an important step in reducing acrylamide formation
in the end-meals, subsequently minimising exposure to acrylamide via home-made potatoes
(Zhang et al., 2018; Shojaee-Aliabadi et al., 2013; Viklund et al., 2010).
Table 3-21 Categories of the reasons behind blanching potatoes
Q17 Why do you parboil the potatoes before cooking?
Category Responses (N) %
Cooking time reduction 114 41.5%
Achieve texture 10 3.6%
Help crispness 26 9.5%
Routine process with
roasted potatoes
27 9.8%
Healthy 1 0.4%
Hygiene 5 1.8%
Tender/fluffy effect 43 15.6%
Tasty 13 4.7%
Remove starch 3 1.1%
Other 40 14.6%
N/A 28 10.2%
Total Respondents (N) 275

98
3.3.7. Potato cooking
This section represents the results of the three questions in relation to the potato-cooking
process. They were the methods for evaluation of food ‘doneness’, usual temperature used in
oven for roasting potatoes and the usual method applied for frying potatoes.
3.3.7.1 Cooking Time Estimation for Pre-cooked Potato Products
With a total of 465 participations in Q18, the majority 60% rely on visual or tasting assessment,
or both, for evaluating the pre-cooked food doneness in foods such as frozen chips, while almost
35% follow the specific food's label instructions. These collected responses are illustrated in
Figure 3-7.
Table 3-22 displays the individual data. Visual assessment represented almost half, followed
by 31.6% for strictly following the food's label instruction for cooking. Some people referred
to mixing the instruction with other assessment methods.
Figure 3-7 The Food Doneness Assessment Methods

99
Table 3-22 Percentage of the Food Doneness Assessment Methods
Q18.When you cook pre-cooked foods (e.g. frozen chips), how do you
estimate the cooking time?
Answer Choices Responses (N) Responses (%)
Visual assessment (i.e. of colour and
texture)
232 49.9%
Abiding strictly to the instructed time
on the label
147 31.6%
Tasting assessment 45 9.7%
Both tasting and visual assessment 2 0.4%
Following instructions plus other
assessments (visual, taste)
15 3.2%
Never use frozen potatoes or chips 23 5.0%
Other 1 0.2%
Total responses 465
The findings reflected that just one in four persons follow the label instructions regarding
temperature and time for cooking. Meanwhile, over 60% of people depend on their other ways
of judgment for doneness. This opens the door for unexpected higher levels of acrylamide
generation in home-made potatoes, as shown among Spanish home-made potatoes. In the
Spanish case, researchers analysed fried potatoes samples from home-made chips in Spanish
households in a pilot study and the results revealed there was a markedly high level of
acrylamide reached to the double estimated level by EFSA (Mesias et al., 2018). However, in
the same year, by the same researchers, a survey study was conducted in Spain with regard to
domestic frying habits. This recorded that the percentage of those who followed the instruction
100
on food packages reached 58.6% among Spanish consumers (Mesias, Delgado-Andrade and
Morales, 2018).
Although, following the instructions in food packages is advised by HEATOX (2007b) and
Regulation (EU) 2017/2158, mentioned in details to obligate the FBOs under “Information to
the end users” (European Commission, 2017). There was lower attempts to follow
manufactures' instructions, as also noticed by Brook Lyndhurst (2014); Brook Lyndhurst and
WRAP (2011); Wright, Canham and Masrani ( 2011).
Brook Lyndhurst (2014) recorded, during an actual cooking practice study among participants,
that visual assessment was an important part for judging the food cooking status as well as the
other factors such as time guide. This is in line with the current results, where visual assessment
alone represented 50% of the end-point evaluation tool in roasted potatoes.
3.3.7.2. Oven Temperature
The vital role of cooking temperature in influencing acrylamide levels have been extensively
demonstrated through studies, as shown in the literature review. Therefore, the data was
collected regarding common temperature degree that is used in the oven for roasting potatoes.
The present findings in Table 3-23 illustrate the usual oven temperature choices among 462
total respondents. It is clear that 200°C (180°C in fan oven) is the most common option used
for roasting fresh potatoes, followed by 150°C (130°C in fan oven), which represented 23.2%
and 21.9% respectively. Meanwhile, 220°C (200°C in fan oven) represents about 15%. The
sum of over 200 °C choices represent 20%, as shown in detail in Table 3-23.

101
Table 3-23 Frequency of oven temperature degree choices for roasting fresh potatoes.
Q19.What heat setting on your oven do you often select for roasting fresh potatoes?
Answer Choices Responses (N) Responses (%)
Gas oven Fan/ Electric oven temp.
1 (120)/(275°F/140°C) 45 9.7%
2 (130)/(300°F/150°C) 101 21.9%
3 (150)/(325°F/170°C) 20 4.3%
4 (160)/(350°F/180°C) 49 10.6%
5 (170)/(375°F/190°C) 23 5.0%
6 (180)/(400°F/200°C) 107 23.2%
7 (200)/ (425°F/220°C) 71 15.4%
8 (210)/(450°F/230°C) 5 1.1%
9 (220)/(475°F/240°C) 17 3.7%
I cannot remember 24 5.2%
Total responses 462
Skipped 93
The tendency for keeping the oven temperature between 180°C-220°C for roasting fresh
potatoes was recorded in an actual field study project in the UK. Furthermore, this field project
report pointed out that, in home conditions, the oven temperature usually fluctuated during the
cooking process and it was not constant during the cooking duration (Brook Lyndhurst, 2014).
In line with the recommended oven temperature for baking (not over 200°C /180°C on hot air
oven) as recommended by HEATOX (2007b) and FSAI (2009a), the present study's findings
referred to almost 75% of the participants keeping oven temperature for roasted potatoes within
200°C (180°C fan oven) or less.
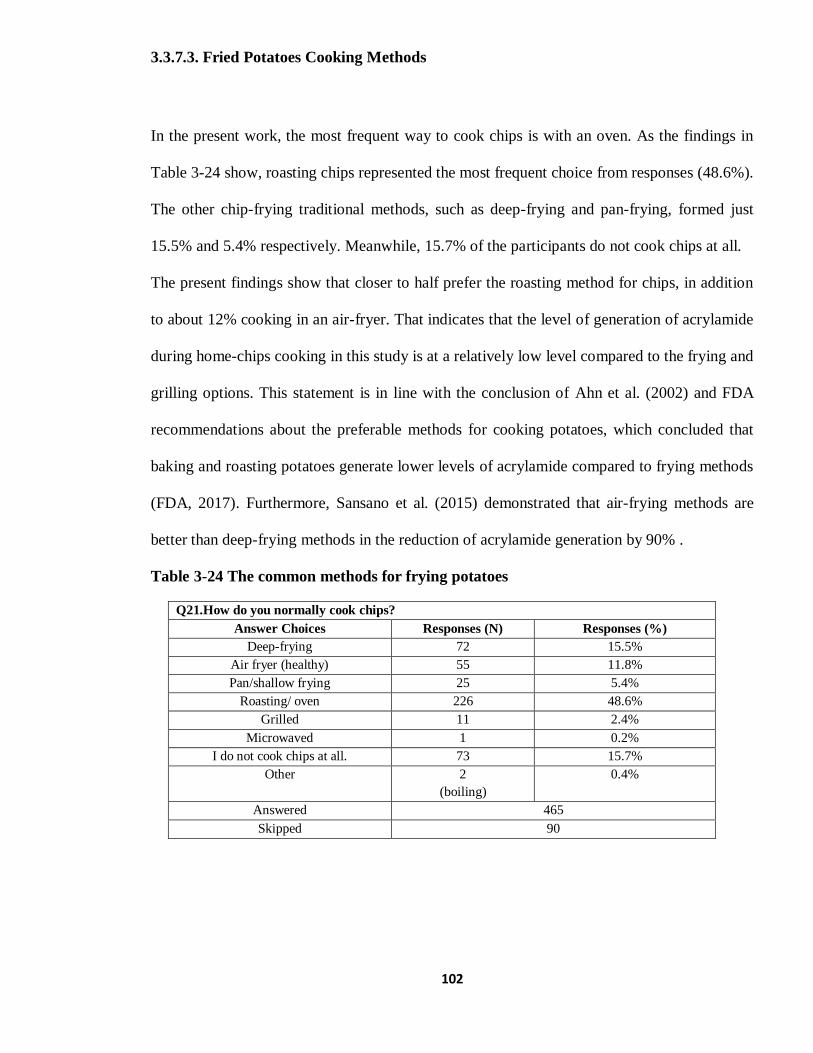
102
3.3.7.3. Fried Potatoes Cooking Methods
In the present work, the most frequent way to cook chips is with an oven. As the findings in
Table 3-24 show, roasting chips represented the most frequent choice from responses (48.6%).
The other chip-frying traditional methods, such as deep-frying and pan-frying, formed just
15.5% and 5.4% respectively. Meanwhile, 15.7% of the participants do not cook chips at all.
The present findings show that closer to half prefer the roasting method for chips, in addition
to about 12% cooking in an air-fryer. That indicates that the level of generation of acrylamide
during home-chips cooking in this study is at a relatively low level compared to the frying and
grilling options. This statement is in line with the conclusion of Ahn et al. (2002) and FDA
recommendations about the preferable methods for cooking potatoes, which concluded that
baking and roasting potatoes generate lower levels of acrylamide compared to frying methods
(FDA, 2017). Furthermore, Sansano et al. (2015) demonstrated that air-frying methods are
better than deep-frying methods in the reduction of acrylamide generation by 90% .
Table 3-24 The common methods for frying potatoes
Q21.How do you normally cook chips?
Answer Choices Responses (N) Responses (%)
Deep-frying 72 15.5%
Air fryer (healthy) 55 11.8%
Pan/shallow frying 25 5.4%
Roasting/ oven 226 48.6%
Grilled 11 2.4%
Microwaved 1 0.2%
I do not cook chips at all. 73 15.7%
Other 2
(boiling)
0.4%
Answered 465
Skipped 90

103
3.4. Cooking End-Point Preferences
As this section is about the cooking preferences degree, it depended on visual assessment,
therefore the answer choices were displayed in the form of validated images from literature
sources.
3.4.1. Potatoes
Roasted Potatoes
Relating to roasted potatoes doneness degree, validated photos were adapted from Brook
Lyndhurst (2014, p. 42) Figure 2.2 .Where, the images pointed out the acrylamide level
according to the lab analysis results were; dark surface colour photo 490µg/kg acrylamide,
medium surface colour 190µg/kg and light surface colour 6µg/kg.
Relating to roasted potatoes preferences (Q20), among 465 total responses, the present results
illustrated that in Table 3-25, over half prefer medium colour degree for roasted potatoes 52.7%.
Moreover, 26.2% like brown surface colour sample photo. Those who prefer to eat light colour
roasted potatoes represents 12.5%, in addition to 8.6% who expressed that they refrain from
cooking roasted potatoes in general.

104
Table 3-25 Colour-degree preferences for roasted potato cooking
Q20. Which photo represents your preference for roasted potatoes?
Answer Choices Responses (N) Responses (%)
Dark surface colour 122 26.2%
Medium surface colour 245 52.7%
Light surface colour 58 12.5%
I do not cook roasted potatoes at all 40 8.6%
Total respondents 465
Skipped answers 90
There are differences in roasted potato colour preferences among those who eat roasted
potatoes. However, most of the participants chose the middle roasted potatoes photo to describe
their preferences. This surface colour degree provided about 190µg/kg acrylamide (Brook
Lyndhurst, 2014).
Furthermore, there are 28.7% among those who eat roasted potatoes that prefer brown surface
colour degree, which reached 490ug/kg acrylamide (Brook Lyndhurst, 2014).
The tendency for golden brown colour was also described as almost universally desired among
UK domestic food practices in a field study by Brook Lyndhurst (2014). Moreover, the
researchers pointed out that the term “golden “colour was not specific among the people when
they described the degree of doneness. Therefore, the current study relied on photos to avoid
misinterpretation in the wording of questions.

105
Fried Potatoes
Concerning the preference colour for chips (Q22), as shown in Table 3-26, the preferred colour
ranged between yellow and brown degree. The findings demonstrate that there is a similarity in
numbers of participants who like golden yellow chips and golden brown chips. Together, those
preferences represent the majority, with about 93% among those who eat chips. On the other
hand, only 6.7% like cooking chips to a light degree.
Table 3-26 The chips colour-degree preferences
Q22.Which photo represents your preference for chips?
Answer Choices Responses (N) Responses (%)
Light golden colour 31 6.7%
Golden yellow colour 211 45.4%
Golden brown colour 207 44.5%
I do not like /eat at all 16 3.4%
Total respondents 465
When searching for the reasons behind the cooking preferences, particularly for roasted potatoes and
chips, almost all the reasons for both were the same per individual. Where the responses were through
open-ended question (Q23). Thus, the answers had been reviewed and sorted in 11 categories, as shown
in Table 3-27.
The desire for a tastier end-product appeared clearly behind their reasons, such as crispy, tasty, crunchy
and soft.
From the present results, the desire for crispness was the most mentioned reason. Furthermore,
some other reasons described did not differ from the main one, which is the taste, such as

106
crunchy and tasty. Consistent with this finding, Brook Lyndhurst (2014) summarised that most
people look for crispness and golden colouration in the potatoes. In addition, the researcher
pointed out the desire for specific food preferences originating from childhood experiences. In
line with that, in the Spanish home-cooking pilot study, Mesias et al. (2018) recorded that the
end-point for frying chips was the colour of fried potatoes and represented 87.7%. Golden
degree preferences hit 92% aiming for crunchiness and softness, which were considered the
major reason 85%.
The other indication from the present study is that the desired taste depends on the specific
colour degree. Therefore, the link between taste and colour or appearance of the food helps
people in their choices, and that was also showed in above British and Spanish studies
Most people prefer golden to brown colour and believe it to be more tasty. Some also assume
that if, at the research level, potato varieties could obtain a golden colour early at the cooking
stage without increasing the level of acrylamide that may help to overcome the present level of
exposure which is linked to visual appearance.
Table 3-27 The frequency of reasons behind chips and roasted potatoes preferences.
Q23. For what reasons do you have these colour preferences?
Category Responses (N) %
Cooked assurance 58 12.5%
Crispy 135 29.0%
Crunchy 29 6.2%
Tasty 88 18.9%
Healthy 4 0.9%
Texture 13 2.8%
Visually appealing 21 4.5%

107
Soft 12 2.6%
I do not cook it 11 2.4%
Other 66 14.2%
N/A 61 13.1%
Total Respondents (N) 465
3.4.2. Toasted Bread
Concerning the bread-toasting degree, the validated photos had been used in the answer choices
(Jackson, 2008, slide no.16). (Figure 2.4)
The toasted bread preferences results in this study refers to medium toasted degree being the
predominant choice, with 354 / 465 responses, as illustrated in
Table 3-28 .
Less than 5% was recorded for preferences to dark colour toasted and untoasted, which was
represented by 22 and 15 participants respectively. The light-toasting option is the less risky
one and recommended by HEATOX (2007a). However, in the present results the percentage of
those who prefer light toasted bread was under 15%, with 66 responses.
The findings from the previous studies (Granby et al., 2008; Eerola et al., 2007;
HAETOX, 2007a) confirmed that greater elevation in acrylamide contents in medium toasting
may reach to fivefold than untoasted bread. The level of acrylamide does not influence solely
by the toasting degree, but also by the type of the bread.
Consequently, in the present study, the findings refer to 76.1% (354) of participants who prefer
medium brown colouration of the bread. Regarding the types of bread preferences there are
among brown and wholemeal bread, about 76.5% (250) of consumers also preferred medium
toasting (Figure 3-8 and Table 3-29). Thus, the number forms about 70.6% (250) from the total
number of whom desire a medium toasting degree for bread.

108
Furthermore, the findings about dark toasting preferences pointed out that about 22 participants
like this degree, as it was displayed in the validated photo, with 610µg/kg acrylamide contents.
Moreover, about 77% from them prefer dark toasted bread and also prefer brown or wholemeal
bread.
Table 3-28 The frequency of toasted bread degree
Q26.Which photo represents your preference for toasting bread?
Answer Choices Responses (N) Responses (%)
Untoasted bread 15 3.23%
Light 66 14.19%
Medium 354 76.13%
Dark 22 4.73%
Other ( specify):
- Not eating bread
- Well done
- Between medium & dark
8
(6)
1
1
1.72%
Total respondents 465

109
Figure 3-8 The Percentage of toasted degree preferences in wholemeal /brown bread.
Table 3-29 Bread-toasting preferences among brown/wholemeal bread responses
Bread Type
Total Wholemeal Brown
Bread preference Dark toasted Count 15 12 17
% within Bread Preference 88.2% 70.6%
% within Brown wholemeal 6.1% 6.3%
Light toasted Count 27 29 48
% within Bread Preference 56.3% 60.4%
% within Brown wholemeal 11.0% 15.3%
Medium toasted Count 193 139 250
% within Bread Preference 77.2% 55.6%
% within Brown wholemeal 78.8% 73.5%
Other Count 2 1 2
% within Bread Preference 100.0% 50.0%
% within Brown wholemeal 0.8% 0.5%
Untoasted bread Count 8 8 10
% within Bread Preference 80.0% 80.0%
% within Brown wholemeal 3.3% 4.2%
Total Count 245 189 327
Percentages and totals are based on respondents.
a. Dichotomy group tabulated at value 1.
Through an open-ended question (Q27), about 464 participants described their reasons behind
their particular toasting degree preferences. The results were displayed in Table 3-30. The
respondents’ reasons were categorised into 13 categories. Where the findings indicated that, the
most frequently recorded reasons were, in general, the taste characteristic of the specific
toasting degree 23.5%, specifically the desire for crispness 19.6% and crunchiness12.5%.
For further insight, the link between the toasting-degree preferences with the different reasons
has been summarised in Table 3-31. It was noticed that there is an ascending trend, with the

110
tendency for darker toasted bread preferences. “Tasty” reasons form about 20% in light and
untoasted bread responses, and reached over 40% among dark toasting responses. The same
pattern was observed in regard to crunchiness desire, while crispness dominates in medium
toasting choices.
This results pattern agrees with the fact that the Maillard reaction is responsible for producing
the aroma, flavour and the colour of the cooked food, which is also linked to acrylamide
generation (Nursten, 2005).
It is clear that among light toasting preferences, the tendency to just warm the toast in order to
help melt the butter was the purpose behind toasting the bread. Also, fewer responses 6.2%
referred to light or untoasted choices for health aims.
Furthermore, the degree of toasting term such as “medium” is not fully understood among the
participants, in spite of the answers displayed in photo formats to avoid misleading scenarios.
Some responses among light-toasting options considered this degree to be medium, while other
groups believe the medium degree was the other photo. This evidence is in line with the
previous findings about the description of the degree of doneness under the term “middle”. It is
uncertain among the people as some see light brown or golden as medium degree, whereas
others considered it to be dark (Brook Lyndhurst, 2014).
Table 3-30 The reasons behind toasting degree preferences
Q27. Why do you like your preference for how well toasted you
like your bread?
Category Cases (N) Cases (%)
Visually appealing 23 5.0%
Texture 38 8.2%
Aroma 4 0.9%
Tasty 109 23.5%
Crispy 91 19.6%
Crunchy 58 12.5%
Warm/hot 25 5.4%
Soft 11 2.4%
Healthy 6 1.3%
Medium toasted 28 6.0%

111
I don't like burnt toast 3 0.7%
Other 77 16.6%
N/A 37 8.0%
Total Respondents 464
Table 3-31 Frequency of reasons for specific toasting degree Vs toasting preferences
Toasting preference Untoasted+Light Medium Dark Total
Reason Category N % N % N % N %
Visually appealing 1 1.2% 21 5.9% 1 4.6% 24 4.8%
Texture 5 6.2% 33 9.3% 0 0.0% 38 7.6%
Aroma 2 2.5% 1 0.3% 1 4.6% 4 0.8%
Tasty 17 21.0% 83 23.5% 9 40.9% 109 21.7%
Crispy 8 9.9% 77 21.8% 4 18.2% 89 17.7%
Crunchy 2 2.5% 52 14.7% 4 18.2% 58 11.5%
Warm/hot 8 9.9% 16 4.5% 1 4.6% 25 5.0%
Soft 6 7.4% 5 1.4% 0 0.0% 11 2.2%
Healthy 5 6.2% 1 0.3% 0 0.0% 6 1.2%
Medium toasted 11 13.6% 17 4.8% 0 0.0% 28 5.6%
I don't like burnt toast 2 2.5% 1 0.3% 0 0.0% 3 0.6%
Other 16 19.8% 57 16.1% 1 4.6% 74 14.7%
N/A 6 7.4% 25 7.0% 3 13.6% 34 6.8%
Total responders 81 100% 354 100% 22 100% 503 100%
3.5. Frequency of Consumption of the Selected Products and Respondents,
Preferences
It is accepted that fried and roasted potatoes, bread and coffee are considered as major
foodstuffs that contribute in the exposure to acrylamide. Therefore, this section highlights the
actual consumption rate among the respondents’ sample. Subsequently, it reflects the
acrylamide exposure level among those food groups.
3.5.1 Potatoes Consumption
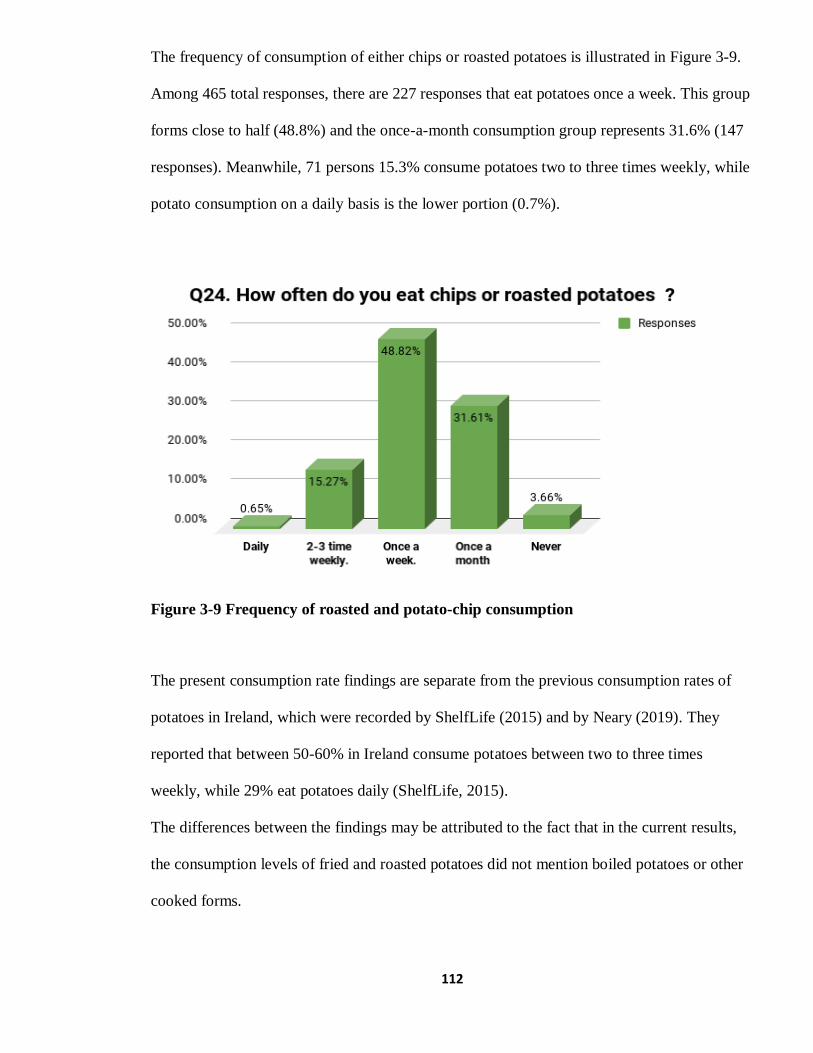
112
The frequency of consumption of either chips or roasted potatoes is illustrated in Figure 3-9.
Among 465 total responses, there are 227 responses that eat potatoes once a week. This group
forms close to half (48.8%) and the once-a-month consumption group represents 31.6% (147
responses). Meanwhile, 71 persons 15.3% consume potatoes two to three times weekly, while
potato consumption on a daily basis is the lower portion (0.7%).
Figure 3-9 Frequency of roasted and potato-chip consumption
The present consumption rate findings are separate from the previous consumption rates of
potatoes in Ireland, which were recorded by ShelfLife (2015) and by Neary (2019). They
reported that between 50-60% in Ireland consume potatoes between two to three times
weekly, while 29% eat potatoes daily (ShelfLife, 2015).
The differences between the findings may be attributed to the fact that in the current results,
the consumption levels of fried and roasted potatoes did not mention boiled potatoes or other
cooked forms.
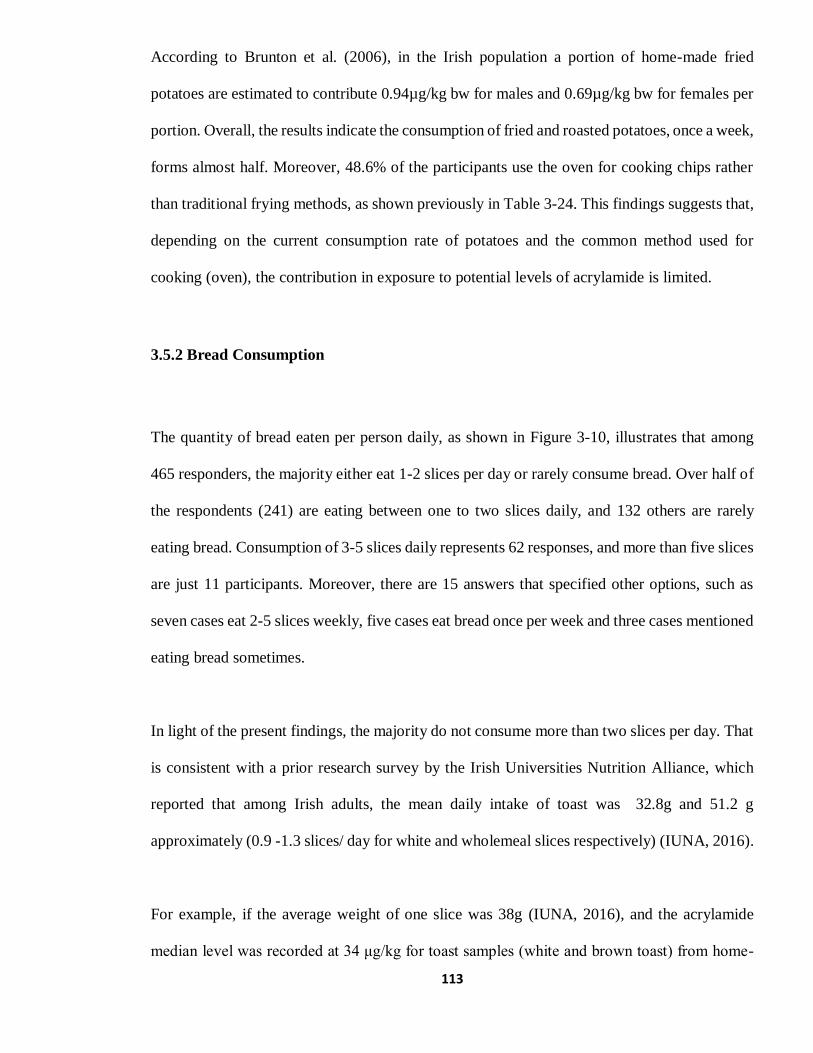
113
According to Brunton et al. (2006), in the Irish population a portion of home-made fried
potatoes are estimated to contribute 0.94µg/kg bw for males and 0.69µg/kg bw for females per
portion. Overall, the results indicate the consumption of fried and roasted potatoes, once a week,
forms almost half. Moreover, 48.6% of the participants use the oven for cooking chips rather
than traditional frying methods, as shown previously in Table 3-24. This findings suggests that,
depending on the current consumption rate of potatoes and the common method used for
cooking (oven), the contribution in exposure to potential levels of acrylamide is limited.
3.5.2 Bread Consumption
The quantity of bread eaten per person daily, as shown in Figure 3-10, illustrates that among
465 responders, the majority either eat 1-2 slices per day or rarely consume bread. Over half of
the respondents (241) are eating between one to two slices daily, and 132 others are rarely
eating bread. Consumption of 3-5 slices daily represents 62 responses, and more than five slices
are just 11 participants. Moreover, there are 15 answers that specified other options, such as
seven cases eat 2-5 slices weekly, five cases eat bread once per week and three cases mentioned
eating bread sometimes.
In light of the present findings, the majority do not consume more than two slices per day. That
is consistent with a prior research survey by the Irish Universities Nutrition Alliance, which
reported that among Irish adults, the mean daily intake of toast was 32.8g and 51.2 g
approximately (0.9 -1.3 slices/ day for white and wholemeal slices respectively) (IUNA, 2016).
For example, if the average weight of one slice was 38g (IUNA, 2016), and the acrylamide
median level was recorded at 34 μg/kg for toast samples (white and brown toast) from home-
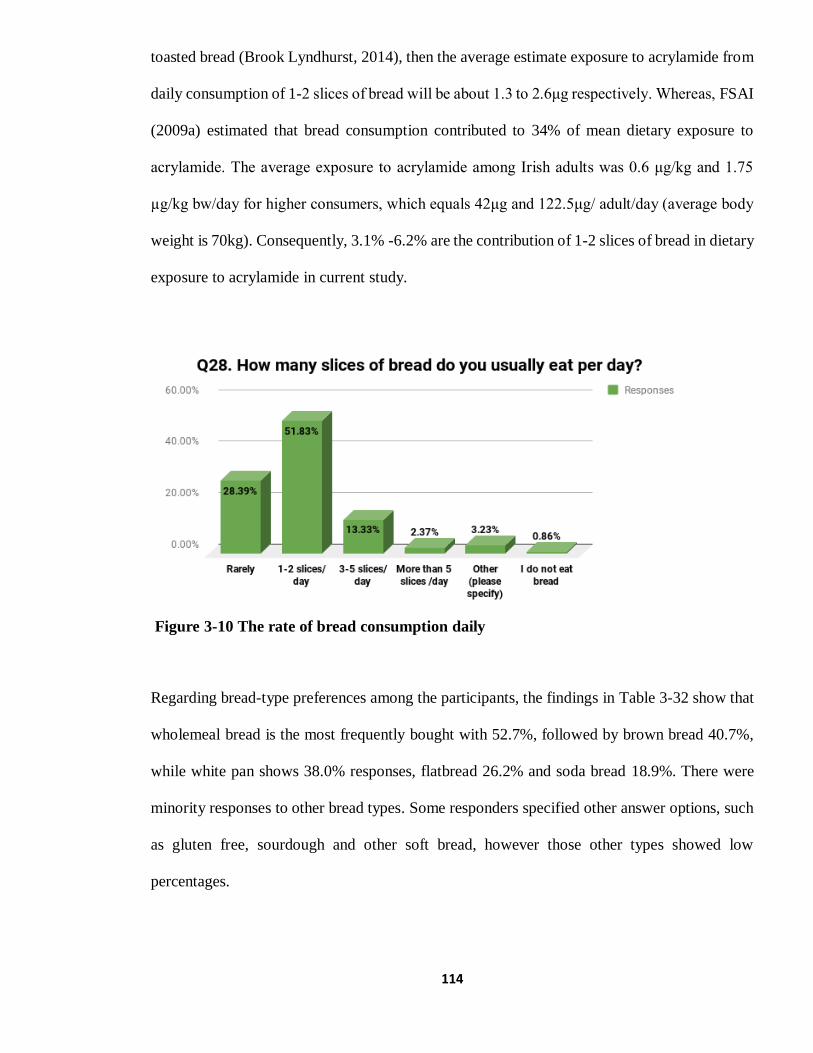
114
toasted bread (Brook Lyndhurst, 2014), then the average estimate exposure to acrylamide from
daily consumption of 1-2 slices of bread will be about 1.3 to 2.6μg respectively. Whereas, FSAI
(2009a) estimated that bread consumption contributed to 34% of mean dietary exposure to
acrylamide. The average exposure to acrylamide among Irish adults was 0.6 μg/kg and 1.75
µg/kg bw/day for higher consumers, which equals 42μg and 122.5μg/ adult/day (average body
weight is 70kg). Consequently, 3.1% -6.2% are the contribution of 1-2 slices of bread in dietary
exposure to acrylamide in current study.
Figure 3-10 The rate of bread consumption daily
Regarding bread-type preferences among the participants, the findings in Table 3-32 show that
wholemeal bread is the most frequently bought with 52.7%, followed by brown bread 40.7%,
while white pan shows 38.0% responses, flatbread 26.2% and soda bread 18.9%. There were
minority responses to other bread types. Some responders specified other answer options, such
as gluten free, sourdough and other soft bread, however those other types showed low
percentages.
115
Table 3-32 The bread-type preferences
Q25.What type of bread do you usually buy? (Tick all that apply)
Answer Choices Cases (N) Cases (%)
White sliced pan 177 38.1%
Brown sliced pan 189 40.7%
Wholemeal bread 245 52.7%
Soft flatbread /wraps 122 26.2%
Soda bread 88 18.9%
Potato bread 9 1.9%
Ginger bread 3 0.7%
Rye bread 28 6. %
Crisp bread 25 5.4%
I do not use bread. 27 5.8%
Others (Specified answers)
Gluten free 14 3.0%
Soft bread (baguette/bagel) 11 2.4%
Sourdough bread 12 2.6%
Other 14 3.0%
Total Respondents 465
Skipping 90
Overall, the results revealed that wholemeal and brown bread are the most frequently consumed
among the participants.
Although the high health benefits of wholemeal and brown bread compare favourably to white
bread, exposure to acrylamide is higher from wholemeal bread and brown than from white
bread types (Gündüz and Cengiz, 2015). Moreover, the level of acrylamide generation in brown
/wholemeal were much higher than in white toast (Ahn et al., 2002; Brook Lyndhurst, 2014;
HEATOX, 2007a).

116
Despite this, the current total consumption rate of wholemeal and brown bread was equal 93.3%
and white bread (white pan & white soft) was 40.8%. This appears higher than the consumption
rate of wholemeal 72% and lower than white bread 57% which were reported by IUNA (2016)
among Irish adult consumers. These differences can be expected and are related to the
consumption attitude for healthier diets, with more fibre and nutrients sources, as recommended
in the Healthy Eating Guidelines by Healthy Ireland and Department of Health (Healthy Ireland,
2019). That encourages Irish society to shift to more whole grain products such as wholemeal
brown bread and cereals. As shown from about 20 years ago, the consumption rate of white
bread was 94%, as reported in North/South Ireland Food Consumption Survey (IUNA, 2001).
3.5.3 Coffee Consumption
The consumption rate of coffee among 465 respondents shows that more than one-third of the
participants 170 do not drink coffee at all and represents the largest group. Less than 2% (9)
drink five cups or more per day (Figure 3-11).
Meanwhile, among coffee-drinker groups, drinking one cup daily represented 43.7%, two
cups 33.2%, 14.2% consume three cups of coffee daily, four cups 5.8% and five cups or more
formed 3% of responses.

117
Figure 3-11 Rate of Drinking Coffee Daily
Consumption of more than one cup of coffee per day among the coffee drinker about 56% and
equals 35.7% over the total respondents. This consumption rate is consistent with the
percentage 34% that had been recorded in 2016 by Empathy Research Company (Checkout,
2018).
Comparing to other European nations’ consumption rates, the coffee consumption rate in the
current study was slightly lower than in a Polish study, where it was reported that 51%
consumed one cup of coffee daily, 38% drink two cups and 11% consume three cups daily
(Kowalska, et al., 2017).
Regarding coffee-type preferences among the participants, nearly one-third 31.4% do not prefer
coffee, as demonstrated in Table 3-34. About one-third of the female participants in this study

118
do not drink coffee and 28.9% of males do not drink coffee from the total male participants.
Distribution of those percentages among the age subgroups is illustrated in Table 3-35.
There was evidence of statistically medium significant difference between males and females
in regard to the amount of coffee consumption per day, as shown in Table 3-33 through Pearson
Chi-Square ( p =0.019), the degree of freedom df = 4 and Cramer's V value was 0.202 (Kim,
2017; Cohen, 1988).
Table 3-33 Coffee consumption rate among genders
Cups consumption/ day Gender Total
Female Male
1 cup Count 106 20 126
% within gender 46.9% 30.8% 43.3%
% of Total 36.4% 6.9% 43.3%
2 cups Count 73 24 97
% within gender 32.3% 36.9% 33.3%
% of Total 25.1% 8.2% 33.3%
3 cups Count 33 11 44
% within gender 14.6% 16.9% 15.1%
% of Total 11.3% 3.8% 15.1%
4 cups Count 7 8 15
% within gender 3.1% 12.3% 5.2%
% of Total 2.4% 2.7% 5.2%
5 cups or
more
Count 7 2 9
% within gender 3.1% 3.1% 3.1%
% of Total 2.4% 0.7% 3.1%
Total Count 226 65 291
% within gender 100.0% 100.0% 100.0%
% of Total 77.7% 22.3% 100.0%
Chi-Square Tests

119
Value df
Asymptotic
Significance (2-
sided)
Pearson Chi-Square 11.846a 4 .019
Likelihood Ratio 10.569 4 .032
Linear-by-Linear Association 6.424 1 .011
Number of Valid Cases 291
a. 2 cells (20.0%) have expected count less than 5. The minimum expected count is
2.01.
Over the coffee drinker group, as shown in Figure 3-12 , the majority prefer drinking roasted ground
coffee (60.5%), compared to instant coffee preferences which formed over one-third (35.4%). Fewer
drink coffee substitutes (2.5%) and other types (decaffeinated coffee and mixed choices).
The type of coffee with the amount of consumption according to the gender was illustrated in
Table 3-36. The frequency of drinking one cup of instant coffee per day formed about 50% in
both genders, while roasted coffee was consumed at a rate of two cups more among males than
females. The Pearson Chi-Square test revealed that there was a significant correlation between
the gender type and the type of the coffee (p =.044) and the strength of the correlation was small
(Cramer's V value = .115 and df 1), as shown in Table 3-37.
In regard to age groups, 35-44 consumed the most coffee, representing 30.2% overall. Also,
this group represents the highest consumers of roasted coffee in both genders.
Consumption of instant coffee among males shows high frequency among 18-24 year-olds,
while among female age groups, 35-44 formed the highest instant coffee consumption group.
The current findings state that roasted ground coffee is the most common type of coffee consumed
amongst the Irish adult participants. That is different to what was reported about instant coffee
being the most common type (Checkout, 2018; Bord Bia, 2011). Mintel (2018) recorded that
ground coffee was the common type among the high social class in Ireland.

120
Overall, acrylamide concentration in dry instant coffee is higher than in dry roasted coffee, as
demonstrated in the literature. However, the contribution of roasted ground coffee in the
acrylamide total exposure is higher due to the dilution factor (EFSA, 2015).
Table 3-34 Frequency of common coffee-type preferences among the total participants
Q29.Which type of coffee do you usually drink?
Answer Choices Responses (N) Responses (%)
Instant coffee 113 24.3%
Roasted/ground coffee 193 41.5%
Coffee substitutes 8 1.7%
I don’t drink coffee 146 31.4%
Other (please specify) 5 1.1%
Total Responses 465
Figure 3-12 Percentage of coffee-type preferences among coffee consumers

121
Table 3-35 Frequency of who do not drink coffee, according to gender and age
Table 3-36 Coffee consumption rate according to gender, age and the type of coffee
Coffee type Roasted/ground coffee Instant coffee Total
Gender Female Male Female Male
% N % N % N % N N %
1 cup 44.7% 59 27.9% 12 49.4% 43 50.0% 8 122 43.9%
2 cups 35.6% 47 44.2% 19 25.3% 22 18.8% 3 91 32.7%
3 cups 15.9% 21 16.3% 7 13.8% 12 12.5% 2 42 15.1%
4 cups 3.0% 4 9.3% 4 6.9% 6 12.5% 2 16 5.8%
5 cups 0.8% 1 2.3% 1 2.3% 2 6.3% 1 5 1.8%
More than 5 cups
0.0% 0 0.0% 0 2.3% 2 0.0% 0 2 0.7%
Age Range
18-24 17.4% 23 16.3% 7 23.0% 20 37.5% 6 56 20.1%
25-34 23.5% 31 16.3% 7 28.7% 25 18.8% 3 66 23.7%
35-44 31.1% 41 30.2% 13 32.2% 28 12.5% 2 84 30.2%
45-54 18.2% 24 23.3% 10 12.6% 11 25.0% 4 49 17.6%
55-64 9.9% 13 9.3% 4 2.3% 2 6.3% 1 20 7.2%
65+ 0.0% 0 4.7% 2 1.2% 1 0.0% 0 3 1.1%
Total
responses 100.0% 132 100.0% 43 100.0% 87 100.0% 16 278 100.0%

122
Table 3-37 The relation between gender type and coffee consumption type
Coffee Type Gender
Total Female Male
Instant coffee Count 94 18 112
% within which type of coffee do
you usually drink?
83.9% 16.1% 100.0%
% of Total 30.9% 5.9% 36.8%
Roasted/ground coffee Count 142 50 192
% within which type of coffee do
you usually drink?
74.0% 26.0% 100.0%
% of Total 46.7% 16.4% 63.2%
Count 236 68 304
% within which type of coffee do
you usually drink?
77.6% 22.4% 100.0%
% of Total 77.6% 22.4% 100.0%
Chi-Square Tests
Value df
Asymptotic
Significance (2-sided)
Exact Sig.
(2-sided)
Exact Sig.
(1-sided)
Pearson Chi-Square 4.049a 1 .044
Continuity Correctionb 3.496 1 .062
Likelihood Ratio 4.199 1 .040
Fisher's Exact Test .047 .029
Linear-by-Linear Association 4.036 1 .045
Number of Valid Cases 304
a. 0 cells (0.0%) have expected count less than 5. The minimum expected count is 25.05.
b. Computed only for a 2x2 table
Symmetric Measures
Value
Approximate
Significance
Nominal by Nominal Phi .115 .044
Cramer's V .115 .044
N of Valid Cases 304

123
3.6. Consumers Perceptions and Attitudes to Acrylamide Labelling
This part demonstrates the participants’ opinions and attitudes to acrylamide labelling and
information in food packages through three questions (Q34, Q35 and Q36), as seen in
Table 3-38 .
Concerning the labelling information about the acrylamide content level on the food packages
suggestion question, the majority 338 of 458 respondents perceived a need for further
information, while 103 others do not have strong opinion about that, with negligible responses
against this idea. From the results, it is clear that most of participants 73.8% positively
respondent to the suggestion about more information about the level of acrylamide in the
foodstuffs. While, the other responses with “no strong opinion” supposing to be related to the
lake of information about the acrylamide potential effects or that information will not affect
their habits at all. That suggestion agreed with the findings in a Polish study about the attitude
of the consumers in relation to acrylamide labelling in food packages. In that study, 35% argued
that information is useless, and they persist with their food behaviours. However, in the same
study there were 55% who agreed that information about presence of any harmful compounds
in food, even small levels, will be important (Kowalska et al., 2017).
Regarding the appearance of acrylamide precautionary information on food packages,
particularly mentioning the potential formation of acrylamide if cooking instructions are not
properly followed, highly positive responses reached to over 80%.
The percentage fell down to 55.7% when testing the influence of recorded acrylamide content
level on the products containers and their choice of purchase. Furthermore, there was a doubt
among 42.4% about the acceptance to purchasing that labelled products. Approximately 7%
confirmed their rejections to deal with any acrylamide warning products.

124
Also, in this question’s responses, results indicate a deficiency of knowledge about the existence
or formation of acrylamide in daily food practices. Where the participants choose not to
consume products with known acrylamide levels, meanwhile, acrylamide is present in most of
the processed and home-made foods without any attention. Or may interpret as it is due to
healthcare reasons.
Table 3-38 Details of the responses to the questions related to acrylamide information in
food packages
Q34. “Acrylamide is a harmful compound produced when some carbohydrate foods
become brown due to overheating”, should food packaging contain information
about the content and safe level of acrylamide (for example the maximum daily
limit)?
Answer Choices Responses (N) Responses (%)
Yes, definitely 338 73.8%
Definitely not 17 3.7%
I don’t have a strong opinion either. 103 22.5%
Total Responses 458
Q35. In your opinion, should food packaging contains information about the
potential formation of acrylamide in the product if the cooking instructions are not
properly followed?
Yes, definitely 370 80.8%
Definitely not 13 2.8%
I don’t have a strong opinion either. 75 16.4%
Total Responses 458
Q36. In your opinion, if a product’s label listed acrylamide at a safe level (or below
the recommended daily limit), would you buy the product?
Yes, definitely 232 50.7%
Definitely not 32 7.0%
Not sure 194 42.4%
Total Responses 458
Skipped 97

125
A FSAI research survey about the Irish attitudes to food labelling revealed that about one-
quarter of the Irish consumers were always interested to read food labels during shopping for
food or before using the food products. On the other hand, there were nearly the same
percentage who did not review the food label at all (FSAI, 2009b).
However, the results from previous studies recorded that consumers commonly do not follow
manufacturer cooking instructions or guide labels (Brook Lyndhurst, 2014; Brook Lyndhurst
and WRAP, 2011; Wright, Canham and Masrani, 2011). Thus, acrylamide warning messages
in food packages may help consumers to notice and comply with the product’s cooking
instructions and be aware about the acrylamide potential risks. Moreover, there is a vital need
for public information campaigns to help consumers reduce exposure to acrylamide and elevate
the awareness through reading the food packages information rather than just warnings. The
recommendation for including nutritional advices about the healthy culinary methods in regard
to reducing acrylamide in food stuffs was mentioned in the European Consumer Organisation
(BEUC) letter to the director of DG SANTA, European Commission, for requesting more
protection to the EU consumers from acrylamide levels in EU market products (BEUC, 2019).
There was a noted appetite for clear information regarding good cooking practices and
acrylamide generation among the participants in the current study, through personal
communication with researching for more information and verification for their actual
practices. This further suggests the need for massive education awareness programmes and
campaigns to fulfill the needs for information and cover this gap scientifically, rather than
individuals’ suggestions and inherited beliefs.

126
CONCLUSION & RECOMMENDATIONS

127
Chapter 4 . CONCLUSION and DISCUSSIONS
4.1 Conclusion
The existing knowledge about acrylamide formation and its risk among Irish residents
suggested that the scientific term “acrylamide” was not recognised widely among the
inhabitants 14.8%, in contrast to the definition as a harmful component formed during heat
treatment of carbohydrate-rich food, which showed about 39% recognising that.
However, the awareness about the health risk of this harmful compound (acrylamide) showed
significant high percentage about the carcinogenic effects, which reached 94.5% among those
who heard about this harmful compound. The awareness about the role of high cooking
temperature as the main contributor in AA generation represented 85.4% in responses.
Additionally, the results indicated that linking the major foodstuff contributors in acrylamide
formation showed that potatoes 75%, bread, biscuits and cracks 52%, cereals 48% and coffee
38% were among the foodstuffs people associated with acrylamide.
Regarding home-food practices which may influence in dietary exposure to acrylamide:
Domestic potatoes storage behaviours do not indicate to significantly increase of
acrylamide exposure.
Pealing, washing fresh potatoes practices and preferences to not cutting potatoes to
small or thin cuts helped decrease the risk of high acrylamide exposure in prepared
meals.
In contrast, soaking fresh potatoes practices before cooking, and the duration of soaking,
showed that almost 40% soaking potatoes and 17% from them soaking potatoes for 30
minutes or more.
128
The process of parboiling and proper soaking fresh potatoes were not considered
common practices among the participants, which reflects the possibility of keeping the
levels of the precursors high, consequently increasing risk of acrylamide exposure.
Oven temperature options for fresh roasted potatoes and common methods for frying
chips do not appear to significantly contribute in risk of acrylamide exposure, except
the end-point cooking estimation assessments. There were less than one-third strictly
following the manufactures’ instructions in the foods packages in relation to cooking
time and temperature. That rose the possibility for exposure to acrylamide higher than
the expected level as estimated by the food product manufacturers.
Regarding the foods preferences and consumption rate:
The tendency for medium golden degree of the roasted potatoes surface was the most
common, with over half of the preferences. Furthermore, 28.7% preferred brown surface
degree.
The desire for more golden brown increased to form with the golden yellow preferences
about 93% among the chips consumers’ participants. Thus, the roasted potatoes and
chips’ surface-colour-degree preferences indicate a significant risk of acrylamide
exposure.
Concerning toasted bread, the tendency for medium toasted degree was the most popular
choice with 76% responses that raises the risk. Moreover, preferences for wholemeal
brown bread type indicates significantly elevated acrylamide exposure, with consuming
of more brown and wholemeal bread types than white bread.
The consumption rate of the selected foodstuffs among the participants in general did
not point to significant over-consumption.

129
Concerning bread types, the majority prefer wholemeal and brown bread than white
bread.
The frequency of drinking roasted/ground coffee was 10% more than the frequency of
drinking instant coffee.
Regarding the suggestion to add acrylamide information label in foods packages, the majority
73.8% agreed for further information in food containers about the level of AA contents in food
products. This agreement showed an increase to 80%, and confirmation particularly in relation
to precautionary information about potential formation of acrylamide if the cooking instructions
are not properly followed. Nevertheless, the participants’ attitudes to purchase the acrylamide
labelled food products showed a decline 55.66%.
Therefore, overall the suspected high exposure to AA through home-made food practices or
food preferences in this study emerge from lack of knowledge of good cooking practices. This
particularly relates to fresh potato soaking and parboiling before cooking and potato storage
time. This is also in addition to the tendency for golden yellow to brown degree for cooked
foods surfaces such as roasted potatoes, chips and toasted bread. That highlights the need for
extensive efforts at different levels to teach and improve knowledge about good cooking
practices and changing food habits to minimise exposure to acrylamide from home-prepared
meals. Those awareness programmes should cover all age groups, with sharing of all relative
bodies and agencies as well as education sectors, food safety and industry.
4.2 Recommendations
In general, it is clear form this study that there is a deficiency of knowledge in regard to
acrylamide issues. Therefore, clear information campaigns are necessary for dealing with
acrylamide topics, accompanied by intense publicity, as previously recommended by Meng,

130
Zhao and Qian (2012). The promotion of knowledge over all ages is required as well (Zajac et
al., 2013).
It is recommended for educators, food safety communicators, relevant agencies and the media
to send the correct message to Ireland’s inhabitants about acrylamide and its causes for
formation. They should be taught to avoid high exposure through an educational approach to
behavioural changes, such as ideal choice of foodstuffs, proper ways for storage, preparations,
cooking meals at home and how to modify their preferences.
At home level, adapting additional measures in order to guarantee reducing the probability of
risk exposure through home-made meals such as: readjust the toaster to be at less time setting
heat degree, oven temperature not over 200°C, adapt healthier frying methods.
Further field work should be carried out as a national initiative and with collaboration from
relevant bodies such as the universities, FSAI, EFSA and other relevant agencies.
4.3 Future Work
Since the investigation about the relationship between different demographic
characteristic and exposure risks to acrylamide is out of the scope of the present study,
it would be worthwhile to carry out further work aimed at detecting the correlation
between the culinary background origin and the food practices and food preferences. It
was noticed that in the current results there was a correlation between origin and food
preferences. That will help to highlight if there are groups in the population under high
exposure risk to acrylamide. The future work will be more reliable if conducted through
field investigations and observations.

131
Further investigate the actual domestic food practices, particularly in regard to potato
varies used, and compile suitable methods for cooking according to potato varies
recommendations, amount of oil used, temperature of frying oil and types.
For gaining accurate and reliable data about the actual acrylamide exposure level
among Irish inhabitants, it is recommended to conduct analytical lab tests about the
level of acrylamide present from home-made meal samples include potatoes, toasted
bread and home prepared coffee, as well as samples from commercial ready-to-eat
foods and restaurants meals.

132
REFERENCES

133
Chapter 5 . References
Ahn, J.S., Castle, L., Clarke, D.B., Lloyd, A.S., Philo, M.R. and Speck, D.R., 2002. Verification of the findings of acrylamide in heated foods. Food Additives and Contaminants, 19(12), pp.1116–1124.
Akgün, B. and Arıcı, M., 2019. Evaluation of acrylamide and selected parameters in some Turkish coffee brands from the Turkish market. Food Additives & Contaminants: Part A, 36(4), pp.1–13.
Akinosun, T., Ojinnaka, D. and Aouzelleg, A., 2018. An awareness survey on the presence and implications of acrylamide in West African foods and the extent of consumption of such foods. Journal of Food Processing & Technology, 09, p.53.
Alves, R.C., Soares, C., Casal, S., Fernandes, J.O. and Oliveira, M.B.P.P., 2009. Acrylamide in espresso coffee: Influence of species, roast degree and brew length. Food Chemistry, 119(3), pp.929–934.
Amrein, T.M., Bachmann, S., Noti, A., Biedermann, M., Barbosa, M.F., Biedermann-Brem, S., Grob, K., Keiser, A., Realini, P., Escher, F. and Amadó, R., 2003. Potential of acrylamide formation, sugars, and free asparagine in potatoes: A comparison of cultivars and farming systems. Journal of Agricultural and Food Chemistry, 51(18), pp.5556–5560.
Amrein, T.M., Schönbächler, B., Escher, F. and Amadò, R., 2004a. Acrylamide in gingerbread: Critical factors for formation and possible ways for reduction. Journal of Agricultural and Food Chemistry, 52(13), pp.4282–4288.
Amrein, T.M., Schönbächler, B., Rohner, F., Lukac, H., Schneider, H., Keiser, A., Escher, F. and Amadò, R., 2004b. Potential for acrylamide formation in potatoes: data from the 2003 harvest. European Food Research and Technology, 219(6), pp.572–578.
Andrzejewski, D., Roach, J.A.G., Gay, M.L. and Musser, S.M., 2004. Analysis of Coffee for the Presence of Acrylamide by LC-MS/MS. Journal of Agricultural and Food Chemistry, 52(7), pp.1996–2002.
Atieno, O.P., 2009. An analysis of the Strengths and Limitatin of Qualitative and Quantitative Research Paradigms. Problems of education in the 21st century, 13, pp.13–18.
ATSDR, 2012. Toxicological profile of acrylamide. [online] Available at: <https://www.atsdr.cdc.gov/ToxProfiles/tp203.pdf> [Accessed 15 Mar. 2019].
Auguste Escoffier School of Culinary Arts, 2014. How to Cube a Potato - Escoffier. [online] Available at: <https://www.escoffier.edu/blog/culinary-arts/how-to-cube-a-potato/> [Accessed 15 Jul. 2019].
Bagdonaite, K., Derler, K. and Murkovic, M., 2008. Determination of acrylamide during roasting of coffee. In: Journal of Agricultural and Food Chemistry. American Chemical Society, pp.6081–6086.
Bagdonaite, K. and Murkovic, M., 2018. Factors affecting the formation of acrylamide in coffee. Czech Journal of Food Sciences, 22(SI), pp.S22–S24.
Bartkiene, E., Jakobsone, I., Juodeikiene, G., Vidmantiene, D., Pugajeva, I. and Bartkevics, V., 2013. Study on the reduction of acrylamide in mixed rye bread by fermentation with bacteriocin-like inhibitory substances producing lactic acid bacteria in combination with Aspergillus niger glucoamylase. Food Control, 30(1), pp.35–40.
Becalski, A., Brady, B., Feng, S., Gauthier, B.R. and Zhao, T., 2011. Formation of acrylamide at temperatures lower than 100°C: The case of prunes and a model study. Food Additives and Contaminants - Part A Chemistry, Analysis, Control, Exposure and Risk Assessment, 28(6), pp.726–730.
Becalski, A., Lau, B.P.Y., Lewis, D. and Seaman, S.W., 2003. Acrylamide in foods: Occurrence, sources,

134
and modeling. Journal of Agricultural and Food Chemistry, 51(3), pp.802–808.
BEUC, 2019. More efforts needed to protect consumers from acrylamide in food, new EU test shows. [online] Available at: <https://www.beuc.eu/publications/beuc-x-2019-010_more_efforts_needed_to_protect_consumers_from_acrylamide_in_food.pdf> [Accessed 2 Feb. 2019].
Biedermann-Brem, S., Noti, A., Grob, K., Imhof, D., Bazzocco, D. and Pfefferle, A., 2003. How much reducing sugar may potatoes contain to avoid excessive acrylamide formation during roasting and baking? European Food Research and Technology, 217(5), pp.369–373.
Blank, I., Robert, F., Goldmann, T., Pollien, P., Varga, N., Devaud, S., Saucy, F., Huynh-Ba, T. and Stadler, R.H., 2005. Mechanisms of Acrylamide Formation. In: M. Friedman and D. Mottram, eds., Chemistry and Safety of Acrylamide in Food. Advances in Experimental Medicine and Biology. Springer, Boston, MA, pp.171–189.
Bord Bia, 2011. Coffee Consumer Research Retail & Foodservice Channels Republic of Ireland Market. [online] Available at: <http://docplayer.net/29337314-Coffee-consumer-research-retail-foodservice-channels-republic-of-ireland-market-oi-research-september-2011.html> [Accessed 5 Mar. 2019].
Bord Bia, 2017. Irish and British Consumers And Their Food Summary. [online] Available at: <https://www.bordbia.ie/industry/manufacturers/insight/publications/bbreports/pages/marketingreports.aspx> [Accessed 5 Mar. 2019].
Brook Lyndhurst, 2011. Consumer insight: date labels and storage guidance. Brook Lyndhurst, .
Brook Lyndhurst, 2014. Acrylamide in the home: Home-cooking practices and acrylamide formation A report for the Food Standards Agency.
Brunton, N., Ronan, G., Butle, F., Cummins, E., Danaher, M. and O’Keeffe, M., 2006. Acrylamide Formation in Potato Products. Teagasc.Final Report Project RMIS No. 5265, Carlow.
Capuano, E., Ferrigno, A., Acampa, I., Serpen, A., Açar, Ö.Ç., Gökmen, V. and Fogliano, V., 2009. Effect of flour type on Maillard reaction and acrylamide formation during toasting of bread crisp model systems and mitigation strategies. Food Research International, 42(9), pp.1295–1302.
Capuano, E., Oliviero, T., Açar, Ö.Ç., Gökmen, V. and Fogliano, V., 2010. Lipid oxidation promotes acrylamide formation in fat-rich model systems. Food Research International, 43(4), pp.1021–1026.
Casado, F.J., Montaño, A., Spitzner, D. and Carle, R., 2013. Investigations into acrylamide precursors in sterilized table olives: Evidence of a peptic fraction being responsible for acrylamide formation. Food Chemistry, 141(2), pp.1158–1165.
Checkout, 2018. Almost 6 In 10 Irish Adults Are Drinking Coffee At Least Once A Day. [online] Available at: <https://www.checkout.ie/almost-6-10-irish-adults-drinking-coffee-least-day/65947> [Accessed 7 May 2019].
Chuda, Y., Ono, H., Yada, H., Ohara-Takada, A., Matsuura-Endo, C. and Mori, M., 2003. Effects of Physiological Changes in Potato Tubers ( Solanum tuberosum L.) after Low Temperature Storage on the Level of Acrylamide Formed in Potato Chips. Bioscience, Biotechnology, and Biochemistry, 67(5), pp.1188–1190.
Claeys, W., Baert, K., Mestdagh, F., Vercammen, J., Daenens, P., de Meulenaer, B., Maghuin-Rogister, G. and Huyghebaert, A., 2010. Assessment of the acrylamide intake of the Belgian population and the effect of mitigation strategies. Food Additives and Contaminants - Part A Chemistry, Analysis, Control, Exposure and Risk Assessment, 27(9), pp.1199–1207.

135
Claeys, W.L., De Vleeschouwer, K. and Hendrickx, M.E., 2005. Kinetics of acrylamide formation and elimination during heating of an asparagine-sugar model system. Journal of Agricultural and Food Chemistry, 53(26), pp.9999–10005.
Claus, A., Weisz, G.M., Schieber, A. and Carle, R., 2006. Pyrolytic acrylamide formation from purified wheat gluten and gluten-supplemented wheat bread rolls. Molecular Nutrition and Food Research, 50(1), pp.87–93.
Cohen, J., 1988. Statistical Power Analysis for the Behavioral Sciences. 2nd ed. Lawrence Erlbaum Associates.
Crawford, L.M., Kahlon, T.S., Chiu, M.C.M., Wang, S.C. and Friedman, M., 2019. Acrylamide Content of Experimental and Commercial Flatbreads. Journal of Food Science, 84(3), pp.659–666.
Cross, A.J. and Sinha, R., 2004. Meat-related mutagens/carcinogens in the etiology of colorectal cancer. Environmental and Molecular Mutagenesis, 44(1), pp.44–55.
CSO, 2016. Census of Population 2016 - Profile 4 Households and Families. [online] Census of Population 2016. Available at: <https://www.cso.ie/en/csolatestnews/presspages/2017/cp4hf/> [Accessed 18 Aug. 2019].
CSO, 2018. Population and Migration Estimates. [online] Available at: <https://www.cso.ie/en/statistics/population/populationandmigrationestimates/> [Accessed 18 Aug. 2019].
Curtis, T.Y., Powers, S.J., Balagiannis, D., Elmore, J.S., Mottram, D.S., Parry, M.A.J., Rakszegi, M., Bedö, Z., Shewry, P.R. and Halford, N.G., 2010. Free amino acids and sugars in rye grain: Implications for acrylamide formation. Journal of Agricultural and Food Chemistry, 58(3), pp.1959–1969.
Daniali, G., Jinap, S., Sanny, M. and Tan, C.P., 2018. Effect of amino acids and frequency of reuse frying oils at different temperature on acrylamide formation in palm olein and soy bean oils via modeling system. Food Chemistry, 245, pp.1–6.
Delatour, T., Périsset, A., Goldmann, T., Riediker, S. and Stadler, R.H., 2004. Improved sample preparation to determine acrylamide in difficult matrixes such as chocolate powder, cocoa, and coffee by liquid chromatography tandem mass spectroscopy. Journal of Agricultural and Food Chemistry, 52, pp.4625–4631.
DSM, 2018. How much do consumers really know about acrylamide? [online] Available at: <https://www.dsm.com/markets/food-specialties/en/insights/articles/baking/how-much-do-consumers-really-know-about-acrylamide.html>.
Dybing, E., Farmer, P.B., Andersen, M., Fennell, T.R., Lalljie, S.P.D., Müller, D.J.G., Olin, S., Petersen, B.J., Schlatter, J., Scholz, G., Scimeca, J.A., Slimani, N., Törnqvist, M., Tuijtelaars, S. and Verger, P., 2005. Human exposure and internal dose assessments of acrylamide in food. Food and Chemical Toxicology, 43(3), pp.365–410.
Dybing, E. and Sanner, T., 2003. Risk assessment of acrylamide in foods. Toxicological Sciences, 75(1), pp.7–15.
Eerola, S., Hollebekkers, K., Hallikainen, A. and Peltonen, K., 2007. Acrylamide levels in Finnish foodstuffs analysed with liquid chromatography tandem mass spectrometry. Molecular Nutrition and Food Research, 51(2), pp.239–247.
EFSA, 2011. SCIENTIFIC REPORT OF EFSA. Results on acrylamdie levels in food drom monitoring years 2007-2009 and exposure assesment. EFSA Journal, 9(4), pp.1–48.
136
EFSA, 2015. Scientific Opinion on acrylamide in food. [online] EFSA Journal. Available at: <http://doi.wiley.com/10.2903/j.efsa.2015.4104> [Accessed 22 Feb. 2019].
EFSA, 2019. Eurobarometer 91.3 Food safety in the EU - Ireland. [online] Available at: <https://www.efsa.europa.eu/sites/default/files/corporate_publications/files/eurobarometer19/country-factsheets/EB91.3_EFSA_fact_ie_en.pdf> [Accessed 26 Jun. 2019].
Elfaitouri, T.A., Ghazali, H.M., Sumnu, G. and Ariffin, A.A., 2018. Effect of Microwave Frying on Acrylamide Formation in Potato Chips Effect of Microwave Frying on Acrylamide Formation in Potato Chips. World Journal of Food Science and Technology, 2(2), pp.33–37.
Elmore, J.S., Briddon, A., Dodson, A.T., Muttucumaru, N., Halford, N.G. and Mottram, D.S., 2015. Acrylamide in potato crisps prepared from 20 UK-grown varieties: Effects of variety and tuber storage time. Food Chemistry, 182, pp.1–8.
Elmore, J.S., Koutsidis, G., Dodson, A.T., Mottram, D.S. and Wedzicha, B.L., 2005. Measurement of acrylamide and its precursors in potato, wheat, and rye model systems. Journal of Agricultural and Food Chemistry, 53(4), pp.1286–1293.
Eltawil, M.A., Samuel, D.V.K. and Singhal, O.P., 2006. Potato Storage Technology and Store Design Aspects. Agricultural Engineering International: the CIGR Ejournal, VIII(11).
Esfahani, B.N., Kadivar, M., Shahedi, M. and Soleimanian-Zad, S., 2017. Reduction of acrylamide in whole-wheat bread by combining lactobacilli and yeast fermentation. Food Additives and Contaminants - Part A Chemistry, Analysis, Control, Exposure and Risk Assessment, 34(11), pp.1904–1914.
Eslamizad, S., Kobarfard, F., Tsitsimpikou, C., Tsatsakis, A., Tabib, K. and Yazdanpanah, H., 2019. Health risk assessment of acrylamide in bread in Iran using LC-MS/MS. Food and Chemical Toxicology, 126, pp.162–168.
EUPPA, 2019. The Golden Frying Recipe - Good Fries. [online] Available at: <https://goodfries.eu/en/rules/> [Accessed 25 Feb. 2019].
European Coffee Federation (ECF), 2018. European Coffee Report 2017 / 2018. [online] Available at: <https://www.ecf-coffee.org/publications/european-coffee-report> [Accessed 8 Jun. 2019].
European Commission, 2017. Commission Regulation (EU) 2017/2158 of 20 November 2017 : establishing mitigation measures and benchmark levels for the reduction of the resence of acrylamide in food. Official Journal of the European Union, 2017(315), pp.24–44.
FDA, 2016. Guidance for Industry Acrylamide in Foods. [online] FDA Food Guidances. Available at: <https://www.fda.gov/food/guidanceregulation/guidancedocumentsregulatoryinformation/ucm374524.htm> [Accessed 21 Feb. 2019].
FDA, 2017. Acrylamide and Diet, Food Storage, and Food Preparation | FDA. [online] Available at: <https://www.fda.gov/food/chemicals/acrylamide-and-diet-food-storage-and-food-preparation> [Accessed 29 May 2019].
Fiselier, K., Bazzocco, D., Gama-Baumgartner, F. and Grob, K., 2006. Influence of the frying temperature on acrylamide formation in French fries. European Food Research and Technology, 222(3–4), pp.414–419.
FoodDrinkEurope, 2019. ACRYLAMIDE TOOLBOX 2019. [online] Available at: <https://www.fooddrinkeurope.eu/uploads/publications_documents/FoodDrinkEurope_Acrylamide_Toolbox_2019.pdf>.

137
Fredriksson, H., Tallving, J., Rosén, J. and Åman, P., 2004. Fermentation Reduces Free Asparagine in Dough and Acrylamide Content in Bread. Cereal Chemistry Journal, 81(5), pp.650–653.
Friedman, M. and Levin, C.E., 2008. Review of methods for the reduction of dietary content and toxicity of acrylamide. Journal of Agricultural and Food Chemistry, 56(15), pp.6113–6140.
FSAI, 2009a. Acrylamide in food. [online] Toxocology factsheet series. Available at: <https://www.fsai.ie/WorkArea/DownloadAsset.aspx?id=8408> [Accessed 4 May 2019].
FSAI, 2009b. A research study into consumers’ attitudes to food labelling. [online] Available at: <https://www.fsai.ie/WorkArea/DownloadAsset.aspx?id=8900> [Accessed 5 Mar. 2019].
FSAI, 2016. Report on a Total Diet Study carried out by the Food Safety Authority of Ireland in the period 2012 – 2014. [online] Available at: <https://www.fsai.ie/news_centre/press_releases/total_diet_study_15032016.html> [Accessed 4 May 2019].
Gertz, C. and Klostermann, S., 2002. Analysis of acrylamide and mechanisms of its formation in deep-fried products. European Journal of Lipid Science and Technology, 104(11), pp.762–771.
Gökmen, V. and Şenyuva, H.Z., 2006. Study of colour and acrylamide formation in coffee, wheat flour and potato chips during heating. Food Chemistry, 99, pp.238–243.
Gökmen, V. and Şenyuva, H.Z., 2007. Acrylamide formation is prevented by divalent cations during the Maillard reaction. Food Chemistry, 103(1), pp.196–203.
Gökmen, V., Şenyuva, H.Z., Dülek, B. and Çetin, A.E., 2007. Computer vision-based image analysis for the estimation of acrylamide concentrations of potato chips and french fries. Food Chemistry, 101(2), pp.791–798.
Granby, K. and Fagt, S., 2004. Analysis of acrylamide in coffee and dietary exposure to acrylamide from coffee. Analytica Chimica Acta, 520(1–2), pp.177–182.
Granby, K., Nielsen, N.J., Hedegaard, R. V., Christensen, T., Kann, M. and Skibsted, L.H., 2008. Acrylamide–asparagine relationship in baked/toasted wheat and rye breads. Food Additives and Contaminants - Part A Chemistry, Analysis, Control, Exposure and Risk Assessment, 25(8), pp.921–929.
Granda, C., Moreira, R.G. and Tichy, S.E., 2004. Reduction of acrylamide formation in potato chips by low-temperature vacuum frying. Journal of Food Science, 69(8), pp.E405–E411.
Granvogl, M., Jezussek, M., Koehler, P. and Schieberle, P., 2004. Quantitation of 3-aminopropionamide in potatoes - A minor but potent precursor in acrylamide formation. Journal of Agricultural and Food Chemistry, 52(15), pp.4751–4757.
Granvogl, M. and Schieberle, P., 2006. Thermally generated 3-aminopropionamide as a transient intermediate in the formation of acrylamide. Journal of Agricultural and Food Chemistry, 54(16), pp.5933–5938.
Granvogl, M. and Schieberle, P., 2007. Quantification of 3-aminopropionamide in cocoa , coffee and cereal products Correlation with acrylamide concentrations determined by an improved clean-up method for complex matrices. pp.857–863.
Gray, E.C., 2018. An investigation into the decline in the use of fresh potatoes and the increased demand for processed potato products in the foodservice sector in the Leinster area. Dublin Institute of Technology, 14(1), pp.1–26.
Grob, K., 2007. Options for legal measures to reduce acrylamide contents in the most relevant foods. In: Food Additives and Contaminants. pp.71–81.

138
Gündüz, P.B.C. and Cengiz, M.F., 2015. Acrylamide contents of commonly consumed bread types in Turkey. International Journal of Food Properties, 18(4), pp.833–841.
Halford, N.G., Curtis, T.Y., Muttucumaru, N., Postles, J. and Mottram, D.S., 2011. Sugars in crop plants. Annals of Applied Biology, 158(1), pp.1–25.
Halford, N.G., Muttucumaru, N., Powers, S.J., Gillatt, P.N., Hartley, L., Elmore, J.S. and Mottram, D.S., 2012. Concentrations of free amino acids and sugars in nine potato varieties: Effects of storage and relationship with acrylamide formation. Journal of Agricultural and Food Chemistry, 60(48), pp.12044–12055.
Hammond, J.B.W., Burrell, M.M. and Kruger, N.J., 1990. Effect of low temperature on the activity of phosphofructokinase from potato tubers. Planta, 180(4), pp.613–616.
Healthy Ireland, 2019. Healthy Eating Guidelines - Healthy Ireland. [online] Department of Health. Available at: <http://www.healthyireland.ie/health-initiatives/heg/> [Accessed 21 Jul. 2019].
HEATOX, 2007a. Guidelines to authorities and cosumer organisations on home cooking and cosumption. [online] Available at: <http://www.ub.edu/cecem/Index/documents_index/D59_guidelines_to_authorities_and_consumer_organisations_on_home_cooking_and_consumption.pdf> [Accessed 2 Feb. 2019].
HEATOX, 2007b. HEATOX Heat-generated food toxicants : identification , characterisation and risk minimisation Final report. [online] Available at: <https://cordis.europa.eu/publication/rcn/12731_en.html> [Accessed 2 Feb. 2019].
Hoenicke, K. and Gatermann, R., 2005. Studies on the stability of acrylamide in food during storage. Journal of AOAC International, 88(1), pp.268–273.
Hogervorst, J.G.F., Baars, B.-J., Schouten, L.J., Konings, E.J.M., Goldbohm, R.A. and van den Brandt, P.A., 2010. The carcinogenicity of dietary acrylamide intake: A comparative discussion of epidemiological and experimental animal research. Critical Reviews in Toxicology, 40(6), pp.485–512.
IARC, 1994. Acrylamide. IARC Monographs on the EValuation of Carcinogen Risk to Humans: Some Industrial Chemicals, UK: WHO.
IUNA, 2001. North/South Ireland Food Consumption. [online] Available at: <https://safefood.eu/SafeFood/media/SafeFoodLibrary/Documents/Publications/Research Reports/NorthSouthIrelandFoodConsumptionSurveyIrishUniversitiesNutritionAllianceSummaryReport.pdf> [Accessed 5 Mar. 2019].
IUNA, 2016. Report on the pattern of white and wholemeal bread consumption in Irish adults and pre-school children . Analysis of the National Adult Nutrition Survey and the National Pre-School Nutrition Survey.
Jackson, L., 2008. PPT - Effect of Consumer Food Preparation on Acrylamide Formation PowerPoint Presentation - ID:3534746.
Jackson, L.S. and Al-Taher, F., 2005. Effects of consumer food preparation on acrylamide formation. In: M.D. Friedman M., ed., Advances in Experimental Medicine and Biology. Boston: Springer, pp.447–465.
JECFA, 2006. Evaluation of certain food contaminants. World Health Organization technical report series., 930.
JECFA, 2011. Evaluation of certain contaminants in food: seventy-second report of the Joint FAO/WHO Expert Committee on Food Additives.
Jouquand, C., Niquet-Léridon, C., Jacolot, P., Petit, N., Marier, D. and Gadonna-Widehem, P., 2018.

139
Effects of Maillard Reaction Products on Sensory and Nutritional Qualities of the Traditional French Baguette. Journal of Food Science, 83(10), pp.2424–2431.
Jung, M.Y., Choi, D.S. and Ju, J.W., 2003. A Novel Technique for Limitation of Acrylamide Formation in Fried and Baked Corn Chips and in French Fries. Journal of Food Science, 68(4), pp.1287–1290.
Kalita, D. and Jayanty, S., 2017. Nutrient Composition of Continuous and Kettle Cooked Potato Chips from Three Potato Cultivars. Current Research in Nutrition and Food Science Journal, 5(2), pp.75–88.
Kalita, D. and Jayanty, S.S., 2013. Reduction of acrylamide formation by vanadium salt in potato French fries and chips. Food Chemistry, 138(1), pp.644–649.
Khan, M.R., Alothman, Z.A., Naushad, M., Alomary, A.K., Alfadul, S.M., Alsohaimi, I.H. and Algamdi, M.S., 2017. Occurrence of acrylamide carcinogen in Arabic coffee Qahwa, coffee and tea from Saudi Arabian market. Scientific Reports, 7(41995), pp.1–8.
Kim, H.-Y., 2017. Statistical notes for clinical researchers: Chi-squared test and Fisher’s exact test. Restorative Dentistry & Endodontics, 42(2), p.152.
Kowalska, M., Żbikowska, A., Onacik-Gür, S. and Kowalska, D., 2017. Acrylamide in food products – eating habits and consumer awareness among medical school students. Annals of Agricultural and Environmental Medicine, 24(4), pp.570–574.
Lachenmeier, D.W., Schwarz, S., Teipel, J., Hegmanns, M., Kuballa, T., Walch, S.G., Breitling-Utzmann, C.M., Lachenmeier, D.W., Schwarz, S., Teipel, J., Hegmanns, M., Kuballa, T., Walch, S.G. and Breitling-Utzmann, C.M., 2018. Potential Antagonistic Effects of Acrylamide Mitigation during Coffee Roasting on Furfuryl Alcohol, Furan and 5-Hydroxymethylfurfural. Toxics, 7(1), pp.1–13.
Lantz, I., Ternité, R., Wilkens, J., Hoenicke, K., Guenther, H. and Van Der Stegen, G.H.D., 2006. Studies on acrylamide levels in roasting, storage and brewing of coffee. Molecular Nutrition and Food Research, 50, pp.1039–1046.
Levine, R.A. and Ryan, S.M., 2009. Determining the Effect of Calcium Cations on Acrylamide Formation in Cooked Wheat Products Using a Model System. Journal of Agricultural and Food Chemistry, 57(15), pp.6823–6829.
Majcher, M. and Jeleń, H.H., 2007. Acrylamide formation in low-fat potato snacks and its correlation with colour development. Food Additives and Contaminants, 24(4), pp.337–342.
Malhotra, N.K., 2004. Chapter 5 QUESTIONNAIRE DESIGN AND SCALE DEVELOPMENT What Is a Questionnaire ? Why Is a Questionnaire Important ? What Information Is Needed ? How Should Individual Questions Be Framed ? Marketing Research, pp.176–202.
Marchettini, N., Focardi, S., Guarnieri, M., Guerranti, C. and Perra, G., 2013. Determination of acrylamide in local and commercial cultivar of potatoes from biological farm. Food Chemistry, 136(3–4), pp.1426–1428.
Marshall, E. and Boggis, E., 2016. The Statistics Tutor’s Quick Guide to Commonly Used Statistical Tests. [online] Statstutor Community Project. Available at: <www.statstutor.ac.uk> [Accessed 5 Jul. 2019].
Matsuura-Endo, C., Ohara-Takada, A., Chuda, Y., Ono, H., Yada, H., Yoshida, M., Kobayashi, A., Tsuda, S., Takigawa, S., Noda, T., Yamauchi, H. and Mori, M., 2006. Effects of Storage Temperature on the Contents of Sugars and Free Amino Acids in Tubers from Different Potato Cultivars and Acrylamide in Chips. Bioscience, Biotechnology, and Biochemistry, 70(5), pp.1173–1180.
Matthäus, B., Haase, N.U. and Vosmann, K., 2004. Factors affecting the concentration of acrylamide during deep-fat frying of potatoes. European Journal of Lipid Science and Technology, 106(11), pp.793–

140
801.
McCarthy, M., Brennan, M., Kelly, A.L., Ritson, C., de Boer, M. and Thompson, N., 2007. Who is at risk and what do they know? Segmenting a population on their food safety knowledge. Food Quality and Preference, 18(2), pp.205–217.
Meng, X., Zhao, J. and Qian, J., 2012. Investigation of the awareness and exposure level of dietary acrylamide in the college students in Nanjing. [online] Chinese Journal of School Health. Available at: <http://en.cnki.com.cn/Article_en/CJFDTotal-XIWS201202004.htm> [Accessed 19 Feb. 2019].
Mesias, M., Delgado-Andrade, C., Holgado, F. and Morales, F.J., 2018. Acrylamide content in French fries prepared in households: A pilot study in Spanish homes. Food Chemistry, 260, pp.44–52.
Mesias, M., Delgado-Andrade, C., Holgado, F. and Morales, F.J., 2019. Acrylamide content in French fries prepared in food service establishments. LWT - Food Science and Technology, 100, pp.83–91.
Mesias, M., Delgado-Andrade, C. and Morales, F., 2018. Evaluation of domestic frying habits and consumer ’ s preferences in Spanish households. SDRP Journal of Food Science & Technology, 3(5), pp.450–459.
Mesías, M. and Morales, F.J., 2015. Acrylamide in commercial potato crisps from Spanish market: Trends from 2004 to 2014 and assessment of the dietary exposure. Food and Chemical Toxicology, 81, pp.104–110.
Mestdagh, F., De Meulenaer, B. and Van Peteghem, C., 2007. Influence of oil degradation on the amounts of acrylamide generated in a model system and in French fries. Food Chemistry, 100(3), pp.1153–1159.
Mestdagh, F., De Wilde, T., Castelein, P., Németh, O., Van Peteghem, C. and De Meulenaer, B., 2008a. Impact of the reducing sugars on the relationship between acrylamide and Maillard browning in French fries. European Food Research and Technology, 227(1), pp.69–76.
Mestdagh, F., De Wilde, T., Fraselle, S., Govaert, Y., Ooghe, W., Degroodt, J.M., Verhé, R., Van Peteghem, C. and De Meulenaer, B., 2008b. Optimization of the blanching process to reduce acrylamide in fried potatoes. LWT - Food Science and Technology, 41(9), pp.1648–1654.
Michalak, J., Gujska, E., Czarnowska-Kujawska, M. and Nowak, F., 2017. Effect of different home-cooking methods on acrylamide formation in pre-prepared croquettes. Journal of Food Composition and Analysis, 56, pp.134–139.
Michalak, J., Gujska, E., Czarnowska, M., Klepacka, J. and Nowak, F., 2016. Effect of Storage on Acrylamide and 5-hydroxymethylfurfural Contents in Selected Processed Plant Products with Long Shelf-life. Plant Foods for Human Nutrition, 71(1), pp.115–122.
Michalak, J., Gujska, E. and Klepacka, J., 2011. The Effect of Domestic Preparation of Some Potato Products on Acrylamide Content. Plant Foods for Human Nutrition, 66(4), pp.307–312.
Mintel, 2018a. Hot Drinks - Ireland - August 2018: Types of Coffee Used. [online] Available at: <http://0-academic.mintel.com.ditlib.dit.ie/display/912266/> [Accessed 13 Jun. 2019].
Mintel, 2018b. Hot DrMintel, 2018. Hot Drinks - Ireland - August 2018: Market Drivers. [online] Available at: <http://0-academic.mintel.com.ditlib.dit.ie/display/912266/> [Accessed 6 Jun. 2019].
Mintel, 2019a. Bread & Baked Goods - Ireland - April 2019: Usage of Bread. [online] Available at: <http://0-academic.mintel.com.ditlib.dit.ie/display/952394/> [Accessed 6 Jun. 2019].
Mintel, 2019b. Fruit and Vegetables - Ireland - March 2019: Usage of Potato Products. [online] Available at: <http://0-academic.mintel.com.ditlib.dit.ie/display/948540/> [Accessed 6 Jun. 2019].

141
Mojska, H. and Gielecińska, I., 2013. Studies of acrylamide level in coffee and coffee substitutes: influence of raw material and manufacturing conditions. Roczniki Panstwowego Zakladu Higieny, 64(3), pp.173–81.
Morales, F.J. and Mesias, M., 2015. Analysis of Acrylamide in Coffee. In: V.R. Preedy, ed., Coffee in Health and Disease Prevention. Academic Press, pp.1013–1021.
Moreb, N.A., Priyadarshini, A. and Jaiswal, A.K., 2017. Knowledge of food safety and food handling practices amongst food handlers in the Republic of Ireland. Food Control, 80, pp.341–349.
Mottram, D.S., 2007. The Maillard Reaction: Source of Flavour in Thermally Processed Foods. In: Flavours and Fragrances. Berlin, Heidelberg: Springer Berlin Heidelberg, pp.269–283.
Mottram, D.S., Wedzicha, B.L. and Dodson, A.T., 2002. Food chemistry: Acrylamide is formed in the Maillard reaction. Nature, 419, pp.448–449.
Mustafa, A., 2008. Acrylamide in bread : precursors, formation and reduction. Dept. of Food Science, Swedish University of Agricultural Sciences.
Mustafa, A., Andersson, R., Rosén, J., Kamal-Eldin, A. and Åman, P., 2005. Factors influencing acrylamide content and color in rye crisp bread. Journal of Agricultural and Food Chemistry, 53(15), pp.5985–5989.
Muttucumaru, N., Powers, S.J., Elmore, J.S., Dodson, A., Briddon, A., Mottram, D.S. and Halford, N.G., 2017. Acrylamide-forming potential of potatoes grown at different locations, and the ratio of free asparagine to reducing sugars at which free asparagine becomes a limiting factor for acrylamide formation. Food Chemistry, 220, pp.76–86.
Nachi, I., Fhoula, I., Smida, I., Ben Taher, I., Chouaibi, M., Jaunbergs, J., Bartkevics, V. and Hassouna, M., 2018. Assessment of lactic acid bacteria application for the reduction of acrylamide formation in bread. LWT - Food Science and Technology, 92, pp.435–441.
Napolitano, A., Morales, F., Sacchi, R. and Fogliano, V., 2008. Relationship between Virgin Olive Oil Phenolic Compounds and Acrylamide Formation in Fried Crisps. Journal of Agricultural and Food Chemistry, 56(6), pp.2034–2040.
Neary, M., 2019. Fresh Potatoes and the Millennial Generation. [online] Available at: <https://www.bordbia.ie/industry/insights/food-alert/fresh-potatoes-and-the-millennial-generation/> [Accessed 27 Jun. 2019].
Norén, L., 2019. Acrylamide in Ready-to-Eat Potato Products. Lunds Universitey.
Nursten, H.E., 2005. The Maillard reaction : chemistry, biochemistry, and implications. Cambridge: Royal Society of Chemistry.
O’Keefe, J.H., DiNicolantonio, J.J. and Lavie, C.J., 2018. Coffee for Cardioprotection and Longevity. Progress in Cardiovascular Diseases, 61(1), pp.38–42.
Ölmez, H., Tuncay, F., Özcan, N. and Demirel, S., 2008. A survey of acrylamide levels in foods from the Turkish market. Journal of Food Composition and Analysis, 21(7), pp.564–568.
Palazog̀lu, T.K., Savran, D. and Gökmen, V., 2010. Effect of cooking method (baking compared with frying) on acrylamide level of potato chips. Journal of Food Science, 75(1), pp.E25–E29.
Palermo, M., Gökmen, V., Meulenaer, B. De, Ciesarová, Z., Zhang, Y., Pedreschi, F. and Fogliano, V., 2016. Acrylamide Mitigation Strategies: Critical Appraisal of the FoodDrinkEurope Toolbox. Food & Function, 7, pp.2516-2525.

142
Panke, D., 2018. Research design and method selection : making good choices in the social sciences. SAGE.
Pedreschi, F., Bustos, O., Mery, D., Moyano, P., Kaack, K. and Granby, K., 2007a. Color kinetics and acrylamide formation in NaCl soaked potato chips. Journal of Food Engineering, 79(3), pp.989–997.
Pedreschi, F., Kaack, K. and Granby, K., 2006. Acrylamide content and color development in fried potato strips. Food Research International, 39(1), pp.40–46.
Pedreschi, F., León, J., Mery, D., Moyano, P., Pedreschi, R., Kaack, K. and Granby, K., 2007b. Color development and acrylamide content of pre-dried potato chips. Journal of Food Engineering, 79(3), pp.786–793.
Pedreschi, F., Moyano, P., Kaack, K. and Granby, K., 2005. Color changes and acrylamide formation in fried potato slices. Food Research International, 38, pp.1–9.
Rapp, M., Schwadorf, K., Leiser, W.L., Würschum, T. and Longin, C.F.H., 2018. Assessing the variation and genetic architecture of asparagine content in wheat: What can plant breeding contribute to a reduction in the acrylamide precursor? Theoretical and Applied Genetics, 131(11), pp.2427–2437.
Regulation (EC) No 1272/2008 of the European Parliament and of the Council, of 16 December 2008, on Classification, Labelling and Packaging of Substances and Mixtures. EUR-Lex.
Rivadeneyra-Domínguez, E., Becerra-Contreras, Y., Vázquez-Luna, A., Díaz-Sobac, R. and Rodríguez-Landa, J.F., 2018. Alterations of blood chemistry, hepatic and renal function, and blood cytometry in acrylamide-treated rats. Toxicology Reports, 5, pp.1124–1128.
Rosen, C., Sun, N., Olsen, N., Thornton, M., Pavek, M., Knowles, L. and Richard Knowles, N., 2018. Impact of Agronomic and Storage Practices on Acrylamide in Processed Potatoes. American Journal of Potato Research, 95(4), pp.319–327.
Rydberg, P., Eriksson, S., Tareke, E., Karlsson, P., Ehrenberg, L. and Törnqvist, M., 2003. Investigations of factors that influence the acrylamide content of heated foodstuffs. Journal of agricultural and food chemistry, 51(24), pp.7012–8.
Saeed, M., Naveed, M., BiBi, J., Ali Kamboh, A., Phil, L. and Chao, S., 2019. Potential nutraceutical and food additive properties and risks of coffee: a comprehensive overview. Critical Reviews in Food Science and Nutrition, pp.1–27.
Sansano, M., Juan-Borrás, M., Escriche, I., Andrés, A. and Heredia, A., 2015. Effect of Pretreatments and Air-Frying, a Novel Technology, on Acrylamide Generation in Fried Potatoes. Journal of Food Science, 80(5), pp.T1120–T1128.
Scientific Committee on Food (SCF), 2002. Opinion of the Scientific Committee on Food on new findings regarding the presence of acrylamide in food. SCF/CS/CNTM/CONT/4 Final.
Serpen, A. and Gökmen, V., 2009. Evaluation of the Maillard reaction in potato crisps by acrylamide, antioxidant capacity and color. Journal of Food Composition and Analysis, 22(6), pp.589–595.
ShelfLife, 2015. National Potato Day gets a KISS from Keogh’s Farm - Shelflife Magazine. [online] Available at: <https://www.shelflife.ie/national-potato-day-gets-a-kiss-from-keoghs-farm/> [Accessed 6 Jun. 2019].
Shen, Y., Chen, G. and Li, Y., 2019. Effect of added sugars and amino acids on acrylamide formation in white pan bread. Cereal Chemistry, 00, pp.1–9.
Shojaee-Aliabadi, S., Nikoopour, H., Kobarfard, F., Parsapour, M., Moslehishad, M., Hassanabadi, H., Frias, J.M., Hashemi, M. and Dahaghin, E., 2013. Acrylamide reduction in potato chips by selection of

143
potato variety grown in Iran and processing conditions. Journal of the Science of Food and Agriculture, 93(10), pp.2556–2561.
Siaw, Oppong, M., Ofosu, W, I., Lutterodt, E, H. and Ankar-Brewoo, M, G., 2018. Acrylamide Exposure and Risks in Most Frequently Consumed Foods in a Total Diet Study. American Journal of Food Science and Technology, 6(4), pp.123–137.
Silva, E.M. and Simon, P.W., 2005. Genetic, Physiological, and Environmental Factors Affecting Acrylamide Concentration in Fried Potato Products. In: Chemistry and Safety of Acrylamide in Food. New York: Springer-Verlag, pp.371–386.
Sirot, V., Hommet, F., Tard, A. and Leblanc, J.C., 2012. Dietary acrylamide exposure of the French population: Results of the second French Total Diet Study. Food and Chemical Toxicology, 50(3–4), pp.889–894.
Skog, K., Viklund, G., Olsson, K. and Sjöholm, I., 2008. Acrylamide in home-prepared roasted potatoes. Molecular Nutrition & Food Research, 52(3), pp.307–312.
Sowokinos, J., 1990. Stress-induced alterations in carbohydrate metabolism. In: M.E.. Vayda and W.D. Park, eds., The molecular and cellular biology of the potato. CAB International, pp.137–158.
Stadler, R.H., Blank, I., Varga, N., Robert, F., Hau, J., Guy, P.A., Robert, M.C. and Riediker, S., 2002. Food chemistry: Acrylamide from Maillard reaction products. Nature, 419(6906), pp.449–450.
Statista, 2019. Bread - Ireland. [online] Available at: <https://www.statista.com/outlook/40050100/140/bread/ireland?currency=eur> [Accessed 28 Apr. 2019].
Stockmann, F., Weber, E., Mast, B., Schreiter, P., Merkt, N., Claupein, W. and Graeff-Hönninger, S., 2018. Evaluation of Asparagine Concentration as an Indicator of the Acrylamide Formation in Cereals Grown under Organic Farming Conditions. Agronomy, 8(294), pp.1–17.
Summa, C.A., De, B., Brohee, M., Stadler, R.H. and Anklam, E., 2007. Impact of the roasting degree of coffee on the in vitro radical scavenging capacity and content of acrylamide. 40, pp.1849–1854.
Sun, N., Rosen, C.J. and Thompson, A.L., 2018. Acrylamide Formation in Processed Potatoes as Affected by Cultivar, Nitrogen Fertilization and Storage Time. American Journal of Potato Research, 95(5), pp.473–486.
Surdyk, N., Rosén, J., Andersson, R. and Åman, P., 2004. Effects of Asparagine, Fructose, and Baking Conditions on Acrylamide Content in Yeast-Leavened Wheat Bread. Journal of Agricultural and Food Chemistry, 52, pp.2047–2051.
Tareke, E., Rydberg, P., Karlsson, P., Eriksson, S. and Törnqvist, M., 2000. Acrylamide: A Cooking Carcinogen? Chemical Research in Toxicology, 13(6), pp.517–522.
Tareke, E., Rydberg, P., Karlsson, P., Eriksson, S. and Törnqvist, M., 2002. Analysis of acrylamide, a carcinogen formed in heated foodstuffs. Journal of Agricultural and Food Chemistry, 50(17), pp.4998–5006.
Taubert, D., Harlfinger, S., Henkes, L., Berkels, R. and Schömig, E., 2004. Influence of Processing Parameters on Acrylamide Formation during Frying of Potatoes. Journal of Agricultural and Food Chemistry, 52, pp.2735–2739.
Tawfik, M.S. and El-Ziney, M.G., 2008. Acrylamide levels in selected foods in Saudi Arabia with reference to health-risk assessment of dietary acrylamide intake. American Journal of Food Technology, 3(6), pp.347–353.

144
Teagasc, 2018. Ireland’s Potato consumption show a slight increase - Teagasc | Agriculture and Food Development Authority. [online] Available at: <https://www.teagasc.ie/news--events/news/2018/health-benefits-of-potato.php> [Accessed 6 Jun. 2019].
The Codex Alimentarius Commission, 2004. Discussion paper on acrylamide.
UKHospitality, 2018. Industry Guide To Acrylamide Catering and Food Service. [online] Available at: <https://www.ukhospitality.org.uk/page/FoodSafetyRegulationsandGuidance>.
US-EPA, 2000. Acrylamide. [online] Available at: <https://www.epa.gov/sites/production/files/2016-09/documents/acrylamide.pdf> [Accessed 9 May 2019].
US-EPA, 2010. Toxicological review of acrylamide (CAS No. 79-06-1) in support of summary information on the Integrated Risk Information System (IRIS). [online] Available at: <https://cfpub.epa.gov/ncea/iris/iris_documents/documents/toxreviews/0286tr.pdf> [Accessed 26 Feb. 2019].
Vattem, D.A. and Shetty, K., 2003. Acrylamide in food: A model for mechanism of formation and its reduction. Innovative Food Science and Emerging Technologies, 4(3), pp.331–338.
Viklund, G.Å.I., Olsson, K.M., Sjöholm, I.M. and Skog, K.I., 2008. Impact of harvest year on amino acids and sugars in potatoes and effect on acrylamide formation during frying. In: Journal of Agricultural and Food Chemistry. American Chemical Society, pp.6180–6184.
Viklund, G.Å.I., Olsson, K.M., Sjöholm, I.M. and Skog, K.I., 2010. Acrylamide in crisps: Effect of blanching studied on long-term stored potato clones. Journal of Food Composition and Analysis, 23(2), pp.194–198.
Vivanti, V., Finotti, E. and Friedman, M., 2006. Level of Acrylamide Precursors Asparagine, Fructose, Glucose, and Sucrose in Potatoes Sold at Retail in Italy and in the United States. Journal of Food Science, 71(2), pp.C81–C85.
Wang, S., Yu, J., Xin, Q., Wang, S. and Copeland, L., 2017. Effects of starch damage and yeast fermentation on acrylamide formation in bread. Food Control, 73, pp.230–236.
WHO, 2002. Health Implications of Acrylamide in Food. Report of a Joint FAO/WHO Consultation, Geneva, Switzerland, 25–27th June.
Wicklund, T., Østlie, H., Lothe, O., Knutsen, S.H., Bråthen, E. and Kita, A., 2006. Acrylamide in potato crisp - The effect of raw material and processing. LWT - Food Science and Technology, 39(5), pp.571–575.
De Wilde, T., De Meulenaer, B., Mestdagh, F., Govaert, Y., Ooghe, W., Fraselle, S., Demeulemeester, K., Van Peteghem, C., Calus, A., Degroodt, J.-M. and Verhé, R., 2006. Selection Criteria for Potato Tubers To Minimize Acrylamide Formation during Frying. Journal of Agricultural and Food Chemistry, 54, pp.2199–2205.
De Wilde, T., De Meulenaer, B., Mestdagh, F., Govaert, Y., Vandeburie, S., Ooghe, W., Fraselle, S., Demeulemeester, K., Van Peteghem, C., Calus, A., Degroodt, J.M. and Verhé, R., 2005. Influence of storage practices on acrylamide formation during potato frying. Journal of Agricultural and Food Chemistry, 53(16), pp.6550–6557.
Williams, J.S.E., 2005. Influence of variety and processing conditions on acrylamide levels in fried potato crisps. Food Chemistry, 90(4), pp.875–881.
Wright, M., Canham, R. and Masrani, R., 2011. Food safety behaviours in the home Final Report for the Food Standards Agency.

145
Yam, K.L. and Papadakis, S.E., 2004. A simple digital imaging method for measuring and analyzing color of food surfaces. Journal of Food Engineering, 61(1), pp.137–142.
Yasuhara, A., Tanaka, Y., Hengel, M. and Shibamoto, T., 2003. Gas chromatographic investigation of acrylamide formation in browning model systems. Journal of Agricultural and Food Chemistry, 51(14), pp.3999–4003.
Yuan, Y., Chen, F., Zhao, G.H., Liu, J., Zhang, H.X. and Hu, X.S., 2007. A comparative study of acrylamide formation induced by microwave and conventional heating methods. Journal of Food Science, 72(4), pp.C212–C216.
Zajac, J., Bojar, I., Helbin, J., Kolarzyk, E., Potocki, A., Strzemecka, J. and Owoc, A., 2013. Dietary acrylamide exposure in chosen population of South Poland. Annals of Agricultural and Environmental Medicine, 20(2), pp.351–355.
Zhang, H., Zhang, H., Cheng, L., Wang, L. and Qian, H., 2015. Influence of deep-frying using various commercial oils on acrylamide formation in French fries. Food Additives & Contaminants: Part A, 32(7), pp.1083–1088.
Zhang, Y., Kahl, D.H.W., Bizimungu, B. and Lu, Z.-X., 2018. Effects of blanching treatments on acrylamide, asparagine, reducing sugars and colour in potato chips. Journal of Food Science and Technology, 55(10), pp.4028–4041.
Zhivagui, M., Ng, A.W.T., Ardin, M., Churchwell, M.I., Pandey, M., Renard, C., Villar, S., Cahais, V., Robitaille, A., Bouaoun, L., Heguy, A., Guyton, K.Z., Stampfer, M.R., McKay, J., Hollstein, M., Olivier, M., Rozen, S.G., Beland, F.A., Korenjak, M. and Zavadil, J., 2019. Experimental and pan-cancer genome analyses reveal widespread contribution of acrylamide exposure to carcinogenesis in humans. Genome Research, 29(4), pp.521–531.
Žilić, S., Dodig, D., Basić, Z., Vančetović, J., Titan, P., Đurić, N. and Tolimir, N., 2017. Free asparagine and sugars profile of cereal species: the potential of cereals for acrylamide formation in foods. Food Additives and Contaminants - Part A Chemistry, Analysis, Control, Exposure and Risk Assessment, 34(5), pp.705–713.
Zyzak, D. V., Sanders, R.A., Stojanovic, M., Tallmadge, D.H., Eberhart, B.L., Ewald, D.K., Gruber, D.C., Morsch, T.R., Strothers, M.A., Rizzi, G.P. and Villagran, M.D., 2003. Acrylamide formation mechanism in heated foods. Journal of Agricultural and Food Chemistry, 51(16), pp.4782–4787.

146
JOURNAL ARTICLE

147
Chapter 6 . JOURNAL ARTICAL
Acrylamide Awareness and Related Domestic Food
Practices among the Residents of the Republic of
Ireland
Amany Alya and Julie Dunnea
a School of Food Science and Environmental Health, College of Sciences and Health, Technological
University Dublin, Cathal Brugha Street, Dublin 1, Ireland.
*Corresponding author.
E-mail address: [email protected] (A. Aly)
ABSTRACT
Limited knowledge about acrylamide risks, combined with a lack of good food preparation practices, is
leading to daily exposure to high levels of acrylamide contamination from home-made meals across a
number of different nations. The aim of this study was to explore to what extent the actual specific
domestic food practices and food preferences with regard to potatoes, bread and coffee can give
indication of the extent that consumers may be exposed to AA risks, while also gauging the level of
acrylamide knowledge among adult inhabitants in Ireland over 18 years old.
In this study, mixed open-end and closed-end questions have been used in a questionnaire (online and
hardcopy). A questionnaire (N=555, over 18, Irish inhabitants, from March to June 2019).
The results showed that 39% had heard about a harmful component formed during heat treatment of
carbohydrate-rich food, while 14.8% recognised the term ‘acrylamide’. Awareness of the carcinogenic
effects of acrylamide reached 94.5% among those who had heard about this harmful compound.
Realisation that high cooking temperature is the main contributor in acrylamide generation represented
85.4%, while linking the major foodstuff contributors in acrylamide formation showed that potatoes
accounted for 75%, bread, biscuits and crackers 52 %, cereals 48% and coffee 38%.
Some domestic practices pointed to a concern, such as the practice of soaking fresh potatoes before
cooking and the duration of soaking. This showed that although 40% were soaking potatoes, 17% were
soaking potatoes for 30 minutes or more. In addition, almost one-third of the respondents practiced the
process of parboiling in their preparation. In terms of the duration of cooking times, 50% of respondents
made this decision based on visual assessments of food as it cooked. Those who strictly followed food-
package instructions accounted for 31.6%. The most commonly preferred appearance of roasted
potatoes, chips and toasted bread was a medium golden colour
Overall, these results substantiate the need for educational initiatives tailored towards developing
knowledge about good cooking practices and changing food habits to minimise exposure to acrylamide
from home-prepared meals and food preferences.
Keywords: Acrylamide, Home Food Practices, Coffee, Toasted Bread, Soaking, Parboil, Roasted
Potatoes, Chips.

148
1. Introduction
Although domestic food practices play a significant role in consumers’ exposure to acrylamide (Michalak,
Gujska, Czarnowska-Kujawska, & Nowak, 2017), studies relating to the generation of acrylamide (AA)
during home-food preparation and actual cooking practices have been few and infrequent, and include
Jackson and Al-Taher (2005), HEATOX (2007b), Brook Lyndhurst(2014), Mesias, Delgado-Andrade,
Holgado & Morales (2018) and Mesias, Delgado-Andrade and Morales (2018). Mesias, Delgado-Andrade,
Holgado, et al.(2018) investigated the contribution of home practices to the increased level of AA in chips
(French fries) in Spanish houses. The study revealed that formation of AA in home-prepared chips from fresh
potato samples were about 45.2%. Samples exceeded the EU benchmark level for French fries (500ug/kg)
by two to four times and exceeded EFSA estimated l. For instance, 6.9% of the collected home-prepared
chips recorded 2000ug/kg AA contents, while the average of the other samples was 644 µg/kg in home-made
fried. In 2014, a field study project for Food Standards Agency in the UK examined the influence of home-
cooking practices on acrylamide formation (Brook Lyndhurst, 2014). It concluded that there was a low level
of awareness of acrylamide exposure among British participants. That project focused on the different home
practices for instant potato storage, preparation of potatoes, cooking preferences and bread-toasting practices.
The study reported a correlation between consumer preferences and AA exposure, as well as a link between
desired food colour and AA levels in examined foods.
Since the role of domestic food practices, food preferences and consumption habits have a major impact on
the total dietary level of exposure to AA (Mesias, Delgado-Andrade, Holgado, et al., 2018). Therefore, the
scientific opinion of the European Food Safety Authority (EFSA) is that AA investigation among the
population and related home-food practices is crucial to achieving a safe-level exposure to AA (EFSA, 2015).
There is consensus that the major food contributors to total AA exposure are are potato chips and crisps
(fried, roasted, baked), potato products, bread and bakery products, cereals and grain products including
coffee (EFSA, 2015; JECFA, 2006; Scientific Committee on Food (SCF), 2002; Tareke, Rydberg, Karlsson,
Eriksson, & Törnqvist, 2002; WHO, 2002). For example, potato chips contribute 10% to 60% of AA intake,
potato crisps 10% to 22%, bread/toast 13% to 34%, and pastry and biscuits 10% to 15% (JECFA, 2011).
The main aims behind blanching or soaking potatoes, from a food-safety perspective, are to decrease the
concentration of reducing sugars and asparagine in potato cuts, as well as reducing the time required to cook
under high heat treatment (frying, roasting, this is reflected in the reduction of AA content in the final product,
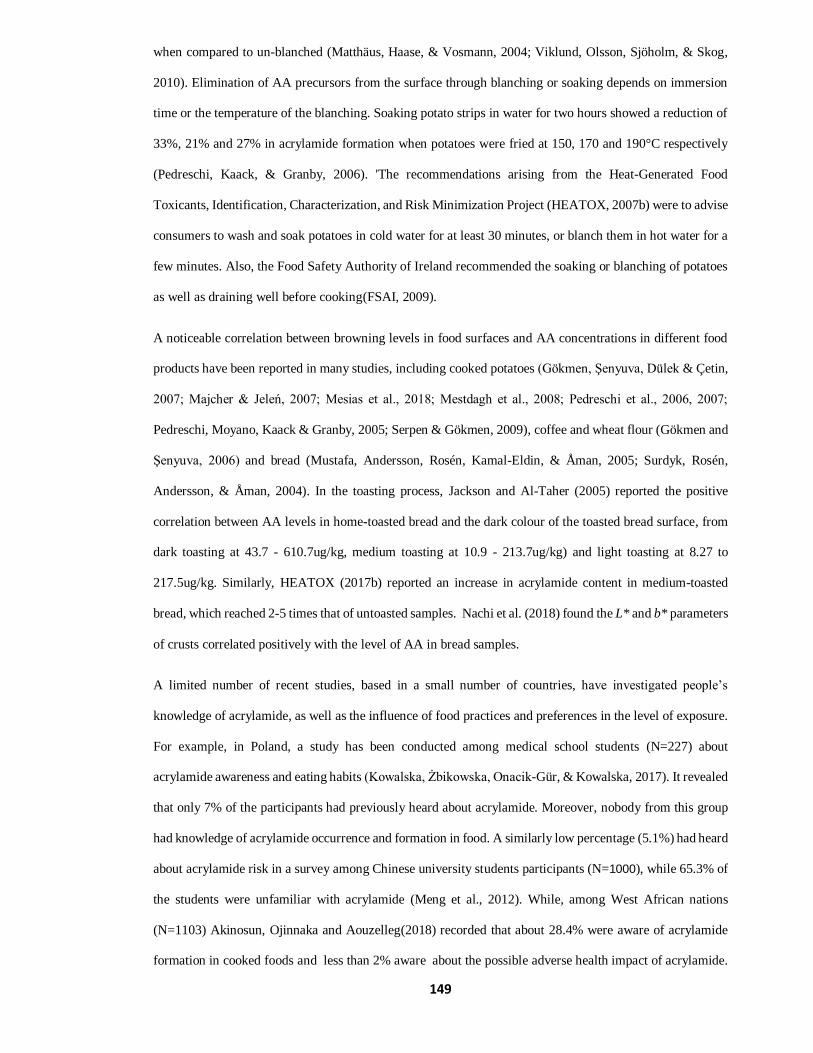
149
when compared to un-blanched (Matthäus, Haase, & Vosmann, 2004; Viklund, Olsson, Sjöholm, & Skog,
2010). Elimination of AA precursors from the surface through blanching or soaking depends on immersion
time or the temperature of the blanching. Soaking potato strips in water for two hours showed a reduction of
33%, 21% and 27% in acrylamide formation when potatoes were fried at 150, 170 and 190°C respectively
(Pedreschi, Kaack, & Granby, 2006). 'The recommendations arising from the Heat-Generated Food
Toxicants, Identification, Characterization, and Risk Minimization Project (HEATOX, 2007b) were to advise
consumers to wash and soak potatoes in cold water for at least 30 minutes, or blanch them in hot water for a
few minutes. Also, the Food Safety Authority of Ireland recommended the soaking or blanching of potatoes
as well as draining well before cooking(FSAI, 2009).
A noticeable correlation between browning levels in food surfaces and AA concentrations in different food
products have been reported in many studies, including cooked potatoes (Gökmen, Şenyuva, Dülek & Çetin,
2007; Majcher & Jeleń, 2007; Mesias et al., 2018; Mestdagh et al., 2008; Pedreschi et al., 2006, 2007;
Pedreschi, Moyano, Kaack & Granby, 2005; Serpen & Gökmen, 2009), coffee and wheat flour (Gökmen and
Şenyuva, 2006) and bread (Mustafa, Andersson, Rosén, Kamal-Eldin, & Åman, 2005; Surdyk, Rosén,
Andersson, & Åman, 2004). In the toasting process, Jackson and Al-Taher (2005) reported the positive
correlation between AA levels in home-toasted bread and the dark colour of the toasted bread surface, from
dark toasting at 43.7 - 610.7ug/kg, medium toasting at 10.9 - 213.7ug/kg) and light toasting at 8.27 to
217.5ug/kg. Similarly, HEATOX (2017b) reported an increase in acrylamide content in medium-toasted
bread, which reached 2-5 times that of untoasted samples. Nachi et al. (2018) found the L* and b* parameters
of crusts correlated positively with the level of AA in bread samples.
A limited number of recent studies, based in a small number of countries, have investigated people’s
knowledge of acrylamide, as well as the influence of food practices and preferences in the level of exposure.
For example, in Poland, a study has been conducted among medical school students (N=227) about
acrylamide awareness and eating habits (Kowalska, Żbikowska, Onacik-Gür, & Kowalska, 2017). It revealed
that only 7% of the participants had previously heard about acrylamide. Moreover, nobody from this group
had knowledge of acrylamide occurrence and formation in food. A similarly low percentage (5.1%) had heard
about acrylamide risk in a survey among Chinese university students participants (N=1000), while 65.3% of
the students were unfamiliar with acrylamide (Meng et al., 2012). While, among West African nations
(N=1103) Akinosun, Ojinnaka and Aouzelleg(2018) recorded that about 28.4% were aware of acrylamide
formation in cooked foods and less than 2% aware about the possible adverse health impact of acrylamide.

150
The level of awareness about AA and its potential risks was 22% in a recent survey (N=2000) focusing on
France, UK , USA and 54% among participants from Germany, that study carried out by DSM Research
Company (DSM, 2018). Of these, 50% were aware of AA formation, while 19% of the participants believed
that AA is not harmful at all. Despite considerable efforts, the author could not find a study that reviewed
this issue in regard to home food practices and preferences among people living in the Republic of Ireland.
Therefore, the aim of this study was to investigate AA and Related Domestic Food Practices among the
residents of the Republic of Ireland.
2. Materials and methods
2.1. Questionnaire design
The design of the questionnaire was based on a mixture of closed end questions (multiple-choice with
multiple-answer questions and single answer-choice questions), as well as open-ended questions. The
questionnaire development was guided by questions used in published literature to assess knowledge and
eating habits of a population in the area of acrylamide, as well as home-cooking practices and acrylamide
formation (Mesias et al., 2018; Kowalska et al., 2017; Brook Lyndhurst, 2014). Appropriate modifications
were made to the questions to fit the objective of the study. For validation of the questionnaire, a pilot test
was conducted with 16 food-safety management professionals. These assessed the clarity of the questions
and associated pictures, suitability of wording and the average time needed for its completion. The required
amendments and enhancements were made according to the feedback that was received, then re-evaluation
occurred before final distribution.
The questionnaire was designed on the SurveyMonkey platform and organised in a logical, automatic order.
This depended on the participants’ responses to questions, without distinguishing separated sections in order
to avoid any influence during the experiment and to prevent bias. Furthermore, the closed-end questions
contained options stating “other” or “I do not know” to avoid limiting responses to a predetermined list of
options.
The questions were distributed as follows; two questions aimed to screen participants and fulfil criteria (age
and country of living). Twelve questions related to acrylamide knowledge and awareness, while in the
consumer preferences category there were five questions about cooking end-point preferences and three
questions queried the consumption rate of potatoes, bread and coffee. The domestic food practices category,
which included storage, preparation, pre-treatment and cooking, was represented by 11 questions. Three

151
questions aimed to discover the participants’ attitudes and opinions towards acrylamide labelling suggestions.
Additionally, there were seven questions about data relating to demographics.
2.2. Participant sample and data collection
The questionnaire was completed using sample of people aged over 18 and living in Ireland. The survey was
carried out, either by electronic questionnaire via the SurveyMonkey platform or manual hardcopies, from
March to June of 2019. The participants were reached in a non-systematic way in different forums, common
public areas, community-based centres and community training centres. Also, the survey web link was
advertised in different public places and universities in Ireland via direct emails, social media platforms or
paper advertisements, which were distributed to cover multiple areas in the Republic of Ireland. On average,
the participants spent around 10 to 14 minutes to complete the survey. The total number of participants was
642. The disqualified respondents numbered 68. Disqualification criteria such as 'do not live in Ireland' (60)
and 'under 18 years old' (8), in addition to incomplete responses (19), brought the final qualified participants
to 555.
2.3. Data analysis
The data from paper responses was entered manually in the same survey platform as the output data, which
was received in the same Excel data sheets for further analysis and interpretations. For the data analysis, the
software package of SPSS version 25 by IBM Corporation was used to statistically analyse some variables
relationships. Meanwhile, in accordance with Bryman (2016), the thematic analysis was applied through
extracting core meanings that could be distinguished in and between the text words responses. Thus, the
responses to the open-ended questions were firstly manually categorised by conducting a thematic analysis
and coding for the responses in SurveyMonkey. After coding the answers, re-evaluation and sorting took
place, as well as further analysis as the data was expressed in frequencies, percentages and graphs.
3. Results and discussion
3.1 Samples profile
The demographic characteristics of the participants’ sample is shown in Table 1.

152
Table 39 The demographic characteristics of the resident participants’ sample.
Demographic
Characters
Category Respondents (n.) Percentage (%)
Age 18-24 107 23.4%
25-34 120 26.2%
35-44 121 26.4%
45-54 67 14.6%
55-64 39 8.5%
65+ 4 0.9%
Gender Male 90 19.7%
Female 367 80.1%
Other 1 0.2%
Place of Residence City 396 86.5%
Countryside 62 13.5%
Education Level University and Above 386 84.3%
Leaving Cert. 59 12.9% Junior Cert. 11 2.4%
No qualification 2 0.4%
Per Capita Annual
Income (Euro)
Under 30,000 139 30.4%
30,000-60,000 184 40.2%
Above 60,000 133 28.8%
I do not like to answer 2 0.4%
Family Status Single 154 33.6% Single with children 19 4.2%
Couple without
children
96 21.0%
Couple with children 182 39.7%
Other 7 1.5%
Culinary Practices
Origin
European-Irish 213 46.5%
European- non-Irish 85 18.6%
North American 10 2.2%
South American 14 3.1%
Asian 49 10.7%
African 34 7.4%
Australian 1 0.2% Middle Eastern 52 11.4%
Total responses / question 458
Total Skipping / question 97

153
3.2. The Respondents’ Awareness of Acrylamide
There were seven questions used to assess the acrylamide awareness topic, as shown in Table 40.
Table 40: Responses to questions related to acrylamide awareness
Q3, Have you previously heard about acrylamide in food?
Total Respondents (N) Category Respondents (N) Percentage
(%)
555 Yes 82 14.8%
No 473 85.2%
Q31 Have you previously heard about the formation of a harmful compound when some carbohydrate foods (eg.
bread, potatoes) are overheated to a brown-colour appearance?
465
Skipped 90
Yes 183 39.4%
No 282 60.7%
Q4 Which of the following foods have the potential to contribute to high acrylamide exposure? (Tick as many as
are relevant)
82
Skipped
473
Green vegetables 9 11.0%
Fruit 4 4.9%
Milk 8 9.8%
Meat 27 32.9%
Fish 16 19.5%
Bread 43 52.4%
Eggs 12 14.6%
Potatoes 62 75.6%
Poultry 15 18.3%
Coffee 31 37.8%
Biscuits & Crackers 43 52.4%
Cereals 40 47.6%
Beer 8 9.8%
Q5 Why do you think so?
83
I do not know 26 31.7%
Presented a reason 56 68.3%
Q6 Under what conditions do you think acrylamide might form in foods? (Tick as many as are relevant)
82
During freezing 3 3.66%
During preparation 12 14.63%
In a refrigerator 2 2.44%
During storing in room temperature 6 7.32%
High-temperature cooking 70 85.37%
After eating/ digestion 0 0.00%
I do not know 4 4.88%
Q32 What do you think are the negative health effects from this harmful compound?
177 I do not know. 68 38.4%
I know that (please specify) 109 61.6%
The negative health
effects
N 109
Carcinogenic 103 94.5%
Neurotoxic 1 0.9%
Other 4 3.7%
N/A 3 2. 8%
Q33. From what source did you get your information about this harmful compound? (Tick as many as are
relevant)
178
Skipped 377
TV 33 18.5%
Internet/ social media 60 33.7%
Journal/Magazine 41 23.0%
From person (Family/friends) 74 41.6%
School/College 45 25.3%
Food Safety Authority of Ireland 14 7.9%
Other 13 7.3%

154
The first of these questions (Q3) in this section determined the pathway through the survey for the
respondents according to their responses. Over the total of 555 respondents, there were 473 (85.2%) who
had not heard about acrylamide. Therefore, they were brought automatically to the second section of this
questionnaire. On the other hand, the positive responses to Q3, those who heard about acrylamide as a term,
amounted to 82 respondents (14.8%). When this question was asked using the terminology in Q31
(“hearing about a harmful compound that forms when some carbohydrate foods are overheated”) the results
rose to 183 from the 465 respondents and represented 39.4% from the total respondents. In
Table 41 there was significant evidence of a relationship between Q3 and Q31, which was confirmed among
Pearson Chi-Square test (with value 67.84,df =1 and p=0.000). In this study, the frequency of hearing the
term ‘acrylamide’ was xx%, double compared to the results from the Polish study, which recorded that 7%
(Kowalska et al., 2017), and almost treble the 5.1% of Chinese students (Meng et al., 2012).Furthermore,
acrylamide awareness levels among Irish people is almost within the level of awareness among UK, USA
and France (22%) (DSM, 2018), but considerably less than Germany (54%).
The positive respondents to Q3 progressed to Q4, a multiple-choice question, for further evaluation of their
knowledge. Therefore, from the 82 respondents, 75.6% chose potatoes as a potential food source contributing
to high acrylamide exposure. Bread, biscuits and crackers were chosen by 52.4%, while 37.8% selected
coffee as a main contributory source of acrylamide (Table 3-5).
Meat was chosen by almost one-third of the respondents as one of the main food contributors in acrylamide
exposure. This is contrary to Tareke et al. (2002), who reported that, in general, protein-rich foods such as
fish, meat and poultry under heat-treatment showed lower amounts of acrylamide than carbohydrate-rich
foods. It is suggested that the data about choosing meat as a main source for acrylamide generation in this
study developed due to mis-differentiation between acrylamide and heterocyclic amines (HCAs) and
polycyclic aromatic hydrocarbons (PAHs) compounds. HCAs and PAHs can commonly be generated in
some cooked meats under high temperature, such as grilling and pan cooking (Cross and Sinha, 2004; Skog
et al., 1998).
To gain further insight about the knowledge of the respondents, and for data validity, an open question (Q5)
tested the reasons behind their selections regarding potential sources that contribute to high acrylamide
exposure. About one-third of respondents did not know their reasons, on the other hand, 56 participants gave
reasons. The results showed that starchy nature of the foods (as the reason for acrylamide formation) was
37.5%, while high temperature as a cause was represented by 19.6%. Additionally, ‘just knowledge’ was
selected by 26.8% as the reason behind their responses. Other reasons such as cooking methods, cooking
time and presence of asparagine in foodstuffs also were mentioned by two participants.

155
In order to gain further, in-depth understanding and evaluation of awareness, another confirmative question
(Q6) was asked about the conditions which may be responsible for the formation of acrylamide in foods.
From the 82 respondents, the amount who chose cooking at high temperatures represented 85.4%. This
percentage reflects the high level of awareness about the main causes for acrylamide formation in food, which
also confirmed the reliability of positive responses in regard to hearing about acrylamide. Q32 tested the
knowledge about the adverse health impact associated with chronic exposure to acrylamide or over-heated
carbohydrate foods. This question followed Q31, which informed the survey participants (N=555) about the
acrylamide term.
The results showed that there was nearly a consensus of 94.5% who stated that there were carcinogenic risks
associated with consumption of acrylamide. This percentage was shown in an open-ended question (Q32)
among the 177 respondents who heard about harmful compounds associated with overheating of
carbohydrate-based foods.
The recent EFSA report regarding the main sources for food-safety information in Ireland reported that TV
formed the highest source of information about food safety topics (59%), followed by internet searching
(47%), while paper media, radio and social media are nearly the same, between 37% to 39%. Person-to-
person information reached almost one-third (32%) (EFSA, 2019). These results indicate that the food-safety
issues are relatively well addressed among the media, but person-to-person knowledge or experiences are
sometimes not accurate and mostly depend on individual opinions rather than scientific facts. Comparing to
the present study data, as represented in answers to Q33, the main sources of information for those who
answered that “they had previously heard about harmful compounds arising from overheating carb foods”
are as follows: The dominant channels were via person-to-person (family/friends) which represents 41.6%,
followed by internet and social media as a channel for information (33.7%), while TV shows 18.5%.
The results indicate a shortage in media, press and TV channels to highlight acrylamide topics compared to
other food-safety topics. Therefore, most people take information from their family’s daily activities (habits)
or through searching for information online, as shown from the answers distribution. This way of gaining
information will open the door to the possibility of widespread misunderstanding and personal opinions rather
than scientific information, leading to unclear and incomplete perceptions about the potential risk. This
suggestion is confirmed when compared with the EFSA (2019) report. Additionally, this suggestion is
supported by the participants’ responses. While they referred to knowing about acrylamide, further questions
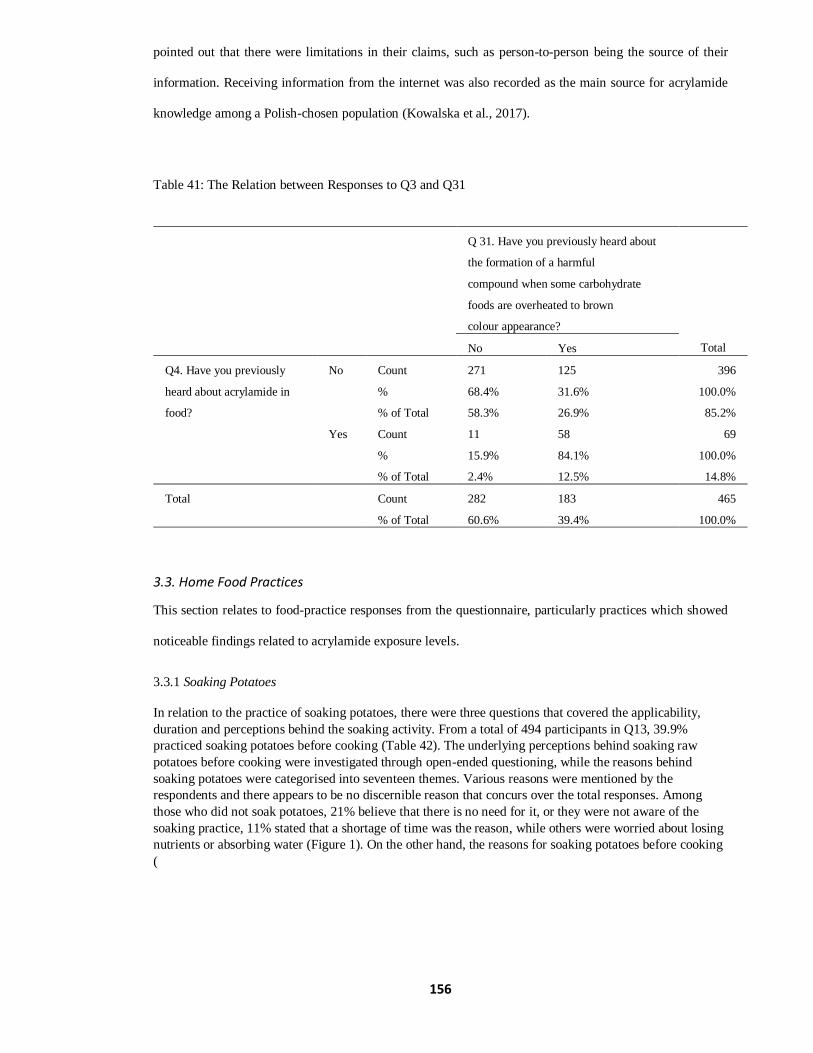
156
pointed out that there were limitations in their claims, such as person-to-person being the source of their
information. Receiving information from the internet was also recorded as the main source for acrylamide
knowledge among a Polish-chosen population (Kowalska et al., 2017).
Table 41: The Relation between Responses to Q3 and Q31
Q 31. Have you previously heard about
the formation of a harmful
compound when some carbohydrate
foods are overheated to brown
colour appearance?
Total No Yes
Q4. Have you previously
heard about acrylamide in
food?
No Count 271 125 396
% 68.4% 31.6% 100.0%
% of Total 58.3% 26.9% 85.2%
Yes Count 11 58 69
% 15.9% 84.1% 100.0%
% of Total 2.4% 12.5% 14.8%
Total Count 282 183 465
% of Total 60.6% 39.4% 100.0%
3.3. Home Food Practices
This section relates to food-practice responses from the questionnaire, particularly practices which showed
noticeable findings related to acrylamide exposure levels.
3.3.1 Soaking Potatoes
In relation to the practice of soaking potatoes, there were three questions that covered the applicability,
duration and perceptions behind the soaking activity. From a total of 494 participants in Q13, 39.9%
practiced soaking potatoes before cooking (Table 42). The underlying perceptions behind soaking raw
potatoes before cooking were investigated through open-ended questioning, while the reasons behind
soaking potatoes were categorised into seventeen themes. Various reasons were mentioned by the
respondents and there appears to be no discernible reason that concurs over the total responses. Among
those who did not soak potatoes, 21% believe that there is no need for it, or they were not aware of the
soaking practice, 11% stated that a shortage of time was the reason, while others were worried about losing
nutrients or absorbing water (Figure 1). On the other hand, the reasons for soaking potatoes before cooking
(

157
Figure 14) shows that starch extraction and preventing potatoes browning were the most repeated responses,
at 23.4% and 22.8% respectively. Some mentioned that they carried out soaking for hygienic purposes and
others referred to it being a transferable habit from the family.
Regarding to the average time for soaking fresh potatoes question, there was 309 participants, revealed that
the most common duration was five minutes or less 28.2%, whilst 25% soak potatoes for a 'convenient' time,
meanwhile soaking for 30 minutes or more represented the lowest group at 17%.
Table 42: Frequency of Soaking Potatoes before Cooking
Q13. Do you soak peeled or cut potatoes before frying or roasting?
Answer Choices Responses (N) Responses (%)
Always 85 17.2%
Never 165 33.4%
Usually 112 22.7%
Rarely 112 22.7%
Not sure 20 4.1%
Total participants 494
Skipping 61

158
Figure 21: The Reasons behind No-Soaking (Never and Rarely) Potatoes.
Figure 14: The Reasons behind Soaking (Always& Usually) Potatoes
Overall, the data about potato-soaking practices among the respondents indicates that almost 40% of those
who practice soaking as a part of the potato-preparation process. This result is more than double the soaking-
practice results among Spanish consumers, which was recorded to be 19.2% (Mesias, Delgado-Andrade,
0.0% 10.0% 20.0% 30.0% 40.0% 50.0% 60.0% 70.0% 80.0% 90.0%100.0%
Avoid absorbing waterCleaning
Crisp/ tastyImmediately cooking
In advance preparationloss nutrients
N/ANo Idea about Soaking
No need for soakingOther
ParboilPrevent browning
Prior washing occurred Starch Removal
SeasoningSoftening
Time consuming/not enough timeTransferable habit/ habit
No-Soaking Reasons
Never Rarely
0.0% 5.0% 10.0% 15.0% 20.0% 25.0% 30.0% 35.0% 40.0% 45.0% 50.0%
CleaningCrisp/ tasty
In advance preparationN/A
No Idea about SoakingNo need for soaking
OtherPrevent browning
Starch RemovalSeasoningSoftening
Time consuming/not enough timeTransferable habit/ habit
Reasons for Soaking Potatoes
Always Usually

159
Holgado, et al., 2018). However, the overall applicable times for soaking was a relatively short or non-
specific duration. Whereas, HEATOX (2007b) recommended the soaking time to be at least for 30 minutes
or more. In comparison, the result from a British field study showed that the participants did not consider
soaking potatoes before cooking as part of the preparation procedures. However, they did it whenever it was
convenient or when potatoes were peeled in advance to save time for other cooking tasks i.e. to prevent potato
browning (Brook Lyndhurst, 2014). Moreover, the present findings show there are perceptions about the
reasons behind soaking potatoes, such as removal of starch from potatoes, which was recorded as the most
common reason for soaking potatoes. This is reported as a powerful way to reduce acrylamide generation
(Pedreschi et al., 2006). Conversely, 'no need for soaking' as a reason was also presented among those who
denied the necessity for soaking, while some attributed it to shortage of available time for preparations and
cooking. Therefore, although there is awareness about soaking processes, the common actual time was not
long enough to fulfil the purpose of extracting the large portion of acrylamide precursors.
3.3.2 Parboiling Potatoes
Aiming to reduce the generation of higher amounts of acrylamide when dealing with fresh potatoes, many
projects and bodies recommended parboiling, soaking and blanching fresh potatoes before cooking to
eliminate starch contents from potatoes. This would subsequently limit acrylamide level in end-cooked meals
(FSAI, 2009; HEATOX, 2007a; UKHospitality, 2018). From a total of 493 who answered a question about
parboiling fresh potatoes before cooking, there were 51 respondents who confirmed that they always blanch
potatoes before further use (roasting or frying) in addition to 112 others who usually practice it, which
together formed almost 33%. The majority do not parboil potatoes before cooking, representing 58.4%. In
contrast to the current results, Brook Lyndhurst (2014) noted that all home-made fresh potatoes had been
parboiled before roasting by the British participants, aiming to save roasting time and gaining desirable
texture (N=275 respondents, open-ended questioning). In the current study, the most popular reason was
reducing the cooking time at 41.5%, while achieving desired tenderness and fluffiest taste represented 15.6%.
These are in line with the reasons that were mentioned previously by Brook Lyndhurst (2014). The results in
regard to blanching fresh potatoes before cooking suggest it is not a common practice at home in Ireland,
although it is an important step in reducing acrylamide formation in the end meals, and consequently
minimising exposure to acrylamide via home-made potatoes (Zhang et al., 2018; Shojaee-Aliabadi et al.,
2013; Viklund et al., 2010).
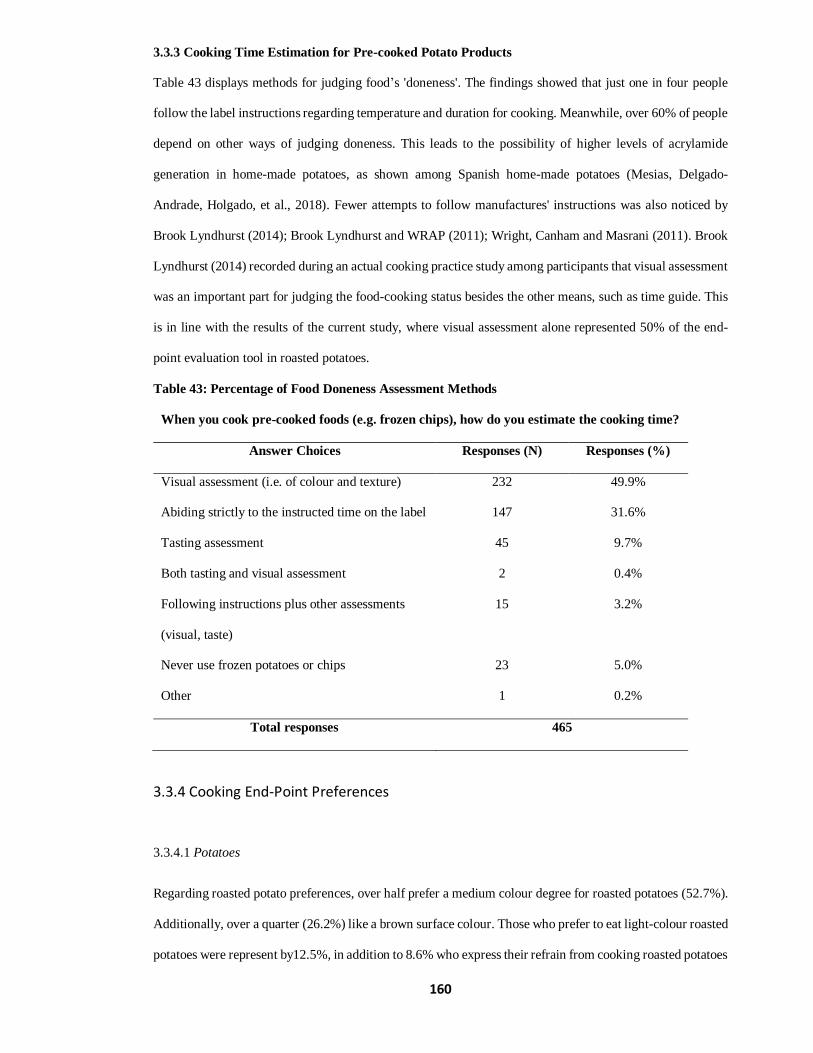
160
3.3.3 Cooking Time Estimation for Pre-cooked Potato Products
Table 43 displays methods for judging food’s 'doneness'. The findings showed that just one in four people
follow the label instructions regarding temperature and duration for cooking. Meanwhile, over 60% of people
depend on other ways of judging doneness. This leads to the possibility of higher levels of acrylamide
generation in home-made potatoes, as shown among Spanish home-made potatoes (Mesias, Delgado-
Andrade, Holgado, et al., 2018). Fewer attempts to follow manufactures' instructions was also noticed by
Brook Lyndhurst (2014); Brook Lyndhurst and WRAP (2011); Wright, Canham and Masrani (2011). Brook
Lyndhurst (2014) recorded during an actual cooking practice study among participants that visual assessment
was an important part for judging the food-cooking status besides the other means, such as time guide. This
is in line with the results of the current study, where visual assessment alone represented 50% of the end-
point evaluation tool in roasted potatoes.
Table 43: Percentage of Food Doneness Assessment Methods
When you cook pre-cooked foods (e.g. frozen chips), how do you estimate the cooking time?
Answer Choices Responses (N) Responses (%)
Visual assessment (i.e. of colour and texture) 232 49.9%
Abiding strictly to the instructed time on the label 147 31.6%
Tasting assessment 45 9.7%
Both tasting and visual assessment 2 0.4%
Following instructions plus other assessments
(visual, taste)
15 3.2%
Never use frozen potatoes or chips 23 5.0%
Other 1 0.2%
Total responses 465
3.3.4 Cooking End-Point Preferences
3.3.4.1 Potatoes
Regarding roasted potato preferences, over half prefer a medium colour degree for roasted potatoes (52.7%).
Additionally, over a quarter (26.2%) like a brown surface colour. Those who prefer to eat light-colour roasted
potatoes were represent by12.5%, in addition to 8.6% who express their refrain from cooking roasted potatoes

161
in general. The preference for a golden brown colour was also described as almost universally desired among
UK domestic food practices in a field study by Brook Lyndhurst (2014). Moreover, the researchers pointed
out that the term “golden” colour was not specific among the people when they described the degree of
doneness. Therefore, the current study used photos to avoid confusion or misinterpretation of the questions’
words.
The preferences of colour for chips ranged between yellow and brown. The findings demonstrate that there
is a similarity in the number of participants who like golden-yellow chips and golden-brown chips.
Combined, both preferences represent the majority, with approximately 93% among those who eat chips. On
the other hand, only 6.7% like cooking chips to a light degree.
When searching for the reasons behind cooking preferences, particularly for roasted potatoes and chips,
almost all the reasons for both were the same per individual, where the responses were through open-ended
questioning. The desire for tastier potatoes appeared clearly behind reasons such as crispy, crunchy and soft.
From the present results, the desire for crispness was the most mentioned reason. However, some other
reasons described did not differ from the comprehensive item, which is the taste, such as crunchy and tasty.
Consistent with this finding, Brook Lyndhurst (2014) summarised that most people look for crispness and
golden colouration of the potatoes, and reported that the desire for specific food preferences originated from
childhood experiences. In line with that, in a Spanish home-cooking pilot study, Mesias et al. (2018) recorded
that the colour of fried potatoes was considered as the major estimated parameter using for frying chips
cooking end-point and represented 87.7%, furthermore, golden degree preferences hit 92% aiming for
crunchiness and softness, which were considered the major reasons . The indication from the present study
is that the desired taste depends on the specific colour degree. Therefore, the link between taste and colour,
or appearance of the food, helps people in their choices, and that is also shown in previously mentioned
British and Spanish studies.
Most people prefer golden-to-brown colour, this suggests there may be scope to engineer potato varieties that
obtain a golden colour early at the cooking stage without increasing the level of acrylamide that may help to
overcome the present level of exposure which is linked to visual appearance.

162
3.3.4.2 Toasted Bread
The toasted bread preferences in this study shows the predominant choice is medium-toasted with 354 out of
465 respondents. Less than 5% recorded preferences for dark-coloured toast. The light toasting option is the
lowest risk, and is recommended by HEATOX (2007a), however the present study shows those who prefer
light toasted bread was under 15%.
Since, the findings from previous studies (Granby et al., 2008; Eerola et al., 2007; HAETOX, 2007a)
confirmed that elevated levels of acrylamide in medium toasting may reach fivefold higher than untoasted
bread. The level of acrylamide is also related to the type of the bread. In the present study, the findings refer
to there were among brown and wholemeal bread consumers about 76.5% (250) preferred medium toasting
degree (Table 44). This number forms about 70.6% (250) from the total number of whom desire a medium
toasting degree for bread in this current study. In the same time, the desire to medium toasting degree formed
76.1% (354) among the overall types of bread toasting preference degrees.
Table 44 Bread Toasting Preferences among Brown/Wholemeal Bread Responses
Bread Preference Bread Type Total
Wholemeal Brown
Dark Toasted Count 15 12 17
% within Bread Preference 88.2% 70.6%
% within Brown wholemeal 6.1% 6.3%
Light Toasted Count 27 29 48
% within Bread Preference 56.3% 60.4%
% within Brown wholemeal 11.0% 15.3%
Medium Toasted Count 193 139 250
% within Bread Preference 77.2% 55.6%
% within Brown wholemeal 78.8% 73.5%
Other Count 2 1 2
% within Bread Preference 100.0% 50. %
% within Brown wholemeal 0.8% 0.5%

163
Untoasted bread Count 8 8 10
% within Bread Preference 80.0% 80. %
% within Brown wholemeal 3.3% 4.2%
Total Count 245 189 327
Percentages and totals are based on respondents.
a. Dichotomy group tabulated at value 1.
Through an open-ended question, 464 participants described the reasons behind their particular toasting
degree preferences. The most frequently recorded reasons were in general the taste characteristic of the
specific toasting degree (23.5%), specifically the desire for crispness (19.6%) and crunchiness (12.5%). For
further insight, the link between the toasting degree preferences with the different reasons has been
summarised in Table 45. It was noticed that “tasty” reason showed ascending trend with the tendency for
more darker toasted bread preference, as “ tasty” reason forms about 20% in light and untoasted bread
responses and reached to over 40% among dark toasting responses. Also, the same pattern was observed in
regard to crunchiness desire, while crispness dominates in medium toasting choices. This results pattern is in
line with the fact that the Maillard reaction is responsible for producing the aroma, flavour and colour of the
cooked food, which is also linked to acrylamide generation (Nursten, 2005).
Table 45 Frequency of Reasons for Specific Toasting Degree Vs Toasting Preferences.
Toasting preference Untoasted+Light Medium Dark Total
Reason Category N % N % N % N %
Visually appealing 1 1.2% 21 5.9% 1 4.6% 24 4.8%
Texture 5 6.2% 33 9.3% 0 0.0% 38 7.6%
Aroma 2 2.5% 1 0.3% 1 4.6% 4 0.8%
Tasty 17 21.0% 83 23.5% 9 40.9% 109 21.7%
Crispy 8 9.9% 77 21.8% 4 18.2% 89 17.7%
Crunchy 2 2.5% 52 14.7% 4 18.2% 58 11.5%
Warm/hot 8 9.9% 16 4.5% 1 4.6% 25 5.0%
Soft 6 7.4% 5 1.4% 0 0.0% 11 2.2%
Healthy 5 6.2% 1 0.3% 0 0.0% 6 1.2%
Medium toasted 11 13.6% 17 4.8% 0 0.0% 28 5.6%
I don't like burnt toast 2 2.5% 1 0.3% 0 0.0% 3 0.6%
Other 16 19.8% 57 16.1% 1 4.6% 74 14.7%
N/A 6 7.4% 25 7.0% 3 13.6% 34 6.8%
Total responders 81 100% 354 100% 22 100% 503 100%
164
4. Conclusion
The existing knowledge about acrylamide formation and its risk among Irish residents suggested that the
scientific term “acrylamide” was not recognised widely among the inhabitants 14.8%, in contrast to the
definition as a harmful component formed during heat treatment of carbohydrate-rich food, which showed
about 39% recognising that. However, the awareness about the health risk of this harmful compound
(acrylamide) showed significant high percentage about the carcinogenic effects, which reached 94.5% among
those who heard about this harmful compound. The awareness about the role of high cooking temperature as
the main contributor in AA generation represented 85.4% in responses. Additionally, the results indicated
that linking the major foodstuff contributors in acrylamide formation showed that potatoes 75%, bread,
biscuits and cracks 52%, cereals 48% and coffee 38% were among the foodstuffs people associated with
acrylamide.
Overall, the suspected high exposure to AA through home-made food practices or food preferences in this
study emerge from a lack of knowledge of good cooking practices. In particularly, parboiling, soaking and
the surface colour degree preferences for cooked food. The process of parboiling and proper soaking fresh
potatoes were not considered common practices among the participants, which reflects the possibility of
keeping the levels of the precursors high, consequently increasing risk of acrylamide exposure. Where almost
40% soaking potatoes and 17% from them soaking potatoes for 30 minutes or more. While just 33% of the
participants are practicing parboiling before cooking. In addition to this, the tendency for golden yellow to
brown degree for cooked foods surfaces such as roasted potatoes, chips and toasted bread.
This highlights the recommendations for extensive focused efforts at different levels to teach and improve
knowledge about good cooking practices. Food habits must change to minimise exposure to acrylamide from
home- prepared meals. Awareness programmes should cover all age groups, with input from all relative
bodies and agencies, such as education sectors, food safety and industry. Those campaigns such as
a public awareness campaign Go for Gold, which aims to help consumers reduce their exposure to acrylamide
when cooking at home, which was launched by the Food Standards Agency (FSA) in the UK. Hand washing
campaign, food waste and other food safety campaigns by Safefood.
Acknowledgement
The author would like to acknowledge the support and facilities provided by Technological University
Dublin, Dublin, Ireland. Also, appreciation is noted for all participants in this survey.

165
References
Akinosun, T., Ojinnaka, D., & Aouzelleg, A. (2018). An awareness survey on the presence and
implications of acrylamide in West African foods and the extent of consumption of such
foods. Journal of Food Processing & Technology, 09, 53. https://doi.org/10.4172/2157-
7110-c5-090
Brook Lyndhurst. (2011). Consumer insight: date labels and storage guidance. Brook Lyndhurst
(Vol. 2010).
Brook Lyndhurst. (2014). Acrylamide in the home: Home-cooking practices and acrylamide
formation A report for the Food Standards Agency.
Cross, A. J., & Sinha, R. (2004). Meat-related mutagens/carcinogens in the etiology of colorectal
cancer. Environmental and Molecular Mutagenesis, 44(1), 44–55.
https://doi.org/10.1002/em.20030
DSM. (2018). How much do consumers really know about acrylamide? Retrieved from
https://www.dsm.com/markets/food-specialties/en/insights/articles/baking/how-much-do-
consumers-really-know-about-acrylamide.html
EFSA. (2015, June). Scientific Opinion on acrylamide in food.
https://doi.org/10.2903/j.efsa.2015.4104
EFSA. (2019). Eurobarometer 91.3 Food safety in the EU - Ireland. Retrieved June 26, 2019,
from
https://www.efsa.europa.eu/sites/default/files/corporate_publications/files/eurobarometer19/
country-factsheets/EB91.3_EFSA_fact_ie_en.pdf
FSAI. (2009). Acrylamide in food. Retrieved May 4, 2019, from
https://www.fsai.ie/WorkArea/DownloadAsset.aspx?id=8408
Gökmen, V, Şenyuva, H. Z., Dülek, B., & Çetin, A. E. (2007). Computer vision-based image
analysis for the estimation of acrylamide concentrations of potato chips and french fries.
Food Chemistry, 101(2), 791–798. https://doi.org/10.1016/j.foodchem.2006.02.034
Gökmen, Vural, & Şenyuva, H. Z. (2006). Study of colour and acrylamide formation in coffee,
wheat flour and potato chips during heating. Food Chemistry, 99, 238–243.
https://doi.org/10.1016/j.foodchem.2005.06.054
HEATOX. (2007a). Guidelines to authorities and cosumer organisations on home cooking and
cosumption. Retrieved February 2, 2019, from
http://www.ub.edu/cecem/Index/documents_index/D59_guidelines_to_authorities_and_con
sumer_organisations_on_home_cooking_and_consumption.pdf
HEATOX. (2007b). HEATOX Heat-generated food toxicants : identification , characterisation
and risk minimisation Final report. Retrieved February 2, 2019, from
https://cordis.europa.eu/publication/rcn/12731_en.html
Jackson, L. S., & Al-Taher, F. (2005). Effects of consumer food preparation on acrylamide
formation. In M. D. Friedman M. (Ed.), Advances in Experimental Medicine and Biology
(Vol. 561, pp. 447–465). Boston: Springer. https://doi.org/10.1007/0-387-24980-X_34
JECFA. (2006). Evaluation of certain food contaminants. World Health Organization Technical

166
Report Series., 930.
JECFA. (2011). Evaluation of certain contaminants in food: seventy-second report of the Joint
FAO/WHO Expert Committee on Food Additives.
Kowalska, M., Żbikowska, A., Onacik-Gür, S., & Kowalska, D. (2017). Acrylamide in food
products – eating habits and consumer awareness among medical school students. Annals of
Agricultural and Environmental Medicine, 24(4), 570–574.
https://doi.org/10.5604/12321966.1232764
Majcher, M., & Jeleń, H. H. (2007). Acrylamide formation in low-fat potato snacks and its
correlation with colour development. Food Additives and Contaminants, 24(4), 337–342.
https://doi.org/10.1080/02652030601185709
Matthäus, B., Haase, N. U., & Vosmann, K. (2004). Factors affecting the concentration of
acrylamide during deep-fat frying of potatoes. European Journal of Lipid Science and
Technology, 106(11), 793–801. https://doi.org/10.1002/ejlt.200400992
Meng, X., Zhao, J., & Qian, J. (2012). Investigation of the awareness and exposure level of
dietary acrylamide in the college students in Nanjing. Retrieved February 19, 2019, from
http://en.cnki.com.cn/Article_en/CJFDTotal-XIWS201202004.htm
Mesias, M., Delgado-Andrade, C., Holgado, F., & Morales, F. J. (2018). Acrylamide content in
French fries prepared in households: A pilot study in Spanish homes. Food Chemistry, 260,
44–52. https://doi.org/10.1016/j.foodchem.2018.03.140
Mesias, M., Delgado-Andrade, C., & Morales, F. (2018). Evaluation of domestic frying habits
and consumer ’ s preferences in Spanish households. SDRP Journal of Food Science &
Technology, 3(5), 450–459. https://doi.org/10.25177/JFST.3.5.1
Mestdagh, F., De Wilde, T., Castelein, P., Németh, O., Van Peteghem, C., & De Meulenaer, B.
(2008). Impact of the reducing sugars on the relationship between acrylamide and Maillard
browning in French fries. European Food Research and Technology, 227(1), 69–76.
https://doi.org/10.1007/s00217-007-0694-9
Michalak, J., Gujska, E., Czarnowska-Kujawska, M., & Nowak, F. (2017). Effect of different
home-cooking methods on acrylamide formation in pre-prepared croquettes. Journal of
Food Composition and Analysis, 56, 134–139. https://doi.org/10.1016/j.jfca.2016.12.006
Mustafa, A., Andersson, R., Rosén, J., Kamal-Eldin, A., & Åman, P. (2005). Factors influencing
acrylamide content and color in rye crisp bread. Journal of Agricultural and Food
Chemistry, 53(15), 5985–5989. https://doi.org/10.1021/jf050020q
Nachi, I., Fhoula, I., Smida, I., Ben Taher, I., Chouaibi, M., Jaunbergs, J., … Hassouna, M.
(2018). Assessment of lactic acid bacteria application for the reduction of acrylamide
formation in bread. LWT - Food Science and Technology, 92, 435–441.
https://doi.org/10.1016/j.lwt.2018.02.061
Nursten, H. E. (2005). The Maillard reaction : chemistry, biochemistry, and implications.
Cambridge: Royal Society of Chemistry.
Pedreschi, F., Kaack, K., & Granby, K. (2006). Acrylamide content and color development in
fried potato strips. Food Research International, 39(1), 40–46.
https://doi.org/10.1016/J.FOODRES.2005.06.001

167
Pedreschi, F., León, J., Mery, D., Moyano, P., Pedreschi, R., Kaack, K., & Granby, K. (2007).
Color development and acrylamide content of pre-dried potato chips. Journal of Food
Engineering, 79(3), 786–793. https://doi.org/10.1016/j.jfoodeng.2006.03.001
Pedreschi, F., Moyano, P., Kaack, K., & Granby, K. (2005). Color changes and acrylamide
formation in fried potato slices. Food Research International, 38, 1–9.
https://doi.org/10.1016/j.foodres.2004.07.002
Scientific Committee on Food (SCF). (2002). Opinion of the Scientific Committee on Food on
new findings regarding the presence of acrylamide in food. Brussel.
Serpen, A., & Gökmen, V. (2009). Evaluation of the Maillard reaction in potato crisps by
acrylamide, antioxidant capacity and color. Journal of Food Composition and Analysis,
22(6), 589–595. https://doi.org/10.1016/J.JFCA.2008.11.003
Shojaee-Aliabadi, S., Nikoopour, H., Kobarfard, F., Parsapour, M., Moslehishad, M.,
Hassanabadi, H., … Dahaghin, E. (2013). Acrylamide reduction in potato chips by selection
of potato variety grown in Iran and processing conditions. Journal of the Science of Food
and Agriculture, 93(10), 2556–2561. https://doi.org/10.1002/jsfa.6076
Surdyk, N., Rosén, J., Andersson, R., & Åman, P. (2004). Effects of Asparagine, Fructose, and
Baking Conditions on Acrylamide Content in Yeast-Leavened Wheat Bread. Journal of
Agricultural and Food Chemistry, 52, 2047–2051. https://doi.org/10.1021/jf034999w
Tareke, E., Rydberg, P., Karlsson, P., Eriksson, S., & Törnqvist, M. (2002). Analysis of
acrylamide, a carcinogen formed in heated foodstuffs. Journal of Agricultural and Food
Chemistry, 50(17), 4998–5006. https://doi.org/10.1021/jf020302f
UKHospitality. (2018). Industry Guide To Acrylamide Catering and Food Service. Retrieved
from https://www.ukhospitality.org.uk/page/FoodSafetyRegulationsandGuidance
Viklund, G. Å. I., Olsson, K. M., Sjöholm, I. M., & Skog, K. I. (2010). Acrylamide in crisps:
Effect of blanching studied on long-term stored potato clones. Journal of Food Composition
and Analysis, 23(2), 194–198. https://doi.org/10.1016/J.JFCA.2009.07.009
WHO. (2002). Health Implications of Acrylamide in Food. Report of a Joint FAO/WHO
Consultation, Geneva, Switzerland, 25–27th June.
Wright, M., Canham, R., & Masrani, R. (2011). Food safety behaviours in the home Final Report
for the Food Standards Agency.
Zajac, J., Bojar, I., Helbin, J., Kolarzyk, E., Potocki, A., Strzemecka, J., & Owoc, A. (2013). Dietary
acrylamide exposure in chosen population of South Poland. Annals of Agricultural and
Environmental Medicine, 20(2), 351–355.
Zhang, Y., Kahl, D. H. W., Bizimungu, B., & Lu, Z.-X. (2018). Effects of blanching treatments on
acrylamide, asparagine, reducing sugars and colour in potato chips. Journal of Food Science and
Technology, 55(10), 4028–4041. https://doi.org/10.1007/s13197-018-3329-1

168
APPENDICES
169
APPENDICES
Appendix A: The study questionnaire
Domestic Food Practices & Acrylamide Awareness in the
Republic of Ireland 2019
Dear Sir or Madam,
I am studying Food Safety Management. This survey is designed to measure the
acrylamide risk awareness and related domestic food practices of the residents in
Ireland. The survey is carried out as part of my master thesis. The questionnaire
can help researchers identify whether or not there are any common practices or
misconceptions that should be addressed. It takes about 7 minutes.
This survey is anonymous and your participation is voluntary. The data will be kept
confidentially, will not be disclosed to third parties and will be used solely for the
scientific purpose of this study. By completing this survey you are agreeing that that
anonymous data you provide will be analysed and may later be published by the
author. Kindly ask you to answer the questions completely and truthfully.
Please do not worry about spelling mistakes or grammar. I am only interested in
your actual daily food practices.
You are welcome to contact me with any questions or for more information.
E-mail: [email protected]
Thank you for participating in this survey.

170
* 4. Which of the following foods have the potential to contribute to high
acrylamide exposure? (Tick as many as are relevant).
Green vegetables
Fruit
Milk
Meat
Fish
Bread
Eggs
Potatoes
Poultry
Coffee
Biscuits /Crackers Cereals.
Beer. ………
.. Cereals.
No (ship to question No. 7)
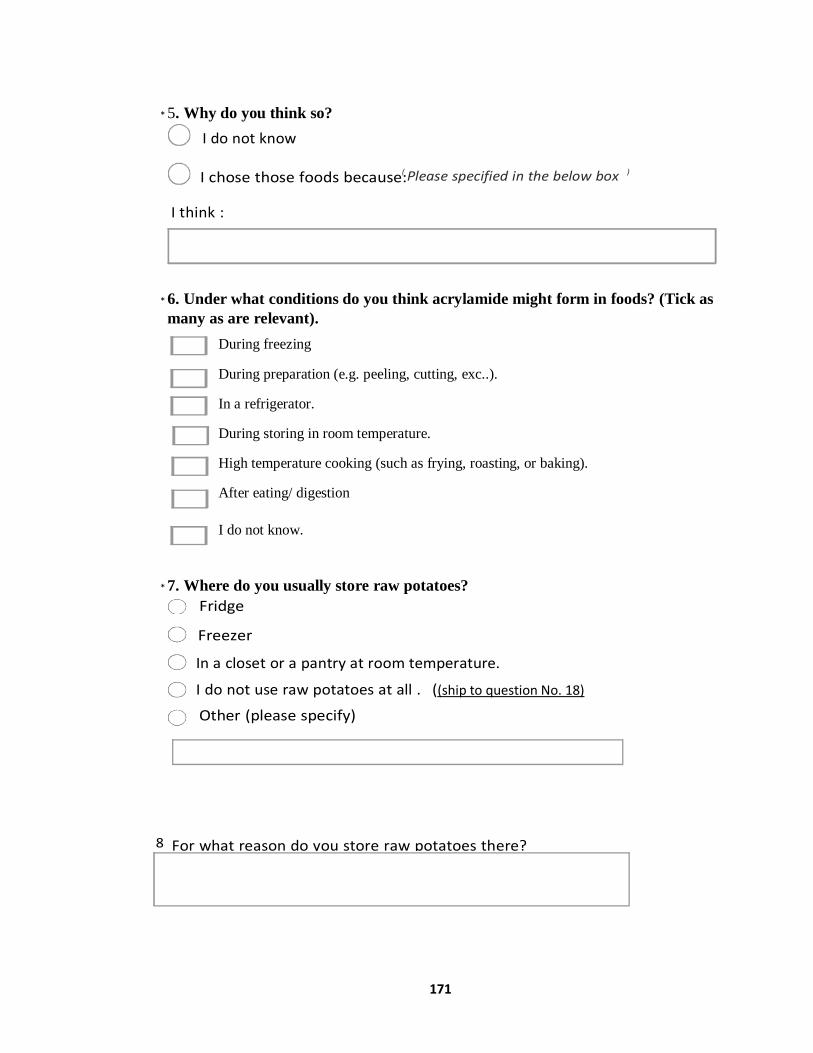
171
* 5. Why do you think so?
* 6. Under what conditions do you think acrylamide might form in foods? (Tick as
many as are relevant).
During freezing
During preparation (e.g. peeling, cutting, exc..).
In a refrigerator.
During storing in room temperature.
High temperature cooking (such as frying, roasting, or baking).
After eating/ digestion
I do not know.
* 7. Where do you usually store raw potatoes?
(ship to question No. 18)

172
9. For how long would you say you usually store raw potatoes from date of purchase?
0-3 days
4-6 days
7-9 days
For 2 weeks
More than 2 weeks
I can not remember.
* 10. Do you usually peel the potatoes before cooking?
Always
Never (skip to question No. 12)
Usually
Rarely
Not sure.

173
* 12. Which size do you usually cut potatoes for roasting? (Tick as many as are relevant)
Smaller size than above
photos.

174
* 13. Do you soak peeled or cut potatoes before frying or roasting?
Always
Never (skip to question No. 16)
Usually
Rarely
Not sure (skip to question No. 16)
* 14. For what reason do you soak, or not soak raw potatoes?
16. Do you parboil the potatoes before cooking?
Always
Never (skip to question No. 18)
Usually
Rarely
Not sure. (skip to question No. 18)

175
* 18. When you cook pre-cooked foods (e.g. frozen chips ), how do you estimate the
cooking time?
I can’t
rememb
er

176
* 20. Which photo represents your preference for roasted potatoes?
A
B
C
D. I do not cook roasted potatoes at all.
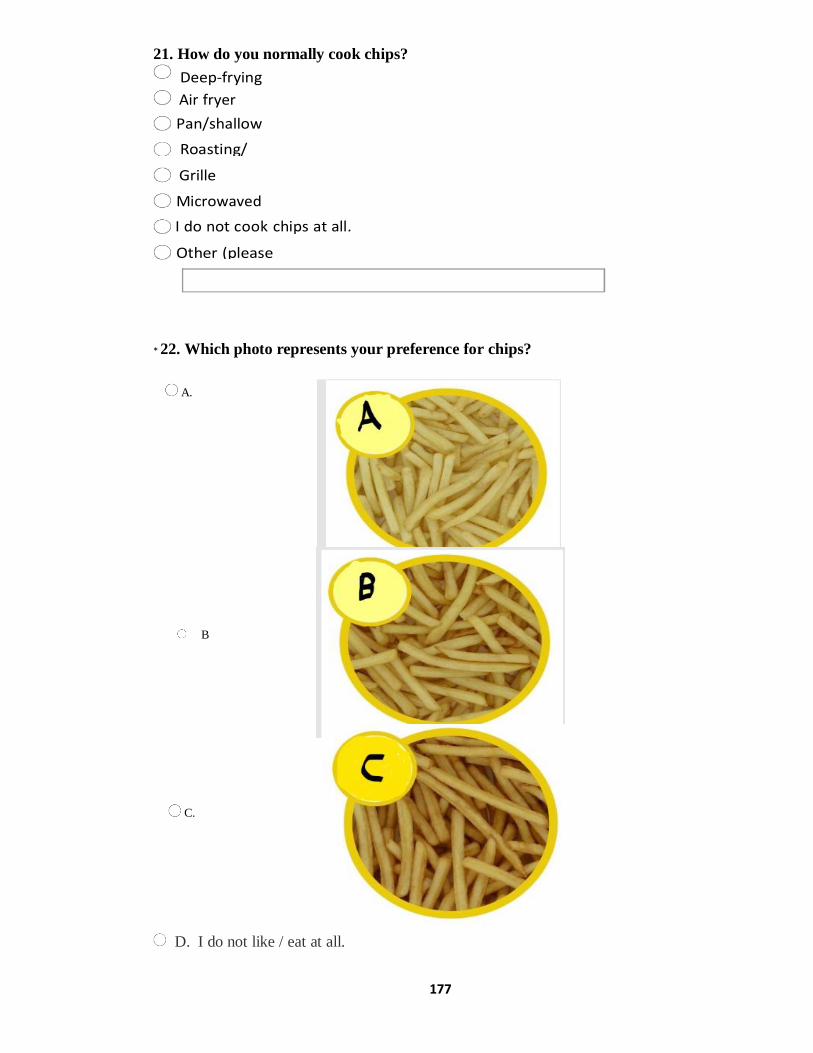
177
21. How do you normally cook chips?
* 22. Which photo represents your preference for chips?
A.
B
C.
D. I do not like / eat at all.

178
* 23. For what reasons do you have these colour preferences?
* 24. How often do you eat chips or roasted potatoes?
Daily
2-3 time weekly.
Once a week.
Once a month
Never
* 25. What type of bread do you usually buy? 'tick all that apply'
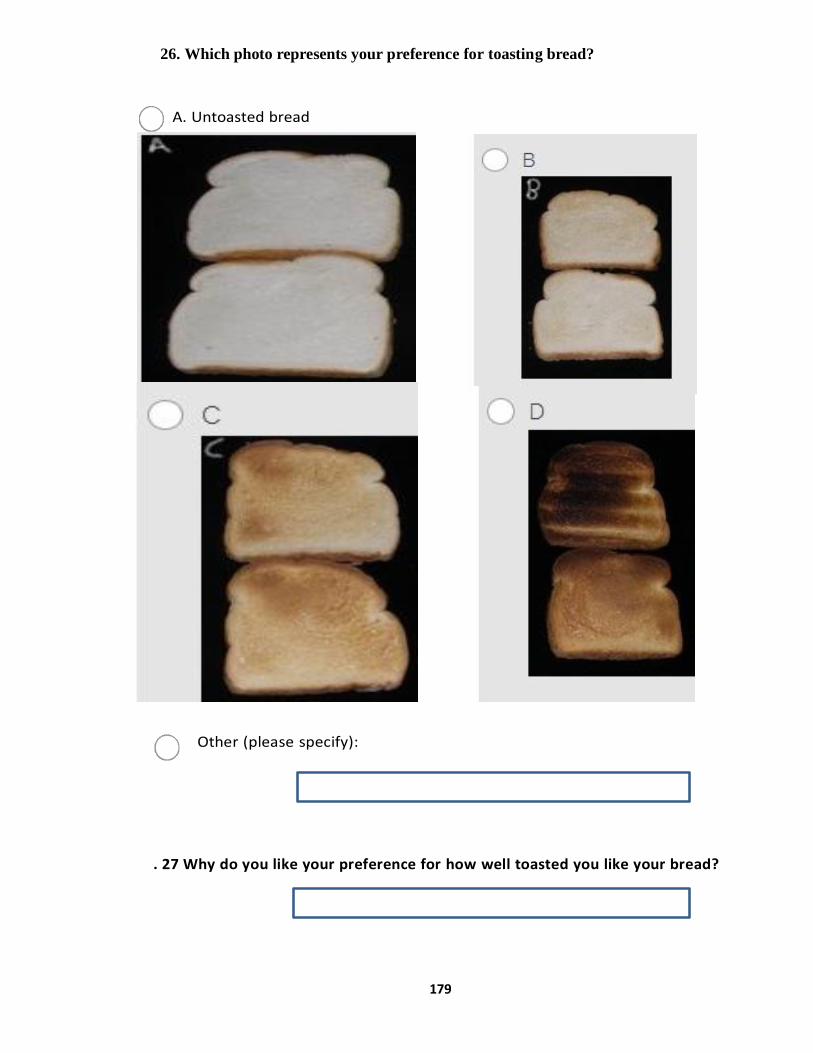
179
26. Which photo represents your preference for toasting bread?
A. Untoasted bread
Other (please specify):
. 27 Why do you like your preference for how well toasted you like your bread?

180
28. How many slices of bread do you usually eat per day?
* 29. Which type of coffee do you usually drink?
* 30. How many cups of coffee do you drink daily?
0 cup
1 cup
2 cups
3 cups
4 cups
5 cups
More than 5 cups.
* 31. Have you previously heard about the formation of a harmful compound when
some carbohydrate foods (eg. bread, potatoes) are overheated to brown colour
appearance?
Yes
No (skip to question No. 34)

181
32. What do you think are the negative health effects from this a harmful
compound?
* 33. From what source did you get your information about this harmful compound? ((Tick as many as are
relevant).
TV
Internet/ social media
Journal/Magazine
From person (Family/friends)
School/Collage.
Food Safety Authority of Ireland.
Other (please specify)
* 34. “Acrylamide is a harmful compound produced when some carbohydrate foods become brown due to
overheating” , should food packaging contain information about the content and safe level of acrylamide ( for
example the maximum daily limit)?
Yes, definitely
Definitely, not
I don’t have a strong opinion either.
* 35. In your opinion, should food packaging contain information about the potential formation of acrylamide in
the product if the cooking instructions are not properly followed?
Yes, definitely
Definitely not
I don’t have a strong opinion either.
* 36. In your opinion, if a product’s label listed acrylamide at a safe level ( or below the recommended daily
limit), would you buy the product?
Yes, definitely
Definitely not
Not sure
* 37. What is your residence area?
City/Town
Countryside

182
* 38. What is your age range?
Under 18
18-24
25-34
35-44
45-54
55-64
65+
39. Average household Income is
Below € 30,000
€ 30,000- € 60,000
Above € 60,000
* 40. What is the highest level of education you have completed?
University or other higher qualification
Leaving cert.
Junior cert.
No qualification
* 41. What is your gender?
Male
Female
Other
* 42. Family status:
Single
Single with children
Couple without children
Couple with children
Other
43. From what continental origins would your family’s culinary practices be most influenced by?
European-Irish
European- non Irish
North American
South American
Asian
African
Australian
Middle Eastern
Thank You ….Your participation is greatly appreciated

183
Appendix B: Author Guidelines for the Food Control Journal
FOOD CONTROL An official scientific journal of the European Federation of Food Science and Technology (EFFoST) and the International Union of Food Science and Technology (IUFoST). GUIDE FOR AUTHORS . INTRODUCTION
Food Control is an international journal that provides essential information for those involved in
food safety and process control.
Food Control covers: Microbial food safety and antimicrobial systemsMycotoxins Hazard analysis, HACCP and food
safety objectivesRisk assessment, including microbial risk assessmentQuality assurance and
controlGood manufacturing practicesFood process systems design and controlFood Packaging Rapid methods of analysis and detection, including sensor technology Environmental control and
safetyCodes of practice, legislation and international harmonizationConsumer issuesEducation,
training and researchneeds.
The scope of Food Control is comprehensive and includes original research papers, authoritative reviews, short communications, comment articles that report on new developments in food control,
and position papers.
The work described should be innovative either in the approach or in the methods used. The significance of the results either for the science community or for the food industry must also be
specified. Contributions that do not fulfil these requirements will not be considered for review and
publication. Types of paper
Original high-quality research papers (preferably no more than 7000 words, including tables and
illustrations). Major review articles, up to 10,000 words Short communications of up to 3000 words
(not including references), describing work that may be of a preliminary nature but which merits immediate publication. Short reviews on topical subjects, up to 6000 words. Comment articles not
exceeding 2000 words. Authoritative position papers from expert groups are also welcome.
Food Control also publishes book reviews, Letters to the Editor, conference reports and a calendar
of forthcoming events. The Editor-in-Chief has the right to decline formal review of a manuscript when it is deemed that
the manuscript is 1) on a topic outside the scope of the Journal; 2) lacking technical merit; 3) of
insufficient novelty for a wide international readership; 4) fragmentary and providing marginally incremental results; or 5) is poorly written.
All contributions deemed suitable for review are read by two or more referees to ensure both
accuracy and relevance, and revisions to the script may thus be required. On acceptance,
contributions are subject to editorial amendment to suit house style. When a manuscript is returned for revision prior to final acceptance, the revised version must be submitted as soon as possible
after the author's receipt of the referees' reports. Revised manuscripts returned after four months
will be considered as new submissions subject to full re-review.
Contact details for submission
Submission to this journal proceeds totally online. Use the following guidelines to prepare your
article. Via the homepage of this journal http://ees.elsevier.com/foodcont you will be guided stepwise
through the creation and uploading of the various files.
Submission checklist
You can use this list to carry out a final check of your submission before you send it to the journal for review. Please check the relevant section in this Guide for Authors for more details.
Ensure that the following items are present:
One author has been designated as the corresponding author with contact details: • E-mail address

184
• Full postal address
All necessary files have been uploaded: Manuscript: • Include keywords • All figures (include relevant captions) • All tables (including titles, description, footnotes) • Ensure all figure and table citations in the text match the files provided • Indicate clearly if color should be used for any figures in print Graphical Abstracts / Highlights files (where applicable) Supplemental files (where applicable) Further considerations • Manuscript has been 'spell checked' and 'grammar checked' • All references mentioned in the Reference List are cited in the text, and vice versa • Permission has been obtained for use of copyrighted material from other sources (including the Internet) • A competing interests statement is provided, even if the authors have no competing interests to declare • Journal policies detailed in this guide have been reviewed • Referee suggestions and contact details provided, based on journal requirements For further information, visit our Support Center. BEFORE YOU BEGIN Ethics in publishing Please see our information pages on Ethics in publishing and Ethical guidelines for journal publication. Declaration of interest All authors must disclose any financial and personal relationships with other people or organizations that could inappropriately influence (bias) their work. Examples of potential competing interests include employment, consultancies, stock ownership, honoraria, paid expert testimony, patent applications/registrations, and grants or other funding. Authors must disclose any interests in two places: 1. A summary declaration of interest statement in the title page file (if double-blind) or the manuscript file (if single-blind). If there are no interests to declare then please state this: 'Declarations of interest: none'. This summary statement will be ultimately published if the article is accepted. 2. Detailed disclosures as part of a separate Declaration of Interest form, which forms part of the journal's official records. It is important for potential interests to be declared in both places and that the information matches. More information. Submission declaration and verification Submission of an article implies that the work described has not been published previously (except in the form of an abstract, a published lecture or academic thesis, see 'Multiple, redundant or concurrent publication' for more information), that it is not under consideration for publication elsewhere, that its publication is approved by all authors and tacitly or explicitly by the responsible authorities where the work was carried out, and that, if accepted, it will not be published elsewhere in the same form, in English or in any other language, including electronically without the written consent of the copyrightholder. To verify originality, your article may be checked by the originality detection service Crossref Similarity Check. Preprints Please note that preprints can be shared anywhere at any time, in line with Elsevier's sharing policy. Sharing your preprints e.g. on a preprint server will not count as prior publication (see 'Multiple, redundant or concurrent publication' for more information). Use of inclusive language Inclusive language acknowledges diversity, conveys respect to all people, is sensitive to differences, and promotes equal opportunities. Articles should make no assumptions about the beliefs or commitments of any reader, should contain nothing which might imply that one individual is superior to another on the grounds of race, sex, culture or any other characteristic, and should use inclusive language throughout. Authors should ensure that writing is free from bias, for instance

185
by using 'he or she', 'his/her' instead of 'he' or 'his', and by making use of job titles that are free of stereotyping (e.g. 'chairperson' instead of 'chairman' and 'flight attendant' instead of 'stewardess'). Changes to authorship Authors are expected to consider carefully the list and order of authors before submitting their manuscript and provide the definitive list of authors at the time of the original submission. Any addition, deletion or rearrangement of author names in the authorship list should be made only before the manuscript has been accepted and only if approved by the journal Editor. To request such a change, the Editor must receive the following from the corresponding author: (a) the reason for the change in author list and (b) written confirmation (e-mail, letter) from all authors that they agree with the addition, removal or rearrangement. In the case of addition or removal of authors, this includes confirmation from the author being added or removed. Only in exceptional circumstances will the Editor consider the addition, deletion or rearrangement of authors after the manuscript has been accepted. While the Editor considers the request, publication of the manuscript will be suspended. If the manuscript has already been published in an online issue, any requests approved by the Editor will result in a corrigendum. Copyright Upon acceptance of an article, authors will be asked to complete a 'Journal Publishing Agreement' (see more information on this). An e-mail will be sent to the corresponding author confirming receipt of the manuscript together with a 'Journal Publishing Agreement' form or a link to the online version of this agreement. Subscribers may reproduce tables of contents or prepare lists of articles including abstracts for internal circulation within their institutions. Permission of the Publisher is required for resale or distribution outside the institution and for all other derivative works, including compilations and translations. If excerpts from other copyrighted works are included, the author(s) must obtain written permission from the copyright owners and credit the source(s) in the article. Elsevier has preprinted forms for use by authors in these cases. For gold open access articles: Upon acceptance of an article, authors will be asked to complete an 'Exclusive License Agreement' (more information). Permitted third party reuse of gold open access articles is determined by the author's choice of user license. Author rights As an author you (or your employer or institution) have certain rights to reuse your work. More
information.
Elsevier supports responsible sharing Find out how you can share your research published in Elsevier
journals.
Role of the funding source
You are requested to identify who provided financial support for the conduct of the research and/or
preparation of the article and to briefly describe the role of the sponsor(s), if any, in study design; in the
collection, analysis and interpretation of data; in the writing of the report; and in the decision to submit the article for publication. If the funding source(s) had no such involvement then this should be stated.
Funding body agreements and policies Elsevier has established a number of agreements with funding bodies
which allow authors to comply with their funder's open access policies. Some funding bodies will reimburse
the author for the gold open access publication fee. Details of existing agreements are available online.
Open access
This journal offers authors a choice in publishing their research:
Subscription
• Articles are made available to subscribers as well as developing countries and patient groups through our
universal access programs.
• No open access publication fee payable by authors.
• The Author is entitled to post the accepted manuscript in their institution's repository and make this public
after an embargo period (known as green Open Access). The published journal article cannot be shared publicly, for example on Research Gate or Academia.edu, to ensure the sustainability of peer reviewed
research in journal publications. The embargo period for this journal can be found below.
Gold open access
• Articles are freely available to both subscribers and the wider public with permitted reuse.
• A gold open access publication fee is payable by authors or on their behalf, e.g. by their research funder or
institution.
Regardless of how you choose to publish your article, the journal will apply the same peer review
criteria and acceptance standards.
For gold open access articles, permitted third party (re)use is defined by the following Creative
Commons user licenses:
Creative Commons Attribution (CC BY)
186
Lets others distribute and copy the article, create extracts, abstracts, and other revised versions,
adaptations or derivative works of or from an article (such as a translation), include in a collective
work (such as an anthology), text or data mine the article, even for commercial purposes, as long
as they credit the author(s), do not represent the author as endorsing their adaptation of the article, and do not modify the article in such a way as to damage the author's honor or reputation.
Creative Commons Attribution-NonCommercial-NoDerivs (CC BY-NC-ND)
For non-commercial purposes, lets others distribute and copy the article, and to include in a collective work
(such as an anthology), as long as they credit the author(s) and provided they do not alter or modify the
article.
The gold open access publication fee for this journal is USD 3550, excluding taxes. Learn more about
Elsevier's pricing policy: https://www.elsevier.com/openaccesspricing.
Green open access Authors can share their research in a variety of different ways and Elsevier has a number of green open access options available. We recommend authors see our open access page for further information. Authors can also self-archive their manuscripts immediately and enable public access from their institution's repository after an embargo period. This is the version that has been accepted for publication and which typically includes author-incorporated changes suggested during submission, peer review and in editor-author communications. Embargo period: For subscription articles, an appropriate amount of time is needed for journals to deliver value to subscribing customers before an article becomes freely available to the public. This is the embargo period and it begins from the date the article is formally published online in its final and fully citable form. Find out more. This journal has an embargo period of 12 months. Elsevier Researcher Academy Researcher Academy is a free e-learning platform designed to support early and mid-career researchers throughout their research journey. The "Learn" environment at Researcher Academy offers several interactive modules, webinars, downloadable guides and resources to guide you through the process of writing for research and going through peer review. Feel free to use these free resources to improve your submission and navigate the publication process with ease. Language (usage and editing services) Please write your text in good English (American or British usage is accepted, but not a mixture of these). Authors who feel their English language manuscript may require editing to eliminate possible grammatical or spelling errors and to conform to correct scientific English may wish to use the English Language Editing service available from Elsevier's Author Services. Submission Our online submission system guides you stepwise through the process of entering your article details and uploading your files. The system converts your article files to a single PDF file used in the peer-review process. Editable files (e.g., Word, LaTeX) are required to typeset your article for final publication. All correspondence, including notification of the Editor's decision and requests for revision, is sent by e-mail. Authors must provide and use an email address unique to themselves and not shared with another author registered in EES, or a department. Referees Please submit the names and institutional e-mail addresses of several potential referees. For more details, visit our Support site. Note that the editor retains the sole right to decide whether or not the suggested reviewers are used. PREPARATION Peer review This journal operates a single blind review process. All contributions will be initially assessed by the editor for suitability for the journal. Papers deemed suitable are then typically sent to a minimum of two independent expert reviewers to assess the scientific quality of the paper. The Editor is responsible for the final decision regarding acceptance or rejection of articles. The Editor's decision is final. More information on types of peer review. Use of word processing software It is important that the file be saved in the native format of the word processor used. The text should be in single-column format. Keep the layout of the text as simple as possible. Most formatting codes will be removed and replaced on processing the article. In particular, do not use the word processor's options to justify text or to hyphenate words. However, do use bold face, italics, subscripts, superscripts etc. When preparing tables, if you are using a table grid, use only

187
one grid for each individual table and not a grid for each row. If no grid is used, use tabs, not spaces, to align columns. The electronic text should be prepared in a way very similar to that of conventional manuscripts (see also the Guide to Publishing with Elsevier). Note that source files of figures, tables and text graphics will be required whether or not you embed your figures in the text. See also the section on Electronic artwork. To avoid unnecessary errors you are strongly advised to use the 'spell-check' and 'grammar-check' functions of your word processor. Request you to kindly submit your manuscript with continuous line numbers. Article structure Subdivision - numbered sections Divide your article into clearly defined and numbered sections. Subsections should be numbered 1.1 (then 1.1.1, 1.1.2, .), 1.2, etc. (the abstract is not included in section numbering). Use this numbering also for internal cross-referencing: do not just refer to 'the text'. Any subsection may be given a brief heading. Each heading should appear on its own separate line. Introduction State the objectives of the work and provide an adequate background, avoiding a detailed literature survey or a summary of the results. Materials and Methods Provide sufficient details to allow the work to be reproduced by an independent researcher. Methods that are already published should be summarized, and indicated by a reference. If quoting directly from a previously published method, use quotation marks and also cite the source. Any modifications to existing methods should also be described. Key Resources Table To enable reproducibility of the research, we encourage authors to submit a Key Resources Table, which helps make the resources clear to readers. The Key Resources Table highlights the genetically modified organisms and strains, cell lines, reagents and other resources essential to reproduce the results presented in a paper. More information is available here https://www.elsevier.com/authors/ author-resources/key-resources-table Theory/calculation A Theory section should extend, not repeat, the background to the article already dealt with in the Introduction and lay the foundation for further work. In contrast, a Calculation section represents a practical development from a theoretical basis. Results Results should be clear and concise. Discussion This should explore the significance of the results of the work, not repeat them. A combined Results and Discussion section is often appropriate. Avoid extensive citations and discussion of published literature. Conclusions The main conclusions of the study may be presented in a short Conclusions section, which may stand alone or form a subsection of a Discussion or Results and Discussion section. Appendices If there is more than one appendix, they should be identified as A, B, etc. Formulae and equations in appendices should be given separate numbering: Eq. (A.1), Eq. (A.2), etc.; in a subsequent appendix, Eq. (B.1) and so on. Similarly for tables and figures: Table A.1; Fig. A.1, etc. Essential title page information • Title. Concise and informative. Titles are often used in information-retrieval systems. Avoid abbreviations and formulae where possible. • Author names and affiliations. Please clearly indicate the given name(s) and family name(s) of each author and check that all names are accurately spelled. You can add your name between parentheses in your own script behind the English transliteration. Present the authors' affiliation addresses (where the actual work was done) below the names. Indicate all affiliations with a lowercase superscript letter immediately after the author's name and in front of the appropriate address. Provide the full postal address of each affiliation, including the country name and, if available, the e-mail address of each author. • Corresponding author. Clearly indicate who will handle correspondence at all stages of refereeing and publication, also post-publication. This responsibility includes answering any future queries about Methodology and Materials. Ensure that the e-mail address is given and that contact details are kept up to date by the corresponding author. • Present/permanent address. If an author has moved since the work described in the article was done, or was visiting at the time, a 'Present address' (or 'Permanent address') may be indicated as

188
a footnote to that author's name. The address at which the author actually did the work must be retained as the main, affiliation address. Superscript Arabic numerals are used for such footnotes. Highlights Highlights are mandatory for this journal. They consist of a short collection of bullet points that convey the core findings of the article and should be submitted in a separate editable file in the online submission system. Please use 'Highlights' in the file name and include 3 to 5 bullet points (maximum 85 characters, including spaces, per bullet point). You can view example Highlights on our information site. Abstract A concise and factual abstract is required. The abstract should state briefly the purpose of the research, the principal results and major conclusions. An abstract is often presented separately from the article, so it must be able to stand alone. For this reason, References should be avoided, but if essential, then cite the author(s) and year(s). Also, non-standard or uncommon abbreviations should be avoided, but if essential they must be defined at their first mention in the abstract itself. Keywords Immediately after the abstract, provide a maximum of 6 keywords, using American spelling and avoiding general and plural terms and multiple concepts (avoid, for example, 'and', 'of'). Be sparing with abbreviations: only abbreviations firmly established in the field may be eligible. These keywords will be used for indexing purposes. Abbreviations Define abbreviations that are not standard in this field in a footnote to be placed on the first page of the article. Such abbreviations that are unavoidable in the abstract must be defined at their first mention there, as well as in the footnote. Ensure consistency of abbreviations throughout the article. Acknowledgements Collate acknowledgements in a separate section at the end of the article before the references and do not, therefore, include them on the title page, as a footnote to the title or otherwise. List here those individuals who provided help during the research (e.g., providing language help, writing assistance or proof reading the article, etc.). Formatting of funding sources List funding sources in this standard way to facilitate compliance to funder's requirements: Funding: This work was supported by the National Institutes of Health [grant numbers xxxx, yyyy]; the Bill & Melinda Gates Foundation, Seattle, WA [grant number zzzz]; and the United States Institutes of Peace [grant number aaaa]. It is not necessary to include detailed descriptions on the program or type of grants and awards. When funding is from a block grant or other resources available to a university, college, or other research institution, submit the name of the institute or organization that provided the funding. If no funding has been provided for the research, please include the following sentence: This research did not receive any specific grant from funding agencies in the public, commercial, or not-for-profit sectors. Units Follow internationally accepted rules and conventions: use the international system of units (SI). If other units are mentioned, please give their equivalent in SI. Math formulae Please submit math equations as editable text and not as images. Present simple formulae in line with normal text where possible and use the solidus (/) instead of a horizontal line for small fractional terms, e.g., X/Y. In principle, variables are to be presented in italics. Powers of e are often more conveniently denoted by exp. Number consecutively any equations that have to be displayed separately from the text (if referred to explicitly in the text). Matematical and technical settings Use the appropriate number of significant figures to express your data - they should be justifiable and reflect the necessary level of accuracy of the method. A normal maximum should be 3 - e.g. 37.1, 2.53). Detailed mathematical discussion should be placed in an appendix. Equations and formulae should be typewritten. Equations should be numbered consecutively with Arabic numerals in parentheses on the right hand side of the page. Special symbols should be identified in the margin, and the meaning of all symbols should be explained in the text where they first occur. If you use several symbols, a list of definitions (not necessarily for publication) will help the editor. Type mathematical equations exactly as they should appear in print. Journal style for letter symbols is as follows: italic (indicated by underlining); constants, roman type; matrices and vectors, bold type (indicated by wavy underlining). Footnotes

189
Footnotes should be used sparingly. Number them consecutively throughout the article. Many word processors can build footnotes into the text, and this feature may be used. Otherwise, please indicate
the position of footnotes in the text and list the footnotes themselves separately at the end of the
article. Do not include footnotes in the Reference list.
Artwork Electronic artwork
General points
• Make sure you use uniform lettering and sizing of your original artwork. • Embed the used fonts if the application provides that option.
• Aim to use the following fonts in your illustrations: Arial, Courier, Times New Roman, Symbol,
or
use fonts that look similar. • Number the illustrations according to their sequence in the text.
• Use a logical naming convention for your artwork files.
• Provide captions to illustrations separately. • Size the illustrations close to the desired dimensions of the published version.
• Submit each illustration as a separate file.
A detailed guide on electronic artwork is available.
You are urged to visit this site; some excerpts from the detailed information are given here.
Formats
If your electronic artwork is created in a Microsoft Office application (Word, PowerPoint, Excel)
then please supply 'as is' in the native document format. Regardless of the application used other than Microsoft Office, when your electronic artwork is
finalized, please 'Save as' or convert the images to one of the following formats (note the resolution
requirements for line drawings, halftones, and line/halftone combinations given below): EPS (or PDF): Vector drawings, embed all used fonts.
TIFF (or JPEG): Color or grayscale photographs (halftones), keep to a minimum of 300 dpi.
TIFF (or JPEG): Bitmapped (pure black & white pixels) line drawings, keep to a minimum of 1000 dpi.
TIFF (or JPEG): Combinations bitmapped line/half-tone (color or grayscale), keep to a minimum
of 500 dpi.
Please do not: • Supply files that are optimized for screen use (e.g., GIF, BMP, PICT, WPG); these typically have
a low number of pixels and limited set of colors;
• Supply files that are too low in resolution; • Submit graphics that are disproportionately large for the content.
Color artwork
Please make sure that artwork files are in an acceptable format (TIFF (or JPEG), EPS (or PDF), or
MS Office files) and with the correct resolution. If, together with your accepted article, you submit usable color figures then Elsevier will ensure, at no additional charge, that these figures will appear
in color online (e.g., ScienceDirect and other sites) regardless of whether or not these illustrations
are reproduced in color in the printed version. For color reproduction in print, you will receive
information regarding the costs from Elsevier after receipt of your accepted article. Please
indicate your preference for color: in print or online only. Further information on the preparation
of electronic artwork. Figure captions
Ensure that each illustration has a caption. Supply captions separately, not attached to the figure. A
caption should comprise a brief title (not on the figure itself) and a description of the illustration.
Keep text in the illustrations themselves to a minimum but explain all symbols and abbreviations used.
Tables
Please submit tables as editable text and not as images. Tables can be placed either next to the relevant text in the article, or on separate page(s) at the end. Number tables consecutively in
accordance with their appearance in the text and place any table notes below the table body. Be
sparing in the use of tables and ensure that the data presented in them do not duplicate results

190
described elsewhere in the article. Please avoid using vertical rules and shading in table cells.
References
Citation in text
Please ensure that every reference cited in the text is also present in the reference list (and vice
versa). Any references cited in the abstract must be given in full. Unpublished results and personal communications are not recommended in the reference list, but may be mentioned in the text. If
these references are included in the reference list they should follow the standard reference style of
the journal and should include a substitution of the publication date with either 'Unpublished results' or 'Personal communication'. Citation of a reference as 'in press' implies that the item has been
accepted for publication.
Web references
As a minimum, the full URL should be given and the date when the reference was last accessed. Any further information, if known (DOI, author names, dates, reference to a source publication,
etc.), should also be given. Web references can be listed separately (e.g., after the reference list)
under a different heading if desired, or can be included in the reference list. Data references this journal encourages you to cite underlying or relevant datasets in your
manuscript by citing them in your text and including a data reference in your Reference List. Data
references should include the following elements: author name(s), dataset title, data repository, version (where available), year, and global persistent identifier. Add [dataset] immediately before
the reference so we can properly identify it as a data reference. The [dataset] identifier will not
appear in your published article.
References in a special issue Please ensure that the words 'this issue' are added to any references in the list (and any citations in
the text) to other articles in the same Special Issue.
Reference management software Most Elsevier journals have their reference template available in many of the most popular
reference management software products. These include all products that support Citation Style
Language styles, such as Mendeley. Using citation plug-ins from these products, authors only need to select the appropriate journal template when preparing their article, after which citations and
bibliographies will be automatically formatted in the journal's style. If no template is yet available
for this journal, please follow the format of the sample references and citations as shown in this
Guide. If you use reference management software, please ensure that you remove all field codes before submitting the electronic manuscript. More information on how to remove field codes from
different reference management software.
Users of Mendeley Desktop can easily install the reference style for this journal by clicking the following link: http://open.mendeley.com/use-citation-style/food-control
When preparing your manuscript, you will then be able to select this style using the Mendeley
plugins for Microsoft Word or LibreOffice.
Reference style Text: Citations in the text should follow the referencing style used by the American Psychological
Association. You are referred to the Publication Manual of the American Psychological Association,
Sixth Edition, ISBN 978-1-4338-0561-5, copies of which may be ordered online or APA Order Dept., P.O.B. 2710, Hyattsville, MD 20784, USA or APA, 3 Henrietta Street, London, WC3E 8LU, UK.
List: references should be arranged first alphabetically and then further sorted chronologically if
necessary. More than one reference from the same author(s) in the same year must be identified by the
letters 'a', 'b', 'c', etc., placed after the year of publication.
Examples:
Reference to a journal publication:
Van der Geer, J., Hanraads, J. A. J., & Lupton, R. A. (2010). The art of writing a scientific article.
Journal of Scientific Communications, 163, 51–59. https://doi.org/10.1016/j.Sc.2010.00372.
Reference to a journal publication with an article number:
Van der Geer, J., Hanraads, J. A. J., & Lupton, R. A. (2018). The art of writing a scientific article.
Heliyon, 19, e00205. https://doi.org/10.1016/j.heliyon.2018.e00205.
Reference to a book: Strunk, W., Jr., & White, E. B. (2000). The elements of style. (4th ed.). New York: Longman, (Chapter 4).
Reference to a chapter in an edited book:

191
Mettam, G. R., & Adams, L. B. (2009). How to prepare an electronic version of your article. In B. S.
Jones, & R. Z. Smith (Eds.), Introduction to the electronic age (pp. 281–304). New York: E-Publishing Inc.
Reference to a website:
Cancer Research UK. Cancer statistics reports for the UK. (2003). http://www.cancerresearchuk.org/aboutcancer/statistics/cancerstatsreport/ Accessed 13 March 2003.
Reference to a dataset:
[dataset] Oguro, M., Imahiro, S., Saito, S., Nakashizuka, T. (2015). Mortality data for Japanese
oak wilt disease and surrounding forest compositions. Mendeley Data, v1.
https://doi.org/10.17632/xwj98nb39r.1.
Reference to a conference paper or poster presentation:
Engle, E.K., Cash, T.F., & Jarry, J.L. (2009, November). The Body Image Behaviours Inventory-3:
Development and validation of the Body Image Compulsive Actions and Body Image Avoidance
Scales.Poster session presentation at the meeting of the Association for Behavioural and Cognitive
Therapies,New York, NY.
Journal abbreviations source Journal names should be abbreviated according to the List of Title Word Abbreviations.
Video
Elsevier accepts video material and animation sequences to support and enhance your scientific
research. Authors who have video or animation files that they wish to submit with their article are
strongly encouraged to include links to these within the body of the article. This can be done in the same way as a figure or table by referring to the video or animation content and noting in the body
text where it should be placed. All submitted files should be properly labeled so that they directly
relate to the video file's content. . In order to ensure that your video or animation material is directly
usable, please provide the file in one of our recommended file formats with a preferred maximum size of 150 MB per file, 1 GB in total. Video and animation files supplied will be published online
in the electronic version of your article in Elsevier Web products, including ScienceDirect. Please
supply 'stills' with your files: you can choose any frame from the video or animation or make a separate image. These will be used instead of standard icons and will personalize the link to your
video data. more detailed instructions please visit our video instruction pages. Note: since video
and animation cannot be embedded in the print version of the journal, please provide text for both the electronic and the print version for the portions of the article that refer to this content.
Data visualization
Include interactive data visualizations in your publication and let your readers interact and engage
more closely with your research. Follow the instructions here to find out about available data visualization options and how to include them with your article.
Supplementary material
Supplementary material such as applications, images and sound clips, can be published with your article to enhance it. Submitted supplementary items are published exactly as they are received
(Excel or PowerPoint files will appear as such online). Please submit your material together with
the article and supply a concise, descriptive caption for each supplementary file. If you wish to make changes to supplementary material during any stage of the process, please make sure to
provide an updated file.
Do not annotate any corrections on a previous version. Please switch off the 'Track Changes' option
in Microsoft Office files as these will appear in the published version.
Research data
This journal encourages and enables you to share data that supports your research publication
where appropriate, and enables you to interlink the data with your published articles. Research data refers to the results of observations or experimentation that validate research findings. To facilitate
reproducibility and data reuse, this journal also encourages you to share your software, code,
models, algorithms, protocols, methods and other useful materials related to the project.
Below are a number of ways in which you can associate data with your article or make a statement about the availability of your data when submitting your manuscript. If you are sharing data in one
of these ways, you are encouraged to cite the data in your manuscript and reference list. Please refer
to the "References" section for more information about data citation. For more information on depositing, sharing and using research data and other relevant research materials, visit the research
data page.

192
Data linking If you have made your research data available in a data repository, you can link your article directly
to the dataset. Elsevier collaborates with a number of repositories to link articles on ScienceDirect
with relevant repositories, giving readers access to underlying data that gives them a better
understanding of the research described. There are different ways to link your datasets to your article. When available, you can directly link
your dataset to your article by providing the relevant information in the submission system. For
more information, visit the database linking page. For supported data repositories a repository banner will automatically appear next to your published
article on ScienceDirect. In addition, you can link to relevant data or entities through identifiers
within the text of your manuscript, using the following format: Database: xxxx (e.g., TAIR:
AT1G01020; CCDC: 734053;PDB: 1XFN). Mendeley Data
This journal supports Mendeley Data, enabling you to deposit any research data (including raw and
processed data, video, code, software, algorithms, protocols, and methods) associated with your manuscript in a free-to-use, open access repository. During the submission process, after uploading
your manuscript, you will have the opportunity to upload your relevant datasets directly to
Mendeley Data. The datasets will be listed and directly accessible to readers next to your published article online. For more information, visit the Mendeley Data for journals page.
Data statement
To foster transparency, we encourage you to state the availability of your data in your submission.
This may be a requirement of your funding body or institution. If your data is unavailable to access or unsuitable to post, you will have the opportunity to indicate why during the submission process,
for example by stating that the research data is confidential. The statement will appear with your
published article on ScienceDirect. For more information, visit the Data Statement page.
AFTER ACCEPTANCE
Online proof correction
Corresponding authors will receive an e-mail with a link to our online proofing system, allowing annotation and correction of proofs online. The environment is similar to MS Word: in addition to
editing text, you can also comment on figures/tables and answer questions from the Copy Editor.
Web-based proofing provides a faster and less error-prone process by allowing you to directly type
your corrections, eliminating the potential introduction of errors. If preferred, you can still choose to annotate and upload your edits on the PDF version. All
instructions for proofing will be given in the e-mail we send to authors, including alternative
methods to the online version and PDF. We will do everything possible to get your article published quickly and accurately. Please use this
proof only for checking the typesetting, editing, completeness and correctness of the text, tables
and figures. Significant changes to the article as accepted for publication will only be considered
at this stage with permission from the Editor. It is important to ensure that all corrections are sent back to us in one communication. Please check carefully before replying, as inclusion of any
subsequent corrections cannot be guaranteed. Proofreading is solely your responsibility.
Offprints The corresponding author will, at no cost, receive a customized Share Link providing 50 days free
access to the final published version of the article on ScienceDirect. The Share Link can be used
for sharing the article via any communication channel, including email and social media. For an extra charge, paper offprints can be ordered via the offprint order form which is sent once the article
is accepted for publication. Both corresponding and co-authors may order offprints at any time via
Elsevier's Author Services. Corresponding authors who have published their article gold open
access do not receive a Share Link as their final published version of the article is available open access on ScienceDirect and can be shared through the article DOI link.
AUTHOR INQUIRIES
Visit the Elsevier Support Center to find the answers you need. Here you will find everything from Frequently Asked Questions to ways to get in touch.
You can also check the status of your submitted article or find out when your accepted article will
be published. © Copyright 2018 Elsevier | https://www.elsevier.com