Research Article - mes mampad college
88
Research Article MES MAMPAD International Journal of Humanities and Social Science (MESIJHSS) Corresponding Author: Anjusha. K. P 1 Anjusha. K. P Abstract Public distribution system (PDS) is an Indian food security system, established by the Government of India under ministry of consumer affairs, food and public distribution, that are managed jointly by the all state governments in India. The present study basically tries to study different aspect of public distribution system which will help to improve socio-economic status of study area .This study completely focuses public distribution through Maveli Store. The study is descriptive in nature and collected data from 60 households to conduct the study. Key Words: Public distribution system, Maveli store,subsidy, food security Public distribution system (PDS) is an Indian food security system, established by the Government of India under ministry of consumer affairs, food and public distribution, that are managed jointly by the all state governments in India .It distributes subsidized food and non-food items to India’s poor .This scheme was launched in India on June 1947.Major commodities distributed include staple food grains, such as wheat, rice and also other essential articles like sugar, kerosene oil. The central and state governments shared the responsibility of regulating the PDS .While the central government is responsible for procurement, storage, transportation and bulk allocation of food grains .State government hold the responsibility for distributing the same to the consumer trough the established network of fair price shops (FPSS).State governments are also responsible for operational responsibilities including allocation and identification of families below poverty line. India’s distribution system consists two components namely private distribution system channel and public distribution system channel .Both are supplemental but very influential. The public Available online at http://mesmampad.org/researchjournals.php ERFORMANCE OF PUBLIC DISTRIBUTION SYSTEM IN KERALA WITH SPECIAL REFERENCE TO MAVELI STORE- A CASE STUDY OF MANKADA GRAMMA PANCHAYAT
-
Upload
khangminh22 -
Category
Documents
-
view
2 -
download
0
Transcript of Research Article - mes mampad college

Research Article
MES MAMPAD International Journal of Humanities and Social Science (MESIJHSS)
Corresponding Author: Anjusha. K. P 1
Anjusha. K. P
Abstract
Public distribution system (PDS) is an Indian food security system, established by
the Government of India under ministry of consumer affairs, food and public distribution,
that are managed jointly by the all state governments in India. The present study
basically tries to study different aspect of public distribution system which will help to
improve socio-economic status of study area .This study completely focuses public
distribution through Maveli Store. The study is descriptive in nature and collected data
from 60 households to conduct the study.
Key Words: Public distribution system, Maveli store,subsidy, food security
Public distribution system (PDS) is an Indian food security system, established by
the Government of India under ministry of consumer affairs, food and public distribution,
that are managed jointly by the all state governments in India .It distributes subsidized
food and non-food items to India’s poor .This scheme was launched in India on June
1947.Major commodities distributed include staple food grains, such as wheat, rice and
also other essential articles like sugar, kerosene oil.
The central and state governments shared the responsibility of regulating the PDS
.While the central government is responsible for procurement, storage, transportation
and bulk allocation of food grains .State government hold the responsibility for
distributing the same to the consumer trough the established network of fair price shops
(FPSS).State governments are also responsible for operational responsibilities including
allocation and identification of families below poverty line. India’s distribution system
consists two components namely private distribution system channel and public
distribution system channel .Both are supplemental but very influential. The public
Available online at http://mesmampad.org/researchjournals.php
ERFORMANCE OF PUBLIC DISTRIBUTION SYSTEM IN
KERALA WITH SPECIAL REFERENCE TO MAVELI STORE- A CASE
STUDY OF MANKADA GRAMMA PANCHAYAT

Research Article
MES MAMPAD International Journal of Humanities and Social Science (MESIJHSS)
Corresponding Author: Anjusha. K. P 2
distribution system channel operates a system which is both anti-inflationary and anti-
poverty
The essential commodities act 1955 was enacted by government of India .As an
act to facilitate control and regulate usage of essential commodities and the government
of Kerala made the Kerala rationing order in 1965.The civil supplies department
discharges the responsibilities of market discipline and promotion of consumer
awareness and protection of their interest.
Antyodaya Anna Yojana (AAY) and Annapurna schemes are special programs
which were launched in 2000, to support the poorest of the poor and needy senior
citizens. Both these schemes are linked with the existing public distribution system.
More than 1Crore families below the poverty line have benefited through this scheme .At
Present the whole country is covered by the public distribution system for food grains.
However, there are many differences commodity coverage, entitlements, prices
etc……from state to state. The public distribution system as a permanent feature of
strategy to control prices, reduce fluctuations and achieve equitable distribution of
essential commodities. Now a day there is tremendous growth in the use of PDS. The
government of Kerala assists this operation by giving grant every year .The task has
been fulfilled through the network of maveli store. Now maveli store has become a
familiar and accessible among consumers rather than ration shop.
Thus governments has introduced a dual-pricing formula in the public
distribution which would ensure a better deal to the 32crore of people living below the
poverty line, designated targeted public distribution system will thus provide 10kgs food
grains per month to families living below the poverty line with annual income of Rs
15000,or less. Special cards are be issued to those families the issue prices of food grains
sold to holders of special cards have been fixed at Rs 3.50 per kg of rice and Rs 2.50 per
kg of wheat .For card holders who are above the poverty line the revised issue prices will
be Rs 6.50 and Rs 7.50 for fine and super fine varieties of rice and Rs 4.50 for a kg of
wheat.
Research Article
MES MAMPAD International Journal of Humanities and Social Science (MESIJHSS)
Corresponding Author: Anjusha. K. P 3
The total food subsidy has been projected at Rs 8,282Crore. Prior to the
introduction of revised PDS, the subsidy had been calculated at Rs5, 884crore.The
annual income of Rs 15000 a year cut off line had been fixed by the planning commission
using the methodology devised by the expert group led by Prof Lakdawala Subsequently
the amount of supply of food grains for a family living below the poverty line (BPL) has
been enhance from 10kg per month per family to 25kg per month per family. Thus, in
order to make PDS more responsive to the needs of the poor, the targeted public
distribution system (TPDS) was introduced in June 1997.This system is now making
attempt to target families below the poverty line (BPL) at heavily subsidized rates.
Major Objectives of PDS
1. To protect the low income groups by guaranteeing the supply of certain minimum
quantities of food grains at affordable price.
2. Ensuring equitable distribution.
3. Controlling the price rise of essential commodities in the open market.
The study basically tries to study different aspect of public distribution system
which will help to improve socio-economic status of study area .This study completely
focuses public distribution through Maveli store. Maveli store is a venture of the Kerala
State civil supplies corporation (supply co)under thegovernment program of market
invention, pulses and spices are purchased and sold to the consumers at subsidized prices
fixed by government. The government of Kerala aids this operation by giving grants
every year.
The prime objective of the state food policy is to eliminate hunger and poverty by
ensuring food security to all the people. The Government of Kerala has been
implementing universal public distribution system to realize this objective .Adequate
availability of food grains at affordable rates and ensure easy access of public distribution
system outlets by establishing it in close proximity to habitations are the key parameters
on which the system of public distribution is being built.
Research Article
MES MAMPAD International Journal of Humanities and Social Science (MESIJHSS)
Corresponding Author: Anjusha. K. P 4
Although Targeted Public Distribution System (TPDS) is advocated by
government of India it may lead to exclusion of large number of genuine BPL families
and vulnerable APL families thereby depriving them from the benefit of public
distribution system. The process of identifying BPL families is also fraught with errors
and bias resulting in high level of exclusion of deserving family’s .Further due to
unforeseen natural calamities like droughts, floods and disaster….,a large number of
vulnerable APL families may be forced in to poverty trap again. Our rigid government
system will not be able to respond quickly to such situation. Therefore targeting a
specific segment of population as BPL or APL and excluding large number of vulnerable
families under public distribution system is felt administratively unacceptable and
socially risky to the government .thus out of its own experience government of Kerala
better feels that universal public distribution system assures better food security to people
Methodology The research design is descriptive in nature and it involves observing and
describing the behavior of the subject wit out influencing it any way. In order to carry out
the project work sample size is fixed as 60 and method used for sample selection was
convenience sampling. It is the process of collecting information as a representative part
of the population. For this study both primary and secondary data has been used. Data
collected from60 numbers of maveli store. The data has been collected from direct
consumer through a structured questionnaire, and the secondary data’s has been collected
from books, internet, and journals etc.
Analysis In order to collect primary data for analyzing the performance of PDS in Mankada
Gramm Panchayat, sample has been collected from 18 ward among the 60 households
with the help of pre-scheduled questionnaire. The study mainly focus the socio-economic
status of study area through PDS and so education level ,occupation ,income level are the
major factors of the study and also this study tries to reveal the benefit derived out of
PDS and the problem related to PDS. Educational level of sampled consumers is given
below:

Research Article
MES MAMPAD International Journal of Humanities and Social Science (MESIJHSS)
Corresponding Author: Anjusha. K. P 5
Education Level of Consumers
Table 1: Education Level of Consumers
Class No: of Respondent Percentage
Illiterate 14 23.3
SSLC 30 50
Plus Two 6 10
Higher Educated 10 16.7
Total 60 100
Source: Primary data
Education is classified in to four categories that is Illiterate, SSLC, Plus two and
Higher educated. The study shows that 23.3% of consumer are illiterate,50% of
consumers are SSLC, 10% of consumers are Plus two and16.7% of consumers are higher
educated. The table specifies that highly educated or above SSLC are prefer less maveli
store. The study also reveals that 66.7% of consumers are daily wages only 4% of
consumers are private employees and 8% are both government employees and others and
so, most of the consumers are daily wage earner and the majority of consumers included
5000-10000 monthly income group and least number of consumers are among the high
income group.
Opinion about prices is depicted in Table No.2
Opinion about Price
Table:2 Opinion About Price
Opinion No:of Respondent Percentage
Very High 2 3.4
High 10 16.6
Moderate 32 53.3
Low 14 23.3
Very Low 2 3.4
Total 60 100

Research Article
MES MAMPAD International Journal of Humanities and Social Science (MESIJHSS)
Corresponding Author: Anjusha. K. P 6
Source: Primary data
This table is showing opinion about price charged by PDS.3.4% of respondents
opined maveli stores charged very high price.16.6% of consumers suggest high price
charged by maveli store.23.3% of consumers opined maveli store charged low price,3.4%
of respondents suggest very low price charged by maveli store and most of the consumers
that is 53.3% are opined maveli stores charged moderate price. so that majority of the
people attracted to maveli store on the basis of faire price so, price is the main factor
which attract people to maveli store.
Opinion about Quality of Food Items
Table:3 Opinion About Quality of Food Items
Opinion No:of Respondent Percentage
Very Good 8 13.3
Good 30 50
Average 14 23.4
Bad 6 10
Very Bad 2 3.3
Total 60 100
Source:Primarydata
Figure: 1
0
10
20
30
40
50
60
VERY GOOD GOOD AVERAGE BAD VERY BAD
NO OF RESPONDENT PERCENTAGE

Research Article
MES MAMPAD International Journal of Humanities and Social Science (MESIJHSS)
Corresponding Author: Anjusha. K. P 7
It is clear that opinion about quality of food items.13.3% of consumers suggest
very good quality items provided through PDS. 50% of them opined good,23.4% of
consumers suggest quality of product have average level. 10and 3.3 of them suggest
product quality is bad and also very bad. Most of the consumers suggest products of
maveli store have good quality level.
Common Difficulties Faced From Maveli Store
TABLE: 4. Common Difficulties Faced From Maveli Store
Difficulties No:of Respondent Percentage
Inferior Quality 4 6.7
Long Queue 40 66.7
Black Marketing _ _
More Than Prescribed Rate 2 3.3
Faulty Weightment 2 3.3
Un Availability of Branded Products 12 20
Total 60 100
Source:Primarydata.
Figure 2
0
10
20
30
40
50
60
70
80
INFERIORQUALITY
LONG QUEUE BLACKMARKETING
MORE THANPRESCRIBED RATE
FAULTYWEIGHTMENT
UN AVAILABILITYOF BRANDED
PRODUCTS
Chart Title
NO OF RESPONDENT PERCENTAGE

Research Article
MES MAMPAD International Journal of Humanities and Social Science (MESIJHSS)
Corresponding Author: Anjusha. K. P 8
It is clear that one of the most common difficulty faced from maveli store is long
queue,20% of people face difficulty is un availability of brand products.6.7% of
consumers suggest the main difficulty is inferior quality and 3.3% of consumers suggest
main difficulty is they faced from maveli store is both more than prescribed rates and
faulty weights .It is clear that black marketing does not exist in Maveli store. Besides in
the above the study we can understand that maveli stores are insufficient to provide
proper availability of food items and most of the respondents opined they did not get
perfect awareness about subsidized food grains per month and unavailability of branded
products is the major difficult problem facing from maveli store
Suggestions:
Maveli stores should be make efforts to improve various services offered by it,
and it should be continued to enabling poor people to avail them in better service and also
it should try to bring transparent service, provide more branded products.
Conclusion:
From the study it is concluded that the low income groups get quality product at
fair price. The objectives of maveli store is that of price stabilization and poverty
elimination. They are help full to avoid poverty of our nation. In the present situation in
mankada Panchayatthe usage of Maveli store increases day by day because their quality
of product, service availabilities etc. The analysis has shown that Consumers have
positive attitude towards Maveli store in Mankada Panchayat.
References
1. Surya Narayana.M.H.: “PDS Reform and scope for commodity based
targeting”.
2. Ruddar Duff: “Food Security in India”- papper presented seminar on social
on India.
3. Ravi.k&Radakrishna: “National Food Security” A policy perspective for
India.

Research Article
MES MAMPAD International Journal of Humanities and Social Science (MESIJHSS)
Corresponding Author: Anjusha. K. P 9
4. Ishwar.c.Dingra﴾ 1995 ﴿: The Indian Economy- Resources Planning
development and problem Sulthanchand&Sona- New Delhi.
5. PhanaSulkar.S.J: Edible oil problem and Public Distribution, Economic and
political weekly Vol xxv – Dec – 1990
6. Aravind Gupta: Public Distribution of food grains in India CMA menegraph
No. 69.
7. Gupta ﴾ 1997 ﴿: Distribution of food grains in India.
8. Mishra G.P ﴾ 1979 ﴿: “Food Policy and Procurement of food grains.”
9. Journals:
Southern economics
Yojana
w.w.wpds in India.com
w.w.wpds in Kerala.com

Research Article
MES MAMPAD International Journal of Humanities and Social Science (MESIJHSS)
Corresponding Author: Anjusha. K. P 10
PROBLEMS FACED BY WORKING WOMEN IN THEIR WORKING PLACE:
AN OCCUPATION WISE ANALYSIS
Anusha George
Student, Third Semester MA Economics, MES Mampad College, Mampad
Abstract
Generally women have to play various roles in our social life. But mostly they are
considered as backward or depressed class of people. The attitude towards women is
changing at present in our society. Most of them are now working in organised and
unorganised sectors. At present they earn, and their decision powers increased also. But
as a member from the depressed class they are facing lots of challenges in their working
place and family life. This study focuses on issues related to occupational segregation,
and the gendered division of domestic duties at home. So this study is proposed to be held
in wandoor Gram Panchayat in Malappuram.
Key Words: Working women,harassment,working place
Introduction
A women who earns a salary, wages, or other income through regular
employment, usually, outside the home is called working women. In other words, a
woman employed in a manual or industrial labour is considered as working women.
Women in workforce earning wages or salary as a part of the modern phenomenon, one
that developed at the same time as the growth of paid employment for man, but women
have been challenged by inequality in the workforce. Women’s lack of access to higher
education had effectively excluded them from the practice of well paid and high status
occupations.
Majority of female employees tend to pay less than their male counterparts. This
is different from direct wage discrimination within occupations, as males in the female
dominated professions will also make lower than average wages and the women in the
male dominated occupations usually make higher than average wages. The occupational
Available online at http://mesmampad.org/researchjournals.php
Corresponding Author: Anusha George

Research Article
MES MAMPAD International Journal of Humanities and Social Science (MESIJHSS)
Corresponding Author: Anjusha. K. P 11
dissimilarity index is a measure from Zero to Hundred; it measures the percent of labours
that would need to be rearranged in to a job typically done by the opposite sex in order
for the wage differential to disappear. Working women’s status is changed and they have
a lot of problems also. As a working woman most of them are facing a conflict between
family life and working life. Most of them need to do their domestic duties along with
their paid jobs. Most of them are not ready to travel long distance for job due to family
restrictions. Safety in working place is another problem. They face much harassment in
their working place. Inequality in workplace is also shown in their wages too.
Mainly there are Five problems that the working women are faced:-
I) Work Life Balance
II) Gender Pay Gap
III) Harassment at Work Place
IV) Unequal Career Opportunity
V) Impact of having Children in their Career.
Work Life Balance
Working women wants to make solution for the conflict between working life and
family life. Presently our society changes their concern to woman. They also supported to
earn by women. But they expected to return home at a certain time, cook, clean and take
care of family affairs. That means they are not accepted as working professionals in their
family. Now times, they still visualize women as individuals who should be in charge of
the kitchen and other domestic affairs.
Gender Pay Gap
Gender pay gap means the difference between the wages paid to men and women.
The gender pay wage gap is shrinking in India. Women earn 56% of what their male
colleagues earn for performing the same work. The more educated a women is the wider
the gender pay gap. The gender pay gap increases as women advance in their careers. The
gender pay gap is an inequality faced by working women in their workplace.
Corresponding Author: Anusha George

Research Article
MES MAMPAD International Journal of Humanities and Social Science (MESIJHSS)
Corresponding Author: Anjusha. K. P 12
Harassment in Work Place
Woman faces mental or sexual harassment or gender bias in their workplace from
the side of their boss or from their male counter parts. Gossips, non-acceptance of talent
are the main types of harassments faced by woman. They are not capable to make a voice
against this. The harassments will not reveal by them to their families. If there is such
problem most of them are decided to resign the job. But some of them are make wise
solutions to it.
Equal Career Opportunities
There is difference between males and females in making their career progress.
Even if both male and female have same educational qualification their career
opportunities are different. Most of the time female counter part has a restriction of
family. They cannot work in the late nights; they will not have permission for business
tours or a long distance to travel. And another problem is that there is no much role
model to working women. So they need always a support from their male counter parts.
Impact of Having Children in their Careers
For a married woman, faces lots of troubles from their families. Having a child
will not be permissible in some workplace. If she is pregnant there will be physical
problems to her. Such problems can get solutions if their colleagues adjust to it. But some
of them will ask to her why you come in this situation. If the baby born then she will need
to gave special attention to the baby. This will be conflicted with her family duties and
working life.
The problems discussed above are the main problems faced by working woman.
In short, discrimination at work, challenges to safety, life and dignity, harassments, non-
acceptance of talent, family duties are the problems faced by working women.
Working women in Indian(Source of data is missing) labour force have following trends:-
Overall the labour force participation rate for women is falling from 37% in
2004-05 to 29% in 2009-10.
Corresponding Author: Anusha George

Research Article
MES MAMPAD International Journal of Humanities and Social Science (MESIJHSS)
Corresponding Author: Anjusha. K. P 13
In 2011-12, women comprised 24.8% of all rural workers, down from 31.8%
in 1972-73.
In 2011-12, women comprised 14.7% of all urban workers, a small increase
from 13.4% in 1972-73.
13.4% of Indian working women have a regular salaried job as compared to
21.2% of working men [aged 15-59].
The study depends on primary and secondary data. This study is based on primary
data which has been collected by personal interview from working women through 50
samples questionnaire. A sample of 50 working women has been selected on a random
sampling basis.
The secondary data which has been collected from selected official journals,
records, internet, books, etc.
Working women are those who are earn wage or salary through regular
employment outside the home. Working women need to play two roles as a member of
the family and as an employee.
Working women get sounder now-a- days. Economic power of them has
increased. But even in these times the status of them are has remained unchanged in some
perspectives. The imbalances between working life and family life, pay gap, harassments
in work place, domestic duties etc are some of them.
These problems affected her working potential, and it will also make her
relationships inactive. To get a happy and active life a working women need her family
support immensely.
Only a micro level study can provide a concrete and clear cut picture of all these
issues in rural areas. So this study is proposed to be held in wandoor Gram Panchayat in
Malappuram district with the following specific objectives:-
To find various challenges faced by working women.
To analyse the role played by working women in social and family life.
To study the problems of working women in various occupation. Corresponding Author: Anjusha George

Research Article
MES MAMPAD International Journal of Humanities and Social Science (MESIJHSS)
Corresponding Author: Anjusha. K. P 14
According to 2011 census there is 12115 total workers in Wandoor panchayath.
Among them 9640 males and 2475 females are included. Wandoor has 31% (about 16
thousand) population engaged in either main or marginal workers.50% males and 13%
female population are workers.
The analysis of working women problem shows that they want to perform dual
role. This became a serious issue in their life. They are suffering from a lot of problems
in working life and family life.
An important observation from the analysis of the data is the changing attitude of
working women. This changing trend can be seen from the age wise distribution of
samples. Most of the samples is included in the age of 25-35. And samples from above 45
are comparatively low. That means as years passing the number of women who enter into
work force increased.
Educational qualifications of working women are satisfactory. Most of them have
plus two level educations. But the number is comparatively lower in the case of higher
education.
Another important finding of this study is that most of the women are working in
unorganized sector. Private sector is give job to majority of the women. And most of
these jobs are temporary. But they need to work more than six hour.
The study reveals that women prefer the jobs like teacher, nurse, sales girl etc.
The main attraction that they pointed out is those jobs are female dominated ones.
But except nurse, police etc women did not prefer night shift jobs. The reasons for
this attitude are having child, family responsibility, there is no support from family, less
time to spend with children etc. Those who work in night also considered the night duty
as a problem which arises due to compulsion.
Corresponding Author: Anusha George

Research Article
MES MAMPAD International Journal of Humanities and Social Science (MESIJHSS)
Corresponding Author: Anjusha. K. P 15
Another important finding of the study is that the primary reason for work force
participation of women is economic fulfilment. They are argued that their remuneration is
a support to family expenses. And all of them have economic power by this job.
The major issue they faced are harassments, time management problem, and wage
difference. Harassment in work place are divided as mental harassment, gender bias, and
sexual harassment. They are not ready to say about these problems. But most of them are
agreed that there is mental harassment and gender bias exist in the work place.
Harassments at work place faced by sampled working women is given in Table No.1
Table No.1Harassment faced by Working Women at Work Place
Type of harassment No. of persons Percentage
Mental harassment 20 40
Gender bias 8 16
Sexual harassment 4 8
Mental harassment plus gender bias 7 14
No such experience 11 22
Total 50 100
Source: Sample Survey
39 out of total 50 samples are agreed that they are facing harassments at work
place. 40% of them are facing mental harassment. 16%faced gender bias and 8% faced
sexual harassment.14% says that they face both mental harassment and gender bias
also.22% says that they have no such experience.
The working women have time management problem. They have no enough time
to spend with their children. Workloads, harassments in work place and family duties are
badly affect their working potential and health status. They are worked about 6-8 hour in
work place and 5-8 hour in home also. Most of the women do their domestic duties such
as washing, cooking, cleaning etc. This will make her tired. If she travels regularly for
job purpose then the health condition also badly affected. The mode of travelling they
Corresponding Author:Anusha George
Corresponding Author: Anusha George

Research Article
MES MAMPAD International Journal of Humanities and Social Science (MESIJHSS)
Corresponding Author: Anjusha. K. P 16
selected is bus or two wheeler. The main problem of working women is to adjustments in
family life and working life. The time management problem is mainly three losses –they
are miss of any career related functions, or family functions and time spend with children.
The time management problem shown in the following table:-
Table: 2 Time management problem
Time management problem No. of samples Percentage
Present 40 80
Not present 10 20
Total 50 100
Source : sample survey
80 percentage working women faces time management problem. But 20
percentage dose not affected by such problems.
Another area is gender pay gap. More than half of the samples show that there
exists wage difference usually above 500. The duty or work load is heavy but the wage is
less. The extent of wage difference is shown below:-
Table: 2 The extent of wage difference
Level of wage difference No. of samples Percentage
100-300 3 12
300-500 13 48
500-1000 11 40
Total 27 100
Source: sample survey
50% of total population is suffering from health problems. They have frequent
headache, back pain etc. But 22 out of 50 is done physical exercise .others are opinion
that there is no time to spend for physical exercise. Those who done physical exercise, is
to get relief or to reduce life style diseases. And no one has done it above 45 minutes. The
main health problems are shown as below:-
Corresponding Author: Anusha George

Research Article
MES MAMPAD International Journal of Humanities and Social Science (MESIJHSS)
Corresponding Author: Anjusha. K. P 17
Table:3 The main health problems
Health problem No. of samples Percentage
Stress 10 20
BP 5 10
Back pain 4 8
Headache 6 12
No such problem 25 50
Total 50 100
Source:sample survey
50% have no permanent health problem. 20% have stress, 12% have headache,
10% have BP, and only 8%have back pain.
More than half of the population argued that there is no equal career opportunity
to women. But they are argued that their family gave full support to them. The following
table shows the career opportunity.
Table: 3 career opportunity
Career opportunity No. of persons Percentage
Equal 13 26
Not equal 37 74
Total 50 100
Source: sample survey
74% says that there is no equal career opportunity and the remaining 26% says
that there is equal career opportunity.
By analysing all these facts we can see that working women have a lot of
problems. Even there exist a number of problems they are enjoyed their busy life and
economic decision power.
Corresponding Author: Anusha George

Research Article
MES MAMPAD International Journal of Humanities and Social Science (MESIJHSS)
Corresponding Author: Anjusha. K. P 18
Suggesstions
Family can give immense support to the busy life of working women.
Employer should remember that she is not only his staff but also a mother or
house wife
Government can take following steps to improve working women life
a. Give higher interest in all bank deposits to women
b. Give 30-50% discount in all rail/bus fares to them
c. Legislative strict laws against sexual harassment in offices
d. Legislate leeway for special leaves needed by working women
e. Set up special courts for handling complaints for working women against
their employers
f. Legislative laws to curb inequality
The problems faced by each working women are common to all and they have
unique comments on their family and social life. The problems can be solved through the
immense support from family and society also.
References
1. Indian Economy : Misra and Puri -2010
2. Indian Economy: Ruddardutt and Kpmsundharan -2009
3. Kerala ‘s Development issues the New Millennium BA Prakash ,VR Prabakaran
2008
4. Women and Health services in HariyalTalunka of Karwar –ShanthaB.Asthie
(southern economist –March 1,2012 )
5. Empowerment of Rural women through healthcare –Ramna .B .Gouda (southern
Economist March 1 ,2012 )
6. Health problems of women in slums –Mehurunnisa .H .Huller (Southern
Economist March 1 ,2013 )
7. Inequalities in Health service (Economic and political weekly ) .Sept .18 2010 vol
No .29
Corresponding Author: Anusha George
Research Article
MES MAMPAD International Journal of Humanities and Social Science (MESIJHSS)
Corresponding Author: Anjusha. K. P 19
8. Nutan Kumari study titled “Life stress in working women : a critical analysis’’
ACCT Research journal
9. WOMEN, GENDER AND HEALTH:A Review of the Recent Literature B. L.
Janzen
10. Karnataka J. Agric. Sci.,25 (4) : (510-513) 2012
11. Comparative study of mental health of working and non-working women R. V.
MANKANI AND GANGA V. YENAGI Department of Human Development and
Family Studies, Rural Home Science College, University of Agricultural
Sciences, Dharwad-580 005
12. Sinhgad e Journal of Nursing, Vol. II, Issue I, June 2012.
13. Mental health of middle aged working women Mr. Game Vishal Raghunath M.
Sc. Mental Health Nursing Aggarwal, O. P., Bhasin, S. K., Sharma, A. K.,
Chhabra, P., Aggarwal, K. and Rajoura, O. P., 2005,
14. A new instrument (scale) for measuring the socio-economic status of a family:
Preliminary study. Indian J. Comm. Med., 34 (4) : 111-114. Bharati, T., and
Reddy, N.V., 2002,
15. Sources of job stress among primary school teachers. J. Com. Gui. Res., 19(2):
247-253. Bhatia, B. D., 1982, Mental health in education. Advanced educational
psychology, Sterling publisherspvt. Ltd., Jagadish , S. and Srivastava, A. K.,
1983,
16. Manual for mental health inventory, published by
manovaigyanikparikshansansthan,
17. Murray, C. L., Gein, I. and Solberg, M., 2003, A comparison of the mental health
of employed and unemployed women in the context of a massive layoff. Women
and health, 37(2): 55-72Ojha, S. and Rani, U., 2004,
18. A comparative study of the level of life stress and various dimension of mental
health among working and non-working Indian women.J. com. Guid. Res., 21(3):
297-303. Rastogi, R. and Kashyap, K., 2001,
19. A study of occupational stress and mental health among married working women.
J. Com. Guid. Res., 18(2): 189-196.
Corresponding Author: Anusha George

Research Article
MES MAMPAD International Journal of Humanities and Social Science (MESIJHSS)
Corresponding Author: Anjusha. K. P 20
EPIGRAPHY: A SOURCE OF KERALA HISTORY
BalasubrahmanianUruniankuth
Assistant Professor Department of History MES Mampad College
Abstract
Epigraphy forms an important source for the study of Kerala history especially
the history of medieval Kerala. Epigraphy is the study of inscriptions. Inscriptions are
important sources for the study of other parts also. Inscription means writing engraved
on any object, rock, stone blocks, metallic plates, pillars, etc. used for inscribing
information. Inscriptions are also seen on pots, bricks, tablets, shells, ivory etc. on hard
objects inscriptions are incised. in certain inscriptions words are not engraved but
embossed by scooping out the space around them.1
In the history of world civilizations we hear about great epigraphists like
Champollion and jamesprincep. Champollion is famous for decipherment of
hieroglyphics from the Rosetta stone, James prince is known in the history of epigraphy
for the decipherment of edicts of Asoka. South Indian inscriptions are mainly on temples,
collection of revenue, land grants etc. This is the case of Kerala inscriptions also.
Sometimes inscriptions will have eulogistic compositions prefaced to them. They are
called prasastis, butprasasti is not seen Kerala inscriptions. If the inscribed information
is in the form of an advice or extortion it is called edicts. E.g. Edicts of Asoka.
Epigraphy mentioning grants of land were mainly on copperplates. Unlike the
stone inscriptions, the copper plate inscriptions were to handle and easily portable.
Most often thamrasasna or copper inscriptions were indented to private custody. but
stone engravements were generally set up in public places for general information2 ,
temples bear stone inscriptions.
The inscriptions vary in length; sometimes inscriptions would record installation
of the images by devotees or the fall of a hero in the battle etc. Sometimes inscriptions
embodied even a kavya or drama.
Available online at http://mesmampad.org/researchjournals.php
Corresponding Author: Balasubrhamanian. U

Research Article
MES MAMPAD International Journal of Humanities and Social Science (MESIJHSS)
Corresponding Author: Anjusha. K. P 21
A page of the copper plate inscription usually will be in the size of the long sack,
30 cm long and double the width of a small scale. Information will be engraved on
them3.if the inscriptions and long there will be number of plates like these. These plates
would be strung together through the slit on the leftern most side of the plates. Generally
there will be royal seal on royal inscriptions. These inscriptions would be kept in safe and
secure place.
North Indian inscriptions are mainly in the brahmi script. There is brahmi script in
south Indian inscriptions 4.kerala inscriptions of medieval period are in vattelluthu. This
is a script used for writing old Malayalam.
What are inscribed on the inscription would be contemporary events. the intention
of the inscription is not generally the preservation of historical material but the
documentation of incidents, grants etc. but this inscriptional material forms an important
source of history.thy must be seen in the light of contemporary events. Sometimes
inscriptions do not give direct evidences but facts can be called out from the information
seen in the in the inscriptions. Epigraphic records may be broadly classified in to two
groups-those engraved on behalf of ruling authorities and those inscribed on behalf of
private individuals and organizations. The epigraphs recording royal grants of land were
generally engraved on copper plates.
Epigraphy devolved in India by 18 thcentury. It was European scholars in India to
have a firsthand knowledge about intellectual achievements of India. Thus Charles
Wilkins, will iwmjones,james prince and like scholars came to India. In their search for
Indian antiquity, they tried to read inscriptions. The foundation of the royal Asiatic
society of Bengal gave great encouragement to the study of inscriptions. Collin
Mackency collected transcripts of stone and palm leaves from the old Madras presidency
.This was the first major step in the development of south Indian epigraphy. The
Mackency s collection gave a primary idea of the inscriptional wealth of south India.
A.Burnell studied south Indian inscriptions. He studied vatteluthu and deciphered many a
inscription. these European scholars trying to establish that this system of writing was
Corresponding Author: Balasubrhamanian. U

Research Article
MES MAMPAD International Journal of Humanities and Social Science (MESIJHSS)
Corresponding Author: Anjusha. K. P 22
borrowed from Europe. But it was not so, it was only because of their superiority
complex that they thought so. vattelluthu is an indigenous system of writing.
Hultz deciphered many a south Indian inscription. He collected and edited the
inscriptions under the title south Indian inscriptions. It was followed by the great services
of T.A.GopinathaRao to Kerala historiography. It was with the publication of the
Travancore Archaeological series by Gopinatha Rao, that the study of Kerala epigraphy
received a new direction P. Sundaram Pillai wrote a book mainly based on
inscriptions5.Elamkulam Kunjan Pillai, MGS.Narayananan, M.R.Raghavavarier,
Maheswaram Nair and like scholars have made invaluable contribution to the Kerala
epigraphy.
The name of gopinatharao is ever memorable in the historiography of Kerala. He
collected, deciphered and edited many an inscription of Kerala. This edited work,
Travancore Archaeological series in 10 volumes has been the monumental work on
Kerala epigraphy6.In 1902 Gopinatha Rao was appointed as superintendent of the
department of archaeology, Travancore. Through painstaking field work, he could faint
out a number of inscriptions from various parts of south India. he had a good knowledge
of the Brahmin script and vattelluthu. But it was with Gopinatharao, pookilkelunair,
Bernel had deciphered the Kerala inscriptions. But it was with Gopinatharao and
Ellamkulam that Kerala epigraphy had its real development. The premature death of
gopinatharao in 1918 was a great lose to the intellectual world .what K. P.
Padmanabhamenon did for Kerala History, Gopinatharao did Kerala epigraphy7.
Elamkulamkunjanpillai made an intense study and research on Kerala
inscriptions. He was a multi linguist and also knew how to calculate the date of the
records out of the Astronomical data presented in them. Elamkulam had a fundamental
grasp of many an aspect of these inscriptions8. Elamkulam not only deciphered and
translated inscription but also interpreted them Elamkulam used linguistic and
palaeographic data from the inscriptions to arrive at conclusions with regard to kings and
their chronology. Though a study of inscriptions, Elamkulamkunjanpillai could re-
Corresponding Author: Balasubrhamanian. U

Research Article
MES MAMPAD International Journal of Humanities and Social Science (MESIJHSS)
Corresponding Author: Anjusha. K. P 23
examine many theories of earlier writers. The advent of Elamkulamkunjanpillai brought
about revolutionary changes in the study of history of Kerala. He could construct the
political and social history of Kerala during the period between 9 and 16 centuries in
outline. He used the knowledge from inscription as the key to open many a mysteries in
Kerala history9.
M.G.S. Narayanan found out and deciphered many an inscription of Kerala. He
re-examined certain theories of Kunjanpillai. He affected corrections in the details of the
chronology of the perumalas of mahodayapuram. M.G.S reinterpreted the theories on the
hundred organizations and salais in the light of inscriptions. He integrated the evidence
from inscriptions with those from tradition. With the help of the inscriptions from
kolathnadu, M.G.S established the historical value mooshakavamsa kavya.10 The greatest
contribution of M.G.S to Kerala epigraphy is the index to cera inscriptions.11
M.G.S studied epigraphy in order to examine the authenticity of the records and
reconstruct Kerala history .In this sense he was a consumer of epigraphy.12 M.G.S has
deciphered many an inscriptions.
M.R .Raghavavarier is the most outstanding epigraphist in Kerala today. As an
epigraphist he has worked close cooperation with M.G.S. He also was a multilinguist
and masterly over ancient. The vatteluthu, kolezhuthu and brahmi. M.R .Raghavavarier
has deciphered a number of inscriptions. Among them are chembra,thiruvattur,ezhimala
etc. varier is of the opinion that the writing of history with the help of inscriptions is
dependent on the historiography of the age in which it is written. When inscriptions are
used as a source for history inferences can be made. Raghavavarier has effectively used
these references in historical writings. The teacher of raghavavarier in epigraphy is
K.G.Krishnan.
During the period of colonialism scholars took interest in the inscriptions as a
source of history. The services of George Mathan and Herman Gundert are important in
this respect. As noted before inscriptions are among the most important sources of Kerala
Corresponding Author: Balasubrhamanian. U

Research Article
MES MAMPAD International Journal of Humanities and Social Science (MESIJHSS)
Corresponding Author: Anjusha. K. P 24
history. Sometimes we will get many a fact and pointer to truth from inscriptions which
have no outward connection with the topic of study. Many an inscription like the
thirunnelli inscription contains words and usages that throw light into the aspects of
contemporary society. Facts derived from the inscriptions are to be supplemented by the
evidence from other contemporary sources also.
Inscriptions are very important as a source for the history of ancient and medieval
Kerala. They supply valuable clues to the reconstruction of dynastic history of various
kingdoms. They throw light on the political, social and cultural life of the people through
the ages. It helps to analyse many a factor related with land relation, management of the
temples, local assemblies etc.
Certain inscriptions are directly related with trade and trading centres in medieval
Kerala. We can discern many a fact regarding the socio-economic history of certain
period seemingly sources.13
Inscriptions of Kerala are very small in number. Of this bulk of this are temple
inscriptions. They give a direct and indirect information about the contemporary society.
The affairs of the temples cannot be suited without relation with the society. That is the
micro aspect can study only in the background of a macro history. It is to be noted that
the temple is the centre of life and culture of Kerala. During this period the traders and
chieftains made liberal donations to the temples. Sometimes they would get them
inscribed. Among other things it was part of the devices for social recognition. Giving
food or shelter to the Brahmins also was considered to be the act of piety.
Sometimes from simple inscriptions we will get many a fact and pointers to the
truth. Classical example is to this that of tharisapalli copper plate .Words and phrases in
the inscriptions are to be analysed to get the real and literal meaning.
Reference
1.D.C.Sircar,IndianEpigraphy,Delhi, 1965,p.1
2.LewiesRice,Mysore Inscriptions, Banglore1879,p.1
Corresponding Author:Balasubrhamanian. U
Research Article
MES MAMPAD International Journal of Humanities and Social Science (MESIJHSS)
Corresponding Author: Anjusha. K. P 25
3.D.C.Sircar,op.cit.,p.3
4.D.C.Sircar,op.cit.,p.3
5.P.Sundaranpillai, Some Early Sovereigs of Travancore (1894)Delhi,1988
6.T.A. Gopinatharao(ed),Travancore Archeological series,10volmes,1910-
1941,thiruvananthpuram
7.T.A.S.,Vol.I and II, thiruvananthpuram,1990,introduction.
8.A.Sreeddharamenon, Elamkulamkujanpillai,Makers of Indian literature,sahithya
academy,2001,p.49.
9.Kesavanveluthat, Brahmin settlements in kerala,Calicut,197
10.M.G.S.Narayanan, History from Mooshakavamsakavya, proceedings of the All india
Oriented Conference,1969.
11.M.G.S.Narayan, Index to cerainscriptions, companion volume to the Ph.D. Thesis,
Social and Economic Condition of Kerala under the Kulasekhara Empire, university of
kerala,1972
12.Interview with M.G.S.Narayanan, dated 10.09.2005.
13.Vijayalekshmy. M. Trade And Trading Centers in Kerala (ad 800-1500),
Ph.D.thesis,university ofcalicut,pp.49-50
Corresponding Author: Balasubrhamanian. U

Research Article
MES MAMPAD International Journal of Humanities and Social Science (MESIJHSS)
Corresponding Author: Anjusha. K. P 26
INDIA TOWARDS KNOWLEDGE BASED ECONOMY: PROSPECTS &
CHALLENGES
Ibrahim.P.K
Assistant Professor in Economics Pkmua College, Pulikkal
Abstract
In the Information Age, the global economy moved towards the knowledge
economy. This transition to the knowledge based economy includes the best practices
taken from the service-intensive, manufacture-intensive and labor-intensive types of
economies and added knowledge-based factors. In a knowledge economy, a significant
part of a company's value may consist of intangible assets, such as its workers'
knowledge. As a highly populated country, India has a high potential if it uses its human
capital effectively. In this age of knowledge economy, it is very essential to make a huge
investment and deliberate attempt to increase the productivity and efficiency of human
resource by giving quality technical and vocational knowledge \and training. This paper
trying to make an attempt to anlyse the scope and prospects of India to become as a
Knowledge Based Economy (KBE) and it also studying its major challenges in this way
of journey. It is also examining the expenditure on education by the government an
initiatives to make India as an educational hub and an economy which is based mainly on
knowledge and digitalized operations.
Keywords: Knowledge Based Economy, policy initiatives, higher education, India
as a emerging KBE, digital India, challenges, KBE is a myth.
Introduction
When we analyze the history of human transition from the hunter-gathering
society to a civilized society, it is clear that it has moved through different stages of
farming, settlement and the period of industrial revolution. Now in the digital age, our
civilisation may be in the midst of another equally great transformation that is the age of
the knowledge economy.
Available online at http://mesmampad.org/researchjournals.php
Corresponding Author: Ibrahim. P. K.
Research Article
MES MAMPAD International Journal of Humanities and Social Science (MESIJHSS)
Corresponding Author: Anjusha. K. P 27
A knowledge economy is an economy in which the production of goods and
services is based primarily upon knowledge-intensive activities. In this system the
consumption and production will be mainly based on intellectual capital rather than
physical and financial capital. The knowledge economy addresses how education and
knowledge can serve as a productive asset or a business product since innovative and
intellectual services and products can be sold and exported and can yield profits for the
individual, the business and the economy
The concept of the knowledge economy was first used by Peter Drucker in his
book "The Effective Executive" in 1966. In this book he has discussed the difference
between a knowledge worker and a manual worker. According to Drucker, the manual
worker uses his hands and other physical capabilities to produce and provide services and
other goods. On the other hand, a knowledge worker uses his head and produces
knowledge, information and ideas that may be beneficial for the overall system of the
business. According to the World Bank, knowledge economies are defined by four
pillars. These are: institutional structures that provide incentives for entrepreneurship and
the use of knowledge, skilled labour availability and good education systems, ICT
infrastructure and access, and, finally, a vibrant innovation landscape that includes
academia, the private sector and civil society.
Knowledge Economy: A Multi-dimensional Analysis in Indian Context
In 2001, the K4D (Knowledge for Development) program held a high-level policy
forum to share knowledge strategies among key stakeholders from Brazil, India and
China—potential knowledge super powers representing 45 percent of the world’s
population. India towards KBE: Recent Policy Initiatives
Growth of Higher Education
On the eve of Independence there were 20 universities in India. By 2014 there
were a total of 637 universities in India out of which 289 were State universities, 130
Deemed Universities, 94 Private universities and 43 Central universities. (UGC 2012).
Corresponding Author: Ibrahim. P. K.
Research Article
MES MAMPAD International Journal of Humanities and Social Science (MESIJHSS)
Corresponding Author: Anjusha. K. P 28
With the increase in enrolment and number of institutions, number of teachers in
educational institutions (including universities and affiliated colleges) went up from
2,63,819 in 1990-91 to 6,97,885 in 2013-14.
Union Budget 2017-18 has pegged an outlay of Rs79,685.95crore for the
education sector for financial year 2017-18, up from Rs72,394 crore in 2016-17—a 9.9%
rise. Of the total outlay, Rs46,356.25 was for the school sector and the rest for higher
education.
NITI Aayog’s Step to Improve Education Sector
In a major push to competitive, cooperative federalism, NITI Aayog, announced
partnership with three States each to radically transform their Health and Education
sectors.
NITI Aayog has selected Uttar Pradesh, Assam, and Karnataka to improve
healthcare delivery and key outcomes in these States. In Education, Madhya Pradesh,
Odisha, and Jharkhand have been selected for support to better learning outcomes. This
three-way partnership between NITI, State Governments and a knowledge partner for
each of the sectors is part of the Sustainable Action for Transforming Human Capital
(SATH) initiative of NITI Aayog.
Another notable announcement by NITI Ayog in this regard is that non-
performing or "hollowed" government schools should be handed over to private players
under the public- private partnership (PPP).
NITI Aayog’s Three Year Action Agenda: NITI Aayog also suggests reforms in
the Right to Education Act as well as the University Grants Commission, and a
comprehensive & continuous evaluation system to bring in improvement in learning
outcomes. In a series of proposals that might lead to improvement in the higher education
infrastructure and skill development of individuals in urban regions, the NITI Aayog in
its Three Year Action Agenda 2017-18 to 2019-20 said that the government needs to
create 20 world-class universities, provide autonomy for top colleges and universities,
reform the regulatory system, establish system of project-/researcher-specific grants and
increase focus on vocational and profession-led education.
Corresponding Author: Ibrahim. P. K.
Research Article
MES MAMPAD International Journal of Humanities and Social Science (MESIJHSS)
Corresponding Author: Anjusha. K. P 29
The major Initiatives by NITI Aayog and Government of India in this regard are
Mobile Seva, Vikaspedia, MyGov.in, Aadhaar:e-Payment Framework ,Common Services
Centre, State Wide Area Network ,GI Cloud, Information Technology Investment Region
(ITIR), romotion of Manufacturing of Electronics, IT-ITES, Promotion of R&D and
Innovation Technological Incubation and Development of Entrepreneurs (TIDE),
Multiplier Grant Scheme (MSG) and National Supercomputing Mission (NSM).
Vision of Digital India
It aims to transform the country into a digitally empowered society and
knowledge economy, implemented in phases till 2018, by DEIT. It would also bring in
public accountability through mandated delivery of Government’s services electronically;
a Unique ID and e-Pramaan The source of funding is through budgetary Provisions. The
main Initiatives under the Digital India Programme are:
(i) Legal Information and Management Based System is an easy to access, web-based
tool for comprehensive, regulatory and proactive monitoring of court cases.
(ii) NDSAP (National Data Sharing and Accessibility Programme) is to facilitate the
access to Government of India owned shareable data and information.
(iii) e-Office: The main objective of e-office is to improve efficiency, consistency and
effectiveness of government responses.
Key Challenges
Education
India’s system education especially higher education suffers from several
limitations. Firstly, the gross enrolment ratio in higher education is less than nine percent
in India, compared to 15 percent in China and more than 20 percent in many developing
countries such as Mexico, Malaysia, Thailand, Chile and Brazil. In the case of youth
literacy, India lags substantially behind all the other BRIC countries. The problem in the
education sector is further compounded by the lack of proper teaching facilities and best-
practices, especially in the rural areas. According to the Third International Mathematics
and Science study, 9th and 11th grade students in India scored way below the
international average.
Corresponding Author: Ibrahim. P. K.

Research Article
MES MAMPAD International Journal of Humanities and Social Science (MESIJHSS)
Corresponding Author: Anjusha. K. P 30
Deficiency in spending on higher education: In India alone, the spending on
education and skilling has touched approximately 74,000 crore. This may seem like a
daunting figure but is still not sufficient. India spends about 4% of its GDP on all of
education (about 1% on higher education), whereas globally the minimum recommended
expenditure on education is 6% of GDP (Economic Review 2014). Most public
expenditure on higher education is used up on salaries and maintaining existing
institutions, leaving very little to be spent on curriculum, research and technology.
However, spending on education still has enormous scaling to do and this is
where the private sector comes in. Private players will have opportunities from rising
demand in segments not well covered by the public education system (like adult
education and vocational training). They bring in additional capital and are able to make
huge investments, especially when government spending is insufficient and results in
substantial infrastructure and investment deficit.
Over-Regulated and Cumbersome Bureaucracy
India has more than 17 million state and federal government employees. “About
20,000-odd federal officers control the collection and disbursement of over US$71 billion
federal revenue every year. because of this highly complicated bureaucracy, it is very
difficult to manage the system efficiently.
Infrastructure Development
To develop a knowledge-based economy, the role of ICT, education and scientific
infrastructure are necessary. However, equally critical is the need for supporting physical
infrastructure such as railways, roads, ports, telecommunications and energy.
Comparison of India with Global Averages
Amongst the BRICS nations, despite a significant growth in gross domestic
product (GDP) over the years, the share of GDP devoted to education remains low for
China and India. India has decreased its spending on education from 4.4 percent of GDP
in 1999 to around 3.71 percent in the budget estimate of 2017-18. The Kothari Education
Corresponding Author: Ibrahim. P. K.

Research Article
MES MAMPAD International Journal of Humanities and Social Science (MESIJHSS)
Corresponding Author: Anjusha. K. P 31
Commission had recommended an allocation of 6 percent of GDP on education, which
has never been achieved. According to the World Bank’s Knowledge Economy Index
(KEI)22 that takes into account the conduciveness of an economy’s environment for
knowledge to be used effectively for economic development, India ranked 101st out of
140 countries in 2007.23 Ireland, Israel and China ranked 14th, 22nd and 75th
respectively. Comparison of India’s knowledge economy index with two major global
regions is given in following table.
TableNo.1
Comparison of India’s knowledge Economy Index with Two Major Global Regions
Country/ Region Knowledge Economy Index
India 3.06
Asia and the Pacific Average 4.28
OECD 8.25
Source: World Bank, Knowledge Economy Index
Looking at these information, one can safely conclude that India has made
significant progress in its knowledge-based sectors. But India is still behind with major
countries and global performance
.
India’s Strategic Advantages as A Emerging KBE
Despite all the challenges India has a prosperous future and huge advantage as a
knowledge based economy because of its unique demographic and economic features.
Some of the advantages are explained below:
Big section of young population: India has huge number of young working
population with high technical and vocational skill. Working age population (between 15
and 64 years) to touch 1 Billion, surpassing China by 2030.According to ADB report,
India, with its youthful population and thriving information and communication
technology (ICT) industry, can become a leading knowledge-driven economy as long as
regulatory, education, and infrastructure barriers are overcome.
Corresponding Author: Ibrahim. P. K.

Research Article
MES MAMPAD International Journal of Humanities and Social Science (MESIJHSS)
Corresponding Author: Anjusha. K. P 32
Large and fast growing domestic market: Domestic market in India is one of the
largest in the world. The population in India has been touched with 130 cr which is
contributing to increase domestic demand and there by total production and employment
in the country.
Large and impressive diaspora: The Indian diaspora allows for invaluable
knowledge linkages and networks globally. At the same time, the highly influential
diaspora of Indian professionals and entrepreneurs have been instrumental in bringing
high technology investments to Bangalore, Hyderabad and other Indian cities. The
decision by the Indian government to allow for dual citizenship has provided further
impetus to the diaspora to continue to stay rooted to India.
Emerging financial sector – In recent years, India has attained macroeconomic
stability and has made significant strides in institutional developments, including having
a well-functioning financial sector.
5 Indian think tanks in world’s top 150: Five Indian think tanks have made it to
the list of top 150 worldwide including Centre for Civil Society (CCS), Institute for
Defence Studies and Analyses (IDSA), The Energy and Resources Institute (TERI),
Observer Research Foundation (ORF) and Development Alternatives (DA)
Knowledge Economy: A Critical Analysis
Even though knowledge based economy has been widely encouraged by at world
level, recently, there has been several criticisms against this concept. According to the
opinion of some of the economists, the knowledge economy is a myth. We don’t need
more universities to feed it. They have justified their voice with an empirical case from
UK and US. According to their opinion, the idea of the knowledge economy is appealing.
The only problem is it is largely a myth. Developed western economies such as the UK
and the US are not brimming with jobs that require degree-level qualifications. For every
job as a skilled computer programmer, there are three jobs flipping burgers. The fastest-
growing jobs are low-skilled repetitive ones in the service sector. One-third of the US
labour market is made up of three types of work: office and administrative support, sales
and food preparation.
Corresponding Author: Ibrahim. P. K.
Research Article
MES MAMPAD International Journal of Humanities and Social Science (MESIJHSS)
Corresponding Author: Anjusha. K. P 33
The majority of jobs being created today do not require degree-level
qualifications. In the US in 2010, 20% of jobs required a bachelor’s degree, 43% required
a high-school education, and 26% even did not require that. Meanwhile,40% of young
people study for degrees. This means over half the people gaining degrees today will find
themselves working in jobs that don’t require one.
The stark mismatch between the number of people with degrees and the number
of jobs requiring degrees has created a generation of bored employees who feel like they
are working “bullshit jobs” It’s no surprise 37% of UK employees think their jobs
make no meaningful contribution to world at all. According to Hanas A. Cader, About
52% of high-knowledge-based industries in 1991 had been transformed into non-
knowledge-intensive industries by 2001, while 10% of non-knowledge-based industries
became knowledge-intensive industries by 2001. Despite of all these issues and
criticisms, the idea of knowledge base economy has been widely encouraged by this new
age of knowledge.
Conclusion
In this age it is very essential for a country to move towards an economy with
knowledge intensive activities and digitalized operations. As a developing economy, this
is very crucial for Indian economy. Here this analysis briefly explained the major
initiatives by government of India in this way of journey. The increasing trends in
expenditure on higher education, initiatives and programs by NITI Aayog and vision
digital India initiatives are the some of the attempts in this regard. However, when we
compare India with global performance we are still lagging behind in this scenario. Our
expenditure on education is still less than our sufficient level and the higher education
sector also facing the problem of quality and excellence. Despite of all these challenges,
Indian economy has a high potential to become as a world leading knowledge base
economy.
Corresponding Author: Ibrahim. P. K.

Research Article
MES MAMPAD International Journal of Humanities and Social Science (MESIJHSS)
Corresponding Author: Anjusha. K. P 34
References
1. Anuradha De and Tanuka Endow(2008)” Public Expenditure on Education in
India: Recent Trends and Outcomes” Research Consortium on Educational
Outcomes and Poverty WP08/18
2. MHRD, Statistics of Higher and Technical Education:2009–10 (2011). New Delhi:
Bureau of Planning,Monitoring and Statistics
3. Tarkeshwar Pandey(2016) Higher Education Expenditure in India- Imperial Journal
of Interdisciplinary Research (IJIR) Vol-2, Issue-5
4. Innovative Asia: Advancing The Knowledge-Based Economy—highlights of the
forthcoming ADB study report(2013)-Asian Development Bank.
5. Bhattacharya Jonaki and Pal Prasenjit(2016) Higher Education in India: Recent
Issues and Trends- Research Journal of Educational Sciences. ISSN 2321-0508
6. Knowledge Assessment Methodology (2012). Retrieved from
https://knoema.com/atlas/sources/WB?to pic=World-Rankings. World Bank
7. Knowledge Economy http://www.investopedia.com/terms/k/knowledge-
economy.asp#ixzz4twyWxCqP
8. Tasleem Araf C(2016) Trends, Growth and Changing Patterns of Public
Expenditure on Education in India-Journal of Global Economics
9. Ministry of Human Resources Govt of India. (Budgetary Analysis) various issues
10. Analysis of Budgeted Expenditure on Education, Ministry of HRD, Govt. of India
various issues
11. Press Information Bureau Government of India -NITI Aayog
Corresponding Author: Ibrahim. P. K.

Research Article
MES MAMPAD International Journal of Humanities and Social Science (MESIJHSS)
Corresponding Author: Anjusha. K. P 35
GENDER DIFFERENCES IN HEALTH STATUS OF RURAL AREA
A CASE STUDY WITH SPECIAL REFERENCE TO
KARUVARAKUNDUGRAMA PANCHAYATH
Nimisha. P. M PG Scholar, Department of Economics, MES Mampad College
Abstract
India is one of the largest third world countries were females are considered as
disadvantaged sections, demographically, socially, culturally and economically Women
are described as the most vulnerable group exposed to various adversities of life. India is
one of the few countries where males significantly greater than females and the countries
maternal mortality rates in rural areas are among the world’s highest. Kerala, one of the
small states in India Many analyst to talk about a unique “Kerala model of health” worth
emulating by other developing parts of the world. Kerala has made significant gains in
health indices like infant mortality rate, birth rate, death rate and expectancy of life at
birth. But inspite of these achievements there exist some gender inequalities in health
status.So this study is an enquiry into the nature and extent of gender disparity in health
status in Kerala
Keywords: health status,female,male,gender,disparity
Introduction
Healthis considered as a fundamental human right. It is defined not only in terms
of the wellbeing of mental and physical health but also improving sanitation, drinking
water, shelter and assured livelihood condition of the population( According to the
National Rural Health Mission – NRHM). One of the important strategy of the NRHM to
reach out to pregnant women through Accredited Social Health Activities (ASHA) to
improve the health of women as well as to encourage them to go for institutional delivery
in the nearby hospital. The objective is to reduce both maternal and infant mortality.
ASHA acts as a community worker to bridge between the health personal and village
women. It is indeed heartening to know that 89% said that they were aware of the
activities of ASHA.
Available online at http://mesmampad.org/researchjournals.php
Corresponding Author: Nimisha. P. M.

Research Article
MES MAMPAD International Journal of Humanities and Social Science (MESIJHSS)
Corresponding Author: Anjusha. K. P 36
Health is the functional or metabolic efficiency of a living organism. In human it
is an ability of individuals of communities to adapt and self-manage when facing
physical, mental or social challenges. The World Health Organisation (WHO) defined
health is its broader sense in its 1948 constitution as a “State of complete physical, mental
and social wellbeing and not merely the absence of disease or infirmity.”
India is one of the largest third world countries were females are considered as
disadvantaged sections, demographically, socially, culturally and economicallyWomen
are described as the most vulnerable group exposed to various adversities of life. India is
one of the few countries where males significantly greater than females and the countries
maternal mortality rates in rural areas are among the world’s highest. Female diseases is
more than males and are less likely to receive medical treatment. Disease burden per
1000 population in India is much more on women than men. In India, the problems of
health hazards are guided by religious beliefs and practices. In India it found that poor are
the worst affected by epidemics and contagious diseases.
Kerala has attained remarkable achievements in social development despite its
economic backwardness. Kerala women enjoyed high health status compared to the
women of other states. Kerala’s achievement in health has prompted many analyst to talk
about a unique Kerala Model of Health’ worth emulating by other developing parts of the
world.
Health status in India and Kerala are examined on the basis of sex ratio, life
expectancy, age at marriage, reproductive health care, nutritional status, morbidity,
mortality, literacy and education.
Malappuram, the most populated district in the state has spent 92% of the funds
allocated for its implementation of the health. Major health programs implemented in
Malappuram district were “ JananiSurakshaYojana” for maternal benefit of women and
also undertaken “ Arogyakeralam Project”. Under this programme certain project was
implemented health program in schools, Panchayaths and municipalities.
Eventhough Malappuram is educationally forward, studies on morbidity shows
that the prevalence of morbidity is much more in Malappuram. In this context it is
necessary to assess the gender wise health status of people in the district.
Corresponding Author: Nimisha. P. M.
Research Article
MES MAMPAD International Journal of Humanities and Social Science (MESIJHSS)
Corresponding Author: Anjusha. K. P 37
Methodology and Data
The primary data is collected by using a well-structured questionnaire, interviews
and discussion with selected people in the rural area. There are 21 wards in the panchayath
.from these 60 households were selected by using random method.
Secondary data is collected from Panchayats, different publication like economic
review, different journal, report and government record of hospitals etc.
Health Status in India and Kerala
Kerala state in India is one geographical area where in spite of the lower per-
capita income, achieve significant improvements in its education and health scenario. In
India, health indices (Fertility, Mortality, Life expectancy etc...) have registered a steady
improvement to each level comparable to those in the developed countries. Most analyst
have seen Kerala’s achievement in health has prompted. Many analyst to talk about a
unique “Kerala model of health” worth emulating by other developing parts of the world.
Kerala has made significant gains in health indices like infant mortality rate, birth rate,
death rate and expectancy of life at birth.
India has traditionally been a rural agrarian economy. The Constitution of
India makes health in India the responsibility of the state governments, rather than the
central federal government. It makes every state responsible for "raising the level
of nutrition and the standard of living of its people and the improvement of public
health as among its primary duties". The National Health Policy was endorsed by
the Parliament of India in 1983 and updated in 2002. The National Health Policy is being
worked upon further in 2017 and a draft for public consultation has been released. There
are great inequalities in health between states. Infant mortality in Kerala is 12 per
thousand live births, but in Assam it is 56.
Health Status of Male and Female in India
The following table features key indicators of the status of male and female in
India and Kerala. Table:1 key indicators of the status of male and female in India and
Kerala.
Corresponding Author: Nimisha. P. M.

Research Article
MES MAMPAD International Journal of Humanities and Social Science (MESIJHSS)
Corresponding Author: Anjusha. K. P 38
Sl. No Indicator Kerala India
1.
Death Rate # 6.6 6.5
Male 7.6 6.9
Female 5.7 6.1
2.
Infant Mortality Rate 12 37
Male 10 35
Female 11 39
3.
Mean Age At Effective Marriage
Male 27.3 23.2
Female 21.4 20
4. Maternal Mortality Ratio 66 178
5.
Expectancy Of Life At Birth
Male 71.4 62.6
Female 76.9 67.7
Source: Economic review 2016
In Kerala, most of the health indicators are highly favorable to women. Health
indicators of women in Kerala are much better than their counterparts in the country as
well as their male counterparts in the state. Life expectancy at birth of women in Kerala
at 76.9 years is the highest in India; much higher than for women in India as a whole,
which is 67.7 years.
Analysis
In the analysis the study was mainly focused on three aspects. They are the
comparison between male and female health status in rural area, their socio-economic
condition and finally evaluate the recent health facilities available to the rural people and
also their health status through a case study of Karuvarakundu Panchayath.
1 Socio-Economic Condition
The socio economic condition of male and female in the study area are quite
good. As in the case of social status the study is focused on certain indicators like age,
caste, religion etc. As in the case of age composition majority of the respondent
Corresponding Author: Nimisha. P. M.

Research Article
MES MAMPAD International Journal of Humanities and Social Science (MESIJHSS)
Corresponding Author: Anjusha. K. P 39
belonging to the age group of 15 to 25 are females and 35 – 45 are males. Majority of the
people in rural areas are Muslims. While comparing the marital status in other area of
Karuvarakundu Panchayath, rural area is in better position about 58.3% people are
married. In the study area most of them are following nuclear family system ie, out of 60
samples 35 of them belongs to nuclear family system. There shows an improvement in
the social status of the rural people in the Karuvarakundu Panchayath and this mainly
because of the educational level of the people. In which 43.3% of people are SSLC
qualified. W eknow that education indicates high status of health status.
As per the economic status, in the study area 90% of the people are coolies. In
which 50% are males and 40% female and remaining 10% are unoccupied category. On
the basis of income wise distribution of 60 households 38.3% are living under the income
5000 and only 6.67 are living in the income 25000 and above. Among 60 samples 66.6%
belongs to BPL family. So, in the socio economic condition both male and female are in
better position. Variable such as family composition, occupation, income, education
indicate high status of health.
2 Health Status of Male and Female in Rural Area
Health status is a holistic concept that is determined by more than the presents of
absence of any disease. It is often summarized by life expectancy of self-assessed health
status, and more broadly includes a measure of functioning, physical illness and mental
wellbeing.
The below table shows the comparison between male and female health status in
rural area.
Table: 2Health Profile in the Study Area
Sl. No Indicator Study area
1. Infant Mortality rate (Percentage) 2%
2. Maternal mortality rate -
3. Life expectancy (Age)
Male 69
Corresponding Author: Nimisha. P. M.

Research Article
MES MAMPAD International Journal of Humanities and Social Science (MESIJHSS)
Corresponding Author: Anjusha. K. P 40
Female 72
4.
Nutritional status (%)
Male 54%
Female 46%
Source : Field survey
The above table shows the male and female health status in rural area. While
comparing with Kerala and India the selected rural area has very well-known
achievement in the area of health status. Out of the total population in the rural area
majority of them are females. While considering the death rate it was higher in males
with comparing females. The main reasons for increasing male death rates are;
1. Alcoholic uses
2. Tobacco consumption
3. And Excessive use of drugs.
In the Rural area, the availability of drugs are comes down in recent years. But its
overall effect are still continuing in rural area. Most of the male death rates are increased
due this kind of practices. Female death rates are lower when compared to males because
there is accessibility of health services, nutrition to rural area are given by Panchayath. In
the case of birth rate females are greater than that of males. While comparing the infant
mortality rate with Kerala and other rural areas it is declined that is only 2%. There is no
maternal mortality rate. In the case of life expectancy females have greater life
expectancy (72) than that of males (69).Nutritional status is a important indicator that
determines the health status of a person. Here the male nutritional status is 54% the
female health status are more or less proportionate to male at 46%. While comparing the
male and female health status they are more or less equal. But there is a slight difference
in death rate, birth rate and nutritional status etc.
As in the case of distribution of patients on the basis of sex, in the study area 45%
are male and 55% are females. There is only a slight difference between male and
females.
Corresponding Author: Nimisha. P. M.

Research Article
MES MAMPAD International Journal of Humanities and Social Science (MESIJHSS)
Corresponding Author: Anjusha. K. P 41
Major Health Problems in the Study Area
a. Communicable diseases affected in the last yearTable:3
Sl. No Communicable disease No. of persons (%)
Male (%) Female (%)
1. Malaria 41.7 40.275
2. Typhoid 33.35 29.16
3. Dengue fever 24.95 30.56
Source: Field Survey
During the last year, from the 60 samples most of them are faced by
communicable diseases. On the basis of gender, most victim of the communicable
diseases are female out of them 60% of them are faced communicable diseases. Major
reported diseases among communicable diseases are Malaria.
b. Non communicable diseases affected in the last year
Table: 3
Sl. No Non Communicable diseases No. of persons (%)
Male Female
1. Lung diseases 51.16 17.65
2. Cholesterol 9.30 -
3. Mental depression 11.62 29.41
4. Diabetics 9.32 11.77
5. Hyper tension 18.60 41.17
Source: Field survey
Out of 60 sample in the last year most of them are faced by non-communicable
disease in which majority them are males. Because the behavior such as smoking
unhealthy diet and physical inactivity which can lead to hypertension and obesity.
There are different opinions regarding major causes of health problem in the study
area. As per the study major causes of health problem are liquid waste (28.3%), mosquito
Corresponding Author: Nimisha. P. M.
Research Article
MES MAMPAD International Journal of Humanities and Social Science (MESIJHSS)
Corresponding Author: Anjusha. K. P 42
breeding (8.33), increasing life style diseases (30%), lack of traditional practices (6.67%),
absence of blood bank (15%), lack of nutrition (1.67%) etc. So in the study area most of
the people depend on Allopathic. In which 53.1% of them are males and 64.2 of them are
females. From this data it clarifies that the female patients is more than that of male
patients.
In the Panchayath most of the are so aware about the medical checkup. They have
taken it monthly, annually, and usually. Here the medical checkups are usually taken by
the males (50%) than that of females (35%). But the majority of the females take medical
checkups annually (50%). There is a positive situation existing here that is, there heath
expenditure is less than of their income. So it show a better health condition in the area.
The study shows a better female health status or more or less equal to males.
Major Health Progaramme Conducted in the Study Area
There are various programs implemented or practiced for the improvement of
health status of both male and female and also other peoples in the rural area. They are as
follows:
1. Immunization program
2. RNDCP (Rebiced National Tuberculosis controlled Program)
3. National Deveming day
4. Family welfare program
5. NCD (Non Communicable disease Program)
3. Health Care System in KaruvarkunduPanchayath
a. Public Health Care System
Public health care system in Karuvarakundu consist of Ayurveda and Modern
medicines. A primary health care center is working on the Rural area, One
Ayurvedic dispensary is functioning under public health care system. 18 doctors
and 27 nurses are working in the primary health care center with 123 beds.
Corresponding Author: Nimisha. P. M.

Research Article
MES MAMPAD International Journal of Humanities and Social Science (MESIJHSS)
Corresponding Author: Anjusha. K. P 43
b. Private Health Care System
The role of health care sector in Karuvarakundu Panchayath has been very
decisive and significant. There are 7 private medical institution and other
individual medical clinics functioning in the Panchayath. Among hese institution
had facilities with 37 doctors 114 nurses are working under the sector with 175
beds. The Cooperative sector institutions are not functioning in the
Karuvarakundu Panchayath.
PHC is the oldest health care in Karuvarakundu Panchayath. Majority of the
people are depending on the PHC in which majority are comes from Rural area. Some of
the private institutions are recently organized. It provides most of the modern medicines
and it functioning with better infrastructural facilities .There are no wide changes in the
number of doctors and nurses during the period from 2015-2016.But there is variations in
the number of patients in every year.
Suggesstions
1. To Increases the age of marriage of females in the rural area.
2. To conduct awareness class and activities among people in order to reduce
Alcoholic, Tobacco and drugs use among males.
3. To take preventive methods to control life style diseases.
4. Reduce the number of female patients through better medical facilities.
5. To conduct medical camps weekly
Conclusion
In this study it review the male and female health status in Karuvarakundu
Panchayath by discussing through socio-economic condition health status, health
facilities and health problems in the study area. The health status of male and female in
the rural area of Karuvarakundu Panchayath is found to be high. It differs from other
rural areas and also described recognized position of health care. To calculate the health
care system of proportion is shaped by a variety of factors such as level of income,
Corresponding Author: Nimisha. P. M.

Research Article
MES MAMPAD International Journal of Humanities and Social Science (MESIJHSS)
Corresponding Author: Anjusha. K. P 44
standard of living, housing, sanitation, Education, Availability of medicine and
Accessibility of hospital facilities more over there are certain socio-economic factors.
While comparing the health status of female in Kerala and India it has better position in
Karuvarakundu Panchayath.
References
1. Adler Nancy, Ostrov, and Joan, M. (1999). Socio Economic Status and Health: What We Know and What We Don’t, Annals of the New York Academy of Sciences, No: 896, pp.3-15. 2. Akshaya Project in Malappuram district, District Census Hand Book, 2001. Alagh, Yogindra, K. (2004). 3. Fore word to Economic Empowerment of Muslims in India by Abu Saleh Sheriff and Mahatabal Azam, Institute of Objective Studies, New Delhi. 4. Amartya Sen (2001). Text of an Inauguration Lecture for the New Rad Cliffe Institute at the Harward University, FrontlineVol.18, Issue.22. 5. Aras, R, N. Pai., and Purandare (1990). “Pre natal Mortality- A Retrospective Hospital Study” Journal of Obstetrics and Gynecology, 40.No: 3,June, 365-69. 6. Ascadi George, T. F., and Gwendolyn Johnson-Ascadi (1990). “Safe Motherhood in South Asia: Socio Cultural and Demographic aspects of Maternal Health” Background Paper, Safe Motherhood, South Asia Conference, Lahore.
Corresponding Author: Nimisha. P. M.

Research Article
MES MAMPAD International Journal of Humanities and Social Science (MESIJHSS)
Corresponding Author: Anjusha. K. P 45
FINANCIAL LITERACY IN INDIA: AN OVERVIEW
Nujoom. K.K.
Abstract
Access to finance, especially by the poor people, is an essential requisite for employment
generation, poverty alleviation, economic growth and social upliftment. India is one of
the fastest growing economies of the world. India has tremendous growth in financial
sector. The major concern is that financial institutions have not able to include all
sections of the population; especially rural household’s i.e. called financial exclusion.
Even though there are people who desire the use of financial services, but are denied
access to the same. In this scenario financial literacy becomes more important, as
financial literacy improves financial inclusion among the rural people. Through this
paper the author shows that the position of financial literacy in India. And need for
financial literacy, suggestions to improve financial literacy. This paper exhibit that India
has low level of financial literacy than other countries and Kerala hold second position
among other states of India. This is a difficult problem. Financial illiteracy may prevent
ability to save, invest and well being of the people.
Key words: - financial literacy, financial inclusion, financial exclusion financial stability,
poverty and poor people
Introduction
Access to finance, especially by the poor, is an essential requisite for employment
generation, poverty alleviation and social upliftment. As per the Human Development
Report (2006) India has the largest poor in the world i.e. about 70-80 million families are
poor, which is due to financial exclusion. Financial exclusion means ‘the lack of access
by certain consumers to appropriate, low cost, fair and safe financial products and
services from main stream providers’. In this scenario, India has implemented a wide
range of reforms as in the war against poverty, financial inclusion has emerged as a
priority for policy makers of India. Financial inclusion is the process of ensuring access
to appropriate financial products and services needed by weaker sections and low income
groups in the society at an affordable cost in a fair and transparent manner. As a nation
Available online at http://mesmampad.org/researchjournals.php
Corresponding Author: Najoom. K. K.

Research Article
MES MAMPAD International Journal of Humanities and Social Science (MESIJHSS)
Corresponding Author: Anjusha. K. P 46
like India, with huge amount of financial excluded population there arises a compulsory
need to include them and bring them into the main stream. And to this the first and most
important action is to tell and teach them about basic financial concepts like bank
deposit, credit, saving, insurance ,payment and remittance of security etc. this is called
financial literacy. Simply financial literacy means the ability of a person to understand
financial matters. Financial inclusion and financial literacy are twin pillars. While
financial literacy stimulates the demand side, and make people aware of what they can
demand. Financial inclusion acts from supply side providing the financial markets or
services what people demand. Thus financial literacy becomes prerequisite for achieving
the objectives of financial inclusion and inclusive growth. In India need for financial
literacy is greater because large sections of population are financially excluded. With a
view to increase financial literacy RBI and Govt. of India has adopted many programs
like project financial literacy, Pradhan Mantra Jan DhanYojana and demonetization etc.
in this paper discusses about the condition of financial literacy in India.
Review of literature
Chen and Volpe (1998) conducted a financial literacy survey ‘An Analysis Of
Personal Financial Literacy Among College Students’ involving 924 college students
from thirteen colleges in U S and found that the overall mean percentage of correct score
was just 52.87 percent. The survey examined literacy across four main areas and
investigated the relationship between literacy and students characteristics.
Planning Commission of India (2007) reveals that accessibility to institutional
credit to rural women is very limited and there is sex bias in extending the credit to them.
However, women from the non-farm sector have better access to banks than the women
working in the farm sector. Male members have greater influence on accessibility to
credit utilization and its repayment.
Hussein A. Hussan Al-Tamimi Al Anood Bin Kalli (2009) states that financial
literacy has secured a vital role in the recent scenario due to factors including the
development of the new financial products, complexity of the financial markets,
information asymmetry and the changes in the other economic factors
Corresponding Author: Najoom. K. K.

Research Article
MES MAMPAD International Journal of Humanities and Social Science (MESIJHSS)
Corresponding Author: Anjusha. K. P 47
Bahl and Sarita (2012) opined that financial literacy is a way by which individuals
can enhance their understanding about the financial concepts, markets and products to
take effective action to improve overall wellbeing and avoid distress, in financial matters
thus improve their financial status.
Gathergood.J. (2014) results shoes that individuals with low level of financial
literacy and with impulsive buying decision were significantly more likely to hold
alternative non-amortizing, mortgage products.
Ramya Krishnan (2014) through her minor project report “A Study of Financial
Inclusion and Financial Literacy among the Tribal People in Wayanad District in Kerala”
found that the tribal people are poorly informed about various financial products and
practices. This is troubling because financial illiteracy may stunt their ability to save and
invest for retirement, undermining their wellbeing in old age.
Wagner and Jamie (2015) through their paper ‘An analysis of the effects of
financial education on financial literacy and financial behavior’. The result of this survey
showed that most of the participants of the survey were in favor of importance of
financial literacy and financial literacy curriculum was also important. The conclusion of
this study was financial education is advantageous and that the concepts taught in that
type of curriculum were appreciated.
Jayanth Sinha-led panel (2016), ‘Financial Literacy Way Forward Financial
Inclusion’ says that for financial inclusion through promoting financial literacy. The
people’s participation and use of technology are central for the successful implementation
of financial inclusion scheme like PradhanMantrhi Jan DhanYojana (PMJDY).
Definition of Financial Inclusion and Financial Literacy
Dr. C Rangarajan committee on financial inclusion (2008) appointed by the
government of India to study financial inclusion defined ‘financial inclusion as the
process of ensuring access to financial services and timely and adequate credit where
needed by the vulnerable group such as weaker sections and low income groups at an
Corresponding Author: Najoom. K. K.

Research Article
MES MAMPAD International Journal of Humanities and Social Science (MESIJHSS)
Corresponding Author: Anjusha. K. P 48
affordable cost’. Nair (2012) financial inclusion can be described as the delivery of
banking and other financial services at affordable costs to the vast sections of
disadvantaged and low income groups.
Financial literacy can be interpreted broadly or narrowly. In a broader
perspective, financial literacy can be stated as “understanding of economics and how
economic conditions and circumstances affect household decisions” (Worthington, 2006).
A narrow definition of financial literacy focuses on “basic money management tools such
as budgeting, saving, investing and insurance” (Natalie, Newton and Chrisann, 2010).
Why we need financial literacy?
Need for financial literacy in India is ever greater considering low level of
financial literacy and a large population particularly rural population remaining out of
the formal financial setup. People need to be aware of advantages of access to formal
financial system, saving, credit, repayment of loans to help them make informed
choices. As Financial literacy and financial inclusion are twin pillars. While financial
literacy stimulates the demand side, making people aware of what they can demand.
Financial inclusion acts from supply side providing the financial markets or services
what people demand. Financial literacy programs are tailored to be relevant for each
group of the society. It spans the formal and informal financial sectors assisting clients
in the usage of varied financial services. Financial literacy creates awareness in
common men regarding the financial products and services offered by banks and
accelerate the pace of financial inclusion (RBI, 2013).
As financial inclusion is a priority of India. And the government has been done
many measures on financial inclusion. When implementing financial inclusion program,
India has to face many constraints on the basis of income inequality, poverty, gender gap
etc. for example the implementation of Pradhan Mantra Jan Dhan Yojana, a national
mission on financial inclusion in 2014, it becomes as a most successful program by
making 214 million zero balance accounts were created, which means huge population
were financially included. But our financial literacy level remains lowest among the
Corresponding Author: Najoom. K. K.

Research Article
MES MAMPAD International Journal of Humanities and Social Science (MESIJHSS)
Corresponding Author: Anjusha. K. P 49
nations. So we want financial literacy for effective implantation of monetary policies and
financial reforms like PMJDY and demonetization etc. and also to access financial
products and services, to make saving, investment and wellbeing of rural people of India
Financial literacy centers (FLC) in India
In 2012, RBI revised guidelines related to Financial Literacy Centers (FLC).
The guidelines advised commercial banks and all the rural branches of banks act as
FLC. Financial literacy camps should be conducted at least once a month. And by two
essential provisions of ‘Financial Literacy’, ‘Financial Access’ should be facilitated by
financial inclusion. Besides all, reserve bank have engaged commercial banks, NGOs,
government machinery, school, college and other agencies actively to execute the
program effectively.
Financial literacy status of India
The level of financial literacy varies across globe due to variations in the socio-
demographic variables like age, sex, religion, education level, etc. The level of financial
literacy among different nations in the year 2014 is shown in the table.
Table: 1 The level of financial literacy among different nations
Nations Financial Literacy
Norway 71%
Sweden 71%
Denmark 71%
United kingdom 67%
Germany 66%
United states 57%
South Africa 42%
Russia 38%
Brazil 35%
Corresponding Author: Najoom. K. K.
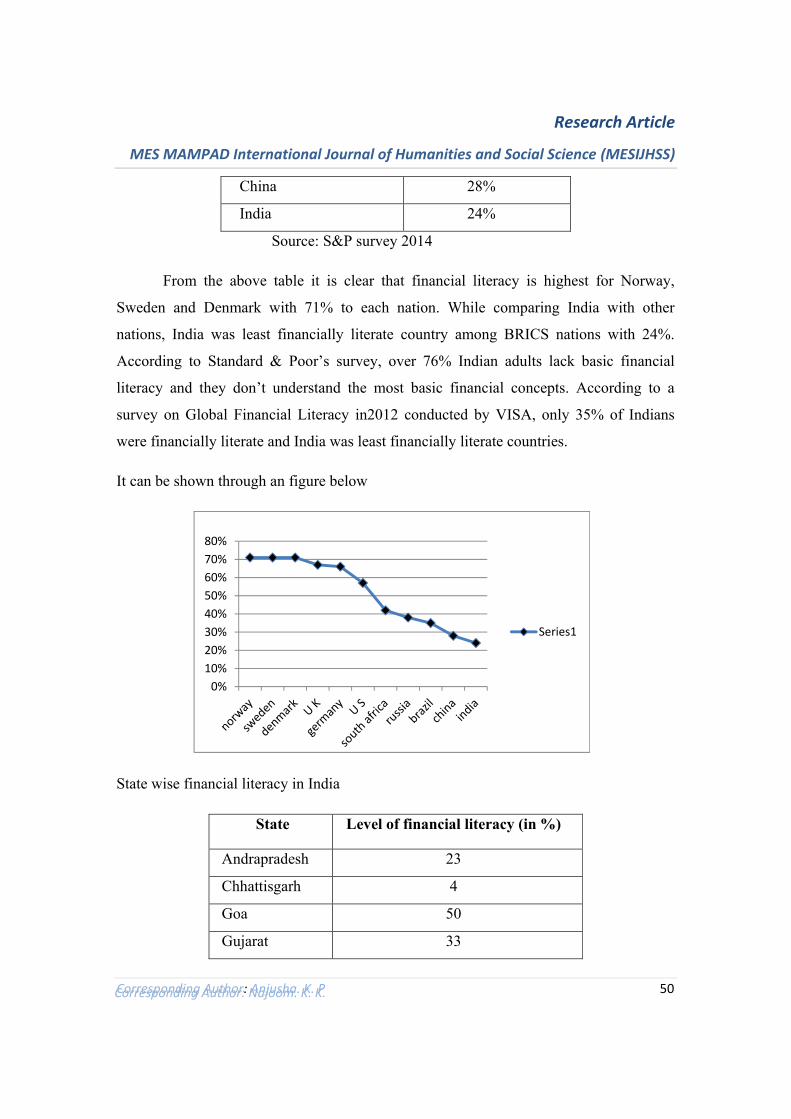
Research Article
MES MAMPAD International Journal of Humanities and Social Science (MESIJHSS)
Corresponding Author: Anjusha. K. P 50
China 28%
India 24%
Source: S&P survey 2014
From the above table it is clear that financial literacy is highest for Norway,
Sweden and Denmark with 71% to each nation. While comparing India with other
nations, India was least financially literate country among BRICS nations with 24%.
According to Standard & Poor’s survey, over 76% Indian adults lack basic financial
literacy and they don’t understand the most basic financial concepts. According to a
survey on Global Financial Literacy in2012 conducted by VISA, only 35% of Indians
were financially literate and India was least financially literate countries.
It can be shown through an figure below
State wise financial literacy in India
State Level of financial literacy (in %)
Andrapradesh 23
Chhattisgarh 4
Goa 50
Gujarat 33
Corresponding Author: Najoom. K. K.
0%10%20%30%40%50%60%70%80%
Series1

Research Article
MES MAMPAD International Journal of Humanities and Social Science (MESIJHSS)
Corresponding Author: Anjusha. K. P 51
Kerala 36
Manipur 36
Mizoram 8
Sikkim 8
Tamilnadu 22
Utterpradesh 10
As financial literacy determines success of financial inclusion, it is important to know the
level of financial literacy among Indian states to implement any financial inclusion
program like Pradhan Mantri Jan DhanYojana. The below table shows financial literacy
level of major 10 states in India as per the data compiled from the national centre for
financial education report 2015.
Source: Data compiled from the National Centre for Financial
Education Report 2015
It is clear from the table that Goa hold highest level of financial literacy among
states of India, with 50% of financial literacy. Kerala being the highly literate state India,
Kerala has the second highest level of financial literacy i.e. 36 percent. Chhattisgarh,
Mizoram, Sikkim and utherpradesh have least level of financial literacy.
It can be shown through a figure below
Corresponding Author: Najoom. K. K.
0%
10%
20%
30%
40%
50%
60%

Research Article
MES MAMPAD International Journal of Humanities and Social Science (MESIJHSS)
Corresponding Author: Anjusha. K. P 52
What Should Be Done To Improve Financial Literacy in India?
The major suggestion to increase financial literacy among rural people in India are
given bellow
1) Government agencies and NGOs may undertake financial awareness
programs among the rural people to increase their financial literacy. That
will be helpful to bring a practice of recording of incomes and expenditures
among them.
2) Banks, Insurance companies and other financial service providers may
concentrate more on the rural area because they are not yet fully financially
included. It will help the agencies to increase their customer base.
3) Authorities may take necessary steps to include financial literacy programs
in the school curriculum. It will help to mould a financially educated new
generation.
4) The focus of financial literacy programs should be a mass based approach to
include more financially excluded households.
5) The effectiveness of financial literacy program can be higher when coupled
with financial inclusion program as exhibited in the informal case like
SHGs.
6) The policy makers should promote the concept of financial literacy as an
integral part of financial inclusion, the policy when implemented will give
better result not only inclusion but enhanced frequent usage in future.
Second it would catalyze the process in banks towards an integrated
approach rather than financial inclusion only.
7) The public can be made aware about the harmful effects of financial
illiteracy. Seminars and discussions can be conducted for this purpose.
Conclusion
Financial literacy is considered as an important factor for promoting financial
inclusion and ultimately financial stability. Because of this reason, government
Corresponding Author: Najoom. K. K.
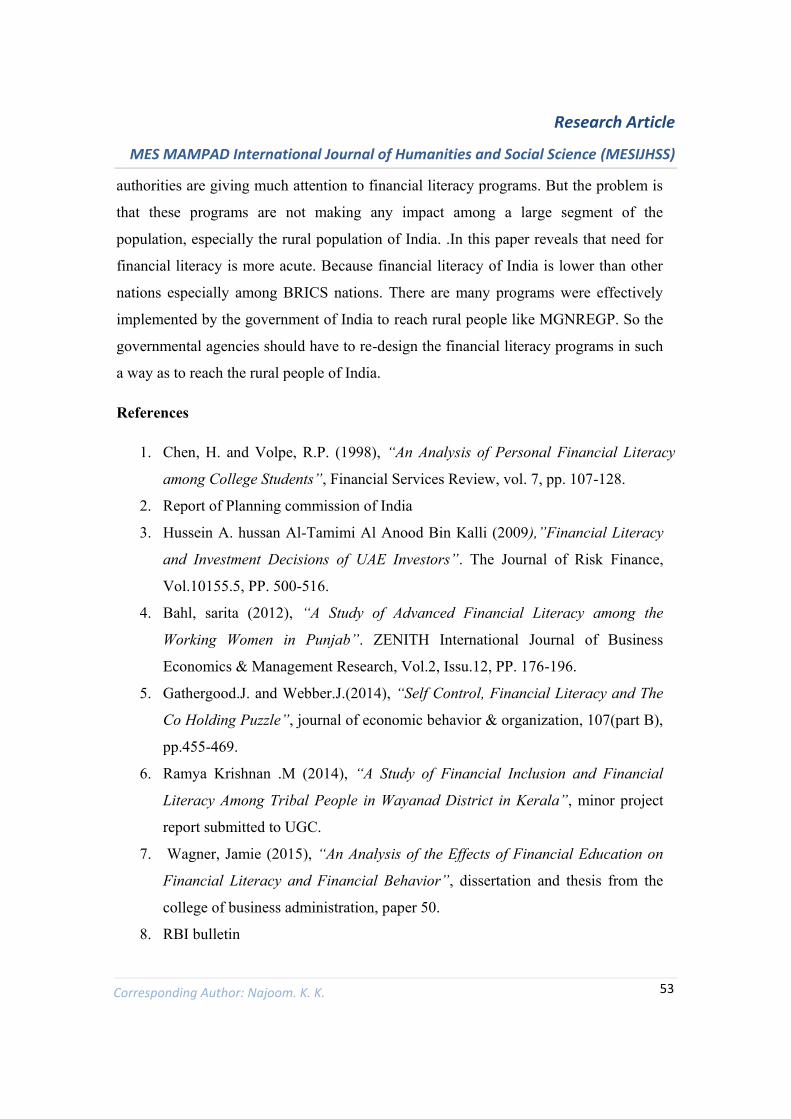
Research Article
MES MAMPAD International Journal of Humanities and Social Science (MESIJHSS)
Corresponding Author: Anjusha. K. P 53
authorities are giving much attention to financial literacy programs. But the problem is
that these programs are not making any impact among a large segment of the
population, especially the rural population of India. .In this paper reveals that need for
financial literacy is more acute. Because financial literacy of India is lower than other
nations especially among BRICS nations. There are many programs were effectively
implemented by the government of India to reach rural people like MGNREGP. So the
governmental agencies should have to re-design the financial literacy programs in such
a way as to reach the rural people of India.
References
1. Chen, H. and Volpe, R.P. (1998), “An Analysis of Personal Financial Literacy
among College Students”, Financial Services Review, vol. 7, pp. 107-128.
2. Report of Planning commission of India
3. Hussein A. hussan Al-Tamimi Al Anood Bin Kalli (2009),”Financial Literacy
and Investment Decisions of UAE Investors”. The Journal of Risk Finance,
Vol.10155.5, PP. 500-516.
4. Bahl, sarita (2012), “A Study of Advanced Financial Literacy among the
Working Women in Punjab”. ZENITH International Journal of Business
Economics & Management Research, Vol.2, Issu.12, PP. 176-196.
5. Gathergood.J. and Webber.J.(2014), “Self Control, Financial Literacy and The
Co Holding Puzzle”, journal of economic behavior & organization, 107(part B),
pp.455-469.
6. Ramya Krishnan .M (2014), “A Study of Financial Inclusion and Financial
Literacy Among Tribal People in Wayanad District in Kerala”, minor project
report submitted to UGC.
7. Wagner, Jamie (2015), “An Analysis of the Effects of Financial Education on
Financial Literacy and Financial Behavior”, dissertation and thesis from the
college of business administration, paper 50.
8. RBI bulletin
Corresponding Author: Najoom. K. K.

Research Article
MES MAMPAD International Journal of Humanities and Social Science (MESIJHSS)
Corresponding Author: Anjusha. K. P 54
9. Rangarajan, (2008) , Report of the Committee on Financial Inclusion,
Government of India.
10. Ramy Nair(2012), India lags behind emerging nations in financial Inclusion,
published by http://origin
www.livemint.com/Industry/ZLqb6dEHp9nav1OsubWJQL/India-lags-
behindemerging-nations-in-financial-inclusion.html
11. Natalie Gallery, Cameron Newton and Chrisann Palm (2010), ‘A Framework for
Assessing Financial Literacy and Superannuation Investment Choice Decisions’
12. Anshika, Dr. anjusingle(2017), ‘Financial Literacy In India-An Appraisal’,
published in 6th International Conference On Recent Trends In Engineering
Science And Management, pp 1228-1294.
13. S&P Survey (2014),’More than 70% Indians fare badly in financial literacy’
14. National centre for financial education(2014), report on Financial Literacy In
India
Corresponding Author: Najoom. K. K.
Research Article
MES MAMPAD International Journal of Humanities and Social Science (MESIJHSS)
Corresponding Author: Anjusha. K. P 55
TITLE: “THE DEBT SUSTAINABILITY OF KERALA: WHAT IS REALITY?”
Muhammedsalim. A.P
Assistant Professor of EconomicsM.E.S. Mampad College (Autonomous), Malappuram
Dist., Kerala, India, Email: [email protected]: 9526525760
Site: sites.google.com/site/muhammedsalimap/
Abstract
The indicator-based analysis has been operated to understand fair-faced status of
Kerala state finance. It was revealed from seven selected indicators that Kerala has not
been in crisis for at least since 2004-05 although the state doesn’t enjoy perfected fiscal
condition. Even though Kerala state finance fulfilled the debt sustainability requirements
from 2004-05 to 2011-12 in a row on most indicators, fiscal indiscipline has outstripped
the state in most of the debt sustainability indicators four years thereafter. The study
evinces that Kerala, which stands ahead of many socio-economic indicators, lagged
behind ‘All states’ in terms of debt-GSDP ratio.
Keywords: Kerala state finance, indicator-based analysis, debt sustainability, debt-
GSDP ratio.
Introduction
A nation’s financial strength and deficit financing capacity can be seen from or
examined on the basis of its fiscal sustainability. Fiscal sustainability, best judged by debt
sustainability, helps measure the ability of a government for further access to debt from
the market. Credit worthiness of the state will be ascended with the vigorous debt
sustainability of the country. Since the government’s role is inevitable even in the current
market oriented economy, role of public finance in a developing-less market oriented
economy like India need no special mention. Public finance and good governance has
been so vital in the world since it satisfies both welfare objective and growth objective
altogether. Both revenue and expenditure of the national or sub-national authority would
be for fulfilling both welfare maximisation objective and stable growth objective. Only a
sound public finance can make it happen without any tickler.
Corresponding Author: Muhammed Salim. A. P [email protected]
Available online at http://mesmampad.org/researchjournals.php

Research Article
MES MAMPAD International Journal of Humanities and Social Science (MESIJHSS)
Corresponding Author: Anjusha. K. P 56
Debt Status of India and Growing Public Expenditure
India has been witnessing significant upsurge on its government level spending
for the last few decades. Akrani (2011) noted that “before independence, there was no
planning in India and hence no effort was made on the part of government to provide
welfare services but the accelerating growth of government expenditure began in late
seventies”. The combined revenue and capital expenditure of the Centre and states
recorded Rs900 cr in 1950-51 unprecedentedly up surged to Rs. 1.5 lakh cr in 1990-91
and Rs31.5 lakh cr in 2013-14 (Ministry of Finance (MoF), 2015). It is cognizant that
growth of population, ascended allocation for defence sector in the context of ceaseless-
aggravated longstanding tension in borders, increase in committed expenditure, growth of
urbanization and industrialization, and centre’s share to the states and union territories
have really brought about quite flagrant growth in India’s public expenditure. This
tremendous growth in expenditure was never backed by adequate revenue. This has
created huge budgetary deficit in India. Subsequently India’s total public debt has
become Rs56 lakh cr in 2013-14 proliferated from Rs. 10 lakh cr in 1999-00. There in,
the outstanding external debt alone progressed from Rs 32 cr in 1950-51 to Rs 1 lakh cr
in 1990-91 and Rs. 3.75 lakh cr in 2013-14. (MoF, 2015).
Kerala’s public finance: Standing incredulity
The state finance of Kerala is being questioned on its credit worthiness and ability
to cover surging revenue expenditure. Great majority of Kerala’s revenue spending is
being allocated for committed expenditure (69.74% in 2014-15 and 68.61% in 2015-16).
Lion share (60% in 2015-16) of it was being exhausted under the heads of salary, pension
and interest payment. (Kerala State Planning Board (KSPB), 2017). The state
government, in recent years, was running the treasury without over draft and closure
scantly. Many a time the state has resorted ways and means advance to meet daily
expenses to avoid overdraft. The state can avail up to Rs 350 cr per annum through
market borrowing. If the treasury fell in over draft and stayed it for 14 consecutive
working days, the RBI will declare treasury closure ceasing all treasury transactions
Corresponding Author: Muhammed Salim. A. P [email protected]

Research Article
MES MAMPAD International Journal of Humanities and Social Science (MESIJHSS)
Corresponding Author: Anjusha. K. P 57
including salary and pension disbursements. Regularly raising concerns and misgiving on
state finance elucidate that Kerala’s state finance has been running on the enfeebled
overpass which requires scaffolding or restoration. As pointed out by Ayyappan (2014)
that the revenue starved state of Kerala is recklessly pushing itself towards a treasury
shutdown by December. Besides the non-renouncing overdraft and treasury closure
browbeats or putting on these, Kerala now faces the menace of the loss of public revenue
in the context of the recent ban on beverages outlet. Following the closure of 1956 liquor
outlets in line with the Supreme Court order banning sale within 500 meter radius of the
national and state highways, the Kerala government is likely to sustain a revenue loss of
up to Rs 2,500 crore (Manorama Online, 2017).
Objectives
1. To unearth Kerala's placing on debt status among Indian states.
2. To discover the debt sustainability of Kerala.
3. Methodology
The study entirely banked upon secondary data which were collected from the
crowning provenances such as Reserve Bank of India (RBI) and Kerala State Planning
Board (KSPB). Simple statistical tools such as percentage and ratio were employed
throughout the study for the analysis of data. The study organized an indicator-wise
analysis of the debt sustainability of Kerala. All such indicators are based onstate income,
public revenue, public expenditure and public debt indicators of the Kerala state.
Moreover Debt-GDP ratio was also employed in the study to understand the fiscal
standings and enormity of public debt of Kerala and other states in the last few decades.
4. Debt/GSDP Ratio of Kerala: Reversing Trend
Kaur, Mukherjee, Kumar, and Prakash (2014) in their study for RBI found that
the fiscal position of the state governments had remained comfortable in the first three
decades since independence. Kaur et al. (2014) explored that the state finances exhibited
signs of fiscal stress since the mid-1980s. Kerala had better debt position than national
average. The table 1 shows that Kerala’s debt/GSDP (Gross State Domestic Product)
Corresponding Author: Muhammed Salim. A. P [email protected]

Research Article
MES MAMPAD International Journal of Humanities and Social Science (MESIJHSS)
Corresponding Author: Anjusha. K. P 58
ratio was just 14.6 which was lower than the national average of 18.3 during the pre-
reform era of 1980-81 to 1991-92. The situation has been repeated in second period of
1992-93 to 1996-97 with a small reduction in gap between state and national averages.
The situation, accruing body blow to the state of Kerala, has been capsized thereafter
since most other states were able to bring down their ratios. The third phase witnessed a
larger increase in Debt-GDP ratio both in Kerala and in India. This phase of six years
from 1997-98 befall an increase of 10 per cent of Debt-GSDP ratio of Kerala while All
states had a lesser hike of 6 per cent in Debt-GSDP ratio. The hike in Debt-GSDP ratio of
Kerala continued to rise and reached an average of 33.3 per cent which is greater than
that of India during 2004-05 to 2012-13. The towered gap between debt-GSDP ratio of
Kerala and All States continued in 2013-14 also with around 10 per cent. While All
states’ ratio was mere 21.9 per cent, Kerala’s ratio stood high at 31.7 per cent. At once
the revised estimates show that the gap will be subsided significantly in 2014-15 to
around 6 per cent. While Kerala’s ratio decline to 28.5 per cent, All states’ ratio stood
almost stagnant on 22.3 per cent. The recent trend shows that Indian states, due to their
obligations, compelled to reduce Debt/GSDP ratio. The state of affairs in which Kerala,
which has advantage on many live social development indicators, fell below other states
on state finances is exceedingly portentous and imaginably.
Table 1: Debt-GDP/GSDP ratio
Period Kerala India (All States)
1980-81 to 1991-92 14.6 18.3
1992-93 to 1996-97 18.6 20.8
1997-98 to 2003-04 28.2 26.9
2004-05 to 2012-13 33.3 26.4
2012-13 31.6 22.2
2013-14 31.7 21.9
2014-15 (Revised Estimates) 28.5 22.3
Source: www.rbi.org.in/scripts/publications and State Finances (RBI)
Corresponding Author: Muhammed Salim. A. P [email protected]
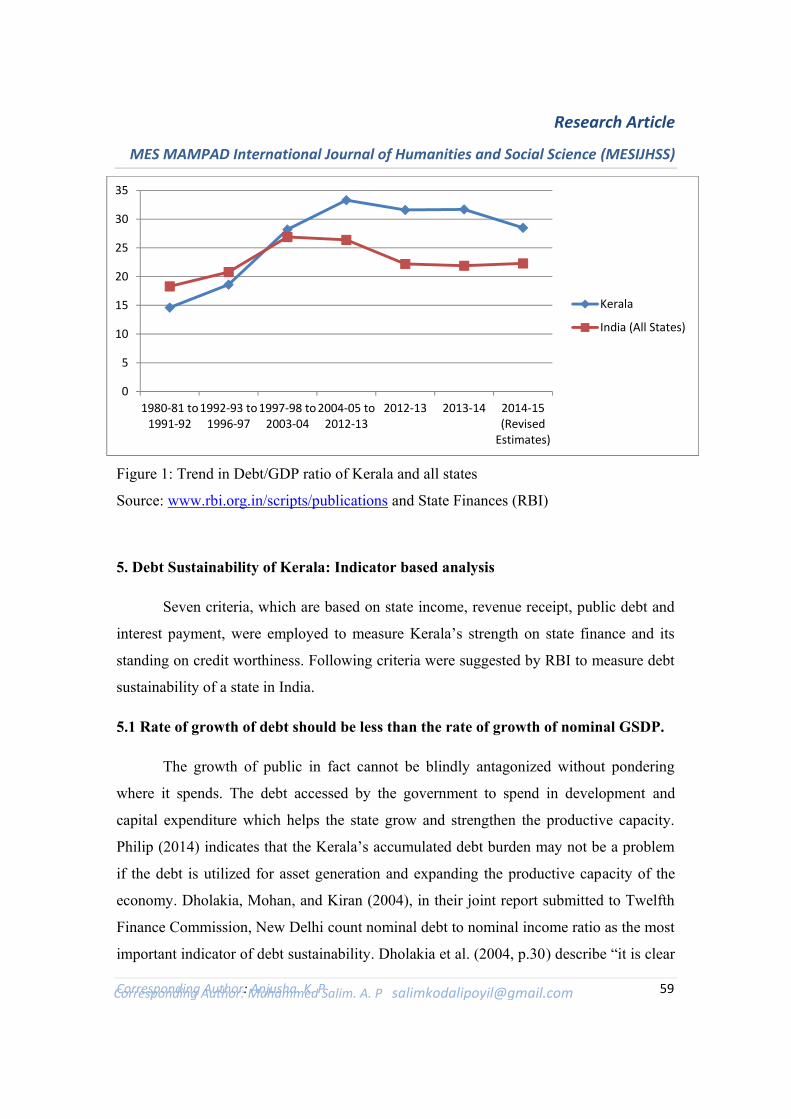
Research Article
MES MAMPAD International Journal of Humanities and Social Science (MESIJHSS)
Corresponding Author: Anjusha. K. P 59
Figure 1: Trend in Debt/GDP ratio of Kerala and all states
Source: www.rbi.org.in/scripts/publications and State Finances (RBI)
5. Debt Sustainability of Kerala: Indicator based analysis
Seven criteria, which are based on state income, revenue receipt, public debt and
interest payment, were employed to measure Kerala’s strength on state finance and its
standing on credit worthiness. Following criteria were suggested by RBI to measure debt
sustainability of a state in India.
5.1 Rate of growth of debt should be less than the rate of growth of nominal GSDP.
The growth of public in fact cannot be blindly antagonized without pondering
where it spends. The debt accessed by the government to spend in development and
capital expenditure which helps the state grow and strengthen the productive capacity.
Philip (2014) indicates that the Kerala’s accumulated debt burden may not be a problem
if the debt is utilized for asset generation and expanding the productive capacity of the
economy. Dholakia, Mohan, and Kiran (2004), in their joint report submitted to Twelfth
Finance Commission, New Delhi count nominal debt to nominal income ratio as the most
important indicator of debt sustainability. Dholakia et al. (2004, p.30) describe “it is clear
Corresponding Author: Muhammed Salim. A. P [email protected]
0
5
10
15
20
25
30
35
1980-81 to1991-92
1992-93 to1996-97
1997-98 to2003-04
2004-05 to2012-13
2012-13 2013-14 2014-15(Revised
Estimates)
Kerala
India (All States)

Research Article
MES MAMPAD International Journal of Humanities and Social Science (MESIJHSS)
Corresponding Author: Anjusha. K. P 60
that debt is always at market prices, and therefore income should be also at market prices
to make sense”. Kerala’s nominal GSDP had mostly higher growth rate than that of total
debt liability of the state since 2005-06 to 2011-12. Since 2005-06 all years up to 2011-12
marked that Kerala moved in a safer zone of having sufficient growth rate of GSDP to
cover the danger of debt growth. Where in, the state had just a narrow edge advantage in
a few years like 2005-06 and 2008-09 when the difference didn’t cross 1.5 per cent. But
in the rest years, the state had considerable advantage with about 2.5 to 6 per cent.
Although it evinces the credence of the state economy without wavering in the
background of global meltdown, transverse occurrence of having higher debt growth rate
since 2012-13 hardly renounces the fear of hideous existence of Kerala economy. The
above national average growth rate has helped the state to attain a decent status in this
period. Since rate of growth of Kerala’s public debt is lower than that of its GSDP in
most years, it can be indubitably retorted that Kerala is not standing at the door step of
fiscal collapse. At that, the fact is that apprehension is not desisting completely as the
state economy has faced back-to-back backlash in 2012-13, 2013-14, 2014-15 and 2015-
16 when debt growth rate over took GSDP growth rate. So to say, the current decade of
the 21st century is shown to be the period of set back to the Kerala economy. This warns
the ascending debt instability of the state of Kerala since the last few years.
(See Figure 2).
Figure 2: Trends in growth rates of Kerala’s GSDP and public debt
Corresponding Author: Muhammed Salim. A. P [email protected].
02468
1012141618
Debt growth rate (%)
GSDP growth rate (%)

Research Article
MES MAMPAD International Journal of Humanities and Social Science (MESIJHSS)
Corresponding Author: Anjusha. K. P 61
Source: Kerala Economic Review
5.2 Revenue Receipts (RR) as Percentage of GSDP should increase overtime
Debt to income ratio cannot be considered as the lone important indicator of debt
sustainability since a notable share of RR is being contributed by the Centre which would
be principally disposed on the basis of Central Finance Commission’s recommendations.
The data augured in figure 3 convinces that Kerala is not at all in success as per this
indicator. RR as percentage of GSDP 12.61 per cent in 2004-05 slightly fell to 11.14 per
cent in 2014-15 and slightly rose to 11.73 per cent in 2015-16. It is clear from the table
that ever since 2004-05, the figure has not crossed 13 per cent. High level of instability or
state of constancy can be seen from the figure 3 as the RR to GSDP ratio was a little
above 12 per cent from 2004-05 to 2008-09, fell below 12 per cent in 2009-10 and 2010-
11. From 2011-12 to 2013-14, the ratio again surged marginally to above 12 per cent and
diminished again to below 12 per cent in 2014-15 and 2015-16. This constancy or
instability in RR to GSDP ratio shows the financial debility of Kerala. This would
question the credibility of the state on debt financing. Helplessness and indifference of
the state to raise the level of RR as percentage spreads concern over the debt
sustainability of Kerala. Kurian (2014) in his study remembered that the clouds of a fiscal
or liquidity crisis are looming large over Kerala, a visible trend of which is the slower
growth of own tax revenue.
Corresponding Author: Muhammed Salim. A. P [email protected].
0
50
100
150
200
250
300
350
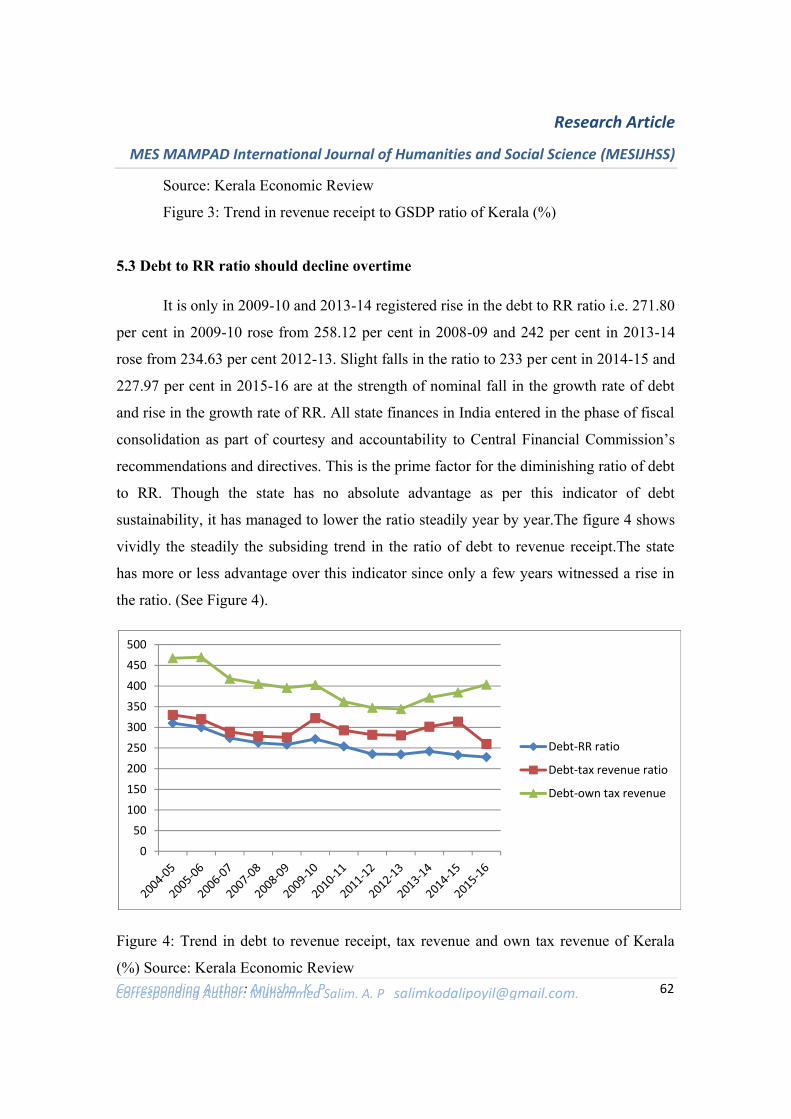
Research Article
MES MAMPAD International Journal of Humanities and Social Science (MESIJHSS)
Corresponding Author: Anjusha. K. P 62
Source: Kerala Economic Review
Figure 3: Trend in revenue receipt to GSDP ratio of Kerala (%)
5.3 Debt to RR ratio should decline overtime
It is only in 2009-10 and 2013-14 registered rise in the debt to RR ratio i.e. 271.80
per cent in 2009-10 rose from 258.12 per cent in 2008-09 and 242 per cent in 2013-14
rose from 234.63 per cent 2012-13. Slight falls in the ratio to 233 per cent in 2014-15 and
227.97 per cent in 2015-16 are at the strength of nominal fall in the growth rate of debt
and rise in the growth rate of RR. All state finances in India entered in the phase of fiscal
consolidation as part of courtesy and accountability to Central Financial Commission’s
recommendations and directives. This is the prime factor for the diminishing ratio of debt
to RR. Though the state has no absolute advantage as per this indicator of debt
sustainability, it has managed to lower the ratio steadily year by year.The figure 4 shows
vividly the steadily the subsiding trend in the ratio of debt to revenue receipt.The state
has more or less advantage over this indicator since only a few years witnessed a rise in
the ratio. (See Figure 4).
Figure 4: Trend in debt to revenue receipt, tax revenue and own tax revenue of Kerala
(%) Source: Kerala Economic Review Corresponding Author: Muhammed Salim. A. P [email protected].
0
50
100
150
200
250
300
350
400
450
500
Debt-RR ratio
Debt-tax revenue ratio
Debt-own tax revenue
Research Article
MES MAMPAD International Journal of Humanities and Social Science (MESIJHSS)
Corresponding Author: Anjusha. K. P 63
5.4 Debt to tax revenue should decline overtime
This is an almost similar indicator of the debt to revenue receipt ratio. Even
though this indicator of Kerala’s debt sustainability also evinces the declining trend as
required, it has little more fluctuation in the ratio. Although steadily declined from 330.23
per cent in 2004-05 to 301.57 per cent in 2013-14, this abatement is explicitly faring
below that of the debt to RR ratio that lowered from 310.20 per cent in 2004-05 to 242
per cent in 2013-14. Apart from it, the ratio increased to 313.82 per cent in 2014-
15ascending up by 12 per cent. Showing some signs of the effort to bring back the state
finance, the ratio has declined significantly to 259.66 per cent in 2015-16 as desired. (See
Figure 4).
5.5 Debt to own tax revenue should decline overtime
There has been a remarkable abatement in debt to own tax revenue of the
Government of Kerala over a period of 10 years. Debt to own tax revenue marked 467.20
per cent in 2004.05 fell sharply to 395.68 per cent in 2008-09. Kerala finance faced little
bit of fluctuations thereafter. Increasing seven per cent, the ratio rose to 402.66 per cent
in 2009-10. Though the ratio ameliorating its status subsided significantly to 362.18 per
cent in 2010-11 and 347.70 per cent in 2011-12 and repulsing the efforts of fiscal
consolidation, the ratio got behind at 371.96 per cent in 2013-14. Divulging the fiscal
trouble of Kerala economy, debt to own tax revenue of the state accrued to 384.42 per
cent in 2014-15 and 403.56 per cent in 2015-16.Unlike debt to RR and debt to tax
revenue ratios, debt to own tax revenue shows an increasing trend in the recent years.
From 2012-13 onwards, the ratio has been on an accruing trend giving body blow to the
revival efforts of the government. (See Figure 4).
5.6 Interest payment as Percentage of GSDP should decline overtime
The state meliorated its position by minimizing the interest payment as percentage
of GSDP 3.37 in 2004-05 to 1.88 in 2015-16 over a period of time. This process of
stabilization was in due course as the ratio fell to 3.05 per cent in 2005-06, 2.94 per cent
Corresponding Author: Muhammed Salim. A. P [email protected].

Research Article
MES MAMPAD International Journal of Humanities and Social Science (MESIJHSS)
Corresponding Author: Anjusha. K. P 64
in 2006-07, 2.47 per cent in 2007-08, 2.32 per cent in 2008-09 and 2.28 per cent in 2009-
10. 2010-11 is the isolated year in the decade registered a rise in the ratio (2.39%).
Thereafter it fell continuously to 2.09 per cent in 2013-14 and 1.88 per cent in 2014-15
and 2015-16. This diminution should thank to the growing state economy of Kerala.The
figure 5 clearly the depicts the declining trend in the interest payment to GSDP ratio of
Kerala. But still interest payment of the state constitutes a major share of its revenue
expenditure subsists next to salary and pension disbursements per annum. Raghavan
(2015) shared his view in a study on Punjab state finance that arising financial
bottlenecks or fiscal trouble in the states has been reckoned as after effects of huge share
of committed expenditure of the state on payments like interest, salaries of the
government employees and pensions and growing subsidy bills. The study warns that it
makes government very sensitive to any changes in the economy, especially a slowdown
in growth.
Figure 5: Trend in interest payment as percentage of GSDP and RR of Kerala
Source: Kerala Economic Review
5.7 Interest payment as a Percentage of revenue receipt should decline overtime
It is explicated from the figure 5 that this ratio is also shown a meliorating-
decreasing trend like some other indicators. Wherein, the interest-RR ratio since 2004-05
Corresponding Author: Muhammed Salim. A. P [email protected].
0
5
10
15
20
25
30
Interest payment as % ofGSDP
Interest payment as % of RR
Research Article
MES MAMPAD International Journal of Humanities and Social Science (MESIJHSS)
Corresponding Author: Anjusha. K. P 65
to 2008-09 is improving without any snugging. 26.76 per cent in 2004-05 stage by stage
diminished to 19.01 per cent in 2008-09. Though the ratio rose to 20.27 per cent and
20.31 per cent in 2009-10 and 2010-11 respectively, pre-existence of contiguous fall in
the ratio has been recaptured by registering a lower 18.95 per cent in 2011-12, 17.39 per
cent in 2012-13 and 16.81 per cent in 2013-14. Like other indicators of debt
sustainability, the ratio increased nominally to 16.85 per cent in 2014-15 due to fiscal
stress of the Kerala economy. The ratio, showing some signs of fiscal revival efforts of
the state, afresh subsided to 16.09 per cent in 2015-16. Interest payment as percentage of
RR of Kerala is one of the highest in the country (MoF, 2015).
It would be vivid that the state of Kerala has not at all an absolute advantage on
any of the indicators which were brought under examination for a period of duo-
decennium from 2004-05 to 2015-16 to unearth the debt sustainability of the state.While
Kerala explicitly expresses domination over three of the seven indicators, two indicators
accorded articulate set back to the state and not much improvement can be seen from two
other indicators. While it shows the domination over debt to revenue receipt ratio, interest
payment as percentage of GSDP and interest payment as percentage of revenue receipt,
faced set back obviously on the growth rates of debt and GSDP, and revenue receipt as
percentage of GSDP. Although a slight edge was obtained over debt to tax revenue and
own tax revenue, high uncertainty after the roomy fluctuation has been witnessed
intermittently eliciting the debility of the Kerala public finance. Nevertheless, the state
since 2012-13 has been in a period of fiscal distress as many indicators were on bad run.
Notwithstanding, Kerala moves not through the stage of stalemate as it ameliorated its
fiscal position as part of the commitment to fiscal consolidation over a period of time.The
years since 2012-13 appeared some signs of illness for the economy and down-ward
trend in many indicators. Even though the year of 2015-16 shows some signs of revival
after the fiscal discipline efforts of the government, the debt sustainability status and
capability of Kerala remained grave. The decline in growth rate of central transfers in
2012-13 and 2013-14 have worsened the financial status of Kerala economy. Kerala
attained only 78 per cent of estimated central transfer for the period. At once, significant
Corresponding Author: Muhammed Salim. A. P [email protected].

Research Article
MES MAMPAD International Journal of Humanities and Social Science (MESIJHSS)
Corresponding Author: Anjusha. K. P 66
hike in central allocation thereafter to the states with the recommendations of the 14th
Finance Commission has helped hold out in the fiscal thorn. That’s why the debt to tax
revenue ratio declined to 259.56 per cent in 2015-16 from 313.82 per cent in 2014-15 and
debt to own tax revenue ratio rose to 403.56 per cent in 2015-16 from 384.42 per cent in
2014-15.
Although Kerala had advantage in many indicators in most years, recent body
blow especially since 2012-13 raises concern over its present fiscal status. Some of the
debt sustainability indicators were highly in favour of Kerala. Some other indicators are
more or less against the state. Although Kerala by holding about in many indicators
proved its ability in further access to debt, recent backlash in many indicators ceases the
state’s debt sustainability on prolong. However Kerala had no absolute advantage in any
one of the indicators. However the reality is that the phenomenon of fiscal crisis has not
yet come in at least since 2004-05 although the state has witnessed intense fiscal ticklers.
As explained delicately by Abraham (2004, p.381), fiscal crisis manifests when the
government departments and agencies are unable get their allocations on time and when
the common man, who has to get money from the government treasury, has to wait weeks
or days together to get the cash.
6. Sinking State Finance of Kerala: Instrumental Factors
It was revealed from the earlier exposition that Kerala state finance, even though
not in crisis, has been passing through knotty juncture of ascended fiscal ticklers. This
fiscal disturbance was emerged after the steep rise in revenue expenditure especially
committed expenditure, insufficient growth of revenue receipt, diminishing share of own
tax revenue and upsurge of public debt.
6.1 Long-lasting enormity of revenue expenditure
Due to the ascended and constantly growing committed expenditure, Kerala’s
revenue expenditure has been on the rise. It was in fact galloping fromRs 17,000 cr in
2004-05 to Rs 78,000 cr in 2015-16. Although it’s natural and necessary, it was not being
sufficiently backed by revenue receipt of the State. Revenue receipt was increased from
Rs 13,500 cr in 2004-05to Rs 69000 cr in 2015-16. Thus revenue deficit of Rs 3500 in
2004-05 and Rs 9000 cr was registered. But the important fact to be noted here is that
Corresponding Author: Muhammed Salim. A. P [email protected]

Research Article
MES MAMPAD International Journal of Humanities and Social Science (MESIJHSS)
Corresponding Author: Anjusha. K. P 67
Kerala, discharging its commitment to the fiscal consolidation efforts of the Centre, was
able to subside the revenue deficit as percentage of the state income from 3.66 per cent in
2004-05 to 1.65 per cent in 2015-16.
Figure 6: Growth rates of Revenue Receipts (RR) and Revenue Expenditure (RE) of
Kerala
6.2 Effectiveness of Centre’s share to Kerala’s RR
Figure 7: Trend in share of Kerala’s own tax revenue and Centre’s tax and grants out of
RR
Corresponding Author: Muhammed Salim. A. P [email protected]
0
5
10
15
20
25
30
35
Growth rate of RR (%)
Growth rate of RE (%)
01020304050607080
OTR
Centre's share

Research Article
MES MAMPAD International Journal of Humanities and Social Science (MESIJHSS)
Corresponding Author: Anjusha. K. P 68
6.3 Surging immensity of Kerala’s debt
The figure 8 vividly shows that the growth rate of Kerala’s public debt level is
steadily surging in the last decade although some years witnessed a decline.According to
Naidu (2016), low growth of revenue receipts, economic stagnation, underdeveloped and
insufficient private sector as an alternative development agency, periodical political
cycles and traditional ‘state dependent’ psyche of people have altogether caused for the
huge consolidated debt status of the state.
Figure 8: Trend in growth rates of Kerala’s debt (In percentage)
7. Concluding Remarks
The paper raises intense distress over the debt sustainability and creditworthiness
of the Indian state of Kerala although the state finance doesn’t fell in crisis in the
unabridged substance at least since 2004-05. The study followed two ingresses to
measure the debt sustainability of Kerala viz. debt-GSDP of Kerala and All states, and
indicator based analysis. Kerala’s status on the basis of debt-GSDP ratio was much better
than ‘All states’ in early eighties but worsened miserably in the subsequent years. The
present situation was in fact led by aggravated transfer payments accompanied by
mismanagement of finance shown by counterblast on some debt sustainability indicators
in last some years.
Corresponding Author: Muhammed Salim. A. P [email protected]
0
2
4
6
8
10
12
14
16
18

Research Article
MES MAMPAD International Journal of Humanities and Social Science (MESIJHSS)
Corresponding Author: Anjusha. K. P 69
What is shown from the indicator-wise analysis of Kerala’s debt sustainability is
not soundly undesirable to the state unlike debt-GSDP ratio. Even though Kerala had
decent standings in most indicators, last four years 2012-13, 2013-14, 2014-15 and 2015-
16 had heavy repulsion to the state finance when many indicators turned slightingly
undesirable. Even though it cannot be concluded that the state finance trapped in fiscal
crisis, it will take time to overtake the recent dilemma.
References
1. Abraham, K.M. (2004). Kerala: The fiscal crisis and aftermath. In B.A. Prakash
(Ed.), Kerala’s Economic Development: Performance and Problems in the Post-
Liberalisation Period, p.381. New Delhi, India: Sage Publications.
2. Akrani, Gaurav. (2011, November 2). Causes for the growth of public expenditure
in India. Blog Post. Retrieved from kalyan-city.blogspot.in/2011/02/causes-for-
growth-of-public-ependiture.html.
3. Ayyappan, R. (2014, September 9). Kerala state government treasury inching
towards closure. Deccan Chronicle. Retrieved from www.deccanchronicle.com
4. Dholakia, R, H., Mohan, R, TT.,& Karan, N. (2004). Fiscal sustainability of debts
of states. Report submitted to the Twelfth Finance Commisson, New Delhi.
5. Kaur, B, Mukherjee, A., Kumar, N., and Prakash, A. (2014).'Debt sustainability
at the state level in India. Retrieved fromhttp/www.rbi.org.in/scripts/publications.
6. Kerala State Planning Board. (2017). 'Economic review 2016'.
Thiruvananthapuram: KSPB.
7. Kurian, Vinson. (2014, September 19). Slow growth in Tax Revenue at the core of
fiscal crisis. The Hindu Business Line. Retrieved from
www.thehindubusinessline.com/news/national
Corresponding Author: Muhammed Salim. A. P [email protected].

Research Article
MES MAMPAD International Journal of Humanities and Social Science (MESIJHSS)
Corresponding Author: Anjusha. K. P 70
8. Manorama Online. (2017, April 2). Kerala stares at revenue loss of Rs 2,500
crore. Retrieved from www.english.manoramaonline.com
9. Ministry of Finance. (2015). Indian public finance statistics 2014-2015. New
Delhi: MoF.
10. Naidu, V.N. (2016, September 3). Kerala: Fiscal sustainability of public debt.
Retrieved from www.deccanchronicle.com/amp/business/in-other-
news/030916/kerala-fiscal-sustainability-of-public-debt.html
11. Philip, P.J. (2014). Kerala’s fiscal crisis: Structural causes and remedies. In V.
Mathew Kurian and Raju John (Eds.), Kerala Economy and its Emerging Issues.
Pp.232-237. Kottayam, India: Sahithya Pravarthaka Co-operative Society Ltd.
12. Raghavan, Pyaralal. (2015, December 9). Huge committed expenditures makes
government finances in Punjab very sensitive to trends in growth. Blog Post.
Retrieved from blogs.timesofindia.indiatimes.com/minorityview
13. Reserve Bank of India. (2014). 'State level debt sustainability'. Retrieved from
http/www.rbi.org.in/scripts/publications.
14. Reserve Bank of India. (2016). State finances: A study of budgets of 2015-16.
Mumbai, India: RBI.
Corresponding Author: Muhammed Salim. A. P [email protected].
Research Article
MES MAMPAD International Journal of Humanities and Social Science (MESIJHSS)
Corresponding Author: Anjusha. K. P 71
A COMPARATIVE ANALYSIS OF ISLAMIC BANKING AND INTEREST
BASED BANKING; ISSUES AND CONSTRAINTS IN INDIAN CONTEXT
Farshana Jabil V & Subisha K
Assistant Professorson contract,PG Academy, Wandoor, Malappuram
District,Kerala
Abstract
This paper explores the basic principles and concepts in Islamic Banking. The
paper highlights difference between conventional banking and Islamic banking and also
emphasise the major issues and constraints of Islamic Banking system. And also explore
the operations and activities of both conventional banking and Islamic banking. Many
studies finds that India has the potential of emerging as a significant market for Islamic
banking institutions, provided there is a favourable change in regulatory environment
and increased awareness among Muslims and India as a whole. Islamic banking has
unfortunately been misunderstood in India as a religious charitable venture restricted to
the country‘s poverty-ridden and economically downtrodden Muslim community. Even
years of successful Islamic banking operations and its phenomenal growth around the
world have failed to demolish this myth. When Islamic banking reaches Indian shores, it
will be welcomed as a vibrant, modern and progressive alternate financial system, not as
a rudimentary, indigenous and outdated method of finance.
Key Words:Islamic banking, conventional banking, principles, issues and constraints.
Introduction
Bank is a financial institution that performs several functions like accepting
deposits, lending loans, agriculture and rural development etc. Bank plays an important
role in the economic development of the country. It is necessary to encourage people to
deposit their surplus funds with the banks. These funds are used -for providing loans to
the industries thereby making productive investments. The concept of interest is
fundamental to the business of banking. With this background it is very interesting that
Sharia banking is working without profits and is still flourishing. They are not only
Corresponding Author: Farshana Jabil
Available online at http://mesmampad.org/researchjournals.php

Research Article
MES MAMPAD International Journal of Humanities and Social Science (MESIJHSS)
Corresponding Author: Anjusha. K. P 72
profitable but are also growing at an astonishing rate in sense of capital, assets and
consumers. From Jakarta to Jeddah to Jordan, 280 Islamic banks operate in over 50
countries, with assets estimated between $ 250 million and $ 300 billion. As a concept
Islamic banking has gained momentum world over and in India over the past few years.
Several foreign banks operating in India, like Citibank, International Journal of
Marketing .HBSC are operating interest free windows in several West Asian countries,
Europe and USA. Several banks in the country have shown an inclination to undertake
this form of interest-free banking. However, unless proper regulations are in place to
oversee this form of banking, it will not be possible for scheduled commercial banks to
follow the Islamic rules of banking even in a small way. Islamic banking has
unfortunately been misunderstood in India as a religious charitable venture restricted to
the country‘s poverty-ridden and economically downtrodden Muslim community. Even
years of successful Islamic banking operations and its phenomenal growth around the
world have failed to demolish this myth.
Objective of The Study
The objectives of this paper are:
To explore the basic principles and concepts in Islamic Banking
To explore the basic principles and concepts in interest based banking.
To compare Islamic banking and interest based banking.
To study the major issues and constraints of Islamic Banking
Methodology
The present study is based on mainly secondary data .Secondary sources
comprises of the articles, books, websites, journals, etc...
Content
Islamic Banking – An Overview
Islamic Banking refers to a method of banking that is based on Islamic Law
(Shariah) which prohibits interest based banking‘ and permits only profit sharing based
banking.The concept is based on a verse of the Holy Quran that says ―Allah has allowed
Corresponding Author :Farshana Jabil

Research Article
MES MAMPAD International Journal of Humanities and Social Science (MESIJHSS)
Corresponding Author: Anjusha. K. P 73
only legitimate trade and prohibits interest. It is against the interest, as interest is believed
to lead to exploitation and unproductive income. Islamic banking has the same purpose as
conventional banking except that it operates in accordance with the rules of the Shariah,
known as Fiqh al-Muamalat (Islamic rules on transactions). So, today, by Islamic
Banking one does not mean a mere lending institution extending interest-free loans, but a
package of Shariah-compliant (strict adherence to Islamic economic norms) financial
services like Islamic mutual funds, Islamic bonds (sukuk), Islamic insurance (takaful),
Islamic credit cards and other technology-driven services like ATMs and online banking,
all of which have a tremendous market in India. In India there are reportedly 200 small
Islamic banking institutions in Kerala alone. The deposits of each of these banks range
from Rs. one lakh to Rs. ten lakhs and they do not restrict their lending to Muslims
alone.The concept of Islamic Banking was developed by Muslim scholars to address the
religious prohibition of the payment or receipt of interest, along with other unethical
practices found in the conventional banking system. The fundamental principles of
Islamic Banking are found in the laws of Islamic transaction or 'Mu' amalath', which goes
back over one thousand four hundred years. They are set out in the Islamic Shari'ah and
are enshrined in the Qur'an and the Sunna, the main two sources of Islamic Shari'ah.
Today, these principles form the basis of the contemporary Islamic Banking range of
evolving and fast growing Islamic financial products & services.
Basic Principles of Islamic Banking
The basic principles of Islamic banking are:
Sharing of Profit and Loss: The borrower and the lender share the profits as well as
losses arising from the venture with the finances obtained from the lender. The basic
view is that the general community should benefit from such activities.
Prohibition of Investing in Unlawful Businesses: Islamic Law prohibits investing in
unlawful businesses such as businesses involved in selling alcohol or pork; or
businesses that produce media for instance, gossip columns or pornography; or
gambling industry.
Corresponding Author: Farshana Jabil

Research Article
MES MAMPAD International Journal of Humanities and Social Science (MESIJHSS)
Corresponding Author: Anjusha. K. P 74
Prohibition of Riba (Interest): Islamic Law prohibits the receiving and giving interest.
The disclosures coming to light for prohibitions of interest by Islamic Laws are
The interest deprives someone from the blessings of Allah‘ as it leads to taking
away of property actually belonging to someone
Muslims should stay away from interest for their own welfare as it eventually
invites Allah‘ fury;
The Law prevents taking of any type of agreed and prearranged amount over and
above the actual principal amount from the borrower. And in case the borrower is
unable to repay the principal then they should also forgo their demand for
principal.
The Islamic Law condemns not only those who demands interest but also those
who pay interest.
All interest-free banks agree on the same basic principles. However, individual
banks differ in their application. These differences can be because of several
reasons including the laws of the country, objectives of the different banks,
individual banks circumstances and experiences, the need to interact with other
interest-based banks, etc
Concepts in Islamic Banking
Amongst the common Islamic concepts used in Islamic banking are:
Profit sharing (mudarabah): Islamic Banks offer savings and time deposits in the form
of investment accounts under the system of mudarabah. The depositors of such
accounts share profits and/or losses of the institutions under an agreed-upon formula.
The depositors in mudarabah accounts are the suppliers of capital, rabb al-mal, who
entrust their funds to the bank, mudarib, in the tradition of Western style investment
banking, subject to dealings with only noninterest bearing instruments. The mudarib,
acting as money manager or agent, invests the money and then distributes the profits
and/or losses on the basis of the agreed-upon contract
Corresponding Author: Farshana Jabil

Research Article
MES MAMPAD International Journal of Humanities and Social Science (MESIJHSS)
Corresponding Author: Anjusha. K. P 75
Profits to be shared must be proportional to the funds contributed to the
mudarabah account and these cannot be in lump sums or in guaranteed
amounts.
The loss to the depositor (contributor of funds) cannot be more than the amount
of deposit.
Non-interest bearing demand deposits (checking accounts): Conventional checking
accounts in modern commercial banks are non-interest bearing deposits, and since
Islamic Banking Institutions shun interest rate based dealings, most of them offer
such demand deposit accounts. Ideally, Islamic Banks should not be charging any fees
on checking accounts as they are free to employ the depositors‘ money, subject to the
reserve requirements, if there are any, into earning assets. In practice, however, this is
not always the case. Depending on the size of the deposit, service charges and fees get
collected to meet operating costs.
Joint venture (musharakah): The third instrument used by Islamic Banks
ismusharakah, which is a form of equity financing through joint ventures. Unlike
the case of mudarabah, here the bank not only participates in the supply of capital to
the venture, but also in its management. Thus, the Islamic Banking Institutions
assumes the role of an entrepreneur as well as that of a financier
Cost plus (murabahah): The fourth instrument, murabahah (or more specifically,
baimujalmurabah -cost plus financing), used by the Islamic Banks consist of
transactions where the institution buys a product (e.g., a car or a machinery) on a
client‘s behalf and then resells this with a mark-up to a client, the borrower. Thus, an
automobile selling at a price of $20,000 may be bought by the Islamic Banking
Institutions and resold to a client at $25,000, to be paid back in monthly installments
(or a lump sum at the end of the loan term) over a 2-year period. Instead of interest in
a traditional loan, the bank makes a profit with the difference of the purchase value.
Leasing (ijarah): The fifth instrument used by the Islamic Banks is ijarah or leasing.
Two types of leases are used. In one, the lessee pays the lessor installment payments
that go towards ultimate purchase of the equipment by the lessee. This type of
Corresponding Author: Farshana Jabil

Research Article
MES MAMPAD International Journal of Humanities and Social Science (MESIJHSS)
Corresponding Author: Anjusha. K. P 76
lease/purchase agreement is known as ijarahWa-iqtina. The second type of lease
maintains the ownership of the lesser as per the lease contract
Interest Based Banking
Bank is a financial institution that performs several functions like accepting
deposits, lending loans, agriculture and rural development etc. Bank plays an important
role in the economic development of the country. It is necessary to encourage people to
deposit their surplus funds with the banks. These funds are used -for providing loans to
the industries thereby making productive investments.
A bank is a financial intermediary that accepts deposits and channels those
deposits into lending activities. They are the active players in financial market. The
essential role of a bank is to connect those who have capital with those who seek capital.
After the post economic liberalization and globalization, there has been a significant
impact on the banking industry.
Banking in India originated in the 18th century. The oldest bank in existence in
India is the State Bank of India, a government-owned bank in 1806. SBI is the largest
commercial bank in the country.
After the independence, Reserve Bank of India was nationalized and given wide
powers. Currently, India has 96 Scheduled Commercial Banks, 27 public sector banks, 31
private banks and 38 foreign banks.
Today, banks have diversified their activities and are getting into new products
and services that include opportunities in credit cards, consumer finance, wealth
management, life and general insurance, investment banking, mutual funds, pension fund
regulation, stock broking services, etc.
Further, most of the leading Indian banks are going global, setting up offices in
foreign countries, by themselves or through their subsidiaries.
Difference between Conventional Banking and Islamic Banking
No. Conventional Banking Islamic Banking
1 The functions and operating modes
are based on fully man made
The functions and operating modes are
based on the principles of Islamic
Corresponding Author: Farshana Jabil

Research Article
MES MAMPAD International Journal of Humanities and Social Science (MESIJHSS)
Corresponding Author: Anjusha. K. P 77
principles. Shariah.
2 It aims at maximizing profit without
any restriction.
It also aims at maximizing profit but
subject to Shariah restrictions
3 It can charge additional money
(penalty and compound interest) in
case of defaulters.
This type of banking has no provision to
charge any extra money from the
defaulters. Only small amount of
compensation is charged and these
proceeds are given to charity.
4 Lending money and getting it back
with compound interest is the
fundamental function of the
conventional bank.
Participation in partnership business is
the fundamental function of the Islamic
banks.
5 The investor is assured of a
predetermined rate of interest.
It promotes risk sharing between
provider of capital (investor) and the
user of funds (entrepreneur)
6 Since income from the advances is
fixed, it gives little importance to
developing expertise in project
appraisal and evaluations
Since it shares profit and loss, the
Islamic banks pays greater attention to
developing project appraisal and
evaluations.
7 The status of a conventional bank, in
relation to its clients is that of
creditor and debtors.
The status of Islamic Bank in relation to
its clients is that of partners, investors
and trader, buyer and seller
8 Conventional banking practices are
concerned with elimination of risk
when involve in any transaction
Islamic banking practices are concerned
with risk bearing when involved in any
transaction
9 It does not deal with Zakat (Islamic
Tax)
In the modern Islamic Banking system, it
has become one of the service-oriented
functions of the Islamic Banks to be a
Zakat Collection Centre and they also
pay out their zakat.
Corresponding Author: Farshana Jabil

Research Article
MES MAMPAD International Journal of Humanities and Social Science (MESIJHSS)
Corresponding Author: Anjusha. K. P 78
10 When conventional banks involve in
transaction with consumer they do
not take the liability only get the
benefit from consumer in form of
interest.
Islamic banks bear all liability when
involve in transaction with consumer.
Getting out any benefit without bearing
its liability is declared Haram in Islam
Major Issues and Constraints in Islamic Banking
The major issues and constraints involved in Islamic Banking are mentioned
herein below:
No Power to Issue Cheque: The biggest issue which is a permanent hurdle for Islamic
banks operating in countries with interest-based banking is that they cannot function
as banks unless powers of issuing cheques are given to them. They cannot be
members of settlement/clearing house unless they accept two conditions regarding
their liabilities and assets like conventional banks that have to keep fractional cash
reserve with the central bank and statutory liquid assets in their assets. Thus banks in
India have to maintain deposit account with the RBI over which they get interest. The
SLR includes government and approved securities.
Financial Products are Interest Based: A bank licensed by the RBI becomes part of the
monetary system, which means it can create money by deposit generation through
deposit acceptance. Since these assets are interest based, Islamic bank cannot hold
them. Consequently, the central bank cannot act as the lender of last resort because
such accommodation by the monetary authority is also interest based. Islamic banks
cannot interact with conventional banks based on principles of interest
Inability to Maintain Capital Adequacy: Another constraint is the inability to maintain
capital adequacy and would be unable to interact with interest based banks and
money market in India.
Inability to Evaluate Projects: Islamic banking concentrates more on short-term and
medium-term operations because long-term lending involves project appraisals and
assessing long term profitability. Most such banks are ill equipped to handle this
responsibility because of the smallness of their operations. Corresponding Author: Farshana Jabil

Research Article
MES MAMPAD International Journal of Humanities and Social Science (MESIJHSS)
Corresponding Author: Anjusha. K. P 79
Not Possible under the Present Legal Framework: Islamic Banking cannot be offered
by Indian banks as well as the overseas branches of local banks under the present
legal framework. Except a basic offering like current account, almost no other
banking product in India can be modified to meet the conditions of Islamic Banking.
Tax Procedures: Another important consideration is the tax procedures. While interest
is a passive income, profit is defiantly an earned income which is treated differently.
If principles of Islamic Banking are incorporated then how does it comply with the
tax procedure is the moot question. Furthermore RBI cannot act as the lender to such
banks because such accommodation by the monetary authority is also interest based.
Legal Tricks: Some Muslim critics maintain that the Islamic banks hide the payment
of interest behind legal tricks. They compare Islamic banking to "contractumtrinium"
a legal trick designed by European bankers in the middle Ages intended to allow the
charging of interest for borrowed money, which was against Church teachings. The
trick was in the form of three different contractual agreements, which in and of them
was not prohibited by the church.
Findings
The main aim of the conventional banking is the maximising its profit without
any restriction,but the main aim of the Islamic banking is to maximise profit but subject
to shariahrestriction.Conventional bank can charge additional money in case of defaulters
But Islamic banking has no provisions to charge extra amount for any defaulters
Conclusion
It shall be in the interest of India to allow Islamic banks to operate and expand
their network in the country along with traditional banks as their main focus is on social
well being and wealth generation activities in the society. It is hoped that their
participation in Indian banking will lead to further infrastructural development in India.
Corresponding Author: Farshana Jabil

Research Article
MES MAMPAD International Journal of Humanities and Social Science (MESIJHSS)
Corresponding Author: Anjusha. K. P 80
References
1. International Journal of Research In Commerce &Management, Vol. 4(2013), Issue
No. 1 (January).
2. Financial Inclusion: The Islamic Finance Perspective, Zamir Iqbal and Abbas
Mirakhor, 2012
4. Financial Exclusion of Indian Muslims, Published on- 20th February 2008, Syed
Zahid Ahmad
5. Inclusive Banking, Purnima S. Tripathi, (HinduOnnet)
6. The Role of Islamic Finance in Enhancing Financial Inclusion in Organization of
Islamic Cooperation (OIC) Countries, Islamic Economic Studies, Vol. 20, No. 2,
December 2012, Zamir Iqbal and Abbas Mirakhor
7. Why India needs Islamic Banking, Thought Paper by Infosys, India.
8. Islamic Finance: An Ethical Alternative to Conventional
Finance, Robert E Michael, the Head of Islamic Finance at the New York City.
9. Ethica Institute of Islamic Finance, Achieving Islamic Finance in India, How can
Islamic Finance Help?
10. Islamic Economics Bulletin, Volume 6-10, Shariq Nisar Website.
11. Social Science Research Network (SSRN), Principles and Practice of Islamic
Finance Systems, Dr. Julius B. Bertillo and Dr. Josefina B. Salando, CPA.
Corresponding Author: Farshana Jabil

Research Article
MES MAMPAD International Journal of Humanities and Social Science (MESIJHSS)
Corresponding Author: Anjusha. K. P 81
NEED FOR REJUVENATING INDIAN AGRICULTURE: AN INCUBATION Shijil. K
Assistant Professor-Department of Economics, Kr’s Sree Narayana College [email protected], Mob: 9605314252
Abstract
Basically India is an agrarian economy. Agriculture has been a way of life and
about 16 million families (48.9 per cent of working population) depend upon this sector
for their livelihood. But in terms of contribution to GDP agriculture sector accounts only
14.1 per cent. Since independence contribution from agriculture sector has been showing
a declining trend. Indian agriculture is experiencing sluggish growth due to various
factors. Such factors include problems related to agriculture profitability, availability of
land for cultivation, problems of irrigation, cutting down of subsidies, problems related
with agriculture credit, bottlenecks related to agriculture modernization, policy issues,
problems of small and marginal farmers, disguised unemployment, issue of income
security and sustainability, etc… These problems have to be addressed with immediate
effect. With the increasing population pressure a sustained high level agriculture growth
is a pre-requisite for inclusive growth, reduction of poverty and rural development. It is
not feasible to achieve higher growths in agriculture sector without incremental
productivity and technological diffusion across the country. So rejuvenation of Indian
agriculture is vital for sustainable agriculture growth. Since there is a linkage between
agriculture and industry an upsurge in primary sector is critical to overall development
of the nation. India needs to insist new lifeblood into farmers by removing all the
obstacles in the wake of an agrarian economy so that faster growth is possible. This
paper is essentially an attempt to elicit the need for rejuvenating Indian agriculture on
the verge of raising challenges and tries to point out some policy solution for the
betterment of Indian agriculture.
Key words: Rejuvenation, GDP, Sustainability, Agriculture credit, Small and Marginal
farmers, Agrarian economy
Available online at http://mesmampad.org/researchjournals.php
Corresponding Author: Shijil. K. [email protected]
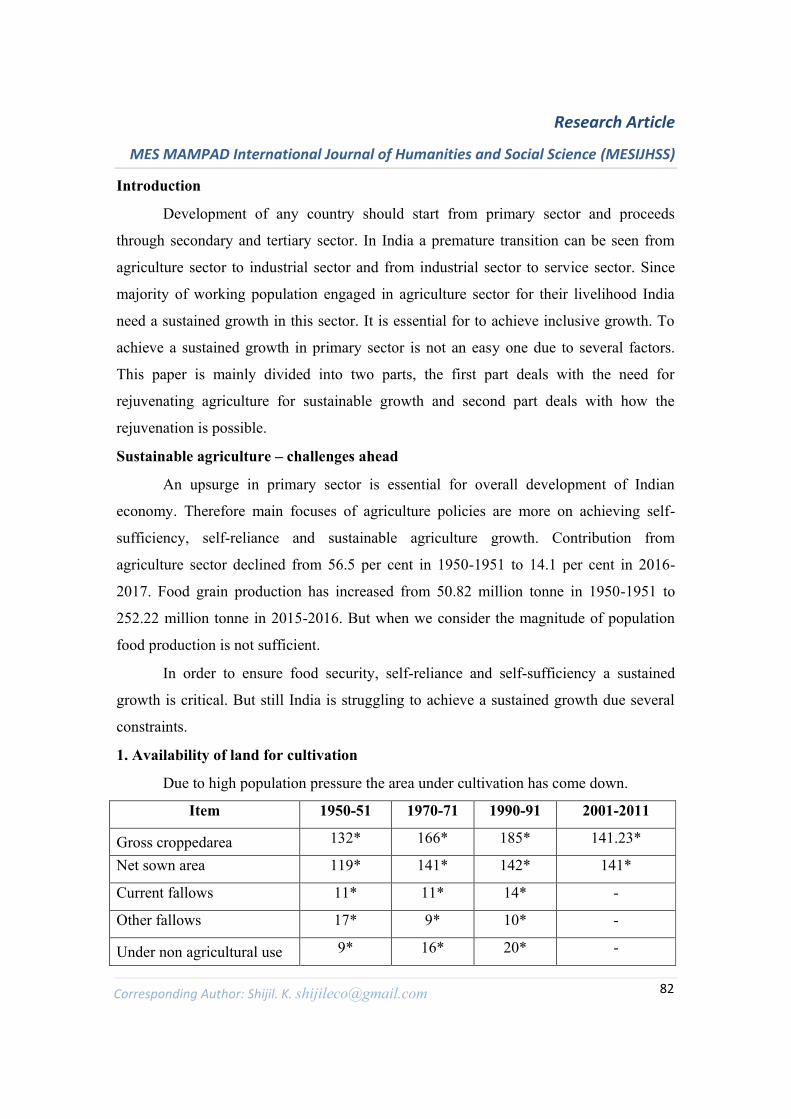
Research Article
MES MAMPAD International Journal of Humanities and Social Science (MESIJHSS)
Corresponding Author: Anjusha. K. P 82
Introduction
Development of any country should start from primary sector and proceeds
through secondary and tertiary sector. In India a premature transition can be seen from
agriculture sector to industrial sector and from industrial sector to service sector. Since
majority of working population engaged in agriculture sector for their livelihood India
need a sustained growth in this sector. It is essential for to achieve inclusive growth. To
achieve a sustained growth in primary sector is not an easy one due to several factors.
This paper is mainly divided into two parts, the first part deals with the need for
rejuvenating agriculture for sustainable growth and second part deals with how the
rejuvenation is possible.
Sustainable agriculture – challenges ahead
An upsurge in primary sector is essential for overall development of Indian
economy. Therefore main focuses of agriculture policies are more on achieving self-
sufficiency, self-reliance and sustainable agriculture growth. Contribution from
agriculture sector declined from 56.5 per cent in 1950-1951 to 14.1 per cent in 2016-
2017. Food grain production has increased from 50.82 million tonne in 1950-1951 to
252.22 million tonne in 2015-2016. But when we consider the magnitude of population
food production is not sufficient.
In order to ensure food security, self-reliance and self-sufficiency a sustained
growth is critical. But still India is struggling to achieve a sustained growth due several
constraints.
1. Availability of land for cultivation
Due to high population pressure the area under cultivation has come down.
Item 1950-51 1970-71 1990-91 2001-2011
Gross croppedarea 132* 166* 185* 141.23*
Net sown area 119* 141* 142* 141*
Current fallows 11* 11* 14* -
Other fallows 17* 9* 10* -
Under non agricultural use 9* 16* 20* -
Corresponding Author: Shijil. K. [email protected]

Research Article
MES MAMPAD International Journal of Humanities and Social Science (MESIJHSS)
Corresponding Author: Anjusha. K. P 83
Barren and uncultivable 38* 28* 21* 17.02(2008-09)
*area in million hectors
Source: agriculture censuses
After the adoption of new economic policy there has been a declining trend in
gross cropped area. Due to globalization there is a sharp increase in service sector
growth. Area under non-agriculture use also explicit an increasing trend which
demonstrate the population pressure on the country.
2. Irrigation
Indian agriculture is a gamble in monsoon. Only 40 per cent area coming under
irrigated area and the remaining 60 per cent under rain irrigated area. Irrigation is the
major factor that helps farmers to yield more. Proportion of irrigated area to net sown
area was 47 per cent in 2005-06 but in 2010-11 it was only 46 per cent. Net irrigated area
in 2005-06 was 54270000 where as in 2010-11 it was 64567000. A slight increase can be
seen. Hence a significant part of the net sown area continues to be rain fed.
3. Agriculture credit
Agriculture credit provides adequate and timely support to farmers. Which will
helps to raise the agriculture produce and income. Government provides large amount as
agriculture credit. Priority sector lending also meant for agriculture credit at relatively
low interest rates. It is mandatory for every bank to lend a prescribed amount as priority
sector lending. But actually what is happening is that most of the farmers use agriculture
loan for other purposes like marriage, construction of house etc… and they may misuse
the loan. Flow of institutional credit to agriculture has been showing an increasing trend.
In 2006-07 it was 2.29 lakh crore and in 2011-12 it increased into 2.62 lakh crore.
Interest subsidy on farmer credit is also showing an increasing trend. As per 2016-17
budget estimates it was 13619 crore and in 2017-18 budget estimates it is 15000 crore.
Crop insurance is also given impetus. In 2015-16 it was 2983 crore but in the budget
estimates of 2017-18 an amount of 9000 crore were earmarked. Most of the beneficiaries
of agriculture credit belong to large land holders.
Corresponding Author: Shijil. K. [email protected]
Research Article
MES MAMPAD International Journal of Humanities and Social Science (MESIJHSS)
Corresponding Author: Anjusha. K. P 84
4. Modernization of agriculture
Modernization of agriculture is critical to sustain agriculture growth. For
technological diffusion across the country a huge investment is needed. New technology
as new agriculture strategy should be taken as the motto for sustained agriculture growth.
Technological diffusion is one of the major problems in India. Small and marginal
farmers are not able to purchase advanced technologies and they lack technical
knowhow. With the new technology India experienced high growth in agriculture sector
during green revolution period, but that growth was not a sustained one. So
modernization should compatible with soil fertility and affordable to farmers.
Introduction of most modern technology requires huge investment in research and
developmental activities. But in India year by year a slight increase can be seen but it is
not sufficient.
5. Income security and sustainability
The two terms income security and sustainability are highly controversial.
Recently our government is focusing on income security to farmers and promised that
income of farmers will double by 2022. Now the question relies upon can income
security leads to sustainability. For of the working population engaged in agriculture
sector has zero marginal productivityensuring income security government must ensure
that farmers receive fair wages and fair price for agriculture produce.
6. Disguised unemployment
One of the important features of Indian agriculture is the prevalence of disguised
unemployment. Most. People are engaging in farming but contribute nothing to total
produce. Agriculture development is possible through shifting of redundant labour to
industrial sector.
7. Problems of small and marginal farmers
Small and marginal farmers constitute a sizable portion of agriculture population.
For a sustained agriculture growth upliftment of such poor segments are inevitable. In
India those who hold less than 2 hectors of land is called small farmers and farmers
Corresponding Author: Shijil. K. [email protected]

Research Article
MES MAMPAD International Journal of Humanities and Social Science (MESIJHSS)
Corresponding Author: Anjusha. K. P 85
cultivating less than one hector is classified as marginal farmers. Both small and marginal
farmers are producers and workers at the same time. They have only low ratio of
marketed surplus to output. Since they are unable to make huge investment they are
facing technological constraints. Most of the small farmers are engaging in production by
augmenting their operational area through leasing. They are facing several constraints
related to adequate irrigation water, unavailability of credit, community’s power structure
etc… They lack timely market information and facing several problems pertaining to
access of government services. Sustained agriculture development is not possible without
addressing the problems faced by these sections.
8. Issue of subsidy
Agriculture subsidy is one of the heating debates in India. Usually government
provides subsidy for boosting the production in agriculture sector. To some extent
subsidies are beneficial to farmers because it reduce the cost of production. Spending of
subsidy out of control will harm the fiscal condition of the nation. A general subsidy on
scarce resources like water and electricity have a negative impact because it did not cover
the cost incurred for providing it. Sometimes subsidies are mistargeted and most of the
benefits of subsidies go to large farmers and land holders. In India there exists some kind
of regional inequalities in providing agriculture input subsidy. Input subsidies for
fertilizers will leads to environmental degradation. Every budget focusing on cutting
down the amount of input subsidy.
9. Profitability
Low profitability is one of the major reasons for the sluggish growth of Indian
agriculture. Often farmers were exploited by middlemen and sellers. Farmers get only a
nominal profit. So without proper minimum support price and timely support from
government during crop failure due to deficiency of rain fall or drought agriculture is not
profitable. Economic survey of 2016-17 shows that minimum support price has increased
but slower in recent years.
Corresponding Author: Shijil. K. [email protected]

Research Article
MES MAMPAD International Journal of Humanities and Social Science (MESIJHSS)
Corresponding Author: Anjusha. K. P 86
How to tackle challenges through rejuvenation
India can achieve a sustainable agriculture by tackling the challenges ahead.
Following are some practical solution for to maintain a high sustainable growth in
agriculture sector.
1. Regenerative agriculture – beyond sustainability
Regenerative agriculture is an advanced form of organic farming. This farming is
based upon ecological principles and it recaptures carbon emission from the atmosphere.
It regenerates soil fertility and it protects soil from chemical fertilizers. This is the best
way to cultivate in healthy soil. This farming keeps carbon in the soil which is the basic
element for every living creature.
2. Research and development
Investment in research and development activities by both public and private
sector is critical to sustain agriculture growth. Since India is a developing country its
priority goes to poverty alleviation, upliftment of weaker sections of the society etc... The
accrued amount by the reduction of input subsidies should be utilized for research and
developmental activities. Since the availability of land is limited the future of agriculture
rest upon research. Research is critical for soil conservation, moisture conservation in
drought areas, addressing the problems of salinity and water logging in rainfall areas.
3. Diversification of agriculture produce
One of the major problems in India is lack of adequate buffer stock and cold
storage facilities. So diversification of agriculture produce especially perishable
commodities is needed. It is also a way for reaping the benefits of globalization. To some
extent it is useful for reducing the problem of disguised unemployment.
4. Capital formation
Capital formation in agriculture sector is critical. Government should use the
amount from cutting down input subsidies for capital formation in agriculture.
5. Adequate and productive agriculture credit
Agriculture credit should be provide at lowest interest rate and should provide a
long payback period for farmers. Government must constitute a mechanism to check
Corresponding Author: Shijil. K. [email protected]
Research Article
MES MAMPAD International Journal of Humanities and Social Science (MESIJHSS)
Corresponding Author: Anjusha. K. P 87
whether the credited amount utilized for agriculture purpose or not. Government must
ensure the outreach of financial institutions for availing the credit facilities for small and
marginal farmers.
6. Insurance
Widening of crop insurance is critical to sustain agriculture. Crop insurance
should be extended to the whole production process of crop. It is the duty of government
to encourage private participation in crop insurance.
7. Marketing
In most of the cases farmers will not get adequate price for their produce because
of the interventions of intermediates. Government should ensure fair prices for
agriculture produce by providing market information, procurement system, announcing
minimum support price and expansion of e-markets. Market accessibility of farmers
should be strengthened and a direct contact between farmers and market has to be made.
Conclusion
Indian agriculture is in a vicious circle. Only a deliberate attempt can pull up and
sustain agriculture sector in India. Since the availability of land is limited new
perspectives on agriculture development is needed. India can transform into a developed
nation by achieving a sustained growth in primary sector and it is way of achieving
inclusive growth. There is an urge for rejuvenating Indian agriculture for a self-sufficient,
self-reliant and a sustainable agrarian economy. There is a need for redefining Indian
agriculture and its policy frame works on the verge of raising challenges. Still India has
better opportunities for to achieve a sustained agriculture growth.
References
1. Government of India, Ministry of Finance, Economic Survey 2016-17, New Delhi,
2017
2. Hnumantha Rao, C.H. and Gulati Ashok, (1994).Indian Agriculture: Emerging
Perspectives and Policy Issues, International/Food policy Research Institute.
3. Sundaram, K.V(2006). Small Farmer Development Strategies For The Next
Millennium. In Ali Mohammad, Abdul Munir, Shamsul Haque Siddiqui and
Corresponding Author: Shijil. K. [email protected]
Research Article
MES MAMPAD International Journal of Humanities and Social Science (MESIJHSS)
Corresponding Author: Anjusha. K. P 88
Rocket Ibrahim (Eds.), Environment Agriculture And Poverty( 1st ed., pp. 223-
237). Ashok Kumar Mittal Concept Publishing Bhalla, G S and D S Tyagi (1989):
Patterns of Indian Agricultural Development, ISID, New Delhi
4. Vaidyanathan, A (2002). India’s Agricultural Development Policy. In Uma Kapila
(Edt)., Indian Economy Since Independence ( 14th ed.,pp.315-333). Academic
Foundation
5. Rao, V M and Jeromi P D (2002). Modernising Indian Agriculture. In Uma
Kapila (Edt)., Indian Economy Since Independence ( 14th ed.,pp.226-314).
Academic Foundation
6. Union Budget 2017-18, February 1
https://us.organicindia.com
http://m.economictimes.com
http://niti.gov.in
Corresponding Author: Shijil. K. [email protected]