Republic of Funisia From Universal Food Subsidies to a Self ...
132
Report No. 15878-TUN Republic of Funisia From Universal FoodSubsidies to a Self-Targeted Prog,ram June 1996 Document of the World Bank Public Disclosure Authorized Public Disclosure Authorized Public Disclosure Authorized Public Disclosure Authorized
-
Upload
khangminh22 -
Category
Documents
-
view
2 -
download
0
Transcript of Republic of Funisia From Universal Food Subsidies to a Self ...

Report No. 15878-TUN
Republic of FunisiaFrom Universal Food Subsidiesto a Self-Targeted Prog,ramJune 1996
Document of the World Bank
Pub
lic D
iscl
osur
e A
utho
rized
Pub
lic D
iscl
osur
e A
utho
rized
Pub
lic D
iscl
osur
e A
utho
rized
Pub
lic D
iscl
osur
e A
utho
rized

Currency and Equivalent Units
Currency Unit = Tunisian Dinar (TD)ITD = 1,000 millimes
US$1.00 = TDO.9697 (estimated average 1995)TD1.000 = US$1.0312
Fiscal Year
January 1 - December 31
Glossary of Abbreviations
AES Subsidy already eliminated (under reform program)AIDS Almost Ideal Demand SystemASAL II Second Agricultural Structural Adjustment LoanBW Bread WheatBMI Body Mass IndexCCGC Central Field Crops Cooperative
(Cooperative Centrale des Grandes Cultures)CGC General Compensation Fund
(Caisse Generale de Compensation)COCEBLE Central Cooperative for Wheat
(Coop&rative Centrale de B1e)CST Tunisian Sugar Complex
(Complexe Sucrier de Tunisie)DHS Demographic and Health Surveys ProjectDW Durum wheatEFRSL Economic and Financial Reform Support LoanES Subsidy eliminated under reform scenarioFAO Food and Agriculture OrganizationINS National Statistics Institute
(Institut Nationale de la Statistique)LAINO A new private dairy processor for sterilized local fresh milk.LF Local Fresh MilkNF Needy Families Direct Assistance ProgramOC National Cereal Authority
(Office des Cerdales)OCT Tunisian Trade Organization
(Office du Commerce de Tunisie)ONH National Oil Board
(Office National de l'Huile)PAE Per Adult EquivalentPS Specific Weight of flour.
(Poids Specifique)SAL Structural Adjustment LoanSRM Sterilized-Reconstituted MilkSTIL Tunisian Dairy Products Company (largest)
(Societe Tunisienne des Industries Laitieres)STS Tunisian Sugar Company
(Societe Tunisienne de Sucre)UHT Ultra High TemperatureUTSS Tunisian Union of Social Solidarity
(Union Tunisienne de Solidarite Sociale)

REPUBLIC OF TUNISIAFROM UNIVERSAL FOOD SUBSIDIES TO A SELF-TARGETED PROGRAM
EXECUTIVE SUMIMARY
Overview
i. Through the Caisse Generale de Compensation (CGC), the Tunisian Government hassubsidized the consumption of basic food-stuffs and a variety of other items since 1970. Subsidies havebeen paid on an unrestricted basis, meaning that the transfers have been available to anyone who choosesto purchase subsidized commodities in any quantity desired.
ii. While CGC subsidies had always made a substantial contribution to the welfare andnutritional intake of the poor, by the 1980s it became apparent that the universal subsidy program hadbecome too costly. The Tunisian Government was then faced with a common policy dilemma inreforming its subsidy program: how to reduce budgetary costs, in a politically acceptable way, whileprotecting low income groups. Rather than switching to an entirely different method of transferringincome to the poor, the Government sought to fine-tune the existing framework of price subsidies byshifting subsidies to food products which are primarily consumed by lower-income households. With thisapproach, a type of self-targeting, subsidized products are still available to all, but they are selectedspecifically to discourage the rich from consuming them.
iii. The transition from universal subsidies towards a more self-targeted program has beena continuing process rather than a discrete policy change. The rationale for this study is to evaluate theimpact of CGC food subsidies, particularly on the poor, and to undertake a mid-term assessment of theon-going reform program. The analysis provides a basis for policy-makers in Tunisia to sharpentargeting mechanisms and offers lessons to other countries regarding the practical issues involved inimplementing self-targeting reforms.
Impact of the Universal Subsidy Program
iv. Since its inception, the central objectives of the CGC subsidy program have involvedredistributing income toward the poor and protecting the purchasing power and nutritional status of low-income groups. To some extent, the universal subsidy program' was successful in meeting these goals.It was progressive in relative terms, contributing over five times more to the purchasing power of the
I/The "universal subsidy" program covers the period until 1990, after which the Government launched a series ofreforms designed explicitly to improve the targeting of CGC subsidies. Under the universal program, subsidies wereplaced on a broad range of products, and the subsidized commodities were generally the only variety of the productavailable on the market. During this period (1970-90), the program experienced virtually universal "take-up" acrossincome groups; hence the term "universal." The program after 1990, however, is referred to as the "reform" programor the "self-targeted" program due to the efforts of policy-makers to introduce quality differentiation in order to improvethe targeting of food subsidies.

ii Executive Summary
poor than to that of the rich (as a share of total expenditures).2 This is not surprising since most CGCsubsidies have been placed on food products which, by Engel's Law, generally constitute a larger shareof total spending by lower-income consumers than by the more well-to-do. In 1990, expenditures onsubsidized products accounted for close to nine percent of the total expenditures of the lowest-incomequintile, as compared to less than two percent for the wealthiest quintile.3 Moreover, roughly 60 percentof total caloric intake and 73 percent of protein consumption of the poor were derived from subsidizedfoods.4
v. Despite these benefits, by the mid-1980s, it was clear that the universal subsidy programwas inefficient and costly. It was inefficient because it subsidized a broad range of products availableto all Tunisians regardless of need. In fact, the wealthiest-income group benefitted twice as much as thepoorest-income group from the program in absolute terms.' The program was costly because it claimeda large share of Government resources: by 1984, outlays on subsidies hovered around four percent ofGDP and ten percent of total Government expenditures.
Alternative Courses of Reform
vi. The high and rising costs of the program, combined with inefficiencies and substantialleakages to the non-poor, nade an overhaul of the universal subsidy system an urgent priority. In theearly 1980s, Tunisian policy-makers began exploring ways in which to reform the program. An initialattempt to reduce the budgetary costs of the CGC was made at that time, and subsidies on several fooditems were eliminated, effectively doubling their prices. However, violent riots, which erupted inresponse to these efforts, forced officials to rescind the measures and delayed the adoption of significantreforms until the end of the decade.
vii. Because a complete elimination of the program no longer seemed like a feasible optionfrom a political standpoint, the Government examined alternatives to better target the transfers to thepoor. Targeting was considered an attractive option because it reduces leakages of program benefits tothe non-poor and concentrates public expenditures on those who need them the most.
viii. Traditional targeted programs, such as direct-assistance schemes, however, generallyrequire specific selection of the target group. As a result, they often entail administrative costs,experience implementation difficulties and suffer from a lack of political support. Administrative costsare associated with, inter alia, identifying beneficiaries, screening applicants, maintaining eligibility lists,
ann 198S, food subsidies contributed 5.5 times more to the total expenditures of the lowest-income group than thehighest; in 1990, they accounted for 5.4 times more of the purchasing power of the lowest-income quintile than thehighest; by 1993, they contributed to 7.2 times more.
I/Population is ranked by total expenditure per adult equivalent which is used as a proxy for income throughout theanalysis.
I/INS Household Expenditure Survey, District of Tunis component (1990). Intake derived from purchased subsidizedproducts only (excludes on-farm consumption).
I/On a per capita basis. INS Household Expenditure Survey (1985).

Executive Summary iii
and preventing fraud. Implementation difficulties often arise in selecting the beneficiaries and keepingup-to-date eligibility lists due to a lack of information regarding individual or household incomes.Without such information, these programs tend to be plagued by leakages to the non-poor and exclusionof eligible beneficiaries. Political support for well-targeted programs can be weak due to the narrowrange of beneficiaries which usually excludes powerful and vocal groups within the population. Attemptsto implement other targeted direct-assistance programs in Tunisia have not been able to avoid theseproblems.6 As a result, the Tunisian Government did not consider traditional direct-assistance schemes(such as food stamps) as feasible alternatives to the CGC food subsidy program.
ix. Other targeting mechanisms were also explored, but did not prove to be appropriatecandidates for reforming the food subsidy program. For example, geographic targeting was rejectedbecause, in most areas, distinctions between neighborhoods were too obscure to make it effective.
The Reform Program: From Universal Subsidies to Self-Targeting
x. Given political, economic, and administrative constraints, the foundations provided bythe universal food subsidy system favored reforms to reduce costs and improve the distribution ofsubsidies across income groups within the existing framework of food price subsidies over those requiringan entirely new institutional structure to channel transfers to intended beneficiaries. In this context, areform program was developed and incorporated into the VIII Development Plan (1991-96). Its explicitgoals aimed to reduce CGC expenditures with the least possible impact on the lower-income households.The primary components of the reform program included: (i) improving the targeting of CGC interventiontoward the poor; (ii) gradually adjusting prices to progressively reduce and eliminate subsidies on certainproducts; and (iii) reducing unnecessary production and distribution costs for subsidized products.
xi. A particularly innovative aspect of the Tunisian reform program has been its reliance onself-selection mechanisms to improve the distributional incidence of subsidies. Self-targeting occurs whenbenefits are available to all, but the program is specifically designed so that the non-poor elect not toparticipate. While other targeted programs require social workers or other agents to undertake some kindof screening (such as individual or group assessment) to determine eligibility, with self-targeting thedecision to participate is made by individuals themselves.
xii. The principal device used to promote self-targeting in Tunisia is quality differentiation.Designing a self-targeted food subsidy program using quality grading involves examining householdexpenditure data to determine whether there are significant differences in consumption across incomegroups. If the poor consume a different basket of goods from wealthier consumers, this basket can beselected for subsidization. Using existing survey data to identify goods that should benefit from subsidiesallows self-targeted programs to economize on information costs by avoiding the cumbersome task ofassessing individuals' income levels to determine eligibility. In practice, however, consumption patternsmay not differ significantly across income groups. This does not mean that self-targeting is not feasible,
6/Direct-assistance schemes include the Needy Families Program and the Union Tunisienne de Solidarite Sociale, whichis responsible for low-income food ration programs and cash transfers to the elderly and handicapped. These programsare quite small in comparison to the CGC program and would not compensate the poor for an elimination of foodsubsidies. The World Bank (April 1993).

iv Executive Summary
but rather that it may require some creativity to invent "inferior" subsidized goods which are unattractiveto wealthier consumers and unsubsidized high-quality alternatives ("superior" goods) to siphon off thedemand by the rich.
xiii. As a first step in improving the targeting accuracy of the Tunisian program, subsidieswere eliminated on goods clearly consumed disproportionately by the rich (such as meat). Remainingsubsidies were focused on basic staples, and currently all of the subsidized products, with the possibleexception of certain types of milk, are consumed in substantial quantities by the poor.
xiv. The reform program in Tunisia extended self-targeting efforts still further by developinga range of goods that represent distinct "quality" grades to consumers of different incomes. Two newapproaches to self-targeting are currently being implemented (a summary of self-targeting measures ispresented in Box A below).
xv. The first tactic for extending self-targeting, a variation of the "inferior goods" approach,involves shifting subsidies to narrowly-defined items within a product line that are perceived byconsumers to be of a lower quality because they possess certain unattractive features in their packagingor ingredients. Although the intrinsic value of these products is preserved, these perceived "inferior"characteristics discourage consumption by wealthier households.7 Examples are discussed in paras. xvii-xxi below.
xvi. The second method, the "superior goods" approach, is appropriate when a governmenthas traditionally subsidized a particular commodity and no other varieties or qualities are available on themarket at cost (usually because of official marketing regulations or restrictions). In Tunisia, the qualityof subsidized products has generally been reasonable, but not exceptional. Since markets have otherwisebeen tightly controlled by state marketing boards, the subsidized product has often been the only varietyavailable on the market. To reduce subsidy costs while maintaining benefits to the poor, authorities haveliberalized the sale of higher-quality versions of these products, which are sold at cost and attract thedemand from wealthier households who then consume less of the subsidized products. This "superiorgoods" approach is consistent with the pursuit of a general liberalization strategy designed to increaseefficiency in the subsector, but has the added benefit, in this context, that it promotes self-targeting.Several examples are discussed below.
xvii. Data from the 1990 household expenditure survey clearly indicated which cereals productsjustified continued subsidies under the CGC reform program and which were candidates for removal fromthe program. In 1990, baguettes were consumed virtually exclusively by the rich; wealthier householdsalso consumed disproportionately more pasta, couscous and pastry flour. Although the lowest-incomequintile consumed slightly more gros paing than the richest, expenditure patterns for gros pain did notdiffer significantly across quintiles, and middle-income households spent the most on this type of bread.
I/It is important to note that it is perceived inferior characteristics, and not any real downgrading of nutritional value,that make a particular item suitable for self-targeting. In fact, some "inferior" products are actually nutritionally richerthan their "superior' counterparts, although they possess certain features (such as color, texture, taste or packaging) thatmake them unattractive to wealthier consumers.
8/Gros pain is a larger loaf bread made from the same type of traditional baking flour as baguettes.

Executive Summary v
Semolina was the only existing cereals product that was clearly consumed more by the poor than the richin both absolute and relative terms. The CGC reform program responded to these expenditure patternsby eliminating direct subsidies on baguettes, pasta, couscous and pastry flour.9 Household survey datafor 1993 indicate that, despite these measures, the rich did not substitute consumption in favor ofsemolina or gros pain, which remain subsidized under the CGC program, and the reforms were indeedsuccessful in improving the targeting of cereals subsidies. In addition, the Government recently appliedthe "superior goods" approach by liberalizing the sale of unsubsidized high-quality varieties of bread thathad not previously been allowed on the market but which appeal to high-income consumers.'° Currentreform plans entail further pursuit of the "inferior goods" approach. Since subsidies on baguettes havealready been eliminated, there will only be a subsidy on one type of bread. This bread will have the"inferior" features of gros pain (similar size, shape, weight) but, in addition, will be made from adistinct, high-extraction rate flour. This flour is considered unattractive to wealthier consumers becauseof its darker color and rougher texture."
xviii. Self-targeting reforms have also been applied to cooking oils. Market studies andhousehold expenditure survey data indicate that, while the rich consume more cooking oil than the poor(1990 data), they tend to purchase it in bottles with labels clearly identifying the type of oil theycontain.'2 Since the poor are willing to buy unmarked oil identified merely as "cooking oil," genericgrain oil,'3 sold unpackaged from bulk retailers'4 or in inexpensive bottles, was chosen to carry CGCsubsidies. In addition, to redirect the demand of wealthier consumers away from subsidized genericcooking oil, the Government recently liberalized imports of "superior" pure grain oils, which are heavilyadvertised by European television in Tunisia, to be sold at cost by private operators.
xix. Several attempts have been made to improve the targeting of sugar subsidies, which haveprimarily been justified as a means to preserve the purchasing power of the poor, who spend over threetimes more on sugar (as a share of total expenditures) than the rich, and not on the basis of anynutritional rationale (although sugar does provide a significant caloric input). Because 1990 survey datarevealed that cube sugar was consumed virtually exclusively by the rich, the subsidy on cube sugar wascompletely eliminated in 1991. The Government also attempted to apply the "inferior goods" approach
9/Although direct subsidies on pasta and couscous were eliminated in 1993, these products remain subsidized indirectlyvia the subsidy on semolina, which is an input into their production.
10/Prior to self-targeting reforms, baguettes and gros pain were the only varieties of bread available on the market. Bothbaguettes and gros pain were subsidized under the universal subsidy program.
I I/In addition, because the new high extraction rate flour re-incorporates bran particles, it is nutritionally richer than thetraditional baking flour currently used to make gros pain and baguettes. Thus although the new bread is less attractiveto wealthier consumers, it is not "inferior" from a nutritional standpoint.
12/Market study conducted by Com&:e Engineering, May 1989; INS 1990 Household Expenditure Survey.
13/In fact, generic grain oil was explicitly created for the purpose of improving the targeting of subsidies as part of the"inferior goods" approach under the CGC reform program.
14/An issue that requires attention, however, is the hygienic concerns surrounding the sales of bulk oil, as discussedbelow.

vi Executive Summary
by introducing a heavily-subsidized new variety, a less-refined brown sugar, that was thought to beunattractive to high-income consumers. In fact, despite being over 43 percent cheaper than granulatedwhite sugar (which continues to benefit from CGC subsidies), brown sugar was not readily accepted byconsumers of any income level and demand remained low. Even poorer households rejected less-refinedbrown sugar at existing price differentials, apparently because of consumer perceptions that the darkersugar was "dirty." This experience presents an important lesson regarding the practicalities involved indesigning a self-targeted program and the importance of consumer acceptance. Indeed, there is a fineline between designing a product to be unappealing to wealthier consumers and preventing its rejectionby the poor (as noted in Box B).
BDox A - SUtMARY OF SELF-TARGETING EFFORTSUNDRWAY OR UNDER CONSIERATION IN TUNISIA
INFERIOR GOODS APPROACH SUPERIOR GOODS APPROACH
Durum- *Maintain subsidies on semolina (continuous) *Eliminate direct subsidies on couscous and pastaWheat (1993)Products
Bread- *Replace subsidies on gros pain with subsidies on a *Eliminate subsidies on baguettes (1993)Wheat single subsidized bread (pain unique) made from a sEliminate subsidy on pastry flour (1991)Products distinct high extraction rate flour (1995196) *Liberalize production of ocher breads that attract
the demand of high-income consunmers (1991-present)
Cooking *Eliniinate olive oil from subsidized huile de minange *Liberalize imports of pure grain oils packaged inOils: resulting In the creation of a subsidized generic grain glass bottles sold at cost to attract demand of high-
oil (1989) income consumers and reduce consumption of*Shift subsidy toward generic oil sold mostly to the subsidized oils (1992)poor in small quantities from large drums (en vrac) and *Create 'fixed mixed" cooking oil with 40 percentaway from bottled oil which is mainly purchased by the olive oil and 60 percent grain oil to diversify rangerich (oil type differentials: since 1989; packaging of products on market and reduce unit subsidies perdifferentials: proposed) liter (1993)
*Olive oil also serves as a "superior' good(continuous)
Sugar: *Shift subsidy toward a less-refined brown sugar *Eliminate subsidies on cube sugar which iswhich is not preferred by upper-income groups (1990) consumed virtually exclusively by the rich (1991)
Milk: *Shift subsidies to pasteurized-reconstituted milk (least- *Apply a small, temporary, promotional subsidy topreferred type of milk) packaged in cheaper cartons fresh, locally-produced sterilized milk (a luxury)that are less attractive to wealthy consumers, such as which is consumed primarily by the rich (1992)berlingot cartons and coussin milk pouches (1991-94)
xx. Data from INS household expenditures surveys indicated that milk as a category is notparticularly well-suited to carry subsidies under the CGC reform program because the rich consumeroughly three times more processed milk than the poor.'5 Survey data revealed that only one type ofmilk, pasteurized-reconstituted, justifies subsidization from a redistributive standpoint. Yet for perceivednutritional, and perhaps political, reasons, the Government has classified milk as an essential product for
15/ln per adult equivalent terms in 1990.
Executive Summary vi
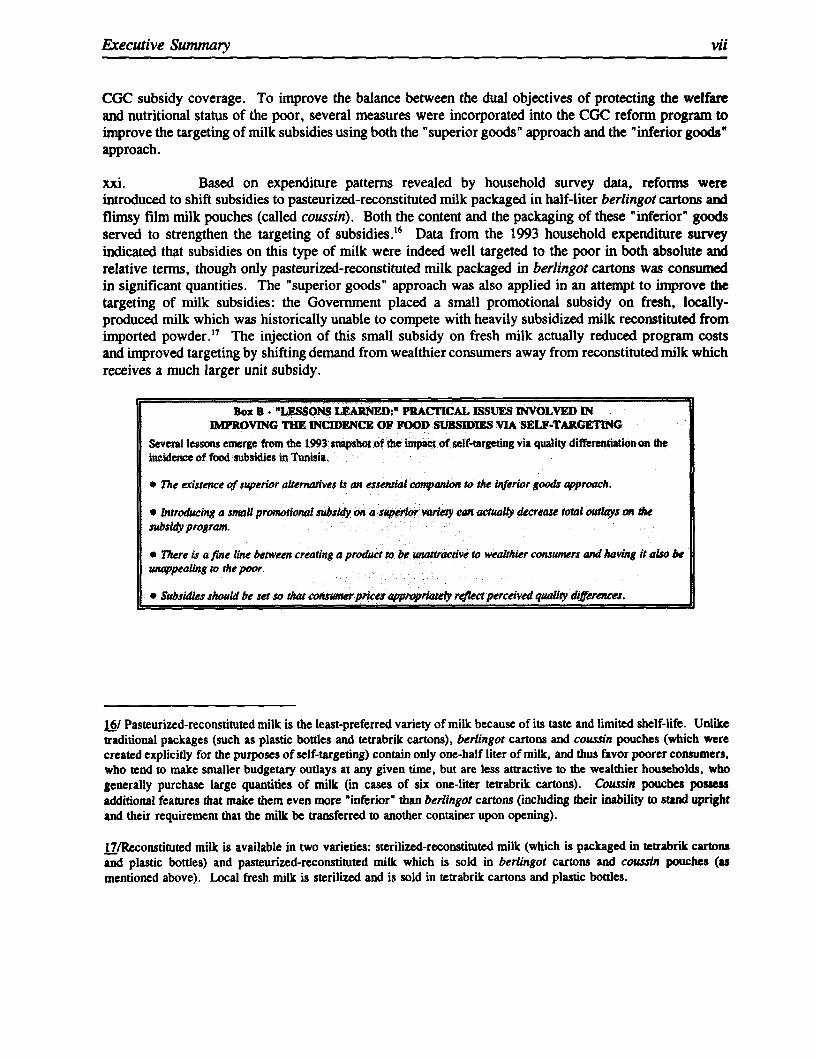
CGC subsidy coverage. To improve the balance between the dual objectives of protecting the welfareand nutritional status of the poor, several measures were incorporated into the CGC reform program toimprove the targeting of milk subsidies using both the "superior goods" approach and the "inferior goods'approach.
xxi. Based on expenditure patterns revealed by household survey data, reforms wereintroduced to shift subsidies to pasteurized-reconstituted milk packaged in half-liter berlingot cartons andflimsy film milk pouches (called coussin). Both the content and the packaging of these "inferior" goodsserved to strengthen the targeting of subsidies.'6 Data from the 1993 household expenditure surveyindicated that subsidies on this type of milk were indeed well targeted to the poor in both absolute andrelative terms, though only pasteurized-reconstituted milk packaged in berlingot cartons was consumedin significant quantities. The "superior goods" approach was also applied in an attempt to improve thetargeting of milk subsidies: the Government placed a small promotional subsidy on fresh, locally-produced milk which was historically unable to compete with heavily subsidized milk reconstituted fromimported powder.'7 The injection of this small subsidy on fresh milk actually reduced program costsand improved targeting by shifting demand from wealthier consumers away from reconstituted milk whichreceives a much larger unit subsidy.
Box B . LESSONS LEARNEI:" PRACICAL ISSUES INVOLVED INIM&ROVING THE INCIDENCE OF FOOD SUBSDIES VIA SELF-TARGETING
Several lessons emerge from the 1993 snapshot of the inpwt of self-targeting via quaity difntiation on theincidence of food subsidies in Tunisia.
* The existence of superior atternatives is an essental companion to the inferior goods approach.
* Introducing a smalt promotional susidy on a suiperlor ariety can twalty decrease total outlays an thesubsidy,program.
* ahere fine line between creating a product to be unattractive to wealthier conswumrs and having It also bewappeaing to the poor.
|* usidies should be set so at cw er price apprapriae' relectperceived quality differences.
16/ Pasteurized-reconstituted milk is the least-preferred variety of milk because of its taste and limited shelf-life. Unliketraditional packages (such as plastic bottles and tetrabrik cartons), berlingot cartons and coussin pouches (which werecreated explicitly for the purposes of 3elf-targeting) contain only one-half liter of milk, and thus favor poorer consumers,who tend to make smaller budgetary outlays at any given time, but are less attractive to the wealthier households, whogenerally purchase large quantities of milk (in cases of six one-liter tetrabrik cartons). Coussin pouches posaessadditional features that make them even more "inferior" than berlingot cartons (including their inability to stand uprightand their requirement that the milk be transferred to another container upon opening).
17/Reconstituted milk is available in two varieties: sterilized-reconstituted milk (which is packaged in tetrabrik cartonsand plastic bottles) and pasteurized-reconstituted milk which is sold in berlingot cartons and coussin pouches (asmentioned above). Local fresh milk is sterilized and is sold in tetrabrik cartons and plastic bottles.

viii Executive Summar)
Impact of the Reform Program
xxii. These two mutually reinforcing techniques for self-targeting have been implemented withsuccess in Tunisia. Reforms have had an excellent impact on improving fiscal accounts. as shown inFigure A on page xiii below: outlays on the subsidy program were cut from over four percent of GDPand ten percent of government expenditures in 1984 to two and six percent respectively in 1993.Moreover, simulations suggest that self-targeting reforms would have led to a 34 percent drop in outlayson the CGC subsidy program from 1990 to 1993, to 1.9 percent of GDP and 5.1 percent of publicexpenditures, holding all other factors'8 constant.
xxiii. Reforms have also been effective in transforming program incidence from a situation inwhich the universal subsidy transferred more absolute benefits to the rich than the poor, to one in whichthe poor benefitted more from food subsidies than the rich (as shown in Figure B on page xiii heiow).'`
Recommendations
xxiv. In fine-tuning the current reform program, Tunisian policy-makers must pay closeattention to the genuine trade-off that exists between reducing budgetary costs and protecting the poor.Any adjustments that increase prices in real terms have an adverse effect on the welfare and dietary intakeof the poor. "Targeted" price adjustments, which reduce or eliminate subsidies on products consutmeddisproportionately by the rich, dampen these effects. However, even these adjustments hurt the poor tothe extent that the poor consume the goods in question.
xxv. Political considerations, imperfect information and the importance of food subsidies to the poorlimit the tools available to Tunisian policy-makers in reforming the universal subsidy program. Thethree-p:onged reform program adopted by the Tunisians makes use of available information and theexisting institutions developed by the universal subsidy system. With careful management of retorlnimplementation (see Box C), this approach has also proved to be a politically acceptable way of cuttingbudgetary expenditures while protecting the consumption of the poor. Despite these successes, there areseveral ways in which the CGC reform program could be sharpened in its effectiveness.
18/Simulations assume that factors such as GDP and population growth are held constant.
19/ln 1985, the rich benefitted two times more from the CGC program than the poor (in per capita terms for the lowest-and highest-income groups which represented 13 percent and 12 percent of the population respectively). In 1990, thlprogram transferred 1.1 times more absolute benefits to the rich than the poor (in per adult equivalent terms for thelowest- and highest-income quintiles, each representing 20 percent of the population). In 1993, the poor benefitted 1.2times more from CGC subsidies than the rich (in per adult equivalent terms for the lowest- and highest-income quintiles).

Executive Summary ix
Box C - MANAGING TIE ON-GOING REFORM PROCESS
Policy-makers should take into account the political consequences of food subsidy reforms, in addition to their impact onthe poor. Past experience in Tunisia and in numerous other countries demonstrates the potentially explosive nature offood subsidy reforms. Careful management of the on-going reform program has facilitated the Tunisian Government'sefibnts to carry out reforms. Similar steps should be taken to manage additional reform measures, including:
* Adopting a gradual approach to reforms
* Instituting price increases in a timely and staggered manner
* "Sensitizing the population (including various government ministries, parastatal agencies, organized interest groupsand the general public) about the necessity and rationalefor reforms via media campaigns and timely press releases (forexanmle, with articles demonstrating the opportunity cost of existing policies)
* Simultaneously introducing targeted compensating measures (with appropriate publicity about these efforts)
* Appointing a team of public-relations experts to manage the 'sensitization - aspects of the reform process
Reform Measures
xxvi. Self-Targeting. Self-targeting efforts in Tunisia could be reinforced by strengthening theapplication of both the "inferior goods" and the "superior goods" approaches. A summary of thesemeasures is presented in Box D below.
xxvii. Incidence analysis indicates that the application of the "superior goods" approach has beenvery successful in diverting the demand of wealthier households away from subsidized products.L'iberalizing government controls on "superior goods" and allowing unsubsidized goods to enter themarket through private channels to siphon off the demand of wealthier consumers should be intensifiedin all subsectors. Recent efforts to introduce new varieties of unsubsidized "superior" breads, importedpure grain oils, and locally-produced fresh milk should be encouraged. The Tunisian experiencedemonstrates that the availability of attractive alternatives is a necessary condition for the success of self-targeting (see Box B).
xxviii. The analysis also reveals that the "inferior goods" approach can be an effective way to self-targetfood subsidies. A prime example of this success in the Tunisian program is semolina, which has beentargeted for subsidies because it is consumed disproportionately more by the poor than the rich. Forother product categories, however, the application of the "inferior goods" approach has stumbled to acertain degree over a variety of public health (pasteurized milk, bulk oil), consumer acceptance (brownsugar), and political (high-extraction rate bread) obstacles. It seems that the targeting of semolina as an"inferior good," as compared with other attempts to apply this approach, is facilitated by the fact thatsemolina is a traditional product in the diets of the Tunisians, and does not involve the introduction ofa new good that is perceived to be of lower-quality. Indeed, creating new higher quality products via the"superior goods" approach (such as the new local fresh milk) appears to be more technically andpolitically feasible than introducing new "lower" quality items.
xxix. For durum-wheat products, expenditure patterns clearly support a targeting of subsidiestowards semolina and away from pasta and couscous. Semolina is by far the best targeted item in theCGC subsidy program. It is also nutritionally rich and highly important in terms of its contribution to

x Executive Summary
the diets and total expenditures of the poor. Indirect subsidies on pasta and couscous (from the subsidyon semolina which is an input into their production) should be gradually eliminated via the establishmentof a "redevance' payment system whereby pastiers, which process pasta and couscous from semolina,reimburse the CGC an equivalent unit amount for the subsidy on semolina used to make these items.'Policy-makers might also consider possibilities for self-targeting pasta subsidies (via differentiation ofshapes and colors), which contribute substantially to the total expenditures and nutrient intake of the poor(despite their currently untargeted incidence).
xxx. For bread-wheat products, steps should be taken to carry out the Government's plans toreplace gros pain subsidies with a subsidy on a single bread (pain unique), which preserves the features(size, shape and weight) that make gros pain less attractive to wealthier consumers, but which is madefrom a distinct, higher-extraction rate flour. Implementation of these plans has been slow, despiteevidence that this measure would be technically feasible and would result in improved targeting, due topolicy-makers' fears that the darker, rougher bread would invoke a negative "stigmna" effect for what isarguably the most politically sensitive product subsidized by the CGC and due to their perceptions thatpolitical resistance to such a shift would erupt. These reforms are apparently still programmed, thoughimplementation is being delayed until policy-makers carry out an active public relations campaign(campagne de sensibilisation) intended to "sensitize" various parties (ministries within the Government,agents involved in the bread-wheat market, and the general public) about the rationale for such measures.
xxxi. For cooking oils, expenditure patterns indicate that subsidies should be shifted towardsgeneric grain oil sold in small quantities from bulk oil retailers because this variety is consumeddisproportionately by lower-income groups. Reports of oil becoming rancid or contaminated in bulk oildrums, however, should be thoroughly explored. If a sanitation investigation reveals that bulk oil salesare unhygienic, or if it appears that leakages of subsidized bulk generic oil to the production of othercooking oils (such as bottled oil) would jeopardize targeting efforts, these subsidies should be graduallyeliminated or shifted towards generic grain oil packaged in cheap, low-quality bottles with plain labelswhich simply identify their contents as "cooking oil" (as opposed to unsubsidized oil which is packagedin attractive bottles which clearly identify their contents).
xxxii. For sugar, the apparent rejection of subsidized, less-refined brown sugar by consumersshould be examined. If necessary, a greater subsidy/price differential should be created between whiteand brown sugar to entice lower-income consumers to purchase the more heavily-subsidized brown sugar.Otherwise, sugar subsidies, which are currently placed only on domestically-produced sugar (and hencelargely benefit producers) should be eliminated.
2Q/A similar system already exists for bread-wheat, whereby millers reimburse the CGC for subsidies on bread-wheatgrain that iS used to make pastry flour (which is not intended to be subsidized under the CGC program). See Chapter Ifor details.

Executive Summary xi
Box D - SUMMARY OF RECOMMENDATIONS FOR FU1RTHER TARGETING REFORMS
INFERIOR GOODS APPROACH SUPERIOR GOODS APPROACH
Durum- 0 Maintain consumer subsidies on semolina in the a Enstitute a redevance system whereby pastiersWheat medium-term, since semolina is well-targeted and is reimburse the subsidy received on semolina that isProducts particularly important to low-income groups from a used to make pasta and couscous, which are not well
welfare and nutritional standpoint targeted; regularly adjust the prices of pasta andcouscous so as to ensure that these items are notsubsidized (either explicitly or implicitly)
* Explore possibilities for self-targeting pastasubsidies whereby the pastiers reimburse the indirectsubsidy on semolina used to produce 'superior'varieties of pasta (attractive shapes, colors) so thatthese varieties are not subsidized (even indirectly)
Bread- 0 Shift subsidies to a new bread made from a distinct high * Liberalize the prices of baguettes, or, if theirWheat extraction rate flour (that incorporates bran particles) that prices remain administratively determined, continueProducts maintains the features of gros pain that are well-targeted to increase them regularly so as to ensure that
to the poor (size, shape, weight) baguettes do not become subsidized again
* Carefully examine the impact of any subsidy reductionsfor gros pain on the poor since existing survey dataindicate that subsidies on gros pain are particularlyimportant to the poor, in terms of protecting thepurchasing power and the nutritional status of low-incomegroups ___
Cooking * Shift subsidies to unpackaged generic grain oil sold * Encourage private operators to mnarket pure grainOil from bulk retailers, which is well-targeted to the poor, oils packaged in attractive bottles with labels clearly
provided that (i) this variety does not entail hygienic indicating the type of oil being sold by eliminatingproblems (such as the oil becoming rancid in bulk drums); the tariff differential between imports of pure grainand (ii) leakages of subsidized bulk generic grain oil to the oils by private importers (currently 43 %) and importsproduction of other oils (such as bottled generic grain oil) of generic grain oil (soy, canola) by the ONHdo not jeopardize targeting efforts; or (preferential tariff rate is currently 15%)
* If the above conditions do not hold, shift subsidies togeneric grain oil packaged in cheap, unattractive bottleswith plain labels which simply identify their contents as.cooking oil"
Milk * Shift subsidies to pasteurized-reconstitutedmilk * Gradually eliminate subsidies on sterilized milkpackaged in berlingot cartons provided that the milk is (both reconstituted and local fresh), which isadequately refrigerated along distribution channels currently packaged in Tetrabrik cartons and plastic
bottles
Sugar * Review the apparent rejection of heavily subsidized, * Gradually eliminate subsidies on white granulatedless-refined brown sugar, by low-income consumers; sugar, while monitoring the impact of these cuts onconduct product trials, testing the less-refined sugar at the welfare and caloric intake of the poorvarious price differentials, and monitor consumptionpatterns
* If poorer consumers reject the less-refined variety evenwith larger price differentials between white and brownsugar, subsidies on both white and brown sugar should begradually eliminated, but the impact of these cuts on thewelfare and caloric intake by low-income consumersshould be monitored

xii Executive Summary
xxxiii. For milk, expenditure patterns clearly support a shifting of subsidies towards pasteurized-reconstituted milk packaged in less attractive containers (e.g., berlingot tetrahedron cartons), because itis the only variety of milk that is consumed disproportionately by the poor. However, this product waseliminated from the subsidy program via a ministerial order in 1994. The reasons given for this reformreversal include: (i) public health concerns regarding potentially inadequate refrigeration of thepasteurized-reconstituted milk along the various distribution channels (particularly in poor neighborhoods)and the very limited shelf-life of this type of milk;2 ' and (ii) the relatively small importance ofpasteurized-reconstituted milk subsidies and the wide range of available substitutes (sterilized-reconstitutedmilk and local fresh milk). Unless the technical aspects regarding the refrigeration of pasteurized-reconstituted milk can be overcome, or unless policy-makers are unable to identify an alternative well-targeted variety of milk, all remaining milk subsidies (which are currently placed on sterilized-reconstituted and local fresh milk, neither of which are well-targeted) should be eliminated.
xxxiv. Price Increases. In general, price increases should be gradual but should at least keeppace with inflation to control budgetary costs. Faster price increases should be reserved for goodsconsumed disproportionately by higher-income groups. The Government should nonetheless pay closeattention to the impact of any price increases on the poor. Compensating measures, or increases insubsidies on well-targeted products, to cushion this impact might also be considered.
xxxv. Liberalization. An issue related to cost reduction involves the liberalization of productionand distribution channels for subsidized products. Close monitoring of operators' production claimsrelative to their known capacity should permit privatization and liberalization of subsidized subsectorswithout allowing private operators to fraudulently receive higher subsidy payments. In fact, self-targetingefforts could actually reinforce monitoring by creating more distinct and easily recognizable subsidizedproducts. A gradual, but significant, liberalization of these subsectors is advised, beginning with pilotprograms with licensed private firms.
xxxvi. Data Requirements and Monitoring. The information necessary to design a self-targetedsubsidy program includes, inter alia, household expenditure data. The Tunisian Government should seekto collect this information regularly to monitor the progress of the on-going reform program. This couldbe done using frequent, small-scale surveys as opposed to the larger, five year surveys.' In addition,marketing studies which test consumer acceptance of self-targeted products should be conducted prior towide spread introduction of new targeted goods. Moreover, policy-makers should seek to establish anexplicit, consistent definition of the target group and then coordinate monitoring the standard of livingof this group.
21/Unlike other varieties, pasteurized milk requires the milk to be refrigerated prior to opening and has a shelf-life ofabout two days).
22/ln fact, a small-scale household consumption survey, Enqu&e Restreinte sur la Consommation des ProduitsSubventionncs, funded by the World Bank Research Support Budget was conducted in 1993 and was designed specificallyto follow-up with quantitative and qualitative questions regarding the products that have been the focus of self-targetingreforms. This survey could serve as a pilot for future program monitoring.

Executive Summary xiii
Figure A - Actual and Simulated Outlays on CGC Subsidies asPercent of GDP and Total Government Expenditures
12.0
10.0
8.0
8 6.0 -*;% of GDP6.0
0 % of Tot. Govt. Exp.4.0
2.0
0.0(act.) (act.) (act.) (sim.) (sim.) (sim.)1984 1990 1993 1993 Si S2
Figure B - Actual and Simulated Absolute Incidence of FoodSubsidies: Share of Benefits Transferred to Poorest and
Richest
3025
=20 poorest
X,03 richest5
(act). (act). (act). (sim.) (sim.)1985 1990 1993 Si S2
Note: The simulations in the above charts represent the predicted values (outlays, incidence) thatarising from various reform scenarios, holding all other factors constant. "Sim. 1993" presents thesimulated outlays for that year arising from self-targeting reforms instituted between 1990 and 1993,ceteris paribus. 'Sim. SI" and "Sim. S2" indicate the simulated values (outlays, incidence) arisingfrom alternative hypothetical reform scenarios (Scenario I involves a 50% across-the-board cut in allsubsidies from their 1993 levels; Scenario 2 involves a set of hypothetical targeted subsidy cuts).These scenarios are described in more detail below.

xiv Executive Sumrnmay
Impact of Recommended Reforms
xxxvii. The fiscal, distributional and nutritional effects of the reforms recommended above weresimulated2u using demand elasticities and data from two household expenditure surveys.24 Todemonstrate the benefits of self-targeting, the effects of a hypothetical across-the-board 50 percent cut inall subsidies from their 1993 levels (Scenario 1) were compared with the impact of a hypotheticaltargeted refonn scenario (Scenario 2), involving an elimination of subsidies on sterilized milk (bothreconstituted and local fresh); bottled generic grain oil, pasta and couscous, as well as an 80 percent cutin subsidies on gros pain.'
xxxviii. As shown in Figure A above, simulation results reveal that both scenarios wouldyield comparable -- and substantial -- reductions in outlays on the CGC subsidy program, cutting outlaysfrom over two percent of GDP and close to six percent of total Government expenditures in 1993 to lessthan one percent of GDP and roughly two percent of Government expenditures.2'
xxxix. Although both scenarios would entail virtually identical effects on program outlays,simulations reveal that their distributional impact would differ substantially (as shown in Figure B above).The across-the-board cuts (from their 1993 levels) under Scenario 1 would simply duplicate thedistributional incidence observed for 1993 (in which the bottom quintile benefitted 1.1 times more thanthe top quintile in absolute terms roughly seven times more in relative terms). Simulation results forScenario 2, however, clearly demonstrate that it is indeed possible to sharpen the self-targeting of foodsubsidies. With Scenario 2, the poorest quintile would benefit 2.1 times more from CGC subsidies thanthe richest in absolute terms and 13.2 times more in relative terms. By reducing subsidies on specificproducts, the distributional incidence of CGC subsidies would be strengthened in favor of poorerconsumers. With these refinements, self-targeting can be pushed beyond the situation observed in 1993,which presented a "mid-term snapshot" of the incidence of the CGC reform program.27
23/See Annex 6 for details on the methodology used for estimation and simulations.
24/INS 1990 Household Expenditure Survey, which shows expenditure patterns under the universal subsidy program(prior to reforms); INS 1993 Enquete Restreinte sur la Consomwation des Produits Subventionnes, which was fundedby a grant from the World Bank Research Support Budget and which reveals expenditure patterns under the self-targetedreform program.
25/Both scenarios assume that subsidies baguettes and PS-7 flour, as well as direct subsidies on pasta and couscous,which were eliminated under the CGC reform program because of their untargeted incidence, were held constant at zeroin the simulations. For obvious reasons, the simulations do not incorporate the effects of targeted reforms that wereimplemented after the 1993 survey was carried out (summer 1993), including the introduction of: (i) "superior" breadswhich were liberalized in 1991 but were not widely available at the time of the 1993 survey; (ii) subsidies on a singlebread (pain unique) made from a high extraction rate flour; (iii) unsubsidized pure grain oils; and (iv) zit sannafa, a new"fixed mixed" cooking oil which was not widely available at the time of the survey. In addition, because the 1993 surveydid not cover consumption patterns for sugar, the simulations do not include the effects of reforms pertaining to sugarsubsidies. Finally, because less than one percent of those households sampled in the 1993 survey actually purchasedpasteurized-reconstituted milk packaged in coussin pouches, this variety of milk was grouped together with pasteurized-reconstituted milk packaged in berlingot cartons for the purposes of policy simulations.
26/Holding all other factors constant at 1993 levels, including GDP and total Government expenditures.
27/ln fact, by completely eliminating subsidies on gros pain and generic grain oil (both bulk and bottled), in conjunctionwith the other reforms in Scenario 2, simulations reveal that it is possible to improve the targeting of food subsidies toan even greater degree. With this additional reform, the poorest quintile would receive 3.1 times more absolute transfers

Executive Summary xv
xl. Simulation results reveal that targeted subsidy cuts under Scenario 2 would producesmaller and more equitable losses in calorie and protein intake than the across-the-board subsidy cutsunder Scenario 1. Moreover, the significant losses in nutritional intake associated with the 80 percentcut in subsidies on gros pain under Scenario 2 could be offset by replacing the subsidy on the flour usedto make gros pain with subsidies on pain unique, made from a high extraction rate flour that re-incorporates bran particles.'
Conclusions
xli. The Tunisian case study provides a useful example for other countries which arecontemplating similar reforms but are concerned about the practicalities involved in implementing self-targeting reforms. It is important to note, however, that Tunisian self-targeting efforts are part of aneffort to reform an existing program. Self-targeting via quality differentiation is appropriate in Tunisiaprecisely because a system of food price subsidies was already in place. The goal of the self-targetingcomponent is to modify existing institutions in order to reduce leakages to the non-poor, cut the scopeof the program, and yet protect the welfare and consumption of the poor. Self-targeting of food productsmay not be suitable in countries where the institutional framework of food subsidies did not previouslyexist. In cases where self-targeting is deemed appropriate, the technicalities of the program, such asparticular quality features of targeted products, are likely to be specific to the region or country inquestion. The Tunisian experience offers an example of the method by which these reforms areimplemented and illustrates the information requirements necessary for the design of an effective self-targeting reform program.
than the richest, and would benefit 20.1 times more in relative terms. A complete elimination of subsidies on grospainand generic oil (bulk as well as bottled) would, however, result in larger losses in purchasing power and caloric intakethan under Scenario 2 (which involves an 80% cut in subsidies on gros pain and an elimination of subsidies on botledgeneric oil while maintaining subsidies on bulk generic oil).
a/Although pain unique is believed to be well-targeted to the poor because of its dark color and rough texture, thepresence of bran particles in the flour used to make this new bread actually improves the nutritive quality of pain uniquebecause it contains more protein, dietary fibers and other nutrients than gros pain.


CHAPTER IFOUNDATIONS FOR REFORM: THE UNIVERSAL SUBSIDY PROGRAM'
1. Through the Caisse Generale de Compensation (CGC), the Tunisian Government hassubsidized the consumption of basic foodstuffs and a variety of other items since 1970. Subsidies havebeen uniformly available to anyone who chooses to purchase subsidized commodities in any quantitydesired.
2. CGC subsidies were introduced to meet a multitude of somewhat conflicting objectives.The initial aims of the CGC included: (i) stabilizing the fluctuating prices of basic staples; (ii) preservingthe purchasing power of the poor; (iii) keeping salary increases low to promote employment, production,and international competitiveness; and (iv) redistributing income towards low-income groups. Over time,further objectives were added, including: (i) encouraging production to achieve self-sufficiency in basicstaples; (ii) promoting exports, particularly of olive oil; and (iii) improving the nutritional status of thepopulation, particularly vulnerable groups.
3. Since its inception, the subsidy program has maintained extensive commodity coverage.The range of products covered by CGC subsidies includes food staples, such as cereals (bread wheat,durum wheat), cooking oil, sugar and milk, and several non-food items, such as animal feed (barley,maize and soybean meal), acid oils2, fertilizers and school supplies. Although CGC intervention has notbeen limited to foodstuffs, this analysis concentrates on the subsidy issues associated with the food itemsin the program.
A. INSTITUTIONAL ARRANGEMENTS3
4. Under the Tunisian food subsidy program, consumer prices are fixed below marketprices. The program allows for unrestricted access to subsidized commodities, meaning that effectiveincome transfers are available to anyone who chooses to purchase the subsidized goods, and the welfarecosts associated with rationing and queuing are not incurred. The magnitude of the income transfer toany individual is limited only by the amount of subsidized products he or she chooses to consume.Subsidies are extra-marginal and have an impact on consumer welfare and nutritional intake via themarginal price as well as through an implicit income transfer.
1\The 'universal subsidy" program covers the period until 1990, after which the Government launched a series ofreforms designed explicitly to improve the targeting of CGC subsidies. Under the universal subsidy program, subsidieswere placed on a broad range of products, and the subsidized commodities were generally the only varieties availableon the market. The program during this period (1970-90) experienced virtually universal "take-up" across incomegroups; hence the term "universal." The program after 1990, however, is referred to as the "reform" program or the"self-targeted" program due to the efforts of policy makers to introduce quality differentiation in order to improve thetargeting of food subsidies. These reforms are discussed in Chapter 3.
2\Acid oils are used for making soap and have been subsidized in Tunisia with the objective of promoting hygiene.
3\Generally, the institutional arrangements developed under the pre-reform program have been maintained under thereform program. Specific modifications to simplify subsidy payments under the reform program are discussed inChapter 3.
2 Chapter I
5. Although the CGC manages the program, many other institutions are involved in thepayment of subsidies and the distribution of subsidized goods. Several ministries and agencies areresponsible for monitoring the CGC, determining prices and financing the subsidies, including theMinistries of Commerce (formerly the Ministry of the National Economy) and Finance. In mostsubsectors, the universal subsidy system has perpetuated an elaborate array of marketing boards and state-controlled distribution networks. In fact, liberalization and privatization of these subsectors has beenslower than in other subsectors due to fears that the private sector could not be entrusted with theresponsibility of handling the subsidies.
The Cereals Subsector
6. The cereals subsector is the most politically sensitive, complex, and costly part of thesubsidy system. Subsidies are injected at three points along the marketing chain: the collection of localproduction, imports, and milling. Until August 1989, they were also paid at the bakery level.
7. L'Office des Cereales (OC), which was created in 1962 under the supervision of theMinistry of Agriculture, dominates cereal marketing channels. The OC manages all subsidy paymentsin the cereals subsector on behalf of the CGC. The OC has a monopoly on cereal imports. It alsocollects locally produced cereals from farmers at collection centers throughout the country, paying themofficial producer prices after making adjustments for margins, taxes and other allowances.4 Bothimported and locally produced wheat are sold to the mills at the same officially determined price (prixde retrocession). Since this price is below the cost of procurement and delivery, the OC receives asubsidy from the CGC to cover the difference.
8. Along with the OC, two cooperatives, the Cooperative Centrale de Ble (COCEBLE) andthe Cooperative Centrale des Grandes Cultures (CCGC), have traditionally dominated storage, handling,and delivery services for locally produced cereals. Though technically private, these cooperatives arehighly regulated and work on behalf of the OC. They purchase wheat from farmers at the officialproducer price and sell it to the mills at the official prix de retrocession. The OC pays the cooperativesa subsidy to cover the difference, and is reimbursed by the CGC.
9. The collection of cereals was liberalized in 1990 under the Second Agricultural SectorAdjustment Loan.5 Since then, additional cooperatives are being allowed to collect cereals from farmers,but they too are subject to very strict licensing standards (cahier des charges). Three new cooperativeshave been licensed.6 They receive a subsidy similar to that paid to the two original cooperatives andthe OC.
10. A more widespread liberalization of collection services has been rejected by authoritieson the grounds that private collection agents and private mills might collude to fraudulently overstate the
4\Since the mid-1980s, producer prices have been set above their border equivalents.
5\ASAL 11, Loan 3078-TUN.
6\Comete Engineering (March 1995).

Foundations for Refonn: The Universal Subsidy Program 3
quantities handled and thereby receive illegitimate subsidy payments. Imports also remain monopolized,in part for the same reason.
11. There are some 22 mills in Tunisia (1989). They are private, but strictly regulated.Millers pay a fixed price (prix de retrocession) for their purchases of wheat. Until recently, millers paidtransport-cost equalization charges (perequation de transport) which were intended to standardizeproducer prices across the country. The perequation de transport was eliminated in 1991 because ofchronic deficits in the transport accounts and the economic distortions caused by these charges.
12. The mills transform bread wheat into baking flour, at a 78 percent extraction rate (PS),and pastry flour, at a 71 percent extraction rate (PS-7).7 Durum wheat is transformed into semolina (PS-10, with a 67 percent extraction rate), couscous and pasta.
13. Millers sell the processed bread wheat and durum wheat to bakeries and durum-wheatprocessors (pastiers) at government-determined prices. They receive a fixed milling margin forprocessing. The sales price at which they are allowed to sell their products is less than the cost of the(already subsidized) grain plus the margin. The difference is compensated by the OC which is, in turn,reimbursed by the CGC. The millers reimburse the OC a "redevance" payment, which is in turn paidto the CGC, for use of subsidized bread-wheat grain to produce PS-7 pastry flour (which is not intendedto be subsidized under the CGC program).8
14. The primary role of the some 2000 bakeries across Tunisia is to purchase bread-wheatflour from millers to transform it into two types of bread: gros pain (700 grams before 1986, then 600grams, and 500 grams since 1989) and baguettes (300 grams before 1986 and 250 grams since), whichare both made from 78 percent extraction rate flour (PS).' The sales price of bread is set officially toallow bakers to cover costs plus a margin. Bakeries no longer receive a direct subsidy. Many bakeriesalso produce pastries with pastry flour (PS-7), which is not subsidized.
15. Unit subsidies are intended to be higher on gros pain than on baguettes because gros painis consumed disproportionately by lower-income groups. However, the same flour is used for both typesof bread and only the flour is subsidized. Therefore, to maintain a subsidy differential between gros painand baguettes, the sales price of flour is set with the assumption that bakers use 85 percent of thesubsidized flour for gros pain and only 15 percent for baguettes. In reality, some bakers make extraprofits from this differential by using more than 15 percent of the subsidized flour to produce baguettes.
7\The abbreviation "PS" refers to the specific weight, or poids specifique, which is a percentage of the mass (inkilograms) of a hectoliter of wheat. Theoretical extraction rates are somewhat lower than actual rates. The ratesreported here are actual rather than theoretical.
8\The CGC team in the Ministry of Commerce (formerly the Ministry of the National Economy) monitors this redevancepayment system by verifying supporting documents (pi&es justificatives) submitted by the mills via the OC. Millsprovide supporting documents to the OC for review on a monthly basis, reporting acquired quantities of grain and thequantities of various processed grain products that are sold for each period. In recent years (1994-95), the total amountcollected by the CGC in redevance payments averaged TD7.5 million (or roughly 15 percent of total bread-wheatsubsidies). Sources: Ministry of Commerce and Redjeb et. al. (February 1990).
9\Minist6re de l'Economie Nationale (1991).

4 Chapter I
The actual allocation of subsidized PS flour between the two types of bread by each baker cannot becontrolled and no attempt has been made to do so. (See Annex 1 for a more detailed explanation.)
16. Several leakages of the subsidy also occur at the bakery level because subsidized PS flouris often put to uses other than the intended gros pain and baguettes, such as pizza, pastries, and biscuits.Unsubsidized pastry flour (PS-7) is virtually impossible to distinguish from subsidized PS flour and it isnot difficult for pastry makers (particularly those who also produce bread) to substitute PS flour into themanufacturing of these pastry products.
17. There are 21 durum-wheat manufacturers (pastiers) in Tunisia.'° Their primary roleis to purchase semolina from the millers and transform it into couscous and pasta sold in bulk form towholesale and retail intermnediaries." The direct subsidy on pasta and couscous was eliminated as partof the reformn program in 1993 (as discussed in greater detail in Chapter 3), but these products are stillsubsidized indirectly via the subsidy on semolina.
The Cooking Oil Subsector
18. The institutional arrangements for the cooking oil subsector are less complex than forcereals. Tunisia is one of the world's major producers of olive oil. Due to international pricedifferentials, it mainly reserves olive oil for export, and imports grain oil,'2 Mostly soybean or rapeseed(the price ratio for olive oil to grain oil is between 2:1 and 3:1 depending on the year).
19. L'Office National de I 'Huile (ONH) controls the import and refining of cooking oil. TheONH imports and stores unrefined grain oils which are allocated to the twelve existing private refineriesaccording to quotas based on installed refining capacity. Existing quota mechanisms do not favor efficientrefineries nor do they provide incentives for cost minimization. Rather, they create incentives tocontinually expand capacity through investments which are often unnecessary. The ONH repossesses therefined oil from refineries for sale to wholesalers and bottlers. The consumer price for cooking oil isfixed below cost and the ONH is reimbursed by the CGC for the difference.
20. Until 1989, the ONH used olive oil left over from the export campaign to mix withgeneric grain oil (zero to 15 percent olive oil), creating what was called huile de melange (mixed oil).The objective of incorporating olive oil into the mix was purportedly to satisfy consumer tastes for oliveoil, which is considered a luxury product and part of the traditional heritage in Tunisia. Since olive oilexpon prices are considerably higher than grain oil prices, the incorporation of grain oil raised thesubsidy cost of the huile de melange. Blending olive oil with grain oils was suspended in 1989, andsubsidized cooking oil now consists of generic grain oils (soybean or rapeseed oil, depending on whichoil is the cheapest to import at the time of procurement).
IO\ln 1989.
1 l\Semolina, which is a processed form of finely ground durum wheat, is processed to create couscous and pasta.
12\For convenience, the term "grain oil" will be used loosely to describe a variety of cooking oils throughout theanalysis, including corn oil as well as rapeseed, sunflower, and soybean oil (which are technically classified as oilseeds).

Foundations for Refonn: The Universal Subsidy Program S
21. Roughly two-thirds of cooking oil is sold in bulk oil drums (en vrac) to retailers who,in turn, dispense small quantities of unpackaged oil to their clients.'3 The poor primarily purchaseunpackaged cooking oil in this manner. The remainder of the cooking oil is sold to bottlers(conditionneurs) who cater primarily to higher-income consumers by packaging the oil in glass bottleswhich are more attractive and convenient than the storage containers used by the retailers for bulk oil.
The Sugar Subsector
22. There are three state-owned or operated institutions involved in collecting, refining, anddistributing sugar in Tunisia: L'Office du Commerce de Tunisie (OCT), the Societe Tunisienne de Sucre(STS), and the Complexe Sucrier de Tunisie (CST).
23. The primary function of the OCT, which was established in 1962, is to import refinedwhite and unrefined brown sugar. It sells the white sugar directly to wholesalers and the raw brownsugar to the STS. The STS, which was created in 1960, refines brown sugar and transforms sugar beetsfrom local production into white sugar. The STS sells the refined sugar back to the OCT which sells itwholesale. The CST, which was established in 1980, produces white sugar from local beet productionand sells it to wholesalers, cube manufacturers and industrial users, such as soft drink producers.
24. The CGC subsidizes sugar by making direct payments to the parastatal agencies. TheSTS and the CST are compensated for the difference between their total revenues and their total costsover a year, rather than per unit of product. Until 1992, when the subsidy on imported sugar waseliminated, the CGC paid a subsidy to compensate the OCT for the difference between the import priceand the fixed sales price.
The Milk Subsector
25. Until recently, subsidies were only injected on reconstituted milk (both pasteurized andsterilized) made from imported powder. Two parastatals, the Societe Tunisienne des Industries Laitieres(STIL) and Tunisie-Lait, have dominated the collection, processing, and distribution of subsidizedreconstituted milk. These parastatals import powdered milk, which serves as the raw material forreconstituted milk."4 STIL, which was established in 1967, produces over three-fourths of this milk,while Tunisie-Lait, which was established in 1973, supplies the rest.'5
26. Consumers purchase reconstituted milk at fixed prices which vary according to differenttypes of processing and packaging and are all sold below cost. The CGC compensates STIL and Tunisie-Lait by reimbursing them for the difference between the fixed price and their unit cost, plus a profit
13UJn 1990, bulk oil sales accounted for approximately 79 percent of total subsidized cooking oil.
14\Powdered milk imports were controlled exclusively by STIL and Tunisie-Lait until they were liberalized under theASAL II in 1990. Despite this liberalization, STIL and Tunisie-Lait are still the only processors eligible to receive thesubsidy on reconstituted milk made from imported powder.
15\ In 1990, total sales of subsidized reconstituted milk were 184 million liters. STIL supplied 144 million liters andTunisie-Lait sold 40 million. Source: Ministere de l'Economie Nationale.
6 Chapter I
margin. Until 1989, this margin was calculated as a 15 percent markup. As a result, neither companyhad an incentive to operate efficiently or to adopt innovative processing techniques that would reducecosts. 6 In an effort to promote efficiency, reforms have since fixed operating margins at their 1989levels.
27. Reconstituted milk from imported powder is available in both sterilized and pasteurizedvarieties. 17 Sterilized milk is processed at ultra-high temperatures and can be stored without refrigerationfor approximately six months until opened, whereas pasteurized milk has a limited shelf-life of 48 hoursand requires refrigeration at all times. Sterilized-reconstituted milk is packaged by STIL in plastic bottlesand aseptic tetrabrik cartons and by Tunisie-Lait in plastic bottles. Pasteurized-reconstituted milk, whichis processed exclusively at STIL, is packaged in half-liter berlingot tetrahedron cartons. STIL, the largerparastatal, imports tetrabrik and berlingot cartons from Europe under a Swiss patent. Plastic bottles aremanufactured domestically from imported plastic granules.
28. Under the reform program, a small subsidy was recently granted on sales of sterilizedlocal fresh milk (as discussed in more detail in Chapter 3).18 In contrast to subsidies on other productsin the CGC program (which are calculated as the difference between cost- and sales-prices), the subsidyon local fresh milk is set at a fixed pre-determined value.'9 Consumers purchase local fresh milk at retailprices which equal the ex-factory cost-prices minus the fixed unit subsidy. In addition, unlike subsidieson reconstituted milk, which are restricted to STIL and Tunisie-Lait, private processors are eligible toreceive the subsidy on this variety of milk. In fact, LAINO, a private dairy processor, was the first toproduce subsidized local fresh milk; three new private firms have recently been authorized to receive thesubsidy. STIL and Tunisie-Lait have also begun marketing subsidized local fresh milk. With theexception of STIL, which markets this variety of milk in both tetrabrik cartons and plastic bottles, allsterilized local fresh milk is packaged in plastic bottles.
B. SUBSIDY PAYMENTS UNDER THE UNIVERSAL PROGRAM (1981-1990)
29. Tables 1-3 indicate the magnitude of subsidy payments for each of the subsectors.Cereals absorb the largest part of total subsidies, claiming 54 percent of CGC expenditures in 1990.Durum wheat received the most support, with subsidies averaging 26 percent of total program outlaysin 1990, followed by bread wheat, for which subsidies accounted for an average of 22 percent of totalsubsidy expenditures in that same year. Sugar subsidies claimed about twelve percent in 1990. Subsidies
16\A recent study comparing Tunisian processing costs to American dairy plants of similar capacity found that, onaverage, Tunisian dairy processing costs were three to four times higher than those of comparable American dairy plants.Ericksen et. al. (1990).
17\AII subsidized milk (both reconstituted and local fresh, which is discussed below) is low-fat, with 15.5 grams of fatper liter.
18\Consumers also purchase unprocessed raw milk, generally from milk peddlers, but this is not covered by the subsidyprogram.
19\The subsidy on local fresh milk was set at 80 millimes per liter in 1991, and 70 millimes per liter for each year sincethen.

Foundations for Reform: The Universal Subsidy Program 7
on cooking oils and milk subsidies accounted for approximately nine and seven percent respectively inthat same year.
30. Unit subsidies for products covered by the CGC are presented in Table 4 in currentmillimes, and in Table 5 as a share of unsubsidized prices.' Subsidies account for a substantial shareof the value of most products in the program. In 1990, subsidies on gros pain and baguetes represented39 and 18 percent of the value of each good respectively. Semolina subsidies were notably large,contributing close to one-half of the product's value, as were subsidies on pasta and couscous, which eachrepresented 38 percent. Cooking oil subsidies accounted for over one-third of the value of the goods.Milk subsidies ranged from 19 percent of the product's value for sterilized-reconstituted milk packagedin tetrabrik cartons to 38 percent for pasteurized-reconstituted milk sold in berlingot cartons. Unitsubsidies on locally produced sugar were the largest, contributing 69 percent of the product's value.
&\Calculated as: unsubsidized price = subsidized price + unit subsidy for each good.

8 Chapter I
Table I - TOTAL NOMINAL FOOD SUBSIDY EXPENDITURES BY PRODUCT, 1984-95Million Dinars (Current)
1984 1985 1986 1987 1988 1989 1990 1991 1992 1993 1994 1995Cereals-Total: 143 136 122 112 131 172 170 162 195 212 191 189
Durum Wheat 58 53 48 50 58 74 84 101 118 124 137 114Bread Wheat 48 50 46 43 53 72 69 51 64 82 48 67Processing Margins 37 34 28 18 20 26 16 10 13 6 6 9
Cooking Oil 32 50 20 14 30 38 30 30 26 27 56 63Bulk na na na 7 20 27 24 22 19 20 38 43Bottled na na na 7 10 11 6 7 7 7 17 19
Sugar 12 8 20 20 22 32 37 19 13 14 15 19Milk S 16 9 12 20 31 22 22 24 27 21 26Mcat 8 0 0 0 0 0 0 0 0 0 0 01Total Food Subsidies 203 210 171 158 203 273 258 232 258 280 283 297Source: Ministcre de l'Economie Nationale, Yusuf Numbers may not add due to rounding.
Table 2 - TOTAL REAL FOOD SUBSIDY EXPENDITURES BY PRODUCT, 1984-95Million Dinars (Constant 1980 prices)
1984 1985 1986 1987 1988 1989 1990 1991 1992 1993 1994 1995Cereals - Total: 98 86 73 62 68 84 78 68 78 82 70 66
Durum Wheat 40 33 29 28 30 36 39 43 47 48 51 4(Bread Wheat 33 31 27 24 27 35 32 21 26 32 18 23Processing Margins 25 22 17 10 10 13 7 4 5 2 2 3
CookingOil 22 32 12 8 16 18 14 13 10 10 20 22Bulk na na na 4 10 13 11 9 8 8 14 15Bottled na na na 4 5 5 3 3 3 3 6 7
Sugar 8 5 12 11 12 15 17 8 5 5 6 7Milk 6 10 6 7 10 15 10 9 10 10 8 9Meat 5 0 0 0 0 0 0 0 0 0 0 0
otal Food Subsidies 139 133 103 88 106 133 118 98 103 108 104 103CPI(1980=100) 146 158 167 179 191 205 218 236 250 260 272 289Source: Ministre de l'Economie Nationale, Yusuf. Numbers may not add due to rounding.
Table 3 - CGC FOOD SUBSIDY EXPENDITURES BY PRODUCT, PERCENT OF TOTAL, 1984-95Percent
1984 1985 1986 1987 1988 1989 1990 1991 1992 1993 1994 1995Cereals - Total: 70% 65% 71% 71% 64% 63% 66% 70% 75% 76% 67% 64%
Durum Wheat 29% 25% 28% 32% 29% 27% 33% 44% 46% 44% 49% 38%Bread Wheat 24% 24% 27% 27% 26% 26% 27% 22% 25% 29% 17°' 22%Processing Margins 18% 16% 17% 11% 10% 10% 6% 4% 5% 2% 2% 3%/o
Cooking Oil 16% 24% 12% 9% 15% 14% 12% 13% 10% 10% 20% 21%Bulk na na na 5% 10% 10% 9% 10% 7% 7% 14% 15%Bottled na na na 4% 5% 4% 2% 3% 3% 3% 6% 7°,o
Sugar 6% 4% 12% 13% 11% 12% 14% 8% 5% 5% 5% 6%Milk 4% 7% 5% 8% 10% 11% 8% 9% 9% 10% 8% 9%Meat 4% 0% 0% 0% 0% 0% 0% 0% 0% 0% 0% 0%Total Food Subsidies 100% 100% 100% 100% 100% 100% 100% 100% 100% 100% 100% 100%Source: Minist6re de l'Economie Nationale, Yusuf Numbers may not add due to rounding.

Foundations for Reform. The Universal Subsidy Program 9
Table 4 - CGC UNIT SUBSIDIES BY PRODUCT, 1986-951986 1987 1988 1989 1990 1991 1992 1993 1994 1995
CEREALSGros pain (mil/gram) (a) 0.11 0.11 0.12 0.16 0.14 0.12 0.10 0.10 0.12 0.10(mil/unit) unit=500 grams 57 53 60 79 70 58 50 50 60 50
Baguette (mil/gram) (b) 0.06 0.04 0.06 0.09 0.08 0.03 0.01 0.00 0.00 0.00(mil/unit) unit=250 grams 16 10 14 23 20 8 3 0 0 0
Flou (mnil/kg) 64 67 62 83 31 0 0 0 0 0Semolina (mil/kg) 114 125 144 131 191 183 210 210 251 250Pasta (mil/kg) (c) 163 133 153 184 225 204 218 218 261 260Couscous(mil/kg)(c) 166 136 157 188 231 209 227 227 271 270
COOKING Oll, (millliter)-bulk/vrac 172 102 208 253 225 229 210 210 387 463bottled/conditionnee 172 143 250 284 225 223 210 210 387 463
MILK (mil/liter)Sterilized-ReconstitutedTetrabrik cartons 100 79 181 158 100 103 130 155 146 191Plastic bonles 47 39 95 136 95 96 166 142 146 193
Pasteurized-ReconstitutedBerlingot tetrahedrons 134 134 154 207 200 183 166 155 155 0Coussin pouches na na na na na na 109 122 122 0
Sterilized Local Fresh MilkPlastic Bottles na na na na na 80 70 70 70 70Tetrabrik cartons na na na na na na 70 70 70 70
SUGAR (milUkg)White, granulated, local prod'n 900 721 688 910 887 706 520 450 477 400White, granulated, imported 17 -18 0 38 78 22 0 0 0 0White, cube 57 73 73 28 2 0 0 0 0 0Brown, granulated na na na na 130 137 137 0 0 0
OTHERBarley (D/Q) 1.2 2.2 3.8 5.9 4.8 4.6 2.7 2.0 na naCorn (D/Q) 1.8 0.7 2.1 6.2 3.6 3.6 0.6 0.0 na naSoybean Meal (D/Q) 4.1 4.0 14.7 15.6 5.1 3.1 0.0 0.0 na naUrea (D/T) 63 37 35 59 44 36 19 0 0 0Super 16 (D/T) 34 29 20 36 29 26 0 0 0 0Super45 (D/T) 79 64 75 103 84 54 25 7 20 18.5DAP (D/T) 110 127 130 173 85 78 8 6 na 36
Sourcc: Ministere de l'Economie Nationale.\The weight of gros pain was reduced in 1986 from 700 to 600g, and in 1989 to 500g.\The weight of baguettes was reduced in 1986 from 300 to 250g.',Direct subsidies on pasta and couscous were eliminated in 1992. These products were subsidized indirectly, however,via the subsidy on semolina (which is an input into the production of pasta and couscous). Roughly 1.04 kg
and 1.08 kg of semolina is needed to produce I kg of pasta and couscous respectively.

10 Chapter I
Table 5 - CGC UNIT SUBRSIDIES AS A SHARE OF PRODUCT VALU 196951986 1987 1988 1989 1990 1991 1992 1993 1994 1995
EREALSGros pain (mil/gram) (a) 41% 39/o 42% 44% 39% 33% 28% 26% 290/o 25%
(mil/unit) unitP500 grarns 41% 39% 42% 44% 39% 33% 28% 26% 29% 25%Baguette (miU/gram) (b) 19% 13% 17% 22% 18% 7% 3% 0% 0% 0%
(mil/unit) unitP250 grams 19% 13% 17% 22% 18% 7% 3% 0% 0% 0%Flour (mil/kg) 25% 26% 24% 25% 10% 0% 0% 0% 0% 0%Semolina (mil/kg) 42% 45% 48% 43% 490/o 47% 49% 48% 52% 52%Pasta (mil/kg) (c) 38% 33% 37% 37% 38% 34% 35% 34% 37% 37%Couscous (mil/kg) (c) 38% 33% 37% 37% 38% 34% 35% 35% 38% 38%
OOKING OIL (mil/iter)bulk/vrac 36% 24% 390/o 43% 38% 38% 36% 34% 47% 52%
bottled/conditionn& 34% 28% 41% 40% 33% 33% 30% 30% 42% 46%
MILK (milAiter)terilized-ReconstitutedTetrabrik cartons 25% 21% 36% 29% 19% 19% 22% 24% 23% 26%Plastic bottles 15% 13% 25% 29% 21% 20% 29% 25% 25% 29%
Pasteurized-Reconstituted
Berlingot tetrahedrons 36% 36% 37% 40% 38% 34% 31% 28% 28% naCoussin pouches na na na na na na 23% 24% 24% naterilized Local Fresh MilkPlastic Bottles na na na na na 17% 13% 12% 11% 11%Tetrabrikcartons na na na na na na 13% 12% 11% 11%
UGAR (miVkg)White, granulated, local prod'n 79% 73% 70% 72% 69% 64% 53% 48% 48% 41%White, granulated, imported 7% -7% 0% 10% 16% 5% 0% 0% 0% 0%
White, cube 14% 16% 15% 5% 0% 0% 0% na na naBrown, granulated na na na na 30% 31% 30% na na na
THERBarley (D/Q) 10% 17% 29% 38% 28% 23% 14% 11% na naCom (D/Q) 15% 5% 14% 33% 19% 16% 3% na na naSoybean Meal (D/Q) 19% 17% 42% 44% 17% 10% 0% na na naUrea (D/T) 43% 25% 24% 34% 25% 18% na na na naSuper 16(D/T) 45% 36% 28% 41% 31% 23% na na na naSuper 45 (D/T) 63% 37% 41% 49% 44% 27% 13% 4% 10% 9%DAP(D/T) 51% 52% 53% 60% 33% 29% 3% 2% 0% 13%urce: Ministry of Commerce. Calculated as a percent of unsubsidized prices, where
nsubsidized price = subsidized price + unit subsidy.\The weight of gros pain was reduced in 1986 from 700 to 600g, and in 1989 to 500g.\The weight of baguettes was reduced in 1986 from 300 to 250g.\Direct subsidies on pasta and couscous were eliminated in 1992. These products were subsidized indirectly, however,ia the subsidy on semolina (which is an input into the production of pasta and couscous). Roughly 1.04 kgd 1.08 kg of semolina is needed to produce I kg of pasta and couscous respectively.

CHAPTER IIIMPACT OF THE UNIVERSAL FOOD SUBSIDY PROGRAM (1981-1990)
A. FISCAL IMPACT
CGC Expenditures and other Macroeconomic Indicators
30. Government outlays on the universal subsidy programn were substantial throughout the1980s, amounting to 3.3 percent of GDP in 1981, 4.1 percent in 1984, and 2.9 percent in 1990, asindicated in Table 6. Total CGC expenditures were TD139 million (US$281 million) in 1981 andclimbed to TD317 million (US$361 million) by 1990, rising by close to nine percent p.a. in real termsbetween 1981 and 1985, and an average of 1.4 percent p.a. in real terms between 1985 and 1990. Percapita expenditures on the subsidy program averaged TD32.3, rising from TD21.7 (US$44) in 1981 toTD39.3 (US$45) in 1990.
31. The universal subsidy program has also claimed a large share of public resources.Outlays on consumer subsidies averaged roughly nine percent of total government expenditures duringthe 1980s, rising from just under nine percent in 1981, peaking at ten percent in 1984 and then fallingto just under seven percent in 1990.
Subsidy Costs in Relation to other Assistance Programs
32. The Tunisian Government spends a large share of its budget, over one-half in 1990, onsocial transfers which, in addition to the CGC subsidy program, include spending on education, publichealth, social insurance, regional development, employment and training schemes, programs for youths,social housing schemes and direct assistance programs for the poor.2 ' Expenditures on these programsamounted to roughly 20 percent of GDP in 1990.
33. The food subsidy program claims a larger share of total social spending than the directassistance programs that are aimed specifically at aiding the poor. As Table 7 indicates, CGC foodsubsidies account for a considerable share of these expenditures, close to 15 percent in 1990, whereasdirect assistance programs, including cash transfers for "Needy Families" and food rations for low-incomepre-school-aged children and students, represented only one percent of total spending on transfers thatyear.
21\For a thorough discussion of the social protection system in Tunisia, see The World Bank (April 1993).

T: bJe ATO LC SUBSi IES, MAC$OECONOMIC INDICATORS,1981-951981 1982 1983 1984 1985 1986 1987 1988 1989 1990 1991 1992 1993 1994 1995
Cieit TD:ominal Subsidies (MD) 139 161 174 258 262 218 201 275 362 317 290 291 314 304 343
Subsidies Per Capita(D) 21.7 23.9 25.3 36.7 36.4 29.6 26.6 35.5 45.8 39.2 35.1 34.5 36.5 34.6 38.7Subsidies as % of:GDP 3.3 3.4 3.2 4.1 3.8 3.1 2.5 3.2 3.8 2.9 2.4 2.1 2.1 1.9 2.0Gov't Expenditures 8.8 9.0 8.6 10.0 9.5 7.2 6.5 8.1 9.5 7.7 6.3 6.1 5.7 5.1 5.2
Subsidies(MD) 127 130 129 176 166 131 112 144 177 145 123 116 121 112 119SubsidicsPer Capita (D) 19.9 19.3 18.8 25.1 23.0 17.7 14.8 18.6 22.4 17.9 14.8 13.8 14.0 12.7 13.4
CDtTD:ominal GDP (MD) 4162 4804 5497 6240 6910 7021 7997 8685 9590 10816 12029 13706 14606 15867 17215DPPerCapita(D) 651 713 799 888 958 951 1059 1124 1212 1335 1456 1626 1698 1805 1941otal Gov't Expenditure 1583 1793 2028 2579 2757 3019 3073 3405 3808 4133 4610 4771 5467 5974 6595
stuant 190 TIGDP (MD) 3736 3718 3774 4005 4281 4202 4474 4581 4726 5061 5258 5669 5799 5994 6201
I 1980=100 109 124 135 146 158 167 179 191 205 219 236 250 260 272 289DPDeflator 1980=100 111 129 146 156 161 167 179 190 203 214 229 242 252 265 278xch. Ratc: Av. TD/USS 0.494 0.591 0.679 0.777 0.835 0.794 0.829 0.858 0.949 0.878 0.925 0.884 1.004 1.013 0.970
opulation (million) 6.39 6.74 6.88 7.03 7.21 7.38 7.55 7.73 7.91 8.10 8.26 8.43 8.60 8.79 8.87urce: Minisabe de 1'Economic Nationale, IMF (IFS), the World Bank. Numbers may not add due to rounding.

Impact of the Universal Subsidy Program (1981-1990) 13
Table 7 - FISCAL COSTS OF SOCLAL SPENDING PROGRAMS, 1986-93
Milion Dinars (Current) 1986 1987 1988 1989 1990 1991 1992 1993
Total CGC Subsidlee^ 218 201 275 362 317 290 291 314CGC Food Subsidies 171 158 203 273 258 232 258 280
Education 435 449 476 545 642 731 805 875Public Health 162 175 198 221 240 270 296 319Social Insurance 264 295 335 379 440 492 575 664Regional Development 112 102 171 184 189 224 199 179Direct Assistance 11 13 15 19 24 29 32 36
UTSSb 7 7 7 6 8 9 8 9Needy Familiesc 4 6 8 13 16 20 24 27
Other Social Spendingd 189 228 210 312 307 325 349 412Total Transfers 1390 1463 1679 2022 2160 2361 2547 2798
Share of Total Transfers %Total CGC Subsidies' 15.7 13.7 16.4 17.9 14.7 12.3 11.4 11.2
CGC Food Subsidies 12.3 10.8 12.1 13.5 11.9 9.8 10.1 10.0Direct Assistance 0.8 0.9 0.9 0.9 1.1 1.2 1.2 1.3
UTSS 0.5 0.4 0.4 0.3 0.4 0.4 0.3 0.3Needy Families 0.3 0.4 0.5 0.6 0.7 0.9 0.9 0.9
Memo: Total Transfers as Share ofTotal Government Outlays % 46.1 47.6 49.3 53.1 52.3 53.7 53.0 52.4Memo: Total Government Outlaysas Share of GDP % 43.0 38.4 39.2 39.4 37.6 36.1 34.3 35.5
Sources: World Bank (April 1993), Ministry of Planning and Regional Development, Ministry of the NationalEconomy (1991), Redjeb et. al. (1990), Staff estimates. Numbers may not add due to rounding.a\Total CGC subsidies includes food + non-food subsidies.b\UTSS (Union Tunisienne de Solidarite Sociale) is responsible for the low-income food ration programs and cashtransfers to the elderly and handicapped.c\The Needy Families Program provides cash transfers to 100,000 needy families.| Other social spending includes programs for youths, social housing subsidies, employment and training programs,price stabilization funds, etc.
B. DISTRIBUTIONAL IMPACT (INCIDENCE)
The Target Group
34. An analysis of the incidence of food subsidies and the effect of the program on the poorrequires a rigorous definition of the poor. Although the objectives of the CGC program refer toprotecting the poor, the Government has never formally defined the intended beneficiaries of CGCsubsidies. While absolute poverty lines have been estimated by the National Statistics Office (INS), thesehave not been used for program design. Moreover, the methodology for calculating poverty lines hasbeen the subject of considerable debate and has recently been revised by the INS in collaboration withthe World Bank. For these reasons, rather than adopting the poverty line as a definition of the targetgroup, this analysis identifies the poor as the lowest-income group (in 1985) or quintile (in 1990), whereexpenditures are used as a proxy for income.

14 Chapter II
35. Target Group: 1985. In 1985, the poorest-income group represented 13 percent of thepopulation with per capita incomes' below TD150.3 The average level of per capita income for thisgroup was TD1 13, which is slightly lower than the level used to identify the "core poor" according tothe new methodology for defining poverty lines. Average daily caloric intake for the poorest-incomegroup was 1990 kcal per capita in 1985, which is lower than the recommended minimum intake estimatedby the INS.'
36. Target Group: 1990. Available survey data for 1990 permit ranking by income quintiles,which has the advantage of allowing for comparisons of income groups of similar sizes.' These dataalso permit adjusting expenditure and consumption data to take into account household economies of scaleby calculating adult equivalence scales, whereby children (for whom food consumption expenditures aregenerally lower) are given smaller weights than adults.' The 1990 target group, therefore, is definedas the poorest quintile of the population with income less than TD616 per adult equivalent and with amean income of TD454 per adult equivalent. The estimated average daily caloric intake for this groupwas 2031 kcal per adult equivalent, which is lower than the minimum requirement estimated by the INS.
Incidence of the Universal Subsidy Program
37. Because the 1985 and 1990 Household Expenditure Surveys were conducted prior to theimplementation of most targeting reforms, their results reflect the distributional consequences of the
22\Defined as total household expenditure divided by household size.
23\Tunisian expenditure data for 1985 is reported by expenditure group rather than by deciles or quintiles of thepopulation. Income groups for 1985 are defined as follows: less than TD150 (13 percent of population with mean percapita income of TDI 13); TD150-TD250 (22 percent of population with mean per capita income of TD199); TD250-TD350 (19 percent of population with mean per capita income of TD299); TD350-TD500 (18 percent of population withmean per capita income of TD419); TD500-TD800 (16 percent of population with mean per capita income of TD627);and greater than TD800 (12 percent of population with mean per capita income of TD1 150). Source: INS, NationalHousehold Expenditure Survey (1985).
24\The INS estimates average caloric requirements of Tunisians to be 2,165 kcal per person per day. INS (1990 VolumeB), p. 38.
25\1ncome quintiles for 1990 are defined as follows: income per adult equivalent less than TD616 (with mean incomeper adult equivalent of TD454); income per adult equivalent between TD617 and TD873 (with mean income per adultequivalent of TD75 1); income per adult equivalent between TD874 and TD1 173 (with mean income per adult equivalentof TD1006); income per adult equivalent between TD1174 and TD1749 (with mean income per adult equivalent ofTD1416); and income per adult equivalent greater than TD1750 (with mean income per adult equivalent of TD2837).Source: INS, Household Expenditure Survey, District of Tunis Component (1990). For more information on the INS1990 Household Expenditure Survey, see Annex 3.
26\In terms of adult equivalents, children less than seven years old are assigned a weight of 0.2, children between theages of seven and twelve are given a weight of 0.3 and children between the ages of 13 and 17 receive weights of 0.5.Adults over age 18 are assigned a weight of 1.0. Although a rigorous construction of adult equivalent scales for Tunisiais beyond the scope of this study, these weights are consistent with those estimated for Sri Lanka, Indonesia and CMted'lvoire. Deaton and Muellbauer (1986), Glewwe (1988).

Impact of the Universal Subsidy Program (1981-1990) 15
universal subsidy program.' Data from both surveys indicate that consumer price subsidies under thissystem increased absolute income disparities, but tended to reduce them in relative terms.
38. Incidence of the Universal Subsidy Program: 1985. Table 8 shows that the universalsubsidy program as a whole in 1985 benefitted the rich more than the poor in absolute terms. Thepoorest-income group (thirteen percent of the population) received eight percent of food subsidyexpenditures whereas the wealthiest income group (twelve percent of the population) received more thandouble that (17 percent of food subsidy outlays). The highest-income group received 2.3 times more ofthe subsidies on foodstuffs than the lowest, with average per capita subsidies of TD40 and TD17respectively.
39. The disparities in absolute benefits were especially evident for milk and bread-wheatsubsidies. In 1985, the rich benefitted close to 16 times more than the poor from milk subsidies, andalmost five times more from subsidies on bread-wheat products (in per capita terms). The only subsectorfor which the poor received more of the absolute subsidies than the rich was durum-wheat products,which had a subsidy ratio of 0.8 for richest to poorest in per capita terms.
40. Despite granting larger absolute benefits to the rich than the poor, survey results revealthat the universal subsidy program was progressive in relative terms. Table 8 shows that in 1985, foodsubsidies constituted a meaningful source of income for the poor, amounting to over 15 percent of totalexpenditures for the lowest-income group, and that the contribution to total expenditures declinedmonotonically with increases in income, to 2.7 percent for the highest-income group.'
41. Subsidies on durum-wheat products in particular represented a large share of totalexpenditures for the poorest-income group; in 1985, these subsidies contributed to over six percent oftotal purchasing power for the poorest group, and were 16 times more important for the poor than therich as a share of total expenditures. Sterilized-reconstituted milk was the only product category in whichsubsidies contributed more to total expenditures of the wealthy than lower-income groups, thus makingthe transfers regressive in both absolute and relative terms for milk.
27\Subsidy analysis includes purchased products only. The INS expenditure data include on-farm consumption as animputed value. Unless otherwise noted, throughout this analysis these data have been adjusted so that the consumptionof subsidized goods is derived from marketed products only (excludes on-farm consumption) so as to capture only theeffects of the purchased products that benefit from the subsidy program. Total consumption figures, however, includeon-farm consumption as an imputed value.
28\Figures on the importance of subsidies as shares of total expenditures for 1985 may be somewhat overestimated. Thisis due to the fact that total subsidy bill is allocated proportionately across income groups according to their expenditureson subsidized products. However, some of the subsidized products are consumed by tourists and some by institutions(such as the army, which may have a very different income distribution than the population as a whole). These estimateshave, however, been adjusted to include purchased products only and to exclude on-farm consumption.

16 Chapter II
Table 8 - DIST IIBUON OF FOOD SUBSWDIE PER CAPITA,BY INCOME GROUP: UNIVERSAL SUBSIDY PROGRAM 198S
POOR _ I CH RATlo RATIOl __________________ 1 1 1 2 1 3 j 4 5 j6 [ AVG 1 6/1 1/6
ABSOLUTE INCIDENCE OF FOOD SUBSIDIESMean Subsidies Per Capita (Current TD)
DW Products 7.2 8.1 7.9 7.6 7.0 5.8 7.4 0.8 1.2BW Products 3.9 7.9 11.4 13.7 15.8 18.7 11.7 4.8 0.2Cooking Oil 4.9 6.0 6.9 7.7 8.2 8.4 7.0 1.7 0.5Sugar 0.7 0.9 1.1 1.2 1.3 1.6 1.1 2.4 0.4Milk (SRM) 0.3 0.8 1.8 2.4 3.6 5.0 2.2 15.9 0.1
Total Above Subsidies 16.9 23.7 29.0 32.5 35.8 39.5 29.4 2.3 0.4
% of Food Subsidies 8% 18% 18% 20% 20% 17% 100%
RELATIVE INCMENCE OF FOOD SUBSIDIESSubsidies as Share of Mean Total Expenditures Per Capita (Percent)
DW Products 6.4 4.0 2.6 1.8 1.1 0.4 1.6 0.1 15.9BW Products 3.5 4.0 3.8 3.3 2.5 1.3 2.5 0.4 2.7Cooking Oil 4.3 3.0 2.3 1.8 1.3 0.6 1.5 0.1 7.5Sugar 0.6 0.4 0.3 0.3 0.2 0.1 0.2 0.2 5.6Milk (SRM) 0.3 0.4 0.6 0.6 0.6 0.3 0.5 1.3 0.8
Total Above Subsidies 15.1 11.9 9.7 7.8 5.7 2.7 6.2 0.2 5.5
Mean TotalExpenditures Per Capita 113 199 299 419 627 1450 471 12.8 0.1
Population (%) 13 22 19 18 16 12 100
urce: INS, Household Expenditure Survey, 1985. AVG = average; DW = durum wheat; BW - bread wheat;SRM = sterilized-reconstituted milk. Numbers may not add due to rounding.
42. Incidence of the Universal Subsidy Program: 1990. By 1990, the situation remainedvirtually unchanged, and the rich still benefitted more from the program than the poor, with subsidiesper adult equivalent of TD45.7 and TD39.6 for the top and bottom quintiles respectively. In 1990, thepoorest quintile of the population received just 17 percent of total food subsidies whereas the wealthiestquintile received 20 percent.
43. Table 9 suggests that, overall, durum-wheat subsidies were the best targeted to low-income consumers and milk the worst. Within product categories, however, absolute disparities varied.Semolina subsidies were the best-targeted item among durum-wheat products, with the poorest quintilebenefitting roughly two times more from semolina subsidies than the wealthiest. In terms of the shareof absolute subsidies accruing to low-income consumers, couscous and pasta were not well targeted.Among bread-wheat products, gros pain subsidies were somewhat well targeted in their distribution ofprogram benefits. Subsidies on other bread-wheat products, however, were regressive in absolute terms:in particular, the wealthiest quintile benefitted over 20 times more from baguette subsidies than the

Impact of the Universal Subsidy Program (1981-1990) 17
poorest. Sugar and cooking oil subsidies were not particularly well targeted, transferring more absolutebenefits to wealthier consumers than to lower-income groups. For milk, subsidies on pasteurized-reconstituted milk packaged in berlingot cartons were better targeted than subsidies on sterilized-reconstituted milk in plastic bottles and tetrabrik cartons, in terms of the share of subsidies going to thepoor as opposed to the rich.
44. As was the case in 1985, although the rich benefitted more from the universal subsidyscheme in absolute terms, the program in 1990 was progressive in relative terms. Table 9 reveals thatfood subsidies contributed close to nine percent of total expenditures by the poor, as compared with lessthan two percent for the rich.
45. Incidence of Program Financing. It is beyond the scope of this report to examine thedistributional consequences of revenue collection for the funding of the CGC program. The Governmenthas avoided placing the burden of financing the consumer subsidy program on agricultural producers byfixing producer prices for domestically produced foodstuffs (cereals and sugar) independently of worldor consumer prices.29 Consumer subsidies are financed entirely through the budget of the CentralGovernment. Initially, financing came from earmarked sources collected specifically for the CGC.However, the inadequacy of these funds to match spending on the subsidy program forced the CGC torely on additional resources from the general budget. Since 1987, all pretenses of earmarked fundinghave been abandoned. The bulk of Government revenues is collected through indirect taxes, such asimport tariffs and value-added taxes on luxury products, alcoholic beverages, tobacco products and fuel.Only a small percentage accrues from direct income taxes.30
46. A Government-commissioned study found that the collection of total tax revenues (ofwhich CGC subsidies claim a share) is slightly progressive in relative terms, claiming roughly33.4 percent of total expenditures of individuals in the poorest-income group and 39.2 percent of totalexpenditures of those in the highest-income group."
29\1n fact, since the mid-1980s, producer prices for these commodities have been above their border equivalents. Thisanalysis estimates consumer subsidies as the difference between producer prices and consumer prices. (For a moredetailed discussion of producer subsidies, see Annex 2.) The analysis also assumes that producer revenues are heldconstant.
30\As of 1987, 58.7 percent of government revenues was collected in the form of indirect taxes, 14.6 percent accruedfrom direct income taxation, and 26.7 was raised from "non-fiscal" sources (revenues generated from the petroleumindustry). Redjeb et. al. (1990).
31\Redjeb et. al. (1990). This study analyzed the incidence of public finances using the 1985 INS HouseholdExpenditure Survey and data on revenue collection from 1987. A lack of data on the incidence of the collection ofrevenues generated by the petroleum industry ("non-fiscal" revenues) meant that the authors could only allocate total non-fiscal revenue collection on a per capita basis across income groups. This allocation would automatically result inregressive incidence results, since these transfers would claim a larger share of total expenditures for individuals in thepoorest income group than the richest, even if individuals in all groups "contribute" the same absolute amount. Theabove results, therefore, only include the incidence of direct and indirect taxation.

18 Chapter II
Table 9 - DISTRIBUTION OF FOOD SUBSiDIES PER ADULT EQUIVALENTBY QUINTILE, UNIVERSAL SUBSIDY PROGRAM - 1990
POOR RICH Ratio Ratio| 1 2 3 4 5 Average 5/1 1/5
Absolute Incidence of Food Subsidies, Mean Subsidies Per Adult EquivalentTotal DW 14.6 12.3 13.0 13.2 11.4 12.9 0.8 1.3Semolina 8.9 5.8 6.0 6.0 4.7 6.3 0.5 1.9Couscous 1.4 1.6 1.7 2.2 1.8 1.8 1.3 0.8Pasta 4.3 4.9 5.3 5.0 4.9 4.9 1.1 0.9
Total BW 15.1 18.5 20.0 19.6 16.6 18.0 1.1 0.9Gros Pain 14.9 18.1 19.4 18.4 13.6 16.9 0.9 1.1BW Flour 0.1 0.1 0.1 0.1 0.2 0.1 2.0 0.5Baguette 0.1 0.2 0.4 1.0 2.8 0.9 21.3 0.0
Generic Cooking Oil 4.8 7.6 5.9 6.3 6.3 6.2 1.3 0.8
Sugar 1.2 1.7 1.8 1.9 2.3 1.2 1.9 0.5
Total Milk 3.8 6.2 7.2 8.5 9.1 7.0 2.4 0.4PST 1.9 2.2 2.0 2.7 1.8 2.1 1.0 1.0SRM 2.0 4.0 5.2 5.8 7.3 4.9 3.7 0.3
Total Above 39.6 46.2 47.8 49.6 45.7 45.2 1.2 0.9Percent of Subsidies 17% 20% 21% 22% 20% 100% 1.2 0.9
Relative Incidence of Food Subsidies, Subsidies as Share of Total Expenditures PAETotal DW 3.2% 1.6% 1.3% 0.9% 0.4% 1.0% 0.1 8.0
Semolina 2.0% 0.8% 0.6% 0.4% 0.2% 0.5% 0.1 11.9Couscous 0.3% 0.2% 0.2% 0.2% 0.1% 0.1% 0.2 4.8Pasta 0.9% 0.6% 0.5% 0.4% 0.2%ho 0.4% 0.2 5.4
Total BW 3.3% 2.5% 2.0% 1.4% 0.6% 1.4% 0.2 5.7Gros Pain 3.3% 2.4% 1.9% 1.3% 0.5% 1.3% 0.1 6.8BW Flour 0.0% 0.0% 0.0% 0.0% 0.0%/0 0.0% 0.3 3.1Baguette 0.0% 0.0% 0.0% 0.1% 0.1% 0.1% 3.4 0.3
Generic Cooking Oil 1.1% 1.0% 0.6% 0.4% 0.2% 0.5% 0.2 4.8
ugar 0.3% 0.2% 0.2% 0.1% 0.1% 0.1% 0.3 3.3
Total Milk 0.8% 0.8% 0.7% 0.6% 0.3% 0.5% 0.4 2.6PST 0.4% 0.3% 0.2% 0.2% 0.1% 0.2% 0.2 6.4SRM 0.4% 0.5% 0.5% 0.4% 0.3% 0.4% 0.6 1.7
Total Above B.7% 6.2% 4.8% 3.5% 1.4% 3.5% 0.2 5.4Total Expenditures 454 751 1006 1416 2837 1292.8 6.2 0.2Source: INS, Household Expenditure Survey, District of Tunis, 1990. Sugar consumption pattems extrapolated from 1990National Survey (adjusted for adult equivalent). DW = durum wheat; BW = bread wheat; PST = pasteurized-reconstituted milk;SRM = sterilized-reconstituted milk; PAE = per adult equivalent. Numbers may not add due to roundin

Impact of the Universal Subsidy Program (1981-1990) 19
Incidence of Direct Transfer Programs
47. As mentioned in above, there are several direct assistance programs in Tunisia which,like the CGC subsidy program, are aimed at protecting the poor. The most important direct transferprogram is the Needy Families (NF) program, which is designed specifically to reach the "poorest ofpoor." In 1990, approximately 100,000 Needy Families32 received cash payments of TD56 per familyper quarter, or TD34 per person per year.33 In terms of coverage, the Needy Families program ismodest in comparison to the CGC food subsidy program: while both programs transferred roughly TD34per person to the poor in 1990,34 the Needy Families program reached roughly 500,000 people ascompared with the CGC subsidy scheme which benefitted an estimated 1.7 million low-incomeindividuals.
48. The direct transfer programs, such as the Needy Families Scheme, suffer from thetraditional difficulties that arise in targeting assistance to the poor using means tests and specific eligibilitycriteria. Administration of the programs is complex, and eligibility lists are rarely updated. When theyare, coverage is not always extended. As a result, many of the truly needy do not benefit from theprogram, while others receive multiple benefits from various social insurance programs. Errors ofexclusion are particularly visible in the Needy Families program, where at least 40,000 families remainon the waiting lists. Moreover, the screening process has completely bypassed the transitional and newlypoor. Meanwhile, of the 100,000 families participating in the program, 23 percent receive overlappingsupport from other programs, and an additional three to five percent are covered by the social insurancesystem, implying that they should not be eligible to receive benefits from the NF prograrn.
49. General food price subsidies such as the CGC food subsidy scheme, on the other hand,have several advantages over the direct assistance programs. They are flexible enough to reach the newlyand transitional poor. Eligibility for food subsidies is not determined by social workers, and hence thereis no need to continuously update beneficiary lists. Finally, they do not rely on information aboutincomes, which is generally unavailable in any case, to determine eligibility.35
-2\Or 500,000 people, assuming that the average family size is roughly 5 members.
33\The program was established in 1986 and is monitored by the Ministry of Social Affairs. To be eligible, at least oneof the following criteria must be satisfied: (a) the head of household is not productive (unemployed or inactive forphysical reasons); (b) the head of household has no financial resources (including informal earnings and income fromother assistance programs); (c) the head of household is not covered by the social insurance system. Screening ofpotential beneficiaries is initiated by the 'Hamda," a local authority, and assessment is made by a local committee ofsocial workers.
34\The CGC subsidy program transferred TD34 per person (11D40 per adult equivalent) to the poorest quintile (twentypercent) of the population and an average of TD40 per person (TD45 per adult equivalent) to the population as a wholein 1990.
35kDifficulties in monitoring the practice of under-reporting make existing data on incomes questionable. Approximately70 percent of the poorest Tunisian heads of households are not wage earners and do not have regular incomes, whichare used in eligibility screening for direct assistance programs.

20 Chapter II
Incidence of Universal Food Subsidy Programs: International Comparison
50. Table 10 shows that Tunisia's untargeted subsidy program was typical of similar universalprograms in other countries in its distributional impact. In fact, the poor in Tunisia received slightlymore of total outlays on food subsidies than their counterparts in Algeria and Egypt.
Table 10 - ABSOLUTE INCIDENCE OF UNIVERSAL FOOD SUBSIDIES,INTERNATIONAL COMPARISON
% of Benefits Accruing to Quintile
POOR RICHCountry Product 1 2 3 4 5
Tunisia Food Subsidies 17 20 21 22 20(1990)___
Algeria Food Subsidies 13 17 20 23 27(1988) __ _ _ _ _ _ __ _ _ _ _ _ __ _ __ _ _
Sri Lanka Wheat, Bread 14 17 21 23 25(1978/79) Sugar 16 17 19 21 27
Brazil Rice 19 66 15(1974) Wheat 15 62 23
Jamaica Powdered Milk, Wheat,and 14 20 | 20 | 21 26(1988) Cornmeal l I Egypt (1982) Cereals Quartile Group
Urban 10 30 42 18Rural 13 30 27 39
Brazil, Jamaica, Egypt, Sri Lanka: Reproduced from Grosh (June 1992).Tunisia: INS, 1990 Household Expenditure Survey, District of Tunis (quintiles per adult equivalent); total coversdurum-wheat products, bread-wheat products, cooking oil, sugar and milk.Algeria: World Bank (1991), 1988 Household Expenditure Survey (per capita quintiles); total food subsidiescovers durum- and bread-wheat products, cooking oil, sugar and milk.Numbers may not add due to rounding.
C. NUTRITIONAL IMPACT
51. Improving the nutritional status of the poor is an explicit objective of the food subsidyprogram in Tunisia. The impact of the program on nutritional intake, therefore, merits investigation.
52. Many factors determine nutritional status, including the ability of households to obtainfood, the quantities and types of food available, the tendency of households to allocate resources towardthe acquisition of additional food, the intra-household distribution of food, health considerations, the
Impact of the Universal Subsidy Program (1981-1990) 21
physiological utilization of food, knowledge about nutrition, eating habits, weaning practices and fertilityrates. Subsidies influence food availability as well as the ability of households to acquire food, andtherefore have the potential to improve per capita consumption levels. The impact of food subsidies onnutritional status depends on the extent to which insufficient acquisition of food is the binding constraintto improved nutrition. The extent and distribution of undernutrition also determines the potential impactof food subsidies. Nutritional benefits from income transfers tend to be maximized for those with thelargest nutritional deficiencies, which are generally the lower-income groups.'
53. Several prominent patterns emerge from the nutrition profile of Tunisia.37 First, chronicundemutrition in Tunisia is significantly more common in lower-income groups. Second, it is morefrequent in rural areas. Third, the occurrence of undernutrition has declined over time. Finally, a lion'sshare of calorie and protein intake is derived from subsidized conmmodities.
54. Data on nutrient intake in Tunisia are available from INS Household Expenditure andNutrition Surveys. The estimated average human energy requirement for Tunisia is 2165 calories perday. This level was derived by the INS using the 1990 age/sex population distributions to weightrequirements, and assumes a moderate activity level. The recommended level of protein intake is41.5 grams.3" While calorie and protein intake is not synonymous with nutrition, it is often used toassess the prevalence of undernutrition. Indeed, protein-energy malnutrition can a have substantial impacton morbidity, infant and child mortality, brain development, aptitude, exploratory behavior, productivity,strength, endurance, and reproduction.3 9
36\Kumar and Alderman (1988) and Pinstrup-Anderson (1989). Children up to age five and women of reproductive agetend to be at a higher risk from a nutritional standpoint because of their special requirements. This is particularly thecase in rural areas, where fertility generally exceeds the national average and where the maternal depletion syndromecaused by closely spaced pregnancies is likely to be more devastating.
37\There are few recent time-series estimates of nutritional conditions in Tunisia. Most available assessments use variousanthropometric and dietary intake indicators, but even the existing estimates have considerable limitations. A rigorousassessment of the impact of food subsidies on the nutritional status of women and young children and on the prevalenceof micronutrient deficiencies is not available; neither is an assessment of the role of parasitic infections, high fertility,and intra-household food distribution habits in determining the nutritional status of the population.
38\Source: INS (1993 vol. B). This figure (41.5 grams) does not take into account the quality of protein intake basedon amino acid content.
39\McGuire (1990).

22 Chapter II
Box 1 - NuTiRiIONAL STATUS USING THE BODY MASS INDEX (1980,8S)
One anthropometric indicator of nutritional status % Below Cut-Off 1980 1985estimated for Tunisia is the Body Mass Index (BMI),which is used to assess thinness by calculating weight TOTAL 4.5 3.3for squared height (in metric units). The BMI isessentially a different way of presenting the same Income Groupeinformation as weight for height." The standard cut-off < TD150 5.7 4.4point for chronic energy deficiency in adults is a value TDI50-TD250 4.4 4.2of the BMI less than 18.5. TD250-TD350 5.2 2.9
TD3S0-TD500 4.3 3.4The BMI was estimated for Tunisia for 1980 and 1985, TD500-TD800 3.1 3.3permitting an assessment of nutritional trends over > TD800 2.8 1.8time. The average index for the nation as a whole was23.4 in 1980 and 24.1 in 1985, both well above the RegionBMI cut-off point for energy deficiency. BMI Urban 3.0 2.8estimates indicate that the frequency of undernutrition Rural 5.6 4.0is falUng, which is reflected in the downward trend ofthe percent of people with chronic energy deficiencies Sexat all income levels. The BM1 reveals that 4.5 percent Male 4.1 2.9of the population was energy deficient in 1980, but Female 4.8 3.6that, by 1985, this share had fallen to 3.3 percent.
The share of people suffering from energy deficiency appears to be negatively correlated withincome, In general, larger nutritional deficits occur in the lowest-income groups. In 1985,4.4 percent of the poorest-income group suffered from chronic energy deficits, whereas only1,8 percent of those in the highest-income group experienced such deficiencies.
Evidence of an urban-rural differential also emerges, with energy deficiencies being more comnmon inrural areas (for all income groups). Four percent of those living in rural areas experienced suchdeficits, as compared with 2.8 percent fbr urban areas. Undernutrition was slightly more prevalentamong females than males. Approximately 3.6 percent of females registered below the cutoff point,compared to 2.9 percent for males.
|kThe main advantage of BMI is that its calculation does not require popubtion-specific reference values since it isa self-contained rao. It thus becomes a standardized indcator for international comparison. The BMI coversTunlislnS who were at leat 20 year of age at t time of te household surveys. For more information on thelody Mass index, see Fourad - FAO (1992).kllncome gmups in 1985 prices.
55. Survey data reveal that, on average, daily per capita caloric intake exceeded therecommended minimum requirement, with a mean daily intake of 2277 kcal per person in 1990 ascompared with the recommended minimum of 2165 kcal (see Table 11 below). Daily caloric intake inrural areas was higher than in urban areas, with 2412 and 2184 calories per person respectively in thatsame year. Average per capita protein intake, which was 46.4 grams in 1990, surpassed thereconmnended daily allowance of 41.5 grams. Unlike calorie consumption, daily protein intake wasslightly higher in urban areas than rural, with 46.8 and 45.8 grams per person respectively in 1990.Although protein intake was sufficient for the population on average, the bottom two quintiles consumedless than the recommended daily allowance (with intakes of 33 and 38 grams for the poorest and second-poorest quintiles respectively).

Impact of the Universal Subsidy Program (1981-1990) 23
56. Table 11 indicates that the consumption of calories, protein and micronutrients in Tunisiaincreases monotonically with income. In 1990, the average per capita caloric intake for the highest-income group was 2610 calories per day as compared with 1938 for the lowest-income group (which fallsbelow the INS recommended daily allowance). Protein consumption was also higher for wealthier incomegroups, as was the intake of micronutrients.
57. Survey data indicate that in 1990, there were several micronutrient deficiencies in Tunisia,particularly among low-income groups (as shown in Table 11 below). Intake of calcium and vitamin B2was deficient for the population as a whole and markedly so for the poor. Average intake of iron wasslightly deficient, and again, the situation was worse for lower-income groups. Iron deficiencies areassociated with anemia which has historically been widespread in Tunisia, affecting close to one-third ofall children in 1980. Vitamin A, which is critical in averting blindness, was consumed in sufficientquantities on average, but lower-income groups tended to consume less than recommended amounts. Inparticular, the poorest group consumed only slightly more than two-thirds of the recommended dailyallowance. The highest-income group consumed over two times as much calcium and close to three timesas much vitamin C and vitamin A as the poorest-income group. Subsidized foods contributedsubstantially to the intake of micronutrients, accounting for 39 percent of calcium, 49 percent of iron,68 percent of vitamin BI and 38 percent of vitamin B2 consumption. Subsidized bread- and durum-wheatproducts in particular were also the primary sources of iron, each accounting for 24 percent of total ironintake. Although iron intake in Tunisia is theoretically high because of the cereal-based diet, the phyticacid and polyphenols contained in cereals makes the bioavailability of iron low. Vitamins A and C wereprimarily derived from fruits and vegetables, which are not subsidized.
Tab 11 - AVEAGE PER CATA DALY NTAU:OF PERoNuThIEN SY INCOME O
< than 250- 30 500- 700- >than250D 350D SOOD 700D 1200D 1200D
Ratio1 2 3 4 5 6 Avrage 6/1
Calcium (mg) 303 376 430 493 566 651 476 2.2Iron (mg) 12.4 13.3 14.0 14.7 15.6 17.2 14.6 1.4Vitamin A (micrograms) 434 569 655 735 902 1158 748 2.7Viomin Bl (mg) 1.37 1.43 1.46 1.52 1.58 1.66 1.51 1.2Vitamin B2 (mg) 0.61 0.71 0.80 0.89 1.03 1.24 0.88 2.0Vitamin C (mg) 51.5 68.4 78.9 93.6 112.1 141.1 91.9 2.7
Memo: Calories (kcal)' 1938 2125 2203 2284 2428 2610 2277 1.4Memo: Protein' 33.3 38.4 42.3 46.8 53.2 61.4 46.4 1.8
Population (%) 13 18 18 19 22 13 100 1.0
#\FAO 1980. k\Weissman (1992)._\Note that these dat for daily calorie and protein intake differ from those in Table 12 in that they present consumption calculated inper capita terms (rather than per adul equivalent), they plot consumption against income groups (rather than income quindks) andthey am derived from the 1990 national household nutrition survey (rather than the 1990 expenditure survey component covering thedistrict of Tunis).Recommtended Daily Allowance (RDA): 2165 calories; 41.5 protein; 504 calcium; 14.7 iron; 628 Vitanin A; 0.87 Vitamin Bi;1. 19 Vitamin B2; 26 Vitamin C. Source: INS Household Expenditure and Nutrition Surveys 1990, (1990 Vols. A and B).Numbers may not add due to rounding.

24 Chapter II
58. Table 12 reveals that the contribution of food subsidies to calorie and protein intake wassubstantial in 1990.4 On average, roughly 58 percent of total caloric intake and 62 percent of totalprotein intake was derived from food subsidies. CGC subsidies were particularly important to thenutritional intake of the poor, contributing to 60 percent of caloric intake and 73 percent of proteinconsumption for the lowest-income quintile in 1990.4'
59. The Tunisian diet is dominated by cereals, oils, and sugar, which are all heavilysubsidized. On average subsidies on bread- and durum-wheat products contributed 23 and 18 percentof total caloric intake per adult equivalent respectively in 1990 (as shown in Table 12).42 These productswere also the main sources of protein, with subsidies on bread- and durum-wheat products accountingfor roughly 35 percent and 24 percent of average total protein consumption per adult equivalentrespectively. Subsidies on these cereals were especially important to the poor, contributing to 45 percentof caloric intake and 71 percent of protein consumption for the lowest-income quintile.
60. Because subsidized food accounts for a substantial share of total dietary intake in Tunisia,it is clear that the CGC program plays an important role in maintaining nutritionally sufficientconsumption levels. Insufficient income (an inability to acquire food) is clearly an important contributorto undernutrition among the poor in Tunisia. The impact of food subsidies on nutritional status istherefore potentially significant.
40\Note that these tables differ from the data in Box 2 in that they present consumption calculated as per adult equivalent(rather than per capita), they plot consumption against income quintiles (rather than income groups), and the data arederived from the 1990 household expenditure survey component covering the District of Tunis (rather than the entire1990 national nutrition survey.
41\Figures on total calorie and protein intake, as well as the nutritional importance of food subsidies, come from the INShousehold expenditure surveys (rather than the national food and nutrition survey). Consequently, these data refer toacquisitions of calories and protein (including those derived from purchases and on-farm consumption), rather than actualintake of these nutrients. These figures do not, therefore, take into account leftovers (portions uneaten) or portionsallocated to guests or household animals.
42\Regional variations are slight, and result mainly from differences in cereal intake. Soft wheat products dominateurban diets, whereas durum wheat products dominate rural diets.

Impact of the Universal Subsidy Program (1 981-1990) 25
Table 12 - CALORIE & PROTEIN INTAKE FROM FOOD SUBSIDIES AS SHARE OFTOTAL INTAKE, PAE, BY QUINTILE: UNIVERSAL SUBSIDY PROGRAM - 1990
POOR RICH Ratio Ratio1 2 3 4 5 Average 5/1 1/5
Calories Per Adult EquivalentTotal DW 23.7% 17.4% 17.7% 17.4% 14.0% 18.0% 0.6 1.7
Semolina 17.5% 10.7% 10.7% 10.4% 7.7% 11.4% 0.4 2.3Couscous 1.5% 1.6% 1.6% 2.0% 1.6% 1.7% 1.1 0.9Pasta 4.8% 5.1% 5.3% 4.9% 4.6% 5.0% 1.0 1.0
Total BW 21.6% 24.8% 25.8% 24.2% 18.8% 23.0% 0.9 1.2Gros Pain 21.3% 24.4% 25.3% 23.3% 16.4% 22.1% 0.8 1.3BW Flour 0.1% 0.2% 0.2% 0.2% 0.2% 0.2% 1.7 0.6Baguette 0.1% 0.2% 0.3% 0.8% 2.1% 0.7% 18.0 0.1
Generic Cooking Oil 12.4% 18.3% 13.9% 14.4% 13.7% 14.5% 1.1 0.9
Sugar 1.2% 1.5% 1.6% 1.6% 1.9% 1.6% 1.6 0.6
Total Milk 0.9% 1.3% 1.4% 1.7% 1.7% 1.4% 1.9 0.5PST 0.5% 0.5% 0.4% 0.6% 0.4% 0.5% 0.8 1.2SRM 0.4% 0.8% 1.0% 1.1% 1.3% 0.9% 3.1 0.3
Total Above 59.8% 63.2% 60.4% 59.3% 49.9% 58.5% 0.8 1.2otal Calories 2551 2716 2802 2890 3026 2797 1.2 0.8
Protein Per Adult EquivalentTotal DW 34.1% 23.8% 23.3% 21.8% 15.9% 23.8% 0.5 2.1
Semolina 24.2% 13.9% 13.4% 12.4% 8.3% 14.4% 0.3 2.9Couscous 2.0% 2.0% 2.0% 2.4% 1.7% 2.0% 0.8 1.2Pasta 7.8% 7.8% 7.9% 6.9% 5.9% 7.3% 0.8 1.3
Total BW 36.6% 39.2% 39.3% 35.2% 24.6% 35.0% 0.7 1.5Gros Pain 36.2% 38.6% 38.6% 33.8% 21.6% 33.7% 0.6 1.7BW Flour 0.2% 0.3% 0.2% 0.2% 0.3% 0.2% 1.3 0.7Baguette 0.2% 0.3% 0.5% 1.1% 2.7% 1.0% 14.0 0.1
Generic Cooking Oil 0.0% 0.0% 0.0% 0.0% 0.0% 0.0%
Sugar 0.0% 0.0% 0.0% 0.0% 0.0% 0.0%
Total Milk 2.3% 3.2% 3.4% 3.7% 3.4% 3.2% 1.5 0.7PST 1.2% 1.3% 1.0% 1.3% 0.8% 1.1% 0.6 1.6SRM 1.1% 1.9% 2.3% 2.4% 2.6% 2.1% 2.4 0.4
rotal Above 73.0% 66.2% 66.0% 60.7% 44.00/o 61.9% 0.6 1.7Total Protein 44.7 50.9 54.6 59.1 68.3 55.5 1.5 0.7Source: INS, Household Expenditure Survey, District of Tunis, 1990. Sugar consumption patterns extrapolated from 1990 National
Survey (adjusted for adult equivalent). Note that these data for daily intake differ from those in Table II in that they present
_onsumption calculated as per adult equivalent (rather than in per capita terms), they plot consumption against income quintile
,rather than income groups), and they are derived from the 1990 expenditure survey component covering the District of Tunis
,rather than the 1990 national household nutrition survey). DW = durum wheat, BW = bread wheat, PST = pasteurized-
reconstituted milk, SRM = sterilized-reconstituted milk, PAE = per adult equivalent. Numbers may not add due to rounding.

26 Chapter 11
D. LABOR MARKET EFFECTS AND WAGE LEVELS
61. An explicit objective of the food subsidy program in Tunisia is to limit salary increasesin order to promote employment, production, and international competitiveness. While a lack ofempirical evidence prevents an analysis of the extent to which wages are affected by food subsidies, itis clear that linking subsidies to basic staples, or wage-goods, could potentially dampen wage increases.The effect is believed to manifest itself most clearly in public sector wages for which food subsidies areoften seen as wages-in-kind. This wage effect could offset the income effects of the implicit incometransfer.
62. Increases in official wages in Tunisia were, in fact, rather modest during the 1980s.During the Development VII Plan, minimum wages rose by 4.5 percent per year, and average annualpublic sector wages rose by 7.5 percent, compared to the consumer price index which also increased byan average of 7.5 percent over that period.
63. Lack of sufficient data limits the analysis of whether food subsidies played a substantialrole in reducing pressure for wage increases. Public sector wages, thought most likely to reflect thedepressing effect of food subsidies, rose faster than minimum wages, though adjustments in both werefairly restrained. While a precise conclusion regarding the effect of food subsidies on wages andemployment is not possible, it is likely that the fact that food subsidies were used to keep food pricesfrom rising was indeed an important factor in ensuring that wages did not rise at all in real terms overthe period.

CHAPTER IIITHE REFORM PACKAGE: TOWARDS A SELF-TARGETED PROGRAM
64. Despite the explicit objectives of the CGC to protect the consumption of vulnerablegroups, by the mid-1980s, substantial leakages to the non-poor made it clear that the universal subsidyprogram had not proven to be a cost-effective way of transferring income to the poor. In addition, theextensive system of universal subsidies had perpetuated inefficient, centralized distribution networks,particularly in the cereals subsector. Production costs for subsidized commodities were often excessiveor unnecessary, and institutional arrangements were not transparent. Subsidies were injected at multiplelevels making the program unnecessarily complex. State-dominated distribution channels discouragedcompetition, provided few incentives to improve efficiency, and created numerous possibilities for fraud.
65. Moreover, the subsidy program had become a large burden on public finances. Althoughthe Government could select the goods to be subsidized and set retail prices, most other determinants ofactual subsidy outlays were beyond its control, including international prices, input costs, technicalcoefficients and quantities consumed. These latter in fact have increased much faster than populationgrowth, reflecting healthy GDP (income) growth, urbanization, a reduction in on-farm consumption (asfarmers realized it was cheaper to sell their produce at market prices and purchase their food at subsidizedprices), and leakages (as operators became more adept at manipulating the system to their own economicbenefit).
66. By 1984-85, the high and rising costs of the program made an overhaul of the subsidyprogram an urgent priority. Other macro-imbalances were also reaching worrisome levels, promptingthe Government to introduce a structural adjustment program the following year. This program includedan important component to reduce the budget deficit. In compliance with that effort, the Governmentdecided that an attempt should be made to cut CGC expenditures. A reform package was developedunder the Structural Adjustment Loan in 1988, and implementation began under the Economic andFinancial Reforms Support Loan in 1991.43
A. POLITICAL ECONOMY OF REFORM
Early Attempts to Eliminate Cereals Subsidies
67. The political economy of reforrn has been fundamentally shaped by negative experienceswith early reform efforts. At the end of December 1983, the Governmnent doubled prices of cerealsproducts (in particular bread, semolina, pasta, and couscous) in an effort to eliminate the fiscallyburdensome subsidy program.44
43\Structural Adjustment Loan, Loan 2962-TUN; Economic and Financial Reforms Support Loan, Loan 3424-TUN.
44\The price of gros pain, which is consumed disproportionately by lower-income groups, was increased by over112 percent (from 80 millimes per loaf to 170). Price increases on baguenes, consumed primarily by the rich, were notas dramatic. For semolina, mainly consumed by the poor, especially in southern regions, prices were increased over86 percent (from 145 millimes per kilogram to 270). Flour prices spiraled, rising from 120 millimes per kilogram to295 (over 149 percent).

28 Chapter III
68. Although plans to raise food prices had been discussed for several weeks in Governmentcircles, the details of the price hikes were announced to the public only 24 hours in advance. Theincreases, which were the first in fifteen years, took consumers by surprise.
69. The shock at the sudden doubling of cereals prices rapidly turned into violence in thesouthern regions. The South West, which has historically been one of the poorest regions, was badly hurtby the price increases. Spontaneous riots erupted in the poor towns of Douz, Kebili, and el Hanmua.They quickly spread north to Gafsa, Kasserine, Sfax and Tunis, particularly to lower-incomeneighborhoods (les quartiers populaires).
70. The source of protest was primarily the mass of the poor and disinherited: peasants,shopkeepers, seasonal workers, the unemployed and students. Many of the protesters were young, low-income teenagers. Though the violence originated in the southern regions, it quickly expanded to poorneighborhoods throughout the country, rural and urban alike. The protest came from those most hurt bythe price hikes: those with lower incomes for whom expenditures on food represent a large share of theirbudget. Schools and universities went on strike, as students sided with the poor in the name of solidarity.
71. In an effort to ease tensions, the Government responded with television announcementsof compensatory measures, including wage and benefit increases of 1.5 dinars per month per person.But, as one southern Tunisian pointed out, "compensation was directed only towards those with regularemployment. It did not affect peasants, shopkeepers, seasonal and casual workers, or theunemployed."4 5 The Government's compensatory measures appeased trade unions and organized labor,from whom it feared the most unified protest. These measures were misdirected, however, and failedto reach the students and lower-income groups from whom the protest actually erupted. The result wasthe worst violence since independence in 1956, with some 60-100 killed and many more injured.
72. One week later, President Bourghiba rescinded the measures, announcing a reversal ofthe price hikes and a restoration of subsidies. He emphasized the importance of recognizing andimproving plight of the poor. "I do not want the poor to pay," he declared in his televised speech. "Ihave asked the Government to prepare a new budget within three months time that takes into account theinterests of the poor. "' Moments after the announcements the rioters filled the streets praising thePresident and his actions. Peace was restored. Contrary to conventional wisdom, the poor had becomepolitically important in Tunisia.
73. The protest by lower-income groups forced the Government to abandon its effort toeliminate the food subsidy program. Yet reform of the costly system was still necessary. The TunisianGovernment had to find an alternative path for reform that was more politically feasible.
The Transition to Self-Targeted Subsidies
74. The response of the poor in the "January bread riots" of 1984 continues to conditionpolicy deliberations about the course of reform. Indeed, the transition from a universal subsidy system
45\ Le Monde, January 31, 1984.
46\ Le Monde, January 7 and 8, 1984.

The Reform Package: Towards a Self-Targeted Program 29
to one which better targets the needs of the poor bears testimony to this influence. A targeted subsidyprogram reconciles the dual objectives of reducing the economic costs of subsidies without sacrificing thepolitical necessity of protecting vulnerable groups.
75. The adoption of a subsidy program reliant on self-targeting mechanisms, rather thanadministratively targeted direct assistance programs, is also significant. Politically, a reformed programhad to reach the groups that had been active in the "January bread riots." These constituencies includestudents, low- and middle- income groups, and the unemployed. A direct assistance program based ona social-worker screening process would risk excluding certain groups (including students). With a self-targeting scheme, however, consumers themselves choose whether or not to purchase the subsidizedfoodstuffs. Hence only those who so choose are excluded from subsidy coverage. Policy-makers selectitems to be subsidized based on an analysis of expenditure patterns. Self-targeting is politically attractivein that it is flexible, it avoids the exclusion of entire critical groups, and it relies on individual consumerchoice for participation.
76. In making the transition towards a targeted subsidy system, the method by whichGovernment implements reforms has also been influenced by the previous reaction of low-income groups.Specifically, there are several ways in which the Government has changed its approach to implementingreforms.
77. Gradual price increases. Rather than relying on sudden and discrete price hikes, theTunisian Government has recognized the value of steady price increases. In fact, since the violentreaction to abrupt measures in 1984, all price increases have been moderate and gradual.
78. Timely and staggered reforms. The Government has also developed an appreciation forthe political power of the students who were instrumental in the revolts in 1984. Since the January riots,most price increases have been implemented during the summer months, when the students are not inschool. Price increases were even accepted without protest in July 1984, just months after the riots.Moreover, the Government has adopted a practice of staggering price increases across the summer monthsso as to avoid increasing the prices of food staples all at once. For example, in recent years, the pricesof milk and sugar were increased on separate dates in May, cooking oil prices were raised in July andhe prices of bread- and durum-wheat products (the most politically sensitive items) were increased atdifferent dates in August (the peak vacation month).
79. Advance preparation. In contrast to the surprise price hikes of 1983/84, policy-makershave learned to strategically prepare the country for price increases months in advance. In fact, increasedcommunication about the role of the CGC and the rationale for policy changes, such as price increases,was one of the key recommendations of a Government-commissioned study on public perceptions of theCGC and the role of the state in Tunisia.47
47\"La Caisse Generale de Comnpensation et le Role de P'EWat," Projet de Mise en Oeuvre de la Politique Agricole,Direction Gcnerale de la Planification, du Diveloppement et des Investissements Agricoles, Ministry of Agriculture,February 1990. The study included the results of a public opinion poll that was conducted in December 1989 andcovered a representative sample of 1016 households residing in some 50 districts (localites) throughout Tunisia.

30 Chapter III
80. An example of this strategy is the "awareness campaign" that preceded price adjustmentsin 1989.4 As early as the spring of that year, newspaper articles began emphasizing the heavy burdenof the CGC budget on the economy. The need to ease this burden was even a focus of the President'sindependence day speech. Plans to target subsidies to the more sensitive products, milk, oil and cereals,while gradually eliminating support for fertilizers and animal feed, were announced almost three monthsin advance.
81. In early August, one week before price adjustments were implemented, another wave ofnewspaper articles hit the press, calling the reform of the CGC "a strategic necessity." The inequitableaspects of existing subsidies were also emphasized, playing on the egalitarianism that characterizes mostTunisians, particularly the young. To illustrate the burden of the CGC, one announcement even includeda discussion of the opportunity cost of the CGC budget in terms of the 10,000 hospital beds, 20,000classrooms, 5,000 kilometers of roads, five dams, or 10,000 manufacturing jobs that could have beenobtained had the CGC been eliminated and the savings so spent. The proposed measures in no way calledfor an elimination of CGC subsidies, but rather sought to better channel its benefits to the truly needy.
82. Immediately following the price increases, front page headlines carried the slogans "Wemust do the necessary" (ilfaut ce qu'ilfaut), and other strategic articles. One displayed a statistical tablecomparing Tunisian bread, oil, and milk prices to those in other Maghreb countries, showing that, evenafter the price increases, food prices were lowest in Tunisia.49 The country was well-prepared for theprice increases. Polls showed that most Tunisians believed that "CGC expenditures had becomeintolerable for the national budget. "I Those interviewed stated that the adjustments were understood,accepted and perceived as necessary.
83. Compensating measures. To ease political pressure and the impact of adjustment on thepoor, compensating measures are now usually announced at the same time as price increases. Thoughsimilar attempts had been made in January 1984, these measures had been directed at organized labor andnot specifically at low-income groups, including students and the unemployed. Since the riots, a numberof compensating measures aimed at assisting low- and middle-income groups facing higher prices havebeen introduced each time retail prices are increased. Allowances for beneficiaries of direct assistanceprograms are typically raised.5' Other measures aim at appeasing the students, including improvementsin direct aid programs for school cafeterias. Still others include measures intended to placate organizedlabor and the middle classes, such as raising construction workers' salaries and minimum wages.Strategic press coverage often accompanies the dual announcements of price increases and compensatingmeasures.
48\1n 1989, the prices for most subsidized products were increased in real terms.
49\Le Difi August 13, 1989.
50\La Presse, August 13, 1989.
5 1\Direct assistance programs, however, are small in comparison to expenditures on food subsidies. For a discussionof these programs, see Chapter 2.
T7he Reform Package: Towards a Self-Targeted Program 31
B. THE REFORM PACKAGE
84. Scarred by the political impact of the riots, the Government made only a few priceadjustments during the late 1980s. Few attempts were made to explore the possibilities for bettertargeting the subsidies. The prices of many basic staples remained fixed in nominal terms. As a result,budgetary costs continued to rise, and the universal subsidy system remained fundamentally unchanged.More ambitious measures were clearly necessary, and a reform program was developed for incorporationinto the VIII Development Plan (1991-96).
85. A central theme of the Tunisian approach to reform is its reliance on existing institutions.Rather than fundamentally altering the methods for channelling benefits to the poor, reforms seek to fine-tune existing mechanisms in order to improve the distribution of subsidies across income groups. Theintention is to avoid the dislocations associated with drastically transforming the existing set of institutionsby switching from price subsidies to some other mechanism, such as means-tested food stamps. Theprogram currently under implementation consists of a three-pronged approach to contain CGCexpenditures while protecting the poor, including: (i) improving the targeting of subsidies, (ii) raisingretail prices, particularly on items consumed disproportionately by the rich, and (iii) reducing productionand distribution costs for subsidized products.
Targeting
86. The first component of the reform package entails a gradual transition towards a moretargeted program. The rationale for targeting food subsidies is based on the premise that, while the costsof the program are essentially the samne for all beneficiaries, the marginal benefits from the transfersdiffer across members of society. Targeting is attractive because it concentrates expenditures on thosewho need them most. Experience with targeted programs in other countries has shown that they aremuch more progressive than general food price subsidies (see Table 10 in Chapter 2 above and Table 20in Chapter 4 below).52
87. Targeted subsidy programs generally require some sort of screening mechanism todetermine eligibility. With regard to food subsidies, techniques for targeting public expenditures ofteninvolve food stamps, school lunch rations (particularly in poor neighborhoods), food distributionprograms to needy families, and so forth. These conventional approaches for targeting food policyusually rely on some form of individual or group assessment (means-testing, targeting by indicators,geographic area, etc.) to screen participants.
88. Self-Targeting. Tunisia has opted for a self-targeting mechanism whereby the decisionto participate is made by individuals themselves rather than by social workers or other Governmentagents. Self-targeting occurs when benefits are available to all, but the program is designed so that onlythe poor elect to participate. Time costs, stigma, and quality differentiation are the principal devices usedto encourage self-targeting. The Tunisian program has implemented self-targeting through qualitydifferentiation which exploits consumers' preferences for product quality in order to discourage higher-income groups from consuming subsidized goods.
52\For an extensive discussion and several case studies, see Grosh (September 1992).

32 Chapter III
89. Self-targeting via quality differentiation is particularly appropriate in countries, such asTunisia, where a system of food price subsidies is already in place and where the goal is to reduceleakages to the non-poor, cut the costs and scope of the program, and yet protect the welfare andconsumption of the poor. It may not be suitable in cases where the institutional framework of foodsubsidies did not previously exist. Furthermore, a greater degree of target accuracy than is attainableunder self-targeting may be possible in cases where there are opportunities for tying eligibility to thescreening devices of other already existing transfer programs (such as providing food rations to users ofpublic health clinics).
90. Self-targeting has several advantages. First, it minimizes the costs of administration,eligibility identification, and monitoring without sacrificing coverage. Second, self-targeting does not relyon information about individuals' income levels to determine eligibility. Accurate data on income levelsare generally unavailable, making explicit identification of the poor difficult. Rather, with self-selection,the choice of goods to be subsidized exploits existing household survey data on budget shares andelasticities. As a result, self-selection avoids the problems of asymmetric information regarding incomelevels. Third, self-targeting is one of the least divisive and most politically acceptable methods of reformbecause participation is based on the choice of the individual rather than the bureaucracy. Fourth, self-selection mechanisms have the flexibility to respond to changing economic conditions. They are moreeasily phased out as the country develops because people voluntarily reduce their consumption ofsubsidized commodities as higher incomes allow them to purchase what they perceive to be higher-qualityfood. A potential drawback to self-targeting mechanisms is that they can be less precise than other morerigorous methods of distinguishing the needy from the non-needy and could therefore result in greaterleakage.
91. Most consumer subsidy programs contain a rudimentary degree of self-targeting, aswitnessed in the fact that subsidies are frequently placed on food items. Since, by Engel's Law, foodrepresents a larger share of the total expenditures of the poor than the rich, there is a de facto elementof self-targeting inherent in all food subsidy programs. Indeed, even Tunisia's pre-reform universalsubsidy program contained a degree of self-targeting at this level.
92. Programs can be targeted to an even greater degree by selecting certain foodstuffs tocarry higher subsidies than others. Designing a self-targeted food subsidy program typically involvesexamining household expenditure survey data to determine whether there are significant differences inconsumption behavior across income groups. If the poor consume a different basket of goods fromhigher-income groups, this basket can be selected for subsidization. "Inferior" goods constitute excellentcandidates for self-targeted subsidies because the consumption of these goods falls as income rises.53The use of existing survey data to identify goods for subsidies allows self-targeted programs to economizeon information costs by avoiding the cumbersome task of assessing incomes to differentiate between theneedy and the non-needy.
93. In practice, however, there may be no existing inferior goods in the local diet andconsumption patterns may not differ significantly across income groups. In fact, the difficulty inidentifying items consumed disproportionately by the poor has proved to be an obstacle in the
53\This approach has led to the subsidization of yellow maize in Mozambique, where the rich prefer white maize, andmillet in West Africa, where the rich primarily consume rice.
The Reform Package: Towards a Self-Targeted Program 33
development of self-targeted programs in many countries. This does not mean that self-targeting is outof the question, but rather that it may require some creativity to develop a range of goods that representdistinct "quality" grades to consumers of different incomes.
94. Self-Targeting Reforms in Tunisia. As a first step in improving the self-targeting of theprogram in Tunisia, expenditure patterns were examined to identify which products merited relativelyhigher subsidies. The criteria used were based on budget shares, consumption by the poor, and the shareof consumption derived from on-farm production. Recent survey data on expenditure patterns arepresented in Tables 13 and 14. Subsidies were then eliminated on goods clearly consumeddisproportionately by the rich. Remaining subsidies were focused on basic staples, and currently all ofthe commodities selected for subsidization, with the possible exception of certain types of milk, areconsumed in substantial quantities by the poor.
95. The reform program in Tunisia has extended self-targeting efforts still further byexplicitly creating commodities that could carry targeted subsidies. Two new approaches to self-selectionare currently being implemented.
96. The first tactic for extending self-targeting, a variant of the "inferior goods" approach,involves shifting subsidies to narrowly-defined items within a product line that are perceived byconsumers to be of a lower quality because they possess certain unattractive features in their packagingor ingredients. Although the intrinsic value of these products is preserved, these perceived "inferior"characteristics discourage consumption by wealthier households."
97. The second method, the "superior goods" approach, is appropriate when a governmenthas traditionally subsidized a particular commodity and no other varieties or qualities are available on themarket at cost (usually because of official marketing regulations or restrictions). In Tunisia, the qualityof subsidized products is generally reasonable, but not exceptional. Since markets have otherwise beentightly controlled by state marketing boards, the subsidized product has often been the only varietyavailable on the market. To reduce subsidy costs while maintaining benefits to the poor, authorities haveliberalized the sale of higher-quality versions of these products, which are sold at cost and attract thedemand from wealthier households who then consume less of the subsidized products. This "superiorgoods" approach is consistent with the pursuit of a general liberalization strategy designed to increaseefficiency in the subsector, but has the added benefit, in this context, that it promotes self-targeting.
98. The two approaches are mutually reinforcing. A summary of self-targeting measuresbeing introduced in Tunisia is presented in Box 2 below.
54\For more information on the 1990 and 1993 expenditure surveys, see Annex 3.
55\1t is important to note that perceived inferior characteristics, and not any true downgrading in nutritional value, makea particular item well targeted. In fact, as discussed in para. 110, some "inferior' products that are targeted for CGCsubsidies are actually nutritionally richer than their "superior" counterparts, although they possess certain features (suchas color, texture, taste or packaging) that make them unattractive to wealthier consumers.
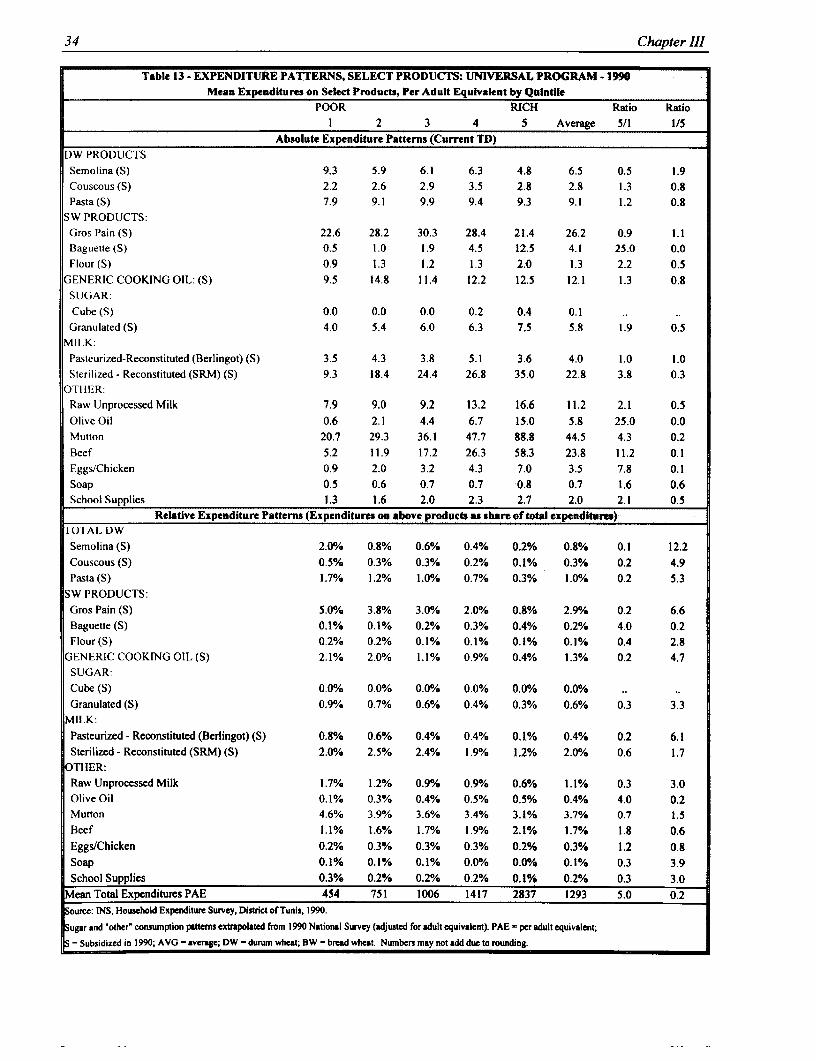
34 Chapter 1I
Tablc 13 - EXPENDITURE PATTERNS, SELECT PRODUCTS: UNIVERSAL PROGRAM - 1990Mean Expenditures on Select Products, Per Adult Equivalent by Quintile
POOR RICH Ratio Ratio1 2 3 4 5 Average 5/1 1/5
Absolute Expenditure Patterns (Current TD)DW PRODUCTSSemolina(S) 9.3 5.9 6.1 6.3 4.8 6.5 0.5 1.9Couscous (S) 2.2 2.6 2.9 3.5 2.8 2.8 1.3 0.8Pasta(S) 7.9 9.1 9.9 9.4 9.3 9.1 1.2 0.8
SW PRODUCTS:Gros Pain (S) 22.6 28.2 30.3 28.4 21.4 26.2 0.9 1.1Baguette (S) 0.5 1.0 1.9 4.5 12.5 4.1 25.0 0.0Flour(S) 0.9 1.3 1.2 1.3 2.0 1.3 2.2 0.5
GENERIC COOKING OIL: (S) 9.5 14.8 11.4 12.2 12.5 12.1 1.3 0.8SUGAR:Cube (S) 0.0 0.0 0.0 0.2 0.4 0.1Granulated (S) 4.0 5.4 6.0 6.3 7.5 5.8 1.9 0.5
MILK:Pastcurized-Reconstituted (Berlingot) (S) 3.5 4.3 3.8 5.1 3.6 4.0 1.0 1.0Sterilized - Reconstituted (SRM) (S) 9.3 18.4 24.4 26.8 35.0 22.8 3.8 0.3
OTIII,R:Raw Unprocessed Milk 7.9 9.0 9.2 13.2 16.6 11.2 2.1 0.5Olive Oil 0.6 2.1 4.4 6.7 15.0 5.8 25.0 0.0Mutton 20.7 29.3 36.1 47.7 88.8 44.5 4.3 0.2Beef 5.2 11.9 17.2 26.3 58.3 23.8 11.2 0.1Eggs/Chicken 0.9 2.0 3.2 4.3 7.0 3.5 7.8 0.1Soap 0.5 0.6 0.7 0.7 0.8 0.7 1.6 0.6School Supplies 1.3 1.6 2.0 2.3 27 2.0 2.1 0.5
Relative Expenditure Pattcrns (Expenditures on above products s share of total expenditurs)TOTAI DWSemolina (S) 200/e 0.8% 0.6% 0.4% 0.2% 0.8% 0.1 12.2Couscous (S) 0.5% 0.3% 0.3% 0.2% 0. 1% 0.3% 0.2 4.9Pasta(S) 1.7% 1.2% 1.0% 0.7% 0.3% 1.0% 0.2 5.3
SW PRODUCTS:Gros Pain (S) 5.0% 3.8% 3.00/e 2.0% 0.8°/e 2.9% 0.2 6.6Baguene (S) 0.1% 0.1% 0.2% 0.3% 0.4% 0.2% 4.0 0.2Flour(S) 0.2% 0.2% 0.1% 0.1% 0.1% 0.1% 0.4 2.8
GENERIC COOKING OIL (S) 2.1% 2.0% 1.1% 0.9% 0.4% 1.3% 0.2 4.7SUGAR:Cube (S) 0.0% 0.0% 0.00/% 0.0% 0.00/% 0.0%Granulated (S) 0.9% 0.7% 0.6% 0.4% 0.3% 0.6% 0.3 3.3
MILK:Pasteurized - Reconstituted (Berlingot) (S) 0.8% 0.6% 0.4% 0.4% 0. 1% 0.4% 0.2 6.1Sterilized - Reconstituted (SRM) (S) 2.0% 2.5% 2.4% 1.9% 1.2% 2.0% 0.6 1.7
OTHER:Raw Unprocessed Milk 1.7% 1.2% 0.9% 0.9% 0.6% 1.1% 0.3 3.0Olive Oil 0.1% 0.3% 0.4% 0.5% 0.5% 0.4% 4.0 0.2Mutton 4.6% 3.9% 3.6% 3.4% 3.1% 3.7% 0.7 1.5Beef 1.1% 1.6% 1.7% 1.9% 2.1% 1.7% 1.8 0.6Eggs/Chicken 0.2% 0.3% 0.3% 0.3% 0.2% 0.3% 1.2 0.8Soap 0.1% 0.1% 0.1% 0.0% 0.0°/e 0.1% 0.3 3.9School Supplies 0.3% 0.2% 0.2% 0.2% 0.1% 0.2% 0.3 3.0
Mean Total Expenditures PAE 454 751 1006 1417 2837 1293 5.0 0.2ource: INS, Household Expenditure Survey, District of Tunis, 1990.ugar and "other' consumption patterns extrapolated from 1990 National Survey (adjusted for adult equivalent). PAE - per adult equivalent;
S = Subsidized in 1990; AVG - average; DW - durum wheat; BW = bread wheat. Numbers may not add due to rounding.

The Reform Package: Towards a Self-Targeted Program 35
Table 14 - EXPENDITURE PATTERNS, SELECT PRODUCTS: REFORM PROGRAM -1993Mean Expenditurts on Select Products, Per Adult Equlvalnt by Quintile
POOR RICH Ratio Ratio1 2 3 4 5 Average 5/1 1/5
Absolute Expenditure Patterns (Current TD)DW PRODUCTSSemolina (S) 12.5 7.4 6.2 5.6 4.2 7.2 0.3 3.0
Couscous 2.7 3.5 3.8 3.5 3.7 3.4 1.1 0.7
Pasta 10.6 10.4 11.2 10.3 10.1 10.5 1.1 1.0SW PRODUCTS:Gros Pain (S) 22.6 28.2 30.3 28.4 21.4 30.1 0.8 1.1Baguette 0.5 1.0 1.9 4.5 12.5 4.1 10.0 0.0
Flour 0.9 1.3 1.2 13.3 2.0 1.4 2.0 0.5
GENERIC COOKING OIL: (S)Unpackaged, sold by bulk retailers (S) 8.4 8.8 9.0 8.5 5.0 7.9 0.6 1.7
Bottled (S) 5.2 5.3 5.7 6.6 8.7 6.3 1.6 0.6
SUGAR (Granulated) (S) 4.9 6.6 7.3 8.0 9.7 23.9 2.0 0.5
MILK:Pasteurized-Reconstituted (Berlingot) (S) 7.3 4.2 6.2 3.5 2.3 4.7 0.3 3.1Sterilized - Reconstituted (SRM) (S)
SRM - bottled (S) 1.4 3.9 3.4 4.6 3.7 3.4 2.5 0.4SRM - tetrabrik (S) 7.0 11.1 10.9 13.6 15.1 11.5 2.0 0.5
Sterilized Local Fresh (LF)LF - bottled (S) 2.0 4.9 4.4 5.3 11.0 5.5 5.0 0.2LF - tetrabrik (S) 2.6 5.7 7.6 10.0 19.0 9.0 10.0 0.1
Relative Expenditure Patterns (Expenditures on above products as share of total expenditurefs)DW PRODUCTSSemolina(S) 2.4% 0.9% 0.5% 0.3% 0.1% 0.8% 0.1 19.1Couscous 0.5% 0.4% 0.3% 0.2% 0.1% 0.3% 0.2 4.6
Pasta 2.00/o 1.2% 0.9% 0.6% 0.3% 1.0% 0.2 6.6SW PRODUCTS:Gros Pain (S) 4.3% 3.2% 2.6% 1.7% 0.6%/0 2.5% 0.1 6.7Baguette 0.1% 0.1% 0.2% 0.3% 0.4% 0.2% 3.8 0.3
Flour 0.2% 0.1% 0.1% 0.8% 0.1% 0.3% 0.3 2.9GENERIC COOKING OILUnpackaged, sold by bulk retailers (S) 1.6% 1.0% 0.8% 0.5% 0.24o 0.8% 0.1 10.7
Bottled (S) I.00/e 0.6% 0.5% 0.4% 0.3% 0.5% 0.3 3.8SUGAR (Granulated (S): 0.90/% 0.8% 0.6% 0.5% 0.3% 0.6% 0.3 3.2MILK:
Pasteurized - Reconstituted (Berlingot) (S) 1.4% 0.5% 0.5% 0.2% 0.1% 0.5% 0.0 20.2Sterilized - Reconstituted (SRM) (S)
SRM - bottled (S) 0.3% 0.4% 0.3% 0.3% 0.1%N 0.3% 0.4 2.4SRM - tetrabrik (S) 1.3% 1.3% 0.9% 0.8% 0.5% 1.0% 0.3 3.0
Sterilized Local Fresh (LF)LF - bottled (S) 0.4% 0.6% 0.4% 0.3% 0.3% 0.4% 0.9 1.1
LF - tetntbrik (S) 0.5% 0.7% 0.6% 0.6% 0.6% 0.6% 1.1 0.9
Mean Total Expenditures PAE 524 869 1184 1684 3345 1521 6.4 0.2Source: INS, Enquete Restreinte sur a Consommation des Products Subventionnes, District of Tunis, 1993.otal Expenditure and supr consumption patterns extrapolated from 1990 National Survey (adjusted for inflation and adult equivalent).
= Subsidized in 1993; AVG = average; DW = durum wheat; BW = bread wheat: PAE = per adult equivalent.
[Numbers may not add due to rounding.

36 Chapter III
99. Cereals products offer a number of opportunities for targeting subsidies both because theyrepresent a larger budgetary outlay for the poor than for the rich (seven percent of total expenditurescompared with less than one percent respectively),56 and because several individual cereals products areconsumed more by the poor than the rich in absolute terns.
100. For durum-wheat products (semolina, couscous, pasta), absolute consumption per adultequivalent was roughly 1.5 times higher for the poorest-income quintile than for the richest in 1993. Asa share of total budgetary outlays, the lowest-income quintile spent close to ten times more than thehighest on durum-wheat products. From a nutrition standpoint, durum-wheat products are also importantvehicles for channelling benefits to the poor, contributing substantially to both calorie and protein intake(as discussed in Chapter 2).
101. Semolina appears to be particularly well-targeted to the poor. Survey data reveal that,in 1993, semolina consumption per adult equivalent was three times higher for the poorest-income quintilethan for the richest. Semolina also accounted for 2.4 percent of total budgetary outlays for the poor, ascompared with just 0.1 percent of total expenditures for the rich. Pasta and couscous are less well-targeted: consumption patterns for these items do not differ significantly across quintiles: the top andbottom quintiles spent roughly the same amount on pasta and couscous (in 1990 and 1993). Bothproducts, however, contributed more to the total expenditures of the poor than the rich; pasta, inparticular, accounted for two percent of total outlays by the poorest-income quintile, versus less thanone percent for the highest.
102. As part of the CGC reform program, these expenditure patterns were used to improvethe targeting of subsidies on durum-wheat products. In fact, subsidies have been shifted to semolina anddirect subsidies on pasta and couscous were eliminated in 1993, although these products remain subsidizedindirectly via the subsidy on semolina, which serves as an input into their production.
103. For the category as a whole, bread-wheat products (gros pain, flour, baguettes) are notas well-targeted as durum-wheat products. Overall, the rich consumed more bread-wheat products thandid the poor (1.5 times more in both 1990 and 1993), although outlays on bread-wheat products claimeda larger share of total expenditures for the poor than the rich (roughly four times more).
104. Baguettes, in particular, are not well-targeted to the poor. In absolute terms, the highest-income quintile consumed 25 times more baguettes than the lowest in 1990 and ten times morein 1993.5' In addition, baguettes were one of the few items that represented a larger share of totalexpenditures for the rich than the poor. Low-income groups consumed virtually no baguettes, indicatingthat, from a distributional perspective, baguettes are not appropriate commodities for targeted subsidycoverage. Because of this, the subsidy on baguettes was gradually reduced, until it was completelyeliminated in 1993.
56\Budget shares from INS 1993 Enque^e Restreinte sur la Consommation des Produits Subventionnds; data on totalexpenditures extrapolated from INS 1990 Household Expenditure Survey.
57\In per adult equivalent terms.

The Reform Package: Towards a Self-Targeted Program 37
105. With regard to gros pain, absolute consumption per adult equivalent was slightly higherfor the poorest-income quintile than the richest. Outlays on gros pain also comprised a larger share oftotal expenditures for the poor than the rich. Gros pain, therefore, seems more suited to carry a CGCsubsidies than baguettes.
106. The drawback to targeting gros pain for greater subsidy coverage is that both types ofbread are made from the same flour (PS baking flour with a 78 percent extraction rate). In addition,since subsidies are paid at the milling level, subsidized flour can be used illegally for other purposes, suchas for the production of pastries, biscuits and pizza (which are generally made from PS-7 pastry flourwith an extraction rate of 71 percent). In fact, leakages of subsidized flour are a common occurrence(as discussed in Chapter 1).
107. To improve the Government's ability to control unauthorized uses of subsidized flour forproducts consumed primarily by the rich, a campaign to intensify monitoring was adopted in 1991. Thiseffort includes establishing a computerized system for tracking flour sales, suspending deliveries ofsubsidized baking flour to more than 100 offending bakeries, and conducting surveys on the sources ofthe supply of flour for non-bakery users. Another measure, which was adopted in 1992, involvesintroducing sacks with different colored stripes (red, blue) which distinguish between subsidized bakingflour (PS) and unsubsidized pastry flour (PS-7) flour to clearly identify their contents and to discourageleakages of the subsidized flour to these other products.
108. Additional reform measures are under consideration to further reduce these problems andimprove targeting. Current plans entail eliminating the subsidy on PS baking flour for gros pain andbaguettes and simultaneously introducing a subsidy on a new flour destined for the production of a singlenew bread (pain unique). Bakeries would be permitted to continue producing gros pain and baguettes,but subsidies would no longer be placed on the PS baking flour used to produce them. This wouldremove the problem of trying to differentiate subsidies between two products that are made from the samesubsidized flour (as discussed in Chapter 1 and Annex 1).
109. The new quality of flour to be subsidized for the production of pain unique would usethe same raw material input (bread-wheat grain), but would be milled at a higher extraction rate andwould reincorporate bran particles. Beginning in 1990, a series of pilot operations at the milling andbaking levels were carried out to examine the technical feasibility of producing bread with new types offlour for the purposes of self-targeting.58 The resulting candidate for self-targeting was a distinct bakingflour "PS +2" with a higher extraction rate (80 percent as opposed to 78 percent for the typical PS bakingflour), and a two percent re-incorporation of bran particles. These tests have been successful, indicatingthat the production of this new flour is technically feasible.
110. Shifting subsidies to a single bread made from PS+ 2 flour generates several potentialbenefits for the purposes of self-targeting. Pain unique is differentiated from the traditional breadsprimarily by its color, which is darker, and its texture, which is rougher. It is believed that the darkercolor is unattractive to Tunisian consumers because a dark bread (pain noir) was used for rationing during
58\Bureau de Conseils, D'Etudes et de Formation (1992). Several varieties of new flour were tested, with differingextraction rates and varying percentages of reincorporated bran particles. Some varieties also incorporated a percentageof gruau, or hulled durum wheat, which is a by-product of semolina processing.

38 Chapter III
the Second World War. Moreover, the presence of rough bran particles makes PS+2 flour easilydistinguishable from PS baking flour and PS-7 pastry flour, which reduces the possibilities for leakagesof the subsidized flour to unintended uses. Besides being made from a different quality of flour, the painunique would preserve the characteristics of the gros pain (size, shape, weight), and would thus maintainfeatures that make it better suited for self-targeting than a bread with the shape and size of baguettes.While this is considered to be an application of the "inferior goods" approach to targeting because thecommodity in question is less-preferred by wealthier consumers, in fact, the presence of bran particlesactually improves the nutritive quality of the bread because it contains more dietary fibers, proteins,phosphates, calcium, iron, and vitamins BI and B2.59
111. A consumer survey was conducted in December 1992 to explore consumer acceptanceof bread made from PS+ 2 flour.' Over one-thousand consumers were given samples of the new bread(pain unique) at many bakeries throughout the greater Tunis area. The results of this survey show that,in general, the new bread would be accepted by Tunisian consumers.6' Survey results are disaggregatedaccording to income group.62 The correlation between income and the consumption of pain unique wasweaker than expected. However, of those who preferred the new bread to their standard bread purchases,and would hence be likely to substitute consumption in favor of the new bread, over 25 percent wereamong the poorest-income group whereas less than eight percent were among the highest.'
112. Although the differences in attitudes towards the new bread were not as sharp as expectedacross income groups, shifting subsidies towards a pain unique made from the easily distinguishablePS+2 flour has the potential to improve targeting by reducing the leakages of subsidies to wealthierconsumers. Extrapolations from survey results indicate that reforms which improve targeting by shifting
59\Bureau de Conseils, D'Etudes et de Formation, Final Report (1992) p. 43.
60\The survey was conducted by Bureau de Conseils, D'Etudes et de Formation (1992).
-1\Overall, only eight percent rejected the new bread, while 23 percent found it acceptable but not as good as theirtraditional bread purchases, 33 percent found it equivalent to the other breads and 35 percent preferred it. The primarysource of dissatisfaction involves the texture of the new bread, followed by odor, color and, to a lesser extent, taste.A substantial share, over one-half of all consumers, actually preferred the darker color of pain unique, which issomewhat surprising given historical preferences for fine white bread in Tunisia.
62\Socio-professional categories were uses as proxies for income levels since a private organization rather than the INS(which has exclusive access to income-expenditure data) carried out the survey. The approximate income groups forthese categories were the following: greater than TD600 (7.1 percent of sample), TD400 to TD600 (16.3 percent),TD200 to TD400 (51.1 percent), and less than TD200 (24.2 percent) per household per month.
63\Unfortunately, the possibilities for exploiting differences in the size and shape of the new bread were not incorporatedinto the consumer acceptance survey. The bread made from PS+2 flour used in the survey was made into 250 gramloaves - the size of bagueaes. This test size could have biased results in favor of greater acceptance by the rich whotend to purchase baguettes rather than gros pain. When pain unique is actually introduced on the market, most likelyin 1993, it should preserve the size and shape of gros pain, traditionally purchased by the poor, to further exploit itspotential for self-targeting.
The Reform Package: Towards a Self-Targeted Program 39
subsidies to pain unique while simultaneously eliminating subsidies on gros pain and bagueutes couldresult in an estimated savings of TD1O million, or over three percent of the CGC budget, per year.'
113. The "superior goods" approach to self-targeting is also being applied to breads.Production of other breads was liberalized in 1991, allowing several attractive new varieties to be soldat cost by private merchants. These breads include whole wheat bread (pain complet) with a 100 percentextraction rate, rye bread, a brioche-style bread (pain de mie) and mbassis. With the exception of wholewheat bread, they are all made from the finer PS-7 flour. These products provide alternatives that appealto the rich and hence siphon off demand by wealthier households and reduce the consumption ofsubsidized bread. Anecdotal evidence suggests that this approach has been successful in areas wherethese "superior" breads have been introduced.
114. Like cereals, cooking oils offer several possibilities for improved targeting. They areparticularly important as a vehicle for channelling income transfers to the poor since they account forclose to three percent of total expenditures of the lowest-income quintile.
115. One application of self-targeting in the cooking oils subsector employs the "inferiorgoods" approach. As described in Chapter 1, subsidies were previously placed on huile de melange, ablend of grain oils with a variable amount of olive oil blended into it (up to 15 percent). Olive oil is anexpensive, luxury product preferred by all income groups in Tunisia, but purchased primarily by the rich.In fact, the rich consume on average 25 times more olive oil than the poor (in per adult equivalent terms).The incorporation of olive oil into the subsidized cooking oil has recently been eliminated. Thegeneric' cooking oil, which currently benefits from subsidies, typically consists of a variable mix ofsoybean and canola oils (depending on which is cheaper). While the introduction of this measure wasintended primarily to reduce costs for the CGC, it also has the effect of improving targeting because theresulting product is less preferred by wealthier consumers.
116. The second method used for targeting cooking oil subsidies involves the use of differentpackaging methods. The wealthy tend to purchase cooking oil in bottles, whereas the poor tend to buyvery small quantities of unpackaged (less-refined) oil from retailers who sell from bulk drums (en vrac).Table 14 indicates that, in 1993, the poor purchased close to two times more "bulk oil" than the rich,whereas for the same blend of generic grain oil packaged in bottles, the pattern was exactly reversed,with the rich purchasing roughly two times more bottled oil than the poor. Consumer prices of bottledoil are being increased somewhat faster than those on oil purchased from bulk druns. The unit subsidieson bulk and bottled oil, however, have not been significantly differentiated. The lower prices for bulkoil do not result from explicit attempts to target bulk oil, but simply reflect the fact that the cost structurefor bulk oil is lower than for bottled oil since it is sold to consumers without any packaging (theconsumers provide their own containers).
64\Bureau de Conseils, D'Etudes et de Formation (1992). Compared to 1992 CGC expenditures.
6S\The term 'generic" refers to a product in which the exact content/ingredients are not revealed to consumers (or, inthe case of many "generic" products marketed in the U.S., the "brand name", or identity of the manufacturer, is notdisplayed). In the case of Tunisian generic cooking oil, the oil is either soy or canola oil (or a mix of the two), but thetype of oil is not indicated, and the label simply states "cooking oil" (or huile de graine).

40 Chapter III
117. Yet another self-targeting tactic for cooking oil involves applying the "superior goods"approach, whereby the private sector is allowed to import high-quality, pure grain oils for sale at costto appeal to wealthier consumers. This step would significantly reinforce the targeting of generic cookingoil by presenting the consumers with a wider range of quality gradations. In 1989, a feasibility surveywas conducted to test potential demand for unsubsidized pure grain oils as an alternative to the subsidizedgeneric product available on the market at that time.66 The price used in the survey for these high-costalternatives was 58 percent higher than the price of the generic oil sold in bulk drums and 25 percenthigher than the price of the generic oil sold in bottles. Over one-half of the households surveyedindicated a preference for pure, imported grain oils (mostly corn and sunflower) over the current genericproduct. The most important explanations for this preference were: (i) that people wanted to know thetype of oil being purchased, either to use various oils for different cooking purposes or because thedifferent oils have different health effects; and (ii) that the imported oils benefitted from French andItalian advertising shown on Tunisian television. Imports of pure grain oils were liberalized in 1992, andprivate operators have since imported varying quantities of pure corn and sunflower oil. Despite theliberalization of these imports, the existing tariff differential between imports of pure grain oils (corn,sunflower) by private operators (currently 43 percent) and imports of generic grain oil (soy, canola) bythe ONH (preferential tariff rate is currently 15 percent) has effectively hampered a more widespreadintroduction of these pure grain oils through private channels. This differential should be eliminated inorder to encourage a more active implementation of the superior goods approach.
118. A recent measure intended to diversify the range of cooking oil products available andredirect the demand of wealthier consumers involves the introduction of a new "fixed mixed" (zit sannafa,which means "oil for the good cook" or "huile de la bonne cuisiniere") cooking oil in early 1993. Thisnew mixed oil blends a fixed amount of unsubsidized olive oil (40 percent) with a fixed portion of genericgrain oil (60 percent).67 It is believed that wealthier consumers will prefer this new "fixed mixed" oilover generic grain oil for several reasons. First, it is packaged in glass bottles with attractive labels thatclearly identify the ingredients and their fixed shares, whereas the labels on bottled generic oil simplydescribe their contents as "cooking oil" (or "grain oil"). Second, the new oil contains a fixed amountof olive oil which is largely preferred by wealthier consumers. Although the generic grain oil componentof the "fixed mixed" oil is subsidized at the same rate as generic cooking oil, the unit subsidy on the"fixed mixed" oil is, in fact, lower because the subsidized grain oil represents only a fraction of the totalcontents of the new mixed oil. It is estimated therefore that CGC expenditures on cooking oil subsidieswill be reduced by this application of the "superior goods" approach and that the targeting of cooking oilsubsidies will be improved.
119. Sugar subsidies have primarily been justified as a means to preserve the purchasing powerof the poor, and not on the basis of any nutritional rationale (although sugar does provide a significantcaloric input). Granulated sugar claims roughly one percent of total expenditures by the lowest-incomequintile. This is in contrast to the rich who spend just 0.3 percent of their total budget on sugar, althoughin absolute terms wealthier consumers purchase greater quantities (in per adult equivalent terms).
66\ Survey conducted by Comnte Engineering (1989).
67\The initial price of this new mixed oil is 900 millimes per liter which is intended to serve as a promotional price.It will soon be increased to 1.3 dinars per liter, as compared with 480 millimes per liter for bottled generic oil and 1.9dinars per liter for unsubsidized olive oil.

The Reform Package: Towards a Self-Targeted Program 41
120. The CGC has made several attempts to improve the targeting of sugar subsidies. In 1991,subsidies on sugar cubes, which are consumed virtually exclusively by the rich, were completelyeliminated.
121. Another reform effort involves the application of the "inferior goods" approach byintroducing a heavily-subsidized new variety, a less-refined brown sugar, that is unattractive to high-income consumers. Brown sugar was introduced in 1990 with an initial unit subsidy that wasconsiderably higher than the subsidy on white sugar.' Despite being over 43 percent cheaper, brownsugar was not readily accepted by consumers and demand remained low. Even poorer consumersevidently rejected less-refined brown sugar at existing price differentials, apparently because the darkersugar was perceived to be "dirty." They even resisted purchasing white sugar when grains of brownsugar were mixed in. This experience presents an important lesson regarding the practicalities involvedin designing a self-targeted program and the importance of consumer acceptance. Indeed, there is a fineline between designing a product to be unappealing to wealthier consumers and preventing its rejectionby the poor.
122. In contrast to the other subsidized food products, milk, as a category, is not particularlywell-suited to carry subsidies for the purposes of targeting. Tables 13 and 14 reveal that the richconsumed approximately three times more processed milk than the poor (in per adult equivalent termsfor both 1990 and 1993).69 Yet for perceived nutritional, and perhaps political, reasons, theGovernment has classified milk as an essential product for subsidy coverage. To improve the balancebetween the dual objectives of protecting the nutritional status and preserving the purchasing power ofthe poor, several measures were adopted to improve the targeting of milk subsidies using both the"superior goods" approach and the "inferior goods" approach.
123. A "superior good" in the form of fresh milk from local production was introduced toattract the demand of wealthier consumers. Locally-produced fresh milk, called laitfrais or lait naturel,is considered a natural, high-quality product for which households are willing to pay premium prices.It is highly preferred over milk that is reconstituted from imported milk powder.70 In the past, localfresh milk was sold at cost. However, consumer preferences were not strong enough to overcome thehuge price differential relative to reconstituted milk which benefited from a significant subsidy. As aresult, the effective demand for local fresh milk was low.
124. In 1991, however, LAINO, a private dairy processing firm, was granted a smallpromotional subsidy of 80 millimes per liter (which was later reduced to 70 millimes per liter) by the
68\This brown sugar should not be confused with "brown sugar" in the United States which is a white sugar withmolasses added back in. "Brown sugar" in Tunisia is a less-refined, "raw" sugar.
62\They also consumed more raw milk, which is either consumed on-farm or purchased from milk-peddlers making homedelivers or from milk distribution centers, and is thus not the subject of CGC subsidies.
70\1n fact, most consumers cited taste as the reason for purchasing local fresh milk (roughly three-quarters and two-thirdsof consumers of local fresh milk in plastic bottles and tetrabrik cartons respectively). See Annex 4 for details.

42 Chapter III
CGC on its sales of sterilized local fresh milk in plastic bottles."' This subsidy, which compares to unitsubsidies on reconstituted milk of up to 183 millimes per liter (for that same year), was introduced tonarrow the price differential between fresh milk from local production and milk that is reconstituted fromimported powder. The small subsidy allows local producers to compete with the more heavily subsidizedimports. It also entices consumers, particularly the more well-to-do, to consume more local fresh milk(with a low unit subsidy) and less reconstituted milk (with a high unit subsidy), thereby reducing CGCexpenditures.
125. The response by consumers to this new measure has been extremely positive, and actualsales of local fresh milk have far exceeded projections. As a result of LAINO's success in selling thismilk, Tunisie-Lait introduced sterilized local fresh milk in plastic bottles in 1992. STIL likewiseintroduced sterilized local fresh milk in both plastic bottles and tetrabrik cartons. Three new private dairyprocessors have recently been granted an "accord de principe" allowing them to receive the subsidy forthe production of local fresh milk. Total sales of sterilized local fresh milk by all three processorsaccounted for over one-third of all subsidized milk sales in 1993 (compared to no sterilized local freshmilk sales in 1990). By 1995, this share had risen to close to 70 percent of all subsidized milk sales.
126. Survey data on consumption patterns indicate that this application of the "superior goods"approach has been highly successful in diverting the demand of wealthier consumers away from the moreheavily subsidized varieties. In fact, the highest-income quintile consumed five times more local freshmilk in plastic bottles and ten times more local fresh milk packaged in tetrabrik cartons than did thepoorest quintile in 1993. Perhaps even more striking is the fact that the introduction of the small subsidyon local fresh milk has resulted in a marked substitution by wealthier consumers away from the moreheavily-subsidized reconstituted varieties: survey data reveal that from 1990 to 1993, the highest-incomequintile reduced its consumption of heavily subsidized reconstituted milk by close to 50 percent.'
127. The "inferior goods" approach has also been implemented in the milk subsector, boththrough the type of milk being targeted and through packaging differentials.7 " Using ingredients andpackaging as mechanisms for targeting has the advantage that the intrinsic quality of the final product,low-fat milk, remains good, and thus nutritional benefits are not compromised with self-targeting.'
128. To better target subsidies, the CGC reform program has sought to gradually shift milksubsidies towards pasteurized-reconstituted milk packaged in half-liter plastic film pouches (coussin) andin berlingot tetrahedron cartons. In this case, both the content and the packaging are thought to be well-targeted to the poor. Pasteurized-reconstituted milk is the least-preferred variety of subsidized milk
71\The fresh local milk undergoes a sterilization process to give it the same long-life properties of the sterilized-reconstituted milk.
72\1n absolute per adult equivalent terms.
73\Although these reforms were later modified (for reasons discussed in Chapter 5), this application of the inferior goodsapproach was in effect at the time of the 1993 survey, and highlights many important "lessons-learned" associated withself-targeting.
74\As mentioned in Chapter 1, all subsidized milk is low-fat, with 15.5 grams of fat per liter.

The Reform Package: Towards a Self-Targeted Program 43
because of its taste and limited shelf-life.'5 The packaging used for pasteurized-reconstituted milk is alsodesigned to discourage consumption by the rich. Whereas sterilized milk (both reconstituted and fresh)is available in traditional tetrabrik cartons and plastic bottles, pasteurized-reconstituted milk is packagedin two types of cheaper, less attractive containers: berlingot tetrahedron-shaped cartons and plastic filmpouches known as coussin.7 6
129. Berlingot cartons, which have existed since the mid-1980s, contain only one-half liter ofmilk, and thus favor poorer consumers who make smaller budgetary outlays at any given time. Thesehalf-liter cartons are less attractive to the rich, however, who tend to purchase large quantities, generallyat supermarkets in cases of 8-12 one-liter tetrabrik cartons.
130. Coussin packages are flimsy, plastic pillow-shaped milk pouches that were createdexplicitly for the purposes of self-targeting. Like berlingot tetrahedrons, coussin are half-liter pouchesthat are designed for consumption by the poor who tend to make small budgetary outlays on any givenpurchase." Coussin pouches possess additional features that make them even more "inferior" thanberlingot cartons because (i) they lie flat and are not stored upright in refrigerators; and (ii) once coussinpouches are opened, the milk must be transferred to another container. Survey results indicate thatcoussin packaging was a stronger consumption deterrent for the rich than for the poor: in the 1993survey, wealthier households cited packaging as the reason for not consuming pasteurized-reconstitutedmilk in coussin pouches two times more than households among the poorest-income quintiles.
131. Pasteurized-reconstituted milk carries the same price for both containers (berlingottetrahedrons and coussin pouches), which is well over 20 percent cheaper than sterilized milk (bothreconstituted and local fresh) packaged in tetrabrik cartons and plastic bottles. Unit subsidies on
_5\Undeed, survey data show that roughly 20 percent cited taste as the reason for not consuming pasteurized milk (seeAnnex 4 for details). Limited shelf-life was the most commonly cited reason for deterring consumption of pasteurized-reconstituted milk (pasteurized milk must be refrigerated at all times and its shelf-life is limited to 48 hours as opposedto six months for sterilized milk). For berlingot cartons and coussin pouches respectively, 30 and 40 percent of thosehouseholds did not consume pasteurized-reconstituted milk because of its limited shelf-life (see Annex 4 for details). Thisfeature is particularly unattractive to high-income consumers, who often purchase large quantities of long-life sterilizedmilk which does not require refrigeration for storage prior to opening. The fact that pasteurized milk requires constantrefrigeration could also possibly discourage poorer consumers who have less access to refrigeration (although all typesof milk, even sterilized, require refrigeration once their containers have been opened). Results from the 1993 surveyindicate that roughly one-half of respondents observed pasteurized milk for sale without refrigeration. It should be noted,however, that pasteurized milk is sometimes intentionally left unrefrigerated in order to allow it to curdle (within the 48hour limits of its shelf-life). Tunisians sometimes consume curdled milk (lait caille), particularly with couscous.Berlingot cartons are apparently the preferred container for preparing curdled milk because the milk stays intact, whereaswith coussin pouches, which are flimsy and do not maintain a definite shape or structure, the milk becomes chunky inthe curdling process.
76\Both coussin pouches and berlingot cartons bear the same green and white labels that have become familiar signalsfor Tunisian consumers, indicating pasteurized-reconstituted milk.
77\The type of milk (pasteurized-reconstituted milk which must be refrigerated at all times and has a short shelf-life) andthe size of the bertingot and coussin packages (half-liter) both make these varieties more appropriate for promptconsumption. Indeed, anecdotal evidence suggests that they have primarily been sold in poorer neighborhoods and tolow-income workers on public works projects (les travailleurs des chantiers) for immediate consumption.

44 Chapter I
pasteurized-reconstituted milk, however, were not explicitly targeted, and were similar to those placedon sterilized-reconstituted milk, which is more preferred by wealthier consumers. The lower prices forpasteurized-reconstituted milk simply reflect cheaper packaging costs for berlingot cartons and coussinpouches. 78
132. Survey data indicate that pasteurized-reconstituted milk packaged in berlingot tetrahedroncartons is indeed well-targeted to the poor. In 1993, the lowest-income quintile consumed over threetimes more of this variety than the highest (in absolute per adult equivalent terms), as shown inTable 14.7 Pasteurized-reconstituted milk in berlingot cartons also contributed more as a share of totalspending by the poor than the rich (1.4 percent of total outlays for the lowest-income quintile ascompared with 0.1 percent for the highest in 1993).
133. Survey results suggest that the targeting of coussin was less successful: of the householdscovered by the 1993 expenditure survey, less than one percent actually purchased pasteurized-reconstituted milk in coussin pouches.80 It seems that, with both varieties of pasteurized-reconstitutedmilk carrying the same price, the poor opted to purchase the milk packaged in the slightly less inferiorberlingot carton rather than in the plastic film pouches.
134. This pattern highlights the practical difficulties that arise in developing "inferior" goodsfor the purposes of targeting. If two products are priced at the same level but one item is perceived tobe of higher quality, consumers (rich and poor alike) will inevitably purchase the more attractive variety.Moreover, pricing differentials constitute a key variable for effective self-targeting, the products selectedto serve as the vehicles through which transfers are channeled to the poor must not be perceived to beso inferior that they discourage consumption by the intended beneficiaries. Although the fact that coussinpouches do not stand upright and require the milk to be transferred to another container upon openingdiscourages the wealthy from purchasing them, these features may likewise be prohibitively inconvenientfor the low-income worker. In addition, the resemblance of coussin pouches to a familiar laundrydetergent package ("OMO") could also lead to its rejection, even by poorer consumers. Another possible
78\As discussed in para. 145 below and in Annex 5, coussin pouches are the cheapest form of packaging, followed byberlingot tetrahedron cartons.
79\It is interesting to note that this result was not as strong in 1990. In that year, the highest- and the lowest-incomequintiles consumed roughly the same amount of pasteurized-reconstituted milk in berlingot cartons, whereas consumersin the middle-income quintiles consumed the most. Although 1993 survey data reveal that pasteurized-reconstituted milkin berlingot cartons is indeed "inferior" (in the sense that it is consumed more by the poor than the rich), this tendencywas not as robust until the distinctly "superior" sterilized local fresh milk had been introduced to attract the demand ofwealthier consumers away from the less-preferred, more heavily subsidized varieties. This highlights the mutuallyreinforcing nature of the "superior" and "inferior" goods approaches.
80\1n the qualitative section of the 1993 survey, however, over five percent of households responded that they do tendto purchase pasteurized-reconstituted milk in coussin pouches. This discrepancy, between households that were recordedas actually consuming the product and those that tend to purchase it, could arise because pasteurized-reconstituted milkin coussin pouches is not always regularly available in all neighborhoods. Responses to qualitative questions in the 1993survey indicate that availability (or lack of it) was a stronger deterrent for the consumption of pasteurized-reconstitutedmilk in coussin pouches than for any other milk product. See Annex 4 for details.
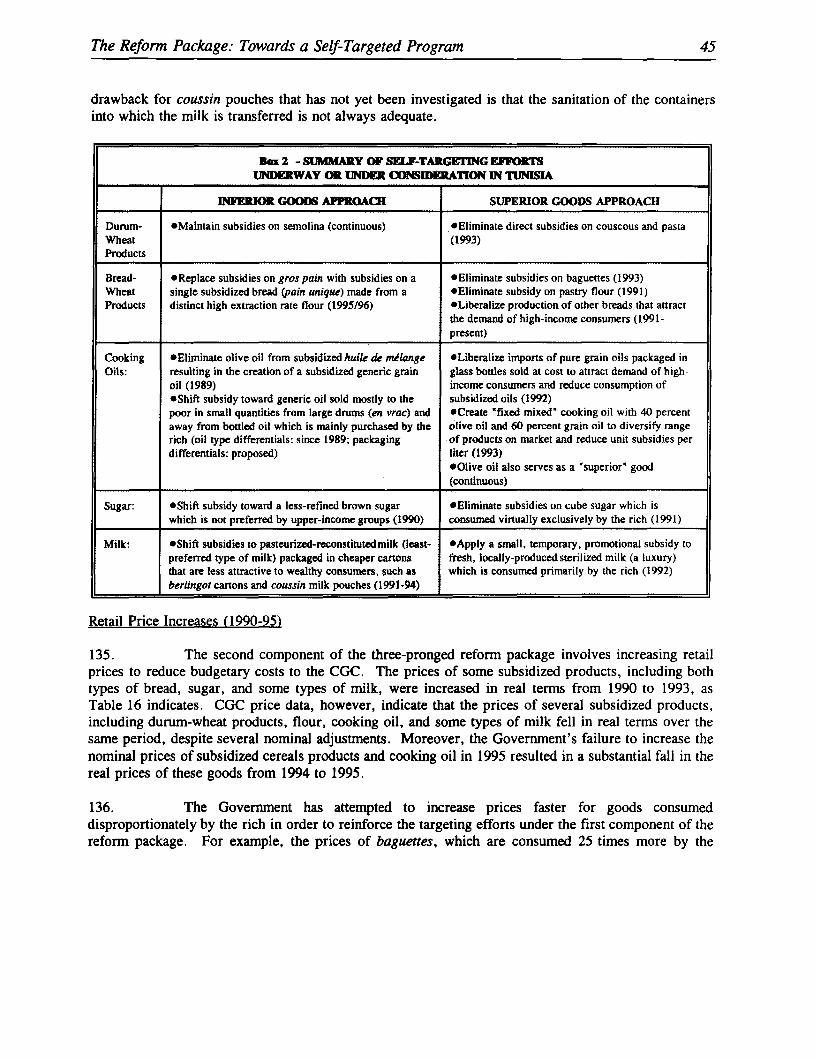
The Reform Package: Towards a Self-Targeted Program 45
drawback for coussin pouches that has not yet been investigated is that the sanitation of the containersinto which the milk is transferred is not always adequate.
Box 2 - SUM1ARY OF SELF-TARGETING EFFORTSUNDERWAY OR UNDQC CNSIE RATION IN TUNISIA
IYEIOR GOOIS APPROACH SUPERIOR GOODS APPROACH
Durum- *Maintain subsidies on semolina (continuous) *Eliminate direct subsidies on couscous and pastaWheat (1993)Products
Bread- *Replace subsidies on gros pain with subsidies on a *Eliminate subsidies on baguettes (1993)Wheat single subsidized bread (pain unique) made from a *Eliminate subsidy on pastry flour (1991)Products distinct high extraction rate flour (1995/96) oLiberalize production of other breads that attract
the demand of high-income consumers (1991-present)
Cooking *Eliminate olive oil from subsidized haile de mtlange *Liberalize imports of pure grain oils packaged inOils: resulting in the creation of a subsidized generic grain glass bottles sold at cost to attract demand of high-
oil (1989) income consumers and reduce consumption of*Shift subsidy toward generic oil sold mostly to the subsidized oils (1992)poor in small quantities from large drums (en vrac) and *Create 'fixed mixed" cooking oil with 40 percentaway from bottled oil which is mainly purchased by the olive oil and 60 percent grain oil to diversify rangerich (oil type differentials: since 1989; packaging of products on market and reduce unit subsidies perdifferentials: proposed) liter (1993)
*Olive oil also serves as a 'superior" good(continuous)
Sugar: *Shift subsidy toward a less-refined brown sugar *Eliminate subsidies on cube sugar which iswhich is not preferred by upper-income groups (1990) consumed virtually exclusively by the rich (1991)
Milk: *Shift subsidies to pasteurized-reconstitutedmilk (least- *Apply a small, temporary, promotional subsidy topreferred type of milk) packaged in cheaper cartons fresh, locally-produced sterilized milk (a luxury)that are less attractive to wealthy consumners, such as which is consumed primarily by the rich (1992)berlingot cartons and coussin milk pouches (1991-94) _
Retail Price Increases (1990-95)
135. The second component of the three-pronged reform package involves increasing retailprices to reduce budgetary costs to the CGC. The prices of some subsidized products, including bothtypes of bread, sugar, and some types of milk, were increased in real terms from 1990 to 1993, asTable 16 indicates. CGC price data, however, indicate that the prices of several subsidized products,including durum-wheat products, flour, cooking oil, and some types of milk fell in real terms over thesame period, despite several nominal adjustments. Moreover, the Government's failure to increase thenominal prices of subsidized cereals products and cooking oil in 1995 resulted in a substantial fall in thereal prices of these goods from 1994 to 1995.
136. The Government has attempted to increase prices faster for goods consumeddisproportionately by the rich in order to reinforce the targeting efforts under the first component of thereform package. For example, the prices of baguettes, which are consumed 25 times more by the

46 Chapter III
wealthiest income quintile than the poorest,"' increased faster than gros pain over the period from 1990to 1993. In fact, the gradual increases in the price of baguettes eventually led to the elimination ofbaguette subsidies in 1993. The prices of other program goods were also adjusted enough to eliminatesubsidies on several goods that contributed more to the consumption of the rich than the poor, includingdirect subsidies on pasta and couscous (in 1993), cube sugar (in 1991), and granulated imported sugar(in 1992). The prices of most milk products, however, fell in real terms despite the fact that mostvarieties are clearly consumed more by the rich than the poor (with the exception of pasteurized-reconstituted milk in berlingot cartons and coussin pouches).
Cost Reduction Measures
137. For the third component of the three-pronged reform program, the Government has takena number of steps to reduce unnecessary costs in the production and marketing of commodities subsidizedby the CGC, particularly those caused by specific regulations or Government policies. Efforts are beingmade to simplify subsidy channels and to ensure better resource management. Price adjustments andmany targeting reforms also serve as cost reduction measures.
138. In the cereals subsector, several reforms that are specifically intended to reduceunnecessary costs involve streamlining the way subsidies are paid. Subsidies at the bakery level wereeliminated in 1989, thus reducing the number of subsidy payment points in that subsector. The complexnature of the method of calculating subsidies for flour and semolina has also been simplified, resultingin an estimated savings of TD1.2 million. Transport-cost equalization charges (perequation de transport)were abolished in 1991, resulting in an estimated savings of TD1.3 millionF. Future reforms includelimiting CGC intervention to one level in the marketing chain, probably the miller level.
139. Other cost reduction measures focus on dismantling the OC monopoly by liberalizing andprivatizing collection channels. Collection, storage, handling, and delivery services were liberalizedin 1990 as part of the conditions of the ASAL II. To date, three new private cooperatives have beenlicensed for these operations (as discussed in Chapter 1).
140. Several of the proposed targeting reforms would also serve to reduce subsidy costs. Forexample, eliminating subsidies on baguettes and gros pain and placing them on a new bread (pain unique)made from PS+2 flour would result in an estimated savings of approximately TD1O million, or overthree percent of the CGC budget due to improved targeting, as discussed in para. 112.
81\1n 1990 per adult equivalent terms.
82\Ministry of the National Economy.
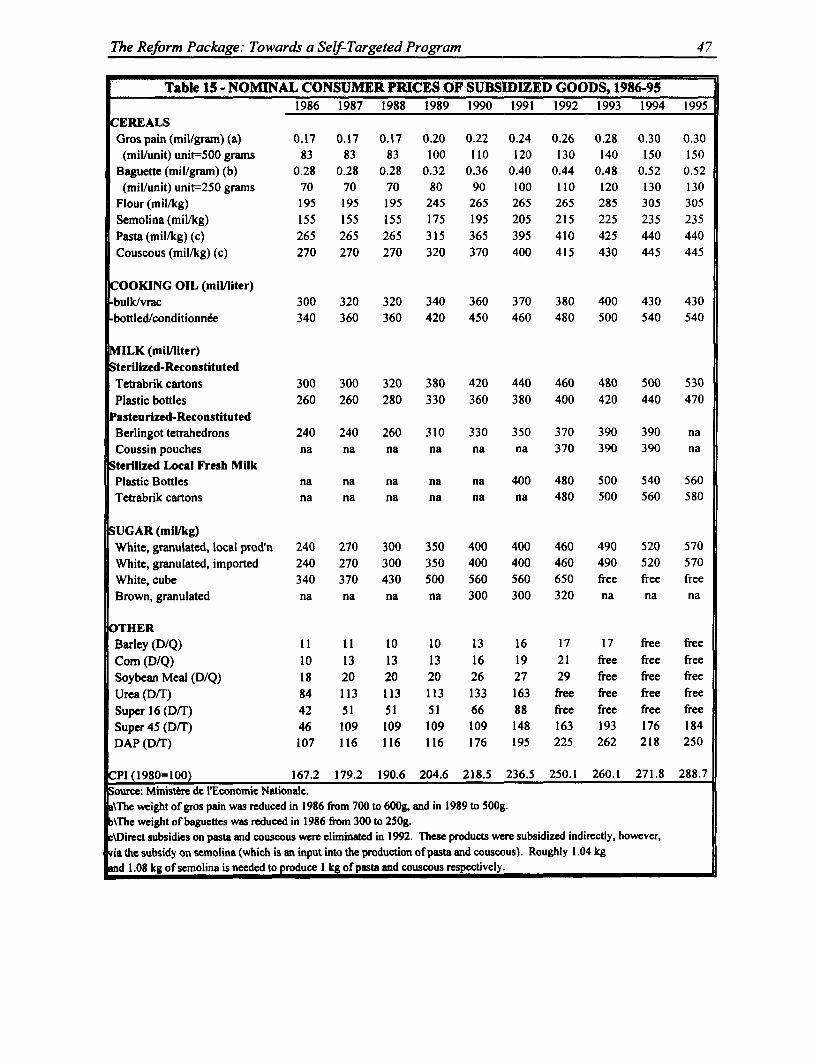
The Reform Package: Towards a Self-Targeted Program 47
Table 15 - NOMINAL CONSUMER PRICES OF SUBSIDIZED GOODS, 1986-951986 1987 1988 1989 1990 1991 1992 1993 1994 1995
EREALS
Gros pain (mil/grain) (a) 0.17 0.17 0.17 0.20 0.22 0.24 0.26 0.28 0.30 0.30(mil/unit)unit=SOOgrams 83 83 83 100 110 120 130 140 150 150
Baguette (miUgram) (b) 0.28 0.28 0.28 0.32 0.36 0.40 0.44 0.48 0.52 0.52
(mil/unit) unit=2S0 grams 70 70 70 80 90 100 110 120 130 130
Flour (mil/kg) 195 195 195 245 265 265 265 285 305 305
Semolina(mil/kg) 155 155 155 175 195 205 215 225 235 235
Pasta(mil/kg) (c) 265 265 265 315 365 395 410 425 440 440
Couscous (mil/kg) (c) 270 270 270 320 370 400 415 430 445 445
OOKING OIL (miUliter)bulk/vrac 300 320 320 340 360 370 380 400 430 430
bottled/conditionnte 340 360 360 420 450 460 480 500 540 540
ILK (mil/liter)terilized-ReconstitutedTetrabrik cartons 300 300 320 380 420 440 460 480 500 530
Plastic bottles 260 260 280 330 360 380 400 420 440 470
Psteurized-ReconstitutedBerlingot tetrahedrons 240 240 260 310 330 350 370 390 390 naCoussin pouches na na na na na na 370 390 390 na
terilized Local Fresh MilkPlastic Bottles na na na na na 400 480 500 540 560Tetrabrik cartons na na na na na na 480 500 560 580
UGAR (mIUkg)White, granulated, local prod'n 240 270 300 350 400 400 460 490 520 570
White, granulated, imported 240 270 300 350 400 400 460 490 520 570
White, cube 340 370 430 500 560 560 650 free free free
Brown, granulated na na na na 300 300 320 na na na
THERBarley(D/Q) 11 11 10 10 13 16 17 17 free free
Com (D/Q) 10 13 13 13 16 19 21 free free free
Soybean Meal (D/Q) 18 20 20 20 26 27 29 free free free
Urea (D/T) 84 113 113 113 133 163 free free free free
Super 16 (D/T) 42 51 51 51 66 88 free free free freeSuper45(D/T) 46 109 109 109 109 148 163 193 176 184
DAP (D/T) 107 116 116 116 176 195 225 262 218 250
1P(1980=100) 167.2 179.2 190.6 204.6 218.5 236.5 250.1 260.1 271.8 288.7ource: Ministere de l'Economie Nationale.\The weight of gros pain was reduced in 1986 from 700 to 600g, and in 1989 to 500g.\The weight of baguettes was reduced in 1986 from 300 to 250g.\Direct subsidies on pasta and couscous were eliminated in 1992. These products were subsidized indirectly, however,ia the subsidy on semolina (which is an input into the production of pasta and couscous). Roughly 1.04 kg
and 1.08 kg of semolina is needed to produce I kg of pasta and couscous respectively.

48 Chapter III
Table 16 - REAL CONSUMER PRICES OF SUBSIDIZED GOODS, 19S6-951986 1987 1988 1989 1990 1991 1992 1993 1994 1995
EREALSGros pain (mil/gram) (a) 0.1 0.1 0.1 0.1 0.1 0.1 0.1 0.1 0.1 0.1
(mil/unit) unit=500 grams 49.6 46.3 43.5 48.9 50.3 50.7 52.0 53.8 55.2 52.0Baguette (mil/gram) (b) 0.2 0.2 0.1 0.2 0.2 0.2 0.2 0.2 0.2 0.2
(mil/unit) unit=250 grams 41.9 39.1 36.7 39.1 41.2 42.3 44.0 46.1 47.8 45.0Flour (mil/kg) 116.6 108.8 102.3 119.7 121.3 112.1 106.0 109.6 112.2 105.7Semolina (mil/kg) 92.7 86.5 81.3 85.5 89.2 86.7 86.0 86.5 86.5 81.4Pasta (mil/kg) (c) 158.5 147.9 139.0 154.0 167.0 167.0 163.9 163.4 161.9 152.4Couscous (mil/kg) (c) 161.5 150.7 141.7 156.4 169.3 169.1 165.9 165.3 163.7 154.2
OOKING OIL (mil/liter)lbulk/vrac 179.4 178.6 167.9 166.2 164.8 156.5 151.9 153.8 158.2 149.0lbottled/conditionnee 203.3 200.9 188.9 205.3 205.9 194.5 191.9 192.2 198.7 187.1
MILK (mi/liter)terilized-ReconstitutedTetrabrik cartons 179.4 167.4 167.9 185.7 192.2 186.1 183.9 184.5 184.0 183.6Plastic bottles 155.5 145.1 146.9 161.3 164.8 160.7 159.9 161.5 161.9 162.8
Pasteurized-Reconstituted
Berlingot tetrahedrons 143.5 133.9 136.4 151.5 151.0 148.0 147.9 149.9 143.5 naCoussin pouches na na na na na na 147.9 149.9 143.5 naterilized Local Fresh MilkPlastic Bottles na na na na na 169.1 191.9 192.2 198.7 194.0Tetrabrik cartons na na na na na na 191.9 192.2 206.0 200.9
SUGAR (miUl/kg)White, granulated, local prod'n 143.5 150.7 157.4 171.1 183.1 169.1 183.9 188.4 191.3 197.5
White, granulated, imported 143.5 150.7 157.4 171.1 183.1 169.1 183.9 188.4 191.3 197.5White, cube 203.3 206.5 225.6 244.4 256.3 236.8 259.9 free free free
Brown, granulated na na na na 137.3 126.9 127.9 na na na
OTHERBarley (D/Q) 6.4 6.0 5.0 4.6 5.7 6.6 6.6 6.3 free freeCorn (D/Q) 6.0 7.0 6.6 6.1 7.2 7.8 8.2 free free freeSoybean Meal (D/Q) 10.8 11.2 10.5 9.8 11.7 11.2 11.4 free free freeUrea (DIT) 50.3 62.9 59.1 55.1 60.7 68.9 free free free free
Super 16 (D/T) 24.8 28.5 26.8 24.9 30.2 37.2 free free free freeSuper 45 (D/T) 27.2 60.8 57.2 53.3 49.9 62.6 65.2 74.2 64.8 63.7DAP (D/T) 64.2 64.7 60.9 56.7 80.5 82.5 90.0 100.7 80.2 86.6
CPI(1980=100) 167.2 179.2 190.6 204.6 218.5 236.5 250.1 260.1 271.8 288.7ource: Ministere de l'Economie Nationale.
a\The weight of gros pain was reduced in 1986 from 700 to 600g, and in 1989 to 500g.\The weight of baguettes was reduced in 1986 from 300 to 250g.
c\Direct subsidies on pasta and couscous were eliminated in 1992. These products were subsidized indirectly, however,via the subsidy on semolina (which is an input into the production of pasta and couscous). Roughly 1.04 kgand 1.08 kg of semolina is needed to produce I kg of pasta and couscous respectively.

The Reform Package: Towards a Self-Targeted Program 49
141. In addition to improving targeting, the introduction of PS+2 flour offers otherpossibilities for reducing costs even further, despite the fact that this new flour would requiremodifications to the current production process. The one-time costs of machinery investments for theintroduction of PS + 2 flour have been estimated and weighed against the on-going gains from arising froma higher extraction rate. Real investment costs are estimated to range from TD180,000 to TD292,000depending on the production technique adopted, which translate into an average cost of 60 to 80 millimesper quintal of flour over a period of ten years. 3 However, a higher extraction rate would result in anestimated gain of 80 millimes per quintal of flour. These costs and savings would therefore offset eachother, with a possible slight net gain.
142. A more substantial source of savings would arise from reducing the leakages of subsidizedflour to unauthorized uses, such as pastries, pizza and biscuits. These leakages are estimated to representfrom seven to ten percent of subsidized PS flour.S' The new PS+2 flour is easily distinguishable fromPS baking flour and PS-7 pastry flour because of its distinct color and texture. It has a darker brownish-creme color and contains rough bran particles, whereas the traditional types of flour are very white andfinely textured. Reducing leakages to unauthorized uses by shifting the subsidies to the distinctPS+2 flour would result in an estimated savings to the CGC of between TD6 million and TD1O millionper year. 5 When combined with the savings due to improved targeting, it is estimated that shiftingsubsidies to pain unique made from PS+2 flour would save the CGC between TD16 million andTD20 million per year (between 5.5 and 6.9 percent of the total CGC budget in 1992).
143. For cooking oils, several targeting reforms are also cost reduction measures. Mostnotably, the elimination of olive oil in huile de melange has resulted in a generic mix of grain oils thatis less attractive to high-income consumers and cheaper for the CGC to subsidize. Since olive oil prices,calculated as the average annual export value, are considerably higher than grain oil prices, eliminatingolive oil has substantially lowered the cost of cooking oil subsidies.
144. In addition to reducing subsidy costs, removing olive oil from the mix eliminated severalinefficiencies in the system. With huile de melange the ONH had to physically repossess grain oil formixing because it did not trust the refineries to add the proper variable amount of olive oil. This resultedin cumbersome and costly movements of oil. Removing olive oil from the mix has eliminated the needfor these movements and refineries now sell directly to local markets.'
145. In the milk subsector, several cost reduction measures have been incorporated into thereform of the subsidy program, primarily shifting subsidies on milk away from milk packaged in therelatively more expensive containers. Tetrabrik cartons, by far the most expensive form of packaging,
83\Costs figures are in real terms. These estimates are based on a production of 300,000 quintals per day. Bureau deConseils, D'Etudes et de Formation (1992).
84\Bureau de Conseils, D'Etudes et de Formation (1992).
85\1bid.
86\These problems do not apply to the new mixed oil since the proportions of its ingredients are fixed and are controlledby state standards.

50 Chapter I1
are 1.6 times more expensive than plastic bottles, 1.7 times more costly than berlingot cartons, and closeto five times more expensive than coussin pouches (see Annex 5 for more details on milk packagingcosts). STIL is quickly switching its sterilized milk (both reconstituted and local fresh) from tetrabrikcartons to plastic bottles.'7 Before the end of the VIII Development Plan, virtually all sterilized milkfrom STIL will be sold in plastic bottles.' This switch will result in an estimated savings ofTD2.6 million annually. In addition, the move to shift subsidies to pasteurized-reconstituted milkpackaged in berlingot cartons and coussin milk pouches is, in part, an effort to better self-target milksubsidies, and, in part, a cost reduction measure since these products are unattractive to wealthierconsumers and are the cheapest forms of packaging.' Currently, proposals have also been made toswitch to high-capacity packaging for sale to large consumers, such as hospitals, universities and militaryestablishments.
146. Fixing operating margins for STIL and Tunisie-Lait in absolute terms at their 1989 levelsis another measure introduced by the Government to reduce costs. While this is an important steptowards reducing expenditures of the CGC, arbitrarily linking margins to their level in one particular yearrather than to appropriate financial indicators could lead to distortions in the incentive structure.
87\STIL is the only dairy processor which uses Tetrabrik cartons.
88\With the exception of sterilized milk packaged at the Sfax factory, which produces a very small share of sterilizedmilk (five percent).
89\Although increasing the capacity of coussin production could entail additional investment costs.

CHAPrER IVIMPACT OF THE REFORM PROGRAM (since 1990)
A. ESTIMATED FISCAL IMPACT
147. Despite the difficulties, both political and economic, experienced during the 1980s,reforms under the VIII Development Plan (1991-96) are fairly ambitious in their efforts to reduce outlayson the subsidy program. Indeed, the reform program has been successful in reducing the budgetary costsof the CGC: the subsidy program was cut from over four percent of GDP and ten percent of Governmentexpenditures in 1984 to two percent of GDP and less than six percent of Government expenditures in 1993as indicated in Table 17 below. Moreover, simulations suggest that self-targeting reforms would have ledto a 34 percent drop in outlays on the CGC subsidy program from 1990 to 1993, to 1.9 percent of GDPand 5.1 percent of public expenditures, if other factors, such as population and GDP, had been heldconstant (see Figure 1).
Figure I - Actual and Simulated Outlays on CGC Subsidiesas Percent of GDP and Total Government Expenditures
12.0
10.0
8.0 -
6.0 *~~~~~~% ofGDP6.0 0% of Tot. Govt. Exp.4.0-
2.0
0.0(act.) (act.) (act.) (sim.)1984 1990 1993 1993
Note: 'Sim. 1993" represents the simulated level of outlays for that year arising fromself-targeting reforms instituted between 1990 and 1993, holding all other factorsconstant.
148. Many aspects of the three-pronged reform strategy have the potential to reduce fiscalcosts. In fact, many targeting reforms also serve as cost reduction measures, price increases result inlower subsidy costs, and steps to reduce inefficiencies in the production and distribution of subsidizedproducts also reduce CGC expenditures.
149. In 1991, the Ministry of National Economy (now called the Ministry of Commerce)attempted to quantify and project the effect of proposed reforms on predicted expenditures during the VIIIDevelopment Plan. The results of these projections are presented in Table 17 and are compared to a"base-case" scenario that projected program outlays in the absence of reforms.
90\Ministere de l'Economie Nationale (1991).

52 Chapter IV
150. The scenario "without reforms" illustrates the need for decisive measures to reducesubsidy expenditures. This "base case" scenario assumed that costs and quantities consumed wouldfollow past trends, but that subsidies and retail prices would remain at their 1991 levels. Withoutreforms, by 1996, total annual expenditures were projected to be more than double their level in 1991(in nominal terms) so that the cost of the subsidy program under the VIII Development Plan would beover 1.5 times more than outlays under the VII Plan. Without reforms, CGC outlays were projected toclimb back to three percent of GDP and eight percent of total Government expenditures by 1996. Theseprojected costs clearly demonstrate the need for extensive cost saving reforms.
151. An alternative "with reforms" scenario projected the savings that would occur withimplementation of the three-pronged reform program.9" Implementing the reform package was forecastto reduce the total cost of the subsidy program from roughly TD2300 million to less than TD1300million, resulting in a projected savings of over TD1000 million (or 44 percent) for the duration of theVIII Development Plan.
152. The Ministry of the National Economy made these projections in 1991, using estimateddata for later years. Data on actual CGC expenditures on the program have since become available.Actual outlays exceeded the projected "with reform" scenario in all years, but were substantially less thanthe projected outlays under the scenario "without reforms." Comparing actual outlays with those underthe "without reforms" scenario reveals an actual savings of TD621 million (or 27 percent) for the durationof the VIII Development Plan.
153. These deviations in actual outlays from the projected "with reform" levels arose primarilydue to additional modifications to the CGC reform program (beyond those assumed at the time theprojections were made), and due to the fact that factors beyond the control of policy planners (includingworld prices, exchange rates, input costs and the quantities consumed/produced) differed from those usedin the estimates.
154. In particular, more recent estimates of outlays for 1995 and 1996 substantially exceed theMinistry's original 1991 "with reform" projections (though these estimates are still far below outlaysunder the projected scenario "without reforms"), as shown in Table 18. These divergences in projectedoutlays arise due to differences in actual and projected quantities consumed for all products.
91\ The scenario with reforms is based on the implementation of the three-pronged reform program (discussed inChapter 3) using the reform measures (including proposed price adjustments, cost reduction measures, and severalqualitative reforms) that were planned and proposed as of 1991 when the projections were estimated. Other hypothesesincluded the following: For all commodities, CIF prices and exchange rates were assumed to increase by 3%.Additional assumptions included: for cereals: quantities would increase by 3 %, while domestic procurement prices wouldrise by 5 %; for cooking oils: quantities and costs would rise by 3% and the allocation of oil between bulk and bottledoil sales would remain constant, at 70 and 30 percent respectively; for milk, the cost of powdered milk imports, andprocessing and packaging costs would all increase by 5 %; for sugar and fertilizer, quantities would rise by 3 % and costsby 2%. It was also assumed that animal feed subsidies would be eliminated by 1993 and fertilizer subsidies by 1996.

Impact of the Reform Program (since 1990) 53
Table 17 - FISCAL IMPACT OF REFORMSTotal
1984 1992 1993 1994 1995 1996 VIII PlanW*ith ReformsActual Outlays (with) 258 291 314 304 343 419 1671
As%ofGDP 4.1% 2.1% 2.1% 1.9%/0 2.0% 2.2%As%ofTotalGov'tExp. 10.0% 6.1% 5.7% 5.1% 5.2% 5.8%
Predicted Outlays (with) .. 271 263 244 247 257 1282As%ofGDP .. 2.0%/o 1.8% 1.5% 1.4% 1.3%
As%ofTotalGov'tExp. .. 5.7% 4.8% 4.1% 3.7% 3.5%[Vithout Reforms
Predicted Outlays (w/o) .. 334 391 453 520 594 2292As%ofGDP .. 2.4% 2.7% 2.9% 3.0% 3.1%
As % of Total Gov't Exp. .. 70/o 7.2% 7.6% 7.9% 8.2%Savings From ReformsActual .. 43 77 149 177 175 621
Predicted .. 63 128 209 273 337 1010
GDP 6240 13706 14606 15867 17215 19201Total Gov't Expenditures 2579 4771 5467 5974 6595 7281
Source: Ministere de l'Economie Nationale (1991), recent estimates. The Vill Plan covers the period from 1992-96.umbers may not add due to rounding.
Table 18 - FISCAL IMPACT OF WORLD PRICE HIKES1995 - Estimated 1996 - Projected
Actual Outlays With Refs. Revised Current With Refs. Revised Current1993 1994 proj. 1991 est. 5/95 est. 10/95 proj. 1991 proj. 5/95 proj. 10/95
Cereals - Total 212 183 172 182 200 182 186 274Durum-Wheat 124 137 .. 114 121 .. 115 145
Bread-Wheat 82 40 .. 59 71 .. 61 119
DW & BW processing 6 6 .. 9 9 .. 9 10
Cooking Oils 27 56 35 63 68 36 64 64Sugar 14 15 9 19 14 10 16 12Milk 27 21 9 26 24 8 27 25Meat 0 0 0 0 0 0 0 0Sub-Total: Food Subsidies 280 275 226 290 305 236 292 375Other 34 29 21 37 38 21 40 44|Total CGC 314 304 247 327 343 257 332 419
CGC as % of:GDP 2.1% 1.9% 1.4% 1.9/e 2.0% 1.3% 1.7% 2.2%Total Gov't Expenditures 5.7% 5.1% 3.7% 5.00/a 5.2% 3.5% 4.6% 5.8%
Memo:GDP 14606 15867 17215 17215 17215 19201 19201 19201Total Gov't Expenditures 5467 5974 6595 6595 6595 7281 7281 7281
Source: Ministry of Commerce (formerly the Ministere de l'Economie Nationale).
nitial "With Reform" projections made by the Ministry of the National Economy in 1991.
Revised estimates/projections made in May 1995. Current estimates/projections made in October 1995.
1996 projections assume that unit subsidies remain at their 1995 levels.

54 Chapter IV
155. For cooking oils and cereals, additional factors account for the difference between currentdata and earlier projections. In the case of cooking oils, nominal prices have been maintained in 1995-96for subsidized generic oil at their 1994 levels, and outlays on oil subsidies increased accordingly. Inaddition, a poor olive crop in 1995 caused the price of olive oil to increase, encouraging a shift inconsumption towards subsidized grain oil, and a corresponding increase in CGC outlays on cooking oilsubsidies.
156. For cereals products, a lack of nominal price increases (and corresponding subsidyreductions) from their 1994 levels has increased CGC outlays on cereals subsidies in 1995-96 over andabove earlier projections. In addition, the recent upward spiral in world cereals prices has caused CGCoutlays on cereals subsidies to balloon. Recent estimates indicate that international cereals price hikeshave increased CGC outlays cereals subsidies by roughly ten percent for 1995 and by close to 50 percentfor 1996 (projected).' These increases are projected to cause total outlays on CGC subsidies to inchback up to 2.2 percent of GDP and 5.8 percent of total Government expenditures in 1996. The impactof these recent trends demonstrates the fiscal vulnerability of outlays on food-price subsidy schemes likethe CGC program to variations in international prices.
B. DISTRIBUTIONAL IMPACT (INCIDENCE)
157. To assess the impact of targeting measures and price increases under the CGC reformprogram, a small-scale household expenditure survey was conducted in 1993 covering roughly onethousand households in the District of Tunis region. The survey was specifically designed coverquantitative and qualitative questions regarding the products that have been the focus of self-targetingreforms.93
Distributional Impact of Reform Pro2zram: 1993
158. A clear conclusion that can be derived from the 1993 survey is that self-targeting isindeed an effective way to redistribute income to the poor. Figure 2 shows that self-targeting reformstransformed program incidence from a situation in which the universal CGC program transferredmore absolute subsidies to the rich than the poor, to one in which the poor benefitted more fromfood subsidies than the rich.'
92\These figures compare estimates made in May 1995 (prior to the world price hikes) with those made in October 1995.Source: Ministry of Commerce.
93\To avoid having to estimate the total income (proxied by total expenditures) of each household, which would haverequired a much larger and more comprehensive household budget survey, the same households as those sampled in theDistrict of Tunis area in 1990 were included and data on total income (expenditures) come from the 1990 survey. Totalincome (expenditures) was, however, explicitly adjusted for 1993 household composition using equivalence scales. SeeAnnex 3 for more details on the 1990 and 1993 surveys.
94\1985 calculated as per capita subsidies for the lowest and highest income groups which represented 13 percent and12 percent of the population respectively; 1990 and 1993 calculated as subsidies per adult equivalent for the lowest andhighest income quintiles (each representing 20 percent of the population).

Impact of the Reform Program (since 1990) 55
Figure 2 - Absolute Incidence of Food Subsidies:Share of Benefits Transferred to Poorest and Richest;
25 1985, 1990, 1993
~' 15 0 poorest
O 10- Q richest10
5 -
0~
1985 1990 1993
159. Table 19 shows the details for 1993. In contrast to 1985 and 1990 when the rich receivedtwo and 1.2 times more subsidies respectively than the poor in absolute terms,95 in 1993 the poorbenefitted 1.1 times more from the CGC program than the rich (the poor benefitted more in relative termsin all three years). Specifically, in 1993, the poorest quintile of the population received 21 percent of totalfood subsidies whereas the wealthiest quintile received 18 percent, with annual subsidies per adultequivalent of TD36 and TD41 for the top and bottom quintiles respectively. In relative terms, eventhough subsidies were already progressive under the universal subsidy program (accounting for over fivetimes more of total expenditures for the poor than the rich in 1990), self-targeting reforms strengthened
this result: by 1993, subsidies contributed over six times more to the total annual expenditures of the
lowest quintile than to those of the highest.
160. For durum-wheat products, although reforms eliminated direct subsidies on pasta and
couscous (which were not particularly well-targeted), the rich did not substitute consumption in favor of
semolina (which is well-targeted and remains subsidized), and the incidence of durum-wheat subsidies
improved. By 1993, the poor benefitted from durum-wheat subsidies 1.7 times more than the rich,
whereas in 1990 overall durum-wheat subsidies transferred just 1.3 times more absolute benefits to the
lowest-income quintile than the highest.
25\The poor is defined as the bottom quintile of the population, with annual incomes less than TD721 per adult equivalentand with a mean income per adult equivalent of TD524. The estimated average daily caloric intake for this group was 2122kcal per adult equivalent, which is lower than the minimum requirement of 2165 kcal estimated by the INS.
96\As discussed in Chapter 3, however, despite the elimination of direct subsidies on pasta and couscous, these itemscontinued to benefit from indirect subsidies on semolina (an input into their production). The magnitude of the total unitsubsidy on these items did decrease with the elimination of direct subsidies.

56 Chapter IV
Table 19 - DISTRIBUTION OF FOOD SUBSIDIES PER ADULT EQUIVALENT, BY QUINTILEREFORM PROGRAM - 1993
POOR RICH Ratio Ratio1 2 3 4 5 Average 5/1 1/5
Absolute Incidence of Food Subsidies, Mean Subsidies Per Adult EquivalentTotal DW 18.5 13.7 13.2 12.1 10.6 13.6 0.6 1.7Semolina 12.1 7.0 6.0 5.4 4.0 6.9 0.3 3.1Couscous 1.4 1.8 2.0 1.8 1.9 1.8 1.4 0.7Pasta 4.9 4.9 5.2 4.9 4.7 4.9 1.0 1.0
Total BW 10.7 12.3 13.2 12.1 9.1 11.5 0.9 1.2Gros Pain 10.7 12.3 13.2 12.1 9.1 11.5 0.9 1.2BW Flour ES ES ES ES ES ES ES ESBaguette ES ES ES ES ES ES ES ES
Generic Cooking Oil 5.9 6.1 6.3 6.5 5.6 6.1 1.0 1.0Unpackaged (bulk) 3.9 4.1 4.2 3.9 2.3 3.7 0.6 1.7Bottled 2.0 2.0 2.2 2.5 3.3 2.4 1.7 0.6
ugar 0.5 0.7 0.8 0.9 1.1 0.8 2.0 0.5
Total Milk 5.3 6.7 7.3 8.1 9.7 7.4 1.8 0.5PST 2.4 1.4 2.1 1.2 0.9 1.6 0.3 2.9SRM 2.3 4.1 3.8 5.0 5.2 4.1 2.2 0.4Loc. Fresh Bottle 0.2 0.6 0.5 0.6 1.3 0.7 5.7 0.2Loc. Fresh Tetrab. 0.3 0.7 0.9 1.2 2.3 1.1 7.2 0.1
Total Above 40.8 39.5 40.8 39.6 36.1 39.4 0.9 1.1PercentofSubsidies 21% 20% 21% 20% 18% 100% 0.9 1.1
Relative Incidence of Food Subsidies, Subsidies as Share of Total Expenditures, PAETotalDW 3.5% 1.6% 1.1% 0.7% 0.3% 0.9°/O 0.1 11.1Semolina 2.3% 0.8% 0.5% 0.3% 0.1% 0.5% 0.1 19.5Couscous 0.3% 0.2% 0.2% 0.1% 0.1% 0.1% 0.2 4.7Pasta 0.9% 0.6% 0.4% 0.3% 0.1% 0.3% 0.2 6.6
TotalBW 2.0% 1.4% 1.1% 0.7% 0.3% 0.8% 0.1 7.5Gros Pain 2.0% 1.4% 1.1% 0.7% 0.3% 0.8% 0.1 7.5BW Flour ES ES ES ES ES ES ES ESBaguette ES ES ES ES ES ES ES ES
Generic Cooking Oil 1.1% 0.7% 0.5% 0.4% 0.2% 0.4% 0.2 6.6Unpackaged (bulk) 0.7% 0.5% 0.4% 0.2% 0.1% 0.2% 0.1 10.7Bottled 0.4% 0.2% 0.2% 0.1% 0.1% 0.2% 0.3 3.8
Sugar 0.1% 0.1% 0.1% 0.1% 0.0% 0.1% 0.3 3.2
Total Milk 1.0% 0.8% 0.6% 0.5% 0.3% 0.5% 0.3 3.5PST 0.5% 0.2% 0.2% 0.1% 0.0% 0.1% 0.1 18.3SRM 0.4% 0.5% 0.3% 0.3% 0.2% 0.3% 0.4 2.8Loc. Fresh Bottle 0.0O/o 0.1% 0.0% 0.0% 0.0% 0.0% 0.9 1.1Loc.FreshTetrab. 0.1% 0.1% 0.1% 0.1% 0.1% 0.1% 1.1 0.9
TotalAbove 7.8% 4.5% 3.4% 2.4% 1.1% 2.6% 0.1 7.2Total Expenditures 524 869 1184 1684 3345 1521 6.4 0.2ource: INS, Household Expenditure Survey, District of Tunis. 1990. Total expenditure & sugar cons. panems extrapolated
from 1990 Survey (adjusted for adult equivalent). DW = durum wheat; BW = bread wheat; PST = pasteurized-reconstituted milk;I4RM - sterilized-reconstituted milk; ES = subsidy eliminated; PAE - per adult equivalent. Numbers may not add due to rounding.

Imnpact of the Reform Program (since 1990) 57
161. The reform program was also successful in improving the incidence of bread-wheatsubsidies by eliminating subsidies on baguettes and bread-wheat flour which were poorly targeted.Despite the elimination of these subsidies, the rich did not substitute consumption in favor of gros pain,and bread-wheat subsidies became progressive in absolute terms, as shown in Table 19.
162. Regarding cooking oil, as mentioned in Chapter 3, although generic grain oil sold frombulk vendors is better targeted to the poor than the same type of oil packaged in bottles, the unit subsidiesfor these items have not been very different and targeting would be strengthened by differentiatingsubsidies accordingly. Moreover, imported pure grain oils, which were liberalized in 1992 to serve assuperior alternatives to the subsidized varieties, have not been widely marketed and were therefore notcaptured in the 1993 survey.'
163. Sugar was not included in the 1993 survey, so evidence of efforts to improve theincidence of sugar subsidies is largely anecdotal.98 As discussed in Chapter 3, with the exception of theelimination of subsidies on cube sugar in 1991, attempts to improve the targeting of sugar subsidies byintroducing an inferior less-refined brown sugar failed because even poorer consumers rejected it.
164. Reform efforts did achieve the intended results for milk subsidies, however. The"superior goods" approach was particularly effective in shifting the demand by wealthier consumers awayfrom the more heavily subsidized varieties and toward local fresh milk which carries a lower unit subsidy.As discussed in Chapter 3, survey data indicate that the highest-income quintile reduced its consumptionof reconstituted milk by 50 percent, substituting consumption in favor of local fresh milk.
165. In addition, the introduction of "superior" alternatives (local fresh milk) strengthened thetargeting of the more "inferior" pasteurized-reconstituted milk. Although pasteurized-reconstituted milkwas available in berlingot cartons under the universal subsidy program and was thus captured by the 1990survey, the targeting of berlingot subsidies was not very strong at that time because of an absence ofhighly-preferred superior alternatives (although it was better targeted than other varieties of milk). By1993, however, the targeting of berlingot was greatly improved by the introduction of local fresh milkwhich served to siphon off the demand of the rich. These results demonstrate the mutually reinforcingnature of the "superior" and "inferior" goods approaches.
i66. As discussed in Chapter 3, the targeting of coussin was less effective than berlingot,however, because, although coussin pouches are the most unattractive form of packaging and contain theleast-preferred type of milk, coussin pouches were priced the same as berlingot cartons. While bothpackages contained the same type of milk (pasteurized-reconstituted) berlingot is a slightly moreconvenient form of packaging (as discussed in Chapter 3). With similar prices for both varieties ofpasteurized-reconstituted milk, the poor apparently opted to purchase the slightly less inferior version(berlingot) instead of coussin.
97\One possible explanation for the lack of wide-spread response from the private sector to the liberalization of importsof pure grain oils is that they cannot compete with generic grain oil (which is imported by the Office National de I 'Huile)which is not only subsidized, but also benefits from a preferential customs duty. The customs duty for imports of puregrain oils is 43 percent, whereas the tariff for imports of generic grain oil (soy or canola) by the ONH is only 15 percent.
98\Consumption patterns for sugar in Table 19 were extrapolated from the 1990 National Household Expenditure Survey.

58 Chapter IV
Box 3 - "LESSONS LEARNED:" PRACTICAL ISSUES INVOLVED INIMPROVING THE INCIDENCE OF FOOD SUBSIDIES VIA SELF-TARGETING
Several lessons emerge from the 1993 snapshot of the impact of self-targeting via quality differentiationon the incidence offood subsidies in Tunisia.
* Introducing a small promotional subsidy on a superior variety can actually decrease total outlays on the subsidy program.For example, to encourage private operators to market a higher-quality milk, the Govemment placed a small promotionalsubsidy on sterilized local fresh milk which is highly-preferred by wealthy consumers but which has historically been unable tocompete with heavily subsidized milk reconstituted from imported milk powder. The injection of this minimal subsidy on localfresh milk has actually reduced program costs and improved targeting by shifting demand of high-income consumers awayfrom reconstituted milk which receives a much larger unit subsidy.
* There is a fine line between creating a product to be unattractive to wealthier consumers and having it also be unappealingto the poor. For example, although heavily-subsidized less-refined brown sugar was over 43 percent cheaper than refinedwhite sugar, brown sugar has not been readily accepted by consumers, rich and poor alike. Even poorer consumers haverejected less-refined brown sugar, apparently because the darker sugar is perceived to be "dirty.'
* Subsidies should be set so that consumer prices appropriately reflect perceived quality differences. For example,pasteurized-reconstituted milk, which is the least-preferred variety of milk, is packaged in two types of half-liter containers:berlingot tetrahedron cartons and flimsy plastic film pouches called coussin. While both varieties are perceived to beunattractive to wealthier consumers, coussin possesses additional features (see Chapter 3) that make them even more "inferior'than berlingot cartons. However, they both carry the same price; even the poor rejected the variety packaged in coussinpouches and opted to purchase pasteurized-reconstituted milk in berlingot canons instead.
Incidence of Targeted Food Subsidy Programs, International Comparison
167. Table 20 presents the incidence of targeted food subsidy programs in various developingcountries. A comparison of Table 10 in Chapter 2 and Table 20 below reveals that targeted programsare far more effective in reducing leakages to the non-poor than universal schemes. The very effort oftargeting, however, entails program costs that are generally not associated with universal programs,including: identification of beneficiaries, screening, maintaining eligibility lists, preventing fraud, etc.Considerable research has focused on the trade-off between reduced program costs from directing benefitsexclusively to intended recipients and the increased costs associated with narrow targeting, and found thatthere is little correlation between improved incidence and the share of administrative cost in total programexpenditures.'
168. Although the poor benefitted more from CGC subsidies than the rich in 1993, Table 20shows that the Tunisian reform program was not as well-targeted as targeted schemes in other countries."Hybrid" self-selection programs, such as the self-targeted Jamaican program which distributes foodstamps at strategically-chosen health clinics, might result in greater target accuracy than self-targeted foodprice subsidy programs because they use additional information about consumer behavior to supplementtheir emphasis on staples. The relatively poorer standing of the Tunisia program is also partly due to thefact that the 1993 Tunisian survey presents a "mid-term snapshot" of the incidence of the CGC programas self-targeting reforms are being implemented. These results do not demonstrate the final degree to
99\For a thorough treatment of the trade-off between target accuracy and administrative costs, see Grosh (June 1992).

Impact of the Reform Program (since 1990) 59
which targeting can be achieved using quality differentiation. In fact, as discussed in Chapter 5, severaladditional reformns could be undertaken to fine-tune the menu of goods eligible for CGC subsidies andfurther improve program incidence.
Table 20 - ABSOLUTE INCIDENCE OF TARGETED FOOD PROGRAMS,INTERNATIONAL COMPARISON
% of Benefits Accruing to Quintile
Country Program 1 2 3 4 5
Tunisia (1993) SELF-SELECTION: Food Price 21 20 21 20 18Subsidies (total)
Morocco SELF-SELECTION: Food price 23 24 22 18 13subsidies, High Extraction Rate Flour(FNBT)
Jamaica SELF-SELECTION: Food Stamps at 44 31 18 5 2Health Clinic
Chile SELF-SELECTION: Food Supplement 41 28 18 10 3at Health Clinic
Peru GEOGRAPHIC TARGETING: Food 42 30 20 6 3Supplement by neighborhood
Jamaica MEANS TEST: Food Stamps 47 29 15 6 3
Jamaica, Chile, Peru: Reproduced from Grosh (June 1992).Tunisia: Quinuiles per adult equivalent. INS 1993 Enquite Restreinte sur la Consommation des ProduitsSubvenrionnes; District of Tunis. Total expenditure and sugar consumption patterns extrapolated from 1990household expenditure survey (adjusted for inflation and adult equivalent); total food subsidies covers durum-wheatproducts, bread-wheat products, cooking oil, sugar and milk. Morocco: Living Standards Survey, 1990/91 (percapita quintiles). Numbers may not add due to rounding.
C. NUTRITIONAL IMPACT
169. The contribution of food subsidies to calorie and protein intake have remained substantialunder the reform program, despite the reduction and elimination of subsidies on many products, asdiscussed in Chapter 3 above. Table 21 indicates that, on average, roughly 44 percent of total calorieand protein intake was derived from food subsidies in 1993 (as compared with 59 and 62 percentrespectively in 1990, see Chapter 2 for details).'°° Food subsidies under the reform program areespecially important to the poor, contributing to approximately 54 and 62 percent of total calorie and
100\As discussed in Chapter 2, figures on total calorie and protein intake, as well as the nutritional importance of foodsubsidies, come from the INS household expenditure survey (rather than the national food and nutrition survey).Consequently, these data refer to acquisitions of calories and protein (including those derived from purchases and on-farmconsumption), rather than actual intake of these nutrients. These figures do not, therefore, take into account leftovers(portions uneaten) or portions allocated to guests or household animals.

60 Chapter IV
protein intake respectively by the poorest quintile in 1993. The importance of food subsidies tonutritional intake drops monotonically with increases in income; this is likely due to the fact that wealthierconsumers tend to have more diversified diets (with greater consumption of meat, for exarnple) and relyless on the basic staples supported by the CGC subsidy program.
170. Although Table 21 provides a useful "snapshot" of the importance of food subsidies tonutritional intake under the self-targeted program, it does not isolate the nutritional impact of CGCreforms. The nutritional effects of these reforms"' can be simulated using estimated demand elasticitieswhich determine the direction and magnitude of quantities consumed of individual goods."0 Unitcalorie and protein coefficients are then applied to simulated changes in quantities, and the total effectof reforms on intake is calculated as the sum of the effects on individual products as a share of totalintake. A negative result indicates a loss in calorie and protein consumption.
171. The results of these simulations are presented in Table 22. On average, CGC reformsfrom 1990 to 1993 caused in a drop in caloric intake of roughly 14 percent and a loss in protein intakeof 16 percent, with all other factors held constant.'03 Cuts in subsidies on bread-wheat products,"0followed by reforms involving durum-wheat subsidies, had the strongest adverse effect on the nutritionalintake for all consumers. These losses were only partially offset by increases in subsidies on reconstitutedmilk and the introduction of subsidies on local fresh milk.
l01\Reforms captured by the simulations include: (i) for durum wheat: the elimination of direct subsidies on pasta andcouscous; (ii) for bread wheat: the elimination of subsidies on baguettes and flour, and the reduction of subsidies on grospain; (iii) for cooking oil: the reduction of subsidies on generic grain oil (both "bulk" and bottled); and (iv) for milk:the increase in subsidies on sterilized-reconstituted milk (in both plastic bottles and tetrabrik cartons) and the introductionof promotional subsidies on local fresh milk packaged in plastic bottles and tetrabrik cartons ('new goods"). Becauseless than one percent of those households included in the 1993 survey actually purchased pasteurized- reconstituted milkpackaged in coussin pouches, this variety of milk was grouped together with pasteurized-reconstituted milk packaged inBerlingot cartons for the purposes of policy simulations. For obvious reasons, the simulations do not incorporate thewelfare effects of reforms that were implemented after the 1993 survey was carried out (summer 1993). These reformsinclude the introduction of: (i) "superior" breads that were liberalized in 1991 but were not widely available at the timeof the 1993 survey (see para. 50); (ii) subsidies on a single bread (pain unique) made from a high extraction rate flour(see paras. 45-49); (iii) unsubsidized pure grain oils (see para. 54); and (iv) zit sanafa, a new "fixed mixed" cooking oilwhich was not widely available at the time of the survey (see para. 55). In addition, because sugar was not includedin the 1993 survey, the simulations do not include the effects of sugar price changes and targeting reforms.
102\See Annex 6 for details on the methodology used for estimation and simulations.
103\Actual changes in consumption differ from these simulated responses because of changes in other variables. Thesesimulations isolate the effects of price changes and targeting reforms holding all other factors constant (including theprices of other goods).
104\Although semolina prices did not vary substantially in real terms from 1990 to 1993, semolina consumption wasnonetheless affected by reforms via cross-price effects of pasta and couscous (for which subsidies were eliminated) andvia indirect income-effects arising from changes in total expenditures allocated to durum-wheat products.

Impact of the Reform Program (since 1990) 61
Table 21 - CALORIE & PROTEIN INTAKCE FROM FOOD SUBSIDIESAS SHARE OF TOTAL INTAKE, PAE, BY QUINTILE: REFORM PROGRAM - 1993
POOR RICH Ratio Ratio
1 2 3 4 5 Average 5/1 115
Calories Per Adult EquivalentTotal DW 26.9% 17.3% 15.5% 13.7% 11.0% 16.90/o 0.4 2.4
Semolina 20.9% 11.4% 9.3% 8.1% 5.7% 11.1% 0.3 3.6Couscous 1.3% 1.5% 1.6% 1.4% 1.5%/o 1.5% 1.1 0.9Pasta 4.8% 4.4% 4.6% 4.1% 3.8%/a 4.3% 0.8 1.2
Total BW 12.1% 13.0% 13.5% 12.1% 8.6%o 11.90/% 0.7 1.4
Gros Pain 12.1% 13.0% 13.5% 12.1% 8.6% 11.9% 0.7 1.4
BW Flour ES ES ES ES ES ES ES ES
Baguette ES ES ES ES ES ES ES ES
Generic Cooking Oil 13.7% 13.3% 13.4% 13.2% 11.0% 12.90/o 0.8 1.2Unpackaged (bulk) 10.2% 10.1% 9.90/% 9.1% 5.1% 8.90/e 0.5 2.0Bottled 4.1% 4.0% 4.1% 4.6% 5.8% 4.5% 1.4 0.7
Sugar 0.4% 0.5% 0.6% 0.6% 0.7/o 0.6% 1.7 0.6
Total Milk 1.0% 1.2% 1.2% 1.3% 1. 4% 1.2% 1.4 0.7
PST 0.5% 0.3% 0.4% 0.2% 0.1% 0.3% 0.3 3.4
SRM 0.4% 0.7% 0.6% 0.8% 0.8% 0.7% 1.9 0.5
Loc. Fresh Bottle 0.0% 0.1% 0.1% 0.1% 0.2% 0.1% 4.8 0.2Loc. Fresh Tetrab. 0.1% 0.1% 0.1% 0.2% 0.3% 0.2% 6.0 0.2
Total Above 54.2% 45.3% 44.3% 40.9% 32.8% 43.5% 0.6 1.6
Total Calories 2531 2700 2792 2884 3020 2785 1.2 0.8Protein Per Adult Equivakant
Total DW 38.8% 23.6% 20.5% 17.2% 12.7% 22.6% 0.3 3.1
Semolina 29.2% 14.8% 11.7% 9.7% 6.2%/o 14.3% 0.2 4.7
Couscous 1.8% 2.0% 2.0% 1.7% 1.6% 1.8% 0.9 1.1
Pasta 7.90/o 6.8% 6.8% 5.8% 4.9% 6.4% 0.6 1.6
Total BW 20.7% 20.8% 20.7% 17.6% 11.4% 18.2% 0.6 1.8Gros Pain 20.7% 20.8% 20.7% 17.6% 11.4% 18.2% 0.6 1.8BW Flour ES ES ES ES ES ES ES ESBaguette ES ES ES ES ES ES ES ES
Generic Cooking Oil 0.0% 0.0'/! 0.0e 0,00/. 0,0°/e 0.00/.
Unpackaged (bulk) 0.0% 0.00/! 0.0% 0.0% 0.0% 0.0%
Bottled 0.0% 0.0% 0.0%/° 0.0%/0 0.0%o0 0.0%..
Sugar 0.0% 0.0% 0.0'/° 0.00/0 0.0%h 0.0°/e
Total Milk 2.7% 2.9% 2.90/e 2.9Ye 3.0% 2.9%e 1.1 0.9PST 1.4% 0.7% 0.9°/e 0.5% 0.3%/e 0.7% 0.2 4.4SRM 1.1% 1.7% 1.5% 1.8% 1.6% 1.6% 1.5 0.7
Loc. Fresh Bottle 0.1% 0.2% 0.2% 0.2% 0.4% 0.2% 3.7 0.3
Loc. Fresh Tetrab. 0.1% 0.3% 0.3% 0.4% 0. 7 O/ 0.4% 4.7 0.2
Ttal Above 62.2% 47.3% 44.1% 37.7% 27.0°/o 43.7% 0.4 2.3Total Protein 44.0 50.2 54.2 58.8 67.9 55.0 1.5 0.6
Source: INS, Household Expenditure Survcy, District of Tunis, I990. Tot li expenditure h sugpr cons. pattemns extr polated1990 Survey (adjusted for adult equivalent). DW = durum wieat; BW - bread wheat; PST - pasteurized-reconstituted milk
SRM = sterilized-reconstituted milk; ES = subsidy eliminated; PAE - per adult equivalent. Numbers may not dd due to rounding.
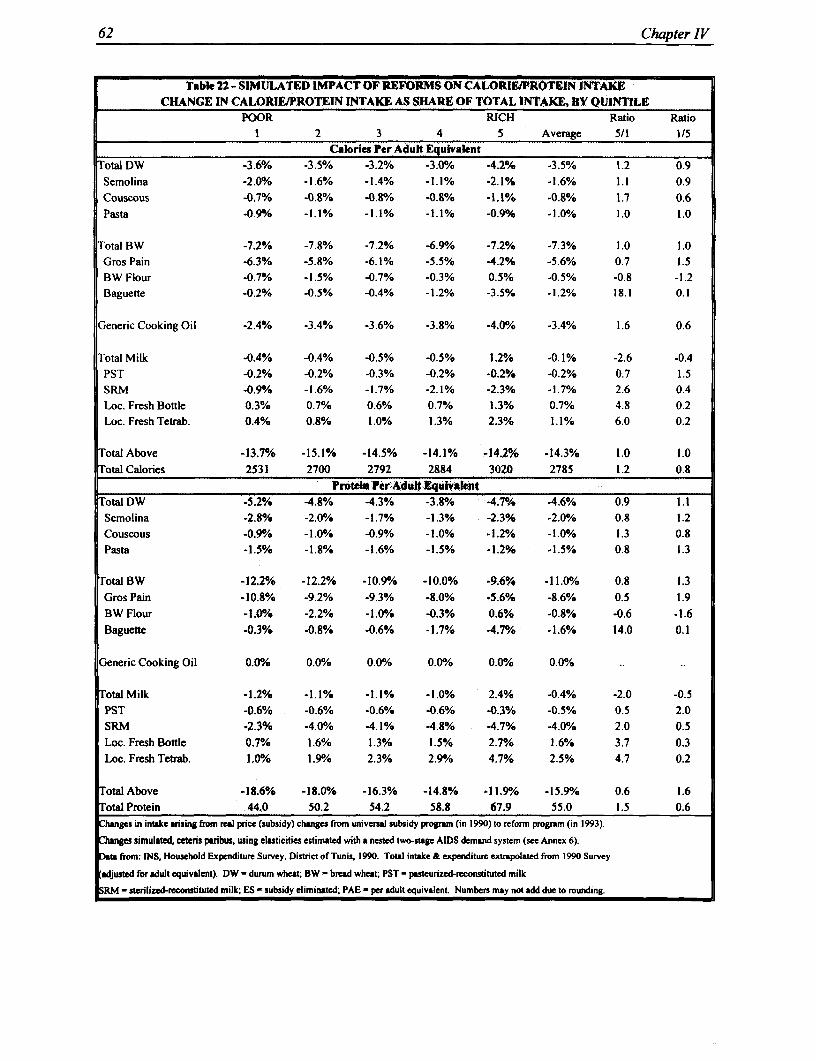
62 Chapter IV
Tabk 22 -SIMULATED IMPACT OF REFORMS ON CALORIEIPROTEIN INTAKECHANGE IN CALORIE/PROTEIN INTAKE AS SHARE OF TOTAL INTAIE, BY QUINTILE
POOR RICH Ratio Ratio1 2 3 4 5 Average 5/1 1/5
Calories Per Adult EquivalentTotal DW -3.6% -3.5% -3.2% -3.0% -4.2% -3.5% 1.2 0.9
Semolina -2. 0/o -1.6% -1.4% -1.1% -2.1% -1.6% 1.1 0.9Couscous -0.7% -0.8% -0.8% -0.8% -1.1% -0.8% 1.7 0.6Pasta -0.9Y -1.1% -1.1% -1.1% -0.9% -1.0% 1.0 1.0
Total BW -7.2% -7.8% -7.2% -6.9% -7.2% -7.3% 1.0 1.0Gros Pain -6.3% -5.8% -6.1% -5.5% -4.2% -5.6% 0.7 1.5BW Flour -0.7% -1.5% -0.7% -0.3% 0.5% -0.5% -0.8 -1.2Baguette -0.2% -0.5% -0.4% -1.2% -3.5% -1.2% 18.1 0.1
Generic Cooking Oil -2.4% -3.4% -3.6% -3.8% -4.0% -3.4% 1.6 0.6
Total Milk -0.4% -0.4% -0.5% -0.5% 1.2% -0.1% -2.6 -0.4PST -0.2% -0.2% -0.3% -0.2% -0.2% -0.2% 0.7 1.5SRM -0.90/% -1.6% -1.7% -2.1% -2.3% -1.7% 2.6 0.4Loc. Fresh Bottle 0.3% 0.7% 0.6% 0.7% 1.3% 0.7% 4.8 0.2Loc. Fresh Tetrab. 0.4% 0.8% 1.0% 1.3% 2.3% 1.1% 6.0 0.2
otal Above -13.7% -15.1% -14.5% -14.1% -14.2% -14.3% 1.0 1.0Total Calories 2531 2700 2792 2884 3020 2785 1.2 0.8
Pro=d P_Adult Equ__l_ .. total DW -5.2% -4.8% -4.3% -3.8% -4.1% -4.6% 0.9 1.1Semolina -2.8% -2.00/e -1.7% -1.3% -2.3% -2.0% 0.8 1.2Couscous -0.9% -1.0% -0.9%!. -1.0% -1.2% -1.0% 1.3 0.8Pasta -1.5% -1.8% -1.6% -1.5% -1.2% -1.5% 0.8 1.3
OtaIBW -12.2% -12.2% -10.9% -10.0% -9.6% -11.0% 0.8 1.3Gros Pain -10.8% -9.2% -9.3% -8.0% -5.6% -8.6% 0.5 1.9BW Flour -LONG -2.2% -1.0%oe -0.3% 0.6% -0.8% -0.6 -1.6Baguette -0.3% -0.8% -0.6% -1.7% -4.7% -1.6% 14.0 0.1
Generic Cooking Oil 0.0%/o 0.0% 0.0% 0. 0%! 0.0% 0.0%
otal Milk -1.2%/c -1.1% -1.1% -1.0% 2.4% -0.4% -2.0 -0.5PST -0.6% -0.6% --0.6% -0.6% -0.3% -0.5% 0.5 2.0SRM .2.3% -4.0% -4.1% -4.8% -4.7% -4.0% 2.0 0.5Loc. Fresh Bottle 0.70/ 1.6% 1.3% 1.5% 2.7% 1.6% 3.7 0.3Loc. Fresh Tetrab. 1.0% 1.90/e 2.3% 2.9% 4.7% 2.5% 4.7 0.2
TotalAbove -18.6% -18.0% -16.3% -14.8% -11.9%/o -15.90/o 0.6 1.6Total Protein 44.0 50.2 54.2 58.8 67.9 55.0 1.5 0.6hanges in intake arsing from real price (subsidy) changes from universal subsidy program (in 1990) to reform program (in 1993).
hanges simulated, ceters paribus, using elasticities estimated with a nested two-stage AIDS demand system (see Annex 6).
from: INS, Household Expenditure Survey, District of Tunis, 1990. Total intake & expenditure extrapolated from 1990 Survey
adjusted for adult equivalent). DW - durum wheat; BW - bread wheat; PST - pasteurized-reconstituted milk
RM - sterilized-reconstituted milk; ES - subsidy eliminated; PAE - per adult equivalent. Numbers may not add due to rounding.

Impact of the Reform Program (since 1990) 63
172. In terms of caloric intake, the measures taken under the reform program had a slightlylarger adverse impact on wealthier consumers than the poorest households. Other things equal, thesimulations show that the reforms resulted in a loss in caloric intake of 14.2 percent and 13.7 percent forthe top and bottom quintiles respectively. In particular, reductions in the subsidies on couscous, cookingoil, and especially baguettes resulted in calorie losses that were disproportionately higher for the richestquintile than for the poorest. This result is not insignificant, given the substantially lower level of totalcaloric intake for the poorest quintile (which was below the INS recommended daily level) as comparedwith the richest, and it demonstrates the role of targeting in shielding the poor from subsidy cuts.
173. In contrast to the more equitable impact on caloric intake, the reforms resulted in a largerreduction in protein intake for the poor than for the rich. Other things equal, the resulting drop in proteinintake that was 1.6 times greater for the lowest-income quintile than for the richest. Wider diversity indiets and greater consumption of meats (which are not subsidized) helped shield the protein intake ofwealthier consumers from subsidy cuts under the reform program. The rich also gained more in termsof nutritional intake from increases in milk subsidies and the introduction of subsidies on local fresh milk,because, with the exception of pasteurized-reconstituted milk, higher-income consumers consume moremilk than poorer households.
171. The simulations reveal that the reforms succeeded in increasing the share of the poor'sconsumption of subsidized calories and protein from 1990 to 1993. Table 23 indicates that a greatershare of subsidized calories and protein was consumed by the poor in 1993 than in 1990 (with a gain ofover four percentage points for total subsidized calories and protein).
Table 23 - CHANGE IN EACH QUINTILE'S SHARE OF CONSUMPION OF SUBSIDIZED CALORIES ANDPROTEIN, FROM UNIVERSAL SUBSIDY PROGRAM (1990) TO REFORM PROGRAM (1993)
POOR 2RICH| 2 |3 4 | 5
CHANGE IN EACH QUINTILE'S SHARE OF SUBSIDIZED CALORIESChange in Percentage Points
4.1 -0.6 1 -0.1 1 -1.4 -2.0
CHANGE IN EACH QUINTILE'S SHARE OF SUBSIDIZED PROTEINChange in Percentage Points
4.3 0.5 1 -0.7 1 -2.1 -2.0
Source: INS 1990 and 1993 household expenditure surveys; District of Tunis. All figures in per adult equivalent terms.Numbers may not add due to rounding. Percentage points calculated as: [consumption of subsidized calories (protein) byquintile X / consumption of total subsidized calories (protein)]93 - [consumption of subsidized calories (protein) by quintileX / consumption of total subsidized calories (protein)190 For example, the poorest quintile's share of the consumption ofsubsidized calories rose by five percentage points from 1990 to 1993 (using calories as an example; the same formulas andinterpretation apply for protein intakc).


CHAPTER VRECOMMENDATIONS
A. APPROACH TO ON-GOING REFORMS
172. In the Tunisian political context, a complete elimination of food subsidies is not likelyto be feasible in the foreseeable future. A clear demonstration of the possible consequences of such anaction was given during the 1984 "January bread riots." Eliminating the transfers also seems unwisefrom a poverty alleviation standpoint, given the relative importance of food subsidies to the welfare andnutritional status of the poor.
173. Despite the significance of food subsidies to the poor, the high costs of the programcombined with substantial leakages to the non-poor made an overhaul of the universal subsidy system anurgent priority for the 1990s. Tunisian policy-makers have rejected the possibility of replacing the foodsubsidy program with means-tested food stamps or direct income transfers. A primary justification forthis is political: according to several officials, food stamps are politically unpopular in Tunisia.Moreover, given informational constraints and the inability to discern individuals' incomes efficiently andaccurately, efforts to institute means-tested transfer programs in Tunisia have not proven to be effectiveor efficient alternatives to food subsidies. Indeed, direct assistance programs, such as the Needy FamiliesProgram which was designed to provide cash transfers to the poorest of the poor, have been plagued withadministrative difficulties, substantial leakages, and errors of exclusion."
174. Geographic targeting mechanisms, which select specific regions or neighborhoods inwhich subsidized commodities should be sold, have been explored for application, but do not appear tobe appropriate in Tunisia. Proposals were recently made to establish geographical boundaries on salesof bulk oil, limiting them to the poorer neighborhoods by selling quotas to merchants operating indesignated areas. However, it appears that in many areas, distinctions between neighborhoods are tooobscure to make geographic targeting effective. In addition, there are the usual questions as to whetherthere would have been shortages, due to the quotas placed on sales, or leakages of subsidized bulk oilto unintended neighborhoods.
175. Given political and administrative constraints, the foundations provided by the universalfood subsidy system favor reforms that seek to reduce costs and improve incidence within the existingframework of generalized food price subsidies over those requiring an entirely new institutional structureto channel transfers to intended beneficiaries. The three-pronged reform program (which includesimproved targeting, gradual price increases, and cost reduction measures) adopted by the Tunisians makesuse of available information and the existing institutions developed by the universal subsidy system. Thisapproach has also proved to be a politically acceptable way of cutting budgetary expenditures whileprotecting the consumption of the poor.
105\Another example of inefficient income-based transfers involves health care, whereby the Tunisian Governmentprovides free or subsidized health care to the poor through two health care schemes (Assistance Medicale Gratuite -I)pe 1, AMG 1, and Assistance Medicale Gratuite - lYpe 11, AMG 11). Although intended for the poor, access to theseprograms, in particular AMG II, is easy: roughly 660,000 families or 40 percent of the population, benefit from AMG11, although official Tunisian poverty lines define the poor as representing approximately 6.7 percent of the population.The availability of these programs to the non-poor has weakened incentives to contribute and participate in the healthinsurance system. For more information on these health care schemes, see World Bank (April 1993).

66 Chapter V
176. Reforms have indeed been effective in reducing the fiscal burden of the CGC programand in improving the targeting of subsidies. From over four percent of GDP and ten percent of totalGovernment expenditures in 1984, the subsidy program was cut to two percent of GDP and six percentof total public outlays by 1993. Reforms have also transformed program incidence from a situation inwhich the universal program transferred more absolute benefits to the rich, to one in which the poorbenefitted more from food subsidies than the rich.
177. Despite these successes, additional reforms using the three-pronged approach could furthersharpen the effectiveness of the CGC program. Several poorly targeted products remain in the subsidyprogram, and a phasing out of these subsidies would further improve the incidence of the CGC programand generate substantial fiscal savings. Retail prices should be increased according to targeting prioritiesso as to remove any remaining untargeted items from the Caisse. In addition, the Government shouldseek to reduce unnecessary costs associated with the injection of subsidies and the regulation of subsidizedfoods. The current ballooning of subsidy outlays due to the recent rise in world cereals prices makesthese additional reforms an urgent priority from a fiscal standpoint.
B. MANAGING THE ON-GOING REFORM PROCESS
178. Policy-makers should take into account both the impact on the poor and the politicalconsequences of additional reforms. In fine-tuning the current reform program, Tunisian policy-makersmust pay close attention to the genuine trade-off that exists between reducing budgetary costs andprotecting the poor. Any adjustments which increase prices in real terms can have an adverse effect onthe welfare and nutritional intake of the poor. Although "targeted" price adjustments which seek toreduce or eliminate subsidies on specific products could dampen these effects, they still hurt the poor tothe extent that the poor consume the goods in question. This means that measures to reduce programcosts via price increases can only be achieved by rendering the subsidy program more regressive inrelative terms and by reducing the welfare of the poor. In cutting subsidies, therefore, considerationshould be given to possible compensating measures that could cushion the impact of price increases onthe poor and to maintain the existing level of transfers to lower-income groups. To a certain extent, self-targeting reforms which introduce heavily subsidized "inferior" goods could offset the adverse welfareand nutritional effects of subsidy reductions on other products. To reduce poverty, other complementarymeasures may be necessary, however, since the magnitude of subsidy benefits is limited by the quantityof subsidized products consumed.
179. In general, policy-makers should also consider the issue of political support for, oropposition to, food subsidy reforms by a variety of actors, including, inter alia: the government itself(e.g. the degree of political commitment to reforms among the various ministries); parastatal agencies(which often have vested interests in existing institutional arrangements); organized interest groups (laborunions, agricultural lobbies, etc.); and the public. Past experience in Tunisia and in numerous othercountries demonstrates the potentially explosive nature of food subsidy reforms. As discussed inChapter 3, careful management of the on-going reform program has facilitated the Tunisian Government'sefforts to implement reforms and to successfully avoid a repeat of the "food riots" which hadcharacterized previous attempts at reform. Similar steps should be taken to manage additional reformmeasures, including: (i) adopting a gradual approach to reforms; (ii) instituting price hikes in a timelyand staggered manner (e.g., at different times during the summer months); (iii) "sensitizing" thepopulation about the necessity and rationale for the reforms through media campaigns (demonstrating well

Recommendations 67
in advance, for example, the need for reforms by illustrating the opportunity cost of existing policies);and (iv) simultaneously phasing in targeted compensating measures (with appropriate publicity about theseefforts). The use of public-relations experts could be an additional way to help manage the reformprocess and "sensitize" various actors about the rationale behind the measures.
C. RECOMMENDED REFORM MEASURES
180. A number of additional reforms could be taken to reduce the costs of the CGC subsidyprogram and sharpen the targeting of these transfers. The recommended reforms follow the three-pronged approach adopted by the Government under the VIII Development plan, including additionalmeasures to better target the subsidies, gradual price increases, and cost reduction measures.
Targeting
181. Self-targeting efforts in Tunisia could be reinforced by strengthening the application ofboth the "inferior goods" and the "superior goods" approaches. A summary of these measures ispresented in Box 4 below.
182. Incidence analysis indicates that the application of the "superior goods" approach hasclearly been successful in diverting the demand of wealthier households away from subsidized products.Liberalizing government controls on "superior goods" and allowing unsubsidized goods to enter themarket through private channels to siphon off the demand of high-income consumers, should beintensified in all subsectors. Indeed, the availability of attractive alternatives is a necessary condition forthe success of self-targeting.
183. The analysis also reveals that the "inferior goods" approach can be an effective way toself-target food subsidies. A prime example of this success in the Tunisian program is semolina, whichhas been targeted for subsidies because it is consumed disproportionately more by the poor than the rich.For other product categories, however, the application of the "inferior goods" approach has stumbled toa certain degree over a variety of public health (pasteurized milk, bulk oil), consumer acceptance (brownsugar), and political (high-extraction rate bread) obstacles, as discussed in greater detail below." Itseems that the targeting of semolina as an "inferior good," as compared with other attempts to apply thisapproach, is facilitated by the fact that semolina is a traditional product in the diets of the Tunisians, anddoes not involve the introduction of a new good that is perceived to be of lower-quality. Indeed, creatingnew higher quality products via the "superior goods" approach (such as the new local fresh milk) appearsto be more technically and politically feasible than introducing new "lower" quality items.
106\Another interesting example of the difficulty of shifting subsidies to new "inferior" goods involves the targeting ofsubsidies to lower-quality school notebooks (les cahiers scolaires), which are also covered by the CGC program. Stiamaappears to be the main obstacle in this case. Policy-makers have attempted to self-target school notebooks by shiftingsubsidies to a lower-quality notebook (with lower-quality paper and ink lines, and a less attractive cover), while allowinghigher-quality notebooks (with higher-quality paper and ink lines, and attractive, colorful cartoons on the cover) to bemarketed at less-subsidized prices. The price differential between the two types of notebooks is huge (50 millimes forthe lower-quality notebook versus 450 millimes for the superior item). But the targeted "inferior" notebooks are notapparently being rejected by consumers and policy-makers alike. Policy-makers argue that the stigma associated withvisibly separating the rich from the poor, particularly for a durable item consumed by children, is unacceptable, andapparently this distinction is to be eliminated.

68 Chapter V
184. For durum-wheat Rroducts, expenditure patterns clearly support a targeting of subsidiestowards semolina and away from pasta and couscous. Semolina is by far the best targeted item in theCGC subsidy program. It is also nutritionally rich and highly important in terms of its contribution tothe diets and total expenditures of the poor.
185. A potential drawback to targeting subsidies on semolina is that it is used as an input intothe production of pasta and couscous. Although direct subsidies on pasta and couscous, which are notwell-targeted to the poor (see Tables 13 and 14), were eliminated in 1993, these items remain subsidizedindirectly via the subsidy on semolina. To eliminate these indirect untargeted transfers, the Governmentcould gradually phase in a "redevance" payment system whereby pastiers, which process pasta andcouscous from semolina, reimburse the CGC an equivalent unit amount for the subsidy on semolina usedto make these items. Such a system has already been adopted for PS-7 flour, whereby millers reimbursethe CGC for the subsidies accruing from the use of subsidized bread wheat for the production ofunsubsidized PS-7 flour.
186. In addition, the Government is currently exploring the possibility of self-targeting pastasubsidies in light of their importance in the diets and budgets of the poor. This option includes theintroduction of unsubsidized higher-quality "superior" varieties of pasta (via nicer packaging, attractivepasta shapes, and multi-colored spinach-tomato pasta varieties). If such a system were instituted, the lessattractive "inferior" pasta varieties could continue to benefit from the indirect subsidy (via the subsidyon semolina), whereas the "redevance" payment system, described in para. 185 above, could apply tothe "superior" varieties.
187. For bread-wheat products, gros pain subsidies should be gradually phased out, despitethe fact that they are somewhat well-targeted, because of the observed leakages of the subsidized flourthat used to make gros pain to other "unsubsidized" poorly targeted products (baguetues, pastries, biscuitsand pizza). Steps should be taken to implement the Government's plans to replace gros pain subsidieswith a subsidy on a single bread (pain unique), which preserves the features (size, shape and weight) thatmake gros pain less attractive to wealthier consumers, but which is made from a distinct, higher-extraction rate flour.'°'
188. As discussed in Chapter 3, feasibility trials and a consumer survey were conducted inDecember 1992 and revealed that (i) production of this bread/flour was technically feasible; and (ii) sucha reform would entail an improvement in the self-targeting of bread-wheat subsidies and would reduceleakages of subsidized flour to unintended uses. Despite these results, the Government has been hesitantto implement the planned shift in subsidies from gros pain to this higher-extraction ratepain unique. Theslow pace of implementation seems to arise from policy-makers' fears that the darker, rougher breadwould invoke a negative "stigma" effect for what is arguably the most politically sensitive product in theCGC program and from their perceptions of resulting political resistance to such a shift. These reformsare apparently still under consideration, though policy-makers perceive a need to precede theirimplementation with a public relations campaign (campagne de sensibilisation) intended to "sensitize"various parties (ministries within the Government, agents involved in the bread-wheat market, and thegeneral public) about the rationale for such measures.
107\As discussed in Chapter 3, this higher-extraction rate flour is actually nutritionally superior to the traditional flourused to make gros pain and baguettes.

Recommendations 69
Box 4 - SUMMARY OF RECOMMENDATIONS FOR FURTHER TARGETING REFORMS
INFERIOR GOODS APPROACH SUPERIOR GOODS APPROACH
Durum- * Maintain consumer subsidies on semolina in the * Institute a redevance system whereby pastiersWheat medium-term, since semolina is well-targeted and is reimburse the subsidy received on semolina that isProducts particularly important to low-income groups from a used to make pasta and couscous, which are not well
welfare and nutritional standpoint targeted; regularly adjust the prices of pasta andcouscous so as to ensure that these items are notsubsidized (either explicitly or implicitly)
* Explore possibilities for self-targeting pastasubsidies whereby the pastiers reimburse the indirectsubsidy on semolina used to produce 'superior'varieties of pasta (attractive shapes, colors) so thatthese varieties are not subsidized (even indirectly)
Bread- * Shift subsidies to a new bread made from a distinct high * Liberalize the prices of bagueutes, or, if theirWheat extraction rate flour (that incorporates bran particles) that prices remain administratively determined, continueProducts maintains the features of gros pain that are well-targeted to increase them regularly so as to ensure that
to the poor (size, shape, weight) baguettes do not become subsidized again
* Carefully examine the impact of any subsidy reductionsfor gros pain on the poor since existing survey dataindicate that subsidies on gros pain are panicularlyimportant to the poor, in terms of protecting thepurchasing power and the nutritional status of low-incomegroups
Cooking * Shift subsidies to unpackaged generic grain oil sold * Encourage private operators to market pure grainOil from bulk retailers, which is well-targeted to the poor, oils packaged in attractive bottles with labels clearly
provided that (i) this variety does not entail hygienic indicating the type of oil being sold by eliminatingproblems (such as the oil becoming rancid in bulk drums); the tariff differential between imports of pure grainand (ii) leakages of subsidized bulk generic grain oil to the oils by private importers (currently 43 %) and importsproduction of other oils (such as bottled generic grain oil) of generic grain oil (soy, canola) by the ONHdo not jeopardize targeting efforts; or (preferential tariff rate is currently 15 %)
* If the above conditions do not hold, shift subsidies togeneric grain oil packaged in cheap, unauractive bottleswith plain labels which simply identify their contents as_cooking oil'
Milk * Shift subsidies to pasteurized-reconstitutedmilk * Gradually eliminate subsidies on sterilized milkpackaged in berlingot cartons provided that the milk is (both reconstituted and local fresh), which isadequately refrigerated along distribution channels currently packaged in Tetrabrik cartons and plastic
bottles
Sugar * Review the apparent rejection of heavily subsidized, * Gradually eliminate subsidies on white granulatedless-refined brown sugar, by low-income consumers; sugar, while monitoring the impact of these cuts onconduct product trials, testing the less-refined sugar at the welfare and caloric intake of the poorvarious price differentials, and monitor consumptionpatterns
* If poorer consumers reject the less-refined variety evenwith larger price differentials between white and brownsugar, subsidies on both white and brown sugar should begradually eliminated, but the impact of these cuts on thewelfare and caloric intake by low-income consumersshould be monitored

70 Chapter V
189. For cooking oils, expenditure patterns indicate that subsidies should be shifted towardsgeneric grain oil sold in small quantities from bulk oil retailers because this variety is consumeddisproportionately by lower-income groups. However, shifting subsidies to bulk generic oil, as opposedto bottled generic oil, suffers the drawback that bottlers could potentially divert subsidized bulk oiltowards the production of bottled oil (which is consumed more by wealthier consumers), therebyjeopardizing targeting efforts. Moreover, policy-makers have apparently recently retreated from plansto target bulk oil, due to reports of sanitation problems associated with bulk oil sales.'08 Such hygienicproblems violate the intentions of self-targeting, in that they result in a true down-grading of the intrinsicvalue of the subsidized "inferior good" rather than a mere perception on behalf of consumers that the itemis "less attractive."
190. These public health concerns should be thoroughly investigated. If a sanitationinvestigation reveals that bulk oil sales are contaminated or unhygienic, or if it appears that leakages ofsubsidized bulk generic oil to the production of other cooking oils (such as bottled oil) would jeopardizetargeting efforts, cooking oil subsidies should be gradually eliminated or shifted towards generic grainoil packaged in cheap, low-quality bottles with plain labels which simply identify their contents as"cooking oil" (as opposed to unsubsidized oil which is packaged in attractive bottles which clearly identifytheir contents).
191. For sugar, the apparent rejection of subsidized, less-refined brown sugar by consumersshould also be examined. If necessary, a greater price differential should be created between white andbrown sugar to entice lower-income consumers to purchase the more heavily-subsidized brown sugar.Otherwise, sugar subsidies, which are currently injected only on domestically-produced sugar (and hencelargely benefits producers) should be eliminated.
192. For milk, expenditure patterns clearly support a shifting of subsidies towards pasteurized-reconstituted milk because it is the only type of milk that is consumed disproportionately by the poor (asshown in Table 14). Packaging differentials have been used to strengthen the targeting of this type ofmilk. The relatively inexpensive half-liter containers (berlingot cartons and coussin pouches) used topackage pasteurized-reconstituted milk favor consumption by the poor (who tend to make smallerbudgetary outlays at any given time) over the rich (who prefer to buy large quantities of milk with long-life storage properties). As discussed in Chapters 3 and 4, survey data reveal that berlingot is a moresuitable than coussin as a package for the targeted milk because of the observed rejection of coussin by
108\Several factors have been identified as potential causes of contamination and/or rancidity of bulk oil, including(i) potentially poor sanitation of the oil drums (at the wholesale and retail levels), which have been observed to be rustyand banged up and which are not always thoroughly cleaned at the time of replenishing; (ii) the slow turnover of oilstored in bulk drums (with new oil being added to old, resulting in the oil becoming rancid); (iii) possible contaminationat the time the unpackaged oil is purchased at the retail level, arising from unclean handling and potentially pollutedcontainers into which the oil is transferred. In fact, bulk oil sales have been banned in other countries due to similarpublic health concerns.

Recomunendations 71
consumers across-the-board (rich and poor alike) who were apparently deterred by the additionalinconvenient attributes of the milk pouches.'9
193. Although expenditure patterns support a shifting of subsidies towards pasteurized-reconstituted milk packaged in berlingot cartons, this product was eliminated from the subsidy programvia a ministerial order in 1994. The reasons given for this reform reversal include: (i) public healthconcerns regarding potentially inadequate refrigeration of the pasteurized-reconstituted milk along variousdistribution channels (particularly in poor neighborhoods) and the very limited shelf-life of this type ofmilk;... and (ii) the relatively small importance of pasteurized-reconstituted milk subsidies and the widerange of available substitutes (sterilized-reconstituted milk and local fresh milk), which seem to havefacilitated the elimination of this subsidy from a political standpoint.
194. Unless the technical aspects regarding the refrigeration of pasteurized-reconstituted milkcan be overcome, or unless policy-makers are unable to identify an alternative well-targeted variety ofmilk, all remaining milk subsidies (which are currently injected on sterilized-reconstituted and local freshmilk, neither of which are well-targeted) should be eliminated.
Retail Price Increases
195. The prices of all commodities in the CGC should be adjusted regularly to keep pace withinflation. Beyond that, attempts should be made to ensure that prices are increased faster on goodsconsumed disproportionately by higher income groups. However, evidence that even these "targeted"price adjustments reduce the purchasing power and consumption of the poor should be weighed againstthe gains from reduced outlays on the program. The Government should especially refrain fromambitiously increasing prices on commodities heavily consumed by the poor, such as semolina, large loafbreads (e.g., gros pain, or eventually, pain unique), bulk oil, and pasteurized-reconstituted milk packagedin berlingot cartons or coussin pouches. Increases in the price of semolina, in particular, were shownto have potentially detrimental effects on the levels of per capita calorie and protein consumption bylower-income groups.
196. The sensitivity surrounding the issue of price hikes requires careful attention to politicalconsiderations, without sacrificing economic and targeting effectiveness. Price increases should begradual and well publicized. In particular, increases in the prices of the more politically sensitive goodsshould be implemented gradually and cautiously. For example, in the case of baguettes, which are notwell-targeted, political considerations (in light of the violent reactions to previous attempts increases inthe price of bread) implied a need for a gradual approach to subsidy cuts; after several years ofincremental reductions, baguette subsidies were successfully eliminated in 1993. Similar steps shouldbe taken so as to reduce (and eventually eliminate) the subsidy on sterilized milk (both reconstituted and
lO9\Coussin pouches, unlike berlingot cartons, do not stand upright and require the milk to be transferred to anothercontainer upon opening. In addition, the flimsy plastic film milk pouches resemble a popular laundry detergent packageused in Tunisia ("OMO").
1 1O\Unlike other varieties, pasteurized milk requires the milk to be refrigerated prior to opening and has a shelf-life ofabout two days).

72 Chapter V
local fresh) packaged in tetrabrik cartons and plastic bottles. Prices should also be adjusted to graduallyeliminate subsidies on white sugar.
Cost Reduction Measures
197. Within the existing framework of food subsidies, there remains a large scope for furthercost reduction and liberalization measures. In general, to reduce the costs of the subsidy program, thecalculation of subsidies should be made as simple and as transparent as possible. The practice ofcalculating margins as a percent markup over costs should be modified to encourage cost minimization.Payments should be made as fixed subsidies per unit of each product sold, irrespective of productioncosts. Subsidies in all subsectors should be limited to payments at a single, easily observable, level.
198. For cereals, the possibility for bakers to earn additional subsidy payments by producingmore than 15 percent of their bread in the form of baguettes should be removed by concentratingsubsidies on a single bread, such as pain unique, made from an easily distinguishable flour, such asPS+2. This flour would also serve to reduce leakage of subsidized flour into other products.
199. For oils, efficiency could be improved by eliminating the current practice of allocatingoils among the private refineries according to installed capacity and allocating it instead according to acompetitive bid system.
200. Subsidies on milk packaged in tetrabrik cartons and plastic bottles should be graduallyphased out over the medium term because they are the most expensive forms of packaging (see Annex 5).
Liberalization
201. An issue related to cost reduction involves the liberalization of production and distributionchannels within the context of a targeted food subsidy system. Tunisian authorities have limitedliberalization in several subsidized food subsectors due to concerns that private operators might colludeto fraudulently manipulate the system in order to receive higher subsidy payments. Close monitoringof capacity, however, combined with privatization could quell these fears and encourage greaterefficiency. A gradual, but significant liberalization is advised beginning with pilot programs with licensedprivate firms. The existence of a targeted subsidy program should not delay liberalization provided thatsubsidies are injected at a single, transparent level and that capacity and subsidy payments are monitored.
202. To some extent, privatization has already begun in the milk subsector, although thisprocess is by no means complete. As discussed in Chapter 3, LAINO, a private firm, has been entrustedwith the production of locally-produced sterilized fresh milk which benefits from a small subsidy to allowfor competition with the more heavily subsidized reconstituted milk produced by parastatal dairyprocessors. Rather than a calculating the subsidy on fresh milk as a percentage markup over costs, toencourage efficiency, the subsidy granted to LAINO is a fixed subsidy per unit of fresh milk sold. Threenew private dairy processors have recently been granted an "accord de principe" to produce subsidizedlocal fresh milk. Further liberalization along these lines, including streamlining existing parastatal dairyprocessors (STIL and Tunisie-Lait), should be explored."'
11 I\ln fact, a study to explore possibilities for privatizing the milk subsector is currently underway in Tunisia.

Recommendations 73
203. Similar reforms should be considered in the cereals sector which is currently dominatedby the parastatal marketing board, the Office des Ceriales. A rather fundamental step in liberalizing thissector involves streamlining the OC and transforming its role from collection and distribution to one ofregulation. Monitoring subsidy payments in the context of a privatized marketing system would greatlybe facilitated if subsidies were injected at a single level, preferably the milling level. Milling capacityand electricity and water use provide indicators for monitoring the quantities of subsidized flour.Customs records also provide systematic data for monitoring imported cereals. Self-targeting effortscould actually reinforce monitoring within the context of a privatized distribution system since thesemeasures create more easily distinguishable subsidized products (such as darker, rougher PS+2 flour).
D. IMPACT OF RECOMMENDED REFORMS
Reform Scenarios
204. The fiscal, distributional and nutritional effects of various reforms recommended abovewere simulated, holding all other factors constant, using demand elasticities and household-level data fromthe INS 1990 and 1993 surveys."2 To demonstrate the benefits of self-targeting, the effects of ahypothetical across-the-board 50 percent cut in subsidies from their 1993 levels (Scenario 1) werecompared to the impact of a hypothetical targeted reform scenario (Scenario 2).' '3
205. Scenario 2 involves a complete elimination of subsidies on pasta, couscous, sterilized milk(both reconstituted and local fresh), and bottled generic oil. Under this scenario, subsidies are maintainedat 100 percent of their 1993 levels for semolina, bulk generic oil, and pasteurized-reconstituted milkpackaged in berlingot cartons,"4 because these items are well-targeted to the poor, and at 20 percentof their 1993 levels for gros pain. Despite the slightly targeted incidence of gros pain, the subsidy onthe flour used to make this large loaf bread was assumed to be reduced by 80 percent in light of observedleakages of this flour to the production of other untargeted items (as discussed above).
1 12\See Annex 6 for details on the methodology used for estimation and simulations.
113\Both scenarios assume that subsidies baguettes and PS-7 flour, as well as direct subsidies on pasta and couscous,which were eliminated under the CGC reform program because of their untargeted incidence, were held constant at zeroin the simulations. For obvious reasons, the simulations do not incorporate the effects of targeted reforms that wereimplemented after the 1993 survey was carried out (summer 1993), including the introduction of: (i) "superior" breadswhich were liberalized in 1991 but were not widely available at the time of the 1993 survey; (ii) subsidies on a singlebread (pain unique) made from a high extraction rate flour; (iii) unsubsidized pure grain oils; and (iv) zit sannafa, a new"fixed mixed" cooking oil which was not widely available at the time of the survey. In addition, because the 1993 surveydid not cover consumption patterns for sugar, the simulations do not include the effects of reforms pertaining to sugarsubsidies. Finally, because less than one percent of those households sampled in the 1993 survey actually purchasedpasteurized-reconstituted milk packaged in coussin pouches, this variety of milk was grouped together with pasteurized-reconstituted milk packaged in berlingot cartons for the purposes of policy simulations.
114\1f investigation validates concerns about potential inadequate refrigeration of pasteurized-reconstituted milk andpossible contamination or rancidity of bulk oil, the subsidies on these items should also be eliminated.

74 Chapter V
Estimated Fiscal Impact of Recommended Reforms
206. Table 24 below presents estimates of fiscal savings associated with the two scenarios,using actual outlays on the 1993 program as a basis for comparison."5 Simulation results reveal thatboth scenarios would yield substantial reductions in spending on the CGC subsidy program, cuttingoutlays from over two percent of GDP and close to six percent of total Government expenditures in 1993to less than one percent of GDP and roughly two percent of Government expenditures."6 Thesesavings would be comparable for both scenarios, with both scenarios generating program savings of justover 60 percent.
Table 24 - SIMULATED SAVINGS ON CGC SUBSIDIES FROM VARIOUS HYPOTHETICAL REFORMSCENARIOS, AS COMPARED WITH ACTUAL 1993 PROGRAM OUTLAYS
Actual 1993 Scenario I' Scenario 2b
Actual Outlays on CGC program, Million TD 314
Simulated Savings on CGC program, (% of 1993 outlays) .. 62% 61%
Simulated Outlays on CGC program, Million TD .. 119 122
Outlays on CGC program as Percent of: (%)- 1993 Nominal GDP 2.1% 0.8% 0.8%- 1993 Total Government Expenditures 5.7% 2.2% 2.3%
Changes in outlays arising from the two reform scenarios were simulated, ceteris paribus, using elasticities estimated with anested two-stage AIDS demand system (see Annex 6 for details). Data come from INS 1990 Household ExpenditureSurvey and INS 1993 Enquete Restreinte sur la Consommnation des Produits Subventionnes; District of Tunis.a\Scenario 1 involves a 50 percent across-the-board cut in all subsidies (from their 1993 levels).b\Scenario 2 involves a hypothetical elimination of subsidies on sterilized milk (reconstituted + local fresh), bottled genericoil, pasta and couscous, and an 80% cut in subsidies on gros pain. Subsidies are assumed to be maintained at 100% oftheir 1993 levels for pasteurized-reconstituted milk, semolina, and bulk generic oil, and at 20% for gros pain.
Distributional Incidence of CGC Program with Recommended Reforms
207. Although both scenarios would have virtually identical effects on total expenditures onthe CGC program, simulations reveal that their distributional impact would differ substantially. Tables 25and 26 below present the relative and absolute distributional incidence that would result from eachscenario, holding all other factors constant.
208. Both scenarios would generate situations in which program incidence is progressive inabsolute and relative terms. Even Scenario 1, which involves a hypothetical across-the-board 50 percentcut in all subsidies, would yield greater transfers to the poor than the rich (transferring 1.1 times morebenefits to the poorest quintile than the richest). This is not due to any explicit effort to target subsidy
115\It is important to note that these estimates of "national" fiscal savings have been extrapolated from survey data,which are only available for the District of Tunis region.
116\Holding all other factors constant at 1993 levels, including GDP and total Government expenditures.

Recommendations 75
cuts, however. It merely reflects the fact that overall subsidies were reasonably well targeted to the poorin 1993, since Scenario 1 involves an even cut in all subsidies from their 1993 levels. In fact, thedistribution of subsidies across quintiles under Scenario 1 would duplicate incidence patterns observedfor the CGC program in 1993, with the poorest quintile receiving 21 percent of benefits and the richestreceiving 18 percent (as shown in Table 25 below and Table 19 in Chapter 4), although the magnitudeof total transfers would be much more modest under Scenario 1.
209. A clear conclusion that can be derived from simulation results for Scenario 2 (presentedin Table 26) is that it is indeed possible to sharpen the self-targeting of food price subsidies. WithScenario 2, the poorest quintile would benefit 2.1 times more from CGC subsidies than the richest inabsolute terms, and 13.2 times more in relative terms. By reducing subsidies on select products, thedistributional incidence of CGC subsidies would be strengthened in favor of poorer consumers. Withthese refinements, self-targeting can be pushed beyond the situation described in Table 19, whichpresented a "mid-term snapshot" of the incidence of the CGC reform program in 1993."'
Nutritional Impact of Recommended Reforms
210. Tables 27 and 28 below reveal that reforms under the two scenarios would have differingeffects on calorie and protein intake across quintiles. The 50 percent across-the-board subsidy cut underScenario 1 would have a larger adverse affect on the nutritional intake of the poor, reducing the poorestquintile's consumption of calories and protein by roughly 24 percent and 28 percent respectively. Underthis scenario, reductions in nutritional intake would be much larger for the poor than the rich: the poorestquintile's consumption of calories and protein would both fall two times more than the richest quintile'sintake.
211. Targeted subsidy cuts under Scenario 2 would produce more even effects on nutritionalintake across quintiles. In fact, reforms under Scenario 2 would result in equal losses in the richest andpoorest quintiles' caloric intake. This result is significant, given the substantially lower level of totalcaloric intake for the poorest quintile as compared with the richest, and it demonstrates the role oftargeting in shielding the poor from subsidy cuts. Although targeted reforms would result in slightlylarger reductions in protein intake for the lowest-income quintile than the highest for Scenario 2, theselosses would be distributed more equitably across quintiles than under Scenario 1, and losses in proteinintake by the poorest quintile would be roughly 1.2 times smaller under Scenario 2 than under Scenario 1.
212. The significant losses in calorie and protein intake arising from the 80 percent cut insubsidies on gros pain under Scenario 2 could be offset by replacing the subsidy on the flour used tomake gros pain with subsidies on a single bread (pain unique) made from a high extraction rate flour(PS+2) with bran particles mixed in (as suggested in above). Althoughpain unique is believed to be well
1 17\In fact, by completely eliminating subsidies on gros pain and generic grain oil (both bulk and bottled), in conjunctionwith the other reforms in Scenario 2, simulations reveal that it is possible to improve the targeting of food subsidies toan even greater degree. With this additional reform, the poorest quintile would receive 3.1 times more absolute transfersthan the richest, and would benefit 20.1 times more in relative terms. A complete elimination of subsidies on gros painand all generic oil (bulk as well as bottled) would, however, result in larger losses in purchasing power and caloric intakethan with Scenario 2 (which involves only an 80 percent cut in subsidies on gros pain and an elimination of subsidieson bottled generic oil while maintaining subsidies on bulk generic oil).
76 Chapter V
targeted to the poor because of its dark color and rough texture,"8 the presence of bran particlesactually improves the nutritive quality of this new bread because it contains more protein, dietary fibersand other nutrients than gros pain (as discussed in Chapter 3). "9
E. DATA REQUIREMENTS AND MONITORING
213. An explicit definition of the target group for CGC subsidies is imperative. Althoughseveral objectives refer to protecting the poor, the Government has never fonnally defined the intendedbeneficiaries of the CGC program. One option is to define the target group in terms of an officialpoverty line. In fact, the methodology for calculating poverty lines is currently being revised by the INSin collaboration with the World Bank. An alternative definition of the target group would be to focuson the poorest 20 percent of the population, provided that data are available by decile or quintile."2
214. Once a formal definition of the target group is adopted, the effect of food subsidy reformsand price increases on the welfare and nutritional status of that group should be carefully monitored. Inaddition to expenditures, nutritional surveillance indicators could usefully be included in surveys. Theimpact of reforms on both the poor and the non-poor, once identified, should be monitored to ensure thatcoverage of the target group is maximized and leakages to unintended beneficiaries are minimized.
215. Monitoring the impact of the food subsidy program could be improved. Though policydesign is undertaken by the CGC and various other ministerial departments, data collection and surveydesign are performed independently by the INS. There are few formal links between the CGC and theINS. The official identification of a target group could be facilitated by greater cooperation between thesetwo agencies. Improved information about the "poor" and a better understanding of the impact of policyreforms on the "poor" would result from a coordinated and clearly communicated definition of a specifictarget group.
216. The data requirements for self-selection are minimal relative to the information necessaryfor direct assistance programs based on means-testing. Most of the data are readily available in existingsurveys. There are some ways, however, in which the collection of data could be improved to bettermonitor the impact of food subsidy reforms. Reporting survey data according to deciles or quintiles ofthe population, rather than expenditure groups of varying sizes, would facilitate analysis of the impactof the program on various income groups. In addition to the larger Household Expenditure Surveys thatare conducted by the INS every five years, occasional small-scale, disaggregated surveys, would allowpolicy-makers to ascertain whether reforms are achieving their objectives and to make any necessary
118\As discussed in Chapter 3, pain unique would also preserve the characteristics (size, shape, weight) that make grospain well targeted to the poor.
119\Although this additional reform would help compensate for the calorie and protein losses associated with reformsthat reduce subsidies on gros pain, it was not included in the simulations for Scenarios A and B because pain unique hadnot been marketed at the time of the 1993 survey (and data were therefore not available for this new product).
120\This is the definition used in the above analysis of program incidence.
Recommendations 77
modifications to the on-going program. In fact, a small-scale survey,'2 ' funded by a grant from theWorld Bank Research Support Budget, was conducted by the INS in 1993 in collaboration with theMinistry of the National Economy (which oversees the CGC); the survey was designed specifically tofollow-up with quantitative and qualitative questions pertaining to subsidized foods. This survey couldserve as a pilot for future program monitoring.
217. Of particular importance is the need to harmonize the information collected by INS'Household Expenditure Survey with the specific products subsidized by the CGC. For example, in themilk subsector, the CGC differentiates subsidies among several varieties of milk, including pasteurized-reconstituted milk packaged in berlingot cartons and coussin pouches, sterilized-reconstituted milkpackaged in tetrabrik cartons and plastic bottles, and local fresh milk also packaged in tetrabrik cartonsand plastic bottles. The INS classification of milk products in the 1990 Household Expenditure Survey,however, included categories such as curdled fresh cow's milk (product code 1601), pasteurized-reconstituted milk in berlingot (1604), milk without any indications (1609), and sterilized milk in bottlesor tetrabrik (as an aggregated category with product code 1621).'" Another example involving productdifferentiation arises in the cooking oil subsector. While the CGC distinguishes bulk from bottled genericgrain oil, the INS 1990 survey only disaggregated expenditures on cooking oil into olive oil (product code1821) and mixed oil (huile melangee, product code 1811). Linking program design with survey designby matching these product categories would improve the monitoring of the food subsidy program.
12 1\1NS Enqucte Restreinte sur la Consommation des Produits Subventionnis, 1993.
122\Pasteurized reconstituted milk packaged in coussin pouches and local fresh milk packaged in Tetrabrik cartons andplastic bottles had not yet been introduced by the CGC at the time of the 1990 survey.

78 Chapter V
Tabk 25 - Scenmrio l: SIMULATED INCIDENCE OF FOOD SUBSIDIES WITH A 50% CUT INUNIT SUBSIDIES FROM THEIR 1993 LEVELS, PAE, BY QUINTILE
POOR RICH Ratio Ratio1 2 3 4 5 Average 5/l l/5
Absolute Incidence of Food Subsidies, Mean Subsidies Per Adult Equivalentotal DW 5.7 4.4 4.3 4.0 3.6 4.4 0.6 1.6Semolina 3.3 1.9 1.6 1.5 1.1 1.9 0.3 3.0Couscous 0.6 0.7 0.8 0.7 0.8 0.7 1.4 0.7Pasta 1.8 1.7 1.9 1.7 1.7 1.8 1.0 1.0
Tota BW 4.7 5.4 5.8 5.3 4.0 5.1 0.9 1.2Gros Pain 4.7 5.4 5.8 5.3 4.0 5.1 0.9 1.2BW Flour ES ES ES ES ES ES ES ESBaguette ES ES ES ES ES ES ES ES
Generic Cooking Oil 2.2 2.3 2.4 2.5 2.2 2.3 1.0 1.0
Total Milk 2.3 2.9 3.2 3.5 4.3 3.2 1.8 0.5PST 1.1 0.6 0.9 0.5 0.4 0.7 0.3 2.9SRM 1.0 1.7 1.6 2.1 2.1 1.7 2.2 0.4Loc. Fresh Bottle 0.1 0.3 0.3 0.3 0.7 0.3 5.7 0.2Loc.FreshTetrab. 0.1 0.3 0.4 0.6 1.1 0.5 7.2 0.1
otalAbove 14.9 15.0 15.7 15.3 14.0 15.0 0.9 1.1PercentofSubsidies 200/. 200/o 21% 20% 19% 100%/. 0.9 1.1
Rdatwve Incidence of Food Subsidies, Subsidies as Share of Total Expenditures PAETotal DW 1.1% 0.5% 0.4% 0.2% 0.1% 0.3% 0.1 10.1Semolina 0.6% 0.2% 0.1% 0.1% 0.0%/. 0.1% 0.1 19.3Couscous 0.1% 0.1% 0.1% 0.0% 0.0%/. 0.0% 0.2 4.7Pasta 0.3% 0.2% 0.2% 0.1% 0.1% 0.1% 0.2 6.6
otal BW 0.9% 0.6% 0.5% 0.3% 0.1% 0.3% 0.1 7.5Gros Pain 0.9%/ 0.6% 0.5% 0.3% 0.1% 0.3% 0.1 7.5BWFlour ES ES ES ES ES ES ES ESBaguette ES ES ES ES ES ES ES ES
eneric Cooking Oil 0.4% 0.3% 0.2% 0.1% 0.1% 0.2% 0.2 6.5
tal Milk 0.4% 0.3% 0.3% 0.2% 0.1% 0.2% 0.3 3.5PST 0.2% 0.1% 0.1% 0.0% 0.0% 0.0% 0.1 18.5SRM 0.2% 0.2% 0.1% 0.1% 0.1% 0.1% 0.4 2.8Loc. Fresh Bottle 0.00/% 0.0% 0.0% 0.0% 0.0% 0.0% 0.9 1.1Loc. Fresh Tetrab. 0.0% 0.0% 0.0% 0.0% 0.0% 0.0% 1.1 0.9
Total Above 2.8/° 1.7% 1.3% 0.9% 0.4% 1.0% 0.1 6.8
Total Expenditures 524 869 1184 1684 3345 1521.2 6.4 0.2SCENARIO 1: Incidence was simulated, ceteris pmribus, using elasticities estimated with a nested two-stage AIDS demand system
see Annex 6). Data come from INS 1990 & 1993 Surveys, District of Tunis. Simulations include the effects of a 500/. across-the
board cut in unit subsidies from their 1993 levels. Total expenditure was extrapolated from 1990 survey (adjusted for inflation and
ult equivalent). BW - bread wheat; DW - durum wheat; PST - pasteurized-reconstituted milk; SRM = sterilized-reconstituted
ilk; PAE - per adult equivalent. Numbers may not add due to rounding.

Recommendations 79
Table 26 - Scenario 2: SIMULATED INCIDENCE OF FOOD SUBSIDIES WITH A TARGETEDREDUCTION IN SUBSIDIES ON VARIOUS PRODUCTS, PAE, BY QUINTILE
POOR RICH Ratio Ratio1 2 3 4 5 Average 5/1 1/5
Absolute Incidence of Food Subsidies, Mean Subsidies Per Adult EquivalentTotalDW 11.4 6.6 5.6 5.0 3.7 6.5 0.3 3.1Semolina 11.4 6.6 5.6 5.0 3.7 6.5 0.3 3.1Couscous ES ES ES ES ES ES ES ESPasta ES ES ES ES ES ES ES ES
otal BW 4.3 5.0 5.3 4.9 3.7 4.6 0.9 1.2Gros Pain 4.3 5.0 5.3 4.9 3.7 4.6 0.9 1.2BW Flour AES AES AES AES AES AES AES AESBaguette AES AES AES AES AES AES AES AES
GenericCookingOil 4.0 4.2 4.2 4.0 2.4 3.7 0.6 1.7
Unpackaged (bulk) 4.0 4.2 4.2 4.0 2.4 3.7 0.6 1.7Bottled ES ES ES ES ES ES ES ES
Total Milk 2.3 1.3 1.9 1.1 0.8 1.5 0.3 2.9PST 2.3 1.3 1.9 1.1 0.8 1.5 0.3 2.9SRM ES ES ES ES ES ES ES ESLoc. Fresh Bottle ES ES ES ES ES ES ES ESLoc. Fresh Tetrab. ES ES ES ES ES ES ES ES
Total Above 21.9 17.0 17.1 15.0 10.6 16.3 0.5 2.1PercentofSubsidies 27% 21% 21% 18% 13% 100% 0.5 2.1
Relativt Incidence of Food Subsidie, Subsidies as Share of Total Expenditures PAEotal DW 2.2% 0.8% 0.5% 0.3% 0. 1% 0.4% 0.1 19.5Semolina 2.2% 0.8% 0.5% 0.3% 0.1% 0.4% 0.1 19.5Couscous ES ES ES ES ES ES ES ESPasta ES ES ES ES ES ES ES ES
otal BW 0.8% 0.6% 0.5% 0.3% 0.1% 0.3% 0.1 7.5Gros Pain 0.8% 0.6% 0.5% 0.3% 0.1% 0.3% 0.1 7.5BW Flour AES AES AES AES AES AES AES AESBaguette AES AES AES AES AES AES AES AES
enericCookingOil 0.8% 0.5% 0.4% 0.2% 0.1% 0.2% 0.1 10.7Unpackaged (bulk) 0.8% 0.5% 0.4% 0.2% 0.1% 0.2% 0.1 10.7Bottled ES ES ES ES ES ES ES ES
Total Milk 0.4% 0.1% 0.2% 0.1% 0.0% 0.1% 0.1 18.3PST 0.4% 0.1% 0.2% 0.1% 0.0% 0.1% 0.1 18.3SRM ES ES ES ES ES ES ES ESLoc. Fresh Bottle ES ES ES ES ES ES ES ES
Loc. Fresh Tetrab. ES ES ES ES ES ES ES ES
otal Above 4.2% 2.0% 1.4% 0.9% 0.3% 1.1% 0.1 13.2otal Expenditures 524 869 1184 1684 3345 1521.2 6.4 0.2ENARIO 2: Incidence was simulated. ceteris paribus. using elasticities estimated with a nested two-stage AIDS demand system
see Annex 6). Data come from INS 1990 & 1993 Surveys; District of Tunis. Simulations include the effects of an elimination
f subsidies on sterilized milk (reconstituted & fresh), bottled generic oil, pasta and couscous, and an 80% cut in subsidies on large
oaf bread. Subsidies are maintained at 100% of 1993 levels for semolina, bulk generic oil and PST, and at 20%/. for large loaf bread.
ou expenditure extrapolated from 1990 survey (adjusted for inflation and adult equivalent). BW = bread wheat; DW = durum
eat; PST - pasteurized-reconstituted milk; SRM = sterilized-reconstituted milk; PAE - per adult equivalent; ES = subsidy
liminated under scenario; AES - subsidy already eliminated under reform program. Numbers may not add due to rounding.

80 Chapter V
Table 27 - Scenario 1: SIMULATED NUTRITIONAL IMPACT OF A 50%* CUT INUNIT SUBSIDIES FROM THEIR 1993 LEVELS, PAE, BY QUINTILE
POOR RICH Ratio Ratio1 2 3 4 5 Average 5/1 1/5
Change in Caloric Intake as % of Total Caloric Intake Per Adult EquivalentTotal DW -13.2% -8.4% -7.6% -6.7% -5.4% -8.2% 0.4 2.5Semolina -10.1% -5.5% -4.5% -3.90/o -2.7% -5.3% 0.3 3.7Couscous -0.5% -0.5% -0.6% -0.5% -0.5% -0.5% 1.2 0.9Pasta -2.6% -2.4% -2.5% -2.2% -2.1% -2.4% 0.8 1.2
Total BW 4.4% -4.7% -5.0%/c -4.7% -4.7% -4.7% 1.1 0.Gros Pain 4.1% -4.3% -4.5% -4.00/o -2.9% -4.0% 0.7 1.4BW Flour -0.2% -0.2% -0.2% -0.2% -0.2% -0.2% 1.4 0.Baguette -0.1% -0.2% -0.3% -0.5% -1.6% -0.6% 11.5 0.1
Generic Cooking Oil -7. 1% -6.90/o -7.0% -6.7% -5.4% -6.6% 0.8 1.3
Total Milk 0.3% 0.9%/. 1.0% 1.4% 3.0% 1.3% 10.8 0.1PST -0.1% -0.1% -0.1% -0.1% 0.0%/ -0.1% 0.3 3.1SRM -0.2% -0.4% -0.3% -0.4% -0.4% -0.3% 1.9 0.5Loc. Fresh Bottle 0.0% 0.0% 0.0% 0.0% 0.0% 0.0% 5.3 0.Loc. Fresh Tetrab. 0. 0% -0.1% -0.1% -0.1% -0.2% -0.1% 6.0 0.2
Total Above -24.3% -19.1% -18.5% -16.8% -12.5% -18.2% 0.5 1.9Total Calories 2531 2700 2792 2884 3020 2785 1.2 0.8
Change in Protein Intake as % of Total Protein Intake Per Adult EquivalentTotalDW -19.1% -11.6% -10.1% -8.5% -6.2% -11.1% 0.3 3.1Semolina -14.1% -7.1% -5.7% -4.7% -3.0% -6.9% 0.2 4.8Couscous -0.6% -0.7% -0.7% -0.6% -0.6% -0.7% 0.9 1.1Pasta -4.3% -3.7% -3.7% -3.2% -2.7% -3.5% 0.6 1.6
Total BW -7.4% -7.5% -7.6% -6.90/o -6.2% -7.1% 0.8 1.2Gros Pain -6.90/o -6.90/o -6.90/% -5.8% -3.8% -6.1% 0.5 1.8BW Flour -0.3% -0.2% -0.3% -0.3% -0.3% -0.3% 1.0 1.0Baguette -0.2% -0.3% -0.4% -0.8% -2.1% -0.8% 8.9 0.1
Generic Cooking Oil 0.0% 0.0% 0.0% 0.0% 0.0% 0.0%
Total Milk -1.0% -1.2% -1.2% -1.3% -1.3% -1.2% 1.3 0.8PST -0.3% -0.2% -0.2% -0.1% -0.1% -0.2% 0.2 4.0SRM -0.6% -0.90/. -0.8% -1.0%/0 -0.8% -0.8% 1.4 0.7Loc. Fresh Bottle 0.0% 0.0% 0.0% 0.0% 0.0% 0.0% 4.1 0.2
Loc. Fresh Tetrab. -0.1% -0.1% -0.2% -0.2% -0.3% -0.2% 4.6 0.2
Total Above -27.5% -20.3% -18.9% -16.6% -13.7% -19.4% 0.5 2.0Total Protein 44.0 50.2 54.2 58.8 67.9 55.0 1.5 0.6SCENARIO 1: Changes in intake were simulated, ceteris parbus, using elasticities estimated with a nested two-stage AIDS demand
system (see Annex 6). Data come from INS 1990 & 1993 Surveys; District of Tunis. Simulations include the effects of a 50% across
the-board cut in unit subsidies from their 1993 levels. Total expenditure and calorietprotein intake were extrapolated from 1990
urvey (adjusted for inflation and household composition). BW - bread wheat. DW = durum wheat; PST = pasteurized-reconstituted
ilk; SRM - sterilized-reconstituted milk; PAE - per adult equivalent. Numbers may not add due to rounding.

Recommendations 81
Table 28 - Scenario 2: SIMULATED NUTRITIONAL IMPACT OF TARGETED REDUCI IONIN SUBSIDIES FOR VARIOUS PRODUCTS, PAE, BY QUINTILE
POOR RICH Ratio Ratio1 2 3 4 5 Average 5/1 1/5
Change in Caloric Intake as % of Total Caloric Intake Per Adult EquivalentTotal DW -6.4% -5.9%/o -6.0% -5.4% -5.1% -5.8% 0.8 1.3
Semolina -1.4% -0.8% -0.6% -0.6% -0.4% -0.7% 0.3 3.6Couscous -1.8% -2.1% -2.3% -2.0% -2.0% -2.0% 1.1 0.9Pasta -3.3% -3.0% -3.1% -2.8% -2.6% -3.0% 0.8 1.2
Total BW -7.0% -7.6% -8.0% -7.6% -7.5% -7.5% 1.1 0.9Gros Pain -6.5% -7.0% -7.2% -6.4% -4.6% -6.3% 0.7 1.4BW Flour -0.3% -0.3% -0.3% -0.3% -0.4% -0.3% 1.4 0.7Baguette -0.2% -0.3% -0.5% -0.9% -2.6% -0.9% 11.5 0.1
Generic Cooking Oil -7.9% -7.5% -8.1% -8.9% -11.4% -8.8% 1.4 0.7Unpackaged (bulk) 0.4% 0.4% 0.4% 0.3% 0.2% 0.3% 0.5 2.0Bottled -8.3% -7.9% -8.5% -9.3% -11.6% -9.1% 1.4 0.7
Total Milk 0.1% 0.7% 0.8% 1.0% 2.6% 1.0% 17.7 0.1PST -0.1% -0.1% -0.1% 0.0% 0.0% -0.1% 0.3 3.4SRM -0.4% -0.6% -0.5% -0.7% -0.7% -0.6% 1.9 0.5Loc. Fresh Bottle 0.0% 0.0% 0.0% 0.0% 0.0% 0.0% 5.4 0.2Loc. Fresh Tetrab. 0.0% -0.1% -0.1% -0.2% -0.3% -0.1% 6.0 0.2
Total Above -21.2% -20.3% -21.3% -20.9% -21.5% -21.0% 1.0 1.0Total Calories 2531 2700 2792 2884 3020 2785 1.2 0.8
Change in Protein Intake as % of Total Protein Intake Per Adult EquivalentTotal DW -9.8% -8.4% -8.2% -7.1% -6.0% -7.9% 0.6 1.6Semolina -2.0% -1.0% -0.8% -0.7% -0.4% -1.0% 0.2 4.6Couscous -2.5% -2.8% -2.8% -2.4% -2.2% -2.5% 0.9 1.1Pasta -5.4% -4.7% -4.6% -4.0% -3.4% -4.4% 0.6 1.6
Total BW -11.9%/o -12.0% -12.2% -11.0% -9.9%/o -11.4% 0.8 1.2Gros Pain -1 1.1% -1 1.1% -1 1.1% -9.4% -6.1% -9.7% 0.5 1.8BW Flour -0.4% -0.4% -0.4% -0.4% -0.4% -0.4% 1.0 1.0Baguette -0.4% -0.5% -0.7% -1.2% -3.4% -1.3% 8.9 0.1
Generic Cooking Oil 0.0% 0.0% 0.0% 0.0% 0.0% 0.0%Unpackaged (bulk) 0.0% 0.0% 0.0% 0.0% 0.0% 0.0%Bottled 0.0% 0.0% 0.0% 0.0% 0.0% 0.0%
Total Milk -1.4% -1.9% -1.8% -2.0% -2.1% -1.8% 1.6 0.6PST -0.3% -0.1% -0.2% -0.1% -0.1% -0.1% 0.2 4.4SRM -0.9% -1.5% -1.3% -1.5% -1.4% -1.3% 1.4 0.7Loc. Fresh Bottle 0.0% 0.0% 0.0% 0.0% -0.1% 0.0% 4.2 0.2Loc. Fresh Tetrab. -0.1% -0.3% -0.3% -0.4% -0.6% -0.3% 4.6 0.2
TotalAbove -23.1% -22.3% -22.2% -20.1% -18.0%/0 -21.1% 0.8 1.3Total Protein 44.0 50.2 54.2 58.8 67.9 55.0 1.5 0.6SCENARIO 2: Changes in intake were simulated, ceteris paribus, using elasticities estimated with a nested two-stage AIDS demand
ystem (see Annex 6). Data come from INS 1990 & 1993 Surveys; District of Tunis. Simulations include the effects of an elimination
f subsidies on sterilized milk (reconstituted & fresh), bottled generic oil, pasta and couscous, and an 80% cut in subsidies on large
loaf bread. Subsidies are maintained at 100% of 1993 levels for semolina, bulk generic oil and PST, and at 20% for large loaf bread.
otal expenditure & intake extrapolated from 1990 survey (adjusted for inflation and adult equivalent). BW = bread wheat;
W = durum wheat; PST = pasteurized-reconstituted milk; SRM = sterilized-reconstituted milk; PAE = per adult equivalent.
Numbers may not add due to rounding.


LIST OF REFERENCES
Abdessalem, Tahar, Mongi Boughzala, and Chokri Mamoghli. "Rationalisation du Systeme". InEtude sur la Caisse Generale de Compensation. Tunis, Tunisia, Abt Associates Inc., February1990.
Alderman, Harold. "Food Subsidies and the Poor." In Essays on Poverty. Equitv and Growth. Ed.George Psacharopoulos. Pergamon Press, 1991. pp. 172-202.
----- "New Research on Poverty and Malnutrition: What are the Implications for Research andPolicy?" In Including the Poor. Ed. Michael Lipton and Jacques van der Gaag. Washington,D.C.: The World Bank, 1993.
Ariza-Nino, Edgar J. and Cheri Rassas. "Tunisia's Economic Adjustment Program: Impact on LowerIncome Groups." Washington, D.C.: Abt Associates Inc., March 1987.
Baker, Judy L. and Margaret E. Grosh. "Poverty Reduction Through Geographic Targeting: HowWell Does it Work?" unpublished paper, June 1992.
Bienen, Henry S. and Mark Gersovitz. "Consumer Subsidy Cuts, Violence, and Political Stability. InComparative Politics, October 1986.
Bureau de Conseils, d'Etudes et de Formation. "Etude de la Rfforme due Systeme de Subvention auNiveau de la Transformation du Ble Tendre." Tunisia, Final Report: December 1992.
Comete Engineering. "Plan Directeur Pour la Commercialisation des Huiles en Tunisie. Tunisia,May 1989.
----- Evaluation Retrospective des Reformes Reglementaires et Institutionnelles pour la Liberalisationdu Commerce des Produits Agricoles. March 1995.
Cornia, Giovanni Andrea and Frances Stewart. "Two Errors of Targeting." World Bank Conferenceon Public Expenditures and the Poor: Incidence and Targeting. Washington, D.C.: The WorldBank, June 1992.
Deaton, Angus. "Price Elasticities from Survey Data: Extensions and Indonesian Results." Journal ofEconometrics. Vol. 44, 1990.
----- "Quality, Quantity, and Spatial Variation of Price." American Economnic Review. Vol.78, No. 3, June 1988.
Deaton, Angus and John Muellbauer. "An Almost Ideal Demand System." American EconomicReview. Vol. 70 No. 3, pp. 312-326, 1991.
Division des Enquetes Aupras des Menages. Direction de la Statistique, Ministere du Plan. "Nivauxde Vie des Menages, 1990-91. Premiers RPsultats. Volume 1. " Morocco, May 1992.
Eriksen, John, et. al. Agricultural Policy Implementation Project. Dairy Processing Case Study.APIP Report no. 90-1. Tunis, Tunisia, January 1990.

84 List of References
Food and Agriculture Organization. Food Composition Tables for the Near East. Rome, Italy, 1982.
--- "Population-Nutrition Relationships in Tunisia." Rome, Italy, 1984.
Foster, James, Joel Greer, and Erik Thorbecke. 'A Class of Decomposable Poverty Measures."Econometrica. Vol 52(3), 1984.
Fourati, Habib. "Evolution de l'Indice de Quetelet et des Mesures Anthropometriques des AdultesTunisiens au Cours de la Decennie 1975-1985." Tunis, Tunisia: INS/FAO, 1992.
Galloway, Rae. "Global Indicators of Nutritional Risk." World Bank Working Paper Series, no. 591.Washington, D.C.: Population and Human Resources Department, The World Bank, 1991.
Grosh, Margaret. "Towards Quantifying the Tradeoff: Administrative Costs and Targeting Accuracy."World Bank Conference on Public Expenditures and the Poor: Incidence and Targeting.Washington, D.C.: The World Bank, June, 1992.
Grosh, Margaret. From Platitudes to Practice: Targeting Social Programs in Latin America; Vols.I and II. Washington, D.C.: The World Bank, September 1992.
Grosh, Margaret. Administering Targeted Social Programs in Latin America: From Platitudes toPractice. Washington, D.C.: The World Bank, 1994.
Hopkins, Raymond F. "Political Calculations in Subsidizing Food." In Pinstrup-Anderson, 1988.
Institute for Resource Development/Macro Systems, Inc. "Enquete Demographique et de Sante enTunisie." Columbia, Maryland, 1988.
Institut National de la Statistique. Annuaire Statistique de la Tunisie. Tunis, Tunisia, December1991.
Enquete Nationale sur le Budget et la Consommation des Menages. Tunis, Tunisia, 1985.
Enquite Nationale sur le Budget et la Consommation des Menages. Tunis, Tunisia, 1990,Vols. A and B.
Enquite Restreinte sur la Consommation des Produits Subventionnes. Tunis, Tunisia, 1993.
----- -Les Subventions de la Caisse Generale de Compensation: Repartition et Incidence sur laDistribution des Revenus. " Unpublished document. 1990.
---- "Resultats Dffinitifs de I'Enquete sur le Budget et la Consommation des Menages 1990-1991."Unpublished document. 1990.
List of References 85
Ireland, Norman J. "Stigma and Quality as Self-Selection Mechanisms." World Bank Conference onPublic Expenditures and the Poor: Incidence and Targeting. Washington, D.C.: The WorldBank, June 1992.
Kumar, Shubh K. and Harold Alderman. "Food Consumption and Nutritional Effects of ConsumerOriented Food Subsidies." In Pinstrup-Anderson, 1988.
"La Caisse Generale de Compensation et le Role de I'Etat." Abt Associates, February, 1990.
Matoussi, Mohame Salah, Mohamed Ayadi, Rafik Baccouche and Mohamed Goaied. "Projet Taxeset Subventions: Rapport Technique Interm0diare." Preliminary Report: 1993.
McDermott, Ann K. "Targeting Cereals Subsidies: Case Studies of Morocco, Algeria, Egypt andTunisia." Washington, D.C.: Development Alternatives, Inc. August 1992.
McGuire, Judith S. "The Payoff from Improving Nutrition," Unpublished document. 1990.
Ministere de I 'Economie Nationale. La Caisse Generale de Compensation et le Role de I'Etat. Tunis,Tunisia, August 1991.
Ministere de I 'Economie Nationale. Rapport Dtfinitif de la Commission Nationale des Prix, desRevenus et de la Compensation. Tunis, Tunisia, August 1991.
Minist&re du Plan et du De6veloppement Regional. "Projet d Assainissement et de Maitrise a MoyenTerme des Charges de la Caisse Generale de Compensation." Tunis, Tunisia, October 1990.
Nelson, Joan M. "The Politics of Pro-Poor Adjustmnent." In Joan Nelson, Ed. Fragile Coalitions: ThePolitics of Economic Adjustment. Overseas Development Council, 1989.
Newbery, David M. The Design of Agricultural Policy in Tunisia. August, 1987, Unpublished paper.
Oueslati, Abdelmajid. "Determination d'un seuil de pauvrete en Tunisie.n In Bulletin de Stateco.Paris, France: Institut National de la Statistique et des Etudes Economiques. June 1987.
Pines, James M. "A Compensatory Food Aid Program for Tunisia." Washington, D.C.: AbtAssociates Inc., March 1987.
Pinstrup-Anderson, Per and Harold Alderman. "The Effectiveness of Consumer-Oriented FoodSubsidies in Reaching Rationing and Income Transfer Goals." In Pinstrup-Anderson, 1988.
Pinstrup-Anderson, Per, Ed. Food Subsidies in Developing Countries. Baltimore, Maryland: JohnsHopkins University Press, 1988.
"- The Role of Food-Linked Income Transfers in Efforts to Alleviate Malnutrition." Washington,D.C.: Intemational Food Policy Research Institute, 1989.
86 List of References
Radwan, Samir, Vali Jamal, and Ajit Ghose. Tunisia: Rural Labour and Structural Transformation.London: Rourledge, 1991.
Ravallion, Martin. "Income Effects on Undernutrition." Economic Development and Cultural Change.1990.
----- -Poverty Comparisons: A Guide to Concepts and Methods." Living Standards MeasurementStudy Working Paper No. 88. Washington, D.C.: The World Bank, 1992.
Redjeb, Mohammed Saleh. "Synth>se des Etudes sur la Caisse Generale de Compensation." Tunis,Tunisia: Abt Associates Inc., July 1991.
----- Mongi Boughzala, Mohamed Hedi Lahouel, Chokri Mamoghli and Hermassi. Analyse Critiquedu Systeme Actuel d 'Intervention de la CGC: Incidences Economiques et Sociales. In Etudesur la Caisse GMnerale de Compensation. Tunis, Tunisia: Abt Associates Inc., February 1990.
-- and Mohammed Hedi Lahouel. Reduction des Depenses de la CGC: Ajustement des Prix desProduits Subventionnes, Ciblage des Subventions et Optimisation des Couts. In Etude sur laCaisse Gengrale de Compensation Tunis, Tunisia, Abt Associates Inc., July 1990.
Republique Tunisienne. "Note Commune. Subventions a la Consommation (Actions Soutenues par lePAREF)." September 1991.
Rogers, Beatrice Lorge. "Design and Implementation Considerations for Consumer-Oriented FoodSubsidies." In Pinstrup-Anderson, 1988.
Scobie, Grant M. "Macroeconomic and Trade Implications of Consumer-Oriented Food Subsidies." InPinstrup-Anderson, 1988.
Seddon, David. "Politics and the Price of Bread in Tunisia." In Food, States, and Peasants: Analysisof The Agrarian Ouestion In the Middle East. Edited by Alan Richards. Westview SpecialStudies on the Middle East, 1986.
Sen, Amartya. "The Political Economy of Targeting." World Bank Conference on PublicExpenditures and the Poor: Incidence and Targeting. Washington, D.C.: The World Bank,June 1992.
Tuck, Laura. "Tunisia: SAL Supervision, Analysis of the CGC." Washington, D.C.: World BankOffice Memorandum, March 1989.
von Braun, Joachim. "Implications of Consumer-Oriented Food Subsidies for Domestic Agriculture."In Pinstrup-Anderson, 1988.
Weissman, Juliana. "Morocco: Nutrition and National Development, Issues and Options."Unpublished paper. Washington, D.C.: The World Bank, 1992.

List of References 87
World Bank. "Democratic and Popular Republic of Algeria: Consumer Price Subsidy Reform."Report No. 9881-AL. Washington, D.C.: The World Bank, 1991.
- 'Republic of Tunisia: The Social Protection System in Tunisia." Report No. 11376-TUN.Washington, D.C.: The World Bank, April 1993.
- World Development Report 1990: Poverty. Washington, D.C.: The World Bank, 1990.
Yusuf, Moez. "On Reforming Tunisia's Food Subsidy Program." Unpublished paper. Washington,D.C.: The World Bank, 1989.
Numnerous other documents and data from the Caisse Gcncrale de Compensation, the Institut Natonalde la Statistique, and the World Bank.
Numerous articles from Le Monde, La Presse, Le Temps, Le Renouveau, and The New York Times.


ANNEX 1: SUBSIDY DIFFERENTIAL ON GROS PAIN AND BAGUETTES
1. As mentioned in the text, subsidies per quintal of flour are intended to be higher on grospain than on baguettes because gros pain is consumed disproportionately by lower income groups.However, the same flour is used for both types of bread and only the flour is subsidized. Therefore, tomaintain a subsidy differential between gros pain and baguettes, the sales prices are set with theassumption that bakers use 85 percent of the subsidized flour for gros pain and only 15 percent forbaguettes. In reality, most bakers make extra profits from this differential by using more than 15 percentof the subsidized flour to produce baguettes. The actual allocation of subsidized PS flour between thetwo types of bread by each baker cannot be controlled and no attempt has been made to do so.
2. A hypothetical example, illustrates these incentives and is presented in the table below.'One quintal of flour can produce either 182 loaves of gros pain or 400 baguettes.2 The costs of onequintal of flour are the same no matter which of these breads it is used to produce. Other costs arehigher for baguette production, although, given the fixed sales prices for each bread, the higher revenuesfrom baguette production more than offset these additional costs. Before the subsidy is counted in,baguette production would generate a profit of 590 millimes, whereas gros pain production wouldgenerate a loss of 5880 millimes (per quintal of flour). With the assumption that 85 percent of thequintal of flour is used to produce gros pain and the remaining 15 percent is used to produce baguettes,the net loss for the quintal of flour is 4910 millimes (4998 - 88), as shown in the table below. This lossis exactly compensated for by the subsidy per quintal of flour. If instead bakers use more than theassumed 15 percent flour to produce baguettes, extra profits accrue.
Subsidy Differential On Gros Pain and Baguettes
Millimes per Quintal of flour Gros Pain Baguettes
COSTS:Flour (I Quintal) 10500 10500Other Costs 13580 16910Total Costs 24080 27410
REVENUES:Price * Quantity 100*182= 70*400=Total Revenue 18200 28000
GAIN/LOSS:*With entire Quintal of flour -5880 +590*With assumption of using XX% (85%) (15%)of Quintal of flour -4998 +88
Subsidy per Quintal of flour 4190
Notes: Bread weight: gros pain=700g, baguette=300g. Quantities are derived from using an entire quintal of flouron one type of bread. Prices based on 1985 prices.
I/Data for 1985 used when possible. Source: Programme de Developpement du Secteur Cer6alier, Ministere de l'Agriculture, 1986.
2/Weight of gros pain assumed to be 700 grams. Weight of baguenes assumed to be 300 grams.


ANNEX 2: PRODUCER SUBSIDIES
1. While CGC expenditures are often called consumer subsidies, this is a partial misnomer.One of the Government's explicit objectives for the food subsidy program has been to encourageproduction of basic staples'. Not only has the Government avoided the common practice of implicitlytaxing agricultural producers to pay for its cheap food policies; it has used the CGC to support manyproducer prices well above their opportunity costs. Thus CGC expenditures have simultaneouslysubsidized producers and consumers for the same commodities. Of course, the allocation of the subsidybetween these two groups depends on the relative elasticities of demand for, and supply of, the subsidizedproducts. However, the distinction between the two is somewhat academic and for the purposes of thisreport, CGC expenditures are all considered to be "consumer subsidies."
2. Nonetheless, if world prices are used as a benchmark for measuring the degree to whichproducer and consumer prices differ from their opportunity costs, the relative allocation of subsidiesbetween producers and consumers can be calculated.
3. The table below shows that a large and growing share of subsidies on many locallyproduced food items should technically be considered producer subsidies. In fact, with the exception ofthe drought years in 1988/89, producer prices have diverged increasingly from comparable CIF pricessince 1986. As a result, the share of total "food" subsidies accruing to producers has risen.
Percent of "Consumer" Subsidies afCrUing to Producers
1986 1987 1988 1989 1990 1991 199
Durum Wheat' 7.5 26.8 13.0 -3.0 29.3 39.0 44.8Bread Wheatb 12.9 24.6 6.3 -0.4 19.5 15.8 32.0Total Wheat 9.8 25.9 11.0 -2.4 26.9 30.4 42.5Cooking Oilc 0.0 0.0 0.0 0.0 0.0 0.0 0.0Sugard 14.1 14.4 26.3 39.7 44.9 10.8 13.7Milk 0.0 0.0 0.0 0.0 0.0 0.0 0.0TOTAL (all five):-Producer (%) 8.4 19.2 9.6 5.2 23.3 22.0 28.9-Consumer (%) 91.6 80.8 90.4 94.8 76.7 78.0 71.1
arrhe producer subsidy for durum wheat was calculated as the difference between the producer price and the world price at thecollection center. The world price is constructed from the FOB price for Hard Amber Durum No. I Minneapolis (soure: USDASntuation and Outlook Report) plus a 15% markup for insurance and freight. Port charges re estimated at 5% of the calculatcd CIFvalue and handling. storage and transport to the collection center at an additional 5%. The total producer subsidy was obtained bymultiplying the unit subsidy by the total quantity of domestic production (source: CGC) subsidized. The producer subsidy wouldhavc been higher had actual CIF prices been used becme Tunisia benefis from export subsidies granted by Europe nd NorthAmerican countries.b/Producer subsidies for soft wheat were calculated in s manner similar s for durum, but the FOB price is Soft Red Winter No. 2Gulf of Mexico (source: World Bank Commodity Dat). The same caveat about export subsidies applies.c/For milk and oil, none of the subsidy went to loca producers bese both conmodities are imported. Widt the recent inuoeductionof locally produced pasteurized fresh milk, future subsidies on milk will go to both producers and consumer, and will have to beallocated accordingly.d/For sugar, none of the subsidy on OCT sugar wem to local producers becamue it is imported. Most of the CST tnd STS subsidieswent to producers (both agricultural and industrial). For CST. the producer subsidy was calculated as the difference between thelocal and imported unit subsidies, since the consumer price is the sarm for both. The totd producer subsidy was then estimaedmultiplying the producer unit subsidy by the amount of subsidized CST sugar. Tbe CST producer subsidy was approximately equalto the total subsidy. The STS subsidy wu asumed to have accrued entirely to producers
1/ For a thorough discussion of the effects of food subsidies on agriculture see von Braun (1988).


ANNEX 3: DATA COLLECTION
1. At the outset of this study, the most recent Household Expenditure Survey in Tunisia wasundertaken by the Tunisian National Statistics Office (Institut National de la Statistique, INS) in 1990.'Because most self-targeting reforms were implemented after 1990, data from this survey reveal theincidence of the universal subsidy program (as discussed in Chapter 2). To capture incidence of thereform program, a grant from the World Bank Research Support Budget2 funded a small-scale surveydesigned specifically to follow-up with quantitative and qualitative questions regarding the products thathave been the focus of self-targeting reforms.3 With the joint collaboration of the World Bank and theTunisian Ministry of the National Economy, which oversees the CGC subsidy program, the NationalStatistics Office (INS) prepared the survey and questionnaire in spring 1993. The INS conductedinterviews in summner 1993.
2. Household-level data from the two surveys allow for a comparison of the incidence ofthe universal subsidy program (1990) with the redistributive gains associated with the self-targeted reformprogram (1993). Data available for this analysis cover the same 1018 households in the District of Tunisregion (the nation's capital) for each year (for a total of 2036 observations).4
A. The 1990 Survey: the Universal Subsidy Programn
3. The Tunisian National Statistics Office (Institut National de la Statistique, INS) conductedan extensive Household Expenditure Survey in 1990. Although the 1990 survey covered some7,500 households throughout the nation, limitations in funding for the 1993 survey constrained the sizeof the 1993 sample to 1,018 households in the District of Tunis; this analysis therefore uses only thesesame households from the 1990 survey. Because the survey was conducted prior to most self-targetingreforms, these data permit an evaluation of the universal subsidy program.
Survey Design and Coverage
4. Sampling was random and was based on geographic zones selected from the nationalcensus.' The sample was stratified according to the department (gouvernorat) and region of residence(urban, rural). Sampling was conducted in two stages: first, a sample of primary units (districts) wasselected with probabilities proportional to district size (number of resident households); second, withineach district, clusters of 12 households were selected with probabilities equal to household size plus thenumber of income earners in each household.6
1 /Enquite Nationalk sur lc Budget et la Consommation des MInages, 1990.
2/Research Support Budget Grant No. RSB 678-14.
3IEnquifte Restreinte sur la Consommation des Produits Subventionnis, 1993.
4/Some households in the District of Tunis sample had to dropped because of incomplete responses: 28 were dropped from the 1990sample (bringing the total from 1,046 to 1,018) and 35 were dropped from the 1993 sample (bringing the total from 1,053 to 1,018).
5/The national census was conducted in 1984 and updated in 1989.
6/1NS (1993).

94 Annex 3
Scope and Data
5. Data available for the analysis covered 1,018 households in the District of Tunis, andinclude: (i) demographic data concerning household composition (number of members, gender, age,member occupations, education, location of residence, etc.); (ii) total household expenditures, which areused as a proxy for income; (iii) household expenditures on specific food items in the subsidy program(milk, bread wheat, durum wheat, cooking oil); (iv) household quantities consumed of these products;and (v) unit values for these products.
6. As shown in Table A3. 1 below, 86 percent of these households resided in urban areas.Less than ten percent of these households were headed by a female, most were married, and the majorityof household heads (56 percent) were employed as workers, followed by households without a workinghousehold head (27 percent) and households with a household head in a professional career (17 percent).Most household heads had no schooling or up to middle school training.
Table A3.1 - DESCRIPTIVE STATISTICS REGARDING HOUSzHOLDs IN TmE 1990 SURVEY,BY QUImNTILV _
POOR IUC:H TOTAL1 2 3 4 5 AVG.
% in urban areas 70 83 88 93 97 86% in professional (high, middle) careersJ 1 6 16 18 44 17% in working class careersh 69 62 61 54 35 56% not working (unemployed, student, retired)b 30 62 24 28 21 27% with no schooling or up to middle school trainingb 100 96 91 80 51 83% with high school educationb 0 4 8 17 27 1 1% with university educationh 0 0 1 3 22 5% with female household headb 9 9 10 10 8 9% married"' 90 87 86 89 91 89
Mean total caloric intake per adult equiv. (kcal)c 2131 2245 2343 2500 3045 2453Mean total protein intake per adult equiv. (grams)' 40.8 45.6 49.6 56.2 79,1 54.2
Mean household size 6.6 6.2 5.7 5.4 4.6 5.7Mean adjusted household size (adult equiv.)d 4.7 4.5 4.2 4.0 3.6 4.2
Quintile total exp. (per adult equiv.) cut-offs:minimum expenditure cut-off: 0 617 874 1174 1750maximum expenditure cut-off: < 616 873 1173 1749
Mean total expenditures per adult equivalent: 454 751 1006 1416 2837 1293
Number of households 204 204 204 204 202 1018
Source: INS, Household Expenditure Survey, District of Tunis, 1990.a\Quintiles ranked by 1990 household total expenditure per adult equivalent.b\Percent of household heads.c\Data on total nurritional intake extrapolated from INS national 1990 Household Food and Nutrition Survey (adjustedfor adult equivalent)._\Equivalence Scales: Children less than seven years old are assigned a weight of 0.2, children between the ages ofseven and twelve are given a weight of 0.3 and children between the ages of 13 and 17 receive weights of 0.5; adultsover age 18 are assigned a weight of I.0. These weights are consistent with those estimated for Sri Lanka, Indonesiaand Cote d'lvoire; Deaton and Muellbauer (1986), Glewwe (1988).Numbers mnay not add due to rounding.
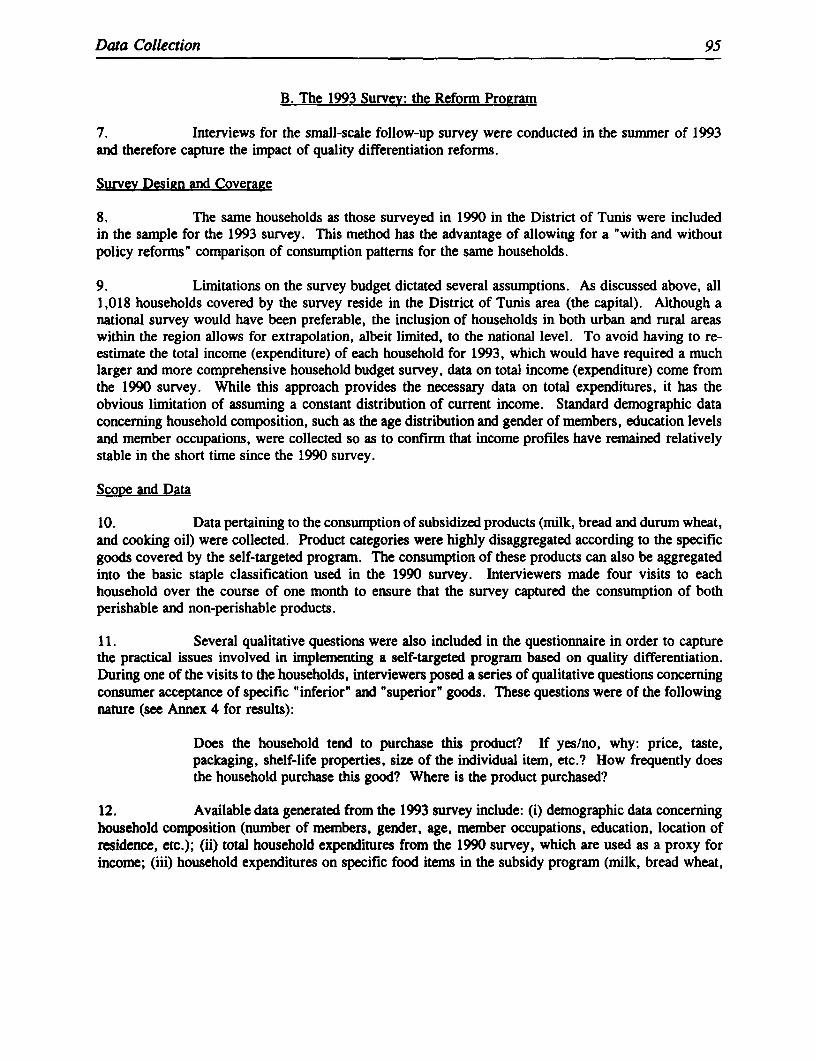
Data Collection 95
B. The 1993 Survey: the Reform Program
7. Interviews for the small-scale follow-up survey were conducted in the summer of 1993and therefore capture the impact of quality differentiation reforms.
Survey Design and Coverage
8. The same households as those surveyed in 1990 in the District of Tunis were includedin the sample for the 1993 survey. This method has the advantage of allowing for a 'with and withoutpolicy reforms" comparison of consumption patterns for the same households.
9. Limitations on the survey budget dictated several assumptions. As discussed above, all1,018 households covered by the survey reside in the District of Tunis area (the capital). Although anational survey would have been preferable, the inclusion of households in both urban and rural areaswithin the region allows for extrapolation, albeit limnited, to the national level. To avoid having to re-estimate the total income (expenditure) of each household for 1993, which would have required a muchlarger and more comprehensive household budget survey, data on total income (expenditure) come fromthe 1990 survey. While this approach provides the necessary data on total expenditures, it has theobvious limitation of assuming a constant distribution of current income. Standard demographic dataconcerning household composition, such as the age distribution and gender of members, education levelsand member occupations, were collected so as to confirm that income profiles have remained relativelystable in the short time since the 1990 survey.
Scope and Data
10. Data pertaining to the consumption of subsidized products (milk, bread and durum wheat,and cooking oil) were collected. Product categories were highly disaggregated according to the specificgoods covered by the self-targeted program. The consumption of these products can also be aggregatedinto the basic staple classification used in the 1990 survey. Interviewers made four visits to eachhousehold over the course of one month to ensure that the survey captured the consumption of bothperishable and non-perishable products.
11. Several qualitative questions were also included in the questionnaire in order to capturethe practical issues involved in implementing a self-targeted program based on quality differentiation.During one of the visits to the households, interviewers posed a series of qualitative questions concerningconsumer acceptance of specific "inferior" and "superior" goods. These questions were of the followingnature (see Annex 4 for results):
Does the household tend to purchase this product? If yes/no, why: price, taste,packaging, shelf-life properties, size of the individual item, etc.? How frequently doesthe household purchase this good? Where is the product purchased?
12. Available data generated from the 1993 survey include: (i) demographic data concerninghousehold composition (number of members, gender, age, member occupations, education, location ofresidence, etc.); (ii) total household expenditures from the 1990 survey, which are used as a proxy forincome; (iii) household expenditures on specific food items in the subsidy program (milk, bread wheat,

96 Annex 3
durum wheat, cooking oil); (iv) household quantities consumed of these products; (v) unit values for theseproducts; and (vi) responses to the qualitative questions, as discussed in para. 11 above.
13. Table A3.2 indicates that, as was the case in 1990, 86 percent of those householdscovered by the survey resided in urban areas. Twelve percent were headed by a female member, mostwere married, and most were employed as workers or were unemployed. Most household heads had noschooling or up to middle school training.
Table A3.2 - DESCRIPTIVE STATISTICS REGARDING HOUSEHOLDS IN THE 1993 SURVEY,BY QUINTILE8 |
POOR RJCH TOTAL1 2 3 4 5 AVG.
% in urban areas 68 87 88 91 97 86% in professional (high, middle) careers' 3 6 9 21 36 15% in working class careers5 64 58 58 52 32 53% not working (unemployed, student, retired)h 33 35 33 27 33 32% with no schooling or up to middle school training5 99 95 91 81 56 84% with high school educationb 0 5 8 14 21 10% with university educationh 0 0 t 5 22 6% with female household head' 12 10 14 16 10 12% married" 88 87 84 83 89 86
Mean total caloric intake per adult equiv. (kcal)' 2122 2230 2330 2487 3009 2435Mean total protein intake per adult equiv. (grams)' 40.3 44.9 49.1 55.6 77.5 53.5
Mean household size 6.4 6.1 5.6 5.1 4.7 5.6Mean adjusted household size (adult equiv.)d 4.8 4.5 4.1 4.0 3.7 4.2
Quintile total exp. (per adult equiv.) cut-offs:minimum expenditure cut-off: 0 722 1023 1385 > 2069maximum expenditure cut-off: < 721 1022 1384 2068
Mean total expenditures per adult equivalentf 524 869 1184 1684 3345 1521
Number of households 204 204 204 204 202 1018
Source: INS, Enquete Restreinte sur la Consommation des Produits Subventionnes, District of Tunis, 1993.a\Quintiles ranked by 1990 household total expenditures, adjusted for inflation and 1993 household composition (adultequivalent).b\Percent of households heads.c\Data on total nutritional intake extrapolated from INS national 1990 Household Food and Nutrition Survey (adjustedfor 1993 adult equivalent).d\Equivalence Scales: Children less than seven years old are assigned a weight of 0.2, children between the ages ofseven and twelve are given a weight of 0.3 and children between the ages of 13 and 17 receive weights of 0.5; adultsover age 18 are assigned a weight of 1.0. These weights are consistent with those estimated for Sri Lanka, Indonesiaand CMte d'lvoire; Deaton and Muellbauer (1986), Glewwe (1988).e\Total expenditure patterns extrapolated from 1990 Survey (adjusted for inflation and adult equivalent).Numbers may not add due to rounding.
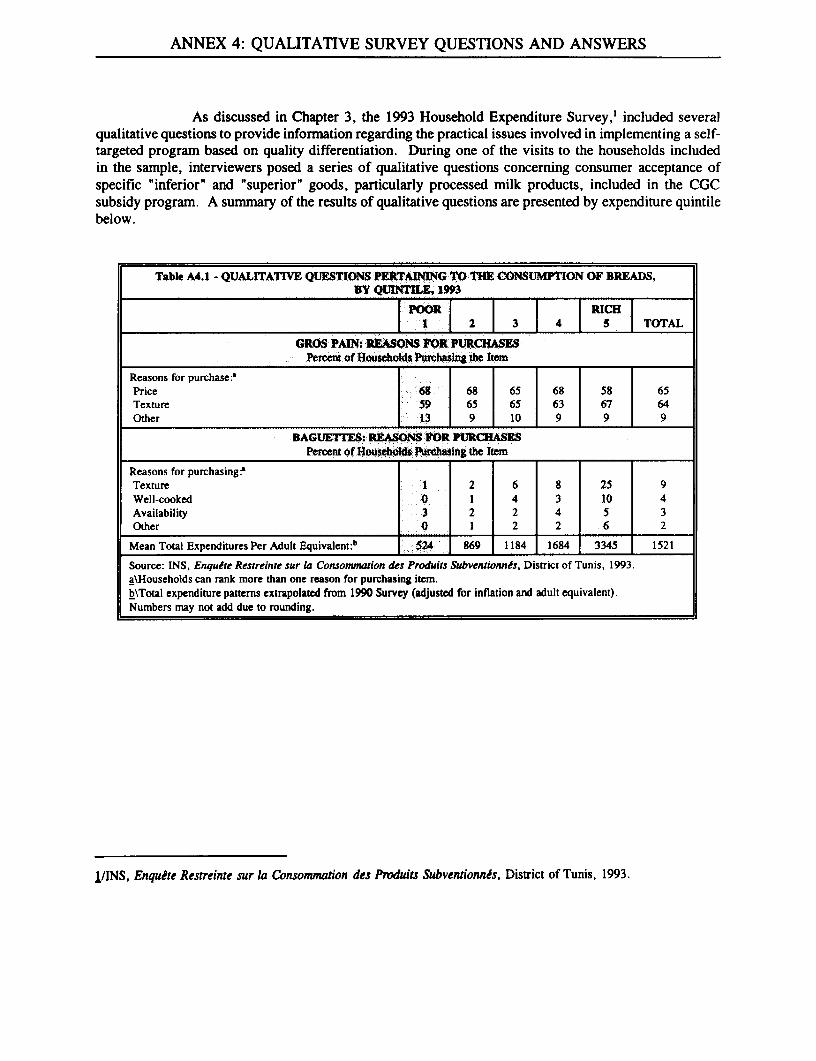
ANNEX 4: QUALITATIVE SURVEY QUESTIONS AND ANSWERS
As discussed in Chapter 3, the 1993 Household Expenditure Survey,' included severalqualitative questions to provide information regarding the practical issues involved in implementing a self-targeted program based on quality differentiation. During one of the visits to the households includedin the sample, interviewers posed a series of qualitative questions concerning consumer acceptance ofspecific "inferior" and "superior" goods, particularly processed milk products, included in the CGCsubsidy program. A summary of the results of qualitative questions are presented by expenditure quintilebelow.
Table A4.1 - QUALITATIVE QUESTIONS PERTAINING TO THE CONSUMPTION OF BREADS,BY QUEv IE, 1993
PO 2 3 4 TOTAL
GROS PAIN: REASONS FOR PURCHASESPercent of Households Purchasing the Item
Reasons for purchase:' "Price 68 68 65 68 58 65Texture 59 65 65 63 67 64Other 13 9 1 0 9 9 9
BAGUETTES: REASONS FOR PURCHASESPercent of Household. Purchasing the Item |
Reasons for purchasing'Texture 1 2 6 8 25 9Well-cooked 0 1 4 3 10 4Availability 3 2 2 4 5 3Other 0 1 2 2 6 2
Mean Total Expenditures Per Adult Equivalent:b 524 869 1184 1684 3345 1521
Source: INS, Enquafc Restreinte sur la Consommation des Produits Subventionncs, District of Tunis, 1993.a\Households can rank more than one reason for purchasing item.b\Total expenditure patterns extrapolated from 1990 Survey (adjusted for inflation and adult equivalent).Numbers may not add due to rounding.
1/INS, Enquete Restreinte sur la Consommation des Produits Subventionnis, District of Tunis, 1993.

98 Annex 4
Table A4.2 - QUALITATIVE QUESTIONS PERTAINING TO THE CONSUMPSON OFPASTEURIZED-RECONSTITUIED MILK IN COUSSIN POUCHES, By QUINTILEI 199"3_-____IPOOR I IIRICHl
1 2 3 L4 "C TOTAL
REASONS FOR AND LOCATION/REQUENCY OF PURC*SESPercent of Households Purchasing the Item
Reasons for purchase:'Price 70 67 79 75 42 66Availability 30 33 14 13 0 17Shelf-life 0 0 7 0 8 4Taste 40 11 21 25 33 26Size of package 0 0 0 0 0 0Packaging 0 0 0 0 0 0Like brand name 10 0 0 0 8 4Familiar with brand name 0 0 0 0 0 0
Location of purchase:Small store (epicerie) 82 63 60 50 .. 72Supermarket 5 0 20 0 5Creamery 5 13 20 0 8
Frequency of purchase:Daily 77 75 80 75 .. 77Every two days 14 13 0 25 13Every three days 0 13 0 0 3Weekly 0 0 0 0 0Every two weeks 0 0 0 0 0
Demographics:Percent residing in urban areas 100 100 100 100 100 100Percent in professional (high, middle) careers 0 11 0 13 42 13Percent in working class careers 60 89 86 38 25 60Percent not working (unemployed, student, retired) 40 0 14 50 42 28
REASONS FOR NOT PURCHASING ITEMPercent of HousehDlds Not Purchasing the Item _
Reasons for not purchasing'Price 4 4 4 4 1 3Availability 10 12 17 9 12 12Shelf-life 24 32 28 34 29 29Taste 22 23 16 15 18 19Size of package 5 4 4 3 4 4Packaging 8 8 12 13 13 11Like brand name 5 5 6 4 7 6Familiar with brand name 5 5 8 6 10 7
Demographics:Percent residing in urban areas 71 92 93 95 99 90Percent in professional (high, middle) careers 4 7 11 23 36 16Percent in working class careers 64 53 53 50 31 50Percent not working (unemployed, student, retired) 33 40 37 27 32 34
Mean Total Expenditures Per Adult Equivalent:b 524 869 1184 1684 3345 1521
Source: INS, Enqulte Restreinte sur la Consomnation des Produits Subventionnis, District of Tunis, 1993.a\Households can rank more than one reason for purchasing/not purchasing item.b\Total expenditure patterns extrapolated from 1990 National Survey (adjusted for inflation and adult equivalent).Numbers may not add due to rounding.
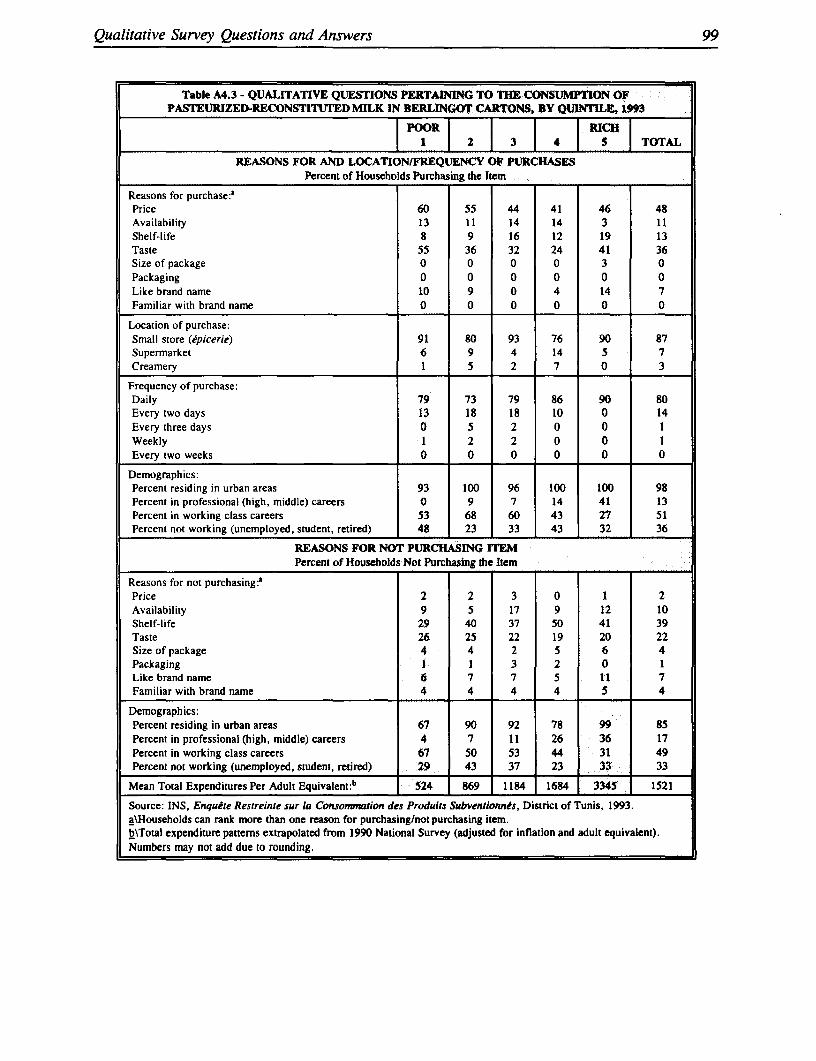
Qualitative Survey Questions and Answers 99
Table A4.3 - QUALITATIVE QUESTIONS PERTAINING TO THE CONSUMPION OFPASTEURIZED-RECONSTITUrED MILK IN BERLINGOT CARTONS. BY QUINTI, 1993
POO" RICH | T l| 11 2 |3 |4 | 5 |TOTAL l
REASONS FOR AND LOCATIONIFkEQUENCY OF PURCHASESPercent of Households Purchasing the Item _ _
Reasons for purchase:'lPrice 60 55 44 41 46 48Availability 13 11 14 14 3 11Shelf-life 8 9 16 12 19 13Taste 55 36 32 24 41 36Size of package 0 0 0 0 3 0Packaging 0 0 0 0 0 0Like brand name 10 9 0 4 14 7Familiar with brand name 0 0 0 0 0 0
Location of purchase:Small store (epicerie) 91 80 93 76 90 87Supermarket 6 9 4 14 5 7Creamery 1 5 2 7 0 3
Frequency of purchase:Daily 79 73 79 86 90 80Every two days 13 18 18 10 0 14Every three days 0 5 2 0 0 1Weekly 1 2 2 0 0 1Every two weeks 0 0 0 0 0 0
Demographics:Percent residing in urban areas 93 100 96 100 100 98Percent in professional (high, middle) careers 0 9 7 14 41 13Percent in working class careers 53 68 60 43 27 51Percent not working (unemployed, student, retired) 48 23 33 43 32 36
REASONS FOR NOT PURCHASING ITEMPercent of Households Not Purchasing the Item
Reasons for not purchasing:'Price 2 2 3 0 1 2Availability 9 5 17 9 12 10Shelf-life 29 40 37 50 41 39Taste 26 25 22 19 20 22Size of package 4 4 2 5 6 4Packaging 1 1 3 2 0 1Like brand name 6 7 7 5 11 7Familiar with brand name 4 4 4 4 5 4
Demographics:Percent residing in urban areas 67 90 92 78 99 85Percent in professional (high, middle) careers 4 7 11 26 36 17Percent in working class careers 67 50 53 44 31 49Percent not working (unemployed, student, retired) 29 43 37 23 33 33
Mean Total Expenditures Per Adult Equivalent:b 524 869 1184 1684 3345 1521
Source: INS, Enqute Restreinte sur la Consommation des Produits Subventionnts, District of Tunis, 1993.a\Households can rank more than one reason for purchasing/not purchasing item.b\Total expenditure pattems extrapolated from 1990 National Survey (adjusted for inflation and adult equivalent).Numbers may not add due to rounding.

100 Annex 4
Table A4.4 - QUALITATIVE QUEsTIONS PERTAINING TO THE CONSUMPItON OFSTERILIZED-RECONSTMTD MILK IN PLASTIC BOTTLES, BY Q13NTE, 1993
I . ' lt~~~~~~~~ ~ ~~~POOR 1' -I IRC"'| I | 2 1 3 | 4 [ TOTAL
REASONS FOR AND LOCATIN OP PURCHASESPercent of Households Purchasing the Item
Reasons for purchase:'Price 41 24 46 32 14 31Availability 28 28 23 32 45 32Shelf-life 7 16 6 0 5 6Taste 62 60 60 74 57 62Size of package 3 4 0 0 0 1Packaging 3 4 0 0 0 1Like brand name 14 24 20 10 29 20Familiar with brand name 31 36 31 13 36 30
Location of purchase:Small store (Epicerie) 0 11 0 0 0 2Supermarket 0 0 5 0 0 1Creamery 92 83 91 94 100 92
Frequency of purchase:Daily 67 94 77 88 78 81Every two days 8 6 18 0 6 8Every three days 0 0 0 6 0 1Weekly 0 0 0 0 0 0Every two weeks 0 0 0 0 0 0Occasionally 8 0 0 0 0 1Once per month 8 6 0 6 .17 7
Demographics:Percent residing in urban areas 66 92 97 90 100 90Percent in professional (high, middle) careers 10 4 9 6 33 14Percent in working class careers 59 68 49 58 33 51Percent not working (unemployed, student, retired) 31 28 43 35 33 35
REASONS5 FOR NOT PURCHASING ]rEMPercent of Households Not Purchasing the Item _
Reasons for not purchasing:'Price 10 12 15 10 10 12Availability 7 10 11 10 10 10Shelf-life 5 2 2 3 3. 3Taste 40 43 33 40 38- 39Size of package 1 1 1 1 |2 1Packaging 1 2 1 3 5 2Like brand namefl 13 12 18 18 .18 15Familiar with brand name 29 27 31 21 34 28
Demographics:Percent residing in urban areas 69 87 86 91 96 85Percent in professional (high, middle) careers 2 7 9 23 36 15Percent in working class careers 65 57 60 5 1 31 53Percent not working (unemployed, student, retired) 33 36 31 26 33 32
Mean Total Expenditures Per Adult Equivalent:b 524 869 1184 1684 | 3345 1521
Source: INS, Enqucte Restreinte sur la Consommation des Produits SubventionnEs, District of Tunis, 1993.a\Households can rank more than one reason for purchasing/not purchasing item.b\Total expenditure patterns extrapolated from 1990 National Survey (adjusted for inflation and adult equivalent).Numbers may not add due to rounding.

Qualitative Survey Questions and Answers 101
Table A4S - QUALIrATm QUEmONS PiRTAING TO TmE CONSUMPTON OFSTERILIWZ-RECONSTJU1EI) MILK IN TETRABRIK CARTONS, BY QUINTlLE, 1993
NOR ~~~~RICHPOIOR 1 2 1 3 1 4 5 TOTAL
REASONS FOR AND LOCATIONIFREQUENCY OF PURCHASESPerlt of Households Purchasing the Item
Reasons for purchase:'Price 12 11 13 4 11 10Availability 28 21 24 45 33 30Shelf-life 11 18 16 11 6 12Taste 56 66 59 43 64 58Size of package 2 1 0 0 1 1Packaging 0 0 0 0 1 0Like brand name 12 19 13 20 18 16Familiar with brand name 0 2 1 0 0 1 I
Location of purchase:Small store (cpicerie) 64 68 70 75 67 69Supermarket 7 3 2 5 0 3Creamery 25 25 27 17 22 23
Frequency of purchase:Daily 61 70 65 80 70 70Every two days 18 9 13 8 6 10Every three days 4 7 6 6 2 5Weekly 0 0 1 0 4Every two weeks 1 0 0 0 1 0Occasionally 14 13 8 5 11 10Once per month 0 1 1 0 1 I
Demographics:Percent residing in urban areas 69 89 95 96 100 89Percent in professional (high, middle) careers 4 7 11 23 34 16Percent in working class careers 70 56 55 60 33 55Percent not working (unemployed, student, retired) 26 36 35 17 34 30
REASONS FOR NOT PMRCHASING ITEMPeifcnt of Houehdlids Not Purchasing the Item
Reasons for not purchasing:Price .23 22 21 19 21 21Availability 6 5 9 9 8 8Shelf-life S 3 4 3 3 3Taste 45 35 31 39 36 37Size of package .0 0 0 1 2 1Packaging I 0 0 0 1 0Like brand name 5 13 15 15 16 13Familiar with brand name 5 3 5 4 8 5
Demographics:Percent residing in urban areas 76 95 93 94 99 92Percent in professional (high, middle) careers 2 7 9 21 39 16Percent in working class careers 57 53 56 42 29 47Percent not working (unemployed, student, retired) 41 39 36 36 32 37
Mean Total Expenditures Per Adult Equivalent:b 524 869 1184 1684 3345 1521
Source: INS. Enquire Restrebue sur la Consommation des Produats Subvenrionnis, District of Tunis, 1993.a\Households can rank more than one reason fbr purchasing/not purchasing item.b\Total expenditure patterns extrapolated from 1990 National Survey (adjusted for inflation and adult equivalent).Numbers may not add due to rounding.

102 Anne-x 4
Table A4.6 - QUALITATIVE QUESTIONS PERTAINING TO THE CONSUMPTION OFSTERILIZED LOCAL FRESH MILK IN PLASTIC BOrTLES, BY QUINTILE, 1993
POOR RICH TOAIPOR 2 3 4 I5 TOTALREASONS FOR AND LOCATION/FREQUENCY OF PURCHASES
Percent of Households Purchasing the Item
Reasons for purchase:'Price 17 7 10 5 19 11Availability 13 23 35 33 31 29Shelf-life 13 10 3 2 10 7Taste 78 80 68 79 69 74Size of package 43 50 45 50 50 48Packaging 4 3 3 2 6 4Like brand name 22 33 39 33 23 30Familiar with brand name 57 43 35 31 33 38
Location of purchase:Small store (epicerie) 7 3 4 3 2 0Supermarket 7 0 0 10 4 3Creamery 93 90 100 87 74 4
86
Frequency of purchase:Daily 86 80 76 58 76 74Every two days 7 7 16 16 10 11Every three days 0 3 0 10 2 3Weekly 0 3 0 3 4 3Every two weeks 0 0 0 0 2 1Occasionally 21 3 4 3 10 7Once per month 0 0 0 0 0 0
Demographics:Percent residing in urban areas 83 97 94 95 98 94Percent in professional (high, middle) careers 0 7 10 21 27 16Percent in working class careers 65 43 48 52 38 48Percent not working (unemployed, student, retired) 35 50 42 26 35 37
REASONS FOR NOT PURCHASING ITEMPercent of Households Not Purchasing the Item
Reasons for not purchasing'Price 17 20 26 25 15 20Availability 7 9 10 13 13 10Shelf-life I 1 2 1 1 1Taste 33 36 26 31 27 31Size of package 2 5 4 7 10 6Packaging 0 1 1 2 2 1Like brand name 7 9 10 14 12 10Familiar with brand name 27 29 32 20 34 28
Demographics:Percent residing in urban areas 66 86 87 90 91 83Percent in professional (high, middle) careers 3 6 9 20 36 15Percent in working class careers 64 61 60 52 28 53Percent not working (unemployed, student, retired) 33 33 31 28 30 31
Mean Total Expenditures Per Adult Equivalent:b 524 869 1184 1684 3345 1521
Source: INS, Enquete Restreinte sur la Consomnation des Produits Subventionnes, District of Tunis, 1993.a\Households can rank more than one reason for purchasing/not purchasing item.b\Total expenditure patterns extrapolated from 1990 National Survey (adjusted for inflation and adult equivalent).Numbers may not add due to rounding.

Qualitative Survey Questions and Answers 103
Tebk A4.1 - QUAtAIV QU TIONS PERTANNG TO TIM CONSUMdION OFSMRILIZED LOCAL FRESH MILK IN TETRABRIK CARTONS, BY QUINTLE 193
lI |1R 2 | 3 | 4 RSCH TOTAL
REASONS FOR AND LOCATION/FREQUENCY OF PURCEHASESPercent of Households Purchasing the Item
Reasons for purchase:'Price 18 2 8 2 4 6Availability 24 22 22 39 39 30Shelf-life 6 13 12 8 6 9Taste 68 74 63 57 62 65Size of package 0 0 0 0 0 0Packaging 2 0 0 0 0 0Like brand name 16 26 14 18 17 18Familiar with brand nane 0 2 0 0 0 0
Location of purchase:Smnall store (cpicerie) 3 8 6 13 14 10Supermarket 7 2 4 3 4 4Creamery 87 83 86 79 79 82
Frequency of purchase:Daily 53 63 67 79 77 70Every two days 20 8 16 7 5 10Every three days 7 8 4 5 0 4Weekly 3 6 2 2 4 3Every two weeks 0 0 0 2 1 1Occasionally 23 8 8 5 13 10Once per month 0 2 4 3 1 2
Demographics:Percent residing in urban areas 72 94 96 97 99 92Percent in professional (high, middle) careers 4 15 8 30 36 20Percent in working class careers 68 44 63 56 32 51Percent not working (unemployed, student, retired) 28 41 31 15 32 29
REASONS lOR NOT :PUR5C1ANG ITEMPercent of Households .Not Purchasing rne Item
Reasons for not purchasing:'Price 22 28 33 34 25 28Availability ;6 8 7 7 6 7Shelf-life 2 2 0 0 0 1Taste 24 25 20 23 20 22Size of package O.: I 0 2 1 1Packaging 1 0 0 0 0 0Like brand name 6 6 5 9 9 7Familiar with brand name 12 10 13 8 13 11
Demographics:Percent residing in urban areas 73 91 92 91 98 89Percent in professional (high, middle) careers 3 4 11 18 36 14Percent in working class careers 62 59 52 45 29 49Percent not working (unemployed, student, retired) 3S 37 37 34 33 35
Mean Total Expenditures Per Adult Equivalent:b 524 869 1184 1684 3345 1521
Source: INS, Enqute Restreinte sur la Consommation des Prodzdts Subventonnis, District of Tunis, 1993.\Households can rank more than one reason for purchasing/not purchasing item._\Total expenditure patterns extrapolated from 1990 National Survey (adjusted for inflation and adult equivalent).Numbers may not add due to rounding.
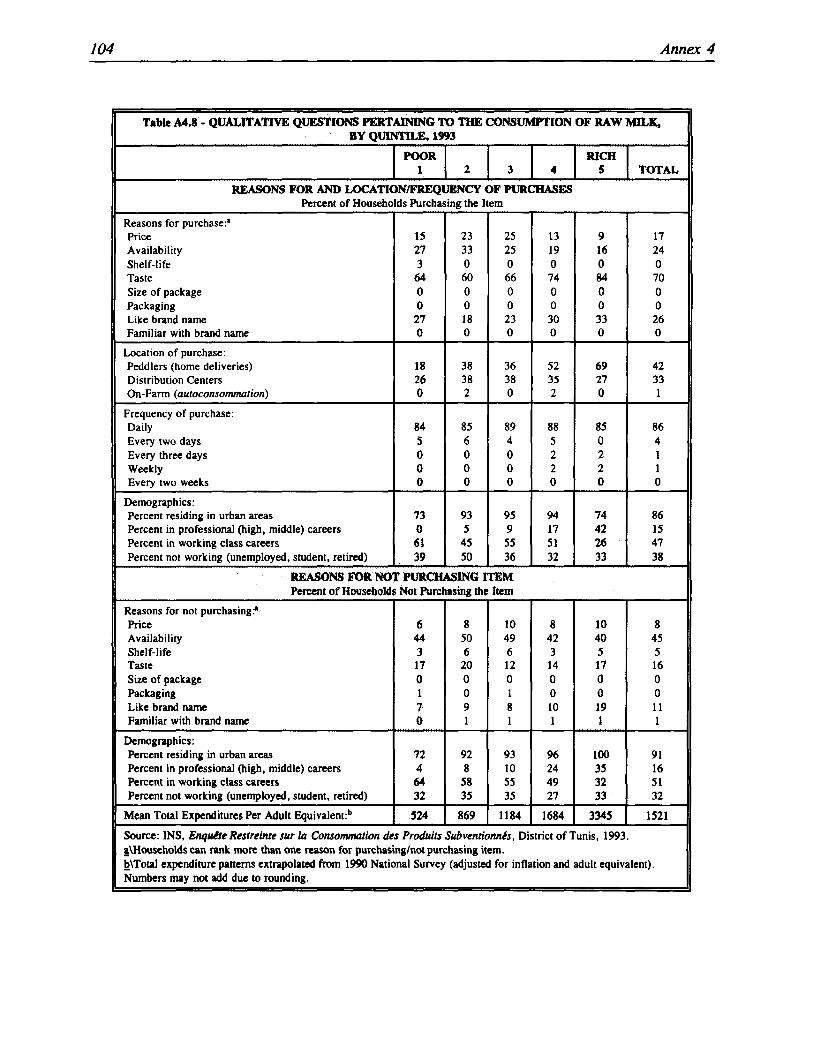
104 Annex 4
Table A4.8 - QUALITATIVE QUETIONS PERTAINING TO THE CONSUMPTION OF RAW MILK,BY QUINTILE 1993
POOR RIHI RI 2 3 4 SI TOTAL
REASONS FOR ANI) LOCATION/FREQUENCY OF PURCHASESPercent of Households Purchasing the Item
Reasons for purchase:'Price 15 23 25 13 9 17Availability 27 33 25 19 16 24Shelf-life 3 0 0 0 0 0Taste 64 60 66 74 84 70Size of package 0 0 0 0 0 0Packaging 0 0 0 0 0 0Like brand name 27 18 23 30 33 26Familiar with brand name 0 0 0 0 0 0
Location of purchase:Peddlers (home deliveries) 18 38 36 52 69 42Distribution Centers 26 38 38 35 27 33On-Farm (autoconsommation) 0 2 0 2 0 1
Frequency of purchase:Daily 84 85 89 88 85 86Every two days 5 6 4 5 0 4Every three days 0 0 0 2 2 1Weekly 0 0 0 2 2 1Every two weeks 0 0 0 0 0 0
Demographics:Percent residing in urban areas 73 93 95 94 74 86Percent in professional (high, middle) careers 0 5 9 17 42 15Percent in working class careers 61 45 55 51 26 47Percent not working (unemployed, student, retired) 39 50 36 32 33 38
REASONS FOR NOT PURCHASING ITEMPercent of Households Not Purchasing the Item
Reasons for not purchasing'Price 6 8 10 8 10 8Availability 44 50 49 42 40 45Shelf-life 3 6 6 3 5 STaste 17 20 12 14 17 16Size of package 0 0 0 0 0 0Packaging I 0 1 0 0 0Like brand name 7 9 8 10 19 11Familiar with brand name 0 1 1 1 1
Demographics:Percent residing in urban areas 72 92 93 96 100 91Percent in professional (high, middle) careers 4 8 10 24 35 16Percent in working class careers 64 58 55 49 32 51Percent not working (unemployed, student, retired) 32 35 35 27 33 32
Mean Total Expenditures Per Adult Equivalent:b 524 869 1184 1684 3345 1521
Source: INS, EnquCte Restreinte sur la Consommation des Produits SubventionnCs, District of Tunis, 1993.a\Households can rank more than one reason for purchasing/not purchasing item.b\Total expenditure pattems extrapolated from 1990 National Survey (adjusted for inflation and adult equivalent).Numbers may not add due to rounding.

ANNEX 5: MILK PACKAGING
Table ASA - TYPES OF SUBSIDIMED PROCESSED MILK
Sterilized Milk Pasteurized Milk Sterilized Fresh Milk(Reconstituted Imports) (Reconstituted Imports) (Local Production)
Packaging Type and *Tetrabrik (STIL) *Berlingor (STIL) *Plastic BottlesProducer *Plastic Bottles *Coussin (STIL) (LAINO, TLAIT, STIL)
(STIL & TLAIT) *Tetrabrik (STIL)
Most liquid milk is packaged in Tetrabrik, plastic bottles, and Berlingot cartons. Tetrabrik cartons,which are imported from Europe, are by far the most expensive. They are close to five times as costlyas coussin, 1.7 times as costly as Berlingot and 1.6 as expensive as plastic bottles. Note that the per litercost of plastic bottles includes the cost of a covering material for transportation of 10 millimes perpackage.
Table A5.2 - UNIT PACKAGING COSTS
Tetrabrik 132Plastic Bottles 82Berlingot 76Coussin 28


ANNEX 6: METHODOLOGY FOR ESTIMATION AND SIMULATIONS
1. The fiscal, distributional and nutritional impact of various reforms was simulated usingdemand elasticities and data from the INS 1990 and 1993 household expenditure surveys (described inAnnex 3). Simulations were conducted using the assumption that all reforms manifest themselves interms of real price changes, holding all other factors constant. Targeting reforms, which differentiationamong goods based on quality characteristics, are incorporated into the analysis by modelling each varietyas an individual product. All self-targeting measures and price changes that were implemented by thetime of the 1993 survey (summer 1993) are captured in the simulations, including the introduction of"new goods," such as local fresh milk packaged in plastic bottles and tetrabrik cartons, which were notavailable at the time of the 1990 survey. The analysis treats these "new goods" as if they were rationedin 1990 (so that the budget shares of these goods equal zero for that year). Household-specificreservation prices, which are defined as the lowest price at which individual households would notconsume positive quantities of the product in question, were calculated for these items in 1990.
2. For simplicity, demand elasticities were estimated using the assumption that householdsfirst allocate total expenditures across broad product groups (first stage), and then allocate groupexpenditures across individual products within product groups (second stage). First-stage elasticities wereestimated by Matoussi et. al. using the model developed by Deaton (1988 and 1990) based on the spatialvariation of prices.' Regression equations for this model closely resemble the Almost Ideal DemandSystem (AIDS), except that, in the spatial variation specification, (i) demand equations are not deriveddirectly from consumer preferences; and (ii) consumers choose both quantity and quality under thespacial-variation model (as opposed to quantities under the AIDS specification).
3 . The second-stage of consumer budgeting was estimated with a linear-approximate AIDSfunctional form based on Stone's (1953) geometric price index. Demand equations for each productgroup were estimated as a system using Zellner's (1962) Seemingly Unrelated Regression (SUR)technique. Following Heien and Wessells (July 1990), the inverse mills ratio, obtained for eachindividual product from the estimation of PROBIT equations, was included as a regressor in the productequations of the second-stage group AIDS systems to take into account the potential censoring of budgetshares at zero.2 With two-stage budgeting, changes in prices affect the quantity consumed of a particulargood in two ways (i) through a direct effect via own- and cross-price changes of goods within a productsgroup (e.g., milk); and (ii) through an indirect income effect via changes in total expenditures allocatedto that particular product group. First- and second-stage elasticities are thus combined so as to take intoaccount both the direct- and indirect- effects of changes in prices under the various policy scenarios.
I/Matoussi et. al. used national-level data from the INS 1990 household expenditure survey. Matoussi et. al. conducted separatedemand regressions for urban and rural areas. Although available data for the second stage cover both urban and rural areas inthe District of Tunis area (as discussed in Annex 3), urban elasticities estimated by Matoussi et. al. are used for the first-stage inthis analysis, since the second-stage sample was 86 percent urban (second-stage estimation takes into account regional differencesusing a regional binary variable).
2/ln addition to prices, group expenditures, and the inverse mills ratio, demographic variables (household composition, educationlevels, gender, seasonal binary variables, etc.) were also included in the demand equations in the second-stage AIDS systems.


I


IMAG lNG
Report No: 15878 TUNType: Sh