Seabed segmentation using optimized statistics of sonar textures
Upload
khangminh22Category
view
0download
0
Advance Unedited Version
English Only
12 May 2020
Report to the International Seabed Authority
Study of the Potential Impact of Polymetallic Nodules
Production from the Area on the Economies of Developing
Land-based Producers of those Metals which are Likely to be
Most Seriously Affected

The opinions expressed in this study, the designations employed, as well as the content and presentations
of material in this publication do not imply the expression of any opinion whatsoever on the part of the
Secretariat of the International Seabed Authority, including, inter alia, concerning the legal status of any
body, country or territory or of its authorities; or concerning the delimitation of its frontiers or maritime
boundaries.
Authors: Lapteva Anna, Chernova Alexandra, Khodina Marina, Mustafa Tatiana, Mustafina Farida, and
Smolnikova Anastasiya from All-Russian Scientfic-Research Institute of Mineral Resources Named after
N.M. Fedorovsky (FSBI “VIMS”).

Content Abbreviations ................................................................................................................................................ 5
Executive summary ....................................................................................................................................... 6
Introduction ............................................................................................................................................. 12
Objectives and methodology ............................................................................................................... 13
Overview of work done by the Preparatory Commission ....................................................................... 16
A. Analysis of work in connection with potential impacts .............................................................. 17
B. Criteria for or background to concept of serious adverse effects ................................................ 18
C. In-depth investigation of potential effects of seabed mineral production for DLBPS ................ 21
Overview of mineral production from activities in the Area .................................................................. 23
A. Types of mineral resources and affected metals for study purposes ........................................... 23
B. Assumptions for future mineral resource production in the Area ............................................... 24
World market conditions for the affected metals .................................................................................... 32
A. Overview of the value chain for the affected metals ................................................................... 32
B. Overview of the value chain of developing land-based producers of the affected metals .......... 37
C. Analysis of trends and developments in the affected metals, including future supply and
demand prospects, and potential effects of transfer pricing ................................................................ 38
D. Primary sector products of the affected metals ........................................................................... 79
E. Semi-finished products sector of the affected metals .................................................................. 93
F. End products sector of the affected metals .................................................................................. 99
Study data and methodology ................................................................................................................. 119
A. Type of methods of analysis ...................................................................................................... 119
B. Presentation of the approach and assumptions adopted for the potential impact analysis ........ 122
C. Overview of affected metals tariffs on exports and earnings of developing state producers .... 126
Impact on the affected metals tariffs for developing State producers ................................................... 142
A. Effects of the affected metals tariffs on overall economic performance ................................... 142
B. Sectoral effects of the affected metals tariffs ............................................................................ 161
C. Potential effects of a targeted tariff on semi-finished products ................................................. 162
D. Potential effects of targeted tariff on end products ................................................................... 167
Potential impact analysis and discussion............................................................................................... 176
A. Identification of relevant developing land-based producers ..................................................... 176
B. Assessment of potential impact on relevant developing land-based producers ........................ 178
C. Discussion of uncertainties in impact analysis, including future supply and demand
prospects ............................................................................................................................................ 181
Summary and conclusions ..................................................................................................................... 191
Recommendations for further studies ................................................................................................... 194
Appendices .......................................................................................................................................... 195
Terms and Definition ........................................................................................................................ 195
Data and information tables .............................................................................................................. 199

A. Copper production ..................................................................................................................... 199
B. Copper export ............................................................................................................................ 202
C. Nickel production ...................................................................................................................... 208
D. Nickel export ............................................................................................................................. 210
E. Cobalt production ...................................................................................................................... 214
F. Cobalt export ............................................................................................................................. 216
G. Manganese production .............................................................................................................. 219
H. Manganese export ..................................................................................................................... 221
References ........................................................................................................................................... 229

5
ABBREVIATIONS
BGS British Geological Survey
DLBPS Developing Land-Based Producer States
EIA U.S. Energy Information Administration
EMD electrolytic manganese dioxide
EMM electrolytic manganese metal
ES energy storage
EU European Union
EV electric vehicle
GDP gross domestic product
GNI gross national income
GNP gross national product
GVC global value chain
HHI Herfindahl-Hirschman Index
ICA International Copper Association
ICSG International Copper Study Group
IEA International Energy Agency
IMF International Monetary Fund
IMnI International Manganese Institute
INSG International Nickel Study Group
IPCC Intergovernmental Panel on Climate Change
ISA International Seabed Authority
ITC International Trade Centre
LME London metal exchange
MIT Massachusetts Institute of Technology
NA not available
NPI nickel pig iron
OECD Organisation for Economic Co-operation and Development
ROW Rest Of World
SHFE Shanghai Futures Exchange
UN United Nations
UNEP United Nations Environment Programme
UNCTAD United Nations Conference on Trade and Development
USGS United States Geological Survey
WB World Bank Group
WBMS World Bureau of Metal Statistics

6
EXECUTIVE SUMMARY
1. The Secretariat of the International Seabed Authority commissioned the preparation of this
report to study the potential impact of mineral production from the Area on the economies of developing
land-based producers of those minerals, which are likely to be most seriously affected, with a view to
minimizing their difficulties and assisting them in their economic adjustment, taking into account the work
done in this regard by the Preparatory Commission.
2. The purpose of the study is to provide a preliminary assessment of the impact of activities in
the Area on developing land-based producers States (DLBPS). Activities in the Area may lead to serious
adverse effects on the export earnings or economies of DLBPS resulting from the decline in price or supply
volumes of the affected metals. The need for such a study is determined by the provision of the United
Nations Convention on the Law of the Sea that developing States must be protected “from adverse effects
on their economies or on their export earnings resulting from a reduction in price of an affected mineral, or
in the volume of exports of that mineral, to the extent that such reduction is caused by activities in the
Area…” (Convention, articles 150 (h) and 1 (3)). The Agreement relating to the Implementation of Part XI
of the United Nations Convention on the Law of the Sea of 10 December 1982 (“1994 Agreement”)
provides that between the entry into force of the Convention and the Approval of the first plan of work for
exploitation, the Authority shall concentrate on, among others, study of the potential impact of mineral
production from the Area on the economies of developing land-based producers of those minerals which
are likely to be most seriousely affected, with a vew to minimizing their difficulties and assisting them in
their economic adjustment, taking into account the work done in this regard by the Preparatory Commission
(Section 1, paragraph 5 (e), Annex to the 1994 Agreement).
3. The study considers the implications of metals production from the future exploitation of
polymetallic nodules in the Area. Affected metals include copper, nickel, cobalt and manganese.
4. Potential impacts of seabed mineral production (including polymetallic nodules) on DLBPS
and the criteria of their assessment were considered by the Special Commission 1 of the Preparatory
Commission. The Special Commission 1 has also identified areas of research that are needed to be
undertaken in order to study the possible impacts of seabed mineral production on DLBPS. Conclusions
and methodology of the Special Commission 1 of the Preparatory Commission have been confirmed in the
submitted report.
5. The study supports the conclusion of the Special Commission 1that an assessment of the
relationship between mining in the Area and land-based mining should be made for each mineral separately.
The assessment of the impacts of mining in the Area should also be carried out for each specific DLBPS
that may be affected individually.
6. The members of the study group fully support the conclusion of Special Commission 1 that
statistics on current export levels allow only preliminary identification of DLBPS, which are likely to be
seriously affected by the start of deep sea mining. Specific impacts can only be assessed once mining in
the Area has commenced. Such an assessment can be made by comparing certain quantitative indicators
(such as the value of exports of affected metals' products and its contribution to the value of total export
earnings, physical volumes of production of affected metals, the value of export earnings relative to GDP,
etc.) before and after the beginning of seabed mining. It is important to understand, however, that
provisionally identifying certain DLBPS as the States that may be most seriously affected does not mean
that those same States will indeed be severely affected after the beginning of seabed mining.
7. Special Commission 1 emphasized that when assessing the impact of the start of seabed
mining on DLBPS, it should be kept in mind that any change in the market situation affecting the price
dynamics is always determined by a set of diverse and/or multidirectional factors. It is very difficult to
quantify the individual role of each of these factors. The members of the study group fully support this
conclusion, while noting that, in addition to the obvious factors affecting mineral prices, there may also be
hidden factors whose very existence is not obvious.
8. In assessing the potential impact of activities in the Area by the research group, the following
factors have been taken into account:

7
i. the timing of the production of polymetallic nodules, its volume and the number of affected
metals (copper, nickel, cobalt, and manganese), which can be extracted from the mined
nodules;
ii. the demand/supply balance for each of the affected metals that may have developed by the
time the mining of polymetallic nodules in the Area begins;
iii. the place of any DLBPS in the markets of affected metals;
iv. the role of the affected metals in the economy or export earnings of specific DLBPS.
9. In its work, the study group took into account assumptions from the economic model for
polymetallic nodule exploitation developed by the Massachusetts Institute of Technology, as well as
assumptions from the economic models proposed by the African Group, Germany and China.
10. There is considerable uncertainty concerning the time frame of the commencement of
mining, which is compounded by uncertainty concerning future processing of nodules. It is likely that
individual contractors may start seabed mining in about 2027. It is also likely that the number of such
contractors will increase in the following years and may reach 12 by 2035. If one contractor extracts 3
million tonnes of dry nodules per year, jointly they will produce 36 million tonnes of nodules. The
processing of this amount of nodules could provide 356.4 thousand tonnes of copper, 444.6 thousand tonnes
of nickel, 61.2 thousand tonnes of cobalt, and 9.2 million tonnes of manganese. However, it is more realistic
that only a few of the twelve contractors would be fully prepared to commence production on time. The
remainder will continue working under exploration contracts, which will be extended under the 1994
Agreement.
11. At the average global market price over the past five years, the price of metals in 3 million
tonnes of nodules would amount to approximately USD 173 million for copper, approximately
USD 436.5 million for nickel, and about USD 220 million for cobalt. The nodules themselves were
considered equivalent to manganese ores; their price can amount to approximately USD 425 million. The
price of the manganese products that can be produced as a result of nodule processing will be several times
higher. However, the specific composition of nodules (high phosphorous content) may have a negative
impact on their demand as an equivalent to manganese ores and on their price.
12. The actual value of nodules and the products derived as a result of nodule processing will be
determined by the market situation during the period of extraction.
13. In the analysis of trends and prospects of the development of affected metals markets
(including supply and demand prospects), each market was considered separately. The selected
retrospective level is 2008, the selected forecast horizon is 2035. When estimating demand prospects for
affected metals, consumption forecasts prepared by various consulting agencies and research groups were
used. When assessing supply prospects from land-based producers, parameters of existing mines and
expected indicators of projected mines were used.
14. Considering mining of polymetallic nodules and its potential impact on markets of affected
metals three scenarios were considered: minimum (two contractors), base (six contractors) and maximum
(twelve contractors). All scenarios imply that the first contractor starts mining in 2027 and the second —
in 2030; the remaining contractors (if they participate) join the process in 2031–2033. It is also implied that
a maximum aggregate production level of six or twelve contractors could be reached in 2035. Under these
introductory conditions, three deep-sea mining scenarios for each of the metals in question were considered
(Table I).
15. Copper. There is a considerable number of world copper consumption forecasts. They are
based on the expected growth rates of world GDP and population, the development of “green technologies”,
the transition to renewable energy sources, compliance with the Paris Agreement on the regulation of
measures to reduce carbon dioxide in the atmosphere, and other factors. For all diversity of forecasts, the
projected growth rate of copper consumption varies between 1.8–4 % per year.
16. Three cases of world copper consumption growth were chosen for the analysis: 2 %, 2.8 %,
and 3.5 %.

8
17. It is expected that the bulk of land-based mine projects will be commissioned from 2025,
and in 2035 they will be able to produce 10.3 million tonnes of copper (50 % of the current level).
Production of secondary copper is also expected.
Table I. Projected rates of mining of polymetallic nodules and production of affected metals with two, six
and twelve contractors mining
2 contractors 6 contractors 12 contractors
Beginning of production, year 2027 2027 2027
Reaching full capacity, year 2032 2035 2035
Mining of polymetallic nodules at full
capacity, tonnes 6,000,000 18,000,000 36,000,000
Production of affected metals with mining at
full capacity, tonnes
Cobalt 10,200 30,600 61,200
Nickel 74,100 222,300 444,600
Copper 59,400 178,200 356,400
Manganese 1,533,600 4,600,800 9,201,600
18. With the global copper consumption growing by 2 % per year and the implementation of all
land-based projects, the market will be saturated with copper until 2035, which will have a negative impact
on price movements. Under such conditions, some of the land-based mine projects will be delayed or
temporarily abandoned.
19. With the copper consumption growth at 2.8 % per year, the threat of metal shortages may
arise even if all projects are commissioned, but after 2032.
20. With the global consumption growth at 3.5 % per year, metal shortages may occur after 2030,
and if the commissioning of some of the projects is delayed for some reason, metal shortages may occur
earlier.
21. It can be expected that if the average annual growth rates of real consumption will exceed
2–2.5 %, then from the mid-2020s new projects of land-based production will appear, including those based
on the currently explored objects.
22. Mining of polymetallic nodules, with copper consumption increasing by 3.5 % per year
alone, will not have any impact on the copper supply/demand balance; under such circumstances, even a
maximum scenario would not have serious adverse effects on the market. However, there may still be some
decline in copper prices, as possible supply tensions will be reduced. Under other consumption growth
scenarios, copper shortage may manifest itself either after 2032 or not at all — all the world economy's
copper needs may be met by land-based production and secondary metal. In this case, even small volumes
of copper from polymetallic nodules may put additional pressure on the market.
23. Nickel. The main prospects for growth of nickel consumption are related to the electrification
of motor vehicles and the production of high-capacity batteries. Estimates of nickel demand growth in this
area vary greatly and range from 4 to 14 times increase by 2030.
24. Three cases of world nickel consumption growth were chosen for the analysis: 2.6 %, 4 %,
and 5 %.
25. It is expected that the commissioning of new land-based mines will start in the next year or
two. In 2035, they may provide about 750 thousand tonnes of additional metal; as a result, nickel mine
production may exceed the current level by one third.
26. Despite a significant increase in production with consumption growth of 2.6 % per year after
2029, the market may face a primary metal shortage. However, this forecast does not take into account

9
stocks reserves (exchanges and companies) and secondary metal (there are prospects for growth of its
production). Therefore, the shortage may turn out to be significantly lower.
27. In the other two scenarios, the market may experience a shortage over the whole period under
consideration. This would create conditions for the intensification of preparations for the exploitation of
known but inactive deposits. In addition, in recent years, there has been an increase in expenditures for
nickel exploration, which may result in the identification of new deposits that can be put into operation
quickly.
28. If production of polymetallic nodules starts in 2027 and increases with the intensity we
expect, it will not cause overproduction of nickel even with the minimum expected growth rate of
consumption, the commissioning of all currently known projects of new land-based mines, and offshore
mining by twelve contractors. Only the first years of offshore mining can be an exception. The earlier
appearance of nickel from polymetallic nodules on the market at the lowest expected growth rate of metal
consumption may cause a significant surplus of the metal, which may persist for several years. Only if
nickel consumption growth rates are higher than the low scenario of consumption growth, the beginning of
offshore mining will not cause overproduction of the metal.
29. Cobalt. Almost all cobalt production is a by-product, mainly with copper (from sediment-
hosted stratiform and stratabound copper deposits) or nickel (from magmatic nickel-copper-cobalt sulphide
deposits and nickel laterites). As a result, the dynamics of cobalt mining and production are correlated with
the production of copper and nickel from certain types of deposits. This determines the complexity of
bringing the demand for cobalt and its production in a balanced state.
30. Prospects for cobalt consumption are linked to the lithium-ion batteries sector. At the same
time, several factors (including price volatility and concerns about insufficient supplies) have led to changes
in the chemical composition of lithium-ion batteries, which are aimed at complete replacement of cobalt or
reduction of its content.
31. To date, there is quite a large number of forecasts for global cobalt consumption growth.
Three cases were chosen for the analysis: 5.6 %, 7.2 %, and 8.8 %.
32. The commissioning of new land-based mines is expected to start in the next year or two. By
2035, they may provide 75 thousand tonnes of additional metal; as a result, cobalt mine production may
exceed the current level by one third even if some of the currently exploited fields are exhausted.
33. With an annual growth rate of 5.6 % in world cobalt consumption and the realization of all
projects, the metal shortage may occur after 2028. Given the expected overproduction in previous years,
the market may feel it with a delay.
34. If the cobalt consumption grows by more than 7 % per year, the threat of a shortage will
already occur in 2026–2027, even if all projects are commissioned.
35. The expansion of land-based production of cobalt is complicated by the by-product nature
of its production. However, there is reason to believe that with the shortage approaching, the commissioning
of projects based on cobalt-containing ore deposits, which are currently inactive or are on the early stages
of exploration, will accelerate. The shortage of cobalt and the resulting price increase may also stimulate
its fuller extraction from mined ores, primarily laterite ores.
36. If production of polymetallic nodules starts in 2027 and increases according to any of the
scenarios we are considering, even with a minimum expected consumption growth rate (+5.6 % per year)
and the commissioning of all currently known new land-based mine projects, there will be no formal
overproduction of cobalt. Only the first years of offshore mining can be an exception. However, significant
overproduction of cobalt can be expected up to 2028 and is difficult to avoid. As a result, so large stocks
of cobalt may accumulate in various warehouses that insufficient production will be compensated for by
these stocks for a long time to come. Accordingly, the metal prices will be at a low level. Then, the
beginning of offshore mining will exacerbate the situation. At the same time, it is possible that the price
level will be critical for the offshore mining itself, making it low-profit or even unprofitable.
37. Manganese. The main factor determining the prospects of the world manganese
consumption is the dynamics of steel industry development, which, in turn, depends on the global economic
situation as a whole.

10
38. Forecasts of manganese ores consumption made by various analysts are relatively close —
it is expected to increase by 1–3 % per year. Three cases of manganese demand forecasts were chosen for
the analysis: 1 %, 1.5 %, and 3 %.
39. Production of manganese ores on existing mines can increase by approximately 20 % by
mid-2020s by expanding their capacity. In addition, in the next year or two, new land-based mines will be
commissioned, which together could provide over 7 million tonnes of additional ore per year by 2035. As
a result, production of manganese ore may exceed the current level by about a third by 2035.
40. If the consumption of manganese ores grows by 1 % per year (this scenario is possible with
a decrease in steel output growth rates in China, which is forecasted by many analysts), demand for it will
be provided by existing operations. At the same time, the production volumes of manganese ores may
significantly exceed the consumption level, which will have a negative impact on prices. Market surpluses
and low prices will force producers of manganese ore to reduce output or suspend operations; most new
mine projects will be frozen and exploration will be stopped.
41. If the consumption of manganese ores grows by 1.5 % per year, the capacity of the existing
enterprises will be sufficient to provision manganese ores until 2030; the shortage that may arise in the
future will be covered by the existing projects.
42. At the growth of consumption of manganese ores by 3 % per year, the operating mines and
ground projects can provide manganese ores only until 2025. Expectancies of shortage in the next years
can cause intensification of development of new deposits, and also exploration works aimed at revealing
new manganese ores deposits. Commissioning of new deposits may eliminate the potential shortage of raw
materials.
43. A “niche” in the manganese market, which can be occupied by deep-sea mining, will emerge
only if consumption of manganese ore grows by more than 2 % per year. At the same time, the volumes of
“sea” manganese production, which the market will be able to absorb painlessly, will be determined by the
consumption growth rate. If they are 3 % per year and production starts in 2027 at our anticipated rate, the
manganese market is likely not to be adversely affected by the operation of no more than six contractors.
With more contractors operating or at a lower rate of growth in consumption, the manganese market will
be adversely affected, which may have a negative impact not only on land-based producers but also on the
contractors themselves.
44. Polymetallic nodules. It is important to understand that the situation in the markets will also
have an impact on the prospects for implementing seabed mining projects. A decrease in prices for one or
more of the four affected metals, caused by any reason, automatically reduces the market value of
polymetallic nodules as raw materials for the extraction of these metals. This decline may result in some or
even all seabed mining projects becoming subeconomic or unprofitable. This transformation is possible
both before and during seabed mining. At the same time, one should expect tougher competition between
different market participants, which will include seabed mines; the survival of each of them will depend on
the level of profitability at a certain level of prices for affected metals.
45. The market position of polymetallic nodules and, consequently, the profitability of their
production projects will also be affected by the organization of their processing. At present, it is anticipated
that nodules will first be processed to extract copper, nickel, and cobalt, and the remaining manganese-rich
slag will then be sold to producers of manganese products (ferro-alloys or EMM). In this connection, the
issue of interaction between different links of such an organizational and production chain remains
unsolved.
46. Assessment of potential impact on relevant DLBPS. Offshore mining, under any scenario,
will have a significant impact on the markets of affected metals, changing the direction and volume of
supply of these metals. An additional factor of influence on affected metals markets and their participants
will be a possible decline in prices for these metals. Both the change in the structure of markets and the
decline in prices can have a negative impact on the economy and export earnings of DLBPS, with varying
degrees of intensity. First of all, it may affect those DLBPS, export deliveries of which are oriented to the
markets of the contractor sponsoring countries.

11
47. Developing land-based producers States. Depending on the state and specialization of the
economies of specific DLBPS, the degree of negative impacts of seabed mining may vary. Such an indicator
as a share of export earnings from affected metals in export earnings of DLBPS as a whole is used as a
criterion for estimation of the severity of negative effects. It is accepted that if at least 10 % of DLBPS
export earnings are generated by affected metals, the economy of this DLBPS is dependent on the export
of affected metals, and a decrease in income from it can lead to serious negative effects.
48. It has been determined that among the countries exporting affected metals, which are likely
to be most seriously affected by seabed mining, there are 13 DLBPS (Table II):
Table II. Countries exporting copper, nickel, cobalt and manganese products which are likely to be most
seriously affected by seabed production
Products share in export
revenues, %
Products share in GDP,
%
Exporters of copper products
Zambia 56.1 18.7
Democratic Republic of the Congo 55 11.1
Eritrea 50 5.6
Chile 48.9 12.8
Lao People's Democratic Republic 34.4 7.7
Mongolia 26 15.9
Peru 25.8 5.1
Exporters of nickel products
Madagascar 20.3 3.7
Zimbabwe 15.6 3.1
Exporters of cobalt products
Democratic Republic of the Congo 24.3 4.8
Exporters of manganese products
Gabon 21.9 5
Cumulative effect of exports of all affected metals
Mauritania 12 4.8
Namibia 11.4 4.9
Papua New Guinea 10.6 4.3
49. It should be noted that this study identified DLBPS, which are likely to be seriously affected
by seabed mining, but did not offer any assistance or compensation to such DLBPS since that this issue is
taken into account in the Agreement relating to the Implementation of Part XI of the United Nations
Convention on the Law of the Sea of 10 December 1982 (1994 Agreement).
50. 1994 Agreement establishes principles for the provision of economic assistance to
developing countries which suffer serious adverse effects on their export earnings or economies resulting
from a reduction in the price of an affected mineral or in the volume of exports of that mineral, to the extent
that such reduction is caused by activities in the Area. According to that document, the Authority shall
establish an economic assistance fund in the proportion of the Authority's funds, which exceeds those
necessary to cover the administrative expenses of the Authority. For the establishment of such a fund, only
those funds from royalty payments received by the Authority from contractors, including the Enterprise,
and voluntary contributions shall be used (1994 Agreement).
51. Thus, the first step for the Authority is to determine the rates of royalty payments to be
received from contractors in order to be able to pre-assess the possible extent of the economic assistance
fund for the affected DLBPS. With the start of seabed mining, the amount and duration of economic
assistance will be determined individually, taking into account the nature and magnitude of the problems
faced by the affected DLBPS (Agreement 1994).

12
INTRODUCTION
52. For about half a century, mankind has been concerned that the rapidly increasing production
of mineral resources could lead to the rapid depletion of the world's mineral resource base. The main reason
of such anxiety is in fundamental importance of mineral resources both for world economy and for existence
of human civilization as a whole. Long-term provision of economy with mineral resources is one of
guarantors of its sustainable development.
53. These fears are not quite groundless. Statistical data on production indicators of the world
mining industry unequivocally show the increasing load on the Earth's mineral and raw material base. Thus,
if we consider the basic metals contained in ocean polymetallic nodules, according to USGS estimates1,
over the entire XX century, global copper production amounted to 396.4 million tonnes, and over the period
from 2000 to 2015 — to 251.2 million tonnes. For nickel, these figures were 34.8 and 28.6 million tonnes
respectively, for cobalt — 1.34 and 1.31 million tonnes, for manganese — 433.3 and 198.2 million tonnes.
Therefore, it is natural to expect that at this rate of mining growth, there will be a moment when there will
be no mineral resources available for humankind.
54. Indeed, increased mining has resulted in accelerated depletion of the resources of mined
deposits, a reduction in the number of untapped deposits located in traditional mining areas or in easily
accessible areas, and a decrease in the quality of mined ores. However, the vast majority of minerals are
not experiencing quantitative reductions, as the data in Table 1.1 clearly demonstrate. Among the metals
presented in the table the exception is manganese, but in 2016 its reserves increased to 690 million tonnes2.
Table 1.1. Identified land-based resources of copper, nickel, cobalt, and manganese in 1995 and 2015 and
joint production of these metals in 1995–2015
Metal
Identified land-based resources Total mine
production for
1995–20153 19954 20155
Copper, billion t 1.6 2.1 0.3
Nickel, Mt 130* 130* 34
Cobalt, Mt 11 25 1.5
Manganese, Mt 680** 620** 235.6
* — resources containing at least 1% nickel
** — reserves; no resource estimate
55. The growth of resources against the background of increased production is based on two key
factors. Firstly, it is active exploration with the involvement of new methods and techniques, including new
areas, and secondly, the emergence of new and better known technologies in the field of ore processing,
which transfers deposits unprofitable in the past into the category of profitable.
56. Thus, the exhaustion of raw material bases of industrial metals in general is a distant
prospect. Nevertheless, active work is being done to identify potential and promising sources of minerals.
These include the mineral resources of the World Ocean floor.
57. The emergence of a major source of a new type of raw material and the beginning of the
process of its development make the question of what consequences it may provoke for the world market
1 USGS. National Minerals Information Center. Historical Statistics for Mineral and Material Commodities in the
United States (2016 version), https://www.usgs.gov/centers/nmic/historical-statistics-mineral-and-material-
commodities-united-states 2 USGS. Mineral Commodity Summaries 2017, https://s3-us-west-2.amazonaws.com/prd-
wret/assets/palladium/production/mineral-pubs/mcs/mcs2017.pdf 3 USGS. National Minerals Information Center. Historical Statistics for Mineral and Material Commodities in the
United States (2016 version), https://www.usgs.gov/centers/nmic/historical-statistics-mineral-and-material-
commodities-united-states 4 USGS. Mineral Commodity Summaries 1996, https://prd-wret.s3-us-west-
2.amazonaws.com/assets/palladium/production/atoms/files/mcs-1996ocr.pdf 5 USGS. Mineral Commodity Summaries 2016, https://s3-us-west-2.amazonaws.com/prd-
wret/assets/palladium/production/mineral-pubs/mcs/mcs2016.pdf

13
of raw materials in general and its individual participants in particular. This question is usually of theoretical
nature. However, in relation to the resources of the World Ocean floor, it is of fundamental importance.
The reason for that is, according to the UN Convention on the Law of the Sea, “area of the seabed and
ocean floor and the subsoil thereof, beyond the limits of national jurisdiction, as well as its resources, are
the common heritage of mankind, the exploration and exploitation of which shall be carried out for the
benefit of mankind as a whole.” “Activities in the Area shall … be carried out in such a manner as to foster
healthy development of the world economy and balanced growth of international trade, and to promote
international cooperation for the over-all development of all countries, especially developing States, and
with a view to ensuring: … f) the promotion of just and stable prices remunerative to producers and fair to
consumers for minerals derived both from the Area and from other sources, and the promotion of long-term
equilibrium between supply and demand; … h) the protection of developing countries from adverse effects
on their economies or on their export earnings resulting from a reduction in the price of an affected mineral,
or in the volume of exports of that mineral, to the extent that such reduction is caused by activities in the
Area” (Convention, article 150 (f, h)).
58. Under the regime of the Area established by the Convention and the 1994 Agreement,
activities in the Area are organized and controlled by the International Seabed Authority (Authority).
Among other things, the Authority's functions include “study of the potential impact of mineral production
from the Area on the economies of developing land-based producers of those minerals which are likely to
be most seriously affected, with a view to minimizing their difficulties and assisting them in their economic
adjustment, taking into account the work done in this regard by the Preparatory Commission”.
59. The study has been carried out in line with the terms of the references endorsed by the Legal
and Technical Commission at its meetings in March 2019.6
60. The purpose of the study is to inform the Legal and Technical Commission, in performing
the funcition of the Economic Planning Commission, with a preliminary assessment7 of the potential
magnitude of any impact on developing land-based producers who may suffer serious adverse effects on
their export earnings or ecnomies as a result of a reduction in price or reduction in the volume of an affected
matals, and where such reduction could be caused by activities in the Area. The Study is also expected to
make an important contribution to the development of an economic assistance policy by the Authority in
accordance with the principles established by the 1994 Agreement (Annex, Section 7), and to recommend
areas of further study or research.
61. The study concerned four metals contained in polymetallic nodules: copper, nickel, cobalt,
and manganese.
62. This report presents the results of the study.
Objectives and methodology
63. Potential seabed mineral production (including polymetallic nodules production) for DLBPS
and their evaluation criteria were considered by Special Commission 1 of the Preparatory Commission.
Areas for in-depth studies to be carried out to examine the possible impacts of seabed mineral production
on DLBPS were also identified at that time. These included, in particular, the following areas:
a) projection and estimation of the production volume of each of the following metals from
mining in the Area,
b) assessment of the interaction between land-based mining in the Area and production in the
context of the world supply and demand situation and the various world markets; such an
assessment should indicate short-term (less than 5 years), medium-term (between 5 and 20 years)
and long-term (more than 10 years) trends,
c) quantitative assessment of the impact on export and economy.
6 See paragraph 14 of ISBA/25/C/19. 7 At this stage, the study will be indicative of the potential magnitude of any impact, and consideration of how this is properly traced through the value chain at the later stage of exploitation activities.

14
64. These directions were in line with the key tasks assigned to the research team by the
Authority.
65. The research team was also tasked with identifying and demonstrating development trends
in copper, nickel, cobalt and manganese markets.
66. In accordance with the recommendations of Special Commission 1, 2035 was chosen as the
forecast horizon for the ongoing study.
Projection or estimation of the volume of production of each metal from mining in the Area
67. Owing to the uncertainties in the timing of the commencement of mining in the Area and its
possible scale, the only possible approach to addressing this issue was a scenario-based approach.
The start of production scenarios considered were based on the completion dates of the current exploration
contracts. Information in public space regarding the status of exploration contracts, which expire in 2021,
and the readiness of the processing industry to operate on new raw materials was also taken into account.
This has made it possible not only to assess the possible timing of the commencement of production, but
also the maximum number of contractors who may be ready to commence production during the period
under review. The results, combined with the economic model of the Massachusetts Institute of Technology
(2019), allowed to identify scenarios of deep-sea production development.
68. In order to estimate the production of each of the four metals considered (copper, nickel,
cobalt and manganese) for mining in the Area, data on the productivity of one polymetallic nodule mining
contractor (including the rate of full productivity), the polymetallic nodule contents of those metals and the
recovery rates of those metals as shown in the economic model of the Massachusetts Institute of Technology
(2019) were used. Production volumes for different scenarios were proportional to the number of
contractors producing in a given estimated year.
69. As a result, the study considered three possible scenarios for the development of deep-sea
mining: a minimum scenario involving two contractors; a baseline scenario involving six contractors; and
a maximum scenario involving 12 contractors. All of the scenarios assumed the following:
• the first contractor starts production in 2027 and the second one in 2030; the remaining
contractors (subject to their participation) join the process in 2031–2033;
• a maximum aggregate production level of six or twelve contractors may be reached in 2035;
• each contractor achieves full capacity progressively over three years: the first year, 33 %
(1 million tonnes of dry nodules), the second year, 66 % (2 million tonnes of dry nodules), the
third year and beyond, 100 % (3 million tonnes of dry nodules).
Assessment of the relationship between mining in the Area and land-based production in the context of
the world supply and demand situation and the various markets around the world
70. This task required a comparison of the expected supply/demand balance in the copper,
nickel, cobalt and manganese markets over the period under review with the possible production of these
metals in the Area.
71. To assess potential demand, current consumption projections of the affected metals made by
various research groups and international organizations, as well as some interested companies, were used.
Since these forecasts are multiple, we also used a scenario approach. For these purposes, we chose 3 cases:
minimum, maximum and basic (intermediate).
72. In order to assess the potential proposal, a possible land-based mining production was
assessed for the period until 2035.
73. Possible future production consists of two components: production of currently operating
mines and production that can be achieved through new deposit development projects.
74. The expected production from existing mines was determined based on actual production in
2018, taking into account planned expansion projects for existing capacity (if any). At the same time, the
resource base of the enterprises was taken into account while maintaining production at the achieved or
planned level. In this way, the operations that could drop out during the period under review due to the

15
complete exhaustion of resources were identified. Prospects of expansion of resource base at the expense
of geological exploration works and, accordingly, possible prolongation of term of existence of the
operations, were not considered. The main source of information for this was mining companies' reports.
75. Due to the fact that most countries do not have data for all the countries in operation, in order
to get the most complete picture of the world mining industry, the missing production volumes were
recorded based on official government statistics and/or industry statistics. This primarily concerned China,
but also several other countries such as DR Congo and Latin America (Chile, Peru, etc.). Data for the
country as a whole were also drawn from relatively small producing countries. Taking this part of
production into account, it was assumed that it would remain at 2018 levels.
76. When assessing production at the fields currently under development, the expected (design)
production and planned commissioning dates of the projects were taken into account. If for a project the
commissioning dates are not defined by the company that implements the project, they have been evaluated
on the basis of its implementation stage (Preproduction, Construction, Feasibility Study, Prefeasibility
Study). Also on the basis of design productivity and the sizes of resource base the possible term of existence
of the operations was considered.
77. As part of the scenario approach, all the projects under consideration were conditionally
divided into the Proved and Possible categories in terms of their potential involvement in operation.
78. Comparison of consumption growth scenarios with land-based production scenarios allowed
to estimate possible balance of supply and demand in the period under review. Inclusion of the expected
levels of metal production in the Area under different scenarios made it possible to assess possible
interaction between land-based and offshore production depending on market developments.
Analysis of market trends for affected metals
79. The analysis of trends characterizing the markets of affected metals was carried out on the
basis of data reflecting the dynamics of production of various products (primary, semi-finished and end
products), dynamics of their consumption and international trade, and world market prices.
80. The materials of British Geological Survey, International Copper Study Group, International
Nickel Study Group, Cobalt Institute, International Manganese Institute, and United States Geological
Survey were the sources of production and consumption data. Websites of International Trade Centre
(https://www.trademap.org) and Chatham House, the Royal Institute of International Affairs
(https://resourcetrade.earth) were the sources of international trade data.
81. The period under consideration included 2008–2017.
Quantitative assessment of consequences for export and economy
82. Depending on the state and specialization of the economy of a particular DLBPS, the degree
of adverse impacts from seabed mining may vary. Criteria for identifying DLBPS which may be most
severely affected by seabed mining have been proposed by Special Commission 1. These criteria are called
dependency thresholds. They make it possible to estimate how much the export earnings or the DLBPS
economy depends on the four affected metals for it. It was assumed that States whose dependency levels
exceeded the established values could be severely affected by seabed mining.
83. In this study we used such thresholds of dependence as absolute value of export revenue in
total DLBPS export revenue and value of export revenue from four minerals in DLBPS economy. It is
accepted that if at least 10 % of DLBPS export revenue is generated by affected metals, the total export
revenue of this DLBPS depends on the export of affected metals. The second criterion used is the share of
export earnings in DLBPS GDP: if at least 5 % of GDP is based on export earnings from the four affected
metals, the economy of this DLBPS is dependent on exports of affected metals. If a DLBPS met the criteria,
the State was considered dependent on one or more of the four metals affected. The decrease in that State's
income from the export of those metals, due to seabed mining, could then have serious negative
consequences.

16
OVERVIEW OF WORK DONE BY THE PREPARATORY
COMMISSION
84. While establishing an international régime for the newly-defined maritime zone, the Area,
i.e., “the sea-bed and ocean floor and subsoil thereof, beyond the limits of national jurisdiction”
(Convention, article 1 (1)), the 1982 United Nations Convention on the Law of the Sea dealt with a number
of related issues, one of them being “the protection of developing countries from adverse effects on their
economies or on their export earnings resulting from a reduction in the price of an affected mineral, or in
the volume of exports of that mineral, to the extent that such reduction is caused by activities in the Area,
...” i.e., “all activities of exploration for, and exploitation of, the resources of the Area” (Convention, articles
150 (h) and 1 (3)).
85. In the above context, pursuant to paragraphs 9 and 5 (i) of Resolution I of the Third United
Nations Conference on the Law of the Sea, the Preparatory Commission for the International Seabed
Authority and for the International Tribunal for the Law of the Sea, during its resumed session in Summer
1983, established Special Commission 1.
86. Mandate of the Special Commission included “undertak(ing) studies on the problems which
would be encountered by developing land-based producer States (DLBPS) likely to be most seriously
affected by the production of minerals derived from the Area with a view to minimizing their difficulties
and helping them to make the necessary economic adjustment, including studies on the establishment of a
compensation fund, and submit(ting) recommendations on the (International Seabed) Authority thereon”
(Resolution 1, paragraph 5(i)).
87. The Special Commission started its work in Spring 1984 during the second session of the
Preparatory Commission. Understanding that “in studying the problems of developing land-based producer
States, it is necessary to know, first, which minerals would be produced from sea-bed sources; second, how
the introduction of the minerals from this new source would affect the existing land-based producers; third,
what would these effects be and which developing States would be affected; fourth, what problems or
difficulties, in connection with these effects, these developing States would encounter; and finally, what
could be done to minimize these difficulties” constituted the programme of work of the Special Commission
1. The programme included the following subject areas:
i. Projection of future production from the international seabed Area;
ii. Relationship between production from the Area and existing land-based production;
iii. Identification, definition and measurement of effects of seabed production on DLBPS;
iv. Determination of the problems/difficulties that would be encountered by the affected
DLBPS;
v. Formulation of measures to minimize problems/difficulties of affected land-based
producer States.
88. The discussions revealed the interrelationships between all these areas, especially between
(ii), (iii) and (iv). Furthermore, the need for relevant data and information was recognized and discussed on
several occasions by the Commission. In this regard, the discussions on the problematic areas have been
conducted in an integrated manner. Nevertheless, four main areas of concern can be identified:
A. Projection of future production from the international seabed Area;
B. Relationship between production from the Area and existing land-based production;
Identification, definition and measurement of effects of seabed production on DLBPS;
Determination of the problems/difficulties that would be encountered by the affected
DLBPS;
C. Formulations of measures to minimize problems/difficulties of DLBPS;
D. Data and information needs.
89. Regarding the necessary data and information, the Commission concluded that the following
topics are of particular importance:

17
− Information about minerals, their markets, production, consumption, export, import, trade
flows, prices etc.
− Information about DLBPS, their production, importance of minerals for their economies;
− Information of the existing international or multilateral economic measures that can be
related to the work of the Special Commission.
90. It should be noted that the mandate of Special Commission 1 was of a somewhat different
nature from that of the other organs of the Preparatory Commission. It did not presuppose procedural
preparation for the start of the functioning of various structures, but the conduct of studies, mainly aimed
at determining the potential impact of future development of the seabed on the production of relevant
minerals in developing States, and making recommendations on the basis of such studies. So, the work of
the Special Commission was very difficult from a technical point of view; it provided for the use of data
and information, research and analysis, studies and assessments. As a result of this work, it was recognized
that the documentation, which is a report on its work, is an extremely useful source of material for the
Authority. In this regard, all the documentation of Special Commission 1 is fully presented in the Report
of the Preparatory Commission for submission to the Assembly of the Authority at its first session
(document LOS/PCN/153). These documents were included in volumes VI – IX.
A. Analysis of work in connection with potential impacts
Minerals that were used as a basis for identification of potential impact
91. Special Commission 1 came to a conclusion that the Authority should concentrate its work
on polymetallic nodules, including the projected timing of commercial production from the Area. It was
further decided to concentrate work on extraction of copper, nickel, cobalt and manganese which appeared
to be more cost-effective, rather than consider all the minerals contained in polymetallic nodules. For other
minerals it was recommended by the Special Commission 1 to keep in view all the trends and development
regarding them.
Relationship between the seabed mineral production and the price and the volume of export of the
relevant mineral
92. Regarding the relationship between production from the Area and existing land-based
production (identification, definition, and measurement of effects of seabed production on DLBPS;
determination of the problems/difficulties that would be encountered by the affected DLBPS) Special
Commission 1 came to a conclusion that, taking into account the fact that seabed mining will only occur in
the future, the above mattes cannot be studied with any reasonable degree of precision and accuracy. In this
regard the Authority should concentrate on relevant data, information and analysis as well as on the
expected time frame for the beginning of production from the Area, which require the projections regarding
the demand for manganese, copper, nickel and cobalt contained in polymetallic nodules to identify.
93. At that, the Commission came to a conclusion that it is more efficient to assess the
relationship between the production from the Area and land-based production for each mineral separately.
This assessment should be of long-term nature.
94. A similar approach should be used to assess the effects of production from the Area: these
should be considered separately for each state that can be affected.
95. The Commission identified that the adverse effects of seabed mineral production on the
export earnings and economies of DLBPS are the possibility of the excess supply of primary products
extracted from the relevant minerals and the following price reduction. In addition to that, there is an
opportunity for consumer countries to supply the import demand with the seabed mineral production, which
will lead to the reduction in export volume from DLBPS to these countries.
96. Price reduction for certain mineral or the reduction in its export volume may lead to the
reduction in export earnings or to the adverse effects on the economies of DLBPS. These adverse effects
may lead to
i. direct reduction of earnings for DLBPS,

18
ii. increase in unemployment,
iii. lack of foreign currency,
iv. reduction in state income and reduction in development investment funds,
v. the so-called side effects as reduction in production of minor minerals,
vi. the multiplier effect which reflects the connections of affected mining sectors with other
sectors of the economies of DLBPS.
97. The difficulties may also be encountered in the field of balance of payments, economic
slowdown, social upheaval and political implications.
98. At the same time Special Commission 1 noted that the main issue for DLBPS may be their
limited ability to counter and control these effects and not the effects themselves, whereas the degree of
limitations may be different for each state depending on a number of factors. This requires the examination
by the Authority.
Isolation of the effects of the seabed exploitation
99. Special Commission 1 noted that it is an issue to identify if the price reduction for a certain
mineral or reduction in export volume from DLBPS was caused by the seabed production of this mineral,
because this can be the cumulative effect of seabed mineral production as well as other factors. Thus, if the
seabed mineral production begins simultaneously with commissioning of the big new land-based mining
operation, the resulting price will reflect the impact of the new mineral flow both produced from the seabed
and from the new land-based mining operation. To identify the impact of flow of minerals produced from
the seabed, it is necessary to separate it from the impact of the minerals produced from the new land-based
mining operation.
100. Following this reasoning, a list of factors which can act simultaneously with the seabed
mineral production and impact the price or export volume of the relevant minerals, was composed.
Therefore, the effects of these factors must be isolated. The list included the following factors:
i. change of economic environment in relevant DLBPS;
ii. changing situation on the market of relevant metals;
iii. change in supply of relevant metals from other sources and changing of production costs
from other sources;
iv. change of technology in exploitation, processing and using of relevant metals;
v. substitution of one mineral with the other;
vi. natural disasters occurring in the relevant time frame;
vii. strikes or riots occurring in the relevant time frame;
viii. changing situation in DLBPS regarding the reserves and resources of relevant metals;
ix. change in the system of using of secondary resources (recycling);
x. cyclical fluctuations of economy;
xi. fluctuations of exchange rates etc.
101. It was noted that these factors should be taken into account in developing the methodology
of identifying the price reduction for the affected mineral or the export reduction of the mineral caused by
the seabed mineral production.
B. Criteria for or background to concept of serious adverse effects
102. Special Commission 1 marked that the characterization of adverse effects of seabed
production on the export earnings or economies on developing land-based producer States (DLBPS)
involves a combination of two aspects:
1. one or more of the four minerals concerned – copper, nickel, cobalt and manganese
– have an important or significant role in the total export earnings or economies of the individual

19
DLBPS, that is, the individual DLBPS have to be dependent to a certain degree on these
minerals;
2. there has to be a decrease of a somewhat substantial extent in the export earnings
of individual DLBPS from the export of these minerals, or an unfavorable change of a somewhat
substantial extent in the economies of individual DLBPS.
103. These two aspects of the dependency of a DLBPS on the export earnings of the four minerals
concerned, and a somewhat substantial fall in export earnings have been discussed in Special Commission
1. There have been attempts to characterize the dependency aspect in a quantifiable manner with the use of
some figures. These are called “dependency levels”. Again, there have been attempts to characterize the
aspect of somewhat substantial unfavorable change after seabed production occurs in a quantifiable manner
with the use of some figures. These are called “trigger levels”, because they form the basis of triggering
some action by the organization concerned.
104. Under agreements reached in Special Commission 1, DLBPS can contact the Authority if it
considers that it is affected or is likely to be affected. The Authority will examine the request of the State
and will conduct an in-depth investigation with a view to identify common effects on the export earnings
and economy of the State, to find out to which extent these effects were/will be a result of seabed mineral
production, and to determine the remedial measures to be taken, if necessary.
Criteria for identification of DLBPS likely to be seriously affected as a result of seabed production of
minerals
105. In conformity with the provisions of Articles 150(h) and 151(10) of Convention, Special
Commission 1 agreed that the criteria on which DLBPS should be considered most seriously affected by
seabed mining, would be related to export earnings or economies of DLBPS. These criteria will be based
on the extent to which individual States depend on the contribution of copper, nickel, cobalt and manganese
to their export earnings and their economies before the beginning of the seabed mining.
106. Special Commission 1 concluded that as quantitative indicators reflecting the role of the
metals in question in export earnings and the DLBPS economy, one can use
i. absolute value of exports of the four minerals;
ii. absolute value of export earnings in relation to total export earnings;
iii. absolute amount of production;
iv. value of production in relation to total Gross National Product or total Gross Domestic
Product;
v. value of export earnings from the four minerals in relation to the economy;
vi. some combination of various quantifiable yardsticks related to export earnings and those
related to economies. The Special Commission, if it preferred such combination, should
have expressed this quantitatively.
107. The Commission concluded that the most efficient implementation of these criteria lies in
the use of relevant statistical data. Under this approach the emphasis should be placed on statistically
measurable indicators.
108. Members of Special Commission 1 agreed that the effects on export earnings are more
suitable for statistic assessment than the effects on economy. The clearest statistically measurable indicator
of export earnings from one or more minerals concerned is their price. It was noted, however, that such an
assessment is related to a number of issues, among them the need to consider the export on barter basis
correctly. In terms of direct economic indicators one of them is the value of production of one or more of
the four mineral commodities concerned. It was noted that the main issue to be considered with regard to
the value of production is the availability of statistics on the valuation of the amounts of outputs in the
mineral sectors concerned. For the purpose of measuring gross domestic or national product accountable to
these sectors, double-counting of the values of secondary inputs has to be avoided. The prices at which the
outputs are valued should be the prices the producers receive rather than any reported prices. This is
considered a major issue in the present and was so in the past.

20
109. The criteria for identification of DLBPS likely to be seriously affected as a result of seabed
mineral production will be the “critical” level of certain indicator that requires identification. At that, it was
noted by Commission that the numerical indicators of “critical” levels can change depending on many
factors, such as
i. producing capacity of certain state regarding one or more relevant minerals;
ii. the projected future production;
iii. size of raw material base (resource) of relevant minerals;
iv. Gross Domestic Product (GDP) and per capita income;
v. population size;
vi. the size of the state;
vii. geographical position of the state.
110. Special Commission 1 pointed out that the statistical data on the current level of export can
only allow preliminary identification of relevant developing states. It was emphasized that preliminary
identification of various DLBPS as states likely to be seriously affected will not presume that these states
will be identified as seriously affected after the seabed mining occurs. The final identification of DLBPS
that will be seriously affected by seabed mining will only be possible with taking into account the actual
effects of seabed mining on export earnings or the economy of relevant DLBPS.
111. During the work of Special Commission 1 the question of categorization of DLBPS based
on the dependence of their economies and export earnings from the production and export of copper, nickel,
cobalt and manganese was actively discussed. It was originally suggested that three DLBPS categories
should be distinguished by their dependency: i) dependent, ii) highly dependent, and iii) very highly
dependent. Accordingly, it was also suggested that three DLBPS groups should be distinguished by the
level of probable negative impact: i) likely to be affected, ii) likely to be seriously affected, and iii) likely
to be most seriously affected.
112. These proposals were subsequently revised and, as a result, Special Commission 1 decided
to designate only one category of DLBPS by degree of dependency – “dependent”. This category should
include DLBPS, which receive on average at least 10 % of annual export earnings from exports of the
metals in question in the last 3 years preceding the application. Regarding the “least developed” DLBPS
identified in the relevant United Nations documents, critical levels of dependency fall by 33 %. In certain
cases, when DLBPS can demonstrate that they are likely to face or are facing certain issues as a result of
seabed mineral production, the Authority can consider them “dependent”, even if the percentage of relevant
metals in their export volume is lower than the established percentage.
Serious adverse effects of seabed mining
113. Special Commission 1 emphasized that it is essential to agree on criteria to be used by the
Authority to determine, when seabed mining occurs, whether or not the effects on the export earnings or
economies of the DLBPS concerned are serious.
114. After seabed mining occurs, if the observed effects on the export earnings or economies of
the DLBPS concerned are of an extent more than, or equal to the established indicators, the Authority shall
carry out an in-depth study, which will include a thorough assessment of the effects of seabed production
in the Area on the DLBPS concerned, and the associated problems. The study will be carried out on a case-
by-case basis; the cases will pertain to particular DLBPS and particular minerals. In the course of the study,
one of the most important mattes that would be addressed is the determination of whether, and to what
extent, the observed serious effects have been caused by seabed production. The conclusions made by the
Authority following by the findings of the in-depth study will form the basis for the application of
appropriate remedial measures.
115. The following formulations to categorize serious adverse effects were suggested:
A. The adverse effects on the export earnings of DLBPS could be considered to be serious if,
in the year seabed production occurs:

21
i. the price of any of the four minerals concerned – copper, nickel, cobalt and manganese –
falls by the average of (X per cent) from the price of these minerals in the previous year;
or
ii. the volume of exports of any of the four minerals from the DLBPS, provisionally
identifies previously, falls by (Y per cent); or
iii. the export earnings of the DLBPS, provisionally identified previously, from the four
minerals falls by (Z per cent).
B. The adverse effects on the economies of DLBPS could be considered to be serious if, in the
year seabed production occurs:
i. the national income of the DLBPS concerned falls by (N per cent) from the previous
year; or
ii. the rate of economic growth of the DLBPS concerned falls by (M) percentage point; or
iii. the rate of unemployment in the DLBPS concerned increases by (P) percentage point;
iv. the foreign exchange reserves of the DLBPS concerned fall by (R per cent).
116. Following the results of the discussion, Special Commission 1 made a decision whereby
trigger threshold is the actual fall (if the applications are submitted after the commencement of commercial
production from the Area) or the estimated fall (if the applications are submitted before the commencement
of commercial production from the Area) in the export earnings of a particular DLBPS from the export of
one or more of the four metals concerned by at least 10 per cent in comparison with the situation where
there is no seabed production. In the cases of the “least developed” among the DLBPS, identified in the
relevant United Nations documents, the dependency thresholds and the trigger thresholds shall be reduced
by 33 per cent. In the cases of DLBPS where the actual or estimated fall in export earnings from the export
of one or more of the four metals concerned is less than 10 per cent, the trigger thresholds under which the
Authority should determine, on a case-by-case basis, the necessary remedial measure or measures to help
that particular DLBPS, were discussed but not fully coordinated.
C. In-depth investigation of potential effects of seabed mineral production for DLBPS
117. Following the results of the discussion Special Commission 1 came to a conclusion whereby
there are two main fields that require thorough investigation regarding the in-depth study of potential effects
of seabed mineral production for DLBPS:
a) After the beginning of seabed exploitation, the resulting price of certain mineral and
the volume of export of this mineral from DLBPS can be affected by other factors aside from
seabed mineral production. These factors can be of internal nature as well as of external nature
regarding DLBPS. It is necessary to take these factors into account to identify the effects of the
seabed mineral production as such. This is a technically complex area.
b) The problems of DLBPS will be to a large extent associated with limited abilities of
these states to eliminate the effects of seabed mineral production on their export earnings or their
economies, and to control these effects. It is necessary to thoroughly assess these limitations,
and any long-term remedial measures should take into account the elimination of these
limitations.
118. The plan agreed by the Special Commission 1 for an in-depth study of potential impact of
seabed production from the Area for DLBPS and related issues coordinated included the following
positions:
a) Identification of resources of the Area exploited, and the metals extracted from these
resources.
b) Forecast or estimation of volume of production of each metal from the Area.
c) Assessment of the relationship between production from the Area and land-based
production, within the context of the world supply-demand situation and the different world
markets as well as different trade practices; such assessment should indicate the short-term (less
than 5 years), medium-term (5 to 20 years) and long-term (longer than 10 years) trends.

22
d) Formulation of methodology to establish to what extent effects on price or volume of
exports of a metal of a DLBPS can potentially result from or are caused by production of the
metal from the Area. Such a methodology shall take into account: world metal market situation;
change in consumption patterns; production from maritime zone under national jurisdiction;
substitution; recycling; technological developments; other relevant factors, such as the general
economic conditions, the government policies and the exhaustion of deposits within national
jurisdiction of the DLBPS concerned.
e) Quantification of effects on exports.
f) Quantification on effects on economies, taking into account the various factors
such as
i. Unemployment, to the extent that it is caused by or related to reduced production
of the four metals;
ii. Lack of development as a result of reduced government revenues from the four
metals;
iii. Side effects, such reduced production of accessory minerals as a result of the
reduction in the production of the four metals;
iv. Multiplier effects on the economy as a whole;
g) Investigation of the problems directly linked with the effects, including assessment of
capabilities and limitation of the affected State to counter or control the effect.
h) When applications are made simultaneously, a study should be made in order to
determine in what way the adverse effects of seabed production would cause more problems to
certain DLBPS as compared to other land-based producers, in order to establish a priority.
119. It was found that a measurement of actual effects should be carried out only after seabed
production occurs.

23
OVERVIEW OF MINERAL PRODUCTION FROM ACTIVITIES IN
THE AREA
A. Types of mineral resources and affected metals for study purposes
120. The contracts for exploration currently cover all three mineral resources for which the
International Seabed Authority has adopted regulations on exploration. These are polymetallic nodules,
polymetallic sulphides and cobalt-rich ferro-manganese crusts. There are three types of deep-sea mineral
resources: polymetallic nodules, polymetallic sulphides and cobalt-rich ferro-manganese crusts. The
International Seabed Authority has adopted Regulations on prospecting and exploration of these minerals,
and to date thirty contractors have concluded contracts with the Authority for exploration of these mineral
resources.
121. In this study only polymetallic nodules are considered as minerals. This study will be focused
on polymetallic nodules.
122. Polymetallic nodules consist of more than 50 metals, including precious, refractory and rare
earth elements (REE)8. Meanwhile, Preparatory Commission recommended to concentrate only on four
metals: copper, nickel, cobalt and manganese, extraction of which seemed to be economically feasible.
Economic models developed by Massachusetts Institute of Technology (MIT), African Group and China
Central South University (CSU) are also based on extraction of these four metals from nodules. However,
according to MIT experts, thallium, rubidium, other REE & yttrium, titanium and precious metals are also
of economic interest. Model prepared by German Federal Ministry for Economic Affairs and Energy Model
(BMWi) provides only the extraction of copper, nickel and cobalt.
123. In this study, four metals contained in polymetallic nodules were considered: copper, nickel,
cobalt, and manganese. We do not allow for failure to extract manganese from nodules, as it contradicts
with the principle of rational management of the resources of the Area for the benefit of mankind as a whole
(UN Convention on the Law of the Sea, Article 150(b)). Failure to extract manganese will also principally
lower the economic performance of the nodules exploitation project, which will result in reduction in
derivative payments, including payments to the Authority.
124. The assessment of resource potential of polymetallic nodules from the Clarion-Clipperton
Zone and manganese, copper, nickel and other metals contained in these nodules is provided in Table 3.1.
Table 3.1. Amount of metals in manganese nodules from the Clarion-Clipperton Zone compared to land-
based reserves and resources (in million tons)
Elements Visbeck M,
Gelpke N
(2014)
ISA (2012)* Global resources on land
(both economically and sub-
economic)9
Global reserves on
land10
Nodules 21,100 21,100–30,700
Manganese (Mn) 5,992 5,950–8,657 NA 810
Copper (Cu) 226 234–341 2,100 870
Nickel (Ni) 274 270–393 130+ 89
Cobalt (Co) 44 46.4–67.5 25 7.0
Titanium (Ti) 67 1,200 491
Rare earth oxides 15 NA 120
8 Kuhn T., Wegorzewski A., Rühlemann C., Vink (2017) A Composition, Formation, and Occurrence of
Polymetallic Nodules. In R. Sharma (ed.), Deep-Sea Mining: Resource Potential, Technical and Environmental
Considerations. Springer, pp 23–63 9 USGS. Mineral Commodity Summaries 2020, https://pubs.usgs.gov/periodicals/mcs2020/mcs2020.pdf 10 USGS. Mineral Commodity Summaries 2020, https://pubs.usgs.gov/periodicals/mcs2020/mcs2020.pdf

24
Molybdenum (Mo) 12 25+ 18
Lithium (Li) 2.8 80 17
Tungsten (W) 1.3 NA 3.2
Niobium (Nb) 0.46 NA ˃13.0
Arsenic (As) 1.4 NA NA
Thorium (Th) 0.32 6.4 NA
Bismuth (Bi) 0.18 NA NA
Yttrium (Y2O3) 2 NA 0.5+
Platinum group metals 0.003 0.1 0.07
Tellurium (Te) 0.08 NA 0.03
Thallium (Tl) 4.2 0.017 NA
* — Inferred Resources
125. It is notable that the number of metals contained in polymetallic nodules exceeds the reserves
and resources of land-based deposits or is consistent with them. This makes it necessary to consider the
technological, financial, economic, and market aspects of extraction of polymetallic nodules in further
studies. It is obvious that economic indicators of deep-sea mining and all the derivative payments will
increase due to the process capability of commercial extraction of additional metals. At the same time, it
can negatively affect the wider range of raw material markets and widen the list of developing land-based
producer States likely to be affected as a result of exploitation in the Area, which requires to be addressed
separately.
B. Assumptions for future mineral resource production in the Area
126. As at December 2019, 18 contracts for exploration of polymetallic nodules had entered into
force. A complete list of the contracts, with details of the sponsoring State (States) and the dates of expiry
of each contract, is provided in Figure 3.1.
127. In our assumptions for future mineral exploitation in the Area, we proceed from the
following input conditions:
i. the regulations on exploitation of mineral resources in the Area are to be adopted in 2020,
ii. applications for approval of a plan of work for exploitation of mineral resources in the Area
in the form of contracts are to be submitted by the applicant after the expiry of its contract
for exploration,
iii. the duration of Design & Build phase preceding the beginning of production, is 2–4 years
Figure 3.2).

25
Figure 3.1. Timing of contracts for exploration for polymetallic nodules

26
Figure 3.2. Modeled progression of seabed mining activities (MIT, 2019)
128. Two scenarios were considered:
A. first applications for approval of a plan of work for exploitation of mineral resources in the
Area are submitted in 2021, after the expiry of timing of the first extension of contracts for
exploration works. In this case, the first contract for exploitation of polymetallic nodules
can be signed in 2022. Then, considering the duration of Design & Build phase,
exploitation can begin already in 2025–2027 (Figure 3.3);
B. contracts for exploration expiring in 2021 are extended for 5 years — until 2026. Then first
applications for approval of a plan of work for exploitation of mineral resources in the Area
can as well be submitted in 2026, and the first contact for exploitation of polymetallic
nodules can be signed in 2027. In this case exploitation (considering the duration of Design
& Build phase) can begin in 2030–2032 (Figure 3.4);
129. It appears that, if the contractors with the contracts for exploration expiring in 2021 planned
to proceed to exploitation, they would have already declared their intentions. Our confidence is based,
above all, on the necessity to find investments for realization of projects of exploitation of polymetallic
nodules. In practice of land-based mining companies this is preceded by open publication of Feasibility
studies results. This information is currently absent from public space. However, one of the contractors
reported the completion of Preliminary Economic Assessment only in 2019, bearing in mind that it precedes
Pre-Feasibility and Feasibility studies. It is noted that the activities undertaken do not allow contractor to
make investment decisions. It is emphasized, however, that the results justify further analytical work and
technological studies11. Another contractor stated that he plans to carry out the mining system test at a depth
of 1000 m12 approximately in 2020. It is obvious that such timing will not allow him to prepare for the
beginning of exploitation in time according to Scenario 1. Thus, we believe that probability of realization
of Scenario 1 is low, while Scenario 2 appears more realistic.
130. In our assumptions for future exploitation it is necessary to take into account the possibility
of submitting an application before the expiration of the contract for exploration. To date, this can happen
to one of the contractors, who declared his intentions to begin commercial extraction by 202713. It is quite
possible, however, that his plans will change (specifically due to unfavourable market situation on the
market of affected metals). It is possible that other companies will follow the same path, but in the longer
term. In such scenario the dates of signing the contracts for exploitation and, accordingly, the dates of the
beginning of exploitation, cannot align with the limited time frame (such as the expiry of the contract for
exploration).
11 Interoceanmetal Joint Organization. Preliminary Economic Assessment Technical Report IOM polymetallic
nodules project in CCZ, Pacific Ocean. 2019. (https://iom.gov.pl/wp-content/uploads/2019/05/pdf-23-Balaz-et-al-
2019.pdf) 12 Chinadialogueocean.net. China’s deep-sea mining, a view from the top. 18.10.2019
(https://chinadialogueocean.net/10891-china-deep-sea-exploration-comra/) 13 Nature.com. Seabed mining is coming — bringing mineral riches and fears of epic extinctions. 24.07.2019
(https://www.nature.com/articles/d41586-019-02242-y)

27
Figure 3.3. Possible dates of the beginning of production. Scenario 1

28
Figure 3.4. Possible dates of the beginning of production. Scenario 2

29
131. Thus, there is still a significant uncertainty in projecting the time frames of the beginning of
exploitation of polymetallic nodules. It is compounded by uncertainty regarding future processing of
nodules. Information on the existing processing companies ready to do that, or on the projects of creation
of specific companies, is absent. Without such companies, the beginning of exploitation is impossible. In
theory, such companies can appear within five years, which argues in favour of Scenario 2 or the
intermediate option with the beginning of production approximately in 2027. At the same time, it should
be taken into account that not only the existence of specialized processing plants is necessary to start
processing, but also the registration of all supply agreements between them and contractors, which requires
additional time.
132. An important factor of assessment of potential effects of production in the Area on relevant
metal prices is the volumes of production of these metals.
133. The fundamental proposition of all economic models is production level of three million dry
tonnes of nodules per year by each contractor.14. The assessment of volumes of future production, however,
requires additional assumption on the number of contractors.
134. In the MIT model15, the baseline scenario of exploitation in the Area by two contractors was
considered. We, following MIT, base our assumptions on the fact that initially the exploitation can be
started by two contractors with production levels of three million dry tonnes of nodules per year each. For
the first one the determined period of the beginning of exploitation can be 2027, for the second one —
2030. Like MIT, we proceed from steady production increase by both contractors: 33 % productivity (one
million dry tonnes of nodules) in the first year, 66 % (two million dry tonnes of nodules) in the second year,
100 % (three million dry tonnes of nodules) in the third year.
135. At the same time, we cannot exclude the probability that all nine contractors, whose contract
for exploration (initial or extended) will expire in 2026, will begin exploitation in 2030–2032. The contract
of two more contractors expired in 2027, which allows them to begin exploitation approximately in the
same period (see Figure 3.4). Thus, it is likely that the number of contractors who will start deep-water
mining in the early 2030s may reach twelve. However, it is more realistic that only a few of the twelve
contractors would be fully prepared to commence production on time. The remainder will continue work
on exploration contracts, which will be extended under the 1994 Agreement.
136. In addition, an important factor affecting the number of contractors who have started mining
will be the state of world markets and prices for these metals. If we speak about the state of the markets, it
means their ability to absorb additional quantities of metals without serious negative consequences for
DLBPS. In terms of prices, they should be at a level that ensures the cost-effective exploitation and
processing of polymetallic nodules.
137. Figure 3.5 shows the possible scenarios for two, six and twelve contractors to increase nodule
mining. The general condition for them is that the first contractor starts mining in 2027 and the second in
2030. The scenarios for six and twelve contractors assume that additional contractors whose exploration
contracts expire between 2026 and 2027 will start between 2031 and 2033; full capacity will be reached
gradually over a period of three years.
14 “Financial Regimes for Polymetallic Nodule Mining: A Comparison of Four Economic Models” that was
submitted to the ISA by Massachusetts Institute of Technology on January 2019 15 “Report to the International Seabed Authority on the Development of an Economic Model and System of
Payments for the Exploitation of Polymetallic Nodules in the Area” that was submitted to the ISA by Massachusetts
Institute of Technology on 3 June 2019

30
Figure 3.5. Possible scenarios for polymetallic nodules mining, Mt
A) two contractors
B) six contractors
C) twelve contractors
138. The amount of produced and marketed metal is determined by its content in the ore (in our
case, in nodules) and its extraction parameters in course of processing. Table 3.2 shows the annual amount
of production for each of relevant metals, provided full functioning of two, six and twelve contractors, each
producing three million dry tonnes of nodules per year. In the case of a different number of contractors,
annual production rates will be proportional to their number and annual productivity. It should also be noted
that actual metal content and recovery rates of nodules may differ from those estimated in the developed
economic models, which will also have an impact on annual production rates.
Table 3.2. Rough estimate of metals recovered annually by 2, 6 or 12 contractors
Composition,
%* Recovery
Rate,%* Amount Recoverable (tonnes per annum)
2 contractors 6 contractors 12 contractors
Cobalt 0.2 85 10,200 30,600 61,200
Nickel 1.3 95 74,100 222,300 444,600
Copper 1.1 90 59,400 178,200 356,400
Manganese 28.4 90 1,533,600 4,600,800 9,201,600
* Data from “Report to the International Seabed Authority on the Development of an Economic Model and System
of Payments for the Exploitation of Polymetallic Nodules in the Area”. MIT, 2019
0
2
4
6
8
10
12
14
16
18
20
20
25
20
26
20
27
20
28
20
29
20
30
20
31
20
32
20
33
20
34
20
35
A
0
2
4
6
8
10
12
14
16
18
20
20
25
20
26
20
27
20
28
20
29
20
30
20
31
20
32
20
33
20
34
20
35
B
0
5
10
15
20
25
30
35
402
02
5
20
26
20
27
20
28
20
29
20
30
20
31
20
32
20
33
20
34
20
35
C

31
139. On the basis of average prices over the past 5 years (this interval is chosen to smooth out
short-term price fluctuations), the cost of metals encapsulated in 3 million tonnes of nodules would be about
USD 173 million for copper, approximately USD 436.5 million for nickel, approximately USD 220 million
for cobalt (taking into account the period of abnormally high prices in 2017–2018; at the average price of
approximately USD 172 million in 2019).16
140. The nodules themselves are considered to be analogous to manganese ores. On the basis of
a five-year average price of manganese ores with comparable manganese content, the value of manganese
ores could be approximately USD 425 million. The cost of manganese products that can be produced from
nodule processing will knowingly be several times higher. However, the characteristics of the composition
of the nodules, namely their high phosphorous content, may have a negative impact on their demand as
analogues of manganese ores, and on the price.
141. The actual value of nodules and the products derived from their processing will be
determined by the market situation during the period of extraction.
16 The prices (cash) of the London Metal Exchange are used for calculations.

32
WORLD MARKET CONDITIONS FOR THE AFFECTED METALS
A. Overview of the value chain for the affected metals
142. The structure of value chain intrinsic to the metals industry is shown on Figure 4.1. The end
consumption of the metals industry is divided into industrial production and consumer end consumption.
The industrial production purchases its raw materials through traders and metal exchanges, the main one of
which is the London Metal Exchange (LME).
Figure 4.1. Value chain in metals industry17
143. There are three models of interrelationships between the commodity links in the value chains
of the metallurgical industry. They are presented in Figure 4.2. The most common are traditional and
resource driven value chains. Metal producers, such as smelting plants, process the raw material coming
from the mining industry. The traders’ main function is selling and delivering various metals, but they can
be bypassed in the value chain if the metal producer sells directly to the industrial end customer. The global
metal community uses LME to trade futures and options to hedge against adverse price movements – prices
which are discovered on our markets and are used as the global reference. Participants can trade six different
types of contract against 14 underlying metals (incl. copper, nickel and cobalt) on three trade platforms.
This is also called a market of “last resort” as can be used to sell excess stock in periods of oversupply as
well as a source of material in periods of extreme shortage.
Figure 4.2. Vertical integration in mining18
144. In this study we consider the value chain to the industrial end consumption level.
145. The value chain is shown in Figure 4.3 for copper, Figure 4.4 for nickel, Figure 4.5 for cobalt,
and Figure 4.6 for manganese.
17 Alajoutsijärvi K., Mainela T., Ulkuniemi P., Montell E. (2012) Dynamic effects of business cycles on business
relationships. Management Decision. V.50 No 2. pp. 291–304 18 The Business of Mining (2010). Vertical integration in mining: the trader’s value chain. 21.05.2010
(https://thebusinessofmining.com/2010/05/21/vertical-integration-in-mining-the-traders-value-chain/)

33
Figure 4.3. Copper value chain

34
Figure 4.4. Nickel value chain

35
Figure 4.5. Cobalt value chain

36
Figure 4.6. Manganese value chain19
Abbreviations: EMM — electrolytic manganese metal, EMD — electrolytic manganese dioxide, MMT — methylcyclopentadienyl manganese tricarbonyl, HSLA — high
strength low alloy steel
19 Van Zyl H.J., Bam W.G., Steenkamp J.D. (2016) identifying barriers faced by key role players in the South African manganese industry. SAIIE27 Proceedings, Stonehenge,
South Africa (https://www.researchgate.net/publication/309556467_Identifying_barriers_faced_by_key_role_players_in_the_South_African_manganese_industry)

37
B. Overview of the value chain of developing land-based producers of the affected metals
146. Currently, 126 UN Member States are classified as developing countries, which, despite
being united into one category, are very heterogeneous in economic situation. Thus, they include high-
income, upper-middle-income, lower-middle-income and low-income countries (measured by per capita
gross national income (GNI). Among these, the least developed countries, which included 47 countries in
2019, also stand out.20 In addition, some political scientists and economists among developing countries
highlight the so-called newly industrialized countries (NIC). These include countries which, by their level
of development, are between developing and developed countries. These countries have moved away from
an agriculture-based economy and into a more industrialized, urban economy. The main feature of the NIC
is a significant growth in gross domestic product. The list of existing NICs is open to some debate among
experts and economist. IMF refers к NIC South Africa, Mexico, Brazil, China, India, Indonesia, Malaysia,
Philippines, Thailand, and Turkey.21
147. The deepening international division of labour in the global economy has created and spread
global value chains (GVCs), that account for a rising share of international trade, global GDP and
employment. Evolution of GVCs in various economic sectors, including commodities, has significant
implications in terms of global trade, production and employment and how developing country firms,
producers and workers are integrated in the global economy. GVCs link firms, workers and consumers
around the world and often provide a stepping stone for firms and workers in developing countries to
integrate into the global economy. For many countries, especially low-income countries, the ability to
effectively insert themselves into GVCs is a vital condition for their development.
148. All countries, regardless of the state of their economy or domestic political situation,
participate in GVCs but in different ways. Developed and newly industrialized countries participate in
complex GVCs producing advanced and innovative manufactures and services. By contrast, many countries
in Africa, Central Asia, and Latin America still produce commodities for further processing in other
countries or engage in limited manufacturing (Figure 4.7).
149. As for value chains for affected metals (copper, nickel, cobalt and manganese) characteristic
of DLBPS they are generally limited to mining or metallurgical processing of mining products.
Accordingly, such countries participate in GVCs at best as suppliers of metallurgical products, and at worst
as ores and/or concentrates. Often, exports contain both due to the lack of capacity of local metallurgy to
fully process mining products. The exception is in the newly industrialized countries that have developed
industries consuming affected metals. These include, first of all, China.
20 UN (2020), World Economic Situation Prospects 2020,
https://unctad.org/en/PublicationsLibrary/wesp2020_en.pdf 21 IMF (2016), The Role of Newly Industrialized Economies in Global Value Chains, IMF Working Paper,
https://www.imf.org/external/pubs/ft/wp/2016/wp16207.pdf

38
Figure 4.7. Participation of various countries in GVCs Source: World Bank Group
Note: The following four types of country participation in GVC are particularly notable: (1) commodities; (2)
limited manufacturing; (3) advanced manufacturing and services; and (4) innovative activities. Commodity-related
countries are divided into three categories: Low participation: primary goods’ share of total domestic value added in
exports is less than 20 per cent; Limited commodities: primary goods’ share of total domestic value added in exports
is equal to or greater than 20 per cent but less than 40 per cent; High commodities: primary goods’ share of total
domestic value added in exports is equal to or greater than 40 per cent.22
C. Analysis of trends and developments in the affected metals, including future supply and
demand prospects, and potential effects of transfer pricing
Copper
Consumption
150. Copper is one of the most widely used metals in the world due to its high electrical and
thermal conductivity, corrosive resistance and plasticity. It is widely used in many fields of industry, among
them building construction and infrastructure, production of consumer and general products, transport,
industrial and other equipment production (Figere 4.8, Table 4.1).
Figure. 4.8. Copper end-use structure in 2017, % Source: ICA
22 World Bank Group (2020), World Development Report 2020: Trading for Development in the Age of Global
Value Chains, https://openknowledge.worldbank.org/handle/10986/32437
Building Construction
28%
Infrastructure17%Transport
13%
Industrial Equipment
11%
Consumer & General
Products, Other Equipment

39
Table 4.1. Copper end-use by products and sector in 2017, kt (copper content)
Copper
Wire*
Copper/Alloy Copper
foil
Mech.
wire
Castings/
Powder Tube RBS** PSS**
Building construction
Electrical Power 5 769 33/- -/74 - - - -
Communications 232 - - - - - -
Plumbing - 491/- -/561 12/- - - 138/-
Architecture - 4/18 -/78 129/- - 10 58/-
Building Plant (Aircon tube) - 213/- - - - - -
Infrastructure
Power Utility 3 091 -/85 452/116 4/- 77 - -
Telecommunications 813 - - 28/- - - -
Transport
Automotive Electrical
(harnesses, motors) 1 642 1/- - 278/276 - - -
Automotive Non Electrical
(radiators, tubing) - 2/7 1/67 -/42 66 24 -
Other Transport (railroad,
shipping and marine) 777 -/36 52/32 - - 69 295/-
Industrial Equipment
Electrical (industrial
transformers and motors) 1 257 - 87/35 228/83 - - -
Non Electrical (valves,
fittings, instruments and in
plant equip.)
- 153/138 -/763 1/- - - 394/-
Consumer & General Products, Other Equipment
Consumer & General
Products (appliances,
instruments, tools and etc)
1 779 1/- 1/123 163/279 - 117 -
Aircon and refrigeration 371 1 825/- -/55 - - - -
Electronics and PCs 474 3/- 4/- 44/280 526 - -
Ammunition, clothing, coins
and other 550 8/70 19/168 703/762 - 207 202/104
Source: ICA
*Copper Wire include: building wire, power cable, magnet wire, telecom cable, other communication cable, other
LV energy, automotive wire & cable, bare conductor
**RBS — rod bar section, PSS — plate sheet strip
151. There are more than 50 saleable types of copper and copper-based alloys in structure of metal
production and consumption. The main types are copper of different purity, brass, bronze, copper-nickel
alloys. Copper and copper alloys are used for production of wire rods and semi-finished products: plates,
sheets, strips, foil, rods, bars, tubes, fittings, powders and castings.
152. Pure copper is mainly used in electrical and electronic industry. It is used for production of
power cable and wire, which is further used for winding of motor controllers, electric motors, power

40
accumulators and transformers. In electronics copper is used for production of computer and cellphone
components, including microprocessors.
153. Due to its good thermal conductivity copper is used in production of various heat exchangers,
including cooling, conditioning and heating radiators, PC cooling systems, and heat pipes. Copper pipes
are widely used for liquids and gas transmission in water, gas supply, heating and conditioning systems,
refrigeration units and chemical engineering (production of vacuum apparatus and coil).
154. Due to its high corrosive resistance and resilience to wide range of climate changes copper
is used for roof covering.
155. In other fields of industry alloys of copper with various metals are mainly used, primarily
with brass, bronze, and nickel (cupronickel etc.).
156. According to the data of International Copper Association (ICA), world copper semis
consumption (inclusive of refined copper and direct melt copper scrap) was estimated at 28,1 million tonnes
in 201723. According to International Copper Study Group (ICSG), refined copper consumption in 2017
amounted to 23.7 million tonnes24. Thus, the amount of metal extracted by direct melting from high-quality
scrap is estimated to be approximately 4.5 million tonnes. In further analysis direct melt copper is not taken
into account in the absence of such statistics.
157. In the period from 2008 to 2017 the world refined copper consumption in general increased
by 33 % (Figure 4.9). This increase was achieved almost entirely by China, which had more than doubled
metal consumption due to the increase in pace of construction and production of consumer goods.
Meanwhile, in the states considered the largest copper consumers to the 2000s — USA, Japan, Germany
— the consumption decreased by 11–16 % during the reporting period.
Figure 4.9. World refined copper production, consumption and stocks in 2008–2017, Mt *Production from ores and concentrates, excluding SX-EW copper
Sources: ICSG, WBMS25
23 International Copper Association, Ltd. Data Set. Global 2018 Semis End Use Data. URL:
https://copperalliance.org/trends-and-innovations/data-set/ 24 International Copper Study Group. Selected Data. World refined copper production and usage trends. URL:
https://www.icsg.org/index.php/component/jdownloads/finish/165/871 25 World Bureau of Metal Statistics. URL: https://world-bureau.com/
0
5000
10000
15000
20000
25000
2008 2009 2010 2011 2012 2013 2014 2015 2016 2017
Primary refined copper production* SX-EW production
Secondary refined copper production Refined copper stocks
Refined copper consumption Concentrate production (Cu content)

41
Production
158. In 2017, 23.5 million tonnes of refined copper was produced in the world; approximately
67 % of it was extracted from ores and concentrates, 16 % — from low-metal content/oxide-bearing ore
under Solvent Extraction-Electrowinning technology (SX-EW), and 17 % was provided by metallurgical
secondary raw material processing companies26.
159. Metal production in period from 2008 to 2017 increased in proportion to the consumption
simultaneously with the increase in its extraction both from primary and secondary sources (Figure 4.9).
The increase in metal production was ensured by China, its main consumer. Besides from the exploitation
capacity expansion, China actively purchased raw material overseas, primarily in Chile and Peru — the
world’s largest copper mine producers. Due to the copper scrap import, secondary copper production in the
state doubled during the reported period, and in 2017 China provided for half of its world production.
160. Although copper consumption levels are slightly above the output, copper deficit on the
world market does not occur. The reason is copper stocks, the rate of which varies annually and is on
average 5–7% from total production volumes. Thus, the global copper market is overall surplus
(Figures 4.9, 4.10).
Figure 4.10 World refined copper production/consumption balance, stocks (kt; left scale) and prices
(USD/t; right scale) in 2008–2017 Sources: ICSG, LME
Prices
161. Copper is an exchange-traded metal. Copper prices are determined on trading platforms, the
largest of them being London Metal Exchange27. Having recovered from 2008–2009 financial and
economic crisis, copper prices started to grow actively and peaked in 2011, which was followed by the long
period of decline (Figure 4.10). The growth trend in prices only occurred in 2016 and established in 2017
and in the beginning of 2018 against the background of a deficit threat caused by a prolonged strike on the
world’s largest copper mine Escondida in Chile, and increase in demand from electrical industry.
Nevertheless, the prices started to decline already in the second half of 2018 and continued shrinking in
2019. The main reason is “the trade war” between China and USA, which affects negatively the economies
of both countries.
26 International Copper Study Group. ICSG 2018 Statistical Yearbook 27 London Metal Exchange. Market Data. Reports and data. Monthly averages. URL: https://www.lme.com/Market-
Data/Reports-and-data/Monthly-averages
0
2250
4500
6750
9000
-500
0
500
1,000
1,500
2,000
2008 2009 2010 2011 2012 2013 2014 2015 2016 2017
USD
/t
kt
Refined copper stocks Refined copper deficit/proficit LME copper prices (cash)

42
Forecast of Demand and Consumption
162. The main prospects for growth of copper consumption in the future are being linked to
development of so called “green technologies”: electric vehicles and renewable energy (wind and solar
power generations etc.).
163. According to DBS Group Research estimates, copper consumption by electric vehicles will
increase by 19 % per year exclusive from chargers and infrastructure28. By 2020 already, metal
consumption in this industry will exceed the current level by nine times (from 207 thousand tonnes to
1,91 million tonnes), and by 2035, with sustained growth rate, by 22 times, to 4,6 million tonnes. According
to ICA estimates, copper consumption by electric vehicles will increase at a higher rate and will reach
1.74 million tonnes already by 202729.
164. While production of a passenger car with internal combustion engine requires approximately
23 kg copper, hybrid electric vehicle requires 40 kg, plug-in hybrid electric vehicle — 60 kg, battery
electric vehicle — 83 kg, hybrid electric bus — 89 kg, battery-powered electric bus — 224–369 kg.
165. Besides the electric vehicles themselves, copper is required for chargers and necessary
infrastructure. Depending on capacity, one charger requires from 0.7 to 0.8 kg copper. For example, the
American WiTricity Corporation developed a wireless charger for sedan type electric vehicle, which
requires 4 kg copper to produce30.
166. It is obvious that the expected copper consumption growth in electric transportation industry
depends directly on its development rates. The proportion of sales of electric vehicles in the structure of
world vehicle trade amounted to 2.2 %, with more than 2 million electric cars sold in total. At the same
time, this is 64 % more than last year and hundreds of times more than in 2010, when only several thousands
of cars were sold31. According to Bloomberg forecast, sales of electric vehicles will exceed 40 million by
2035, which will amount to 20 % of vehicle sales32. At present, the main consumer of electric vehicles is
China — according to the data of International Energy Agency, almost half (45 %) of 5.1 million electric
vehicles in the world at the end of 2018 travel the roads of China33. Taking into account the significant
government support, the market of electric automobiles is expected to grow by 25 % annually34, and in the
long run the main demand growth will be ensured by China. Besides from the electric motor vehicles, China
is actively developing electric rail transport, including high-speed rail transport, demanding significant
amount of copper (377 kg per train and 12 tonnes per 1 km of railroad). According to ICA forecast, by 2030
copper consumption in Chinese transport industry will increase almost three times, by 3.3 million tonnes35.
167. The electric transport markets of European countries, USA, Japan, India etc. are developing
at a lower pace. Chile is worth special mentioning, as it has the largest electric bus fleet after China and is
planning to electrify all public transport by 2040 and 40 % of private vehicles by 205036.
28 DBS Group Research. Copper and Its Electrifying Future. May 2018. URL:
https://www.dbs.com/aics/templatedata/article/generic/data/en/GR/102018/181004_insights_copper_and_its_electrif
ying_future.xml 29 International Copper Association, Ltd. Copper Alliance. The Electric Vehicle Market and Copper Demand. June
2017. https://copperalliance.org/wp-content/uploads/2017/06/2017.06-E-Mobility-Factsheet-1.pdf 30 International Copper Association, Ltd. Copper Alliance. Copper in EV Charging — An Emerging Standard
Around Wireless Charging. URL: https://copperalliance.org/trends/copper-in-ev-charging-an-emerging-standard-
around-wireless-charging/ 31 EV-volumes.com. Global EV Sales for 2018 – Final Results. URL: http://www.ev-volumes.com/news/global-ev-
sales-for-2018/ 32 Bloomberg Finance L.P. Electric Vehicle Outlook 2019. URL: https://about.bnef.com/electric-vehicle-
outlook/#toc-download 33 International Energy Agency. Global EV Outlook 2019. May 2019. URL: https://www.iea.org/reports/global-ev-
outlook-2019 34 DBS Group Research. Copper and Its Electrifying Future. May 2018. URL:
https://www.dbs.com/aics/templatedata/article/generic/data/en/GR/102018/181004_insights_copper_and_its_electrif
ying_future.xml 35 International Copper Association, Ltd. Copper Alliance. Future China Transport. November 2019. URL:
https://copperalliance.org/wp-content/uploads/2019/11/04-Future-china-transport-v22.pdf 36 International Energy Agency. Global EV Outlook 2019. May 2019. URL: https://www.iea.org/reports/global-ev-
outlook-2019

43
168. Construction of power plants functioning on renewable energy sources implies increase in
copper consumption, but to a lesser extent compared to electric transportation industry. According to the
data of DBS Search Group, in 2010–2016 construction of solar, wind etc. power generations took
approximately 463 thousand tonnes of copper, and in the period from 2017 to 2040 amount of metal can
increase to 635 thousand tonnes per year. Wood Mackenzie analytics made a much broader forecast —
according to their estimates, construction of wind power generations alone will take more than 5.5 million
tonnes of copper — about 400 thousand tonnes per year from 2018 to 2022 and 600 thousand tonnes
through 2028. At the same time, there is a trend towards replacing copper wires with aluminum wires in
wind turbines, which can weaken the demand for copper37.
169. Aluminum, for what it’s worth, is the main alternative to copper, but its advantages (relative
cheapness and lightness) are offset by disadvantages (low conductivity compared to copper and higher
material consumption). Therefore, we cannot expect muss substitution of copper with aluminum in the
foreseeable future.
170. To date, there is a large number of world copper consumption forecasts. They are based on
expected growth rates of world GDP and population, “green technologies” development, shift to renewable
energy sources, compliance with Paris Treaty on the regulation of measured to reduce carbon dioxide in
the atmosphere, and other factors.
171. In the course of the work, several options were considered for forecasting the growth in
demand for copper from various sources. Due to the different approaches of researchers to the presentation
of data (graphs, specific figures, annual growth rates in %), the authors of this Report have performed their
interpretation for visualization on the graph (Figure 4.11):
Figure 4.11. Copper consumption forecasts in 2018–2035, kt
37 Mining com. Global wind turbine fleet to consume over 5.5Mt of copper by 2028 — report. 02.09.2019. URL:
https://www.mining.com/global-wind-turbine-fleet-to-consume-over-5-5mt-of-copper-by-2028-report/
20000
25000
30000
35000
40000
45000
50000
2018 2019 2020 2021 2022 2023 2024 2025 2026 2027 2028 2029 2030 2031 2032 2033 2034 2035
McKinsey Global Institute RoskillFitch Solutions SSP1-SSP5 (Netherlands scientists)SSP3 (Netherlands scientists) SSP2-SSP4 (Netherlands scientists)EF (Yale University) SF (Yale University)MF-PF (Yale University) DBS Group

44
172. The copper consumption forecasts offered by Roskill38, McKinsey Global Institute39, Fitch
Solutions40, DBS Group41 are based on the growth prospects for copper demand associated with the
development of “green technologies” — electric vehicles and renewable energy sources. According to the
abovementioned forecasts, the annual growth in demand for copper will amount to 2–3%.
173. The work of Netherlands scientists42 and researchers from Yale University43 takes an
integrated approach where many factors are taken into account.
174. The study by a group of scientists from the Netherlands examined options for growth in
demand for copper up to 2100 based on 5 world development scenarios (SSP 1-5), taking into account
“green technologies”, population growth rates and GDP in various combinations. In part, these scenarios
correlate with the emission scenarios (SRES) of the Intergovernmental Panel on Climate Change (IPCC
Special Report on Emission Scenarios)44. The SSP scenarios assume that the annual growth rate of global
demand for copper up to 2035 will roughly range from 2.8–3.5 %. At the same time, the least optimistic
scenario (SSP3) implies weak “green technologies” development with rapid population growth and slow
GDP growth. The most optimistic (SSP1 and SSP5), which imply the growth of demand for copper at the
same level (about 3.5%) until 2060, imply diametrically opposite schemes of global socio-economic
development: SSP1 assumes active development of “green technologies” with moderate population growth,
and SSP5 assumes a course on continuation of use of carbon fuels with low level of investments in
development of energy on renewable sources, but active economic development and growth of GDP, and
low population growth.
175. Scientists from Yale University did a copper demand growth forecast up to 2050 based on
UNEP Global Environment Outlook-4 scenarios: Market First (MF), Policy First (PF), Security First (SF),
Equitability First (EF)45. The scenarios are based on dominance of market relations, politics, security or
their harmonious combination in the world order. The most optimistic scenario in terms of annual growth
in demand for copper is the EF scenario, according to which it will reach 4 % by 2035. The SF scenario,
aimed at resolving a large number of different conflicts, is the most pessimistic (annual growth of 1.8 %).
The MF and PF scenarios assume that demand for copper will grow at the same pace until 2035 — about
2.9 % per year.
176. Thus, despite the diversity of forecasts, the expected growth in consumption varies within
rather narrow limits — 1.8–4 %.
177. Based on the analysis of the above options, and taking into account the average annual
growth in demand for copper over the last decade, we chose 3 cases (Figure 4.12). These cases allow to
38 Roskill. Market Reports. Copper. Demand to 2035, 1st Edition. Copper — The Electric Metal. 01.08.2019. URL:
https://roskill.com/market-report/copper-demand-to-2035/ 39 McKinsey Global Institute. Beyond The Supercycle: How Technology Is Resharping Resources. February 2017.
URL:
https://www.mckinsey.com/~/media/McKinsey/Business%20Functions/Sustainability/Our%20Insights/How%20tec
hnology%20is%20reshaping%20supply%20and%20demand%20for%20natural%20resources/MGI-Beyond-the-
Supercycle-Full-report.ashx 40 Mining com. Global copper market under supplied, demand on the rise — report. 06.01.2019. URL:
https://www.mining.com/global-copper-market-supplied-demand-rise-report/ 41 DBS Group Research. Copper And Its Electrifying Future. May 2018. URL:
https://www.dbs.com/aics/templatedata/article/generic/data/en/GR/102018/181004_insights_copper_and_its_electrif
ying_future.xml 42 ScienceDirect. Estimating global copper demand until 2100 with regression and stock dynamics. 04.01.2018.
URL: https://www.sciencedirect.com/science/article/pii/S0921344918300041 43 ScienceDirect. Copper demand, supply, and associated energy use to 2050. 06.06.2016. URL:
https://www.sciencedirect.com/science/article/pii/S0959378016300802 44 Intergovernmental Panel on Climate Change. Emissions Scenarios. 2000. URL:
https://www.ipcc.ch/site/assets/uploads/2018/03/emissions_scenarios-1.pdf 45 United Nations Environment Programme. Global Environment Outlook – environment for development (GEO-4).
2007. URL: https://wedocs.unep.org/bitstream/handle/20.500.11822/7646/-
Global%20Environment%20Outlook%20%204%20(GEO-4)-2007768.pdf?sequence=3&isAllowed=y

45
reflect the full picture of possible development of the situation, however, as well as any long-term forecasts,
are to a high degree tentative.
178. Case 1 implies annual world copper consumption growth by 2 % and is proposed on the basis
of forecast data by Roskill, McKinsey Global Institute, and SF and SSP3 scenarios.
179. Case 2 is based on average copper consumption growth in 2007–2018, which amounted to
2.8 %. A similar annual growth is implied by the SSP2-SSP4 scenarios, while the MF-PF scenarios and
DBS Group and Fitch Solutions forecasts also have similar figures.
180. Case 3 implies the highest copper consumption — 3.5 %. It is based on SSP1-SSP5 and
EF scenarios.
Figure 4.12. Copper land-based production and consumption forecast in 2018–2035, kt
181. Despite different pace of expected copper consumption growth, all analytics agree that China
remains the primary consumer of metal. According to the data of Antaike agency, copper consumption in
the country will peak after 2027, exceeding 10 kg per person. Meanwhile, GDP growth is expected to reach
16 thousand dollars per person, and energy consumption will amount to 7534 kWh, which corresponds to
the level of developed countries46.
182. India, whose economy is entering a phase of rapid growth, has significant potential for
copper consumption growth. According to the data of DBS Group Research, in the short term (through
2022) the country is expecting very high growth rate of copper consumption — 6.2 %.
183. Thus, we can say that the main “engine” of copper consumption is economic growth,
regardless of the course of further energy development, which is due to the wide range of applications of
the metal.
Resources and reserves
184. According to the data of USGS, world copper reserves are estimated at 870 million tonnes,
resources — at 2.1 billion tonnes, and undiscovered resources — at 3.5 billion tonnes47. At the current rates
of copper mining production (more than 20 million tonnes) given the loss in processing, reserves can
provide mining operations for 40 years, resources — for more than 100 years.
46 DBS Group Research. Copper and Its Electrifying Future. May 2018. URL:
https://www.dbs.com/aics/templatedata/article/generic/data/en/GR/102018/181004_insights_copper_and_its_electrif
ying_future.xml 47 USGS. Mineral Commodity Summaries 2020, https://pubs.usgs.gov/periodicals/mcs2020/mcs2020.pdf
0
5000
10000
15000
20000
25000
30000
35000
40000
45000
2018 2019 2020 2021 2022 2023 2024 2025 2026 2027 2028 2029 2030 2031 2032 2033 2034 2035
Production mines Secondary copper production Proved projects
Possible projects "On hold" projects Consumption (3,5%)
Consumption (2,8%) Consumption (2%)

46
Forecast of land-based mining
185. To assess the rates of world copper production through 2035 the data about reserves and
identified resources (measured + indicated + inferred resources) of more than 300 world copper mines and
projects was collated and analyzed; resources of prospected field were not taken into account. The
production forecast is based on measured + indicated + inferred resources, given the recovery loss. The
expected copper production on existing mines is calculated on the basis of actual production in 2018, taking
into account the planned projects of expansion of existing capacities. The main source of information were
the reports of mining companies. Thus, information was obtained on the enterprises that jointly provide
more than 80 % of the world production.
186. In view of the absence of data on all mines in most of the countries, the lacking production
volumes are taken into account on the basis of data from national statistics and/or industrial statistics with
a view to getting a full picture of global copper extracting industry. This particularly applies to China as
well as DR Congo and countries of Latin America (Chile, Peru etc.). In addition, data for the country as a
whole was collected from relatively small copper producers (such as Armenia, Serbia, Uzbekistan, etc.).
187. Besides mine copper production (inclusive of concentrates and cathode copper by SX-EW),
production from secondary sources was taken into account. At present End-of-life Recycling Rate for
copper amounts to 50 %, Recycled Content — to 30 %48. It is expected to grow against rising copper
consumption and the general trend towards increased recycling of resources.
188. Copper projects are conditionally divided into three groups on the perspectivity of their
involvement in production: Proved projects, Possible projects and “On-hold” projects (Figure 4.12). The
main criterion for assigning a project to a group was a current stage of its development (Preproduction,
Construction, Feasibility Study, Prefeasibility Study). Their planned implementation dates and the
difficulties arising therefrom were also taken into consideration. For example, the project of exploration of
Resolution copper-porphyry deposit in USA, implying the construction of the largest new copper
production operation (600 thousand tonnes per year) is technically at the Preproduction stage, but due to
absence of necessary mining permits its operation will not begin until 2030. Permits are difficult to obtain,
because the deposit is located within the “sacred lands” of North American Indians. For that reason the
project is assigned to the second group (Possible projects).
189. The “On-hold” group includes projects, whose implementation is suspended for various
reasons: court proceedings (Reko Diq in Pakistan, Panguna in Papua New Guinea), mining ban (Kingking
in Philippines), issues with obtaining permits from environmental agencies (Harper Creek in Canada) etc.
190. Meanwhile, assigning the project to the most perspective Proved projects group does not
imply its timely implementation, because the commissioning dates of deposits (especially those with large
and enormous reserves) are often postponed for various reasons.
191. According to our analysis, copper production from existing mines will decrease by 7 % by
2035 due to the complete depletion of the fields on which they operate. At the same time, possible growth
of secondary copper production (approximately by 1.8 times by 2035) can offset the capacity outage
completely.
192. The main number of Proved and Possible projects is expected to be put into operation from
2025, and by 2035 they will provide 4 and 5 million tonnes of copper per year respectively. “On-hold”
projects will only provide 1.3 million tonnes of copper per year by 2035.
193. Thus, with annual copper consumption growth by 2 % (case 1) and implementation of Proved
and Possible projects, there are no prerequisites for deficit occurrence. In this case the market will be
oversaturated with copper, which can negatively affect the pricing trend. At the same time, if the majority
of Possible projects will not be put into operation on time, difficulties with copper supply to industry can
occur from 2030, even with moderate global consumption growth.
194. If the average annual copper consumption growth will amount to 2.8 % (case 2), the deficit
threat can arise even if all the projects are launched, but in the long term — after 2032. In 2035 copper
48 OECD. Global Material Resources Outlook to 2060. 2018. URL:
https://espas.secure.europarl.europa.eu/orbis/sites/default/files/generated/document/en/OECD.pdf

47
deficit can amount to 3 up to 13 million tonnes, depending on the emergence and implementation of new
projects.
195. With the highest prognoses global copper consumption growth rate of all (3.5 % per year,
case 3), copper deficit on the market can arise earlier — already after 2030 or even after 2025 — if the
commissioning of the majority of Possible projects will be suspended. By the end of the period under review
copper deficit can amount go 7.5–18 million tonnes, which is likely to boost metal prices on the world
market. At the same time, expectations of such a deficit will become a powerful incentive to intensify
preparations for the development of new copper deposits.
196. Besides the supply and the demand, copper prices are affected by a variety of factors,
economical (dollar change, OECD CLI etc.) and socio-political (strikes, “trade wars” etc.), therefore any
price change forecasts are conditional.
197. As shown in the Figure 4.12, the mines operating on the base of existing mines will remain
the main source of copper throughout the period under review. The most significant mines are located in
Chile as well as in Peru, China, USA, Democratic Republic of the Congo and Zambia. The main role in the
planned increase in copper production, in addition to scrap processing operations, will be played by Proved
and Possible projects — they can provide 6–9 million tonnes of metal in total annually after 2025. The
majority of them is located in the aforementioned countries. Besides, large projects are being implemented
in Argentina, Mexico, Canada, Russia, and Papua New Guinea. “On-hold” projects will only be able to
compensate partially for the copper deficit, which could theoretically arise after 2030.
Impact of nodules mining
198. With regard to the possible development of the nodules, we consider three options: a
minimum (with two contractors; Figure 4.13), a base (with six contractors; Figure 4.14) and a maximum
(with 12 contractors; Figure 4.15). All scenarios imply the first contractor starting production in 2027 and
the second in 2030; the remaining contractors (subject to their participation) will join the process in 2031–
2033. It is assumed that the maximum aggregate production level of six or twelve contractors may be
reached in 2035.
Figure 4.13. Copper production and consumption forecast inclusive of polymetallic nodules mining
(2 contractors) in 2018–2035, kt
22500
25000
27500
30000
32500
35000
37500
40000
2018 2019 2020 2021 2022 2023 2024 2025 2026 2027 2028 2029 2030 2031 2032 2033 2034 2035
Secondary copper production Proved projectsPossible projects "On hold" projectsPolymetallic nodules mining (2 contractors) Consumption (3,5%)Consumption (2,8%) Consumption (2%)

48
Figure 4.14. Copper production and consumption forecast inclusive of polymetallic nodules mining
(6 contractors) in 2018–2035, kt
Figure 4.15. Copper production and consumption forecast inclusive of polymetallic nodules mining
(12 contractors) in 2018–2035, kt
199. As can be seen from Figures 4.13–4.15, if deep-sea mining is carried out only by two or even
six contractors, its volume will be practically invisible against the background of ground mines production.
200. Even under a maximum scenario of 12 contractors in 2035, only about 350 thousand tonnes
of copper per year could be produced together (Figure 4.15), which is the annual output of a very large
enterprise (e.g. Los Pelambres in Chile). Formally, such an increase is not noticeable for world production;
it corresponds to less than 2% of current world mining production. If at least part of the ground projects we
are considering are put into operation, this share will be even smaller. However, the real effect from the
start of production will depend on the demand/supply balance that will be formed in the market by that
time.
201. According to the scenarios we are considering, if all of the new land-based mine projects
currently in place are commissioned on time, it is only with annual consumption growth of 3.5% by the
possible beginning of deep-sea mining (i.e. by 2027) that a copper shortage may emerge in the market
by then. In this case, the start of polymetallic nodules mining even under the maximum scenario will
22500
25000
27500
30000
32500
35000
37500
40000
42500
2018 2019 2020 2021 2022 2023 2024 2025 2026 2027 2028 2029 2030 2031 2032 2033 2034 2035
Secondary copper production Proved projectsPossible projects "On hold" projectsPolymetallic nodules mining (6 contractors) Consumption (3,5%)Consumption (2,8%) Consumption (2%)
22500
25000
27500
30000
32500
35000
37500
40000
42500
2018 2019 2020 2021 2022 2023 2024 2025 2026 2027 2028 2029 2030 2031 2032 2033 2034 2035
Secondary copper production Proved projectsPossible projects "On hold" projectsPolymetallic nodules mining (12 contractors) Consumption (3,5%)Consumption (2,8%) Consumption (2%)

49
not be able to negatively affect the copper supply/demand balance. However, it could still lead to some
price reductions, as it would reduce possible supply tensions. With earlier start dates, seabed mining may
increase the metal surplus, likely if all ongoing onshore projects are commissioned, increasing pressure on
prices.
202. Under other scenarios of copper consumption growth (+2.8 % and +2 % per year),
copper shortages may occur either after 2032 or none at all, and all the world economy's copper needs
will be met by land-based production and secondary metals. With such development, even relatively
small volumes of copper from polymetallic nodules will put additional pressure on the market.
Besides, one cannot ignore the psychological pressure on market participants, which will be caused by the
fact of appearance of an additional source of metal with a great potential for growth.
Nickel
Consumption
203. Primary nickel products are divided into two classes. The first includes high-grade nickel
with 99 % or more metal content: electrolytic nickel, pellets, briquettes, granules, rondelles, powder, flakes.
The second one is low-grade nickel: ferro-nickel, nickel pig iron (NPI), nickel oxide sinter, utility. The
production of a particular type of product depends on the type of raw material, and the type of product, in
turn, determines its application in various fields.
204. The main field of application of nickel is the production of stainless and special steels, where
the addition of nickel increases their strength, resistance to corrosion and aggressive environments.
Steelmaking consistently accounts for more than two thirds of the world's metal output. In 2017, the share
of this industry in global consumption was 79 % or 1768 thousand tonnes of nickel (Figure 4.16). Both
high-grade nickel and some class 2 products are used for steel production: ferro-nickel, NPI. The steel
quality does not depend on the type of product used.
Figure 4.16. Primary nickel consumption in 2017 by industry, %
Source: PJSC “MMC “NORILSK NICKEL” 49
205. There are several stainless steel series. The biggest amount of nickel is used in AISI 304 300th
series steels (8–12 %, up to 20 % of nickel in individual grades; 18–20 % chromium), which have a wide
range of applications. The 300th series steels account for two thirds of total stainless steels volume. The
steels of the 200th and 400th series are produced in approximately equal volumes. The 200th series steel has
a lower nickel content due to manganese alloying and is not a full replacement for grades with high nickel
content. The 400th series steels mostly do not contain nickel50.
206. In other areas of application, only high-grade nickel can be used.
49 PJSC “MMC “NORILSK NICKEL”. Annual Report 2017, https://ar2017.nornickel.com/download/full-
reports/ar_en_annual-report_pages.pdf 50 PJSC “MMC “NORILSK NICKEL”, Annual Report 2017, https://ar2017.nornickel.com/download/full-
reports/ar_en_annual-report_pages.pdf
72%
7%
8%
7%5%
1%
2.2 Mt
Stainless steel
Special steels
Nickel-based alloys
Electroplating
Batteries
Other uses

50
207. Another important area of application is the production of nickel alloys and superalloys,
which are in demand primarily in the aerospace industry for engine manufacturing. In addition, alloys are
used in the petrochemical and automotive sectors, where they can replace some stainless steel grades. In
2017, nickel consumption for their production amounted to 8 % of the world's total, or 153 thousand tonnes
(Figure 4.16).
208. Nickel is widely used for decorative and protective coatings with thickness of 1–100
micrometers, so-called galvanizing or nickel plating. Such coatings have high resistance to corrosion in air
and water environments, high hardness and good decorative properties. In 2017 galvanic plating accounted
for 7 % of the world consumption, or 131 thousand tonnes (Figure 4.16).
209. The application of nickel in the production of batteries for electric transport is most actively
developing. In 2017, 109 thousand tonnes of metal were used for their production, which accounted for 5 %
of world consumption (Figure 4.16). Nickel is one of the main components in the production of active
cathode material for battery cells. Nickel is not contained in the most popular (primarily in China) lithium-
ion batteries LCO (lithium cobalt oxide), LFP (lithium iron phosphate), LMO (lithium manganese oxide).
The nickel-metal hydride accumulators NMC (lithium nickel manganese cobalt oxide), NCA (lithium
nickel cobalt aluminum oxide), where the nickel content depending on the modification is from 30 to 80 %,
are significantly less common nowadays51.
210. Other applications of nickel include foundry, coinage, its usage as a catalyst for chemical
reactions, in the production of ferrite materials and as a pigment for glass, glazes and ceramics, in the
manufacture of various chemical equipment, in shipbuilding, in electrical engineering and for many other
purposes.
211. Global consumption of primary nickel extracted from the subsoil has almost doubled since
the early 2000s, reaching 2.2 million tonnes in 2017 (Figure 4.17). Practically the only reason for this was
the rapid development of the steel industry in China. Metal consumption in the country during this period
increased by more than 10 times and in 2017 amounted to 1.17 million tonnes (54 % of the world total).
The rest of the countries are inferior to China in the amount of metal used. Thus, the total share of former
leaders (EU27, USA, Japan and South Korea) in nickel consumption is approximately a third of the world's
total.
Figure 4.17. World mine production, primary nickel production and usage, kt Source: INSG52
51 Bloomberg. News. Nickel Ban Shows Indonesia’s Ambition to Build EV Industry (29.10.2019)
https://www.bloomberg.com/news/articles/2019-10-28/indonesia-will-trade-nickel-riches-for-an-electric-car-
industry?sref=AjlywoTi 52 International Nickel Study Group (INSG). World Nickel Statistics. Yearbook. Vol XXVIII. No. 12. November
2019
0
250
500
750
1,000
1,250
1,500
1,750
2,000
2,250
2,500
2,750
2008 2009 2010 2011 2012 2013 2014 2015 2016 2017
Mine production Primary metal production Primary metal usage

51
212. Changes in the geography of consumption did not affect its industry structure as a whole —
stainless steel production remained the main area where about two thirds of the metal were used steadily.
213. The structure of metal usage within the main consumer countries corresponds to the world
structure: two thirds are directed to stainless steel production. The main growth of consumption by EV-
industry is observed in China, where the production of nickel-cobalt-manganese compounds is developing,
while the trend of partial replacement of cobalt with nickel persists. Production capacities of nickel-cobalt
and aluminum compounds are being increased in Japan and South Korea53.
Production
214. The increase in world demand led to a corresponding growth in primary nickel production,
which since the early 2000s has also doubled and exceeded 2 million tonnes in 2017 (Figure 4.17). The
main growth in production also came from Chinese producers. However, the amount of nickel produced in
the country does not fully meet the demand for it from domestic consumers.
215. The processing industry is developing most dynamically in Indonesia due to the state policy
in the spheres of subsoil use and industry. In 2014–2018 the country was banned from exporting nickel ore,
which forced investors, mainly Chinese, to invest in the construction of processing operations. As a result,
primary nickel output increased from 2 % of world nickel in 2015 to 10 % in 2017. From 2020, the
country’s government will again impose an export ban, which is expected to lead to even greater production
growth in Indonesia 54,55.
216. As shown in chapter 4A, there is a differentiation between the production of high-grade and
low-grade nickel depending on the type of raw material. The main nickel sources are two types of ores —
sulphide and silicate (“laterite”). When processing sulfide ores, only refined nickel is obtained. Processing
of laterite ores is possible by two schemes with obtaining either ferro-nickel and nickel pig iron or refined
metal. The second scheme requires significantly larger investments and is implemented at single sites.
217. Recycling of secondary nickel-containing raw materials is not developed properly and is
applicable only for stainless steel production. It is known that the contribution of secondary raw materials
to steel production is most significant in China (there are no reliable estimates of the share of use) and in
Japan (up to 40 % of production). According to International Nickel Study Group (INSG) estimates, about
4–4.6 million tonnes of nickel bearing scrap containing 350 thousand tonnes of nickel are used annually for
steel production56.
218. Until the early 2000s, sulphide ore deposits were the main source of nickel raw materials.
Their main reserves are concentrated in traditional regions of the nickel industry — Russia, Canada,
Australia, China and South Africa. These Countries specifically provided the bulk of nickel mining and
primary nickel production. In the early 2000s, a new low-cost product was developed in China — nickel
pig iron produced by processing laterite ores. The rapid growth of production that characterizes the 21st
century became possible due to that. Indonesia, the Philippines, New Caledonia, Brazil, Colombia, Cuba
and a number of other countries have become sources of raw materials for Chinese producers. They were
the ones that ensured the main growth of nickel production. In 2009–2014 the growth rates of global nickel
production increased sharply. This was due to the announcement of a ban on the export of nickel ore from
Indonesia, and Chinese companies sought to stockpile raw materials to maintain production after the
termination of Indonesian supplies. In 2014 global nickel production declined by 17 % due to a sharp drop
in Indonesia, which could not be compensated by the growth in the Philippines and New Caledonia. In
2015, the decline in global production continued due to the suspension of nickel plants that did not meet
53 PJSC “MMC “NORILSK NICKEL”. Annual Report 2017. p.36 54 Reuters. Miners welcome Indonesian export ore ban, plan smelting expansion (11.09.2019)
https://mobile.reuters.com/article/amp/idUSKCN1VW2AP 55 Bloomberg. News. Nickel Ban Shows Indonesia’s Ambition to Build EV Industry (29.10.2019)
https://www.bloomberg.com/news/articles/2019-10-28/indonesia-will-trade-nickel-riches-for-an-electric-car-
industry?sref=AjlywoTi 56 International Nickel Study Group (INSG). About Nickel. Recycle and Environment Issues
https://insg.org/index.php/about-nickel/recycle-and-environment-issues/

52
environmental standards in China, primarily the nickel pig iron operations. Since 2016, the global nickel
industry has stabilized and there has been an increase in nickel production and primary nickel production.
Prices
219. Nickel is an exchange-traded metal. Its prices are formed on trading platforms, the main one
of which is the London Metal Exchange (LME).
220. In 2005–2007 nickel prices demonstrated an unprecedented growth due to increasing demand
from Chinese producers, fears of a deficit, but more due to an inflow of speculative capital (Figure 4.18).
The collapse of prices that followed from the middle of 2007 was related exclusively to the introduction of
new rules for exchange trading that stopped speculation. The consequences of the global financial and
economic crisis of 2008–2009 aggravated the price failure. Stable growth began only by mid-2009, which
was facilitated by continued rapid development of the Chinese economy as a whole and increased demand
for raw materials from stainless steel producers in the country. This led to the expansion of production
capacities at existing enterprises and the emergence of a large number of nickel deposit development
projects around the world. Some of these projects were successfully implemented, which resulted in
increased production.
Figure 4.18. World primary nickel production/demand balance, stocks (kt; left scale) and prices (USD/t;
right scale) in 2008–2017 Sources: INSG57, LME58
221. However, the continuous growth of metal mining and metallurgical production, stimulated
by high prices, resulted in a shift of the market balance towards surplus since 2007 (Figure 4.18). The
unclaimed metal “settled” in LME warehouses — its reserves reached a maximum of 466 thousand tonnes
in May 2015, which is comparable to a quarter of world production for the same year. At the same time,
refined nickel trading started at Shanghai Futures Exchange (SHFE), which partially reduced LME stocks
but did not change the situation as a whole. As of the end of December 2018, LME Stocks accounted for
206.4 thousand tonnes of nickel, while SHFE Stocks accounted for 93.9 thousand tonnes, which
corresponds to approximately 1.5-month metal consumption.
222. Apart from a slight deficit in 2010–2011, the market was in surplus until 2015, which
affected the drop in exchange prices for nickel. Short-term growth of quotations was observed in early 2014
under the threat of reduced supplies due to the beginning of the export ban in Indonesia. However, Filipino
57 International Nickel Study Group (INSG). World Nickel Statistics. Yearbook. Vol XXVIII. No. 12. November
2019 58 London Metal Exchange https://www.lme.com/
0
5000
10000
15000
20000
25000
-200
-100
0
100
200
300
400
500
2008 2009 2010 2011 2012 2013 2014 2015 2016 2017
USD
/t
Kt
LME Stocks, nickel primary SHFE Stocks, nickel primaryMarket balance LME Nickel Price (settlement)

53
suppliers that closed the emerging shortage of rough did not allow the nickel price to win back its positions,
and it continued to fall (Figure 4.18).
223. Since 2016, the nickel market has been in a state of deficit, which affects the gradual increase
in nickel quotations on the back of the recovery of demand both from the Chinese metallurgical industry
and from alkaline battery producers, the production of which is one of the promising applications of the
metal. According to International Nickel Study Group (INSG), in 2018 the nickel deficit increased to
144.2 thousand tonnes59. INSG also expects to reduce the deficit in 2019 and 2020 to 79 thousand tonnes
and 47 thousand tonnes respectively. This could have a negative impact on the growth rate of the metal
exchange value.
Forecast of Demand and Consumption
224. The main prospects for the growth of nickel consumption are associated with an increase in
the share of electrification of motor vehicles and the production of high-capacity storage batteries. The key
factors driving electrification of the transport system are incentives offered by the state, transformation of
the consumer mindset and improved technical specifications of batteries.
225. The electric car market growth is led by China. By 2020, it plans to increase the NEV
(electric cars and plug-in HEVs) sales to 2 million, and by 2025 – up to 7 million vehicles60. The
government has also introduced benefits and subsidies for the purchase and production of passenger electric
transport. Similar measures have been taken by the governments of a number of European countries,
including Belgium, Germany, the United Kingdom, France and Norway.
226. Growth of electric cars production is possible not only due to already established production
clusters in China, European countries, USA, but also due to new regions — the Indonesian government has
already announced plans to develop EV-industry in the country61.
227. Growing nickel consumption in Li-Ion batteries comes not only on the back of increasing
share of nickel-containing types, but also higher average nickel content in the cathode material triggered
by the need to substitute expensive cobalt units. While in 2016 NCM 1:1:1 (with nickel mass fraction of
20 %) accounted for the lion share of nickel-magnesium compounds of the cathode material, in 2018 nickel-
intensive compounds — NCM 6:2:2 (with nickel mass fraction of 36 %) and NCM 5:3:2 (30 %) took the
lead. Going forward, batteries are expected to switch to NCM 8:1:1 (with the nickel mass fraction of 48 %),
and some producers announce plans to launch commercial production of LNO, a cathode material with
nickel content of over 50 %. Further development of the automotive industry, the growing popularity of
electric and hybrid cars, along with the evolution of the cathode technology towards nickel-intensive types
lay the groundwork for major expansion of primary nickel consumption in this industry in the long run.62
228. Estimates of nickel demand growth in battery production by analytical agencies vary greatly
and range from 4 to 14 times by 2030 (Figure 4.19). Such large differences are due to the inability to
determine the most likely development of the situation in a number of key areas. The main factors, the
impact of which is assessed differently by different experts, include, first of all, issues related to the
prospects of using a particular type of battery and the prevailing type of electric vehicles, on which the
share of this or that metal depends. This raises questions about the speed with which the mining sector can
respond to potential changes in the demand structure, the long-term availability of raw materials for
expected growth in consumption, and the impact of these changes on traditional segments of metal demand.
59 International Nickel Study Group (INSG). Press Release. INSG October 2019 Meetings. (22.10.2019) 60 PJSC "MMC "Norilsk Nickel". Annual Report 2018. p.43 61 Bloomberg. News. Nickel Ban Shows Indonesia’s Ambition to Build EV Industry. 29.10.2019.
https://www.bloomberg.com/news/articles/2019-10-28/indonesia-will-trade-nickel-riches-for-an-electric-car-
industry 62 PJSC "MMC "Norilsk Nickel". Annual Report 2018. p.43

54
Figure 4.19. Nickel consumption forecasts by EV-industry, kt
229. The most optimistic forecast is given by the analytical group of BloombergNEF, estimating
the demand for nickel in batteries by 2030 at 1800 thousand tonnes of metal63. The agency estimates that
by 2030 the global annual lithium-ion battery demand will reach 2000 GWh, with passenger EVs
accounting for more than 70%.
230. Roskill anticipate an increase in nickel demand from EVs of 700 thousand tonnes by 2030,
with a slowdown already by 202864.
231. McKinsey&Company, Australian multinational independent investment bank and financial
services company Macquarie Group Ltd give close estimates, given the other forecast horizon: according
to their forecasts, the demand for high-grade nickel will increase 17-fold to 570–590 thousand tonnes by
2025. At the same time, the McKinsey agency estimates that by 2030 the annual demand for electricity will
increase to 2,300 GWh, while passenger EVs will account for no more than half of them. McKinsey sees
changes in the types of batteries produced in China as the main reason. Whereas nowadays, Chinese
preferences for battery chemistries clearly diverge from those in the rest of the world, with Lithium Iron
Phosphorus (LFP) capturing 55 % of the Chinese market, analysts expects preferences to converge toward
Nickel Manganese Cobalt (NMC) chemistries, with NMC811 and NMC622 the winners capturing a
combined market share of >90 % by 2025–30. These chemistries are less cobalt-intensive, NMC811
contains ~25 % of the cobalt per kWh compared to NMC111, but also more nickel-intensive, with the nickel
content in NMC811 a factor 1.75 higher per kWh (Figure 4.20).
63 Bloomberg. News. There's One Metal Worrying Tesla and EV Battery Suppliers. 05.08.2019.
https://www.bloomberg.com/news/articles/2019-08-05/there-s-one-metal-worrying-tesla-and-the-ev-battery-supply-
chain 64 Independence Group NL. Austmine 2019 https://www.igo.com.au/site/PDF/2741_2/Austmine2019Presentation
0
200
400
600
800
1000
1200
1400
1600
1800
2000
2018 2019 2020 2021 2022 2023 2024 2025 2026 2027 2028 2029 2030 2031 2032 2033 2034 2035
Roskill Macquarie (low case) Macquarie (base case)Macquarie (high case) McKinsey&Co Vale S.A. (base case)Vale S.A. (high case) Wood Mackenzie BloombergNEF

55
Figure 4.20. Distribution of EV-battery chemistries Source: McKinsey&Company65
232. Vale S.A., one of the largest nickel producers, is considering two scenarios of consumption
development. Under the maximum growth scenario, EVs production will exceed 40 million units by 2030,
and demand for nickel will reach 1,700 thousand tonnes, which is in line with Bloomberg NEF estimates.
According to the conservative scenario, the number of EVs would not exceed 20 million units, with nickel
consumption falling within the range of most estimates (Figure 4.19). On the whole, the company expects
a significant increase in the first class nickel deficit by 2030, which cannot be covered by the formed stocks
of refined metal (Figure 4.21).
Figure 4.21. Class 1 (non-stainless) market balance Source: Vale S.A.66
233. Wood Mackenzie estimates strong demand from non-stainless applications, increasing by
approximately 5 % a year. This is driven by nickel consumption in Li-ion batteries for electric vehicles
(EVs) and energy storage (ES)67. With such growth dynamics, by 2030 the share of stainless steel in the
65 McKinsey&Company. Metal mining constraints on the electric mobility horizon. April 2018,
https://www.mckinsey.com/industries/oil-and-gas/our-insights/metal-mining-constraints-on-the-electric-mobility-
horizon 66 Vale S.A. Electric Vehicle Revolution and Implications for New Energy Metals. Mining and Steel Conference
2018, http://www.vale.com/EN/investors/information-market/presentations-
webcast/PresentationsWebcastsDocs/BofA%20-%20May%202018%20-%20Bob%20Morris%20vFinal_i.pdf 67 Horizonte Minerals Plc. Investor Presentation Q4 2019 Nickel market.
https://horizonteminerals.com/news/en_20191024-investor-presentation.pdf

56
consumption structure may significantly decrease in favor of the predominance of batteries (Figure 4.22).
If this trend continues in the longer term, the share of the battery sector can be expected to equal that of
stainless steel in the mid-2030s.
Figure 4.22. Breakdown of Ni demand 2017 vs. 2030 Source: Wood Mackenzie
234. Speaking about forecasts of future demand from stainless steel producers, all analysts agree
that it will maintain stable growth. At the same time, estimates of its demand growth vary significantly:
Roskill expects a 40 % increase by 2030, while Wood Mackenzie expects only a 20 % increase68,69.
235. We chose three cases of primary nickel demand forecast based on the abovementioned
consumption growth options, reflecting both minimum and maximum growth rates of consumption
dynamics (Figure 4.23). However, like all long-term forecast, they are to a high degree tentative:
236. Case 1 (low) — corresponds to Wood Mackenzie forecast and expects the annual growth of
global demand by 2,6 %; these are the lowest growth rates from the examined forecasts;
237. Case 2 (base) — corresponds to Roskill forecast and expects the average annual growth of
global demand by 4 %; it generally corresponds to the average value of consumption growth rates projected
by most analytical agencies;
238. Case 3 (high) — corresponds to Bloomberg forecasts and expects the fastest average annual
growth in demand by 5 %.
Resources and reserves
239. According to USGS70, world nickel reserves estimated at least 89 million tonnes of nickel,
identified land-based resources averaging 1 % nickel or greater contain — at least 130 million tonnes of
nickel. At the current level of production of nickel commercial ores and concentrates (about 2.1 million
tonnes in 2017), taking into account losses during processing of raw materials, reserves availability at the
achieved production level exceeds 40 years, resources availability — 60 years.
68 Independence Group NL. Austmine 2019 https://www.igo.com.au/site/PDF/2741_2/Austmine2019Presentation 69 Horizonte Minerals Plc. Investor Presentation Q4 2019 Nickel market.
https://horizonteminerals.com/news/en_20191024-investor-presentation.pdf 70 USGS. Mineral Commodity Summaries 2020, https://pubs.usgs.gov/periodicals/mcs2020/mcs2020.pdf

57
Figure 4.23. Primary nickel land-based production and consumption forecasts up to 2035, kt
Forecast of land-based mining
240. In order to forecast the level of the world production of primary nickel by 2035, data on
reserves and identified resources (measured + indicated + inferred resources) of more than 150 nickel ore
deposits of various degrees of development were compiled and analyzed; resources of prospected fields
were not taken into account. The expected nickel production from existing mines is calculated based on
actual production in 2018, taking into account the planned expansion projects of existing capacities. The
main source of information was mining company reports. China and Indonesia were the exceptions; site-
specific information on these countries is limited and therefore production estimates for these countries as
a whole are used.
241. Nickel projects are conditionally divided into two categories in terms of readiness for
development: Proved and Possible Projects. The main criterion for assigning a project to a group was its
development stage (Preproduction, Construction, Feasibility Study, Prefeasibility Study). The timing of
their implementation and the complexities involved were also taken into account. However, it should be
noted that the stated deadlines are quite often postponed for various reasons.
242. It should be noted that the information on existing projects is obviously not complete. First
of all, it is connected with inaccessibility of data on projects implemented in the territory of China. Also,
there is no confidence in completeness of data on Indonesia and some other producers (such as Madagascar,
New Caledonia, etc.).
243. According to the analysis, by 2035 the production at the existing operations due to exhaustion
of their resource base may decrease by 2 % compared to the current level due to the complete depletion of
the fields on which they operate (Figure 4.23).
244. Production at Proved projects may start already in 2020. By 2035, these projects will account
for almost 350 thousand tonnes of nickel. Possible projects may be put into operation from 2024. By the
end of the period under review, they may jointly produce about 400 thousand tonnes of nickel. Thus, the
well-known projects will not only fully compensate for the retiring production from the existing mines, but
will also ensure its significant growth. As a result, nickel mine production may exceed the current level by
one third in 2035.
245. Despite a significant increase in production, even if consumption grows by 2.6 % per year
(Case 1, low), the market may experience a primary metal deficit after 2029 (in previous years the market
will be close to a balanced state). At the same time, the possible deficit of metal will begin to exceed the
current deficit only by 2032, so the value of metal may be very unstable practically until the end of the
period under consideration. It should be noted that we do not take into account stocks of stock exchanges
and private companies, as well as secondary metal, for the production of which there are prospects for
growth (primarily due to used batteries). Therefore, the actual deficit may manifest itself later and/or be
much lower.
0
500
1000
1500
2000
2500
3000
3500
4000
4500
5000
5500
2018 2019 2020 2021 2022 2023 2024 2025 2026 2027 2028 2029 2030 2031 2032 2033 2034 2035
Active Mines Proved Projects Possible ProjectsConsumption (2,6%) Consumption (4%) Consumption (5%)

58
246. In the other two scenarios of consumption growth (base and high), the market may
experience a deficit over the whole period under consideration. This situation may lead to a significant
increase in metal prices. This, in turn, will create conditions for the intensification of work on preparation
for the exploitation of known but so far inactive deposits, as was already the case in the first half of the
2000s. In this respect, laterite ore deposits are very promising, mainly concentrated on the territory of
developing countries, development of which does not require much time and is relatively cheap. In addition,
in recent years there has already been a significant increase in nickel exploration costs. According to
S&P Global, in 2019 alone their costs increased to USD 351.6 million, or by almost USD 54 million,
compared to the previous year71. Such work may result in the identification of new raw material facilities,
which may also be put into operation promptly.
247. In addition to the balance of supply and demand, the political sentiment regarding the
development of the nickel consuming and producing sectors in Indonesia and China will continue to have
a significant impact on the nickel market situation. The pace of global economic growth in general and the
pace of development of electric transport in particular will also play a major role.
Impact of nodules mining
248. With regard to the possible development of polymetallic nodules, we are considering three
scenarios: a minimum scenario (involving two contractors; Figure 4.24), a base scenario (involving six
contractors; Figure 4.25) and a maximum scenario (involving 12 contractors; Figure 4.26). All scenarios
imply the first contractor starting production in 2027 and the second in 2030; the remaining contractors
(subject to their involvement) will join the process in 2031–2033. It is assumed that the maximum aggregate
production level may be reached in 2035.
249. Provided that the minimum scenario is implemented and that two contractors are involved in
deep sea mining, their contribution to global nickel production will be negligible and will not exceed 3 %
of the expected surface mining at that time, provided that all the projects under consideration are
commissioned (Figure 4.24). However, with a maximum potential production level (about 74 thousand
tonnes of nickel per year), which is expected to be reached as early as 2032, deep sea mining would be
comparable to the production expected at that time in Finland or Papua New Guinea. This level may be
enough to make deep sea mining one of the Top 10 world metal producers. In terms of potential production,
one contractor is comparable to a medium-scale surface plant; these include Trident (Zambia), Cerro
Matoso (Columbia), Biankouma-Sipilou (Cote-d'Ivoire) and others.
Figure 4.24. Primary nickel production and consumption forecasts inclusive of polymetallic nodules mining
(2 contractors) in 2018–2035, kt
71 PR Newswire. 2019 exploration budget recovery falters due to difficult market conditions and high-profile M&A
activity (15.10.2019) https://www.prnewswire.com/news-releases/2019-exploration-budget-recovery-falters-due-to-
difficult-market-conditions-and-high-profile-ma-activity-300938552.html
1500
2000
2500
3000
3500
4000
4500
5000
5500
2018 2019 2020 2021 2022 2023 2024 2025 2026 2027 2028 2029 2030 2031 2032 2033 2034 2035
Active Mines Proved ProjectsPossible Projects Pollymetalic Nodules Mining (2 contractors)Consumption (2,6%) Consumption (4%)Consumption (5%)

59
Figure 4.25. Primary nickel production and consumption forecasts inclusive of polymetallic nodules mining
(6 contractors) in 2018–2035, kt
250. Under the implementation of base or maximum scenarios (involving 6 or 12 contractors),
deep sea nickel production volumes in 2035 may amount at approximately 222 thousand tonnes or
445 thousand tonnes respectively (see chapter 3B). This would be 8 % or 15 % of the surface mining
expected at this point, provided that all the projects under consideration are commissioned (Figures 4.25,
4.26).
Figure 4.26. Primary nickel production and consumption forecasts inclusive of polymetallic nodules mining
(12 contractors) in 2018–2035, kt
251. Thus, if production of polymetallic nodules starts in 2027 and increases with the
intensity we expect, it will not cause overproduction of nickel even with the minimum expected
growth rate of consumption, the commissioning of all currently known projects of new surface mines,
and deep sea mining by twelve contractors. Only the first years of deep sea mining may be an exception.
The earlier appearance of nickel from polymetallic nodules on the market at the lowest expected rate of
growth in metal consumption may cause a significant surplus of metal that may persist for several years.
Only if the growth rate of nickel consumption is higher than the low scenario of consumption growth, the
start of deep sea mining will not cause overproduction of the metal.
2000
2500
3000
3500
4000
4500
5000
5500
2018 2019 2020 2021 2022 2023 2024 2025 2026 2027 2028 2029 2030 2031 2032 2033 2034 2035
Active Mines Proved Projects
Possible Projects Pollymetalic Nodules Mining (6 contractors)
Consumption (2,6%) Consumption (4%)
Consumption (5%)
2000
2500
3000
3500
4000
4500
5000
5500
2018 2019 2020 2021 2022 2023 2024 2025 2026 2027 2028 2029 2030 2031 2032 2033 2034 2035
Active Mines Proved ProjectsPossible Projects Pollymetalic Nodules Mining (12 contractors)Consumption (2,6%) Consumption (4%)Consumption (5%)

60
252. However, even though the development of deep sea mining in the scenarios we are
considering will not have a negative impact on the nickel demand/supply balance, it may still lead to a
slight decline in the previously established prices, as it will reduce possible supply tensions. Besides, as it
was mentioned above, one cannot ignore the psychological pressure on market participants, which will be
caused by the fact of appearance of an additional source of metal with a great potential for growth.
Cobalt
Consumption
253. Cobalt application areas can be combined into two segments: chemical compounds and
metals (Figure 4.27). Its main area of use is production of rechargeable batteries, various alloys and
catalysts. In so doing, the structure of cobalt consumption has changed fundamentally over the last ten
years: due to the rapid growth of lithium-ion batteries production, metal cobalt has given way to chemical
compounds.
Figure 4.27. Cobalt end-use structure in 2017, % Source: Cobalt Institute
254. The most frequently used types of cobalt batteries are lithium-ion batteries, such as NMC
(lithium nickel manganese cobalt oxide), LCO (lithium cobalt oxide) and NCA (lithium nickel cobalt
aluminium oxide). Cobalt is also important in other types of batteries, such as nickel-cadmium (NiCd) and
nickel-metal hydride (NiMH). These batteries are used in portable devices (smartphones, tablets), energy
storage systems (solar panels), car electric motors and household appliances. The unique properties of
cobalt allow the thermal stability of lithium batteries and the integrity of the cathode to be maintained,
which is a determining factor in their safe use.
255. Cobalt is widely used in various alloys in order to make them magnetic, heat-resistant, wear-
resistant and corrosion-resistant. Cobalt-containing alloys are divided into superalloys, alloys for
prosthetics, magnetic and wear-resistant alloys by their properties. Their areas of application are aerospace,
cutting tools, automotive, industrial equipment and prosthetics.
256. Cobalt and its compounds act as a catalyst in natural gas and oil product desulfurization
reactions. Cobalt catalysts reduce the activation energy required for industrial processes such as the creation
of recyclable plastics.
257. Cobalt oxide is used as a bright blue pigment in the manufacture of glass, porcelain, ceramics,
enamels, paints, and inks.
258. Among other areas of cobalt applications are electronics, medical diagnosis, cancer
treatment, pharmaceuticals, etc.
46
7
5
6
17
8
353
0%
10%
20%
30%
40%
50%
60%
70%
80%
90%
100%
2017
High speed steel
Magnetic alloys
Hard Facing
Hardmetals
Super alloys
Other chemicals
Pigments
Catalysts
Rechargeable batteries
Ch
em
ical
sM
etal

61
259. Products made from cobalt metal and its alloys, as well as batteries, are suitable for recycling.
Cobalt waste and scrap are recycled for economical (lower costs compared to extraction of cobalt from
ores) and ecological reasons (to prevent damage caused by battery contents entering the soil). Cobalt waste
and scrap are divided into new (generated during the manufacture of alloys and other cobalt-bearing
materials and products) and old (collected after consumption). Collecting old scrap is more difficult because
it is often mixed with other scrap that does not contain cobalt. United Nations Environment Programme
(UNEP) estimates end-of-life recycling rate at 32 %, recycled content is estimated at 68 %72. Difficulties
in recycling of batteries are due to the variety of their forms and composition. In areas such as pigments,
glass, paint, etc. recycling is not possible due to the low cobalt content in waste. The estimates of current
secondary cobalt production vary greatly and range from 6 to 15 tonnes73.
260. In 2008–2017 cobalt consumption increased by more than two times and in 2017, according
to Cobalt Institute, reached 123 thousand tonnes74 (Figure 4.28). The main reason for this was its use in
lithium-ion batteries, the production of which was expanding rapidly these years.
Figure 4.28. World refined cobalt consumption, production and annual prices in 2008–2017 Sources: Cobalt Institute, BGS, IMF
Production
261. The refined cobalt production was expanding as well (including cobalt contained in the
chemical compounds). However, it did not match the demand from consumers at certain periods. In such
cases, the shortage of metal was compensated by various warehouse stocks (producers', traders' or stock
exchanges') accumulated in periods of overproduction.
262. The difficulty in bringing the demand for cobalt and its production in a balanced state is that
cobalt mining is mainly carried out along with copper (from sediment-hosted stratiform and stratabound
copper deposits) and nickel (from magmatic nickel-copper-cobalt sulphide deposits and nickel laterites).
The only cobalt deposit in the world where its commercial extraction is carried out is Bou Azzer deposit in
Morocco. According to the estimates of CRU, in 2016 г. approximately 61 % of produced cobalt was
72 UNEP (2011), Recycling Rates of Metals: a status report, International Resource Panel.
http://wedocs.unep.org/bitstream/handle/20.500.11822/8702/-
Recycling%20rates%20of%20metals%3a%20A%20status%20report-
2011Recycling_Rates.pdf?sequence=3&isAllowed=y 73 Al Barazi, S. (2018), Rohstoffrisikobewertung – Kobalt, DERA Rohstoffinformationen 36, Berlin, 120 S.,
https://www.deutsche-
rohstoffagentur.de/DE/Gemeinsames/Produkte/Downloads/DERA_Rohstoffinformationen/rohstoffinformationen-
36.pdf 74 Cobalt Institute. Production and Supply https://www.cobaltinstitute.org/statistics.html
0
10
20
30
40
50
60
70
80
0
20
40
60
80
100
120
140
2008 2009 2010 2011 2012 2013 2014 2015 2016 2017
tho
usa
nd
$/t
Kt
Refinery production, Kt Refined cobalt demand, Kt
Annual prices, U.S. cathodes, spot ,thousand $/t

62
extracted as a by-product of copper mining, 37 % — a by-product of nickel mining75. As a result, the
dynamics of cobalt mining and, consequently, refined cobalt production, correlate with copper and nickel
mining from certain types of deposits rather than with the metal demand dynamics. Nevertheless, in
2008–2017 copper production was growing. According to British Geological Survey76,77 (BGS), during this
period mine production increased by 1.7 times — to 139 thousand tonnes (Figure 4.29), the world
production of refined cobalt increased by 2.1 times — to 119.4 thousand tonnes. According to Cobalt
Institute78, the refined cobalt production in 2017 was slightly lower — 117 thousand ronnes, having
increased by 2.2 times over 10 years.
Figure 4.29. World mine and refinery cobalt production in 2008–2017, kt Sources: BGS
263. The main center of cobalt mine production is Democratic Republic of the Congo
(DR Congo), which accounts for approximately 60 % of the world production. Approximately 15–20 % of
production in this country comes from artisanal-based operations, where child labor is widespread79. Wide
distribution of artisanal mining makes it difficult to keep record of mine production in the country, a part
of artisanal mines carries out illegal mining. Therefore, this might be the reason the statistical data on cobalt
mine production in DR Congo differ greatly across various sources (USGS, BGS, S&P Global).
264. The world leader in the production of refined cobalt and its compounds is China, whose
production is mainly based on imported raw materials. As of 2016, USGS estimated cobalt refinery
capacities of China at 65 thousand tonnes of cobalt per year, which accounted for approximately 44 % of
the world's capacity80.
75 Al Barazi, S. (2018), Rohstoffrisikobewertung – Kobalt, DERA Rohstoffinformationen 36, Berlin, 120 S.,
https://www.deutsche-
rohstoffagentur.de/DE/Gemeinsames/Produkte/Downloads/DERA_Rohstoffinformationen/rohstoffinformationen-
36.pdf 76 BGS (2014), World Mineral Production 2008–2012, British Geological Survey, Keyworth, Nottingham, pp. 100,
https://www.bgs.ac.uk/mineralsuk/statistics/worldArchive.html 77 BGS (2019), World Mineral Production 2013–2017, British Geological Survey, Keyworth, Nottingham, pp. 100
https://www.bgs.ac.uk/mineralsuk/statistics/worldArchive.html 78 Cobalt Institute. Production and Supply https://www.cobaltinstitute.org/statistics.html 79 JRC (2018), Cobalt: demand-supply balances in the transition to electric mobility, European Commission
Technical Report, https://publications.jrc.ec.europa.eu/repository/bitstream/JRC112285/jrc112285_cobalt.pdf 80 USGS (2019), Cobalt (advance release), 2016 Minerals Yearbook, https://prd-wret.s3-us-west-
2.amazonaws.com/assets/palladium/production/atoms/files/myb1-2016-cobal.pdf
0
20
40
60
80
100
120
140
160
2008 2009 2010 2011 2012 2013 2014 2015 2016 2017
Mining production Refined production

63
Prices
265. Cobalt prices are largely controlled by the political and economic situation in DR Congo (the
major supplier of cobalt to the world market) and economic situation in China (as its main consumer).
266. At the moment, cobalt is the exchange-traded metal — it trades on London Metal Exchange
(LME) since 2010. Transactions with it and its compounds are also conducted on the so-called free market,
including the US market.
267. In 2007 and especially in 2008 the prices for cobalt showed rapid growth. This was
stimulated by the rapid growth in demand, especially from China, with insufficient supply. As a result, in
March 2008 the monthly average price reached a record high. On the US market (spot) it exceeded
USD 95 thousand per tonne, and at the end of the year it was almost USD 71 thousand per tonne81. The
global financial and economic crisis of 2008–2009 caused a sharp drop in demand for cobalt, while its
production increased significantly (Figure 4.28). This led to the excess of metal on the market, which led
to a sharp drop in price — on the US market, the average of 2009 was 2.2 times lower than the previous
year’s average, amounting to USD 32 thousand per tonne. Since mid-2009, prices started to recover, but a
year later their decline resumed. From mid-2010 to early 2016 prices demonstrated volatility with a general
downward trend. In 2016, there was an increase, but it was so small that the annual average was still lower
than in 2015. The situation changed drastically in the beginning of 2017 — there was a rush on the market
caused by the so-called “EV-boom”. Cobalt prices started to grow rapidly, and the annual average exceeded
the average of 2016 by 2.2 times on the US market, and by 2.3 times on LME. This growth resumed until
spring 2018, when metal price reached USD 90.8 thousand per tonne on the US market and exceeded
USD 93.5 thousand per tonne on LME. Thus, the minimum level of the beginning of 2016 was exceeded
by more than 4 times. This spike in metal prices caused a significant increase in supplies from DR Congo.
However, expectations of the metal deficit turned out to be overstated. China has announced changes in the
policy to stimulate new energy vehicles to cut subsidies by an average of 50 % since July 201982. As a
result, the prices collapsed as rapidly as they had previously grown — already in January–February 2019
they returned to the approximate level of USD 30 thousand per tonne. Obviously, this drop has had a
negative impact on producers, causing production cuts or suspension.
Forecast of Demand and Consumption
268. Prospects for future cobalt consumption are linked to the sector of lithium-ion batteries,
primarily for electric transport as well as electronic devices and stationary batteries. At the same time, a
number of risk factors, including price volatility and concerns about insufficient supplies, have led to
changes in chemical composition of lithium-ion batteries, which are aimed at complete substitution of
cobalt or reduction of its content. Thus, LCO used in electronics and containing 60 % of cobalt, are being
gradually replaced by NMC containing 10–30 % of cobalt, NCA containing 14 % of cobalt, and LFP that
do not contain cobalt. At the same time, in EVs lithium-ion batteries cobalt abandonment has not yet been
observed, because it ensures optimal battery performance. In so doing, batteries with lower cobalt content
and higher nickel and aluminum content are considered to be more widely used after 202083.
81 International Monetary Fund (2019), Primary Commodity Price System, http://data.imf.org/?sk=471DDDF8-
D8A7-499A-81BA-5B332C01F8B9&sId=1547558078595 82 Mining Review Africa. Battery metals: Long term demand remains strong, 29.01.2020,
https://miningreview.com/battery-metals/battery-metals-long-term-demand-remains-strong-despite-price-woes/ 83 JRC (2018), Cobalt: demand-supply balances in the transition to electric mobility, European Commission
Technical Report, https://publications.jrc.ec.europa.eu/repository/bitstream/JRC112285/jrc112285_cobalt.pdf

64
Figure 4.30. Some forecasts of EVs (incl. commercial) fleet dynamics until 2035 84 Source: BloombergNEF, organization websites
Note: BNEF’s 2019 outlook includes passenger and commercial EVs. Some values for other outlooks are BNEF
estimates based on organization charts, reports and/or data (estimates assume linear growth between known data
points). Outlook assumptions and methodologies vary. See organization publications for more.
269. To date, all of the forecasts of global cobalt consumption growth are largely based on the
development of electric transport, but have different target levels for the growth of the electric car fleet. It
was the diversity of these target levels (Figure 4.30) that determined the diversity of forecasts concerning
the prospects of cobalt consumption: according to different experts, cobalt consumption in 2030 may
amount to 320 to 535 thousand tonnes85,86.
270. As an example, let us present the scenarios of the International Energy Agency (IEA)87:
i. Reference Technology Scenario (RTS) — reflects projections that respond to policies on
energy efficiency, energy diversification, air quality and decarbonisation that have been
announced or are under consideration. This forecast is quite conservative: as it suggests, in
2030, the fleet of electric cars will amount to 56 million units, and global cobalt demand in
2030 will not exceed 241.5 thousand tonnes, i.e. the average annual growth rate after 2018
should be 5.6 %;
ii. Deep decarbonisation scenario — IEA 2DS — reflects the ambition for 160 million electric
cars in 2030 in a context consistent with a 50 % probability of limiting the expected global
average temperature increase to 2°C. The forecast assumes that in this case the global
cobalt demand in 2030 will reach 438.5 thousand tonnes, i.e. the average annual growth
rate after 2018 should be 11 %.
iii. Deep decarbonisation scenario — IEA B2DS — projects around 200 million electric cars
in 2030, targeting the achievement of net-zero GHG emissions from the energy sector
shortly after 2060. The forecast assumes that the potential demand for cobalt in 2030 will
grow to 534.5 thousand tonnes, i.e. the average annual growth rate after 2018 should be
12.9 %.
iv. Paris declaration Scenario — provides the indicators necessary to achieve the objectives of
the Paris Agreement on the regulation of measures to reduce carbon dioxide in the
84 BloombergNEF. Electric Vehicle Outlook 2019, https://about.bnef.com/electric-vehicle-outlook/ 85 Fu, X., D.N. Beatty, G.G. Gaustad and al. (2020) Perspectives on Cobalt Supply through 2030 in the Face of
Changing Demand, Environmental Science and Technology, 2020, 54 (5), 2985–2993 86 JRC (2018), Cobalt: demand-supply balances in the transition to electric mobility, European Commission
Technical Report, https://publications.jrc.ec.europa.eu/repository/bitstream/JRC112285/jrc112285_cobalt.pdf 87 JRC (2018), Cobalt: demand-supply balances in the transition to electric mobility, European Commission
Technical Report, https://publications.jrc.ec.europa.eu/repository/bitstream/JRC112285/jrc112285_cobalt.pdf

65
atmosphere. One of the main goals of this agreement is to limit the increase in the average
temperature on the planet to 2˚C compared to the pre-industrial period, and to reduce it to
1.5˚C if possible. To this end, it is essential to expand the global fleet of electric vehicles
to 20 % of the total fleet of vehicles used by 2030. This means that 110 million electric
cars and 400 million electric two-wheelers will be used in 2030. In this regard, the forecast
assumes an increase in world cobalt consumption to 344 thousand tonnes in 2030, i.e. the
average annual growth rate after 2018 should be 8.8 % per year.
271. The BloombergNEF scripts are highly respected — they are the ones that are based on
UNCTAD 88. According to the current BloombergNEF model, sales of electric cars will increase from
2 million in 2018 to 10 million in 2025, 28 million in 2030 and 56 million in 2040. As a result, in 2040,
about 550 million electric vehicles, including commercial vehicles, will be moved on the roads, and the
sales of electric vehicles will increase from 2 million in 2018 to 10 million in 2025, 28 million in 2030 and
56 million in 204089. Based on these parameters, cobalt consumption is projected to reach 327 thousand
tonnes in 2030. 90. To reach this level, the average annual growth in consumption after 2018 should be
8.3 %.
272. CRU agency gives a close forecast of cobalt consumption in 2030: according to its estimates
it will be at the level of 300 thousand tonnes, of which 70 % or more will come from batteries of all types.91
273. Speaking about the prospects of cobalt consumption in non-battery areas, a little attention is
paid to them. Nevertheless, significant growth is also expected there. Thus, according to CRU estimates, it
will increase by 45 %. However, in physical terms, this increase will only be around 26 thousand tonnes —
from about 59 thousand tonnes to over 85 thousand tonnes.92
274. We have selected 3 cases for analysis, two of which were prepared by the IEA and reflect
minimum and maximum fleet growth estimates for electric vehicles (Figure 4.31). All available forecasts
are limited to 2030. As part of our study, they are extended until 2035, while maintaining the trends that
characterized the previous period of time.
275. Case 1 (low) — corresponds to the IEA RTS scenario (considered the most optimal by IEA)
and assumes an increase in world cobalt consumption to 5.6 % per year.
276. For Case 2 (base), the average value between Case 1 and Case 3 of the selected IEA
projections is taken and amounts to 7.2 % per year.
277. Case 3 (high) — corresponds to the IEA Paris declaration Scenario to achieve which, the
consumption growth should be 8.8 % per year.
88 UNCTAD (2019) Commodities and Development Report 2019,
https://unctad.org/en/pages/PublicationWebflyer.aspx?publicationid=2499 89 BloombergNEF. Electric Vehicle Outlook 2019, https://about.bnef.com/electric-vehicle-outlook/ 90 Petersen J. (2019), The Cobalt Cliff Could Eradicate Non-Chinese EV Manufacturing Before 2030, Seeking
Alpha, https://seekingalpha.com/article/4273346-cobalt-cliff-eradicate-non-chinese-ev-manufacturing-
2030?app=1&isDirectRoadblock=false 91 JOGMEC (2019), Securing critical materials for Japanese industry, JOGMEC Presentation, Tokyo, June 2019,
http://mric.jogmec.go.jp/wp-content/uploads/2019/06/mrseminar2019_03_03.pdf 92 JOGMEC (2019), Securing critical materials for Japanese industry, JOGMEC Presentation, Tokyo, June 2019,
http://mric.jogmec.go.jp/wp-content/uploads/2019/06/mrseminar2019_03_03.pdf

66
Figure 4.31. Cobalt land-based production and consumption forecast in 2018–2035, kt
278. However, we are not sure that these scenarios take into account the prospect of reducing the
use of cobalt in batteries.
Resources and reserves
279. According to USGS93, world cobalt reserves are estimated at 7 million tonnes, identified
world terrestrial cobalt resources — approximately at 25 million tonnes. At the current level of mining
production of cobalt (about 140 thousand tonnes), taking into account losses during processing, reserves
can provide mining operations for about 50 years, resources — for more than 100 years.
Forecast of land-based mining
280. In order to estimate the level of world cobalt production up to 2035 the data on reserves and
identified resources of more than 90 cobalt-containing fields under development and being prepared for
operation of the world were compiled and analyzed; exploration resources have not been taken into account.
Production forecast is based on measured + indicated + inferred resources, taking into account extraction
losses. Expected cobalt production at the fields under development is calculated on the basis of actual
production in 2018, taking into account planned projects for expansion of existing capacities. The main
sources of information were mining company reports.
281. Due to the lack of data on all fields under development, to obtain the most complete picture
of the world cobalt mining industry, the missing production volumes have been taken into account based
on official government statistics and/or industry statistical compilations. This concerns primarily the
DR Congo.
282. In addition to mining cobalt production, secondary cobalt production was also taken into
account. Against the backdrop of increasing cobalt consumption and the general trend towards increased
recycling of resources, it will definitely grow.
283. The fields to be prepared for operation are conditionally divided into two groups according
to the prospects of their involvement in operation: Proved projects, Possible projects (watch Figure 4.31).
The main criterion for assigning a project to a group was the stage of its development (Preproduction,
Construction, Feasibility Study, Prefeasibility Study). Planned implementation dates and difficulties were
also taken into account. However, inclusion of a project in the most promising group of Proved projects
does not mean its timely implementation, as commissioning dates of fields (especially large and gigantic in
terms of reserves) are very often postponed for various reasons.
93 USGS. Mineral Commodity Summaries 2020, https://pubs.usgs.gov/periodicals/mcs2020/mcs2020.pdf
0
100
200
300
400
500
600
2018 2019 2020 2021 2022 2023 2024 2025 2026 2027 2028 2029 2030 2031 2032 2033 2034 2035
Production of mines Secondary refined cobalt Proved projectsPossible projects Consumption (5,6%) Consumption (7,2%)Consumption (8,8%)

67
284. According to our analysis, production of cobalt from existing mines could decline by 23 %
by 2035 due to exhaustion of their resource base. At the same time, the possible increase in the production
of secondary cobalt (by about 2 times by 2035) may make this reduction less sharp.
285. The main number of Proved and Possible projects is expected to be put into operation from
2021. By 2035 they can provide 58 and 17 thousand tonnes of cobalt per year respectively.
286. As shown in Figure 4.31, the expected increase in cobalt production will not be able to
provide the projected consumption level over the whole period under consideration.
287. With an annual growth of 5,6 % in world cobalt consumption (case 1; +5.6% per year) and
the implementation of all Proved and Possible projects, metal deficit may occur after 2028. However, given
the possible overproduction in previous years, the market may feel it with some delay. At the same time, it
is possible that some part of the Proved and Possible projects will not be put into operation in time (their
commissioning may be adversely affected by unfavorable prices both for cobalt itself and for the main
components of developed deposits — copper and nickel). Then the difficulties with providing copper to
industry may occur earlier.
288. If the average annual growth rate of cobalt consumption is 8.8 % (case 3), the threat of a
deficit may occur already in 2026, even if all the Proved and Possible projects are launched.
289. Depending on which of the scenarios of consumption growth under review we have chosen,
in 2035 the metal deficit may amount to 110–320 thousand tonnes, even if all the currently available
projects are implemented.
290. As already emphasized, growth of cobalt production is complicated by the absence of cobalt
deposits proper and by the presence of metal as a by-product in complex ores — nickel laterites, nickel-
copper-cobalt sulphide and others. Cobalt mining at such deposits is determined by interest in the basic
metals — nickel and copper. However, there is reason to believe that as the deficit approaches, the
commissioning of projects based on cobalt-containing ore deposits, which are not currently active or are in
the early stages of exploration, will accelerate. In addition, a number of new projects may emerge. Such
expectations are based on the rapid growth of cobalt exploration costs. According to S&P Global94, in 2018
95 companies were working for it, investing about USD 111 million in exploration. A year earlier, such
works were carried out by 52 companies, whose costs amounted to about USD 36 million.
291. The deficit of cobalt and the price increase caused by it may become an incentive for its full
extraction from mined ores, primarily laterite ores. Currently, only part of the mined ores of this type is
used as a source of cobalt.
292. Lack of cobalt may give rise to an active growth of its prices. However, as shown in
Figure 4.31, it is unlikely that they will grow in the short term. On the contrary, there is reason to believe
that overproduction, which could continue until the mid-2020s, would lead to an even greater reduction in
cobalt prices. It should be taken into account that cobalt prices are influenced not only by the balance of
supply and demand, but also by a number of other factors. Above all, it concerns the situation in and around
DR Congo. As mentioned above, this country is the largest supplier of cobalt raw materials in the world.
At the same time, about 15–20 % of this cobalt is produced by artisanal operations, where child labour is
used on a large scale. This is an outrage to the world community, and measures have already been taken to
combat the use of such cobalt in the products of major Western companies. An additional risk factor is the
unstable political situation in DR Congo. All of this threatens the stability of cobalt supplies from
DR Congo and makes investments in its mining industry highly risky. Positive changes in the country may
attract new major investors, which will have a positive impact on the entire global cobalt industry.
Impact of nodules mining
293. As for possible polymetallic nodules extraction projects, we consider 3 options of its
development: minimum (involving two contractors; Figure 4.32), base (involving six contractors;
Figure 4.33) and maximum (involving 12 contractors; Figure 4.34). All scenarios imply that production
will start by the first contractor in 2027 and by the second in 2030; the remaining contractors (subject to
94 S&P Global (2019), World Exploration Trends 2018, PDAC Special Edition, http://www.egcsouthafrica.com/wp-
content/uploads/2018/07/20190425_2018-World-Exploration-Trends.pdf

68
their involvement) will join the process in 2031–2033. It is assumed that the maximum cumulative level of
production by six or twelve contractors may be reached in 2035.
294. As can be seen from Figures 4.32–4.34, even if deep-sea mining is carried out under the
maximum scenario (with the participation of 12 contractors) and provides about 61 thousand tonnes of
additional cobalt in 2035, it will not be able to cover even the deficit that is formed at the minimum expected
rate of consumption growth.
Figure 4.32. Cobalt production and consumption forecast inclusive of polymetallic nodules mining
(2 contractors) in 2018–2035, kt
Figure 4.33. Cobalt production and consumption forecast inclusive of polymetallic nodules mining
(6 contractors) in 2018–2035, kt
100
150
200
250
300
350
400
450
500
2018 2019 2020 2021 2022 2023 2024 2025 2026 2027 2028 2029 2030 2031 2032 2033 2034 2035
Production of mines Secondary refined cobaltProved projects Possible projectsPolymetallic nodules mining (2 contractors) Consumption (5,6%)Consumption (7,2%) Consumption (8,8%)
100
150
200
250
300
350
400
450
500
2018 2019 2020 2021 2022 2023 2024 2025 2026 2027 2028 2029 2030 2031 2032 2033 2034 2035
Production of mines Secondary refined cobaltProved projects Possible projectsPolymetallic nodules mining (6 contractors) Consumption (5,6%)Consumption (7,2%) Consumption (8,8%)

69
Figure 4.34. Cobalt production and consumption forecast inclusive of polymetallic nodules mining
(12 contractors) in 2018–2035, kt
295. However, the absence of formal overproduction does not mean that production of
polymetallic nodules will not affect the cobalt market in any way. It is enough to compare its potential
volumes with the current production. According to the scenarios we are considering
• two contractors, having reached their maximum production, will ensure the market entry
of more than 10 thousand tonnes of additional cobalt per year from 2032, which will
correspond to about 5 % of the expected ground production by that time (about 7.5 %
compared to current production).
• six contractors, achieving a maximum cumulative production in 2035, will provide an
additional 30.6 thousand tonnes of cobalt, which will correspond to approximately 15 % of
the expected surface production by that time (over 22 % of current production);
• 12 contractors, reaching a maximum cumulative production in 2035, will provide an
additional over 61 thousand tonnes of cobalt, which will correspond to approximately 30 %
of the then expected ground production (about 45 % of current production).
296. Even if there is an uncompensated shortage of metal in the market, the appearance of such
additional metal portions (this even applies to metal from two contractors) will lead to a reduction in prices
that had been formed by that time. In this case there will be two factors that will work — reduction of
supply tension and psychological impact on the market participants by the very fact of appearance of an
additional stable source of metal, which, moreover, has a potential for growth.
297. If deep-sea mining starts earlier or develops faster than we anticipate, with consumption
growth in line with Case 1 “marine” cobalt will exacerbate the expected significant metal surplus in the
market. In this case, acute competition is expected with surface mines (including new ones), most of which
are located in DR Congo. If consumption grows according to Case 2 or Case 3, the threat of such
confrontation will be less (especially with Case 3), but it also cannot be excluded.
298. The result of the competitive struggle may be the displacement of the least efficient cobalt
mining enterprises from the market, but this will depend not only on the situation in the cobalt market, but
also on the situation in the adjacent copper and nickel markets, with which cobalt is mined. In addition, the
resulting price level for cobalt may be such that offshore mining itself is not economically viable and its
start is not economically feasible.
299. Thus, if extraction of polymetallic nodules starts in 2027 and increases according to any
of the scenarios we are considering, even with the minimum expected growth rate of consumption
(+5.6 % per year) and the commissioning of all currently known projects of new surface mines, there
100
150
200
250
300
350
400
450
500
2018 2019 2020 2021 2022 2023 2024 2025 2026 2027 2028 2029 2030 2031 2032 2033 2034 2035
Production of mines Secondary refined cobaltProved projects Possible projectsPolymetallic nodules mining (12 contractors) Consumption (5,6%)Consumption (7,2%) Consumption (8,8%)

70
will be no formal overproduction of cobalt. Only the first years of offshore mining can be an exception.
However, significant overproduction of cobalt can be expected up to 2028 and is difficult to avoid.
The reason for this is that cobalt is mainly mined as a by-product, which has already been repeatedly
mentioned. That is, the emergence of new mines producing cobalt is practically not controlled by the
situation in the market for this metal. As a result, so large reserves of cobalt may accumulate in various
warehouses that the lack of extraction will be compensated by these reserves for a long time. Accordingly,
the metal prices will be at a low level. Then, the beginning of offshore mining will exacerbate the situation.
At the same time, it is not ruled out that the price level will be critical for offshore mining itself, making it
low-profit or even unprofitable.
Manganese
Consumption
300. Over 90 % of the world's manganese is used in ferrous metallurgy. Manganese is used in the
form of manganese ferro-alloys or metallic manganese as an alloying element to improve hardness, abrasion
resistance of steel and, to a lesser extent, foundry pig iron, also for deoxidation and desulphurisation during
theirs production95.
301. Manganese ores are mainly processed into manganese ferro-alloys. There are two groups of
manganese ferro-alloys — ferro-manganese (FeMn) and silico-manganese (SiMn). Ferro-manganese is
divided into high carbon (HC FeMn) and refined (Ref FeMn). HC FeMn contains 65–80 % manganese and
6–8 % carbon, Ref FeMn (medium- and low-carbon ferro-manganese) contains more than 85 % manganese
and 0.5–2 % carbon. SiMn contains 60–75 % manganese and 10–35 % silicon.
302. Also, manganese ore, including low-grade, is used for the production of manganese metal,
mainly electrolytic (EMM). EMM is an extremely pure manganese product, containing over 99 % Mn
content. One of the areas of use of manganese metal is the production of various alloys with non-ferrous
metals, primarily with copper, copper-nickel, aluminum, and many others.
303. Figure 4.35 shows the structure of use of manganese ore.
Figure 4.35. Structure of consumption of manganese ores in 2017, % Source: Benchmark minerals96
304. Important non-metallurgical uses of manganese include battery cathodes. For their
production electrolytic manganese dioxide (EMD) and, to a lesser extent, EMM are used.
305. There are several types of EMD produced in the world. The bulk of EMD production comes
from alkaline & other (Li-primary) grades, followed by carbon-zinc (C-Zn) grade (Figure 4.36). In recent
years, lithium manganese oxide (LMO) grade EMD has demonstrated the most intensive growth in
95 Eramet S.A (2019), 2018 Registration document, https://www.eramet.com/sites/default/files/2019-
05/DRF_Eramet_2018_AMF_UK.pdf 96 Benchmark Minerals Intelligence
https://www.element25.com.au/site/PDF/1771_0/BenchmarkMineralIntelligenceManganeseTheBlackArt
88
93
Mn Ferroalloys
EMM (steel, alloys, battery, other)
EMD (battery) and other chemicals

71
production — by 47 % in 2017 and 2018 compared to 2016 and 2017 respectively, however, its share in
total EMD production does not yet exceed 15 %.
Figure 4.36. Global EMD production by grade in 2018, % Source: IMnI
306. According to Benchmark Minerals, it is estimated that about 250 thousand tonnes of
manganese were used in all types of batteries in 2017 and about 22 % was used in lithium-ion batteries.
The structure of a lithium-ion battery consists of three main functional components: an anode (made of
carbon), a cathode (which is a metal oxide), and an electrolyte between them (which is a lithium salt in an
organic solvent). In lithium-ion batteries containing manganese, the cathode is represented by lithium
manganese oxide (LMO)97.
307. The chemical industry also produces other manganese compounds used in agriculture (as an
ingredient for fertilizers and animal feed), medicine (potassium permanganate), electronics (for the
production of soft manganese ferrites), as a dye in the production of glass, textiles, ceramics, and more.
308. The main factor determining the level of global consumption of manganese is the state and
dynamics of the steel industry, which, in turn, depends largely on the situation in such industries as housing,
infrastructure construction, automotive industry and shipbuilding. In 2008–2017 global steel production
grew by 26 %, leading to a significant increase in demand for manganese. As a result, during this period
production of manganese ores in terms of metal and manganese alloys in physical terms increased by
approximately 32 % (Figure 4.37)98,99.
97 The ASSAY. Group Mining Magazine. Manganese: No Longer Just an Input on Steel. 03 January 2019
https://www.theassay.com/technology-metals-edition-insight/manganese-no-longer-just-an-input-on-steel/ 98 IMnI (2019), Statistics 2019, https://www.manganese.org/wp-content/uploads/2019/05/IMnI_statistics_2019.pdf 99 IMnI (2016), 2013 Public Annual Market Research Report,
https://www.manganese.org/files/publications/PUBLIC%20RESEARCH%20REPORTS/2013_IMnI_Public_Report

72
Figure 4.37. Dynamics of manganese ore production in terms of metal and manganese ferro-alloys (left
scale) and steel (right scale) in 2008–2017 Sources: USGS, BGS, IMnI
Production
309. The engine of the world steel industry is China. The economic take-off of China, which has
experienced rapid urbanization with growing demands on its infrastructure, has contributed significantly to
the strong period of growth in steel production and demand for manganese. As a result, since the early
2000s, China has become the world's main manganese ore consumer, while also acting as its largest
producer. Despite increasing its own mining capacity, China imports manganese ore in large volumes,
primarily from South Africa, Gabon and Australia, which are among the Top-3 world manganese ore
producers (in terms of manganese content). Ores from Australia and Gabon are of high quality, while those
from South Africa are of medium quality; when producing manganese products, they are added to mainly
low quality (<30 % Mn) Chinese ores.
310. China is also the world’s largest producer and consumer of manganese products
(Figure 4.38) — manganese ferro-alloys, electrolytic manganese metal (EMM), electrolytic manganese
dioxide (EMD).
Figure 4.38. Production distribution of manganese products among main producing countries in 2017, % Source: IMnI
Prices
311. Prices for manganese ore are mainly formed on a contract basis and depend on a large number
of factors, including market conditions (balance of supply and demand), the volume of stocks in Chinese
ports, the economic situation in the world as a whole, and others.
0
200
400
600
800
1000
1200
1400
1600
1800
0
5000
10000
15000
20000
25000
2008 2009 2010 2011 2012 2013 2014 2015 2016 2017
Mtkt
Manganese ore Mn ferroalloys Steel
68
97
56 13 10 10
32
3
11
0% 20% 40% 60% 80% 100%
EMD
EMM
Mn alloys
China India Norway Malaysia Other

73
312. Between 2009 and 2014, manganese ore production volumes exceeded steel producers'
demand for them (Figure 4.39). The reason for this was a significant increase in manganese ore production
in China100 and the commissioning of about a dozen new deposits, primarily in South Africa, Gabon and
Côte d'Ivoire, which has led to market oversaturation. The response to this was a rapid fall in manganese
prices. Thus, the average annual price of South32 Australian lumpy commercial manganese ore for
shipments to China in 2015 was 2.2 times lower than in 2011. As a result, some mining operations reduced
or completely stopped production, which created conditions for reducing excess supply on the market.
However, the global economic recession that followed the global financial and economic crisis of 2008–
2009 excluded opportunities for price increases.
Figure 4.39. Dynamics of manganese ore production and demand (left scale, kt of Mn) and average annual
contract prices for Australian lump ore with Mn content of 46 % for shipments to China (right scale,
USD per 1 % of Mn in dry metric tonne of ore). Sources: IMnI, The Tex Report Ltd.
313. The world manganese market improved only by the autumn of 2016, when in conditions of
revival of demand and shortage of supplies prices for manganese ore began to grow steadily. Thus, the
average price in 2018 for Australian lumpy manganese ore supplied by South32 to China exceeded the
average annual price in 2017 by 17 % and more than doubled since 2015. However, in 2019, due to the new
imbalance of the manganese ore market, prices for manganese ore once again showed a decline.
Forecast of Demand and Consumption
314. In the future, the steel industry will remain the main consumer of manganese products.
Demand for manganese from battery manufacturers, including some lithium-ion batteries, is also expected
to grow rapidly over the next decade. Globally, the demand for EMD, and to a lesser extent for EMM, is
increasing worldwide with the increased production of batteries, in particular due to the growing
introduction of electric vehicles.
315. The automotive sector is expected to be one of the major end-user segments for lithium-ion
batteries in the near future. The penetration of electric vehicles is anticipated to provide a massive impetus
for the lithium-ion battery industry growth. There is much uncertainty about how fast manganese
consumption growth will be in batteries, but production of lithium manganese oxide (LMO) grade EMD
used in lithium-ion batteries containing manganese is already increasing rapidly — by 47 % per year in
2017–2018.
100 It should be noted that statistics on manganese ore production in China are controversial; data from different
sources may differ almost by a factor of two.
0
2
4
6
8
10
12
14
16
0
2000
4000
6000
8000
10000
12000
14000
16000
18000
20000
2008 2009 2010 2011 2012 2013 2014 2015 2016 2017
USD
/% M
n
kt M
n
Production Demand Prices

74
316. To date, there is a number of forecasts of manganese use in batteries. One of them is for
manganese demand growth for use in lithium-ion batteries was made by Bloomberg101; according to this
forecast, demand will reach approximately 0.2 million tonnes of metal by 2030 (Figure 4.40). However,
such volumes will not have a significant impact on the global manganese market due to their relative
insignificance.
Figure 4.40. Global metals and materials demand from EV lithium-ion batteries Source: BloombergNEF
317. Cairn ERA and CPM give a more optimistic scenario, according to which in 2030 the
consumption of manganese in batteries will reach 500 thousand tonnes, and in 2040 it will reach 1 million
tonnes (Figure 4.41).102 This level of additional demand may already affect the demand for the metal as a
whole: if we compare it with the current production, it corresponds to about 5 %.
Figure 4.41. Manganese demand from Li-ion batteries (nickel-cobalt-manganese and lithium-nickel-
manganese oxide battery chemistries only) Source: Cairn ERA, CPM103
101 Djukanovic G. (2019), Manganese, copper and aluminium: The role of these metals in global battery demand,
Battery Materials Europe 2019
https://www.metalbulletin.com/events/download.ashx/document/speaker/E001854/a0I1t00000I5R1mEAF/Presentati
on 102 Euro Manganese Inc. (2019), Manganese, https://www.mn25.ca/manganese 103 Euro Manganese Inc. (2019), Manganese, https://www.mn25.ca/manganese

75
Note: HPEMM — High-Purity Electrolytic Manganese Metal; HPMSM — High-Purity Manganese Sulphate
Monohydrate
318. Speaking about other forecasts, they are relatively close and expect annual growth of 1–3 %
per year.104,105,106 The largest contribution to the demand growth is expected from China and, to a lesser
extent, from other developing countries, especially India.
319. One of the factors for the projected growth of manganese consumption in China is the
tightening of the rebar standards introduced by the government in 2018, which suggests an increase in
manganese consumption for melting 1 tonne of steel. This was a surprise, as a few years before this index
was, on the contrary, reduced.107
320. As part of this work, we chose 3 cases of manganese demand forecast, reflecting both
maximum and minimum growth in consumption dynamics (Figure 4.42):
321. Case 1 (low) — expects to grow by 1% per year, which is in line with Eramet S.A.'s
forecast.108
322. Case 2 (base) — expects annual growth of 1.5 % and is an intermediate evaluation indicator.
A moderate increase in steel production is expected due to the global economic slowdown, modernization
of Chinese enterprises to meet environmental requirements, and uncertainty about trade policy. A close
growth rate (1.4 % per year before 2035) is considered in the OECD forecast.109
323. Case 3 (high) — expects demand for manganese to grow by 3 % per year, which corresponds
to the average annual growth rate of steel production in the world in 2008–2017.
Figure 4.42. Manganese ore land-based production and consumption forecast in 2018–2035, Mt
104 World steel associated (2019)
http://www.indiansteelmarkets.com/presentations/Session1/4.0%20Edwin%20Basson_WSA.pptx 105 Chalabyan A., Mori L., Vercammen S. (2018), The current capacity shake-up in steel and how the industry is
adapting, McKinsey&Company,
https://www.mckinsey.com/~/media/McKinsey/Industries/Metals%20and%20Mining/Our%20Insights/The%20curr
ent%20capacity%20shake%20up%20in%20steel%20and%20how%20the%20industry%20is%20adapting/The-
current-capacity-shake-up-in-steel-and-how-the-industry-is-adapting.ashx 106 OECD https://www.oecd.org/industry/ind/Item_4b_Accenture_Timothy_van_Audenaerde.pdf 107 Roskill. Manganese Outlook to 2029. 30.09.2019 https://roskill.com/market-report/manganese/ 108 Eramet S.A (2019), 2018 Registration document, https://www.eramet.com/sites/default/files/2019-
05/DRF_Eramet_2018_AMF_UK.pdf 109 OECD (2017), Steel Demand Beyond 2030,
http://www.oecd.org/industry/ind/Item_4b_Accenture_Timothy_van_Audenaerde.pdf
0
10
20
30
40
50
60
70
80
90
100
2018 2019 2020 2021 2022 2023 2024 2025 2026 2027 2028 2029 2030 2031 2032 2033 2034 2035
Production mines Proved projects Possible projects
Consumption (3%) Consumption (1%) Consumption (1,5%)

76
Resources and reserves
324. According to USGS, manganese reserves are estimated at 810 million tonnes (manganese
content); resource assessment is not provided.110 At the current level of mining production of manganese
ore (about 20 million tonnes of manganese content) reserves can provide mining operations for
approximately 40 years. If we take into account the total physical volumes of reserves and resources of
manganese ore contained in specific known deposits (both developed and explored), the reserves will
amount to more than 5 billion tonnes of ore, and the resources — to more than 12 billion tonnes of ore.
Then the availability of manganese ores to the industry depending on their production level can be estimated
in 70–90 years on the basis of reserves and 150–200 years on the basis of resources in kind.
Forecast of land-based mining
325. In order to estimate manganese ore production until 2035, data on reserves and identified
resources (measured + indicated + inferred resources) of about 90 manganese ore mines or groups of mines
and projects have been compiled and analysed. The production forecast is based on
measured + indicated + inferred resources. The expected production of manganese ore at existing mines is
calculated on the basis of actual production in 2018, taking into account planned expansion projects of
existing capacities. The main sources of information were mining company reports.
326. Due to the lack of open data for some countries (primarily China), to get the most complete
picture of the world manganese mining industry, the missing production volumes are accounted for based
on official government statistics and/or industry statistics.
327. We did not take into account the use of steel scrap by the steel industry, which is gradually
growing. As steel scrap already contains manganese, its use in steelmaking reduces the need for manganese
products.
328. Due to the rather inactive market in recent years, projects to expand the capacity of existing
mines and develop new deposits are not proceeding as actively as they could under other market conditions.
However, expansion is envisaged at a number of deposits under development, primarily in South Africa
and Gabon.
329. Manganese ore projects are conditionally divided into two groups on the perspective of their
involvement in operation: Proved projects and Possible projects. The main criterion for classifying a project
as a group was the stage of its development (Preproduction, Construction, Feasibility Study, Prefeasibility
Study), as well as the planned terms of their implementation and the difficulties encountered in this process.
330. Major proved projects are being implemented in Guyana, Togo, Australia, Kazakhstan and
Russia. The possible projects include those that are currently in conservation. Such projects are known in
Chile, Australia, Burkina Faso and Russia.
331. At the same time, inclusion of the project in the most promising group of proved projects
does not mean its timely implementation, as the terms of deposit commissioning are very often postponed
for various reasons, primarily economic.
332. According to our analysis, the production of manganese ore from existing mines could
increase by about 20 % by the mid-2020s through the expansion of their capacity. In the future, it will be
virtually unchanged throughout the period under review.
333. The first of the Proved projects under consideration may come into operation in the very near
future. By 2035 they can provide additional production of about 2.3 million tonnes. Possible projects, if
commissioned, could add up to 5 million tonnes of ore per year (Figure 4.42). Thus, as a result of increasing
the capacity of currently operating mines and commissioning of all existing and possible projects in 2035,
the annual capacity of manganese ore may reach 82 million tonnes, which is one third higher than the
current level.
334. It should be noted that China is conducting intensive geological exploration for manganese
ores. In 2016–2017 alone, the country's manganese ore reserves and resources grew by 454 million
110 USGS (2020), Mineral Commodity Summaries 2020, https://pubs.usgs.gov/periodicals/mcs2020/mcs2020.pdf

77
tonnes.111 In the subsequent period, several other facilities were opened, which provided an additional
increase of 660 million tonnes of manganese ore112. It can be expected that at least some of the discovered
deposits will be put into operation in the period under review, which will significantly increase the
production of manganese ores.
335. In case the average annual growth rate of manganese consumption will be at 1 %, the demand
for manganese will be fully satisfied by the existing enterprises. Such a scenario will be implemented if the
Chinese metallurgical industry significantly reduces the growth rate of steel output, trends to which are
predicted by many analysts. At the same time, the production volume of manganese ores will exceed the
level of consumption, which on one hand will inevitably reduce prices, but on the other hand will increase
the warehouse stock, primarily of China. The market surplus and low prices will force the producers of
manganese ores to reduce their output, while the small ones, who are the most difficult to survive in such
conditions, will have to close down or suspend their work. Most development projects will also be frozen
and exploration will be phased out, especially in areas with low quality mineralization.
336. If the average annual growth rate of manganese consumption is 1.5 %, operating mines will
be able to provide it until 2030. In the coming years there may be a shortage of raw materials, but this could
be fully compensated by the Proved projects. At the same time, it is possible that the missing ore volumes
will be replenished with stocks accumulated during the years of surplus. Then the real need for
implementation of proved projects (if they are not yet operational by then) will be delayed.
337. In case the average annual growth rate of manganese consumption will be at the level of 3 %,
from 2020 there may be an insignificant shortage of products coming from the objects under development,
but it can be compensated by the proved projects. However, from 2026 onwards, the market may face a
deficit even if all the existing projects, both proved and possible, are implemented. This situation may
stimulate price growth and intensify the process of involvement in the development of new deposits, as
well as the expansion of geological exploration aimed at identifying new manganese ore deposits, primarily
of high quality. Exploration for high-grade ores in Indonesia and Brazil and for low-grade ores in China
and Australia has already increased. Commissioning of new facilities in the period under review may
eliminate potential shortage of raw materials.
Impact of nodules mining
338. With regard to the possible exploration of polymetallic nodules, we are considering three
scenarios: a minimum scenario (involving two contractors; Figure 4.43), a base scenario (involving six
contractors; Figure 4.44), and a maximum scenario (involving twelve contractors; Figure 4.45). All
scenarios imply that first contractor starts production in 2027 and the second in 2030; the remaining
contractors (subject to their involvement) will join the process in 2031–2033. It is assumed that the
maximum aggregate production level of six or twelve contractors may be reached in 2035.
339. As shown above, only with annual consumption growth of more than 1.5 % at the end of the
period under review will the currently operating mines be unable to fully meet potential demand. However,
the potential deficit will be fully covered by the projects currently under way. Only if consumption grows
by more than 2 % per year, the operating mines, together with possible manganese projects, will not be able
to fully meet the expected demand, but such a situation may occur only after 2032. Accordingly, it is only
if manganese consumption grows by more than 2 % a year after 2030 that a niche may emerge on the market
that deep-sea mining may occupy (Figure 4.43). At the same time, as it was already noted when considering
the prospects of the copper, nickel and cobalt markets, the emergence of a new supplier in almost any case
may cause a price decline. It is determined not by the imbalance of supply/demand, but by the stabilization
of supply.
111 China Mineral Resources (2018), Ministry of Natural Resources, PRC, https://www.gov.cn/xinwen/2018-
10/22/5333589/files/01d0517b9d6c430bbb927ea5e48641b4.pdf 112 SMM News, China's 1st large manganese-rich mine uncovered in Guizhou, 19.06.2019,
https://news.metal.com/newscontent/100939677/Report:-China%27s-1st-large-manganese-rich-mine-uncovered-in-
Guizhou/

78
Figure 4.43. Manganese ore production and consumption forecast inclusive of polymetallic nodules mining
(2 contractors) in 2018–2035, Mt
Figure 4.44. Manganese ore production and consumption forecast inclusive of polymetallic nodules mining
(6 contractors) in 2018–2035, Mt
Figure 4.45. Manganese ore production and consumption forecast inclusive of polymetallic nodules mining
(12 contractors) in 2018–2035, Mt
50
55
60
65
70
75
80
85
90
95
100
2018 2019 2020 2021 2022 2023 2024 2025 2026 2027 2028 2029 2030 2031 2032 2033 2034 2035
Polimetallic nodules mining (2 contractors) Possible projectsProved projects Production minesConsumption (3%) Consumption (1%)Consumption (1,5%) Consumption (2%)
50
55
60
65
70
75
80
85
90
95
100
2018 2019 2020 2021 2022 2023 2024 2025 2026 2027 2028 2029 2030 2031 2032 2033 2034 2035
Production mines Proved projectsPossible projects Polimetallic nodules mining (6 contractors)Consumption (3%) Consumption (1%)Consumption (1,5%) Consumption (2%)
50
60
70
80
90
100
110
120
2018 2019 2020 2021 2022 2023 2024 2025 2026 2027 2028 2029 2030 2031 2032 2033 2034 2035
Production mines Proved projectsPossible projects Polimetallic nodules mining (12 contractors)Consumption (3%) Consumption (1%)Consumption (1,5%) Consumption (2%)

79
340. Let's consider the prospects of the situation on the manganese market after the beginning of
offshore mining under conditions of consumption growth by 3 % per year.
341. As Figure 4.43 shows, under the minimum scenario (two contractors entering the market,
which from 2032 will jointly produce 6 million tonnes and ore containing about 1.5 million tonnes of
manganese per year), there are no prerequisites for overproduction even if all land mine projects are put
into operation.
342. Under the base scenario involving six contractors (from 2035, they will be able to produce
18 million tonnes of ore per year containing 4.6 million tonnes of manganese), in the last years of the period
under review, there will be prerequisites for excess supply on the market (Figure 4.44). If some of the six
contractors start production earlier than the scenario assumes, the excess supply will appear earlier and will
be more significant.
343. Under the maximum scenario of 12 contractors (from 2035, 36 million tonnes of ore per year
containing 9.2 million tonnes of manganese could be produced, corresponding to about half of current
production) overproduction could occur from 2032 and as contractors reach full capacity, this would
increase dramatically (Figure 4.45). This will inevitably lead to a price collapse, which will affect not only
land producers, but also contractors themselves.
344. Thus, only if consumption of manganese ores grows by more than 2 % per year will
there be a niche in the market that can be occupied by deep sea mining. At the same time, the volume
of “sea” manganese production, which the market will be able to absorb painlessly, will be
determined by consumption growth rates. If they are in line with Case 3 (+3 % per year) we are
considering, and production starts in 2027 and increases at the rates we expect, then only if no more
than six contractors are operating, the manganese market is likely to be unaffected. If more contractors
enter the market or if consumption increases at a lower rate, the manganese market will experience adverse
effects that may affect not only land-based producers but also contractors themselves.
D. Primary sector products of the affected metals
Copper
345. The main primary sector products of copper are concentrates derived from the benefication
of sulphide ores (as shown in chapter 4A). Intermediate products from oxide ores hydrometallurgical
processing using the solvent-extraction/electrowinning (SX-EW) method are copper solutions, but they do
not participate in the copper project trade chain. Copper produced by SX-EW method accounts for
approximately a fifth of the world’s mining production. According to the data of International Copper Study
Group (ICSG)113, its contribution to the world index in 2008-2017 varied between 18.7 and 21.2 %
(Figure 4.46).
Figure 4.46. World copper production dynamics by process in 2008–2017, copper content, kt, Source: ICSG
113 International Copper Study Group (2018). Annual Publication. Vol. 15 (www.icsg.org)
12,455.7 12,680.5 12,666.1 12,506.1 13,047.614,398.7 14,520.5 15,234.4 16,474.7 16,291.0
3,081.7 3,264.4 3,324.4 3,458.93,643.9
3,791.4 3,905.73,914.4
3,881.8 3,747.4
0
4000
8000
12000
16000
20000
2008 2009 2010 2011 2012 2013 2014 2015 2016 2017Concentrates SX-EW

80
346. As of 2017, a significant number of copper ores were mined and processed in 53 countries
worldwide. Mining production volumes in particular countries vary from 5.5 million tonnes (Chile) to
0.1 thousand tonnes (Albany)114.
347. According to ICSG, global copper mining production in 2017 exceeded 20 million tonnes,
having increased by 29 %, or 4.5 million tonnes, in 10 years (Figure 4.47). Simultaneously world mine
capacity in conversion to copper equivalent increased by approximately 5.3 million tonnes — up to
23,9 million tonnes per year (+28.4 %). Mine capacity utilization in 2017 amounted to 83.9 %; it was
83.6 % in 2008. The world’s 20 largest mining operations account for approximately 37 % of capacity.
Figure 4.47. World copper mining dynamics by major producing and other countries in 2008–2017,
copper content, kt, Source: ICSG
348. Increase in copper mining was provided primarily by Peru (+1178 thousand tonnes),
Democratic Republic of the Congo (+789 thousand tonnes), China (+614 thousand tonnes), Mexico
(+495 thousand tonnes), Zambia (+261 thousand tonnes) and Kazakhstan (+192 thousand tonnes), which
are in the world’s Top-10 largest mine copper producers. Significant increase in production was shown by
Spain (+188 thousand tonnes against 7 thousand tonnes in 2008) and Mongolia (+182 thousand tonnes).
349. Democratic Republic of the Congo has benefited the most from the expansion of copper
mining production: in 10 years, it has risen from rank 15 to 5. After the civil war (1998–2003) the country
started to develop its mining industry, and between 2007 and 2011, several large copper mines were put
into operation, where primarily SX-EW technology was used, which accounted for approximately 72 % of
the country's performance in 2017 (718 out of 1002 thousand tonnes). In 2008, this copper accounted for
less than 25 % of Republic’s mining production (approximately 53 out of 213 thousand tonnes).
350. The ranking of Peru (from rank 3 to 2), China (from rank 4 to 3), Zambia (from rank 9 to 7)
and Mexico (from rank 11 to 8) also went up.
351. Despite the past shifts in the global copper producer ranking, Chile, where both sulphide and
poor oxide ores are being extracted and processed, remains the world leader in the industry (Figure 4.32).
However, its share in the global index decreased from 34.3% in 2008 to 27.5% in 2017. In 2017,
5503.5 thousand tonnes of copper was produced in the country, which only exceeded the 2008 index by
176 thousand tonnes (3.3 %).
352. The products of mining production, depending on its type, are either smelted and refined
(concentrates) or are immediately ready for further use in various fields of industry (cathode copper
produced by SX-EW technology).
114 International Copper Study Group (2018). Annual Publication. Vol. 15 (www.icsg.org)
15,537.4
15,944.9 15,990.5 15,965.116,691.5
18,190.0 18,426.219,148.8
20,356.5 20,038.4
0
2000
4000
6000
8000
10000
12000
14000
16000
18000
20000
22000
2008 2009 2010 2011 2012 2013 2014 2015 2016 2017
Chile Peru China USA Congo, D.R.
Australia Zambia Mexico Russian Fed. Kazakhstan
Indonesia Canada Others World total

81
353. The consumers of copper concentrates are copper smelters, located not only in countries
where copper ores are mined and processed, but also in countries that do not have their own mine
production, or it is insufficient to meet the raw material needs of the copper smelter. This led to large-scale
global trade in copper concentrates.
354. More than 60 % of copper concentrates produced worldwide participate in global trade.
According to the estimates of Chatham House, the Royal Institute of International Affairs115, in 2017 copper
concentrates accounted for 59 % of world trade in copper products in weight terms and 30 % in money
terms.
355. In 2008–2017 the volume of global trade in copper concentrates (HS code 2603) increased
by approximately 1.8 times.
356. Increase in export of copper concentrates over 10 years amounted to about 14.9 million tons
(Figure 4.33). It was provided primarily by expanding supplies from Peru (+5.1 million tonnes), Chile
(+3.4 million tonnes), Spain (+1.5 million tonnes), Mexico (+1.3 million tonnes), Mongolia (+0.9 million
tonnes), Kazakhstan (+0.7 million tonnes), and Brazil (+0.6 million tonnes). Nevertheless, in 2017 Chile
remained the largest copper exporter, accounting for approximately 28 % of world exports. As a result of
Peru's strong export growth between 2015 and 2017, its share in the world total exceeded 23 %.
Figure 4.48. World copper ores and concentrates export dynamics in 2008–2017, gross weight, kt Source: ITC
357. The import growth of copper concentrates was primarily obtained by China (+12.1 million
tonnes) (Figure 4.48). If in 2008 China imported about the same amount of concentrate as Japan, in 2017 it
exceeded Japan's index by more than 3.5 times. In 2017 total of 17.3 million tonnes of copper concentrates
were imported into China. The main suppliers were Peru (4.9 million tonnes), Chile (4.6 million tonnes),
Mongolia (1.4 million tonnes), Mexico (0.9 million tonnes), Australia (0.85 million tonnes), Kazakhstan
(0.7 million tonnes), and Spain (0.7 million tonnes) (Figures 4.49, 4.50).
115 Chatham House, the Royal Institute of International Affairs, https://resourcetrade.earth/
19 473.5 19 256.7 20 605.5 19 573.4
21 745.6
24 665.3 25 617.7
28 382.3
33 344.7 34 358.7
0
5,000
10,000
15,000
20,000
25,000
30,000
35,000
40,000
2008 2009 2010 2011 2012 2013 2014 2015 2016 2017
Chile Peru Australia Spain IndonesiaMexico Mongolia Brazil Kazakhstan IranCongo, D.R. Others World

82
Figure 4.49. World copper ores and concentrates import dynamics in 2008–2017, gross weight, kt Source: ITC
Figure 4.50. Major international trade flows of copper ores and concentrates in 2017 Source: https://resourcetrade.earth/
358. The object of international trade is also the copper mattes. However, their trade volumes are
negligibly small (in 2017 — 268.4 thousand tons, or less than 1 % of trade in concentrates).
Nickel
359. Depending on the type of mined and processed raw materials, primary sector nickel products
include ores with a high nickel content (a product primarily produced from laterite ores) or concentrates (a
product primarily produced from the extraction and processing of sulphide ores). In 2008–2017 the
production volumes of concentrates in general remained at approximately the same level, however, due to
a significant increase in the production of laterite ores, their contribution to the global index decreased from
52 to 37 % (Figure 4.51).
19,928.8 20,425.8 21,059.2 20,326.322,539.3
27,333.7 27,326.728,839.0
32,807.134,579.3
0
5,000
10,000
15,000
20,000
25,000
30,000
35,000
2008 2009 2010 2011 2012 2013 2014 2015 2016 2017
China Japan Spain Korean Rep. Germany
Bulgaria India Philippines Others World

83
Figure 4.51. World nickel mine production by type in 2008-2017, nickel content, kt Source: INSG
360. As of 2017, nickel-containing ores were mined and processed in 33 countries worldwide.
Country-specific mining production volumes ranged from 355 thousand tonnes (Indonesia) to 0.2 thousand
tonnes (Norway)116.
361. According to INSG, world nickel mine production in 2017 exceeded 2.1 million tonnes,
having increased by 37 % or 579 thousand tonnes over 10 years (Figure 4.52). At the same time, the
maximum mine production level of 2.6 million tonnes was reached in 2013. This was ensured by the rapid
expansion of laterite ore mining in Indonesia; the subsequent sharp (almost 17 %) decline in the global
index was a consequence of the restriction on nickel ore exports imposed by the Indonesian government
in 2014.
Figure 4.52. World nickel mine production by countries in 2008–2017, nickel content, kt Source: INSG
362. The main production increase was provided by the Philippines (+260 thousand tonnes),
Indonesia (+136 thousand tonnes) and New Caledonia (+109 thousand tonnes). Significant increases were
also seen in Guatemala (+54 thousand tonnes), Madagascar (+38 thousand tonnes), Brazil (+38 thousand
tonnes) and Papua New Guinea (+35 thousand tonnes); in Madagascar, Guatemala and Papua New Guinea,
production only started in 2012. The rest of the world's leading nickel producers, including Russia
116 International Nickel Study Group (INSG). World Nickel Statistics. Yearbook. Vol XXVIII. No. 12. November
2019
863 703 757 877 870 872 896 929 835 790
684657
888
1 319 1 4891 724
1 268 1 2171 163 1 335
1 5471 359
1 645
2 1962 358
2 596
2 164 2 1461 998
2 125
0
500
1000
1500
2000
2500
3000
2008 2009 2010 2011 2012 2013 2014 2015 2016 2017
Concentrate Ores World
1,546.61,359.5
1,645.0
2,196.22,358.2
2,596.2
2,163.8 2,146.31,998.4
2,125.4
0
500
1000
1500
2000
2500
3000
2008 2009 2010 2011 2012 2013 2014 2015 2016 2017
Indonesia Philippines Russian Fed. New Caledonia Canada
Australia China, P.R. Brazil Colombia Cuba
Guatemala Others World

84
(-47 thousand tonnes), Canada (-48 thousand tonnes) and Australia (-21 thousand tonnes), have reduced
production.
363. The geographical structure of world nickel production in 2008–2017 underwent significant
changes. Until 2011, Russia, Canada and Australia remained the main producing regions, which provided
about 40-45 % of the world annual production. In 2011–2013 the leading supplier of commercial ores and
concentrates was Indonesia, which increased production volumes from 280 to 834 thousand tonnes of
nickel and accounted for almost 32 % of global production in 2013. At the same time, the nickel industry
in the Philippines started to develop; by 2011 it already accounted for 12 % of world mine production.
364. This rate of production growth in Indonesia was driven by strong demand for ore, triggered
by the expectation of a ban on ore exports from the country. The ban, which entered into force in January
2014, was adopted by the government with the aim of developing the country's domestic processing sector.
As a result, nickel production in Indonesia fell by almost 5 times, or to 177.1 thousand tonnes, in 2014
compared to 2013. This threw Indonesia to the sixth position in the ranking of the world's leading nickel
producers. As a result, the Philippines took the lead, providing 444 thousand tonnes of nickel. New
Caledonia, the third major supplier and producer of laterite ores, increased its production. In the traditional
nickel regions — Russia, Canada and Australia — by contrast, production declined slightly during this
period.
365. In mid-2016, the change of the head of government in the Philippines affected the country's
raw material policy. A powerful campaign was launched against open pit mining because of the significant
environmental damage to the tourism industry, which makes a major contribution to the country's GDP.
More than half of the country's operating mines have been shut down, including one third of the nickel
mines. In addition, almost all recently issued mining permits have been revoked. As a result, production in
the Philippines decreased by 20 % in 2016, but the country remained the world's leading producer in this
year. This did not lead to a significant reduction in nickel production as a whole. Discontinued capacity
was offset by increased production in New Caledonia (oriented towards China) and Indonesia, where
several new metallurgical plants started operating.
366. In 2017, after a three-year hiatus, Indonesia again became the mining leader, increasing
production volumes to 355 thousand tonnes nickel mine production. The situation with the mining industry
in the Philippines has not changed — production at the closed mines has not been resumed, but the country
remains the world's second largest producer of nickel raw materials.
367. Other major nickel suppliers with commercial ore and concentrate production volumes
consistently exceeding 70 thousand tonnes of nickel include Russia (221 thousand tonnes in 2017), New
Caledonia (215 thousand tonnes), Canada (211 thousand tonnes), Australia (179 thousand tonnes), China
(95 thousand tonnes) and Brazil (77 thousand tonnes).
368. As shown in chapter 4A, depending on the initial type of nickel ores, the type of products
produced differs: sulfide ores are used to produce refined metal, laterite ores are mainly ferro-nickel and
nickel pig iron with low nickel content.
369. Consumers of nickel raw materials are metallurgical and hydrometallurgical operations
located not only in countries where nickel ore is mined, but also in countries where there is no own mine
production or it is not sufficient to meet the needs of the processing plants. This has led to large-scale global
trade in raw nickel products.
370. Estimating the amount of metal contained in nickel ores and concentrates involved in global
trade is problematic due to the variability in their metal content. Chatham House, the Royal Institute of
International Affairs117, estimates that in 2017 nickel ores and concentrates accounted for 92 % of world
trade in nickel products in weight terms and 9 % in money terms. The main type of nickel raw material
products is nickel ore. This has been ensured by the fact that for 10 years the majority of deliveries have
been from Indonesia, the Philippines and New Caledonia.
117 Chatham House, the Royal Institute of International Affairs, https://resourcetrade.earth/
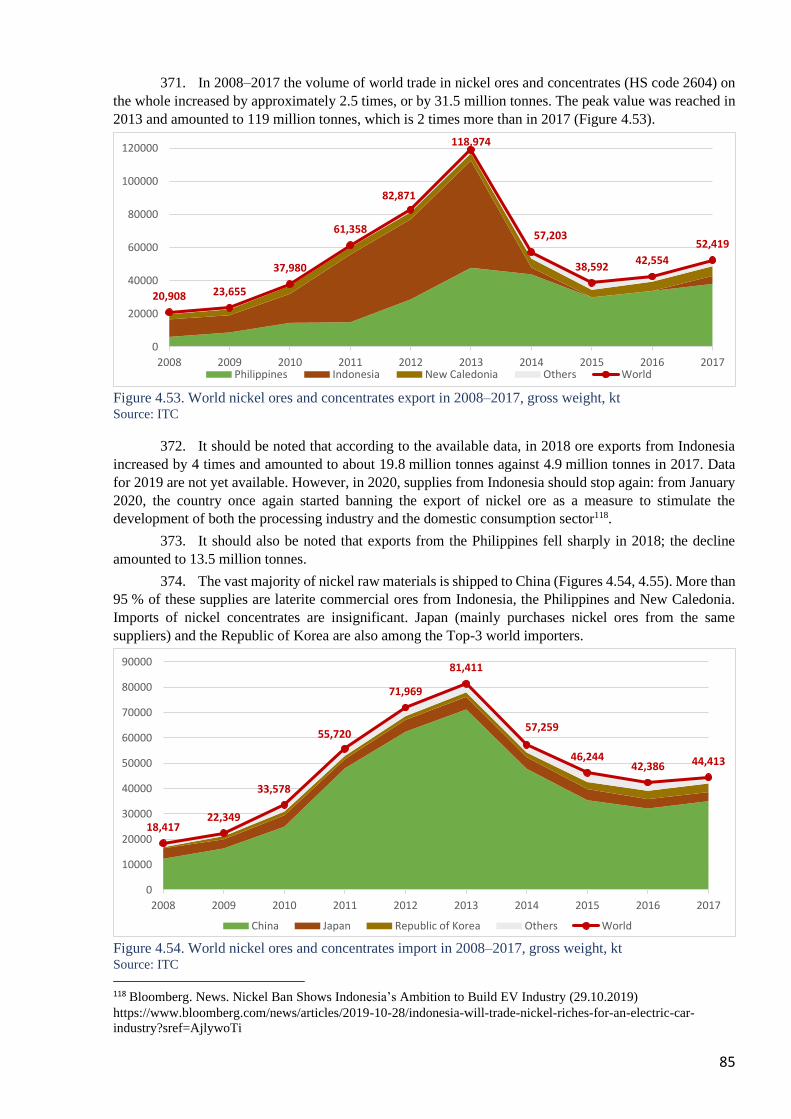
85
371. In 2008–2017 the volume of world trade in nickel ores and concentrates (HS code 2604) on
the whole increased by approximately 2.5 times, or by 31.5 million tonnes. The peak value was reached in
2013 and amounted to 119 million tonnes, which is 2 times more than in 2017 (Figure 4.53).
Figure 4.53. World nickel ores and concentrates export in 2008–2017, gross weight, kt Source: ITC
372. It should be noted that according to the available data, in 2018 ore exports from Indonesia
increased by 4 times and amounted to about 19.8 million tonnes against 4.9 million tonnes in 2017. Data
for 2019 are not yet available. However, in 2020, supplies from Indonesia should stop again: from January
2020, the country once again started banning the export of nickel ore as a measure to stimulate the
development of both the processing industry and the domestic consumption sector118.
373. It should also be noted that exports from the Philippines fell sharply in 2018; the decline
amounted to 13.5 million tonnes.
374. The vast majority of nickel raw materials is shipped to China (Figures 4.54, 4.55). More than
95 % of these supplies are laterite commercial ores from Indonesia, the Philippines and New Caledonia.
Imports of nickel concentrates are insignificant. Japan (mainly purchases nickel ores from the same
suppliers) and the Republic of Korea are also among the Top-3 world importers.
Figure 4.54. World nickel ores and concentrates import in 2008–2017, gross weight, kt Source: ITC
118 Bloomberg. News. Nickel Ban Shows Indonesia’s Ambition to Build EV Industry (29.10.2019)
https://www.bloomberg.com/news/articles/2019-10-28/indonesia-will-trade-nickel-riches-for-an-electric-car-
industry?sref=AjlywoTi
20,908 23,655
37,980
61,358
82,871
118,974
57,203
38,59242,554
52,419
0
20000
40000
60000
80000
100000
120000
2008 2009 2010 2011 2012 2013 2014 2015 2016 2017Philippines Indonesia New Caledonia Others World
18,41722,349
33,578
55,720
71,969
81,411
57,259
46,24442,386 44,413
0
10000
20000
30000
40000
50000
60000
70000
80000
90000
2008 2009 2010 2011 2012 2013 2014 2015 2016 2017
China Japan Republic of Korea Others World
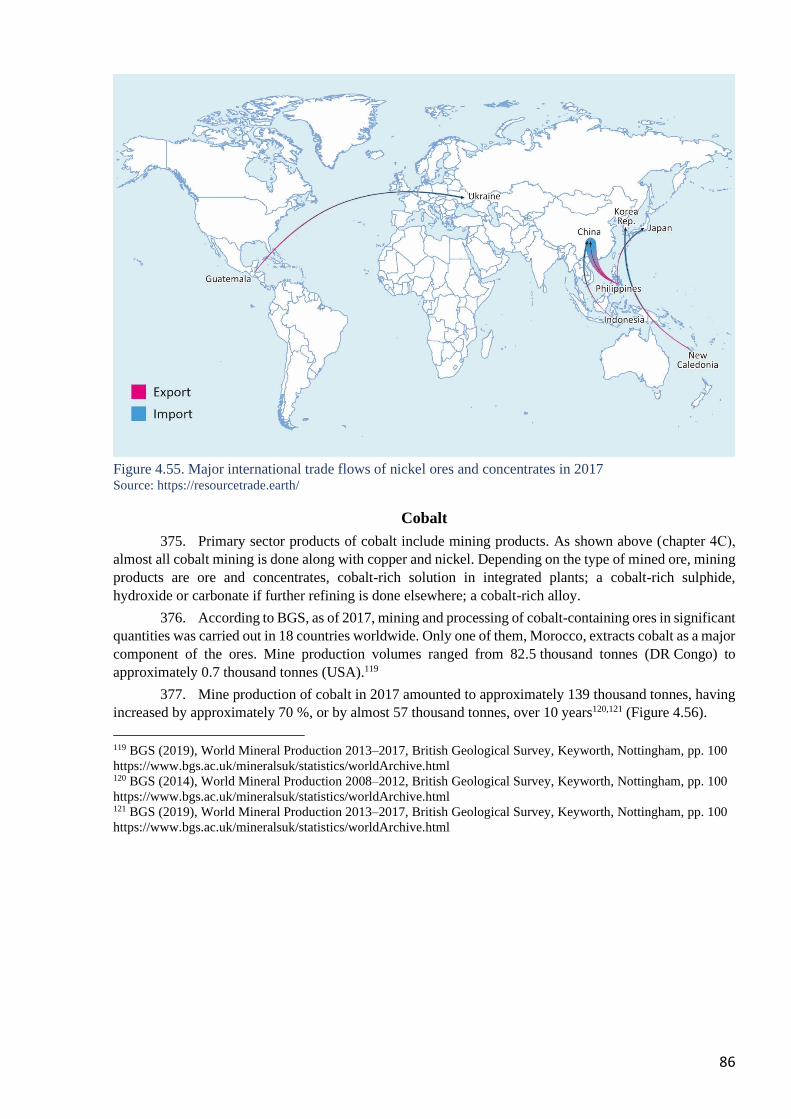
86
Figure 4.55. Major international trade flows of nickel ores and concentrates in 2017 Source: https://resourcetrade.earth/
Cobalt
375. Primary sector products of cobalt include mining products. As shown above (chapter 4С),
almost all cobalt mining is done along with copper and nickel. Depending on the type of mined ore, mining
products are ore and concentrates, cobalt-rich solution in integrated plants; a cobalt-rich sulphide,
hydroxide or carbonate if further refining is done elsewhere; a cobalt-rich alloy.
376. According to BGS, as of 2017, mining and processing of cobalt-containing ores in significant
quantities was carried out in 18 countries worldwide. Only one of them, Morocco, extracts cobalt as a major
component of the ores. Mine production volumes ranged from 82.5 thousand tonnes (DR Congo) to
approximately 0.7 thousand tonnes (USA).119
377. Mine production of cobalt in 2017 amounted to approximately 139 thousand tonnes, having
increased by approximately 70 %, or by almost 57 thousand tonnes, over 10 years120,121 (Figure 4.56).
119 BGS (2019), World Mineral Production 2013–2017, British Geological Survey, Keyworth, Nottingham, pp. 100
https://www.bgs.ac.uk/mineralsuk/statistics/worldArchive.html 120 BGS (2014), World Mineral Production 2008–2012, British Geological Survey, Keyworth, Nottingham, pp. 100
https://www.bgs.ac.uk/mineralsuk/statistics/worldArchive.html 121 BGS (2019), World Mineral Production 2013–2017, British Geological Survey, Keyworth, Nottingham, pp. 100
https://www.bgs.ac.uk/mineralsuk/statistics/worldArchive.html

87
Figure 4.56. World cobalt mining dynamics by major producing and other countries in 2008–2017, cobalt
content, kt Source: BGS
378. Production growth was provided by DR Congo (+40 thousand tonnes or by almost 2 times),
New Caledonia (+8.5 thousand tonnes or by 11 times), Papua New Guinea (production started in 2012 and
amounted to 3.3 thousand tonnes in 2017), Madagascar (production started also in 2012 and amounted to
2.8 thousand tonnes in 2017) and the Philippines (+1.5 thousand tonnes or by 2.2 times). At the same time,
mine production reached its maximum level in 2015, which was mainly due to its surge in DR Congo.
379. As noted above, the main cobalt mining center is DR Congo. Its share in world production
in 2008–2017 ranged from approximately 50 % to more than 70 %. In physical terms, production volumes
varied between 42.5 (in 2008) and 99.5 thousand tonnes (in 2011). DR Congo also contains the main cobalt
deposits (according to USGS, almost half of the world's deposits, or 3.6 million tonnes122). They are
enclosed in cobalt stratiform and stratabound copper deposits (the same type of deposits is the source of
cobalt in Zambia).
380. Approximately 15–20 % of cobalt mine production in DR Congo falls on small-scale mining
also called “artisanal mining”. According to Amnesty International estimates, 110–150 thousand people
are involved in cobalt mining practices.123 The exact figure cannot be determined due to the lack of
statistical studies and high rates of staff turnover and migration. Trade in artisanal raw materials is also not
fully controlled and accounted for. Often there are conflicts between mining and large-scale mining. If large
companies want to start mining in an area that was previously mined artisanal, it leads to displacement of
many people and other problems such as the absence of compensation for loss of their livelihood. With the
growing global demand of cobalt, the conflicts between artisanal miners and industrial mining companies
increase. There are consistent conflicts about mining rights and missing space/areas authorized for artisanal
miners. Small-scale miners invade concession areas assigned to large-scale mining companies for the
purpose of digging for minerals and thereby securing their survival.
381. Due to the peculiarities of the cobalt mining industry in DR Congo and the political
instability in the country, the supply of cobalt from the country to the world market is assessed as high risk.
This determined the inclusion of cobalt as a critical material in the US 124 and EU countries125.
122 USGS. Mineral Commodity Summaries 2020, https://pubs.usgs.gov/periodicals/mcs2020/mcs2020.pdf 123 ÖNZ (2018), Cobalt Critical, https://oenz.de/sites/default/files/oenz_inkota_factsheet_cobalt.critical3.pd 124 USGS (2017), Cobalt, Chapter F of Critical Mineral Resources of the United States—Economic and
Environmental Geology and Prospects for Future Supply, https://pubs.usgs.gov/pp/1802/f/pp1802f.pdf 125 EC (2017), Critical raw materials, https://ec.europa.eu/growth/sectors/raw-materials/specific-interest/critical_en
82.087.2
137.1143.6
137.2 138.7 137.6150.4
139.1 139.4
0
25
50
75
100
125
150
2008 2009 2010 2011 2012 2013 2014 2015 2016 2017Congo, D.R. New Caledonia China CanadaAustralia Cuba Papua New Guines ZambiaMadagascar Philippines Brazil IndonesiaOthers World total

88
382. Consumers of cobalt mining products are refineries located both in countries where cobalt is
mined and in countries that do not have their own mine production. There is an overall imbalance in the
distribution of major cobalt mining and refining centers worldwide. This has led to large-scale global trade
in cobalt raw materials.
383. Estimating the amount of metal contained in ores and cobalt concentrates involved in global
trade as a whole is problematic because of the variability in their metal content. According to the available
data, in concentrates obtained from the enrichment of sulphide copper-nickel ores, the cobalt content is
usually 1–1,5 % and 2,5–3 % in those obtained from the enrichment of copper-cobalt ores.126 According to
estimates based on international trade data, in 2017 cobalt ores and concentrates accounted for about 33 %
of world trade in cobalt products in weight terms and about 10 % in money terms.
384. Based on the data on export supplies, in 2008–2017 the volume of world trade in ores and
cobalt concentrates (HS code 2605) decreased by almost a third. DR Congo, where refining production was
destroyed by wars and crises and has hardly recovered so far, remains practically the only supplier of cobalt
raw materials to the world market (Figure 4.57). The recipients of this raw material are China and Zambia
(Figures 4.58, 4.59).
385. In 2013, it was announced that DR Congo intends to ban exports of copper and cobalt
concentrates to encourage domestic processing. To date, the process has been suspended and no
implementation is expected in the near future. The importance of the export of raw materials for national
GDP and the lack of necessary electricity for an energy-intensive sector such as refining were cited as the
main reasons (according to USGS127, electricity requirements for the recovery of cobalt cathode from
intermediate products by electrowinning in chloride and sulfate media are on average 3100 KWh/tonne and
6500 KWh/tonne for operations in China, Japan, Norway, Zambia, DR Congo and Canada. In DR Congo
these requirements are said to vary between 5000 and 6000 KWh/tonne). Nevertheless, according to OECD
data, in 2010–2014 the country introduced export duties of up to 25 % on cobalt ores and concentrates128.
Figure 4.57 World cobalt ores and concentrates export dynamics in 2008–2017, gross weight, kt Source: ITC
126 Al Barazi, S. (2018), Rohstoffrisikobewertung – Kobalt, DERA Rohstoffinformationen 36, Berlin, 120 S.,
https://www.deutsche-
rohstoffagentur.de/DE/Gemeinsames/Produkte/Downloads/DERA_Rohstoffinformationen/rohstoffinformationen-
36.pdf 127 USGS (2011), Estimates of Electricity Requirements for the Recovery of Mineral Commodities, with Examples
Applied to Sub-Saharan Africa, https://pubs.usgs.gov/of/2011/1253/report/OF11-1253.pdf 128 JRC (2018), Cobalt: demand-supply balances in the transition to electric mobility, European Commission
Technical Report, https://publications.jrc.ec.europa.eu/repository/bitstream/JRC112285/jrc112285_cobalt.pdf
255.3
360.4
451.7
407.3
265.9
331.9 327.6 325.7
215.6
174.6
0
50
100
150
200
250
300
350
400
450
500
2008 2009 2010 2011 2012 2013 2014 2015 2016 2017Congo, D.R. Zambia New Caledonia Indonesia Others World

89
Figure 4.58. World cobalt ores and concentrates import dynamics in 2008–2017, gross weight, kt Source: ITC
Figure 4.59. Major international trade flows of cobalt ores and concentrates in 2017 Source: https://resourcetrade.earth/
Manganese
386. Primary sector products of manganese include manganese ore. The ores produced are divided
into three categories depending on their manganese content: high-grade (≥ 44 % Mn), mid-grade (≥ 30 %
and ˂ 44 % Mn) and low-grade (˂ 30% Mn). According to International Manganese Institute (IMnI), high-
grade (approximately 41 % in metal terms in 2017) and mid-grade (approximately 43 % in metal terms in
2017) ores129 account for the main production. High-grade ores are produced mainly in Australia, Gabon,
Brazil and South Africa, but also (in significantly lower quantities) in Indonesia, India, Côte d'Ivoire,
Morocco, Namibia and Vietnam. Mid-grade ores are produced mainly in South Africa, India, Kazakhstan,
Malaysia, Australia and Ukraine. Low-grade ores are produced mainly in China, as well as in Georgia,
129 IMnI (2019), Statistics 2019, https://www.manganese.org/wp-content/uploads/2019/05/IMnI_statistics_2019.pdf
294.6
350.5
440.6 420.8
263.0249.7
283.4
328.7
213.0
166.9
0
50
100
150
200
250
300
350
400
450
2008 2009 2010 2011 2012 2013 2014 2015 2016 2017
China Zambia Finland Others World

90
Ghana and several other countries.130 However, two or all three categories of ores may be produced in the
same country. In different years, the proportions of ores of different categories in the production of specific
countries and, as a consequence, in the world, have changed (Figure 4.60).
Figure 4.60. Distribution of manganese ore production by ore types, Mn content, Mt Source: IMnI
387. According to available data, production of manganese ores in 2017 in significant quantities
was conducted in 29 countries. Mine production volumes in specific countries ranged from around
14 million tonnes (South Africa) to 1.1 million tonnes (Egypt).
388. According to BGS data available as of the beginning of 2020, which we adjusted based on
national statistics of Kazakhstan, the volume of manganese ore production in 2017 amounted to about
51 million tonnes, having increased by more than 34 % or 13 million tonnes over 10 years (Figure 4.61).
According to IMnI estimates, production in 2017 amounted to 19.1 million tonnes Mn content, an increase
of approximately 32.5 %, or 4.7 million tonnes, over 10 years.131,132
Figure 4.61. World manganese ore production dynamics by major producing and other countries in 2008–
2017, gross weight, kt Sources: BGS and national statistic of Kazakhstan
130 IMnI (2016), 2013 Public Annual Market Research Report,
https://www.manganese.org/files/publications/PUBLIC%20RESEARCH%20REPORTS/2013_IMnI_Public_Report.pdf 131 IMnI (2019), Statistics 2019, https://www.manganese.org/wp-content/uploads/2019/05/IMnI_statistics_2019.pdf 132 IMnI (2016), 2013 Public Annual Market Research Report,
https://www.manganese.org/files/publications/PUBLIC%20RESEARCH%20REPORTS/2013_IMnI_Public_Report.pdf
6.94.8
6.1 6.9 7 7.7 7.5 7.76.3
7.8
3.7
3.6
5.65.7 5.7
7.5 7.96
5.8
8.23.8
3
3.84.4 4.2
3.5 3.8
2.63
3.1
0
2
4
6
8
10
12
14
16
18
20
2008 2009 2010 2011 2012 2013 2014 2015 2016 2017High-grade (≥ 44% Mn) Mid-grade (≥ 30% and ˂ 44% Mn) Low-grade (˂ 30% Mn)
37,867
33,863
43,952
52,021 51,91754,054 53,773
50,729
46,124
50,908
0
10000
20000
30000
40000
50000
60000
2008 2009 2010 2011 2012 2013 2014 2015 2016 2017
South Africa China Australia Gabon Ghana IndiaBrazil Ukraine Malaysia Others World total

91
389. Production growth was mainly provided by South Africa, where it increased by more than
2 times, or by 7.6 million tonnes. Smaller but significant growth was also provided by Ghana (+1.9 million
tonnes, or by 2.8 times), China (+1.5 million tonnes, or by 14 %), Gabon (+0.9 million tonnes, or by 28 %),
Malaysia (+0.7 million tonnes, or by 2.3 times), and Brazil (+0.5 million tonnes, or by 20%). In this period,
production decreased only in Australia (-0.8 million tonnes in 2017, or by almost 16 %), although in 2014
production in the country was at the maximum level (+2.8 million tonnes, or 57 % compared to 2008), India
(-0.2 million tonnes) and Ukraine.
390. South Africa is currently the world's largest producer of manganese ores, in 2017 it accounted
for more than 27 % of gross production weight (18 % in 2008); in terms of metal — 36 % (21 % in 2008).
In terms of gross weight of ore extraction South Africa was inferior to China until 2014. However, in terms
of metal contained in ore, it was at the top of the world ranking of manganese raw material producers due
to the higher quality of the ores in some years up to 2012; after 2012, South Africa's leadership on this
indicator has again become steady. In 2005–2014 the country's manganese ore production capacities were
increased through both the commissioning of new mines and the expansion of existing ones' capacities. At
the same time, depending on the situation on the market, capacity utilization was changing. Thus, according
to IMnI in 2009 (in the conditions of the global financial and economic crisis) capacity utilization was only
52 %, whereas in 2008 and 2010 — 86 % and 88 % respectively, and in 2012 it reached 96 %.133
391. In 2017, China accounted for about 25 % of the gross weight of manganese ore production
(29 % in 2008), but metal accounted for only 9 % (24 % in 2008). The problem of the country's manganese
mining industry is the low quality of the raw material base — the average manganese content in mined ores
currently does not exceed 30 %. For comparison, in South Africa it is 35–38 %, in Australia it is close to
40 %, and in Gabon it exceeds 45 %.134
392. The main consumers of manganese ores are producers of manganese ferro-alloys. There is a
pronounced disproportion in the distribution of manganese ore and ferro-alloys production centers
(Figure 4.62). This has determined a large-scale ore trade.
Figure 4.62. Distribution of production of manganese ore by content of manganese and ferro-alloys gross
weight among major countries in 2017, % Source: IMnI
133 IMnI (2016), 2013 Public Annual Market Research Report,
https://www.manganese.org/files/publications/PUBLIC%20RESEARCH%20REPORTS/2013_IMnI_Public_Report
.pdf 134 USGS (2019), Manganese [advance release], 2015 Minerals Yearbook, https://prd-wret.s3-us-west-
2.amazonaws.com/assets/palladium/production/atoms/files/myb1-2015-manga.pdf
0%
10%
20%
30%
40%
50%
60%
70%
80%
90%
100%
Mn ore Mn ferroalloys
Others
Malaysia
Ukraine
India
Ghana
Brazil
China
Gabon
Australia
South Africa

92
393. Approximately 60 % of manganese ores produced in the world are involved in world trade.
According to Chatham House, the Royal Institute of International Affairs135, in 2017 they accounted for
85% of world trade in manganese products in weight terms and 45% in money terms.
394. In 2008–2017 the volume of world trade in manganese ores (HS code 2602) increased by
approximately 1.7 times.
395. Export growth of manganese ores in 10 years amounted to 13.3 million tonnes (Figure 4.63).
It was mainly ensured by expansion of supplies from South Africa (+9.8 million tonnes, or by 2.7 times).
Significant growth was demonstrated by Australia (+1.6 million tonnes, or by 1.4 times), Gabon
(+1.3 million tonnes, or by 1.4 times), as well as Brazil (+0.65 million tonnes, or by 1.3 times) and Côte
d'Ivoire (+0.6 million tonnes, or by 13 times).
Figure 4.63. World manganese ore export dynamics in 2008–2017, gross weight, kt Source: ITC
396. It should be noted that Côte d'Ivoire entered the Top-5 largest exporters of manganese ores
only in 2017; the rapid development of manganese mining and export in this country was largely facilitated
by the arrival of a large Chinese business in 2009.136 Côte d'Ivoire has very ambitious plans to develop the
mining sector in general and manganese ore mining in particular. The aim is to diversify the country's
economy, which is traditionally based on cocoa production.
397. The main importer of manganese ores is China, whose purchases in 2008–2017 increased by
13.7 million tonnes, or by 2.8 times (Figure 4.64); manganese ore in the country is supplied by South Africa,
Australia, Ghana, Gabon, Brazil, Malaysia and many other countries. China, being the main producer of
manganese ores, however, of low quality, imports higher-grade ores and mixes them with its own for further
production of ferro-alloys. Major importers also include India (its imports during the period under review
increased by 2.3 million tonnes, or 3.2 times), Ukraine, South Korea, Norway, Russia, Malaysia, Japan,
Spain and France (Figure 4.65). It is noteworthy that India and Ukraine, which are their major producers,
import manganese ore in significant quantities. The reason for this in India is that the country's ferro-alloys
production facilities are underutilized, while Ukraine, like China, mixes imported ores with its manganese
ores of insufficient quality.
135 Chatham House, the Royal Institute of International Affairs https://resourcetrade.earth/ 136 RTI. La production globale de manganиse en Cфte d'Ivoire atteindra le million de tonne en 2017,
https://www.rti.ci/info/economie/5423/la-production-globale-de-manganese-en-cote-divoire-atteindra-le-million-de-
tonne-en-2017
17,706
15,591
20,45521,439 21,829
25,590
28,946
26,29425,270
30,962
0
5000
10000
15000
20000
25000
30000
35000
2008 2009 2010 2011 2012 2013 2014 2015 2016 2017
South Africa Australia Gabon Brazil Côte d'Ivoire
Malaysia Kazakhstan Others World

93
Figure 4.64. World manganese ore import dynamics in 2008–2017, gross weight, kt
Source: ITC
Figure 4.65. Major international trade flows of manganese ore in 2017
Source: https://resourcetrade.earth/
E. Semi-finished products sector of the affected metals
Copper
398. Semi-finished copper products include copper mattes, cement copper (precipitates) and
smelter production. Smelter production is divided into three groups relating to the source of material used
in producing blister, anode and other smelter-level products. The three categories are: primary, from
concentrates; low-grade electrowon from SX-EW and RLE (roast-leach-electrowon) plants; and secondary,
from scrap materials. According to ICSG137, secondary copper currently accounts for approximately 16 %
137 International Copper Study Group (2018). Annual Publication. Vol. 15 (www.icsg.org)
18,551
15,175
20,696
23,190 22,871
26,87728,013
26,862 26,207
34,007
0
5000
10000
15000
20000
25000
30000
35000
2008 2009 2010 2011 2012 2013 2014 2015 2016 2017
China India Ukraine Korea, Rep.Norway Russian Fed. Malaysia JapanSpain France Others World

94
of blister copper production, compared to 14.4 % in 2008. In 2011–2013, its share exceeded 16.5 % (Figure
4.66).
Figure 4.66. World primary and secondary copper smelter production dynamics in 2008–2017, kt Source: ICSG
399. This review focuses on copper extracted from natural ores. In doing so, primary and
electrowon production is considered jointly.
400. According to ICSG (2018), primary blister copper production in 2017 exceeded 16 million
tonnes, an increase of more than 30 %, or approximately 3.8 million tonnes, over 10 years (Figure 4.67).
Almost all of this increase was provided by China (+3.6 million tonnes). Zambia has also shown significant
growth (+0.5 million tonnes).
Figure 4.67. World primary copper smelter production dynamics in 2008–2017 by major producing and
other countries, kt Source: ICSG
401. Since 2005, China has been the world’s largest primary blister copper producer. This was
facilitated by the possibility of the large-scale import of copper concentrates, which exceeded the volumes
of domestic mine production for more than 20 years. In 2017 more than 70 % of blister copper was produced
from imported raw materials.
402. The statistics of international trade do not allow for separation of primary and secondary
metal transactions, and they are considered jointly.
12,428.7 12,662.4 12,939.7 12,781.7 13,269.8 13,844.415,220.9 15,696.8 16,062.1 16,209.3
2,090.2 2,064.1 2,384.5 2,529.72,685.5
2,781.1
2,824.9 2,815.0 2,889.7 3,021.4
0
4000
8000
12000
16000
20000
2008 2009 2010 2011 2012 2013 2014 2015 2016 2017
Primary Secondary
12,428.7
12,662.4 12,939.7 12,781.7 13,269.813,844.4
15,220.9 15,696.8 16,062.1 16,209.3
0
2000
4000
6000
8000
10000
12000
14000
16000
18000
2008 2009 2010 2011 2012 2013 2014 2015 2016 2017
China Chile Japan India Zambia
Russian Fed. Korean Rep. USA Poland Australia
Peru Kazakhstan Canada Others World total

95
403. Blister copper is mainly refined at its production sites. As a result, less than 8 % of the world's
primary and secondary blister copper production is involved in world trade. According to the estimates of
Chatham House, the Royal Institute of International Affairs138, in 2017 it accounted for 3.1 % of world
trade in copper products in weight terms and 6 % in money terms.
404. In 2008-2017, the volume of blister copper (HS code 7402) world trade increased by
approximately 1.5 times (Figure 4.53).
405. Increase in blister copper export amounted at approximately 0.5 million tonnes in 10 years
(Figure 4.68). It was provided by Zambia (+0.6 million tonnes). The rapid expansion of blister copper
production in this country allowed it to become the largest supplier of metal to the world market within
three years. In 2017, it accounted for 40 % of the world total.
Figure 4.68. World unrefined copper export dynamics in 2008–2017, kt Source: ITC
406. Chile, the main metal exporter for many years, has shifted to second place among blister
copper exporters. In 2008–2017, its export volumes in physical terms remained unchanged, while its share
in the world decreased from 35 % in 2008 to approximately 26.5 %.
407. The main export directions are China and Western European countries, primarily Belgium
and Germany (Figures 4.69, 4.70). In 2008–2017 blister copper import to China increased by 0.6 million
tonnes, or by 4 times. As a result, the share of China in world import increased from approximately 19 %
to more than 48 % over 10 years.
138 Chatham House, the Royal Institute of International Affairs, https://resourcetrade.earth/
981.3
835.6
720.9808.6 828.0 850.2 809.1
930.0
1,135.8
1,465.5
0
200
400
600
800
1000
1200
1400
1600
2008 2009 2010 2011 2012 2013 2014 2015 2016 2017
Zambia Chile Bulgaria Congo, D.R. Slovakia Spain
Namibia Philippines Canada Others World

96
Figure 4.69. World unrefined copper import dynamics in 2008–2017, kt Source: ITC
Figure 4.70. Major international trade flows of unrefined copper in 2017 Source: https://resourcetrade.earth/
Nickel
408. Semi-finished nickel products include nickel-containing mattes, mixed sulphide concentrates
(containing more than 35 % combined nickel and cobalt), and other intermediate products of nickel
metallurgy, including salts and oxides for further refining.
409. The market for semi-finished products is significantly inferior to other nickel products in
terms of volume and has a limited number of participants. According to INSG, in 2017 only 8 countries
were producing them (Figure 4.71). At the same time, the available statistics do not allow to identify
production indicators for specific types of products. In addition, these statistics are clearly incomplete; this
is indicated by the fact that they do not take into account a number of countries (such as Russia and Canada)
1,045.0
940.0 970.2 992.81,054.9
1,220.51,147.5
1,225.9
1,454.2
1,657.2
0
200
400
600
800
1000
1200
1400
1600
1800
2008 2009 2010 2011 2012 2013 2014 2015 2016 2017
China Belgium India Germany CanadaKorea, Rep. Austria Namibia USA MexicoAustralia Others World

97
that supply semi-finished products to the world market. It can be argued that the production of semi-finished
nickel products by these countries is taken into account in mine production. In our view, the indicators of
semi-finished nickel products production are important, first of all, for countries with underdeveloped
nickel metallurgy. If we talk about Russia and Canada, these are the largest producers of metallic nickel,
so the lack of data on their production of semi-finished nickel products as such does not affect the
assessment of the industry.
Figure 4.71. World nickel intermediate production by countries in 2008–2017, nickel content, kt Source: INSG
410. In 2008–2017 the production of semi-finished nickel products increased by 31 %, or almost
64 thousand tonnes, in the countries included in the production statistics (Figure 4.71). It peaked in 2014,
and the previous growth was mainly due to increased production in Australia in 2010–2014; in these years,
it was 51–69 thousand tonnes, compared to about 30 thousand tonnes in previous years and about
40 thousand tonnes in subsequent years. In addition, production started in Papua New Guinea in 2012 and
doubled in the Philippines in 2014. It should be noted that throughout the period under consideration,
production in Indonesia remained constant and was supplied by several operations producing semi-finished
nickel products.
411. Consumers of semi-finished nickel products are metallurgical and hydrometallurgical
operations that purchase them along with mining products.
412. Chatham House, the Royal Institute of International Affairs139, estimates that in 2017 semi-
finished nickel products (HS code 7501) accounted for 2 % of world trade in nickel products in weight
terms and 18 % in money terms. The largest suppliers of semi-finished nickel products to the market are
currently Papua New Guinea, Canada, Russia, Indonesia, the Philippines and New Caledonia (Figure 4.72).
At the same time, Russia, Canada, Indonesia, Finland and Botswana are the main suppliers of nickel matte;
Papua New Guinea, the Philippines and New Caledonia are the main suppliers of nickel oxide sinters and
other intermediate products of nickel metallurgy (excluding nickel mattes).
413. In 2008–2017 exports of semi-finished nickel products increased by almost 2 times, or by
353 thousand tonnes (Figure 4.72). All the growth took place in 2013–2017. It was ensured, first of all, by
Papua New Guinea entering the market (+160 thousand tonnes), where nickel production began in 2012,
as well as by a sharp increase in exports by Russia (+107 thousand tonnes).
139 Chatham House, the Royal Institute of International Affairs, https://resourcetrade.earth/
203.8 202.0
260.2246.4
268.9284.9 294.3
275.1262.2 267.4
0
50
100
150
200
250
300
2008 2009 2010 2011 2012 2013 2014 2015 2016 2017
Indonesia Philippines Cuba AustraliaPapua New Guinea Finland New Caledonia TurkeyBotswana Brazil World

98
Figure 4.72. World nickel intermediate production export in 2008–2017, gross weight, kt Source: ITC
414. The main consumers of semi-finished nickel products are the largest producers of stainless
steel — China, Japan, Norway (Figure 4.73). At the same time, nickel oxide sinters and other intermediate
products prevail in the import structure of China; Japan and Norway import mostly nickel matte.
Figure 4.73. World nickel intermediate production import in 2008–2017, gross weight, kt Source: ITC
Cobalt
415. Prior to refining, cobalt ores and concentrates are further processed into intermediate
products. The majority of mining producers undertake processing to intermediate products domestically to
lower the high costs of shipping bulky, low value ores and concentrates. Intermediate cobalt products
include cobalt salts (hydroxide, carbonate and sulphate), accounting for 56 % of capacity and production,
crude cobalt oxide, alliage blanc cobalt, and cobalt containing mattes. Their production volumes are not
explicitly recorded; they are included in statistical data of mine production. As far as international trade
statistics are concerned, they also do not take into account intermediate products as separate products, but
together with refined cobalt products. Therefore, their trade will be considered in chapter 4F.
398.7 396.2424.5 403.9 398.9
529.8
589.4547.5
696.1751.7
0
100
200
300
400
500
600
700
800
2008 2009 2010 2011 2012 2013 2014 2015 2016 2017
Papua New Guinea Canada Russian Fed. Indonesia
Philippines New Caledonia Botswana Finland
Brazil Others World
628.2
537.6
634.9
716.0 703.9
849.7
973.9
857.3
949.6 934.9
0
200
400
600
800
1000
1200
2008 2009 2010 2011 2012 2013 2014 2015 2016 2017
China Japan Norway Finland United Kingdom Others World

99
Manganese
416. The products of manganese ore processing are manganese ferro-alloys, manganese metal,
manganese dioxide and other manganese chemicals. Almost all these products are obtained directly from
enriched ores. The exception is for refined ferro-manganese, which can be produced either directly from
ore or by refining high-carbon ferro-manganese or silico-manganese. Since it is not possible to determine
which part of the silico-manganese and high-carbon ferro-manganese produced in the world as a whole and
in individual countries are forwarded to production of refined ferro-manganese and which part to
steelmaking, we consider them as the end manganese products in chapter 4F.
F. End products sector of the affected metals
Copper
417. End products include refined metal. Refinery production is broken into three statistical
source categories: primary (electrolytic and fire-refined); secondary (electrolytic and fire-refined); and
electrowon (High-grade SX-EW) refined production. According to ICSG140, secondary copper accounts for
more than 17 % of refined copper production against 15,5 % in 2008. In doing so, in 2011–2013 its share
was at 17.7–18 % (Figure 4.74).
418. According to ICSG (2018), in 2017 refined copper production (secondary included)
exceeded 23.5 million tonnes, having increased by more than 29 %, or by 5.3 million tonnes, over 10 years.
At the same time world refinery capacity increased by 5.2 million tonnes — to 27.4 million tonnes
(+23.5 %). Refineries capacity utilization in 2017 г. amounted at 85.9 %; in 2008 it was 82.1 %. 20 largest
refining operations in the world account for approximately 40 % of capacity.
Figure 4.74. World primary and secondary copper refinery production dynamics in 2008–2017, kt Source: ICSG
419. This review focuses on copper extracted from natural ores. In doing so, primary and
electrowon production is considered jointly.
420. The volume of primary refined copper production in 2017 amounted at 19.5 million tonnes,
having increased by approximately 27 %, or by 4.1 million tonnes, over 10 years (Figure 4.75).
421. This increase was mainly provided by China (+4 million tonnes) and Democratic Republic
of the Congo (+0.7 million tonnes). At the same time, a number of countries that are among the largest
exporters of metal have reduced their supplies. This is primarily about Chile (-0.6 million tonnes).
140 International Copper Study Group (2018). Annual Publication. Vol. 15 (www.icsg.org)
15,366.3 15,386.3 15,744.1 16,133.1 16,597.5 17,254.918,575.3 18,897.1 19,471.5 19,469.5
2,824.9 2,847.4 3,236.4 3,467.6 3,596.53,803.5
3,915.0 3,945.5 3,866.1 4,053.1
0
3000
6000
9000
12000
15000
18000
21000
24000
2008 2009 2010 2011 2012 2013 2014 2015 2016 2017
Primary Secondary

100
Figure 4.75. World primary copper refinery production dynamics in 2008–2017 by major producing and
other countries, kt Source: ICSG
422. Since 2011, China has been the world’s largest refined copper producer. In 2017 its share in
the world metal production amounted at almost 34 % against 17 % in 2008. Approximately 90 % of
production was provided by domestic production of primary blister copper, the rest was provided by its
import. The bulk of refined copper produced in China is consumed domestically.
423. The share of Chile in domestic production of refined copper in 2017 amounted at 12.5 %
against 20 % in 2008. The decline in the country's role was not only due to the growth of production in
China, but also due to the decline in domestic production. Almost all metal is exported.
424. Since 2013, Democratic Republic of the Congo has been among Top-10 refined copper
producer states. This was due to the rapid expansion of the SX-EW copper production. In 2017 the country
accounted for approximately 4 % of the world production of primary refined copper. All metal is exported.
425. According to ICSG141, in 2008–2017 the use of primary and secondary refined copper in
industry increased by 33 %, or by 5.9 million tonnes, and amounted at 23.8 million tonnes (Figure 4.76).
This increase was provided by China — the consumption of refined copper by its industry increased by
6.6 million tonnes (+127 %) over 10 years. In 2017 the industry of China provided almost 50 % of the
world metal consumption; that was 29 % in 2008.
426. In economically developed countries, the use of refined copper in industry declined during
this period. In EU-15 this decline amounted at 0,6 million tonnes (-17 %), in USA and Japan — 0.2 million
tonnes (-11 and -16 % respectively). Nevertheless, the industry of economically developed countries in
2017 provided 26 % of world metal consumption in total.
141 International Copper Study Group (2018). Annual Publication. Vol. 15 (www.icsg.org)
15 366,3
15 386,3 15 744,1 16 133,1 16 597,517 254,9
18 575,3 18 897,1 19 471,5 19 469,5
0
2000
4000
6000
8000
10000
12000
14000
16000
18000
20000
2008 2009 2010 2011 2012 2013 2014 2015 2016 2017China Chile Japan USA
India Russian Fed. Congo, D.R. Korean Rep.
Zambia Mexico Poland Germany
Australia Peru Others World total

101
Figure 4.76. World refined copper (primary + secondary) usage dynamics in 2008–2017 by major and
other countries, kt Source: ICSG
427. A comparison of the main centers of production and consumption of refined copper shows
that they are largely fragmented (Figure 4.77). Despite the fact that the main metal consumers usually have
their own refining operations, often their capacity is insufficient to meet their needs. This also applies to
China. This situation has determined the large-scale international refined metal trade.
Figure 4.77. Distribution of refined copper production and usage among major countries in 2017, % Source: ICSG
428. The statistics of international trade do not allow for separation of primary and secondary
metal transactions, and they are considered jointly.
429. Refined copper in cathodes, billets for wire manufacturing and billets for rolling (HS code
740311) is a key product in the copper market. Approximately 40 % of produced refined copper (secondary
included) is involved in the international trade. According to the estimates of Chatham House, the Royal
Institute of International Affairs142, in 2017 it accounted for 16 % of world copper products trade in weight
terms and approximately 30 % in money terms.
142 Chatham House, the Royal Institute of International Affairs, https://resourcetrade.earth/
17,887.517,899.2
19,140.6 19,714.920,482.5
21,417.322,926.5 23,081.1 23,604.8 23,788.9
0
2000
4000
6000
8000
10000
12000
14000
16000
18000
20000
22000
24000
2008 2009 2010 2011 2012 2013 2014 2015 2016 2017China EU-15 (apparent) USA Japan
Korean Rep. Taiwan (China) India Turkey
Others World total
0%
10%
20%
30%
40%
50%
60%
70%
80%
90%
100%
Refinery production Refined copper usage
Others
Thailand
UAE
Turkey
Taiwan (China)
Korean Rep.
India
Brazil
Indonesia
Mexico
Zambia
Congo, D.R.
China
Peru
Chile

102
430. The dynamics of international refined copper trade differed from those of other copper
products. This primarily applies to its decrease in 2017, while the operations with concentrates and blister
copper were expanding.
431. In 2007–2018 the export of refined copper increased by 38 % (+2.5 million tonnes)
(Figure 4.78). However, compared to 2016 it decreased by 4.5 % (0.4 million tonnes). The largest increase
in export over 10 years was demonstrated by Chile, Democratic Republic of the Congo and Russia: the
supplies of each country expanded by approximately 0.4 million tonnes.
Figure 4.78. World refined copper export dynamics in 2008–2017, kt Source: ITC
432. Chile remained the largest exporter of refined copper in 2008–2017. However, its share in
the world index decreased from 29.4 % to 25.6 %. This is largely due to the increased contribution of small
suppliers.
433. China remains the main export direction (Figures 4.79, 4.80). In 2008–2017 its import of
refined copper increased by 2.2 times, and this increase occurred in 2009. As a result, the share of China in
the world import increased from 19.5 % to 37.4 %. In the following years, China's imports varied within a
fairly narrow range, and its share in the world index was 34.3–39.4 %.
Figure 4.79. World refined copper import dynamics in 2008–2017, kt Source: ITC
6,667.4
7,698.7
8,499.0 8,651.79,191.9 9,188.6 9,151.3 9,549.8 9,644.6 9,213.0
0
1000
2000
3000
4000
5000
6000
7000
8000
9000
10000
2008 2009 2010 2011 2012 2013 2014 2015 2016 2017Chile Russian Fed. Japan Zambia Congo, D.R.Kazakhstan India Australia China PeruKorea, Rep. Poland Philippines Others World
7,459.68,517.8 8,519.6 8,220.5
8,810.1 8,991.0 9,108.3 9,430.210,054.6
9,244.8
0
2000
4000
6000
8000
10000
2008 2009 2010 2011 2012 2013 2014 2015 2016 2017
China USA Germany Taipei, ChineseItaly UAE Turkey ThailandMalaysia Korea, Rep. Others World

103
Figure 4.80. Major international trade flows of refined copper in 2017 Source: https://resourcetrade.earth/
Nickel
434. End products include unwrought nickel and ferro-nickel, including nickel pig iron (NPI).
Secondary nickel-containing products in significant quantities are only used for the production of stainless
steel and often go into production without being pre-processed to metal.143
435. According to INSG144, in 2017 primary nickel production exceeded 2 million tonnes, having
increased by 1.5 times, or by 0.7 million tonnes, over 10 years (Figure 4.81). Unlike the mining industry,
primary nickel production did not fluctuate sharply during the same period. After a brief decline in 2009
due to the consequences of the global financial crisis, there was a steady increase in production. In 2009-
2013 the growth dynamics was characterized by high rates — by 10 % annually. However, since 2014 the
development has stabilized and the production growth rates have averaged 2 % a year.
436. The available statistics do not allow for a complete division of primary nickel production
into product classes: there is no such information on China, which is the largest producer. At the same time,
there are reasons to believe that more than 90 % of Chinese production falls on products of class 2 — NPI
& ferro-nickel with a predominance of the former. Therefore, all production in China can be conditionally
attributed to the share of class 2 products. Thus, since 2011 low-grade nickel products have been dominating
in the world primary nickel production (Figure 4.81).
143 International Nickel Study Group (INSG). About Nickel. Recycle and Environment Issues
https://insg.org/index.php/about-nickel/recycle-and-environment-issues/ 144 International Nickel Study Group (INSG). World Nickel Statistics. Yearbook. Vol XXVIII. No. 12. November
2019

104
Figure 4.81. World nickel primary production by class in 2008–2017, nickel content, kt Source: INSG
437. Primary nickel production in 2008–2017 was carried out in 29 countries. Since 2015,
26 countries have been consistently producing it. At the same time, 75 % of production is provided by only
countries. The industry leaders producing over 100 thousand tonnes of nickel annually include China,
Indonesia, Japan, Russia, Canada, Australia and New Caledonia (Figure 4.82).
Figure 4.82. World nickel primary production by countries in 2008–2017, nickel content, kt Source: INSG
438. The main increase in nickel production was provided by Chinese operations; they increased
production by 3 times, or by 400 thousand tonnes. The decrease in nickel production observed in 2014–
2016 in the country was caused by the state environmental policy aimed at tightening control over harmful
emissions into the atmosphere in large industrial regions where most NPI production facilities are located.
439. Russia, Japan, Canada and Australia, which have long been leaders of nickel metallurgy, are
now 3–5 times inferior to China.
440. Ferro-nickel & NPI are produced in 17 other countries. Besides China, Indonesia, Japan and
New Caledonia are also major producers. Production in each of these countries exceeds 100 thousand
tonnes of nickel. In addition, Brazil, the Republic of Korea and Colombia have significant production (over
40 thousand tonnes of nickel per year).
1,361.11,316.4
1,441.81,602.3
1,759.7
1,955.1 1,987.9 1,976.3 1,986.9 2,041.7
0
500
1000
1500
2000
2500
2008 2009 2010 2011 2012 2013 2014 2015 2016 2017
China, P.R. II class I class World
1,361.11,316.4
1,441.8
1,602.3
1,759.7
1,955.1 1,987.9 1,976.3 1,986.9 2,041.7
0
250
500
750
1000
1250
1500
1750
2000
2008 2009 2010 2011 2012 2013 2014 2015 2016 2017China, P.R. Indonesia Japan RussiaCanada EU27 Australia New CaledoniaNorway Brazil Others World

105
441. The main nickel producers of class 1 are Russia, Canada and Australia. Annual production
in each of these countries exceeds 100 thousand tonnes of metal, and together they provide more than half
of the world's production of high-grade metal. Norway, Finland, Japan, United Kingdom, South Africa,
Madagascar are also major producers with annual production of over 30 thousand tonnes.
442. A comparison of primary nickel's major production and consumption centers shows that they
are largely disjointed (Figure 4.83). Most major consumer countries of primary nickel are unable to meet
the demand for metal from their own production. This is particularly true for China. Most consumer
countries do not have their own production at all; for example, the US and some EU countries. This situation
has determined a large-scale international trade in primary nickel.
Figure 4.83. Primary nickel production and usage by countries in 2017, nickel content, kt Source: INSG
443. Chatham House, the Royal Institute of International Affairs145, estimates that ferro-nickel
(incl. NPI) accounted for 4 % of world trade in nickel products in 2017 in weight terms and 15 % in money
terms.
444. World trade in ferro-nickel and NPI (HS code 720260) in 2008–2017 was characterized by
positive dynamics; the volume of export operations increased by 3 times, or by almost 1400 thousand
tonnes (Figure 4.84). The main growth was provided by Indonesia (+960 thousand tonnes), where own
processing industry started to develop. Supplies from New Caledonia and Japan remained consistently high.
445. The main importer of ferro-nickel since 2009 is China (Figures 4.85, 4.86). In 2015–2017,
its foreign purchases of ferro-nickel demonstrated abnormally high growth rates, having increased by
almost 5 times in three years — from 283 to 1365 thousand tonnes. As a result, in 2008–2017 ferro-nickel
imports to China increased by more than 20 times in physical terms, and its share in the global index rose
from 8 to 64 %.
145 Chatham House, the Royal Institute of International Affairs, https://resourcetrade.earth/
0%
10%
20%
30%
40%
50%
60%
70%
80%
90%
100%
Production Usage
Others
Norway
New Caledonia
Australia
Canada
Brazil
Russia
Indonesia
Taiwan, China
India
Korea, Rep.
United States
Japan
EU27
China, P.R.

106
Figure 4.84. World ferro-nickel (incl. NPI) export by countries in 2008–2017, gross weight, kt Source: ITC
Figure 4.85. World ferro-nickel (incl. NPI) import by countries in 2008–2017, gross weight, kt Source: ITC
446. The main product in the nickel market is refined unwrought nickel (HS code 750201). Over
90 % of the metal produced is involved in international trade. However, according to Chatham House, the
Royal Institute of International Affairs estimates146, its share in world trade in nickel products in 2017 was
only 2 % in weight terms and 34 % in money terms.
447. Unwrought nickel is an exchange-traded commodity that the LME and Shanghai Futures
Exchange (SHFE) trade with. Therefore, the geography of metal supplies is affected by the location of
exchange warehouses. For example, LME warehouses are mainly located in the the following countries:
Netherlands, Belgium, Germany, the United Kingdom, Spain, the US, the Republic of Korea, Malaysia,
Singapore and the United Arab Emirates. SHFE warehouses are located in China.
146 Chatham House, the Royal Institute of International Affairs https://resourcetrade.earth/
692.4 659.7800.7
721.8
1,031.4 1,009.11,137.2
1,222.4
1,408.6
2,075.1
0
250
500
750
1000
1250
1500
1750
2000
2250
2008 2009 2010 2011 2012 2013 2014 2015 2016 2017
Indonesia New Caledonia BrazilJapan Colombia UkraineNorth Macedonia Others World
863.1
814.4904.1 949.6 995.0 946.0
1,109.8
1,320.6
1,716.7
2,132.9
0
500
1000
1500
2000
2500
2008 2009 2010 2011 2012 2013 2014 2015 2016 2017
China Taipei, Chinese Korea, Rep. India USABelgium Spain Germany Others World

107
Figure 4.86. Major international trade flows of ferro-nickel (incl. NPI) in 2017 Source: https://resourcetrade.earth/
448. In 2008–2017 exports of unwrought nickel increased by about 34 %, or by 216 thousand
tonnes. In so doing, it reached its maximum in 2015 after abnormal growth in 2013–2015 (Figure 4.87).
The reason for this spike was mainly the increase in metal deliveries from Malaysia and Singapore, where
LME warehouses are located. It is important to understand, though, that metal exported by countries with
large trading floors can be counted twice in export statistics: first by the country of manufacture (importer
— the country where the trading floor is located), and then — by the country where it was stored before
reaching the consumer.
449. The main exporters of unwrought nickel are major metal producers — Russia, Australia,
Canada and Norway.
Figure 4.87. World unwrought nickel export by countries in 2008–2017, gross weight, kt Source: ITC
642.0 722.0 721.2 759.0 789.4
952.8
1,066.61,154.9
960.9
858.4
0
200
400
600
800
1000
1200
1400
2008 2009 2010 2011 2012 2013 2014 2015 2016 2017
Australia Russia Canada Norway Netherlands
Finland Taipei, Chinese Madagascar United Kingdom China
Singapore Malaysia Others World

108
450. China has been the main direction of unwrought nickel supplies since 2007. Despite the
wave-like dynamics, in 2008–2017 they increased by 2 times, or by almost 120 thousand tonnes. A
significant number of supplies are also to the USA. In addition, in 2013–2016 significant quantities of metal
were shipped to Malaysia and Singapore, where LME warehouses are located (Figures 4.88, 4.89).
Figure 4.88. World unwrought nickel import by countries in 2008–2017, gross weight, kt Source: ITC
Figure 4.89. Major international trade flows of unwrought nickel in 2017 Source: https://resourcetrade.earth/
Cobalt
451. End products include refined cobalt products, which are divided into metal products (such as
cathodes, briquettes, ingots, granules and powder) and chemical products (such as oxides, carbonates,
sulphates and others).
665.0 650.9 682.9766.5
702.2
815.1
907.7
1,027.4
907.9
819.3
0
200
400
600
800
1000
1200
2008 2009 2010 2011 2012 2013 2014 2015 2016 2017
China USA Germany Netherlands
Japan Italy India Taipei, Chinese
Singapore Malaysia Others World

109
452. As shown above (chapter 4С), in addition to primary refined cobalt, the world also produces
secondary refined cobalt, derived from the processing of new and old waste and scrap. Statistics on
secondary cobalt production are not available, and estimates vary greatly. Thus, according to CRU
estimates, in 2016, about 6 thousand tonnes of cobalt were extracted from secondary sources. According to
Roskill estimates, world secondary cobalt production currently ranges between 10 and 15 thousand tonnes,
with 6.5 thousand tonnes produced in China. Antaike estimates current production of secondary cobalt in
China at 5 thousand tonnes.147 Based on the information available, statistics on the production of refined
cobalt does not include secondary cobalt.
453. According to BGS (2019)148 in 2017 the production of refined (primary) cobalt exceeded
119 thousand tonnes, having increased by more than 2 times, or by almost 62 thousand tonnes, over
10 years (Figure 4.90) In the same period of time, according to USGS estimates, world refinery capacity
increased by approximately 1.6 times — from 95.6 thousand tonnes in the beginning of 2008 to
149 thousand tonnes in the beginning of 2018.149,150 There are reasons to believe that the capacity for the
production of refined cobalt and the production itself is higher than that accounted for. This is particularly
indicated by statistics on imports of cobalt raw materials. Thus, cobalt ores and concentrates are
intermediate products are supplied to the Republic of Korea, but no statistics are available on the production
of refined cobalt products in that country.
Figure 4.90. World primary cobalt refinery production dynamics in 2008–2017 by major producing and
other countries, kt Source: BGS
454. Refined cobalt production growth was primarily provided by China (+51.4 thousand tonnes,
or by 3.8 times). Significant, but fundamentally smaller increases have been demonstrated by Belgium
(+4 thousand tonnes, or by 2.3 times), Japan (+3.1 thousand tonnes, or by almost 4 times), Finland
(+2.6 thousand tonnes, or +27 %). In addition, production of refined cobalt started in 2012 in Madagascar
(in 2017 it exceeded 3 thousand tonnes) and in New Caledonia (in 2017 it exceeded 2 thousand tonnes).
147 DERA (2018), Rohstoffrisikobewertung – Kobalt, Deutsche Rohstoffagentur (DERA) in der Bundesanstalt für
Geowissenschaften und Rohstoffe (BGR), Berlin, https://www.deutsche-
rohstoffagentur.de/DE/Gemeinsames/Produkte/Downloads/DERA_Rohstoffinformationen/rohstoffinformationen-
36.pdf;jsessionid=5E27543065DB072D00053BC464611B02.2_cid331?__blob=publicationFile&v=2 148 BGS (2019), World Mineral Production 2013–2017, British Geological Survey, Keyworth, Nottingham, pp. 100
https://www.bgs.ac.uk/mineralsuk/statistics/worldArchive.html 149 USGS (2010), Cobalt, 2007 Minerals Yearbook, https://s3-us-west-2.amazonaws.com/prd-
wret/assets/palladium/production/mineral-pubs/cobalt/myb1-2007-cobal.pdf 150 USGS (2019), Cobalt (advance release), 2016 Minerals Yearbook, https://prd-wret.s3-us-west-
2.amazonaws.com/assets/palladium/production/atoms/files/myb1-2016-cobal.pdf
57.462.2
79.6 82.378.2
87.893.1
101.2 99.6
119.4
0
20
40
60
80
100
120
2008 2009 2010 2011 2012 2013 2014 2015 2016 2017
China Finland Belgium Canada Japan
Norway Madagascar Australia Zambia New Caledonia
Russia Congo, D.R. Others World total

110
455. Since 2004, the world's largest producer of refined cobalt is China. In 2017, its share in global
metal production was more than 58 % compared to approximately 32 % in 2008. In physical terms, metal
production in 2017 amounted to 69.6 thousand tonnes versus 18.2 thousand tonnes in 2008.151 Production
is largely driven by imports of cobalt raw materials in the form of ores, concentrates and intermediate
products, mainly from DR Congo. Most of China's refined cobalt is consumed domestically.
456. The Top-3 producers of refined cobalt also include Finland and Belgium, whose share in
world production in 2017 was more than 10 % and approximately 6 %, respectively.
457. Until 1992, the largest producer of refined cobalt in the world was DR Congo, which at that
time accounted for about a third of world production. The domestic political situation in the country in the
early 1990s, which caused political and social unrest, the cessation of foreign investment and rampant
inflation, led to the destruction of the country's economy in general and the production of refined cobalt in
particular. The ensuing wars and continuing political instability have prevented them from regaining their
former format. In 2017 DR Congo produced only 0.2 thousand tonnes of refined cobalt (0.2 % of world
total); in 2008–2016, its index varied between 1 thousand and 4.2 thousand tonnes.152 At the same time, the
capacities available in the country allow producing up to 9 thousand tonnes of refined cobalt per year.153
458. According to Cobalt Institute estimates, cobalt consumption in 2017 amounted to
123 thousand tonnes, having exceeded the 2008 index by more than 2 times. As mentioned above (chapter
4C), the main reason for this was its use in lithium-ion batteries, whose production is rapidly expanding.
Systemic data on cobalt use in specific countries is not available. It is difficult to estimate the apparent
consumption of cobalt (calculated by the formula “production + import – export”) due to the variability of
cobalt content in products grouped into commodity groups with refined products. However, even rough
estimates suggest that the main consumer of refined cobalt is China.
459. On the world market, refined cobalt products are traded in the form of metal and chemical
compounds. In so doing, international trade statistics take them into account together with intermediate
products.
460. International trade statistics take into account refined metal cobalt (unwrought and powders)
together with cobalt mattes and other intermediate products of cobalt metallurgy. We will further consider
them under the unifying name metal cobalt. Metal cobalt is a key product in the cobalt market. According
to estimates based on international trade data, in 2017 it accounted for more than 51 % of world trade in
cobalt products in weight terms and about 65 % in money terms.
461. In 2008–2017 metal cobalt (HS code 810520) exports increased by 2.6 times (+164 thousand
tonnes). This was provided by DR Congo, which during this period increased its supplies to the world
market by 4.5 times (+167 thousand tonnes). Exports from New Caledonia (+4 thousand tonnes), Japan
(+3 thousand tonnes) and China (+1.3 thousand tonnes) also increased, with New Caledonia having become
one of the exporters of metal cobalt only in 2016. All other Top-8 exporters reduced their supplies (by more
than 14 thousand tonnes in total) (Figure 4.91).
151 BGS (2019), World Mineral Production 2013–2017, British Geological Survey, Keyworth, Nottingham, pp. 100
https://www.bgs.ac.uk/mineralsuk/statistics/worldArchive.html 152 BGS (2019), World Mineral Production 2013–2017, British Geological Survey, Keyworth, Nottingham, pp. 100
https://www.bgs.ac.uk/mineralsuk/statistics/worldArchive.html 153 USGS (2019), Cobalt (advance release), 2016 Minerals Yearbook, https://prd-wret.s3-us-west-
2.amazonaws.com/assets/palladium/production/atoms/files/myb1-2016-cobal.pdf

111
Figure 4.91. World metal cobalt export dynamics in 2008–2017, kt Source: ITC
462. Since 2007, DR Congo has been the largest metal cobalt exporter. At the same time, almost
all exported metal is represented by intermediate products of cobalt metallurgy. This is indicated by the
level of refined cobalt production — according to BGS, in 2017 it only amounted to 0.2 thousand tonnes.
This is also indicated by the export tariff of the product: according to the International Trade Center, in
2017 it was about USD 9,000 per tonne, while the export tariff of the product of Canadian origin was about
51 thousand dollars per tonne.
463. A comparison of statistics on the production of refined cobalt and international trade in metal
cobalt indicates that the export structure of a number of other major supplier countries, such as Canada,
Russia and New Caledonia, includes intermediate products in various proportions. The main export
direction of metal cobalt is China. In 2008–2017 its imports of metal cobalt increased by almost 10 times
(Figures 4.92, 4.93).
Figure 4.92. World metal cobalt import dynamics in 2008–2017, kt Source: ITC
104.495.5
135.4 129.9
184.0
208.3219.3
206.3 209.5
268.3
0
50
100
150
200
250
300
2008 2009 2010 2011 2012 2013 2014 2015 2016 2017
Congo, D.R. Canada Finland Russian Fed. China
New Caledonia Japan Australia Others World
104.5 97.0
147.2
171.4186.7
212.3225.7
216.6228.5
284.9
0
50
100
150
200
250
300
2008 2009 2010 2011 2012 2013 2014 2015 2016 2017
China Finland Japan USA Netherlands
United Kingdom Norway Others World

112
Figure 4.93. Major international trade flows of metal cobalt in 2017 Source: https://resourcetrade.earth/
464. Cobalt is traded on the world market also in the form of oxides and hydroxides (HS code
2822), which can be both refined and intermediate products of cobalt. Their belonging to a certain group
can be evaluated by export tariff. According to estimates based on international trade data, in 2017 they
accounted for about 13.5 % of world trade in cobalt products in weight terms and about 24 % in money
terms.
465. In 2008–2017 exports of cobalt oxides and hydroxides increased by almost 6 times, or by
59 thousand tonnes (Figure 4.94). The main reason for this was the beginning of the export of cobalt in this
form from DR Congo in 2009; in 2017 it exceeded 43 thousand tonnes. At the same time, Zambia began
exporting cobalt in the form of oxides and hydroxides; in 2017 it exceeded 8.5 thousand tonnes. Exports of
cobalt oxides and hydroxides peaked in 2013 due to their sharp surge from Zambia. Both countries supply
the market with intermediate products — crude oxides. This is indicated by their export tariffs. In 2017,
they were at the level of 17 thousand dollars per tonne, while export tariffs of the product supplied to the
world market from China or Great Britain were 37–38 thousand dollars per tonne.

113
Figure 4.94. World cobalt oxides and hydroxides export dynamics in 2008–2017, kt Source: ITC
466. The main recipient of cobalt oxides and hydroxides produced in DR Congo is Zambia, where
some of them are apparently being refined (Figure 4.95). The Republic of Korea is also a major recipient;
in 2017 China, Belgium and Finland were the main suppliers. Judging by the level of export tariffs, these
countries supply the Republic of Korea with refined products.
Figure 4.95. World cobalt oxides and hydroxides import dynamics in 2008–2017, kt Source: ITC
Manganese
467. End manganese products include manganese ferro-alloys, manganese metal, manganese
dioxide and other manganese chemicals. The main ones are manganese ferro-alloys, which are an integral
component of all steel types (including special): They account for about 90% of manganese products
produced in 2017 in weight terms. At the same time, silico-manganese prevails in the structure of
manganese ferro-alloys production (Figure 4.96).154
154 IMnI (2019), Statistics 2019, https://www.manganese.org/wp-content/uploads/2019/05/IMnI_statistics_2019.pdf
12.1 11.8
36.0
44.236.7
89.5
29.8
50.6 52.9
70.9
0
10
20
30
40
50
60
70
80
90
100
2008 2009 2010 2011 2012 2013 2014 2015 2016 2017Congo, D.R. Zambia China Finland United Kingdom Others World
16.7 16.4
39.7
49.947.6
67.3
38.4
58.3 59.6
69.3
0
10
20
30
40
50
60
70
2008 2009 2010 2011 2012 2013 2014 2015 2016 2017
Zambia Korea Rep. Brazil Spain China
USA Morocco Germany Others World

114
Figure 4.96. Distribution of manganese ferro-alloy production by type in 2017, % Source: IMnI
468. According to the available data, in 2008–2017 the world production of silico-manganese
increased by 54%, or by 4.8 million tonnes (Figure 4.97). This increase was mainly provided by China
(+3.4 million tonnes, or 68 %), which has been the largest producer of this alloy since the mid-1990s. India,
the second largest producer in the world since 2009, also showed significant growth (+1.1 million tonnes,
or 2.3 times). In 2017 the two countries accounted for 62 % and 14 % of the world total production
respectively; in 2008, they accounted for about 57 % and 10 % respectively.
Figure 4.97. World silico-manganese production dynamics in 2008–2017 by major producing and other
countries, kt Sources: BGS, USGS, IMnI
469. Since 2009, almost all silico-manganese produced in China has been consumed domestically
(until 2009 significant volumes of alloy were exported to foreign markets, and China was one of the largest
suppliers). Such a high demand for this alloy is ensured by the scale of the Chinese steel industry, which is
currently the largest in the world.
470. Silico-manganese, produced in India and Ukraine (ranks third in the world ranking), is
exported in significant quantities. Although the two countries have a strong steel industry, the volume of
silico-manganese produced by them is significantly higher than domestic demand and the excess material
is supplied to foreign markets. However, it can be expected that when steelmaking expands, their supply
may decrease.
471. The relatively large producers of silico-manganese also include Norway and Georgia, whose
production is export-oriented.
71%
21%
8%
SiMn
High-carbon FeMn
Refined FeMn
8,823
8,610
10,232
11,46712,223
12,880 13,10012,484 12,653
13,609
0
2000
4000
6000
8000
10000
12000
14000
2008 2009 2010 2011 2012 2013 2014 2015 2016 2017
China India Ukraine Norway Georgia Others World

115
472. No statistics are available to trace the production of high-carbon and refined ferro-manganese
separately, with a country-by-country breakdown for the entire time period under review. Therefore, in this
section we consider the production and international trade of ferro-manganese as a whole. In addition, for
a number of countries, total production of ferro-alloys is reported without differentiation into specific types;
for example, for the US, production of bulk ferro-alloys is reported, which includes chrome and silicon
alloys in addition to manganese ferro-alloys. Therefore, the available statistics cannot be considered
complete.
473. On the basis of available statistics, ferro-manganese world production in 2008–2017 showed
generally unsustainable dynamics, while at the end of the decade it declined slightly (Figure 4.98).
However, the dynamics of production of different types of ferro-manganese was differently directed:
according to IMnI, production of high-carbon ferro-manganese decreased by 6%, while production of
refined ferro-manganese increased by 7%.155,156 At the same time, in 2010–2014 ferro-manganese output
was noticeably (5–10%) higher than in 2017. This spike occurred during the period of steel production
growth that followed the decline caused by the global financial and economic crisis of 2008–2009.
Figure 4.98. World ferro-manganese (incl. high-carbon and refined) production dynamics in 2008–2017
by major producing and other countries, kt Sources: BGS, USGS, IMnI
474. The main ferro-manganese producer is China, which accounted for about 42 % of world
production in 2017. As the world's largest steel producer, it is also a leading ferro-manganese customer. In
10 years, its share in global alloy production has remained virtually unchanged, although production
volumes have declined slightly. This decline, which was also caused by government environmental
measures, did not affect the availability of alloy for Chinese industry — it was fully compensated by an
increase in silico-manganese production (Figure 4.97).
475. As shown in Figures 4.99, China is currently the main production centre for manganese ferro-
alloys: it accounts for 55 % of world production. It is also the main steel-making center: its share in the
world index in 2017 was 50 %.157 At the same time, it can be said that the current production volumes of
manganese ferro-alloys and steel practically match each other: this is indicated by small volumes of imports
of manganese ferro-alloys to China (at the level of several tens of thousands of tonnes with the total
155 IMnI (2016), 2013 Public Annual Market Research Report,
https://www.manganese.org/files/publications/PUBLIC%20RESEARCH%20REPORTS/2013_IMnI_Public_Report
.pdf 156 IMnI (2019), Statistics 2019, https://www.manganese.org/wp-content/uploads/2019/05/IMnI_statistics_2019.pdf 157 Steel Statistical Yearbook 2019: concise version, World Steel Association,
https://www.worldsteel.org/en/dam/jcr:7aa2a95d-448d-4c56-b62b-
b2457f067cd9/SSY19%2520concise%2520version.pdf
5,789
4,323
5,927 6,016 6,0406,264
6,0285,559
4,921
5,647
0
1000
2000
3000
4000
5000
6000
7000
2008 2009 2010 2011 2012 2013 2014 2015 2016 2017
China India Japan Norway Korea, Rep.Malaysia South Africa Ukraine Russia BrazilAustralia Others World

116
production of manganese ferro-alloys at the level of 10 million tonnes). There is practically no Chinese
product entering foreign markets.
Figure 4.99. Distribution of manganese ferro-alloys and steel production among major countries
in 2017, % Sources: IMnI, World Steel Association
476. Among the producers of manganese ferro-alloys there are other countries whose ferro-alloy
production is oriented to the domestic steel industry. Among them are Japan, South Korea, Russia and
several others. At the same time, ferro-alloy production in countries such as India, Ukraine and Norway,
and a number of others, is largely oriented towards foreign markets. In total, about a quarter of manganese
ferro-alloys currently produced are involved in international trade.
477. As for silico-manganese (HS code 720230), Chatham House, the Royal Institute of
International Affairs158 estimates that in 2017 it accounted for 8.4 % of world trade in manganese products
by weight and 26 % by money. Its largest exporters are India and Ukraine, whose combined share in 2017
was about 46 % (Figure 4.100), as well as Georgia, Norway, Malaysia and South Africa, which together
supply about 29 % more. Their main destinations are the USA, Germany, Japan, Turkey, Italy and Russia
(Figure 4.101).
Figure 4.100. World silico-manganese export dynamics in 2008–2017, kt Source: ITC
158 Chatham House, the Royal Institute of International Affairs, https://resourcetrade.earth/
0%
10%
20%
30%
40%
50%
60%
70%
80%
90%
100%
Mn ferroalloys Steel
Others
Brazil
Russia
South Africa
Japan
Malaysia
South Korea
Norway
Ukraine
India
China
3234.2
2000.1
2898.5 2888.23085.5
2970.83200.2
2691.4 2784.3
3132.8
0
500
1000
1500
2000
2500
3000
3500
2008 2009 2010 2011 2012 2013 2014 2015 2016 2017
India Ukraine Georgia Norway Malaysia South Africa
Netherlands Kazakhstan France China Others World

117
Figure 4.101. World silico-manganese import dynamics in 2008–2017, kt
Source: ITC
478. As for ferro-manganese, Chatham House, the Royal Institute of International Affairs159,
estimates that in 2017 it accounted for 5.3% of world trade in manganese products in weight terms and
20.6% in money terms, including the share of high-carbon ferro-manganese (HS code 720211) — 3.5 and
12% respectively, the share of high-carbon ferro-manganese (HS code 720219) — 1.8 and 8.6%
respectively.
479. In 2008–2017 the geographical structure of ferro-manganese exports underwent significant
changes. While in 2008 the main supplier of alloy was South Africa, which accounted for about 34% of
world exports (about 674 thousand tonnes) and China (over 18%, or about 366 thousand tonnes), in 10
years the share of South Africa decreased to about 15% (about 252 thousand tonnes), and China practically
stopped exporting. At the same time, India and Malaysia have become major suppliers, each with a share
of 16–17% (Figure 4.102). Export destinations are very diverse (Figure 4.103).
Figure 4.102. World ferro-manganese export dynamics in 2008–2017, kt Source: ITC
159 Chatham House, the Royal Institute of International Affairs, https://resourcetrade.earth/
2992.0
2063.4
2959.23157.3
2844.2 2857.7
3614.8
2676.52694.3
3246.8
0
500
1000
1500
2000
2500
3000
3500
4000
2008 2009 2010 2011 2012 2013 2014 2015 2016 2017
USA Germany Japan TurkeyItaly Russian Fed. Taipei, Chinese Korea, Rep.Poland Qatar Others World
1,995.8
887.4
1,458.5
1,709.4
1,532.2 1,509.61,613.3
1,303.31,359.4
1,652.4
0
200
400
600
800
1000
1200
1400
1600
1800
2000
2008 2009 2010 2011 2012 2013 2014 2015 2016 2017
South Africa India Malaysia Korea, Rep. Ukraine Netherlands
Spain China Russian Fed. Others World

118
Figure 4.103. World ferro-manganese import dynamics in 2008–2017, kt Source: ITC
480. As mentioned above, end manganese products also include manganese metal. According to
IMnI, in 2011-2016, its production was relatively stable at 1.2 million tonnes per year. In 2017, its output
rose sharply (by 37%) to 1.74 million tonnes. Almost all metal is produced in China, which accounts for
about 98% of the world total. The rest of the metal is produced in South Africa, Ukraine, Gabon and
Indonesia (since early 2019).160
160 IMnI (2019), Statistics 2019, https://www.manganese.org/wp-content/uploads/2019/05/IMnI_statistics_2019.pdf
2,960.6
1,430.5
2,241.92,360.5
2,094.4 2,083.6 2,132.7
1,785.4 1,745.7
2,070.3
0
500
1000
1500
2000
2500
3000
2008 2009 2010 2011 2012 2013 2014 2015 2016 2017
USA Germany Iran IndiaTaipei, Chinese Netherlands Japan TurkeyItaly Canada Others World

119
STUDY DATA AND METHODOLOGY
A. Type of methods of analysis
481. The purpose of current study is to make preliminary assessment of the potential magnitude
of any impact on DLBPS, who may suffer serious adverse effects on their export earnings or economies as
a result of a reduction in price or reduction in the volume of an affected metals, and where such reductions
could be caused by activities in the Area.
482. As it is hard to analyze changes in the economies of developing States before exploitation
activities in the Area start, it is possible only to make a preliminary assessment of what impact on the
developing States' economies may be. For this purpose, it was decided to analyze exports of affected metals
in the world.
483. Firstly, data on a quantity and a value of exports of affected metals’ products in the world
for the last 10 years (2008–2017) were collected from an online source called Trade Map161. The exporting
States were ranked by the value or the quantity of products exported in 2017, thus leading exporter States
could be identified. The total value and the quantity of exports of affected metals were found by summing
up exports of each product.
484. For identification of developing States, which are likely to be most seriously affected by
seabed production, in this study, two quantifiable yardsticks suggested by the Special Commission 1 were
considered162. Firstly, concerning the export earnings of a developing State, an absolute value of export
earnings from four affected metals in total export earnings of the DLBPS was found as follows:
ie
t
ES
E=
Where eS is the absolute value of export earnings from four affected metals in total export earnings
of the DLBPS,
iE is the annual exported value of product i of each affected metal, exported from the DLBPS,
tE is the annual exported value of all products, exported from the DLBPS.
485. Second, concerning the economies of the DLBPS, another yardstick was used – a value of
export earnings from the four metals in the economy of the DLBPS (here the economy of the State is
expressed by GDP), using the following formula:
iGDP
ES
GDP=
Where GDPS is the value of export earnings from four metals in the economy of the DLBPS,
iE is the annual exported value of product i of each affected metal, exported from the DLBPS,
GDP is the Gross Domestic Product of each exporting the DLBPS.
486. Data for the GDP were taken from the data center of the United Nations Conference on Trade
and Development called UNCTADstat163.
161 Trade statistics for international business development — Trade Map. URL: https://www.trademap.org/Index.aspx 162 ISA (1985). Statement of the Chairman of Special Commission 1, provisionally concluding the discussion on the
issue of the concrete formulation of the criteria for the identification of developing land-based producer States likely
to be most seriously affected by sea-bed production. Preparatory Commission for the International Seabed Authority
and for the International Tribunal on the Law of the Sea, Special Commission 1. LOS/PCN/SCN.1/1985/CRP.8 163 United Nations Conference on Trade and Development – UNCTADstat,
https://unctadstat.unctad.org/wds/ReportFolders/reportFolders.aspx?sCS_ChosenLang=en

120
487. Thus, the DLBPS, which are likely to be seriously affected by exploitation activities in the
Area, were identified for each of four affected metals using two yardsticks. Herewith, the export earnings
yardstick was considered basic, whereas economy yardstick was used for checking and reinforcing results.
488. Then a cumulative value of export earnings from all affected metals in total export earnings
and in the GDP of each exporting DLBPS was calculated as follows:
mce
t
ES
E=
Where ceS is the value of cumulative export earnings from all affected metals in total export
earnings of the DLBPS,
mE is the annual exported value of affected metal m, exported from the DLBPS,
tE is the annual exported value of all products, exported from the DLBPS.
mcGDP
ES
GDP=
Where cGDPS is the value of cumulative export earnings from all affected metals in the GDP of
each exporting DLBPS,
mE is the annual exported value of affected metal m, exported from the DLBPS,
GDP is the gross domestic product of each exporting DLBPS.
489. When the DLBPS, which are likely to be seriously affected, are identified, it makes sense to
focus further analysis only on these States.
490. Export earnings of the State from affected metals are directly related to the price of these
metals on the world market. That is why year-to-year changes in prices of affected metals from 2008 to
2017 were calculated as follows:
1
1
( )100%n n
pn
p pC
p−
−
−=
Where pC is a year-to-year change of price,
np is the price in year n,
1np − is the price in the previous year n-1.
491. Source for copper and nickel nominal price data is the World Bank164. Price data for
manganese were taken from the Financial Model of a Nodules Mining Concession by Massachusetts
Institute of Technology165. Real 2015 price for manganese metal was used. Several sources were used for
cobalt nominal prices:
• from 2008 to 2010 — from the report by U.S. Geological Survey166 “Metal prices in the
United States through 2010”;
164 World Bank Commodity Price Data - The Pink Sheet. URL: https://www.worldbank.org/en/research/commodity-
markets#1 165 R. Kirchain et al., 2019. Financial Model of a Nodules Mining Concession. Massachusetts Institute of Technology 166 U.S. Geological Survey, 2013. Metal prices in the United States through 2010: U.S. Geological Survey Scientific
Investigations Report 2012–5188. URL: http://pubs.usgs.gov/sir/2012/5188

121
• from 2011 to 2013 and from 2014 to 2015 — from the U.S. Geological Survey Minerals
Yearbook167,168; and
• from 2016 to 2018 — from Macquarie Wealth Management Research169.
492. Further analysis requires a comparison of changes in metal prices with changes in export
prices (or export tariffs) of each affected metal product per unit. Export price per unit of product was
calculated by dividing the exported value of the product to its exported quantity. In addition, these changes
in export prices of products for each DLBPS, which is likely to be affected, were compared with changes
in the average export prices of these products in the world market.
493. Export prices for various products of one metal can be different. To look at the added value
of different products, exported quantities and exported values of the products were compared.
494. Besides, a share of exports of developing States on the world market and a concentration of
the metal market were analyzed using an annually computed Herfindahl-Hirschman Index (HHI). Market
share of each State for each product of four affected metals and for the sum of these products for each of
four metals was found as follows:
100%ii
w
ES
E=
Where iS is the market share of the State i,
iE is the exported value of metal’s product, exported from the State i,
wE is the exported value of metal’s product in the world.
495. The market concentration can be found using the following formula:
2( )m iC S=
Where mC is the market concentration,
iS is the market share of the State i.
496. HHI range between 0 and 10,000 points and indicates the following:
• HHI less than 1500 shows low-market concentrations and competitive market,
• HHI from 1500 to 2500 shows moderately-market concentrations,
• HHI higher than 2500 shows high-market concentrations.
167 U.S. Geological Survey, 2013. Metals and Minerals: U.S. Geological Survey Minerals Yearbook 2013. URL: https://pubs.er.usgs.gov/publication/70048194 168 U.S. Geological Survey, 2016. Advance Data Release of the 2016 Annual Tables, Metals and Minerals: U.S.
Geological Survey Minerals Yearbook 2016. URL: https://www.usgs.gov/centers/nmic/cobalt-statistics-and-
information 169 Macquarie Wealth Management Research, 2018. Commodities Comment. URL:
https://www.macquarie.com.au/dafiles/Internet/mgl/au/apps/retail-newsletter/docs/2018-
01/MacquarieCommoditiesComment240118e.pdf

122
B. Presentation of the approach and assumptions adopted for the potential impact analysis
497. Metals are traded globally in a variety of forms including ores and concentrates, mattes and
intermediates, and refined products. The refined products are tailored to end-use market requirements and
are traded as oxide, hydroxide, powder, metal, sulphate, chloride, nitrate, acetate, carbonate, and numerous
other compounds of varying metal content. Trade statistics do not provide data for all the different metal
products, so it is complicated to obtain a world total for refined metal production. Several forms of metals
are commonly grouped under a single trade code170.
498. In this analysis, trade data following the Harmonized System of trade codes were used. In
addition, the Authority decided to emphasize on different forms of metals, such as primary, semi-finished,
and end-products. Thus, four copper products were considered:
• Copper ores and concentrates (HS 2603) – primary products of copper production,
• Copper mattes, cement copper (precipitated copper) (HS 7401) – semi-finished products
of copper production,
• Copper, unrefined, copper anodes for electrolytic refining (HS 7402) – which are also
semi-finished products of copper production, and
• Copper, refined, unwrought, cathodes and sections of cathodes (HS 740311), which are
end-products of copper production.
499. Four products of nickel production were considered too:
• Nickel ores and concentrates (HS 2604) – primary products of nickel production,
• Nickel mattes, nickel oxide sinters and other intermediate products of nickel metallurgy
(HS 7501) - semi-finished products of nickel production,
• Ferro-alloys, ferro-nickel (HS 720260) – end-products of nickel production, and
• Nickel, unwrought, not alloyed (HS 750210), which are also end-products of nickel
production.
500. As for cobalt, three products were considered:
• Cobalt ores and concentrates (HS 2605), which are primary products of cobalt production,
• Cobalt mattes and other intermediate products of cobalt metallurgy, unwrought cobalt,
cobalt powders (HS 810520), which are end-products of cobalt production, and
• Cobalt oxides and hydroxides, commercial cobalt oxides (HS 2822), which are end-
products of cobalt production.
501. Manganese has not semi-finished products, however, there are many end products, which
were considered:
• Manganese ores and concentrates, including ferruginous manganese ores and
concentrates with a manganese content of 20% or more, calculated on the dry weight (HS
2602) – primary products of manganese production,
• Manganese oxides (HS 2820) – end-products of manganese production,
• Ferro-alloys, ferro-manganese, containing by weight more than 2 % of carbon (HS
720211) – end-products of manganese production,
• Ferro-alloys, ferro-manganese, containing by weight 2 % or less of carbon (HS 720219)
– end-products of manganese production,
• Ferro-alloys, ferro-silico-manganese (HS 720230) – end-products of manganese
production, and
• Manganese, articles thereof, including waste and scrap (HS 811100) – end-products of
manganese production.
170 Petavratzi, E, Gunn, G, Kresse, C., 2019. Commodity review: Cobalt. British Geological Survey

123
502. However, worth noting that usage of Harmonized System gives only an approximate idea of
products' flows. The many different forms that metals are refined into complicate obtaining a world total
for refined metals production. Metals are moved around the world in “intermediate” forms that are
subsequently further refined and consequently the risk of double counting is considerable. A product that
is considered by one country as an end-product may simply be a semi-finished product in another. Product
reported as “oxides and hydroxides” for one country is not necessarily the same product that another country
exports. The product produced in one country may be of an impure form, which is further refined elsewhere
outside the exporting country171.
503. No adjustments have been made for metal content in this analysis. Instead, the gross weight
of the different traded forms is compared and discussed. Metal content can vary significantly for different
traded forms. Adjusting for metal content is not straightforward, especially for the mattes and intermediates,
unwrought metal, waste, and scrap, which includes several different metal-bearing materials with metal
contents ranging from 20 % to 100 %172.
504. The Harmonized System trade code for mattes and intermediates, unwrought metal, waste,
and scrap does not differentiate between metal compounds. As a result, it is not possible to undertake an
analysis of specific traded metal compounds from individual countries. Exports for the different countries
may represent different compounds and consequently different stages in the metal supply chain173.
505. Normally, only formal and legal operations are included in trade statistics. There is,
therefore, an element of uncertainty about the trade of metal ores and concentrates produced by informal
operations, for example, artisanal cobalt mines. Various sources suggest that cobalt ore produced from
informal mining operations is sold to wholesale traders and cooperatives, who, in turn, sell on to processing
companies for the production of cobalt concentrates174,175,176. It is likely, therefore, that the majority of the
output from informal mining is captured by international trade statistics as the export from these processing
companies is recorded. However, some quantities may enter illegal trade routes and be excluded from global
trade data. At present, it is not possible to quantify informal trade in cobalt compounds177.
506. The issue of identification of the DLBPS, which are likely to be most seriously affected by
seabed production, is important for the Authority. However, before the start of commercial production in
the Area, it is not possible to make the final identification of such States. It can be carried by the Authority
at a time rather closer to the time of the earliest commercial production from the seabed in the Area.
Nevertheless, some kind of preliminary identification can be done at present, and it is presented in the
current analysis.
507. Before the actual identification of the DLBPS, which are likely to be most seriously affected
by seabed production, the Preparatory Commission should first decide on the criteria for identification. In
conformity with the provisions of Articles 150(h) and 151(10) of the United Nations Convention on the
Law of the Sea (UNCLOS)178, Special Commission 1 decided that such criteria would be related to export
earnings or economies of DLBPS. The idea was to see how dependent a DLBPS is on four affected metals
for its export earnings or its economy. Concerning the criteria of export earnings and economy, several
quantifiable yardsticks, called dependency thresholds, were suggested by the Special Commission 1:
171 Petavratzi, E, Gunn, G, Kresse, C. (2019). Commodity review: Cobalt. British Geological Survey 172 Petavratzi, E, Gunn, G, Kresse, C., 2019. Commodity review: Cobalt. British Geological Survey 173 Petavratzi, E, Gunn, G, Kresse, C., 2019. Commodity review: Cobalt. British Geological Survey 174 Amnesty International, 2016. This is what we Die For: Human Rights Abuses in the Democratic Republic of the
Congo-Power the Global Trade in Cobalt. URL: https://www.amnestyusa.org/files/this_what_we_die_for_-
_report.pdf 175 Al Barazi, S. (2018), Rohstoffrisikobewertung – Kobalt, DERA Rohstoffinformationen 36, Berlin, 120 S.,
https://www.deutsche-
rohstoffagentur.de/DE/Gemeinsames/Produkte/Downloads/DERA_Rohstoffinformationen/rohstoffinformationen-
36.pdf 176 Faber, B, Krause, B, & Sánchez de la Sierra, R., 2017. Artisanal Mining, Livelihoods, and Child Labor in the
Cobalt Supply Chain of the Democratic Republic of Congo. Center for Effective Global Action. U. o. California.
Policy Report. 62. URL: https://escholarship.org/content/qt17m9g4wm/qt17m9g4wm.pdf 177 Petavratzi, E, Gunn, G, Kresse, C., 2019. Commodity review: Cobalt. British Geological Survey 178 UN, 1982. United Nations Convention on Law of the Sea (UNCLOS). United Nations, New York, USA

124
a) An absolute value of exports of the four metals. If a DLBPS has export earnings of
US$100 million a year from these four minerals during the last 5 years before production
authorizations are issued to the seabed miners, it is likely to be most seriously affected by seabed
production.
b) An absolute value of export earnings in total export earnings. If a DLBPS is earning
10% of its total export earnings from these four minerals during the last 5 years before production
authorizations are issued to the seabed miners, it is likely to be most seriously affected by seabed
production.
c) An absolute amount of production of four affected minerals. If a DLBPS produces an
average 100,000 tonnes of copper, or 50,000 tonnes of nickel, or 10,000 tonnes of cobalt, or
50,000 tonnes of manganese a year during the last 5 years before production authorizations are
issued to the seabed miners, it is likely to be most seriously affected by seabed production.
d) Value of production in total Gross National Product (GNP) or total Gross Domestic
Product (GDP). A DLBPS whose average production of the four minerals per year during the
last 5 years before production authorizations are issued to the seabed miners, represent 10 % of
its GDP on GNP, is likely to be most seriously affected by seabed production.
e) Value of export earnings from the four minerals in the economy. If a DLBPS's exports
of the four minerals account for 5 % or more of its GDP, it is likely to be most seriously affected
by seabed production179.
508. However, the identification of DLBPS under these yardsticks is solely to study their potential
problems and cannot at this time be considered as an automatic basis for future formulation of remedial
measures about their specific problems. Besides, these yardsticks do not address the issue of whether or not
or how much the effects are attributable to seabed mining180.
509. Besides the abovementioned yardsticks, the Special Commission 1 has suggested that the
Authority could use other dependency thresholds (“dependency levels”, as these were called in Chapter 2)
to determine the importance to a DLBPS of, or its dependence on four affected metals for its export earnings
or its economy. Concerning these dependency thresholds, the Authority should be guided by the following:
1) During the relevant period when applications by DLBPS are submitted, either before
the commencement of commercial production from the Area or after, those DLBPS which earn
10 % or more of their total export earnings per year from the export of one or more of the four
affected metals shall be categorized as “dependent”.
2) In the cases when DLBPS can demonstrate that they actually encounter or that they
are likely to encounter special problems resulting from seabed production, although either their
export earnings from the export of one or more of the four affected metals may not account for
the specified percentage of their total export earnings, as above, the Authority shall determine,
on a case-to-case basis, whether they can be categorized as “dependent” or not.
3) An average shall be used over three years before the year of application by that
DLBPS181.
510. Thus, according to the suggestions of the Special Commission 1, if a DLBPS considers itself
affected by seabed production, it can apply to the Authority. It should show its statistics on production, the
179 ISA, 1985. Statement of the Chairman of Special Commission 1, provisionally concluding the discussion on the
issue of the concrete formulation of the criteria for the identification of developing land-based producer States likely
to be most seriously affected by sea-bed production. Preparatory Commission for the International Seabed Authority
and for the International Tribunal on the Law of the Sea, Special Commission 1. LOS/PCN/SCN.1/1985/CRP.8 180 ISA, 1985. Statement of the Chairman of Special Commission 1, provisionally concluding the discussion on the
issue of the concrete formulation of the criteria for the identification of developing land-based producer States likely
to be most seriously affected by sea-bed production. Preparatory Commission for the International Seabed Authority
and for the International Tribunal on the Law of the Sea, Special Commission 1. LOS/PCN/SCN.1/1985/CRP.8 181 ISA, 1992. Draft provisional report of Special Commission 1. Preparatory Commission for the International Seabed
Authority and for the International Tribunal on the Law of the Sea, Special Commission 1.
LOS/PCN/SCN.1/1992/CRP.22

125
volume of exports, export earnings from one or more of the four minerals concerned, the changes in the
economy that it feels occurred because of seabed production, indicating how it considers that these effects
have been as a result of seabed production, and, finally, what kind of remedial it requires182.
511. Having received the application by the DLBPS, the Authority firstly shall determine
whether production, the volume of exports, export earnings from one or more of the four minerals
concerned exceed the abovementioned dependency thresholds. If the dependency thresholds are exceeded,
then the Authority shall determine whether the effects that are considered to have resulted from seabed
production exceed any of the levels specified below (so-called trigger thresholds, or “trigger levels” as it
was said in Chapter 2):
a) The actual or estimated fall in the export earnings of a particular DLBPS from the
export of one or more of the four metals concerned has to be at least 10 % in comparison with
the situation, where there is no seabed production.
b) If the actual or estimated fall in export earnings of a particular DLBPS from the
export of one or more of the four metals concerned is less than 10 %, but more than 5 % in
comparison with the situation, where there is no seabed production, the Authority shall determine
the necessary remedial measures to help that DLBPS.
c) If the actual or estimated fall in export earnings of a particular DLBPS from the
export of one or more of the four metals concerned is less than 10 % in comparison with the
situation, where there is no seabed production, but amounts to 2 % of the total export earnings,
the Authority shall determine whether an action would be triggered183.
512. As for the last two trigger thresholds, the Authority shall determine, on a case-to-case basis,
taking into account all relevant factors, bearing in mind considerations of cost-effectiveness and its work
efficiency, whether an in-depth investigation needs to be carried out.
513. In the cases of the “least developed” land-based producer States, the dependency thresholds
and the trigger thresholds shall be reduced by 33 %184.
514. However, it is hard to determine a quantifiable effect of seabed mining on the export earnings
or on the economy of DLBPS, because various mineral products are considered, and for seabed mining
only a targeted production rate of 3 million dry tonnes of manganese nodules per year from one exploitation
area is known. Currently, it is not possible to isolate different metal products from this production rate.
Only the quantity of refined metal can be calculated, but the quality can differ from those on land.
Manganese nodules, collected from the seabed, are considered as an ore, but this ore contains different
metals, so it is not possible to compare it even with terrestrial metal ores. For that reason, at this stage of
the analysis, only theoretical scenarios of the impact of seabed mining on DLBPS' export earnings are
possible to consider.
515. That is why, with the purpose of showing how dependent a DLBPS is on four affected metals
for its export earnings or for its economy and suggestion that this DLBPS is likely to be most seriously
affected by seabed production only two following dependency thresholds, suggested by the Special
Commission 1, were considered in the current analysis:
1) An absolute value of export earnings in total export earnings. If a DLBPS is earning
10% of its total export earnings from these four minerals during the last 5 years before production
authorizations are issued to the seabed miners, it is likely to be most seriously affected by seabed
production;
182 ISA, 1992. Draft provisional report of Special Commission 1. Preparatory Commission for the International Seabed
Authority and for the International Tribunal on the Law of the Sea, Special Commission 1.
LOS/PCN/SCN.1/1992/CRP.22 183 ISA, 1992. Draft provisional report of Special Commission 1. Preparatory Commission for the International Seabed
Authority and for the International Tribunal on the Law of the Sea, Special Commission 1.
LOS/PCN/SCN.1/1992/CRP.22 184 ISA, 1992. Draft provisional report of Special Commission 1. Preparatory Commission for the International Seabed
Authority and for the International Tribunal on the Law of the Sea, Special Commission 1.
LOS/PCN/SCN.1/1992/CRP.22

126
2) Value of export earnings from the four minerals in the economy. If a DLBPS's
exports of the four minerals account for 5 % or more of its GDP, it is likely to be most seriously
affected by seabed production185.
516. Herewith the first threshold was used as the basis in the analysis, while the purpose of the
second one was to check and reinforce obtained results.
517. In addition to the identification of dependence of the DLBPS on four affected metals, it
makes sense to analyze the dependence of the world market on these States for the trade of these metals,
which means analyzing the share of exports of these States on the world market. For that purpose, the
concentration of the metal market was covered in the analysis. One way to capture this analytically is
through an annually computed Herfindahl-Hirschman Index (HHI), a measure approved by the United
States Department of Justice and the Federal Trade Commission for characterizing market concentration.
Usually, this index used to measure the concentration of individual firms in the domestic market of the
country; however, instead of measuring individual firms, HHIs computed for this study evaluate the
concentration of affected metal products exports by country. HHIs theoretically range between 0 and 10,000
points, which indicate low- and high-market concentrations, respectively. Increased risk theoretically
corresponds to high HHI measures, and scores exceeding 2500 show a high concentration186.
518. Metal prices affect export earnings of the States, consequently, affecting export prices of
products. However, the effect of metal prices on the world market can be different for various metal
products. Some products are more dependent on the price of the world market than others. Anyway, price
changes can affect export earnings and economies of DLBPS. Another issue is that such price changes may
occur not necessarily because of the seabed mining activities in the Area. Consideration of price trends is
an important part of the analysis.
519. Affected metals tariffs, which were considered as export prices of a product unit, were
calculated and compared with the world average export price of the product unit and with metal prices on
the world market. This could help to understand the economic processes going on in DLBPS and why prices
of products may differ from those on the world market. Such a comparison could show how dependent
different products on metal prices on the world market. For understanding export prices, exported values
of products were compared with exported quantities of those. This can show how export prices change
through the value chain.
C. Overview of affected metals tariffs on exports and earnings of developing state
producers
520. First of all, exports of each of the four affected metals of the DLBPS were considered. The
following results of the analysis include an overview of export earnings of the DLBPS from each of four
metals, as well as identification of the DLBPS, which are likely to be seriously affected by seabed
production. For such identified States, export prices (export tariffs) of each product of four metals and the
relation between exported quantities and values of these products were considered.
Copper
521. In 2017, by exported values, the leader exporter States of copper products in the world are
presented in Table 5.1.
185 ISA, 1985. Statement of the Chairman of Special Commission 1, provisionally concluding the discussion on the
issue of the concrete formulation of the criteria for the identification of developing land-based producer States likely
to be most seriously affected by sea-bed production. Preparatory Commission for the International Seabed Authority
and for the International Tribunal on the Law of the Sea, Special Commission 1. LOS/PCN/SCN.1/1985/CRP.8 186 U.S. Department of Justice, 2015 - Herfindahl-Hirschman index. URL: https://www.justice.gov/atr/herfindahl-
hirschmanindex

127
Table 5.1. The largest exporter States of copper products in the world in 2017187
State Exported value,
thousand USD
Chile* 32,935,691
Peru* 13,729,278
Australia 5,799,489
Zambia* 5,519,946
Indonesia* 4,519,242
Canada 4,276,757
Democratic Republic of the Congo* 3,645,247
Russian Federation 3,472,124
Spain 3,258,407
Kazakhstan 3,161,114
* — developing states
522. From countries in Table 5.1, Chile, Peru, Zambia, Indonesia, and DR Congo are developing
States.
523. Regarding various products of copper, the largest exporter of copper ores and concentrates
among the DLBPS is Chile (USD 15,665,931 thousand). The share of Peru is also very high – USD
11,974,968 thousand, then Indonesia (USD 3,439,604 thousand), Brazil (USD 2,485,258 thousand), and
Mexico (USD 1,891,122 thousand) follow.
524. The largest exporter of copper mattes is Mexico (USD 99,562 thousand). The share of Chile
is USD 46,477 thousand, Malaysia – USD 26,959 thousand, the Republic of Korea – USD 22,293 thousand.
525. As for unrefined copper, the largest exporter is Zambia (USD 3,618,105 thousand), followed
by Chile (USD 2,485,038 thousand).
526. The largest exporter of refined copper is Chile (USD 14,738,245 thousand), then DR Congo
(USD 2,464,846 thousand), India (USD 2,425,162 thousand), China (USD 2,054,824 thousand) follow.
527. For all the countries in the world, exporting copper products, shares of these products’
exports in total exports of these countries were found. An average value of this parameter for 5 years was
compared to the dependence level, and if it exceeds this level, DLBPS considers likely to be seriously
affected. According to the Special Commission 1, the dependence level is equal to 10 %, it represents the
dependence of export earnings of the DLBPS on the exports of copper products and that this DLBPS is
likely to be seriously affected by seabed production188. Thus, DLBPS, exporting copper products, as well
as those DLBPS, which are likely to be seriously affected by seabed production, are presented in Table 5.2
(here and after in such tables DLBPS with shares of more than 0.5 % will be presented, smaller shares are
considered negligible).
Table 5.2. Share of copper products’ exports in total exports of the DLBPS
DLBPS
5 years average share of Cu
products’ exports in total
exports of the DLBPS
DL
BP
S,
wh
ich
are
likel
y t
o b
e
seri
ou
sly
affe
cted
Zambia 56.1 %
Democratic Republic of the Congo 55 %
Eritrea 50 %
Chile 48.9 %
Mongolia 36 %
187 Trade statistics for international business development - Trade Map. URL: https://www.trademap.org/Index.aspx 188 ISA, 1985. Statement of the Chairman of Special Commission 1, provisionally concluding the discussion on the
issue of the concrete formulation of the criteria for the identification of developing land-based producer States likely
to be most seriously affected by sea-bed production. Preparatory Commission for the International Seabed Authority
and for the International Tribunal on the Law of the Sea, Special Commission 1. LOS/PCN/SCN.1/1985/CRP.8

128
Lao People's Democratic Republic 34.4 %
Peru 25.8 %
Mauritania 12 %
Namibia 11.4 %
Papua New Guinea 7.9 %
United Republic of Tanzania 2.7 %
Syrian Arab Republic 2.5 %
Indonesia 2.3 %
Philippines 2.2 %
Myanmar 1.9 %
528. To look at the dependence of the economy of the DLBPS on exports of copper products,
another dependence level was used. Thus, for all the countries in the world, exporting copper products,
shares of these products’ exports in the GDP of these countries were found. The average value of this
parameter for 5 years was compared to the dependence level of 5 %, and if it exceeds this level, the DLBPS
considers likely to be seriously affected189. The results are presented in Table 5.3.
Table 5.3. Share of copper products’ exports in the GDP of the DLBPS
DLBPS
5 years average share of
Cu products’ exports in
GDP of the DLBPS
DL
BP
S,
whic
h
are
likel
y t
o b
e
seri
ousl
y a
ffec
ted Zambia 18.7 %
Mongolia 15.9 %
Chile 12.8 %
Democratic Republic of the Congo 11.1 %
Lao People's Democratic Republic 7.7 %
Eritrea 5.6 %
Peru 5.1 %
Namibia 4.9 %
Mauritania 4.8 %
Papua New Guinea 3.1 %
Philippines 0.5 %
529. Among the DLBPS, which are likely to be seriously affected according to the export earnings
dependence threshold, economies of Namibia and Mauritania did not exceed the economy dependence
level, so these States are not included in the further analysis.
530. Share of copper products exports of the States, which are likely to be seriously affected, in
world exports of these products in 2017 shown in Figure 5.1.
189 ISA, 1985. Statement of the Chairman of Special Commission 1, provisionally concluding the discussion on the
issue of the concrete formulation of the criteria for the identification of developing land-based producer States likely
to be most seriously affected by sea-bed production. Preparatory Commission for the International Seabed Authority
and for the International Tribunal on the Law of the Sea, Special Commission 1. LOS/PCN/SCN.1/1985/CRP.8

129
Figure 5.1. Share of copper products' exports from the DLBPS, which are likely to be seriously affected,
and the rest of the world (ROW) in the world's exports of these copper products in 2017
531. From Figure 5.1, it becomes clear that exports of different copper products unevenly
distributed among DLBPS. Chile exports mostly copper ores and concentrates, unrefined copper and
refined copper, but its share in exports of copper mattes is also high compared to other DLBPS. The main
exported copper product of Peru is copper ores and concentrates. As for Mongolia, DR Congo, Lao
People's Democratic Republic (Laos), and Eritrea, their shares in all copper products are small. Exports of
Zambia mostly based on unrefined copper. Share of copper ores and concentrates and copper mattes in the
world exports of copper products in 2017 is less than 1%. A small amount of refined copper exported from
Zambia in 2017.
532. Using the exported values and the quantities of copper products, the export price of a unit of
each copper product in 2017 in the world and the DLBPS were found and compared to each other, which
is shown in Figure 5.2.
Figure 5.2. Export prices of copper products in the DLBPS and the world in 2017
533. The graph in Figure 5.2 shows that generally, export prices of Chile, Peru, and Laos are quite
close to the world export prices. There are gaps for Mongolia and Eritrea because these States did not export
all copper products concerned. Export prices of DR Congo are close to the world prices in case of copper
ores and refined copper (cathodes), but much higher for copper mattes and, in the opposite, lower for
unrefined copper. As for Zambia, only the export price of refined copper (cathodes) in 2017 is little higher
0%10%20%30%40%50%60%70%80%90%
100%
Copper ores andconcentrates (HS
code 2603)
Copper mattes;cement copper(precipitated
copper) (HS code7401)
Copper; unrefined,copper anodes for
electrolytic refining(HS code 7402)
Copper; refined,unwrought,
cathodes andsections of cathodes
(HS code 740311)
Shar
e o
f e
xpo
rts
Zambia Chile Peru Mongolia DR Congo Laos Eritrea ROW
0
1000
2000
3000
4000
5000
6000
7000
Export price of 1unit of Cu ores and
concentrates
Export price of 1unit of Cu mattes
and others
Export price of 1unit of unrefined
Cu
Export price of 1unit of Cu cathods
Pri
ce, U
SD p
er
t
World Chile Peru Mongolia DR Congo Laos Eritrea Zambia
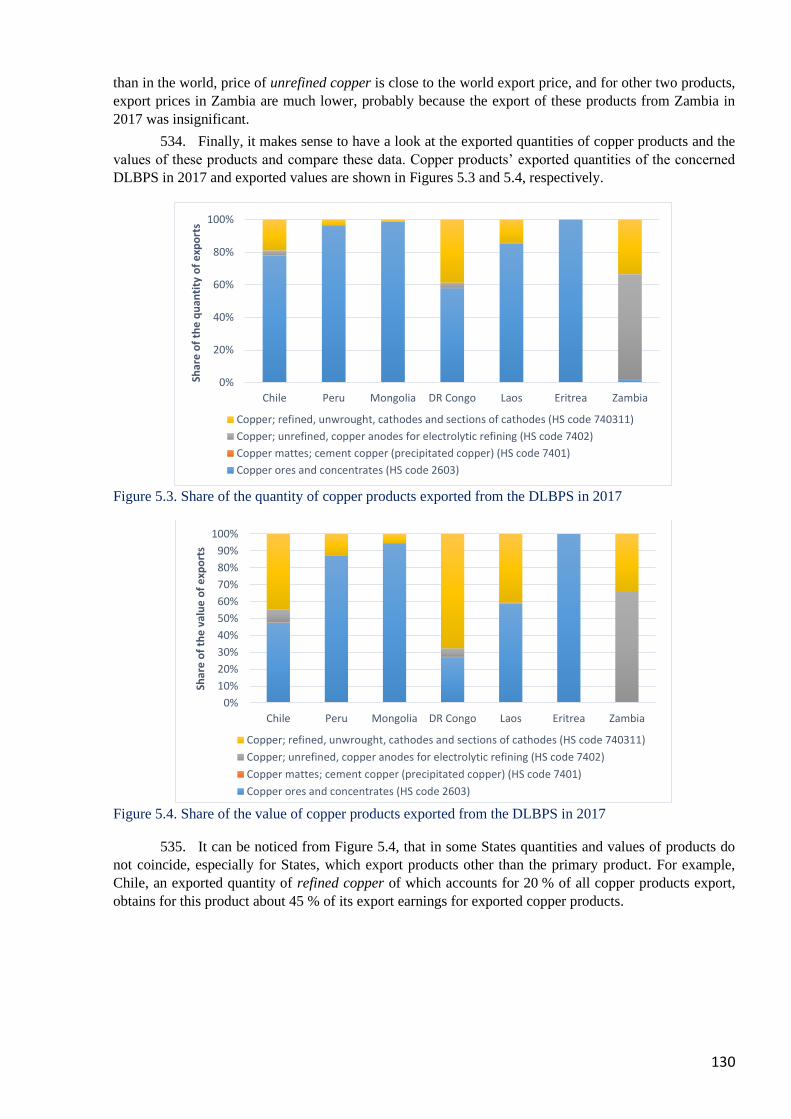
130
than in the world, price of unrefined copper is close to the world export price, and for other two products,
export prices in Zambia are much lower, probably because the export of these products from Zambia in
2017 was insignificant.
534. Finally, it makes sense to have a look at the exported quantities of copper products and the
values of these products and compare these data. Copper products’ exported quantities of the concerned
DLBPS in 2017 and exported values are shown in Figures 5.3 and 5.4, respectively.
Figure 5.3. Share of the quantity of copper products exported from the DLBPS in 2017
Figure 5.4. Share of the value of copper products exported from the DLBPS in 2017
535. It can be noticed from Figure 5.4, that in some States quantities and values of products do
not coincide, especially for States, which export products other than the primary product. For example,
Chile, an exported quantity of refined copper of which accounts for 20 % of all copper products export,
obtains for this product about 45 % of its export earnings for exported copper products.
0%
20%
40%
60%
80%
100%
Chile Peru Mongolia DR Congo Laos Eritrea Zambia
Shar
e o
f th
e q
uan
tity
of
exp
ort
s
Copper; refined, unwrought, cathodes and sections of cathodes (HS code 740311)
Copper; unrefined, copper anodes for electrolytic refining (HS code 7402)
Copper mattes; cement copper (precipitated copper) (HS code 7401)
Copper ores and concentrates (HS code 2603)
0%
10%
20%
30%
40%
50%
60%
70%
80%
90%
100%
Chile Peru Mongolia DR Congo Laos Eritrea Zambia
Shar
e o
f th
e v
alu
e o
f e
xpo
rts
Copper; refined, unwrought, cathodes and sections of cathodes (HS code 740311)
Copper; unrefined, copper anodes for electrolytic refining (HS code 7402)
Copper mattes; cement copper (precipitated copper) (HS code 7401)
Copper ores and concentrates (HS code 2603)

131
Nickel
536. In 2017, by the exported values, the largest exporter States of nickel products in the world
are shown in Table 5.4.
Table 5.4. The largest exporter States of nickel products in the world in 2017190
State Exported value,
thousand USD
Canada 2,570,308
Indonesia* 2,116,090
Russian Federation 2,006,877
Australia 1,782,150
New Caledonia* 1,502,902
Philippines* 1,129,607
Finland 915,379
Norway 892,731
Zimbabwe* 805,222
Brazil* 538,347
* — developing states
537. From these 10 States, Indonesia, New Caledonia, Philippines, Zimbabwe, and Brazil are
developing States. However, New Caledonia is a non-UN member, so this State cannot claim being
seriously affected by seabed production and will not be considered further in the analysis.
538. Regarding various products of nickel, the main exporters of nickel ores and concentrates
among developing States are the Philippines (USD 685,300 thousand) and Zimbabwe (USD 369,013
thousand).
539. The largest exporters of nickel mattes and other intermediate products of nickel metallurgy
are Indonesia (USD 629,334 thousand), Philippines (USD 444,307 thousand), Zimbabwe (USD 436,088
thousand), Papua New Guinea (USD 367,466 thousand), and Cuba (USD 140,788 thousand).
540. As for ferro-nickel, the largest exporter is again Indonesia (USD 1,331,567 thousand),
followed by Brazil (USD 538,048 thousand), Colombia (USD 360,544 thousand), and Myanmar (USD
345,042 thousand).
541. As for unwrought nickel, top exporters are Malaysia (USD 534,350 thousand), Madagascar
(USD 340,961 thousand), and Singapore (USD 256,024 thousand).
542. Talking about DLBPS, which are likely to be seriously affected, 5-years average share of
nickel products’ exports in total exports of all DLBPS is shown in Table 5.5.
Table 5.5. Share of nickel products’ exports in total exports of the DLBPS
DLBPS
5 years average share of Ni
products’ exports in total
exports of the DLBPS
DL
BP
S, w
hic
h a
re
likel
y t
o b
e
seri
ou
sly
aff
ecte
d
Madagascar 20.3 %
Zimbabwe 15.6 %
Cuba 7 %
Botswana 3.6 %
190 Trade statistics for international business development - Trade Map. URL: https://www.trademap.org/Index.aspx

132
Papua New Guinea 2.7 %
Philippines 2 %
Myanmar 1.4 %
Guatemala 1.3 %
Colombia 1.1 %
Indonesia 1 %
Dominican Republic 1 %
Dominica 0.8 %
543. Analysis of the dependence of the economy of DLBPS on exports of nickel products had
shown that none of these two States, which are likely to be seriously affected by seabed production, has
exceeded the dependence levels (Table 5.6). Anyway, both the abovementioned States will be considered
further.
Table 5.6. Share of nickel products’ exports in the GDP of the DLBPS
DLBPS
5 years average share of
Ni products’ exports in
GDP of the DLBPS
Madagascar 3.7 %
Zimbabwe 3.1 %
Botswana 1.7 %
Papua New Guinea 1.1 %
544. Share of nickel products exports of the DLBPS, which are likely to be seriously affected, in
world exports of these products in 2017 shown in Figure 5.5.
Figure 5.5. Share of nickel products' exports from the DLBPS, which are likely to be seriously affected,
and the rest of the world (ROW) in the world's exports of these nickel products in 2017
545. Thus, Figure 5.5 shows that these States have exported a small amount of all nickel products
in the world in 2017. Zimbabwe mostly exports nickel ores and nickel mattes. None of the States exports
ferro-nickel. As for unwrought nickel, Madagascar is the main exporter from these two States.
546. Export prices of nickel products in the world and in the DLBPS in 2017 are shown in
Figure 5.6.
0%10%20%30%40%50%60%70%80%90%
100%
Nickel ores andconcentrates (HS code
2604)
Nickel mattes; nickeloxide sinters and otherintermediate products
of nickel metallurgy(HS code 7501)
Ferro-alloys; ferro-nickel (HS code
720260)
Nickel; unwrought, notalloyed (HS code
750210)
Shar
e o
f e
xpo
rts
Zimbabwe Madagascar ROW

133
Figure 5.6. Export prices of nickel products in the DLBPS, which are likely to be seriously affected, and
in the world in 2017
547. The graph in Figure 5.6 shows that the export price of nickel ores and concentrates in 2017
is very low in comparison with other nickel products. There are gaps in the graph because some States do
not export all concerned products. The export price of nickel mattes in Zimbabwe is almost as high as world
prices. The export price of unwrought nickel from Madagascar is close to world prices, whereas the price
in Zimbabwe is much lower.
548. Nickel products’ exported quantities of the DLBPS, which are likely to be seriously affected,
in 2017 and exported values are shown in Figures 5.7 and 5.8, respectively.
Figure 5.7. Share of the quantity of nickel products exported from the DLBPS, which are likely to be
seriously affected, in 2017
0
2000
4000
6000
8000
10000
12000
Export price of 1unit of Ni ores and
concentrates
Export price of 1unit of Ni mattes
and others
Export price of 1unit of ferro-nickel
Export price of 1unit of unwrought
nickel
Exp
ort
pri
ce, U
SD p
er
t
Zimbabwe Madagascar World
0%
10%
20%
30%
40%
50%
60%
70%
80%
90%
100%
Zimbabwe Madagascar
Shar
e o
f th
e q
uan
tity
of
exp
ort
s
Nickel; unwrought, not alloyed (HS code 750210)
Ferro-alloys; ferro-nickel (HS code 720260)
Nickel mattes; nickel oxide sinters and other intermediate products of nickel metallurgy (HS code 7501)
Nickel ores and concentrates (HS code 2604)

134
Figure 5.8. Share of the value of nickel products exported from the DLBPS, which are likely to be
seriously affected, in 2017
549. It can be seen from the figures, that the quantity and the value of products do not coincide.
As for Zimbabwe, its exported quantities of nickel mattes are very low, but the exported value is quite
significant. This trend is not relevant for Madagascar, because it exported only unwrought nickel in 2017.
Cobalt
550. In 2017, by exported values, the largest exporter States of cobalt products in the world are
presented in Table 5.7 below.
Table 5.7. The largest exporter States of cobalt products in the world in 2017191
State Exported value,
thousand USD
Democratic Republic of the Congo* 3,154,785
China* 529,245
Canada 420,044
Australia 170,501
Japan 158,747
Madagascar* 151,915
Zambia* 150,834
United States of America 93,672
United Kingdom 86,179
Morocco* 80,965
* — developing states
551. From this list, DR Congo, China, Madagascar, Zambia, and Morocco are developing States.
552. Regarding various products of cobalt, an absolute exporter of cobalt ores and concentrates
among developing States is DR Congo (USD 524,045 thousand). Shares of other States are insignificant.
553. The largest exporter of cobalt mattes and other intermediate products of cobalt metallurgy
is DR Congo (USD 1,896,638 thousand). The share of China is USD 208,728 thousand, Madagascar – USD
151,915 thousand, and Morocco – USD 79,680 thousand. The share of Zambia is insignificant.
554. As for cobalt oxides and hydroxides, the largest exporter is again DR Congo (USD 734,112
thousand), followed by China (USD 320,382 thousand) and Zambia (USD 150,289 thousand).
555. Shares of these products’ exports in total exports of all the developing States in the world,
exporting cobalt products, were found (Table 5.8). It was found that only DR Congo is likely to be seriously
191 Trade statistics for international business development - Trade Map. URL: https://www.trademap.org/Index.aspx
0%
10%
20%
30%
40%
50%
60%
70%
80%
90%
100%
Zimbabwe Madagascar
Shar
e o
f th
val
ue
of
exp
ort
s
Nickel; unwrought, not alloyed (HS code 750210)
Ferro-alloys; ferro-nickel (HS code 720260)
Nickel mattes; nickel oxide sinters and other intermediate products of nickel metallurgy (HS code 7501)
Nickel ores and concentrates (HS code 2604)

135
affected by seabed production in the Area; its share is 24.3 %, whereas shares of other States are
insignificant. Further analysis regarding cobalt products will be focused on DR Congo only.
Table 5.8. Share of cobalt products’ exports in total exports of the DLBPS
DLBPS
5 years average share of Co
products’ exports in total
exports of the DLBPS
DL
BP
S,
wh
ich
are
likel
y t
o b
e
seri
ou
sly
aff
ecte
d
Democratic Republic
of the Congo 24.3 %
Madagascar 4 %
Zambia 0.8 %
556. Moreover, the share of cobalt products’ exports in the GDP of DLBPS for the last 5 years
does not exceed a 5 % dependence level (Table 5.9). For DR Congo it is 4.8 %. Even though two
dependence thresholds were chosen for the current analysis, there is no necessity to use both at the same
time. The economy dependence threshold was used in order to check and reinforce the results, produced by
the usage of export earnings dependency threshold, so the fact that the share of cobalt products’ exports in
the GDP of DR Congo does not exceed the dependence level can be neglected.
Table 5.9. Share of cobalt products’ exports in the GDP of the DLBPS
DLBPS
5 years average share of
Co products’ exports in
GDP of the DLBPS
Democratic Republic of the Congo 4.8 %
Madagascar 0.8 %
557. Share of cobalt products exports of DR Congo in the world exports of these products in 2017
is shown in Figure 5.9.
Figure 5.9. Share of cobalt products' exports from DR Congo and the rest of the world (ROW) in the
world's exports of these cobalt products in 2017
558. Figure 5.9 shows that DR Congo gets 97 % of world export earnings for cobalt ores and
concentrates and half of world export earnings for cobalt mattes and cobalt oxides.
0%10%20%30%40%50%60%70%80%90%
100%
Cobalt ores & concentrates(HS code 2605)
Cobalt mattes and otherintermediate products of
cobalt metallurgy; unwroughtcobalt; cobalt powders (HS
code 810520)
Cobalt oxides& hydroxides(HS code 2822)
Shar
e o
f e
xpo
rts
DR Congo ROW

136
559. Export prices of cobalt products in the world and in DR Congo in 2017 are shown in
Figure 5.10.
Figure 5.10. Export prices of cobalt products in DR Congo and in the world in 2017
560. The graph in Figure 5.10 shows that the export price of cobalt ores and concentrates in 2017
in DR Congo is higher than in the world, unlike prices for two other cobalt products.
561. Cobalt products’ exported quantities of DR Congo in 2017 and exported values are shown
in Figures 5.11 and 5.12, respectively.
Figure 5.11. Share of the quantity of cobalt products exported from DR Congo in 2017
Figure 5.12. Share of the value of cobalt products exported from DR Congo in 2017
0
5000
10000
15000
20000
Export price of 1 unit of Coores and concentrates
Export price of 1 unit of Comattes and others
Export price of 1 unit of Cooxides and hydroxides
Exp
ort
pri
ce, U
SD p
er
t
DR Congo World
39%
51%
10%Cobalt ores & concentrates (HScode 2605)
Cobalt mattes and otherintermediate products of cobaltmetallurgy; unwrought cobalt;cobalt powders (HS code 810520)
Cobalt oxides& hydroxides (HScode 2822)
17%
60%
23%
Cobalt ores & concentrates (HScode 2605)
Cobalt mattes and otherintermediate products of cobaltmetallurgy; unwrought cobalt;cobalt powders (HS code 810520)
Cobalt oxides& hydroxides (HScode 2822)

137
562. It can be seen from Figures 5.11 and 5.12 that the quantity and the value of products do not
coincide. For example, the exported quantity of cobalt ores and concentrates from DR Congo is high –
almost 40 % - in total exports of all cobalt products from the country, however, the value of this product is
the lowest in total exported value of cobalt products.
Manganese
563. In 2017, by the exported values, the largest exporter States of manganese products in the
world are presented in Table 5.10.
Table 5.10. The largest exporter States of manganese products in the world in 2017192
State Exported value,
thousand USD
South Africa* 3,092,939
Gabon* 1,190,316
India* 1,140,100
China* 961,957
Ukraine 898,811
Malaysia* 529,678
Brazil* 459,929
Netherlands 389,631
Norway 356,580
Republic of Korea 323,565
* — developing states
564. From this list, South Africa, Gabon, India, China, Malaysia, and Brazil are developing States.
565. Regarding exports of various products of manganese in 2017, the main exporters of
manganese ores and concentrates among developing States are South Africa (USD 2,527,273 thousand),
Gabon (USD 1,147,697 thousand), Brazil (USD 365,636 thousand), and Ghana (USD 155,381 thousand).
566. The largest exporter of manganese oxides is China (USD 95,339 thousand), whereas exports
of other DLBPS are insignificant.
567. As for ferro-manganese (more than 2 % of carbon), the largest exporters are Malaysia (USD
300,132 thousand), India (USD 258,586 thousand), and South Africa (USD 221,459 thousand).
568. The largest exporters of another form of ferro-manganese (2% or less of carbon) are the
Republic of Korea (USD 246,578 thousand), South Africa (USD 127,030 thousand), and India (USD
63,968 thousand).
569. Top exporter of ferro-silico-manganese is India (USD 801,204 thousand), followed by
Malaysia (USD 204,654 thousand) and South Africa (USD 134,387 thousand).
570. As for the last considered product – manganese articles – the main exporter is again China
(USD 847,770 thousand), while shares of other States are insignificant.
571. Among all manganese exporting countries, there is one State, which is likely to be seriously
affected by seabed production, and it is Gabon (Table 5.11).
192 Trade statistics for international business development - Trade Map. URL: https://www.trademap.org/Index.aspx

138
Table 5.11. Share of manganese products’ exports in total exports of the DLBPS
DLBPS
5 years average share of Mn
products’ exports in total
exports of the DLBPS
DL
BP
S,
wh
ich
are
likel
y t
o b
e
seri
ou
sly
aff
ecte
d
Gabon 11.8 %
South Africa 2.7 %
572. Besides, Gabon is at the edge of dependence level, related to the economy of the country –
5% (Table 5.12). Thus, only this State was considered in the analysis.
Table 5.12. Share of manganese products’ exports in the GDP of the DLBPS
DLBPS
5 years average share of Mn
products’ exports in GDP of
the DLBPS
DL
BP
S,
whic
h a
re
likel
y t
o b
e
seri
ousl
y a
ffec
ted
Gabon 5 %
South Africa 0.7 %
573. Share of manganese products exports of Gabon in the world exports of these products in
2017 shown in Figure 5.13.
Figure 5.13. Share of manganese products' exports from Gabon and the rest of the world (ROW) in the
world's exports of these manganese products in 2017
0%
10%
20%
30%
40%
50%
60%
70%
80%
90%
100%
Manganese ores andconcentrates, includingferruginous manganeseores and concentrates
with a manganesecontent of 20% or more,
calculated on the dryweight (HS code 2602)
Ferro-alloys; ferro-manganese, containingby weight 2% or less of
carbon (HS code720219)
Ferro-alloys; ferro-silico-manganese (HS code
720230)
Manganese; articlesthereof, including waste
and scrap (HS code811100)
Shar
e o
f e
xpo
rts
Gabon ROW

139
574. Gabon did not export manganese oxides and ferro-manganese (more than 2 % of carbon) in
2017. Share of this country in world exports of manganese products is low, especially for ferro-manganese
(2 % or less of carbon), ferro-silico-manganese and manganese articles. The product, which makes the
State dependent on exports, is manganese ores and concentrates.
575. Export prices of manganese products in the world and in Gabon in 2017 are shown in
Figure 5.14.
Figure 5.14. Export prices of manganese products in Gabon and in the world in 2017
576. The graph 5.14 shows that export prices of manganese ores and concentrates, ferro-silico-
manganese and manganese articles are higher in Gabon than in the world in 2017, though exported
quantities of the last two products are extremely low compared to world exports of these products. As for
ferro-manganese, this product was not exported from Gabon in 2017, that is why the export price is
unavailable.
577. Manganese products’ exported quantities of Gabon in 2017 and exported values are shown
in Figures 5.15 and 5.16, respectively.
Figure 5.15. Share of the quantity of manganese products exported from Gabon in 2017
0
500
1000
1500
2000
2500
Export price of 1 unitof Mn ores andconcentrates
Export price of 1 unitof ferro-manganese(2% or less carbon)
Export price of 1 unitof ferro-silico-
manganese
Export price of 1 unitof manganese articles
Exp
ort
pri
ce, U
SD p
er
t
Gabon World
99%
1% 0%Manganese ores and concentrates, includingferruginous manganese ores and concentrates witha manganese content of 20% or more, calculatedon the dry weight (HS code 2602)
Ferro-alloys; ferro-manganese, containing byweight 2% or less of carbon (HS code 720219)
Ferro-alloys; ferro-silico-manganese (HS code720230)
Manganese; articles thereof, including waste andscrap (HS code 811100)

140
Figure 5.16. Share of the value of manganese products exported from Gabon in 2017
578. It can be seen from Figures 5.15 and 5.16, that the quantity and the value of products are
coincided, because almost all of the exports of manganese products from Gabon is based on manganese
ores and concentrates (99 %), and shares of other products are negligible.
All affected metals
579. During the analysis of four affected metals share in exports of the DLBPS it was found that
many various States are likely to be seriously affected by seabed mining. Some of such States repeated for
different metals. That is why it is important to analyze the multiple effects of the sum of affected metals in
the exports of the DLBPS. Moreover, the Special Commission 1 specified the effect on exports of one or
more metals concerned.
580. Calculations have shown that the share of affected metals exports in all exports of the DLBPS
is huge, as well as the number of the DLBPS, which are likely to be affected (Table 5.13).
Table 5.13. Share of affected metals exports in total exports of the DLBPS
DLBPS
5-years average share of
affected metals exports in
total exports of DLBPS
DL
BP
S, w
hic
h a
re l
ikel
y t
o b
e
affe
cted
Democratic Republic of the Congo 79.3 %
Zambia 57.2 %
Eritrea 49.8 %
Chile 48.9 %
Mongolia 36 %
Lao People's Democratic Republic 34.4 %
Peru 25.8 %
Madagascar 24.3 %
Zimbabwe 15.9 %
Mauritania 12 %
Gabon 11.8 %
Namibia 11.4 %
Papua New Guinea 10.6 %
Cuba 7.3 %
Botswana 4.5 %
Philippines 4.2 %
Grenada 4 %
South Africa 3.5 %
Indonesia 3.3 %
97%
2% 1%Manganese ores and concentrates, includingferruginous manganese ores and concentrateswith a manganese content of 20% or more,calculated on the dry weight (HS code 2602)
Ferro-alloys; ferro-manganese, containing byweight 2% or less of carbon (HS code 720219)
Ferro-alloys; ferro-silico-manganese (HS code720230)
Manganese; articles thereof, including wasteand scrap (HS code 811100)

141
Myanmar 3.3 %
United Republic of Tanzania 2.7 %
Syrian Arab Republic 2.5 %
Brazil 1.7 %
Dominican Republic 1.6 %
Guatemala 1.3 %
Colombia 1.2 %
India 1.2 %
Argentina 1 %
Dominica 0.8 %
Democratic People's Republic of Korea 0.8 %
Malaysia 0.8 %
Morocco 0.8 %
Mexico 0.6 %
Plurinational State of Bolivia 0.6 %
Islamic Republic of Iran 0.5 %
581. Concerning the economies of the DLBPS, results of the usage of the economy dependence
threshold are presented in Table 5.14.
Table 5.14. Share of affected metals exports in the GDP of the DLBPS
DLBPS
5-years average share of
affected metals exports in
GDP of DLBPS
DL
BP
S,
whic
h a
re
likel
y t
o b
e af
fect
ed Zambia 19.1 %
Democratic Republic of the Congo 16 %
Mongolia 15.9 %
Chile 12.8 %
Lao People's Democratic Republic 7.7 %
Eritrea 5.6 %
Peru 5.1 %
Gabon 5 %
Namibia 4.9 %
Mauritania 4.8 %
Madagascar 4.4 %
Papua New Guinea 4.3 %
Zimbabwe 3.1 %
Botswana 2.1 %
South Africa 0.9 %
Philippines 0.9 %
Myanmar 0.6 %
Indonesia 0.6 %
Malaysia 0.5 %
582. Some States are at the edge of the dependence level: Eritrea (5.6 %), Peru (5.1 %), and Gabon
(5 %). The remaining States were close to the dependence level but did not exceed it.

142
IMPACT ON THE AFFECTED METALS TARIFFS FOR
DEVELOPING STATE PRODUCERS
A. Effects of the affected metals tariffs on overall economic performance
583. Metal prices affect export earnings of the States, consequently, affecting export prices of
products in the world and in the DLBPS, which are likely to be affected by seabed production. However,
the effect of metal prices on the world market can be different for various metal products. Some products
are more dependent on the price on the world market than others. Anyway, metal price changes can affect
export earnings and the economies of the DLBPS through changes in the share of exports in the GDP of
the State.
584. Another issue is that such metal price changes may occur not necessarily because of the
seabed mining activities in the Area. Other reasons for metal price changes can be such events, like de-
stocking, geopolitical unrest, the setting of a joint price, and recession. Besides, usually the price of a
commodity varies in response to general global economic conditions, supply and demand fundamentals and
several other factors of relatively short duration. In order to analyze the effect of these changes on export
prices of products, the evolution of export prices of metal products was considered together with metal
prices on the world market.
Copper
585. Changes in copper prices and export prices of copper products in the world are shown in
Figure 6.1.
Figure 6.1. Changes in copper prices and export prices of copper products in the world
586. In general, there was a sharp rise in copper prices from 2003 to 2011. The financial crisis in
2008 influenced this tendency, and price slumped to approximately USD 5000 per metric tonne to 2009.
However, the prices were recovered and rose further basically due to the booming economy and high
demand193. Right after a peak of almost USD 9000 per metric tonne in 2011, the downward trend in prices
since 2011 appeared. It was related to weak demand from China and demand for substitutes, such as
aluminum194.
193 Stuermer M., 2014. 150 years of boom and bust: what drives mineral commodity prices? Federal Reserve Bank of
Dallas Research Department. Working Paper 1414, 37 p. URL:
https://www.dallasfed.org/~/media/documents/research/papers/2014/wp1414.pdf 194 UN, 2015. World commodity trends and prospects. Report of the Secretary-General. General Assembly, United
Nations, 24 p. URL: https://unctad.org/meetings/en/SessionalDocuments/a70d184_en.pdf
-60
-40
-20
0
20
40
60
2008 2009 2010 2011 2012 2013 2014 2015 2016 2017
Ch
ange
, %
Year-to-year change of export price of 1 unit of Cu ores and concentratesYear-to-year change of export price of 1 unit of Cu mattes and othersYear-to-year change of export price of 1 unit of unrefined CuYear-to-year change of export price of 1 unit of Cu cathodsYear-to-year change of Cu prices

143
587. Almost all the changes in export prices of copper products coincide with changes in the
copper price, especially those for copper ores, and unrefined copper. Falling of copper mattes export price
because of the 2008 recession was more significant than for other products, and its further increase was, in
the opposite, less intense. The trend of more intense slumps persisted over the whole period.
588. Considering exports of copper products of individual DLBPS, which are likely to be
seriously affected, further in this chapter only Chile and Peru will be discussed as examples of such States.
Thus, changes in copper prices and export prices of copper products in Chile are shown in Figure 6.2.
Figure 6.2. Changes in copper prices and export prices of copper products in Chile
589. The situation in Chile is close to the situation in the world: export prices of unrefined copper
and copper ores and concentrates change in accordance with copper price. The export price of copper
cathodes does not follow the general trend, it is reduced by 7% from 2008 to 2009 and continued to fall,
unlike the prices of other products. The most inconsistent price is the export price of copper mattes. It has
faced great upturns, like the 237 % rise from 2009 to 2010 and the 88 % rise from 2015 to 2016. Its collapses
were also more significant than for other products.
590. Trends for Peru are shown in Figure 6.3.
Figure 6.3. Changes in copper prices and export prices of copper products in Peru
-70
-20
30
80
130
180
230
280
2008 2009 2010 2011 2012 2013 2014 2015 2016 2017
Ch
ange
, %
Year-to-year change of export price of 1 unit of Cu ores and concentratesYear-to-year change of export price of 1 unit of Cu mattes and othersYear-to-year change of export price of 1 unit of unrefined CuYear-to-year change of export price of 1 unit of Cu cathodsYear-to-year change of Cu prices
-80
-60
-40
-20
0
20
40
60
80
2008 2009 2010 2011 2012 2013 2014 2015 2016 2017
Ch
ange
, %
Year-to-year change of export price of 1 unit of Cu ores and concentratesYear-to-year change of export price of 1 unit of Cu mattes and othersYear-to-year change of export price of 1 unit of unrefined CuYear-to-year change of export price of 1 unit of Cu cathodsYear-to-year change of Cu prices

144
591. The general trend, when export prices of unrefined copper and copper ores and concentrates
change in accordance with copper price persists in Peru, but there are some variations. On the opposite,
changes in the export price of copper cathodes completely coincide with changes in the copper price.
Changes in copper mattes price were not such intense, like for Chile, but they are still quite volatile. For
example, from 2010 to 2011 in the world and in Chile price increased, but in Peru it decreased by 64 %.
Such sharp changes happened during the whole period.
592. As it was said before, changes in metal prices affect export earnings of the States with
affecting export prices. This additionally affects the economies of the DLBPS through changes in the share
of exports in the GDP of the State. Thus, the GDP of Chile and Peru, the share of copper products exports
in their GDP and copper price were considered.
Figure 6.4. Changes in the copper prices, the GDP and export earnings from the copper products exports
in Chile
593. Figure 6.4 shows that changes in export earnings from all copper products exports fully
consistent with changes in the metal price. In general, the GDP of the State changes accordingly. For
example, in the period when export earnings from copper products exports decreased, there was also a
decrease in the GDP (2014-2016), so probably the State’s economy is quite dependent on exports of these
products. According to UNCTADstat data on individual States’ GDP by type of expenditure and gross
value added (VA) by kind of economic activity195, the average share of exports of all goods and services
from Chile in the GDP of the State during the last 10 years is 34 %, but it is decreasing throughout the
period. As for the average share of mining, manufacturing, utilities in the VA, it is 28 % for the last 10
years.
195 United Nations Conference on Trade and Development – UNCTADstat. Data center, Economic trends, National
accounts, GDP by type of expenditure, VA by kind of economic activity. URL:
https://unctadstat.unctad.org/wds/TableViewer/tableView.aspx?ReportId=95
-30
-20
-10
0
10
20
30
40
50
60
2008 2009 2010 2011 2012 2013 2014 2015 2016 2017
Ch
ange
, %
Year-to-year change of export earnings from Cu products' exportsYear-to-year change of GDPYear-to-year change of Cu prices

145
Figure 6.5. Changes in the copper prices, the GDP and export earnings from the copper products exports
in Peru
594. Figure 6.5 shows a quite similar situation for Peru. In most years, changes in export earnings
from all copper products exports consistent with changes in the metal price. This continued until 2011, then
a shift happened: export earnings reduction occurred one year later than a decrease in the metal price.
However, since 2015 export earnings rose sharply, one year before it happened to metal price. In the
evolution of the GDP similar trends can be noticed, like growth in 2010, then a slowdown of growth until
2014, followed by a decrease of the GDP until 2016. However, this is hardly can be related to changes in
export earnings only. More likely it was a cumulative effect of different processes in the economy, which
also influenced metal prices and export earnings correspondingly. According to UNCTADstat data on
individual States’ GDP by type of expenditure and VA by kind of economic activity 196, the average share
of exports of all goods and services from Peru in the GDP during the last 10 years is 26 %. As for the
average share of mining, manufacturing, utilities in the VA, it is 30 % for the last 10 years.
595. Indeed, a market definition for affected metals was defined, which includes a market share
of each DLBPS and market concentration. Market shares of the DLBPS, which are likely to be seriously
affected, are shown in Figure 6.6.
Figure 6.6. Market share of the DLBPS, which are likely to be seriously affected, for all copper products
196 United Nations Conference on Trade and Development – UNCTADstat. Data center, Economic trends, National
accounts, GDP by type of expenditure, VA by kind of economic activity. URL:
https://unctadstat.unctad.org/wds/TableViewer/tableView.aspx?ReportId=95
-30
-20
-10
0
10
20
30
40
50
60
2008 2009 2010 2011 2012 2013 2014 2015 2016 2017
Ch
ange
, %
Year-to-year change of export earnings from Cu products' exportsYear-to-year change of GDPYear-to-year change of Cu prices
0
5
10
15
20
25
30
35
40
2008 2009 2010 2011 2012 2013 2014 2015 2016 2017
Mar
ket
shar
e, %
Chile
Peru
Mongolia
DR Congo
Laos
Eritrea
Zambia

146
596. It was found that Chile has the greatest market share of all copper products (32 % on
average).
597. Regarding markets of each product, Chile on average has the largest market share of copper
ores and concentrates in value (30 %), followed by Peru (15.3 %) (Figure 6.7).
Figure 6.7. Market share of the DLBPS, which are likely to be seriously affected, for copper ores and
concentrates
598. Among the DLBPS, which are likely to be seriously affected, Chile has the largest share in
copper mattes’ markets (13.8 % on average) (Figure 6.8).
Figure 6.8. Market share of the DLBPS, which are likely to be seriously affected, for copper mattes
599. Again, Chile has the greatest market share of unrefined copper – 42.5 % on average. Then
Zambia follows with its average market share of 8.3 %, and DR Congo (6.6 %) (Figure 6.9).
0
5
10
15
20
25
30
35
40
2008 2009 2010 2011 2012 2013 2014 2015 2016 2017
Mar
ket
shar
e, %
Chile
Peru
Mongolia
DR Congo
Laos
Eritrea
Zambia
0
5
10
15
20
25
30
35
2008 2009 2010 2011 2012 2013 2014 2015 2016 2017
Mar
ket
shar
e, % Chile
DR Congo
Laos
Peru
Zambia

147
Figure 6.9. Market share of the DLBPS, which are likely to be seriously affected, for unrefined copper
600. Chile has the largest market share of refined copper – 32.7 % on average. Shares of other
States are much less (Figure 6.10).
Figure 6.10. Market share of the DLBPS, which are likely to be seriously affected, for refined copper
601. However, from Figure 6.11 it seems that concentrations of copper markets are not very high.
Figure 6.11. The concentration of copper products markets
0
10
20
30
40
50
60
2008 2009 2010 2011 2012 2013 2014 2015 2016 2017
Mar
ket
shar
e, % Zambia
Chile
DR Congo
Laos
0
5
10
15
20
25
30
35
40
45
2008 2009 2010 2011 2012 2013 2014 2015 2016 2017
Mar
ket
shar
e, %
Chile
DR Congo
Zambia
Peru
Laos
Mongolia
0
500
1000
1500
2000
2500
3000
3500
2008 2009 2010 2011 2012 2013 2014 2015 2016 2017
HH
I
Cu ores andconcentrates
Cu mattes
Unrefined Cu
Refined Cu

148
602. Thus, the average HHI for copper ores and concentrates is about 1400, which proves that
this market has low concentration and it is competitive. As for copper mattes’ markets, it has HHI of 1600,
this market has moderate concentration. The concentration of the unrefined copper market is higher –
almost HHI=2500 – on average, this market is moderately concentrated, but it is on the edge of high
concentration. The market for refined copper has the lowest concentration – HHI=1300. This means that
generally speaking copper products markets are quite competitive and have moderate to low concentrations.
Global production is distributed evenly over a large number of countries.
603. Thus, based on the results of the analysis of copper products’ exports, it can be concluded
that among all the copper products copper ores and concentrates export prices are the most correlated with
copper prices. In the world, in general export prices of other copper products are also more or less correlated
with copper prices. This, however, changes for some States, for example, export prices of copper mattes
are not correlated with copper prices in Chile and Peru. In addition, copper prices are directly related to the
export earnings of the States, which export copper products. Export earnings, in their turn, affect State’s
GDP to some extent.
604. A possible decrease in copper prices as a result of deep-sea mining can lead to the decrease
of export prices of copper products, first of all, of those products, which are highly correlated with copper
prices, for example, copper ores and concentrates or unrefined copper. The market of unrefined copper is
quite high concentrated with the highest market share of Chile in there. A decrease in the export price of
this product can result in low export earnings of the State. One may expect that the share of Chile on the
unrefined copper market will fall, when a new actor on the market will appear, as it happened in 2014 since
exports of Zambia increased and the market share of this State increased. Probably, the situation would not
be such painful for the markets, which have lower concentrations, like refined copper or copper ores and
concentrates.
Nickel
605. Changes in nickel prices and export prices of nickel products in the world are shown on
Figure 6.12.
Figure 6.12. Changes in nickel prices and export prices of nickel products in the world
606. The decrease of nickel prices since the world economic crisis in 2007 was related to
oversupply197. After the fall until almost USD 14,500 per metric tonne in 2009, there was a short rise in the
price with a peak of almost USD 23,000 per metric tonne in 2011. Then the falling trend started earlier
continued, and price slumped to USD 9500 per metric tonne in 2016. However, the trend changed from
197 Ehrlich L.G., 2018. What drives nickel prices – A structural VAR Approach. HWWI Research Paper 186. Hamburg
Institute of International Economics (HWWI), 44 p. URL:
http://www.hwwi.org/fileadmin/hwwi/Publikationen/Publikationen_PDFs_2018/ HWWI_ResearchPaper_186.pdf
-100
0
100
200
300
400
2008 2009 2010 2011 2012 2013 2014 2015 2016 2017
Ch
ange
, %
Year to year change of export price of 1 unit of Ni ores and concentratesYear to year change of export price of 1 unit of Ni mattes and othersYear to year change of export price of 1 unit of ferro-nickelYear to year change of export price of 1 unit of unwrought NiYear to year change of Ni prices

149
2016, following the enforcement of an export ban of unprocessed ores in 2014 by Indonesia, the world-
leading nickel producer198.
607. Almost all the changes in export prices of nickel products coincide with changes in nickel
prices, especially those for ferro-nickel and unwrought nickel. Export prices of nickel mattes and nickel
ores in some years have changed according to metal price. However, there were some extreme changes,
like a 344% growth of nickel mattes export price.
608. Considering individual States, changes in nickel prices and export prices of nickel products
in Zimbabwe and Madagascar are shown in Figure 6.13.
Figure 6.13. Changes in nickel prices and export prices of nickel products in Zimbabwe and Madagascar
609. Export prices for all products in Zimbabwe are volatile and do not follow changes of nickel
price generally. However, it worth to mention, that export prices for nickel ores and concentrates and nickel
mattes do not seem to be credible. There is a sharp increase of nickel ores and concentrates export price in
2014 by 401 %, which is inconsistent with nickel price changes. In addition, there is a significant increase
of unwrought nickel export price in 2012 in Zimbabwe by 253 %, whereas world metal prices were
declining by 23 %. Since Madagascar started exports of unwrought nickel in 2012, its export price changes
fully consistent with metal price changes.
610. The GDP of Zimbabwe, the share of nickel products exports in the GDP and nickel prices
were considered (Figure 6.14).
Figure 6.14. Changes in nickel prices, the GDP and export earnings from nickel products exports in
Zimbabwe
198 UN, 2015. World commodity trends and prospects. Report of the Secretary-General. General Assembly, United
Nations, 24 p. URL: https://unctad.org/meetings/en/SessionalDocuments/a70d184_en.pdf
-150
-50
50
150
250
350
450
2008 2009 2010 2011 2012 2013 2014 2015 2016 2017
Ch
ange
, %
Year to year change of export price of 1 unit of Ni ores and concentrates in ZimbabweYear to year change of export price of 1 unit of Ni mattes in ZimbabweYear to year change of export price of 1 unit of unwrought Ni in ZimbabweYear to year change of Ni prices Year-to-year change of export price of 1 unit of unwrought Ni in Madagascar
-80
-40
0
40
80
120
2008 2009 2010 2011 2012 2013 2014 2015 2016 2017
Ch
ange
, %
Year-to-year change of export earnings from Ni products' exports
Year-to-year change of GDP
Year-to-year change of Ni prices

150
611. Figure 6.14 shows that changes in export earnings from all nickel products exports quite
consistent with changes in the metal price. However, there were periods, when the metal price decreased
by 30 %, whereas export earnings increased by 46 % (in 2009), or when an increase in export earnings
(145 %) was higher than an increase of prices (8 %) (in 2017). There was a period when the metal price
increased by 12 %, but export earnings decreased by 52 % in 2014. The GDP of the State has never changed
negatively during the analyzed period. According to UNCTADstat data on individual States’ GDP by type
of expenditure and VA by kind of economic activity 199, the average share of exports of all goods and
services from Zimbabwe in the GDP of the State during the last 10 years is 29.3 %. As for the average share
of mining, manufacturing, utilities in the VA, it is 23.6 % for the last 10 years.
612. The GDP of Madagascar, the share of nickel products exports in GDP and nickel price are
shown in Figure 6.15.
Figure 6.15. Changes in nickel prices, the GDP and export earnings from nickel products exports in
Madagascar
613. Figure 6.15 shows that changes in export earnings from nickel products exports are intense
compared to changes in the metal price. The GDP of the State generally keeps positive changes. According
to UNCTADstat data on individual States’ GDP by type of expenditure and VA by kind of economic
activity 200, the average share of exports of all goods and services from Madagascar in the GDP of the State
during the last 10 years is 18.6 %. As for the average share of mining, manufacturing, utilities in the VA, it
is 9 % for the last 10 years.
614. Market shares of the DLBPS, which are likely to be seriously affected, are shown in Figure
6.16.
199 United Nations Conference on Trade and Development – UNCTADstat. Data center, Economic trends, National
accounts, GDP by type of expenditure, VA by kind of economic activity. URL:
https://unctadstat.unctad.org/wds/TableViewer/tableView.aspx?ReportId=95 200 United Nations Conference on Trade and Development – UNCTADstat. Data center, Economic trends, National
accounts, GDP by type of expenditure, VA by kind of economic activity. URL:
https://unctadstat.unctad.org/wds/TableViewer/tableView.aspx?ReportId=95
-100
0
100
200
300
400
500
2008 2009 2010 2011 2012 2013 2014 2015 2016 2017
Ch
ange
, %
Year-to-year change of export earnings from Ni products' exportsYear-to-year change of GDPYear-to-year change of Ni prices

151
Figure 6.16. Market share of the DLBPS, which are likely to be seriously affected, for all nickel products
615. It was found that both Madagascar and Zimbabwe have very low market shares of all nickel
products.
616. Regarding markets of each product, shares of Zimbabwe and Madagascar are in Figure 6.17.
Figure 6.17. Market share of Zimbabwe and Madagascar for nickel products
617. The average share of Zimbabwe in nickel ores and concentrates market is 9.8 %. Its share in
nickel mattes’ markets is 5 %. As for unwrought nickel, the average market share of Zimbabwe is less than
1 % and of Madagascar – 1.8 %.
618. It seems that nickel products markets have not very high concentration, but exports are
concentrated in Indonesia, the Philippines, Zimbabwe, and other DLBPS (Figure 6.18).
0
0.5
1
1.5
2
2.5
3
3.5
4
2008 2009 2010 2011 2012 2013 2014 2015 2016 2017
Mar
ket
shar
e, %
Zimbabwe
Madagascar
0
2
4
6
8
10
12
14
16
2008 2009 2010 2011 2012 2013 2014 2015 2016 2017
Mar
ket
shar
e, %
Ni ores and concentrates(Zimbabwe)
Ni mattes (Zimbabwe)
Unwrought Ni(Madagascar)
Unwrought Ni(Zimbabwe)
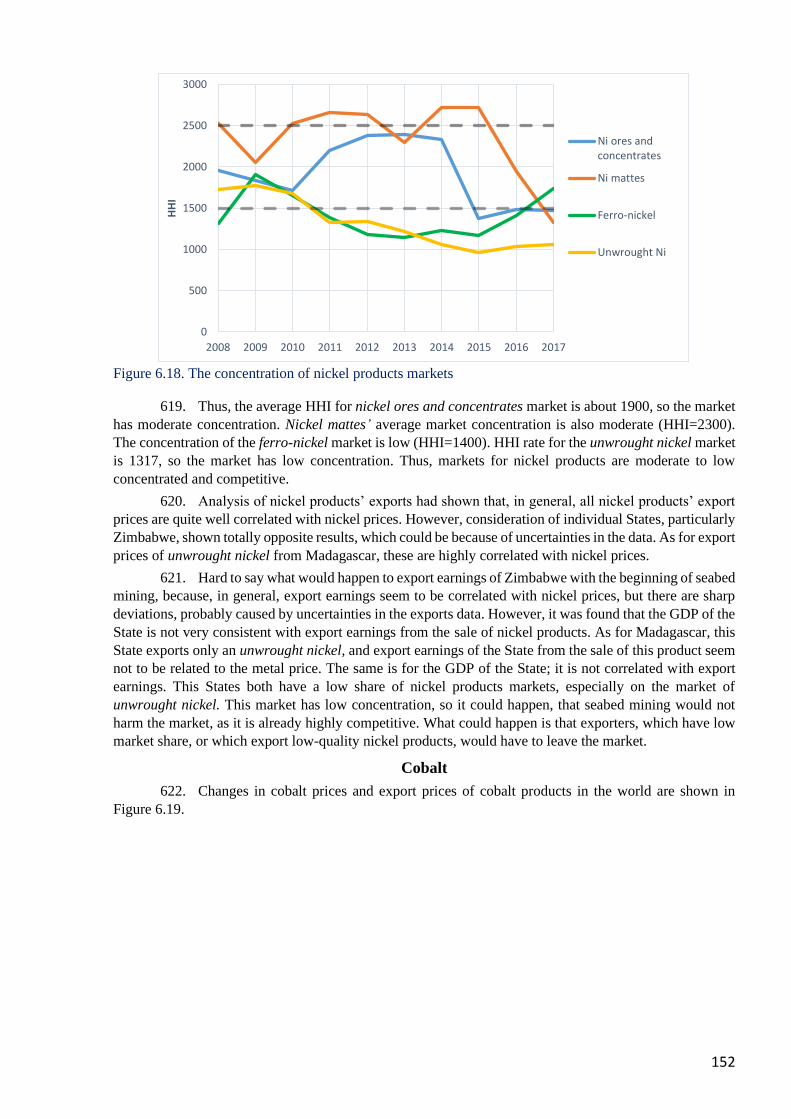
152
Figure 6.18. The concentration of nickel products markets
619. Thus, the average HHI for nickel ores and concentrates market is about 1900, so the market
has moderate concentration. Nickel mattes’ average market concentration is also moderate (HHI=2300).
The concentration of the ferro-nickel market is low (HHI=1400). HHI rate for the unwrought nickel market
is 1317, so the market has low concentration. Thus, markets for nickel products are moderate to low
concentrated and competitive.
620. Analysis of nickel products’ exports had shown that, in general, all nickel products’ export
prices are quite well correlated with nickel prices. However, consideration of individual States, particularly
Zimbabwe, shown totally opposite results, which could be because of uncertainties in the data. As for export
prices of unwrought nickel from Madagascar, these are highly correlated with nickel prices.
621. Hard to say what would happen to export earnings of Zimbabwe with the beginning of seabed
mining, because, in general, export earnings seem to be correlated with nickel prices, but there are sharp
deviations, probably caused by uncertainties in the exports data. However, it was found that the GDP of the
State is not very consistent with export earnings from the sale of nickel products. As for Madagascar, this
State exports only an unwrought nickel, and export earnings of the State from the sale of this product seem
not to be related to the metal price. The same is for the GDP of the State; it is not correlated with export
earnings. This States both have a low share of nickel products markets, especially on the market of
unwrought nickel. This market has low concentration, so it could happen, that seabed mining would not
harm the market, as it is already highly competitive. What could happen is that exporters, which have low
market share, or which export low-quality nickel products, would have to leave the market.
Cobalt
622. Changes in cobalt prices and export prices of cobalt products in the world are shown in
Figure 6.19.
0
500
1000
1500
2000
2500
3000
2008 2009 2010 2011 2012 2013 2014 2015 2016 2017
HH
I
Ni ores andconcentrates
Ni mattes
Ferro-nickel
Unwrought Ni

153
Figure 6.19. Changes in cobalt prices and export prices of cobalt products in the world
623. With the ensuing global financial crisis and economic downturn, demand fell and cobalt
prices slumped to below USD 40,000 per metric tonne in December 2008. This also was related to the
instability of DR Congo. Despite a short-lived upturn during 2009, attributed to growing battery demand
and concerns about supply from Canada and Zambia, the cobalt price followed a general downward trend
between 2010 and late 2016, caused by cobalt surplus and China de-stocking201. While prices have remained
relatively stable and low since 2012 (on average USD 30,000 per metric tonne), these nearly doubled to
values around USD 60,000 per metric tonne in 2017202. The fundamental reasons for this spectacular
increase were strong demand from consumers in China for rechargeable batteries, together with concerns
about mine production from DR Congo and the availability of cobalt metal from refineries in China203. This
upward trend could be transitory, with the industry returning to the lower prices of the recent past, or further
price increases may occur due to limited cobalt output204.
624. Almost all the changes in export prices of cobalt products coincide with changes in cobalt
prices, especially those for cobalt ores and cobalt mattes. Changes in cobalt oxides export prices are
different. For example, while the prices for other products and the metal price rose in 2010, cobalt oxides
price decreased by 31 %, and the opposite, while its price increased by 15 % in 2012, other prices have
fallen. Further upturns and slumps were much more intense for cobalt oxides price than for the prices of
other products.
625. Considering individual States, changes in cobalt prices and export prices of cobalt products
in DR Congo are shown in Figure 6.20.
201 Alves Dias P., Blagoeva D., Pavel C., Arvanitidis N., 2018. Cobalt: demand-supply balances in the transition to
electric mobility. EUR 29381 EN, Publications Office of the European Union, Luxembourg 202 S&P Global Market Intelligence, 2018. SNL Metals & Mining database 203 Petavratzi, E, Gunn, G, Kresse, C., 2019. Commodity review: Cobalt. British Geological Survey 204 Alves Dias P., Blagoeva D., Pavel C., Arvanitidis N., 2018. Cobalt: demand-supply balances in the transition to
electric mobility. EUR 29381 EN, Publications Office of the European Union, Luxembourg
-100
-50
0
50
100
150
2008 2009 2010 2011 2012 2013 2014 2015 2016 2017
Ch
ange
, %
Year-to-year change of export price of 1 unit of Co ores and concentrates
Year-to-year change of export price of 1 unit of Co mattes and others
Year-to-year change of export price of 1 unit of Co oxides and hydroxides
Year-to-year change of Co prices

154
Figure 6.20. Changes in cobalt prices and export prices of cobalt products in DR Congo
626. The situation in DR Congo is the same as in the world: export prices of cobalt ores and cobalt
mattes change in accordance with cobalt price. The export price of cobalt oxides does not follow the general
trend, but its volatility is not as high as in the world. The main inconsistency is the rise of cobalt oxides
export price in 2015 by 49 %, while the price of cobalt mattes rose by 7 %, the price of cobalt ores decreased
by 2 %, and the price of cobalt metal decreased by 7 %.
627. The GDP of DR Congo, the share of cobalt products exports in its GDP and cobalt prices
were considered (Figure 6.21).
Figure 6.21 Changes in cobalt prices, the GDP and export earnings from cobalt products exports in
DR Congo
628. Figure 6.21 shows that changes in export earnings from all cobalt products exports are not
consistent with changes in the metal price. The general trend is that changes in metal prices are shifted by
at least one year ahead from changes in export earnings. Hard to say whether changes in the GDP of the
State are associated with changes in export earnings. These changes have different rates. According to
UNCTADstat data on individual States’ GDP by type of expenditure and VA by kind of economic activity
-100
-50
0
50
100
150
2008 2009 2010 2011 2012 2013 2014 2015 2016 2017
Ch
ange
, %
Year-to-year change of export price of 1 unit of Co ores and concentratesYear-to-year change of export price of 1 unit of Co mattes and othersYear-to-year change of export price of 1 unit of Co oxides and hydroxidesYear-to-year change of Co prices
-150
-100
-50
0
50
100
150
2008 2009 2010 2011 2012 2013 2014 2015 2016 2017
Ch
ange
, %
Year-to-year change of export earnings from Co products' exportsYear-to-year change of GDPYear-to-year change of Co prices

155
205, the average share of exports of all goods and services from DR Congo during the last 10 years is 34 %,
and the average share of mining, manufacturing, utilities in the VA is 40 % for the last 10 years.
629. Market shares of DR Congo including each cobalt product are shown in Figure 6.22.
Figure 6.22. Market share of DR Congo for cobalt products
630. It was found that DR Congo has on average 45 % market share of all cobalt products.
Regarding markets of each product, the largest share of DR Congo is on the cobalt ores market – 90 %. As
for cobalt mattes, the share of DR Congo on this market is 33 % and the 30 % share on the cobalt oxides
market.
631. It was found out that the cobalt products market is highly concentrated with the concentration
of production of cobalt products in DR Congo (Figure 6.23).
Figure 6.23. The concentration of cobalt products markets
632. On average, the HHI score for the exported values of cobalt ores and concentrates is equal
to approximately 8100, so this market is highly concentrated in DR Congo. As for cobalt mattes and other
intermediate products of cobalt metallurgy, its HHI is about 1700 on average, so the market is moderately
concentrated. The market of cobalt oxides and hydroxides has an average HHI of about 2600, so the market
is highly concentrated.
633. Thus, it was found that export prices of cobalt products are highly correlated with cobalt
prices both in the world and in DR Congo. Export earnings of DR Congo correlated with cobalt prices, but
205 United Nations Conference on Trade and Development – UNCTADstat. Data center, Economic trends, National
accounts, GDP by type of expenditure, VA by kind of economic activity. URL:
https://unctadstat.unctad.org/wds/TableViewer/tableView.aspx?ReportId=95
0
10
20
30
40
50
60
70
80
90
100
2008 2009 2010 2011 2012 2013 2014 2015 2016 2017
Mar
ket
shar
e, %
All Co products
Co ores andconcentrates
Co mattes andothers
Co oxides andhydroxides
0
1000
2000
3000
4000
5000
6000
7000
8000
9000
10000
2008 2009 2010 2011 2012 2013 2014 2015 2016 2017
HH
I
Co ores andconcentrates
Co mattes andothers
Co oxides andhydroxides

156
with a shift of year-two. The economy of the State is quite dependent on cobalt products, especially on
cobalt ores and concentrates.
634. The fact that mined cobalt supply is highly concentrated in one country poses high risk
compared to a circumstance where the global mine production is distributed more evenly over a large
number of countries. Currently, no alternative country is positioned to increase production to meet global
demand if production from DR Congo were to be constrained or disrupted206.
635. Problems in DR Congo, such as natural disasters or high sociopolitical instability can result
in vulnerability to supply-chain disruptions. Reduction of production in the largest exporter can lead to
political and social unrest, declining economic conditions, a lack of foreign investment and declining cobalt
mine production, like in 1990 in DR Congo. From 2000 to 2015, cobalt mine production in DR Congo
continued to trend upward and by 2015 one-half of world mine production was from DR Congo. As a result,
the geographic distribution of world cobalt mine production became increasingly concentrated207.
Manganese
636. Changes in manganese prices and export prices of manganese products in the world are
shown in Figure 6.24.
Figure 6.24. Changes in manganese prices and export prices of manganese products in the world
637. The economic crisis in 2008 caused a sharp decrease in manganese price, like for other
metals208, to almost USD 1500 per metric tonne. A further decrease in manganese price in 2010 again to
USD 1500 per metric tonne and in 2013 to even lower level – USD 1200 per metric tonne – is probably
related to the decrease in global crude steel production. The manganese ore market was oversupplied, as
206 Shedd K. et al., 2017. Global trends affecting the supply security of cobalt. Mining Engineering, December 2017,
pp. 37-42 207 Shedd K. et al., 2017. Global trends affecting the supply security of cobalt. Mining Engineering, December 2017,
pp. 37-42 208 Papp J. F., Corathers L. A., Edelstein D. L., Fenton M. D., Kuck P. H., Magyar M. J., 2007. Cr, Cu, Mn, Mo, Ni,
and Steel Commodity Price Influences, Version 1.1: Reston, VA, U.S. Geological Survey Open-File Report 2007–
1257, 112 p. URL: https://pubs.usgs.gov/of/2007/1257/ofr2007-1257v1.1.pdf
-60
-40
-20
0
20
40
60
80
100
2008 2009 2010 2011 2012 2013 2014 2015 2016 2017
Ch
ange
, %
Year-to-year change of export price of 1 unit of Mn ores and concentrates
Year-to-year change of export price of 1 unit of Mn oxides
Year-to-year change of export price of 1 unit of ferro-manganese (more than 2% of carbon)
Year-to-year change of export price of 1 unit of ferro-manganese (2% or less of carbon)
Year-to-year change of export price of 1 unit of ferro-silico-manganese
Year-to-year change of export price of 1 unit of Mn articles
Year-to-year change of Mn price

157
demand fell faster than production, but recent production cuts are contributing to rebalancing the market.
It returned to equilibrium in 2017209, reaching below USD 1700 per metric tonne.
638. Export prices of almost all products, except manganese articles and manganese ores close
to the manganese price and follow its fluctuations. One noticeable inconsistency of manganese ores price
is its growth higher than other products in 2010 by 64%. As for manganese articles, its price significantly
decreased by 31% in 2013, unlike other products’ prices. Worth to note the inconsistency of all products
with metal prices in 2016, when manganese prices peaked, while export prices of manganese products
decreased.
639. Considering individual States, changes in manganese prices and export prices of manganese
products in Gabon are shown in Figure 6.25.
Figure 6.25. Changes in manganese prices and export prices of manganese products in Gabon
640. There are gaps in the graph 6.25 because Gabon does not export manganese oxides, ferro-
manganese (more than 2 % of carbon), and ferro-silicon; also, because ferro-manganese (2 % or less of
carbon) was exported from Gabon only once during this period – in 2013; ferro-silico-manganese was
exported in 2011, then exports stopped, and started again since 2014; and since 2015 exports of manganese
articles started. The export price changes of many products do not coincide with manganese prices due to
the abovementioned gaps. The export price of manganese ores had great inconsistency with manganese
price changes in 2009 when the growth of manganese ores export price was above 60 %.
641. The GDP of Gabon, the share of manganese products exports in its GDP and manganese
prices were considered (Figure 6.26).
209 d’Harambure A., 2016. Overview of the Global Manganese Industry with a special focus on China. International
Manganese Institute (IMnI), Metal Bulletin Conference, March 24, 2016, Singapore. URL:
https://www.metalbulletin.com/events/download.ashx/document/speaker/8479/a0ID000000ZP1jZMAT/Presentation
-75
-50
-25
0
25
50
75
2008 2009 2010 2011 2012 2013 2014 2015 2016 2017
Ch
ange
, %
Year-to-year change of export price of 1 unit of Mn ores and concentratesYear-to-year change of export price of 1 unit of ferro-manganese (2% or less of carbon)Year-to-year change of export price of 1 unit of ferro-silico-manganeseYear-to-year change of export price of 1 unit of Mn articles
Year-to-year change of Mn price

158
Figure 6.26. Changes in manganese prices, the GDP and export earnings from manganese products
exports in Gabon
642. Figure 6.26 shows that changes in export earnings from all manganese products exports
inconsistent with changes in the metal price. There is a great increase in export earnings in 2010 by 92 %,
while an increase in price was just 8 %. The GDP of the State hardly follows the trend of price and export
earnings changes. However, according to UNCTADstat data on individual States’ GDP by type of
expenditure and VA by kind of economic activity 210, the average share of exports of all goods and services
from Gabon during the last 10 years is 53 %, so probably it includes exports of manganese products also.
As for the average share of mining, manufacturing, utilities in the GDP, it is also high – 52 % for the last
10 years.
643. Market shares of each manganese product for Gabon are shown in Figure 6.27.
Figure 6.27. Market share of Gabon for all manganese products
644. Gabon has a quite large share of manganese ores market (19 %), and it is the only significant
contribution of the State to manganese products markets.
645. Figure 6.28 shows concentrations of each manganese market.
210 United Nations Conference on Trade and Development – UNCTADstat. Data center, Economic trends, National
accounts, GDP by type of expenditure, VA by kind of economic activity. URL:
https://unctadstat.unctad.org/wds/TableViewer/tableView.aspx?ReportId=95
-100
-50
0
50
100
150
2008 2009 2010 2011 2012 2013 2014 2015 2016 2017
Ch
ange
, %
Year-to-year change of export earnings from Mn products' exportsYear-to-year change of GDPYear-to-year change of Mn price
0
5
10
15
20
25
30
2008 2009 2010 2011 2012 2013 2014 2015 2016 2017
Mar
ket
shar
e, %
Mn ores andconcentrates
Ferro-manganese (2% orless of carbon)
Ferro-silico-manganese
Mn articles
Al Mn products

159
Figure 6.28. The concentration of manganese products markets
646. The average HHI score for the manganese ores market is above 2500, which shows high
market concentration. The market for manganese oxides has low concentration, its HHI=1200. As for ferro-
manganese, (more than 2 % of carbon) market with an HHI score of 1800, showing the moderate
concentration of the market. The ferro-manganese (2 % or less of carbon) market also has moderate
concentration, its HHI score equals approximately 1700. The market for ferro-silico-manganese is low-
concentrated with average HHI=1300. Ferro-silicon market has even lower concentration (HHI=900).
However, the concentration of the manganese articles market is very high (HHI=4500).
647. The analysis of manganese products’ exports results in a conclusion, that, in general, in the
world export prices of almost all concerned manganese products are correlated with manganese prices,
except for manganese ores and manganese articles. In concerned State – Gabon – none of these products’
export prices are correlated with manganese price, probably because of the gaps in exports of some products
from Gabon. The same thing is for the relation of export earnings to manganese price and to the GDP of
the State. However, Gabon has quite a high share of the manganese ores market, which is highly
concentrated.
Summary
648. Production of metals from manganese nodules can lower metal prices on the world market
because of increased supply. A decrease in metal prices can cause a decrease in export prices of this metal’s
products, as exporters cannot sell their products at high prices anymore, but the products should be sold.
Thus, the export earnings of the State can fall. This can lead to the closure of mines, especially if the profits
of a mining company are less than production expenditures in such a situation when export prices are low.
Closure of mines, in turn, will cause unemployment and other social problems.
649. The present problem of the international economy is a high concentration of metal markets.
Probably, this problem would be solved, if production in the country with the highest market share
decreases considerably, or if there is increased production in another country. Low market concentration
may become even lower in the case of new production and exports source in the international market.
Concentration can also increase if production in one State increases until it displaces other exporters and
becomes a monopolist.
650. These changes could happen with the start of seabed production in the Area. Exports of metal
products from the DLBPS can decrease, consequently, export earnings of the State can decrease.
Potentially, this would decrease market concentration for metal products and stabilize the world market, if
the State had a high market share. If the State had a low market share, and if the market has low
concentration, the start of seabed activities could lead to even greater growth of competition on the market.
651. One of the possible reasons for high exports from the States concerned is economic processes
in the States, like devaluation of national currency. Devaluation means depreciation of the national currency
against the US dollar. Trade in the world market and export of products occur in the US dollars. Income
0
1000
2000
3000
4000
5000
6000
2008 2009 2010 2011 2012 2013 2014 2015 2016 2017
HH
I
Mn ores andconcentrates
Mn oxides
Ferro-manganese (morethan 2% of carbon)
Ferro-manganese (2% orless of carbon)
Ferro-silico-manganese
Mn articles

160
receiving by the country when exchanging the foreign currency to its national currency called devaluation
income. This income is noticeable when national currency rates are lower than the US dollar rates.
Devaluation processes lead to an increase in exports from the State. With this, the competitiveness of the
national economy and local goods in the international market is increasing. At the same time, domestic
production is stimulated. In particular, the devaluation of the national currency makes it possible for
exporters of this country to lower the prices of their products in foreign currency. They can receive a
premium when exchanging the proceeds of a more expensive foreign currency for a cheaper national
currency, and sell goods at prices below the world average, which leads to their enrichment at the expense
of material losses of their country.
652. However, devaluation has disadvantages for the economy of the State. It can cause an
increase in the inflation rate in the State. Inflation rate increases, because when domestic products become
cheaper, manufacturers raise prices on the domestic market. Imported products become less competitive
and inaccessible to the average consumer, as well as their prices increase. Lowering of exchange rate leads
to a decrease in the inflow of foreign and national capital into the country.
653. At the beginning of devaluation, countries that artificially lowered the exchange rate of their
own currency face a revival of the economy, caused by an increase in export competitiveness. However,
further restrictions on intra-and inter-sectoral redistribution of resources are increasing, most of the national
income is directed to the sphere of production by reducing the share of consumption in it, which leads to
an increase in consumer prices in the country, due to which there is a decline in the standard of living of
the population.
654. The DLBPS exports metal products and receives earnings in the US dollars, which are then
exchanged for State’s local currency. The lower the exchange rate, the more devaluation income is received
by the State. However, in case of a reduction of exports, for instance, because of seabed production, the
lower the exchange rate, the more is the loss of export earnings of the State.
655. The economic performance of the State in terms of exports is directly related to the
production of mineral. If there is a high demand for some products, production increases, especially in
countries, which have high reserve bases. Certainly, there are several barriers that can limit production.
These factors include reserves depletion or unforeseeable production stoppages at active mines, the slow
speed of developing mining projects from exploration to production, economic and socio-environmental
determinants, high costs of production restricting extraction at certain prices, events such as strikes, plant
failures and other factors that can lead to unforeseeable production stoppages211.
656. Probably seabed production is going to be started by such countries, like China, Japan,
France, Russia, Germany, Belgium. Currently, these countries are importers of metal ores from the DLBPS.
Seabed production will provide these States raw materials, so their imports from the DLBPS will be
stopped. This will create negative effects on the export earnings of the developing States. Besides, increased
volumes of raw materials in international markets will push the prices of metals down. Thus, export prices
of metal products from the DLBPS and, respectively, their export earnings will fall. A decrease in exports
may lead to a decrease in production rates, closure of mine sites, and consequently to decrease in export
earnings of the State.
657. However, the reduction of exports of raw materials could stimulate the DLBPS to process
these materials in their own territory, to develop the metallurgical sector. This will provide a population
with working places and maintain the economy, as well as allow the DLBPS to export more valuable semi-
finished and end products of metals.
211 Alves Dias P., Blagoeva D., Pavel C., Arvanitidis N., 2018. Cobalt: demand-supply balances in the transition to
electric mobility. EUR 29381 EN, Publications Office of the European Union, Luxembourg

161
B. Sectoral effects of the affected metals tariffs
658. As it was mentioned before, economies of the DLBPS are directly related to the production
of minerals. In periods of high demand for some mineral product, production of this mineral increase,
especially in the States, which are rich in this mineral resource, like Chile (copper), Zimbabwe (nickel),
DR Congo (cobalt), and Gabon (manganese). Mostly these are developing States, and for implementation
of new mining projects, they need capital, which is rarely available in such States. Foreign investments can
help, but it is preferable to invest in projects in the States with a stable economic, social and political
situation.
659. Besides, barriers, such as reserves depletion, unforeseeable production stoppages at active
mines, slow speed of developing mining projects from exploration to production, economic and socio-
environmental determinants, high costs of production restricting extraction at certain prices, strikes, plant
failures, and other factors can lead to unforeseeable production stoppages212.
660. Probably, seabed production is going to be started by such States’ contractors, like China,
Japan, France, Russia, Germany, and Belgium. Currently, these countries import metal ores from the
DLBPS, including those, which are likely to be seriously affected by seabed production. Raw materials,
obtained from manganese nodules, will be used by these States to produce the finished product, and they
will be no more dependent on the DLBPS. This will create negative effects for economies of developing
States by reducing their export earnings from exports of affected metals and, consequently, by decreasing
export prices of these metals’ products.
661. In addition, increased volumes of raw materials on international markets will push prices of
metals down, which is another related reason for the reduction of export prices of metal products in the
DLBPS and, respectively, decrease of their export earnings. After all, a decrease in exports because of the
low demand for affected metals from the DLBPS may lead to a decrease in production rates of raw materials
in these States, closure of mine sites, and, consequently, to decrease in export earnings of the State. Thus,
the decrease in export prices of raw materials directly influences the extractive sector of the DLBPS.
662. However, the reduction of exports of raw materials has positive sides: it can stimulate the
DLBPS to process these materials in their territory, as such developing the metallurgical sector. This will
provide a population with working places and maintain the economy, as well as allowing the DLBPS to
export more valuable semi-finished and finished metal products.
663. An important issue of future seabed production is where manganese nodules are going to be
processed. What is also important is that currently there are no special metallurgical plants to extract metal
products from nodules. Such a plant can be located either in the Host Nation of a contractor or in another
State. In the first case, all the revenues will go to the contractor and the processor, which are probably the
part of one vertically integrated system, and to their Host Nation, not counting royalties. In the second case,
even if the contractor and the processor are part of one vertically integrated system, some part of revenues
will go to the State, where the processing facilities are located. If such plants are located in the DLBPS, this
can be an additional source of revenue for these States.
664. It is expected that developed States, who are planning to start seabed mining in the nearest
future, are going to process raw materials in order to use finished products in their country, not for the
primary purpose of exports, but to be independent on other States. However, the rest of the finished
products, which are not demanded in the State, probably can be sold on the international market to other
States. Thus, a new competitor on the market can appear, and its effect on market conditions will depend
on the quantity of its supply, export prices, as well as on the existing concentration of the market. In the
case of a highly concentrated market, a new competitor, wanting to sell products for lower prices, can
change market concentration, reduce monopoly, and stabilize the market. In the case of a low concentrated
market, lower prices of a new competitor can be the reason for the States, who sell for higher prices, reduce
their share or even exit the market.
212 Alves Dias P., Blagoeva D., Pavel C., Arvanitidis N., 2018. Cobalt: demand-supply balances in the transition to
electric mobility. EUR 29381 EN, Publications Office of the European Union, Luxembourg

162
665. Thus, increased supply on the international market may reduce metal prices and export prices
of metal products. As was mentioned before, a high supply of raw materials on the international market can
reduce exports of these materials from the DLBPS. This will stimulate the sale of these materials on the
domestic market for cheaper prices. Thus, industries that are located downstream from the mining sector
can source the raw material at a lower price. In the vertical structure of the minerals industries, metallurgical
sector and the sector of manufacture of metal products are sufficiently close to the extractive sector in the
value chain, so these sectors can benefit when more and cheaper raw material becomes available.
Consequently, such industries can sell produced finished products at a cheaper price than would otherwise
be possible. In turn, this can enable the State to export the end products at a relatively cheaper price that
therefore may get a larger share of the export market and receive more export earnings.
666. The higher-value products are able to compete successfully in the domestic or international
market, so the share of processed products in the State’s overall export activity rises relative to that of the
rest of the world. Economies can benefit from downstream production through higher and more stable
export earnings resulting from a more diversified export offer, more employment, the acquisition of skills
and more advanced technology and linkages to other sectors. However, this again can result negatively,
when returns, profits, and welfare of producers of the primary raw material diminish, which may lead them
to cut back existing mining operations or new investments.
C. Potential effects of a targeted tariff on semi-finished products
667. For four metals concerned in this study, there are three semi-finished products, which were
considered:
• Copper mattes, cement copper (precipitated copper) (HS 7401) – semi-finished products of copper
production;
• Copper, unrefined, copper anodes for electrolytic refining (HS 7402) – end-products of copper
production, and
• Nickel mattes, nickel oxide sinters and other intermediate products of nickel metallurgy (HS 7501)
- semi-finished products of nickel production.
Copper
668. Export prices for relevant products and metal prices for the DLBPS, which are likely to be
seriously affected, and for the world in general were analyzed together. A comparison of copper mattes
price changes is on Figure 6.29.
Figure 6.29. Year-to-year changes in copper price and copper mattes export prices for the DLBPS, which
are likely to be seriously affected, and the world
669. It can be seen in Figure 6.29 that export prices of copper mattes vary widely for different
States and in comparison with the metal price. Export prices of DR Congo are consistent with the world
export price, and with the copper price. The greatest inconsistencies are for Chile, Peru, and Zambia. The
-150
-100
-50
0
50
100
150
200
250
2008 2009 2010 2011 2012 2013 2014 2015 2016 2017
Ch
ange
, %
World
Chile
Peru
DR Congo
Zambia
Cu price

163
decrease of export price for the latter may be related to the fact that Zambia terminated exports of copper
mattes in 2011 until 2017. To 2010, when export prices rose for all the States on average by 36 %, the rise
in Chile was by 237 %. In 2016 during the decrease in prices, the export price in Chile increased by 88 %.
As for Peru, in 2011 its export price has fallen by 64 %, while prices in other States and in the world
increased. The opposite trend was from 2012 to 2013, when all the prices were falling, unlike the price in
Peru, which was rising.
670. A comparison of unrefined copper price changes is in Figure 6.30.
Figure 6.30. Year-to-year changes in copper price and unrefined copper export prices for the DLBPS,
which are likely to be seriously affected, and the world
671. It can be seen in Figure 6.30 that export prices of unrefined copper are consistent with copper
prices for all States, except Zambia, probably because exports of this product were temporary and
terminated to 2012. Some discrepancies are noticeable for the export prices of Peru. In 2009 and in 2014,
for example, the export price of unrefined copper increased by 41 % and 6 %, respectively, while export
prices of other States and metal prices were decreasing.
672. It worth considering exported values and quantities of copper semi-finished products for the
DLBPS together with metal prices. Chile, Peru, and DR Congo were chosen for further analysis. For copper
mattes, it is shown in Figures 6.31, 6.32, and 6.33.
Figure 6.31. Year-to-year changes in copper price, copper mattes export prices, exported quantities and
export earnings of Chile
-150
-100
-50
0
50
100
150
2008 2009 2010 2011 2012 2013 2014 2015 2016 2017
Ch
ange
, %
World
Zambia
Chile
DR Congo
Peru
Cu price
-150
50
250
450
650
850
1050
2008 2009 2010 2011 2012 2013 2014 2015 2016 2017
Ch
ange
, %
Change of export price Change of export earnings
Change in exported volume Cu price

164
Figure 6.32. Year-to-year changes in copper price, copper mattes export prices, exported quantities and
export earnings of Peru
Figure 6.33. Year-to-year changes in copper price, copper mattes export prices, exported quantities and
export earnings of DR Congo
673. In general, a decrease in metal price leads to a decrease in export prices and export earnings,
and the opposite. However, an increase of export price not necessarily leads to the same rate of increase of
export earnings, for example, in Chile in 2010 export price rose by 237 %, while the rise of export earnings
was 121 %, or in DR Congo in 2011 export price rose by 30 %, while the rise of export earnings was just
3 %. In some years, the increase of export price was in line with the decrease of export earnings (in 2011
in Chile), and in the opposite decrease of export price sometimes was associated with the extreme rise of
export earnings (in 2012 in Chile). For example, the decrease in export price and at the same time the rise
of export earning happened in DR Congo in 2014–2015. During some years of high metal prices, even the
decrease in exported volumes could be in line with the increase of export prices, like in 2011 in DR Congo
and 2010-2011 in Chile.
674. Analyses of unrefined copper prices for these States are in Figures 6.34, 6.35, and 6.36.
-100
900
1900
2900
3900
4900
5900
6900
7900
2008 2009 2010 2011 2012 2013 2014 2015 2016 2017
Ch
ange
, %
Change of export price Change of export earnings
Change in exported volume Cu price
-100
-50
0
50
100
150
2008 2009 2010 2011 2012 2013 2014 2015 2016 2017
Ch
ange
, %
Change of export price Change of export earnings
Change in exported volume Cu price

165
Figure 6.34. Year-to-year changes in copper price, unrefined copper export prices, exported quantities and
export earnings of Chile
Figure 6.35. Year-to-year changes in copper price, unrefined copper export prices, exported quantities and
export earnings of Peru
Figure 6.36. Year-to-year changes in copper price, unrefined copper export prices, exported quantities and
export earnings of DR Congo
-40
-20
0
20
40
60
2008 2009 2010 2011 2012 2013 2014 2015 2016 2017
Change of export price Change of export earnings
Change in exported volume Cu price
-100
-50
0
50
100
150
200
250
2008 2009 2010 2011 2012 2013 2014 2015 2016 2017
Change of export price Change of export earnings
Change in exported volume Cu price
-60
-40
-20
0
20
40
60
80
100
120
140
2008 2009 2010 2011 2012 2013 2014 2015 2016 2017
Change of export price Change of export earnings
Change in exported volume Cu price

166
675. In general, a decrease in metal prices leads to a decrease in export prices and export earnings,
and in the opposite, an increase in prices leads to an increase in export prices. However, increase of export
price never leads to the same rate of increase of export earnings, for example, in Chile in 2010 export price
rose by 57 %, while the rise of export earnings was 46 %, or in Peru in 2010 export price rose by 34 %,
while the rise of export earnings was 20 %. In some years, the increase of export price was consistent with
the decrease of export earnings (in 2011, 2013 and 2017 in Peru), and in the opposite decrease of export
price sometimes was associated with the rise of export earnings (in 2012–2013 in Chile, in 2015 in Peru).
During some periods of high metal prices, even the decrease in exported volumes could be associated with
the increase of export prices, like in 2017 in DR Congo and in 2010 in Chile, and in 2010–2011 in Peru.
676. It worth reminding that export data has many uncertainties, and cannot be considered as
absolute true information. That is why some extreme changes, like on the graph for Peru for copper mattes,
may be the result of mistakes in the data.
Nickel
677. Comparison of nickel mattes price changes is on Figure 6.37.
Figure 6.37. Year-to-year changes in nickel price and nickel mattes export prices for the world and for
Zimbabwe
678. It can be seen in Figure 6.37 that export prices of nickel mattes, in general, follow the metal
price trends, but discrepancies happened. Until 2011, export prices in the world and in Zimbabwe coincide
with the metal price. After, significant variations of export prices started. For example, in 2013 the metal
price decreased, while export prices in the world rose by 345 %, in Zimbabwe – by 126 %. After 2014,
when the export price of Zimbabwe has fallen by 100%, exports of nickel mattes from the State were
terminated until 2016.
679. It worth considering exported values and quantities of the product for the DLBPS together
with metal prices. A comparison for Zimbabwe is shown in Figure 6.38.
-150
-100
-50
0
50
100
150
200
250
300
350
400
2008 2009 2010 2011 2012 2013 2014 2015 2016 2017
Ch
ange
, % World
Zimbabwe
Ni price

167
Figure 6.38. Year-to-year changes in nickel price, nickel mattes export prices, exported quantities and
export earnings of Zimbabwe
680. In general, a decrease in metal price leads to a decrease in export prices and export earnings,
and the opposite. However, increase of export price not necessarily leads to the same rate of increase of
export earnings, for example, in 2010 export price rose by 97 %, while the rise of export earnings was 65 %,
or in 2016, when export price rose by 119 %, while the rise of export earnings was 58 %. In some years,
the increase of export price coincided with the decrease of export earnings (2011), and in the opposite, a
decrease of export price sometimes was associated with the extreme rise of export earnings (2014). During
some years of high metal prices, even the decrease in exported volumes can coincide with the increase of
export prices and export earnings, like in 2010.
681. It is worth to mention for nickel also, that exports data has many uncertainties, and cannot
be considered as absolute true information. That is why some extreme changes (2013, 2015) may be the
result of mistakes in the data. Besides, there are gaps in the graph, because Zimbabwe exported nickel
mattes with breaks.
682. Thus, it can be concluded that export prices are not as easy as they may seem. In general,
they depend on export earnings and exported values, as well as on metal prices, but these are not the only
drivers. Sometimes under the effect of external factors, export prices can change completely inconsistent
with the abovementioned internal factors.
D. Potential effects of targeted tariff on end products
683. For four affected metals, most of the products are considered primary end-products. Changes
in export prices of the end products were analyzed.
Copper
684. There is only one end product of copper production. Export prices of refined copper for the
relevant DLBPS, which are likely to be seriously affected, and for the world in general were compared to
metal prices on the world market. The graph for refined copper is shown in Figure 6.39.
-150
-50
50
150
250
350
450
2008 2009 2010 2011 2012 2013 2014 2015 2016 2017
Ch
ange
, %
Change of export earnings Change of exported volume
Change of export price Ni price

168
Figure 6.39. Year-to-year changes in copper price and refined copper export prices for the DLBPS, which
are likely to be seriously affected, and the world
685. It can be seen in Figure 6.39 that export prices of refined copper significantly vary from
metal prices for some States and for the world in general. Export prices of the world, Chile, and Zambia
experience the highest variations. For example, when metal prices and other States’ export prices peaked
in 2010 with growth by about 50 %, an increase in the world price was 19 %, whereas the price in Peru
decreased by 14 %. The fall of prices in 2012 was more significant for Zambia, prices decreased by 18 %
but then started to rise, unlike in other prices. Thus, in 2014, the price in Zambia increased by 4 %, when
other prices were kept negative growth rates. However, the fall of prices in 2015 was stronger for Zambia,
like in 2012.
686. It is worth to consider exported values and quantities of the products for the DLBPS together
with metal prices. The same as for semi-finished products, Chile, Peru, and DR Congo were chosen for
further analysis of end products’ prices. Analyses of refined copper prices follows in Figures 6.40, 6.41,
and 6.42.
Figure 6.40. Year-to-year changes in copper price, refined copper export prices, exported quantities and
export earnings of Chile
-40
-30
-20
-10
0
10
20
30
40
50
60
2008 2009 2010 2011 2012 2013 2014 2015 2016 2017
Ch
ange
, %
World
Zambia
Chile
DR Congo
Peru
Mongolia
Cu price
-30
-20
-10
0
10
20
30
40
50
60
70
2008 2009 2010 2011 2012 2013 2014 2015 2016 2017
Ch
ange
, %
Change of export price Change of export earnings
Change in exported volume Cu price

169
Figure 6.41. Year-to-year changes in copper price, refined copper export prices, exported quantities and
export earnings of Peru
Figure 6.42. Year-to-year changes in copper price, refined copper export prices, exported quantities and
export earnings of DR Congo
687. The general trend for refined copper is a decrease in metal prices leads to a decrease in export
prices and export earnings, and in the opposite, an increase in prices leads to increase in export prices.
However, there were some periods, when an increase in metal price led to the decrease of export price, like
in 2010 in Chile, while export earnings extremely increased. In periods of high metal prices, export earnings
and export prices can increase, even if exported quantities decrease. For example, in 2010 the metal price
rose by 46%, export earnings of Peru increased by 36%, the export price of refined copper increased by
50%, but exported value decreased by 9%.
Nickel
688. There are also two end products of nickel production, but it is not exported by two concerned
DLBPS, so it will not be considered. A comparison of unwrought nickel export price with nickel price is in
Figure 6.43.
-40
-30
-20
-10
0
10
20
30
40
50
60
2008 2009 2010 2011 2012 2013 2014 2015 2016 2017
Ch
ange
, %
Change of export price Change of export earnings
Change in exported volume Cu price
-50
0
50
100
150
200
250
300
2008 2009 2010 2011 2012 2013 2014 2015 2016 2017
Ch
ange
, %
Change of export price Change of export earnings
Change in exported volume Cu price

170
Figure 6.43. Year-to-year changes in nickel price and unwrought nickel export prices for the DLBPS,
which are likely to be seriously affected, and for the world
689. It can be seen in Figure 6.43 that export prices of unwrought nickel for Madagascar and for
the world are fully consistent with nickel prices. Export prices of Zimbabwe widely vary from other prices.
For instance, in 2012, when metal prices and export prices in Madagascar and in the world decreased by
about 23 %, price in Zimbabwe peaked by 254 %. Probably, there could be uncertainties in the exports data.
690. Analyses of the exported values and quantities of unwrought nickel for the DLBPS together
with nickel prices are shown on Figures 6.44 and 6.45.
Figure 6.44. Year-to-year changes in nickel price, unwrought nickel export prices, exported quantities
and export earnings of Zimbabwe
-100
-50
0
50
100
150
200
250
300
2008 2009 2010 2011 2012 2013 2014 2015 2016 2017
Ch
ange
, %World
Zimbabwe
Madagascar
Ni price
-150
-50
50
150
250
350
450
550
650
750
850
2008 2009 2010 2011 2012 2013 2014 2015 2016 2017
Ch
ange
, %
Change of export earnings Change of exported volume
Change of export price Ni price
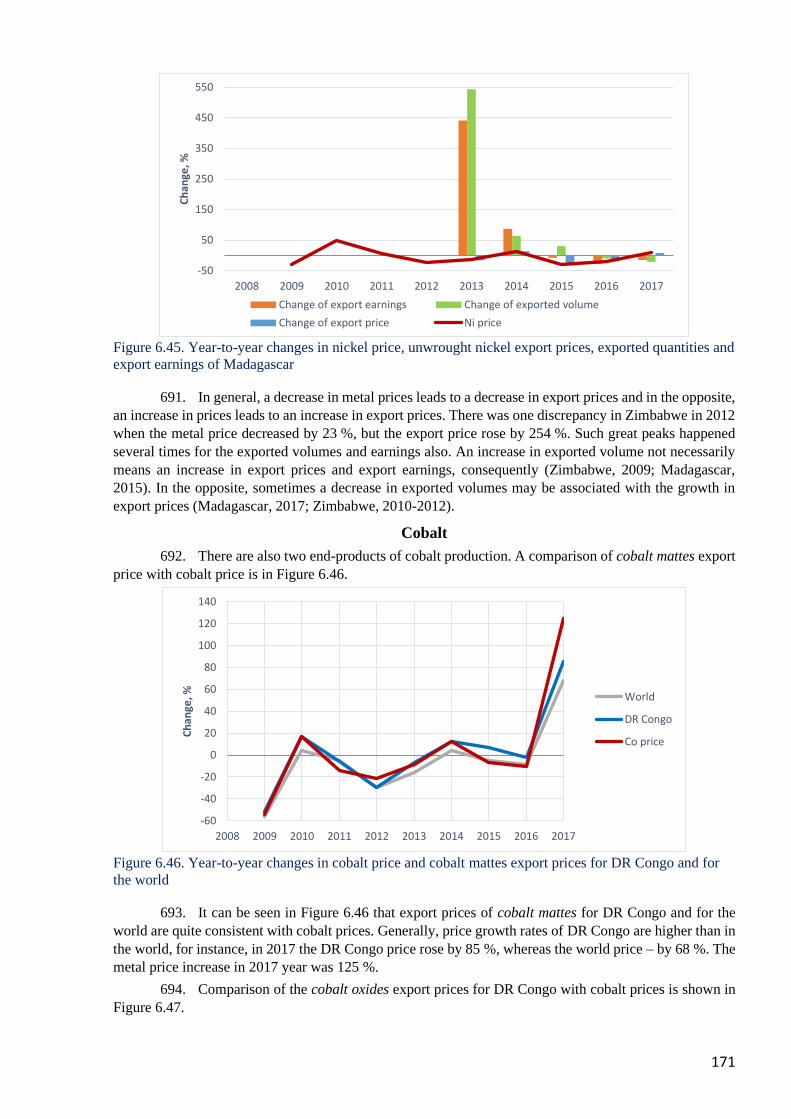
171
Figure 6.45. Year-to-year changes in nickel price, unwrought nickel export prices, exported quantities and
export earnings of Madagascar
691. In general, a decrease in metal prices leads to a decrease in export prices and in the opposite,
an increase in prices leads to an increase in export prices. There was one discrepancy in Zimbabwe in 2012
when the metal price decreased by 23 %, but the export price rose by 254 %. Such great peaks happened
several times for the exported volumes and earnings also. An increase in exported volume not necessarily
means an increase in export prices and export earnings, consequently (Zimbabwe, 2009; Madagascar,
2015). In the opposite, sometimes a decrease in exported volumes may be associated with the growth in
export prices (Madagascar, 2017; Zimbabwe, 2010-2012).
Cobalt
692. There are also two end-products of cobalt production. A comparison of cobalt mattes export
price with cobalt price is in Figure 6.46.
Figure 6.46. Year-to-year changes in cobalt price and cobalt mattes export prices for DR Congo and for
the world
693. It can be seen in Figure 6.46 that export prices of cobalt mattes for DR Congo and for the
world are quite consistent with cobalt prices. Generally, price growth rates of DR Congo are higher than in
the world, for instance, in 2017 the DR Congo price rose by 85 %, whereas the world price – by 68 %. The
metal price increase in 2017 year was 125 %.
694. Comparison of the cobalt oxides export prices for DR Congo with cobalt prices is shown in
Figure 6.47.
-50
50
150
250
350
450
550
2008 2009 2010 2011 2012 2013 2014 2015 2016 2017
Ch
ange
, %
Change of export earnings Change of exported volume
Change of export price Ni price
-60
-40
-20
0
20
40
60
80
100
120
140
2008 2009 2010 2011 2012 2013 2014 2015 2016 2017
Ch
ange
, % World
DR Congo
Co price

172
Figure 6.47. Year-to-year changes in cobalt price and cobalt oxides export prices for DR Congo and for
the world
695. Unlike cobalt mattes, export prices for cobalt oxides vary from metal prices, but the
variations of export prices of DR Congo are close to metal prices during some periods. In 2010, when the
metal price increased by 17 %, the export price in DR Congo increased by 4 %, whereas the world price
fell by 31 %. In 2012, in the opposite, the world price rose by 15 %, when other prices have fallen. The
greatest rise of the world price was in 2014 (105 %), when the metal price rose by 12 %, DR Congo price
– just by 1 %. In 2015, in turn, the price of DR Congo rose by 49 %, when the metal price fell by 7 %, the
world price – by 41 %.
696. Comparison of export prices of each product with export earnings, exported volumes and
metal prices follow (Figures 6.48 and 6.49).
Figure 6.48. Year-to-year changes in cobalt price, cobalt mattes export prices, exported quantities and
export earnings of DR Congo
-60
-40
-20
0
20
40
60
80
100
120
2008 2009 2010 2011 2012 2013 2014 2015 2016 2017
Ch
ange
, % World
DR Congo
Co price
-60
-40
-20
0
20
40
60
80
100
120
140
160
2008 2009 2010 2011 2012 2013 2014 2015 2016 2017
Ch
ange
, %
Change of export earnings Change of exported volume
Change of export price Co price

173
Figure 6.49. Year-to-year changes in cobalt price, cobalt oxides export prices, exported quantities and
export earnings of DR Congo
697. The general trends as for other metals end-products noticeable for the cobalt end-products
also. An increase in metal price causes an increase in export prices, except for cobalt mattes in 2015 when
the metal price decreased by 7 % and the export price increased by 7 %. Cobalt oxides experienced
extremely high growth rates of the export earnings and the exported volumes in 2010 and 2015.
Manganese
698. Many manganese end-products were considered in the analysis, but only three of them are
exported from Gabon, which is the only DLBPS concerned in the study. However, exports of ferro-
manganese (2 % or less of carbon) from Gabon was only in 2013, so it does not make sense to consider
this product. In addition, worth to note that exports of two other products from Gabon were not during all
10 years period.
699. Comparison of ferro-silico-manganese export prices for Gabon and the world with
manganese prices is given in Figure 6.50.
Figure 6.50. Year-to-year changes in manganese price and ferro-silico-manganese export prices for
Gabon and for the world
700. It can be seen in Figure 6.50 that, generally, export prices of ferro-silico-manganese in the
world are quite consistent with manganese prices. The same is for export prices of Gabon where available.
However, in 2013 when the manganese price increased by 14 %, the world export price fell by 6 %; in 2016
the metal price rose by 35 %, whereas the export price in the world decreased by15 % and in Gabon by
-100
0
100
200
300
400
500
600
700
800
900
1000
2008 2009 2010 2011 2012 2013 2014 2015 2016 2017
Ch
ange
, %
Change of export earnings Change of exported volume
Change of export price Co price
-60
-40
-20
0
20
40
60
2008 2009 2010 2011 2012 2013 2014 2015 2016 2017
Ch
ange
, % World
Gabon
Mn price

174
26 %. In 2017, the metal price increase was 4 %, but the world export price rose by 49 % and in Gabon the
price increased by 58 %.
701. Comparison of manganese articles export prices for Gabon and the world with manganese
price is in the following Figure 6.51.
Figure 6.51. Year-to-year changes in manganese price and manganese articles export prices for Gabon
and for the world
702. The graph in Figure 6.51 shows that export prices of manganese articles in the world are
fully inconsistent with manganese prices. It seems that the metal price is shifted against the world export
price. Thus, in 2011 the metal price fell by 5 % and the world export price increased by 15 %; in 2013 the
metal price, in the opposite, increased by 14 %, whereas the world export price decreased by 31 %; in 2015
the metal price again decreased by 10 % and the export price increased by 7 %. The greatest discrepancy
happened in 2016, when the manganese price peaked by 35 %, but the world export price fell by 22 %.
703. Comparison of export prices of each product with export earnings, exported volumes and
metal price are given in Figures 6.52 and 6.53.
Figure 6.52. Year-to-year changes in manganese price, ferro-silico-manganese export prices, exported
quantities and export earnings of Gabon
-50
-40
-30
-20
-10
0
10
20
30
40
2008 2009 2010 2011 2012 2013 2014 2015 2016 2017
Ch
ange
, % World
Gabon
Mn price
-150
-50
50
150
250
350
450
550
650
2008 2009 2010 2011 2012 2013 2014 2015 2016 2017
Ch
ange
, %
Change of export earnings Change of exported volumes
Change of export price Mn price

175
Figure 6.53. Year-to-year changes in manganese price, manganese articles export prices, exported
quantities and export earnings of Gabon
704. From the graph in Figure 6.53, it is hard to say anything about manganese articles because
exports of this product from Gabon just started in 2014, that is why the growth rate is extremely high.
Exports of ferro-silico-manganese restarted in 2014 also, so growth rates are also high, despite negative
movement of the metal price. In 2016 the export price of ferro-silico-manganese decreased by 26 %,
whereas the metal price rose by 35 % and export earnings and volumes increased too. In 2017 despite the
negative growth rate of exported volume of ferro-silico-manganese, export price and, consequently, export
earnings increased by 58 % and 35 %, respectively.
705. Thus, it can be concluded that the same as for semi-finished products, export prices depend
on export earnings and exported values, as well as on metal price, but these are also external factors, which
can strongly influence export prices, and they, in turn, can influence export earnings and economies of the
DLBPS, which are likely to be seriously affected.
-100
19900
39900
59900
79900
99900
119900
139900
2008 2009 2010 2011 2012 2013 2014 2015 2016 2017
Ch
ange
, %
Change of export earnings Change of exported volumes
Change of export price Mn price

176
POTENTIAL IMPACT ANALYSIS AND DISCUSSION
A. Identification of relevant developing land-based producers
706. Tables 7.1–7.4 show DLBPS that mine copper, nickel, cobalt and manganese. Some of them
process mining products.
Table 7.1 Developing countries producing copper products
Mine producers Blister copper producers
(primary)
Refined copper
producers(primary)
Chile China* China*
Peru Chile Chile
China* India* India*
D.R. Congo** Zambia ** D.R. Congo**
Zambia** Peru Zambia **
Indonesia* Mexico* Mexico*
Mexico* Indonesia* Peru
Brazil* Philippines* Indonesia*
Mongolia Iran Philippines*
Iran Brazil* Iran
Laos** South Africa* Brazil*
Papua New Guinea Turkey* Myanmar**
Saudi Arabia Namibia Turkey*
Turkey* Pakistan South Africa*
Philippines* Vietnam Laos**
South Africa* Oman Namibia
India* North Korea Mongolia
Morocco Botswana Oman
Myanmar** North Korea
Mauritania Vietnam
Argentina
Zimbabwe
Eritrea**
Bolivia
North Korea
Namibia
Vietnam
Pakistan
Colombia
Dominican Rep.
Zimbabwe
Bolivia
Botswana
Tanzania**
≥10% of the world's production 2–10% of the world's
production
˂2% of the world's production
Source: ICA
* Newly industrialized country
** Least developed countries

177
Table 7.2 Developing countries producing nickel products
Mine producers Intermediate products
producers Primary nickel producers
Indonesia* Indonesia* China*
Philippines* Philippines* Indonesia*
China* Cuba* Brazil*
Brazil* Papua New Guinea South Africa*
Cuba Turkey* Colombia
Guatemala Madagascar**
South Africa* Myanmar**
Colombia Cuba
Madagascar** Dominican Rep.
Papua New Guinea Guatemala
Myanmar**
Turkey*
Zimbabwe
Dominican Rep.
≥10% of the world's production 2–10% of the world's
production
˂2% of the world's production
Source: INSG
* Newly industrialized country
** Least developed countries
Table 7.3 Developing countries producing cobalt products
Mine producers Refined cobalt producers
D.R. Congo** China*
China* Madagascar**
Cuba Zambia**
Papua New Guinea Morocco 1.5
Zambia** South Africa*
Madagascar** D.R. Congo**
Philippines* Brazil*
Morocco
South Africa*
Brazil*
Indonesia*
≥10% of the world's production 2–10% of the world's
production
˂2% of the world's production
Source: BGS
* Newly industrialized country
** Least developed countries

178
Table 7.4 Developing countries producing manganese products
Mine producers Ferro-alloys producers
China* China*
South Africa* India*
Gabon Malaysia*
Ghana South Africa*
Brazil* Brazil*
India* Mexico
Malaysia* Gabon
Mexico Egypt
Myanmar**
Côte d'Ivoire
Morocco
Iran
Turkey
Namibia
Egypt
Peru
Vietnam
Thailand
Sudan
Kenya
Oman
Pakistan
Philippines
≥10% of the world's production 2–10% of the world's
production
˂2% of the world's production
Source: BGS
* Newly industrialized country
** Least developed countries
B. Assessment of potential impact on relevant developing land-based producers
707. As shown in chapter 4C, mining of polymetallic nodules may bring to the market significant
quantities of metals contained in nodules. These quantities would be proportional to the number of
contractors operating at a given time, each of whom would be mining 3 million nodules per year. It is clear
that 12 contractors could generate the maximum revenue: their combined production would correspond to
approximately 50 % of current cobalt and manganese production, approximately 20 % of nickel, and
approximately 2 % of copper. However, such development is unlikely. The market entry of two or six
tractors seems more realistic. Possible scenarios for the development of deep-sea mining and its relationship
to projected consumption with different numbers of active contractors are discussed in detail in chapter 4C.
708. When considering individual markets of affected metals, we noted that even relatively small
additional portions of metal that entered the market at an unfavorable moment (when it is oversaturated or
in a balanced state) can lead to a fall in prices for affected metals. We also noted that even if new metal
supplies did not upset the supply/demand balance, they could still cause prices to fall, as they would reduce
supply tensions and also put psychological pressure on other market participants. The consequences of
lower prices will be determined by their scale and financial and economic condition of market participants
at all levels (from individual enterprises to industries of entire countries and regions). At the same time, we
consider it important to note that three of the metals under consideration (copper, nickel and cobalt) are
often found in ores together (copper + nickel; nickel + cobalt; copper + nickel + cobalt). In case of

179
asynchronous price dynamics for these metals, the decrease of one of them can be compensated by the level
of the other. However, in case of a synchronous decrease, the negative effect may increase significantly.
709. In addition, in assessing the potential impact of polymetallic nodules mining, the cost of
nodules as an analogue of ore or concentrate for processing operations and the cost of copper, nickel, cobalt
and manganese products from the processing of polymetallic nodules should be taken into account
compared to those from land-based mining. However, this issue has not been sufficiently studied to date.
710. If the market situation unfavorably develops, the start of production may lead to global,
regional (affecting individual countries or groups of countries) or local (affecting individual
enterprises/companies) consequences. At the same time, we believe it is important to emphasize the close
causal links between the consequences of all three levels.
711. Speaking about global effects, they include changes in the market supply/demand balance,
which may cause excess supply of one or more of the four metals in question.
712. With regard to the decline in prices for commodities derived from the metals under
consideration as a result of increased supply, we would like to emphasize once again that its scope will be
determined by the specific conditions that will characterize the market at that time. At the same time, even
a relatively small price decline may lead to critical consequences for specific market participants.
713. Decrease in prices for one or more of the four metals under consideration will trigger a
cascade of diverse local and regional effects.
714. Here are some examples of such cascades:
i. decrease in profitability of enterprises up to their transition to the category of unprofitable
→ reduction in production (transition to partial capacity utilization) or suspension of
enterprises → reduction in the volumes of marketed products → reduced revenue and profits
→ tax cuts and reduced revenues to budgets of different levels;
ii. decrease in profitability of enterprises up to their transition to the category of unprofitable
→ reduction of production (transition to operation with partial capacity utilization) or
suspension of enterprises → reduction in the volumes of marketed products → reduction of
export volumes → reduction of export revenues to the state budget;
iii. decrease in profitability of enterprises up to their transition to the category of unprofitable
→ reduction in production (transition to operation with partial capacity utilization) or
suspension of enterprises → reduction in wages or reduction in the number of employees in
affected enterprises → decrease in living standards and purchasing capacity of families of
workers in affected enterprises → decrease in consumer demand from families of workers
in affected enterprises → decrease in financial revenues to service enterprises serving
families of workers in affected enterprises until they become unprofitable → closure of some
service enterprises → reduction in the number of people employed in the service sector →
... → general decline in living standards and employment in the zone of influence of affected
enterprises → emergence of social tensions, migration, etc.
iv. decline in profitability of enterprises up to their transition to the category of unprofitable →
reduction of production (transition to operation with partial capacity utilization) or
suspension of enterprises → closure of enterprises serving affected production → ... →
general decline in living standards and employment of population in the zone of influence
of affected enterprises → emergence of hotbeds of social tension, migration of population,
etc.
715. It should be noted that different cascades of consequences will act synchronously.
716. Local and regional impacts are spreading at the global level. This transmission will manifest
itself, inter alia, in a decline in world production of one or more of the four metals in question, which will
entail a shift in the demand/supply balance towards deficit and a corresponding change in price movements.
The structure of the mining and metallurgy industries and the global value chain will be affected.
717. As for the structure of the mining and metallurgical industries and the global value chain,
they may be affected by the intended purpose of the extracted polymetallic nodules. Let us assume that the
“destination” of nodules are operations that focus on supplying the metals under consideration to the
sponsoring states of the contractors. The sponsoring states of the contractors that may start production

180
before 2035 include China, Japan, France, Germany, Belgium and Russia. All these states are major
importers of mining and/or metallurgical products of one or more of the four metals under consideration.
The emergence of their new source of production will lead to a reduction in their imports from traditional
supplier countries. For example, China imports manganese ore in large quantities (the main suppliers among
developing countries are South Africa, Gabon, Ghana and Brazil), copper products (Chile, Peru, Mongolia,
etc.), nickel (Philippines, Indonesia) and cobalt (DR Congo). These countries are the main suppliers of the
metals under consideration to other sponsoring states. As a result of the commencement of polymetallic
nodule mining, the import requirements of sponsoring states from traditional supplier countries will
decrease or no longer exist. These supplier countries will be faced with the need to enter new markets.

181
C. Discussion of uncertainties in impact analysis, including future supply and demand
prospects
718. The sustainable functioning and progressive development of the mining industry as a whole
and its individual enterprises in particular, as well as the development and mastering of the mineral resource
base is subject to the influence of multiple factors: economic (including macroeconomic), financial, market
(including price), political (external and/or internal), social, environmental, technological and even
climatic. At the same time, they can have both positive and negative impact on the situation.
719. In addition, there is a separate category of purely negative factors — contingencies that may
affect enterprises at any stage of their development. These may include various production risks (energy
supply disruptions, equipment failures, geotechnical failures, etc.), natural disasters, accidents, etc. The
effect of their influence can be both short-term and long-term. In some cases (such as natural disasters),
they may affect not only individual enterprises, but also entire countries and regions.
720. With regard to the metals under consideration, such factor as the growth rate of the world
economy is of universal nature. At the same time, manganese and copper markets are most affected by this
factor, while cobalt is the least affected, which is determined by the specifics of use of these metals.
721. In terms of the current situation, all international organizations and experts have noted a
slowdown in that pace. Thus, the International Monetary Fund (IMF) in the October issue of its regular
review “World Economic Outlook” noted that the global economy is experiencing a synchronized
slowdown.213 This was the reason for the systematic decrease in the forecast indicators of the world
economy growth rates in 2020–2021, which could be observed in each new issue in 2019 and in the
beginning of 2020.
722. The same universality is characterized by such factor of growth of consumption of
considered metals, as development of “green technologies”: electric vehicles and renewable energy (wind
and solar power generations, etc.). It may even have some impact on the growth of manganese consumption,
although it is fundamentally less than for copper, cobalt or nickel.
723. Despite optimistic forecasts, the global transition to “green technologies” may be severely
slowed down or even stopped. The reasons for this may be the lack of energy capacity and necessary
infrastructure (for the development of the electric transport industry), the reduction of government support,
which is currently the main engine of “green technologies”, especially in China, and a number of other
factors. Moreover, if we talk about China, it has already announced changes in the policy of stimulating
new energy vehicles to reduce subsidies by an average of 50% from July 2019. As already reported, without
these subsidies, Chinese electric vehicle manufacturers have to raise prices, which leads to lower sales and
production volumes as they become less affordable for consumers214.
724. EV-revolution risks are often overlooked, such as reputational risks in the closely-linked
extractive sector, the scarcity of essential raw materials, and underestimated environmental impacts (the
climate and environmental impact of electric transport is often underestimated215).
725. Speaking about deep-sea mining, its commissioning will create additional risks for land
producers. The extent of their impact will largely depend on the supply/demand balance that will actually
emerge in the market by the time it begins and will remain as it increases.
726. In the first quarter of 2020, the world was struck by an outbreak of coronavirus infection,
COVID-19, which became a pandemic. As a result of the antiviral measures taken, the world economy has
virtually stopped. As IMF notes in its April review216, in 2020, the world economy will face the worst
recession since the Great Depression: global economic growth in 2020 is projected to be negative at -3 %.
213 IMF (2019), World Economic Outlook, October 2019,
https://www.imf.org/en/Publications/WEO/Issues/2019/10/01/world-economic-outlook-october-2019 214 Mining Review Africa. Battery metals: Long term demand remains strong, 29.01.2020,
https://miningreview.com/battery-metals/battery-metals-long-term-demand-remains-strong-despite-price-woes/ 215 Special Report: The hidden risks of the electric car revolution, Global Risk Insights, 31.01.2018,
https://globalriskinsights.com/2018/01/electric-car-revolution-risks/ 216 IMF (2020), World Economic Outlook, April 2020,
https://www.imf.org/en/Publications/WEO/Issues/2020/04/14/weo-april-2020

182
This is much more than during the 2008–2009 financial crisis. Moreover, economically developed countries
will suffer the most: their decline will amount to -6.1 %. For emerging markets and developing economies,
the projected decline is fundamentally less (-1 %). World trade volumes will decrease by 11 % (and by
9.6 % for emerging market and developing economies).
727. At the same time, IMF believes that due to specific reasons for the current crisis, the recession
caused by it will be short-lived. According to the baseline scenario, the global economy is expected to grow
by 5.8 % already in 2021 (6.6 % for emerging markets and developing economies). At the same time, world
trade volumes will increase by 8.4 % (and by 11 % for emerging markets and developing economies).
728. If these forecasts are confirmed, the current recession will not affect the medium- and long-
term forecasts for the development of the mining industry in general and the metals in particular. It is
unlikely that the recession will affect the prospects for deep-sea mining as well.
729. However, if the recession is prolonged or the pace of economic recovery is slower than
expected, it could lead to noticeable negative consequences for the entire mining and processing industry,
including the metals under consideration. They may manifest both in decrease of expected consumption
growth rates and in the development of the extractive sector. Then it is also expected to shift the terms of
subsea production to a more distant future: both because of the lack of necessary investments for its
development and because of changes in the market situation in general.
730. Besides universal factors, there are specific risks for the market of each particular metal. We
consider the main risks below.
Copper
731. The supply of raw materials to the global copper industry as a whole is quite high: 35 years
on the basis of reserves and more than 100 years on the basis of resources. The prospects for growth of
copper production and its supply to the world market, as noted in chapter 4C, are mainly related to the
possible involvement of new deposits, as well as to the expansion of capacities of some existing operations.
732. The world's leading copper producer and supplier of mine copper is Chile, providing 28% of
global copper mine production. Chile has the largest copper mines in the world, where the reduction or
increase in production volumes may have a significant impact on the global market situation. Production
levels are negatively affected by strikes, which have increased in recent years. For example, in 2017, 120
thousand tonnes of copper were lost due to a 43-day strike at Escondida mine alone. Strikes are also taking
place in the mines of the Chilean state-owned company Codelco, which is the world's largest copper
producer. At the end of 2019, the company reported that it had to cut its investment program by 20% due
to increased allocations to the country's budget amid numerous protests. Thus, the plans for the transition
to underground exploitation of Chuquicamata's largest mine, as well as the El Teniente mine life extension
project, may be adjusted.
733. Unpredictable factors affecting copper production in Chile also include climate: severe
droughts traditional for the region, and heavy rains. While mining companies are building desalination
plants to minimise the impact of droughts, heavy rains can cause mines to suspend operations, as happened
in March 2019.
734. Similar problems are also relevant for Peru and Mexico, the world's major copper producers.
735. Other DLBPS included in Top-10 world leading copper producing countries are China,
Democratic Republic of Congo (DRC), Zambia and Indonesia.
736. China, as a major copper producer, is also a major global copper consumer. Moreover, its
own mine production is unable to meet the demand of its domestic consumers — there are few large mining
enterprises in China, the bulk of copper production is provided by numerous medium and small mines. This
made the country the largest importer of copper concentrates. However, Chile and Peru provide more than
half of the supply in roughly equal proportions. Consequently, a possible reduction in production in these
two countries could have a negative impact on China as well.
737. Of African countries, the most problematic is the DRC, where artisanal mining, including
with the involvement of child labour, provides a significant proportion of copper production (about 20 %).

183
The world community is taking measures to control mining in the country, and a number of major car
companies have announced the termination of copper (and cobalt) supplies from the DRC.
738. In Zambia, two copper smelters, Mufulira and Nchanga, were shut down in 2019 for various
reasons, which may cause a decline in copper production and output, exports of which account for more
than half of the country's total exports revenues.
739. In Indonesia, copper mining problems may arise from a ban on export of certain types of
minerals, which will primarily affect the nickel industry, but will also affect copper industry. The ban will
enter into force in January 2022; it is assumed that by that time metallurgical capacities for processing of
raw materials will be created in the country. Currently, about 40 % of copper concentrates are processed in
the country.
740. In addition to the problems of specific countries, it is important to note the general trend
towards expensive underground mining of copper deposits and a decrease in the average metal content in
ores. In addition, it is necessary to take into account the constant shifting of the terms of development of
so-called “sleeping giants” — large and giant new copper deposits — for various reasons, from financial
and economic to environmental. At the same time, the commissioning of one or more such facilities may
have a significant impact on the global copper market.
741. As follows from the above, the presence of significant resources of metal in the subsoil is
not yet a guarantee of ensuring its sustainable production and, moreover, of increasing its pace. Therefore,
any forecasts of global copper production (as well as any other metal) have a rather large probability ratio,
and in developing countries with unstable economic and political environment this uncertainty will be
maximized.
742. In addition to copper mining from the subsoil, we need to take into account the possible
growth rate of secondary metal production, with which the situation is ambiguous. On the one hand, the
trend towards recycling in general should lead to the growth of secondary copper production. At the same
time, China, the main producer of secondary copper, in mid-2019 imposed a ban on the import of copper
scrap, while increasing the import of concentrates. Meanwhile, a major German copper semi producer
Aurubis in late 2019 reported on the production reorientation from the production of flat products to copper
scrap recycling.
743. Due to the wide range of applications, demand for copper is expected to grow. As shown in
chapter 4C, its projected growth rate varies between 1.8–4 %. High growth rates of copper consumption
are primarily associated with the development of “green technologies”: electric vehicles and renewable
energy (wind and solar power generations, etc.). Nevertheless, as mentioned above, despite optimistic
forecasts, the global transition to “green technologies” may be severely slowed down or even stopped.
744. If the global energy industry continues to be based on carbon fuels, copper consumption
could also grow rapidly. However, this requires strong economic growth, and, as mentioned above, there
are currently not many prerequisites for it. At the same time, against the background of a slowdown in the
growth rates of such countries as China, USA, Japan, economic improvement is expected in a number of
developing countries: India, Indonesia, Mexico, South Africa, which can provide for the growth of demand
for red metal.
745. However, China will remain the main copper consumer in the future, which will largely
determine the growth rate of demand for the metal. In general, “trade wars” between China and the US,
unstable economic situation and tense geopolitical situation have a negative impact on the world copper
market.
746. As for the impact on deep-sea mining, according to the scenarios we are considering
(chapter 4C), at the time of its proposed start (i.e. by 2027) only a 3.5 % annual growth in consumption
could cause copper deficit in the market. In this case, even under the maximum scenario (with the
participation of 12 contractors) the copper supply/demand balance would not be seriously affected.
However, it could still lead to some price reductions, as it would reduce possible supply tensions. With
lower consumption growth rates, copper shortages may manifest themselves either in the early 2030s or
none at all — all the world economy's copper needs may be met by land-based production and secondary

184
metal. In such a situation, the untimely appearance of even small volumes of copper from polymetallic
nodules may put pressure on the market and give an additional incentive to lower prices.
747. In the face of low or declining prices, competition between producers of all types (including
deep sea producers) will intensify. In this struggle, enterprises whose products will be characterized by the
lowest cost will have an advantage. This competition may result in the exclusion from the market of the
least cost-effective operations, which may include contractors.
Nickel
748. The supply of raw materials to the world nickel industry at the current level of production as
a whole is quite high and is more than 40 years on the basis of reserves and more than 60 years on the basis
of resources. The prospects for the growth of nickel production and its supply to the world market, as noted
in chapter 4C, are related to the development of new deposits and, to a lesser extent, to the increase in
production at existing operations.
749. The main consumer of all nickel products, from nickel ore to refined metal, is China. Almost
all the changes that have taken place in the structure of the nickel industry are related to the development
of the Chinese economy and the growth of nickel consumption within the country. As a result, countries
that produce nickel products have become dependent to varying degrees on the state of China's consuming
industries. First of all, it concerns countries whose nickel industry was developing with an emphasis on
Chinese consumers. These include primarily DLBPS such as Indonesia and the Philippines as well as Papua
New Guinea and Myanmar. Some traditional nickel-producing countries have reoriented their exports to
China as Chinese demand develops and are also highly dependent on the situation in that country. These
include South Africa, Cuba, Brazil, Colombia and some others. Obviously, the decline in nickel
consumption by China will lead to the emergence of huge surpluses in the market and disruption of the
existing trade flows. Thus, the demand factor for nickel from the Chinese industry is currently a global risk
for the entire nickel industry.
750. However, there are also local risks that not only affect the status of a particular market
participant, but influence its partners.
751. Among the major nickel suppliers are Indonesia and the Philippines. As shown in chapter 4
(sections C, D, E, F), nickel production in these countries has undergone the most significant changes in
the past decade, affecting the global nickel industry as a whole. Nickel production in the other Top-10
countries remained fairly stable
752. For both countries, the government's policy towards the mining and metals industry has been
a determining factor in production dynamics. In Indonesia, however, emphasis was placed on domestic
development of the processing sector, while in the Philippines more ecological activities, especially
tourism, were emphasized. This led to a reduction in raw material supplies from these countries, which
affected primarily China, its main consumer. As a result, a number of Chinese operations had to reduce
production of nickel metallurgical products.
753. However, the market supply of the metal as a whole was affected slightly — the ban on the
export of nickel ore in Indonesia in 2014–2017 led to the accelerated construction of ferro-nickel plants.
As a result, by 2017 the country's metallurgical production increased by 10 times (from 22 thousand tonnes
in 2014 to 204 thousand tonnes in 2017217) and continues to grow: analysts estimate that it is expected to
grow to 530 thousand tonnes by 2020218. In so doing, the Indonesian operations are launched at the expense
of Chinese investors. Thus, the retired Chinese facilities were quickly replaced and the nickel market
remained in a fairly balanced state.
754. In this regard, the risk of reducing the supply of raw materials for Chinese consumers
remains. The ban on the export of nickel ore from Indonesia was renewed on January 1, 2020, and the
217 International Nickel Study Group (INSG). World Nickel Statistics. Yearbook. Vol XXVIII. No. 12. November
2019 218 Reuters. Commodities. Miners welcome Indonesian export ore ban, plan smelting expansion
https://www.reuters.com/article/us-nickel-indonesia/miners-welcome-indonesian-export-ore-ban-plan-smelting-
expansion-idUSKCN1VW2AP

185
situation with production in the Philippines remains — the banned operations are still not active. This may
lead to further decrease in metallurgical capacities in China219.
755. However, the situation with raw material supply should not affect the consumers of final
products — the outgoing production capacity will be compensated by Indonesian goods to be produced at
enterprises owned by Chinese companies. Under these circumstances possible changes in the Indonesian
government's policy aimed at further development of its industry and consumption sector, with similar
export bans on other nickel-containing products, will remain the main risk for the consumers.
756. The main risk for the consumption prospects is a slowdown in transport electrification. As
mentioned above, the reasons for this may be, inter alia, the lack of energy generating capacities and the
necessary infrastructure for the creation and functioning of electric transport production, the lack of state
support, which is now the main engine of “green technologies”, especially in China, and a number of other
factors. EV-revolution risks are often overlooked, such as reputational issues in the closely-linked
extractive sector, the scarcity of essential raw materials, and underestimated environmental impacts (the
climate and environmental impact of electric transport is often underestimated)220.
757. As shown in chapter 4C, at present, it is the demand for nickel products from manufacturers
of high-capacity batteries for electric vehicles that is developing most dynamically. To ensure this, new
operations are launched and new deposits are prepared for development. It should be noted here that for
these purposes specific products are produced, which are in demand mainly and specifically in batteries. In
case of a slowdown in the development of the EV industry, the demand for nickel and, consequently, its
prices may decrease. This will lead to the shutdown of most of the new deposit development projects as the
nickel market is close to the balance without taking into account EV demand.
758. The nickel market is expected to face a deficit in the next two years221. In the long term, if
the rate of development of electrification of transport is maintained, it will grow, but it is impossible to
estimate what the real rate of its growth will be. As shown in chapter 4C, under the pessimistic scenario of
consumption growth (Case 1) primary metal production will not be able to meet demand for it only after
2029. At the same time, it should be taken into account that in the period of excess nickel production in
2012-2015 (chapter 4C) substantial stocks have been accumulated at stock exchanges; their introduction to
the market, as well as the expected increase in recycling, will help to reduce the expected deficit.
759. As for the impact on the mining situation, according to the scenarios under consideration
(chapter 4C), provided that it starts in 2027, their entry into the market will not lead to nickel oversaturation
and thus there is no reason to expect severe consequences for other market participants. Nevertheless, even
under these conditions, there may be some decline in prices caused by the very fact of additional quantities
of metal.
760. If production starts earlier than our scenarios suggest, it is likely to shift the supply/demand
balance towards surplus. Then the drop in prices will become inevitable. Its consequences will depend on
the scale of the fall and the situation at specific nickel enterprises. In the competition that will unfold among
producers, the enterprises producing the lowest cost products will have the advantages. This competition
may result in the displacement of the least economically efficient enterprises from the market, which may
include contractors.
Cobalt
761. The supply of raw materials to the world cobalt industry as a whole is quite high: 45 years
on the basis of reserves and more than 100 years on the basis of resources. Growth prospects of cobalt
production and its supply to the world market, as noted in chapter 4C, are mainly related to the possible
involvement of new fields, as well as to the expansion of the capacity of some existing operations.
219 INSG. Press Release. INSG October 2019 Meeting. 22.10.2019 http://insg.org/wp-
content/uploads/2019/10/pressrel_INSG_Press_Release_October2019.pdf 220 Special Report: The hidden risks of the electric car revolution, Global Risk Insights, 31.01.2018,
https://globalriskinsights.com/2018/01/electric-car-revolution-risks/ 221 INSG. Press Release. INSG October 2019 Meeting. 22.10.2019 http://insg.org/wp-
content/uploads/2019/10/pressrel_INSG_Press_Release_October2019.pdf

186
762. As noted earlier, cobalt is mainly a by-product of copper and nickel production. Therefore,
its current and future mining production is practically not controlled by the situation in the market for this
metal. This turns out to be particularly sensitive for the market, when the trends in consumption of cobalt
and basic copper and nickel by-products are omnidirectional.
763. Mining production of cobalt is characterized by high geographical concentration. Currently,
more than 60% of global cobalt mine production is provided by DR Congo, and by the mid-2020s its share
may increase to more than 70 %. Such a high concentration of production itself represents a high risk for
supplies. In the case of DR Congo, this risk is fundamentally increased due to the domestic political and
economic situation in the country.
764. A large proportion of the risks associated with DR Congo are due to the high proportion of
artisanal (about 15–20 %), where child labour is often involved. While the main growth in DR Congo's
production will come from industrial mining, the rise in metal prices in 2017–2018 ensured an influx of
labour into small-scale mining, which is of vital importance for poverty-stricken local population. Although
artisanal mining is legislated (DRC Mining Code 2002 and new DRC Mining Code 2018) and is legal in
formally established artisanal mining areas, in practice it is largely illegal and unregulated. Typically,
illegally produced concentrates are sold to local intermediaries and resold by them to larger trading
companies and processors.
765. In recent years, civil society has repeatedly criticized the cobalt supply chains associated
with DR Congo and called for greater consumer compliance with due diligence requirements in order to
confront social disadvantages such as child labour or unstable working conditions during extraction. “Due
Diligence Guidance for Responsible Supply Chains of Minerals from Conflict-Affected and High-Risk
Areas”222 developed by the OECD, which is applicable to all types of minerals and therefore cobalt,
provides a basis for addressing relevant supply chain risks. Although not defined as “conflict mineral”,
cobalt is subject to similar risks due to framework conditions in the artisanal and small-scale mining sector
in DR Congo. The problem is not the artisanal origins per se, but a review and improvement of mining
conditions. The OECD recommends that international buyers and their customers, when purchasing cobalt
from DR Congo, ensure that mining and processing in the country complies with due diligence requirements
such as legality, absence of child labour, lack of conflict financing and supply chain traceability. This
requirement must be critically reviewed, particularly in the case of documented or suspected origin of the
ores from small-scale artisanal mining. Since supply chains with cobalt that is allegedly only industrially
mined may also contain artisanal cobalt, a detailed assessment of supply chain risks is essential. As a result,
some companies and industry associations in the downstream cobalt supply chain also emphasize the need
for due diligence. Specifically, two general risk categories can be distinguished for cobalt sourcing from
the DR Congo. On the one hand, there are supply chain-related risks that must be considered in the context
of due diligence and corporate reputation. In addition to these supply chain-related risks, raw materials
sourced from the DR Congo are also exposed to generally higher country risks due to relatively weak
government structures and the volatility of the security and political situation in the country, which can also
influence relatively stable areas such as the former province of Katanga, where the majority of the country's
copper and cobalt production takes place.
766. The production of cobalt in DR Congo and, consequently, the volume of its supply to the
world market will be significantly affected by any changes in the country's legislation and tax policy with
regard to production. The adoption of the new Mining Code in 2018 is an example of this. Among its key
provisions are introduction of a 10 per cent royalty for strategic minerals, which include cobalt, and creation
of a special 50 % tax on excess profits, defined as profits made when a commodity exceeds by 25 % the
price used in the bankable feasibility study.
222 OECD (2016), OECD Due Diligence Guidance for Responsible Supply Chains of Minerals from Conflict-
Affected and High-Risk Areas: Third Edition, OECD Publishing, Paris. http://dx.doi.org/10.1787/9789264252479-
en

187
767. Thus, there is a whole series of diverse risks related to the supply of cobalt from DR Congo
and its increasing production. This was one of the reasons for including cobalt on the list of critical minerals
in USA and EU.223,224
768. At the same time, high supply risks from DR Congo could become a powerful incentive for
the development of new fields in countries and regions with stable economic and domestic political
conditions, as well as for exploration for cobalt there. They can stimulate an increase in the number of
operations processing laterite cobalt-nickel ores to produce cobalt products, as well as an increase in
extraction of cobalt from secondary sources.
769. Future prospects for cobalt consumption are mainly related to the sector of lithium-ion
batteries used in electric transport, electronic devices and stationary batteries; consumption in nonbattery
areas will not play a significant role in the forecasts.
770. Cobalt consumption growth projections are based mainly on expectations of the pace of
development of electric transport. However, as mentioned above, in reality the global transition to “green
technologies” may be severely slowed down or even stopped.
771. Changes in the chemical composition of lithium-ion batteries aimed at the complete
replacement of cobalt or at reducing its content may reduce the potential consumption of cobalt. This
process is already underway in batteries for electronic devices; it is expected to spread to EV after 2020.
However, there are no quantitative estimates of its consequences yet.
772. Thus, the development of the situation in the cobalt market is subject to a large number of
risks both in terms of demand and supply. Nevertheless, there are reasons to believe that by the mid-2020s
the cobalt market will be saturated.
773. As for the influence on the situation with deep-sea mining, if the mining of deep-water
nodules starts from 2027, as the scenarios under consideration (see chapter 4C) suggest, it is quite likely
that it will be carried out against the background of metal deficit on the market. However, there is no
certainty as to the scale of this deficit: it will be determined by the real production level (some of it may be
provided by deposits which are currently being explored and are not taken into account in our forecast) and
consumption at the moment the production of polymetallic nodules starts. The degree of impact of deep-
sea mining on land-based mining will be determined by the ratio of its volume to the deficit. If it exceeds
the deficit, the market will move from a state of saturation and this will create the conditions for a price
decline whose scale cannot be assessed.
774. If deep-sea mining starts earlier, it will increase market surpluses that can be maintained until
around mid-2025-2027, depending on the rate of consumption growth. It would then cause increased
competition among producers of all types (including deep-sea producers). It is believed that in such a
struggle the enterprises whose production is characterized by the lowest prime cost have advantages are the
ones with greater resistance to market fluctuations. As far as cobalt producers are concerned, it is becoming
more and more complicated due to the fact that this metal is present as a by-product component in the ores
of practically all developed deposits. Nevertheless, this struggle may result in displacement of the least
economically efficient enterprises from the market, which may include contractors. Among land-based
producers, the most affected may be the enterprises located in DR Congo due to the fact that their share is
the main production.
Manganese
775. The world industry's manganese ore supply is generally high: depending on the level of their
output, it is estimated at 70–90 years based on reserves and 150–200 years based on resources. However,
the quality of the ores is not uniform. Low-grade (China) and mid-grade (South Africa, India) ores account
223 USGS (2017), Cobalt, Chapter F of Critical Mineral Resources of the United States—Economic and
Environmental Geology and Prospects for Future Supply, Ed. by Klaus J. Schulz, John H. DeYoung, Jr., Robert R.
Seal II, and Dwight C. Bradley, https://pubs.usgs.gov/pp/1802/f/pp1802f.pdf 224 EC (2017), Communication from the Commission to the European Parliament, the Council, the European
Economic and Social Committee and the Committee of the Regions on the 2017 list of Critical Raw Materials for
the EU, https://eur-lex.europa.eu/legal-content/EN/TXT/?uri=CELEX:52017DC0490

188
for a significant share of reserves and resources. High-grade manganese ore is concentrated in a limited
number of countries, including Australia, Gabon, Brazil, South Africa, Indonesia and some others.
776. The global production and consumption of manganese ores is determined mainly by the
volume of steelmaking and the rate of its growth, which in turn depends largely on the global economic
situation. During stagnation or economic downturn, steel production may decrease both in individual
countries and globally. Accordingly, when the world economy slows down, the demand for manganese ores
decreases. This, in turn, leads to lower prices for them, some mines reduce production volumes or suspend
production, and production of manganese ores decreases.
777. As mentioned above, the global economy is in a synchronized slowdown.225 Therefore,
throughout 2019 short-term growth forecasts for the world economy as a whole and for the economies of
key countries and regions, in particular China, were declining. Should these forecasts be confirmed, they
will have a corresponding impact on the world steel industry and, subsequently, on manganese ore
production.
778. It should also be noted that steadily more recycled materials are used in steelmaking,
including steel scrap already containing manganese. As a result, the consumption of manganese ores for
the production of 1 tonne of steel decreases, and thus the increase in their consumption gradually becomes
more restrained.
779. Since China is the main producer of both steel and manganese alloys, their production is
heavily influenced by the cycles of the Chinese economy, as well as by the Chinese government's economic
policy, in particular that aimed at tightening environmental requirements and modernizing the industry.
Numerous small metallurgical plants smelting silico-manganese and polluting the environment are being
shut down or modernized. This also applies to manganese mines. Thus, in 2018 environmental and safety
inspections suspended the operating of many medium and small mines226, and in 2019 National
Development and Reform Commission of China started a public discussion on the prospects for closing
down low-yielding and outdated manganese ore production. In particular, it could affect the largest by
reserves and the most important mining region in China — the so-called “manganese ore triangle” of the
provinces of Húnán and Gùizhōu227.
780. In addition, there is uncertainty regarding manganese consumption in China. On the one
hand, some decline in steel production is forecasted in the short term,228 on the other hand, the requirements
for manganese content in 1 tonne of steel have increased. Actual consumption will be determined by which
of these trends will have a greater impact.
781. Many countries where the mining of manganese ore is currently underway or planned are
characterized by a relatively unstable political and business environment. This creates additional risks for
the manganese industry. Thus, in Indonesia a significant number of mines were forced to close down under
the Indonesian government’s beneficiation policy in 2013, which banned the export of unprocessed ores.229
In DR Congo Kisenge mine was inactive for more than 40 years; the reason for this were the Congolese
wars, as well as the civil war in Angola, through which manganese ore from Kisenge mine was exported.
782. Tax policy of the producing countries also influences changes in production volumes. Thus,
the government of Gabon launched a new mining code with effect from July 2019 in a bid to attract more
mining investments and reduce reliance on oil (crude oil sales account for about 30 % of state revenue).
The measure will cut corporate taxes by slashing fees on mineral exports. The country is aiming to draw
225 IMF (2019), World economic outlook, 2019 October,
https://www.imf.org/en/Publications/WEO/Issues/2019/10/01/world-economic-outlook-october-2019 226 SMM. News. Highlights of China's manganese industry in 2018
https://news.metal.com/newscontent/100864496/Highlights-of-China%27s-manganese-industry-in-2018/ 227 Metal of Ukraine and the world. FORECAST: Global prices for manganese are promised stability
https://ukrmet.dp.ua/2019/06/07/prognoz-mirovym-cenam-na-marganec-obeshhayut-stabilnost.html 228 Reuters. China's 2020 crude steel output expected to fall -govt research body. 12.12.2019
https://uk.reuters.com/article/china-steel/chinas-2020-crude-steel-output-expected-to-fall-govt-research-body-
idUKB9N28M000 229 Gulf Manganese Corp. Ltd. Quarterly Activities Report Period ended September 30. 31 October 2019,
https://www.gulfmanganese.com/wp-content/uploads/2019/10/20191031-Quarterly-Reports-September.pdf

189
investors interested in manganese, gold and iron ore as it tries to boost the mining sector’s GDP
contribution.230
783. In the future, despite increased demand for manganese from battery manufacturers, the steel
industry will remain the main area of use, while China will remain the main consumer. The observed
slowdown in the world economy, and especially in China, does not imply high growth rates of manganese
ore consumption in the short term. The situation may change in the medium and long term.
784. Speaking about the prospects of deep-sea mining, based on the current macroeconomic
situation, the most probable scenarios are those where manganese consumption growth rate will not exceed
2% per year. Then the potential demand can be fully met by land-based production. Moreover, with
consumption growth at 1 %, only operating mines with sufficient capacity to provoke overproduction will
be able to satisfy the demand. If production of manganese ore begins in such circumstances, it will finally
bring down the manganese ore market to the limit, aggravating the competition between operations of all
types (including deep-sea operations). The winners in this struggle will be the operations whose production
will be characterized by the lowest cost at the best quality. The result of this struggle may be the ousting of
the least economically efficient operation from the market, which may include contractors. If the sale price
of nodules is higher than that of manganese ore from land-based mines, there will be no demand for
manganese alloy and electrolytic manganese producers.
785. If, after all, the growth rate of consumption of manganese ores will exceed 2 % per year, the
manganese market may face a deficit, which will not be able to compensate for the currently operating
mines and manganese projects. The extent of this deficit will be determined by the specific situation. Based
on the scenarios we are considering (see chapter 4C), if consumption increases by 3 % per year, the deficit
may occur in the mid-2020s and reach a maximum of 18 million tonnes of manganese ore in 2035. These
volumes correspond to the total productivity of six contractors. If the number of contractors entering the
market by 2035 is greater and all the ground projects we take into account are successfully commissioned,
there will be a surplus in the market again.
Polymetallic nodules
786. Factors influencing the situation in the markets of affected metals (collectively and
individually) will also affect the prospects for implementation of deep-sea mining projects.
787. A decrease in the price of one or more of the four metals caused by any cause (including the
very beginning of deep-sea mining) automatically reduces the market value of the polymetallic nodules as
raw materials for these metals. Such a decline may result in some or even all of the deep-sea mining projects
becoming subeconomic or unprofitable. Such transformation of markets is possible both before and during
sea-bed mining. At the same time, as noted above, there will be an intensification of competition between
different market participants, which will include sea-bed mines. The survival of each of the participants in
this struggle will depend on the level of its profitability at a certain level of prices for affected metals.
788. It should be emphasized that the level of prices for affected metals that will be in place by
the time deep-sea production begins may prove critical for contractors and force them to postpone their
entry into the market.
789. It is important to bear in mind that the market position of polymetallic nodules and,
consequently, the profitability of their production projects will be significantly (if not fundamentally)
influenced by the organization of their processing. It is now estimated (including by the MIT economic
model) that nodules will first be processed to extract copper, nickel and cobalt, with the remainder to be
sold to manganese rich slag (ferro-alloys or EMM) producers. In this connection, the issue of interaction
between different links of such organizational and production chain remains unsolved.
790. An important technological feature of polymetallic nodules as a source of manganese is the
relatively high content of phosphorous, which is a harmful impurity for manganese raw materials. Its
presence in the ores of land-based producers forces producers of manganese alloys to include the process
230 Mining Weekly. Sector News. Gabon’s new mining code to boost revenue, attract investment. 05 August 2019,
https://www.miningweekly.com/article/gabons-new-mining-code-to-boost-revenue-attract-investment-2019-08-
05/rep_id:3650

190
of dephosphorization in the technological schemes. In manganese rich slag, remaining after extraction of
non-ferrous metals, the phosphorus content may become a critical parameter for the prospects of their
implementation.
791. In this regard, the technological and economic aspects of polymetallic nodule processing in
general, and manganese rich slag in particular, require more careful consideration.

191
SUMMARY AND CONCLUSIONS
792. Activities in the Area may result in serious adverse effects on export earnings or economy
of DLBPS as a result of the decline in the price or supply volumes of affected metals. In doing so, as
stipulated in the UN Convention on the Law of the Sea, developing states shall be protected from
“…adverse effects on their economies or on their export earnings resulting from a reduction in the price of
an affected mineral, or in the volume of exports of that mineral, to the extent that such reduction is caused
by activities in the Area…” (Convention, Articles 150 (h) and 1 (3)). This identified the need to study the
potential impact of mining in the Area on the economies of developing land-based producer States of these
minerals, which are likely to be most severely affected, with a view to minimizing their difficulties and
helping them to adapt to the economy. This need was enshrined in the 1994 Agreement.
793. Potential impact of seabed mineral production (including polymetallic nodules) for DLBPS
and criteria for its assessment were considered by Special Commission 1 of Preparatory Commission.
Recommendations developed by Special Commission 1 concerning research directions required to study
the possible impacts of seabed mineral production on DLBPS are comprehensive and have not lost their
relevance.
794. The basis for the assessment of possible consequences of seabed mineral production is the
forecast of the balance of demand/supply (consumption/production) in the markets of affected metals,
which will be in place by the time of possible start of offshore mining. The optimal option for the market
to start offshore production will be the period of deficit, which will not be able to compensate for the land-
based production. Given the multiplicity of factors affecting both consumption and land-based production
prospects, and given the forecast horizon, any forecast will be subject to a significant degree of uncertainty.
This makes scenario-based forecasting advisable.
795. There is a high degree of uncertainty about the timing and intensity of commercial production
of polymetallic nodules. One of the factors of this uncertainty is the level of prices for commercial metals,
which will be formed in the market by the time the contractors are ready to start production: it could be
such that the contractors' work is not profitable. It is possible, however, that a single contractor may start
work around 2027 and that the number of such contractors may increase from 2030.
796. This report considers three scenarios for the development of mining: minimum (two
contractors), base (six contractors) and maximum (12 contractors). All scenarios imply that the first
contractor starts production in 2027 and the second in 2030; the remaining contractors (subject to their
involvement) will join the process in 2031-2033. It is also assumed that the maximum aggregate production
level of six or twelve contractors may be reached in 2035. According to these introductory conditions, three
deep-sea mining scenarios are considered for each of the metals under consideration (Table 8.1).
Table 8.1 Estimated extraction rates of polymetallic nodules and production rates of affected metals for
two, six and twelve contractors.
2 contractors 6 contractors 12 contractors
Start of production, year 2027 2027 2027
Getting to full capacity, year 2032 2035 2035
Mining of polymetallic nodules at
full capacity, tonnes 6,000,000 18,000,000 36,000,000
Production of affected metals at
full production capacity, tonnes
Cobalt 10,200 30,600 61,200
Nickel 74,100 222,300 444,600
Copper 59,400 178,200 356,400
Manganese 1,533,600 4,600,800 9,201,600

192
797. The analysis of the development of the situation on the markets of the metals under
consideration in the period up to 2035 shows that in case of commissioning of all the projects for the
development of new deposits of copper, nickel, cobalt and manganese with the minimum projected growth
rates of consumption (they are individual for each metal) the deficit on the markets of copper and
manganese will not appear, and on the markets of nickel and cobalt it will appear only after 2029. At the
maximum consumption growth rate, the deficit on the nickel market will appear in the next two years, on
the cobalt and manganese ore markets — after 2025, and on the copper market — only after 2030. Provided
that the deficit in the copper, nickel and cobalt markets is formed, regardless of the consumption growth
scenario under review, it will exceed the potential production of these metals even by twelve contractors.
In the case of manganese ores, the maximum number of contractors should not exceed six.
798. The asynchronous and disharmonious development of situations in the related markets of the
metals under consideration makes possible a scenario in which on some of them a deficit will appear, while
on others it will not. This makes it more difficult to assess the impact of the start of deep-sea mining on
DLBPS. However, it can be said that there are conditions under which the start of mining after 2027 by no
more than six contractors will not cause oversaturation of the market with the metals under consideration.
799. Production of metals from manganese nodules may cause the price of metals to fall even
without a surplus, but due to increased supply. This may trigger a decrease in export prices of metal products
and, as a result, export revenues to the country. The only way to avoid a drop in export revenues in this
scenario is to increase export volumes, which is likely to be impossible or lead to a further drop in prices.
There is an opinion that the situation may be mitigated by organizing or expanding processing of raw
materials on the territory of DLBPS. This can be seen as a two-way positive effect: through the development
of domestic industry and economy, and through the emergence or expansion of export opportunities for
more expensive products. However, it should be taken into account that any additional products must find
their consumers (and it's not clear whether there will be such consumers). In addition, it will in any case
put pressure on the market. As a result, the development of the processing industry in DLBPS may not
bring the expected effect.
800. The analysis of the role of export earnings from the four affected metals in total DLBPS
export earnings and in their GDP allowed to identify the countries which are likely to be most seriously
affected by seabed production. The criterion for their allocation was the share of export earnings from
metals in total export earnings of the country, which should be at least 10 %. The second criterion (was
used to check and reinforce the results) was the share of export revenues from affected metals to the
country’s GDP, which should be at least 5%. These countries included 7 countries exporting copper
products, 2 countries exporting nickel products and 1 country exporting cobalt and manganese products.
Further three countries were included in this category based on the share of total exports of all four metals
(Table 8.2). However, identifying the full list of countries which may truly be most seriously affected by
seabed production, will be possible only after the actual start of deep-sea mining.
Table 8.2. Countries exporting copper, nickel, cobalt and manganese products which are likely to be most
seriously affected by seabed production
Products share in export
revenues, %
Products share in GDP,
%
Exporters of copper products
Zambia 56.1 18.7
Democratic Republic of the Congo 55 11.1
Eritrea 50 5.6
Chile 48.9 12.8
Lao People's Democratic Republic 34.4 7.7
Mongolia 26 15.9
Peru 25.8 5.1
Exporters of nickel products
Madagascar 20.3 3.7
Zimbabwe 15.6 3.1

193
Exporters of cobalt products
Democratic Republic of the Congo 24.3 4.8
Exporters of manganese products
Gabon 21.9 5
Cumulative effect of exports of all affected metals
Mauritania 12 4.8
Namibia 11.4 4.9
Papua New Guinea 10.6 4.3
801. Besides, the decrease in prices will result in aggravation of competition between operations
of all types (including contractors). This may result in the closure of the least cost-effective land-based
mining operations or their transition to variable capacity functioning, which may have a cascade of negative
consequences, not only economic but also social and political. At the same time, it is possible that the
decline in prices will reach a level at which deep-sea mining will be on the verge of profitability or will
become completely unprofitable.
802. As part of this study, we do not offer any assistance or compensation for losses of DLBPS
that could be seriously affected by deep-sea mining. The Agreement relating to the Implementation of Part
XI of the UN Convention on the Law of the Sea of December 10, 1982 (1994 Agreement) takes account of
this issue. According to that document, the Authority shall establish an economic assistance fund for which
only receipts in the form of royalty payments from contractors, including the Enterprise, and voluntary
contributions to the Authority shall be used (1994 Agreement, article 7). The Authority therefore needs to
determine the rates of royalty payments by contractors in order to be able to pre-assess the possible extent
of the economic assistance fund for affected DLBPS. Once deep-sea mining begins, the amount and
duration of economic assistance will be determined on a case-by-case basis, taking into account the nature
and extent of the problems faced by the affected DLBPS (1994 Agreement, Article 7).

194
RECOMMENDATIONS FOR FURTHER STUDIES
803. The results of the study reflect the market development prospects mainly based on the data
available for analysis as of the end of 2019. However, the market situation is changing rapidly. A clear
indication of this is the outbreak of coronavirus infection, which in just three months has not only spread
around the world, but also resulted in the sharp downturn in the global economy. Therefore, it is advisable
to conduct studies such as the one carried out on a regular basis, at intervals of at least 3-5 years. In addition,
we consider it necessary to conduct such a study immediately before the start of deep-sea mining. This will
create a factual basis for assessing its real impact on the markets of affected metals and on their DLBPS
participants.
804. In addition, for a more complete picture of the possible impact of offshore mining it seems
useful to make a comparative assessment of the cost of deep-sea mining and ore extraction by different
methods on land, the cost of processing of polymetallic nodules with the production of marketable metal
products with the cost of similar products received from ores and concentrates of land-based producers.
This will allow for a more correct assessment of the potential impact of seabed mining, as well as the degree
of resilience of land producers to the impacts of offshore mining.
805. In terms of further elaborating the issue of possible consequences of the beginning of deep-
sea mining for DLBPS, we believe it would be advisable to elaborate in detail on the impact of changes in
prices for the affected metals on the situation in these countries. At the same time, we should consider
changes in the situation both in case of falling and growing prices. In this regard, we consider it interesting
to assess the impact of organizing the production of products with higher added value in DLBPS, which
may be most seriously affected.
806. With respect to the offshore production taking place in the deepest areas, we consider it
important to assess technological, financial and economic, and market aspects of extraction of metals other
than copper, nickel, cobalt and manganese from polymetallic nodules. It is obvious that with technological
opportunities for profitable extraction of additional types of metals, the economic performance of deep-sea
mining and all derivatives will increase. At the same time, this could have a negative impact on a wider
range of commodity markets and widen the list of DLBPS that are likely to be affected by mining in the
Area, which also requires separate consideration.
807. It also seems important to conduct a study to assess the possible positive impact of
polymetallic nodule mining on the economies of DLBPS. The need for such a study is determined by the
opinion that a decline in the prices of affected metals will not only reduce export earnings to DLBPS, but
also the cost of goods produced from these metals. This, in turn, will ensure cheaper imports of such goods
into DLBPS, which will somewhat compensate for losses in export earnings of countries, as well as make
imported goods more accessible to the population and businesses of DLBPS. Such cheapening, if it is
indeed possible, can act as an incentive for the development of DLBPS economies.

195
APPENDICES
Terms and Definition
Anode Crude metal (nickel or copper) obtained from anode smelting and
fed for electrolytic refining (electrolysis) whereby it is dissolved.
Artisanal (small-scale) mining A complex and diversified sector that includes poor informal
individual miners seeking to eke out or supplement a subsistence
livelihood, to small-scale formal commercial mining activities that
can produce minerals in a responsible way respecting local laws.
Blister copper The product of a converting furnace. It is an intermediate, more
concentrated (with respect to the desired metal) material than matte,
from which it is made, and is usually transferred to another furnace
for further concentration.
Cathode Pure metal (nickel or copper) obtained as a result of electrolytic
refining of anodes.
Cement copper (precipitated
copper)
A product obtained by precipitation (cementation), i.e., by adding
iron to the aqueous solution resulting from the leaching of certain
ores or waste. It is a finely devised black powder containing oxides
and insoluble impurities. Cement copper is often added to the
charge which goes to a converting furnace to produce copper matte.
Cobalt alliage blanc An alloy of cobalt, copper and iron.
Concentrate A product of ore concentration with a high grade of the extracted
mineral, which gives its name to the concentrate (copper, nickel,
etc.).
Concentration Artificial improvement of metallurgical feedstock mineral grades
by removal of a major portion of waste rock not containing any
valuable minerals.
Conversion Autogenous pyrometallurgical process, where ferrous and other
detrimental impurities are oxidised and removed as slag. The result
of the conversion is blister copper (copper concentrate smelting) or
high-grade matte (copper and nickel concentrate smelting).
Copper electrowon Product of SX-EW process. High-grade electrowon (Commercial
Cathode) is SX-EW production that can be treated as refined
cathode and sold as such. Low-grade electrowon is SX-EW
production that must be re-refined.
Direct melt copper scrap Direct‐melt, or re‐melt scrap is secondary material that can be used
directly in a furnace without cleanup through the use of fluxes and
poling and re‐refining.
Electrolytic nickel Finished nickel product, with a nickel content of 99% and more.
Electrolytic manganese
dioxide (EMD)
A complex composite of various crystals of manganese and oxygen
that is produced through electrowinning. It is used primarily as the
active constituent of alkaline batteries and increasingly as the
feedstock for the cathode material in lithium-ion batteries.
Electrolytic manganese metal
(EMM)
A type of electrolytic manganese, which is a refined manganese
product created through the purification and electrolysis of a
manganese-rich solution that is made by dissolving manganese
carbonate ore or calcined manganese oxide ore.

196
Feasibility study Detailed technical plan and financial budget for the construction
and operation of the project.
Ferro-alloys Various alloys of iron with a high proportion of one or more other
elements such as manganese, aluminium or silicon. They are used
in the production of steels and alloys.
Ferro-manganese Ferro-alloy with high content of manganese, is made by heating a
mixture of the oxides MnO2 and Fe2O3, with carbon, usually as coal
and coke, in either a blast furnace or an electric arc furnace-type
system, called a submerged arc furnace.
Silico-manganese Ferro-alloy with high contents of manganese and silicon, is made
by heating a mixture of the oxides manganese oxide (MnO2), silicon
dioxide (SiO2), and iron oxide (Fe2O3), with carbon in a furnace.
Ferro-nickel An alloy of iron and nickel obtained by direct reduction during
reduction smelting.
Flotation A concentration process where specific mineral particles suspended
within the pulp attach to air bubbles. Poorly wettable mineral
particles attach to the air bubbles and rise through the suspension to
the top of the pulp, producing foam, while well wettable mineral
particles do not attach to the bubbles and remain in the pulp. This
is how the minerals are separated.
Green technologies The application of one or more of environmental science, green
chemistry, environmental monitoring and electronic devices to
monitor, model and conserve the natural environment and
resources, and to curb the negative impacts of human involvement.
Hydrometallurgical processes Extraction of metal from ore by preparing an aqueous solution of a
salt of the metal and recovering the metal from the solution. The
operations usually involved are leaching, or dissolution of the metal
or metal compound in water, commonly with additional agents;
separation of the waste and purification of the leach solution; and
the precipitation of the metal or one of its pure compounds from the
leach solution by chemical or electrolytic means. The most
common leaching agent is dilute sulfuric acid.
Laterite A consolidated product of humid tropical weathering
predominantly composed of goethite, hematite, kaolin, quartz,
bauxite and other clay minerals. Laterite ores are the source of
nickel.
Magmatic nickel-copper-
cobalt sulphide deposits
Deposits, in which sulphur saturation of mafic magma causes dense
cobalt and nickel sulphides to be concentrated in basal sections of
magma chambers.
Matte (cobalt, copper, nickel) Intermediate product in the form of an alloy of sulphides of iron
and nonferrous metals with a varying chemical composition. Matte
is the main product accumulating precious metals and metal
impurities the feedstock contains.
Mine A mining location for extraction of ores.
Mineral deposit A mass of naturally occurring mineral material (near to the surface
or deeper underground) which is economically valuable in terms of
quantity, quality and conditions.

197
Mixed Hydroxide Precipitate
(MHP)
One of intermediate products of nickel laterite ore processing
through hydrometallurgical route.
Mixed Sulphide Precipitate
(MSP)
An intermediate product that is re-dissolved to make concentrated
solutions of nickel and cobalt suitable for high-purity metal
production.
Nickel Pig Iron (NPI) A low grade ferro-nickel invented in China as a cheaper alternative
to pure nickel for the production of stainless steel.
Ore Natural minerals containing metals or their compounds in
economically valuable amounts and forms.
Polymetallic nodules Are rounded accretions of manganese and iron hydroxides that
cover vast areas of the seafloor, but are most abundant on abyssal
plains at water depths of 4000-6500 metres.
Prefeasibility study An early stage analysis of a potential mining project. Conducted by
a small team and are designed to give company stakeholders the
basic information they need to green light a project or choose
between potential investments.
Pyrometallurgical processes Metallurgical processes performed at high temperatures, including
roasting, smelting and conversion, which are distinguished
depending on their technological characteristics.
Refining Purification of primary metals from impurities.
Reserves The economically mineable part of a measured or indicated mineral
resource. It includes diluting materials and allowances for losses,
which may occur when the material is mined.
Proved reserves Ore reserves that represent the economically mineable part of a
measured mineral resource. It includes diluting materials and
allowances for losses which may occur when the material is mined.
Probable reserves The economically mineable part of an indicated, and in some
circumstances, a measured mineral resource. It includes diluting
materials and allowances for losses which may occur when the
material is mined.
Resources A concentration or occurrence of material of intrinsic economic
interest in or on the Earth’s crust in such form, quality and quantity
that there are reasonable prospects for eventual economically viable
extraction.
Measured resources Resources representing that part of mineral resources from which
tonnage, densities, shape, physical characteristics, grade and
mineral content can be estimated with a high level of confidence. It
is based on detailed and reliable exploration, sampling and testing
information gathered through appropriate techniques from
locations such as outcrops, trenches, pits, workings and drill holes.
The locations are spaced closely enough to confirm geological
and/or grade continuity

198
Indicated resources Resources representing that part of mineral resources from which
tonnage, densities, shape, physical characteristics, grade and
mineral content can be estimated with a reasonable level of
confidence. It is based on exploration, sampling and testing
information gathered through appropriate techniques from
locations such as outcrops, trenches, pits, workings and drill holes.
The locations are too widely or inappropriately spaced to confirm
geological and/or grade continuity but are spaced closely enough
for continuity to be assumed.
Inferred resources Resources representing that part of mineral resources from which
tonnage, grade and mineral content can be estimated with a low
level of confidence. It is inferred from geological evidence and
assumed but not verified geological and/or grade continuity. It is
based on information gathered through appropriate techniques
from.
Economic resources This term implies that profitable extraction or production under
defined investment assumptions has been established, analytically
demonstrated, or assumed with reasonable certainty.
Sub-economic
resources
The part of identified resources that does not meet the economic
criteria of reserves.
Undiscovered
resources
Resources, the existence of which are only postulated, comprising
deposits that are separate from identified resources. Undiscovered
resources may be postulated in deposits of such grade and physical
location as to render them economic, marginally economic, or sub-
economic.
Roast-leach-electrowon (RLE)
process
The electrolysis process, that consists of 4 steps: leaching,
purification, electrolysis, and melting and casting.
Scrap Recyclable materials left over from product manufacturing and
consumption, such as parts of vehicles, building supplies, and
surplus materials. Unlike waste, scrap has monetary value,
especially recovered metals, and non-metallic materials are also
recovered for recycling.
Sediment-hosted stratiform
(stratabound ) deposits
Copper and cobalt deposits, characterized by ore minerals
contained within organic-rich pyritic shales and sandstones
deposited in a near-shore lagoonal environment, under reducing
conditions.
Smelting A pyrometallurgical process performed at high temperatures
enabling the complete melting of the processed material.
Solvent Extraction -
Electrowining (SX-EW)
A two-stage hydrometallurgical process that first extracts and
upgrades copper ions from low-grade leach solutions into a solvent
containing a chemical that selectively reacts with and binds the
copper in the solvent. The copper is extracted from the solvent with
strong aqueous acid which then deposits pure copper onto cathodes
using an electrolytic procedure (electrowinning).
Super-alloys A group of nickel, iron–nickel and cobalt alloys used in aircraft
turbine engines for their exceptional heat-resistant properties.

199
Data and information tables
A. Copper production
Mine production (concentrates & SX-EW), thousand metric tonnes Cu
COUNTRY* Medium 2017 2017, %
Chile 5 520.3 5 503.5 27.5
Peru 1 558.0 2 445.6 12.2
China 1 501.6 1 706.4 8.5
Congo, D.R. 650.9 1 002.0 5.0
Zambia 694.3 794.1 4.0
Mexico 481.1 742.2 3.7
Indonesia 627.6 622.0 3.1
Brazil 271.6 384.4 1.9
Mongolia 209.7 310.9 1.6
Iran 254.9 302.0 1.5
Laos 143.4 153.3 0.8
Myanmar 33.6 115.1 0.6
Papua New Guinea 115.6 105.0 0.5
Turkey 99.7 83.0 0.4
Philippines 67.6 67.8 0.3
South Africa 86.4 65.5 0.3
Saudi Arabia 10.8 43.0 0.2
Argentina 108.2 33.3 0.2
India 32.0 31.1 0.2
Mauritania 35.7 28.8 0.1
North Korea 16.0 20.0 0.1
Pakistan 20.0 20.0 0.1
Morocco 16.0 18.0 ˂0.1
Tanzania 11.1 15.8 ˂0.1
Namibia 7.4 15.5 ˂0.1
Vietnam 13.2 15 ˂0.1
Dominican Rep. 9.5 11.1 ˂0.1
Colombia 3.4 9.4 ˂0.05
Eritrea 20.6 8.0 ˂0.05
Zimbabwe 6.5 8 ˂0.05
Bolivia 5.8 6.4 ˂0.05
Botswana 28.8 1.4 ˂0.05
Oman** 12.4 0 0
DLBPS Total 12 673.7 14 687.6 73.3
World Total 17 628.9 20 038.4 100.0
Source: ICSG.
* — DLBPS only.
** — Mine production has not been conducted since 2016
Note: The value in column Medium corresponds to the average level of the indicator in 2008–2017.
Coloring of indicator values for 2017 means the following: green is for the values, which are higher than the 10-year
average; red is for the values, which are lower than the 10-year average, black is for the values corresponding to the
10-year average.

200
Smelter production (copper in primary blister and anode), thousand metric tonnes
COUNTRY* Medium 2017 2017, %
China 4 136.1 6 050.0 37.3
Chile 1 426.5 1 404.7 8.7
India 713.5 813.1 5.0
Zambia 542.7 787.9 4.9
Peru 319.2 316.9 2.0
Mexico 223.3 270.0 1.7
Indonesia 244.3 245.8 1.5
Philippines 196.7 240.0 1.5
Brazil 169.0 118.8 0.7
Iran 164.8 114.2 0.7
South Africa 75.4 70.0 0.4
Turkey 35.5 46.0 0.3
Namibia 29.1 44.9 0.3
Pakistan 20.0 20.0 0.1
Oman** 11.7 12 ˂0.1
Vietnam 7.2 8.0 ˂0.1
Botswana 17.0 0 0
DLBPS Total 8 342.0 10 572.3 65.2
World Total 14 111.6 16 209.3 100.0
Source: ICSG.
* — DLBPS only.
** — Mine production has not been conducted since 2016.
Note: The value in column Medium corresponds to the average level of the indicator in 2008–2017.
Coloring of indicator values for 2017 means the following: green is for the values, which are higher than the 10-year
average; red is for the values, which are lower than the 10-year average, black is for the values corresponding to the
10-year average.

201
Refinery production (primary copper), thousand metric tonnes
COUNTRY* Medium 2017 2017, %
China 4 404.0 6 614.3 34.0
Chile 2 878.8 2 429.5 12.5
India 713.5 813.1 4.2
Congo, D.R. 495.5 717.5 3.7
Zambia 491.2 466.1 2.4
Mexico 362.8 441.0 2.3
Peru 368.9 335.3 1.7
Indonesia 246.1 268.2 1.4
Philippines 160.9 205.0 1.1
Brazil 177.9 118.3 0.6
Myanmar 33.6 115.1 0.6
Iran 140.6 103.2 0.5
Turkey 63.9 88.0 0.5
South Africa 74.3 70.0 0.4
Laos 77.0 62.9 0.3
Namibia 4.3 15.5 ˂0.1
Mongolia 5.0 14.4 ˂0.1
Oman** 11.7 12.0 ˂0.1
North Korea 10.0 10.0 ˂0.1
Vietnam 7.2 8.0 ˂0.05
Zimbabwe 4.5 5.0 ˂0.05
Bolivia 2.3 3.0 ˂0.05
DLBPS Total 10 733.8 12 915.4 66.3
World Total 17 289.6 19 469.5 100.0
Source: ICSG.
* — DLBPS only.
** — Mine production has not been conducted since 2016.
Note: The value in column Medium corresponds to the average level of the indicator in 2008–2017.
Coloring of indicator values for 2017 means the following: green is for the values, which are higher than the 10-year
average; red is for the values, which are lower than the 10-year average; black is for the values corresponding to the
10-year average.

202
B. Copper export
Export of copper ores and concentrates (2603), thousand metric tonnes
COUNTRY* Medium 2017 2017, %
Chile 7 699.1 9 727.5 28.3
Peru 4 433.2 8 023.2 23.4
Indonesia 1 652.7 1 539.8 4.5
Mexico 688.3 1 483.4 4.3
Mongolia 928.4 1 447.2 4.2
Brazil 837.8 1 248.3 3.6
Iran 283.1 612.4 1.8
Congo, D.R. 388.4 607.6 1.8
Papua New Guinea 439.8 415.5 1.2
Laos 246.1 377.8 1.1
Turkey 319.1 246.3 0.7
Philippines 274.3 198.8 0.6
Morocco 80.3 166.0 0.5
Argentina 425.2 154.6 0.4
Mauritania 179.7 142.0 0.4
Saudi Arabia 33.0 107.9 0.3
Namibia 32.4 56.4 0.2
Colombia 16.0 51.2 0.1
India 17.0 45.8 0.1
Dominican Rep. 28.4 43.2 0.1
Eritrea 66.4 29.8 ˂0.1
Oman** 79.1 27.9 ˂0.1
Bolivia 28.5 27.2 ˂0.1
Zambia 106.6 19.6 ˂0.1
Tanzania 17.6 7.2 ˂0.05
Botswana 67.0 5.0 ˂0.05
Myanmar 0.3 1.3 ˂0.05
Pakistan 2.1 0.8 ˂0.05
North Korea 23.6 0.5 ˂0.05
Zimbabwe 0.6 0.3 ˂0.001
China 2.4 0.2 ˂0.001
Vietnam 4.8 0.2 ˂0.001
DLBPS Total 19 401.2 26 814.9 78.0
World Total 24 702.3 34 358.7 100.0
Source: ITC.
* — DLBPS only.
** — Mine production has not been conducted since 2016.
Note: The value in column Medium corresponds to the average level of the indicator in 2008–2017.
Coloring of indicator values for 2017 means the following: green is for the values, which are higher than the 10-year
average; red is for the values, which are lower than the 10-year average.

203
Export of copper ores and concentrates (2603), million USD
COUNTRY* Medium 2017 2017, %
Chile 14 167.5 15 665.9 27.7
Peru 7 301.4 11 975.0 21.1
Indonesia 3 751.2 3 439.6 6.1
Brazil 1 634.9 2 485.3 4.4
Mexico 1 114.6 1 891.1 3.3
Mongolia 1 307.2 1 613.1 2.8
Congo, D.R. 809.8 988.7 1.7
Papua New Guinea 1 009.3 814.5 1.4
Laos 425.7 578.0 1.0
Iran 97.3 575.0 1.0
Argentina 1 008.5 409.2 0.7
Philippines 461.9 371.4 0.7
Turkey 343.2 234.8 0.4
Namibia 149.4 220.8 0.4
South Africa 379.2 209.2 0.4
Mauritania 211.5 195.0 0.3
Saudi Arabia 52.8 177.4 0.3
Morocco 87.9 164.3 0.3
Colombia 23.7 58.3 0.10
Dominican Rep. 37.4 48.3 ˂0.1
India 17.0 42.9 ˂0.1
Eritrea 119.8 39.3 ˂0.1
Tanzania 86.6 38.9 ˂0.1
Bolivia 28.6 31.6 ˂0.1
Ecuador 12.7 28.6 ˂0.1
Oman** 35.7 27.9 ˂0.05
Zambia 138.1 5.5 ˂0.05
Zimbabwe 1.9 5.1 ˂0.05
Botswana 75.7 3.7 ˂0.05
Myanmar 0.2 1.6 ˂0.05
Vietnam 7.5 0.2 ˂0.001
China 3.2 0.1 ˂0.001
North Korea 13.3 0.1 ˂0.001
DLBPS Total 34 914.5 42 340.6 74.8
World Total 47 253.1 56 622.1 100.0
Source: ITC
* — DLBPS only
** — Mine production has not been conducted since 2016.
Note: The value in column Medium corresponds to the average level of the indicator in 2008–2017.
Coloring of indicator values for 2017 means the following: green is for the values, which are higher than the 10-year
average; red is for the values, which are lower than the 10-year average.

204
Export of copper unrefined (7402), thousand metric tonnes
COUNTRY* Medium 2017 2017, %
Zambia 108.4 586.5 40.0
Chile 380.2 387.2 26.4
Namibia 34.0 42.1 2. 9
Philippines 7.2 35.2 2.4
Congo, D.R. 61.4 33.6 2.3
South Africa 11.0 20.5 1.4
Mexico 4.1 12.1 0.8
Peru 12.8 3.3 0.2
Laos 0.08 0.11 ˂0.05
Iran 0.1 0.1 ˂0.05
China 1.9 0.1 ˂0.05
Oman** 0.4 0.05 ˂0.05
Brazil 0.3 0.04 ˂0.05
Morocco 0.2 0.02 ˂0.05
India 1.4 0.02 ˂0.05
Indonesia 0.9 0.01 ˂0.05
Turkey 4.0 0.01 ˂0.001
Botswana 0.01 ˂0.01 ˂0.001
Dominican Rep. 12.3 0.0 0
Tanzania 0.2 0.0 0
Vietnam 0.1 0.0 0
Myanmar 0.02 0.0 0
Colombia 0.01 0.0 0
North Korea 0.01 0.0 0
Saudi Arabia 0.01 0.0 0
DLBPS Total 641.1 1 121.1 76.5
World Total 936.5 1 465.5 100.0
Source: ITC.
* — DLBPS only.
** — Mine production has not been conducted since 2016.
Note: The value in column Medium corresponds to the average level of the indicator in 2008–2017.
Coloring of indicator values for 2017 means the following: green is for the values, which are higher than the 10-year
average; red is for the values, which are lower than the 10-year average; black is for the values corresponding to the
10-year average.

205
Export of copper unrefined (7402), million USD
COUNTRY* Medium 2017 2017, %
Zambia 608.6 3 618.1 38.5
Chile 2589.5 2 485.0 26.4
Philippines 64.2 316.1 3.4
Namibia 163.5 275.4 2.9
Congo, D.R. 403.7 185.8 2.0
South Africa 59.5 139.3 1.5
Mexico 43.1 71.0 0.8
Peru 87.8 20.7 0.2
Pakistan 0.6 1.7 ˂0.05
Laos 0.5 0.7 ˂0.05
China 12.4 0.5 ˂0.05
Tanzania 0.1 0.5 ˂0.05
Brazil 2.4 0.2 ˂0.05
Oman** 1.5 0.2 ˂0.05
Morocco 1.3 0.1 ˂0.05
Indonesia 5.3 0.1 ˂0.001
Turkey 25.5 0.1 ˂0.001
Botswana ˂0.05 ˂0.05 ˂0.001
Iran 0.6 ˂0.01 ˂0.001
Colombia ˂0.05 ˂0.01 ˂0.001
Dominican Rep. 20.9 0.0 0
Myanmar 0.5 0.0 0
North Korea ˂0.05 0.0 0
DLBPS Total 4 091.5 7 115.4 75.7
World Total 6 202.1 9 400.9 100.0
Source: ITC.
* — DLBPS only.
** — Mine production has not been conducted since 2016.
Note: The value in column Medium corresponds to the average level of the indicator in 2008–2017.
Coloring of indicator values for 2017 means the following: green is for the values, which are higher than the 10-year
average; red is for the values, which are lower than the 10-year average.

206
Export of copper refined, unwrought (740311), thousand metric tonnes
COUNTRY* Medium 2017 2017, %
Chile 2 575.4 2 358.9 24.8
Zambia 663.8 413.2 4.3
Congo, D.R. 312.5 407.9 4.3
India 271.1 400.6 4.2
China 217.3 337.7 3.6
Peru 306.4 284.2 3.0
Philippines 108.3 209.3 2.2
Indonesia 132.2 177.6 1.9
Mexico 116.3 159.7 1.7
Iran 129.2 136.2 1.4
Myanmar 23.0 85.8 0.9
Laos 36.4 62.8 0.7
Brazil 68.9 49.3 0.5
South Africa 20.8 48.2 0.5
Mongolia 6.0 15.6 0.2
Turkey 10.4 15.5 0.2
Pakistan 4.2 8.5 ˂0.1
Namibia 37.1 7.0 ˂0.1
Bolivia 1.1 2.1 ˂0.05
Saudi Arabia 1.5 1.6 ˂0.05
Argentina 0.3 1.2 ˂0.05
Morocco 1.0 1.0 ˂0.05
Zimbabwe 2.5 0.4 ˂0.05
Colombia 2.2 0.2 ˂0.05
Oman** 2.1 0.1 ˂0.001
Botswana 0.5 0.02 ˂0.001
Vietnam 3.7 0.01 ˂0.001
Dominican Rep. 0.3 ˂0.01 ˂0.001
North Korea 1.4 0.0 0
Tanzania 0.4 0.0 0
DLBPS Total 5 056.3 5 184.5 54.5
World Total 9 033.8 9 518.4 100.00
Source: ITC.
* — DLBPS only.
** — Mine production has not been conducted since 2016.
Note: The value in column Medium corresponds to the average level of the indicator in 2008–2017.
Coloring of indicator values for 2017 means the following: green is for the values, which are higher than the 10-year
average; red is for the values, which are lower than the 10-year average; black is for the values corresponding to the
10-year average.

207
Export of copper refined, unwrought (740311), million USD
COUNTRY* Medium 2017 2017, %
Chile 18 439.2 14 738.2 27.7
Congo, D.R. 2 011.4 2 464.8 4.6
India 2 197.0 2 425.2 4.6
China 1 479.2 2 054.8 3.9
Zambia 3 317.5 1 896.3 3.6
Peru 2 037.8 1 729.7 3.3
Philippines 726.7 1 269.9 2.4
Indonesia 846.0 1 078.4 2.0
Mexico 635.3 952.4 1.8
Myanmar 136.0 489.9 0.9
Laos 449.5 397.5 0.7
Brazil 429.4 270.3 0.5
South Africa 89.4 185.5 0.3
Iran 366.0 157.4 0.3
Mongolia 35.0 92.7 0.2
Namibia 124.0 21.0 ˂0.05
Bolivia 7.5 12.3 ˂0.05
Saudi Arabia 1.2 7.0 ˂0.05
Vietnam 22.8 0.0 0
Turkey 6.6 0.1 ˂0.05
North Korea 9.0 0.0 0
Zimbabwe 5.7 0.0 0
Oman** 4.9 0.0 0
Colombia 0.7 0.0 0
Tanzania 0.4 0.0 0
Argentina ˂0.05 0.0 0
Botswana ˂0.05 0.0 0
Morocco ˂0.05 0.0 0
DLBPS Total 33 378.3 30 243.4 56.8
World Total 56 377.2 53 208.3 100.0
Source: ITC
* — DLBPS only
** — Mine production has not been conducted since 2016.
Note: The value in column Medium corresponds to the average level of the indicator in 2008–2017.
Coloring of indicator values for 2017 means the following: green is for the values, which are higher than the 10-year
average; red is for the values, which are lower than the 10-year average.

208
C. Nickel production
Mine production, thousand metric tonnes Ni
COUNTRY* Medium 2017 2017, %
Indonesia 363.6 355.0 16.7
Philippines 294.8 339.4 16.0
China 90.9 94.5 4.4
Brazil 80.4 76.8 3.6
Guatemala 21.5 53.7 2.5
Cuba 61.6 52.9 2.5
South Africa 45.2 48.4 2.3
Colombia 62.3 45.6 2.1
Madagascar 21.1 38.5 1.8
Papua New Guinea 12.0 34.7 1.6
Myanmar 8.5 20.0 0.9
Zimbabwe 10.8 17.7 0.8
Turkey 5.3 17.0 0.8
Dominican Rep. 8.2 15.6 0.7
Botswana** 25.9 0.0 0
Venezuela*** 6.5 0.0 0
Vietnam** 2.0 0.0 0
DLBPS Total 1 120.7 1 209.7 56.9
World Total 2 013.6 2 125.4 100.0
Source: INSG.
* — DLBPS only.
** — Mine production has not been conducted since 2017.
*** — Mine production has not been conducted since 2016.
Note: The value in column Medium corresponds to the average level of the indicator in 2008–2017.
Coloring of indicator values for 2017 means the following: green is for the values, which are higher than the 10-year
average; red is for the values, which are lower than the 10-year average.

209
Production of nickel intermediate products, thousand metric tonnes Ni
COUNTRY* Medium 2017 2017, %
Indonesia 74.5 76.8 28.7
Philippines 32.3 50.6 18.9
Cuba 40.1 37.1 13.9
Papua New Guinea 12.0 34.7 13.0
Turkey 0.6 4.0 1.5
Botswana** 18.7 0.0 0
Brazil 5.6 0.0 0
DLBPS Total 183.7 203.1 76.0
World Total 256.5 267.4 100.0
Source: INSG.
* — DLBPS only.
** — Mine production has not been conducted since 2017.
Note: The value in column Medium corresponds to the average level of the indicator in 2008–2017.
Coloring of indicator values for 2017 means the following: green is for the values, which are higher than the 10-year
average; red is for the values, which are lower than the 10-year average.
Production of primary nickel (incl. ferro-nickel), thousand metric tonnes
COUNTRY* Medium 2017 2017, %
China 489.8 600.0 29.4
Indonesia 48.8 204.3 10.0
Brazil 53.3 68.5 3.4
South Africa 35.2 43.0 2.1
Colombia 43.6 40.6 2.0
Madagascar 19.3 35.5 1.7
Myanmar 8.5 20.0 1.0
Cuba 21.5 15.8 0.8
Dominican Rep. 8.2 15.6 0.8
Guatemala 3.7 12.4 0.6
Venezuela** 6.4 0.0 0
Zimbabwe 2.7 0.0 0
DLBPS Total 741.1 1055.6 51.7
World Total 1 742.9 2 041.7 100.0
Source: INSG.
* — DLBPS only.
** — Mine production has not been conducted since 2016.
Note: The value in column Medium corresponds to the average level of the indicator in 2008–2017.
Coloring of indicator values for 2017 means the following: green is for the values, which are higher than the 10-year
average; red is for the values, which are lower than the 10-year average.

210
D. Nickel export
Export of nickel ores and concentrates (2604), thousand metric tonnes
COUNTRY* Medium 2017 2017, %
Philippines 26 633.3 38 015.8 72.5
Indonesia 20 168.3 4 882.7 9.3
Guatemala 1 039.2 2 474.6 4.7
Turkey 174.6 239.9 0.5
Zimbabwe 139.0 230.1 0.4
Papua New Guinea 0.1 1.1 ˂0.05
China 2.4 0.5 ˂0.05
South Africa 26.9 0.0 0
Myanmar 0.6 0.0 0
Brazil 40.5 0.0 0
Vietnam** 7.1 0.0 0
Botswana** 10.7 0.0 0
DLBPS Total 48 242.7 45 844.8 87.5
World Total 53 651.4 52 418.5 100.0
Source: ITC
* — DLBPS only
** — Mine production has not been conducted since 2017.
Note: The value in column Medium corresponds to the average level of the indicator in 2008–2017.
Coloring of indicator values for 2017 means the following: green is for the values, which are higher than the 10-year
average; red is for the values, which are lower than the 10-year average.
Export of nickel ores and concentrates (2604), million USD
Country Medium 2017 2017, %
Philippines 646.7 685.3 27.7
Zimbabwe 283.9 369.0 14.9
Indonesia 617.8 155.2 6.3
Guatemala 35.4 66.2 2.7
Turkey 7.7 9.2 0.4
China 2.3 0.3 ˂0.05
Papua New Guinea 0.02 0.2 ˂0.05
South Africa 36.1 ˂0.01 ˂0.001
Botswana** 13.3 0 0
Brazil 56.3 0 0
Vietnam** 20.8 0 0
DLBPS Total 1 720.3 1 285.4 51.9
World total 3 081.7 2 474.5 100.0
Source: ITC
* — DLBPS only
** — Mine production has not been conducted since 2017.
Note: The value in column Medium corresponds to the average level of the indicator in 2008–2017.
Coloring of indicator values for 2017 means the following: green is for the values, which are higher than the 10-year
average; red is for the values, which are lower than the 10-year average.

211
Export of intermediate products of nickel metallurgy (7501), thousand metric tonnes
COUNTRY* Medium 2017 2017, %
Papua New Guinea 67.9 160.1 21.3
Indonesia 94.5 96.5 12.8
Philippines 25.0 84.2 11.2
Turkey 3.2 21.3 2.8
Cuba 21.6 21.7 2.9
Zimbabwe 5.3 9.8 1.3
China 1.3 0.0 0.0
Botswana** 48.4 0.0 0.0
Brazil 14.4 0.0 0.0
South Africa 9.0 0.0 0.0
DLBPS Total 290.6 393.7 52.4
World Total 513.7 751.7 100.0
Source: ITC
* — DLBPS only
** — Mine production has not been conducted since 2017.
Note: The value in column Medium corresponds to the average level of the indicator in 2008–2017.
Coloring of indicator values for 2017 means the following: green is for the values, which are higher than the 10-year
average; red is for the values, which are lower than the 10-year average.
Export of intermediate products of nickel metallurgy (7501), million USD
COUNTRY* Medium 2017 2017, %
Indonesia 954.6 629.3 14.3
Philippines 136.3 444.3 10.1
Zimbabwe 263.1 436.1 9.9
Papua New Guinea 126.3 367.5 8.3
Cuba 283.3 140.8 3.2
Turkey 5.0 34.5 0.8
South Africa 50.2 ˂0.01 ˂0.001
China 5.9 0 0
Botswana** 361.2 0 0
Brazil 95.6 0 0
DLBPS Total 2 281.5 2 052.5 46.5
World Total 5 164.0 4 412.8 100.0
Source: ITC
* — DLBPS only
** — Mine production has not been conducted since 2017.
Note: The value in column Medium corresponds to the average level of the indicator in 2008–2017.
Coloring of indicator values for 2017 means the following: green is for the values, which are higher than the 10-year
average; red is for the values, which are lower than the 10-year average.

212
Export of ferro-nickel (720260), thousand metric tonnes
COUNTRY* Medium 2017 2017, %
Indonesia 212.4 1 016.7 49.0
Brazil 91.4 209.9 10.1
Colombia 131.9 111.0 5.3
Myanmar 21.1 98.1 4.7
Dominican Rep. 21.1 43.8 2.1
Guatemala 9.0 30.5 1.5
China 4.9 2.2 0.1
Venezuela** 12.8 ˂0.01 0.0
South Africa 0.1 ˂0.01 0.0
Vietnam*** 0.1 0.0 0.0
Philippines 0.7 0.0 0.0
DLBPS Total 505.5 1 512.3 72.9
World Total 1 075.8 2 075.1 100.0
Source: ITC.
* — DLBPS only.
** — Mine production has not been conducted since 2016.
*** — Mine production has not been conducted since 2017.
Note: The value in column Medium corresponds to the average level of the indicator in 2008–2017.
Coloring of indicator values for 2017 means the following: green is for the values, which are higher than the 10-year
average; red is for the values, which are lower than the 10-year average.
Export of ferro-nickel (720260), million USD
COUNTRY* Medium 2017 2017, %
Indonesia 454.9 1 331.6 31.7
Brazil 333.8 538.0 12.8
Colombia 670.4 360.5 8.6
Myanmar 83.7 345.0 8.2
Dominican Rep. 145.3 156.0 3.7
Guatemala 36.7 120.6 2.9
China 28.7 8.8 0.2
Turkey 0.0 0.1 ˂0.05
South Africa 0.7 ˂0.01 ˂0.001
Venezuela** 66.6 ˂0.01 ˂0.001
Philippines 1.704 0 0
Vietnam*** 0.317 0 0
DLBPS Total 1 822.8 2 860.7 68.1
World Total 3 702.6 4 203.4 100.0
Source: ITC.
* — DLBPS only.
** — Mine production has not been conducted since 2016.
*** — Mine production has not been conducted since 2017.
Note: The value in column Medium corresponds to the average level of the indicator in 2008–2017.
Coloring of indicator values for 2017 means the following: green is for the values, which are higher than the 10-year
average; red is for the values, which are lower than the 10-year average.

213
Export of nickel unwrought (750210), thousand metric tonnes
COUNTRY* Medium 2017 2017, %
Madagascar 18.5 33.4 3.9
China 34.6 18.3 2.1
South Africa 5.6 6.3 0.7
Turkey 0.2 0.4 0.0
Zimbabwe 1.7 ˂0.05 0.0
Brazil 11.9 ˂0.01 0.0
Colombia ˂0.01 ˂0.01 0.0
Philippines 0.1 0.0 0.0
Indonesia ˂0.01 0.0 0.0
Cuba 2.4 0.0 0.0
DLBPS Total 75.1 58.4 6.8
World Total 862.7 858.4 100.0
Source: ITC.
* — DLBPS only.
Note: The value in column Medium corresponds to the average level of the indicator in 2008–2017.
Coloring of indicator values for 2017 means the following: green is for the values, which are higher than the 10-year
average; red is for the values, which are lower than the 10-year average.
Export of nickel unwrought (750210), million USD
COUNTRY* Medium 2017 2017, %
Madagascar 227.3 341.0 3.8
China 646.2 189.8 2.1
South Africa 80.7 63.8 0.7
Turkey 3.3 2.7 ˂0.05
Brazil 173.8 0.3 ˂0.05
Zimbabwe 10.9 0.1 ˂0.05
Colombia 0.1 0.06 ˂0.001
Indonesia 0.1 0 0
Cuba 39.3 0 0
DLBPS Total 1 181.8 597.8 6.7
World Total 13 673.2 8 335.4 100.0
Source: ITC.
* — DLBPS only.
Note: The value in column Medium corresponds to the average level of the indicator in 2008–2017.
Coloring of indicator values for 2017 means the following: green is for the values, which are higher than the 10-year
average; red is for the values, which are lower than the 10-year average.

214
E. Cobalt production
Mine production, thousand metric tonnes Co
COUNTRY* Medium 2017 2017, %
Congo, D.R. 76.9 82.5 59.4
China 8.0 9.0 6.5
Cuba 3.6 3.6 2.6
Papua New Guines 1.2 3.3 2.4
Zambia 4.4 3.2 2.3
Madagascar 1.6 2.8 2.0
Philippines 2.4 2.7 1.9
Morocco 1.6 1.9 1.4
South Africa 1.0 1.1 0.8
Brazil 2.6 0.8 0.6
Zimbabwe 0.2 0.4 0.3
Indonesia 1.6 0.3 0.2
Uganda** 0.3 0.0 0
Botswana*** 0.2 0.0 0
DLPPS Total 105.7 111.7 80.1
World Total 129.2 139.4 100.0
Source: BGS.
* — DLBPS only.
** — Mine production has not been conducted since 2014.
*** — Mine production has not been conducted since 2017.
Note: The value in column Medium corresponds to the average level of the indicator in 2008–2017.
Coloring of indicator values for 2017 means the following: green is for the values, which are higher than the 10-year
average; red is for the values, which are lower than the 10-year average; black is for the values corresponding to the
10-year average.

215
Refinery production (incl. metal, oxides, carbonates, sulphates and other compounds), thousand
metric tonnes
COUNTRY* Medium 2017 2017, %
China 38.3 69.6 58.3
Madagascar 1.5 3.1 2.6
Zambia 4.3 2.5 2.1
Congo, D.R. 2.4 0.2 0.2
Morocco 1.6 1.9 1.6
South Africa 0.9 1.1 0.9
Uganda** 0.3 0.0 0
Brazil 1.2 0.0 0
DLBPS Total 50.6 78.4 65.7
World Total 86.1 119.4 100.0
Source: BGS.
* — DLBPS only.
** — Mine production has not been conducted since 2017.
Note: The value in column Medium corresponds to the average level of the indicator in 2008–2017.
Coloring of indicator values for 2017 means the following: green is for the values, which are higher than the 10-year
average; red is for the values, which are lower than the 10-year average.

216
F. Cobalt export
Export of cobalt ores and concentrates (2605), thousand metric tonnes
COUNTRY* Medium 2017 2017, %
Congo, D.R. 272.1 160.8 92.1
South Africa 2.6 0.2 0.1
China 0.0 0.1 ˂0.1
Brazil 0.1 0.1 ˂0.05
Zambia 12.2 0.1 ˂0.05
Indonesia 7.6 0.0 0
Cuba 4.4 0.0 0
Uganda** 0.2 0.0 0
Morocco 0.1 0.0 0
Botswana*** ˂0.01 0.0 0
DLBPS Total 299.3 161.2 92.3
World Total 311.6 174.6 100.0
Source: ITC.
* — DLBPS only.
** — Mine production has not been conducted since 2014.
*** — Mine production has not been conducted since 2017.
Note: The value in column Medium corresponds to the average level of the indicator in 2008–2017.
Coloring of indicator values for 2017 means the following: green is for the values, which are higher than the 10-year
average; red is for the values, which are lower than the 10-year average; black is for the values corresponding to the
10-year average.
Export of ores and concentrates (2605), million USD
COUNTRY* Medium 2017 2017, %
Congo, D.R. 648.9 524.0 96.7
South Africa 9.1 6.7 1.2
Brazil 0.1 0.3 0.1
China 0.05 0.1 ˂0.05
Zambia 29.7 0.0 0
Cuba 24.7 0.0 0
Uganda** 3.7 0.0 0
Indonesia 0.2 0.0 0
Morocco 0.1 0.0 0
Zimbabwe 0.01 0.0 0
Botswana*** ˂0.01 0.0 0
Vietnam ˂0.01 0.0 0
DLBPS Total 716.6 531.2 98.0
World Total 732.9 541.8 100.0
Source: ITC.
* — DLBPS only.
** — Mine production has not been conducted since 2014.
*** — Mine production has not been conducted since 2017.
Note: The value in column Medium corresponds to the average level of the indicator in 2008–2017.
Coloring of indicator values for 2017 means the following: green is for the values, which are higher than the 10-year
average; red is for the values, which are lower than the 10-year average.

217
Export of cobalt intermediate products of cobalt metallurgy and unwrought cobalt (810520),
thousand metric tonnes
COUNTRY* Medium 2017 2017, %
Congo, D.R. 123.9 214.9 80.1
South Africa 1.0 2.0 0.8
China 3.2 4.2 1.6
Madagascar 1.4 2.8 1.1
Morocco 1.7 2.0 0.7
Zambia 0.5 0.1 0.1
Brazil 0.9 0.0 0.0
Uganda** 0.3 0.0 0.0
Cuba 0.3 0.0 0.0
Zimbabwe 0.01 0.0 0.0
Indonesia ˂0.001 0.0 0.0
Vietnam ˂0.010 0.0 0.0
DLBPS Total 133.0 226.1 84.3
World Total 176.1 268.3 100.0
Source: ITC.
* — DLBPS only.
** — Mine production has not been conducted since 2014.
Note: The value in column Medium corresponds to the average level of the indicator in 2008–2017.
Coloring of indicator values for 2017 means the following: green is for the values, which are higher than the 10-year
average; red is for the values, which are lower than the 10-year average.
Export of cobalt intermediate products of cobalt metallurgy and unwrought cobalt (810520),
million USD
COUNTRY* Medium 2017 2017, %
Congo, D.R. 724.2 1 896.6 52.9
China 129.9 208.7 5.8
Madagascar 47.1 151.9 4.2
Morocco 56.1 79.7 2.2
South Africa 8.8 25.3 0.7
Zambia 3.1 0.5 0.0
Brazil 13.7 ˂0.05 ˂0.001
Uganda** 6.9 0.0 0
Indonesia ˂0.01 0.0 0
Vietnam ˂0.1 0.0 0
Zimbabwe ˂0.1 0.0 0
Cuba 0.9 0.0 0
DLBPS Total 990.8 2 362.8 65.8
World Total 2 194.5 3 588.4 100.0
Source: ITC.
* — DLBPS only.
** — Mine production has not been conducted since 2014.
Note: The value in column Medium corresponds to the average level of the indicator in 2008–2017.
Coloring of indicator values for 2017 means the following: green is for the values, which are higher than the 10-year
average; red is for the values, which are lower than the 10-year average.

218
Export of cobalt oxides and hydroxides (2822), thousand metric tonnes
COUNTRY* Medium 2017 2017, %
Congo, D.R. 23.0 43.2 60.9
Zambia 4.9 8.6 12.2
China 6.3 8.4 11.8
South Africa 0.15 0.15 0.21
Morocco 0.01 0.03 ˂0.05
Brazil 0.03 0.01 ˂0.05
Cuba 0.05 0.06 ˂0.1
DLBPS Total 34.5 60.4 85.2
World Total 43.5 70.9 100.0
Source: ITC.
* — DLBPS only.
Note: The value in column Medium corresponds to the average level of the indicator in 2008–2017.
Coloring of indicator values for 2017 means the following: green is for the values, which are higher than the 10-year
average; red is for the values, which are lower than the 10-year average; black is for the values corresponding to the
10-year average.
Export of cobalt oxides and hydroxides (2822), million USD
COUNTRY* Medium 2017 2017, %
Congo, D.R. 209.4 734.1 56.1
China 170.6 320.4 24.5
Zambia 38.6 150.3 11.5
South Africa 1.7 1.3 0.1
Morocco 0.4 1.3 0.1
Cuba 0.6 0.5 ˂0.05
Brazil 0.6 0.4 ˂0.05
DLBPS Total 421.9 1 208.3 92.4
World Total 603.6 1 308.1 100.0
Source: ITC.
* — DLBPS only.
Note: The value in column Medium corresponds to the average level of the indicator in 2008–2017.
Coloring of indicator values for 2017 means the following: green is for the values, which are higher than the 10-year
average; red is for the values, which are lower than the 10-year average.

219
G. Manganese production
Production of manganese ore, gross weight, thousand metric tonnes
COUNTRY* Medium 2017 2017, %
South Africa 10 456.3 13 889.3 26.9
China 14 615.0 12 500.0 24.2
Gabon 3 556.9 4 163.0 8.1
Ghana 1 672.8 3 003.6 5.8
Brazil 2 751.2 2 880.0 5.6
India 2 523.9 2 589.3 5.0
Malaysia 807.0 1 226.1 2.4
Mexico 515.9 561.6 1.1
Myanmar 389.8 310.0 0.6
Côte d'Ivoire 196.4 295.0 0.6
Morocco 82.1 99.0 0.2
Iran 128.8 80.0 0.2
Turkey 147.6 77.9 0.2
Namibia 66.7 27.9 0.1
Thailand 28.9 13.8 c
Vietnam 23.0 13.4 ˂0.05
Sudan 7.4 9.5 ˂0.05
Kenya 0.9 9.1 ˂0.05
Oman 20.3 9.0 ˂0.05
Egypt** 22.3 0.0 0
DLBPS Total 38 013.4 41 757.5 81.0
World Total 48 612.1 51 556.9 100.0
Source: BGS.
* — DLBPS only.
** — Mine production has not been conducted since 2015.
Note: The value in column Medium corresponds to the average level of the indicator in 2008–2017.
Coloring of indicator values for 2017 means the following: green is for the values, which are higher than the 10-year
average; red is for the values, which are lower than the 10-year average.

220
Production of ferro-silico-manganese, thousand metric tonnes
COUNTRY* Medium 2017 2017, %
China 7 030.5 8 400.0 61.7
India 1 506.5 1 950.0 14.3
Malaysia 21.0 210.0 1.5
South Africa 213.1 210.0 1.5
Brazil 209.0 200.0 1.5
Mexico 137.9 148.1 1.1
Gabon 8.4 30.0 0.2
DLBPS Total 9 126.4 11 148.1 81.9
World Total 11 608.1 13 608.6 100.0
Source: BGS, USGS.
* — DLBPS only.
Note: The value in column Medium corresponds to the average level of the indicator in 2008–2017.
Coloring of indicator values for 2017 means the following: green is for the values, which are higher than the 10-year
average; red is for the values, which are lower than the 10-year average.
Production of ferro-manganese (incl. high-carbon and refined), thousand metric tonnes
COUNTRY* Medium 2017 %
China 2 595.0 2 346.0 41.5
India 459.7 533.7 9.5
Malaysia 29.6 250.7 4.4
South Africa 465.9 248.0 4.4
Brazil 101.9 133.1 2.4
Mexico 72.7 90.0 1.6
Egypt 21.3 12.0 0.2
DLBPS Total 3 746.2 3 613.5 64.0
World Total 5 651.4 5 647.0 100.0
Source: BGS, USGS.
* — DLBPS only.
Note: The value in column Medium corresponds to the average level of the indicator in 2008–2017.
Coloring of indicator values for 2017 means the following: green is for the values, which are higher than the 10-year
average; red is for the values, which are lower than the 10-year average.

221
H. Manganese export
Export of manganese ores and concentrates (2602), thousand metric tonnes
COUNTRY* Medium 2017 2017, %
South Africa 9 312.1 15 604.6 50.4
Gabon 3 204.5 4 478.1 14.5
Brazil 2 009.2 2 683.3 8.7
Côte d'Ivoire 197.3 636.1 2.1
Malaysia 713.6 521.9 1.7
Morocco 95.4 79.0 0.3
Mexico 57.3 73.0 0.2
Thailand 39.5 40.0 0.13
China 49.2 36.3 0.12
Namibia 65.6 31.9 0.10
Turkey 92.7 30.2 0.10
Oman 12.1 15.8 0.05
Kenya 4.9 12.1 0.04
Ghana 1.2 2.3 0.01
India 93.7 2.2 0.01
Iran 1.2 0.5 0.00
Egypt** 4.4 0.1 0.00
Myanmar 0.0 0.0 0.00
Vietnam 0.9 0.0 0.0
Sudan 0.2 0.0 0.0
DLBPS Total 15 954.9 24 247.3 78.3
World Total 23 408.2 30 961.8 100.0
Source: ITC.
* — DLBPS only.
** — Mine production has not been conducted since 2015.
Note: The value in column Medium corresponds to the average level of the indicator in 2008–2017.
Coloring of indicator values for 2017 means the following: green is for the values, which are higher than the 10-year
average; red is for the values, which are lower than the 10-year average.

222
Export of manganese ores and concentrates (2602), million USD
COUNTRY* Medium 2017 2017, %
South Africa 1 452.6 2 527.3 55.9
Gabon 798.9 1 147.7 25.4
Brazil 287.4 365.6 8.1
Ghana 77.4 155.4 3.4
Côte d'Ivoire 20.5 53.0 1.2
Malaysia 33.4 23.2 0.5
Morocco 16.7 17.4 0.4
Mexico 11.5 16.2 0.4
China 11.5 8.0 0.2
Turkey 13.6 4.8 0.1
Thailand 4.6 2.3 0.1
Namibia 6.3 2.0 ˂0.05
Oman 1.1 0.8 ˂0.05
Kenya 0.7 0.7 ˂0.05
India 10.1 0.3 ˂0.05
Iran 0.2 0.2 ˂0.01
Vietnam 1.5 0.1 ˂0.01
Egypt** 3.1 0.05 ˂0.01
Myanmar 0.1 0.01 ˂0.01
Sudan ˂0.05 0.0 0
DLBPS Total 2 751.4 4 326.9 95.6
World Total 4 150.9 4 524.1 100.0
Source: ITC.
* — DLBPS only.
** — Mine production has not been conducted since 2015.
Note: The value in column Medium corresponds to the average level of the indicator in 2008–2017.
Coloring of indicator values for 2017 means the following: green is for the values, which are higher than the 10-year
average; red is for the values, which are lower than the 10-year average; black is for the values corresponding to the
10-year average.

223
Export of ferro-manganese, containing by weight > 2% of carbon (720211), thousand metric tonnes
COUNTRY* Medium 2017 2017, %
Malaysia 32.0 276.6 22.7
India 136.0 228.6 18.8
South Africa 399.0 181.1 14.9
Brazil 12.1 21.0 1.7
Vietnam 1.1 4.4 0.4
China 24.6 2.3 0.2
Mexico 2.6 1.4 0.1
Turkey 0.6 0.6 ˂0.1
Egypt** 1.3 0.1 ˂0.01
Thailand 0.1 0.1 ˂0.01
Oman ˂0.05 0.1 ˂0.01
Iran ˂0.05 0.01 0.0
DLBPS Total 609.5 716.2 58.8
World Total 1048.2 1 218.8 100.0
Source: ITC.
* — DLBPS only.
** — Mine production has not been conducted since 2015.
Note: The value in column Medium corresponds to the average level of the indicator in 2008–2017.
Coloring of indicator values for 2017 means the following: green is for the values, which are higher than the 10-year
average; red is for the values, which are lower than the 10-year average; black is for the values corresponding to the
10-year average.
Export of ferro-manganese, containing by weight > 2% of carbon (720211), million USD
COUNTRY* Medium 2017 2017, %
Malaysia 32.8 300.1 20.7
India 145.7 258.6 17.8
South Africa 395.1 221.5 15.3
Brazil 16.2 22.2 1.5
Vietnam 1.1 5.8 0.4
China 49.6 2.6 0.2
Mexico 3.6 1.7 0.1
Turkey 0.9 0.8 ˂0.1
Egypt** 1.9 0.1 ˂0.01
Thailand 0.1 0.0 ˂0.01
Oman ˂0.01 ˂0.05 ˂0.01
Iran ˂0.05 ˂0.05 ˂0.01
DLBPS Total 646.9 813.4 56.1
World Total 1149.5 1449.6 100.0
Source: ITC.
* — DLBPS only.
** — Mine production has not been conducted since 2015.
Note: The value in column Medium corresponds to the average level of the indicator in 2008–2017.
Coloring of indicator values for 2017 means the following: green is for the values, which are higher than the 10-year
average; red is for the values, which are lower than the 10-year average; black is for the values corresponding to the
10-year average.

224
Export of ferro-manganese, containing by weight ≤ 2% of carbon (720219), thousand metric tonnes
COUNTRY* Medium 2017 2017, %
South Africa 132.6 71.1 16.4
India 17.8 41.2 9.5
Vietnam 6.2 12.1 2.8
Mexico 14.5 10.8 2.5
Brazil 2.3 0.8 0.2
Turkey 1.5 0.8 0.2
China 30.4 0.4 0.1
Malaysia 0.2 0.4 0.1
Thailand 0.1 ˂0.05 ˂0.05
Egypt** 1.1 0.0 0
Iran ˂0.05 0.0 0
Ghana 0.1 0.0 0
Oman 0.2 0.0 0
Gabon 0.1 0.0 0
DLBPS Total 207.0 137.5 31.7
World Total 453.9 433.6 100.0
Source: ITC.
* — DLBPS only.
** — Mine production has not been conducted since 2015.
Note: The value in column Medium corresponds to the average level of the indicator in 2008–2017.
Coloring of indicator values for 2017 means the following: green is for the values, which are higher than the 10-year
average; red is for the values, which are lower than the 10-year average.
Export of ferro-manganese, containing by weight ≤ 2% of carbon (720219), million USD
Country Medium 2017 2017, %
South Africa 180.1 127.0 16.8
India 27.6 64.0 8.5
Vietnam 9.7 23.0 3.0
Mexico 27.2 17.9 2.4
Brazil 6.1 1.5 0.2
Turkey 3.2 1.5 0.2
China 85.4 0.8 0.1
Malaysia 0.3 0.6 0.1
Thailand 0.1 ˂0.05 ˂0.01
Ghana 0.1 0.0 0
Oman 0.1 0.0 0
Egypt** 0.3 0.0 0
Iran ˂0.05 0.0 0
Gabon ˂0.05 0.0 0
DLBPS 340.4 236.2 31.3
World total 762.7 755.8 100.0
Source: ITC.
* — DLBPS only.
** — Mine production has not been conducted since 2015.
Note: The value in column Medium corresponds to the average level of the indicator in 2008–2017.
Coloring of indicator values for 2017 means the following: green is for the values, which are higher than the 10-year
average; red is for the values, which are lower than the 10-year average.

225
Export of ferro-silico-manganese (720230), thousand metric tonnes
COUNTRY* Medium 2017 2017, %
India 699.4 794.6 25.4
Malaysia 21.3 197.5 6.3
South Africa 173.9 124.9 4.0
Vietnam 47.4 59.9 1.9
Brazil 46.9 55.1 1.8
Mexico 30.0 27.8 0.9
Gabon 6.0 24.0 0.8
China 98.0 6.7 0.2
Turkey 1.9 5.2 0.2
Iran 0.2 0.6 0.019
Kenya 0.2 0.6 0.018
Egypt** 0.4 0.3 0.008
Morocco ˂0.05 0.2 0.008
Oman 0.1 0.0 0.000
Thailand ˂0.05 0.0 0.000
DLBPS Total 1 125.8 1 297.3 41.4
World Total 2 872.3 3 132.8 100.0
Source: ITC.
* — DLBPS only.
** — Mine production has not been conducted since 2015.
Note: The value in column Medium corresponds to the average level of the indicator in 2008–2017.
Coloring of indicator values for 2017 means the following: green is for the values, which are higher than the 10-year
average; red is for the values, which are lower than the 10-year average.

226
Export of ferro-silico-manganese (720230), million USD
COUNTRY* Medium 2017 2017, %
India 684.7 801.2 23.5
Malaysia 21.9 204.7 6.0
South Africa 173.3 134.4 3.9
Vietnam 45.2 68.8 2.0
Brazil 56.1 61.1 1.8
Mexico 32.8 31.7 0.9
Gabon 5.5 26.8 0.8
China 169.2 7.4 0.2
Turkey 2.3 8 0.2
Kenya 0.2 0.8 ˂0.05
Iran 0.2 0.4 ˂0.05
Egypt** 0.6 0.3 ˂0.05
Morocco ˂0.05 0.3 ˂0.05
Oman ˂0.05 0.0 0
Thailand ˂0.05 0.0 0
DLBPS Total 1 192.2 1 343.4 39.4
World total Total 3 157.0 3 408.2 100.0
Source: ITC.
* — DLBPS only.
** — Mine production has not been conducted since 2015.
Note: The value in column Medium corresponds to the average level of the indicator in 2008–2017.
Coloring of indicator values for 2017 means the following: green is for the values, which are higher than the 10-year
average; red is for the values, which are lower than the 10-year average.

227
Total annual Gross domestic product of DLBPS (at current prices), million USD
COUNTRY Medium 2017 2017, % from
world GDP
2017, % from
total developing
states GDP
China 8 652 503.4 12 237 781.8 15.20 38.47
India 1 893 637.2 2 575 666.6 3.20 8.10
Brazil 2 123 246.2 2 055 512.2 2.55 6.46
Mexico 1 144 505.5 1 158 229.1 1.44 3.64
Indonesia 829 568.1 1 015 539.0 1.26 3.19
Turkey 834 719.5 851 541.6 1.06 2.68
Saudi Arabia 637 034.6 683 827.1 0.85 2.15
Argentina 525 769.8 637 486.2 0.79 2.00
Iran 478 859.7 460 976.1 0.57 1.45
Thailand 377 870.5 455 302.5 0.57 1.43
South Africa 345 023.8 348 872.1 0.43 1.10
Malaysia 286 992.0 314 707.3 0.39 0.99
Philippines 248 403.5 313 595.1 0.39 0.99
Colombia 310 908.7 309 191.4 0.38 0.97
Pakistan 222 961.8 302 139.5 0.38 0.95
Chile 240 002.5 277 081.0 0.34 0.87
Venezuela 336 205.8 255 092.5 0.32 0.80
Vietnam 159 216.0 223 779.9 0.28 0.70
Peru 174 866.6 211 403.0 0.26 0.66
Egypt 242 993.4 195 135.5 0.24 0.61
Sudan 49 520.0 120 265.8 0.15 0.38
Morocco 100 939.8 109 708.8 0.14 0.34
Cuba 76 309.7 96 851.0 0.12 0.30
Dominican Rep. 61 316.1 75 931.7 0.09 0.24
Guatemala 53 687.5 75 619.6 0.09 0.24
Kenya 53 164.8 74 938.2 0.09 0.24
Oman 67 648.3 70 783.8 0.09 0.22
Myanmar 54 179.1 67 101.9 0.08 0.21
Ghana 50 268.5 58 996.3 0.07 0.19
Tanzania 40 729.3 53 481.4 0.07 0.17
Côte d'Ivoire 29 889.9 38 054.9 0.05 0.12
Congo, D.R. 29 962.7 37 642.5 0.05 0.12
Bolivia 27 281.7 37 508.6 0.05 0.12
Uganda 23 463.3 27 698.8 0.03 0.09
Zambia 22 573.1 25 868.1 0.03 0.08
Papua New Guinea 18 753.4 22 005.8 0.03 0.07
Zimbabwe 13 385.9 18 036.9 0.02 0.06
Botswana 14 239.9 17 406.5 0.02 0.05
North Korea 15 531.1 17 364.7 0.02 0.05
Laos 11 029.5 16 853.1 0.02 0.05
Gabon 15 604.9 14 623.4 0.02 0.05
Namibia 11 578.5 13 244.6 0.02 0.04
Madagascar 11 532.5 13 208.4 0.02 0.04
Mongolia 10 060.7 11 135.0 0.01 0.03

228
COUNTRY Medium 2017 2017, % from
world GDP
2017, % from
total developing
states GDP
Eritrea 3 376.1 5 812.7 0.01 0.02
Mauritania 4 800.3 4 992.1 0.01 0.02
DLBPS Total 20 936 115.3 26 007 994.2 32.31 81.75
World Total 72 631 911.8 80 501 414 100.00 Note: The value in column Medium corresponds to the average level of the indicator in 2008–2017.
Coloring of indicator values for 2017 means the following: green is for the values, which are higher than the 10-year
average; red is for the values, which are lower than the 10-year average.

229
REFERENCES
1. Al Barazi, S. (2018), Rohstoffrisikobewertung – Kobalt, DERA Rohstoffinformationen 36,
Berlin, 120 S., https://www.deutsche-
rohstoffagentur.de/DE/Gemeinsames/Produkte/Downloads/DERA_Rohstoffinformationen/roh
stoffinformationen-36.pdf
2. Alajoutsijärvi K., Mainela T., Ulkuniemi P., Montell E. (2012) Dynamic effects of business
cycles on business relationships. Management Decision. V.50 No 2. pp. 291–304
3. Alves Dias P., Blagoeva D., Pavel C., Arvanitidis N. (2018), Cobalt: demand-supply balances
in the transition to electric mobility. EUR 29381 EN, Publications Office of the European Union,
Luxembourg
4. Amnesty International (2016), This is what we Die For: Human Rights Abuses in the
Democratic Republic of the Congo-Power the Global Trade in Cobalt. URL:
https://www.amnestyusa.org/files/this_what_we_die_for_-_report.pdf
5. Benchmark Minerals Intelligence
https://www.element25.com.au/site/PDF/1771_0/BenchmarkMineralIntelligenceManganeseT
heBlackArt
6. BGS (2014), World Mineral Production 2008–2012, British Geological Survey, Keyworth,
Nottingham, pp. 100, https://www.bgs.ac.uk/mineralsuk/statistics/worldArchive.html
7. BGS (2019), World Mineral Production 2013–2017, British Geological Survey, Keyworth,
Nottingham, pp. 100 https://www.bgs.ac.uk/mineralsuk/statistics/worldArchive.html
8. Bloomberg Finance L.P. Electric Vehicle Outlook 2019. URL: https://about.bnef.com/electric-
vehicle-outlook/#toc-download
9. Bloomberg. News. Nickel Ban Shows Indonesia’s Ambition to Build EV Industry
(29.10.2019) https://www.bloomberg.com/news/articles/2019-10-28/indonesia-will-trade-
nickel-riches-for-an-electric-car-industry?sref=AjlywoTi
10. Bloomberg. News. Nickel Ban Shows Indonesia’s Ambition to Build EV Industry.
29.10.2019. https://www.bloomberg.com/news/articles/2019-10-28/indonesia-will-trade-
nickel-riches-for-an-electric-car-industry
11. Bloomberg. News. There's One Metal Worrying Tesla and EV Battery Suppliers. 05.08.2019.
https://www.bloomberg.com/news/articles/2019-08-05/there-s-one-metal-worrying-tesla-and-
the-ev-battery-supply-chain
12. BloombergNEF. Electric Vehicle Outlook 2019, https://about.bnef.com/electric-vehicle-
outlook/
13. Chalabyan A., Mori L., Vercammen S. (2018), The current capacity shake-up in steel and how
the industry is adapting, McKinsey&Company,
https://www.mckinsey.com/~/media/McKinsey/Industries/Metals%20and%20Mining/Our%20
Insights/The%20current%20capacity%20shake%20up%20in%20steel%20and%20how%20the
%20industry%20is%20adapting/The-current-capacity-shake-up-in-steel-and-how-the-
industry-is-adapting.ashx
14. Chatham House, the Royal Institute of International Affairs, https://resourcetrade.earth/
15. China Mineral Resources (2018), Ministry of Natural Resources, PRC,
https://www.gov.cn/xinwen/2018-
10/22/5333589/files/01d0517b9d6c430bbb927ea5e48641b4.pdf
16. Chinadialogueocean.net. China’s deep-sea mining, a view from the top. 18.10.2019
(https://chinadialogueocean.net/10891-china-deep-sea-exploration-comra/)
17. Cobalt Institute. Production and Supply https://www.cobaltinstitute.org/statistics.html
18. d’Harambure A., 2016. Overview of the Global Manganese Industry with a special focus on
China. International Manganese Institute (IMnI), Metal Bulletin Conference, March 24, 2016,

230
Singapore.
https://www.metalbulletin.com/events/download.ashx/document/speaker/8479/a0ID000000ZP
1jZMAT/Presentation
19. DBS Group Research. Copper and Its Electrifying Future. May 2018. URL:
https://www.dbs.com/aics/templatedata/article/generic/data/en/GR/102018/181004_insights_c
opper_and_its_electrifying_future.xml
20. Djukanovic G. (2019), Manganese, copper and aluminium: The role of these metals in global
battery demand, Battery Materials Europe 2019
https://www.metalbulletin.com/events/download.ashx/document/speaker/E001854/a0I1t00000
I5R1mEAF/Presentation
21. EC (2017), Communication from the Commission to the European Parliament, the Council,
the European Economic and Social Committee and the Committee of the Regions on the 2017
list of Critical Raw Materials for the EU, https://eur-lex.europa.eu/legal-
content/EN/TXT/?uri=CELEX:52017DC0490
22. EC (2017), Critical raw materials, https://ec.europa.eu/growth/sectors/raw-materials/specific-
interest/critical_en
23. Ehrlich L.G. (2018), What drives nickel prices – A structural VAR Approach. HWWI Research
Paper 186. Hamburg Institute of International Economics (HWWI), 44 p. URL:
http://www.hwwi.org/fileadmin/hwwi/Publikationen/Publikationen_PDFs_2018/
HWWI_ResearchPaper_186.pdf
24. Eramet S.A (2019), 2018 Registration document,
https://www.eramet.com/sites/default/files/2019-05/DRF_Eramet_2018_AMF_UK.pdf
25. Euro Manganese Inc. (2019), Manganese, https://www.mn25.ca/manganese
26. EV-volumes.com. Global EV Sales for 2018 – Final Results. URL: http://www.ev-
volumes.com/news/global-ev-sales-for-2018/
27. Faber, B, Krause, B, & Sánchez de la Sierra, R. (2017), Artisanal Mining, Livelihoods, and
Child Labor in the Cobalt Supply Chain of the Democratic Republic of Congo. Center for
Effective Global Action. U. o. California. Policy Report. 62. URL:
https://escholarship.org/content/qt17m9g4wm/qt17m9g4wm.pdf
28. Fu, X., D.N. Beatty, G.G. Gaustad and al. (2020), Perspectives on Cobalt Supply through 2030
in the Face of Changing Demand, Environmental Science and Technology, 2020, 54 (5),
2985–2993
29. Gulf Manganese Corp. Ltd. Quarterly Activities Report Period ended September 30. 31
October 2019, https://www.gulfmanganese.com/wp-content/uploads/2019/10/20191031-
Quarterly-Reports-September.pdf
30. Horizonte Minerals Plc. Investor Presentation Q4 2019 Nickel market.
https://horizonteminerals.com/news/en_20191024-investor-presentation.pdf
31. IMF (2016), The Role of Newly Industrialized Economies in Global Value Chains, IMF
Working Paper, https://www.imf.org/external/pubs/ft/wp/2016/wp16207.pdf
32. IMF (2019), World economic outlook, 2019 October,
https://www.imf.org/en/Publications/WEO/Issues/2019/10/01/world-economic-outlook-
october-2019
33. IMF (2020), World Economic Outlook, April 2020,
https://www.imf.org/en/Publications/WEO/Issues/2020/04/14/weo-april-2020
34. IMnI (2016), 2013 Public Annual Market Research Report,
https://www.manganese.org/files/publications/PUBLIC%20RESEARCH%20REPORTS/2013
_IMnI_Public_Report.pdf
35. IMnI (2019), Statistics 2019, https://www.manganese.org/wp-
content/uploads/2019/05/IMnI_statistics_2019.pdf

231
36. Independence Group NL. Austmine 2019
https://www.igo.com.au/site/PDF/2741_2/Austmine2019Presentation
37. INSG. Press Release. INSG October 2019 Meeting. 22.10.2019 http://insg.org/wp-
content/uploads/2019/10/pressrel_INSG_Press_Release_October2019.pdf
38. Intergovernmental Panel on Climate Change. Emissions Scenarios. 2000. URL:
https://www.ipcc.ch/site/assets/uploads/2018/03/emissions_scenarios-1.pdf
39. International Copper Association, Ltd. Copper Alliance. Copper in EV Charging — An
Emerging Standard Around Wireless Charging. URL:
https://copperalliance.org/trends/copper-in-ev-charging-an-emerging-standard-around-
wireless-charging/
40. International Copper Association, Ltd. Copper Alliance. Future China Transport. November
2019. URL: https://copperalliance.org/wp-content/uploads/2019/11/04-Future-china-transport-
v22.pdf
41. International Copper Association, Ltd. Copper Alliance. The Electric Vehicle Market and
Copper Demand. June 2017. https://copperalliance.org/wp-content/uploads/2017/06/2017.06-
E-Mobility-Factsheet-1.pdf
42. International Copper Association, Ltd. Data Set. Global 2018 Semis End Use Data. URL:
https://copperalliance.org/trends-and-innovations/data-set/
43. International Copper Study Group (2018). Annual Publication. Vol. 15 (www.icsg.org)
44. International Copper Study Group. ICSG 2018 Statistical Yearbook
45. International Copper Study Group. Selected Data. World refined copper production and usage
trends. URL: https://www.icsg.org/index.php/component/jdownloads/finish/165/871
46. International Energy Agency. Global EV Outlook 2019. May 2019. URL:
https://www.iea.org/reports/global-ev-outlook-2019
47. International Monetary Fund (2019), Primary Commodity Price System,
http://data.imf.org/?sk=471DDDF8-D8A7-499A-81BA-
5B332C01F8B9&sId=1547558078595
48. International Nickel Study Group (INSG). About Nickel. Recycle and Environment Issues
https://insg.org/index.php/about-nickel/recycle-and-environment-issues/
49. International Nickel Study Group (INSG). Press Release. INSG October 2019 Meetings.
(22.10.2019)
50. International Nickel Study Group (INSG). World Nickel Statistics. Yearbook. Vol XXVIII.
No. 12. November 2019
51. Interoceanmetal Joint Organization. Preliminary Economic Assessment Technical Report IOM
polymetallic nodules project in CCZ, Pacific Ocean. 2019. (https://iom.gov.pl/wp-
content/uploads/2019/05/pdf-23-Balaz-et-al-2019.pdf)
52. ISA (1985), Statement of the Chairman of Special Commission 1, provisionally concluding the
discussion on the issue of the concrete formulation of the criteria for the identification of
developing land-based producer States likely to be most seriously affected by sea-bed
production. Preparatory Commission for the International Seabed Authority and for the
International Tribunal on the Law of the Sea, Special Commission 1.
LOS/PCN/SCN.1/1985/CRP.8
53. ISA (1992), Draft provisional report of Special Commission 1. Preparatory Commission for the
International Seabed Authority and for the International Tribunal on the Law of the Sea, Special
Commission 1. LOS/PCN/SCN.1/1992/CRP.22
54. JOGMEC (2019), Securing critical materials for Japanese industry, JOGMEC Presentation,
Tokyo, June 2019, http://mric.jogmec.go.jp/wp-
content/uploads/2019/06/mrseminar2019_03_03.pdf

232
55. JRC (2018), Cobalt: demand-supply balances in the transition to electric mobility, European
Commission Technical Report,
https://publications.jrc.ec.europa.eu/repository/bitstream/JRC112285/jrc112285_cobalt.pdf
56. Kuhn T., Wegorzewski A., Rühlemann C., Vink (2017) A Composition, Formation, and
Occurrence of Polymetallic Nodules. In R. Sharma (ed.), Deep-Sea Mining: Resource
Potential, Technical and Environmental Considerations. Springer, pp 23–63
57. London Metal Exchange. Market Data. Reports and data. Monthly averages. URL:
https://www.lme.com/Market-Data/Reports-and-data/Monthly-averages
58. Macquarie Wealth Management Research, 2018. Commodities Comment. URL:
https://www.macquarie.com.au/dafiles/Internet/mgl/au/apps/retail-newsletter/docs/2018-
01/MacquarieCommoditiesComment240118e.pdf
59. McKinsey Global Institute. Beyond The Supercycle: How Technology Is Resharping
Resources. February 2017. URL:
https://www.mckinsey.com/~/media/McKinsey/Business%20Functions/Sustainability/Our%2
0Insights/How%20technology%20is%20reshaping%20supply%20and%20demand%20for%20
natural%20resources/MGI-Beyond-the-Supercycle-Full-report.ashx
60. McKinsey&Company. Metal mining constraints on the electric mobility horizon. April 2018,
https://www.mckinsey.com/industries/oil-and-gas/our-insights/metal-mining-constraints-on-
the-electric-mobility-horizon
61. Metal of Ukraine and the world. FORECAST: Global prices for manganese are promised
stability https://ukrmet.dp.ua/2019/06/07/prognoz-mirovym-cenam-na-marganec-obeshhayut-
stabilnost.html
62. Mining com. Global copper market under supplied, demand on the rise — report. 06.01.2019.
URL: https://www.mining.com/global-copper-market-supplied-demand-rise-report/
63. Mining com. Global wind turbine fleet to consume over 5.5Mt of copper by 2028 — report.
02.09.2019. URL: https://www.mining.com/global-wind-turbine-fleet-to-consume-over-5-
5mt-of-copper-by-2028-report/
64. Mining Review Africa. Battery metals: Long term demand remains strong, 29.01.2020,
https://miningreview.com/battery-metals/battery-metals-long-term-demand-remains-strong-
despite-price-woes/
65. Mining Weekly. Sector News. Gabon’s new mining code to boost revenue, attract investment.
05 August 2019, https://www.miningweekly.com/article/gabons-new-mining-code-to-boost-
revenue-attract-investment-2019-08-05/rep_id:3650
66. Nature.com. Seabed mining is coming — bringing mineral riches and fears of epic extinctions.
24.07.2019 (https://www.nature.com/articles/d41586-019-02242-y)
67. OECD (2016), OECD Due Diligence Guidance for Responsible Supply Chains of Minerals
from Conflict-Affected and High-Risk Areas: Third Edition, OECD Publishing, Paris.
http://dx.doi.org/10.1787/9789264252479-en
68. OECD (2017), Steel Demand Beyond 2030,
http://www.oecd.org/industry/ind/Item_4b_Accenture_Timothy_van_Audenaerde.pdf
69. OECD (2018), Global Material Resources Outlook to 2060. 2018. URL:
https://espas.secure.europarl.europa.eu/orbis/sites/default/files/generated/document/en/OECD.
70. ÖNZ (2018), Cobalt Critical,
https://oenz.de/sites/default/files/oenz_inkota_factsheet_cobalt.critical3.pd
71. Papp J. F., Corathers L. A., Edelstein D. L., Fenton M. D., Kuck P. H., Magyar M. J., 2007. Cr,
Cu, Mn, Mo, Ni, and Steel Commodity Price Influences, Version 1.1: Reston, VA, U.S.
Geological Survey Open-File Report 2007–1257, 112 p. URL:
https://pubs.usgs.gov/of/2007/1257/ofr2007-1257v1.1.pdf

233
72. Petavratzi, E, Gunn, G, Kresse, C. (2019). Commodity review: Cobalt. British Geological
Survey
73. Petersen J. (2019), The Cobalt Cliff Could Eradicate Non-Chinese EV Manufacturing Before
2030, Seeking Alpha, https://seekingalpha.com/article/4273346-cobalt-cliff-eradicate-non-
chinese-ev-manufacturing-2030?app=1&isDirectRoadblock=false
74. PJSC “MMC “Norilsk Nickel”. Annual Report 2018.
https://www.nornickel.ru/upload/iblock/4d0/Godovoy_otchet_2018.pdf
75. PJSC “MMC “NORILSK NICKEL”, Annual Report 2017,
https://ar2017.nornickel.com/download/full-reports/ar_en_annual-report_pages.pdf
76. PR Newswire. 2019 exploration budget recovery falters due to difficult market conditions and
high-profile M&A activity (15.10.2019) https://www.prnewswire.com/news-releases/2019-
exploration-budget-recovery-falters-due-to-difficult-market-conditions-and-high-profile-ma-
activity-300938552.html
77. R. Kirchain et al. (2019), Financial Model of a Nodules Mining Concession. Massachusetts
Institute of Technology
78. Reuters. China's 2020 crude steel output expected to fall -govt research body. 12.12.2019
https://uk.reuters.com/article/china-steel/chinas-2020-crude-steel-output-expected-to-fall-govt-
research-body-idUKB9N28M000
79. Reuters. Commodities. Miners welcome Indonesian export ore ban, plan smelting expansion
https://www.reuters.com/article/us-nickel-indonesia/miners-welcome-indonesian-export-ore-
ban-plan-smelting-expansion-idUSKCN1VW2AP
80. Reuters. Miners welcome Indonesian export ore ban, plan smelting expansion (11.09.2019)
https://mobile.reuters.com/article/amp/idUSKCN1VW2AP
81. Roskill (2019), Manganese Outlook to 2029. https://roskill.com/market-report/manganese/
82. Roskill (2019), Market Reports. Copper. Demand to 2035, 1st Edition. Copper — The Electric
Metal. https://roskill.com/market-report/copper-demand-to-2035/
83. RTI. La production globale de manganиse en Cфte d'Ivoire atteindra le million de tonne en
2017, https://www.rti.ci/info/economie/5423/la-production-globale-de-manganese-en-cote-
divoire-atteindra-le-million-de-tonne-en-2017
84. S&P Global (2019), World Exploration Trends 2018, PDAC Special Edition,
http://www.egcsouthafrica.com/wp-content/uploads/2018/07/20190425_2018-World-
Exploration-Trends.pdf
85. S&P Global Market Intelligence, 2018. SNL Metals & Mining database
86. ScienceDirect. Copper demand, supply, and associated energy use to 2050. 06.06.2016. URL:
https://www.sciencedirect.com/science/article/pii/S0959378016300802
87. ScienceDirect. Estimating global copper demand until 2100 with regression and stock
dynamics. 04.01.2018. URL:
https://www.sciencedirect.com/science/article/pii/S0921344918300041
88. Shedd K. et al. (2017), Global trends affecting the supply security of cobalt. Mining
Engineering, December 2017, pp. 37-42
89. SMM News, China's 1st large manganese-rich mine uncovered in Guizhou, 19.06.2019,
https://news.metal.com/newscontent/100939677/Report:-China%27s-1st-large-manganese-
rich-mine-uncovered-in-Guizhou/
90. SMM. News. Highlights of China's manganese industry in 2018
https://news.metal.com/newscontent/100864496/Highlights-of-China%27s-manganese-
industry-in-2018/
91. Special Report: The hidden risks of the electric car revolution, Global Risk Insights,
31.01.2018, https://globalriskinsights.com/2018/01/electric-car-revolution-risks/

234
92. Stuermer M. (2014), 150 years of boom and bust: what drives mineral commodity prices?
Federal Reserve Bank of Dallas Research Department. Working Paper 1414, 37 p. URL:
https://www.dallasfed.org/~/media/documents/research/papers/2014/wp1414.pdf
93. The ASSAY. Group Mining Magazine. Manganese: No Longer Just an Input on Steel. 03
January 2019 https://www.theassay.com/technology-metals-edition-insight/manganese-no-
longer-just-an-input-on-steel/
94. The Business of Mining (2010). Vertical integration in mining: the trader’s value chain.
21.05.2010 (https://thebusinessofmining.com/2010/05/21/vertical-integration-in-mining-the-
traders-value-chain/)
95. Trade statistics for international business development - Trade Map.
https://www.trademap.org/Index.aspx
96. U.S. Department of Justice (2015), Herfindahl-Hirschman index.
https://www.justice.gov/atr/herfindahl-hirschmanindex
97. UN (1982), United Nations Convention on Law of the Sea (UNCLOS). United Nations, New
York, USA
98. UN (2015), World commodity trends and prospects. Report of the Secretary-General. General
Assembly, United Nations, 24 p. URL:
https://unctad.org/meetings/en/SessionalDocuments/a70d184_en.pdf
99. UN (2015). World commodity trends and prospects. Report of the Secretary-General. General
Assembly, United Nations, 24 p. URL:
https://unctad.org/meetings/en/SessionalDocuments/a70d184_en.pdf
100. UN (2020), World Economic Situation Prospects 2020,
https://unctad.org/en/PublicationsLibrary/wesp2020_en.pdf
101. UNCTAD (2019) Commodities and Development Report 2019,
https://unctad.org/en/pages/PublicationWebflyer.aspx?publicationid=2499
102. UNEP (2011), Recycling Rates of Metals: a status report, International Resource Panel.
http://wedocs.unep.org/bitstream/handle/20.500.11822/8702/-
Recycling%20rates%20of%20metals%3a%20A%20status%20report-
2011Recycling_Rates.pdf?sequence=3&isAllowed=y
103. United Nations Conference on Trade and Development – UNCTADstat. Data center, Economic
trends, National accounts, GDP by type of expenditure, VA by kind of economic activity.
https://unctadstat.unctad.org/wds/TableViewer/tableView.aspx?ReportId=95
104. United Nations Environment Programme (2007). Global Environment Outlook – environment
for development (GEO-4). https://wedocs.unep.org/bitstream/handle/20.500.11822/7646/-
Global%20Environment%20Outlook%20%204%20(GEO-4)-
2007768.pdf?sequence=3&isAllowed=y
105. USGS (2010), Cobalt, 2007 Minerals Yearbook, https://s3-us-west-2.amazonaws.com/prd-
wret/assets/palladium/production/mineral-pubs/cobalt/myb1-2007-cobal.pdf
106. USGS (2011), Estimates of Electricity Requirements for the Recovery of Mineral
Commodities, with Examples Applied to Sub-Saharan Africa,
https://pubs.usgs.gov/of/2011/1253/report/OF11-1253.pdf
107. USGS (2013), Metal prices in the United States through 2010: U.S. Geological Survey Scientific
Investigations Report 2012–5188. http://pubs.usgs.gov/sir/2012/5188
108. USGS (2013), Metals and Minerals: U.S. Geological Survey Minerals Yearbook 2013.
https://pubs.er.usgs.gov/publication/70048194
109. USGS (2016), Advance Data Release of the 2016 Annual Tables, Metals and Minerals: U.S.
Geological Survey Minerals Yearbook 2016. URL: https://www.usgs.gov/centers/nmic/cobalt-
statistics-and-information

235
110. USGS (2017), Cobalt, Chapter F of Critical Mineral Resources of the United States—
Economic and Environmental Geology and Prospects for Future Supply,
https://pubs.usgs.gov/pp/1802/f/pp1802f.pdf
111. USGS (2019), Cobalt (advance release), 2016 Minerals Yearbook, https://prd-wret.s3-us-west-
2.amazonaws.com/assets/palladium/production/atoms/files/myb1-2016-cobal.pdf
112. USGS (2019), Manganese [advance release], 2015 Minerals Yearbook, https://prd-wret.s3-us-
west-2.amazonaws.com/assets/palladium/production/atoms/files/myb1-2015-manga.pdf
113. USGS. Mineral Commodity Summaries 1996, https://prd-wret.s3-us-west-
2.amazonaws.com/assets/palladium/production/atoms/files/mcs-1996ocr.pdf
114. USGS. Mineral Commodity Summaries 2017, https://s3-us-west-2.amazonaws.com/prd-
wret/assets/palladium/production/mineral-pubs/mcs/mcs2017.pdf
115. USGS. Mineral Commodity Summaries 2020,
https://pubs.usgs.gov/periodicals/mcs2020/mcs2020.pdf
116. USGS. National Minerals Information Center. Historical Statistics for Mineral and Material
Commodities in the United States (2016 version),
https://www.usgs.gov/centers/nmic/historical-statistics-mineral-and-material-commodities-
united-states
117. Vale S.A. Electric Vehicle Revolution and Implications for New Energy Metals. Mining and
Steel Conference 2018, http://www.vale.com/EN/investors/information-market/presentations-
webcast/PresentationsWebcastsDocs/BofA%20-%20May%202018%20-
%20Bob%20Morris%20vFinal_i.pdf
118. Van Zyl H.J., Bam W.G., Steenkamp J.D. (2016) identifying barriers faced by key role players
in the South African manganese industry. SAIIE27 Proceedings, Stonehenge, South Africa
(https://www.researchgate.net/publication/309556467_Identifying_barriers_faced_by_key_rol
e_players_in_the_South_African_manganese_industry)
119. World Bank Commodity Price Data - The Pink Sheet. URL:
https://www.worldbank.org/en/research/commodity-markets#1
120. World Bank Group (2020), World Development Report 2020: Trading for Development in the
Age of Global Value Chains, https://openknowledge.worldbank.org/handle/10986/32437
121. World Bureau of Metal Statistics. URL: https://world-bureau.com/
122. World Steel Association (2019), Steel Statistical Yearbook 2019: concise version,
https://www.worldsteel.org/en/dam/jcr:7aa2a95d-448d-4c56-b62b-
b2457f067cd9/SSY19%2520concise%2520version.pdf
Copyright © 2022 FDOKUMEN