Untitled - Bangalore Development Authority
214
-
Upload
khangminh22 -
Category
Documents
-
view
3 -
download
0
Transcript of Untitled - Bangalore Development Authority
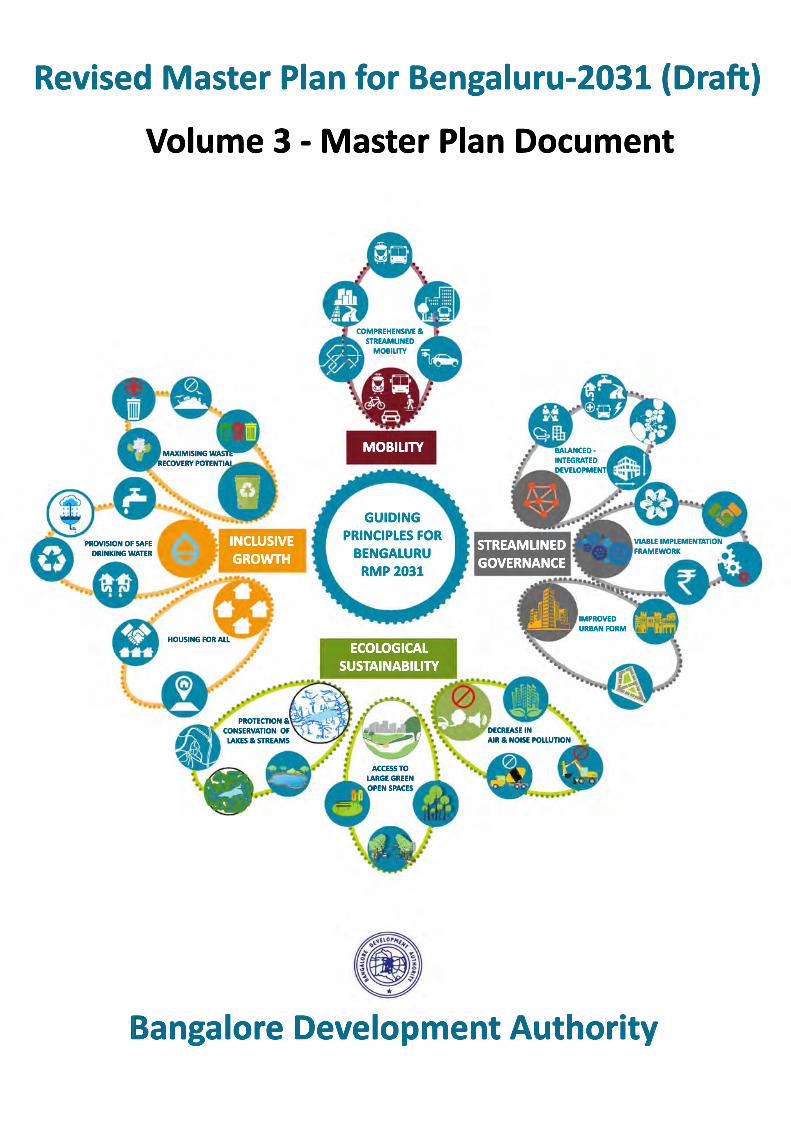

Revised Master Plan for Bengaluru - 2031 (Draft): Volume-3
i
TABLE OF CONTENT
1 INTRODUCTION........................................................................................................................................ 1
1.1 An Overview .................................................................................................................................... 1
1.2 Master Plan Preparation- Provisions under the KTCP Act .................................................................. 1
1.3 Constitution of BDA ......................................................................................................................... 2
1.4 Local Planning Area of BDA for RMP 2031 ........................................................................................ 2
1.5 Structure of the Master Plan Document ........................................................................................... 2
2 REGIONAL CONTEXT................................................................................................................................. 3
2.1 Introduction .................................................................................................................................... 3
2.2 Administrative Jurisdictions in BMR ................................................................................................. 4
2.3 Urbanisation in the BMR .................................................................................................................. 5
2.4 Urban Growth Directions in the BMR ............................................................................................... 6
2.5 Economy of BMA in the regional context.......................................................................................... 7
2.6 Industrial Infrastructure: Industrial Estates and SEZs ........................................................................ 8
2.7 Environmental Features in the Region .............................................................................................. 9
2.8 Regional Transportation Network .................................................................................................. 10
3 LOCAL PLANNING AREA OF BDA ............................................................................................................. 12
3.1 Notifications for LPA of BDA ........................................................................................................... 12
3.2 Administrative Units in LPA ............................................................................................................ 13
4 SURVEYS AND STUDIES........................................................................................................................... 16
4.1 General ......................................................................................................................................... 16
4.2 Data from Secondary Sources ........................................................................................................ 16
4.3 Primary Surveys ............................................................................................................................. 17
4.4 Studies Conducted ......................................................................................................................... 20
5 BASE MAP AND EXISTING LAND USE MAP .............................................................................................. 22
5.1 Relevance of GIS in Master Planning .............................................................................................. 22
5.2 Application of GIS in RMP-2031...................................................................................................... 23
5.3 Methodology for Base Map and ELU .............................................................................................. 24
5.4 Base Map Preparation ................................................................................................................... 25
5.4.1 Process & Methodology ............................................................................................................. 25
5.4.2 Final Base Map .......................................................................................................................... 28

Revised Master Plan for Bengaluru - 2031 (Draft): Volume-3
ii
5.5 Existing Land Use Map ................................................................................................................... 28
6 DEMOGRAPHY ....................................................................................................................................... 31
6.1 Census Data ................................................................................................................................... 31
6.2 Population Trends.......................................................................................................................... 31
6.3 Spatial Distribution of Population in BMA....................................................................................... 32
6.4 Density of Population .................................................................................................................... 34
6.5 Birth and Death Rate ..................................................................................................................... 35
6.6 Migration ...................................................................................................................................... 35
6.7 Sex Ratio........................................................................................................................................ 36
6.8 Literacy Rate .................................................................................................................................. 37
6.9 Population Age Pyramid ................................................................................................................. 37
6.10 Household Size .............................................................................................................................. 38
6.11 Population Projections ................................................................................................................... 39
6.12 Future Age Distribution .................................................................................................................. 40
7 ECONOMY ............................................................................................................................................. 42
7.1 Economy of Bengaluru- The Historical Perspective ......................................................................... 42
7.2 Major Sectors of Economy ............................................................................................................. 44
7.3 Workers......................................................................................................................................... 44
7.4 Occupational Structure .................................................................................................................. 46
7.5 Current State of Industries ............................................................................................................. 46
7.6 Special Economic Zones in BMA ..................................................................................................... 47
7.7 Industrial Infrastructure within BMA .............................................................................................. 48
7.8 Establishments .............................................................................................................................. 48
7.9 Hierarchy of Commercial Areas/ Markets ....................................................................................... 50
7.10 Employment by Sector ................................................................................................................... 52
7.11 Workforce Participation and Employment Projections.................................................................... 54
8 ENVIRONMENT ...................................................................................................................................... 56
8.1 Climatology ................................................................................................................................... 56
8.1.1 Temperature ............................................................................................................................. 56
8.1.2 Rainfall ...................................................................................................................................... 57
8.1.3 Relative Humidity ...................................................................................................................... 59
8.1.4 Wind Speed and Wind Direction ................................................................................................ 59
8.2 Geology & Topography .................................................................................................................. 62
8.2.1 Geo Technical Characteristics (Seismicity) .................................................................................. 64
8.2.2 Topography & Contours ............................................................................................................. 65

Revised Master Plan for Bengaluru - 2031 (Draft): Volume-3
iii
8.3 Environmentally Sensitive Areas .................................................................................................... 66
8.3.1 Forests ...................................................................................................................................... 66
8.3.2 Eco –Sensitive Zone of Bannerghatta National Park (BNP) .......................................................... 67
8.3.3 Historical Trees .......................................................................................................................... 69
8.3.4 Historical gardens in BMA .......................................................................................................... 69
8.3.5 Conservation Zones along Arkavathi River and Thippagondanahalli Reservoir ............................ 70
8.4 Natural Drainage System and Classification of Streams .................................................................. 71
8.4.1 Natural Drainage System ........................................................................................................... 71
8.4.2 Natural Drainage Classification .................................................................................................. 74
8.5 Mining and Quarrying Areas within BMA ........................................................................................ 75
8.6 Environmental Pollution ................................................................................................................ 76
8.6.1 Air Pollution .............................................................................................................................. 76
8.6.2 Noise Pollution .......................................................................................................................... 76
8.6.3 Water Pollution ......................................................................................................................... 78
8.6.4 Mapping Pollution Hotspots in BMA .......................................................................................... 78
8.7 Mater Plan Proposals and Strategies .............................................................................................. 79
9 HOUSING, REAL ESTATE ASSESSMENT AND ADDITIONAL LAND REQUIREMENTS FOR 2031 ..................... 81
9.1 Housing ......................................................................................................................................... 81
9.1.1 Existing Housing Situation .......................................................................................................... 81
9.1.2 Characteristics of the Tracked Residential Market ...................................................................... 83
9.1.3 Additional Housing Demand for 2031......................................................................................... 83
9.1.4 Additional Land Requirement for Residential Use by 2031 ......................................................... 83
9.1.5 Housing Strategy of RMP 2031- Focus on Affordable Housing .................................................... 85
9.2 Assessment of Industrial and Service Sector Offices ....................................................................... 86
9.2.1 Nature of Demand ..................................................................................................................... 86
9.2.2 Built Space Assessment ............................................................................................................. 86
9.2.3 Additional Land Requirement .................................................................................................... 86
9.3 Assessment of Land for Other Major Uses ...................................................................................... 87
9.4 Additional Land Requirement for RMP 2031................................................................................... 87
10 CONURBATION LIMIT 2031 AND PROPOSED LAND USE ........................................................................... 88
10.1 Considerations for Extension of Conurbation Limits ....................................................................... 88
10.2 Land Use Strategy for RMP 2031 .................................................................................................... 90
10.3 Proposed Land Use 2031 ................................................................................................................ 92
11 TRAFFIC AND TRANSPORTATION ............................................................................................................ 94
11.1 Traffic and Transport Scenario in Bengaluru ................................................................................... 94
11.2 Model Development for the Revision of Master Plan...................................................................... 95
11.3 Forecast Scenario .......................................................................................................................... 95
11.4 Approach to Traffic and Transport Planning of the BMA ................................................................. 96
Revised Master Plan for Bengaluru - 2031 (Draft): Volume-3
iv
11.5 Transport Strategy ......................................................................................................................... 97
11.6 Traffic and Transportation Proposals .............................................................................................. 98
11.6.1 Circulation Plan ..................................................................................................................... 98
11.6.2 Public Transport Systems ..................................................................................................... 101
11.6.3 Bus Augmentation ............................................................................................................... 102
11.6.4 Interstate Bus Terminal ....................................................................................................... 102
11.6.5 Intermodal Interchange ....................................................................................................... 103
11.6.6 Freight/ Goods Infrastructure .............................................................................................. 103
12 PHYSICAL AND SOCIAL INFRASTRUCTURE ............................................................................................. 104
12.1 Water and Waste Water .............................................................................................................. 104
12.2 Municipal Solid Waste ................................................................................................................. 107
12.2.1 Municipal Solid Waste Generation ....................................................................................... 108
12.2.2 Waste Streams & Composition – BMA ................................................................................. 109
12.2.3 Waste Segregation, Collection & Transportation .................................................................. 110
12.2.4 Waste Disposal .................................................................................................................... 113
12.3 Construction & Demolition (C&D) Waste ...................................................................................... 114
12.4 Power Infrastructure.................................................................................................................... 115
12.4.1 Existing Situation and Trends ............................................................................................... 115
12.4.2 Power Demand/ Forecast and Land Demand ....................................................................... 118
12.4.3 Use of Renewal Energy ........................................................................................................ 120
12.5 Social Infrastructure..................................................................................................................... 120
12.5.1 Educational Infrastructure ................................................................................................... 120
12.5.2 Healthcare Infrastructure: ................................................................................................... 122
12.5.3 Public Open Spaces ............................................................................................................. 123
12.5.4 Sports Complex (city level sports facilities)........................................................................... 124
12.5.5 Fire Stations ........................................................................................................................ 125
12.5.6 Art and Cultural Infrastructure ............................................................................................. 125
12.5.7 Markets............................................................................................................................... 125
12.5.8 Cemetry and Graveyard ....................................................................................................... 125
12.5.9 Night Shelters ...................................................................................................................... 125
12.5.10 Women’s Hostels ................................................................................................................ 126
13 DISASTER AND HAZARD MANAGEMENT ............................................................................................... 127
13.1 Introduction ................................................................................................................................ 127
13.2 Hazard Risk Assessment ............................................................................................................... 127
13.3 Hazards Affecting Bengaluru ........................................................................................................ 127
13.3.1 Earthquake .......................................................................................................................... 127
13.3.2 Urban Floods in Bengaluru................................................................................................... 128
13.3.3 Environmental Pollution ...................................................................................................... 128
13.3.4 Water Scarcity ..................................................................................................................... 129
13.3.5 Hazards Associated with Waste ........................................................................................... 130
13.3.6 Hazards due to Traffic Congestion ....................................................................................... 131
13.3.7 Fire Hazards ........................................................................................................................ 131
Revised Master Plan for Bengaluru - 2031 (Draft): Volume-3
v
13.3.8 Industrial and Chemical Hazards .......................................................................................... 132
13.4 Probabilistic Hazard Assessment .................................................................................................. 133
13.5 Institutional Framework for Disaster Management in BMA .......................................................... 134
13.6 Hazard Mitigation and Disaster Management............................................................................... 134
14 HERITAGE CONSERVATION AND PROTECTION ...................................................................................... 136
14.1 Need for addressing Heritage Conservation in BMA ..................................................................... 136
14.2 Identification and Listing of Heritage Sites .................................................................................... 137
14.2.1 Brief Historical Context of Bengaluru ................................................................................... 137
14.2.2 Identification and Listing of Heritage Sites in Bengaluru. ...................................................... 141
14.3 Classification of Heritage Sites ..................................................................................................... 143
14.3.1 Architectural and Built heritage ........................................................................................... 143
14.3.2 Natural Heritage .................................................................................................................. 144
14.3.3 Cultural and Intangible heritage........................................................................................... 144
14.4 Delineation of Heritage Zones and Heritage Precincts .................................................................. 145
15 URBAN DESIGN .................................................................................................................................... 147
15.1 Urban Design Strategies for RMP 2031 ......................................................................................... 147
15.2 Urban Design Scheme .................................................................................................................. 148
15.3 Providing for Well-Designed Public Realm .................................................................................... 148
15.3.1 Promoting Lake front and treatment to Buffer Areas for water bodies ................................. 148
15.3.2 Providing Streetscape and Avenue Plantation ...................................................................... 148
15.3.3 Parks and Open Spaces ........................................................................................................ 148
15.4 Universal Accessibility .................................................................................................................. 149
16 MASTER PLAN PROJECTS AND PHASING ............................................................................................... 152
16.1 Project Listing .............................................................................................................................. 152
16.2 Phasing and Responsible Agencies ............................................................................................... 155
17 IMPLEMENTATION AND FINANCIAL FRAMEWORK ................................................................................ 163
17.1 Institutional Framework ............................................................................................................... 163
17.1.1 Role of Metropolitan Planning Committee ........................................................................... 163
17.1.2 Strengthening the Master Plan Implementation Process within BDA .................................... 163
17.1.3 Coordination with Adjoining LPAs ........................................................................................ 164
17.1.4 BDA and BBMP Coordination ............................................................................................... 164
17.1.5 Municipalisation of Conurbation Limit ................................................................................. 164
17.2 Financial Framework for RMP-2031 ............................................................................................. 165
17.2.1 Land Procurement ............................................................................................................... 165
17.2.2 Development Cost ............................................................................................................... 165
17.3 RMP Implementation Monitoring Mechanism .............................................................................. 167
ANNEXURE – 1: SCHEDULE OF LPA OF BDA ................................................................................................... 168
Revised Master Plan for Bengaluru - 2031 (Draft): Volume-3
vi
LIST OF TABLES Table 2-1: Districts in BMR 4
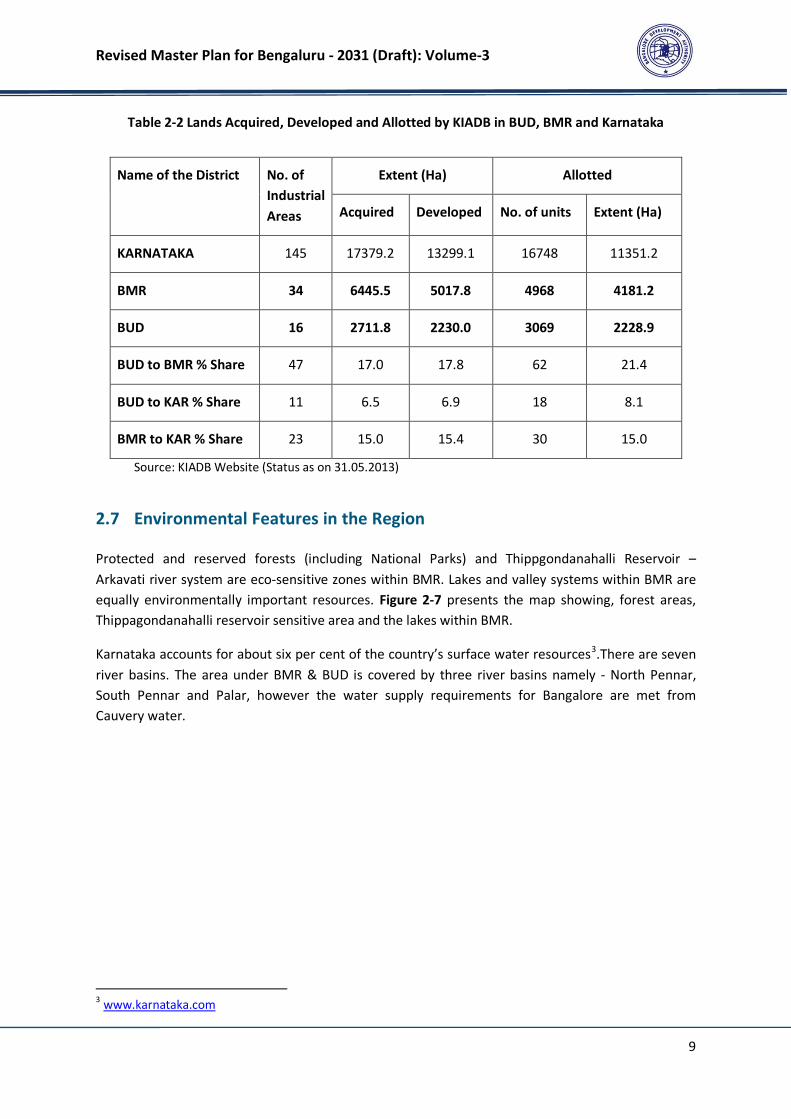
Table 2-2 Lands Acquired, Developed and Allotted by KIADB in BUD, BMR and Karnataka 9
Table 5-1: ELU Area Statement 29
Table 6-1: Population Trends for BMA 31
Table 6-2: Population Distribution in BMA 32
Table 6-3: Variation in Densities for different spatial units 34
Table 6-4: Migrants in Bangalore Urban Agglomeration 36
Table 6-5: Sex Ratio in BMA 37
Table 6-6: Households & Household Size in BMA 38
Table 6-7: Observed & Projected Population Range for BMA: 1971-2031 (in ‘00000) 39
Table 6-8: Strategic Age Distribution Pattern 40
Table 6-9: Projected age distribution of population for BMA for 2011, 2021 and 2031 41
Table 7-1: Key Economic Timelines OF Bengaluru 42
Table 7-2 : Workforce Participation Rate (WPR) 46
Table 7-3: Nine-Fold Classification of Census Workers 1991 and 2001 46
Table 7-4: Establishments by number of Workers in Bengaluru Urban District 49
Table 7-5: Workforce Participation Rate Trend BMA, BUD and BMR 52
Table 7-6: Existing (2016) Population, Workers and Employment in BMA and BMR 52
Table 7-7: Sectoral Share of Workers 52
Table 7-8: Comparison of Work Force in BMA 55
Table 7-9: Employment Projections for BMA 55
Table 8-1: Prevalent Wind Direction (period 1971-2000) 60
Table 8-2: Heritage trees by Karnataka Bio Diversity Board 69
Table 8-3: Regulations of Zones of Arkavathy and T.G. Halli Buffer Areas 70
Table 10-1: Proposed Land Use Area Statement 92
Table 11-1: Inventory of Existing and Proposed Primary Circulation Network (Category-1 Projects) 99
Table 12-1 Waste Generation Estimates for BMA 109
Table 12-2: Projected Composition of Total solid waste for 2031 - BMA 110
Table 12-3: Proposed Units for processing of Dry waste generated 113
Table 12-4: Approved C&D waste management sites designated by BBMP for each zone 115
Table 12-5: Summary of Power Consumption Trend for BMAZ 117
Table 12-6: 19th Electric Power Survey Forecast for Energy and Peak Demand for BMAZ 118
Table 12-7: Details of Existing and Additionally Required Sub-Stations 119
Table 12-8: Land Requirement of Sub-stations 119
Table 12-9: Indian Electric Rules, 1956 prescribed Safe Distance for Buildings 119
Table 12-10: Number of existing government and private schools in each category 121
Table 12-11 Categories of Parks and Open spaces 124
Table 13-1 Probabilistic Hazard Risk Assessment 134
Table 14-1: List of Protected Monuments in BMA 141
Table 16-1: Phasing of Master Plan Programme and Projects 156
Revised Master Plan for Bengaluru - 2031 (Draft): Volume-3
vii
LIST OF FIGURES
Figure 2-1: Location of Karnataka, BMR & BMA................................................................................................. 3
Figure 2-2: Planning Authorities in the BMRDA ................................................................................................. 5
Figure 2-3: Urban Growth Pattern in BMR ......................................................................................................... 6
Figure 2-4: GDDP Share of BUD & BMR to Karnataka GSDP ............................................................................... 7
Figure 2-5: District wise GDDP & Its share to State GSDP (2012-13) ................................................................... 7
Figure 2-6: Per capita Income Growth in BUD, BMR, Karnataka and India .......................................................... 8
Figure 2-7: Environmentally Sensitive Zones in BMR ....................................................................................... 10
Figure 2-8: Regional Transport Network of BMR ............................................................................................. 11
Figure 3-1: Local Planning Area of Bangalore Development Authority ............................................................. 13
Figure 3-2: Villages falling Partly & Fully within LPA of BMICAPA ..................................................................... 14
Figure 3-3: Extent of BBMP within LPA of BDA and LPA of BMICAPA................................................................ 15
Figure 4-1: Locations of Traffic and Transportation Surveys............................................................................. 18
Figure 4-2: Comprehensive Socio-Economic Survey - Wards and Villages ........................................................ 19
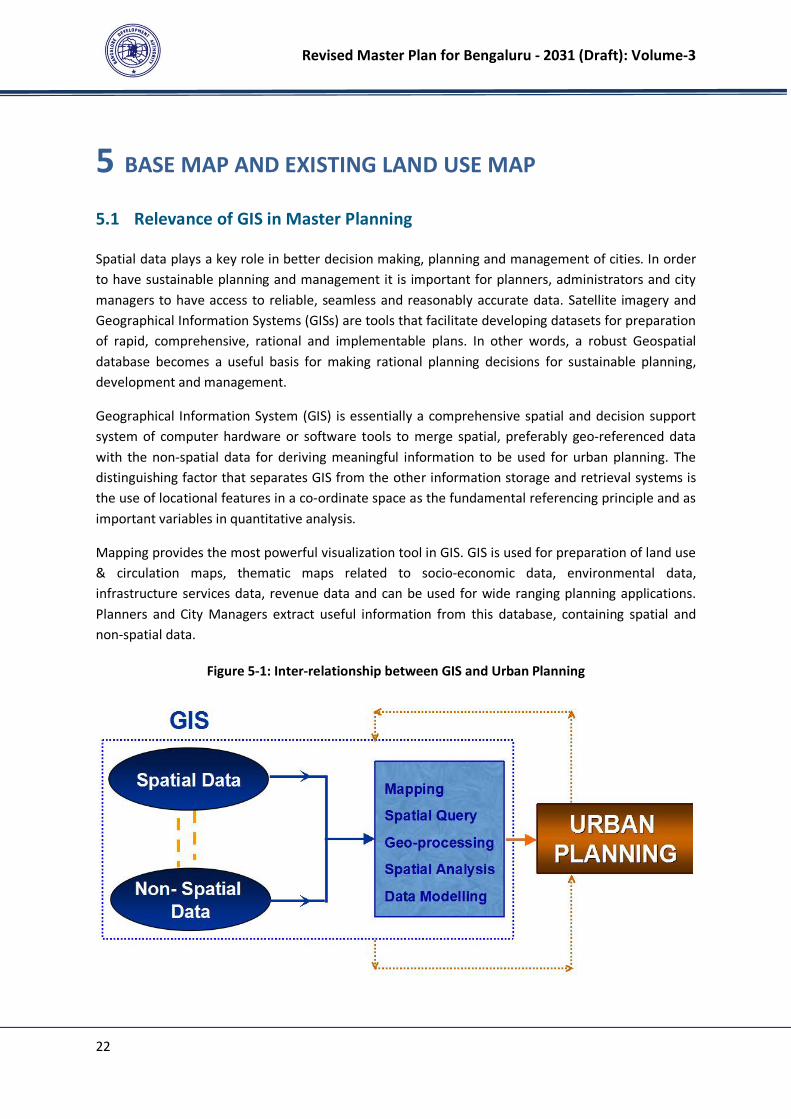
Figure 5-1: Inter-relationship between GIS and Urban Planning....................................................................... 22
Figure 5-2: Evolution and Usefulness of a GIS for Urban Planning .................................................................... 23
Figure 5-3: Overall Methodology for Preparation of Base Map & Existing Land Use Map ................................. 24
Figure 5-4: Process of Cadastral Base Map Preparation with Survey Point Collection ....................................... 26
Figure 5-5: Process of Survey point Integration with Cadastral Base Map & Mosaicking .................................. 27
Figure 5-6: Existing Land Use Map of BMA ...................................................................................................... 30
Figure 6-1: Population Growth in BMA (2001 to 2011) .................................................................................... 32
Figure 6-2: Population Distribution within BMA .............................................................................................. 33
Figure 6-3: Population Distribution in BMA ..................................................................................................... 33
Figure 6-4: Population Density of BMA 2001 ................................................................................................... 34
Figure 6-5: Population Density of BMA 2011 ................................................................................................... 35
Figure 6-6: Reason for Migration - 2001 .......................................................................................................... 36
Figure 6-7: Population Pyramid of BMA for past three Decades....................................................................... 38
Figure 7-1: Sectoral GDDP Share trends for Bengaluru Urban District (1991, 2001 and 2011)........................... 45
Figure 7-2: Exports from SEZs ......................................................................................................................... 47
Figure 7-3: KIADB Industrial Areas in and around BMA .................................................................................... 48
Figure 7-4: Ward-wise concentration of number of Establishments in BBMP ................................................... 50
Figure 7-5: Markets in BMA ............................................................................................................................ 51
Figure 7-6: Share of Major Sectors of Employment for Bangalore Urban District ............................................. 53
Figure 8-1: Average Monthly variation of Temperature for period 2001-2013 in BMA ..................................... 57
Figure 8-2: Average Monthly variation of Rainfall for period 2001-2013 .......................................................... 57
Figure 8-3: Grid Density Map of Heavy Rainfall in BMA ................................................................................... 58
Figure 8-4: Monthly Average Relative Humidity .............................................................................................. 59
Figure 8-5: Month wise Average Mean of Wind Speed (in km/hr) .................................................................... 60
Figure 8-6: Annual Windrose at 08:30 hr ......................................................................................................... 61
Figure 8-7: Geology and Mineral Map of BMA................................................................................................. 62
Figure 8-8: Geomorphological Map of BMA .................................................................................................... 63
Figure 8-9: Thirty Two Seismic Zones of India .................................................................................................. 64
Figure 8-10: Topography (Digital Surface Model) of BMA ................................................................................ 65
Figure 8-11: Contour Map of BMA .................................................................................................................. 66
Figure 8-12: Forests Areas within BMA ........................................................................................................... 67
Figure 8-13: Extents of Eco-Sensitive zone of Bannerghatta National Park in BMA ........................................... 68

Revised Master Plan for Bengaluru - 2031 (Draft): Volume-3
viii
Figure 8-14: Two Catchments in BMA ............................................................................................................. 72
Figure 8-15: Four Major Watersheds in BMA .................................................................................................. 72
Figure 8-16: Lake Series in the Valleys of BMA ................................................................................................ 73
Figure 8-17: Drainage Classification ................................................................................................................ 74
Figure 8-18: Map showing Location of Mining and Quarrying Sites in BMA ...................................................... 75
Figure 8-19: Traffic Congestion (2015) ............................................................................................................ 77
Figure 8-20: Environment Pollution Hotspots (2015) ....................................................................................... 78
Figure 9-1: Spatial Distribution of Slums across BMA ...................................................................................... 82
Figure 10-1: Proposed Conurbation Limit for RMP 2031 ................................................................................. 89
Figure 10-2: Proposed Land Use for RMP 2031 (draft) .................................................................................... 93
Figure 11-1: Map showing Over-capacity links as per Business as Usual or Do Nothing scenario for BMA 2031 96
Figure 11-2: Map showing Proposed Primary Circulation Network- RMP 2031................................................. 98
Figure 11-3: Map showing Proposed Public Transport Network of RMP 2031 ................................................ 103
Figure 12-1: Integrated Solid Waste Management System Hierarchy ............................................................. 107
Figure 12-2: Waste Composition - BMA......................................................................................................... 110
Figure 12-3: Waste Segregation Guidelines ................................................................................................... 111
Figure 12-4: Waste Collection & Transportation Process ............................................................................... 111
Figure 12-5: Dry Waste Flow ......................................................................................................................... 112
Figure 12-6: Wet Waste Flow ........................................................................................................................ 112
Figure 12-7: BESCOM Zones .......................................................................................................................... 116
Figure 12-8: BESCOM BMAZ and Bengaluru Metropolitan Area Overlay ........................................................ 116
Figure 12-9: BMAZ Peak Demand (2004-2015) .............................................................................................. 117
Figure 12-10: 19th Electric Power Survey Forecasts for BMAZ ....................................................................... 118
Figure 12-11 Spatial spread of schools within Bengaluru Metropolitan Area ................................................. 121
Figure 12-12: Healthcare Facility Accessibility ............................................................................................... 123
Figure 13-1: Areas of High Fire Risk within BMA ............................................................................................ 132
Figure 14-1: Chronological Heritage mapping................................................................................................ 139
Figure 14-2: Map showing Bangalore 1850, distinctly showing the Petta and the Cantonment ...................... 140
Figure 14-3: Protected Monuments in Bengaluru .......................................................................................... 142
Figure 14-4: Classification of Heritage Sites in BMA ....................................................................................... 143
Revised Master Plan for Bengaluru - 2031 (Draft): Volume-3
ix

Revised Master Plan for Bengaluru - 2031 (Draft): Volume-3
1
1 INTRODUCTION
1.1 An Overview
Bengaluru, a multifunctional Metropolitan and the capital city of Karnataka, is one of the fastest
growing cities in India and is branded as the ‘Silicon Valley of India’ for spearheading the growth of
Information and Communication Technology (ICT) based industries. Bangalore has become a
cosmopolitan city attracting people and business alike, within India and internationally and has
become a symbol of India’s integration with the global economy. With the growth of IT and
industries in other sectors (e.g. textiles, light engineering and defence) and the onset of economic
liberalization since the early 1990s, Bangalore has taken a lead in service-based industries fuelling
growth of the city both economically and spatially.
The city has grown rapidly in the past few decades from pensioner’s paradise to the information
technology capital of India. The presence of IT/ITES industries, large public sector undertakings like
BEL, BEML and HAL, along with major hardware garment industries has led to in-migration and rapid
growth of the city. Bengaluru has also emerged as the start-up hub of the nation, bringing innovation
and contribution to GDP, diversity of economy and adding to employment opportunities. The city is
also a major education hub with a very large number of higher educational institutions in and
around the city.
Bengaluru, with its strong economic base, contributes about 1.9% to India’s GDP (2013-14) and 34%
to Karnataka’s GSDP (2013-14). The Metropolis houses about 40% of urban population of Karnataka
and has witnessed 42% growth in population during the decade 2001-2011, thus playing the role of a
primate city in the State. In context of the State, the population in the city of Bengaluru accounts for
nearly 14.60% of the State’s population concentrated in only about 0.64% of land area.
1.2 Master Plan Preparation- Provisions under the KTCP Act
The Master Plan for any local planning area in the State of Karnataka is prepared under the
provisions of Section 9 of the Karnataka Town and Country Planning Act 1961 (KTCP Act, 1961). The
Master Plan is to be revised once every ten years as per the provisions of Section 13D of the KTCP
Act, 1961. The Master Plan for BMA (i.e. RMP 2015), prepared and approved on June 25, 2007 is
currently in force.
As per Section 81B for the KTCP Act, 1961, the Bangalore Development Authority is the Local
Planning Authority and BDA is exercising the powers, perform the functions and discharging the
duties under the provisions of the KTCP Act, 1961 as the Local Planning Authority for the Bengaluru
Local Planning Area

Revised Master Plan for Bengaluru - 2031 (Draft): Volume-3
2
1.3 Constitution of BDA
The Government of Karnataka (GoK) constituted the Bangalore Development Authority (BDA) in
1976 under separate statute, viz. the Bangalore Development Authority Act, 1976 with the functions
related to planning, development, enforcement and implementation of the schemes coming under
one agency to achieve coordinated development activities of the city. Under the aegis of BDA there
have been continuous efforts to plan and manage the growth of city through four Plans viz. ODP-
1972, Comprehensive Development Plans (CDP) 1984, CDP 1995 and Revised Master Plan 2015 for
its LPA. Currently operational Revised Master Plan (RMP) 2015 was notified by Government vide
G.O. No UDD 540 BEM AA SE 2004, dated 22.06.2007 for the horizon year 2015 with the LPA area of
1219.50 Sqkm.
1.4 Local Planning Area of BDA for RMP 2031
The LPA of BDA comprises of the major part of the Bruhat Bangalore Mahanagara Palike (excluding
area under BMICAPA) and 251 villages in the periphery of BBMP. The city has experienced an
unprecedented population growth translating into varied challenges of urbanisation and urban
management in general and urban land management in particular. BDA entrusted with the
responsibility of preparing and revising the Master Plan as a Planning Authority for the Local
Planning Area of BDA under the KTCP Act, 1961 has undertaken the revision of the RMP-2015 for the
horizon period of 2031 (herein referred as RMP-2031). The area of BMA comprising of LPA of BDA
and LPA of BMICAPA as per the amended boundaries admeasures 1294 Sqkm.
The Local Planning Area (LPA) of Bangalore Development Authority (BDA) for RMP-2031 spreads
over an area of about 1206.97 Sqkm with an estimated population ranging between 18-20 million
for 2031.
1.5 Structure of the Master Plan Document
The Master Plan Document comprises of six volumes as given hereunder:
i. Volume-1: Vision Document
ii. Volume-2: Base Map and Existing Land Use Maps
iii. Volume-3: Master Plan Report
iv. Volume-4: Planning District Report
v. Volume-5: Proposed Land Use Maps
vi. Volume-6: Zoning Regulations

Revised Master Plan for Bengaluru - 2031 (Draft): Volume-3
3
2 REGIONAL CONTEXT
2.1 Introduction
Karnataka, a vibrant, unique, multi-cultural, multi-religious state, is the seventh largest state in India
by area and eight largest by population size in India (Census 2011, came into existence in the Year
1956 and was called as State of Mysore and was renamed as Karnataka in the year 1973. Karnataka
is lo ated etween ˚ ’ ” and ˚ ’ ” Latitude North and ˚ ’ ” and ˚ ’ ” Longitude East in the south western region of India and is bordered by the Arabian Sea and the
Laccadive Sea to the west, Goa to the north west, Maharashtra to the north, Telangana to the North
east, Andhra Pradesh to the east, Tamil Nadu to the south east, and Kerala to the south west.
Figure 2-1 presents the location of Karnataka in the World and India and Bangalore Metropolitan
Region in Karnataka. The total geographical area1 of the state is 191,791 Sq. Km accounting for
5.83% of the total geographical area of the country.
Figure 2-1: Location of Karnataka, BMR & BMA
Note: Above figure is a graphical representation only.
The State is situated on a table land where the Western and Eastern Ghats converge into the Nilgiri
Hills complex in the Deccan Plateau region of India. Karnataka has one of the highest average
elevations at 1,500 feet.
Bengaluru is the largest city in Karnataka and the 5th most populous city in India. Bengaluru, is
expected to become a Meta City with forward/ backward regional linkages (at Global, National, State
and Metropolitan Region) which will have an impact on the growth of the city and it is thus
important to understand the regional context while planning for Bengaluru. The City took shape as a
fortified settlement under the ruler Kempegowda of the Vijaynagara state when he established the
mud fort in year 1537.
1 Source: www.karnataka.gov.in

Revised Master Plan for Bengaluru - 2031 (Draft): Volume-3
4
2.2 Administrative Jurisdictions in BMR
Bangalore Metropolitan Region Development Authority
(BMRDA) is the regional development authority that has
jurisdiction over BMR, and is functioning as per the
provisions of Bangalore Metropolitan Region
Development Authority Act (BMRDA), 1985. Bengaluru
Metropolitan Region (BMR) is defined2 as the combined
geographical extents of three districts, namely Bengaluru
Urban District (BUD), Bengaluru Rural District (BUR) and
Ramanagara of Bangalore Revenue Division of the
Karnataka State. Total extent of BMR is 8005 sq km.
Table 2-1 presents the details of districts (Name,
geographical extent, name of taluks) within BMR.
Table 2-1: Districts in BMR
Sl.
No.
Name of District Area as per
DRSP
2031(sq km)
Percentage
Share (%)
Name of Taluks in District
1 Bangalore Urban 2190 27.36 North, South, East, & Anekal
2 Bangalore Rural 2260 28.23 Nelamangala, Dod Ballapur, Devanahalli
& Hosakote
3 Ramanagara 3555 44.41 Magadi, Ramanagara, Channapatna &
Kanakapura
4 BMR (3 Districts) 8005 100% Twelve Taluks
Source: Revised Structure Plan for BMR 2031 by BMRDA, Administrative Atlas of Karnataka 2011, Census of
India, 2011
Bangalore Development Authority, constituted under Bangalore Development Authority Act (BDA),
1976, exercises its planning and development function over its local planning area under the
provisions of BDA Act, 1976 and Karnataka Town and Country Planning (KTCP) Act, 1961.
In addition to the Bangalore Development Authority, the other Planning Authorities within the
jurisdictions of BMRDA include Hoskote, Anekal, Kanakapura, Magadi, BIAAPA, Neelmangala,
Ramanagara-Channapatna and two recently added Planning Authorities namely Satellite Town Ring
2 As defined by sub-section c of section 2 “Definitions” of Bangalore Metropolitan Region Development
Authority Act, 1985.
Revised Master Plan for Bengaluru - 2031 (Draft): Volume-3
5
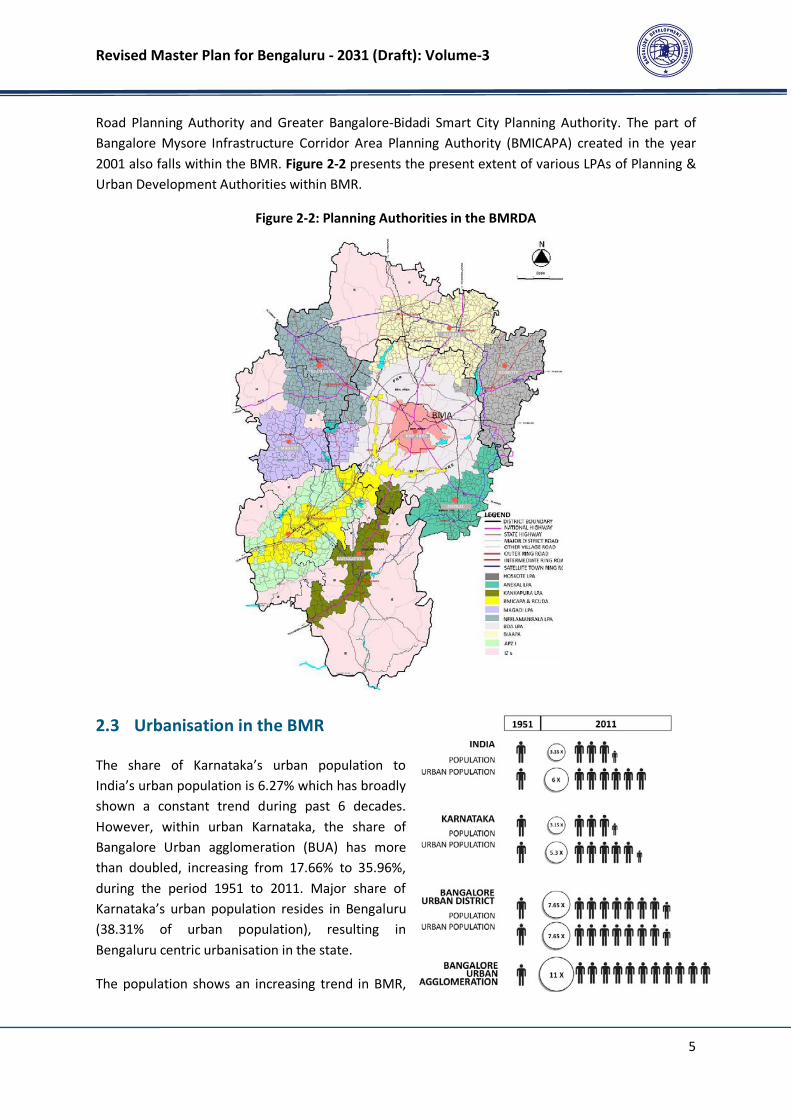
Road Planning Authority and Greater Bangalore-Bidadi Smart City Planning Authority. The part of
Bangalore Mysore Infrastructure Corridor Area Planning Authority (BMICAPA) created in the year
2001 also falls within the BMR. Figure 2-2 presents the present extent of various LPAs of Planning &
Urban Development Authorities within BMR.
Figure 2-2: Planning Authorities in the BMRDA
2.3 Urbanisation in the BMR
The share of Karnataka’s urban population to
India’s urban population is 6.27% which has broadly
shown a constant trend during past 6 decades.
However, within urban Karnataka, the share of
Bangalore Urban agglomeration (BUA) has more
than doubled, increasing from 17.66% to 35.96%,
during the period 1951 to 2011. Major share of
Karnataka’s urban population resides in Bengaluru
(38.31% of urban population), resulting in
Bengaluru centric urbanisation in the state.
The population shows an increasing trend in BMR,
Revised Master Plan for Bengaluru - 2031 (Draft): Volume-3
6
BUD, BMA primarily because of Bangalore City’s stupendous population growth. Bangalore Urban
Agglomeration (BUA) has increased in population by ~11 times since 1951, growing at the rate of
4.05% CAGR since 1951. This rise is reflected in the population growth for BUD and BMR. The
population of Class 1 cities (25 in number) of Karnataka together accounts for 58.17% (13.74million
out of 23.63 million) of Karnataka Urban Population. The next city in the urban hierarchy after
Bengaluru in Karnataka is Hubballi-Dharwad, with population of 0.9 million which is 1/10th
the size of
Bengaluru. Out of 13.74 million population, Bengaluru alone has 8.5 million population, while
balanced is distributed in 24 cities as per Census 2011.
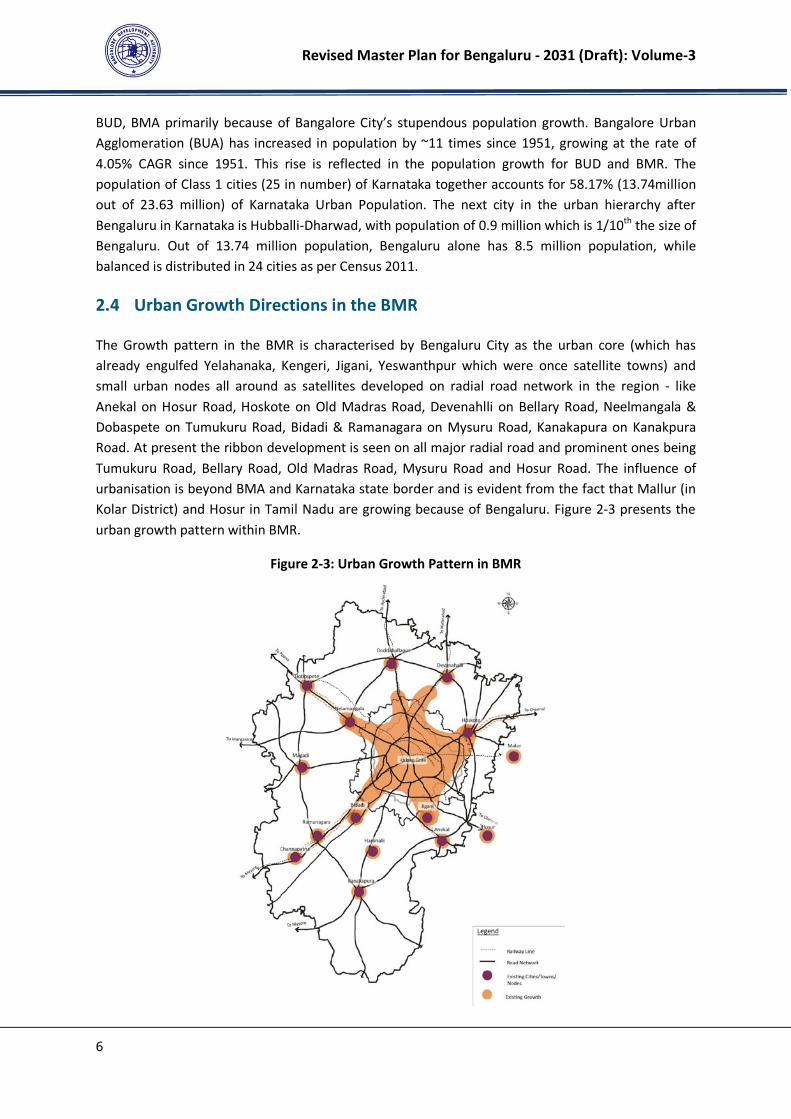
2.4 Urban Growth Directions in the BMR
The Growth pattern in the BMR is characterised by Bengaluru City as the urban core (which has
already engulfed Yelahanaka, Kengeri, Jigani, Yeswanthpur which were once satellite towns) and
small urban nodes all around as satellites developed on radial road network in the region - like
Anekal on Hosur Road, Hoskote on Old Madras Road, Devenahlli on Bellary Road, Neelmangala &
Dobaspete on Tumukuru Road, Bidadi & Ramanagara on Mysuru Road, Kanakapura on Kanakpura
Road. At present the ribbon development is seen on all major radial road and prominent ones being
Tumukuru Road, Bellary Road, Old Madras Road, Mysuru Road and Hosur Road. The influence of
urbanisation is beyond BMA and Karnataka state border and is evident from the fact that Mallur (in
Kolar District) and Hosur in Tamil Nadu are growing because of Bengaluru. Figure 2-3 presents the
urban growth pattern within BMR.
Figure 2-3: Urban Growth Pattern in BMR
Revised Master Plan for Bengaluru - 2031 (Draft): Volume-3
7
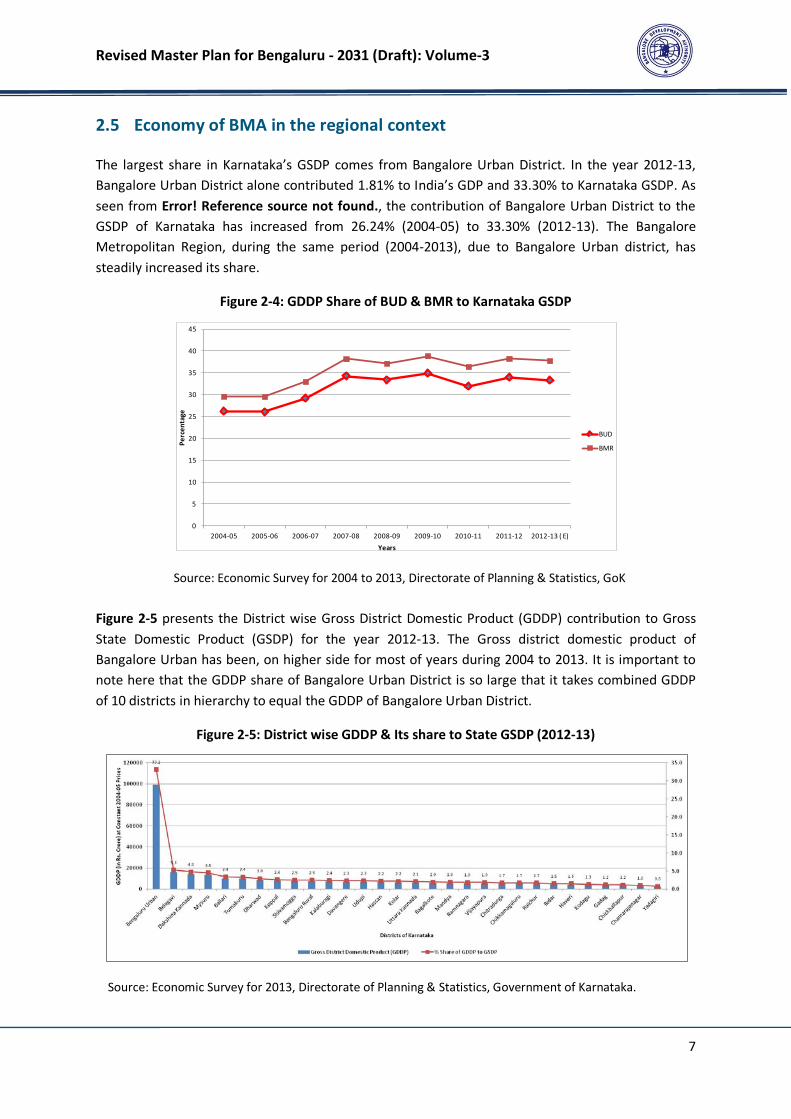
2.5 Economy of BMA in the regional context
The largest share in Karnataka’s GSDP comes from Bangalore Urban District. In the year 2012-13,
Bangalore Urban District alone contributed 1.81% to India’s GDP and 33.30% to Karnataka GSDP. As
seen from Error! Reference source not found., the contribution of Bangalore Urban District to the
GSDP of Karnataka has increased from 26.24% (2004-05) to 33.30% (2012-13). The Bangalore
Metropolitan Region, during the same period (2004-2013), due to Bangalore Urban district, has
steadily increased its share.
Figure 2-4: GDDP Share of BUD & BMR to Karnataka GSDP
Source: Economic Survey for 2004 to 2013, Directorate of Planning & Statistics, GoK
Figure 2-5 presents the District wise Gross District Domestic Product (GDDP) contribution to Gross
State Domestic Product (GSDP) for the year 2012-13. The Gross district domestic product of
Bangalore Urban has been, on higher side for most of years during 2004 to 2013. It is important to
note here that the GDDP share of Bangalore Urban District is so large that it takes combined GDDP
of 10 districts in hierarchy to equal the GDDP of Bangalore Urban District.
Figure 2-5: District wise GDDP & Its share to State GSDP (2012-13)
Source: Economic Survey for 2013, Directorate of Planning & Statistics, Government of Karnataka.
0
5
10
15
20
25
30
35
40
45
2004-05 2005-06 2006-07 2007-08 2008-09 2009-10 2010-11 2011-12 2012-13 ( E)
Pe
rce
nta
ge
Years
BUD
BMR
Revised Master Plan for Bengaluru - 2031 (Draft): Volume-3
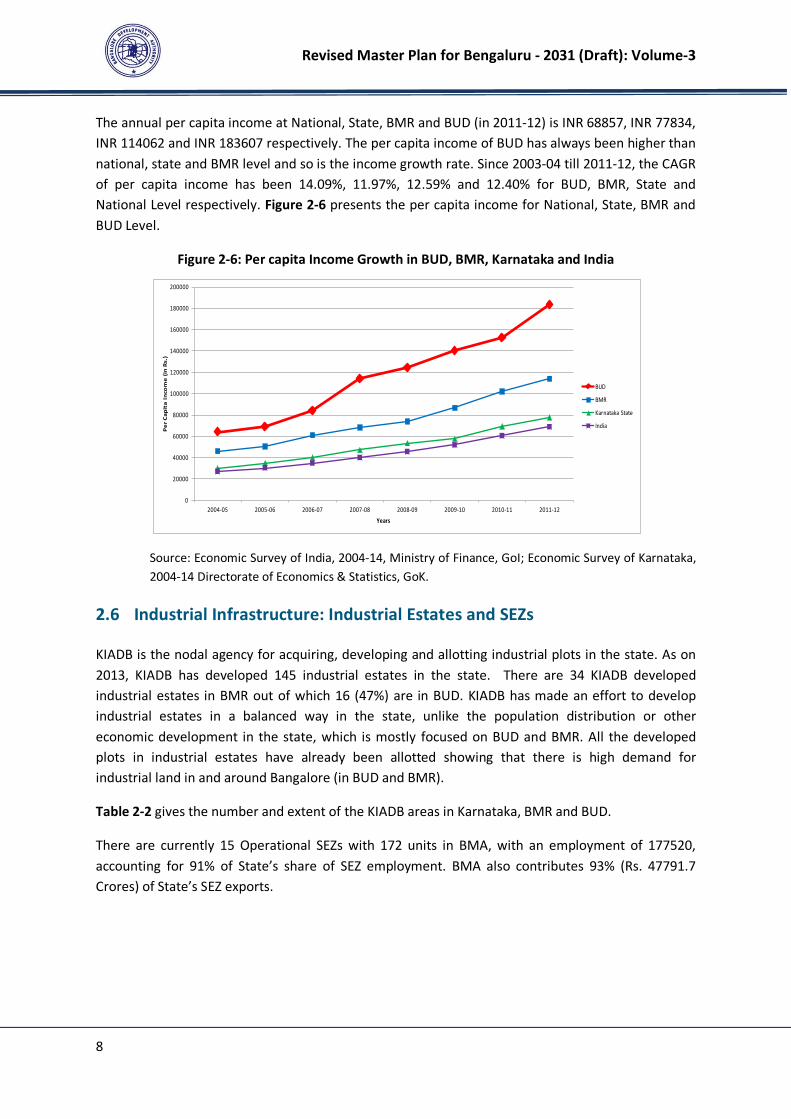
8
The annual per capita income at National, State, BMR and BUD (in 2011-12) is INR 68857, INR 77834,
INR 114062 and INR 183607 respectively. The per capita income of BUD has always been higher than
national, state and BMR level and so is the income growth rate. Since 2003-04 till 2011-12, the CAGR
of per capita income has been 14.09%, 11.97%, 12.59% and 12.40% for BUD, BMR, State and
National Level respectively. Figure 2-6 presents the per capita income for National, State, BMR and
BUD Level.
Figure 2-6: Per capita Income Growth in BUD, BMR, Karnataka and India
Source: Economic Survey of India, 2004-14, Ministry of Finance, GoI; Economic Survey of Karnataka,
2004-14 Directorate of Economics & Statistics, GoK.
2.6 Industrial Infrastructure: Industrial Estates and SEZs
KIADB is the nodal agency for acquiring, developing and allotting industrial plots in the state. As on
2013, KIADB has developed 145 industrial estates in the state. There are 34 KIADB developed
industrial estates in BMR out of which 16 (47%) are in BUD. KIADB has made an effort to develop
industrial estates in a balanced way in the state, unlike the population distribution or other
economic development in the state, which is mostly focused on BUD and BMR. All the developed
plots in industrial estates have already been allotted showing that there is high demand for
industrial land in and around Bangalore (in BUD and BMR).
Table 2-2 gives the number and extent of the KIADB areas in Karnataka, BMR and BUD.
There are currently 15 Operational SEZs with 172 units in BMA, with an employment of 177520,
accounting for 91% of State’s share of SEZ employment. BMA also contributes 93% (Rs. 47791.7
Crores) of State’s SEZ exports.
0
20000
40000
60000
80000
100000
120000
140000
160000
180000
200000
2004-05 2005-06 2006-07 2007-08 2008-09 2009-10 2010-11 2011-12
Pe
r C
ap
ita
In
co
me
(in
Rs.)
Years
BUD
BMR
Karnataka State
India
Revised Master Plan for Bengaluru - 2031 (Draft): Volume-3
9
Table 2-2 Lands Acquired, Developed and Allotted by KIADB in BUD, BMR and Karnataka
Name of the District No. of
Industrial
Areas
Extent (Ha) Allotted
Acquired Developed No. of units Extent (Ha)
KARNATAKA 145 17379.2 13299.1 16748 11351.2
BMR 34 6445.5 5017.8 4968 4181.2
BUD 16 2711.8 2230.0 3069 2228.9
BUD to BMR % Share 47 17.0 17.8 62 21.4
BUD to KAR % Share 11 6.5 6.9 18 8.1
BMR to KAR % Share 23 15.0 15.4 30 15.0
Source: KIADB Website (Status as on 31.05.2013)
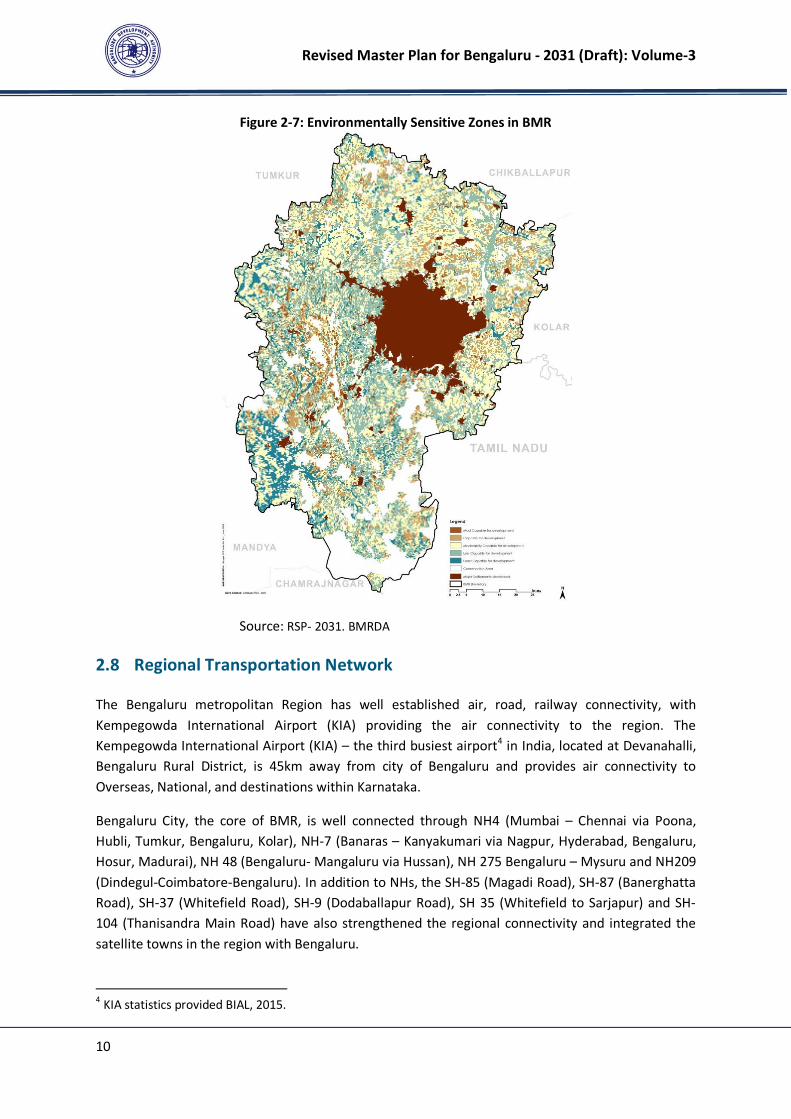
2.7 Environmental Features in the Region
Protected and reserved forests (including National Parks) and Thippgondanahalli Reservoir –
Arkavati river system are eco-sensitive zones within BMR. Lakes and valley systems within BMR are
equally environmentally important resources. Figure 2-7 presents the map showing, forest areas,
Thippagondanahalli reservoir sensitive area and the lakes within BMR.
Karnataka accounts for about six per cent of the country’s surface water resources3.There are seven
river basins. The area under BMR & BUD is covered by three river basins namely - North Pennar,
South Pennar and Palar, however the water supply requirements for Bangalore are met from
Cauvery water.
3 www.karnataka.com
Revised Master Plan for Bengaluru - 2031 (Draft): Volume-3
10
Figure 2-7: Environmentally Sensitive Zones in BMR
Source: RSP- 2031. BMRDA
2.8 Regional Transportation Network
The Bengaluru metropolitan Region has well established air, road, railway connectivity, with
Kempegowda International Airport (KIA) providing the air connectivity to the region. The
Kempegowda International Airport (KIA) – the third busiest airport4 in India, located at Devanahalli,
Bengaluru Rural District, is 45km away from city of Bengaluru and provides air connectivity to
Overseas, National, and destinations within Karnataka.
Bengaluru City, the core of BMR, is well connected through NH4 (Mumbai – Chennai via Poona,
Hubli, Tumkur, Bengaluru, Kolar), NH-7 (Banaras – Kanyakumari via Nagpur, Hyderabad, Bengaluru,
Hosur, Madurai), NH 48 (Bengaluru- Mangaluru via Hussan), NH 275 Bengaluru – Mysuru and NH209
(Dindegul-Coimbatore-Bengaluru). In addition to NHs, the SH-85 (Magadi Road), SH-87 (Banerghatta
Road), SH-37 (Whitefield Road), SH-9 (Dodaballapur Road), SH 35 (Whitefield to Sarjapur) and SH-
104 (Thanisandra Main Road) have also strengthened the regional connectivity and integrated the
satellite towns in the region with Bengaluru.
4 KIA statistics provided BIAL, 2015.

Revised Master Plan for Bengaluru - 2031 (Draft): Volume-3
11
The Bengaluru division of SWR covers entire Bengaluru Metropolitan Region. Major stations within
Bangalore Metropolitan Area are Bengaluru City Station Jn, Yeshwantpura Jn, Yelahanka Jn,
Baiyyanpannahalli Jn. These stations are supported by second order stations like Bengaluru Cantt.,
Krishnarajapurama Station, Nayandahalli, Kengeri, etc. Railway network from Bangalore is
extensively connected to inter-state and intra-state. It connects to Chennai (through Jolarpettai
route) in the east, Chikkabellapur in the north east, Guntakal and Hyderabad (via Dharmaravam)
towards the north, Tumkur in the northwest, Nelamangala in the west, Mumbai (via Goa),
Mangalore & Mysore (via Ramanagara) in the south west and Coimbatore (via Salem) in the south.
Figure 2-8: Regional Transport Network of BMR
BMR RSP-2031 has proposed the regional connectivity plan to further strengthen the network within
the region and minimising the through traffic crossing Bengaluru City. The major proposals of BMR
RSP-2031 include STRR and ITRR that will help in easing the regional traffic in Bengaluru. The
circulation network of RMP 2031 has integrated other proposals of the RSP 2031 for better regional
connectivity.
Revised Master Plan for Bengaluru - 2031 (Draft): Volume-3
12
3 LOCAL PLANNING AREA OF BDA
3.1 Notifications for LPA of BDA
Government of Karnataka has issued several notifications amending the extent of LPA of BDA from
time to time. These notifications have been collated with Revenue Maps, Census Maps and RMP
2015 base map showing administrative boundaries of villages in LPA of BDA. The Government
Notifications defining the extent of LPA of BDA are:
1. Government Notification No. S.0.3446 dated 1st
November 1965, declaring the Local Planning
Area (LPA) for Bengaluru City was the first notification issued by GoK after enactment of
Karnataka Town and Country Planning Act, 1961. This was much before the constitution of
Bangalore Development Authority.
2. Government Notification No. HUD 496 TTP 83 dated 15th March 1984 and its “Schedule –I:
Statement showing the list of Villages included in the Bangalore City Planning Area” declaring
the Local Planning Area for the environs of Bengaluru. This notification is after the Constitution
of Bangalore Development Authority under the provisions of Bangalore Development Authority
Act, 1976. This notification further expanded the extent of LPA of BDA.
3. Government Notification No. HUD 167 MNJ 87 dated 1st March 1988 specifying the areas falling
within Bengaluru Development Authority.
4. Government Notification No. Na Aa Ee130 Bem Ru Pra 2001 dated 20th November 2001
declaring the Local Planning Area for the Bengaluru Mysore Infrastructure Corridor Area
Planning Authority (BMICAPA). This notification reduced the extent of LPA of BDA as 62 villages
(9 full and 53 in parts) were transferred to LPA of BMICAPA.
5. Government Notification No. UDD/ 118/ Bem Ru Pra 2003, dated 3rd March 2006 declaring the
extent of Hoskote Local Planning Area. This notification further reduced the LPA of BDA as eight
villages were transferred to LPA of Hoskote Planning Authority.
6. Government Notification No. UDD 92 MNY 2006, dated 16th January 2007 declaring extent of
Bruhat Bengaluru Mahanagar Pallike (BBMP).This notification has no bearing on the extent of
LPA of BDA, however, this notification provides the clarity on 110 villages that were falling within
(fully or in part) the extend of LPA of BDA.
7. Government Notification No. UDD 36N BMR 2009 dated 26th September 2012 specifying
exclusion of 8 villages from LPA of BDA, which was overlapping with Hoskote Local Planning
Area.
Revised Master Plan for Bengaluru - 2031 (Draft): Volume-3
13
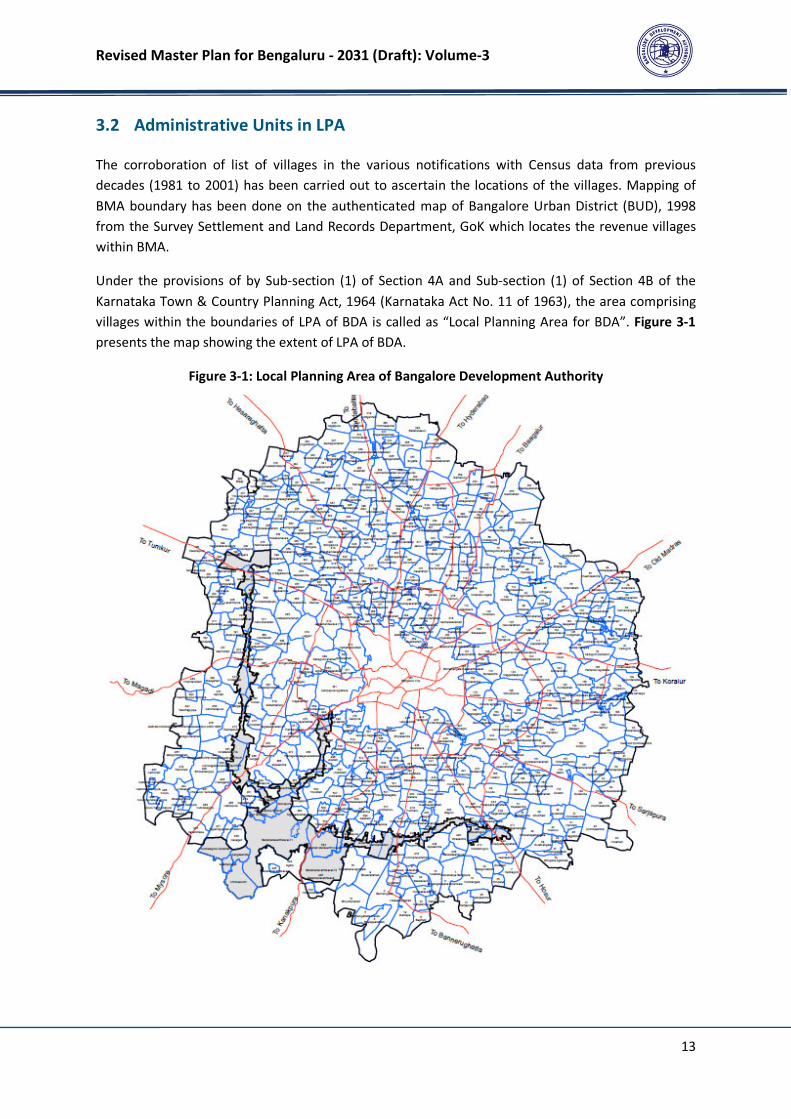
3.2 Administrative Units in LPA
The corroboration of list of villages in the various notifications with Census data from previous
decades (1981 to 2001) has been carried out to ascertain the locations of the villages. Mapping of
BMA boundary has been done on the authenticated map of Bangalore Urban District (BUD), 1998
from the Survey Settlement and Land Records Department, GoK which locates the revenue villages
within BMA.
Under the provisions of by Sub-section (1) of Section 4A and Sub-section (1) of Section 4B of the
Karnataka Town & Country Planning Act, 1964 (Karnataka Act No. 11 of 1963), the area comprising
villages within the boundaries of LPA of BDA is called as “Local Planning Area for BDA”. Figure 3-1
presents the map showing the extent of LPA of BDA.
Figure 3-1: Local Planning Area of Bangalore Development Authority
Revised Master Plan for Bengaluru - 2031 (Draft): Volume-3
14
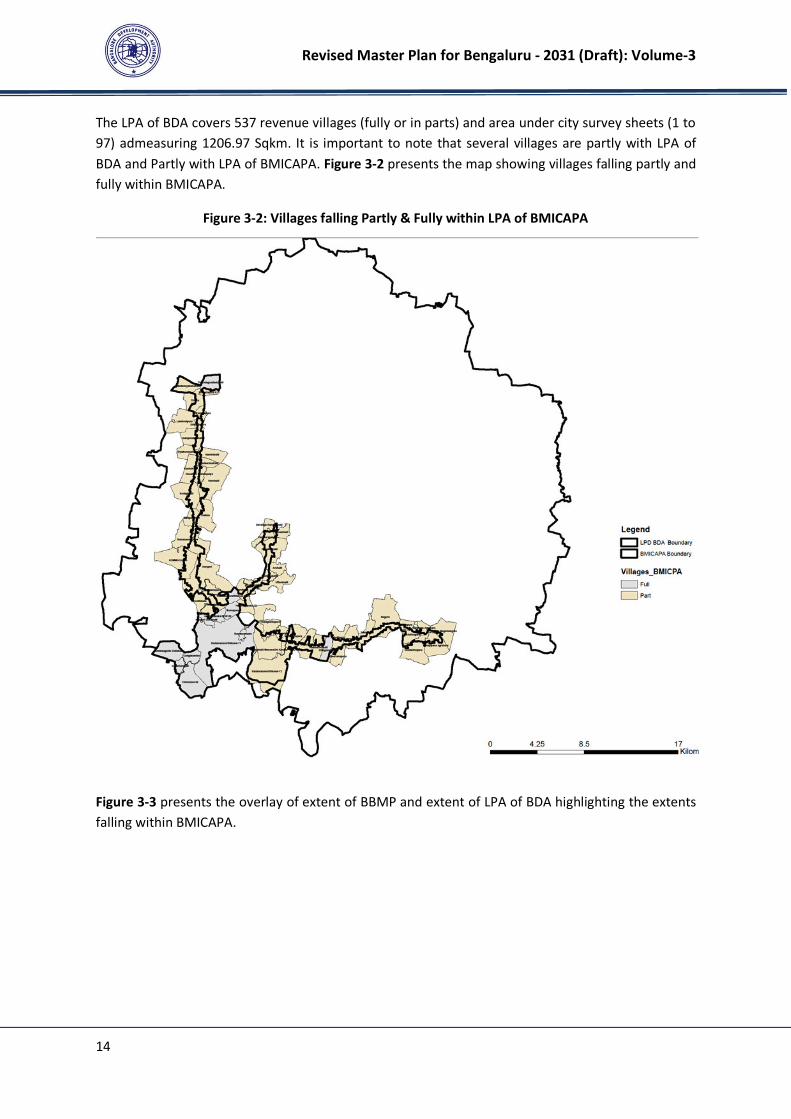
The LPA of BDA covers 537 revenue villages (fully or in parts) and area under city survey sheets (1 to
97) admeasuring 1206.97 Sqkm. It is important to note that several villages are partly with LPA of
BDA and Partly with LPA of BMICAPA. Figure 3-2 presents the map showing villages falling partly and
fully within BMICAPA.
Figure 3-2: Villages falling Partly & Fully within LPA of BMICAPA
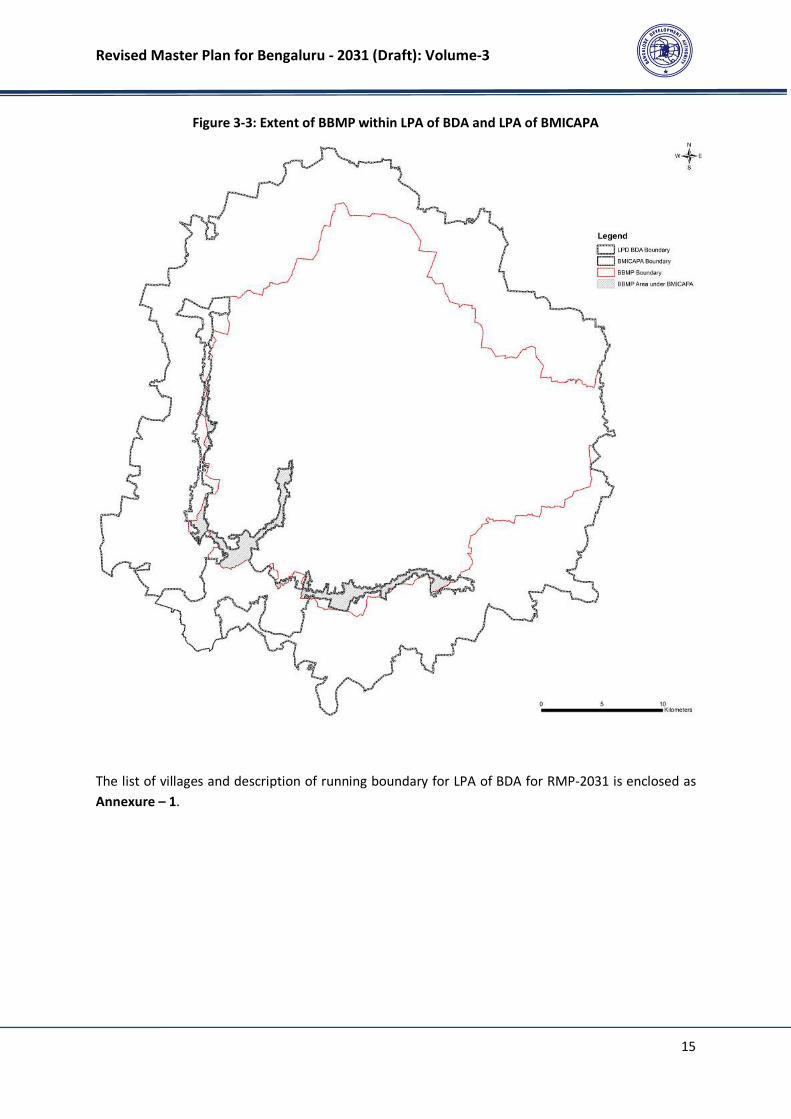
Figure 3-3 presents the overlay of extent of BBMP and extent of LPA of BDA highlighting the extents
falling within BMICAPA.
Revised Master Plan for Bengaluru - 2031 (Draft): Volume-3
15
Figure 3-3: Extent of BBMP within LPA of BDA and LPA of BMICAPA
The list of villages and description of running boundary for LPA of BDA for RMP-2031 is enclosed as
Annexure – 1.
Revised Master Plan for Bengaluru - 2031 (Draft): Volume-3
16
4 SURVEYS AND STUDIES
4.1 General
The preparation of Revised Master Plan for the LPA of Bengaluru required reliable and factual data
regarding existing physical and socio-economic conditions such as existing land use, housing,
transport, industries, employment and social services such as educational, health and recreational
facilities, etc for analysing the existing situation and make projections for the future requirements.
RMP-2031 made rigorous efforts for the collection of data from various sources including secondary
source as well as primary surveys and studies with a clearly defined objective of minimising the
variations/ discrepancies.
4.2 Data from Secondary Sources
The secondary information available with BDA as well as various agencies of the state and the
central government has been collected for the preparation of RMP-2031.
1. Data with BDA:
The Planning Authority is a custodian of data base related to approved Layouts and Development
Plans for Residential and Non-Residential developments and Change of Land Use (CLU) cases. As part
of master plan preparation process, all these Development Plans, Layouts and CLU cases approved
after the final notification of RMP 2015 have been assimilated, translated and integrated in GIS
database for incorporation in the proposals.
2. Data from Government Departments (State and Central):
Large amount of data/ information has been collected from various government departments and
same has been collated, complied, selected, assimilated, analysed and mapped for the preparation
of RMP-2031. The following key areas have been incorporated as part of the GIS database created
for RMP 2031 based on the data provided by various government departments/ agencies:
i Revenue maps procured from Department of Survey Settlement and Land Records, GoK
ii Mapping of Public Transport Infrastructure (Namma Metro, BMTC, and KSRTC) and Logistics
facilities like Truck Terminals, ICD.
iii Detailed inventory of slums within BMA (notified & non-notified) and spatial Mapping of slums
iv Detailed inventory and mapping of Lakes within BMA
v Mapping of Forest Areas, Eco-Sensitive Areas and Protection Areas
vi Mapping of spread of health and education facilities within BMA
vii Mapping of Air Funnel Zones
viii Mapping of SWM Infrastructure and Facilities within BMA
Revised Master Plan for Bengaluru - 2031 (Draft): Volume-3
17
4.3 Primary Surveys
The primary surveys conducted as part of preparation of RMP-2031 includes DGPS Surveys, Existing
Land Use Survey, Socio-economic Survey, Traffic and Transportation Surveys, Market Tracking and
Housing Supply Survey, Heritage Survey, Lake Mapping, etc aimed at preparation of base map with
various layers depicting physical, natural and administrative features; existing land use survey maps
and creation of analytical base for arriving at proposals supplementing the inputs from the public
consultation process.
1. DGPS Surveys for Preparation of Base Map:
DGPS surveys were conducted over 1200 points across BMA to help identify survey parcels
points/corners for integration of revenue maps procured from Department of Survey Settlement and
Land Records, GoK in the GIS based Base Map prepared using high resolution stereo pair satellite
imagery procured from National Remote Sensing Agency.
2. Existing Land Use Survey:
Extensive field surveys were carried out to map the existing land use and cross verification of the
features extracted from satellite imagery using the base map. The ELU Survey was conducted in line
with the provisions of Karnataka Planning Authority Rules, 1967 (as amended from time to time)
during Nov 01, 2014 to Nov 30, 2015. The details of Existing Land Use Map 2015 for RMP 2031 are
given in Chapter 5 of this report.
3. Traffic and Transportation Surveys:
Traffic & Transportation surveys were conducted to assess the traffic and transport characteristic of
the study area (base line scenario) and provide inputs to developing the transport model. Focus of
the surveys has been on obtaining traffic volume data on as many roads as possible. This has been
done as for using a process called ‘Most likely Trip estimates from traffic volume counts’ to correct
and update Origin Destination Matrices syntheses from earlier studies like CTTP and CTTS. Following
primary surveys were carried out across BMA during December 2014 to April 2015 and there
locations are presented in Figure 4-1.
• Screen Lines/ Classified Volume counts- 45 Locations (Video Surveys for 16 Hours)
• OD surveys- 13 Location (24hrs for one day at 13 Outer Cordon Points)
• Speed and Delay surveys – 375 km (using Floating Car Method)
• Road Network inventory – 375 km (Major arterial roads)
• Turning volume counts- 14 Locations (24 hrs for one day)
• Goods Focal /ICD/ CFS/ Transport Nagar Survey- 8 Locations (24 hrs for One day)
• Video Footage from Bengaluru City Traffic Police for 50 locations (one hr) was also used to
capture volume counts at city centre.

Revised Master Plan for Bengaluru - 2031 (Draft): Volume-3
18
Figure 4-1: Locations of Traffic and Transportation Surveys
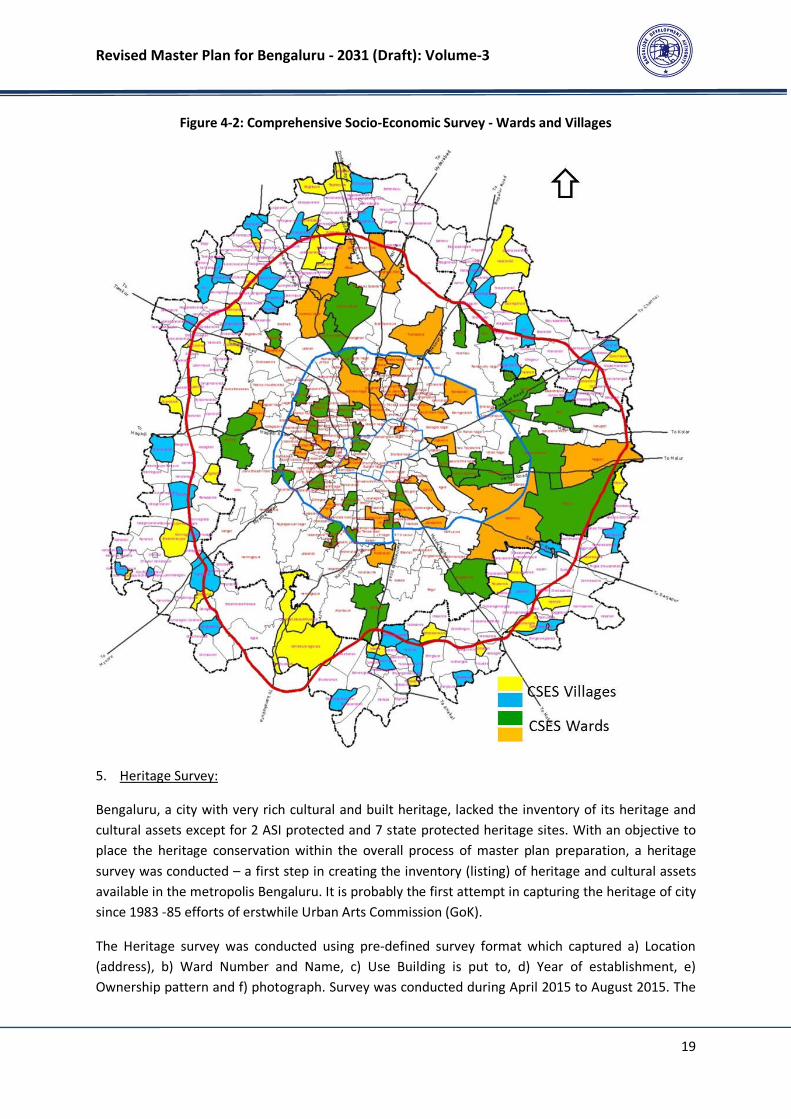
4. Comprehensive Socio-economic Survey (CSES)
Comprehensive Socio-economic survey was undertaken to understand socio-economic status,
infrastructure availability and aspirations of citizens within the planning area. By using stratified
random sampling technique, 30 wards and 18 villages within BMA were identified and the survey
was undertaken. The survey was conducted during December 2014 to January 2015. The Stratified
Socio-economic sample survey covered 10130 households, of which 90% were within BBMP and 10%
in villages within BMA. Further, 7% of samples were taken from slums. The nature of survey
included face to face interviews; door to door questionnaire based comprehensive socio-
economic survey. Figure 4-2 presents the locations of wards and villages wherein Comprehensive
Socio-economic survey was conducted.
Revised Master Plan for Bengaluru - 2031 (Draft): Volume-3
19
Figure 4-2: Comprehensive Socio-Economic Survey - Wards and Villages
5. Heritage Survey:
Bengaluru, a city with very rich cultural and built heritage, lacked the inventory of its heritage and
cultural assets except for 2 ASI protected and 7 state protected heritage sites. With an objective to
place the heritage conservation within the overall process of master plan preparation, a heritage
survey was conducted – a first step in creating the inventory (listing) of heritage and cultural assets
available in the metropolis Bengaluru. It is probably the first attempt in capturing the heritage of city
since 1983 -85 efforts of erstwhile Urban Arts Commission (GoK).
The Heritage survey was conducted using pre-defined survey format which captured a) Location
(address), b) Ward Number and Name, c) Use Building is put to, d) Year of establishment, e)
Ownership pattern and f) photograph. Survey was conducted during April 2015 to August 2015. The
Revised Master Plan for Bengaluru - 2031 (Draft): Volume-3
20
heritage buildings have been mapped in GIS platform and translated into demarcation of heritage
precincts/ zones and preparation of appropriate regulations for developments in such heritage
precincts/ zones.
4.4 Studies Conducted
In addition to secondary data collection and various primary surveys, the following studies have also
been undertaken as part of the preparation of RMP 2031.
1. Review of RMP 2015 and BMR RSP-2031:
The review of the RMP-2015 has been carried out to derive the lessons learnt with respect to its
implementation on ground and understand the emerging imperatives as a result of the envisioned
provisions of RMP-2015. The BMR RSP-2031 has been reviewed with a perspective of integrating the
broad spatio-policy framework for the region and aligning RMP-2031 with these provisions. The
review has been discussed in Volume 1: Vision Document of Draft Revised Master Plan 2031.
2. Classification of Natural Drainage:
The Hon’ble NGT passed the judgement as part of the hearing of the PIL and issued guidelines for
buffers applicable to lakes and different types of drains within the BMA during the course of
preparation of the RMP-2031. The guidelines issued by the Hon’ble NGT necessitated the need for
classification of natural drainage system within BMA. In this regard, a study for classification of
natural drainage system based on contours and digital elevation model generated using high
resolution stereo pair satellite imagery assessment and delineation natural drainage system was
taken up for classification of streams into primary, secondary and tertiary. The classification has
been carried using GIS software and in consultation with Karnataka State Natural Disaster
Monitoring Centre. The RMP-2031 has earmarked the buffers based on the classification of the
streams in the PLU Maps.
3. Urban Transport Model:
The traffic and transportation survey results and previous studies have been used to build a
sophisticated urban transport model to replicate the “Bangalore Metropolitan Area” transportation
system (roads, Congestion delays, transit system, etc.) with state-of-the-art software and modelling
technology. The purpose of the model development is to develop a tool to help in understanding
transport characteristics in the Future under changed Land use and Network conditions. A
conventional 4 stage model with a combined mode choice cum distribution function has been
calibrated. This model has been used to analyse the potential major future network enhancements
such as introduction of an MRTS and allocating proposed land use. A very fine zoning system has
been adopted (534 zones), covering Bengaluru Metropolitan Region (not only BMA). The Network
was developed using the large GIS database that has been created for the RMP and hence boasts of
more than 30000 links. Also all BMTC bus routes (~2500) are coded onto this Network. The Model
has been developed using CUBE Voyager. The modes modelled are Car+ Taxi, Two Wheeler, Auto
rickshaw, Public Transport and modes preloaded are MAV/Trucks/LCV. The Traffic Assignment is
Revised Master Plan for Bengaluru - 2031 (Draft): Volume-3
21
Multi User Class, Capacity Restraint and Public Transport Assignment is True Multi path Assignment
with a crowd modelling.
4. Risk & Vulnerability Assessment:
Bengaluru is vulnerable to various natural and manmade disasters. It has therefore become
important to identify and assess the hazards and risks (natural & manmade) that Bengaluru is
vulnerable to, and their spatial analysis (within BMA). The main objective of the Hazard and Risk
Assessment is to prepare a multi-hazard map (MHM) for the planning area. The assessment has
been carried out primarily based on database gathered from various government departments and
includes multi-hazard assessment and a generic probabilistic assessment for future. Stakeholder
consultations with Karnataka State Pollution Control Board (KSPCB), Karnataka Fire and Emergency
Services (KFES) and District Disaster Management Authority (DDMA) have been carried out as part of
the assessment.
5. Market Tracking (Residential, Commercial, and Industrial Developments) and Land Market
Values Study:
The trends in housing, the characteristics of residential developments, characteristics of commercial
(offices spaces, retails, and hospitality) development, the characteristics of industrial activities, and
land values provide a sense of the current growth directions. The market tracking survey and land
market value survey were undertaken with the following objectives:
a) Assess the past trends in housing supply in tracked, share of organised (tracked market) and un-
organised market, definitions, affordable housing initiatives, supply demand, slums and their
characteristics, slum rehabilitation and redevelopment framework, issues related to
development of affordable housing, etc.
b) Understand the characteristics of Residential Developments (Typology, size and growth
corridors), characteristics of Commercial Developments (Typology, size and growth corridors),
Characteristics of Industrial Developments,
c) Map the market values and guidance values at various locations across BMA
The study also looked at composition of household income and housing typologies to assess the
future requirement of housing including demand for affordable housing.
Revised Master Plan for Bengaluru - 2031 (Draft): Volume-3
22
5 BASE MAP AND EXISTING LAND USE MAP
5.1 Relevance of GIS in Master Planning
Spatial data plays a key role in better decision making, planning and management of cities. In order
to have sustainable planning and management it is important for planners, administrators and city
managers to have access to reliable, seamless and reasonably accurate data. Satellite imagery and
Geographical Information Systems (GISs) are tools that facilitate developing datasets for preparation
of rapid, comprehensive, rational and implementable plans. In other words, a robust Geospatial
database becomes a useful basis for making rational planning decisions for sustainable planning,
development and management.
Geographical Information System (GIS) is essentially a comprehensive spatial and decision support
system of computer hardware or software tools to merge spatial, preferably geo-referenced data
with the non-spatial data for deriving meaningful information to be used for urban planning. The
distinguishing factor that separates GIS from the other information storage and retrieval systems is
the use of locational features in a co-ordinate space as the fundamental referencing principle and as
important variables in quantitative analysis.
Mapping provides the most powerful visualization tool in GIS. GIS is used for preparation of land use
& circulation maps, thematic maps related to socio-economic data, environmental data,
infrastructure services data, revenue data and can be used for wide ranging planning applications.
Planners and City Managers extract useful information from this database, containing spatial and
non-spatial data.
Figure 5-1: Inter-relationship between GIS and Urban Planning
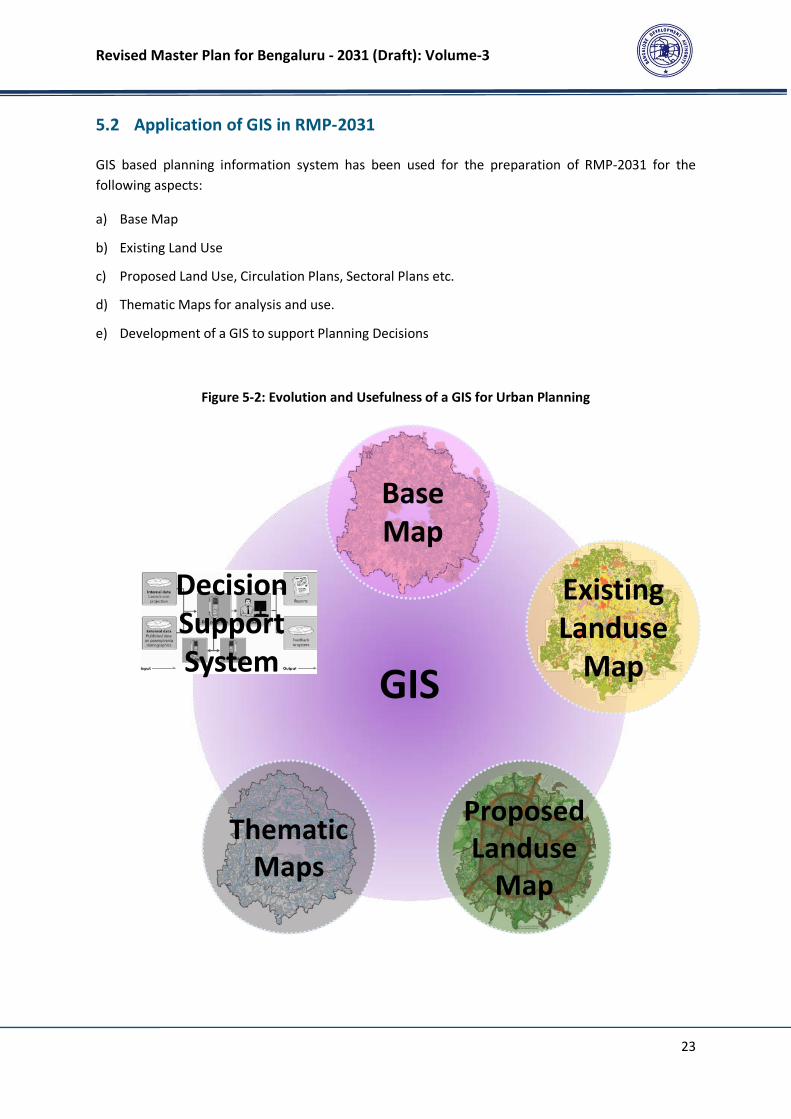
Revised Master Plan for Bengaluru - 2031 (Draft): Volume-3
23
5.2 Application of GIS in RMP-2031
GIS based planning information system has been used for the preparation of RMP-2031 for the
following aspects:
a) Base Map
b) Existing Land Use
c) Proposed Land Use, Circulation Plans, Sectoral Plans etc.
d) Thematic Maps for analysis and use.
e) Development of a GIS to support Planning Decisions
Figure 5-2: Evolution and Usefulness of a GIS for Urban Planning
GIS
Decision
Support
System
Proposed
Landuse
Map
Existing
Landuse
Map
Base
Map
Thematic
Maps
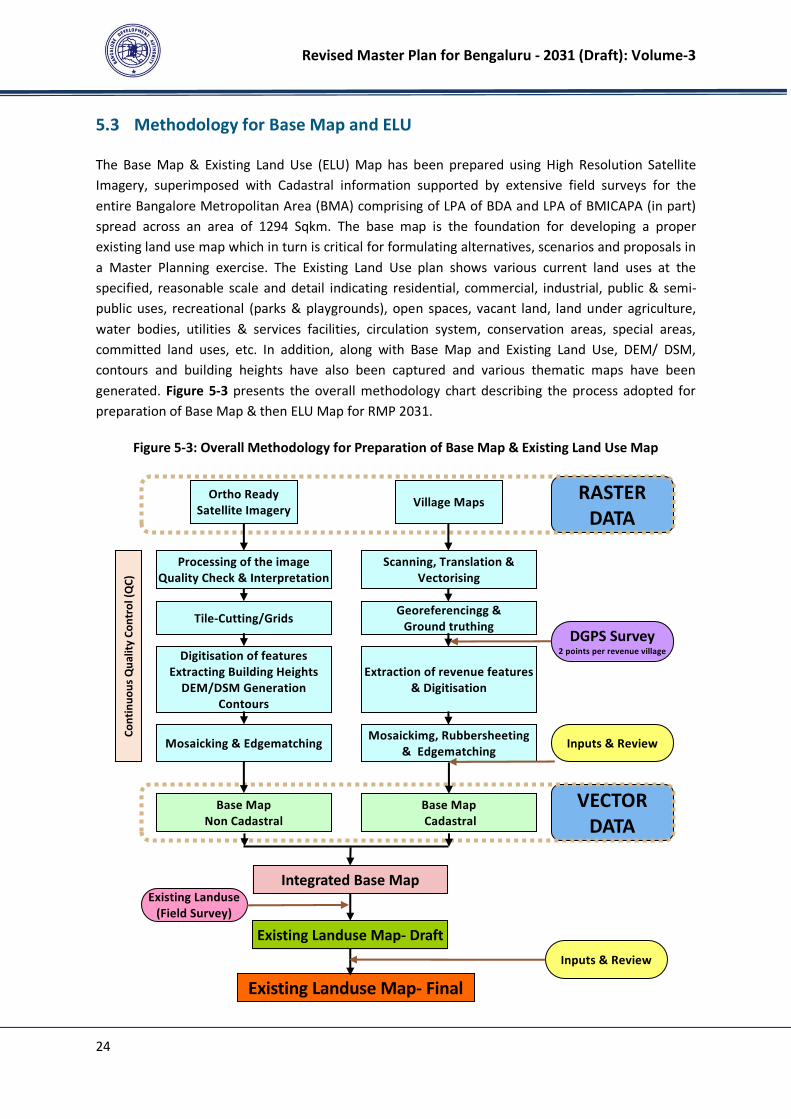
Revised Master Plan for Bengaluru - 2031 (Draft): Volume-3
24
5.3 Methodology for Base Map and ELU
The Base Map & Existing Land Use (ELU) Map has been prepared using High Resolution Satellite
Imagery, superimposed with Cadastral information supported by extensive field surveys for the
entire Bangalore Metropolitan Area (BMA) comprising of LPA of BDA and LPA of BMICAPA (in part)
spread across an area of 1294 Sqkm. The base map is the foundation for developing a proper
existing land use map which in turn is critical for formulating alternatives, scenarios and proposals in
a Master Planning exercise. The Existing Land Use plan shows various current land uses at the
specified, reasonable scale and detail indicating residential, commercial, industrial, public & semi-
public uses, recreational (parks & playgrounds), open spaces, vacant land, land under agriculture,
water bodies, utilities & services facilities, circulation system, conservation areas, special areas,
committed land uses, etc. In addition, along with Base Map and Existing Land Use, DEM/ DSM,
contours and building heights have also been captured and various thematic maps have been
generated. Figure 5-3 presents the overall methodology chart describing the process adopted for
preparation of Base Map & then ELU Map for RMP 2031.
Figure 5-3: Overall Methodology for Preparation of Base Map & Existing Land Use Map
RASTER
DATA
Ortho Ready
Satellite ImageryVillage Maps
Processing of the image
Quality Check & Interpretation
Scanning, Translation &
Vectorising
Tile-Cutting/GridsGeoreferencingg &
Ground truthing
Digitisation of features
Extracting Building Heights
DEM/DSM Generation
Contours
Extraction of revenue features
& Digitisation
Mosaicking & EdgematchingMosaickimg, Rubbersheeting
& Edgematching
Co
nti
nu
ou
s Q
ua
lity
Co
ntr
ol
(QC
)
Base Map
Non Cadastral
Base Map
Cadastral
Integrated Base Map
Existing Landuse Map- Draft
Existing Landuse Map- Final
DGPS Survey2 points per revenue village
Inputs & Review
VECTOR
DATA
Inputs & Review
Existing Landuse
(Field Survey)
Revised Master Plan for Bengaluru - 2031 (Draft): Volume-3
25
5.4 Base Map Preparation
The most crucial information for preparing any master/ spatial plan is an accurate and updated base
map of the planning area. It is a necessary component, without which no spatial planning exercise
can be undertaken. A base map helps the planners and administrators to prepare the existing land
use, circulation pattern, road networks, spatial extent of development, natural features, and also
information on the use of each land parcel including man-made and natural features on ground. It
brings together in a common base the physical features, topography, drainage pattern, water
bodies, power lines, road network, rail, forest area, settlement areas etc.
The Base Map for RMP 2031 has been generated by extracting spatial features visible from high
resolution satellite imagery and integrating with other sources of information such as
revenue/cadastral maps and relevant spatial information available including maps sourced from
various other government departments. Appropriate techniques were deployed to improve the
accuracy of the information and also the geo-referencing.
5.4.1 Process & Methodology
The base map preparation for RMP 2031 involved three broad stages:
a) Preparation of Base map- Non Cadastral (with the use of Satellite Imagery)
b) Preparation of Base map- Cadastral (with Revenue Village Maps)
c) Preparation of Integrated Base map (Superimposing of base map obtained from satellite
imagery and cadastral maps)
A. Preparation of Base map- Non Cadastral (with the use of Satellite Imagery)
The Base Map for RMP 2031 contains features extracted from the satellite images like buildings,
roads, natural features (lakes & streams/ drains), contours, railway line, metro rail line, power sub-
station, High Tension Power lines, Sewage Treatment Plants etc. Secondary spatial data of other
departments has also been integrated with the base map to form the overall geospatial database.
Satellite imagery (GEOEYE -1, with 0.5 Meters and 2 Meters resolution for PAN and MSI respectively)
was used for this purpose. Part of the BMA area which was under cloud cover in the original satellite
imagery was updated using fresh satellite imagery (Archive Data, World View 01 -0.5 mtrs and PAN
& Multi Spectral Ortho Image, 2015). Appropriate steps were taken to properly merge the two
satellite images to extract relevant features and complete the base map.
B. Preparation of Base map- Cadastral (with Revenue Village Maps)
The Cadastral Maps (revenue maps) were procured (in Paper as well as jpeg/ pdf files in soft format)
from the Revenue Department, GoK scanned, digitized, mosaicked, geo referenced and integrated in
to the geo-spatial data. All the revenue survey numbers were translated to English. Ground truthing
and validation of Base Map has been carried out through preliminary field identification (x,y
coordinates) of survey points on the village maps followed by point data collection using Differential
Global Positioning System (DGPS) equipment and capturing two points per revenue village. The
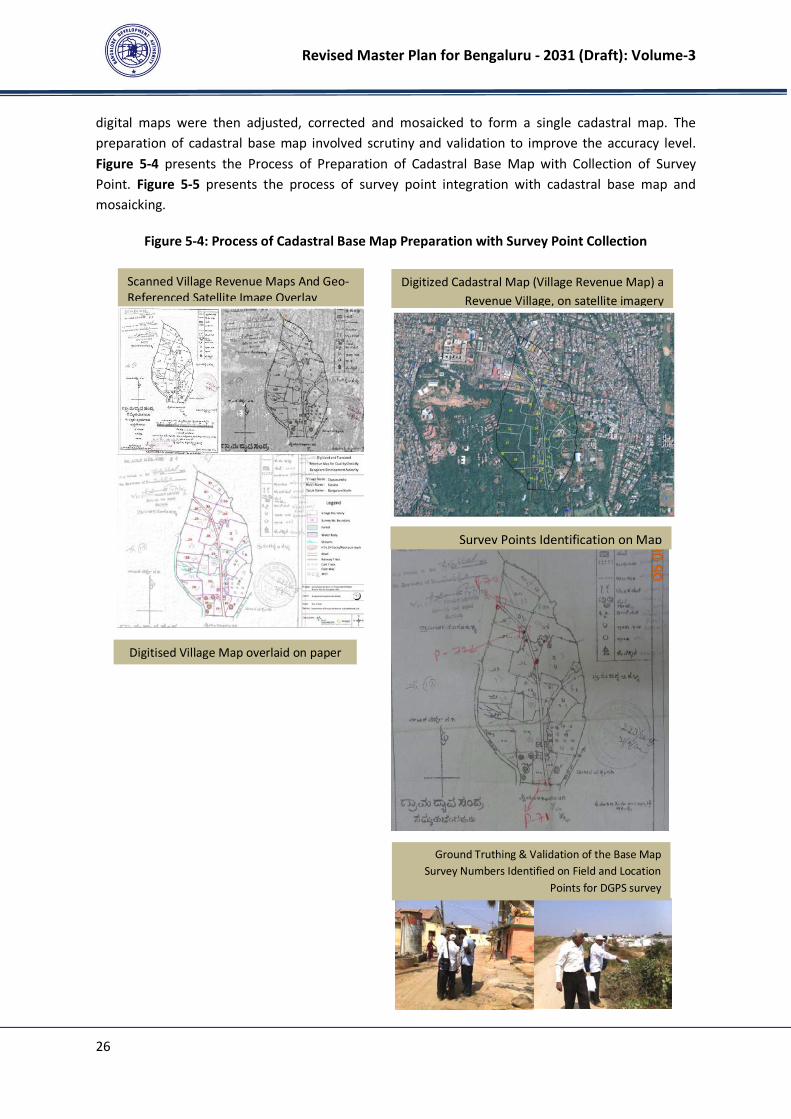
Revised Master Plan for Bengaluru - 2031 (Draft): Volume-3
26
digital maps were then adjusted, corrected and mosaicked to form a single cadastral map. The
preparation of cadastral base map involved scrutiny and validation to improve the accuracy level.
Figure 5-4 presents the Process of Preparation of Cadastral Base Map with Collection of Survey
Point. Figure 5-5 presents the process of survey point integration with cadastral base map and
mosaicking.
Figure 5-4: Process of Cadastral Base Map Preparation with Survey Point Collection
Scanned Village Revenue Maps And Geo-
Referenced Satellite Image Overlay
Digitized Cadastral Map (Village Revenue Map) a
Revenue Village, on satellite imagery
Ground Truthing & Validation of the Base Map
Survey Numbers Identified on Field and Location
Points for DGPS survey
Survey Points Identification on Map
Digitised Village Map overlaid on paper
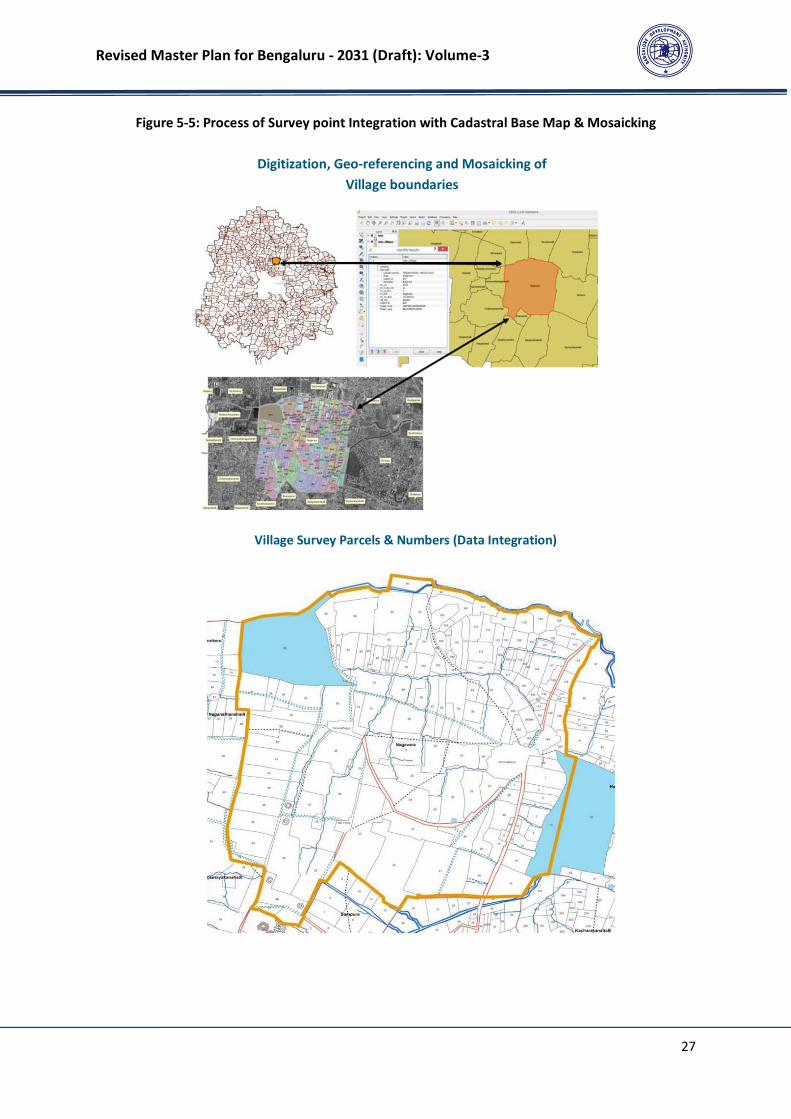
Revised Master Plan for Bengaluru - 2031 (Draft): Volume-3
27
Figure 5-5: Process of Survey point Integration with Cadastral Base Map & Mosaicking
Digitization, Geo-referencing and Mosaicking of
Village boundaries
Village Survey Parcels & Numbers (Data Integration)

Revised Master Plan for Bengaluru - 2031 (Draft): Volume-3
28
Adequate measures have been taken to improve the level of geo-referencing of the village maps,
mosaicking and overlay on satellite images. It is a well-known fact that preparation of cadastral base
maps, especially overlaying the cadastral information on satellite imagery is a difficult task for the
fact that paper revenue maps were prepared based on field surveys surveyed many decades ago and
field measurements were undertaken using chains and other field measurement techniques. These
constraints have been suitably addressed by using rubber sheeting and edge-matching techniques.
An observation which has come to the fore during this exercise is the difference in extent/ alignment
of water bodies (streams/ lakes) as per revenue maps and satellite imagery. This could be due to
changes in natural course of streams over a period of time. The overlay of streams and lakes
features extracted from the village revenue maps do not always match with the streams and lakes
captured from the satellite imagery in all locations. This has an implication on the course of the
streams, their widths and also the shape and extent of the water bodies and creates challenges in
planning and management.
The cadastral information in the city is very old (almost five decades or so). In a city of 11 million
people (2015-16), the urban fabric has drastically changed in the past five decades and the surface of
the city has undergone much changes. Also the core city area does not have revenue survey
numbers and it has totally urbanised and largely covered with buildings and structures.
C. Preparation of Integrated Base Map
(Superimposing base map prepared from satellite imagery with the cadastral maps)
After due process both the cadastral and non-cadastral features of the Base Map were overlaid and
corrected to the maximum extent thus creating an Integrated Base Map for BMA. The Integrated
Base Map so prepared was scrutinized and reviewed by Karnataka State Remote Sensing Application
Centre (KSRSAC). The base map was then updated and finalized in consultation with KSRSAC.
5.4.2 Final Base Map
A fresh GIS based Base Map has been prepared for the BMA. Entire data set for Base Map has been
structured and layered and is ready for further use, value addition and continuous updation in
future. This base map has formed the basis for the Existing Land Use survey and mapping.
5.5 Existing Land Use Map
The Existing Land Use (ELU) is the next critical input in devising the future growth strategy of any
city/town, formulating alternatives and proposals in any Master Planning exercise. The ELU maps
show various current land uses at the specified and reasonable scale indicating residential,
commercial, industrial, public & semi- public uses, recreational (parks & playgrounds), open spaces,
vacant land, land under agriculture, water bodies, utilities & services facilities, circulation system,
conservation areas, special areas, committed land uses, reservations and mixed land uses etc.
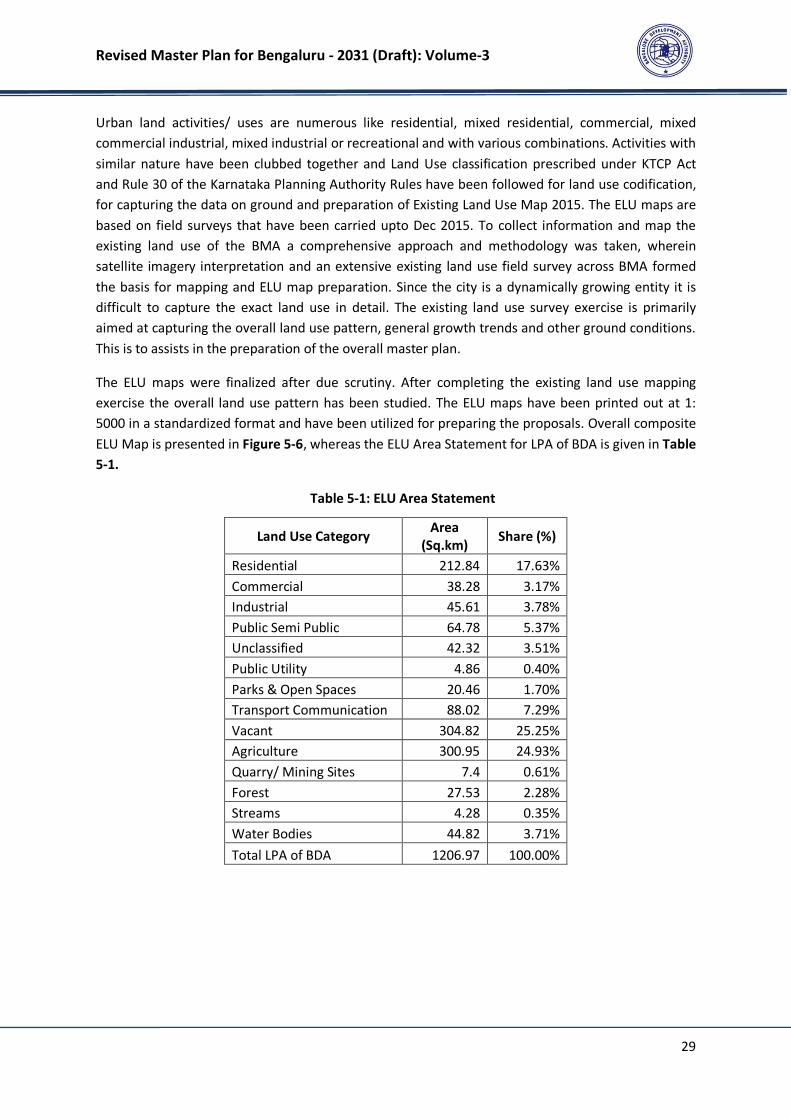
Revised Master Plan for Bengaluru - 2031 (Draft): Volume-3
29
Urban land activities/ uses are numerous like residential, mixed residential, commercial, mixed
commercial industrial, mixed industrial or recreational and with various combinations. Activities with
similar nature have been clubbed together and Land Use classification prescribed under KTCP Act
and Rule 30 of the Karnataka Planning Authority Rules have been followed for land use codification,
for capturing the data on ground and preparation of Existing Land Use Map 2015. The ELU maps are
based on field surveys that have been carried upto Dec 2015. To collect information and map the
existing land use of the BMA a comprehensive approach and methodology was taken, wherein
satellite imagery interpretation and an extensive existing land use field survey across BMA formed
the basis for mapping and ELU map preparation. Since the city is a dynamically growing entity it is
difficult to capture the exact land use in detail. The existing land use survey exercise is primarily
aimed at capturing the overall land use pattern, general growth trends and other ground conditions.
This is to assists in the preparation of the overall master plan.
The ELU maps were finalized after due scrutiny. After completing the existing land use mapping
exercise the overall land use pattern has been studied. The ELU maps have been printed out at 1:
5000 in a standardized format and have been utilized for preparing the proposals. Overall composite
ELU Map is presented in Figure 5-6, whereas the ELU Area Statement for LPA of BDA is given in Table
5-1.
Table 5-1: ELU Area Statement
Land Use Category Area
(Sq.km) Share (%)
Residential 212.84 17.63%
Commercial 38.28 3.17%
Industrial 45.61 3.78%
Public Semi Public 64.78 5.37%
Unclassified 42.32 3.51%
Public Utility 4.86 0.40%
Parks & Open Spaces 20.46 1.70%
Transport Communication 88.02 7.29%
Vacant 304.82 25.25%
Agriculture 300.95 24.93%
Quarry/ Mining Sites 7.4 0.61%
Forest 27.53 2.28%
Streams 4.28 0.35%
Water Bodies 44.82 3.71%
Total LPA of BDA 1206.97 100.00%
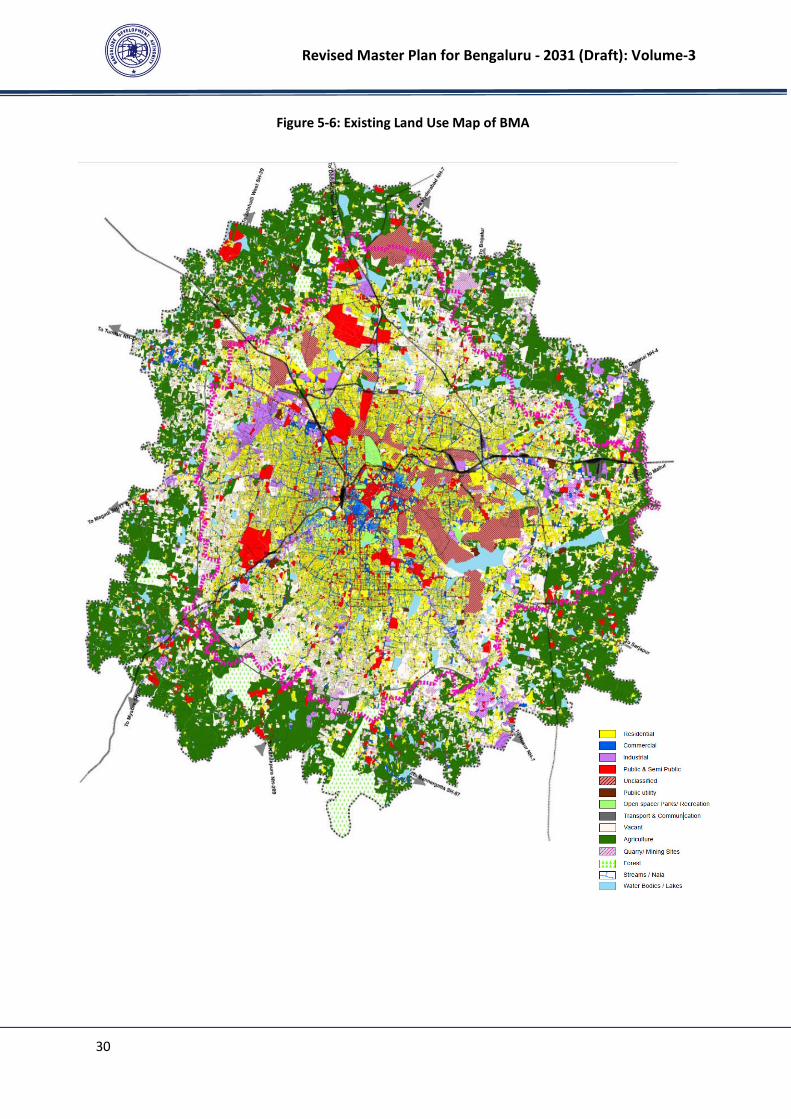
Revised Master Plan for Bengaluru - 2031 (Draft): Volume-3
30
Figure 5-6: Existing Land Use Map of BMA
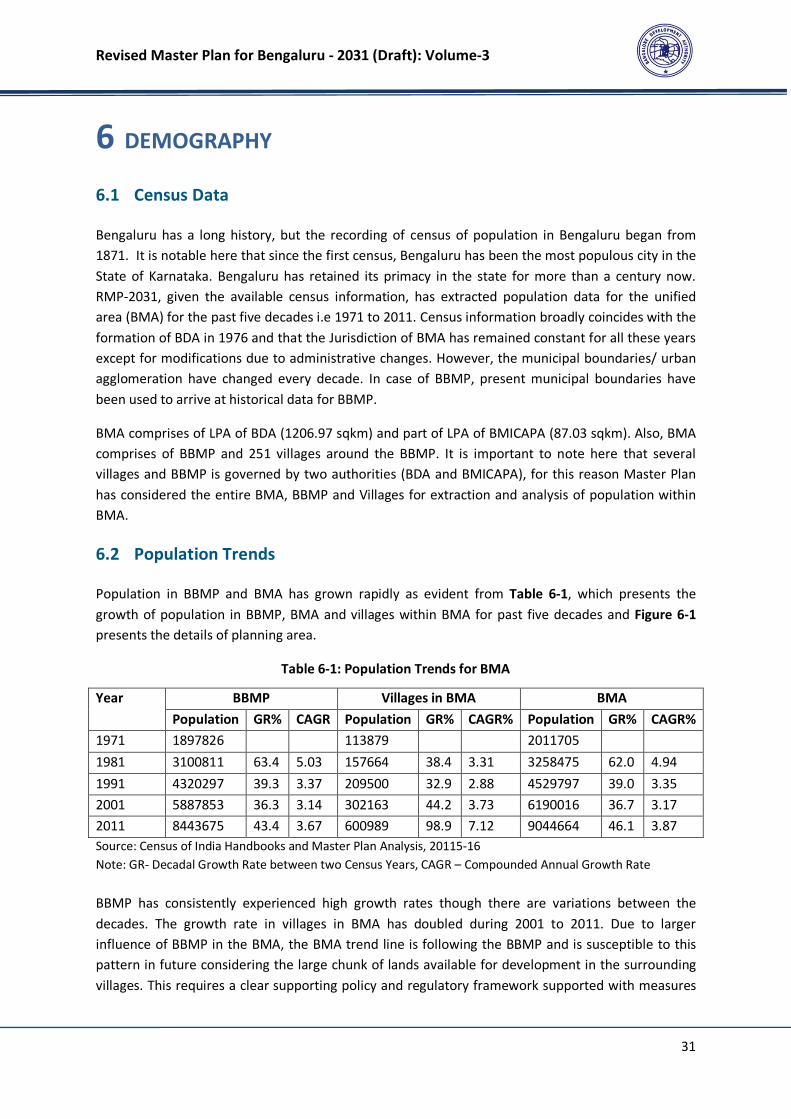
Revised Master Plan for Bengaluru - 2031 (Draft): Volume-3
31
6 DEMOGRAPHY
6.1 Census Data
Bengaluru has a long history, but the recording of census of population in Bengaluru began from
1871. It is notable here that since the first census, Bengaluru has been the most populous city in the
State of Karnataka. Bengaluru has retained its primacy in the state for more than a century now.
RMP-2031, given the available census information, has extracted population data for the unified
area (BMA) for the past five decades i.e 1971 to 2011. Census information broadly coincides with the
formation of BDA in 1976 and that the Jurisdiction of BMA has remained constant for all these years
except for modifications due to administrative changes. However, the municipal boundaries/ urban
agglomeration have changed every decade. In case of BBMP, present municipal boundaries have
been used to arrive at historical data for BBMP.
BMA comprises of LPA of BDA (1206.97 sqkm) and part of LPA of BMICAPA (87.03 sqkm). Also, BMA
comprises of BBMP and 251 villages around the BBMP. It is important to note here that several
villages and BBMP is governed by two authorities (BDA and BMICAPA), for this reason Master Plan
has considered the entire BMA, BBMP and Villages for extraction and analysis of population within
BMA.
6.2 Population Trends
Population in BBMP and BMA has grown rapidly as evident from Table 6-1, which presents the
growth of population in BBMP, BMA and villages within BMA for past five decades and Figure 6-1
presents the details of planning area.
Table 6-1: Population Trends for BMA
Year BBMP Villages in BMA BMA
Population GR% CAGR Population GR% CAGR% Population GR% CAGR%
1971 1897826 113879 2011705
1981 3100811 63.4 5.03 157664 38.4 3.31 3258475 62.0 4.94
1991 4320297 39.3 3.37 209500 32.9 2.88 4529797 39.0 3.35
2001 5887853 36.3 3.14 302163 44.2 3.73 6190016 36.7 3.17
2011 8443675 43.4 3.67 600989 98.9 7.12 9044664 46.1 3.87
Source: Census of India Handbooks and Master Plan Analysis, 20115-16
Note: GR- Decadal Growth Rate between two Census Years, CAGR – Compounded Annual Growth Rate
BBMP has consistently experienced high growth rates though there are variations between the
decades. The growth rate in villages in BMA has doubled during 2001 to 2011. Due to larger
influence of BBMP in the BMA, the BMA trend line is following the BBMP and is susceptible to this
pattern in future considering the large chunk of lands available for development in the surrounding
villages. This requires a clear supporting policy and regulatory framework supported with measures
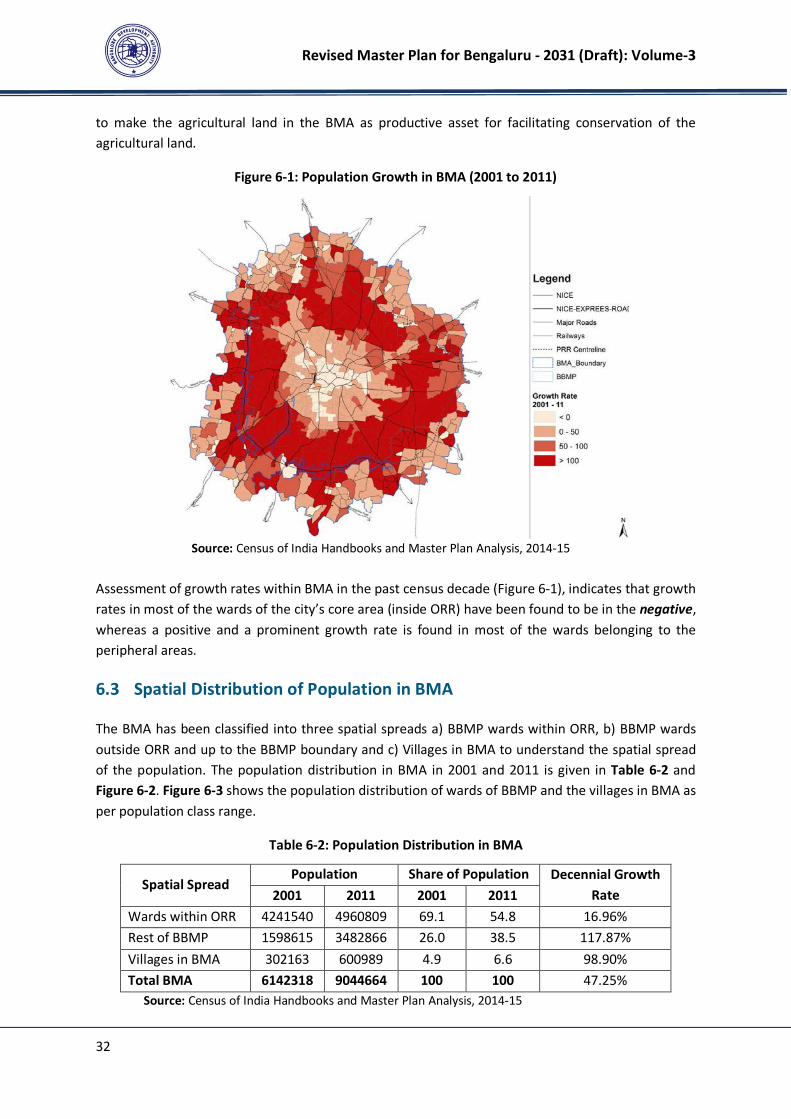
Revised Master Plan for Bengaluru - 2031 (Draft): Volume-3
32
to make the agricultural land in the BMA as productive asset for facilitating conservation of the
agricultural land.
Figure 6-1: Population Growth in BMA (2001 to 2011)
Source: Census of India Handbooks and Master Plan Analysis, 2014-15
Assessment of growth rates within BMA in the past census decade (Figure 6-1), indicates that growth
rates in most of the wards of the city’s core area (inside ORR) have been found to be in the negative,
whereas a positive and a prominent growth rate is found in most of the wards belonging to the
peripheral areas.
6.3 Spatial Distribution of Population in BMA
The BMA has been classified into three spatial spreads a) BBMP wards within ORR, b) BBMP wards
outside ORR and up to the BBMP boundary and c) Villages in BMA to understand the spatial spread
of the population. The population distribution in BMA in 2001 and 2011 is given in Table 6-2 and
Figure 6-2. Figure 6-3 shows the population distribution of wards of BBMP and the villages in BMA as
per population class range.
Table 6-2: Population Distribution in BMA
Spatial Spread Population Share of Population Decennial Growth
Rate 2001 2011 2001 2011
Wards within ORR 4241540 4960809 69.1 54.8 16.96%
Rest of BBMP 1598615 3482866 26.0 38.5 117.87%
Villages in BMA 302163 600989 4.9 6.6 98.90%
Total BMA 6142318 9044664 100 100 47.25%
Source: Census of India Handbooks and Master Plan Analysis, 2014-15

Revised Master Plan for Bengaluru - 2031 (Draft): Volume-3
33
Figure 6-2: Population Distribution within BMA
Source: Census of India Handbooks and Consultant’s analysis, 2014-15
Figure 6-3: Population Distribution in BMA
Source: Census of India Handbooks and Master Plan Analysis, 2014-15
0%
10%
20%
30%
40%
50%
60%
70%
80%
90%
100%
Population_ 2001 Population_ 2011
Wards within ORR Wards Outside ORR in the BBMP Villages in BMA
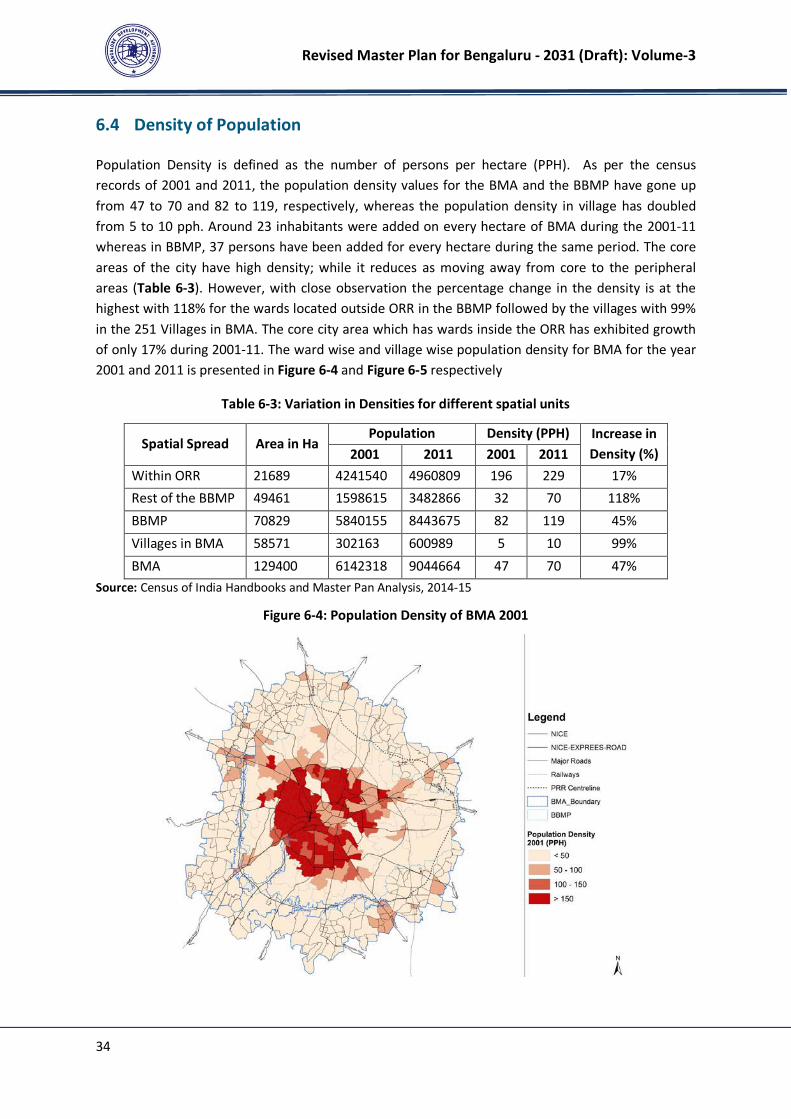
Revised Master Plan for Bengaluru - 2031 (Draft): Volume-3
34
6.4 Density of Population
Population Density is defined as the number of persons per hectare (PPH). As per the census
records of 2001 and 2011, the population density values for the BMA and the BBMP have gone up
from 47 to 70 and 82 to 119, respectively, whereas the population density in village has doubled
from 5 to 10 pph. Around 23 inhabitants were added on every hectare of BMA during the 2001-11
whereas in BBMP, 37 persons have been added for every hectare during the same period. The core
areas of the city have high density; while it reduces as moving away from core to the peripheral
areas (Table 6-3). However, with close observation the percentage change in the density is at the
highest with 118% for the wards located outside ORR in the BBMP followed by the villages with 99%
in the 251 Villages in BMA. The core city area which has wards inside the ORR has exhibited growth
of only 17% during 2001-11. The ward wise and village wise population density for BMA for the year
2001 and 2011 is presented in Figure 6-4 and Figure 6-5 respectively
Table 6-3: Variation in Densities for different spatial units
Spatial Spread Area in Ha Population Density (PPH) Increase in
Density (%) 2001 2011 2001 2011
Within ORR 21689 4241540 4960809 196 229 17%
Rest of the BBMP 49461 1598615 3482866 32 70 118%
BBMP 70829 5840155 8443675 82 119 45%
Villages in BMA 58571 302163 600989 5 10 99%
BMA 129400 6142318 9044664 47 70 47%
Source: Census of India Handbooks and Master Pan Analysis, 2014-15
Figure 6-4: Population Density of BMA 2001
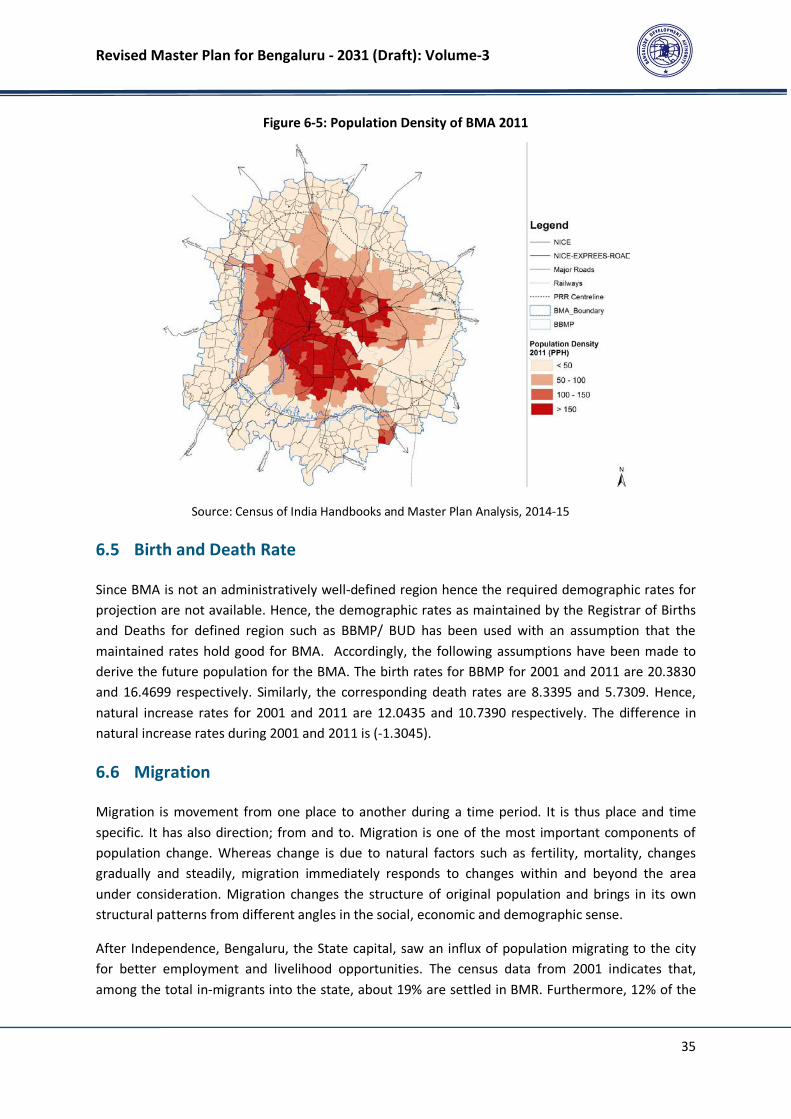
Revised Master Plan for Bengaluru - 2031 (Draft): Volume-3
35
Figure 6-5: Population Density of BMA 2011
Source: Census of India Handbooks and Master Plan Analysis, 2014-15
6.5 Birth and Death Rate
Since BMA is not an administratively well-defined region hence the required demographic rates for
projection are not available. Hence, the demographic rates as maintained by the Registrar of Births
and Deaths for defined region such as BBMP/ BUD has been used with an assumption that the
maintained rates hold good for BMA. Accordingly, the following assumptions have been made to
derive the future population for the BMA. The birth rates for BBMP for 2001 and 2011 are 20.3830
and 16.4699 respectively. Similarly, the corresponding death rates are 8.3395 and 5.7309. Hence,
natural increase rates for 2001 and 2011 are 12.0435 and 10.7390 respectively. The difference in
natural increase rates during 2001 and 2011 is (-1.3045).
6.6 Migration
Migration is movement from one place to another during a time period. It is thus place and time
specific. It has also direction; from and to. Migration is one of the most important components of
population change. Whereas change is due to natural factors such as fertility, mortality, changes
gradually and steadily, migration immediately responds to changes within and beyond the area
under consideration. Migration changes the structure of original population and brings in its own
structural patterns from different angles in the social, economic and demographic sense.
After Independence, Bengaluru, the State capital, saw an influx of population migrating to the city
for better employment and livelihood opportunities. The census data from 2001 indicates that,
among the total in-migrants into the state, about 19% are settled in BMR. Furthermore, 12% of the
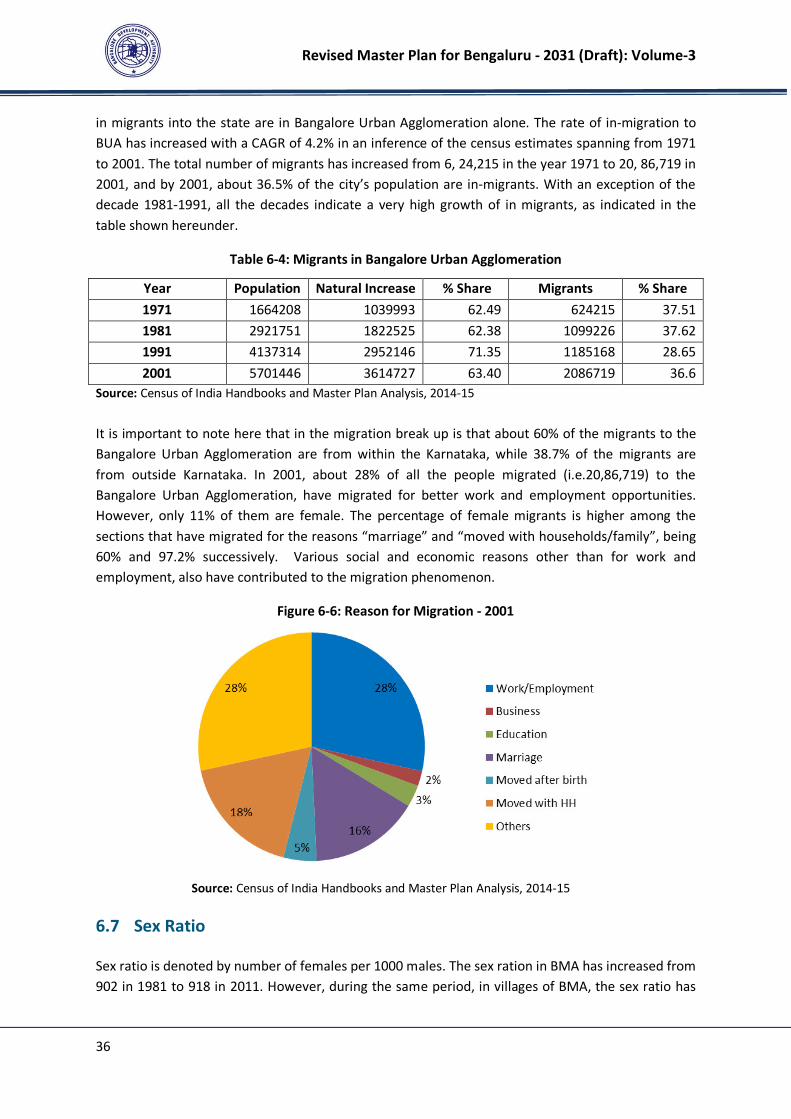
Revised Master Plan for Bengaluru - 2031 (Draft): Volume-3
36
in migrants into the state are in Bangalore Urban Agglomeration alone. The rate of in-migration to
BUA has increased with a CAGR of 4.2% in an inference of the census estimates spanning from 1971
to 2001. The total number of migrants has increased from 6, 24,215 in the year 1971 to 20, 86,719 in
2001, and by 2001, about 36.5% of the city’s population are in-migrants. With an exception of the
decade 1981-1991, all the decades indicate a very high growth of in migrants, as indicated in the
table shown hereunder.
Table 6-4: Migrants in Bangalore Urban Agglomeration
Year Population Natural Increase % Share Migrants % Share
1971 1664208 1039993 62.49 624215 37.51
1981 2921751 1822525 62.38 1099226 37.62
1991 4137314 2952146 71.35 1185168 28.65
2001 5701446 3614727 63.40 2086719 36.6
Source: Census of India Handbooks and Master Plan Analysis, 2014-15
It is important to note here that in the migration break up is that about 60% of the migrants to the
Bangalore Urban Agglomeration are from within the Karnataka, while 38.7% of the migrants are
from outside Karnataka. In 2001, about 28% of all the people migrated (i.e.20,86,719) to the
Bangalore Urban Agglomeration, have migrated for better work and employment opportunities.
However, only 11% of them are female. The percentage of female migrants is higher among the
sections that have migrated for the reasons “marriage” and “moved with households/family”, being
60% and 97.2% successively. Various social and economic reasons other than for work and
employment, also have contributed to the migration phenomenon.
Figure 6-6: Reason for Migration - 2001
Source: Census of India Handbooks and Master Plan Analysis, 2014-15
6.7 Sex Ratio
Sex ratio is denoted by number of females per 1000 males. The sex ration in BMA has increased from
902 in 1981 to 918 in 2011. However, during the same period, in villages of BMA, the sex ratio has

Revised Master Plan for Bengaluru - 2031 (Draft): Volume-3
37
decreased from 884 in 1991 to 857 in 2011. Table 6-5 presents the sex ratio in BMA for past three
decades.
Table 6-5: Sex Ratio in BMA
Area 1991 2001 2011
BMA 902 907 918
BBMP 903 909 923
251 Villages in BMA 884 878 854
Source: Census of India Handbooks and Master Plan Analysis, 2014-15
6.8 Literacy Rate
Bengaluru has always recorded a high literacy rate since its inception due to the high quality of
educational infrastructure available in the city. The literacy rate in BMA has increased from 77.5% to
88.3% during the period 1991-2011. The literacy rate in 2011 is higher than Karnataka Urban
(85.7%).
6.9 Population Age Pyramid
Age structure of a population in a city / metropolis plays a major role in urban planning. It gives an
idea about dependent population, working population, jobs to be created, the present and future
requirements of land, educational, health and other facilities and amenities. It depends on birth rate,
death rate and also migration.
The Population pyramid is shown in Figure 6-7 indicating the higher migration into the city of the age
group of 20 to 60. However, the base of the pyramid which is in the age group of 0 to 14 is wider
enough to reflect higher birth rate in the city (15 out of 1000 persons). The sides are not too concave
reflecting the death rate is falling (6 out of 1000 persons). However, the lesser percentage of the
people in peak of the pyramid indicates the life expectancy is better but still low.
The index of ageing increased rapidly from 18 elderly to 100 children in 1991 to 32 elderly to 100
children in 2011. However, the dependency ratio has decreased from 2 persons for every family to 3
persons per family. The number of persons in the age group of 15 to 60 has witnessed significant
increase from 58% in 1991 to 63% in 2011. Especially the middle age group of 25 to 44 has increased
tremendously from 30% in 1991 to 37% in 2011 reflecting the higher in-migration.
Further, analyzing information for the past three decades, the pyramid indicates the falling in birth
and death rates from 1991 to 2011. The index of ageing indicates the shift in the balance between
the child and older populations and is expressed as the number of persons above 60 years for every
100 children below the age of 15 years.
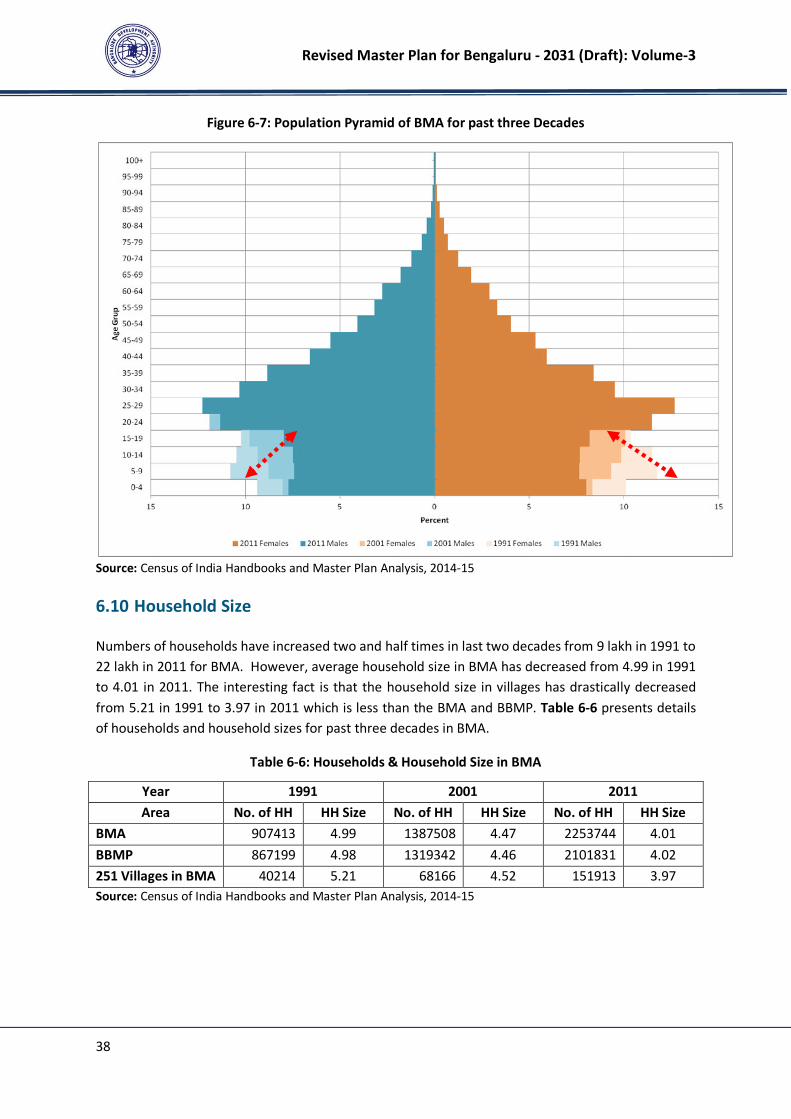
Revised Master Plan for Bengaluru - 2031 (Draft): Volume-3
38
Figure 6-7: Population Pyramid of BMA for past three Decades
Source: Census of India Handbooks and Master Plan Analysis, 2014-15
6.10 Household Size
Numbers of households have increased two and half times in last two decades from 9 lakh in 1991 to
22 lakh in 2011 for BMA. However, average household size in BMA has decreased from 4.99 in 1991
to 4.01 in 2011. The interesting fact is that the household size in villages has drastically decreased
from 5.21 in 1991 to 3.97 in 2011 which is less than the BMA and BBMP. Table 6-6 presents details
of households and household sizes for past three decades in BMA.
Table 6-6: Households & Household Size in BMA
Year 1991 2001 2011
Area No. of HH HH Size No. of HH HH Size No. of HH HH Size
BMA 907413 4.99 1387508 4.47 2253744 4.01
BBMP 867199 4.98 1319342 4.46 2101831 4.02
251 Villages in BMA 40214 5.21 68166 4.52 151913 3.97
Source: Census of India Handbooks and Master Plan Analysis, 2014-15
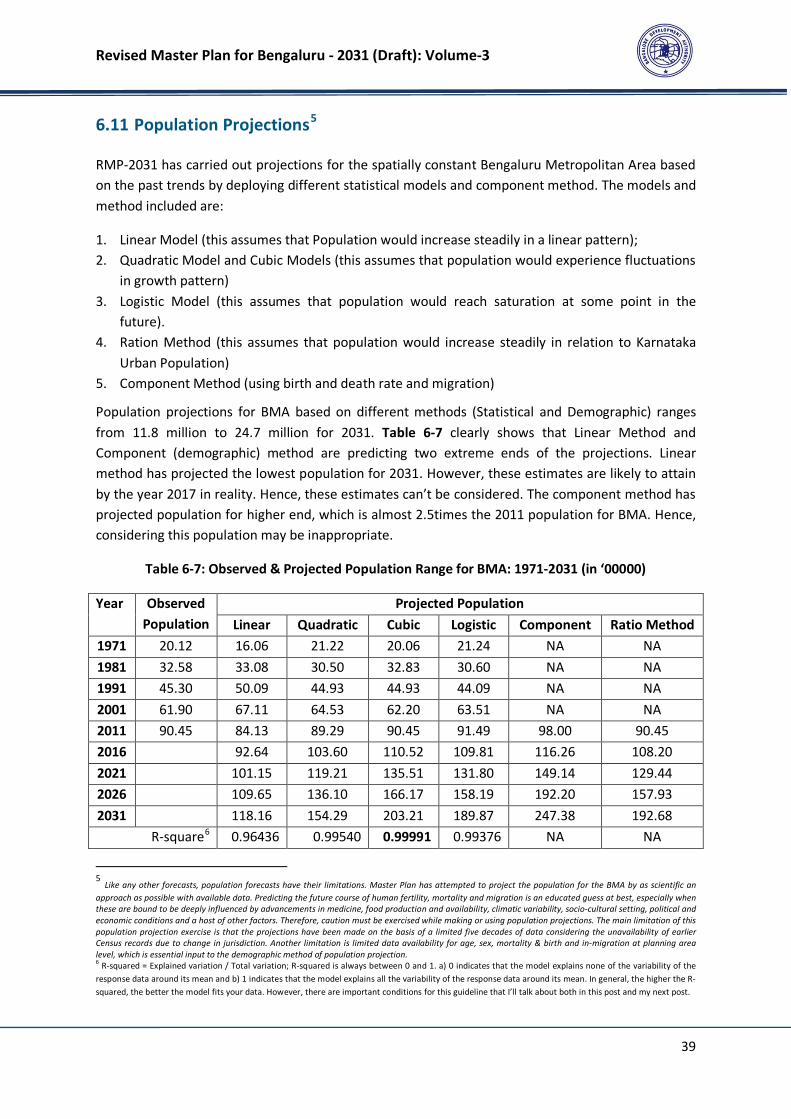
Revised Master Plan for Bengaluru - 2031 (Draft): Volume-3
39
6.11 Population Projections5
RMP-2031 has carried out projections for the spatially constant Bengaluru Metropolitan Area based
on the past trends by deploying different statistical models and component method. The models and
method included are:
1. Linear Model (this assumes that Population would increase steadily in a linear pattern);
2. Quadratic Model and Cubic Models (this assumes that population would experience fluctuations
in growth pattern)
3. Logistic Model (this assumes that population would reach saturation at some point in the
future).
4. Ration Method (this assumes that population would increase steadily in relation to Karnataka
Urban Population)
5. Component Method (using birth and death rate and migration)
Population projections for BMA based on different methods (Statistical and Demographic) ranges
from 11.8 million to 24.7 million for 2031. Table 6-7 clearly shows that Linear Method and
Component (demographic) method are predicting two extreme ends of the projections. Linear
method has projected the lowest population for 2031. However, these estimates are likely to attain
by the year 2017 in reality. Hence, these estimates can’t be considered. The component method has
projected population for higher end, which is almost 2.5times the 2011 population for BMA. Hence,
considering this population may be inappropriate.
Table 6-7: Observed & Projected Population Range for BMA: 1971-2031 (in ‘00000)
Year Observed
Population
Projected Population
Linear Quadratic Cubic Logistic Component Ratio Method
1971 20.12 16.06 21.22 20.06 21.24 NA NA
1981 32.58 33.08 30.50 32.83 30.60 NA NA
1991 45.30 50.09 44.93 44.93 44.09 NA NA
2001 61.90 67.11 64.53 62.20 63.51 NA NA
2011 90.45 84.13 89.29 90.45 91.49 98.00 90.45
2016 92.64 103.60 110.52 109.81 116.26 108.20
2021 101.15 119.21 135.51 131.80 149.14 129.44
2026 109.65 136.10 166.17 158.19 192.20 157.93
2031 118.16 154.29 203.21 189.87 247.38 192.68
R-square6 0.96436 0.99540 0.99991 0.99376 NA NA
5 Like any other forecasts, population forecasts have their limitations. Master Plan has attempted to project the population for the BMA by as scientific an
approach as possible with available data. Predicting the future course of human fertility, mortality and migration is an educated guess at best, especially when
these are bound to be deeply influenced by advancements in medicine, food production and availability, climatic variability, socio-cultural setting, political and
economic conditions and a host of other factors. Therefore, caution must be exercised while making or using population projections. The main limitation of this
population projection exercise is that the projections have been made on the basis of a limited five decades of data considering the unavailability of earlier
Census records due to change in jurisdiction. Another limitation is limited data availability for age, sex, mortality & birth and in-migration at planning area
level, which is essential input to the demographic method of population projection. 6 R-squared = Explained variation / Total variation; R-squared is always between 0 and 1. a) 0 indicates that the model explains none of the variability of the
response data around its mean and b) 1 indicates that the model explains all the variability of the response data around its mean. In general, the higher the R-
squared, the better the model fits your data. However, there are important conditions for this guideline that I’ll talk about both in this post and my next post.

Revised Master Plan for Bengaluru - 2031 (Draft): Volume-3
40
Population projections by three methods, namely Logistics, Ratio and Cubic method are in the range
of 19-20 million. The projection by logistic model (19 million) is ideal considering the fact that the
population cannot grow for ever due to its natural carrying capacity limit and instead population
growth will taper off and reach saturation. However, while planning for metropolitan region it would
be appropriate to plan for higher range to account for sudden growth in the population – which
cannot be predicted. Also, that the R-square among the statics method is close to accuracy for cubic
method.
The Population Projection methodology and results were shared with Department of Economics and
Statistics, GoK and Institute for Social and Economic Change for independent review and
confirmation. Both have confirmed that the BMA population could be in the range of 19 to 20
million by 2031. Hence it is appropriate to consider projections by Cubic method at 20.3 million for
BMA by 2031.
6.12 Future Age Distribution
The purpose of knowing demographic characteristic of future population is to understand the
potential employable population, demand for social infrastructure, and social composition (age &
sex).
For the purpose of assessment of Age Distribution, due to non-availability of age distribution for
BMA, the age distribution pattern of urban population of BUD for 2001 and 2011 (as per census) has
been considered. The percentage difference between 2001 and 2011 age distribution pattern has
formed the basis for future (2021 and 2031) age distribution pattern of BMA.
Table 6-8 presents the most strategic age distributions for which future projections have been
attempted based on representative description following national and international profiles.
Table 6-8: Strategic Age Distribution Pattern
Age Distribution Description
0 – 6 Infants
7 - 15 Education Aspirant Children
16 – 24 Higher Education Aspirant Children
25 - 44 Young Job Seekers/Employed
45 - 59 Middle Aged Skills
60 - 79 Aged And Dependents
80+ Aged Dependents
The age wise population distribution ratio for the 2021 and 2031 based on 2001 - 2011 pattern is
presented in the below Table 6-9.
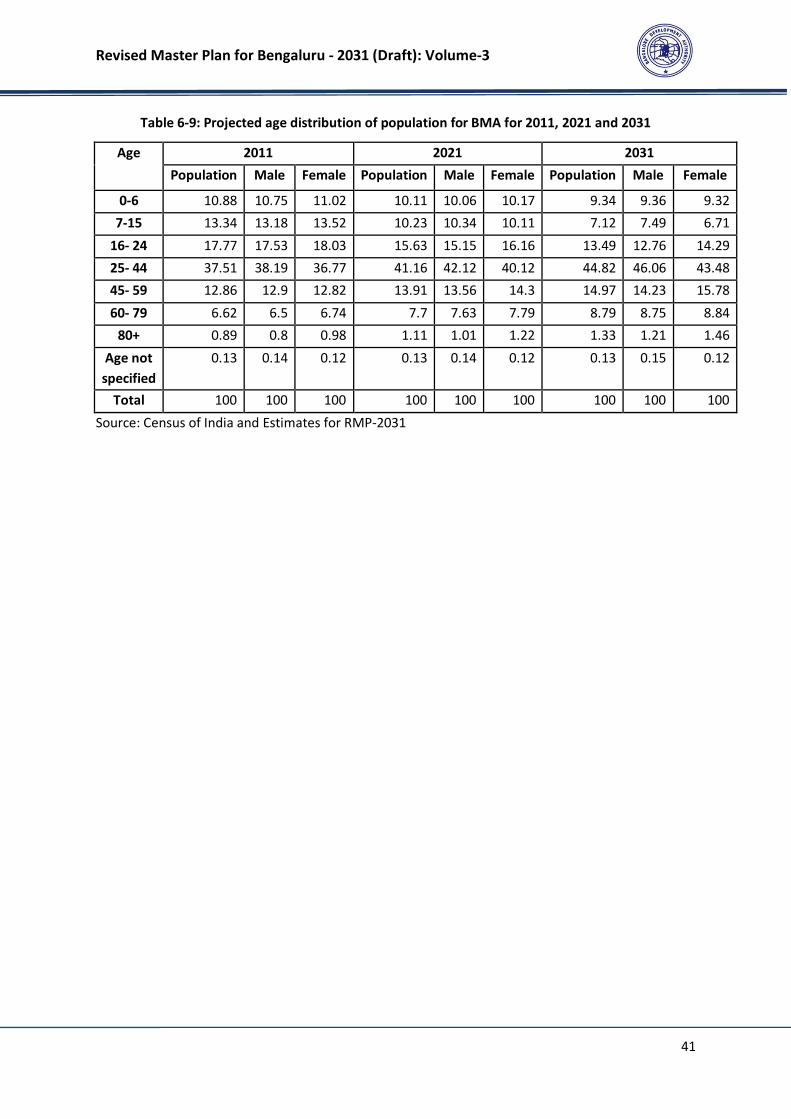
Revised Master Plan for Bengaluru - 2031 (Draft): Volume-3
41
Table 6-9: Projected age distribution of population for BMA for 2011, 2021 and 2031
Age 2011 2021 2031
Population Male Female Population Male Female Population Male Female
0-6 10.88 10.75 11.02 10.11 10.06 10.17 9.34 9.36 9.32
7-15 13.34 13.18 13.52 10.23 10.34 10.11 7.12 7.49 6.71
16- 24 17.77 17.53 18.03 15.63 15.15 16.16 13.49 12.76 14.29
25- 44 37.51 38.19 36.77 41.16 42.12 40.12 44.82 46.06 43.48
45- 59 12.86 12.9 12.82 13.91 13.56 14.3 14.97 14.23 15.78
60- 79 6.62 6.5 6.74 7.7 7.63 7.79 8.79 8.75 8.84
80+ 0.89 0.8 0.98 1.11 1.01 1.22 1.33 1.21 1.46
Age not
specified
0.13 0.14 0.12 0.13 0.14 0.12 0.13 0.15 0.12
Total 100 100 100 100 100 100 100 100 100
Source: Census of India and Estimates for RMP-2031
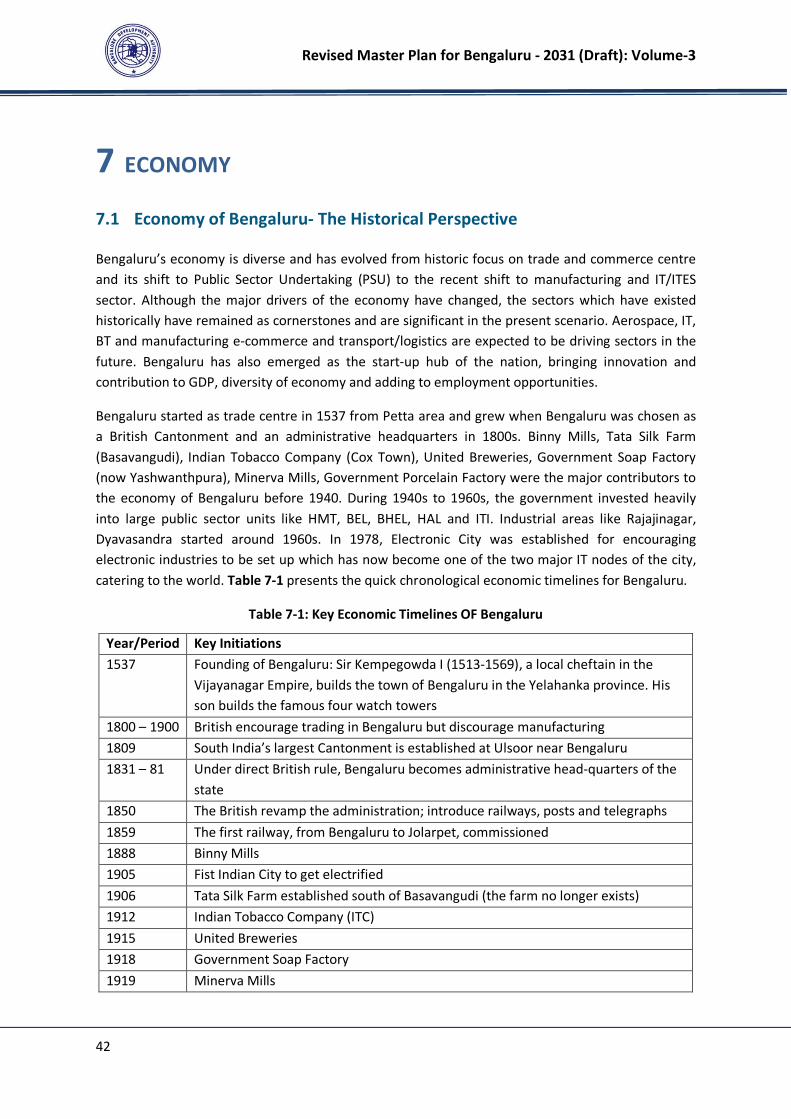
Revised Master Plan for Bengaluru - 2031 (Draft): Volume-3
42
7 ECONOMY
7.1 Economy of Bengaluru- The Historical Perspective
Bengaluru’s economy is diverse and has evolved from historic focus on trade and commerce centre
and its shift to Public Sector Undertaking (PSU) to the recent shift to manufacturing and IT/ITES
sector. Although the major drivers of the economy have changed, the sectors which have existed
historically have remained as cornerstones and are significant in the present scenario. Aerospace, IT,
BT and manufacturing e-commerce and transport/logistics are expected to be driving sectors in the
future. Bengaluru has also emerged as the start-up hub of the nation, bringing innovation and
contribution to GDP, diversity of economy and adding to employment opportunities.
Bengaluru started as trade centre in 1537 from Petta area and grew when Bengaluru was chosen as
a British Cantonment and an administrative headquarters in 1800s. Binny Mills, Tata Silk Farm
(Basavangudi), Indian Tobacco Company (Cox Town), United Breweries, Government Soap Factory
(now Yashwanthpura), Minerva Mills, Government Porcelain Factory were the major contributors to
the economy of Bengaluru before 1940. During 1940s to 1960s, the government invested heavily
into large public sector units like HMT, BEL, BHEL, HAL and ITI. Industrial areas like Rajajinagar,
Dyavasandra started around 1960s. In 1978, Electronic City was established for encouraging
electronic industries to be set up which has now become one of the two major IT nodes of the city,
catering to the world. Table 7-1 presents the quick chronological economic timelines for Bengaluru.
Table 7-1: Key Economic Timelines OF Bengaluru
Year/Period Key Initiations
1537 Founding of Bengaluru: Sir Kempegowda I (1513-1569), a local cheftain in the
Vijayanagar Empire, builds the town of Bengaluru in the Yelahanka province. His
son builds the famous four watch towers
1800 – 1900 British encourage trading in Bengaluru but discourage manufacturing
1809 South India’s largest Cantonment is established at Ulsoor near Bengaluru
1831 – 81 Under direct British rule, Bengaluru becomes administrative head-quarters of the
state
1850 The British revamp the administration; introduce railways, posts and telegraphs
1859 The first railway, from Bengaluru to Jolarpet, commissioned
1888 Binny Mills
1905 Fist Indian City to get electrified
1906 Tata Silk Farm established south of Basavangudi (the farm no longer exists)
1912 Indian Tobacco Company (ITC)
1915 United Breweries
1918 Government Soap Factory
1919 Minerva Mills
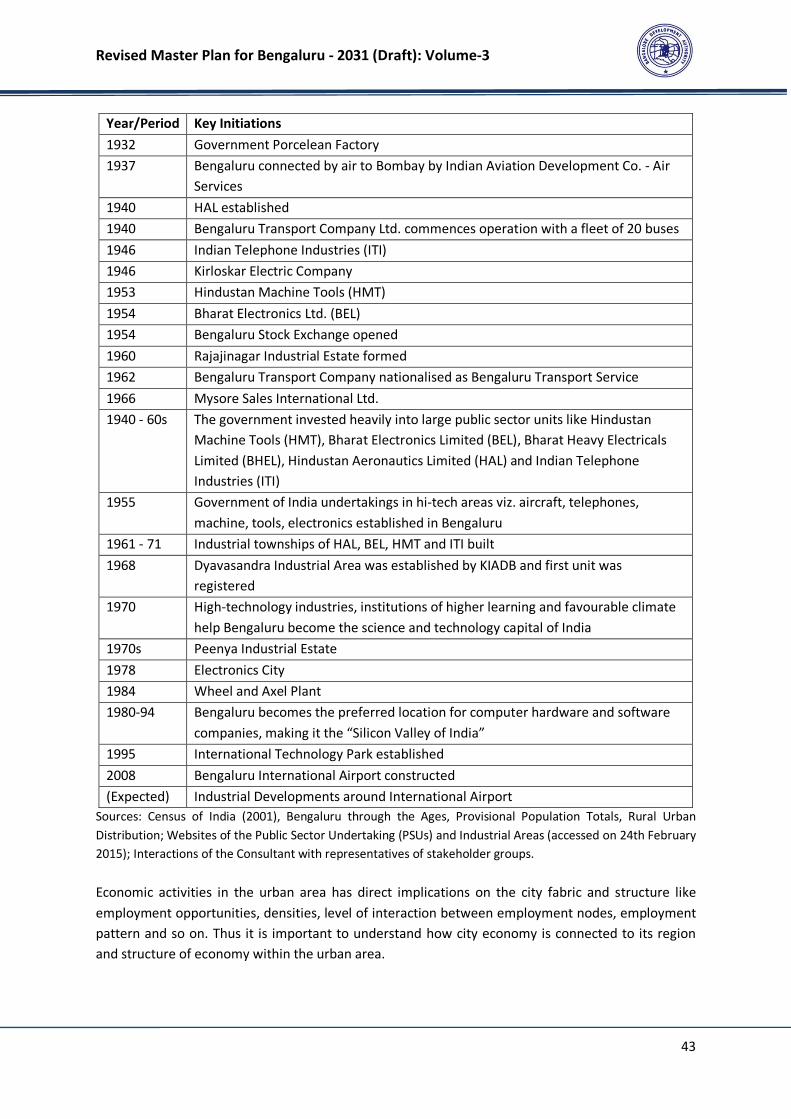
Revised Master Plan for Bengaluru - 2031 (Draft): Volume-3
43
Year/Period Key Initiations
1932 Government Porcelean Factory
1937 Bengaluru connected by air to Bombay by Indian Aviation Development Co. - Air
Services
1940 HAL established
1940 Bengaluru Transport Company Ltd. commences operation with a fleet of 20 buses
1946 Indian Telephone Industries (ITI)
1946 Kirloskar Electric Company
1953 Hindustan Machine Tools (HMT)
1954 Bharat Electronics Ltd. (BEL)
1954 Bengaluru Stock Exchange opened
1960 Rajajinagar Industrial Estate formed
1962 Bengaluru Transport Company nationalised as Bengaluru Transport Service
1966 Mysore Sales International Ltd.
1940 - 60s The government invested heavily into large public sector units like Hindustan
Machine Tools (HMT), Bharat Electronics Limited (BEL), Bharat Heavy Electricals
Limited (BHEL), Hindustan Aeronautics Limited (HAL) and Indian Telephone
Industries (ITI)
1955 Government of India undertakings in hi-tech areas viz. aircraft, telephones,
machine, tools, electronics established in Bengaluru
1961 - 71 Industrial townships of HAL, BEL, HMT and ITI built
1968 Dyavasandra Industrial Area was established by KIADB and first unit was
registered
1970 High-technology industries, institutions of higher learning and favourable climate
help Bengaluru become the science and technology capital of India
1970s Peenya Industrial Estate
1978 Electronics City
1984 Wheel and Axel Plant
1980-94 Bengaluru becomes the preferred location for computer hardware and software
companies, making it the “Silicon Valley of India”
1995 International Technology Park established
2008 Bengaluru International Airport constructed
(Expected) Industrial Developments around International Airport
Sources: Census of India (2001), Bengaluru through the Ages, Provisional Population Totals, Rural Urban
Distribution; Websites of the Public Sector Undertaking (PSUs) and Industrial Areas (accessed on 24th February
2015); Interactions of the Consultant with representatives of stakeholder groups.
Economic activities in the urban area has direct implications on the city fabric and structure like
employment opportunities, densities, level of interaction between employment nodes, employment
pattern and so on. Thus it is important to understand how city economy is connected to its region
and structure of economy within the urban area.
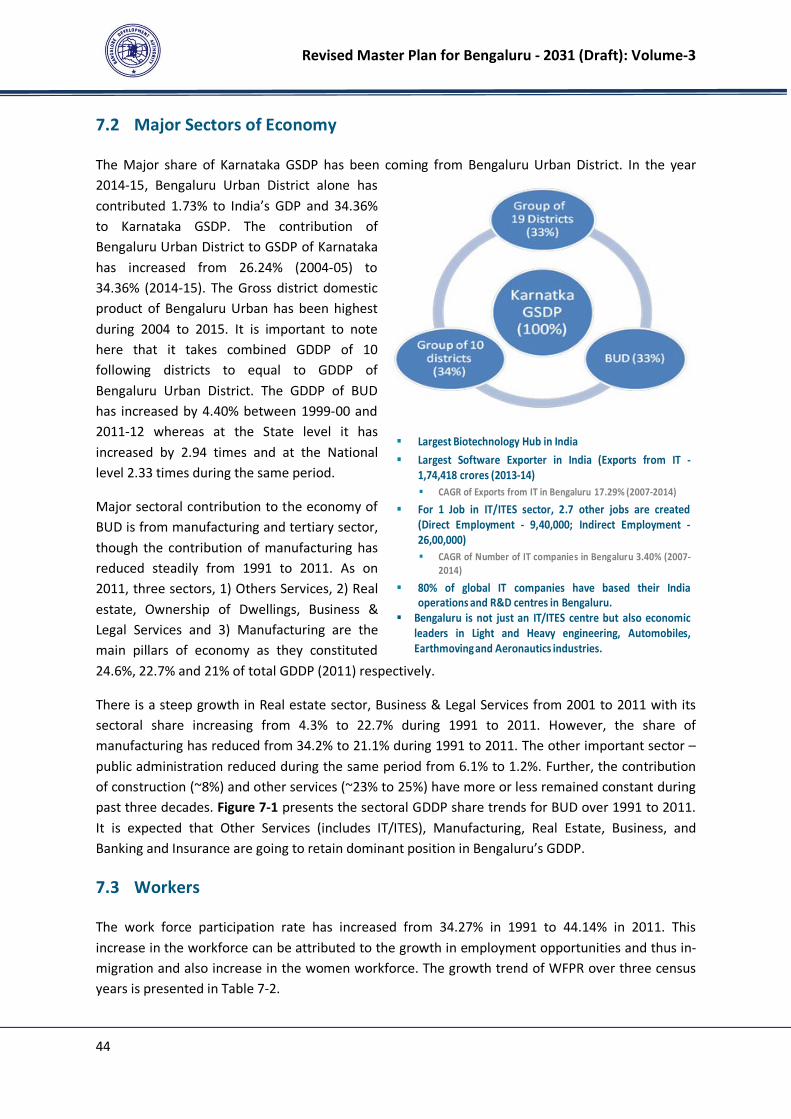
Revised Master Plan for Bengaluru - 2031 (Draft): Volume-3
44
7.2 Major Sectors of Economy
The Major share of Karnataka GSDP has been coming from Bengaluru Urban District. In the year
2014-15, Bengaluru Urban District alone has
contributed 1.73% to India’s GDP and 34.36%
to Karnataka GSDP. The contribution of
Bengaluru Urban District to GSDP of Karnataka
has increased from 26.24% (2004-05) to
34.36% (2014-15). The Gross district domestic
product of Bengaluru Urban has been highest
during 2004 to 2015. It is important to note
here that it takes combined GDDP of 10
following districts to equal to GDDP of
Bengaluru Urban District. The GDDP of BUD
has increased by 4.40% between 1999-00 and
2011-12 whereas at the State level it has
increased by 2.94 times and at the National
level 2.33 times during the same period.
Major sectoral contribution to the economy of
BUD is from manufacturing and tertiary sector,
though the contribution of manufacturing has
reduced steadily from 1991 to 2011. As on
2011, three sectors, 1) Others Services, 2) Real
estate, Ownership of Dwellings, Business &
Legal Services and 3) Manufacturing are the
main pillars of economy as they constituted
24.6%, 22.7% and 21% of total GDDP (2011) respectively.
There is a steep growth in Real estate sector, Business & Legal Services from 2001 to 2011 with its
sectoral share increasing from 4.3% to 22.7% during 1991 to 2011. However, the share of
manufacturing has reduced from 34.2% to 21.1% during 1991 to 2011. The other important sector –
public administration reduced during the same period from 6.1% to 1.2%. Further, the contribution
of construction (~8%) and other services (~23% to 25%) have more or less remained constant during
past three decades. Figure 7-1 presents the sectoral GDDP share trends for BUD over 1991 to 2011.
It is expected that Other Services (includes IT/ITES), Manufacturing, Real Estate, Business, and
Banking and Insurance are going to retain dominant position in Bengaluru’s GDDP.
7.3 Workers
The work force participation rate has increased from 34.27% in 1991 to 44.14% in 2011. This
increase in the workforce can be attributed to the growth in employment opportunities and thus in-
migration and also increase in the women workforce. The growth trend of WFPR over three census
years is presented in Table 7-2.
Largest Biotechnology Hub in India
Largest Software Exporter in India (Exports from IT -
1,74,418 crores (2013-14)
CAGR of Exports from IT in Bengaluru 17.29% (2007-2014)
For 1 Job in IT/ITES sector, 2.7 other jobs are created
(Direct Employment - 9,40,000; Indirect Employment -
26,00,000)
CAGR of Number of IT companies in Bengaluru 3.40% (2007-
2014)
80% of global IT companies have based their India
operations and R&D centres in Bengaluru.
Bengaluru is not just an IT/ITES centre but also economic
leaders in Light and Heavy engineering, Automobiles,
Earthmovingand Aeronautics industries.
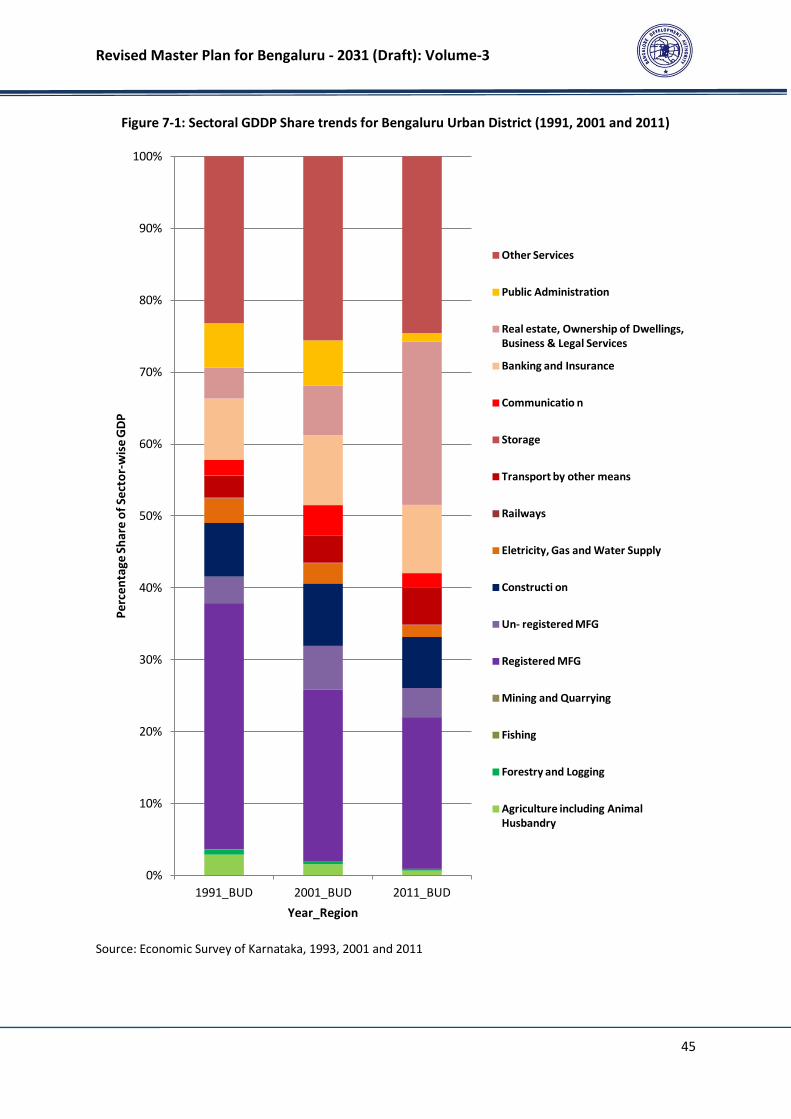
Revised Master Plan for Bengaluru - 2031 (Draft): Volume-3
45
Figure 7-1: Sectoral GDDP Share trends for Bengaluru Urban District (1991, 2001 and 2011)
Source: Economic Survey of Karnataka, 1993, 2001 and 2011
0%
10%
20%
30%
40%
50%
60%
70%
80%
90%
100%
1991_BUD 2001_BUD 2011_BUD
Pe
rce
nta
ge
Sh
are
of
Se
cto
r-w
ise
GD
P
Year_Region
Other Services
Public Administration
Real estate, Ownership of Dwellings,
Business & Legal Services
Banking and Insurance
Communicatio n
Storage
Transport by other means
Railways
Eletricity, Gas and Water Supply
Constructi on
Un- registered MFG
Registered MFG
Mining and Quarrying
Fishing
Forestry and Logging
Agriculture including Animal
Husbandry
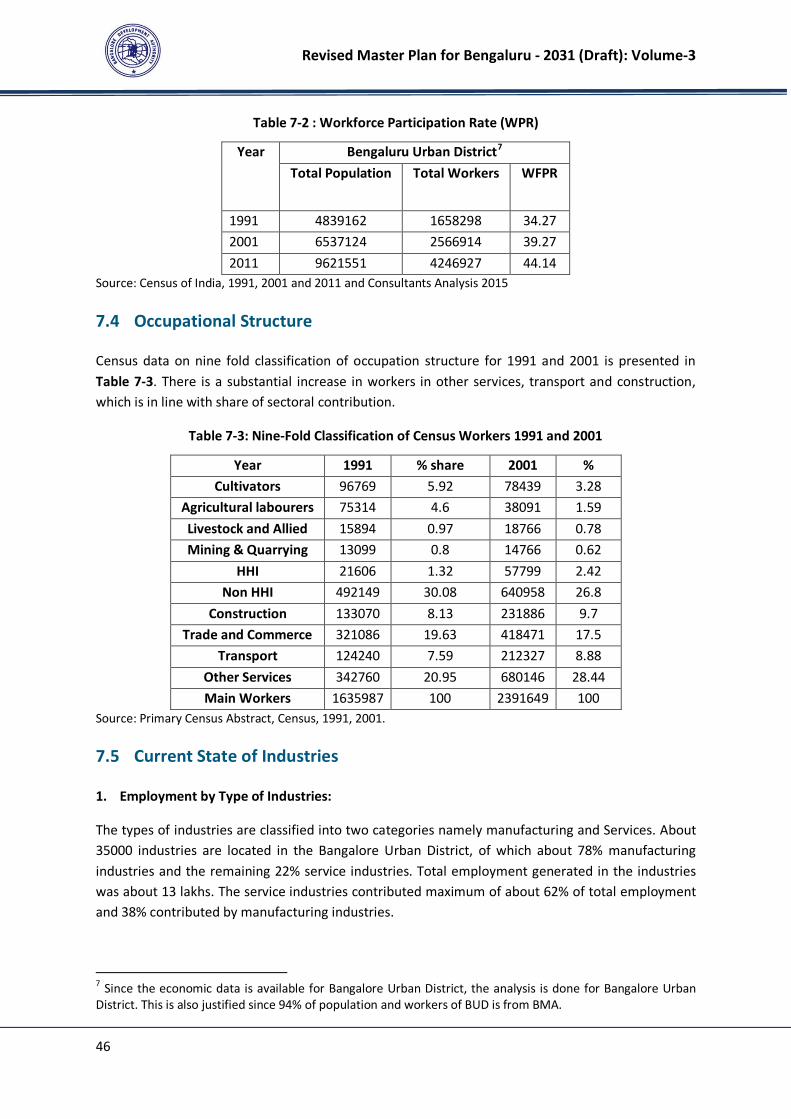
Revised Master Plan for Bengaluru - 2031 (Draft): Volume-3
46
Table 7-2 : Workforce Participation Rate (WPR)
Year Bengaluru Urban District7
Total Population Total Workers WFPR
1991 4839162 1658298 34.27
2001 6537124 2566914 39.27
2011 9621551 4246927 44.14
Source: Census of India, 1991, 2001 and 2011 and Consultants Analysis 2015
7.4 Occupational Structure
Census data on nine fold classification of occupation structure for 1991 and 2001 is presented in
Table 7-3. There is a substantial increase in workers in other services, transport and construction,
which is in line with share of sectoral contribution.
Table 7-3: Nine-Fold Classification of Census Workers 1991 and 2001
Year 1991 % share 2001 %
Cultivators 96769 5.92 78439 3.28
Agricultural labourers 75314 4.6 38091 1.59
Livestock and Allied 15894 0.97 18766 0.78
Mining & Quarrying 13099 0.8 14766 0.62
HHI 21606 1.32 57799 2.42
Non HHI 492149 30.08 640958 26.8
Construction 133070 8.13 231886 9.7
Trade and Commerce 321086 19.63 418471 17.5
Transport 124240 7.59 212327 8.88
Other Services 342760 20.95 680146 28.44
Main Workers 1635987 100 2391649 100
Source: Primary Census Abstract, Census, 1991, 2001.
7.5 Current State of Industries
1. Employment by Type of Industries:
The types of industries are classified into two categories namely manufacturing and Services. About
35000 industries are located in the Bangalore Urban District, of which about 78% manufacturing
industries and the remaining 22% service industries. Total employment generated in the industries
was about 13 lakhs. The service industries contributed maximum of about 62% of total employment
and 38% contributed by manufacturing industries.
7 Since the economic data is available for Bangalore Urban District, the analysis is done for Bangalore Urban
District. This is also justified since 94% of population and workers of BUD is from BMA.
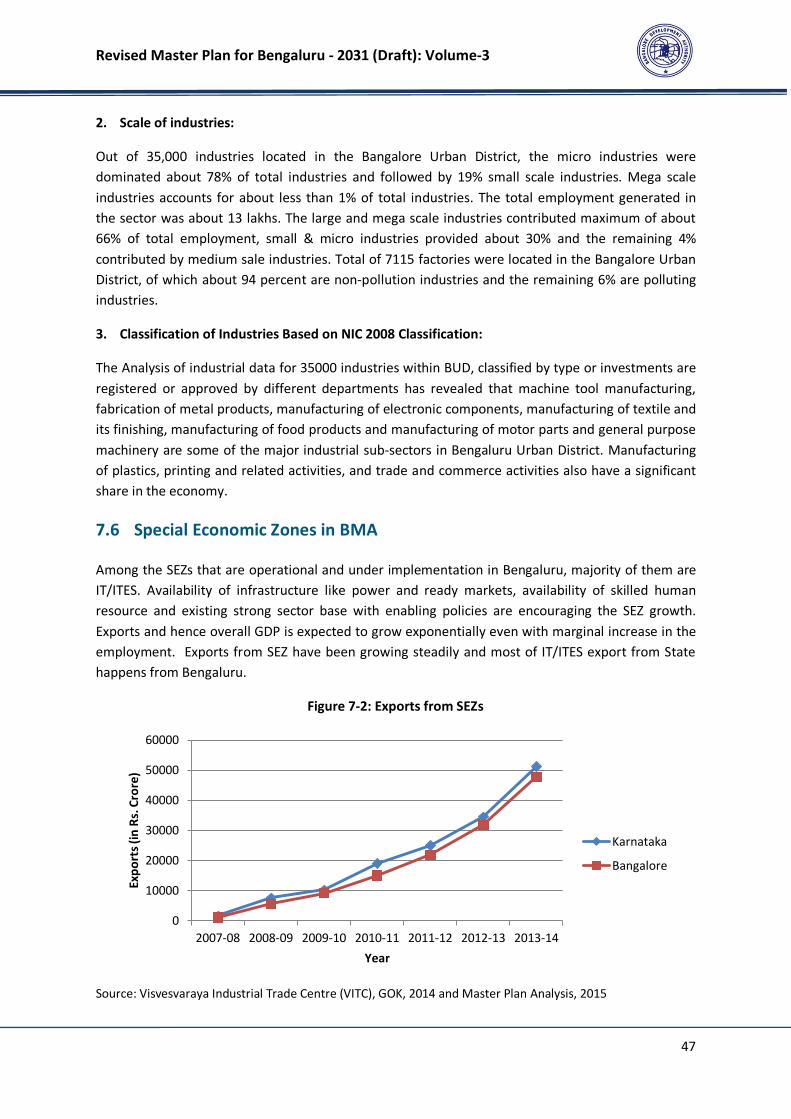
Revised Master Plan for Bengaluru - 2031 (Draft): Volume-3
47
2. Scale of industries:
Out of 35,000 industries located in the Bangalore Urban District, the micro industries were
dominated about 78% of total industries and followed by 19% small scale industries. Mega scale
industries accounts for about less than 1% of total industries. The total employment generated in
the sector was about 13 lakhs. The large and mega scale industries contributed maximum of about
66% of total employment, small & micro industries provided about 30% and the remaining 4%
contributed by medium sale industries. Total of 7115 factories were located in the Bangalore Urban
District, of which about 94 percent are non-pollution industries and the remaining 6% are polluting
industries.
3. Classification of Industries Based on NIC 2008 Classification:
The Analysis of industrial data for 35000 industries within BUD, classified by type or investments are
registered or approved by different departments has revealed that machine tool manufacturing,
fabrication of metal products, manufacturing of electronic components, manufacturing of textile and
its finishing, manufacturing of food products and manufacturing of motor parts and general purpose
machinery are some of the major industrial sub-sectors in Bengaluru Urban District. Manufacturing
of plastics, printing and related activities, and trade and commerce activities also have a significant
share in the economy.
7.6 Special Economic Zones in BMA
Among the SEZs that are operational and under implementation in Bengaluru, majority of them are
IT/ITES. Availability of infrastructure like power and ready markets, availability of skilled human
resource and existing strong sector base with enabling policies are encouraging the SEZ growth.
Exports and hence overall GDP is expected to grow exponentially even with marginal increase in the
employment. Exports from SEZ have been growing steadily and most of IT/ITES export from State
happens from Bengaluru.
Figure 7-2: Exports from SEZs
Source: Visvesvaraya Industrial Trade Centre (VITC), GOK, 2014 and Master Plan Analysis, 2015
0
10000
20000
30000
40000
50000
60000
2007-08 2008-09 2009-10 2010-11 2011-12 2012-13 2013-14
Ex
po
rts
(in
Rs.
Cro
re)
Year
Karnataka
Bangalore

Revised Master Plan for Bengaluru - 2031 (Draft): Volume-3
48
7.7 Industrial Infrastructure within BMA
Karnataka Industrial Areas Development Board (KIADB) has several industrial estates within BMR
and majority of them are in the BUD. Spatially the industrial areas are located in the North-West,
East and South-East of BMA. Jigani and Bommasandra Industrial estates partly fall within BMA and
Attibele is located outside BMA in Anekal Taluk. Figure 7-3 shows the spatial spread of Industrial
Areas in BUD.
Figure 7-3: KIADB Industrial Areas in and around BMA
Source: KIADB, 2014 and Consultant’s Analysis, 2015
7.8 Establishments
1. Nature of Establishments
Establishments as defined by The Shops and Establishments Act, 19618, includes all premises where
goods are sold either by retail or wholesale or where services are rendered to customers, and
include an office, a store-room, godown, warehouse or workhouse or work place. Establishments are
defined as shop, a commercial establishment, residential hotel, restaurant, eating-house, theatre or
other places of public amusement or entertainment. Further, establishments as defined by the act
may also include such other establishments as defined by the Government by notification in the
8 The Karnataka Shops and Establishments Act, 1961 is derived from the Central Shops and Establishments Act,
1953
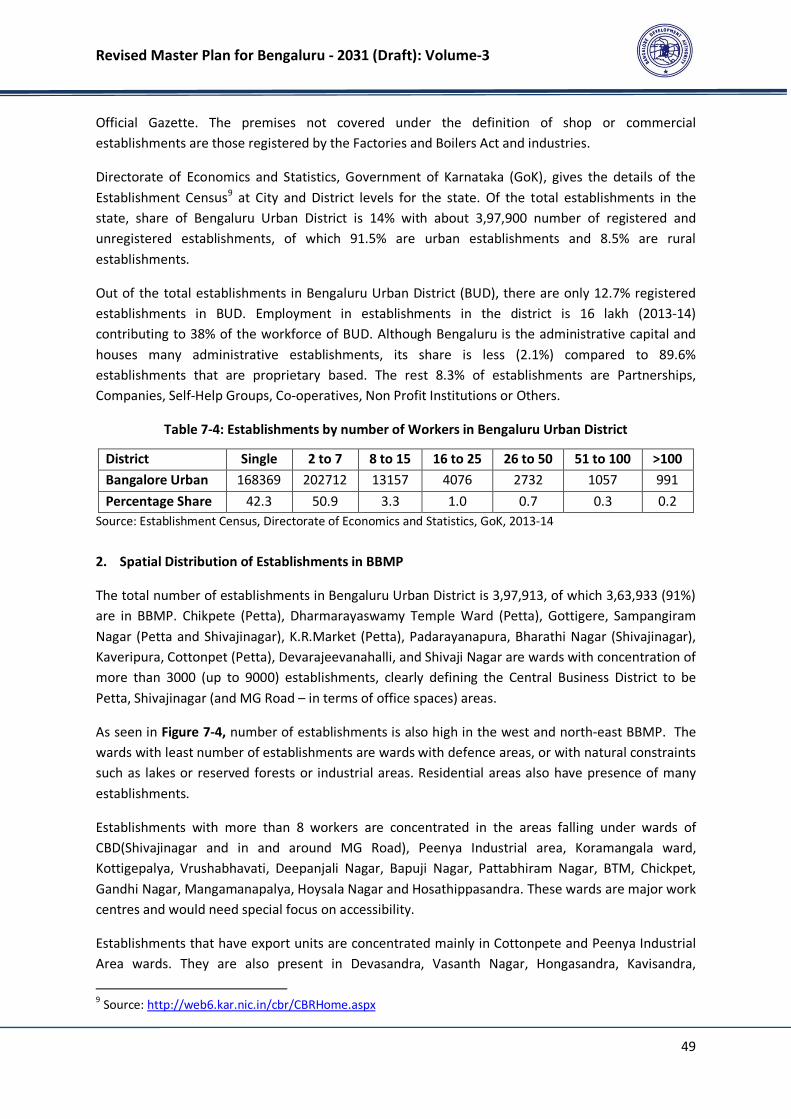
Revised Master Plan for Bengaluru - 2031 (Draft): Volume-3
49
Official Gazette. The premises not covered under the definition of shop or commercial
establishments are those registered by the Factories and Boilers Act and industries.
Directorate of Economics and Statistics, Government of Karnataka (GoK), gives the details of the
Establishment Census9 at City and District levels for the state. Of the total establishments in the
state, share of Bengaluru Urban District is 14% with about 3,97,900 number of registered and
unregistered establishments, of which 91.5% are urban establishments and 8.5% are rural
establishments.
Out of the total establishments in Bengaluru Urban District (BUD), there are only 12.7% registered
establishments in BUD. Employment in establishments in the district is 16 lakh (2013-14)
contributing to 38% of the workforce of BUD. Although Bengaluru is the administrative capital and
houses many administrative establishments, its share is less (2.1%) compared to 89.6%
establishments that are proprietary based. The rest 8.3% of establishments are Partnerships,
Companies, Self-Help Groups, Co-operatives, Non Profit Institutions or Others.
Table 7-4: Establishments by number of Workers in Bengaluru Urban District
District Single 2 to 7 8 to 15 16 to 25 26 to 50 51 to 100 >100
Bangalore Urban 168369 202712 13157 4076 2732 1057 991
Percentage Share 42.3 50.9 3.3 1.0 0.7 0.3 0.2
Source: Establishment Census, Directorate of Economics and Statistics, GoK, 2013-14
2. Spatial Distribution of Establishments in BBMP
The total number of establishments in Bengaluru Urban District is 3,97,913, of which 3,63,933 (91%)
are in BBMP. Chikpete (Petta), Dharmarayaswamy Temple Ward (Petta), Gottigere, Sampangiram
Nagar (Petta and Shivajinagar), K.R.Market (Petta), Padarayanapura, Bharathi Nagar (Shivajinagar),
Kaveripura, Cottonpet (Petta), Devarajeevanahalli, and Shivaji Nagar are wards with concentration of
more than 3000 (up to 9000) establishments, clearly defining the Central Business District to be
Petta, Shivajinagar (and MG Road – in terms of office spaces) areas.
As seen in Figure 7-4, number of establishments is also high in the west and north-east BBMP. The
wards with least number of establishments are wards with defence areas, or with natural constraints
such as lakes or reserved forests or industrial areas. Residential areas also have presence of many
establishments.
Establishments with more than 8 workers are concentrated in the areas falling under wards of
CBD(Shivajinagar and in and around MG Road), Peenya Industrial area, Koramangala ward,
Kottigepalya, Vrushabhavati, Deepanjali Nagar, Bapuji Nagar, Pattabhiram Nagar, BTM, Chickpet,
Gandhi Nagar, Mangamanapalya, Hoysala Nagar and Hosathippasandra. These wards are major work
centres and would need special focus on accessibility.
Establishments that have export units are concentrated mainly in Cottonpete and Peenya Industrial
Area wards. They are also present in Devasandra, Vasanth Nagar, Hongasandra, Kavisandra,
9 Source: http://web6.kar.nic.in/cbr/CBRHome.aspx

Revised Master Plan for Bengaluru - 2031 (Draft): Volume-3
50
Yelachanahalli, Gaali Anjaneya Swamy Temple ward, Deepanjali Nagar, and Vrushabhavathi ward.
These are wards with either IT/ITES companies or manufacturing units.
Figure 7-4: Ward-wise concentration of number of Establishments in BBMP
Source: Establishment Census, 2013-14, Directorate of Economics and Statistics, Government of Karnataka
(GoK)
7.9 Hierarchy of Commercial Areas/ Markets
Commercial areas in Bengaluru can be grouped under three categories: commercial areas along the
street, commercial areas concentrated in markets and office spaces. There are 28 major and
important markets within BMA (Figure 7-5). These markets have been placed under hierarchy based
on following considerations:
• Population growth rate of wards – Wards with negative decadal population growth (2001 to
2011) were considered to be highly commercialised which coincides with the number or extent
of the markets present in the wards
• Concentration of market places – Wards with dense commercial areas (Chickpet, Gandhi Nagar,
Koramangala) were given higher weighs than the wards with lesser density of commercial areas
(HSR Layout, Domalur, etc)
• Extent – Approximate extents of the markets has been used to determine the weightage

Revised Master Plan for Bengaluru - 2031 (Draft): Volume-3
51
• Distance from the Core – The wards with Chickpet/Shivajinagar/MG Road were considered core
and got the highest weight; the markets moving outwards got lower weight
1st
Order Markets: Petta, MG Road (Also Brigade Road, Commercial Street), Shivajinagar10
, Gandhi
Nagar, KR Market, and Kalasipalya being within the Central Business District.
2nd
Order Markets: Jayanagar Shopping Complex, Malleshwaram, Yeshwanthpur fish, fruits and
vegetable markets, Madiwala market, etc. are acting as District Centres.
3rd
Order Markets: Cox Town, Moore Road, and a few BDA complexes are assigned as Community
Centres.
4th
Order Markets: The smaller markets such as, Chikka Mavalli, L N Pura Market, Srirampura,
Yadiyur, etc., are assigned as Housing Clusters.
Figure 7-5: Markets in BMA
Source: Master Plan Analysis, 2015
10
Russell Market, Tarpaulin Market, Automobile Parts/Scrap Market, Bamboo bazaar and Furniture Market are
although District Centres/Community Centres according the weights assigned, since they are located near each
other and are next to core, together they form part of CBD. In other words, they are contiguous to core and
hence are part of CBD, distinct only based on the specialization of goods sold.

Revised Master Plan for Bengaluru - 2031 (Draft): Volume-3
52
7.10 Employment by Sector
The workers residing in the area are considered as the census workers, and employment is the
workers employed at given location. Workers data as per Census has been used to derive the Work
Force Participation Rate and is presented in Table 7-5. WFPR for BMA has increased from 33.7% to
44% during 1991 to 2011 period.
Table 7-5: Workforce Participation Rate Trend BMA, BUD and BMR
WPR Area/Year 1991 2001 2011
BMA 33.7 38.9 44.0
BUD 34.0 39.5 44.3
BMR 36.5 41.2 44.9
Source: Primary Census Abstract, Census 1991, 2001, 2011
Table 7-6 presents the estimated workers and employment in BMA and BMR for 2016.
Table 7-6: Existing (2016) Population, Workers and Employment in BMA and BMR
Area/Ratio Population 2016 (in Lakh) Workers 2016 (in Lakh) Employment 2016 (in Lakh)
BMA 110 49 55
BMR 137 62 68
BMA:BMR Ratio 0.80 0.79 0.81
Note: Population and Workers data source is Census 2011. 2016 population and Workers are estimated based
on the CAGR of previous decade. Employment is estimated for 2016 based on Industrial Stakeholder Meetings,
Real Estate Report and various Government Reports.
Data on workers for major sectors has been compiled from various sources:- Industries data from
Karnataka Udyog Mitra and KSSIDC; IT/ITES data from Department of IT,BT and S&T; data on
Establishments from Establishment Census, Directorate of Economics and Statistics11
. The sectoral
shares of workers are given in Table 7-7 and Figure 7-6 and it can be observed that industrial
workers are about 23%, IT/ITES workers are 15% and workers in Establishments are 29%. The other
sectors contribute about 33% of the total workers.
Table 7-7: Sectoral Share of Workers
Sectors Employment % Share Employment
Industries 1300067 23.45%
IT/ITES/ESDM 830000 14.97%
Establishments 1600323 28.86%
Others including Street Vendors 1814538 32.73%
Total 5544928 100.00%
Source: District Industries Centre (DIC), Karnataka Udyog Mitra (KUM), Karnataka State Small Industries Development
Corporation (KSSIDC), Department of IT,BTandS&T(DIT),2014-15 and Master Plan Analysis, 2016
11
http://web6.kar.nic.in/cbr/CBRHome.aspx
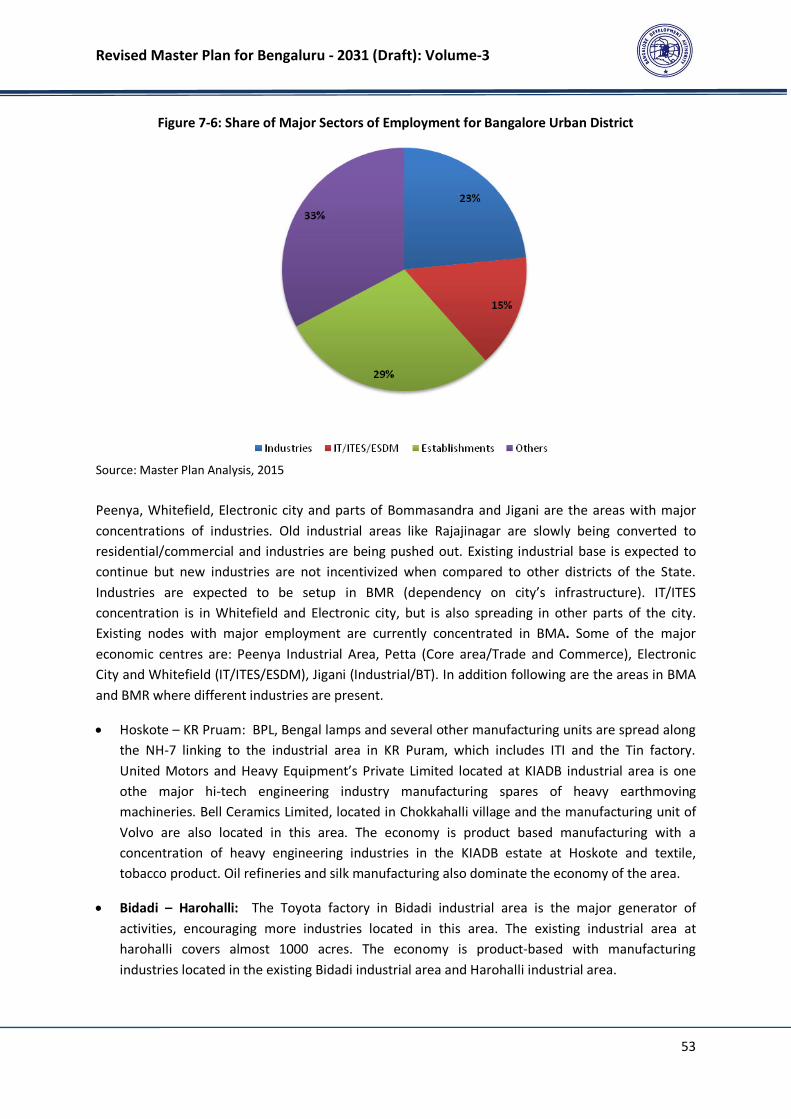
Revised Master Plan for Bengaluru - 2031 (Draft): Volume-3
53
Figure 7-6: Share of Major Sectors of Employment for Bangalore Urban District
Source: Master Plan Analysis, 2015
Peenya, Whitefield, Electronic city and parts of Bommasandra and Jigani are the areas with major
concentrations of industries. Old industrial areas like Rajajinagar are slowly being converted to
residential/commercial and industries are being pushed out. Existing industrial base is expected to
continue but new industries are not incentivized when compared to other districts of the State.
Industries are expected to be setup in BMR (dependency on city’s infrastructure). IT/ITES
concentration is in Whitefield and Electronic city, but is also spreading in other parts of the city.
Existing nodes with major employment are currently concentrated in BMA. Some of the major
economic centres are: Peenya Industrial Area, Petta (Core area/Trade and Commerce), Electronic
City and Whitefield (IT/ITES/ESDM), Jigani (Industrial/BT). In addition following are the areas in BMA
and BMR where different industries are present.
• Hoskote – KR Pruam: BPL, Bengal lamps and several other manufacturing units are spread along
the NH-7 linking to the industrial area in KR Puram, which includes ITI and the Tin factory.
United Motors and Heavy Equipment’s Private Limited located at KIADB industrial area is one
othe major hi-tech engineering industry manufacturing spares of heavy earthmoving
machineries. Bell Ceramics Limited, located in Chokkahalli village and the manufacturing unit of
Volvo are also located in this area. The economy is product based manufacturing with a
concentration of heavy engineering industries in the KIADB estate at Hoskote and textile,
tobacco product. Oil refineries and silk manufacturing also dominate the economy of the area.
• Bidadi – Harohalli: The Toyota factory in Bidadi industrial area is the major generator of
activities, encouraging more industries located in this area. The existing industrial area at
harohalli covers almost 1000 acres. The economy is product-based with manufacturing
industries located in the existing Bidadi industrial area and Harohalli industrial area.

Revised Master Plan for Bengaluru - 2031 (Draft): Volume-3
54
• Nelamangala – Peenya: The economy is product based manufacturing with textile and other
small and medium scaled manufacturing industries in the Peenya industrial estate. Other
products contributing to the economy are horticulture and tobacco products.
• Nelamangala: The economy is product based manufacturing with textiles and manufacturing –
iron & steel, plastic, bio-tech, electronic and electrical and ancillary automobile in the KIADB
industrial area.
• Dodaballapur: The economy is product based dominated by the textile industry (silk weaving)
and apparel parks. Other economics includes floriculture, wine industry and food processing.
• Devanahalli – Yelahanka: The economy is product based manufacturing and textile industry
with the proposed Hardware park and Aerospace park. Airport related freight and logistics
services and horticultural activities are also dominant.
• Jigani – Electronic City – Bommasandra – Attibele: The major attraction in the area that has
caused industries to agglomerate in the region is the Electronic City in Bangalore. Industries
along the entire stretch along NH-7 from Electronic city to Attibele, and beyond, to Hosur in
Tamil Nadu from this area. Attibele located at the Tamil Nadu State border, Jigani,
Bommasandra, Hebbagodi, Chandapura and Sarjapur are part of the industrial area. The
industrial areas of Attibele, Jigani- Bommasandra contribute to the economy of the cluster. The
industries concentrating around Sarjapur town and a few scattered ones along the Sarjapur-
Attible road also form a part of the industrial cluster. Adjacent areas such as Hebbagodi,
Dommasandra, Chandapur (a market town) and parts around Jigani and Anekal town serve as a
residential base for the industrial area. This area has the internationally known multi-speciality
hospital – Narayan Hrudalaya. The economy is product based secondary manufacturing and
textile industry with the KIADB industrial area. Attibele is home for most manufacturing and
textile industries. Automobile giants of India – TVS Motors and Ashok Leyand are very near to
this area. Attibele, Bommansandra and the Jigani-Bommsandra industrial areas consist of
manufacturing industries.
• Ramanagara – Channapatna: The economy of the two major areas is mainly a product-based
secondary sector economy with includes agro-based industry, tobacco products, toys and
wooden products and enlarged segment of the workforce.
7.11 Workforce Participation and Employment Projections
The workforce participation rate for BMA, as per Census, in 2011, is 43.9%, which has increased from
33.4% in 1991, indicating 5% increase in every decade. As per Census 2011, the male workforce
participation is at 61.87%, whereas female work participation is 24.42%. The female participation
rate has increase from 11.88% in 1991 to 24.42% in 2011, which is still lower that national (31.1%)
and state average (34.4%). Table 7-8 presents the workers by sex for past three decades.
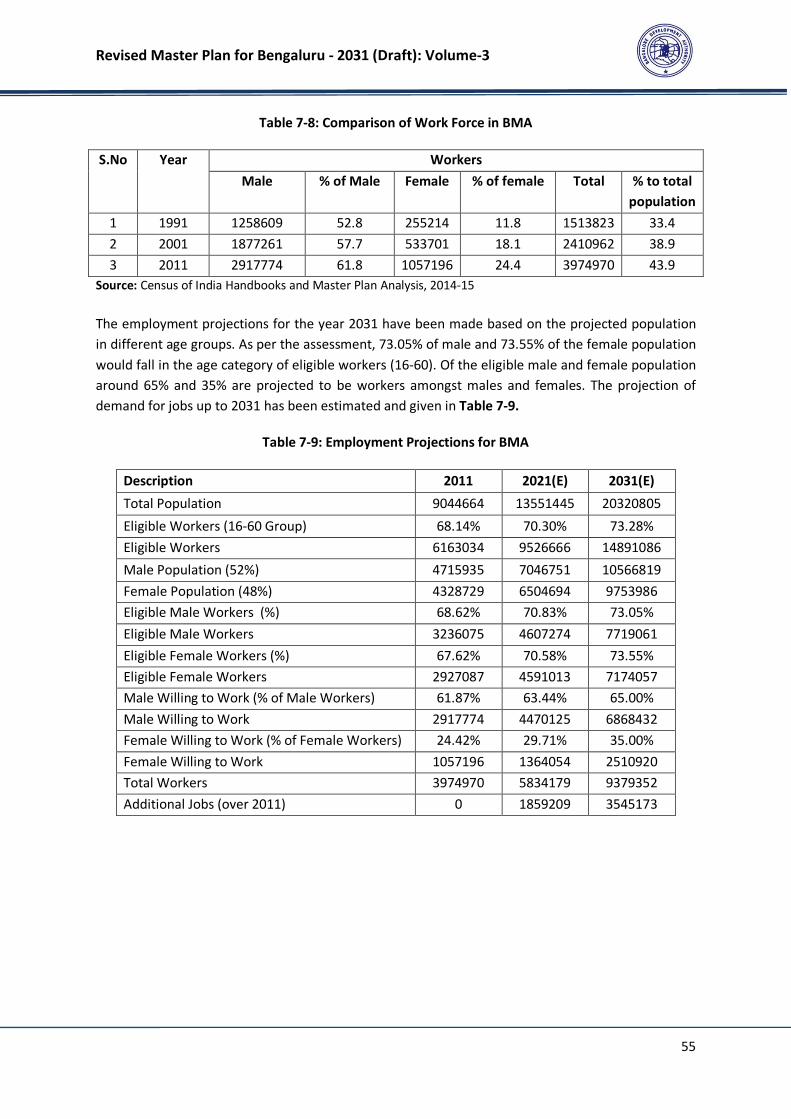
Revised Master Plan for Bengaluru - 2031 (Draft): Volume-3
55
Table 7-8: Comparison of Work Force in BMA
S.No Year Workers
Male % of Male Female % of female Total % to total
population
1 1991 1258609 52.8 255214 11.8 1513823 33.4
2 2001 1877261 57.7 533701 18.1 2410962 38.9
3 2011 2917774 61.8 1057196 24.4 3974970 43.9
Source: Census of India Handbooks and Master Plan Analysis, 2014-15
The employment projections for the year 2031 have been made based on the projected population
in different age groups. As per the assessment, 73.05% of male and 73.55% of the female population
would fall in the age category of eligible workers (16-60). Of the eligible male and female population
around 65% and 35% are projected to be workers amongst males and females. The projection of
demand for jobs up to 2031 has been estimated and given in Table 7-9.
Table 7-9: Employment Projections for BMA
Description 2011 2021(E) 2031(E)
Total Population 9044664 13551445 20320805
Eligible Workers (16-60 Group) 68.14% 70.30% 73.28%
Eligible Workers 6163034 9526666 14891086
Male Population (52%) 4715935 7046751 10566819
Female Population (48%) 4328729 6504694 9753986
Eligible Male Workers (%) 68.62% 70.83% 73.05%
Eligible Male Workers 3236075 4607274 7719061
Eligible Female Workers (%) 67.62% 70.58% 73.55%
Eligible Female Workers 2927087 4591013 7174057
Male Willing to Work (% of Male Workers) 61.87% 63.44% 65.00%
Male Willing to Work 2917774 4470125 6868432
Female Willing to Work (% of Female Workers) 24.42% 29.71% 35.00%
Female Willing to Work 1057196 1364054 2510920
Total Workers 3974970 5834179 9379352
Additional Jobs (over 2011) 0 1859209 3545173
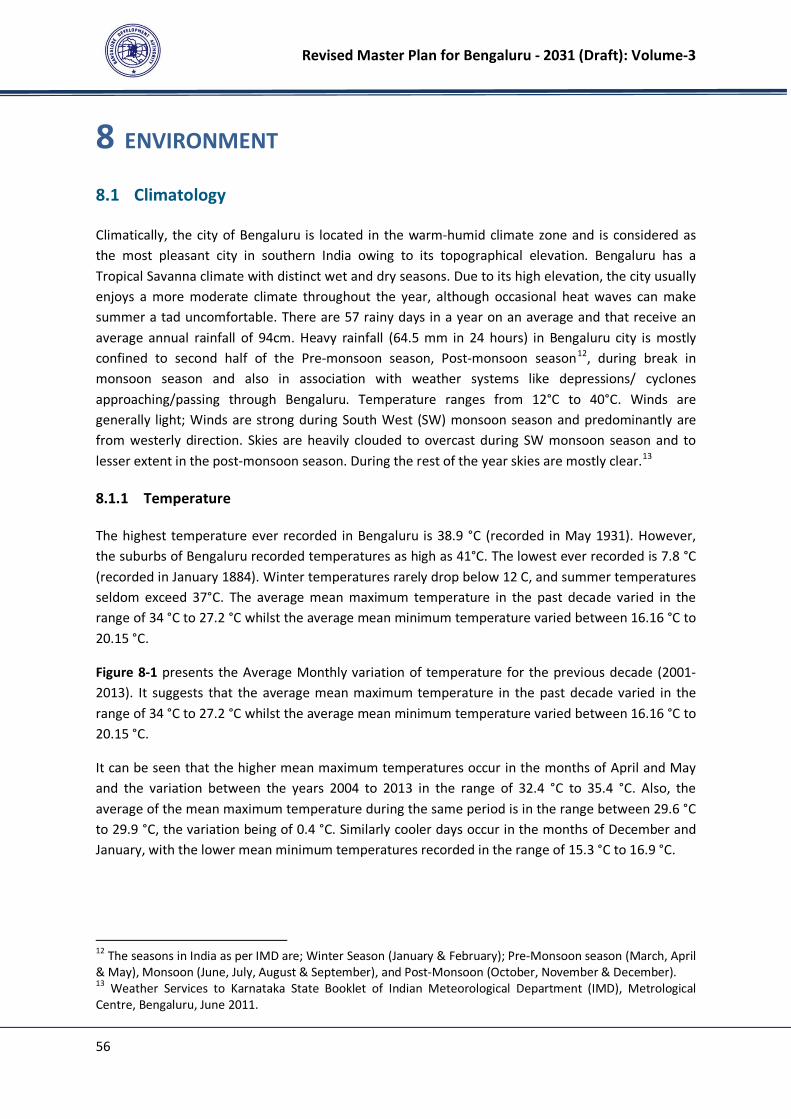
Revised Master Plan for Bengaluru - 2031 (Draft): Volume-3
56
8 ENVIRONMENT
8.1 Climatology
Climatically, the city of Bengaluru is located in the warm-humid climate zone and is considered as
the most pleasant city in southern India owing to its topographical elevation. Bengaluru has a
Tropical Savanna climate with distinct wet and dry seasons. Due to its high elevation, the city usually
enjoys a more moderate climate throughout the year, although occasional heat waves can make
summer a tad uncomfortable. There are 57 rainy days in a year on an average and that receive an
average annual rainfall of 94cm. Heavy rainfall (64.5 mm in 24 hours) in Bengaluru city is mostly
confined to second half of the Pre-monsoon season, Post-monsoon season12
, during break in
monsoon season and also in association with weather systems like depressions/ cyclones
approaching/passing through Bengaluru. Temperature ranges from 12°C to 40°C. Winds are
generally light; Winds are strong during South West (SW) monsoon season and predominantly are
from westerly direction. Skies are heavily clouded to overcast during SW monsoon season and to
lesser extent in the post-monsoon season. During the rest of the year skies are mostly clear.13
8.1.1 Temperature
The highest temperature ever recorded in Bengaluru is 38.9 °C (recorded in May 1931). However,
the suburbs of Bengaluru recorded temperatures as high as 41°C. The lowest ever recorded is 7.8 °C
(recorded in January 1884). Winter temperatures rarely drop below 12 C, and summer temperatures
seldom exceed 37°C. The average mean maximum temperature in the past decade varied in the
range of 34 °C to 27.2 °C whilst the average mean minimum temperature varied between 16.16 °C to
20.15 °C.
Figure 8-1 presents the Average Monthly variation of temperature for the previous decade (2001-
2013). It suggests that the average mean maximum temperature in the past decade varied in the
range of 34 °C to 27.2 °C whilst the average mean minimum temperature varied between 16.16 °C to
20.15 °C.
It can be seen that the higher mean maximum temperatures occur in the months of April and May
and the variation between the years 2004 to 2013 in the range of 32.4 °C to 35.4 °C. Also, the
average of the mean maximum temperature during the same period is in the range between 29.6 °C
to 29.9 °C, the variation being of 0.4 °C. Similarly cooler days occur in the months of December and
January, with the lower mean minimum temperatures recorded in the range of 15.3 °C to 16.9 °C.
12
The seasons in India as per IMD are; Winter Season (January & February); Pre-Monsoon season (March, April
& May), Monsoon (June, July, August & September), and Post-Monsoon (October, November & December). 13
Weather Services to Karnataka State Booklet of Indian Meteorological Department (IMD), Metrological
Centre, Bengaluru, June 2011.
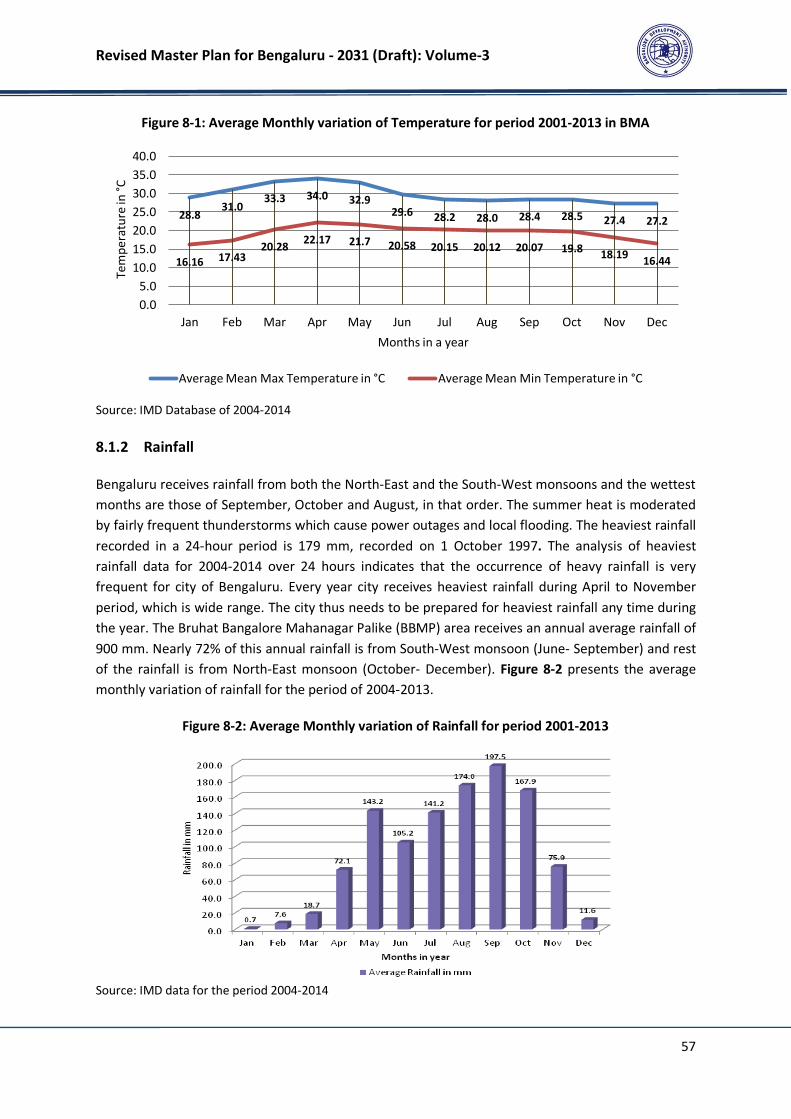
Revised Master Plan for Bengaluru - 2031 (Draft): Volume-3
57
Figure 8-1: Average Monthly variation of Temperature for period 2001-2013 in BMA
Source: IMD Database of 2004-2014
8.1.2 Rainfall
Bengaluru receives rainfall from both the North-East and the South-West monsoons and the wettest
months are those of September, October and August, in that order. The summer heat is moderated
by fairly frequent thunderstorms which cause power outages and local flooding. The heaviest rainfall
recorded in a 24-hour period is 179 mm, recorded on 1 October 1997. The analysis of heaviest
rainfall data for 2004-2014 over 24 hours indicates that the occurrence of heavy rainfall is very
frequent for city of Bengaluru. Every year city receives heaviest rainfall during April to November
period, which is wide range. The city thus needs to be prepared for heaviest rainfall any time during
the year. The Bruhat Bangalore Mahanagar Palike (BBMP) area receives an annual average rainfall of
900 mm. Nearly 72% of this annual rainfall is from South-West monsoon (June- September) and rest
of the rainfall is from North-East monsoon (October- December). Figure 8-2 presents the average
monthly variation of rainfall for the period of 2004-2013.
Figure 8-2: Average Monthly variation of Rainfall for period 2001-2013
Source: IMD data for the period 2004-2014
28.8 31.0
33.3 34.0 32.9 29.6 28.2 28.0 28.4 28.5 27.4 27.2
16.16 17.43 20.28
22.17 21.7 20.58 20.15 20.12 20.07 19.8 18.19
16.44
0.0
5.0
10.0
15.0
20.0
25.0
30.0
35.0
40.0
Jan Feb Mar Apr May Jun Jul Aug Sep Oct Nov Dec
Te
mp
era
ture
in °
C
Months in a year
Average Mean Max Temperature in °C Average Mean Min Temperature in °C
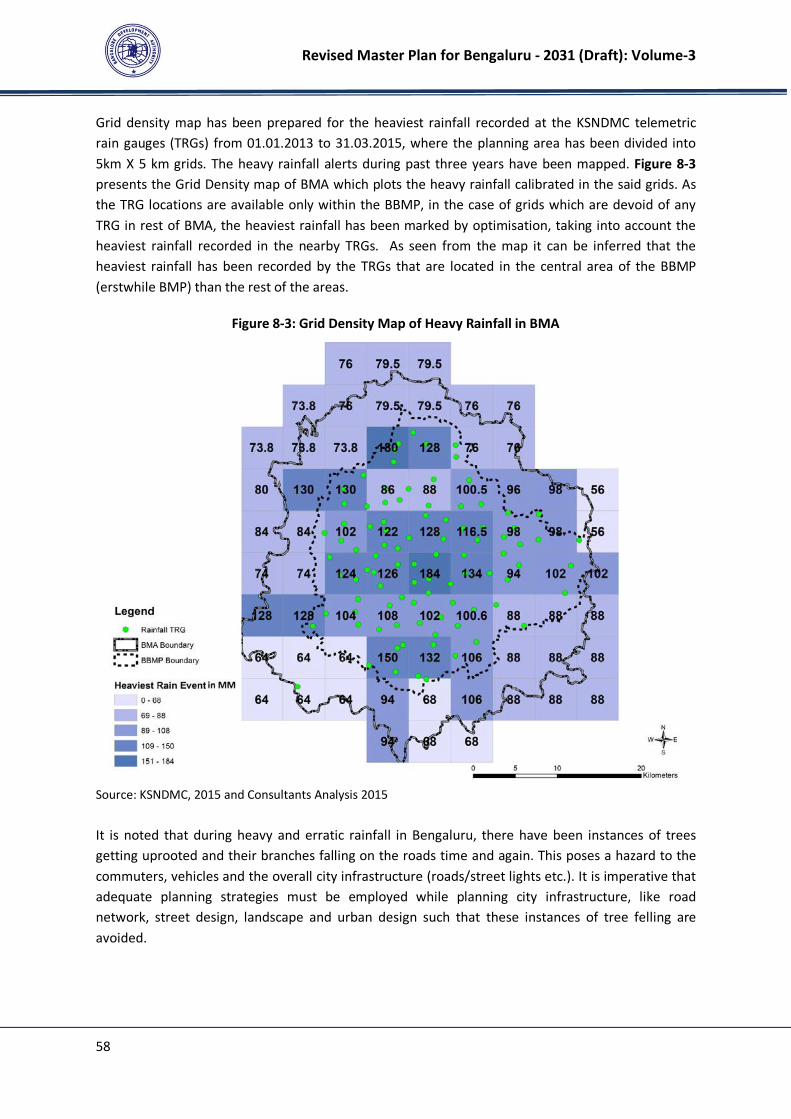
Revised Master Plan for Bengaluru - 2031 (Draft): Volume-3
58
Grid density map has been prepared for the heaviest rainfall recorded at the KSNDMC telemetric
rain gauges (TRGs) from 01.01.2013 to 31.03.2015, where the planning area has been divided into
5km X 5 km grids. The heavy rainfall alerts during past three years have been mapped. Figure 8-3
presents the Grid Density map of BMA which plots the heavy rainfall calibrated in the said grids. As
the TRG locations are available only within the BBMP, in the case of grids which are devoid of any
TRG in rest of BMA, the heaviest rainfall has been marked by optimisation, taking into account the
heaviest rainfall recorded in the nearby TRGs. As seen from the map it can be inferred that the
heaviest rainfall has been recorded by the TRGs that are located in the central area of the BBMP
(erstwhile BMP) than the rest of the areas.
Figure 8-3: Grid Density Map of Heavy Rainfall in BMA
Source: KSNDMC, 2015 and Consultants Analysis 2015
It is noted that during heavy and erratic rainfall in Bengaluru, there have been instances of trees
getting uprooted and their branches falling on the roads time and again. This poses a hazard to the
commuters, vehicles and the overall city infrastructure (roads/street lights etc.). It is imperative that
adequate planning strategies must be employed while planning city infrastructure, like road
network, street design, landscape and urban design such that these instances of tree felling are
avoided.

Revised Master Plan for Bengaluru - 2031 (Draft): Volume-3
59
8.1.3 Relative Humidity
Relative humidity in Bengaluru varies from 32% in the month of March to 87% in August- September.
The relative humidity is more than 65% during July to November months. Sunlight hours for the city
range from 3.0 hours during July to 9.5 hours during March. The area experiences sunshine hours of
6.7 hours per day. Figure 8-4 presents the variation of humidity in Bengaluru at 08:30 hrs and 17:30
hrs.
Figure 8-4: Monthly Average Relative Humidity
Source: IMD data for the period 2004-2013
8.1.4 Wind Speed and Wind Direction
The surface winds in Bengaluru have seasonal character with the easterly components
predominating during one period followed by the westerly in the other. The high wind speed
averages 17 km/h during the westerly winds in the month of July and a minimum of 8-9 km/h during
the months of April and October.
Figure 8-5presents the month wise average wind speed of Bengaluru for the period of 2004 to 2013.
Annual wind rose diagram of Bengaluru recorded at 08:30 hr and 17:30 hr presented in Figure 8-6.
Data has been represented as 30 years average. At 8:30 hr (morning period) annual wind speed is in
the range of 1.5 - 4.5 m/s i.e 5.4 to 16.2 km/h14
.Wind direction is mostly easterly or westerly. Calm
condition is only 13% cases. At 17:30 hr (evening period) wind direction is mostly easterly or
westerly, like at 08:30 hr. Wind speed is mostly in the range of 1.5-4.5 m/s i.e 5.4 to 16.2 km/h.
Occasionally wind speed increased to 4.5 – 7.0 m/s i.e 16.2 km/h to 25.2 km/h. Calm conditions are
14
The unit of wind speed is in meters per second (m/s) which is equal to 3.6 km per hour(km/h)
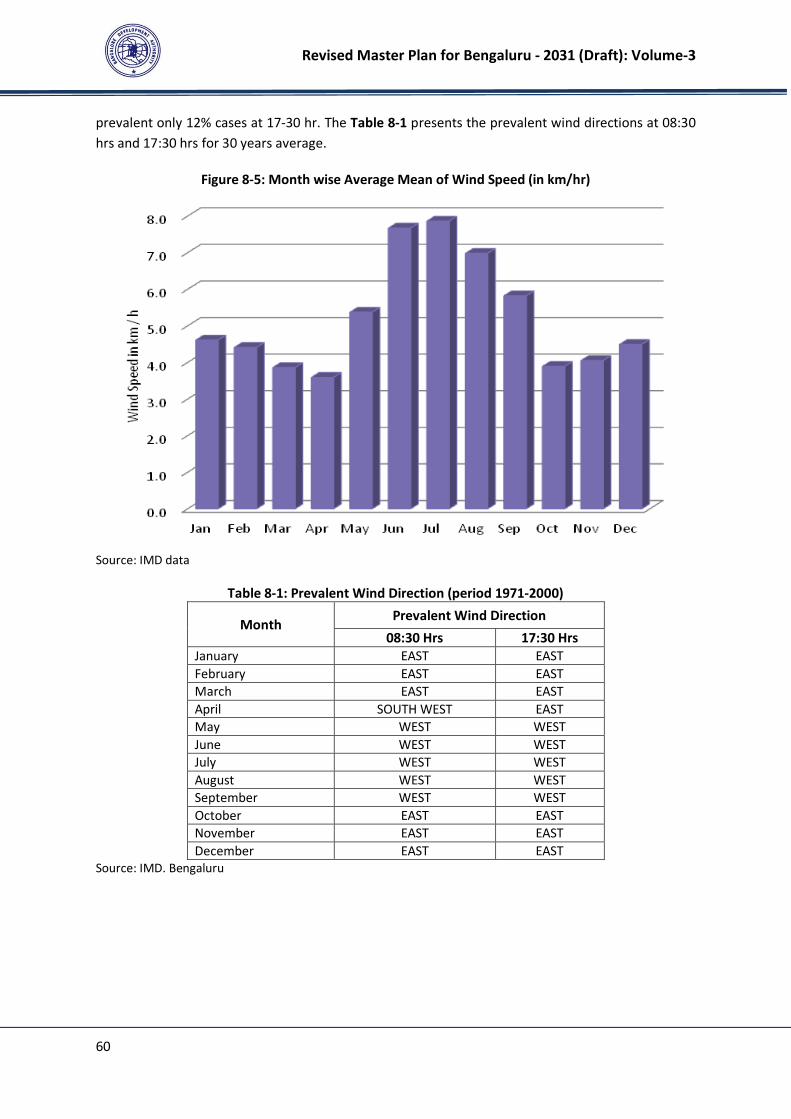
Revised Master Plan for Bengaluru - 2031 (Draft): Volume-3
60
prevalent only 12% cases at 17-30 hr. The Table 8-1 presents the prevalent wind directions at 08:30
hrs and 17:30 hrs for 30 years average.
Figure 8-5: Month wise Average Mean of Wind Speed (in km/hr)
Source: IMD data
Table 8-1: Prevalent Wind Direction (period 1971-2000)
Month Prevalent Wind Direction
08:30 Hrs 17:30 Hrs
January EAST EAST
February EAST EAST
March EAST EAST
April SOUTH WEST EAST
May WEST WEST
June WEST WEST
July WEST WEST
August WEST WEST
September WEST WEST
October EAST EAST
November EAST EAST
December EAST EAST
Source: IMD. Bengaluru
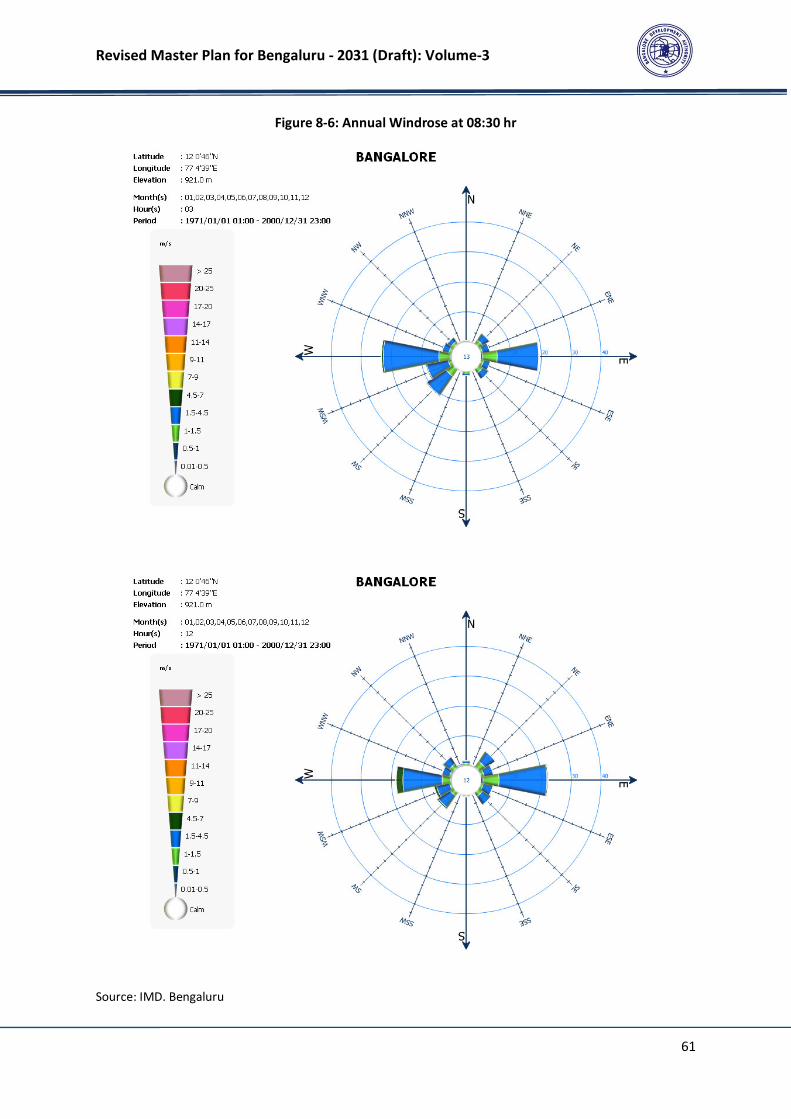
Revised Master Plan for Bengaluru - 2031 (Draft): Volume-3
61
Figure 8-6: Annual Windrose at 08:30 hr
Source: IMD. Bengaluru
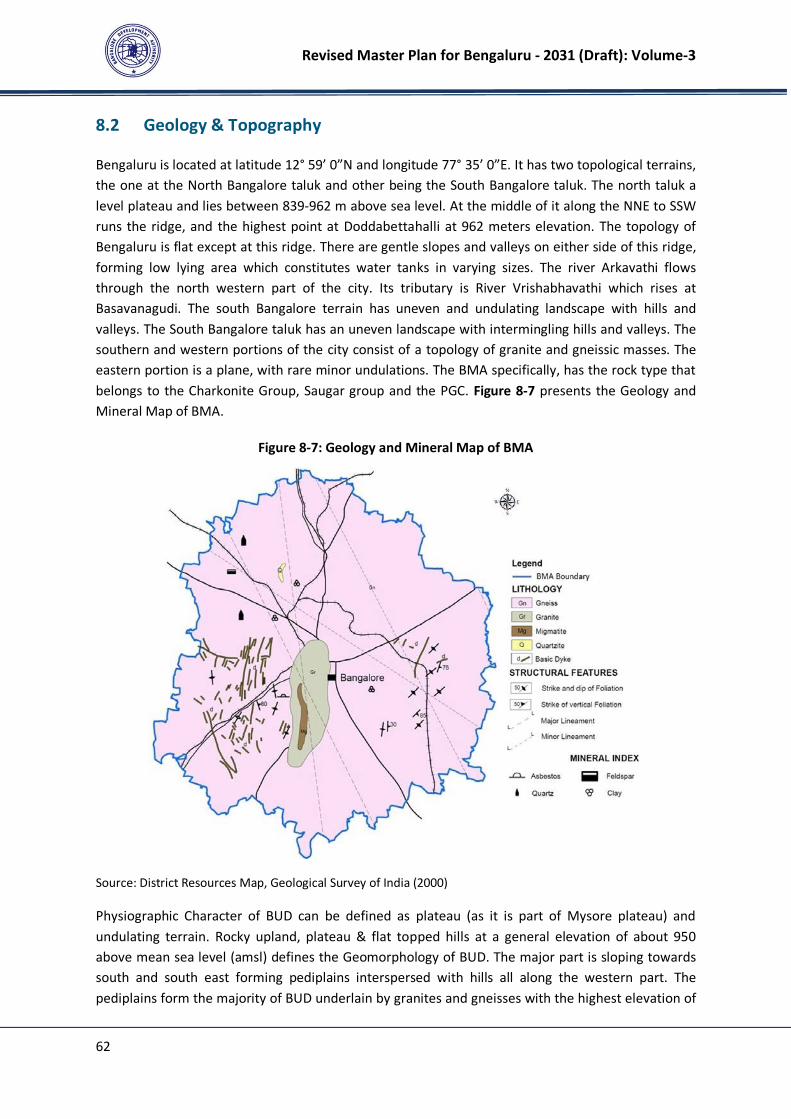
Revised Master Plan for Bengaluru - 2031 (Draft): Volume-3
62
8.2 Geology & Topography
Bengaluru is located at latitude 12° 59’ 0”N and longitude 77° 35’ 0”E. It has two topological terrains,
the one at the North Bangalore taluk and other being the South Bangalore taluk. The north taluk a
level plateau and lies between 839-962 m above sea level. At the middle of it along the NNE to SSW
runs the ridge, and the highest point at Doddabettahalli at 962 meters elevation. The topology of
Bengaluru is flat except at this ridge. There are gentle slopes and valleys on either side of this ridge,
forming low lying area which constitutes water tanks in varying sizes. The river Arkavathi flows
through the north western part of the city. Its tributary is River Vrishabhavathi which rises at
Basavanagudi. The south Bangalore terrain has uneven and undulating landscape with hills and
valleys. The South Bangalore taluk has an uneven landscape with intermingling hills and valleys. The
southern and western portions of the city consist of a topology of granite and gneissic masses. The
eastern portion is a plane, with rare minor undulations. The BMA specifically, has the rock type that
belongs to the Charkonite Group, Saugar group and the PGC. Figure 8-7 presents the Geology and
Mineral Map of BMA.
Figure 8-7: Geology and Mineral Map of BMA
Source: District Resources Map, Geological Survey of India (2000)
Physiographic Character of BUD can be defined as plateau (as it is part of Mysore plateau) and
undulating terrain. Rocky upland, plateau & flat topped hills at a general elevation of about 950
above mean sea level (amsl) defines the Geomorphology of BUD. The major part is sloping towards
south and south east forming pediplains interspersed with hills all along the western part. The
pediplains form the majority of BUD underlain by granites and gneisses with the highest elevation of
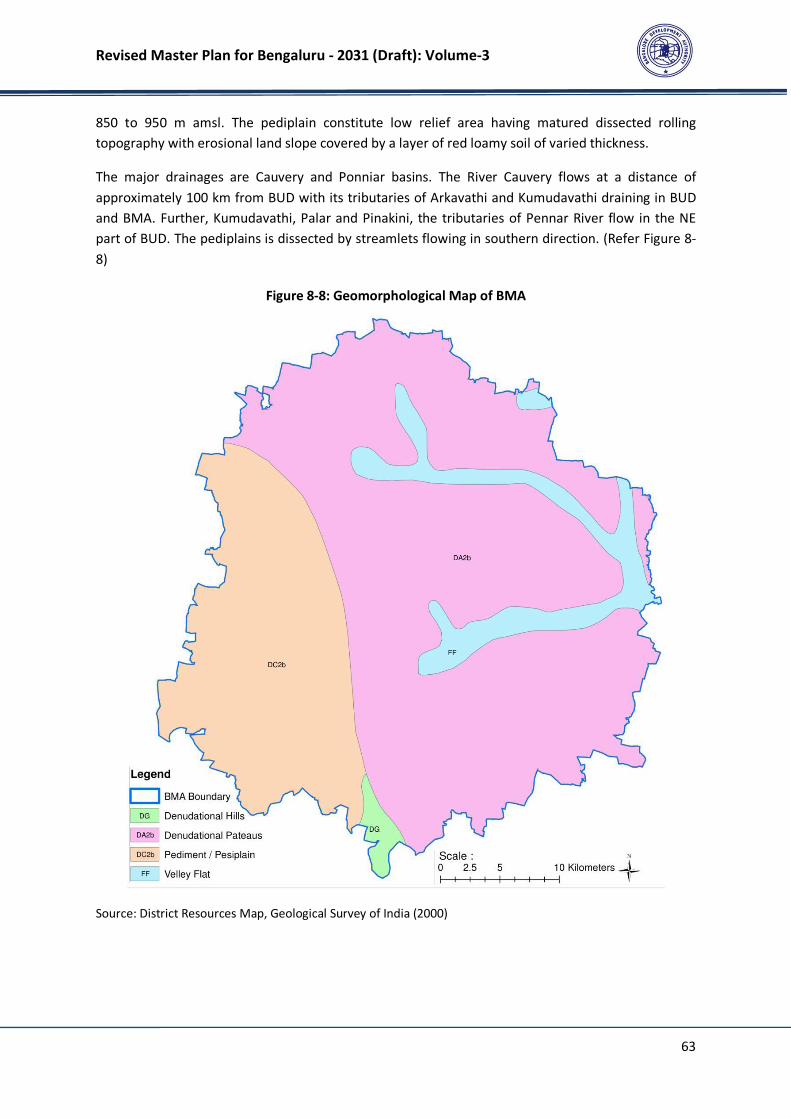
Revised Master Plan for Bengaluru - 2031 (Draft): Volume-3
63
850 to 950 m amsl. The pediplain constitute low relief area having matured dissected rolling
topography with erosional land slope covered by a layer of red loamy soil of varied thickness.
The major drainages are Cauvery and Ponniar basins. The River Cauvery flows at a distance of
approximately 100 km from BUD with its tributaries of Arkavathi and Kumudavathi draining in BUD
and BMA. Further, Kumudavathi, Palar and Pinakini, the tributaries of Pennar River flow in the NE
part of BUD. The pediplains is dissected by streamlets flowing in southern direction. (Refer Figure 8-
8)
Figure 8-8: Geomorphological Map of BMA
Source: District Resources Map, Geological Survey of India (2000)

Revised Master Plan for Bengaluru - 2031 (Draft): Volume-3
64
8.2.1 Geo Technical Characteristics (Seismicity)
As per Final Report on Development of Probabilistic Seismic Hazard Map of India (PSHMI), by
National Disaster Management Authority (NDMA), 2010, there are thirty two seismic zones of India
(Refer Figure 8-9). Bengaluru city falls under Zone No. 29 called as Southern Craton. As per PHSMI
report, Southern Craton has received 45 earthquakes and this zone has max potential of magnitude
upto 6.8 Mw scale. Further, PHSMI report has carried out probabilistic analysis for 48 cities in India
including Bengaluru by computing peak ground acceleration (PGA) over 500, 2500, 5000 and 10000
years. According to PHSMI report Bengaluru has relative seismic hazard at 0.02, 0.04, 0.05 and 0.06
PGA (g) respectively, which puts Bengaluru relatively the safest among the other cities.
Figure 8-9: Thirty Two Seismic Zones of India
Source:
http://www.hpsdma.nic.in/Development%20of%20Probablistic%20Seismic%20Hazard%20Map%20of%20India
.pdf,
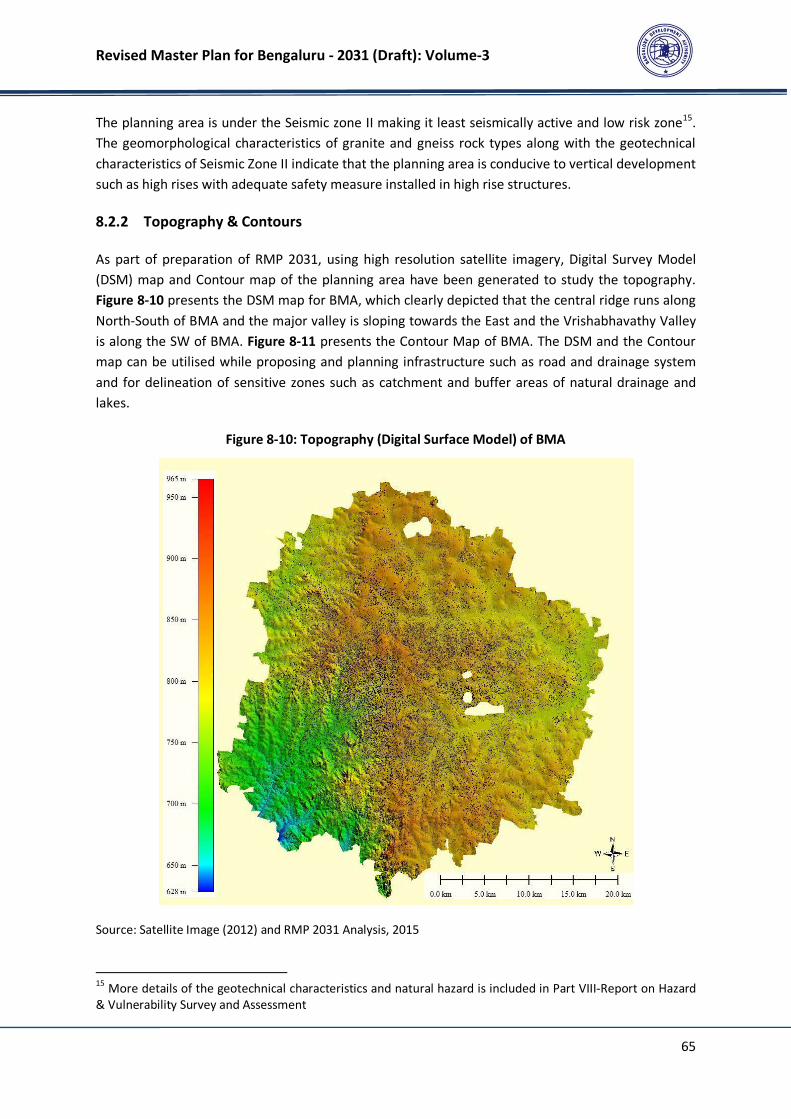
Revised Master Plan for Bengaluru - 2031 (Draft): Volume-3
65
The planning area is under the Seismic zone II making it least seismically active and low risk zone15
.
The geomorphological characteristics of granite and gneiss rock types along with the geotechnical
characteristics of Seismic Zone II indicate that the planning area is conducive to vertical development
such as high rises with adequate safety measure installed in high rise structures.
8.2.2 Topography & Contours
As part of preparation of RMP 2031, using high resolution satellite imagery, Digital Survey Model
(DSM) map and Contour map of the planning area have been generated to study the topography.
Figure 8-10 presents the DSM map for BMA, which clearly depicted that the central ridge runs along
North-South of BMA and the major valley is sloping towards the East and the Vrishabhavathy Valley
is along the SW of BMA. Figure 8-11 presents the Contour Map of BMA. The DSM and the Contour
map can be utilised while proposing and planning infrastructure such as road and drainage system
and for delineation of sensitive zones such as catchment and buffer areas of natural drainage and
lakes.
Figure 8-10: Topography (Digital Surface Model) of BMA
Source: Satellite Image (2012) and RMP 2031 Analysis, 2015
15
More details of the geotechnical characteristics and natural hazard is included in Part VIII-Report on Hazard
& Vulnerability Survey and Assessment
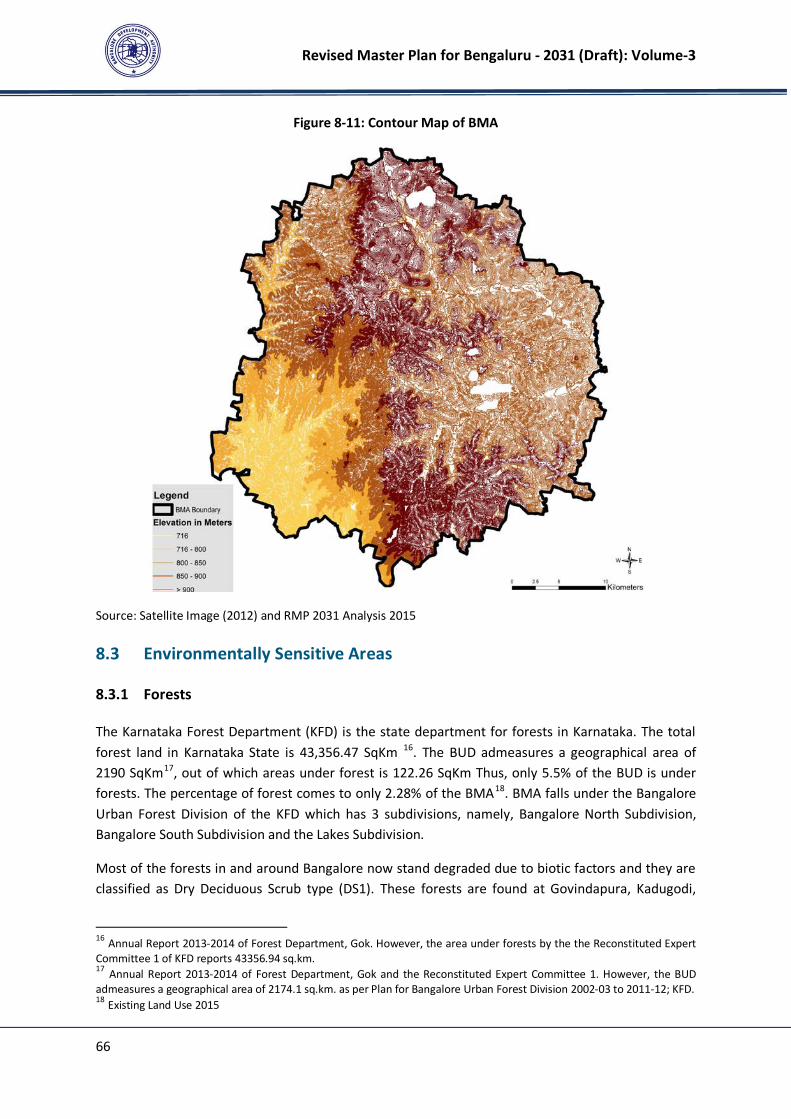
Revised Master Plan for Bengaluru - 2031 (Draft): Volume-3
66
Figure 8-11: Contour Map of BMA
Source: Satellite Image (2012) and RMP 2031 Analysis 2015
8.3 Environmentally Sensitive Areas
8.3.1 Forests
The Karnataka Forest Department (KFD) is the state department for forests in Karnataka. The total
forest land in Karnataka State is 43,356.47 SqKm 16
. The BUD admeasures a geographical area of
2190 SqKm17
, out of which areas under forest is 122.26 SqKm Thus, only 5.5% of the BUD is under
forests. The percentage of forest comes to only 2.28% of the BMA18
. BMA falls under the Bangalore
Urban Forest Division of the KFD which has 3 subdivisions, namely, Bangalore North Subdivision,
Bangalore South Subdivision and the Lakes Subdivision.
Most of the forests in and around Bangalore now stand degraded due to biotic factors and they are
classified as Dry Deciduous Scrub type (DS1). These forests are found at Govindapura, Kadugodi,
16
Annual Report 2013-2014 of Forest Department, Gok. However, the area under forests by the the Reconstituted Expert
Committee 1 of KFD reports 43356.94 sq.km. 17
Annual Report 2013-2014 of Forest Department, Gok and the Reconstituted Expert Committee 1. However, the BUD
admeasures a geographical area of 2174.1 sq.km. as per Plan for Bangalore Urban Forest Division 2002-03 to 2011-12; KFD. 18
Existing Land Use 2015
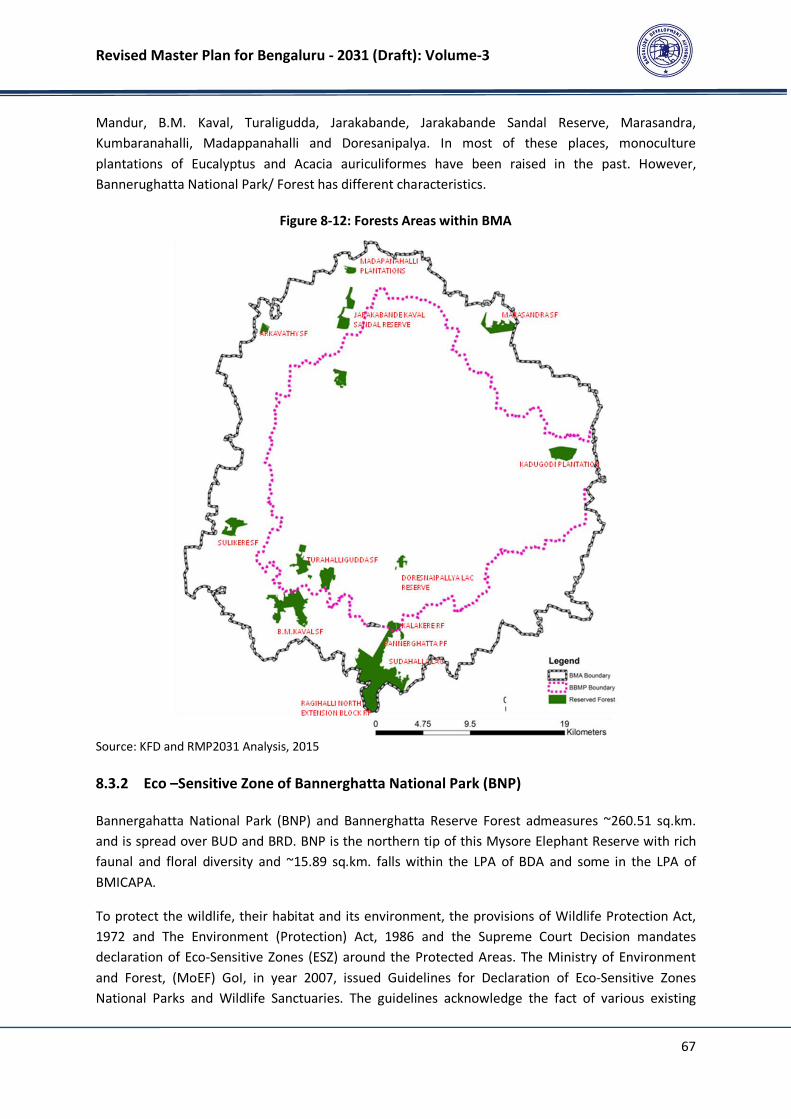
Revised Master Plan for Bengaluru - 2031 (Draft): Volume-3
67
Mandur, B.M. Kaval, Turaligudda, Jarakabande, Jarakabande Sandal Reserve, Marasandra,
Kumbaranahalli, Madappanahalli and Doresanipalya. In most of these places, monoculture
plantations of Eucalyptus and Acacia auriculiformes have been raised in the past. However,
Bannerughatta National Park/ Forest has different characteristics.
Figure 8-12: Forests Areas within BMA
Source: KFD and RMP2031 Analysis, 2015
8.3.2 Eco –Sensitive Zone of Bannerghatta National Park (BNP)
Bannergahatta National Park (BNP) and Bannerghatta Reserve Forest admeasures ~260.51 sq.km.
and is spread over BUD and BRD. BNP is the northern tip of this Mysore Elephant Reserve with rich
faunal and floral diversity and ~15.89 sq.km. falls within the LPA of BDA and some in the LPA of
BMICAPA.
To protect the wildlife, their habitat and its environment, the provisions of Wildlife Protection Act,
1972 and The Environment (Protection) Act, 1986 and the Supreme Court Decision mandates
declaration of Eco-Sensitive Zones (ESZ) around the Protected Areas. The Ministry of Environment
and Forest, (MoEF) GoI, in year 2007, issued Guidelines for Declaration of Eco-Sensitive Zones
National Parks and Wildlife Sanctuaries. The guidelines acknowledge the fact of various existing
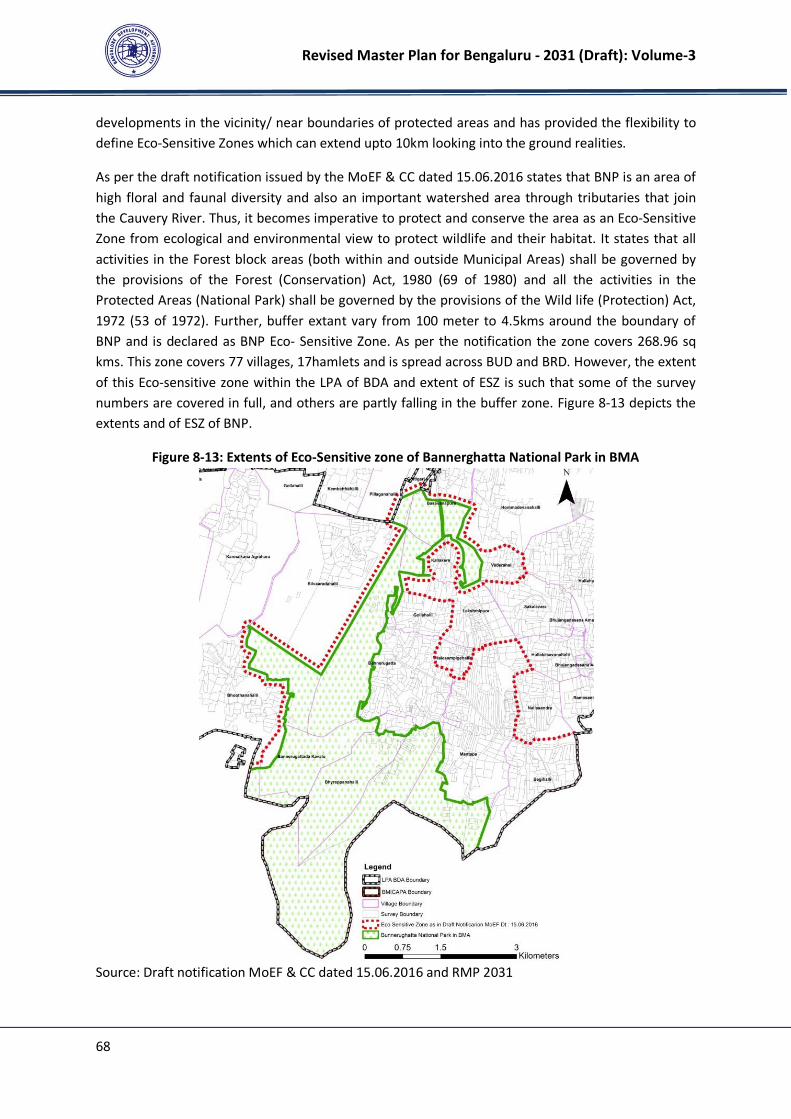
Revised Master Plan for Bengaluru - 2031 (Draft): Volume-3
68
developments in the vicinity/ near boundaries of protected areas and has provided the flexibility to
define Eco-Sensitive Zones which can extend upto 10km looking into the ground realities.
As per the draft notification issued by the MoEF & CC dated 15.06.2016 states that BNP is an area of
high floral and faunal diversity and also an important watershed area through tributaries that join
the Cauvery River. Thus, it becomes imperative to protect and conserve the area as an Eco-Sensitive
Zone from ecological and environmental view to protect wildlife and their habitat. It states that all
activities in the Forest block areas (both within and outside Municipal Areas) shall be governed by
the provisions of the Forest (Conservation) Act, 1980 (69 of 1980) and all the activities in the
Protected Areas (National Park) shall be governed by the provisions of the Wild life (Protection) Act,
1972 (53 of 1972). Further, buffer extant vary from 100 meter to 4.5kms around the boundary of
BNP and is declared as BNP Eco- Sensitive Zone. As per the notification the zone covers 268.96 sq
kms. This zone covers 77 villages, 17hamlets and is spread across BUD and BRD. However, the extent
of this Eco-sensitive zone within the LPA of BDA and extent of ESZ is such that some of the survey
numbers are covered in full, and others are partly falling in the buffer zone. Figure 8-13 depicts the
extents and of ESZ of BNP.
Figure 8-13: Extents of Eco-Sensitive zone of Bannerghatta National Park in BMA
Source: Draft notification MoEF & CC dated 15.06.2016 and RMP 2031
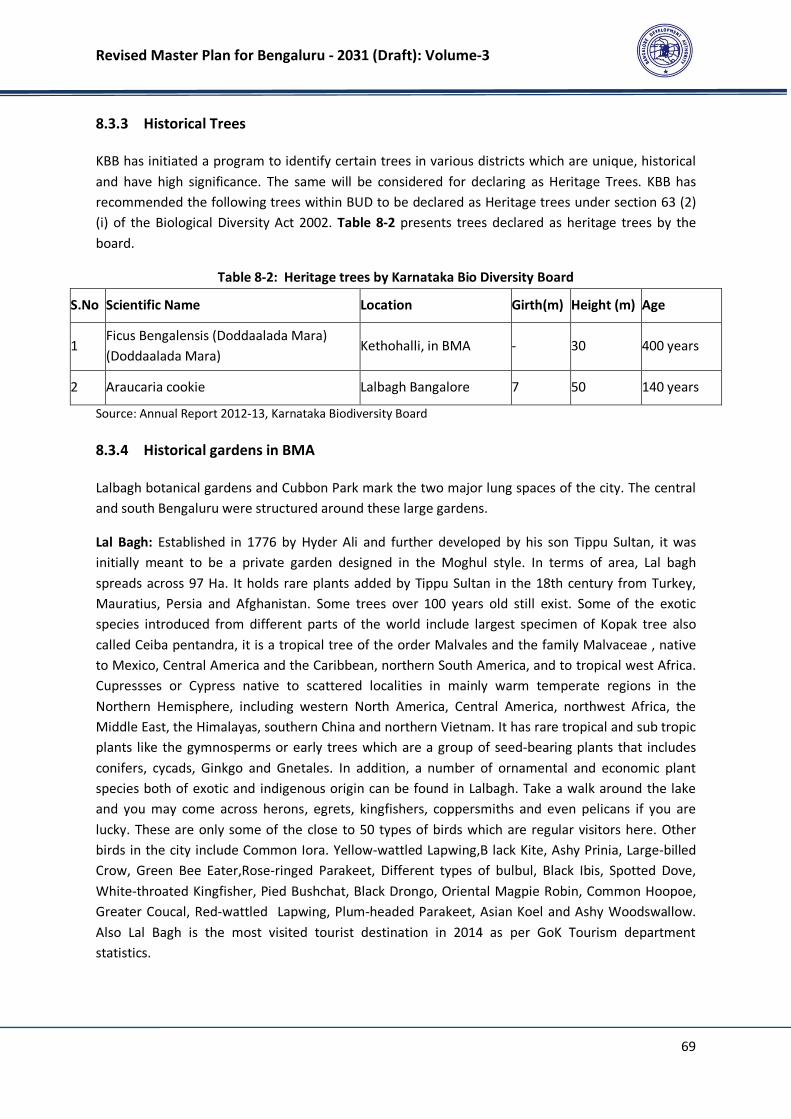
Revised Master Plan for Bengaluru - 2031 (Draft): Volume-3
69
8.3.3 Historical Trees
KBB has initiated a program to identify certain trees in various districts which are unique, historical
and have high significance. The same will be considered for declaring as Heritage Trees. KBB has
recommended the following trees within BUD to be declared as Heritage trees under section 63 (2)
(i) of the Biological Diversity Act 2002. Table 8-2 presents trees declared as heritage trees by the
board.
Table 8-2: Heritage trees by Karnataka Bio Diversity Board
S.No Scientific Name Location Girth(m) Height (m) Age
1 Ficus Bengalensis (Doddaalada Mara)
(Doddaalada Mara) Kethohalli, in BMA - 30 400 years
2 Araucaria cookie Lalbagh Bangalore 7 50 140 years
Source: Annual Report 2012-13, Karnataka Biodiversity Board
8.3.4 Historical gardens in BMA
Lalbagh botanical gardens and Cubbon Park mark the two major lung spaces of the city. The central
and south Bengaluru were structured around these large gardens.
Lal Bagh: Established in 1776 by Hyder Ali and further developed by his son Tippu Sultan, it was
initially meant to be a private garden designed in the Moghul style. In terms of area, Lal bagh
spreads across 97 Ha. It holds rare plants added by Tippu Sultan in the 18th century from Turkey,
Mauratius, Persia and Afghanistan. Some trees over 100 years old still exist. Some of the exotic
species introduced from different parts of the world include largest specimen of Kopak tree also
called Ceiba pentandra, it is a tropical tree of the order Malvales and the family Malvaceae , native
to Mexico, Central America and the Caribbean, northern South America, and to tropical west Africa.
Cupressses or Cypress native to scattered localities in mainly warm temperate regions in the
Northern Hemisphere, including western North America, Central America, northwest Africa, the
Middle East, the Himalayas, southern China and northern Vietnam. It has rare tropical and sub tropic
plants like the gymnosperms or early trees which are a group of seed-bearing plants that includes
conifers, cycads, Ginkgo and Gnetales. In addition, a number of ornamental and economic plant
species both of exotic and indigenous origin can be found in Lalbagh. Take a walk around the lake
and you may come across herons, egrets, kingfishers, coppersmiths and even pelicans if you are
lucky. These are only some of the close to 50 types of birds which are regular visitors here. Other
birds in the city include Common Iora. Yellow-wattled Lapwing,B lack Kite, Ashy Prinia, Large-billed
Crow, Green Bee Eater,Rose-ringed Parakeet, Different types of bulbul, Black Ibis, Spotted Dove,
White-throated Kingfisher, Pied Bushchat, Black Drongo, Oriental Magpie Robin, Common Hoopoe,
Greater Coucal, Red-wattled Lapwing, Plum-headed Parakeet, Asian Koel and Ashy Woodswallow.
Also Lal Bagh is the most visited tourist destination in 2014 as per GoK Tourism department
statistics.
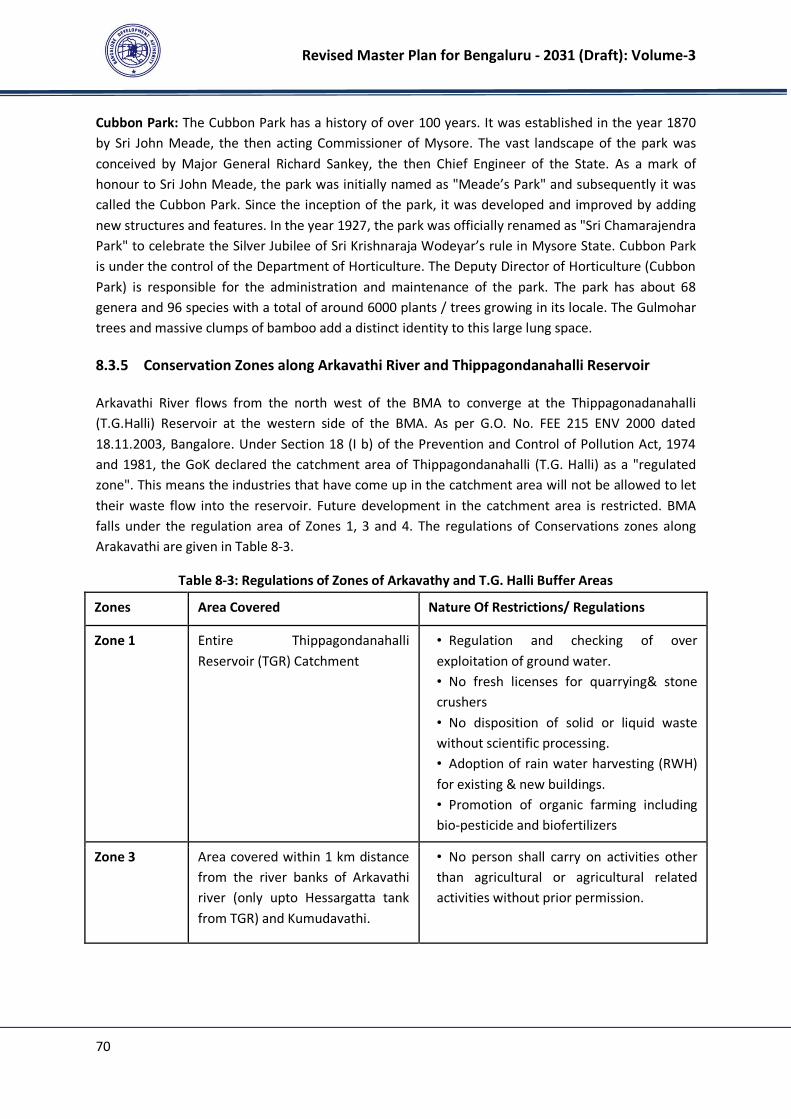
Revised Master Plan for Bengaluru - 2031 (Draft): Volume-3
70
Cubbon Park: The Cubbon Park has a history of over 100 years. It was established in the year 1870
by Sri John Meade, the then acting Commissioner of Mysore. The vast landscape of the park was
conceived by Major General Richard Sankey, the then Chief Engineer of the State. As a mark of
honour to Sri John Meade, the park was initially named as "Meade’s Park" and subsequently it was
called the Cubbon Park. Since the inception of the park, it was developed and improved by adding
new structures and features. In the year 1927, the park was officially renamed as "Sri Chamarajendra
Park" to celebrate the Silver Jubilee of Sri Krishnaraja Wodeyar’s rule in Mysore State. Cubbon Park
is under the control of the Department of Horticulture. The Deputy Director of Horticulture (Cubbon
Park) is responsible for the administration and maintenance of the park. The park has about 68
genera and 96 species with a total of around 6000 plants / trees growing in its locale. The Gulmohar
trees and massive clumps of bamboo add a distinct identity to this large lung space.
8.3.5 Conservation Zones along Arkavathi River and Thippagondanahalli Reservoir
Arkavathi River flows from the north west of the BMA to converge at the Thippagonadanahalli
(T.G.Halli) Reservoir at the western side of the BMA. As per G.O. No. FEE 215 ENV 2000 dated
18.11.2003, Bangalore. Under Section 18 (I b) of the Prevention and Control of Pollution Act, 1974
and 1981, the GoK declared the catchment area of Thippagondanahalli (T.G. Halli) as a "regulated
zone". This means the industries that have come up in the catchment area will not be allowed to let
their waste flow into the reservoir. Future development in the catchment area is restricted. BMA
falls under the regulation area of Zones 1, 3 and 4. The regulations of Conservations zones along
Arakavathi are given in Table 8-3.
Table 8-3: Regulations of Zones of Arkavathy and T.G. Halli Buffer Areas
Zones Area Covered Nature Of Restrictions/ Regulations
Zone 1 Entire Thippagondanahalli
Reservoir (TGR) Catchment
• Regulation and checking of over
exploitation of ground water.
• No fresh licenses for quarrying& stone
crushers
• No disposition of solid or liquid waste
without scientific processing.
• Adoption of rain water harvesting (RWH)
for existing & new buildings.
• Promotion of organic farming including
bio-pesticide and biofertilizers
Zone 3 Area covered within 1 km distance
from the river banks of Arkavathi
river (only upto Hessargatta tank
from TGR) and Kumudavathi.
• No person shall carry on activities other
than agricultural or agricultural related
activities without prior permission.

Revised Master Plan for Bengaluru - 2031 (Draft): Volume-3
71
Zones Area Covered Nature Of Restrictions/ Regulations
Zone 4 Area covered within 1 km to 2 km
distance from the river banks of
Arkavathi river(only upto.
Hessargatta tank from TGR) and
Kumudavathi (excluding the area
within Zone 2)
• Permit only those industrial activities
which are listed under the Green category
by the KSPCB.
• Adoption of RWH & waste water
treatment facilities
• Consent for Establishment to be obtained
by KSPCB.
• Permit G - G+1 new buildings- RWH.
8.4 Natural Drainage System and Classification of Streams
8.4.1 Natural Drainage System
Watershed: Watershed is a geo-hydrological unit of all land and water within the confines of
drainage divide which contributes runoff to a common point. It is a land area that captures rainfall
and conveys the overland flow and runoff to an outlet in the main flow channel.
The major drainages in the BUD are the Cauvery and the South Pennar basins19
. BMA by its N-S
ridge is drained by rivers Arkavathy on the west and South Pennar or South Pinakani River to the
east. Arkavathy River is a mountain river originating from Nandi hills which is further north of the
BMA boundary and is a tributary of Cauvery River. Arkavathy joins Cauvery River at 34 kms south of
Kanakpura outside the boundary of BMA. Additionally, Kumudavathy and Vrishabhavathy rivers are
tributaries to the Arkavathy. The two catchments of Arkavathy and Pennar rivers (Figure 8-14) are
further divided to four main watersheds in BMA which form separate and distinct drainage zones.
The Arkavathy River in the Arkavathy catchment is a tributary to the Cauvery River and flows in N-S
direction. Its drainage pattern is trellis to sub-dendritic and it has high drainage density mainly due
to a higher density of first order streams with lesser lengths and is dotted with number of mounds,
hills and possesses only small sized tanks to the south west. The Arkavathy catchment is divided into
two watersheds, namely,
• the Kumadavathy or upper Arkavathy watershed along the north west of BMA and the
• the Lower Arkavathy watershed along the south west of BMA
The two main tributary systems are flowing from North east to South east direction and the other
from east to west and confluence each other at Mysore road. The eastern area of BMA comes under
the Upper Pennar watershed and South Pennar watershed. The Figure 8-15 presents the four
watersheds in BMA. The lower Arkavathy watershed comprises of the Vrishavabhavathi valley. The
Vrishabahavathy River originates at the Bull temple and flows further from the south of BMA where
it joins the Cauvery River.
19
The South Pennar river of Ponnaiyar basin takes its birth from Nandi hills and flows towards south.

Revised Master Plan for Bengaluru - 2031 (Draft): Volume-3
72
Figure 8-14: Two Catchments in BMA
Figure 8-15: Four Major Watersheds in BMA
Source: Karnataka State Remote Sensing Application Centre, GoK, 2015

Revised Master Plan for Bengaluru - 2031 (Draft): Volume-3
73
Lakes & Valley System: In the eastern part of BMA is the Upper Pennar watershed and South
Pennar watershed, there are two major drainages, namely one is from Yelahanka flowing south
easterly and the other from Sarakki area. These two watersheds constitutes the Hebbal valley to the
north is characterized by first and second order stream, and the Bellandur valley to the south east
where the streams passes on to third order. The Bellandur valley system further has the Challaghatta
sub valley and Koramangala sub valley. The rainfall in BMA due to its N-S ridge gets divided and
flows down to the east or west over the valleys of gentle slopes of Vrishbhavathy, Hebbal and
Koramangala & Chalaghatta.
Five minor valleys, the Kathriguppa and Tavarekere to the south, the Arkavathi and
Kethamaranahally to the northwest and Marathhally to the east, lie outside the tributary area of the
major valleys and they drain independently to the fringe areas. The configurations of valleys in well
graded side slopes of their tributary areas have provided Bangalore with a natural system of
drainage without resource to pumping. Both sewage and storm water flows by gravity beyond the
city. It is noteworthy that each of the valley systems, comprise of system of lake series that are
essentially formed by interlinking / cascading lakes or tanks to one another through natural streams/
drains. Figure 8-16 presents the valley system and their respective lake series in BMA. The valley
systems and their respective lake series are as following:
a) Hebbal Valley: Yellamappachetty Lake Series and Madvara lake series
b) Koramangala and Challaghatta Valley: Varthur Lake Series, Puttanahalli lake series, Hulimavu
Series
c) Vrishbhavathi Valley: Byramangala lake Series
Figure 8-16: Lake Series in the Valleys of BMA
Source: KLCDA
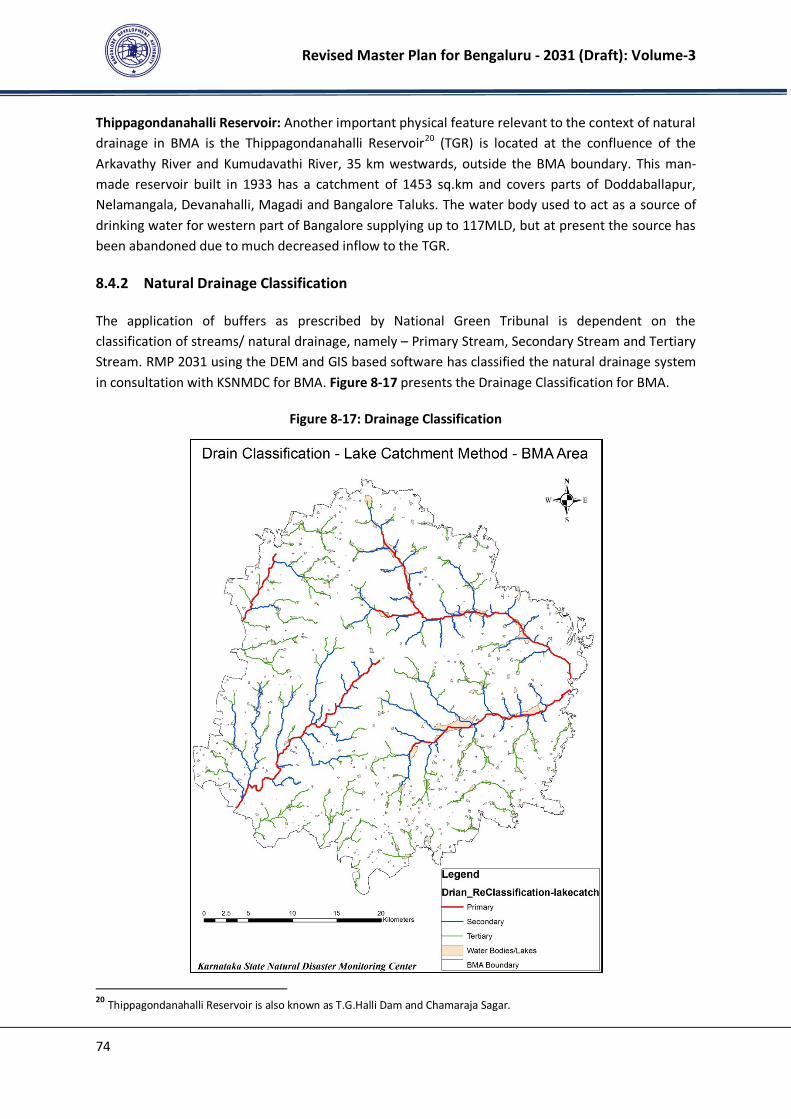
Revised Master Plan for Bengaluru - 2031 (Draft): Volume-3
74
Thippagondanahalli Reservoir: Another important physical feature relevant to the context of natural
drainage in BMA is the Thippagondanahalli Reservoir20
(TGR) is located at the confluence of the
Arkavathy River and Kumudavathi River, 35 km westwards, outside the BMA boundary. This man-
made reservoir built in 1933 has a catchment of 1453 sq.km and covers parts of Doddaballapur,
Nelamangala, Devanahalli, Magadi and Bangalore Taluks. The water body used to act as a source of
drinking water for western part of Bangalore supplying up to 117MLD, but at present the source has
been abandoned due to much decreased inflow to the TGR.
8.4.2 Natural Drainage Classification
The application of buffers as prescribed by National Green Tribunal is dependent on the
classification of streams/ natural drainage, namely – Primary Stream, Secondary Stream and Tertiary
Stream. RMP 2031 using the DEM and GIS based software has classified the natural drainage system
in consultation with KSNMDC for BMA. Figure 8-17 presents the Drainage Classification for BMA.
Figure 8-17: Drainage Classification
20
Thippagondanahalli Reservoir is also known as T.G.Halli Dam and Chamaraja Sagar.

Revised Master Plan for Bengaluru - 2031 (Draft): Volume-3
75
The natural drainage so classified was translated to ground situation using Base Map prepared for
RMP 2031. The buffers, as prescribed by National Green Tribunal, have been applied to streams/
drainage accordingly for preparation of Proposed Land Use Map.
8.5 Mining and Quarrying Areas within BMA
BUD does not contain minerals of sufficient commercial value. Nodular concentrations of lime
canker are found as secondary products in many places in the gneissic regions. Graphite is observed
to occur as crystalline flakes near Chikkabanavara. Mining activities are rampant in BMA where
quarrying of building stone (granite) and brick earth are active. Based on list of licensed quarrying/
mining sites, procured from the Department of Mines and Geology, GoK, and Satellite Imagery 2012
(provided by BDA), the existing stone quarrying sites/ locations within BMA have been mapped.
Figure 8-18 presents the location & extent of mining/ quarrying activities within BMA.
Figure 8-18: Map showing Location of Mining and Quarrying Sites in BMA
Source: Department of Mines and Geology, GoK.
Revised Master Plan for Bengaluru - 2031 (Draft): Volume-3
76
The mining activities though scattered are predominantly concentrated in North East quadrant of
BMA (areas between Bellary Road, Hennur Main Road and old madras road and along the BMA
periphery) as well as in southern side (in proximity of Bennerghatta National Park and within the
2km buffer zone promoted by Forest Department, GoK). Quarrying and mining activities add to air
pollution like dust, smoke, noise, etc. Airborne particulate matter is the main air pollutant associated
with mining.
8.6 Environmental Pollution
Environmental Pollution refers to the contamination of the natural environment which has adverse
direct effects on the physical environment like air, water, soil and also has negative impacts on
health, socio-economic conditions of humans. Most of our air, water and soil resources are gradually
becoming polluted due to the addition of foreign materials from the surroundings. These include
organic matter of plant and animal origin, land surface washing, industrial and sewage effluents and
vehicular emissions. Rapid urbanization and industrialization with improper environmental planning
often has lead pollution and depletion of the environment. This section discusses on air, noise,
water, and soil pollution in the context of BMA. For all forms of pollution the sources can be
classified into two types:
1. Point Source: Contamination is introduced into the environment from a single area
2. Non-point Source: Contamination is introduced into the environment from multiple/ large area
8.6.1 Air Pollution
Air pollution is a major hazard that has been growing steadily in Bengaluru. The increased number of
vehicles on road, industrial activity, construction activity, poor quality of roads and dust on road add
to the suspended particulate matter in air. There are more than 67 lakhs vehicles registered in
Bengaluru (March 2017) and there has been a consistent increase in the vehicular population at an
average rate of 8% per annum. Old vehicles with worn out engines, adulterated fuels, and slow
moving traffic lead to increased emissions. The total emissions in 2015 due to vehicular traffic is
estimated at 196 tonnes of CO per day, 50 tonnes of HC per day, 9 tonnes of SPM per day, and 321
tonnes of NOX per day21
. The increasing vehicles as can be seen have a direct correlation to
increasing levels of air and noise pollution. Reducing the number of private vehicle trips, and
increasing public transport share is expected have a positive impact in reducing the emissions due to
vehicular traffic. The vulnerabilities of air pollution include people living along the major roads,
travellers, pedestrians and especially children and the elderly. Mining and quarrying acitivities within
BMA are also adding to air pollution.
8.6.2 Noise Pollution
Another important source of pollution in Bangalore is of excessive noise. The sources of Noise
pollution can be attributed to Vehicular traffic, Flying aircraft near airports (four air funnels are
21
Estimation is based on Urban Transport Modal built for RMP 2031.
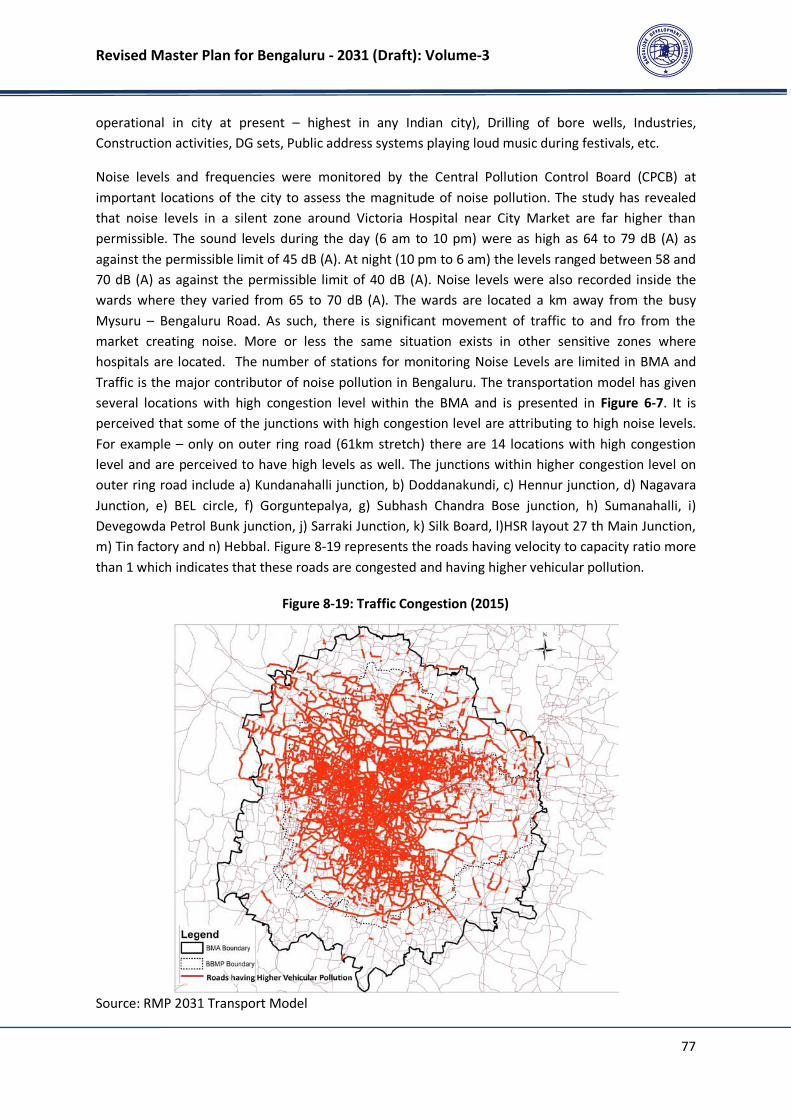
Revised Master Plan for Bengaluru - 2031 (Draft): Volume-3
77
operational in city at present – highest in any Indian city), Drilling of bore wells, Industries,
Construction activities, DG sets, Public address systems playing loud music during festivals, etc.
Noise levels and frequencies were monitored by the Central Pollution Control Board (CPCB) at
important locations of the city to assess the magnitude of noise pollution. The study has revealed
that noise levels in a silent zone around Victoria Hospital near City Market are far higher than
permissible. The sound levels during the day (6 am to 10 pm) were as high as 64 to 79 dB (A) as
against the permissible limit of 45 dB (A). At night (10 pm to 6 am) the levels ranged between 58 and
70 dB (A) as against the permissible limit of 40 dB (A). Noise levels were also recorded inside the
wards where they varied from 65 to 70 dB (A). The wards are located a km away from the busy
Mysuru – Bengaluru Road. As such, there is significant movement of traffic to and fro from the
market creating noise. More or less the same situation exists in other sensitive zones where
hospitals are located. The number of stations for monitoring Noise Levels are limited in BMA and
Traffic is the major contributor of noise pollution in Bengaluru. The transportation model has given
several locations with high congestion level within the BMA and is presented in Figure 6-7. It is
perceived that some of the junctions with high congestion level are attributing to high noise levels.
For example – only on outer ring road (61km stretch) there are 14 locations with high congestion
level and are perceived to have high levels as well. The junctions within higher congestion level on
outer ring road include a) Kundanahalli junction, b) Doddanakundi, c) Hennur junction, d) Nagavara
Junction, e) BEL circle, f) Gorguntepalya, g) Subhash Chandra Bose junction, h) Sumanahalli, i)
Devegowda Petrol Bunk junction, j) Sarraki Junction, k) Silk Board, l)HSR layout 27 th Main Junction,
m) Tin factory and n) Hebbal. Figure 8-19 represents the roads having velocity to capacity ratio more
than 1 which indicates that these roads are congested and having higher vehicular pollution.
Figure 8-19: Traffic Congestion (2015)
Source: RMP 2031 Transport Model
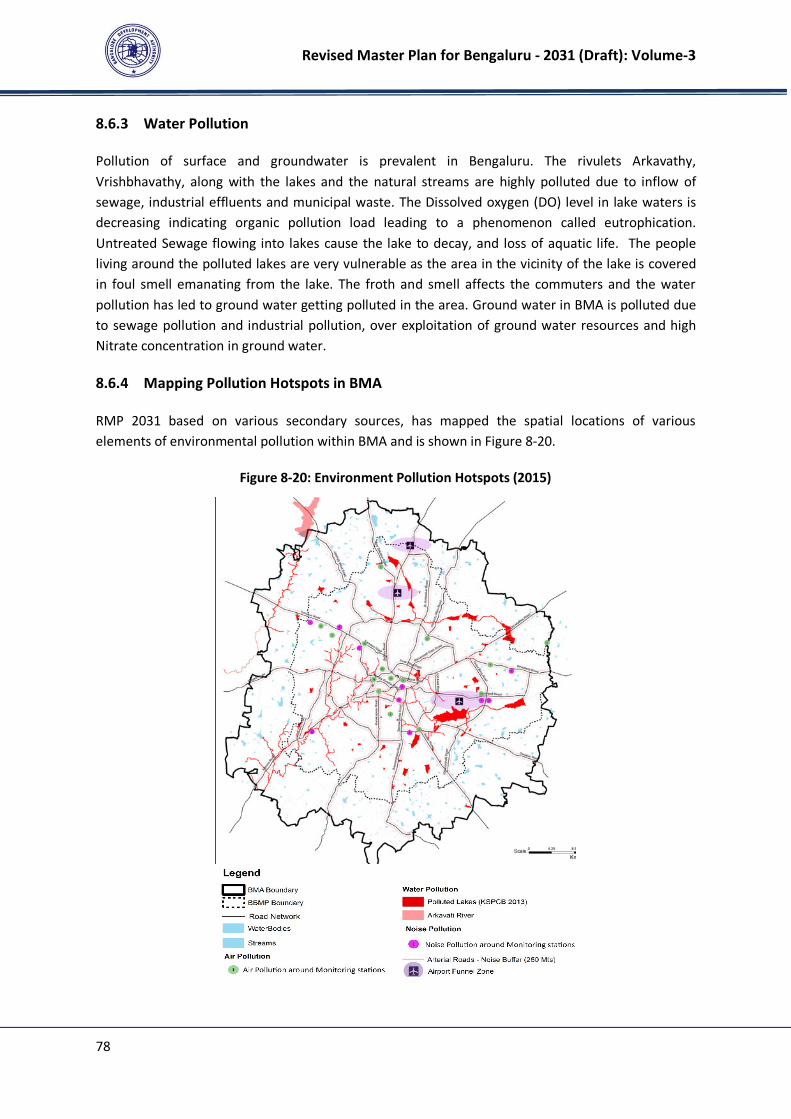
Revised Master Plan for Bengaluru - 2031 (Draft): Volume-3
78
8.6.3 Water Pollution
Pollution of surface and groundwater is prevalent in Bengaluru. The rivulets Arkavathy,
Vrishbhavathy, along with the lakes and the natural streams are highly polluted due to inflow of
sewage, industrial effluents and municipal waste. The Dissolved oxygen (DO) level in lake waters is
decreasing indicating organic pollution load leading to a phenomenon called eutrophication.
Untreated Sewage flowing into lakes cause the lake to decay, and loss of aquatic life. The people
living around the polluted lakes are very vulnerable as the area in the vicinity of the lake is covered
in foul smell emanating from the lake. The froth and smell affects the commuters and the water
pollution has led to ground water getting polluted in the area. Ground water in BMA is polluted due
to sewage pollution and industrial pollution, over exploitation of ground water resources and high
Nitrate concentration in ground water.
8.6.4 Mapping Pollution Hotspots in BMA
RMP 2031 based on various secondary sources, has mapped the spatial locations of various
elements of environmental pollution within BMA and is shown in Figure 8-20.
Figure 8-20: Environment Pollution Hotspots (2015)
Revised Master Plan for Bengaluru - 2031 (Draft): Volume-3
79
8.7 Mater Plan Proposals and Strategies
RMP 2031 has following proposals and strategies to improve the environment of BMA
1. Preparation of Ecology Master Plan for BMA: RMP 2031 proposes that Ecology Master Plan shall
be prepared for entire BMA.
2. Development of Environmental Health Monitoring System: RMP 2031 proposes that a common
digital data base for all environmental aspects and assets are developed and monitoring of
health of lakes and streams.
3. Development of Public Transport System (discussed in Chapter on Traffic and Transportation)
Transportation proposals aimed at increasing public transport share to 60-70% and development
of Non-Motorised Transport. This would help in reducing air pollution and noise pollution.
4. Improving Green cover: A multipronged strategy is proposed to increase green cover within the
BMA which includes
a. Development of Large Regional Parks across BMA
b. Block Plantation
c. Tree Planting mandatory for every development
d. Landscaping Plan mandatory for certain developments (as defined in Zoning Regulations)
e. Plantation along Lakes and Streams
f. Avenue Plantation on all Master Plan Roads
g. Protection of Forest – clear demarcation of Forest Extents
5. Protection and Conservation of Lakes & water bodies
a. Lakes considered in Master Plan to be marked in land use
b. Clearly Defined Streams Network
c. Protection of Valley System
d. Guidelines for developments adjoining lakes and water bodies
e. All New Layouts/ Apartment Complex’s/ Commercial Spaces/ Government Buildings/ to
follow zero discharge concept and implement dual pipeline system. Reuse of Grey Water
mandatory.
f. Rainwater Harvesting and Other Ground Water Recharge Techniques
g. All red category industries to be shifted outside BMA
6. Air & Noise Pollution
a. Banning of Mining Areas/ activities within BMA
b. Provision of land for Truck Terminal/ Logistic Hubs. Once developed restriction on entry of
heavy vehicles in to city centre to be imposed.
Revised Master Plan for Bengaluru - 2031 (Draft): Volume-3
80
c. Insisting Traffic Impact Study for Large Scale Developments
d. Regulations for Installation of Recharge Points for Battery Operated Vehicles
e. Assigning land for Solid Waste Collection Centres, Transfer Stations, Treatment Plants
f. Energy Conservation:
g. Assigning land for Waste to Energy plants
h. Rooftop solar plants for public building, residential, institutional and commercial buildings as
prescribed
i. Charge Points for Battery operated vehicles
Revised Master Plan for Bengaluru - 2031 (Draft): Volume-3
81
9 HOUSING, REAL ESTATE ASSESSMENT AND ADDITIONAL
LAND REQUIREMENTS FOR 2031
9.1 Housing
9.1.1 Existing Housing Situation
Bangalore's urban growth has spurred an overwhelming demand for housing owing to the large
concentration of jobs and opportunities in the city, and this is at the centre of several of the
development challenges that the city faces. Although the Bangalore Development Authority and
Karnataka Housing Board have developed several layouts and townships with accompanying
infrastructure in different parts of the city, there has been a gap between the supply and demand
thereby opening large avenues for private sector participation in this sector.
With an estimated slum population of about 10% of the total population, Bangalore is generally not
perceived as a city of slums, but skyrocketing population and economic growth in the city over the
last few decades has attracted large numbers of poor migrants seeking a livelihood in the city. The
slums in Bengaluru, as in other cities, tend to be located in low-lying areas that are susceptible to
inundation, quarry pits, tank beds, along railway lines etc. In the context of the above, the RMP 2031
places emphasis on affordable housing, including the recognition of slums as contributors to
affordable housing stock.
The key parameters considered for the assessment of existing housing situation are summarized
hereunder:
a) Existing housing stock: The housing stock data for the BBMP and Outgrowth area as per Census
2011 shows nearly 21.04 Lakh Houses under residential uses and about an estimated 2.18 Lakh
units were available in the form of vacant houses. It is important to highlight here that there
were about 1.66 Lakh households without any exclusive room and an estimated about 1.40 Lakh
households were living under the slums as per Census 2011 data. The housing stock for 2016 has
been estimated at about 30.39 Lakh in the BMA area.
b) Rental housing: An increasing number of rented houses as a share of the total number of
houses, a trend sharply observed in rural areas as well. Renting a house is seen as most
convenient because of unaffordable land rates and long travelling distances. Nearly 60% of the
households are dependent on the rental housing as per Census 2011.
c) Decrease in household size: Average household size in Bengaluru has decreased from 5.44 in
1961 to 5 in 1991 to 4.05 in 2011 and based on UN Headship Rate Method, it is projected to
reach 3.89 by 2031.
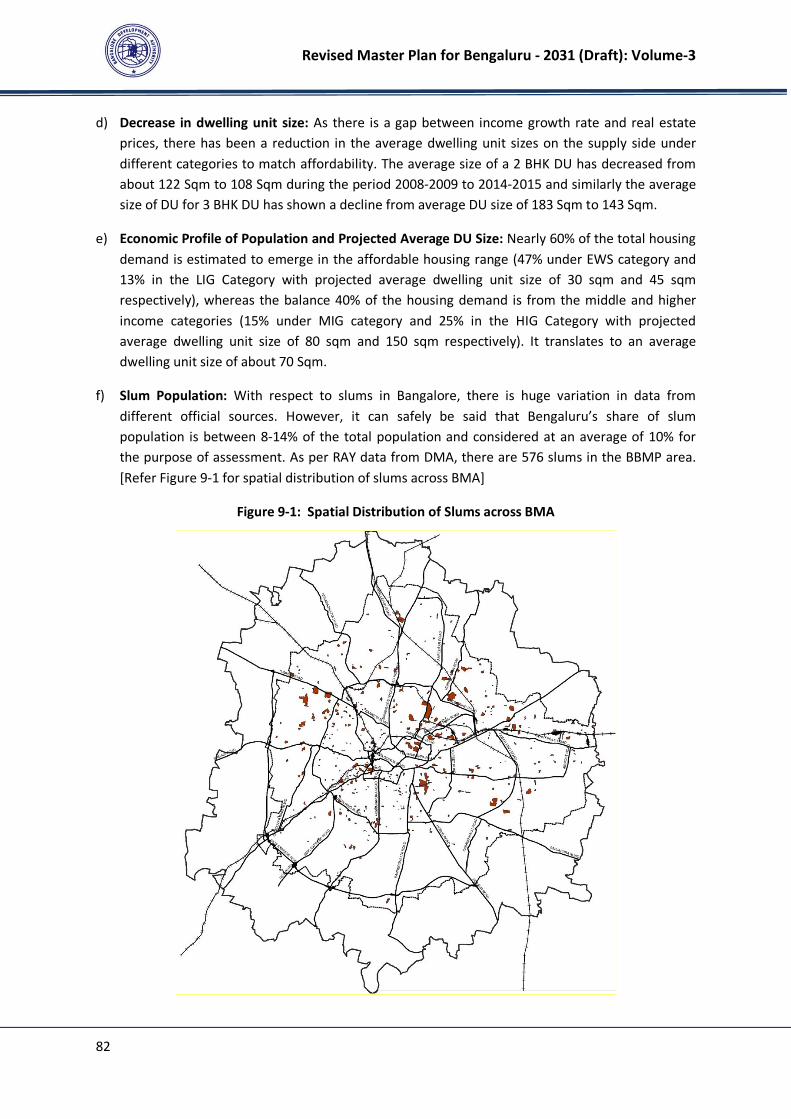
Revised Master Plan for Bengaluru - 2031 (Draft): Volume-3
82
d) Decrease in dwelling unit size: As there is a gap between income growth rate and real estate
prices, there has been a reduction in the average dwelling unit sizes on the supply side under
different categories to match affordability. The average size of a 2 BHK DU has decreased from
about 122 Sqm to 108 Sqm during the period 2008-2009 to 2014-2015 and similarly the average
size of DU for 3 BHK DU has shown a decline from average DU size of 183 Sqm to 143 Sqm.
e) Economic Profile of Population and Projected Average DU Size: Nearly 60% of the total housing
demand is estimated to emerge in the affordable housing range (47% under EWS category and
13% in the LIG Category with projected average dwelling unit size of 30 sqm and 45 sqm
respectively), whereas the balance 40% of the housing demand is from the middle and higher
income categories (15% under MIG category and 25% in the HIG Category with projected
average dwelling unit size of 80 sqm and 150 sqm respectively). It translates to an average
dwelling unit size of about 70 Sqm.
f) Slum Population: With respect to slums in Bangalore, there is huge variation in data from
different official sources. However, it can safely be said that Bengaluru’s share of slum
population is between 8-14% of the total population and considered at an average of 10% for
the purpose of assessment. As per RAY data from DMA, there are 576 slums in the BBMP area.
[Refer Figure 9-1 for spatial distribution of slums across BMA]
Figure 9-1: Spatial Distribution of Slums across BMA

Revised Master Plan for Bengaluru - 2031 (Draft): Volume-3
83
g) Existing Housing Gap: The existing housing gap in 2015 is estimated at about 129998 houses
considering the dilapidated and overstressed housing. It is important to highlight here that
though the slum population is about 10%, the slums are also characterized by the access and
availability of the services and not only the housing condition alone.
9.1.2 Characteristics of the Tracked Residential Market
A growing base of young professionals with rising disposable incomes and substantial global
exposure, tracked market developments for a variety of uses from residential to commercial office
space to retail to hospitality have become increasingly common in Bangalore. Bangalore has
emerged as one of the most preferred residential locations in the country in terms of developments
in the residential tracked market22. It must be noted here that supply in the tracked market is
skewed towards higher income groups
With an increase in land prices over a period of time, taller buildings are being constructed in order
to utilize the entire FSI and even applicable TDR. As such, apartments form 90% of the total under-
construction housing supply. Considering increasing demand, land prices, construction cost and lag
in the social infrastructure development in the city, the share of apartment projects in the total
residential supply is expected to increase.
9.1.3 Additional Housing Demand for 2031
The additional housing stock for 2031 has been estimated considering the projected household size
of 3.89 by 2031 and the estimated population of 2031. While projecting the future demand for
housing stock, it has been assumed that 10% of the total housing stock would be available as vacant
housing stock as per the past census trends in Bangalore. Considering the overall projection of nearly
20.30 million population in the two LPAs of the BMA (BDA and BMICAPA), the total housing demand
has been estimated at about 57.00 lakh for the year 2031.
It is estimated that the total additional housing stock required for BMA would be about 26.80 lakh
by the year 2031, out of which about 1.73 lakh would be provided under BMICAPA and the balance
about 25.07 lakh would be within the LPA of BDA including the existing gramathan areas. It is
estimated that about 5% of this demand would be met from the gramathan areas and the balance
95% would be the urban housing by the year 2031 within the LPA of BDA.
9.1.4 Additional Land Requirement for Residential Use by 2031
The following assumptions have been made for assessing the land requirement for residential use:
• Average DU size has been considered as 70 Sqm based on the assessment of real estate market
trends and the economic profile of the population in Bangalore.
22
For the purposes of this analysis, the "residential tracked market" refers to multi-dwelling apartment and
villa projects with more than 10 units which are sold in the primary market. It does not include government
housing projects and small scale independent developments

Revised Master Plan for Bengaluru - 2031 (Draft): Volume-3
84
• Average FAR of 2 has been considered for the purpose of calculation of net residential land for
the housing in the urbanisable area for RMP 2031 considering the pattern of existing
development, which is predominantly in the form of plotted development, utilising an average
FAR of 1.5 and the developments in vacant/undeveloped areas within the conurbation limits
would potentially absorb higher FARs estimated at 2.5 in context of provisions defined in the
zoning regulations for promoting high density compact development in the special development
zones and integrated townships in other undeveloped lands within the existing conurbation.
• The gross land area requirement has been worked out considering 40% of the total land would
be under the net residential land and balance 60% of the land would accommodate the
circulation patterns for these areas including the Master Plan Level Roads, the neighbourhood
and sector level greens and recreational areas, the local retail level commercial and the land
requirements for social amenities (educational/ Health/ other Community facilities) and utilities
at neighbourhood and sector levels.
• It is assumed that about 5-10% of the residential land will be used for Industrial and Commercial
activities of higher order as per the provisions of Integrated Development Plans, Integrated
Townships and permissible uses in residential areas as per space standards and road widths in
the Zoning Regulations.
• No separate land provisions have been made for the existing backlog in the housing stock as
certain amount of densification through redevelopment and extension of additional floors
creating additional housing stock has been considered to cover-up for the backlog.
• The major share of slum population (75%) can be provided the housing through redevelopment
of the existing land to cover up for the existing slum population and the balance about 25% of
the total slum population would require relocation/ rehabilitation at alternate locations due to
unsuitability of land for residential purposes.
• About 5% of the land earmarked for residential use will be undevelopable as a result of NGT
buffer considering 50% of the NGT buffer could be utilised for mandatory greens within the
layouts/ Development Plans.
Based on the above assumptions, the total additional land requirement under the residential land
use has been assessed at about 220-230 Sq Km.
The existing net residential density in the core area (inside ORR) has been estimated at about 515
PPH, whereas the density in the remaining urbanised areas of RMP-2015 is estimated at about 355
PPH. This translates to a city level net residential density of about 435.
With the average assigned net residential density of 450 PPH for the urbanisable area, the
requirement for additional land works out to about 220 Sqkm (after deducting the existing
residential area). Accounting for non-residential uses in the residential land use in the range of 5% to
10%, the total demand for additional land under residential land use is estimated at 230-240 Sqkm
using the density method.
Revised Master Plan for Bengaluru - 2031 (Draft): Volume-3
85
9.1.5 Housing Strategy of RMP 2031- Focus on Affordable Housing
The RMP 2031 recognizes affordable housing as one of the key components as part of the Inclusive
Growth, one of the 4 major pillars around which entire Plan has been envisioned. The Housing
Strategy as part of RMP 2031 has been proposed with supporting provisions in the ZR to ensure that
a substantial share of the new housing stock is developed in the affordable housing category
especially targeted towards the EWS housing. The RMP 2031 has taken a cognizance of the
Karnataka Affordable Housing Policy, 2016, that has advocated various strategies for enhancing the
supply of affordable housing supply including the role of public agencies, private developers and
public-private partnerships as well as laid advocated supporting regulatory and fiscal mechanisms
for encouraging the development of rental housing stock and night shelters. In line with the
strategies and the actions suggested under the Karnataka Affordable Housing Policy 2016, the RMP
2031has made the following specific provisions.
1. Government Land Parcels for Affordable Housing:
All the government land parcels earmarked for residential land use shall be mandatorily developed
through public agencies exclusively for meeting the demand for affordable housing especially
targeted towards the EWS sections with atleast 60% of the share of dwelling units with size of upto
30 Sqm.
2. Special Provisions for EWS Housing and Redevelopment of Slums:
The zoning regulations have introduced special regulations for EWS Housing in the ZR including use
of maximum allowable FAR as the base FAR free of cost by the public agencies. The provision
related to permissibility of maximum allowable FAR as base FAR free of cost shall also be applicable
for slum redevelopment/ affordable housing schemes on PPP basis taken up as part of any
government scheme/ program if atleast 60% of the total built-up area is proposed for EWS/
affordable housing.
3. Creation of Land Bank for Affordable Housing through Mandatory Provisions in the Layouts/
Development Plan Approval:
The Zoning Regulations for RMP-2031 has made a provision for mandatory relinquishment of 2.5% of
the land under the layouts in favour of the Authority for construction of EWS Housing by the public
agencies under the government schemes/ programs. In addition, for all the DPs, provision of 15% of
the total number of units or 5% of the built-up area counted towards FAR, whichever is higher has
been made mandatory. An alternative has been provided for the Developers to relinquish 5% of the
total land area in favour of the Authority in case they do not intend to develop the EWS housing on
their own. The incentives in FAR for mandatory provision for EWS housing has been introduced in
the ZR. The provisions for EWS housing as part of the integrated townships or integrated DPs have
also been made mandatory in line with the provisions under Development Plans.
Revised Master Plan for Bengaluru - 2031 (Draft): Volume-3
86
9.2 Assessment of Industrial and Service Sector Offices
9.2.1 Nature of Demand
The additional industrial land for large manufacturing sector industries has not been envisaged for
BMA given the past trends and the Master Plans for adjoining LPAs. The demand for future would be
on the non-polluting and service sector soft industries with land character similar to that of
commercial land use. The household industries are permissible under the residential use for which
necessary provisions have been defined in the Zoning Regulations as part of permissible activities.
9.2.2 Built Space Assessment
The total requirement for the built space has been assessed at about 300 Million Sqft or 2788 Ha of
built space during the period 2016-2031 derived based on the assessment of market absorption
trends of these spaces during the period 2008-2014. Based on historical information on supply and
demand of office space from the same market tracking survey, it is observed that only 90% of office
space supplied is absorbed, i.e. actually used. Thus, it is anticipated that about 3100 Ha of office
space will actually be built.
9.2.3 Additional Land Requirement
The following assumptions have been made for assessing the land requirement for industrial and
office space use:
• The total built-up space requirement would be about 31 Sqkm
• The average FAR for these developments would be of the order of 2.50
• The retail commercial development requirement shall be met through the residential land use in
light of the provisions for permitting commercial activities as part of the layouts/ DPs to ensure
development of planned commercial activities rather than informal street side
commercialisation of residential sites.
At an average FSI of 2.5, the total net land requirement works out to about 1239 Ha or 12.39 Sqkm.
It is assumed that 10% of this land requirement would be met through the areas falling under the
jurisdiction of BMICAPA that makes the requirement for land pegged at about 11 Sqkm within the
LPA of BDA. Considering 60% of the total land earmarked for these uses will be available as net land
after making provisions for master plan and access roads, public utilities at zonal/ sector level, the
greens and open spaces, parking areas etc, the gross land required for these activities is estimated at
about 18 Sq Km. It is also important to highlight here that these demands would be predominantly
met through the land use earmarked for industrial and commercial land use including the
redevelopment of existing industrial areas.
In addition the provisions have been made under the Zoning Regulations for promoting walk to work
concepts for which Integrated Townships and Integrated DPs have been promoted through
incentives in FAR which are permissible even in the residential land use. Similarly, the provisions
Revised Master Plan for Bengaluru - 2031 (Draft): Volume-3
87
related to permissible activities within residential use zone subject to fulfilment of space standards
and road width would also encourage such activities to promote mixed use developments in planned
manner in the new developments.
9.3 Assessment of Land for Other Major Uses
The net land requirement for additional city level infrastructure facilities, utilities and amenities
comprising of water supply, power, solid waste management, city level greens and recreational,
higher level educational and health facilities, burial and cremation grounds and the road network
has been estimated at about 25-30 Sqkm. Considering 50% of the land would only be available as net
land, the total land requirement for other major uses has been assessed as 50-60 Sqkm.
In addition, the requirement for certain major road networks and traffic and transportation facilities,
planned as part of RMP 2031 has been assessed at about 20-30 Sqkm.
9.4 Additional Land Requirement for RMP 2031
The total additional land requirement for accommodating the additional population and the
supporting activities has been estimated to be between 318-348 Sq Km for RMP 2031. The analysis
of the existing land use clearly indicates that about 304 Sqkm of vacant land is available under the
existing conurbation limits of RMP 2015, out of which nearly 46 Sqkm falls under the purview of NGT
buffer that leaves about 258 Sqkm available for development.
Thus, the total additional land requirement for accommodating the future population with a
perspective of compact city development is estimated to be between 60-90 SqKm for RMP 2031
considering that entire additional land is available as developable land. However, considering the
requirements of NGT buffer (estimated at 15-20% in the peripheral areas), the total additional land
requirement has been assessed to range between 72-108 Sqkm.
The URDPFI Guidelines issued by the Ministry of Urban Development, Government of India have
recommended a gross density of more than 200 PPH for the metropolitan cities.
The gross density of 200 PPH translates to the gross urbanisable area of nearly 932 Sqkm for
accommodating about 18.60 million population residing in urban part of BMA. Similarly, the density
of 210 PPH and 220 PPH translate to gross urbanisable area requirements of about 888 Sqkm and
847 Sqkm respectively targeted towards the objectives of compact city development.
Revised Master Plan for Bengaluru - 2031 (Draft): Volume-3
88
10 CONURBATION LIMIT 2031 AND PROPOSED LAND USE
10.1 Considerations for Extension of Conurbation Limits
The Differential Strategy Scenario was approved by the Bangalore Development Authority for
detailing of the RMP-2031 in a Board meeting held on June 9, 2017. Summary of the directions/
decisions by the Authority are given hereunder:
• While delineating the additional land requirements for the extension of conurbation limits of
RMP 2015 for RMP 2031, the aspects related to circulation pattern, buffer zones, affordable
housing and economic nodes should be considered as per the outcomes of the public
consultation meetings.
• The indicative identified economic nodes should be located near to the junctions of the major
roads to the extent possible and the activities should be suitable for such locations and balance
with the regional context. The proposals of the Master Plans of adjacent LPAs should be
considered while formulating the proposals for RMP 2031 to achieve the balanced regional
development. Separate regulations should be considered for these nodes.
Based on the decision and guidelines given by the Authority, the conurbation limits have been
extended with the following considerations:
• The Major road corridors considered for extension of conurbation considering the existing
directions of growth and the capacity of the major road network, the five Special Development
Zones (SDZ)/ Economic Nodes proposed are (1) SDZ Bellary Road, (2) SDZ Old Madras Road, (3)
SDZ Sarjapur Road, (4) SDZ Hosur Road and (5) SDZ Mysuru Road.
• The emergence of economic activities is highly governed as per the backward-forward linkage,
however, it is a very dynamic phenomenon guided by the market demand. Considering the
existing pattern of growth in these zones and in the adjoining region, SDZ Bellary Road, Hosur
Road and Sarjapur Road would act as hubs of IT and other related Hi-Tech industries and
supporting service sector Offices. SDZ Mysore road is envisaged as a hub for Knowledge Driven
Economy. SDZ Old Madras road is envisioned to create opportunities through light and service
sector industries.
• The delineation of Special Development Zones as an extension of the conurbation limits of RMP
2015 has also taken cognisance of the existing level of development in these zones in order to
plan for compact high density developments as per the availability of vacant land.
• The Special Development Zones have been envisaged as High Density Integrated Developments
providing employment opportunities (Economic Nodes) supported with the necessary residential
and amenity requirements. The road network in these special development zones have
accordingly been proposed to accommodate the high density developments.
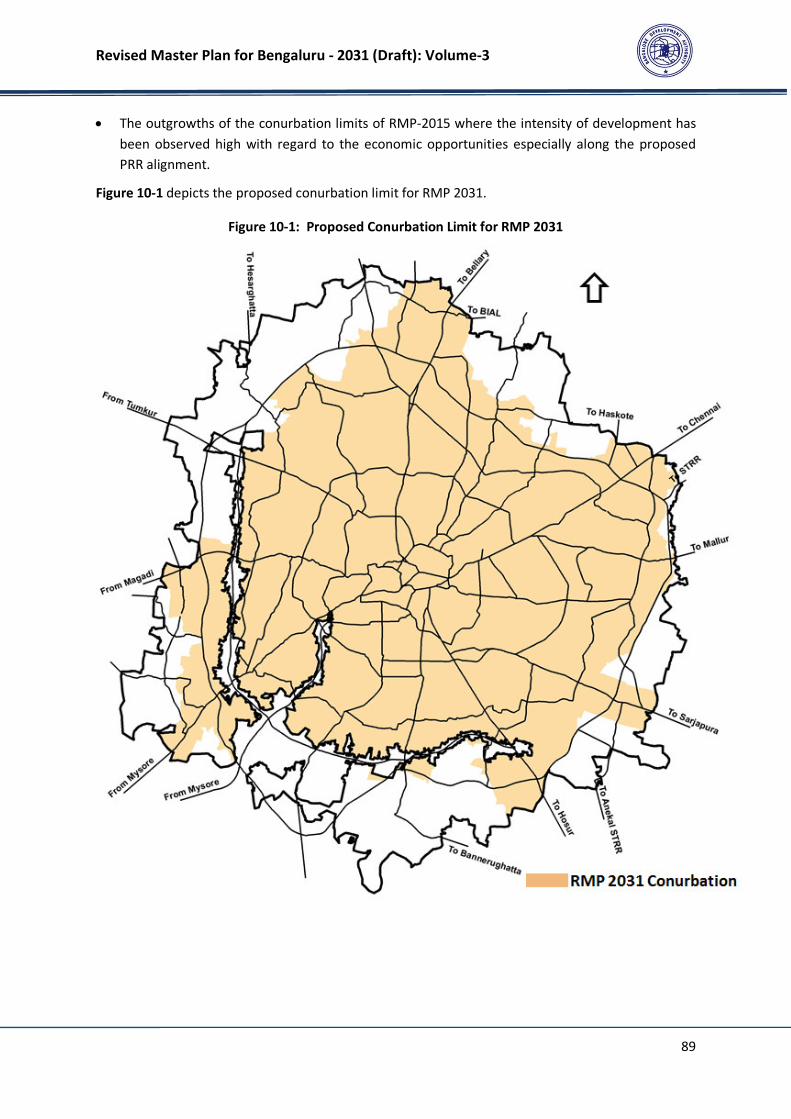
Revised Master Plan for Bengaluru - 2031 (Draft): Volume-3
89
• The outgrowths of the conurbation limits of RMP-2015 where the intensity of development has
been observed high with regard to the economic opportunities especially along the proposed
PRR alignment.
Figure 10-1 depicts the proposed conurbation limit for RMP 2031.
Figure 10-1: Proposed Conurbation Limit for RMP 2031
Revised Master Plan for Bengaluru - 2031 (Draft): Volume-3
90
10.2 Land Use Strategy for RMP 2031
The Land Use for RMP-2031has been proposed with the following considerations:
• The Land Use Zoning is as per the provisions of the Rule Number 30 of the KPA Rules.
• For the purpose of detaining of RMP-2031, the entire LPA of BDA has been divided into 42
Planning Districts for which the Planning District Level Proposed Land Use Maps and proposed
major development proposals are given in Volume-5 and Volume-4 respectively.
• The commercial strip model including commercial axis, mutation corridor in the RMP 2031 has
been relooked at and a multi-pronged strategy of planned commercial areas in the new areas of
development and strip model on selected corridors/ roads of width 15 m and above has been
provided based on the existing commercialisation in the existing developed areas.
• The economic centres/ industrial areas and the amenity areas have been spatial distributed
across different Planning Districts for balancing the growth at the LPA Level.
• The Development Constraints such as Air Funnel Zones, regulations related to eco-sensitive
zones, quarry and mining sites, defense areas etc have been given due cognisance while
delineating the conurbation limits as well as formulating the land use proposals.
• Except for the developments proposed along the five major corridors and the existing
conurbation limits of RMP 2015, the agricultural belt admeasuring nearly 323 Sqkm has been
retained along the periphery of the entre LPA to act as a buffer between the LPA of BDA and the
developments in the adjoining LPAs.
• The Proposed Land Use for RMP 2031 has considered and incorporated the planning permissions
and change of land use accorded by the Authority/ Government. The Proposed Land Use of RMP
2015 has been suitably amended in several zones based on the predominant existing land use
and the development pattern.
• The entire LPA has been divided into three planning zone i.e.
Planning Zone A (Ring 1+Ring 2 of the RMP 2015) comprises of the core of the City area
falling within the outer ring road (erstwhile BMP). Owing to limited availability of land and
high densities, there is very little scope for further growth in this zone. This is also the zone
that – owing to its high densities – is crippled by traffic congestion and environmental
pollution. This zone requires, strategies to stabilise the growth in this zone and interventions
that discourage further commercialisation in the residential areas as well as densification
process.
Planning Zone B (Part of Ring 3 of the RMP 2015), the areas between the outer ring road
and the proposed Conurbation limit of RMP-2031 form part of this zone. The infrastructure
is poor in several areas in this zone, in spite of being major part falling under the jurisdiction
of BBMP. Numerous lakes and water bodies present an opportunity to conserving the overall
valley and tank network in the BMA. This zone is characterised by narrow roads and absence
of a good network hierarchy. Improvement of infrastructure will lead to increased capacity
to hold higher densities and more population in Zone B. The zone envisaged as zone of
Revised Master Plan for Bengaluru - 2031 (Draft): Volume-3
91
consolidation – one where development can be further encouraged through strengthened
infrastructure.
Planning Zone C (Part of Ring 3 of the RMP 2015) is the outermost zone that extends from
the conurbation limits till the boundary of the BMA. This area consists of agricultural land
use and has sparse developments. RMP 2031 views this zone as a preservation zone, one
where the agriculture land-use, to the extent possible, will be retained, although it requires
certain additional interventions beyond zoning regulations in order to facilitate better
economic utilisation of the agricultural lands. This may be conceptualised as productive
landscapes.
• The road hierarchy has been given special attention by way of identifying major activities and
the importance of the area with regard to the envisaged density patterns.
• The proposed circulation pattern has been evolved on the concept of rings and radials whereby
necessary missing links or widening proposals have been included to create a network
comprising of 5 rings and 26 radials. The land has been earmarked for the critical junctions for
easing the free flow of traffic by construction of grade separators/ flyovers. Truck terminals and
ISBTs have been proposed along the major corridors and land has been accordingly allocated.
• The proposals of BMRDA for regional level network including Intermediate Town Ring Road
(ITRR) of Hoskote and other roads have been integrated as part of the RMP 2031 based on the
ground situation and utilising the alignment of the proposed PRR with 100 m RoW under RMP
2031.
• The RMP 2031 has also integrated the road network of BMICAPA.
• The RMP 2031 has also taken cognizance of the road network proposed under RMP 2015 and
amended several roads especially the lower hierarchy roads in the form of reduction of the
proposed road widths and/ or removal of certain roads due to lack of feasibility of achieving
such RoWs on ground due to high intensity of development.
• RMP 2031 has identified Regional Parks/ City Level Parks in different zones utilising the
abandoned quarry sites, wherever suitable, and the areas having high intensity of streams and
water bodies where NGT buffers have been integrated as part of such large open spaces.
• The land for Public and Semi-public and the public utilities has been earmarked across different
Planning Districts to cater to the zonal level requirements. Efforts have been made to allocate
the government land parcels to the extent possible for demarcation of land for such facilities.
• The Eco-sensitive zones along with their extent of regulation boundaries like Arkavati, TG Halli
and Bannergatta National Park has been demarcated on the PLU Map.
• RMP-2031 for the first time has classified the streams into primary, secondary and tertiary based
on the Flood Modelling carried out in association with KSNMDC, GoK and earmarked on the PLU
maps along with demarcation of buffers as per the orders of the Hon’ble NGT. This measure will
help in keeping a close check on the encroachments in the buffer zones and also address a major
issue for the city in the form of urban flooding. It will also contribute towards enhancement in
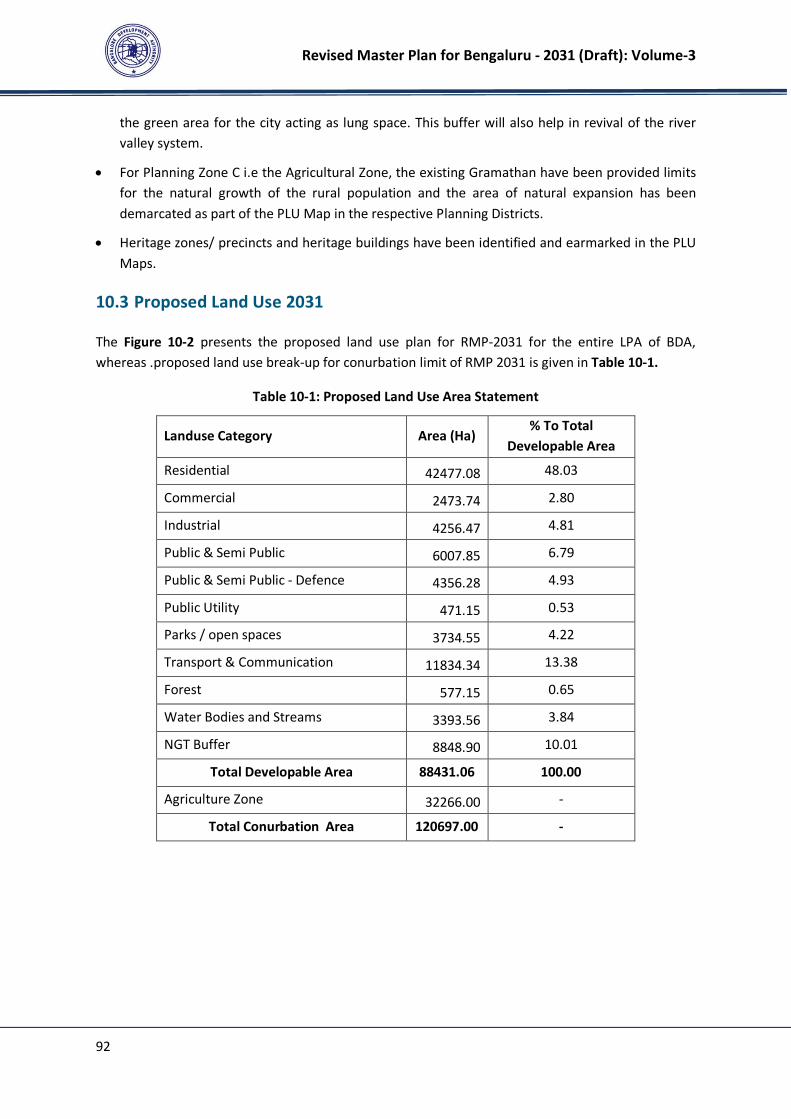
Revised Master Plan for Bengaluru - 2031 (Draft): Volume-3
92
the green area for the city acting as lung space. This buffer will also help in revival of the river
valley system.
• For Planning Zone C i.e the Agricultural Zone, the existing Gramathan have been provided limits
for the natural growth of the rural population and the area of natural expansion has been
demarcated as part of the PLU Map in the respective Planning Districts.
• Heritage zones/ precincts and heritage buildings have been identified and earmarked in the PLU
Maps.
10.3 Proposed Land Use 2031
The Figure 10-2 presents the proposed land use plan for RMP-2031 for the entire LPA of BDA,
whereas .proposed land use break-up for conurbation limit of RMP 2031 is given in Table 10-1.
Table 10-1: Proposed Land Use Area Statement
Landuse Category Area (Ha) % To Total
Developable Area
Residential 42477.08 48.03
Commercial 2473.74 2.80
Industrial 4256.47 4.81
Public & Semi Public 6007.85 6.79
Public & Semi Public - Defence 4356.28 4.93
Public Utility 471.15 0.53
Parks / open spaces 3734.55 4.22
Transport & Communication 11834.34 13.38
Forest 577.15 0.65
Water Bodies and Streams 3393.56 3.84
NGT Buffer 8848.90 10.01
Total Developable Area 88431.06 100.00
Agriculture Zone 32266.00 -
Total Conurbation Area 120697.00 -
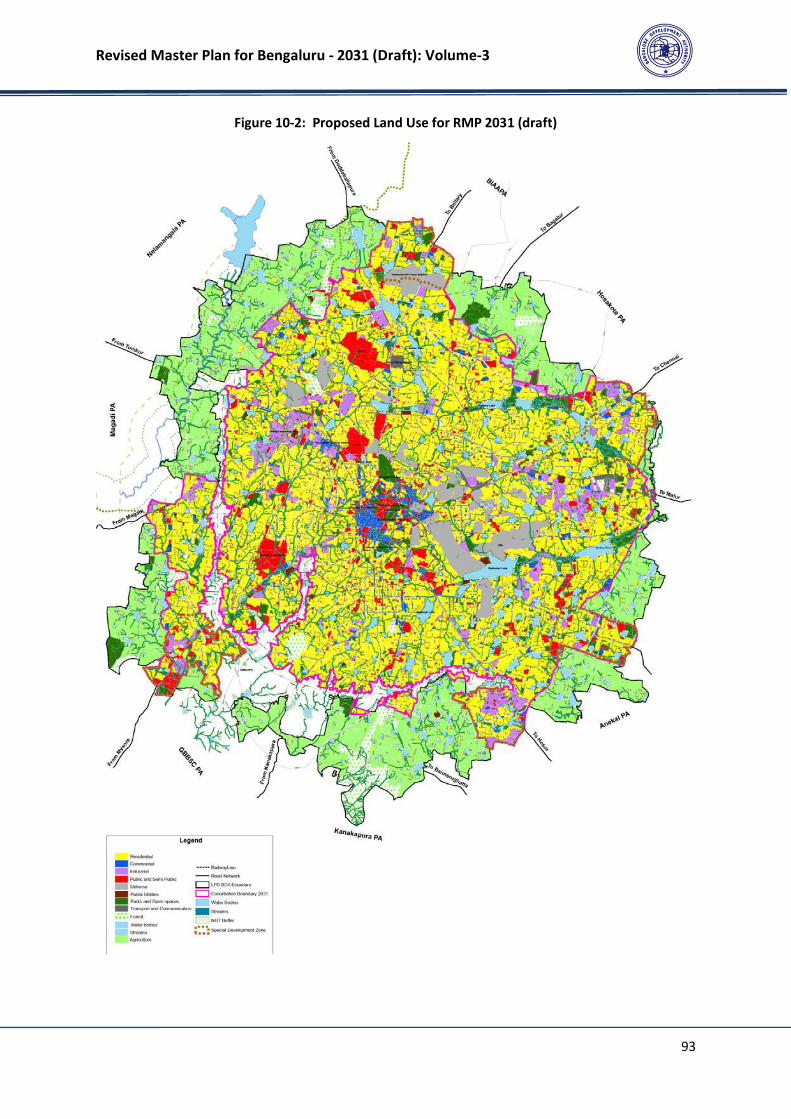
Revised Master Plan for Bengaluru - 2031 (Draft): Volume-3
93
Figure 10-2: Proposed Land Use for RMP 2031 (draft)
Revised Master Plan for Bengaluru - 2031 (Draft): Volume-3
94
11 TRAFFIC AND TRANSPORTATION
11.1 Traffic and Transport Scenario in Bengaluru
Bengaluru is spatially characterized by a ring-radial system of roads formed by five big axes, which
converge towards the centre of the city. Bengaluru Metropolitan Area with more than 11 million
people, travelling is getting more and more difficult as the city witnesses nearly 10 million trips a
day. Traffic in Bangalore has become a scourge and is only becoming worse. Network speeds are
dropping at an alarming rate as overcapacity of its junctions and links are being reached and traffic
jams have become the order of the day. Being a victim of its own success, Bangalore’s traffic
infrastructure has just not been able to keep pace with the fast growing IT industry to which
Bangalore is associated with.
Today, home to more than 11 million people the strained network is loaded with more than 100 lakh
trips per day. BMTC operates more than 6000 buses and carry more than half these trips, but this is
hardly enough, the rest of the traffic has simply overwhelmed the network.
The paucity of public transport services, lack of road network, over dependence of private vehicles
and a high growth rate with the city (in the past decade, the city has nearly doubled), has resulted in:
• Traffic Jams/ Extreme congestion
• Decline in journey speeds from 18kmph (2008) to 11kmph (2015) leading to severely
overburdened Road Network and long commute times.
• Present trip rate 0.9 per capita per day – approximately 90 lakh trips per day
• Mode share 52% trips on vehicular traffic and 48% on Public Transport (includes private buses)
• Absence of clearly defined road network hierarchy
• Network congestion hampers bus operations significantly - Share of Public Transport dropping
further
• Growing use of personalized vehicles
• Intensification of existing economic nodes leading to traffic congestion
• Deficient multimodal integration
• Movement of Freight/ Goods inside the city area
• Intercity Bus Travel Movements disorganized and is scattered all over the city
• Non-Motorized Transport is inadequate with respect to provisions of footpaths and cycling
facilities.
• Parking is disorganized in most parts of the city.
• A high car dependency has also added to high air and noise pollution levels
Revised Master Plan for Bengaluru - 2031 (Draft): Volume-3
95
To address the growing concerns of the prevailing and anticipated traffic demands, it is imperative to
understand the traffic related issues both at a macro level and a micro level. Hence, to respond to
transport requirements of future more appropriately, for the first time in a master planning exercise
in India, a transport model has been developed with a focus on integrating land use and transport
planning. The model has more than 500 zones and includes 15000 road links and 2300 bus routes.
11.2 Model Development for the Revision of Master Plan
A state of the art transportation modelling suite (CUBE VOYAGER) has been employed for the
modelling purpose. A detailed circulation network was drawn taking into cognizance the spatial
growth of the city and the road proposals of RSP 2031 and RMP 2015. On this circulation network
BMTC bus routes where meticulously coded. All the wards in the BBMP zones and the Villages up to
the BDA limit were considered as individual zones. The model was extended to include the BMR as
many transport solutions may include the BMR region as well. The Origin and destination data was
estimated from the earlier Comprehensive Traffic and Transport Study (CTTS) calibrated functions
and further refined and brought up to date through a process called “Matrix estimation from
Counts”.
A conventional four stage model was calibrated for Bangalore afresh, and validated across screen
lines to prove that the input data is satisfactorily representing city travel. The model was calibrated
over 4 modes, Cars and Taxis, Two Wheelers, Auto rickshaws and Public Transport. Trucks, Multi
Axial Vehicle’s (MAV’s), Light Commercial Vehicle’s (LCV’s) and Bicycles where separately considered
for the assignment. The model has been calibrated to represent the morning peak period – the
journey to work period (the period used for network capacity analysis)
11.3 Forecast Scenario
The model was run for 2031 assuming spatial growth in line with the growth trends observed today.
The metro phase 1 and phase 2 were included in the model. The peripheral ring road was included.
The existing network was also improved to a limited extent – example the outer ring road was fully
completed and buses have been doubled. The forecast Business As Usual (BAU) scenario shows very
high congestion, the followings are the key observations. Refer Figure 11-1.
• The Vehicular trips increase more than 3 times and the network is severely congested
• Public Transport share reduces substantially
• Bus frequency would reduce to less than half even with double the fleet
• Almost all roads will be operating at higher than Capacity
• Network speed drops to 8kmph. In the peak direction its < 5kmph. A clearly non sustainable
situation.
• The pollution levels from vehicular emission would increase 3 times
• Doing nothing but believing that the Metro phase-II will solve Bengaluru’s problem is not a
solution
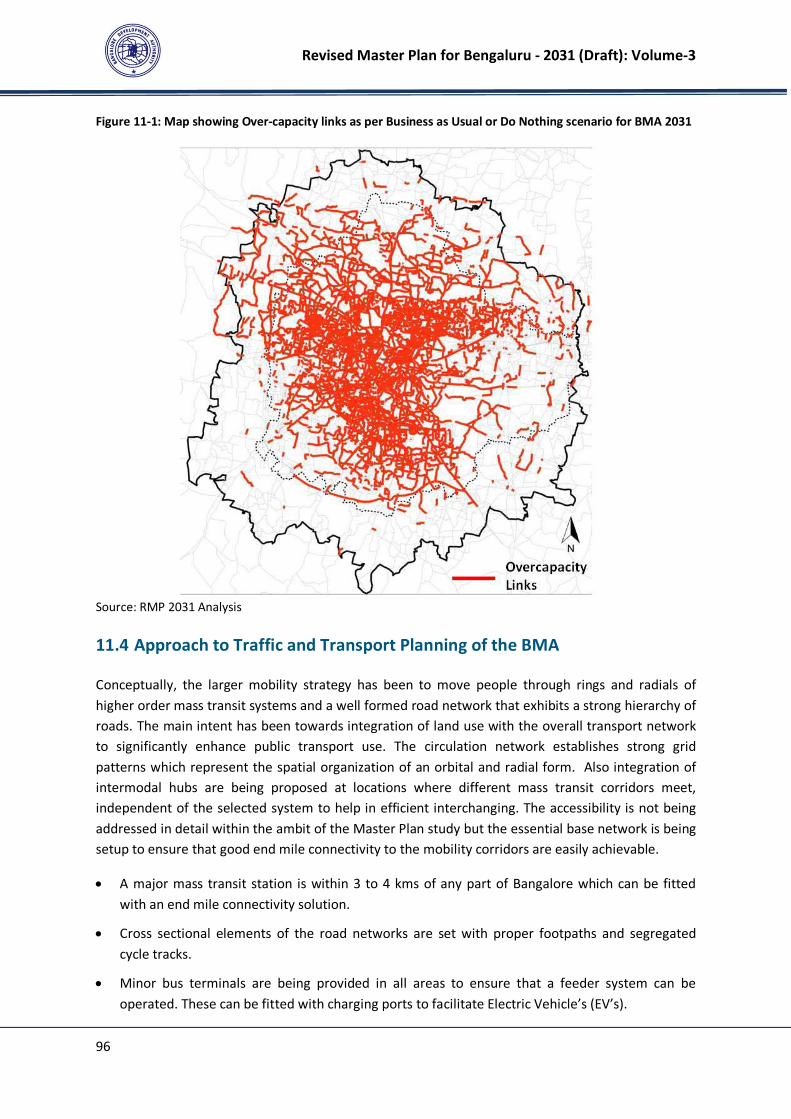
Revised Master Plan for Bengaluru - 2031 (Draft): Volume-3
96
Figure 11-1: Map showing Over-capacity links as per Business as Usual or Do Nothing scenario for BMA 2031
Source: RMP 2031 Analysis
11.4 Approach to Traffic and Transport Planning of the BMA
Conceptually, the larger mobility strategy has been to move people through rings and radials of
higher order mass transit systems and a well formed road network that exhibits a strong hierarchy of
roads. The main intent has been towards integration of land use with the overall transport network
to significantly enhance public transport use. The circulation network establishes strong grid
patterns which represent the spatial organization of an orbital and radial form. Also integration of
intermodal hubs are being proposed at locations where different mass transit corridors meet,
independent of the selected system to help in efficient interchanging. The accessibility is not being
addressed in detail within the ambit of the Master Plan study but the essential base network is being
setup to ensure that good end mile connectivity to the mobility corridors are easily achievable.
• A major mass transit station is within 3 to 4 kms of any part of Bangalore which can be fitted
with an end mile connectivity solution.
• Cross sectional elements of the road networks are set with proper footpaths and segregated
cycle tracks.
• Minor bus terminals are being provided in all areas to ensure that a feeder system can be
operated. These can be fitted with charging ports to facilitate Electric Vehicle’s (EV’s).
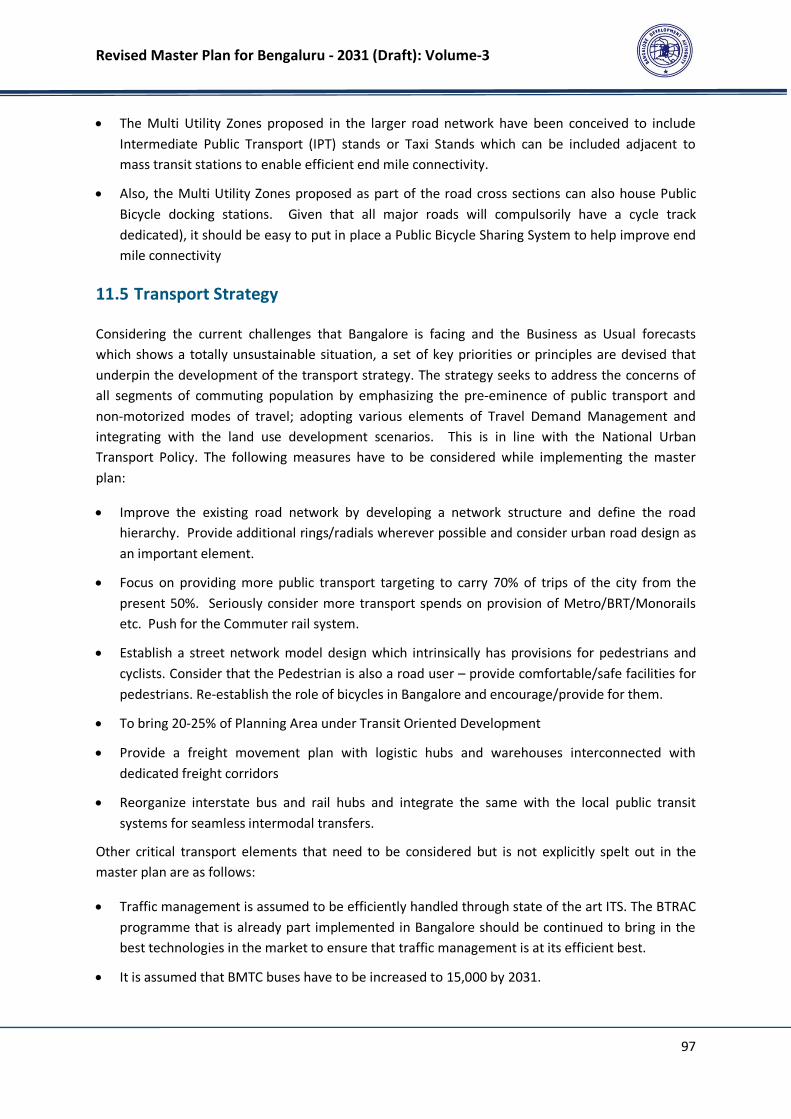
Revised Master Plan for Bengaluru - 2031 (Draft): Volume-3
97
• The Multi Utility Zones proposed in the larger road network have been conceived to include
Intermediate Public Transport (IPT) stands or Taxi Stands which can be included adjacent to
mass transit stations to enable efficient end mile connectivity.
• Also, the Multi Utility Zones proposed as part of the road cross sections can also house Public
Bicycle docking stations. Given that all major roads will compulsorily have a cycle track
dedicated), it should be easy to put in place a Public Bicycle Sharing System to help improve end
mile connectivity
11.5 Transport Strategy
Considering the current challenges that Bangalore is facing and the Business as Usual forecasts
which shows a totally unsustainable situation, a set of key priorities or principles are devised that
underpin the development of the transport strategy. The strategy seeks to address the concerns of
all segments of commuting population by emphasizing the pre-eminence of public transport and
non-motorized modes of travel; adopting various elements of Travel Demand Management and
integrating with the land use development scenarios. This is in line with the National Urban
Transport Policy. The following measures have to be considered while implementing the master
plan:
• Improve the existing road network by developing a network structure and define the road
hierarchy. Provide additional rings/radials wherever possible and consider urban road design as
an important element.
• Focus on providing more public transport targeting to carry 70% of trips of the city from the
present 50%. Seriously consider more transport spends on provision of Metro/BRT/Monorails
etc. Push for the Commuter rail system.
• Establish a street network model design which intrinsically has provisions for pedestrians and
cyclists. Consider that the Pedestrian is also a road user – provide comfortable/safe facilities for
pedestrians. Re-establish the role of bicycles in Bangalore and encourage/provide for them.
• To bring 20-25% of Planning Area under Transit Oriented Development
• Provide a freight movement plan with logistic hubs and warehouses interconnected with
dedicated freight corridors
• Reorganize interstate bus and rail hubs and integrate the same with the local public transit
systems for seamless intermodal transfers.
Other critical transport elements that need to be considered but is not explicitly spelt out in the
master plan are as follows:
• Traffic management is assumed to be efficiently handled through state of the art ITS. The BTRAC
programme that is already part implemented in Bangalore should be continued to bring in the
best technologies in the market to ensure that traffic management is at its efficient best.
• It is assumed that BMTC buses have to be increased to 15,000 by 2031.
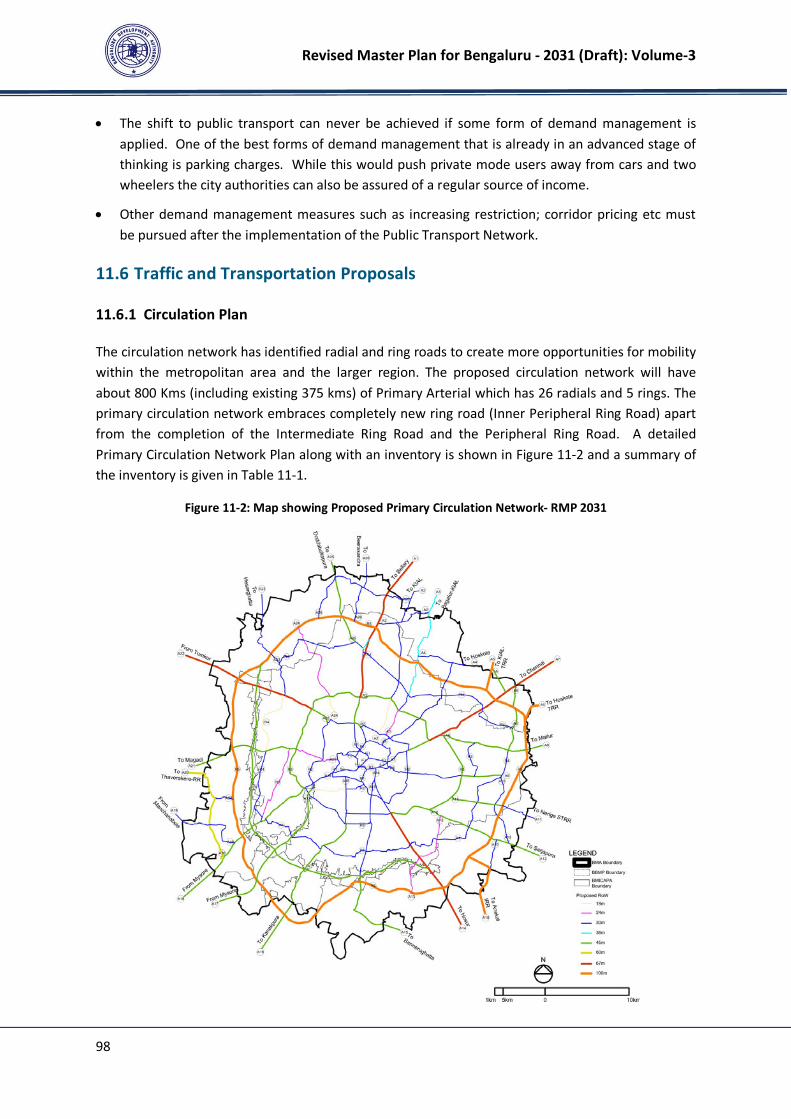
Revised Master Plan for Bengaluru - 2031 (Draft): Volume-3
98
• The shift to public transport can never be achieved if some form of demand management is
applied. One of the best forms of demand management that is already in an advanced stage of
thinking is parking charges. While this would push private mode users away from cars and two
wheelers the city authorities can also be assured of a regular source of income.
• Other demand management measures such as increasing restriction; corridor pricing etc must
be pursued after the implementation of the Public Transport Network.
11.6 Traffic and Transportation Proposals
11.6.1 Circulation Plan
The circulation network has identified radial and ring roads to create more opportunities for mobility
within the metropolitan area and the larger region. The proposed circulation network will have
about 800 Kms (including existing 375 kms) of Primary Arterial which has 26 radials and 5 rings. The
primary circulation network embraces completely new ring road (Inner Peripheral Ring Road) apart
from the completion of the Intermediate Ring Road and the Peripheral Ring Road. A detailed
Primary Circulation Network Plan along with an inventory is shown in Figure 11-2 and a summary of
the inventory is given in Table 11-1.
Figure 11-2: Map showing Proposed Primary Circulation Network- RMP 2031
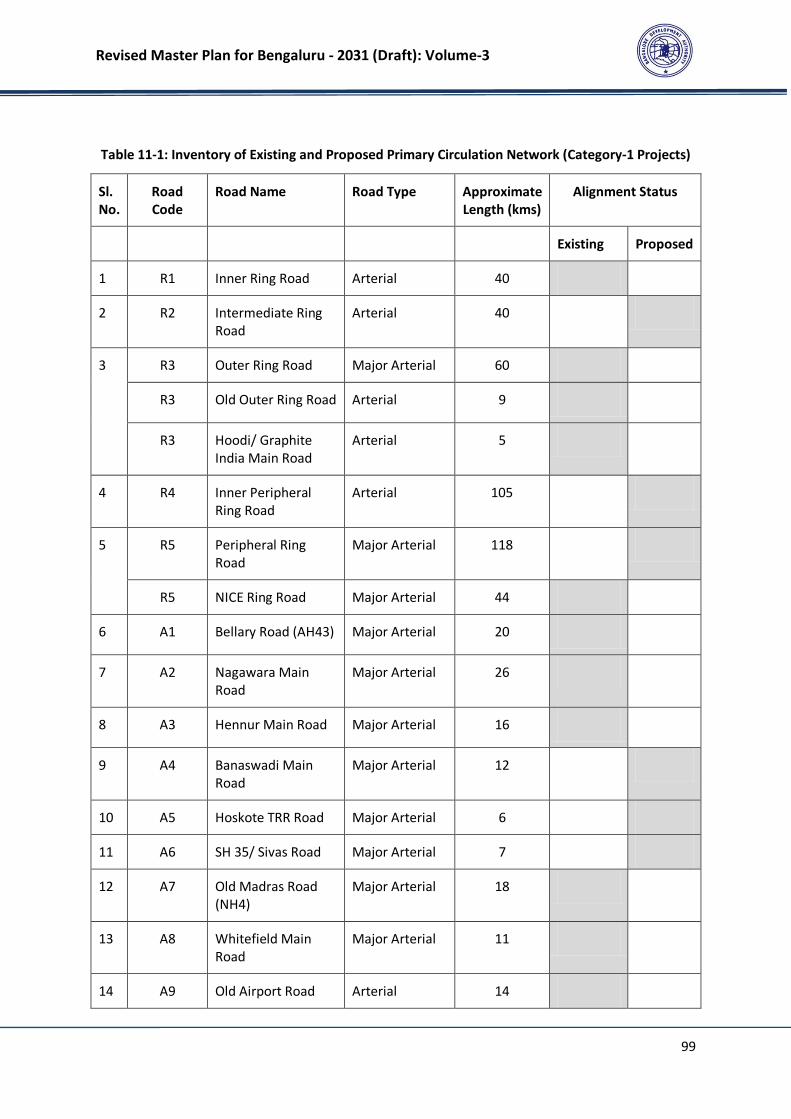
Revised Master Plan for Bengaluru - 2031 (Draft): Volume-3
99
Table 11-1: Inventory of Existing and Proposed Primary Circulation Network (Category-1 Projects)
Sl.
No.
Road
Code
Road Name Road Type Approximate
Length (kms)
Alignment Status
Existing Proposed
1 R1 Inner Ring Road Arterial 40
2 R2 Intermediate Ring
Road
Arterial 40
3
R3 Outer Ring Road Major Arterial 60
R3 Old Outer Ring Road Arterial 9
R3 Hoodi/ Graphite
India Main Road
Arterial 5
4 R4 Inner Peripheral
Ring Road
Arterial 105
5
R5 Peripheral Ring
Road
Major Arterial 118
R5 NICE Ring Road Major Arterial 44
6 A1 Bellary Road (AH43) Major Arterial 20
7 A2 Nagawara Main
Road
Major Arterial 26
8 A3 Hennur Main Road Major Arterial 16
9 A4 Banaswadi Main
Road
Major Arterial 12
10 A5 Hoskote TRR Road Major Arterial 6
11 A6 SH 35/ Sivas Road Major Arterial 7
12 A7 Old Madras Road
(NH4)
Major Arterial 18
13 A8 Whitefield Main
Road
Major Arterial 11
14 A9 Old Airport Road Arterial 14
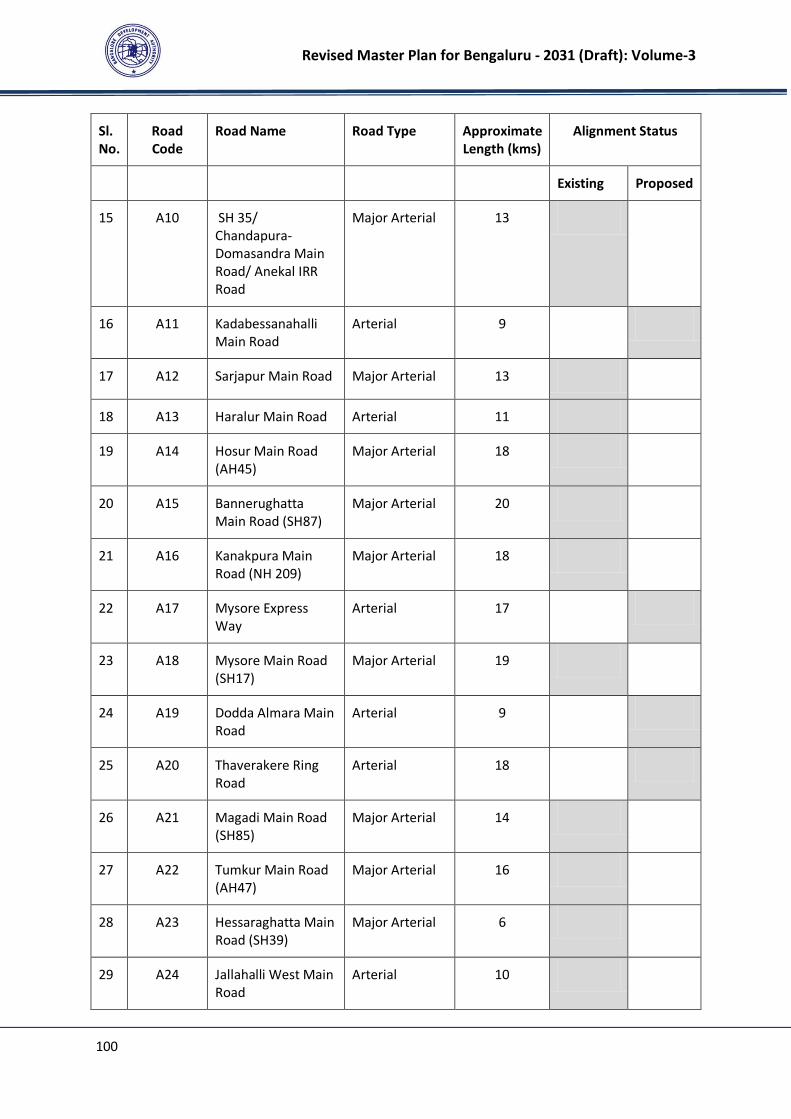
Revised Master Plan for Bengaluru - 2031 (Draft): Volume-3
100
Sl.
No.
Road
Code
Road Name Road Type Approximate
Length (kms)
Alignment Status
Existing Proposed
15 A10 SH 35/
Chandapura-
Domasandra Main
Road/ Anekal IRR
Road
Major Arterial 13
16 A11 Kadabessanahalli
Main Road
Arterial 9
17 A12 Sarjapur Main Road Major Arterial 13
18 A13 Haralur Main Road Arterial 11
19 A14 Hosur Main Road
(AH45)
Major Arterial 18
20 A15 Bannerughatta
Main Road (SH87)
Major Arterial 20
21 A16 Kanakpura Main
Road (NH 209)
Major Arterial 18
22 A17 Mysore Express
Way
Arterial 17
23 A18 Mysore Main Road
(SH17)
Major Arterial 19
24 A19 Dodda Almara Main
Road
Arterial 9
25 A20 Thaverakere Ring
Road
Arterial 18
26 A21 Magadi Main Road
(SH85)
Major Arterial 14
27 A22 Tumkur Main Road
(AH47)
Major Arterial 16
28 A23 Hessaraghatta Main
Road (SH39)
Major Arterial 6
29 A24 Jallahalli West Main
Road
Arterial 10
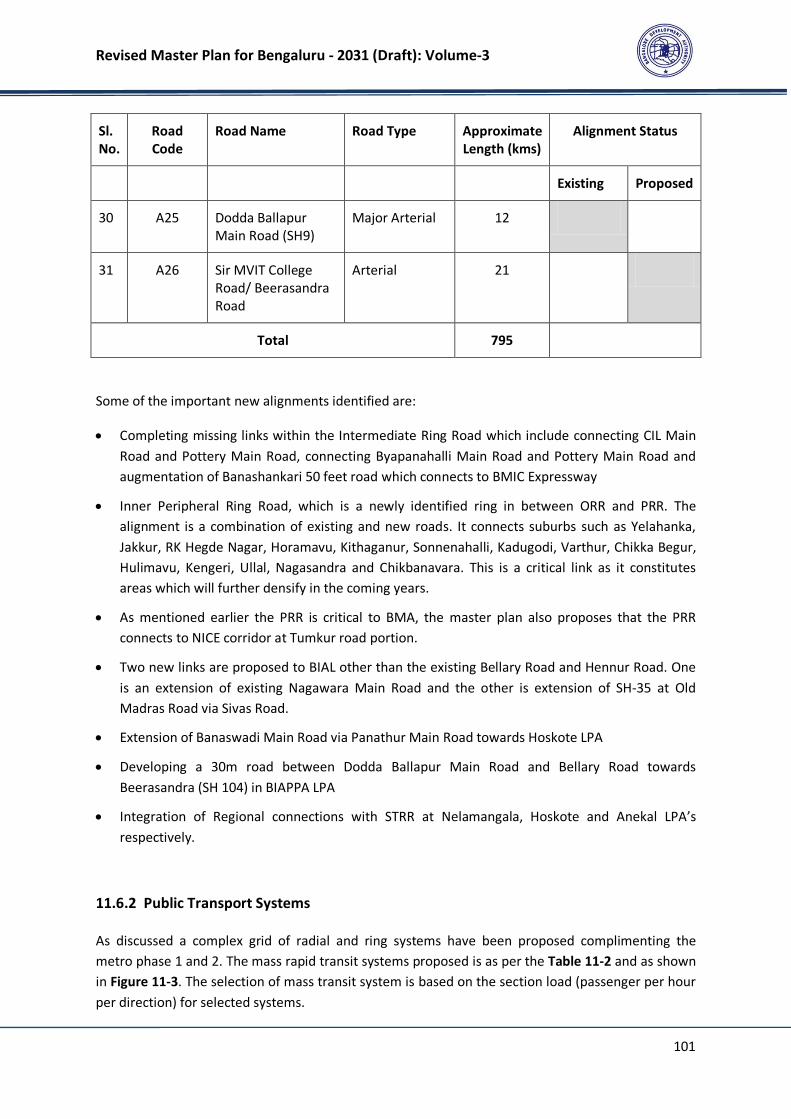
Revised Master Plan for Bengaluru - 2031 (Draft): Volume-3
101
Sl.
No.
Road
Code
Road Name Road Type Approximate
Length (kms)
Alignment Status
Existing Proposed
30 A25 Dodda Ballapur
Main Road (SH9)
Major Arterial 12
31 A26 Sir MVIT College
Road/ Beerasandra
Road
Arterial 21
Total 795
Some of the important new alignments identified are:
• Completing missing links within the Intermediate Ring Road which include connecting CIL Main
Road and Pottery Main Road, connecting Byapanahalli Main Road and Pottery Main Road and
augmentation of Banashankari 50 feet road which connects to BMIC Expressway
• Inner Peripheral Ring Road, which is a newly identified ring in between ORR and PRR. The
alignment is a combination of existing and new roads. It connects suburbs such as Yelahanka,
Jakkur, RK Hegde Nagar, Horamavu, Kithaganur, Sonnenahalli, Kadugodi, Varthur, Chikka Begur,
Hulimavu, Kengeri, Ullal, Nagasandra and Chikbanavara. This is a critical link as it constitutes
areas which will further densify in the coming years.
• As mentioned earlier the PRR is critical to BMA, the master plan also proposes that the PRR
connects to NICE corridor at Tumkur road portion.
• Two new links are proposed to BIAL other than the existing Bellary Road and Hennur Road. One
is an extension of existing Nagawara Main Road and the other is extension of SH-35 at Old
Madras Road via Sivas Road.
• Extension of Banaswadi Main Road via Panathur Main Road towards Hoskote LPA
• Developing a 30m road between Dodda Ballapur Main Road and Bellary Road towards
Beerasandra (SH 104) in BIAPPA LPA
• Integration of Regional connections with STRR at Nelamangala, Hoskote and Anekal LPA’s
respectively.
11.6.2 Public Transport Systems
As discussed a complex grid of radial and ring systems have been proposed complimenting the
metro phase 1 and 2. The mass rapid transit systems proposed is as per the Table 11-2 and as shown
in Figure 11-3. The selection of mass transit system is based on the section load (passenger per hour
per direction) for selected systems.

Revised Master Plan for Bengaluru - 2031 (Draft): Volume-3
102
Table 11-2: Existing and Proposed Public Transport Systems under RMP 2031
Sl.No Corridor Length (kms) System
1. Metro Phase 1 42.4 Metro (Implemented)
2. Metro Phase 2 81.4 Metro (Under Implementation)
3. Metro Phase 3 (Airport Link) 29.5 Metro (18.3 km within BMA)
4. Commuter Rail Network 106 Commuter Rail System
5. Intermediate Ring Road (R2) 37 LRT/ Monorail/ BRTS (Medium Level)
6. Outer Ring Road (R3) 62.6 Metro
7. Inner Peripheral Ring Road (R4) 81.8 LRT/ Monorail/ BRTS (Medium Level)
8. Peripheral Ring Road (R5) 106 Metro
9. Bellary Road (A1) 13.5 LRT/ Monorail/ BRTS (Medium Level)
10. Hennur -Bagalur Main Road (A3) 21.6 BRTS
11. Sarjapura Road (A10) 26.3 LRT/ Monorail/ BRTS (Medium Level)
12. Old Airport Road (A8) 26 LRT/ Monorail/ BRTS (Medium Level)
13. Magadi Road (A20) 9.2 LRT/ Monorail/ BRTS (Medium Level)
14. Jalahalli West Main Road (A24) 10.4 LRT/ Monorail/ BRTS (Medium Level)
Total 653.7
11.6.3 Bus Augmentation
BMTC, at present is operating 6249 buses on 2500 routes. There are 10 TTMC’s (Traffic and Transit
Management Centre’s) and 40 depots, new depots and TTMC/ Bus Terminals have been identified
within the newly planned areas of BMA. It is assumed that the bus fleet size will be in the range of
15,000.
11.6.4 Interstate Bus Terminal
BMTC along with KSRTC provides the regional/ interstate connectivity from Bangalore to other parts
of the cities and vice versa. A total of six interstate bus terminals are proposed on Tumkur Road,
Mysore Road, Old Madras Road, Hosur Road, Bellary Road and Magadi Road so that intercity traffic
will not get mixed with the city traffic.
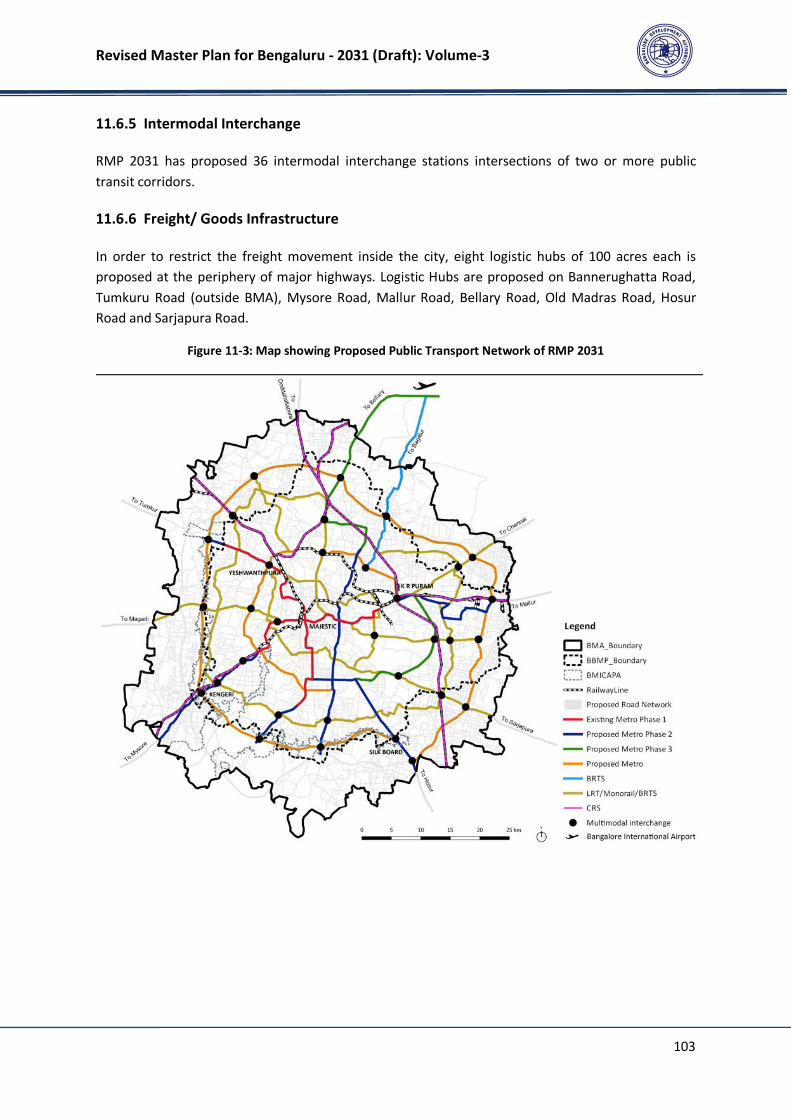
Revised Master Plan for Bengaluru - 2031 (Draft): Volume-3
103
11.6.5 Intermodal Interchange
RMP 2031 has proposed 36 intermodal interchange stations intersections of two or more public
transit corridors.
11.6.6 Freight/ Goods Infrastructure
In order to restrict the freight movement inside the city, eight logistic hubs of 100 acres each is
proposed at the periphery of major highways. Logistic Hubs are proposed on Bannerughatta Road,
Tumkuru Road (outside BMA), Mysore Road, Mallur Road, Bellary Road, Old Madras Road, Hosur
Road and Sarjapura Road.
Figure 11-3: Map showing Proposed Public Transport Network of RMP 2031
Revised Master Plan for Bengaluru - 2031 (Draft): Volume-3
104
12 PHYSICAL AND SOCIAL INFRASTRUCTURE
12.1 Water and Waste Water
The water availability for meeting the future demands of Bengaluru for the master plan period and
beyond was one of the concerns expressed by some citizens during the public consultations. By all
accounts, the availability of surface water (synonym as Cauvery water) has not affected the growth
of city (in terms of population and spatial). Having said that Bengaluru is at the situation where the
only surface water source available to city (River Cauvery) is legally getting exhausted and
dependency on ground water is growing. Will the city continue to grow? probably yes – for the fact
that Bengaluru has become self-sustaining economic growth centre in entire state of Karnataka.
Even if the policy decision is taken to reduce the pressure on Bengaluru by developing counter
magnets, the real impact would only be visible after decade or two, provided all policy initiatives are
implemented in time bound manner.
Water would be required for future population in Bengaluru – during the master plan period (2031)
and beyond. It is indeed a fact that city is to face water shortage in future even after having
exhausted the only surface water source, thereby increasing the dependency on ground water much
more than today. The situation is likely to persist in future, the only difference being the spatial
impact. The water is likely to be available and supplied to entire of BBMP by master plan period, it is
the adjoining villages with Bengaluru Metropolitan Area, that are likely to get urbanised over next 15
years. How we reduce the water demand and manage the water demand is going to be most
important aspect in utilising existing resources to providing safe drinking water to fellow city
residents. The implementation of dual pipeline system and use of recycled water for non-potable
activities for all future developments is likely bring substantial reduction in potable water demand,
thereby dependency on resources. Further, social acceptability of use of recycled yet potable water
would completely change the water dynamics in the city. However, this is possible only if the of
water supply and sewage system covers the entire planning area.
Located at 950 Mean Sea Level Bengaluru is only metropolitan city which is not abutting to any
major surface water source (River). Bangalore Water Supply and Sewerage Board (BWSSB) formed
in 1964 under BWSSB Act, 1964 is mandated to provide water supply and sewage systems primarily
within the BBMP (708.5 sqkm). However in the Bengaluru Metropolitan Area (admeasuring 1294
sqkm), in addition to BBMP, there are 51 Gram Panchayat’s (with 251 villages having spatial extent
of 583 sqkm) served by Panachayath Raj Engineering Department (RDPR/ PRED). At present BWSSB
is extending the water supply and sewage network to entire BBMP area and is expected to complete
the works by 2021. However, there is no coverage of water supply and sewage network in many
areas already urbanised and under process of urbanisation outside the BBMP Limits. These areas are
expected to get further urbanised by 2031 with planned development as envisaged under Revised
Master Plan - 2031. It is therefore recommended that BWSSSB provide support to RDPR in planning
for water supply and sewerage network for entire BMA, for the fact that existing/ planned systems
Revised Master Plan for Bengaluru - 2031 (Draft): Volume-3
105
within BBMP will have to be integrated/ extended to villages outside BBMP. This is to help in
designing and implementing the integrated networks across BMA.
As per Census, BBMP has a population of 8.4 Million (93% of BMA) whereas the rest of 251 villages
together hold 0.7 million persons, thus a total of ~9.1 million in BMA. The population projections for
RMP 2031 suggests that population within BMA is expected to reach ~20 million by 2031, thereby,
making Bengaluru the third most populous city in the country.
At present BWSSB is withdrawing about 19 TMC of water (1470 MLD) from Cauvery to meet city’s
water demand. The Plan/ work is on for getting additional 10 TMC (775 MLD) of water as accorded
by the Cauvery Tribunal to meet the water demand for BBMP area alone. Thus, altogether about 29
TMC (2250 MLD) of water is available for Bengaluru from Cauvery. Though Unaccounted for Water
amounts to 46%, the actual water losses (transmission, leaks, treatment and distribution) are around
15-18%. Also, network coverage (both water supply and sewage) in the city is limited and work is in
progress to get entire BBMP covered by 2021.
The water demand has been established considering 135 LPCD supply to the population. Non-
domestic water demand for potable purposes has been established considering 45 lpcd for
estimated work force. Equal amount of non-potable water has been considered for non-domestic
sector to establish the total non-domestic demand. The net water demand including water demand
for non-domestic activities has been estimated at 3639MLD for the projected population of 20.3
million for BMA by 2031. The net demand of 3639MLD translates to the total gross water
requirement for BMA at 4282 MLD considering 15% losses towards transmission & distribution.
As mentioned earlier, dual pipeline system for use of recycled water would reduce the overall water
demand for potable water. If the water supply is split (within plot/ site) into two – potable (@90
lpcd) and non-potable (45lpcd) then the water demand for potable water can be reduced by 865
MLD. However, still there will be water shortage of about 862MLD [refer table 2]. This water
shortage likely to be met through Ground Water, thereby increasing the dependency on ground
water from present level 677 MLD to 862 MLD (about 27% (185MLD) higher than present levels). It
may be noted that due to change of land use from Agriculture to urban activities within BMA, the
water withdrawal for current agriculture activities to the tune of 100-150 MLD would be available
for urban activities. This is with the assumption that present over draft will continue. Thus, the
status of ground water dependence in 2031 would be of the similar scale as it is at present.
To meet the future water demand following are the master plan suggestions:
Providing Infrastructure across the Planning Area: Being a public utility, providing water to the
public has a vital interest in its functioning and wellness of the society. More than 27% of water
supplied by BWSSB is among the BPL and EWS of the society and is provided free of charge.
BWSSB has coverage of 575 sq.km area out of 710 sq.kms of BBMP. The rest 135 Sq.km under
110 villages is expected to be covered by 2021. However, rest of the planning are outside BBMP
are not covered by BWSSB, and it is imperative to improve the coverage to not only within BBMP
but also in villages outside BBMP falling within BMA. It is therefore recommended to
institutionalise the planned water supply and sewage network out BBMP as well to reduce the
dependency on ground water.
Revised Master Plan for Bengaluru - 2031 (Draft): Volume-3
106
Dual pipe line for drinking and other purposes for the newly planned areas and additional
population. On implementation of Dual pipeline, Government has to take measures to supply
Cauvery water for all the purposes for population expected to be living in the BBMP in existing
establishments and for only potable purposes for the population residing in any new
developments in BBMP area which need to be developed on the basis of zero liquid discharge
policy. Similarly, dual pipeline system shall cater to additional population expected to be residing
in 251 villages of BMA with only potable water demand being supplied by Government
infrastructure. This initiative could minimize additional water requirement significantly but it is
difficult to make an assessment of the same at master plan level. As per IS 1172, out of a total
per capita demand of 135-200 lpcd, a flushing water requirement of 45 lpcd may be taken for
flushing requirements and the remaining quantity for other domestic purposes. However, other
non-potable water uses may include gardening, washing etc. Recycled water has to be made
available for non-domestic purposes and non-drinking purposes in the 251 villages where the
new supply network is planned. Even after realising 865mld of treated recycled water and
additional about 2000mld recycled water would be available, which can be utilised for revival of
lakes and valley system. Using innovative systems like artificial aquifer recharge would help in
improve the ground water levels.
Water Conservation: Over 50% of the population of the project population of 2031 has been
assumed to be supplied potable water @135lpcd; however there is a strong potential for
reducing this demand of 135lpcd through promoting awareness for water conservation,
implementation of decentralised sewerage treatment plants for the local area, which can be
utilised for gardening, horticulture purposes and other activities like car washing. This would
lead to reduction in potable water demand to 120lpcd, which translate to saving of about
166MLD. Thereby bringing down the dependence on ground water below the present level.
Treating Recycled Water to Potable Level: The fact that Cauvery will not be adequate for city
and relishing water from other sources is still to determined, it is proposed to recycle the
sewage water with tertiary treatment technologies available in the market and supply to the city
for all the purposes.
Evaluation of Proposals of Thyagaraja Committee: For long term purposes some of the major
interventions proposed by the Thyagaraja Committee to explore new sources have to be
considered by the state government on priority basis.
Rejuvenation of Lake and Valley System: The lake and valley system has been historically water
supply source, however due to limited sewage network coverage; most of the lakes are filled
with sewage. The improved coverage of sewage network is expected to improve the quality of
water flowing into lakes. In addition to that recycled water shall be used to rejuvenate the lakes
along with dredging of some of large lake to improve the holding capacities and aid ground
water percolation. Adequate sewage network and infrastructure shall be developed to contain
the sewage flow into lakes and streams.
Towards provision of land for water and sewage infrastructure, the Master Plan has incorporated
the proposals provided by BWSSB for BBMP area and are appropriated depicted in proposed land
use maps.
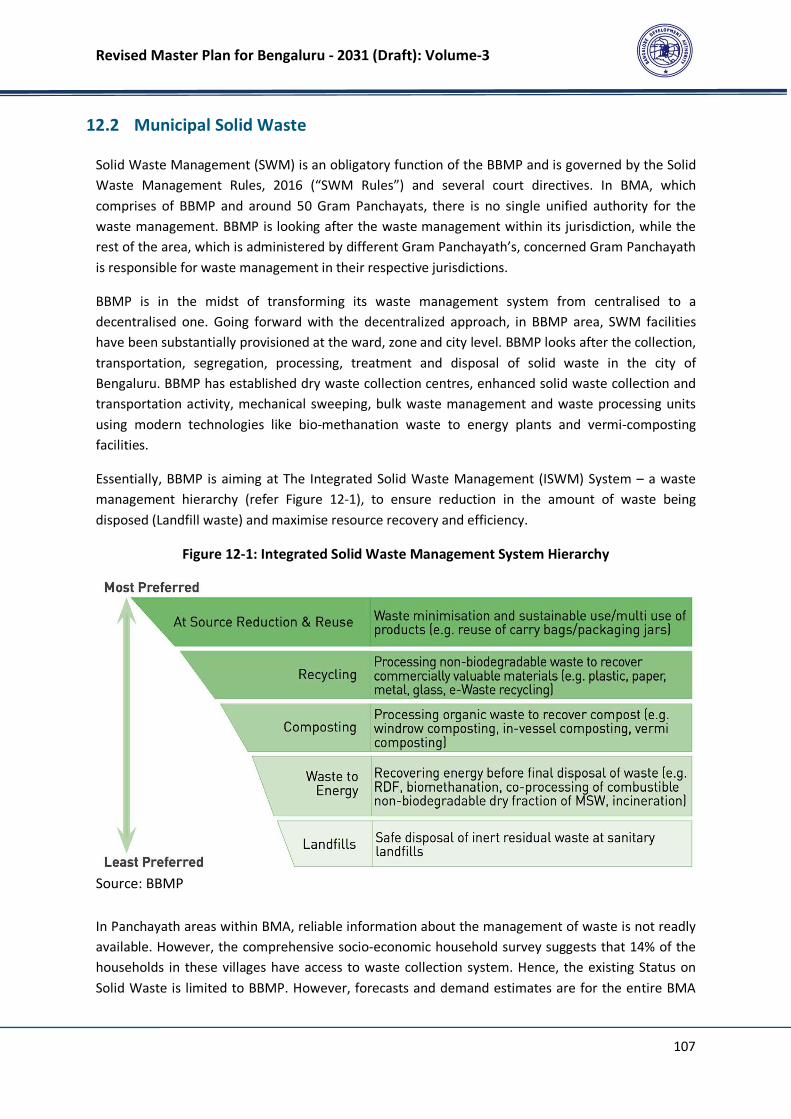
Revised Master Plan for Bengaluru - 2031 (Draft): Volume-3
107
12.2 Municipal Solid Waste
Solid Waste Management (SWM) is an obligatory function of the BBMP and is governed by the Solid
Waste Management Rules, 2016 (“SWM Rules”) and several court directives. In BMA, which
comprises of BBMP and around 50 Gram Panchayats, there is no single unified authority for the
waste management. BBMP is looking after the waste management within its jurisdiction, while the
rest of the area, which is administered by different Gram Panchayath’s, concerned Gram Panchayath
is responsible for waste management in their respective jurisdictions.
BBMP is in the midst of transforming its waste management system from centralised to a
decentralised one. Going forward with the decentralized approach, in BBMP area, SWM facilities
have been substantially provisioned at the ward, zone and city level. BBMP looks after the collection,
transportation, segregation, processing, treatment and disposal of solid waste in the city of
Bengaluru. BBMP has established dry waste collection centres, enhanced solid waste collection and
transportation activity, mechanical sweeping, bulk waste management and waste processing units
using modern technologies like bio-methanation waste to energy plants and vermi-composting
facilities.
Essentially, BBMP is aiming at The Integrated Solid Waste Management (ISWM) System – a waste
management hierarchy (refer Figure 12-1), to ensure reduction in the amount of waste being
disposed (Landfill waste) and maximise resource recovery and efficiency.
Figure 12-1: Integrated Solid Waste Management System Hierarchy
Source: BBMP
In Panchayath areas within BMA, reliable information about the management of waste is not readly
available. However, the comprehensive socio-economic household survey suggests that 14% of the
households in these villages have access to waste collection system. Hence, the existing Status on
Solid Waste is limited to BBMP. However, forecasts and demand estimates are for the entire BMA
Revised Master Plan for Bengaluru - 2031 (Draft): Volume-3
108
(including part of BMICAPA). In view of the above, to attain a sustainable solid waste management
system in Bengaluru, BBMP has adopted the following Approach and Strategies within its
jurisdiction.
a) The Approach:
Reduce – Reuse – Recycle (3R approach): The 3R Approach is aimed at optimising SWM management
from all the waste-generating sectors and involving all the stakeholders (waste generators, service
providers, informal sector, regulators, government, and community or neighbourhoods). The
adoption of 3R minimizes the waste being handled by the local bodies (BBMP/GPs), minimizing
public health and environment risk associated with it.
b) Strategies:
• Decentralised SWM Systems: In order to reduce the burden of unscientific handling of large
volumes of MSW, the city has opted to shift its focus from a centralised ‘single stream’ collection
and ‘Landfill disposal’ system to a decentralised ‘multiple stream’ collection and scientific
‘Processing’ system.
• Separating Bulk Generators: Bulk Generators contribute to 25% of the city’s waste and have
been separated from the regular collection cycle. They include domestic generators - apartment
complexes with more than 50 units and Commercial bulk generators viz. hotel/ restaurant, clubs,
factory, choultry, mall, shopping complex, marriage halls, convention hall, place of worship,
institution, office establishment, railway stations, bus stand or any other commercial or public
entity which accumulates MSW of a quantity not less than 10 kg per day. These generators are
being mandated to set up in-situ systems or link with BBMP empanelled vendors to manage
their waste.
• Micro plan: A Micro Plan is a process of creating a solid waste management plan for the smallest
unit of management, by splitting the ward into blocks (750 Households + shops). City-wide
implementation of the micro SWM plan is already being rolled out in the BBMP area.
The master plan proposes that similar approach and strategies be followed by respective Gram
Panchayats in consultation with various stakeholders including ward committees and SWM experts
within LPA of BDA for better synchronisation synergies and optimisation of resources. With this
background, the RMP 2031 has analysed the existing status of SWM within BMA and has formulated
the proposals for allocation of land for SWM facilities in consultation with BBMP.
12.2.1 Municipal Solid Waste Generation
As per the assessment and quantification of municipal solid waste generation carried out by BBMP in
the year 2016, the waste generation rate in BBMP area is approximately 564 grams/capita/day
(gcpd). In addition, the villages administered by the Gram Panchayath’s are expected to get further
urbanised/ populated by 2031 with planned development as envisaged by RMP-2031 and therefore,
similar estimates have been made for areas outside BBMP.
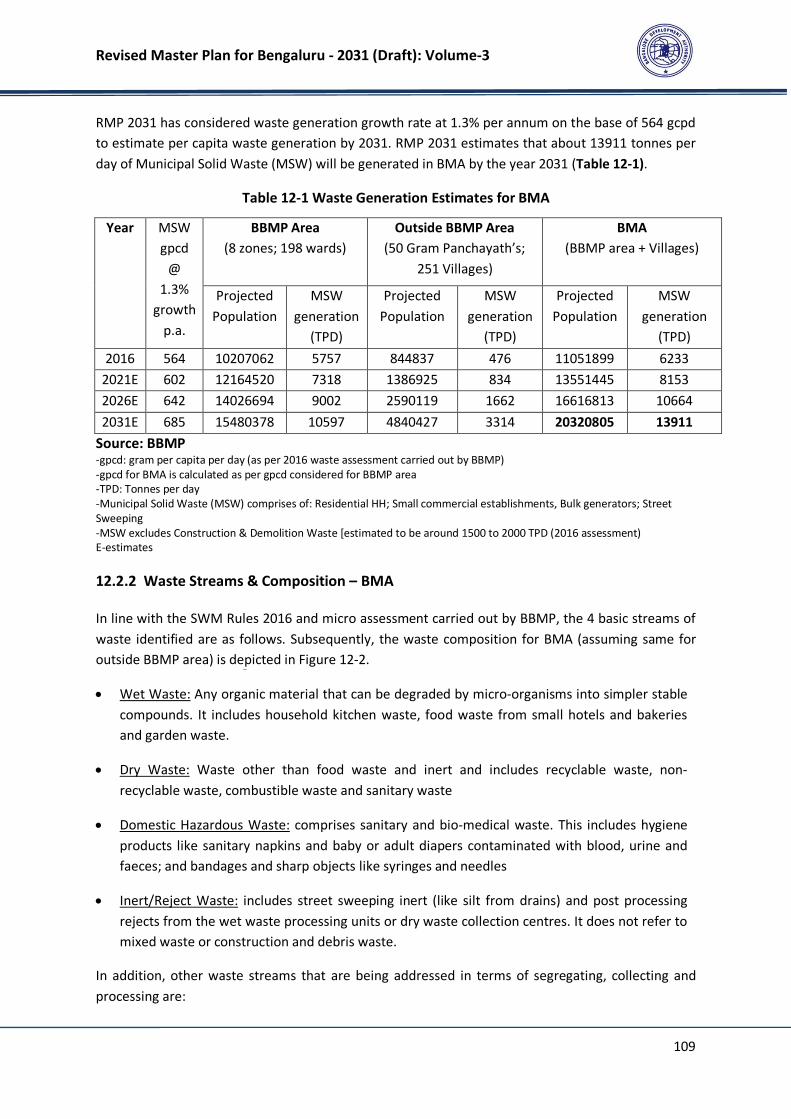
Revised Master Plan for Bengaluru - 2031 (Draft): Volume-3
109
RMP 2031 has considered waste generation growth rate at 1.3% per annum on the base of 564 gcpd
to estimate per capita waste generation by 2031. RMP 2031 estimates that about 13911 tonnes per
day of Municipal Solid Waste (MSW) will be generated in BMA by the year 2031 (Table 12-1).
Table 12-1 Waste Generation Estimates for BMA
Year MSW
gpcd
@
1.3%
growth
p.a.
BBMP Area
(8 zones; 198 wards)
Outside BBMP Area
(50 Gram Panchayath’s;
251 Villages)
BMA
(BBMP area + Villages)
Projected
Population
MSW
generation
(TPD)
Projected
Population
MSW
generation
(TPD)
Projected
Population
MSW
generation
(TPD)
2016 564 10207062 5757 844837 476 11051899 6233
2021E 602 12164520 7318 1386925 834 13551445 8153
2026E 642 14026694 9002 2590119 1662 16616813 10664
2031E 685 15480378 10597 4840427 3314 20320805 13911
Source: BBMP -gpcd: gram per capita per day (as per 2016 waste assessment carried out by BBMP)
-gpcd for BMA is calculated as per gpcd considered for BBMP area
-TPD: Tonnes per day
-Municipal Solid Waste (MSW) comprises of: Residential HH; Small commercial establishments, Bulk generators; Street
Sweeping
-MSW excludes Construction & Demolition Waste [estimated to be around 1500 to 2000 TPD (2016 assessment)
E-estimates
12.2.2 Waste Streams & Composition – BMA
In line with the SWM Rules 2016 and micro assessment carried out by BBMP, the 4 basic streams of
waste identified are as follows. Subsequently, the waste composition for BMA (assuming same for
outside BBMP area) is depicted in Figure 12-2.
• Wet Waste: Any organic material that can be degraded by micro-organisms into simpler stable
compounds. It includes household kitchen waste, food waste from small hotels and bakeries
and garden waste.
• Dry Waste: Waste other than food waste and inert and includes recyclable waste, non-
recyclable waste, combustible waste and sanitary waste
• Domestic Hazardous Waste: comprises sanitary and bio-medical waste. This includes hygiene
products like sanitary napkins and baby or adult diapers contaminated with blood, urine and
faeces; and bandages and sharp objects like syringes and needles
• Inert/Reject Waste: includes street sweeping inert (like silt from drains) and post processing
rejects from the wet waste processing units or dry waste collection centres. It does not refer to
mixed waste or construction and debris waste.
In addition, other waste streams that are being addressed in terms of segregating, collecting and
processing are:
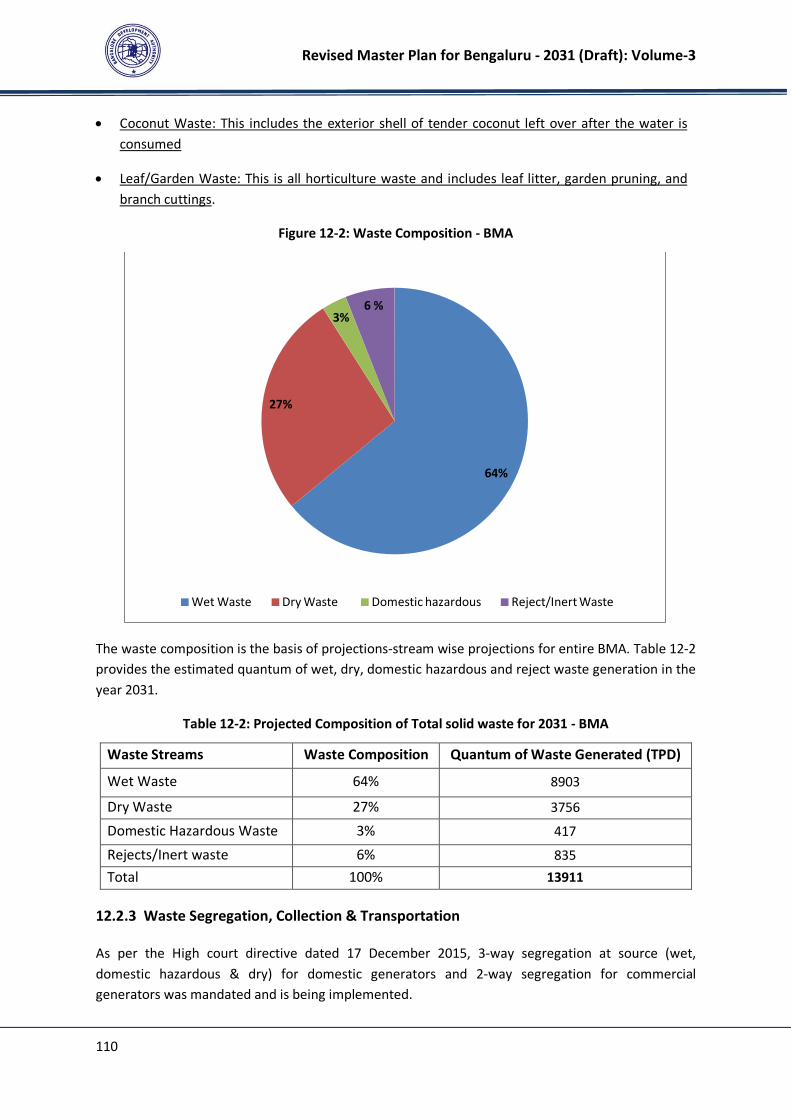
Revised Master Plan for Bengaluru - 2031 (Draft): Volume-3
110
• Coconut Waste: This includes the exterior shell of tender coconut left over after the water is
consumed
• Leaf/Garden Waste: This is all horticulture waste and includes leaf litter, garden pruning, and
branch cuttings.
Figure 12-2: Waste Composition - BMA
The waste composition is the basis of projections-stream wise projections for entire BMA. Table 12-2
provides the estimated quantum of wet, dry, domestic hazardous and reject waste generation in the
year 2031.
Table 12-2: Projected Composition of Total solid waste for 2031 - BMA
Waste Streams Waste Composition Quantum of Waste Generated (TPD)
Wet Waste 64% 8903
Dry Waste 27% 3756
Domestic Hazardous Waste 3% 417
Rejects/Inert waste 6% 835
Total 100% 13911
12.2.3 Waste Segregation, Collection & Transportation
As per the High court directive dated 17 December 2015, 3-way segregation at source (wet,
domestic hazardous & dry) for domestic generators and 2-way segregation for commercial
generators was mandated and is being implemented.
64%
27%
3% 6 %
Wet Waste Dry Waste Domestic hazardous Reject/Inert Waste
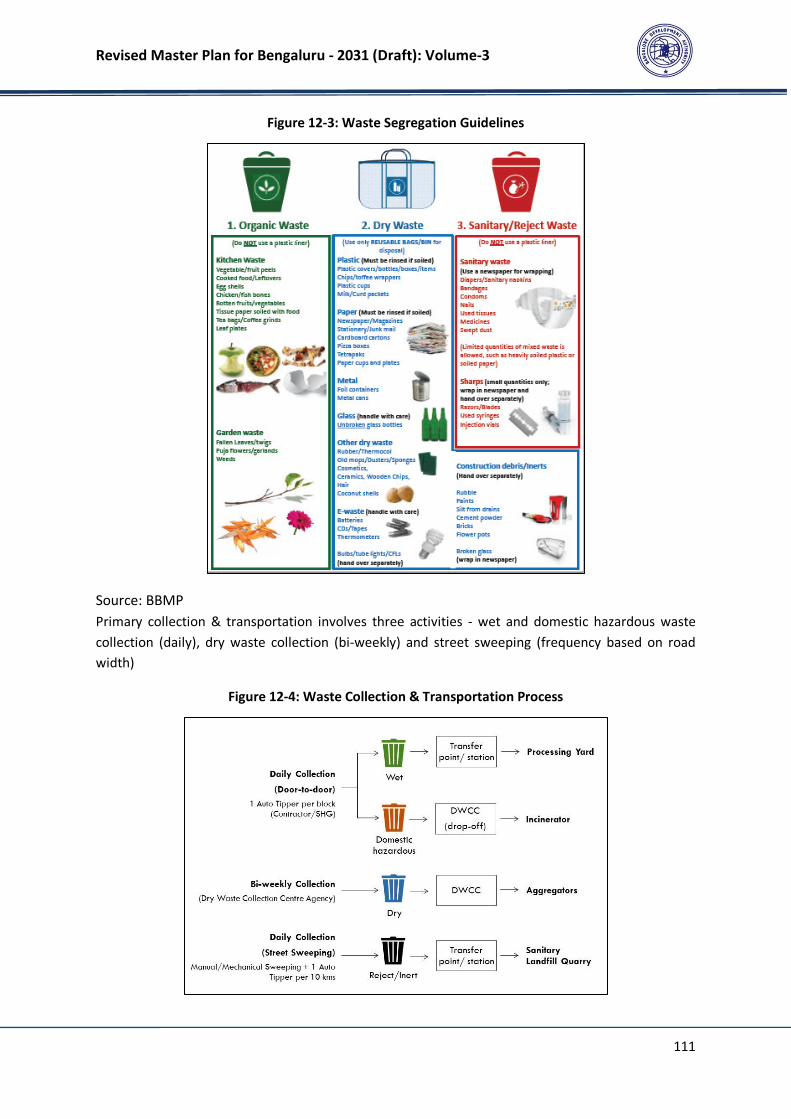
Revised Master Plan for Bengaluru - 2031 (Draft): Volume-3
111
Figure 12-3: Waste Segregation Guidelines
Source: BBMP
Primary collection & transportation involves three activities - wet and domestic hazardous waste
collection (daily), dry waste collection (bi-weekly) and street sweeping (frequency based on road
width)
Figure 12-4: Waste Collection & Transportation Process

Revised Master Plan for Bengaluru - 2031 (Draft): Volume-3
112
• Dry Waste: For recycling of Dry waste in the city, at present there are 196 Dry Waste Collection
Centers (DWCC), 1 per ward and large aggregators as per zonal requirement. Out of 27% of dry
waste generated in the city, only 36% of it is currently processed. Figure 12-5 presents the Dry
waste flow.
Figure 12-5: Dry Waste Flow
• Wet Waste: For city level processing of wet waste, at present there are 11 bio-methanation
units (BMU), 7 organic waste converters (OWC) as per ward requirement – small hotels and
markets and windrow composting in 9 integrated waste processing plants (IWPP) at the zone
level. At present, out of 64% of the total wet waste generated in the city 92.5% is processed in
IWPP, 7% in BMU and 0.25% in OWC’s.
Figure 12-6: Wet Waste Flow

Revised Master Plan for Bengaluru - 2031 (Draft): Volume-3
113
• Domestic Hazardous Waste: At present, out of 3% of the total domestic hazardous waste
generated in the city, only 1% of the waste is processed by existing biomedical waste
processing agencies.
• Inert/Reject Waste: At present, 6% of the total waste generated in the city is inert waste,
meaning waste that cannot be further processed or utilized in any other form. This waste is
usually termed as Landfill waste as it is disposed of in a sanitary landfill.
• Facilities required by 2031: Table 12-3 presents the facilities required with BMA for Waste
Segregation, Collection & Transportation.
Table 12-3: Proposed Units for processing of Dry waste generated
Particulars No.s
DWCC (3 TPD to 5TPD) @240 to 480 sqm 470
Aggregators (50 TPD @ 1200 sq.m) 19
BMU (5 TPD @ 600 sq.m) 12
OWC (1 TPD @ 220 sq.m) 85
IWPP (500 TPD @ 97125 sq.m) 8
Source: BBMP and RMP 2031
12.2.4 Waste Disposal
Although Inert waste comprise 6% of the total waste generated at present and the waste to be
landfilled should be approx. 10-12% of the total waste however, taking into account post-processing
rejects from the wet waste processing units or dry waste collection centres including unprocessed
dry waste (~17%) along with construction and debris waste altogether, make up to over 25-30% of
the waste going to Landfill.
(a) Processing of Domestic Hazardous Waste generated:
The segregated domestic hazardous Waste (including sanitary waste) will be collected from drop-off
locations/points (DWCCs) and further processed by existing biomedical waste processing agencies.
The facilities include incinerators, Autoclaves, Shredders and Effluent Treatment Plants to
scientifically dispose this waste. There are 3 units to manage bio-medical waste in Bengaluru: 1)
SembRamky Environmental Management Pvt. Ltd. 2) Maridi Eco Industries Pvt. Ltd. 3) Anu Autoclave
(b) Lorry Point/Transfer Stations:
A Lorry Point is a point where the transfer of waste takes place from the Primary to the Secondary
vehicle, within a ward. These are usually located by the side of the road, vacant sites and in front of
decentralised waste facilities. At present, there are 340 lorry points throughout the city. As these
Lorry points are informally located within wards, they result in several issues such as garbage on
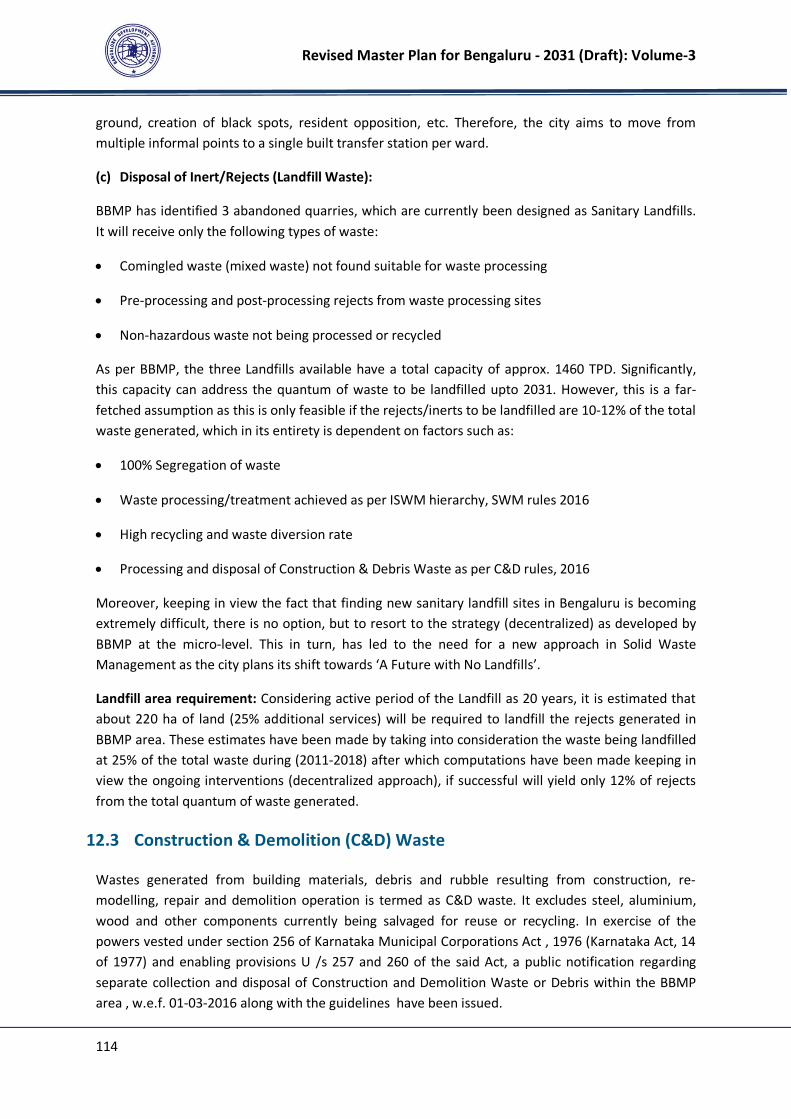
Revised Master Plan for Bengaluru - 2031 (Draft): Volume-3
114
ground, creation of black spots, resident opposition, etc. Therefore, the city aims to move from
multiple informal points to a single built transfer station per ward.
(c) Disposal of Inert/Rejects (Landfill Waste):
BBMP has identified 3 abandoned quarries, which are currently been designed as Sanitary Landfills.
It will receive only the following types of waste:
• Comingled waste (mixed waste) not found suitable for waste processing
• Pre-processing and post-processing rejects from waste processing sites
• Non-hazardous waste not being processed or recycled
As per BBMP, the three Landfills available have a total capacity of approx. 1460 TPD. Significantly,
this capacity can address the quantum of waste to be landfilled upto 2031. However, this is a far-
fetched assumption as this is only feasible if the rejects/inerts to be landfilled are 10-12% of the total
waste generated, which in its entirety is dependent on factors such as:
• 100% Segregation of waste
• Waste processing/treatment achieved as per ISWM hierarchy, SWM rules 2016
• High recycling and waste diversion rate
• Processing and disposal of Construction & Debris Waste as per C&D rules, 2016
Moreover, keeping in view the fact that finding new sanitary landfill sites in Bengaluru is becoming
extremely difficult, there is no option, but to resort to the strategy (decentralized) as developed by
BBMP at the micro-level. This in turn, has led to the need for a new approach in Solid Waste
Management as the city plans its shift towards ‘A Future with No Landfills’.
Landfill area requirement: Considering active period of the Landfill as 20 years, it is estimated that
about 220 ha of land (25% additional services) will be required to landfill the rejects generated in
BBMP area. These estimates have been made by taking into consideration the waste being landfilled
at 25% of the total waste during (2011-2018) after which computations have been made keeping in
view the ongoing interventions (decentralized approach), if successful will yield only 12% of rejects
from the total quantum of waste generated.
12.3 Construction & Demolition (C&D) Waste
Wastes generated from building materials, debris and rubble resulting from construction, re-
modelling, repair and demolition operation is termed as C&D waste. It excludes steel, aluminium,
wood and other components currently being salvaged for reuse or recycling. In exercise of the
powers vested under section 256 of Karnataka Municipal Corporations Act , 1976 (Karnataka Act, 14
of 1977) and enabling provisions U /s 257 and 260 of the said Act, a public notification regarding
separate collection and disposal of Construction and Demolition Waste or Debris within the BBMP
area , w.e.f. 01-03-2016 along with the guidelines have been issued.
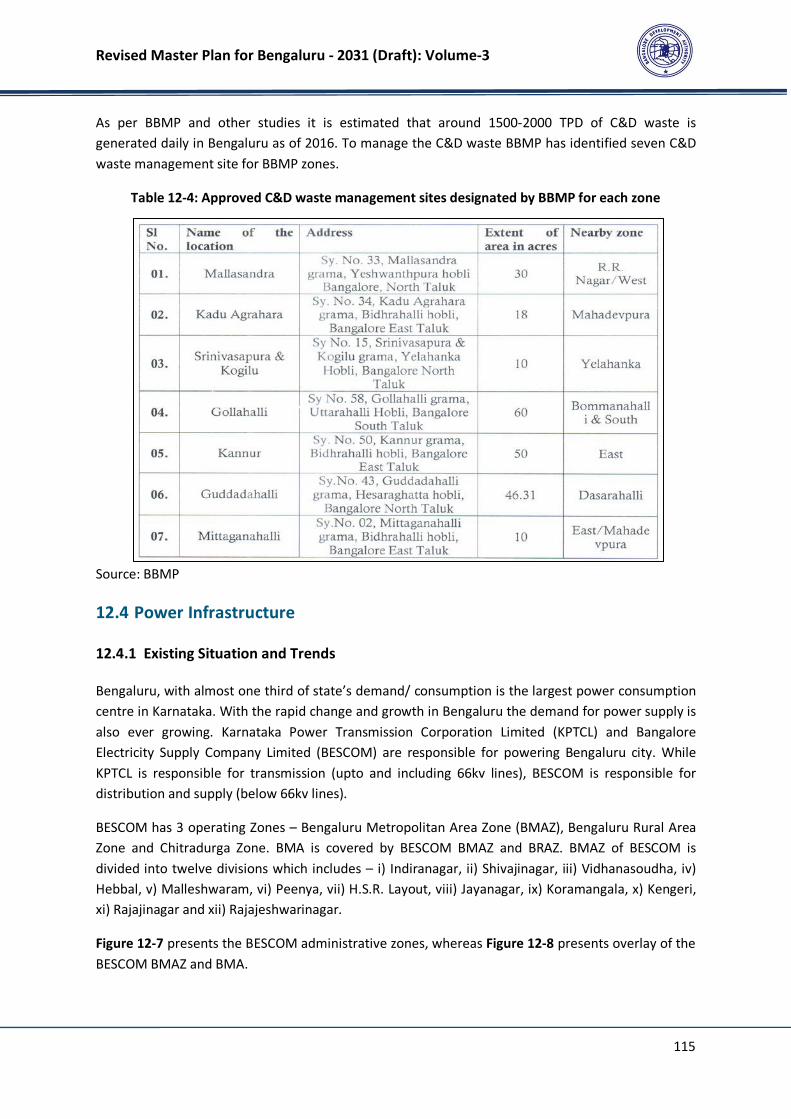
Revised Master Plan for Bengaluru - 2031 (Draft): Volume-3
115
As per BBMP and other studies it is estimated that around 1500-2000 TPD of C&D waste is
generated daily in Bengaluru as of 2016. To manage the C&D waste BBMP has identified seven C&D
waste management site for BBMP zones.
Table 12-4: Approved C&D waste management sites designated by BBMP for each zone
Source: BBMP
12.4 Power Infrastructure
12.4.1 Existing Situation and Trends
Bengaluru, with almost one third of state’s demand/ consumption is the largest power consumption
centre in Karnataka. With the rapid change and growth in Bengaluru the demand for power supply is
also ever growing. Karnataka Power Transmission Corporation Limited (KPTCL) and Bangalore
Electricity Supply Company Limited (BESCOM) are responsible for powering Bengaluru city. While
KPTCL is responsible for transmission (upto and including 66kv lines), BESCOM is responsible for
distribution and supply (below 66kv lines).
BESCOM has 3 operating Zones – Bengaluru Metropolitan Area Zone (BMAZ), Bengaluru Rural Area
Zone and Chitradurga Zone. BMA is covered by BESCOM BMAZ and BRAZ. BMAZ of BESCOM is
divided into twelve divisions which includes – i) Indiranagar, ii) Shivajinagar, iii) Vidhanasoudha, iv)
Hebbal, v) Malleshwaram, vi) Peenya, vii) H.S.R. Layout, viii) Jayanagar, ix) Koramangala, x) Kengeri,
xi) Rajajinagar and xii) Rajajeshwarinagar.
Figure 12-7 presents the BESCOM administrative zones, whereas Figure 12-8 presents overlay of the
BESCOM BMAZ and BMA.
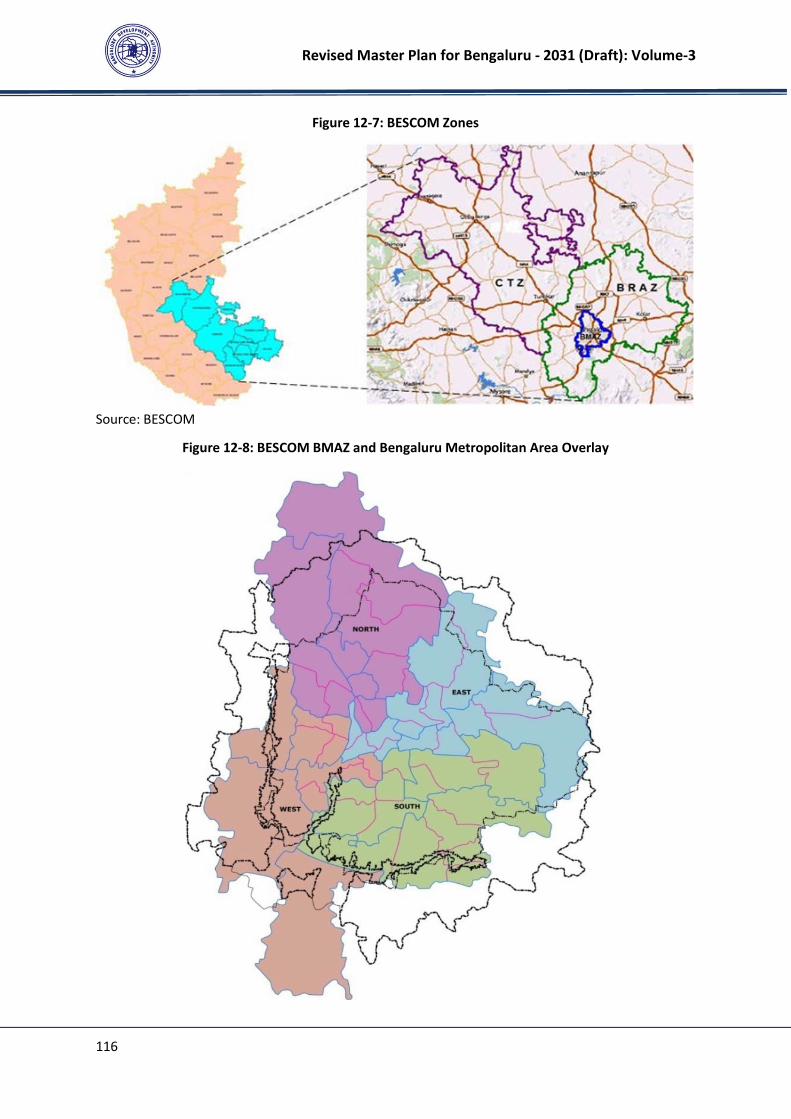
Revised Master Plan for Bengaluru - 2031 (Draft): Volume-3
116
Figure 12-7: BESCOM Zones
Source: BESCOM
Figure 12-8: BESCOM BMAZ and Bengaluru Metropolitan Area Overlay
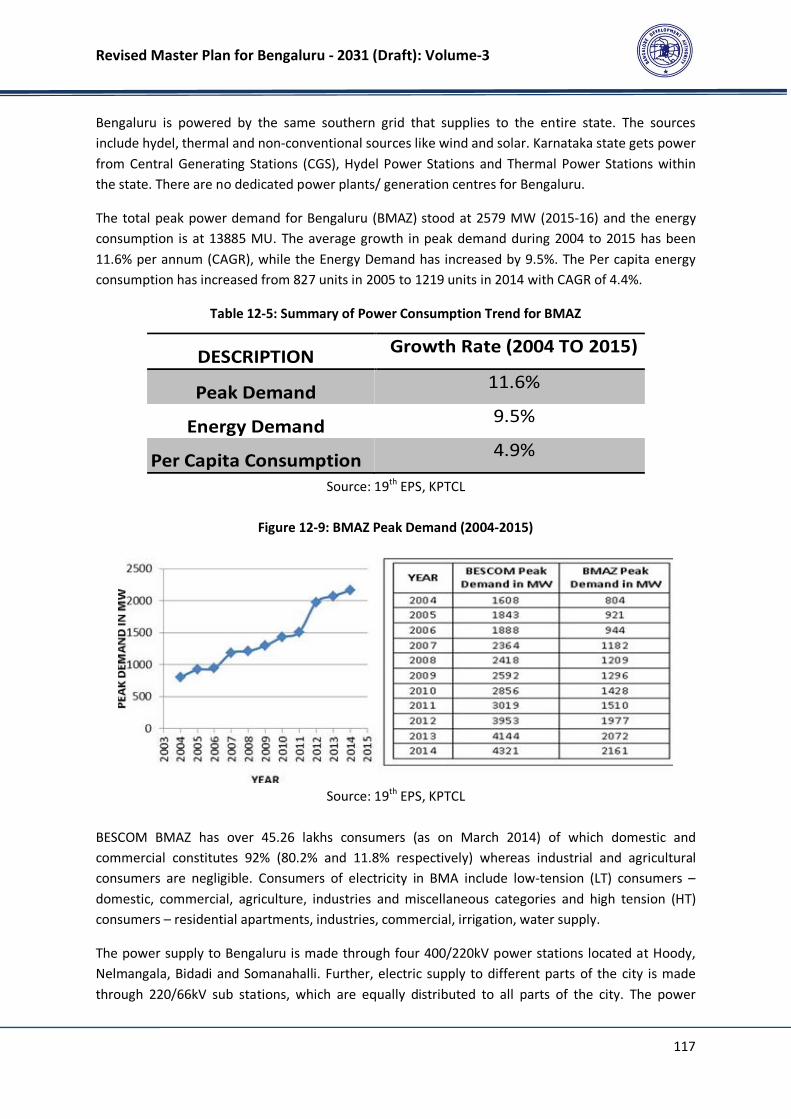
Revised Master Plan for Bengaluru - 2031 (Draft): Volume-3
117
Bengaluru is powered by the same southern grid that supplies to the entire state. The sources
include hydel, thermal and non-conventional sources like wind and solar. Karnataka state gets power
from Central Generating Stations (CGS), Hydel Power Stations and Thermal Power Stations within
the state. There are no dedicated power plants/ generation centres for Bengaluru.
The total peak power demand for Bengaluru (BMAZ) stood at 2579 MW (2015-16) and the energy
consumption is at 13885 MU. The average growth in peak demand during 2004 to 2015 has been
11.6% per annum (CAGR), while the Energy Demand has increased by 9.5%. The Per capita energy
consumption has increased from 827 units in 2005 to 1219 units in 2014 with CAGR of 4.4%.
Table 12-5: Summary of Power Consumption Trend for BMAZ
Source: 19th
EPS, KPTCL
Figure 12-9: BMAZ Peak Demand (2004-2015)
Source: 19th
EPS, KPTCL
BESCOM BMAZ has over 45.26 lakhs consumers (as on March 2014) of which domestic and
commercial constitutes 92% (80.2% and 11.8% respectively) whereas industrial and agricultural
consumers are negligible. Consumers of electricity in BMA include low-tension (LT) consumers –
domestic, commercial, agriculture, industries and miscellaneous categories and high tension (HT)
consumers – residential apartments, industries, commercial, irrigation, water supply.
The power supply to Bengaluru is made through four 400/220kV power stations located at Hoody,
Nelmangala, Bidadi and Somanahalli. Further, electric supply to different parts of the city is made
through 220/66kV sub stations, which are equally distributed to all parts of the city. The power
DESCRIPTION Growth Rate (2004 TO 2015)
Peak Demand 11.6%
Energy Demand 9.5%
Per Capita Consumption 4.9%
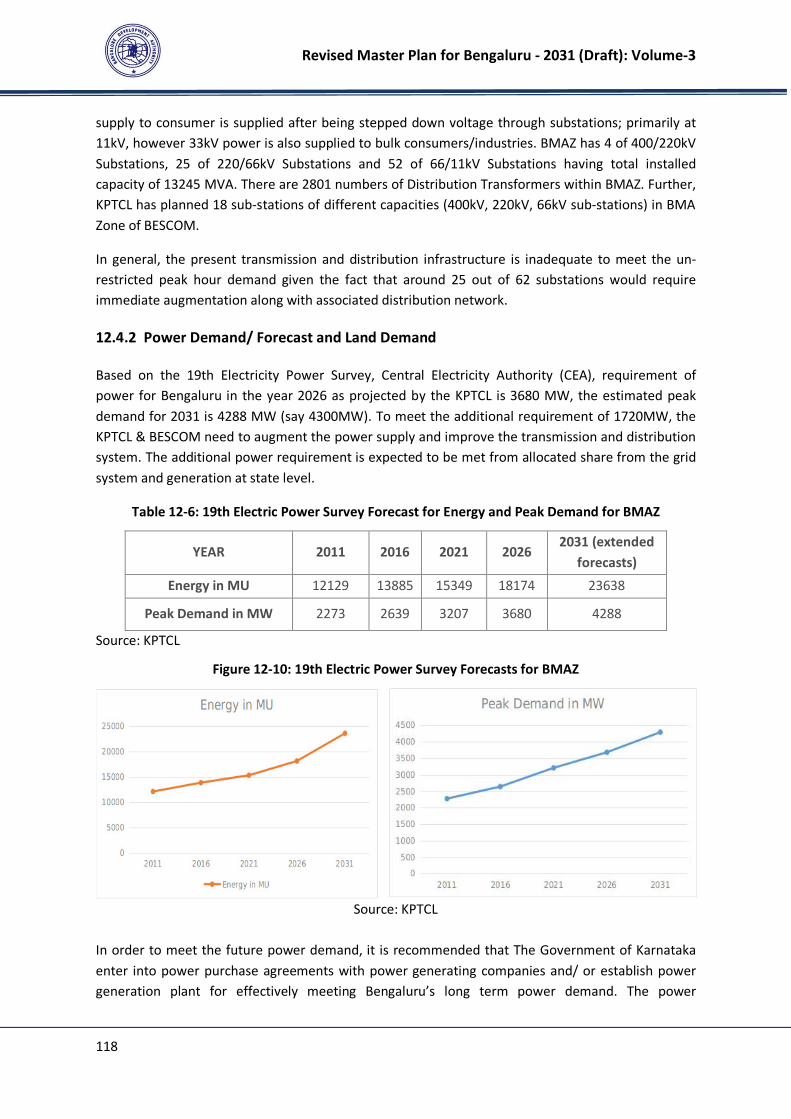
Revised Master Plan for Bengaluru - 2031 (Draft): Volume-3
118
supply to consumer is supplied after being stepped down voltage through substations; primarily at
11kV, however 33kV power is also supplied to bulk consumers/industries. BMAZ has 4 of 400/220kV
Substations, 25 of 220/66kV Substations and 52 of 66/11kV Substations having total installed
capacity of 13245 MVA. There are 2801 numbers of Distribution Transformers within BMAZ. Further,
KPTCL has planned 18 sub-stations of different capacities (400kV, 220kV, 66kV sub-stations) in BMA
Zone of BESCOM.
In general, the present transmission and distribution infrastructure is inadequate to meet the un-
restricted peak hour demand given the fact that around 25 out of 62 substations would require
immediate augmentation along with associated distribution network.
12.4.2 Power Demand/ Forecast and Land Demand
Based on the 19th Electricity Power Survey, Central Electricity Authority (CEA), requirement of
power for Bengaluru in the year 2026 as projected by the KPTCL is 3680 MW, the estimated peak
demand for 2031 is 4288 MW (say 4300MW). To meet the additional requirement of 1720MW, the
KPTCL & BESCOM need to augment the power supply and improve the transmission and distribution
system. The additional power requirement is expected to be met from allocated share from the grid
system and generation at state level.
Table 12-6: 19th Electric Power Survey Forecast for Energy and Peak Demand for BMAZ
YEAR 2011 2016 2021 2026 2031 (extended
forecasts)
Energy in MU 12129 13885 15349 18174 23638
Peak Demand in MW 2273 2639 3207 3680 4288
Source: KPTCL
Figure 12-10: 19th Electric Power Survey Forecasts for BMAZ
Source: KPTCL
In order to meet the future power demand, it is recommended that The Government of Karnataka
enter into power purchase agreements with power generating companies and/ or establish power
generation plant for effectively meeting Bengaluru’s long term power demand. The power
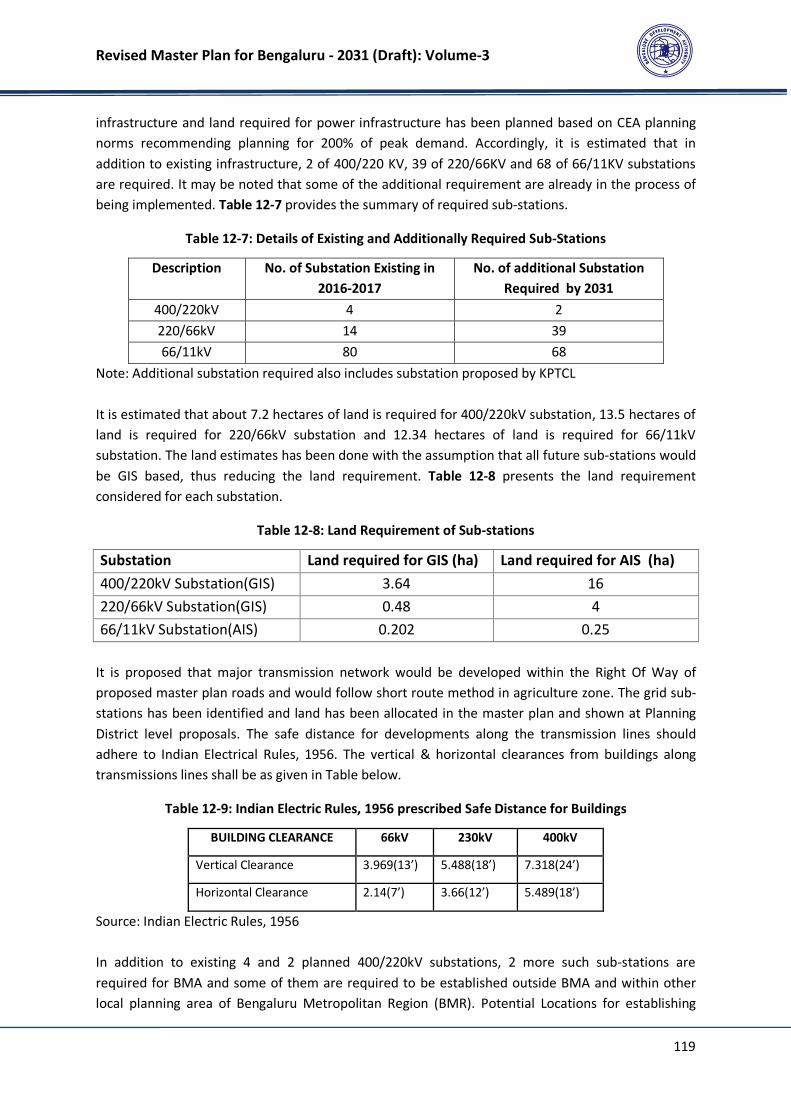
Revised Master Plan for Bengaluru - 2031 (Draft): Volume-3
119
infrastructure and land required for power infrastructure has been planned based on CEA planning
norms recommending planning for 200% of peak demand. Accordingly, it is estimated that in
addition to existing infrastructure, 2 of 400/220 KV, 39 of 220/66KV and 68 of 66/11KV substations
are required. It may be noted that some of the additional requirement are already in the process of
being implemented. Table 12-7 provides the summary of required sub-stations.
Table 12-7: Details of Existing and Additionally Required Sub-Stations
Description No. of Substation Existing in
2016-2017
No. of additional Substation
Required by 2031
400/220kV 4 2
220/66kV 14 39
66/11kV 80 68
Note: Additional substation required also includes substation proposed by KPTCL
It is estimated that about 7.2 hectares of land is required for 400/220kV substation, 13.5 hectares of
land is required for 220/66kV substation and 12.34 hectares of land is required for 66/11kV
substation. The land estimates has been done with the assumption that all future sub-stations would
be GIS based, thus reducing the land requirement. Table 12-8 presents the land requirement
considered for each substation.
Table 12-8: Land Requirement of Sub-stations
Substation Land required for GIS (ha) Land required for AIS (ha)
400/220kV Substation(GIS) 3.64 16
220/66kV Substation(GIS) 0.48 4
66/11kV Substation(AIS) 0.202 0.25
It is proposed that major transmission network would be developed within the Right Of Way of
proposed master plan roads and would follow short route method in agriculture zone. The grid sub-
stations has been identified and land has been allocated in the master plan and shown at Planning
District level proposals. The safe distance for developments along the transmission lines should
adhere to Indian Electrical Rules, 1956. The vertical & horizontal clearances from buildings along
transmissions lines shall be as given in Table below.
Table 12-9: Indian Electric Rules, 1956 prescribed Safe Distance for Buildings
BUILDING CLEARANCE 66kV 230kV 400kV
Vertical Clearance 3.969(13’) 5.488(18’) 7.318(24’)
Horizontal Clearance 2.14(7’) 3.66(12’) 5.489(18’)
Source: Indian Electric Rules, 1956
In addition to existing 4 and 2 planned 400/220kV substations, 2 more such sub-stations are
required for BMA and some of them are required to be established outside BMA and within other
local planning area of Bengaluru Metropolitan Region (BMR). Potential Locations for establishing
Revised Master Plan for Bengaluru - 2031 (Draft): Volume-3
120
these sub-stations are Devanahalli and Jiganii. It is therefore required that BMRDA and KPTCL
coordinate for allocation of Land in other LPAs within BMR for establishing 400/200kV sub-stations.
12.4.3 Use of Renewal Energy
In order to reduce the dependency on fossil fuels and attend energy efficiency it is critical to attend
the following:
• Non-conventional energy sources like recovering energy from municipal waste, sewerage, solar
energy, etc. should be used for street lighting, lighting at public spaces, open areas, traffic
signals, hoardings, etc.
• To supplement part of the estimated growing power requirement, nonconventional sources /
solar energy and other actions proposed are as follows:
o Solar energy should be encouraged for all establishments with floor area of more than 300
sq.mt.
o All public buildings to install roof top solar panels and use CFL blubs.
o Solar Panels for public advertising, lighting in open areas, public utilities, streets, etc.
o As alternate mandatory arrangement during power cuts to replace generators/inverters etc.
o Interim solutions of single point connection in unauthorized developments and slums.
o Incentivizing energy savings and use of energy efficient gadgets.
o Promotion of Battery Operated Vehicles and Non-motorized Transport.
It is proposed that a Government of Karnataka prepares a detailed Renewal Energy Master Plan for
Bengaluru and implements the same for long term energy savings.
12.5 Social Infrastructure
RMP 2031 envisages good quality of life in the city with accessible social infrastructure for all
citizens. As the city grows rapidly, there will be need to expand the number of social infrastructure
facilities like educational infrastructure, healthcare infrastructure, recreational infrastructure, safety
and security infrastructure, and other necessities like neighbourhood amenities, opens spaces etc.
12.5.1 Educational Infrastructure
Primary and Secondary Educational Infrastructure: Bengaluru has very good educational
infrastructure in comparison to the rest of the state. For the purpose of administration, the
education department categorises schools under various educational districts. Table 12-10 shows
the number of government and private schools across various categories in Bengaluru Urban
District, whereas Figure 12-11 presents the spatial spread.
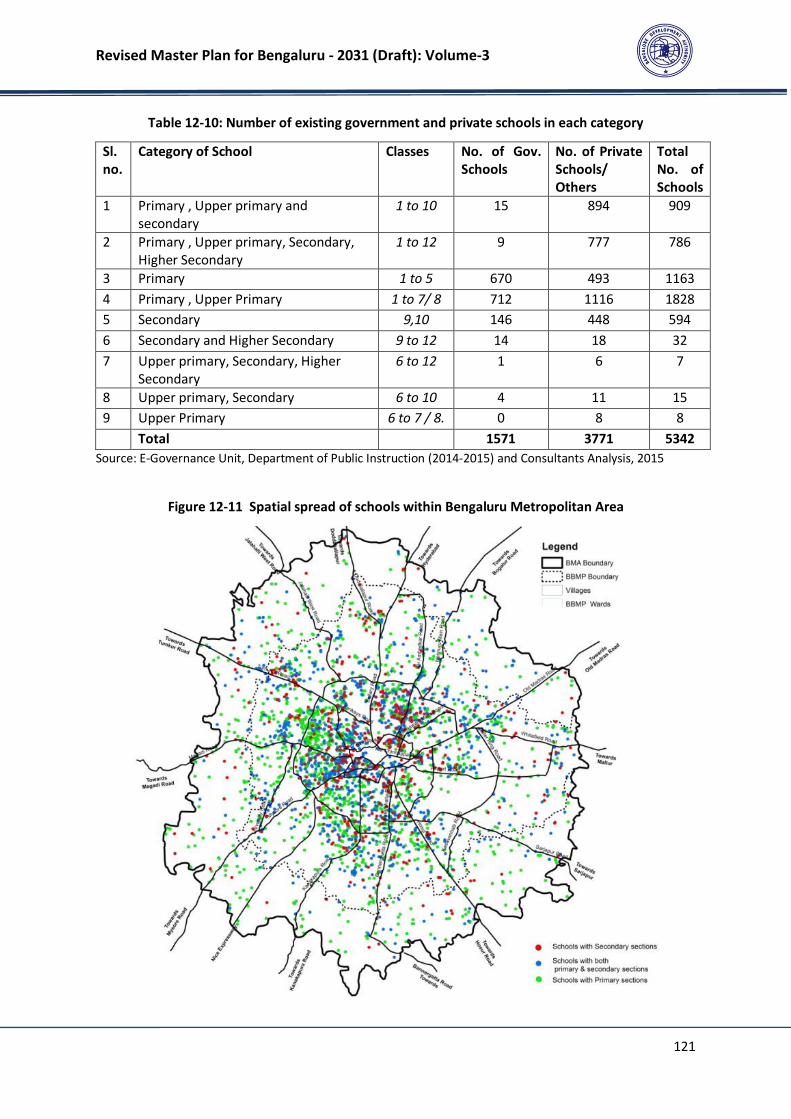
Revised Master Plan for Bengaluru - 2031 (Draft): Volume-3
121
Table 12-10: Number of existing government and private schools in each category
Sl.
no.
Category of School Classes No. of Gov.
Schools
No. of Private
Schools/
Others
Total
No. of
Schools
1 Primary , Upper primary and
secondary
1 to 10 15 894 909
2 Primary , Upper primary, Secondary,
Higher Secondary
1 to 12 9 777 786
3 Primary 1 to 5 670 493 1163
4 Primary , Upper Primary 1 to 7/ 8 712 1116 1828
5 Secondary 9,10 146 448 594
6 Secondary and Higher Secondary 9 to 12 14 18 32
7 Upper primary, Secondary, Higher
Secondary
6 to 12 1 6 7
8 Upper primary, Secondary 6 to 10 4 11 15
9 Upper Primary 6 to 7 / 8. 0 8 8
Total 1571 3771 5342
Source: E-Governance Unit, Department of Public Instruction (2014-2015) and Consultants Analysis, 2015
Figure 12-11 Spatial spread of schools within Bengaluru Metropolitan Area
Revised Master Plan for Bengaluru - 2031 (Draft): Volume-3
122
A gap analysis study shows that most inhabited areas in BMA have access to a primary school within
1 km radius. The schools also face challenges like traffic safety and congestion during the schools
hours.
The RMP 2031 envisages development of new schools in the transitional periphery zone of BMA. The
educational infrastructure in the inner and outer core may be reinforced by provision of playground
spaces wherever possible. Presently there are no gaps, and all areas are adequately covered by
schools. There is less concentration of schools outside the outer ring road presently. However the
city needs more government schools to be more inclusive. It is expected that land areas of
government schools is met by the land ceded to the BDA under C.A site.
Higher Education Infrastructure: Bengaluru plays a role of primacy in the state of Karnataka, in the
education sector. Bengaluru Metropolitan Area (BMA) has a fair share of institutes of higher
education and professional institutions. Bengaluru is a hub of higher education in the country with a
high number of colleges and professional institutes.
12.5.2 Healthcare Infrastructure:
Accessible health infrastructure is a necessity for welfare of the residents. The city of Bengaluru has
a high concentration of healthcare facilities in the BBMP area. Bengaluru serves as a tertiary
healthcare centre for the surrounding region with several tertiary and referral hospitals in the city.
Bengaluru has many super speciality and multispecialty facilities which also make it a healthcare
tourism destination. The BBMP runs several government hospitals, maternity centres, and
healthcare centres within the erstwhile BBMP areas. The rest of the BMA is served by healthcare
infrastructure run by the department of health and Family Welfare. Private healthcare facilities are
spread around the city. Most of the large referral and tertiary care hospitals are located within
BBMP and concentrated in the core areas within the outer ring road
Gaps: There are several pockets in the peripheral areas of BMA, which are more than 5kms away
from a healthcare facility. With the increasing traffic congestion, and reducing vehicle speeds in the
city, the accessibility to medical facilities has reduced even in some of the core areas in Bengaluru,
especially for people living far away from healthcare centres. The access to tertiary healthcare is a
major gap in the peripheral areas of BMA.
RMP 2031 proposes that government run public healthcare facilities be opened in some of
peripheral areas of the city outside the BBMP so that no area is more than 3 Kms away from a
government healthcare unit.

Revised Master Plan for Bengaluru - 2031 (Draft): Volume-3
123
Figure 12-12: Healthcare Facility Accessibility
Source: RMP 2031, District Health Officer, BBMP,
12.5.3 Public Open Spaces
Bengaluru has public open spaces like Cubbon Park, Lalbagh, several city level and neighbourhood
level parks, as well as other accessible open spaces. The loss of green cover in the city in the last
decade is a major cause of concern. While there are large city level parks and neighbourhood parks
in the core areas of the city, there is a lack of playgrounds in the city. The peripheral areas which lack
large parks or playgrounds, give an opportunity for the same to be developed in a systematic way,
owing to availability of vacant lands and buffer areas along the lakes and streams. RMP-2031
proposes regional parks and city level public open spaces. These open spaces shall conserve the
greenery, lake buffers and eco-sensitive areas, while also providing recreational benefits to the
residents of the city. The RMP 2031 also envisages development of playgrounds and sports centres
in the city, in the peripheral areas, which are easily accessible to the public. The need of playgrounds
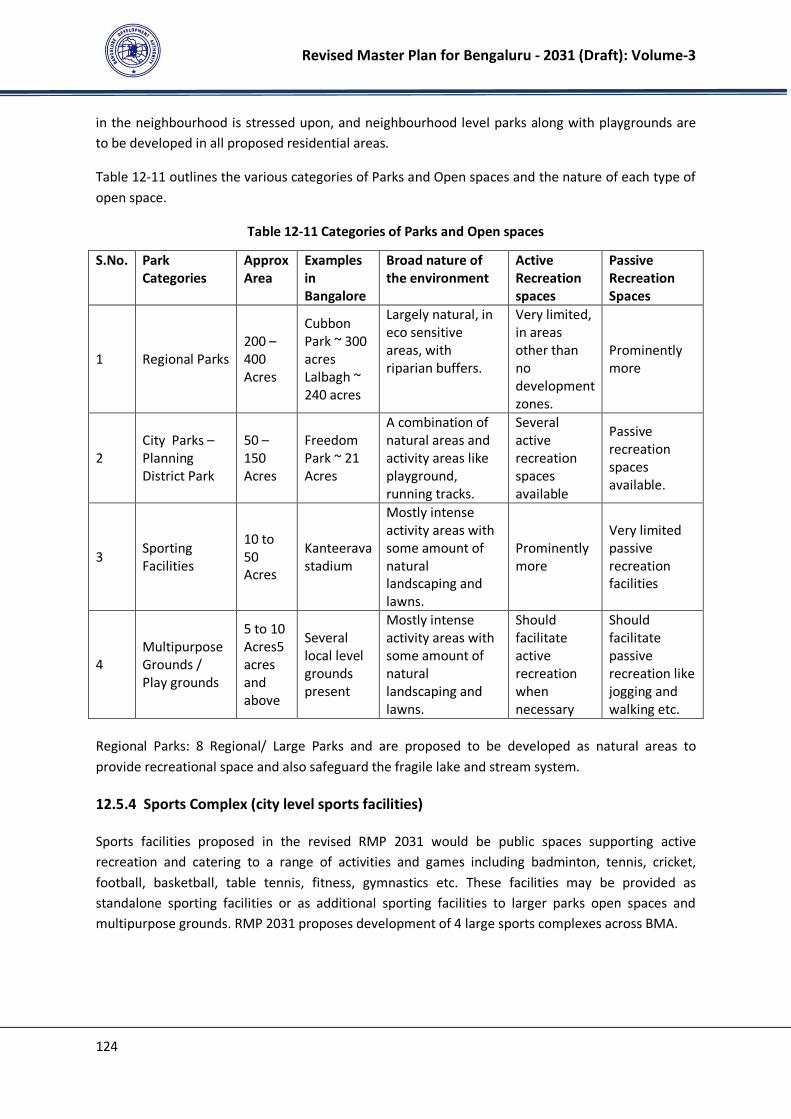
Revised Master Plan for Bengaluru - 2031 (Draft): Volume-3
124
in the neighbourhood is stressed upon, and neighbourhood level parks along with playgrounds are
to be developed in all proposed residential areas.
Table 12-11 outlines the various categories of Parks and Open spaces and the nature of each type of
open space.
Table 12-11 Categories of Parks and Open spaces
S.No. Park
Categories
Approx
Area
Examples
in
Bangalore
Broad nature of
the environment
Active
Recreation
spaces
Passive
Recreation
Spaces
1 Regional Parks
200 –
400
Acres
Cubbon
Park ~ 300
acres
Lalbagh ~
240 acres
Largely natural, in
eco sensitive
areas, with
riparian buffers.
Very limited,
in areas
other than
no
development
zones.
Prominently
more
2
City Parks –
Planning
District Park
50 –
150
Acres
Freedom
Park ~ 21
Acres
A combination of
natural areas and
activity areas like
playground,
running tracks.
Several
active
recreation
spaces
available
Passive
recreation
spaces
available.
3 Sporting
Facilities
10 to
50
Acres
Kanteerava
stadium
Mostly intense
activity areas with
some amount of
natural
landscaping and
lawns.
Prominently
more
Very limited
passive
recreation
facilities
4
Multipurpose
Grounds /
Play grounds
5 to 10
Acres5
acres
and
above
Several
local level
grounds
present
Mostly intense
activity areas with
some amount of
natural
landscaping and
lawns.
Should
facilitate
active
recreation
when
necessary
Should
facilitate
passive
recreation like
jogging and
walking etc.
Regional Parks: 8 Regional/ Large Parks and are proposed to be developed as natural areas to
provide recreational space and also safeguard the fragile lake and stream system.
12.5.4 Sports Complex (city level sports facilities)
Sports facilities proposed in the revised RMP 2031 would be public spaces supporting active
recreation and catering to a range of activities and games including badminton, tennis, cricket,
football, basketball, table tennis, fitness, gymnastics etc. These facilities may be provided as
standalone sporting facilities or as additional sporting facilities to larger parks open spaces and
multipurpose grounds. RMP 2031 proposes development of 4 large sports complexes across BMA.
Revised Master Plan for Bengaluru - 2031 (Draft): Volume-3
125
12.5.5 Fire Stations
Fire stations are critical infrastructure that needs to be present in every planning district. An
optimum distance for fire station is 10.5 sq km radius, but the frequency of fire stations need to be
more in high density areas due to increase of risks. Bengaluru has 19 fire stations, mostly located in
the core areas.
As per the requirement of Karnataka Emergency and Fire Services Department 16 new fire stations
have been incorporated in RMP 2031. In addition, RMP 2031 has identified additional fire stations
and defined in Proposed land Use map as Public and Semi-public use.
12.5.6 Art and Cultural Infrastructure
Bengaluru is an important centre of art and culture with several prominent art schools, performance
spaces and cultural hubs. Bengaluru is the capital of the Kannada cinema industry, and an important
theatre and drama hub in the country. The city has several art installations, and hosts street art
festivals along with formal events like art exhibitions, book fairs etc. Formal and informal spaces
must be provided for art and culture to thrive city. Informal spaces include street pavements, plazas,
open spaces, parks and open spaces etc. Formal spaces like art galleries, museums, performance
spaces, outdoor spaces like open air theatres, cinema halls etc must be provided in all planning
districts.
12.5.7 Markets
Markets, both formal and informal, are needed at accessible distance. While the core areas of the
city have very good market facilities, such facilities must be provided in the outer areas. Each market
must also have space for informal vendors and vendors who sell occasionally or seasonally. It is
proposed to develop markets along with logistic hubs and in the planning districts which are devoid
of markets.
12.5.8 Cemetry and Graveyard
Bengaluru has limited number of cemeteries and graveyards. Most of the graveyards in the city have
reached the threshold. More number of graveyards is required in the city and the outer areas.
RMP2031 proposes development of burial grounds, cremation ground/ cemetery in each planning
district.
12.5.9 Night Shelters
RMP 2031 proposes that adequate number of night shelters be developed based across BBMP
depending on the requirement by BBMP for the urban poor.
Revised Master Plan for Bengaluru - 2031 (Draft): Volume-3
126
12.5.10 Women’s Hostels
Bengaluru attracts many people from other parts of the state and the country who come here to
study and work. Women, especially from poorer families find it very difficult to find a safe place to
stay while they work or study in the city. RMP 2031 proposes development women’s hostels for
working women and female students in each planning district that would provide affordable and
safe accommodation to women.
Revised Master Plan for Bengaluru - 2031 (Draft): Volume-3
127
13 DISASTER AND HAZARD MANAGEMENT
13.1 Introduction
Bengaluru has been experiencing very high rates of urbanisation and population growth. Parts of the
city are vulnerable to several natural and manmade disasters in varied degrees. Urban flooding, wide
spread pollution and scarcity of water are some of the challenges the city faces presently. Certain
hazards like droughts, earthquakes etc in other parts of Karnataka also have impact on the city.
Hazard and Disaster Management as part of the revised master plan is an attempt to understand the
hazards, reduce their impact and decrease the vulnerability of the city to these hazards.
13.2 Hazard Risk Assessment
Hazard Risk Assessment includes identification of the major hazards (natural & manmade) affecting
the Bengaluru metropolitan area, understanding the risk the city faces from the hazard, and profiling
the hazard and its vulnerabilities. Identification of the major hazards in BMA has been done through
past occurrences, frequency and impact levels. The physical, social, economic and environmental
vulnerabilities of the hazards have been assessed to prepare strategies to reduce vulnerabilities.
13.3 Hazards Affecting Bengaluru
Bengaluru, owing to its location, is not affected by hazards like volcanoes, tsunami and coastal
cyclones. The climate in Bengaluru is favourable and it is not affected by extreme temperatures.
However, the city is affected by several natural and manmade hazards in varying degrees. Some
hazards like earthquake, floods and drought outside BMA/planning area but primarily limited to
Karnataka may also affect the city in various ways like in migration from other parts of the state,
water scarcity, agricultural scarcity, energy deficit, water deficit and loss of critical supplies to the
city. The Hazards affecting the city may be classified into natural and man-made hazards.
13.3.1 Earthquake
Earthquake is a major natural hazard with severe impact and high vulnerability. Bureau of Indian
Standards [IS 1893 (Part I):2002], has grouped the country into four seismic zones, viz. Zone II, III, IV
and V with zone V being the most seismically active region while zone II is the least. Bengaluru
region is located in low seismicity zone (Seismic zone 2). The intervention of the Master Plan is
restricted to guidelines that may help reduce vulnerability to an earthquake.
Vulnerability: Since Bengaluru is in a region, prone to low and moderate earthquakes earthquake
related environmental vulnerability is less significant. In the event of a medium intensity earthquake
in the region, there will be some physical damage to buildings and infrastructures. Economic
activities in the city are expected to be disrupted for a short while. There may be loss to life and
property depending on the intensity of the earthquake.
Revised Master Plan for Bengaluru - 2031 (Draft): Volume-3
128
Mitigation: To reduce the physical damage, buildings, communication towers and public utility
centres, and other critical infrastructure need to withstand damage during an earthquake.
Construction rules need to be followed to resist vulnerable condition. All multi-storey buildings must
be designed and constructed adopting the norms prescribed in the National Building Code.
13.3.2 Urban Floods in Bengaluru
Urban flooding is a natural hazard triggered by climatic events, and aggravated by human activities
and urbanisation. Flooding of major roads, hinder the functioning of smooth traffic in the city, leads
to congestion. In the recent past, incidences of flooding have been reported in 2005, 2007, 2010 and
2013 and very prominently in 2017.
The areas which are particularly prone to flooding include parts of the city which lie within the
natural floodplains of the river and drainage channels. Several slums and unauthorised
developments in low lying flood prone areas make a large population of the city directly vulnerable
to urban flooding. Urban flooding occurs due to natural and manmade factors. Some of the major
reasons identified for flooding in BMA are as following.
a. Heavy and incessant rains: Heavy rainfall event leads to urban flooding. As per the Karnataka
State Action Plan for Climate Change, the climate change is expected to affect the rainfall
pattern and may lead to several heavy rain events in the future.
b. Increased urbanisation: Increased urbanisation has led to significant changes in the hydrologic
flow of storm water runoff from developed areas. Effects of urbanisation like increased peak
flow; reduced ground water infiltration and diminishing base flow of streams have impacted
urban flooding.
c. Breached water bodies: The loss of retention basins such as lakes and reservoirs has led to
increase in the urban flooding. The breached network of natural water bodies and tanks, which
play a major role in storm water drainage and runoff within the city, is leading areas getting
flooded during heavy rainfall events. It may be noted here that many of the low lying areas are
the locations where slums have developed, leaving a large group vulnerable to floods and
epidemics. The loss of lakes and streams this also increased the vulnerability of these areas to
urban flooding Also, at several locations, storm water drainage system have been broken/ lost
due to developmental activities, which is also contributing to urban floods.
13.3.3 Environmental Pollution
Environmental Pollution includes pollution of air, water and noise within the Planning Area.
Air Pollution: Air pollution is a major hazard that has been growing steadily in Bengaluru. The
increased number of vehicles on road, industrial activity, construction activity, poor quality of roads
and dust on road add to the suspended particulate matter in air. There are more than 67 lakhs
vehicles registered in Bengaluru (March 2017). Old vehicles with worn out engines, adulterated
fuels, and slow moving traffic lead to increased emissions. The total emissions in 2015 due to
vehicular traffic is estimated at 196 tonnes of CO per day, 50 tonnes of HC per day, 9 tonnes of SPM
Revised Master Plan for Bengaluru - 2031 (Draft): Volume-3
129
per day, and 321 tonnes of NOX per day23
. Reducing the number of private vehicle trips, and
increasing public transport share is expected have a positive impact in reducing the emissions due to
vehicular traffic. The vulnerabilities of air pollution include people living along the major roads,
travellers, pedestrians and especially children and the elderly.
Water Pollution: Pollution of surface and groundwater is prevalent in Bengaluru. The rivulets
Arkavathy, Vrishbhavathy, along with the lakes and the natural streams are highly polluted due to
inflow of sewage, industrial effluents and municipal waste. The Dissolved oxygen (DO) level in lake
waters is decreasing indicating organic pollution load leading to a phenomenon called
eutrophication. Untreated Sewage flowing into lakes cause the lake to decay, and loss of aquatic life.
The people living around the polluted lakes are very vulnerable as the area in the vicinity of the lake
is covered in foul smell emanating from the lake. The froth and smell affects the commuters and the
water pollution has led to ground water getting polluted in the area. Ground water in BMA is
polluted due to sewage pollution and industrial pollution, over exploitation of ground water
resources and high Nitrate concentration in ground water.
Noise pollution: The sources of noise pollution in BMA are a) vehicular traffic, b) flying aircrafts near
airports, c) drilling of bore wells, d) industrial sound, e) construction activities, f) DG sets, g) public
address systems, etc. Noise sensitive areas like hospital area, schools and also residential
neighbourhoods are witnessing heavy noise pollution due to traffic and unnecessary honking.
13.3.4 Water Scarcity
Bengaluru faces a major challenge in the availability and access to reliable good quality water supply.
Water is supplied in the BMA from Cauvery River catchment pipeline systems linked with water
storage and replenish-able groundwater resources, all of which are rain fed. The Karnataka State
Action Plan on Climate Change24
has estimated change in rainfall patterns in the future that may
have an impact on water availability. Further detailed studies are required in regards to the impact
on climate change on the water availability in BMA to fully comprehend this future challenge.
Drinking Water: Peripheral areas in BMA, where Cauvery water is not supplied, is facing acute
shortage of good quality drinking water. Considering the demand in BMA and the requirements of
Non-Domestic and industrial supplies, total water shortage at present in BMA could be established
as 876 MLD. However, with envisaged tapping of additional 10 TMC of Cauvery water, the current
demand could be met. Unaccounted flow of water (UFW) has been observed as 46% which is
predominantly due to leakages in the old system of the core city area. UFW needs to be moderated
to 15 – 20 % on priority. Availability of water in the future shall depend on the population
distribution, and reducing losses.
Ground Water: Ground water table in BMA is depleting, increasing the risk of unavailability of
drinking water in the future. Urbanisation has increased in the last two decades leading to wiping
out of many tanks and lakes that were helpful in maintaining the ground water level. Increased
23
Estimation is based on Urban Transport Modal built for RMP 2031. 24
Karnataka State action plan on climate change: by Department of Forest Ecology and Environment-
Government of Karnataka.
Revised Master Plan for Bengaluru - 2031 (Draft): Volume-3
130
dependency on water tankers as well as bore wells especially in areas where BWSSB supply is not
present. Groundwater levels have fallen steadily as a result of withdrawal for private self-supply and
supply through private water tankers. Over exploitation of ground water has led to decrease in
water tables and reduction in ground water quality.
As per CGWB net annual groundwater availability in Bangalore Urban district is 11723 ham, total
ground water draft for irrigation, domestic and industrial uses is 3794 ham and existing gross ground
water draft for all uses is 16,703 ham. Thus, draft exceeds the total available ground water resources
leaving absolutely nil ground water resources for future use. In view of the stage of the ground
water development to the tune of 128- 176% and over exploitation of ground water resources water
level has gone deeper thereby leaving the only solution of building up of ground water resource
through artificial recharge and rainwater harvesting. The stage of ground water development in all
the four Taluks of the district is above 100% and are in the over exploited category as per the Central
Ground Water Authority. Increase in paved areas due to urbanisation and encroachment of
catchment areas has led to drying of aquifers.
Drought: Bengaluru is prone to droughts and several years in the past few decades have been
declared as drought years for the Bangalore urban district. Droughts occur at approximately fixed
intervals, the phenomenon referred to as 'stationarity' in hydrology. Due to changing climate and
varied rainfall patterns, it has become difficult to predict a drought by stationarity and hence it is
difficult to be prepared for drought. Bengaluru has been declared drought hit several times.
Bengaluru is dependent on Cauvery River for drinking water, which is a rain fed, and drought in
other regions is likely to have an impact on Bengaluru. Drought in BMA will deplete the ground
water resources and lakes, reservoirs, leading to shortage of drinking water. In the outer areas of
BMA, drought may affect the availability of water for irrigation, and cattle fodder may also be
affected. The people, whose livelihood is based on agriculture and other allied activities in BMA,
would be worst hit during a drought. Due to depletion of water resources, there would be shortage
of drinking water, which may turn into a health hazard.
13.3.5 Hazards Associated with Waste
Municipal Waste: Solid waste disposal is a challenge in BMA. It is difficult to manage the quantum
of waste that is produced in Bengaluru. As per the BBMP, the total waste generated in the BBMP
area is about 6233MT, with wet waste contributing upto 64% and 27% of dry waste. Waste mixed
with rain water, is a hub of diseases. Stray animals often feed on the waste, further resulting in the
spread of diseases. Improper disposal of waste in the landfills leads to Leachate seeping into the soil,
which may enter the human food chain and lead to diseases.
Electronic waste: Bengaluru is the IT Capital of India and employs over 8,30,000 people in IT industry
with more than 1300 IT/ ITES companies (as per ENVIS news letter dated June 2011) working from
Bengaluru. The number of computers and consumption of electronic goods is directly linked to
software professionals and rising income which mostly leading to higher generation of e-waste in
the city than perhaps any other city in the country. It is estimated that Bengaluru generates close to
Revised Master Plan for Bengaluru - 2031 (Draft): Volume-3
131
199768 MT/ annum (547 MT/ day) of e-waste, which is huge. Of which 45438.5MT/ annum (less
than quarter of e-waste generated), is recycled through organised / authorised e-waste recyclers25
.
The majority of e-waste management/ handling and recycling is through informal sector and hence
un-regulated. The informal sector handling of e-waste is not always environmentally safe and is
leading to environmental pollution and health hazards.
13.3.6 Hazards due to Traffic Congestion
Traffic congestion may be defined as a hazard, considering the impact on human health,
productivity, and economy. Traffic congestion gives rise to several other hazards like accidents, road
rage, air pollution and also financial losses due to loss of productive time. The average speed of
vehicles in the city has decreased due to increased congestion. Reasons of traffic congestion are
increased number of vehicles, inadequate or non-uniform road width, poorly designed junctions,
poor road surface, and improper traffic management. Rash driving without concern for others on the
road leads to traffic grid locks and ultimately congestion. Sometimes, vehicle breakdowns, festivals
or rallies etc are responsible for congestion. Congested corridors are also hubs of air pollution due to
suspended particulate matter, leading to several health hazards. There is a huge economic loss on
account of congestion in BMA.
13.3.7 Fire Hazards
Fire Hazard: The Karnataka Fire and Emergency Services Department (KFES) has carried out an fire
risk assessment for entire planning area of Bengaluru, classifying BMA in four fire risk zones – Very
High Risk, High Risk, Medium Risk and Low Risk zones, formulated considering factors like population
density, concentration of commercial, public assembly, industrial areas and high rise buildings, and
major accident hazard units as well as Planning District boundaries of RMP 2015. Figure 12-1 shows
the Fire Hazard risk zones within BMA as per KFES. It can be seen that seven zones are classified
under “Very High Risk (Petta, Richmond Town, Malleshwaram, Baiyyappanahalli, Peenya, CV Raman
Nagar, Byatarayanapura), 12 as “High Risk”, 10 “Medium” and remaining 9 as “Low Risk” zones.
Overall 14 percent of total area is classified as Very High Risk. Thus, many areas in Bengaluru are
vulnerable to fire hazards. Fire can easily spread in highly congested areas. Narrow and congested
roads also make accessibility for fire tenders difficult in the area. The central market area in
Bengaluru, namely the Petta area is susceptible to fire hazards. Markets selling easily inflammable
goods are more vulnerable than others. People living or working in high rise buildings, or enclosed
spaces, are more vulnerable to fire hazards
Hazards from Electricity: In several places in the city, safety norms as prescribed by Karnataka Power
Transmission Corporation Limited (KTCPL) guidelines on safety buffer zones along the HT corridors
have not been enforced and developments have been within safety buffer zones of the HT Line.
Many buildings have been constructed not only in close proximity but beneath the HT lines, posing a
great risk to human life and property. As may be observed, HT lines run over buildings and
25
http://www.cpcb.nic.in/Ewaste_Registration_List.pdf
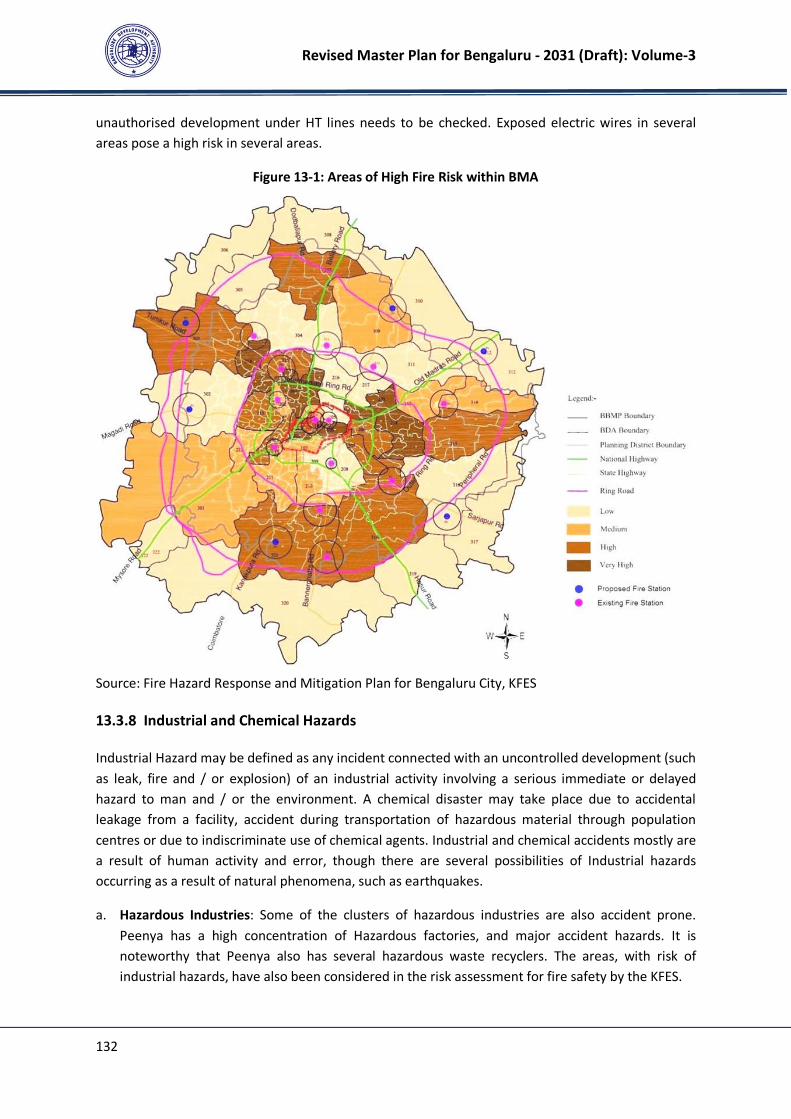
Revised Master Plan for Bengaluru - 2031 (Draft): Volume-3
132
unauthorised development under HT lines needs to be checked. Exposed electric wires in several
areas pose a high risk in several areas.
Figure 13-1: Areas of High Fire Risk within BMA
Source: Fire Hazard Response and Mitigation Plan for Bengaluru City, KFES
13.3.8 Industrial and Chemical Hazards
Industrial Hazard may be defined as any incident connected with an uncontrolled development (such
as leak, fire and / or explosion) of an industrial activity involving a serious immediate or delayed
hazard to man and / or the environment. A chemical disaster may take place due to accidental
leakage from a facility, accident during transportation of hazardous material through population
centres or due to indiscriminate use of chemical agents. Industrial and chemical accidents mostly are
a result of human activity and error, though there are several possibilities of Industrial hazards
occurring as a result of natural phenomena, such as earthquakes.
a. Hazardous Industries: Some of the clusters of hazardous industries are also accident prone.
Peenya has a high concentration of Hazardous factories, and major accident hazards. It is
noteworthy that Peenya also has several hazardous waste recyclers. The areas, with risk of
industrial hazards, have also been considered in the risk assessment for fire safety by the KFES.
Revised Master Plan for Bengaluru - 2031 (Draft): Volume-3
133
b. Quarrying in urban limits: Several stone quarry sites are located in BMA which are in close
proximity to forest areas such as the Bannerghatta National Park and residential areas.
Quarrying activities add to air and noise pollution. Fine solid particles from drilling, blasting and
mining are scattered across wide areas and habitations by the wind. Transportation of ore by
road adds to the problem significantly. Activities like drilling, blasting, loading and
transportation, results in significant noise. Human habitations located adjacent to quarries are
especially subjected to high levels of noise. Abandoned quarries are safety hazards for humans.
Several unauthorised sites are left abandoned without any precaution, causing risk to humans.
c. Hazardous Material transportation/ Oil and Gas Installations: Transportation of Hazardous
materials like Oil and gas through pipelines or by tankers on road is a risk and may lead to
industrial accidents. Spur lines carrying gas are being laid in Bengaluru that will distribute gas in
the BMA. Oil and Gas installations are hazardous in nature and may pose risk to traffic,
properties and economic activities in case of burst/ fire in pipelines. Further, highly inflammable
liquids and gas storage is done at Devanagonthi, outside BMA. Several oil and gas tankers use
roads within BMA, to transport the oil from Devanagonthi depot. Quality of road surface and
narrow road widths pose great danger on these roads leading to Devanagonthi from BMA.
13.4 Probabilistic Hazard Assessment
A probabilistic assessment of hazard occurrence for BMA over next 25 to 50 years has been done for
natural hazards only as it is not possible to assess the possibilities of occurrence for manmade
hazards. The assessment is the compilation of assessment done by various government agencies.
a. Earthquake: Bengaluru lies in a low intensity seismic zone (Seismic Zone II) and is at minimal risk
of an earthquake. However, there have been a few incidents of low to medium intensity
earthquakes in the region that have affected Bengaluru. There may be a possibility of an
earthquake in the Bengaluru region in the next 100 years. Such earthquake may lead to a
damage to physical infrastructure, and lead to economic loss. Strict adherence to codes will help
reduce vulnerability to earthquakes in the future.
b. Heavy Rainfall Events leading to Urban Flooding: Urban flooding may take place in the future
due to heavy rain events in BMA. The clearing of blockage in the rainwater drainage system shall
help mitigate some of the urban flooding events. The present infrastructure need to be
upgraded to handing very heavy rain events, as such events may cause extensive flooding
especially in the identified low lying areas in BMA.
c. Drought: Drought conditions may affect Bengaluru, and will have some impact on availability of
water. The change in rainfall pattern in the future shall affect the occurrence of drought. The
areas with limited access to the water supply network will have a higher impact from the
drought.
Table 13-1 gives a probability matrix of the major hazards that BMA may face in the future. Some
events like Earthquakes cannot be predicted. With change of climate and rainfall patterns, it has
become difficult to predict droughts too. The probability matrix, gives the risk from each hazard. A
general probability analysis for the various natural hazards is given for 25 years, 50 years and 100
Revised Master Plan for Bengaluru - 2031 (Draft): Volume-3
134
years horizon. It may be noted that it is difficult to predict other man made / technological hazards
due to the dynamic nature of the associated risks. With newer technology, it is expected that some
of the technological hazards may have lower impact in the future.
Table 13-1 Probabilistic Hazard Risk Assessment
Hazard
Identification
Probability
Hazard
Risk to
BMA
Level of
Impact 25 years 50 years 100 years
1 Urban Floods High Moderate
to High
High Possibility High Possibility High Possibility
2 Earthquake Low Low to
moderate
Low to moderate
possibility
Low to moderate
possibility
Low to moderate
possibility
3 Drought Low Low Low to moderate
possibility
Low to moderate
possibility
Low to moderate
possibility
Source: Consultant’s Analysis.
13.5 Institutional Framework for Disaster Management in BMA
Disaster monitoring Centre: Karnataka State Natural Disaster Monitoring Centre (KSNDMC), an
autonomous Body affiliated to Department of Science & Technology, Govt. of Karnataka, monitors
natural Hazards and disasters and issues early warnings in BMA as well as for the whole state.
KSNDMC issues alerts for heavy rain events, heavy wind etc and monitors rainfall patterns in the
state as well as BMA.
Disaster Management Cell: The Disaster Management Act 2005 mandates every district to establish
a District Disaster Management Authority under the chairmanship of the deputy chairman or
collector and to be co-chaired by the elected representative of the local body.
Bangalore Urban District has a Disaster Management Cell overseen by the Deputy Commissioner of
the district. The cell coordinates between various government agencies, organisations, stakeholders
and hospitals, in the event of any disaster and manages available resources and manpower to tackle
emergencies. Some of the agencies with which coordination is involved during emergency situations
are the Karnataka Fire and Emergency Services (KFES), BESCOM, BBMP, and the Bengaluru City
Police. In addition, several organisations and service providers have their own disaster management
cells that manage the disasters in their respective sectors and services.
13.6 Hazard Mitigation and Disaster Management
The Masterplan recommends the following actions to mitigate the hazards and to reduce
vulnerabilities in BMA.
• Effective implementation of National Building Codes for fire safety of buildings.
Revised Master Plan for Bengaluru - 2031 (Draft): Volume-3
135
• Rejuvenating the lake and stream system to their intended volume and flow.
• Using open spaces, parks and playground as a flood protection strategy.
• Strengthening of the public transportation system which will address congestion and air
pollution.
To understand the Hazards in detail, the masterplan recommends an in-depth study that shall
establish the mitigation measures for all the hazards and disaster that are likely to affect BMA in
near future.
As part of strengthening the institutional capacity, the masterplan recommends the District Disaster
Management cell to be upgraded to a District Disaster Management Authority and it shall be
responsible for preparation of the ‘District Disaster Management Plan’ and upgrade it regularly in
coordination with all the stakeholders, subject experts, government bodies, elected representatives,
and citizen groups.
Revised Master Plan for Bengaluru - 2031 (Draft): Volume-3
136
14 HERITAGE CONSERVATION AND PROTECTION
Bengaluru has a rich cultural and built heritage dating back from the Western Ganga civilization (860
A.D.) to the Vijaynagara dynasty (1343 A.D.) to Hyder Ali-Tippu Sultan period (1753 A.D.) and later
the during British period (1806 A.D.). It is noteworthy that the settlement of Bengaluru has been in
existence for almost four and half centuries. Bengaluru also has a unique landform, as it is located at
the ridge that separates the two river basins of the Arkavathi and S.Pinakini rivers. The city since
historical times has a well-established system of cascading lakes and tanks developed over centuries.
The natural heritage of lakes, heritage buildings/sites, and cultural ethos of the city exhibited
through its festivals and cuisine stands testimony to its glorious past.
Conserving this ancient heritage (natural, built and cultural) is imperative as it serves as identity to
the city and its origin. Yet, heritage and culture of the city needs to be more than a record of the
past that creates urban identities for not only the past and present but also for the future.It is
noteworthy that Bengaluru, till date, lacked the formal inventory of its heritage and cultural assets
and therefore the RMP 2031 has placed heritage protection and conservation within the overall
process of urban development and in course of its preparation.
The city has seen unprecedented growth demographically and spatially since the past two decades,
evolving the city into a vibrant cosmopolitan. Under this context it is additionally important to
protect its Built-Cultural Heritage. The heritage narrative of Bengaluru has mostly revolved around
the four Kempe Gowda’s watch towers, Tippu Sultan’s Palace precinct, the traditional markets,
British era buildings of MG road, Cleveland town / Richards town, Vidhana Soudha and High Court
administrative amongst many other buildings, which evoke a sense of pride and ownership among
all Kannadigas and residents of Bengaluru.
14.1 Need for addressing Heritage Conservation in BMA
It is essential that the heritage in Bengaluru is safeguarded, conserved and maintained in to order to
mitigate and cope with impacts of rapid and fast paced urbanisation. The narrative around Heritage
conservation has usually focused at improvements to build form of Heritage Site. It is important to
understand that the heritage and cultural preservation/ conservation of heritage precincts do have
positive impact on economy, social aspects and environment of the city, though these impacts are
long term in nature. Heritage and cultural conservation may lead to boost tourism and helps in
educating ourselves about our rich cultural history. Heritage conservation and designation increases
property values, both of the restored building and surrounding properties. Thus Heritage
preservation & conservation should be an integral part of urban development. However, it is
important to note that the objective of the assignment is to prepare the Revised Master Plan 2031
and therefore the assessment of Heritage & Cultural Heritage has been done to evolve guidelines for
heritage conservation in line with the provisions of Karnataka Town & Country Planning Act, 1961
(KTCP Act, 1961).
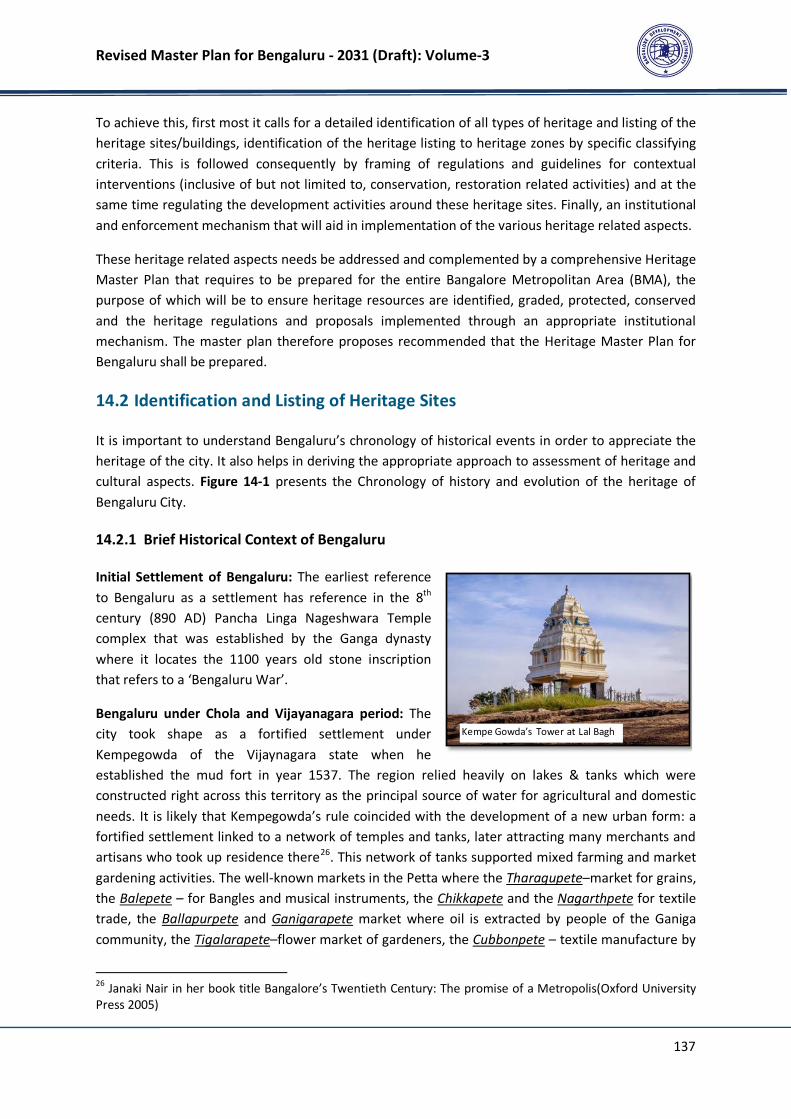
Revised Master Plan for Bengaluru - 2031 (Draft): Volume-3
137
To achieve this, first most it calls for a detailed identification of all types of heritage and listing of the
heritage sites/buildings, identification of the heritage listing to heritage zones by specific classifying
criteria. This is followed consequently by framing of regulations and guidelines for contextual
interventions (inclusive of but not limited to, conservation, restoration related activities) and at the
same time regulating the development activities around these heritage sites. Finally, an institutional
and enforcement mechanism that will aid in implementation of the various heritage related aspects.
These heritage related aspects needs be addressed and complemented by a comprehensive Heritage
Master Plan that requires to be prepared for the entire Bangalore Metropolitan Area (BMA), the
purpose of which will be to ensure heritage resources are identified, graded, protected, conserved
and the heritage regulations and proposals implemented through an appropriate institutional
mechanism. The master plan therefore proposes recommended that the Heritage Master Plan for
Bengaluru shall be prepared.
14.2 Identification and Listing of Heritage Sites
It is important to understand Bengaluru’s chronology of historical events in order to appreciate the
heritage of the city. It also helps in deriving the appropriate approach to assessment of heritage and
cultural aspects. Figure 14-1 presents the Chronology of history and evolution of the heritage of
Bengaluru City.
14.2.1 Brief Historical Context of Bengaluru
Initial Settlement of Bengaluru: The earliest reference
to Bengaluru as a settlement has reference in the 8th
century (890 AD) Pancha Linga Nageshwara Temple
complex that was established by the Ganga dynasty
where it locates the 1100 years old stone inscription
that refers to a ‘Bengaluru War’.
Bengaluru under Chola and Vijayanagara period: The
city took shape as a fortified settlement under
Kempegowda of the Vijaynagara state when he
established the mud fort in year 1537. The region relied heavily on lakes & tanks which were
constructed right across this territory as the principal source of water for agricultural and domestic
needs. It is likely that Kempegowda’s rule coincided with the development of a new urban form: a
fortified settlement linked to a network of temples and tanks, later attracting many merchants and
artisans who took up residence there26
. This network of tanks supported mixed farming and market
gardening activities. The well-known markets in the Petta where the Tharagupete–market for grains,
the Balepete – for Bangles and musical instruments, the Chikkapete and the Nagarthpete for textile
trade, the Ballapurpete and Ganigarapete market where oil is extracted by people of the Ganiga
community, the Tigalarapete–flower market of gardeners, the Cubbonpete – textile manufacture by
26
Janaki Nair in her book title Bangalore’s Twentieth Century: The promise of a Metropolis(Oxford University
Press 2005)
Kempe Gowda’s Tower at Lal Bagh
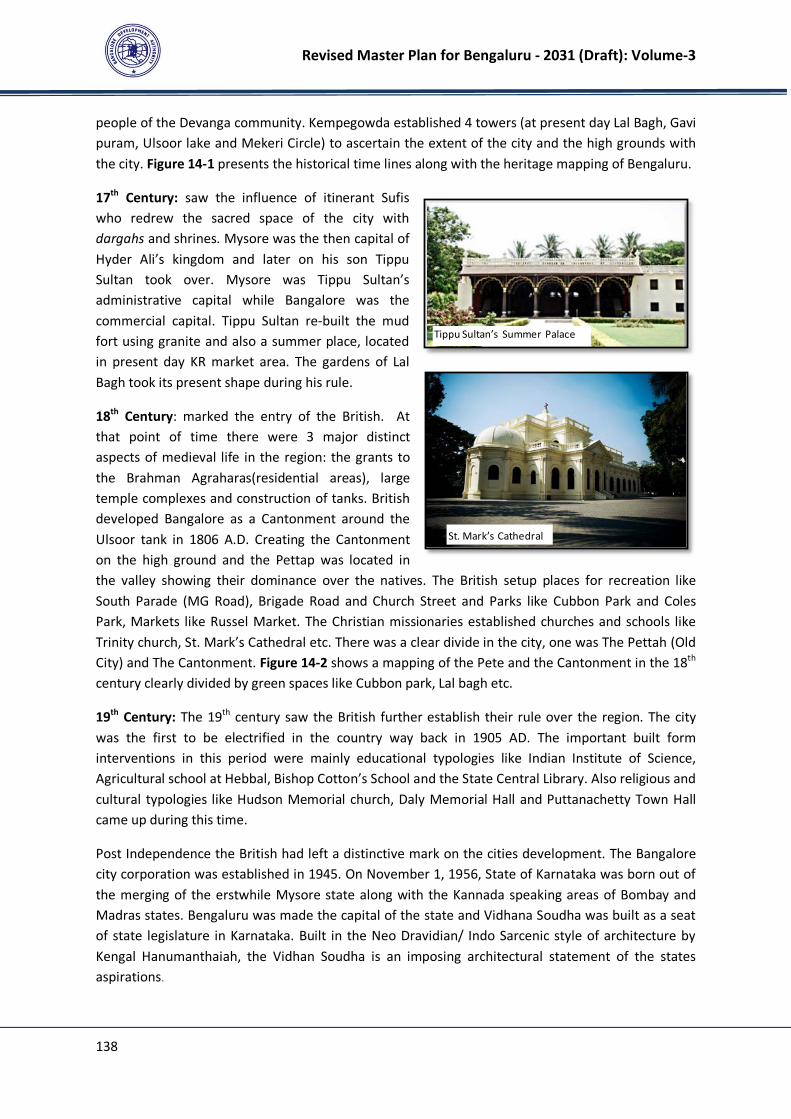
Revised Master Plan for Bengaluru - 2031 (Draft): Volume-3
138
people of the Devanga community. Kempegowda established 4 towers (at present day Lal Bagh, Gavi
puram, Ulsoor lake and Mekeri Circle) to ascertain the extent of the city and the high grounds with
the city. Figure 14-1 presents the historical time lines along with the heritage mapping of Bengaluru.
17th
Century: saw the influence of itinerant Sufis
who redrew the sacred space of the city with
dargahs and shrines. Mysore was the then capital of
Hyder Ali’s kingdom and later on his son Tippu
Sultan took over. Mysore was Tippu Sultan’s
administrative capital while Bangalore was the
commercial capital. Tippu Sultan re-built the mud
fort using granite and also a summer place, located
in present day KR market area. The gardens of Lal
Bagh took its present shape during his rule.
18th
Century: marked the entry of the British. At
that point of time there were 3 major distinct
aspects of medieval life in the region: the grants to
the Brahman Agraharas(residential areas), large
temple complexes and construction of tanks. British
developed Bangalore as a Cantonment around the
Ulsoor tank in 1806 A.D. Creating the Cantonment
on the high ground and the Pettap was located in
the valley showing their dominance over the natives. The British setup places for recreation like
South Parade (MG Road), Brigade Road and Church Street and Parks like Cubbon Park and Coles
Park, Markets like Russel Market. The Christian missionaries established churches and schools like
Trinity church, St. Mark’s Cathedral etc. There was a clear divide in the city, one was The Pettah (Old
City) and The Cantonment. Figure 14-2 shows a mapping of the Pete and the Cantonment in the 18th
century clearly divided by green spaces like Cubbon park, Lal bagh etc.
19th
Century: The 19th
century saw the British further establish their rule over the region. The city
was the first to be electrified in the country way back in 1905 AD. The important built form
interventions in this period were mainly educational typologies like Indian Institute of Science,
Agricultural school at Hebbal, Bishop Cotton’s School and the State Central Library. Also religious and
cultural typologies like Hudson Memorial church, Daly Memorial Hall and Puttanachetty Town Hall
came up during this time.
Post Independence the British had left a distinctive mark on the cities development. The Bangalore
city corporation was established in 1945. On November 1, 1956, State of Karnataka was born out of
the merging of the erstwhile Mysore state along with the Kannada speaking areas of Bombay and
Madras states. Bengaluru was made the capital of the state and Vidhana Soudha was built as a seat
of state legislature in Karnataka. Built in the Neo Dravidian/ Indo Sarcenic style of architecture by
Kengal Hanumanthaiah, the Vidhan Soudha is an imposing architectural statement of the states
aspirations.
Tippu Sultan’s Summer Palace
St. Mark’s Cathedral
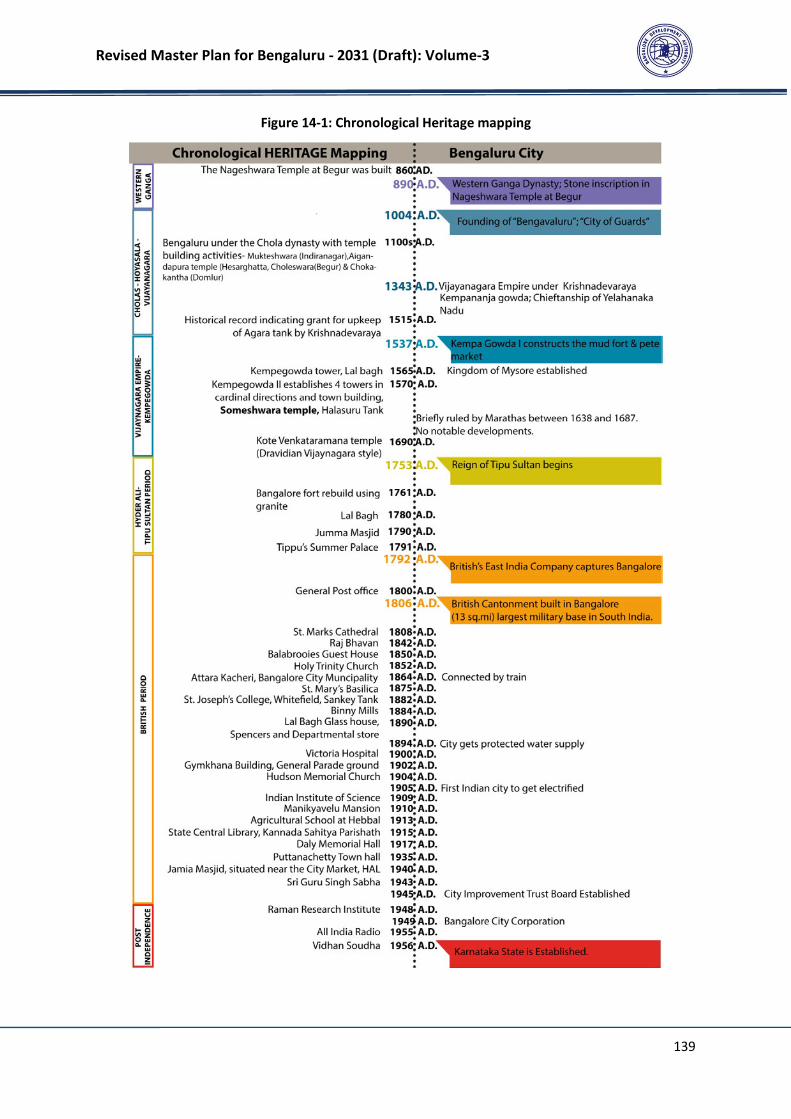
Revised Master Plan for Bengaluru - 2031 (Draft): Volume-3
139
Figure 14-1: Chronological Heritage mapping
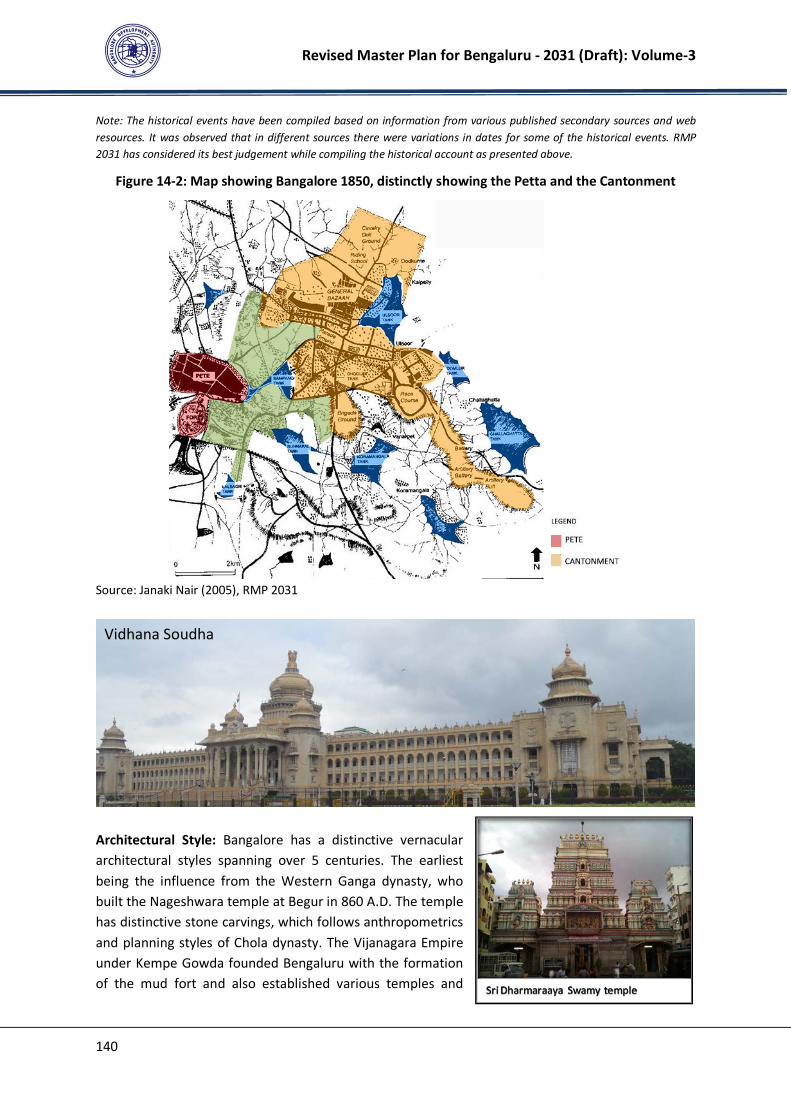
Revised Master Plan for Bengaluru - 2031 (Draft): Volume-3
140
Note: The historical events have been compiled based on information from various published secondary sources and web
resources. It was observed that in different sources there were variations in dates for some of the historical events. RMP
2031 has considered its best judgement while compiling the historical account as presented above.
Figure 14-2: Map showing Bangalore 1850, distinctly showing the Petta and the Cantonment
Source: Janaki Nair (2005), RMP 2031
Architectural Style: Bangalore has a distinctive vernacular
architectural styles spanning over 5 centuries. The earliest
being the influence from the Western Ganga dynasty, who
built the Nageshwara temple at Begur in 860 A.D. The temple
has distinctive stone carvings, which follows anthropometrics
and planning styles of Chola dynasty. The Vijanagara Empire
under Kempe Gowda founded Bengaluru with the formation
of the mud fort and also established various temples and
Vidhana Soudha
Sri Dharmaraaya Swamy temple
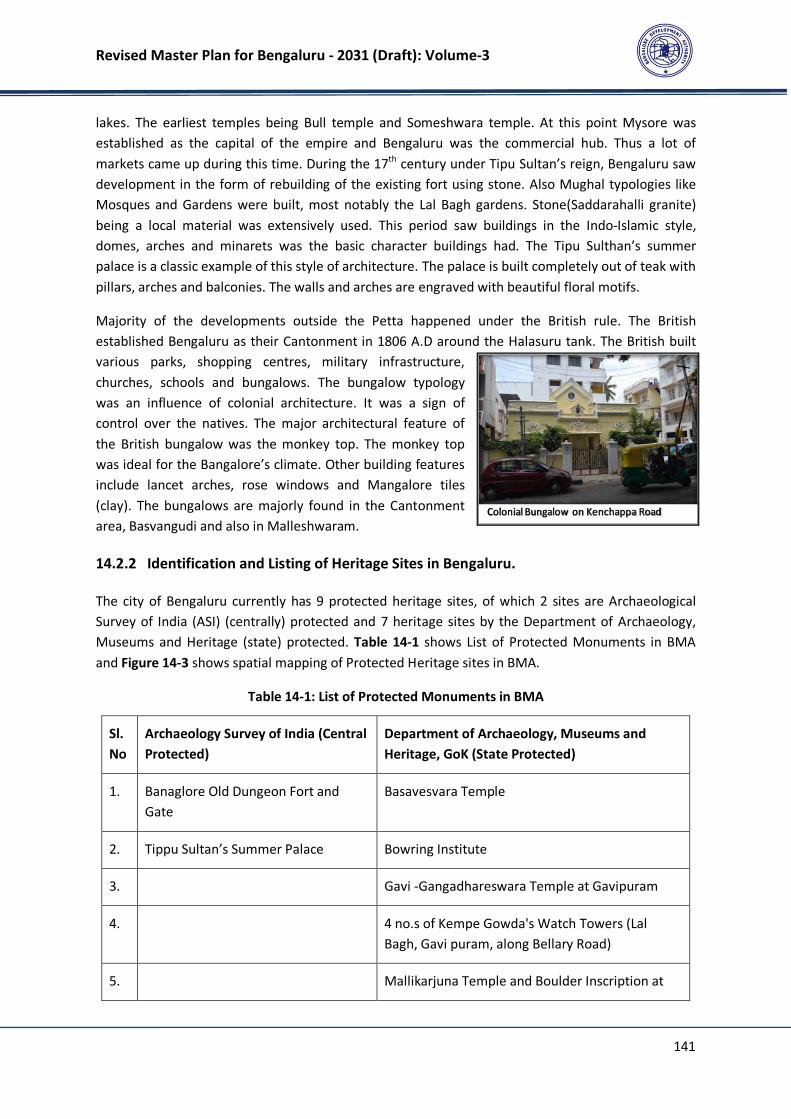
Revised Master Plan for Bengaluru - 2031 (Draft): Volume-3
141
lakes. The earliest temples being Bull temple and Someshwara temple. At this point Mysore was
established as the capital of the empire and Bengaluru was the commercial hub. Thus a lot of
markets came up during this time. During the 17th
century under Tipu Sultan’s reign, Bengaluru saw
development in the form of rebuilding of the existing fort using stone. Also Mughal typologies like
Mosques and Gardens were built, most notably the Lal Bagh gardens. Stone(Saddarahalli granite)
being a local material was extensively used. This period saw buildings in the Indo-Islamic style,
domes, arches and minarets was the basic character buildings had. The Tipu Sulthan’s summer
palace is a classic example of this style of architecture. The palace is built completely out of teak with
pillars, arches and balconies. The walls and arches are engraved with beautiful floral motifs.
Majority of the developments outside the Petta happened under the British rule. The British
established Bengaluru as their Cantonment in 1806 A.D around the Halasuru tank. The British built
various parks, shopping centres, military infrastructure,
churches, schools and bungalows. The bungalow typology
was an influence of colonial architecture. It was a sign of
control over the natives. The major architectural feature of
the British bungalow was the monkey top. The monkey top
was ideal for the Bangalore’s climate. Other building features
include lancet arches, rose windows and Mangalore tiles
(clay). The bungalows are majorly found in the Cantonment
area, Basvangudi and also in Malleshwaram.
14.2.2 Identification and Listing of Heritage Sites in Bengaluru.
The city of Bengaluru currently has 9 protected heritage sites, of which 2 sites are Archaeological
Survey of India (ASI) (centrally) protected and 7 heritage sites by the Department of Archaeology,
Museums and Heritage (state) protected. Table 14-1 shows List of Protected Monuments in BMA
and Figure 14-3 shows spatial mapping of Protected Heritage sites in BMA.
Table 14-1: List of Protected Monuments in BMA
Sl.
No
Archaeology Survey of India (Central
Protected)
Department of Archaeology, Museums and
Heritage, GoK (State Protected)
1. Banaglore Old Dungeon Fort and
Gate
Basavesvara Temple
2. Tippu Sultan’s Summer Palace Bowring Institute
3. Gavi -Gangadhareswara Temple at Gavipuram
4. 4 no.s of Kempe Gowda's Watch Towers (Lal
Bagh, Gavi puram, along Bellary Road)
5. Mallikarjuna Temple and Boulder Inscription at
Colonial Bungalow on Kenchappa Road

Revised Master Plan for Bengaluru - 2031 (Draft): Volume-3
142
Sl.
No
Archaeology Survey of India (Central
Protected)
Department of Archaeology, Museums and
Heritage, GoK (State Protected)
Basavanagudi
6. Sri Nagareshwara Group of Temples at Begur
7. Venkataramanaswami Temple at V.V. Puram
Source: ASI, GoI, and Department of Archaeology, Museums and Heritage, GoK
Figure 14-3: Protected Monuments in Bengaluru
This is against the listing of 747 heritage buildings prepared by INTACH for the erstwhile Bangalore
Urban Arts Commission (BUAC) (constituted in 1983 and disbanded since 2002). This clearly
indicated the urgent need for greater heritage awareness and sensitiveness amongst governing
agencies and citizens alike. As mentioned above, city does not have inventory of its heritage assets.
RMP 2031 has created the listing of heritage and cultural assets available in the Bengaluru.
The Revised Master Plan 2031 (RMP 2031) carried out the physical survey for identification of
heritage sites and has documented the heritage sites based on various parameters like spatial
location and extent, age of the building, building use, ownership, classification of heritage and their
respective heritage value.
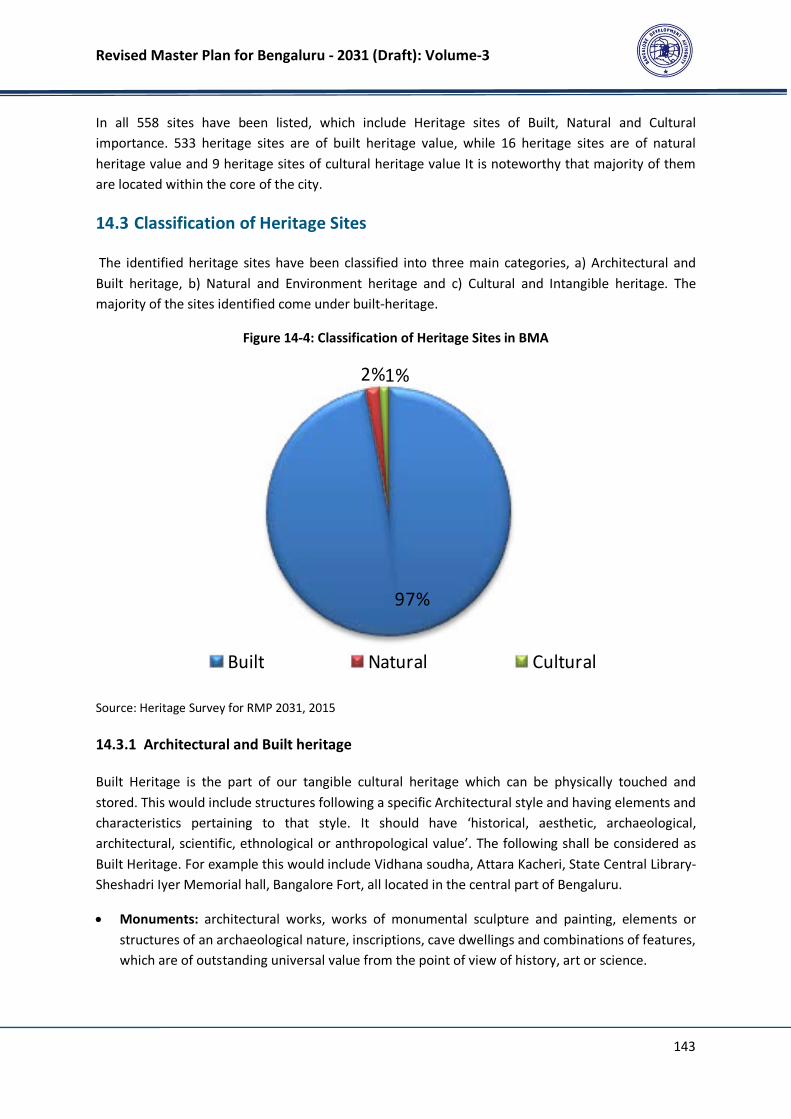
Revised Master Plan for Bengaluru - 2031 (Draft): Volume-3
143
In all 558 sites have been listed, which include Heritage sites of Built, Natural and Cultural
importance. 533 heritage sites are of built heritage value, while 16 heritage sites are of natural
heritage value and 9 heritage sites of cultural heritage value It is noteworthy that majority of them
are located within the core of the city.
14.3 Classification of Heritage Sites
The identified heritage sites have been classified into three main categories, a) Architectural and
Built heritage, b) Natural and Environment heritage and c) Cultural and Intangible heritage. The
majority of the sites identified come under built-heritage.
Figure 14-4: Classification of Heritage Sites in BMA
Source: Heritage Survey for RMP 2031, 2015
14.3.1 Architectural and Built heritage
Built Heritage is the part of our tangible cultural heritage which can be physically touched and
stored. This would include structures following a specific Architectural style and having elements and
characteristics pertaining to that style. It should have ‘historical, aesthetic, archaeological,
architectural, scientific, ethnological or anthropological value’. The following shall be considered as
Built Heritage. For example this would include Vidhana soudha, Attara Kacheri, State Central Library-
Sheshadri Iyer Memorial hall, Bangalore Fort, all located in the central part of Bengaluru.
• Monuments: architectural works, works of monumental sculpture and painting, elements or
structures of an archaeological nature, inscriptions, cave dwellings and combinations of features,
which are of outstanding universal value from the point of view of history, art or science.
97%
2%1%
Built Natural Cultural
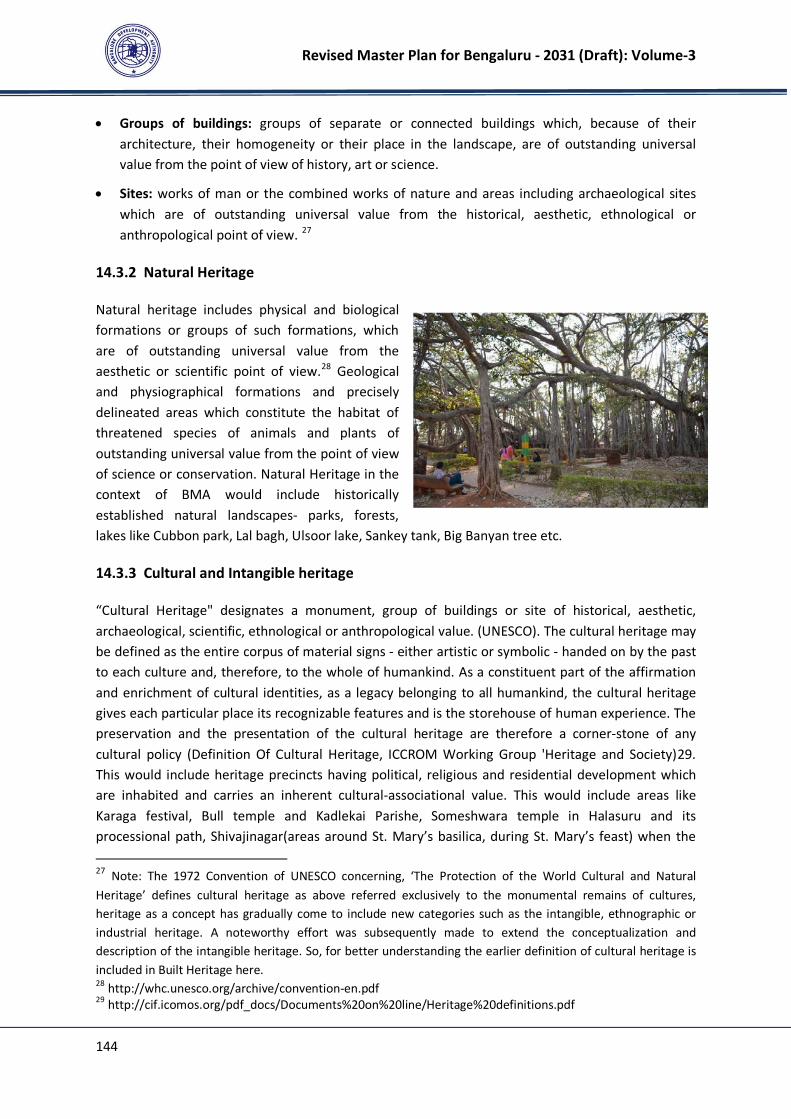
Revised Master Plan for Bengaluru - 2031 (Draft): Volume-3
144
• Groups of buildings: groups of separate or connected buildings which, because of their
architecture, their homogeneity or their place in the landscape, are of outstanding universal
value from the point of view of history, art or science.
• Sites: works of man or the combined works of nature and areas including archaeological sites
which are of outstanding universal value from the historical, aesthetic, ethnological or
anthropological point of view. 27
14.3.2 Natural Heritage
Natural heritage includes physical and biological
formations or groups of such formations, which
are of outstanding universal value from the
aesthetic or scientific point of view.28
Geological
and physiographical formations and precisely
delineated areas which constitute the habitat of
threatened species of animals and plants of
outstanding universal value from the point of view
of science or conservation. Natural Heritage in the
context of BMA would include historically
established natural landscapes- parks, forests,
lakes like Cubbon park, Lal bagh, Ulsoor lake, Sankey tank, Big Banyan tree etc.
14.3.3 Cultural and Intangible heritage
“Cultural Heritage" designates a monument, group of buildings or site of historical, aesthetic,
archaeological, scientific, ethnological or anthropological value. (UNESCO). The cultural heritage may
be defined as the entire corpus of material signs - either artistic or symbolic - handed on by the past
to each culture and, therefore, to the whole of humankind. As a constituent part of the affirmation
and enrichment of cultural identities, as a legacy belonging to all humankind, the cultural heritage
gives each particular place its recognizable features and is the storehouse of human experience. The
preservation and the presentation of the cultural heritage are therefore a corner-stone of any
cultural policy (Definition Of Cultural Heritage, ICCROM Working Group 'Heritage and Society)29.
This would include heritage precincts having political, religious and residential development which
are inhabited and carries an inherent cultural-associational value. This would include areas like
Karaga festival, Bull temple and Kadlekai Parishe, Someshwara temple in Halasuru and its
processional path, Shivajinagar(areas around St. Mary’s basilica, during St. Mary’s feast) when the
27
Note: The 1972 Convention of UNESCO concerning, ‘The Protection of the World Cultural and Natural
Heritage’ defines cultural heritage as above referred exclusively to the monumental remains of cultures,
heritage as a concept has gradually come to include new categories such as the intangible, ethnographic or
industrial heritage. A noteworthy effort was subsequently made to extend the conceptualization and
description of the intangible heritage. So, for better understanding the earlier definition of cultural heritage is
included in Built Heritage here. 28
http://whc.unesco.org/archive/convention-en.pdf 29
http://cif.icomos.org/pdf_docs/Documents%20on%20line/Heritage%20definitions.pdf
Revised Master Plan for Bengaluru - 2031 (Draft): Volume-3
145
streets are pedestrian-only streets during these festival. In addition, there are several fairs and
festivals that are organized/ celebrated in the City of Bengaluru having scale ranging from local to
international.
14.4 Delineation of Heritage Zones and Heritage Precincts
The RMP 2031 based on the identification, listing and spatial mapping of heritage sites, has
delineated Heritage Zones and identified Heritage Precincts for Bengaluru. A Heritage Zone is the
zone delineated in the Master Plan that requires special attention in terms of heritage conservation
and a Heritage Precinct means and includes spaces that require conservation or preservation for
historical or architectural or aesthetic or cultural or environmental or ecological purpose and walls
or other boundaries of a particular area or place or building which may enclose such space by an
imaginary line drawn around it. 30
As defined above, the heritage zones are to be treated as special areas around which the heritage
sites / buildings are retained/conserved/restored in best possible manner along with guiding and
regulating the proximal new development and or redevelopment as the same may be, by adopting
approaches that protects, conserves and enhance the heritage value of these heritage sites.
Proposals such as upgrading infrastructure, facilitating public transportation, providing for its better
access transportation are few of the aspects in a heritage zone that are required to be promoted.
It is envisaged that the heritage zones and precincts will engage the public and seek participation in
the process of development and conservation of these zones. The identified zones can be developed
based on their potentials such as administrative, tourism or residential heritage zones.
For the purpose of identifying and delineating Heritage Zones and precincts, the RMP 2031,
considered the following criteria:
1. Historicity of the Heritage area / building / monument
2. Urban Character and Nature of activities
3. Architectural Character and style
4. Spatial contiguity and congruence
Based on the above listed criteria of historicity, urban character and nature of activities,
architectural style, spatial congruity, the RMP 2031 has delineated 12 heritage zones in the LPA of
BDA. They are as following:
1. Central Administrative Heritage Zone
2. Petta and Bangalore Fort Heritage Zone
3. Gavipuram, Basavanagudi and VV Puram Heritage Zone
4. M.G.Road Heritage Zone
30
Model Heritage Guidelines, 2011; Town and Country Planning Office, Ministry of Urban Development, GoI.

Revised Master Plan for Bengaluru - 2031 (Draft): Volume-3
146
5. Shivajinagar Heritage Zone
6. Cleveland Town Heritage Zone
7. Richards Town Heritage Zone
8. Malleshwaram Heritage Zone
9. Ulsoor Heritage Zone
10. Whitefield Inner Circle Heritage Zone
11. Begur Temple Heritage Zone
12. Bangalore Palace Heritage Zone
Revised Master Plan for Bengaluru - 2031 (Draft): Volume-3
147
15 URBAN DESIGN
The urbanscape of a city constitutes the built man made environment of buildings, the streets along
which they are located, modelled to provide access to & fro places of living to work places and public
services through transport, communication interfaces that connect with places of natural
environment for leisure and recreation. In other words, cities are concentrated points for flows of
socio-cultural and economic exchange over space. These exchanges and flows happen between
buildings, streets, system of communication and utilities, places of work, along transportation
networks, leisure and meeting places of the city. Urban Design encompasses the design and
integration of the built form (i.e. urban structure and morphology or the relationship between
buildings and their form, in accordance with their typology) with the public realm (i.e. streets,
transport corridors, markets, parks & open spaces, lakes etc) into the city.
It is in this context that urban design is envisaged as a tool to realise sustainable planned urban
development and interventions to give the city a modern urban character, establish a strong public
realm that lends from its past and yet ushers into the future with a world view of a Global City.
15.1 Urban Design Strategies for RMP 2031
Urban Design helps in shaping the physical setting for life in cities, creating places where people
want to live, work and play. Urban Design guidelines aim to preserve and enhance the urban
character of different existing and future physical areas in the BMA. These guidelines will help to
ensure that developments integrate well with their surrounding urban environments. The following
are the urban design strategies that are proposed in RMP 2031.
1. Urban Design aspects for Certain Areas that require special and intended treatment
2. Providing for well-designed public realm
• Promoting Lake front and treatment to Buffer Areas for water bodies
• Providing Streetscape and Avenue Plantation
• Parks and Open Spaces
• Promoting and regulating Street Vending
3. Landscaping Plan for BMA.
4. Accessibility Improvement Plans for transportation modes and educational institutes
5. Conservation of Heritage Zones and Heritage Precincts
6. Providing for Universal Accessibility such that the city is accessible and made user friendly.
7. Regulating Signages and hoardings such that the visual character of the city is not marred.
Revised Master Plan for Bengaluru - 2031 (Draft): Volume-3
148
15.2 Urban Design Scheme
Master Plan proposes that Urban Design shall be embedded in all area development,
redevelopment, linear projects etc in consideration to physical features, providing improvements in
the physical layout, making infrastructure and amenities accessible and their upgradation,
conservation of heritage zones and precincts, managing the area to enhance health and safety of the
occupants, to support economic development as well as to enhance the quality of living,
environment, and preparation of area specific regulatory parameters for the area covered31
. Urban
design guidelines need to be formulated for specifications of plot frontage, building line regulations,
landscaping features and architectural elements, for specific particular plots/area. Local Area Plans
can be used on peri-urban areas for providing plot layouts, laying of infrastructure and providing
social amenities while respecting the traditional and prevalent culture of the people. This aids in
achieving structured development and densities along with visual integration.
15.3 Providing for Well-Designed Public Realm
15.3.1 Promoting Lake front and treatment to Buffer Areas for water bodies
Bengaluru requires urban places for recreation for its people. The lakes and water bodies can serve
as the public realm, but with careful consideration to the sensitive wetland ecosystem. Specific
guidelines are recommended, that regulates activities and other landscaped interventions.
15.3.2 Providing Streetscape and Avenue Plantation
The streetscape and visual character of any city is not resplendent without designed and well
thought out interventions in streetscape. Streetscape includes street furniture, road side planting,
street lighting, pedestrian and non-motorised lanes, spaces and pockets for street vending, public
interaction with surrounding land uses such as commercial, markets, institutions etc. the streetscape
is envisaged to enliven the spaces for vibrant and safe public interaction.
15.3.3 Parks and Open Spaces
RMP-2031 proposes Parks and Open spaces that are envisaged to provide public recreation,
conserve the ecology, and also provide for flood protection and ground water recharge. The
following are the guidelines;
• Parks and Open spaces are natural habitats of rich and varied flora and fauna. The habitats must
be conserved, and the open spaces must protect the ecology.
• Emphasis has to be given on native plants species, and only limited use of ornamental and
decorative plant species shall be allowed.
• The parks also have a role to play in flood control. All regional parks and zonal level parks to be
designed based on the gradient. Low lying areas in the park must not be paved.
31
Draft URDPFI Guidelines 2014

Revised Master Plan for Bengaluru - 2031 (Draft): Volume-3
149
• Rain Gardens and bio swales may be designed in zones identified as flood prone, in smaller parks
where the pervious area is less.
15.4 Universal Accessibility
Any public open space needs to be accessible to everyone, irrespective of their disabilities and
shortcomings. Most areas in the open space should be accessible for the differently-abled. Elderly
need passive recreation and some amount of active recreation. Frequent seating needs to be
provided along the walkways for resting. Sufficient lighting along the walking tracks. Activities for
adults may include passive recreation as well as active recreation like outdoor Gym, jogging track,
and sports. Play areas for children of school going age (shall involve a lot of running and active
recreation) is necessary in suitable areas within the parks. Safety of Toddlers shall be taken care of.
Smaller level plays spaces within the parks, which can be easily monitored. The Universal
Accessibility and Urban design Guidelines for Public Spaces are as following:
Guidelines for Footpaths, Paving and Street Furniture:
1. Public walkways, footpaths must be minimum 1.2 m wide with a maximum gradient of 1 in 20
and must have ramps at all the entrances for entry and exit.
2. The footpaths should be well lit, with proper marking.
3. Tactile paving should be used for lead persons with vision impairments to the lifts, crossings,
toilets, bus stops etc, and away from the flowing traffic.
4. Obstructions: A 1500 – 2000mm pathway (depending on pedestrian volumes) clear from any
obstruction must be dedicated to pedestrian use. Trees, planters, street furniture etc must be
placed beyond this 1500 m.
5. Bollards: A minimum width of 815 mm between bollards is required for the passage of
wheelchairs.
6. Seats: All public walk ways must preferably be provided with seating facilities, and the seats
should be easily accessible to the differently abled.
Universal Accessibility for Transportation
1. At least one accessible route should be provided from the alighting and boarding point of the
bus stand to the walkway that leads to the accessible building entrance.
2. Public transport system must be barrier free with easy entry from bus stop/rail station, into the
vehicle, for all groups of users using person using wheelchairs.
3. Bus stops with designated spaces to wait and relax (Urban Mobility India)
4. Alighting and Boarding Areas:
5. Directional signs should be installed to direct the differently abled to an accessible entrance.
6. Guiding blocks should be provided along the accessible walkway from the bus stand to the
building entrance to aid persons with visual impairments.
Revised Master Plan for Bengaluru - 2031 (Draft): Volume-3
150
7. The bus stand shall have optimum illumination levels (minimum 35 to 40 lux) for ease of
visibility.
8. Accessible car parking to be provided in the parking areas, with 1200 metres access for
wheelchair. Where there are two accessible parking bays adjoining each other, then the
1200mm side transfer bay may be shared by the two parking bays. The transfer zones, both on
the side and the rear should have yellow or white cross-hatch road markings.
9. Accessible parking lots that serve a building should be located nearest to an accessible entrance
and / or lift lobby within 30 meters. In case the access is through lift, the parking shall be located
within 30 meters. The accessible route of 1200 mm width is required for wheelchair users to
pass behind vehicle that may be backing out.
10. International symbol of accessibility (wheelchair sign) should be displayed at approaches and
entrances to car parks to indicate the provision of accessible parking lot for Persons with
Disabilities within the vicinity.
11. Appropriate signage including directional signs must be installed at suitable location.
12. Accessible parking lots that serve a building should be located nearest to an accessible entrance
and / or lift lobby within 30 meters. In case the access is through lift, the parking shall be located
within 30 meters. The accessible route of 1200 mm width is required for wheelchair users to
pass behind vehicle that may be backing out.
13. Foot over bridge, pedestrian underpass: Any pedestrian foot-over bridge or pedestrian
underpass must be installed with Elevators and ramps for differently-abled persons. The entry to
the underpass/ foot over bridge must have ramps if there is any difference in level.
Universal Accessibility for Public buildings
1. All public buildings must comply with accessibility requirements for differently abled persons,
including government institutions, office buildings, residential buildings, commercial buildings,
health facilities, restaurants, recreational and sports facilities, religious buildings and all other
building types used by the general public.
2. Entrance: At least one entrance per facility should be accessible to a wheelchair user. For new
buildings, the accessible entrance(s) should be the main entrance(s), and not side or back entry,
intended for use by the public.
3. Facilities: Wherever waiting areas, coffee shops, display areas, merchandising departments,
service areas, ticket counters, refreshment stands, etc. are provided for public use, these
facilities should be accessible to all Persons with Disabilities and not just wheelchair users only.
4. Washroom: In all buildings at least one unisex accessible washroom/toilet should be provided. In
multi-level buildings all floors should have one such facility near the general washrooms.
5. Vertical Transportation (Ramps, Elevators and escalators): Ramps must be installed in all public
buildings to the plinth level. All public buildings should be accessible by lift / ramp on the upper
floors.
6. Lighting: All pathways must be lit properly.
Revised Master Plan for Bengaluru - 2031 (Draft): Volume-3
151
7. Signage: All areas in public building should have proper signage for entry, exits, and fire escape.
Universal Accessibility for Recreation- Parks and Open Spaces
1. There should not be any difference in level around an approach to a park and/or park roads. If a
level difference is unavoidable, a ramp must be provided for every level change, in addition to
steps if any.
2. Benches, dustbins and drinking fountains should be installed with adequate space around them
for wheelchair users to manoeuvre.
3. A level landing should be provided before and after the change in level, and the level changes
must be negotiable in wheelchair.
Revised Master Plan for Bengaluru - 2031 (Draft): Volume-3
152
16 MASTER PLAN PROJECTS AND PHASING
16.1 Project Listing
To ensure the implementation of Master Plan proposals, the proposals have been projectised. The
clear definition of projects, responsible agencies and time schedule shall help line departments
visualise long term requirements and prioritise their actions in their budgets and financial resources
taking into account the projects identified by Master Plan. Projectisation would also help in better
coordination among various line agencies and concerned stakeholders. Broadly following are the
Projects and Programmes identified by Master Plan for implementation:
A. Road Development Plan: This includes following components
1. Demarcation of Master Plan Roads (18m above only) on Ground
2. Upgradation/ Widening of Existing Roads
3. Development of New Links
4. Junction Improvement Programme and Development of Flyovers/ Railway Bridges
5. Preparation of Parking plans for Streets/ Areas
B. Public Transport Network Development: This includes following components
1. Development of Commuter Rail Service
2. Development of Metro Network
3. Development of LRT/Mono Rail/ BRTS
4. Development of Intermodal Interchanges
5. Development ISBTs
6. Development of Bus Stations/ Terminals
C. Development of Logistic Facilities: This includes following components
1. Demarcation of Land for Logistic Facilities
2. Development of Logistic Hubs/ Truck Terminals
D. Rejuvenation of Lakes and Streams: This includes following components
1. Prioritise Lakes for Rejuvenation
2. Demarcation of Lakes Extent
Revised Master Plan for Bengaluru - 2031 (Draft): Volume-3
153
3. Demarcation of Primary, Secondary & Tertiary Drains (which are not existing on ground, missing
links only)
4. Preparation of Lake Rejuvenation Plans and Lake Area Development Plan
5. Preparation of Stream Development Plans
6. Implementation of Plans and Project for Lake & Stream Rejuvenation
E. Green Development Plan: This includes following components
1. Demarcation of Regional Parks
2. Demarcation of Other Parks
3. Land Acquisition of Regional & Other Parks
4. Development of Parks and Open Spaces (Regional Parks & Other Parks)
5. Avenue Plantation (Master Plan Roads)
6. NGT Buffer Area Development
7. Block Plantation in Villages / Forest Areas
8. Development of Sports Complex’s
F. Redevelopment/ Upgradation/ Development Plans: This includes following components
1. Preparation of Industrial Area/ Estates Redevelopment Plans
2. Preparation of Area Redevelopment Plans/ Upgradation of Urban Villages
3. Preparation of Slum Redevelopment Plans
4. Preparation of Village Development Plans
G. Heritage Area Protection and Conservation Scheme: This includes following components
1. Grading and Listing of Heritage Buildings
2. Preparation of Heritage Master Plan for Bengaluru
H. Development of Social Infrastructure: This includes following components
1. Development of Crematoriums/ Graveyards
a. Land Identification and Demarcation of Land
b. Development of Facility
2. Development of Fire Stations
a. Land Identification and Demarcation of Land
Revised Master Plan for Bengaluru - 2031 (Draft): Volume-3
154
b. Development of Facility
3. Development Night Shelters
a. Land Identification and Demarcation of Land
b. Development of Facility
4. Street Vending
a. Preparation of Street Vending Plan
b. Declaration of Street Vending Zones and Streets
I. Development of Physical Infrastructure: This includes following components
Water Supply & Sewerage
1. Finalisation of Water Source and development of Trunk Pipeline to BMA
2. Development of Water Supply and Sewerage Network for BBMP
3. Preparation of Water Supply and Sewage Network Plan for areas outside BBMP
4. Development of Water Supply and Sewerage Network for Areas outside BBMP
Solid Waste Management
5. Demarcation of Land and Development of SWM facilities
a. Dry Waste Collection Centre
b. Organic Waste Collection Center (OWCC)
c. Aggregators (AGGR)
d. Bio-Methanation Units (BMU)
e. Coconut waste Processing Unit (CPU)
f. Integrated Waste Processing unit (IWPU)
g. Central processing unit
h. Leaf litter
i. Landfill
Power Supply
6. Demarcation of Land and Development of Sub-station (220kv only)
J. Disaster & Hazard Management: This includes following components
1. Preparation of Disaster & Hazard Mitigation Plan
2. Implementation of Components and Projects of Disaster & Hazard Mitigation Plan

Revised Master Plan for Bengaluru - 2031 (Draft): Volume-3
155
K. Town Planning Scheme / Development Schemes: This includes following components
1. Prioritise Area for TPS / DS/ SDZ
2. Identity extent and declare intention of prepare TPS / DS (2/3 Schemes)
3. Planning & Implementation of Scheme
16.2 Phasing and Responsible Agencies
Table 16-1 lists the projects/ actions proposed by Master Plan, the responsible agencies and phasing
of projects (time schedule).
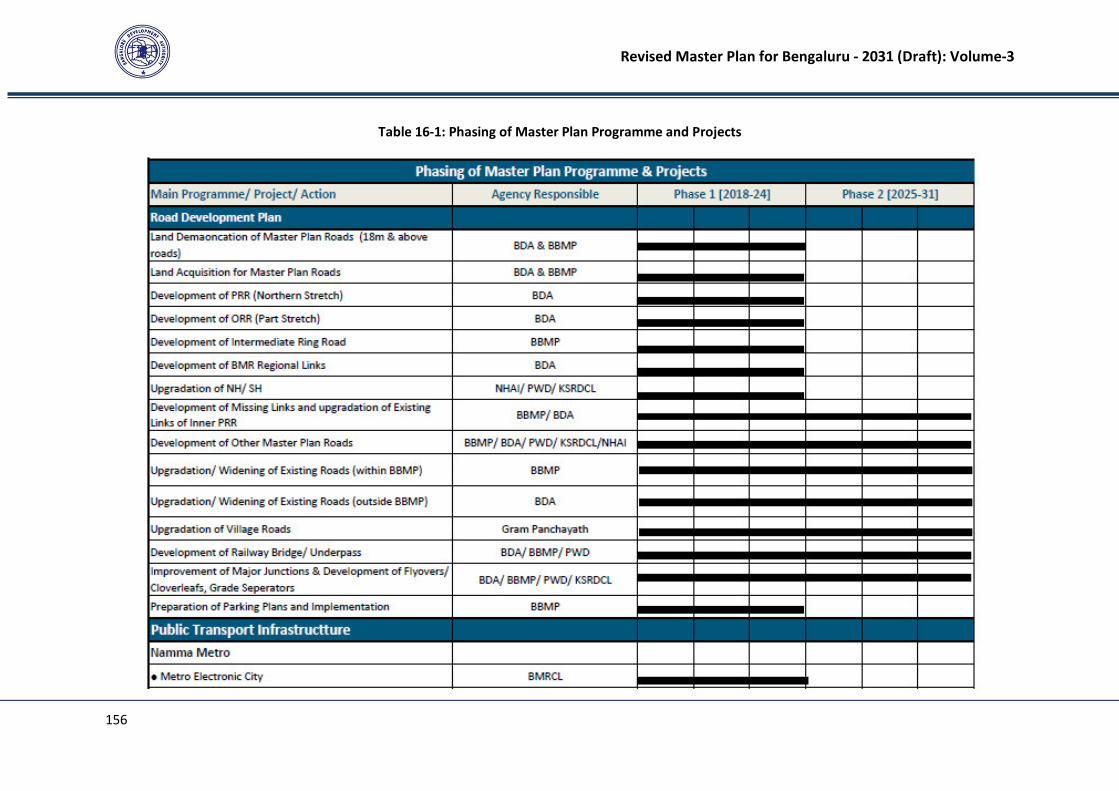
Revised Master Plan for Bengaluru - 2031 (Draft): Volume-3
156
Table 16-1: Phasing of Master Plan Programme and Projects

Revised Master Plan for Bengaluru - 2031 (Draft): Volume-3
157

Revised Master Plan for Bengaluru - 2031 (Draft): Volume-3
158
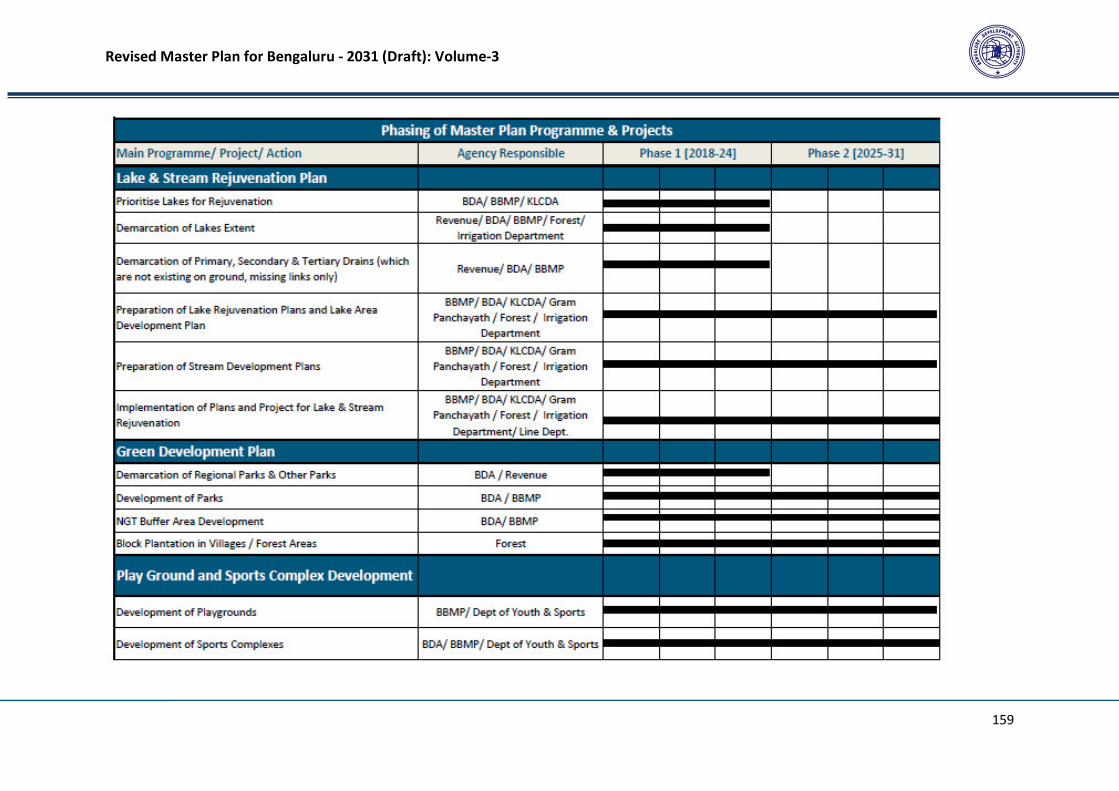
Revised Master Plan for Bengaluru - 2031 (Draft): Volume-3
159
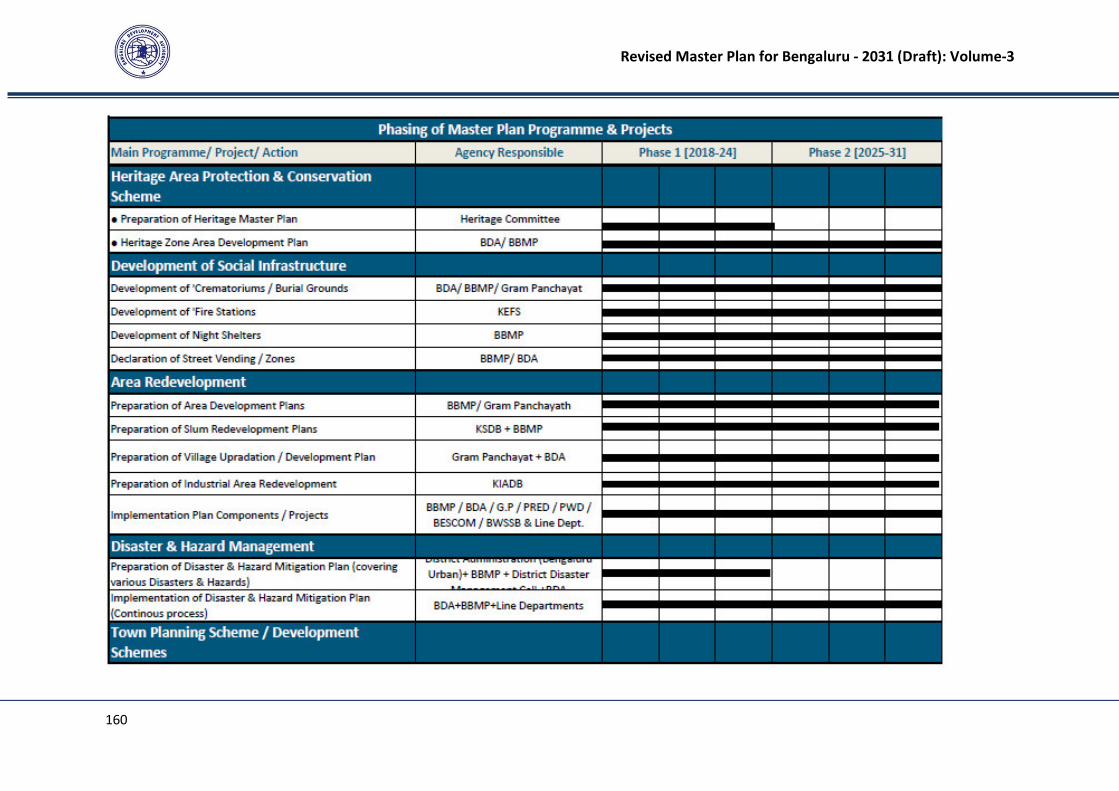
Revised Master Plan for Bengaluru - 2031 (Draft): Volume-3
160

Revised Master Plan for Bengaluru - 2031 (Draft): Volume-3
161
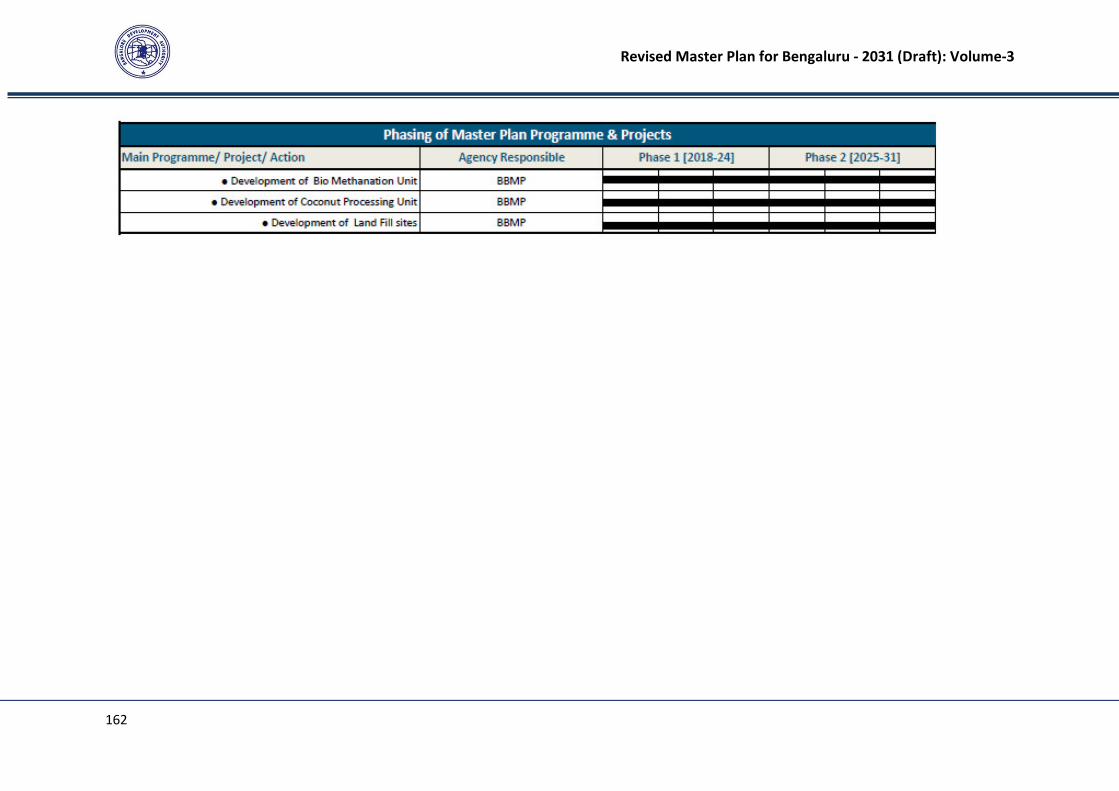
Revised Master Plan for Bengaluru - 2031 (Draft): Volume-3
162
Revised Master Plan for Bengaluru - 2031 (Draft): Volume-3
163
17 IMPLEMENTATION AND FINANCIAL FRAMEWORK
The RMP-2031 has evolved a spatial plan and identified various project proposals with regard to the
different components of infrastructure and urban development. The responsibility for
implementation of projects across different sectors along with the phasing plan and the agencies
responsible for the implementation of these projects has been illustrated in the previous section.
The RMP 2031 has taken cognizance of the major hurdles including (i) gaps in the existing
institutional framework and the areas of strengthening the Institutional Arrangements with regard
to the enforcement and implementation of the Plan; (ii) Access to Land and Land Procurement; and
(iii) Financial Resources for Plan Implementation.
17.1 Institutional Framework
Considering the complexities of administrative and spatial jurisdictional for BMA, RMP-2031 has
envisioned the streamlining of the institutional framework for effective implementation and
enforcement of the Plan. The key components of the Institutional framework are defined in the
following sections.
17.1.1 Role of Metropolitan Planning Committee
RMP 2031 for the LPA of BDA covers the areas under the jurisdictions of BBMP as well as 251 Gram
Panchayats (in full or part). In addition, the LPA of BMICAPA also integrated symbiotically with LPA of
BDA as part of the BMA. For effective implementation of RMP 2031, large number of projects and
developments would involve issues related to (i) translating the RMP 2031 into development plan (5
year plan and annual plans) for implementation in phased manner; (ii) coordination between
multiple institutions of local self-government with regard to the matters of common interest; (iii)
sharing of resources, financial, physical and natural, available with different sectoral departments.
RMP 2031 strongly recognizes and envisages the critical role of Metropolitan Planning Committee
(MPC) in context of the provisions of the 74th Constitution Amendment Act. RMP 2031 envisages
that MPC being an institution with jurisdictions across municipal and panchayats shall be able
address the issue mentioned above for successful implementation of RMP 2031.
17.1.2 Strengthening the Master Plan Implementation Process within BDA
BDA endeavours to take the following actions targeted towards strengthening of the Master Plan
Implementation Process and making it citizen friendly through improved governance measures.
A. Setting-up the Spatial Data Management Cell (SDMC)
BDA will set-up this cell under the ambit of the Town Planning Section which shall be responsible for
managing the GIS data base created under the RMP-2031. The Cell shall be responsible for updation
of the planning permissions granted in GIS data base and make the information related to
permissions granted accessible to general public. The Cell shall manage the uploading and
Revised Master Plan for Bengaluru - 2031 (Draft): Volume-3
164
availability of RMP-2031 on-line in a user friendly interactive mode for citizens to access the
information related to their land with regard to the Proposals under RMP-2031.
SDMC shall also maintain the database of the land assets of the Authority including the CA/ open
space/ EWS housing/roads land parcels relinquished in favour of the Authority as part of the
planning permissions as well as the government lands transferred to the Authority for different
projects like affordable housing, commercial exploitation for project financing etc.
SDMC shall also be responsible for linking the database on Development Rights issued by the BDA
and BBMP and its online updation of information on the availability of TDR.
BDA also intends to set-up a system for on-line applications for Planning Permission, change of land
use.
B. Special Development Zone Cell (SDZC)
The RMP 2031 has proposed five Special Development Zones envisaged as high density zones and
are envisioned to be implemented through Development Scheme or and Town Planning Scheme
Model by the Authority. The SDZC shall be responsible for formulation, notification, implementation,
resource mobilisation and regulation of the developments in these zones.
The SDZC shall also be responsible for assisting the Authority and the GoK for the development of
policy, legislative and regulatory framework for land pooling and land assemblage through alternate
mechanisms.
17.1.3 Coordination with Adjoining LPAs
The proposals of BMRSP 2031 with regard to the regional road network have been integrated as part
of RMP-2031 based on the ground situation and utilizing the alignment of proposed PRR (100 m
RoW). The institution of BMRDA is already in place for coordination of these projects.
17.1.4 BDA and BBMP Coordination
BBMP is the key agency for enforcement of RMP-2031 within the BBMP limits, the coordination
between the BDA and the BBMP is a pre-requisite for effective implementation and enforcement of
the plan. The Spatial Data Management Cell proposed as part of the BDA will be responsible for the
coordination with the IT Cell of the BBMP. All building permissions within the BBMP area are
envisaged to be aligned with the database of planning permissions inclusive of change of land use
managed by SDMC.
17.1.5 Municipalisation of Conurbation Limit
RMP 2031 also recognises the importance of municipalisation of the rural areas incorporated as part
of the conurbation limit of RMP-2031 and envisages that by the end of the plan period as the areas
under conurbation transforms from rural to urban character, the areas would be brought under the
Municipal Umbrella from the perspective of management of urban services.

Revised Master Plan for Bengaluru - 2031 (Draft): Volume-3
165
17.2 Financial Framework for RMP-2031
The financing of infrastructure and Urban Development projects can be broadly classified into two
major components i.e. (i) Land Procurement and (ii) Development Cost, for majority of the city level
infrastructure/ urban development projects. The operation and maintenance of these projects, a
very critical component for the sustenance of the capital investments, has been considered to be
financed through the existing institutional mechanisms in place under different agencies including
the levy of statutory taxes, user charges/ user fee/ service charges by the service providing agencies
and budgetary allocations from state governments in the form of grants to various agencies.
17.2.1 Land Procurement
RMP 2031 has also recognized the provisions of the Section 69(2) of the KTCP Act, 1961 with regard
to the validity of the designated land use for a period of five years and subsequent lapse of the
assigned land use for the purposes defined under Section 12 other than the land earmarked for
roads and traffic circulation. RMP 2031 has identified the location for regional parks/city parks and
public utilities. An effort has been made to earmark the land for regional parks/city parks and public
utilities in the government land to the extent possible and it is envisaged that the concerned
agencies shall initiate the process for transfer/ allotment of government land or acquisition of the
land within the period of five years.
The land earmarked for roads is envisaged to be mobilized/ procured through the following
mechanisms:
(i) Relinquishment of land for Master Plan Roads in favour of the Authority as part of layout/ sub-
division and development plan approvals.
(ii) Acquisition of land as per the provisions of Karnataka Town and Country Planning (Benefit of
Development Rights) Rules, 2016
(iii) Transfer of Government Land parcels in the road alignment to the agency responsible for a
particular road project
(iv) Transferring Developed Land in lieu of Acquired Land based on the guidance values of land in the
two areas
17.2.2 Development Cost
The financing of infrastructure and urban development projects for a large metropolitan city like
Bengaluru cannot be managed through resources generated by the local authorities/ agencies of the
state government alone and large share of financing comes through budgetary allocations from the
state or central government under various programs.
In addition, RMP 2031 also recognizes the important role that the private sector would need to play
in supplementing the efforts made by the local authorities/ state through their participation in the
implementation of projects either directly or through the Public Private Partnership models.

Revised Master Plan for Bengaluru - 2031 (Draft): Volume-3
166
The infrastructure projects identified under the RMP-2031 for agencies other than BDA are
envisaged to be aligned with the budgets of the respective agencies.
The BDA which shall have major role in the development of the major master plan roads especially in
the undeveloped areas within the proposed conurbation limit outside the BBMP limits or certain
sections/ links of major roads within the BBMP limits, affordable housing and Regional Parks shall
endeavour to mobilise resources through financing instruments including:
i. levy of betterment taxes by notifying SDZs as Development Schemes under Section 20 of the
BDA Act
ii. land monetisation from the CA sites relinquished in favour of the Authority
iii. private sector participation in development of roads as part of the layout/ DP approval
provisions in the ZR for access roads as well as Master Plan Roads
iv. mobilise project financing for major master plan/ regional level roads from NHAI/ budgetary
allocations with the state road agencies through MPC
v. resources available under housing programs of the central and state government in
collaboration with BBMP for affordable housing especially focussing on the EWS section
In addition, the Authority also intends to initiate the process of exploring new avenues with the
approval of the GoK through legislative enactments and policy directions. The potential areas
identified by the Authority for generating additional resources for the implementation of RMP-2031
include:
i. Introduction of Premium FAR and External Development Charges through amendment in KTCP
Act
ii. Assignment of share of state revenues from Stamp Duty and Registration Fees collected from
within BMA area to the Authority which shall be exclusively used for the development of road
infrastructure
iii. Levy of environmental cess on state taxes on petrol for the petrol pumps within the BMA which
shall be exclusively used for development of the regional parks and implementation of other
environmental measures related to lake rejuvenation and streams development
iv. Redefining the role of the Authority in terms of facilitator for availability of developed bulk land
through land pooling mechanisms and development of trunk infrastructure directly or through
joint venture models
v. Commercial exploitation of government land parcels allotted to BDA free of cost for project
financing of major road projects and commercial component in affordable housing projects
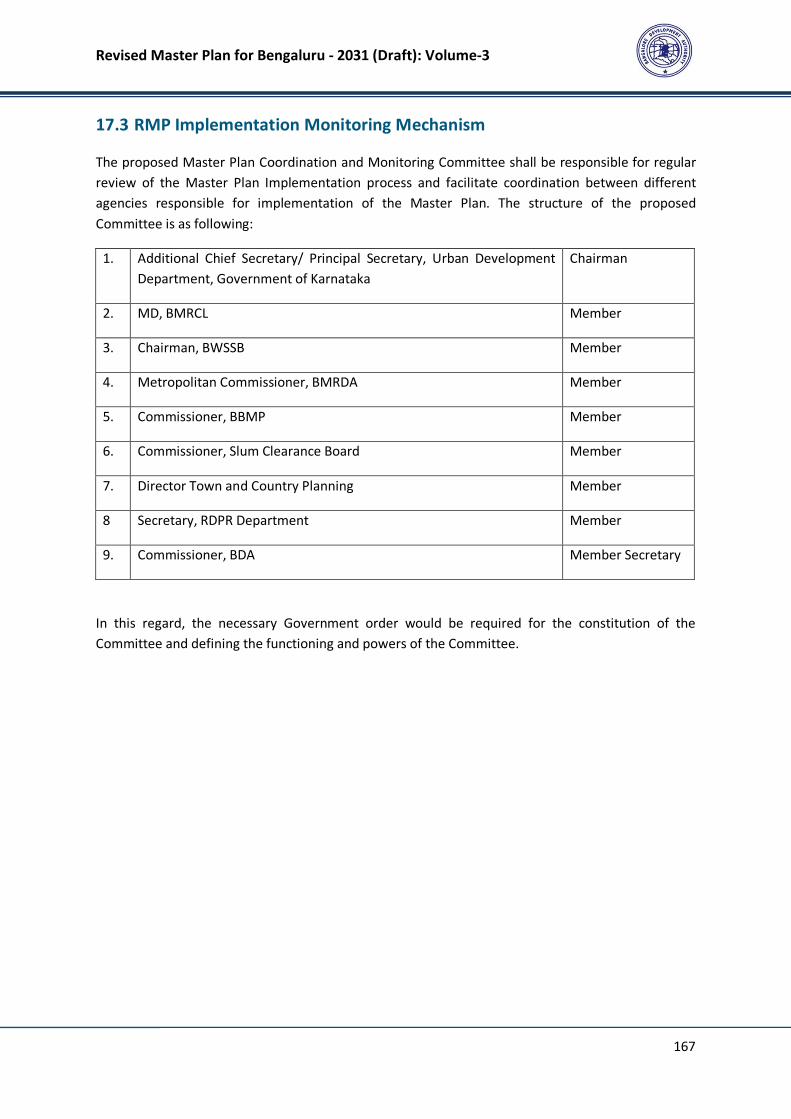
Revised Master Plan for Bengaluru - 2031 (Draft): Volume-3
167
17.3 RMP Implementation Monitoring Mechanism
The proposed Master Plan Coordination and Monitoring Committee shall be responsible for regular
review of the Master Plan Implementation process and facilitate coordination between different
agencies responsible for implementation of the Master Plan. The structure of the proposed
Committee is as following:
1. Additional Chief Secretary/ Principal Secretary, Urban Development
Department, Government of Karnataka
Chairman
2. MD, BMRCL Member
3. Chairman, BWSSB Member
4. Metropolitan Commissioner, BMRDA Member
5. Commissioner, BBMP Member
6. Commissioner, Slum Clearance Board Member
7. Director Town and Country Planning Member
8 Secretary, RDPR Department Member
9. Commissioner, BDA Member Secretary
In this regard, the necessary Government order would be required for the constitution of the
Committee and defining the functioning and powers of the Committee.
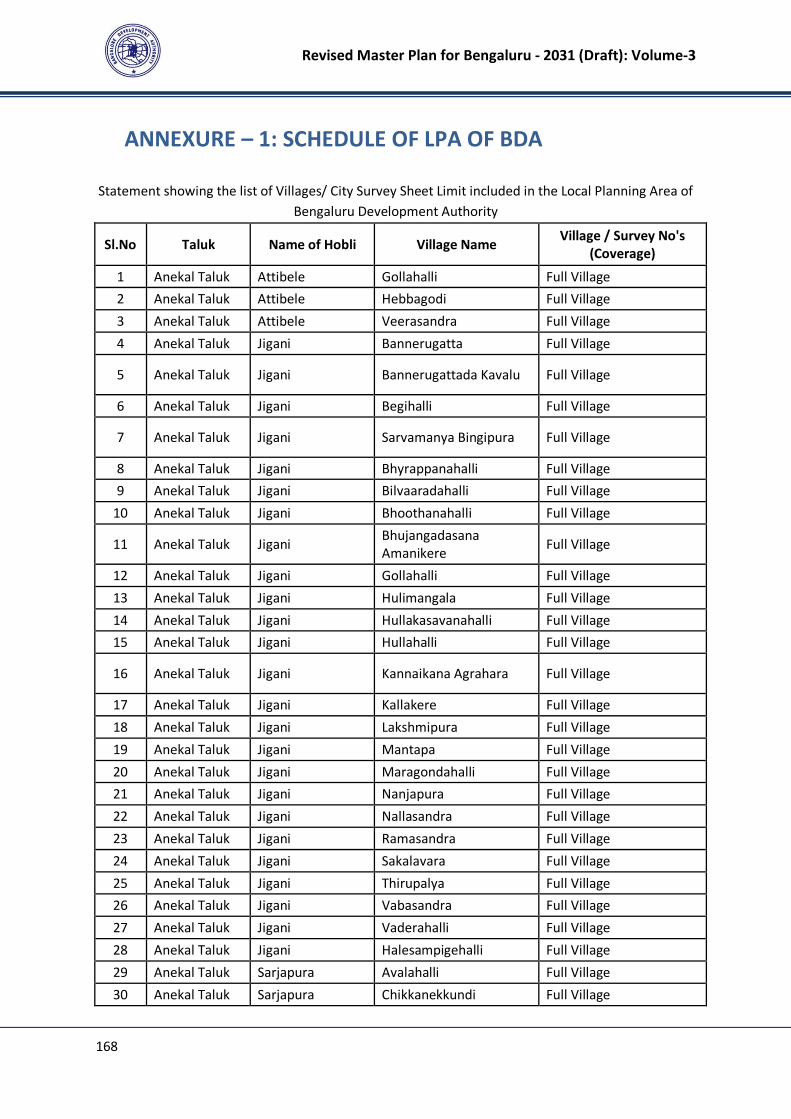
Revised Master Plan for Bengaluru - 2031 (Draft): Volume-3
168
ANNEXURE – 1: SCHEDULE OF LPA OF BDA
Statement showing the list of Villages/ City Survey Sheet Limit included in the Local Planning Area of
Bengaluru Development Authority
Sl.No Taluk Name of Hobli Village Name Village / Survey No's
(Coverage)
1 Anekal Taluk Attibele Gollahalli Full Village
2 Anekal Taluk Attibele Hebbagodi Full Village
3 Anekal Taluk Attibele Veerasandra Full Village
4 Anekal Taluk Jigani Bannerugatta Full Village
5 Anekal Taluk Jigani Bannerugattada Kavalu Full Village
6 Anekal Taluk Jigani Begihalli Full Village
7 Anekal Taluk Jigani Sarvamanya Bingipura Full Village
8 Anekal Taluk Jigani Bhyrappanahalli Full Village
9 Anekal Taluk Jigani Bilvaaradahalli Full Village
10 Anekal Taluk Jigani Bhoothanahalli Full Village
11 Anekal Taluk Jigani Bhujangadasana
Amanikere Full Village
12 Anekal Taluk Jigani Gollahalli Full Village
13 Anekal Taluk Jigani Hulimangala Full Village
14 Anekal Taluk Jigani Hullakasavanahalli Full Village
15 Anekal Taluk Jigani Hullahalli Full Village
16 Anekal Taluk Jigani Kannaikana Agrahara Full Village
17 Anekal Taluk Jigani Kallakere Full Village
18 Anekal Taluk Jigani Lakshmipura Full Village
19 Anekal Taluk Jigani Mantapa Full Village
20 Anekal Taluk Jigani Maragondahalli Full Village
21 Anekal Taluk Jigani Nanjapura Full Village
22 Anekal Taluk Jigani Nallasandra Full Village
23 Anekal Taluk Jigani Ramasandra Full Village
24 Anekal Taluk Jigani Sakalavara Full Village
25 Anekal Taluk Jigani Thirupalya Full Village
26 Anekal Taluk Jigani Vabasandra Full Village
27 Anekal Taluk Jigani Vaderahalli Full Village
28 Anekal Taluk Jigani Halesampigehalli Full Village
29 Anekal Taluk Sarjapura Avalahalli Full Village
30 Anekal Taluk Sarjapura Chikkanekkundi Full Village
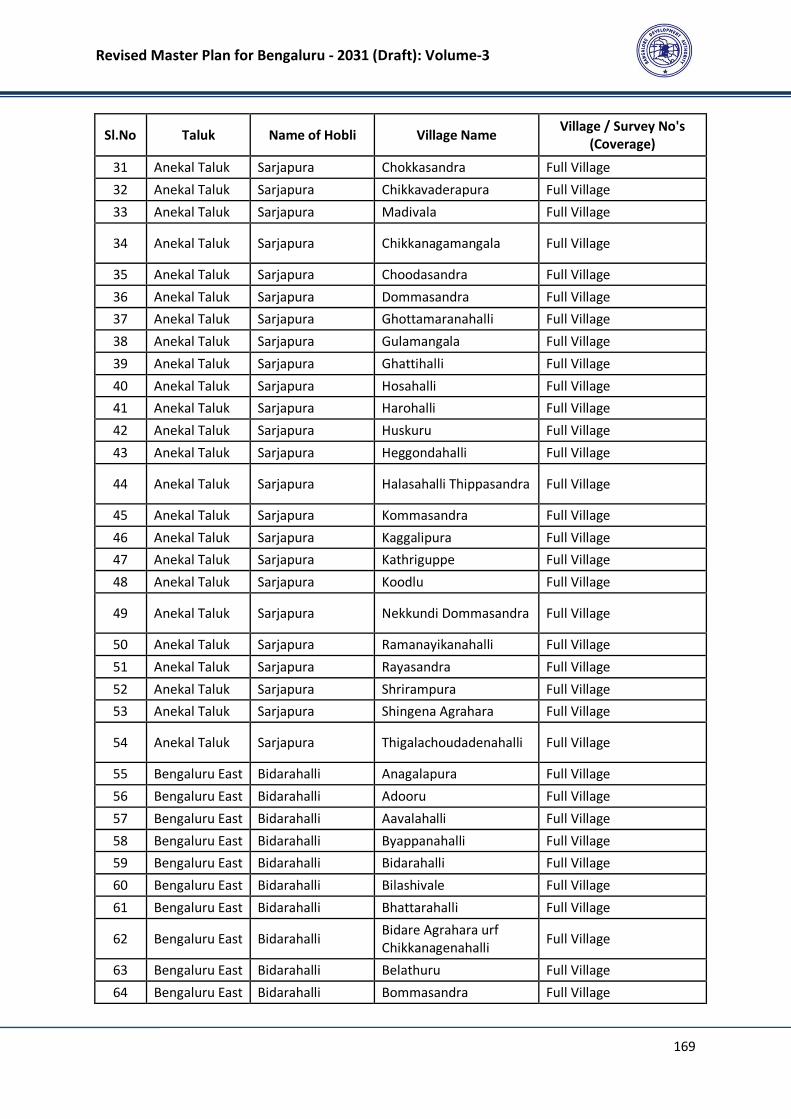
Revised Master Plan for Bengaluru - 2031 (Draft): Volume-3
169
Sl.No Taluk Name of Hobli Village Name Village / Survey No's
(Coverage)
31 Anekal Taluk Sarjapura Chokkasandra Full Village
32 Anekal Taluk Sarjapura Chikkavaderapura Full Village
33 Anekal Taluk Sarjapura Madivala Full Village
34 Anekal Taluk Sarjapura Chikkanagamangala Full Village
35 Anekal Taluk Sarjapura Choodasandra Full Village
36 Anekal Taluk Sarjapura Dommasandra Full Village
37 Anekal Taluk Sarjapura Ghottamaranahalli Full Village
38 Anekal Taluk Sarjapura Gulamangala Full Village
39 Anekal Taluk Sarjapura Ghattihalli Full Village
40 Anekal Taluk Sarjapura Hosahalli Full Village
41 Anekal Taluk Sarjapura Harohalli Full Village
42 Anekal Taluk Sarjapura Huskuru Full Village
43 Anekal Taluk Sarjapura Heggondahalli Full Village
44 Anekal Taluk Sarjapura Halasahalli Thippasandra Full Village
45 Anekal Taluk Sarjapura Kommasandra Full Village
46 Anekal Taluk Sarjapura Kaggalipura Full Village
47 Anekal Taluk Sarjapura Kathriguppe Full Village
48 Anekal Taluk Sarjapura Koodlu Full Village
49 Anekal Taluk Sarjapura Nekkundi Dommasandra Full Village
50 Anekal Taluk Sarjapura Ramanayikanahalli Full Village
51 Anekal Taluk Sarjapura Rayasandra Full Village
52 Anekal Taluk Sarjapura Shrirampura Full Village
53 Anekal Taluk Sarjapura Shingena Agrahara Full Village
54 Anekal Taluk Sarjapura Thigalachoudadenahalli Full Village
55 Bengaluru East Bidarahalli Anagalapura Full Village
56 Bengaluru East Bidarahalli Adooru Full Village
57 Bengaluru East Bidarahalli Aavalahalli Full Village
58 Bengaluru East Bidarahalli Byappanahalli Full Village
59 Bengaluru East Bidarahalli Bidarahalli Full Village
60 Bengaluru East Bidarahalli Bilashivale Full Village
61 Bengaluru East Bidarahalli Bhattarahalli Full Village
62 Bengaluru East Bidarahalli Bidare Agrahara urf
Chikkanagenahalli Full Village
63 Bengaluru East Bidarahalli Belathuru Full Village
64 Bengaluru East Bidarahalli Bommasandra Full Village
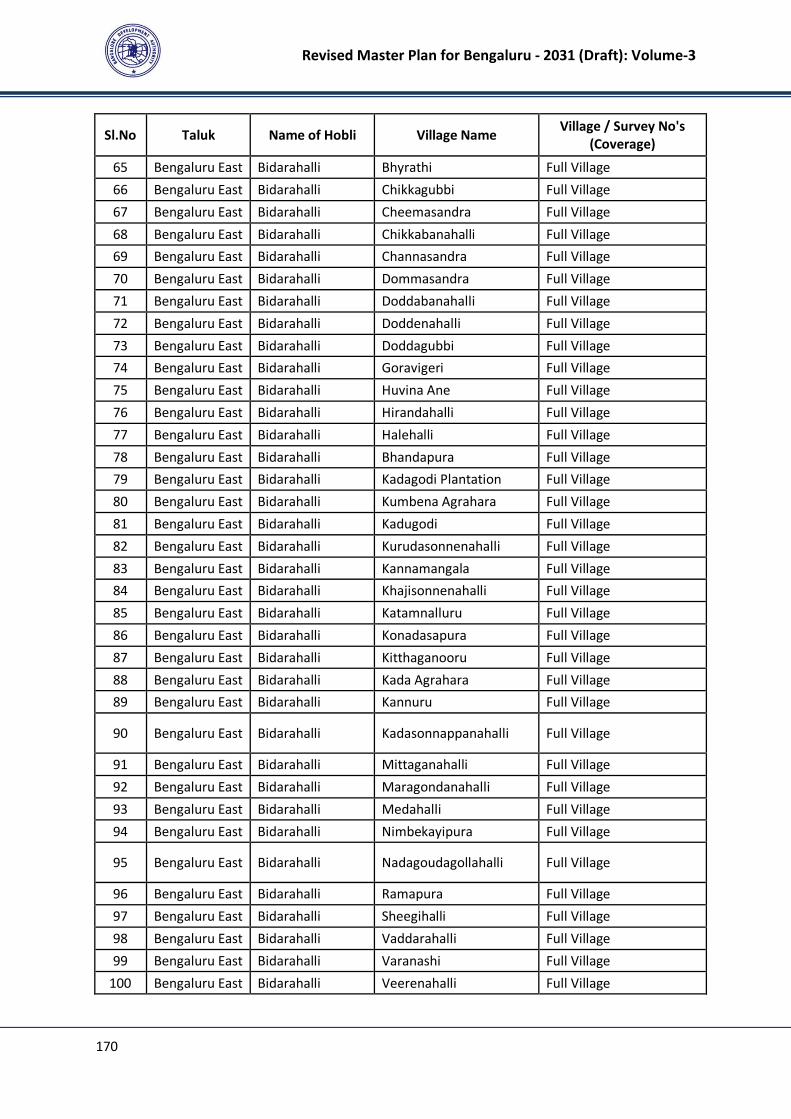
Revised Master Plan for Bengaluru - 2031 (Draft): Volume-3
170
Sl.No Taluk Name of Hobli Village Name Village / Survey No's
(Coverage)
65 Bengaluru East Bidarahalli Bhyrathi Full Village
66 Bengaluru East Bidarahalli Chikkagubbi Full Village
67 Bengaluru East Bidarahalli Cheemasandra Full Village
68 Bengaluru East Bidarahalli Chikkabanahalli Full Village
69 Bengaluru East Bidarahalli Channasandra Full Village
70 Bengaluru East Bidarahalli Dommasandra Full Village
71 Bengaluru East Bidarahalli Doddabanahalli Full Village
72 Bengaluru East Bidarahalli Doddenahalli Full Village
73 Bengaluru East Bidarahalli Doddagubbi Full Village
74 Bengaluru East Bidarahalli Goravigeri Full Village
75 Bengaluru East Bidarahalli Huvina Ane Full Village
76 Bengaluru East Bidarahalli Hirandahalli Full Village
77 Bengaluru East Bidarahalli Halehalli Full Village
78 Bengaluru East Bidarahalli Bhandapura Full Village
79 Bengaluru East Bidarahalli Kadagodi Plantation Full Village
80 Bengaluru East Bidarahalli Kumbena Agrahara Full Village
81 Bengaluru East Bidarahalli Kadugodi Full Village
82 Bengaluru East Bidarahalli Kurudasonnenahalli Full Village
83 Bengaluru East Bidarahalli Kannamangala Full Village
84 Bengaluru East Bidarahalli Khajisonnenahalli Full Village
85 Bengaluru East Bidarahalli Katamnalluru Full Village
86 Bengaluru East Bidarahalli Konadasapura Full Village
87 Bengaluru East Bidarahalli Kitthaganooru Full Village
88 Bengaluru East Bidarahalli Kada Agrahara Full Village
89 Bengaluru East Bidarahalli Kannuru Full Village
90 Bengaluru East Bidarahalli Kadasonnappanahalli Full Village
91 Bengaluru East Bidarahalli Mittaganahalli Full Village
92 Bengaluru East Bidarahalli Maragondanahalli Full Village
93 Bengaluru East Bidarahalli Medahalli Full Village
94 Bengaluru East Bidarahalli Nimbekayipura Full Village
95 Bengaluru East Bidarahalli Nadagoudagollahalli Full Village
96 Bengaluru East Bidarahalli Ramapura Full Village
97 Bengaluru East Bidarahalli Sheegihalli Full Village
98 Bengaluru East Bidarahalli Vaddarahalli Full Village
99 Bengaluru East Bidarahalli Varanashi Full Village
100 Bengaluru East Bidarahalli Veerenahalli Full Village
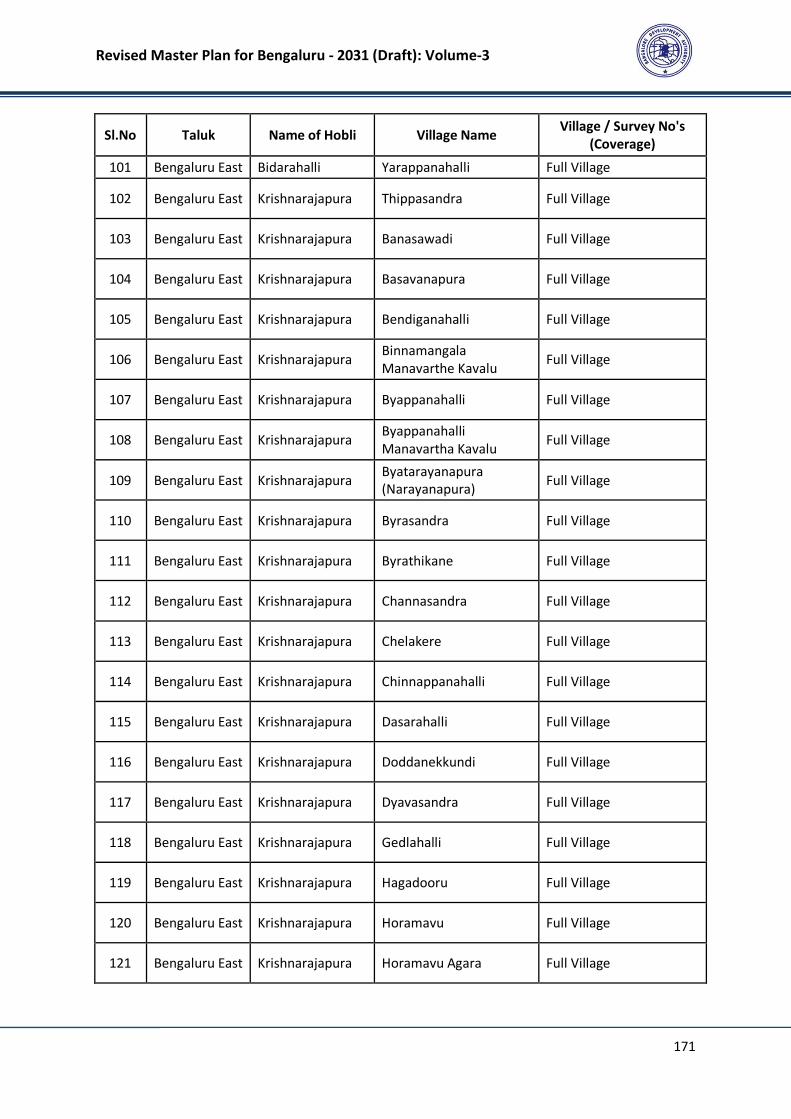
Revised Master Plan for Bengaluru - 2031 (Draft): Volume-3
171
Sl.No Taluk Name of Hobli Village Name Village / Survey No's
(Coverage)
101 Bengaluru East Bidarahalli Yarappanahalli Full Village
102 Bengaluru East Krishnarajapura Thippasandra Full Village
103 Bengaluru East Krishnarajapura Banasawadi Full Village
104 Bengaluru East Krishnarajapura Basavanapura Full Village
105 Bengaluru East Krishnarajapura Bendiganahalli Full Village
106 Bengaluru East Krishnarajapura Binnamangala
Manavarthe Kavalu Full Village
107 Bengaluru East Krishnarajapura Byappanahalli Full Village
108 Bengaluru East Krishnarajapura Byappanahalli
Manavartha Kavalu Full Village
109 Bengaluru East Krishnarajapura Byatarayanapura
(Narayanapura) Full Village
110 Bengaluru East Krishnarajapura Byrasandra Full Village
111 Bengaluru East Krishnarajapura Byrathikane Full Village
112 Bengaluru East Krishnarajapura Channasandra Full Village
113 Bengaluru East Krishnarajapura Chelakere Full Village
114 Bengaluru East Krishnarajapura Chinnappanahalli Full Village
115 Bengaluru East Krishnarajapura Dasarahalli Full Village
116 Bengaluru East Krishnarajapura Doddanekkundi Full Village
117 Bengaluru East Krishnarajapura Dyavasandra Full Village
118 Bengaluru East Krishnarajapura Gedlahalli Full Village
119 Bengaluru East Krishnarajapura Hagadooru Full Village
120 Bengaluru East Krishnarajapura Horamavu Full Village
121 Bengaluru East Krishnarajapura Horamavu Agara Full Village
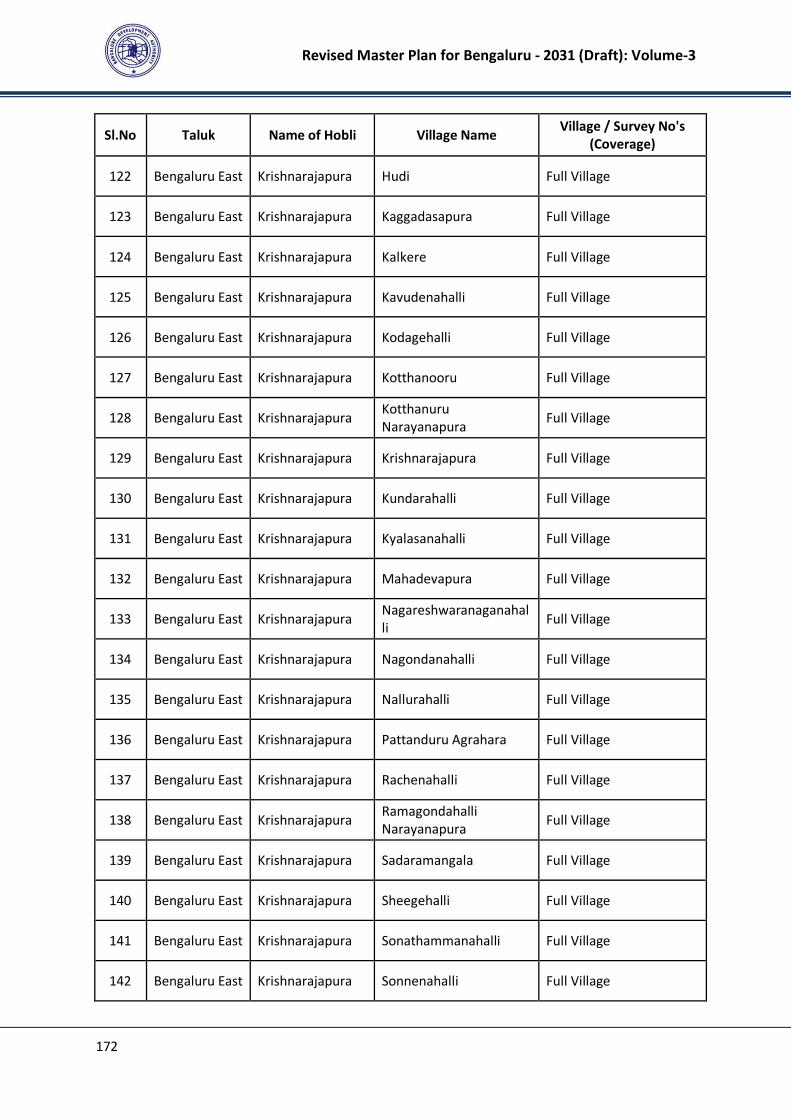
Revised Master Plan for Bengaluru - 2031 (Draft): Volume-3
172
Sl.No Taluk Name of Hobli Village Name Village / Survey No's
(Coverage)
122 Bengaluru East Krishnarajapura Hudi Full Village
123 Bengaluru East Krishnarajapura Kaggadasapura Full Village
124 Bengaluru East Krishnarajapura Kalkere Full Village
125 Bengaluru East Krishnarajapura Kavudenahalli Full Village
126 Bengaluru East Krishnarajapura Kodagehalli Full Village
127 Bengaluru East Krishnarajapura Kotthanooru Full Village
128 Bengaluru East Krishnarajapura Kotthanuru
Narayanapura Full Village
129 Bengaluru East Krishnarajapura Krishnarajapura Full Village
130 Bengaluru East Krishnarajapura Kundarahalli Full Village
131 Bengaluru East Krishnarajapura Kyalasanahalli Full Village
132 Bengaluru East Krishnarajapura Mahadevapura Full Village
133 Bengaluru East Krishnarajapura Nagareshwaranaganahal
li Full Village
134 Bengaluru East Krishnarajapura Nagondanahalli Full Village
135 Bengaluru East Krishnarajapura Nallurahalli Full Village
136 Bengaluru East Krishnarajapura Pattanduru Agrahara Full Village
137 Bengaluru East Krishnarajapura Rachenahalli Full Village
138 Bengaluru East Krishnarajapura Ramagondahalli
Narayanapura Full Village
139 Bengaluru East Krishnarajapura Sadaramangala Full Village
140 Bengaluru East Krishnarajapura Sheegehalli Full Village
141 Bengaluru East Krishnarajapura Sonathammanahalli Full Village
142 Bengaluru East Krishnarajapura Sonnenahalli Full Village
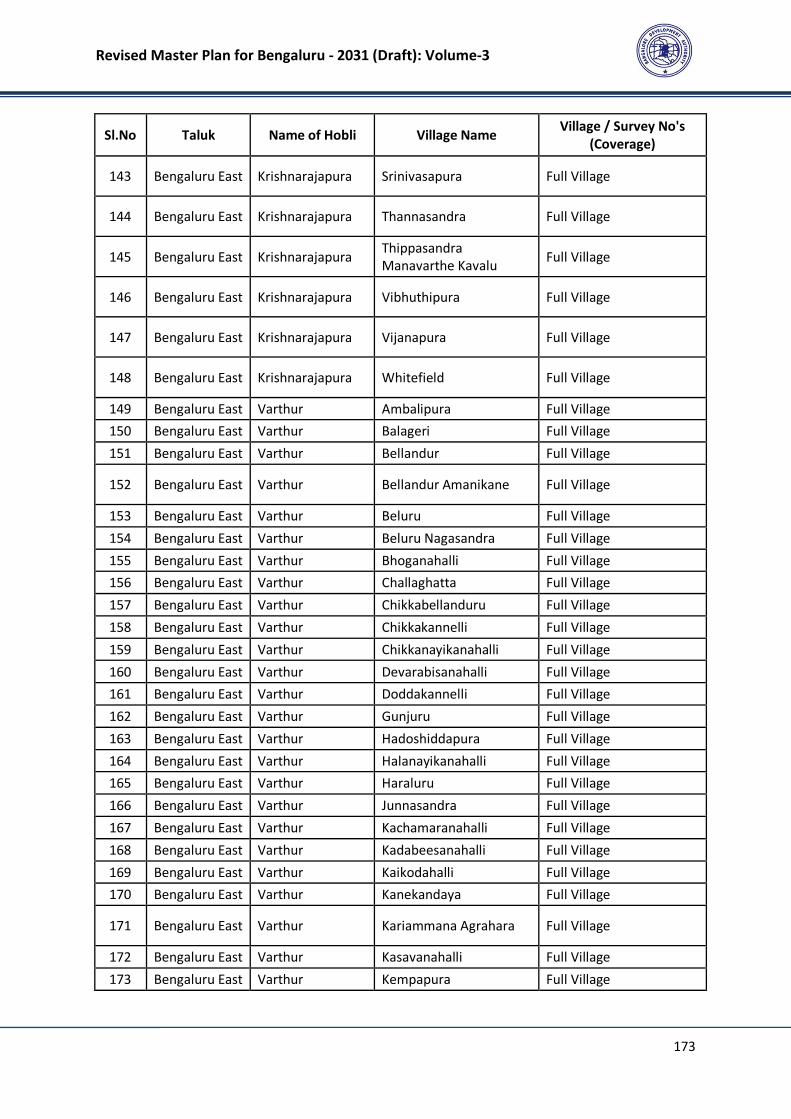
Revised Master Plan for Bengaluru - 2031 (Draft): Volume-3
173
Sl.No Taluk Name of Hobli Village Name Village / Survey No's
(Coverage)
143 Bengaluru East Krishnarajapura Srinivasapura Full Village
144 Bengaluru East Krishnarajapura Thannasandra Full Village
145 Bengaluru East Krishnarajapura Thippasandra
Manavarthe Kavalu Full Village
146 Bengaluru East Krishnarajapura Vibhuthipura Full Village
147 Bengaluru East Krishnarajapura Vijanapura Full Village
148 Bengaluru East Krishnarajapura Whitefield Full Village
149 Bengaluru East Varthur Ambalipura Full Village
150 Bengaluru East Varthur Balageri Full Village
151 Bengaluru East Varthur Bellandur Full Village
152 Bengaluru East Varthur Bellandur Amanikane Full Village
153 Bengaluru East Varthur Beluru Full Village
154 Bengaluru East Varthur Beluru Nagasandra Full Village
155 Bengaluru East Varthur Bhoganahalli Full Village
156 Bengaluru East Varthur Challaghatta Full Village
157 Bengaluru East Varthur Chikkabellanduru Full Village
158 Bengaluru East Varthur Chikkakannelli Full Village
159 Bengaluru East Varthur Chikkanayikanahalli Full Village
160 Bengaluru East Varthur Devarabisanahalli Full Village
161 Bengaluru East Varthur Doddakannelli Full Village
162 Bengaluru East Varthur Gunjuru Full Village
163 Bengaluru East Varthur Hadoshiddapura Full Village
164 Bengaluru East Varthur Halanayikanahalli Full Village
165 Bengaluru East Varthur Haraluru Full Village
166 Bengaluru East Varthur Junnasandra Full Village
167 Bengaluru East Varthur Kachamaranahalli Full Village
168 Bengaluru East Varthur Kadabeesanahalli Full Village
169 Bengaluru East Varthur Kaikodahalli Full Village
170 Bengaluru East Varthur Kanekandaya Full Village
171 Bengaluru East Varthur Kariammana Agrahara Full Village
172 Bengaluru East Varthur Kasavanahalli Full Village
173 Bengaluru East Varthur Kempapura Full Village
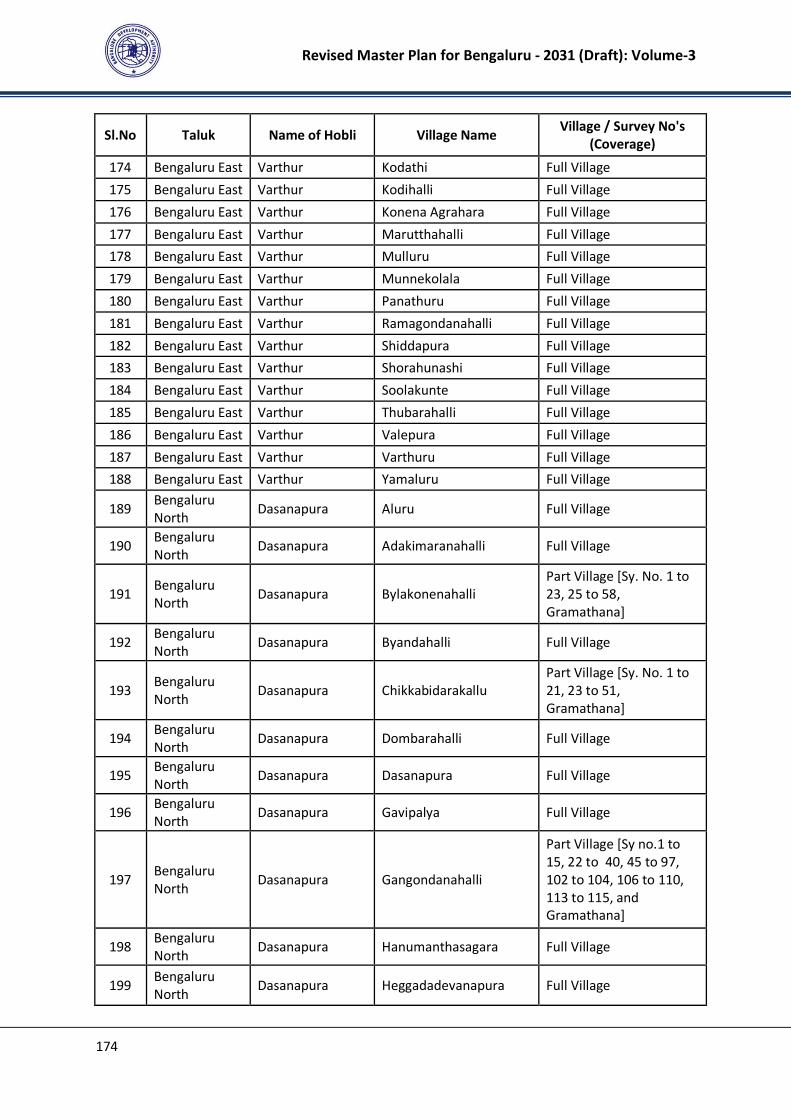
Revised Master Plan for Bengaluru - 2031 (Draft): Volume-3
174
Sl.No Taluk Name of Hobli Village Name Village / Survey No's
(Coverage)
174 Bengaluru East Varthur Kodathi Full Village
175 Bengaluru East Varthur Kodihalli Full Village
176 Bengaluru East Varthur Konena Agrahara Full Village
177 Bengaluru East Varthur Marutthahalli Full Village
178 Bengaluru East Varthur Mulluru Full Village
179 Bengaluru East Varthur Munnekolala Full Village
180 Bengaluru East Varthur Panathuru Full Village
181 Bengaluru East Varthur Ramagondanahalli Full Village
182 Bengaluru East Varthur Shiddapura Full Village
183 Bengaluru East Varthur Shorahunashi Full Village
184 Bengaluru East Varthur Soolakunte Full Village
185 Bengaluru East Varthur Thubarahalli Full Village
186 Bengaluru East Varthur Valepura Full Village
187 Bengaluru East Varthur Varthuru Full Village
188 Bengaluru East Varthur Yamaluru Full Village
189 Bengaluru
North Dasanapura Aluru Full Village
190 Bengaluru
North Dasanapura Adakimaranahalli Full Village
191 Bengaluru
North Dasanapura Bylakonenahalli
Part Village [Sy. No. 1 to
23, 25 to 58,
Gramathana]
192 Bengaluru
North Dasanapura Byandahalli Full Village
193 Bengaluru
North Dasanapura Chikkabidarakallu
Part Village [Sy. No. 1 to
21, 23 to 51,
Gramathana]
194 Bengaluru
North Dasanapura Dombarahalli Full Village
195 Bengaluru
North Dasanapura Dasanapura Full Village
196 Bengaluru
North Dasanapura Gavipalya Full Village
197 Bengaluru
North Dasanapura Gangondanahalli
Part Village [Sy no.1 to
15, 22 to 40, 45 to 97,
102 to 104, 106 to 110,
113 to 115, and
Gramathana]
198 Bengaluru
North Dasanapura Hanumanthasagara Full Village
199 Bengaluru
North Dasanapura Heggadadevanapura Full Village
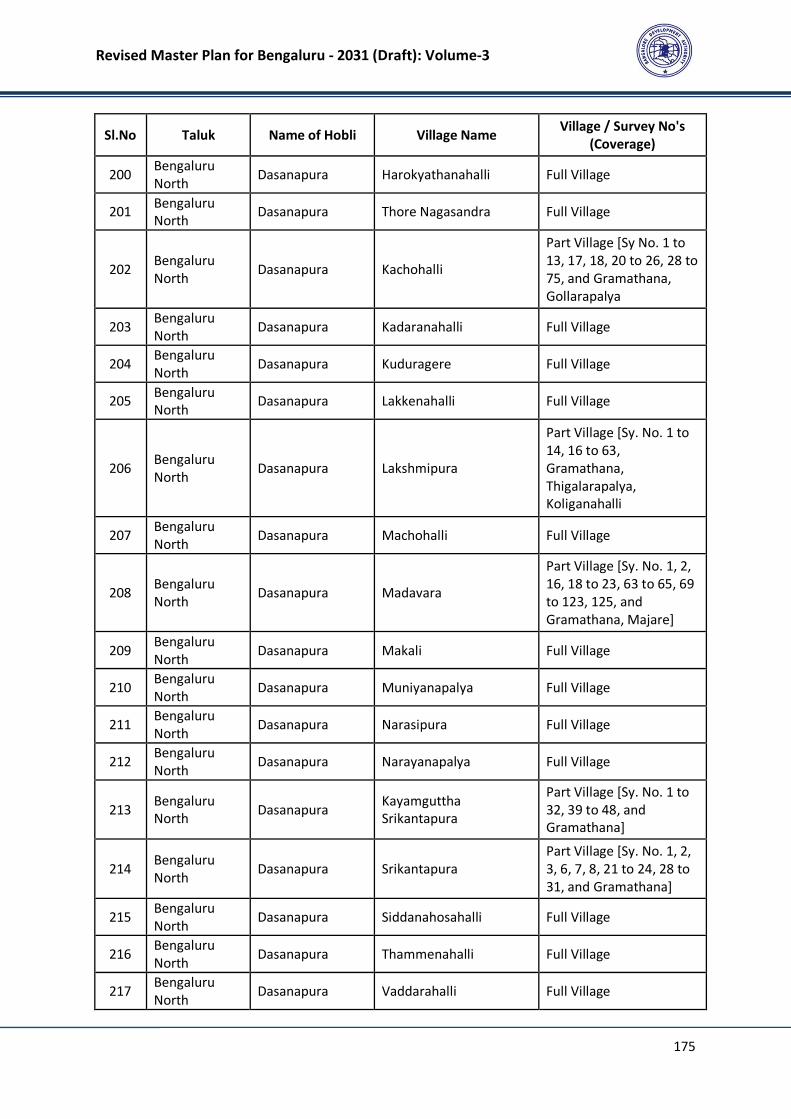
Revised Master Plan for Bengaluru - 2031 (Draft): Volume-3
175
Sl.No Taluk Name of Hobli Village Name Village / Survey No's
(Coverage)
200 Bengaluru
North Dasanapura Harokyathanahalli Full Village
201 Bengaluru
North Dasanapura Thore Nagasandra Full Village
202 Bengaluru
North Dasanapura Kachohalli
Part Village [Sy No. 1 to
13, 17, 18, 20 to 26, 28 to
75, and Gramathana,
Gollarapalya
203 Bengaluru
North Dasanapura Kadaranahalli Full Village
204 Bengaluru
North Dasanapura Kuduragere Full Village
205 Bengaluru
North Dasanapura Lakkenahalli Full Village
206 Bengaluru
North Dasanapura Lakshmipura
Part Village [Sy. No. 1 to
14, 16 to 63,
Gramathana,
Thigalarapalya,
Koliganahalli
207 Bengaluru
North Dasanapura Machohalli Full Village
208 Bengaluru
North Dasanapura Madavara
Part Village [Sy. No. 1, 2,
16, 18 to 23, 63 to 65, 69
to 123, 125, and
Gramathana, Majare]
209 Bengaluru
North Dasanapura Makali Full Village
210 Bengaluru
North Dasanapura Muniyanapalya Full Village
211 Bengaluru
North Dasanapura Narasipura Full Village
212 Bengaluru
North Dasanapura Narayanapalya Full Village
213 Bengaluru
North Dasanapura
Kayamguttha
Srikantapura
Part Village [Sy. No. 1 to
32, 39 to 48, and
Gramathana]
214 Bengaluru
North Dasanapura Srikantapura
Part Village [Sy. No. 1, 2,
3, 6, 7, 8, 21 to 24, 28 to
31, and Gramathana]
215 Bengaluru
North Dasanapura Siddanahosahalli Full Village
216 Bengaluru
North Dasanapura Thammenahalli Full Village
217 Bengaluru
North Dasanapura Vaddarahalli Full Village
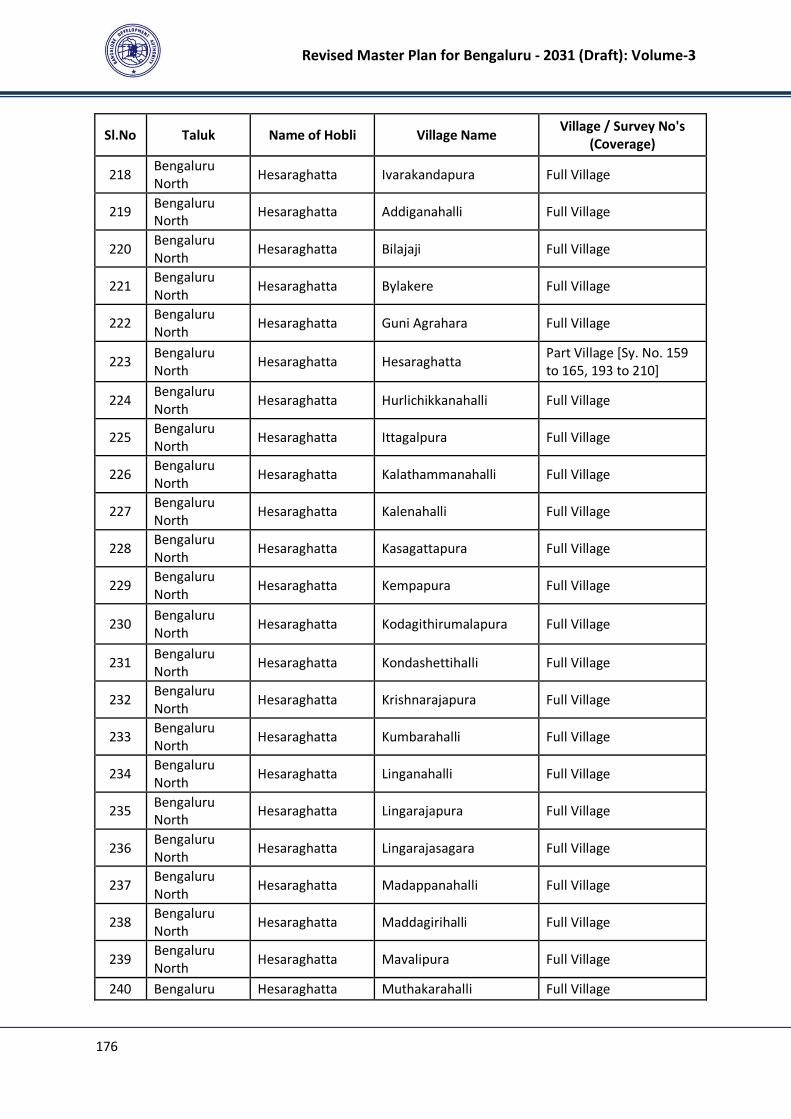
Revised Master Plan for Bengaluru - 2031 (Draft): Volume-3
176
Sl.No Taluk Name of Hobli Village Name Village / Survey No's
(Coverage)
218 Bengaluru
North Hesaraghatta Ivarakandapura Full Village
219 Bengaluru
North Hesaraghatta Addiganahalli Full Village
220 Bengaluru
North Hesaraghatta Bilajaji Full Village
221 Bengaluru
North Hesaraghatta Bylakere Full Village
222 Bengaluru
North Hesaraghatta Guni Agrahara Full Village
223 Bengaluru
North Hesaraghatta Hesaraghatta
Part Village [Sy. No. 159
to 165, 193 to 210]
224 Bengaluru
North Hesaraghatta Hurlichikkanahalli Full Village
225 Bengaluru
North Hesaraghatta Ittagalpura Full Village
226 Bengaluru
North Hesaraghatta Kalathammanahalli Full Village
227 Bengaluru
North Hesaraghatta Kalenahalli Full Village
228 Bengaluru
North Hesaraghatta Kasagattapura Full Village
229 Bengaluru
North Hesaraghatta Kempapura Full Village
230 Bengaluru
North Hesaraghatta Kodagithirumalapura Full Village
231 Bengaluru
North Hesaraghatta Kondashettihalli Full Village
232 Bengaluru
North Hesaraghatta Krishnarajapura Full Village
233 Bengaluru
North Hesaraghatta Kumbarahalli Full Village
234 Bengaluru
North Hesaraghatta Linganahalli Full Village
235 Bengaluru
North Hesaraghatta Lingarajapura Full Village
236 Bengaluru
North Hesaraghatta Lingarajasagara Full Village
237 Bengaluru
North Hesaraghatta Madappanahalli Full Village
238 Bengaluru
North Hesaraghatta Maddagirihalli Full Village
239 Bengaluru
North Hesaraghatta Mavalipura Full Village
240 Bengaluru Hesaraghatta Muthakarahalli Full Village
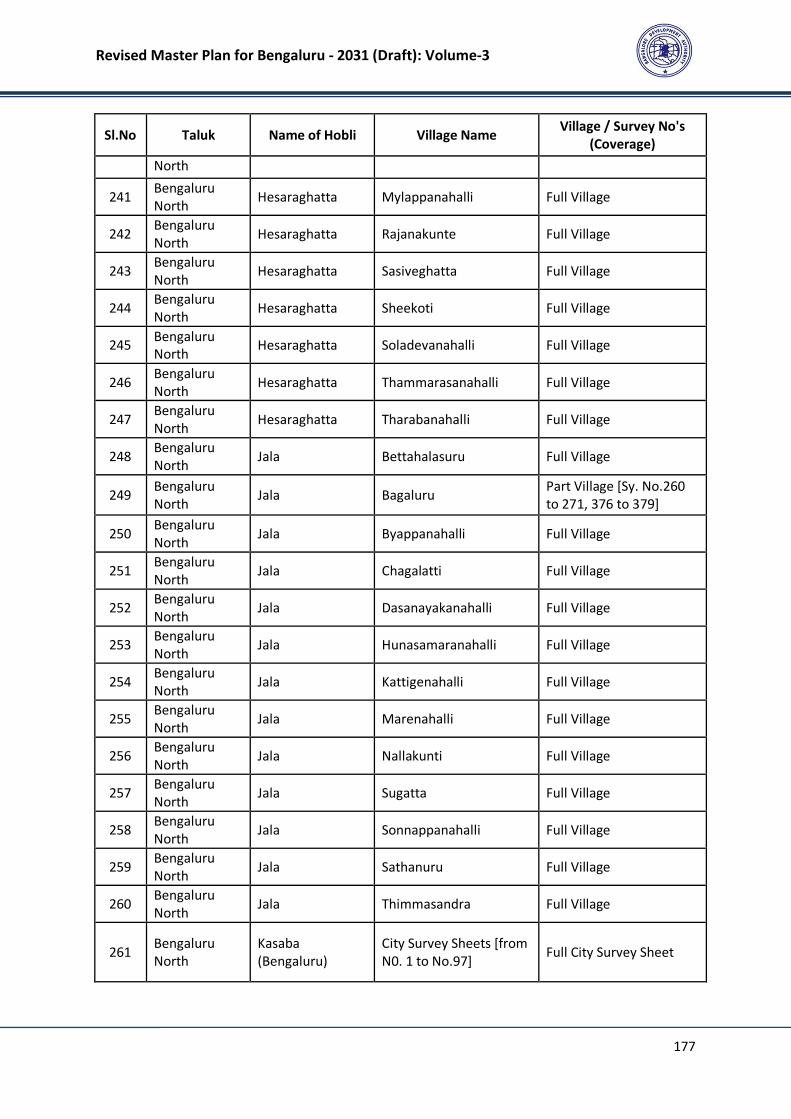
Revised Master Plan for Bengaluru - 2031 (Draft): Volume-3
177
Sl.No Taluk Name of Hobli Village Name Village / Survey No's
(Coverage)
North
241 Bengaluru
North Hesaraghatta Mylappanahalli Full Village
242 Bengaluru
North Hesaraghatta Rajanakunte Full Village
243 Bengaluru
North Hesaraghatta Sasiveghatta Full Village
244 Bengaluru
North Hesaraghatta Sheekoti Full Village
245 Bengaluru
North Hesaraghatta Soladevanahalli Full Village
246 Bengaluru
North Hesaraghatta Thammarasanahalli Full Village
247 Bengaluru
North Hesaraghatta Tharabanahalli Full Village
248 Bengaluru
North Jala Bettahalasuru Full Village
249 Bengaluru
North Jala Bagaluru
Part Village [Sy. No.260
to 271, 376 to 379]
250 Bengaluru
North Jala Byappanahalli Full Village
251 Bengaluru
North Jala Chagalatti Full Village
252 Bengaluru
North Jala Dasanayakanahalli Full Village
253 Bengaluru
North Jala Hunasamaranahalli Full Village
254 Bengaluru
North Jala Kattigenahalli Full Village
255 Bengaluru
North Jala Marenahalli Full Village
256 Bengaluru
North Jala Nallakunti Full Village
257 Bengaluru
North Jala Sugatta Full Village
258 Bengaluru
North Jala Sonnappanahalli Full Village
259 Bengaluru
North Jala Sathanuru Full Village
260 Bengaluru
North Jala Thimmasandra Full Village
261 Bengaluru
North
Kasaba
(Bengaluru)
City Survey Sheets [from
N0. 1 to No.97] Full City Survey Sheet
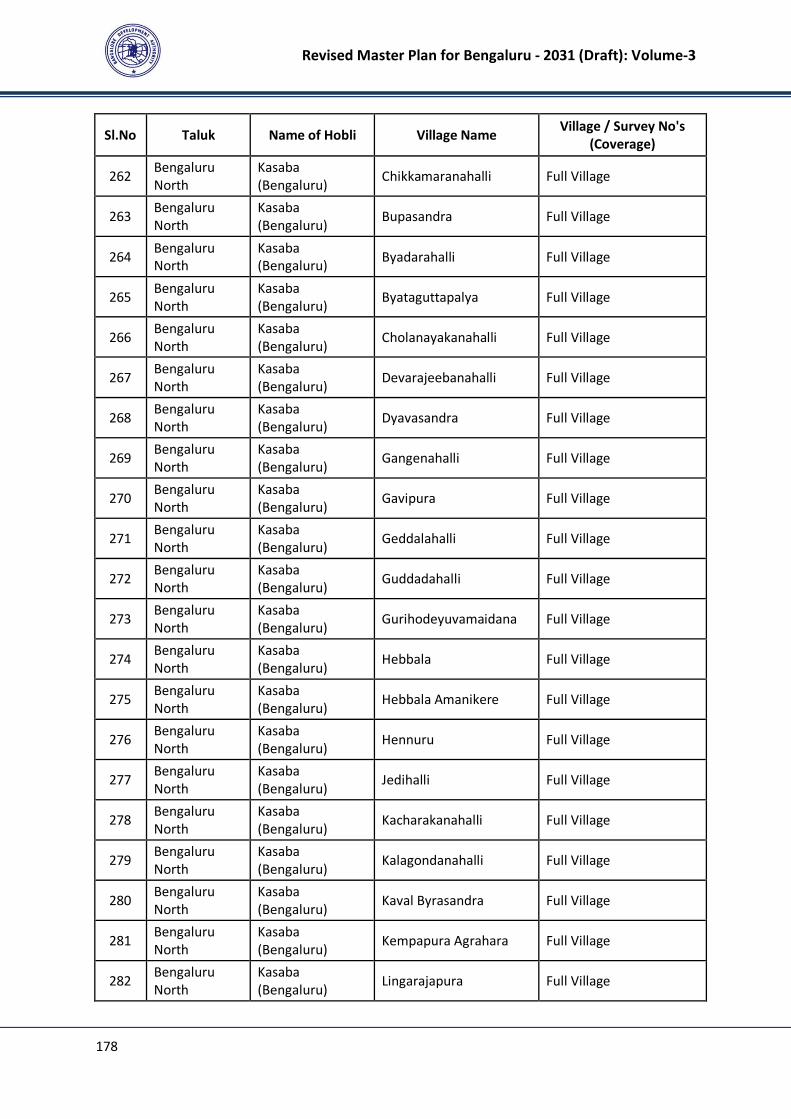
Revised Master Plan for Bengaluru - 2031 (Draft): Volume-3
178
Sl.No Taluk Name of Hobli Village Name Village / Survey No's
(Coverage)
262 Bengaluru
North
Kasaba
(Bengaluru) Chikkamaranahalli Full Village
263 Bengaluru
North
Kasaba
(Bengaluru) Bupasandra Full Village
264 Bengaluru
North
Kasaba
(Bengaluru) Byadarahalli Full Village
265 Bengaluru
North
Kasaba
(Bengaluru) Byataguttapalya Full Village
266 Bengaluru
North
Kasaba
(Bengaluru) Cholanayakanahalli Full Village
267 Bengaluru
North
Kasaba
(Bengaluru) Devarajeebanahalli Full Village
268 Bengaluru
North
Kasaba
(Bengaluru) Dyavasandra Full Village
269 Bengaluru
North
Kasaba
(Bengaluru) Gangenahalli Full Village
270 Bengaluru
North
Kasaba
(Bengaluru) Gavipura Full Village
271 Bengaluru
North
Kasaba
(Bengaluru) Geddalahalli Full Village
272 Bengaluru
North
Kasaba
(Bengaluru) Guddadahalli Full Village
273 Bengaluru
North
Kasaba
(Bengaluru) Gurihodeyuvamaidana Full Village
274 Bengaluru
North
Kasaba
(Bengaluru) Hebbala Full Village
275 Bengaluru
North
Kasaba
(Bengaluru) Hebbala Amanikere Full Village
276 Bengaluru
North
Kasaba
(Bengaluru) Hennuru Full Village
277 Bengaluru
North
Kasaba
(Bengaluru) Jedihalli Full Village
278 Bengaluru
North
Kasaba
(Bengaluru) Kacharakanahalli Full Village
279 Bengaluru
North
Kasaba
(Bengaluru) Kalagondanahalli Full Village
280 Bengaluru
North
Kasaba
(Bengaluru) Kaval Byrasandra Full Village
281 Bengaluru
North
Kasaba
(Bengaluru) Kempapura Agrahara Full Village
282 Bengaluru
North
Kasaba
(Bengaluru) Lingarajapura Full Village
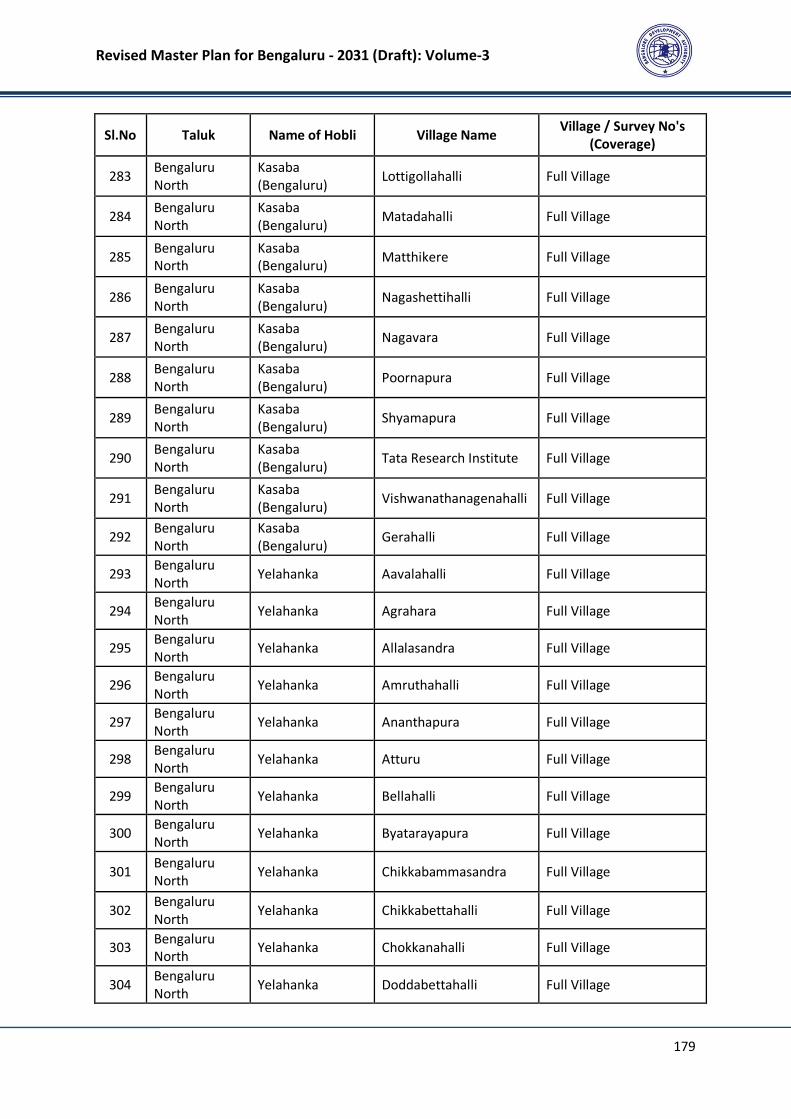
Revised Master Plan for Bengaluru - 2031 (Draft): Volume-3
179
Sl.No Taluk Name of Hobli Village Name Village / Survey No's
(Coverage)
283 Bengaluru
North
Kasaba
(Bengaluru) Lottigollahalli Full Village
284 Bengaluru
North
Kasaba
(Bengaluru) Matadahalli Full Village
285 Bengaluru
North
Kasaba
(Bengaluru) Matthikere Full Village
286 Bengaluru
North
Kasaba
(Bengaluru) Nagashettihalli Full Village
287 Bengaluru
North
Kasaba
(Bengaluru) Nagavara Full Village
288 Bengaluru
North
Kasaba
(Bengaluru) Poornapura Full Village
289 Bengaluru
North
Kasaba
(Bengaluru) Shyamapura Full Village
290 Bengaluru
North
Kasaba
(Bengaluru) Tata Research Institute Full Village
291 Bengaluru
North
Kasaba
(Bengaluru) Vishwanathanagenahalli Full Village
292 Bengaluru
North
Kasaba
(Bengaluru) Gerahalli Full Village
293 Bengaluru
North Yelahanka Aavalahalli Full Village
294 Bengaluru
North Yelahanka Agrahara Full Village
295 Bengaluru
North Yelahanka Allalasandra Full Village
296 Bengaluru
North Yelahanka Amruthahalli Full Village
297 Bengaluru
North Yelahanka Ananthapura Full Village
298 Bengaluru
North Yelahanka Atturu Full Village
299 Bengaluru
North Yelahanka Bellahalli Full Village
300 Bengaluru
North Yelahanka Byatarayapura Full Village
301 Bengaluru
North Yelahanka Chikkabammasandra Full Village
302 Bengaluru
North Yelahanka Chikkabettahalli Full Village
303 Bengaluru
North Yelahanka Chokkanahalli Full Village
304 Bengaluru
North Yelahanka Doddabettahalli Full Village
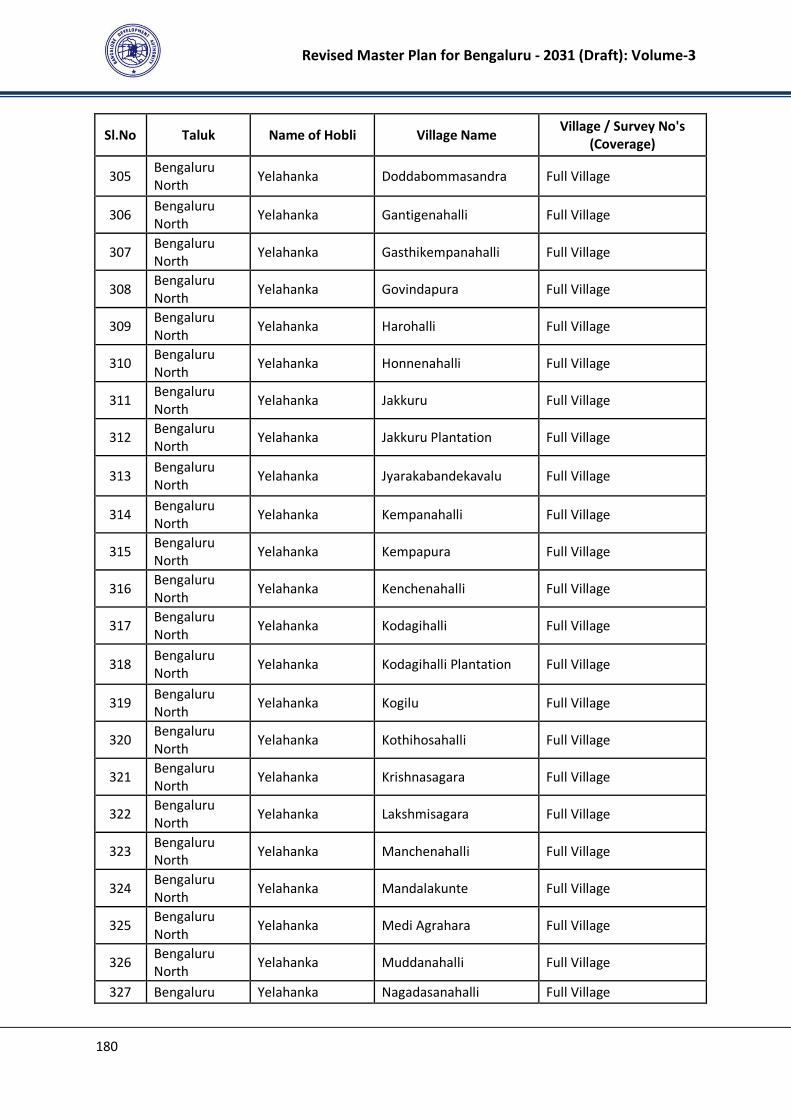
Revised Master Plan for Bengaluru - 2031 (Draft): Volume-3
180
Sl.No Taluk Name of Hobli Village Name Village / Survey No's
(Coverage)
305 Bengaluru
North Yelahanka Doddabommasandra Full Village
306 Bengaluru
North Yelahanka Gantigenahalli Full Village
307 Bengaluru
North Yelahanka Gasthikempanahalli Full Village
308 Bengaluru
North Yelahanka Govindapura Full Village
309 Bengaluru
North Yelahanka Harohalli Full Village
310 Bengaluru
North Yelahanka Honnenahalli Full Village
311 Bengaluru
North Yelahanka Jakkuru Full Village
312 Bengaluru
North Yelahanka Jakkuru Plantation Full Village
313 Bengaluru
North Yelahanka Jyarakabandekavalu Full Village
314 Bengaluru
North Yelahanka Kempanahalli Full Village
315 Bengaluru
North Yelahanka Kempapura Full Village
316 Bengaluru
North Yelahanka Kenchenahalli Full Village
317 Bengaluru
North Yelahanka Kodagihalli Full Village
318 Bengaluru
North Yelahanka Kodagihalli Plantation Full Village
319 Bengaluru
North Yelahanka Kogilu Full Village
320 Bengaluru
North Yelahanka Kothihosahalli Full Village
321 Bengaluru
North Yelahanka Krishnasagara Full Village
322 Bengaluru
North Yelahanka Lakshmisagara Full Village
323 Bengaluru
North Yelahanka Manchenahalli Full Village
324 Bengaluru
North Yelahanka Mandalakunte Full Village
325 Bengaluru
North Yelahanka Medi Agrahara Full Village
326 Bengaluru
North Yelahanka Muddanahalli Full Village
327 Bengaluru Yelahanka Nagadasanahalli Full Village

Revised Master Plan for Bengaluru - 2031 (Draft): Volume-3
181
Sl.No Taluk Name of Hobli Village Name Village / Survey No's
(Coverage)
North
328 Bengaluru
North Yelahanka Narashipura Full Village
329 Bengaluru
North Yelahanka Puttenahalli Full Village
330 Bengaluru
North Yelahanka Ramachandrapura Full Village
331 Bengaluru
North Yelahanka Ramagondahalli Full Village
332 Bengaluru
North Yelahanka Sampigehalli Full Village
333 Bengaluru
North Yelahanka Shinganayakanahalli Full Village
334 Bengaluru
North Yelahanka
Shinganayakanahalli
Amanikere Full Village
335 Bengaluru
North Yelahanka Shingapura Full Village
336 Bengaluru
North Yelahanka Shivanahalli Full Village
337 Bengaluru
North Yelahanka Shyamarajapura Full Village
338 Bengaluru
North Yelahanka Sreerampura Full Village
339 Bengaluru
North Yelahanka Srinivasapura Full Village
340 Bengaluru
North Yelahanka Thindalu Plantation Full Village
341 Bengaluru
North Yelahanka Thindlu Full Village
342 Bengaluru
North Yelahanka Thirumalenahalli Full Village
343 Bengaluru
North Yelahanka Vaderahalli Full Village
344 Bengaluru
North Yelahanka Vaderapura Full Village
345 Bengaluru
North Yelahanka Vasudevapura Full Village
346 Bengaluru
North Yelahanka Veerasagara Full Village
347 Bengaluru
North Yelahanka Vengatala Full Village
348 Bengaluru
North Yelahanka Venkateshapura Full Village
349 Bengaluru
North Yelahanka Yelahanka Full Village
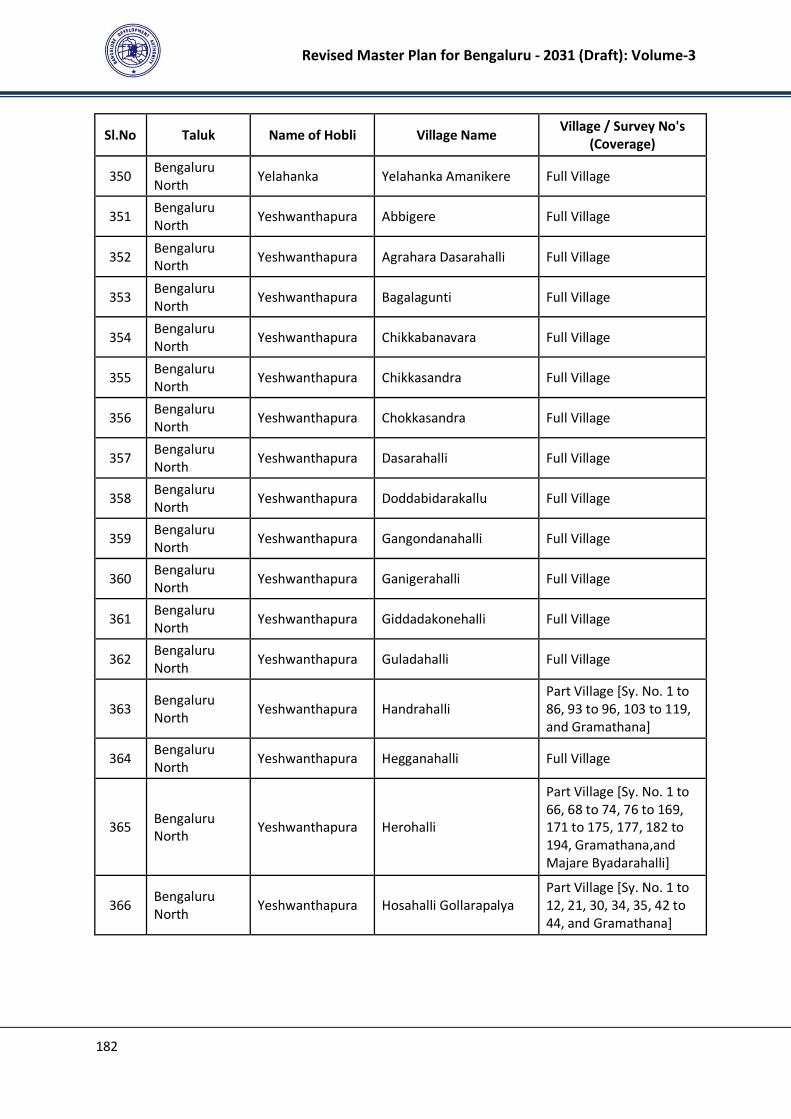
Revised Master Plan for Bengaluru - 2031 (Draft): Volume-3
182
Sl.No Taluk Name of Hobli Village Name Village / Survey No's
(Coverage)
350 Bengaluru
North Yelahanka Yelahanka Amanikere Full Village
351 Bengaluru
North Yeshwanthapura Abbigere Full Village
352 Bengaluru
North Yeshwanthapura Agrahara Dasarahalli Full Village
353 Bengaluru
North Yeshwanthapura Bagalagunti Full Village
354 Bengaluru
North Yeshwanthapura Chikkabanavara Full Village
355 Bengaluru
North Yeshwanthapura Chikkasandra Full Village
356 Bengaluru
North Yeshwanthapura Chokkasandra Full Village
357 Bengaluru
North Yeshwanthapura Dasarahalli Full Village
358 Bengaluru
North Yeshwanthapura Doddabidarakallu Full Village
359 Bengaluru
North Yeshwanthapura Gangondanahalli Full Village
360 Bengaluru
North Yeshwanthapura Ganigerahalli Full Village
361 Bengaluru
North Yeshwanthapura Giddadakonehalli Full Village
362 Bengaluru
North Yeshwanthapura Guladahalli Full Village
363 Bengaluru
North Yeshwanthapura Handrahalli
Part Village [Sy. No. 1 to
86, 93 to 96, 103 to 119,
and Gramathana]
364 Bengaluru
North Yeshwanthapura Hegganahalli Full Village
365 Bengaluru
North Yeshwanthapura Herohalli
Part Village [Sy. No. 1 to
66, 68 to 74, 76 to 169,
171 to 175, 177, 182 to
194, Gramathana,and
Majare Byadarahalli]
366 Bengaluru
North Yeshwanthapura Hosahalli Gollarapalya
Part Village [Sy. No. 1 to
12, 21, 30, 34, 35, 42 to
44, and Gramathana]
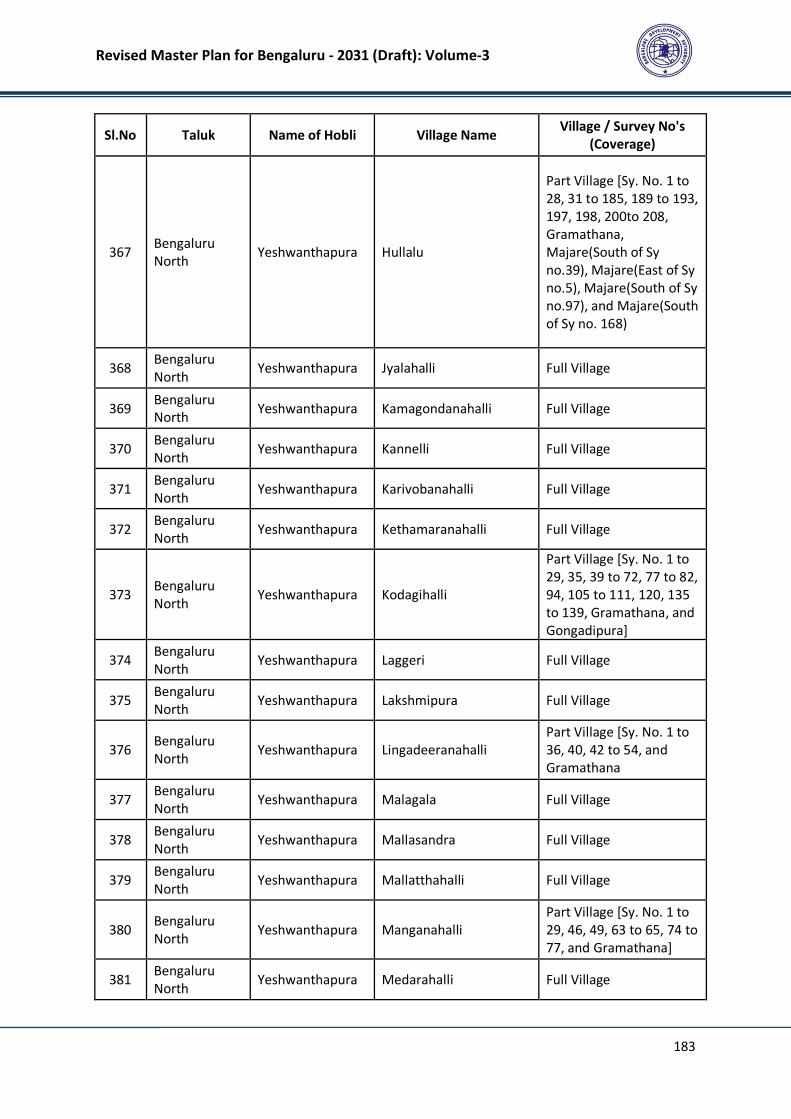
Revised Master Plan for Bengaluru - 2031 (Draft): Volume-3
183
Sl.No Taluk Name of Hobli Village Name Village / Survey No's
(Coverage)
367 Bengaluru
North Yeshwanthapura Hullalu
Part Village [Sy. No. 1 to
28, 31 to 185, 189 to 193,
197, 198, 200to 208,
Gramathana,
Majare(South of Sy
no.39), Majare(East of Sy
no.5), Majare(South of Sy
no.97), and Majare(South
of Sy no. 168)
368 Bengaluru
North Yeshwanthapura Jyalahalli Full Village
369 Bengaluru
North Yeshwanthapura Kamagondanahalli Full Village
370 Bengaluru
North Yeshwanthapura Kannelli Full Village
371 Bengaluru
North Yeshwanthapura Karivobanahalli Full Village
372 Bengaluru
North Yeshwanthapura Kethamaranahalli Full Village
373 Bengaluru
North Yeshwanthapura Kodagihalli
Part Village [Sy. No. 1 to
29, 35, 39 to 72, 77 to 82,
94, 105 to 111, 120, 135
to 139, Gramathana, and
Gongadipura]
374 Bengaluru
North Yeshwanthapura Laggeri Full Village
375 Bengaluru
North Yeshwanthapura Lakshmipura Full Village
376 Bengaluru
North Yeshwanthapura Lingadeeranahalli
Part Village [Sy. No. 1 to
36, 40, 42 to 54, and
Gramathana
377 Bengaluru
North Yeshwanthapura Malagala Full Village
378 Bengaluru
North Yeshwanthapura Mallasandra Full Village
379 Bengaluru
North Yeshwanthapura Mallatthahalli Full Village
380 Bengaluru
North Yeshwanthapura Manganahalli
Part Village [Sy. No. 1 to
29, 46, 49, 63 to 65, 74 to
77, and Gramathana]
381 Bengaluru
North Yeshwanthapura Medarahalli Full Village
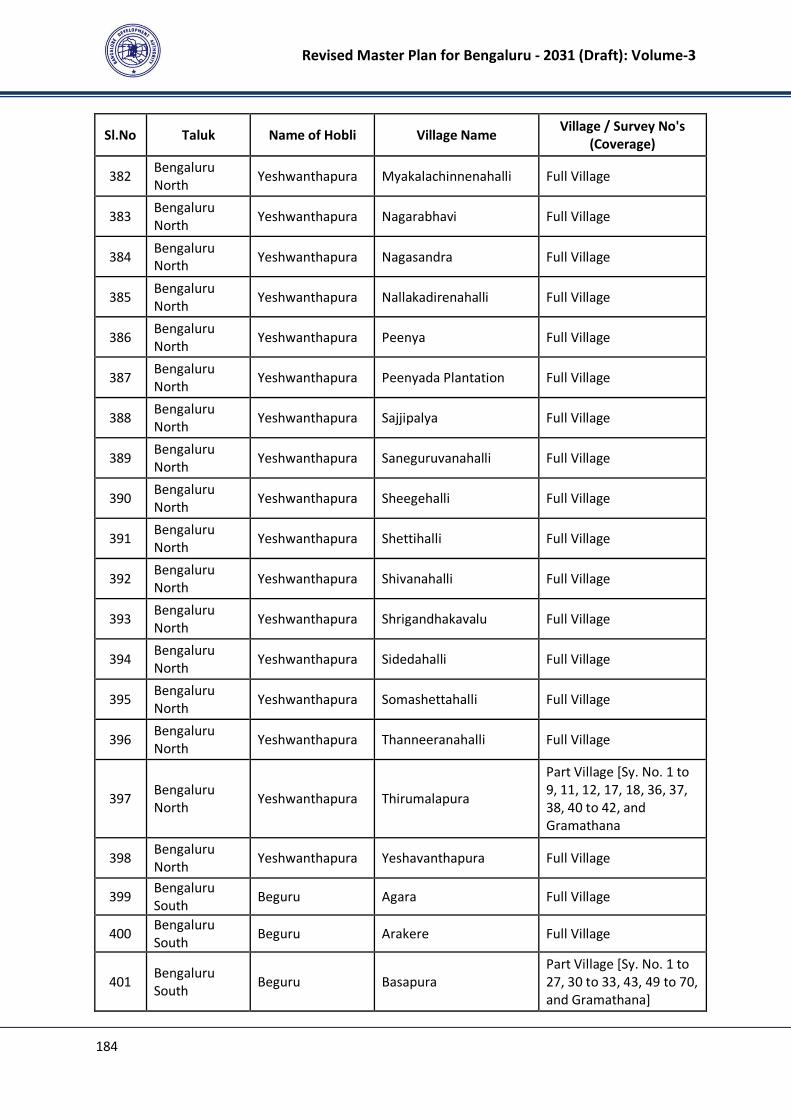
Revised Master Plan for Bengaluru - 2031 (Draft): Volume-3
184
Sl.No Taluk Name of Hobli Village Name Village / Survey No's
(Coverage)
382 Bengaluru
North Yeshwanthapura Myakalachinnenahalli Full Village
383 Bengaluru
North Yeshwanthapura Nagarabhavi Full Village
384 Bengaluru
North Yeshwanthapura Nagasandra Full Village
385 Bengaluru
North Yeshwanthapura Nallakadirenahalli Full Village
386 Bengaluru
North Yeshwanthapura Peenya Full Village
387 Bengaluru
North Yeshwanthapura Peenyada Plantation Full Village
388 Bengaluru
North Yeshwanthapura Sajjipalya Full Village
389 Bengaluru
North Yeshwanthapura Saneguruvanahalli Full Village
390 Bengaluru
North Yeshwanthapura Sheegehalli Full Village
391 Bengaluru
North Yeshwanthapura Shettihalli Full Village
392 Bengaluru
North Yeshwanthapura Shivanahalli Full Village
393 Bengaluru
North Yeshwanthapura Shrigandhakavalu Full Village
394 Bengaluru
North Yeshwanthapura Sidedahalli Full Village
395 Bengaluru
North Yeshwanthapura Somashettahalli Full Village
396 Bengaluru
North Yeshwanthapura Thanneeranahalli Full Village
397 Bengaluru
North Yeshwanthapura Thirumalapura
Part Village [Sy. No. 1 to
9, 11, 12, 17, 18, 36, 37,
38, 40 to 42, and
Gramathana
398 Bengaluru
North Yeshwanthapura Yeshavanthapura Full Village
399 Bengaluru
South Beguru Agara Full Village
400 Bengaluru
South Beguru Arakere Full Village
401 Bengaluru
South Beguru Basapura
Part Village [Sy. No. 1 to
27, 30 to 33, 43, 49 to 70,
and Gramathana]
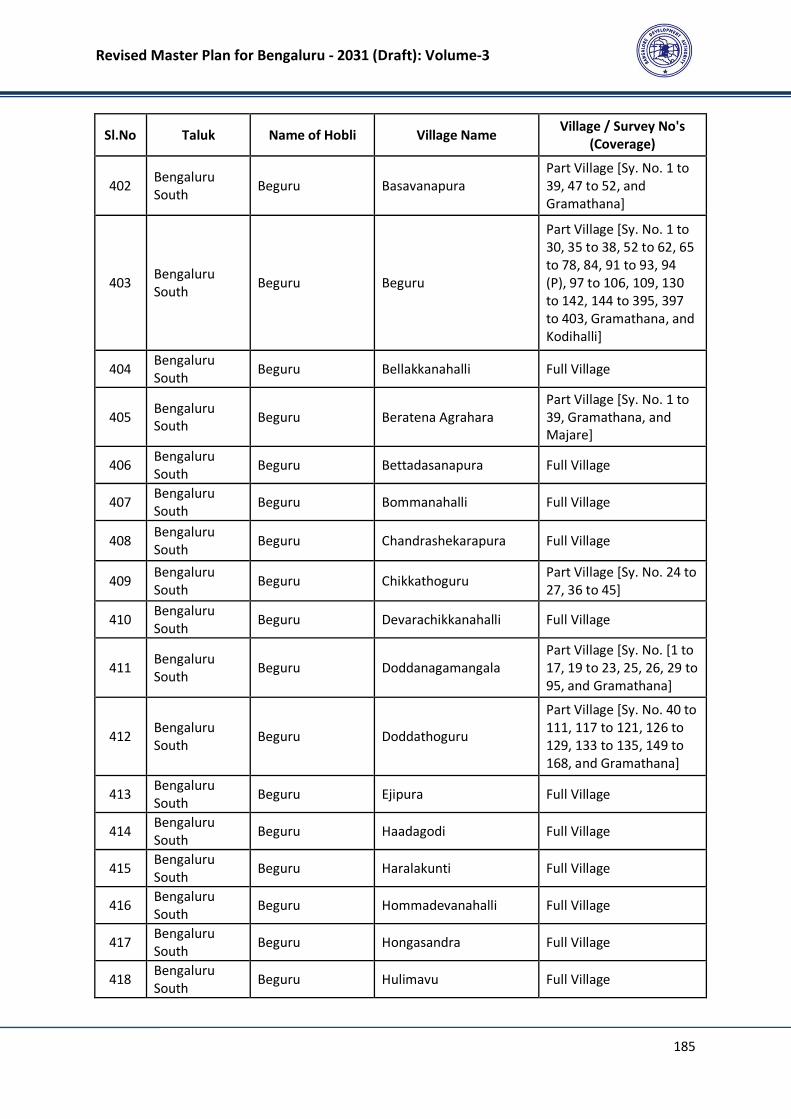
Revised Master Plan for Bengaluru - 2031 (Draft): Volume-3
185
Sl.No Taluk Name of Hobli Village Name Village / Survey No's
(Coverage)
402 Bengaluru
South Beguru Basavanapura
Part Village [Sy. No. 1 to
39, 47 to 52, and
Gramathana]
403 Bengaluru
South Beguru Beguru
Part Village [Sy. No. 1 to
30, 35 to 38, 52 to 62, 65
to 78, 84, 91 to 93, 94
(P), 97 to 106, 109, 130
to 142, 144 to 395, 397
to 403, Gramathana, and
Kodihalli]
404 Bengaluru
South Beguru Bellakkanahalli Full Village
405 Bengaluru
South Beguru Beratena Agrahara
Part Village [Sy. No. 1 to
39, Gramathana, and
Majare]
406 Bengaluru
South Beguru Bettadasanapura Full Village
407 Bengaluru
South Beguru Bommanahalli Full Village
408 Bengaluru
South Beguru Chandrashekarapura Full Village
409 Bengaluru
South Beguru Chikkathoguru
Part Village [Sy. No. 24 to
27, 36 to 45]
410 Bengaluru
South Beguru Devarachikkanahalli Full Village
411 Bengaluru
South Beguru Doddanagamangala
Part Village [Sy. No. [1 to
17, 19 to 23, 25, 26, 29 to
95, and Gramathana]
412 Bengaluru
South Beguru Doddathoguru
Part Village [Sy. No. 40 to
111, 117 to 121, 126 to
129, 133 to 135, 149 to
168, and Gramathana]
413 Bengaluru
South Beguru Ejipura Full Village
414 Bengaluru
South Beguru Haadagodi Full Village
415 Bengaluru
South Beguru Haralakunti Full Village
416 Bengaluru
South Beguru Hommadevanahalli Full Village
417 Bengaluru
South Beguru Hongasandra Full Village
418 Bengaluru
South Beguru Hulimavu Full Village
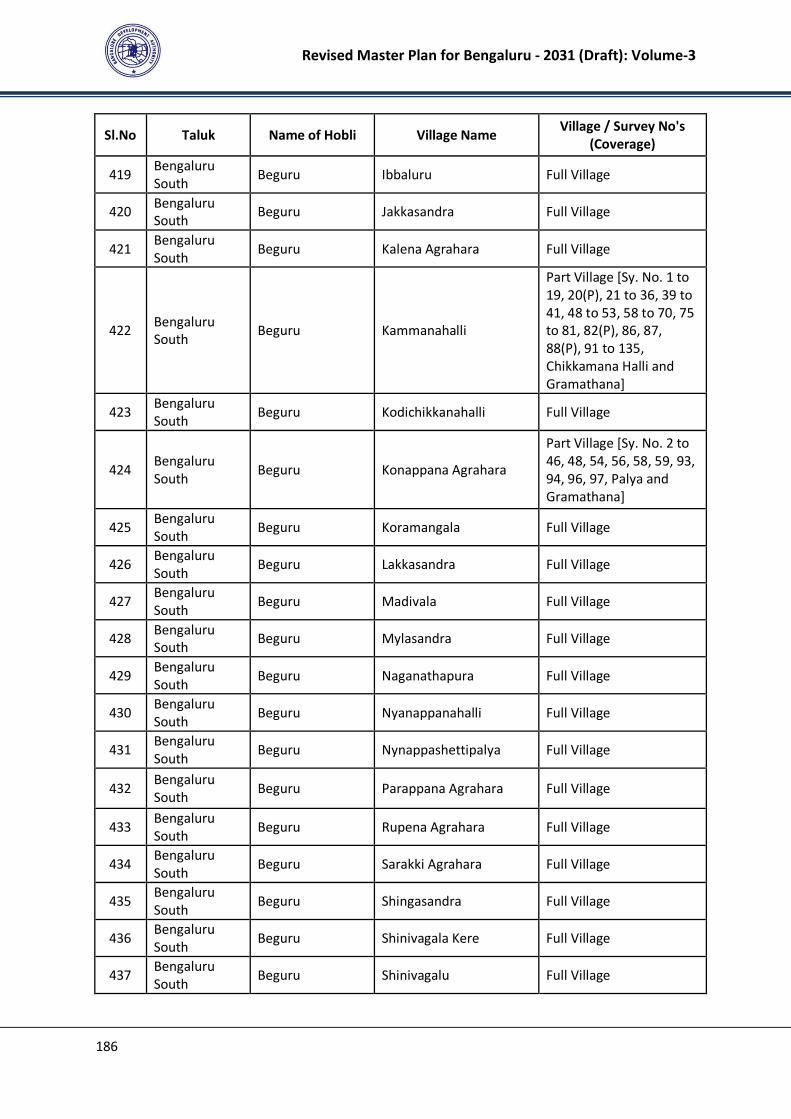
Revised Master Plan for Bengaluru - 2031 (Draft): Volume-3
186
Sl.No Taluk Name of Hobli Village Name Village / Survey No's
(Coverage)
419 Bengaluru
South Beguru Ibbaluru Full Village
420 Bengaluru
South Beguru Jakkasandra Full Village
421 Bengaluru
South Beguru Kalena Agrahara Full Village
422 Bengaluru
South Beguru Kammanahalli
Part Village [Sy. No. 1 to
19, 20(P), 21 to 36, 39 to
41, 48 to 53, 58 to 70, 75
to 81, 82(P), 86, 87,
88(P), 91 to 135,
Chikkamana Halli and
Gramathana]
423 Bengaluru
South Beguru Kodichikkanahalli Full Village
424 Bengaluru
South Beguru Konappana Agrahara
Part Village [Sy. No. 2 to
46, 48, 54, 56, 58, 59, 93,
94, 96, 97, Palya and
Gramathana]
425 Bengaluru
South Beguru Koramangala Full Village
426 Bengaluru
South Beguru Lakkasandra Full Village
427 Bengaluru
South Beguru Madivala Full Village
428 Bengaluru
South Beguru Mylasandra Full Village
429 Bengaluru
South Beguru Naganathapura Full Village
430 Bengaluru
South Beguru Nyanappanahalli Full Village
431 Bengaluru
South Beguru Nynappashettipalya Full Village
432 Bengaluru
South Beguru Parappana Agrahara Full Village
433 Bengaluru
South Beguru Rupena Agrahara Full Village
434 Bengaluru
South Beguru Sarakki Agrahara Full Village
435 Bengaluru
South Beguru Shingasandra Full Village
436 Bengaluru
South Beguru Shinivagala Kere Full Village
437 Bengaluru
South Beguru Shinivagalu Full Village
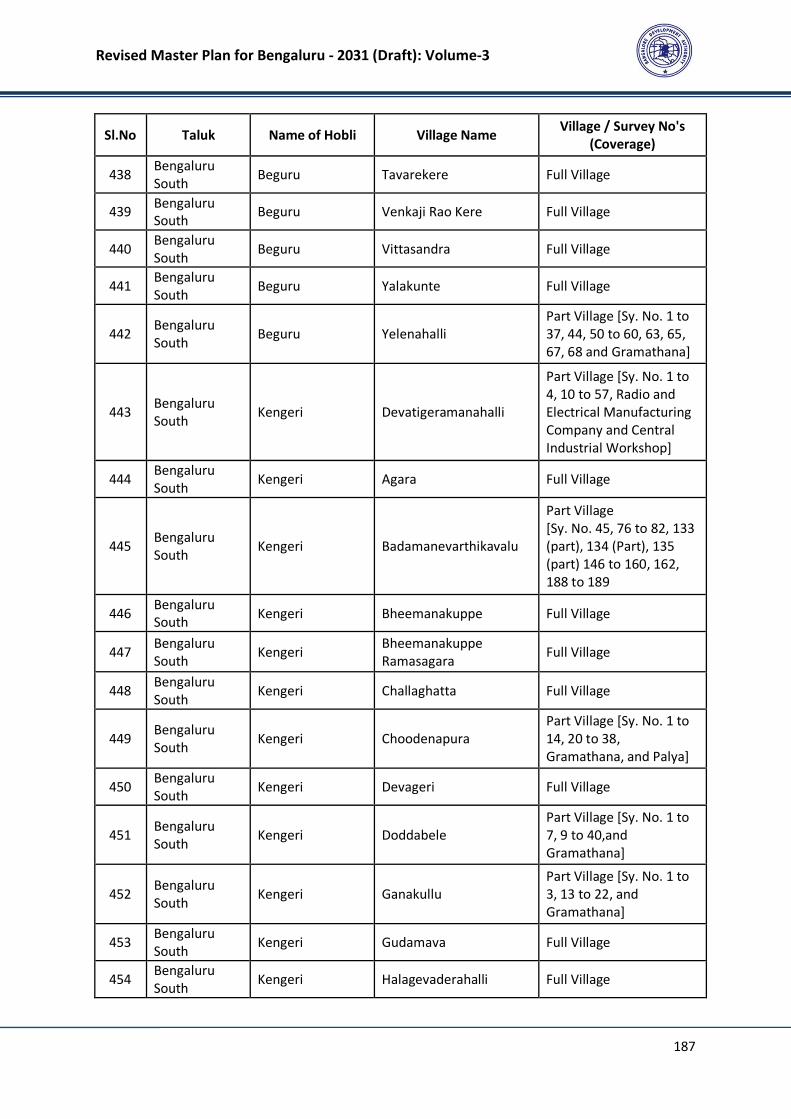
Revised Master Plan for Bengaluru - 2031 (Draft): Volume-3
187
Sl.No Taluk Name of Hobli Village Name Village / Survey No's
(Coverage)
438 Bengaluru
South Beguru Tavarekere Full Village
439 Bengaluru
South Beguru Venkaji Rao Kere Full Village
440 Bengaluru
South Beguru Vittasandra Full Village
441 Bengaluru
South Beguru Yalakunte Full Village
442 Bengaluru
South Beguru Yelenahalli
Part Village [Sy. No. 1 to
37, 44, 50 to 60, 63, 65,
67, 68 and Gramathana]
443 Bengaluru
South Kengeri Devatigeramanahalli
Part Village [Sy. No. 1 to
4, 10 to 57, Radio and
Electrical Manufacturing
Company and Central
Industrial Workshop]
444 Bengaluru
South Kengeri Agara Full Village
445 Bengaluru
South Kengeri Badamanevarthikavalu
Part Village
[Sy. No. 45, 76 to 82, 133
(part), 134 (Part), 135
(part) 146 to 160, 162,
188 to 189
446 Bengaluru
South Kengeri Bheemanakuppe Full Village
447 Bengaluru
South Kengeri
Bheemanakuppe
Ramasagara Full Village
448 Bengaluru
South Kengeri Challaghatta Full Village
449 Bengaluru
South Kengeri Choodenapura
Part Village [Sy. No. 1 to
14, 20 to 38,
Gramathana, and Palya]
450 Bengaluru
South Kengeri Devageri Full Village
451 Bengaluru
South Kengeri Doddabele
Part Village [Sy. No. 1 to
7, 9 to 40,and
Gramathana]
452 Bengaluru
South Kengeri Ganakullu
Part Village [Sy. No. 1 to
3, 13 to 22, and
Gramathana]
453 Bengaluru
South Kengeri Gudamava Full Village
454 Bengaluru
South Kengeri Halagevaderahalli Full Village
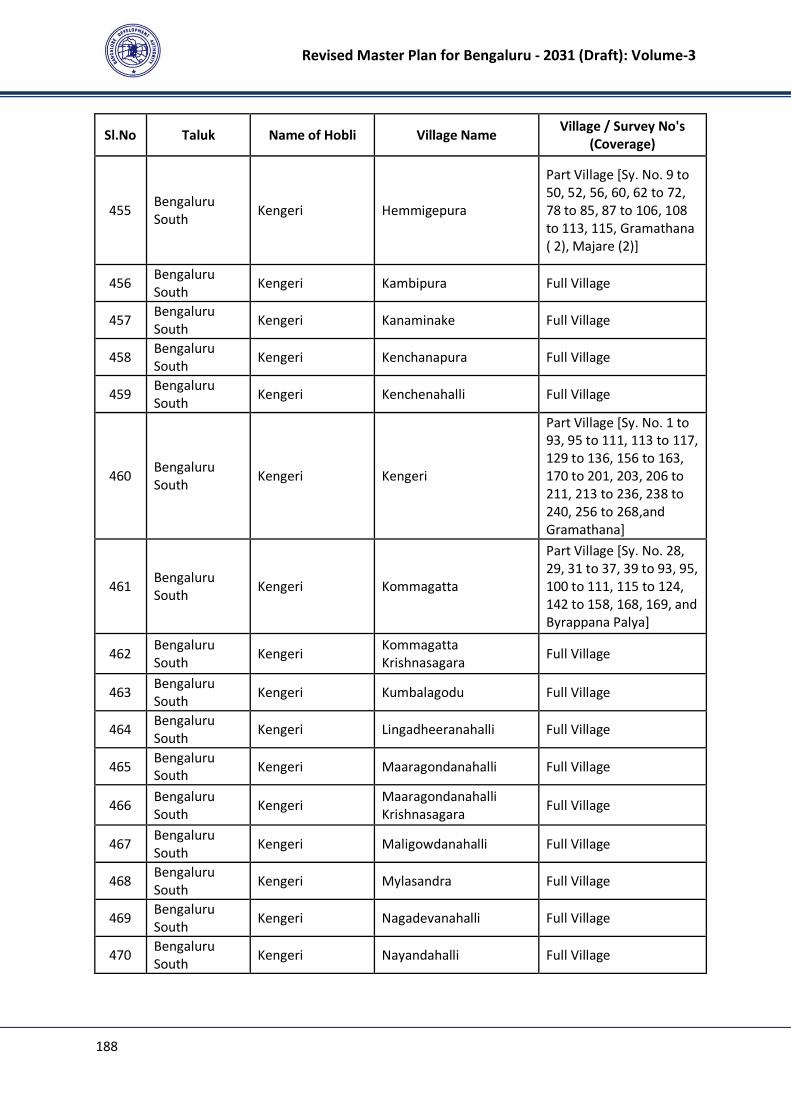
Revised Master Plan for Bengaluru - 2031 (Draft): Volume-3
188
Sl.No Taluk Name of Hobli Village Name Village / Survey No's
(Coverage)
455 Bengaluru
South Kengeri Hemmigepura
Part Village [Sy. No. 9 to
50, 52, 56, 60, 62 to 72,
78 to 85, 87 to 106, 108
to 113, 115, Gramathana
( 2), Majare (2)]
456 Bengaluru
South Kengeri Kambipura Full Village
457 Bengaluru
South Kengeri Kanaminake Full Village
458 Bengaluru
South Kengeri Kenchanapura Full Village
459 Bengaluru
South Kengeri Kenchenahalli Full Village
460 Bengaluru
South Kengeri Kengeri
Part Village [Sy. No. 1 to
93, 95 to 111, 113 to 117,
129 to 136, 156 to 163,
170 to 201, 203, 206 to
211, 213 to 236, 238 to
240, 256 to 268,and
Gramathana]
461 Bengaluru
South Kengeri Kommagatta
Part Village [Sy. No. 28,
29, 31 to 37, 39 to 93, 95,
100 to 111, 115 to 124,
142 to 158, 168, 169, and
Byrappana Palya]
462 Bengaluru
South Kengeri
Kommagatta
Krishnasagara Full Village
463 Bengaluru
South Kengeri Kumbalagodu Full Village
464 Bengaluru
South Kengeri Lingadheeranahalli Full Village
465 Bengaluru
South Kengeri Maaragondanahalli Full Village
466 Bengaluru
South Kengeri
Maaragondanahalli
Krishnasagara Full Village
467 Bengaluru
South Kengeri Maligowdanahalli Full Village
468 Bengaluru
South Kengeri Mylasandra Full Village
469 Bengaluru
South Kengeri Nagadevanahalli Full Village
470 Bengaluru
South Kengeri Nayandahalli Full Village
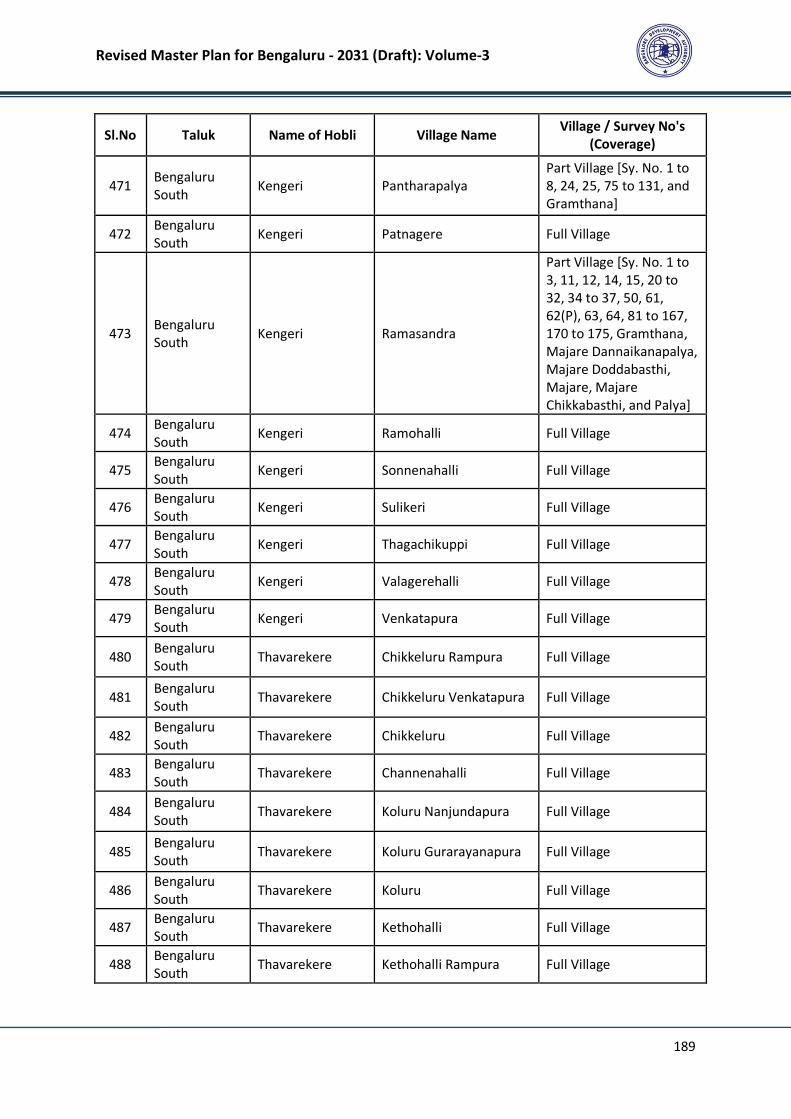
Revised Master Plan for Bengaluru - 2031 (Draft): Volume-3
189
Sl.No Taluk Name of Hobli Village Name Village / Survey No's
(Coverage)
471 Bengaluru
South Kengeri Pantharapalya
Part Village [Sy. No. 1 to
8, 24, 25, 75 to 131, and
Gramthana]
472 Bengaluru
South Kengeri Patnagere Full Village
473 Bengaluru
South Kengeri Ramasandra
Part Village [Sy. No. 1 to
3, 11, 12, 14, 15, 20 to
32, 34 to 37, 50, 61,
62(P), 63, 64, 81 to 167,
170 to 175, Gramthana,
Majare Dannaikanapalya,
Majare Doddabasthi,
Majare, Majare
Chikkabasthi, and Palya]
474 Bengaluru
South Kengeri Ramohalli Full Village
475 Bengaluru
South Kengeri Sonnenahalli Full Village
476 Bengaluru
South Kengeri Sulikeri Full Village
477 Bengaluru
South Kengeri Thagachikuppi Full Village
478 Bengaluru
South Kengeri Valagerehalli Full Village
479 Bengaluru
South Kengeri Venkatapura Full Village
480 Bengaluru
South Thavarekere Chikkeluru Rampura Full Village
481 Bengaluru
South Thavarekere Chikkeluru Venkatapura Full Village
482 Bengaluru
South Thavarekere Chikkeluru Full Village
483 Bengaluru
South Thavarekere Channenahalli Full Village
484 Bengaluru
South Thavarekere Koluru Nanjundapura Full Village
485 Bengaluru
South Thavarekere Koluru Gurarayanapura Full Village
486 Bengaluru
South Thavarekere Koluru Full Village
487 Bengaluru
South Thavarekere Kethohalli Full Village
488 Bengaluru
South Thavarekere Kethohalli Rampura Full Village
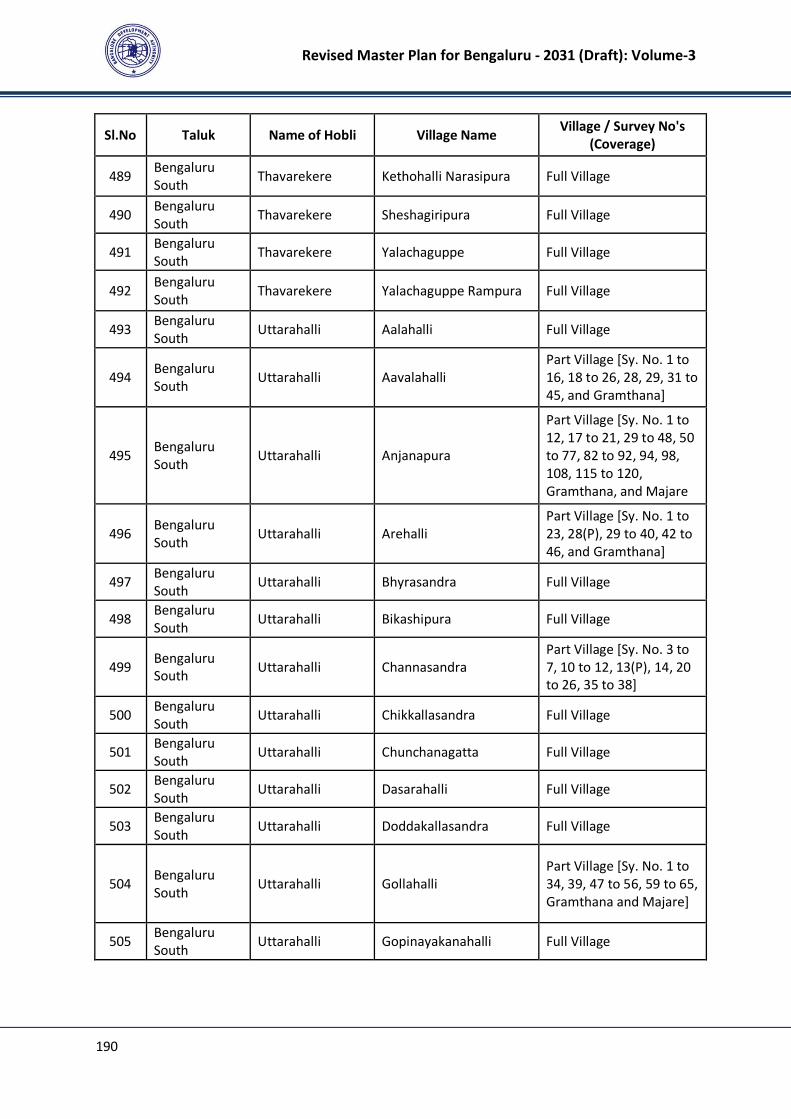
Revised Master Plan for Bengaluru - 2031 (Draft): Volume-3
190
Sl.No Taluk Name of Hobli Village Name Village / Survey No's
(Coverage)
489 Bengaluru
South Thavarekere Kethohalli Narasipura Full Village
490 Bengaluru
South Thavarekere Sheshagiripura Full Village
491 Bengaluru
South Thavarekere Yalachaguppe Full Village
492 Bengaluru
South Thavarekere Yalachaguppe Rampura Full Village
493 Bengaluru
South Uttarahalli Aalahalli Full Village
494 Bengaluru
South Uttarahalli Aavalahalli
Part Village [Sy. No. 1 to
16, 18 to 26, 28, 29, 31 to
45, and Gramthana]
495 Bengaluru
South Uttarahalli Anjanapura
Part Village [Sy. No. 1 to
12, 17 to 21, 29 to 48, 50
to 77, 82 to 92, 94, 98,
108, 115 to 120,
Gramthana, and Majare
496 Bengaluru
South Uttarahalli Arehalli
Part Village [Sy. No. 1 to
23, 28(P), 29 to 40, 42 to
46, and Gramthana]
497 Bengaluru
South Uttarahalli Bhyrasandra Full Village
498 Bengaluru
South Uttarahalli Bikashipura Full Village
499 Bengaluru
South Uttarahalli Channasandra
Part Village [Sy. No. 3 to
7, 10 to 12, 13(P), 14, 20
to 26, 35 to 38]
500 Bengaluru
South Uttarahalli Chikkallasandra Full Village
501 Bengaluru
South Uttarahalli Chunchanagatta Full Village
502 Bengaluru
South Uttarahalli Dasarahalli Full Village
503 Bengaluru
South Uttarahalli Doddakallasandra Full Village
504 Bengaluru
South Uttarahalli Gollahalli
Part Village [Sy. No. 1 to
34, 39, 47 to 56, 59 to 65,
Gramthana and Majare]
505 Bengaluru
South Uttarahalli Gopinayakanahalli Full Village
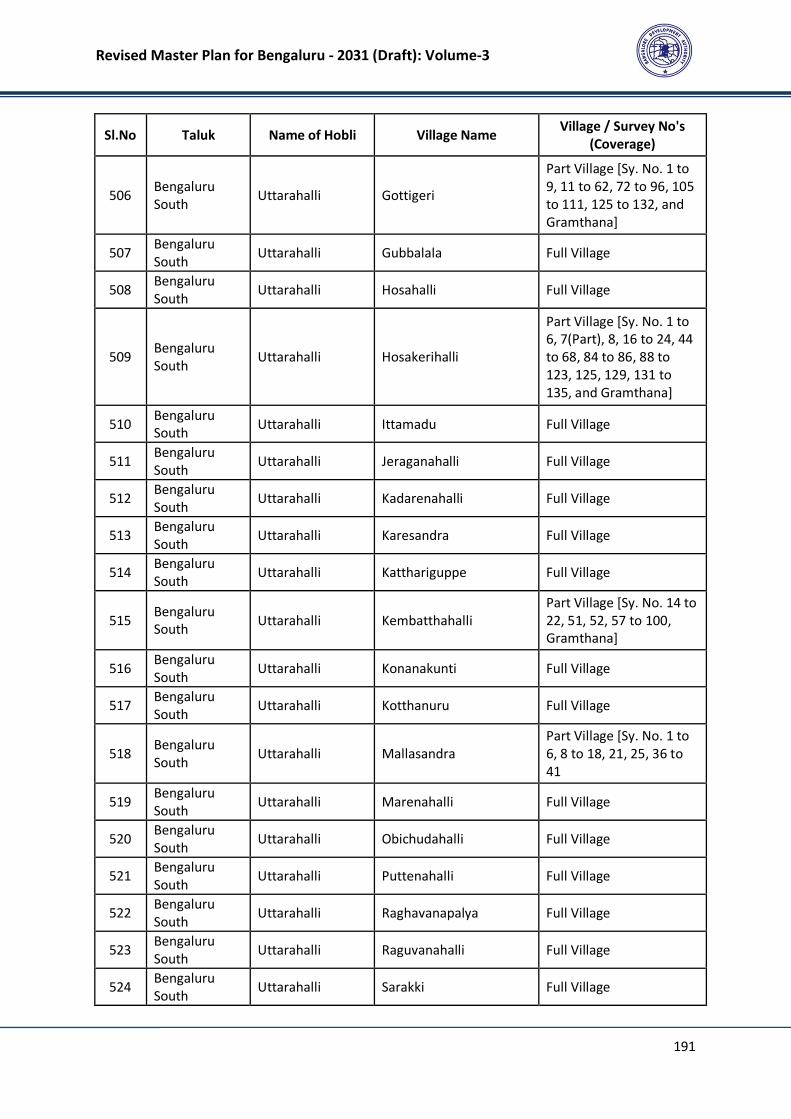
Revised Master Plan for Bengaluru - 2031 (Draft): Volume-3
191
Sl.No Taluk Name of Hobli Village Name Village / Survey No's
(Coverage)
506 Bengaluru
South Uttarahalli Gottigeri
Part Village [Sy. No. 1 to
9, 11 to 62, 72 to 96, 105
to 111, 125 to 132, and
Gramthana]
507 Bengaluru
South Uttarahalli Gubbalala Full Village
508 Bengaluru
South Uttarahalli Hosahalli Full Village
509 Bengaluru
South Uttarahalli Hosakerihalli
Part Village [Sy. No. 1 to
6, 7(Part), 8, 16 to 24, 44
to 68, 84 to 86, 88 to
123, 125, 129, 131 to
135, and Gramthana]
510 Bengaluru
South Uttarahalli Ittamadu Full Village
511 Bengaluru
South Uttarahalli Jeraganahalli Full Village
512 Bengaluru
South Uttarahalli Kadarenahalli Full Village
513 Bengaluru
South Uttarahalli Karesandra Full Village
514 Bengaluru
South Uttarahalli Katthariguppe Full Village
515 Bengaluru
South Uttarahalli Kembatthahalli
Part Village [Sy. No. 14 to
22, 51, 52, 57 to 100,
Gramthana]
516 Bengaluru
South Uttarahalli Konanakunti Full Village
517 Bengaluru
South Uttarahalli Kotthanuru Full Village
518 Bengaluru
South Uttarahalli Mallasandra
Part Village [Sy. No. 1 to
6, 8 to 18, 21, 25, 36 to
41
519 Bengaluru
South Uttarahalli Marenahalli Full Village
520 Bengaluru
South Uttarahalli Obichudahalli Full Village
521 Bengaluru
South Uttarahalli Puttenahalli Full Village
522 Bengaluru
South Uttarahalli Raghavanapalya Full Village
523 Bengaluru
South Uttarahalli Raguvanahalli Full Village
524 Bengaluru
South Uttarahalli Sarakki Full Village
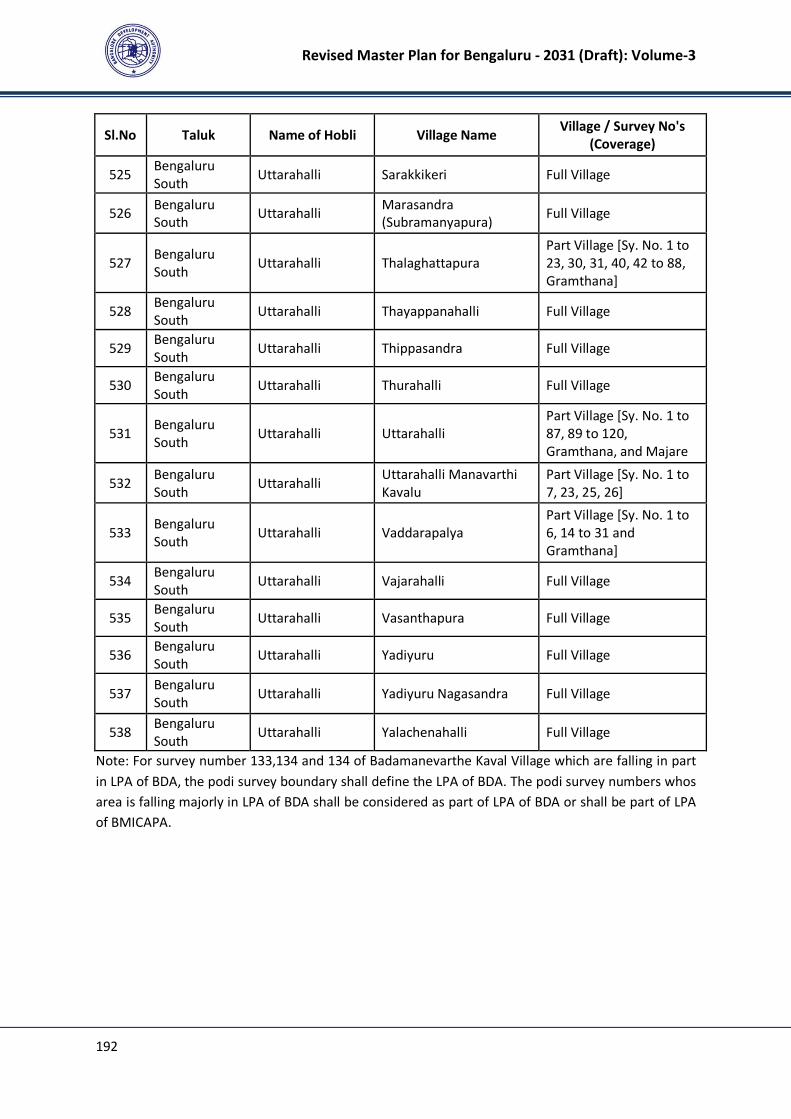
Revised Master Plan for Bengaluru - 2031 (Draft): Volume-3
192
Sl.No Taluk Name of Hobli Village Name Village / Survey No's
(Coverage)
525 Bengaluru
South Uttarahalli Sarakkikeri Full Village
526 Bengaluru
South Uttarahalli
Marasandra
(Subramanyapura) Full Village
527 Bengaluru
South Uttarahalli Thalaghattapura
Part Village [Sy. No. 1 to
23, 30, 31, 40, 42 to 88,
Gramthana]
528 Bengaluru
South Uttarahalli Thayappanahalli Full Village
529 Bengaluru
South Uttarahalli Thippasandra Full Village
530 Bengaluru
South Uttarahalli Thurahalli Full Village
531 Bengaluru
South Uttarahalli Uttarahalli
Part Village [Sy. No. 1 to
87, 89 to 120,
Gramthana, and Majare
532 Bengaluru
South Uttarahalli
Uttarahalli Manavarthi
Kavalu
Part Village [Sy. No. 1 to
7, 23, 25, 26]
533 Bengaluru
South Uttarahalli Vaddarapalya
Part Village [Sy. No. 1 to
6, 14 to 31 and
Gramthana]
534 Bengaluru
South Uttarahalli Vajarahalli Full Village
535 Bengaluru
South Uttarahalli Vasanthapura Full Village
536 Bengaluru
South Uttarahalli Yadiyuru Full Village
537 Bengaluru
South Uttarahalli Yadiyuru Nagasandra Full Village
538 Bengaluru
South Uttarahalli Yalachenahalli Full Village
Note: For survey number 133,134 and 134 of Badamanevarthe Kaval Village which are falling in part
in LPA of BDA, the podi survey boundary shall define the LPA of BDA. The podi survey numbers whos
area is falling majorly in LPA of BDA shall be considered as part of LPA of BDA or shall be part of LPA
of BMICAPA.
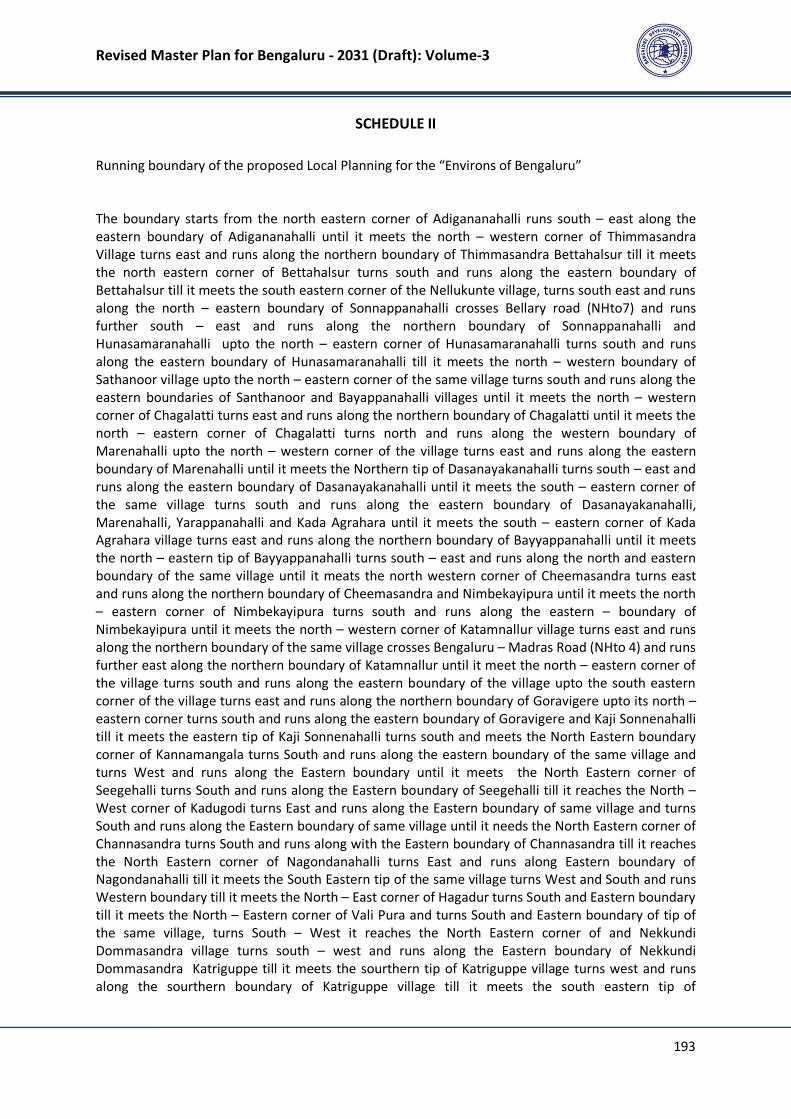
Revised Master Plan for Bengaluru - 2031 (Draft): Volume-3
193
SCHEDULE II
Running boundary of the proposed Local Planning for the “Environs of Bengaluru”
The boundary starts from the north eastern corner of Adigananahalli runs south – east along the
eastern boundary of Adigananahalli until it meets the north – western corner of Thimmasandra
Village turns east and runs along the northern boundary of Thimmasandra Bettahalsur till it meets
the north eastern corner of Bettahalsur turns south and runs along the eastern boundary of
Bettahalsur till it meets the south eastern corner of the Nellukunte village, turns south east and runs
along the north – eastern boundary of Sonnappanahalli crosses Bellary road (NHto7) and runs
further south – east and runs along the northern boundary of Sonnappanahalli and
Hunasamaranahalli upto the north – eastern corner of Hunasamaranahalli turns south and runs
along the eastern boundary of Hunasamaranahalli till it meets the north – western boundary of
Sathanoor village upto the north – eastern corner of the same village turns south and runs along the
eastern boundaries of Santhanoor and Bayappanahalli villages until it meets the north – western
corner of Chagalatti turns east and runs along the northern boundary of Chagalatti until it meets the
north – eastern corner of Chagalatti turns north and runs along the western boundary of
Marenahalli upto the north – western corner of the village turns east and runs along the eastern
boundary of Marenahalli until it meets the Northern tip of Dasanayakanahalli turns south – east and
runs along the eastern boundary of Dasanayakanahalli until it meets the south – eastern corner of
the same village turns south and runs along the eastern boundary of Dasanayakanahalli,
Marenahalli, Yarappanahalli and Kada Agrahara until it meets the south – eastern corner of Kada
Agrahara village turns east and runs along the northern boundary of Bayyappanahalli until it meets
the north – eastern tip of Bayyappanahalli turns south – east and runs along the north and eastern
boundary of the same village until it meats the north western corner of Cheemasandra turns east
and runs along the northern boundary of Cheemasandra and Nimbekayipura until it meets the north
– eastern corner of Nimbekayipura turns south and runs along the eastern – boundary of
Nimbekayipura until it meets the north – western corner of Katamnallur village turns east and runs
along the northern boundary of the same village crosses Bengaluru – Madras Road (NHto 4) and runs
further east along the northern boundary of Katamnallur until it meet the north – eastern corner of
the village turns south and runs along the eastern boundary of the village upto the south eastern
corner of the village turns east and runs along the northern boundary of Goravigere upto its north –
eastern corner turns south and runs along the eastern boundary of Goravigere and Kaji Sonnenahalli
till it meets the eastern tip of Kaji Sonnenahalli turns south and meets the North Eastern boundary
corner of Kannamangala turns South and runs along the eastern boundary of the same village and
turns West and runs along the Eastern boundary until it meets the North Eastern corner of
Seegehalli turns South and runs along the Eastern boundary of Seegehalli till it reaches the North –
West corner of Kadugodi turns East and runs along the Eastern boundary of same village and turns
South and runs along the Eastern boundary of same village until it needs the North Eastern corner of
Channasandra turns South and runs along with the Eastern boundary of Channasandra till it reaches
the North Eastern corner of Nagondanahalli turns East and runs along Eastern boundary of
Nagondanahalli till it meets the South Eastern tip of the same village turns West and South and runs
Western boundary till it meets the North – East corner of Hagadur turns South and Eastern boundary
till it meets the North – Eastern corner of Vali Pura and turns South and Eastern boundary of tip of
the same village, turns South – West it reaches the North Eastern corner of and Nekkundi
Dommasandra village turns south – west and runs along the Eastern boundary of Nekkundi
Dommasandra Katriguppe till it meets the sourthern tip of Katriguppe village turns west and runs
along the sourthern boundary of Katriguppe village till it meets the south eastern tip of
Revised Master Plan for Bengaluru - 2031 (Draft): Volume-3
194
Romanaikanahalli turns south and runs along the Eastern boundary of Thigala Chavadadenahalli
crosses Bengaluru – Sarjapur Road runs further south along the Eastern boundary of Thigala
Chavadadenahalli, Dommasandra, Kammasandra, until it meets the north western tip of Hosahalli
Village turns east and runes along the northern boundary of Hosahalli Village till it meets the north
eastern boundary corner of Hosahalli turns south and runs along the Eastern boundary of the same
village till it meets the Southto Eastern corner of the village turns west and runs along the southern
boundary of Hosahalli , Kammasandra and Kaggalipura till it meets the south eastern corner of
Huskuru village turns south and runs along the Eastern Boundary of Shingena Agrahara until it meets
the south eastern corner of the same village turner west and runs along the southern boundary of
Shingena Agrahara till it meets the western tip of Shingena Agrahara turns south and runs along the
eastern boundary of Gulimangala village areas BengalurutoHosur road and runs further south – west
along the eastern boundary of Hebbagodi Village till it meets the southto eastern tip of Hebbagodi
village turns west and runs along the southern boundary of Hebbagodi and Thirupalya until it meets
the south – western comer of Thirupalya village turns south and runs along the Eastern boundary of
Hulimangala and Vabasandra village till it meets the southto eastern corner of Vabasandra village
turns south and runs along the eastern boundary of Nanjapura till it meets the southern tip of
Nanjapura village turns in the north – west direction and run s along the western boundary of
Nanjapura village until it meets the southern tip of Hulimangala village turns west and runs along the
southern boundary of S. Bingipura and Ramasandra till it meets the southtowestern corner of the
same village turns south and runs along the eastern boundary of Bogihalli , crosses Bengaluru –
Anekal Road and rune further south along the Eastern boundary of Bogihalli until it meets the
southto eastern corner of the village turns south west and runs along the southern boundary of the
same village until it meets the southern boundary turn corner of Mantapa village turns north west
run along the southern boundary of Mantapa Village till it meets the south – western corner of
Mantapa turn west and south along the south eastern boundary of Bannerghatta village till it meets
the southern tip of Bannerghatta village turns north and runs along the western boundary
Bannerghatta village and Bannerghatta Kaval till it meets the boundary of Bhuthanahalli turns west
and runs along the southern boundary of Bhuthanahalli until it meets the south western corner of
Bhuthanahalli turns north and runs along the Western boundary of Bhuthanahalli until it meets the
south – eastern tip of Badamanavarthikaval and turns west and runs along the southern boundary of
Badamanavarthikaval and Obichudahalli crosses Bengaluru – Kanakapura road and runs further west
along the southern boundary of Agara until it meets the southern tip of Badamanavarthikaval village
turns north and runs along the western boundary of Agara (Sy No’s 76 to 82 of Badamanavarthikaval
village are included) till it meets the norttowestern corner of Sy no. 153 of same village, crosses
stream and runs along the western boundary of Agara and western side of stream turns southtoeast
and runs along the northern boundary of Agara till it meets northern tip of Sy no. 192 of Agara and
turns towards northtoeast and runs along the boundary of Agara till it meets the northtoeast corner
of Sy no. 37 of Agara and turns east and runs along the northern boundary of Agara till it meets the
northtoeast corner of Sy no. 48 and turns south and runs along the eastern boundary of Agara till it
meets the northtoeast corner of Sy no. 49 and continues along north boundary of same sy.no. to
meet north corner of Sy.no.126 of Badamenvarthe Kaval village and follows the village boundary of
Agara Village along the boundary of Sy. No.49, MajreHosa Thathagun, 50, 51,and 53 till it meets
southern corner of sy.no.53 of Agara Village and turns south running along the boundary of Agara
Villlage to meet southern corner of sy.no of 57 of same village and truns south east to meet north
east corner of sy.no. 130 of Badamanevarthe Kaval and turns south running along the Sy.no. 130,
131 and 132 till its meest the north east corner of Sy.No. 64 of Agara Villages and truns east to meet
north west coner of same sy.no. and truns south to meet south east corner of sy.no 64 and turns
west to south west corner of same sy.no. and turns south following the boundary of sy.no. 132 and
133 of Badamanevarthe Kaval village till it meets the western corner of Sy.No. 133 and turns east in
straight line cutting through Sy.no. 133, 134 and 135 to meet northwest corner of Sy. No.189 follows
Revised Master Plan for Bengaluru - 2031 (Draft): Volume-3
195
northern boundary to reach north east corner of same sy.no. then turns south east cutting through
sy.no. 135 to meet north eastern corner of sy. No. 146 then follows the boundary of Sy. No. 146,
156, 160 and 151 till it meets the eastern corner of Sy. No. 151 and turns north folliwng boundary of
Sy. No. 162 to meeth the northern corner of Sy. No. 162 amd truns east to mmeet south east corner
of Sy. No. 163 ammd turns north following the eastern boundry of Badamanevarthe Kaval village
along sy. No. 163, 164, Amal Majare, 166, 274, 273, 167, 168, 169 till it meets north east corner of
Sy. No. 169 of Badamanavarthikaval village and truns west and runs along the western boundary of
Sy no's 89 and 98 of Anjanapura and meets northern tip of Sy no. 98 and turns east and runs along
the northern boundary of Sy no's 98, 75, 21, 18 and 17 till it meets the southtoeast corner of Sy no.
19 of Anjanapura village and turns east and runs on northern boundary of Sy no. 39 of Gollahalli till it
meets the northtoeastern corner and turns south and runs along the eastern boundary of same Sy
no till it meets the northern boundary of Bilwaradahalli and turns east and runs along the northern
boundary of same village till it meets the southtowestern corner of Sy no. 109 of Gottigere and turns
north and runs along the western boundary of Sy no's 109, 111, 107, 106 and turns east and runs
along the northern boundary of Sy no's 106 and 105 and turns south and runs along the eastern
boundary of Sy no's 105 and 107 of same village till it meets the northtowestern corner of Sy no. 7
of Basavanapura and turns east and then turns north and runs along the western boundary of Sy
no's 7, 9, 10 crosses Bannerughatta Road and turns north and runs along western boundary of Sy
no's 30, 39, 37, 36 and turns east and runs along the northern boundary of Sy no's 36, 35, 34, 21, 50,
49, 47 till it meets the southtowestern corner of Sy no. 88 of Kammanahalli and cuts diagonally
through the Sy no. 88 till it touches northtoeast corner of same Sy no. and turns east and runs along
northern boundary of Sy no's 86 crosses stream and continues along 70, 68, 67, 58, 61, 53, 49, 48,
35, 36 and turns south and runs along the eastern boundary of Sy no's 36, 29, 28, 22, 21 till it meets
the northern boundary of Hommadevanahalli and turns east and runs along northern boundary of
Hommadevanahalli till it meets the southtowestern corner of Mylasandra and turns north and runs
along the western boundary of Mylasandra till it meets the southtowestern corner of Sy no. 44 of
Yelenahalli and turns north and runs along the western boundary of same Sy no. turns east and runs
along the northern boundary of Sy no's 44, 68 till it meets the western boundary of Mylasandra and
turns north and runs along the northern boundary of same village till it meets the southtowestern
corner of Sy no. 52 of Begur and turns northtoeast and runs along the boundaries of Sy no's 52, 57,
59, 61, 62, 71, 66, 65, 78, 101, 100, 99, 98, 97, 106, 105 and turns south and runs along eastern
boundary of Sy no's 105, 104 of same village till it meets the northern boundary of Vittasandra and
turns east and runs till it meets the southtowest corner of Sy no. 109 of Begur and runs along
northern boundary of Sy no. 109 till it touches the western boundary of vittasandra and turns north
and runs along northern boundary of vittasandra and turns south and runs along the eastern
boundary of vittasandra till it meets the northtowest corner of Sy no. 27 of Chikkathoguru and turns
east and runs along eastern boundary of Sy no's 27, 26, 25, 24 of same village till it touches the
village boundary of Vittasandra and turns south and runs along the eastern boundary of Vittasandra
till it meets the northtowest corner of Sy no. 110 of Doddathoguru and turns east and runs along
northern bounday of Sy no's 110, 111, 117, 118 and turns north and runs along western boundary of
Sy no's 119, 120, 121, 126, 127, 128 and turns east and runs along northern boundary of Sy no's 128,
129, 51, Gramthana, 41, 40 and turns south and runs along eastern boundary of Sy no. 40, 44 of
Doddathoguru till it meets the northtowest corner of Sy no. 8 of Konappana Agrahara and turns east
and runs along northern bounday of Sy no's 8, 93, 94, Gramthana boundary, 2, 3, 28, crosses
Bengaluru to Hosur road, 59, 58, 54, Palya boundary, 48, 44 and turns north till it meets the
northtowest corner of Sy no. 46 of Konnappana Agrahara further continues north along with
western boundary of Dodda Nagamangala till it meets the southtowest corner of Sy no. 16 of Dodda
Nagamangala and turns northtoeast and runs along northtowestern boundary of Sy no's 16, 17, 16
and turns west and runs along southern boundary of Sy no's 19, 22, 23, 25, 26, 29, 36, 37, 38, 39 till
it meets the Baretena Agrahara boundary and turns south and runs along eastern boundary of same
Revised Master Plan for Bengaluru - 2031 (Draft): Volume-3
196
village till it crosses the hosur road and turns northtowest and runs along hosur road till it meets the
southtoeast corner of Sy no. 2 and turns west and runs along southern boundary of Sy no's 2,
gramthana boundary, 1 and turns north and runs along western boundary of Sy no's 1, 2 till it
touches hosur road and runs along hosur road till it meets the southtoeast corner of majare
boundary and turns west and runs along majare boundary till it touches chikkathoguru boundary
and turns south and runs along southern boundary of Sy no. 45 of Chikkathoguru till it touches the
southtoeast corner of Sy no. 135 of Doddathoguru and turns west and runs along southern boundary
of Doddathoguru till it meets the Chikkathoguru and turns south and runs along eastern boundary of
Sy no's 38, 37 and turns west and runs along southern boundary of Sy no's 37, 36 of Chikkathoguru,
till it meets Basapaura boundary and runs along southern boundary of Sy no's 27, 30, 33, 32, 70, 69,
67, 43, 66, 56, 54, 53, 52, 51, 49 of Basapura and turns north and runs along the western boundary
of Basapura till it meets the southtoeast corner of Sy no. 144 of Begur and turns west and runs along
southern boundary of Sy no's 144, 142, 141, 140, 130, 132 cuts through Sy no. 94 till it touches the
eastern boundary of Sy no. 93 and continues west along southern boundary of Sy no's 93, 92, 18, 84,
22, 37, 38, 36, 35, 30 of Begur till it meets boundary of Yelenahalli and turns south and runs along
eastern boundary of Yelenahalli till it meets the southtoeast corner of Sy no. 36 and turns west and
runs along southern boundary of Sy no's 36, 37, 51, 60, 59, 58, 57, 63, 50, 67 and turns north and
runs along western boundary of yelenahalli till it touches the southtoeast corner of Sy no. 112 of
Kammanahalli and turns south and runs along eastern boundary of Sy no's 112, 113, 19, 11, 9 and
turns west and runs along southern boundary of Sy no's 9, 8, 7, 5, 39, 41, 75, cuts through part of Sy
no. 82, and runs along southern boundary of Sy no. 91, till it meets the boundary of Gottigere and
runs along southern boundary of Sy no's 62, 83, 77, 76, 75, 72, 88, 92, 93, 94, 95, 96, crosses
Bannerughatta Road, gramthana boundary, 127, 125, 7, 8, 9, 11 of Gottigere till it meets the
boundary of Kothanuru and turns south and runs along eastern boundary of Kothanuru and turns
west and runs along southern boundary of Kothanuru till it meets the northtoeast corner of Sy no.
98 of Kembathanahalli and turns south and runs along eastern boundary of Sy no's 98, crosses
stream, 99, 64, Gramthana boundary, 17, 16, 15, 14, 15, 16, 17, 18, 19, 22, 57, 58, 59, 60, 61, 62, 71,
74, 52, 51 till it meets the boundary of Gollahalli and further continues west along southern
boundary of Sy no's 34, 33, 32, 31, 30, 26, 63, 61, 59, 55, 56, 65, 56, 49, 47 till it meets the boundary
of Anjanapura and turns west and runs along southern boundary of Sy no's 12, 10, 32, 31, 30, 29, 92,
115 and turns north and runs along western boundary of Sy no's 115, 108, 92, 94, 118, 83, 84, 82,
86, 119, 120, 87, 76, 77, 88, 74, 72 and turns south and runs along the eastern boundary of Sy no's
67, 85, 91, 90, 50, 51, crosses stream and meets northtoeast corner of Sy no 17 of Mallasandra and
further continues south along eastern boundary of Sy no's 17, 18 and turns west and runs along
southtowestern boundary of Sy no’s 18, 25, 15, 9, 8, 7 till it touches the northtowest corner of Sy no.
7 and turns west and runs along the southern boundary of Sy no’s 5, 39, 38, 37, 36 till it touches the
boundary of Talaghattapura and further continues west along southern boundaries of Sy no's 23,
22, 30, 31 crosses kanakapura road, 46, 40, 42 turns northtowest and runs along western boundary
of Talaghattapura till it touches the southtowest corner of Sy no. 23 and further continues along
western boundary of Sy no’s 23, 26, 25, 7, 6 of Uttarahalli Manavarthe Kaval till it meets the
northtoeast corner of Sy no. 6 of Lingadeeranahalli and turns south and runs along the southern
boundary of lingadeeranahalli till it meets the southtowest corner of same village and turns north
and runs along the same village boundary till it meets the southtowest corner of Hemmigepura and
further continues north along western boundary of same village till it meets the northtowest corner
of Sy no. 82 and turns east and runs along northern boundary of Sy no’s 82, 85 and turns north and
runs along western boundary of Sy no’s 98, 99, 100, 89 and continues along west side of stream
(west of Sy no. 88) and turns east along the stream and continues untill it touches southtowest
corner of Sy no. 13 of Channasandra and continues along western boundary of Sy no. 13 cuts
through northern portion of Sy no. 13 and turns northtoeast and runs along western boundary of Sy
no’s 12, 10, 7, 5, 4, 3 till it meets the boundary of Channasandra and continues along eastern
Revised Master Plan for Bengaluru - 2031 (Draft): Volume-3
197
boundary of Channasandra till it meets the northtowest corner of Sy no. 85 of Uttarahalli and turns
east and runs along northern boundary of Sy no’s 85, 86, 87, 90, 89 till it meets the boundary of
Vaddarapalya further continues north along the southtowestern boundary of Sy no’s 19, 18, 16, 14,
15, 6 till it meets the southtowest corner of Sy no. 28 of Arehalli and runs along western boundary of
Sy no. 28, cuts through Sy no. 28 till it meets the boundary of Hosakerahalli, cuts through Sy no. 7 till
it touches the southtowest corner of Sy no. 8 of Hosakerahalli and runs along western boundary of
same Sy no. Till it meets the northtowest corner of Sy no. 8 and turns east and runs along northern
boundary of Sy no’s 8, 7 till it touches the southtowest corner of Sy no. 3 and turns north and runs
along southtowestern boundary of Sy no’s 3, 16, 17, 19, 24, 83 till it touches the northtowest corner
of Sy no.83and turns east till it meets the western corner of Sy no. 85 and turns north runs along
western boundary of 86, 90, 91, 89, 88 till it meets the boundary of Avalahalli and further continues
north along western boundary of Sy no’s 16, 18, 26, 28, 29, 33 and turns west and runs along
southern boundary of Sy no 31 of Avalahalli till it touches the southtoeast corner of Sy no. 41 of
Byatarayapura and turns north and runs along eastern boundary of Sy no’s 41, 40, 6 till it touches
the Bengaluru to Mysuru Road and turns southtowest and continues along the same road till it
meets the north corner of Sy no. 4 of Devatige Ramanahalli and turns south and runs along eastern
boundary of Sy no’s 4, 11, 10 crosses stream and continues along south and eastern side of stream
till it meets the southtowest corner of Sy no. 128 of Hosakerahalli and turns east and runs along
northern side of the stream till it meets the northtowest corner of Sy no. 44 of Hosakerahalli and
turns south and runs along north east of Sy no’s 44, 45, 47, 48, 49, 50, 52 till it meets the boundary
of Halagevaderahalli and runs along eastern boundary of Halagevaderahalli till it meets the
northtoeast corner of Sy no. 25 of Channasandra and turns south and runs along eastern boundary
of Sy no’s 25, 26, 24, 22, 20 and turns east and runs along southern boundary of Sy no’s 20, 21, 22,
35 till it meets the east corner of Sy no. 3 of Ganakallu and continues along the southern boundary
of Sy no’s 3, 2, 13 of Ganakallu till it meets the boundary of Badamanevarthekavalu and turns south
follows eastern boundary of Sy. No. 68 of Badamanavarthikaval village and runs along the southern
boundary of Sy.69 of Badamanavarthikaval village till it meets the boundary of Chudenapura village
till it meets norther corner of Sy. No. 63 of Badamanavarthikaval and truns east along the northern
side of Sy. No. 66, 69, 68 till it meets the corner of Sy. No. 172 of Badamanavarthikaval and turns
south along western side of Sy. No. 172 and turns west along boundary of Sy. No. 68, 69 and meets
east corner of Sy. No. 104 of Badamanavarthikaval and follows eastern boundary of Sy. No. 103, 101
and runs along southtowestern boundaries of Sy no’s 71, 72, 105, 106, 64, 62, 60, till it meets the
boundary of Chudenapura further continues and runs along southtowestern boundaries of Sy no’s
30, 29, 10, 9, 8, 20 crosses stream and continues along west side of the stream till it meets the
southtoeast corner of the Sy No. 117 of Kengeri and runs along southtowestern boundaries of Sy
no’s 117, 113, 111, 129, crosses Bengaluru to Mysuru Road, 134, 136, crosses Bengaluru to Mysuru
railway line, 170, 201, 203, 193, 268, 260, 261, 211, 213 till it meets the boundary of Ramasandra
and turns east and runs along Ramsandra boundary till it meets the southtowest corner of Sy no. 32
and turns north and runs along western boundary of Sy no’s 32, 31 and turns northtowest and runs
along the southtowestern boundary of Sy no’s 34, 35, 37, cuts through 62, 61, 63 and continues
along west side of stream till it touches southtowest corner of Sy no. 76 and runs along the south
boundary of Sy no. 76 and western boundary of Sy no’s 20, 21, majare chikkabasthi boundary, 15,
167, majare, 14, 12, 11 till it meets the boundary of Hullalu and continues north and runs along the
southtowestern boundary of Sy no’s 185, west of road, 198, 203, 202, 200, 6, 8, 9, 11, 21, 25, 26, 28,
31 till it meets the boundary of Herohalli, and continues north and runs along the southtowestern
boundary of Sy no’s 182, 183, 184, 186, 188, 66, 164, 169, 63, 62, 69, 68, 73, 74, 76 till it meets the
boundary of Hosahalli Gollarapalya and continues north and runs along the southtowestern
boundary of Sy no’s 12, crosses magadi road, 8, 6, 5, 34, 35, 44, 43, 42 till it meets the boundary of
Lingadeeranahalli further continues north and runs along the southtowestern boundary of Sy no’s
36, 35, 34, 40, 43, 42 till it meets the boundary of Handrahalli further continues north and runs along

Revised Master Plan for Bengaluru - 2031 (Draft): Volume-3
198
the southtowestern boundary of Sy no’s 86, 93, 95, 96, 105, 104, 103 till it meets the boundary of
Karivobanahalli further continues north and runs along the western boundary of Karivobanahalli till
it touches the southtoeast corner of Sy no. 24 of Srikantapura and turns west and runs along the
southern boundary of Sy no’s 24, 23, 22, 21 and turn north and run along the western boundary of
Sy no. 21till it touches the boundary of Doddabidarakallu and runs towards north along the
boundary of the same village till it touches the boundary of Thirumalapura and continues north and
runs along the southtowestern boundary of Sy no’s 8, 9, 11, 12, 17, 18, 40, 41, 38, 36 and continues
along the eastern boundary of Thirumalapura till it meets the southtowest corner of
Chikkabidarakallu boundary and continues north along the boundary of same village crosses
Bengaluru to Tumkur road and runs further till it meets the boundary of Srikantapura K. G. and
continues along the western boundary of Sy no’s 32, Gramthana boundary, 48, 47, 39, 41 of same
village and crosses stream and turns east and runs along the north side of stream and boundary of
Srikantapura K. G. till it meets the boundary of K.G. Bagalakunte and turns north and runs along
western boundary of K.G. Bagalakunte further continues along western boundary of Sidedahalli till it
meets the southtoeast boundary of Thammenahalli and turns west and runs along southern
boundary of Thammenahalli till it touches the boundary of Kuduragere and turns south and runs
along eastern boundary of Kuduragere and turns west and runs along the boundary of Kuduragere
further continues along the southern boundary of Hanumanthasagara till it touches the stream and
turns south and runs along east side of the stream till it touches the boundary of Siddanahosahalli
and turns east and runs along northern boundary of Siddanahosahalli further continues along
northern boundary of Madavara crosses stream (above Sy no. 21) and turns south and runs along
eastern boundary of Sy no’s 16, 2, gramthana boundary, 64, 63, 65, 75, 74, 70, 69 till it meets the
boundary of Lakshmipura and turns east and runs along the boundary of same village till it touches
the northtoeast corner of Sy no. 14 and turns south and runs along east and northern boundary of Sy
no’s 14, 16 till it touches the boundary of Srikantapura and turns south and runs along the eastern
boundary of Sy no’s 8, 7, 6, 3, 2, 1, gramthana boundary, 28 of Srikantapura till it meets the
boundary of Gangondanahalli further continues south and runs along eastern boundary of Sy no’s
102, 103, 15, 10, 23, 22, 24, 29, 30, 35, 40, 45, 104 of Gangondanahalli till it touches the northtoeast
corner of Sy no. 27 of Bylakonenahalli and continues south and runs along eastern boundary of Sy
no’s 27, 26, 46, 48, 49, 23 till it touches the boundary of Kachohalli further continues south and runs
along eastern boundary of Sy no’s 13, 17, 18, 20, 25, 26, 54, 34 till it touches the northtowest
boundary of Sy no. 30 of Hosahalli Gollarapalya and runs along the eastern boundary of Sy no. 30
and runs along the western boundary of Hosahalli Gollarapalya crosses Bengaluru to Magadi Road
and runs along the eastern boundary of Sy no. 21 till it touches the boundary of Kodigehalli runs
along the north, west boundary of Sy no. 38 of Kodigehalli and turns south and runs along north and
eastern boundaries of Sy no’s 39, 40, 42, 35, 28, 29, 94, 3, 72, 71, 77, 79, 80, 81, 82 of Kodigehalli till
it touches the northtowestern corner of Sy no. 6 of Kanneli and runs along eastern boundary of
Kanneli till it touches Manganahalli boundary and continues south along the north, eastern
boundaries of Sy no’s 25, 26, 29, 28, 46, 19, 49, gramthana boundary, 63, 65, runs along road (east of
Sy no. 75) till it meets the boundary of Ramsandra and continues south and runs along the eastern
boundary of Sy no’s 162, 163, 164, gramthana boundary, 3, 81, Majare Dannaikanapalya, 50, 106,
road connecting palya, palya boundary, 109 till it meets the boundary of Kommaghatta and runs
west and runs along the Kommaghatta boundary till it touches the northtoeast corner of Sy no. 110
and turns south and runs along north eastern boundary of Sy no’s 110, 111, 108, 107, 100, 95, 101,
93, 40 continues along stream, 39, 37, 158, 123, 115 and turns west and runs along southern
boundary of Sy no’s 115, 116 till it meets the boundary of Kommaghatta Krishnasagara and turns
south and runs along boundary of Kommaghatta Krishnasagara till it touches the northtowest corner
of Sy no. 29 of Kommaghatta and runs south along eastern boundary of Sy no’s 29, 28 of
Kommaghatta till it touches the boundary of Chellaghatta and turns east and runs along the
northern boundary of Chellaghatta further continues along the northern boundary of Kengeri till it
Revised Master Plan for Bengaluru - 2031 (Draft): Volume-3
199
touches the northtoeast corner of Sy no. 162 and turn south and runs along the eastern boundary of
Sy no’s 162, crosses Bengaluru to Mysuru Railway line, 159, 156, Bengaluru to Mysuru road, 235,
234, 233, 231 and turns north and runs along western boundary of Sy no. 231 till it touches the
Bengaluru to Mysuru road and turns southtowest and runs along Bengaluru to Mysuru road till it
touches the Kambipura boundary and turns southtoeast and runs along Kambipura boundary till it
touches the northtowest boundary of Sy no. 240 and runs along northern boundary of Sy no’s 240,
238 and turns south and runs along eastern boundary of Sy no’s 238, 239, 240 till it touches the
Kambipura boundary and turns southtoeast and runs along Kambipura boundary till it touches the
southtowest corner of Sy no. 5 of Doddabele and turn northtoeast and runs along the western
boundary of Doddabele till it touches the north corner of Sy no. 7 and turns southtoeast and runs
along the eastern boundary of Sy no. 7, 9 crosses stream and continues along east side of stream till
it touches the northtowest corner of Sy no. 56 of Hemmigepura and runs along eastern boundary of
Sy no’s 56, 96, 50, 52, gramthana boundary, 34, 16, 15, 11, 10, 9 till it touches the boundary of
Varahasandra and turns southtowest and runs along southern boundary of Hemmigepura south side
of stream (northern boundary of Kengeri Gollahalli) till it touches the northtoeast corner of Sy no.
110 of Kambipura and turn south and runs along eastern boundary of Kambipura further continues
along eastern boundary of Gudimavu and Devageri and turns southtowest and runs along southern
boundary of Devageri further continues west along southern boundary of Gudimavu and
Tagachiguppe till it meets the stream (east of Kanaminike) and runs east side of stream until it meets
south eastern corner of Kanaminake turns west and runs along the sourthern boundary of
Kanaminake till it meets the south western corner of the same village turns north and north west
and runs along the western boundary of Kanaminake village crosses Bengaluru Mysore road and
Bengaluru – Mysore railway line runs further north west till it meets the southern boundary of
Sheshagiripura turns west and runs along the southern boundary of Sheshagiripura and southern tip
of Koluru village till it meets the south western corner of Koluru turns north and runs along the
western boundary of Koluru, Koluru Gurarayanapura, Kethohalli Ramapura and Kethohalli till it
meets the North – Western corner of Kethohalli village turns east and runs along northern boundary
of Kethohalli till it meets the boundary of Ramohalli turns north and runs along the western
boundary of Ramohalli and Maligowdanahalli until it meets the north – western corner of
Maligowdanahalli turns east and runs along the northern boundary of Maligowdanahalli until it
meets the north – western corner of Maragondanahalli and turns north and runs along the western
boundary of Maragondanahalli and Yelachaguppe and Channenahalli crosses Bengaluru – Magadi
road and runs further north until it meets the north western corner of Channenahalli turns east and
runs along the northern boundary of Channenahalli village until it meets the boundary of Seegehalli
turns north and runs along the western boundary of Seegehalli and Machohalli along the western
boundary of Byandhalli till it meets the north – western corner Byandahalli turns east and runs along
the northern boundary of Byandahalli till it meets the northtowestern corner of Byandahalli turns
north and runs along the Western boundary of Vaddarahalli Kadarenahalli, Harokyathanahalli,
Narayanappan palya until it meets the southern tip of Dasanapura village turns north west and run
along the southern boundary of Dasanapura village until it meets the south western corner of
Dasanapura turns in north and runs along the western boundary of Dasanapura crosses
BengalurutoPoona Road (NHto4) and runs further north until it is meets the NorthtoWestern corner
of Dasanapura village turns east and runs along the northern boundary of Dasanapura village until it
meets the NorthtoEastern corner of the same village turns north and runs along the western
boundary of Heggadadevanapura Aluru and Narasipura crosses BengalurutoPoona Railway line and
runs further north until it meets the western tip of Bilajaji turns east and north and runs along the
western boundary of Bilajaji until it meets the northern west tip or Bilajaji village turns east and runs
along the northern boundary of the same village until it meets the northtoeastern corner of the
village turns south and runs along the eastern boundary of Bilajaji village and Thore Nagasandra until
it meets the northern boundary of Kodagi Thirumalapura (B) village turns east and runs along the
Revised Master Plan for Bengaluru - 2031 (Draft): Volume-3
200
northern boundary of Kodagi Thirumalapura (B) village turns east and runs along the northern
boundary of Kodagi Thirumalapura (B) village until it meets the western boundary of
Huralichikkanahalli turns north and runs along the western boundary of Huralichikkanahalli turns
north and urns along the western boundary of Huralichikkanahalli and Kodagi Thirumalapura until it
meets the northtowestern corner of Kodagi Thirumalapura village until it meets the boundary of
Ivarakandapura village turns north east and runs along the western boundary of Ivarakandapura
village until it meets the north western corner of Kalenahalli turns east part runs along the northern
boundary of Kalenahalli and Seekote until it meets Linganahalli village boundary turns north and
runs along the western boundary of Linganahalli until it meets the north – western corner of
Linganahalli turns east and runs along the northern boundary of Linganahalli until it meets the
western boundary of Madappanahalli turns north and runs along the western boundary of
Madappanahalli and Ittagalapura until it meets the north – western corner of Ittagalapura turns east
and runs along the northern boundary of Ittagalapura till it meets the western tip of Rajanakunte
village turns north – east and runs along the north – western tip of Rajanakunte village turns north –
east and runs along the north – western boundary of Rajanakunte village till it meets the south –
western corner of Adiganahalli turns north and along the western boundary of Adiganahalli until it
meets the north – western corner of Adiganahalli turns east and runs along the northern boundary
of Adiganahalli crosses the Bengaluru – Doddaballapur road and Bengaluru – Guntakal Railway line
and runs further east until it meets the north – eastern corner of Adiganahalli village, the starting
point.
Town Planner Member
BDA
Commissioner
BDA
Chairman
BDA