
Report On A STUDY ON MONTE CARLO SIMULATION FOR ...
130
1| P a g e Report On A STUDY ON MONTE CARLO SIMULATION FOR STOCK PRICE FORECASTING RESEARCH DISSERTATION for the Swiss School of Business and Management DBA Program Prepared by: Thangjam Ravichandra Singh SSBM ID 00515 SUPERVISOR / MENTOR Dr. Hrvoje Volarevic November 2021
-
Upload
khangminh22 -
Category
Documents
-
view
1 -
download
0
Transcript of Report On A STUDY ON MONTE CARLO SIMULATION FOR ...

1| P a g e
Report On
A STUDY ON MONTE CARLO SIMULATION FOR STOCK PRICE
FORECASTING
RESEARCH DISSERTATION
for the Swiss School of Business and Management
DBA Program
Prepared by:
Thangjam Ravichandra Singh
SSBM ID 00515
SUPERVISOR / MENTOR
Dr. Hrvoje Volarevic
November 2021

2| P a g e
RESEARCH DISSERTATION
for the Swiss School of Business and Management
DBA Program
Declaration
This is to declare that the report entitled “A STUDY ON MONTE CARLO SIMULATION FOR
STOCK PRICE FORECASTING” is prepared for the fulfilment of the Dissertation of the
Doctor of Business Administration (Global DBA) by me under the guidance of Dr. Hrvoje
Volarevic.
I confirm that this dissertation truly represents my work. This work is not a replication of work done
previously by any other person. I also confirm that the contents of the report and the views contained
therein have been discussed and deliberated with the research guide / mentor.
Signature of the Student :
Name of the Student (in Capital Letters): Thangjam Ravichandra Singh
Registration No: SSBM ID 00515

3| P a g e
ACKNOWLEDGEMENT
First and foremost, I would like to thank The Almighty God, my family members and friends for
encouraging me to do this Global DBA program.
I express my profound gratitude to Dr. Hrvoje Volarevic for allowing me to work under his guidance.
He has provided me valuable inputs to build my dissertation and has also been a constant support.
Finally, I thank UpGrad and Swiss School of Business Management (SSBM) for providing me an
opportunity and I would like to thank all the ones that helped me to bring out this research dissertation
- a great success.
Thangjam Ravichandra Singh
SSBM ID 00515

4| P a g e
TABLE OF CONTENTS
Particulars Page
Executive Summary 7
Chapter 1: Introduction 8
1.1 Introduction 9
1.2 Methods of Stock Price Forecasting 10
1.3 Monte Carlo Simulation 11
1.4 Application 12
1.5 Advantage and Disadvantage 15
1.6 Benefits Of Monte Carlo Simulation 16
1.7 Step By Step Instruction To Utilize Monte Carlo Technique 17
1.8 Global Outlook of Sector During Pandemic 17
1.9 View Of COVID-19 In India 20
1.10 SWOT Analysis of COVID-19 In India 22
1.11 Indian Start Up Hit During Pandemic 24
1.12 Impact On Indian Stock Market 25
1.13 Indian Economy Outlook 28
Chapter 2: Literature Review 31

5| P a g e
Particulars Page
Chapter 3: Research Methodology 39
3.1 Research Motivation 40
3.2 Scope Of The Study 40
3.3 Problem Statement 40
3.4 Research Objectives 41
3.5 Research Questions 41
3.6 Research Hypothesis 41
3.7 Methodology Planned 42
3.8 Expected Outcomes 74
3.9 Limitation Of The Study 75
Chapter 4: Data Analysis 76
4.1 Population 77
4.2 Sample 77
4.3 Data Collection 77
4.4 Forecasting Techniques 77
4.5 Reliability and Validity of Knowledge 79
4.6 Mode Of Study 79

6| P a g e
Particulars Page
4.7 Observations and Analysis 80
Observations - Bank Sector 84
Observations - Hotel Sector 95
Observations - Media Sector 106
Chapter 5: Findings & Conclusion 117
5.1 Findings 118
5.2 Suggestions 119
5.3 Conclusion 120
Chapter 6: Learning Outcomes 122
6.1 Learning Outcomes 123
6.2 Scope For Future Research 123
References 124

7| P a g e
EXECUTIVE SUMMARY
The financial market may be a stochastic and sophisticated system that's challenging to model.
Investors should be able to predict or simulate the probable outcomes of their portfolio or the
interested investment strategy or the decision of choosing the asset class to yield the desired
and expected return from the selected portfolio investments.
This research project will check the feasibility and capacity of Monte Carlo Simulation to
forecast the futuristic prices of equity shares of selected corporates from the India’s largest and
oldest stock exchange National Stock Exchange (NSE). Five stocks of the banking sector, five
stocks of the entertainment sector, and five stocks of the hotel sector were used as data set for
the simulation and evaluates them over their past year data and predicted the data for the present
year and further interpreted whether the business is strong for the future and what will be the
forecasted present price.
Monte Carlo Simulation is a very important part of the firm as it states the stock price
forecasting and tells us about efficient market hypothesis. Stock price forecasting will be taken
for analysis purpose as it simplifies the fundamental hypothesis with respect to stock value
anticipating is the Proficient Market Theory (EMH), which declares that the cost of a stock
market as all data are accessible, and everybody has some level of admittance to the
information. Time arrangement investigation covers countless forecasting strategies. It also
allows the management to recognize problem relates areas so they can work on them.
The main parameters which determine the outcome of the simulations are the mean return of a
stock, median return of the stock, standard deviation, and the percentiles returns. When these
parameters were calculated and proved to be statistically significant for predictions for a month.
By varying the assumptions regarding price distribution concerning the size of the current
period time, the method could prove to be more accurate than what this study suggests. Monte
Carlo Simulations proved to have the potential to become the best tool which will gives the
accurate and effective stock price prediction model.

8| P a g e
CHAPTER 1
INTRODUCTION

9| P a g e
1.1 INTRODUCTION
Since many years, multiple market experts and analyst have used different analysis techniques
to predict the stock prices. They have applied many kinds of predictive analysis tools in the
stock market to reach the desired goal of predicting the prices in the stock market. The theory
of predicting the stock prices refers to the technique of market profit making for achieving
sustainable and better returns in the market with the same risk. Therefore, the process of reliable
price prediction is a daunting task for traders and investors as many factors including the
economic, social, political, and psychological, and due to the formation of patterns of
movement of bearings, they interact in a very complex way.
However, the theory of efficient market hypothesis (EMH) confirms that there are no effective
or reliable market price forecasting methods. The process of reliable market prices prediction
is usually a combination of two or more approaches: a basic analytical or fundamental approach
and a technical analysis approach along with statistical calculations. Both the approach
mentioned above has got their own merits and demerits. Bodie et all states that the fundamental
analysis of a company shares prices typically revolves around the earnings, the interest rate, the
expected yield / return, expected dividends or the risk assessments to determine the fair price
of the share or the net present value of the shares. Do note that the fundamental analysis usually
takes the historical prices which means to study the past prices, returns, earnings and analyze
the company's financial statements (balance sheet, income statement, profit) to compute the
intrinsic value. As per the theory, the expected return of the company stock investment is
aligned over the holding period, and that for the undervalued or overvalued shares, its market
price is equal to its base value.
Stock price forecasting or prediction is the process in which the value of the future stock can
be forecasted, and other financial instruments traded on an exchange. The effective market
theory sets that stock costs are a component of data and reasonable assumptions, and that
recently uncovered data about an organization's possibilities is very quickly reflected in the
current stock cost. This would suggest that all freely known data about an organization, which
clearly incorporates its value history, would as of now be reflected in the current cost of the
stock. A securities exchange expectation is an endeavor to estimate the future worth of an
individual stock, a specific area or the market, or the market overall. These estimates for the
most part utilize central investigation of an organization or economy, or specialized
examination of graphs, or a mix of the two.

10| P a g e
1.2 METHODS FOR STOCK PRICE FORECASTING
There are two basic methods for stock price forecasting:
• The first is essential investigation, which is separated into 'base up' and 'hierarchical'
examinations. Base up assesses an organization's presentation utilizing pointers like
value/profit (P/E) proportion, while hierarchical beginnings with the general economy and
predicts what it will mean for singular stocks.
• The second is specialized investigation, which endeavors to discover designs in outlines
and use past value patterns to anticipate future value activity. A few financial backers utilize
both: the crucial investigation gives them a general view on a stock, and the specialized
examination gives a passage cost to the exchange.
This research project will use the technical analysis approach to create the most reliable and
efficient model for the prediction of stock returns using Monte Carlo Simulation. In particular,
the simulations are used to estimate the corporates listed in National Stock Market (NSE) stock
index. Forecasting the exchange yield rate can be a very important topic for investors,
academics and professional in the stock market. Thus, when the returns on the securities market
are predictable, investors can build its strategy after considering the outcome of technical
analysis approach for their investment decision. Market Experts can make strategies on the plan
of action for their investment portfolio based on the result of such forecasts of stock market
prices.
The novelty of this research work stems from the lack of similar studies that use descriptive or
technical analytic approaches to predict the performance of NSE stocks. From the research to
be effective, primary data will be collected and analyze to predict the stock of NSE market. It
seems very important to explore predicting the prices using technical analysis methods that can
effectively predict the performance of the selected stock price from the NSE market.

11| P a g e
Figure 1: Financial Markets in Digital Screen
Source: Google Images
1.3 MONTE CARLO SIMULATION
Monte Carlo Simulation, otherwise called the Monte Carlo Method or a numerous likelihood
re-enactment, is a numerical strategy, which is utilized to assess the potential results of an
unsure occasion. The Monte Carlo Method was concocted by John von Neumann and Stanislaw
Elam during World War II to improve dynamic under questionable conditions. It was named
after a notable club town, called Monaco, since the component of chance is center to the
displaying approach, like a round of roulette.
Since its presentation, Monte Carlo Simulations have evaluated the effect of hazard in some
genuine situations, for example, in man-made consciousness, stock costs, deals determining,
project the executives, and valuing. They additionally give various benefits over prescient
models with fixed sources of info, like the capacity to lead affectability investigation or
ascertain the connection of sources of info. Affectability examination permits chiefs to see the
effect of individual contributions on a given result and connection permits them to comprehend
connections between any information factors.
The rationale behind using Monte Carlo Simulation over other methods is because of the
efficient performance of extrapolating the data (predicting beyond known data points). It
creates on random thousands of data representing potential pay-outs for possible outcome.

12| P a g e
Consequently, the random modelling improves the reliability and validity as a prediction
method.
The Monte Carlo method is a statistical method sufficient to solve any good mathematical or
statistical problem. It can be a commonly used probabilistic method for approximating
expectations. They also provide several advantages over predictive models with fixed inputs,
such as the ability to conducts sensitivity analysis or calculate the correlation of inputs.
Sensitivity analysis allows decision-makers to see the impact of individual inputs on a given
outcome and correlation allows them to understand relationships between any input variables.
The Monte Carlo Simulation is based on the principle of Law of Large Numbers and the Central
Limit Theorem. In addition, the first function of Monte Carlo is to reduce variability by
averaging the outcomes over more samples, even if the convergence is slow. The law of large
numbers is also very useful for modelling phenomena where there is significant uncertainty in
the degrees of freedom of the sample, suggesting that the average sample size should approach
the population average as the sample size increases.
1.4 APPLICATIONS
Monte Carlo methods are especially useful for simulating phenomena with significant
uncertainty in inputs and systems with many coupled degrees of freedom. Areas of application
include:
PHYSICAL SCIENCES: Monte Carlo methods are important in computational physics,
chemical science, and related fields, and have diverse applications from complicated QCD
calculations to designing heat shields and aerodynamic forms similarly as in modeling radiation
transport for radiation dosimetry calculations. In statistical physics town, molecular modeling
is an alternative to computational molecular dynamics, and Monte Carlo methods are
accustomed to compute statistical field theories of straightforward particle and polymer
systems. Quantum Monte Carlo methods solve the many-body problem for quantum systems.
In radiation materials science, the binary collision approximation for simulating ion
implantation is typically supported as a town approach to picking the following colliding atom.
In experimental high-energy physics, town methods are used for designing detectors,
understanding their behavior, and comparing experimental data to theory. Town methods are
utilized in the ensemble models that form the idea of contemporary meteorology

13| P a g e
ENGINEERING: Monte Carlo methods are widely employed in engineering for sensitivity
analysis and quantitative probabilistic analysis current design. The requirement arises from the
interactive, co-linear, and non-linear behavior of typical process simulations. For instance,
In telecommunications, when planning a wireless network, the planning must be proved
to work for an honest sort of scenarios that depend mainly on the number of users, their
locations, and therefore the services they require to use. Monte Carlo methods are
typically accustomed to generate these users and their states. The network performance
is then evaluated and, if results aren't satisfactory, the network design goes through an
optimization process.
In reliability engineering, Monte Carlo Simulation is employed to compute system-
level response given the component level response. for instance, for a transportation
network subject to an earthquake event, town Simulation is wont to assess the k-
terminal reliability of the network given the failure probability of its components, e.g.,
Bridges, roadways, etc.
CLIMATE CHANGE AND RADIATIVE FORCING: The inter-governmental panel on
temperature change relies on town methods in probability density function analysis of radiative
forcing. Probability density function (PDF) of ERF thanks to total GHG, aerosol forcing, and
total anthropogenic forcing. The GHG consists of WMGHG, ozone, and stratospheric vapor.
The PDFs are generated supported uncertainties. the mixture of the individual RF agents to
derive total forcing over the commercial Era is done by Monte Carlo Simulations and supported
the tactic in Boucher and Haywood (2001). PDF of the ERF from surface albedo changes and
combined contrails and contrail-induced cirrus are included within the entire anthropogenic
forcing, but not shown as a separate PDF. We currently don't have ERF estimates for a few
forcing mechanisms: ozone, land use, solar, etc.
COMPUTER GRAPHICS: Path tracing occasionally cited as town ray tracing, renders a 3D
scene by randomly tracing samples of possible light paths. Repeated sampling of any given
pixel will eventually cause the type of the samples to converge on the proper solution of the
rendering equation, making it one in every of the foremost physically accurate 3D graphics
rendering methods alive

14| P a g e
APPLIED STATISTICS: The standards for town experiments in statistics were set by
Salkowski. In applied statistics, town methods are also used for a minimum of four purposes:
to match competing statistics for little samples under realistic data conditions.
To supply implementations of hypothesis tests that are more efficient than exact
tests like permutation tests while being more accurate than critical values for
asymptotic distributions.
To produce a random sample from the posterior distribution in Bayesian inference.
To produce efficient random estimates of the hessian matrix of the negative log-
likelihood function which will be averaged to estimate the Fisher information
matrix.
ARTIFICIAL INTELLIGENCE FOR GAMES: Monte Carlo methods are developed into a
way called Mote-Carlo tree search that's useful for trying to find the simplest move in an
exceedingly game. Possible moves are organized during a search tree and plenty of random
simulations are accustomed to estimate the long-term potential of every move. A recording
machine simulator represents the opponent’s moves.
DESIGN AND VISUALS: Monte Carlo methods are efficient in solving coupled integral
differential equations of radiation fields and energy transport, and thus these methods are
employed in global illumination computations that produce photo-realistic images of virtual
3D models, with applications in video games, architecture, design, computer-generated films,
and cinematic computer graphics.
LAW: A town approach was used for evaluating the potential value of a proposed program to
assist female petitioners in Wisconsin achieve success in their applications for harassment and
domestic abuse restraining orders. it was proposed to assist women to reach their petitions by
providing them with greater advocacy thereby potentially reducing the danger of rape and
physical assault.
FINANCE AND BUSINESS: Monte Carlo Simulation is usually accustomed to evaluate the
chance and uncertainty that might affect the result of various decision options. Monte Carlo
Simulation allows the business risk analyst to include the whole effects of uncertainty in
variables like sales volume, commodity and labor prices, interest and exchange rates, further
because of the effect of distinct risk events just like the cancellation of the contract or the
change of law. Monte Carlo methods in finance are often accustomed to evaluate investments

15| P a g e
in projects at a business unit or corporate level or other financial valuations. they'll be wont to
model project schedules, where simulations aggregate estimates for worst-case, best-case, and
possibly durations for every task to see outcomes for the general project.
1.5 ADVANTAGES AND DISADVANTAGES
ADVANTAGES:
I. Monte Carlo is straightforward to resolve a posh financial problem.
II. Monte Carlo simulation may provide statistical sampling for the numerical experiments
using a computer.
III. For optimization problems, town simulation often can reach global optimum and
overcome local extreme.
IV. Monte Carlo simulation provides an approximate solution to several mathematical
problems.
V. Monte Carlo is usually being attractive to cope with problems that have many
dimensions because its rate of convergence doesn't rely upon the dimensionality of the
matter
VI. The execution of Monte Carlo doesn't consume a lot of your time thanks to the increasing
speed of programming
VII. Finally, Monte Carlo is free from the restrictions of solving newton’s equations of
motion.
VIII. This freedom allows generating trail configurations within the physical science
ensemble of choice.
DISADVANTAGES:
I. Inappropriate inputs like standard deviations and correlations can result in wrong
simulation results.
II. There are a variety of unknown factors that simulation can’t truly account for during an
investor’s lifetime.

16| P a g e
III. MCs is troubled from its ability to model the serial correlation between what comes out
and what was just drawn because there are no thanks to controlling variables. So that,
the user should be prepared to create the mandatory adjustments if the results that are
generated seem out of line.
IV. Because newton’s equations of motion don’t solve, therefore no dynamical information
will be gathered from a standard MC
V. It is often expensive to live how one thing affects another, to require the initial
measurements, and to make the model itself.
VI. To simulate something, a radical understanding is required and an awareness of all the
factors involved. Without this, a simulation cannot be created.
1.6 BENEFITS OF MONTE CARLO SIMULATION
1. Probabilistic Results: Results show not only what could happen but how likely each
outcome is possible.
2. Graphical Results: In Monte Carlo Simulation, it’s easy to create graphs of different
outcomes and their chances of occurrence.
3. Sensitivity Analysis: In Monte Carlo Simulation, it’s easy to see which inputs had the
biggest effect on results
Figure 2: Monte Carlo Methodology
Source: Google Images

17| P a g e
1.7 STEP BY STEP INSTRUCTIONS TO UTILIZE MONTE CARLO TECHNIQUES
Monte Carlo methods include three essential advances:
Set up the prescient model, recognizing both the reliant variable to be anticipated and
the autonomous factors (otherwise called the information, hazard or indicator factors)
that will drive the forecast.
Indicate likelihood disseminations of the free factors. Utilize chronicled information or
potentially the expert's emotional judgment to characterize a scope of likely qualities
and allot likelihood loads for each.
Run reproductions over and again, producing irregular upsides of the free factors. Do
this until enough outcomes are assembled to make up a delegate test of the close to
endless number of potential mixes.
1.8 GLOBAL OUTLOOK OF SECTORS DURING PANDEMIC
A series of sectoral briefs summaries the ILO's preliminary assessment of COVID-19's impact
on particular social and economic sectors and industries. The briefs also include ILO
constituents' policy responses and actions – governments, employers, and workers – as well as
accessible ILO instruments and remedies at the sectoral level. ILO members at the national,
sectoral, regional, and global levels, as well as international organizations and other partners in
the struggle to develop decent work for women and men in certain social and economic sectors,
are the intended audience. Here we are looking at some of the majorly impacted sectors.
Port Sector
Ports promote international trade and the global economy by providing critical infrastructure.
They range in size from small wharves that handle a few hundred tons of cargo per year to huge
international ports or multi-modal hubs that offer a wide range of logistical services, from
warehousing to complete supply chain management. Ports had to respond to lower volumes,
labor shortages, the introduction of occupational health and safety measures for dockers and
shore staff, and the adoption of teleworking and remote operations for office workers during
the COVID-19 pandemic. Cruise ship calls have come to a standstill in several places.

18| P a g e
Meat Processing
The COVID-19 epidemic is still putting strain on the agri-food industry, both from a business
and labor standpoint, with some sectors bearing a disproportionately heavy impact. One of them
is the meat processing industry. As the pandemic's repercussions on our food systems continue
to emerge, the lessons learned from outbreaks in processing plants in several key meat-
producing countries are catalyzing reforms that will help the sector grow sustainably.
Construction
The COVID-19 pandemic has wreaked havoc on the construction industry, which is very
susceptible to economic cycles. On the plus side, because to its ability to create jobs,
construction has a lot of potential to drive recovery; in turn, recovery measures can help the
sector's development towards sustainability and digitization. To foster a human-centered
recovery of the construction sector from the crisis, tripartite cooperation and social discussion,
as well as international labor norms, are essential.
Home Care
In several countries, the COVID-19 pandemic has brought attention to the already overworked
and understaffed home and institutional-based care system. The challenges of recruiting,
deploying, retaining, and protecting a sufficient number of well-trained and motivated care
workers are highlighted in this brief. To ensure the sector's preparedness and resilience in times
of crisis and beyond, long-term investment in health and social care systems, including
workforce development and fair working conditions, is required. It's vital to ensure that
caregivers, as well as their employers and other relevant stakeholders, get a chance to speak
up.
Textile
Workers are being urged to stay at home, factories are closing, and global supply chains are
coming to a halt, threatening the textiles, clothing, leather, and footwear industries' survival.
Order cancellations have wreaked havoc on thousands of businesses and millions of people.
We urgently require unity and coordinated action across industry supply networks. The ILO is
dedicated to assisting governments in preserving the health and economic well-being of textile,
clothing, leather, and footwear workers and firms.

19| P a g e
Aviation
International travel has nearly come to a halt as a result of a combination of airline cancellations
and limitations aimed at curbing the spread of COVID-19. The pandemic's impact on
employment was immediate and profound. Cost-cutting initiatives could involve a variety of
policies that affect employment and good work in the civil aviation industry. To assist the sector
in recovering from this shock, the ILO has acquired expertise from prior crisis circumstances.
Health
The COVID-19 outbreak is bringing attention to many countries already overcrowded public
health systems, as well as the difficulty of recruiting, deploying, maintaining, and protecting
enough well-trained, supported, and motivated health workers. It emphasizes the critical
importance of long-term investment in health systems, including the health personnel, as well
as good working conditions, training, and equipment, particularly in the areas of personal
protective equipment and occupational safety. Social dialogue is key to the development of
resilient health systems, and so plays an important role in both crisis response and the
development of a future that is prepared for health emergencies.
Education
As roughly 94 percent of all students have experienced school closures, teachers have had to
adapt to a world of almost universal online education. Most instructors and their organizations
have accepted this challenge, despite the fact that many teachers in underdeveloped nations
lack the necessary skills and equipment to conduct successful distance education. As
governments explore reopening schools as solitary confinement laws are reduced, the safety of
students and staff must be prioritized, with social distance of students, access to personal
protective equipment, and frequent virus testing being crucial.
Shipping
The majority of global trade is carried by ship, and fishing provides important food. The
epidemic has an impact on sailors' and fishermen's safety and well-being, as well as their
capacity to rejoin their vessels and return home, as well as the future of their jobs. Cruise ship
crews, who are sometimes prevented from visiting ports, are particularly hard struck. As the
globe strives to defend public health, the ILO is striving to protect these vital maritime workers.

20| P a g e
Tourism
Tourism is an important source of employment and economic growth. COVID-19, on the other
hand, has drastically altered this. The impact on tourism businesses and workers, the bulk of
whom are young women, has never been seen before. In cooperation with governments,
employers' and workers' representatives, and taking into account applicable ILO international
labor standards, timely, large-scale, and, in particular, coordinated policy actions are required
at both the international and national levels.
Many agricultural workers are unable to elevate themselves out of poverty and food insecurity
despite their efforts to feed the world. As the epidemic spreads, the continuing operation of
food supply systems is critical in avoiding a food crisis and lowering the global economic
effect. To promote agribusiness and the livelihoods and working conditions of millions of
agricultural workers in accordance with relevant international labor standards, coordinated
policy actions are required.
Agriculture
Many agricultural workers are unable to elevate themselves out of poverty and food insecurity
despite their efforts to feed the world. As the epidemic spreads, the continuing operation of
food supply systems is critical in avoiding a food crisis and lowering the global economic
effect. To promote agribusiness and the livelihoods and working conditions of millions of
agricultural workers in accordance with relevant international labor standards, coordinated
policy actions are required.
1.9 VIEW OF COVID-19 IN INDIA
The COVID-19 pandemic in India is part of the global coronavirus disease pandemic of 2019
(COVID-19), which is caused by the coronavirus 2 that causes severe acute respiratory
syndrome (SARS-CoV-2). According to official estimates, India has the world's second-highest
number of confirmed cases of COVID-19 infection (after the United States of America) and
the third-highest number of COVID-19 deaths (after the United States and Brazil). However,
these numbers show a significant under-reporting.
On 30 January 2020, the first instances of COVID-19 in India were recorded in three locations
in Kerala, among three Indian medical students who had returned from Wuhan, the pandemic's

21| P a g e
epicenter. On the 23rd of March, Kerala declared a state of emergency, followed by the rest of
the country on the 25th. For the first time on June 10, India's recoveries surpassed active cases.
In September, infection rates began to decline, as did the number of new and active cases. The
number of cases recorded per day peaked in mid-September, with over 90,000 cases reported
every day.
Timelines:
The WHO confirmed on January 12, 2020, that a novel coronavirus was the source of a
respiratory ailment in a group of patients in Wuhan, Hubei, China, which had been reported to
the WHO on December 31, 2019.
India announced its first incidence of COVID-19 on 30 January 2020 in Thrissur, Kerala, which
grew to three instances by 3 February 2020, all of which were students returning from Wuhan.
Apart from them, there was no discernible increase in transmissions in February. On the 4th of
March, 22 new cases were announced, including 14 affected Italian tourists. After numerous
people with travel records to affected countries, as well as their contacts, tested positive,
transmissions escalated over the month. On March 12, a 76-year-old man with a history of
travel to Saudi Arabia became India's first COVID-19 fatality.
By attending a Sikh celebration in Anandpur Sahib from March 10–12, a Sikh preacher with a
history of travel to Italy and Germany became a super spreader. On March 27, almost 40,000
individuals in 20 villages throughout Punjab were isolated to prevent the spread of the disease.
A Tablighi Jamaat religious assembly event in Delhi, which took place earlier in March, was
designated as a COVID-19 hotspot on March 31.
Around 4,000 stranded pilgrims returned to Punjab on May 2nd from Hazur Sahib in Nanded,
Maharashtra. Many of them, including 27 bus drivers and conductors who were part of the
transportation arrangement, tested positive. Based on antibody tests, it was predicted in July
2020 that at least 57 percent of the residents of Mumbai's slums had been infected with COVID-
19 at some point. In October 2020, a government commission on COVID-19 claimed that the
epidemic has peaked in India and that it could be under control by February 2021. This
prediction is based on the "Indian Supermodel," a mathematical simulation that assumes India
achieves herd immunity. A novel SARS-CoV-2 strain, Lineage B.1.617, was discovered in the
country that month.

22| P a g e
1.10 SWOT ANALYSIS OF COVID-19 IN INDIA
India's quarantine was both historic and crucial in combating the virus's spread. Meanwhile, the
administration took a number of steps to protect the country from Covid-19. However,
appropriately identifying internal and external elements is critical for developing an efficient
plan for combating covid-19 while reducing risks and increasing results. To examine India's
current situation in combating the epidemic, a SWOT analysis was conducted. The reason behind
having this analysis as part of our research as it could give an insight into India’s ability to fight
pandemic and see if the simulated results align to our SWOT results.
Strengths:
Institutional (Government and Governance) and Infrastructure
Schools, train wagons, hotels, offices, and other existing infrastructure were turned into isolation
wards.
India is the world's leading producer and supplier of hydroxychloroquine, a potential treatment
for covid-19.
India was able to balance its supply and demand by quickly enacting steps such as establishing
travel restrictions and a lockdown.
A mandatory thermal screening check is required of all domestic and international travelers and
offices.
The leadership's open communication resulted in the masses following the necessary instructions
to slow the development of covid-19.
Academicians and Practitioners
The medical and health-care systems are progressively preparing for the new challenge.
Innovation and Economy Drivers
To combat the situation, a massive repository of start-ups, intellectual property, and platforms
has been created.
Weaknesses:
Institutional (Government and Governance) and Infrastructure
Testing kits and relief items such as medical equipment, personal protective equipment, masks,
and ventilators are in short supply.

23| P a g e
We are reliant on imports because we are unable to manufacture testing kits and relief material
in-house.
Community and Civil Society
Lack of awareness among certain segments of the population
Isolation creates a psychological barrier: individuals are afraid of the quarantine circumstances.
Disease susceptibility is high, while immunity is low (India ranks 135 out of 195 on UNDP
Health Index)
Incubation period is long, ranging from 1 to 14 days.
Academicians and Practitioners
Infrastructure and specialists in emergency healthcare are in short supply:
o 1:445 is the doctor-to-patient ratio.
o The ratio of hospital beds to population is 0.7:1000.
o Ventilators to population ratio 40000: 1.3billion
Innovation and Economy Drivers
There aren't enough flexible work arrangements for employees.
Opportunities:
Institutional (Government and Governance) and Infrastructure
Establish a strong third-tier governance framework (at the panchayat/gramin level) for
monitoring and spreading knowledge.
India has the potential to become a global leader (setting example for other nations on how to
fight the crisis)
For the current and future epidemics, standard operational standards and procedures in the form
of an emergency preparedness and response plan are being developed.
Academicians and Practitioners
Covid-19 vaccination and antidote development
Innovation and Economy Drivers
Involve start-ups, small and medium-sized businesses, corporate R&D, and academic institutions
in developing new solutions to combat covid.
Investigate the ancillary industries that grew in prominence as a result of the covid-19 epidemic,
such as video conferencing for working from home and schooling.

24| P a g e
Threats:
Institutional (Government and Governance) and Infrastructure
Failure to trace contacts could exacerbate the current situation and raise the chances of getting
affected by the second wave of covid-19.
Community and Civil Society
Coronavirus has reached epidemic level 3, or community transmission stage.
Violations of lockdown protocols and social-distance norms
Increased chances of infection spreading (high population density with 27.9 percent people lying
below the poverty line)
Academicians and Practitioners
Frontline workers have a higher risk of catching the disease.
Innovation and Economy Drivers
The economy and overall growth of the country have slowed.
Stock markets, as well as global, national, and local trade, are all affected.
The global lockdown is driving a slowdown into recession, resulting in higher unemployment
and poverty rates.
1.11 INDIAN START UPS HIT DURING PANDEMIC
According to a new survey, the COVID-19 pandemic has caused 38 percent of Indian startups
and small and medium businesses to run out of money. Only 12% claimed they had less than a
month's worth of cash. In April, 27% of companies indicated they were financially-strapped,
while 20% said they had less than a month's worth of cash on hand.
While the situation for Indian startups and SMEs is not as bad as feared in April, it is
developing. Around two-thirds of the companies said they were lowering expenditures across
the board as a result of the crisis, including marketing, human resources, and operating budgets,
as well as deferring tax payments. Similarly, a majority of businesses indicated they had not
benefited from government assistance so far.

25| P a g e
Figure 3: Indian Startups During Pandemic
Source: Local Circles
1.12 IMPACT ON INDIAN STOCK MARKET
The unprecedented COVID19 epidemic has put the world in peril and shifted the global
landscape in unanticipated ways. The SARSCoV2 virus, which caused the COVID19 outbreak,
first appeared in Wuhan, Hubei Province, China, in December 2019, and quickly spread around
the world. This pandemic is not only a global health crisis, but it is also a major global economic
depression. Many countries' economic operations are suddenly halted as tight quarantine rules
are implemented to combat an unknown disease. Transportation between countries is limited,
if not prohibited, which has hampered global economic activity. Most crucially, terror among
consumers and businesses has stopped them from engaging in their customary purchase habits,
resulting in market abnormality.

26| P a g e
Uncertainty and risk are being created as a result of the epidemic, which is having a substantial
economic impact on both established and rising economies such as the United States, Spain,
Italy, Brazil, and India. The financial market has reacted with spectacular movement and has
been badly affected as a result of this. The financial system, which includes both stock and
bond markets, has been significantly impacted by the economic instability related with
COVID19. The price of oil has dropped dramatically, but the price of gold has risen
dramatically as a result of the epidemic. This epidemic is referred to by Firzli (2020) as "the
larger financial catastrophe."
As a result of the pandemic, the global financial market risk has increased significantly (Zhang
et al., 2020). Fear and uncertainty have caused enough losses for investors. For example, the
global stock market lost nearly US$6 trillion in one week from February 24 to February 28 as
a result of the pandemic's impact (Ozili & Arun, 2020). Since the COVID19 outbreak, the
market value of standard & poor (S&P) 500 indices have dropped by 30%. Increased
uncertainty, according to Azimili (2020), impacts the needed rate of return and consequently
the present market value of stocks.
Although there is limited contemporary literature on the impact of COVID19 on the financial
market, the empirical investigations that have been conducted so far have yielded promising
results. In their investigation on financial markets and banks, Baret et al. (2020) discovered that
the COVID19 pandemic has caused a drop in the share of oil, equities, and bonds around the
world. Companies' productivity was negatively affected by social distancing measures, which
resulted in a loss in revenue, greater operating costs, and cash flow problems. Since 1987, the
Financial Times Stock Exchange 100 index in Europe has had a severe one-day drop (BBC
News, 2020).
This unanticipated epidemic has had a negative impact on the financial markets of most
developed and developing countries. In March 2020, the world's most powerful economy, the
United States, hit the circuit breaker mechanism four times in ten days (Zhang et al., 2020).
Europe and Asia's stock markets have also risen. On March 12, 2020, the leading index in the
United Kingdom, the FTSE, fell by more than 10%. (Zhang et al., 2020). The stock market in
Japan had plummeted more than 20% in December 2019, according to Vishnoi and Mookerjee
(2020). From March 8, 2020 to March 18, 2020, the stock markets of Spain, Hong Kong, and
China all dropped by 25.1, 14.75, and 12.1%, respectively (Shehzad et al., 2020). In his

27| P a g e
research, he discovered that the COVID19 had a negative impact on stock returns in the S&P
500 and a negligible impact on the Nasdaq composite index. Georgieva (2020) noted that the
COVID19 epidemic placed the entire world dangerously close to financial problems
comparable to the Global Financial Crisis of 2007–2008.
The pandemic's severe effects gradually spread to emerging economies as well. When we look
at the financial market of the emerging economy, we see a bleak picture, as this economy has
been struck the hardest by the drop in oil prices. The outbreak of the COVID19 pandemic has
heightened the urgency of this situation. Leading rising economies such as Brazil, Russia, and
Mexico have increasingly tightened mobility restrictions, causing the emerging economies to
enter a 1% recession by 2020 (Herfero). After ten years, the Coronavirus illness in South Korea
caused KOSPI to fall below 1,600 for the first time in their history (So, 2020).
On March 22, 2020, the Indian government proclaimed a Janata Curfew and a lockdown
program to preserve social distancing practices in order to limit epidemics. Various business
operations were abruptly halted after the government adopted such a lockdown policy. As a
result of the worldwide market disruption, India's financial market has seen significant
volatility (Raja Ram, 2020). The Indian stock market is experiencing high volatility as a result
of the global financial system's downturn. It's also been hit hard by the COVID19 pandemic.
In India, there are two major stock indices: the Sensex on the Bombay Stock Exchange (BSE)
and the Nifty on the National Stock Exchange (NSE). The Sensex index fell to 13.2 percent on
March 23, 2020, according to the Bombay Stock Exchange. It was their highest single after the
Harshad Mehta Scam broke on April 28, 1991. (Mandal, 2020). Similarly, Nifty has dropped
nearly 29% over the same time span. COVID19's influence on the Indian stock market has been
dubbed a "black swan event" by some economists, referring to the occurrence of a highly
unexpected event with catastrophic consequences. As a result of the government's lockdown
strategy, factories have cut their labor force as well as output levels, disrupting the supply chain.
People limit their consumption patterns as a result of the uncertainty that exists among
mankind, resulting in demand-side shock. According to studies, the last pandemic merely had
an effect on the demand chain. However, the COVID19 pandemic has had an impact on both
the demand and supply chains.

28| P a g e
Despite the numerous literatures on the impact of COVID19 on the entire economy's stock
market, there has been little research, particularly in the situation of an emerging economy.
This article seeks to evaluate the influence of COVID19 on India's two major stock markets in
order to shed light on this issue. To make the analysis more meaningful in terms of volatility
in stock index prices due to the advent of the pandemic and the Indian Government's lockdown
policy, the Glosten–Jagannathan–Runkle (GJR) generalized autoregressive conditional
heteroscedasticity (GJR GARCH) model is utilized. The study's main findings demonstrate
how volatile the BSE Sensex and NSE Nifty are. COVID19 has shattered the financial market's
backbone. To stimulate the stock market, the government must take appropriate policy
measures. The situation would have been the worse if it hadn't been for some unusual policy
support. As a result, liquidity injection measures are required. The Reserve Bank of India (RBI),
India's central bank, has lowered its benchmark policy rate by 115 basis points in the last three
months. Since its first announcement on March 27, 2020, it has declared a liquidity injection
of roughly Rs 8 lakh crore in the financial markets. Despite the fact that this virus has brought
the entire world to a standstill, the death rate is extremely low.
Liquidity will propel stock prices up throughout this recovery period, according to George
(2020). Long-term investors should take advantage of the current turbulence. The RBI must
decrease the rate to help the debt markets. At this time, there is a lot of uncertainty in the market.
To balance their job and prevent risk, investors must transform their investment from a dark
outlook to a bright one. In this regard, the pharmaceutical industry is currently appealing.
Domestic policies will need to be created in order to maintain inclusive and sustainable growth.
The highest authority must provide financial aid to the destroyed required sectors.
1.13 INDIAN ECONOMY OUTLOOK
When we look at the difficulties in developing markets, we see that they are mostly COVID-
19-related. We expect India's GDP to fall in the full year 2020, but we believe that the
government's actions, such as the Rs 20 lakh crore economic package, will be quite focused in
terms of what it offers to the rural population. In addition, there are other long-awaited reforms
on the way, such as a 10% increase in the national rural job guarantee scheme, public works,
and the free rationing that is being seen in many countries. When it comes to the equities
market, both internationally and in India, quality is crucial at this point. One issue to keep an
eye on in India is what occurs with credit risk and credit crises, as well as how credit risk

29| P a g e
aversion is manifested. Banks, non-banks, mutual funds, and ordinary investors are all still risk
averse. As we examine the Indian financial industry and see what emerges, how credit risk is
managed and how it bounces back will be key for us.
We like information technology, telecommunications, fast moving consumer goods, consumer
durables, and insurance in general. Even globally, they are our favored sectors. Although
valuations are stretched, demand has recovered in pharma, metals, cement, and oil and gas, just
as it has in China. We consider a diverse strategy, but quality Indian equities, global equities
with a US bias, and even gold remain relevant given the predicted rise in inflation.
Although the size of the Federal Reserve and European Central Bank balance sheets stabilized
in July, liquidity remained abundant. In reality, the monetary base in the United States surged
by about 23% year over year in June, and the global monetary base is estimated to have
increased by around $8 trillion since the pandemic began. Central banks would like to "wait
and see" how the situation develops at this point, but their next move, if any, is likely to be in
the direction of more easing rather than tightening. Furthermore, we expect fiscal stimulus to
operate as a powerful relay and support the recovery even if central banks remain unchanged.
From a fiscal standpoint, we expect mature markets to fare better than emerging markets. As a
result, it's more of a risk spectrum debate. The fact is that a pandemic in emerging economies
can cause challenges that are less likely to affect comparable industries in established markets.
The impact of the budgetary reaction and the targeted package launched by the government
remains to be seen. Investors will look at valuations and demand for sectors from the
perspective of foreign funds, and there is now more value in developed markets.
Oil rebalances in the same way that gold does. Quarantine measures that are being eased,
geopolitical concerns, a probable COVID-19 increase, and low interest rates all appear to be
bullish for oil. Oil and gold prices appear to be mostly driven by concerns about the virus and
the probability of a quick economic recovery. The OPEC+ group, according to our Investments
Strategy team, will likewise stick to their production cutbacks agreement. They want to
establish a pricing floor.
With a 46 percent drop in April, India's demand has already recovered by 23 percent year on
year. Oil demand is increasing, although not at the same rate as it has been since May. Because

30| P a g e
activities and industries have risen up, there was inevitable to be an initial robust bounce.
However, we believe it will take time to restore air travel, for example. There may be incentives
for non-OPEC suppliers as well as OPEC countries to reduce production, but overall inventory
remains high. Everyone is dealing with an oversupply of oil, and additional increases in oil
prices are unlikely in the next six to twelve months.
The current economic damage caused by the crisis should be mitigated, not countered, by a
stronger rural sector. There are several high frequency data trends in India that imply the
economy is normalizing, though the recovery will be slow. Support for the rural sector is a big
part of the government's economic plan. When these large government efforts are combined,
the goal is to increase rural households' disposable income levels and stimulate expenditure.
As a result of the influx of migrant workers, the demand for government assistance and
temporary work has increased significantly.

31| P a g e
CHAPTER 2
LITERATURE
REVIEW

32| P a g e
2. LITERATURE REVIEW
The result outcomes display that the approaches Moving Average and MACD would possibly
impact the return and the net profits of the investment portfolio. Whereas the stochastic process
version with identify all possible cases for the net loss in the planned investment strategy. Also,
the GARCH Model (Generalized Autoregressive Conditional Heteroskedasticity), Wavelet
Decomposition Model, and Monte Carlo Model will usually result to predict the net profits and
provides better and higher profits in stock / equity investments as compared to the alternative
exiting techniques.
Predicting direction of stock price index movement using Artificial Neural Networks and
Support Vector Machines
The research author Kara et al. (2011) proves the reliable and predictability of financial motion
path with Artificial Neural Networks (ANN) and accurately assist the Neural Network through
the network to predict the every-day price movement of Istanbul Securities Market (ISE)
National 100 Index for the duration of January 2, 1997, to New Year's Eve, 2007.
Performing stock price prediction use of hybrid model
The scholar Tsao pan (2010) introduced a model for the hybrid version to strengthen the stock
price prediction ability. The proposed version is the combination of Principal Component
Regression Model with GRNN (General Regression Neural Network) to solve both
multicollinearity and the problem at the same time. The research revolved around the duration
of 2004 to 2008 for the share prices of Taiwanese and Chinese organizations. The analysis
examines the most important ten (10) ratios: receivables turnover, stock turnover, fixed assets
turnover, current ratio, net profit ratio, liquid ratio, debt ratio, return on asset ratio, long- term
capital to fixed asset ratio and sales/shares. This study results in power of prediction using
hybrid model is better than any individual existing techniques.

33| P a g e
As per the multiple research which uses Monte Carlo to predict share prices, the scholar gets a
very reliable and steady result (Boyle et al, 1997; Chen & Hong, 2007; Whiteside II PE, 2008).
The random prediction using a large data set is its advantages to get the most accurate
prediction. This observation is applied using the Monte Carlo Simulations to forecast stock
market returns in ASE.
Challenges of project planning in the probabilistic approach using PERT, GERT and
Monte Carlo
Wyrozebski, P. & Wyrozebska, A. (September 2013) the merits & shortcomings of these two
methods Program Evaluation and Review Technique and Monte Carlo Simulation gives us the
possible outcomes for assessing the budget or a strategy like the case study mentioned in the
paper where the construction project is given. The technique of Monte Carlo Simulation was
executed in MS Excel using the automated Add On “Risk for Excel”. From the research, we
found the result that this research gives better accuracy and extensiveness of Monte Carlo
simulation in disparity against the famous PERT method. The Method of PERT do gives us the
project estimates when executed in consideration of Monte Carlo technique.
A literature review and future perspectives on maintenance optimization
Sharma et al. (2011), the paper outlines important techniques used in various maintenance
optimization models including the analytical hierarchy process, the Bayesian approach, the
Galbraith information processing model, and genetic algorithms. There is an emerging trend
towards uses of simulation for maintenance optimization which has changed the maintenance
view.
Why the Monte Carlo method is so important today
Dirk et al. (2014), the start of electronic registering, individuals have been keen on completing
irregular examinations on a PC. Such Monte Carlo methods are currently a fundamental fixing
in numerous quantitative examinations. For what reason is the Monte Carlo strategy (MCM)
so significant today? This article investigates the reasons why the MCM has advanced from a

34| P a g e
'final retreat' answer for a main technique that penetrates a lot of contemporary science,
account, and designing.
A Quantitative Risk Assessment of Waterborne Cryptosporidiosis in France Using
Second-Order Monte Carlo Simulation
Pouillot et al (2004), the dangers of waterborne Cryptosporidium partum contamination and
Cryptosporidiosis in immunocompetent and immunodeficient French Populaces is proposed.
The model considers French specificities, for example, the French strategy for locust
identification execution and faucet water utilization. The extent of infective locusts depends on
writing survey and master information. The likelihood of contamination for a given number of
ingested feasible locusts is displayed utilizing the dramatic portion reaction model applied on
distributed information from exploratory diseases in immunocompetent human volunteers
tested with the IOWA strain. Second-request Monte Carlo reproductions are utilized to portray
the vulnerability and fluctuation of the danger gauges. Everyday hazard of disease and ailment
for the immunocompetent and the immunodeficient populaces are assessed by the quantity of
locusts saw in a solitary stock piling supply water test.
A Comparison of Approaches for the Analysis of Interaction Effects between Latent
Variables Using Partial Least Squares Path Modelling
Henseler J. & Chin W (2010), a significance of the investigation of communication impacts
between show just as dormant factors consistently increments. Specialists utilizing fractional
least squares (PLS) to examine cooperation impacts between dormant factors need an outline
of the accessible methodologies just as their reasonableness. This article presents 4 PLS-based
methodologies: an item marker approach (Chin, Marceline, and Newsfeed, 2003), a 2-stage
approach (Chin et al., 2003; Hensley and Fusspot, in press), a crossover approach (Wold, 1982),
and an orthogonal zing approach (Little, Bovaird, and Widaman, 2006), and contrasts them
utilizing information identified with an innovation acknowledgment model. Through a broader
Monte Carlo analyse, the various methodologies are looked at as far as their point gauge
exactness, their measurable force, and their expectation precision. In light of the consequences
of the investigation, the utilization of the orthogonal zing approach is recommendable under
most conditions. Just if the orthogonal zing approach doesn't track down

35| P a g e
a critical connection impact, the 2-stage approach ought to be moreover utilized for importance
test, since it has a higher measurable force.
Accounting for uncertainty in a forest Sector model using Monte Carlo simulation
Maarit A. & Kallio I. (2010), huge scope backwoods are a models will in general have a huge
number of boundaries, of which many have values that are obscure or not known precisely.
Regardless of the wide utilization of such models in the strategy examinations, the effect of the
general vulnerability on the outcomes and the circulation of the subsequent variable qualities
has not been thought of. It would be significant for the clients of the outcomes to know the
power of the model yields and ends made to varieties in model data sources. This investigation
endeavors to efficiently represent the vulnerabilities in backwoods are a model examination.
Monte Carlo re-enactment is applied to aspatial incomplete harmony model for the Finnish
woods area to inspect how the vulnerability over the parametric information and yield value
advancements influence the model projections. The emphasis is on the saw log market and
sawn wood creation.
Integrating Stock Twits with Sentiment Analysis for better Prediction of Stock Price
Movement
Batra R. & Daudpota M. S., (2018), early examination on Stock Market forecast were
completely based on irregular’s trolls and mathematical expectation however with the
presentation of conduct money, individuals' conviction, and mind-set were like wise thought
of while anticipated about stock development. Making it more productive we utilized the
possibility of supposition investigation of Stock Tweets through AI models. We executed the
thought by gathering supposition in formation and stock value market information and
assembled a SVM models for forecast and in the last we estimated the expectation precision.
Results showed that we have accomplished 75.22%.

36| P a g e
Electricity price Forecasting Using Artificial Neural Network
Ranjbar et al. (2007), this paper proposes a far-reaching model for the versatile momentary
power value determining utilizing Counterfeit Neural Organizations (ANN) in the rebuilt
power markets. The model comprises: value reproduction, value gauging, and execution
investigation. The elements affecting the power value determining, including time factors, load
factors, save factors, and recorded value factor are talked about. We embraced ANN and
proposed another definition for the MAPE utilizing the middle to consider the connection
between these elements and market cost just as the presentation of the power value determining.
The save factors are incorporated to upgrade the presentation of the anticipating interaction.
The proposed model handles the value spikes all the more effectively due to considering the
middle rather than the normal.
Dividend Innovations and Stock Price Volatility
West. D. K (1986), A standard productive business sectors model expresses that a stock value
approaches the normal present limited worth of its profits, with a steady rebate rate. This is
appeared to suggest that the change of the development in the stock cost is more modest than
that of a stock value figure produced using a subset of the market's data set. The ramifications
follow regardless of whether costs and profits require differencing to prompt stationary. The
connection between the differences seems not to hold for some yearly U.S. financial exchange
information. The dismissal of the model is both quantitatively and genuinely critical.
Valuation Ratios and the Long-Run Stock Market Outlook
Campbell. Y. J., & Shiller. J. R., (2001) this is a synopsis and understanding of a portion of the
writing on stock value unpredictability that was animated by Leroy and Porter and Shiller.
Apparently neither small‐sample inclination, sane air pockets nor some standard models for
expected returns enough clarify stock value unpredictability. This proposes a job for some
nonstandard models for anticipated returns. One chance is a "prevailing fashions" model in
which clamour exchanging by guileless financial backers is significant. As of now,
notwithstanding, there is minimal direct proof that such trends assume a huge part in stock
value assurance.

37| P a g e
Ali et al. (2011) applies the specious neural network in designing the share prices of 7 (seven)
Jordanian corporates listed in Amman exchange. The design was assessed by the stock
exchange with the method of employment of questionnaire technique that was dispersed in the
Amman trading exchange. A year’s time was utilized for each company for instructing the
channels in the neural network. The network proceeds exceedingly close by the authentic data
aside from the previous month, where the certain value embraces a small drop. The majority
appellant was willing to be contingent on substitute neural network technique, which they had
a reliance that the approach is pertinent to any or all categories of the organizations.
Assaleh et al. (2011) makes use of the forecasting securities and the prediction models of the
two most prime stocks of Dubai Stock market. Being more appropriate about the stocks they
were Emaar properties (EMAAR) and Dubai Islamic Bank (DIB). These two companies are
really captivating the market in its segment with EMAAR being the most sufficient and large
company leading the property developer industry within the region and DIB being the first
wholly equipped with features and facilities Islamic bank.
The reason for picking the selected stocks was the arising requirement for the adequate
historical data, active volume transaction, and a special represented sector within the economy
of the UAE. The research considers the daily closing prices for the duration of 2000 to 2006
(with about 2176 data series). The technique of Polynomial Classifiers (PC) and Artificial
Neural Networks (ANN) has been brought in use as a method to forecast stock value from the
historical price data. While in the stock price prediction, this is the primary time to use
Polynomial technique. As of the results, both the models showed up to be efficient and accurate.
Atmeh and Dobbs (2006) look into the execution of fourteen (14) MA trading directives of
prophesy as forward for daily general index of Amman stock exchange from the financial year
1992 to 2001. The research moves forward with the new and emerging bootstrap strategies
such as: GARCH-M, Stochastic Random Process Model. As of the evaluation the outcomes
put forward the idea that trading regulations can help predict market movements, with
identified proof that the short run regulations would be profitable despite the transaction
expenses incurred. Also, the returns are revealed that were caused by the bootstrap as t h e

38| P a g e
trading profits are not including with individual who may be generated by stochastic process
or AR method.
Dopke et al. (2008) gives evidence of the monthly superfluity stock returns of the ex-ante
likelihood in Berlin, Germany. The macroeconomics data from the year of 1994 to 2005 was
utilized for the research. This research also uses Recursive Modelling to helps predict the
returns on stock in real time. The method of Sharpe, Treynor and Jenson’s ratios are applied to
align with the results of the stock returns.
Furthermore, the execution of the portfolio changing their strategies gave support to the
foregoing real time macroeconomic data is alike because the execution holds up the revised
macroeconomic data.
Giovanis (2011) in his research looks forward at the workings of various investment strategies
that held the back of four (4) different prediction technique: MACD (Moving Average
Convergence-Divergence, Generalized Autoregressive Condition Heteroskedasticity
(GARCH), a stochastic process autoregressive model, and Monte Carlo Simulation algorithm
advanced in MATLAB.
This research had four important stock exchange:
1. S&P 500 – USA
2. FTSE-100 index – UK
3. CAC – France
4. NIKKEI – Japan
The data ranges are as follows:
1. January 3, 1950 - S&P 500,
2. April 2, 1984 - FTSE 100, 2
3. November 6, 1990 - CAC and
4. January 4, 1984 - NIKKEI

39| P a g e
CHAPTER 3
RESEARCH
METHODOLOGY

40| P a g e
3.1 RESEARCH MOTIVATION
The main motivation to do the study is I wanted to understand how the Monte Carlo Simulation
helps to research in the forecasting of the stock price. the various sorts of statistical approaches
are used which is useful in understanding the analysis. The study shows how effectively and
efficiently the exchange prediction may result in new knowledge which enables corporations
in addition to individual investors to create a sustainable profit. As many of the new investors
are confused on the technique and process to be used for stock price forecasting, I am very keen
to seek the knowledge of price forecasting methodology. Thus, I have taken the Monte Carlo
Simulation for the Stock Price Forecasting to prediction the profitability and future stock value
of the companies listed in NSE.
3.2 SCOPE OF THE STUDY
There are many ways of using Monte Carlo simulation to model the variables. This study will
concentrate on one among the more basic variations and can only use the expected level of
return and volatility (calculated supported historical data) as input parameters.
The modifications to enhance the simulation will therefore mainly concentrate on calculating
these parameters in a very way that better represents the information. To analyse the
performance of the simulation, we'll carry out the test on 15 stocks. 5 Bank sector stocks, 5
Media and Entertainment sector stocks, and 5 hotel sector stocks.
3.3 PROBLEM STATEMENT
To analyse the trend and growth of shareholders and investors wealth and value in the
selected companies.
To understand the various measures of shareholders and investors value and valuation
of the companies.
To analyse and interpret the trend between the company valuation and its shareholders
value or the industry average.

41| P a g e
3.4 RESEARCH OBJECTIVE
• To understand Monte Carlo Simulation as the best for equity Stock Price Forecasting
techniques.
• For future Stock Price of the firm, Monte Carlo Simulation should predict.
• In this exploration, our goal is to fabricate a condition of-craftsmanship expectation
model for price trend forecasting prediction, which centers on price trend prediction.
3.5 RESEARCH QUESTIONS
How to use Monte Carlo random walk simulations to simulate possible future stock
returns?
How accurate is this Monte Carlo Simulation method?
How to improve the accuracy and reliability for the simulation of the stock prices?
3.6 RESEARCH HYPOTHESIS
There are various ways of conducting the prediction using monte Carlo simulation to model
the expected variables. This study research will investigate on one of the most fundamental
input and considers only the expected returns and expected fluctuations (calculated from
historical data) as inputs. Thus, modifications to improve simulation focus mainly on
calculating these parameters to better represent the analysis.
H0: The Monte Carlo Simulation of the selected companies has a positive impact on
the shareholders’ and investors wealth when it is higher.
H0: The performance of the companies has a significant impact on the creation of
shareholders’ and investors value and wealth.
H1: The Monte Carlo Simulation of the selected companies has a negative impact on
the shareholders’ and investors wealth when it is higher.
H1: The performance of the companies has no significant impact on the creation of
shareholders’ and investors value and wealth.

42| P a g e
3.7 METHODOLOGY PLANNED
A major part of the data for the research will be collected by using the secondary sources of
information that is already available in the websites of the company.
The companies listed in NSE will be shortlisted first and then the data will be analyzed and
then further shortlisted with the sufficient data and then the companies will be selected. Will
be taking 15 companies that is (5 banking sector, 5 media and entertainment and 5 hotel) sector
which will be used for the study. The forecasting technique that we use during this study is the
Monte Carlo simulation. The tools such as Mean, Median Standard deviation, Percentile
analysis has been planned to be used in the report for analysis.
For the purpose of our research, we have selected three sectors that have a mixed impact of
COVID on its performances –
Banking Sector
Media & Entertainment Sector
Hospitality Sector
In all of these sectors we have had mixed performance, while some organizations have
performed externally well, some have slumped and been adversely affected. Due to this, it
becomes a good mix to simulate the trends on Monte Carlo.
1. Banking Sector
COVID-19's exponential spread had caused a large drop in major indexes, suggesting its
influence and ability to have a big impact on GDP growth. While COVID-19 was predicted to
have a negative overall impact on credit growth in most sectors, the degree and form of the
impact will likely vary depending on the duration and scope of the disruption. The COVID-19
pandemic has the potential to be one of the most catastrophic threats to the financial services
industry in in a century. The impact of COVID-19 on banking will be a significant drop in
demand, decreased incomes, and production shutdowns, all of which will harm banks' business.
As enterprises race to deal with the impact of COVID-19 on financial services, the problem is
exacerbated by staff shortages, a lack of digital maturity, and pressure on current infrastructure.
In the wake of the novel coronavirus epidemic COVID-19, banks have their hands full. As the
virus spreads around the world, borrowers and businesses risk job losses, slowed sales, and
ssbm
Highlight

43| P a g e
decreased earnings. Customers of banking institutions are likely to seek financial assistance.
Pandemics have a clear impact on financial systems because of their significant economic
consequences. To manage the coronavirus's direct economic impact, banks must have a plan in
place to protect personnel and customers from the virus's spread. Many institutions are already
encouraging some workers to work from home. The goal of this article is to show how
pandemic covid-19 affects the banking and financial sectors. According to the Indian bank, the
coronavirus outbreak in India threatens a years-long clean-up of the country's financial system.
In the face of the epidemic, the Indian financial system has proven to be unexpectedly resilient,
despite various pessimistic predictions. This is because corporate borrowers, who account for
more than half of all loans, are in better financial position and banks are well-capitalized. This
is encouraging news for loan growth and bank performance in the aftermath of the pandemic.
We chose this sector to test this exact theory through Monte Carlo Simulation, we would like
to test if indeed Monte Carlo can forecast real-life scenarios by simulating stock price patterns.
1.1 SBI
The State Bank of India (SBI), a Fortune 500 business, is an Indian multinational banking and
financial services statutory organization with its headquarters in Mumbai. SBI has a strong
history and legacy dating back over 200 years, making it the most trusted bank among Indians.
SBI, India's largest bank, serves over 45 crore customers through a vast network of over 22,000
branches, 62617 ATMs/ADWMs, and 71,968 BC outlets, all with an unwavering focus on
innovation and customer centricity, which stems from the Bank's core values of Service,
Transparency, Ethics, Politeness, and Sustainability.
SBI General Insurance, SBI Life Insurance, SBI Mutual Fund, SBI Card, and other subsidiaries
have successfully diversified the Bank's business. It has a global presence, with 229 offices in
31 different countries, and operates across time zones. SBI continues to revolutionize banking
in India as it strives to provide responsible and long-term banking solutions. SBI was quick to
adapt to the impact of Covid-19 wave in the year 2020. On the business side of affairs, they
were quick to assess the risk and business procedures in addition to quick adaption of digital
technology. They even focused on their various customer portfolios who were likely to be
impacted though job cut and salary reductions and formulated BCP plans to manage
contingencies. The re-organization of global supply chains gives India with an opportunity to
establish itself as a manufacturing base to fulfil global demand. To the degree that state

44| P a g e
governments are successful in securing such business relocations from China, banks saw
possibilities to grow their operations which SBI was focused on. In a word, the prognosis for
the Bank's operations and the economy was contingent on how quickly the virus is eradicated
and normalcy is restored, however adaptability and digitization were key to which SBI
performed well, and thus considered in our portfolio.
SWOT analysis
Strengths
In terms of market share, sales, and reserves, SBI is India's largest bank.
SBI is one of the Fortune Global 500 companies.
The bank has more than 22141 branches and 58555 ATMs, according to latest reports.
The bank operates in 36 countries and engages in currency trading all over the world.
SBI has a competitive advantage in terms of commercial banking services.
SBI's vision and mission statements were recently changed, showing a move toward new-
age banking services.
The State Bank of India employs a total of 257252 people.
SBI has 143306 crore rupees in revenue (20 billion US Dollars).
The State Bank of India is owned by the Indian government.
Weaknesses
In comparison to private banks, there is a dearth of suitable technology-driven infrastructure.
Employees are unwilling to repair problems quickly since they have more job security, and
the turnaround time for clients is long compared to private banks.
On their leased houses, the banks pay a considerable fee.
SBI has the largest workforce in the banking industry, which explains why the bank spends
a significant portion of its profits on staff compensation.
Despite its renovation, the bank nonetheless gives new-age clientele the impression of a
conventional bank.
SBI does not draw corporate payroll accounts, and all government payroll accounts have
been transferred to private banks for convenience.

45| P a g e
Opportunities
SBI is in the process of merging with five other banks: the State Bank of Hyderabad, the
State Bank of Patiala, the State Bank of Bikaner and Jaipur, the State Bank of Travancore,
and the State Bank of Mysore.
Mergers would result in a boost in market share, allowing it to keep its top status.
Due to a substantial inflow of funds from the Asian economy, SBI intends to expand and
engage in foreign enterprises.
Because some banking functions have yet to be modernized, there is a greater chance to use
new technology and applications to strengthen customer relationships.
New horizons are being opened by the emergence of young and brilliant graduate and B
school pools.
Threats
Other private banks, including as HDFC, AXIS, and others, have increased the amount of
FDI allowed in the banking sector to 49 percent, posing a significant challenge to SBI as
citizens continue to flock to overseas banks for better banking services and technology.
Other government banks are forming, including GNP, Andhra, Allahabad Bank, and Indian
Bank.
Customers prefer to borrow money from commercial banks and financial service providers
rather than SBI since SBI has stringent verification procedures and takes a long time to
complete.
1.2 Canara Bank
Canara Bank was formed in July 1906 in Mangalore, then a tiny port town in Karnataka, by
Shri Ammembal Subba Rao Pai, a remarkable thinker and philanthropist. Over the course of
its hundred-year history, the Bank has gone through numerous stages of its growth trajectory.
Canara Bank grew at a breakneck pace, particularly following nationalization in 1969,
achieving the status of a national player in terms of geographic reach and clientele categories.
For the Bank, the 1980s were marked by commercial diversification. The Bank celebrated a
century of service in the Indian banking market in June 2006.
Despite the pandemic impact, Canara bank shows resilience in performances. With effect from
April 1, 2020, the former Syndicate Bank merged with Canara Bank to become the combined
business. Canara Bank, for example, has completed a year of consolidated operations. The

46| P a g e
Bank accomplished harmonization of all policies, products, and processes based on the 'Best
of Two' principle during the past year, resulting in the best product suite for clients. From the
first day (01.04.2020), the Bank has provided interoperable choices for all frequent transactions
in CBS, which customers can complete at any branch. The bank has concentrated on
maintaining business as usual. The bank has also taken several initiatives to improve
operational efficiency, such as centralizing and digitizing business processes such as account
opening through Central Processing Hubs, which are exclusively monitored by the Central
Processing Wing, retail loan processing through RAH KYC updating through CKYC app, and
forex transactions through the CPCFT Recovery Call Centre (RECC), which are based on
analytics. Retail credit has partnerships with Fin-Tech and E-Commerce to generate leads, as
well as a Document Management System to simplify processes and promote paperless banking.
The combined entity has not only reported a much higher operating profit but also returned to
positive profit in FY 2020-21. This performance encouraged us to add it to our portfolio for
our analysis.
SWOT analysis
Strengths
Schemes are inventive in nature - The bank's schemes are extremely innovative in character.
It offers low-interest loans to persons living in rural areas, thereby contributing to the
improvement of rural living standards by assisting farmers. It cooperated with UNEP to
establish a solar lending program.
Canara Bank, in compared to other public banks in India, articulates best practices and
provides a positive banking experience for consumers, resulting in a stronger brand image
in the minds of customers.
Employment Generation - Banks employ around 40000 individuals in India, resulting in a
large number of people being employed.
Weaknesses
Poor marketing - As a state bank in India, the marketing focus is relatively low, resulting in
poor market visibility despite providing excellent banking services and experiences to
consumers. The bank does not have a marketing department that concentrates on enhancing
the bank's market recognition.
Poor Customer Service - The banking sector in India is fiercely competitive, and customer
service is one of the few things that sets a bank apart. Canara Bank has failed to provide

47| P a g e
excellent customer service. Customers are frequently dissatisfied with the way bank
employees respond to inquiries and provide services. In addition, the online banking
services aren't particularly well designed.
Poor Client Base — The bank does not have a large number of high-income customers. As
a result, low-income groups generate money, which does not enhance the bank's bottom
line, and hence growth is gradual.
Opportunities
Rural Banking - The bank can go deeper into rural financial because the majority of Indians
live in rural regions, and by meeting their banking needs, the bank can increase its revenue.
Social Banking - In the age of social media, banks are utilizing social channels to respond
to the demands of clients while posing a new challenge and saving them time from having
to visit a physical bank.
Threats
Private Sector Banks are Increasing Their Competition - Private sector banks are developing
novel investment packages and thereby gaining market share among retail consumers.
Economic Crisis - As a result of the economic crisis, clients are not saving money in banks,
reducing bank liquidity and making it difficult for them to operate efficiently.
Changing Policies - Banking policies are governed by RBI laws and regulations, therefore
any changes made by the RBI have a direct impact on the bank's operations.
1.3 Indian Bank
Indian Bank is a government-owned financial services and banking organization in India. It is
owned by the Ministry of Finance of the Indian government. The bank was founded in 1907 and
is based in Chennai, India. It employs 41,620 people and has 6,004 branches with 5,428 ATMs
and cash deposit machines. It is one of India's best-performing public sector banks. On August
30, 2019, Finance Minister Nirmala Sitharaman announced the merger of Allahabad Bank with
an Indian bank. With assets of 8.08 lakh crore (US$110 billion), the proposed merger will create
the country's seventh largest public sector bank. On March 4, 2020, the Union Cabinet
authorized the merger. On April 1, 2020, Indian Bank took possession of Allahabad Bank.
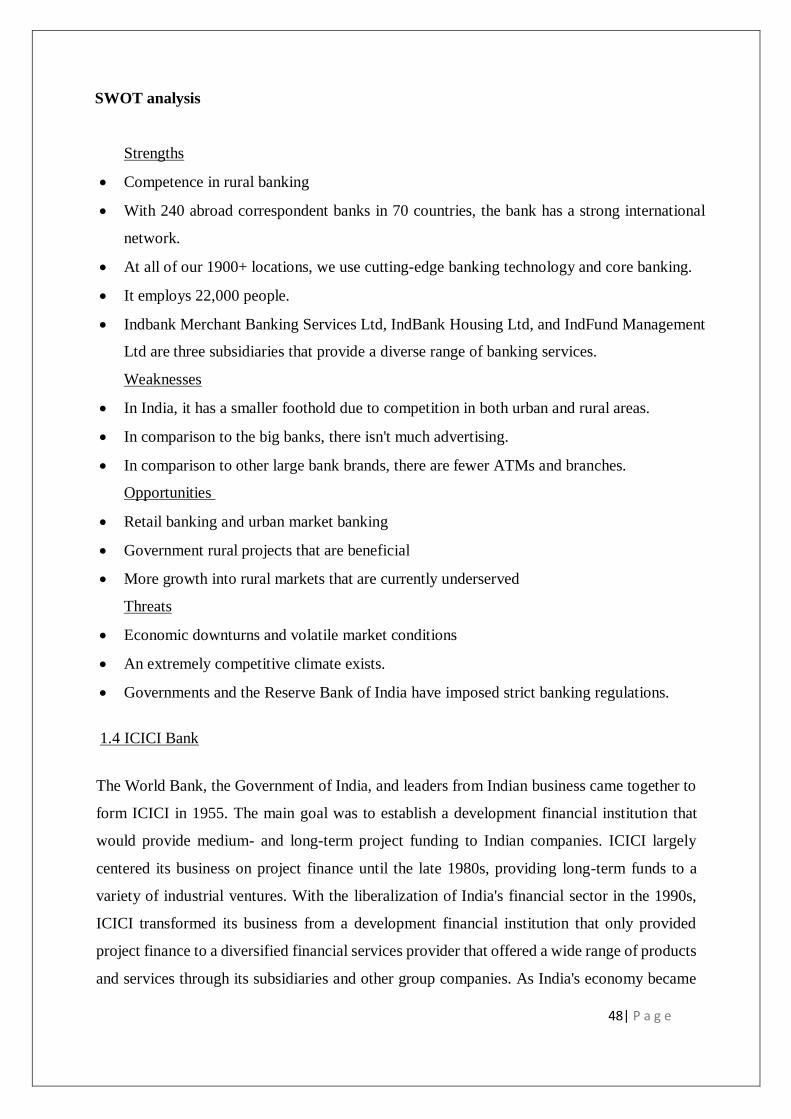
48| P a g e
SWOT analysis
Strengths
Competence in rural banking
With 240 abroad correspondent banks in 70 countries, the bank has a strong international
network.
At all of our 1900+ locations, we use cutting-edge banking technology and core banking.
It employs 22,000 people.
Indbank Merchant Banking Services Ltd, IndBank Housing Ltd, and IndFund Management
Ltd are three subsidiaries that provide a diverse range of banking services.
Weaknesses
In India, it has a smaller foothold due to competition in both urban and rural areas.
In comparison to the big banks, there isn't much advertising.
In comparison to other large bank brands, there are fewer ATMs and branches.
Opportunities
Retail banking and urban market banking
Government rural projects that are beneficial
More growth into rural markets that are currently underserved
Threats
Economic downturns and volatile market conditions
An extremely competitive climate exists.
Governments and the Reserve Bank of India have imposed strict banking regulations.
1.4 ICICI Bank
The World Bank, the Government of India, and leaders from Indian business came together to
form ICICI in 1955. The main goal was to establish a development financial institution that
would provide medium- and long-term project funding to Indian companies. ICICI largely
centered its business on project finance until the late 1980s, providing long-term funds to a
variety of industrial ventures. With the liberalization of India's financial sector in the 1990s,
ICICI transformed its business from a development financial institution that only provided
project finance to a diversified financial services provider that offered a wide range of products
and services through its subsidiaries and other group companies. As India's economy became

49| P a g e
more market-oriented and integrated with the global economy, ICICI took advantage of new
chances to offer a greater range of financial goods and services to a wider range of customers.
As part of the ICICI group, ICICI Bank was founded in 1994.
In the late 1990s, the issue of universal banking, which in India entailed converting long-term
lending institutions like ICICI into commercial banks, was hotly debated. With the conversion
to a bank, ICICI gained the ability to accept low-cost demand deposits, offer a broader range
of products and services, and earn non-fund-based income in the form of banking fees and
commissions. The managements of ICICI and ICICI Bank came to the conclusion that merging
ICICI and ICICI Bank would be the best strategic option for both entities, and would create the
best legal structure for the ICICI group's universal banking strategy, after considering various
corporate structuring alternatives in the context of the emerging competitive scenario in the
Indian banking industry and the move towards universal banking. The amalgamated entity's
access to low-cost deposits, increased potential for fee-based income, and ability to participate
in the payments system and provide transaction-banking services would all provide value to
ICICI shareholders. Through a large capital base and scale of operations, seamless access to
ICICI's strong corporate relationships built up over five decades, entry into new business
segments, higher market share in various business segments, particularly fee-based services,
and access to ICICI and its subsidiaries' vast talent pool, the merger would enhance value for
ICICI Bank shareholders.
The private sector lender posted a net profit of Rs 1,221 crore in the March quarter, much
exceeding analysts' expectations. Bloomberg polled 16 analysts, and the average expectation
for net profits for the fourth quarter of FY20 was 3,510 crores. ICICI Bank lost money because
it elected to make more provisions than the Reserve Bank of India required (RBI). Well, not
all banks could perform over expectations during the pandemic, so week a good mix in our
portfolio which would simulate reality as much as possible.
SWOT analysis
Strengths
In terms of total assets and market share, ICICI is the second largest bank.
ICICI's total assets are Rs. 4062.34 billion, with a profit after tax of Rs. 51.51 billion with
offices in 19 countries.

50| P a g e
According to financial observers, one of ICICI bank's primary strengths is its robust and
transparent balance sheet.
In several banking and financial services, ICICI Bank has a first mover advantage. ICICI
Bank was the first bank in India to offer full mobile banking services as well as a jewelry
card.
The bank has roughly 2,567 branches and 8003 ATMs in India.
ICICI Bank is the first bank in India to link lifestyle benefits to banking services for unique
purchases and partnerships with industry leaders like Nakshatra, Asmi, and D'damas.
Customers are drawn to ICICI Bank because of its long operating hours and other services
offered at ATMs.
In comparison to other Indian banks, ICICI's marketing and advertising tactics have a wide
reach.
Weaknesses
In terms of handling concerns, the ICICI section's customer service is not performing
effectively.
ICICI Bank has received numerous consumer complaints.
In terms of recovering debts and loans, as well as credit payments, the ICICI bank has the
strictest standards. They hire a third-party recovery management company.
Them have also reported being assaulted and abused while recovering, and credit payment
reminders are sent out much before the deadlines, which irritates customers.
In comparison, bank service fees are greater.
Because of the aggressive policies of the management to stay ahead in the race, the
employees of ICICI are under a lot of stress.
Opportunities
In the next three years, the banking sector is predicted to increase at a rate of 17%.
Saving in banks and investing in financial products is becoming more popular in rural areas,
where more than 62 percent of India's population still resides.
According to data published in the Times of India in 2010, India has around 1500 business
schools. This would provide a steady supply of qualified human resources in the financial
products and banking services industries.
ICICI Bank intends to open 1500 additional branches over the next four years.
Because of its financial strength, ICICI may purchase small and non-performing banks.
In the following years, ICICI Bank is predicted to boost its loans by 20%.

51| P a g e
ICICI bank has the smallest quantity of non-performing assets.
Threats
The Reserve Bank of India (RBI) has permitted foreign banks to invest up to 74 percent in
Indian banking.
Government-owned banks are under pressure to upgrade their capabilities in order to reduce
the number of customers who migrate to newer institutions.
HDFC is ICICI's main competitor, while other up-and-coming banks such as AXIS and
HSBC pose a serious threat.
Microfinance organizations have a significant presence in rural areas.
While client acquisition is strong on one hand, dissatisfied consumers are on the rise,
prompting them to transfer banks.
1.5 HDFC Bank
HDFC Bank is one of India's top private banks, having been one of the first to acquire Reserve
Bank of India (RBI) authorization to open a private sector bank in 1994. As of April 2021,
HDFC Bank is India's largest private sector bank in terms of assets and market capitalization.
On the Indian stock exchanges, it is the third largest firm by market capitalization. Wholesale
banking, retail banking, treasury, auto loans, two-wheeler loans, personal loans, loans against
property, consumer durable loan, lifestyle loan, and credit cards are among the goods and
services offered by HDFC Bank. Payzapp and SmartBUY are two of the many digital goods
available. With approximately 120,000 people, it is India's tenth largest employer. The Bank's
distribution network had 5,500 branches in 2,764 cities as of 30 June 2019. In fiscal year 2017,
the bank also installed 430,000 point-of-sale terminals and issued 23,570,000 debit cards and
12 million credit cards. As of March 21, 2020, it had 1,16,971 permanent employees.
Yes Bank received a 1,000-crore investment from HDFC (parent company of HDFC BANK)
in March 2020. According to Yes Bank's rehabilitation plan, 75 percent of the company's entire
investment will be locked in for three years. Yes Bank allotted 100 crore shares with a face
value of 2 each to the Corporation on March 14 for a consideration of 10 per share (including
an 8 premium), accounting for 7.97 percent of Yes Bank's post-issue equity share capital.

52| P a g e
SWOT analysis
Strengths
With 2,201 branches and 7,110 ATMs, HDFC Bank is India's second largest private banking
industry.
HDFC Bank is present in 1,174 cities across India and has over 800 locations where
consumers may conduct telephone banking transactions.
The bank's ATM card works with all Visa/Mastercard, Visa Electron/Maestro, Plus/cirus,
and American Express cards, both domestic and foreign. This is one of the reasons why
HDFC cards are so popular for shopping and online transactions.
When compared to other private banks, HDFC Bank has a high level of client satisfaction.
HDFC has a low attrition rate and is one of the greatest places to work in the private banking
sector.
Weaknesses
HDFC bank does not have a strong presence in rural areas, and while ICICI bank, its direct
competitor, is expanding in the rural market, HDFC cannot take advantage of the first mover
advantage. In terms of financial services, rural people are fiercely loyal.
Like ICICI, HDFC lacks aggressive marketing initiatives.
The bank caters mostly to high-net-worth individuals.
Some of the bank's product categories are underperforming and have limited market reach.
HDFC's stock price fluctuates frequently, forcing investors to be uncertain.
Opportunities
Because HDFC bank has stronger asset quality parameters than government banks, profit
growth is expected to be higher.
Large and small businesses are expanding at a rapid rate. In terms of corporate salary
accounts, HDFC has a strong reputation.
When compared to government banks, HDFC Bank has improved its bad debt portfolio and
has a high recovery rate of bad loans.
HDFC has a lot of prospects in the international market.
Due to the company's solid financial situation, there is more room for acquisitions and
strategic alliances.

53| P a g e
Threats
The percentage of nonperforming assets (NPA) held by HDFC grew from 0.18 percent to
0.20 percent. Even though it's a minor difference, it's not a good omen for the bank's
financial health.
In India, the number of non-banking financial enterprises and new generation banks is
growing.
The HDFC is unable to increase its market share since ICICI poses a significant threat.
To compete with private banks, government banks are attempting to modernize.
Foreign banks can now invest in India at a rate of up to 74 percent, according to the Reserve
Bank of India.
2. Hotel Sector
As the consequences of COVID-19 spread over the globe, governments and companies must
prioritize the protection of their citizens. While this focus will continue, the consequences for
economic development and corporate earnings will almost certainly result in a significant sell-
off in equities markets around the world. We are pleased to see that, as the first to be affected
by the severe weather, our hotel and leisure clients are moving promptly and remaining focused
on understanding and quantifying the operational and financial impact on their businesses. On
both revenue and supply chains, the impact is massive and unpredictable. Hotel, restaurant,
theme park, and movie closures, not to mention the full disruption effect of the travel
ecosystem, all have a huge influence on global tourism. Operators and investors are working
together to address liquidity and working capital concerns while maintaining strong
communication with their stakeholders.
While the hospitality industry is slowly rebounding, the COVID-19 situation continues to have
a significant impact on how businesses operate in the hospitality industry. In the COVID-19
business environment, hospitality organizations are expected to make significant adjustments
to their operations in order to maintain the health and safety of their employees and customers,
as well as increase customer willingness to visit their establishment. This epidemic is also
anticipated to have a considerable impact on hotel marketing and management researchers'
study agendas. With the hotel business facing new hurdles in the COVID-10 age, scholars are
required to redirect their research attention to developing solutions for the industry. Customers'
feelings about patronizing a restaurant or hotel during a coronavirus outbreak will be one of

54| P a g e
the key concerns that hospitality scholars will need to answer. Is it safe to say they're ready to
return? If not, what will entice them back? All these factors make hospitality industry an
interest sector for our research to test if Monte Carlo Simulation can simulate even fragile
market conditions factoring downturns through trends.
2.1 Taj DVK
Taj Hotels is a premium hotel brand located in Nariman Point, Mumbai, and is a subsidiary of
the Indian Hotels Company Limited. Jamsetji Tata, the Tata Group's founder, founded the
company in 1903. It is now a part of the Tata Group, one of India's major economic giants. In
2010, the corporation employed approximately 20,000 individuals.
By 2020, the company will have a total of 100 hotels and hotel-resorts, with 84 in India and 16
in other countries such as Bhutan, Malaysia, Maldives, Nepal, South Africa, Sri Lanka, the
United Arab Emirates, the United Kingdom, the United States, and Zambia. The extent to
which Covid has bled the hospitality industry is beginning to become obvious. Taj parent
Indian Hotels Company Ltd (IHCL), South Asia's largest hotel conglomerate, recorded a loss
of Rs 720 crore in the pandemic-hit FY 2020-21, compared to a profit of Rs 354 crore the year
before. The hospitality sector leader sponsored by the Tata Group has joined the list of
enterprises such as Bajaj Auto, Borosil, Tata Motors, Tata Steel, and Tech Mahindra that have
launched aid programs for the families of employees who have lost their struggle with Covid-
19. IHCL, like its counterparts, had maintained some of its properties operational even
throughout the pandemic's peak. These establishments catered to a diverse range of visitors,
including hospital medical staff such as doctors and nurses, other healthcare workers, members
of essential services, and quarantined visitors, to name a few. In addition to ama Stays and
Trails, IHCL has Taj, Vivanta, SeleQtions, and Ginger as its principal hotel brands. Taj focused
on its operational efficiencies during the pandemic and thus sustained the market pressure. Give
this factor we chose Taj in our portfolio.
SWOT analysis
Strengths
Catering to a wide range of customers: The Taj Group of Hotels offers something for
everyone. Taj Vivanta caters to the upper upscale market, Taj to the luxury market, Gateway

55| P a g e
to the upscale market, and Ginger to the economy market. This ensures that all customers,
regardless of their financial status, pick a Taj Hotel for their stay.
Business Philosophy: The Taj's business philosophy is built on the notion that no two people
are alike. As a result of accurately segmenting the market, the hotel has been able to
differentiate their offering not only to cater to various income classes, but also to various
cultures.
The Taj Group of Hotels offers a wide range of amenities at all of their properties. Rooms,
spas, jacuzzis, multi-cuisine restaurants, swimming pools, pubs, resto cafés, fitness centers,
and banquet halls are all available to guests at their hotels. Some of their hotels also include
gigantic convention centers with the capability of hosting large-scale gatherings.
Loyalty programs for customers: Unlike other hotel chains, the Taj Group offers customers
the opportunity to earn points from all of their stays at any of the group's locations. The
automatic upgrade to a higher-class hotel within the group is a crucial aspect of their reward
program.
Service Differentiation: The Taj research team has identified around 155 touch points in
customer service from the time a customer enters their hotel until they leave, where a face-
to-face interaction occurs. The hotel company has guaranteed that there is a noticeable
service difference in each of these areas.
Pay special attention to the business class: Taj Residency, a business class hotel, was
launched when the hotel company identified the potential for expansion in business class
travel. The hotel chain has also expanded into smaller towns and cities, which has helped
the company's customer base grow.
Weaknesses
Customer Relationship Management: Hotels must be on their toes when it comes to
customer relationship management today. The key to today's success is a collection of client
data that allows businesses to better understand them and provide customized services. This
is proving to be prohibitively expensive for Taj.
Growth is uneven between segments: While the economic and higher upmarket segments
grew rapidly, the luxury segment remained stagnant. Luxury hotels, on the other hand, have
higher maintenance and upkeep costs and lower profits. The hotel has been injecting money
into their premium hotels from their medium segments.
The high cost of maintenance: With a network of nearly 100 hotels across India and other
properties in countries such as Bhutan, Malaysia, Maldives, Nepal, South Africa, Sri Lanka,

56| P a g e
the United Arab Emirates, the United Kingdom, the United States, and Zambia, the cost of
maintenance is becoming unaffordable.
Opportunities
The Taj Group of Hotels is a well-established participant in the Indian industry, and the
hotel chain is expanding into smaller towns and cities, a feat that global hoteliers find
impossible.
Threats
Oberoi, Sheraton, Radisson, Hilton, Wyndham Worldwide, and Intercontinental Hotels are
the Taj Group of Hotels' primary competitors.
2.2 Royal Orchid
Chender K. Baljee founded the flagship hotel in Bangalore in 1973. Royal Orchid Hotels has
15 hotels in 2008, according to their website. By May 2015, the company had 28 hotels, 10 of
which it owned and 18 of which it managed through joint ventures or contracts. The Hotel
Royal Orchid Azure in Nairobi, Kenya, was the Royal Orchid Hotels' first hotel outside of
India, which opened in 2015. Royal Orchid Hotels has 58 hotels under its umbrella as of
October 26, 2019, with 3948 keys – just shy of 4000 – of which 47 are managed.
Lockdowns and limits imposed on various activities as a result of the Covid-19 pandemic have
caused obstacles to Royal Orchid Hotels Limited and its subsidiaries in all of their operations.
The corporation told the stock markets on Wednesday that the Central and State governments
had issued lockdown rules that required the closure of hotels and the suspension of air traffic
and other kinds of public transportation. Low occupancies and hotel closures have resulted as
a result of this.
Royal Orchid Hotels Ltd is currently trading at Rs52.80 on the BSE, down Rs2.5 (4.42%) from
its previous close of Rs55.30. "With the exception of several managed properties that were shut
down owing to government limitations imposed by various state governments," the business
added, "all of our hotels were running at minimum occupancies at minimum cost." Because our
operations are now closed in most geographies and will progressively ramp up only when the
pandemic is resolved, the business anticipates this will have an impact on sales volumes,
revenue, and profitability in Q1 and Q2 FY21.
However, the company is confident in its ability to adapt to the changing business environment
and respond appropriately to its consumers' needs. Given the trust in our brand, the company
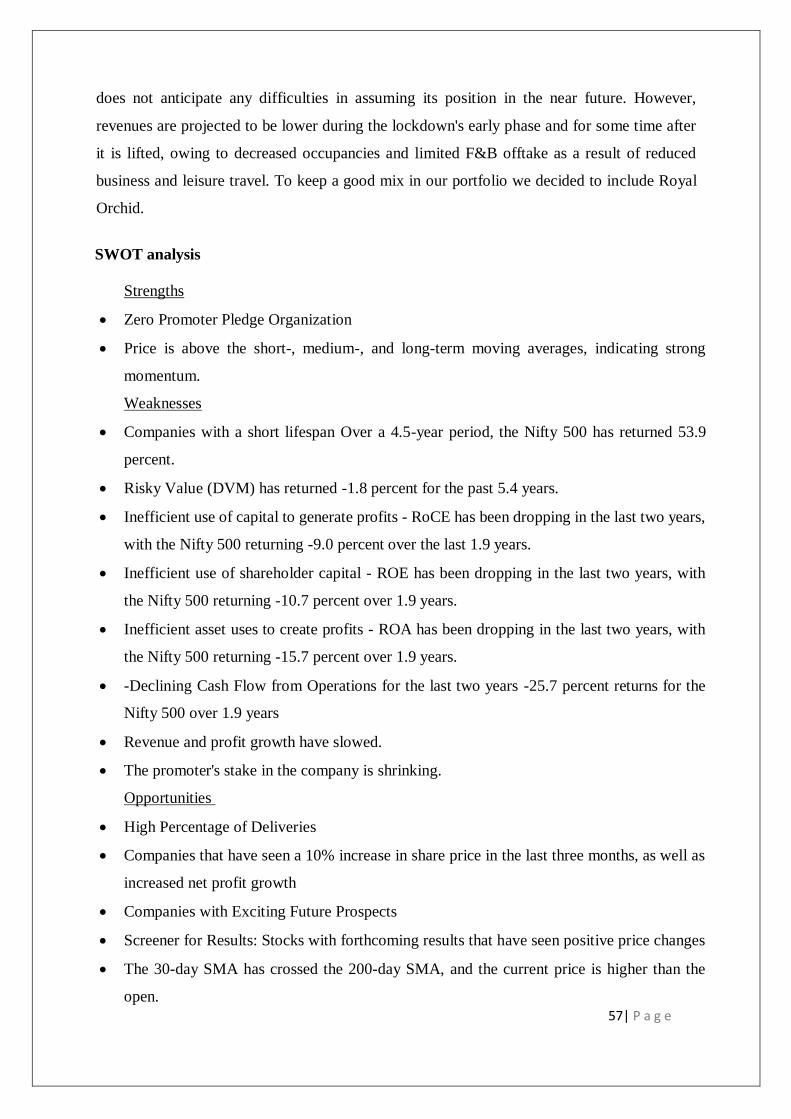
57| P a g e
does not anticipate any difficulties in assuming its position in the near future. However,
revenues are projected to be lower during the lockdown's early phase and for some time after
it is lifted, owing to decreased occupancies and limited F&B offtake as a result of reduced
business and leisure travel. To keep a good mix in our portfolio we decided to include Royal
Orchid.
SWOT analysis
Strengths
Zero Promoter Pledge Organization
Price is above the short-, medium-, and long-term moving averages, indicating strong
momentum.
Weaknesses
Companies with a short lifespan Over a 4.5-year period, the Nifty 500 has returned 53.9
percent.
Risky Value (DVM) has returned -1.8 percent for the past 5.4 years.
Inefficient use of capital to generate profits - RoCE has been dropping in the last two years,
with the Nifty 500 returning -9.0 percent over the last 1.9 years.
Inefficient use of shareholder capital - ROE has been dropping in the last two years, with
the Nifty 500 returning -10.7 percent over 1.9 years.
Inefficient asset uses to create profits - ROA has been dropping in the last two years, with
the Nifty 500 returning -15.7 percent over 1.9 years.
-Declining Cash Flow from Operations for the last two years -25.7 percent returns for the
Nifty 500 over 1.9 years
Revenue and profit growth have slowed.
The promoter's stake in the company is shrinking.
Opportunities
High Percentage of Deliveries
Companies that have seen a 10% increase in share price in the last three months, as well as
increased net profit growth
Companies with Exciting Future Prospects
Screener for Results: Stocks with forthcoming results that have seen positive price changes
The 30-day SMA has crossed the 200-day SMA, and the current price is higher than the
open.

58| P a g e
Over a 1.2-year period, the Nifty 500 returned 34.5 percent.
Scores with a lot of momentum (Technical Scores greater than 50)
Over 5.1 years, the Nifty 500 has returned 319.5 percent.
Stocks with a low PE (PE = 10) are a good investment.
Price strength as measured by the RSI Volume Shockers
Threats
The Trendline Valuation Score identifies stocks with high valuations. Over a 4.5-year
period, the Nifty 500 has returned 177.2 percent.
Companies According to the Annual Report, debt is increasing.
Promoters are reducing their shareholding in a company that is experiencing poor growth.
Non-Core Income is Increasing on a Quarter-over-Quarter Basis
2.3 Chalet Hotel
Chalet Hotels Limited, a subsidiary of the K Raheja Corp group, is an owner, developer, asset
manager, and operator of high-end hotels and hotel-led mixed-use developments in India's
important metro cities, including Mumbai, Hyderabad, Bengaluru, and Pune. Chalet focuses
on maximizing returns on every square foot owned and operated, starting with pre-development
and continuing through the asset's existence. The property includes seven fully operating hotels
with a total of 2,554 rooms in the mainstream and luxury segments, as well as four commercial
and retail spaces totaling 0.9 million square feet in close proximity to the hotels. The business
proposal is an unmistakable option among stakeholders and consumers alike, thanks to its
contemporary and well-planned designs, strategic locations, and long-standing experience in
asset management. Chalet aims to construct properties that meet high standards, focusing on
the luxury-upper upscale and upscale hotel segments with a low gross built-up area and per-
key development cost. For hotels maintained by third parties, the Company uses an active asset
management methodology, closely monitoring and exercising regular supervision. Due to its
first-mover advantage in major, mixed-use developments in certain micro-markets, Chalet has
constructed commercial spaces in close proximity to the hotels, giving it a competitive
advantage in key metro areas.
The year 2020 has been a particularly difficult one for the hospitality and travel industries in
general. Beginning in the first financial quarter, covid-19 caused restrictions wreaked havoc on
the industry's operations and business from April to July 2020. With the lifting of travel

59| P a g e
restrictions and the relaxing of lockdowns, the general mood has improved, resulting in a
positive shift in travel, tourism, and hospitality, as well as other economic activity. People's
perceptions of the situation have improved, and they are more capable of adapting to change
while taking the required safeguards and feeling less fearful. This has brought a positive impact
on the businesses.
SWOT analysis
Strengths
Stocks in which Mutual Funds have increased their holdings in the last month Growth in
Net Profit with growing Profit Margin (QoQ) FII / FPI or Institutions expanding their
shareholding
Strong Momentum: Near 52 Week High: Short, medium, and long-term moving averages
are all above the current price.
Last quarter, mutual funds increased their stock holdings.
Weaknesses
Momentum Trap (DVM) has returned 197.0 percent for the past 5.4 years.
Companies with a short lifespan
Over a 4.5-year period, the Nifty 500 has returned 53.9 percent.
Inefficient use of capital to generate profits - RoCE has been dropping in the last two years,
with the Nifty 500 returning -9.0 percent over the last 1.9 years.
Declining Cash Flow from Operations for the last two years -25.7 percent returns for the
Nifty 500 over 1.9 years
Revenue and profit growth have slowed.
Companies having a low Piotroski score have bad financials.
Companies who are unable to create net cash flow are experiencing a decline in their net
cash flow.
Stock commitments from high-ranking promoters
Opportunities
The Delivery Percentage is Increasing Companies with a 10% increase in share price over
three months and rising net profit growth compared to Prev Day Companies with a 10%
increase in share price over three months and rising net profit growth
The Delivery Percentage is Increasing In comparison to the day before and the month before,
Massive Volumes

60| P a g e
Positive Third Resistance Breakout (LTP > R3)
The 30-day SMA has crossed the 200-day SMA, and the current price is higher than the
open.
Over a 1.2-year period, the Nifty 500 returned 34.5 percent.
Scores with a lot of momentum (Technical Scores greater than 50)
Over 5.1 years, the Nifty 500 has returned 319.5 percent.
Sales and profit growth have shifted from negative to positive, owing to strong price
movement.
Highest 52-Week Recoveries Low PE (PE = 10) stock with low PE (PE = 10) PE (PE = 10)
stock with low PE (PE = 10)
Price strength is shown by the RSI.
Shockers with a lot of volume and a lot of gain
Threats
Companies with a large market capitalization have a reduced public shareholding.
The Trendline Valuation Score identifies stocks with high valuations.
Over a 4.5-year period, the Nifty 500 has returned 177.2 percent.
A red flag has been raised. Coronavirus has had a tremendous influence on businesses.
2.4 Lemon Tree Hotel
The hotel chain Lemon Tree Hotels is founded in India. According to the Horwath Report, it is
India's largest hotel chain in the mid-priced hotel sector and the third largest overall in terms
of controlling interest in owned and leased rooms as of 30 June 2017. To date, the firm owns
and runs 84 hotels in 52 cities across India, totaling 8300 rooms. Patanjali (Patu) Keswani
founded Lemon Tree Hotels. In May 2004, this award-winning Indian hotel chain established
its first hotel, which has 49 rooms.
Aurika Hotels and Resorts (upscale), Lemon Tree Premier (higher midscale), Lemon Tree
Hotels (midscale), Red Fox by Lemon Tree Hotels (economy), Keys Prima (upper midscale),
Keys Select (midscale), and Keys Lite (low-cost) are the company's seven brands (economy).
Berggruen Hotels Private Limited was acquired by the firm in 2019 for Rs 605 crore in
enterprise value. Berggruen Hotels owned 936 rooms and operated 975 rooms under the 'Keys'
brand in 21 cities across India at the time of acquisition.

61| P a g e
In India, the company's hotels may be found in major cities such as Ahmedabad, Aligarh,
Alwar, Amritsar, Aurangabad, Baddi, Bandhavgarh, Bengaluru, Bhiwadi, Bhubaneswar,
Calcutta, Chandigarh, Chennai, Coimbatore, Corbett, Dehradun, Delhi, Gangtok, Ghaziabad,
Goa, Gurgaon, Hyderabad, Indore, Lemon Tree Hotels will operate 105 hotels with 10,500
rooms in 66 cities in India and abroad once the present pipeline is complete. Lemon Tree Hotels
went public in early 2018, and on April 9, 2018, it was listed on the National Stock Exchange
of India.
Revenue from operations climbed by 17% to Rs 176 crore in Q4 FY20, up from Rs 150 crore
the previous fiscal quarter, but total expenses increased by more than 10% to Rs 112 crore, up
from Rs 102 crore. EBITDA (earnings before interest, taxes, depreciation, and amortization)
increased by 31% in Q4 FY20 to Rs 64 crore from Rs 49 crore in Q4 FY19. Following the
directions issued by several state governments regarding the Covid-led lockdown, the company
stated nearly 66% of its owned and leased rooms were functioning in April. Quarantine guests,
doctors, nurses, healthcare workers, and corporate guests for business continuity planning
accounted for over 33.4 percent of occupancy in the operational owned and leased hotels. In
May, 78 percent of its rooms were operating, thanks to the partial lifting of lockdown in various
states. The hotel occupancy rate was close to 40%. While all food and beverage outlets, as well
as banquets, were closed, in-room dining was available. The hotel's operations were hampered
by restrictions on personnel movement and the provision of raw materials and room amenities.
SWOT analysis
Strengths
The Lemon Tree Hotel Group offers a diverse range of hotels ranging from mid-market to
upscale.
The hotel provides a warm and welcoming atmosphere, which customers like. India's
cultural and geographical richness attracts tourists.
The personnel at the hotel are incredibly pleasant (They have particular staff in yellow
ribbons). This team is especially dedicated to resolving people's complaints.
The Lemon Tree Group is dedicated to offering the most refreshing experience possible.
They make their own shampoos and soaps.

62| P a g e
Weaknesses
There is no presence in two of the world's most populous metropolises, namely Mumbai and
Kolkata.
Because it is newer in the sector, it has a smaller market share.
When compared to market leaders, the hospitality experience is less.
Opportunities
MICE (Meetings, Incentives, Conferences, and Exhibitions)– The lemon tree may be found
in major cities such as Bangalore, where meetings and conferences can be hosted.
Government Support for Mid-Market Hotels is Growing the Lemon Tree collection of hotels
are modest and economical, making them ideal for a weekend getaway.
Threats
Terrorist threats, a slump in the economy, and political turmoil
People are increasingly preferring well-furnished guest houses than hotels.
Because of the substantial initial expenditure, changing patterns from the west may be
difficult to implement by already established players.
2.5 Asian Hotel
Asian Hotels (North) Ltd is a major operator in the Indian hospitality business, owning and
operating the Hyatt Regency Hotels chain of deluxe hotels. The firm currently operates the
Hyatt Regency Delhi, a five-star premium hotel in Delhi. The 5-Star Deluxe Hotel Hyatt
Regency New Delhi is located in Bhikaji Cama Place. The hotel offers 508 rooms and suites
and is well-equipped with amenities such as high-speed Internet, a swimming pool, a fitness
center, a business center, boutiques, and restaurants that cater to a wide range of tastes. R S
Saraf R K Jatia promoted Asian Hotels (North) Ltd, which was founded in 1980 as Asian Hotels
Ltd. Three non-resident Indians, Chaman Lal Gupta, Sushil Gupta, and Shiv Jatia, and their
Indian Associates During the Asian Games in 1982, the company set up their first-class room
amenities for visitors. In 1983, the hotel began full-fledged commercial operations.
GJS Hotels Ltd, a subsidiary of the corporation, was established on December 9, 2002. In order
to expand its geographic reach, they built two additional five-star deluxe hotels, the Hyatt
Regency Kolkata and Hyatt Regency Mumbai. The former began full-fledged operations on
January 1, 2003, while the latter began operations on April 1, 2003. Chillwinds Hotels Ltd,
Vardhman Hotels Ltd, and Aria Hotels and Consultancy Services Pvt Ltd were all bought by

63| P a g e
the firm during the 2007-08 financial year. In 2008, the company ventured into a new business
division, electricity generating, and erected two wind turbine generators.
According to them, the pandemic caused significant changes in consumer travel and
experiences, resulting in a new wave of trends influencing hotel operations and strategy.
Vaccinations that are currently being administered have given travelers renewed hope, resulting
in a boost to the hotel industry's real-estate revival. According to Ercan, pricing in 2019 reached
an all-time high, owing to robust operational cash flow at the hotel level, which priced private
equity out of the market. The 'reset' has opened up prospects for acquisition at "more
opportunistic levels of price with an ultimate exit in five to seven years," according to the
company.
According to Ercan, pricing in 2019 reached an all-time high, owing to robust operational cash
flow at the hotel level, which priced private equity out of the market. The 'reset' has opened up
prospects for acquisition at "more opportunistic levels of price with an ultimate exit in five to
seven years," according to the company. Keeping these factors in mind we decided to include
Asian Hotels in our portfolio.
SWOT analysis
Strengths
Increased Profit Margin leads to an increase in Net Profit (QoQ)
Weaknesses
Companies with a short lifespan Over a 4.5-year period, the Nifty 500 has returned 53.9
percent.
Risky Value (DVM) has returned -1.8 percent for the past 5.4 years.
Quarterly Net Profit Decrease (YoY)
Debt-ridden businesses
Piotroski Score is Low: Financially troubled businesses
For the past two years, annual net profit has been falling.
High Promoter Pledge Companies
Stock commitments from high-ranking promoters
Companies that have larger interest payments than revenues are referred to as zombies.

64| P a g e
Opportunities
Companies with Upcoming Results have a Rising Delivery Percentage Compared to Prev
Day Companies.
Stocks with a Low PE (PE = 10) and a High-Volume Shocker
Threats
Stocks with Expensive Valuations According to the Trendline Valuation Score, the Nifty
500 has returned 177.2 percent over the last 4.5 years.
3. Media and Entertainment Sector
The global pandemic had an influence on the theatrical and home/mobile entertainment
industries in 2020, as movie theatres and production companies were forced to close
temporarily. Viewers were compelled to stay at home for their audiovisual pleasure while
millions of people were confined. It will take a long time for the industry to return to normal.
As the globe heals from COVID-19, production will gradually resume, and theatres will reopen
to their full capacity. Streaming, on the other hand, is the new normal in the meanwhile. With
people spending more time at home than ever before, streaming has become a popular way for
them to escape reality. As a result, viewers are now consuming a larger range of information.
As they work from home offices, consumers are now streaming material throughout the day,
including music and podcasts.
The epidemic has had an impact on the type of content available, with consumers displaying a
greater interest in overseas series and films. Even as the industry returns to normal, the greater
demand in cultural content is likely to continue. Netflix CEO Reed Hastings confirmed the
shift to international programming in June, claiming that Netflix members were consuming
more diversified content from other countries and cultures. The majority of large streaming
platforms understand the value of localization and are working hard to provide high-quality
subtitles and dubbed material. This is due to the fact that they have a well-defined methodology
for localizing content. Those who do not yet have such procedures in place are actively working
on them.
The Indian Media and Entertainment (M&E) sector hit Rs 1.82 trillion (US$25.7 billion) in
2019, according to FICCI research (a growth of 9 percent over 2018). According to the report,
India's M&E sector is predicted to reach Rs 2.4 trillion (US$34 billion) by 2022, with a CAGR
of 10%. However, these forecasts were made before to the impact of Covid-19, and according

65| P a g e
to CRISIL, the Indian M&E industry's income is expected to drop by 16 percent, or Rs 25,000
crore, to Rs 1.3 lakh crore in the current fiscal year. The M&E sector's profitability is projected
to be significantly impacted by this overall decrease in revenue.
3.1 Balaji Telefilms
Ekta Kapoor and Shobha Kapoor founded Balaji Telefilms Private Limited on November 11,
1994, in Mumbai, India, with the goal of producing serials and other entertainment products.
Balaji specializes in structured programming that can be adapted for languages both
domestically and internationally. Balaji became a public limited company on February 29,
2000, and changed its name to 'Balaji Telefilms Ltd' on April 19, 2000. The corporation issued
28,00,000 equity shares of ten rupees each at a premium of 120 rupees each, totaling 36.40
crore. A book-built portion of 25,20,000 equity shares and a fixed-price portion of 2,80,000
equity shares were included in the offering. Nine Network Entertainment India Pvt. Ltd., a
wholly owned subsidiary of Nine Broadcasting India Pvt. Ltd., and Balaji Telefilms Ltd.
amalgamated in the same year. When Star India bought a 26 percent share in the company in
2000–04, the stock market value soared sixteen-fold to 571 crores.
Producer Ekta Kapoor has said that she has paused all administrative and production activity
across Balaji Telefilms Limited, Balaji Motion Pictures Limited, and ALTBalaji in order to
contain the spread of the new coronavirus. Ekta stated the safety and well-being of the
company's employees, cast, and crew is of fundamental significance to her in a statement
released on her official Twitter account. The COVID-19 epidemic and the government's
subsequent lockdown had a negative influence on the whole media and entertainment industry,
and as a result, the Group's business activities were also hurt in the current quarter.
Following the pandemic in 2020, the TV business, which accounts for the majority of Balaji
Telefilms' operations and revenue, was affected by higher expenses and limitations. However,
ALTBalaji, the production house's over-the-top (OTT) platform, performed well during this
time. During the year, the site sold 4.7 million subscriptions and now has over 2.3 million active
subscribers who watch 83 different episodes. In FY20, the firm sold 3.4 million subscriptions.

66| P a g e
SWOT analysis
Strengths
Teams with a lot of creativity
Captive studios and recurring lead actors – Low-cost manufacturing
For the Top 100 positions, the majority of the TRP
From broadcasting to production to acquisition, we're looking into a variety of topics.
Due to the production of popular movies and serials, the company has a strong brand
presence.
Weaknesses
Lack of scalability and viewers' changeable desires
Adaptability to regional demands is slow.
It's difficult to carve out a niche when there's a lot of competition.
Opportunities
With the advent of FDI, new broadcasting companies are entering the market.
Increasing Customer Awareness of Diverse Content Production in Regional Areas
Threats
Regional networks are gaining popularity at a rapid rate.
Interest is shifting away from mainstream entertainment and toward niche genres.
Foreign networks are becoming more popular.
3.2 Inox Leisure
INOX Leisure Limited was established as a Public Limited Company on November 9, 1999.
The company's operations span a wide range of industries, including industrial gases,
engineering plastics, refrigerants chemicals, renewable energy, cryogenic engineering, and
entertainment. It maintains a network of multiplexes in India and is a subsidiary of Gujarat
Fluorochemicals Ltd. With 128 buildings, 512 screens, and 1,25,508 seats in 64 cities, it has a
broad footprint across India. The company has signed a Memorandum of Understanding with
the Pantaloon Group for privileged access to multiplex spaces in all Pantaloon Group-owned
real estate developments. During the 2005-06 fiscal year, the business opened multiplexes in
Indore, Darjeeling, and Kota. During the year, they issued 16500000 equity shares of Rs.10
each at a price of Rs.120 per share, which included a fresh issue of 12000000 equity shares of
Rs.10 each and a sale of 4500000 equity shares of Rs.10 each by Gujarat Fluorochemicals Ltd.

67| P a g e
The company won the ICICI Entertainment Retailer of the Year Award in 2005, as well as the
TAAL Multiplexer Award in 2006.
As of March 31, 2018, the Company's total number of multiplex cinema theatres was at 123,
with 492 screens and 121573 seats. During the fiscal year under review, 17 multiplex cinema
theatres with a total of 77 screens were added, as well as 8 screens in an existing multiplex
theatre. An agreement for a single 3-screen multiplex cinema was cancelled. As of March 31,
2019, the Company's total number of multiplex cinema theatres was at 139, with 574 screens
and 135586 seats. During the year under review, the Company issued 6400000 equity shares
of Rs 10 each to GFL Limited (formerly Gujarat Fluorochemicals Limited), the Company's
Promoter, at a price of Rs 250 per share (at a premium of Rs 240 per share) on November 30,
2018 (Preferential Issue), raising Rs 160 crore.
During Pandemic, the corporation stated that retail customers were more vulnerable to the
pandemic's immediate impact, and hence postponed their discretionary spending owing to a
shift in priorities. The company said it has taken steps, including cutting costs across all
functions and departments, engaging with business partners such as developers, distributors,
and producers, and making representations to State and Central governments for support, in its
disclosure to the exchanges about the material impact of the Covid-19 pandemic. The
company's management thinks that these steps will provide enough liquidity to fund business
operations for at least the next six months, according to the statement. These factors make it a
choice in our portfolio.
SWOT analysis
Strengths
With over 60 locations and approximately 250 screens scattered across India, it has the
greatest multiplex screen capacity in the country.
Market capitalization in India has one of the biggest market shares.
INOX was also chosen after a countrywide competition to design, build, and run the famous
multiplex in Goa that hosts the Indian Film Festival.
Modern projection and audio systems, international-standard furnishings, stadium-styled
high back seating with cup holder armrests, high levels of hygiene, a diverse theatre menu,
and a variety of Hindi, English, and regional films
Excellent customer service and top-of-mind brand recall are provided.

68| P a g e
Weaknesses
Low presence in Tier-2 towns, as well as piracy-affected margins
Market share and profitability are being squeezed as competition grows.
Opportunities
Creating strategic connections to achieve 100 percent digitization
Prioritize emerging Tier-2 cities.
Customers will be reached through more international collaborations and unique screenings.
Threats
Real estate prices are increasing.
DTH and VOD services are growing in popularity.
Television and over-the-top (OTT) film releases early
Increased online piracy has an impact on businesses.
3.3 Sun TV
Sun TV is a Tamil-language general entertainment pay channel in India that debuted on April
14, 1993. Sun TV Network is the flagship channel of the Sun Group, a media company based
in Chennai. Kalanithi Maran established and owns the company. On December 11, 2011, Sun
TV released its HD edition. All of their shows are available to watch on their own digital
platform, Sun NXT. Sun TV went public on the Bombay Stock Exchange on April 24, 2006,
after receiving $133 million in funding. [7] It is the world's most popular Tamil television
channel, with broadcasts in the United States, the United Arab Emirates, Singapore, Malaysia,
Sri Lanka, Australia, Canada, South Africa, Qatar, Hong Kong, Europe (the United Kingdom,
France, Germany, Italy, Denmark, Austria, Switzerland, the Netherlands, and Ireland), and
other countries.
Sun TV, a media company owned by Kalanithi Maran, reported that sales are close to 75% of
pre-COVID levels. If things settle down and the market truly opens up, the entire fall could be
limited to 15-20%. Meanwhile, the business allocated roughly Rs 250 crore in capital
expenditure on digital, content creation to increase subscription income, and film production.
Narayanan stated that the company will invest roughly Rs 100 crore in exclusive content for
its OTT platform Sun NXT. "These investments will be substantially larger when things return
to normal, because we are already producing that type of money in our streaming business. It
was always the intention to make it a viable business rather than squander money only to make

69| P a g e
a profit. We're re-evaluating the entire annual business strategy since no one expected
everything to go apart so quickly. In terms of annualized spending, I believe this number will
rise "he added in a new interview with Business Standard.
Investors have slammed Sun TV NSE 2.35 percent after the company lowered its FY21 annual
payouts. The company's dividend payment ratio averaged 49 percent during the previous five
years, but it has suddenly dropped to 13 percent this fiscal year. Sun Pharma was seriously
impacted by Pandemic and thus we have decided to include the stock in our portfolio to make
sure we have a diverse mix.
SWOT analysis
Strengths
Brand recognition and a one-of-a-kind business model
Strong distribution backbone with two verticals: one for promotions in South India and the
other for promotions in other countries.
With 20 channels and 43 FM radio stations in numerous Indian languages, it is India's
second largest television network.
The world's no. 1 Tamil channel, which broadcasts movies, news, serials, and shows 24
hours a day, has a strong brand reputation.
South Africa, Australia, Europe, the United States, Canada, and Asia are among the nations
where the company has a presence.
The Karnataka Premier League's telecast rights were purchased for a five-year period (KPL)
Forayed in radio broadcasting and print media.
Reach, frequency, and patronage are competitive advantages.
Have a bigger number of viewers
Excellent political ties
Owns a number of television and radio stations in several languages that broadcast in all
Indian states.
For revenue creation, he owns the Sun Risers, an IPL franchise based in Hyderabad.
Weaknesses
They are only known in the south.
There is a lack of active marketing and advertising.
The quality of the content and the preferences of the viewers must be regularly examined.

70| P a g e
Constant necessity to keep track of programs that have been broadcast
Opportunities
Increase the number of adverts and subscriptions to attract more customers.
Increase viewership by launching services in other significant Indian markets at a lower
cost.
Through its companies, generate revenue through movie distribution and content trading.
Participate in the creation, distribution, and acquisition of film content. Form a distribution
venture with other broadcasting firms.
Identify out-of-date technologies and replace them with the most recent developments.
Threats
New entrants have increased competition, which has resulted in more innovation.
Advertising revenue is the most important source of revenue, and it fluctuates a lot.
Carriage fees have risen dramatically as stations fight for premium spots in prime-time slots.
3.4 Zee Entertainment
Zee Entertainment Enterprises (formerly Zee Telefilms) is a media corporation based in India.
It has interests in broadcast, print, internet, film, mobile content, and allied companies, and is
headquartered in Mumbai. The company was founded on December 15, 1991, under the name
Zee Telefilms, which it used until 2006. As part of a distribution contract between Viacom
International and Zee Telefilms, Zee Telefilms established a Nickelodeon-branded television
block in 1999. In 2002, it was replaced by a new Cartoon Network block.
ETC Networks was purchased by the firm in 2002 for a majority (51%). They bought Integrated
Subscriber Management Services Limited in 2006, and Taj Television, the owner of TEN
Sports, in November of the same year. The company was renamed Zee Entertainment
Enterprises in the same year. In February 2010, the company purchased a further 95% share in
TEN Sports. Zee Motion Pictures and Zee Limelight (now Zee Studios) were established by
Zee Networks in 2008 for the development, production, distribution, and marketing of major
films in Indian languages such as Hindi, Malayalam, Tamil, Telegu, Kannada, Bengali, and
Marathi.
From 2000 to 2005, the company was listed on the BSE Sensex as Zee Telefilms. In 2006, Zee
News, a news and regional entertainment channel, was spun off as an independent entity.

71| P a g e
In May 2011, Star Den formed a 50/50 joint venture with Zee Turner and Zee Entertainment
Enterprises (ZEEL) in India, Nepal, and Bhutan to distribute and advertise all of the company's
and ZEEL's channels, as well as affiliated channels and other third-party channels. It also owns
Zee Music Company, a music label.
Sarthak TV, an Odia-language pay-television station, was purchased by Zee in 2015. It released
Zee One, focused at the German market, a year later, on July 28, 2016. ZEE Entertainment
Enterprises Ltd, a media and entertainment corporation, said on April 7 that it will provide
financial assistance to approximately 5,000 daily wage earners who work directly or indirectly
for the company in its whole production ecosystem.
ZEE Entertainment Enterprises Ltd (ZEEL) has taken this measure to ensure that the families
of daily wage earners are not impacted during the ongoing hard phase, citing the unprecedented
impact of the lockdown on all daily wage earners.
SWOT analysis
Strengths
India's first private Hindi television channel
Antakshari began the heritage of reality shows by launching the incredibly successful
singing reality show Sa Re Ga Ma in HD quality, which was the first cooking show on
television (Khana Khazana)
Weaknesses
Despite being the oldest pvt channel, it is unable to adapt to changes in audience preferences.
The number of people watching the show is steadily decreasing.
The drama between SaaS and Bahu is the main theme of the shows.
Previously, shows like Disney Hour were able to readily capture the attention of children.
The expansion of Zee Network's regional channel took the spotlight away from the original
Zee TV Channel, which had produced notable programs such as 'Phillips Top 10', 'Hum
Paanch,' and 'Filmy Chakkar,' but was now unable to break the ground.
TRP is given an excessive amount of weight.
Opportunities
TRP, a shaky and dubious technique of assessing viewership, does not need to be given such
a high priority.

72| P a g e
Make some great shows for kids, especially on weekends, because Zee Network does not
have a kid’s station.
Can re-capture the audience by delivering authentic humor-based programming
The 'Once a week show' method can be reintroduced to gain traction and produce high-
quality content.
The key is a creative renaissance.
Threats
Shows are similar across all GECs, and new networks like Colors have been able to take the
top slot.
3.5 PVR
PVR Cinemas (Priya Village Roadshow) is an Indian film production and distribution firm. In
1995, the company was founded as a 60:40 joint venture between Priya Exhibitors Private
Limited and Village Roadshow Limited. In June 1997, it commenced commercial operations.
Ajay Bijli, the chairman and managing director of PVR Cinemas, started the company. Sanjeev
Kumar Bijli, Ajay Bijli's brother, is the Joint Managing Director of PVR Ltd. Under PVR, the
company also has a proactive CSR wing. The first PVR Gold Screen opened in Bengaluru's
Forum Mall.
When Priya Village Roadshow decided to leave the partnership in 2003, ICICI Ventures
invested 40 crores in PVR. [5] In 2012, the Kanakia group's CineMAX movie chain was
purchased for 395 crore (US$52 million) by Cine Hospitality Private Ltd, a subsidiary of PVR
Cinemas, establishing PVR India's largest cinema chain. [6] [7] PVR Cinemas purchased DT
Cinemas from the DLF group in May 2016 for Rs 500 crore (US$66 million). [8] [9] PVR
Cinemas just opened a Superplex in Noida, a new theatre concept. The theatre includes 15
screens, including IMAX, 4DX, Gold Class, a playhouse, and regular auditoriums.
PVR Cinemas has put a total of Rs. 48 crores into this new endeavor. In 2007, PVR opened its
first "Gold Screen" in Indore. PVR Cinemas, in collaboration with HP India, recently opened
Asia's first Virtual Reality (VR) Lounge at PVR ECX in Noida's Mall of India. In August 2018,
PVR Cinemas announced the cash and stock acquisition of Chennai-based SPI Cinemas for
850 crores. PVR Cinemas reached the milestone of 800 screens in India in August of this year.

73| P a g e
SWOT analysis
Strengths
India's multiplex industry has a first-mover advantage.
To produce a better-quality ambience, develop and operate cutting-edge multiplexes.
Utilization of technologically advanced equipment such as Dolby stereo sound, Digital
Cinema, and Xenon technology, among others.
Exclusive rights to screen blockbusters were obtained from big distributors such as Warner
Brothers, 20th Century Fox, and others.
With more than 1500 screens in operation, it is the world's largest multiplex company.
Brand equity is quite strong, and the mix of shopping and entertainment is very appealing.
Weaknesses
Higher-priced ticket sales
Customer retention in the long run
Parking issues
There is a lack of client input for service improvement.
Opportunities
Develop a longer-term engagement with village road shows.
Spending on entertainment by a growing family
With almost 200 films released each year, there is a large film industry.
To keep PVR loyalists, further deals are being made.
Enter the film distribution business.
Increase the number of screens in your business to reach a larger audience.
Collaborate with franchises and networking sites.
Threats
Similar multiplexes are posing a growing threat.
Interference by the government in the entertainment tax
Consumers are turning to alternative forms of entertainment.
Piracy and the slowing economy may have an impact on the sector.
Multiplexes' brand is being sabotaged by a movie.

74| P a g e
3.8 EXPECTED OUTCOMES
Long-term earnings forecasting can be a very important topic for academia, research scholar,
investors, and anyone interested in available exchanges. In this study, Monte Carlo simulations
were presented as a technical analysis to support these sections in estimating stock prices,
which will continue to be important for capital pricing, portfolio management, and other
financial decisions. It is not used in current inventory analysis applications. This is because the
method may not have been tested before and turned out to be better, for example, fundamental
analysis or technical analysis. However, there are many questions that need to be answered.
Investors need to be able to model the possible results of financial investments and financial
decisions in order to make profitable and productive investments. This study examines the
ability of Monte Carlo simulations to track market prices in the NSE. There are however many
questions to be answered:
The Monte Carlo analysis for the companies computed and analyzed.
How the reporting effects the wealth maximization of the companies?
How do companies compare and evaluate the financial performance?
How useful is the analysis for the investors and predictors?

75| P a g e
The Monte simulation allows analysts and advisors to convert investment chances into choices.
The advantage of Monte Carlo is its ability to give some thought to a range of values for various
inputs; this can be often also its greatest disadvantage within the sense that assumptions must
be fair because the output is just nearly pretty much as good because of the inputs. Another
great disadvantage is that Monte Carlo simulation tends to underestimate the probability of
utmost bear events type of a financial crisis. Experts argue that a simulation like this is unable
to give some thought to the behavioral aspects of finance and thus the irrationality exhibited by
market participants. It is, however a useful gizmo for advisors.
3.9 LIMITATION OF THE STUDY
The lack of previous studies in this research area makes the literature review small and
difficult to gather more research work.
The sample size used the forecasting is for the duration of 30 days. Bigger sample size
is difficult to find the significant relations from the data to ensure the representative
distribution.
Due to the COVID-19 situation, I had not got the access to the library, data, and
documents.

76| P a g e
CHAPTER 4
DATA ANALYSIS

77| P a g e
4. DATA ANALYSIS
This chapter sets out the research methodology which will be accustomed to meet the target of
the study. Included herein are the population of the study, the sample, the model, and data
analysis to be adopted for the aim of this study.
4.1 POPULATION
The population of this study consists of NSE stocks.
4.2 SAMPLE
The sample of this study consisted of NSE stocks of five (5) banks sector, five (5) entertainment
sectors, and five (5) hotel sector data set for the simulation.
4.3 DATA COLLECTION
To satisfy the objectives and hypotheses of the study, data is collected from secondary sources
mainly from NSE stock because the sources of samples data for the sample period of one month
each. Furthermore, this research only focuses on the knowledge available within the NSE
website.
4.4 FORECASTING TECHNIQUES
The forecasting technique that we use during this study is the Monte Carlo simulation Monte
Carlo simulation is to model possible movements of asset price using excel. There are two
kinds of assets price movement:
Drift is a constant directional movement
Random input which represents market volatility

78| P a g e
By taking the starting price and annual volatility, we can determine the daily volatility and by
analyzing the iteration, we will get the simulated price through which we can determine the
mean price, median price, variance, and percentile price movement of a security.
To process the simulation, we must project by taking the starting price from the NSE portal,
then seek for the annual volatility, then we have got to search out the daily volatility:
Daily volatility = Annual volatility/SQRT (252)
After finding daily volatility, we will be able to take any number of days to simulate the stock
price and here we have taken 30 days each for all the sectors which can help to simulate the
value for
DAY 1: STARTING PRICE*(1+NORM.INV (RAND (),0, DAILY
VOLATILITY) DAY 2: DAY 1 PRICE *(1+NORM.INV (RAND (),0, DAILY
VOLATILITY) DAY 3: DAY 2 PRICE *(1+NORM.INV (RAND (),0, DAILY
VOLATILITY)
.............
DAY 30: DAY 29 PRICE *(1+NORM.INV (RAND (),0, DAILY VOLATILITY)
But one simulated outcome is not that useful but if we do it 500 times to 1000 times and record
all the outcomes, we can start to develop a range within which we expect the price to fall or
rise over the next month.
So, we are going to collect 1000 30th day outcomes and then we will start the statistics from
those 30th-day outcomes. So first we are going to reference the ending price and to simulate it
1000 times so that each one of those numbers is the simulated outcome after 30 days. Now we
can start calculating the statistics of what the price will look like after 30 days.

79| P a g e
4.5 RELIABILITY AND VALIDITY OF KNOWLEDGE
Secondary data for the study is drawn from the NSE website as fairly accurate and reliable.
Therefore, these data could also be considered reliable for the study. Necessary checking and
cross-checking were done while scanning information and data from secondary sources. of
these made to get valid data for this study.
4.6 MODE OF STUDY
Data collected on the variables of interest within the amount of study was analyzed through
descriptive statistics. Further, mean price, median price, variance, and percentile were wont to
explain the character and significance of the connection between changes within the response
variable and changes within the predictor variables identified within the study.
Mean price: AVERAGE (1 to 1000) outcomes
Median price: median (1 to 1000) outcomes
Standard price: STDEV.S (1 to 1000) outcomes
Percentiles: PERCENTILE.EXC (1 to 1000 outcomes, percentile)
ssbm
Highlight

80| P a g e
4.7 OBSERVATIONS AND ANALYSIS
Monte Carlo simulation is a significant aspect of many firms' decision-making processes.
Simulation is used by companies like GM, Procter & Gamble, Pfizer, Bristol-Myers Squibb,
and Eli Lilly to evaluate both the average return and the risk factor of new goods. At GM, the
CEO uses this data to choose which products will be released.GM uses simulation for things
like estimating net revenue, predicting structural and purchasing costs, and figuring out how
vulnerable business is to various types of risk (such as interest rate changes and exchange rate
fluctuations). Proctor and Gamble models and hedges foreign exchange risk using simulation.
Sears employs simulation to figure out how many units of each product line should be ordered
from suppliers this year, such as the number of pairs of Dockers trousers. Simulation is used
by oil and medicine firms to value "actual choices," such as the value of a project's option to
grow, reduce, or postpone. Monte Carlo simulation is used by financial planners to assess the
best investment plans for their clients' retirement.
What happens when you use a RAND Function?
When you use the formula =RAND() in a cell, you receive a number that has an equal chance
of being between 0 and 1. Thus, approximately 25% of the time, you should get a value less
than or equal to 0.25; approximately 10% of the time, you should get at least 0.90, and so on.
After selecting the stocks, the Monte Carlo Simulation was run using an investment fund.
FV = Ci (1 + r)n for a lump sum (Ci), where r denotes the rate of return and n denotes the
number of periods.
For a constant cash flow (where r denotes the rate of return and n denotes the number of
periods), we utilize the NORM function to presume that the rate of return follows a normal
distribution. We assign a random probability of getting a return % using INV in Microsoft
Excel® and the RAND function; the mean of the function is selected as the average price of
the selected stock, and the standard deviation is the stock's volatility.

81| P a g e
One conceivable outcome of the price would be its value at the conclusion of the period.
Because the future is unpredictable, this value cannot be considered the investment's outcome
because there are many alternative outcomes and no way to know which ones will occur. As a
result, we build many more simulation iterations or possible outcomes. We ran thousands of
iterations for the purposes of the research.
To explain this better, we will take one example from our research. The stock we have chosen
for this is State Bank of India. On 17th May 2020, the Stock Price of SBI closed at Rs.390, this
will be our start price for Simulation. We also noted the Annual Volatility (risk factor) of the
stock from NSE portal which will determine to what extend our stock prices will fluctuate, this
is represented in the B2 Cell in Figure 1.0. However, we are talking about a 30-day period for
this research and annual volatility would be very high for daily fluctuation, thus we convert the
annual volatility into Daily Volatility by dividing the value by Square Root of 252 (there are
252 trading days in a year)
Figure 4. Excel Calculation Step-wise 1
Source: Prepared by author.
Now that the basic input points are ready, we begin with the steps to build the Simulation
model. Each day’s price is forecasted using the NORM.INV and RAND functions. In Figure
2.0 we have simulated Day 1 price on Cell E2. In the formula, we also have to factor in the
daily volatility

82| P a g e
Figure 5. Excel Calculation Step-wise 2
Source: Prepared by author.
The outcome is one of the N number of possibilities of Day 1 stock price. Now we apply the
same logic for day 2, however we will consider Day 1 price instead of starting price and we
continue the activity till 30th Day (Figure 3.0). While 30 days is a period we have chosen for
our research, one can choose to do it for as many days as they wish to project.
Figure 6. Excel Calculation Step-wise 3
Source: Prepared by author.
The price on the 30th day signifies one of the many possibilities that SBI stock can achieve and
arriving at a conclusion from this one iteration is not appropriate. Hence, we create 1000
different iterations of the same stock and run the simulation multiple times till we arrive at a
constant range. Now we calculate mean, median and standard deviation of all our 1000
iterations to arrive at a singular output which we use as a reference. We further calculate
Percentiles which indicates our Confidence Level (Figure 4.0), for instance at 5 percentiles, we

83| P a g e
are 95% confident that the stock price would be above Rs.346.13.
Figure 7. Excel Calculation Step-wise 4
Source: Prepared by author.

84| P a g e
A) BANK SECTOR
1. STATE BANK OF INDIA
Table 1. Simulated Price Using Monte Carlo Model for State Bank of India
Starting price
₹
390.00
DAYS IN
FUTURE
SIMULATED
PRICE
Annual volatility 20.90% 1 ₹ 386.01
Daily volatility 1.32% 2 ₹ 386.25
3 ₹ 385.49
Mean price ₹ 392.45 4 ₹ 397.97
Median price ₹ 390.48 5 ₹ 397.51
standard deviation ₹ 27.94 6 ₹ 397.06
percentiles 7 ₹ 392.18
5% ₹ 348.44 8 ₹ 400.00
25% ₹ 373.22 9 ₹ 398.62
75% ₹ 408.08 10 ₹ 397.95
95% ₹ 443.68 11 ₹ 390.47
12 ₹ 390.55
13 ₹ 401.46
14 ₹ 405.60
15 ₹ 401.75
16 ₹ 398.85
17 ₹ 399.51
18 ₹ 393.63
19 ₹ 396.63
20 ₹ 400.82
21 ₹ 406.38
22 ₹ 410.24

85| P a g e
23 ₹ 412.50
24 ₹ 421.68
25 ₹ 421.69
26 ₹ 426.26
27 ₹ 430.70
28 ₹ 419.66
29 ₹ 425.07
30 ₹ 426.61
SIMULATED PRICE
₹ 435.00
₹ 430.00
₹ 425.00
₹ 420.00
₹ 415.00
₹ 410.00
₹ 405.00
₹ 400.00
₹ 395.00
₹ 390.00
₹ 385.00
₹ 380.00
0 5 10 15 20 25 30 35
Chart 1. Simulated Price Using Monte Carlo Model for State Bank of India
After simulating we can calculate the statistics about what the price will look like in 30 days
now since we expect the price moving to be 0 the mean price should be close to the current
starting price and the starting price is 390 and the mean price is 392.45, and with this, we can
find out whether is there any skewness in the distribution by calculating the median so in this
simulated outcome it looks like there is no skewness, and standard deviation so while we expect
the price in a month to be above where it is known. and we also expect that it could deviate
from there around close to Rs 27 and know the percentiles which I was interested in
5% - ₹ 348.44
25% - ₹ 373.22

86| P a g e
75% - ₹ 408.08
95% - ₹ 443.68
So, if we generate another simulation, 1000 outcome simulation all these numbers should stay
reasonably close to where they are known and they are not going to be exact but if I generate a
few different integrations of these 1000 outcomes obviously that’s not everything that can
happen but it is a pretty good representation of what can happen.
2. CANARA BANK
Table 2. Simulated Price Using Monte Carlo Model for Canara Bank
Starting price
₹
155.90
DAYS IN
FUTURE
SIMULATED
PRICE
Annual volatility 24.22% 1 ₹ 152.75
Daily volatility 1.53% 2 ₹ 157.08
3 ₹ 155.82
Mean price ₹ 155.76 4 ₹ 154.00
Median price ₹ 155.23 5 ₹ 155.27
standard deviation ₹ 12.91 6 ₹ 158.87
percentiles 7 ₹ 160.40
5% ₹ 135.12 8 ₹ 160.72
25% ₹ 146.65 9 ₹ 162.26
75% ₹ 164.40 10 ₹ 161.16
95% ₹ 177.84 11 ₹ 159.57
12 ₹ 159.81
13 ₹ 163.42
14 ₹ 165.38
15 ₹ 163.32
16 ₹ 161.48
17 ₹ 163.25
18 ₹ 163.89

87| P a g e
19 ₹ 166.30
20 ₹ 173.45
21 ₹ 168.75
22 ₹ 170.22
23 ₹ 172.00
24 ₹ 166.84
25 ₹ 168.72
26 ₹ 168.73
27 ₹ 167.64
28 ₹ 166.01
29 ₹ 166.99
30 ₹ 169.34
SIMULATED PRICE
₹175.00
₹170.00
₹165.00
₹160.00
₹155.00
₹150.00
0 5 10 15 20 25 30 35
Chart 2. Simulated Price Using Monte Carlo Model for Canara Bank
After simulating we can calculate the statistics about what the price will look like in 30 days
now since we expect the price moving to be 0 the mean price should be pretty close to the
current starting price and the starting price is 155.90 and the mean price is 155.76, and with
this we can find out whether is there any skewness in the distribution by calculating the median
so in this simulated outcome it looks like it is positively skewed, and standard deviation so
while we expect the price in a month to be above where it is known. and we also expect that it

88| P a g e
could deviate from there around close to Rs 12 and know the percentiles which I was
interested in
5% - ₹ 135.12
25% - ₹ 146.65
75% - ₹ 164.40
95% - ₹ 177.84
So, if we generate another simulation 1000 outcome simulation all these numbers should stay
reasonably close to where they are known and they are not going to be exact but if I generate a
few different integrations of these 1000 outcomes obviously that’s not everything that can
happen but it is a pretty good representation of what can happen.
3. INDIAN BANK
Table 3. Simulated Price Using Monte Carlo Model for Indian Bank
Starting price
₹
128.00
DAYS IN
FUTURE
SIMULATED
PRICE
Annual volatility 29.62% 1 ₹ 123.96
Daily volatility 1.87% 2 ₹ 125.74
3 ₹ 127.42
Mean price ₹ 128.19 4 ₹ 129.31
Median price ₹ 127.67 5 ₹ 129.71
standard deviation ₹ 13.55 6 ₹ 130.60
percentiles 7 ₹ 133.00
5% ₹ 107.10 8 ₹ 132.78
25% ₹ 118.44 9 ₹ 132.50
75% ₹ 136.64 10 ₹ 133.49
95% ₹ 152.20 11 ₹ 133.47
12 ₹ 133.16

89| P a g e
13 ₹ 139.46
14 ₹ 141.86
15 ₹ 140.41
16 ₹ 136.69
17 ₹ 140.97
18 ₹ 141.30
19 ₹ 135.86
20 ₹ 138.35
21 ₹ 141.03
22 ₹ 140.34
23 ₹ 140.87
24 ₹ 142.94
25 ₹ 146.00
26 ₹ 145.87
27 ₹ 144.51
28 ₹ 146.83
29 ₹ 144.54
30 ₹ 138.54
SIMULATED PRICE
₹150.00
₹145.00
₹140.00
₹135.00
₹130.00
₹125.00
₹120.00
0 5 10 15 20 25 30 35
Chart 3. Simulated Price Using Monte Carlo Model for Indian Bank

90| P a g e
After simulating we can calculate the statistics about what the price will look like in 30 days
now since we expect the price moving to be 0 the mean price should be pretty close to the
current starting price and the starting price is 128 and the mean price is 128.19, and with this
we can find out whether is there any skewness in the distribution by calculating the median so
in this simulated outcome it looks like it is positively skewed, and standard deviation so while
we expect the price in a month to be above where it is known. and we also expect that it could
deviate from there around close to Rs 13 and know the percentiles which I was interested in
5% - ₹ 107.10
25% - ₹ 118.44
75% - ₹ 136.64
95% - ₹ 152.20
So, if we generate another simulation 1000 outcome simulation all these numbers should stay
reasonably close to where they are known and they are not going to be exact but if I generate a
few different integrations of these 1000 outcomes obviously that’s not everything that can
happen but it is a pretty good representation of what can happen.
4. ICICI BANK
Table 4. Simulated Price Using Monte Carlo Model for ICICI Bank
Starting price
₹
628.00
DAYS
FUTURE
IN SIMULATED
PRICE
Annual volatility 17.04% 1 ₹ 621.90
Daily volatility 1.07% 2 ₹ 620.82
3 ₹ 624.36
Mean price ₹ 627.35 4 ₹ 621.74
Median price ₹ 626.93 5 ₹ 622.82
standard deviation ₹ 36.00 6 ₹ 610.65
percentiles 7 ₹ 620.29
5% ₹ 567.15 8 ₹ 623.86
25% ₹ 603.39 9 ₹ 626.29

91| P a g e
75% ₹ 650.85 10 ₹ 632.76
95% ₹ 688.22 11 ₹ 636.52
12 ₹ 639.68
13 ₹ 642.05
14 ₹ 648.21
15 ₹ 636.02
16 ₹ 636.42
17 ₹ 648.40
18 ₹ 643.93
19 ₹ 643.17
20 ₹ 649.88
21 ₹ 661.27
22 ₹ 662.14
23 ₹ 663.09
24 ₹ 657.93
25 ₹ 647.15
26 ₹ 645.91
27 ₹ 628.28
28 ₹ 623.81
29 ₹ 620.50
30 ₹ 632.74
SIMULATED PRICE
₹670.00
₹660.00
₹650.00
₹640.00
₹630.00
₹620.00
₹610.00
₹600.00
0 5 10 15 20 25 30 35
Chart 4. Simulated Price Using Monte Carlo Model for ICICI Bank

92| P a g e
After simulating we can calculate the statistics about what the price will look like in 30 days
now since we expect the price moving to be 0 the mean price should be pretty close to the
current starting price and the starting price is 628 and the mean price is 627.35, and with this
we can find out whether is there any skewness in the distribution by calculating the median so
in this simulated outcome it looks like it is positively skewed, and standard deviation so while
we expect the price in a month to be above where it is known. and we also expect that it could
deviate from there around close to Rs 36 and know the percentiles which I was interested in
5% - ₹ 567.15
25% - ₹ 603.39
75% - ₹ 650.85
95% - ₹ 688.22
So, if we generate another simulation 1000 outcome simulation all these numbers should stay
reasonably close to where they are known and they are not going to be exact but if I generate a
few different integrations of these 1000 outcomes obviously that’s not everything that can
happen but it is a pretty good representation of what can happen.
5. HDFC BANK
Table 5. Simulated Price Using Monte Carlo Model for HDFC Bank
Starting price
₹
1,458.95
DAYS IN
FUTURE
SIMULATED
PRICE
Annual volatility 12.99% 1 ₹ 1,462.13
Daily volatility 0.82% 2 ₹ 1,467.25
3 ₹ 1,468.53
Mean price ₹ 1,458.28 4 ₹ 1,475.87
Median price ₹ 1,453.82 5 ₹ 1,481.86
standard deviation ₹ 62.86 6 ₹ 1,474.37
percentiles 7 ₹ 1,468.70

93| P a g e
5% ₹ 1,357.14 8 ₹ 1,481.40
25% ₹ 1,415.58 9 ₹ 1,456.20
75% ₹ 1,500.59 10 ₹ 1,459.65
95% ₹ 1,562.97 11 ₹ 1,446.68
12 ₹ 1,454.54
13 ₹ 1,464.33
14 ₹ 1,466.85
15 ₹ 1,466.00
16 ₹ 1,468.74
17 ₹ 1,474.66
18 ₹ 1,492.27
19 ₹ 1,483.51
20 ₹ 1,490.69
21 ₹ 1,498.45
22 ₹ 1,493.14
23 ₹ 1,493.89
24 ₹ 1,505.50
25 ₹ 1,503.42
26 ₹ 1,490.54
27 ₹ 1,479.82
28 ₹ 1,479.92
29 ₹ 1,456.77
30 ₹ 1,451.25

94| P a g e
SIMULATED PRICE
₹ 1,510.00 ₹ 1,500.00
₹ 1,490.00
₹ 1,480.00
₹ 1,470.00
₹ 1,460.00
₹ 1,450.00
₹ 1,440.00
0 5 10 15 20 25 30 35
Chart 5. Simulated Price Using Monte Carlo Model for HDFC Bank
After simulating we can calculate the statistics about what the price will look like in 30 days
now since we expect the price moving to be 0 the mean price should be pretty close to the
current starting price and the starting price is 1458.95 and the mean price is 1458.28, and with
this we can find out whether is there any skewness in the distribution by calculating the median
so in this simulated outcome it looks like it is positively skewed, and standard deviation so
while we expect the price in a month to be above where it is known. and we also expect that it
could deviate from there around close to Rs 62 and know the percentiles which I was interested
in
5% - ₹ 1357.14
25% - ₹ 1,415.58
75% - ₹ 1,500.59
95% - ₹ 1,562.97
So, if we generate another simulation 1000 outcome simulation all these numbers should stay
reasonably close to where they are known and they are not going to be exact but if I generate a
few different integrations of these 1000 outcomes obviously that’s not everything that can
happen but it is a pretty good representation of what can happen.

95| P a g e
B) HOTEL SECTOR
1. TAJ GVK
Table 6. Simulated Price Using Monte Carlo Model for TAJ
Starting price
₹
119.00
DAYS IN
FUTURE
SIMULATED
PRICE
Annual volatility 18.83% 1 ₹ 119.67
Daily volatility 1.19% 2 ₹ 119.93
3 ₹ 122.26
Mean price ₹ 118.84 4 ₹ 120.65
Median price ₹ 118.63 5 ₹ 118.74
standard deviation ₹ 7.66 6 ₹ 117.15
percentiles 7 ₹ 116.92
5% ₹ 106.34 8 ₹ 115.80
25% ₹ 113.84 9 ₹ 114.14
75% ₹ 123.93 10 ₹ 113.61
95% ₹ 131.71 11 ₹ 114.86
12 ₹ 113.46
13 ₹ 114.79
14 ₹ 114.80
15 ₹ 114.95
16 ₹ 115.28
17 ₹ 111.73
18 ₹ 113.45
19 ₹ 113.87
20 ₹ 113.67
21 ₹ 115.27
22 ₹ 114.58
23 ₹ 115.37
24 ₹ 115.34

96| P a g e
25 ₹ 115.05
26 ₹ 113.13
27 ₹ 109.91
28 ₹ 110.39
29 ₹ 112.42
30 ₹ 111.82
SIMULATED PRICE
₹ 124.00
₹ 122.00
₹ 120.00
₹ 118.00
₹ 116.00
₹ 114.00
₹ 112.00
₹ 110.00
₹ 108.00
0 5 10 15 20 25 30 35
Chart 6. Simulated Price Using Monte Carlo Model for TAJ
After simulating we can calculate the statistics about what the price will look like in 30 days
now since we expect the price moving to be 0 the mean price should be pretty close to the
current starting price and the starting price is 119 and the mean price is 118.84, and with this
we can find out whether is there any skewness in the distribution by calculating the median so
in this simulated outcome it looks like it is positively skewed, and standard deviation so while
we expect the price in a month to be above where it is known. and we also expect that it could
deviate from there around close to Rs 7 and know the percentiles which I was interested in
5% - ₹ 106.34
25% - ₹ 113.84
75% - ₹ 123.93

97| P a g e
95% - ₹ 131.71
So, if we generate another simulation 1000 outcome simulation all these numbers should stay
reasonably close to where they are known and they are not going to be exact but if I generate a
few different integrations of these 1000 outcomes obviously that’s not everything that can
happen but it is a pretty good representation of what can happen.
2. ROYAL ORCHID
Table 7. Simulated Price Using Monte Carlo Model for Royal Orchid
Starting price
₹
63.40
DAYS IN
FUTURE
SIMULATED
PRICE
Annual volatility 27.00% 1 ₹ 62.87
Daily volatility 1.70% 2 ₹ 62.05
3 ₹ 62.21
Mean price ₹ 63.30 4 ₹ 60.13
Median price ₹ 63.18 5 ₹ 62.27
standard deviation ₹ 5.94 6 ₹ 60.81
percentiles 7 ₹ 59.36
5% ₹ 53.94 8 ₹ 57.14
25% ₹ 59.14 9 ₹ 57.73
75% ₹ 67.24 10 ₹ 58.98
95% ₹ 73.13 11 ₹ 58.97
12 ₹ 59.18
13 ₹ 59.59
14 ₹ 60.71
15 ₹ 59.38
16 ₹ 60.07
17 ₹ 61.25
18 ₹ 62.38
19 ₹ 63.16

98| P a g e
20 ₹ 64.01
21 ₹ 66.41
22 ₹ 67.42
23 ₹ 65.48
24 ₹ 65.24
25 ₹ 64.47
26 ₹ 64.71
27 ₹ 64.19
28 ₹ 62.76
29 ₹ 62.21
30 ₹ 62.68
SIMULATED PRICE
₹ 68.00
₹ 66.00
₹ 64.00
₹ 62.00
₹ 60.00
₹ 58.00
₹ 56.00
0 5 10 15 20 25 30 35
Chart 7. Simulated Price Using Monte Carlo Model for Royal Orchid
After simulating we can calculate the statistics about what the price will look like in 30 days
now since we expect the price moving to be 0 the mean price should be pretty close to the
current starting price and the starting price is 63.40 and the mean price is 63.30, and with this
we can find out whether is there any skewness in the distribution by calculating the median so
in this simulated outcome it looks like it is positively skewed, and standard deviation so while
we expect the price in a month to be above where it is known. and we also expect that it could
deviate from there around close to Rs 5 and know the percentiles which I was interested in

99| P a g e
5% - ₹ 53.94
25% - ₹ 59.14
75% - ₹ 67.24
95% - ₹ 73.13
So, if we generate another simulation 1000 outcome simulation all these numbers should stay
reasonably close to where they are known and they are not going to be exact but if I generate a
few different integrations of these 1000 outcomes obviously that’s not everything that can
happen but it is a pretty good representation of what can happen.
3. CHALET HOTELS
Table 8. Simulated Price Using Monte Carlo Model for Chalet Hotels
Starting price
₹
149.80
DAYS IN
FUTURE
SIMULATED
PRICE
Annual volatility 24.14% 1 ₹ 147.68
Daily volatility 1.52% 2 ₹ 148.78
3 ₹ 148.30
Mean price ₹ 149.45 4 ₹ 147.02
Median price ₹ 148.92 5 ₹ 144.10
standard deviation ₹ 12.07 6 ₹ 141.94
percentiles 7 ₹ 142.99
5% ₹ 129.50 8 ₹ 140.59
25% ₹ 140.90 9 ₹ 145.25
75% ₹ 157.89 10 ₹ 145.96
95% ₹ 169.35 11 ₹ 141.21
12 ₹ 141.78
13 ₹ 140.36
14 ₹ 138.95

100| P a g e
15 ₹ 140.96
16 ₹ 141.77
17 ₹ 138.84
18 ₹ 136.10
19 ₹ 139.44
20 ₹ 138.32
21 ₹ 136.65
22 ₹ 133.41
23 ₹ 136.04
24 ₹ 135.62
25 ₹ 133.76
26 ₹ 133.19
27 ₹ 132.74
28 ₹ 129.94
29 ₹ 130.44
30 ₹ 127.90
SIMULATED PRICE
₹ 150.00
₹ 145.00
₹ 140.00
₹ 135.00
₹ 130.00
₹ 125.00
0 5 10 15 20 25 30 35
Chart 8. Simulated Price Using Monte Carlo Model for Chalet Hotels
After simulating we can calculate the statistics about what the price will look like in 30 days
now since we expect the price moving to be 0 the mean price should be pretty close to the

101| P a g e
current starting price and the starting price is 149.80 and the mean price is 149.45, and with
this we can find out whether is there any skewness in the distribution by calculating the median
so in this simulated outcome it looks like it is positively skewed, and standard deviation so
while we expect the price in a month to be above where it is known. and we also expect that it
could deviate from there around close to Rs 12 and know the percentiles which I was interested
in
5% - ₹ 129.50
25% - ₹ 140.90
75% - ₹ 157.89
95% - ₹ 169.35
So, if we generate another simulation 1000 outcome simulation all these numbers should stay
reasonably close to where they are known and they are not going to be exact but if I generate a
few different integrations of these 1000 outcomes obviously that’s not everything that can
happen but it is a pretty good representation of what can happen.
4. LEMON TREE HOTELS
Table 9. Simulated Price Using Monte Carlo Model for Lemon Tree Hotels
Starting price
₹
38.40
DAYS IN
FUTURE
SIMULATED
PRICE
Annual volatility 26.59% 1 ₹ 39.57
Daily volatility 1.68% 2 ₹ 39.01
3 ₹ 39.51
Mean price ₹ 38.49 4 ₹ 38.88
Median price ₹ 38.24 5 ₹ 38.17
standard deviation ₹ 3.40 6 ₹ 38.54
percentiles 7 ₹ 38.61
5% ₹ 33.13 8 ₹ 38.90

102| P a g e
25% ₹ 36.32 9 ₹ 38.56
75% ₹ 40.61 10 ₹ 39.17
95% ₹ 44.32 11 ₹ 40.03
12 ₹ 39.56
13 ₹ 40.87
14 ₹ 41.44
15 ₹ 42.08
16 ₹ 40.91
17 ₹ 42.05
18 ₹ 42.16
19 ₹ 42.69
20 ₹ 43.85
21 ₹ 44.17
22 ₹ 43.78
23 ₹ 43.60
24 ₹ 44.31
25 ₹ 44.33
26 ₹ 43.88
27 ₹ 44.93
28 ₹ 44.60
29 ₹ 43.88
30 ₹ 44.00

103| P a g e
SIMULATED PRICE
₹ 43.00 ₹ 42.00 ₹ 41.00 ₹ 40.00 ₹ 39.00 ₹ 38.00 ₹ 37.00 ₹ 36.00
0 5 10 15 20 25 30 35
Chart 9. Simulated Price Using Monte Carlo Model for Lemon Tree Hotels
After simulating we can calculate the statistics about what the price will look like in 30 days
now since we expect the price moving to be 0 the mean price should be pretty close to the
current starting price and the starting price is 38.40 and the mean price is 38.49, and with this
we can find out whether is there any skewness in the distribution by calculating the median so
in this simulated outcome it looks like it is positively skewed, and standard deviation so while
we expect the price in a month to be above where it is known. and we also expect that it could
deviate from there around close to Rs 3 and know the percentiles which I was interested in
5% - ₹ 33.13
25% - ₹ 36.32
75% - ₹ 40.61
95% - ₹ 44.32
So, if we generate another simulation 1000 outcome simulation all these numbers should stay
reasonably close to where they are known and they are not going to be exact but if I generate a
few different integrations of these 1000 outcomes obviously that’s not everything that can
happen but it is a pretty good representation of what can happen.

104| P a g e
5. ASIAN HOTEL
Table 10. Simulated Price Using Monte Carlo Model for Asian Hotels
Starting price
₹
66.55
DAYS IN
FUTURE
SIMULATED
PRICE
Annual volatility 21.22% 1 ₹ 66.69
Daily volatility 1.34% 2 ₹ 66.49
3 ₹ 68.06
Mean price ₹ 66.63 4 ₹ 67.84
Median price ₹ 66.44 5 ₹ 67.19
standard deviation ₹ 5.00 6 ₹ 68.11
percentiles 7 ₹ 70.18
5% ₹ 58.48 8 ₹ 69.25
25% ₹ 63.17 9 ₹ 69.25
75% ₹ 69.72 10 ₹ 68.80
95% ₹ 74.95 11 ₹ 68.82
12 ₹ 70.50
13 ₹ 71.00
14 ₹ 70.17
15 ₹ 70.57
16 ₹ 69.65
17 ₹ 69.79
18 ₹ 69.60
19 ₹ 69.55
20 ₹ 69.54
21 ₹ 69.01
22 ₹ 68.62
23 ₹ 68.37
24 ₹ 68.20
25 ₹ 68.72
26 ₹ 68.87
27 ₹ 68.01

105| P a g e
28 ₹ 67.78
29 ₹ 66.66
30 ₹ 67.91
SIMULATED PRICE
₹ 69.00
₹ 68.50
₹ 68.00
₹ 67.50
₹ 67.00
₹ 66.50
₹ 66.00
₹ 65.50
₹ 65.00
₹ 64.50
₹ 64.00
₹ 63.50
0 5 10 15 20 25 30 35
Chart 10. Simulated Price Using Monte Carlo Model for Asian Hotels
After simulating we can calculate the statistics about what the price will look like in 30 days
now since we expect the price moving to be 0 the mean price should be pretty close to the
current starting price and the starting price is 66.55 and the mean price is 66.63, and with this
we can find out whether is there any skewness in the distribution by calculating the median so
in this simulated outcome it looks like it is positively skewed, and standard deviation so while
we expect the price in a month to be above where it is known. and we also expect that it could
deviate from there around close to Rs 5 and know the percentiles which I was interested in
5% - ₹ 58.48
25% - ₹ 63.17
75% - ₹ 69.72
95% - ₹ 74.95
So, if we generate another simulation 1000 outcome simulation all these numbers should stay
reasonably close to where they are known and they are not going to be exact but if I generate a
few different integrations of these 1000 outcomes obviously that’s not everything that can
happen but it is a pretty good representation of what can happen.

106| P a g e
C) MEDIA AND ENTERTAINMENT SECTOR
1. BALAJI TELEFILM
Table 11. Simulated Price Using Monte Carlo Model for Balaji Telefilm
Starting price
₹
56.50
DAYS IN
FUTURE
SIMULATED
PRICE
Annual volatility 21.27% 1 ₹ 55.91
Daily volatility 1.34% 2 ₹ 54.93
3 ₹ 54.84
Mean price ₹ 56.26 4 ₹ 56.89
Median price ₹ 56.06 5 ₹ 56.64
standard deviation ₹ 4.36 6 ₹ 56.99
percentiles 7 ₹ 56.62
5% ₹ 49.14 8 ₹ 57.59
25% ₹ 53.37 9 ₹ 56.04
75% ₹ 59.16 10 ₹ 56.48
95% ₹ 63.63 11 ₹ 57.18
12 ₹ 58.10
13 ₹ 58.63
14 ₹ 57.39
15 ₹ 56.91
16 ₹ 56.97
17 ₹ 56.31
18 ₹ 56.91
19 ₹ 57.82
20 ₹ 58.05
21 ₹ 58.91
22 ₹ 60.07
23 ₹ 60.19
24 ₹ 60.56

107| P a g e
25 ₹ 60.72
26 ₹ 61.32
27 ₹ 62.64
28 ₹ 62.90
29 ₹ 63.63
30 ₹ 64.38
SIMULATED PRICE
₹66.00
₹64.00
₹62.00
₹60.00
₹58.00
₹56.00
₹54.00
0 5 10 15 20 25 30 35
Chart 11. Simulated Price Using Monte Carlo Model for Balaji Telefilm
After simulating we can calculate the statistics about what the price will look like in 30 days
now since we expect the price moving to be 0 the mean price should be pretty close to the
current starting price and the starting price is 56.50 and the mean price is 56.26, and with this
we can find out whether is there any skewness in the distribution by calculating the median so
in this simulated outcome it looks like it is positively skewed, and standard deviation so while
we expect the price in a month to be above where it is known. and we also expect that it could
deviate from there around close to Rs 4 and know the percentiles which I was interested in
5% - ₹ 49.14
25% - ₹ 53.37
75% - ₹ 59.16

108| P a g e
95% - ₹ 63.63
So, if we generate another simulation 1000 outcome simulation all these numbers should stay
reasonably close to where they are known and they are not going to be exact but if I generate a
few different integrations of these 1000 outcomes obviously that’s not everything that can
happen but it is a pretty good representation of what can happen.
2. INOX LESIURE
Table 12. Simulated Price Using Monte Carlo Model for Inox
Starting price
₹
282.90
DAYS IN
FUTURE
SIMULATED
PRICE
Annual volatility 21.88% 1 ₹ 287.84
Daily volatility 1.38% 2 ₹ 284.27
3 ₹ 288.17
Mean price ₹ 282.32 4 ₹ 286.79
Median price ₹ 281.70 5 ₹ 292.37
standard deviation ₹ 21.98 6 ₹ 294.32
percentiles 7 ₹ 289.94
5% ₹ 247.70 8 ₹ 291.57
25% ₹ 266.24 9 ₹ 292.94
75% ₹ 296.77 10 ₹ 295.61
95% ₹ 318.11 11 ₹ 288.06
12 ₹ 283.65
13 ₹ 286.63
14 ₹ 285.39
15 ₹ 285.14
16 ₹ 285.82
17 ₹ 284.62
18 ₹ 286.56
19 ₹ 285.27

109| P a g e
20 ₹ 286.18
21 ₹ 287.70
22 ₹ 287.57
23 ₹ 292.72
24 ₹ 298.87
25 ₹ 309.17
26 ₹ 311.16
27 ₹ 311.21
28 ₹ 313.63
29 ₹ 313.13
30
₹ 312.10
SIMULATED PRICE
₹320.00
₹315.00
₹310.00
₹305.00
₹300.00
₹295.00
₹290.00
₹285.00
₹280.00
0 5 10 15 20 25 30 35
Chart 12. Simulated Price Using Monte Carlo Model for Inox
After simulating we can calculate the statistics about what the price will look like in 30 days
now since we expect the price moving to be 0 the mean price should be pretty close to the
current starting price and the starting price is 282.90 and the mean price is 282.32, and with
this we can find out whether is there any skewness in the distribution by calculating the median
so in this simulated outcome it looks like it is positively skewed, and standard deviation so
while we expect the price in a month to be above where it is known. and we also expect that it

110| P a g e
could deviate from there around close to Rs 21 and know the percentiles which I was interested
in
5% - ₹ 247.70
25% - ₹ 266.24
75% - ₹ 296.77
95% - ₹ 318.11
So, if we generate another simulation 1000 outcome simulation all these numbers should stay
reasonably close to where they are known and they are not going to be exact but if I generate a
few different integrations of these 1000 outcomes obviously that’s not everything that can
happen but it is a pretty good representation of what can happen.
3. SUN TV
Table 13. Simulated Price Using Monte Carlo Model for Sun TV
Starting price
₹
530.00
DAYS IN
FUTURE
SIMULATED
PRICE
Annual volatility 17.87% 1 ₹ 521.66
Daily volatility 1.13% 2 ₹ 518.49
3 ₹ 512.46
Mean price ₹ 529.79 4 ₹ 522.31
Median price ₹ 528.97 5 ₹ 531.38
standard deviation ₹ 33.93 6 ₹ 531.94
percentiles 7 ₹ 533.73
5% ₹ 473.97 8 ₹ 535.00
25% ₹ 507.02 9 ₹ 530.16
75% ₹ 552.77 10 ₹ 532.09
95% ₹ 585.70 11 ₹ 531.19
12 ₹ 517.52

111| P a g e
13 ₹ 518.18
14 ₹ 512.50
15 ₹ 519.35
16 ₹ 530.76
17 ₹ 531.57
18 ₹ 526.42
19 ₹ 526.96
20 ₹ 523.34
21 ₹ 525.69
22 ₹ 529.63
23 ₹ 533.24
24 ₹ 531.38
25 ₹ 526.90
26 ₹ 525.42
27 ₹ 517.48
28 ₹ 517.71
29 ₹ 518.95
30 ₹ 525.23
SIMULATED PRICE
₹540.00
₹535.00
₹530.00
₹525.00
₹520.00
₹515.00
₹510.00
0 5 10 15 20 25 30 35
Chart 13. Simulated Price Using Monte Carlo Model for Sun TV

112| P a g e
After simulating we can calculate the statistics about what the price will look like in 30 days
now since we expect the price moving to be 0 the mean price should be pretty close to the
current starting price and the starting price is 530 and the mean price is 529.79, and with this
we can find out whether is there any skewness in the distribution by calculating the median so
in this simulated outcome it looks like it is positively skewed, and standard deviation so while
we expect the price in a month to be above where it is known. and we also expect that it could
deviate from there around close to Rs 33 and know the percentiles which I was interested in
5% - ₹ 473.97
25% - ₹ 507.02
75% - ₹ 552.77
95% - ₹ 585.70
So, if we generate another simulation 1000 outcome simulation all these numbers should stay
reasonably close to where they are known and they are not going to be exact but if I generate a
few different integrations of these 1000 outcomes obviously that’s not everything that can
happen but it is a pretty good representation of what can happen.
4. ZEE ENTERTAINMENT
Table 14. Simulated Price Using Monte Carlo Model for Zee Entertainment
Starting price
₹
190.00
DAYS IN
FUTURE
SIMULATED
PRICE
Annual volatility 25.47% 1 ₹ 193.75
Daily volatility 1.60% 2 ₹ 199.26
3 ₹ 195.04
Mean price ₹ 189.79 4 ₹ 204.22
Median price ₹ 188.83 5 ₹ 203.17
standard deviation ₹ 16.61 6 ₹ 199.21
percentiles 7 ₹ 199.55

113| P a g e
5% ₹ 161.65 8 ₹ 203.15
25% ₹ 178.36 9 ₹ 203.75
75% ₹ 200.05 10 ₹ 199.55
95% ₹ 218.84 11 ₹ 200.97
12 ₹ 199.72
13 ₹ 199.78
14 ₹ 198.53
15 ₹ 205.30
16 ₹ 202.50
17 ₹ 202.36
18 ₹ 203.95
19 ₹ 204.75
20 ₹ 205.37
21 ₹ 206.35
22 ₹ 208.04
23 ₹ 209.36
24 ₹ 214.47
25 ₹ 218.13
26 ₹ 219.20
27 ₹ 219.17
28 ₹ 219.95
29 ₹ 218.82
30 ₹ 214.02

114| P a g e
SIMULATED PRICE
₹225.00 ₹220.00 ₹215.00 ₹210.00 ₹205.00 ₹200.00 ₹195.00 ₹190.00
0 5 10 15 20 25 30 35
Chart 14. Simulated Price Using Monte Carlo Model for Zee Entertainment
After simulating we can calculate the statistics about what the price will look like in 30 days
now since we expect the price moving to be 0 the mean price should be pretty close to the
current starting price and the starting price is 190 and the mean price is 189.79, and with this
we can find out whether is there any skewness in the distribution by calculating the median so
in this simulated outcome it looks like it is positively skewed, and standard deviation so while
we expect the price in a month to be above where it is known. and we also expect that it could
deviate from there around close to Rs 16 and know the percentiles which I was interested in
5% - ₹ 161.65
25% - ₹ 178.36
75% - ₹ 200.05
95% - ₹ 218.84
So, if we generate another simulation 1000 outcome simulation all these numbers should stay
reasonably close to where they are known and they are not going to be exact but if I generate a
few different integrations of these 1000 outcomes obviously that’s not everything that can
happen but it is a pretty good representation of what can happen.
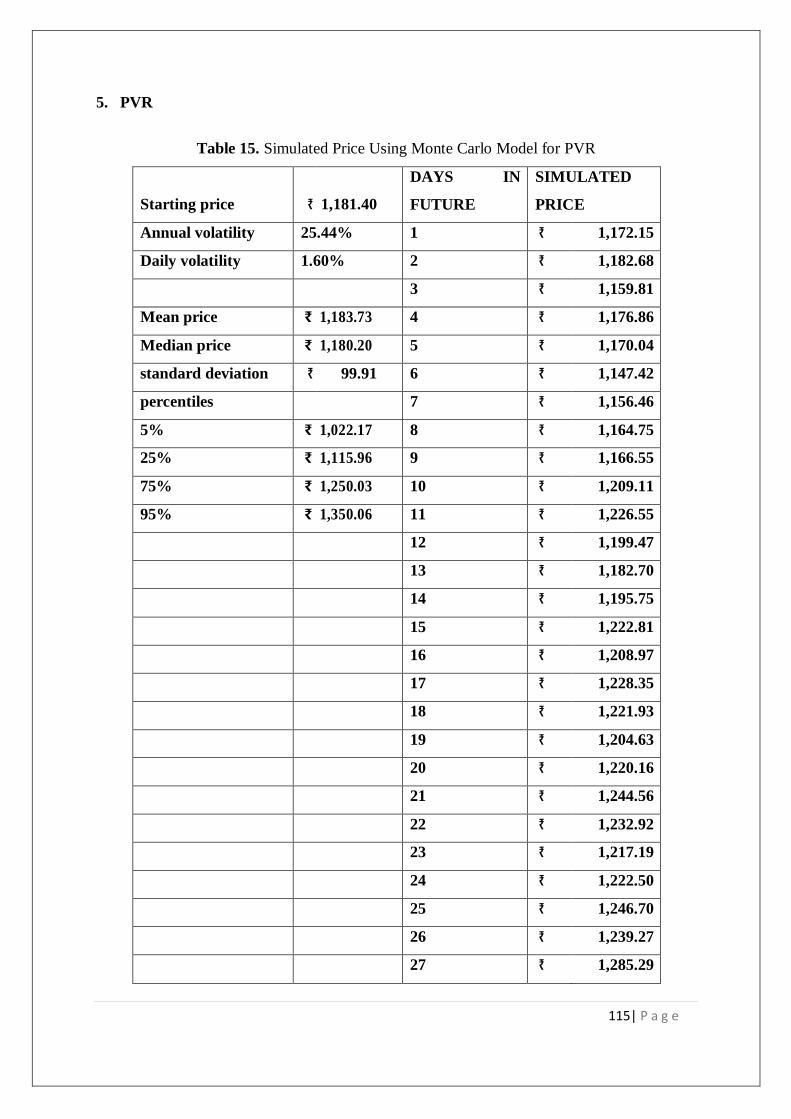
115| P a g e
5. PVR
Table 15. Simulated Price Using Monte Carlo Model for PVR
Starting price
₹
1,181.40
DAYS IN
FUTURE
SIMULATED
PRICE
Annual volatility 25.44% 1 ₹ 1,172.15
Daily volatility 1.60% 2 ₹ 1,182.68
3 ₹ 1,159.81
Mean price ₹ 1,183.73 4 ₹ 1,176.86
Median price ₹ 1,180.20 5 ₹ 1,170.04
standard deviation ₹ 99.91 6 ₹ 1,147.42
percentiles 7 ₹ 1,156.46
5% ₹ 1,022.17 8 ₹ 1,164.75
25% ₹ 1,115.96 9 ₹ 1,166.55
75% ₹ 1,250.03 10 ₹ 1,209.11
95% ₹ 1,350.06 11 ₹ 1,226.55
12 ₹ 1,199.47
13 ₹ 1,182.70
14 ₹ 1,195.75
15 ₹ 1,222.81
16 ₹ 1,208.97
17 ₹ 1,228.35
18 ₹ 1,221.93
19 ₹ 1,204.63
20 ₹ 1,220.16
21 ₹ 1,244.56
22 ₹ 1,232.92
23 ₹ 1,217.19
24 ₹ 1,222.50
25 ₹ 1,246.70
26 ₹ 1,239.27
27 ₹ 1,285.29

116| P a g e
28 ₹ 1,312.08
29 ₹ 1,294.41
30 ₹ 1,282.25
SIMULATED PRICE
₹1,340.00
₹1,320.00
₹1,300.00
₹1,280.00
₹1,260.00
₹1,240.00
₹1,220.00
₹1,200.00
₹1,180.00
₹1,160.00
₹1,140.00
₹1,120.00
0 5 10 15 20 25 30 35
Chart 15. Simulated Price Using Monte Carlo Model for PVR
After simulating we can calculate the statistics about what the price will look like in 30 days
now since we expect the price moving to be 0 the mean price should be pretty close to the
current starting price and the starting price is 1181.40 and the mean price is1183.73, and with
this we can find out whether is there any skewness in the distribution by calculating the median
so in this simulated outcome it looks like it is positively skewed, and standard deviation so
while we expect the price in a month to be above where it is known. and we also expect that it
could deviate from there around close to Rs 99 and know the percentiles which I was interested
in 5% - ₹ 1022.17
25% - ₹ 1115.96
75% - ₹ 1250.03
95% - ₹ 1350.06
So, if we generate another simulation 1000 outcome simulation all these numbers should stay
reasonably close to where they are known and they are not going to be exact but if I generate a
few different integrations of these 1000 outcomes obviously that’s not everything that can
happen but it is a pretty good representation of what can happen.

117| P a g e
CHAPTER 5
FINDINGS
&
CONCLUSION

118| P a g e
5.1 FINDINGS
To urge an insight into the effectiveness of the Monte Carlo Simulation model in predicting the
stock prices, we forecasted the stock prices of 15 stocks from NSE. Prediction of share prices
through technical analysis relies more on the past behavior pattern of share prices. It is very
helpful for predicting share price movements over the future. When the share price movements
don't exhibit any discernible pattern, when the fluctuations within the share price movements,
are very small, and when the share price makes a stochastic process around the mean. The
above analysis shows that prediction using town simulation works rather well.
The persistence in the quality of prediction of 1 or other methods leads us to the possible
generalization of results.
It is very that Monte Carlo is seen as a method of higher quality in predicting stock price
with interruption of 30 days. Monte Carlo Simulation model is created to explain
stochastic process pattern, and weak form market efficiency assumes that future securities
prices are random and not influenced by past events.
It is feasible that assumptions about days' stock prices reflect all the information of past
prices being satisfied with your time lag.
We assume that market interruption appears because of information imperfection or
another process of market information absorption, after what they're being included within
the value.
Monte Carlo methods are a broad category of computational algorithms that obtain numerical
results by repeated random sampling. The basic idea is to employ randomness to solve
problems that are in principle deterministic. The randomness helps factor in the erratic and
random nature of the stock market which is not factored in the other ratio-based stock price
forecasting.
Some advantages we fond while using Monte Carlo Simulation is:
When random variables are present, a Monte Carlo simulation is a model used to
forecast the likelihood of various outcomes.
Monte Carlo simulations can be used to show how risk and uncertainty affect prediction
and forecasting models.
ssbm
Highlight
ssbm
Sticky Note
The interpretation of the results???

119| P a g e
Monte Carlo simulations are used in a range of industries, including banking,
engineering, supply chain, and science.
A Monte Carlo simulation is based on giving many values to an uncertain variable in
order to generate different outcomes, which are then averaged to obtain an estimate.
Monte Carlo simulations are based on the assumption that markets are completely
efficient.
A normal distribution, or bell curve, will be formed by the frequencies of different outcomes
created by this simulation. The most likely return is in the middle of the curve, which means
that the actual return has an equal probability of being greater or lower than that value. The
probability that the actual return will be within one standard deviation of the most probable
("anticipated") rate is 68 percent, 95 percent for two standard deviations, and 99.7% for three
standard deviations. Even yet, there's no guarantee that the most likely event will occur, or that
actual movements will not exceed the most speculative estimates. Importantly, Monte Carlo
simulations omit anything that isn't built into the price movement (macro trends, company
leadership, hype, cyclical factors), implying that markets are totally efficient.
5.2 SUGGESTIONS
The Monte simulation allows analysts and advisors to convert investment chances into
choices.
The advantage of Monte Carlo is its ability to give some thought to a range of values
for various inputs; this can be often also its greatest disadvantage within the sense that
assumptions must be fair because the output is just nearly pretty much as good because
of the inputs.
Another great disadvantage is that Monte Carlo simulation tends to underestimate the
probability of utmost bear events type of a financial crisis.
Experts argue that a simulation similar to the town is unable to give some thought to
the behavioral aspects of finance and thus the irrationality exhibited by market
participants.
It is, however a useful gizmo for advisors.

120| P a g e
5.3 CONCLUSION
Monte Carlo simulation is a computer-assisted mathematical technique for incorporating risk
into quantitative analysis and decision-making. Professionals in a variety of sectors, including
finance, project management, energy, manufacturing, engineering, research and development,
insurance, oil and gas, transportation, and the environment, employ the technique. For each
given course of action, it provides the decision-maker with a range of probable outcomes as
well as the probabilities that they will occur. It depicts the extreme outcomes—the implications
of going for broke and the most conservative decision—as well as all possible outcomes for
middle-of-the-road selections.
Monte Carlo simulation is a risk analysis technique that involves creating models of probable
outcomes by substituting a set of values—a probability distribution—for any factor with
inherent uncertainty. It then repeats the process, using a different set of random values from
the probability functions each time. A Monte Carlo simulation could take thousands or tens of
thousands of recalculations to complete, depending on the amount of uncertainty and the ranges
provided for them. Monte Carlo simulation generates probabilistic distributions of alternative
outcomes.
There are also ways to use probabilities that aren't Monte Carlo simulations, such as
deterministic modelling with single-point estimates. A "best guess" estimate is assigned to each
uncertain variable in a model. For each input variable, scenarios (such as best, worst, or most
likely case) are chosen, and the results are recorded. Monte Carlo simulations, on the other
hand, take a sample from each variable's probability distribution to generate hundreds or
thousands of different outcomes. The data is evaluated to determine the likelihood of various
outcomes. It's worth noting that the Monte Carlo simulations used here assume a normal return
distribution. However, history has demonstrated that this is not the case. The Cauchy
distribution is the most exact, although being comparable. Nonetheless, a normal distribution
is precise enough for most purposes across thousands of trials.
Non-institutional traders have increased their use of advanced trading techniques as a result of
the development of open source software and statistical tools. This is evidenced by the
numerous posts on Medium about how to set up personal algorithmic trading systems. But one
question that keeps coming up as these tools become more widely used is how will they alter

121| P a g e
market structure. Will it become increasingly difficult to discover excess returns if more
investors adopt strict investment strategies? Will there be any unintended effects, like there
were with the Flash Crash? Will individuals continue to flock to low-cost market tracking ETFs
in order to keep up with the market without having to worry about actively managing their
money? It's an unsettled subject, but the convergence of data science and finance is a
fascinating place to be right now.
Predicting the longer-term returns may be a very critical subject to academicians, investors,
policymakers, and all others who have an interest in available exchange. This study has
introduced the Monte Carlo Simulation as a technical approach that would help these parts in
forecasting the stock prices which successively are going to be vital within the calculations of
the price of capital, portfolio management, and other financial decisions.
Through this scientific research, we utilized the gained knowledge from theory and applied it
practically to conduct this evaluation study. This research gave me an opportunity that helped
me in gaining more relevant information and learn some new things.

122| P a g e
CHAPTER 6
LEARNING
OUTCOMES

123| P a g e
6.1 LEARNING OUTCOMES
It helped me to know the overall functioning of Monte Carlo Simulation in forecasting the
stock price. How it is done to predict the price and how it helps the investors and corporations
to make a sustainable profit.
It also gave me practical exposure to the various functional areas of which we only had theoretical
knowledge so far.
6.2 SCOPE FOR FUTURE RESEARCH
The Monte Carlo method is not used in today’s applications regarding the stock analysis. This
is because the method may have been tried before, and not proven to be superior for example
fundamental analysis and technical analysis. There are however many questions to be
answered.
How would the quality of the simulations change if the stocks are categorized and
treated differently?
How would the simulations behave if the parameters were not assumed to be constant,
but variables instead?
Would it be beneficial to add more parameters to the simulations, such as inflation and
current rates?
Is the method more accurate of other types for instruments such as indices?
We do believe that this report showcases that the method has the potential to be improved and
thereby becoming a powerful tool that will extend our abilities to predict and model stock
prices.

124| P a g e
REFERENCES

125| P a g e
REFERENCES
1. Ali, S. Abu Hammad, A. Samhouria, M. and Al-Ghandoora, A. (2011). "Modelling stock
market exchange prices using Artificial Neural Network: A study of Amman Stock
Exchange". Jordan Journal of Mechanical and Industrial Engineering. 5 (5): 439 – 446.
http://jjmie.hu.edu.jo/files/v5n5/JJMIE-127-09.pdf
2. Assaleh, K. El-Baz, H. and Al-Salkhadi, S. (2011). "Predicting stock prices using
polynomial classifiers: The case of Dubai financial market”. Journal of Intelligent Learning
Systems and Applications, 3: 82-89.
https://file.scirp.org/pdf/JILSA20110200001_85718640.pdf
3. Atmeh, M. and Dobbs, I. (2006). "Technical analysis and the stochastic properties of the Jordanian
stock market index return". Studies in Economics and Finance, Vol. 23 (2):119–140.
https://www.emerald.com/insight/content/doi/10.1108/10867370610683914/full/html
4. Batra. R. & Daudpota. M. S., (2018) Integrating Stock Twits with Sentiment Analysis for
better Prediction of Stock Price Movement, International Conference on Computing,
Mathematics and Engineering Technologies,1-5. Integrating Stock Twits with sentiment
analysis for better prediction of stock price movement | IEEE Conference Publication |
IEEE Xplore
5. Boyle, P. Broadie, M. and Glasserman, P. (1997). "Monte Carlo methods for security
pricing". Journal of Economic Dynamics and Control. 21: 1267-1321. Monte Carlo
methods for security pricing - ScienceDirect
6. Campbell. Y. J., & Shiller. J. R., (May 2001), Valuation Ratios and the Long-Run Stock
Market Outlook, 36, 1871-2001. Valuation Ratios and the Long-Run Stock Market
Outlook: An Update | NBER
7. Chen, N., and Hong, L. (2007). “Monte Carlo Simulation in Financial Engineering.
Department of Systems Engineering and Industrial Engineering". Working Paper, Winter
Simulation Conference, Washington, DC, USA. Pp. 919-931. Monte Carlo simulation in
financial engineering | Proceedings of the 39th conference on Winter simulation: 40 years!
The best is yet to come (acm.org)
8. Dirk P. Kroese, Tim Brereton, Thomas Taimre, Zdravko I. Botev (2014), Why the Monte
Carlo method is so important today. WIREs Computer Stat 2014, 6:386–392. DOI:
10.1002/wics.1314 Why the Monte Carlo method is so important today (fit.edu)
9. Döpke, J. Hartmann, D. and Pierdzioch, C. (2008). "Real-time macroeconomic data and
ex- ante stock return predictability". International Review of Financial Analysis. 17: 274-

126| P a g e
29. https://www.sciencedirect.com/science/article/abs/pii/S1057521906000871
10. Giovanis, E. (2011). "GARCH -Monte-Carlo simulation models with wavelets
decomposition algorithm for stock returns prediction". International Journal of Computer
Information Systems. 2 (3): 29-35.
https://www.researchgate.net/publication/215464500_GARCH_-_Monte-
Carlo_Simulation_Models_with_Wavelets_Decomposition_Algorithm_for_Stock_Retur
ns
11. Henseler. J. & Chin. W, (2010), A Comparison of Approaches for the Analysis of
Interaction Effects between Latent Variables Using Partial Least Squares Path Modelling,
Structural Equation Modelling: A Multidisciplinary, 17:1, 82-10 9. A Comparison of
Approaches for the Analysis of Interaction Effects Between Latent Variables Using Partial
Least Squares Path Modeling: Structural Equation Modelling: A Multidisciplinary Journal:
Vol 17, No 1 (tandfonline.com)
12. Kara, Y. Boyacioglu, M. and Baykan, O. (2011). "Predicting direction of stock price index
movement using Artificial Neural Networks and Support Vector Machines: The sample of
the Istanbul stock exchange". Expert Systems with Applications. 38: 5311– 5319.
Predicting direction of stock price index movement using artificial neural networks and
support vector machines: The sample of the Istanbul Stock Exchange - ScienceDirect
13. Maarit. A. & Kallio. I. (2010) Accounting for uncertainty in a forest Sector model using
Monte Carlo simulation,12:1,9-16, Accounting for uncertainty in a forest sector model
using Monte Carlo simulation - ScienceDirect
14. Pouillot. P, & Beaudeau. P, & Denis. J. B., & Derouin. F, (2004), A Quantitative Risk
Assessment of Waterborne Cryptosporidiosis in France Using Second-Order Monte Carlo
Simulation, 52, 1 to 27. Risk Anal. 24:1–17. 10.1111/j.0272-4332.2004.00407
15. Ranjbar. M., & Soleymani. S.& Sadati. N., (January 2007), Electricity price Forecasting
Using Artificial Neural Network, IEEE Xplore, 21. (PDF) Electricity Price Forecasting
Using Artificial Neural Network (researchgate.net)
16. Sharma, A., Yadava, G.S. and Deshmukh, S.G. (2011),"A literature review and future
perspectives on maintenance optimization", Journal of Quality in Maintenance
Engineering, Vol.17No.1, pp.5- 25. A literature review and future perspectives on
maintenance optimization | Emerald Insight
17. Tsao Pan, W. 2010. "Performing stock price prediction use of hybrid model". Chinese
Management Studies. 4 (1): 77 – 86. Performing stock price prediction use of hybrid model

127| P a g e
| Emerald Insight
18. West. D. K (1986) “Dividend Innovations and Stock Price Volatility”, NBER Working
Papers, 125, 25-39. Dividend Innovations and Stock Price Volatility by Kenneth D. West:
SSRN
19. Whiteside II PE, J. (2008). "A practical application of Monte Carlo simulation in
forecasting". AACE International Transactions. 4: 1-12. A Practical Application of Monte
Carlo Simulation in Forecasting (icoste.org)
20. Wyrozębski, Paweł & Wyrozębska, Agnieszka. (2013). Challenges of project planning in
the probabilistic approach using PERT, GERT and Monte Carlo. Journal of Management
and Marketing. 1. 1-8. (PDF) Challenges of project planning in the probabilistic approach
using PERT, GERT and Monte Carlo (researchgate.net)
Other Links:
1. https://www.investopedia.com/terms/m/montecarlosimulation.asp
2. https://www.ibm.com/cloud/learn/monte-carlo-simulation
3. https://economictimes.indiatimes.com/definition/monte-carlo-simulation
4. https://datascienceplus.com/how-to-apply-monte-carlo-simulation-to-forecaststock-
prices- using-python/
5. https://towardsdatascience.com/stock-price-prediction-intervals-using-montecarlo-
simulation- 6b52b8ac9c27
6. https://doi.org/10.1108/13552511111116222
7. https://doi.org/10.1002/wics.1314
8. https://doi.org/10.1111/j.0272-4332.2004.00407
9. https://doi.org/10.1016/j.forpol.2009.09.01407
10. DOI:10.1109/PEDES.2006.344294
11. DOI: 10.1080/10705510903439003

128| P a g e
LIST OF FIGURES
Sl. No. Particulars Page
1 Financial Market in Digital Screen 11
2 Monte Carlo Methodology 16
3 Indian Startups During Pandemic 25
4 Excel Calculation Step-wise 1 81
5 Excel Calculation Step-wise 2 82
6 Excel Calculation Step-wise 3 82
7 Excel Calculation Step-wise 4 83

129| P a g e
LIST OF TABLES
Sl. No. Particulars Page
1 Simulated Price Using Monte Carlo Model for State Bank of India 84
2 Simulated Price Using Monte Carlo Model for Canara Bank 86
3 Simulated Price Using Monte Carlo Model for Indian Bank 88
4 Simulated Price Using Monte Carlo Model for ICICI Bank 90
5 Simulated Price Using Monte Carlo Model for HDFC Bank 92
6 Simulated Price Using Monte Carlo Model for TAJ 95
7 Simulated Price Using Monte Carlo Model for Royal Orchids 97
8 Simulated Price Using Monte Carlo Model for Chalet Hotels 99
9 Simulated Price Using Monte Carlo Model for Lemon Tree Hotels 101
10 Simulated Price Using Monte Carlo Model for Asian Hotel 104
11 Simulated Price Using Monte Carlo Model for Balaji Telefilms 106
12 Simulated Price Using Monte Carlo Model for Inox Leisure 108
13 Simulated Price Using Monte Carlo Model for SUN TV 110
14 Simulated Price Using Monte Carlo Model for Zee Entertainment 112
15 Simulated Price Using Monte Carlo Model for PVR 115

130| P a g e
LIST OF CHARTS
Sl. No. Particulars Page
1 Simulated Price Using Monte Carlo Model for State Bank of India 85
2 Simulated Price Using Monte Carlo Model for Canara Bank 87
3 Simulated Price Using Monte Carlo Model for Indian Bank 89
4 Simulated Price Using Monte Carlo Model for ICICI Bank 91
5 Simulated Price Using Monte Carlo Model for HDFC Bank 94
6 Simulated Price Using Monte Carlo Model for TAJ 96
7 Simulated Price Using Monte Carlo Model for Royal Orchids 98
8 Simulated Price Using Monte Carlo Model for Chalet Hotels 100
9 Simulated Price Using Monte Carlo Model for Lemon Tree Hotels 103
10 Simulated Price Using Monte Carlo Model for Asian Hotel 105
11 Simulated Price Using Monte Carlo Model for Balaji Telefilms 107
12 Simulated Price Using Monte Carlo Model for Inox Leisure 109
13 Simulated Price Using Monte Carlo Model for SUN TV 111
14 Simulated Price Using Monte Carlo Model for Zee Entertainment 114
15 Simulated Price Using Monte Carlo Model for PVR 116