Report of the Working Group on Photon and Weak Boson Production
51
arXiv:hep-ph/0005226v2 3 Nov 2000 Report of the Working Group on Photon and Weak Boson Production Conveners: U. Baur (Buffalo), E.L. Berger (ANL), H.T. Diehl (FNAL), and D. Errede (UIUC) Subgroup Conveners: Photon Production: J. Huston (MSU), J. Owens (FSU), and J. Womersley (FNAL) Weak Boson Production: D. Casey (MSU) and T. Dorigo (Harvard), Diboson Production: U. Baur (Buffalo) and H.T. Diehl (FNAL) Contributing authors: L. Apanasevich (Rochester), M. Begel (Rochester), Y. Gershtein (Brown), M. Kelly (Michigan), S. E. Kuhlmann (ANL), S. Leone (Pisa), D. Partos (Brandeis), D. Rainwater (FNAL), W.K. Sakumoto (Rochester), G. Steinbr¨ uck (Columbia), M. Zieli´ nski (Rochester), and V. Zutshi (Rochester) This report discusses physics issues which can be addressed in photon and weak boson production in Run II at the Tevatron. The current understanding and the potential of Run II to expand our knowledge of direct photon production in hadronic collisions is discussed. We explore the prospects for using the W -boson cross section to measure the integrated luminosity, improving the measurement of the W and Z boson transverse momentum distributions, the Z → b ¯ b signal, and the lepton angular distribution in W decays. Finally, we consider the prospects for measuring the trilinear gauge boson couplings in Run II. 1. Introduction For the next few years, the Fermilab Tevatron Col- lider will be the high energy frontier of particle physics. The luminosity enhancement provided by the Main In- jector will significantly increase the discovery reach of the Tevatron experiments over what has been achieved with Run I data. It will also move the experimen- tal program into a regime of precision hadron collider physics. This will make it possible to address open questions of high energy physics from several comple- mentary directions. Understanding the mechanism of production for photons, W , and Z -bosons is important for several rea- sons. First of all, it provides an opportunity to directly test the Standard Model (SM). Second, photon and weak boson production often constitute an irreducible background in searches for new physics. Finally, a de- tailed understanding of the production mechanism for these particles is necessary to control the systematic errors in precision measurements, such as the determi- nation of the W mass (see Ref. [ 1]). In this report, we consider several aspects of the production of photons, W , and Z bosons which are of interest for Run II of the Tevatron Collider. In Sec. 2, direct photon production is discussed. A de- tailed overview of our current experimental and the- oretical understanding of direct photon production in hadronic collisions is presented. Direct photon pro- duction has long been considered a probe of QCD and a source for extracting the gluon distribution of the proton. Unfortunately, not all existing (fixed target and Tevatron collider) datasets are consistent, and our current theoretical understanding of direct pho- ton production, especially at small photon transverse momenta, is incomplete. Recent theoretical develop- ments, however, offer optimism that the long-standing difficulties in direct photon production can finally be resolved. The enormous number of photon-jet events expected in Run II may help to shed light on these issues. In particular, photon – jet correlations should be helpful in sorting out the source of disagreement between theory and experiment. In addition, the kine- matic reach in transverse momentum will be greatly extended in Run II. In Sec. 3 several important topics associated with W and Z -boson production are discussed. For many measurements in Run II, knowledge of the integrated luminosity is essential. The integrated luminosity can be extracted either from the total inelastic cross section or from the cross section of a theoretically well under- stood process with high statistics, such as inclusive W production. Using the total inelastic cross section to determine the integrated luminosity for Run I has led to inconsistencies which may well persist in Run II. It may thus be advantageous to use the W production cross section as an alternative. In Sec. 3.1 we present a brief overview of the magnitude of the experimen- tal uncertainties in such a measurement. The total uncertainty in the W cross section is found to be dom- inated by the uncertainty from the parton distribution functions, which is considered in more detail in the Report of the Working Group on Parton Distribution Functions [ 2]. In Sec. 3, we also consider the transverse momentum distribution of the Z boson, Z → b ¯ b decays, and the prospects to measure the lepton angular distribution in W decays. The Zp T distribution is of interest as a test of QCD, and as a tool for reducing uncertainties in the transverse momentum distribution of the W . This 1
Transcript of Report of the Working Group on Photon and Weak Boson Production
arX
iv:h
ep-p
h/00
0522
6v2
3 N
ov 2
000
Report of the Working Group on Photon and Weak Boson Production
Conveners: U. Baur (Buffalo), E.L. Berger (ANL), H.T. Diehl (FNAL), and D. Errede (UIUC)Subgroup Conveners: Photon Production: J. Huston (MSU), J. Owens (FSU), and J. Womersley (FNAL)Weak Boson Production: D. Casey (MSU) and T. Dorigo (Harvard), Diboson Production: U. Baur (Buffalo) andH.T. Diehl (FNAL)Contributing authors: L. Apanasevich (Rochester), M. Begel (Rochester), Y. Gershtein (Brown), M. Kelly(Michigan), S. E. Kuhlmann (ANL), S. Leone (Pisa), D. Partos (Brandeis), D. Rainwater (FNAL),W.K. Sakumoto (Rochester), G. Steinbruck (Columbia), M. Zielinski (Rochester), and V. Zutshi (Rochester)
This report discusses physics issues which can be addressed in photon and weak boson production in Run II at the Tevatron.
The current understanding and the potential of Run II to expand our knowledge of direct photon production in hadronic
collisions is discussed. We explore the prospects for using the W -boson cross section to measure the integrated luminosity,
improving the measurement of the W and Z boson transverse momentum distributions, the Z → bb signal, and the lepton
angular distribution in W decays. Finally, we consider the prospects for measuring the trilinear gauge boson couplings in
Run II.
1. Introduction
For the next few years, the Fermilab Tevatron Col-lider will be the high energy frontier of particle physics.The luminosity enhancement provided by the Main In-jector will significantly increase the discovery reach ofthe Tevatron experiments over what has been achievedwith Run I data. It will also move the experimen-tal program into a regime of precision hadron colliderphysics. This will make it possible to address openquestions of high energy physics from several comple-mentary directions.
Understanding the mechanism of production forphotons, W , and Z-bosons is important for several rea-sons. First of all, it provides an opportunity to directlytest the Standard Model (SM). Second, photon andweak boson production often constitute an irreduciblebackground in searches for new physics. Finally, a de-tailed understanding of the production mechanism forthese particles is necessary to control the systematicerrors in precision measurements, such as the determi-nation of the W mass (see Ref. [ 1]).
In this report, we consider several aspects of theproduction of photons, W , and Z bosons which areof interest for Run II of the Tevatron Collider. InSec. 2, direct photon production is discussed. A de-tailed overview of our current experimental and the-oretical understanding of direct photon production inhadronic collisions is presented. Direct photon pro-duction has long been considered a probe of QCD anda source for extracting the gluon distribution of theproton. Unfortunately, not all existing (fixed targetand Tevatron collider) datasets are consistent, andour current theoretical understanding of direct pho-ton production, especially at small photon transverse
momenta, is incomplete. Recent theoretical develop-ments, however, offer optimism that the long-standingdifficulties in direct photon production can finally beresolved. The enormous number of photon-jet eventsexpected in Run II may help to shed light on theseissues. In particular, photon – jet correlations shouldbe helpful in sorting out the source of disagreementbetween theory and experiment. In addition, the kine-matic reach in transverse momentum will be greatlyextended in Run II.
In Sec. 3 several important topics associated withW and Z-boson production are discussed. For manymeasurements in Run II, knowledge of the integratedluminosity is essential. The integrated luminosity canbe extracted either from the total inelastic cross sectionor from the cross section of a theoretically well under-stood process with high statistics, such as inclusive Wproduction. Using the total inelastic cross section todetermine the integrated luminosity for Run I has ledto inconsistencies which may well persist in Run II. Itmay thus be advantageous to use the W productioncross section as an alternative. In Sec. 3.1 we presenta brief overview of the magnitude of the experimen-tal uncertainties in such a measurement. The totaluncertainty in the W cross section is found to be dom-inated by the uncertainty from the parton distributionfunctions, which is considered in more detail in theReport of the Working Group on Parton DistributionFunctions [ 2].
In Sec. 3, we also consider the transverse momentumdistribution of the Z boson, Z → bb decays, and theprospects to measure the lepton angular distributionin W decays. The Z pT distribution is of interest as atest of QCD, and as a tool for reducing uncertainties inthe transverse momentum distribution of the W . This
1
is important for a precise determination of the mass ofthe W boson (see Ref. [ 1]). Searching for a light Higgsboson in the range between 110 GeV and 180 GeV isone of the prime objectives for Run II. H → bb decaysdominate for Higgs boson masses MH < 135 GeV. Theability to separate the Higgs boson signal in the Wbband ttbb channels from the large QCD background de-pends critically on on the bb invariant mass resolution,and thus on the measured b-quark jet energies. Z → bbdecays offer a testing ground for algorithms designedto improve the jet energy measurement for b jets andare also useful as a calibration tool. The measurementof the lepton angular distributions in W decays servesas a probe of NLO QCD. The measurement carriedout by DØ in Run I is statistics limited. While a QCDcalculation is preferred, large deviations from QCD arenot excluded. In Run II, this measurement will allowfor a much improved test of the QCD prediction.
In Sec. 4 of this report, we discuss di-boson produc-tion. Vector boson pair production provides a sensitiveground for direct tests of the trilinear gauge bosoncouplings. A brief overview of the WWV (V = γ, Z),ZγV and ZZV couplings is presented and recent ad-vances in our theoretical understanding of the NLOQCD corrections to di-boson production are described.After a brief review of the limits on trilinear couplingsobtained in Run I, the prospects for strengthening ex-isting bounds in Run II are discussed. In additionto improving the measurements of WWV and ZγVcouplings, it will be possible to determine the ZZVcouplings via ZZ production with an accuracy of about15% in Run II, and to observe the so-called “radiationzero” in Wγ production.
2. Direct Photon Production
The use of direct photon production as an elec-tromagnetic probe of hard scattering dynamics hasa history which covers more than twenty years. Asin other electromagnetic processes such as lepton pairproduction or deep inelastic scattering, the point-likecoupling of the photon to charged particles offers somesimplifications over purely hadronic probes. Comparedto hadronic jet production, direct photon productionoffers the apparent advantages of having fewer subpro-cesses at lowest order and of avoiding the complicationsof jet definitions when measuring or calculating a crosssection. This latter point means that one can extendthe range of transverse momenta to smaller valuesfor direct photons than for jets. However, in actualpractice, these apparent simplifications must be tem-pered by having to deal with backgrounds from neu-tral meson decays, a lower event rate compared to jetproduction, and complications from photons produced
during jet fragmentation, to name just a few. Never-theless, direct photon data provide information whichcomplements that obtained from other hard scatteringprocesses. Furthermore, photons may be importantsignatures of physics beyond the SM. Therefore, it isnecessary to understand the “conventional” sources ofphotons before one can fully exploit them in signaturesdesigned to look for new physics.
In this Section, recent work concerning the phe-nomenology of initial-state gluon emission in direct-photon production in hadron collisions is reported. InSec. 2.1, high-mass direct-photon pairs are used to ex-plore the impact of such radiation in terms of effectiveparton transverse momenta, kT . At fixed-target ener-gies, data on high-p
Tinclusive π0 and π0π0 production
are used to further clarify the arguments presented.We then review progress towards fully resummed QCDdescriptions and present comparisons of a phenomeno-logical kT model to recent fixed-target and colliderdata. Possibilities for more extensive studies withdata from Run II, and the additional information theycan provide for these considerations, are explored inSec. 2.1.5. A consistent picture of the observed de-viations of NLO perturbative QCD (pQCD) calcula-tions from inclusive direct-photon and π0 data is nowemerging, and we comment on the implications of theseresults for the extraction of the gluon distribution,G(x), in Sec. 2.1.6.
Run II has the potential to significantly expand ourknowledge of direct photon production. Issues relatedto our understanding of the relevant production mech-anisms in the kinematic range accessible during Run IIare reviewed in Sec. 2.2. In this Section, we also discussobservables which may help improve our understandingof direct photon production as well as experimentalissues which can affect the quality of the data. InSec. 2.2.4 some predictions for photon-jet correlationsare presented. The potential of observables other thanthe usual single photon pT distribution to help eluci-date the underlying dynamics is discussed.
Run I data are available on the associated produc-tion of a γ carrying large transverse momentum alongwith a charm quark c whose transverse momentumbalances a substantial portion of that of the photon [3]. An intriguing possibility is that the data may beused to measure the charm quark density in the nu-cleon as well as to probe dynamical correlations pre-dicted by QCD. These possibilities are discussed inRef. [ 4] where predictions are obtained from a fullnext-to-leading order perturbative QCD calculation ofp + p → γ + c + X at high energy. The associated pro-duction of a photon and a heavy quark is not discussedfurther in this report.
2
2.1. Present Status of Direct Photon Produc-tion in Hadronic Collisions1
2.1.1. IntroductionSingle and double direct-photon production at high
pT
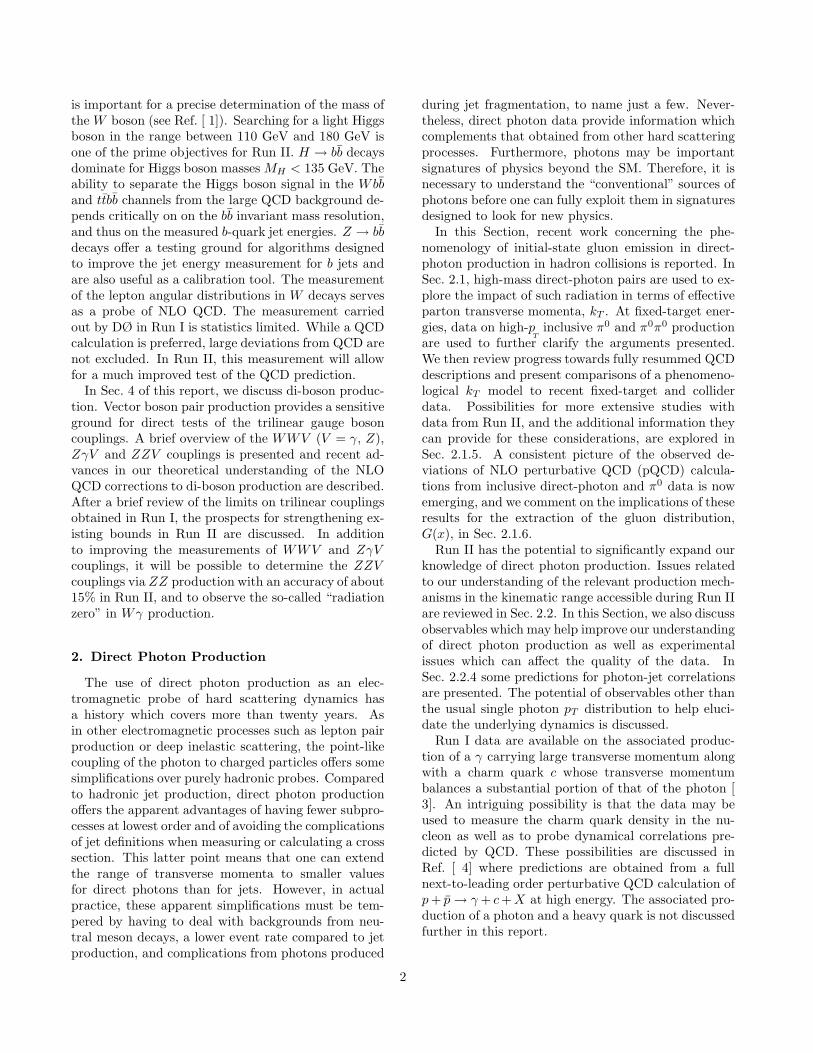
have long been viewed as ideal processes for testingthe formalisms of pQCD. NLO calculations are avail-able for both processes [ 5, 6, 7, 8, 9]. While theimportance of including gluon emission through theresummation formalism was recognized and availablefor some time for the di-photon process [ 10, 11], itis only recently that this approach has been devel-oped for inclusive direct-photon production [ 12, 13,14, 15, 16, 17]. A complete theoretical descriptionof the direct-photon process is of special importanceas it has long been expected to provide one of thebest measurements of the gluon distribution in theproton. The quark–gluon Compton scattering sub-process (gq → γq) shown in Fig. 1 provides a ma-jor contribution to inclusive direct-photon production.The gluon distribution (G(x)) is relatively well con-strained for x < 0.1 by deep-inelastic scattering (DIS)and Drell-Yan (DY) data, but less so at larger x [ 18].Fixed-target direct-photon data can constrain G(x) atlarge x, and consequently has been incorporated inseveral modern global parton distribution analyses [19, 20, 21]. More recently, however, both the com-pleteness of the theoretical NLO description of thedirect-photon process, and the consistency of the avail-able data sets have been the subject of intense debate [21, 22, 23, 24, 25, 26, 27]. Direct-photon measurements
q
q_
γ
g
q
g
γ
qAnnihilation Compton Scattering
Figure 1. Leading order diagrams for direct-photonproduction.
in collider data, and especially the data expected fromthe forthcoming Run II at the Tevatron, provide animportant testing ground for novel approaches and im-provements in the understanding of the direct-photonprocess, and therefore can help resolve the present ar-guments.
1 Contributed by: L. Apanasevich, M. Begel, Y. Ger-shtein, J. Huston, S. E. Kuhlmann, D. Partos, J. Womersley,M. Zielinski, and V. Zutshi.
10-1
1
10
10-1
xT →
Dat
a/T
heor
y
WA70 √s=23.0 GeVUA6 √s=24.3 GeVE706 √s=31.6 GeVE706 √s=38.8 GeVR806 √s=63.0 GeVR807 √s=63.0 GeVR110 √s=63.0 GeVCDF √s=1800 GeVD∅ √s=1800 GeV
NLO Theoryµ = pT / 2CTEQ4M parton distributionsStat and sys uncertainties combined
Direct photon productionby proton beams
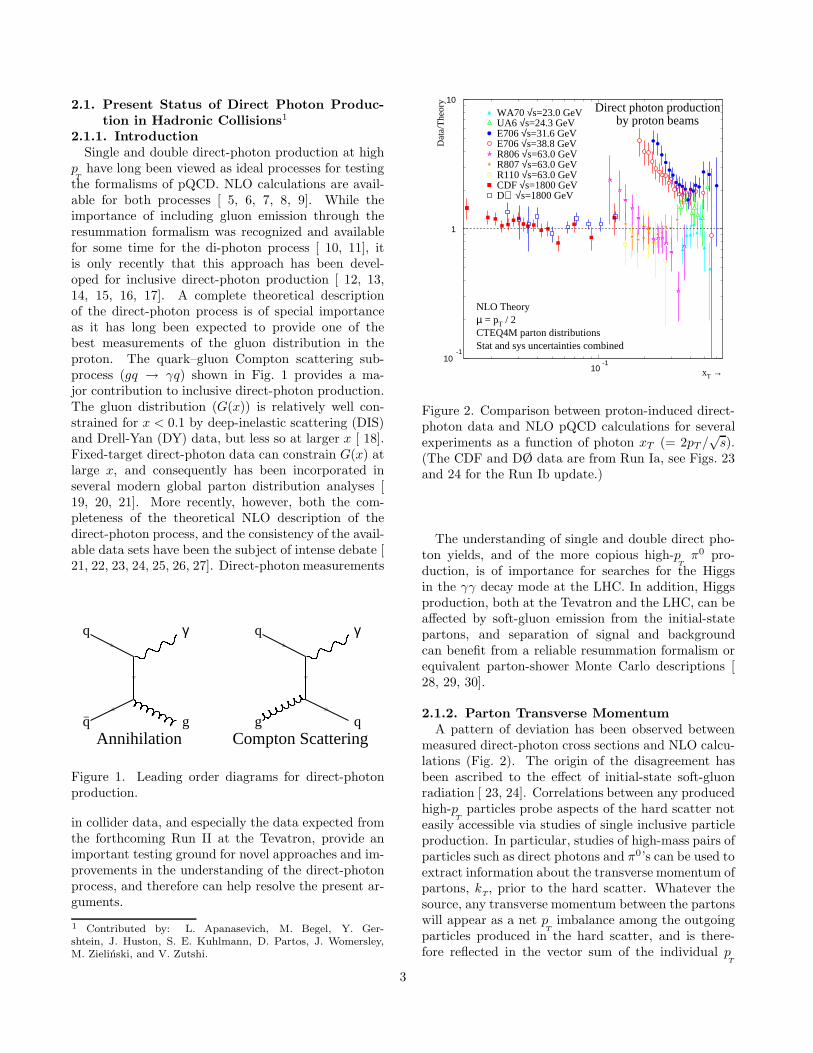
Figure 2. Comparison between proton-induced direct-photon data and NLO pQCD calculations for severalexperiments as a function of photon xT (= 2pT /
√s).
(The CDF and D6O data are from Run Ia, see Figs. 23and 24 for the Run Ib update.)
The understanding of single and double direct pho-ton yields, and of the more copious high-p
Tπ0 pro-
duction, is of importance for searches for the Higgsin the γγ decay mode at the LHC. In addition, Higgsproduction, both at the Tevatron and the LHC, can beaffected by soft-gluon emission from the initial-statepartons, and separation of signal and backgroundcan benefit from a reliable resummation formalism orequivalent parton-shower Monte Carlo descriptions [28, 29, 30].
2.1.2. Parton Transverse MomentumA pattern of deviation has been observed between
measured direct-photon cross sections and NLO calcu-lations (Fig. 2). The origin of the disagreement hasbeen ascribed to the effect of initial-state soft-gluonradiation [ 23, 24]. Correlations between any producedhigh-p
Tparticles probe aspects of the hard scatter not
easily accessible via studies of single inclusive particleproduction. In particular, studies of high-mass pairs ofparticles such as direct photons and π0’s can be used toextract information about the transverse momentum ofpartons, k
T, prior to the hard scatter. Whatever the
source, any transverse momentum between the partonswill appear as a net p
Timbalance among the outgoing
particles produced in the hard scatter, and is there-fore reflected in the vector sum of the individual p
T
3
0
1
2
3
4
5
6
7
10 102
103
√s− (GeV)
<QT>
(GeV
/c)
Diphoton
Dimuon
Dijet
Proton Data
0
1
2
10 √s− (GeV)
Pion Data
Figure 3. 〈QT〉 of pairs of muons, photons, and jets
produced in hadronic collisions versus√
s.
values of the outgoing particles (QT). If the outgo-
ing particles are pairs of photons or leptons, then thisvariable should provide a good measure of 〈k
T〉, with
〈kT〉/parton ≈ 〈Q
T〉/√
2. When the outgoing particlesare partons, they will hadronize, but the reconstructedjets can also yield a measure of 〈k
T〉.
Evidence of significant kT
has been found in severalmeasurements of dimuon, diphoton, and dijet produc-tion; a collection of 〈Q
T〉 measurements is displayed in
Fig. 3 for a wide range of√
s [ 31, 32, 33, 34, 35]. Thevalues of 〈Q
T〉 are large, and increase with increasing√
s. The dijet kT
measurements (Fig. 3) agree quali-tatively with the dimuon and diphoton results, thoughthey have somewhat higher mean values. Such a shiftis expected since there is also potential for final-statesoft-gluon emission in dijet events. The values of 〈k
T〉
per parton indicated by these data are too large tobe interpreted as due only to the size of the proton.From these observations, one can infer that the 〈k
T〉
per parton is of order 1 GeV/c at fixed-target energies,increasing to 3 GeV/c to 4 GeV/c at the Tevatroncollider, whereas 〈k
T〉 would be expected to be of the
order of 0.3 GeV/c to 0.5 GeV/c based solely on protonsize.
The pT
imbalance between the outgoing particles canalso be examined using kinematic variables other thanQ
T. Given some finite k
T, the two outgoing particles
no longer emerge back-to-back; the azimuthal anglebetween the particles, ∆φ, will differ from 180◦. Thetransverse momentum normal to the scattering plane,
0.00
0.02
0.04
0.06
0.08
0.10
140 160 180∆φ (degrees)
(1/σ
) dσ
/d∆φ
(de
gree
)−1 π−Be→γγ at 515 GeV/cpT
γ > 4.0 GeV/c−0.8 < yγ < 0.8
∆φ > 105o
M > 10 GeV/c2
0.0
0.1
0.2
0.3
0.4
0.5
0.6
-4 -2 0 2 4pOUT (GeV/c)
(1/σ
) dσ
/dp O
UT (
GeV
/c)−1
0.0
0.2
0.4
0.6
0.8
0 2 4 6QT (GeV/c)
(1/σ
) dσ
/dQ
T (
GeV
/c)−1 Resummed Theory
NLO TheoryPYTHIA(<kT>=1.1 GeV/c)
0.0
1.0
2.0
0 2z (pT Balance)
(1/σ
) dσ
/dz
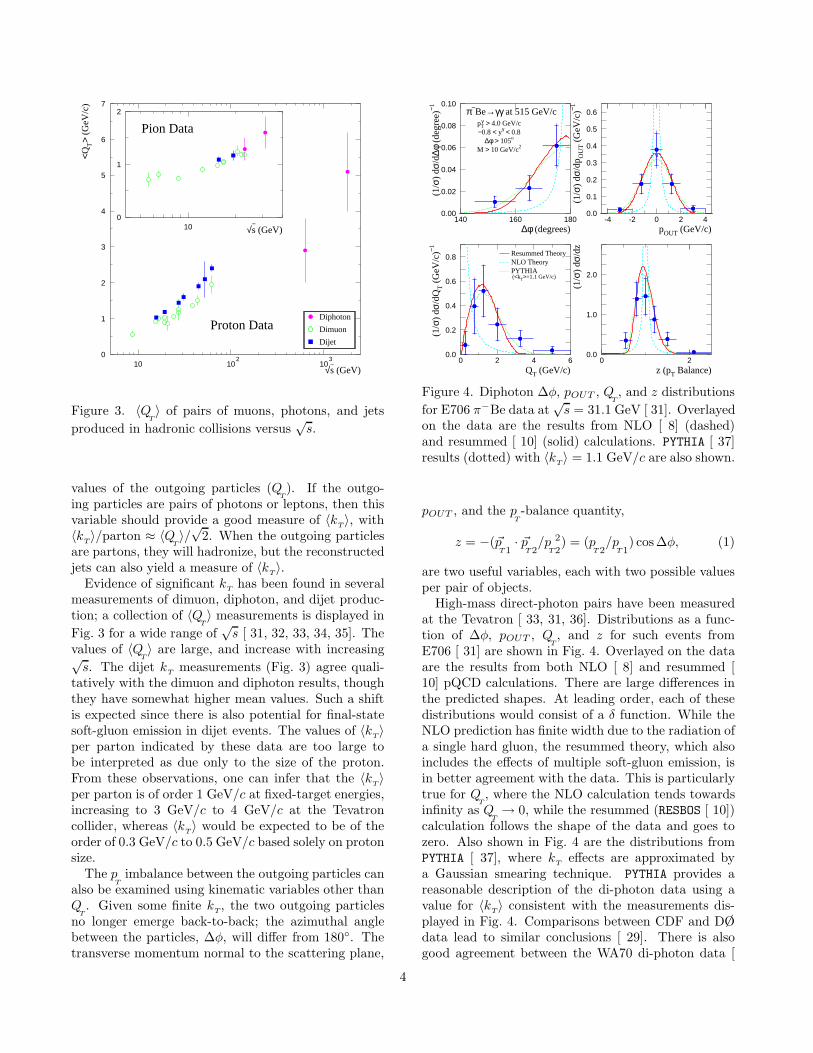
Figure 4. Diphoton ∆φ, pOUT , QT, and z distributions
for E706 π−Be data at√
s = 31.1 GeV [ 31]. Overlayedon the data are the results from NLO [ 8] (dashed)and resummed [ 10] (solid) calculations. PYTHIA [ 37]results (dotted) with 〈k
T〉 = 1.1 GeV/c are also shown.
pOUT , and the pT-balance quantity,
z = −(~pT1
· ~pT2
/pT
2
2) = (p
T2/p
T1) cos∆φ, (1)
are two useful variables, each with two possible valuesper pair of objects.
High-mass direct-photon pairs have been measuredat the Tevatron [ 33, 31, 36]. Distributions as a func-tion of ∆φ, pOUT , Q
T, and z for such events from
E706 [ 31] are shown in Fig. 4. Overlayed on the dataare the results from both NLO [ 8] and resummed [10] pQCD calculations. There are large differences inthe predicted shapes. At leading order, each of thesedistributions would consist of a δ function. While theNLO prediction has finite width due to the radiation ofa single hard gluon, the resummed theory, which alsoincludes the effects of multiple soft-gluon emission, isin better agreement with the data. This is particularlytrue for Q
T, where the NLO calculation tends towards
infinity as QT→ 0, while the resummed (RESBOS [ 10])
calculation follows the shape of the data and goes tozero. Also shown in Fig. 4 are the distributions fromPYTHIA [ 37], where k
Teffects are approximated by
a Gaussian smearing technique. PYTHIA provides areasonable description of the di-photon data using avalue for 〈k
T〉 consistent with the measurements dis-
played in Fig. 4. Comparisons between CDF and D6Odata lead to similar conclusions [ 29]. There is alsogood agreement between the WA70 di-photon data [
4
0.1
0.2
0.3
0.4
0.5
0.6
(1/σ
) dσ
/dp O
UT (
GeV
/c)-1
γγNLO TheoryResummedPYTHIA(<kT>=1.1 GeV/c)pT
γ>4.0 GeV/cM>10 GeV/c2
∆φ>105o
π0π0 LO Theory<kT>=0.0 GeV/c
<kT>=1.2 GeV/c
<kT>=1.4 GeV/cpT
π >2.5 GeV/c∆φ>105o
0.0
0.1
0.2
0.3
0.4
0.5
0.6
-4 -2 0 2 4
γπ0 LO Theory
<kT>=0.0 GeV/c
<kT>=1.2 GeV/c
<kT>=1.4 GeV/cpT
γ>4.0 GeV/cpT
π >2.5 GeV/c∆φ>105o
-4 -2 0 2 4pOUT (GeV/c)
ηπ0 π0π0 data
pTη>2.5 GeV/c
pTπ >2.5 GeV/c
∆φ>105o
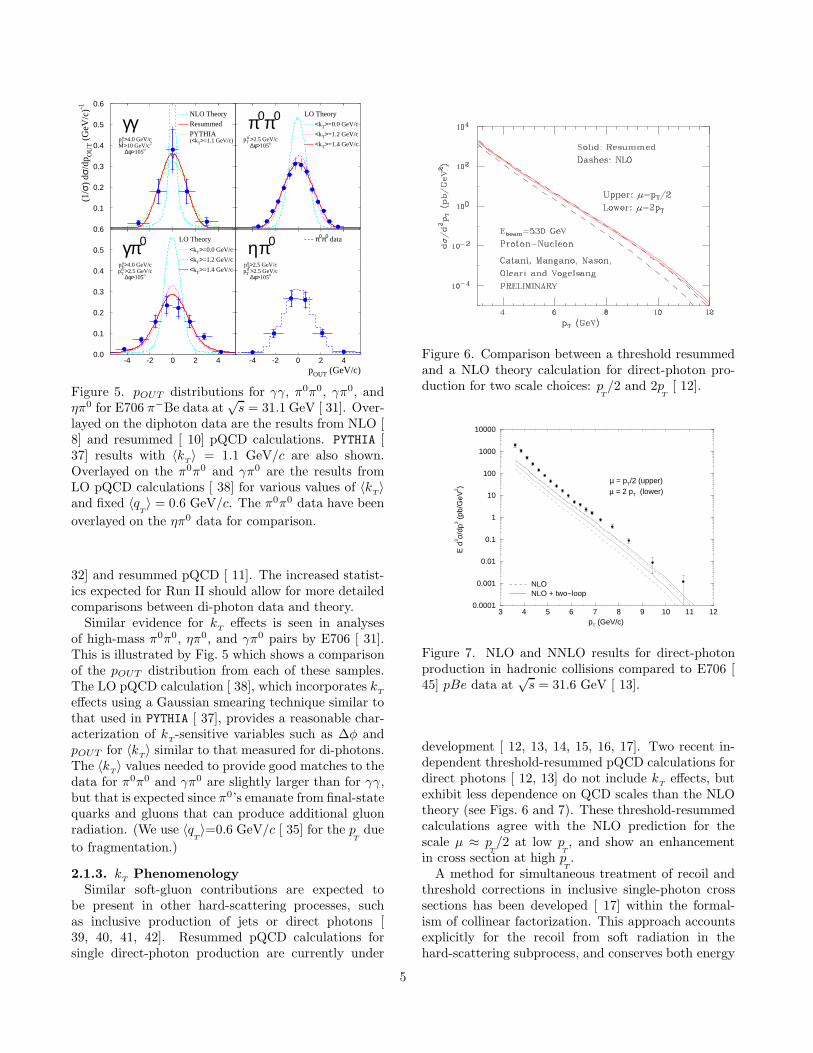
Figure 5. pOUT distributions for γγ, π0π0, γπ0, andηπ0 for E706 π−Be data at
√s = 31.1 GeV [ 31]. Over-
layed on the diphoton data are the results from NLO [8] and resummed [ 10] pQCD calculations. PYTHIA [37] results with 〈k
T〉 = 1.1 GeV/c are also shown.
Overlayed on the π0π0 and γπ0 are the results fromLO pQCD calculations [ 38] for various values of 〈k
T〉
and fixed 〈qT〉 = 0.6 GeV/c. The π0π0 data have been
overlayed on the ηπ0 data for comparison.
32] and resummed pQCD [ 11]. The increased statist-ics expected for Run II should allow for more detailedcomparisons between di-photon data and theory.
Similar evidence for kT
effects is seen in analysesof high-mass π0π0, ηπ0, and γπ0 pairs by E706 [ 31].This is illustrated by Fig. 5 which shows a comparisonof the pOUT distribution from each of these samples.The LO pQCD calculation [ 38], which incorporates k
T
effects using a Gaussian smearing technique similar tothat used in PYTHIA [ 37], provides a reasonable char-acterization of k
T-sensitive variables such as ∆φ and
pOUT for 〈kT〉 similar to that measured for di-photons.
The 〈kT〉 values needed to provide good matches to the
data for π0π0 and γπ0 are slightly larger than for γγ,but that is expected since π0’s emanate from final-statequarks and gluons that can produce additional gluonradiation. (We use 〈q
T〉=0.6 GeV/c [ 35] for the p
Tdue
to fragmentation.)
2.1.3. kT
PhenomenologySimilar soft-gluon contributions are expected to
be present in other hard-scattering processes, suchas inclusive production of jets or direct photons [39, 40, 41, 42]. Resummed pQCD calculations forsingle direct-photon production are currently under
Figure 6. Comparison between a threshold resummedand a NLO theory calculation for direct-photon pro-duction for two scale choices: p
T/2 and 2p
T[ 12].
3 4 5 6 7 8 9 10 11 12pT (GeV/c)
0.0001
0.001
0.01
0.1
1
10
100
1000
10000
E d
3 σ/dp
3 (pb
/GeV
2 )
NLONLO + two−loop
µ = pT/2 (upper)µ = 2 pT (lower)
Figure 7. NLO and NNLO results for direct-photonproduction in hadronic collisions compared to E706 [45] pBe data at
√s = 31.6 GeV [ 13].
development [ 12, 13, 14, 15, 16, 17]. Two recent in-dependent threshold-resummed pQCD calculations fordirect photons [ 12, 13] do not include k
Teffects, but
exhibit less dependence on QCD scales than the NLOtheory (see Figs. 6 and 7). These threshold-resummedcalculations agree with the NLO prediction for thescale µ ≈ p
T/2 at low p
T, and show an enhancement
in cross section at high pT.
A method for simultaneous treatment of recoil andthreshold corrections in inclusive single-photon crosssections has been developed [ 17] within the formal-ism of collinear factorization. This approach accountsexplicitly for the recoil from soft radiation in thehard-scattering subprocess, and conserves both energy
5
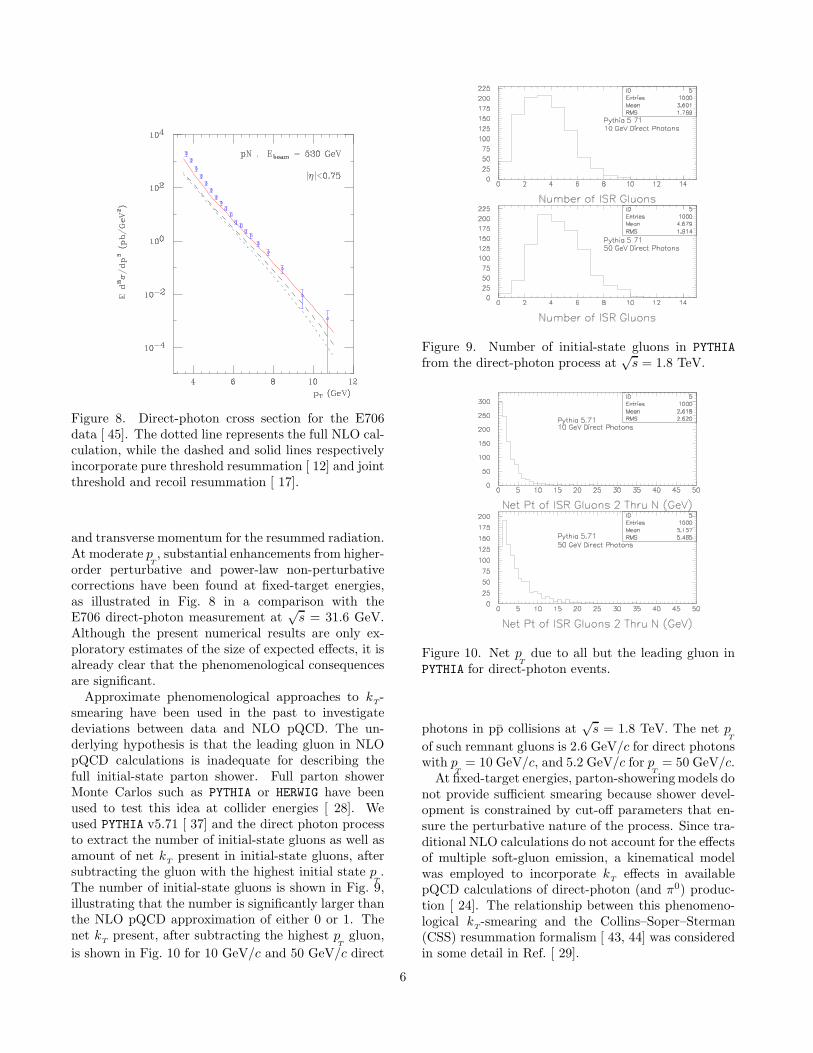
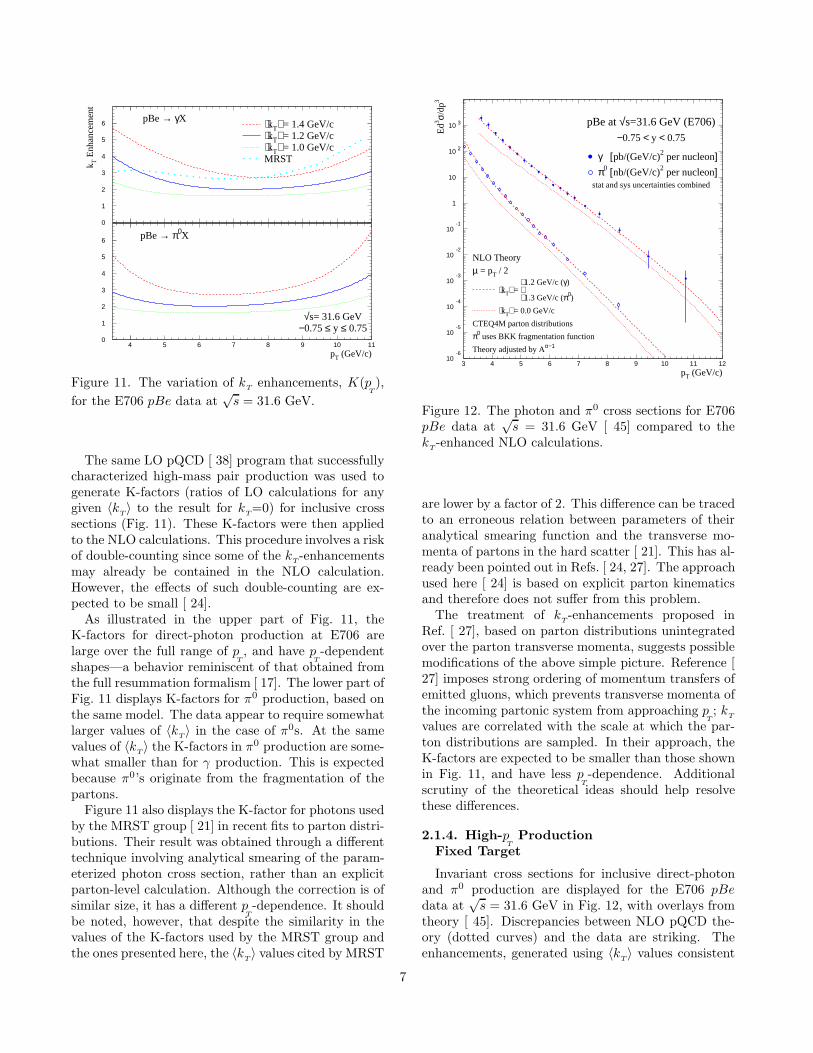
Figure 8. Direct-photon cross section for the E706data [ 45]. The dotted line represents the full NLO cal-culation, while the dashed and solid lines respectivelyincorporate pure threshold resummation [ 12] and jointthreshold and recoil resummation [ 17].
and transverse momentum for the resummed radiation.At moderate p
T, substantial enhancements from higher-
order perturbative and power-law non-perturbativecorrections have been found at fixed-target energies,as illustrated in Fig. 8 in a comparison with theE706 direct-photon measurement at
√s = 31.6 GeV.
Although the present numerical results are only ex-ploratory estimates of the size of expected effects, it isalready clear that the phenomenological consequencesare significant.
Approximate phenomenological approaches to kT-
smearing have been used in the past to investigatedeviations between data and NLO pQCD. The un-derlying hypothesis is that the leading gluon in NLOpQCD calculations is inadequate for describing thefull initial-state parton shower. Full parton showerMonte Carlos such as PYTHIA or HERWIG have beenused to test this idea at collider energies [ 28]. Weused PYTHIA v5.71 [ 37] and the direct photon processto extract the number of initial-state gluons as well asamount of net k
Tpresent in initial-state gluons, after
subtracting the gluon with the highest initial state pT.
The number of initial-state gluons is shown in Fig. 9,illustrating that the number is significantly larger thanthe NLO pQCD approximation of either 0 or 1. Thenet k
Tpresent, after subtracting the highest p
Tgluon,
is shown in Fig. 10 for 10 GeV/c and 50 GeV/c direct
Figure 9. Number of initial-state gluons in PYTHIA
from the direct-photon process at√
s = 1.8 TeV.
Figure 10. Net pT
due to all but the leading gluon inPYTHIA for direct-photon events.
photons in pp collisions at√
s = 1.8 TeV. The net pT
of such remnant gluons is 2.6 GeV/c for direct photonswith p
T= 10 GeV/c, and 5.2 GeV/c for p
T= 50 GeV/c.
At fixed-target energies, parton-showering models donot provide sufficient smearing because shower devel-opment is constrained by cut-off parameters that en-sure the perturbative nature of the process. Since tra-ditional NLO calculations do not account for the effectsof multiple soft-gluon emission, a kinematical modelwas employed to incorporate k
Teffects in available
pQCD calculations of direct-photon (and π0) produc-tion [ 24]. The relationship between this phenomeno-logical k
T-smearing and the Collins–Soper–Sterman
(CSS) resummation formalism [ 43, 44] was consideredin some detail in Ref. [ 29].
6
0
1
2
3
4
5
6
k T E
nhan
cem
ent
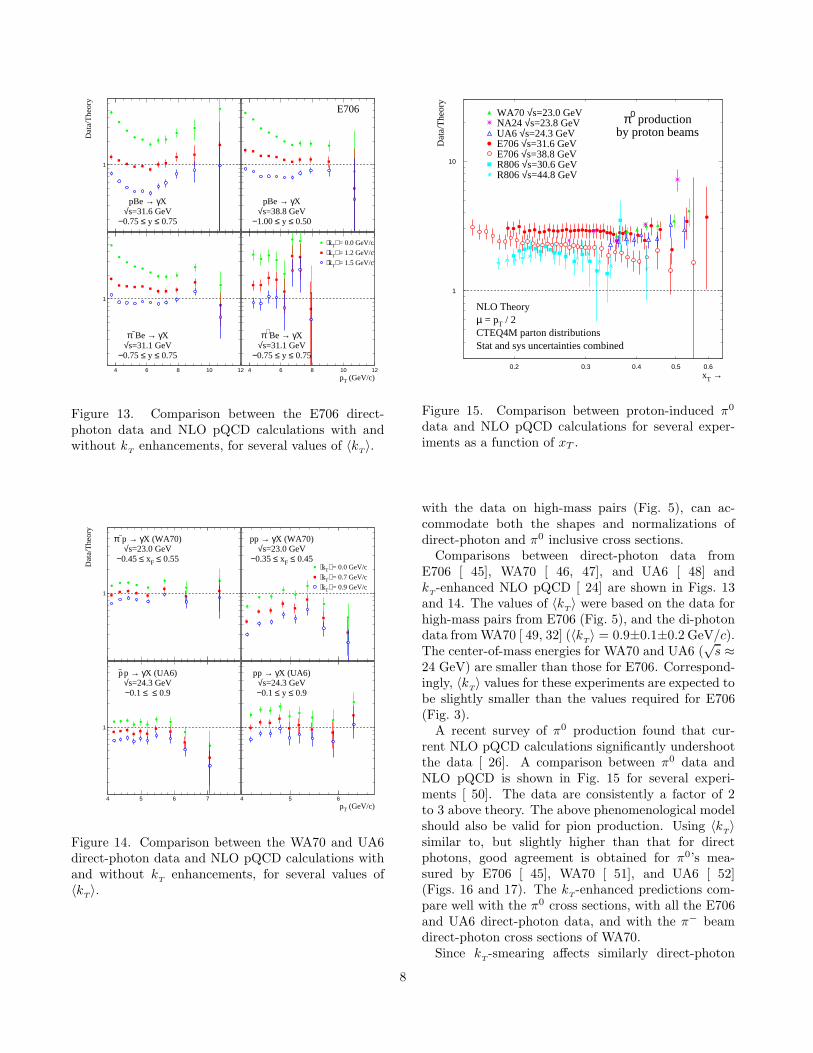
pBe → γX ⟨kT⟩ = 1.4 GeV/c⟨kT⟩ = 1.2 GeV/c⟨kT⟩ = 1.0 GeV/cMRST
0
1
2
3
4
5
6
4 5 6 7 8 9 10 11
pT (GeV/c)
pBe → π0X
√s= 31.6 GeV−0.75 ≤ y ≤ 0.75
Figure 11. The variation of kT
enhancements, K(pT),
for the E706 pBe data at√
s = 31.6 GeV.
The same LO pQCD [ 38] program that successfullycharacterized high-mass pair production was used togenerate K-factors (ratios of LO calculations for anygiven 〈k
T〉 to the result for k
T=0) for inclusive cross
sections (Fig. 11). These K-factors were then appliedto the NLO calculations. This procedure involves a riskof double-counting since some of the k
T-enhancements
may already be contained in the NLO calculation.However, the effects of such double-counting are ex-pected to be small [ 24].
As illustrated in the upper part of Fig. 11, theK-factors for direct-photon production at E706 arelarge over the full range of p
T, and have p
T-dependent
shapes—a behavior reminiscent of that obtained fromthe full resummation formalism [ 17]. The lower part ofFig. 11 displays K-factors for π0 production, based onthe same model. The data appear to require somewhatlarger values of 〈k
T〉 in the case of π0s. At the same
values of 〈kT〉 the K-factors in π0 production are some-
what smaller than for γ production. This is expectedbecause π0’s originate from the fragmentation of thepartons.
Figure 11 also displays the K-factor for photons usedby the MRST group [ 21] in recent fits to parton distri-butions. Their result was obtained through a differenttechnique involving analytical smearing of the param-eterized photon cross section, rather than an explicitparton-level calculation. Although the correction is ofsimilar size, it has a different p
T-dependence. It should
be noted, however, that despite the similarity in thevalues of the K-factors used by the MRST group andthe ones presented here, the 〈k
T〉 values cited by MRST
10-6
10-5
10-4
10-3
10-2
10-1
1
10
10 2
10 3
3 4 5 6 7 8 9 10 11 12
pT (GeV/c)
Ed3 σ/
dp3
pBe at √s=31.6 GeV (E706)−0.75 < y < 0.75
γ [pb/(GeV/c)2 per nucleon]π0 [nb/(GeV/c)2 per nucleon]
stat and sys uncertainties combined
NLO Theoryµ = pT / 2
⟨kT⟩ =
1.2 GeV/c (γ)
1.3 GeV/c (π0)
⟨kT⟩ = 0.0 GeV/c
CTEQ4M parton distributions
π0 uses BKK fragmentation function
Theory adjusted by Aα−1
Figure 12. The photon and π0 cross sections for E706pBe data at
√s = 31.6 GeV [ 45] compared to the
kT-enhanced NLO calculations.
are lower by a factor of 2. This difference can be tracedto an erroneous relation between parameters of theiranalytical smearing function and the transverse mo-menta of partons in the hard scatter [ 21]. This has al-ready been pointed out in Refs. [ 24, 27]. The approachused here [ 24] is based on explicit parton kinematicsand therefore does not suffer from this problem.
The treatment of kT-enhancements proposed in
Ref. [ 27], based on parton distributions unintegratedover the parton transverse momenta, suggests possiblemodifications of the above simple picture. Reference [27] imposes strong ordering of momentum transfers ofemitted gluons, which prevents transverse momenta ofthe incoming partonic system from approaching p
T; k
T
values are correlated with the scale at which the par-ton distributions are sampled. In their approach, theK-factors are expected to be smaller than those shownin Fig. 11, and have less p
T-dependence. Additional
scrutiny of the theoretical ideas should help resolvethese differences.
2.1.4. High-pT
ProductionFixed Target
Invariant cross sections for inclusive direct-photonand π0 production are displayed for the E706 pBedata at
√s = 31.6 GeV in Fig. 12, with overlays from
theory [ 45]. Discrepancies between NLO pQCD the-ory (dotted curves) and the data are striking. Theenhancements, generated using 〈k
T〉 values consistent
7
1
Dat
a/T
heor
y
pBe → γX√s=31.6 GeV
−0.75 ≤ y ≤ 0.75
pBe → γX√s=38.8 GeV
−1.00 ≤ y ≤ 0.50
E706
1
4 6 8 10 12
π−Be → γX√s=31.1 GeV
−0.75 ≤ y ≤ 0.75
4 6 8 10 12
pT (GeV/c)
π+Be → γX√s=31.1 GeV
−0.75 ≤ y ≤ 0.75
⟨kT⟩ = 0.0 GeV/c
⟨kT⟩ = 1.2 GeV/c
⟨kT⟩ = 1.5 GeV/c
Figure 13. Comparison between the E706 direct-photon data and NLO pQCD calculations with andwithout k
Tenhancements, for several values of 〈k
T〉.
1
Dat
a/T
heor
y
π−p → γX (WA70)√s=23.0 GeV
−0.45 ≤ xF ≤ 0.55
pp → γX (WA70)√s=23.0 GeV
−0.35 ≤ xF ≤ 0.45⟨kT⟩ = 0.0 GeV/c
⟨kT⟩ = 0.7 GeV/c
⟨kT⟩ = 0.9 GeV/c
1
4 5 6 7
p− p → γX (UA6)√s=24.3 GeV−0.1 ≤ ≤ 0.9
4 5 6
pT (GeV/c)
pp → γX (UA6)√s=24.3 GeV−0.1 ≤ y ≤ 0.9
Figure 14. Comparison between the WA70 and UA6direct-photon data and NLO pQCD calculations withand without k
Tenhancements, for several values of
〈kT〉.
1
10
0.2 0.3 0.4 0.5 0.6xT →
Dat
a/T
heor
y
WA70 √s=23.0 GeVNA24 √s=23.8 GeVUA6 √s=24.3 GeVE706 √s=31.6 GeVE706 √s=38.8 GeVR806 √s=30.6 GeVR806 √s=44.8 GeV
NLO Theoryµ = pT / 2CTEQ4M parton distributionsStat and sys uncertainties combined
π0 productionby proton beams
Figure 15. Comparison between proton-induced π0
data and NLO pQCD calculations for several exper-iments as a function of xT .
with the data on high-mass pairs (Fig. 5), can ac-commodate both the shapes and normalizations ofdirect-photon and π0 inclusive cross sections.
Comparisons between direct-photon data fromE706 [ 45], WA70 [ 46, 47], and UA6 [ 48] andk
T-enhanced NLO pQCD [ 24] are shown in Figs. 13
and 14. The values of 〈kT〉 were based on the data for
high-mass pairs from E706 (Fig. 5), and the di-photondata from WA70 [ 49, 32] (〈k
T〉 = 0.9±0.1±0.2 GeV/c).
The center-of-mass energies for WA70 and UA6 (√
s ≈24 GeV) are smaller than those for E706. Correspond-ingly, 〈k
T〉 values for these experiments are expected to
be slightly smaller than the values required for E706(Fig. 3).
A recent survey of π0 production found that cur-rent NLO pQCD calculations significantly undershootthe data [ 26]. A comparison between π0 data andNLO pQCD is shown in Fig. 15 for several experi-ments [ 50]. The data are consistently a factor of 2to 3 above theory. The above phenomenological modelshould also be valid for pion production. Using 〈k
T〉
similar to, but slightly higher than that for directphotons, good agreement is obtained for π0’s mea-sured by E706 [ 45], WA70 [ 51], and UA6 [ 52](Figs. 16 and 17). The k
T-enhanced predictions com-
pare well with the π0 cross sections, with all the E706and UA6 direct-photon data, and with the π− beamdirect-photon cross sections of WA70.
Since kT-smearing affects similarly direct-photon
8
1
Dat
a/T
heor
y
pBe → π0X√s=31.6 GeV
−0.75 ≤ y ≤ 0.75
pBe → π0X√s=38.8 GeV
−1.00 ≤ y ≤ 0.50
E706
1
4 6 8 10 12
π−Be → π0X√s=31.1 GeV
−0.75 ≤ y ≤ 0.75
4 6 8 10 12
pT (GeV/c)
π+Be → π0X√s=31.1 GeV
−0.75 ≤ y ≤ 0.75
⟨kT⟩ = 0.0 GeV/c
⟨kT⟩ = 1.3 GeV/c
⟨kT⟩ = 1.5 GeV/c
Figure 16. Comparison between the E706 π0 data andNLO pQCD calculations with and without k
Tenhance-
ments, for several values of 〈kT〉.
1
Dat
a/T
heor
y
π−p → π0X (WA70)√s=23.0 GeV
−0.45 ≤ xF ≤ 0.55
⟨kT⟩ = 0.0 GeV/c
⟨kT⟩ = 0.9 GeV/c
⟨kT⟩ = 1.1 GeV/c
pp → π0X (WA70)√s=23.0 GeV
−0.35 ≤ xF ≤ 0.45
1
4 5 6 7
p− p → π0X (UA6)√s=24.3 GeV−0.1 ≤ ≤ 0.9
4 5 6
pT (GeV/c)
pp → π0X (UA6)√s=24.3 GeV−0.1 ≤ y ≤ 0.9
Figure 17. Comparison between the WA70 and UA6 π0
data and an NLO pQCD calculation with and withoutk
Tenhancements, for several values of 〈k
T〉.
10-1
1
0.2 0.3 0.4 0.5 0.6xT →
γ/π0
WA70 (√s=23 GeV)UA6 (√s=24.3 GeV)E706 (√s=31.6 GeV)E706 (√s=38.8 GeV)R806 (√s=63 GeV)
γ/π0 in pp (pBe for E706†) reactions
†adjusted for A-dependence
Figure 18. Ratios of direct-photon cross sections tothe π0 cross sections as a function of p
Tfor various
experiments at several values of√
s.
and π0 data, the ratio of direct-photon to π0 pro-duction should be relatively insensitive to k
T. Ex-
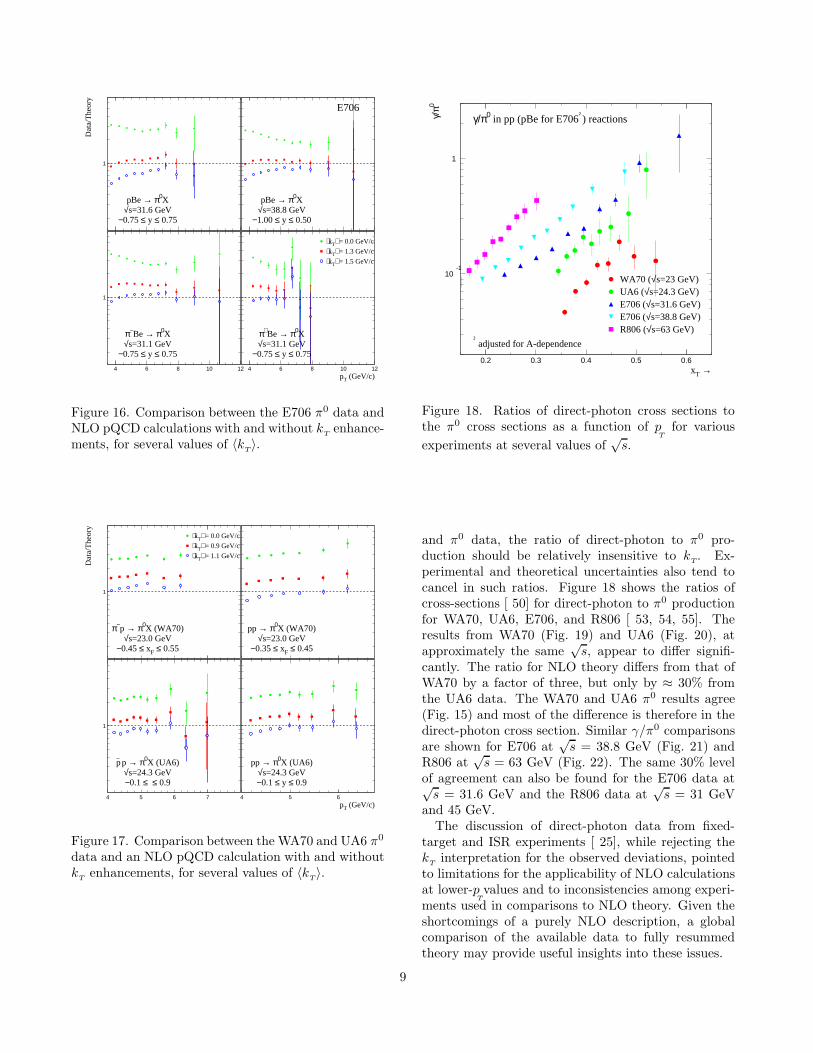
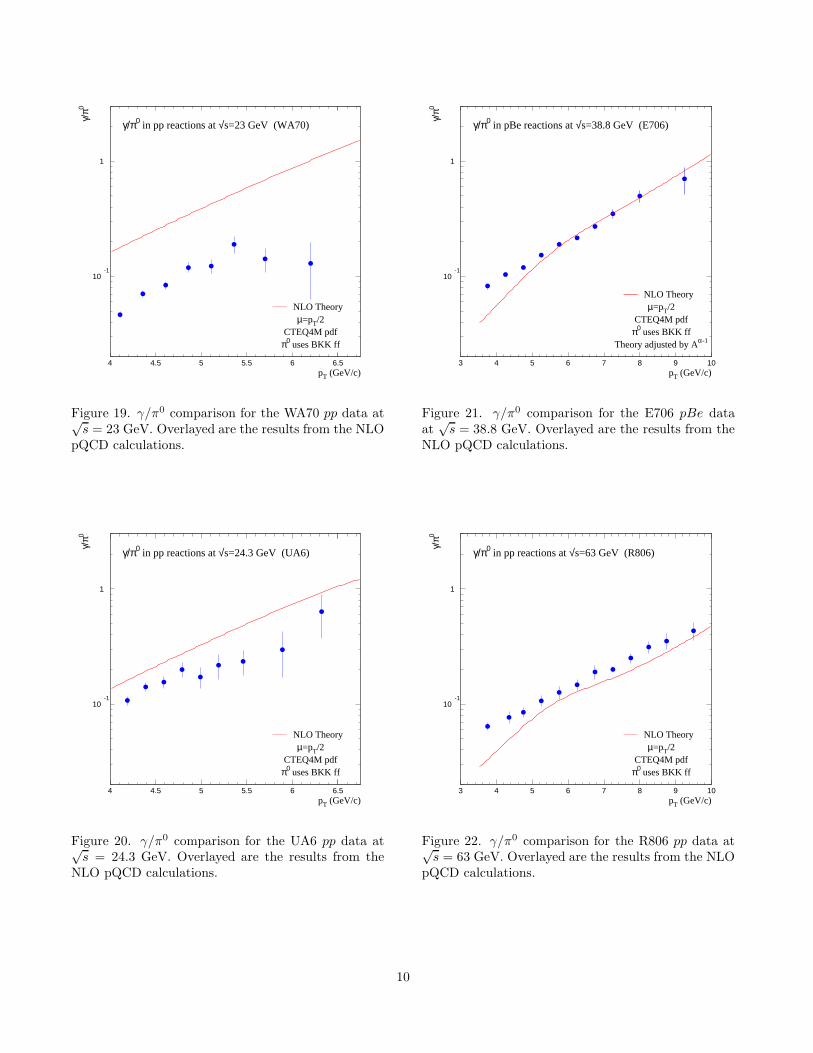
perimental and theoretical uncertainties also tend tocancel in such ratios. Figure 18 shows the ratios ofcross-sections [ 50] for direct-photon to π0 productionfor WA70, UA6, E706, and R806 [ 53, 54, 55]. Theresults from WA70 (Fig. 19) and UA6 (Fig. 20), atapproximately the same
√s, appear to differ signifi-
cantly. The ratio for NLO theory differs from that ofWA70 by a factor of three, but only by ≈ 30% fromthe UA6 data. The WA70 and UA6 π0 results agree(Fig. 15) and most of the difference is therefore in thedirect-photon cross section. Similar γ/π0 comparisonsare shown for E706 at
√s = 38.8 GeV (Fig. 21) and
R806 at√
s = 63 GeV (Fig. 22). The same 30% levelof agreement can also be found for the E706 data at√
s = 31.6 GeV and the R806 data at√
s = 31 GeVand 45 GeV.
The discussion of direct-photon data from fixed-target and ISR experiments [ 25], while rejecting thek
Tinterpretation for the observed deviations, pointed
to limitations for the applicability of NLO calculationsat lower-p
Tvalues and to inconsistencies among experi-
ments used in comparisons to NLO theory. Given theshortcomings of a purely NLO description, a globalcomparison of the available data to fully resummedtheory may provide useful insights into these issues.
9
10-1
1
4 4.5 5 5.5 6 6.5pT (GeV/c)
γ/π0
γ/π0 in pp reactions at √s=23 GeV (WA70)
NLO Theoryµ=pT/2
CTEQ4M pdfπ0 uses BKK ff
Figure 19. γ/π0 comparison for the WA70 pp data at√s = 23 GeV. Overlayed are the results from the NLO
pQCD calculations.
10-1
1
4 4.5 5 5.5 6 6.5pT (GeV/c)
γ/π0
γ/π0 in pp reactions at √s=24.3 GeV (UA6)
NLO Theoryµ=pT/2
CTEQ4M pdfπ0 uses BKK ff
Figure 20. γ/π0 comparison for the UA6 pp data at√s = 24.3 GeV. Overlayed are the results from the
NLO pQCD calculations.
10-1
1
3 4 5 6 7 8 9 10pT (GeV/c)
γ/π0
γ/π0 in pBe reactions at √s=38.8 GeV (E706)
NLO Theoryµ=pT/2
CTEQ4M pdfπ0 uses BKK ff
Theory adjusted by Aα-1
Figure 21. γ/π0 comparison for the E706 pBe dataat
√s = 38.8 GeV. Overlayed are the results from the
NLO pQCD calculations.
10-1
1
3 4 5 6 7 8 9 10pT (GeV/c)
γ/π0
γ/π0 in pp reactions at √s=63 GeV (R806)
NLO Theoryµ=pT/2
CTEQ4M pdfπ0 uses BKK ff
Figure 22. γ/π0 comparison for the R806 pp data at√s = 63 GeV. Overlayed are the results from the NLO
pQCD calculations.
10
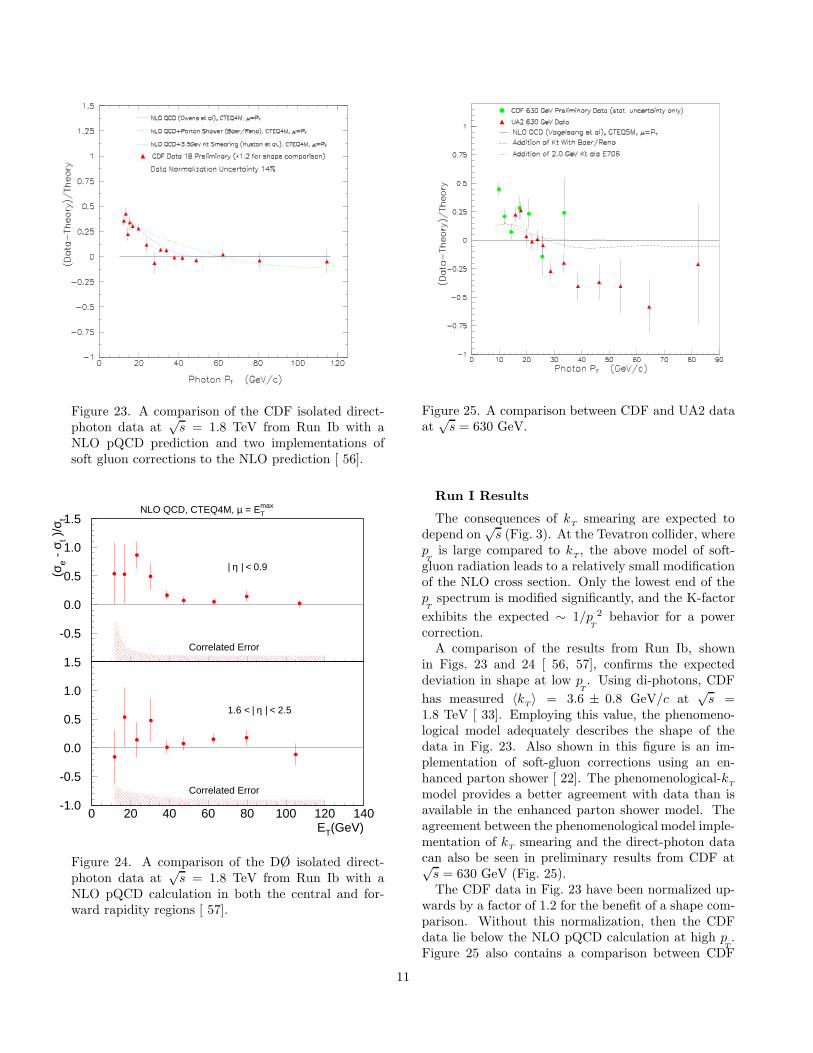
Figure 23. A comparison of the CDF isolated direct-photon data at
√s = 1.8 TeV from Run Ib with a
NLO pQCD prediction and two implementations ofsoft gluon corrections to the NLO prediction [ 56].
-0.5
0.0
0.5
1.0
1.5
(σe
- σ t )
/σt
NLO QCD, CTEQ4M, µ = ETmax
| η | < 0.9
Correlated Error
-1.0
-0.5
0.0
0.5
1.0
1.5
0 20 40 60 80 100 120 140ET(GeV)
1.6 < | η | < 2.5
Correlated Error
Figure 24. A comparison of the D6O isolated direct-photon data at
√s = 1.8 TeV from Run Ib with a
NLO pQCD calculation in both the central and for-ward rapidity regions [ 57].
Figure 25. A comparison between CDF and UA2 dataat
√s = 630 GeV.
Run I Results
The consequences of kT
smearing are expected todepend on
√s (Fig. 3). At the Tevatron collider, where
pT
is large compared to kT, the above model of soft-
gluon radiation leads to a relatively small modificationof the NLO cross section. Only the lowest end of thepT
spectrum is modified significantly, and the K-factor
exhibits the expected ∼ 1/pT
2 behavior for a powercorrection.
A comparison of the results from Run Ib, shownin Figs. 23 and 24 [ 56, 57], confirms the expecteddeviation in shape at low p
T. Using di-photons, CDF
has measured 〈kT〉 = 3.6 ± 0.8 GeV/c at
√s =
1.8 TeV [ 33]. Employing this value, the phenomeno-logical model adequately describes the shape of thedata in Fig. 23. Also shown in this figure is an im-plementation of soft-gluon corrections using an en-hanced parton shower [ 22]. The phenomenological-k
T
model provides a better agreement with data than isavailable in the enhanced parton shower model. Theagreement between the phenomenological model imple-mentation of k
Tsmearing and the direct-photon data
can also be seen in preliminary results from CDF at√s = 630 GeV (Fig. 25).The CDF data in Fig. 23 have been normalized up-
wards by a factor of 1.2 for the benefit of a shape com-parison. Without this normalization, then the CDFdata lie below the NLO pQCD calculation at high p
T.
Figure 25 also contains a comparison between CDF
11

0
1000
2000
3000
4000
5000
10 < pTγ < 15 GeV/c
pTch / pT
γ > 0.2
⟨kT⟩=0.0 GeV/c⟨kT⟩=2.5 GeV/c⟨kT⟩=3.5 GeV/c
0
50
100
150
200
250
300
350
120 140 160 180
Photon--Charged Particle ∆φ (deg)Photon--Charged Particle ∆φ (deg)Photon--Charged Particle ∆φ (deg)
30 < pTγ < 50 GeV/c
10 < pTγ < 15 GeV/c
-10 -5 0 5 10
Photon pOUT (GeV/c)Photon pOUT (GeV/c)Photon pOUT (GeV/c)
30 < pTγ < 50 GeV/c
Figure 26. Left: Distributions of azimuthal angle dif-ference ∆φ between the direct photon and a recoilcharged track for several values of k
Tand for two
photon pT
ranges. Right: Similar dependences for thephoton pOUT .
and UA2 [ 58, 59] data at√
s = 630 GeV, where asimilar deficit is observed at high p
Tfor the UA2 data.
There is currently no explanation for this effect.
2.1.5. Expectations for Run IIk
TStudies at Low-p
T
To study the level of kT
induced by multiple gluonemissions at the collider, the experiments have em-ployed the relatively low-statistics di-photon data. InRun II, both CDF and D6O will have precision mag-netic tracking, which will permit studies of k
Teffects
using “two-arm” data on pairs consisting of a directphoton and a recoil charged track, in a spirit similar tothat of the fixed-target investigations of γπ0 and π0π0
pairs discussed before. The advantage of this approachis that it will obviate the need for jet reconstruction(difficult at low p
T), and minimize complications from
jet energy scale calibration. Of course, photon+jetsystems are also of interest, but may be harder to studyin the range of interest for checking the effects of k
T
smearing.We simulated the expected behavior of photon–track
systems using the same LO Monte Carlo [ 38] employedin previous fixed-target studies. The results are illus-trated in Fig. 26 for ∆φ and pOUT of the photon, fortwo representative ranges of photon p
Tthat span the
region where the kT
effects appear to be important in
the inclusive photon cross sections from Run I. (For themeasurement of pOUT for photon, the scattering planeis defined by the colliding beams and the recoil track.)The sensitivity to the value of 〈k
T〉 in the range of 0
to 3.5 GeV/c is clearly seen for both variables. The ∆φdistributions become narrower with increasing photonpT, as expected from simple kinematic arguments. For
a fixed 〈kT〉, the width of the pOUT distributions is
relatively insensitive to pT, and can therefore be par-
ticularly useful for mapping out the dependence of kT
on event kinematics (especially on the pT
of the pho-
ton). To properly interpret the widths of such distri-butions in terms of k
Tinduced by gluon-radiation, it
is important to subtract the amount generated in thefragmentation of partons into the charged particles (aswas done in the fixed-target analyses).
Additional handles on interpreting the data canbe obtained through studies of p
Tdistributions of
charged particles from fragmentation of partons recoil-ing against direct-photon triggers. In the presence ofsignificant initial-state k
T, such distributions are ex-
pected to become softer than expected from standardfragmentation functions (determined e.g. from e+e−
data), since the kT-kick tends to increase the photon
pT
while taking it away from the recoil side. This shouldbe observed most clearly at low photon p
T’s, where the
effect from kT
is greatest.
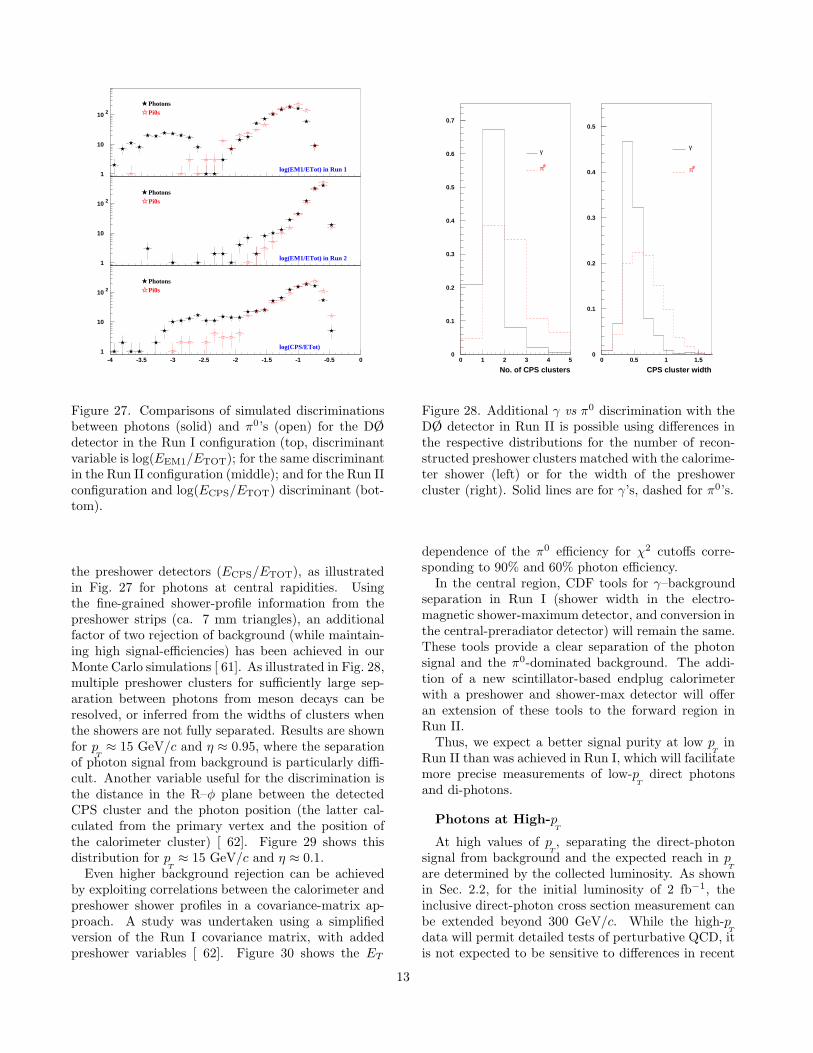
Photon Purity
The particularly interesting connection between two-arm studies and measurements of the inclusive photoncross section is mainly at relatively low p
T(10 GeV/c
to 35 GeV/c), where Run I results indicate significantdeviation of the cross section from expectations fromNLO pQCD (Figs. 23 and 24). This is also the region ofhigh statistics, and, consequently, where detailed stud-ies will be possible. It is therefore important to achievea high photon-signal purity in this region, which hasproved to be difficult in Run I.
In the case of D6O, calorimeter response will be mod-ified in Run II by the presence of a central solenoidmagnet and preshower detectors [ 60]. The separa-tion of photon signal and background in Run I wasbased on the fraction of electromagnetic energy de-tected in the first longitudinal layer of the calorimeter(EEM1/ETOT). This quantity is particularly sensitiveto differences in the early stages of shower develop-ment initiated by single photons, and by photons fromdecays of π0’s of the same p
T. In the Run II configu-
ration, the signal–background discrimination based onthis variable is expected to deteriorate, but simulationsindicate [ 61] that Run I performance can be recoveredby using instead the fraction of energy deposited in
12
1
10
10 2
★ Photons✩ Pi0s
log(EM1/ETot) in Run 1
1
10
10 2
★ Photons✩ Pi0s
log(EM1/ETot) in Run 2
1
10
10 2
-4 -3.5 -3 -2.5 -2 -1.5 -1 -0.5 0
★ Photons✩ Pi0s
log(CPS/ETot)
Figure 27. Comparisons of simulated discriminationsbetween photons (solid) and π0’s (open) for the D6Odetector in the Run I configuration (top, discriminantvariable is log(EEM1/ETOT); for the same discriminantin the Run II configuration (middle); and for the Run IIconfiguration and log(ECPS/ETOT) discriminant (bot-tom).
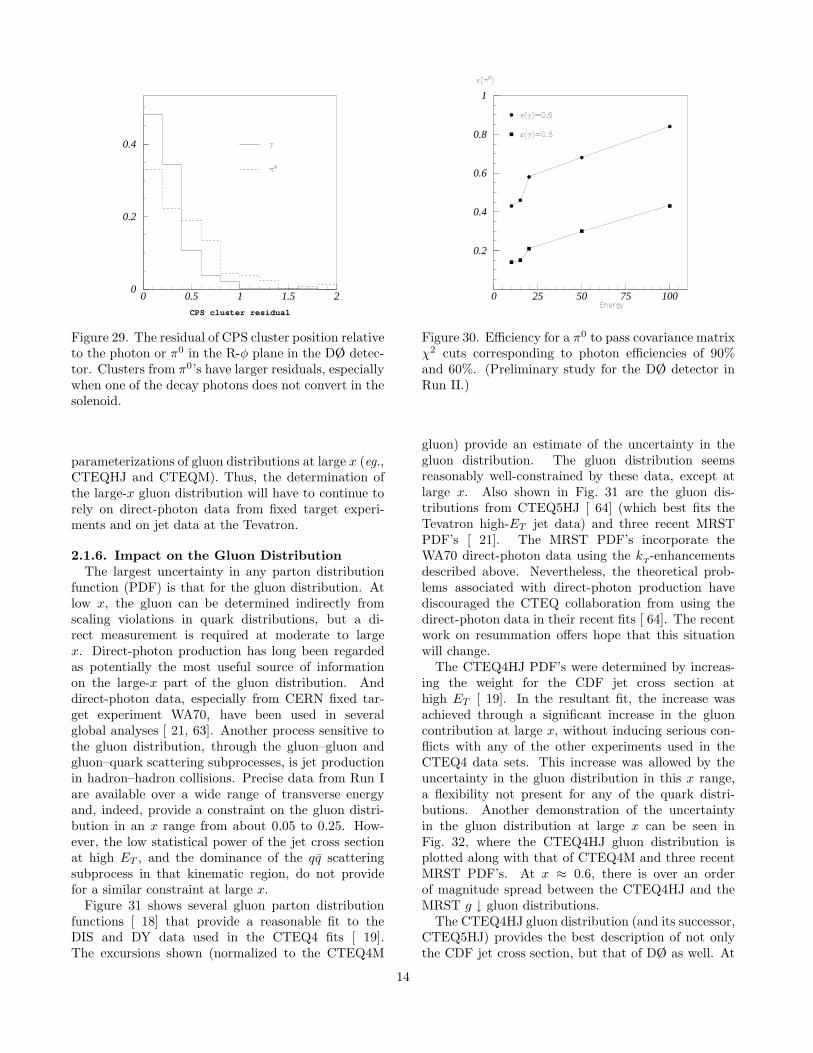
the preshower detectors (ECPS/ETOT), as illustratedin Fig. 27 for photons at central rapidities. Usingthe fine-grained shower-profile information from thepreshower strips (ca. 7 mm triangles), an additionalfactor of two rejection of background (while maintain-ing high signal-efficiencies) has been achieved in ourMonte Carlo simulations [ 61]. As illustrated in Fig. 28,multiple preshower clusters for sufficiently large sep-aration between photons from meson decays can beresolved, or inferred from the widths of clusters whenthe showers are not fully separated. Results are shownfor p
T≈ 15 GeV/c and η ≈ 0.95, where the separation
of photon signal from background is particularly diffi-cult. Another variable useful for the discrimination isthe distance in the R–φ plane between the detectedCPS cluster and the photon position (the latter cal-culated from the primary vertex and the position ofthe calorimeter cluster) [ 62]. Figure 29 shows thisdistribution for p
T≈ 15 GeV/c and η ≈ 0.1.
Even higher background rejection can be achievedby exploiting correlations between the calorimeter andpreshower shower profiles in a covariance-matrix ap-proach. A study was undertaken using a simplifiedversion of the Run I covariance matrix, with addedpreshower variables [ 62]. Figure 30 shows the ET
0
0.1
0.2
0.3
0.4
0.5
0.6
0.7
0 1 2 3 4 5
No. of CPS clusters
γ
π0
0
0.1
0.2
0.3
0.4
0.5
0 0.5 1 1.5
CPS cluster width
γ
π0
Figure 28. Additional γ vs π0 discrimination with theD6O detector in Run II is possible using differences inthe respective distributions for the number of recon-structed preshower clusters matched with the calorime-ter shower (left) or for the width of the preshowercluster (right). Solid lines are for γ’s, dashed for π0’s.
dependence of the π0 efficiency for χ2 cutoffs corre-sponding to 90% and 60% photon efficiency.
In the central region, CDF tools for γ–backgroundseparation in Run I (shower width in the electro-magnetic shower-maximum detector, and conversion inthe central-preradiator detector) will remain the same.These tools provide a clear separation of the photonsignal and the π0-dominated background. The addi-tion of a new scintillator-based endplug calorimeterwith a preshower and shower-max detector will offeran extension of these tools to the forward region inRun II.
Thus, we expect a better signal purity at low pT
inRun II than was achieved in Run I, which will facilitatemore precise measurements of low-p
Tdirect photons
and di-photons.
Photons at High-pT
At high values of pT, separating the direct-photon
signal from background and the expected reach in pT
are determined by the collected luminosity. As shownin Sec. 2.2, for the initial luminosity of 2 fb−1, theinclusive direct-photon cross section measurement canbe extended beyond 300 GeV/c. While the high-p
T
data will permit detailed tests of perturbative QCD, itis not expected to be sensitive to differences in recent
13
CPS cluster residual
0
0.2
0.4
0 0.5 1 1.5 2
Figure 29. The residual of CPS cluster position relativeto the photon or π0 in the R-φ plane in the D6O detec-tor. Clusters from π0’s have larger residuals, especiallywhen one of the decay photons does not convert in thesolenoid.
parameterizations of gluon distributions at large x (eg.,CTEQHJ and CTEQM). Thus, the determination ofthe large-x gluon distribution will have to continue torely on direct-photon data from fixed target experi-ments and on jet data at the Tevatron.
2.1.6. Impact on the Gluon DistributionThe largest uncertainty in any parton distribution
function (PDF) is that for the gluon distribution. Atlow x, the gluon can be determined indirectly fromscaling violations in quark distributions, but a di-rect measurement is required at moderate to largex. Direct-photon production has long been regardedas potentially the most useful source of informationon the large-x part of the gluon distribution. Anddirect-photon data, especially from CERN fixed tar-get experiment WA70, have been used in severalglobal analyses [ 21, 63]. Another process sensitive tothe gluon distribution, through the gluon–gluon andgluon–quark scattering subprocesses, is jet productionin hadron–hadron collisions. Precise data from Run Iare available over a wide range of transverse energyand, indeed, provide a constraint on the gluon distri-bution in an x range from about 0.05 to 0.25. How-ever, the low statistical power of the jet cross sectionat high ET , and the dominance of the qq scatteringsubprocess in that kinematic region, do not providefor a similar constraint at large x.
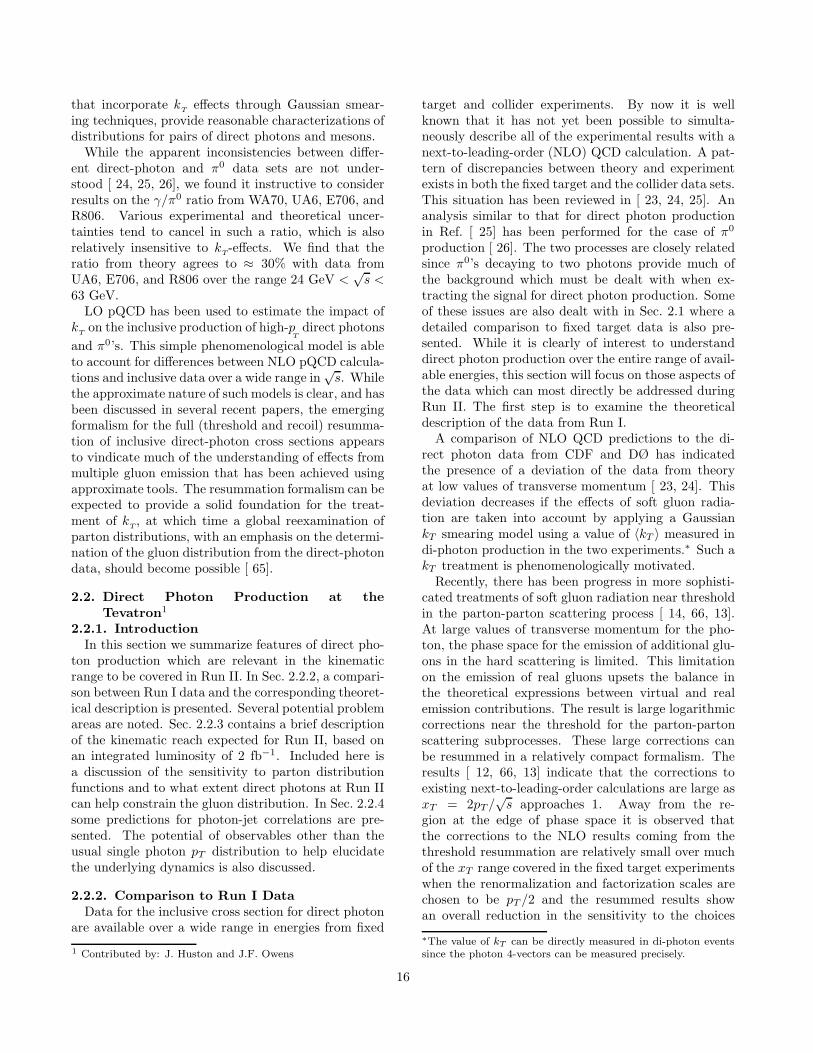
Figure 31 shows several gluon parton distributionfunctions [ 18] that provide a reasonable fit to theDIS and DY data used in the CTEQ4 fits [ 19].The excursions shown (normalized to the CTEQ4M
0.2
0.4
0.6
0.8
1
0 25 50 75 100
Figure 30. Efficiency for a π0 to pass covariance matrixχ2 cuts corresponding to photon efficiencies of 90%and 60%. (Preliminary study for the D6O detector inRun II.)
gluon) provide an estimate of the uncertainty in thegluon distribution. The gluon distribution seemsreasonably well-constrained by these data, except atlarge x. Also shown in Fig. 31 are the gluon dis-tributions from CTEQ5HJ [ 64] (which best fits theTevatron high-ET jet data) and three recent MRSTPDF’s [ 21]. The MRST PDF’s incorporate theWA70 direct-photon data using the k
T-enhancements
described above. Nevertheless, the theoretical prob-lems associated with direct-photon production havediscouraged the CTEQ collaboration from using thedirect-photon data in their recent fits [ 64]. The recentwork on resummation offers hope that this situationwill change.
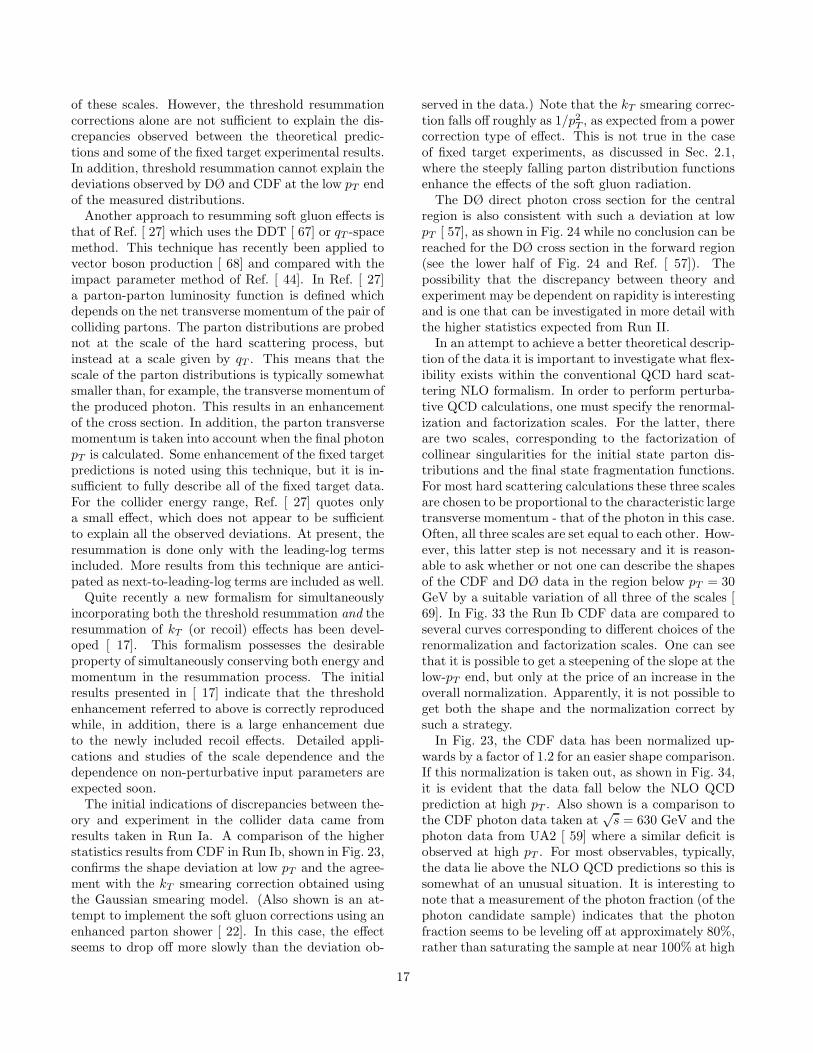
The CTEQ4HJ PDF’s were determined by increas-ing the weight for the CDF jet cross section athigh ET [ 19]. In the resultant fit, the increase wasachieved through a significant increase in the gluoncontribution at large x, without inducing serious con-flicts with any of the other experiments used in theCTEQ4 data sets. This increase was allowed by theuncertainty in the gluon distribution in this x range,a flexibility not present for any of the quark distri-butions. Another demonstration of the uncertaintyin the gluon distribution at large x can be seen inFig. 32, where the CTEQ4HJ gluon distribution isplotted along with that of CTEQ4M and three recentMRST PDF’s. At x ≈ 0.6, there is over an orderof magnitude spread between the CTEQ4HJ and theMRST g ↓ gluon distributions.
The CTEQ4HJ gluon distribution (and its successor,CTEQ5HJ) provides the best description of not onlythe CDF jet cross section, but that of D6O as well. At
14
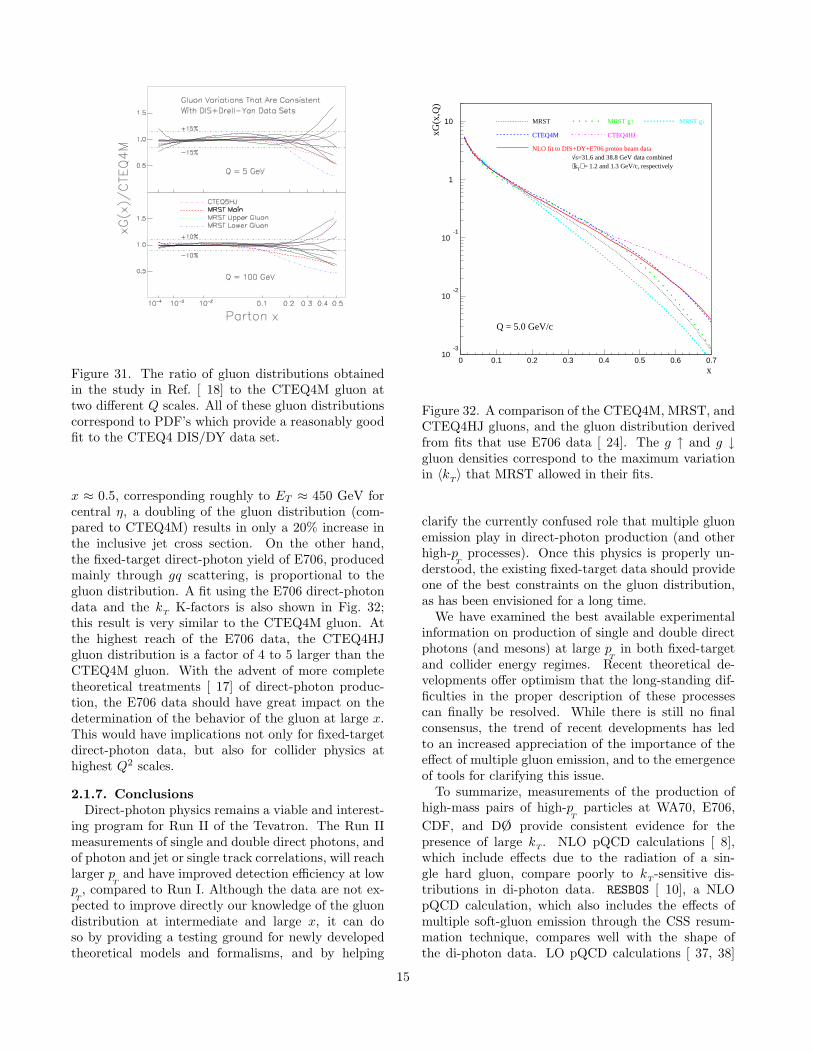
Figure 31. The ratio of gluon distributions obtainedin the study in Ref. [ 18] to the CTEQ4M gluon attwo different Q scales. All of these gluon distributionscorrespond to PDF’s which provide a reasonably goodfit to the CTEQ4 DIS/DY data set.
x ≈ 0.5, corresponding roughly to ET ≈ 450 GeV forcentral η, a doubling of the gluon distribution (com-pared to CTEQ4M) results in only a 20% increase inthe inclusive jet cross section. On the other hand,the fixed-target direct-photon yield of E706, producedmainly through gq scattering, is proportional to thegluon distribution. A fit using the E706 direct-photondata and the k
TK-factors is also shown in Fig. 32;
this result is very similar to the CTEQ4M gluon. Atthe highest reach of the E706 data, the CTEQ4HJgluon distribution is a factor of 4 to 5 larger than theCTEQ4M gluon. With the advent of more completetheoretical treatments [ 17] of direct-photon produc-tion, the E706 data should have great impact on thedetermination of the behavior of the gluon at large x.This would have implications not only for fixed-targetdirect-photon data, but also for collider physics athighest Q2 scales.
2.1.7. ConclusionsDirect-photon physics remains a viable and interest-
ing program for Run II of the Tevatron. The Run IImeasurements of single and double direct photons, andof photon and jet or single track correlations, will reachlarger p
Tand have improved detection efficiency at low
pT, compared to Run I. Although the data are not ex-
pected to improve directly our knowledge of the gluondistribution at intermediate and large x, it can doso by providing a testing ground for newly developedtheoretical models and formalisms, and by helping
10-3
10-2
10-1
1
10
0 0.1 0.2 0.3 0.4 0.5 0.6 0.7x
xG(x
,Q)
MRST MRST g↑ MRST g↓
CTEQ4HJCTEQ4M
NLO fit to DIS+DY+E706 proton beam data√s=31.6 and 38.8 GeV data combined⟨kT⟩ = 1.2 and 1.3 GeV/c, respectively
Q = 5.0 GeV/c
Figure 32. A comparison of the CTEQ4M, MRST, andCTEQ4HJ gluons, and the gluon distribution derivedfrom fits that use E706 data [ 24]. The g ↑ and g ↓gluon densities correspond to the maximum variationin 〈k
T〉 that MRST allowed in their fits.
clarify the currently confused role that multiple gluonemission play in direct-photon production (and otherhigh-p
Tprocesses). Once this physics is properly un-
derstood, the existing fixed-target data should provideone of the best constraints on the gluon distribution,as has been envisioned for a long time.
We have examined the best available experimentalinformation on production of single and double directphotons (and mesons) at large p
Tin both fixed-target
and collider energy regimes. Recent theoretical de-velopments offer optimism that the long-standing dif-ficulties in the proper description of these processescan finally be resolved. While there is still no finalconsensus, the trend of recent developments has ledto an increased appreciation of the importance of theeffect of multiple gluon emission, and to the emergenceof tools for clarifying this issue.
To summarize, measurements of the production ofhigh-mass pairs of high-p
Tparticles at WA70, E706,
CDF, and D6O provide consistent evidence for thepresence of large k
T. NLO pQCD calculations [ 8],
which include effects due to the radiation of a sin-gle hard gluon, compare poorly to k
T-sensitive dis-
tributions in di-photon data. RESBOS [ 10], a NLOpQCD calculation, which also includes the effects ofmultiple soft-gluon emission through the CSS resum-mation technique, compares well with the shape ofthe di-photon data. LO pQCD calculations [ 37, 38]
15
that incorporate kT
effects through Gaussian smear-ing techniques, provide reasonable characterizations ofdistributions for pairs of direct photons and mesons.
While the apparent inconsistencies between differ-ent direct-photon and π0 data sets are not under-stood [ 24, 25, 26], we found it instructive to considerresults on the γ/π0 ratio from WA70, UA6, E706, andR806. Various experimental and theoretical uncer-tainties tend to cancel in such a ratio, which is alsorelatively insensitive to k
T-effects. We find that the
ratio from theory agrees to ≈ 30% with data fromUA6, E706, and R806 over the range 24 GeV <
√s <
63 GeV.LO pQCD has been used to estimate the impact of
kT
on the inclusive production of high-pT
direct photons
and π0’s. This simple phenomenological model is ableto account for differences between NLO pQCD calcula-tions and inclusive data over a wide range in
√s. While
the approximate nature of such models is clear, and hasbeen discussed in several recent papers, the emergingformalism for the full (threshold and recoil) resumma-tion of inclusive direct-photon cross sections appearsto vindicate much of the understanding of effects frommultiple gluon emission that has been achieved usingapproximate tools. The resummation formalism can beexpected to provide a solid foundation for the treat-ment of k
T, at which time a global reexamination of
parton distributions, with an emphasis on the determi-nation of the gluon distribution from the direct-photondata, should become possible [ 65].
2.2. Direct Photon Production at theTevatron1
2.2.1. IntroductionIn this section we summarize features of direct pho-
ton production which are relevant in the kinematicrange to be covered in Run II. In Sec. 2.2.2, a compari-son between Run I data and the corresponding theoret-ical description is presented. Several potential problemareas are noted. Sec. 2.2.3 contains a brief descriptionof the kinematic reach expected for Run II, based onan integrated luminosity of 2 fb−1. Included here isa discussion of the sensitivity to parton distributionfunctions and to what extent direct photons at Run IIcan help constrain the gluon distribution. In Sec. 2.2.4some predictions for photon-jet correlations are pre-sented. The potential of observables other than theusual single photon pT distribution to help elucidatethe underlying dynamics is also discussed.
2.2.2. Comparison to Run I DataData for the inclusive cross section for direct photon
are available over a wide range in energies from fixed
1 Contributed by: J. Huston and J.F. Owens
target and collider experiments. By now it is wellknown that it has not yet been possible to simulta-neously describe all of the experimental results with anext-to-leading-order (NLO) QCD calculation. A pat-tern of discrepancies between theory and experimentexists in both the fixed target and the collider data sets.This situation has been reviewed in [ 23, 24, 25]. Ananalysis similar to that for direct photon productionin Ref. [ 25] has been performed for the case of π0
production [ 26]. The two processes are closely relatedsince π0’s decaying to two photons provide much ofthe background which must be dealt with when ex-tracting the signal for direct photon production. Someof these issues are also dealt with in Sec. 2.1 where adetailed comparison to fixed target data is also pre-sented. While it is clearly of interest to understanddirect photon production over the entire range of avail-able energies, this section will focus on those aspects ofthe data which can most directly be addressed duringRun II. The first step is to examine the theoreticaldescription of the data from Run I.
A comparison of NLO QCD predictions to the di-rect photon data from CDF and DØ has indicatedthe presence of a deviation of the data from theoryat low values of transverse momentum [ 23, 24]. Thisdeviation decreases if the effects of soft gluon radia-tion are taken into account by applying a GaussiankT smearing model using a value of 〈kT 〉 measured indi-photon production in the two experiments.∗ Such akT treatment is phenomenologically motivated.
Recently, there has been progress in more sophisti-cated treatments of soft gluon radiation near thresholdin the parton-parton scattering process [ 14, 66, 13].At large values of transverse momentum for the pho-ton, the phase space for the emission of additional glu-ons in the hard scattering is limited. This limitationon the emission of real gluons upsets the balance inthe theoretical expressions between virtual and realemission contributions. The result is large logarithmiccorrections near the threshold for the parton-partonscattering subprocesses. These large corrections canbe resummed in a relatively compact formalism. Theresults [ 12, 66, 13] indicate that the corrections toexisting next-to-leading-order calculations are large asxT = 2pT /
√s approaches 1. Away from the re-
gion at the edge of phase space it is observed thatthe corrections to the NLO results coming from thethreshold resummation are relatively small over muchof the xT range covered in the fixed target experimentswhen the renormalization and factorization scales arechosen to be pT /2 and the resummed results showan overall reduction in the sensitivity to the choices
∗The value of kT can be directly measured in di-photon eventssince the photon 4-vectors can be measured precisely.
16
of these scales. However, the threshold resummationcorrections alone are not sufficient to explain the dis-crepancies observed between the theoretical predic-tions and some of the fixed target experimental results.In addition, threshold resummation cannot explain thedeviations observed by DØ and CDF at the low pT endof the measured distributions.
Another approach to resumming soft gluon effects isthat of Ref. [ 27] which uses the DDT [ 67] or qT -spacemethod. This technique has recently been applied tovector boson production [ 68] and compared with theimpact parameter method of Ref. [ 44]. In Ref. [ 27]a parton-parton luminosity function is defined whichdepends on the net transverse momentum of the pair ofcolliding partons. The parton distributions are probednot at the scale of the hard scattering process, butinstead at a scale given by qT . This means that thescale of the parton distributions is typically somewhatsmaller than, for example, the transverse momentum ofthe produced photon. This results in an enhancementof the cross section. In addition, the parton transversemomentum is taken into account when the final photonpT is calculated. Some enhancement of the fixed targetpredictions is noted using this technique, but it is in-sufficient to fully describe all of the fixed target data.For the collider energy range, Ref. [ 27] quotes onlya small effect, which does not appear to be sufficientto explain all the observed deviations. At present, theresummation is done only with the leading-log termsincluded. More results from this technique are antici-pated as next-to-leading-log terms are included as well.
Quite recently a new formalism for simultaneouslyincorporating both the threshold resummation and theresummation of kT (or recoil) effects has been devel-oped [ 17]. This formalism possesses the desirableproperty of simultaneously conserving both energy andmomentum in the resummation process. The initialresults presented in [ 17] indicate that the thresholdenhancement referred to above is correctly reproducedwhile, in addition, there is a large enhancement dueto the newly included recoil effects. Detailed appli-cations and studies of the scale dependence and thedependence on non-perturbative input parameters areexpected soon.
The initial indications of discrepancies between the-ory and experiment in the collider data came fromresults taken in Run Ia. A comparison of the higherstatistics results from CDF in Run Ib, shown in Fig. 23,confirms the shape deviation at low pT and the agree-ment with the kT smearing correction obtained usingthe Gaussian smearing model. (Also shown is an at-tempt to implement the soft gluon corrections using anenhanced parton shower [ 22]. In this case, the effectseems to drop off more slowly than the deviation ob-
served in the data.) Note that the kT smearing correc-tion falls off roughly as 1/p2
T , as expected from a powercorrection type of effect. This is not true in the caseof fixed target experiments, as discussed in Sec. 2.1,where the steeply falling parton distribution functionsenhance the effects of the soft gluon radiation.
The DØ direct photon cross section for the centralregion is also consistent with such a deviation at lowpT [ 57], as shown in Fig. 24 while no conclusion can bereached for the DØ cross section in the forward region(see the lower half of Fig. 24 and Ref. [ 57]). Thepossibility that the discrepancy between theory andexperiment may be dependent on rapidity is interestingand is one that can be investigated in more detail withthe higher statistics expected from Run II.
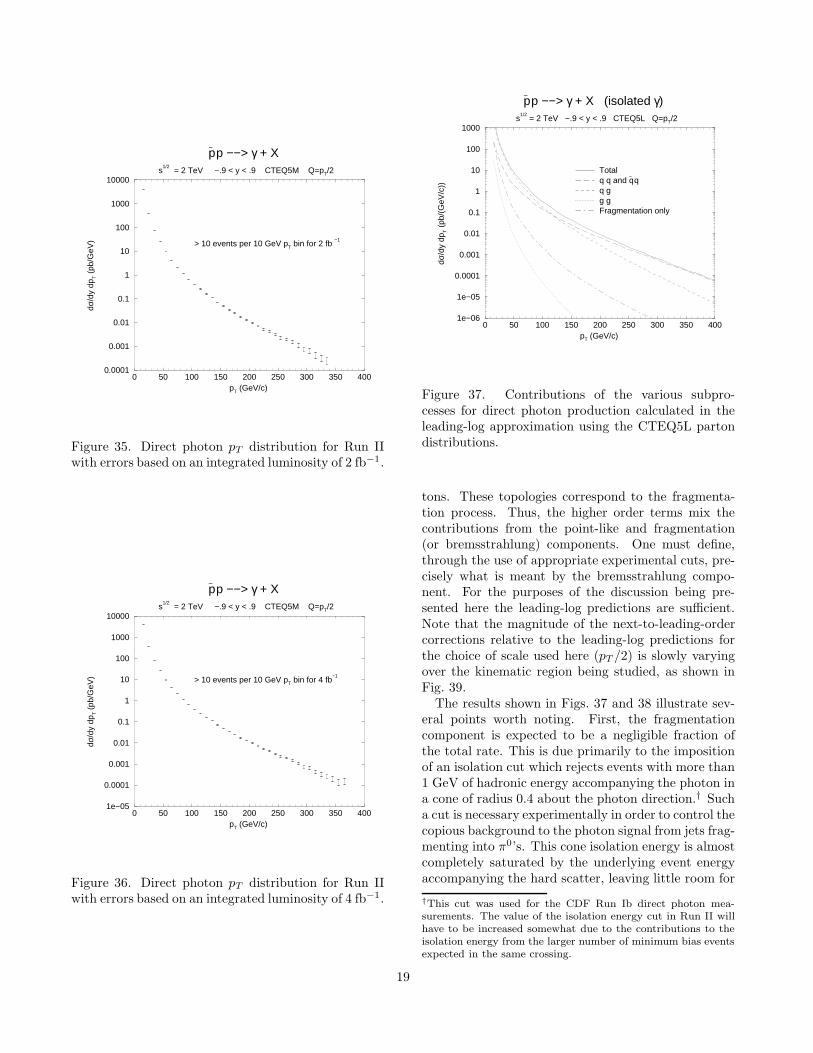
In an attempt to achieve a better theoretical descrip-tion of the data it is important to investigate what flex-ibility exists within the conventional QCD hard scat-tering NLO formalism. In order to perform perturba-tive QCD calculations, one must specify the renormal-ization and factorization scales. For the latter, thereare two scales, corresponding to the factorization ofcollinear singularities for the initial state parton dis-tributions and the final state fragmentation functions.For most hard scattering calculations these three scalesare chosen to be proportional to the characteristic largetransverse momentum - that of the photon in this case.Often, all three scales are set equal to each other. How-ever, this latter step is not necessary and it is reason-able to ask whether or not one can describe the shapesof the CDF and DØ data in the region below pT = 30GeV by a suitable variation of all three of the scales [69]. In Fig. 33 the Run Ib CDF data are compared toseveral curves corresponding to different choices of therenormalization and factorization scales. One can seethat it is possible to get a steepening of the slope at thelow-pT end, but only at the price of an increase in theoverall normalization. Apparently, it is not possible toget both the shape and the normalization correct bysuch a strategy.
In Fig. 23, the CDF data has been normalized up-wards by a factor of 1.2 for an easier shape comparison.If this normalization is taken out, as shown in Fig. 34,it is evident that the data fall below the NLO QCDprediction at high pT . Also shown is a comparison tothe CDF photon data taken at
√s = 630 GeV and the
photon data from UA2 [ 59] where a similar deficit isobserved at high pT . For most observables, typically,the data lie above the NLO QCD predictions so this issomewhat of an unusual situation. It is interesting tonote that a measurement of the photon fraction (of thephoton candidate sample) indicates that the photonfraction seems to be leveling off at approximately 80%,rather than saturating the sample at near 100% at high
17
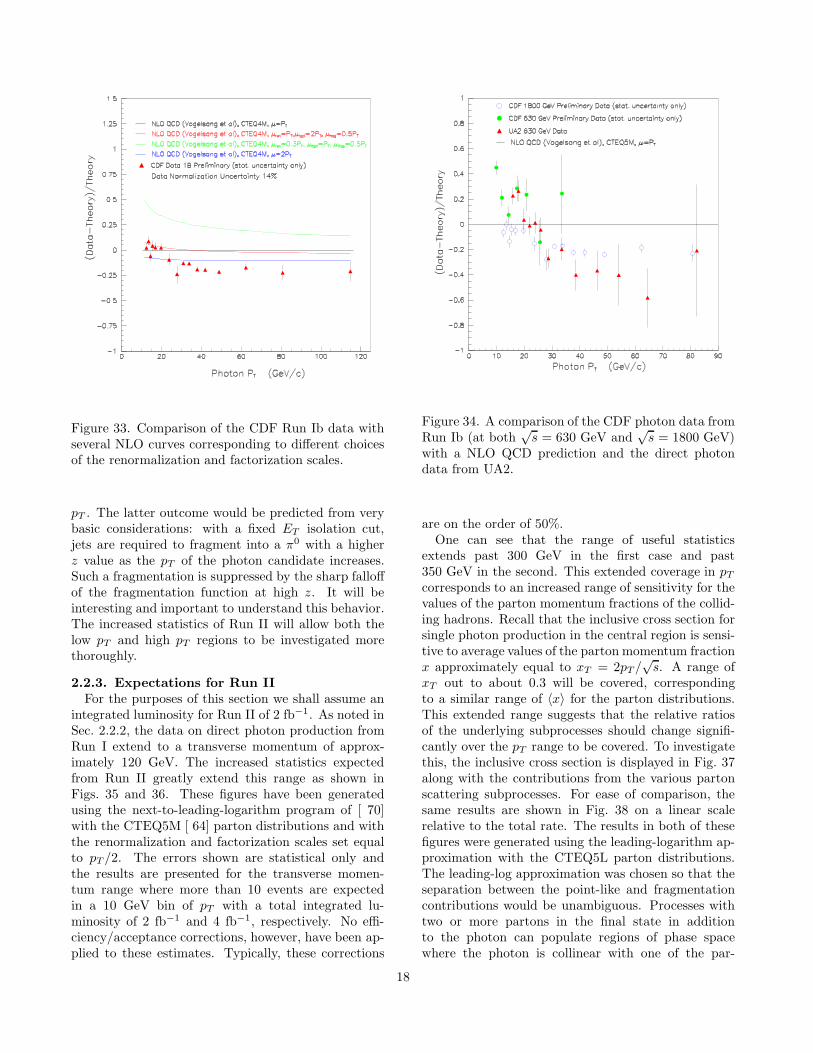
Figure 33. Comparison of the CDF Run Ib data withseveral NLO curves corresponding to different choicesof the renormalization and factorization scales.
pT . The latter outcome would be predicted from verybasic considerations: with a fixed ET isolation cut,jets are required to fragment into a π0 with a higherz value as the pT of the photon candidate increases.Such a fragmentation is suppressed by the sharp falloffof the fragmentation function at high z. It will beinteresting and important to understand this behavior.The increased statistics of Run II will allow both thelow pT and high pT regions to be investigated morethoroughly.
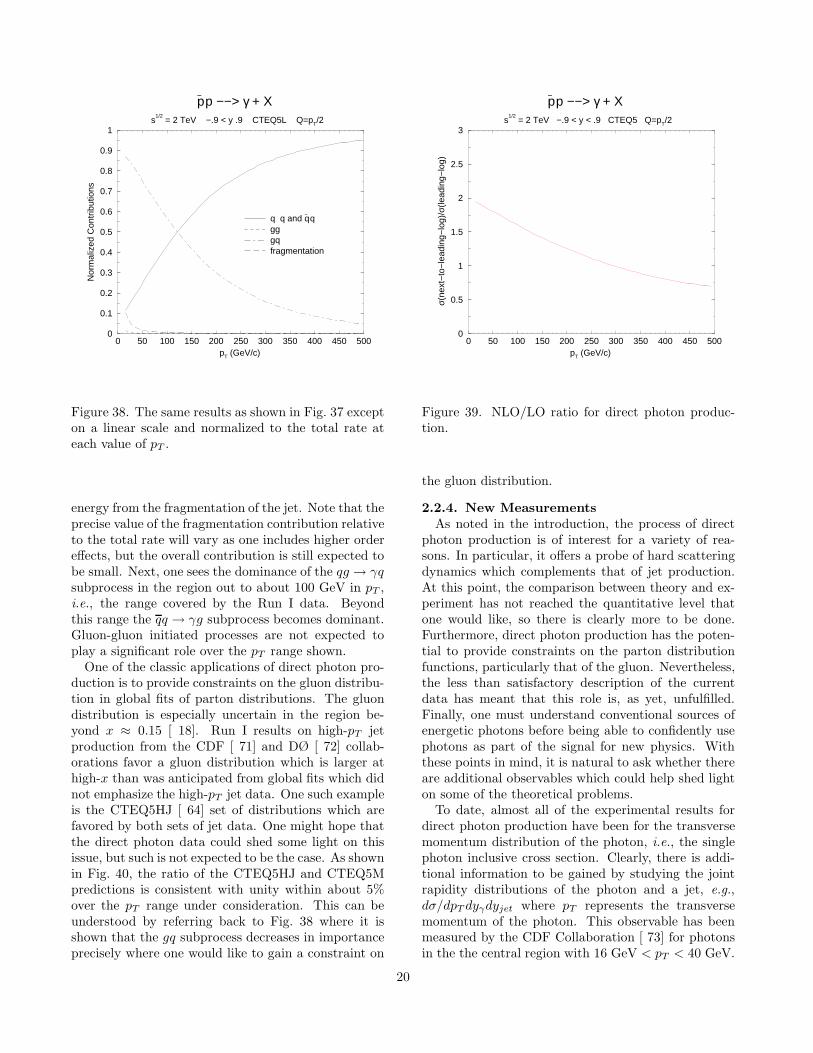
2.2.3. Expectations for Run IIFor the purposes of this section we shall assume an
integrated luminosity for Run II of 2 fb−1. As noted inSec. 2.2.2, the data on direct photon production fromRun I extend to a transverse momentum of approx-imately 120 GeV. The increased statistics expectedfrom Run II greatly extend this range as shown inFigs. 35 and 36. These figures have been generatedusing the next-to-leading-logarithm program of [ 70]with the CTEQ5M [ 64] parton distributions and withthe renormalization and factorization scales set equalto pT /2. The errors shown are statistical only andthe results are presented for the transverse momen-tum range where more than 10 events are expectedin a 10 GeV bin of pT with a total integrated lu-minosity of 2 fb−1 and 4 fb−1, respectively. No effi-ciency/acceptance corrections, however, have been ap-plied to these estimates. Typically, these corrections
Figure 34. A comparison of the CDF photon data fromRun Ib (at both
√s = 630 GeV and
√s = 1800 GeV)
with a NLO QCD prediction and the direct photondata from UA2.
are on the order of 50%.One can see that the range of useful statistics
extends past 300 GeV in the first case and past350 GeV in the second. This extended coverage in pT
corresponds to an increased range of sensitivity for thevalues of the parton momentum fractions of the collid-ing hadrons. Recall that the inclusive cross section forsingle photon production in the central region is sensi-tive to average values of the parton momentum fractionx approximately equal to xT = 2pT /
√s. A range of
xT out to about 0.3 will be covered, correspondingto a similar range of 〈x〉 for the parton distributions.This extended range suggests that the relative ratiosof the underlying subprocesses should change signifi-cantly over the pT range to be covered. To investigatethis, the inclusive cross section is displayed in Fig. 37along with the contributions from the various partonscattering subprocesses. For ease of comparison, thesame results are shown in Fig. 38 on a linear scalerelative to the total rate. The results in both of thesefigures were generated using the leading-logarithm ap-proximation with the CTEQ5L parton distributions.The leading-log approximation was chosen so that theseparation between the point-like and fragmentationcontributions would be unambiguous. Processes withtwo or more partons in the final state in additionto the photon can populate regions of phase spacewhere the photon is collinear with one of the par-
18
0 50 100 150 200 250 300 350 400pT (GeV/c)
0.0001
0.001
0.01
0.1
1
10
100
1000
10000
dσ/d
y dp
T (
pb/G
eV)
p− p −−> γ + X
s1/2
= 2 TeV −.9 < y < .9 CTEQ5M Q=pT/2
> 10 events per 10 GeV pT bin for 2 fb −1
Figure 35. Direct photon pT distribution for Run IIwith errors based on an integrated luminosity of 2 fb−1.
0 50 100 150 200 250 300 350 400pT (GeV/c)
1e−05
0.0001
0.001
0.01
0.1
1
10
100
1000
10000
dσ/d
y dp
T (
pb/G
eV)
p− p −−> γ + X
s1/2
= 2 TeV −.9 < y < .9 CTEQ5M Q=pT/2
> 10 events per 10 GeV pT bin for 4 fb−1
Figure 36. Direct photon pT distribution for Run IIwith errors based on an integrated luminosity of 4 fb−1.
0 50 100 150 200 250 300 350 400pT (GeV/c)
1e−06
1e−05
0.0001
0.001
0.01
0.1
1
10
100
1000
dσ/d
y dp
T (
pb/(
GeV
/c))
p− p −−> γ + X (isolated γ)
s1/2
= 2 TeV −.9 < y < .9 CTEQ5L Q=pT/2
Totalq q and q
− q
q gg gFragmentation only
Figure 37. Contributions of the various subpro-cesses for direct photon production calculated in theleading-log approximation using the CTEQ5L partondistributions.
tons. These topologies correspond to the fragmenta-tion process. Thus, the higher order terms mix thecontributions from the point-like and fragmentation(or bremsstrahlung) components. One must define,through the use of appropriate experimental cuts, pre-cisely what is meant by the bremsstrahlung compo-nent. For the purposes of the discussion being pre-sented here the leading-log predictions are sufficient.Note that the magnitude of the next-to-leading-ordercorrections relative to the leading-log predictions forthe choice of scale used here (pT /2) is slowly varyingover the kinematic region being studied, as shown inFig. 39.
The results shown in Figs. 37 and 38 illustrate sev-eral points worth noting. First, the fragmentationcomponent is expected to be a negligible fraction ofthe total rate. This is due primarily to the impositionof an isolation cut which rejects events with more than1 GeV of hadronic energy accompanying the photon ina cone of radius 0.4 about the photon direction.† Sucha cut is necessary experimentally in order to control thecopious background to the photon signal from jets frag-menting into π0’s. This cone isolation energy is almostcompletely saturated by the underlying event energyaccompanying the hard scatter, leaving little room for
†This cut was used for the CDF Run Ib direct photon mea-surements. The value of the isolation energy cut in Run II willhave to be increased somewhat due to the contributions to theisolation energy from the larger number of minimum bias eventsexpected in the same crossing.
19
0 50 100 150 200 250 300 350 400 450 500pT (GeV/c)
0
0.1
0.2
0.3
0.4
0.5
0.6
0.7
0.8
0.9
1
Nor
mal
ized
Con
trib
utio
nsp− p −−> γ + X
s1/2
= 2 TeV −.9 < y .9 CTEQ5L Q=pT/2
q q and q− q
gg gq fragmentation
Figure 38. The same results as shown in Fig. 37 excepton a linear scale and normalized to the total rate ateach value of pT .
energy from the fragmentation of the jet. Note that theprecise value of the fragmentation contribution relativeto the total rate will vary as one includes higher ordereffects, but the overall contribution is still expected tobe small. Next, one sees the dominance of the qg → γqsubprocess in the region out to about 100 GeV in pT ,i.e., the range covered by the Run I data. Beyondthis range the qq → γg subprocess becomes dominant.Gluon-gluon initiated processes are not expected toplay a significant role over the pT range shown.
One of the classic applications of direct photon pro-duction is to provide constraints on the gluon distribu-tion in global fits of parton distributions. The gluondistribution is especially uncertain in the region be-yond x ≈ 0.15 [ 18]. Run I results on high-pT jetproduction from the CDF [ 71] and DØ [ 72] collab-orations favor a gluon distribution which is larger athigh-x than was anticipated from global fits which didnot emphasize the high-pT jet data. One such exampleis the CTEQ5HJ [ 64] set of distributions which arefavored by both sets of jet data. One might hope thatthe direct photon data could shed some light on thisissue, but such is not expected to be the case. As shownin Fig. 40, the ratio of the CTEQ5HJ and CTEQ5Mpredictions is consistent with unity within about 5%over the pT range under consideration. This can beunderstood by referring back to Fig. 38 where it isshown that the gq subprocess decreases in importanceprecisely where one would like to gain a constraint on
0 50 100 150 200 250 300 350 400 450 500pT (GeV/c)
0
0.5
1
1.5
2
2.5
3
σ(ne
xt−
to−
lead
ing−
log)
/σ(le
adin
g−lo
g)
p− p −−> γ + X
s1/2
= 2 TeV −.9 < y < .9 CTEQ5 Q=pT/2
Figure 39. NLO/LO ratio for direct photon produc-tion.
the gluon distribution.
2.2.4. New MeasurementsAs noted in the introduction, the process of direct
photon production is of interest for a variety of rea-sons. In particular, it offers a probe of hard scatteringdynamics which complements that of jet production.At this point, the comparison between theory and ex-periment has not reached the quantitative level thatone would like, so there is clearly more to be done.Furthermore, direct photon production has the poten-tial to provide constraints on the parton distributionfunctions, particularly that of the gluon. Nevertheless,the less than satisfactory description of the currentdata has meant that this role is, as yet, unfulfilled.Finally, one must understand conventional sources ofenergetic photons before being able to confidently usephotons as part of the signal for new physics. Withthese points in mind, it is natural to ask whether thereare additional observables which could help shed lighton some of the theoretical problems.
To date, almost all of the experimental results fordirect photon production have been for the transversemomentum distribution of the photon, i.e., the singlephoton inclusive cross section. Clearly, there is addi-tional information to be gained by studying the jointrapidity distributions of the photon and a jet, e.g.,dσ/dpT dyγdyjet where pT represents the transversemomentum of the photon. This observable has beenmeasured by the CDF Collaboration [ 73] for photonsin the the central region with 16 GeV < pT < 40 GeV.
20
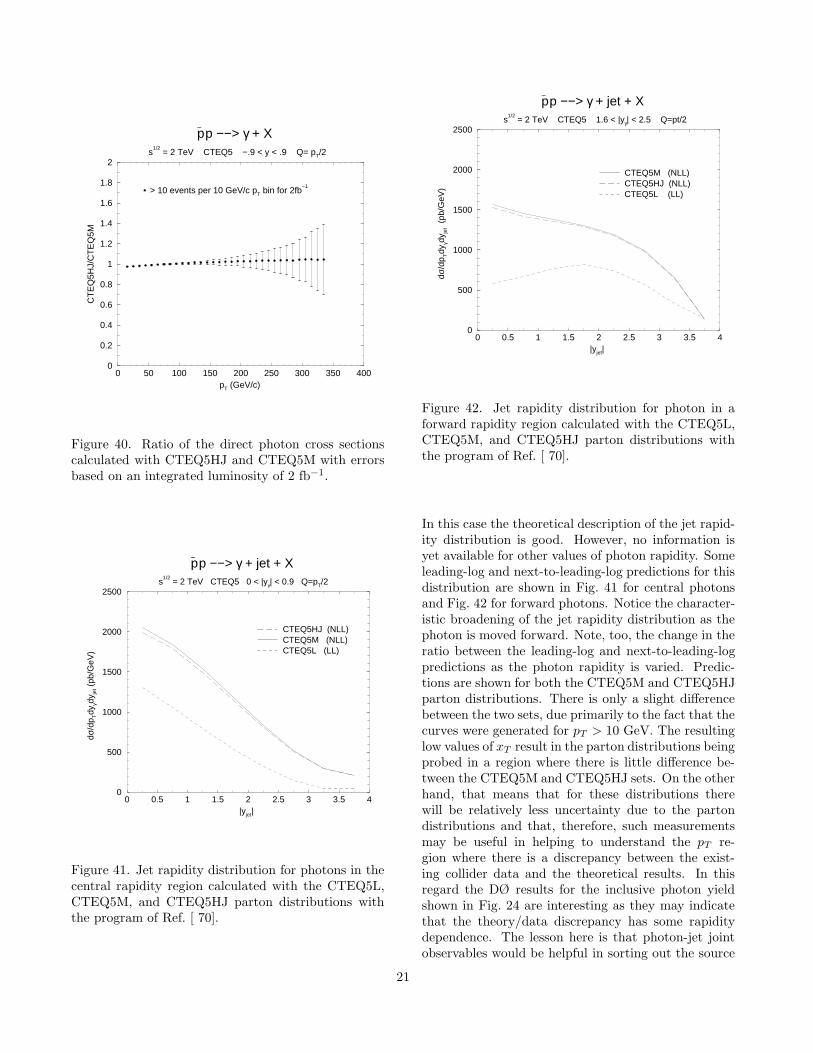
0 50 100 150 200 250 300 350 400pT (GeV/c)
0
0.2
0.4
0.6
0.8
1
1.2
1.4
1.6
1.8
2
CT
EQ
5HJ/
CT
EQ
5M
p− p −−> γ + X
s1/2
= 2 TeV CTEQ5 −.9 < y < .9 Q= pT/2
> 10 events per 10 GeV/c pT bin for 2fb−1
Figure 40. Ratio of the direct photon cross sectionscalculated with CTEQ5HJ and CTEQ5M with errorsbased on an integrated luminosity of 2 fb−1.
0 0.5 1 1.5 2 2.5 3 3.5 4|yjet|
0
500
1000
1500
2000
2500
dσ/d
p Tdy
γdy je
t (pb
/GeV
)
p− p −−> γ + jet + X
s1/2
= 2 TeV CTEQ5 0 < |yγ| < 0.9 Q=pT/2
CTEQ5HJ (NLL)CTEQ5M (NLL)CTEQ5L (LL)
Figure 41. Jet rapidity distribution for photons in thecentral rapidity region calculated with the CTEQ5L,CTEQ5M, and CTEQ5HJ parton distributions withthe program of Ref. [ 70].
0 0.5 1 1.5 2 2.5 3 3.5 4|yjet|
0
500
1000
1500
2000
2500
dσ/d
p Tdy
γdy je
t (p
b/G
eV)
p− p −−> γ + jet + X
s1/2
= 2 TeV CTEQ5 1.6 < |yγ| < 2.5 Q=pt/2
CTEQ5M (NLL)CTEQ5HJ (NLL)CTEQ5L (LL)
Figure 42. Jet rapidity distribution for photon in aforward rapidity region calculated with the CTEQ5L,CTEQ5M, and CTEQ5HJ parton distributions withthe program of Ref. [ 70].
In this case the theoretical description of the jet rapid-ity distribution is good. However, no information isyet available for other values of photon rapidity. Someleading-log and next-to-leading-log predictions for thisdistribution are shown in Fig. 41 for central photonsand Fig. 42 for forward photons. Notice the character-istic broadening of the jet rapidity distribution as thephoton is moved forward. Note, too, the change in theratio between the leading-log and next-to-leading-logpredictions as the photon rapidity is varied. Predic-tions are shown for both the CTEQ5M and CTEQ5HJparton distributions. There is only a slight differencebetween the two sets, due primarily to the fact that thecurves were generated for pT > 10 GeV. The resultinglow values of xT result in the parton distributions beingprobed in a region where there is little difference be-tween the CTEQ5M and CTEQ5HJ sets. On the otherhand, that means that for these distributions therewill be relatively less uncertainty due to the partondistributions and that, therefore, such measurementsmay be useful in helping to understand the pT re-gion where there is a discrepancy between the exist-ing collider data and the theoretical results. In thisregard the DØ results for the inclusive photon yieldshown in Fig. 24 are interesting as they may indicatethat the theory/data discrepancy has some rapiditydependence. The lesson here is that photon-jet jointobservables would be helpful in sorting out the source
21
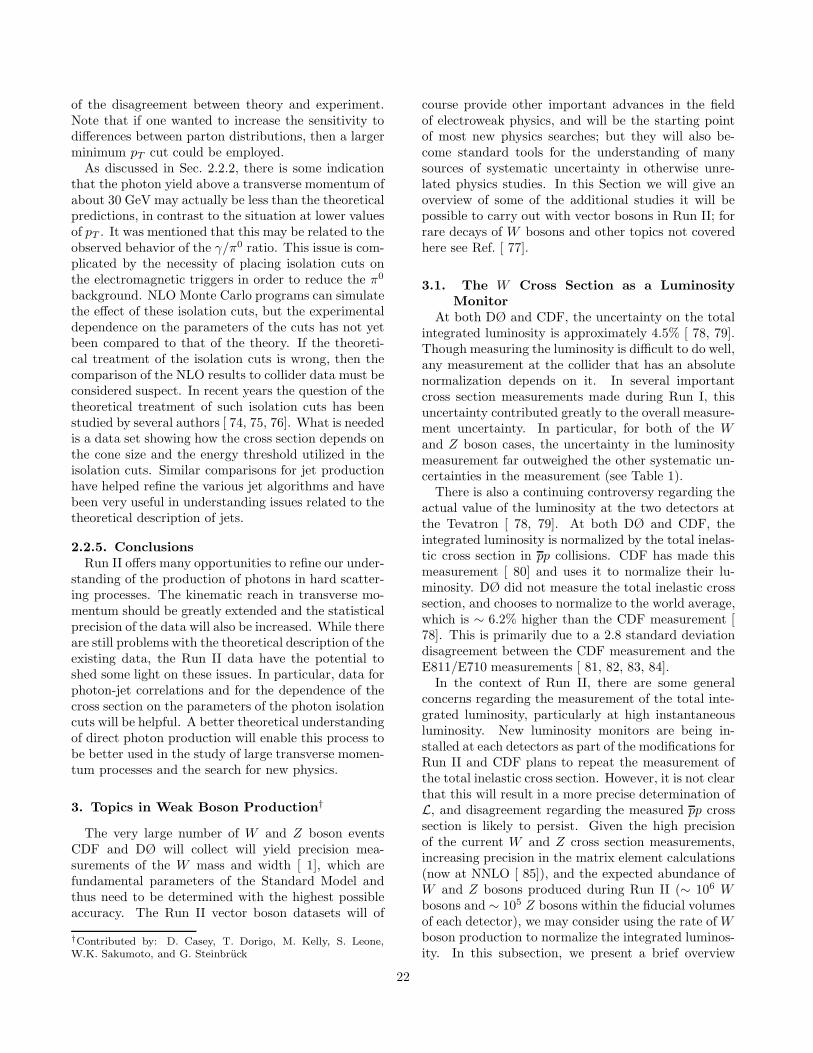
of the disagreement between theory and experiment.Note that if one wanted to increase the sensitivity todifferences between parton distributions, then a largerminimum pT cut could be employed.
As discussed in Sec. 2.2.2, there is some indicationthat the photon yield above a transverse momentum ofabout 30 GeV may actually be less than the theoreticalpredictions, in contrast to the situation at lower valuesof pT . It was mentioned that this may be related to theobserved behavior of the γ/π0 ratio. This issue is com-plicated by the necessity of placing isolation cuts onthe electromagnetic triggers in order to reduce the π0
background. NLO Monte Carlo programs can simulatethe effect of these isolation cuts, but the experimentaldependence on the parameters of the cuts has not yetbeen compared to that of the theory. If the theoreti-cal treatment of the isolation cuts is wrong, then thecomparison of the NLO results to collider data must beconsidered suspect. In recent years the question of thetheoretical treatment of such isolation cuts has beenstudied by several authors [ 74, 75, 76]. What is neededis a data set showing how the cross section depends onthe cone size and the energy threshold utilized in theisolation cuts. Similar comparisons for jet productionhave helped refine the various jet algorithms and havebeen very useful in understanding issues related to thetheoretical description of jets.
2.2.5. ConclusionsRun II offers many opportunities to refine our under-
standing of the production of photons in hard scatter-ing processes. The kinematic reach in transverse mo-mentum should be greatly extended and the statisticalprecision of the data will also be increased. While thereare still problems with the theoretical description of theexisting data, the Run II data have the potential toshed some light on these issues. In particular, data forphoton-jet correlations and for the dependence of thecross section on the parameters of the photon isolationcuts will be helpful. A better theoretical understandingof direct photon production will enable this process tobe better used in the study of large transverse momen-tum processes and the search for new physics.
3. Topics in Weak Boson Production†
The very large number of W and Z boson eventsCDF and DØ will collect will yield precision mea-surements of the W mass and width [ 1], which arefundamental parameters of the Standard Model andthus need to be determined with the highest possibleaccuracy. The Run II vector boson datasets will of
†Contributed by: D. Casey, T. Dorigo, M. Kelly, S. Leone,W.K. Sakumoto, and G. Steinbruck
course provide other important advances in the fieldof electroweak physics, and will be the starting pointof most new physics searches; but they will also be-come standard tools for the understanding of manysources of systematic uncertainty in otherwise unre-lated physics studies. In this Section we will give anoverview of some of the additional studies it will bepossible to carry out with vector bosons in Run II; forrare decays of W bosons and other topics not coveredhere see Ref. [ 77].
3.1. The W Cross Section as a LuminosityMonitor
At both DØ and CDF, the uncertainty on the totalintegrated luminosity is approximately 4.5% [ 78, 79].Though measuring the luminosity is difficult to do well,any measurement at the collider that has an absolutenormalization depends on it. In several importantcross section measurements made during Run I, thisuncertainty contributed greatly to the overall measure-ment uncertainty. In particular, for both of the Wand Z boson cases, the uncertainty in the luminositymeasurement far outweighed the other systematic un-certainties in the measurement (see Table 1).
There is also a continuing controversy regarding theactual value of the luminosity at the two detectors atthe Tevatron [ 78, 79]. At both DØ and CDF, theintegrated luminosity is normalized by the total inelas-tic cross section in pp collisions. CDF has made thismeasurement [ 80] and uses it to normalize their lu-minosity. DØ did not measure the total inelastic crosssection, and chooses to normalize to the world average,which is ∼ 6.2% higher than the CDF measurement [78]. This is primarily due to a 2.8 standard deviationdisagreement between the CDF measurement and theE811/E710 measurements [ 81, 82, 83, 84].
In the context of Run II, there are some generalconcerns regarding the measurement of the total inte-grated luminosity, particularly at high instantaneousluminosity. New luminosity monitors are being in-stalled at each detectors as part of the modifications forRun II and CDF plans to repeat the measurement ofthe total inelastic cross section. However, it is not clearthat this will result in a more precise determination ofL, and disagreement regarding the measured pp crosssection is likely to persist. Given the high precisionof the current W and Z cross section measurements,increasing precision in the matrix element calculations(now at NNLO [ 85]), and the expected abundance ofW and Z bosons produced during Run II (∼ 106 Wbosons and ∼ 105 Z bosons within the fiducial volumesof each detector), we may consider using the rate of Wboson production to normalize the integrated luminos-ity. In this subsection, we present a brief overview
22
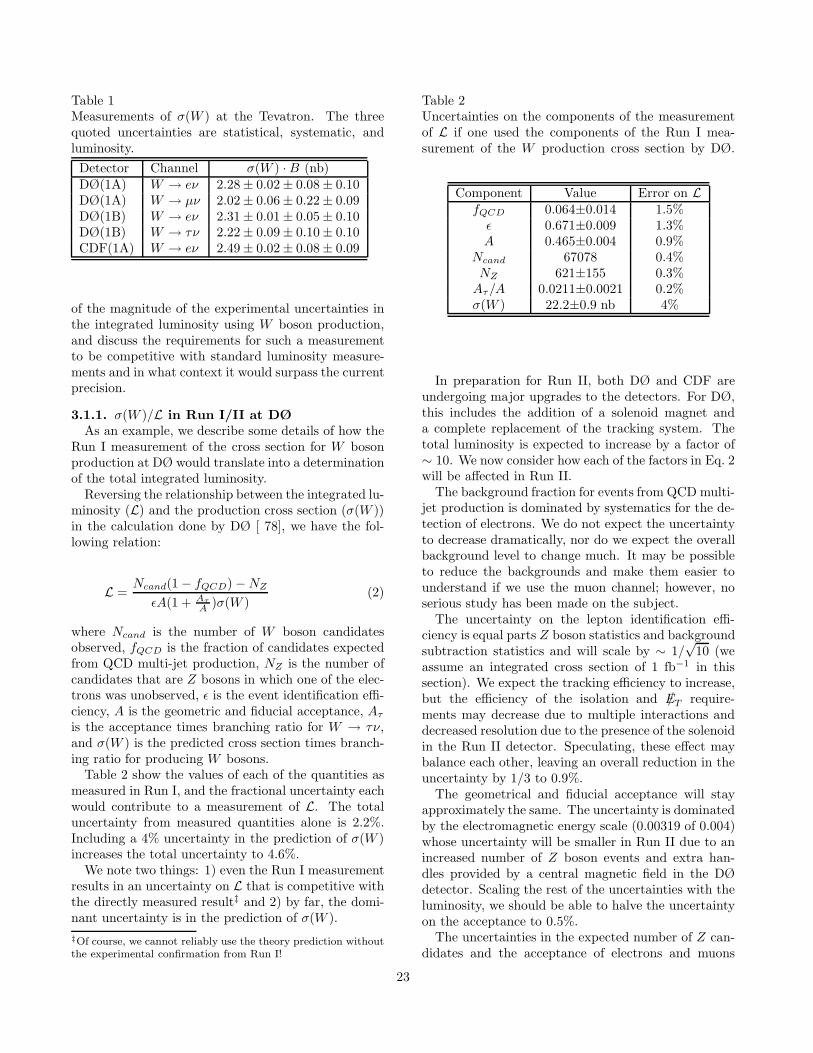
Table 1Measurements of σ(W ) at the Tevatron. The threequoted uncertainties are statistical, systematic, andluminosity.
Detector Channel σ(W ) · B (nb)DØ(1A) W → eν 2.28 ± 0.02 ± 0.08 ± 0.10DØ(1A) W → µν 2.02 ± 0.06 ± 0.22 ± 0.09DØ(1B) W → eν 2.31 ± 0.01 ± 0.05 ± 0.10DØ(1B) W → τν 2.22 ± 0.09 ± 0.10 ± 0.10CDF(1A) W → eν 2.49 ± 0.02 ± 0.08 ± 0.09
of the magnitude of the experimental uncertainties inthe integrated luminosity using W boson production,and discuss the requirements for such a measurementto be competitive with standard luminosity measure-ments and in what context it would surpass the currentprecision.
3.1.1. σ(W )/L in Run I/II at DØAs an example, we describe some details of how the
Run I measurement of the cross section for W bosonproduction at DØ would translate into a determinationof the total integrated luminosity.
Reversing the relationship between the integrated lu-minosity (L) and the production cross section (σ(W ))in the calculation done by DØ [ 78], we have the fol-lowing relation:
L =Ncand(1 − fQCD) − NZ
ǫA(1 + Aτ
A )σ(W )(2)
where Ncand is the number of W boson candidatesobserved, fQCD is the fraction of candidates expectedfrom QCD multi-jet production, NZ is the number ofcandidates that are Z bosons in which one of the elec-trons was unobserved, ǫ is the event identification effi-ciency, A is the geometric and fiducial acceptance, Aτ
is the acceptance times branching ratio for W → τν,and σ(W ) is the predicted cross section times branch-ing ratio for producing W bosons.
Table 2 show the values of each of the quantities asmeasured in Run I, and the fractional uncertainty eachwould contribute to a measurement of L. The totaluncertainty from measured quantities alone is 2.2%.Including a 4% uncertainty in the prediction of σ(W )increases the total uncertainty to 4.6%.
We note two things: 1) even the Run I measurementresults in an uncertainty on L that is competitive withthe directly measured result‡ and 2) by far, the domi-nant uncertainty is in the prediction of σ(W ).
‡Of course, we cannot reliably use the theory prediction withoutthe experimental confirmation from Run I!
Table 2Uncertainties on the components of the measurementof L if one used the components of the Run I mea-surement of the W production cross section by DØ.
Component Value Error on LfQCD 0.064±0.014 1.5%
ǫ 0.671±0.009 1.3%A 0.465±0.004 0.9%
Ncand 67078 0.4%NZ 621±155 0.3%
Aτ/A 0.0211±0.0021 0.2%σ(W ) 22.2±0.9 nb 4%
In preparation for Run II, both DØ and CDF areundergoing major upgrades to the detectors. For DØ,this includes the addition of a solenoid magnet anda complete replacement of the tracking system. Thetotal luminosity is expected to increase by a factor of∼ 10. We now consider how each of the factors in Eq. 2will be affected in Run II.
The background fraction for events from QCD multi-jet production is dominated by systematics for the de-tection of electrons. We do not expect the uncertaintyto decrease dramatically, nor do we expect the overallbackground level to change much. It may be possibleto reduce the backgrounds and make them easier tounderstand if we use the muon channel; however, noserious study has been made on the subject.
The uncertainty on the lepton identification effi-ciency is equal parts Z boson statistics and backgroundsubtraction statistics and will scale by ∼ 1/
√10 (we
assume an integrated cross section of 1 fb−1 in thissection). We expect the tracking efficiency to increase,but the efficiency of the isolation and E/T require-ments may decrease due to multiple interactions anddecreased resolution due to the presence of the solenoidin the Run II detector. Speculating, these effect maybalance each other, leaving an overall reduction in theuncertainty by 1/3 to 0.9%.
The geometrical and fiducial acceptance will stayapproximately the same. The uncertainty is dominatedby the electromagnetic energy scale (0.00319 of 0.004)whose uncertainty will be smaller in Run II due to anincreased number of Z boson events and extra han-dles provided by a central magnetic field in the DØdetector. Scaling the rest of the uncertainties with theluminosity, we should be able to halve the uncertaintyon the acceptance to 0.5%.
The uncertainties in the expected number of Z can-didates and the acceptance of electrons and muons
23
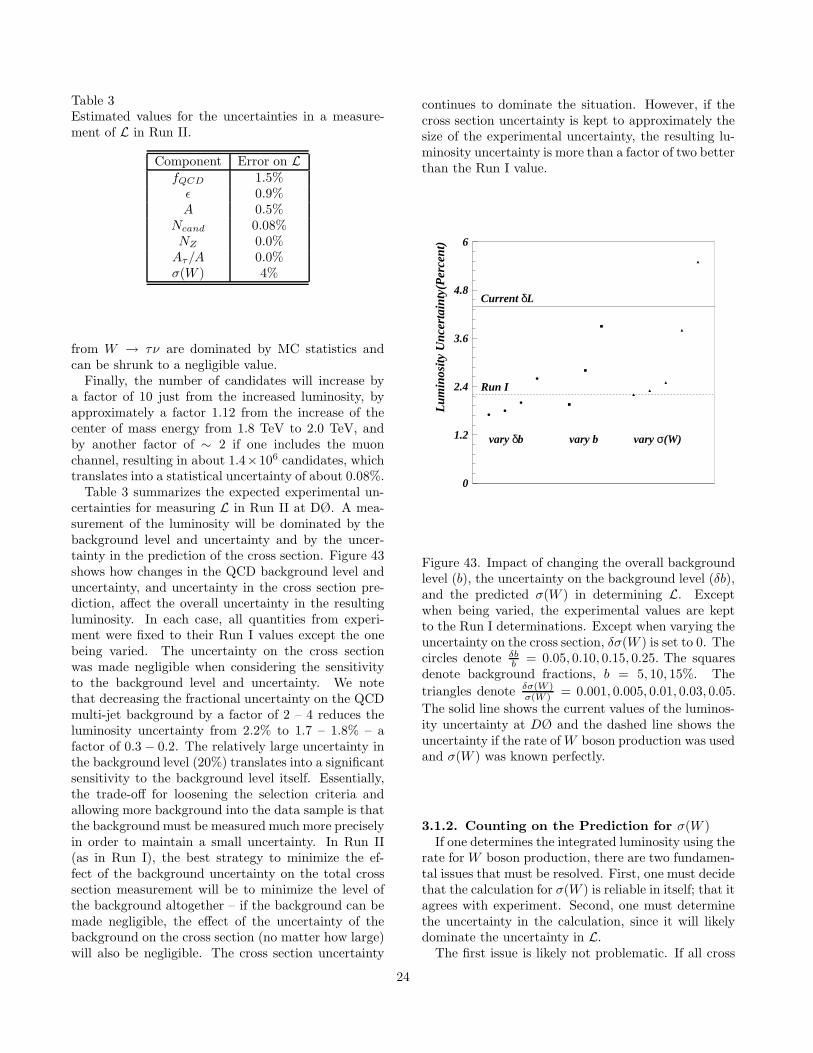
Table 3Estimated values for the uncertainties in a measure-ment of L in Run II.
Component Error on LfQCD 1.5%
ǫ 0.9%A 0.5%
Ncand 0.08%NZ 0.0%
Aτ/A 0.0%σ(W ) 4%
from W → τν are dominated by MC statistics andcan be shrunk to a negligible value.
Finally, the number of candidates will increase bya factor of 10 just from the increased luminosity, byapproximately a factor 1.12 from the increase of thecenter of mass energy from 1.8 TeV to 2.0 TeV, andby another factor of ∼ 2 if one includes the muonchannel, resulting in about 1.4×10⁶ candidates, whichtranslates into a statistical uncertainty of about 0.08%.
Table 3 summarizes the expected experimental un-certainties for measuring L in Run II at DØ. A mea-surement of the luminosity will be dominated by thebackground level and uncertainty and by the uncer-tainty in the prediction of the cross section. Figure 43shows how changes in the QCD background level anduncertainty, and uncertainty in the cross section pre-diction, affect the overall uncertainty in the resultingluminosity. In each case, all quantities from experi-ment were fixed to their Run I values except the onebeing varied. The uncertainty on the cross sectionwas made negligible when considering the sensitivityto the background level and uncertainty. We notethat decreasing the fractional uncertainty on the QCDmulti-jet background by a factor of 2 – 4 reduces theluminosity uncertainty from 2.2% to 1.7 – 1.8% – afactor of 0.3 − 0.2. The relatively large uncertainty inthe background level (20%) translates into a significantsensitivity to the background level itself. Essentially,the trade-off for loosening the selection criteria andallowing more background into the data sample is thatthe background must be measured much more preciselyin order to maintain a small uncertainty. In Run II(as in Run I), the best strategy to minimize the ef-fect of the background uncertainty on the total crosssection measurement will be to minimize the level ofthe background altogether – if the background can bemade negligible, the effect of the uncertainty of thebackground on the cross section (no matter how large)will also be negligible. The cross section uncertainty
continues to dominate the situation. However, if thecross section uncertainty is kept to approximately thesize of the experimental uncertainty, the resulting lu-minosity uncertainty is more than a factor of two betterthan the Run I value.
0
1.2
2.4
3.6
4.8
6
Lum
inos
ity U
ncer
tain
ty(P
erce
nt)
vary δb vary b vary σ(W)
Current δL
Run I
Figure 43. Impact of changing the overall backgroundlevel (b), the uncertainty on the background level (δb),and the predicted σ(W ) in determining L. Exceptwhen being varied, the experimental values are keptto the Run I determinations. Except when varying theuncertainty on the cross section, δσ(W ) is set to 0. Thecircles denote δb
b = 0.05, 0.10, 0.15, 0.25. The squaresdenote background fractions, b = 5, 10, 15%. The
triangles denote δσ(W )σ(W ) = 0.001, 0.005, 0.01, 0.03, 0.05.
The solid line shows the current values of the luminos-ity uncertainty at DØ and the dashed line shows theuncertainty if the rate of W boson production was usedand σ(W ) was known perfectly.
3.1.2. Counting on the Prediction for σ(W )If one determines the integrated luminosity using the
rate for W boson production, there are two fundamen-tal issues that must be resolved. First, one must decidethat the calculation for σ(W ) is reliable in itself; that itagrees with experiment. Second, one must determinethe uncertainty in the calculation, since it will likelydominate the uncertainty in L.
The first issue is likely not problematic. If all cross
24
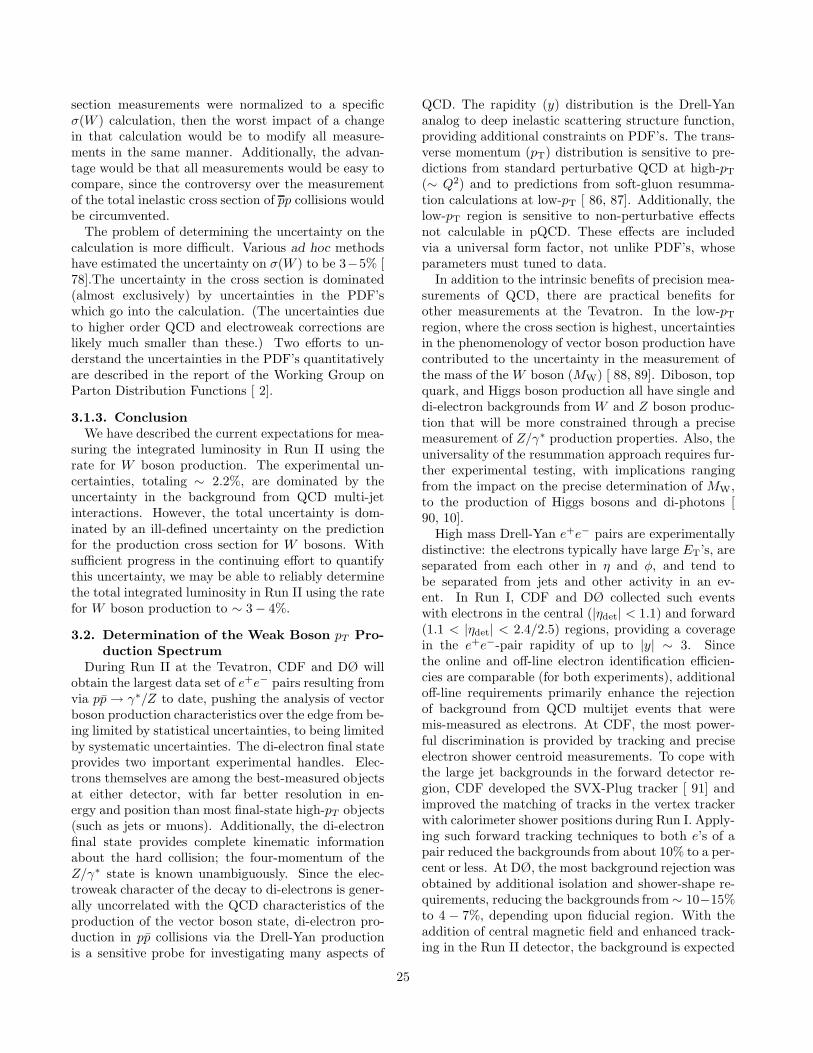
section measurements were normalized to a specificσ(W ) calculation, then the worst impact of a changein that calculation would be to modify all measure-ments in the same manner. Additionally, the advan-tage would be that all measurements would be easy tocompare, since the controversy over the measurementof the total inelastic cross section of pp collisions wouldbe circumvented.
The problem of determining the uncertainty on thecalculation is more difficult. Various ad hoc methodshave estimated the uncertainty on σ(W ) to be 3−5% [78].The uncertainty in the cross section is dominated(almost exclusively) by uncertainties in the PDF’swhich go into the calculation. (The uncertainties dueto higher order QCD and electroweak corrections arelikely much smaller than these.) Two efforts to un-derstand the uncertainties in the PDF’s quantitativelyare described in the report of the Working Group onParton Distribution Functions [ 2].
3.1.3. ConclusionWe have described the current expectations for mea-
suring the integrated luminosity in Run II using therate for W boson production. The experimental un-certainties, totaling ∼ 2.2%, are dominated by theuncertainty in the background from QCD multi-jetinteractions. However, the total uncertainty is dom-inated by an ill-defined uncertainty on the predictionfor the production cross section for W bosons. Withsufficient progress in the continuing effort to quantifythis uncertainty, we may be able to reliably determinethe total integrated luminosity in Run II using the ratefor W boson production to ∼ 3 − 4%.
3.2. Determination of the Weak Boson pT Pro-duction Spectrum
During Run II at the Tevatron, CDF and DØ willobtain the largest data set of e+e− pairs resulting fromvia pp → γ∗/Z to date, pushing the analysis of vectorboson production characteristics over the edge from be-ing limited by statistical uncertainties, to being limitedby systematic uncertainties. The di-electron final stateprovides two important experimental handles. Elec-trons themselves are among the best-measured objectsat either detector, with far better resolution in en-ergy and position than most final-state high-pT objects(such as jets or muons). Additionally, the di-electronfinal state provides complete kinematic informationabout the hard collision; the four-momentum of theZ/γ∗ state is known unambiguously. Since the elec-troweak character of the decay to di-electrons is gener-ally uncorrelated with the QCD characteristics of theproduction of the vector boson state, di-electron pro-duction in pp collisions via the Drell-Yan productionis a sensitive probe for investigating many aspects of
QCD. The rapidity (y) distribution is the Drell-Yananalog to deep inelastic scattering structure function,providing additional constraints on PDF’s. The trans-verse momentum (pT) distribution is sensitive to pre-dictions from standard perturbative QCD at high-pT
(∼ Q2) and to predictions from soft-gluon resumma-tion calculations at low-pT [ 86, 87]. Additionally, thelow-pT region is sensitive to non-perturbative effectsnot calculable in pQCD. These effects are includedvia a universal form factor, not unlike PDF’s, whoseparameters must tuned to data.
In addition to the intrinsic benefits of precision mea-surements of QCD, there are practical benefits forother measurements at the Tevatron. In the low-pT
region, where the cross section is highest, uncertaintiesin the phenomenology of vector boson production havecontributed to the uncertainty in the measurement ofthe mass of the W boson (MW) [ 88, 89]. Diboson, topquark, and Higgs boson production all have single anddi-electron backgrounds from W and Z boson produc-tion that will be more constrained through a precisemeasurement of Z/γ∗ production properties. Also, theuniversality of the resummation approach requires fur-ther experimental testing, with implications rangingfrom the impact on the precise determination of MW,to the production of Higgs bosons and di-photons [90, 10].
High mass Drell-Yan e+e− pairs are experimentallydistinctive: the electrons typically have large ET’s, areseparated from each other in η and φ, and tend tobe separated from jets and other activity in an ev-ent. In Run I, CDF and DØ collected such eventswith electrons in the central (|ηdet| < 1.1) and forward(1.1 < |ηdet| < 2.4/2.5) regions, providing a coveragein the e+e−-pair rapidity of up to |y| ∼ 3. Sincethe online and off-line electron identification efficien-cies are comparable (for both experiments), additionaloff-line requirements primarily enhance the rejectionof background from QCD multijet events that weremis-measured as electrons. At CDF, the most power-ful discrimination is provided by tracking and preciseelectron shower centroid measurements. To cope withthe large jet backgrounds in the forward detector re-gion, CDF developed the SVX-Plug tracker [ 91] andimproved the matching of tracks in the vertex trackerwith calorimeter shower positions during Run I. Apply-ing such forward tracking techniques to both e’s of apair reduced the backgrounds from about 10% to a per-cent or less. At DØ, the most background rejection wasobtained by additional isolation and shower-shape re-quirements, reducing the backgrounds from ∼ 10−15%to 4 − 7%, depending upon fiducial region. With theaddition of central magnetic field and enhanced track-ing in the Run II detector, the background is expected
25
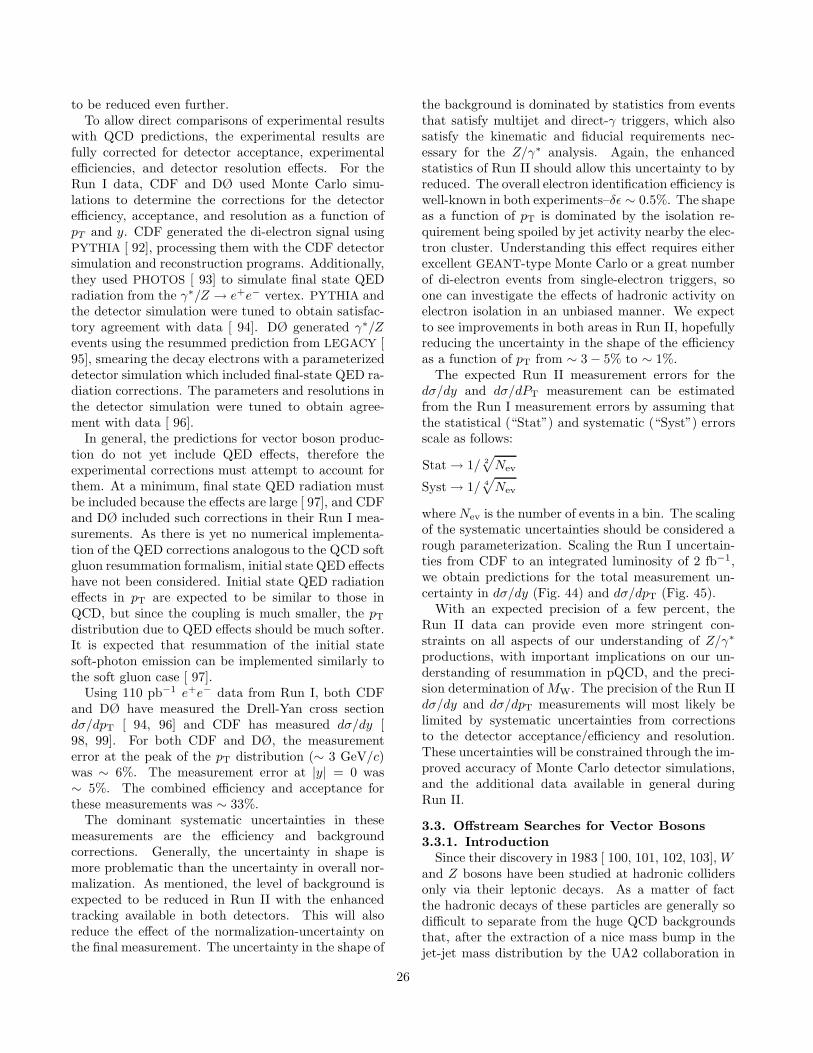
to be reduced even further.To allow direct comparisons of experimental results
with QCD predictions, the experimental results arefully corrected for detector acceptance, experimentalefficiencies, and detector resolution effects. For theRun I data, CDF and DØ used Monte Carlo simu-lations to determine the corrections for the detectorefficiency, acceptance, and resolution as a function ofpT and y. CDF generated the di-electron signal usingPYTHIA [ 92], processing them with the CDF detectorsimulation and reconstruction programs. Additionally,they used PHOTOS [ 93] to simulate final state QEDradiation from the γ∗/Z → e+e− vertex. PYTHIA andthe detector simulation were tuned to obtain satisfac-tory agreement with data [ 94]. DØ generated γ∗/Zevents using the resummed prediction from LEGACY [95], smearing the decay electrons with a parameterizeddetector simulation which included final-state QED ra-diation corrections. The parameters and resolutions inthe detector simulation were tuned to obtain agree-ment with data [ 96].
In general, the predictions for vector boson produc-tion do not yet include QED effects, therefore theexperimental corrections must attempt to account forthem. At a minimum, final state QED radiation mustbe included because the effects are large [ 97], and CDFand DØ included such corrections in their Run I mea-surements. As there is yet no numerical implementa-tion of the QED corrections analogous to the QCD softgluon resummation formalism, initial state QED effectshave not been considered. Initial state QED radiationeffects in pT are expected to be similar to those inQCD, but since the coupling is much smaller, the pT
distribution due to QED effects should be much softer.It is expected that resummation of the initial statesoft-photon emission can be implemented similarly tothe soft gluon case [ 97].
Using 110 pb−1 e+e− data from Run I, both CDFand DØ have measured the Drell-Yan cross sectiondσ/dpT [ 94, 96] and CDF has measured dσ/dy [98, 99]. For both CDF and DØ, the measurementerror at the peak of the pT distribution (∼ 3 GeV/c)was ∼ 6%. The measurement error at |y| = 0 was∼ 5%. The combined efficiency and acceptance forthese measurements was ∼ 33%.
The dominant systematic uncertainties in thesemeasurements are the efficiency and backgroundcorrections. Generally, the uncertainty in shape ismore problematic than the uncertainty in overall nor-malization. As mentioned, the level of background isexpected to be reduced in Run II with the enhancedtracking available in both detectors. This will alsoreduce the effect of the normalization-uncertainty onthe final measurement. The uncertainty in the shape of
the background is dominated by statistics from eventsthat satisfy multijet and direct-γ triggers, which alsosatisfy the kinematic and fiducial requirements nec-essary for the Z/γ∗ analysis. Again, the enhancedstatistics of Run II should allow this uncertainty to byreduced. The overall electron identification efficiency iswell-known in both experiments–δǫ ∼ 0.5%. The shapeas a function of pT is dominated by the isolation re-quirement being spoiled by jet activity nearby the elec-tron cluster. Understanding this effect requires eitherexcellent GEANT-type Monte Carlo or a great numberof di-electron events from single-electron triggers, soone can investigate the effects of hadronic activity onelectron isolation in an unbiased manner. We expectto see improvements in both areas in Run II, hopefullyreducing the uncertainty in the shape of the efficiencyas a function of pT from ∼ 3 − 5% to ∼ 1%.
The expected Run II measurement errors for thedσ/dy and dσ/dPT measurement can be estimatedfrom the Run I measurement errors by assuming thatthe statistical (“Stat”) and systematic (“Syst”) errorsscale as follows:
Stat → 1/ 2
√
Nev
Syst → 1/ 4
√
Nev
where Nev is the number of events in a bin. The scalingof the systematic uncertainties should be considered arough parameterization. Scaling the Run I uncertain-ties from CDF to an integrated luminosity of 2 fb−1,we obtain predictions for the total measurement un-certainty in dσ/dy (Fig. 44) and dσ/dpT (Fig. 45).
With an expected precision of a few percent, theRun II data can provide even more stringent con-straints on all aspects of our understanding of Z/γ∗
productions, with important implications on our un-derstanding of resummation in pQCD, and the preci-sion determination of MW. The precision of the Run IIdσ/dy and dσ/dpT measurements will most likely belimited by systematic uncertainties from correctionsto the detector acceptance/efficiency and resolution.These uncertainties will be constrained through the im-proved accuracy of Monte Carlo detector simulations,and the additional data available in general duringRun II.
3.3. Offstream Searches for Vector Bosons3.3.1. Introduction
Since their discovery in 1983 [ 100, 101, 102, 103], Wand Z bosons have been studied at hadronic collidersonly via their leptonic decays. As a matter of factthe hadronic decays of these particles are generally sodifficult to separate from the huge QCD backgroundsthat, after the extraction of a nice mass bump in thejet-jet mass distribution by the UA2 collaboration in
26
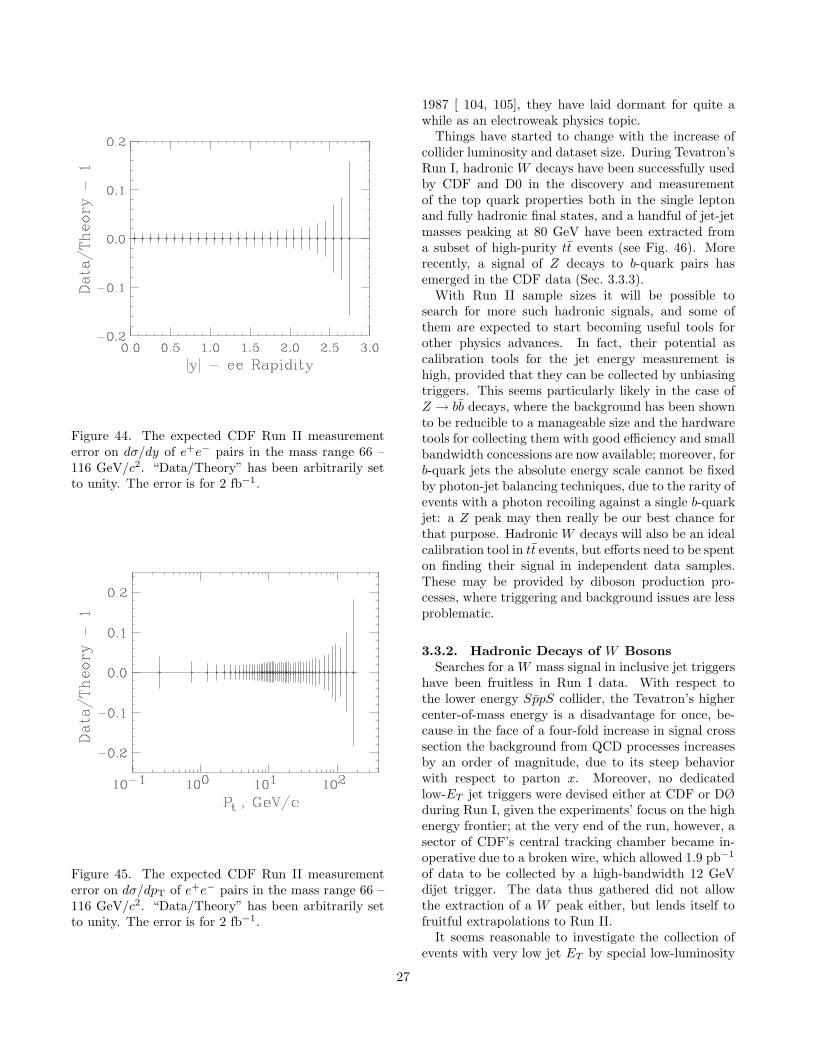
Figure 44. The expected CDF Run II measurementerror on dσ/dy of e+e− pairs in the mass range 66 –116 GeV/c2. “Data/Theory” has been arbitrarily setto unity. The error is for 2 fb−1.
Figure 45. The expected CDF Run II measurementerror on dσ/dpT of e+e− pairs in the mass range 66 –116 GeV/c2. “Data/Theory” has been arbitrarily setto unity. The error is for 2 fb−1.
1987 [ 104, 105], they have laid dormant for quite awhile as an electroweak physics topic.
Things have started to change with the increase ofcollider luminosity and dataset size. During Tevatron’sRun I, hadronic W decays have been successfully usedby CDF and D0 in the discovery and measurementof the top quark properties both in the single leptonand fully hadronic final states, and a handful of jet-jetmasses peaking at 80 GeV have been extracted froma subset of high-purity tt events (see Fig. 46). Morerecently, a signal of Z decays to b-quark pairs hasemerged in the CDF data (Sec. 3.3.3).
With Run II sample sizes it will be possible tosearch for more such hadronic signals, and some ofthem are expected to start becoming useful tools forother physics advances. In fact, their potential ascalibration tools for the jet energy measurement ishigh, provided that they can be collected by unbiasingtriggers. This seems particularly likely in the case ofZ → bb decays, where the background has been shownto be reducible to a manageable size and the hardwaretools for collecting them with good efficiency and smallbandwidth concessions are now available; moreover, forb-quark jets the absolute energy scale cannot be fixedby photon-jet balancing techniques, due to the rarity ofevents with a photon recoiling against a single b-quarkjet: a Z peak may then really be our best chance forthat purpose. Hadronic W decays will also be an idealcalibration tool in tt events, but efforts need to be spenton finding their signal in independent data samples.These may be provided by diboson production pro-cesses, where triggering and background issues are lessproblematic.
3.3.2. Hadronic Decays of W BosonsSearches for a W mass signal in inclusive jet triggers
have been fruitless in Run I data. With respect tothe lower energy SppS collider, the Tevatron’s highercenter-of-mass energy is a disadvantage for once, be-cause in the face of a four-fold increase in signal crosssection the background from QCD processes increasesby an order of magnitude, due to its steep behaviorwith respect to parton x. Moreover, no dedicatedlow-ET jet triggers were devised either at CDF or DØduring Run I, given the experiments’ focus on the highenergy frontier; at the very end of the run, however, asector of CDF’s central tracking chamber became in-operative due to a broken wire, which allowed 1.9 pb−1
of data to be collected by a high-bandwidth 12 GeVdijet trigger. The data thus gathered did not allowthe extraction of a W peak either, but lends itself tofruitful extrapolations to Run II.
It seems reasonable to investigate the collection ofevents with very low jet ET by special low-luminosity
27
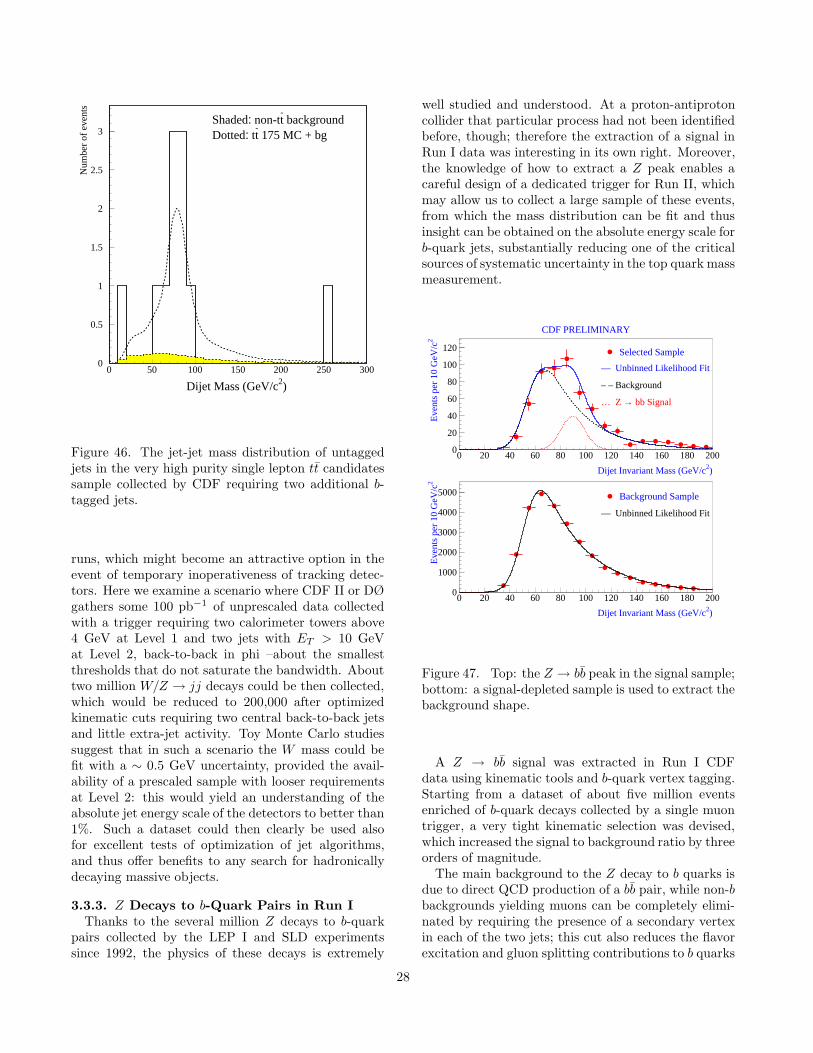
0
0.5
1
1.5
2
2.5
3
0 50 100 150 200 250 300
Dijet Mass (GeV/c2)
Num
ber
of e
vent
s
Shaded: non-tt- background
Dotted: tt- 175 MC + bg
Figure 46. The jet-jet mass distribution of untaggedjets in the very high purity single lepton tt candidatessample collected by CDF requiring two additional b-tagged jets.
runs, which might become an attractive option in theevent of temporary inoperativeness of tracking detec-tors. Here we examine a scenario where CDF II or DØgathers some 100 pb−1 of unprescaled data collectedwith a trigger requiring two calorimeter towers above4 GeV at Level 1 and two jets with ET > 10 GeVat Level 2, back-to-back in phi –about the smallestthresholds that do not saturate the bandwidth. Abouttwo million W/Z → jj decays could be then collected,which would be reduced to 200,000 after optimizedkinematic cuts requiring two central back-to-back jetsand little extra-jet activity. Toy Monte Carlo studiessuggest that in such a scenario the W mass could befit with a ∼ 0.5 GeV uncertainty, provided the avail-ability of a prescaled sample with looser requirementsat Level 2: this would yield an understanding of theabsolute jet energy scale of the detectors to better than1%. Such a dataset could then clearly be used alsofor excellent tests of optimization of jet algorithms,and thus offer benefits to any search for hadronicallydecaying massive objects.
3.3.3. Z Decays to b-Quark Pairs in Run IThanks to the several million Z decays to b-quark
pairs collected by the LEP I and SLD experimentssince 1992, the physics of these decays is extremely
well studied and understood. At a proton-antiprotoncollider that particular process had not been identifiedbefore, though; therefore the extraction of a signal inRun I data was interesting in its own right. Moreover,the knowledge of how to extract a Z peak enables acareful design of a dedicated trigger for Run II, whichmay allow us to collect a large sample of these events,from which the mass distribution can be fit and thusinsight can be obtained on the absolute energy scale forb-quark jets, substantially reducing one of the criticalsources of systematic uncertainty in the top quark massmeasurement.
CDF PRELIMINARY
0
20
40
60
80
100
120
0 20 40 60 80 100 120 140 160 180 200
Selected Sample
Dijet Invariant Mass (GeV/c2)
Eve
nts
per
10 G
eV/c
2
— Unbinned Likelihood Fit
… Z → bb Signal
– – Background
0
1000
2000
3000
4000
5000
0 20 40 60 80 100 120 140 160 180 200
Dijet Invariant Mass (GeV/c2)
Eve
nts
per
10 G
eV/c
2
Background Sample
— Unbinned Likelihood Fit
Figure 47. Top: the Z → bb peak in the signal sample;bottom: a signal-depleted sample is used to extract thebackground shape.
A Z → bb signal was extracted in Run I CDFdata using kinematic tools and b-quark vertex tagging.Starting from a dataset of about five million eventsenriched of b-quark decays collected by a single muontrigger, a very tight kinematic selection was devised,which increased the signal to background ratio by threeorders of magnitude.
The main background to the Z decay to b quarks isdue to direct QCD production of a bb pair, while non-bbackgrounds yielding muons can be completely elimi-nated by requiring the presence of a secondary vertexin each of the two jets; this cut also reduces the flavorexcitation and gluon splitting contributions to b quarks
28

in the sample quite effectively. Most of the direct bbpairs are produced at the Tevatron by a gluon fusionprocess, whose high color charge in the initial stateand color flow topology are distinctive characteristics.To exploit the smaller probability of QCD radiationin the signal, the two leading jets were required to beback-to-back in φ, and the sum of all other calorime-ter clusters in the event was required to be smallerthan 10 GeV. These cuts selected 588 events, whosejet-jet mass distribution was fit to the sum of QCDbackground and Z decay to yield a signal of 91 ± 30events, with a S/N ratio at the Z peak equal to 1/3;the fit resulted in a Z mass of 90.0 ± 2.4 GeV (seeFig. 47). If the same analysis should be replicated with20 times more statistics and no detector improvements,this would yield a relative error in the b-jet energy scalesmaller than 1%. The picture could be even rosier asfar as statistics goes, due to the extended lepton cover-age and improved silicon tracking the Run II detectorswill be endowed with, but the strong bias due to thetriggering lepton will make these findings of difficultuse for generic b-quark jets.
Besides its possible use as a calibration tool, how-ever, a Z → bb peak provides a fine testing ground foralgorithms designed to improve the jet energy measure-ment for b jets, which is one of the critical points forthe discovery of an intermediate mass Higgs boson inRun II. The bb final state is the dominant one in Higgsboson decay if MH < 135 GeV/c2 [ 106]. Our ability toextract this particle from the large QCD backgroundin Run II (for instance in the Wbb final state, whenassociated WH production is sought) will thereforedepend critically on the resolution we can attain onthe Higgs boson mass as reconstructed from the mea-sured b-quark jet energies: both the possibility to seea bump in the mass spectrum of jet pairs associated toa leptonically decaying W bosons, and the alternativeoption of applying a mass window cut as a selectiontool for these events, will strictly depend on the actualmass resolution.
The expected resolution for a generic jet-jet reso-nance at CDF and D0 was roughly σMjj
= 0.1Mjj inRun I. A relative improvement of this number by 30%would significantly extend [ 106] our discovery reachfor the Higgs boson in Run II. In order to achievethat improvement we must study in detail the char-acteristics of b-quark jets emitted in the Higgs decay,and use to their utmost the large amount of availableinformation provided by the various detector compo-nents DØ and CDF II are made up of. For example,three-dimensional tracking in the new SVX II detectormay allow CDF II to infer the momentum of the escap-ing neutrinos in semileptonic b-quark decays, greatlyimproving the energy measurement of the resulting
jets; this plan will work well in Run II, given the largeracceptance for charged leptons from semileptonic de-cays provided by the new detectors. Furthermore, thepossibility of measuring track momenta to higher ra-pidity will allow a fruitful use of tracking informationto improve the calorimetric measurement of jets.
A detailed study of the observable quantities of b-quark jets produced in Z → bb decays followed by onesemileptonic b → µX decay have been shown to allowa sizable reduction of the width of the reconstructedbb peak. The quantities found useful for this purposein the CDF analysis were the muon momentum, theprojection of missing transverse energy along the jetaxes, and the charged fraction of the jets.
The muon momentum is needed in the correction ofjets containing a semileptonic decay of b quarks, be-cause the minimum ionizing muons do not contributelinearly to the energy measured in the calorimeter.The missing ET , projected along the jet directions inthe transverse plane, provides useful information onthe amount of momentum taken away by the neutrinoin the muon jet and on possible fluctuations of theenergy measurement in both the muon and the awayjet. The charged fraction of the jets, defined as theratio between the total momentum of charged tracksbelonging to a jet and the energy measured in thecalorimeter, also helps reducing the uncertainty in theenergy measurement.
By properly accounting for the value of these observ-ables, it was possible to reduce the relative uncertaintyin the dijet mass measurement, σM/Mjj , by nearly50% (see Fig. 48).
If the alternative plan (described in the followingsection) based on collecting Z → bb decays by trig-gering directly on secondary vertices in jets at Level 2should fail, CDF II will anyways be able to observe apeak of several thousand events in the inclusive lep-ton datasets by simply replicating the Run I analysis.These peaks will not allow a precise calibration tool forinclusive b-quark jets, given the biasing semileptonicdecay of one of the two jets, but they will anyways beextremely useful as a testing ground for the algorithmsnow under development which aim at reducing the jetenergy resolution.
3.3.4. Z Decays to b-Quark Pairs in Run IIA strategy to collect Z → bb events in Run II has
been studied having in mind the CDF trigger config-uration. We tried to keep the trigger requirementsas simple as possible and optimize them in order tohave acceptable trigger rates (less than 2% of the totalbandwidth at each level) and maintain a good signalefficiency.
Most Z → bb events should contain two recon-
29
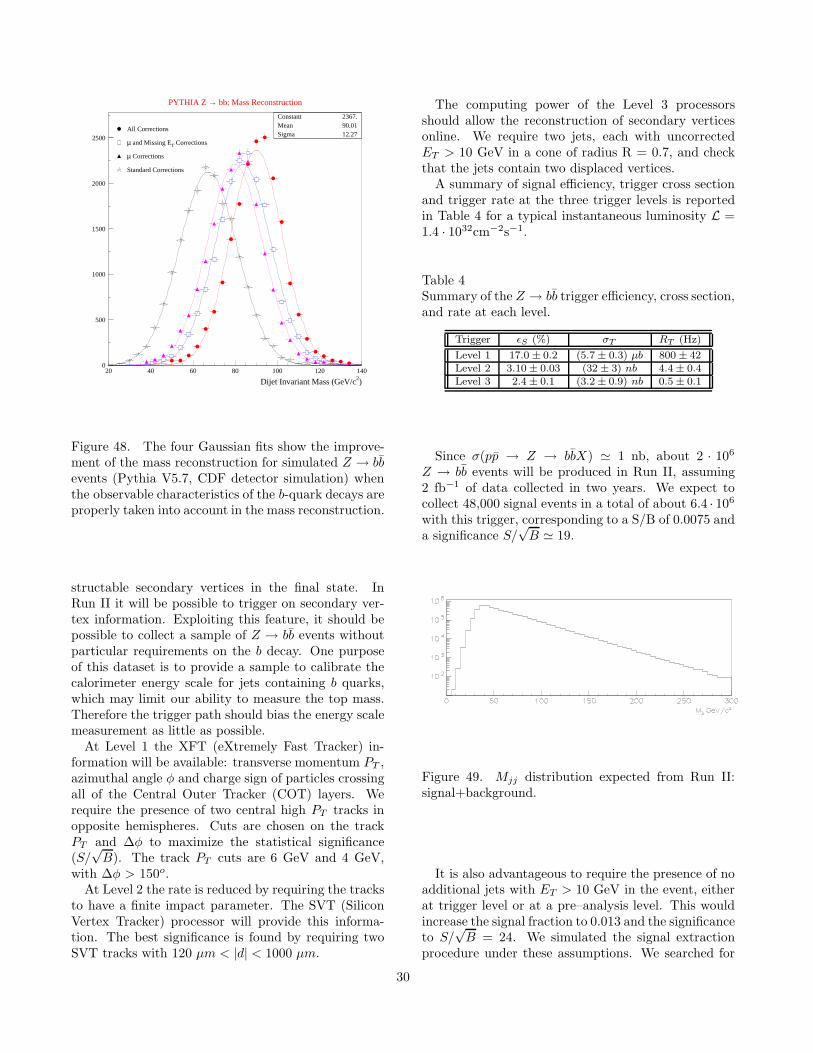
PYTHIA Z → bb: Mass Reconstruction
Constant 2367.Mean 90.01Sigma 12.27
All Corrections
µ and Missing ET Corrections
µ Corrections
Standard Corrections
Dijet Invariant Mass (GeV/c2)
0
500
1000
1500
2000
2500
20 40 60 80 100 120 140
Figure 48. The four Gaussian fits show the improve-ment of the mass reconstruction for simulated Z → bbevents (Pythia V5.7, CDF detector simulation) whenthe observable characteristics of the b-quark decays areproperly taken into account in the mass reconstruction.
structable secondary vertices in the final state. InRun II it will be possible to trigger on secondary ver-tex information. Exploiting this feature, it should bepossible to collect a sample of Z → bb events withoutparticular requirements on the b decay. One purposeof this dataset is to provide a sample to calibrate thecalorimeter energy scale for jets containing b quarks,which may limit our ability to measure the top mass.Therefore the trigger path should bias the energy scalemeasurement as little as possible.
At Level 1 the XFT (eXtremely Fast Tracker) in-formation will be available: transverse momentum PT ,azimuthal angle φ and charge sign of particles crossingall of the Central Outer Tracker (COT) layers. Werequire the presence of two central high PT tracks inopposite hemispheres. Cuts are chosen on the trackPT and ∆φ to maximize the statistical significance(S/
√B). The track PT cuts are 6 GeV and 4 GeV,
with ∆φ > 150o.At Level 2 the rate is reduced by requiring the tracks
to have a finite impact parameter. The SVT (SiliconVertex Tracker) processor will provide this informa-tion. The best significance is found by requiring twoSVT tracks with 120 µm < |d| < 1000 µm.
The computing power of the Level 3 processorsshould allow the reconstruction of secondary verticesonline. We require two jets, each with uncorrectedET > 10 GeV in a cone of radius R = 0.7, and checkthat the jets contain two displaced vertices.
A summary of signal efficiency, trigger cross sectionand trigger rate at the three trigger levels is reportedin Table 4 for a typical instantaneous luminosity L =1.4 · 1032cm−2s−1.
Table 4Summary of the Z → bb trigger efficiency, cross section,and rate at each level.
Trigger ǫS (%) σT RT (Hz)
Level 1 17.0 ± 0.2 (5.7 ± 0.3) µb 800 ± 42Level 2 3.10 ± 0.03 (32 ± 3) nb 4.4 ± 0.4Level 3 2.4 ± 0.1 (3.2 ± 0.9) nb 0.5 ± 0.1
Since σ(pp → Z → bbX) ≃ 1 nb, about 2 · 106
Z → bb events will be produced in Run II, assuming2 fb−1 of data collected in two years. We expect tocollect 48,000 signal events in a total of about 6.4 · 106
with this trigger, corresponding to a S/B of 0.0075 anda significance S/
√B ≃ 19.
Figure 49. Mjj distribution expected from Run II:signal+background.
It is also advantageous to require the presence of noadditional jets with ET > 10 GeV in the event, eitherat trigger level or at a pre–analysis level. This wouldincrease the signal fraction to 0.013 and the significanceto S/
√B = 24. We simulated the signal extraction
procedure under these assumptions. We searched for
30
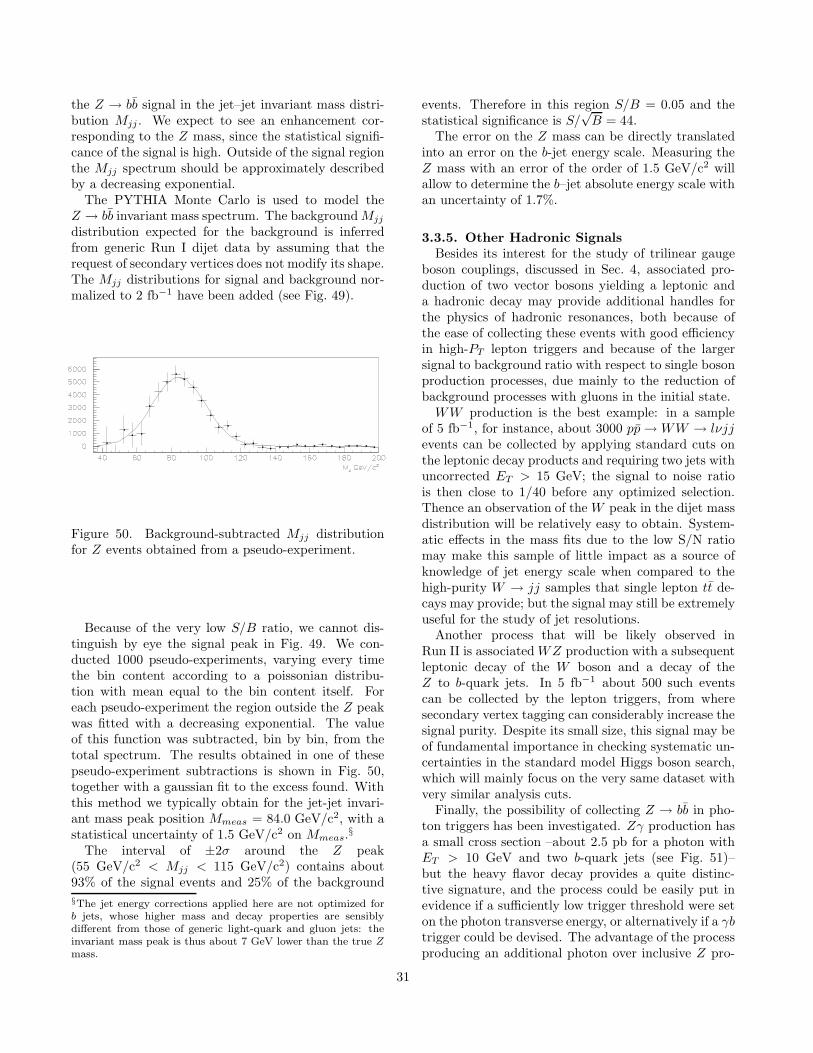
the Z → bb signal in the jet–jet invariant mass distri-bution Mjj . We expect to see an enhancement cor-responding to the Z mass, since the statistical signifi-cance of the signal is high. Outside of the signal regionthe Mjj spectrum should be approximately describedby a decreasing exponential.
The PYTHIA Monte Carlo is used to model theZ → bb invariant mass spectrum. The background Mjj
distribution expected for the background is inferredfrom generic Run I dijet data by assuming that therequest of secondary vertices does not modify its shape.The Mjj distributions for signal and background nor-malized to 2 fb−1 have been added (see Fig. 49).
Figure 50. Background-subtracted Mjj distributionfor Z events obtained from a pseudo-experiment.
Because of the very low S/B ratio, we cannot dis-tinguish by eye the signal peak in Fig. 49. We con-ducted 1000 pseudo-experiments, varying every timethe bin content according to a poissonian distribu-tion with mean equal to the bin content itself. Foreach pseudo-experiment the region outside the Z peakwas fitted with a decreasing exponential. The valueof this function was subtracted, bin by bin, from thetotal spectrum. The results obtained in one of thesepseudo-experiment subtractions is shown in Fig. 50,together with a gaussian fit to the excess found. Withthis method we typically obtain for the jet-jet invari-ant mass peak position Mmeas = 84.0 GeV/c2, with astatistical uncertainty of 1.5 GeV/c2 on Mmeas.
§
The interval of ±2σ around the Z peak(55 GeV/c2 < Mjj < 115 GeV/c2) contains about93% of the signal events and 25% of the background
§The jet energy corrections applied here are not optimized forb jets, whose higher mass and decay properties are sensiblydifferent from those of generic light-quark and gluon jets: theinvariant mass peak is thus about 7 GeV lower than the true Z
mass.
events. Therefore in this region S/B = 0.05 and thestatistical significance is S/
√B = 44.
The error on the Z mass can be directly translatedinto an error on the b-jet energy scale. Measuring theZ mass with an error of the order of 1.5 GeV/c2 willallow to determine the b–jet absolute energy scale withan uncertainty of 1.7%.
3.3.5. Other Hadronic SignalsBesides its interest for the study of trilinear gauge
boson couplings, discussed in Sec. 4, associated pro-duction of two vector bosons yielding a leptonic anda hadronic decay may provide additional handles forthe physics of hadronic resonances, both because ofthe ease of collecting these events with good efficiencyin high-PT lepton triggers and because of the largersignal to background ratio with respect to single bosonproduction processes, due mainly to the reduction ofbackground processes with gluons in the initial state.
WW production is the best example: in a sampleof 5 fb−1, for instance, about 3000 pp → WW → lνjjevents can be collected by applying standard cuts onthe leptonic decay products and requiring two jets withuncorrected ET > 15 GeV; the signal to noise ratiois then close to 1/40 before any optimized selection.Thence an observation of the W peak in the dijet massdistribution will be relatively easy to obtain. System-atic effects in the mass fits due to the low S/N ratiomay make this sample of little impact as a source ofknowledge of jet energy scale when compared to thehigh-purity W → jj samples that single lepton tt de-cays may provide; but the signal may still be extremelyuseful for the study of jet resolutions.
Another process that will be likely observed inRun II is associated WZ production with a subsequentleptonic decay of the W boson and a decay of theZ to b-quark jets. In 5 fb−1 about 500 such eventscan be collected by the lepton triggers, from wheresecondary vertex tagging can considerably increase thesignal purity. Despite its small size, this signal may beof fundamental importance in checking systematic un-certainties in the standard model Higgs boson search,which will mainly focus on the very same dataset withvery similar analysis cuts.
Finally, the possibility of collecting Z → bb in pho-ton triggers has been investigated. Zγ production hasa small cross section –about 2.5 pb for a photon withET > 10 GeV and two b-quark jets (see Fig. 51)–but the heavy flavor decay provides a quite distinc-tive signature, and the process could be easily put inevidence if a sufficiently low trigger threshold were seton the photon transverse energy, or alternatively if a γbtrigger could be devised. The advantage of the processproducing an additional photon over inclusive Z pro-
31
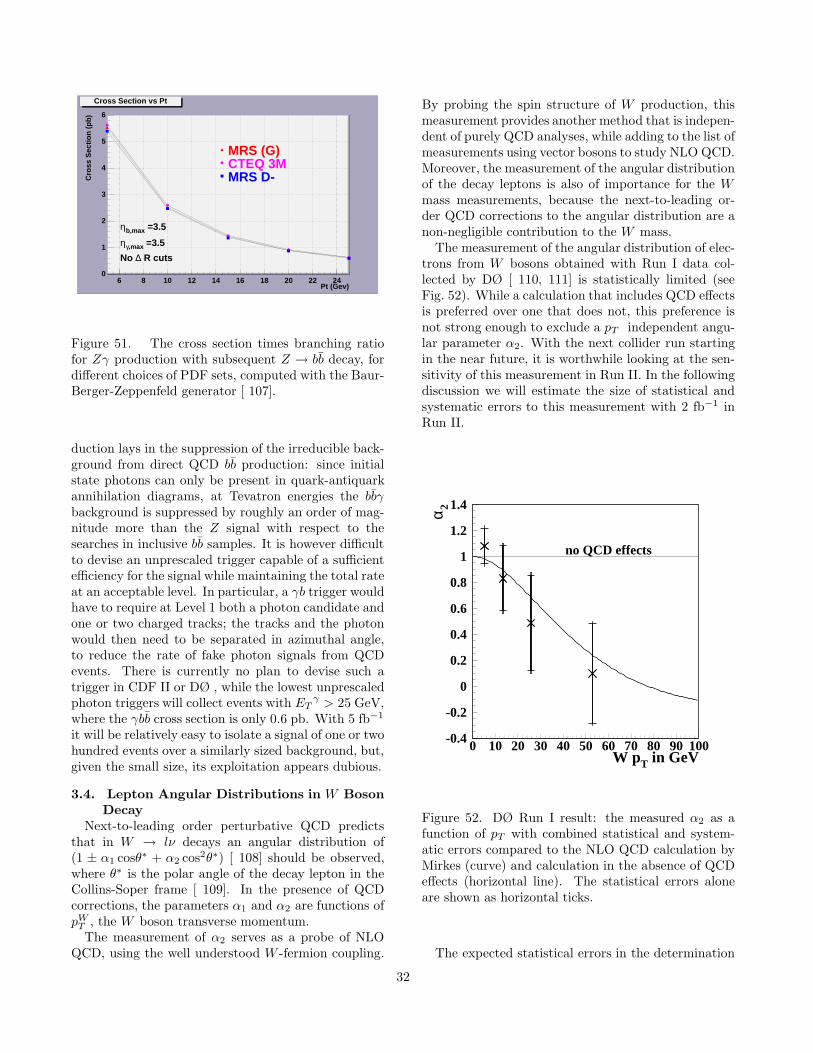
Pt (Gev)6 8 10 12 14 16 18 20 22 24
Cro
ss S
ecti
on
(p
b)
0
1
2
3
4
5
6
MRS (G)CTEQ 3MMRS D-
ηb,max =3.5
ηγ,max =3.5
No ∆ R cuts
Cross Section vs Pt
Figure 51. The cross section times branching ratiofor Zγ production with subsequent Z → bb decay, fordifferent choices of PDF sets, computed with the Baur-Berger-Zeppenfeld generator [ 107].
duction lays in the suppression of the irreducible back-ground from direct QCD bb production: since initialstate photons can only be present in quark-antiquarkannihilation diagrams, at Tevatron energies the bbγbackground is suppressed by roughly an order of mag-nitude more than the Z signal with respect to thesearches in inclusive bb samples. It is however difficultto devise an unprescaled trigger capable of a sufficientefficiency for the signal while maintaining the total rateat an acceptable level. In particular, a γb trigger wouldhave to require at Level 1 both a photon candidate andone or two charged tracks; the tracks and the photonwould then need to be separated in azimuthal angle,to reduce the rate of fake photon signals from QCDevents. There is currently no plan to devise such atrigger in CDF II or DØ , while the lowest unprescaledphoton triggers will collect events with ET
γ > 25 GeV,where the γbb cross section is only 0.6 pb. With 5 fb−1
it will be relatively easy to isolate a signal of one or twohundred events over a similarly sized background, but,given the small size, its exploitation appears dubious.
3.4. Lepton Angular Distributions in W BosonDecay
Next-to-leading order perturbative QCD predictsthat in W → lν decays an angular distribution of(1 ± α1 cosθ∗ + α2 cos2θ∗) [ 108] should be observed,where θ∗ is the polar angle of the decay lepton in theCollins-Soper frame [ 109]. In the presence of QCDcorrections, the parameters α1 and α2 are functions ofpW
T , the W boson transverse momentum.The measurement of α2 serves as a probe of NLO
QCD, using the well understood W -fermion coupling.
By probing the spin structure of W production, thismeasurement provides another method that is indepen-dent of purely QCD analyses, while adding to the list ofmeasurements using vector bosons to study NLO QCD.Moreover, the measurement of the angular distributionof the decay leptons is also of importance for the Wmass measurements, because the next-to-leading or-der QCD corrections to the angular distribution are anon-negligible contribution to the W mass.
The measurement of the angular distribution of elec-trons from W bosons obtained with Run I data col-lected by DØ [ 110, 111] is statistically limited (seeFig. 52). While a calculation that includes QCD effectsis preferred over one that does not, this preference isnot strong enough to exclude a pT independent angu-lar parameter α2. With the next collider run startingin the near future, it is worthwhile looking at the sen-sitivity of this measurement in Run II. In the followingdiscussion we will estimate the size of statistical andsystematic errors to this measurement with 2 fb−1 inRun II.
-0.4
-0.2
0
0.2
0.4
0.6
0.8
1
1.2
1.4
0 10 20 30 40 50 60 70 80 90 100
no QCD effects
W pT in GeV
α 2
Figure 52. DØ Run I result: the measured α2 as afunction of pT with combined statistical and system-atic errors compared to the NLO QCD calculation byMirkes (curve) and calculation in the absence of QCDeffects (horizontal line). The statistical errors aloneare shown as horizontal ticks.
The expected statistical errors in the determination
32
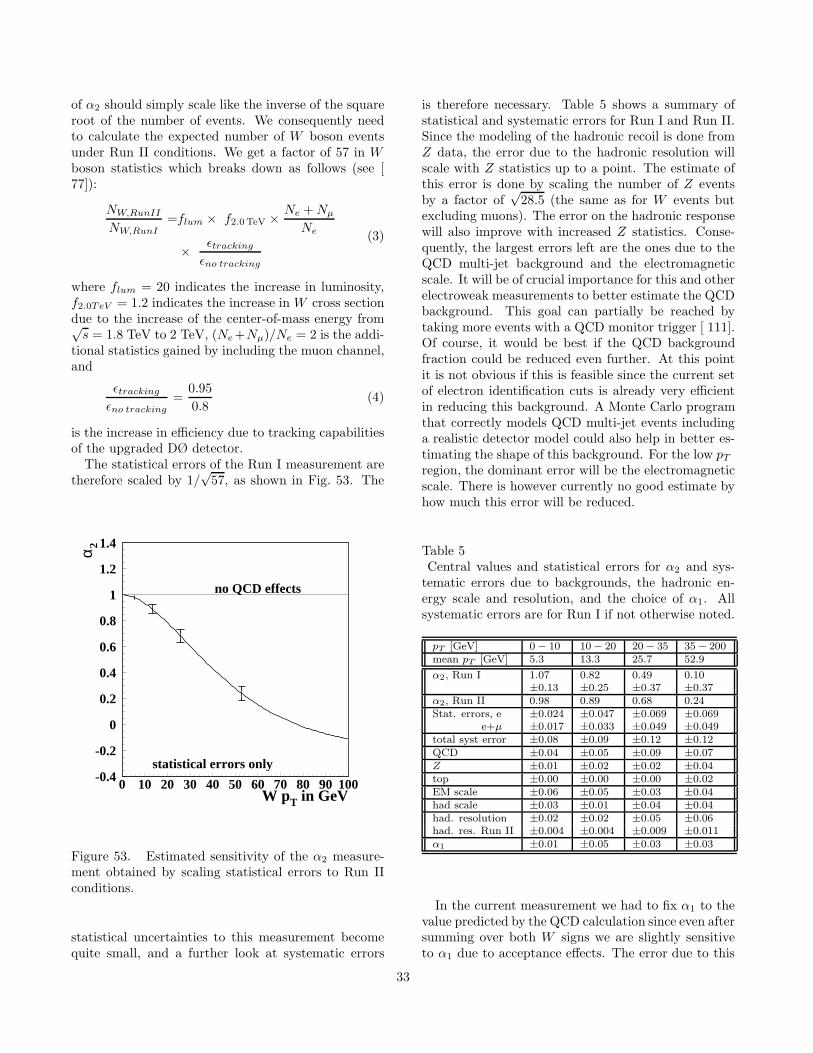
of α2 should simply scale like the inverse of the squareroot of the number of events. We consequently needto calculate the expected number of W boson eventsunder Run II conditions. We get a factor of 57 in Wboson statistics which breaks down as follows (see [77]):
NW,RunII
NW,RunI=flum × f2.0TeV × Ne + Nµ
Ne
× ǫtracking
ǫno tracking
(3)
where flum = 20 indicates the increase in luminosity,f2.0TeV = 1.2 indicates the increase in W cross sectiondue to the increase of the center-of-mass energy from√
s = 1.8 TeV to 2 TeV, (Ne +Nµ)/Ne = 2 is the addi-tional statistics gained by including the muon channel,and
ǫtracking
ǫno tracking=
0.95
0.8(4)
is the increase in efficiency due to tracking capabilitiesof the upgraded DØ detector.
The statistical errors of the Run I measurement aretherefore scaled by 1/
√57, as shown in Fig. 53. The
-0.4
-0.2
0
0.2
0.4
0.6
0.8
1
1.2
1.4
0 10 20 30 40 50 60 70 80 90 100
no QCD effects
statistical errors only
W pT in GeV
α 2
Figure 53. Estimated sensitivity of the α2 measure-ment obtained by scaling statistical errors to Run IIconditions.
statistical uncertainties to this measurement becomequite small, and a further look at systematic errors
is therefore necessary. Table 5 shows a summary ofstatistical and systematic errors for Run I and Run II.Since the modeling of the hadronic recoil is done fromZ data, the error due to the hadronic resolution willscale with Z statistics up to a point. The estimate ofthis error is done by scaling the number of Z eventsby a factor of
√28.5 (the same as for W events but
excluding muons). The error on the hadronic responsewill also improve with increased Z statistics. Conse-quently, the largest errors left are the ones due to theQCD multi-jet background and the electromagneticscale. It will be of crucial importance for this and otherelectroweak measurements to better estimate the QCDbackground. This goal can partially be reached bytaking more events with a QCD monitor trigger [ 111].Of course, it would be best if the QCD backgroundfraction could be reduced even further. At this pointit is not obvious if this is feasible since the current setof electron identification cuts is already very efficientin reducing this background. A Monte Carlo programthat correctly models QCD multi-jet events includinga realistic detector model could also help in better es-timating the shape of this background. For the low pT
region, the dominant error will be the electromagneticscale. There is however currently no good estimate byhow much this error will be reduced.
Table 5Central values and statistical errors for α2 and sys-
tematic errors due to backgrounds, the hadronic en-ergy scale and resolution, and the choice of α1. Allsystematic errors are for Run I if not otherwise noted.
pT [GeV] 0 − 10 10 − 20 20 − 35 35 − 200mean pT [GeV] 5.3 13.3 25.7 52.9
α2, Run I 1.07 0.82 0.49 0.10±0.13 ±0.25 ±0.37 ±0.37
α2, Run II 0.98 0.89 0.68 0.24Stat. errors, e ±0.024 ±0.047 ±0.069 ±0.069
e+µ ±0.017 ±0.033 ±0.049 ±0.049total syst error ±0.08 ±0.09 ±0.12 ±0.12QCD ±0.04 ±0.05 ±0.09 ±0.07Z ±0.01 ±0.02 ±0.02 ±0.04top ±0.00 ±0.00 ±0.00 ±0.02EM scale ±0.06 ±0.05 ±0.03 ±0.04had scale ±0.03 ±0.01 ±0.04 ±0.04had. resolution ±0.02 ±0.02 ±0.05 ±0.06had. res. Run II ±0.004 ±0.004 ±0.009 ±0.011α1 ±0.01 ±0.05 ±0.03 ±0.03
In the current measurement we had to fix α1 to thevalue predicted by the QCD calculation since even aftersumming over both W signs we are slightly sensitiveto α1 due to acceptance effects. The error due to this
33
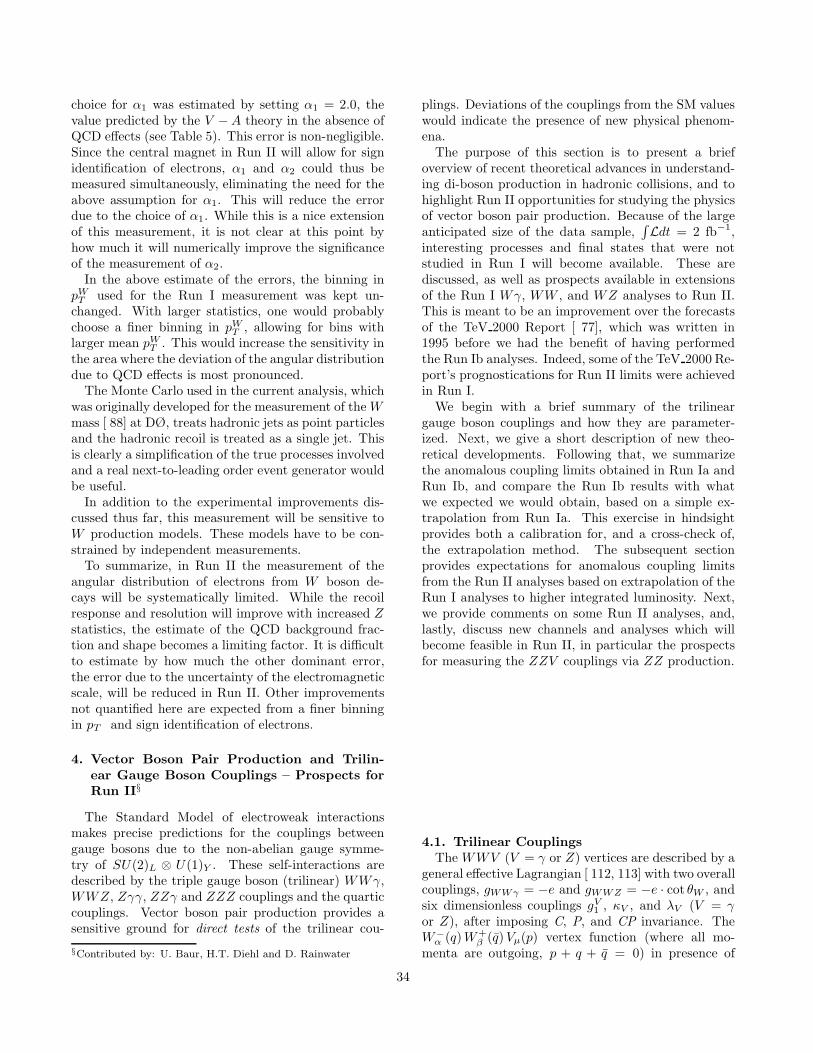
choice for α1 was estimated by setting α1 = 2.0, thevalue predicted by the V − A theory in the absence ofQCD effects (see Table 5). This error is non-negligible.Since the central magnet in Run II will allow for signidentification of electrons, α1 and α2 could thus bemeasured simultaneously, eliminating the need for theabove assumption for α1. This will reduce the errordue to the choice of α1. While this is a nice extensionof this measurement, it is not clear at this point byhow much it will numerically improve the significanceof the measurement of α2.
In the above estimate of the errors, the binning inpW
T used for the Run I measurement was kept un-changed. With larger statistics, one would probablychoose a finer binning in pW
T , allowing for bins withlarger mean pW
T . This would increase the sensitivity inthe area where the deviation of the angular distributiondue to QCD effects is most pronounced.
The Monte Carlo used in the current analysis, whichwas originally developed for the measurement of the Wmass [ 88] at DØ, treats hadronic jets as point particlesand the hadronic recoil is treated as a single jet. Thisis clearly a simplification of the true processes involvedand a real next-to-leading order event generator wouldbe useful.
In addition to the experimental improvements dis-cussed thus far, this measurement will be sensitive toW production models. These models have to be con-strained by independent measurements.
To summarize, in Run II the measurement of theangular distribution of electrons from W boson de-cays will be systematically limited. While the recoilresponse and resolution will improve with increased Zstatistics, the estimate of the QCD background frac-tion and shape becomes a limiting factor. It is difficultto estimate by how much the other dominant error,the error due to the uncertainty of the electromagneticscale, will be reduced in Run II. Other improvementsnot quantified here are expected from a finer binningin pT and sign identification of electrons.
4. Vector Boson Pair Production and Trilin-ear Gauge Boson Couplings – Prospects forRun II§
The Standard Model of electroweak interactionsmakes precise predictions for the couplings betweengauge bosons due to the non-abelian gauge symme-try of SU(2)L ⊗ U(1)Y . These self-interactions aredescribed by the triple gauge boson (trilinear) WWγ,WWZ, Zγγ, ZZγ and ZZZ couplings and the quarticcouplings. Vector boson pair production provides asensitive ground for direct tests of the trilinear cou-
§Contributed by: U. Baur, H.T. Diehl and D. Rainwater
plings. Deviations of the couplings from the SM valueswould indicate the presence of new physical phenom-ena.
The purpose of this section is to present a briefoverview of recent theoretical advances in understand-ing di-boson production in hadronic collisions, and tohighlight Run II opportunities for studying the physicsof vector boson pair production. Because of the largeanticipated size of the data sample,
∫
Ldt = 2 fb−1,interesting processes and final states that were notstudied in Run I will become available. These arediscussed, as well as prospects available in extensionsof the Run I Wγ, WW , and WZ analyses to Run II.This is meant to be an improvement over the forecastsof the TeV 2000 Report [ 77], which was written in1995 before we had the benefit of having performedthe Run Ib analyses. Indeed, some of the TeV 2000 Re-port’s prognostications for Run II limits were achievedin Run I.
We begin with a brief summary of the trilineargauge boson couplings and how they are parameter-ized. Next, we give a short description of new theo-retical developments. Following that, we summarizethe anomalous coupling limits obtained in Run Ia andRun Ib, and compare the Run Ib results with whatwe expected we would obtain, based on a simple ex-trapolation from Run Ia. This exercise in hindsightprovides both a calibration for, and a cross-check of,the extrapolation method. The subsequent sectionprovides expectations for anomalous coupling limitsfrom the Run II analyses based on extrapolation of theRun I analyses to higher integrated luminosity. Next,we provide comments on some Run II analyses, and,lastly, discuss new channels and analyses which willbecome feasible in Run II, in particular the prospectsfor measuring the ZZV couplings via ZZ production.
4.1. Trilinear CouplingsThe WWV (V = γ or Z) vertices are described by a
general effective Lagrangian [ 112, 113] with two overallcouplings, gWWγ = −e and gWWZ = −e · cot θW , andsix dimensionless couplings gV
1 , κV , and λV (V = γor Z), after imposing C, P, and CP invariance. TheW−
α (q)W+β (q)Vµ(p) vertex function (where all mo-
menta are outgoing, p + q + q = 0) in presence of
34
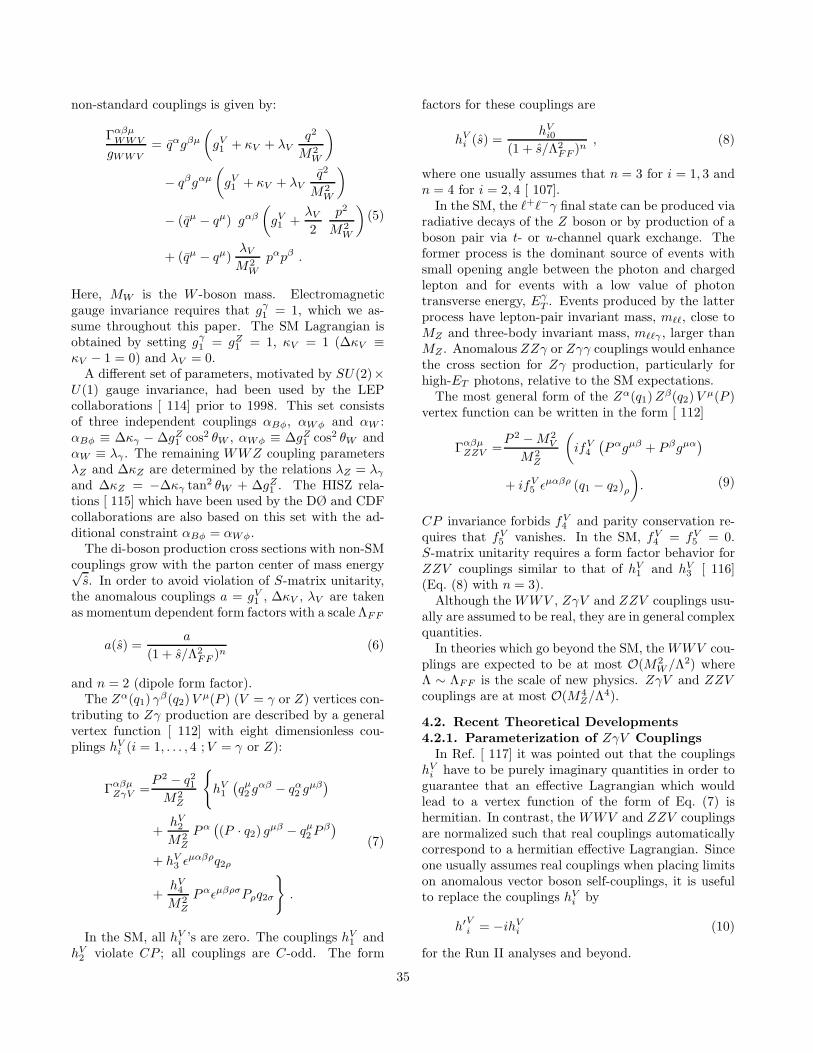
non-standard couplings is given by:
ΓαβµWWV
gWWV= qαgβµ
(
gV1 + κV + λV
q2
M2W
)
− qβgαµ
(
gV1 + κV + λV
q2
M2W
)
− (qµ − qµ) gαβ
(
gV1 +
λV
2
p2
M2W
)
+ (qµ − qµ)λV
M2W
pαpβ .
(5)
Here, MW is the W -boson mass. Electromagneticgauge invariance requires that gγ
1 = 1, which we as-sume throughout this paper. The SM Lagrangian isobtained by setting gγ
1 = gZ1 = 1, κV = 1 (∆κV ≡
κV − 1 = 0) and λV = 0.A different set of parameters, motivated by SU(2)×
U(1) gauge invariance, had been used by the LEPcollaborations [ 114] prior to 1998. This set consistsof three independent couplings αBφ, αWφ and αW :αBφ ≡ ∆κγ − ∆gZ
1 cos2 θW , αWφ ≡ ∆gZ1 cos2 θW and
αW ≡ λγ . The remaining WWZ coupling parametersλZ and ∆κZ are determined by the relations λZ = λγ
and ∆κZ = −∆κγ tan2 θW + ∆gZ1 . The HISZ rela-
tions [ 115] which have been used by the DØ and CDFcollaborations are also based on this set with the ad-ditional constraint αBφ = αWφ.
The di-boson production cross sections with non-SMcouplings grow with the parton center of mass energy√
s. In order to avoid violation of S-matrix unitarity,the anomalous couplings a = gV
1 , ∆κV , λV are takenas momentum dependent form factors with a scale ΛFF
a(s) =a
(1 + s/Λ2FF )n
(6)
and n = 2 (dipole form factor).The Zα(q1) γβ(q2)V µ(P ) (V = γ or Z) vertices con-
tributing to Zγ production are described by a generalvertex function [ 112] with eight dimensionless cou-plings hV
i (i = 1, . . . , 4 ; V = γ or Z):
ΓαβµZγV =
P 2 − q21
M2Z
{
hV1
(
qµ2 gαβ − qα
2 gµβ)
+hV
2
M2Z
Pα(
(P · q2) gµβ − qµ2 P β
)
+ hV3 ǫµαβρq2ρ
+hV
4
M2Z
PαǫµβρσPρq2σ
}
.
(7)
In the SM, all hVi ’s are zero. The couplings hV
1 andhV
2 violate CP ; all couplings are C-odd. The form
factors for these couplings are
hVi (s) =
hVi0
(1 + s/Λ2FF )n
, (8)
where one usually assumes that n = 3 for i = 1, 3 andn = 4 for i = 2, 4 [ 107].
In the SM, the ℓ+ℓ−γ final state can be produced viaradiative decays of the Z boson or by production of aboson pair via t- or u-channel quark exchange. Theformer process is the dominant source of events withsmall opening angle between the photon and chargedlepton and for events with a low value of photontransverse energy, Eγ
T . Events produced by the latterprocess have lepton-pair invariant mass, mℓℓ, close toMZ and three-body invariant mass, mℓℓγ , larger thanMZ . Anomalous ZZγ or Zγγ couplings would enhancethe cross section for Zγ production, particularly forhigh-ET photons, relative to the SM expectations.
The most general form of the Zα(q1)Zβ(q2)V µ(P )vertex function can be written in the form [ 112]
ΓαβµZZV =
P 2 − M2V
M2Z
(
ifV4
(
Pαgµβ + P βgµα)
+ ifV5 ǫµαβρ (q1 − q2)ρ
)
. (9)
CP invariance forbids fV4 and parity conservation re-
quires that fV5 vanishes. In the SM, fV
4 = fV5 = 0.
S-matrix unitarity requires a form factor behavior forZZV couplings similar to that of hV
1 and hV3 [ 116]
(Eq. (8) with n = 3).Although the WWV , ZγV and ZZV couplings usu-
ally are assumed to be real, they are in general complexquantities.
In theories which go beyond the SM, the WWV cou-plings are expected to be at most O(M2
W /Λ2) whereΛ ∼ ΛFF is the scale of new physics. ZγV and ZZVcouplings are at most O(M4
Z/Λ4).
4.2. Recent Theoretical Developments4.2.1. Parameterization of ZγV Couplings
In Ref. [ 117] it was pointed out that the couplingshV
i have to be purely imaginary quantities in order toguarantee that an effective Lagrangian which wouldlead to a vertex function of the form of Eq. (7) ishermitian. In contrast, the WWV and ZZV couplingsare normalized such that real couplings automaticallycorrespond to a hermitian effective Lagrangian. Sinceone usually assumes real couplings when placing limitson anomalous vector boson self-couplings, it is usefulto replace the couplings hV
i by
h′Vi = −ihV
i (10)
for the Run II analyses and beyond.
35
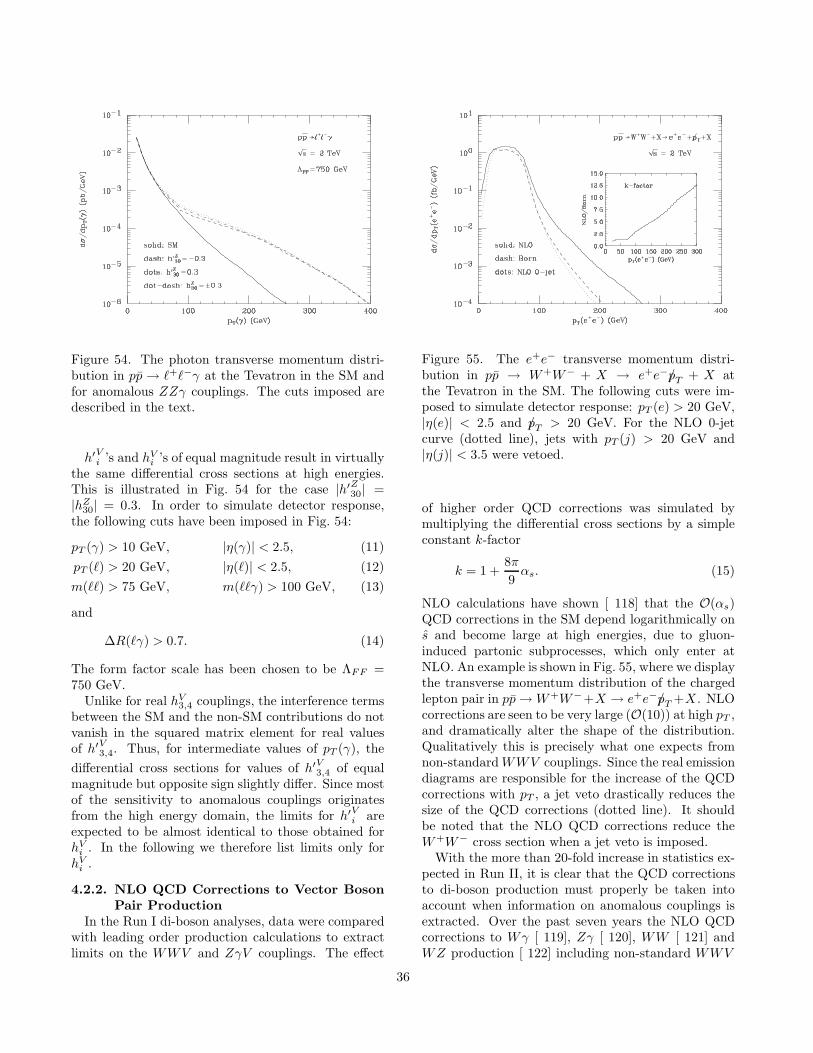
Figure 54. The photon transverse momentum distri-bution in pp → ℓ+ℓ−γ at the Tevatron in the SM andfor anomalous ZZγ couplings. The cuts imposed aredescribed in the text.
h′Vi ’s and hV
i ’s of equal magnitude result in virtuallythe same differential cross sections at high energies.This is illustrated in Fig. 54 for the case |h′Z
30| =|hZ
30| = 0.3. In order to simulate detector response,the following cuts have been imposed in Fig. 54:
pT (γ) > 10 GeV, |η(γ)| < 2.5, (11)
pT (ℓ) > 20 GeV, |η(ℓ)| < 2.5, (12)
m(ℓℓ) > 75 GeV, m(ℓℓγ) > 100 GeV, (13)
and
∆R(ℓγ) > 0.7. (14)
The form factor scale has been chosen to be ΛFF =750 GeV.
Unlike for real hV3,4 couplings, the interference terms
between the SM and the non-SM contributions do notvanish in the squared matrix element for real valuesof h′V
3,4. Thus, for intermediate values of pT (γ), the
differential cross sections for values of h′V3,4 of equal
magnitude but opposite sign slightly differ. Since mostof the sensitivity to anomalous couplings originatesfrom the high energy domain, the limits for h′V
i areexpected to be almost identical to those obtained forhV
i . In the following we therefore list limits only forhV
i .
4.2.2. NLO QCD Corrections to Vector BosonPair Production
In the Run I di-boson analyses, data were comparedwith leading order production calculations to extractlimits on the WWV and ZγV couplings. The effect
Figure 55. The e+e− transverse momentum distri-bution in pp → W+W− + X → e+e−p/T + X atthe Tevatron in the SM. The following cuts were im-posed to simulate detector response: pT (e) > 20 GeV,|η(e)| < 2.5 and p/T > 20 GeV. For the NLO 0-jetcurve (dotted line), jets with pT (j) > 20 GeV and|η(j)| < 3.5 were vetoed.
of higher order QCD corrections was simulated bymultiplying the differential cross sections by a simpleconstant k-factor
k = 1 +8π
9αs. (15)
NLO calculations have shown [ 118] that the O(αs)QCD corrections in the SM depend logarithmically ons and become large at high energies, due to gluon-induced partonic subprocesses, which only enter atNLO. An example is shown in Fig. 55, where we displaythe transverse momentum distribution of the chargedlepton pair in pp → W+W−+X → e+e−p/T +X . NLOcorrections are seen to be very large (O(10)) at high pT ,and dramatically alter the shape of the distribution.Qualitatively this is precisely what one expects fromnon-standard WWV couplings. Since the real emissiondiagrams are responsible for the increase of the QCDcorrections with pT , a jet veto drastically reduces thesize of the QCD corrections (dotted line). It shouldbe noted that the NLO QCD corrections reduce theW+W− cross section when a jet veto is imposed.
With the more than 20-fold increase in statistics ex-pected in Run II, it is clear that the QCD correctionsto di-boson production must properly be taken intoaccount when information on anomalous couplings isextracted. Over the past seven years the NLO QCDcorrections to Wγ [ 119], Zγ [ 120], WW [ 121] andWZ production [ 122] including non-standard WWV
36
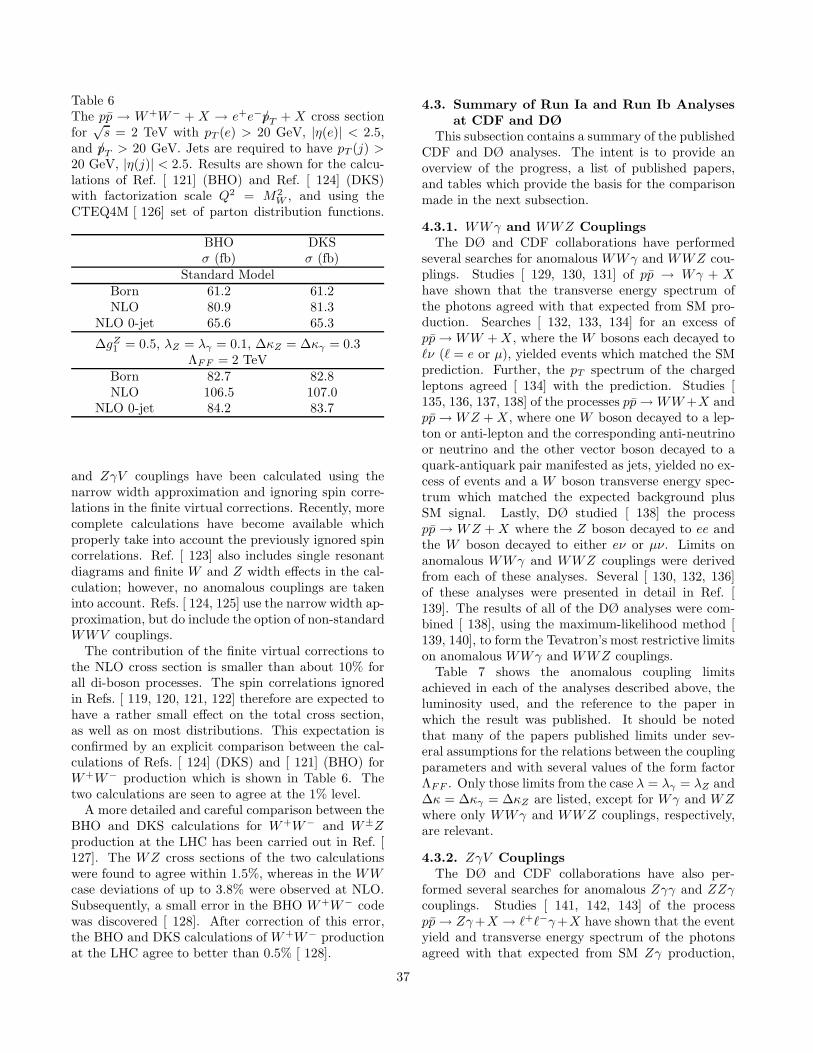
Table 6The pp → W+W− + X → e+e−p/T + X cross sectionfor
√s = 2 TeV with pT (e) > 20 GeV, |η(e)| < 2.5,
and p/T > 20 GeV. Jets are required to have pT (j) >20 GeV, |η(j)| < 2.5. Results are shown for the calcu-lations of Ref. [ 121] (BHO) and Ref. [ 124] (DKS)with factorization scale Q2 = M2
W , and using theCTEQ4M [ 126] set of parton distribution functions.
BHO DKSσ (fb) σ (fb)
Standard ModelBorn 61.2 61.2NLO 80.9 81.3
NLO 0-jet 65.6 65.3
∆gZ1 = 0.5, λZ = λγ = 0.1, ∆κZ = ∆κγ = 0.3
ΛFF = 2 TeVBorn 82.7 82.8NLO 106.5 107.0
NLO 0-jet 84.2 83.7
and ZγV couplings have been calculated using thenarrow width approximation and ignoring spin corre-lations in the finite virtual corrections. Recently, morecomplete calculations have become available whichproperly take into account the previously ignored spincorrelations. Ref. [ 123] also includes single resonantdiagrams and finite W and Z width effects in the cal-culation; however, no anomalous couplings are takeninto account. Refs. [ 124, 125] use the narrow width ap-proximation, but do include the option of non-standardWWV couplings.
The contribution of the finite virtual corrections tothe NLO cross section is smaller than about 10% forall di-boson processes. The spin correlations ignoredin Refs. [ 119, 120, 121, 122] therefore are expected tohave a rather small effect on the total cross section,as well as on most distributions. This expectation isconfirmed by an explicit comparison between the cal-culations of Refs. [ 124] (DKS) and [ 121] (BHO) forW+W− production which is shown in Table 6. Thetwo calculations are seen to agree at the 1% level.
A more detailed and careful comparison between theBHO and DKS calculations for W+W− and W±Zproduction at the LHC has been carried out in Ref. [127]. The WZ cross sections of the two calculationswere found to agree within 1.5%, whereas in the WWcase deviations of up to 3.8% were observed at NLO.Subsequently, a small error in the BHO W+W− codewas discovered [ 128]. After correction of this error,the BHO and DKS calculations of W+W− productionat the LHC agree to better than 0.5% [ 128].
4.3. Summary of Run Ia and Run Ib Analysesat CDF and DØ
This subsection contains a summary of the publishedCDF and DØ analyses. The intent is to provide anoverview of the progress, a list of published papers,and tables which provide the basis for the comparisonmade in the next subsection.
4.3.1. WWγ and WWZ CouplingsThe DØ and CDF collaborations have performed
several searches for anomalous WWγ and WWZ cou-plings. Studies [ 129, 130, 131] of pp → Wγ + Xhave shown that the transverse energy spectrum ofthe photons agreed with that expected from SM pro-duction. Searches [ 132, 133, 134] for an excess ofpp → WW + X , where the W bosons each decayed toℓν (ℓ = e or µ), yielded events which matched the SMprediction. Further, the pT spectrum of the chargedleptons agreed [ 134] with the prediction. Studies [135, 136, 137, 138] of the processes pp → WW +X andpp → WZ + X , where one W boson decayed to a lep-ton or anti-lepton and the corresponding anti-neutrinoor neutrino and the other vector boson decayed to aquark-antiquark pair manifested as jets, yielded no ex-cess of events and a W boson transverse energy spec-trum which matched the expected background plusSM signal. Lastly, DØ studied [ 138] the processpp → WZ + X where the Z boson decayed to ee andthe W boson decayed to either eν or µν. Limits onanomalous WWγ and WWZ couplings were derivedfrom each of these analyses. Several [ 130, 132, 136]of these analyses were presented in detail in Ref. [139]. The results of all of the DØ analyses were com-bined [ 138], using the maximum-likelihood method [139, 140], to form the Tevatron’s most restrictive limitson anomalous WWγ and WWZ couplings.
Table 7 shows the anomalous coupling limitsachieved in each of the analyses described above, theluminosity used, and the reference to the paper inwhich the result was published. It should be notedthat many of the papers published limits under sev-eral assumptions for the relations between the couplingparameters and with several values of the form factorΛFF . Only those limits from the case λ = λγ = λZ and∆κ = ∆κγ = ∆κZ are listed, except for Wγ and WZwhere only WWγ and WWZ couplings, respectively,are relevant.
4.3.2. ZγV CouplingsThe DØ and CDF collaborations have also per-
formed several searches for anomalous Zγγ and ZZγcouplings. Studies [ 141, 142, 143] of the processpp → Zγ +X → ℓ+ℓ−γ +X have shown that the eventyield and transverse energy spectrum of the photonsagreed with that expected from SM Zγ production,
37

Table 795% confidence level WWγ and WWZ anomalous coupling limits achieved in Run I analyses by the DØ and CDFCollaborations.Analysis Ref. Run Lum. (pb−1) ΛFF A.C. Limit (95% CL)
CDF Wγ → [ 129] Ia 20 1.5 TeV −0.7 ≤ λ ≤ 0.7eνγ and µνγ −2.2 ≤ ∆κ ≤ 2.3DØ Wγ → [ 130] Ia 13.8 1.5 TeV −0.6 ≤ λ ≤ 0.6eνγ and µνγ −1.6 ≤ ∆κ ≤ 1.8DØ Wγ → [ 131] Ia + Ib 92.8 1.5 TeV −0.31 ≤ λ ≤ 0.29eνγ and µνγ −0.93 ≤ ∆κ ≤ 0.94DØ WW → [ 132] Ia 14 900 GeV −2.1 ≤ λ ≤ 2.1Dilepton Equal Couplings −2.6 ≤ ∆κ ≤ 2.8CDF WW → [ 133] Ia + Ib 108 1.0 TeV −0.9 ≤ λ ≤ 0.9Dilepton Equal Couplings −1.0 ≤ ∆κ ≤ 1.3DØ WW → [ 134] Ia + Ib 97 1.5 TeV −0.53 ≤ λ ≤ 0.56Dilepton Equal Coupling −0.62 ≤ ∆κ ≤ 0.77CDF WW and WZ →[ 135] Ia 19.6 1.0 TeV −0.81 ≤ λ ≤ 0.84leptons + jets Equal Couplings −1.11 ≤ ∆κ ≤ 1.27DØ WW and WZ → [ 136] Ia 13.7 1.5 TeV −0.6 ≤ λ ≤ 0.7eνjj Equal Couplings −0.9 ≤ ∆κ ≤ 1.1DØ WW and WZ → [ 137] Ia + Ib 96 1.5 TeV −0.36 ≤ λ ≤ 0.39eνjj Equal Couplings −0.47 ≤ ∆κ ≤ 0.63DØ WW and WZ → [ 137] Ia + Ib 96 2.0 TeV −0.33 ≤ λ ≤ 0.36eνjj Equal Couplings −0.43 ≤ ∆κ ≤ 0.59DØ WW and WZ → [ 138] Ib 81 2.0 TeV −0.43 ≤ λ ≤ 0.44µνjj Equal Couplings −0.60 ≤ ∆κ ≤ 0.74DØ WZ → [ 138] Ib 92 1.0 TeV −1.42 ≤ λZ ≤ 1.42eeµν and eeeν −1.63 ≤ ∆gZ
1 ≤ 1.63DØ Combined [ 138] Ia + Ib 96 2.0 TeV −0.18 ≤ λ ≤ 0.19
Equal Couplings −0.25 ≤ ∆κ ≤ 0.39
though it is noted that there were two Zγ → eeγ eventswith photons of ET greater than 70 GeV, expected inonly 7.3% of trial experiments.
Studies of the process Zγ → ννγ have the ad-vantage of the higher branching fraction for decay toneutrinos than does the charged-lepton decay mode.Furthermore, there is no final state radiation becausethe neutrinos are electrically neutral. However, thesignal-to-background ratio is rather lower than in thecharged-lepton analysis. DØ has published [ 144] theresults of the Run Ia Zγ → ννγ analysis. Again, thespectrum of the transverse energy of the photons, forEγ
T ≥ 40 GeV, agreed with the SM prediction.DØ and CDF produced limits on anomalous ZγV
(V = Z, γ) couplings using a fit to the EγT spectrum.
The DØ Run Ia and Run Ib results were combinedin Ref. [ 143]. Table 8 shows a compilation of all theRun I CDF and DØ results. The limits for hγ
30 (hγ40)
and hV10 (hV
20) are almost identical to those obtainedfor hZ
30 (hZ40) and are, therefore, not shown.
4.4. Hindsight: Extrapolating Run Ia Resultsto Run Ib
It is interesting to see how well one can “predict”the Run Ib limits based on the Run Ia results and asimple rule for scaling the limits based on the increasein the luminosity.
The WWγ and WWZ anomalous coupling limitsshould scale by
(∫
Ldt
)1/4
. (16)
One square-root comes from the decrease in the statis-tical uncertainty of the cross section (as a function ofET , for instance) and the other from the fact that thedifferential cross section is a quadratic function of theanomalous couplings.
The Zγγ and ZZγ anomalous coupling limits wouldalso scale by the fourth-root of the ratio of the lumi-nosities, except that the limits depend very stronglyon the form-factor scale.
38
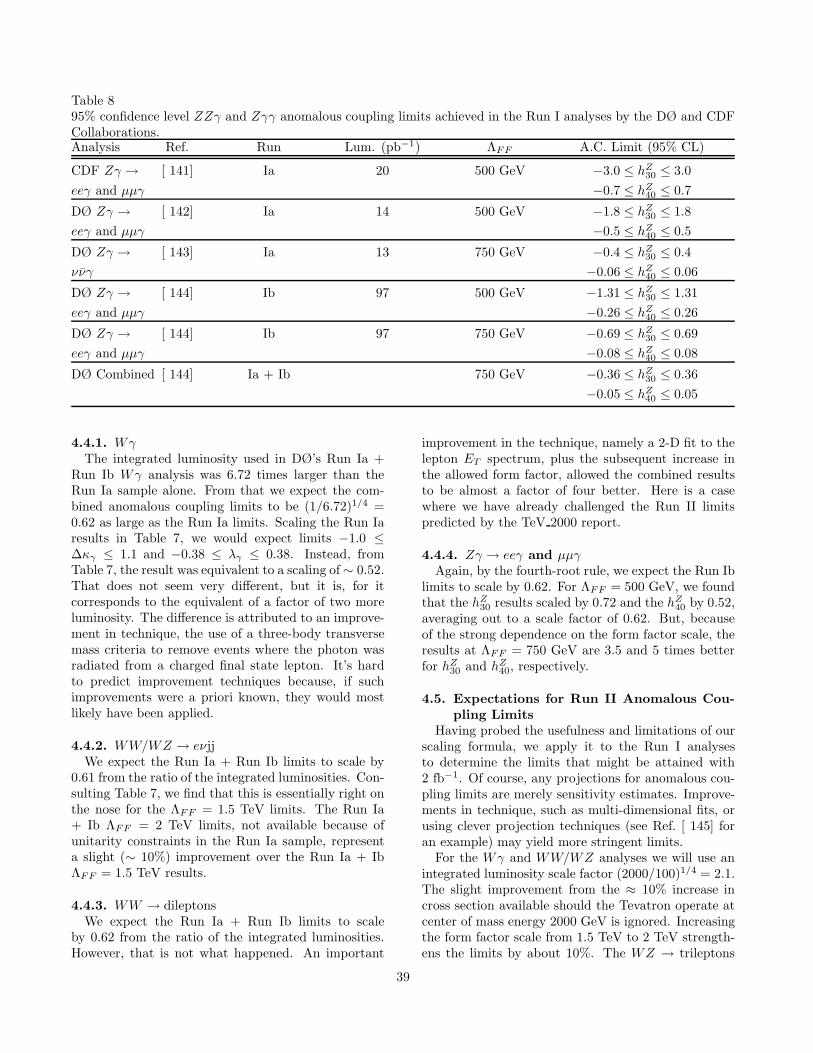
Table 895% confidence level ZZγ and Zγγ anomalous coupling limits achieved in the Run I analyses by the DØ and CDFCollaborations.Analysis Ref. Run Lum. (pb−1) ΛFF A.C. Limit (95% CL)
CDF Zγ → [ 141] Ia 20 500 GeV −3.0 ≤ hZ30 ≤ 3.0
eeγ and µµγ −0.7 ≤ hZ40 ≤ 0.7
DØ Zγ → [ 142] Ia 14 500 GeV −1.8 ≤ hZ30 ≤ 1.8
eeγ and µµγ −0.5 ≤ hZ40 ≤ 0.5
DØ Zγ → [ 143] Ia 13 750 GeV −0.4 ≤ hZ30 ≤ 0.4
ννγ −0.06 ≤ hZ40 ≤ 0.06
DØ Zγ → [ 144] Ib 97 500 GeV −1.31 ≤ hZ30 ≤ 1.31
eeγ and µµγ −0.26 ≤ hZ40 ≤ 0.26
DØ Zγ → [ 144] Ib 97 750 GeV −0.69 ≤ hZ30 ≤ 0.69
eeγ and µµγ −0.08 ≤ hZ40 ≤ 0.08
DØ Combined [ 144] Ia + Ib 750 GeV −0.36 ≤ hZ30 ≤ 0.36
−0.05 ≤ hZ40 ≤ 0.05
4.4.1. WγThe integrated luminosity used in DØ’s Run Ia +
Run Ib Wγ analysis was 6.72 times larger than theRun Ia sample alone. From that we expect the com-bined anomalous coupling limits to be (1/6.72)1/4 =0.62 as large as the Run Ia limits. Scaling the Run Iaresults in Table 7, we would expect limits −1.0 ≤∆κγ ≤ 1.1 and −0.38 ≤ λγ ≤ 0.38. Instead, fromTable 7, the result was equivalent to a scaling of ∼ 0.52.That does not seem very different, but it is, for itcorresponds to the equivalent of a factor of two moreluminosity. The difference is attributed to an improve-ment in technique, the use of a three-body transversemass criteria to remove events where the photon wasradiated from a charged final state lepton. It’s hardto predict improvement techniques because, if suchimprovements were a priori known, they would mostlikely have been applied.
4.4.2. WW/WZ → eνjjWe expect the Run Ia + Run Ib limits to scale by
0.61 from the ratio of the integrated luminosities. Con-sulting Table 7, we find that this is essentially right onthe nose for the ΛFF = 1.5 TeV limits. The Run Ia+ Ib ΛFF = 2 TeV limits, not available because ofunitarity constraints in the Run Ia sample, representa slight (∼ 10%) improvement over the Run Ia + IbΛFF = 1.5 TeV results.
4.4.3. WW → dileptonsWe expect the Run Ia + Run Ib limits to scale
by 0.62 from the ratio of the integrated luminosities.However, that is not what happened. An important
improvement in the technique, namely a 2-D fit to thelepton ET spectrum, plus the subsequent increase inthe allowed form factor, allowed the combined resultsto be almost a factor of four better. Here is a casewhere we have already challenged the Run II limitspredicted by the TeV 2000 report.
4.4.4. Zγ → eeγ and µµγAgain, by the fourth-root rule, we expect the Run Ib
limits to scale by 0.62. For ΛFF = 500 GeV, we foundthat the hZ
30 results scaled by 0.72 and the hZ40 by 0.52,
averaging out to a scale factor of 0.62. But, becauseof the strong dependence on the form factor scale, theresults at ΛFF = 750 GeV are 3.5 and 5 times betterfor hZ
30 and hZ40, respectively.
4.5. Expectations for Run II Anomalous Cou-pling Limits
Having probed the usefulness and limitations of ourscaling formula, we apply it to the Run I analysesto determine the limits that might be attained with2 fb−1. Of course, any projections for anomalous cou-pling limits are merely sensitivity estimates. Improve-ments in technique, such as multi-dimensional fits, orusing clever projection techniques (see Ref. [ 145] foran example) may yield more stringent limits.
For the Wγ and WW/WZ analyses we will use anintegrated luminosity scale factor (2000/100)1/4 = 2.1.The slight improvement from the ≈ 10% increase incross section available should the Tevatron operate atcenter of mass energy 2000 GeV is ignored. Increasingthe form factor scale from 1.5 TeV to 2 TeV strength-ens the limits by about 10%. The WZ → trileptons
39
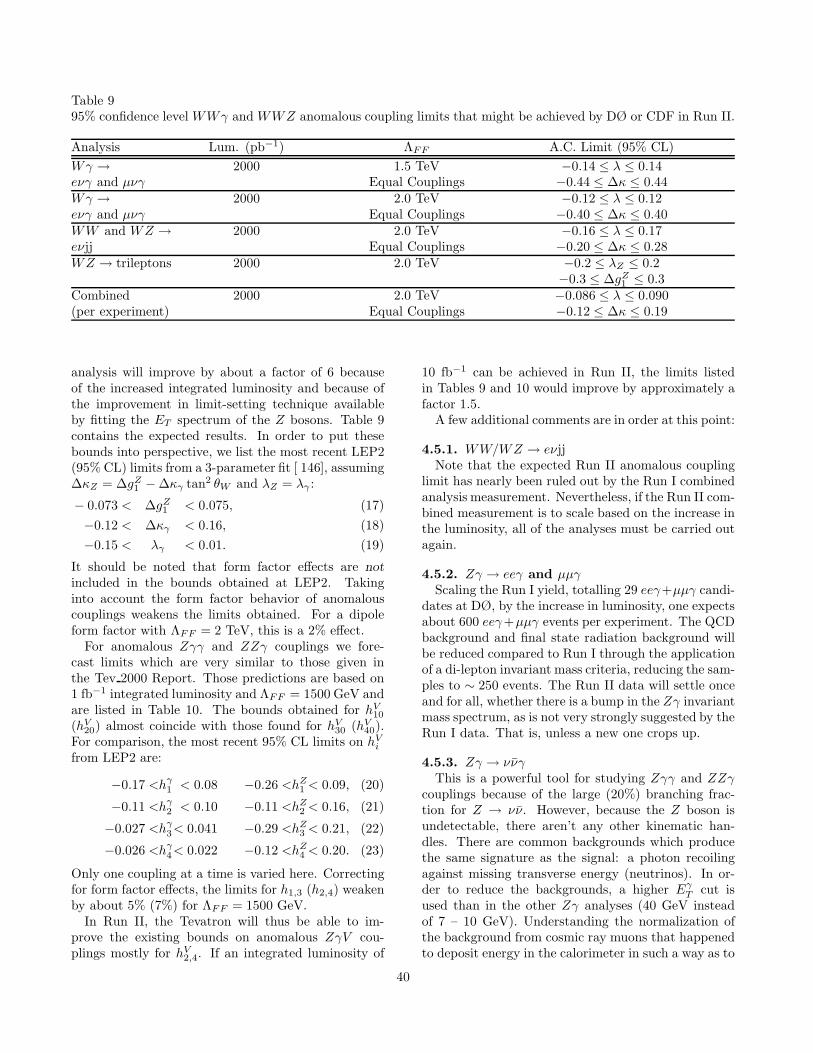
Table 995% confidence level WWγ and WWZ anomalous coupling limits that might be achieved by DØ or CDF in Run II.
Analysis Lum. (pb−1) ΛFF A.C. Limit (95% CL)
Wγ → 2000 1.5 TeV −0.14 ≤ λ ≤ 0.14eνγ and µνγ Equal Couplings −0.44 ≤ ∆κ ≤ 0.44Wγ → 2000 2.0 TeV −0.12 ≤ λ ≤ 0.12eνγ and µνγ Equal Couplings −0.40 ≤ ∆κ ≤ 0.40WW and WZ → 2000 2.0 TeV −0.16 ≤ λ ≤ 0.17eνjj Equal Couplings −0.20 ≤ ∆κ ≤ 0.28WZ → trileptons 2000 2.0 TeV −0.2 ≤ λZ ≤ 0.2
−0.3 ≤ ∆gZ1 ≤ 0.3
Combined 2000 2.0 TeV −0.086 ≤ λ ≤ 0.090(per experiment) Equal Couplings −0.12 ≤ ∆κ ≤ 0.19
analysis will improve by about a factor of 6 becauseof the increased integrated luminosity and because ofthe improvement in limit-setting technique availableby fitting the ET spectrum of the Z bosons. Table 9contains the expected results. In order to put thesebounds into perspective, we list the most recent LEP2(95% CL) limits from a 3-parameter fit [ 146], assuming∆κZ = ∆gZ
1 − ∆κγ tan2 θW and λZ = λγ :
− 0.073 < ∆gZ1 < 0.075, (17)
−0.12 < ∆κγ < 0.16, (18)
−0.15 < λγ < 0.01. (19)
It should be noted that form factor effects are notincluded in the bounds obtained at LEP2. Takinginto account the form factor behavior of anomalouscouplings weakens the limits obtained. For a dipoleform factor with ΛFF = 2 TeV, this is a 2% effect.
For anomalous Zγγ and ZZγ couplings we fore-cast limits which are very similar to those given inthe Tev 2000 Report. Those predictions are based on1 fb−1 integrated luminosity and ΛFF = 1500 GeV andare listed in Table 10. The bounds obtained for hV
10
(hV20) almost coincide with those found for hV
30 (hV40).
For comparison, the most recent 95% CL limits on hVi
from LEP2 are:
−0.17 <hγ1 < 0.08 −0.26 <hZ
1 < 0.09, (20)
−0.11 <hγ2 < 0.10 −0.11 <hZ
2 < 0.16, (21)
−0.027 <hγ3< 0.041 −0.29 <hZ
3 < 0.21, (22)
−0.026 <hγ4< 0.022 −0.12 <hZ
4 < 0.20. (23)
Only one coupling at a time is varied here. Correctingfor form factor effects, the limits for h1,3 (h2,4) weakenby about 5% (7%) for ΛFF = 1500 GeV.
In Run II, the Tevatron will thus be able to im-prove the existing bounds on anomalous ZγV cou-plings mostly for hV
2,4. If an integrated luminosity of
10 fb−1 can be achieved in Run II, the limits listedin Tables 9 and 10 would improve by approximately afactor 1.5.
A few additional comments are in order at this point:
4.5.1. WW/WZ → eνjjNote that the expected Run II anomalous coupling
limit has nearly been ruled out by the Run I combinedanalysis measurement. Nevertheless, if the Run II com-bined measurement is to scale based on the increase inthe luminosity, all of the analyses must be carried outagain.
4.5.2. Zγ → eeγ and µµγScaling the Run I yield, totalling 29 eeγ+µµγ candi-
dates at DØ, by the increase in luminosity, one expectsabout 600 eeγ+µµγ events per experiment. The QCDbackground and final state radiation background willbe reduced compared to Run I through the applicationof a di-lepton invariant mass criteria, reducing the sam-ples to ∼ 250 events. The Run II data will settle onceand for all, whether there is a bump in the Zγ invariantmass spectrum, as is not very strongly suggested by theRun I data. That is, unless a new one crops up.
4.5.3. Zγ → ννγThis is a powerful tool for studying Zγγ and ZZγ
couplings because of the large (20%) branching frac-tion for Z → νν. However, because the Z boson isundetectable, there aren’t any other kinematic han-dles. There are common backgrounds which producethe same signature as the signal: a photon recoilingagainst missing transverse energy (neutrinos). In or-der to reduce the backgrounds, a higher Eγ
T cut isused than in the other Zγ analyses (40 GeV insteadof 7 – 10 GeV). Understanding the normalization ofthe background from cosmic ray muons that happenedto deposit energy in the calorimeter in such a way as to
40
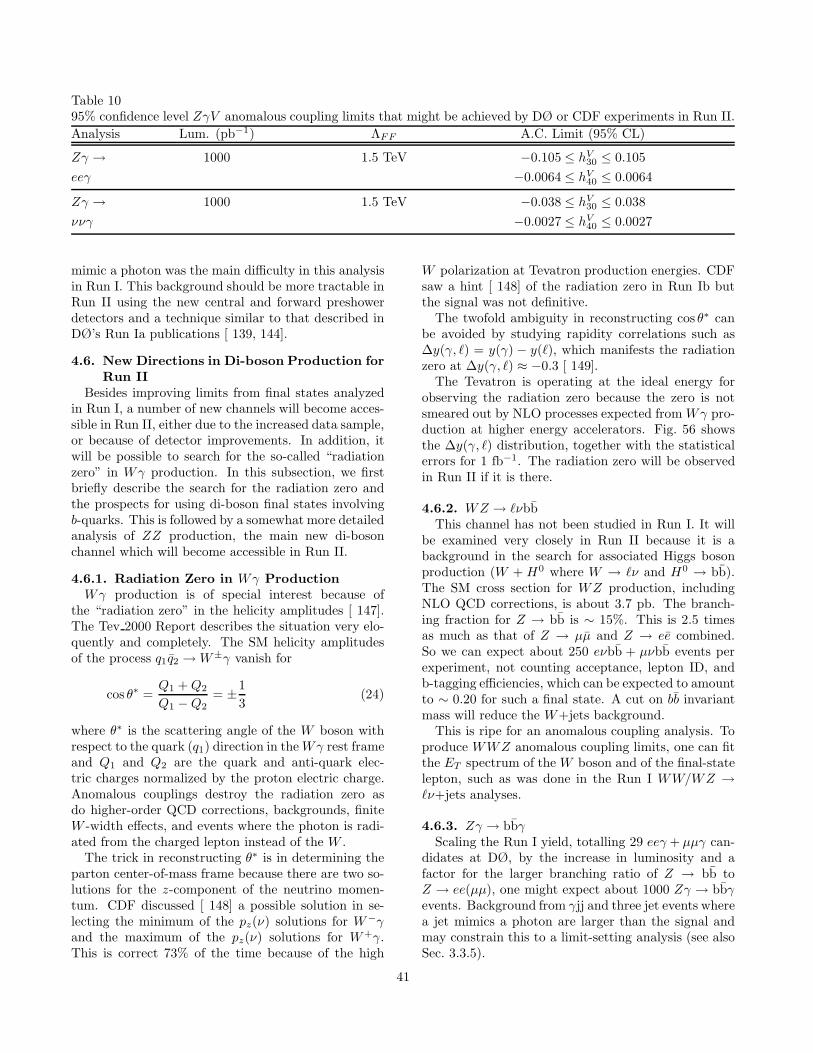
Table 1095% confidence level ZγV anomalous coupling limits that might be achieved by DØ or CDF experiments in Run II.
Analysis Lum. (pb−1) ΛFF A.C. Limit (95% CL)
Zγ → 1000 1.5 TeV −0.105 ≤ hV30 ≤ 0.105
eeγ −0.0064 ≤ hV40 ≤ 0.0064
Zγ → 1000 1.5 TeV −0.038 ≤ hV30 ≤ 0.038
ννγ −0.0027 ≤ hV40 ≤ 0.0027
mimic a photon was the main difficulty in this analysisin Run I. This background should be more tractable inRun II using the new central and forward preshowerdetectors and a technique similar to that described inDØ’s Run Ia publications [ 139, 144].
4.6. New Directions in Di-boson Production forRun II
Besides improving limits from final states analyzedin Run I, a number of new channels will become acces-sible in Run II, either due to the increased data sample,or because of detector improvements. In addition, itwill be possible to search for the so-called “radiationzero” in Wγ production. In this subsection, we firstbriefly describe the search for the radiation zero andthe prospects for using di-boson final states involvingb-quarks. This is followed by a somewhat more detailedanalysis of ZZ production, the main new di-bosonchannel which will become accessible in Run II.
4.6.1. Radiation Zero in Wγ ProductionWγ production is of special interest because of
the “radiation zero” in the helicity amplitudes [ 147].The Tev 2000 Report describes the situation very elo-quently and completely. The SM helicity amplitudesof the process q1q2 → W±γ vanish for
cos θ∗ =Q1 + Q2
Q1 − Q2= ±1
3(24)
where θ∗ is the scattering angle of the W boson withrespect to the quark (q1) direction in the Wγ rest frameand Q1 and Q2 are the quark and anti-quark elec-tric charges normalized by the proton electric charge.Anomalous couplings destroy the radiation zero asdo higher-order QCD corrections, backgrounds, finiteW -width effects, and events where the photon is radi-ated from the charged lepton instead of the W .
The trick in reconstructing θ∗ is in determining theparton center-of-mass frame because there are two so-lutions for the z-component of the neutrino momen-tum. CDF discussed [ 148] a possible solution in se-lecting the minimum of the pz(ν) solutions for W−γand the maximum of the pz(ν) solutions for W+γ.This is correct 73% of the time because of the high
W polarization at Tevatron production energies. CDFsaw a hint [ 148] of the radiation zero in Run Ib butthe signal was not definitive.
The twofold ambiguity in reconstructing cos θ∗ canbe avoided by studying rapidity correlations such as∆y(γ, ℓ) = y(γ) − y(ℓ), which manifests the radiationzero at ∆y(γ, ℓ) ≈ −0.3 [ 149].
The Tevatron is operating at the ideal energy forobserving the radiation zero because the zero is notsmeared out by NLO processes expected from Wγ pro-duction at higher energy accelerators. Fig. 56 showsthe ∆y(γ, ℓ) distribution, together with the statisticalerrors for 1 fb−1. The radiation zero will be observedin Run II if it is there.
4.6.2. WZ → ℓνbbThis channel has not been studied in Run I. It will
be examined very closely in Run II because it is abackground in the search for associated Higgs bosonproduction (W + H0 where W → ℓν and H0 → bb).The SM cross section for WZ production, includingNLO QCD corrections, is about 3.7 pb. The branch-ing fraction for Z → bb is ∼ 15%. This is 2.5 timesas much as that of Z → µµ and Z → ee combined.So we can expect about 250 eνbb + µνbb events perexperiment, not counting acceptance, lepton ID, andb-tagging efficiencies, which can be expected to amountto ∼ 0.20 for such a final state. A cut on bb invariantmass will reduce the W+jets background.
This is ripe for an anomalous coupling analysis. Toproduce WWZ anomalous coupling limits, one can fitthe ET spectrum of the W boson and of the final-statelepton, such as was done in the Run I WW/WZ →ℓν+jets analyses.
4.6.3. Zγ → bbγScaling the Run I yield, totalling 29 eeγ + µµγ can-
didates at DØ, by the increase in luminosity and afactor for the larger branching ratio of Z → bb toZ → ee(µµ), one might expect about 1000 Zγ → bbγevents. Background from γjj and three jet events wherea jet mimics a photon are larger than the signal andmay constrain this to a limit-setting analysis (see alsoSec. 3.3.5).
41
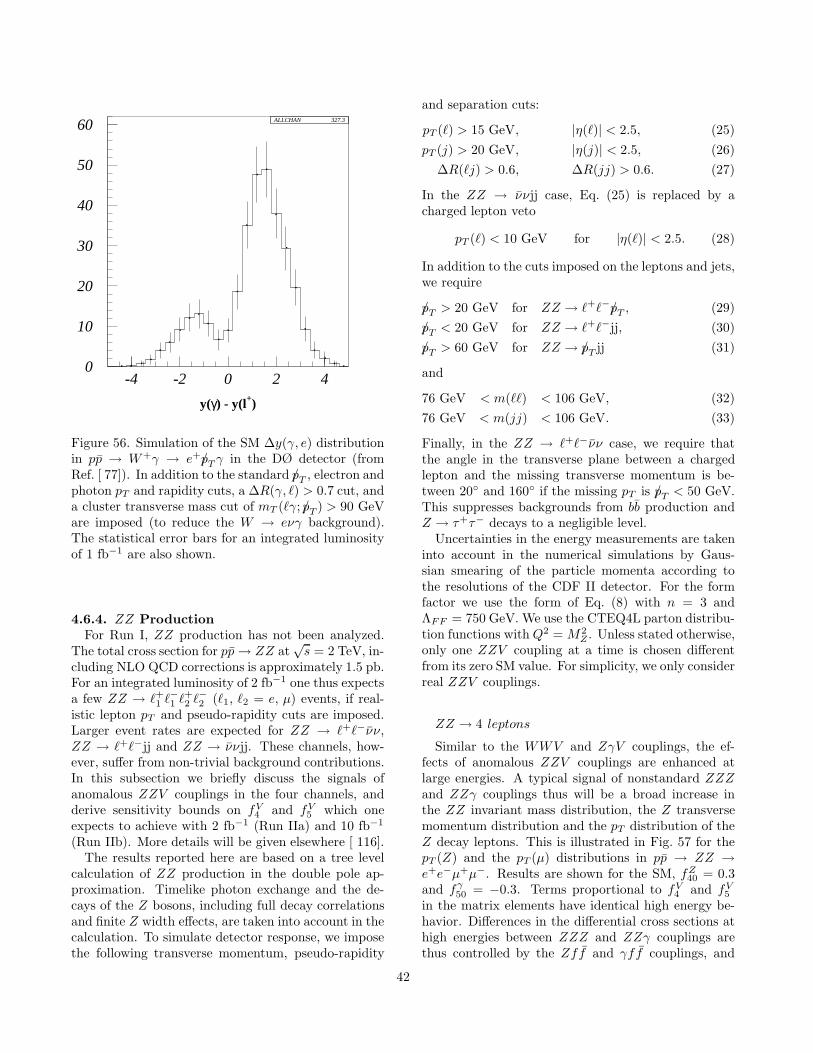
y(γ) - y(l+)
0
10
20
30
40
50
60
-4 -2 0 2 4
ALLCHAN 327.3
Figure 56. Simulation of the SM ∆y(γ, e) distributionin pp → W+γ → e+p/T γ in the DØ detector (fromRef. [ 77]). In addition to the standard p/T , electron andphoton pT and rapidity cuts, a ∆R(γ, ℓ) > 0.7 cut, anda cluster transverse mass cut of mT (ℓγ; p/T ) > 90 GeVare imposed (to reduce the W → eνγ background).The statistical error bars for an integrated luminosityof 1 fb−1 are also shown.
4.6.4. ZZ ProductionFor Run I, ZZ production has not been analyzed.
The total cross section for pp → ZZ at√
s = 2 TeV, in-cluding NLO QCD corrections is approximately 1.5 pb.For an integrated luminosity of 2 fb−1 one thus expectsa few ZZ → ℓ+
1 ℓ−1 ℓ+2 ℓ−2 (ℓ1, ℓ2 = e, µ) events, if real-
istic lepton pT and pseudo-rapidity cuts are imposed.Larger event rates are expected for ZZ → ℓ+ℓ−νν,ZZ → ℓ+ℓ−jj and ZZ → ννjj. These channels, how-ever, suffer from non-trivial background contributions.In this subsection we briefly discuss the signals ofanomalous ZZV couplings in the four channels, andderive sensitivity bounds on fV
4 and fV5 which one
expects to achieve with 2 fb−1 (Run IIa) and 10 fb−1
(Run IIb). More details will be given elsewhere [ 116].The results reported here are based on a tree level
calculation of ZZ production in the double pole ap-proximation. Timelike photon exchange and the de-cays of the Z bosons, including full decay correlationsand finite Z width effects, are taken into account in thecalculation. To simulate detector response, we imposethe following transverse momentum, pseudo-rapidity
and separation cuts:
pT (ℓ) > 15 GeV, |η(ℓ)| < 2.5, (25)
pT (j) > 20 GeV, |η(j)| < 2.5, (26)
∆R(ℓj) > 0.6, ∆R(jj) > 0.6. (27)
In the ZZ → ννjj case, Eq. (25) is replaced by acharged lepton veto
pT (ℓ) < 10 GeV for |η(ℓ)| < 2.5. (28)
In addition to the cuts imposed on the leptons and jets,we require
p/T > 20 GeV for ZZ → ℓ+ℓ−p/T , (29)
p/T < 20 GeV for ZZ → ℓ+ℓ−jj, (30)
p/T > 60 GeV for ZZ → p/T jj (31)
and
76 GeV < m(ℓℓ) < 106 GeV, (32)
76 GeV < m(jj) < 106 GeV. (33)
Finally, in the ZZ → ℓ+ℓ−νν case, we require thatthe angle in the transverse plane between a chargedlepton and the missing transverse momentum is be-tween 20◦ and 160◦ if the missing pT is p/T < 50 GeV.This suppresses backgrounds from bb production andZ → τ+τ− decays to a negligible level.
Uncertainties in the energy measurements are takeninto account in the numerical simulations by Gaus-sian smearing of the particle momenta according tothe resolutions of the CDF II detector. For the formfactor we use the form of Eq. (8) with n = 3 andΛFF = 750 GeV. We use the CTEQ4L parton distribu-tion functions with Q2 = M2
Z . Unless stated otherwise,only one ZZV coupling at a time is chosen differentfrom its zero SM value. For simplicity, we only considerreal ZZV couplings.
ZZ → 4 leptons
Similar to the WWV and ZγV couplings, the ef-fects of anomalous ZZV couplings are enhanced atlarge energies. A typical signal of nonstandard ZZZand ZZγ couplings thus will be a broad increase inthe ZZ invariant mass distribution, the Z transversemomentum distribution and the pT distribution of theZ decay leptons. This is illustrated in Fig. 57 for thepT (Z) and the pT (µ) distributions in pp → ZZ →e+e−µ+µ−. Results are shown for the SM, fZ
40 = 0.3and fγ
50 = −0.3. Terms proportional to fV4 and fV
5
in the matrix elements have identical high energy be-havior. Differences in the differential cross sections athigh energies between ZZZ and ZZγ couplings arethus controlled by the Zff and γff couplings, and
42
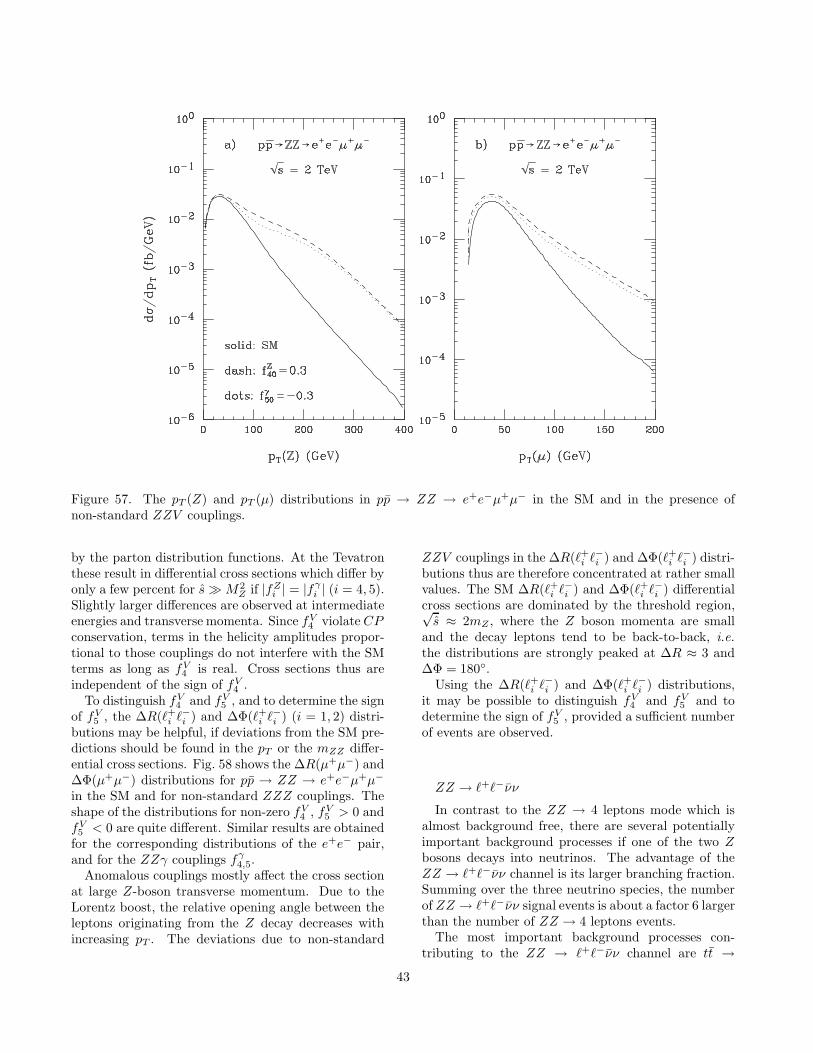
Figure 57. The pT (Z) and pT (µ) distributions in pp → ZZ → e+e−µ+µ− in the SM and in the presence ofnon-standard ZZV couplings.
by the parton distribution functions. At the Tevatronthese result in differential cross sections which differ byonly a few percent for s ≫ M2
Z if |fZi | = |fγ
i | (i = 4, 5).Slightly larger differences are observed at intermediateenergies and transverse momenta. Since fV
4 violate CPconservation, terms in the helicity amplitudes propor-tional to those couplings do not interfere with the SMterms as long as fV
4 is real. Cross sections thus areindependent of the sign of fV
4 .To distinguish fV
4 and fV5 , and to determine the sign
of fV5 , the ∆R(ℓ+
i ℓ−i ) and ∆Φ(ℓ+i ℓ−i ) (i = 1, 2) distri-
butions may be helpful, if deviations from the SM pre-dictions should be found in the pT or the mZZ differ-ential cross sections. Fig. 58 shows the ∆R(µ+µ−) and∆Φ(µ+µ−) distributions for pp → ZZ → e+e−µ+µ−
in the SM and for non-standard ZZZ couplings. Theshape of the distributions for non-zero fV
4 , fV5 > 0 and
fV5 < 0 are quite different. Similar results are obtained
for the corresponding distributions of the e+e− pair,and for the ZZγ couplings fγ
4,5.Anomalous couplings mostly affect the cross section
at large Z-boson transverse momentum. Due to theLorentz boost, the relative opening angle between theleptons originating from the Z decay decreases withincreasing pT . The deviations due to non-standard
ZZV couplings in the ∆R(ℓ+i ℓ−i ) and ∆Φ(ℓ+
i ℓ−i ) distri-butions thus are therefore concentrated at rather smallvalues. The SM ∆R(ℓ+
i ℓ−i ) and ∆Φ(ℓ+i ℓ−i ) differential
cross sections are dominated by the threshold region,√s ≈ 2mZ , where the Z boson momenta are small
and the decay leptons tend to be back-to-back, i.e.
the distributions are strongly peaked at ∆R ≈ 3 and∆Φ = 180◦.
Using the ∆R(ℓ+i ℓ−i ) and ∆Φ(ℓ+
i ℓ−i ) distributions,it may be possible to distinguish fV
4 and fV5 and to
determine the sign of fV5 , provided a sufficient number
of events are observed.
ZZ → ℓ+ℓ−νν
In contrast to the ZZ → 4 leptons mode which isalmost background free, there are several potentiallyimportant background processes if one of the two Zbosons decays into neutrinos. The advantage of theZZ → ℓ+ℓ−νν channel is its larger branching fraction.Summing over the three neutrino species, the numberof ZZ → ℓ+ℓ−νν signal events is about a factor 6 largerthan the number of ZZ → 4 leptons events.
The most important background processes con-tributing to the ZZ → ℓ+ℓ−νν channel are tt →
43
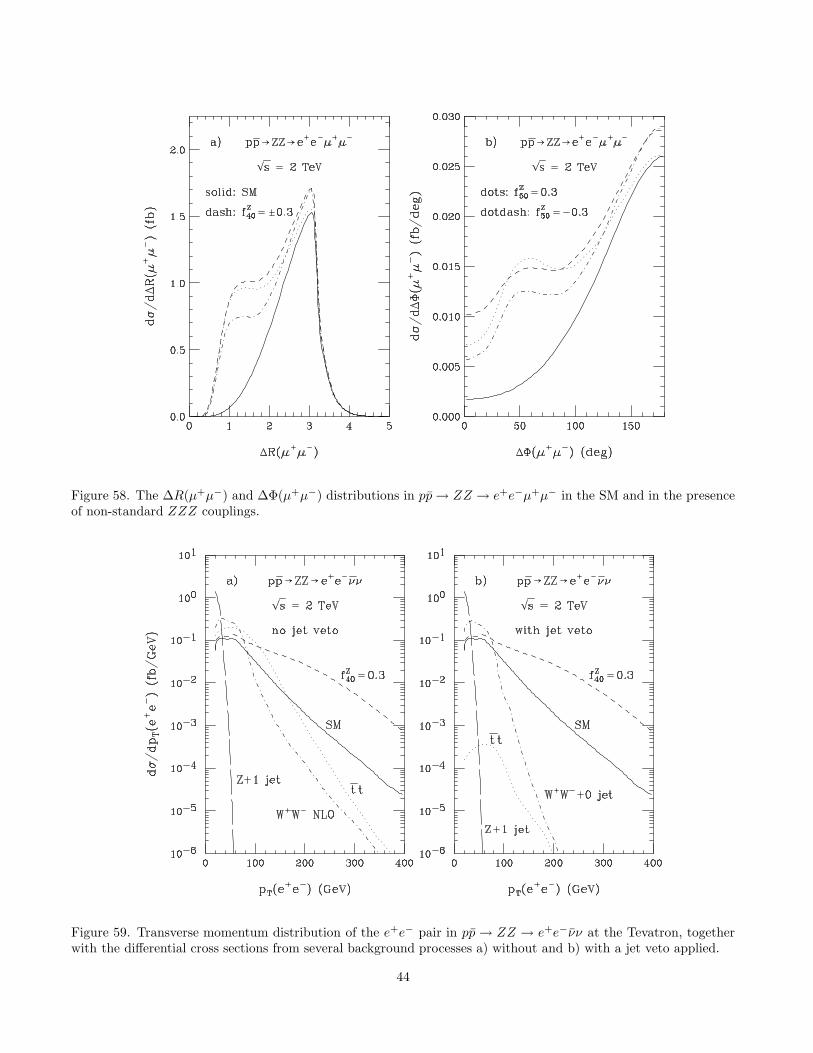
Figure 58. The ∆R(µ+µ−) and ∆Φ(µ+µ−) distributions in pp → ZZ → e+e−µ+µ− in the SM and in the presenceof non-standard ZZZ couplings.
Figure 59. Transverse momentum distribution of the e+e− pair in pp → ZZ → e+e−νν at the Tevatron, togetherwith the differential cross sections from several background processes a) without and b) with a jet veto applied.
44
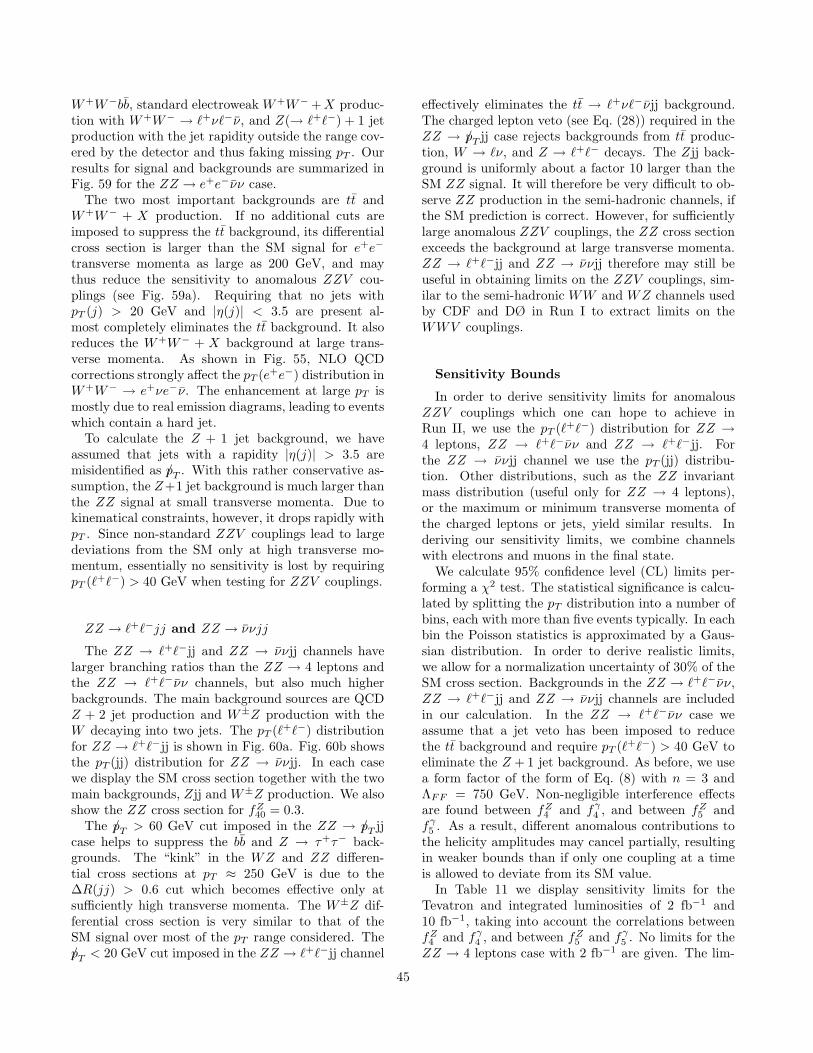
W+W−bb, standard electroweak W+W− + X produc-tion with W+W− → ℓ+νℓ−ν, and Z(→ ℓ+ℓ−) + 1 jetproduction with the jet rapidity outside the range cov-ered by the detector and thus faking missing pT . Ourresults for signal and backgrounds are summarized inFig. 59 for the ZZ → e+e−νν case.
The two most important backgrounds are tt andW+W− + X production. If no additional cuts areimposed to suppress the tt background, its differentialcross section is larger than the SM signal for e+e−
transverse momenta as large as 200 GeV, and maythus reduce the sensitivity to anomalous ZZV cou-plings (see Fig. 59a). Requiring that no jets withpT (j) > 20 GeV and |η(j)| < 3.5 are present al-most completely eliminates the tt background. It alsoreduces the W+W− + X background at large trans-verse momenta. As shown in Fig. 55, NLO QCDcorrections strongly affect the pT (e+e−) distribution inW+W− → e+νe−ν. The enhancement at large pT ismostly due to real emission diagrams, leading to eventswhich contain a hard jet.
To calculate the Z + 1 jet background, we haveassumed that jets with a rapidity |η(j)| > 3.5 aremisidentified as p/T . With this rather conservative as-sumption, the Z+1 jet background is much larger thanthe ZZ signal at small transverse momenta. Due tokinematical constraints, however, it drops rapidly withpT . Since non-standard ZZV couplings lead to largedeviations from the SM only at high transverse mo-mentum, essentially no sensitivity is lost by requiringpT (ℓ+ℓ−) > 40 GeV when testing for ZZV couplings.
ZZ → ℓ+ℓ−jj and ZZ → ννjj
The ZZ → ℓ+ℓ−jj and ZZ → ννjj channels havelarger branching ratios than the ZZ → 4 leptons andthe ZZ → ℓ+ℓ−νν channels, but also much higherbackgrounds. The main background sources are QCDZ + 2 jet production and W±Z production with theW decaying into two jets. The pT (ℓ+ℓ−) distributionfor ZZ → ℓ+ℓ−jj is shown in Fig. 60a. Fig. 60b showsthe pT (jj) distribution for ZZ → ννjj. In each casewe display the SM cross section together with the twomain backgrounds, Zjj and W±Z production. We alsoshow the ZZ cross section for fZ
40 = 0.3.The p/T > 60 GeV cut imposed in the ZZ → p/T jj
case helps to suppress the bb and Z → τ+τ− back-grounds. The “kink” in the WZ and ZZ differen-tial cross sections at pT ≈ 250 GeV is due to the∆R(jj) > 0.6 cut which becomes effective only atsufficiently high transverse momenta. The W±Z dif-ferential cross section is very similar to that of theSM signal over most of the pT range considered. Thep/T < 20 GeV cut imposed in the ZZ → ℓ+ℓ−jj channel
effectively eliminates the tt → ℓ+νℓ−νjj background.The charged lepton veto (see Eq. (28)) required in theZZ → p/T jj case rejects backgrounds from tt produc-tion, W → ℓν, and Z → ℓ+ℓ− decays. The Zjj back-ground is uniformly about a factor 10 larger than theSM ZZ signal. It will therefore be very difficult to ob-serve ZZ production in the semi-hadronic channels, ifthe SM prediction is correct. However, for sufficientlylarge anomalous ZZV couplings, the ZZ cross sectionexceeds the background at large transverse momenta.ZZ → ℓ+ℓ−jj and ZZ → ννjj therefore may still beuseful in obtaining limits on the ZZV couplings, sim-ilar to the semi-hadronic WW and WZ channels usedby CDF and DØ in Run I to extract limits on theWWV couplings.
Sensitivity Bounds
In order to derive sensitivity limits for anomalousZZV couplings which one can hope to achieve inRun II, we use the pT (ℓ+ℓ−) distribution for ZZ →4 leptons, ZZ → ℓ+ℓ−νν and ZZ → ℓ+ℓ−jj. Forthe ZZ → ννjj channel we use the pT (jj) distribu-tion. Other distributions, such as the ZZ invariantmass distribution (useful only for ZZ → 4 leptons),or the maximum or minimum transverse momenta ofthe charged leptons or jets, yield similar results. Inderiving our sensitivity limits, we combine channelswith electrons and muons in the final state.
We calculate 95% confidence level (CL) limits per-forming a χ2 test. The statistical significance is calcu-lated by splitting the pT distribution into a number ofbins, each with more than five events typically. In eachbin the Poisson statistics is approximated by a Gaus-sian distribution. In order to derive realistic limits,we allow for a normalization uncertainty of 30% of theSM cross section. Backgrounds in the ZZ → ℓ+ℓ−νν,ZZ → ℓ+ℓ−jj and ZZ → ννjj channels are includedin our calculation. In the ZZ → ℓ+ℓ−νν case weassume that a jet veto has been imposed to reducethe tt background and require pT (ℓ+ℓ−) > 40 GeV toeliminate the Z + 1 jet background. As before, we usea form factor of the form of Eq. (8) with n = 3 andΛFF = 750 GeV. Non-negligible interference effectsare found between fZ
4 and fγ4 , and between fZ
5 andfγ5 . As a result, different anomalous contributions to
the helicity amplitudes may cancel partially, resultingin weaker bounds than if only one coupling at a timeis allowed to deviate from its SM value.
In Table 11 we display sensitivity limits for theTevatron and integrated luminosities of 2 fb−1 and10 fb−1, taking into account the correlations betweenfZ4 and fγ
4 , and between fZ5 and fγ
5 . No limits for theZZ → 4 leptons case with 2 fb−1 are given. The lim-
45
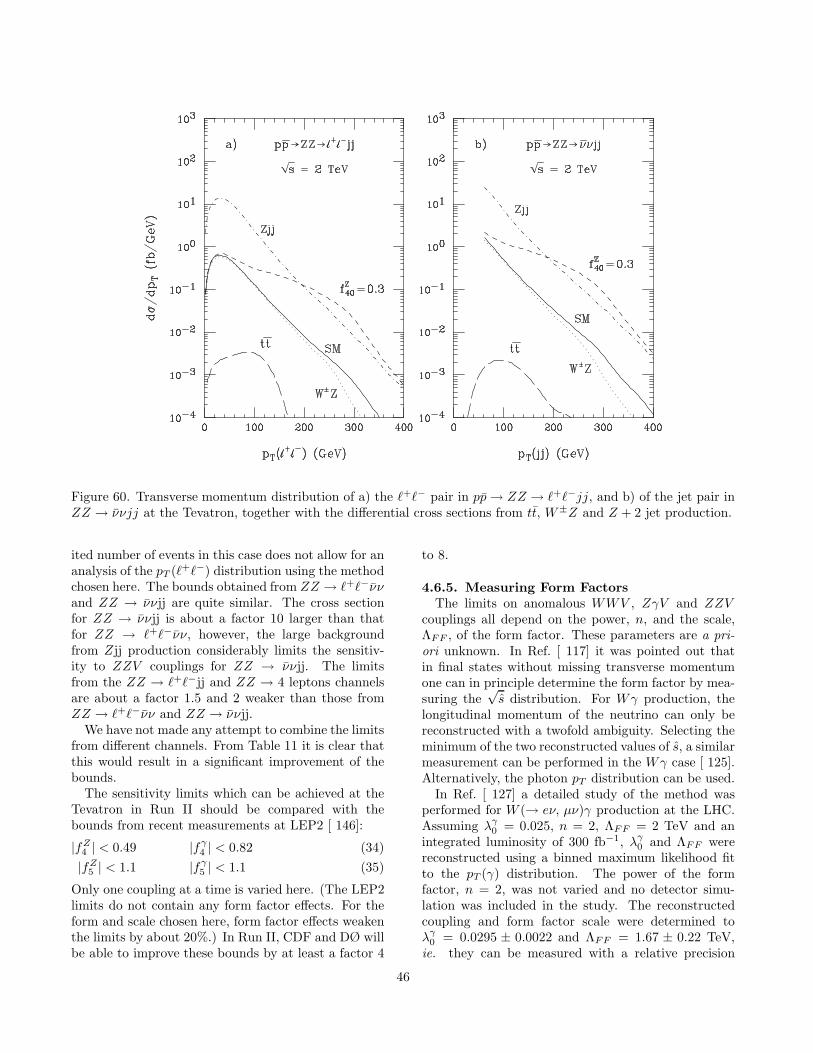
Figure 60. Transverse momentum distribution of a) the ℓ+ℓ− pair in pp → ZZ → ℓ+ℓ−jj, and b) of the jet pair inZZ → ννjj at the Tevatron, together with the differential cross sections from tt, W±Z and Z + 2 jet production.
ited number of events in this case does not allow for ananalysis of the pT (ℓ+ℓ−) distribution using the methodchosen here. The bounds obtained from ZZ → ℓ+ℓ−ννand ZZ → ννjj are quite similar. The cross sectionfor ZZ → ννjj is about a factor 10 larger than thatfor ZZ → ℓ+ℓ−νν, however, the large backgroundfrom Zjj production considerably limits the sensitiv-ity to ZZV couplings for ZZ → ννjj. The limitsfrom the ZZ → ℓ+ℓ−jj and ZZ → 4 leptons channelsare about a factor 1.5 and 2 weaker than those fromZZ → ℓ+ℓ−νν and ZZ → ννjj.
We have not made any attempt to combine the limitsfrom different channels. From Table 11 it is clear thatthis would result in a significant improvement of thebounds.
The sensitivity limits which can be achieved at theTevatron in Run II should be compared with thebounds from recent measurements at LEP2 [ 146]:
|fZ4 | < 0.49 |fγ
4 | < 0.82 (34)
|fZ5 | < 1.1 |fγ
5 | < 1.1 (35)
Only one coupling at a time is varied here. (The LEP2limits do not contain any form factor effects. For theform and scale chosen here, form factor effects weakenthe limits by about 20%.) In Run II, CDF and DØ willbe able to improve these bounds by at least a factor 4
to 8.
4.6.5. Measuring Form FactorsThe limits on anomalous WWV , ZγV and ZZV
couplings all depend on the power, n, and the scale,ΛFF , of the form factor. These parameters are a pri-
ori unknown. In Ref. [ 117] it was pointed out thatin final states without missing transverse momentumone can in principle determine the form factor by mea-suring the
√s distribution. For Wγ production, the
longitudinal momentum of the neutrino can only bereconstructed with a twofold ambiguity. Selecting theminimum of the two reconstructed values of s, a similarmeasurement can be performed in the Wγ case [ 125].Alternatively, the photon pT distribution can be used.
In Ref. [ 127] a detailed study of the method wasperformed for W (→ eν, µν)γ production at the LHC.Assuming λγ
0 = 0.025, n = 2, ΛFF = 2 TeV and anintegrated luminosity of 300 fb−1, λγ
0 and ΛFF werereconstructed using a binned maximum likelihood fitto the pT (γ) distribution. The power of the formfactor, n = 2, was not varied and no detector simu-lation was included in the study. The reconstructedcoupling and form factor scale were determined toλγ
0 = 0.0295 ± 0.0022 and ΛFF = 1.67 ± 0.22 TeV,ie. they can be measured with a relative precision
46

Table 11Sensitivities achievable at 95% CL for the anomalous ZZV couplings in pp → ZZ → 4 leptons, pp → ZZ → ℓ+ℓ−νν,pp → ZZ → ℓ+ℓ−jj, and pp → ZZ → ννjj at the Tevatron a) for an integrated luminosity of 2 fb−1, and b) for anintegrated luminosity of 10 fb−1.
a)∫
Ldt = 2 fb−1
coupling ZZ → 4 leptons ZZ → ℓ+ℓ−νν ZZ → ℓ+ℓ−jj ZZ → ννjj
fZ40 –
+0.169−0.169
+0.219−0.218
+0.156−0.155
fγ40 –
+0.175−0.174
+0.222−0.221
+0.157−0.157
fZ50 –
+0.171−0.204
+0.220−0.244
+0.157−0.179
fγ50 –
+0.184−0.202
+0.229−0.241
+0.166−0.174
b)∫
Ldt = 10 fb−1
coupling ZZ → 4 leptons ZZ → ℓ+ℓ−νν ZZ → ℓ+ℓ−jj ZZ → ννjj
fZ40
+0.180−0.179
+0.097−0.097
+0.146−0.145
+0.104−0.103
fγ40
+0.185−0.185
+0.100−0.099
+0.148−0.147
+0.104−0.104
fZ50
+0.178−0.216
+0.092−0.120
+0.144−0.167
+0.102−0.124
fγ50
+0.192−0.213
+0.103−0.115
+0.151−0.163
+0.109−0.118
of about 10 – 15%. The central values of the recon-structed parameters differ by about 20% from the inputparameters. Including detector response, and treatingthe form factor power n as an additional free parameteris expected to increase the relative error.
The study demonstrates that, due to the restrictednumber of events in each bin, the method will not pro-duce competitive limits. However, if non-zero anoma-lous couplings are observed, the method may be use-ful in determining the shape of the form factor whichprovides indirect information on the dynamics of theunderlying new physics.
At the Tevatron, the limits on the WWV couplingsexhibit only a modest dependence on n and ΛFF . Di-rect measurement of the form factor will thus be verydifficult for these couplings. The situation is morepromising for ZγV and ZZV couplings, where thesensitivity bounds depend more strongly on the formfactor parameters.
Acknowledgements
We acknowledge contributions from the other mem-bers of the working group including P. Aurenche,
C. Balazs, L. Dixon, S. Eno, G. Gomez, N. Kidon-akis, P. Nason, J. Qiu, and G. Sterman. We alsothank T. Ferbel, M. Fontannaz, G. Ginther, B. Kniehl,A. D. Martin, R. Roberts, P. Slattery, J. Stirling,R. Thorne and W.K. Tung. We also wish to thankA. Beretvas, C. Bigongiari, J. Campbell, O. Lobban,and W. Wester for their help. Special thanks go toM. Mangano for some enlightening discussions.
REFERENCES
1. R. Brock et al., Report of the Precision Measure-ment Working Group.
2. L. deBarbaro et al., Report of the Working Groupon Parton Distribution Functions.
3. F. Abe et al. (CDF Collaboration), Phys. Rev.D60, 092003 (1999).
4. B. Bailey, E L. Berger, and L. E. Gordon,Phys.Rev. D54, 1896 (1996).
5. P. Aurenche et al., Phys. Lett. B140, 87 (1984).6. E.L. Berger, E. Braaten, and R.D. Field, Nucl.
Phys. B239, 52 (1984).7. E.L. Berger and J.W. Qiu, Phys. Rev. D44,2002
(1991).
47
8. B. Bailey, J. F. Owens, and J. Ohnemus, Phys.Rev. D46, 2018 (1992).
9. T. Binoth et al., Eur. Phys. J. C16, 311 (2000).10. C. Balazs, E.L. Berger, S. Mrenna, and C.-P.
Yuan, Phys. Rev. D57, 6934 (1998).11. P. Chiappetta, R. Fergani, and J. Guillet, Phys.
Lett. B348, 646 (1995).12. S. Catani et al., JHEP 9903, 025 (1999).13. N. Kidonakis and J. F. Owens, Phys. Rev. D61,
094004 (2000).14. E. Laenen, G. Oderda, and G. Sterman, Phys.
Lett. B438, 173 (1998).15. H.-L. Lai and H. nan Li, Phys. Rev. D58, 114020
(1998).16. H. nan Li, Phys. Lett. B454, 328 (1999).17. E. Laenen, G. Sterman, and W. Vogelsang, Phys.
Rev. Lett. 84, 4296 (2000).18. J. Huston et al. (CTEQ Collaboration), Phys.
Rev. D58, 114034 (1998).19. H. L. Lai et al. (CTEQ Collaboration), Phys. Rev.
D55, 1280 (1997).20. M. Gluck, E. Reya, and A. Vogt, Z. Phys. C53,
127 (1992).21. A. D. Martin et al., Eur. Phys. J. C4, 463 (1998).22. H. Baer and M. Reno, Phys. Rev. D54, 2017
(1996).23. J. Huston et al. (CTEQ Collaboration), Phys.
Rev. D51, 6139 (1995).24. L. Apanasevich et al., Phys. Rev. D59, 074007
(1999).25. P. Aurenche et al., Eur. Phys. J. C9, 107 (1999).26. P. Aurenche et al., Eur. Phys. J. C13, 347 (2000).27. M.A. Kimber, A.D. Martin, and M.G. Ryskin,
Eur. Phys. J. C12, 655 (2000).28. C. Balazs, J. Huston, and I. Puljak, hep-
ph/0002032 (February 2000), submitted to Phys.Rev. D.
29. C. Balazs, Ph.D. thesis, Michigan State Univer-sity, 1999.
30. S. Catani et al., hep-ph/0005114 (May 2000), toappear in the Proceedings of the Workshop onPhysics at TeV Colliders (Les Houches, 1999).
31. M. Begel, Nucl. Phys. B (Proc. Supp.) 79, 244(1999); Ph.D. thesis, University of Rochester,1999.
32. E. Bonvin et al. (WA70 Collaboration), Phys.Lett. B236, 523 (1990).
33. F. Abe et al. (CDF Collaboration), Phys. Rev.Lett. 70, 2232 (1993).
34. R. Barate et al. (WA11 Collaboration), Phys. Rev.Lett. 21, 1541 (1979); M. J. Corden et al. (WA12Collaboration), Phys. Lett. B76, 226 (1978);A. L. S. Angelis et al. (R108 Collaboration), Phys.Lett. B97, 163 (1980); D. Antreasyan et al. (R209
Collaboration), Phys. Rev. Lett. 47, 12 (1981);J. Badier et al. (NA3 Collaboration), Phys. Lett.B117, 372 (1982); A. S. Ito et al. (E288 Collabora-tion), Phys Rev. D23, 604 (1981); D. Antreasyanet al. (E300 Collaboration), Phys. Rev. Lett. 39,906 (1977); M. D. Corcoran et al. (E395 Collabo-ration), Phys. Rev. D21, 641 (1980); K. J. Ander-son et al. (E444 Collaboration), Phys. Rev. Lett.42, 944 (1979); E. Anassontzis et al. (E537 Collab-oration), Phys. Rev. D38, 1377 (1988); G. Morenoet al. (E605 Collaboration), Phys. Rev. D43, 2815(1991); S. Palestini et al. (E615 Collaboration),Phys. Rev. Lett. 55, 2649 (1985); J. S. Conwayet al., Phys. Rev. D39, 92 (1989); J. Alspectoret al. (E687 Collaboration), Phys. Lett. B81, 397(1979).
35. A. L. S. Angelis et al. (R108 Collaboration), Phys.Lett. B97, 163 (1980); A. G. Clark et al. (R702Collaboration), Nucl. Phys. B160, 397 (1979).
36. W. Chen, Ph.D. thesis, State University of NewYork at Stony Brook, 1997.
37. H.-U. Bengtsson and T. Sjostrand, Comput. Phys.Commun. 46, 43 (1987), [Pythia v5.7].
38. J. F. Owens, Rev. Mod. Phys. 59, 465 (1987).39. A. P. Contogouris, S. Papadopoulos, and C. Pa-
pavassiliou, Nucl. Phys. B179, 461 (1981).40. A. P. Contogouris et al., Phys. Rev. D32, 1134
(1985).41. M. Fontannaz and D. Schiff, Nucl. Phys. B132,
457 (1978).42. R. P. Feynman, R. D. Field, and G. C. Fox, Phys.
Rev. D18, 3320 (1978).43. J. Collins and D. Soper, Nucl. Phys. B193, 381
(1981); B213, 545(E) (1983); B197, 446 (1982);J. Collins, D. Soper, G. Sterman, Phys. Lett.B109, 388 (1982).
44. J.C. Collins, D.E. Soper, and G. Sterman, Nucl.Phys. B250, 199 (1985).
45. L. Apanasevich et al. (E706 Collaboration), Phys.Rev. Lett. 81, 2642 (1998).
46. M. Bonesini et al. (WA70 Collaboration), Z. Phys.C37, 535 (1988).
47. M. Bonesini et al. (WA70 Collaboration), Z. Phys.C38, 371 (1988).
48. G. Ballocchi et al. (UA6 Collaboration), Phys.Lett. B436, 222 (1998).
49. E. Bonvin et al. (WA70 Collaboration), Z. Phys.C41, 591 (1989).
50. L. Apanasevich, Ph.D. thesis, Michigan State Uni-versity, 2000.
51. M. Bonesini et al. (WA70 Collaboration), Z. Phys.C37, 39 (1987).
52. J. Antille et al. (UA6 Collaboration), Phys. Lett.B194, 568 (1987).
48
53. E. Anassontzis et al. (R806 Collaboration),Z. Phys. C13, 277 (1982).
54. C. Kourkoumelis et al. (R806 Collaboration),Z. Phys. C5, 95 (1980).
55. M. Diakonou et al. (R806 Collaboration), Phys.Lett. B91, 296 (1980).
56. S. Kuhlmann, Nucl. Phys. B (Proc. Suppl.) 79,241 (1999).
57. B. Abbott et al. (DØ Collaboration), Phys. Rev.Lett. 84, 2786 (2000).
58. R. Ansari et al. (UA2 Collaboration), Z. Phys.C41, 395 (1988).
59. J. Alitti et al. (UA2 Collaboration), Phys. Lett.B288, 386 (1992).
60. S. Abachi et al. (DØ Collaboration), FERMILAB-PUB-96-357-E.
61. V. Zutshi, D6O note in preparation.62. Y. Gershtein, D6O note in preparation.63. H. L. Lai et al. (CTEQ Collaboration), Phys. Rev.
D51, 4763 (1995).64. H. L. Lai et al. (CTEQ Collaboration), Eur. Phys.
J. C12, 375 (2000).65. G. Sterman and W. Vogelsang, hep-ph/0002132
(February 2000).66. S. Catani, M.L. Mangano, and P. Nason, hep-
ph/9806484, JHEP 9807, 024 (1998).67. Yu.L. Dokshitzer, D.I. Dyakanov, and S.I. Troyan,
Phys. Rep. 58, 269 (1980).68. R.K. Ellis and S. Veseli, hep-ph/9706526, Nucl.
Phys. B511, 649 (1998).69. W. Vogelsang and A. Vogt, hep-ph/9505404, Nucl.
Phys. B453, 334 (1995).70. H. Baer, J. Ohnemus, and J.F. Owens, Phys. Rev.
D42, 61 (1990).71. F. Abe et al. (CDF Collaboration), Phys. Rev.
Lett. 77, 439 (1996); a paper on the Run Ib anal-ysis is in preparation.
72. B. Abbott et al. (DØ Collaboration), Phys. Rev.Lett. 82, 2451 (1999).
73. F. Abe et al. (CDF Collaboration), Phys. Rev.D57, 1359 (1998).
74. E. L. Berger, Xiao-feng Guo, and Jian-wei Qiu,hep-ph/9512281, Phys.Rev.Lett. 76, 2234 (1996);hep-ph/9605324, Phys. Rev. D54, 5470 (1996).
75. P. Aurenche et al., hep-ph/9606287, Phys. Rev.D55 1124 (1997).
76. S. Frixione, hep-ph/9801442, Phys. Lett. B429,369 (1998).
77. D. Amidei et al., Future Electro-Weak Physics atthe Fermilab Tevatron, edited by D. Amidei andR. Brock, FERMILAB-Pub-96/082 (1996).
78. B. Abbott et al. (DØ Collaboration), Phys. Rev.D61, 072001 (2000).
79. D. Cronin-Hennessy, A. Beretvas, P.F. Derwent,
Nucl. Instrum. Meth. A443, 37 (2000).80. F. Abe et al. (CDF Collaboration), Phys. Rev.
D50, 5550 (1994).81. C. Avila et al. (E811 Collaboration), Phys. Lett.
B445, 419 (1999).82. N. Amos et al. (E710 Collaboration), Phys. Rev.
Lett. 68, 2433 (1992).83. M. Albrow, A. Beretvas, L. Nodulman, and
P. Giromini, CDF-PUB-4844 (1999).84. J. Bantly, J. Krane, D. Owen, R. Partridge, and
L. Paterno, Fermilab-TM-1995 (1997).85. R. Hamberg, W.L. van Neerven, and T. Matsuura,
Nucl. Phys. B359, 343 (1991); W.L. van Neervenand E.B. Zijlstra, Nucl. Phys. B382, 11 (1992).
86. For a review of resummation in transverse mo-mentum space, see R.K. Ellis and S. Veseli, Nucl.Phys. B511, 649 (1998).
87. For a review of resummation in the Fourier con-jugate impact parameter space, see C. Balazs andC.-P. Yuan, Phys. Rev. D56, 5558 (1997).
88. B. Abbott et al. (DØ Collaboration), Phys. Rev.D58, 092003 (1998).
89. F. Abe et al. (CDF Collaboration), Phys. Rev.D52, 4784 (1995).
90. C. Balazs and C.-P. Yuan, Phys. Rev. D59,114007 (1999).
91. Q. Fan and A. Bodek, Proceedings, 6th Interna-tional Conference on Calorimetry in High EnergyPhysics (ICCHEP 96), Rome, Italy, 8 – 14 June1996, pp. 553 – 560.
92. T. Sjostrand, Comput. Phys. Commun. 82, 74(1994).
93. E. Barberio and Z. Was, Comput. Phys. Commun.79, 291 (1994); E. Barberio, B. van Eijk, and Z.Was, ibid. 66, 115 (1991).
94. T. Affolder et al.(CDF Collaboration), Phys. Rev.Lett. 84, 845 (2000).
95. G.A. Ladinsky and C.-P. Yuan, Phys. Rev. D50,4239 (1994).
96. B. Abbott et al. (DØ Collaboration), Phys. Rev.D61, 032004 (2000).
97. U. Baur, S. Keller, and W. K. Sakumoto, Phys.Rev. D57, 199 (1998).
98. F. Abe et al. (CDF Collaboration), Phys. Rev.D59, 052002 (1999).
99. A. Bodek et al. for the CDF Collaboration, Con-straints on PDF’s from W and Z Rapidity Distri-butions at CDF, Fermilab-Conf-99/160-E, to bepublished in Proceedings, 7th International Con-ference on Deep Inelastic Scattering and QCD(DIS 99), DESY, Zeuthen, Germany, 19 – 24 April1999.
100. G. Arnison et al. (UA1 Collaboration), Phys. Lett.B122, 103 (1983).
49
101. G. Arnison et al. (UA1 Collaboration), Phys. Lett.B126, 398 (1983).
102. G. Banner et al. (UA1 Collaboration), Phys. Lett.B122, 476 (1983).
103. P. Bagnaia et al. (UA1 Collaboration), Phys. Lett.B129, 130 (1983).
104. J. Alitti et al. (UA2 Collaboration), Phys. Lett.B186, 452 (1987).
105. J. Alitti et al. (UA2 Collaboration), Z. Phys. C49,17 (1991).
106. M. Carena et al., Report of the Higgs WorkingGroup, Fermilab Supersymmetry/Higgs Run IIWorkshop (1998).
107. U. Baur and E.L. Berger, Phys. Rev. D47, 4889(1993).
108. E. Mirkes, Nucl. Phys. B387, 3 (1992).109. J.C. Collins and D.E. Soper, Phys. Rev. D16,
2219 (1977).110. M.I. Martin, Measurement of the Angular Distri-
bution of the Electron from W → eν decay in pp at√s= 1.8 TeV as Function of pW
T , PhD thesis, Uni-versidad de Zaragoza, Spain, 1994 (unpublished).
111. G. Steinbruck, Measurement of the Angular Dis-tribution of Electrons from W Boson Decays atDØ , PhD thesis, University of Oklahoma, Nor-man, Oklahoma, 1999 (unpublished).
112. K. Hagiwara, R. D. Peccei, D. Zeppenfeld andK. Hikasa, Nucl. Phys. B282, 253 (1987).
113. U. Baur and D. Zeppenfeld, Nucl. Phys. B308,127 (1988).
114. G. Gounaris et al., in Physics at LEP2, edited byG. Altarelli, T. Sjostrand and F. Zwirner, CERN96-01, 525 (1996).
115. K. Hagiwara, S. Ishihara, R. Szalapski and D. Zep-penfeld, Phys. Rev. D48, 2182 (1993).
116. U. Baur and D. Rainwater, FERMILAB-Pub-00/153-T, to appear in Phys. Rev. D.
117. G.J. Gounaris, J.Layssac and F.M. Renard, Phys.Rev. D61, 073013 (2000).
118. B. Mele, P. Nason and G. Ridolfi, Nucl. Phys.B357, 409 (1991); S. Frixione, P. Nason andG. Ridolfi, Nucl. Phys. B383, 3 (1992); S. Frix-ione, Nucl. Phys. B410, 280 (1993).
119. U. Baur, T. Han, and J. Ohnemus, Phys. Rev.D48, 5140 (1993).
120. U. Baur, T. Han, and J. Ohnemus, Phys. Rev.D57, 2823 (1998).
121. U. Baur, T. Han, and J. Ohnemus, Phys. Rev.D53, 1098 (1996).
122. U. Baur, T. Han, and J. Ohnemus, Phys. Rev.D51, 3381 (1995).
123. J.M. Campbell and R.K. Ellis, Phys. Rev. D60,113006 (1999).
124. L. Dixon, Z. Kunszt and A. Signer, Phys. Rev.
D60, 114037 (1999).125. D. DeFlorian and A. Signer, Eur. Phys. J. C16,
105 (2000).126. H.L. Lai et al. (CTEQ Collaboration), Phys. Rev.
D55, 1280 (1997).127. S. Haywood et al., Report of the Electroweak
Physics Working Group, hep-ph/0003275 (March2000), to appear in the CERN Yellow-Report ofthe 1999 CERN Workshop on Standard ModelPhysics (and more) at the LHC.
128. M. Dobbs, private communication.129. F. Abe et al. (CDF Collaboration), Phys. Rev.
Lett. 74, 1936 (1995).130. S. Abachi et al. (DØ Collaboration), Phys. Rev.
Lett. 75, 1034 (1995).131. S. Abachi et al. (DØ Collaboration), Phys. Rev.
Lett. 78, 3634 (1997).132. S. Abachi et al. (DØ Collaboration), Phys. Rev.
Lett. 75, 1023 (1995).133. F. Abe et al. (CDF Collaboration), Phys. Rev.
Lett. 78, 4537 (1997).134. B. Abbott et al. (DØ Collaboration), Phys. Rev.
D58, 051101 (1998).135. F. Abe et al. (CDF Collaboration), Phys. Rev.
Lett. 75, 1017 (1995).136. S. Abachi et al. (DØ Collaboration), Phys. Rev.
Lett. 77, 3303 (1996).137. B. Abbott et al. (DØ Collaboration), Phys. Rev.
Lett. 79, 1441 (1997).138. B. Abbott et al. (DØ Collaboration), Phys. Rev.
D60, 072002 (1999).139. S. Abachi et al. (DØ Collaboration), Phys. Rev.
D56, 6742 (1997).140. B. Abbott et al. (DØ Collaboration), Phys. Rev.
D58, 031102 (1998).141. F. Abe et al. (CDF Collaboration), Phys. Rev.
Lett. 74, 1941 (1995).142. S. Abachi et al. (DØ Collaboration), Phys. Rev.
Lett. 75, 1028 (1995).143. B. Abbott et al. (DØ Collaboration), Phys. Rev.
D57, 3817 (1998).144. S. Abachi et al. (DØ Collaboration), Phys. Rev.
Lett. 78, 3640 (1997).145. J. Papavassiliou and K. Philippides, Phys. Rev.
D60, 113007 (1999).146. G. Bella et al. (The LEP TGC Working Group),
LEPEWWG/TGC/2000-01 (March 2000).147. R.W. Brown and K.O. Mikaelian, Phys. Rev.
D19, 922 (1979).148. D. Benjamin, Proceedings of the 10th Topical
Workshop on Proton-Antiproton Collider Physics,Batavia, IL, May 1995, edited by R. Raja andJ. Yoh, AIP Press (1996), p. 370.
149. U. Baur, S. Errede and G. Landsberg, Phys. Rev.
50

D50, 1917 (1994).
51