Report (Denver Univ.) 22 p HC $3.25 CSCL 20F Unclas
23
University of Denver Department of Physics and Astronomy "Laboratory Studies of Infrared Absorption by NO 2 and HNO3 D. G. Murcray, A. Goldman and F. Bonomo Final Report NASA Grant 06-004-128 Submitted to National Aeronautics and Space Administration Langley Research Center Hampton, Virginia 23665 (NASA-CR-142190) LABORATORY STUDIES OF N75-18034 INFRARED ABSORPTION BY N02 AND HN03 Final Report (Denver Univ.) 22 p HC $3.25 CSCL 20F Unclas G3/72 10238____
-
Upload
khangminh22 -
Category
Documents
-
view
5 -
download
0
Transcript of Report (Denver Univ.) 22 p HC $3.25 CSCL 20F Unclas

University of Denver
Department of Physics and Astronomy
"Laboratory Studies of Infrared Absorption by NO 2 and HNO3
D. G. Murcray, A. Goldman and F. Bonomo
Final Report
NASA Grant 06-004-128
Submitted to
National Aeronautics and Space Administration
Langley Research Center
Hampton, Virginia 23665
(NASA-CR-142190) LABORATORY STUDIES OF N75-18034
INFRARED ABSORPTION BY N02 AND HN03 Final
Report (Denver Univ.) 22 p HC $3.25CSCL 20F Unclas
G3/72 10238____
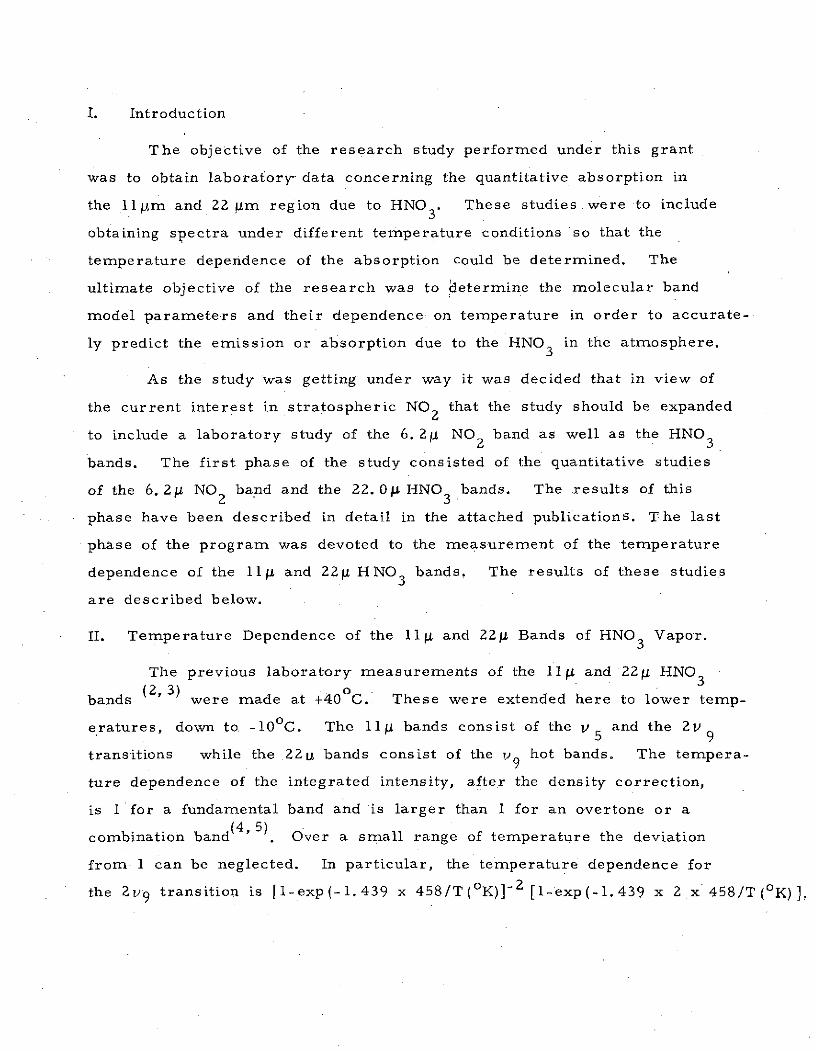
I. Introduction
The objective of the research study performed under this grant
was to obtain laboratory- data concerning the quantitative absorption in
the llpm and 22 krm region due to HNO3. These studies were to include
obtaining spectra under different temperature conditions so that the
temperature dependence of the absorption could be determined. The
ultimate objective of the research was to determine the molecular band
model parameters and their dependence on temperature in order to accurate-
ly predict the emission or absorption due to the HNO 3 in the atmosphere.
As the study was getting under way it was decided that in view of
the current interest in stratospheric NO 2 that the study should be expanded
to include a laboratory study of the 6. 211 NO 2 band as well as the HNO 3
bands. The first phase of the study consisted of the quantitative studies
of the 6. 2 NO 2 band and the 22. 0 AHNO 3 bands. The results of this
phase have been described in detail in the attached publications. The last
phase of the program was devoted to the measurement of the temperature
dependence of the 11A and 22u HNO3 bands. The results of these studies
are described below.
II. Temperature Dependence of the 11 and 22A Bands of HNO 3 Vapor.
The previous laboratory measurements of the 11 and 2 2 p. HNO 3
(2,3) obands (2 3) were made at +40 C. These were extended here to lower temp-
eratures, down to -100C. The 11 bands consist of the v and the 2v 9
transitions while the 2 2 u bands consist of the 19 hot bands. The tempera-
ture dependence of the integrated intensity, after the density correction,
is 1 for a fundamental band and is larger than 1 for an overtone or a
combination band ( 4 '5). Over a small range of temperature the deviation
from. 1 can be neglected. In particular, the temperature dependence for
the 2vo transition is [1-exp(-1.439 x 458/T(oK)1- 2 [1-exp(-1.439 x 2 x 458/T(OK)],

which varies by only a few percent in the 313-263 K range. In addition,
the average, spectral line spacing is not expected to vary over a small
temperature interval. Therefore 'the present (SO/d) measurements at
the lower temperatures are expected to increase as l/T.
Fig 1 shows a quantitative spectrum of the 11 bands at -100C
under - 0. 5cm-1 resolution. Comparison with similar spectrum at +400C
(Fig 4, Ref 3) shows no significant changes in the spectral features. Figs
2 and 3 show low resolution quantitative spectra at +100C and -100C taken
for the purpose of band model analysis. They can be compared with simi-
lar spectra at +40 0 (Fig 5, Ref 3). The resulting (SO/d) values are
tabulated in Table I and also plotted in Fig 4, together with the values
obtained previously at±+400C. It is apparent that the I/T dependence is
verified within the experimental error (5-10%).
Similar data were obtained for the 22um bands. Fig. 5 shows a
0~ -lIquantitative spectrum of the 22 bands at -10OC under ~0.5cm-1 resolution.
Fig. 6 shows a number of low resolution spectra of these bands at +100C.
Such spectra were the basis for the band model analysis of the data.
The analysis of the 22p bands low resolution measurements indicated
that for some unclear reason pressure fluctuations occurred during the
measurements, especially during the -100C measurements. As a result,
significant fluctations were introduced into the derived (-lnT/P ) values
(where -T is the transmittance and P the pressure), and, subsequently,
into the curve of growth. Due to these pressure variations the fitting of
the experimental data to the theoretical curves of growth was not satisfactory.
At a number of frequencies at -100C no fitting was possible. The resulting
S /d values, together with these obtained previously at +400C, are shown
in Fig. 7. A relatively large error (approximately a factor of 2), is to
be associated with those frequencies for which a fitting was accomplished
for both +10 C and -10 C. Due to the large errors involved, no obvious
temperature dependence can be concluded at the moment for the 224 bands.

References
1. A. Goldman, F. S. Bonomo, W. J. Williams and
D. G. Murcray, J. Quant. Spectrosc. Radiat. Transfer
15 107 (1975.
2. A. Goldman, F. S. Bonomo, W. J. Williams and D. G.
Murcray, J. Opt. Soc. Am. 65, 10 (1975).
3. A. Goldman, T. G. Kyle, and F. S. Bonomo, Appl Opt.
10, 65 (1970).
4. B. L. Crawford, Jr. and H. L. Dinsmore, J. Chem. Phys.
18, 983, 1682 (1950)
5. J. C. Breeze, C. C. Ferriso, C. B. Ludwig and M. Malkmus,
J. Chem. Phys. 42, 402 (1965).

Table I. S°/d Values at Several Temperatures for the 11i HNO 3 Bands.
v So/d So/d So/d(cm-1 -1 -1 -1 -1 -1 -1
(cm (atm -cm ) (atm cm (atm cm
at +40 C at+10 °C at -10 C
850. 0 2. 20 2. 31 2. 29
852. 5 2. 98 3. 17 3. 08
855.0 3. 91 4. 12 4. 03
857.5 5.03 5.34 5. 25
860.0 6.15 6.59. 6.80
862. 5 7.27 7.75 8.23
865.0 8.15 8.65 9.30
867.5 8.82 9.24 10.06
870.0 9.22 9.68 10.46
872.5 9. 39 9.88 10.57
875.0 9.46 10.05 10.67
877. 5 10. 55 11.44 12. 10
880.0 11. 56 13.03 14.06
882.5 11.28 11.80 12.84
885.0 11. 10 12.23 13. 20
887. 5 11.24 12.31 13.50
890.0 11. 17 12. 30 13. 52
892. 5 11.57 12.80 14.02
895.0 12.40 13. 96 14.89
897. 5 12.24 14. 53 15. 15
900.0 10.49 11.77 12. 11
902.5 8.64 9.44 9.91
905.0 7.51 8.05 8.41
907. 5 6.84 7.42 8. 15

Table I. S /d Values at Several Temperatures for the 11p HNO 3 Bands.
v So/d So/d S.0/d-1 -1 -1 -1 -1 -1 -1
(cm (atm -cm - (atm cm ) (atm cm
at +40 0 C at +100C at -100C
910.0 6. 14 7. 02 7. 60
912. 5 5. 66 6. 54 6. 97.
915.0 4. 90 5. 66, 5.89
917.5 3. 89 . 4.31 4. 58
920. 0 2.87 3. 10 3.22

100
80-
Z 600
-- 10 0C40- 9.94 cm cel I
20
850 900
WAVENUMBER (cm - ')
Figure 1.

100
80
0 60 +1000 O5. I cm cell
C. P = 0.7 mm Hg.Ji 2.0 L 1 4.0I 40 6.6
D 10.516.5
28.5
20
800 850 900 950
WAVENUMBER (cm -')
Fhire 3

00
80 -
O 60- -100 _5. I cm cell
(, P=0.8 mm HgLU 2.1LL 3.7w 40 5.2
7.4
20
800 850 900 950
WAVENUMBER (cm-')
Figure 3.

16-
A a -10 0 C
14 a o o+400CA
0 A
oA 0 0
E 10 oA A
o 8 0
8C 0 A
0 o A
6-A
2-
850 860 870 880 890 900 910 920
WAVENUMBER (cm-')
Figure 4.

1001
0 60 / 1
-J
L 40 9.94 cm cell
60 mm Hg 3 -29
0 Oi
520 500 480 460 440 420 400 380 360
WAVENUMBER (cm-')
Figure 5

100
80 / %
o 60 -
0 81.9 cm cell_+lO°C
n, P= 0. I mm HgLJ 40 - 0. 2
S/ 0.20.9
2.85.2
20-
500 450 400 350
WAVENUMBER (cm-')
Figure 6

16 a-IO10C0 + I OCr +400 C
14-
12-
10-
0
I 0
8- 0
0 GA .0
A -
M0 00 E
A4 0 A AG A 3A
4 500 480 460 4400 0
WAVENUMBER (cm-')
Figure 7

Reprinted from:
JOURNAL OF TIHE OPTICAL SOCIETY OF AMERICA VOLUME 65, NUMBER 1 JANUARY 1975
Statistical-band-model analysis and integrated intensity for the 21.8 jtm bandsof HNO3 vapor*
A. Goldman, F. S. Bonomo,t W. J. Williams, and D. G. Murcray
Department of Physics and Astronomy, University of Denver, Denver, Colorado 80210(Received 2 August 1974)
The 21.8 jtm absorption bands of HNO3 vapor were measured at 40 "C. Statistical-band-modelanalysis of the data resulted in spectral-band-model parameters and yielded an integrated intensity of393 = 15% (cm- 2 atm-) at 40'C between 390 and 502 cm-'.
Index Headings: Absorption; Spectra; Infrared.
Stratospheric HNO 3 was originally detected by the iden- These values include more hot bands than those observedtification of the 7. 5 Am vibration-rotation band in the earlier, 14 and should be useful for a more-detailed vi-solar spectrum.1 Subsequently, the 5. 9, 11. 3, and 21. 8 brational analysis. The first two of the hot bands, i. e.,Am HNO 3 bands were also observed in the solar spec- 219-v9 and 3vg-2g9, are also observed on the atmospherictrum, a-7 and the 11. 3 and the 21. 8 Am bands were ob- absorption shown in Fig. 3 of Ref. 5.. The first hot bandserved in atmospheric emission spectra. 4-6 The 11. 3 Am is also clearly observed in atmospheric emission; theband, which is centered at an atmospheric window, second one, which is close to a strong H20 line group,has been used extensively for derivation of vertical dis- is smoothed out by the spectrometer slit function (Fig.tributions of HN0 3 in the stratosphere. 4-7 5 of Ref. 5).
Atmospheric absorption and emission spectra of the A large number of low-resolution (~7 cm'- ) quantita-21. 8 jm HNOs bands are shown in Figs. 3 and 5 in Ref. tive spectra were obtained for a band-model analysis of5. Quantitative analysis of such spectra requires labo- the 21. 8jm bands by using five different absorption cellsratory measurements of the spectral absorptivity param- and numerous gas pressures. The 0; 5, 1.0, and 2.0 cmeters of these bands. Such parameters were measured cells were made from Teflon, and the 5. 10 and 9. 94and are presented here.
The instrumentation and the experimental and theoret- tooical techniques used in the present study are quite sim- Goilar to those described previously. 8-11 The spectra wererecorded on a double-beam Beckman infrared spectro- 60
photometer Model IR-7, employing a CsI foreprism and Ygrating optics. (In order to obtain high resolution over o 5-994 U-
the CsI region, two orders of grating are utilized; the 20 9.5o 49'39change occurred at 504 cm "'. ) The AgC1 cell windowsused previously8 show little transmittance of infrared 460 440 420 400 380 360 3
energy below 450 cm' , so they were replaced by AgBr ,windows. Figure 1 shows the HNO 3 vapor survey spectra so lit a Irtas measured in the 340-690 cm - region. Similar spec- ttra for the 600-4000 cm-' region are shown in Ref. 8.Figure 1 shows that the 21.8 jim bands extend from 4about 360 to about 520 cm 1. H20 vapor lines that weresuperimposed on the same chart allow an improved wave- o 1,39.sor
number calibration and show the overlapping regions be-. 0tween HNO3 and H20 lines. This occurs mostly at the too
HNO. vg, 3v9-2g9, and 6v- 5v9 Q-branch peaks. H20calibration spectra under similar resolution and gas o2torr t t
amount are given in Ref. 12. The spectral resolution 6to
of ~ 1 cm -' does not allow a clear separation of the groupsof the HN03 rotational lines, spaced at approximately 40
0. 8 cm' 1, which were observed in the balloon-flight 2I 6 7
data. 5 This spacing is in agreement with a C-typerigid-rotor approximation for the HNO0 v9 fundamental o o oband, as the rotational constants are 3 A =B n 0. 4 cm' 1. WAVENUMBER(cm-1)
The optical path used in Fig. 1 allows for the identifica- FIG. 1. Spectra of HNO 3 vapor in the 340-690 cm-1 region attion of a number of hot bands on the low-wave-number ~ 1 cm-1 resolution obtained with the 9.94 cm cell. The upper
HNO spectrum is at 2. 0 torr; the lower is at 39.5 torr, andside of the v9 fundamental band. The measured Q-branch both are at 40'C. The low-pressure spectrum was deletedpeaks (within ± 0. 1 cm' 1) occur at 457. 8, 438. 5, 422. 1, .from 510 to 540 cm-1 (horizontal arrows) because it does not410. 5, 392. 8, and 376. 5cm-' for the v9, 2v 9 -v 9 , 39-219, have a measured absorption. H20 lines, denoted by vertical4v,-3g, 5Vg-4vg, and 619-5v) bands, respectively. arrows, are superimposed on the HN03 spectra.
10 PRECEDING PAGE BLANK NOT FILMED

Jan. 1975 ANALYSIS OF 21. 8 Am BANDS OF HNO 3 VAPOR 11
500 450 400 350
WAVENLMBER (cm-')
FIG. 2. Low-resolution (- 7 cm'l
) spectra of HNO 3 vapor at40 'C in the 9. 94 cm cell. Pressures from the top are 1.2, 500 450 4002.5, 4. 9, 7.5, 10.5, 15. 0, 21. 0, 34.5, 38. 0, and 51.5 torr. WAVENUMBER(c-')
FIG. 4. (So/d), for the 21. 8 pm HNO 3 bands in the 390-502cm cells were made from Pyrex glass. Some of the cm i region.spectra produced are shown in Figs. 2 and 3. Thesewere made with pure HNO3 vapor at 40 'C, with pres- sponding 6, values are >> 1 so that the fitting is not sen-sures ranging from a few torr to near saturation pres- sitive to this parameter.sures. The saturation pressure at room temperature1 5 The integrated intensitydictated the maximum absorption that could be obtained The integrated intensity S atm, at 40 C) ofwith a given cell. the 21.8 im bands was derived in two ways : one fromwith= fv (So/d)vdv, and one from So= (- 1/pL) flnT(v)dv
The spectral curve of growth analysis was applied to of the short cell. These gave 393 ± 15% and 404± 20%~ 70 frequencies within the band, at ~ 2 cm - 1 intervals (cm-2 atm-1), respectively, between vi= 390 cm " 1 andto closely follow the shape of the absorption curves. v 2 = 502 cm-1. As discussed previously, 8 the first of theFitting - lnT/p vs L [where T is the observed average two values should be regarded as the best value for thetransmittance, p (atm) is the pressure, and L (cm) is integrated intensity.the cell length] to a two-parameter model (with Lorentzline shape)8 yielded the band-model parameters, a, Although the temperature of the gas samples used in(cm 1') and P3° (atm-'). Their product, which yields (So/d), the present study is higher than the lower stratospheric(cm1' atm'), is shown in Fig. 4. This analysis showed temperature, it is expected that the present results willbe useful in the analysis of absorption and emissionthat for most frequencies within the band, the absorption be useful in the analysis of absorption and emissionis in the linear and intermediate regions of the curve of spectra of the lower stratosphere in the 20-24 tm re-growth. The exception is the v9 Q-branch, in which the gion. In particular, these results, in addition to thoseabsorption is in the intermediate and square-root region, from the 11. 3 am band, r can be used for an indepen-with a,= 0.486 cm 1, Po = 34. 1 atm-', and (So/d),- 16. 5 dent determination of HNO3 vertical distribution. Care-cmlatm" . As a result, the accuracy of (S/d), is sig- ful attention should be given, however, to the interfer-
nificantly larger than that of a, and 3°. 8 Fitting - lnT/p ence between the HNO3 and the H20 lines in this spec-tral region.vs L to a three-parameter model (with Voigt lineshape)911 yielded the same values for a,, and Po and, in ACKNOWLEDGMENTSaddition, values for 6. In principle, this allows the es-timation of the Lorentz half-width. However, the corre- Acknowledgment is made to the National Center for
Atmospheric Research, which is sponsored by theNational Science Foundation, for computer time usedin this research. The figures were carefully preparedby Carolyn Bauer.
6 0*Supported in part by NASA Langley Research Center.tChemistry Div., Denver Research Institute, University ofDenver.
4 'D. G. Murcray, T. G. Kyle, F. H. Murcray, and W. J.Williams, Nature 218, 78 (1968).2D. G. Murcray, T. G. Kyle, F. H. Mureray, and W. J. Wil-liams, J. Opt. Soc. Am. 59, 1131 (1969).
D. G. Murcray, F. H. Mureray, W. J. Williams, T. G. Kyle,and A. Goldman, Appl. Opt. 8, 2519 (1969).
50W0 40 400 4W. J. Williams, J. N. Brooks, D. G. Murcray, F. H. Mur-
cray, P. M. Fried, and J. A. Weinman, J. Atmos. Sci. 29,FIG. 3. Low-resolution (- 7 cm- 1) spectra of HNO3 vapor at 1375 (1972).40 C in the 5.10 cm cell. Pressures from the top are 1.4, 5J. N. Brooks, A. Goldman, J. J. Kosters, D. G. Murcray,3.3, 6. 7, 12. 0, 16.5, 24. 0, 29. 0, 36. 0, 45. 5, and 55.5 torr. F. H. Murcray, and W. J. Williams, in Physics and Chemis-

12 GOLDMAN, BONOMO, WILLIAMS, AND MURCRAY Vol. 65
try of Upper Atmospheres, edited by B. M. McCormac (Rei- Transfer 13, 709 (1973).del, Dordrecht, Holland, 1973), p. 278.' °A. Goldnian, F. S. Bonomo, W. J. Williams, D. G. Mur-
6D. G. Murcray, A. Goldman, A. Csoeke-Poeckh, F. H. Mur- cray, and D. E. Snider, J. Quant. Spectrosc. Radiat. Trans-
cray, W. J. Williams, and R. N. Stocker, J. Geophys. Res. fer (1974).78, 7033 (1973). IS. C. Schmidt, A. Goldman, F. S. Bonomo, .D. G. Murcray,
7D. G. Murcray, A. Goldman, W. J. Williams, F. H. Mur- and R. C. Amme, Appl. Opt. 13, 1202 (1974).
cray, J. N. Brooks, J. Van Allen, R. N. Stocker, J. J. Kos- 12L. R. Blaine, E. K. Plyler, and W. S. Benedict, J. Res.
ters, D. B. Barker, and D. E. Snider, in Proceedings of the Natl. Bur. Std. 66A, 223 (1962).Third Conference on the Climatic Impact Assessment Pro- 13A. P. Cox and J. M. Riveros, J. Chem. Phys. 42, 3106
gram, edited by A. J. Broderick (U. S. Dept. of Transporta- (1965).tion, Cambridge, Mass., 1974).
14G. E. McGraw, D. L. Bernitt, and I. C. Hisatsune , J. Chem.8A. Goldman, T. G. Kyle, and F. S. Bonomo, Appl. Opt. 10, Phys. 42, 237 (1965).
65 (1971). 15S. A. Stern, J. T. Mullhaupt, and W. B. Kay, Chem. Rev.
9A. Goldman and S. C. Schmidt, J. Quant. Spectrosc. Radiat. 60, 185 (1960).

Reprinted from
PERGAMON PRESSOXFORD - NEW YORK

J. Quant. Spectrosc. Radiat. Transfer. Vol. 15, pp. 107-112. Pergamon Press 1975. Printed in Great Britain.
ABSOLUTE INTEGRATED INTENSITY AND INDIVIDUALLINE PARAMETERS FOR THE 6-2t BAND OF NO 2*
A. GOLDMAN, F. S. BoNoMOt, W. J. WILLIAMS and D. G. MURCRAYDepartment of Physics and Astronomy, University of Denver, Denver,
Colorado 80210, U.S.A.
andD. E. SNIDER
Ballistic Research Laboratories, Aberdeen Proving Ground,Maryland 21005, U.S.A.
(Received 13 May 1974)
Abstract-The absolute integrated intensity of the 6 .2. band of NO2 at 40'C was determined fromquantitative spectra at - 10 cm-' resolution by the spectral band model technique. A value of 1430 ± 300 cm-2
atm - ' was obtained. Individual line parameters, positions, intensities and ground state energies were derived,and line-by-line calculations were compared with the band model results and with the quantitative spectraobtained at -05 cm-' resolution.
1. INTRODUCTION
SINCE the identification of the v3 NO 2 band in the solar spectrum, as observed from aballoon-borne spectrometer,t" this band has become of considerable importance forspectroscopic studies of NO2 in the atmosphere. 2 ) The quantitative analysis of atmospheric v 3
NO2 data requires a precise knowledge of the spectral-line parameters, i.e. line positions,absolute intensities, halfwidths and ground state energies. A successful rotational analysis of thisband was accomplished only recently by HURLOCK et al.,") from which the line positions, groundstate energies and relative intensities can be computed. However, there exists only themeasurement of the total band intensity"' to which the individual 'relative intensities must benormalized.
In the present work, we have remeasured the 6-2g NO 2 band intensity from quantitativespectra obtained with several absorption cells. These spectra permitted the total band intensity aswell as an estimate of the self broadened Lorentz halfwidth to be determined, using spectral bandmodel analysis of - 10 cm-' resolution spectra. These results and the recently derived rotationalconstants) were used to generate individual line parameters for the v3 14N'60 2 band. Thederived line parameters were used for spectral comparisons with the band model results and withquantitative spectra obtained at - 0-5 cm-' resolution.
2. MEASUREMENTS AND BAND MODEL ANALYSIS
The experimental procedure, instrumentation and methods of analysis used in the presentstudy have been described in detail in previous publications. 5-7 The spectral band model analysisof laboratory data has been described for spectral lines with either Lorentz or Voigt shape.5'6
*Supported in part by NASA Langley Research Center and in part by Ballistic Research Laboratories, Aberdeen ProvingGround.
tChemistry Division, Denver Research Institute, University of Denver.
107

108 A. GOLDMAN et al.
The spectra were recorded on a double-beam Beckman infrared spectrophotometer, Model
IR-7, at 40 0C. A total of four cells was used, all with AgCI windows. The 0-5 cm and 2-0 cm cells
were made from Teflon, and the 4-96 cm and 9-94 cm cells were made from Pyrex glass. The NO2
samples used were CP grade from the Matheson Company. No foreign gases were introduced
into the absorption cells. Numerous spectra were recorded at -10 cm-' resolution and at
-0.5 cm-' resolution with various pressures from -3 to -300 mm Hg. The pressures were read
using both a standard mercury-filled manometer with a small layer of Kel-F fluorocarbon oil
protecting the mercury, and a differential manometer filled with the same oil.
Quantitative NO 2 analysis of these absorption spectra is complicated by the fact that NO2
dimerizes according to 2NO2 z N204. In addition, a small impurity of HNO3 was also present in
the spectra. The HNO3 and N20 4 contaminations were monitored by scanning the
1670-1800 cm-' region at - 0-5 cm - ' resolution, which showed both the 1750 cm-' N204 band and
the 1712 cm - ' HNO 3 band. HNO3 and N20 4 bands, however, do not overlap the v3 band of14N1602"
The band model curve-of-growth analysis was applied to the - 10 cm-' resolution spectra. A
typical set of spectra as obtained in one of the four cells is shown in Fig. 1. In order to minimize
the effects of the dimerization, the analysis was applied to data obtained with pressures less than
100 mm Hg. At a total pressure of 100 mm Hg and at 400 C, the ratio of NO 2 to N204 is 4:1, ascalculated from the known equilibrium constant.' ' As the pressure decreases, the NO2 proportion
increases significantly (larger proportions of NO2 with little N20 4 dimerization can be obtained at
higher temperatures). The NO2 pressures were also corrected for the HNO3 contamination which
was estimated as less than 5 per cent of the total pressure.The curve-of-growth analysis was applied to - 40 frequencies within the band, at - 3 cm- '
intervals, so that the selected net of frequencies closely followed the shape of the transmittance
curves. For each selected frequency v(cm-'), the observed -In T(v)IP (where T is the averagetransmittance and P is the NO2 pressure) was fitted to a curve-of-growth with a Voigt profile, as
described in detail in the previous publications."6'7 This analysis yields values for the band model
parameters a(v)(cm'), p/(v)(atm-') and d°(v)(atm-'),5 -7 shown in Fig. 2. A typical fitting of
- In T(v)IP for one point of Fig. 2 (at v = 1630 cm - ) is shown in Fig. 3. The variance of this
fitting is -4 per cent.
0.9
Os
0.7
06 -05cmcell,40 C
S0.5 -PRESSURE (mm Hg)
04- 63
03 - 236
0.2
0.0
1540 1560 580 1600 20 1640 1660
WAVENUMBER (cm-)
Fig. 1. Typical set of - 10 cm-' resolution spectra of the 6-21L NO, band.

Absolute integrated intensity and individual line parameters for the 6-2/1 band of NO2 109
35
3,0
2.5
a(v
4 + 2.0 m cell
l0o
05
I-
0.10 01560 1580 1600 1620.5 00 025WAVENUMEER (cn'rl)
Fig. 2. Spectral band model parameteters a(v), Pio(v) and dthe) derived for the 62halfwi NO band. The verticalscale applies to a he(v)and is to be multiplied by 10 and 100 for Phigh(v) and d(ensity) respectively.
a .2.1 (cm-1) A 0,5 cm cellsplitting effects and "hot" bands contribution. The quantity a()Lm- where L 2.0 cm cell
5Fig. 3 indicates9( tham-) the fitted 496urvature in the Doppler region is not supported by sufficient datall0 9.94rmell
v-16O cm-l
0.00 0.05, 0.10 0.15 020 0.25
PRESSURE(arm)
Fig. 3. -In '(v)P vs P for P = 1630 cm-'.
In Fig. 2, P°(v) is proportional to the ratio of the average Lorentz halfwidth and the averageline spacing. The peak in the p'(v) curve near 1615 cm- ' indicates high density of the spectrallines. This could be due to the Q-branches in this region (see Fig. 4), as well as possible spinsplitting effects and "hot" bands contribution. The quantity a(,)L, where L is the cell length,yields the Ladenburg-Reiche parameter; therefore 5' the a(v) curve indicates that the presentexperimental data fall mostly in the intermediate region of the curve-of-growth. The parameterd°(,) is proportional to the ratio of the average Lorentz half width to the Doppler half width; thusit can be used to derive the variation of the average Lorentz halfwidth across the band. However,Fig. 3 indicates that the fitted curvature in the Doppler region is not supported by sufficient data

110 A. GOLDMAN et al.
points. In this regard it should be noted here that fitted do(p) values greater than -100 areuncertain. This is due to the fact that, even for the lower pressures pressures (-5 mm Hg) usedfor the present spectra, the Lorentz halfwidth is still of the order of the Doppler halfwidth so thatthe Lorentz shape contribution dominates the Voigt shape. As a result, the fittedcurves-of-growth are not very sensitive to dO(v) a~ 100 and the corresponding Lorentz halfwidths[derived from d0(v)] are uncertain. It is estimated that the average self-broadened Lorentzhalfwidth is 0-08 cm-' atm-' +±50 per cent at 400C. This result indicates the possibility of a highervalue than the theoretical estimate of 0-06 cm - ' atm-' at 3000K.'9' Sensitivity tests show that theresults for a (v) and p3(v) are practically independent of d0(v) when do(v) > 100. This conclusionhas also been verified by fitting the data outside the Doppler region to the spectral band modelwith a Lorentz line shape, i.e. a two parameter model with the same ac(v) and P0 (v) as above.!5"Further sensitivity tests of the fitted band model parameters verified that (S/old), = a(v)p°(v) isthe most accurate parameter derived in the present analysis."5)
The integrated intensity for the total band is then obtained by the f (Sold), dv over the band.The area under the (Sold), curve yields an estimate of 1430 300cm -2 atm-' for the bandintensity at 40 0C. This includes an additional 12 per cent estimated from the spectra in theshortest cell for band wings not covered in the band model analysis. This band intensity is lowerthan that of 2059 cm -2 atm-' at 250C derived by GuTrMAN. 41 It is interesting to note that thepresent curve-of-growth analysis clearly confirms that the small cell length used by GUTrMAN(0-045 cm) is in the linear region of the curve-of-growth so that his derivation of the bandintensity from the -fln T(v)dv/P(NO2)L curve should definitely yield the correct bandintensity. The source of the disagreement is not clear, but may be due to differences betweenGUTrMAN'S and the present determinations of the NO2 gas amounts in the absorption cells.However, GurrMAN's work yielded the generally accepted heat of dissociation for N204, O
) andhis observed temperature dependence for the band intensity verifies the correct change in gascomposition with temperature.
3. SPECTRAL LINE PARAMETERS
Individual line positions, relative intensities, and ground state energies were computed for4N' 60 2, and were then normalized to the total band intensity of 1430 cm -2 atm-'. Upper andlower state rotational energy levels for J I 60 and K-, - 12 were computed from the constants ofHURLOCK et al." Due to the zero spin of the 60O nuclei, only symmetric lower-state rotationalenergy levels are populated. Type A selection rules (with AK_, = +1) were applied to obtain theallowed transitions, for which rigid asymmetric rotor relative line intensities were assumed.Neither "hot" bands [the strongest, (v 3 + v2 - v2), contributing about 5 per cent] nor isotopic bandswere included in this compilation. Spin splitting, due to an unpaired electron, has been observedin v3 of 14N 160 2, but was not included in the rotational analysis. (3 Nor was it taken into account inthe present calculations. Figure 4 shows the derived line intensities as a function of wavenumberv. A number of K_, sub-bands as well as Q-branches can be seen. Due to the relatively largedifference in the rotational constant A in the lower and upper states, the Q-branches do not forma central feature, but are spread out on the low wavenumber side of band center.
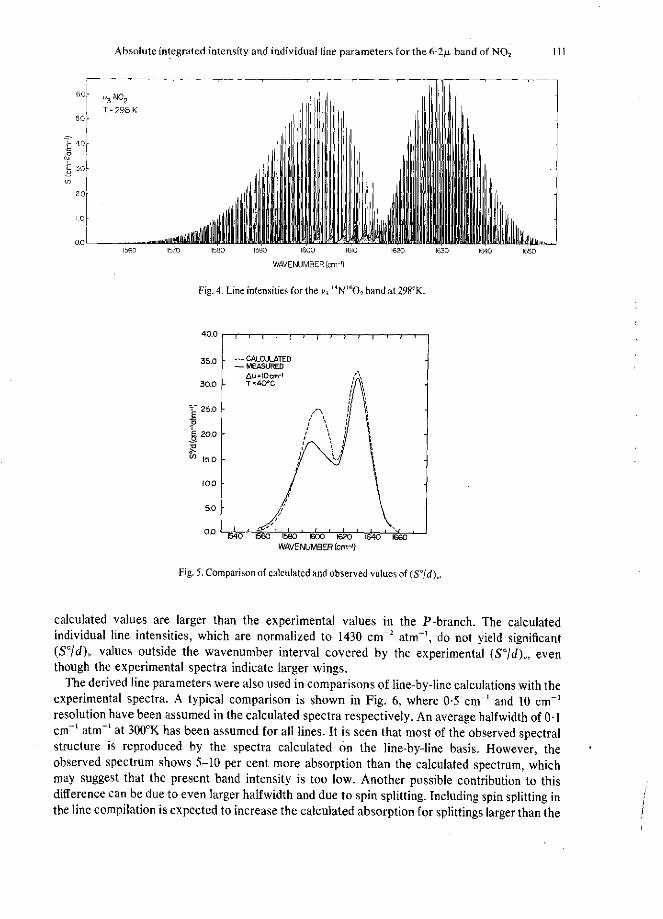
The statistical band model parameters a (v), P3(v) and d(v) can be calculated theoreticallyfrom the individual line parameters and the half-widths." In particular, (Sold), is given by1,SlIAv, where the sums are taken over all spectral lines in the spectral interval Av(cm-'). Figure5 shows a comparison between the calculated and the experimental values of (Sold), for 400Cand Av = 10 cm-'. Such a comparison is independent of the halfwidths and the spin splitting. It isinteresting to note that good agreement is obtained in the R-branch and in the wings, but that the
Absolute integrated intensity and individual line parameters for the 6.2[ band of NO 2 11I
60 NO2T= 298 K
50
S40
20
1560 1570 1580 1590 1600 1610 1620 1650 1640 1650
WAVENUMBER (cm-)
Fig. 4. Line intensities for the v3 4 N'60 2 band at 2980 K.
40.0
35.0 --- CALCULATED- MEASURED
Aa=lOcm-i30.0 T 40*C ]
E 20.0
15.0
10.0
50
0.01540 1560 1580 600 1620 o1640
WAVENUMBER (cm-I)
Fig. 5. Comparison of calculated and observed values of (S0ld),.
calculated values are larger than the experimental values in the P-branch. The calculatedindividual line intensities, which are normalized to 1430 cm -2 atm- ', do not yield significant(S°ld), values outside the wavenumber interval covered by the experimental (S°ld),, eventhough the experimental spectra indicate larger wings.
The derived line parameters were also used in comparisons of line-by-line calculations with theexperimental spectra. A typical comparison is shown in Fig. 6, where 0.5 cm- ' and 10 cm- 'resolution have been assumed in the calculated spectra respectively. An average halfwidth of 0-1cm' atm-' at 300'K has been assumed for all lines. It is seen that most of the observed spectralstructure is reproduced by the spectra calculated on the line-by-line basis. However, theobserved spectrum shows 5-10 per cent more absorption than the calculated spectrum, whichmay suggest that the present band intensity is too low. Another possible contribution to thisdifference can be due to even larger halfwidth and due to spin splitting. Including spin splitting inthe line compilation is expected to increase the calculated absorption for splittings larger than the

112 A. GOLDMAN et al.
100
100 EXP
60
40
20
1550 1560 1570 1580 1590 1600 1610 1620 1630 1640 1650 1660WAVENUMBER (cm-
)
Fig. 6. Comparison of theoretical and experimental spectra at -0-5 cm-' and - 10 cm- ' resolutions for the6-211 NO 2 band at 40'C, 21 mm Hg and 4-96 cm cell. The 100 per cent line is displaced by 40 per cent for
clarity. (The smoother curve corresponds to the 10 cm-' resolution.)
halfwidths. This effect has been verified by recent 6-2A NO2 line-by-line calculations by J.SUSSKIND. "
') Unfortunately, no reliable spin splitting parameters are available at this time.
Acknowledgements-The authors are indebted to S. C. HURLOCK, W. J. LAFFERTY and K. NARAHARI RAO for making their v3
NO 2 analysis available prior to publication.Acknowledgment is made to the National Center for Atmospheric Research, which is sponsored by the National Science
Foundation, for computer time used in this research.Acknowledgment is also made to the Computer Support Division of the Ballistic Research Laboratories, Aberdeen
Proving Ground, for assistance with many of the computations.
REFERENNCES1. A. GOLDMAN, D. G. MURCRAY, F. H. MURCRAY, W. J. WILLIAMS and F. S. BoNoMO, Nature, Lond. 225, 443 (1970).2. D. G. MURCRAY, A. GOLDMAN, W. J. WILLIAMS, F. H. MURCRAY, J. N. BROOKS, J. VAN ALLEN, R. N. STOCKER, J. J.
KOSTERS, D. B. BARKER and D. E. SNIDER, Recent Results of Stratospheric Trace Gas Measurements from Balloon-BorneSpectrometers, Proceedings of the Third Conference on the Climatic Impact Assessment Program, in press (1974).
3. S. C. HURLOCK, W. J. LAFFERTY and K. NARAHARI RAO, J. molec. Spectrosc. 50, 246 (1974).4. A. GUWMAN, JQSRT 2, 1 (1962).5. A. GOLDMAN, T. G. KYLE and F. S. BONOMO, Appl. Opt. 10, 65 (1971).6. A. GOLDMAN and S. C. SCHMIDT, JQSRT 13, 709 (1973).7. S. C. SCHMIDT, A. GOLDMAN, F. S. BONOMO, D. G. MURCRAY and R. C. AMME, Appl. Opt. 13, 1202 (1974).
8. K. SCHOFIELD, J. phys. Chem. Ref. Data 2, 25 (1973).9. G. D. T. TEJWANI, J. chem. Phys. 57, 4676 (1972).
10. A. GUTrMAN and S. S. PENNER, J. chem. Phys. 36, 98 (1962).11. A. GOLDMAN and T. G. KYLE, Appl. Opt. 7, 1167 (1968).12. J. SUSSKIND, private communication (1974).