Replicability of first-order 16PF-5 factors: an analysis of three parcelling methods
11
Replicability of first-order 16PF-5 factors: an analysis of three parcelling methods Anton Aluja * , Angel Blanch Area de Personalitat, Avaluaci o i Tractaments Psicol ogic, Universitat de Lleida, Complex de la Caparrella, s/n, Lleida, Catalonia 25192, Spain Received 2 December 2002; received in revised form 16 September 2003; accepted 6 October 2003 Available online 19 November 2003 Abstract In the present study, the primary factor structure of the 16PF-5 is analysed with both the items and parcels obtained through three different methods in a sample of 288 males and 347 females with a mean age of 25.09 years (SD: 9.20). Four factor extraction methods, Scree Test, Parallel Analysis, Eigenvalue One and Maximum Likelihood suggested different number of factors for the 16PF-5, with the Scree Test being the most adequate to represent the theoretical factor structure of this instrument. In regard to parcels, factor extraction methods pointed to between 8 and approximately 20 factors. The analysis of the items of the 16 PF-5 extracting 16 factors, achieved a 63% correct classification of the items in their theoretical factors, while the Single Factor (S) item parcelling method achieved a completely correct classification (100%) when fixing the d parameter to )2. Ó 2003 Elsevier Ltd. All rights reserved. Keywords: 16PF-5; Factor extraction; Item parcelling; CattellÕs personality model 1. Introduction CattellÕs 16-primary factor personality model was a considerable contribution to the complex area of personality research (Cattell, 1945, 1956). An empirical analysis of this personality model has been mainly performed with factor analysis, a precise statistical technique useful to obtain predictive personality traits of human behaviour in applied contexts such as the work realm (Cattell, Eber, & Tatsuoka, 1970). Even though CattellÕs personality model is undoubtedly useful * Corresponding author. Tel.: +34-973-702-312; fax: +34-973-702-305. E-mail address: [email protected] (A. Aluja). 0191-8869/$ - see front matter Ó 2003 Elsevier Ltd. All rights reserved. doi:10.1016/j.paid.2003.10.001 Personality and Individual Differences 37 (2004) 667–677 www.elsevier.com/locate/paid
Transcript of Replicability of first-order 16PF-5 factors: an analysis of three parcelling methods

Personality and Individual Differences 37 (2004) 667–677www.elsevier.com/locate/paid
Replicability of first-order 16PF-5 factors: an analysisof three parcelling methods
Anton Aluja *, Angel Blanch�Area de Personalitat, Avaluaci�o i Tractaments Psicol�ogic, Universitat de Lleida, Complex de la Caparrella,
s/n, Lleida, Catalonia 25192, Spain
Received 2 December 2002; received in revised form 16 September 2003; accepted 6 October 2003
Available online 19 November 2003
Abstract
In the present study, the primary factor structure of the 16PF-5 is analysed with both the items andparcels obtained through three different methods in a sample of 288 males and 347 females with a mean age
of 25.09 years (SD: 9.20). Four factor extraction methods, Scree Test, Parallel Analysis, Eigenvalue One
and Maximum Likelihood suggested different number of factors for the 16PF-5, with the Scree Test being
the most adequate to represent the theoretical factor structure of this instrument. In regard to parcels,
factor extraction methods pointed to between 8 and approximately 20 factors. The analysis of the items of
the 16 PF-5 extracting 16 factors, achieved a 63% correct classification of the items in their theoretical
factors, while the Single Factor (S) item parcelling method achieved a completely correct classification
(100%) when fixing the d parameter to )2.� 2003 Elsevier Ltd. All rights reserved.
Keywords: 16PF-5; Factor extraction; Item parcelling; Cattell�s personality model
1. Introduction
Cattell�s 16-primary factor personality model was a considerable contribution to the complexarea of personality research (Cattell, 1945, 1956). An empirical analysis of this personality modelhas been mainly performed with factor analysis, a precise statistical technique useful to obtainpredictive personality traits of human behaviour in applied contexts such as the work realm(Cattell, Eber, & Tatsuoka, 1970). Even though Cattell�s personality model is undoubtedly useful
* Corresponding author. Tel.: +34-973-702-312; fax: +34-973-702-305.
E-mail address: [email protected] (A. Aluja).
0191-8869/$ - see front matter � 2003 Elsevier Ltd. All rights reserved.
doi:10.1016/j.paid.2003.10.001

668 A. Aluja, A. Blanch / Personality and Individual Differences 37 (2004) 667–677
in several situations, several criticisms from factor analysis experts have extensively questionedthe factor extraction procedure currently used with the 16 PF, one of the most frequent being thenon-replicability of the 16 first-order factors, provided that a more reduced number of fac-tors might suffice to explain its structure (Eysenck, 1986; Guilford, 1975; Howarth & Browne,1971).
Factor analysis results in as many factors as items included in the questionnaire being analysed,with distinct procedures for the extraction of an optimal number of factors. After examining someof these procedures in the factor analysis of the 16PF, Hakstian, Rogers, and Cattell (1982)ascertained that the best methods were (a) the Scree Test (Cattell, 1966), and (b) the MaximumLikelihood test (J€oreskog, 1977), the former being better than the latter although requiring moreresearch experience. Besides, other authors have suggested complementary techniques such asparallel analysis (Horn, 1965), or the extraction criteria suggested by Everett (1983) and Velicer(1976). Another procedure for the study of the factorial structure of the 16PF has been thegrouping of items into parcels prior to factorisation. Barrett and Kline (1981, 1982) provide twofine examples of radial parcel factor analysis of the 16PF. In the fifth edition of the 16PF (16PF-5),items are grouped into parcels obtained from item correlations that are subsequently factoranalysed (Cattell & Cattell, 1995; Conn & Rieke, 1994; Russell & Karol, 1994, 1995). There existsan array of methods to construct parcels from the items of a given questionnaire. For example,Landis, Beal, and Tesluk (2000) compared different procedures to parcelling items: (a) Random(RAND), items are assigned to each parcel at random; (b) Content (CONT), items are added tothe parcels according to their wording, that is to say, two items equivalent in content are assignedto the same parcel; (c) Exploratory Factor Analysis (EFA), parcels are created from the numberof factors obtained from each scale; for example, when a factor analysis of a scale yields a two-factor structure, the items corresponding to each of them are grouped into a parcel; (d) Corre-lational (R), bivariate correlations among the items of a scale are computed and the pair of itemswith the highest correlation are grouped into the first parcel, the two items with the second highestcorrelation are included in the second parcel, and the procedure continues until all items areexhausted; (e) Empirically Equivalent (E), parcels are constructed grouping the items into parcelssuch that these measures have equivalent means, variances and reliabilities; (f) Single Factor (S),after factor analysing a scale forced to one factor, the item with the highest loading and the itemwith the lowest loading are grouped in the first parcel, the item with the second highest loadingand the item with the second lowest loading are grouped in the second parcel, and this continuesuntil all items are exhausted.
In the present study, four factor extraction methods were compared both with the 16PF-5 itemsand parcels constructed with three different procedures: (a) Scree Test (Cattell, 1966); (b) Parallelanalysis (Horn, 1965); (c) Eigenvalue One (Guttman, 1954; Kaiser, 1961), (d) Maximum Likeli-hood test (J€oreskog, 1977). In regard to the grouping of items into composites, three and fourparcels for each 16PF-5 factor were formed with the correlational (R), empirically equivalent (E)and single factor (S) procedures. These parcelling methods, together with the RAND method,were considered as yielding better fitting models over CONT and EFA methods, furthermore,Landis et al. (2000) argued that the success of the RAND method could be due to the uni-dimensionality of the items in that specific study, thus, it was also discarded in the present work.Subsequently, principal components analyses were performed for both the items and the obtainedparcels. The main objective of the study was twofold. Firstly, it was intended to ascertain which

A. Aluja, A. Blanch / Personality and Individual Differences 37 (2004) 667–677 669
extraction procedure is better adjusted to the personality structure proposed by Cattell. Andsecondly, to replicate the primary 16-factor structure through both items and parcel structures.
2. Method
2.1. Subjects
Participants were 636 undergraduate students in the subject of psychology of personality, aswell as some of their friends and relatives, who anonymously completed the 16PF-5 among otherpersonality questionnaires. Specifically, information was obtained from 288 males and 347females plus one case that did not report the gender, with a mean age of 25.09 year old (SD: 9.20)in a range of 17–83 years.
2.2. Procedure
The Spanish form of the 16PF-5 was used in this study (Russell & Karol, 1995), which wasadapted from Cattell, Cattell, and Cattell (1993) and Russell and Karol (1994). This adaptationincludes the same 185 items as the original, although the item wording, scoring and order ofpresentation of the items has been slightly modified. Internal consistency reliabilities for the 16factors range between 0.54 and 0.84, which are equivalent to those reported by Aluja and Blanch(2002, 2003) and Conn and Rieke (1994). In the comparison of factor extraction methods,principal components analysis with oblique rotation and maximum-likelihood common factoranalysis, are used for both, the Eigenvalue One rule and for the Maximum Likelihood test,respectively.
Three and four parcels were constructed for each factor of the 16PF-5 according to the cor-relational (R), empirically equivalent (E) and single factor (S) procedures. For the correlationalmethod (R), bivariate correlations among the items of a single scale were computed first. Then,the pair of items with the highest correlation were grouped into the first parcel, the two next itemswith the second highest correlation were included into the second parcel, and so forth. We con-tinued with this procedure until all items were exhausted. If there were an odd number of items,the extra item was placed in the next parcel to the one the last pair of items were placed. For theempirically equivalent method (E), first the means, variances and item-total correlations werecomputed and grouped in accordance with its equivalence between the items of a single factor.Secondly, parcels were constructed by placing the first item into one parcel, the second item intoanother different parcel, and so forth. This was repeated until all items were assigned to theparcels. If there were an odd number of items, the extra item was placed into the next parcel to theone that the last item was placed. Finally and for the single factor method (S), principal com-ponents analyses of each single 16PF-5 scale forced to one factor were performed. Subsequently,the two items with the highest and lowest loadings were placed into the first parcel, the two itemswith the next highest and lowest loadings were placed into the second parcel, and so forth. Theprocedure was repeated until all items were assigned to a parcel. If there were an odd number ofitems, the extra item was placed into the next parcel to the one that the last pair of items wereplaced.

670 A. Aluja, A. Blanch / Personality and Individual Differences 37 (2004) 667–677
3. Results
3.1. Factor extraction methods analysis
A scree-plot for the items of the 16PF-5 is shown in Fig. 1. As can be seen, 16 factors are thebest choice as proposed by Cattell. Visual inspection of the three parcelling methods with threeand four parcels, showed the following number of factors to be extracted (Table 1): 16 and 14 forthe correlational (R), 15 and 16 for the empirically equivalent (E) and 14 and 16 for the singlefactor method (S). Parallel analysis results in accordance with the procedure implemented byHorn (1965) and O�Connor (2000), and considering the 95 percentile as comparison baseline arealso shown in Table 1. As can be seen, 15 and 16 factors are to be extracted for the 16PF-5, while 8or 9 factors is the choice in the case of the parcelling methods. Table 1 shows the obtainedprincipal components Eigenvalues for the 16PF-5 items and for the item parcels with the threeprocedures. For the 16PF-5 items, it is observed that 56 factors should be extracted according tothis criterion. Nevertheless, and for the three and four item parcels, a reduced number of factorsbetween 11 and 16 would suffice. The four parcels for the three parcelling procedures indicate thata 16-factor solution is perfectly obtained, while the three parcels yield 11 factors for the corre-lational parcelling method, and 12 for the empirically equivalent and single factor parcellingmethods. Results obtained with the Maximum Likelihood test are shown at the bottom part ofTable 1. For the 16PF-5 items, the v2 value is not significant at the 47 factor, suggesting this as thenumber of factors to be extracted. For the three and four parcels in the three item parcellingprocedures, the number of factors to be extracted falls in between 20 and 24. In both cases, therecommended factors are far from the 16-factor structure proposed by Cattell.
3.2. Item principal components analysis forced to 16 factors
In the original and Spanish versions of the 16PF-5, principal components analysis with a directoblimin oblique rotation was used for the factor extraction, thus it is also the method of choice inthe present work with the aim of obtaining a more adequate comparison of results (Conn &
1661511361211069176614631161
1211109
8765
43210
Fig. 1. Scree-plot for the items of the 16PF-5.

Table 1
Number of factors to be extracted in accordance with four extraction methods for 16PF-5 items and parcels (ST: Scree Test; PA: Parallel Analysis; EG: Eigenvalue P 1; ML:
Maximum Likelihood)
16PF-5 R3 R4 E3 E4 S3 S4
ST 16 16 14 15 16 14 16
PA 15 8 8 8 8 8 9
EG Eig. %r2 Eig. %r2 Eig. %r2 Eig. %r2 Eig. %r2 Eig. %r2 Eig. %r2
1 10.306 5.95 5.83 12.1 6.68 10.4 5.98 12.4 6.90 10.79 6.10 12.7 6.91 10.8
2 8.782 11.03 4.80 22.1 5.40 18.8 4.83 22.5 5.48 19.36 4.96 23.0 5.52 19.4
3 5.794 14.38 3.25 28.9 3.77 24.7 3.35 29.5 3.91 25.46 3.33 29.9 3.87 25.4
4 4.594 17.03 2.63 34.4 2.88 29.2 2.55 34.8 2.86 29.93 2.51 35.2 2.94 30.0
5 4.007 19.35 2.10 38.8 2.53 33.2 2.13 39.2 2.50 33.84 2.13 39.6 2.42 33.8
6 3.486 21.37 1.87 42.7 2.19 36.6 1.78 42.9 2.18 37.24 1.86 43.5 2.14 37.2
7 3.075 23.14 1.52 45.8 1.81 39.4 1.51 46.1 1.76 39.98 1.58 46.8 1.83 40.0
8 2.891 24.81 1.38 48.7 1.73 42.1 1.46 49.1 1.73 42.69 1.45 49.8 1.71 42.7
9 2.415 26.21 1.21 51.3 1.43 44.4 1.24 51.7 1.42 44.91 1.24 52.4 1.50 45.0
10 2.336 27.56 1.09 53.5 1.32 46.4 1.11 54.0 1.38 47.06 1.09 54.6 1.36 47.2
11 2.230 28.85 1.06 55.8 1.23 48.3 1.09 56.3 1.30 49.08 1.05 56.8 1.30 49.2
12 2.103 30.06 1.18 50.2 1.04 58.5 1.19 50.95 1.00 58.9 1.24 51.1
13 1.989 31.21 1.16 52.0 1.17 52.78 1.21 53.0
14 1.880 32.30 1.09 53.7 1.05 54.42 1.13 54.8
15 1.871 33.38 1.04 55.3 1.02 56.01 1.03 56.4
16 1.820 34.43 1.02 56.9 1.01 57.60 1.01 58.0
– – –
56 1.019 64.96
ML 16PF-5 p < 3 p < 4 p < 3 p < 4 p < 3 p < 4 p <
1 30988.6 0.001 7046.1 0.001 9559.9 0.001 7241.8 0.001 9648.4 0.001 7355.1 0.001 9672.3 0.001
2 27156.7 0.001 5055.1 0.001 7343.9 0.001 5265.7 0.001 7370.2 0.001 5301.6 0.001 7349.7 0.001
3 24951.9 0.001 3926.7 0.001 5959.5 0.001 4078.2 0.001 5895.9 0.001 4102.5 0.001 5930.5 0.001
– – – – – – – – – – – – – – –
14 16244.7 0.001 808.9 0.001 1785.6 0.001 797.1 0.001 1643.1 0.001 750.6 0.001 1677.6 0.001
15 15880.9 0.001 717.8 0.001 1646.4 0.001 698.6 0.001 1530.9 0.001 671.8 0.001 1536.5 0.001
16 15520.5 0.001 638.6 0.001 1506.7 0.001 623.5 0.001 1432.9 0.001 604.3 0.001 1418.6 0.001
17 15170.8 0.001 565.9 0.001 1397.7 0.001 557.1 0.001 1339.6 0.001 536.1 0.001 1300.8 0.001
18 14818.5 0.001 487.3 0.010 1294.8 0.001 486.4 0.010 1243.4 0.001 476.3 0.020 1202.7 0.001
19 14502.7 0.001 438.4 0.030 1199.3 0.001 431.9 0.050 1153.1 0.001 423.6 0.090 1108.8 0.001
20 14186.7 0.001 399.5 0.060 1109.4 0.001 384.3 0.160 1069.3 0.001 373.9 0.270 1027.3 0.010
21 13888.9 0.001 346.8 0.250 1023.9 0.001 1002.4a 0.001 948.8 0.050
22 13593.7 0.001 944.4 0.001 873.9 0.190
23 13303.3 0.001 877.5 0.020
24 13014.3 0.001 790.2 0.190
– – –
47 7960.1 0.140
R: Correlational; E: Empirically Equivalent; S: Single Factor.
Eig.: Eigenvalue; %r2, Percentage of accumulated variance.aWhen attempting to extract 22 factors, no local minimum was found, terminating the extraction and not allowing for the analysis of this set.
A.Aluja,A.Blanch
/Perso
nality
andIndivid
ualDifferen
ces37(2004)667–677
671

Table 2
Details of an exploratory factor analysis forced to 16-factors with oblique rotation fixing d parameter to )2
Factors Percentage of
items loading in
corresponding factors
Cross-loadings
H Social Boldness 10/10 100 47 (N)
I Sensitivity 11/11 100 1, 161, 31 (A), 81(M)
Q3 Perfectionism 9/10 90 142 (M), 35 (C)
Q2 Self-Reliance 9/10 90 6, 37, 68, 100, 164 (F), 127, 129 (A)
L Vigilance 9/10 90 151 (Q1), 70 (F), 176 (B)
G Rule-Consciousness 9/11 82 4 (F), 55, 86 (Q1)
Q4 Tension 8/10 80 –
N Privateness 8/10 80 33, 96, 159 (A)
O Apprehension 7/10 70 2, 32 (C), 24 (Q1), 62 (Q4)
B Reasoning 10/15 67 –
C Emotional Stability 5/10 50 39, 103 (F), 46, 49 (M)
E Dominance 4/10 40 98 (A), 138 (I), 149 (O)
Q1 Openness to Change 5/14 36 67 (C), 12, 79, 111 (M), 54, 87, 150 (O), 157 (Q3)
M Abstractedness 3/11 27 20, 83 (O), 160 (C), 134 (F), 43 (L)
A Warmth 2/11 18 173, 174 (B), 5 (G), 52 (Q1), 123, 168 (Q2)
F Liveliness 0/10 0 172, 179 (B), 99, 102, 132 (C), 36, 38, 165 (E), 113,
114 (M), 126 (Q3)
672 A. Aluja, A. Blanch / Personality and Individual Differences 37 (2004) 667–677
Rieke, 1994; Russell & Karol, 1995). Table 2 shows information concerning a solution obtainedwith a principal components analysis with a direct oblimin oblique rotation of the 185 items of the16PF-5 excluding 12 items from the Impression Management Scale (IM) and requiring 16 factors.More specifically, the percentage of items that load on its theoretical factor, and furthermore, theitems that load on a different factor is presented. In this analysis, 350 iterations for factor rotationare specified with a d value of )2. This parameter controls for the obliquity of the factors in such away that solutions tend to be less oblique as becomes more negative (Barrett & Kline, 1982). Nocorresponding items load on the F factor given that all items that should theoretically load on F,load in fact on different factors (item 134 on M; item 70 on L; item 4 on G; items 39 and 103 on C;and finally, items 6, 37, 68, 100 and 164 on Q2). On the other hand, factors H and I include all theitems that theoretically load on these factors, while the remaining factors have a lower number ofitems loading on their corresponding factors. Clearly, the distribution of items of the 16 factorsdoes not fit with the structure proposed by the original authors, given that only 109 out of 173items (63%) load on their corresponding theoretical factors.
3.3. Item parcels principal components analysis forced to 16 factors
Three and four parcel groupings for each parcelling method have been factor analysed througha principal components analysis with a direct oblique rotation forcing the solution to 16 factors.In these analyses, a maximum number of 125 iterations for the rotation are specified as well as a dvalue of )2. Initially, this parameter was fixed to 0, where the obtained solution is most oblique,and it was progressively increased in values of 0.5. The aim of this procedure is to find the mostuniform factor structure that groups the parcels into their corresponding factor. Table 3 shows

Table 3
Principal components analysis with direct oblique rotation fixing d parameter to )2
R E S
Keyed
loadings
Non-
keyed
loadings
Factor
cross-
loadings
Keyed
loadings
Non-keyed
loadings
Factor
cross-
loadings
Keyed
loadings
Non-
keyed
loadings
Factor
cross-
loadings
H1 )0.82 – – )0.72 Q11 – 0.76 – –
H2 )0.70 – – )0.71 – – 0.77 E2 –
H3 )0.74 – – )0.64 – – 0.71 – –
I1 0.68 M1 – 0.68 Q11 – 0.71 – –
I2 0.77 M2 – 0.78 – – 0.72 – –
I3 0.63 – – 0.77 – – 0.77 – –
Q31 0.71 – – 0.72 – – 0.77 – –
Q32 0.74 – – 0.76 – – 0.71 – –
Q33 0.67 – – 0.79 – – 0.70 – –
E1 0.86 – – 0.75 – – 0.60 – –
E2 0.23 – F-16 0.72 – – 0.51 – –
E3 0.83 – – 0.27 – F-14 0.69 – –
M1 0.34 – – )0.37 C1,A1 F-5 0.60 – –
M2 0.29 – – )0.48 C2 – 0.56 – –
M3 )0.10 – F-5 )0.61 – – 0.74 – –
B1 0.70 – – 0.84 – – 0.73 – –
B2 0.29 – F-16 0.71 – – 0.59 – F-14
B3 0.81 – – 0.13 – F-11 0.78 – –
N1 0.33 – – 0.82 – – 0.54 – –
N2 0.80 – – 0.69 – – 0.66 – –
N3 0.77 – – 0.40 – – 0.80 – –
O1 )0.67 – – )0.81 – – 0.73 – –
O2 )0.64 – – )0.75 – – 0.71 – –
O3 )0.70 – – )0.42 – F-16 0.62 – –
L1 0.65 – – 0.70 – – 0.65 – –
L2 0.67 – – 0.77 – – 0.74 – –
L3 0.80 – – 0.67 – – 0.75 – –
Q21 0.70 – – 0.53 – F-16 0.68 – –
Q22 0.58 – – 0.45 – – 0.63 – –
Q23 0.50 – – 0.52 E3,C3 – 0.64 – –
G1 )0.78 – – )0.67 – – 0.71 – –
G2 )0.65 – – )0.68 – – 0.73 – –
G3 )0.63 – – )0.80 – – 0.73 – –
F1 )0.52 – – )0.44 – F-16 0.71 – –
F2 )0.74 – – )0.72 Q22 – 0.71 – –
F3 )0.66 Q23 – )0.71 – – 0.67 – –
A1 )0.50 – – 0.32 C1 – )0.61 – –
A2 )0.47 – – 0.12 M2,C2 F-16 )0.66 – –
A3 )0.78 – – 0.14 M3,N3,C3 F-16 )0.53 – –
C1 0.43 – – 0.35 M1 F-14 0.30 – –
C2 0.62 – – 0.31 M2,C2 – 0.58 – –
C3 0.71 – – 0.36 M3,N3,Q43 F-14 0.79 – –
Q11 0.64 – – 0.42 M1 F-4 0.50 – –
Q12 0.62 – – 0.45 – F-1, F-2 0.73 – –
(continued on next page)
A. Aluja, A. Blanch / Personality and Individual Differences 37 (2004) 667–677 673
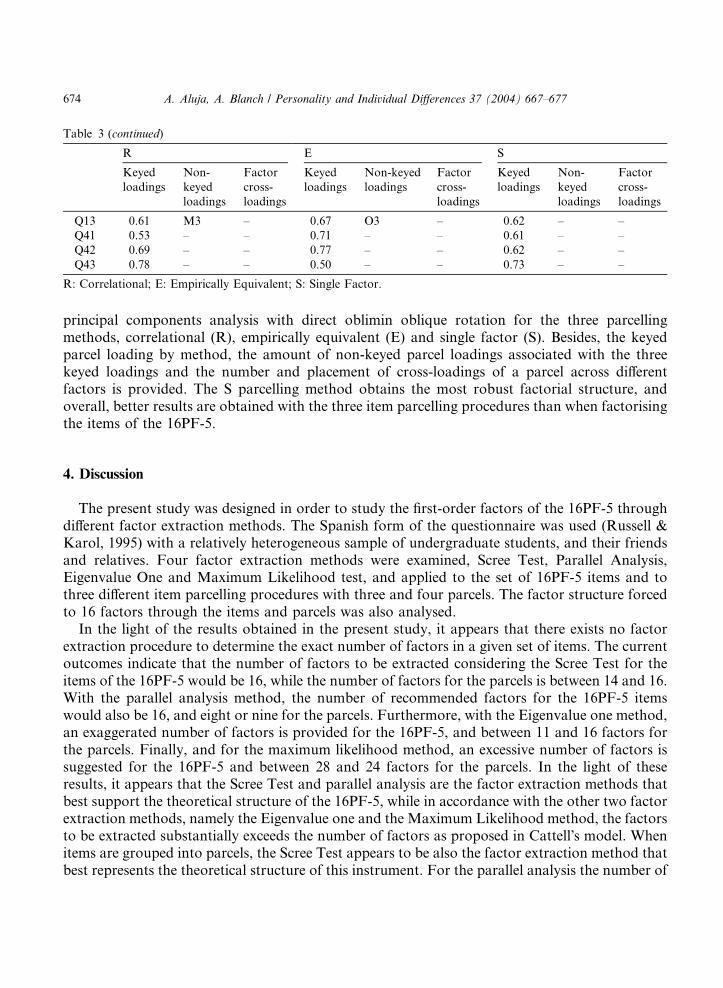
Table 3 (continued)
R E S
Keyed
loadings
Non-
keyed
loadings
Factor
cross-
loadings
Keyed
loadings
Non-keyed
loadings
Factor
cross-
loadings
Keyed
loadings
Non-
keyed
loadings
Factor
cross-
loadings
Q13 0.61 M3 – 0.67 O3 – 0.62 – –
Q41 0.53 – – 0.71 – – 0.61 – –
Q42 0.69 – – 0.77 – – 0.62 – –
Q43 0.78 – – 0.50 – – 0.73 – –
R: Correlational; E: Empirically Equivalent; S: Single Factor.
674 A. Aluja, A. Blanch / Personality and Individual Differences 37 (2004) 667–677
principal components analysis with direct oblimin oblique rotation for the three parcellingmethods, correlational (R), empirically equivalent (E) and single factor (S). Besides, the keyedparcel loading by method, the amount of non-keyed parcel loadings associated with the threekeyed loadings and the number and placement of cross-loadings of a parcel across differentfactors is provided. The S parcelling method obtains the most robust factorial structure, andoverall, better results are obtained with the three item parcelling procedures than when factorisingthe items of the 16PF-5.
4. Discussion
The present study was designed in order to study the first-order factors of the 16PF-5 throughdifferent factor extraction methods. The Spanish form of the questionnaire was used (Russell &Karol, 1995) with a relatively heterogeneous sample of undergraduate students, and their friendsand relatives. Four factor extraction methods were examined, Scree Test, Parallel Analysis,Eigenvalue One and Maximum Likelihood test, and applied to the set of 16PF-5 items and tothree different item parcelling procedures with three and four parcels. The factor structure forcedto 16 factors through the items and parcels was also analysed.
In the light of the results obtained in the present study, it appears that there exists no factorextraction procedure to determine the exact number of factors in a given set of items. The currentoutcomes indicate that the number of factors to be extracted considering the Scree Test for theitems of the 16PF-5 would be 16, while the number of factors for the parcels is between 14 and 16.With the parallel analysis method, the number of recommended factors for the 16PF-5 itemswould also be 16, and eight or nine for the parcels. Furthermore, with the Eigenvalue one method,an exaggerated number of factors is provided for the 16PF-5, and between 11 and 16 factors forthe parcels. Finally, and for the maximum likelihood method, an excessive number of factors issuggested for the 16PF-5 and between 28 and 24 factors for the parcels. In the light of theseresults, it appears that the Scree Test and parallel analysis are the factor extraction methods thatbest support the theoretical structure of the 16PF-5, while in accordance with the other two factorextraction methods, namely the Eigenvalue one and the Maximum Likelihood method, the factorsto be extracted substantially exceeds the number of factors as proposed in Cattell�s model. Whenitems are grouped into parcels, the Scree Test appears to be also the factor extraction method thatbest represents the theoretical structure of this instrument. For the parallel analysis the number of
A. Aluja, A. Blanch / Personality and Individual Differences 37 (2004) 667–677 675
factors is remarkably lower than 16. For the Eigenvalue one the theoretical structure of the 16PF-5 appears well represented only when variables made up of four parcels are considered, althoughthe number of factors is slightly lower for the three parcels. Finally, for the Maximum Likelihoodmethod, the number of suggested factors is higher than the theoretical structure of the 16PF-5.More specifically, when items are grouped in four parcels per factor, the Eigenvalue one methodsuggests 16 neat factors to be extracted in the three parcelling procedures. Item parcelling alsoreduces markedly the number of factors to be extracted by the Maximum Likelihood test.
When forcing the primary 16-factor structure through the items, it is observed that only 63%load on their respective theoretical factors. Several items load on another factor, suggesting thatin the 16PF-5 there is a remarkable information overlap among the factors. In this study, thesingle factor (S) item parcelling method has been shown to be the most efficient one, achieving acomplete correct classification of the corresponding parcels into their respective theoretical fac-tors, although the rotation obliquity is decreased varying d to )2 (Barrett & Kline, 1982), whichincreases factor consistency and artificially reduces the dispersion of items in different factors. Theaverage factor loadings obtained through item parcelling methods is much higher than theaverage factor loadings of the theoretical items for each factor; for example, the average factorloadings for the H factor is 0.65 while the average factor loadings for the three parcels in the singlefactor procedure is 0.88. For the principal components analysis of the single factor procedure (S),the three parcels in the H factor obtain a factor loading average of 0.75.
Although sound evidence has been presented for the support of oblique over orthogonalrotation methods in the study of personality (Fabrigar, Wegener, MacCallum, & Strahan, 1999),principal components analysis with oblique rotation methods works well basically when items areorthogonally distributed, that is to say, when yielding high loadings in their theoretical factorsand low loadings in the other factors. This is the case of the 48 item reduced form of the EysenckPersonality Questionnaire (Eysenck & Eysenck, 1997), in which a 4-factor solution yields 12 itemsin each of the corresponding factors, Neuroticism, Extraversion, Psychoticism and Lie (Aluja,Garc�ıa, & Garc�ıa, 2003; Ib�a~nez, 1996). Oblique and orthogonal solutions with the EPQ have beenshown to be equivalent and highly replicable in different languages and cultures (Barrett, Petrides,Eysenck, & Eysenck, 1998; Eysenck, Barrett, & Barnes, 1993; Hanin, Eysenck, Eysenck, &Barrett, 1991). The NEO-PI-R (Costa & McCrae, 1992) is another questionnaire that hasachieved a high replicability in different countries, precisely due to the use of 30 facets. Whenfactorising the 30 facets with an orthogonal rotation, a 5-factor structure emerges although it isnot possible to obtain a 30-factor structure from the 240 items (Aluja, Garc�ıa, Garc�ıa, & Seis-dedos, submitted for publication).
In the present study, different factor extraction methods do not yield uniform results for thedifferent 16PF-5 analysed structures. Specifically and through the Maximum Likelihood test,Cattell and Cattell (1995) obtained 16 factors while 47 were obtained in the present study. Cattell�sScree Test (1966) is probably more useful although it may be rather inaccurate in as much as theidea is to fix a clear cut-off. As a matter of fact, the aim of factor analysis is to confirm a theo-retical distribution of the items in the proposed dimensions, thus the factor extraction is forcedconsidering the theoretical structure; in the case of the EPQ and in regard to the Eigenvalue onefactor extraction method, for example, a number of factors between 10 and 15 should be ex-tracted, although the extraction is forced to four factors including the Lie Scale (Aluja et al.,submitted for publication). Similarly, the Sensitivity to Punishment and Sensitivity to Reward
676 A. Aluja, A. Blanch / Personality and Individual Differences 37 (2004) 667–677
Questionnaire (SPSRQ; Torrubia, �Avila, Molt�o, & Caseras, 2001) has two orthogonal 24-itemscales, although according to the Eigenvalue One method the number of factors to be extractedshould be much higher.
To sum up, the Scree Test seems to be the best factor extraction method in the present study inorder to represent the theoretical structure of the 16PF-5, nevertheless, the distribution of items inits respective theoretical factors appears to be unsatisfactory. The problem stems from the highcovariance and similar content of several items and consequently, in the similarity in the infor-mation provided by the primary factors. Item parcelling methods are useful to reduce the numberof observed variables concentrating the available information in structural equation modellingcontexts (Landis et al., 2000), although in the case of the 16PF-5 it is paradoxical to find that100% of the parcels fall in the theoretical factor with the single factor (S) item parcelling method,while only 63% of the items load on their theoretical factors. It appears that parcels would forcethe cohesion and stability of the items in a factor. In our opinion, the replicability of the 16PF-5structure should be shown from the items of the questionnaire and not from the item parcels,although these seem to be useful in order to obtain representative theoretical factors.
References
Aluja, A., & Blanch, A. (2002). An�alisis descriptivo y comparativo del 16PF-5 en muestras americanas y espa~nolas[Descriptive and comparative analysis of 16PF-5 in American and Spanish samples]. Bolet�ın de Psicolog�ıa, 74, 27–38.
Aluja, A., & Blanch, A. (2003). Replicabilidad de los factores de segundo orden del 16PF-5 en muestras americanas y
espa~nolas. [Replicability of 16PF-5 second-order factors in American and Spanish samples]. Psicothema, 15, 309–
314.
Aluja, A., Garc�ıa, O., & Garc�ıa, L. F. (2003). A psychometric analysis of the revised Eysenck Personality Questionnaire
short scale. Personality and Individual Differences, 35, 449–460.
Aluja, A., Garc�ıa, O., Garc�ıa, L. F. & Seisdedos, N. (submitted for publication). Invariance of the NEO-PI-R factor
structure across exploratory and confirmatory factor analyses.
Barrett, P. T., & Kline, P. (1981). Radial parcel factor analysis. Personality and Individual Differences, 2, 311–318.
Barrett, P. T., & Kline, P. (1982). An item and radial parcel factor analysis of the 16 PF Questionnaire. Personality and
Individual Differences, 3, 259–270.
Barrett, P. T., Petrides, K. V., Eysenck, S. B. G., & Eysenck, H. J. (1998). The Eysenck Personality Questionnaire: An
examination of the factorial similarity of P, E, N, and L across 34 countries. Personality and Individual Differences,
25, 805–819.
Cattell, R. B. (1945). The description of personality: Principles and findings in a factor analysis. American Journal of
Psychology, 58, 69–90.
Cattell, R. B. (1956). Validation and intensification of the sixteen personality factor questionnaire. Journal of Clinical
Psychology, 12, 204–214.
Cattell, R. B. (1966). The Scree test for number of factors. Multivariate Behavioral Research, 1, 140–161.
Cattell, R. B., & Cattell, H. E. P. (1995). Personality structure and the new fifth edition of the 16PF. Educational and
Psychological Measurement, 6, 926–937.
Cattell, R. B., Cattell, A. K., & Cattell, H. E. P. (1993). Sixteen Personality Factor Questionnaire (fifth ed.). Champaign,
IL: Institute for Personality and Ability Testing, Inc.
Cattell, R. B., Eber, H. W., & Tatsuoka, M. M. (1970). Handbook for the 16PF. Champaign, IL: Institute for
Personality and Ability Testing.
Conn, S. R., & Rieke, M. L. (1994). The 16PF Fifth Edition technical manual. Champaign, IL: Institute for Personality
and Ability Testing, Inc.
Costa, P. T., & McCrae, R. R. (1992). Revised NEO Personality Inventory (NEO-PI-R) and NEO Five-Factor Inventory
(NEO-FFI) professional manual. Odessa, FL: Psychological Assessment Resources.

A. Aluja, A. Blanch / Personality and Individual Differences 37 (2004) 667–677 677
Everett, J. E. (1983). Factor comparability as a means of determining the number of factors and their rotation.
Multivariate Behavioral Research, 18, 197–218.
Eysenck, H. J. (1986). Can personality study ever be scientific? Journal of Social Behavior and Personality, 1, 3–19.
Eysenck, S. B. G., Barrett, P., & Barnes, G. E. (1993). A cross-cultural study of personality: Canada and England.
Personality and Individual Differences, 14, 1–9.
Eysenck, H. J., & Eysenck, S. B. G. (1997). Cuestionario de Personalidad de Eysenck revisado (EPQ-R) y escala
abreviada (EPQ-RS). [Eysenck Personality Questionnaire-Revised (EPQ-R) and short scale (EPQ-RS)]. Madrid:
TEA Ediciones, S.A.
Fabrigar, L. R., Wegener, D. T., MacCallum, R. C., & Strahan, E. J. (1999). Evaluating the use of exploratory factor
analysis in psychological research. Psychological Methods, 4, 272–299.
Guilford, J. P. (1975). Factors and factors of personality. Psychological Bulletin, 82, 802–814.
Guttman, L. (1954). Some necessary conditions for common factor analysis. Psychometrica, 18, 149–162.
Hakstian, A. R., Rogers, W. T., & Cattell, R. B. (1982). The behavior of numbers-of-factors rules with simulated data.
Multivariate Behavioral Research, 17, 193–219.
Hanin, Y., Eysenck, S. B. G., Eysenck, H. J., & Barrett, P. (1991). A cross-cultural study of personality: Russia and
England. Personality and Individual Differences, 12, 265–271.
Horn, J. L. (1965). A rationale and test for the number of factors in factor analysis. Psychometrika, 30, 179–185.
Howarth, E., & Browne, J. A. (1971). An item factor analysis of the 16 PF. Personality, 2, 117–139.
Ib�a~nez, M. I. (1996). Adaptaci�on al castellano del cuestionario revisado de personalidad de Eysenck: versi�on extensa
(EPQ-R) y abreviada (EPQ-RS). Tesis de Licenciatura. Castell�o de la Plana: Universitat Jaume I., Unpublished
manuscript.
J€oreskog, K. G. (1977). Factor analysis by least-squares and maximum likelihood methods. In K. Enslein, A. Ralston,
& H. S. Wilf (Eds.), Statistical methods for digital computers. New York: Wiley.
Kaiser, H. F. (1961). A note on Guttman�s lower bound for the number of common factors. British Journal of Statistical
Psychology, 14, 1–2.
Landis, R. S., Beal, D. J., & Tesluk, P. E. (2000). A comparison of approaches to forming composite measures in
structural equation models. Organizational Research Methods, 3, 186–207.
O�Connor, B. P. (2000). SPSS and SAS programs for determining the number of components using parallel analysis and
Velicer�s MAP test. Behavior Research Methods, Instruments & Computers, 32, 396–402.
Russell, M. & Karol, D. (1994). 16PF Fifth Edition. Administrator manual (2nd ed.) Institute for Personality and Ability
Testing, Inc.
Russell, M. & Karol, D. (1995). 16PF-5. Manual. Publicaciones de Psicolog�ıa Aplicada. Serie menor no. 228. Madrid:
TEA Ediciones, S.A.
Torrubia, R., �Avila, C., Molt�o, & Caseras, X. (2001). The sensitivity to punishment and sensitivity to reward
questionnaire (SPSRQ) as a measure of Gray�s anxiety and impulsivity dimensions. Personality and Individual
Differences, 31, 837–862.
Velicer, W. F. (1976). Determining the number of components from the matrix of partial correlations. Psychometrika,
41, 321–327.