Renal biopsy collagen I mRNA predicts scarring in rabbit antiGBM disease: Comparison with...
16
Kidney International, Vol. 52 (1997), pp. 1000 —1015 Renal biopsy collagen I mRNA predicts scarring in rabbit anti-GBM disease: Comparison with conventional measures SG-Koo LEE, MEERA GOYAL, Mwio DE MIGUEL, PEEDIKAYIL THOMAS, BRYAN WHARRAM, ROBERT DYSKO, SEM PHAN, PAUL D. KILLEN, and ROGER C. WIGGINs Departments of Internal Medicine, Pathology, and Unit for Laboratoiy Animal Medicine, University of Michigan Medical School, Ann Arbor, Michigan, USA Renal biopsy collagen I mRNA predicts scarring in rabbit anti-GBM disease: Comparison with conventional measures. Progressive loss of normal structure associated with scarring is the hallmark of chronic diseases of most organs. To test the hypothesis that measurement of interstitial collagen mRNA levels would he a useful index to predict future scarring, we developed an assay to quantitate ai(I) procollagen mRNA factored for GAPDH mRNA using RT-PCR (the "CI:G ratio"). We first defined conditions under which the assay could he used for analysis of renal biopsy samples. The Ci:G ratio was then used to determine whether mRNA measurements performed at an early stage of inflammation (day 7) in a model of anti-GBM disease in the rabbit would predict outcome at day 30 as measured by interstitial and glomerular scarring and renal cortical hydroxyproline accumulation. The predictive value of this assay was compared to functional (serum creatinine and urine protein:creati- nine ratio) and histologic (glomerular and interstitial scoring) parameters also measured at day 7. We found that the CI:G ratio alone provided a sensitive and discriminating assay over a wide range of renal injury that predicted various parameters of scarring with an average coefficient of determination (r2) of 0.69. This predictive power was higher than that found for conventional measures, which tended to have good discrimina- tory capacity over limited ranges of renal injury. The CI:G ratio provided significant additional predictive power over and above that available from combinations of conventional functional or histologic parameters. We conclude that measurement of the CI:G ratio in biopsy samples deserves further assessment as a potentially useful quantitative predictor of Out- come that could lead to improved clinical decision-making. Interstitial fibrosis is the most powerful predictor of progression to end-stage renal disease (ESRD) regardless of the etiology of renal injury [1—4]. Progression to ESRD requiring dialysis or transplantation is expensive (costing approximately $50,000US per patient per year) as well, as carrying high morbidity and mortality (50% three year mortality in the U.S.) [5]. Therapeutic options are available for preventing progression of fibrosis. How- ever, current approaches carry side effects and complications that make their use unwarranted unless the physician can be confident that the risk of treatment is justified by a greater risk of progres- sion to ESRD. Methodologies currently available to the physician Key words: scarring, collagen 1:GAPDH ratio, injury, anti-GBM disease, progression to ESRD, fibrosis. Received for publication March 6, 1997 and in revised form June 5, 1997 Accepted for publication June 5, 1997 © 1997 by the International Society of Nephrology have rather weak prognostic capability. Functional measurements currently in use are insensitive and nonspecific [6—91. To improve prognostic power, histologic scoring systems have been estab- lished that include measures of the extent of old and established injury (chronicity index) as well as the severity of current injury (activity index) [10]. However, these systems are complex to use and observer-dependent. If we are to make progress in preventing renal failure, we must develop better means of identi'ing and monitoring those individuals at risk for progression. Since the fibrotic process is the principle indicator of irrevers- ible progression, we have mapped the fibrotic response to glomer- ular inflammation in a model of interstitial and glomerular fibrosis induced by anti-GBM antibody in the rabbit [11—17]. Collagen I mRNA was found to be increased by day 4 after injection of anti-GBM antibody [121, and this early increase in collagen I mRNA was localized to the interstitial (extraglomerular perivas- cular) compartment by in situ hybridization [12, 13]. Collagen I mRNA levels peaked by day 7 and had returned to towards baseline by day 30. Activated fibroblasts were observed in the interstitial compartment and apparently migrating through holes in Bowman's capsule as they moved into the glomerulus to contribute to the formation of the fibrous crescent [13]. The major mediator driving collagen synthesis was identified as TGFI3 [14]. The major chemotactic factor for fibroblasts was identified as fibronectin fragments [15]. Fibronectin rapidly accumulates in glomeruli from plasma during inflammation where it is rapidly degraded [16]. Fibronection is also synthesized in glomeruli during crescent formation [17]. The fibrotic response to inflam- mation in this model has thus been carefully characterized and can be used to develop and test novel approaches to predicting progression. In designing an assay system that would allow prediction of fibrosis we focused on the interstitial collagens for several reasons. First, there is substantial evidence linking poor prognosis with interstitial matrix accumulation in the kidney, even in those conditions thought to be of primarily non-interstitial (such as glomerular or vascular) origin [1—41. Second, our previous studies in the rabbit had showed that the normal level of mRNA for type I collagens in renal cortex were low [12, 13]. For example, it appeared to be lower than that of the al(IV) basement membrane collagen level [12]. We therefore anticipated that small changes in levels of collagen mRNA would be easily detected above a low basal level. Third, we have shown that changes in interstitial 1000
-
Upload
independent -
Category
Documents
-
view
1 -
download
0
Transcript of Renal biopsy collagen I mRNA predicts scarring in rabbit antiGBM disease: Comparison with...
Kidney International, Vol. 52 (1997), pp. 1000 —1015
Renal biopsy collagen I mRNA predicts scarring in rabbitanti-GBM disease: Comparison with conventional measures
SG-Koo LEE, MEERA GOYAL, Mwio DE MIGUEL, PEEDIKAYIL THOMAS, BRYAN WHARRAM,ROBERT DYSKO, SEM PHAN, PAUL D. KILLEN, and ROGER C. WIGGINs
Departments of Internal Medicine, Pathology, and Unit for Laboratoiy Animal Medicine, University of Michigan Medical School,Ann Arbor, Michigan, USA
Renal biopsy collagen I mRNA predicts scarring in rabbit anti-GBMdisease: Comparison with conventional measures. Progressive loss ofnormal structure associated with scarring is the hallmark of chronicdiseases of most organs. To test the hypothesis that measurement ofinterstitial collagen mRNA levels would he a useful index to predict futurescarring, we developed an assay to quantitate ai(I) procollagen mRNAfactored for GAPDH mRNA using RT-PCR (the "CI:G ratio"). We firstdefined conditions under which the assay could he used for analysis ofrenal biopsy samples. The Ci:G ratio was then used to determine whethermRNA measurements performed at an early stage of inflammation (day7) in a model of anti-GBM disease in the rabbit would predict outcome atday 30 as measured by interstitial and glomerular scarring and renalcortical hydroxyproline accumulation. The predictive value of this assaywas compared to functional (serum creatinine and urine protein:creati-nine ratio) and histologic (glomerular and interstitial scoring) parametersalso measured at day 7. We found that the CI:G ratio alone provided asensitive and discriminating assay over a wide range of renal injury thatpredicted various parameters of scarring with an average coefficient ofdetermination (r2) of 0.69. This predictive power was higher than thatfound for conventional measures, which tended to have good discrimina-tory capacity over limited ranges of renal injury. The CI:G ratio providedsignificant additional predictive power over and above that available fromcombinations of conventional functional or histologic parameters. Weconclude that measurement of the CI:G ratio in biopsy samples deservesfurther assessment as a potentially useful quantitative predictor of Out-come that could lead to improved clinical decision-making.
Interstitial fibrosis is the most powerful predictor of progressionto end-stage renal disease (ESRD) regardless of the etiology ofrenal injury [1—4]. Progression to ESRD requiring dialysis ortransplantation is expensive (costing approximately $50,000USper patient per year) as well, as carrying high morbidity andmortality (50% three year mortality in the U.S.) [5]. Therapeuticoptions are available for preventing progression of fibrosis. How-ever, current approaches carry side effects and complications thatmake their use unwarranted unless the physician can be confidentthat the risk of treatment is justified by a greater risk of progres-sion to ESRD. Methodologies currently available to the physician
Key words: scarring, collagen 1:GAPDH ratio, injury, anti-GBM disease,progression to ESRD, fibrosis.
Received for publication March 6, 1997and in revised form June 5, 1997Accepted for publication June 5, 1997
© 1997 by the International Society of Nephrology
have rather weak prognostic capability. Functional measurementscurrently in use are insensitive and nonspecific [6—91. To improveprognostic power, histologic scoring systems have been estab-lished that include measures of the extent of old and establishedinjury (chronicity index) as well as the severity of current injury(activity index) [10]. However, these systems are complex to useand observer-dependent. If we are to make progress in preventingrenal failure, we must develop better means of identi'ing andmonitoring those individuals at risk for progression.
Since the fibrotic process is the principle indicator of irrevers-ible progression, we have mapped the fibrotic response to glomer-ular inflammation in a model of interstitial and glomerular fibrosisinduced by anti-GBM antibody in the rabbit [11—17]. Collagen ImRNA was found to be increased by day 4 after injection ofanti-GBM antibody [121, and this early increase in collagen ImRNA was localized to the interstitial (extraglomerular perivas-cular) compartment by in situ hybridization [12, 13]. Collagen ImRNA levels peaked by day 7 and had returned to towardsbaseline by day 30. Activated fibroblasts were observed in theinterstitial compartment and apparently migrating through holesin Bowman's capsule as they moved into the glomerulus tocontribute to the formation of the fibrous crescent [13]. The majormediator driving collagen synthesis was identified as TGFI3 [14].The major chemotactic factor for fibroblasts was identified asfibronectin fragments [15]. Fibronectin rapidly accumulates inglomeruli from plasma during inflammation where it is rapidlydegraded [16]. Fibronection is also synthesized in glomeruliduring crescent formation [17]. The fibrotic response to inflam-mation in this model has thus been carefully characterized andcan be used to develop and test novel approaches to predictingprogression.
In designing an assay system that would allow prediction offibrosis we focused on the interstitial collagens for several reasons.First, there is substantial evidence linking poor prognosis withinterstitial matrix accumulation in the kidney, even in thoseconditions thought to be of primarily non-interstitial (such asglomerular or vascular) origin [1—41. Second, our previous studiesin the rabbit had showed that the normal level of mRNA for typeI collagens in renal cortex were low [12, 13]. For example, itappeared to be lower than that of the al(IV) basement membranecollagen level [12]. We therefore anticipated that small changes inlevels of collagen mRNA would be easily detected above a lowbasal level. Third, we have shown that changes in interstitial
1000
Lee et at: CI:G ratio predicts renal fibrosis 1001
collagen mRNA occurs early in inflammatory renal disease [12,13]. Fourth, we found that ai(I) mRNA levels in renal cortexincreased markedly (at least 18-fold) in the model [12], suggestingthat large changes in collagen I mRNA could be expected in renaldiseases. We thus expected to be able to measure large increasesin collagen I mRNA in disease states against a low basal level.
Quantitative RT-PCR approaches to matrix synthesis havepreviously been used to measure mRNA levels in renal corticaltissues [18—21], and the suggestion has been made that thisapproach could be clinically useful [22]. We sought to design,build and validate a quantitative RT-PCR assay using PCRprimers that would amplify human collagen I cDNAs as well ascollagen I cDNAs from animals commonly used in experimentalsystems (rabbit, rat and mouse). This would allow cross-validationstudies between experimental animals and humans. We thenwanted to test the potential usefulness of the assay with theconcept that to be clinically worthwhile the assay would need toprovide quantitative information not already available to theclinician through conventional clinical measures of function orstructure.
METHODS
cDNA library screening, cloning and sequencing
An oligo(dT)- and random-primed cDNA library in A-Zap(Stratagene, La Jolla, CA, USA) prepared from seven-day rabbitrenal cortex was screened as previously described [23] with ahuman al(I) eDNA (I-1f677; the generous gift of Francis Ramirez[24—26]). In brief, 400,000 recombinant phage plated and repli-cate filter lifts were prepared. DNA was denatured and fixed invacuo at 80°C prior to hybridization. Filters were prehybridized in0.9 M NaCI, 0.09 M sodium citrate, pH 7.0, 0.5% SDS, 0.1% ficoll,0.1% polyvinylpyrrolidine, 0.1% BSA at 65°C for two hours beforethe addition of labeled denatured cDNA probe at I X 106dpm/ml. After 16 hours, the filters were washed three times at65°C with 0.3 M NaCl, 30 m sodium citrate, pH 7.0, 0.5% SDSand twice at 37°C in 15 mivi NaC1, 1.5 m sodium citrate, pH 7.0,0.5% SDS before autoradiographs were prepared. Nine recombi-nant phages were plaque purified and the cDNA inserts weresubcloned into the EcoRI site of pBluescript. One of these, 23SK-2a, was approximately 3 kb in length. A 0,67 kb XhoI-EcoRIfragment from this clone was sequenced in its entirety on bothstrands using synthetic oligonucleotide primers.
RNA isolation
Kidneys were sliced in the coronal plane and tissue correspond-ing to the renal capsule, cortex with the renal capsule, cortexwithout capsule, outer medulla or inner medulla were dissected,weighed and snap frozen in guanidine isothiocyanate (10 ml/g ofwet tissue weight). Needle biopsy samples were prepared fromrenal cortex using a Biopty gun (20, 18 and 16 gauge) and 1 to 2mm long samples were placed in guanidinc isothiocyanatc solu-tion and snap frozcn. Samples were thawed at 0°C and dispersedby homogenization or sonication, and total RNA was extractedusing a commercially available modification of the acid-phenolmethod (RNAz0I; Tel-Test, Inc., Fricndswood, TX, USA) [27].
Northern hybridizationDenatured total RNA from various renal tissue samples were
resolved on 2.2 M formaldehyde, 1% agarose gels and transferred
by capillary blotting to Zetabind filters (CUNO, Meriden, CT,USA). Filters were stained with methylene blue, to check theintegrity, uniformity of loading and transfer of RNA, prior tofixation in vacuo at 80°C for two hours. Filters were prehybridizedat 65°C in 0.5 M NaH2PO4, pH 7.0, 1 mM EDTA, 7% SDS, and 1%BSA for 4 to 6 hours before adding denatured probe (2 x 10⁶dpm/ml). After 18 hours, filters were washed two times with 40mM NaH2PO pH 7.0, 1 mvt EDTA and 7% SDS at 65°C, and fourtimes with 40 ms't NaH2PO4, pH 7.0, 1 m'vi EDTA, and 1% SDSat 65°C, before exposure to preflashed film (X-Omat AR; East-man-Kodak, Rochester, NY, USA) at —80°C. Purified cDNAinserts encoding rabbit al(I), a2(I) [13] and human glyceralde-hyde-3-phosphate dehydrogenase (GAPDH) [28, 29] were labeledwith [a32P]dCTP (3000 Ci/mM; Amersham, Arlington Heights, IL,USA) to a specific activity of i0 dpm4tg using random primers[30], and separated from unincorporated nucleotides by gelfiltration.
Synthetic oligonucleotide synthesisAll synthetic oligonucleotides were synthesized by the DNA
Synthesis Core Facility, a part of the University of Michigan'sBiomedical Research Core Facilities, on automated DNA synthe-sizers (Applied Biosystems, Inc., Foster City, CA, USA) employ-ing f3-cyanoethyl phosphoramidite chemistry on controlled poreglass support. The oligonucleotides used were as follows:
al(I) sense 5'GATGTGCCACTCTGACTGG3';a 1(1) anti-sense 5 'ACATCGATGATGGGCAGGC3';a2(I) sense 5'GCATTGCATAATGGATGAGG3';a2(I) anti-sense S 'GCACAATGCTCTGATCAATCC3';GAPDH sense 5 'TCACCATCTTCCAGGAGCG3';GAPDH anti-sense 5 'CTGCTV['CACCACCTFCTITGA3'.
Mutant template constructionDeletion mutants for rabbit al(I), a2(l) and human GAPDH
were prepared by recombinant PCR using two complementaryprimers [31]. The mutant PCR product was subcloned in pBlue-script KSM13 (Stratagene) and verified by nucleotide sequenc-ing as described above.
Complementary DNA synthesis
Oligo(dT) (0.5 tg; Boehringer-Mannheim, Indianapolis, IN,USA) was annealed to total RNA (20 jg from large samples, allof the RNA recovered in the case of biopsy samples) afterdenaturation at 70°C and eDNA was synthesized at 42°C for onehour using 100 U of Superscript (BRL, Gaithersburg, MD, USA),in a final volume of 20 .tl of the vendor's buffer supplemented with20 U RNAsin (Prornega Biotech, Madison, Wi, USA). cDNA wasprecipitated and dissolved in 1 msi EDTA, 10 m'vi Tris, pH 7.4.
Qua ntitation of eDNA by polymerase chain reaction (PCR)
The approaches used were as previously described [31—36].Serial log dilutions of each eDNA were prepared and analyzed todetermine the dilution within the linear range of each mutanttemplate. PCR reactions were optimized as to pH and Mg2concentration for each primer pair. Each 25 jil reaction wasperformed in a 500 1.d tube containing 15 mrvi (NH4)2S04, 60 mMTris-HCI, pH 8.5 to 9.5, 2.0 to 2.5 mi MgCl2, 0.25 mM dNTP, 6.25M of each primer, 0.625 U AmpliTaq (Perkin-Elmer Cetus,Norwalk, CT, USA) containing 0.5 jiCi [a32P]dCTP (3000 Ci/mM;Amersham, Arlington Heights, IL, USA), an appropriate dilution
1002 Lee et al: CJ:G ratio predicts renal fibrosis
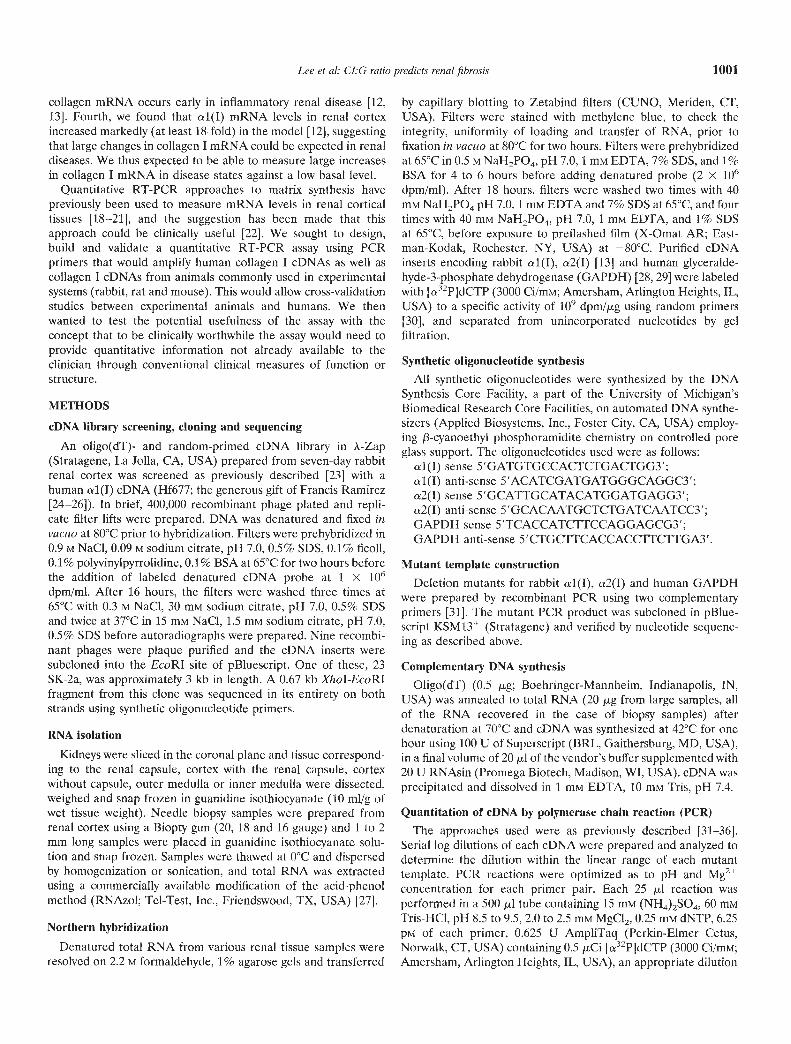
Table 1. Effect of sample size and severity of injury on the values obtained for the CI:G ratio in the model of rabbit anti-GBM disease
Sample size Severity Individual values Mean SEM CV %
0.2 mg ControlMild/Mod.ModerateSevere
0.067, 0.058, 0.092, 0.0970.95, 1.34, 7.34, 4.820.93, 6.95, 3.44, 6.616.26, 5.49, 4.12, 5.62, 2.38
0.078 0.0103.62 1.524.43 1.474.78 0.69
24.383.966.232.5
2.0 mg Mild 1.88, 1.48, 1.86, 1.60, 1.82, 2.19, 1.97 1.83 0.23 12.7
of wild type eDNA and 125, 250, 500, 1,000, 2,000 or 3,000 copiesof mutant template. The optimum Mg concentrations and pHs foreach primer pair were as follows: al(I), 2.0 mrvi Mg2, pH 9.5;a2(I), 2.5 mM Mg2, pH 8.5; or GAPDH, 2.0 mM Mg2, p1-1 9.0.After an initial denaturation at 94°C for 3.5 minutes, reactionswere amplified in a thermal cycler (Coy Laboratory Products, AnnArbor, MI, USA) with cycles of 94°C for 3.5 minutes, 54°C for 1.5minutes and 72°C for 1.5 minutes. After 30 cycles, a finalextension at 72°C for eight minutes was performed. Amplificationof csl(I), cr2(I) and GAPDH was performed in parallel for eachsample. In every experiment, H20 and reverse transcriptioncontrols for contamination were performed.
Quantitation of wild type and mutant cDNAs
An aliquot of each reaction was resolved by electrophoresis in5% polyacrylamide gels in TBE buffer. Gels were dried on filterpapers and 32P activity corresponding to the mutant and targeteDNA band was quantitated on a Model GS-250 MolecularImaging System, (Bio-Rad, Hercules, CA, USA). 32P activity inthe mutant band was normalized by size and plotted against thecopies of DNA added. Linear regression analysis of the log plotswas performed using a minimum of 5 points to construct astandard curve. The amount of target cDNA in a test sample wasdetermined by the intersection with the standard curve. To correctfor variations in RNA recovery and reverse transcription effi-ciency, the amount of al(I) and a2(I) eDNA was normalizedagainst the amount of GAPDH eDNA derived from each sample.
Amplification of eDNA derived from other species
In order to determine whether the selected primers describedabove would successfully and efficiently amplify cDNA frommurine, rat and human tissues, 20 .tg total RNA isolated fromwhole mouse kidneys, whole rat kidneys or human kidney cortexwere reverse transcribed as described above. Serial log dilutionswere prepared and aliquots amplified as described above.
Experimental model of anti-GBM disease in the rabbit
Crescentic nephritis was induced in rabbits as previously de-scribed [12, 131. New Zealand White rabbits (2.0 to 2.5 kg) wereinjected subcutaneously with 200 j.rg guinea pig IgG in completeFreund's adjuvant and five days later they were given a singleintravenous injection of guinea pig anti-rabbit glomerular base-ment membrane (anti-GBM) IgG. To obtain a range of injuryrabbits received an intravenous injection of guinea pig anti-glomerular basement membrane (anti-GBM) IgG (35 to 55 mg inI ml of saline). All times were noted as the number of daysfollowing injection of anti-GBM antibody. For experiments to testthe CI:G methodology, rabbits were euthanized with sodiumpentobarbital at day 7 and the kidneys removed for analysis at thattime. For the studies designed to test the predictive capacity of the
C1:G ratio rabbits were biopsied at day 7 and euthanized withsodium pentobarbital at day 30. Rabbits were kept in individualcages and were given water and regular rabbit chow ad libitum.For biopsy rabbits were anesthetized with ketamine (Ketaset®;Fort Dodge Laboratories Inc., Fort Dodge, JO, USA) and xyla-zine (Rompun®; Miles Inc., Shawnee Mission, KS, USA). After aflank incision, the left kidney was exposed. Renal cortical tissuewas obtained by a polar resection of approximately 30 mg of tissuefrom under the renal capsule. Following biopsy the wound wassutured and animals returned to their cages where they recoveredunder observation. Thus, biopsy samples for the prediction exper-iments contained renal cortex and did not contain renal capsule.
A total of 36 rabbits were used for the prediction experiments.Two separate experiments were performed and the data weremeasured separately and then combined for analysis. Eight rabbits(four in each experiment) were not injected and were used ascontrols. Eight rabbits died from presumed acute renal failure andwere not included in the analysis. Twenty experimental rabbitssurvived the 30 day period of follow-up and were used for theanalysis together with the eight control animals.
For RNA preparation from biopsies, cortical tissue, weighingapproximately 5 to 6 mg, was transferred to guanidinium thiocy-anate buffer (RNAzol B; Tel-Test, Inc., Friendswood, TX,USA), frozen in liquid nitrogen immediately and stored at —80°Cuntil processing. Tissue was placed in 10% neutral bufferedformalin for light microscopic analysis.
Histopathologic analysis
All histologic analysis was done by an individual blinded to thetreatment of animals. There were two Day 7 histologic scoringsystems.
(i) Glomerulus score. A light microscopic scoring system usingMasson-trichrome-stained sections was performed as previouslydescribed [11, 371. The extent of progression towards fibrocellularcrescent formation was scored from 20 consecutive glomeruli onthe renal biopsy obtained at day 7. Scoring was as follows: +0glomeruli within the normal range; + I intraglomerular tuft cellaccumulation scored according to the degree of cellular accumu-lation within the tuft; +2, proteinaceous material in Bowman'sspace scored according to the amount of accumulation; +3,cellular crescents in Bowman's space scored according to thenumber of cells and the size of the cellular crescent; +4, fibro-cellular crescents scored according to the degree of matrixaccumulation within the crescent and the glomerulus; and +5,global glomerulosclerosis.
(ii) Interstitial score. Interstitial inflammatory changes weregraded 0 to 3 [normal (0), mild (1), moderate (2), severe (3)] byevaluating five separate low power fields (bOX) of the biopsy andtaking the mean of these five scores.

Lee et a!: CI:G ratio predicts renal fibrosis 1003
A
2416 CTCGAGGTGGACACCACCCTCAAGAGCCTGAGCCAGCAGATTGAGAACATCCGGAGCCCA11111111 I lilt I 11111111111111 I lull till I lit liii lilt 111111
1 CTCGAGGTGGACACCACCCTCAAGAGCCTGAGCCAGCAGATTGAGAACATCAAGAGCCCC1 L E V D T T L K S L SQ Q I EN 1K S P
2476 GAGGGCNCCCGCAAGAACCCCGCCCGCACCTGCCGTGACCTCAAGATGTGCCACTCTGACiii I I I 111111111111111111111(11111 III I I I I I III ItillIIliii
61 GAGGGCAGCCGCAAGAACCCCGCCCGCACCTGCCGGGACCTCAAGATGTGCCACTCTGAC21 £ G S R K N P A R ¶1' C R D L K M C H S D2536 AAGAGTGGAGAGTACTGGATTGACCCCAACCAAGGCTGCAACCTGGATGCCATCAAA
11111 II 11111111111111111111111 III 111111 11111 liii 11111 III I121 TGGAAGAGCGGAGAGTACTGGATTGACCCCAACCAAGGCTGCAACCTGGATGCCATCAAG41 W K S G H Y W I D P N Q G C N L D A I K
2596 GTCTTCTGCAACATGGAGACTGGTGAGACCTGCGTGTACCCCACTCAGCCCAGTGTGGCClillIlili 1111111 111111 lilliElitItlIlill 11111111 1111
181 GTCTTCTGCGACATGGACACTGGGGCAACCTGCGTGTACCCCACACAGCCCAGCATTGCC61 V F C D M D T G A T C V Y P T Q P S I A2656 CAGAAGAACTGGTACATCAGCAAGAACCCCAAGGACAAGAGGCATGTCTGGTTCGGCGAG
iiIIIiiiIIIiItiiiItIIIIIiIIiIIllItI lilt lii It IiIiiIliiiIi241 CAGAAGAACTGGTACATCAGCAAGAACCCCAAGGAGAAGAAGCACGTGTGGTTCGGCGAG81 Q K N W Y I S K N P K H K K H V W F G E
2716 AGCATGACCGATGGATTCCAGTTCGAGTATGGCGGCCAGGGCTCCGACCCTGCCGATGTGiiuiIIlIIlliIi litlitilItilil Iii liltItlilillit 11111 III
301 AGCATGACCGATGGCTTCCAGTTCGAGTACGGCAGCGAAGGCTCCGACCCCGCCGACGTG101 S M T D G F Q F H Y G S £ G S D P A D V
2776 GCCATCCAGCTGACCTTCCTGCGCCTGATGTCCACCGAGGCCTCCCAGAACATCACCTACIllititli iii I I 11111111111 11111 I 11111111111 III 111111 $111111
361 GCCATCCAGCTGACGTTCCTGCGCCTCATGTCCACCGAGGCCTCCCAGAACATCACCTAC121 A I Q L T F L R L H S T £ A S Q N I T Y
2836 CACPGCAAGAACAGCGTGGCCTACATGGACCAGCAGACTGGCAACCTCAAGAAGGCCCTGItIlililIlililIll ilititlItlilli 11111 iltIlIlittilIli 11111
421 CACTGCAAGAACAGCGTAGCCTACATGGACCAACAGACCGGCAACCTCAAGAAGTCCCTG141 H C K N S V A Y H D Q Q T G N L K K S L2896 CTCCTCNAGGGCTCCAACGAGATCGAGATCCGCGCCGAGGGCAACAGCCGCTTCACCTAClliiliilillItiiIttllIIIlIllittIIliiltIItlIItliiiItiIIii
481 CTCCTCCAGGGCTCCAACGAGATCGAGCTGCGGGGCGAGGGCAACAGCCGCTTCACCTAC161 L L Q G S N £ I H L R G E G N S R F T Y2956 AGCGTCACTGTCGATGGCTGCACGAGTCACACCGGAGCCTGGGGCAAGACAGTGATTGAA
I lii illtIIIIlIIttItIllIIIIlllillIIitIllilltiIIlI541 ACTGTCCTCCACGACGGCTGCACGAGTCACACCGGAACCTGGGGCAAGACCGTGATCGAG181 T V L H D G C T S H P G P W G K P V I E
3016 TACAAAACCACCAAGTCCTCCCCCTGCCCATCAPCGATGTGGCCCCCTTGGACGTTGGT11111 111111111 IIIIIIIIIIIIIIIIIIII1IIII tIItiitIIIIl 1111
601 TACAAGACCACCAAGACCTCCCGCCTGCCCATCAPCGATGTCGCCCCCTTGGACATTGGC201 Y K P T K P S R L P I I D V A P L D I G
3076 GCCCCAGACCAGGAATTC 3093111111111 liii lilt,
661 GCCCCAGACCAGGAMTC 678221 A P D Q H F 226
Fig. 1. (A). Rabbit al(I) procollagen nucleotide sequence. The human al(I) procollagen cDNA sequence numbered as in Bernard [19, 20], GenbankAccession #KM 228 (upper) is aligned with the rabbit al(I) procollagen eDNA sequence (lower) and the deduced rabbit ai(I) C-propeptide sequence.The sequence of the primers were chosen to be identical in rabbit, human, rat and mouse(arrows).
I1004 Lee et al: CI:G ratio predicts renal fibrosis
al(l)
Mouse
—2 —3 —4 —2 —3 —4 —2 —3 —4
Log dilution
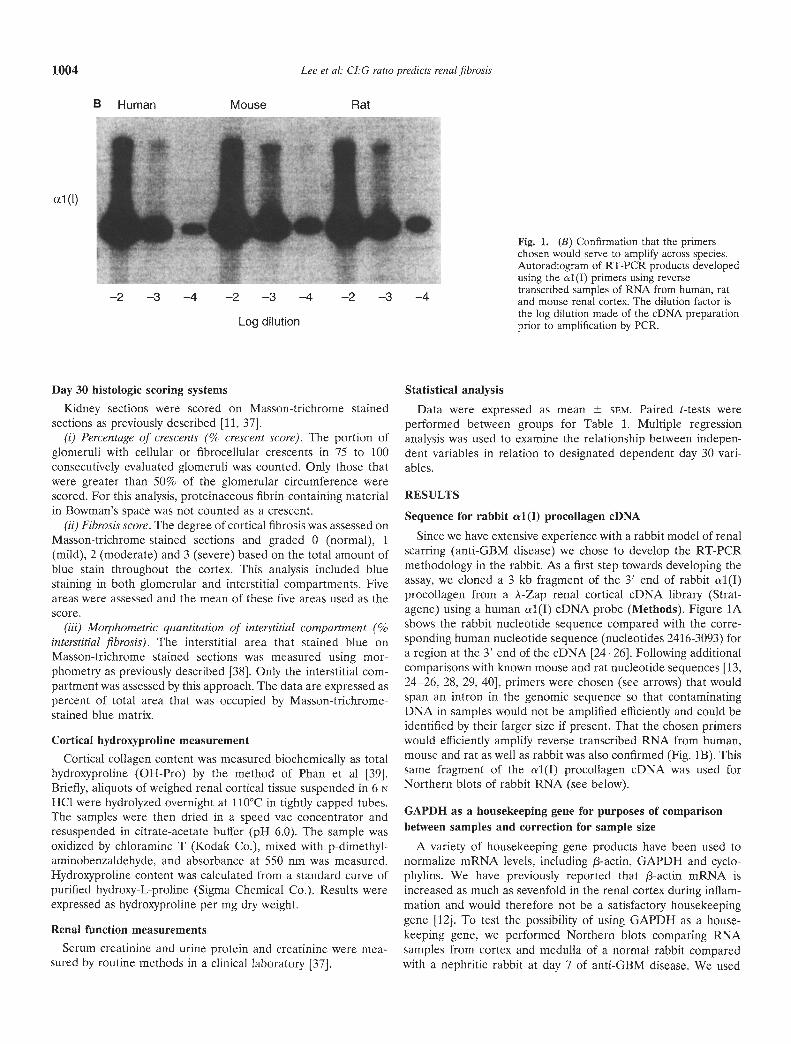
Fig. 1. (B) Confirmation that the primerschosen would serve to amplify across species.Autoradiogram of RT-PCR products developedusing the al(I) primers using reversetranscribed samples of RNA from human, ratand mouse renal cortex. The dilution factor isthe log dilution made of the eDNA preparationprior to amplification by PCR.
Day 30 histologic scoring systemsKidney sections were scored on Masson-trichrome stained
sections as previously described [11, 37].(i) Percentage of crescents (% crescent score). The portion of
glomeruli with cellular or fibrocellular crescents in 75 to 100consecutively evaluated glomeruli was counted. Only those thatwere greater than 50% of the glomerular circumference werescored. For this analysis, proteinaceous fibrin-containing materialin Bowman's space was not counted as a crescent.
(ii) Fibrosis score. The degree of cortical fibrosis was assessed onMasson-trichrome-stained sections and graded 0 (normal), 1(mild), 2 (moderate) and 3 (severe) based on the total amount ofblue stain throughout the cortex. This analysis included bluestaining in both glomerular and interstitial compartments. Fiveareas were assessed and the mean of these five areas used as thescore.
(iii) Morphometric quantitation of interstitial compartment (%interstitial fibrosis). The interstitial area that stained blue onMasson-trichrome stained sections was measured using mor-phometry as previously described [38]. Only the interstitial com-partment was assessed by this approach. The data are expressed aspercent of total area that was occupied by Masson-trichrome-stained blue matrix.
Cortical hydroxyproline measurement
Cortical collagen content was measured biochemically as totalhydroxyproline (OH-Pro) by the method of Phan et al [39].Briefly, aliquots of weighed renal cortical tissue suspended in 6 NHCI were hydrolyzed overnight at 110°C in tightly capped tubes.The samples were then dried in a speed vac concentrator andresuspended in citrate-acetate buffer (pH 6.0). The sample wasoxidized by chloramine T (Kodak Co.), mixed with p-dimethyl-aminobenzaldehyde, and absorbance at 550 nm was measured.Hydroxyproline content was calculated from a standard curve ofpurified hydroxy-L-proline (Sigma Chemical Co.). Results wereexpressed as hydroxyproline per mg dry weight.
Renal function measurements
Serum creatinine and urine protein and ereatinine were mea-sured by routine methods in a clinical laboratory [37].
Statistical analysisData were expressed as mean SEM. Paired t-tests were
performed between groups for Table 1. Multiple regressionanalysis was used to examine the relationship between indepen-dent variables in relation to designated dependent day 30 vari-ables.
RESULTS
Sequence for rabbit al(I) procollagen cDNA
Since we have extensive experience with a rabbit model of renalscarring (anti-GBM disease) we chose to develop the RT-PCRmethodology in the rabbit. As a first step towards developing theassay, we cloned a 3 kb fragment of the 3' end of rabbit al(I)procollagen from a A-Zap renal cortical eDNA library (Strat-agene) using a human al(I) eDNA probe (Methods). Figure 1Ashows the rabbit nucleotide sequence compared with the corre-sponding human nucleotide sequence (nucleotides 2416-3093) fora region at the 3' end of the eDNA [24—26]. Following additionalcomparisons with known mouse and rat nucleotide sequences [13,24—26, 28, 29, 40], primers were chosen (see arrows) that wouldspan an intron in the genomic sequence so that contaminatingDNA in samples would not be amplified efficiently and could beidentified by their larger size if present. That the chosen primerswould efficiently amplify reverse transcribed RNA from human,mouse and rat as well as rabbit was also confirmed (Fig. 1B). Thissame fragment of the al(I) procollagen eDNA was used forNorthern blots of rabbit RNA (see below).
GAPDH as a housekeeping gene for purposes of comparisonbetween samples and correction for sample size
A variety of housekeeping gene products have been used tonormalize mRNA levels, including f3-actin, GAPDH and cyclo-phylins. We have previously reported that -actin mRNA isincreased as much as sevenfold in the renal cortex during inflam-mation and would therefore not be a satisfactory housekeepinggene [12]. To test the possibility of using GAPDH as a house-keeping gene, we performed Northern blots comparing RNAsamples from cortex and medulla of a normal rabbit comparedwith a nephritic rabbit at day 7 of anti-GBM disease. We used
B Human Rat
al(l)
Day 0
Lee et al: CI:G ratio predicts renal fibrosis 1005
Day 7
--- 28S
-4- 18S
GAPDH
RNA /igCompartment
10 10 10 10 10 10 10 10
C C OM IM C C OM IM
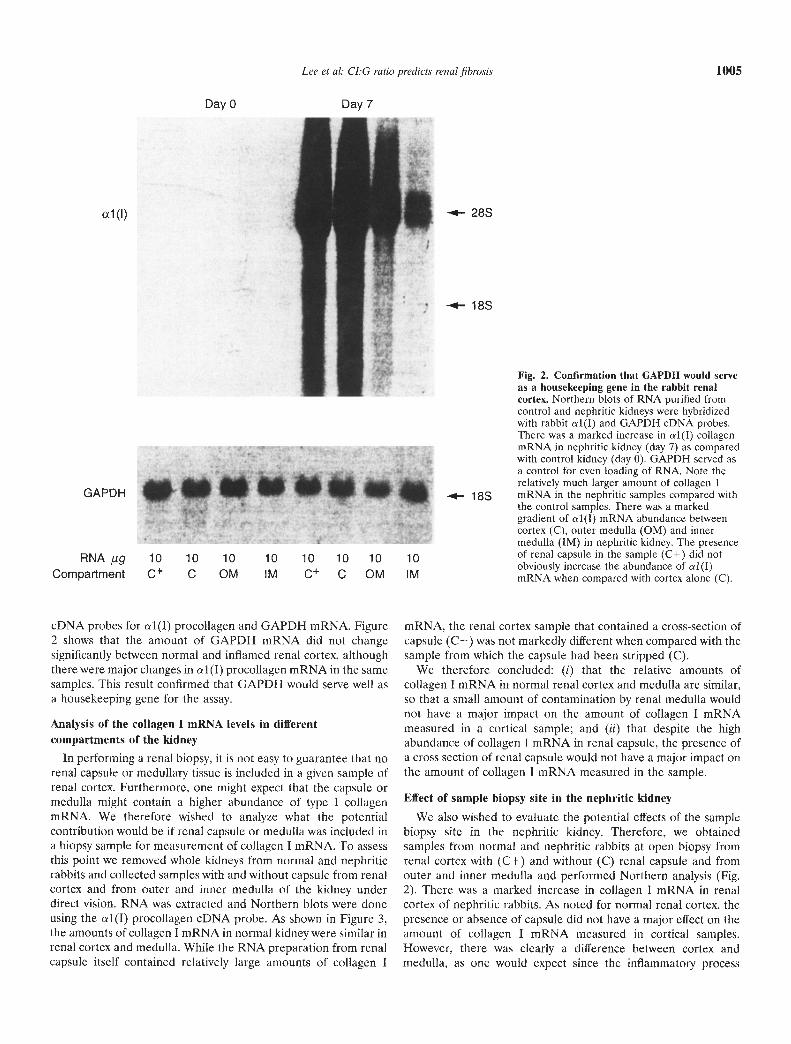
Fig. 2. Confirmation that GAPDH would serveas a housekeeping gene in the rabbit renalcortex. Northern blots of RNA purified fromcontrol and nephritic kidneys were hybridizedwith rabbit al(l) and GAPDH eDNA probes.There was a marked increase in al(I) collagenmRNA in nephritic kidney (day 7) as comparedwith control kidney (day 0). GAPDH served asa control for even loading of RNA. Note therelatively much larger amount of collagen I
—— 1 8S mRNA in the nephritic samples compared withthe control samples. There was a markedgradient of al(l) mRNA abundance betweencortex (C), outer medulla (OM) and innermedulla (IM) in nephritic kidney. The presenceof renal capsule in the sample (C+) did notobviously increase the abundance of al(I)mRNA when compared with cortex alone (C).
cDNA probes for al(1) procollagen and GAPDH mRNA. Figure2 shows that the amount of GAPDH mRNA did not changesignificantly between normal and inflamed renal cortex, althoughthere were major changes in al (I) procollagen mRNA in the samesamples. This result confirmed that GAPDH would serve well asa housekeeping gene for the assay.
Analysis of the collagen I mRNA levels in differentcompartments of the kidney
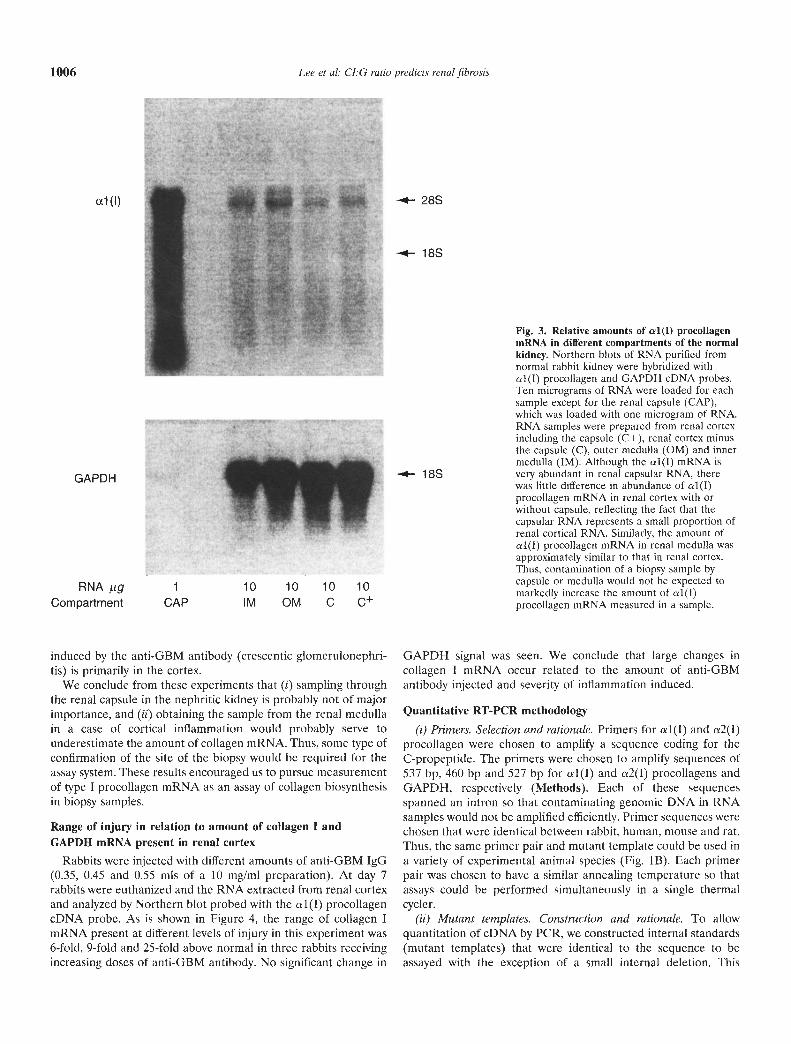
In performing a renal biopsy, it is not easy to guarantee that norenal capsule or medullary tissue is included in a given sample ofrenal cortex. Furthermore, one might expect that the capsule ormedulla might contain a higher abundance of type I collagenmRNA. We therefore wished to analyze what the potentialcontribution would be if renal capsule or medulla was included ina biopsy sample for measurement of collagen I mRNA. To assessthis point we removed whole kidneys from normal and nephriticrabbits and collected samples with and without capsule from renalcortex and from outer and inner medulla of the kidney underdirect vision. RNA was extracted and Northern blots were doneusing the 1 (I) procollagen eDNA probe. As shown in Figure 3,the amounts of collagen I mRNA in normal kidney were similar inrenal cortex and medulla. While the RNA preparation from renalcapsule itself contained relatively large amounts of collagen I
mRNA, the renal cortex sample that contained a cross-section ofcapsule (C+) was not markedly different when compared with thesample from which the capsule had been stripped (C).
We therefore concluded: (i) that the relative amounts ofcollagen I mRNA in normal renal cortex and medulla are similar,so that a small amount of contamination by renal medulla wouldnot have a major impact on the amount of collagen I mRNAmeasured in a cortical sample; and (ii) that despite the highabundance of collagen I mRNA in renal capsule, the presence ofa cross section of renal capsule would not have a major impact onthe amount of collagen I mRNA measured in the sample.
Effect of sample biopsy site in the nephritic kidney
We also wished to evaluate the potential effects of the samplebiopsy site in the nephritic kidney. Therefore, we obtainedsamples from normal and nephritic rabbits at open biopsy fromrenal cortex with (C+) and without (C) renal capsule and fromouter and inner medulla and performed Northern analysis (Fig.2). There was a marked increase in collagen I mRNA in renalcortex of nephritic rabbits. As noted for normal renal cortex, thepresence or absence of' capsule did not have a major effect on theamount of collagen I mRNA measured in cortical samples.However, there was clearly a difference between cortex andmedulla, as one would expect since the inflammatory process
-
AIX
$$ 4j4 4<-
10
1006 Lee et al: I:G ratio predicts renal fibrosis
ctl(l) -*- 28S
-*- 18S
GAPDH
RNA tgCompartment CAP
10 10 10 10IM OM C C
-*-- 18S
Fig. 3. Relative amounts of al(I) procollagenmRNA in different compartments of the normalkidney. Northern blots of RNA purified fromnormal rabbit kidney were hybridized withol(T) procollagen and GAPDH cDNA probes.Ten micrograms of RNA were loaded for eachsample except for the renal capsule (CAP),which was loaded with one microgram of RNA.RNA samples were prepared from renal cortexincluding the capsule (C+), rcnal cortex minusthe capsule (C), outer medulla (OM) and innermedulla (TM). Although the al(I) mRNA isvery abundant in renal capsular RNA, therewas little difference in abundance of al(T)procollagen mRNA in renal Cortex with orwithout capsule, reflecting the fact that thecapsular RNA represents a small proportion ofrenal cortical RNA. Similarly, the amount ofal(1) procollagen mRNA in renal medulla wasapproximately similar to that in renal cortex.Thus, contamination of a biopsy sample bycapsule or medulla would not be expected tomarkedly increase the amount of al(I)procollagen mRNA measured in a sample.
induced by the anti-GBM antibody (crescentic glomerulonephri-tis) is primarily in the cortex.
We conclude from these experiments that (i) sampling throughthe renal capsule in the nephritic kidney is probably not of majorimportance, and (ii) obtaining the sample from the renal medullain a case of cortical inflammation would probably serve tounderestimate the amount of collagen mRNA. Thus, some type ofconfirmation of the site of the biopsy would he required for theassay system. These results encouraged us to pursue measurementof type I procollagen mRNA as an assay of collagen biosynthesisin biopsy samples.
Range of injury in relation to amount of collagen I andGAPDH mRNA present in renal cortex
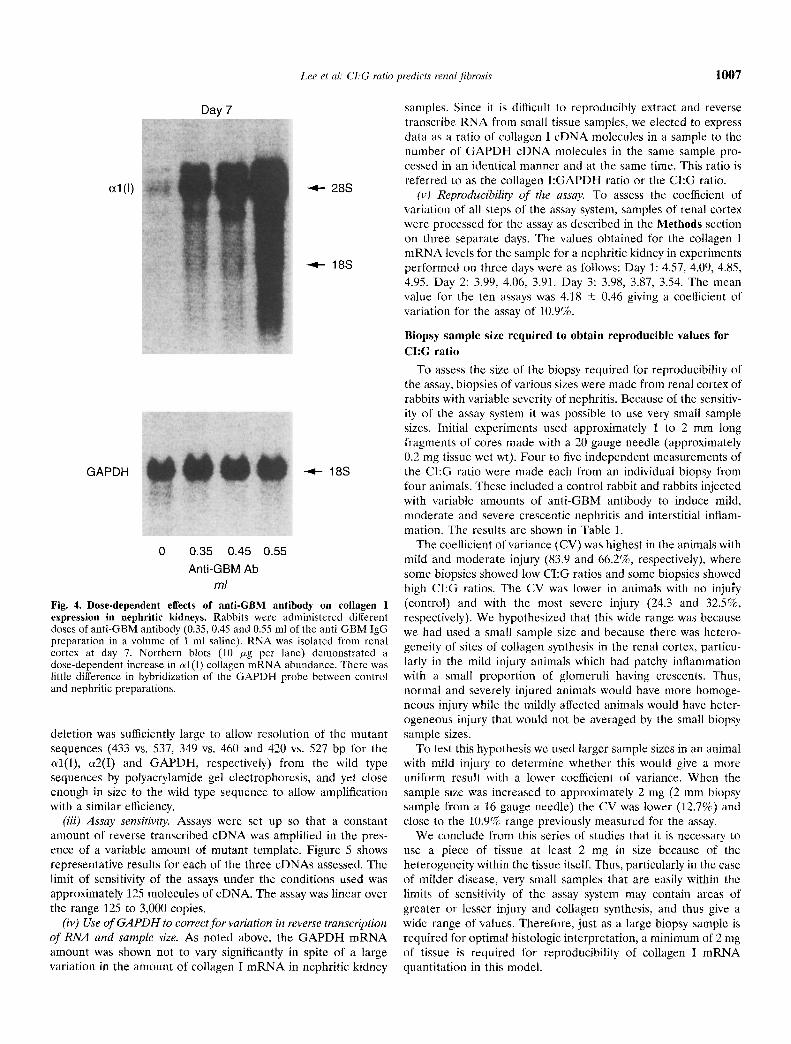
Rabbits were injected with different amounts of anti-GBM IgG(0.35, 0.45 and 0.55 mIs of a 10 mg/ml preparation). At day 7rabbits were euthanized and the RNA extracted from renal cortexand analyzed by Northern blot probed with the al(l) procollageneDNA probe. As is shown in Figure 4, the range of collagen ImRNA present at different levels of injury in this experiment was6-fold, 9-fold and 25-fold above normal in three rabbits receivingincreasing doses of anti-GBM antibody. No significant change in
GAPDH signal was seen. We conclude that large changes incollagen I mRNA occur related to the amount of anti-GBMantibody injected and severity of inflammation induced.
Quantitative RT-PCR methodology(i) Primers. Selection and rationale. Primers for al(I) and cs2(I)
procollagen were chosen to amplifi a sequence coding for theC-propeptide. The primers were chosen to amplii sequences of537 hp, 460 bp and 527 bp for al(I) and a2(I) procollagens andGAPDH, respectively (Methods). Each of these sequencesspanned an intron so that contaminating genomic DNA in RNAsamples would not be amplified efficiently. Primer sequences werechosen that were identical between rabbit, human, mouse and rat.Thus, the same primer pair and mutant template could be used ina variety of experimental animal species (Fig. 1B). Each primerpair was chosen to have a similar annealing temperature so thatassays could be performed simultaneously in a single thermalcycler.
(ii) Mutant templates. Construction and rationale. To allowquantitation of eDNA by PCR, we constructed internal standards(mutant templates) that were identical to the sequence to beassayed with the exception of a small internal deletion. This
Lee et a!: CLG ratio predicts renal fibrosis 1007
al(I)
GAPDH
Day 7
0 0.35 0.45 0.55Anti-GBM Ab
ml
-4-- 28S
—4-- 18S
-4.. 18S
Fig. 4. Dose-dependent effects of anti-GBM antibody on collagen Iexpression in nephritic kidneys. Rabbits were administered differentdoses of anti-GBM antibody (0.35, 0.45 and 0.55 ml of the anti-GBM IgGpreparation in a volume of 1 ml saline). RNA was isolated from renalcortex at day 7. Northern blots (10 jig per lane) demonstrated adose-dependent increase in ul (I) collagen mRNA abundance. There waslittle difference in hybridization of the GAPDH probe between controland nephritic preparations.
deletion was sufficiently large to allow resolution of the mutantsequences (433 vs. 537, 349 vs. 460 and 420 vs .527 bp for theal(l), cx2(I) and GAPDH, respectively) from the wild typesequences by polyacrylamide gel electrophorcsis, and yet closeenough in size to the wild type sequence to allow amplificationwith a similar efficiency.
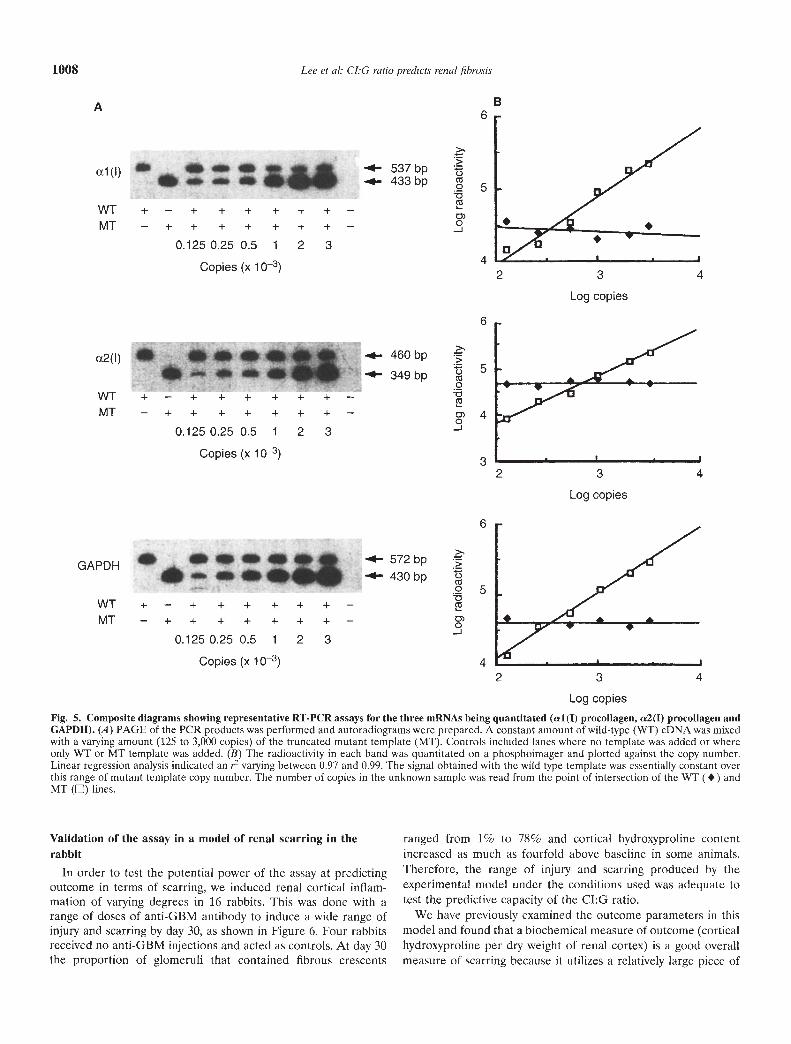
(iii) Assay sensitivity. Assays were set up so that a constantamount of reverse transcribed eDNA was amplified in the pres-ence of a variable amount of oiutant template. Figure 5 showsrepresentative results for each of the three cDNAs assessed. Thelimit of sensitivity of the assays under the conditions used wasapproximately 125 molecules of eDNA. The assay was linear overthe range 125 to 3,000 copies.
(iv) Use of GAPDFI to correct for variation in reverse transcriptionof RNA and sample size. As noted above, the GAPDH mRNAamount was shown not to vary significantly in spite of a largevariation in the amouot of collagen I mRNA in nephritic kidney
samples. Since it is difficult to reproducibly extract and reversetranscribe RNA from small tissue samples, we elected to expressdata as a ratio of collagen I eDNA molecules in a sample to thenumber of GAPDH eDNA molecules in the same sample pro-cessed in an identical manner and at the same time. This ratio isreferred to as the collagen I:GAPDH ratio or the CI:G ratio.
(v) Reproducibility of the assay. To assess the coefficient ofvariation of all steps of the assay system, samples of renal cortexwere processed for the assay as described in the Methods sectionon three separate days. The values obtained for the collagen ImRNA levels for the sample for a nephritic kidney in experimentsperformed on three days were as follows: Day 1: 4.57, 4.09, 4.85,4.95. Day 2: 3.99, 4.06, 3.91. Day 3: 3.98, 3.87, 3.54. The meanvalue for the ten assays was 4.18 0.46 giving a coefficient ofvariation for the assay of 10.9%.
Biopsy sample size required to obtain reproducible values forCI:G ratio
To assess the size of the biopsy required for reproducibility ofthe assay, biopsies of various sizes were made from renal cortex ofrabbits with variable severity of nephritis. Because of the sensitiv-ity of the assay system it was possible to use very small samplesizes. Initial experiments used approximately 1 to 2 mm longfragments of cores made with a 20 gauge needle (approximately0.2 mg tissue wet wt). Four to five independent measurements ofthe C1:G ratio were made each from an individual biopsy fromfour animals. These included a control rabbit and rabbits injectedwith variable amounts of anti-GBM antibody to induce mild,moderate and severe crescentie nephritis and interstitial inflam-mation. The results are shown in Table 1.
The coefficient of variance (CV) was highest in the animals withmild and moderate injury (83.9 and 66.2%, respectively), wheresome biopsies showed low C1:G ratios and some biopsies showedhigh CJ:G ratios. The CV was lower in animals with no injury(control) and with the most severe injury (24.3 and 32.5%,respectively). We hypothesized that this wide range was becausewe had used a small sample size and because there was hetero-geneity of sites of collagen synthesis in the renal cortex, particu-larly in the mild injury animals which had patchy inflammationwith a small proportion of glomeruli having crescents. Thus,normal and severely injured animals would have more homoge-neous injury while the mildly affected animals would have heter-ogeneous injury that would not be averaged by the small biopsysample sizes.
To test this hypothesis we used larger sample sizes in an animalwith mild injury to determine whether this would give a moreuniform result with a lower coefficient of variance. When thesample size was increased to approximately 2 mg (2 mm biopsysample from a 16 gauge needle) the CV was lower 02.7%) andclose to the 10.9% range previously measured for the assay.
We conclude from this series of studies that it is necessary touse a piece of tissue at least 2 mg in size because of theheterogeneity within the tissue itself Thus, particularly in the easeof milder disease, very small samples that are easily within lhelimits of sensitivity of the assay system may contain areas ofgreater or lesser injury and collagen synthesis, and thus give awide range of values. Therefore, just as a large biopsy sample isrequired for optimal histologic interpretation, a minimum of 2 mgof tissue is required for reproducibility of collagen I mRNAquantitation in this model.
a esee•eeeC+ — + + ÷ + + + —— + + + + + + + —
0.125 0.25 0.5 1 2 3
Copies (x 10)
• SOS+ — + + ÷ +— + + + + + + + —
0.125 0.25 0.5 1 2 3Copies (x 10)
a seeSe
1008 Lee et al: CI:G ratio predicts renal fibrosis
>>•.-. 537bp .
-4— 433bpCs
c,)0-J
>•4— 572bp
-4—430bp •0Cs
0-J
Fig. 5. Composite diagrams showing representative RT-PCR assays for the three mRNAs being quantitated (al(I) procollagen, a2(I) procollagen andGAPDH). A) PAGE of the PCR products was performed and autoradiograms were prepared. A constant amount of wild-type (WT) eDNA was mixedwith a varying amount (125 to 3,000 copies) of the truncated mutant template (MT). Controls included lanes where no template was added or whereonly WT or MT template was added. (B) The radioactivity in each band was quantitated on a phosphoimager and plotted against the copy number.Linear regression analysis indicated an r2 varying between 0.97 and 0.99. The signal obtained with the wild type template was essentially constant overthis range of mutant template copy number. The number of copies in the unknown sample was read from the point of intersection of the WT (•) andMT (E) lines.
Validation of the assay in a model of renal scarring in therabbit
In order to test the potential power of the assay at predictingoutcome in terms of scarring, we induced renal cortical inflam-mation of varying degrees in 16 rabbits. This was done with arange of doses of anti-GBM antibody to induce a wide range ofinjury and scarring by day 30, as shown in Figure 6. Four rabbitsreceived no anti-GBM injections and acted as controls. At day 30the proportion of glomeruli that contained fibrous crescents
ranged from 1% to 78% and cortical hydroxyproline contentincreased as much as fourfold above baseline in some animals.Therefore, the range of injury and scarring produced by theexperimental model under the conditions used was adequate totest the predictive capacity of the Cl:G ratio.
We have previously examined the outcome parameters in thismodel and found that a biochemical measure of outcome (corticalhydroxyproline per dry weight of renal cortex) is a good overallmeasure of scarring because it utilizes a relatively large piece of
BA
czl(l)
WT +MT -
ct2(I)
WT +MT -
GAPDH
WT +MT -
2 3 4
Log copies
460 bp
349 bp
— + + + ++ + + + +
0.125 0.25 0.5 1
Copies (x 10—s)
— + + + ++ + + + +
0.125 0.25 0.5 1
Copies (x 1 0—s)
— + + + ++ + + + +0.125 0.25 0.5 1
Copies (x 1 0—s)
>'>0Cs00Cs
0)0-J
+ ++ +23
+ + —+ + —2 3
+ + —+ + —2 3
6
5
4
6
5
4
3
6
5
4
2 3 4
Log copies
2 3 4
Log copies
Lee et a!: CJ:G ratio predicts renal fibrosis 1009
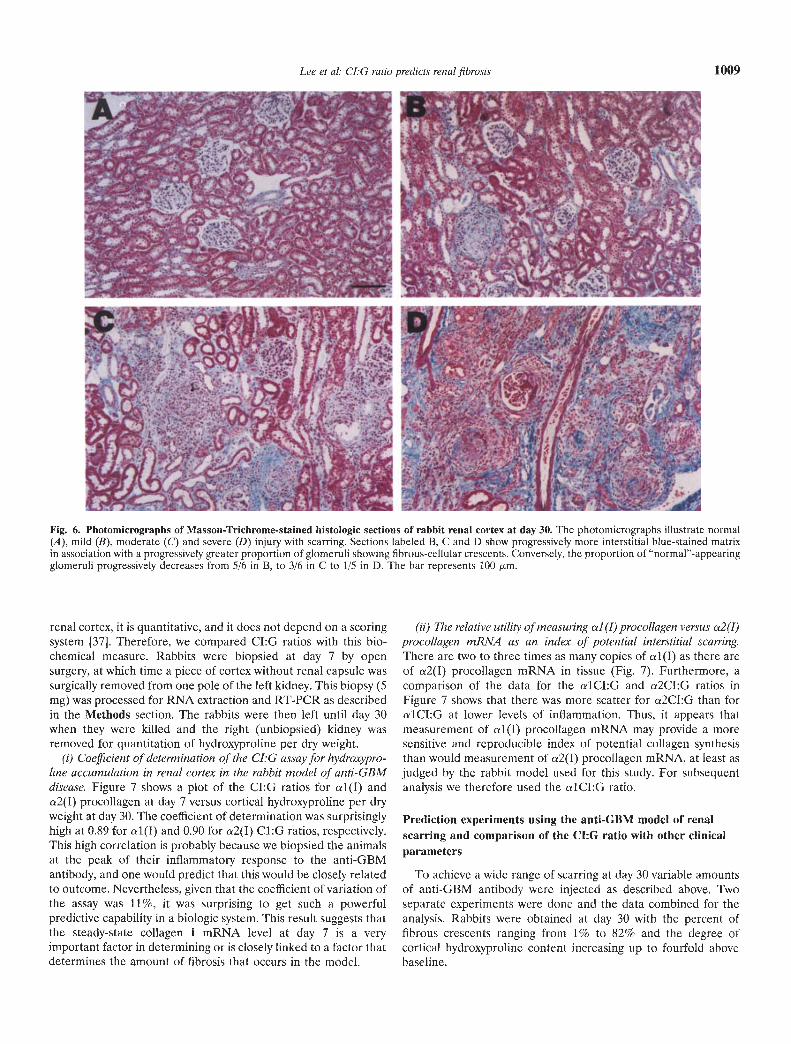
Fig. 6. Photomicrographs of Masson-Trichrome-stained histologic sections of rabbit renal cortex at day 30. The photomicrographs illustrate normal(A), mild (B), moderate (C) and severe (D) injury with scarring. Sections labeled B, C and D show progressively more interstitial blue-stained matrixin association with a progressively greater proportion of glomeruli showing fibrous-cellular crescents. Conversely, the proportion of "normal"-appearingglomeruli progressively decreases from 5/6 in B, to 3/6 in C to 1/5 in D. The bar represents 100 .rm.
renal cortex, it is quantitative, and it does not depend on a scoringsystem [37]. Therefore, we compared CI:G ratios with this bio-chemical measure. Rabbits were biopsied at day 7 by opensurgery, at which time a piece of cortex without renal capsule wassurgically removed from one pole of the left kidney. This biopsy (5mg) was processed for RNA extraction and RT-PCR as describedin the Methods section. The rabbits were then left until day 30when they were killed and the right (unbiopsied) kidney wasremoved for quantitation of hydroxyproline per dry weight.
(i) Coefficient of determination of the LG assay for hydroxypro-line accumulation in renal cortex in the rabbit model of anti-GBMdisease. Figure 7 shows a plot of the Cl:G ratios for al (I) andn2(I) procollagen at day 7 versus cortical hydroxyproline per dryweight at day 30. The coefficient of determination was surprisinglyhigh at 0.89 for 1(l) and 0.90 for 2(I) C1:G ratios, respectively.This high correlation is probably because we biopsied the animalsat the peak of their inflammatory response to the anti-GBMantibody, and one would predict that this would he closely relatedto outcome. Nevertheless, given that the coefficient of variation ofthe assay was 11%, it was surprising to get such a powerfulpredictive capability in a biologic system. This result suggests thatthe steady-state collagen I mRNA level at day 7 is a veryimportant factor in determining or is closely linked to a factor thatdetermines the amount of fibrosis that occurs in the model.
(ii) The relative utility of measuring a] (I) procollagen versus a2(I)procollagen mRNA as an index of potential interstitial scarring.There are two to three times as many copies of al(I) as there areof a2(I) procollagen mRNA in tissue (Fig. 7). Furthermore, acomparison of the data for the alCI:G and a2CI:G ratios inFigure 7 shows that there was more scatter for a2CI:G than foralCI:G at lower levels of inflammation. Thus, it appears thatmeasurement of al(T) procollagen mRNA may provide a moresensitive and reproducible index of potential collagen synthesisthan would measurement of a2(I) procollagen mRNA, at least asjudged by the rabbit model used for this study. For subsequentanalysis we therefore used the alCl:G ratio.
Prediction experiments using the anti-GBM model of renalscarring and comparison of the C1:G ratio with other clinicalparameters
To achieve a wide range of scarring at day 30 variable amountsof anti-GBM antibody were injected as described above. Twoseparate experiments were done and the data combined for theanalysis. Rabbits were obtained at day 30 with the percent offibrous crescents ranging from 1% to 82% and the degree ofcortical hydroxyprolinc content increasing up to fourfold abovebaseline.

1010 Lee et al: CI:G ratio predicts renal fibrosis
0
a 1 Cl:G ratio at day 7
Fig. 7. Relationship between the CI:G ratio at day 7 and corticalhydroxyproline content at day 30. Plots of the C1:G ratios for al(I) (A)and a2(I) (B) procollagens measured at day 7 of the model of anti-GBMdisease against cortical hydroxyproline per mg dry weight at day 30 of themodel. The correlations of determination (r2) for the alCI:G and a2CI:Gratios were 0.89 and 0.90, respectively, suggesting a close relationshipbetween collagen mRNA levels at day 7 and amount of collagen at day 30.Note the difference in copy number for al(I) versus a 2(I) procollagenmRNAs.
Four separate measures of fibrosis outcome were quantitated atday 30 of the model: (a) an overall histologic fibrosis score fromMasson-Trichrome stained sections; (b) a morphometric quanti-tation of interstitial matrix staining; (c) the proportion of glomer-uli that contained fibrous crescents (% crescents); and (d) thebiochemical measure of collagen accumulation (cortical hy-droxyproline content factored per unit dry weight of renal cortex).There was good correlation between these outcome parameters(r = 0.80—0.84) as reported previously in this model [38].
Serum creatinine and urine P/C ratio are poor measures ofestablished renal injury
Serum creatinine concentration is the most commonly usedmethod of monitoring the level of renal function, in spite of itswell-known limitations [6—91. These limitations are highlighted bythe plots shown in Figure 8 where the lack of sensitivity of serum
creatinine measured at day 30 to detect more than 40% fibrouscrescent formation in some animals is shown. This result is notsurprising given the fact that removal of a kidney results in littlechange in serum creatinine in clinical practice.
The urine P/C ratio at day 30 was also an insensitive measure ofthe amount of established injury in the kidney at day 30 (Fig. 8).This parameter only became reliably abnormal when more than40% of glomeruli had fibrous crescents and when the level ofscarring was very significantly increased.
Capacity of parameters measured at day 7 to predict outcome(scarring) at day 30
The day 7 parameters evaluated included two functional pa-rameters (serum creatinine and urine P/C ratio), two histologicparameters (glomerular and interstitial scores) and the CI:Gratio. Correlations of determination (r2) for the day 7 parametersagainst day 30 outcome parameters of fibrosis (cortical hy-droxyproline, percent crescents, percent interstitial fibrosis andfibrosis score) are shown in Table 2. The mean coefficient ofdetermination for the four different scarring parameters was alsocalculated (Table 2). The mean predictive values for each of theday 7 parameters were as follows: 49% for serum creatinine, 49%for urine P/C ratio, 62% for glomerular histologic score, 66% forinterstitial score and 69% for CI:G ratio.
To determine whether combinations of day 7 parameter wouldhave increased predictive power, multiple regression analysis wasperformed with each of the day 30 outcome parameters desig-nated as the dependent variable (Table 2). The combination ofthe two clinical parameters (AB) gave a mean r2 of 0.67, while thecombined histologic parameters (CD) gave a mean r2 of 0.69. Thecombination of clinical plus histologic parameters (ABCD) gavefurther improvement with a mean r2 of 0.76. Addition of the CI:Gratio (E) to any of these groups significantly improved to predic-tive capacity of each of the combinations by about ten percent.Thus, the coefficient of determination (r2) for ABCDE wassignificantly higher than ABCD (0.84 vs. 0.76, P <0.02); ABE washigher than AB (0.80 vs. 0.67, P < 0.01); CDE was higher than CD(0.79 vs. 0.69, P < 0.02); AE was higher than A (0.77 vs. 0.49, P <0.02). Thus, the CI:G ratio contributes information not includedin the other measurements, and this significantly improved abilityto predict outcome in the model.
Table 3 shows the relative power of each variable measured atday 7 to predict outcome at day 30. For this analysis each outcomevariable was again designated as the dependent variable and therelative weight (P value) of all five day 7 variables was calculated.The coefficient of determination for the combined day 7 variablesis also shown in Table 3. For percent crescents at day 30 thestatistically significant predictive factors were CI:G ratio P =0.0002), serum creatinine (P = 0.002) and glomerular score (P =0.04). The urine P/C ratio and the interstitial score did notcontribute significant additional information in the analysis. Forpercent interstitial fibrosis the major factors were CI:G ratio (P =0.02) and urine P/C ratio (P = 0.02). For the fibrosis score theywere CI:G ratio (P = 0.02) and interstitial score (P = 0.02). Forcortical hydroxyproline they were CI:G ratio (P = 0.0005) andurine P/C ratio (P = 0.02). The CI:G ratio was the only predictorthat was found to be statistically significant (P < 0.05) for alloutcomes measured. This analysis also supports the conclusionfrom Table 2 that the CI:G ratio provides additional predictive
A10
8
6
4
2
0
C')>00
C00.I0
0C,)>,00
ci)C00.I0
0 5 10
Ba 1 Cl:G ratio at day 7
15
10
8
6
4
2
0 1 2 3 4

Lee et al: CI:G ratio predicts renal fibrosis 1011
information not provided by the clinical or histologic parameters mild vs. scvere). Animals were divided into groups based on thein the model tested, proportion of glomeruli that had fibrous crescents at day 30 (%
crescents at day 30) as shown in Table 4. This outcome was chosenGroup analysis of data as defined by severity of glomerular as the end point because the anti-GBM model targets thedisease (percent fibrous crescents) at day 30 glomerulus as the primary site of injury and our previous multiple
A C
, a aa
. a
.a9 a
a a.'b
. ..
100
80
60
40
20
0
100
80
60
40
20
00)>
(I)
a)0C))a)
0
00)>m
00.
0
0 2 4 6 8 10
Serum creatinine at day 30
B
12
100
00) 80
'0' 60C))
20
0
100
o 80CC)
>60'(400Io 20
. . S •
.1
.bt•.
. . I I • I • I
0 2 4 6 8
Urine P/C ratio at day 30
..S.
S••
F,
aa
a0aa a,
0 2 4 6 8 10 12 0
- I • I • I • I0 0
Serum creatinine at day 30 Urine P/C ratio at day 30
Fig. 8. Plots showing the relationship between functional parameters [(A, B) serum creatinine concentration (LI) and (C, D) urine protein:creatinineratio.] and outcome parameters (hydroxyproline and percent fibrous crescents) all measured at day 30. Up to 50% crescents and marked increasesin cortical hydroxyproline occurred without increases in serum creatinine or urine P/C ratio as measured at day 30.
Table 2. Coefficients of determination (r2) assessed by multiple regression for the dependent outcome parameters at day 30 in relation to theindependent predictive parameters and combination of parameters measured at day 7
2 4 6 8
Day 30fibrosisoutcome
parameters
Individual day 7 parameters
Serumcreatinine
A
Urine P/Cratio
B
Coefficients of determination (r2)
Glomerularscore
C
Crescents fibrous % 0.67 0.43 0.76Interstitial fibrosis % 0.25 0.59 0.48Fibrosis score 0.58 0.41 0.70OH-Praline Per Wt. 0.44 0.51 0.52
Mean r2 0.49 0.49 0.62
Combinations of day 7 parameters
The mean r2 value for the four fibrosis outcome measures combined is also shown.
Interstitial CI:G Effect of CI:G ratio (E)score ratio Clinical Histologic Clin/Hist
D E AB CD_—_ABCD AE ABE CDE ABCDE0.73 0.69 0.73 0.78 0.85 0.87 0.87 0.88 0.920.54 0.63 0.60 0.54 0.63 0.66 0.71 0.63 0.720.77 0.70 0.65 0.78 0.82 0.77 0.78 0.83 0.860.61 0.72 0.68 0.65 0.72 0.77 0.85 0.80 0.85
0.66 0.69 0.67 0.69 0.76 0.77 0.80 0.79 0.84
We examined the hypothesis that individual day 7 parametersmight discriminate better over a particular range of injury (such as
regression analysis had shown that this variable was the majordeterminant of injury [37]. Groups were designated to include
1012 Lee ci al: CI:G ratio predicts renal fibrosis
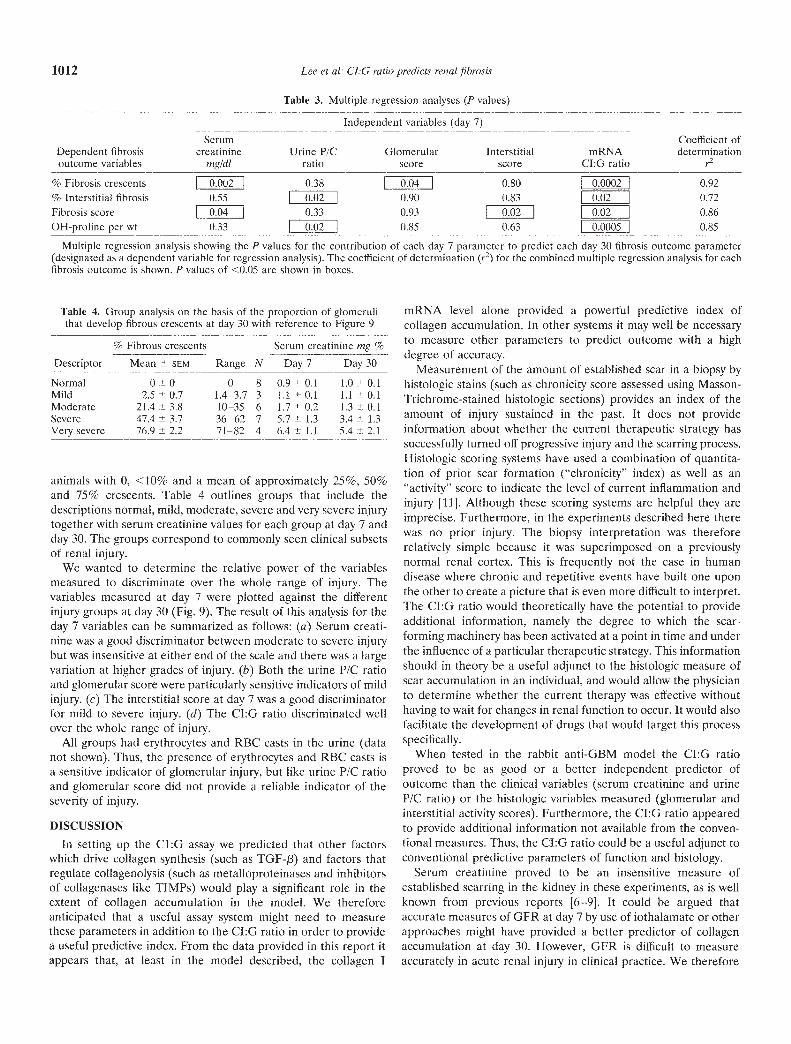
Table 3. Multiple regression analyses (P values)
Independent variables (day 7)Serum Coefficient of
Dependent fibrosis creatinine Urine P/C Glomerular Interstitial mRNA determinationoutcome variables mg/dl ratio score score CI:G ratio r2
% Fibrosis crescents 0.002 I 0.38 I 0.04 I 0.80 0.0002 I 0.92
% Interstitial fibrosis 0.55 I 0.02 I 0.90 0.83 0.02 0.72Fibrosis score 0.04 0.33 0.93 I 0.02 0.02 0.86
OH-proline per wt 0.33 I 0.02 I 0.85 0.63 I 0.0005 I 0.85
Multiple regression analysis showing the P values for the contribution of each day 7 parameter to predict each day 30 fibrosis outcome parameter(designated as a dependent variable for regression analysis). The coefficient of determination (r2) for the combined multiple regression analysis for eachfibrosis Outcome is shown. P values of <0.05 are shown in boxes.
Table 4. Group analysis on the basis of the proportion of glomerulithat develop fibrous crescents at day 30 with reference to Figure 9
Descriptor
% Fibrous crescents
Mean SCM Range NSerum creatmine mg %
Day 7 Day 30
Normal 0 0 (1 8 0.9 0.1 1.0 0.1Mild 2.5 0.7 1.4—3.7 3 1.1 0.1 1.1 0.1Moderate 21.4 3.8 10—35 6 1.7 0.2 1.3 0.1Severe 47.4 3.7 36—62 7 5.7 1.3 3.4 1.3Very severe 76.9 2.2 71—82 4 6.4 1.1 5.4 2.1
animals with 0, <10% and a mean of approximately 25%, 50%and 75% crescents. Table 4 outlines groups that include thedescriptions normal, mild, moderate, severe and very severe injurytogether with serum creatinine values for each group at day 7 andday 30. The groups correspond to commonly seen clinical subsetsof renal injury.
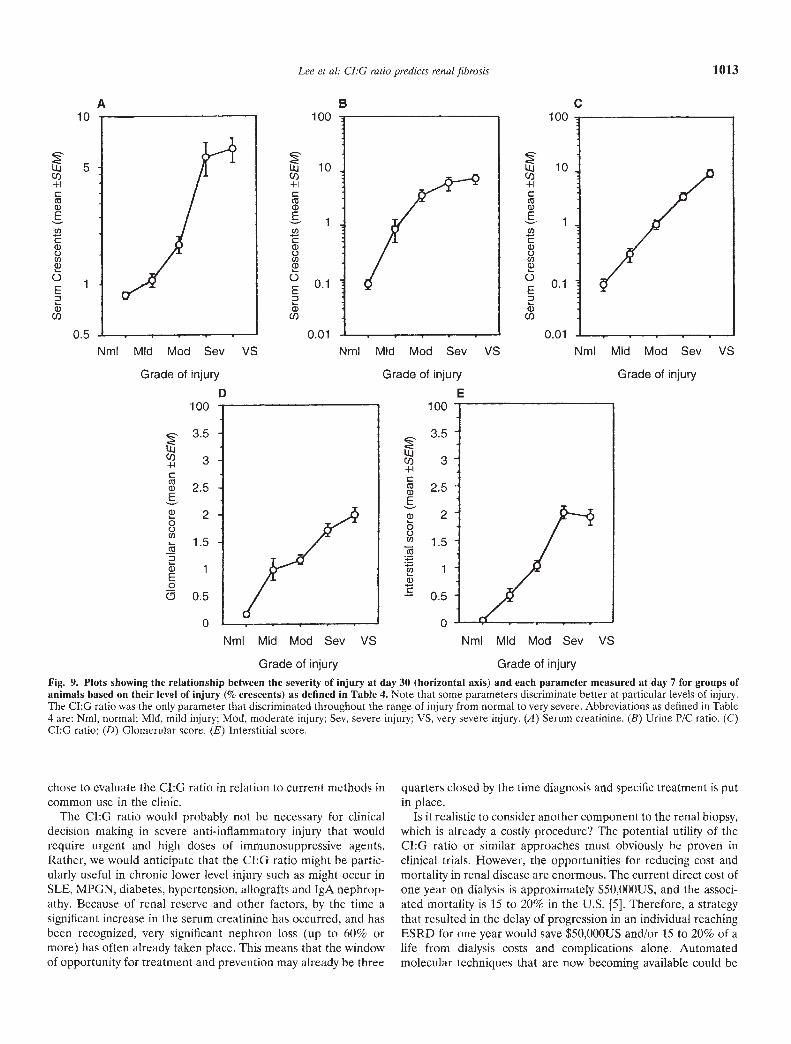
We wanted to determine the relative power of the variablesmeasured to discriminate over the whole range of injury. Thevariables measured at day 7 were plotted against the differentinjury groups at day 30 (Fig. 9). The result of this analysis for theday 7 variables can be summarized as follows: (a) Serum creati-nine was a good discriminator between moderate to severe injurybut was insensitive at either end of the scale and there was a largevariation at higher grades of injury. (b) Both the urine P/C ratioand glomerular score were particularly sensitive indicators of mildinjury. (c) The interstitial score at day 7 was a good discriminatorfor mild to severe injury. (d) The CI:G ratio discriminated wellover the whole range of injury.
All groups had erythrocytes and RBC casts in the urine (datanot shown). Thus, the presence of erythrocytes and RBC casts isa sensitive indicator of glomerular injury, but like urine P/C ratioand glomerular score did not provide a reliable indicator of theseverity of injury.
DISCUSSION
In setting up the C1:G assay we predicted that other factorswhich drive collagen synthesis (such as TGF-f3) and factors thatregulate collagenolysis (such as metalloproteinases and inhibitorsof collagenases like TIMP5) would play a significant role in theextent of collagen accumulation in the model. We thereforeanticipated that a useful assay system might need to measurethese parameters in addition to the CI:G ratio in order to providea useful predictive index. From the data provided in this report itappears that, at least in the model described, the collagen I
mRNA level alone provided a powerful predictive index ofcollagen accumulation. In other systems it may well be necessaryto measure other parameters to predict outcome with a highdegree of accuracy.
Measurement of the amount of established scar in a biopsy byhistologic stains (such as chronicity score assessed using Masson-Trichrome-stained histologic sections) provides an index of theamount of injury sustained in the past. It does not provideinformation about whether the current therapeutic strategy hassuccessfully turned off progressive injury and the scarring process.Histologic scoring systems have used a combination of quantita-lion of prior scar formation ("chronicity" index) as well as an"activity" score to indicate the level of current inflammation andinjury [11]. Although these scoring systems are helpful they areimprecise. Furthermore, in the experiments described here therewas no prior injury. The biopsy interpretation was thereforerelatively simple because it was superimposed on a previouslynormal renal cortex. This is frequently not the case in humandisease where chronic and repetitive events have built one uponthe other to create a picture that is even more difficult to interpret.The Cl:G ratio would theoretically have the potential to provideadditional information, namely the degree to which the scar-forming machinery has been activated at a point in time and underthe influence of a particular therapeutic strategy. This informationshould in theory be a useful adjunct to the histologic measure ofscar accumulation in an individual, and would allow the physicianto determine whether the current therapy was effective withouthaving to wait for changes in renal function to occur. It would alsofacilitate the development of drugs that would target this processspecifically.
When tested in the rabbit anti-GBM model the CI:G ratioproved to be as good or a better independent predictor ofoutcome than the clinical variables (serum creatinine and urineP/C ratio) or the histologic variables measured (glomerular andinterstitial activity scores). Furthermore, the CI:G ratio appearedto provide additional information not available from the conven-tional measures. Thus, the CI:G ratio could be a useful adjunct toconventional predictive parameters of function and histology.
Serum creatinine proved to be an insensitive measure ofestablished scarring in the kidney in these experiments, as is wellknown from previous reports [6—9]. It could be argued thataccurate measures of GFR at day 7 by use of iothalamate or otherapproaches might have provided a better predictor of collagenaccumulation at day 30. However, GFR is difficult to measureaccurately in acute renal injury in clinical practice. We therefore
Lee et al: CI:G ratio predicts renal fibrosis
100
!b0
0.01
Nml Mid Mod Sev VS NmI Mid Mod Sev VS
Grade of injury Grade of injury
1013
Fig. 9. Plots showing the relationship between the severity of injury at day 30 (horizontal axis) and each parameter measured at day 7 for groups ofanimals based on their level of injury (% crescents) as defined in Table 4. Note that some parameters discriminate better at particular levels of injury.The CI:G ratio was the only parameter that discriminated throughout the range of injury from normal to very severe. Abbreviations as defined in Table4 are: Nml, normal; MId, mild injury; Mod, moderate injury; Sev, severe injury; VS, very severe injury. (A) Serum creatinine. (B) Urine P/C ratio. (C)CI:G ratio; (I)) Glomcrular score. (E) Interstitial score.
chose to evaluate the CI:G ratio in relation to current methods incommon use in the clinic.
The CI:G ratio would probably not be necessary for clinicaldecision making iii severe anti-inflammatory injury that wouldrequire urgent and high doses of immunosuppressive agents.Rather, we would anticipate that the Cl:G ratio might be partic-ularly useful in chronic lower level injury such as might occur inSLE, MPGN, diabetes, hypertension, allografts and IgA nephrop-athy. Because of renal reserve and other factors, by the time asignificant increase in the serum creatinine has occurred, and hasbeen recognized, very significant nephron loss (up to 60% ormore) has often already taken place. This means that the windowof opportunity for treatment and prevention may already be three
quarters closed by the time diagnosis and specific treatment is putin place.
Is it realistic to consider another component to the renal biopsy,which is already a costly procedure? The potential utility of theCI:G ratio or similar approaches must obviously he proven inclinical trials. However, the opportunities for reducing cost andmortality in renal disease are enormous. The current direct cost ofone year on dialysis is approximately $50,000US, and the associ-ated mortality is 15 to 20% in the U.S. [51. Therefore, a strategythat resulted in the delay of progression in an individual reachingESRD for one year would save $50,000US and/or 15 to 20% of alife from dialysis costs and complications alone. Automatedmolecular techniques that are now becoming available could be
A B C10
I0.
100
10
1.
0.1
0.01
NmI VSMid Mod Sev
Grade of injury
0
VS
E
Nmi Mid Mod Sev VSGrade of injury
I
100
3.5
3
2.5
2
1.5
1
0.5
0
Nml Mid Mod SevGrade of injury
100
2.5Eo 200. 1.5
1a)
0.5
0
1014 Lee ci at: CI:G ratio predicts renal fibrosis
harnessed to produce an assay that would require little or nohuman effort over and above obtaining the biopsy.
Seen in this light we cannot afford not to develop new ideas andapproaches to preventing progression to ESRD. We look towardsa future when the focus will he on early detection and interventionto prevent progression of renal injuly before significant or evenmeasurable renal function has been lost. The CI:G ratio and otherapproaches may prove cost-effective in the long term as we movetowards this goal.
ACKNOWLEDGMENTS
Equal contributions to this manuscript were made by the senior authors,Drs. Killen and Wiggins. This work was supported by Public HealthService Grants DK-38149, DK-39255, DK-44848, and DK-46469. We aregrateful for support for these studies from the Multipurpose ArthritisCenter at the University of Michigan (P50 AR-20557). Dr. Lee was fundedby a grant from Hyonam Kidney Laboratory, Soon Chun Hyang UniversityHospital, Seoul, Korea. We are grateful to Lisa Riggs for technicalassistance with the histologic sections, and to John Decastor for help withthe animal surgery and postoperative care of the rabbits.
Reprint requests to Dr. Roger C. Wiggins, Nephrology Division, Departmentof Internal Medicine, University of Michigan, 3914 Taubman Center, AnnArbor, Michigan 48109, USA.
APPENDIX
Abbreviations used in this paper are: SDS, sodium dodecyl sulfate;PCR, polymerasc chain reaction; GAPDH, glyceraldehyde-3-phosphatedehydrogenase; CV, coefficient of variance.
REFERENCES1. Riso RA, SLOPER JC, DEWARDENER HE: Relationship between
renal function and histological changes found in renal biopsy speci-mens from patients with persistent glomerular nephritis. Lancet11:363—366, 1968
2. SCHNAINUCK LI, STRIKER GE, LUTHER RE, BENDITT EP: Structure-functional correlations in renal disease: The correlations. Hum Pathol631—641, 1970
3. Bou A, CHRIST H, GRUND KE, MACKENSON 5: The role of theintcrstitium of the renal cortex in renal diseases. Contrib Nephrol16:109—114, 1979
4. EDDY AA: Experimental insights into the tubulointerstitial diseaseaccompanying primary glomerular lesions. JAm Soc Nephrol 5:1273—1287, 1994
5. UNITED STATES RENAL DATA SYSTF.M: USRDS 1996 Annual DataReport. National Institutes of Health, NIDDK, Bethesda, 1996
6. CARRIE BJ, GOLBETZ HV, MICIIAELS AS, MYERS BD: Creatinine: Aninadequate filtration marker in glomerular diseases. Am I Med69:177—182, 1980
7. BAUER JH, BROOKS CS, BURcI-I RN: Clinical appraisal of creatinineclearance as a measurement of glomerular filtration rate. Am J Kid Dis3:337—346, 1982
8. SHEMESH 0, GOLBERTZ H, KRISS JP, MYERS BD: Limitations ofcreatinine as a filtration marker in glomerulopathic patients. (ab-stract) Kidney mt 28:830, 1985
9. WAKER M, DREW 1-1, LA FRANCE N: Creatinine measurements oftenyield false estimates of progression in chronic renal failure. Kidney Jilt34:412—418, 1988
10. AUSTIN HA, MUENTZ LR, JOYCE KM, ANTONOVYTCH yr, BAI,CW JE:Diffuse proliferative lupus ncphritis: Identification of specific patho-logic features affecting renal outcome. Kidney in! 25:689—695, 1984
11. DOWNER G, PIIAN SH, WIGGINS RC: Analysis of renal fibrosis in arabbit model of crescentic ncphritis. J Clin Invest 82:998—1006, 1988
12. MERRrCF SE, KILLEN PD, PI-IAN SH, WI;GINS RC: Analysis of al(I)procollagen al(IV) collagen, and aetin mRNA in glomeruliis andcortex of rabbits with experimental anti-glomerular basement mem-brane disease. Lab Invest 63:762—769, 1990
13. WIGGINS R, GOYAL M, MERRITT S, KILLEN PD: Vascular adventitialcell expression of collagen I messenger rihonueleic acid in anti-GBM
antibody induced creseentic nephritis in the rabbit. Lab Invest 68:557—565, 1993
14. COIMBRA T, WIGGINS R, NOH JW, MERRITT S, PHAN SH: Transform-ing growth factor-a production in anti-glomerular basement mem-brane disease in the rabbit. Am J Pathol 138:223—234, 1991
15. GHARAEE-KERMANI M, WIGGINS R, WOLGER F, GOYAL M, P1 IAN SH:Fibroneetin is the major fibroblast chemoattraetant in rabbit anti-glomerular basement membrane disease. Am J Pathol 148:961—967,1996
16. GOYAL M, WIGGINS R: Fibroncetin mRNA and protein accumulation,distribution and breakdown in rabbit antiGBM disease. J Am SocNephrol 1:1334—1342, 1991
17. SADY SP, THOMAS PE, GOYAL M, WIIARRAM BL, WIGGINS RC:Fihronectin mRNA in the developing glomerular crescent in rabbitanti-glomerular basement membrane disease. J Am Soc Nephrol5:2087—2093, 1995
18. PETEN EP, GARCIA-PEREZ A, TERADA Y, WooDIoW D, MARTIN BM,STRIKER GE, STRIKER U: Age-related changes in al-and a2-chaintype IV collagen mRNA in adult mouse glomeruli: Competitive PCR.Am J Physiol 263:951—957, 1992
19. PETEN EP, STRIKER U, CAROME MA, Eu.IOrr ST, YANG CW,STRIKER GE: The contribution of increased collagen synthesis tohuman glomeruloselerosis: A quantitative analysis of a2 TV collagenmRNA expression by competitive polymerase chain reaction. J ExpMed 176:1571—1576, 1992
20. PETEN EP, STRIKER U, GARCIA-PEREZ A, STRIKER GE: Studies bycompetitive PCR of glomerulosclerosis in growth hormone transgenicmice. Kidney mt 43(Suppl 39):55—58, 1993
21. IwANO M, AKAI Y, FUJII Y, DOHI Y, MATSUMURA M, D0HI K:Intraglomerular expression of transforming growth factor-beta 1(TGF-1) mRNA in patients with glomeruloncphritis: Quantitativeanalysis by competitive polymerase chain reaction. Clin Exp Immunol97:309—314, 1994
22. STRIKER U: Modern renal biopsy interpretation: Can we predictglomerulosclerosis?Semin Nephrol 13:508—515, 1993
23. THOMAS P, WHARRAM B, GOYAL M, WIGGINS J, HOLZMAN L,WIGGINS R: GLEPP1, a renal glomerular epithelial cell (podocyte)membrane protein tyrosine phosphatase. Identification, molecularcloning, and characterization in the rabbit. J Blot Chem 269:19953—19962, 1994
24. BERNARD MP, CIIu ML, MYERS JC, RAMIREZ F, EIKENBERRY EF,PROCKOP DJ: Nucleotide sequences of complementary deoxyribonu-cleic acids for the pro-al chain of human type I procollagen:Statistical evaluation of structures that are conserved during evolu-lion. Biochemistry 22:5213—5223, 1983
25. BERNARD MP, MYERS JC, CIIU ML, RAMIREZ F, EIKENLIERRY EF,PROCKOP DJ: Structure of a eDNA for the pro-a2 chain of human typeI procollagen comparison with chick eDNA for Pro a2(I) identifiesstructurally conserved features of the protein and the gene. Biochem-istry 22:1139—1145, 1983
26. MYERS JC, DICKSON LA, DE WET WJ, BERNARD MP, CHU ML,LIHERTO MD, Puvi G, SANGIORCI FO, RAMIRIiZ F: Analysis of the 3'end of the human pro-a2 (I) collagen gene. I Biol Chem 258:10128—10135, 1983
27. CIIOMCZYNSKI P, SACcHI N: Single step method of RNA isolation byacid guanidinium thiocyanatc-phcnol-chloroform extraction. AnalBiochem 162:156—159, 1987
28. ERCII.ANI U, FLORENCE B, DENARO M, ALEXANDER M: Isolation andcomplete sequence of a functional human glyceraldehydc-3-phos-phate dehydrogenase gene. J Biol Chem 263:15335—15341, 1988
29. ARCARI P, MARTINELI.I R, SALvAroRE F: The complete sequence of afull length dDNA for human liver glyceraldchyde-3-phosphate dehy-drogenase: Evidence for multiple mRNA species. Nuci Acid Res12:9179—9189, 1984
30. FEINBERG AP, VOGELSTEIN B: A technique for labeling DNA restric-tion endonoclease fragments to high specific activity. Anal Biochem132:6—12, 1983
31. I1IGucHI R: Recombinant PCR, in J'(JRProtocols:A Guide to Methodand Application, edited by INNIs MA, GELFAND M, SNINSKY JJ, WIIrruTJ, San Diego, Academic Press, 1990, pp 177—183
32. WANG AM, DOYlE MV, MARK DF: Quantitation of mRNA by thepolymerase chain reaction. i'roc Natl Acad Sci USA 86:9717—9721,1989
Lee et al: CI:G ratio predicts renal fibrosis 1015
33. GILLAND G, PERRIN S, BLANCHARD K, BUNN F: Analysis of cytokinemRNA and DNA: Detection and quantitation by competitive poly-merase chain reaction. Proc Nat! Acad Sci USA 87:2725—2729, 1990
34. Bncic,s JP, TODD-TURLA K, SCHNERMANN JB, KILLEN PD: Approachto the molecular basis of nephron heterogeneity: Application ofreverse transcription-polymerase chain reaction to dissected tubulesegments. Semin Nephrol 13:2—12, 1993
35. FERRE F, MARCHESE A, Pnzzou P, GRIFFIN S, BUXTON E, BOYER V:Quantitative PCR: An overview, in The Polymerase Chain Reaction,edited by MULLIS KB, FERRE F, GIBBS RA, Boston, Birkhauser, 1994,pp 67—88
36. TOOD-TURLA KM, SCHNERMANN J, FEJES-TOTH G, NARAY-FEJES-Tom A, SMART A, KILLEN PD, BRIGGS JP: Distribution of mineralo-corticoid and glucocorticoid receptor mRNA along the nephron. Am JPhysiol 264:F781—F791, 1993
37. MCCLURKIN C, PHAN SH, Hsu CH, SPICKER JK, KSHIRSAGAR AM,YUAN W, WIGGINS RC: Moderate protection of renal function and
reduction of fibrosis by coichicine in a model of anti-GBM disease inthe rabbit. JAm Soc Nephrol 1:257—265, 1990
38. YOUNG EW, ELLIS CN, MESSANA JM, JOHNSON KJ, LEICHTMAN AB,MIHATSCH MJ, HAMILTON TA, GR0ISsER DS, FRADIN MS, VOORHEESJJ: A prospective Study of renal structure and function in psoriasispatients treated with cyclosporine. Kidney mt 46:1216—1222, 1994
39. PHAN SH, SCHRIER D, MCGARRY B, DUQUE RE: Effect of the beigemutation on bleomycin-induced pulmonary fibrosis in mice. Am RevRespir Dis 127:456—459, 1983
40. GENOVESE C, RowE D, KREAM B: Construction of DNA sequencescomplementary to rat alpha 1 and alpha 2 collagen mRNA and theiruse in studying the regulation of type I collagen synthesis by 1,25-dihydroxyvitamin D. Biochemistry 23:6210—6216, 1984
41. SOLEZ K, AXELSON RA, BENEDIKTSSON H: International standardiza-tion criteria for the histologic diagnosis of renal allograft rejection:The Banif working classification of kidney transplant pathology.Kidney mt 44:411, 1993