Removal of nitrate and COD from wastewater using denitrification process: kinetic, optimization, and...
13
1 23 Clean Technologies and Environmental Policy Focusing on Technology Research, Innovation, Demonstration, Insights and Policy Issues for Sustainable Technologies ISSN 1618-954X Clean Techn Environ Policy DOI 10.1007/s10098-013-0621-7 Removal of nitrate and COD from wastewater using denitrification process: kinetic, optimization, and statistical studies Sanak Ray, Ayusman Mohanty, S. S. Mohanty, Snehasish Mishra & G. Roy Chaudhury
-
Upload
independent -
Category
Documents
-
view
1 -
download
0
Transcript of Removal of nitrate and COD from wastewater using denitrification process: kinetic, optimization, and...
1 23
Clean Technologies andEnvironmental PolicyFocusing on Technology Research,Innovation, Demonstration, Insightsand Policy Issues for SustainableTechnologies ISSN 1618-954X Clean Techn Environ PolicyDOI 10.1007/s10098-013-0621-7
Removal of nitrate and COD fromwastewater using denitrification process:kinetic, optimization, and statistical studies
Sanak Ray, Ayusman Mohanty,S. S. Mohanty, Snehasish Mishra &G. Roy Chaudhury

1 23
Your article is protected by copyright and
all rights are held exclusively by Springer-
Verlag Berlin Heidelberg. This e-offprint is
for personal use only and shall not be self-
archived in electronic repositories. If you wish
to self-archive your article, please use the
accepted manuscript version for posting on
your own website. You may further deposit
the accepted manuscript version in any
repository, provided it is only made publicly
available 12 months after official publication
or later and provided acknowledgement is
given to the original source of publication
and a link is inserted to the published article
on Springer's website. The link must be
accompanied by the following text: "The final
publication is available at link.springer.com”.
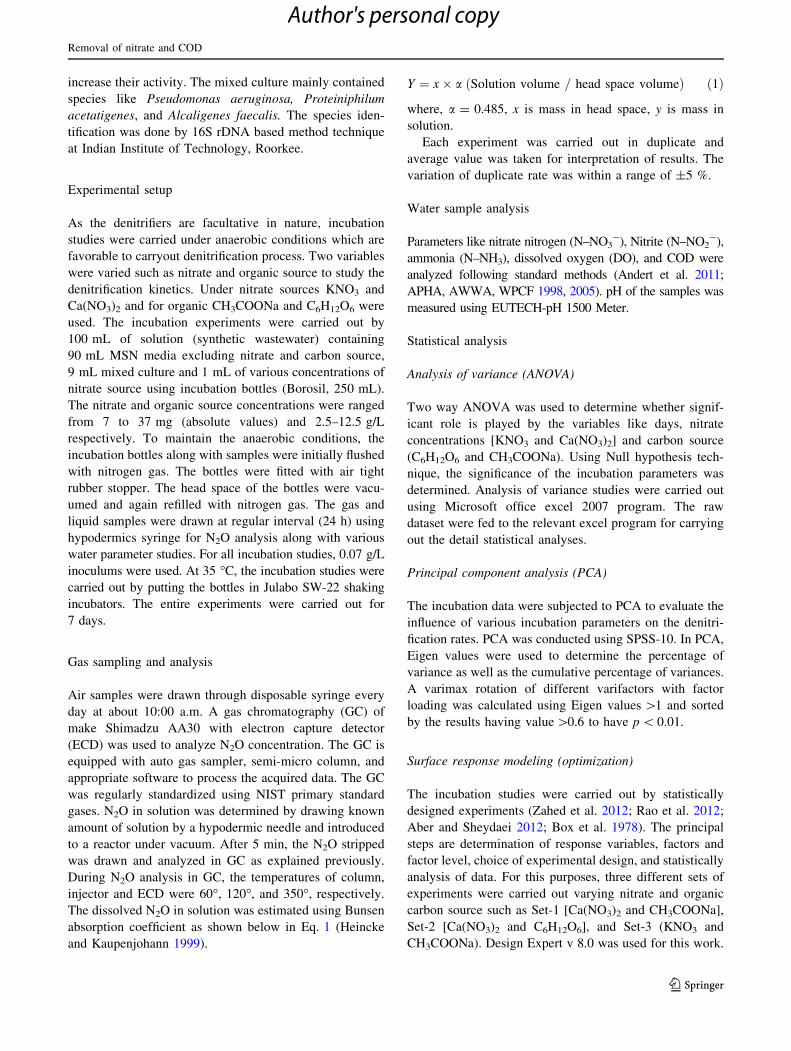
ORIGINAL PAPER
Removal of nitrate and COD from wastewater usingdenitrification process: kinetic, optimization, and statisticalstudies
Sanak Ray • Ayusman Mohanty • S. S. Mohanty •
Snehasish Mishra • G. Roy Chaudhury
Received: 12 December 2012 / Accepted: 3 April 2013
� Springer-Verlag Berlin Heidelberg 2013
Abstract Denitrification process studies were carried out
for removal of N–NO3- and organic carbon from waste
water. Recent researches have shown the efficacy of
N–NO3- removal process from synthetic waste water;
however, they are lacking the data related to kinetics and
optimization that may aid in developing guidance for field-
scale implementation. Various incubation parameters were
varied such as nitrate and carbon source keeping biomass
concentration invariable. For nitrate variation two different
nitrates were used such as potassium nitrate (KNO3) and
calcium nitrate [Ca(NO3)2] and for organic source glucose
(C6H12O6) and sodium acetate (CH3COONa). The deni-
trifying bacteria were isolated from agricultural soil. The
dentrification rates increased with the increase of nitrate as
well as organic source. The denitrification rates were faster
in case of CH3COONa compared to C6H12O6. The regen-
eration time was also calculated which varied 1–3 days.
Analysis of variance studies indicated that both nitrate and
organic concentrations played significant role in terms of
dentrification as well as emission of nitrous oxide (N2O)
rates. Principal components analysis studies were also
carried out. Optimization studies were carried out using
response surface model to evaluate the incubation param-
eters to minimize the N2O emission and at the same time
maximize the removal efficiency of N–NO3- and COD.
Keywords ANOVA � Wastewater treatment �Denitrification � Nitrous oxide � Optimization � PCA
Introduction
Water is the source of life, and it plays an important role in
supporting the life system. Due to increase of population,
industrialization and agricultural activities the overall
quality of water is in wane. The water is gradually being
contaminated with various pollutants such as inorganic as
well as organic nitrogenous compounds originating from
agricultural and human activities. The toxic metal ions
released from metallurgical activities along with organic
compounds produced due to urbanization and industrial
activities leads to the water contamination. The wastewater
containing nitrogenous and organic compounds results in
eutrophication, biochemical oxygen demand increase and
thereby decreases the existence of water bodies.
Due to high solubility of nitrogen compounds in water,
it cannot be removed chemically by precipitation. Waste-
waters containing nitrogenous compounds are habitually
treated bio-chemically by nitrifying as well as denitrifying
bacteria (Kampschreur et al. 2009; Koren et al. 2000).
Denitrification is a primary biological process in which
nitrogenous compounds (oxidized) were reduced to atmo-
spheric nitrogen (N2) gas as a final product. In the deni-
trification process, the bacteria use NO3- or NO2
- as an
electron acceptor during respiration mechanism. The
electron donor in the overall process for the heterotrophic
microorganism are organic substrates such as acetate,
various poly as well as monosaccharide’s, organic acids
like oxalic etc. (Pant et al. 2010; Rabaey and Verstraete
2005). The waste water emerging out of domestic, food
processing, fermentation including sugar mills and poultry
S. Ray � A. Mohanty � S. S. Mohanty � G. R. Chaudhury (&)
CSIR-Institute of Minerals and Materials Technology,
Bhubaneswar 751013, Odissa, India
e-mail: [email protected]
S. Mishra
School of Biotechnology, KIIT University,
Bhubaneswar 751024, Odissa, India
123
Clean Techn Environ Policy
DOI 10.1007/s10098-013-0621-7
Author's personal copy
usually contaminated with nitrate as well as organic pol-
lutants as mentioned above (Pant et al. 2010; Rabaey and
Verstraete 2005). These pollutants need to be removed
before disposal order to keep ecological balance (Metcalf
and Eddy 2003). The denitrification process can be con-
sidered as a redox reaction. The process forms various
intermediates such as nitrite (NO2-), nitric oxide (NO),
N2O, and finally N2 (Wrage et al. 2001; Koren et al. 2000).
In the first step, the NO3- is reduced to NO2
- by nitrate
reductase enzyme (Nar). The NO2- is further reduced to
NO by nitrite reductase, followed by further reduction to
N2O by nitric oxide reductase. The final conversion of N2O
to nitrogen gas is carried out by nitrous oxide reductase
(Hu et al. 2012; Tavares et al. 2006).
The microbiological species involved in the total pro-
cess are termed as denitrifiers (Wrage et al. 2001). The
notable denitrifiers are Pseudomonas, Bacillus, Propioni-
bacterium, etc. (Faulwetter et al. 2009; Firestone 1982).
The biological species are facultative heterotrophs which
utilize nitrate (NO3-) as an electron acceptor instead of
oxygen (O2) during respiration. During wastewater treat-
ment method, the emission of N2O has been pragmatic
(Foley et al. 2010; Kampschreur et al. 2009), a significant
green house gas (GHG) (Dai et al. 2012; Tallec et al. 2008)
which initiates global temperature swell and causes ozone
depletion (Toma et al. 2011; Yang et al. 2011; Bergster-
mann et al. 2011). During the reduction process, N2O gas is
formed as an intermediate by microbial denitrification
route (Gogoi and Baruah 2012). Increasing atmospheric
N2O concentration can be attributed to anthropogenic
(Toma et al. 2011; IPCC 2007) as well as natural (Marinho
et al. 2004) activities. Denitrification plays an important
role in various ecosystems such as wastewater and agri-
cultural activities (Laverman et al. 2010). Various factors
such as oxygen, organic matter, nitrate redox-potential,
temperature, and pH plays an important role in determining
the denitrification kinetics (Koren et al. 2000; Yang et al.
2011; Laverman et al. 2010). The reaction is favored at low
O2 concentration as at higher concentration the denitrifiers
enzymes were deactivated (Nelson and Knowles 1978;
Terai and Mori 1975) but some of the denitrifiers can use
NO3- as well as O2 as electron acceptor (Koren et al.
2000). For continuation of metabolic activities, the denit-
rifiers require carbon source such as methanol, acetate,
ethanol, etc. (Koren et al. 2000; Park and Yoo 2009). The
denitrification rate has a positive correlation with nitrate
concentration whereas the concentration of carbon source
has a complicated correlation (Koren et al. 2000; Laverman
et al. 2010). The optimum pH for growth reported to be in
the range 7–8 and below 6.5 decreased considerably
(Koren et al. 2000). The denitrification is favored at high
temperature whereas low temperature favors the formation
of GHG.
Denitrification process is a complicated one, therefore,
an in-depth analysis is required to correlate the denitrifi-
cation as well as GHG emission rates vis-a-vis the various
parameters. However, this process of denitrification
involves emission of N2O which in turn depends on the
concentration of nutrients like COD and nitrogen source
along with microbial concentration. These parameters play
either a synergistic or an anti-synergistic effect on the
emission of N2O. Considering complicacy of the total
process to be enormous, there is an urgent need to evaluate
the mathematical intra-correlation between all these
parameters to minimize the emission of N2O and simulta-
neously maximizing the removal efficiency of N–NO3-
and COD. Moreover, the scanty relevant literature makes
the problem more difficult. Therefore, as a part of our
systemic studies on emission of GHG through biological
route (Sahoo et al. 2010; Ramulu et al. 2009, 2008), this
communication specifically aims to establish a mathemat-
ical co-relation between the parameters to minimize the
N2O emission through response surface modeling (RSM)
followed by statistical analysis which could be a way for-
ward to this situation. RSM technique is used to optimize
the response of a multivariate system by exploring the
relationships between various variables and their combined
effects on response variables (Zahed et al. 2012; Rao et al.
2012; Aber and Sheydaei 2012). This technique is also
used to reduce the number of experiments and to develop
mathematical models to determine the interactions between
process variables accurately. Batch experiment studies
were conducted to study the effect of variables such as
COD, nitrogen source (nitrate nitrogen) along with days.
The main objective of this study is to evaluate and maxi-
mize the N–NO3- along with COD removal efficiency,
simultaneously minimizing the N–N2O emission.
Materials and methods
Sampling
Soil sample was collected from a paddy field in Tangi-
banta, a rural location 20 km away from Bhubaneswar,
India at a depth of 0–15 cm using an auger (Andert et al.
2011). The typical soil analyses showed: Na: 1.5 %, Mg:
1.8 %, Al: 20.5 %, Si: 53.2 %, K: 1.2 %, and Ca: 2.4 %. It
also contained micronutrients like carbon, nitrogen, and
phosphorous. The denitrifying heterotrophic bacteria were
isolated from the agricultural soil using mineral, salt, and
nutrient (MSN) liquid media (Composition: CH3COONa—
7.86 g/L, KH2PO4—0.2 g/L, (NH4)2SO4—0.5 g/L, MgSO4.
7H2O—0.04 g/L, Ca(NO3)2—0.04 g/L). The isolated
strains were enriched at a regular basis by re-inoculating
into freshly prepared MSN media to enrich the biomass and
S. Ray et al.
123
Author's personal copy
increase their activity. The mixed culture mainly contained
species like Pseudomonas aeruginosa, Proteiniphilum
acetatigenes, and Alcaligenes faecalis. The species iden-
tification was done by 16S rDNA based method technique
at Indian Institute of Technology, Roorkee.
Experimental setup
As the denitrifiers are facultative in nature, incubation
studies were carried under anaerobic conditions which are
favorable to carryout denitrification process. Two variables
were varied such as nitrate and organic source to study the
denitrification kinetics. Under nitrate sources KNO3 and
Ca(NO3)2 and for organic CH3COONa and C6H12O6 were
used. The incubation experiments were carried out by
100 mL of solution (synthetic wastewater) containing
90 mL MSN media excluding nitrate and carbon source,
9 mL mixed culture and 1 mL of various concentrations of
nitrate source using incubation bottles (Borosil, 250 mL).
The nitrate and organic source concentrations were ranged
from 7 to 37 mg (absolute values) and 2.5–12.5 g/L
respectively. To maintain the anaerobic conditions, the
incubation bottles along with samples were initially flushed
with nitrogen gas. The bottles were fitted with air tight
rubber stopper. The head space of the bottles were vacu-
umed and again refilled with nitrogen gas. The gas and
liquid samples were drawn at regular interval (24 h) using
hypodermics syringe for N2O analysis along with various
water parameter studies. For all incubation studies, 0.07 g/L
inoculums were used. At 35 �C, the incubation studies were
carried out by putting the bottles in Julabo SW-22 shaking
incubators. The entire experiments were carried out for
7 days.
Gas sampling and analysis
Air samples were drawn through disposable syringe every
day at about 10:00 a.m. A gas chromatography (GC) of
make Shimadzu AA30 with electron capture detector
(ECD) was used to analyze N2O concentration. The GC is
equipped with auto gas sampler, semi-micro column, and
appropriate software to process the acquired data. The GC
was regularly standardized using NIST primary standard
gases. N2O in solution was determined by drawing known
amount of solution by a hypodermic needle and introduced
to a reactor under vacuum. After 5 min, the N2O stripped
was drawn and analyzed in GC as explained previously.
During N2O analysis in GC, the temperatures of column,
injector and ECD were 60�, 120�, and 350�, respectively.
The dissolved N2O in solution was estimated using Bunsen
absorption coefficient as shown below in Eq. 1 (Heincke
and Kaupenjohann 1999).
Y ¼ x� a Solution volume = head space volumeð Þ ð1Þ
where, a = 0.485, x is mass in head space, y is mass in
solution.
Each experiment was carried out in duplicate and
average value was taken for interpretation of results. The
variation of duplicate rate was within a range of ±5 %.
Water sample analysis
Parameters like nitrate nitrogen (N–NO3-), Nitrite (N–NO2
-),
ammonia (N–NH3), dissolved oxygen (DO), and COD were
analyzed following standard methods (Andert et al. 2011;
APHA, AWWA, WPCF 1998, 2005). pH of the samples was
measured using EUTECH-pH 1500 Meter.
Statistical analysis
Analysis of variance (ANOVA)
Two way ANOVA was used to determine whether signif-
icant role is played by the variables like days, nitrate
concentrations [KNO3 and Ca(NO3)2] and carbon source
(C6H12O6 and CH3COONa). Using Null hypothesis tech-
nique, the significance of the incubation parameters was
determined. Analysis of variance studies were carried out
using Microsoft office excel 2007 program. The raw
dataset were fed to the relevant excel program for carrying
out the detail statistical analyses.
Principal component analysis (PCA)
The incubation data were subjected to PCA to evaluate the
influence of various incubation parameters on the denitri-
fication rates. PCA was conducted using SPSS-10. In PCA,
Eigen values were used to determine the percentage of
variance as well as the cumulative percentage of variances.
A varimax rotation of different varifactors with factor
loading was calculated using Eigen values [1 and sorted
by the results having value [0.6 to have p \ 0.01.
Surface response modeling (optimization)
The incubation studies were carried out by statistically
designed experiments (Zahed et al. 2012; Rao et al. 2012;
Aber and Sheydaei 2012; Box et al. 1978). The principal
steps are determination of response variables, factors and
factor level, choice of experimental design, and statistically
analysis of data. For this purposes, three different sets of
experiments were carried out varying nitrate and organic
carbon source such as Set-1 [Ca(NO3)2 and CH3COONa],
Set-2 [Ca(NO3)2 and C6H12O6], and Set-3 (KNO3 and
CH3COONa). Design Expert v 8.0 was used for this work.
Removal of nitrate and COD
123
Author's personal copy
Equation’s format
All the equations written in this paper was been formatted
using Microsoft equation editor 2003, which is present in
MS-word 2003.
Results and discussions
Variation of nitrate concentration
Nitrate concentration varied from 7 to 37 mg NO3–N
(absolute values) to determine the N2O emission along with
denitrification rates. The denitrification rate for KNO3 was
observed to be more than CaNO3 may be due to more ionic
nature of the former. The decrease in nitrate concentration
in both the cases decreased progressively in time up to 4th
day, thereafter, decrease was very marginal, and the same
trend was observed for different initial nitrate concentra-
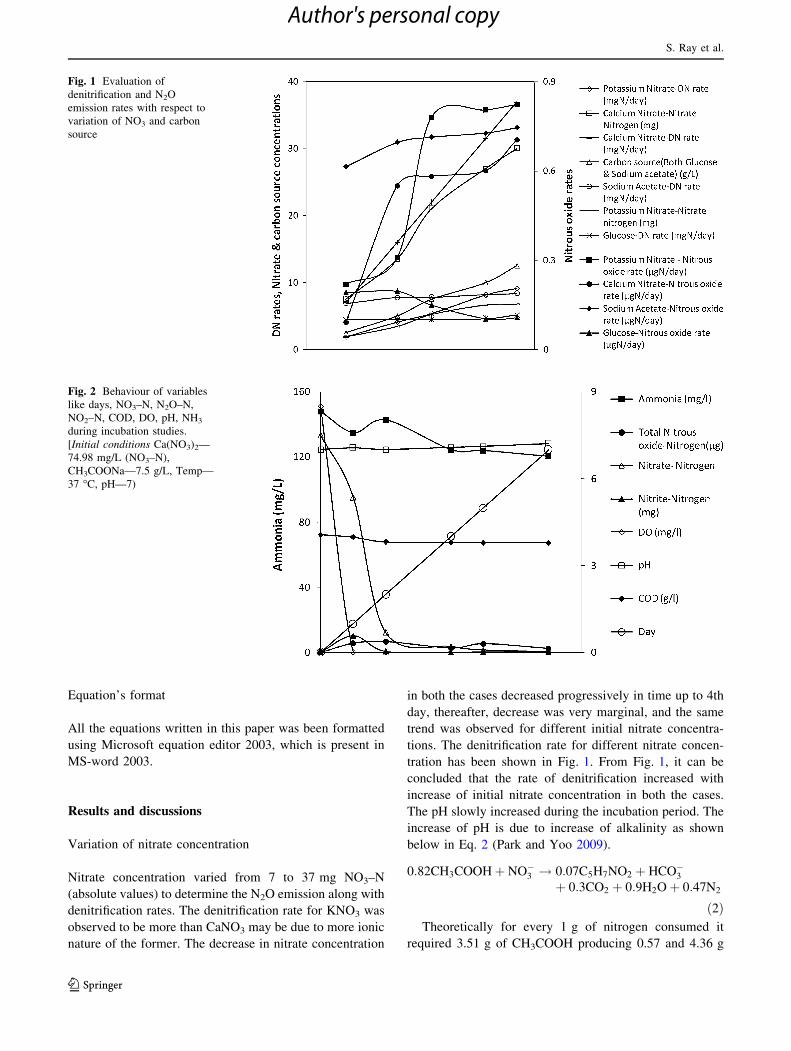
tions. The denitrification rate for different nitrate concen-
tration has been shown in Fig. 1. From Fig. 1, it can be
concluded that the rate of denitrification increased with
increase of initial nitrate concentration in both the cases.
The pH slowly increased during the incubation period. The
increase of pH is due to increase of alkalinity as shown
below in Eq. 2 (Park and Yoo 2009).
0:82CH3COOHþ NO�3 ! 0:07C5H7NO2 þ HCO�3þ 0:3CO2 þ 0:9H2Oþ 0:47N2
ð2ÞTheoretically for every 1 g of nitrogen consumed it
required 3.51 g of CH3COOH producing 0.57 and 4.36 g
Fig. 1 Evaluation of
denitrification and N2O
emission rates with respect to
variation of NO3 and carbon
source
Fig. 2 Behaviour of variables
like days, NO3–N, N2O–N,
NO2–N, COD, DO, pH, NH3
during incubation studies.
[Initial conditions Ca(NO3)2—
74.98 mg/L (NO3–N),
CH3COONa—7.5 g/L, Temp—
37 �C, pH—7)
S. Ray et al.
123
Author's personal copy
of biomass and alkalinity, respectively. The production of
alkalinity eventually increased the pH of the effluent.
Therefore, denitrification process is favored at higher pH
(Koren et al. 2000). The initial dissolved oxygen in the
media in all cases was around 8 mg/L. After the first day of
incubation, the DO was zero due to reaction of ammonia
with oxygen which may be due to the presence of aerobic
ammonium oxidizers (Sliekers et al. 2002; Feng et al.
2007) as shown in Eq. 3
NH3 þ 1:5O2 ! NO2 þ H2Oþ Hþ ð3Þ
The stoichiometry of the equation suggests that to
oxidize 1 g of NH3 it consumes 2.82 g of O2. Therefore, in
the present case, O2 availability for the oxidation reaction
is through DO as the denitrification process is carried out
under anaerobic conditions. The decrease of ammonia
concentration was commensurate with the decrease of DO.
After the first day the ammonia concentration decreased
due to oxidation to nitrate where nitrite is used as an
electron acceptor vide chemical Eq. 4 which may be due to
the presence of anaerobic ammonium oxidizers (Sliekers
et al. 2002; Feng et al. 2007)
NH3 þ 1:32NO�2 þ Hþ ! 1:02N2 þ 0:26NO�3 þ 2H2O
ð4Þ
The nitrite concentration progressively increased up to
3rd day of incubation and there after it showed a negative
trend. The N2O concentration both in the liquid and the gas
phase increased up to 4th day of incubation and there after
decreased. The initial N2O emission rate may be due to
formation of NO2- in the solution (Mathieu et al. 2006;
Wolf and Russow 2000) may be due to enzyme bound
NO2- (NO2
-)e (Wolf and Russow 2000). COD decreased
with time due to denitrification as well as formation of
biomass given by Eq. 2 (results not shown). Figure 2
shows a typical curve of all the variables (Days, N–N2O,
N–NO3-, N–NO2
-, DO, pH, COD, NH3) during
incubation period for a particular data set (Joo et al.
2007) as similar observations were observed in all other
cases. All these variables play an important role in
determining the rate kinetics in denitrification as well as
anaerobic ammonium oxidation process. N2O shown here
as a variable, was emitted as a byproduct during the
denitrification process (Wrage et al. 2001).
Since the rate of bacterial growth is directly proportional
to denitrification, the specific growth rate constant of
bacteria in lg can be calculated by plotting log N2O con-
centration (a metabolite) versus time for each dataset (Das
2002). The slope of the graph would give lg. The regen-
eration time, td, can be evaluated using Eq. 5
td ¼ 0:693=lg ð5Þ
The regeneration time for different experimental
conditions observed to vary between 1 and 3 days
depending on nitrate concentrations as well as organic
source. A faster regeneration time was observed in case of
Table 1 ANOVA for different parameters
Variables F p value F critical Remarks
CaNO3
Denitrification Days 17.59 1.02E-06 2.71 Significant
NO3 5.83 0.002816 2.87 Significant
N2O emission Days 7.64 0.000373 2.71 Significant
N–N2O 3.65 0.02163 2.87 Significant
KNO3
Denitrification Days 16.14 2.01E-06 2.71 Significant
NO3 5.12 0.005238 2.87 Significant
N2O emission Days 10.43 4.91E-05 2.71 Significant
N–N2O 10.95 7.20E-05 2.87 Significant
CH3COONa
Denitrification Days 46.72 1.28E-08 2.9 Significant
NO3 5.26 0.01117 3.29 Significant
N2O emission Days 21.87 2.12E-06 2.9 Significant
N–N2O 9.63 0.000862 3.29 Significant
C6H12O6
Denitrification Days 297.36 1.52E-19 2.49 Significant
NO3 7.91 0.001019 3.07 Significant
N2O emission Days 32.1 7.81E-10 2.49 Significant
N–N2O 16.74 8.74E-06 3.07 Significant
Removal of nitrate and COD
123
Author's personal copy
KNO3 as well as CH3COONa compared to Ca(NO3)2 and
C6H12O6 indicating that the dentrification was more in the
former.
Variation of organic source concentration
Two different types of organic carbon source such as
C6H12O6 and CH3COONa of various concentrations were
used to determine the denitrification as well as N2O
emission rate. The NO2- concentration varied in the range
0.2–5.7 mg (N–NO2-) when C6H12O6 concentration varied
in the range 2.5–12.5 g/L. For CH3COONa concentration
variation in the same range the NO2- concentration varied
from 0.85 to 9.51 mg (N–NO2-). The denitrification rate
increased with increase of organic source as shown in
Fig. 2. The denitrification rate in the presence of C6H12O6
was less compared to CH3COONa. The pH slowly
increased with time as observed in the previous case. The
DO decreases to ‘‘0’’ value after the first day (Fig. 2). The
nitrite concentration in the presence of C6H12O6 was less
than CH3COONa. The N2O emission rate in the presence
of C6H12O6 was also less due to formation of small amount
of nitrite during incubation reaction. N2O emission rate for
different organic source are shown in Fig. 1.
Statistical interpretation
Analysis of variance
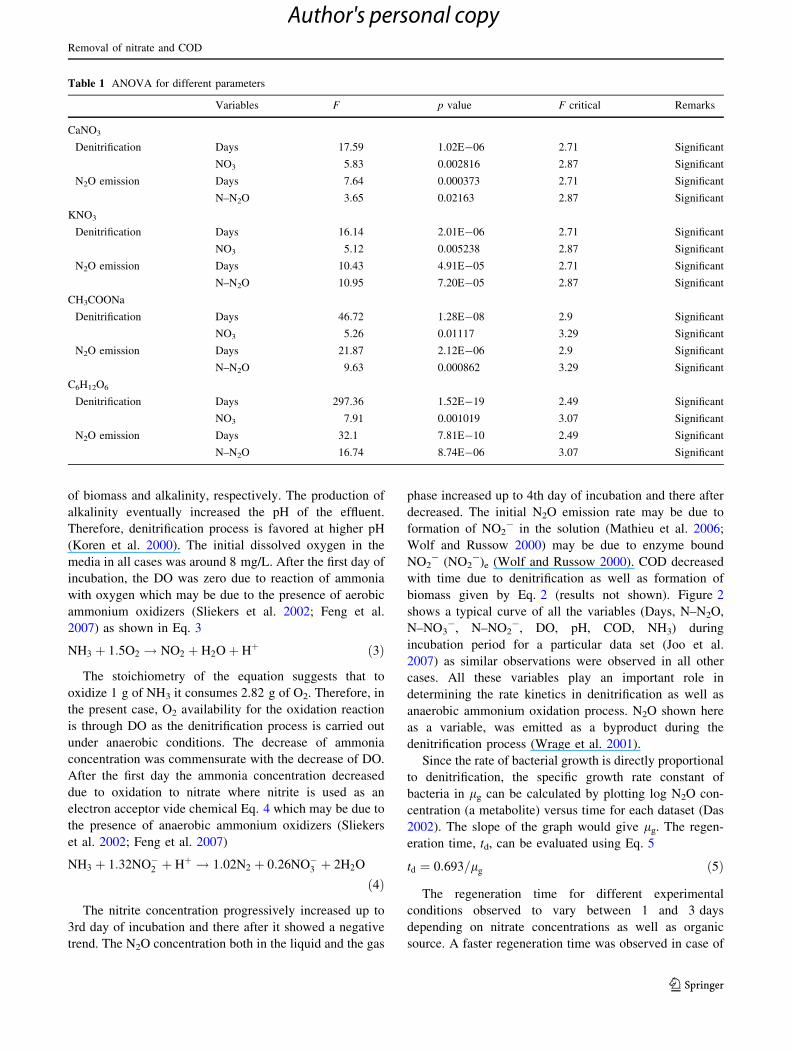
Two way ANOVA studies was carried out in detail to find
out whether the variables like days of incubation, nitrate
concentration [KNO3 and Ca(NO3)2] and organic source
(C6H12O6 and CH3COONa) have any significant role or
not. The results are shown in Table 1. From Table 1, it can
be concluded that time, nutrient concentration (nitrate and
organic source) and emission of N2O had a significant
variation during incubation studies.
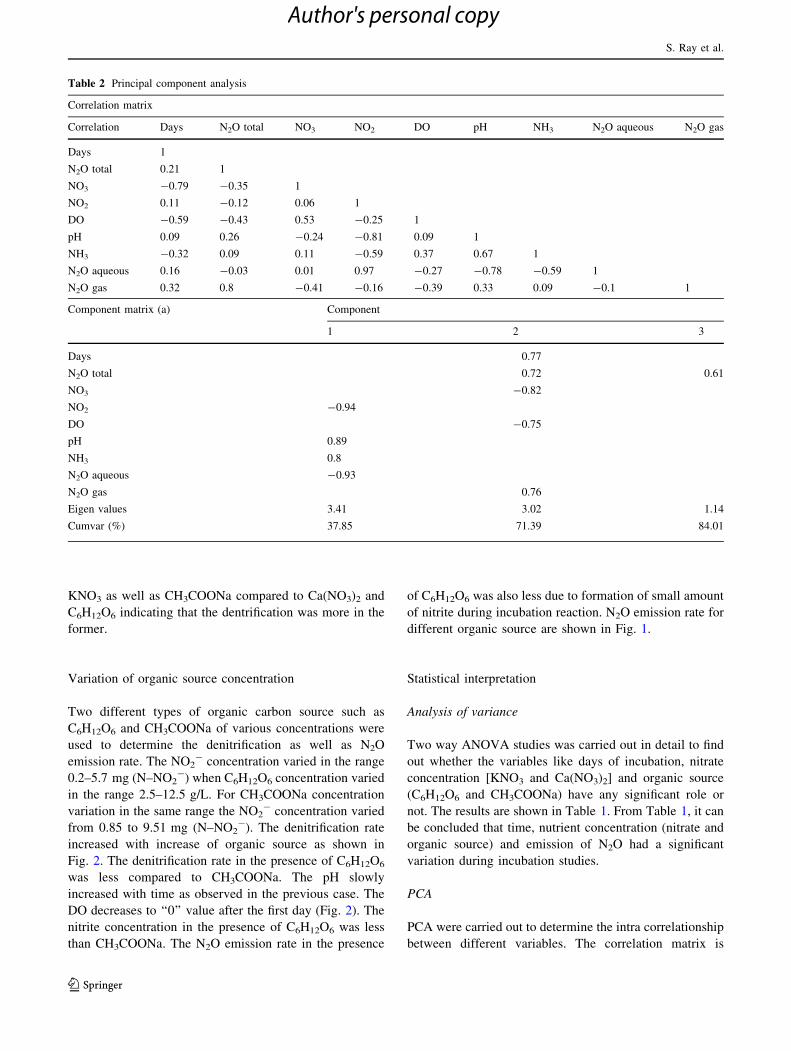
PCA
PCA were carried out to determine the intra correlationship
between different variables. The correlation matrix is
Table 2 Principal component analysis
Correlation matrix
Correlation Days N2O total NO3 NO2 DO pH NH3 N2O aqueous N2O gas
Days 1
N2O total 0.21 1
NO3 -0.79 -0.35 1
NO2 0.11 -0.12 0.06 1
DO -0.59 -0.43 0.53 -0.25 1
pH 0.09 0.26 -0.24 -0.81 0.09 1
NH3 -0.32 0.09 0.11 -0.59 0.37 0.67 1
N2O aqueous 0.16 -0.03 0.01 0.97 -0.27 -0.78 -0.59 1
N2O gas 0.32 0.8 -0.41 -0.16 -0.39 0.33 0.09 -0.1 1
Component matrix (a) Component
1 2 3
Days 0.77
N2O total 0.72 0.61
NO3 -0.82
NO2 -0.94
DO -0.75
pH 0.89
NH3 0.8
N2O aqueous -0.93
N2O gas 0.76
Eigen values 3.41 3.02 1.14
Cumvar (%) 37.85 71.39 84.01
S. Ray et al.
123
Author's personal copy
shown in Table 2. Day’s incubation time showed a nega-
tive correlation with nitrate and DO as the reaction
involves denitrification which was being carried out under
anaerobic conditions. It showed positive correlation with
N2O which indicates that the gas emission rate would
increase with time. The emission of N2O total (gas and
liquid) showed a negative correlation with nitrate and DO.
This is obvious as emission of N2O depends on the deni-
trification rate. Nitrate has a positive correlation with DO
which indicates that denitrification is not favored at higher
DO. pH showed a positive correlation with NH3 whereas
NH3 showed a negative correlation with N2O. This may be
due to denitrification process which involves alkalification
and NH3 is not involved in the formation of N2O,
respectively.
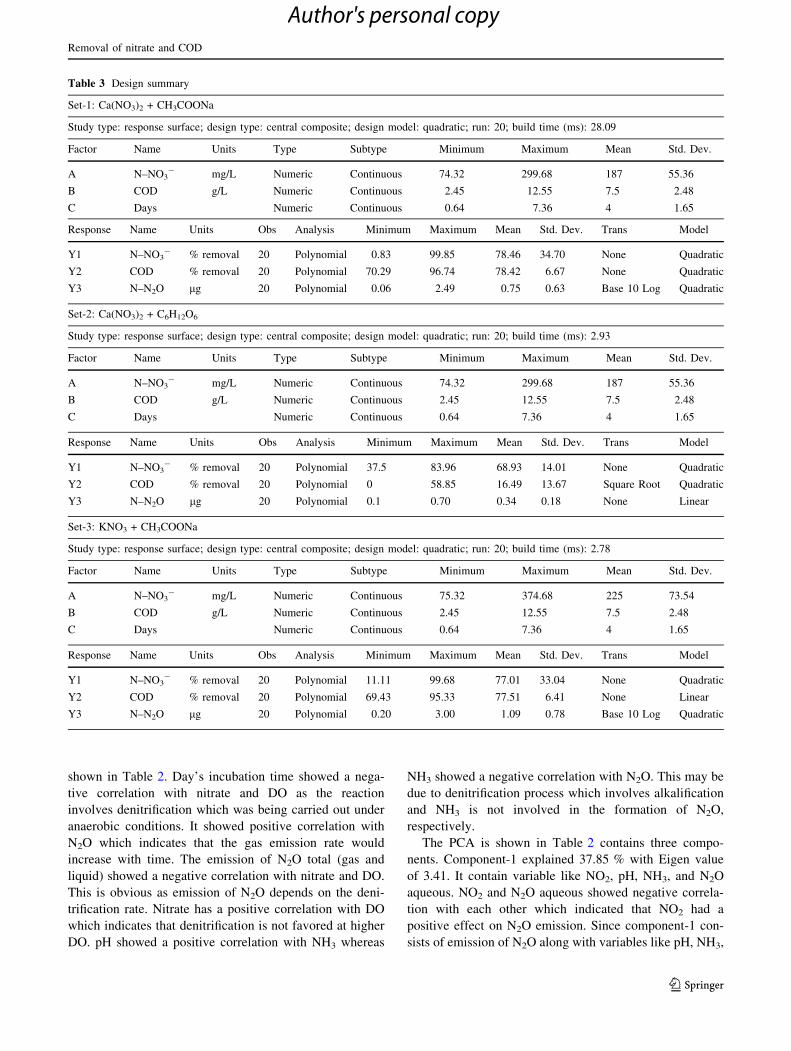
The PCA is shown in Table 2 contains three compo-
nents. Component-1 explained 37.85 % with Eigen value
of 3.41. It contain variable like NO2, pH, NH3, and N2O
aqueous. NO2 and N2O aqueous showed negative correla-
tion with each other which indicated that NO2 had a
positive effect on N2O emission. Since component-1 con-
sists of emission of N2O along with variables like pH, NH3,
Table 3 Design summary
Set-1: Ca(NO3)2 + CH3COONa
Study type: response surface; design type: central composite; design model: quadratic; run: 20; build time (ms): 28.09
Factor Name Units Type Subtype Minimum Maximum Mean Std. Dev.
A N–NO3- mg/L Numeric Continuous 74.32 299.68 187 55.36
B COD g/L Numeric Continuous 2.45 12.55 7.5 2.48
C Days Numeric Continuous 0.64 7.36 4 1.65
Response Name Units Obs Analysis Minimum Maximum Mean Std. Dev. Trans Model
Y1 N–NO3- % removal 20 Polynomial 0.83 99.85 78.46 34.70 None Quadratic
Y2 COD % removal 20 Polynomial 70.29 96.74 78.42 6.67 None Quadratic
Y3 N–N2O lg 20 Polynomial 0.06 2.49 0.75 0.63 Base 10 Log Quadratic
Set-2: Ca(NO3)2 + C6H12O6
Study type: response surface; design type: central composite; design model: quadratic; run: 20; build time (ms): 2.93
Factor Name Units Type Subtype Minimum Maximum Mean Std. Dev.
A N–NO3- mg/L Numeric Continuous 74.32 299.68 187 55.36
B COD g/L Numeric Continuous 2.45 12.55 7.5 2.48
C Days Numeric Continuous 0.64 7.36 4 1.65
Response Name Units Obs Analysis Minimum Maximum Mean Std. Dev. Trans Model
Y1 N–NO3- % removal 20 Polynomial 37.5 83.96 68.93 14.01 None Quadratic
Y2 COD % removal 20 Polynomial 0 58.85 16.49 13.67 Square Root Quadratic
Y3 N–N2O lg 20 Polynomial 0.1 0.70 0.34 0.18 None Linear
Set-3: KNO3 + CH3COONa
Study type: response surface; design type: central composite; design model: quadratic; run: 20; build time (ms): 2.78
Factor Name Units Type Subtype Minimum Maximum Mean Std. Dev.
A N–NO3- mg/L Numeric Continuous 75.32 374.68 225 73.54
B COD g/L Numeric Continuous 2.45 12.55 7.5 2.48
C Days Numeric Continuous 0.64 7.36 4 1.65
Response Name Units Obs Analysis Minimum Maximum Mean Std. Dev. Trans Model
Y1 N–NO3- % removal 20 Polynomial 11.11 99.68 77.01 33.04 None Quadratic
Y2 COD % removal 20 Polynomial 69.43 95.33 77.51 6.41 None Linear
Y3 N–N2O lg 20 Polynomial 0.20 3.00 1.09 0.78 Base 10 Log Quadratic
Removal of nitrate and COD
123
Author's personal copy
and NO2, therefore, this component can be termed as N2O
emission factor. Component-2 explained 71.4 % cumula-
tive variance with Eigen value of 3.02. This component
contains variables like days, incubation time, N2O (total),
nitrate, DO, and N2O gas. All the variables are positively
correlated except nitrate and DO. The positive correlation
with each other suggested that N2O emission would
increased with incubation time. Since factor-2 contains the
various variables, therefore, it can be termed as N2O var-
iable factor. Factor-3 explained 84.01 % with Eigen value
of 1.14. It contains only one variable that is N2O total.
Incubation studies using RSM
As explained earlier denitrification studies were carried out
by varying parameters i.e., nitrate and organic source.
Samples were collected at regulars to analyze the param-
eters such as N–NO3-, COD, N–NO2
-, N–N2O, N–NH3,
and DO. Among all these parameters the concentrations of
N–NO3-, COD, N–N2O and days were taken into consid-
eration for RSM studies. The main aim is to maximize the
removal efficiency of the responses like N–NO3-, COD
and simultaneously minimize N–N2O emission as it is one
of the GHG. Keeping in view of the above some efforts
have been initiated to optimize the overall process through
RSM. Coding was done to reduce the range of each factor
to a common scale, regardless of the magnitude, the typical
scheme being to set-1 as lower level, ?1 as upper level and
0 as middle level.
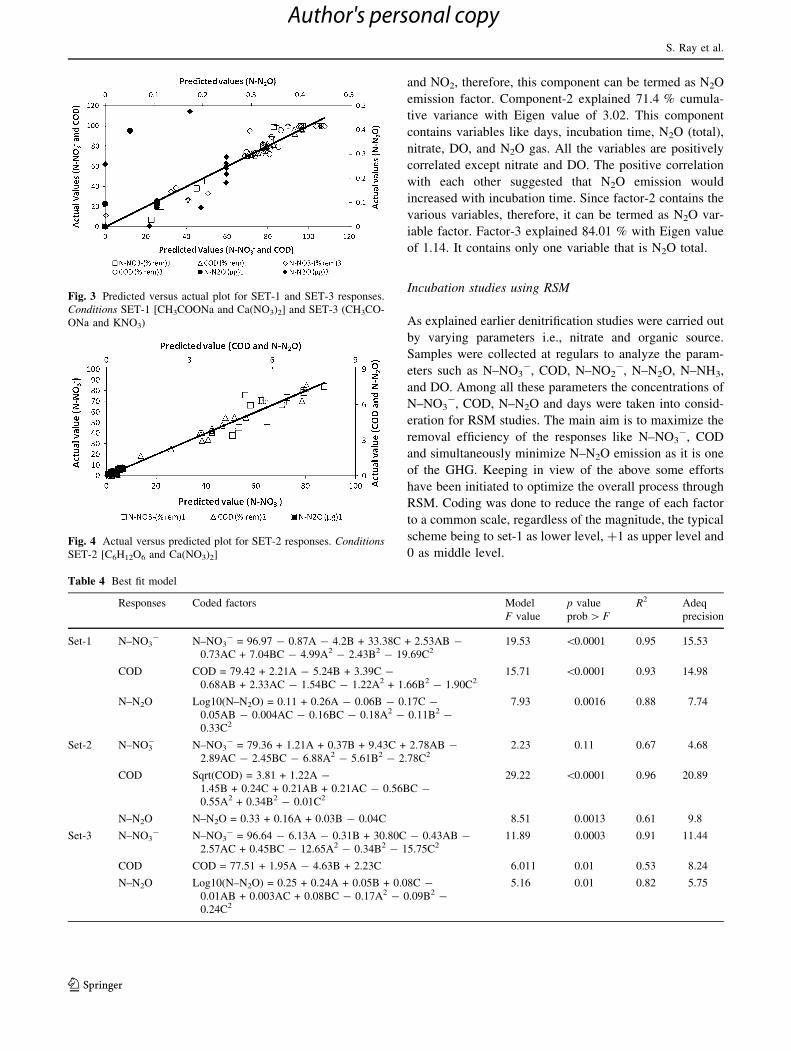
Fig. 3 Predicted versus actual plot for SET-1 and SET-3 responses.
Conditions SET-1 [CH3COONa and Ca(NO3)2] and SET-3 (CH3CO-
ONa and KNO3)
Fig. 4 Actual versus predicted plot for SET-2 responses. ConditionsSET-2 [C6H12O6 and Ca(NO3)2]
Table 4 Best fit model
Responses Coded factors Model
F value
p value
prob [ FR2 Adeq
precision
Set-1 N–NO3- N–NO3
- = 96.97 - 0.87A - 4.2B + 33.38C + 2.53AB -
0.73AC + 7.04BC - 4.99A2 - 2.43B2 - 19.69C219.53 \0.0001 0.95 15.53
COD COD = 79.42 + 2.21A - 5.24B + 3.39C -
0.68AB + 2.33AC - 1.54BC - 1.22A2 + 1.66B2 - 1.90C215.71 \0.0001 0.93 14.98
N–N2O Log10(N–N2O) = 0.11 + 0.26A - 0.06B - 0.17C -
0.05AB - 0.004AC - 0.16BC - 0.18A2 - 0.11B2 -
0.33C2
7.93 0.0016 0.88 7.74
Set-2 N–NO3- N–NO3
- = 79.36 + 1.21A + 0.37B + 9.43C + 2.78AB -
2.89AC - 2.45BC - 6.88A2 - 5.61B2 - 2.78C22.23 0.11 0.67 4.68
COD Sqrt(COD) = 3.81 + 1.22A -
1.45B + 0.24C + 0.21AB + 0.21AC - 0.56BC -
0.55A2 + 0.34B2 - 0.01C2
29.22 \0.0001 0.96 20.89
N–N2O N–N2O = 0.33 + 0.16A + 0.03B - 0.04C 8.51 0.0013 0.61 9.8
Set-3 N–NO3- N–NO3
- = 96.64 - 6.13A - 0.31B + 30.80C - 0.43AB -
2.57AC + 0.45BC - 12.65A2 - 0.34B2 - 15.75C211.89 0.0003 0.91 11.44
COD COD = 77.51 + 1.95A - 4.63B + 2.23C 6.011 0.01 0.53 8.24
N–N2O Log10(N–N2O) = 0.25 + 0.24A + 0.05B + 0.08C -
0.01AB + 0.003AC + 0.08BC - 0.17A2 - 0.09B2 -
0.24C2
5.16 0.01 0.82 5.75
S. Ray et al.
123
Author's personal copy
Central composite design with two labeled factorial
points such as axial and center was done (Rao et al. 2012;
Rath et al. 2012). The axial point is having all factors set to
zero, except one factor which has the value ± a. a represents
the distance from the center of the designed space to an axial
point. Since, in this study, the factors are \5, therefore,
rotatable models were chosen which correspond the alpha
value 1.68. The factorial points such as N–NO3-, COD and
days were considered as input value to analyze the responses
like N–NO3-, COD, and N–N2O. The designed summary is
shown in Table 3. The actual versus predicted value for the
responses are shown in Figs. 3 and 4. Table 4 shows the final
equation in terms of coded factors and respective F values,
Prob [ F values, R2 values and adequate precision along
with model fit. In Set-1 all the responses fits to the quadratic
model. In case of COD, the model F value was observed to be
15.71 which describe the model to be significant. The
Prob [ F\0.0001 indicates the model term to be significant.
Adequate precision were undertaken so that the measure of
signal to noise ratio, should be[4. So in conclusions, all the
statistical values are significant which shows the validity of
the model (Rath et al. 2012). Similar values were obtained for
all other responses as well as Sets. A number of solutions
were available but the maximum desirability was chosen.
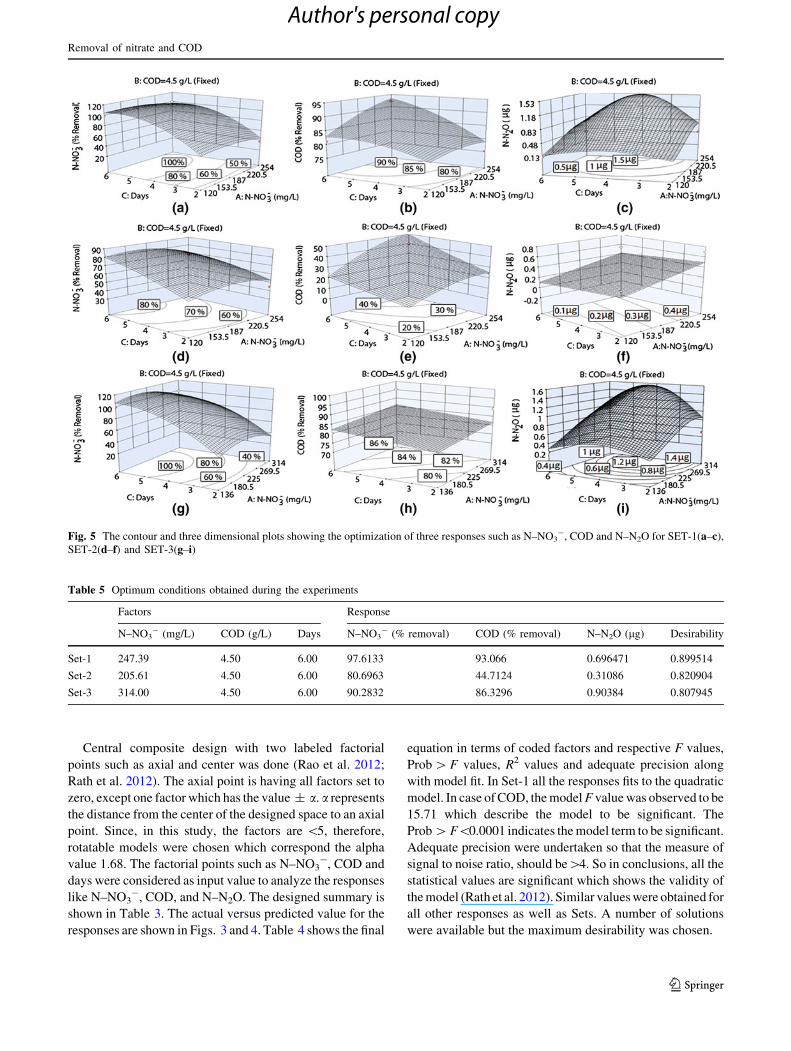
Fig. 5 The contour and three dimensional plots showing the optimization of three responses such as N–NO3-, COD and N–N2O for SET-1(a–c),
SET-2(d–f) and SET-3(g–i)
Table 5 Optimum conditions obtained during the experiments
Factors Response
N–NO3- (mg/L) COD (g/L) Days N–NO3
- (% removal) COD (% removal) N–N2O (lg) Desirability
Set-1 247.39 4.50 6.00 97.6133 93.066 0.696471 0.899514
Set-2 205.61 4.50 6.00 80.6963 44.7124 0.31086 0.820904
Set-3 314.00 4.50 6.00 90.2832 86.3296 0.90384 0.807945
Removal of nitrate and COD
123
Author's personal copy
In the present studies, three responses were considered
such as N–N2O, N–NO3-, and COD along with three
factors like days, COD and N–NO3-. To evaluate the
overall design, the effect of each factor on the particular
response was considered using the contour with 3D plots.
The contour and 3D plots using the quadratic model was
developed by keeping one variable constant at a time. The
optimized contour with 3D plots for responses like
N–NO3-, N–N2O, and COD are shown in Fig. 5a–h for Set-1
(a–c), Set-2 (d–f) and Set-3 (g–i). All the input variables
like nitrate and organic carbon source concentration were
shown in Table 3. Figure 5a shows the contour with 3D
plot for two variables like N–NO3- and days keeping the
other variable COD constant at 4.50 g/L. The % of
N–NO3- removal increased with increase in days. 100 %
N–NO3- removal could be obtained at N–NO3
- concentration
and days ranged between 120–240 mg/L and 4–6 days,
respectively. Figure 5b shows COD removal increased
with increase in N–NO3- concentration and days. 90 %
COD removal could be obtained at N–NO3- concentration
and days ranged between 195–254 mg/L and 4.7–6 days,
respectively. Figure 5c shows 1.5 lg of N–N2O could be
obtained at N–NO3- concentration and days ranged
between 230–254 mg/L and 3.7–4.3 days. Similar expla-
nations could be given for two other sets namely set-2 and
set-3. In Set-1, the optimum values of the process time,
initial N–NO3- concentration and initial COD concentra-
tion in the aqueous solution were found to be 6 days,
247.39 mg/L, 4.50 g/L, respectively. During the optimal
values of the process parameters, a maximum N–NO3-
removal of 97.61 %, and COD removal of 93.07 % was
obtained. Also, the N–N2O formation was minimized to
2.96 lg. A maximum desirability of 0.89 is obtained in
Set-1 having Ca(NO3)2 as nitrate source and CH3COONa
as carbon source. Desirability is an objective function and
varies between 0 and 1 (Rao et al. 2012). Higher the
desirability value indicates the closeness between esti-
mated and experimental values. In the present case, the
desirability values were nearly 0.9 in all the three cases
which unequivocally proves the adequacy of the model.
The optimum conditions obtained during the experiments
along with desirability value is shown in Table 5.
Conclusions
The denitrification rates varied between 1.9 and 9.1 mg
N/day for nitrate as well as organic concentration. The
denitrification rate observed to be higher in the presence of
KNO3 as well as CH3COONa compared to Ca(NO3)2 and
C6H12O6. The N2O emission rate was varied from 0.12 to
0.82 lg N/day for nitrate along with carbon concentrations.
In the presence of CH3COONa and KNO3, the N2O
emission rate was observed to be higher. Detailed statistical
analysis like ANOVA and PCA were carried out. Two way
ANOVA analyses were carried out, and it was observed
that the variables like NO3-, incubation period, and
organic source played a vital role on the emission of N2O.
The PCA showed that the variables can be accommodated
in three components explaining 84 % of total cumulative
variance and the Eigen value of component 1, 2, and 3 are
3.41, 3.02, and 1.14, respectively. The optimization studies
were carried out to minimize N-N2O emission and maxi-
mize the N–NO3- along with COD removal through
denitrification process. In Set-1 under optimized conditions
(N–NO3-—247.39 mg/L, COD—4.5 g/L, time—6 days),
N–NO3- and COD removal efficiency were observed to be
97.61 and 93.07 %, respectively. N–N2O emissions were
minimized to 0.69 lg. Maximum N–NO3- and COD
removal was obtained in Set-1 in comparison with Set-2
and Set-3. The desirability factor for all the three Sets of
experiment were ranged from 0.81 to 0.9.
Acknowledgments The authors were thankful to Director, CSIR-
IMMT, for his kind permission to publish this paper. One of the
author (SR) thanks DST, New Delhi, for the award of INSPIRE
Fellowship. The authors are thankful to MoEF, New Delhi, for the
financial support without which the work could not have been done.
The authors highly acknowledge the anonymous reviewers for their
valuable suggestions, without which the manuscript may not have
come to this stage.
References
Aber S, Sheydaei M (2012) Removal of COD from industrial effluent
containing indigo dye using adsorption method by activated
carbon cloth: optimization, kinetic, and isotherm studies. Clean
Soil Air Water 40(1):87–94
Andert J, Wessen E, Borjesson G, Hallin S (2011) Temporal changes
in abundance and composition of ammonia-oxidizing bacterial
and archaeal communities in a drained peat soil in relation to
N2O emissions. J Soils Sediments 11:1399–1407
APHA (2005) Standard methods for the examination of water and
wastewater. American Public Health Association, American
Water Works Association and Water Environment Federation,
Washington
APHA, AWWA, WPCF (1998) Standard methods for the examina-
tion of water and wastewater, 20th edn. American Public Health
Association, Washington DC
Bergstermann A, Cardenas L, Bol R, Gilliam L, Goulding K, Meijide
A, Scholefield D, Vallejo A, Well R (2011) Effect of antecedent
soil moisture conditions on emissions and isotopologue distri-
bution of N2O during denitrification. Soil Biol Biochem 43:
240–250
Box GEP, Hunter JS, Hunter WG (1978) An introduction to design
data analysis and model building. Wiley, New York
Dai Z, Trettin CC, Li C, Li H, Sun G, Amatya DM (2012) Effect of
assessment scale on spatial and temporal variations in CH4, CO2
and N2O fluxes in a forested wetland. Water Soil Air Pollut
223:253–265
Das T (2002) Bio oxidation of iron using Thiobacillus ferrooxidans.
Doctoral Dissertation Thesis, Utkal University
Faulwetter JL, Gagnon V, Sundberg C, Chazarenc F, Burr MD,
Brisson J, Camper AK, Stein OR (2009) Microbial process
S. Ray et al.
123
Author's personal copy
influencing performance of treatment wetlands: a review. Ecol
Eng 35:987–1004
Feng YJ, Tseng SK, Hsia TH, Ho CM, Chou WP (2007) Partial
nitrification of ammonium-rich waste water as pretreatment for
anaerobic ammonium oxidation (anammox) using membrane
aeration bioreactor. J Biosci Bioeng 3:182–187
Firestone MK (1982) Biological denitrification. In Stevenson FJ (ed)
Nitrogen in agricultural soils. Agronomy 22:289–326
Foley J, De Hass D, Yuan Z, Lant P (2010) Nitrous oxide generation
in full-scale biological nutrient removal wastewater treatment
plants. Water Res 44:831–844
Gogoi B, Baruah KK (2012) Nitrous oxide emissions from fields with
different wheat and rice varieties. Pedosphere 22(1):112–121
Heincke M, Kaupenjohann M (1999) Effects of soil solution on the
dynamics of N2O emissions: a review. Nutr Cycl Agroecosys
55:133–157
Hu Z, Lee JW, Chandran K, Kim S, Khanal SK (2012) Nitrous oxide
(N2O) emission from aquaculture: a review. Environ Sci Technol
46:6470–6480
IPCC (2007) Climate changes: the scientific basis. Contribution of
working group 1 to the third assessment report of the intergov-
ernmental panel on climate change. Cambridge University Press,
Cambridge
Joo HS, Hirai M, Shoda M (2007) Improvement in ammonium
removal efficiency in wastewater treatment by mixed culture of
Alcaligenes faecalis No. 4 and L1. J Biosci Bioeng 103(1):66–73
Kampschreur MJ, Temmink H, Kleerebezem R, Jetten MSM, Van
Loosdrecht MCM (2009) Nitrous oxide emission during waste-
water treatment. Water Res 43:4093–4103
Koren DW, Gould WD, Bedard P (2000) Biological removal of
ammonia and nitrate from simulated mine and mine effluents.
Hydrometallurgy 56:127–144
Laverman AM, Garnier JA, Mounier EM, Roose-Amsaleg CL (2010)
Nitrous oxide production kinetics during nitrate reduction in
river sediments. Water Res 44:1753–1764
Marinho EVA, Delaune RD, Lindau CW (2004) Nitrous oxide flux
from soybeans grown on Mississippi alluvial soil. Commun Soil
Sci Plant Anal 35(1–2):1–8
Mathieu O, Leveque J, Henault C, Milloux MJ, Bizouard F, Andreux
F (2006) Emission and spatial variability of N2O, N2 and nitrous
oxide mole fraction at the field scale, revealed with 15N isotopic
techniques. Soil Biol Biochem 38:941–951
Metcalf and Eddy (2003) Wastewater engineering treatment and
reuses, 4th ed. McGraw-Hill, New York
Nelson LM, Knowles R (1978) Effect of oxygen and nitrate on
nitrogen fixation and denitrification by Azospirillum brasilensegrown in continuous culture. Can J Microbiol 24:1395–1403
Pant D, Van Bogaert G, Diels L, Vanbroekhoven K (2010) A review of
the substrates used in microbial fuel cells (MFCs) for sustainable
energy production. Bioresour Technol 101(6):1533–1543
Park JY, Yoo YJ (2009) Biological nitrate removal in industrial waste
water treatment: which electron donor we can choose: mini-
review. Appl Microbiol Biotechnol 82:415–429
Rabaey K, Verstraete W (2005) Microbial fuel cells: novel biotech-
nology for energy generation. Trends Biotechnol 23:291–298
Ramulu TS, Sahoo SK, Baral SS, Das SN, Swamy YV, Roy
Chaudhury G (2008) Estimation of nitrous oxide emission from
pulse cultivation in rain-fed uplands. Curr Sci 95(5):584–585
Ramulu TS, Sahoo SK, Mohapatra RK, Roy Chaudhury G, Das SN
(2009) Emission of N2O on pulse–rice crop rotation in upland.
Atmos Environ 43(97):2087–2090
Rao KS, Anand S, Rout K, Venkateswarlu P (2012) Response surface
optimization for removal of cadmium from aqueous solution by
waste agricultural biosorbent Psidium guvajava L. leaf powder.
Clean Soil Air Water 40(1):80–86
Rath SS, Nayak P, Mukherjee PS, Roy Chaudhury G, Mishra BK
(2012) Treatment of electronic waste to recover metal values
using thermal plasma coupled with acid leaching—a response
surface modeling approach. Waste Manag 32(3):575–583. doi:
10.1016/j.wasman.2011.11.001
Sahoo SK, Ramulu TS, Kumar M, Roy Chaudhury G, Das SN (2010)
Emission of N2O from farmer’s field during black gram
cultivation and incubation experiments in laboratory. Toxicol
Environ Chem 92:1043–1052
Sliekers AO, Derwort N, Gomez JLC, Strous M, Kuenen JG, Jetten
MSM (2002) Completely autotrophic nitrogen removal over
nitrite in one single reactor. Water Res 36:2475–2482
Tallec G, Garnier J, Billen G, Gousailles M (2008) Nitrous oxide
emissions from denitrifying activated sludge of urban waste
water treatment plants, under anoxia and low oxygenation.
Bioresour Technol 99(7):2200–2209
Tavares P, Pereira AS, Moura JJG, Moura I (2006) Mettalloenzymes
of the denitrification pathway. J Inorg Biochem 100:2087–2100
Terai H, Mori T (1975) Studies on phosphorylation coupled with
denitrification and aerobic respiration in Pseudomonas denitrif-icans. Bot Mag 38:231–244
Toma Y, Takakai F, Darung U, Kuramochi K, Limin SH, Dohong S,
Hatano R (2011) Nitrous oxide emission derived from soil organic
matter decomposition from tropical agricultural peat soil in central
Kalimantan, Indonesia. Soil Sci Plant Nutr 57(3):436–451
Wolf I, Russow R (2000) Different pathways of formation of N2O, N2
and NO in black earth soil. Soil Biol Biochem 32:229–239
Wrage N, Velthof GL, Van Beusichem ML, Oenema O (2001) Role
of nitrifier denitrification in the production of nitrous oxide. Soil
Biol Biochem 33:1723–1732
Yang WH, The YA, Silver W (2011) A test of a field-based 15N-
nitrous oxide pool dilution technique to measure gross N2O
production in soil. Glob Chang Biol 17:3577–3588
Zahed MA, Aziz HA, Isa MH, Mohajeri L (2012) Response surface
analysis to improve dispersed crude oil biodegradation. Clean
Soil Air Water 40:262–267
Removal of nitrate and COD
123
Author's personal copy