Remote Sensing and Geographic Information Systems (GIS) Contribution to the Inventory of...
18
Geosciences 2012, 2, 203-220; doi:10.3390/geosciences2040203 geosciences ISSN 2076-3263 www.mdpi.com/journal/geosciences Article Remote Sensing and Geographic Information Systems (GIS) Contribution to the Inventory of Infrastructure Susceptible to Earthquake and Flooding Hazards in North-Eastern Greece Barbara Theilen-Willige 1, *, Paraskevas Savvaidis 2 , Ilias N. Tziavos 3 and Ioanna Papadopoulou 2 1 Institute of Applied Geosciences, Berlin University of Technology (TU Berlin), Berlin D-10587, Germany 2 Laboratory of Geodesy and Geomatics, Department of Civil Engineering, Aristotle University of Thessaloniki, Thessaloniki 54124, Greece; E-Mails: [email protected] (P.S.); [email protected] (I.P.) 3 Department of Geodesy and Surveying, School of Rural and Surveying Engineering, Aristotle University of Thessaloniki, Thessaloniki 54124, Greece, E-Mail: [email protected] * Author to whom correspondence should be addressed; E-Mail: [email protected]; Tel.:+49-7771-1868. Received: 1 August 2012; in revised form: 12 September 2012 / Accepted: 17 September 2012 / Published: 27 September 2012 Abstract: For civil protection reasons there is a strong need to improve the inventory of areas that are more vulnerable to earthquake ground motions or to earthquake-related secondary effects, such as landslides, liquefaction or soil amplifications. The use of remote sensing and Geographic Information Systems (GIS) methods along with the related geo-databases can assist local and national authorities to be better prepared and organized. Remote sensing and GIS techniques are investigated in north-eastern Greece in order to contribute to the systematic, standardized inventory of those areas that are more susceptible to earthquake ground motions, to earthquake-related secondary effects and to tsunami-waves. Knowing areas with aggregated occurrence of causal (“negative”) factors influencing earthquake shock and, thus, the damage intensity, this knowledge can be integrated into disaster preparedness and mitigation measurements. The evaluation of satellite imageries, digital topographic data and open source geodata contributes to the acquisition of the specific tectonic, geologic and geomorphologic settings influencing local site conditions in an area and, thus, estimate possible damage to be suffered. OPEN ACCESS
-
Upload
independent -
Category
Documents
-
view
1 -
download
0
Transcript of Remote Sensing and Geographic Information Systems (GIS) Contribution to the Inventory of...
Geosciences 2012, 2, 203-220; doi:10.3390/geosciences2040203
geosciences ISSN 2076-3263
www.mdpi.com/journal/geosciences
Article
Remote Sensing and Geographic Information Systems (GIS) Contribution to the Inventory of Infrastructure Susceptible to Earthquake and Flooding Hazards in North-Eastern Greece
Barbara Theilen-Willige 1,*, Paraskevas Savvaidis 2, Ilias N. Tziavos 3 and Ioanna Papadopoulou 2
1 Institute of Applied Geosciences, Berlin University of Technology (TU Berlin),
Berlin D-10587, Germany 2 Laboratory of Geodesy and Geomatics, Department of Civil Engineering, Aristotle University of
Thessaloniki, Thessaloniki 54124, Greece;
E-Mails: [email protected] (P.S.); [email protected] (I.P.) 3 Department of Geodesy and Surveying, School of Rural and Surveying Engineering, Aristotle
University of Thessaloniki, Thessaloniki 54124, Greece, E-Mail: [email protected]
* Author to whom correspondence should be addressed; E-Mail: [email protected];
Tel.:+49-7771-1868.
Received: 1 August 2012; in revised form: 12 September 2012 / Accepted: 17 September 2012 /
Published: 27 September 2012
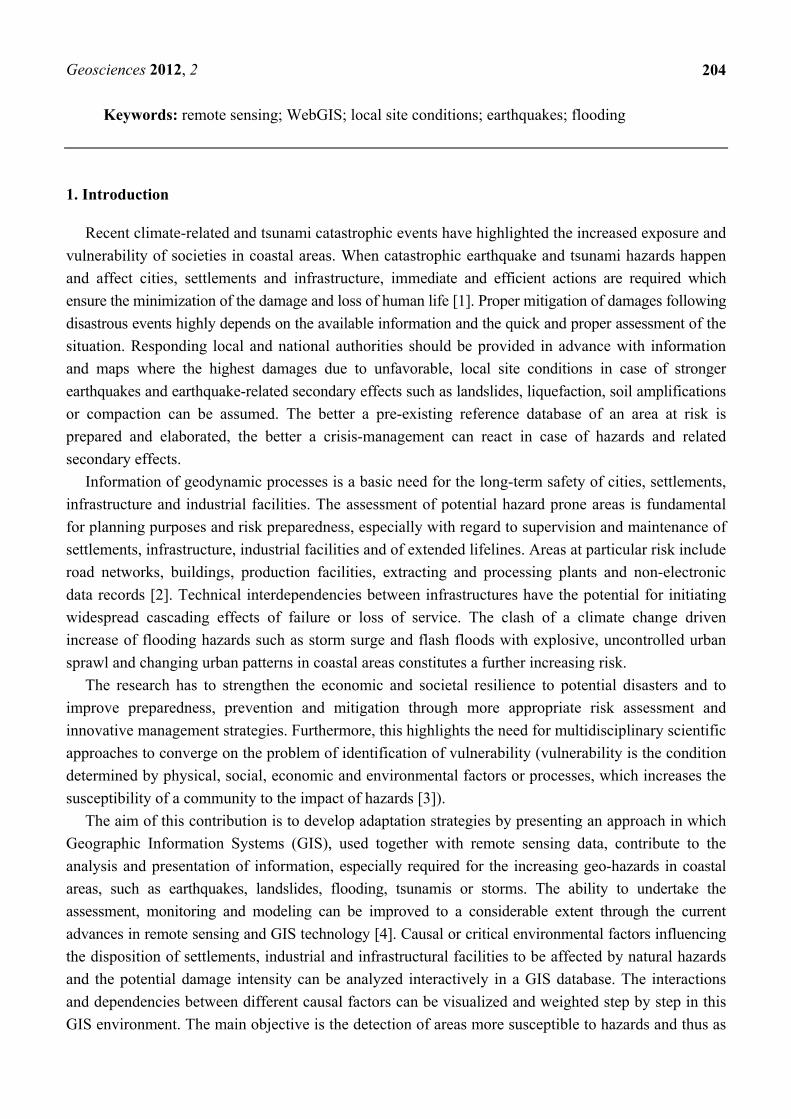
Abstract: For civil protection reasons there is a strong need to improve the inventory of areas
that are more vulnerable to earthquake ground motions or to earthquake-related secondary
effects, such as landslides, liquefaction or soil amplifications. The use of remote sensing and
Geographic Information Systems (GIS) methods along with the related geo-databases can
assist local and national authorities to be better prepared and organized. Remote sensing
and GIS techniques are investigated in north-eastern Greece in order to contribute to the
systematic, standardized inventory of those areas that are more susceptible to earthquake
ground motions, to earthquake-related secondary effects and to tsunami-waves. Knowing
areas with aggregated occurrence of causal (“negative”) factors influencing earthquake shock
and, thus, the damage intensity, this knowledge can be integrated into disaster preparedness
and mitigation measurements. The evaluation of satellite imageries, digital topographic
data and open source geodata contributes to the acquisition of the specific tectonic,
geologic and geomorphologic settings influencing local site conditions in an area and, thus,
estimate possible damage to be suffered.
OPEN ACCESS
Geosciences 2012, 2
204
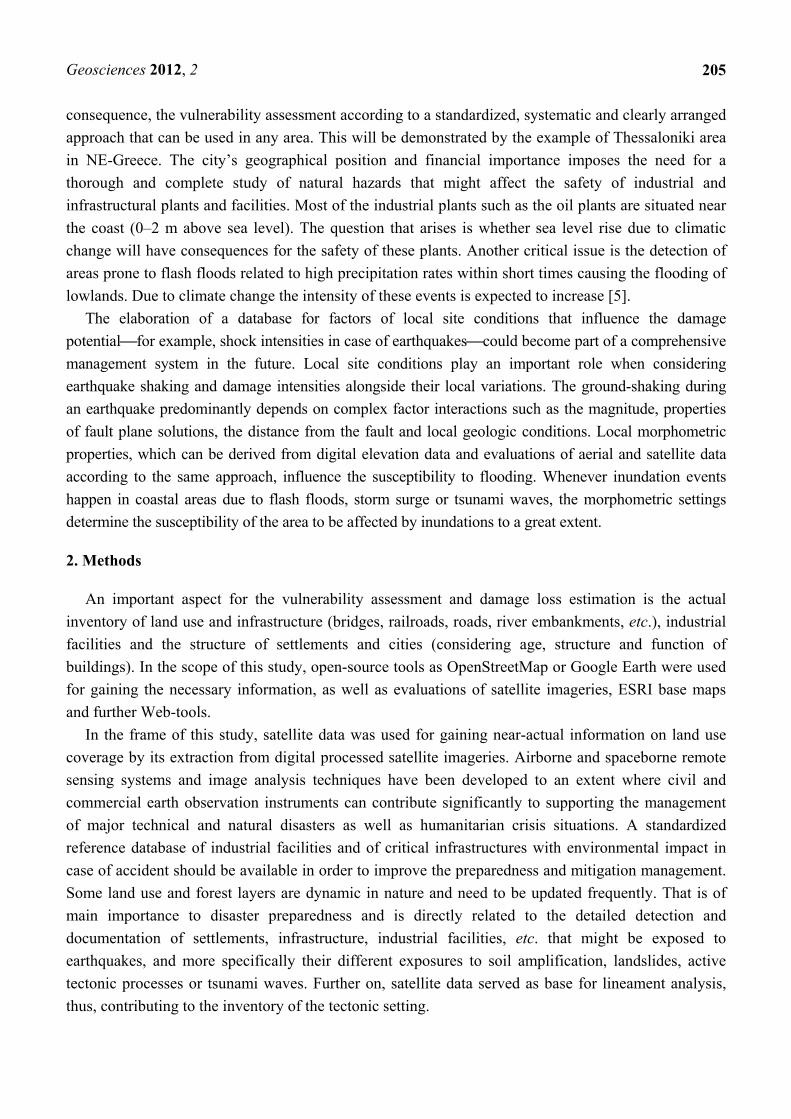
Keywords: remote sensing; WebGIS; local site conditions; earthquakes; flooding
1. Introduction
Recent climate-related and tsunami catastrophic events have highlighted the increased exposure and
vulnerability of societies in coastal areas. When catastrophic earthquake and tsunami hazards happen
and affect cities, settlements and infrastructure, immediate and efficient actions are required which
ensure the minimization of the damage and loss of human life [1]. Proper mitigation of damages following
disastrous events highly depends on the available information and the quick and proper assessment of the
situation. Responding local and national authorities should be provided in advance with information
and maps where the highest damages due to unfavorable, local site conditions in case of stronger
earthquakes and earthquake-related secondary effects such as landslides, liquefaction, soil amplifications
or compaction can be assumed. The better a pre-existing reference database of an area at risk is
prepared and elaborated, the better a crisis-management can react in case of hazards and related
secondary effects.
Information of geodynamic processes is a basic need for the long-term safety of cities, settlements,
infrastructure and industrial facilities. The assessment of potential hazard prone areas is fundamental
for planning purposes and risk preparedness, especially with regard to supervision and maintenance of
settlements, infrastructure, industrial facilities and of extended lifelines. Areas at particular risk include
road networks, buildings, production facilities, extracting and processing plants and non-electronic
data records [2]. Technical interdependencies between infrastructures have the potential for initiating
widespread cascading effects of failure or loss of service. The clash of a climate change driven
increase of flooding hazards such as storm surge and flash floods with explosive, uncontrolled urban
sprawl and changing urban patterns in coastal areas constitutes a further increasing risk.
The research has to strengthen the economic and societal resilience to potential disasters and to
improve preparedness, prevention and mitigation through more appropriate risk assessment and
innovative management strategies. Furthermore, this highlights the need for multidisciplinary scientific
approaches to converge on the problem of identification of vulnerability (vulnerability is the condition
determined by physical, social, economic and environmental factors or processes, which increases the
susceptibility of a community to the impact of hazards [3]).
The aim of this contribution is to develop adaptation strategies by presenting an approach in which
Geographic Information Systems (GIS), used together with remote sensing data, contribute to the
analysis and presentation of information, especially required for the increasing geo-hazards in coastal
areas, such as earthquakes, landslides, flooding, tsunamis or storms. The ability to undertake the
assessment, monitoring and modeling can be improved to a considerable extent through the current
advances in remote sensing and GIS technology [4]. Causal or critical environmental factors influencing
the disposition of settlements, industrial and infrastructural facilities to be affected by natural hazards
and the potential damage intensity can be analyzed interactively in a GIS database. The interactions
and dependencies between different causal factors can be visualized and weighted step by step in this
GIS environment. The main objective is the detection of areas more susceptible to hazards and thus as
Geosciences 2012, 2
205
consequence, the vulnerability assessment according to a standardized, systematic and clearly arranged
approach that can be used in any area. This will be demonstrated by the example of Thessaloniki area
in NE-Greece. The city’s geographical position and financial importance imposes the need for a
thorough and complete study of natural hazards that might affect the safety of industrial and
infrastructural plants and facilities. Most of the industrial plants such as the oil plants are situated near
the coast (0–2 m above sea level). The question that arises is whether sea level rise due to climatic
change will have consequences for the safety of these plants. Another critical issue is the detection of
areas prone to flash floods related to high precipitation rates within short times causing the flooding of
lowlands. Due to climate change the intensity of these events is expected to increase [5].
The elaboration of a database for factors of local site conditions that influence the damage
potential⎯for example, shock intensities in case of earthquakes⎯could become part of a comprehensive
management system in the future. Local site conditions play an important role when considering
earthquake shaking and damage intensities alongside their local variations. The ground-shaking during
an earthquake predominantly depends on complex factor interactions such as the magnitude, properties
of fault plane solutions, the distance from the fault and local geologic conditions. Local morphometric
properties, which can be derived from digital elevation data and evaluations of aerial and satellite data
according to the same approach, influence the susceptibility to flooding. Whenever inundation events
happen in coastal areas due to flash floods, storm surge or tsunami waves, the morphometric settings
determine the susceptibility of the area to be affected by inundations to a great extent.
2. Methods
An important aspect for the vulnerability assessment and damage loss estimation is the actual
inventory of land use and infrastructure (bridges, railroads, roads, river embankments, etc.), industrial
facilities and the structure of settlements and cities (considering age, structure and function of
buildings). In the scope of this study, open-source tools as OpenStreetMap or Google Earth were used
for gaining the necessary information, as well as evaluations of satellite imageries, ESRI base maps
and further Web-tools.
In the frame of this study, satellite data was used for gaining near-actual information on land use
coverage by its extraction from digital processed satellite imageries. Airborne and spaceborne remote
sensing systems and image analysis techniques have been developed to an extent where civil and
commercial earth observation instruments can contribute significantly to supporting the management
of major technical and natural disasters as well as humanitarian crisis situations. A standardized
reference database of industrial facilities and of critical infrastructures with environmental impact in
case of accident should be available in order to improve the preparedness and mitigation management.
Some land use and forest layers are dynamic in nature and need to be updated frequently. That is of
main importance to disaster preparedness and is directly related to the detailed detection and
documentation of settlements, infrastructure, industrial facilities, etc. that might be exposed to
earthquakes, and more specifically their different exposures to soil amplification, landslides, active
tectonic processes or tsunami waves. Further on, satellite data served as base for lineament analysis,
thus, contributing to the inventory of the tectonic setting.
Geosciences 2012, 2
206
2.1. Digital Image Processing
Actual land use information was derived from evaluations and classifications of the available
LANDSAT, ASTER and Google Earth data, in addition to available open-source data such as
open-street-map, Google Earth and ESRI-geodata. An important aspect is the delivery of satellite data in
order to create a most current, high spatial resolution GIS integrated reference database, aiming at
visualizing critical points and areas and providing information about damage in case of emergency due to
natural hazards as fast as possible, as the civil protection units need this information for their management.
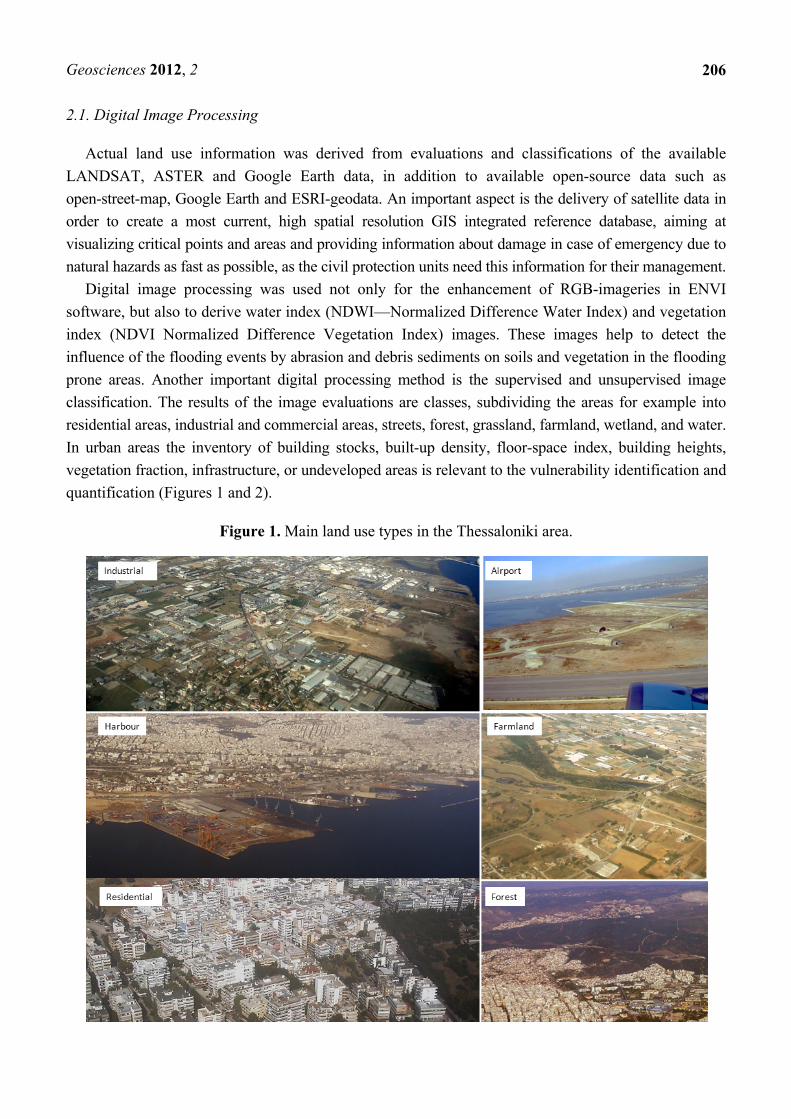
Digital image processing was used not only for the enhancement of RGB-imageries in ENVI
software, but also to derive water index (NDWI—Normalized Difference Water Index) and vegetation
index (NDVI Normalized Difference Vegetation Index) images. These images help to detect the
influence of the flooding events by abrasion and debris sediments on soils and vegetation in the flooding
prone areas. Another important digital processing method is the supervised and unsupervised image
classification. The results of the image evaluations are classes, subdividing the areas for example into
residential areas, industrial and commercial areas, streets, forest, grassland, farmland, wetland, and water.
In urban areas the inventory of building stocks, built-up density, floor-space index, building heights,
vegetation fraction, infrastructure, or undeveloped areas is relevant to the vulnerability identification and
quantification (Figures 1 and 2).
Figure 1. Main land use types in the Thessaloniki area.
Geosciences 2012, 2
207
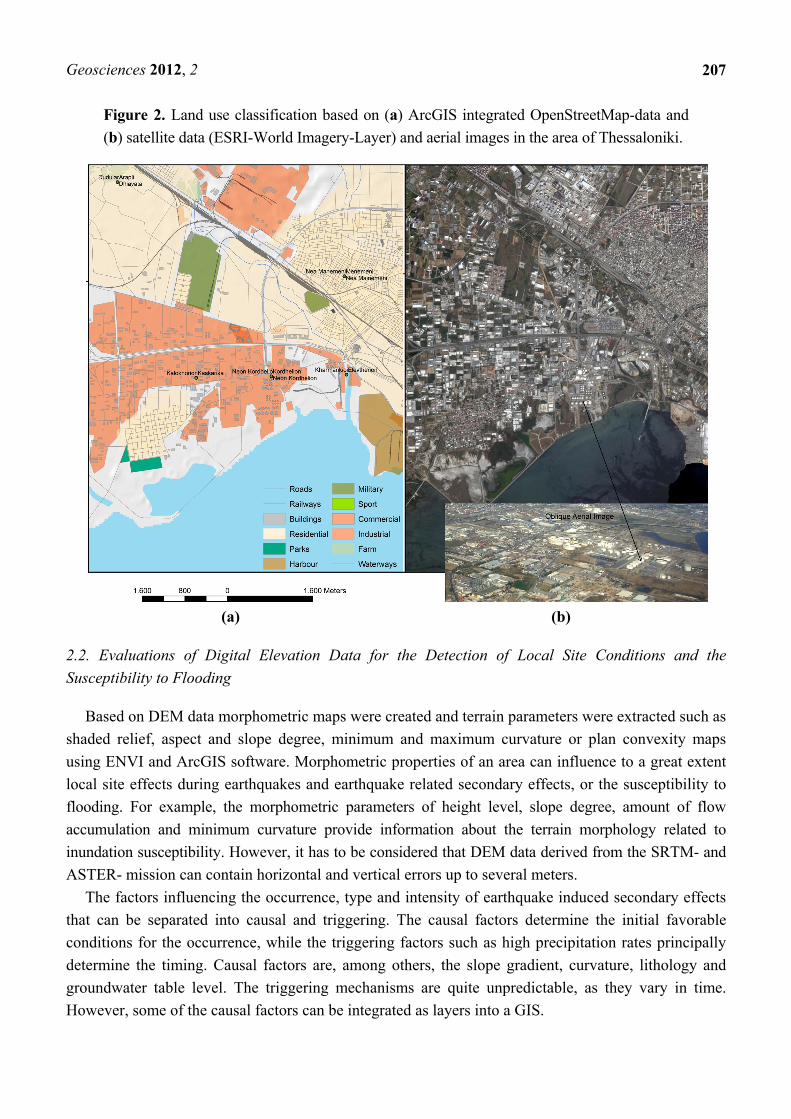
Figure 2. Land use classification based on (a) ArcGIS integrated OpenStreetMap-data and
(b) satellite data (ESRI-World Imagery-Layer) and aerial images in the area of Thessaloniki.
(a) (b)
2.2. Evaluations of Digital Elevation Data for the Detection of Local Site Conditions and the
Susceptibility to Flooding
Based on DEM data morphometric maps were created and terrain parameters were extracted such as
shaded relief, aspect and slope degree, minimum and maximum curvature or plan convexity maps
using ENVI and ArcGIS software. Morphometric properties of an area can influence to a great extent
local site effects during earthquakes and earthquake related secondary effects, or the susceptibility to
flooding. For example, the morphometric parameters of height level, slope degree, amount of flow
accumulation and minimum curvature provide information about the terrain morphology related to
inundation susceptibility. However, it has to be considered that DEM data derived from the SRTM- and
ASTER- mission can contain horizontal and vertical errors up to several meters.
The factors influencing the occurrence, type and intensity of earthquake induced secondary effects
that can be separated into causal and triggering. The causal factors determine the initial favorable
conditions for the occurrence, while the triggering factors such as high precipitation rates principally
determine the timing. Causal factors are, among others, the slope gradient, curvature, lithology and
groundwater table level. The triggering mechanisms are quite unpredictable, as they vary in time.
However, some of the causal factors can be integrated as layers into a GIS.
Geosciences 2012, 2
208
The influence of causal factors on earthquake ground motion is not equally important in the
analysis. It varies according to the specific local settings (surface geology, structure) or according to
the distance of the earthquake source. The percentage of influence of one factor also changes in
consideration of seasonal and climatic factors. In very hot and dry seasons the risk of liquefaction and
landslides is generally lower than in wet seasons with high precipitation.
The integration of different factors in a GIS environment using weighting procedures serves as one
of the key objectives in the GIS application in the frame of this study. The weighted overlay method
takes into consideration the relative importance of the parameters and the classes belonging to each
parameter (ESRI, online support in ArcGIS). For example, as a stronger earthquake during a wet
season will probably cause more secondary effects than during a dry season, the percentage of the
weight of the different factors has to be adjusted to seasonal effects and to the local geomorphologic
and geologic settings.
The application of a weight-linear-combination in susceptibility assessment has been identified as a
semi-quantitative method, involving both expert evaluation and the idea of ranking and weighting
factors. The basic pre-requisite for the use of weighting tools of GIS is the determination of weights
and rating values representing the relative importance of factors and their categories. The efficacy of
the weighted overlay-method lies in the fact that human judgments can be incorporated in the analysis.
The weights and ratings are determined using the expert’s subjective knowledge. The method starts by
assigning an arbitrary weight to the most important criterion (highest percentage), as well as to the
least important attribute according to the relative importance of parameters.
The sum over all the causal factors/layers that can be included into GIS provides some information
about the susceptibility to the amplification of seismic signals. This susceptibility is calculated by adding
every layer, as described below, to a weighted influence and summing all layers. After weighing (in %)
the factors according to their probable influence on ground shaking, susceptibility maps can be
elaborated, where those areas are considered as being more susceptible to higher earthquake shock
intensities, where “negative” causal factors occur aggregated and are interfering with each other.
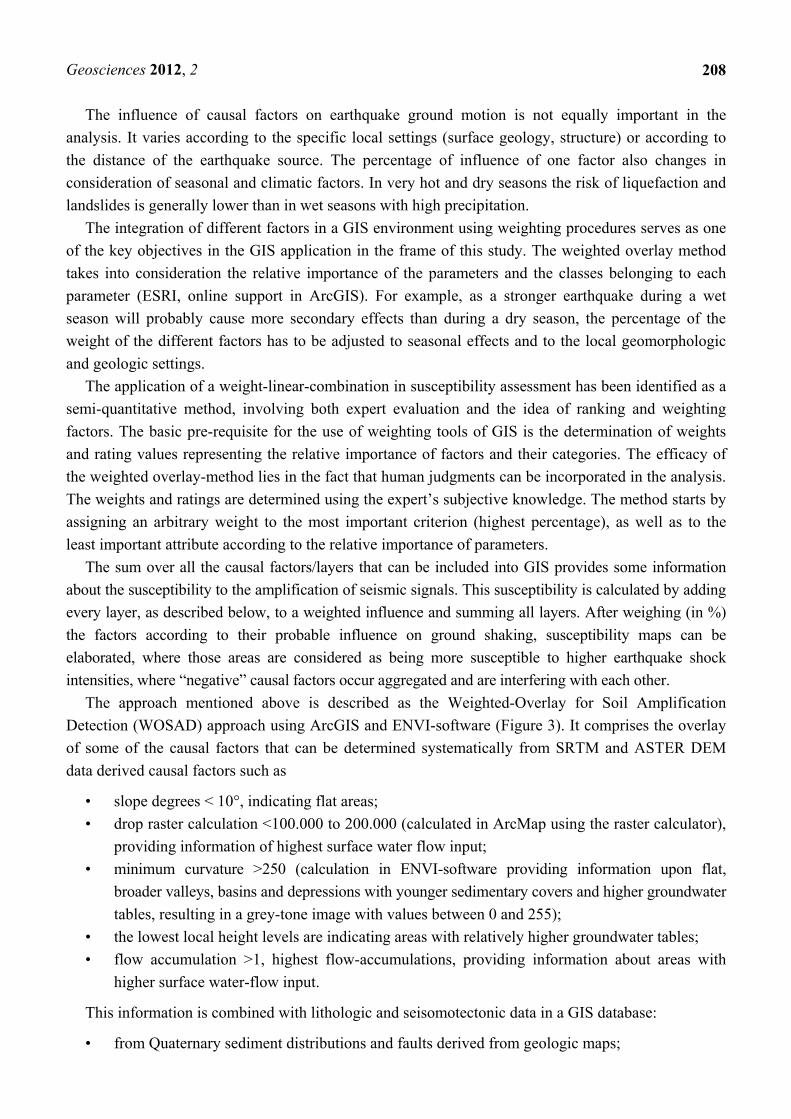
The approach mentioned above is described as the Weighted-Overlay for Soil Amplification
Detection (WOSAD) approach using ArcGIS and ENVI-software (Figure 3). It comprises the overlay
of some of the causal factors that can be determined systematically from SRTM and ASTER DEM
data derived causal factors such as
• slope degrees < 10°, indicating flat areas;
• drop raster calculation <100.000 to 200.000 (calculated in ArcMap using the raster calculator),
providing information of highest surface water flow input;
• minimum curvature >250 (calculation in ENVI-software providing information upon flat,
broader valleys, basins and depressions with younger sedimentary covers and higher groundwater
tables, resulting in a grey-tone image with values between 0 and 255);
• the lowest local height levels are indicating areas with relatively higher groundwater tables;
• flow accumulation >1, highest flow-accumulations, providing information about areas with
higher surface water-flow input.
This information is combined with lithologic and seisomotectonic data in a GIS database:
• from Quaternary sediment distributions and faults derived from geologic maps;
Geosciences 2012, 2
209
• from lineaments derived visually from LANDSAT ETM+ and RapidEye imageries;
• from earthquake data downloaded from International Earthquake Centres (International
Seismological Centre, ISC, US Geological Survey, USGS, etc.);
• Vs30-IDW-interpolation (data from USGS);
• Shake maps, macroseismic observation records and further available data.
Figure 3. Workflow for the weighted overlay approach aggregating factors with influence
on local site conditions.
The different factors were converted into ESRI-GRID-integer format and summarized/aggregated and
weighed in % in the weighted overlay-tool of ArcGIS according to their estimated influence on the local
specific conditions. Those areas are considered to be more susceptible to soil amplification wherein the
following causal factors are summarizing and aggregating their effects: lowest height level of the terrain
combined with relatively high groundwater tables, flat morphology with low slope gradients and no
curvature, loose sedimentary covers within a basin topography or within flat coastal areas.
The resulting maps are divided into susceptibility classes. The susceptibility to soil amplification is
classified by values from 0 to 6, wherein the value 6 is standing for the strongest, assumed
susceptibility to soil amplification due to the aggregation of causal factors. Comparing the results of
the weighted overlay-calculations with geologic maps, there is a clearly visible coincidence of areas
with higher susceptibility values and the outcrop of unconsolidated, quaternary sediments in broader
valleys and depressions.
Geosciences 2012, 2
210
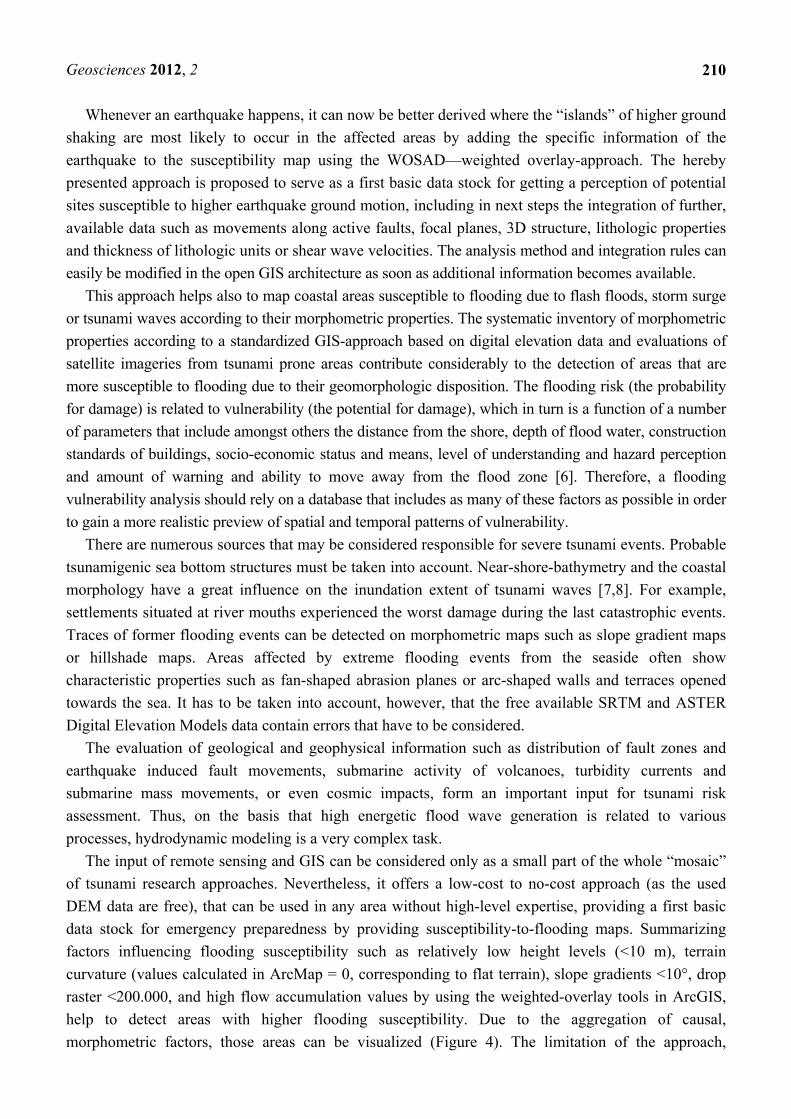
Whenever an earthquake happens, it can now be better derived where the “islands” of higher ground
shaking are most likely to occur in the affected areas by adding the specific information of the
earthquake to the susceptibility map using the WOSAD—weighted overlay-approach. The hereby
presented approach is proposed to serve as a first basic data stock for getting a perception of potential
sites susceptible to higher earthquake ground motion, including in next steps the integration of further,
available data such as movements along active faults, focal planes, 3D structure, lithologic properties
and thickness of lithologic units or shear wave velocities. The analysis method and integration rules can
easily be modified in the open GIS architecture as soon as additional information becomes available.
This approach helps also to map coastal areas susceptible to flooding due to flash floods, storm surge
or tsunami waves according to their morphometric properties. The systematic inventory of morphometric
properties according to a standardized GIS-approach based on digital elevation data and evaluations of
satellite imageries from tsunami prone areas contribute considerably to the detection of areas that are
more susceptible to flooding due to their geomorphologic disposition. The flooding risk (the probability
for damage) is related to vulnerability (the potential for damage), which in turn is a function of a number
of parameters that include amongst others the distance from the shore, depth of flood water, construction
standards of buildings, socio-economic status and means, level of understanding and hazard perception
and amount of warning and ability to move away from the flood zone [6]. Therefore, a flooding
vulnerability analysis should rely on a database that includes as many of these factors as possible in order
to gain a more realistic preview of spatial and temporal patterns of vulnerability.
There are numerous sources that may be considered responsible for severe tsunami events. Probable
tsunamigenic sea bottom structures must be taken into account. Near-shore-bathymetry and the coastal
morphology have a great influence on the inundation extent of tsunami waves [7,8]. For example,
settlements situated at river mouths experienced the worst damage during the last catastrophic events.
Traces of former flooding events can be detected on morphometric maps such as slope gradient maps
or hillshade maps. Areas affected by extreme flooding events from the seaside often show
characteristic properties such as fan-shaped abrasion planes or arc-shaped walls and terraces opened
towards the sea. It has to be taken into account, however, that the free available SRTM and ASTER
Digital Elevation Models data contain errors that have to be considered.
The evaluation of geological and geophysical information such as distribution of fault zones and
earthquake induced fault movements, submarine activity of volcanoes, turbidity currents and
submarine mass movements, or even cosmic impacts, form an important input for tsunami risk
assessment. Thus, on the basis that high energetic flood wave generation is related to various
processes, hydrodynamic modeling is a very complex task.
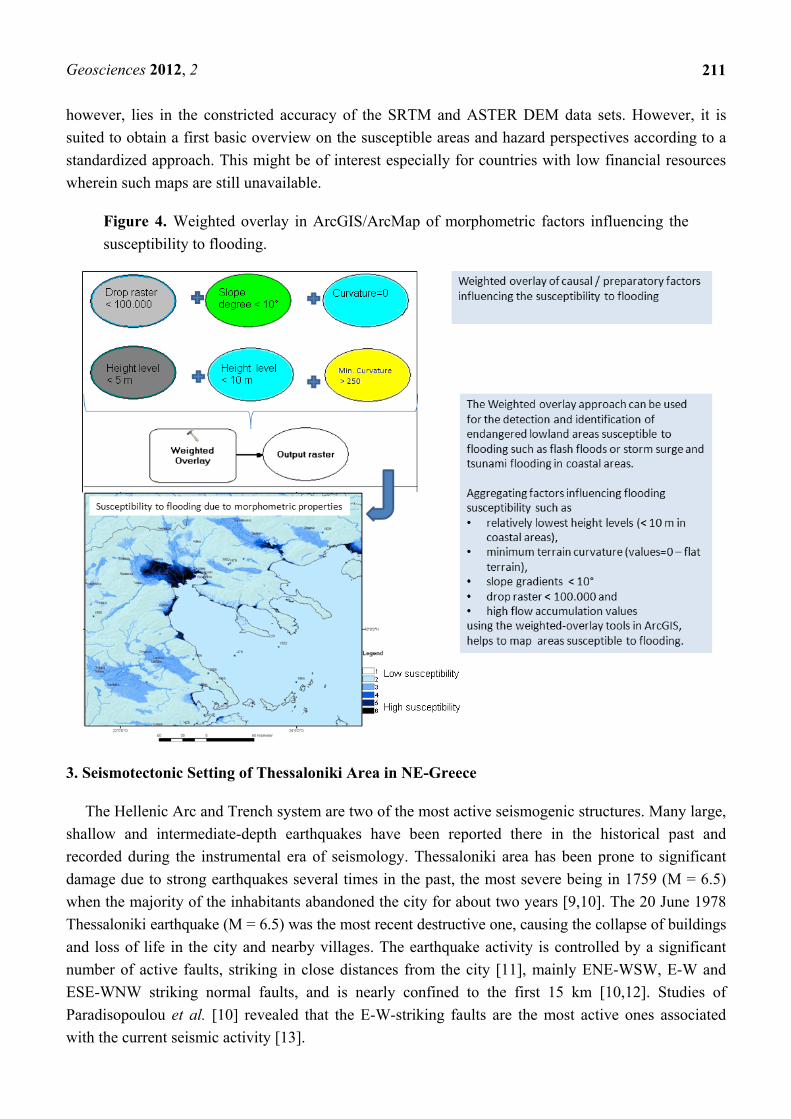
The input of remote sensing and GIS can be considered only as a small part of the whole “mosaic”
of tsunami research approaches. Nevertheless, it offers a low-cost to no-cost approach (as the used
DEM data are free), that can be used in any area without high-level expertise, providing a first basic
data stock for emergency preparedness by providing susceptibility-to-flooding maps. Summarizing
factors influencing flooding susceptibility such as relatively low height levels (<10 m), terrain
curvature (values calculated in ArcMap = 0, corresponding to flat terrain), slope gradients <10°, drop
raster <200.000, and high flow accumulation values by using the weighted-overlay tools in ArcGIS,
help to detect areas with higher flooding susceptibility. Due to the aggregation of causal,
morphometric factors, those areas can be visualized (Figure 4). The limitation of the approach,
Geosciences 2012, 2
211
however, lies in the constricted accuracy of the SRTM and ASTER DEM data sets. However, it is
suited to obtain a first basic overview on the susceptible areas and hazard perspectives according to a
standardized approach. This might be of interest especially for countries with low financial resources
wherein such maps are still unavailable.
Figure 4. Weighted overlay in ArcGIS/ArcMap of morphometric factors influencing the
susceptibility to flooding.
3. Seismotectonic Setting of Thessaloniki Area in NE-Greece
The Hellenic Arc and Trench system are two of the most active seismogenic structures. Many large,
shallow and intermediate-depth earthquakes have been reported there in the historical past and
recorded during the instrumental era of seismology. Thessaloniki area has been prone to significant
damage due to strong earthquakes several times in the past, the most severe being in 1759 (M = 6.5)
when the majority of the inhabitants abandoned the city for about two years [9,10]. The 20 June 1978
Thessaloniki earthquake (M = 6.5) was the most recent destructive one, causing the collapse of buildings
and loss of life in the city and nearby villages. The earthquake activity is controlled by a significant
number of active faults, striking in close distances from the city [11], mainly ENE-WSW, E-W and
ESE-WNW striking normal faults, and is nearly confined to the first 15 km [10,12]. Studies of
Paradisopoulou et al. [10] revealed that the E-W-striking faults are the most active ones associated
with the current seismic activity [13].
Geosciences 2012, 2
212
4. Susceptibility to Soil Amplification in Thessaloniki Area in NE-Greece
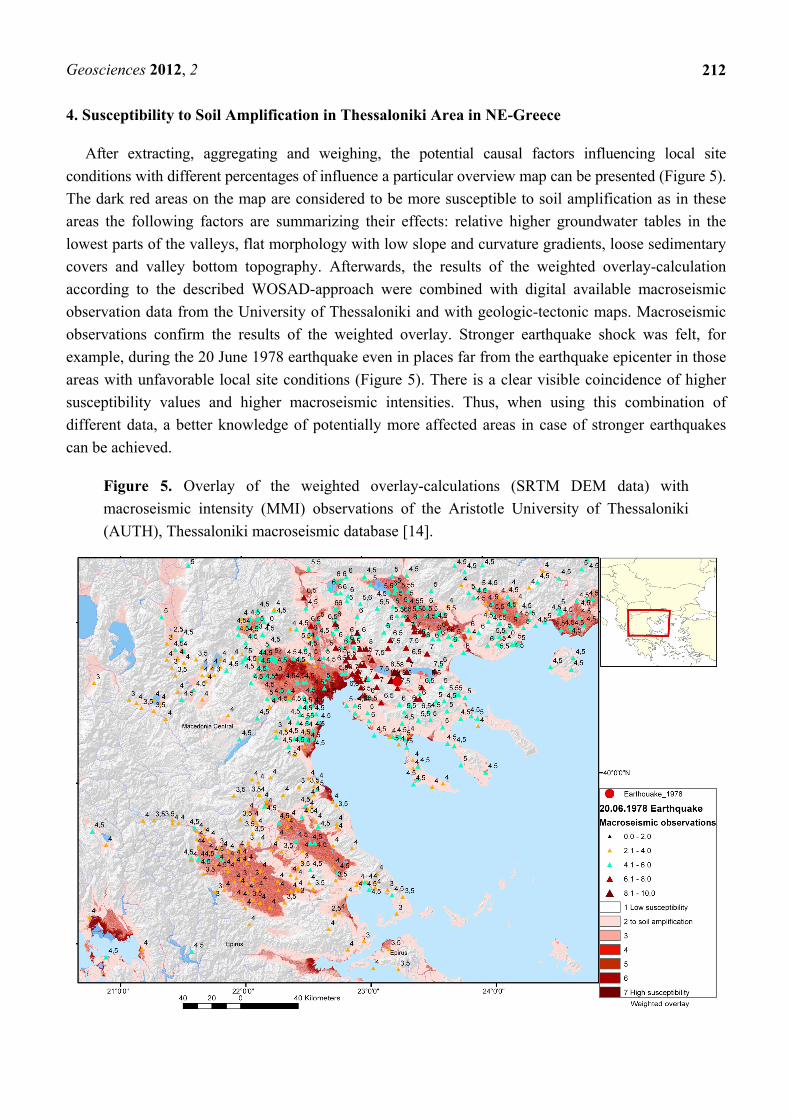
After extracting, aggregating and weighing, the potential causal factors influencing local site
conditions with different percentages of influence a particular overview map can be presented (Figure 5).
The dark red areas on the map are considered to be more susceptible to soil amplification as in these
areas the following factors are summarizing their effects: relative higher groundwater tables in the
lowest parts of the valleys, flat morphology with low slope and curvature gradients, loose sedimentary
covers and valley bottom topography. Afterwards, the results of the weighted overlay-calculation
according to the described WOSAD-approach were combined with digital available macroseismic
observation data from the University of Thessaloniki and with geologic-tectonic maps. Macroseismic
observations confirm the results of the weighted overlay. Stronger earthquake shock was felt, for
example, during the 20 June 1978 earthquake even in places far from the earthquake epicenter in those
areas with unfavorable local site conditions (Figure 5). There is a clear visible coincidence of higher
susceptibility values and higher macroseismic intensities. Thus, when using this combination of
different data, a better knowledge of potentially more affected areas in case of stronger earthquakes
can be achieved.
Figure 5. Overlay of the weighted overlay-calculations (SRTM DEM data) with
macroseismic intensity (MMI) observations of the Aristotle University of Thessaloniki
(AUTH), Thessaloniki macroseismic database [14].
Geosciences 2012, 2
213
The method described in the present paper, aiming at detecting local site conditions that influence
earthquake events, has been implemented as a pilot application in a comprehensive disaster
management system. Such a system is the SyNaRMa (System for Natural Risk Management in the
Mediterranean) tool (Figures 6 and 7) which is available online [15] and has been developed in the
frame of an Interreg III B ArchiMed project [16,17].
The SyNaRMa tool is a web GIS that focuses on the three main stages of disaster management, i.e.,
preparedness, response and recovery [18]. A large variety of geodatabases are already stored within the
SyNaRMa system. For example, recent and historical seismicity, faults, epicenters and focal
mechanisms are some of the data included within the system (Figure 8).
The SyNaRMa system serves for GIS analysis, leading to useful conclusions regarding the
susceptibility of specific areas. Moreover, susceptibility maps that result from the current analysis can be
used in order to reveal hazard sites, i.e., sites from which a catastrophic event could start. Furthermore,
the results of remote sensing may be also incorporated within the system. A thorough study of the
possible collapse scenarios for different categories of buildings can be done, as collapse occurrences are
one of the main reasons for closed roads that could cause delays for rescue teams and assistance
personnel to move around or people to run away from their damaged or destroyed residences [19].
Another category of data that can be stored in the GIS system is the vulnerability of existing
buildings to earthquakes so that a prediction can be made in near real-time of the buildings and areas
that could suffer the most damage after the disaster event takes place. In this case, emergency rescue
teams might be sent first to those places situated in areas with higher estimated susceptibility to
earthquake shock and earthquake related secondary effects. Furthermore, the evaluation of the
vulnerability of buildings in combination with earthquake scenarios and population information can
lead to safe estimations regarding the potential human losses. The important ingredients of earthquake
loss estimation are ground motion, direct physical damage to general building stock, casualties as
direct social losses and financial damage estimation. Usually, existing techniques attempt to calculate,
map, and display damage and loss estimates according to particular scenarios. As the estimation of the
vulnerability of all buildings in a city could be a costly procedure that would last for a long period of
time, the priority should be given to public buildings, health facilities and buildings that host the
activities of large number of persons (hospitals, schools, administrative buildings, shopping malls,
theaters, etc.). A rapid visual screening methodology for the evaluation of the seismic capacity of public
buildings within the framework of the SyNaRMa system is based on the procedure proposed by the
Greek Earthquake Planning and Protection Organization (OASP) with enhancements ([20], Figure 9).
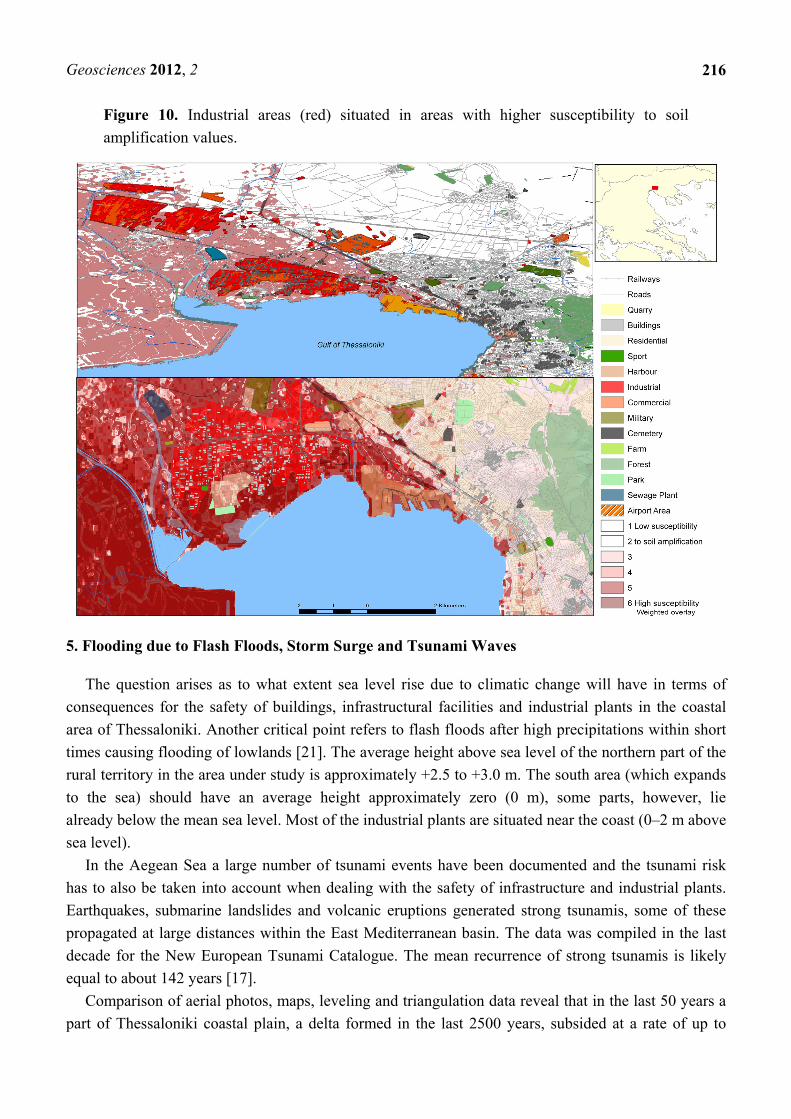
Moreover, industrial facilities situated in areas, where higher susceptibility values (>4) are
calculated and represented in red (Figure 10). 3D perspective views of Thessaloniki region contribute to
a better visualization of those industrial facilities situated in areas with relatively higher susceptibility
to soil amplification.
Finally, in the SyNaRMa system, WebGIS components can be used for the collection and analysis
of real damage to the built environment thus providing valuable information on the behaviour of
buildings and the severity of people’s distress (Figures 9 and 10).
Geosciences 2012, 2
214
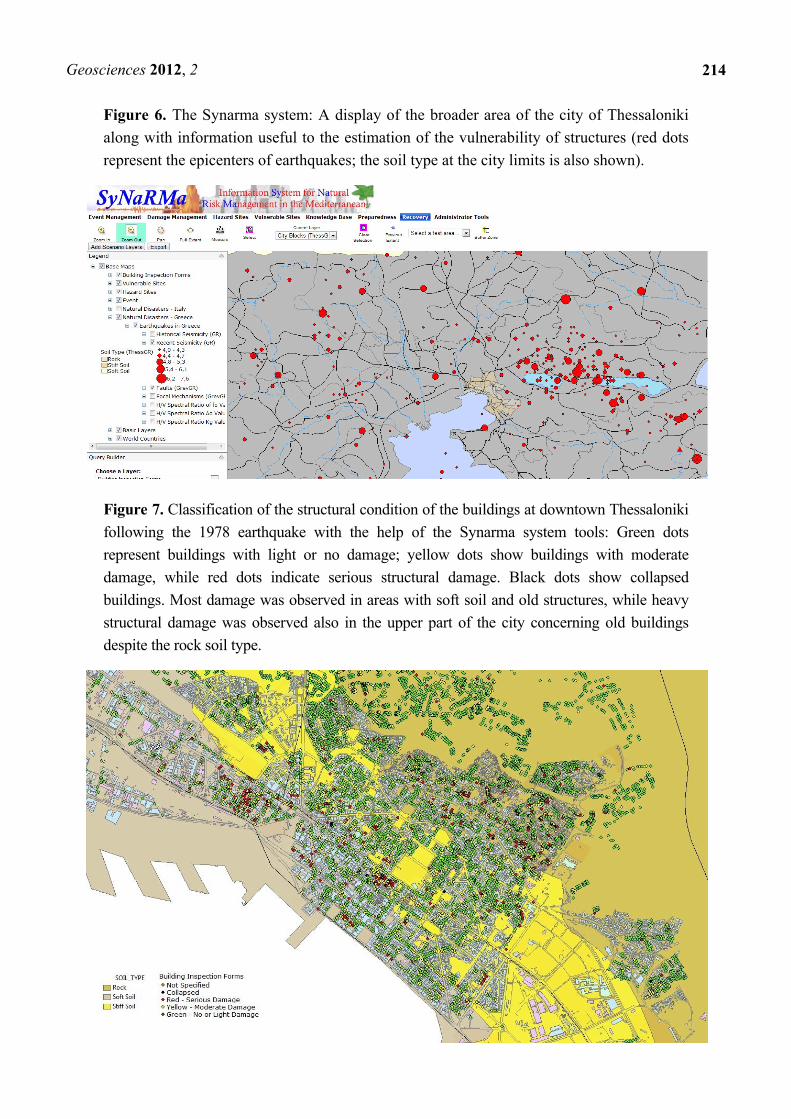
Figure 6. The Synarma system: A display of the broader area of the city of Thessaloniki
along with information useful to the estimation of the vulnerability of structures (red dots
represent the epicenters of earthquakes; the soil type at the city limits is also shown).
Figure 7. Classification of the structural condition of the buildings at downtown Thessaloniki
following the 1978 earthquake with the help of the Synarma system tools: Green dots
represent buildings with light or no damage; yellow dots show buildings with moderate
damage, while red dots indicate serious structural damage. Black dots show collapsed
buildings. Most damage was observed in areas with soft soil and old structures, while heavy
structural damage was observed also in the upper part of the city concerning old buildings
despite the rock soil type.
Geosciences 2012, 2
215
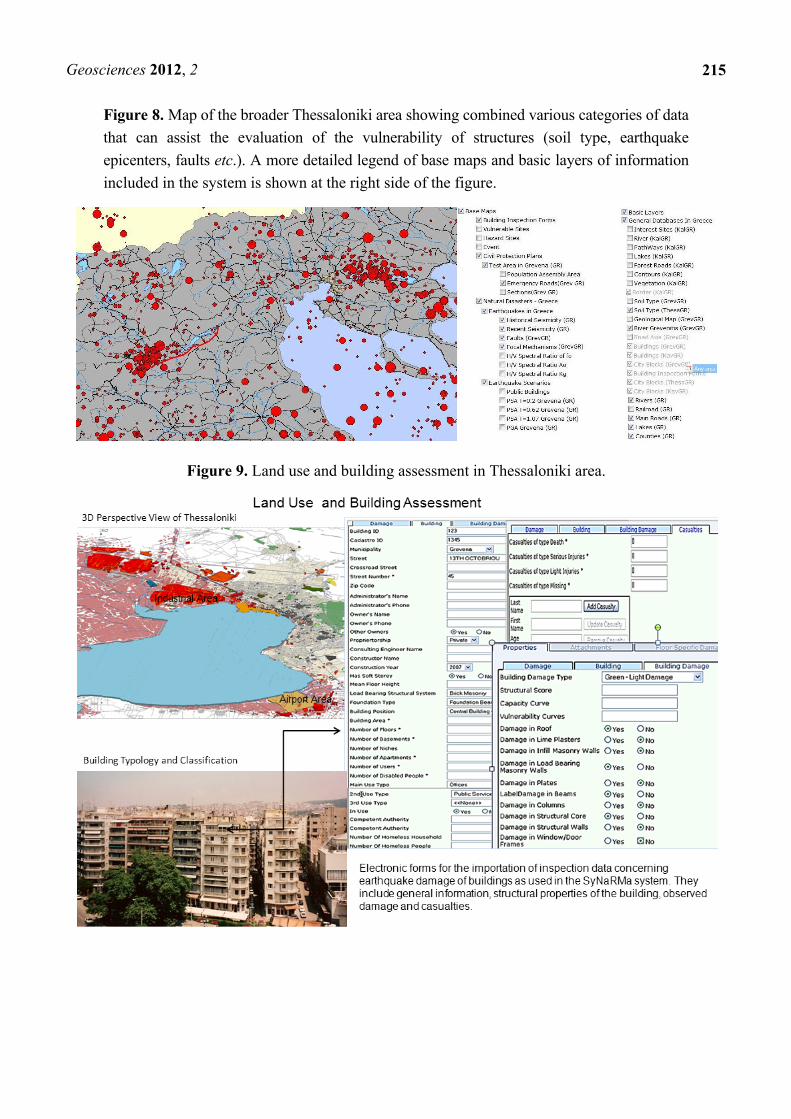
Figure 8. Map of the broader Thessaloniki area showing combined various categories of data
that can assist the evaluation of the vulnerability of structures (soil type, earthquake
epicenters, faults etc.). A more detailed legend of base maps and basic layers of information
included in the system is shown at the right side of the figure.
Figure 9. Land use and building assessment in Thessaloniki area.
Geosciences 2012, 2
216
Figure 10. Industrial areas (red) situated in areas with higher susceptibility to soil
amplification values.
5. Flooding due to Flash Floods, Storm Surge and Tsunami Waves
The question arises as to what extent sea level rise due to climatic change will have in terms of
consequences for the safety of buildings, infrastructural facilities and industrial plants in the coastal
area of Thessaloniki. Another critical point refers to flash floods after high precipitations within short
times causing flooding of lowlands [21]. The average height above sea level of the northern part of the
rural territory in the area under study is approximately +2.5 to +3.0 m. The south area (which expands
to the sea) should have an average height approximately zero (0 m), some parts, however, lie
already below the mean sea level. Most of the industrial plants are situated near the coast (0–2 m above
sea level).
In the Aegean Sea a large number of tsunami events have been documented and the tsunami risk
has to also be taken into account when dealing with the safety of infrastructure and industrial plants.
Earthquakes, submarine landslides and volcanic eruptions generated strong tsunamis, some of these
propagated at large distances within the East Mediterranean basin. The data was compiled in the last
decade for the New European Tsunami Catalogue. The mean recurrence of strong tsunamis is likely
equal to about 142 years [17].
Comparison of aerial photos, maps, leveling and triangulation data reveal that in the last 50 years a
part of Thessaloniki coastal plain, a delta formed in the last 2500 years, subsided at a rate of up to
Geosciences 2012, 2
217
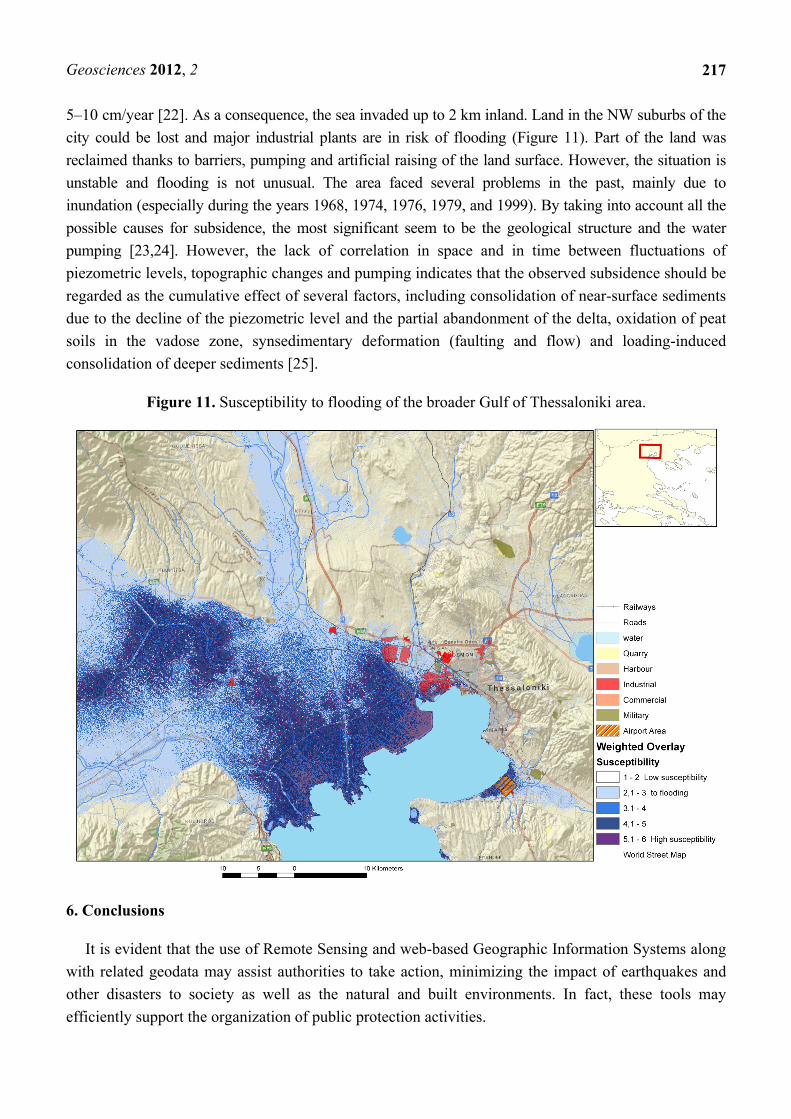
5–10 cm/year [22]. As a consequence, the sea invaded up to 2 km inland. Land in the NW suburbs of the
city could be lost and major industrial plants are in risk of flooding (Figure 11). Part of the land was
reclaimed thanks to barriers, pumping and artificial raising of the land surface. However, the situation is
unstable and flooding is not unusual. The area faced several problems in the past, mainly due to
inundation (especially during the years 1968, 1974, 1976, 1979, and 1999). By taking into account all the
possible causes for subsidence, the most significant seem to be the geological structure and the water
pumping [23,24]. However, the lack of correlation in space and in time between fluctuations of
piezometric levels, topographic changes and pumping indicates that the observed subsidence should be
regarded as the cumulative effect of several factors, including consolidation of near-surface sediments
due to the decline of the piezometric level and the partial abandonment of the delta, oxidation of peat
soils in the vadose zone, synsedimentary deformation (faulting and flow) and loading-induced
consolidation of deeper sediments [25].
Figure 11. Susceptibility to flooding of the broader Gulf of Thessaloniki area.
6. Conclusions
It is evident that the use of Remote Sensing and web-based Geographic Information Systems along
with related geodata may assist authorities to take action, minimizing the impact of earthquakes and
other disasters to society as well as the natural and built environments. In fact, these tools may
efficiently support the organization of public protection activities.
Geosciences 2012, 2
218
The nearly world-wide available SRTM and ASTER-DEM data and LANDSAT imageries support
a standardized, low- to no-cost approach for the detection of some of the surface-near, causal factors of
local site conditions influencing earthquake shock and damage intensity as well as of factors
influencing earthquake-related secondary effects. Aggregating factors influencing the surface-near
earthquake ground motion intensities in a GIS environment allow a first overview of areas with a
likely higher susceptibility to soil amplification. Thus, remote sensing data and GIS integrated
evaluation and analysis can contribute to a better planning of cost and time-intensive geotechnical
measurements that are important to consider. The more geotechnical site data that exists, the better and
more detailed the resulting susceptibility maps will be. The advantage of GIS is that the system is open
and additional data can be integrated as layers as soon as additional data is available. Furthermore, RS
data and results can be combined with updateable and dynamic scenarios for earthquakes and more
categories of data in the geodatabases of a WebGIS system assisting the procedure of preparedness and
increasing the sufficient organization and effectiveness of response and recovery activities. Finally,
WebGIS components can be used for the collection and analysis of real damage to the built environment
in case of stronger earthquakes and related secondary effects, thus, providing valuable information on
the behaviour of buildings and the cost of repair and re-habilitation procedures.
Acknowledgments
The support of EU, FP7, Large Collaborative Research Project, IRIS–Integrated European Industrial
Risk Reduction System, CP-IP 213968-2 as well as of the European Regional Development Fund under
the EU Community Initiative Program INTERREG III B ARCHIMED (Project SyNaRMa—Information
System for Natural Risk Management in the Mediterranean), is kindly acknowledged.
References
1. Mas, E.; Koshimura, S.; Suppasri, A.; Matsuoka, M.; Matsuyama, M.; Yoshii, T.; Jimenez, C.;
Yamazaki, F.; Imamura, F. Developing Tsunami fragility curves using remote sensing and survey
data of the 2010 Chilean Tsunami in Dichato. Nat. Hazards Earth Syst. Sci. 2012, 12, 2689–2697.
2. National Strategy for Critical Infrastructure Protection (CIP Strategy); Federal Ministry of the
Interior, Federal Republic of Germany: Berlin, Germany, 2009. Available online:
http://www.bmi.bund.de/cae/servlet/contentblob/598732/publicationFile/34423/kritis_englisch.pdf
(accessed on 24 July 2012).
3. United Nations International Strategy for Disaster Reduction Secretariat (UNISDR). Living with
Risk: A Global Review of Disaster Reduction Initiatives; UNISDR: Geneva, Switzerland, 2004;
Volume 2. Available online: http://www.unisdr.org/files/657_lwr21.pdf (accessed on 24 July 2012).
4. Theilen-Willige, B.; Papadopoulou, I.D.; Savvaidis, P.; Tziavos, I.N. Use of Remote Sensing and
GIS methods for mitigating the impact of earthquakes in cities. In Proceedings of the International
Congress Natural Cataclysms and Global Problems of the Modern Civilization—GeoCataclysm,
Istanbul, Turkey, 19–21 September 2011; International Committee on issues of Global Changes
of the Geological Environment: Munich, Germany, 2012; pp. 587–596.
Geosciences 2012, 2
219
5. Field, C.B.; Barros, V.; Stocker, T.F.; Qin, D.; Dokken, J.; Ebi, K.L.; Mastrandrea, M.D.;
Mach, K.J.; Plattner, G.-K.; Allen, S.K.; et al. IPCC: Managing the Risks of Extreme Events and
Disasters to Advance Climate Change Adaptation; A Special Report of Working Groups I and II
of the Intergovernmental Panel on Climate Change; Cambridge University Press: Cambridge,
UK, 2012.
6. Papathoma, M.; Dominey-Howes, D.; Zong, Y.; Smith, D. Assessing tsunami vulnerability, an
example from Herakleio, Crete. Nat. Hazards Earth Sys. Sci. 2003, 3, 377–389.
7. Szczuciński, W.; Chaimanee, N.; Niedzielski, P.; Rachlewicz, G.; Saisuttichai, D.; Tepsuwan, T.;
Lorenc, S.; Siepak, J. Environmental and geological impacts of the 26 December 2004 Tsunami in
coastal zone of Thailand—Overview of short and long-term effects. Pol. J. Environ. Stud. 2006,
15, 793–810.
8. Szczuciński, W.; Niedzielski, P.; Kozak, L.; Frankowski, M.; Ziola, A.; Lorenc, S. Effects of
rainy season on mobilization of contaminants from tsunami deposits left in a coastal zone of
Thailand by the 26 December 2004 tsunami. Environ. Geol. 2007, 53, 253–264.
9. Papadopoulos, G.A.; Daskalaki, E.; Fokaefs, A.; Giraleas, N. Tsunami hazards in the Eastern
Mediterranean: Strong earthquakes and tsunamis in the East Hellenic Arc and Trench system. Nat.
Hazards Earth Sys. 2007, 7, 57–64.
10. Paradisopoulou, P.M.; Karakostas, V.G.; Papadimitriou, E.E.; Tranos, M.D.; Papazachos, C.B.;
Karakaisis, G.F. Microearthquake study of the broader Thessaloniki area (Northern Greece). Ann.
Geophys. 2006, 49, 1081–1093.
11. Papazachos, B.C.; Mountrakis, D.M.; Papazachos, C.B.; Tranos, M.D.; Karakaisis, G.F.;
Savvaidis, A.S. The fault which have caused the known major earthquakes in Greece and
surrounding region between the 5th century BC and today. In Proceedings of 2nd National
Conference Anti-Seismic Engineering and Technical Seismology, Thessaloniki, Greece, 28–30
November 2001; Technical Chamber of Greece; Aristotle University of Thessaloniki: Athens,
Greece, 2001; pp. 17–26.
12. Skarlatoudis, A.A.; Papazachos, C.B.; Moczo, P.; Kristek, J.; Theodoulidis, N.; Apostolidis, P.
Evaluation of ground motion simulations for the city of Thessaloniki, Greece using the FD
method: The role of site effects and focal mechanism at short epicentral distances. Geophys. Res.
Abstr. 2007, 9, 10335:1–10335:2.
13. Tranos, M.D.; Papadimitriou, Ε.Ε.; Kilias, A.A. Thessaliniki-Gerakarou Fault Zone (TGFZ): The
western extension of the 1978 Thessaloniki earthquake fault (Northern Greece) and seismic
hazard assessment. J. Struct. Geol. 2003, 25, 2109–2123.
14. AUTH Thessaloniki Macroseismic Database. Available online: http://www.emidius.eu/AUTH/
query_eq/?eq_group=1901_1999 (accessed on 24 July 2012).
15. SyNaRMa Home Page. Available online: http://gserver.civil.auth.gr/synarma (accessed on 17
September 2012).
16. Doukas, I.D.; Savvaidis, P.; Tziavos, I.N.; Grigoriadis, V.N.; Papadopoulou, I.; Vavassis, I. The
use of a Web-based GIS for the management of databases related to natural disasters. Geod.
Cartogr. 2007, 56, 37–52.
17. Papadopoulou, I.D.; Savvaidis, P.; Tziavos, I.N. Using the SyNaRMa system as a disaster
management tool. Nat. Hazards 2011, 57, 453–464.
Geosciences 2012, 2
220
18. Grigoriadis, V.N.; Papadopoulou, I.D.; Spyridaki, P.; Doukas, I.D.; Tziavos, I.N.; Savvaidis, P.
Presentation of a Web-based GIS system for the management of natural disasters. In Proceedings
of Studying, Modeling and Sense Making of Planet Earth, Mytilene, Greece, 1–6 June, 2008;
University of the Aegean: Mytilene, Greece, 2008. Available Online: http://www.geo.aegean.gr/
earth-conference2008/papers/papers/ A06ID092.pdf (accessed on 21 September 2012).
19. Spyridaki, P.; Papadopoulou, I.D.; Grigoriadis, V.N.; Tziavos, I.N.; Savvaidis, P. Methodology
for identification of emergency assembly areas and road network in cities using GIS tools.
In Proceedings of the 9th International Multidisciplinary Scientific GeoConference (SGEM),
Albena, Bulgaria, 14–19 June, 2009; SGEM Geoconferences: Sofia, Boulgaria, 2009; Volume II,
pp. 135–142.
20. Karakostas, C.; Lekidis, V.; Salonikios, T.; Makarios, T.; Sous, I. Rapid visual screening of public
buildings in the town of Grevena within a natural risk management system. In Proceedings of 3rd
Panhellenic Congress on Earthquake Engineering and Engineering Seismology, Athens, Greece,
5–7 November 2008; Technical Chamber of Greece: Athens, Greece, 2008; Paper No. 1985,
pp. 1–14. Available Online: http://library.tee.gr/digital/m2368/m2368_karakostas1.pdf (accessed
on 21 September 2012).
21. Savvaidis, D. Towards an Effective EU Approach for Managing Floods in European Cities: The
Thessaloniki Case Study. Master’s Thesis, University of Bradford, West Yorkshire, UK, 2008.
22. Doukas, I.D.; Ifadis, I.M.; Savvaidis, P. Monitoring and analysis of ground subsidence due to
water pumping in the area of Thessaloniki, Hellas. In Proceedings of FIG Working Week,
TS16.4—Deformation Measurements and Analysis, Athens, Greece, 22–27 May 2004;
International Federation of Surveyors: Copenhagen, Denmark, 2004; pp. 1–14.
23. Metzger, F.L.; Ikehara, M.E.; Howle, F.J. Vertical-Deformation, Water-Level, Microgravity,
Geodetic, Water-Chemistry, and Flow-Rate Data Collected during Injection, Storage, and
Recovery Tests at Lancaster, Antelope Valley, California, September 1995 through September
1998; Open-File Report 01-414; U.S. Geological Survey: Sacramento, CA, USA, 2001.
24. Stiros, S.; Psimoulis, P. Measurement of Land Subsidence Based on GPS and Historical Geodetic
Data. In 2008-2012 UNAVCO Proposal: Geodesy Advancing Earth Science Research; UNAVCO:
Boulder, CO, USA, 2007; pp. 3–140. Available Online: http://www.unavco.org/pubs_reports/
proposals/2007/facility2007/section3/UNV-GRID-SPREAD-R.pdf (accessed on 17 September 2012).
25. Stiros, S. Rapid subsidence of the Thessaloniki (Northern Greece) coastal plain, 1960–1999. Eng.
Geol. 2001, 61, 243–256.
© 2012 by the authors; licensee MDPI, Basel, Switzerland. This article is an open access article
distributed under the terms and conditions of the Creative Commons Attribution license
(http://creativecommons.org/licenses/by/3.0/).